UNITED STATES
SECURITIES AND EXCHANGE COMMISSION
WASHINGTON, D.C. 20549
FORM N-CSR
CERTIFIED SHAREHOLDER REPORT OF REGISTERED
MANAGEMENT INVESTMENT COMPANIES
Investment Company Act file number 811-22208
Valued Advisers Trust
(Exact name of registrant as specified in charter)
Huntington Asset Services, Inc. 2960 N. Meridian Street, Suite 300 Indianapolis, IN 46208 |
| (Address of principal executive offices) (Zip code) |
Capitol Services, Inc.
615 S. Dupont Hwy.
Dover, DE 19901
(Name and address of agent for service)
With a copy to:
John H. Lively, Esq.
The Law Offices of John H. Lively & Associates, Inc.,
A member firm of The 1940 Act Law GroupTM
11300 Tomahawk Creek Parkway,
Ste. 310
Leawood, KS 66221
Registrant’s telephone number, including area code: 317-917-7000
Date of fiscal year end: 1/31
Date of reporting period: 7/31/2013
Item 1. Reports to Stockholders.

Golub Group Equity Fund
Semi-Annual Report
July 31, 2013
Fund Adviser:
Golub Group, LLC
1850 Gateway Drive, Suite 100
San Mateo, CA 94404
Toll Free (866) 954-6682
Investment Results – (Unaudited)
| Total Returns* | ||||||||||||||||
| (For the periods ended July 31, 3013) | ||||||||||||||||
| Average Annual | ||||||||||||||||
| Since Inception | ||||||||||||||||
| Six Months | 1 Year | 3 Year | (April 1, 2009) | |||||||||||||
Golub Group Equity Fund | 13.90 | % | 25.85 | % | 15.72 | % | 18.17 | % | ||||||||
S&P 500(R) Index** | 13.73 | % | 25.00 | % | 17.74 | % | 21.39 | % | ||||||||
| Total Annual Operating Expenses, as disclosed in the Fund’s prospectus dated May 30, 2013, were 1.58% of average daily net assets (1.26% after fee waivers/expense reimbursements by the Adviser). Annual Fund Operating Expenses After Fee Waiver/Expense Reimbursements reflect that the Adviser has contractually agreed to waive or limit its fees and to assume other expenses of the Fund until May 31, 2014, so that Total Annual Fund Operating Expenses does not exceed 1.25%. This operating expense limitation does not apply to brokerage fees and commissions, borrowing costs (such as interest and dividend expenses on securities sold short), taxes, 12b-1 fees, extraordinary expenses and indirect expenses (such as “acquired fund fees and expenses”). |
The performance quoted represents past performance, which does not guarantee future results. The investment return and principal value of an investment will fluctuate so that an investor’s shares, when redeemed, may be worth more or less than their original cost. The returns shown do not reflect deduction of taxes that a shareholder would pay on Fund distributions or the redemption of Fund shares. Current performance of the Fund may be lower or higher than the performance quoted. The Fund’s investment objectives, risks, charges and expenses must be considered carefully before investing. Performance data current to the most recent month end may be obtained by calling 1-866-954-6682.
| * | Return figures reflect any change in price per share and assume the reinvestment of all distributions. |
| ** | The S&P 500® Index is a widely recognized unmanaged index of equity securities and is representative of a broader domestic equity market and range of securities than is found in the Fund’s portfolio. Individuals cannot invest directly in the Index; however, an individual can invest in exchange traded funds or other investment vehicles that attempt to track the performance of a benchmark index. |
The Fund’s investment objectives, strategies, risks, charges and expenses must be considered carefully before investing. The prospectus contains this and other important information about the Fund and may be obtained by calling the same number as above. Please read it carefully before investing. The Fund is distributed by Unified Financial Securities, Inc., member FINRA.
1
Comparison of the Growth of a $10,000 Investment in the Golub Group Equity Fund and the S&P 500(R) Index (Unaudited)
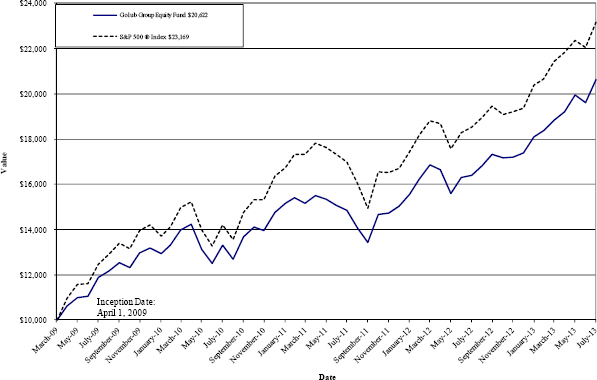
The chart above assumes an initial investment of $10,000 made on April 1, 2009 (commencement of Fund operations) and held through July 31, 2013. The S&P 500® Index is a widely recognized unmanaged index of equity securities and is representative of a broader domestic equity market and range of securities than is found in the Fund’s portfolio. Individuals cannot invest directly in the Index; however, an individual can invest in exchange traded funds or other investment vehicles that attempt to track the performance of a benchmark index. THE FUND’S RETURN REPRESENTS PAST PERFORMANCE AND DOES NOT GUARANTEE FUTURE RESULTS. The returns shown do not reflect deduction of taxes that a shareholder would pay on Fund distributions or the redemption of Fund shares. Investment returns and principal values will fluctuate so that your shares, when redeemed, may be worth more or less than their original purchase price.
Current performance may be lower or higher than the performance data quoted. For more information on the Fund, and to obtain performance data current to the most recent month end or to request a prospectus, please call 1-866-954-6682. You should carefully consider the investment objectives, potential risks, management fees, and charges and expenses of the Fund before investing. The Fund’s prospectus contains this and other information about the Fund, and should be read carefully before investing.
The Fund is distributed by Unified Financial Securities, Inc., member FINRA.
2
Fund Holdings – (Unaudited)
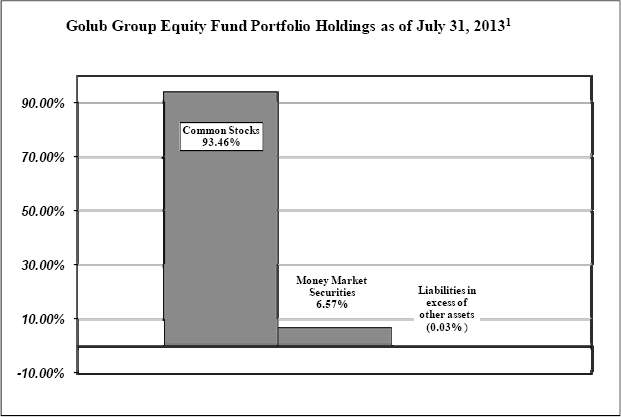
| 1 | As a percentage of net assets. |
The investment objective of the Golub Group Equity Fund is to provide long-term capital appreciation. A secondary objective is to provide current income.
Availability of Portfolio Schedule – (Unaudited)
The Fund files its complete schedule of portfolio holdings with the Securities and Exchange Commission (“SEC”) for the first and third quarters of each fiscal year on Form N-Q. The Fund’s Forms N-Q are available at the SEC’s website at www.sec.gov. The Fund’s Forms N-Q may be reviewed and copied at the SEC’s Public Reference Room in Washington DC. Information on the operation of the Public Reference Room may be obtained by calling 1-800-SEC-0330.
3
Summary of Fund’s Expenses – (Unaudited)
As a shareholder of the Fund, you incur ongoing costs, including management fees and other Fund expenses. This Example is intended to help you understand your ongoing costs (in dollars) of investing in the Fund and to compare these costs with the ongoing costs of investing in other mutual funds.
The Example is based on an investment of $1,000 invested at the beginning and held for the entire period from February 1, 2013 to July 31, 2013.
Actual Expenses
The first line of the table below provides information about actual account values and actual expenses. You may use the information in this line, together with the amount you invested, to estimate the expenses that you paid over the period. Simply divide your account value by $1,000 (for example, an $8,600 account value divided by $1,000 = $8.60), then multiply the result by the number in the first line under the heading entitled “Expenses Paid During the Period” to estimate the expenses you paid on your account during this period.
Hypothetical Example for Comparison Purposes
The second line of the table below provides information about hypothetical account values and hypothetical expenses based on the Fund’s actual expense ratio and an assumed rate of return of 5% per year before expenses, which is not the Fund’s actual return. The hypothetical account values and expenses may not be used to estimate the actual ending account balance or expenses you paid for the period. You may use this information to compare the ongoing costs of investing in the Fund and other funds. To do so, compare this 5% hypothetical example with the 5% hypothetical examples that appear in the shareholder reports of the other funds.
Please note that the expenses shown in the table are meant to highlight your ongoing costs only. Therefore, the second line of the table below is useful in comparing ongoing costs only and will not help you determine the relative costs of owning different funds.
Golub Group Equity Fund | Beginning Account Value February 1, 2013 | Ending Account Value July 31, 2013 | Expenses Paid During the Period Ended July 31, 2013 | |||||||||
Actual* | $ | 1,000.00 | $ | 1,139.00 | $ | 6.64 | ||||||
Hypothetical** | $ | 1,000.00 | $ | 1,018.59 | $ | 6.26 | ||||||
| * | Expenses are equal to the Fund’s annualized net expense ratio of 1.25%, multiplied by the average account value over the period, multiplied by 181/365. |
| ** | Assumes a 5% return before expenses. |
4
Golub Group Equity Fund
Schedule of Investments
July 31, 2013
(Unaudited)
| Shares | Fair Value | |||||||
Common Stocks - 93.46% | ||||||||
Air Courier Services - 1.85% | ||||||||
FedEx Corp. | 6,550 | $ | 694,300 | |||||
|
| |||||||
Aircraft Engines & Engine Parts - 1.61% | ||||||||
United Technologies Corp. | 5,725 | 604,388 | ||||||
|
| |||||||
Beverages - 4.45% | ||||||||
Diageo plc (b) (c) | 4,225 | 529,519 | ||||||
PepsiCo, Inc. | 13,650 | 1,140,321 | ||||||
|
| |||||||
| 1,669,840 | ||||||||
|
| |||||||
Brewery - 2.70% | ||||||||
Anheuser-Busch InBev NV (b) | 10,600 | 1,014,526 | ||||||
|
| |||||||
Computer Communications Equipment - 4.20% | ||||||||
Cisco Systems, Inc. | 61,700 | 1,576,435 | ||||||
|
| |||||||
Crude Petroleum & Natural Gas - 2.18% | ||||||||
Devon Energy Corp. | 14,875 | 818,274 | ||||||
|
| |||||||
Electromedical & Electrotherapeutic Apparatus - 3.06% | ||||||||
Medtronic, Inc. | 20,775 | 1,147,611 | ||||||
|
| |||||||
Electronic & Other Electrical Equipment (No Computer Equipment) - 3.92% | ||||||||
General Electric Co. | 60,400 | 1,471,948 | ||||||
|
| |||||||
Electronic Computers - 2.58% | ||||||||
Apple, Inc. | 2,140 | 968,350 | ||||||
|
| |||||||
Fire, Marine & Casualty Insurance - 6.39% | ||||||||
American International Group, Inc. (a) | 17,750 | 807,802 | ||||||
Berkshire Hathaway, Inc. - Class B (a) | 13,725 | 1,590,316 | ||||||
|
| |||||||
| 2,398,118 | ||||||||
|
| |||||||
Investment Advice - 1.31% | ||||||||
Franklin Resources, Inc. | 10,050 | 491,244 | ||||||
|
| |||||||
Medical - Generic Drugs - 2.66% | ||||||||
Teva Pharmaceutical Industries, Ltd. (b) | 25,125 | 997,463 | ||||||
|
| |||||||
Miscellaneous Fabricated Metal Products - 1.98% | ||||||||
Parker Hannifin Corp. | 7,200 | 743,616 | ||||||
|
| |||||||
Motor Vehicles & Passenger Car Bodies - 3.30% | ||||||||
General Motors Co. (a) | 34,600 | 1,241,102 | ||||||
|
| |||||||
National Commercial Banks - 5.64% | ||||||||
Bank of America Corp. | 57,500 | 839,500 | ||||||
Citigroup, Inc. | 24,550 | 1,280,037 | ||||||
|
| |||||||
| 2,119,537 | ||||||||
|
| |||||||
Oil & Gas Filed Machinery & Equipment - 1.91% | ||||||||
National Oilwell Varco, Inc. | 10,200 | 715,734 | ||||||
|
| |||||||
Petroleum Refining - 7.69% | ||||||||
Chevron Corp. | 8,675 | 1,092,096 | ||||||
ConocoPhillips | 10,900 | 706,974 | ||||||
Exxon Mobil Corp. | 11,600 | 1,087,500 | ||||||
|
| |||||||
| 2,886,570 | ||||||||
|
| |||||||
Pharmaceutical Preparations - 4.36% | ||||||||
Hospira, Inc. (a) | 9,250 | 376,475 | ||||||
Johnson & Johnson | 13,500 | 1,262,250 | ||||||
|
| |||||||
| 1,638,725 | ||||||||
|
| |||||||
See accompanying notes which are an integral part of these financial statements.
| ||||
| 5 | ||||
Golub Group Equity Fund
Schedule of Investments - continued
July 31, 2013
(Unaudited)
| Shares | Fair Value | |||||||
Common Stocks - 93.46% - continued | ||||||||
Search, Detection, Navigation, Guidance, Aeronautical Systems - 2.13% | ||||||||
Northrop Grumman Corp. | 8,700 | $ | 800,922 | |||||
|
| |||||||
Semiconductors & Related Devices - 2.80% | ||||||||
Intel Corp. | 45,175 | 1,052,577 | ||||||
|
| |||||||
Services - Computer Processing & Data Preparation - 3.03% | ||||||||
Fiserv, Inc. (a) | 11,825 | 1,138,038 | ||||||
|
| |||||||
Services - Computer Programming, Data Processing, Etc. - 3.13% | ||||||||
Google, Inc. - Class A (a) | 1,325 | 1,176,070 | ||||||
|
| |||||||
Services - Engineering, Accounting, Research, Management - 3.03% | ||||||||
Paychex, Inc. | 28,850 | 1,137,844 | ||||||
|
| |||||||
Services - Prepackaged Software - 3.96% | ||||||||
Microsoft Corp. | 46,700 | 1,486,461 | ||||||
|
| |||||||
State Commercial Banks - 4.58% | ||||||||
Bank of New York Mellon Corp./The | 54,725 | 1,721,101 | ||||||
|
| |||||||
Super-Regional Banks-US - 5.04% | ||||||||
U.S. Bancorp | 24,700 | 921,804 | ||||||
Wells Fargo & Co. | 22,350 | 972,225 | ||||||
|
| |||||||
| 1,894,029 | ||||||||
|
| |||||||
Telephone Communications (No Radio Telephone) - 2.52% | ||||||||
China Mobile Ltd. (b) | 17,850 | 944,622 | ||||||
|
| |||||||
Trucking & Courier Services (No Air) - 1.45% | ||||||||
United Parcel Service, Inc. - Class B | 6,298 | 546,666 | ||||||
|
| |||||||
TOTAL COMMON STOCKS (Cost $26,783,457) | 35,096,111 | |||||||
|
| |||||||
Money Market Securities - 6.57% | ||||||||
Fidelity Institutional Money Market Portfolio - Institutional Class, 0.11% (d) | 2,466,111 | 2,466,111 | ||||||
|
| |||||||
TOTAL MONEY MARKET SECURITIES (Cost $2,466,111) | 2,466,111 | |||||||
|
| |||||||
TOTAL INVESTMENTS (Cost $29,249,568) - 100.03% | $ | 37,562,222 | ||||||
|
| |||||||
Liabilities in excess of other assets - (0.03%) | (10,657 | ) | ||||||
|
| |||||||
TOTAL NET ASSETS - 100.00% | $ | 37,551,565 | ||||||
|
| |||||||
| (a) | Non-income producing. |
| (b) | American Depositary Receipt. |
| (c) | Public Limited Company. |
| (d) | Variable rate security; the rate shown represents the 7-day yield at July 31, 2013. |
| Percentage of Net Assets | ||||
Diversification of Assets: | ||||
Belgium | 2.70 | % | ||
Hong Kong | 2.52 | % | ||
Israel | 2.66 | % | ||
United Kingdom | 1.41 | % | ||
United States | 90.74 | % | ||
Liabilities in excess of other assets | -0.03 | % | ||
|
| |||
| 100.00 | % | |||
|
| |||
| See accompanying notes which are an integral part of these financial statements. | ||||
6 | ||||
Golub Group Equity Fund
Statement of Assets and Liabilities
July 31, 2013
(Unaudited)
Assets | ||||
Investments in securities, at fair value (cost $29,249,568) | $ | 37,562,222 | ||
Receivable for fund shares sold | 3,000 | |||
Dividends receivable | 25,827 | |||
Interest receivable | 216 | |||
Receivable for tax reclaim | 203 | |||
Prepaid expenses | 4,909 | |||
|
| |||
Total assets | 37,596,377 | |||
|
| |||
Liabilities | ||||
Payable to Adviser (a) | 25,060 | |||
Payable for fund shares redeemed | 1,023 | |||
Payable to administrator, fund accountant, and transfer agent (a) | 8,213 | |||
Payable to custodian (a) | 1,105 | |||
Payable to trustees | 1,144 | |||
Other accrued expenses | 8,267 | |||
|
| |||
Total liabilities | 44,812 | |||
|
| |||
Net Assets | $ | 37,551,565 | ||
|
| |||
Net Assets consist of: | ||||
Paid in capital | $ | 27,596,370 | ||
Undistributed net investment income (loss) | 115,141 | |||
Accumulated net realized gain (loss) on investments | 1,527,400 | |||
Net unrealized appreciation (depreciation) on investments | 8,312,654 | |||
|
| |||
Net Assets | $ | 37,551,565 | ||
|
| |||
Shares outstanding (unlimited number of shares authorized; no par value) | 2,092,378 | |||
|
| |||
Net Asset Value, offering and redemption price per share | $ | 17.95 | ||
|
|
| (a) | See Note 4 in the Notes to the Financial Statements. |
| See accompanying notes which are an integral part of these financial statements. | ||||
7 | ||||
Golub Group Equity Fund
Statement of Operations
For the six months ended July 31, 2013
(Unaudited)
Investment Income | ||||
Dividend income (net of foreign withholding tax of $10,299) | $ | 337,327 | ||
Interest income | 1,257 | |||
|
| |||
Total Investment Income | 338,584 | |||
|
| |||
Expenses | ||||
Investment Adviser fee (a) | 172,261 | |||
Administration expenses (a) | 17,356 | |||
Transfer agent expenses (a) | 15,937 | |||
Fund accounting expenses (a) | 12,397 | |||
Audit expenses | 7,439 | |||
Legal expenses | 7,215 | |||
Custodian expenses (a) | 5,642 | |||
Trustee expenses | 3,678 | |||
Printing expenses | 3,657 | |||
Registration expenses | 3,473 | |||
Insurance expenses | 2,503 | |||
CCO expenses | 1,488 | |||
Miscellaneous expenses | 1,381 | |||
Pricing expenses | 443 | |||
24f-2 fees | 343 | |||
|
| |||
Total Expenses | 255,213 | |||
Fees waived and expenses reimbursed by Adviser (a) | (39,716 | ) | ||
|
| |||
Net operating expenses | 215,497 | |||
|
| |||
Net Investment Income | 123,087 | |||
|
| |||
Realized & Unrealized Gain on Investments | ||||
Net realized gain on investment securities | 1,292,366 | |||
Change in unrealized appreciation on investment securities | 3,104,830 | |||
|
| |||
Net realized and unrealized gain on investment securities | 4,397,196 | |||
|
| |||
Net increase in net assets resulting from operations | $ | 4,520,283 | ||
|
|
| (a) | See Note 4 in the Notes to the Financial Statements. |
| See accompanying notes which are an integral part of these financial statements. | ||||
8 | ||||
Golub Group Equity Fund
Statements of Changes In Net Assets
| For the Six Months Ended July 31, 2013 (Unaudited) | Year Ended January 31, 2013 | |||||||
Increase (Decrease) in Net Assets due to: | ||||||||
Operations | ||||||||
Net investment income | $ | 123,087 | $ | 267,166 | ||||
Net realized gain on investment securities | 1,292,366 | 1,167,364 | ||||||
Change in unrealized appreciation (depreciation) on investment securities | 3,104,830 | 2,848,773 | ||||||
|
|
|
| |||||
Net increase in net assets resulting from operations | 4,520,283 | 4,283,303 | ||||||
|
|
|
| |||||
Distributions | ||||||||
From net investment income | — | (288,218 | ) | |||||
From net realized gains | — | (715,029 | ) | |||||
|
|
|
| |||||
Total distributions | — | (1,003,247 | ) | |||||
|
|
|
| |||||
Capital Share Transactions | ||||||||
Proceeds from shares sold | 3,143,786 | 9,029,658 | ||||||
Reinvestment of distributions | — | 1,003,247 | ||||||
Amount paid for shares redeemed | (2,629,963 | ) | (4,741,918 | ) | ||||
|
|
|
| |||||
Net increase in net assets resulting from capital share transactions | 513,823 | 5,290,987 | ||||||
|
|
|
| |||||
Total Increase in Net Assets | 5,034,106 | 8,571,043 | ||||||
|
|
|
| |||||
Net Assets | ||||||||
Beginning of period | 32,517,459 | 23,946,416 | ||||||
|
|
|
| |||||
End of period | $ | 37,551,565 | $ | 32,517,459 | ||||
|
|
|
| |||||
Undistributed net investment income (loss) included in net assets at the end of each period | $ | 115,141 | $ | (7,946 | ) | |||
|
|
|
| |||||
Capital Share Transactions | ||||||||
Shares sold | 185,899 | 598,533 | ||||||
Shares issued in reinvestment of distributions | — | 67,151 | ||||||
Shares redeemed | (156,987 | ) | (313,222 | ) | ||||
|
|
|
| |||||
Net increase from capital share transactions | 28,912 | 352,462 | ||||||
|
|
|
| |||||
| See accompanying notes which are an integral part of these financial statements. | ||||
9 | ||||
Golub Group Equity Fund
Financial Highlights
(For a share outstanding during each period)
| For the Six Months Ended July 31, 2013 (Unaudited) | For the Year Ended January 31, 2013 | For the Year Ended January 31, 2012 | For the Year Ended January 31, 2011 | For the Period Ended January 31, 2010 (a) | ||||||||||||||||
Selected Per Share Data: | ||||||||||||||||||||
Net asset value, beginning of period | $ | 15.76 | $ | 14.00 | $ | 14.58 | $ | 12.85 | $ | 10.00 | ||||||||||
|
|
|
|
|
|
|
|
|
| |||||||||||
Income from investment operations: | ||||||||||||||||||||
Net investment income (b) | 0.06 | 0.14 | 0.15 | 0.11 | 0.11 | |||||||||||||||
Net realized and unrealized gain on investments | 2.13 | 2.12 | 0.20 | 2.09 | 2.83 | |||||||||||||||
|
|
|
|
|
|
|
|
|
| |||||||||||
Total income from investment operations | 2.19 | 2.26 | 0.35 | 2.20 | 2.94 | |||||||||||||||
|
|
|
|
|
|
|
|
|
| |||||||||||
Less distributions to shareholders: | ||||||||||||||||||||
From net investment income | — | (0.14 | ) | (0.14 | ) | (0.09 | ) | (0.09 | ) | |||||||||||
From net realized gains | — | (0.36 | ) | (0.79 | ) | (0.38 | ) | — | (c) | |||||||||||
|
|
|
|
|
|
|
|
|
| |||||||||||
Total distributions | — | (0.50 | ) | (0.93 | ) | (0.47 | ) | (0.09 | ) | |||||||||||
|
|
|
|
|
|
|
|
|
| |||||||||||
Net asset value, end of period | $ | 17.95 | $ | 15.76 | $ | 14.00 | $ | 14.58 | $ | 12.85 | ||||||||||
|
|
|
|
|
|
|
|
|
| |||||||||||
Total Return (d) | 13.90 | % (e) | 16.34 | % | 2.65 | % | 17.20 | % | 29.37 | % (e) | ||||||||||
Ratios and Supplemental Data: | ||||||||||||||||||||
Net assets, end of period (000) | $ | 37,552 | $ | 32,517 | $ | 23,946 | $ | 19,574 | $ | 9,390 | ||||||||||
Ratio of expenses to average net assets after expense reimbursement | 1.25 | % (f) | 1.25 | % | 1.25 | % | 1.25 | % | 1.25 | % (f) | ||||||||||
Ratio of expenses to average net assets before waiver and reimbursement | 1.48 | % (f) | 1.57 | % | 1.75 | % | 2.21 | % | 3.45 | % (f) | ||||||||||
Ratio of net investment income (loss) to average net assets after expense reimbursement | 0.71 | % (f) | 0.95 | % | 1.03 | % | 0.82 | % | 1.07 | % (f) | ||||||||||
Ratio of net investment income (loss) to average net assets before waiver and reimbursement | 0.48 | % (f) | 0.63 | % | 0.53 | % | (0.14 | )% | (1.13 | )%(f) | ||||||||||
Portfolio turnover rate | 12.55 | % (e) | 16.79 | % | 27.33 | % | 23.15 | % | 8.58 | % (e) | ||||||||||
| (a) | For the period April 1, 2009 (Commencement of Operations) to January 31, 2010. |
| (b) | Net investment income per share is calculated by dividing net investment income by the average shares outstanding throughout the period. |
| (c) | Distributions to shareholders resulted in less than $0.005 per share. |
| (d) | Total return in the above table represents the rate that the investor would have earned or lost on an investment in the Fund, assuming reinvestment of distributions. |
| (e) | Not annualized. |
| (f) | Annualized. |
| See accompanying notes which are an integral part of these financial statements. | ||||
10 | ||||
Golub Group Equity Fund
Notes to the Financial Statements
July 31, 2013
(Unaudited)
NOTE 1. ORGANIZATION
The Golub Group Equity Fund (the “Fund”) was organized as an open-end diversified series of the Valued Advisers Trust (the “Trust”) on April 1, 2009. The Trust is a management investment company established under the laws of Delaware by an Agreement and Declaration of Trust dated June 13, 2008 (the “Trust Agreement”). The Trust Agreement permits the Board of Trustees (the “Board”) to issue an unlimited number of shares of beneficial interest of separate series without par value. The Fund is one of a series of funds authorized by the Board. The Fund’s investment adviser is Golub Group, LLC (the “Adviser”). The investment objective of the Fund is to provide long-term capital appreciation. A secondary objective is to provide current income.
NOTE 2. SIGNIFICANT ACCOUNTING POLICIES
The following is a summary of significant accounting policies followed by the Fund in the preparation of its financial statements. These policies are in conformity with the generally accepted accounting principles in the United States of America (“GAAP”).
Securities Valuation – All investments in securities are recorded at their estimated fair value as described in Note 3.
Federal Income Taxes – The Fund makes no provision for federal income or excise tax. The Fund intends to qualify each year as a regulated investment company (“RIC”) under subchapter M of the Internal Revenue Code of 1986, as amended, by complying with the requirements applicable to RICs and by distributing substantially all of its taxable income. The Fund also intends to distribute sufficient net investment income and net capital gains, if any, so that it will not be subject to excise tax on undistributed income and gains. If the required amount of net investment income or gains is not distributed, the Fund could incur a tax expense.
As of and during the six months ended July 31, 2013, the Fund did not have a liability for any unrecognized tax benefits. The Fund recognizes interest and penalties, if any, related to unrecognized tax benefits as income tax expense in the statement of operations. During the year, the Fund did not incur any interest or penalties. The Fund is subject to examination by U.S. federal tax authorities for all tax years since inception.
Expenses – Expenses incurred by the Trust that do not relate to a specific fund of the Trust are allocated to the individual funds based on each fund’s relative net assets or another appropriate basis (as determined by the Board).
Security Transactions and Related Income - The Fund follows industry practice and records security transactions on the trade date for financial reporting purposes. The first in, first out method is used for determining gains or losses for financial statement and income tax purposes. Interest income is recorded on an accrual basis and dividend income is recorded on the ex-dividend date except in the case of foreign securities, in which case dividends are generally recorded as soon as such information becomes available. Discounts and premiums on securities purchased are accreted or amortized using the effective interest method. The ability of issuers of debt securities held by the Fund to meet their obligations may be affected by economic and political developments in a specific country or region. Withholding taxes on foreign dividends have been provided for in accordance with the Fund’s understanding of the applicable country’s tax rules and rates.
Dividends and Distributions - The Fund intends to distribute all or substantially all of its net investment income, if any, as dividends to its shareholders on at least an annual basis. The Fund intends to distribute its net realized long term capital gains and its net realized short term capital gains, if any, at least once a year. Dividends to shareholders, which are determined in accordance with income tax regulations, are recorded on the ex-dividend date. The treatment for financial reporting purposes of distributions made to shareholders during the period from net investment income or net realized capital gains may differ from their ultimate treatment for federal income tax purposes. These differences are caused primarily by differences in the timing of the recognition of certain components of income, expense or realized capital gain for federal income tax purposes. Where such differences are permanent in nature, they are reclassified in the components of the net assets based on their ultimate characterization for federal income tax purposes. Any such reclassifications will have no effect on net assets, results of operations or net asset values per share of the Fund.
11
Golub Group Equity Fund
Notes to the Financial Statements - continued
July 31, 2013
(Unaudited)
NOTE 3. SECURITIES VALUATION AND FAIR VALUE MEASUREMENTS
Fair value is defined as the price that a Fund would receive upon selling an investment in an orderly transaction to an independent buyer in the principal or most advantageous market of the investment. Accounting principles generally accepted in the United States of America (“GAAP”) establishes a three-tier hierarchy to maximize the use of observable market data and minimize the use of unobservable inputs and establish classification of fair value measurements for disclosure purposes.
Inputs refer broadly to the assumptions that market participants would use in pricing the asset or liability, including assumptions about risk, for example, the risk inherent in a particular valuation technique used to measure fair value including a pricing model and/or the risk inherent in the inputs to the valuation technique. Inputs may be observable or unobservable. Observable inputs are inputs that reflect the assumptions market participants would use in pricing the asset or liability developed based on market data obtained from sources independent of the reporting entity. Unobservable inputs are inputs that reflect the reporting entity’s own assumptions about the assumptions market participants would use in pricing the asset or liability developed based on the best information available in the circumstances.
Various inputs are used in determining the value of the Fund’s investments. These inputs are summarized in the three broad levels listed below.
| • | Level 1 – quoted prices in active markets for identical securities |
| • | Level 2 – other significant observable inputs (including, but not limited to, quoted prices for an identical security in an inactive market, quoted prices for similar securities, interest rates, prepayment speeds, credit risk, etc.) |
| • | Level 3 – significant unobservable inputs (including the Fund’s own assumptions in determining fair value of investments based on the best information available) |
The inputs used to measure fair value may fall into different levels of the fair value hierarchy. In such cases, for disclosure purposes, the level in the fair value hierarchy within which the fair value measurement falls in its entirety, is determined based on the lowest level input that is significant to the fair value measurement in its entirety.
Equity securities, including common stocks, are generally valued by using market quotations, but may be valued on the basis of prices furnished by a pricing service when the Fund believes such prices more accurately reflect the fair value of such securities. Securities that are traded on any stock exchange are generally valued by the pricing service at the last quoted sale price. Lacking a last sale price, an exchange traded security is generally valued by the pricing service at its last bid price. Securities traded in the NASDAQ over-the-counter market are generally valued by the pricing service at the NASDAQ Official Closing Price. When using the market quotations or close prices provided by the pricing service and when the market is considered active, the security will be classified as a Level 1 security. Sometimes, an equity security owned by the Fund will be valued by the pricing service with factors other than market quotations or when the market is considered inactive. When this happens, the security will be classified as a Level 2 security. When market quotations are not readily available, when the Fund determines that the market quotation or the price provided by the pricing service does not accurately reflect the current fair value, or when restricted or illiquid securities are being valued, such securities are valued as determined in good faith by the Fund, in conformity with guidelines adopted by and subject to review by the Board. These securities will be categorized as Level 3 securities.
Investments in mutual funds, including money market mutual funds, are generally priced at the ending net asset value (NAV) provided by the service agent of the funds. These securities will be categorized as Level 1 securities.
12
Golub Group Equity Fund
Notes to the Financial Statements - continued
July 31, 2013
(Unaudited)
NOTE 3. SECURITIES VALUATION AND FAIR VALUE MEASUREMENTS – continued
In accordance with the Trust’s good faith pricing guidelines, the Fund is required to consider all appropriate factors relevant to the value of securities for which it has determined other pricing sources are not available or reliable as described above. No single standard exists for determining fair value, because fair value depends upon the circumstances of each individual case. As a general principle, the current fair value of an issue of securities being valued by the Fund would appear to be the amount which the owner might reasonably expect to receive for them upon their current sale. Methods which are in accordance with this principle may, for example, be based on (i) a multiple of earnings; (ii) a discount from market of a similar freely traded security (including a derivative security or a basket of securities traded on other markets, exchanges or among dealers); or (iii) yield to maturity with respect to debt issues, or a combination of these and other methods. Good faith pricing is permitted if, in the Fund’s opinion, the validity of market quotations appears to be questionable based on factors such as evidence of a thin market in the security based on a small number of quotations, a significant event occurs after the close of a market but before a Fund’s NAV calculation that may affect a security’s value, or the Fund is aware of any other data that calls into question the reliability of market quotations. Good faith pricing may also be used in instances when the bonds the Fund invests in may default or otherwise cease to have market quotations readily available. Any fair valuation pricing done outside the Fund’s approved pricing methods must be approved by the Pricing Committee of the Board.
The following is a summary of the inputs used to value the Fund’s investments as of July 31, 2013:
| Valuation Inputs | ||||||||||||||||
Assets | Level 1 - Quoted Prices in Active Markets | Level 2 - Other Significant Observable Inputs | Level 3 - Significant Unobservable Inputs | Total | ||||||||||||
Common Stocks* | $ | 35,096,111 | $ | — | $ | — | $ | 35,096,111 | ||||||||
Money Market Securities | 2,466,111 | — | — | 2,466,111 | ||||||||||||
|
|
|
|
|
|
|
| |||||||||
Total | $ | 37,562,222 | $ | — | $ | — | $ | 37,562,222 | ||||||||
|
|
|
|
|
|
|
| |||||||||
| * | Refer to the Schedule of Investments for industry classifications. |
The Fund did not hold any assets at any time during the reporting period in which significant unobservable inputs were used in determining fair value; therefore, no reconciliation of Level 3 securities is included for this reporting period. During the six months ended July 31, 2013, the Fund had no transfers between any Levels. The Trust recognizes transfers between fair value hierarchy levels at the end of the reporting period.
NOTE 4. FEES AND OTHER TRANSACTIONS WITH AFFILIATES
Under the terms of the investment advisory agreement, on behalf of the Fund (the “Agreement”), the Adviser manages the Fund’s investments subject to oversight of the Board. As compensation for its services, the Golub Group Equity Fund is obligated to pay the Adviser a fee computed and accrued daily and paid monthly at an annual rate of 1.00% of the average daily net assets of the Fund. For the six months ended July 31, 2013, the Adviser earned a fee of $172,261 from the Fund before the reimbursement described below. At July 31, 2013, the Fund owed the Adviser $25,060.
The Adviser has contractually agreed to waive or limit its fee and reimburse certain Fund operating expenses, until May 31, 2014, so that the ratio of total annual operating expenses does not exceed 1.25%. This operating expense limitation does not apply to interest, taxes, brokerage commissions, other expenditures which are capitalized in accordance with generally accepted accounting principles, other extraordinary expenses not incurred in the ordinary course of the Fund’s business, dividend expense on short sales, expenses incurred under a plan of distribution under Rule 12b-1, and expenses that the Fund has incurred but did not actually pay because of an expense offset arrangement, if applicable, incurred by the Fund in any fiscal year. The operating expense limitation also excludes any “Acquired Fund Fees and Expenses.” Acquired Fund Fees and Expenses represent the pro rata expense indirectly incurred by the Fund as a result of investing in
13
Golub Group Equity Fund
Notes to the Financial Statements - continued
July 31, 2013
(Unaudited)
NOTE 4. FEES AND OTHER TRANSACTIONS WITH AFFILIATES - continued
other investment companies, including ETFs, closed-end funds and money market funds that have their own expenses. The Adviser may be entitled to the reimbursement of any fees waived or expenses reimbursed pursuant to the agreement provided overall expenses fall below the limitations set forth above. The Adviser may recoup the sum of all fees previously waived or expenses reimbursed during any of the previous three (3) years, less any reimbursement previously paid, provided total expenses do not exceed the limitation set forth above. For the six months ended July 31, 2013, the Adviser waived fees of $39,716.
The amounts subject to repayment by the Fund, pursuant to the aforementioned conditions, at January 31, 2013 are as follows:
Amount | January 31, | |||||
| $ | 129,687 | 2014 | ||||
| $ | 107,613 | 2015 | ||||
| $ | 91,129 | 2016 | ||||
For the six months ended July 31, 2013, $39,716 may be subject to potential repayment by the Fund to the Adviser through January 31, 2017.
The Trust retains Huntington Asset Services, Inc. (“HASI”) to manage the Fund’s business affairs and provide the Fund with administrative services, including all regulatory reporting and necessary office equipment and personnel. For the six months ended July 31, 2013, HASI earned fees of $17,356 for administrative services provided to the Fund. At July 31, 2013, HASI was owed $2,773 from the Fund for administrative services. Certain officers of the Trust are members of management and/or employees of HASI. HASI is a wholly-owned subsidiary of Huntington Bancshares, Inc., the parent company of Unified Financial Securities, Inc. (the “Distributor”) and Huntington National Bank, the custodian of the Fund’s investments (the “Custodian”). For the six months ended July 31, 2013, the Custodian earned fees of $5,642 for custody services provided to the Fund. At July 31, 2013, the Custodian was owed $1,105 from the Fund for custody services.
The Trust also retains HASI to act as the Fund’s transfer agent and to provide fund accounting services. For the six months ended July 31, 2013, HASI earned fees of $15,937 for transfer agent services to the Fund. At July 31, 2013, the Fund owed HASI $3,460 for transfer agent services. For the six months ended July 31, 2013, HASI earned fees of $12,397 from the Fund for fund accounting services. At July 31, 2013, HASI was owed $1,980 from the Fund for fund accounting services.
The Fund has adopted a Distribution Plan pursuant to Rule 12b-1 under the 1940 Act (the “Plan”). The Plan provides that the Fund will pay the Distributor and/or any registered securities dealer, financial institution or any other person (the “Recipient”) a shareholder servicing fee of 0.25% of the average daily net assets of the Fund in connection with the promotion and distribution of the Fund’s shares or the provision of personal services to shareholders, including, but not necessarily limited to, advertising, compensation to underwriters, dealers and selling personnel, the printing and mailing of prospectuses to other than current Fund shareholders, the printing and mailing of sales literature and servicing shareholder accounts (“12b-1 Expenses”). The Fund or Distributor may pay all or a portion of these fees to any recipient who renders assistance in distributing or promoting the sale of shares, or who provides certain shareholder services, pursuant to a written agreement. The Plan is a compensation plan, which means that the Plan will benefit shareholders because an effective sales program typically is necessary in order for the Fund to reach and maintain a sufficient size to achieve efficiently its investment objectives and to realize economies of scale. The Plan is not active and will not be activated prior to May 31, 2014.
Unified Financial Securities, Inc. acts as the principal distributor of the Fund’s shares. There were no payments made by the Fund to the Distributor during the six months ended July 31, 2013. An officer of the Trust is an officer of the Distributor and such person may be deemed to be an affiliate of the Distributor.
14
Golub Group Equity Fund
Notes to the Financial Statements - continued
July 31, 2013
(Unaudited)
NOTE 5. INVESTMENTS
For the six months ended July 31, 2013, purchases and sales of investment securities, other than short-term investments and short-term U.S. government obligations, were as follows:
| Amount | ||||
Purchases | ||||
U.S. Government Obligations | $ | — | ||
Other | 4,212,433 | |||
Sales | ||||
U.S. Government Obligations | $ | — | ||
Other | 4,102,190 | |||
At July 31, 2013, the net unrealized appreciation (depreciation) of investments for tax purposes was as follows:
Gross Appreciation | $ | 8,564,929 | ||
Gross (Depreciation) | (252,794 | ) | ||
|
| |||
Net Appreciation (Depreciation) on Investments | $ | 8,312,135 | ||
|
|
At July 31, 2013, the aggregate cost of securities, excluding U.S. government obligations, for federal income tax purposes was $29,250,087 for the Fund.
NOTE 6. ESTIMATES
The preparation of financial statements in conformity with GAAP requires management to make estimates and assumptions that affect the reported amounts of assets and liabilities and disclosure of contingent assets and liabilities at the date of the financial statements and the reported amounts of increases and decreases in net assets from operations during the reporting period. Actual results could differ from those estimates.
NOTE 7. BENEFICIAL OWNERSHIP
The beneficial ownership, either directly or indirectly, of 25% or more of the voting securities of a fund creates a presumption of control of a fund, under Section 2(a) (9) of the Investment Company Act of 1940. At July 31, 2013, Charles Schwab owned, as record shareholder, 95.01% of the outstanding shares of the Fund. The Trust does not know whether Charles Schwab or any of the underlying beneficial owners owned or controlled 25% or more of the voting securities of the Fund.
NOTE 8. DISTRIBUTIONS TO SHAREHOLDERS
The Fund did not make any distributions during the six months ended July 31, 2013.
15
Golub Group Equity Fund
Notes to the Financial Statements - continued
July 31, 2013
(Unaudited)
NOTE 8. DISTRIBUTIONS TO SHAREHOLDERS - continued
The tax characterization of distributions for the fiscal periods ended January 31, 2013 and January 31, 2012, were as follows:
| 2013 | 2012 | |||||||
Distribution paid from: | ||||||||
Ordinary Income* | $ | 283,345 | $ | 470,799 | ||||
Long-term Capital Gain | 719,902 | 1,002,875 | ||||||
|
|
|
| |||||
| $ | 1,003,247 | $ | 4,473,674 | |||||
|
|
|
| |||||
| * | Short term capital gain distributions are treated as ordinary income for tax purposes. |
At January 31, 2013, the components of distributable earnings (accumulated losses) on a tax basis were as follows:
Undistributed long-term capital gains | 235,561 | |||
Accumulated capital and other losses | (7,954 | ) | ||
Unrealized appreciation (depreciation) | 5,207,305 | |||
|
| |||
| $ | 5,434,912 | |||
|
|
At January 31, 2013, the difference between book basis and tax basis unrealized appreciation (depreciation) is attributable to the tax deferral of losses on wash sales in the amount of $519.
Under current tax law, net investment losses and capital losses realized after October 31 of a Fund’s fiscal year may be deferred and treated as occurring on the first business day of the following fiscal year for tax purposes. The Fund deferred losses as follows:
| Late Year Ordinary Loss | ||||
Golub Group Equity Fund | $ | 7,954 | ||
NOTE 9. COMMITMENTS AND CONTINGENCIES
The Fund indemnifies its officers and trustees for certain liabilities that may arise from their performance of their duties to the Fund. Additionally, in the normal course of business, the Fund enters into contracts that contain a variety of representations and warranties which provide general indemnifications. The Fund’s maximum exposure under these arrangements is unknown, as this would involve future claims that may be made against the Fund that have not yet occurred.
16
PROXY VOTING
A description of the policies and procedures that the Fund uses to determine how to vote proxies relating to portfolio securities and information regarding how the Fund voted those proxies is available without charge upon request by (1) calling the Fund at (866) 954-6682 and (2) from Fund documents filed with the Securities and Exchange Commission (“SEC”) on the SEC’s website at www.sec.gov.
TRUSTEES
R. Jeffrey Young, Chairman
Dr. Merwyn R. Vanderlind
Ira Cohen
OFFICERS
R. Jeffrey Young, Principal Executive Officer and President
John C. Swhear, Chief Compliance Officer, AML Officer and Vice-President
Robert W. Silva, Principal Financial Officer and Treasurer
Carol J. Highsmith, Vice President
Matthew J. Miller, Vice President
Heather Bonds, Secretary
INVESTMENT ADVISER
Golub Group, LLC
1850 Gateway Drive, Suite 100
San Mateo, CA 94404
DISTRIBUTOR
Unified Financial Securities, Inc.
2960 North Meridian Street, Suite 300
Indianapolis, IN 46208
INDEPENDENT REGISTERED PUBLIC ACCOUNTING FIRM
Cohen Fund Audit Services, Ltd.
1350 Euclid Avenue, Suite 800
Cleveland, OH 44115
LEGAL COUNSEL
The Law Offices of John H. Lively & Associates, Inc.,
A member firm of The 1940 Act Law GroupTM
11300 Tomahawk Creek Pkwy, Suite 310
Leawood, KS 66211
CUSTODIAN
Huntington National Bank
41 S. High St.
Columbus, OH 43215
ADMINISTRATOR, TRANSFER AGENT AND FUND ACCOUNTANT
Huntington Asset Services, Inc.
2960 North Meridian Street, Suite 300
Indianapolis, IN 46208
This report is intended only for the information of shareholders or those who have received the Fund’s prospectus which contains information about the Fund’s management fee and expenses. Please read the prospectus carefully before investing.
Distributed by Unified Financial Securities, Inc.
Member FINRA/SIPC
Mitchell Capital All-Cap Growth Fund
Semi-Annual Report
July 31, 2013
Fund Adviser:
Mitchell Capital Management Company
11460 Tomahawk Creek Parkway, Suite 410
Leawood, KS 66211
Toll Free (855) 626-8034
Investment Results – (Unaudited)
Total Returns*
(For the period ended July 31, 2013)
| Since Inception (March 01, 2013) | ||||
Mitchell Capital All Cap Growth Fund | 7.00 | % | ||
S&P 500® Index** | 12.11 | % | ||
| The Total Annual Fund Operating Expense ratio, as estimated for the Fund’s first fiscal period ending January 31. 2014 and disclosed in the Fund’s prospectus, is 1.51% of average daily net assets. The Total Annual Fund Operating Expense ratio After Fee Waiver/Expense Reimbursement reflects that the Adviser has contractually agreed to waive or limit its fees and to assume other expenses of the Fund until May 31, 2014, so that the Total Annual Fund Operating Expense ratio does not exceed 0.99%. This operating expense limitation does not apply to brokerage fees and commissions, borrowing costs (such as interest and dividend expenses on securities sold short), taxes, 12b-1 fees, extraordinary expenses and indirect expenses (such as “acquired fund fees and expense”). | ||
The performance quoted represents past performance, which does not guarantee future results. The investment return and principal value of an investment will fluctuate so that an investor’s shares, when redeemed, may be worth more or less than their original cost. The returns shown do not reflect deduction of taxes that a shareholder would pay on Fund distributions or the redemption of Fund shares. Current performance of the Fund may be lower or higher than the performance quoted. The Fund’s investment objectives, risks, charges and expenses must be considered carefully before investing. Performance data current to the most recent month end may be obtained by calling 1-855-626-8034.
| * | Return figures reflect any change in price per share and assume the reinvestment of all distributions. |
| ** | The S&P 500® Index is a widely recognized unmanaged index of equity securities and is representative of a broader domestic equity market and range of securities than is found in the Fund’s portfolio. Individuals cannot invest directly in an Index; however, an individual can invest in exchange traded funds or other investment vehicles that attempt to track the performance of a benchmark index. |
The Fund’s investment objectives, strategies, risks, charges and expenses must be considered carefully before investing. The prospectus contains this and other important information about the Fund and may be obtained by calling the same number as above. Please read it carefully before investing. The Fund is distributed by Unified Financial Securities, Inc., member FINRA.
1
Comparison of the Growth of a $10,000 Investment in the Mitchell Capital All Cap Growth Fund and the S&P 500 (R) Index
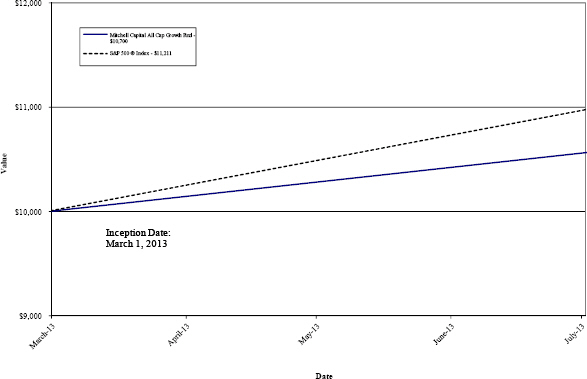
The chart above assumes an initial investment of $10,000 made on March 1, 2013 (commencement of Fund operations) and held through July 31, 2013. The S&P 500® Index is a widely recognized unmanaged index of equity securities and is representative of a broader domestic equity market and range of securities than is found in the Fund’s portfolio. Individuals cannot invest directly in an Index; however, an individual can invest in exchange traded funds or other investment vehicles that attempt to track the performance of a benchmark index. THE FUND’S RETURN REPRESENTS PAST PERFORMANCE AND DOES NOT GUARANTEE FUTURE RESULTS. The returns shown do not reflect deduction of taxes that a shareholder would pay on Fund distributions or the redemption of Fund shares. Investment returns and principal values will fluctuate so that your shares, when redeemed, may be worth more or less than their original purchase price.
Current performance may be lower or higher than the performance data quoted. For more information on the Fund, and to obtain performance data current to the most recent month end or to request a prospectus, please call 1-855-626-8034. You should carefully consider the investment objectives, potential risks, management fees, and charges and expenses of the Fund before investing. The Fund’s prospectus contains this and other information about the Fund, and should be read carefully before investing.
The Fund is distributed by Unified Financial Securities, Inc., member FINRA.
2
Fund Holdings – (Unaudited)
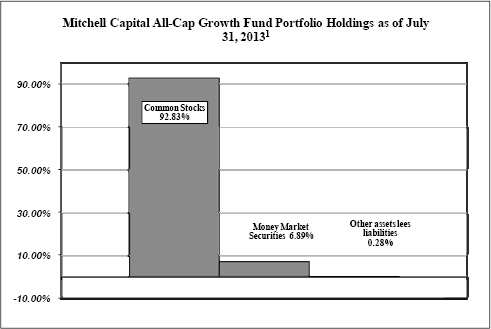
| 1 | As a percentage of net assets. |
The investment objective of the Mitchell Capital All-Cap Growth Fund is to seek long-term capital appreciation.
Availability of Portfolio Schedule – (Unaudited)
The Fund files its complete schedule of portfolio holdings with the Securities and Exchange Commission (“SEC”) for the first and third quarters of each fiscal year on Form N-Q. The Fund’s Forms N-Q are available at the SEC’s website at www.sec.gov. The Fund’s Forms N-Q may be reviewed and copied at the SEC’s Public Reference Room in Washington DC. Information on the operation of the Public Reference Room may be obtained by calling 1-800-SEC-0330.
Summary of Fund’s Expenses – (Unaudited)
As a shareholder of the Fund, you incur two types of costs: (1) transaction costs, such as short-term redemption fees; and (2) ongoing costs, including management fees and other Fund expenses. This Example is intended to help you understand your ongoing costs (in dollars) of investing in the Fund and to compare these costs with the ongoing costs of investing in other mutual funds. The example is based on an investment of $1,000 invested at the beginning and held for the six month period, February 1, 2013 to July 31, 2013.
3
Actual Expenses
The first line of the table below provides information about actual account values and actual expenses. You may use the information in this line, together with the amount you invested, to estimate the expenses that you paid over the period. Simply divide your account value by $1,000 (for example, an $8,600 account value divided by $1,000 = $8.60), then multiply the result by the number in the first line under the heading entitled “Expenses Paid During the Period” to estimate the expenses you paid on your account during this period.
Hypothetical Example for Comparison Purposes
The second line of the table below provides information about hypothetical account values and hypothetical expenses based on the Fund’s actual expense ratio and an assumed rate of return of 5% per year before expenses, which is not the Fund’s actual return. The hypothetical account values and expenses may not be used to estimate the actual ending account balance or expenses you paid for the period. You may use this information to compare the ongoing costs of investing in the Fund and other funds. To do so, compare this 5% hypothetical example with the 5% hypothetical examples that appear in the shareholder reports of the other funds.
Please note that the expenses shown in the table are meant to highlight your ongoing costs only. Therefore, the second line of the table below is useful in comparing ongoing costs only and will not help you determine the relative costs of owning different funds.
Mitchell Capital All-Cap Growth Fund | Beginning Account Value | Ending Account Value February 1, 2013 | Expenses Paid During the Period Ended July 31, 2013 | |||||||||
Actual* | $ | 1,000.00 | $ | 1,070.00 | $ | 4.33 | ||||||
Hypothetical** | $ | 1,000.00 | $ | 1,019.98 | $ | 5.00 | ||||||
| * | Expenses are equal to the Fund’s annualized expense ratio of 0.99%, multiplied by the average account value over the period, multiplied by 153/365 (to reflect the period since commencement of operations on March 1, 2013) |
| ** | Assumes a 5% return before expenses. The hypothetical example is calculated based on a six month period from February 1, 2013 to July 31, 2013. Accordingly, expenses are equal to the Fund’s annualized expense ratio of 0.99% multiplied by the average account value over the six month period, multiplied by 182/365 (to reflect the partial year period). |
4
Mitchell Capital All-Cap Growth Fund
Schedule of Investments
July 31, 2013
(Unaudited)
| Common Stocks - 92.83% | Shares | Fair Value | ||||||
Consumer Discretionary - 17.88% | ||||||||
Dollar Tree, Inc. (a) | 800 | $ | 42,920 | |||||
Panera Bread Co. - Class A (a) | 128 | 21,382 | ||||||
PetSmart, Inc. | 721 | 52,792 | ||||||
Ross Stores, Inc. | 738 | 49,793 | ||||||
Tractor Supply Co. | 448 | 54,266 | ||||||
|
| |||||||
| 221,153 | ||||||||
|
| |||||||
Energy - 11.76% | ||||||||
Ensco PLC - Class A | 659 | 37,787 | ||||||
FMC Technologies, Inc. (a) | 849 | 45,252 | ||||||
Oceaneering International, Inc. | 770 | 62,439 | ||||||
|
| |||||||
| 145,478 | ||||||||
|
| |||||||
Financials - 4.85% | ||||||||
Amtrust Financial Services, Inc. | 723 | 30,098 | ||||||
Toronto-Dominion Bank/The | 355 | 29,884 | ||||||
|
| |||||||
| 59,982 | ||||||||
|
| |||||||
Health Care - 22.33% | ||||||||
Air Methods Corp. | 812 | 27,275 | ||||||
Biogen Idec, Inc. (a) | 168 | 36,646 | ||||||
Cerner Corp. (a) | 982 | 48,118 | ||||||
Exact Sciences Corp (a) | 479 | 6,572 | ||||||
Express Scripts Holding Co. (a) | 747 | 48,966 | ||||||
Gilead Sciences, Inc. (a) | 520 | 31,954 | ||||||
Mettler-Toledo International, Inc. (a) | 187 | 41,252 | ||||||
Novo Nordisk A/S (b) | 209 | 35,304 | ||||||
|
| |||||||
| 276,087 | ||||||||
|
| |||||||
Industrials - 16.10% | ||||||||
Canadian National Railway Co. | 345 | 34,452 | ||||||
Honeywell International, Inc. | 454 | 37,673 | ||||||
IHS, Inc. - Class A (a) | 192 | 21,078 | ||||||
Kirby Corp. (a) | 597 | 50,422 | ||||||
Middleby Corp./The (a) | 145 | 25,946 | ||||||
Quanta Services, Inc. (a) | 1,101 | 29,518 | ||||||
|
| |||||||
| 199,089 | ||||||||
|
| |||||||
See accompanying notes which are an integral part of these financial statements.
5
Mitchell Capital All-Cap Growth Fund
Schedule of Investments - continued
April 30, 2013
(Unaudited)
| Common Stocks - 92.83% - continued | Shares | Fair Value | ||||||
Information Technology - 19.91% | ||||||||
CGI Group, Inc. - Class A (a) | 791 | $ | 27,376 | |||||
Cognizant Technology Solutions Corp. (a) | 420 | 30,404 | ||||||
EMC Corp. | 1,172 | 30,648 | ||||||
Gartner, Inc. (a) | 501 | 30,065 | ||||||
Intuit, Inc. | 458 | 29,275 | ||||||
MICROS Systems, Inc. (a) | 719 | 35,037 | ||||||
NIC, Inc. | 709 | 13,060 | ||||||
Skyworks Solutions, Inc. (a) | 1,091 | 26,206 | ||||||
Synaptics, Inc. (a) | 266 | 10,640 | ||||||
Virtusa Corp. (a) | 523 | 13,483 | ||||||
|
| |||||||
| 246,194 | ||||||||
|
| |||||||
TOTAL COMMON STOCKS (Cost $1,062,624) | 1,147,983 | |||||||
|
| |||||||
Money Market Securities - 6.89% | ||||||||
Federated Treasury Obligations Fund - Institutional shares, 0.01% (c) | 85,145 | 85,145 | ||||||
|
| |||||||
TOTAL MONEY MARKET SECURITIES (Cost $85,145) | 85,145 | |||||||
|
| |||||||
TOTAL INVESTMENTS (Cost $1,147,769) - 99.72% | $ | 1,233,128 | ||||||
|
| |||||||
Other assets less liabilities - 0.28% | 3,465 | |||||||
|
| |||||||
TOTAL NET ASSETS - 100.00% | $ | 1,236,593 | ||||||
|
| |||||||
| (a) | Non-income producing. |
| (b) | American Depositary Receipt (ADR) |
| (c) | The money market fund is not a variable rate security; the rate shown represents the seven-day yield at July 31, 2013. |
See accompanying notes which are an integral part of these financial statements.
6
Mitchell Capital All-Cap Growth Fund
Statement of Assets and Liabilities
July 31, 2013
(Unaudited)
Assets | ||||
Investments in securities, at value (cost $1,147,769) | $ | 1,233,128 | ||
Receivable from Adviser (a) | 15,518 | |||
Dividends receivable | 376 | |||
Receivable for tax reclaim | 52 | |||
Interest receivable | — | |||
Prepaid expenses | 5,704 | |||
Deferred offering costs | 23,367 | |||
Deferred organization costs | 4,630 | |||
|
| |||
Total assets | 1,282,775 | |||
|
| |||
Liabilities | ||||
Payable for investments purchased | 29,092 | |||
Payable to administrator, fund accountant, and transfer agent (a) | 3,753 | |||
Payable to trustees | 119 | |||
Payable to custodian (a) | 728 | |||
Other accrued expenses | 12,490 | |||
|
| |||
Total liabilities | 46,182 | |||
|
| |||
Net Assets | $ | 1,236,593 | ||
|
| |||
Net Assets consist of: | ||||
Paid in capital | $ | 1,164,797 | ||
Accumulated undistributed net investment (loss) | (1,522 | ) | ||
Accumulated net realized (loss) from investments | (12,041 | ) | ||
Net unrealized appreciation on investments | 85,359 | |||
|
| |||
Net Assets | $ | 1,236,593 | ||
|
| |||
Shares outstanding (unlimited number of shares authorized; no par value) | 115,555 | |||
|
| |||
Net Asset Value, offering and redemption price per share | $ | 10.70 | ||
|
|
| (a) | See Note 4 in the Notes to the Financial Statements. |
See accompanying notes which are an integral part of these financial statements.
7
Mitchell Capital All-Cap Growth Fund
Statement of Operations
For the period ended July 31, 2013 (a)
(Unaudited)
Investment Income | ||||
Dividend income (net of foreign withholding tax of $161) | $ | 2,579 | ||
Interest income | 2 | |||
|
| |||
Total Investment Income | 2,581 | |||
|
| |||
Expenses | ||||
Investment advisor fee (b) | 3,095 | |||
Offering expenses | 14,564 | |||
Transfer agent expenses (b) | 14,416 | |||
Fund accounting expenses (b) | 9,611 | |||
Administration expenses (b) | 9,611 | |||
Audit expenses | 6,810 | |||
Legal expenses | 6,356 | |||
Miscellaneous expenses | 5,301 | |||
Organizational expenses | 4,120 | |||
Custodian expenses (b) | 3,511 | |||
Trustee expenses | 3,405 | |||
Report printing expenses | 2,614 | |||
Registration expenses | 1,738 | |||
24f-2 expenses | 1,548 | |||
CCO expenses | 1,297 | |||
Pricing expenses | 946 | |||
|
| |||
Total Expenses | 88,943 | |||
Less: Fees waived and reimbursed by Adviser | (84,840 | ) | ||
|
| |||
Net operating expenses | 4,103 | |||
|
| |||
Net Investment Income | (1,522 | ) | ||
|
| |||
Realized & Unrealized Gain on Investments | ||||
Net realized (loss) on investment securities | (12,041 | ) | ||
Change in unrealized appreciation on investment securities | 85,359 | |||
|
| |||
Net realized and unrealized gain on investment securities | 73,318 | |||
|
| |||
Net increase in net assets resulting from operations | $ | 71,796 | ||
|
|
| (a) | For the period March 1, 2013 (commencement of operations) to July 31, 2013. |
| (b) | See Note 4 in the Notes to the Financial Statements. |
See accompanying notes which are an integral part of these financial statements.
8
Mitchell Capital All-Cap Growth Fund
Statements of Changes In Net Assets
| For the Period Ended July 31, 2013 (Unaudited) (a) | ||||
Increase (Decrease) in Net Assets due to: | ||||
Operations | ||||
Net investment (loss) | $ | (1,522 | ) | |
Net realized (loss) on investment securities | (12,041 | ) | ||
Change in unrealized appreciation on investment securities | 85,359 | |||
|
| |||
Net increase in net assets resulting from operations | 71,796 | |||
|
| |||
Capital Share Transactions | ||||
Proceeds from shares sold | 1,174,008 | |||
Amount paid for shares redeemed | (9,211 | ) | ||
|
| |||
Net increase in net assets resulting from capital share transactions | 1,164,797 | |||
|
| |||
Total Increase in Net Assets | 1,236,593 | |||
|
| |||
Net Assets | ||||
Beginning of period | — | |||
|
| |||
End of period | $ | 1,236,593 | ||
|
| |||
Undistributed net investment income included in net assets at end of period | $ | (1,522 | ) | |
|
| |||
Capital Share Transactions | ||||
Shares sold | 116,441 | |||
Shares redeemed | (886 | ) | ||
|
| |||
Net increase from capital share transactions | 115,555 | |||
|
| |||
| (a) | For the period March 1, 2013 (commencement of operations) to July 31, 2013. |
See accompanying notes which are an integral part of these financial statements.
9
Mitchell Capital All-Cap Growth Fund
Financial Highlights
(For a share outstanding during each period)
| For the Period Ended July 31, 2013 (Unaudited) (a) | ||||
Selected Per Share Data: | ||||
Net asset value, beginning of period | $ | 10.00 | ||
|
| |||
Income from investment operations: | ||||
Net investment income | (0.01 | ) | ||
Net realized and unrealized gain on investments | 0.71 | |||
|
| |||
Total from investment operations | 0.70 | |||
|
| |||
Net asset value, end of period | $ | 10.70 | ||
|
| |||
Total Return (b) | 7.00 | % (c) | ||
Ratios and Supplemental Data: | ||||
Net assets, end of period (000) | $ | 1,237 | ||
Ratio of net expenses to average net assets | 0.99 | % (d) | ||
Ratio of expenses to average net assets before waiver and reimbursement | 21.50 | % (d) | ||
Ratio of net investment income to average net assets | (0.37 | )% (d) | ||
Ratio of net investment income to average net assets before waiver and reimbursement | 20.88 | % (d) | ||
Portfolio turnover rate | 12.42 | % (c) | ||
| (a) | For the period March 1, 2013 (commencement of operations) to July 31, 2013. |
| (b) | Total return in the above table represents the rate that the investor would have earned or lost on an investment in the Fund, assuming reinvestment of distributions. |
| (c) | Not annualized. |
| (d) | Annualized. |
See accompanying notes which are an integral part of these financial statements.
10
Mitchell Capital All-Cap Growth Fund
Notes to the Financial Statements
July 31, 2013
(Unaudited)
NOTE 1. ORGANIZATION
The Mitchell Capital All-Cap Growth Fund (the “Fund”) is an open-end diversified series of the Valued Advisers Trust (the “Trust”). The Trust is a management investment company established under the laws of Delaware by an Agreement and Declaration of Trust dated June 13, 2008 (the “Trust Agreement”). The Trust Agreement permits the Trustees to issue an unlimited number of shares of beneficial interest of separate series without par value. The Fund is one of a series of funds authorized by the Trustees (the “Board”). The Fund commenced operations on March 1, 2013. The Fund’s investment adviser is Mitchell Capital Management Company (the “Adviser”). The investment objective of the Fund is to provide long-term capital appreciation.
NOTE 2. SIGNIFICANT ACCOUNTING POLICIES
The following is a summary of significant accounting policies followed by the Fund in the preparation of its financial statements.
Securities Valuation – All investments in securities are recorded at their estimated fair value as described in Note 3.
Federal Income Taxes – The Fund makes no provision for federal income or excise tax. The Fund intends to qualify each year as a regulated investment company (“RIC”) under subchapter M of the Internal Revenue Code of 1986, as amended, by complying with the requirements applicable to RICs and by distributing substantially all of its taxable income. The Fund also intends to distribute sufficient net investment income and net capital gains, if any, so that it will not be subject to excise tax on undistributed income and gains. If the required amount of net investment income or gains is not distributed, the Fund could incur a tax expense.
As of and during the period ended July 31, 2013, the Fund did not have a liability for any unrecognized tax benefits. The Fund recognizes interest and penalties, if any, related to unrecognized tax benefits as income tax expense in the statement of operations. During the period, the Fund did not incur any interest or penalties. The Fund is subject to examination by U.S. federal tax authorities for all years since inception.
Expenses – Expenses incurred by the Trust that do not relate to a specific fund of the Trust are allocated to the individual funds based on each fund’s relative net assets or another appropriate basis (as determined by the Trustees).
Security Transactions and Related Income - The Fund follows industry practice and records security transactions on the trade date for financial reporting purposes. The first in first out (“FIFO”) method is used for determining gains or losses for financial statement and income tax purposes. Dividend income is recorded on the ex-dividend date and interest income is recorded on an accrual basis. Discounts and premiums on securities purchased are accreted or amortized using the effective interest method. The ability of issuers of debt securities held by the Fund to meet their obligations may be affected by economic and political developments in a specific country or region. Withholding taxes on foreign dividends have been provided for in accordance with the Fund’s understanding of the applicable country’s tax rules and rates.
Dividends and Distributions - The Fund intends to distribute substantially all of its net investment income, if any, as dividends to its shareholders on at least an annual basis. The Fund intends to distribute its net realized long term capital gains and its net realized short term capital gains, if any, at least once a year. Dividends to shareholders, which are determined in accordance with income tax regulations, are recorded on the ex-dividend date. The treatment for financial reporting purposes of distributions made to shareholders during the period from net investment income or net realized capital gains may differ from their ultimate treatment for federal income tax purposes. These differences are caused primarily by differences in the timing of the recognition of certain components of income, expense or realized capital gain for federal income tax purposes. Where such differences are permanent in nature, they are reclassified in the components of the net assets based on their ultimate characterization for federal income tax purposes. Any such reclassifications will have no effect on net assets, results of operations or net asset values per share of the Fund.
11
Mitchell Capital All-Cap Growth Fund
Notes to the Financial Statements - continued
July 31, 2013
(Unaudited)
NOTE 3. SECURITIES VALUATION AND FAIR VALUE MEASUREMENTS
Fair value is defined as the price that a Fund would receive upon selling an investment in an orderly transaction to an independent buyer in the principal or most advantageous market of the investment. Accounting principles generally accepted in the United States of America (“GAAP”) establishes a three-tier hierarchy to maximize the use of observable market data and minimize the use of unobservable inputs and to establish classification of fair value measurements for disclosure purposes.
Inputs refer broadly to the assumptions that market participants would use in pricing the asset or liability, including assumptions about risk, for example, the risk inherent in a particular valuation technique used to measure fair value including such as a pricing model and/or the risk inherent in the inputs to the valuation technique. Inputs may be observable or unobservable. Observable inputs are inputs that reflect the assumptions market participants would use in pricing the asset or liability developed based on market data obtained from sources independent of the reporting entity. Unobservable inputs are inputs that reflect the reporting entity’s own assumptions about the assumptions market participants would use in pricing the asset or liability developed based on the best information available in the circumstances.
Various inputs are used in determining the value of the Fund’s investments. These inputs are summarized in the three broad levels listed below.
| • | Level 1 – quoted prices in active markets for identical securities |
| • | Level 2 – other significant observable inputs (including, but not limited to, quoted prices for an identical security in an inactive market, quoted prices for similar securities, interest rates, prepayment speeds, credit risk, etc.) |
| • | Level 3 – significant unobservable inputs (including the Fund’s own assumptions in determining fair value of investments based on the best information available) |
The inputs used to measure fair value may fall into different levels of the fair value hierarchy. In such cases, for disclosure purposes, the level in the fair value hierarchy within which the fair value measurement falls in its entirety, is determined based on the lowest level input that is significant to the fair value measurement in its entirety.
Equity securities, including common stocks, are generally valued by using market quotations, but may be valued on the basis of prices furnished by a pricing service when the Fund believes such prices more accurately reflect the fair value of such securities. Securities that are traded on any stock exchange are generally valued by the pricing service at the last quoted sale price. Lacking a last sale price, an exchange traded security is generally valued by the pricing service at its last bid price. Securities traded in the NASDAQ over-the-counter market are generally valued by the pricing service at the NASDAQ Official Closing Price. When using the market quotations or close prices provided by the pricing service and when the market is considered active, the security will be classified as a Level 1 security. Sometimes, an equity security owned by the Fund will be valued by the pricing service with factors other than market quotations or when the market is considered inactive. When this happens, the security will be classified as a Level 2 security. When market quotations are not readily available, when the Fund determines that the market quotation or the price provided by the pricing service does not accurately reflect the current fair value, or when restricted or illiquid securities are being valued, such securities are valued as determined in good faith by the Fund, in conformity with guidelines adopted by and subject to review by the Board. These securities will be categorized as Level 3 securities.
Investments in mutual funds, including money market mutual funds, are generally priced at the ending net asset value (NAV) provided by the service agent of the funds. These securities will be categorized as Level 1 securities.
Fixed income securities, when valued using market quotations in an active market, will be categorized as Level 1 securities. However, they may be valued on the basis of prices furnished by a pricing service when the Fund believes
12
Mitchell Capital All-Cap Growth Fund
Notes to the Financial Statements - continued
July 31, 2013
(Unaudited)
NOTE 3. SECURITIES VALUATION AND FAIR VALUE MEASUREMENTS – continued
such prices more accurately reflect the fair value of such securities. A pricing service utilizes electronic data processing techniques based on yield spreads relating to securities with similar characteristics to determine prices for normal institutional-size trading units of debt securities without regard to sale or bid prices. These securities will generally be categorized as Level 2 securities. If the Fund decides that a price provided by the pricing service does not accurately reflect the fair value of the securities, when prices are not readily available from a pricing service, or when restricted or illiquid securities are being valued, securities are valued at fair value as determined in good faith by the Fund, in conformity with guidelines adopted by and subject to review of the Board. These securities will be categorized as Level 3 securities.
Short-term investments in fixed income securities (those with maturities of less than 60 days when acquired or which subsequently are within 60 days of maturity), are valued by using the amortized cost method of valuation, which the Board has determined will represent fair value. These securities will be classified as Level 2 securities.
In accordance with the Trust’s good faith pricing guidelines, the Fund is required to consider all appropriate factors relevant to the value of securities for which it has determined other pricing sources are not available or reliable as described above. No single standard exists for determining fair value, because fair value depends upon the circumstances of each individual case. As a general principle, the current fair value of an issue of securities being valued by the Fund would appear to be the amount which the owner might reasonably expect to receive for them upon their current sale. Methods which are in accordance with this principle may, for example, be based on (i) a multiple of earnings; (ii) a discount from market of a similar freely traded security (including a derivative security or a basket of securities traded on other markets, exchanges or among dealers); or (iii) yield to maturity with respect to debt issues, or a combination of these and other methods. Good faith pricing is permitted if, in the Fund’s opinion, the validity of market quotations appears to be questionable based on factors such as evidence of a thin market in the security based on a small number of quotations, a significant event occurs after the close of a market but before a Fund’s NAV calculation that may affect a security’s value, or the Fund is aware of any other data that calls into question the reliability of market quotations. Good faith pricing may also be used in instances when the bonds the Fund invest in may default or otherwise cease to have market quotations readily available. Any fair valuation pricing done outside the Fund’s approved pricing methods must be approved by the Pricing Committee of the Board.
The following is a summary of the inputs used to value the Fund’s investments as of July 31, 2013:
| Valuation Inputs | ||||||||||||||||
Assets | Level 1 - Quoted Prices in Active Markets | Level 2 - Other Significant Observable Inputs | Level 3 - Significant Unobservable Inputs | Total | ||||||||||||
Common Stocks* | $ | 1,147,983 | $ | — | $ | — | $ | 1,147,983 | ||||||||
Money Market Securities | 85,145 | — | — | 85,145 | ||||||||||||
|
|
|
|
|
|
|
| |||||||||
Total | $ | 1,233,128 | $ | — | $ | — | $ | 1,233,128 | ||||||||
|
|
|
|
|
|
|
| |||||||||
| * | Refer to the Schedule of Investments for industry classifications. |
The Fund did not hold any investments at any time during the reporting period in which significant unobservable inputs were used in determining fair value; therefore, no reconciliation of Level 3 securities is included for this reporting period. The Fund did not hold any derivative instruments during the reporting period. The Trust recognizes significant transfers between fair value hierarchy levels at the reporting period end. There were no significant transfers between all Levels as of July 31, 2013.
13
Mitchell Capital All-Cap Growth Fund
Notes to the Financial Statements - continued
July 31, 2013
(Unaudited)
NOTE 4. FEES AND OTHER TRANSACTIONS WITH AFFILIATES
Under the terms of the management agreement, on behalf of the Fund (the “Agreement”), the Adviser manages the Fund’s investments subject to approval of the Trustees. As compensation for its management services, the Fund is obligated to pay the Adviser a fee computed and accrued daily and paid monthly at an annual rate of 0.75% of the average daily net assets of the Fund. For the period from March 1, 2013 (commencement of operations) to July 31, 2013, the Adviser earned a fee of $3,095 from the Fund before the reimbursement described below. At July 31, 2013, the Adviser owed the Fund $15,518.
The Adviser has contractually agreed to waive its management fee and/or reimburse expenses so that total annual fund operating expenses, excluding interest, taxes, brokerage commissions, other expenditures which are capitalized in accordance with GAAP, other extraordinary expenses not incurred in the ordinary course of the Fund’s business, dividend expense on short sales, and expenses that the Fund has incurred but did not actually pay because of an expense offset arrangement, if applicable, incurred by the Fund in any fiscal year, do not exceed 0.99% of the Fund’s average daily net assets through May 31, 2014. The operating expense limitation also excludes any fees and expenses of acquired funds. For the period from March 1, 2013 (commencement of operations) to July 31, 2013, totaling $84,840 may be subject to potential recoupment by the Adviser until January 31, 2017.
The Trust retains Huntington Asset Services, Inc. (“HASI”) to manage the Fund’s business affairs and provide the Fund with administrative services, including all regulatory reporting and necessary office equipment and personnel. For the period from March 1, 2013 (commencement of operations) to July 31, 2013, HASI earned fees of $9,611 for administrative services provided to the Fund. At July 31, 2013, HASI was owed $1,277 from the Fund for administrative services. Certain officers of the Trust are members of management and/or employees of HASI. HASI is a wholly-owned subsidiary of Huntington Bancshares, Inc., the parent company of Unified Financial Securities, Inc. (the “Distributor”) and Huntington National Bank, the custodian of the Fund’s investments (the “Custodian”). For the period from March 1, 2013 (commencement of operations) to July 31, 2013, the Custodian earned fees of $3,511 for custody services provided to the Fund. At July 31, 2013, the Custodian was owed $728 from the Fund for custody services.
The Trust also retains HASI to act as the Fund’s transfer agent and to provide fund accounting services. For the period from March 1, 2013 (commencement of operations) to July 31, 2013, HASI earned fees of $14,416 for transfer agent services to the Fund. At July 31, 2013, the Fund owed HASI $1,197 for transfer agent services.
For the period from March 1, 2013 (commencement of operations) to July 31, 2013, HASI earned fees of $9,611 from the Fund for fund accounting services. At July 31, 2013, HASI was owed $1,278 from the Fund for fund accounting services.
Unified Financial Securities, Inc. acts as the principal underwriter of the Fund’s shares. There were no payments made by the Fund to the Distributor during the period ended July 31, 2013. An officer of the Trust is an officer of the Distributor and such person may be deemed to be an affiliate of the Distributor.
14
Mitchell Capital All-Cap Growth Fund
Notes to the Financial Statements - continued
July 31, 2013
(Unaudited)
NOTE 5. INVESTMENTS
For the period from March 1, 2013 (commencement of operations) to July 31, 2013, purchases and sales of investment securities, other than short-term investments and short-term U.S. government obligations, were as follows:
U.S. Government Obligations | $ | — | ||
Other | 1,194,425 | |||
Sales | ||||
U.S. Government Obligations | $ | — | ||
Other | 119,753 |
At July 31, 2013, the net unrealized appreciation (depreciation) of investments for tax purposes was as follows:
Gross Appreciation | $ | 100,942 | ||
Gross (Depreciation) | (15,583 | ) | ||
|
| |||
Net Appreciation (Depreciation) on Investments | $ | 85,359 | ||
|
|
At July 31, 2013, the aggregate cost of securities, excluding U.S. government obligations, for federal income tax purposes was $1,147,769 for the Fund.
NOTE 6. ESTIMATES
The preparation of financial statements in conformity with GAAP requires management to make estimates and assumptions that affect the reported amounts of assets and liabilities and disclosure of contingent assets and liabilities at the date of the financial statements and the reported amounts of increases and decreases in net assets from operations during the reporting period. Actual results could differ from those estimates.
NOTE 7. BENEFICIAL OWNERSHIP
The beneficial ownership, either directly or indirectly, of 25% or more of the voting securities of a fund creates a presumption of control of a fund, under Section 2(a) (9) of the Investment Company Act of 1940. At July 31, 2013, Richard S. Jones owned 35.04%. As a result, the Richard S. Jones may be deemed to be a control person on the basis of its ownership of voting securities of the Fund.
NOTE 8. DISTRIBUTIONS TO SHAREHOLDERS
The Fund did not make any distributions during the period ended July 31, 2013.
NOTE 9. COMMITMENTS AND CONTINGENCIES
The Fund indemnifies its officers and trustees for certain liabilities that may arise from their performance of their duties to the Fund. Additionally, in the normal course of business, the Fund enters into contracts that contain a variety of representatives and warranties which provide general indemnifications. The Fund’s maximum exposure under these arrangements is unknown, as this would involve future claims that may be made against the Fund that have not yet occurred.
15
Approval of Investment Advisory Agreement - Unaudited
At a meeting held on December 10-11, 2012, the Board of Trustees (the “Board”) considered the initial approval of an Investment Advisory Agreement (the “Advisory Agreement”) between the Trust and Mitchell Capital Management Co. (the “Adviser”) on behalf of the MCM All-Cap Growth Fund (the “Fund”). Counsel reviewed with the Board the requirements of the 1940 Act and the applicable disclosure obligations associated therewith. The Board discussed the arrangements between the Adviser and the Trust with respect to the Fund and reflected on discussions with the Adviser regarding the Advisory Agreement, the expense limitation agreement and the manner in which the Fund would be managed.
Counsel referred the Board to the Meeting materials, which included, among other things, a memorandum from Counsel addressing the duties of Trustees regarding the approval of the proposed Advisory Agreement, a letter from Counsel to the Adviser and the Adviser’s responses to that letter, a copy of the Adviser’s financial statements, a copy of the Adviser’s Form ADV, and the Advisory Agreement and expense limitation agreement.
Counsel noted that the 1940 Act requires the approval of the investment advisory agreement between the Trust and the Adviser by a majority of the Independent Trustees. The Board discussed the arrangements between the Adviser and the Trust with respect to the Fund. The Board reviewed a memorandum from Counsel, and addressed to the Trustees that summarized, among other things, the fiduciary duties and responsibilities of the Board in reviewing and approving the Advisory Agreement. Counsel discussed with the Trustees the types of information and factors that should be considered by the Board in order to make an informed decision regarding the approval of the Advisory Agreement, including the following material factors: (i) the nature, extent, and quality of the services provided by the Adviser; (ii) the investment performance of the Fund; (iii) the costs of the services to be provided and profits to be realized by the Adviser from the relationship with the Fund; (iv) the extent to which economies of scale would be realized if the Fund grows and whether advisory fee levels reflect those economies of scale for the benefit of the investors of the Fund; and (v) the Adviser’s practices regarding possible conflicts of interest.
The Board did not identify any particular information that was most relevant to its consideration to approve the Agreement and each Trustee may have afforded different weight to the various factors.
| 1. | The nature, extent, and quality of the services to be provided by the Adviser. In this regard, the Board considered the responsibilities the Adviser would have under the Advisory Agreement. The Board reviewed the services to be provided by the Adviser to the Fund including, without limitation: the Adviser’s procedures for formulating investment recommendations and assuring compliance with the Fund’s investment objectives and limitations; the efforts of the Adviser during the Fund’s start-up phase, its anticipated coordination of services for the Fund among the Fund’s service providers, and the anticipated efforts to promote the Fund, grow its assets, and assist in the distribution of the Fund shares. The Board considered: the Adviser’s staffing, personnel, and methods of operating; the education and experience of the Adviser’s personnel; and the Adviser’s compliance program, policies, and procedures. After reviewing the foregoing and further information from the Adviser (e.g., the Adviser’s compliance programs and Form ADV), the Board concluded that the quality, extent, and nature of the services to be provided by the Adviser were satisfactory and adequate for the Fund. |
| 2. | Investment Performance of the Fund and the Adviser. The Board noted that while the Fund had not commenced operations and thus did not have investment performance information to review, |
| that the Board could consider the investment performance of the Adviser in managing accounts similar to the manner in which the Fund would be managed. The Board observed that while the separate accounts would not be subjected to the same operations, expenses and restrictions as the Fund, the performance was very good. The Board concluded, in light of the foregoing factors, that the investment performance of the Adviser was satisfactory. |
| 3. | The costs of the services to be provided and profits to be realized by the Adviser from the relationship with the Fund. In this regard, the Board considered: the financial condition of the Adviser and the level of commitment to the Fund and the Adviser by the principals of the Adviser; the projected asset levels of the Fund; the Adviser’s payment of startup costs for the Fund; and the overall anticipated expenses of the Fund, including the expected nature and frequency of advisory fee payments. The Board also considered potential benefits for the Adviser in managing the Fund. The Board compared the expected fees and expenses of the Fund (including the management fee) to other funds comparable to the Fund in terms of the type of fund, the style of investment management, the anticipated size of fund and the nature of the investment strategy and markets invested in, among other factors. The Board determined that the Fund’s anticipated expense ratio, in light of the contractual Expense Limitation Agreement, and the management fee were generally comparable to those of similar funds. Following this comparison and upon further consideration and discussion of the foregoing, the Board concluded that the fees to be paid to the Adviser by the Fund were fair and reasonable. |
| 4. | The extent to which economies of scale would be realized as the Fund grows and whether advisory fee levels reflect these economies of scale for the benefit of the Fund’s investors. In this regard, the Board considered the Fund’s fee arrangements with the Adviser. The Trustees considered that the management fee for the Fund had breakpoints that would allow shareholders to realize economies of scale as assets grow. The Trustees noted that the Fund had not commenced operations and therefore at the outset, investors would not benefit from the breakpoints in the advisory agreement. However, the Trustees noted that the Fund’s shareholders would experience benefits from the expense limitation arrangements in place for that Fund. In light of the foregoing, the Trustees determined that the fee arrangements for the Fund, in light of all the facts and circumstances, were fair and reasonable in relation to the nature and quality of the services provided by the Adviser. |
| 5. | Possible conflicts of interest. In evaluating the possibility for conflicts of interest, the Board considered such matters as: the experience and ability of the advisory personnel assigned to the Fund; the basis of decisions to buy or sell securities for the Fund and/or the Adviser’s other accounts; the method for bunching of portfolio securities transactions; the substance and administration of the Adviser’s code of ethics and other relevant policies described in the Adviser’s Form ADV. Following further consideration and discussion, the Board indicated that the Adviser’s standards and practices relating to the identification and mitigation of potential conflicts of interest were satisfactory. |
After additional consideration of the factors delineated in the memorandum provided by Counsel and further discussion among the Board, the Board determined to approve the Advisory Agreement between the Trust and the Adviser.
PROXY VOTING
A description of the policies and procedures that the Fund uses to determine how to vote proxies relating to portfolio securities and information regarding how the Funds voted those proxies during the most recent twelve month period ended June 30, is available without charge upon request by (1) calling the Fund at (855) 626-8034 and (2) from Fund documents filed with the Securities and Exchange Commission (“SEC”) on the SEC’s website at www.sec.gov.
TRUSTEES
R. Jeffrey Young, Chairman
Dr. Merwyn R. Vanderlind
Ira Cohen
OFFICERS
R. Jeffrey Young, Principal Executive Officer and President
John C. Swhear, Chief Compliance Officer, AML Officer and Vice-President
Robert W. Silva, Principal Financial Officer and Treasurer
Carol J. Highsmith, Vice President
Matthew J. Miller, Vice President
Heather Bonds, Secretary
INVESTMENT ADVISER
Mitchell Capital Management Company
11460 Tomahawk Creek Parkway, Suite 410
Leawood, KS 66211
DISTRIBUTOR
Unified Financial Securities, Inc.
2960 North Meridian Street, Suite 300
Indianapolis, IN 46208
INDEPENDENT REGISTERED PUBLIC ACCOUNTING FIRM
Cohen Fund Audit Services, Ltd.
800 Westpoint Parkway, Suite 1100
Westlake, OH 44145
LEGAL COUNSEL
The Law Offices of John H. Lively & Associates, Inc.
A member firm of The 1940 Act Law GroupTM
2041 West 141st Terrace, Suite 119
Leawood, KS 66224
CUSTODIAN
Huntington National Bank
41 South High Street
Columbus, OH 43125
ADMINISTRATOR, TRANSFER AGENT AND FUND ACCOUNTANT
Huntington Asset Services, Inc.
2960 North Meridian Street, Suite 300
Indianapolis, IN 46208
This report is intended only for the information of shareholders or those who have received the Fund’s prospectus which contains information about the Fund’s management fee and expenses. Please read the prospectus carefully before investing.
Distributed by Unified Financial Securities, Inc.
Member FINRA/SIPC
PRIVACY POLICY
The following is a description of the Fund’s policies regarding disclosure of nonpublic personal information that you provide to the Fund or that the Fund collects from other sources. In the event that you hold shares of the Fund through a broker-dealer or other financial intermediary, the privacy policy of your financial intermediary would govern how your nonpublic personal information would be shared with nonaffiliated third parties.
Categories of Information the Fund Collects. The Fund collects the following nonpublic personal information about you:
| • | Information the Fund receives from you on applications or other forms, correspondence, or conversations (such as your name, address, phone number, social security number, and date of birth); and |
| • | Information about your transactions with the Fund, its affiliates, or others (such as your account number and balance, payment history, cost basis information, and other financial information). |
Categories of Information the Fund Discloses. The Fund does not disclose any nonpublic personal information about its current or former shareholders to unaffiliated third parties, except as required or permitted by law. The Fund is permitted by law to disclose all of the information it collects, as described above, to service providers (such as the Fund’s custodian, administrator, transfer agent, accountant and legal counsel) to process your transactions and otherwise provide services to you.
Confidentiality and Security. The Fund restricts access to your nonpublic personal information to those persons who require such information to provide products or services to you. The Fund maintains physical, electronic, and procedural safeguards that comply with federal standards to guard your nonpublic personal information.
Disposal of Information. The Fund, through its transfer agent, has taken steps to reasonably ensure that the privacy of your nonpublic personal information is maintained at all times, including in connection with the disposal of information that is no longer required to be maintained by the Fund. Such steps shall include, whenever possible, shredding paper documents and records prior to disposal, requiring off-site storage vendors to shred documents maintained in such locations prior to disposal, and erasing and/or obliterating any data contained on electronic media in such a manner that the information can no longer be read or reconstructed.
SEMI-ANNUAL REPORT
July 31, 2013

Angel Oak Multi-Strategy Income Fund
Angel Oak Capital Advisors, LLC
One Buckhead Plaza
3060 Peachtree Road NW, Suite 500
Atlanta, GA 30305
(404) 953-4902
Investment Results – (Unaudited)
Total Returns*
(For the periods ended July 31, 2013)
| Average Annual Returns | ||||||||||||
| Six Months | One Year | Since Inception (June 28, 2011) | ||||||||||
Angel Oak Multi-Strategy Income Fund, Class A without load | -2.04 | % | 7.86 | % | 13.69 | % | ||||||
Angel Oak Multi-Strategy Income Fund, Class A with load | -7.65 | % | 1.68 | % | 10.52 | % | ||||||
Barclays Capital U.S. Aggregrate Bond Index** | -1.62 | % | -1.90 | % | 2.93 | % | ||||||
Total annual operating expenses, as disclosed in the Fund’s prospectus dated May 30, 2013, were 1.86% of average daily net assets. The Adviser contractually has agreed to waive or limit its fees and assume other expenses of the Fund until August 31, 2014, so that total annual fund operating expenses do not exceed 0.99%. This operating expense limitation does not apply to brokerage fees and commissions, borrowing costs (such as interest and dividend expenses on securities sold short), taxes, 12b-1 fees, extraordinary expenses and indirect expenses (such as “acquired fund fees and expenses”).
Total Returns*
(For the periods ended July 31, 2013)
| Average Annual Returns | ||||||||||||
| Six Months | One Year | Since Inception (March 14, 2012) | ||||||||||
Angel Oak Multi-Strategy Income Fund, Class C without load | -2.30 | % | 7.12 | % | 9.73 | % | ||||||
Angel Oak Multi-Strategy Income Fund, Class C with load | -3.26 | % | 6.12 | % | 9.73 | % | ||||||
Barclays Capital U.S. Aggregrate Bond Index** | -1.62 | % | -1.90 | % | 0.97 | % | ||||||
1
Investment Results – (Unaudited) (continued)
Total annual operating expenses, as disclosed in the Fund’s prospectus dated May 30, 2013, were 2.61% of average daily net assets. The Adviser contractually has agreed to waive or limit its fees and assume other expenses of the Fund until August 31, 2014, so that total annual fund operating expenses do not exceed 0.99%. This operating expense limitation does not apply to brokerage fees and commissions, borrowing costs (such as interest and dividend expenses on securities sold short), taxes, 12b-1 fees, extraordinary expenses and indirect expenses (such as “acquired fund fees and expenses”).
Total Returns*
(For the periods ended July 31, 2013)
| Six Months | Since Inception (August 16, 2012) | |||||||
Angel Oak Multi-Strategy Income Fund, Institutional Class, without load | -1.84 | % | 5.77 | % | ||||
Barclays Capital U.S. Aggregrate Bond Index** | -1.62 | % | -0.95 | % | ||||
Total annual operating expenses, as disclosed in the Fund’s prospectus dated May 30, 2013, were 1.61% of average daily net assets. The Adviser contractually has agreed to waive or limit its fees and assume other expenses of the Fund until August 31, 2014, so that total annual fund operating expenses do not exceed 0.99%. This operating expense limitation does not apply to brokerage fees and commissions, borrowing costs (such as interest and dividend expenses on securities sold short), taxes, 12b-1 fees, extraordinary expenses and indirect expenses (such as “acquired fund fees and expenses”).
The performance quoted represents past performance, which does not guarantee future results. The investment return and principal value of an investment will fluctuate so that an investor’s shares, when redeemed, may be worth more or less than their original cost. The returns shown do not reflect deduction of taxes that a shareholder would pay on Fund distributions or the redemption of Fund shares. The Fund’s investment objectives, risks, charges and expenses must be considered carefully before investing. Current performance of a Fund may be lower or higher than the performance quoted. Performance data current to the most recent month end may be obtained by calling 1-877-625-3042.
The performance above reflects any fee reductions pursuant to expense limitation agreements during the applicable periods. If such fee reductions had not occurred, the quoted performance would be lower.
2
Investment Results – (Unaudited) (continued)
* Return figures reflect any change in price per share and assume the reinvestment of all distributions. Total returns for Class A shares, with load, include the maximum 2.25% sales charge. Prior to May 30, 2013, the maximum sales charge for Class A shares was 5.75%. Had this sales charge adjustment been reflected for the applicable periods the quoted Class A with load performance would have been higher. Total returns for Class C shares, with load, assume the deduction of the maximum 1.00% deferred sales charge as if redemption took place on the last business day of the reporting period.
** The Barclays U.S. Aggregate Bond Index measures the performance of the U.S. investment-grade, fixed-rate bond market, including government and credit securities, agency mortgage pass-through securities, asset-backed securities and commercial mortgage-backed securities. Performance figures include the change in value of the bonds in the index and the reinvestment of interest. The index return does not reflect expenses, which have been deducted from the Fund’s return. You cannot invest directly in an Index; however, an individual can invest in exchange-traded funds or other investment vehicles that attempt to track the performance of a benchmark index.
The Fund’s investment objective, strategies, risks, charges and expenses must be considered carefully before investing. The prospectus contains this and other important information about the investment company and may be obtained by calling 1-877-625-3042. Please read it carefully before investing. The Fund is distributed by Unified Financial Securities, Inc., Member FINRA.
3
Portfolio Holdings – (Unaudited)
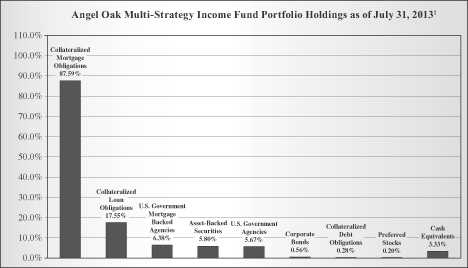
1As a percentage of net assets.
The investment objective of the Angel Oak Multi-Strategy Income Fund is current income.
Availability of Portfolio Schedule – (Unaudited)
The Fund files its complete schedule of portfolio holdings with the Securities and Exchange Commission (“SEC”) for the first and third quarters of each fiscal year on Form N-Q. The Fund’s Forms N-Q are available at the SEC’s website at www.sec.gov. The Fund’s Forms N-Q may be reviewed and copied at the SEC’s Public Reference Room in Washington DC. Information on the operation of the Public Reference Room may be obtained by calling 1-800-SEC-0330.
Summary of Fund’s Expenses – (Unaudited)
As a shareholder of the Fund, you incur ongoing costs, including management fees and other Fund expenses. This Example is intended to help you understand your ongoing costs (in dollars) of investing in the Fund and to compare these costs with the ongoing costs of investing in other mutual funds. The Example is based on an investment of $1,000 invested at the beginning of the period, and held for the entire period from February 1, 2013 to July 31, 2013.
Actual Expenses
The first line of the table below provides information about actual account values and actual expenses. You may use the information in this line, together with the amount you invested, to estimate the expenses that you paid over the period. Simply divide
4
Summary of Fund’s Expenses – (Unaudited) (continued)
your account value by $1,000 (for example, an $8,600 account value divided by $1,000 = $8.60), then multiply the result by the number in the first line under the heading entitled “Expenses Paid During the Period” to estimate the expenses you paid on your account during this period.
Hypothetical Example for Comparison Purposes
The second line of the table below provides information about hypothetical account values and hypothetical expenses based on the Fund’s actual expense ratio and an assumed rate of return of 5% per year before expenses, which is not the Fund’s actual return. The hypothetical account values and expenses may not be used to estimate the actual ending account balance or expenses you paid for the period. You may use this information to compare the ongoing costs of investing in the Fund and other funds. To do so, compare this 5% hypothetical example with the 5% hypothetical examples that appear in the shareholder reports of the other funds.
Please note that the expenses shown in the table are meant to highlight your ongoing costs only. Therefore, the second line of the table below is useful in comparing ongoing costs only and will not help you determine the relative costs of owning different funds.
| Angel Oak Multi-Strategy Income Fund | Beginning Account Value, February 1, 2013 | Ending Account Value, July 31, 2013 | Expenses Paid During Period(1) | Annualized Expense Ratio | ||||||||||||||
Class A | Actual | $ | 1,000.00 | $ | 979.60 | $ | 8.44 | 1.72 | % | |||||||||
| Hypothetical(2) | $ | 1,000.00 | $ | 1,016.27 | $ | 8.59 | 1.72 | % | ||||||||||
Class C | Actual | $ | 1,000.00 | $ | 977.00 | $ | 12.09 | 2.47 | % | |||||||||
| Hypothetical(2) | $ | 1,000.00 | $ | 1,012.56 | $ | 12.31 | 2.47 | % | ||||||||||
Class I | Actual | $ | 1,000.00 | $ | 981.60 | $ | 7.22 | 1.47 | % | |||||||||
| Hypothetical(2) | $ | 1,000.00 | $ | 1,017.51 | $ | 7.35 | 1.47 | % | ||||||||||
(1) Expenses are equal to the Fund’s annualized expense ratios, multiplied by the average account value over the period, multiplied by 181/365 (to reflect the one-half year period). The annualized expense ratios reflect reimbursement of expenses by the Funds’ Adviser for the period beginning February 1, 2013 through July 31, 2013. The “Financial Highlights” tables in the Funds’ financial statements, included in the report, also show the gross expense ratios, without such reimbursements.
| (2) Hypothetical | assumes 5% annual return before expenses. |
5
Angel Oak Multi-Strategy Income Fund
Schedule of Investments
July 31, 2013 (Unaudited)
| Principal Amount | Fair Value | |||||||
Collateralized Mortgage Obligations – 87.59% | ||||||||
Adjustable Rate Mortgage Trust, Series 2004-1, Class 4A1, 5.353%, 1/25/2035 (a) | $ | 411,951 | $ | 410,954 | ||||
Adjustable Rate Mortgage Trust, Series 2005-3, | 1,993,293 | 1,787,082 | ||||||
Adjustable Rate Mortgage Trust, Series 2005-3, Class 2A1, 2.828%, 7/25/2035 (a) | 10,514,789 | 10,138,843 | ||||||
Adjustable Rate Mortgage Trust, Series 2005-4, Class 3A1, 2.934%, 8/25/2035 (a) | 253,876 | 231,320 | ||||||
Adjustable Rate Mortgage Trust, Series 2005-8, Class 7A4, 0.520%, 11/25/2035 (a) | 1,030,856 | 745,907 | ||||||
Adjustable Rate Mortgage Trust, Series 2005-8, Class 4A11, 5.119%, 11/25/2035 (a) | 591,939 | 519,886 | ||||||
Adjustable Rate Mortgage Trust, Series 2007-2, Class 1A21, 5.257%, 6/25/2037 (a) | 10,385,258 | 9,161,147 | ||||||
American Home Mortgage Investment Trust, Series 2004-3, Class 3A, 2.188%, 10/25/2034 (a) | 3,222,225 | 2,879,525 | ||||||
American Home Mortgage Investment Trust, Series 2005-2, Class 5A4C, 5.408%, 9/25/2035 | 10,935,000 | 8,899,488 | ||||||
American Home Mortgage Investment Trust, Series 2006-2, Class 3A2, 6.200%, 6/25/2036 | 767,139 | 443,953 | ||||||
American Home Mortgage Investment Trust, Series 2005-2, Class 2A1, 1.760%, 9/25/2045 (a) | 1,685,848 | 1,396,031 | ||||||
American Home Mortgage Investment Trust, Series 2005-2, Class 1A1, 0.490%, 9/25/2045 (a) | 3,997,058 | 3,450,788 | ||||||
American Home Mortgage Investment Trust, Series 2005-4, Class 3A1, 0.490%, 11/25/2045 (a) | 1,124,368 | 848,861 | ||||||
Bank of America Alternative Loan Trust, Series 2004-3, Class 2A1, 6.000%, 4/25/2034 | 868,300 | 860,061 | ||||||
Bank of America Alternative Loan Trust, Series 2005-6, Class 5A2, 5.500%, 7/25/2035 | 1,868,753 | 1,794,860 | ||||||
Bank of America Alternative Loan Trust, Series 2005-9, Class 1CB2, 5.500%, 10/25/2035 (b) | 10,258,393 | 9,817,913 | ||||||
Bank of America Funding Corp., Series 2004-C, Class 3A1, 3.115%, 12/20/2034 (a) | 158,949 | 143,358 | ||||||
Bank of America Funding Corp., Series 2007-C, Class 4A3, 5.349%, 5/20/2036 (a)(b) | 28,996,172 | 26,759,509 | ||||||
See accompanying notes which are an integral part of these financial statements.
6
Angel Oak Multi-Strategy Income Fund
Schedule of Investments – (continued)
July 31, 2013 (Unaudited)
| Principal Amount | Fair Value | |||||||
Collateralized Mortgage Obligations – (continued) | ||||||||
Bank of America Funding Corp., Series 2006-G, Class 3A2, 5.750%, 7/20/2036 (a) | $ | 5,920,000 | $ | 5,794,703 | ||||
Bank of America Funding Corp., Series 2006-5, Class 1A4, 6.000%, 9/25/2036 | 14,577,983 | 13,668,754 | ||||||
Bank of America Funding Corp., Series 2007-D, Class 3A1, 5.355%, 6/20/2037 (a) | 469,914 | 443,592 | ||||||
Bank of America Funding Corp., Series 2007-D, | 7,955,052 | 7,509,458 | ||||||
Bank of America Mortgage Securities, Inc., Series 2004-I, Class 2A2, 3.099%, 10/25/2034 (a) | 523,767 | 513,342 | ||||||
Bank of America Mortgage Securities, Inc., Series 2005-E, Class 2A1, 2.798%, 6/25/2035 (a) | 1,851,400 | 1,708,151 | ||||||
Bank of America Mortgage Securities, Inc., Series 2005-I, Class 4A1, 5.108%, 10/25/2035 (a) | 329,767 | 312,939 | ||||||
Bank of America Mortgage Securities, Inc., Series 2005-I, Class 2A3, 3.123%, 10/25/2035 (a) | 276,949 | 253,203 | ||||||
Bank United Trust, Series 2005-1, Class 1A1, 0.490%, 9/25/2045 (a) | 15,605,587 | 11,174,763 | ||||||
Bayview Commercial Asset Trust, Series 2005-2A, | 14,605,277 | 11,929,050 | ||||||
Bayview Commercial Asset Trust, Series 2005-4A, | 3,791,144 | 3,101,615 | ||||||
Bayview Commercial Asset Trust, Series 2005-4A, | 3,507,072 | 2,942,347 | ||||||
Bayview Commercial Asset Trust, Series 2006-1A, | 7,005,972 | 5,588,380 | ||||||
Bayview Commercial Asset Trust, Series 2006-2A, | 3,736,740 | 2,910,515 | ||||||
Bear Stearns Adjustable Rate Mortgage Trust, Series 2005-1, Class 2A1, 2.808%, 3/25/2035 (a) | 2,414,692 | 2,209,658 | ||||||
Bear Stearns Adjustable Rate Mortgage Trust, Series 2005-1, Class 4A1, 5.245%, 3/25/2035 (a) | 3,588,910 | 3,407,122 | ||||||
Bear Stearns ALT-A Trust, Series 2005-5, Class 21A1, 2.526%, 7/25/2035 (a) | 5,270,208 | 4,715,308 | ||||||
Bear Stearns ALT-A Trust, Series 2005-7, | 21,686,989 | 17,773,832 | ||||||
See accompanying notes which are an integral part of these financial statements.
7
Angel Oak Multi-Strategy Income Fund
Schedule of Investments – (continued)
July 31, 2013 (Unaudited)
| Principal Amount | Fair Value | |||||||
Collateralized Mortgage Obligations – (continued) | ||||||||
Bear Stearns ALT-A Trust, Series 2005-9, Class 25A1, 2.698%, 11/25/2035 (a) | $ | 4,313,021 | $ | 3,351,983 | ||||
Bear Stearns Asset Backed Securities Trust, Series 2005-AC2, Class 1A, 5.250%, 4/25/2035 (b) | 6,527,022 | 6,211,594 | ||||||
Bear Stearns Asset Backed Securities Trust, Series 2005-AC4, Class A , 5.500%, 7/25/2035 | 3,093,736 | 2,801,907 | ||||||
Bear Stearns Asset Backed Securities Trust, Series 2005-AC5, Class 1A2, 0.690%, 8/25/2035 (a) | 6,055,099 | 4,949,635 | ||||||
Bear Stearns Mortgage Funding Trust, Series 2006-AR5, Class 1X, 0.500%, 12/25/2046 (I/O)(d) | 102,643,612 | 2,100,992 | ||||||
CFCRE Commercial Mortgage Trust, Series 2011-C1, Class F, 5.000%, 4/15/2044 (a)(c) | 7,931,000 | 6,523,636 | ||||||
Chase Mortgage Finance Corp., Series 2005-A1, Class 1A1, 5.079%, 12/25/2035 (a) | 74,523 | 71,235 | ||||||
Chase Mortgage Finance Corp., Series 2005-A1, Class 3A1, 2.911%, 12/25/2035 (a) | 1,685,524 | 1,497,511 | ||||||
Chase Mortgage Finance Corp., Series 2007-A2, Class 7A1, 5.323%, 7/25/2037 (a) | 765,220 | 707,194 | ||||||
ChaseFlex Trust, Series 2006-1, Class A4, 5.421%, 6/25/2036 (a) | 31,247,000 | 26,786,288 | ||||||
ChaseFlex Trust, Series 2006-2, Class A4, 5.745%, 9/25/2036 (a) | 15,695,700 | 14,724,317 | ||||||
Chevy Chase Mortgage Funding Corp., Series 2005-1A, Class A1, 0.340%, 1/25/2036 (a)(c) | 1,239,712 | 1,002,070 | ||||||
Citigroup Mortgage Loan Trust, Inc., Series 2005-2, Class 1A4, 2.643%, 5/25/2035 (a) | 728,426 | 714,574 | ||||||
Citigroup Mortgage Loan Trust, Inc., Series 2005-4, | 923,578 | 893,210 | ||||||
Citigroup Mortgage Loan Trust, Inc., Series 2005-7, | 11,319,765 | 10,328,731 | ||||||
Citigroup Mortgage Loan Trust, Inc., Series 2005-8, Class 1A4A, 5.132%, 10/25/2035 (a) | 767,642 | 687,043 | ||||||
Citigroup Mortgage Loan Trust, Inc., Series 2005-11, Class A3, 2.570%, 11/25/2035 (a) | 15,664,600 | 15,097,283 | ||||||
See accompanying notes which are an integral part of these financial statements.
8
Angel Oak Multi-Strategy Income Fund
Schedule of Investments – (continued)
July 31, 2013 (Unaudited)
| Principal Amount | Fair Value | |||||||
Collateralized Mortgage Obligations – (continued) | ||||||||
Citigroup Mortgage Loan Trust, Inc., Series 2006-AR6, Class 1A1, 5.670%, 8/25/2036 (a) | $ | 6,602,356 | $ | 5,660,454 | ||||
COMM Mortgage Trust, Series 2013-CR6, Class E, 4.320%, 3/10/2046 (a)(c) | 6,146,000 | 4,547,462 | ||||||
CountryWide Alternative Loan Trust, Series 2004-J10, Class 1A3, 4.250%, 10/25/2034 | 1,995,251 | 1,874,135 | ||||||
CountryWide Alternative Loan Trust, Series 2004-36CB, Class 2A1, 5.500%, 2/25/2035 | 165,618 | 161,747 | ||||||
CountryWide Alternative Loan Trust, Series 2005-J1, Class 1A7, 5.500%, 2/25/2035 | 9,602,000 | 8,825,107 | ||||||
CountryWide Alternative Loan Trust, Series 2005-1CB, Class 1A4, 5.500%, 3/25/2035 | 2,054,145 | 1,928,063 | ||||||
CountryWide Alternative Loan Trust, Series 2005-3CB, Class 1A11, 5.500%, 3/25/2035 | 3,637,662 | 3,505,635 | ||||||
CountryWide Alternative Loan Trust, Series 2005-J5, Class 1A1, 0.490%, 5/25/2035 (a) | 216,712 | 210,644 | ||||||
CountryWide Alternative Loan Trust, Series 2005-21CB, Class A17, 6.000%, 6/25/2035 | 1,010,086 | 950,453 | ||||||
CountryWide Alternative Loan Trust, Series 2005-24, Class 4A1, 0.422%, 7/20/2035 (a)(b) | 13,372,224 | 10,973,340 | ||||||
CountryWide Alternative Loan Trust, Series 2005-J6, Class 1A4, 5.500%, 7/25/2035 | 2,033,599 | 1,916,802 | ||||||
CountryWide Alternative Loan Trust, Series 2005-26CB, Class A1, 0.690%, 7/25/2035 (a) | 3,279,169 | 2,325,715 | ||||||
CountryWide Alternative Loan Trust, Series 2005-23CB, Class A2, 5.500%, 7/25/2035 | 10,000,000 | 9,264,915 | ||||||
CountryWide Alternative Loan Trust, Series 2005-J6, Class 1A1, 0.690%, 7/25/2035 (a) | 1,543,935 | 1,226,049 | ||||||
CountryWide Alternative Loan Trust, | 1,575,289 | 1,266,560 | ||||||
CountryWide Alternative Loan Trust, Series 2005-J9, Class 1A6, 5.500%, 8/25/2035 | 2,526,677 | 2,285,792 | ||||||
CountryWide Alternative Loan Trust, Series 2005-31, Class 2A1, 0.490%, 8/25/2035 (a)(b) | 15,322,073 | 12,200,943 | ||||||
CountryWide Alternative Loan Trust, Series 2005-31, Class 2X, 0.000%, 8/25/2035 (I/O)(d) | 65,641,804 | 4,841,083 | ||||||
See accompanying notes which are an integral part of these financial statements.
9
Angel Oak Multi-Strategy Income Fund
Schedule of Investments – (continued)
July 31, 2013 (Unaudited)
| Principal Amount | Fair Value | |||||||
Collateralized Mortgage Obligations – (continued) | ||||||||
CountryWide Alternative Loan Trust, Series 2005-28CB, Class 1A6, 5.500%, 8/25/2035 (b) | $ | 17,561,749 | $ | 16,482,167 | ||||
CountryWide Alternative Loan Trust, Series 2005-46CB, Class A14, 5.500%, 10/25/2035 | 5,257 | 4,817 | ||||||
CountryWide Alternative Loan Trust, Series 2005-J10, Class 1A1, 0.690%, 10/25/2035 (a) | 1,394,873 | 1,030,309 | ||||||
CountryWide Alternative Loan Trust, Series 2005-44, Class 1X, 0.000%, 10/25/2035 (I/O)(a)(d) | 92,196,085 | 7,318,064 | ||||||
CountryWide Alternative Loan Trust, Series 2005-58R, Class A, 2.315%, 12/20/2035 (I/O)(a)(c)(d) | 216,900,008 | 15,725,251 | ||||||
CountryWide Alternative Loan Trust, Series 2005-J14, Class A8, 5.500%, 12/25/2035 | 8,093,500 | 6,980,146 | ||||||
CountryWide Alternative Loan Trust, Series 2005-65CB, Class 2A4, 5.500%, 12/25/2035 (b) | 2,698,593 | 2,466,000 | ||||||
CountryWide Alternative Loan Trust, Series 2006-OA3, Class X, 2.352%, 5/25/2036 (I/O)(a)(d) | 89,129,915 | 7,241,806 | ||||||
CountryWide Alternative Loan Trust, Series 2006-OA10, Class XAD, 1.783%, 8/25/2046 (I/O)(a)(d) | 222,738,512 | 16,148,542 | ||||||
CountryWide Home Loan Mortgage Pass Through Trust, Series 2004-HYB3, Class 2A, 2.561%, 6/20/2034 (a) | 2,008,366 | 1,848,044 | ||||||
CountryWide Home Loan Mortgage Pass Through Trust, Series 2004-11, Class 3A1, 4.774%, 7/25/2034 (a)(b) | 2,541,481 | 2,505,144 | ||||||
CountryWide Home Loan Mortgage Pass Through Trust, Series 2005-9, Class 1X, 0.000%, 5/25/2035 (I/O)(d) | 68,790,013 | 4,877,212 | ||||||
CountryWide Home Loan Mortgage Pass-Through Trust, Series 2003-52, Class A1, 2.912%, 2/19/2034 (a) | 1,249,999 | 1,253,158 | ||||||
See accompanying notes which are an integral part of these financial statements.
10
Angel Oak Multi-Strategy Income Fund
Schedule of Investments – (continued)
July 31, 2013 (Unaudited)
| Principal Amount | Fair Value | |||||||
Collateralized Mortgage Obligations – (continued) | ||||||||
CountryWide Home Loan Mortgage Pass-Through Trust, Series 2005-HYB6, Class 4A1B, | $ | 190,335 | $ | 156,440 | ||||
CountryWide Home Loan Mortgage Pass-Through Trust, Series 2005-HYB8, Class 3A1, 2.611%, 12/20/2035 (a) | 862,301 | 737,850 | ||||||
CountryWide Home Loan Mortgage Pass-Through Trust, Series 2005-HYB8, Class 4A1, | 28,432,211 | 23,143,891 | ||||||
CountryWide Home Loan Mortgage Pass-Through Trust, Series 2007-14, Class A15, 6.500%, 9/25/2037 | 8,439,926 | 8,192,695 | ||||||
CountryWide Home Loan Mortgage Pass-Through Trust, Series 2006-OA2, Class X1P, 0.000%, 5/20/2046 (a)(d) | 160,914,776 | 13,024,040 | ||||||
Credit Suisse First Boston Mortgage Securities Corp., Series 2005-4, Class 2A7, 0.640%, 6/25/2035 (a) | 2,523,994 | 2,141,095 | ||||||
Credit Suisse First Boston Mortgage Securities Corp., Series 2005-9, Class 2A1, 5.500%, 10/25/2035 | 1,771,808 | 1,730,901 | ||||||
Credit Suisse Mortgage Capital Certificates, | 10,363,000 | 9,256,346 | ||||||
DSLA Mortgage Loan Trust, Series 2004-AR1, | 2,296,996 | 2,052,930 | ||||||
DSLA Mortgage Loan Trust, Series 2005-AR1, Class X2, 2.579%, 3/19/2045 (I/O)(d) | 91,182,074 | 8,149,398 | ||||||
First Horizon Alternative Mortgage Securities Trust, Series 2005-AA3, Class 3A1, 2.372%, 5/25/2035 (a)(b) | 22,824,107 | 20,516,042 | ||||||
First Horizon Alternative Mortgage Securities Trust, Series 2005-FA8, Class 1A18, 5.500%, 11/25/2035 | 5,454 | 4,781 | ||||||
First Horizon Alternative Mortgage Securities Trust, Series 2005-AR5, Class 2A1, 2.713%, 11/25/2035 (a) | 2,145,422 | 1,962,604 | ||||||
GMAC Mortgage Corp. Loan Trust, Series 2005-AR2, Class 4A, 5.094%, 5/25/2035 (a) | 2,093,369 | 2,044,997 | ||||||
See accompanying notes which are an integral part of these financial statements.
11
Angel Oak Multi-Strategy Income Fund
Schedule of Investments – (continued)
July 31, 2013 (Unaudited)
| Principal Amount | Fair Value | |||||||
Collateralized Mortgage Obligations – (continued) | ||||||||
GMAC Mortgage Corp. Loan Trust, Series 2005-AF1, Class A11, 5.750%, 7/25/2035 | $ | 657,519 | $ | 414,347 | ||||
GMAC Mortgage Corp. Loan Trust, Series 2005-AR5, Class 5A1, 5.342%, 9/19/2035 (a) | 945,760 | 925,503 | ||||||
GMAC Mortgage Corp. Loan Trust, Series 2005-AR6, Class 2A1, 3.811%, 11/19/2035 (a) | 5,792,279 | 5,028,550 | ||||||
GMAC Mortgage Corp. Loan Trust, Series 2005-AR6, Class 4A1, 5.486%, 11/19/2035 (a) | 627,474 | 595,653 | ||||||
GreenPoint Mortgage Funding Trust, Series 2006-AR1, Class GA1B, 0.360%, 2/25/2036 (a) | 13,427,332 | 10,183,779 | ||||||
GreenPoint Mortgage Funding Trust, Series 2006-AR3, Class 4X, 1.000%, 4/25/2036 (I/O)(d) | 129,241,896 | 6,862,745 | ||||||
GreenPoint Mortgage Funding Trust, Series 2006-AR3, Class 4A1, 0.400%, 4/25/2036 (a) | 28,660,459 | 18,266,414 | ||||||
GreenPoint MTA Trust, Series 2005-AR2, Class A1, 0.420%, 6/25/2045 (a)(b) | 18,246,267 | 14,420,234 | ||||||
GreenPoint MTA Trust, Series 2005-AR3, Class 1A1, 0.430%, 8/25/2045 (a)(b) | 17,794,289 | 14,583,131 | ||||||
GSR Mortgage Loan Trust, Series 2005-AR1, Class 4A1, 4.876%, 1/25/2035 (a) | 2,273,366 | 2,209,589 | ||||||
GSR Mortgage Loan Trust, Series 2005-AR2, Class 1A1, 2.817%, 4/25/2035 (a) | 3,085,117 | 2,708,623 | ||||||
GSR Mortgage Loan Trust, Series 2005-AR3, | 10,849,674 | 10,838,467 | ||||||
GSR Mortgage Loan Trust, Series 2005-AR3, Class 4A1, 2.817%, 5/25/2035 (a) | 18,708,094 | 16,462,870 | ||||||
GSR Mortgage Loan Trust, Series 2005-AR3, | 17,384,491 | 16,114,389 | ||||||
GSR Mortgage Loan Trust, Series 2005-AR7, Class 5A1, 5.100%, 11/25/2035 (a) | 4,757,191 | 4,329,032 | ||||||
See accompanying notes which are an integral part of these financial statements.
12
Angel Oak Multi-Strategy Income Fund
Schedule of Investments – (continued)
July 31, 2013 (Unaudited)
| Principal Amount | Fair Value | |||||||
Collateralized Mortgage Obligations – (continued) | ||||||||
GSR Mortgage Loan Trust, Series 2005-AR7, Class 6A1, 5.084%, 11/25/2035 (a) | $ | 7,929,882 | $ | 7,736,166 | ||||
GSR Mortgage Loan Trust, Series 2005-AR7, Class 4A1, 3.008%, 11/25/2035 (a)(b) | 6,888,405 | 5,853,808 | ||||||
GSR Mortgage Loan Trust, Series 2006-AR1, Class 3A1, 3.178%, 1/25/2036 (a) | 1,197,249 | 1,027,845 | ||||||
GSR Mortgage Loan Trust, Series 2006-2F, Class 3A6, 6.000%, 2/25/2036 | 8,550,549 | 7,759,213 | ||||||
GSR Mortgage Loan Trust, Series 2006-1F, Class 2A5, 6.000%, 2/25/2036 | 5,277,214 | 5,022,106 | ||||||
GSR Mortgage Loan Trust, Series 2006-1F, Class 1A6, 1.140%, 2/25/2036 (a) | 1,055,559 | 894,219 | ||||||
HarborView Mortgage Loan Trust, Series 2005-10, | 25,050,483 | 1,753,534 | ||||||
HarborView Mortgage Loan Trust, Series 2006-10, Class 2A1A, 0.372%, 11/19/2036 (a)(b) | 22,715,556 | 18,438,592 | ||||||
HarborView Mortgage Loan Trust, Series 2005-11, Class X, 2.700%, 8/19/2045 (I/O)(a)(d) | 100,735,537 | 6,170,052 | ||||||
HarborView Mortgage Loan Trust, Series 2006-5, | 124,943,190 | 10,620,171 | ||||||
HarborView Mortgage Loan Trust, Series 2007-3, | 23,319,725 | 18,758,748 | ||||||
HomeBanc Mortgage Trust, Series 2005-1, Class A1, 0.440%, 3/25/2035 (a)(b) | 17,098,154 | 13,891,352 | ||||||
HomeBanc Mortgage Trust, Series 2005-5, Class A1, 0.450%, 1/25/2036 (a)(b) | 40,471,010 | 33,253,896 | ||||||
IMPAC CMB Trust, Series 2004-7, Class 1A1, 0.930%, 11/25/2034 (a)(b) | 6,039,117 | 5,775,081 | ||||||
IMPAC CMB Trust, Series 2004-7, Class 1A2, 1.110%, 11/25/2034 (a) | 1,892,366 | 1,544,629 | ||||||
IMPAC CMB Trust, Series 2005-5, Class A4, 0.950%, 8/25/2035 (a) | 6,042,546 | 3,919,431 | ||||||
INDYMAC Index Mortgage Loan Trust, Series 2004-AR7, Class A2, 1.050%, 9/25/2034 (a) | 1,789,462 | 1,424,208 | ||||||
See accompanying notes which are an integral part of these financial statements.
13
Angel Oak Multi-Strategy Income Fund
Schedule of Investments – (continued)
July 31, 2013 (Unaudited)
| Principal Amount | Fair Value | |||||||
Collateralized Mortgage Obligations – (continued) | ||||||||
INDYMAC Index Mortgage Loan Trust, Series 2004-AR8, Class 2A2A, 0.990%, 11/25/2034 (a) | $ | 1,484,798 | $ | 1,239,875 | ||||
INDYMAC Index Mortgage Loan Trust, Series 2004-A9, Class A4, 5.250%, 12/25/2034 | 7,845,017 | 7,881,924 | ||||||
INDYMAC Index Mortgage Loan Trust, Series 2005-AR3, Class 4A1, 2.689%, 4/25/2035 (a) | 5,386,680 | 5,126,770 | ||||||
INDYMAC Index Mortgage Loan Trust, Series 2005-AR6, Class AX2, | 74,108,682 | 4,631,793 | ||||||
INDYMAC Index Mortgage Loan Trust, Series 2005-AR15, Class A1, 4.694%, 9/25/2035 (a) | 28,485,205 | 24,696,716 | ||||||
INDYMAC Index Mortgage Loan Trust, Series 2005-AR15, Class A2, 4.694%, 9/25/2035 (a) | 18,872,895 | 16,362,829 | ||||||
INDYMAC Index Mortgage Loan Trust, Series 2005-AR25, Class 1A21, 5.065%, 12/25/2035 (a) | 1,364,295 | 1,145,189 | ||||||
INDYMAC Index Mortgage Loan Trust, Series 2006-AR9, Class 3A1, 4.721%, 6/25/2036 (a)(b) | 2,998,089 | 2,869,489 | ||||||
INDYMAC Index Mortgage Loan Trust, Series 2006-AR9, Class 3A3, 4.721%, 6/25/2036 (a) | 3,021,906 | 2,892,284 | ||||||
INDYMAC Index Mortgage Loan Trust, Series 2006-A13, Class A2, 0.490%, 7/25/2036 (a) | 4,395,590 | 3,436,796 | ||||||
INDYMAC Index Mortgage Loan Trust, Series 2006-A13, Class A1, 4.986%, 7/25/2036 (a)(b) | 939,293 | 842,995 | ||||||
INDYMAC Index Mortgage Loan Trust, Series 2005-AR18, Class 1X, | 26,424,163 | 2,113,933 | ||||||
INDYMAC Index Mortgage Loan Trust, Series 2005-AR18, Class 2A1A, | 23,401,785 | 18,262,086 | ||||||
See accompanying notes which are an integral part of these financial statements.
14
Angel Oak Multi-Strategy Income Fund
Schedule of Investments – (continued)
July 31, 2013 (Unaudited)
| Principal Amount | Fair Value | |||||||
Collateralized Mortgage Obligations – (continued) | ||||||||
INDYMAC Index Mortgage Loan Trust, Series 2006-AR2, Class 1A1B, 0.400%, 4/25/2046 (a) | $ | 38,374,635 | $ | 28,885,604 | ||||
JP Morgan Alternative Loan Trust, Series 2006-A1, Class 1A1, 0.420%, 3/25/2036 (a) | 13,141,158 | 10,330,810 | ||||||
JP Morgan Alternative Loan Trust, Series 2006-S4, Class A5, 6.000%, 12/25/2036 | 28,740,000 | 18,926,310 | ||||||
JP Morgan Mortgage Trust, Series 2004-A2, Class 1A2, 2.844%, 5/25/2034 (a)(b) | 2,174,560 | 2,162,898 | ||||||
JP Morgan Mortgage Trust, Series 2005-A1, Class 1A1, 5.114%, 2/25/2035 (a) | 1,025,078 | 1,016,570 | ||||||
JP Morgan Mortgage Trust, Series 2005-A3, Class A3, 2.718%, 6/25/2035 (a)(b) | 6,489,745 | 5,957,102 | ||||||
JP Morgan Mortgage Trust, Series 2005-A7, Class 3A1, 5.142%, 10/25/2035 (a) | 533,586 | 526,969 | ||||||
JP Morgan Mortgage Trust, Series 2005-A8, Class 3A1, 2.919%, 11/25/2035 (a) | 400,842 | 379,923 | ||||||
JP Morgan Mortgage Trust, Series 2005-A8, Class 1A1, 5.153%, 11/25/2035 (a) | 2,114,957 | 2,002,130 | ||||||
JP Morgan Mortgage Trust, Series 2005-S3, Class 1A14, 5.500%, 1/25/2036 | 7,883,731 | 7,410,278 | ||||||
JP Morgan Mortgage Trust, Series 2006-A1, Class 3A2, 2.814%, 2/25/2036 (a) | 1,355,951 | 1,145,342 | ||||||
JP Morgan Mortgage Trust, Series 2006-A1, Class 2A2, 2.849%, 2/25/2036 (a) | 667,599 | 566,660 | ||||||
JP Morgan Mortgage Trust, Series 2006-S4, Class A3, 6.000%, 1/25/2037 | 22,428,867 | 18,712,370 | ||||||
JP Morgan Mortgage Trust, Series 2007-A2, Class 4A2, 5.427%, 4/25/2037 (a) | 2,462,721 | 2,205,757 | ||||||
JP Morgan Mortgage Trust, Series 2007-A2, Class 4A1, 5.427%, 4/25/2037 (a) | 2,217,278 | 1,985,924 | ||||||
JP Morgan Mortgage Trust, Series 2007-A4, Class 3A3, 5.240%, 6/25/2037 (a) | 8,826,235 | 7,660,011 | ||||||
Luminent Mortgage Trust, Series 2005-1, Class A1, 0.450%, 11/25/2035 (a) | 15,462,998 | 12,898,993 | ||||||
See accompanying notes which are an integral part of these financial statements.
15
Angel Oak Multi-Strategy Income Fund
Schedule of Investments – (continued)
July 31, 2013 (Unaudited)
| Principal Amount | Fair Value | |||||||
Collateralized Mortgage Obligations – (continued) | ||||||||
Luminent Mortgage Trust, Series 2006-2, Class X, 2.350%, 2/25/2046 (I/O)(a)(d) | $ | 64,772,264 | $ | 4,615,024 | ||||
MASTR Adjustable Rate Mortgages Trust, Series 2004-15, Class 2A2, 2.994%, 12/25/2034 (a) | 58,312 | 44,955 | ||||||
MASTR Adjustable Rate Mortgages Trust, Series 2005-1, Class 9A1, 5.281%, 1/25/2035 (a) | 1,424,171 | 1,385,460 | ||||||
MASTR Adjustable Rate Mortgages Trust, Series 2005-2, Class 5A1, 2.663%, 3/25/2035 (a)(b) | 4,162,193 | 4,006,427 | ||||||
MASTR Adjustable Rate Mortgages Trust, Series 2005-6, Class 7A1, 5.219%, 6/25/2035 (a) | 489,525 | 475,473 | ||||||
MASTR Adjustable Rate Mortgages Trust, Series 2005-6, Class 5A2, 2.334%, 7/25/2035 (a) | 817,952 | 685,395 | ||||||
MASTR Alternative Loan Trust, Series 2005-3, Class 3A1, 6.500%, 4/25/2035 | 3,670,432 | 3,582,525 | ||||||
Merrill Lynch Mortgage Investors Trust, Series 2005-A7, Class 2A1, 5.136%, 9/25/2035 (a)(b) | 27,799,783 | 26,349,051 | ||||||
Morgan Stanley Mortgage Loan Trust, Series 2004-8AR, Class 4A5, 2.608%, 10/25/2034 (a) | 536,986 | 378,825 | ||||||
Morgan Stanley Mortgage Loan Trust, Series 2007-15AR, Class 2A1, 2.591%, 11/25/2037 (a)(b) | 11,897,909 | 8,990,726 | ||||||
Nomura Asset Acceptance Corp. Alternative Loan Trust, Series 2005-AR4, Class 3A1, 2.950%, 8/25/2035 (a)(b) | 9,691,787 | 9,028,960 | ||||||
Nomura Asset Acceptance Corp. Alternative Loan Trust, Series 2005-AR4, Class 4A1, 3.147%, 8/25/2035 (a) | 2,644,288 | 2,264,514 | ||||||
Prime Mortgage Trust, Series 2005-4, Class 2A4, 0.690%, 10/25/2035 (a) | 199,843 | 163,915 | ||||||
Residential Accredit Loans, Inc., Series 2005-QS2, Class A3, 5.500%, 2/25/2035 (b) | 10,640,600 | 10,406,065 | ||||||
Residential Accredit Loans, Inc., Series 2005-QA4, Class A31, 3.247%, 4/25/2035 (a) | 11,351,146 | 10,370,237 | ||||||
See accompanying notes which are an integral part of these financial statements.
16
Angel Oak Multi-Strategy Income Fund
Schedule of Investments – (continued)
July 31, 2013 (Unaudited)
| Principal Amount | Fair Value | |||||||
Collateralized Mortgage Obligations – (continued) | ||||||||
Residential Accredit Loans, Inc., Series 2005-QS9, Class A6, 5.500%, 6/25/2035 | $ | 9,716,997 | $ | 8,963,541 | ||||
Residential Accredit Loans, Inc., Series 2005-QS11, Class A2, 0.690%, 7/25/2035 (a) | 1,128,474 | 906,648 | ||||||
Residential Accredit Loans, Inc., Series 2005-QS12, Class A4, 5.500%, 8/25/2035 | 23,465,787 | 20,991,590 | ||||||
Residential Accredit Loans, Inc., Series 2005-QS17, Class A10, 6.000%, 12/25/2035 | 2,137 | 1,825 | ||||||
Residential Funding Mortgage Securities I, Series 2006-S3, Class A7, 5.500%, 3/25/2036 | 1,011,936 | 903,540 | ||||||
Residential Funding Mortgage Securities I, Series 2007-S6, Class 2A5, 0.690%, 6/25/2037 (a) | 5,963,221 | 4,591,793 | ||||||
Sequoia Mortgage Trust, Series 2007-1, Class 5A1, 5.178%, 10/20/2046 (a) | 12,616,286 | 11,588,418 | ||||||
Structured Adjustable Rate Mortgage Loan Trust, Series 2004-14, Class 1A, 2.613%, 10/25/2034 (a) | 304 | 295 | ||||||
Structured Adjustable Rate Mortgage Loan Trust, Series 2004-16, Class 5A3, 5.288%, 11/25/2034 (a) | 158,931 | 156,909 | ||||||
Structured Adjustable Rate Mortgage Loan Trust, Series 2004-16, Class 1A2, 2.607%, 11/25/2034 (a) | 6,904,777 | 6,487,535 | ||||||
Structured Adjustable Rate Mortgage Loan Trust, Series 2005-1, Class 4A2, 2.456%, 2/25/2035 (a) | 948,063 | 450,250 | ||||||
Structured Adjustable Rate Mortgage Loan Trust, Series 2005-1, Class 5A2, 2.578%, 2/25/2035 (a) | 510,477 | 292,639 | ||||||
Structured Adjustable Rate Mortgage Loan Trust, Series 2005-4, Class 5A, 4.556%, 3/25/2035 (a) | 7,540,535 | 6,947,080 | ||||||
Structured Adjustable Rate Mortgage Loan Trust, Series 2005-11, Class 3A, 2.512%, 5/25/2035 (a) | 3,080,501 | 2,832,292 | ||||||
Structured Adjustable Rate Mortgage Loan Trust, Series 2005-12, Class 3A1, 2.450%, 6/25/2035 (a) | 65,961 | 63,418 | ||||||
Structured Adjustable Rate Mortgage Loan Trust, Series 2005-15, Class 1A1, 2.475%, 7/25/2035 (a)(b) | 2,377,378 | 1,942,350 | ||||||
Structured Adjustable Rate Mortgage Loan Trust, Series 2005-17, Class 5A1, 4.843%, 8/25/2035 (a) | 8,194,155 | 7,741,878 | ||||||
See accompanying notes which are an integral part of these financial statements.
17
Angel Oak Multi-Strategy Income Fund
Schedule of Investments – (continued)
July 31, 2013 (Unaudited)
| Principal Amount | Fair Value | |||||||
Collateralized Mortgage Obligations – (continued) | ||||||||
Structured Adjustable Rate Mortgage Loan Trust, Series 2005-18, Class 6A1, 2.597%, 9/25/2035 (a) | $ | 3,063,236 | $ | 2,880,915 | ||||
Structured Adjustable Rate Mortgage Loan Trust, Series 2005-18, Class 7A3, 5.066%, 9/25/2035 (a)(b) | 31,500,000 | 27,320,564 | ||||||
Structured Adjustable Rate Mortgage Loan Trust, Series 2005-20, Class 4A1, 5.387%, 10/25/2035 (a) | 102,488 | 86,830 | ||||||
Structured Adjustable Rate Mortgage Loan Trust, Series 2005-21, Class 6A3, 5.225%, 11/25/2035 (a)(b) | 25,316,000 | 19,620,153 | ||||||
Structured Adjustable Rate Mortgage Loan Trust, Series 2005-21, Class 7A1, 5.093%, 11/25/2035 (a) | 8,153,597 | 6,776,030 | ||||||
Structured Adjustable Rate Mortgage Loan Trust, Series 2007-7, Class 1A1, 0.490%, 8/25/2037 (a)(b) | 8,708,534 | 6,446,297 | ||||||
Structured Asset Mortgage Investments II Trust, Series 2005-AR4, Class X2, | 40,628,700 | 560,676 | ||||||
Structured Asset Mortgage Investments II Trust, Series 2005-AR6, Class 2A1, 0.500%, 9/25/2045 (a) | 7,136,675 | 5,749,648 | ||||||
Structured Asset Securities Corp., Series 2003-6A, Class 2A1, 2.474%, 3/25/2033 (a) | 94,637 | 92,567 | ||||||
Structured Asset Securities Corp., Series 2004-2AC, Class A1, 2.472%, 2/25/2034 (a) | 5,896,208 | 5,621,220 | ||||||
Structured Asset Securities Corp., Series 2004-15, Class 3A8, 5.750%, 9/25/2034 | 603,184 | 582,850 | ||||||
Structured Asset Securities Corp., Series 2005-1, Class 7A6, 5.500%, 2/25/2035 | 1,264,260 | 1,121,548 | ||||||
Structured Asset Securities Corp., Series 2005-1, Class 3A3A, 5.110%, 7/25/2035 | 1,390,000 | 1,186,547 | ||||||
Structured Asset Securities Corp., Series 2005-17, Class 5A1, 5.500%, 10/25/2035 | 5,809,691 | 5,474,745 | ||||||
Thornburg Mortgage Securities Trust, Series 2006-4, Class A2C, 5.647%, 7/25/2036 (a) | 13,454,741 | 6,165,810 | ||||||
See accompanying notes which are an integral part of these financial statements.
18
Angel Oak Multi-Strategy Income Fund
Schedule of Investments – (continued)
July 31, 2013 (Unaudited)
| Principal Amount | Fair Value | |||||||
Collateralized Mortgage Obligations – (continued) | ||||||||
Thornburg Mortgage Securities Trust, Series 2004-4, Class 5A, 4.815%, 12/25/2044 (a) | $ | 17,098,325 | $ | 16,444,237 | ||||
UBS-Barclays Commercial Mortgage Trust, Series 2012-C4, Class E, 4.502%, 12/10/2045 (a)(c) | 5,000,000 | 3,845,282 | ||||||
UBS-Barclays Commercial Mortgage Trust, Series 2012-C2, Class F, 4.892%, 5/10/2063 (a)(c) | 7,000,000 | 5,530,896 | ||||||
Wachovia Mortgage Loan Trust LLC Trust, Series 2005-B, Class 4A1, 5.382%, 10/20/2035 (a) | 254,402 | 249,143 | ||||||
Washington Mutual Mortgage Pass-Through Certificates, Series 2005-AR18, Class 3A1, 4.923%, 1/25/2036 (a) | 11,352,751 | 10,456,054 | ||||||
Washington Mutual Mortgage Pass-Through Certificates, Series 2007-HY1, Class 3A3, 4.949%, 2/25/2037 (a)(b) | 12,595,175 | 11,457,258 | ||||||
Washington Mutual Mortgage Pass-Through Certificates, Series 2007-HY3, Class 4A1, 2.554%, 3/25/2037 (a)(b) | 6,499,431 | 5,959,364 | ||||||
Washington Mutual Mortgage Pass-Through Certificates, Series 2007-HY5, Class 3A1, 4.956%, 5/25/2037 (a) | 3,275,963 | 3,150,324 | ||||||
Washington Mutual Mortgage Pass-Through Certificates, Series 2007-HY7, Class 4A1, | 23,731,366 | 21,354,278 | ||||||
Washington Mutual Mortgage Pass-Through Certificates, Series 2005-AR8, Class 2A1A, | 16,593,339 | 15,194,877 | ||||||
Washington Mutual Mortgage Pass-Through Certificates, Series 2006-AR9, Class 1A, | 31,161,742 | 24,895,302 | ||||||
Washington Mutual Mortgage Pass-Through Certificates WMALT, Series 2005-1, Class 1A1, | 871,048 | 846,571 | ||||||
Washington Mutual Mortgage Pass-Through Certificates WMALT, Series 2005-4, Class CB7, | 17,601,018 | 16,353,194 | ||||||
See accompanying notes which are an integral part of these financial statements.
19
Angel Oak Multi-Strategy Income Fund
Schedule of Investments – (continued)
July 31, 2013 (Unaudited)
| Principal Amount | Fair Value | |||||||
Collateralized Mortgage Obligations – (continued) | ||||||||
Washington Mutual Mortgage Pass-Through Certificates WMALT, Series 2005-7, Class 2CB1, | $ | 5,267,233 | $ | 4,903,751 | ||||
Washington Mutual Mortgage Pass-Through Certificates WMALT, Series 2005-11, Class A2, | 4,309,964 | 3,514,308 | ||||||
Washington Mutual Mortgage Pass-Through Certificates WMALT, Series 2006-AR1, Class X2, | 22,378,088 | 1,014,007 | ||||||
Wells Fargo Mortgage Backed Securities Trust, | 6,492,741 | 5,985,116 | ||||||
Wells Fargo Mortgage Backed Securities Trust, | 11,326,393 | 10,883,230 | ||||||
Wells Fargo Mortgage Backed Securities Trust, | 25,000,000 | 23,442,612 | ||||||
Wells Fargo Mortgage Backed Securities Trust, | 495,541 | 483,760 | ||||||
Wells Fargo Mortgage Backed Securities Trust, | 786,533 | 399,479 | ||||||
Wells Fargo Mortgage Backed Securities Trust, | 128,062 | 126,512 | ||||||
Wells Fargo Mortgage Backed Securities Trust, | 2,654,662 | 2,530,384 | ||||||
Wells Fargo Mortgage Backed Securities Trust, | 270,865 | 250,340 | ||||||
Wells Fargo Mortgage Backed Securities Trust, | 969,779 | 937,292 | ||||||
See accompanying notes which are an integral part of these financial statements.
20
Angel Oak Multi-Strategy Income Fund
Schedule of Investments – (continued)
July 31, 2013 (Unaudited)
| Principal Amount | Fair Value | |||||||
Collateralized Mortgage Obligations – (continued) | ||||||||
Wells Fargo Mortgage Backed Securities Trust, | $ | 3,065,387 | $ | 2,999,602 | ||||
|
| |||||||
TOTAL COLLATERALIZED MORTGAGE OBLIGATIONS (Cost $1,474,585,601) |
| 1,448,220,823 | ||||||
|
| |||||||
Collateralized Loan Obligations – 17.55% | ||||||||
Acis CLO 2013-1 Ltd., Series 2013-1A, Class E, 5.866%, 4/18/2024 (a)(c) | 7,000,000 | 6,456,800 | ||||||
AMMC CLO IX Ltd., Series 2011-9A, Class E, | 1,000,000 | 1,002,700 | ||||||
AMMC CLO XII Ltd., Series 2013-12A, Class E, 5.279%, 5/10/2025 (a)(c) | 3,000,000 | 2,649,600 | ||||||
AMMC CLO XII Ltd., Series 2013-12A, Class D1, 4.029%, 5/10/2025 (a)(c) | 5,400,000 | 5,097,600 | ||||||
Anchorage Capital CLO Ltd., Series 2013-1A, Class D, 5.076%, 7/13/2025 (a)(c) | 9,500,000 | 8,452,150 | ||||||
ARES CLO Ltd., Series 2013-2A, Class C, | 3,000,000 | 2,854,800 | ||||||
ARES XXVI CLO Ltd., Series 2013-26A, Class E, 5.310%, 4/15/2025 (a)(c) | 10,000,000 | 9,124,000 | ||||||
ARES XXVI CLO Ltd., Series 2013-26A, Class D, 4.060%, 4/15/2025 (a)(c) | 9,000,000 | 8,694,900 | ||||||
Babson CLO Ltd., Series 2012-1A, Class C, | 9,000,000 | 8,873,100 | ||||||
Benefit Street Partners CLO II Ltd., Series 2013-IIA, | 5,000,000 | 4,256,000 | ||||||
Benefit Street Partners CLO II Ltd., Series 2013-IIA, | 5,000,000 | 4,636,500 | ||||||
BlueMountain CLO Ltd., Series 2012-2A, Class D, 4.374%, 11/20/2024 (a)(c) | 5,000,000 | 4,843,000 | ||||||
Brookside Mill CLO Ltd., Series 2013-1A, Class E, 4.625%, 4/17/2025 (a)(c) | 3,000,000 | 2,606,100 | ||||||
Canyon Capital CLO Ltd., Series 2012-1A, Class D, 4.568%, 1/15/2024 (a)(b)(c) | 3,000,000 | 2,942,700 | ||||||
Carlyle Global Market Strategies CLO Ltd., | 3,000,000 | 2,816,700 | ||||||
See accompanying notes which are an integral part of these financial statements.
21
Angel Oak Multi-Strategy Income Fund
Schedule of Investments – (continued)
July 31, 2013 (Unaudited)
| Principal Amount | Fair Value | |||||||
Collateralized Loan Obligations – (continued) | ||||||||
Carlyle Global Market Strategies CLO Ltd., | $ | 2,850,000 | $ | 2,671,875 | ||||
Carlyle Global Market Strategies CLO Ltd., | 2,000,000 | 1,774,920 | ||||||
Catamaran CLO Ltd., Series 2012-1A, Class D, | 8,750,000 | 8,694,000 | ||||||
Catamaran CLO Ltd., Series 2013-1A, Class D, | 4,000,000 | 3,771,200 | ||||||
CIFC Funding Ltd., Series 2012-1A, Class B2L, 7.275%, 8/14/2024 (a)(c) | 10,000,000 | 10,015,000 | ||||||
CIFC Funding Ltd., Series 2012-2A, Class B2L, 6.273%, 12/5/2024 (a)(c) | 5,000,000 | 4,745,500 | ||||||
CIFC Funding Ltd., Series 2012-2A, Class B1L, 4.523%, 12/5/2024 (a)(c) | 4,000,000 | 3,913,600 | ||||||
Crown Point CLO Ltd., Series 2012-1A, Class B2L, 6.774%, 11/21/2022 (a)(c) | 3,000,000 | 2,946,000 | ||||||
Crown Point CLO Ltd., Series 2012-1A, Class B1L, 5.274%, 11/21/2022 (a)(c) | 5,000,000 | 5,025,500 | ||||||
Emerson Park CLO Ltd., Series 2013-1A, Class E, 5.116%, 7/15/2025 (a)(c)(d) | 3,000,000 | 2,726,250 | ||||||
Figueroa CLO Ltd., Series 2013-1A, Class C, | 7,000,000 | 6,583,500 | ||||||
Finn Square CLO Ltd., Series 2012-1A, Class C, 3.873%, 12/24/2023 (a)(b)(c) | 3,000,000 | 2,875,800 | ||||||
GLG Ore Hill CLO Ltd., Series 2013-1A, Class D, 3.473%, 7/15/2025 (a)(c)(d) | 8,000,000 | 7,320,000 | ||||||
ING IM CLO Ltd., Series 2012-1A, Class C, 3.810%, 4/15/2024 (a)(c) | 11,750,000 | 11,162,500 | ||||||
ING IM CLO Ltd., Series 2013-2A, Class D, 5.271%, 4/25/2025 (a)(c)(d) | 2,000,000 | 1,822,500 | ||||||
JMP Credit Advisors CLO II Ltd., Class E, 5.653%, 4/30/2023 (a)(c) | 8,200,000 | 7,423,460 | ||||||
JMP Credit Advisors CLO II Ltd., Series 2013-1A, | 4,000,000 | 3,818,800 | ||||||
See accompanying notes which are an integral part of these financial statements.
22
Angel Oak Multi-Strategy Income Fund
Schedule of Investments – (continued)
July 31, 2013 (Unaudited)
| Principal Amount | Fair Value | |||||||
Collateralized Loan Obligations – (continued) | ||||||||
KVK CLO 2013-1 Ltd., Class D, | $ | 2,000,000 | $ | 1,967,400 | ||||
KVK CLO Ltd., Class E, 6.518%, 7/15/2023 (a)(b) | 3,700,000 | 3,581,970 | ||||||
Longfellow Place CLO Ltd., Series 2013-1A, Class D, 4.518%, 1/15/2024 (a)(c) | 7,000,000 | 6,842,500 | ||||||
Marine Park CLO Ltd., Class D, 6.024%, 5/18/2023 (a)(c) | 4,500,000 | 4,334,400 | ||||||
Muir Woods CLO Ltd., Class E, | 2,500,000 | 2,447,500 | ||||||
Neuberger Berman CLO Ltd., Series 2012-13A, Class D, 4.765%, 1/23/2024 (a)(c) | 4,550,000 | 4,520,880 | ||||||
Neuberger Berman CLO XIV Ltd., Class D, 3.964%, 4/28/2025 (a)(c) | 7,000,000 | 6,616,400 | ||||||
NewMark Capital Funding CLO Ltd., | 1,000,000 | 880,600 | ||||||
Ocean Trails CLO, Series 2013-4A, Class D, 4.266%, 8/13/2025 (a)(c)(d) | 4,000,000 | 3,820,000 | ||||||
OHA Credit Partners VI Ltd., Series 2012-6A, Class D, 4.775%, 5/15/2023 (a)(b)(c) | 3,000,000 | 3,005,700 | ||||||
Portola CLO Ltd., Series 2007-1A, Class E, 6.675%, 11/15/2021 (a)(c) | 2,913,645 | 2,899,076 | ||||||
Race Point CLO Ltd., Series 2012-7A, Class D, 4.525%, 11/8/2024 (a)(c) | 3,000,000 | 3,000,000 | ||||||
Race Point CLO Ltd., Series 2013-8A, Class D, 3.874%, 2/20/2025 (a)(c) | 1,000,000 | 958,200 | ||||||
Shackleton 2013-III CLO Ltd., Series 2013-3A, Class D, 4.068%, 4/15/2025 (a)(c) | 3,000,000 | 2,841,300 | ||||||
Shackleton 2013-III CLO Ltd., Series 2013-3A, Class E, 5.518%, 4/15/2025 (a)(c) | 3,000,000 | 2,694,900 | ||||||
Shackleton I CLO Ltd., Series 2012-1A, Class D, 5.025%, 8/14/2023 (a)(b)(c) | 11,000,000 | 11,016,500 | ||||||
Sound Point CLO Ltd., Series 2012-1A, Class D, 4.846%, 10/20/2023 (a)(c) | 2,000,000 | 1,997,800 | ||||||
Sound Point CLO Ltd., Series 2013-1A, Class B2L, 4.764%, 4/26/2025 (a)(c) | 7,000,000 | 6,119,400 | ||||||
See accompanying notes which are an integral part of these financial statements.
23
Angel Oak Multi-Strategy Income Fund
Schedule of Investments – (continued)
July 31, 2013 (Unaudited)
| Principal Amount | Fair Value | |||||||
Collateralized Loan Obligations – (continued) | ||||||||
Symphony CLO XI Ltd., Series 2013-11A, Class D, 4.268%, 1/17/2025 (a)(c) | $ | 9,000,000 | $ | 8,854,200 | ||||
TICC CLO LLC, Series 2012-1A, Class D1, 6.023%, 8/25/2023 (a)(c) | 7,000,000 | 6,982,500 | ||||||
Venture X CLO Ltd., Series 2012-12A, Class E, 5.573%, 2/28/2024 (a)(c) | 10,000,000 | 9,039,000 | ||||||
VENTURE XIII CLO Ltd, Series 2013-13A, Class D, 3.969%, 6/10/2025 (a)(b)(c) | 15,000,000 | 14,041,500 | ||||||
Vibrant CLO Ltd., Series 2012-1A, Class C, 4.768%, 7/17/2024 (a)(c) | 10,200,000 | 10,137,780 | ||||||
West CLO 2012-1 Ltd., Series 2012-1A, Class D, 6.766%, 10/30/2023 (a)(c) | 5,000,000 | 4,989,500 | ||||||
Wind River CLO Ltd, Series 2012-1A, Class D, 5.268%, 1/15/2024 (a)(c) | 4,000,000 | 4,022,400 | ||||||
|
| |||||||
TOTAL COLLATERALIZED LOAN OBLIGATIONS (Cost $295,325,207) |
| 290,208,461 | ||||||
|
| |||||||
U.S. Government Mortgage Backed Agencies – 6.38% |
| |||||||
Federal Home Loan Mortgage Corporation – 0.37% |
| |||||||
Pool# J23972, 2.50%, 5/1/2028 | 6,229,647 | 6,229,469 | ||||||
|
| |||||||
Federal National Mortgage Association – 6.01% | ||||||||
Pool# AT0282, 2.50%, 3/1/2028 | 10,627,981 | 10,637,531 | ||||||
Pool# MA1424, 3.00%, 6/1/2028 | 12,827,917 | 13,242,049 | ||||||
Pool# MA1107, 3.50%, 7/1/2032 | 8,607,034 | 8,822,880 | ||||||
Pool# AB8766, 3.00%, 3/1/2033 | 5,906,100 | 5,875,910 | ||||||
Pool# AB8767, 3.00%, 3/1/2033 | 5,845,589 | 5,814,801 | ||||||
Pool# MA1424, 3.50%, 4/1/2033 | 9,809,917 | 10,061,389 | ||||||
Pool# MA1401, 3.00%, 4/1/2033 | 13,273,141 | 13,191,019 | ||||||
Pool# AB9412, 3.50%, 5/1/2033 | 13,251,639 | 13,592,179 | ||||||
Pool# AQ8653, 2.50%, 12/1/2042 | 19,588,023 | 18,085,398 | ||||||
|
| |||||||
| 99,323,156 | ||||||||
|
| |||||||
TOTAL U.S. GOVERNMENT MORTGAGE BACKED AGENCIES (Cost $110,766,347) |
| 105,552,625 | ||||||
|
| |||||||
See accompanying notes which are an integral part of these financial statements.
24
Angel Oak Multi-Strategy Income Fund
Schedule of Investments – (continued)
July 31, 2013 (Unaudited)
| Principal Amount | Fair Value | |||||||
Asset-Backed Securities – 5.80% | ||||||||
Atlas Senior Loan Fund Ltd., Series 2013-1A, Class E, 5.020%, 8/18/2025 (a)(c) | $ | 4,000,000 | $ | 3,460,000 | ||||
Atlas Senior Loan Fund Ltd., Series 2013-1A, Class D, 3.770%, 8/18/2025 (a)(c) | 8,500,000 | 7,870,150 | ||||||
Drug Royalty II LP, Series 2012-1, Class A1, 4.268%, 1/15/2025 (a)(c)(d) | 2,621,104 | 2,660,420 | ||||||
Dryden XXII Senior Loan Fund, Series 2013-28A, Class B6L, 4.175%, 8/15/2025 (a)(c) | 2,000,000 | 1,678,200 | ||||||
Dryden XXII Senior Loan Fund, Series 2013-28A, Class B1L, 3.475%, 8/15/2025 (a)(c) | 5,000,000 | 4,641,000 | ||||||
Fortress Credit BSL Ltd., Series 2013-1A, Class D, 3.766%, 1/19/2025 (a)(c) | 10,000,000 | 9,526,000 | ||||||
Halcyon Loan Advisors Funding Ltd., Series 2012-2A, Class E, 5.672%, 12/20/2024 (a)(c) | 3,000,000 | 2,732,100 | ||||||
Jefferies Loan Trust, Series 2013-A, Class A, 3.698%, 11/2/2014 (d) | 10,000,000 | 10,000,000 | ||||||
JGWPT XXVII LLC, Series 2012-3A, Class A, 3.220%, 9/15/2065 (b)(c) | 13,123,903 | 12,426,611 | ||||||
JGWPT XXVII LLC, Series 2012-3A, Class B, 6.170%, 9/15/2067 (c) | 1,000,000 | 1,051,146 | ||||||
KCAP Senior Funding I LLC, Series 2013-1A, Class D, 5.523%, 6/20/2024 (a)(c) | 2,500,000 | 2,392,000 | ||||||
Octagon Investment Partners XIV Ltd., Series 2012-1A, Class E, 6.768%, 1/15/2024 (a)(c) | 3,300,000 | 3,090,450 | ||||||
Octagon Investment Partners XIV Ltd., Series 2012-1X, Class E, 6.768%, 1/15/2024 (a)(d) | 3,000,000 | 2,962,500 | ||||||
Octagon Investment Partners XVI Ltd., Series 2013-1A, Class D, 3.622%, 7/17/2025 (a)(c) | 3,000,000 | 2,819,400 | ||||||
OZLM Funding IV Ltd., Series 2013-4A, Class C, 3.517%, 7/22/2025 (a)(c) | 7,500,000 | 6,957,750 | ||||||
OZLM Funding IV Ltd., Series 2013-4A, Class D, 4.967%, 7/22/2025 (a)(c) | 7,000,000 | 6,013,700 | ||||||
Slater Mill Loan Fund LP, Class E, | 4,250,000 | 4,014,550 | ||||||
Store Master Funding LLC, Series 2012-1A, Class A, 5.770%, 8/20/2042 (b)(c) | 6,469,293 | 6,758,729 | ||||||
See accompanying notes which are an integral part of these financial statements.
25
Angel Oak Multi-Strategy Income Fund
Schedule of Investments – (continued)
July 31, 2013 (Unaudited)
| Principal Amount | Fair Value | |||||||
Asset-Backed Securities – (continued) | ||||||||
Store Master Funding LLC, Series 2013-1A, Class A1, 4.160%, 3/20/2043 (c)(d) | $ | 4,974,683 | $ | 4,896,948 | ||||
|
| |||||||
TOTAL ASSET-BACKED SECURITIES (Cost $99,328,379) | 95,951,654 | |||||||
|
| |||||||
U.S. Government Agencies – 5.67% | ||||||||
Federal Farm Credit Bank – 0.73% | ||||||||
1.900%,12/17/2021 | 3,000,000 | 2,824,173 | ||||||
2.250%,3/1/2023 | 10,000,000 | 9,237,100 | ||||||
|
| |||||||
| 12,061,273 | ||||||||
|
| |||||||
Federal Home Loan Mortgage Corporation – 1.67% |
| |||||||
0.875%,3/7/2018 | 25,000,000 | 24,370,275 | ||||||
3.750%,3/27/2019 | 3,000,000 | 3,299,550 | ||||||
|
| |||||||
| 27,669,825 | ||||||||
|
| |||||||
Federal National Mortgage Association – 3.27% | ||||||||
0.875%,5/21/2018 | 10,000,000 | 9,715,490 | ||||||
2.000%,5/21/2021 | 5,000,000 | 4,761,245 | ||||||
2.000%,8/27/2021 | 15,000,000 | 14,082,690 | ||||||
2.200%,10/25/2022 | 12,000,000 | 11,178,252 | ||||||
2.500%,2/22/2023 | 15,000,000 | 14,233,635 | ||||||
|
| |||||||
| 53,971,312 | ||||||||
|
| |||||||
TOTAL U.S. GOVERNMENT AGENCIES (Cost $98,294,639) | 93,702,410 | |||||||
|
| |||||||
Corporate Bonds – 0.56% | ||||||||
Information Technology – 0.18% | ||||||||
First Data Corp., 11.750%, 8/15/2021 (c) | 3,000,000 | 2,880,000 | ||||||
|
| |||||||
Consumer Discretionary – 0.38% | ||||||||
Beazer Homes USA, Inc., 9.125%, 6/15/2018 | 4,000,000 | 4,280,000 | ||||||
Goodyear Tire & Rubber Co./The, 7.000%, 3/15/2028 | 2,000,000 | 2,030,000 | ||||||
|
| |||||||
| 6,310,000 | ||||||||
|
| |||||||
TOTAL CORPORATE BONDS (Cost $9,346,738) | 9,190,000 | |||||||
|
| |||||||
See accompanying notes which are an integral part of these financial statements.
26
Angel Oak Multi-Strategy Income Fund
Schedule of Investments – (continued)
July 31, 2013 (Unaudited)
| Principal Amount | Fair Value | |||||||
Collateralized Debt Obligations – 0.28% | ||||||||
Atrium CDO Corp., Series 10A, Class E, 4.776%, 7/16/2025 (a)(c) | $ | 3,500,000 | $ | 3,079,650 | ||||
Venture CDO Ltd., Series 2012-11A, Class E, 6.775%, 11/14/2022 (a)(c) | 1,500,000 | 1,468,500 | ||||||
|
| |||||||
TOTAL COLLATERALIZED DEBT OBLIGATIONS (Cost $4,672,056) |
| 4,548,150 | ||||||
|
| |||||||
| Shares | ||||||||
Preferred Stocks – 0.20% | ||||||||
Financials – 0.20% | ||||||||
Morgan Stanley, Series A, 4.000% (a) | 130,497 | 2,809,600 | ||||||
Wells Fargo & Co., Series P, 5.250% | 23,990 | 536,416 | ||||||
|
| |||||||
TOTAL PREFERRED STOCKS (Cost $3,481,416) | 3,346,016 | |||||||
|
| |||||||
Cash Equivalents – 3.33% | ||||||||
Fidelity Institutional Money Market Portfolio, 0.110% (e) | 55,034,096 | 55,034,096 | ||||||
|
| |||||||
TOTAL CASH EQUIVALENTS (Cost $55,034,096) | 55,034,096 | |||||||
|
| |||||||
TOTAL INVESTMENTS – 127.36% (Cost $2,150,834,479) | $ | 2,105,754,235 | ||||||
|
| |||||||
Liabilities in Excess of Other Assets – (27.36)% | (452,317,465 | ) | ||||||
|
| |||||||
NET ASSETS – 100.00% | $ | 1,653,436,770 | ||||||
|
| |||||||
| (a) | Variable or Floating Rate Security. Rate disclosed is as of July 31, 2013. |
| (b) | All or a portion of the security has been pledged as collateral in connection with open reverse repurchase agreements. On July 31, 2013, securities valued at $673,734,685 were pledged as collateral for reverse repurchase agreements. |
| (c) | Security exempt from registration under Rule 144A or Section 4(2) of the Securities Act of 1933. The security may be resold in transactions exempt from registration, normally to qualified institutional buyers. |
| (d) | Security is fair valued by the Adviser. See Note 3. |
| (e) | Rate disclosed is the seven day yield as of July 31, 2013. |
I/O — Interest Only Security
See accompanying notes which are an integral part of these financial statements.
27
Angel Oak Multi-Strategy Income Fund
Schedule of Investments – (continued)
July 31, 2013 (Unaudited)
Reverse repurchase agreements outstanding as of July 31, 2013 were as follows:
Counterparty | Interest Rate | Trade Date | Maturity Date | Net Closing Amount | Face Amount | |||||||||||||||
Bank of America | 1.940 | % | 7/8/2013 | 8/7/2013 | $ | 5,502,882 | $ | 5,494,000 | ||||||||||||
Bank of America | 1.940 | % | 7/8/2013 | 8/7/2013 | 14,675,687 | 14,652,000 | ||||||||||||||
Bank of America | 1.940 | % | 7/12/2013 | 8/13/2013 | 5,286,100 | 5,277,000 | ||||||||||||||
Bank of America | 1.590 | % | 7/15/2013 | 8/15/2013 | 12,176,649 | 12,160,000 | ||||||||||||||
Bank of America | 2.090 | % | 7/16/2013 | 8/15/2013 | 1,195,078 | 1,193,000 | ||||||||||||||
Bank of America | 1.190 | % | 7/16/2013 | 8/15/2013 | 10,564,466 | 10,554,000 | ||||||||||||||
Bank of America | 2.090 | % | 7/23/2013 | 8/23/2013 | 8,346,995 | 8,332,000 | ||||||||||||||
Barclays | 2.195 | % | 7/8/2013 | 8/7/2013 | 12,813,843 | 12,790,449 | ||||||||||||||
Barclays | 2.195 | % | 7/8/2013 | 8/7/2013 | 4,419,144 | 4,411,076 | ||||||||||||||
Barclays | 2.195 | % | 7/8/2013 | 8/7/2013 | 36,758 | 36,691 | ||||||||||||||
Barclays | 2.191 | % | 7/15/2013 | 8/14/2013 | 6,461,777 | 6,450,000 | ||||||||||||||
Barclays | 2.191 | % | 7/15/2013 | 8/14/2013 | 11,578,236 | 11,557,134 | ||||||||||||||
Barclays | 2.191 | % | 7/15/2013 | 8/14/2013 | 13,892,820 | 13,867,500 | ||||||||||||||
Barclays | 2.192 | % | 7/17/2013 | 8/16/2013 | 5,768,518 | 5,758,000 | ||||||||||||||
Citi | 1.889 | % | 7/24/2013 | 8/23/2013 | 5,726,046 | 5,717,045 | ||||||||||||||
Citi | 1.887 | % | 7/31/2013 | 8/30/2013 | 14,002,892 | 13,980,904 | ||||||||||||||
Credit Suisse | 1.550 | % | 7/8/2013 | 8/7/2013 | 4,303,038 | 4,297,487 | ||||||||||||||
Credit Suisse | 1.900 | % | 7/10/2013 | 8/9/2013 | 4,711,354 | 4,703,906 | ||||||||||||||
Credit Suisse | 1.900 | % | 7/10/2013 | 8/9/2013 | 6,315,541 | 6,305,557 | ||||||||||||||
Credit Suisse | 1.900 | % | 7/11/2013 | 8/12/2013 | 1,871,963 | 1,868,807 | ||||||||||||||
Credit Suisse | 1.950 | % | 7/17/2013 | 8/16/2013 | 8,931,272 | 8,916,782 | ||||||||||||||
Credit Suisse | 1.950 | % | 7/17/2013 | 8/16/2013 | 8,423,599 | 8,409,933 | ||||||||||||||
Credit Suisse | 1.950 | % | 7/17/2013 | 8/16/2013 | 1,456,487 | 1,454,124 | ||||||||||||||
Credit Suisse | 1.950 | % | 7/22/2013 | 8/21/2013 | 7,722,546 | 7,710,017 | ||||||||||||||
Credit Suisse | 1.850 | % | 7/22/2013 | 8/21/2013 | 7,265,283 | 7,254,100 | ||||||||||||||
Credit Suisse | 1.950 | % | 7/25/2013 | 8/23/2013 | 2,096,801 | 2,093,512 | ||||||||||||||
Credit Suisse | 1.950 | % | 7/26/2013 | 8/26/2013 | 555,535 | 554,604 | ||||||||||||||
Credit Suisse | 1.950 | % | 7/26/2013 | 8/26/2013 | 9,059,697 | 9,044,510 | ||||||||||||||
Goldman Sachs | 2.040 | % | 7/15/2013 | 8/14/2013 | 9,964,912 | 9,948,000 | ||||||||||||||
Goldman Sachs | 0.300 | % | 7/19/2013 | 8/19/2013 | 9,553,467 | 9,551,000 | ||||||||||||||
Goldman Sachs | 0.300 | % | 7/19/2013 | 8/19/2013 | 12,563,245 | 12,560,000 | ||||||||||||||
Goldman Sachs | 2.589 | % | 7/24/2013 | 8/23/2013 | 1,988,281 | 1,984,000 | ||||||||||||||
Guggenheim Partners, LLC | 1.950 | % | 7/1/2013 | 8/1/2013 | 2,464,131 | 2,460,000 | ||||||||||||||
See accompanying notes which are an integral part of these financial statements.
28
Angel Oak Multi-Strategy Income Fund
Schedule of Investments – (continued)
July 31, 2013 (Unaudited)
Counterparty | Interest Rate | Trade Date | Maturity Date | Net Closing Amount | Face Amount | |||||||||||||||
Guggenheim Partners, LLC | 1.950 | % | 7/1/2013 | 8/1/2013 | $ | 2,410,040 | $ | 2,406,000 | ||||||||||||
Guggenheim Partners, LLC | 1.900 | % | 7/8/2013 | 8/8/2013 | 2,328,804 | 2,325,000 | ||||||||||||||
Guggenheim Partners, LLC | 2.000 | % | 7/17/2013 | 8/16/2013 | 23,263,708 | 23,225,000 | ||||||||||||||
Guggenheim Partners, LLC | 2.100 | % | 7/30/2013 | 8/30/2013 | 14,007,284 | 13,982,000 | ||||||||||||||
Guggenheim Partners, LLC | 2.000 | % | 7/30/2013 | 8/30/2013 | 2,190,767 | 2,187,000 | ||||||||||||||
Guggenheim Partners, LLC | 2.000 | % | 7/30/2013 | 8/30/2013 | 708,218 | 707,000 | ||||||||||||||
Guggenheim Partners, LLC | 2.000 | % | 7/30/2013 | 8/30/2013 | 5,235,000 | 5,226,000 | ||||||||||||||
Guggenheim Partners, LLC | 2.100 | % | 7/30/2013 | 8/30/2013 | 1,013,830 | 1,012,000 | ||||||||||||||
Guggenheim Partners, LLC | 2.000 | % | 7/31/2013 | 8/30/2013 | 4,817,015 | 4,809,000 | ||||||||||||||
Jeffries | 3.190 | % | 7/23/2013 | 8/23/2013 | 4,199,504 | 4,188,000 | ||||||||||||||
Jeffries | 2.940 | % | 7/23/2013 | 8/23/2013 | 10,767,190 | 10,740,000 | ||||||||||||||
Jeffries | 3.190 | % | 7/23/2013 | 8/23/2013 | 1,286,524 | 1,283,000 | ||||||||||||||
Jeffries | 2.190 | % | 7/23/2013 | 8/23/2013 | 10,369,518 | 10,350,000 | ||||||||||||||
JP Morgan | 1.692 | % | 7/15/2013 | 8/15/2013 | 4,460,489 | 4,454,000 | ||||||||||||||
JP Morgan | 1.692 | % | 7/15/2013 | 8/15/2013 | 7,744,267 | 7,733,000 | ||||||||||||||
JP Morgan | 1.692 | % | 7/15/2013 | 8/15/2013 | 17,180,995 | 17,156,000 | ||||||||||||||
JP Morgan | 1.692 | % | 7/15/2013 | 8/15/2013 | 308,449 | 308,000 | ||||||||||||||
JP Morgan | 1.692 | % | 7/19/2013 | 8/19/2013 | 11,214,311 | 11,198,000 | ||||||||||||||
JP Morgan | 1.592 | % | 7/19/2013 | 8/19/2013 | 8,813,062 | 8,801,000 | ||||||||||||||
JP Morgan | 1.686 | % | 7/29/2013 | 8/29/2013 | 18,958,492 | 18,931,000 | ||||||||||||||
Morgan Stanley | 1.650 | % | 7/3/2013 | 8/2/2013 | 7,177,731 | 7,167,875 | ||||||||||||||
Morgan Stanley | 0.410 | % | 7/11/2013 | 8/12/2013 | 3,589,533 | 3,588,225 | ||||||||||||||
Morgan Stanley | 1.300 | % | 7/11/2013 | 8/12/2013 | 3,472,376 | 3,468,368 | ||||||||||||||
Nomura | 1.942 | % | 7/18/2013 | 8/19/2013 | 1,965,387 | 1,962,000 | ||||||||||||||
Nomura | 2.439 | % | 7/25/2013 | 8/23/2013 | 12,021,576 | 11,998,000 | ||||||||||||||
Nomura | 2.439 | % | 7/25/2013 | 8/27/2013 | 8,672,349 | 8,653,000 | ||||||||||||||
RBC Capital Markets | 1.923 | % | 6/5/2013 | 9/5/2013 | 3,835,760 | 3,817,000 | ||||||||||||||
See accompanying notes which are an integral part of these financial statements.
29
Angel Oak Multi-Strategy Income Fund
Schedule of Investments – (continued)
July 31, 2013 (Unaudited)
Counterparty | Interest Rate | Trade Date | Maturity Date | Net Closing Amount | Face Amount | |||||||||||||||
RBC Capital Markets | 1.922 | % | 6/13/2013 | 9/13/2013 | $ | 6,819,336 | $ | 6,786,000 | ||||||||||||
RBC Capital Markets | 1.923 | % | 6/18/2013 | 9/18/2013 | 24,405,334 | 24,286,000 | ||||||||||||||
RBC Capital Markets | 1.923 | % | 6/18/2013 | 9/18/2013 | 10,641,031 | 10,589,000 | ||||||||||||||
RBC Capital Markets | 1.923 | % | 6/26/2013 | 9/18/2013 | 6,119,331 | 6,092,000 | ||||||||||||||
Wells Fargo | 1.693 | % | 7/10/2013 | 8/9/2013 | 804,133 | 803,000 | ||||||||||||||
Wells Fargo | 1.693 | % | 7/10/2013 | 8/9/2013 | 1,440,029 | 1,438,000 | ||||||||||||||
Wells Fargo | 1.686 | % | 7/29/2013 | 8/29/2013 | 3,361,875 | 3,357,000 | ||||||||||||||
|
| |||||||||||||||||||
Total | $ | 476,373,606 | ||||||||||||||||||
|
| |||||||||||||||||||
A reverse repurchase agreement, although structured as a sale and repurchase obligation, acts as a financing transaction under which the Fund will effectively pledge certain assets as collateral to secure a short-term loan. Generally the other party to the agreement makes the loan in an amount equal to at least 100% of the fair value of the pledged collateral. At the maturity of the reverse repurchase agreement, the Fund will be required to repay the loan and interest and correspondingly receive back its collateral. While used as collateral, the pledged assets continue to pay principal and interest which are for the benefit of the Fund.
See accompanying notes which are an integral part of these financial statements.
30
Angel Oak Multi-Strategy Income Fund
Statement of Assets and Liabilities
July 31, 2013
(Unaudited)
Assets | ||||
Investments in securities at fair value (cost $2,150,834,479) | $ | 2,105,754,235 | ||
Cash | 116,585 | |||
Cash due from broker (a) | 15,435,570 | |||
Receivable for fund shares sold | 5,558,381 | |||
Receivable for investments sold | 8,270,717 | |||
Dividends and interest receivable | 11,267,296 | |||
Prepaid expenses | 257,853 | |||
|
| |||
Total Assets | 2,146,660,637 | |||
|
| |||
Liabilities | ||||
Payable for reverse repurchase agreements | 476,373,606 | |||
Payable for fund shares redeemed | 3,766,553 | |||
Payable for investments purchased | 11,032,356 | |||
Interest payable for reverse repurchase agreements | 417,596 | |||
Payable to Adviser | 1,213,284 | |||
Payable to administrator, fund accountant, and transfer agent | 159,649 | |||
12b-1 fees accrued | 164,836 | |||
Other accrued expenses | 95,987 | |||
|
| |||
Total Liabilities | 493,223,867 | |||
|
| |||
Net Assets | $ | 1,653,436,770 | ||
|
| |||
Net Assets consist of: | ||||
Paid-in capital | $ | 1,695,103,288 | ||
Accumulated net investment (loss) | (1,815,079 | ) | ||
Accumulated net realized gain from investment transactions | 5,228,805 | |||
Net unrealized appreciation (depreciation) on investments | (45,080,244 | ) | ||
|
| |||
Net Assets | $ | 1,653,436,770 | ||
|
| |||
| (a) | Margin claim to be received from broker. |
See accompanying notes which are an integral part of these financial statements.
31
Angel Oak Multi-Strategy Income Fund
Statement of Assets and Liabilities – (continued)
July 31, 2013
(Unaudited)
Class A: | ||||
Net Assets | $ | 590,152,321 | ||
| �� |
|
| ||
Shares outstanding (unlimited number of shares authorized, | 49,830,815 | |||
|
| |||
Net asset value (“NAV”) per share | $ | 11.84 | ||
|
| |||
Offering price per share (NAV/0.9775) (a) | $ | 12.11 | ||
|
| |||
Class C: | ||||
Net Assets | $ | 39,804,091 | ||
|
| |||
Shares outstanding (unlimited number of shares authorized, | 3,370,773 | |||
|
| |||
Net asset value (“NAV”) and offering price per share | $ | 11.81 | ||
|
| |||
Minimum redemption price per share (NAV*0.99) (b) | $ | 11.69 | ||
|
| |||
Institutional Class: | ||||
Net Assets | $ | 1,023,480,358 | ||
|
| |||
Shares outstanding (unlimited number of shares authorized, | 86,429,475 | |||
|
| |||
Net asset value (“NAV”) and offering price per share | $ | 11.84 | ||
|
| |||
| (a) | Class A shares impose a maximum 2.25% sales charge on purchases. |
| (b) | A contingent deferred sales charge (“CDSC”) of 1.00% may be charged. |
See accompanying notes which are an integral part of these financial statements.
32
Angel Oak Multi-Strategy Income Fund
Statement of Operations
For the six months ended July 31, 2013
(Unaudited)
Investment Income | ||||
Dividend income | $ | 42,006 | ||
Interest income | 38,506,210 | |||
|
| |||
Total Investment Income | 38,548,216 | |||
|
| |||
Expenses | ||||
Investment Advisory fees | 8,113,258 | |||
12b-1 fees – Class A | 767,482 | |||
12b-1 fees – Class C (a) | 170,093 | |||
Administration expenses | 278,654 | |||
Fund accounting expenses | 83,306 | |||
Transfer agent expenses | 121,032 | |||
Legal expenses | 12,712 | |||
Registration expenses | 92,134 | |||
Custodian expenses | 98,015 | |||
Auditing expenses | 10,414 | |||
Trustee expenses | 3,039 | |||
Insurance expense | 2,520 | |||
Pricing expenses | 28,036 | |||
Report printing expense | 36,856 | |||
24f-2 expense | 64,242 | |||
CCO expense | 1,499 | |||
Miscellaneous expenses | 6,251 | |||
Interest on reverse repurchase agreements | 3,433,264 | |||
Line of credit expense | 67,200 | |||
|
| |||
Total Expenses | 13,390,007 | |||
|
| |||
Fees contractually waived by Adviser | (1,777,967 | ) | ||
|
| |||
Net operating expenses | 11,612,040 | |||
|
| |||
Net Investment Income | 26,936,176 | |||
|
| |||
Realized and Unrealized Gain (Loss) on Investments | ||||
Net realized gain on investment transactions | 3,185,394 | |||
Net change in unrealized depreciation of investments | (71,590,522 | ) | ||
|
| |||
Net realized and unrealized loss on investments | (68,405,128 | ) | ||
|
| |||
Net decrease in net assets resulting from operations | $ | (41,468,952 | ) | |
|
| |||
| (a) | Class C shares commenced operations on March 14, 2012. |
See accompanying notes which are an integral part of these financial statements.
33
Angel Oak Multi-Strategy Income Fund
Statement of Cash Flows
For the six months ended July 31, 2013
(Unaudited)
Increase/(Decrease) in Cash | ||||
Cash flows from operating activities: | ||||
Net decrease in net assets resulting from operations | $ | (41,468,952 | ) | |
Adjustments to reconcile net increase in net assets from operations to net cash used in operating activities: | ||||
Accretion of discount/amortization of premium, net | (2,034,842 | ) | ||
Purchase of long-term securities | (487,144,906 | ) | ||
Proceeds from sales of long-term securities | 335,736,795 | |||
Purchases of short-term securities, net | (902,526,846 | ) | ||
Increase in dividends and interest receivable | (7,307,245 | ) | ||
Increase in receivable for investments sold | (6,021,092 | ) | ||
Increase in prepaid expenses | (158,676 | ) | ||
Increase in payable to Adviser | 744,650 | |||
Decrease in payable for investments purchased | (43,143,966 | ) | ||
Increase in interest payable for reverse repurchase agreements | 307,932 | |||
Increase in accrued expenses and expenses payable | 111,795 | |||
Net realized gain on investment securities | 3,185,394 | |||
Net gains on paydowns of mortgage-backed securities | (9,255,949 | ) | ||
Change in unrealized depreciation on investments | 71,590,522 | |||
|
| |||
Net cash used in operating activities | (1,087,385,386 | ) | ||
|
| |||
Cash flows from financing activities: | ||||
Increase in payable for reverse repurchase agreements | 321,298,554 | |||
Proceeds from shares sold | 1,283,596,140 | |||
Amount paid for shares redeemed | (497,653,764 | ) | ||
Cash distributions paid | (6,421,539 | ) | ||
|
| |||
Net cash provided from financing activities | 1,100,819,391 | |||
|
| |||
Net change in cash | $ | 13,434,005 | ||
Cash balance beginning of period | $ | 2,118,150 | ||
|
| |||
Cash balance end of period | $ | 15,552,155 | ||
|
|
Non cash financing activities not included herein consist of receivable for fund shares sold of $5,558,381, payable for fund shares redeemed of $3,766,553, and reinvestment of distributions of $25,332,764.
Supplemental Information | ||
Interest paid | $3,015,668 | |
See accompanying notes which are an integral part of these financial statements.
34
Angel Oak Multi-Strategy Income Fund
Statements of Changes in Net Assets
| For the Six Months Ended July 31, 2013 (Unaudited) | For the Year Ended January 31, 2013 | |||||||
Increase in Net Assets due to: | ||||||||
Operations | ||||||||
Net investment income | $ | 26,936,176 | $ | 13,044,015 | ||||
Net realized gain on investment transactions | 3,185,394 | 4,395,366 | ||||||
Net change in unrealized appreciation (depreciation) of investments | (71,590,522 | ) | 26,233,180 | |||||
|
|
|
| |||||
Net increase (decrease) in net assets resulting from operations | (41,468,952 | ) | 43,672,561 | |||||
|
|
|
| |||||
Distributions | ||||||||
From net investment income, Class A | (13,283,303 | ) | (7,249,037 | ) | ||||
From net investment income, Class C | (610,229 | ) | (202,571 | ) | ||||
From net investment income, Institutional Class | (17,860,771 | ) | (2,891,461 | ) | ||||
From net realized gains, Class A | – | (1,321,776 | ) | |||||
From net realized gains, Class C | – | (63,207 | ) | |||||
From net realized gains, Institutional Class | – | (820,614 | ) | |||||
|
|
|
| |||||
Total distributions | (31,754,303 | ) | (12,548,666 | ) | ||||
|
|
|
| |||||
Capital Transactions – Class A | ||||||||
Proceeds from shares sold | 424,603,973 | 540,098,989 | ||||||
Reinvestment of distributions | 9,718,005 | 6,762,399 | ||||||
Amount paid for shares redeemed | (301,619,707 | ) | (109,904,633 | ) | ||||
|
|
|
| |||||
Total Class A | 132,702,271 | 436,956,755 | ||||||
|
|
|
| |||||
Capital Transactions – Class C (a) | ||||||||
Proceeds from shares sold | 20,627,491 | 22,401,838 | ||||||
Reinvestment of distributions | 439,941 | 206,158 | ||||||
Amount paid for shares redeemed | (2,294,601 | ) | (427,809 | ) | ||||
|
|
|
| |||||
Total Class C | 18,772,831 | 22,180,187 | ||||||
|
|
|
| |||||
Capital Transactions – Institutional Class (b) | ||||||||
Proceeds from shares sold | 802,208,015 | 441,330,827 | ||||||
Reinvestment of distributions | 15,174,818 | 3,514,112 | ||||||
Amount paid for shares redeemed | (196,650,176 | ) | (6,908,839 | ) | ||||
|
|
|
| |||||
Total Institutional Class | 620,732,657 | 437,936,100 | ||||||
|
|
|
| |||||
Net increase in net assets resulting from capital transactions | 772,207,759 | 897,073,042 | ||||||
|
|
|
| |||||
Total Increase in Net Assets | 698,984,504 | 928,196,937 | ||||||
|
|
|
| |||||
Net Assets | ||||||||
Beginning of period | 954,452,266 | 26,255,329 | ||||||
|
|
|
| |||||
End of period | $ | 1,653,436,770 | $ | 954,452,266 | ||||
|
|
|
| |||||
Accumulated net investment income (loss) included in net assets at end of period | $ | (1,815,079 | ) | $ | 3,003,048 | |||
|
|
|
| |||||
See accompanying notes which are an integral part of these financial statements.
35
Angel Oak Multi-Strategy Income Fund
Statements of Changes in Net Assets – (continued)
| For the Six Months Ended July 31, 2013 (Unaudited) | For the Year Ended January 31, 2013 | |||||||
Share Transactions – Class A | ||||||||
Shares sold | 34,376,797 | 45,555,230 | ||||||
Shares issued in reinvestment of distributions | 791,116 | 573,388 | ||||||
Shares redeemed | (24,740,158 | ) | (9,185,969 | ) | ||||
|
|
|
| |||||
Total Class A | 10,427,755 | 36,942,649 | ||||||
|
|
|
| |||||
Share Transactions – Class C (a) | ||||||||
Shares sold | 1,672,876 | 1,871,231 | ||||||
Shares issued in reinvestment of distributions | 35,966 | 17,240 | ||||||
Shares redeemed | (191,361 | ) | (35,179 | ) | ||||
|
|
|
| |||||
Total Class C | 1,517,481 | 1,853,292 | ||||||
|
|
|
| |||||
Share Transactions – Institutional Class (b) | ||||||||
Shares sold | 65,227,131 | 36,354,579 | ||||||
Shares issued in reinvestment of distributions | 1,237,037 | 291,363 | ||||||
Shares redeemed | (16,112,431 | ) | (568,204 | ) | ||||
|
|
|
| |||||
Total Institutional Class | 50,351,737 | 36,077,738 | ||||||
|
|
|
| |||||
Net increase in share transactions | 62,296,973 | 74,873,679 | ||||||
|
|
|
| |||||
| (a) | Class C shares commenced operations on March 14, 2012. |
| (b) | Institutional Class commenced operations on August 16, 2012. |
See accompanying notes which are an integral part of these financial statements.
36
Angel Oak Multi-Strategy Income Fund - Class A
Financial Highlights
(For a share outstanding during each period)
| For the Six Months Ended July 31, 2013 (Unaudited) | For the Year Ended January 31, 2013 | For the Period Ended January 31, 2012 (a) | ||||||||||
Selected Per Share Data: | ||||||||||||
Net asset value, beginning of period | $ | 12.35 | $ | 10.67 | $ | 10.00 | ||||||
|
|
|
|
|
| |||||||
Income from investment operations: | ||||||||||||
Net investment income | 0.21 | 0.60 | 0.26 | |||||||||
Net realized and unrealized gain (loss) on investments | (0.46) | 1.74 | 0.63 | (b) | ||||||||
|
|
|
|
|
| |||||||
Total from investment operations | (0.25) | 2.34 | 0.89 | |||||||||
|
|
|
|
|
| |||||||
Less distributions to shareholders: | ||||||||||||
From net investment income | (0.26) | (0.61) | (0.22) | |||||||||
From net realized gains | - | (0.05) | - | |||||||||
|
|
|
|
|
| |||||||
Total distributions | (0.26) | (0.66) | (0.22) | |||||||||
|
|
|
|
|
| |||||||
Net asset value, end of period | $ | 11.84 | $ | 12.35 | $ | 10.67 | ||||||
|
|
|
|
|
| |||||||
Total Return (c) | (2.04)% | (d) | 22.57% | 8.95% | (d) | |||||||
Ratios and Supplemental Data: | ||||||||||||
Net assets, end of period (000 omitted) | $ | 590,152 | $ | 486,444 | $ | 26,255 | ||||||
Ratio of expenses to average net assets | 1.72% | (e) | 1.60% | 2.45% | (e) | |||||||
| Ratio of expenses to average net assets (excluding interest expense) | 1.24% | (e) | 1.26% | 2.25% | (e) | |||||||
| Ratio of expenses to average net assets before waiver and reimbursement | 1.96% | (e) | 2.23% | 3.38% | (e) | |||||||
| Ratio of expenses to average net assets before waiver and reimbursement (excluding interest expense) | 1.49% | (e) | 1.90% | 3.18% | (e) | |||||||
| Ratio of net investment income to average net assets | 3.57% | (e) | 5.02% | 5.29% | (e) | |||||||
| Ratio of net investment income (loss) to average net assets before waiver and reimbursement | 3.32% | (e) | 4.39% | 4.36% | (e) | |||||||
Portfolio turnover rate | 36.47% | (d) | 54.56% | 17.85% | (d) | |||||||
| (a) | For the period June 28, 2011 (commencement of operations) to January 31, 2012. |
| (b) | Realized and unrealized gains and losses per share in this caption are balancing amounts necessary to reconcile the change in net asset value per share for the period, and may not reconcile with the aggregate gains and losses in the Statement of Operations due to share transactions for the period. |
| (c) | Total return in the above table represents the rate that the investor would have earned or lost on an investment in the Fund, assuming reinvestment of dividends, and excludes the maximum sales charge. |
| (d) | Not annualized. |
| (e) | Annualized. |
See accompanying notes which are an integral part of these financial statements.
37
Angel Oak Multi-Strategy Income Fund - Class C
Financial Highlights
(For a share outstanding during each period)
| For the Six Months Ended July 31, 2013 (Unaudited) | For the Year Ended January 31, 2013 (a) | |||||||
Selected Per Share Data: | ||||||||
Net asset value, beginning of period | $ | 12.31 | $ | 11.03 | ||||
|
|
|
| |||||
Income from investment operations: | ||||||||
Net investment income | 0.17 | 0.47 | ||||||
Net realized and unrealized gain (loss) on investments | (0.45) | 1.30 | ||||||
|
|
|
| |||||
Total from investment operations | (0.28) | 1.77 | ||||||
|
|
|
| |||||
Less distributions to shareholders: | ||||||||
From net investment income | (0.22) | (0.44) | ||||||
From net realized gains | - | (0.05) | ||||||
|
|
|
| |||||
Total distributions | (0.22) | (0.49) | ||||||
|
|
|
| |||||
Net asset value, end of period | $ | 11.81 | $ | 12.31 | ||||
|
|
|
| |||||
Total Return (b) | (2.30)% | (c) | 16.39% | (c) | ||||
Ratios and Supplemental Data: | ||||||||
Net assets, end of period (000 omitted) | $ | 39,804 | $ | 22,821 | ||||
Ratio of expenses to average net assets | 2.47% | (d) | 2.33% | (d) | ||||
| Ratio of expenses to average net assets (excluding interest expense) | 1.99% | (d) | 2.00% | (d) | ||||
| Ratio of expenses to average net assets before waiver and reimbursement | 2.71% | (d) | 2.91% | (d) | ||||
| Ratio of expenses to average net assets before waiver and reimbursement (excluding interest expense) | 2.24% | (d) | 2.56% | (d) | ||||
| Ratio of net investment income to average net assets | 2.85% | (d) | 4.12% | (d) | ||||
| Ratio of net investment income (loss) to average net assets before waiver and reimbursement | 2.60% | (d) | 3.55% | (d) | ||||
Portfolio turnover rate | 36.47% | (c) | 54.56% | (c) | ||||
| (a) | For the period March 14, 2012 (commencement of operations) to January 31, 2013. |
| (b) | Total return in the above table represents the rate that the investor would have earned or lost on an investment in the Fund, assuming reinvestment of dividends. |
| (c) | Not annualized. |
| (d) | Annualized. |
See accompanying notes which are an integral part of these financial statements.
38
Angel Oak Multi-Strategy Income Fund - Institutional Class
Financial Highlights
(For a share outstanding during each period)
| For the Six Months Ended July 31, 2013 (Unaudited) | For the Year Ended January 31, 2013 (a) | |||||||
Selected Per Share Data: | ||||||||
Net asset value, beginning of period | $ | 12.34 | $ | 11.71 | ||||
|
|
|
| |||||
Income from investment operations: | ||||||||
Net investment income | 0.23 | 0.25 | ||||||
Net realized and unrealized gain (loss) on investments | (0.45) | 0.65 | ||||||
|
|
|
| |||||
Total from investment operations | (0.22) | 0.90 | ||||||
|
|
|
| |||||
Less distributions to shareholders: | ||||||||
From net investment income | (0.28) | (0.22) | ||||||
From net realized gains | - | (0.05) | ||||||
|
|
|
| |||||
Total distributions | (0.28) | (0.27) | ||||||
|
|
|
| |||||
Net asset value, end of period | $ | 11.84 | $ | 12.34 | ||||
|
|
|
| |||||
Total Return (b) | (1.84)% | (c) | 7.75% | (c) | ||||
Ratios and Supplemental Data: | ||||||||
Net assets, end of period (000 omitted) | $ | 1,023,480 | $ | 445,187 | ||||
Ratio of expenses to average net assets | 1.47% | (d) | 1.34% | (d) | ||||
| Ratio of expenses to average net assets (excluding interest expense) | 0.99% | (d) | 0.99% | (d) | ||||
| Ratio of expenses to average net assets before waiver and reimbursement | 1.71% | (d) | 1.89% | (d) | ||||
| Ratio of expenses to average net assets before waiver and reimbursement (excluding interest expense) | 1.24% | (d) | 1.54% | (d) | ||||
| Ratio of net investment income to average net assets | 3.85% | (d) | 5.07% | (d) | ||||
| Ratio of net investment income (loss) to average net assets before waiver and reimbursement | 3.60% | (d) | 4.52% | (d) | ||||
Portfolio turnover rate | 36.47% | (c) | 54.56% | (c) | ||||
| (a) | For the period August 16, 2012 (commencement of operations) to January 31, 2013. |
| (b) | Total return in the above table represents the rate that the investor would have earned or lost on an investment in the Fund, assuming reinvestment of dividends. |
| (c) | Not annualized. |
| (d) | Annualized. |
See accompanying notes which are an integral part of these financial statements.
39
Angel Oak Multi-Strategy Income Fund
Notes to the Financial Statements
July 31, 2013
(Unaudited)
NOTE 1. ORGANIZATION
The Angel Oak Multi-Strategy Income Fund (the “Fund”) is an open-end non-diversified series of the Valued Advisers Trust (the “Trust”). The Trust is a management investment company established under the laws of Delaware by an Agreement and Declaration of Trust dated June 13, 2008 (the “Trust Agreement”). The Trust Agreement permits the Trustees to issue an unlimited number of shares of beneficial interest of separate series without par value. The Fund is one of a series of funds authorized by the Trustees. The Fund’s investment adviser is Angel Oak Capital Advisors, LLC (the “Adviser”). The investment objective of the Fund is current income.
The Fund currently offers three share classes, Class A, Class C and Institutional Class. Class A shares commenced operations on June 28, 2011, Class C shares commenced operations on March 14, 2012 and the Institutional Class shares commenced operations on August 16, 2012. Each share represents an equal proportionate interest in the assets and liabilities belonging to the Fund and is entitled to such dividends and distributions out of income belonging to the Fund as are declared by the Board. Class A currently has a maximum sales charge on purchases of 2.25% as a percentage of the original purchase price (prior to May 30, 2013 the maximum sales charge was 5.75%). Class C does not have an initial sales charge on purchases. The dealer of record receives a payment from the Fund’s distributor of 1.00% of the amount you invest in Class C shares. If you redeem your Class C shares within one year of purchase, you will be subject to a 1.00% contingent deferred sales charge (“CDSC”), based on the lower of the shares’ cost or current net asset value. Any shares acquired by reinvestment of distributions will be redeemed without a CDSC. For the six months ended July 31, 2013, CDSC fees on Class C Shares paid to the Distributor were $20,470.
NOTE 2. SIGNIFICANT ACCOUNTING POLICIES
The following is a summary of significant accounting policies consistently followed by the Fund in the preparation of its financial statements. These policies are in conformity with the generally accepted accounting principles in the United States of America (“GAAP”).
Securities Valuation – All investments in securities are recorded at their estimated fair value as described in Note 3.
Federal Income Taxes – The Fund makes no provision for federal income or excise tax. The Fund intends to qualify each year as a regulated investment company (“RIC”)
40
Angel Oak Multi-Strategy Income Fund
Notes to the Financial Statements - (continued)
July 31, 2013
(Unaudited)
NOTE 2. SIGNIFICANT ACCOUNTING POLICIES - (continued)
under subchapter M of the Internal Revenue Code of 1986, as amended, by complying with the requirements applicable to RICs and by distributing substantially all of its taxable income. The Fund also intends to distribute sufficient net investment income and net capital gains, if any, so that it will not be subject to excise tax on undistributed income and gains. If the required amount of net investment income or gains is not distributed, the Fund could incur a tax expense.
As of and during the six months ended July 31, 2013 the Fund did not have a liability for any unrecognized tax benefits. The Fund recognizes interest and penalties, if any, related to unrecognized tax benefits as income tax expense in the statement of operations. During the period, the Fund did not incur any interest or penalties. The Fund is subject to examination by U.S. federal tax authorities for all tax years since inception.
Expenses – Expenses incurred by the Trust that do not relate to a specific fund of the Trust are allocated to the individual funds based on each fund’s relative net assets or another appropriate basis (as determined by the Trustees). Expenses attributable to any class are borne by that class. Income, realized gains and losses, unrealized appreciation and depreciation, and expenses are allocated to each class based on the net assets in relation to the relative net assets of the Fund.
Security Transactions and Related Income – The Fund follows industry practice and records security transactions on the trade date. The specific identification method is used for determining gains or losses for financial statement and income tax purposes. Dividend income is recorded on the ex-dividend date and interest income is recorded on an accrual basis. Discounts and premiums on securities purchased are accreted or amortized using the effective interest method. The ability of issuers of debt securities held by the Fund to meet their obligations may be affected by economic and political developments in a specific country or region.
Dividends and Distributions – The Fund intends to distribute substantially all of its net investment income, if any, as dividends to its shareholders on a monthly basis. The Fund intends to distribute its net realized long term capital gains and its net realized short term capital gains, if any, at least once a year. Dividends to shareholders, which are determined in accordance with income tax regulations, are recorded on the ex-dividend date. The treatment for financial reporting purposes of distributions made to shareholders during the period from net investment income or net realized capital gains may differ from their ultimate treatment for federal income tax purposes. These
41
Angel Oak Multi-Strategy Income Fund
Notes to the Financial Statements - (continued)
July 31, 2013
(Unaudited)
NOTE 2. SIGNIFICANT ACCOUNTING POLICIES - (continued)
differences are caused primarily by differences in the timing of the recognition of certain components of income, expense or realized capital gain for federal income tax purposes. Where such differences are permanent in nature, they are reclassified in the components of the net assets based on their ultimate characterization for federal income tax purposes. Any such reclassifications will have no effect on net assets, results of operations or net asset values per share of the Fund. There were no such material reclassifications made as of July 31, 2013.
Reverse Repurchase Agreements – A reverse repurchase agreement is the sale by the Fund of a security to a party for a specified price, with the simultaneous agreement by the Fund to repurchase that security from that party on a future date at a higher price. Securities sold under reverse repurchase agreements are reflected as a liability on the Statement of Assets and Liabilities. Interest payments made are recorded as a component of interest expense on the Statement of Operations. Reverse repurchase agreements involve the risk that the counterparty will become subject to bankruptcy or other insolvency proceedings or fail to return a security to the Fund. In such situations, the Fund may incur losses as a result of a possible decline in the value of the underlying security during the period while the Fund seeks to enforce its rights, a possible lack of access to income on the underlying security during this period, or expenses of enforcing its rights.
NOTE 3. SECURITIES VALUATION AND FAIR VALUE MEASUREMENTS
Fair value is defined as the price that a Fund would receive upon selling an investment in a timely transaction to an independent buyer in the principal or most advantageous market of the investment. GAAP establishes a three-tier hierarchy to maximize the use of observable market data and minimize the use of unobservable inputs and to establish classification of fair value measurements for disclosure purposes.
Inputs refer broadly to the assumptions that market participants would use in pricing the asset or liability, including assumptions about risk (the risk inherent in a particular valuation technique used to measure fair value, such as pricing models and/or the risk inherent in the inputs to the valuation technique). Inputs may be observable or unobservable. Observable inputs are inputs that reflect the assumptions market participants would use in pricing the asset or liability developed based on market data obtained from sources independent of the reporting entity. Unobservable inputs are inputs that reflect the reporting entity’s own assumptions about the assumptions market participants would use in pricing the asset or liability developed based on the best information available in the circumstances.
42
Angel Oak Multi-Strategy Income Fund
Notes to the Financial Statements - (continued)
July 31, 2013
(Unaudited)
NOTE 3. SECURITIES VALUATION AND FAIR VALUE MEASUREMENTS - (continued)
Various inputs are used in determining the value of the Fund’s investments. These inputs are summarized in the three broad levels listed below.
| • | Level 1 – quoted prices in active markets for identical securities |
| • | Level 2 – other significant observable inputs (including, but not limited to, quoted prices for an identical security in an inactive market, quoted prices for similar securities, interest rates, prepayment speeds, credit risk, etc.) |
| • | Level 3 – significant unobservable inputs (including the Fund’s own assumptions in determining fair value of investments based on the best information available) |
The inputs used to measure fair value may fall into different levels of the fair value hierarchy. In such cases, for disclosure purposes, the level in the fair value hierarchy within which the fair value measurement falls in its entirety is determined based on the level input that is most significant to the fair value measurement in its entirety.
Equity securities are generally valued by using market quotations, but may be valued on the basis of prices furnished by a pricing service when the Fund believes such prices more accurately reflect the fair value of such securities. Securities that are traded on any stock exchange are generally valued by the pricing service at the last quoted sale price. Lacking a last sale price, an exchange traded security is generally valued by the pricing service at its last bid price. Securities traded in the NASDAQ over-the-counter market are generally valued by the pricing service at the NASDAQ Official Closing Price. When using the market quotations or close prices provided by the pricing service and when the market is considered active, the security will be classified as a Level 1 security. Sometimes, an equity security owned by the Fund will be valued by the pricing service with factors other than market quotations or when the market is considered inactive. When this happens, the security will be classified as a Level 2 security. When market quotations are not readily available, when the Fund determines that the market quotation or the price provided by the pricing service does not accurately reflect the current fair value, or when certain restricted or illiquid securities are being valued, such securities are valued as determined in good faith by the Fund, in conformity with guidelines adopted by and subject to review by the Board of Trustees (the “Board”). These securities will be categorized as Level 3 securities.
Investments in mutual funds, including money market mutual funds, are generally priced at the ending net asset value (“NAV”) provided by the service agent of the funds. These securities will be categorized as Level 1 securities.
43
Angel Oak Multi-Strategy Income Fund
Notes to the Financial Statements - (continued)
July 31, 2013
(Unaudited)
NOTE 3. SECURITIES VALUATION AND FAIR VALUE MEASUREMENTS - (continued)
Fixed income securities, including collateralized mortgage obligations, collateralized loan obligations, collateralized debt obligations, asset-backed securities, U.S government mortgage-backed agencies, U.S. government agency issues and corporate bonds, when valued using market quotations in an active market, will be categorized as Level 1 securities. However, they may be valued on the basis of prices furnished by a pricing service when the Fund believes such prices more accurately reflect the fair value of such securities. A pricing service utilizes electronic data processing techniques based on yield spreads relating to securities with similar characteristics to determine prices for normal institutional-size trading units of debt securities without regard to sale or bid prices. For collateralized mortgage obligations and mortgage-backed securities, the pricing service may also use prepayment speeds, consideration of collateral, unemployment rates, credit risk, foreclosures, and liquidations. These securities will generally be categorized as Level 2 securities. If the Fund decides that a price provided by the pricing service does not accurately reflect the fair value of the securities, when prices are not readily available from a pricing service, or when restricted or illiquid securities are being valued, securities are valued at fair value as determined in good faith by the Fund, in conformity with guidelines adopted by and subject to review of the Board. These securities will be categorized as Level 3 securities.
Short-term investments in fixed income securities, (those with maturities of less than 60 days when acquired, or which subsequently are within 60 days of maturity), are valued by using the amortized cost method of valuation, which the Board has determined will represent fair value. These securities will be classified as Level 2 securities.
In accordance with the Trust’s good faith pricing guidelines, the Fund is required to consider all appropriate factors relevant to the value of securities for which it has determined other pricing sources are not available or reliable as described above. No single standard exists for determining fair value, because fair value depends upon the circumstances of each individual case. As a general principle, the current fair value of an issue of securities being valued by the Fund would appear to be the amount which the owner might reasonably expect to receive for them upon their current sale. Methods which are in accordance with this principle may, for example, be based on (i) a multiple of earnings; (ii) a discount from market of a similar freely traded security (including a derivative security or a basket of securities traded on other markets, exchanges or among dealers); or (iii) yield to maturity with respect to debt issues, or a combination of these and other methods. Good faith pricing is permitted if, in the
44
Angel Oak Multi-Strategy Income Fund
Notes to the Financial Statements - (continued)
July 31, 2013
(Unaudited)
NOTE 3. SECURITIES VALUATION AND FAIR VALUE MEASUREMENTS - (continued)
Fund’s opinion, the validity of market quotations appears to be questionable based on factors such as evidence of a thin market in the security based on a small number of quotations, a significant event occurs after the close of a market but before a Fund’s NAV calculation that may affect a security’s value, or the Fund is aware of any other data that calls into question the reliability of market quotations. Good faith pricing may also be used in instances when the bonds the Fund invests in may default or otherwise cease to have market quotations readily available. Any fair valuation pricing done outside the Fund’s approved pricing methods must be approved by the Pricing Committee of the Board.
The following is a summary of the inputs used to value the Fund’s investments as of July 31, 2013:
| Valuation Inputs | ||||||||||||||||
| Assets | Level 1 - Quoted Prices in Active Markets | Level 2 - Other Observable Inputs | Level 3 - Unobservable Inputs | Total | ||||||||||||
| Collateralized Mortgage Obligations | $ | – | $ | 1,330,452,500 | $ | 117,768,323 | $ | 1,448,220,823 | ||||||||
| Collateralized Loan Obligations | – | 272,744,791 | 17,463,670 | 290,208,461 | ||||||||||||
| U.S. Government Mortgage Backed Agencies | – | 105,552,625 | – | 105,552,625 | ||||||||||||
| Asset-Backed Securities | – | 75,431,786 | 20,519,868 | 95,951,654 | ||||||||||||
| U.S. Government Agencies | – | 93,702,410 | – | 93,702,410 | ||||||||||||
| Corporate Bonds | – | 9,190,000 | – | 9,190,000 | ||||||||||||
| Collateralized Debt Obligations | – | 4,548,150 | – | 4,548,150 | ||||||||||||
| Preferred Stocks | 3,346,016 | – | – | 3,346,016 | ||||||||||||
| Cash Equivalents | 55,034,096 | – | – | 55,034,096 | ||||||||||||
| Total | $ | 58,380,112 | $ | 1,891,622,262 | $ | 155,751,861 | $ | 2,105,754,235 | ||||||||
| Liabilities | ||||||||||||||||
| Reverse Repurchase Agreements | $ | – | $ | (476,373,606 | ) | $ | – | $ | (476,373,606 | ) | ||||||
45
Angel Oak Multi-Strategy Income Fund
Notes to the Financial Statements - (continued)
July 31, 2013
(Unaudited)
NOTE 3. SECURITIES VALUATION AND FAIR VALUE MEASUREMENTS - (continued)
Following is a reconciliation of investments in which significant unobservable inputs (Level 3) were used in determining fair value for the Fund:
| Total Level 3 Investments | ||||
Balance as of January 31, 2013 | $ | 78,163,675 | ||
Realized gain (loss) | 82,475 | |||
Amortization | (8,969,766 | ) | ||
Change in unrealized appreciation (depreciation) | (2,605,999 | ) | ||
Purchases | 157,797,517 | |||
Sales | (30,045,434 | ) | ||
Transfers in to Level 3 | – | |||
Transfers out of Level 3 | (38,670,607 | ) | ||
|
| |||
Balance as of July 31, 2013 | $ | 155,751,861 | ||
|
| |||
The Fund’s Level 3 investments have been valued using unadjusted third party quotations or acquisition cost. As a result, there were no unobservable inputs that have been internally developed by the Fund in determining the fair values of its investments as of July 31, 2013.
The total change in unrealized appreciation (depreciation) attributable to Level 3 investments still held at July 31, 2013 was $(2,605,999).
The Fund did not hold any derivative instruments during the reporting period. The Trust recognizes transfers between fair value hierarchy levels at the reporting period end. There were no transfers between any Levels for the six months ended July 31, 2013.
46
Angel Oak Multi-Strategy Income Fund
Notes to the Financial Statements - (continued)
July 31, 2013
(Unaudited)
NOTE 3. SECURITIES VALUATION AND FAIR VALUE MEASUREMENTS - (continued)
Balance Sheet Offsetting Information
The following tables provide a summary of offsetting financial liabilities and derivatives and the effect of derivative instruments on the Statements of Assets and Liabilities as of July 31, 2013.
Gross Amounts Not Offset | ||||||||||
Gross Amounts | Gross | Net Amounts | Financial | Cash Collateral | Net Amount | |||||
$476,373,606 | $– | $476,373,606 | $673,734,685 | $– | $– | |||||
NOTE 4. FEES AND OTHER TRANSACTIONS WITH AFFILIATES
Under the terms of the investment advisory agreement, on behalf of the Fund (the “Agreement”), the Adviser manages the Fund’s investments subject to oversight of the Trustees. As compensation for its management services, the Fund is obligated to pay the Adviser a fee computed and accrued daily and paid monthly at an annual rate of 1.50% of the average daily net assets of the Fund on the first $200 million in assets, 1.25% for the next $300 million in assets and 1.00% for any assets in excess of $500 million. For the six months ended July 31, 2013, the Adviser earned a fee of $8,113,258 from the Fund before the reimbursement described below. At July 31, 2013, the Fund owed the Adviser $1,213,284.
The Adviser has contractually agreed to waive or limit its fees and to assume other expenses of the Fund until August 31, 2014, so that Total Annual Fund Operating Expenses does not exceed 0.99%. This operating expense limitation does not apply to brokerage fees and commissions, borrowing costs (such as interest and dividend expenses on securities sold short), taxes, 12b-1 fees; extraordinary expenses and indirect expenses (such as “acquired funds fees and expenses”).
The waiver and/or reimbursement by the Adviser with respect to the Fund is subject to repayment by the Fund within the three fiscal years following the fiscal year in which that particular waiver and/or reimbursement occurred, provided that the Fund is able to
47
Angel Oak Multi-Strategy Income Fund
Notes to the Financial Statements - (continued)
July 31, 2013
(Unaudited)
NOTE 4. FEES AND OTHER TRANSACTIONS WITH AFFILIATES - (continued)
make the repayment without exceeding the expense limitations described above. The amounts subject to repayment by the Fund, pursuant to the aforementioned conditions, at July 31, 2013 are as follows:
Amount | Recoverable through | |
$100,940 | 2015 | |
$1,319,337 | 2016 | |
$1,777,967 | 2017 |
The Trust retains Huntington Asset Services, Inc. (“HASI”) to manage the Fund’s business affairs and provide the Fund with administrative services, including all regulatory reporting and necessary office equipment and personnel related to that function. For the six months ended July 31, 2013, HASI earned fees of $278,654 for administrative services provided to the Fund. At July 31, 2013, HASI was owed $107,076 from the Fund for administrative services. Certain officers and one Trustee of the Trust are members of management and/or employees of HASI. HASI is a wholly-owned subsidiary of Huntington Bancshares, Inc., the parent company of Unified Financial Securities, Inc. (the “Distributor”) and Huntington National Bank, the custodian of the Fund’s investments (the “Custodian”). For the six months ended July 31, 2013, the Custodian earned fees of $98,015 for custody services provided to the Fund.
The Trust also retains HASI to act as the Fund’s transfer agent and to provide fund accounting services. For the six months ended July 31, 2013, HASI earned fees of $121,032 for transfer agent services and reimbursement for out-of-pocket expenses incurred in providing transfer agent services to the Fund. At July 31, 2013, the Fund owed HASI $21,746 for transfer agent services and out-of-pocket expenses.
For the six months ended July 31, 2013, HASI earned fees of $83,306 from the Fund for fund accounting services. At July 31, 2013, HASI was owed $30,827 from the Fund for fund accounting services.
The Fund has adopted a Distribution Plan (the “Plan”) pursuant to Rule 12b-1 under the 1940 Act. The Plan provides that the Fund will pay the Distributor and/or any registered securities dealer, financial institution or any other person (the “Recipient”) a shareholder servicing fee of 0.25% (Class A shares) and 1.00% (Class C shares) of each share classes’ respective average daily net assets of the Fund in connection with
48
Angel Oak Multi-Strategy Income Fund
Notes to the Financial Statements - (continued)
July 31, 2013
(Unaudited)
NOTE 4. FEES AND OTHER TRANSACTIONS WITH AFFILIATES - (continued)
the promotion and distribution of the Fund’s shares or the provision of personal services to shareholders, including, but not necessarily limited to, advertising, compensation to underwriters, dealers and selling personnel, the printing and mailing of prospectuses to other than current Fund shareholders, the printing and mailing of sales literature and servicing shareholder accounts. The Fund or Adviser may pay all or a portion of these fees to any Recipient who renders assistance in distributing or promoting the sale of shares, or who provides certain shareholder services, pursuant to a written agreement. The Plan is a compensation plan, which means that compensation is paid regardless of 12b-1 expenses actually incurred. It is anticipated that the Plan will benefit shareholders because an effective sales program typically is necessary in order for the Fund to reach and maintain a sufficient size to achieve efficiently its investment objectives and to realize economies of scale. For the six months ended July 31, 2013, Class A shares 12b-1 expense incurred by the Fund was $767,482 and Class C shares 12b-1 expense incurred $170,093. The Fund owed $130,951 for Class A shares and $33,885 for Class C shares 12b-1 fees as of January 31, 2013.
Unified Financial Securities, Inc. (“Unified”) acts as the principal distributor of the Fund’s shares. During the six months ended July 31, 2013, the Distributor received $159,524 from commissions earned on sales of Class A shares and $216,824 from commissions earned on sales of Class C shares. An officer of the Trust is an officer of the Distributor and such person may be deemed to be an affiliate of the Distributor.
NOTE 5. PURCHASES AND SALES OF SECURITIES
For the six months ended July 31, 2013, purchases and sales of investment securities, other than short-term investments and short-term U.S. government obligations, were as follows:
| Purchases | Sales | |||||||
U.S. Government Obligations | $ | – | $ | – | ||||
Other | 487,144,906 | 335,736,795 | ||||||
At July 31, 2013, the net unrealized appreciation (depreciation) of investments for tax purposes was as follows:
Gross Unrealized Appreciation | $ | 17,290,245 | ||
Gross Unrealized Depreciation | (62,399,542 | ) | ||
|
| |||
Net Unrealized Depreciation on Investments | $ | (45,109,297 | ) | |
|
|
49
Angel Oak Multi-Strategy Income Fund
Notes to the Financial Statements - (continued)
July 31, 2013
(Unaudited)
NOTE 5. PURCHASES AND SALES OF SECURITIES - (continued)
At July 31, 2013, the aggregate cost of securities, excluding U.S. government obligations, for federal income tax purposes was $2,150,863,532 for the Fund.
NOTE 6. ESTIMATES
The preparation of financial statements in conformity with GAAP requires management to make estimates and assumptions that affect the reported amounts of assets and liabilities and disclosure of contingent assets and liabilities at the date of the financial statements and the reported amounts of increases and decreases in net assets from operations during the reporting period. Actual results could differ from those estimates.
NOTE 7. BENEFICIAL OWNERSHIP
The beneficial ownership, either directly or indirectly, of 25% or more the voting securities of a fund creates a presumption of control of a fund, under Section 2(a)(9) of the Investment Company Act of 1940. At July 31, 2013, Charles Schwab & Co. owned, as record shareholder, 56.54% of the outstanding shares of Institutional Class. The Trust does not know whether Charles Schwab & Co., or any of the underlying beneficial owners, owned or controlled 25% or more of the voting securities of the Fund.
NOTE 8. DISTRIBUTIONS TO SHAREHOLDERS
The Fund paid the following income distributions to shareholders for the six months ended July 31, 2013:
Record Date | Ex-Dividend Date | Per Share | ||||||
Class A | February 4, 2013 | February 5, 2013 | $ | 0.0378 | ||||
| March 4, 2013 | March 5, 2013 | $ | 0.0518 | |||||
| April 4, 2013 | April 5, 2013 | $ | 0.0370 | |||||
| May 3, 2013 | May 6, 2013 | $ | 0.0451 | |||||
| June 4, 2013 | June 5, 2013 | $ | 0.0421 | |||||
| July 3, 2013 | July 5, 2013 | $ | 0.0510 | |||||
50
Angel Oak Multi-Strategy Income Fund
Notes to the Financial Statements - (continued)
July 31, 2013
(Unaudited)
NOTE 8. DISTRIBUTIONS TO SHAREHOLDERS - (continued)
Record Date | Ex-Dividend Date | Per Share | ||||||
Class C | February 4, 2013 | February 5, 2013 | $ | 0.0308 | ||||
| March 4, 2013 | March 5, 2013 | $ | 0.0455 | |||||
| April 4, 2013 | April 5, 2013 | $ | 0.0298 | |||||
| May 3, 2013 | May 6, 2013 | $ | 0.0381 | |||||
| June 4, 2013 | June 5, 2013 | $ | 0.0345 | |||||
| July 3, 2013 | July 5, 2013 | $ | 0.0442 | |||||
Class I | February 4, 2013 | February 5, 2013 | $ | 0.0401 | ||||
| March 4, 2013 | March 5, 2013 | $ | 0.0540 | |||||
| April 4, 2013 | April 5, 2013 | $ | 0.0395 | |||||
| May 3, 2013 | May 6, 2013 | $ | 0.0476 | |||||
| June 4, 2013 | June 5, 2013 | $ | 0.0446 | |||||
| July 3, 2013 | July 5, 2013 | $ | 0.0539 | |||||
The tax character of distributions paid for the fiscal periods ended January 31, 2013 and 2012 was as follows:
| 2013 | 2012 | |||||||
Distributions paid from: | ||||||||
Ordinary Income | $ | 12,450,639 | $ | 481,449 | ||||
Net Long-Term Capital Gain | 98,027 | – | ||||||
|
|
|
| |||||
| $ | 12,548,666 | $ | 481,449 | |||||
|
|
|
| |||||
At January 31, 2013, the components of distributable earnings (accumulated losses) on a tax basis were as follows:
Undistributed ordinary income | $ | 4,940,619 | ||
Undistributed long-term capital gains | 138,294 | |||
Other accumulated losses | (3,401 | ) | ||
Unrealized appreciation | 26,481,225 | |||
|
| |||
| $ | 31,556,737 | |||
|
|
51
Angel Oak Multi-Strategy Income Fund
Notes to the Financial Statements - (continued)
July 31, 2013
(Unaudited)
NOTE 9. COMMITMENTS AND CONTINGENCIES
The Fund indemnifies its officers and trustees for certain liabilities that may arise from performance of their duties to the Fund. Additionally, in the normal course of business, the Fund enters into contracts that contain a variety of representatives and warranties which provide general indemnifications. The Fund’s maximum exposure under these arrangements is unknown, as this would involve future claims that may be made against the Fund that have not yet occurred.
NOTE 10. RESTRICTED SECURITIES
Restricted securities are securities that may only be resold upon registration under federal securities laws or in transactions exempt from such registration. In some cases, the issuer of restricted securities has agreed to register such securities for resale, at the issuer’s expense, either upon demand or in connection with another registered offering of the securities. Many restricted securities may be resold in the secondary market in transactions exempt from registration. Such restricted securities may be determined by the Fund to be liquid. The Fund does not anticipate incurring any registration costs upon such resale. The Fund’s restricted securities are valued at prices provided by a pricing service or dealers in the secondary market or, if no market prices are available, at the fair value price as determined by the Fund’s Adviser or otherwise pursuant to the Fund’s fair value policies and procedures. The Fund has acquired securities, the sale of which is restricted under Rule 144A of the Securities Act of 1933. It is possible that the fair value price may differ significantly from the amount that may ultimately be realized in the near term, and the difference could be material. At July 31, 2013, the Fund held restricted securities representing 27.21% of net assets, as listed below:
| Issuer Description | Acquisition Date | Principal Amount | Amortized Cost | Fair Value | ||||||||||
| Acis CLO 2013-1 Ltd., Series 2013-1A, Class E, 5.866%, 4/18/2024 | 5/16/2013 | $ | 7,000,000 | $ | 6,749,891 | $ | 6,456,800 | |||||||
| AMMC CLO IX Ltd., Series 2011-9A, Class E, 7.718%, 1/15/2022 | 5/10/2013 | 1,000,000 | 1,015,974 | 1,002,700 | ||||||||||
| AMMC CLO XII Ltd., Series 2013-12A, Class D1, 4.031%, 5/10/2025 | 3/13/2013 | 5,400,000 | 5,153,334 | 5,097,600 | ||||||||||
| AMMC CLO XII Ltd., Series 2013-12A, Class E, 5.281%, 5/10/2025 | 3/13/2013 | 3,000,000 | 2,702,865 | 2,649,600 | ||||||||||
| ARES CLO Ltd., Series 2013-2A, Class C, 2.983%, 7/28/2025 | 6/28/2013 | 3,000,000 | 2,853,290 | 2,854,800 | ||||||||||
| Anchorage Capital CLO Ltd., Series 2013-1A, Class D, 5.075%, 7/13/2025 | 6/5/2013 | 9,500,000 | 8,899,846 | 8,452,150 | ||||||||||
52
Angel Oak Multi-Strategy Income Fund
Notes to the Financial Statements - (continued)
July 31, 2013
(Unaudited)
NOTE 10. RESTRICTED SECURITIES - (continued)
| Issuer Description | Acquisition Date | Principal Amount | Amortized Cost | Fair Value | ||||||||||
| ARES XXVI CLO Ltd., Series 2013-26A, Class D, 4.037%, 4/15/2025 | 3/1/2013 | $ | 9,000,000 | $ | 8,295,687 | $ | 8,694,900 | |||||||
| ARES XXVI CLO Ltd., Series 2013-26A, Class E, 5.287%, 4/15/2025 | 3/1/2013 | 10,000,000 | 9,044,407 | 9,124,000 | ||||||||||
| Atlas Senior Loan Fund Ltd., Series 2013-1A, Class D, 3.824%, 8/18/2025 | 5/13/2013 | 8,500,000 | 8,287,637 | 7,870,150 | ||||||||||
| Atlas Senior Loan Fund Ltd., Series 2013-1A, Class E, 5.274%, 8/18/2025 | 5/13/2013 | 4,000,000 | 3,755,428 | 3,460,000 | ||||||||||
| Atrium CDO Corp., Series 10A, Class E, 4.776%, 7/16/2025 | 4/25/2013 | 3,500,000 | 3,172,056 | 3,079,650 | ||||||||||
| Babson CLO Ltd., Series 2012-1A, Class C, 4.268%, 4/15/2022 | 2/13/2013 | 9,000,000 | 9,027,040 | 8,873,100 | ||||||||||
| Bayview Commercial Asset Trust, Series 2005-2A, Class A1, 0.500%, 8/25/2035 | 4/1/2013 | 14,605,277 | 12,097,371 | 11,929,050 | ||||||||||
| Bayview Commercial Asset Trust, Series 2005-4A, Class A1, 0.490%, 1/25/2036 | 4/29/2013 | 3,507,072 | 2,964,277 | 2,942,347 | ||||||||||
| Bayview Commercial Asset Trust, Series 2005-4A, Class A2, 0.580%, 1/25/2036 | 5/3/2013 | 3,791,144 | 3,140,464 | 3,101,615 | ||||||||||
| Bayview Commercial Asset Trust, Series 2006-1A, Class A2, 0.550%, 4/25/2036 | 4/2/2013 | 7,005,972 | 5,788,729 | 5,588,380 | ||||||||||
| Bayview Commercial Asset Trust, Series 2006-2A, Class A2, 0.470%, 7/25/2036 | 2/12/2013 | 3,736,740 | 3,020,159 | 2,910,515 | ||||||||||
| Benefit Street Partners CLO II Ltd., Series 2013-IIA, Class C, 3.775%, 7/15/2024 | 5/6/2013 | 5,000,000 | 4,823,620 | 4,636,500 | ||||||||||
| Benefit Street Partners CLO II Ltd., Series 2013-IIA, Class D, 4.775%, 7/15/2024 | 5/6/2013 | 5,000,000 | 4,503,265 | 4,256,000 | ||||||||||
| BlueMountain CLO Ltd., Series 2012-2A, Class D, 4.425%, 11/20/2024 | 5/3/2013 | 5,000,000 | 5,018,523 | 4,843,000 | ||||||||||
| Brookside Mill CLO Ltd., Series 2013-1A, Class E, 4.680%, 4/17/2025 | 4/25/2013 | 3,000,000 | 2,700,651 | 2,606,100 | ||||||||||
53
Angel Oak Multi-Strategy Income Fund
Notes to the Financial Statements - (continued)
July 31, 2013
(Unaudited)
NOTE 10. RESTRICTED SECURITIES - (continued)
| Issuer Description | Acquisition Date | Principal Amount | Amortized Cost | Fair Value | ||||||||||
| CFCRE Commercial Mortgage Trust, Series 2011-C1, Class F, 5.167%, 4/15/2044 | 5/14/2013 | $ | 7,931,000 | $ | 6,843,056 | $ | 6,523,636 | |||||||
| CIFC Funding Ltd., Series 2012-1A, Class B2L, 7.292%, 8/14/2024 | 4/25/2013 | 10,000,000 | 10,071,809 | 10,015,000 | ||||||||||
| CIFC Funding Ltd., Series 2012-2A, Class B2L, 6.284%, 12/5/2024 | 4/30/2013 | 5,000,000 | 4,981,495 | 4,745,500 | ||||||||||
| CIFC Funding Ltd., Series 2012-2A, Class B1L, 4.534%, 12/5/2024 | 4/30/2013 | 4,000,000 | 4,014,755 | 3,913,600 | ||||||||||
| COMM Mortgage Trust, Series 2013-CR6, Class E, 4.177%, 3/10/2046 | 6/4/2013 | 6,146,000 | 4,847,391 | 4,547,462 | ||||||||||
| Credit Suisse Mortgage Capital Certificates, Series 2012-9, Class B1, 2.742%, 2/25/2050 | 11/21/2012 | 10,363,000 | 9,420,351 | 9,256,346 | ||||||||||
| CountryWide Alternative Loan Trust, Series 2005-58R, Class A, 2.386%, 12/20/2035 | 3/6/2013 | 216,900,008 | 15,793,007 | 15,725,251 | ||||||||||
| Canyon Capital CLO Ltd., Series 2012-1A, Class D, 4.568%, 1/15/2024 | 2/12/2013 | 3,000,000 | 3,006,360 | 2,942,700 | ||||||||||
| Carlyle Global Market Strategies CLO Ltd., Series 2012-3A, Class D, 5.768%, 10/14/2024 | 6/7/2013 | 3,000,000 | 2,888,445 | 2,816,700 | ||||||||||
| Carlyle Global Market Strategies CLO Ltd., Series 2012-4A, Class E, 5.776%, 1/20/2025 | 5/20/2013 | 2,850,000 | 2,855,670 | 2,671,875 | ||||||||||
| Carlyle Global Market Strategies CLO Ltd., Series 2013-3A, Class E, 5.356%, 7/15/2025 | 6/10/2013 | 2,000,000 | 1,776,040 | 1,774,920 | ||||||||||
| Catamaran CLO Ltd., Series 2012-1A, Class D, 5.009%, 12/20/2023 | 5/1/2013 | 8,750,000 | 8,809,768 | 8,694,000 | ||||||||||
| Catamaran CLO Ltd., Series 2013-1A, Class D, 4.026%, 1/27/2025 | 6/4/2013 | 4,000,000 | 3,934,370 | 3,771,200 | ||||||||||
| Chevy Chase Mortgage Funding Corp., Series 2005-1A, Class A1, 0.340%, 1/25/2036 | 6/23/2013 | 1,239,712 | 1,019,799 | 1,002,070 | ||||||||||
| Crown Point CLO Ltd., Series 2012-1A, Class B1L, 5.289%, 11/21/2022 | 5/8/2013 | 5,000,000 | 5,049,068 | 5,025,500 | ||||||||||
54
Angel Oak Multi-Strategy Income Fund
Notes to the Financial Statements - (continued)
July 31, 2013
(Unaudited)
NOTE 10. RESTRICTED SECURITIES - (continued)
| Issuer Description | Acquisition Date | Principal Amount | Amortized Cost | Fair Value | ||||||||||
| Crown Point CLO Ltd., Series 2012-1A, Class B2L, 6.789%, 11/21/2022 | 5/15/2013 | $ | 3,000,000 | $ | 3,022,109 | $ | 2,946,000 | |||||||
| Drug Royalty II LP, Series 2012-1, Class A1, 4.277%, 1/15/2025 | 11/30/2012 | 2,621,104 | 2,621,104 | 2,660,420 | ||||||||||
| Dryden XXII Senior Loan Fund, Series 2013-28A, Class B1L, 3.475%, 8/15/2025 | 5/31/2013 | 5,000,000 | 4,838,329 | 4,641,000 | ||||||||||
| Dryden XXII Senior Loan Fund, Series 2013-28A, Class B6L, 4.175%, 8/15/2025 | 5/31/2013 | 2,000,000 | 1,797,892 | 1,678,200 | ||||||||||
| Emerson Park CLO Ltd., Series 2013-1A, Class E, 7/15/2025 | 7/19/2013 | 3,000,000 | 2,719,147 | 2,726,250 | ||||||||||
| Figueroa CLO Ltd., Series 2013-1A, Class C, 3.940%, 3/21/2024 | 2/21/2013 | 7,000,000 | 6,717,880 | 6,583,500 | ||||||||||
| Finn Square CLO Ltd., Series 2012-1A, Class C, 4.117%, 12/24/2023 | 2/20/2013 | 3,000,000 | 2,956,742 | 2,875,800 | ||||||||||
| First Data Corp., 11.750%, 8/15/2021 | 5/20/2013 | 3,000,000 | 3,017,314 | 2,880,000 | ||||||||||
| Fortress Credit BSL Ltd., Series 2013-1A, Class D, 3.766%, 1/19/2025 | 2/27/2013 | 10,000,000 | 9,683,940 | 9,526,000 | ||||||||||
| GLG Ore Hill CLO Ltd., Series 2013-1A, Class D, 3.480%, 7/15/2025 | 5/31/2013 | 8,000,000 | 7,548,847 | 7,320,000 | ||||||||||
| Halcyon Loan Advisors Funding Ltd., Series 2012-2A, Class E, 5.672%, 12/20/2024 | 6/26/2013 | 3,000,000 | 2,731,265 | 2,732,100 | ||||||||||
| ING IM CLO Ltd., Series 2012-1A, Class C, 4.789%, 4/15/2024 | 2/21/2013 | 11,750,000 | 11,500,286 | 11,162,500 | ||||||||||
| ING IM CLO Ltd., Series 2013-2A, Class D, 5.276%, 4/25/2025 | 7/12/2013 | 2,000,000 | 1,822,890 | 1,822,500 | ||||||||||
| JGWPT XXVII LLC, Series 2012-3A, Class A, 3.220%, 9/15/2065 | 2/11/2013 | 13,123,903 | 13,257,286 | 12,426,611 | ||||||||||
| JGWPT XXVII LLC, Series 2012-3A, Class B, 6.170%, 9/15/2067 | 11/9/2012 | 1,000,000 | 999,985 | 1,051,146 | ||||||||||
| JMP Credit Advisors CLO II Ltd., Series 2013-1A, Class D, 4.133%, 4/30/2023 | 4/3/2013 | 4,000,000 | 3,725,420 | 3,818,800 | ||||||||||
55
Angel Oak Multi-Strategy Income Fund
Notes to the Financial Statements - (continued)
July 31, 2013
(Unaudited)
NOTE 10. RESTRICTED SECURITIES - (continued)
| Issuer Description | Acquisition Date | Principal Amount | Amortized Cost | Fair Value | ||||||||||
| JMP Credit Advisors CLO II Ltd., Class E, 5.533%, 4/30/2023 | 5/13/2013 | $ | 8,200,000 | $ | 7,717,473 | $ | 7,423,460 | |||||||
| KCAP Senior Funding I LLC, Series 2013-1A, Class D, 5.520%, 6/20/2024 | 5/6/2013 | 2,500,000 | 2,403,945 | 2,392,000 | ||||||||||
| KVK CLO 2013-1 Ltd., Class D, 4.654%, 4/14/2025 | 5/16/2013 | 2,000,000 | 2,017,439 | 1,967,400 | ||||||||||
| Longfellow Place CLO Ltd., Series 2013-1A, Class D, 4.696%, 1/15/2024 | 1/15/2013 | 7,000,000 | 6,737,113 | 6,842,500 | ||||||||||
| Marine Park CLO Ltd., Class D, 6.024%, 5/18/2023 | 6/5/2013 | 4,500,000 | 4,511,150 | 4,334,400 | ||||||||||
| Muir Woods CLO Ltd., Class E, 6.773%, 9/14/2023 | 5/13/2013 | 2,500,000 | 2,524,631 | 2,447,500 | ||||||||||
| Neuberger Berman CLO Ltd., Series 2012-13A, Class D, 4.776%, 1/23/2024 | 11/20/2012 | 4,550,000 | 4,344,019 | 4,520,880 | ||||||||||
| Neuberger Berman CLO XIV Ltd., Class D, 3.973%, 4/28/2025 | 5/3/2013 | 7,000,000 | 6,810,880 | 6,616,400 | ||||||||||
| NewMark Capital Funding CLO Ltd., Series 2013-1A, Class D, 3.159%, 6/2/2025 | 5/29/2013 | 1,000,000 | 900,518 | 880,600 | ||||||||||
| OHA Credit Partners VI Ltd., Series 2012-6A, Class D, 4.775%, 5/15/2023 | 2/7/2013 | 3,000,000 | 3,025,287 | 3,005,700 | ||||||||||
| OZLM Funding IV Ltd., Series 2013-4A, Class C, 3.470%, 7/22/2025 | 6/3/2013 | 7,500,000 | 7,161,534 | 6,957,750 | ||||||||||
| OZLM Funding IV Ltd., Series 2013-4A, Class D, 4.920%, 7/22/2025 | 6/3/2013 | 7,000,000 | 6,515,338 | 6,013,700 | ||||||||||
| Ocean Trails CLO, Series 2013-4A, Class D, 4.266%, 8/13/2025 | 7/25/2013 | 4,000,000 | 3,820,000 | 3,820,000 | ||||||||||
| Octagon Investment Partners XIV Ltd., Series 2012-1A, Class E, 7.065%, 1/15/2024 | 5/31/2013 | 3,300,000 | 3,290,005 | 3,090,450 | ||||||||||
| Octagon Investment Partners XVI Ltd., Series 2013-1A, Class D, 3.775%, 7/17/2025 | 5/15/2013 | 3,000,000 | 2,922,037 | 2,819,400 | ||||||||||
| Portola CLO Ltd., Series 2007-1A, Class E, 6.675%, 11/15/2021 | 4/15/2013 | 2,913,645 | 2,895,922 | 2,899,076 | ||||||||||
| Race Point CLO Ltd., Series 2012-7A, Class D, 4.525%, 11/8/2024 | 5/6/2013 | 3,000,000 | 3,011,067 | 3,000,000 | ||||||||||
56
Angel Oak Multi-Strategy Income Fund
Notes to the Financial Statements - (continued)
July 31, 2013
(Unaudited)
NOTE 10. RESTRICTED SECURITIES - (continued)
| Issuer Description | Acquisition Date | Principal Amount | Amortized Cost | Fair Value | ||||||||||
| Race Point CLO Ltd., Series 2013-8A, Class D, 3.889%, 2/20/2025 | 2/6/2013 | $ | 1,000,000 | $ | 990,853 | $ | 958,200 | |||||||
| Shackleton I CLO Ltd., Series 2012-1A, Class D, 5.025%, 8/14/2023 | 2/7/2013 | 11,000,000 | 11,073,971 | 11,016,500 | ||||||||||
| Shackleton 2013-III CLO Ltd., Series 2013-3A, Class D, 4.084%, 4/15/2025 | 3/20/2013 | 3,000,000 | 2,810,421 | 2,841,300 | ||||||||||
| Shackleton 2013-III CLO Ltd., Series 2013-3A, Class E, 5.534%, 4/15/2025 | 3/20/2013 | 3,000,000 | 2,678,954 | 2,694,900 | ||||||||||
| Slater Mill Loan Fund LP, Class E, 5.774%, 8/17/2022 | 6/5/2013 | 4,250,000 | 4,220,618 | 4,014,550 | ||||||||||
| Sound Point CLO Ltd., Series 2012-1A, Class D, 4.856%, 10/20/2023 | 5/6/2013 | 2,000,000 | 2,013,768 | 1,997,800 | ||||||||||
| Sound Point CLO Ltd., Series 2013-1A, Class B2L, 4.784%, 4/26/2025 | 5/6/2013 | 7,000,000 | 6,365,903 | 6,119,400 | ||||||||||
| Store Master Funding LLC, Series 2012-1A, Class A, 5.770%, 8/20/2042 | 8/17/2012 | 6,469,293 | 6,877,466 | 6,758,729 | ||||||||||
| STORE Master Funding LLC, Series 2013-1A, Class A1, 4.160%, 3/20/2043 | 3/20/2013 | 4,974,683 | 4,973,626 | 4,896,948 | ||||||||||
| Symphony CLO XI Ltd., Series 2013-11A, Class D, 4.268%, 1/17/2025 | 1/16/2013 | 9,000,000 | 8,840,021 | 8,854,200 | ||||||||||
| Wind River CLO Ltd, Series 2012-1A, Class D, 5.559%, 1/15/2024 | 4/18/2013 | 4,000,000 | 4,010,653 | 4,022,400 | ||||||||||
| TICC CLO LLC, Series 2012-1A, Class D1, 6.023%, 8/25/2023 | 11/9/2012 | 7,000,000 | 6,963,618 | 6,982,500 | ||||||||||
| UBS-Barclays Commercial Mortgage Trust, Series 2012-C2, Class F, 5.167%, 5/10/2063 | 5/7/2013 | 7,000,000 | 5,884,643 | 5,530,896 | ||||||||||
| UBS-Barclays Commercial Mortgage Trust, Series 2012-C4, Class E, 4.652%, 12/10/2045 | 6/1/2013 | 5,000,000 | 4,130,092 | 3,845,282 | ||||||||||
| Venture CDO Ltd., Series 2012-11A, Class E, 6.775%, 11/14/2022 | 4/17/2013 | 1,500,000 | 1,500,000 | 1,468,500 | ||||||||||
| Venture X CLO Ltd., Series 2012-12A, Class E, 5.573%, 2/28/2024 | 5/20/2013 | 10,000,000 | 9,742,941 | 9,039,000 | ||||||||||
57
Angel Oak Multi-Strategy Income Fund
Notes to the Financial Statements - (continued)
July 31, 2013
(Unaudited)
NOTE 10. RESTRICTED SECURITIES - (continued)
| Issuer Description | Acquisition Date | Principal Amount | Amortized Cost | Fair Value | ||||||||||
| VENTURE XIII CLO Ltd, Series 2013-13A, Class D, 3.968%, 6/10/2025 | 3/12/2013 | $ | 15,000,000 | $ | 14,272,598 | $ | 14,041,500 | |||||||
| Vibrant CLO Ltd., Series 2012-1A, Class C, 4.768%, 7/17/2024 | 5/20/2013 | 10,200,000 | 10,301,662 | 10,137,780 | ||||||||||
| West CLO 2012-1 Ltd., Series 2012-1A, Class D, 6.776%, 10/30/2023 | 5/6/2013 | 5,000,000 | 5,032,047 | 4,989,500 | ||||||||||
NOTE 11. LINE OF CREDIT
The Fund participates in a short-term credit agreement (“Line of Credit”) with Huntington National Bank. (“Huntington”). Under the terms of the agreement, the Fund may borrow up to $100 million. The purpose of the agreement is to meet temporary or emergency cash needs, including redemption requests that might otherwise require the untimely disposition of securities. Huntington receives an annual facility fee of 0.125% on $100 million for providing the Line of Credit. As of July 31, 2013, the Fund had no outstanding borrowings under this Line of Credit.
| Average Daily Loan Balance | Weighted Average Interest Rate | Number of Days Outstanding* | Interest Expense Incurred | Maximum Loan Outstanding | ||||||||||||
$22,793,215 | 1.44 | % | 33 | $ | 29,717 | $ | 40,821,948 | |||||||||
| * | Number of Days Outstanding represents the total days during the six months ended July 31, 2013 that the Fund utilized the Line of Credit. |
58
VALUED ADVISERS TRUST
PRIVACY POLICY
The following is a description of the policies of the Valued Advisers Trust (the “Trust”) regarding disclosure of nonpublic personal information that shareholders provide to a series of the Trust (each, a “Fund”) or that the Fund collects from other sources. In the event that a shareholder hold shares of a Fund through a broker-dealer or other financial intermediary, the privacy policy of the financial intermediary would govern how shareholder nonpublic personal information would be shared with nonaffiliated third parties.
Categories of Information A Fund May Collect. A Fund may collect the following nonpublic personal information about its shareholders:
| • | Information the Fund receives from a shareholder on applications or other forms, correspondence, or conversations (such as the shareholder’s name, address, phone number, social security number, and date of birth); and |
| • | Information about the shareholder’s transactions with the Fund, its affiliates, or others (such as the shareholder’s account number and balance, payment history, cost basis information, and other financial information). |
Categories of Information A Fund May Disclose. A Fund may not disclose any nonpublic personal information about its current or former shareholders to unaffiliated third parties, except as required or permitted by law. A Fund is permitted by law to disclose all of the information it collects, as described above, to its service providers (such as the Fund’s custodian, administrator, transfer agent, accountant and legal counsel) to process shareholder transactions and otherwise provide services to the shareholder.
Confidentiality and Security. Each Fund shall restrict access to shareholder nonpublic personal information to those persons who require such information to provide products or services to the shareholder. Each Fund shall maintain physical, electronic, and procedural safeguards that comply with federal standards to guard shareholder nonpublic personal information.
Disposal of Information. The Funds, through their transfer agent, have taken steps to reasonably ensure that the privacy of a shareholder’s nonpublic personal information is maintained at all times, including in connection with the disposal of information that is no longer required to be maintained by the Funds. Such steps shall include, whenever possible, shredding paper documents and records prior to disposal, requiring off-site storage vendors to shred documents maintained in such locations prior to disposal, and erasing and/or obliterating any data contained on electronic media in such a manner that the information can no longer be read or reconstructed.
59
PROXY VOTING
A description of the policies and procedures that the Fund uses to determine how to vote proxies relating to portfolio securities and information regarding how the Fund voted those proxies during the most recent twelve month period ended June 30, is available without charge upon request by (1) calling the Fund at (877) 625-3042 and (2) from Fund documents filed with the Securities and Exchange Commission (“SEC”) on the SEC’s website at www.sec.gov.
TRUSTEES
R. Jeffrey Young, Chairman
Dr. Merwyn R. Vanderlind
Ira Cohen
OFFICERS
R. Jeffrey Young, Principal Executive Officer and President
John C. Swhear, Chief Compliance Officer, AML Officer and Vice-President
Carol J. Highsmith, Vice President
Matthew J. Miller, Vice President
Robert W. Silva, Principal Financial Officer and Treasurer
Heather A. Bonds, Secretary
INVESTMENT ADVISER
Angel Oak Capital Advisors, LLC
One Buckhead Plaza
3060 Peachtree Road NW
Suite 500
Atlanta, GA 30305
DISTRIBUTOR
Unified Financial Securities, Inc.
2960 North Meridian Street, Suite 300
Indianapolis, IN 46208
INDEPENDENT REGISTERED PUBLIC ACCOUNTING FIRM
Cohen Fund Audit Services, Ltd.
1350 Euclid Avenue, Suite 800
Cleveland, OH 44115
LEGAL COUNSEL
The Law Offices of John H. Lively & Associates, Inc.
A member firm of The 1940 Act Law Group TM
11300 Tomahawk Creek Parkway, Suite 310
Leawood, KS 66211
CUSTODIAN
Huntington National Bank
41 South High Street
Columbus, OH 43215
ADMINISTRATOR, TRANSFER AGENT AND FUND ACCOUNTANT
Huntington Asset Services, Inc.
2960 North Meridian Street, Suite 300
Indianapolis, IN 46208
This report is intended only for the information of shareholders or those who have received the Fund’s prospectus which contains information about the Fund’s management fee and expenses. Please read the prospectus carefully before investing.
Distributed by Unified Financial Securities, Inc.
Member FINRA/SIPC
60
Item 2. Code of Ethics. NOT APPLICABLE – disclosed with annual report
Item 3. Audit Committee Financial Expert. NOT APPLICABLE- disclosed with annual report
Item 4. Principal Accountant Fees and Services. NOT APPLICABLE – disclosed with annual report
Item 5. Audit Committee of Listed Companies. NOT APPLICABLE – applies to listed companies only
Item 6. Schedule of Investments. Schedule filed with Item 1
Item 7. Disclosure of Proxy Voting Policies and Procedures for Closed-End Management Investment Companies. NOT APPLICABLE – applies to closed-end funds only
Item 8. Portfolio Managers of Closed-End Investment Companies. NOT APPLICABLE – applies to closed-end funds only
Item 9. Purchases of Equity Securities by Closed-End Management Investment Company and Affiliated Purchasers. NOT APPLICABLE – applies to closed-end funds only
Item 10. Submission of Matters to a Vote of Security Holders.
The guidelines applicable to shareholders desiring to submit recommendations for nominees to the Registrant’s board of trustees are contained in the statement of additional information of the Trust with respect to the Fund(s) for which this Form N-CSR is being filed.
Item 11. Controls and Procedures.
(a) Based on their evaluation of the registrant’s disclosure controls and procedures (as defined in Rule 30a-3(c) under the Investment Company Act of 1940, as amended) as of a date within 90 days of the filing date of this report, the registrant’s principal executive officer and principal financial officer have concluded that such disclosure controls and procedures are reasonably designed and are operating effectively to ensure that material information relating to the registrant is made known to them by others within those entities and that the information required in filings on Form N-CSR is recorded, processed, summarized, and reported on a timely basis.
(b) There were no significant changes in the registrant’s internal control over financial reporting that occurred during the registrant’s second fiscal quarter of the period covered by this report that have materially affected, or are reasonably likely to materially affect, the registrant’s internal control over financial reporting.
Item 12. Exhibits.
| (a)(1) | Not Applicable – filed with annual report | |
| (2) | Certifications by the registrant’s principal executive officer and principal financial officer, pursuant to Section 302 of the Sarbanes- Oxley Act of 2002 and required by Rule 30a-2under the Investment Company Act of 1940 are filed herewith. | |
| (3) Not Applicable – | ||
| (b) | Certification pursuant to 18 U.S.C. Section 1350, as adopted pursuant to Section 906 of the Sarbanes-Oxley Act of 2002 is filed herewith | |
-2-
SIGNATURES
Pursuant to the requirements of the Securities Exchange Act of 1934 and the Investment Company Act of 1940, the registrant has duly caused this report to be signed on its behalf by the undersigned, thereunto duly authorized.
(Registrant) Valued Advisers Trust
By /s/ R. Jeffrey Young
|
R. Jeffrey Young, President and Principal Executive Officer |
| Date 09/27/2013 |
Pursuant to the requirements of the Securities Exchange Act of 1934 and the Investment Company Act of 1940, this report has been signed below by the following persons on behalf of the registrant and in the capacities and on the dates indicated.
By /s/ R. Jeffrey Young
|
R. Jeffrey Young, President and Principal Executive Officer |
| Date 09/27/2013 |
By /s/ Robert W. Silva
|
Robert W. Silva, Treasurer and Principal Financial Officer |
| Date 09/27/2013 |