UNITED STATES
SECURITIES AND EXCHANGE COMMISSION
WASHINGTON, D.C. 20549
FORM N-CSR
CERTIFIED SHAREHOLDER REPORT OF REGISTERED
MANAGEMENT INVESTMENT COMPANIES
Investment Company Act file number 811-22208
Valued Advisers Trust
(Exact name of registrant as specified in charter)
Huntington Asset Services, Inc. 2960 N. Meridian Street, Suite 300 | Indianapolis, IN 46208 | |
| (Address of principal executive offices) | (Zip code) |
Capitol Services, Inc.
615 S. Dupont Hwy.
Dover, DE 19901
(Name and address of agent for service)
With a copy to:
John H. Lively, Esq.
The Law Offices of John H. Lively & Associates, Inc.
A member firm of The 1940 Act Law Group
11300 Tomahawk Creek Parkway,
Suite 310
Leawood, KS 66221
Registrant’s telephone number, including area code: 317-917-7000
Date of fiscal year end: 1/31
Date of reporting period: 7/31/2014
Item 1. Reports to Stockholders.

Golub Group Equity Fund
Semi-Annual Report
July 31, 2014
Fund Adviser:
Golub Group, LLC
1850 Gateway Drive, Suite 100
San Mateo, CA 94404
Toll Free (866) 954-6682
Investment Results (Unaudited)
Total Returns*
(For the periods ended July 31, 2014)
| Average Annual | ||||||||||||||||
| Six Months | 1 Year | 3 Year | Since Inception (April 1, 2009) | |||||||||||||
Golub Group Equity Fund | 8.92% | 14.95% | 16.90% | 17.56% | ||||||||||||
S&P 500® Index** | 9.44% | 16.94% | 16.84% | 20.55% | ||||||||||||
| Total annual operating expenses, as disclosed in the most recent supplement to the Fund’s prospectus, were 1.46% of average daily net assets (1.26% after fee waivers/expense reimbursements by the Adviser.) The Adviser has contractually agreed to waive or limit its fees and assume other expenses of the Fund until May 31, 2015, so that Total Annual Fund Operating Expenses do not exceed 1.25%. This contractual arrangement may only be terminated by mutual consent of the Adviser and the Fund, and it will automatically terminate upon the termination of the investment advisory agreement between the Fund and the Adviser. This operating expense limitation does not apply to: (i) interest, (ii) taxes, (iii) brokerage commissions, (iv) other expenditures which are capitalized in accordance with generally accepted accounting principles, (v) other extraordinary expenses not incurred in the ordinary course of the Fund’s business, (vi) dividend expense on short sales, (vii) expenses incurred under a plan of distribution under Rule 12b-1, and (viii) expenses that the Fund has incurred but did not actually pay because of an expense offset arrangement, if applicable, incurred by the Fund in any fiscal year. The operating expense limitation also excludes any “Fees and Expense of Acquired Funds,” which are the expenses indirectly incurred by the Fund as a result of investing in money market funds or other investment companies, including ETFs, that have their own expenses. The Adviser may be entitled to the reimbursement of any fees waived or expenses reimbursed pursuant to the agreement provided overall expenses fall below the limitations set forth above. The Adviser may recoup the sum of all fees previously waived or expenses reimbursed during any of the previous three (3) years, less any reimbursement previously paid, provided total expenses do not exceed the limitation set forth above. | ||||||||||||||||
The performance quoted represents past performance, which does not guarantee future results. The investment return and principal value of an investment will fluctuate so that an investor’s shares, when redeemed, may be worth more or less than their original cost. The returns shown do not reflect deduction of taxes that a shareholder would pay on Fund distributions or the redemption of Fund shares. Current performance of the Fund may be lower or higher than the performance quoted. The Fund’s investment objectives, risks, charges and expenses must be considered carefully before investing. Performance data current to the most recent month end may be obtained by calling 1-866-954-6682.
* Return figures reflect any change in price per share and assume the reinvestment of all distributions.
** The S&P 500® Index is a widely recognized unmanaged index of equity securities and is representative of a broader domestic equity market and range of securities than is found in the Fund’s portfolio. Individuals cannot invest directly in the Index; however, an individual can invest in exchange traded funds or other investment vehicles that attempt to track the performance of a benchmark index.
The Fund’s investment objectives, strategies, risks, charges and expenses must be considered carefully before investing. The prospectus contains this and other important information about the Fund and may be obtained by calling the same number as above. Please read it carefully before investing. The Fund is distributed by Unified Financial Securities, Inc., member FINRA.
1
Fund Holdings (Unaudited)
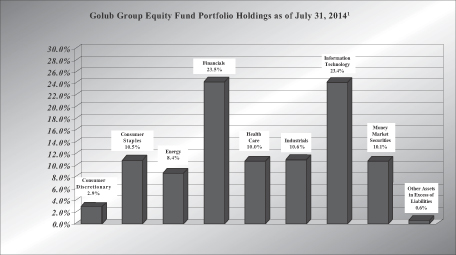
| 1 | As a percentage of net assets. |
The investment objective of the Golub Group Equity Fund is to provide long-term capital appreciation. A secondary objective is to provide current income.
Availability of Portfolio Schedule – (Unaudited)
The Fund files its complete schedule of portfolio holdings with the Securities and Exchange Commission (“SEC”) for the first and third quarters of each fiscal year on Form N-Q. The Fund’s Forms N-Q are available at the SEC’s website at www.sec.gov. The Fund’s Forms N-Q may be reviewed and copied at the SEC’s Public Reference Room in Washington DC. Information on the operation of the Public Reference Room may be obtained by calling 1-800-SEC-0330.
2
Summary of Fund’s Expenses (Unaudited)
As a shareholder of the Fund, you incur ongoing costs, including management fees and other Fund expenses. This Example is intended to help you understand your ongoing costs (in dollars) of investing in the Fund and to compare these costs with the ongoing costs of investing in other mutual funds.
The Example is based on an investment of $1,000 invested at the beginning and held for the entire period from February 1, 2014 to July 31, 2014.
Actual Expenses
The first line of the table below provides information about actual account values and actual expenses. You may use the information in this line, together with the amount you invested, to estimate the expenses that you paid over the period. Simply divide your account value by $1,000 (for example, an $8,600 account value divided by $1,000 = $8.60), then multiply the result by the number in the first line under the heading entitled “Expenses Paid During the Period” to estimate the expenses you paid on your account during this period.
Hypothetical Example for Comparison Purposes
The second line of the table below provides information about hypothetical account values and hypothetical expenses based on the Fund’s actual expense ratio and an assumed rate of return of 5% per year before expenses, which is not the Fund’s actual return. The hypothetical account values and expenses may not be used to estimate the actual ending account balance or expenses you paid for the period. You may use this information to compare the ongoing costs of investing in the Fund and other funds. To do so, compare this 5% hypothetical example with the 5% hypothetical examples that appear in the shareholder reports of the other funds.
Please note that the expenses shown in the table are meant to highlight your ongoing costs only. Therefore, the second line of the table below is useful in comparing ongoing costs only and will not help you determine the relative costs of owning different funds.
| Beginning Account Value | Ending Account Value | Expenses Paid During the Period Ended* | ||||||||||
| February 1, 2014 | July 31, 2014 | July 31, 2014 | ||||||||||
Golub Group Equity Fund | ||||||||||||
Actual | $ | 1,000.00 | $ | 1,089.20 | $ | 6.48 | ||||||
Hypothetical** | $ | 1,000.00 | $ | 1,018.60 | $ | 6.26 | ||||||
| * | Expenses are equal to the Fund’s annualized net expense ratio of 1.25%, multiplied by the average account value over the period, multiplied by 181/365. |
| ** | Assumes a 5% return before expenses. |
3
Schedule of Investments (Unaudited)
July 31, 2014
| Shares | Fair Value | |||||||
| COMMON STOCKS – 89.24% | ||||||||
| Consumer Discretionary 2.85% | ||||||||
| 38,645 | General Motors Co. | $ | 1,306,974 | |||||
|
| |||||||
| Consumer Staples 10.47% | ||||||||
| 8,575 | Anheuser-Busch InBev NV ADR | 925,929 | ||||||
| 33,950 | Coca-Cola Co./The | 1,333,895 | ||||||
| 9,265 | Diageo PLC ADR | 1,113,838 | ||||||
| 16,225 | PepsiCo, Inc. | 1,429,422 | ||||||
|
| |||||||
| 4,803,084 | ||||||||
|
| |||||||
| Energy 8.38% | ||||||||
| 21,225 | Devon Energy Corp. | 1,602,487 | ||||||
| 8,550 | Exxon Mobil Corp. | 845,937 | ||||||
| 17,215 | National Oilwell Varco, Inc. | 1,395,104 | ||||||
|
| |||||||
| 3,843,528 | ||||||||
|
| |||||||
| Financials 23.54% | ||||||||
| 26,050 | American International Group, Inc. | 1,354,079 | ||||||
| 165,900 | Bank of America Corp. | 2,529,975 | ||||||
| 51,800 | Bank of New York Mellon Corp./The | 2,022,272 | ||||||
| 14,925 | Berkshire Hathaway, Inc. – Class B* | 1,872,043 | ||||||
| 38,465 | Citigroup, Inc. | 1,881,323 | ||||||
| 22,350 | Wells Fargo & Co. | 1,137,615 | ||||||
|
| |||||||
| 10,797,307 | ||||||||
|
| |||||||
| Health Care 9.98% | ||||||||
| 6,300 | C.R. Bard, Inc. | 940,149 | ||||||
| 16,710 | Hospira, Inc.* | 926,904 | ||||||
| 13,050 | Johnson & Johnson | 1,306,175 | ||||||
| 26,300 | Teva Pharmaceutical Industries Ltd. ADR | 1,407,050 | ||||||
|
| |||||||
| 4,580,278 | ||||||||
|
| |||||||
| Industrials 10.64% | ||||||||
| 6,550 | FedEx Corp. | 962,064 | ||||||
| 71,885 | General Electric Co. | 1,807,908 | ||||||
| 7,270 | Northrop Grumman Corp. | 896,173 | ||||||
| 6,298 | United Parcel Service, Inc. – Class B | 611,473 | ||||||
| 5,725 | United Technologies Corp. | 601,984 | ||||||
|
| |||||||
| 4,879,602 | ||||||||
|
| |||||||
See accompanying notes which are an integral part of the financial statements.
4
Schedule of Investments (Unaudited) (continued)
July 31, 2014
| Shares | Fair Value | |||||||
| COMMON STOCKS – (continued) | ||||||||
| Information Technology 23.38% | ||||||||
| 14,340 | Apple, Inc. | $ | 1,370,474 | |||||
| 56,600 | Cisco Systems, Inc. | 1,428,018 | ||||||
| 25,645 | eBay, Inc.* | 1,354,056 | ||||||
| 23,650 | Fiserv, Inc.* | 1,458,495 | ||||||
| 2,320 | Google, Inc. – Class A* | 1,344,556 | ||||||
| 1,050 | Google, Inc. – Class C* | 600,180 | ||||||
| 44,450 | Microsoft Corp. | 1,918,462 | ||||||
| 17,000 | QUALCOMM, Inc. | 1,252,900 | ||||||
|
| |||||||
| 10,727,141 | ||||||||
|
| |||||||
Total Common Stocks (Cost $30,511,667) | 40,937,914 | |||||||
|
| |||||||
| MONEY MARKET SECURITIES – 10.14% | ||||||||
| 4,653,105 | Fidelity Institutional Money Market Portfolio – Institutional Class, 0.09%(a) | 4,653,105 | ||||||
|
| |||||||
Total Money Market Securities (Cost $4,653,105) | 4,653,105 | |||||||
|
| |||||||
Total Investments (Cost $35,164,772) 99.38% | $ | 45,591,019 | ||||||
|
| |||||||
Other Assets in Excess of Liabilities 0.62% | 282,165 | |||||||
|
| |||||||
TOTAL NET ASSETS 100.00% | $ | 45,873,184 | ||||||
|
| |||||||
| (a) | Rate disclosed is the seven day yield as of July 31, 2014. |
| * | Non-income producing security. |
| ADR | – American Depositary Receipt |
See accompanying notes which are an integral part of the financial statements.
5
Statement of Assets and Liabilities (Unaudited)
July 31, 2014
Assets | ||||
Investments in securities at fair value (cost $35,164,772) | $ | 45,591,019 | ||
Receivable for investments sold | 591,730 | |||
Dividends receivable | 10,976 | |||
Tax reclaims receivable | 203 | |||
Prepaid expenses | 4,237 | |||
Total Assets | 46,198,165 | |||
Liabilities | ||||
Payable for fund shares redeemed | 258,039 | |||
Payable to Adviser | 36,468 | |||
Payable to administrator, fund accountant, transfer agent, and chief compliance officer | 15,655 | |||
Payable to custodian | 1,076 | |||
Payable to trustees | 1,246 | |||
Other accrued expenses | 12,497 | |||
Total Liabilities | 324,981 | |||
Net Assets | $ | 45,873,184 | ||
Net Assets consist of: | ||||
Paid-in capital | $ | 32,282,604 | ||
Accumulated undistributed net investment income | 74,569 | |||
Accumulated undistributed net realized gain from investments | 3,089,764 | |||
Net unrealized appreciation on investments | 10,426,247 | |||
Net Assets | $ | 45,873,184 | ||
Shares outstanding (unlimited number of shares authorized, no par value) | 2,348,245 | |||
Net asset value, offering and redemption price per share | $ | 19.54 |
6
See accompanying notes which are an integral part of the financial statements.
Statement of Operations (Unaudited)
For the six months ended July 31, 2014
Investment Income | ||||
Dividend income (net of foreign taxes withheld of $7,130) | $ | 363,623 | ||
Total investment income | 363,623 | |||
Expenses | ||||
Investment Adviser | 220,980 | |||
Administration | 19,897 | |||
Fund accounting | 12,397 | |||
Transfer agent | 17,634 | |||
Legal | 7,311 | |||
Registration | 2,947 | |||
Custodian | 3,319 | |||
Audit | 7,439 | |||
Trustee | 3,345 | |||
Insurance | 509 | |||
Pricing | 620 | |||
Printing | 4,799 | |||
Miscellaneous | 1,290 | |||
Total expenses | 302,487 | |||
Fees waived by Adviser | (26,068 | ) | ||
Net operating expenses | 276,419 | |||
Net investment income | 87,204 | |||
Net Realized and Unrealized Gain on Investments |
| |||
Net realized gain on investment securities transactions | 1,828,950 | |||
Net change in unrealized appreciation of investment securities | 1,797,677 | |||
Net realized and unrealized gain on investments | 3,626,627 | |||
Net increase in net assets resulting from operations | $ | 3,713,831 | ||
7
See accompanying notes which are an integral part of the financial statements.
Statements of Changes in Net Assets
| For the Six Months Ended July 31, 2014 (Unaudited) | For the Year Ended January 31, 2014 | |||||||
Increase in Net Assets due to: Operations | ||||||||
Net investment income | $ | 87,204 | $ | 215,423 | ||||
Net realized gain on investment securities transactions | 1,828,950 | 2,997,985 | ||||||
Net change in unrealized appreciation of investments | 1,797,677 | 3,420,746 | ||||||
Net increase in net assets resulting from operations | 3,713,831 | 6,634,154 | ||||||
Distributions | ||||||||
From net investment income | – | (220,112 | ) | |||||
From net realized gains | – | (1,972,205 | ) | |||||
Total distributions | – | (2,192,317 | ) | |||||
Capital Transactions | ||||||||
Proceeds from shares sold | 5,151,992 | 7,788,369 | ||||||
Reinvestment of distributions | – | 2,192,317 | ||||||
Amount paid for shares redeemed | (4,076,867 | ) | (5,855,754 | ) | ||||
Net increase in net assets resulting from | 1,075,125 | 4,124,932 | ||||||
Total Increase in Net Assets | 4,788,956 | 8,566,769 | ||||||
Net Assets | ||||||||
Beginning of period | 41,084,228 | 32,517,459 | ||||||
End of period | $ | 45,873,184 | $ | 41,084,228 | ||||
Accumulated undistributed net investment income (loss) included in net assets at end of period | $ | 74,569 | $ | (12,635 | ) | |||
Share Transactions | ||||||||
Shares sold | 271,426 | 438,267 | ||||||
Shares issued in reinvestment of distributions | – | 121,931 | ||||||
Shares redeemed | (213,178 | ) | (333,667 | ) | ||||
Net increase in share transactions | 58,248 | 226,531 | ||||||
8
See accompanying notes which are an integral part of the financial statements.
Financial Highlights
(For a share outstanding during each period)
For the Six Months Ended 2014 | For the Year Ended January 31, | For the Ended | ||||||||||||||||||||||
| 2014 | 2013 | 2012 | 2011 | |||||||||||||||||||||
Selected Per Share Data: |
| |||||||||||||||||||||||
Net asset value, beginning of period | $ | 17.94 | $ | 15.76 | $ | 14.00 | $ | 14.58 | $ | 12.85 | $ | 10.00 | ||||||||||||
Income from investment operations: | ||||||||||||||||||||||||
Net investment income | 0.04 | 0.10 | (b) | 0.14 | (b) | 0.15 | (b) | 0.11 | (b) | 0.11 | (b) | |||||||||||||
Net realized and unrealized gain on investments | 1.56 | 3.09 | 2.12 | 0.20 | 2.09 | 2.83 | ||||||||||||||||||
|
|
|
|
|
|
|
|
|
|
|
| |||||||||||||
Total income from investment operations | 1.60 | 3.19 | 2.26 | 0.35 | 2.20 | 2.94 | ||||||||||||||||||
|
|
|
|
|
|
|
|
|
|
|
| |||||||||||||
Less distributions to shareholders: | ||||||||||||||||||||||||
From net investment income | – | (0.10 | ) | (0.14 | ) | (0.14 | ) | (0.09 | ) | (0.09 | ) | |||||||||||||
From net realized gains | – | (0.91 | ) | (0.36 | ) | (0.79 | ) | (0.38 | ) | – | (c) | |||||||||||||
|
|
|
|
|
|
|
|
|
|
|
| |||||||||||||
Total distributions | – | (1.01 | ) | (0.50 | ) | (0.93 | ) | (0.47 | ) | (0.09 | ) | |||||||||||||
|
|
|
|
|
|
|
|
|
|
|
| |||||||||||||
Net asset value, end of period | $ | 19.54 | $ | 17.94 | $ | 15.76 | $ | 14.00 | $ | 14.58 | $ | 12.85 | ||||||||||||
|
|
|
|
|
|
|
|
|
|
|
| |||||||||||||
Total Return(d) | 8.92 | %(e) | 20.20 | % | 16.34 | % | 2.65 | % | 17.20 | % | 29.37 | %(e) | ||||||||||||
Ratios and Supplemental Data: |
| |||||||||||||||||||||||
Net assets, end of period (000) | $ | 45,873 | $ | 41,084 | $ | 32,517 | $ | 23,946 | $ | 19,574 | $ | 9,390 | ||||||||||||
Ratio of expenses to average net assets after expense waiver and reimbursement | 1.25 | %(f) | 1.25 | % | 1.25 | % | 1.25 | % | 1.25 | % | 1.25 | %(f) | ||||||||||||
Ratio of expenses to average net assets before expense waiver and reimbursement | 1.37 | %(f) | 1.45 | % | 1.57 | % | 1.75 | % | 2.21 | % | 3.45 | %(f) | ||||||||||||
Ratio of net investment income to average net assets after expense waiver and reimbursement | 0.40 | %(f) | 0.58 | % | 0.95 | % | 1.03 | % | 0.82 | % | 1.07 | %(f) | ||||||||||||
Ratio of net investment income (loss) to average net assets before expense waiver and reimbursement | 0.28 | %(f) | 0.38 | % | 0.63 | % | 0.53 | % | -0.14 | % | -1.13 | %(f) | ||||||||||||
Portfolio turnover rate | 15.75 | %(e) | 29.83 | % | 16.79 | % | 27.33 | % | 23.15 | % | 8.58 | %(e) | ||||||||||||
| (a) | For the period April 1, 2009 (Commencement of Operations) to January 31, 2010. |
| (b) | Net investment income per share is calculated by dividing net investment income by the average shares outstanding throughout the period. |
| (c) | Distributions to shareholders resulted in less than $0.005 per share. |
| (d) | Total return in the above table represents the rate that the investor would have earned or lost on an investment in the Fund, assuming reinvestment of distributions. |
| (e) | Not annualized |
| (f) | Annualized |
9
See accompanying notes which are an integral part of the financial statements.
Notes to Financial Statements (Unaudited)
July 31, 2014
NOTE 1. ORGANIZATION
The Golub Group Equity Fund (the “Fund”) was organized as an open-end diversified series of the Valued Advisers Trust (the “Trust”) on April 1, 2009. The Trust is a management investment company established under the laws of Delaware by an Agreement and Declaration of Trust dated June 13, 2008 (the “Trust Agreement”). The Trust Agreement permits the Board of Trustees (the “Board”) to issue an unlimited number of shares of beneficial interest of separate series without par value. The Fund is one of a series of funds authorized by the Board. The Fund’s investment adviser is Golub Group, LLC (the “Adviser”). The investment objective of the Fund is to provide long-term capital appreciation. A secondary objective is to provide current income.
NOTE 2. SIGNIFICANT ACCOUNTING POLICIES
The Fund is an investment company and follows accounting and reporting guidance under Financial Accounting Standards Board (”FASB”) Accounting Standards Codification (“ASC”) Topic 946, “Financial Services-Investment Companies”. The following is a summary of significant accounting policies followed by the Fund in the preparation of its financial statements. These policies are in conformity with the generally accepted accounting principles in the United States of America (“GAAP”).
Securities Valuation – All investments in securities are recorded at their estimated fair value as described in Note 3.
Federal Income Taxes – The Fund makes no provision for federal income or excise tax. The Fund intends to qualify each year as a regulated investment company (“RIC”) under subchapter M of the Internal Revenue Code of 1986, as amended, by complying with the requirements applicable to RICs and by distributing substantially all of its taxable income. The Fund also intends to distribute sufficient net investment income and net capital gains, if any, so that it will not be subject to excise tax on undistributed income and gains. If the required amount of net investment income or gains is not distributed, the Fund could incur a tax expense.
As of, and during the six months ended July 31, 2014, the Fund did not have a liability for any unrecognized tax benefits. The Fund recognizes interest and penalties, if any, related to unrecognized tax benefits as income tax expense in the statement of operations. During the year, the Fund did not incur any interest or penalties. The Fund is subject to examination by U.S. federal tax authorities for all tax years since inception.
Expenses – Expenses incurred by the Trust that do not relate to a specific fund of the Trust are allocated to the individual funds based on each fund’s relative net assets or another appropriate basis (as determined by the Board).
Security Transactions and Related Income – The Fund follows industry practice and records security transactions on the trade date for financial reporting purposes. The first in, first out method is used for determining gains or losses for financial statement and income tax purposes. Dividend income is recorded on the ex-dividend date and interest income is recorded on an accrual basis. Discounts and premiums on securities purchased are accreted or amortized using the effective interest method. The ability of issuers of debt securities held by the Fund to meet their obligations may be affected by economic and political developments in a specific country or region.
10
Notes to Financial Statements (Unaudited) (continued)
July 31, 2014
Withholding taxes on foreign dividends have been provided for in accordance with the Fund’s understanding of the applicable country’s tax rules and rates.
Dividends and Distributions – The Fund intends to distribute all or substantially all of its net investment income, if any, as dividends to its shareholders on at least an annual basis. The Fund intends to distribute its net realized long term capital gains and its net realized short term capital gains, if any, at least once a year. Dividends to shareholders, which are determined in accordance with income tax regulations, are recorded on the ex-dividend date. The treatment for financial reporting purposes of distributions made to shareholders during the period from net investment income or net realized capital gains may differ from their ultimate treatment for federal income tax purposes. These differences are caused primarily by differences in the timing of the recognition of certain components of income, expense or realized capital gain for federal income tax purposes. Where such differences are permanent in nature, they are reclassified in the components of the net assets based on their ultimate characterization for federal income tax purposes. Any such reclassifications will have no effect on net assets, results of operations or net asset values per share of the Fund.
NOTE 3. SECURITIES VALUATION AND FAIR VALUE MEASUREMENTS
Fair value is defined as the price that a Fund would receive upon selling an investment in an orderly transaction to an independent buyer in the principal or most advantageous market of the investment. Accounting principles generally accepted in the United States of America (“GAAP”) establishes a three-tier hierarchy to maximize the use of observable market data and minimize the use of unobservable inputs and establish classification of fair value measurements for disclosure purposes.
Inputs refer broadly to the assumptions that market participants would use in pricing the asset or liability, including assumptions about risk, for example, the risk inherent in a particular valuation technique used to measure fair value including a pricing model and/or the risk inherent in the inputs to the valuation technique. Inputs may be observable or unobservable. Observable inputs are inputs that reflect the assumptions market participants would use in pricing the asset or liability developed based on market data obtained from sources independent of the reporting entity. Unobservable inputs are inputs that reflect the reporting entity’s own assumptions about the assumptions market participants would use in pricing the asset or liability developed based on the best information available in the circumstances.
Various inputs are used in determining the value of the Fund’s investments. These inputs are summarized in the three broad levels listed below.
| • | Level 1 – quoted prices in active markets for identical securities |
| • | Level 2 – other significant observable inputs (including, but not limited to, quoted prices for an identical security in an inactive market, quoted prices for similar securities, interest rates, prepayment speeds, credit risk, etc.) |
| • | Level 3 – significant unobservable inputs (including the Fund’s own assumptions in determining fair value of investments based on the best information available) |
11
Notes to Financial Statements (Unaudited) (continued)
July 31, 2014
The inputs used to measure fair value may fall into different levels of the fair value hierarchy. In such cases, for disclosure purposes, the level in the fair value hierarchy within which the fair value measurement falls in its entirety, is determined based on the lowest level input that is significant to the fair value measurement in its entirety.
Equity securities, including common stocks, are generally valued by using market quotations, but may be valued on the basis of prices furnished by a pricing service when the Adviser believes such prices more accurately reflect the fair value of such securities. Securities that are traded on any stock exchange are generally valued by the pricing service at the last quoted sale price. Lacking a last sale price, an exchange traded security is generally valued by the pricing service at its last bid price. Securities traded in the NASDAQ over-the-counter market are generally valued by the pricing service at the NASDAQ Official Closing Price.
When using the market quotations or close prices provided by the pricing service and when the market is considered active, the security will be classified as a Level 1 security. Sometimes, an equity security owned by the Fund will be valued by the pricing service with factors other than market quotations or when the market is considered inactive. When this happens, the security will be classified as a Level 2 security. When market quotations are not readily available, when the Adviser determines that the market quotation or the price provided by the pricing service does not accurately reflect the current fair value, or when restricted or illiquid securities are being valued, such securities are valued as determined in good faith by the Adviser, in conformity with guidelines adopted by and subject to review by the Board. These securities will generally be categorized as Level 3 securities.
Investments in mutual funds, including money market mutual funds, are generally priced at the ending net asset value (“NAV”) provided by the service agent of the funds. These securities will be categorized as Level 1 securities.
In accordance with the Trust’s good faith pricing guidelines, the Adviser is required to consider all appropriate factors relevant to the value of securities for which it has determined other pricing sources are not available or reliable as described above. No single standard exists for determining fair value, because fair value depends upon the circumstances of each individual case. As a general principle, the current fair value of an issue of securities being valued by the Adviser would appear to be the amount which the owner might reasonably expect to receive for them upon their current sale. Methods which are in accordance with this principle may, for example, be based on (i) a multiple of earnings; (ii) a discount from market of a similar freely traded security (including a derivative security or a basket of securities traded on other markets, exchanges or among dealers); or (iii) yield to maturity with respect to debt issues, or a combination of these and other methods. Good faith pricing is permitted if, in the Adviser’s opinion, the validity of market quotations appears to be questionable based on factors such as evidence of a thin market in the security based on a small number of quotations, a significant event occurs after the close of a market but before a Fund’s NAV calculation that may affect a security’s value, or the Adviser is aware of any other data that calls into question the reliability of market quotations. Good faith pricing may also be used in instances when the bonds the Fund invests in may default or otherwise cease to have market quotations readily available.
12
Notes to Financial Statements (Unaudited) (continued)
July 31, 2014
The following is a summary of the inputs used to value the Fund’s investments as of July 31, 2014:
| Valuation Inputs | ||||||||||||||||
| Assets | Level 1 Quoted Prices in Active Markets | Level 2 Other Significant Observable Inputs | Level 3 Significant Unobservable Inputs | Total | ||||||||||||
Common Stocks* | $ | 40,937,914 | $ | – | $ | – | $ | 40,937,914 | ||||||||
Money Market Securities | 4,653,105 | – | – | 4,653,105 | ||||||||||||
Total | $ | 45,591,019 | $ | – | $ | – | $ | 45,591,019 | ||||||||
| * | Refer to the Schedule of Investments for industry classifications. |
The Fund did not hold any investments at any time during the reporting period in which other significant observable inputs (Level 2) were used in determining fair value. The Fund did not hold any assets at any time during the reporting period in which significant unobservable inputs were used in determining fair value; therefore, no reconciliation of Level 3 securities is included for this reporting period.
The Trust recognizes transfers between fair value hierarchy levels at the end of the reporting period. There were no transfers between any levels during the period ended July 31, 2014.
NOTE 4. FEES AND OTHER TRANSACTIONS WITH AFFILIATES
Under the terms of the investment advisory agreement, on behalf of the Fund (the “Agreement”), the Adviser manages the Fund’s investments subject to oversight of the Board. As compensation for its services, the Fund is obligated to pay the Adviser a fee computed and accrued daily and paid monthly at an annual rate of 1.00% of the average daily net assets of the Fund. For the six months ended July 31, 2014, the Adviser earned a fee of $220,980 from the Fund before the waivers described below. At July 31, 2014, the Fund owed the Adviser $36,468.
The Adviser has contractually agreed to waive or limit its fee and reimburse certain Fund operating expenses, until May 31, 2015, so that the ratio of total annual operating expenses does not exceed 1.25%. This operating expense limitation does not apply to interest, taxes, brokerage commissions, other expenditures which are capitalized in accordance with generally accepted accounting principles, other extraordinary expenses not incurred in the ordinary course of the Fund’s business, dividend expense on short sales, expenses incurred under a plan of distribution under Rule 12b-1, and expenses that the Fund has incurred but did not actually pay because of an expense offset arrangement, if applicable, incurred by the Fund in any fiscal year. The operating expense limitation also excludes any “Acquired Fund Fees and Expenses.” Acquired Fund Fees and Expenses represent the pro rata expense indirectly incurred by the Fund as a result of investing in other investment companies, including ETFs, closed-end funds and money market funds that have their own expenses. For the six months ended July 31, 2014, the Adviser waived fees of $26,068.
The waiver and/or reimbursement by the Adviser with respect to the Fund is subject to repayment by the Fund within the three fiscal years following the fiscal year in which that particular waiver and/or reimbursement occurred, provided that the Fund is able to make the repayment without
13
Notes to Financial Statements (Unaudited) (continued)
July 31, 2014
exceeding the expense limitations described above. The amounts subject to repayment by the Fund, pursuant to the aforementioned conditions, at July 31, 2014 are as follows:
| Amount | Recoverable through January 31, | |||
| $107,613 | 2015 | |||
| 91,129 | 2016 | |||
| 74,349 | 2017 | |||
| 26,068 | 2018 | |||
The Trust retains Huntington Asset Services, Inc. (“HASI”) to manage the Fund’s business affairs and provide the Fund with administrative and compliance services, including all regulatory reporting and necessary office equipment and personnel. For the six months ended July 31, 2014, HASI earned fees of $19,897 for administrative and compliance services provided to the Fund. At July 31, 2014, HASI was owed $6,100 from the Fund for administrative and compliance services. Certain officers and one Trustee of the Trust are members of management and/or employees of HASI. HASI is a wholly-owned subsidiary of Huntington Bancshares, Inc., the parent company of Unified Financial Securities, Inc. (the “Distributor”) and Huntington National Bank, the custodian of the Fund’s investments (the “Custodian”). For the six months ended July 31, 2014, the Custodian earned fees of $3,319 for custody services provided to the Fund. At July 31, 2014, the Custodian was owed $1,076 from the Fund for custody services.
The Trust also retains HASI to act as the Fund’s transfer agent and to provide fund accounting services. For the six months ended July 31, 2014, HASI earned fees of $17,634 for transfer agent services to the Fund. At July 31, 2014, the Fund owed HASI $5,432 for transfer agent services. For the six months ended July 31, 2014, HASI earned fees of $12,397 from the Fund for fund accounting services. At July 31, 2014, HASI was owed $4,063 from the Fund for fund accounting services.
The Fund has adopted a Distribution Plan pursuant to Rule 12b-1 under the 1940 Act (the “Plan”). The Plan provides that the Fund will pay the Distributor and/or any registered securities dealer, financial institution or any other person (the “Recipient”) a shareholder servicing fee of 0.25% of the average daily net assets of the Fund in connection with the promotion and distribution of the Fund’s shares or the provision of personal services to shareholders, including, but not necessarily limited to, advertising, compensation to underwriters, dealers and selling personnel, the printing and mailing of prospectuses to other than current Fund shareholders, the printing and mailing of sales literature and servicing shareholder accounts (“12b-1 Expenses”). The Fund or Distributor may pay all or a portion of these fees to any recipient who renders assistance in distributing or promoting the sale of shares, or who provides certain shareholder services, pursuant to a written agreement. The Plan is a compensation plan, which means that the Plan will benefit shareholders because an effective sales program typically is necessary in order for the Fund to reach and maintain a sufficient size to achieve efficiently its investment objectives and to realize economies of scale. The Plan is not active and will not be activated prior to May 31, 2015.
Unified Financial Securities, Inc. acts as the principal distributor of the Fund’s shares. There were no payments made by the Fund to the Distributor during the six months ended July 31, 2014. An
14
Notes to Financial Statements (Unaudited) (continued)
July 31, 2014
officer of the Trust is an officer of the Distributor and such person may be deemed to be an affiliate of the Distributor.
NOTE 5. INVESTMENTS
For the six months ended July 31, 2014, purchases and sales of investment securities, other than short-term investments and short-term U.S. government obligations, were as follows:
| Amount | ||||
Purchases | ||||
U.S. Government Obligations | $ | – | ||
Other | 6,791,961 | |||
Sales | ||||
U.S. Government Obligations | $ | – | ||
Other | 6,358,654 | |||
NOTE 6. ESTIMATES
The preparation of financial statements in conformity with GAAP requires management to make estimates and assumptions that affect the reported amounts of assets and liabilities and disclosure of contingent assets and liabilities at the date of the financial statements and the reported amounts of increases and decreases in net assets from operations during the reporting period. Actual results could differ from those estimates.
NOTE 7. BENEFICIAL OWNERSHIP
The beneficial ownership, either directly or indirectly, of 25% or more of the voting securities of a fund creates a presumption of control of a fund, under Section 2(a) (9) of the Investment Company Act of 1940. At July 31, 2014, Charles Schwab owned, as record shareholder, 94.78% of the outstanding shares of the Fund. The Trust does not know whether Charles Schwab or any of the underlying beneficial owners owned or controlled 25% or more of the voting securities of the Fund.
NOTE 8. FEDERAL TAX INFORMATION
At July 31, 2014, the net unrealized appreciation (depreciation) of investments for tax purposes was as follows:
Gross Appreciation | $ | 10,553,323 | ||
Gross (Depreciation) | (127,595 | ) | ||
Net Appreciation (Depreciation) on Investments | $ | 10,425,728 |
At July 31, 2014, the aggregate cost of securities for federal income tax purposes was $35,165,291 for the Fund.
15
Notes to Financial Statements (Unaudited) (continued)
July 31, 2014
The tax characterization of distributions for the fiscal year ended January 31, 2014 was as follows:
| 2014 | ||||
Distributions paid from: | ||||
Ordinary Income* | $ | 463,691 | ||
Long-Term Capital Gain | 1,728,626 | |||
| $ | 2,192,317 | |||
| * | Short-term capital gain distributions are treated as ordinary income for tax purposes. |
At January 31, 2014, the Fund’s most recent fiscal year end, the components of distributable earnings (accumulated losses) on a tax basis was as follows:
Undistributed Ordinary Income | $ | 33,518 | ||
Undistributed Long-Term Capital Gains | 1,227,815 | |||
Accumulated Capital and Other Losses | (12,635 | ) | ||
Unrealized Appreciation (Depreciation) | 8,628,051 | |||
| $ | 9,876,749 |
At January 31, 2014, the difference between book basis and tax basis unrealized appreciation (depreciation) is attributable to the tax deferral of losses on wash sales in the amount of $519.
Under current tax law, net investment losses realized after December 31 and capital losses realized after October 31 of a Fund’s fiscal year may be deferred and treated as occurring on the first business day of the following fiscal year for tax purposes. The Fund deferred losses as follows:
| Late Year Ordinary Loss | ||||
Golub Group Equity Fund | $ | 12,635 | ||
NOTE 9. COMMITMENTS AND CONTINGENCIES
The Fund indemnifies its officers and trustees for certain liabilities that may arise from their performance of their duties to the Fund. Additionally, in the normal course of business, the Fund enters into contracts that contain a variety of representations and warranties which provide general indemnifications. The Fund’s maximum exposure under these arrangements is unknown, as this would involve future claims that may be made against the Fund that have not yet occurred.
NOTE 10. PROXY VOTING RESULTS
On May 21, 2014, a special meeting of the shareholders of the Fund was held at the offices of the Trust for the purpose of:
| 1. | Approval an investment advisory agreement with respect to the Fund between Golub Group, LLC and the Trust. |
| 2. | Approval and ratification of the retention of payments of certain advisory fees for advisory services performed by the Golub Group, LLC and to approve and ratify the right to recoup advisory fees waived and/or expenses reimbursed to the Fund by Golub Group, LLC. |
16
Notes to Financial Statements (Unaudited) (continued)
July 31, 2014
Below are the voting results from the special meeting:
| 1. | Approval of investment advisory agreement: |
For | 2,034,524 | |||
Against | 0 | |||
Abstain | 3,261 |
| 2. | Approval and ratification of retention of payments and recoupment of advisory fees waived/reimbursed: |
For | 2,034,524 | |||
Against | 0 | |||
Abstain | 3,261 |
NOTE 11. SUBSEQUENT EVENT
Management of the Fund has evaluated the need for disclosures and/or adjustments resulting from subsequent events through the date these financial statements were issued. These were no items requiring adjustment of financial statements or additional disclosure.
17
Board Considerations in Approving the New Advisory Agreement
At an in-person meeting held on March 11-12, 2014 the Board considered the approval of the New Advisory Agreement (the “New Agreement”) between the Trust and Golub Group, LLC (the “Adviser” or “Golub”) on behalf of the Golub Group Equity Fund (the “Fund”). Golub provided written information to the Board to assist the Board in its considerations.
The Board discussed the arrangements between the Adviser and the Trust with respect to the Fund. The Board reviewed a memorandum from Counsel, and addressed to the Trustees that summarized, among other things, the fiduciary duties and responsibilities of the Board in reviewing and approving the New Agreement. A copy of this memorandum was circulated to the Trustees in advance of the Meeting. Counsel discussed with the Trustees the types of information and factors that should be considered by the Board in order to make an informed decision regarding the approval of the New Agreement, including the following material factors: (i) the nature, extent, and quality of the services provided by the Adviser; (ii) the investment performance of the Fund; (iii) the costs of the services to be provided and profits to be realized by the Adviser from the relationship with the Fund; (iv) the extent to which economies of scale would be realized if the Fund grows and whether advisory fee levels reflect those economies of scale for the benefit of the Fund’s investors; and (v) the Adviser’s practices regarding possible conflicts of interest.
In assessing these factors and reaching its decisions, the Board took into consideration information furnished for the Board’s review and consideration throughout the year at regular Board meetings, as well as information specifically prepared and/or presented in connection with the annual renewal process, including information presented at the Meeting. The Board requested and was provided with information and reports relevant to the annual renewal of the New Agreement, including: (i) reports regarding the services and support provided to the Fund and its shareholders by the Adviser; (ii) quarterly assessments of the investment performance of the Fund by personnel of the Adviser; (iii) commentary on the reasons for the performance; (iv) presentations by the Adviser addressing its investment philosophy, investment strategy, personnel and operations; (v) compliance and audit reports concerning the Fund and the Adviser; (vi) disclosure information contained in the registration statement of the Trust and the Form ADV of the Adviser; and (vii) a memorandum from Counsel, that summarized the fiduciary duties and responsibilities of the Board in reviewing and approving the New Agreement, including the material factors set forth above and the types of information included in each factor that should be considered by the Board in order to make an informed decision. The Board also requested and received various informational materials including, without limitation: (i) documents containing information about the Adviser, including financial information, a description of personnel and the services provided to the Fund, information on investment advice, performance, summaries of Fund expenses, compliance program, current legal matters, and other general information; (ii) comparative expense and performance information for other mutual funds with strategies similar to the Fund and composite performance of other accounts managed by the Adviser; (iii) the anticipated effect of size on the Fund’s performance and expenses; and (iv) conflicts of interest and benefits to be realized by the Adviser from its relationship with the Fund. The Board did not identify any particular information that was most relevant to its consideration to approve the New Agreement and each Trustee may have afforded different weight to the various factors.
| 1. | The nature, extent, and quality of the services to be provided by the Adviser. In this regard, the Board considered the Adviser’s responsibilities under the New Agreement. The Trustees |
18
considered the services being provided by the Adviser to the Fund including, without limitation: the quality of its investment advisory services (including research and recommendations with respect to portfolio securities), its process for formulating investment recommendations and assuring compliance with the Fund’s investment objectives and limitations, its coordination of services for the Fund among the Fund’s service providers, and its efforts to promote the Fund and grow its assets. The Trustees considered the Adviser’s continuity of, and commitment to retain, qualified personnel and the Adviser’s commitment to maintain its resources and systems, and the Adviser’s continued cooperation with the Independent Trustees and Counsel for the Fund. The Board considered that the Adviser’s approach to portfolio management for the Fund is from a team perspective, and the Board noted that the majority of the portfolio management team would remain managing the Fund. The Trustees considered the circumstances surrounding Mr. Golub’s departure as a portfolio manager to the Fund and concluded that they did not believe it would impact the quality of the services rendered to the Fund by the Adviser. The Trustees considered the Adviser’s personnel, including the education and experience of the Adviser’s personnel. After considering the foregoing information and further information in the Meeting materials provided by the Adviser (including the Adviser’s Form ADV), the Board concluded that, in light of all the facts and circumstances, the nature, extent, and quality of the services provided by the Adviser were satisfactory. |
| 2. | Investment Performance of the Fund and the Adviser. In considering the investment performance of the Fund and the Adviser, the Trustees compared the short-term performance, as well as the 1 year, 3 year and since inception annualized returns of the Fund with the performance of funds with similar objectives managed by other investment advisers, as well as with aggregated peer group data and composite data of other accounts managed by the Adviser. The Trustees also considered the consistency of the Adviser’s management of the Fund with its investment objective, strategies, and limitations. The Trustees noted that the Fund’s performance was lower than some, but higher than others as of the most recent quarter ended December 31, 2013. The Trustees noted that since inception returns showed that the Fund outperformed nearly all of its peers and had above average performance in its category. The Board concluded that the investment performance of the Fund and the Adviser was satisfactory. |
| 3. | The costs of the services to be provided and profits to be realized by the Adviser from the relationship with the Fund. In considering the costs of services to be provided and the profits to be realized by the Adviser from the relationship with the Fund, the Trustees considered: (1) the Adviser’s financial condition; (2) the asset level of the Fund; (3) the overall expenses of the Fund; and (4) the nature and frequency of advisory fee payments. The Trustees reviewed information provided by the Adviser regarding its profits associated with managing the Fund. The Trustees also considered potential benefits for the Adviser in managing the Fund. The Trustees then compared the fees and expenses of the Fund (including the management fee) to other comparable mutual funds. The Trustees noted that the Fund’s management fee tended to be toward the higher end of the comparable mutual funds although the overall expense ratio of the Fund was lower than some of the specifically identified comparable funds and higher than others. It was noted that the Adviser would continue to cap operating expenses of the Fund at 1.25%. Based on the foregoing, the Board concluded that the fees to be paid to the Adviser by the Fund and the profits to be realized by the Adviser, in light of all the facts and circumstances, were fair and reasonable in relation to the nature and quality of the services that the Adviser was required to provide under the investment advisory agreement. |
19
| 4. | The extent to which economies of scale would be realized as the Fund grows and whether advisory fee levels reflect these economies of scale for the benefit of the Fund’s investors. In this regard, the Board considered the Fund’s fee arrangements with the Adviser. The Board considered that while the management fee remained the same at all asset levels, the Fund’s shareholders had experienced benefits from the Fund’s expense limitation arrangement. The Trustees also noted that the Fund’s shareholders would continue to benefit from the economies of scale under the Fund’s agreements with service providers other than the Adviser. In light of its ongoing consideration of the Fund’s asset levels, the Board determined that the Fund’s fee arrangements, in light of all the facts and circumstances, were fair and reasonable at this time. |
| 5. | Possible conflicts of interest and benefits to the Adviser. In considering the Adviser’s practices regarding conflicts of interest, the Trustees evaluated the potential for conflicts of interest and considered such matters as the experience and ability of the advisory personnel assigned to the Fund; the basis of decisions to buy or sell securities for the Fund and/or the Adviser’s other accounts; and the substance and administration of the Adviser’s code of ethics. The Trustees also considered disclosure in the registration statement of the Trust relating to the Adviser’s potential conflicts of interest. The Trustees also considered the Adviser’s practices regarding brokerage and portfolio transactions, including particularly the Adviser’s practice for seeking best execution for the Fund’s portfolio transactions. The Trustees noted that the Adviser benefited from the Fund in that it is able to utilize the Fund as a vehicle into which to direct advisory clients with small account balances and that the Adviser was benefited by managing a public fund with credibility among its advisory clients. Based on the foregoing, the Board determined that the Adviser’s standards and practices of the Adviser relating to the identification and mitigation of potential conflicts of interest and the benefits that it derives from managing the Fund are acceptable. |
The Board then reflected on information reviewed at its special meeting held on February 13, 2014 and its discussion with a representative of Golub at the Meeting. Next, the Independent Trustees met in executive session to discuss the approval of the New Agreement. The officers of the Trust were excused during this discussion. Based on its evaluation of the information and the conclusions with respect thereto at each of the February 13, 2014 and March 11-12, 2014 meetings, as well as information received throughout the year at quarterly meetings, the Board unanimously concluded that: (a) the terms of the New Agreement were fair and reasonable; (b) the approval of the New Agreement would be in the best interests of the shareholders and the Fund; and (c) it would recommend the approval of the New Agreement to shareholders. In the course of their deliberations, the Board did not identify any particular information or factor that was all-important or controlling.
After additional consideration of the factors delineated in the memorandum provided by Counsel and further discussion among the Board, the Board approved the New Agreement between the Adviser and the Trust with respect to the Fund.
20
VALUED ADVISERS TRUST
PRIVACY POLICY
The following is a description of the policies of the Valued Advisers Trust (the “Trust”) regarding disclosure of nonpublic personal information that shareholders provide to a series of the Trust (each, a “Fund”) or that the Fund collects from other sources. In the event that a shareholder holds shares of a Fund through a broker-dealer or other financial intermediary, the privacy policy of the financial intermediary would govern how shareholder nonpublic personal information would be shared with nonaffiliated third parties.
Categories of Information A Fund May Collect. A Fund may collect the following nonpublic personal information about its shareholders:
| • | Information the Fund receives from a shareholder on applications or other forms, correspondence, or conversations (such as the shareholder’s name, address, phone number, social security number, and date of birth); and |
| • | Information about the shareholder’s transactions with the Fund, its affiliates, or others (such as the shareholder’s account number and balance, payment history, cost basis information, and other financial information). |
Categories of Information A Fund May Disclose. A Fund may not disclose any nonpublic personal information about its current or former shareholders to unaffiliated third parties, except as required or permitted by law. A Fund is permitted by law to disclose all of the information it collects, as described above, to its service providers (such as the Fund’s custodian, administrator, transfer agent, accountant and legal counsel) to process shareholder transactions and otherwise provide services to the shareholder.
Confidentiality and Security. Each Fund shall restrict access to shareholder nonpublic personal information to those persons who require such information to provide products or services to the shareholder. Each Fund shall maintain physical, electronic, and procedural safeguards that comply with federal standards to guard shareholder nonpublic personal information.
Disposal of Information. The Funds, through their transfer agent, have taken steps to reasonably ensure that the privacy of a shareholder’s nonpublic personal information is maintained at all times, including in connection with the disposal of information that is no longer required to be maintained by the Funds. Such steps shall include, whenever possible, shredding paper documents and records prior to disposal, requiring off-site storage vendors to shred documents maintained in such locations prior to disposal, and erasing and/or obliterating any data contained on electronic media in such a manner that the information can no longer be read or reconstructed.
21
PROXY VOTING
A description of the policies and procedures that the Fund uses to determine how to vote proxies relating to portfolio securities and information regarding how the Fund voted those proxies is available without charge upon request by (1) calling the Fund at (866) 954-6682 and (2) from Fund documents filed with the Securities and Exchange Commission (“SEC”) on the SEC’s website at www.sec.gov.
TRUSTEES
R. Jeffrey Young, Chairman
Ira Cohen
Andrea N. Mullins
OFFICERS
R. Jeffrey Young, Principal Executive Officer and President
Bryan W. Ashmus, Principal Financial Officer and Treasurer
John C. Swhear, Chief Compliance Officer, AML Officer and Vice-President
Carol J. Highsmith, Vice President and Secretary
Matthew J. Miller, Vice President
INVESTMENT ADVISER
Golub Group, LLC
1850 Gateway Drive, Suite 100
San Mateo, CA 94404
DISTRIBUTOR
Unified Financial Securities, Inc.
2960 North Meridian Street, Suite 300
Indianapolis, IN 46208
INDEPENDENT REGISTERED PUBLIC ACCOUNTING FIRM
Cohen Fund Audit Services, Ltd.
1350 Euclid Avenue, Suite 800
Cleveland, OH 44115
LEGAL COUNSEL
The Law Offices of John H. Lively & Associates, Inc.,
A member firm of The 1940 Act Law GroupTM
11300 Tomahawk Creek Pkwy, Suite 310
Leawood, KS 66211
CUSTODIAN
Huntington National Bank
41 S. High St.
Columbus, OH 43215
ADMINISTRATOR, TRANSFER AGENT AND FUND ACCOUNTANT
Huntington Asset Services, Inc.
2960 North Meridian Street, Suite 300
Indianapolis, IN 46208
This report is intended only for the information of shareholders or those who have received the Fund’s prospectus which contains information about the Fund’s management fee and expenses. Please read the prospectus carefully before investing.
Distributed by Unified Financial Securities, Inc.
Member FINRA/SIPC
SEMI-ANNUAL REPORT
July 31, 2014

Angel Oak Multi-Strategy Income Fund
Angel Oak Capital Advisors, LLC
One Buckhead Plaza
3060 Peachtree Road NW
Suite 500
Atlanta, GA 30305
(404) 953-4900
Investment Results – (Unaudited)
Total Returns*
(For the periods ended July 31, 2014)
| Average Annual Returns | ||||||||||||||||
| Six Months | One Year | Three Year | Since Inception (June 28, 2011) | |||||||||||||
Angel Oak Multi-Strategy Income Fund, Class A without load | 3.20 | % | 9.07 | % | 10.45 | % | 12.18 | % | ||||||||
Angel Oak Multi-Strategy Income Fund, Class A with load | 0.88 | % | 6.64 | % | 8.27 | % | 10.05 | % | ||||||||
Barclays Capital U.S. Aggregate Bond Index** | 2.16 | % | 3.97 | % | 3.04 | % | 3.26 | % | ||||||||
Total annual operating expenses, as disclosed in the Fund’s prospectus dated May 30, 2014, were 1.92% of average daily net assets (1.69% after fee waivers/expense reimbursements by the Adviser. The Adviser has contractually agreed to waive or limit its fees and assume other expenses of the Fund until May 31, 2015, so that total annual fund operating expenses do not exceed 0.99%. This operating expense limitation does not apply to brokerage fees and commissions, borrowing costs (such as interest and dividend expenses on securities sold short), taxes, 12b-1 fees, extraordinary expenses and indirect expenses (such as “acquired fund fees and expenses”). This contractual arrangement may only be terminated by mutual consent of the Adviser and the Board of Trustees of the Fund, and it will automatically terminate upon the termination of the investment advisory agreement between the Fund and the Adviser.
Total Returns*
(For the periods ended July 31, 2014)
| Average Annual Returns | ||||||||||||
| Six Months | One Year | Since Inception (March 14, 2012) | ||||||||||
Angel Oak Multi-Strategy Income Fund, Class C without load | 2.78 | % | 8.16 | % | 9.07 | % | ||||||
Angel Oak Multi-Strategy Income Fund, Class C with load | 1.78 | % | 7.16 | % | 9.07 | % | ||||||
Barclays Capital U.S. Aggregate Bond Index** | 2.16 | % | 3.97 | % | 2.22 | % | ||||||
1
Investment Results – (Unaudited) (continued)
Total annual operating expenses, as disclosed in the Fund’s prospectus dated May 30, 2014, were 2.67% of average daily net assets (2.44% after fee waivers/expense reimbursements by the Adviser). The Adviser has contractually agreed to waive or limit its fees and assume other expenses of the Fund until May 31, 2015, so that total annual fund operating expenses do not exceed 0.99%. This operating expense limitation does not apply to brokerage fees and commissions, borrowing costs (such as interest and dividend expenses on securities sold short), taxes, 12b-1 fees, extraordinary expenses and indirect expenses (such as “acquired fund fees and expenses”). This contractual arrangement may only be terminated by mutual consent of the Adviser and the Board of Trustees of the Fund, and it will automatically terminate upon the termination of the investment advisory agreement between the Fund and the Adviser.
Total Returns*
(For the periods ended July 31, 2014)
| Average Annual Returns | ||||||||||||
| Six Months | One Year | Since Inception (August 16, 2012) | ||||||||||
Angel Oak Multi-Strategy Income Fund, Class I without load | 3.25 | % | 9.28 | % | 7.67 | % | ||||||
Barclays Capital U.S. Aggregate Bond Index** | 2.16 | % | 3.97 | % | 1.51 | % | ||||||
Total annual operating expenses, as disclosed in the Fund’s prospectus dated May 30, 2014, were 1.67% of average daily net assets (1.44% after fee waivers/expense reimbursements by the Adviser). The Adviser has contractually agreed to waive or limit its fees and assume other expenses of the Fund until May 31, 2015, so that total annual fund operating expenses do not exceed 0.99%. This operating expense limitation does not apply to brokerage fees and commissions, borrowing costs (such as interest and dividend expenses on securities sold short), taxes, 12b-1 fees, extraordinary expenses and indirect expenses (such as “acquired fund fees and expenses”). This contractual arrangement may only be terminated by mutual consent of the Adviser and the Board of Trustees of the Fund, and it will automatically terminate upon the termination of the investment advisory agreement between the Fund and the Adviser.
2
Investment Results – (Unaudited) (continued)
The performance quoted represents past performance, which does not guarantee future results. The investment return and principal value of an investment will fluctuate so that an investor’s shares, when redeemed, may be worth more or less than their original cost. The returns shown do not reflect deduction of taxes that a shareholder would pay on Fund distributions or the redemption of Fund shares. The Fund’s investment objectives, risks, charges and expenses must be considered carefully before investing. Current performance of a Fund may be lower or higher than the performance quoted. Performance data current to the most recent month end may be obtained by calling 1-877-625-3042.
The performance above reflects any fee reductions during the applicable period. If such fee reductions had not occurred, the quoted performance would be lower.
* Return figures reflect any change in price per share and assume the reinvestment of all distributions. Total returns for Class A shares, with load, include the maximum 5.75% sales charge (effective May 30, 2013, the maximum sales charge was reduced to 2.25%). Total returns for Class C shares, with load, assume the deduction of the maximum 1.00% deferred sales charge as if redemption took place on the last business day of the reporting period.
** The Barclays U.S. Aggregate Bond Index measures the performance of the U.S. investment-grade, fixed-rate bond market, including government and credit securities, agency mortgage pass-through securities, asset-backed securities and commercial mortgage-backed securities. Performance figures include the change in value of the bonds in the index and the reinvestment of interest. The index return does not reflect expenses, which have been deducted from the Fund’s return. You cannot invest directly in an Index; however, an individual can invest in exchange-traded funds or other investment vehicles that attempt to track the performance of a benchmark index.
The Fund’s investment objective, strategies, risks, charges and expenses must be considered carefully before investing. The prospectus contains this and other important information about the investment company and may be obtained by calling 1-877-625-3042. Please read it carefully before investing.
The Fund is distributed by Unified Financial Securities, Inc., Member FINRA.
3
Portfolio Holdings – (Unaudited)
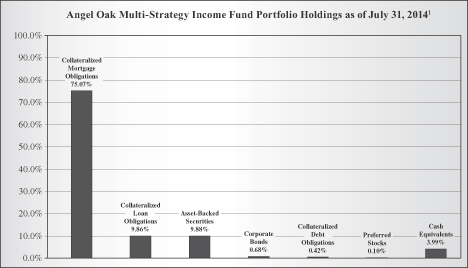
1As a percentage of total investments.
The investment objective of the Angel Oak Multi-Strategy Income Fund is current income.
Availability of Portfolio Schedule – (Unaudited)
The Fund files its complete schedule of portfolio holdings with the Securities and Exchange Commission (“SEC”) for the first and third quarters of each fiscal year on Form N-Q. The Fund’s Forms N-Q are available at the SEC’s website at www.sec.gov. The Fund’s Forms N-Q may be reviewed and copied at the SEC’s Public Reference Room in Washington DC. Information on the operation of the Public Reference Room may be obtained by calling 1-800-SEC-0330.
Summary of Fund’s Expenses – (Unaudited)
As a shareholder of the Fund, you incur ongoing costs, including management fees and other Fund expenses. This Example is intended to help you understand your ongoing costs (in dollars) of investing in the Fund and to compare these costs with the ongoing costs of investing in other mutual funds. The Example is based on an investment of $1,000 invested at the beginning of the period, and held for the entire period from February 1, 2014 to July 31, 2014.
Actual Expenses
The first line of the table below provides information about actual account values and actual expenses. You may use the information in this line, together with the amount you invested, to estimate the expenses that you paid over the period. Simply divide
4
Summary of Fund’s Expenses – (Unaudited) (continued)
your account value by $1,000 (for example, an $8,600 account value divided by $1,000 = $8.60), then multiply the result by the number in the first line under the heading entitled “Expenses Paid During the Period” to estimate the expenses you paid on your account during this period.
Hypothetical Example for Comparison Purposes
The second line of the table below provides information about hypothetical account values and hypothetical expenses based on the Fund’s actual expense ratio and an assumed rate of return of 5% per year before expenses, which is not the Fund’s actual return. The hypothetical account values and expenses may not be used to estimate the actual ending account balance or expenses you paid for the period. You may use this information to compare the ongoing costs of investing in the Fund and other funds. To do so, compare this 5% hypothetical example with the 5% hypothetical examples that appear in the shareholder reports of the other funds.
Please note that the expenses shown in the table are meant to highlight your ongoing costs only. Therefore, the second line of the table below is useful in comparing ongoing costs only and will not help you determine the relative costs of owning different funds.
| Angel Oak Multi-Strategy Income Fund | Beginning Account Value, February 1, 2014 | Ending Account Value, July 31, 2014 | Expenses Paid During Period(1) | Annualized Expense Ratio | ||||||||||||||
Class A | Actual | $ | 1,000.00 | $ | 1,032.00 | $ | 7.83 | 1.55 | % | |||||||||
| Hypothetical(2) | $ | 1,000.00 | $ | 1,017.09 | $ | 7.77 | 1.55 | % | ||||||||||
Class C | Actual | $ | 1,000.00 | $ | 1,027.80 | $ | 11.58 | 2.30 | % | |||||||||
| Hypothetical(2) | $ | 1,000.00 | $ | 1,013.38 | $ | 11.49 | 2.30 | % | ||||||||||
Class I | Actual | $ | 1,000.00 | $ | 1,032.50 | $ | 6.57 | 1.30 | % | |||||||||
| Hypothetical(2) | $ | 1,000.00 | $ | 1,018.33 | $ | 6.52 | 1.30 | % | ||||||||||
(1) Expenses are equal to the Fund’s annualized expense ratios, multiplied by the average account value over the period, multiplied by 181/365 (to reflect the one-half year period). The annualized expense ratios reflect reimbursement of expenses by the Fund’s Adviser for the period February 1, 2014 through July 31, 2014. The “Financial Highlights” tables in the Fund’s financial statements, included in the report, also show the gross expense ratios, without such reimbursements.
| (2) Hypothetical | assumes 5% annual return before expenses. |
5
Angel Oak Multi-Strategy Income Fund
Schedule of Investments
July 31, 2014 (Unaudited)
| Principal Amount | Fair Value | |||||||
Collateralized Mortgage Obligations – 82.12% |
| |||||||
Adjustable Rate Mortgage Trust, Series 2005-3, Class 7A1, 2.518%, 7/25/2035 (a) | $ | 2,009,692 | $ | 1,934,036 | ||||
Adjustable Rate Mortgage Trust, Series 2005-4, Class 3A1, 2.753%, 8/25/2035 (a) | 206,660 | 195,377 | ||||||
Adjustable Rate Mortgage Trust, Series 2005-8, Class 3A21, 2.655%, 11/25/2035 (a) | 12,802,219 | 11,126,383 | ||||||
Adjustable Rate Mortgage Trust, Series 2005-8, Class 3A1, 2.655%, 11/25/2035 (a) | 18,550,976 | 16,122,617 | ||||||
Adjustable Rate Mortgage Trust, Series 2007-2, Class 1A21, 5.376%, 6/25/2037 (a) | 8,537,144 | 7,802,062 | ||||||
American Home Mortgage Assets Trust, Series 2006-2, Class XBJ, 2.532%, 9/25/2046 (I/O) (a) | 75,445,471 | 5,281,183 | ||||||
American Home Mortgage Assets Trust, Series 2006-6, Class XP, 2.301%, 12/25/2046 (I/O) (a) | 98,094,137 | 7,062,778 | ||||||
American Home Mortgage Investment Trust, Series 2004-3, Class 3A, 2.069%, 10/25/2034 (a) | 2,897,689 | 2,732,581 | ||||||
American Home Mortgage Investment Trust, Series 2005-2, Class 5A4C, 5.408%, 9/25/2035 | 41,955,126 | 34,403,371 | ||||||
American Home Mortgage Investment Trust, Series 2006-2, Class 3A2, 6.200%, 6/25/2036 | 732,338 | 438,439 | ||||||
American Home Mortgage Investment Trust, Series 2005-2, Class 2A1, 1.725%, 9/25/2045 (a) | 1,552,272 | 1,324,419 | ||||||
American Home Mortgage Investment Trust, Series 2005-2, Class 1A1, 0.455%, 9/25/2045 (a) | 3,705,788 | 3,232,574 | ||||||
American Home Mortgage Investment Trust, Series 2005-4, Class 3A1, 0.455%, 11/25/2045 (a) | 1,799,811 | 1,442,228 | ||||||
Bank of America Alternative Loan Trust, Series 2004-3, Class 2A1, 6.000%, 4/25/2034 | 769,705 | 782,437 | ||||||
Bank of America Alternative Loan Trust, Series 2005-6, Class 5A2, 5.500%, 7/25/2035 | 2,826,830 | 2,696,638 | ||||||
Bank of America Alternative Loan Trust, Series 2005-9, Class 1CB2, 5.500%, 10/25/2035 | 11,270,920 | 10,532,911 | ||||||
Bank of America Commercial Mortgage Trust, Series 2007-5, Class AJ, 5.995%, 2/10/2051 (a) | 5,000,000 | 5,024,163 | ||||||
See accompanying notes which are an integral part of these financial statements.
6
Angel Oak Multi-Strategy Income Fund
Schedule of Investments – (continued)
July 31, 2014 (Unaudited)
| Principal Amount | Fair Value | |||||||
Collateralized Mortgage Obligations – (continued) |
| |||||||
Bank of America Funding Corp., Series 2004-C, Class 3A1, 2.838%, 12/20/2034 (a) | $ | 141,366 | $ | 133,930 | ||||
Bank of America Funding Corp., Series 2007-C, Class 4A2, 5.269%, 5/20/2036 (a) | 5,118,183 | 5,049,182 | ||||||
Bank of America Funding Corp., Series 2007-C, Class 4A3, 5.269%, 5/20/2036 (a) | 22,057,176 | 21,759,812 | ||||||
Bank of America Funding Corp., Series 2006-G, Class 3A2, 5.750%, 7/20/2036 (a) | 5,920,000 | 5,790,911 | ||||||
Bank of America Funding Corp., Series 2006-5, Class 1A4, 6.000%, 9/25/2036 | 11,928,147 | 10,945,100 | ||||||
Bank of America Funding Corp., Series 2007-1, Class TA3B, 5.943%, 1/25/2037 | 1,786,519 | 1,459,615 | ||||||
Bank of America Funding Corp., Series 2007-1, Class TA1B, 5.846%, 1/25/2037 (a) | 2,661,016 | 2,171,277 | ||||||
Bank of America Funding Corp., Series 2007-1, Class TA4, 6.090%, 1/25/2037 | 1,437,420 | 1,174,053 | ||||||
Bank of America Funding Corp., Series 2007-D, Class 3A3, 5.322%, 6/20/2037 (a) | 6,150,675 | 5,935,905 | ||||||
Bank of America Funding Corp., Series 2007-D, Class 3A1, 5.322%, 6/20/2037 (a) | 363,147 | 350,467 | ||||||
Bank of America Mortgage Securities, Inc., Series 2004-I, Class 2A2, 2.754%, 10/25/2034 (a) | 436,035 | 440,269 | ||||||
Bank of America Mortgage Securities, Inc., Series 2005-E, Class 2A1, 2.703%, 6/25/2035 (a) | 1,361,957 | 1,308,356 | ||||||
Bank of America Mortgage Securities, Inc., Series 2005-I, Class 2A3, 2.779%, 10/25/2035 (a) | 240,304 | 217,550 | ||||||
Bank of America Mortgage Securities, Inc., Series 2005-I, Class 4A1, 5.014%, 10/25/2035 (a) | 7,598,883 | 7,448,201 | ||||||
Bank of America Mortgage Securities, Inc., Series 2006-2, Class A1, 6.000%, 7/25/2046 (a) | 8,478,516 | 7,944,870 | ||||||
Bayview Commercial Asset Trust, Series 2005-2A, Class A1, 0.465%, 8/25/2035 (a)(b) | 12,478,536 | 11,394,613 | ||||||
Bayview Commercial Asset Trust, Series 2005-4A, Class A2, 0.545%, 1/25/2036 (a)(b) | 3,172,390 | 2,837,506 | ||||||
Bayview Commercial Asset Trust, Series 2005-4A, Class A1, 0.455%, 1/25/2036 (a)(b) | 2,934,681 | 2,679,217 | ||||||
See accompanying notes which are an integral part of these financial statements.
7
Angel Oak Multi-Strategy Income Fund
Schedule of Investments – (continued)
July 31, 2014 (Unaudited)
| Principal Amount | Fair Value | |||||||
Collateralized Mortgage Obligations – (continued) |
| |||||||
Bear Stearns Adjustable Rate Mortgage Trust, Series 2005-1, Class 4A1, 4.944%, 3/25/2035 (a) | $ | 2,691,757 | $ | 2,684,879 | ||||
Bear Stearns ALT-A Trust, Series 2005-5, Class 21A1, 2.393%, 7/25/2035 (a) | 4,889,109 | 4,781,211 | ||||||
Bear Stearns ALT-A Trust, Series 2005-7, Class 22A1, 2.696%, 9/25/2035 (a) | 20,094,859 | 17,644,392 | ||||||
Bear Stearns ALT-A Trust, Series 2005-8, Class 11A1, 0.695%, 10/25/2035 (a)(c) | 19,957,013 | 17,668,243 | ||||||
Bear Stearns Asset Backed Securities Trust, Series 2005-AC2, Class 1A, 5.250%, 4/25/2035 | 5,623,281 | 5,554,233 | ||||||
Bear Stearns Asset Backed Securities Trust, Series 2005-AC4, Class A, 5.500%, 7/25/2035 | 2,763,019 | 2,624,774 | ||||||
Bear Stearns Asset Backed Securities Trust, Series 2005-AC5, Class 1A2, 0.655%, 8/25/2035 (a) | 5,206,771 | 4,396,092 | ||||||
Bear Stearns Commercial Mortgage Securities Trust, Series 2007-PW17, Class AJ, 5.886%, 6/11/2050 (a) | 5,000,000 | 5,121,520 | ||||||
Bear Stearns Mortgage Funding Trust, Series 2006-AR5, Class 1X, 0.500%, 12/25/2046 (I/O) | 82,902,525 | 2,279,819 | ||||||
CD Commercial Mortgage Trust, Series 2006-CD3, Class AJ, 5.688%, 10/15/2048 | 4,580,000 | 4,494,136 | ||||||
CFCRE Commercial Mortgage Trust, Series 2011-C1, Class F, 5.000%, 4/15/2044 (b) | 7,931,000 | 7,388,179 | ||||||
Chase Mortgage Finance Corp., Series 2005-A1, Class 1A1, 4.879%, 12/25/2035 (a) | 8,760,755 | 8,499,987 | ||||||
Chase Mortgage Finance Corp., Series 2005-A1, Class 3A1, 2.534%, 12/25/2035 (a) | 1,635,202 | 1,506,881 | ||||||
Chase Mortgage Finance Corp., Series 2007-A2, Class 7A1, 4.965%, 7/25/2037 (a) | 1,723,274 | 1,619,747 | ||||||
ChaseFlex Trust, Series 2006-1, Class A4, 5.126%, 6/25/2036 (a) | 31,805,000 | 28,801,177 | ||||||
ChaseFlex Trust, Series 2006-2, Class A4, 5.516%, 9/25/2036 (a) | 14,791,214 | 14,427,180 | ||||||
Chevy Chase Mortgage Funding Corp., Series 2005-1A, Class A1, 0.305%, 1/25/2036 (a)(b) | 11,104,035 | 9,930,949 | ||||||
Chevy Chase Mortgage Funding Corp., Series 2005-1A, Class A2, 0.355%, 1/25/2036 (a)(b) | 8,914,920 | 8,245,766 | ||||||
See accompanying notes which are an integral part of these financial statements.
8
Angel Oak Multi-Strategy Income Fund
Schedule of Investments – (continued)
July 31, 2014 (Unaudited)
| Principal Amount | Fair Value | |||||||
Collateralized Mortgage Obligations – (continued) |
| |||||||
Chevy Chase Mortgage Funding Corp., Series 2005-3A, Class A1, 0.335%, 7/25/2036 (a)(b) | $ | 9,011,551 | $ | 7,887,279 | ||||
Chevy Chase Mortgage Funding Corp., Series 2005-4A, Class IO, 1.308%, 4/25/2037 (I/O) (a)(b) | 85,207,395 | 5,378,717 | ||||||
Citigroup Commercial Mortgage Trust, Series 2014-GC23, Class D, 4.658%, 7/10/2024 (b) | 10,000,000 | 9,382,101 | ||||||
Citigroup Commercial Mortgage Trust, Series 2014-GC23, Class A4, 3.622%, 7/10/2024 (b) | 7,000,000 | 7,209,702 | ||||||
Citigroup Commercial Mortgage Trust, Series 2013-GC17, Class A4, 4.131%, 11/10/2046 (c) | 10,000,000 | 10,688,455 | ||||||
Citigroup Commercial Mortgage Trust, Series 2014-GC19, Class D, 4.900%, 3/10/2047 (a)(b) | 9,000,000 | 8,752,536 | ||||||
Citigroup Commercial Mortgage Trust, Series 2014-GC21, Class A5, 3.855%, 5/10/2047 (c) | 10,000,000 | 10,421,885 | ||||||
Citigroup Mortgage Loan Trust, Inc., Series 2005-2, Class 1A4, 2.583%, 5/25/2035 (a) | 602,689 | 595,921 | ||||||
Citigroup Mortgage Loan Trust, Inc., Series 2005-4, Class A, 5.229%, 8/25/2035 (a) | 639,172 | 636,712 | ||||||
Citigroup Mortgage Loan Trust, Inc., Series 2005-7, Class 2A2A, 2.852%, 9/25/2035 (a) | 10,472,231 | 9,797,139 | ||||||
Citigroup Mortgage Loan Trust, Inc., Series 2005-8, Class 1A4A, 4.814%, 10/25/2035 (a) | 619,482 | 570,552 | ||||||
Citigroup Mortgage Loan Trust, Inc., Series 2006-AR2, Class 1A2, 2.639%, 3/25/2036 (a) | 379,181 | 357,172 | ||||||
Citigroup Mortgage Loan Trust, Inc., Series 2006-AR6, Class 1A1, 5.531%, 8/25/2036 (a) | 4,946,563 | 4,609,732 | ||||||
Commercial Mortgage Trust, Series 2014-UBS3, Class A4, 3.819%, 6/10/2047 (c) | 10,000,000 | 10,364,285 | ||||||
Commercial Mortgage Trust, Series 2013-CR6, Class E, 4.314%, 3/10/2046 (a)(b) | 6,146,000 | 5,235,639 | ||||||
Commercial Mortgage Trust, Series 2013-CR11, Class AM, 4.715%, 10/10/2046 (a)(c) | 10,000,000 | 10,924,130 | ||||||
Commercial Mortgage Trust, Series 2014-CR14, Class D, 4.612%, | 6,250,000 | 6,071,428 | ||||||
Commercial Mortgage Trust, Series 2014-UBS2, Class AM, 4.199%, 3/10/2047 | 4,250,000 | 4,458,465 | ||||||
See accompanying notes which are an integral part of these financial statements.
9
Angel Oak Multi-Strategy Income Fund
Schedule of Investments – (continued)
July 31, 2014 (Unaudited)
| Principal Amount | Fair Value | |||||||
Collateralized Mortgage Obligations – (continued) |
| |||||||
Commercial Mortgage Trust, Series 2014-UBS2, Class B, 4.701%, 3/10/2047 | $ | 2,000,000 | $ | 2,133,771 | ||||
Commercial Mortgage Trust, Series 2014-CR16, Class AM, 4.278%, 4/10/2047 (c) | 10,000,000 | 10,548,085 | ||||||
Commercial Mortgage Trust, Series 2014-LC15, Class A4, 4.006%, 4/10/2047 (c) | 10,000,000 | 10,546,115 | ||||||
Commercial Mortgage Trust, Series 2014-LC15, Class AM, 4.198%, 4/10/2047 (c) | 10,000,000 | 10,509,395 | ||||||
Commercial Mortgage Trust, Series 2014-CR17, Class D, 4.800%, | 8,250,000 | 7,944,111 | ||||||
Commercial Mortgage Trust, Series 2014-CR17, Class C, 4.736%, 5/10/2047 (a) | 5,000,000 | 5,256,298 | ||||||
Commercial Mortgage Trust, Series 2014-UBS4, Class A5, 3.694%, 8/10/2047 | 10,000,000 | 10,299,969 | ||||||
Commercial Mortgage Trust, Series 2014-UBS4, Class B, 4.350%, 8/10/2047 | 10,000,000 | 10,299,308 | ||||||
Commercial Mortgage Trust, Series 2014-UBS4, Class C, 4.781%, 8/10/2047 (a) | 5,000,000 | 5,149,940 | ||||||
CountryWide Alternative Loan Trust, Series 2004-J10, Class 1A3, 4.250%, 10/25/2034 | 1,446,562 | 1,420,168 | ||||||
CountryWide Alternative Loan Trust, Series 2005-J1, Class 1A7, 5.500%, 2/25/2035 | 8,602,000 | 8,280,027 | ||||||
CountryWide Alternative Loan Trust, Series 2005-1CB, Class 1A4, 5.500%, 3/25/2035 | 1,809,169 | 1,763,178 | ||||||
CountryWide Alternative Loan Trust, Series 2005-3CB, Class 1A11, 5.500%, 3/25/2035 | 2,695,183 | 2,708,548 | ||||||
CountryWide Alternative Loan Trust, Series 2005-14, Class 2A1, 0.365%, 5/25/2035 (a) | 1,557,925 | 1,322,706 | ||||||
CountryWide Alternative Loan Trust, Series 2005-J5, Class 1A1, 0.455%, 5/25/2035 (a) | 10,709 | 10,715 | ||||||
CountryWide Alternative Loan Trust, Series 2005-21CB, Class A17, 6.000%, 6/25/2035 | 900,153 | 932,006 | ||||||
CountryWide Alternative Loan Trust, Series 2005-23CB, Class A2, 5.500%, 7/25/2035 | 9,521,629 | 9,447,227 | ||||||
CountryWide Alternative Loan Trust, Series 2005-J6, Class 1A4, 5.500%, 7/25/2035 | 1,817,670 | 1,780,948 | ||||||
See accompanying notes which are an integral part of these financial statements.
10
Angel Oak Multi-Strategy Income Fund
Schedule of Investments – (continued)
July 31, 2014 (Unaudited)
| Principal Amount | Fair Value | |||||||
Collateralized Mortgage Obligations – (continued) |
| |||||||
CountryWide Alternative Loan Trust, Series 2005-26CB, Class A1, 0.655%, 7/25/2035 (a) | $ | 2,845,822 | $ | 2,261,421 | ||||
CountryWide Alternative Loan Trust, Series 2005-J6, Class 1A1, 0.655%, 7/25/2035 (a) | 1,305,174 | 1,088,124 | ||||||
CountryWide Alternative Loan Trust, Series 2005-28CB, Class 1A6, 5.500%, 8/25/2035 | 15,465,652 | 14,901,860 | ||||||
CountryWide Alternative Loan Trust, Series 2005-31, Class 2X, 2.157%, 8/25/2035 (I/O) (a) | 54,244,399 | 4,136,135 | ||||||
CountryWide Alternative Loan Trust, Series 2005-31, Class 2A1, 0.455%, 8/25/2035 (a) | 18,233,905 | 16,185,198 | ||||||
CountryWide Alternative Loan Trust, Series 2005-J9, Class 1A6, 5.500%, 8/25/2035 | 2,199,744 | 2,047,524 | ||||||
CountryWide Alternative Loan Trust, Series 2005-44, Class 1X, 2.145%, 10/25/2035 (I/O) (a) | 69,515,863 | 4,931,282 | ||||||
CountryWide Alternative Loan Trust, Series 2005-J10, Class 1A1, 0.655%, 10/25/2035 (a) | 1,111,675 | 891,432 | ||||||
CountryWide Alternative Loan Trust, Series 2005-51, Class 3X2, 2.099%, 11/20/2035 (I/O) (a) | 43,826,623 | 2,629,597 | ||||||
CountryWide Alternative Loan Trust, Series 2005-58R, Class A, 2.247%, 12/20/2035 (I/O) (a)(b) | 193,698,845 | 13,316,796 | ||||||
CountryWide Alternative Loan Trust, Series 2005-65CB, Class 2A4, 5.500%, 12/25/2035 | 2,297,855 | 2,099,274 | ||||||
CountryWide Alternative Loan Trust, Series 2005-J14, Class A8, 5.500%, 12/25/2035 | 6,714,881 | 6,170,250 | ||||||
CountryWide Alternative Loan Trust, Series 2006-OA3, Class X, 2.264%, 5/25/2036 (I/O) (a) | 69,952,639 | 4,962,265 | ||||||
CountryWide Alternative Loan Trust, Series 2006-0A10, Class XNB, 1.782%, 8/25/2046 (I/O) (a) | 56,981,514 | 3,048,511 | ||||||
CountryWide Alternative Loan Trust, Series 2006-OA10, Class XAD, 1.701%, 8/25/2046 (I/O) (a) | 178,574,992 | 12,444,445 | ||||||
CountryWide Alternative Loan Trust, Series 2006-OA12, Class X, 2.549%, 9/20/2046 (I/O) (a) | 90,545,287 | 6,736,569 | ||||||
See accompanying notes which are an integral part of these financial statements.
11
Angel Oak Multi-Strategy Income Fund
Schedule of Investments – (continued)
July 31, 2014 (Unaudited)
| Principal Amount | Fair Value | |||||||
Collateralized Mortgage Obligations – (continued) |
| |||||||
CountryWide Alternative Loan Trust, Series 2006-OA19, Class XP, 2.551%, 2/20/2047 (I/O) (a) | $ | 76,502,074 | $ | 6,646,118 | ||||
CountryWide Alternative Loan Trust, Series 2007-HY3, Class 3A1, 5.620%, 3/25/2047 (a) | 522,183 | 455,474 | ||||||
CountryWide Home Loan Mortgage Pass Through Trust, Series 2005-7, Class 3X, 0.853%, 3/25/2035 (I/O) (a) | 4,092,755 | 155,525 | ||||||
CountryWide Home Loan Mortgage Pass Through Trust, Series 2004-HYB3, Class 2A, 2.329%, 6/20/2034 (a) | 1,619,601 | 1,567,300 | ||||||
CountryWide Home Loan Mortgage Pass Through Trust, Series 2004-11, Class 3A1, 2.475%, 7/25/2034 (a) | 1,959,827 | 1,961,805 | ||||||
CountryWide Home Loan Mortgage Pass Through Trust, Series 2005-9, Class 1X, 2.152%, 5/25/2035 (I/O) (a) | 58,595,361 | 3,369,233 | ||||||
CountryWide Home Loan Mortgage Pass-Through Trust, Series 2003-52, Class A1, 2.541%, 2/19/2034 (a) | 1,087,297 | 1,072,716 | ||||||
CountryWide Home Loan Mortgage Pass-Through Trust, Series 2005-HYB8, Class 3A1, 2.507%, 12/20/2035 (a) | 780,014 | 686,481 | ||||||
CountryWide Home Loan Mortgage Pass-Through Trust, Series 2006-12, Class X, 0.276%, 7/25/2036 (I/O) (a) | 142,413,108 | 1,082,340 | ||||||
CountryWide Home Loan Mortgage Pass-Through Trust, Series 2007-9, Class A13, 5.750%, 7/25/2037 | 16,519,987 | 16,108,739 | ||||||
CountryWide Home Loan Mortgage Pass-Through Trust, Series 2007-14, Class A15, 6.500%, 9/25/2037 | 6,773,340 | 6,700,967 | ||||||
CountryWide Home Loan Mortgage Pass-Through Trust, Series 2006-OA2, Class X1P, 0.230%, 5/20/2046 (I/O) (a) | 188,567,048 | 13,965,747 | ||||||
Credit Suisse First Boston Mortgage Securities Corp., Series 2005-4, Class 2A7, 0.605%, 6/25/2035 (a) | 1,862,191 | 1,601,005 | ||||||
See accompanying notes which are an integral part of these financial statements.
12
Angel Oak Multi-Strategy Income Fund
Schedule of Investments – (continued)
July 31, 2014 (Unaudited)
| Principal Amount | Fair Value | |||||||
Collateralized Mortgage Obligations – (continued) |
| |||||||
Credit Suisse First Boston Mortgage Securities Corp., Series 2005-9, Class 2A1, 5.500%, 10/25/2035 | $ | 1,589,713 | $ | 1,559,325 | ||||
Credit Suisse First Boston Mortgage Securities Corp., Series 2005-9, Class 4A2, 0.505%, 10/25/2035 (a) | 3,526,244 | 2,959,845 | ||||||
Credit Suisse First Boston Mortgage Securities Corp., Series 2006-2, Class 6A8, 5.750%, 3/25/2036 | 3,874,897 | 3,569,938 | ||||||
Credit Suisse Mortgage Capital Certificates, Series 2012-9, Class B1, 2.419%, 2/25/2050 (a)(b) | 10,363,000 | 9,308,565 | ||||||
Credit Suisse Mortgage Trust, Series 2006-6, Class 1A10, 6.000%, 7/25/2036 | 2,130,041 | 1,659,349 | ||||||
Deutsche Alt-A Securities Mortgage Loan Trust, Series 2006-AR3, Class A2, 0.275%, 8/25/2036 (a) | 1,316,165 | 1,014,601 | ||||||
Deutsche Alt-A Securities Mortgage Loan Trust, Series 2006-SR3, Class A6, 0.435%, 8/25/2036 (a) | 1,817,843 | 1,231,096 | ||||||
Deutsche Alt-A Securities, Inc. Mortgage Loan Trust, Series 2005-4, Class A3, 5.250%, 9/25/2035 (a) | 12,356,879 | 10,795,637 | ||||||
Deutsche Alt-A Securities, Inc. Mortgage Loan Trust, Series 2006-AB4, Class A1A, 6.005%, 10/25/2036 (a) | 3,636,534 | 2,971,816 | ||||||
Deutsche Alt-A Securities, Inc. Mortgage Loan Trust, Series 2006-AB4, Class A4C, 6.100%, 10/25/2036 | 7,392,019 | 6,060,391 | ||||||
Deutsche Alt-A Securities, Inc. Mortgage Loan Trust, Series 2006-AB4, Class A6A2, 5.886%, 10/25/2036 | 407,329 | 330,960 | ||||||
Deutsche Alt-A Securities, Inc. Mortgage Loan Trust, Series 2006-AB4, Class A6A1, 5.869%, 10/25/2036 | 407,329 | 330,686 | ||||||
Deutsche Alt-A Securities, Inc. Mortgage Loan Trust, Series 2006-AR5, Class 1A2, 0.345%, 10/25/2036 (a) | 11,442,279 | 7,041,727 | ||||||
Deutsche Alt-A Securities, Inc. Mortgage Loan Trust, Series 2006-AR4, Class A2, 0.345%, 12/25/2036 (a) | 5,661,209 | 3,617,886 | ||||||
Deutsche Alt-B Securities Mortgage Loan Trust, Series 2006-AB3, Class A3, 6.510%, 7/25/2036 (a) | 8,642,469 | 6,354,920 | ||||||
Deutsche Alt-B Securities Mortgage Loan Trust, Series 2006-AB3, Class A2, 6.420%, 7/25/2036 (a) | 9,110,762 | 6,719,278 | ||||||
Deutsche Alt-B Securities, Inc. Mortgage Loan Trust, Series 2006-AB2, Class A2, 6.160%, 6/25/2036 (a) | 5,503,594 | 4,498,181 | ||||||
DSLA Mortgage Loan Trust, Series 2004-AR2, Class X2, 2.074%, 11/19/2044 (I/O) (a) | 78,604,842 | 4,323,266 | ||||||
See accompanying notes which are an integral part of these financial statements.
13
Angel Oak Multi-Strategy Income Fund
Schedule of Investments – (continued)
July 31, 2014 (Unaudited)
| Principal Amount | Fair Value | |||||||
Collateralized Mortgage Obligations – (continued) |
| |||||||
DSLA Mortgage Loan Trust, Series 2005-AR2, Class 2A1A, 0.366%, 3/19/2045 (a) | $ | 4,983,142 | $ | 4,562,998 | ||||
DSLA Mortgage Loan Trust, Series 2005-AR1, Class X2, 2.784%, 3/19/2045 (I/O) (a) | 76,902,897 | 6,104,167 | ||||||
First Horizon Alternative Mortgage Securities Trust, Series 2005-FA8, Class 1A18, 5.500%, 11/25/2035 | 4,647 | 4,154 | ||||||
First Horizon Alternative Mortgage Securities Trust, Series 2005-FA8, Class 1A5, 5.125%, 11/25/2035 | 2,260,085 | 1,976,715 | ||||||
First Horizon Alternative Mortgage Securities Trust, Series 2005-AR5, Class 2A1, 2.613%, 11/25/2035 (a) | 4,141,210 | 3,964,165 | ||||||
GE Commercial Mortgage Corp. Trust, Series 2007-C1, Class AM, 5.606%, 12/10/2049 (a) | 10,000,000 | 10,579,300 | ||||||
GMAC Mortgage Corp. Loan Trust, Series 2005-AR2, Class 4A, 4.621%, 5/25/2035 (a) | 1,791,231 | 1,743,523 | ||||||
GMAC Mortgage Corp. Loan Trust, Series 2005-AR2, Class 2A, 3.062%, 5/25/2035 (a) | 13,926,951 | 13,672,366 | ||||||
GMAC Mortgage Corp. Loan Trust, Series 2005-AF1, Class A11, 5.750%, 7/25/2035 | 591,795 | 474,816 | ||||||
GMAC Mortgage Corp. Loan Trust, Series 2005-AR5, Class 5A1, 4.634%, 9/19/2035 (a) | 726,753 | 719,783 | ||||||
GMAC Mortgage Corp. Loan Trust, Series 2005-AR6, Class 2A1, 3.010%, 11/19/2035 (a) | 5,363,368 | 5,084,049 | ||||||
GMAC Mortgage Corp. Loan Trust, Series 2005-AR6, Class 4A1, 4.961%, 11/19/2035 (a) | 476,344 | 464,424 | ||||||
GreenPoint Mortgage Funding Trust, Series 2006-AR3, Class 4A1, 0.365%, 4/25/2036 (a) | 37,425,621 | 29,033,524 | ||||||
GreenPoint Mortgage Funding Trust, Series 2006-AR3, Class 4X, 1.000%, 4/25/2036 (I/O) | 108,579,402 | 5,971,867 | ||||||
GreenPoint Mortgage Funding Trust, Series 2005-AR5, Class 3X1, 2.313%, 11/25/2045 (I/O) (a) | 13,810,931 | 984,029 | ||||||
GreenPoint MTA Trust, Series 2005-AR2, Class X1, 2.157%, 6/25/2045 (I/O) (a) | 54,275,708 | 3,392,232 | ||||||
GreenPoint MTA Trust, Series 2005-AR1, Class X1, 2.195%, 6/25/2045 (I/O) (a) | 64,067,733 | 4,124,360 | ||||||
GreenPoint MTA Trust, Series 2005-AR3, Class 1A1, 0.395%, 8/25/2045 (a) | 16,356,857 | 14,608,914 | ||||||
See accompanying notes which are an integral part of these financial statements.
14
Angel Oak Multi-Strategy Income Fund
Schedule of Investments – (continued)
July 31, 2014 (Unaudited)
| Principal Amount | Fair Value | |||||||
Collateralized Mortgage Obligations – (continued) |
| |||||||
GS Mortgage Securities Corp. II, Series 2013-GC10, Class C, 4.285%, 2/10/2046 (a)(b) | $ | 5,000,000 | $ | 5,083,535 | ||||
GS Mortgage Securities Corp. II, Series 2014-GC20, Class D, 4.866%, 4/10/2047 (a)(b) | 5,000,000 | 4,827,708 | ||||||
GS Mortgage Securities Trust, Series 2013-GC14, Class D, 4.775%, | 7,260,000 | 7,077,683 | ||||||
GS Mortgage Securities Trust, Series 2013-GC14, Class C, 4.775%, | 6,600,000 | 6,943,114 | ||||||
GS Mortgage Securities Trust, Series 2012-GCJ7, Class C, 5.723%, | 3,000,000 | 3,359,324 | ||||||
GS Mortgage Securities Trust, Series 2013-GC12, Class AS, 3.375%, 6/10/2046 | 3,000,000 | 2,981,633 | ||||||
GS Mortgage Securities Trust, Series 2013-GC12, Class A4, 3.135%, 6/10/2046 | 5,000,000 | 4,991,503 | ||||||
GS Mortgage Securities Trust, Series 2013-GC13, Class C, 4.072%, | 7,500,000 | 7,545,026 | ||||||
GS Mortgage Securities Trust, Series 2013-GC16, Class C, 5.315%, 11/10/2046 (a)(c) | 7,000,000 | 7,639,058 | ||||||
GS Mortgage Securities Trust, Series 2013-GC16, Class A4, 4.271%, 11/10/2046 | 5,000,000 | 5,392,250 | ||||||
GS Mortgage Securities Trust, Series 2014-GC18, Class C, 4.949%, 1/10/2047 (a) | 5,000,000 | 5,303,432 | ||||||
GS Mortgage Securities Trust, Series 2014-GC22, Class D, 4.646%, | 5,000,000 | 4,724,095 | ||||||
GSR Mortgage Loan Trust, Series 2005-AR1, Class 4A1, 4.520%, 1/25/2035 (a) | 1,935,559 | 1,914,456 | ||||||
GSR Mortgage Loan Trust, Series 2005-AR2, Class 1A1, 2.783%, 4/25/2035 (a) | 2,799,569 | 2,668,734 | ||||||
GSR Mortgage Loan Trust, Series 2005-AR3, Class 4A1, 2.634%, 5/25/2035 (a) | 16,698,581 | 15,299,357 | ||||||
GSR Mortgage Loan Trust, Series 2005-AR3, Class 8A1, 5.191%, 5/25/2035 (a) | 8,031,222 | 7,951,697 | ||||||
GSR Mortgage Loan Trust, Series 2005-AR4, Class 3A5, 2.584%, 7/25/2035 (a) | 7,717,743 | 7,370,645 | ||||||
GSR Mortgage Loan Trust, Series 2005-6F, Class 3410, 6.000%, 7/25/2035 | 595,136 | 590,265 | ||||||
See accompanying notes which are an integral part of these financial statements.
15
Angel Oak Multi-Strategy Income Fund
Schedule of Investments – (continued)
July 31, 2014 (Unaudited)
| Principal Amount | Fair Value | |||||||
Collateralized Mortgage Obligations – (continued) |
| |||||||
GSR Mortgage Loan Trust, Series 2005-AR7, Class 4A1, 2.570%, 11/25/2035 (a) | $ | 6,010,953 | $ | 5,141,991 | ||||
GSR Mortgage Loan Trust, Series 2005-AR7, Class 6A1, 5.072%, 11/25/2035 (a) | 5,645,601 | 5,619,592 | ||||||
GSR Mortgage Loan Trust, Series 2005-AR7, Class 5A1, 4.903%, 11/25/2035 (a) | 3,663,791 | 3,417,863 | ||||||
GSR Mortgage Loan Trust, Series 2006-AR1, Class 3A1, 2.867%, 1/25/2036 (a) | 1,104,197 | 1,023,931 | ||||||
GSR Mortgage Loan Trust, Series 2006-2F, Class 3A6, 6.000%, 2/25/2036 | 7,023,718 | 6,173,230 | ||||||
GSR Mortgage Loan Trust, Series 2006-1F, Class 2A5, 6.000%, 2/25/2036 | 4,283,158 | 4,093,757 | ||||||
GSR Mortgage Loan Trust, Series 2006-1F, Class 1A6, 1.105%, 2/25/2036 (a) | 804,338 | 686,526 | ||||||
HarborView Mortgage Loan Trust, Series 2005-12, Class 2A12, 0.906%, 10/19/2035 (a) | 18,381,886 | 16,206,408 | ||||||
HarborView Mortgage Loan Trust, Series 2005-10, Class X, 2.080%, 11/19/2035 (I/O) (a) | 20,353,062 | 1,297,508 | ||||||
HarborView Mortgage Loan Trust, Series 2006-1, Class X1, 2.273%, 3/19/2036 (I/O) (a) | 180,869,788 | 12,321,754 | ||||||
HarborView Mortgage Loan Trust, Series 2006-10, Class 2A1A, 0.336%, 11/19/2036 (a) | 21,268,613 | 17,987,547 | ||||||
HarborView Mortgage Loan Trust, Series 2007-6, Class 2A1A, 0.346%, 8/19/2037 (a) | 22,306,931 | 19,434,869 | ||||||
HarborView Mortgage Loan Trust, Series 2005-11, Class X, 2.305%, 8/19/2045 (I/O) (a) | 88,177,564 | 5,235,543 | ||||||
HarborView Mortgage Loan Trust, Series 2005-15, Class X1P, 2.259%, 10/20/2045 (I/O) (a) | 20,045,072 | 1,277,873 | ||||||
HarborView Mortgage Loan Trust, Series 2006-5, Class X2, 3.035%, 7/19/2046 (I/O) (a) | 100,854,858 | 8,572,663 | ||||||
HarborView Mortgage Loan Trust, Series 2006-14, Class 2A1A, 0.306%, 1/25/2047 (a) | 56,757,247 | 45,689,640 | ||||||
HarborView Mortgage Loan Trust, Series 2007-3, Class 2A1A, 0.356%, 5/19/2047 (a) | 32,682,888 | 28,517,650 | ||||||
HarborView Mortgage Loan Trust, Series 2007-5, Class A1A, 0.346%, 9/19/2037 (a) | 8,356,448 | 6,835,115 | ||||||
See accompanying notes which are an integral part of these financial statements.
16
Angel Oak Multi-Strategy Income Fund
Schedule of Investments – (continued)
July 31, 2014 (Unaudited)
| Principal Amount | Fair Value | |||||||
Collateralized Mortgage Obligations – (continued) |
| |||||||
HarborView Mortgage Loan Trust, Series 2007-2, Class 2A1A, 0.315%, 5/25/2038 (a) | $ | 30,847,991 | $ | 23,871,656 | ||||
HomeBanc Mortgage Trust, Series 2005-1, Class A1, 0.405%, 3/25/2035 (a) | 17,866,109 | 16,189,840 | ||||||
IMPAC CMB Trust, Series 2005-4, Class 1A1A, 0.695%, 5/25/2035 (a) | 148,274 | 138,721 | ||||||
IMPAC CMB Trust, Series 2005-5, Class A2, 0.595%, 8/25/2035 (a) | 11,381,739 | 10,188,227 | ||||||
IMPAC CMB Trust, Series 2005-5, Class A4, 0.915%, 8/25/2035 (a) | 8,238,370 | 6,205,173 | ||||||
IMPAC CMB Trust, Series 2005-6, Class 1A1, 0.655%, 10/25/2035 (a) | 337,490 | 285,175 | ||||||
IMPAC Secured Assets Corp., Series 2006-2, Class 1A2C, 0.435%, 8/25/2036 (a) | 6,928,887 | 5,431,166 | ||||||
IMPAC Secured Assets Corp., Series 2007-2, Class 1A1C, 0.535%, 5/25/2037 (a) | 8,252,449 | 5,766,028 | ||||||
IMPAC Secured Assets Corp., Series 2007-3, Class A1B, 0.395%, 9/25/2037 (a) | 7,797,433 | 5,167,842 | ||||||
INDYMAC IMSC Mortgage Loan Trust, Series 2007-AR2, Class AX, 2.385%, 3/25/2047 (I/O) (a) | 85,273,752 | 5,542,794 | ||||||
INDYMAC INDA Mortgage Loan Trust, Series 2006-AR1, Class A3, 5.044%, 8/25/2036 (a) | 1,865,212 | 1,859,531 | ||||||
INDYMAC Index Mortgage Loan Trust, Series 2004-AR5, Class AX2, 1.271%, 8/25/2034 (I/O) (a) | 52,187,507 | 2,979,907 | ||||||
INDYMAC Index Mortgage Loan Trust, Series 2004-AR8, Class 2A2A, 0.955%, 11/25/2034 (a) | 1,353,674 | 1,243,096 | ||||||
INDYMAC Index Mortgage Loan Trust, Series 2004-A9, Class A4, 5.250%, 12/25/2034 | 7,345,755 | 7,344,631 | ||||||
INDYMAC Index Mortgage Loan Trust, Series 2005-AR3, Class 4A1, 2.674%, 4/25/2035 (a) | 4,858,445 | 4,824,601 | ||||||
INDYMAC Index Mortgage Loan Trust, Series 2005-AR15, Class A2, 4.553%, 9/25/2035 (a) | 16,267,762 | 14,531,764 | ||||||
See accompanying notes which are an integral part of these financial statements.
17
Angel Oak Multi-Strategy Income Fund
Schedule of Investments – (continued)
July 31, 2014 (Unaudited)
| Principal Amount | Fair Value | |||||||
Collateralized Mortgage Obligations – (continued) |
| |||||||
INDYMAC Index Mortgage Loan Trust, Series 2005-AR15, Class A1, 4.553%, 9/25/2035 (a)(c) | $ | 24,553,230 | $ | 21,933,057 | ||||
INDYMAC Index Mortgage Loan Trust, Series 2005-A11, Class 1A1, 0.605%, 10/25/2035 (a) | 394,088 | 347,821 | ||||||
INDYMAC Index Mortgage Loan Trust, Series 2005-AR1, Class 3A1, 4.784%, 11/25/2035 (a) | 5,620,510 | 5,405,138 | ||||||
INDYMAC Index Mortgage Loan Trust, Series 2005-AR25, Class 1A21, 4.880%, 12/25/2035 (a) | 1,246,388 | 1,042,555 | ||||||
INDYMAC Index Mortgage Loan Trust, Series 2006-AR9, Class 3A1, 4.372%, 6/25/2036 (a) | 2,712,220 | 2,634,277 | ||||||
INDYMAC Index Mortgage Loan Trust, Series 2006-AR9, Class 3A3, 4.372%, 6/25/2036 (a) | 2,645,266 | 2,569,246 | ||||||
INDYMAC Index Mortgage Loan Trust, Series 2006-A13, Class A1, 4.759%, 7/25/2036 (a) | 820,020 | 762,893 | ||||||
INDYMAC Index Mortgage Loan Trust, Series 2006-A13, Class A2, 0.455%, 7/25/2036 (a) | 3,837,432 | 3,148,786 | ||||||
INDYMAC Index Mortgage Loan Trust, Series 2005-AR18, Class 2A1A, 0.465%, 10/25/2036 (a) | 22,848,703 | 17,614,042 | ||||||
INDYMAC Index Mortgage Loan Trust, Series 2006-AR2, Class 1A1B, 0.365%, 4/25/2046 (a) | 4,971,918 | 4,175,128 | ||||||
INDYMAC Index Mortgage Loan Trust, Series 2006-AR12, Class A1, 0.345%, 9/25/2046 (a) | 10,671,411 | 9,212,949 | ||||||
JP Morgan Alternative Loan Trust, Series 2005-S1, Class 2A9, 6.000%, 12/25/2035 | 589,648 | 551,145 | ||||||
JP Morgan Alternative Loan Trust, Series 2005-A2, Class 1A1, 0.675%, 1/25/2036 (a) | 2,471,430 | 2,276,063 | ||||||
JP Morgan Alternative Loan Trust, Series 2006-A1, Class 1A1, 0.385%, 3/25/2036 (a) | 11,984,313 | 9,938,064 | ||||||
JP Morgan Alternative Loan Trust, Series 2006-S4, Class A5, 6.000%, 12/25/2036 | 28,740,000 | 22,710,923 | ||||||
JP Morgan Chase Commercial Mortgage Securities Trust, Series 2013-C16, Class D, 5.008%, 12/15/2046 (a)(b) | 10,000,000 | 9,945,015 | ||||||
See accompanying notes which are an integral part of these financial statements.
18
Angel Oak Multi-Strategy Income Fund
Schedule of Investments – (continued)
July 31, 2014 (Unaudited)
| Principal Amount | Fair Value | |||||||
Collateralized Mortgage Obligations – (continued) |
| |||||||
JP Morgan Chase Commercial Mortgage Securities Trust, Series 2013-C16, Class A4, 4.166%, 12/15/2046 (c) | $ | 5,000,000 | $ | 5,351,472 | ||||
JP Morgan Chase Commercial Mortgage Securities Trust, Series 2013-C16, Class C, 5.008%, 12/15/2046 (a) | 7,000,000 | 7,538,020 | ||||||
JP Morgan Chase Commercial Mortgage Securities Trust, Series 2007-CB18, Class AJ, 5.502%, 6/12/2047 | 10,000,000 | 9,978,440 | ||||||
JP Morgan Chase Commercial Mortgage Securities Trust, Series 2013-C10, Class C, 4.160%, 12/15/2047 (a) | 2,755,000 | 2,809,269 | ||||||
JP Morgan Chase Commercial Mortgage Securities Trust, Series 2007-LD11, Class AM, 5.805%, 6/15/2049 (a) | 5,000,000 | 5,291,823 | ||||||
JP Morgan Chase Commercial Mortgage Securities Trust , Series 2006-CB14, Class AJ, 5.489%, 12/12/2044 (a) | 5,000,000 | 4,986,683 | ||||||
JP Morgan Mortgage Trust, Series 2004-A2, Class 1A2, 2.609%, 5/25/2034 (a) | 1,639,534 | 1,648,983 | ||||||
JP Morgan Mortgage Trust, Series 2005-A8, Class 1A1, 5.131%, 11/25/2035 (a) | 1,680,620 | 1,627,081 | ||||||
JP Morgan Mortgage Trust, Series 2005-A8, Class 3A1, 2.536%, 11/25/2035 (a) | 318,523 | 309,972 | ||||||
JP Morgan Mortgage Trust, Series 2005-S3, Class 1A14, 5.500%, 1/25/2036 | 5,715,880 | 5,514,838 | ||||||
JP Morgan Mortgage Trust, Series 2006-A1, Class 3A2, 2.604%, 2/25/2036 (a) | 1,155,064 | 1,029,589 | ||||||
JP Morgan Mortgage Trust, Series 2006-A1, Class 2A2, 2.654%, 2/25/2036 (a) | 580,681 | 522,568 | ||||||
JP Morgan Mortgage Trust, Series 2006-A5, Class 3A2, 5.552%, 10/25/2036 (a) | 1,156,942 | 1,073,123 | ||||||
JP Morgan Mortgage Trust, Series 2007-A2, Class 4A2, 5.040%, 4/25/2037 (a) | 2,206,831 | 2,062,463 | ||||||
JP Morgan Mortgage Trust, Series 2007-A2, Class 4A1, 5.040%, 4/25/2037 (a) | 1,986,891 | 1,856,911 | ||||||
JP Morgan Mortgage Trust, Series 2007-A4, Class 3A3, 5.252%, 6/25/2037 (a) | 7,263,832 | 6,698,176 | ||||||
See accompanying notes which are an integral part of these financial statements.
19
Angel Oak Multi-Strategy Income Fund
Schedule of Investments – (continued)
July 31, 2014 (Unaudited)
| Principal Amount | Fair Value | |||||||
Collateralized Mortgage Obligations – (continued) |
| |||||||
JPMBB Commercial Mortgage Securities Trust, Series 2013-C15, Class A5, 4.131%, 11/15/2045 (c) | $ | 15,000,000 | $ | 16,015,425 | ||||
JPMBB Commercial Mortgage Securities Trust, Series 2013-C14, Class D, 4.713%, 8/15/2046 (a)(b) | 5,000,000 | 4,848,218 | ||||||
JPMBB Commercial Mortgage Securities Trust, Series 2013-C17, Class C, 4.887%, 1/15/2047 (a) | 10,000,000 | 10,667,920 | ||||||
JPMBB Commercial Mortgage Securities Trust, Series 2014-C18, Class A5, 4.079%, 2/15/2047 (c) | 10,000,000 | 10,609,215 | ||||||
LB-UBS Commercial Mortgage Trust, Series 2008-C1, Class AJ, 6.150%, 4/15/2041 (a) | 4,855,516 | 4,853,120 | ||||||
Luminent Mortgage Trust, Series 2005-1, Class A1, 0.415%, 11/25/2035 (a) | 13,455,716 | 12,232,605 | ||||||
Luminent Mortgage Trust, Series 2007-2, Class 1A2, 0.435%, 5/25/2037 (a) | 11,714,803 | 8,983,708 | ||||||
Luminent Mortgage Trust, Series 2006-2, Class X, 2.348%, 2/25/2046 (I/O) (a) | 49,604,722 | 3,162,301 | ||||||
Luminent Mortgage Trust, Series 2006-6, Class A1, 0.355%, 10/25/2046 (a) | 29,629,521 | 26,128,141 | ||||||
MASTR Adjustable Rate Mortgages Trust, Series 2004-15, Class 2A2, 2.742%, 12/25/2034 (a) | 49,298 | 47,249 | ||||||
MASTR Adjustable Rate Mortgages Trust, Series 2005-1, Class 9A1, 5.243%, 1/25/2035 (a) | 1,260,416 | 1,268,230 | ||||||
MASTR Adjustable Rate Mortgages Trust, Series 2005-2, Class 5A1, 2.528%, 3/25/2035 (a) | 3,417,919 | 3,452,087 | ||||||
MASTR Adjustable Rate Mortgages Trust, Series 2005-6, Class 7A1, 5.195%, 6/25/2035 (a) | 2,046,669 | 1,951,501 | ||||||
MASTR Adjustable Rate Mortgages Trust, Series 2005-6, Class 5A2, 2.210%, 7/25/2035 (a) | 673,955 | 592,735 | ||||||
MASTR Adjustable Rate Mortgages Trust, Series 2006-OA2, Class X1, 0.900%, 12/25/2046 (I/O) | 123,187,418 | 6,351,851 | ||||||
MASTR Adjustable Rate Mortgages Trust, Series 2007-2, Class A1, 0.305%, 3/25/2047 (a) | 3,293,845 | 2,809,544 | ||||||
MASTR Alternative Loan Trust, Series 2005-3, Class 3A1, 6.500%, 4/25/2035 | 3,568,974 | 3,567,832 | ||||||
MASTR Asset Securitization Trust, Series 2007-2, Class A3, 6.250%, 1/25/2038 | 2,286,284 | 2,122,620 | ||||||
See accompanying notes which are an integral part of these financial statements.
20
Angel Oak Multi-Strategy Income Fund
Schedule of Investments – (continued)
July 31, 2014 (Unaudited)
| Principal Amount | Fair Value | |||||||
Collateralized Mortgage Obligations – (continued) |
| |||||||
Merrill Lynch Alternative Note Asset Trust, Series 2007-AF1, Class 1AF4, 6.000%, 5/25/2037 | $ | 5,053,615 | $ | 4,059,165 | ||||
Merrill Lynch Mortgage Investors Trust, Series 2005-A7, Class 2A1, 5.085%, 9/25/2035 (a) | 22,535,163 | 21,778,522 | ||||||
Merrill Lynch-CFC Commercial Mortgage Trust, Series 2006-1, Class B, 5.568%, 2/12/2039 (a) | 2,500,000 | 2,385,091 | ||||||
Morgan Stanley Bank of America Merrill Lynch Trust, Series 2013-C7, Class D, 4.303%, 2/15/2046 (a)(b) | 10,000,000 | 9,542,310 | ||||||
Morgan Stanley Bank of America Merrill Lynch Trust, Series 2013-C9, Class D, 4.160%, 5/15/2046 (a)(b) | 6,500,000 | 6,119,152 | ||||||
Morgan Stanley Bank of America Merrill Lynch Trust, Series 2013-C11, Class A4, 4.218%, 8/15/2046 (a)(c) | 21,000,000 | 22,611,897 | ||||||
Morgan Stanley Bank of America Merrill Lynch Trust, Series 2013-C12, Class A4, 4.259%, 10/15/2046 (a)(c) | 17,480,000 | 18,827,778 | ||||||
Morgan Stanley Bank of America Merrill Lynch Trust, Series 2013-C12, Class C, 4.770%, 10/15/2046 (a) | 4,000,000 | 4,201,732 | ||||||
Morgan Stanley Bank of America Merrill Lynch Trust, Series 2014-C15, Class D, 4.899%, 4/15/2047 (a)(b) | 15,000,000 | 14,537,310 | ||||||
Morgan Stanley Bank of America Merrill Lynch Trust, Series 2014-C17, Class C, 4.609%, 8/15/2047 (a) | 10,000,000 | 9,999,675 | ||||||
Morgan Stanley Bank of America Merrill Lynch Trust, Series 2014-C17, Class A5, 3.741%, 8/15/2047 | 8,000,000 | 8,239,755 | ||||||
Morgan Stanley Bank of America Merrill Lynch Trust, Series 2014-C14, Class C, 4.835%, 2/15/2047 (a) | 4,000,000 | 4,240,418 | ||||||
Morgan Stanley Bank of America Merrill Lynch Trust, Series 2014-C14, Class D, 4.835%, 2/15/2047 (a)(b) | 7,500,000 | 7,313,332 | ||||||
Morgan Stanley Bank of America Merrill Lynch Trust, Series 2014-C16, Class A5, 3.892%, 6/15/2047 (c) | 6,500,000 | 6,790,972 | ||||||
Morgan Stanley Bank of America Merrill Lynch Trust, Series 2014-C16, Class D, 4.758%, 6/15/2047 (a)(b) | 10,500,000 | 9,970,548 | ||||||
Morgan Stanley Bank of America Merrill Lynch Trust, Series 2014-C16, Class C, 4.758%, 6/15/2047 (a) | 10,000,000 | 10,464,050 | ||||||
Morgan Stanley Capital I Trust, Series 2007-IQ14, Class AMFX, 5.685%, 4/15/2049 (a) | 9,700,000 | 10,337,959 | ||||||
Morgan Stanley Capital I Trust, Series 2007-IQ14, Class AM, 5.685%, 4/15/2049 (a) | 20,000,000 | 21,298,870 | ||||||
See accompanying notes which are an integral part of these financial statements.
21
Angel Oak Multi-Strategy Income Fund
Schedule of Investments – (continued)
July 31, 2014 (Unaudited)
| Principal Amount | Fair Value | |||||||
Collateralized Mortgage Obligations – (continued) |
| |||||||
Morgan Stanley Mortgage Loan Trust, Series 2004-8AR, Class 4A5, 2.455%, 10/25/2034 (a) | $ | 470,492 | $ | 358,023 | ||||
Morgan Stanley Mortgage Loan Trust, Series 2006-3AR, Class 2A1, 2.810%, 3/25/2036 (a) | 16,095,715 | 13,813,198 | ||||||
Morgan Stanley Mortgage Loan Trust, Series 2007-15AR, Class 2A1, 2.628%, 11/25/2037 (a) | 12,110,144 | 9,798,378 | ||||||
Mortgage IT Trust, Series 2006-1, Class 2A1A, 0.365%, 4/25/2036 (a) | 8,215,096 | 7,247,777 | ||||||
Nomura Asset Acceptance Corp. Alternative Loan Trust, Series 2005-AR4, Class 3A1, 2.871%, 8/25/2035 (a) | 8,546,335 | 8,368,819 | ||||||
Prime Mortgage Trust, Series 2005-4, Class 2A4, 0.655%, 10/25/2035 (a) | 160,251 | 143,691 | ||||||
RAIT Trust, Series 2014-FL2, Class B, 2.302%, 5/13/2031 (a)(b) | 650,000 | 641,875 | ||||||
Residential Accredit Loans, Inc. Trust, Series 2005-QS2, Class A3, 5.500%, 2/25/2035 | 9,720,973 | 9,722,265 | ||||||
Residential Accredit Loans, Inc. Trust, Series 2005-QA4, Class A31, 3.061%, 4/25/2035 (a) | 10,255,978 | 9,792,254 | ||||||
Residential Accredit Loans, Inc. Trust, Series 2005-QS9, Class A6, 5.500%, 6/25/2035 | 7,911,958 | 7,469,197 | ||||||
Residential Accredit Loans, Inc. Trust, Series 2005-QS11, Class A2, 0.655%, 7/25/2035 (a) | 1,002,494 | 875,428 | ||||||
Residential Accredit Loans, Inc. Trust, Series 2005-QS12, Class A3, 5.500%, 8/25/2035 | 2,640,920 | 2,560,216 | ||||||
Residential Accredit Loans, Inc. Trust, Series 2005-QS12, Class A4, 5.500%, 8/25/2035 | 19,761,862 | 18,003,708 | ||||||
Residential Accredit Loans, Inc. Trust, Series 2005-QS12, Class A10, 1.505%, 8/25/2035 (a) | 12,894,031 | 10,664,679 | ||||||
Residential Accredit Loans, Inc. Trust, Series 2005-QS13, Class 1A6, 5.500%, 9/25/2035 | 4,480,638 | 3,920,003 | ||||||
Residential Accredit Loans, Inc. Trust, Series 2006-QS1, Class A5, 1.065%, 1/25/2036 (a) | 22,309,370 | 16,750,388 | ||||||
Residential Accredit Loans, Inc. Trust, Series 2006-QS2, Class 1A5, 1.155%, 2/25/2036 (a) | 3,099,901 | 2,238,727 | ||||||
Residential Accredit Loans, Inc. Trust, Series 2006-QS2, Class 1A9, 5.500%, 2/25/2036 | 6,195,797 | 5,316,230 | ||||||
See accompanying notes which are an integral part of these financial statements.
22
Angel Oak Multi-Strategy Income Fund
Schedule of Investments – (continued)
July 31, 2014 (Unaudited)
| Principal Amount | Fair Value | |||||||
Collateralized Mortgage Obligations – (continued) |
| |||||||
Residential Accredit Loans, Inc. Trust, Series 2006-QS2, Class 1A14, 0.855%, 2/25/2036 (a) | $ | 17,348,850 | $ | 12,787,490 | ||||
Residential Accredit Loans, Inc. Trust, Series 2006-QS3, Class 1A14, 6.000%, 3/25/2036 | 6,365,263 | 5,577,473 | ||||||
Residential Accredit Loans, Inc. Trust, Series 2006-QS3, Class 1A8, 0.555%, 3/25/2036 (a) | 7,722,837 | 5,504,329 | ||||||
Residential Accredit Loans, Inc. Trust, Series 2006-QS4, Class A9, 6.000%, 4/25/2036 | 1,222,609 | 1,054,306 | ||||||
Residential Accredit Loans, Inc. Trust, Series 2006-QS4, Class A4, 6.000%, 4/25/2036 | 1,984,858 | 1,711,624 | ||||||
Residential Accredit Loans, Inc. Trust, Series 2006-QS5, Class A1, 6.000%, 5/25/2036 | 3,772,158 | 3,207,383 | ||||||
Residential Accredit Loans, Inc. Trust, Series 2006-QS9, Class 1A15, 7.000%, 7/25/2036 | 5,763,766 | 4,966,660 | ||||||
Residential Accredit Loans, Inc. Trust, Series 2006-QS11, Class 1A4, 6.500%, 8/25/2036 | 9,599,237 | 8,148,130 | ||||||
Residential Accredit Loans, Inc. Trust, Series 2006-QA7, Class 1A1, 0.345%, 8/25/2036 (a) | 16,067,645 | 12,509,915 | ||||||
Residential Accredit Loans, Inc. Trust, Series 2006-QS10, Class A5, 0.455%, 8/25/2036 (a) | 3,571,874 | 2,400,157 | ||||||
Residential Accredit Loans, Inc. Trust, Series 2006-QS10, Class A1, 6.000%, 8/25/2036 | 5,742,242 | 4,877,868 | ||||||
Residential Accredit Loans, Inc. Trust, Series 2006-QS11, Class 1A8, 6.000%, 8/25/2036 | 10,025,736 | 8,259,793 | ||||||
Residential Accredit Loans, Inc. Trust, Series 2006-QS12, Class 2A4, 6.000%, 9/25/2036 | 11,383,287 | 9,423,643 | ||||||
Residential Accredit Loans, Inc. Trust, Series 2006-QS14, Class A1, 6.500%, 11/25/2036 | 1,672,142 | 1,348,031 | ||||||
Residential Accredit Loans, Inc. Trust, Series 2006-QS14, Class A13, 6.500%, 11/25/2036 | 3,568,456 | 2,876,782 | ||||||
Residential Accredit Loans, Inc. Trust, Series 2006-QS14, Class A15, 0.455%, 11/25/2036 (a) | 6,719,765 | 4,257,683 | ||||||
Residential Accredit Loans, Inc. Trust, Series 2006-Q17, Class A7, 6.000%, 12/25/2036 | 9,193,146 | 7,284,208 | ||||||
Residential Accredit Loans, Inc. Trust, Series 2007-QS2, Class A6, 6.250%, 1/25/2037 | 8,772,774 | 7,272,709 | ||||||
See accompanying notes which are an integral part of these financial statements.
23
Angel Oak Multi-Strategy Income Fund
Schedule of Investments – (continued)
July 31, 2014 (Unaudited)
| Principal Amount | Fair Value | |||||||
Collateralized Mortgage Obligations – (continued) |
| |||||||
Residential Accredit Loans, Inc. Trust, Series 2007-QS8, Class A13, 6.000%, 6/25/2037 | $ | 2,480,937 | $ | 2,029,699 | ||||
Residential Asset Securitization Trust, Series 2007-A5, Class 2A3, 6.000%, 5/25/2037 | 7,595,740 | 6,814,761 | ||||||
Residential Funding Mortgage Securities I Trust, Series 2007-S6, Class 1A15, 6.000%, 6/25/2037 | 1,832,295 | 1,635,085 | ||||||
Residential Funding Mortgage Securities I Trust, Series 2006-SA1, Class 1A1, 3.224%, 2/25/2036 (a) | 463,989 | 418,334 | ||||||
Residential Funding Mortgage Securities I Trust, Series 2006-S3, Class A7, 5.500%, 3/25/2036 | 865,663 | 794,109 | ||||||
Residential Funding Mortgage Securities I Trust, Series 2006-S6, Class A15, 6.000%, 7/25/2036 | 3,146,102 | 2,916,389 | ||||||
Residential Funding Mortgage Securities I Trust, Series 2006-S7, Class A7, 6.250%, 8/25/2036 | 289,258 | 264,923 | ||||||
Residential Funding Mortgage Securities I Trust, Series 2007-S6, Class 2A5, 0.655%, 6/25/2037 (a) | 5,118,338 | 4,010,361 | ||||||
Residential Funding Mortgage Securities I Trust, Series 2007-S6, Class 1A10, 6.000%, 6/25/2037 | 229,967 | 205,216 | ||||||
Residential Funding Mortgage Securities I Trust, Series 2007-S6, Class 1A11, 6.000%, 6/25/2037 | 1,305,866 | 1,165,316 | ||||||
Sequoia Mortgage Trust, Series 2013-1, Class 2A1, 1.855%, 2/25/2043 (a)(c) | 4,716,935 | 4,145,686 | ||||||
Sequoia Mortgage Trust, Series 2013-3, Class A2, 2.500%, 3/25/2043 (a)(c) | 18,864,312 | 17,559,732 | ||||||
Sequoia Mortgage Trust, Series 2007-1, Class 5A1, 5.112%, 10/20/2046 (a) | 10,454,294 | 10,005,177 | ||||||
Structured Adjustable Rate Mortgage Loan Trust, Series 2004-16, Class 5A3, 3.888%, 11/25/2034 (a) | 125,564 | 124,561 | ||||||
Structured Adjustable Rate Mortgage Loan Trust, Series 2004-16, Class 1A2, 2.476%, 11/25/2034 (a) | 6,696,923 | 6,521,882 | ||||||
Structured Adjustable Rate Mortgage Loan Trust, Series 2005-1, Class 4A2, 2.374%, 2/25/2035 (a) | 888,806 | 523,489 | ||||||
Structured Adjustable Rate Mortgage Loan Trust, Series 2005-1, Class 5A2, 2.703%, 2/25/2035 (a) | 451,291 | 329,976 | ||||||
Structured Adjustable Rate Mortgage Loan Trust, Series 2005-1, Class 1A1, 2.541%, 2/25/2035 (a) | 8,737,787 | 8,330,370 | ||||||
See accompanying notes which are an integral part of these financial statements.
24
Angel Oak Multi-Strategy Income Fund
Schedule of Investments – (continued)
July 31, 2014 (Unaudited)
| Principal Amount | Fair Value | |||||||
Collateralized Mortgage Obligations – (continued) |
| |||||||
Structured Adjustable Rate Mortgage Loan Trust, Series 2005-4, Class 5A, 4.454%, 3/25/2035 (a) | $ | 5,363,818 | $ | 5,025,694 | ||||
Structured Adjustable Rate Mortgage Loan Trust, Series 2005-11, Class 3A, 2.443%, 5/25/2035 (a) | 9,412,942 | 9,020,018 | ||||||
Structured Adjustable Rate Mortgage Loan Trust, Series 2005-9, Class AX, 1.089%, 5/25/2035 (I/O) (a) | 123,554,246 | 3,436,352 | ||||||
Structured Adjustable Rate Mortgage Loan Trust, Series 2005-15, Class 1A1, 2.561%, 7/25/2035 (a) | 2,595,587 | 2,107,092 | ||||||
Structured Adjustable Rate Mortgage Loan Trust, Series 2005-17, Class 5A1, 5.150%, 8/25/2035 (a) | 11,660,945 | 11,139,071 | ||||||
Structured Adjustable Rate Mortgage Loan Trust, Series 2005-18, Class 6A1, 2.507%, 9/25/2035 (a) | 2,759,482 | 2,518,621 | ||||||
Structured Adjustable Rate Mortgage Loan Trust, Series 2005-18, Class 7A3, 4.852%, 9/25/2035 (a) | 25,964,608 | 22,309,259 | ||||||
Structured Adjustable Rate Mortgage Loan Trust, Series 2005-20, Class 4A1, 5.437%, 10/25/2035 (a) | 27,802,026 | 24,936,388 | ||||||
Structured Adjustable Rate Mortgage Loan Trust, Series 2005-21, Class 7A1, 5.052%, 11/25/2035 (a) | 7,317,916 | 6,357,052 | ||||||
Structured Adjustable Rate Mortgage Loan Trust, Series 2007-7, Class 1A1, 0.455%, 8/25/2037 (a) | 8,043,845 | 6,755,953 | ||||||
Structured Asset Mortgage Investments II Trust, Series 2005-AR4, Class X2, 0.719%, 12/25/2035 (I/O) (a) | 30,802,087 | 385,026 | ||||||
Structured Asset Securities Corp. Mortgage Loan Trust, Series 2005-10, Class 5A4, 5.750%, 12/25/2034 | 782,581 | 756,684 | ||||||
Structured Asset Securities Corp. Mortgage Loan Trust, Series 2005-17, Class 5A1, 5.500%, 10/25/2035 | 4,756,331 | 4,323,862 | ||||||
Structured Asset Securities Corp. Mortgage Pass-Through Certificates, Series 2003-6A, Class 2A1, 2.369%, 3/25/2033 (a) | 75,358 | 75,526 | ||||||
Thornburg Mortgage Securities Trust, Series 2006-4, Class A2C, 5.640%, 7/25/2036 (a) | 9,467,919 | 4,815,573 | ||||||
UBS-Barclays Commercial Mortgage Trust, Series 2012-C4, Class E, 4.501%, 12/10/2045 (a)(b) | 5,000,000 | 4,398,785 | ||||||
UBS-Barclays Commercial Mortgage Trust, Series 2013-C5, Class B, 3.649%, 3/10/2046 (a)(b) | 190,000 | 187,646 | ||||||
See accompanying notes which are an integral part of these financial statements.
25
Angel Oak Multi-Strategy Income Fund
Schedule of Investments – (continued)
July 31, 2014 (Unaudited)
| Principal Amount | Fair Value | |||||||
Collateralized Mortgage Obligations – (continued) |
| |||||||
UBS-Barclays Commercial Mortgage Trust, Series 2012-C3, Class C, 4.958%, 8/10/2049 (a)(b) | $ | 3,500,000 | $ | 3,750,723 | ||||
UBS-Barclays Commercial Mortgage Trust, Series 2012-C2, Class F, 4.890%, 5/10/2063 (a)(b) | 7,000,000 | 6,365,138 | ||||||
Wachovia Bank Commercial Mortgage Trust, Series 2006-C26, Class AJ, 5.997%, 6/15/2045 (a) | 5,105,000 | 5,216,029 | ||||||
Wachovia Bank Commercial Mortgage Trust, Series 2007-C33, Class B, 5.941%, 2/15/2051 (a) | 5,000,000 | 5,064,848 | ||||||
Wachovia Mortgage Loan Trust LLC Trust, Series 2005-B, Class 4A1, 5.438%, 10/20/2035 (a) | 204,265 | 205,210 | ||||||
Washington Mutual Mortgage Pass-Through Certificates, Series 2005-AR16, Class 1A1, 2.358%, 12/25/2035 (a) | 1,564,569 | 1,519,521 | ||||||
Washington Mutual Mortgage Pass-Through Certificates, Series 2005-AR18, Class 3A1, 4.693%, 1/25/2036 (a) | 8,976,534 | 8,502,043 | ||||||
Washington Mutual Mortgage Pass-Through Certificates, Series 2006-AR14, Class 1A1, 2.049%, 11/25/2036 (a) | 2,347,231 | 2,088,038 | ||||||
Washington Mutual Mortgage Pass-Through Certificates, Series 2007-HY1, Class 3A3, 4.610%, 2/25/2037 (a) | 20,538,328 | 19,238,436 | ||||||
Washington Mutual Mortgage Pass-Through Certificates, Series 2007-HY5, Class 3A1, 4.652%, 5/25/2037 (a) | 6,932,216 | 6,675,117 | ||||||
Washington Mutual Mortgage Pass-Through Certificates, Series 2007-HY7, Class 4A1, 4.676%, 7/25/2037 (a) | 18,946,618 | 17,963,516 | ||||||
Washington Mutual Mortgage Pass-Through Certificates, Series 2006-AR8, Class 1A1, 2.314%, 8/25/2046 (a) | 1,275,112 | 1,123,874 | ||||||
Washington Mutual Mortgage Pass-Through Certificates, Series 2006-AR9, Class 1A, 1.118%, 8/25/2046 (a) | 28,058,032 | 25,272,487 | ||||||
Washington Mutual Mortgage Pass-Through Certificates, Series 2006-AR15, Class 2XPP, 0.396%, 11/25/2046 (I/O) (a) | 64,139,591 | 771,663 | ||||||
Washington Mutual Mortgage Pass-Through Certificates WMALT, Series 2005-1, Class 1A1, 5.500%, 3/25/2035 | 696,427 | 705,998 | ||||||
See accompanying notes which are an integral part of these financial statements.
26
Angel Oak Multi-Strategy Income Fund
Schedule of Investments – (continued)
July 31, 2014 (Unaudited)
| Principal Amount | Fair Value | |||||||
Collateralized Mortgage Obligations – (continued) |
| |||||||
Washington Mutual Mortgage Pass-Through Certificates WMALT, Series 2005-7, Class 2CB1, 5.500%, 8/25/2035 | $ | 4,461,174 | $ | 4,249,509 | ||||
Washington Mutual Mortgage Pass-Through Certificates WMALT, Series 2005-11, Class A2, 5.750%, 1/25/2036 | 7,420,660 | 6,669,326 | ||||||
Washington Mutual Mortgage Pass-Through Certificates WMALT, Series 2006-AR1, Class X2, 1.418%, 2/25/2036 (I/O) (a) | 36,712,678 | 1,560,289 | ||||||
Washington Mutual Mortgage Pass-Through Certificates WMALT, Series 2006-8, Class A5, 4.943%, 10/25/2036 | 13,990,428 | 10,131,281 | ||||||
Washington Mutual Mortgage Pass-Through Certificates WMALT, Series 2006-8, Class A6, 4.943%, 10/25/2036 | 14,353,024 | 10,398,134 | ||||||
Washington Mutual Mortgage Pass-Through Certificates WMALT, Series 2006-8, Class A1, 0.272%, 10/25/2036 (a) | 19,660,026 | 11,516,057 | ||||||
Washington Mutual Mortgage Pass-Through Certificates WMALT, Series 2006-AR5, Class 5XPP, 0.752%, 6/25/2046 (I/O) (a) | 25,182,602 | 516,243 | ||||||
Washington Mutual Mortgage Pass-Through Certificates WMALT, Series 2006-AR4, Class X2, 0.696%, 6/25/2046 (I/O) (a) | 156,256,709 | 3,047,006 | ||||||
Washington Mutual Mortgage Pass-Through Certificates WMALT, Series 2006-AR6, Class 2XPP, 0.658%, 8/25/2046 (I/O) (a) | 157,615,459 | 2,915,886 | ||||||
Washington Mutual Mortgage Pass-Through Certificates WMALT, Series 2006-AR8, Class 3X1, 1.388%, 10/25/2046 (I/O) (a) | 56,341,029 | 2,447,313 | ||||||
Washington Mutual Mortgage Pass-Through Certificates WMALT, Series 2006-AR9, Class CX2P, 1.247%, 11/25/2046 (I/O) (a) | 59,931,448 | 2,472,172 | ||||||
Washington Mutual Mortgage Pass-Through Certificates WMALT, Series 2007-0A1, Class CX2P, 1.515%, 12/25/2046 (I/O) (a) | 197,152,165 | 7,905,802 | ||||||
See accompanying notes which are an integral part of these financial statements.
27
Angel Oak Multi-Strategy Income Fund
Schedule of Investments – (continued)
July 31, 2014 (Unaudited)
| Principal Amount | Fair Value | |||||||
Collateralized Mortgage Obligations – (continued) |
| |||||||
Wells Fargo Alternative Loan Trust, Series 2007-PA3, Class 2A1, 6.000%, 7/25/2037 | $ | 7,996,748 | $ | 7,683,711 | ||||
Wells Fargo Alternative Loan Trust, Series 2007-PA3, Class 2A4, 6.000%, 7/25/2037 | 3,402,903 | 3,269,694 | ||||||
Wells Fargo Mortgage Backed Securities Trust, Series 2005-AR15, Class 1A1, 2.613%, 9/25/2035 (a) | 5,283,627 | 5,014,992 | ||||||
Wells Fargo Mortgage Backed Securities Trust, Series 2005-AR15, Class 1A2, 2.613%, 9/25/2035 (a) | 9,263,486 | 9,074,590 | ||||||
Wells Fargo Mortgage Backed Securities Trust, Series 2005-AR16, Class 7A2, 5.203%, 10/25/2035 (a) | 617,997 | 243,426 | ||||||
Wells Fargo Mortgage Backed Securities Trust, Series 2006-AR6, Class 7A1, 5.014%, 3/25/2036 (a) | 86,205 | 87,053 | ||||||
Wells Fargo Mortgage Backed Securities Trust, Series 2006-5, Class 1A6, 5.250%, 4/25/2036 | 181,075 | 178,550 | ||||||
Wells Fargo Mortgage Backed Securities Trust, Series 2006-AR4, Class 2A1, 5.598%, 4/25/2036 (a) | 2,277,800 | 2,262,955 | ||||||
Wells Fargo Mortgage Backed Securities Trust, Series 2006-AR10, Class 4A1, 2.610%, 7/25/2036 (a) | 301,616 | 277,890 | ||||||
Wells Fargo Mortgage Backed Securities Trust, Series 2006-AR10, Class 5A6, 2.612%, 7/25/2036 (a) | 282,942 | 277,778 | ||||||
Wells Fargo Mortgage Backed Securities Trust, Series 2006-AR11, Class A1, 2.613%, 8/25/2036 (a) | 901,581 | 863,691 | ||||||
Wells Fargo Mortgage Backed Securities Trust, Series 2006-AR14, Class 1A3, 5.881%, 10/25/2036 (a) | 6,190,649 | 6,089,509 | ||||||
Wells Fargo Mortgage Backed Securities Trust, Series 2006-AR19, Class A3, 5.443%, 12/25/2036 (a) | 770,955 | 767,694 | ||||||
Wells Fargo Mortgage Backed Securities Trust, Series 2007-10, Class 1A19, 6.000%, 7/25/2037 | 840,728 | 839,475 | ||||||
Wells Fargo Mortgage Backed Securities Trust, Series 2007-8, Class 1A5, 6.000%, 7/25/2037 | 1,069,442 | 1,068,201 | ||||||
Wells Fargo Mortgage Backed Securities Trust, Series 2007-15, Class A1, 6.000%, 11/25/2037 | 2,429,150 | 2,450,303 | ||||||
WF-RBS Commercial Mortgage Trust, Series 2012-C9, Class C, 4.543%, 11/15/2045 (a) | 4,225,000 | 4,361,320 | ||||||
See accompanying notes which are an integral part of these financial statements.
28
Angel Oak Multi-Strategy Income Fund
Schedule of Investments – (continued)
July 31, 2014 (Unaudited)
| Principal Amount | Fair Value | |||||||
Collateralized Mortgage Obligations – (continued) |
| |||||||
WF-RBS Commercial Mortgage Trust, Series 2012-C9, Class D, 4.803%, 11/15/2045 (a)(b) | $ | 9,000,000 | $ | 8,944,344 | ||||
WF-RBS Commercial Mortgage Trust, Series 2013-C14, Class D, 4.001%, 6/15/2046 (a)(b) | 8,470,000 | 7,814,236 | ||||||
WF-RBS Commercial Mortgage Trust, Series 2013-C15, Class A4, 4.153%, 8/15/2046 (a)(c) | 9,710,000 | 10,380,709 | ||||||
WF-RBS Commercial Mortgage Trust, Series 2013-C16, Class D, 4.984%, 9/15/2046 (a)(b) | 4,000,000 | 3,962,458 | ||||||
WF-RBS Commercial Mortgage Trust, Series 2013-C17, Class C, 5.127%, 12/15/2046 (a) | 1,000,000 | 1,071,679 | ||||||
WF-RBS Commercial Mortgage Trust, Series 2013-C17, Class D, 5.127%, 12/15/2046 (a)(b) | 8,229,000 | 8,165,258 | ||||||
WF-RBS Commercial Mortgage Trust, Series 2014-C20, Class C, 4.513%, 5/15/2047 (a) | 10,000,000 | 10,162,340 | ||||||
WF-RBS Commercial Mortgage Trust, Series 2014-C21, Class A5, 3.678%, 8/15/2047 | 8,000,000 | 8,239,512 | ||||||
WF-RBS Commercial Mortgage Trust, Series 2013-C12, Class A4, 3.198%, 3/15/2048 | 4,435,000 | 4,437,710 | ||||||
|
| |||||||
TOTAL COLLATERALIZED MORTGAGE OBLIGATIONS (Cost 2,408,792,704) |
| 2,469,069,470 | ||||||
|
| |||||||
Collateralized Loan Obligations – 10.79% | ||||||||
Acis CLO Ltd., Series 2013-1A, Class E, 5.834%, 4/18/2024 (a)(b) | 12,000,000 | 11,259,600 | ||||||
Acis CLO Ltd., Series 2014-3A, Class E, 4.990%, 2/1/2026 (a)(b) | 4,500,000 | 3,934,800 | ||||||
Adams Mill CLO Ltd., Series 2014-1A, Class E1, 5.235%, 7/15/2026 (a)(b) | 3,000,000 | 2,760,000 | ||||||
ALM Loan Funding, Series 2014-14A, Class D, 5.084%, 7/28/2026 (a)(b) | 7,500,000 | 6,865,500 | ||||||
AMMC CLO IX Ltd., Series 2011-9A, Class E, 7.684%, 1/15/2022 (a)(b) | 1,000,000 | 1,000,400 | ||||||
Anchorage Capital CLO Ltd., Series 2013-1A, Class D, 5.034%, 7/13/2025 (a)(b) | 5,000,000 | 4,556,500 | ||||||
Ares XXVII CLO Ltd., Series 2013-2A, Class E, 5.085%, 7/28/2025 (a)(b) | 5,500,000 | 5,066,600 | ||||||
See accompanying notes which are an integral part of these financial statements.
29
Angel Oak Multi-Strategy Income Fund
Schedule of Investments – (continued)
July 31, 2014 (Unaudited)
| Principal Amount | Fair Value | |||||||
Collateralized Loan Obligations – (continued) | ||||||||
Arrowpoint CLO Ltd., Series 2012-2A, Class E, 4.954%, 3/12/2026 (a)(b) | $ | 6,000,000 | $ | 5,333,400 | ||||
Arrowpoint CLO Ltd., Series 2012-2A, Class D, 3.934%, 3/12/2026 (a)(b) | 3,000,000 | 2,846,700 | ||||||
Brookside Mill CLO Ltd., Series 2013-1A, Class E, 4.633%, 4/17/2025 (a)(b) | 7,250,000 | 6,561,250 | ||||||
Canyon Capital CLO Ltd., Series 2012-1A, Class D, 4.534%, 1/15/2024 (a)(b) | 3,000,000 | 2,998,800 | ||||||
Carlyle Global Market Strategies CLO Ltd., Series 2012-4A, Class E, 5.734%, 1/20/2025 (a)(b) | 2,850,000 | 2,783,310 | ||||||
Catamaran CLO Ltd., Series 2012-1A, Class D, 4.731%, 12/20/2023 (a)(b) | 8,750,000 | 8,756,125 | ||||||
CIFC Funding Ltd., Series 2012-1A, Class B2L, 7.225%, 8/14/2024 (a)(b) | 10,000,000 | 10,002,000 | ||||||
CIFC Funding Ltd., Series 2012-2A, Class B2L, 6.227%, 12/5/2024 (a)(b) | 6,630,000 | 6,625,359 | ||||||
CIFC Funding Ltd., Series 2012-2A, Class B3L, 7.227%, 12/5/2024 (a)(b) | 2,000,000 | 1,944,400 | ||||||
CIFC Funding Ltd., Series 2012-3A, Class B2L, 6.234%, 1/29/2025 (a)(b) | 9,200,000 | 9,080,400 | ||||||
CIFC Funding Ltd., Series 2012-3A, Class B3L, 7.134%, 1/29/2025 (a)(b) | 1,000,000 | 952,700 | ||||||
CIFC Funding Ltd., Series 2013-1A, Class E, 6.358%, 4/16/2025 (a)(b) | 4,800,000 | 4,363,200 | ||||||
ColumbusNova CLO IV Ltd., Series 2007-2A, Class D, 4.734%, 10/15/2021 (a)(b) | 3,440,000 | 3,445,848 | ||||||
Crown Point CLO II Ltd, Series 2013-2A, Class B1L, 3.784%, 12/14/2023 (a) | 4,000,000 | 3,811,600 | ||||||
Crown Point CLO Ltd., Series 2012-1A, Class B1L, 5.229%, 11/21/2022 (a)(b) | 5,000,000 | 5,019,000 | ||||||
Crown Point CLO Ltd., Series 2012-1A, Class B2L, 6.729%, 11/21/2022 (a)(b) | 6,625,000 | 6,630,300 | ||||||
Emerson Park CLO Ltd., Series 2013-1A, Class E, 5.084%, 7/15/2025 (a)(b) | 3,000,000 | 2,775,600 | ||||||
Finn Square CLO Ltd., Series 2012-1A, Class C, 3.831%, 12/24/2023 (a)(b) | 3,000,000 | 2,930,100 | ||||||
See accompanying notes which are an integral part of these financial statements.
30
Angel Oak Multi-Strategy Income Fund
Schedule of Investments – (continued)
July 31, 2014 (Unaudited)
| Principal Amount | Fair Value | |||||||
Collateralized Loan Obligations – (continued) | ||||||||
Finn Square CLO Ltd, Series 2012-1A, Class D, 5.281%, 12/24/2023 (a)(b) | $ | 4,600,000 | $ | 4,373,220 | ||||
Gallatin CLO IV Ltd., Series 2012-1A, Class E, 5.484%, 10/15/2023 (a)(b) | 3,000,000 | 2,838,900 | ||||||
ING IM CLO Ltd., Series 2012-1RA, Class ER, 6.731%, 3/14/2022 (a)(b) | 2,000,000 | 1,951,400 | ||||||
ING IM CLO Ltd., Series 2012-1RA, Class DR, 5.431%, 3/14/2022 (a)(b) | 1,750,000 | 1,737,225 | ||||||
ING IM CLO Ltd., Series 2014-1A, Class D, 5.169%, 4/18/2026 (a)(b) | 9,500,000 | 8,975,600 | ||||||
JFIN Revolver CLO Ltd., Series 2013-1A, Class D, 3.984%, 1/20/2021 (a)(b) | 7,000,000 | 6,633,200 | ||||||
JFIN Revolver CLO Ltd., Series 2014-2A, Class C, 2.984%, 2/20/2022 (a)(b) | 5,000,000 | 4,787,500 | ||||||
JMP Credit Advisors CLO II Ltd., Series 2013-1A, Class E, 5.484%, | 13,200,000 | 12,372,360 | ||||||
JMP Credit Advisors CLO II Ltd., Series 2013-1A, Class D, 4.084%, 4/30/2023 (a)(b) | 4,000,000 | 3,856,000 | ||||||
KVK CLO Ltd., Series 2012-1X, Class E, 6.484%, 7/15/2023 (a)(b) | 3,700,000 | 3,700,000 | ||||||
KVK CLO Ltd., Series 2013-1A, Class D, 4.584%, 4/14/2025 (a)(b) | 2,000,000 | 1,981,400 | ||||||
Longfellow Place CLO Ltd., Series 2013-1A, Class D, 4.484%, | 9,000,000 | 8,990,100 | ||||||
Muir Woods CLO Ltd., Series 2012-1A, Class E, 6.731%, 9/14/2023 (a)(b) | 2,500,000 | 2,500,750 | ||||||
Neuberger Berman CLO XIII Ltd., Series 2012-13A, Class D, 4.733%, 1/23/2024 (a)(b) | 5,050,000 | 5,054,545 | ||||||
NewMark Capital Funding CLO Ltd., Series 2013-1A, Class D, 3.017%, 6/2/2025 (a)(b) | 1,000,000 | 904,600 | ||||||
Ocean Trails CLO IV, Series 2013-4A, Class A, 1.524%, 8/13/2025 (a)(b)(c) | 25,000,000 | 25,007,500 | ||||||
Ocean Trails CLO IV, Series 2013-4A, Class D, 4.224%, 8/13/2025 (a)(b) | 4,000,000 | 3,879,200 | ||||||
OHA Credit Partners VI Ltd., Series 2012-6A, Class D, 4.724%, 5/15/2023 (a)(b) | 3,000,000 | 3,000,300 | ||||||
See accompanying notes which are an integral part of these financial statements.
31
Angel Oak Multi-Strategy Income Fund
Schedule of Investments – (continued)
July 31, 2014 (Unaudited)
| Principal Amount | Fair Value | |||||||
Collateralized Loan Obligations – (continued) | ||||||||
Portola CLO Ltd., Series 2007-1A, Class E, 6.624%, 11/15/2021 (a)(b) | $ | 2,747,252 | $ | 2,748,351 | ||||
Saratoga Investment Corp. CLO Ltd., Series 2013-1A, Class E, 4.734%, 10/20/2023 (a)(b) | 13,100,000 | 11,636,730 | ||||||
Saratoga Investment Corp. CLO Ltd., Series 2013-1A, Class D, 3.734%, 10/20/2023 (a)(b) | 8,000,000 | 7,548,000 | ||||||
Shackleton CLO Ltd., Series 2012-1A, Class D, 4.973%, 8/14/2023 (a)(b) | 6,000,000 | 6,000,600 | ||||||
Shackleton CLO Ltd., Series 2013-3A, Class D, 4.034%, 4/15/2025 (a)(b) | 3,000,000 | 2,873,100 | ||||||
Sound Point CLO Ltd., Series 2012-1A, Class D, 4.814%, 10/20/2023 (a)(b) | 2,000,000 | 2,001,600 | ||||||
Sound Point CLO Ltd., Series 2013-1A, Class B2L, 4.735%, 4/26/2025 (a)(b) | 7,000,000 | 6,259,400 | ||||||
Steele Creek CLO Ltd., Series 2014-1A, Class E2, 7.184%, 8/21/2026 (a)(b) | 2,000,000 | 1,982,856 | ||||||
Steele Creek CLO Ltd., Series 2014-1A, Class D, 3.634%, 8/21/2026 (a)(b) | 2,000,000 | 1,831,864 | ||||||
Sudbury Mill CLO Ltd., Series 2013-1A, Class E, 4.983%, 1/17/2026 (a)(b) | 5,000,000 | 4,561,000 | ||||||
TICC CLO LLC, Series 2012-1A, Class D1, 5.977%, 8/25/2023 (a)(b) | 7,000,000 | 7,000,000 | ||||||
Tuolumne Grove CLO Ltd., Series 2014-1A, Class E, 4.977%, 4/25/2026 (a)(b) | 5,000,000 | 4,449,000 | ||||||
Vibrant CLO II Ltd., Series 2013-2A, Class C, 3.833%, 7/24/2024 (a)(b) | 3,000,000 | 2,838,000 | ||||||
Vibrant CLO II Ltd., Series 2013-2A, Class D, 5.133%, 7/24/2024 (a)(b) | 3,200,000 | 2,929,920 | ||||||
Vibrant CLO Ltd., Series 2012-1A, Class C, 4.733%, 7/17/2024 (a)(b) | 10,200,000 | 10,200,000 | ||||||
Voya CLO Ltd., Series 2014-3A, Class D, 5.233%, 7/25/2026 (a)(b) | 1,750,000 | 1,591,800 | ||||||
Washington Mill CLO Ltd., Series 2014-1A, Class E, 5.076%, 4/20/2026 (a)(b) | 5,000,000 | 4,584,000 | ||||||
Washington Mill CLO Ltd., Series 2014-1A, Class D, 3.676%, 4/20/2026 (a)(b) | 5,000,000 | 4,771,000 | ||||||
See accompanying notes which are an integral part of these financial statements.
32
Angel Oak Multi-Strategy Income Fund
Schedule of Investments – (continued)
July 31, 2014 (Unaudited)
| Principal Amount | Fair Value | |||||||
Collateralized Loan Obligations – (continued) | ||||||||
West CLO Ltd., Series 2012-1A, Class D, 6.736%, 10/30/2023 (a)(b) | $ | 5,000,000 | $ | 5,003,500 | ||||
Wind River CLO Ltd., Series 2012-1A, Class E, 5.484%, 1/15/2024 (a)(b) | 5,000,000 | 4,729,000 | ||||||
Wind River CLO Ltd., Series 2012-1A, Class D, 5.234%, 1/15/2024 (a)(b) | 4,000,000 | 4,012,400 | ||||||
|
| |||||||
TOTAL COLLATERALIZED LOAN OBLIGATIONS (Cost 320,690,197) |
| 324,399,413 | ||||||
|
| |||||||
Asset-Backed Securities – 10.81% | ||||||||
321 Henderson Receivables LLC, Series 2012-3A, Class B, 6.170%, 8/15/2041 (b) | 1,000,000 | 1,129,547 | ||||||
321 Henderson Receivables LLC, Series 2012-3A, Class A, 3.220%, 8/15/2041 (b) | 12,338,099 | 12,100,177 | ||||||
321 Henderson Receivables LLC, Series 2014-1A, Class B, 4.940%, 3/16/2065 (b) | 1,500,000 | 1,554,783 | ||||||
321 Henderson Receivables LLC, Series 2013-3A, Class A, 4.080%, 1/17/2073 (b) | 4,834,519 | 5,053,772 | ||||||
321 Henderson Receivables LLC, Series 2014-2A, Class A, 3.610%, 1/17/2073 (b) | 6,000,000 | 5,996,111 | ||||||
321 Henderson Receivables LLC, Series 2014-2A, Class B, 4.480%, 1/15/2075 (b) | 1,000,000 | 999,531 | ||||||
ACE Securities Corp., Series 2006-CW1, Class A2C, 0.295%, 7/25/2036 (a) | 6,496,746 | 4,663,689 | ||||||
Cajun Global LLC, Series 2011-1A, Class A2, 5.955%, 2/20/2041 (b) | 7,190,284 | 7,400,959 | ||||||
Carrington Mortgage Loan Trust, Series 2006-NC5, Class A5, 0.215%, 1/25/2037 (a) | 7,217,718 | 5,697,623 | ||||||
Carrington Mortgage Loan Trust, Series 2006-NC5, Class A2, 0.265%, 1/25/2037 (a) | 5,021,264 | 3,938,087 | ||||||
Carrington Mortgage Loan Trust, Series 2006-NC3, Class A2, 0.255%, 8/25/2036 (a) | 12,338,462 | 10,529,248 | ||||||
Credit-Based Asset Servicing and Securitization LLC, Series 2006-CB4, Class AV3, 0.302%, 5/25/2036 (a) | 26,992,872 | 20,018,480 | ||||||
Credit-Based Asset Servicing and Securitization LLC, Series 2007-CB1, Class AF4, 5.910%, 1/25/2037 | 2,234,089 | 1,262,917 | ||||||
See accompanying notes which are an integral part of these financial statements.
33
Angel Oak Multi-Strategy Income Fund
Schedule of Investments – (continued)
July 31, 2014 (Unaudited)
| Principal Amount | Fair Value | |||||||
Asset-Backed Securities – (continued) | ||||||||
Credit-Based Asset Servicing and Securitization LLC, Series 2007-CB1, Class AF1B, 6.004%, 1/25/2037 | $ | 8,467,733 | $ | 4,797,724 | ||||
Credit-Based Asset Servicing and Securitization LLC, Series 2007-CB1, Class AF3, 5.737%, 1/25/2037 | 11,170,447 | 6,263,471 | ||||||
Credit-Based Asset Servicing and Securitization LLC, Series 2007-CB1, Class AF6, 5.835%, 1/25/2037 | 13,385,736 | 7,541,591 | ||||||
Drug Royalty II LP, Series 2014-1, Class A2, 3.484%, 7/15/2023 (b) | 9,713,043 | 9,712,932 | ||||||
Dryden XXVIII Senior Loan Fund, Series 2013-28A, Class B6L, 4.124%, 8/15/2025 (a)(b) | 4,000,000 | 3,515,200 | ||||||
Fieldstone Mortgage Investment Corp., Series 2006-1, Class A2, 0.345%, 5/25/2036 (a) | 12,802,442 | 8,476,190 | ||||||
Fieldstone Mortgage Investment Corp., Series 2007-1, Class 2A3, 0.492%, 4/25/2047 (a) | 17,606,378 | 11,954,396 | ||||||
Fortress Credit BSL II Ltd, Series 2013-2A, Class D, 4.084%, 10/19/2025 (a)(b) | 7,750,000 | 7,357,075 | ||||||
Fortress Credit BSL II Ltd., Series 2013-2A, Class E, 5.384%, 10/19/2025 (a)(b) | 5,000,000 | 4,515,500 | ||||||
FREMF Mortgage Trust, Series 2014-K36, Class C, 4.361%, 12/25/2046 (a)(b)(c) | 6,000,000 | 6,103,518 | ||||||
FREMF Mortgage Trust, Series 2014-K37, Class C, 4.558%, 1/25/2047 (a)(b) | 8,500,000 | 8,760,444 | ||||||
Fremont Home Loan Trust, Series 2006-C, Class 2A2, 0.305%, 10/25/2036 (a) | 40,737,123 | 21,310,241 | ||||||
GSAA Home Equity Trust, Series 2007-5, Class 1F4A, 6.032%, 3/25/2047 | 9,290,449 | 6,628,020 | ||||||
Halcyon Loan Advisors Funding Ltd., Series 2012-2A, Class E, 5.631%, 12/20/2024 (a)(b) | 3,000,000 | 2,862,600 | ||||||
HOA Funding LLC, Series 2014-1A, Class A2, 4.846%, 8/20/2044 (b) | 5,000,000 | 5,000,000 | ||||||
INDYMAC Residential Asset Backed Trust, Series 2006-E, Class 2A2, 0.275%, 4/25/2037 (a) | 4,860,053 | 3,273,503 | ||||||
KCAP Senior Funding I LLC, Series 2013-1A, Class D, 5.484%, 7/20/2024 (a)(b) | 2,500,000 | 2,442,500 | ||||||
Morgan Stanley ABS Capital I, Inc. Trust, Series 2007-HE1, Class A2C, 0.305%, 11/25/2036 (a) | 6,963,408 | 4,707,333 | ||||||
Morgan Stanley ABS Capital I, Inc. Trust, Series 2007-HE1, Class A2B, 0.255%, 11/25/2036 (a) | 3,170,631 | 2,130,227 | ||||||
See accompanying notes which are an integral part of these financial statements.
34
Angel Oak Multi-Strategy Income Fund
Schedule of Investments – (continued)
July 31, 2014 (Unaudited)
| Principal Amount | Fair Value | |||||||
Asset-Backed Securities – (continued) | ||||||||
Morgan Stanley Mortgage Loan Trust, Series 2007-3XS, Class 2A4S, 5.963%, 1/25/2047 | $ | 11,814,880 | $ | 8,520,289 | ||||
Nomura Home Equity Loan, Inc., Series 2006-HE3, Class 2A3, 0.305%, 7/25/2036 (a) | 9,100,000 | 7,754,656 | ||||||
Octagon Investment Partners XIV Ltd., Series 2012-1A, Class E, 6.734%, 1/15/2024 (a)(b) | 6,300,000 | 6,014,610 | ||||||
OFSI Fund VI Ltd., Series 2014-6A, Class D, 5.213%, 3/20/2025 (a)(b) | 5,000,000 | 4,374,000 | ||||||
Option One Mortgage Loan Trust, Series 2007-3, Class 2A3, 0.395%, 4/25/2037 (a) | 4,562,382 | 2,765,200 | ||||||
RAMP Trust, Series 2007-RS2, Class A2, 0.435%, 5/25/2037 (a) | 12,359,143 | 10,573,568 | ||||||
RASC Trust, Series 06-KS9, Class AI3, 0.315%, 11/25/2036 (a) | 10,285,955 | 8,831,645 | ||||||
Regatta III Funding Ltd., Series 2014-1A, Class D, 5.153%, 4/15/2026 (a)(b) | 4,375,000 | 3,935,750 | ||||||
Saranac CLO I Ltd., Series 2013-1A, Class D, 3.785%, 10/26/2024 (a)(b) | 4,000,000 | 3,712,400 | ||||||
Securitized Asset Backed Receivables LLC, Series 2006-HE2, Class A2B, 0.255%, 7/25/2036 (a) | 37,422,819 | 21,053,853 | ||||||
SolarCity LMC LLC, Series 2014-1, Class A, 4.590%, 4/20/2044 (b) | 2,214,646 | 2,292,104 | ||||||
Specialty Underwriting & Residential Finance Trust, Series 2006-BC5, Class A2C, 0.255%, 11/25/2037 (a) | 5,483,767 | 3,962,389 | ||||||
Store Master Funding LLC, Series 2012-1A, Class A, 5.770%, 8/20/2042 (b) | 6,376,524 | 6,855,911 | ||||||
Store Master Funding LLC, Series 2013-1A, Class A1, 4.160%, 3/20/2043 (b) | 4,896,309 | 4,981,212 | ||||||
Store Master Funding LLC, Series 2013-3A, Class A2, 5.210%, 11/20/2043 (b) | 14,853,694 | 15,615,837 | ||||||
Structured Asset Securities Corp. Mortgage Loan Trust, Series 2006-BC2, Class A3, 0.305%, 9/25/2036 (a) | 4,841,118 | 4,010,508 | ||||||
Trade MAPS 1 Ltd., Series 2013-1A, Class D, 5.153%, 12/10/2018 (a)(b) | 2,000,000 | 2,014,380 | ||||||
|
| |||||||
TOTAL ASSET-BACKED SECURITIES (Cost 326,710,156) |
| 324,965,701 | ||||||
|
| |||||||
See accompanying notes which are an integral part of these financial statements.
35
Angel Oak Multi-Strategy Income Fund
Schedule of Investments – (continued)
July 31, 2014 (Unaudited)
| Shares or Principal Amount | Fair Value | |||||||
Corporate Bonds – 0.75% | ||||||||
Financials – 0.75% | ||||||||
Brand Group Holdings, Inc., 8.500%, 6/27/2024 (b)(d) | $ | 10,000,000 | $ | 10,000,000 | ||||
Eagle Bancorp, Inc., 5.750%, 9/1/2024 | 12,500,000 | 12,500,000 | ||||||
|
| |||||||
TOTAL CORPORATE BONDS (Cost 22,500,000) |
| 22,500,000 | ||||||
|
| |||||||
Collateralized Debt Obligations – 0.46% | ||||||||
Venture CDO Ltd., Series 2012-11A, Class E, 6.725%, 11/14/2022 (a)(b) | 1,500,000 | 1,501,200 | ||||||
Venture X CLO Ltd., Series 2012-10X, Class E, 6.234%, 7/20/2022 (a) | 3,000,000 | 2,957,700 | ||||||
Venture X CLO Ltd., Series 2012-12A, Class E, 5.529%, 2/28/2024 (a)(b) | 10,000,000 | 9,394,000 | ||||||
|
| |||||||
TOTAL COLLATERALIZED DEBT OBLIGATIONS (Cost 14,231,630) |
| 13,852,900 | ||||||
|
| |||||||
Preferred Stocks – 0.11% | ||||||||
Financials – 0.11% | ||||||||
Morgan Stanley, Series A, 4.000% (a) | 130,497 | 2,655,614 | ||||||
Wells Fargo & Co., Series P, 5.250% | 23,990 | 555,369 | ||||||
|
| |||||||
TOTAL PREFERRED STOCKS (Cost 3,481,416) |
| 3,210,983 | ||||||
|
| |||||||
Cash Equivalents – 4.36% |
| |||||||
Fidelity Institutional Money Market Portfolio - Institutional Class, 0.090% (e) | 131,248,792 | 131,248,792 | ||||||
|
| |||||||
TOTAL CASH EQUIVALENTS (Cost 131,248,792) | 131,248,792 | |||||||
|
| |||||||
TOTAL INVESTMENTS – 109.40% (Cost 3,227,654,895) | 3,289,247,259 | |||||||
|
| |||||||
Liabilities in Excess of Other Assets – (9.40)% | (282,690,154 | ) | ||||||
|
| |||||||
NET ASSETS – 100.00% | $ | 3,006,557,105 | ||||||
|
| |||||||
See accompanying notes which are an integral part of these financial statements.
36
Angel Oak Multi-Strategy Income Fund
Schedule of Investments – (continued)
July 31, 2014 (Unaudited)
| (a) | Variable or Floating Rate Security. Rate disclosed is as of July 31, 2014. |
| (b) | Security exempt from registration under Rule 144A or Section 4(2) of the Securities Act of 1933. The security may be resold in transactions exempt from registration, normally to qualified institutional buyers. |
| (c) | All or a portion of the security has been pledged as collateral in connection with open reverse repurchase agreements and futures contracts. On July 31, 2014 securities valued at $279,613,057 were pledged as collateral for reverse repurchase agreements and futures contracts. |
| (d) | Security is fair valued by the Adviser. |
| (e) | Rate disclosed is the seven day yield as of July 31, 2014. |
I/O — Interest Only Security
The value of Futures Contracts as of July 31, 2014 was as follows:
Long Futures Contracts | Number of Contracts | Underlying Face Amount at Fair Value | Unrealized Appreciation (Depreciation) | |||||||||
10 Year U.S. Dollar Deliverable Interest Rate Swap Future expiring 9/17/14 | 152 | $ | 14,512,154 | $ | 19,760 | |||||||
Short Futures Contracts | Number of (Short) Contracts | Underlying Face Amount at Fair Value | Unrealized Appreciation (Depreciation) | |||||||||
5 Year U.S. Dollar Deliverable Interest Rate Swap Future expiring 9/15/14 | (3,451 | ) | $ | (349,952,969 | ) | $ | 1,118,857 | |||||
10 Year U.S. Dollar Deliverable Interest Rate Swap Future expiring 9/17/14 | (4,167 | ) | (436,102,594 | ) | (2,167,928 | ) | ||||||
|
|
|
| |||||||||
Total Short Futures Contracts | (7,618 | ) | $ | (1,049,071 | ) | |||||||
|
|
|
| |||||||||
See accompanying notes which are an integral part of these financial statements.
37
Angel Oak Multi-Strategy Income Fund
Schedule of Investments – (continued)
July 31, 2014 (Unaudited)
Reverse repurchase agreements outstanding as of July 31, 2014 were as follows:
Counterparty | Interest Rate | Trade Date | Maturity Date | Net Closing Amount | Face Value | |||||||||||||||
Bank of America | 1.50 | % | 5/14/2014 | 8/14/2014 | $ | 2,405,185 | $ | 2,396,000 | ||||||||||||
Bank of America | 0.90 | % | 7/11/2014 | 8/12/2014 | 10,657,519 | 10,649,000 | ||||||||||||||
BNP Paribas | 1.31 | % | 7/23/2014 | 8/22/2014 | 4,937,364 | 4,932,000 | ||||||||||||||
Credit Suisse | 1.00 | % | 7/7/2014 | 8/6/2014 | 15,105,027 | 15,092,450 | ||||||||||||||
Goldman Sachs | 1.00 | % | 7/9/2014 | 8/8/2014 | 4,842,032 | 4,838,000 | ||||||||||||||
Goldman Sachs | 0.95 | % | 7/9/2014 | 8/4/2014 | 9,325,412 | 9,319,000 | ||||||||||||||
Goldman Sachs | 0.90 | % | 7/11/2014 | 8/11/2014 | 8,081,272 | 8,075,000 | ||||||||||||||
JP Morgan | 0.76 | % | 7/16/2014 | 8/18/2014 | 14,431,987 | 14,422,000 | ||||||||||||||
JP Morgan | 0.76 | % | 7/16/2014 | 8/18/2014 | 3,673,542 | 3,671,000 | ||||||||||||||
Mizuho | 0.75 | % | 7/25/2014 | 8/20/2014 | 8,477,590 | 8,473,000 | ||||||||||||||
Mizuho | 0.75 | % | 7/25/2014 | 8/20/2014 | 16,138,737 | 16,130,000 | ||||||||||||||
Mizuho | 0.75 | % | 7/25/2014 | 8/13/2014 | 9,031,574 | 9,028,000 | ||||||||||||||
Mizuho | 0.75 | % | 7/25/2014 | 8/20/2014 | 4,587,484 | 4,585,000 | ||||||||||||||
Mizuho | 0.75 | % | 7/25/2014 | 8/20/2014 | 8,185,431 | 8,181,000 | ||||||||||||||
Mizuho | 0.75 | % | 7/25/2014 | 8/20/2014 | 8,507,606 | 8,503,000 | ||||||||||||||
Mizuho | 0.75 | % | 7/25/2014 | 8/13/2014 | 9,147,620 | 9,144,000 | ||||||||||||||
Mizuho | 0.75 | % | 7/25/2014 | 8/27/2014 | 8,929,135 | 8,923,000 | ||||||||||||||
Mizuho | 0.75 | % | 7/25/2014 | 8/27/2014 | 8,871,095 | 8,865,000 | ||||||||||||||
Mizuho | 0.75 | % | 7/25/2014 | 8/27/2014 | 5,817,997 | 5,814,000 | ||||||||||||||
Mizuho | 0.75 | % | 7/25/2014 | 8/27/2014 | 8,912,123 | 8,906,000 | ||||||||||||||
Mizuho | 0.75 | % | 7/25/2014 | 8/27/2014 | 8,837,071 | 8,831,000 | ||||||||||||||
Nomura | 1.19 | % | 10/3/2013 | 4/3/2015 | 23,493,864 | 23,075,625 | ||||||||||||||
RBC Capital Markets | 1.82 | % | 5/12/2014 | 8/12/2014 | 13,371,016 | 13,309,000 | ||||||||||||||
RBC Capital Markets | 1.83 | % | 5/12/2014 | 8/12/2014 | 17,377,058 | 17,296,000 | ||||||||||||||
|
| |||||||||||||||||||
| $ | 232,458,075 | |||||||||||||||||||
|
| |||||||||||||||||||
A reverse repurchase agreement, although structured as a sale and repurchase obligation, acts as a financing transaction under which the Fund will effectively pledge certain assets as collateral to secure a short-term loan. Generally the other party to the agreement makes the loan in an amount equal to at least 100% of the fair value of the pledged collateral. At the maturity of the reverse repurchase agreement, the Fund will be required to repay the loan and interest and correspondingly receive back its collateral. While used as collateral, the pledged assets continue to pay principal and interest which are for the benefit of the Fund.
See accompanying notes which are an integral part of these financial statements.
38
Angel Oak Multi-Strategy Income Fund
Statement of Assets and Liabilities
July 31, 2014
(Unaudited)
Assets | ||||
Investments in securities at fair value (cost $3,227,654,895) | $ | 3,289,247,259 | ||
Cash | 5,301,537 | |||
Cash due from broker (a) | 13,870,609 | |||
Cash held at broker (b) | 11,526,900 | |||
Receivable for fund shares sold | 7,353,454 | |||
Receivable for investments sold | 32,741,024 | |||
Receivable for net variation margin on futures contracts | 220,195 | |||
Dividends and interest receivable | 15,964,842 | |||
Prepaid expenses | 342,980 | |||
|
| |||
Total Assets | 3,376,568,800 | |||
|
| |||
Liabilities | ||||
Payable for reverse repurchase agreements | 232,458,075 | |||
Payable for fund shares redeemed | 3,197,426 | |||
Payable for investments purchased | 127,994,806 | |||
Payable for distributions to shareholders | 3,364,390 | |||
Interest payable for reverse repurchase agreements | 417,166 | |||
Payable to Adviser | 2,218,791 | |||
Payable to administrator, fund accountant, and transfer agent | 95,783 | |||
Payable to custodian | 36,449 | |||
12b-1 fees accrued | 206,719 | |||
Other accrued expenses | 22,090 | |||
|
| |||
Total Liabilities | 370,011,695 | |||
|
| |||
Net Assets | $ | 3,006,557,105 | ||
|
| |||
Net Assets consist of: | ||||
Paid-in capital | $ | 2,979,920,465 | ||
Accumulated net investment loss | (5,045,154 | ) | ||
Accumulated net realized loss from investment transactions | (28,881,259 | ) | ||
Net unrealized appreciation on investments | 61,592,364 | |||
Net unrealized appreciation (depreciation) on futures contracts | (1,029,311 | ) | ||
|
| |||
Net Assets | $ | 3,006,557,105 | ||
|
| |||
| (a) | Margin claim to be received from broker. |
| (b) | Cash used as collateral for futures contract transactions. |
See accompanying notes which are an integral part of these financial statements.
39
Angel Oak Multi-Strategy Income Fund
Statement of Assets and Liabilities – (continued)
July 31, 2014
(Unaudited)
Class A: | ||||
Net Assets | $ | 549,312,618 | ||
|
| |||
Shares outstanding (unlimited number of shares authorized, | 44,813,377 | |||
|
| |||
Net asset value (“NAV”) per share | $ | 12.26 | ||
|
| |||
Offering price per share (NAV/0.9775) (c) | $ | 12.54 | ||
|
| |||
Class C: | ||||
Net Assets | $ | 55,027,771 | ||
|
| |||
Shares outstanding (unlimited number of shares authorized, | 4,502,082 | |||
|
| |||
Net asset value (“NAV”) and offering price per share | $ | 12.22 | ||
|
| |||
Minimum redemption price per share (NAV*0.99) (d) | $ | 12.10 | ||
|
| |||
Institutional Class: | ||||
Net Assets | $ | 2,402,216,716 | ||
|
| |||
Shares outstanding (unlimited number of shares authorized, | 196,054,436 | |||
|
| |||
Net asset value (“NAV”) and offering price per share | $ | 12.25 | ||
|
| |||
| (c) | Class A shares impose a maximum 2.25% sales charge on purchases. |
| (d) | A contingent deferred sales charge (“CDSC”) of 1.00% may be charged. |
See accompanying notes which are an integral part of these financial statements.
40
Angel Oak Multi-Strategy Income Fund
Statement of Operations
For the six months ended July 31, 2014
(Unaudited)
Investment Income | ||||
Dividend income | $ | 159,102 | ||
Interest income | 77,291,824 | |||
|
| |||
Total Investment Income | 77,450,926 | |||
|
| |||
Expenses | ||||
Investment Advisory | 13,331,693 | |||
12b-1 – Class A | 1,077,506 | |||
12b-1 – Class C | 241,140 | |||
Administration | 375,357 | |||
Fund accounting | 107,836 | |||
Transfer agent | 129,884 | |||
Legal | 10,252 | |||
Registration | 108,826 | |||
Custodian | 141,194 | |||
Audit | 30,647 | |||
Trustee | 5,563 | |||
Insurance | 9,546 | |||
Pricing | 81,904 | |||
Printing | 51,885 | |||
24f-2 | 20,743 | |||
Miscellaneous | 13,158 | |||
Interest on reverse repurchase agreements | 3,786,318 | |||
Line of credit | 130,660 | |||
|
| |||
Total Expenses | 19,654,112 | |||
|
| |||
Fees contractually waived by Adviser | (2,055,481 | ) | ||
|
| |||
Net operating expenses | 17,598,631 | |||
|
| |||
Net Investment Income | 59,852,295 | |||
|
| |||
Realized and Unrealized Gain (Loss) on Investments | ||||
Net realized gain on investment transactions | 12,626,259 | |||
Net realized loss on futures contracts | (16,052,293 | ) | ||
Net change in unrealized appreciation on investments | 22,270,571 | |||
Net change in unrealized appreciation on futures contracts | 3,208,314 | |||
|
| |||
Net realized and unrealized gain on investments | 22,052,851 | |||
|
| |||
Net increase in net assets resulting from operations | $ | 81,905,146 | ||
|
| |||
See accompanying notes which are an integral part of these financial statements.
41
Angel Oak Multi-Strategy Income Fund
Statement of Cash Flows
For the six months ended July 31, 2014
(Unaudited)
Increase/(Decrease) in Cash | ||||
Cash flows from operating activities: | ||||
Net increase in net assets resulting from operations | $ | 81,905,146 | ||
Adjustments to reconcile net increase in net assets from operations to net cash used in operating activities: | ||||
Accretion of discount/amortization of premium, net | (5,368,471 | ) | ||
Purchase of long-term securities | (1,593,767,549 | ) | ||
Proceeds from sales of long-term securities | 950,501,630 | |||
Sales of short-term securities, net | 45,194,742 | |||
Increase in dividends and interest receivable | (4,475,084 | ) | ||
Increase in receivable for investments sold | (29,793,524 | ) | ||
Increase in prepaid expenses | (157,388 | ) | ||
Decrease in payable for variation margin on futures contracts | (1,047,601 | ) | ||
Increase in payable to Adviser | 682,066 | |||
Increase in payable for investments purchased | 77,402,390 | |||
Decrease in interest payable for reverse repurchase agreements | (151,489 | ) | ||
Decrease in accrued expenses and expenses payable | (230,577 | ) | ||
Net realized losses on investment securities | 3,426,034 | |||
Net gains on paydowns of mortgage-backed securities | (7,785,078 | ) | ||
Change in unrealized appreciation on investments | (25,478,885 | ) | ||
|
| |||
Net cash used in operating activities | (509,143,638 | ) | ||
|
| |||
Cash flows from financing activities: | ||||
Decrease in payable for reverse repurchase agreements | (311,379,086 | ) | ||
Proceeds from shares sold | 1,577,250,427 | |||
Amount paid for shares redeemed | (735,026,806 | ) | ||
Cash distributions paid | (11,907,041 | ) | ||
|
| |||
Net cash provided from financing activities | 518,937,494 | |||
|
| |||
Net change in cash | $ | 9,793,856 | ||
Cash balance beginning of period | $ | 20,905,190 | ||
|
| |||
Cash balance end of period | $ | 30,699,046 | ||
|
|
Non cash financing activities not included herein consist of receivable for fund shares sold of $7,353,454, payable for fund shares redeemed of $3,197,426, payable for distributions to shareholders of $3,364,390 and reinvestment of distributions of $49,453,735.
Supplemental Information | ||
Interest paid | $3,937,807 | |
See accompanying notes which are an integral part of these financial statements.
42
Angel Oak Multi-Strategy Income Fund
Statements of Changes in Net Assets
| For the Six Months Ended July 31, 2014 (Unaudited) | For the Year Ended January 31, 2014 | |||||||
Increase in Net Assets due to: | ||||||||
Operations | ||||||||
Net investment income | $ | 59,852,295 | $ | 77,697,243 | ||||
Net realized gain (loss) on investment transactions and futures contracts | (3,426,034 | ) | (23,937,489 | ) | ||||
Net change in unrealized appreciation on investments and futures contracts | 25,478,885 | 8,573,890 | ||||||
|
|
|
| |||||
Net increase in net assets resulting from operations | 81,905,146 | 62,333,644 | ||||||
|
|
|
| |||||
Distributions | ||||||||
From net investment income, Class A | (20,558,962 | ) | (30,301,416 | ) | ||||
From net investment income, Class C | (1,034,014 | ) | (1,545,459 | ) | ||||
From net investment income, Institutional Class | (43,132,190 | ) | (50,498,388 | ) | ||||
From net realized gains, Class A | – | (684,577 | ) | |||||
From net realized gains, Class C | – | (46,361 | ) | |||||
From net realized gains, Institutional Class | – | (1,341,331 | ) | |||||
|
|
|
| |||||
Total distributions | (64,725,166 | ) | (84,417,532 | ) | ||||
|
|
|
| |||||
Capital Transactions – Class A | ||||||||
Proceeds from shares sold | 316,113,142 | 757,804,040 | ||||||
Reinvestment of distributions | 19,869,637 | 25,380,973 | ||||||
Amount paid for shares redeemed | (553,068,885 | ) | (498,378,952 | ) | ||||
|
|
|
| |||||
Total Class A | (217,086,106 | ) | 284,806,061 | |||||
|
|
|
| |||||
Capital Transactions – Class C | ||||||||
Proceeds from shares sold | 16,838,221 | 29,188,997 | ||||||
Reinvestment of distributions | 845,789 | 1,240,310 | ||||||
Amount paid for shares redeemed | (7,540,191 | ) | (8,082,943 | ) | ||||
|
|
|
| |||||
Total Class C | 10,143,819 | 22,346,364 | ||||||
|
|
|
| |||||
Capital Transactions – Institutional Class | ||||||||
Proceeds from shares sold | 1,248,281,868 | 1,274,111,591 | ||||||
Reinvestment of distributions | 28,738,309 | 40,059,812 | ||||||
Amount paid for shares redeemed | (173,078,668 | ) | (461,314,303 | ) | ||||
|
|
|
| |||||
Total Institutional Class | 1,103,941,509 | 852,857,100 | ||||||
|
|
|
| |||||
Net increase in net assets resulting from capital transactions | 896,999,222 | 1,160,009,525 | ||||||
|
|
|
| |||||
Total Increase in Net Assets | 914,179,202 | 1,137,925,637 | ||||||
|
|
|
| |||||
Net Assets | ||||||||
Beginning of period | 2,092,377,903 | 954,452,266 | ||||||
|
|
|
| |||||
End of period | $ | 3,006,557,105 | $ | 2,092,377,903 | ||||
|
|
|
| |||||
Accumulated net investment loss included in net assets at end of period | $ | (14,302,830 | ) | $ | (172,283 | ) | ||
|
|
|
| |||||
See accompanying notes which are an integral part of these financial statements.
43
Angel Oak Multi-Strategy Income Fund
Statements of Changes in Net Assets – (continued)
| For the Six Months Ended July 31, 2014 (Unaudited) | For the Year Ended January 31, 2014 | |||||||
Share Transactions – Class A | ||||||||
Shares sold | 25,912,017 | 62,096,058 | ||||||
Shares issued in reinvestment of distributions | 1,630,745 | 2,098,034 | ||||||
Shares redeemed | (45,161,102 | ) | (41,165,435 | ) | ||||
|
|
|
| |||||
Total Class A | (17,618,340 | ) | 23,028,657 | |||||
|
|
|
| |||||
Share Transactions – Class C | ||||||||
Shares sold | 1,382,259 | 2,387,418 | ||||||
Shares issued in reinvestment of distributions | 69,581 | 102,990 | ||||||
Shares redeemed | (619,515 | ) | (673,943 | ) | ||||
|
|
|
| |||||
Total Class C | 832,325 | 1,816,465 | ||||||
|
|
|
| |||||
Share Transactions – Institutional Class | ||||||||
Shares sold | 102,059,977 | 104,592,577 | ||||||
Shares issued in reinvestment of distributions | 2,357,532 | 3,317,550 | ||||||
Shares redeemed | (14,174,252 | ) | (38,176,686 | ) | ||||
|
|
|
| |||||
Total Institutional Class | 90,243,257 | 69,733,441 | ||||||
|
|
|
| |||||
Net increase in share transactions | 73,457,242 | 94,578,563 | ||||||
|
|
|
| |||||
See accompanying notes which are an integral part of these financial statements.
44
Angel Oak Multi-Strategy Income Fund - Class A
Financial Highlights
(For a share outstanding during each period)
| For the Six Months Ended July 31, 2014 (Unaudited) | For the Year Ended January 31, 2014 | For the Year Ended January 31, 2013 | For the Period Ended January 31, 2012 (a) | |||||||||||||
Selected Per Share Data: | ||||||||||||||||
Net asset value, beginning of period | $ | 12.17 | $ | 12.35 | $ | 10.67 | $ | 10.00 | ||||||||
|
|
|
|
|
|
|
| |||||||||
Income from investment operations: | ||||||||||||||||
Net investment income | 0.29 | 0.54 | 0.60 | 0.26 | ||||||||||||
Net realized and unrealized gain (loss) on investments | 0.10 | (0.13 | ) | 1.74 | 0.63 | |||||||||||
|
|
|
|
|
|
|
| |||||||||
Total from investment operations | 0.39 | 0.41 | 2.34 | 0.89 | ||||||||||||
|
|
|
|
|
|
|
| |||||||||
Less distributions to shareholders: | ||||||||||||||||
From net investment income | (0.30 | ) | (0.58 | ) | (0.61 | ) | (0.22 | ) | ||||||||
From net realized gains | - | (0.01 | ) | (0.05 | ) | - | ||||||||||
|
|
|
|
|
|
|
| |||||||||
Total distributions | (0.30 | ) | (0.59 | ) | (0.66 | ) | (0.22 | ) | ||||||||
|
|
|
|
|
|
|
| |||||||||
Net asset value, end of period | $ | 12.26 | $ | 12.17 | $ | 12.35 | $ | 10.67 | ||||||||
|
|
|
|
|
|
|
| |||||||||
Total Return (b) | 3.20 | % (c) | 3.52 | % | 22.57 | % | 8.95 | % (c) | ||||||||
Ratios and Supplemental Data: | ||||||||||||||||
| Net assets, end of period (000 omitted) | $ | 549,313 | $ | 760,039 | $ | 486,444 | $ | 26,255 | ||||||||
| Ratio of expenses to average net assets | 1.55 | % (d) | 1.68 | % | 1.60 | % | 2.45 | % (d) | ||||||||
| Ratio of expenses to average net assets (excluding interest expense) | 1.24 | % (d) | 1.24 | % | 1.26 | % | 2.25 | % (d) | ||||||||
| Ratio of expenses to average net assets before waiver and reimbursement | 1.72 | % (d) | 1.91 | % | 2.23 | % | 3.38 | % (d) | ||||||||
| Ratio of expenses to average net assets before waiver and reimbursement (excluding interest expense) | 1.41 | % (d) | 1.47 | % | 1.90 | % | 3.18 | % (d) | ||||||||
| Ratio of net investment income to average net assets | 4.68 | % (d) | 4.60 | % | 5.02 | % | 5.29 | % (d) | ||||||||
| Ratio of net investment income (loss) to average net assets before waiver and reimbursement | 4.51 | % (d) | 4.36 | % | 4.39 | % | 4.36 | % (d) | ||||||||
Portfolio turnover rate | 33.74 | % (c) | 61.70 | % | 54.56 | % | 17.85 | % (c) | ||||||||
| (a) | For the period June 28, 2011 (commencement of operations) to January 31, 2012. |
| (b) | Total return in the above table represents the rate that the investor would have earned or lost on an investment in the Fund, assuming reinvestment of dividends, and excludes the sales charge. |
| (c) | Not annualized |
| (d) | Annualized |
See accompanying notes which are an integral part of these financial statements.
45
Angel Oak Multi-Strategy Income Fund - Class C
Financial Highlights
(For a share outstanding during each period)
| For the Six Months Ended July 31, 2014 (Unaudited) | For the Year Ended January 31, 2014 | For the Period Ended January 31, 2013 (a) | ||||||||||
Selected Per Share Data: | ||||||||||||
Net asset value, beginning of period | $ | 12.14 | $ | 12.31 | $ | 11.03 | ||||||
|
|
|
|
|
| |||||||
Income from investment operations: | ||||||||||||
Net investment income | 0.23 | 0.45 | 0.47 | |||||||||
Net realized and unrealized gain (loss) on investments | 0.10 | (0.12 | ) | 1.30 | ||||||||
|
|
|
|
|
| |||||||
Total from investment operations | 0.33 | 0.33 | 1.77 | |||||||||
|
|
|
|
|
| |||||||
Less distributions to shareholders: | ||||||||||||
From net investment income | (0.25 | ) | (0.49 | ) | (0.44 | ) | ||||||
From net realized gains | - | (0.01 | ) | (0.05 | ) | |||||||
|
|
|
|
|
| |||||||
Total distributions | (0.25 | ) | (0.50 | ) | (0.49 | ) | ||||||
|
|
|
|
|
| |||||||
Net asset value, end of period | $ | 12.22 | $ | 12.14 | $ | 12.31 | ||||||
|
|
|
|
|
| |||||||
Total Return (b) | 2.78 | % (c) | 2.82 | % | 16.39 | % (c) | ||||||
Ratios and Supplemental Data: | ||||||||||||
Net assets, end of period (000 omitted) | $ | 55,028 | $ | 44,567 | $ | 22,821 | ||||||
Ratio of expenses to average net assets | 2.30 | % (d) | 2.43 | % | 2.33 | % (d) | ||||||
| Ratio of expenses to average net assets (excluding interest expense) | 1.99 | % (d) | 1.99 | % | 2.00 | % (d) | ||||||
| Ratio of expenses to average net assets before waiver and reimbursement | 2.47 | % (d) | 2.66 | % | 2.91 | % (d) | ||||||
| Ratio of expenses to average net assets before waiver and reimbursement (excluding interest expense) | 2.16 | % (d) | 2.22 | % | 2.56 | % (d) | ||||||
| Ratio of net investment income to average net assets | 3.91 | % (d) | 3.83 | % | 4.12 | % (d) | ||||||
| Ratio of net investment income (loss) to average net assets before waiver and reimbursement | 3.74 | % (d) | 3.60 | % | 3.55 | % (d) | ||||||
Portfolio turnover rate | 33.74 | % (c) | 61.70 | % | 54.56 | % (c) | ||||||
| (a) | For the period March 14, 2012 (commencement of operations) to January 31, 2013. |
| (b) | Total return in the above table represents the rate that the investor would have earned or lost on an investment in the Fund, assuming reinvestment of dividends and excludes any contingent deferred sales charge. |
| (c) | Not annualized |
| (d) | Annualized |
See accompanying notes which are an integral part of these financial statements.
46
Angel Oak Multi-Strategy Income Fund - Institutional Class
Financial Highlights
(For a share outstanding during each period)
| For the Six Months Ended July 31, 2014 (Unaudited) | For the Year Ended January 31, 2014 | For the Period Ended January 31, 2013 (a) | ||||||||||
Selected Per Share Data: | ||||||||||||
Net asset value, beginning of period | $ | 12.17 | $ | 12.34 | $ | 11.71 | ||||||
|
|
|
|
|
| |||||||
Income from investment operations: | ||||||||||||
Net investment income | 0.29 | 0.56 | 0.25 | |||||||||
Net realized and unrealized gain (loss) on investments | 0.10 | (0.10 | ) | 0.65 | ||||||||
|
|
|
|
|
| |||||||
Total from investment operations | 0.39 | 0.46 | 0.90 | |||||||||
|
|
|
|
|
| |||||||
Less distributions to shareholders: | ||||||||||||
From net investment income | (0.31 | ) | (0.62 | ) | (0.22 | ) | ||||||
From net realized gains | - | (0.01 | ) | (0.05 | ) | |||||||
|
|
|
|
|
| |||||||
Total distributions | (0.31 | ) | (0.63 | ) | (0.27 | ) | ||||||
|
|
|
|
|
| |||||||
Net asset value, end of period | $ | 12.25 | $ | 12.17 | $ | 12.34 | ||||||
|
|
|
|
|
| |||||||
Total Return (b) | 3.25 | % (c) | 3.88 | % | 7.75 | % (c) | ||||||
Ratios and Supplemental Data: | ||||||||||||
Net assets, end of period (000 omitted) | $ | 2,402,217 | $ | 1,287,772 | $ | 445,187 | ||||||
Ratio of expenses to average net assets | 1.30 | % (d) | 1.43 | % | 1.34 | % (d) | ||||||
| Ratio of expenses to average net assets (excluding interest expense) | 0.99 | % (d) | 0.99 | % | 0.99 | % (d) | ||||||
| Ratio of expenses to average net assets before waiver and reimbursement | 1.47 | % (d) | 1.66 | % | 1.89 | % (d) | ||||||
| Ratio of expenses to average net assets before waiver and reimbursement (excluding interest expense) | 1.16 | % (d) | 1.22 | % | 1.54 | % (d) | ||||||
| Ratio of net investment income to average net assets | 4.88 | % (d) | 4.81 | % | 5.07 | % (d) | ||||||
| Ratio of net investment income (loss) to average net assets before waiver and reimbursement | 4.71 | % (d) | 4.58 | % | 4.52 | % (d) | ||||||
Portfolio turnover rate | 33.74 | % (c) | 61.70 | % | 54.56 | % (c) | ||||||
| (a) | For the period August 16, 2012 (commencement of operations) to January 31, 2013. |
| (b) | Total return in the above table represents the rate that the investor would have earned or lost on an investment in the Fund, assuming reinvestment of dividends. |
| (c) | Not annualized |
| (d) | Annualized |
See accompanying notes which are an integral part of these financial statements.
47
Angel Oak Multi-Strategy Income Fund
Notes to the Financial Statements
July 31, 2014
(Unaudited)
NOTE 1. ORGANIZATION
The Angel Oak Multi-Strategy Income Fund (the “Fund”) is an open-end non-diversified series of the Valued Advisers Trust (the “Trust”). The Trust is a management investment company established under the laws of Delaware by an Agreement and Declaration of Trust dated June 13, 2008 (the “Trust Agreement”). The Trust Agreement permits the Trustees to issue an unlimited number of shares of beneficial interest of separate series without par value. The Fund is one of a series of funds authorized by the Trustees. The Fund’s investment adviser is Angel Oak Capital Advisors, LLC (the “Adviser”). The investment objective of the Fund is current income.
The Fund currently offers three share classes, Class A, Class C and Institutional Class. Class A shares commenced operations on June 28, 2011, Class C shares commenced operations on March 14, 2012 and the Institutional Class shares commenced operations on August 16, 2012. Each share represents an equal proportionate interest in the assets and liabilities belonging to the Fund and is entitled to such dividends and distributions out of income belonging to the Fund as are declared by the Board of Trustees. Class A currently has a maximum sales charge on purchases of 2.25% as a percentage of the original purchase price. Class C does not have an initial sales charge on purchases. The dealer of record receives a payment from the Fund’s distributor of 1.00% of the amount you invest in Class C shares. If you redeem your Class C shares within one year of purchase, you will be subject to a 1.00% contingent deferred sales charge (“CDSC”), based on the lower of the shares’ cost or current net asset value. Any shares acquired by reinvestment of distributions will be redeemed without a CDSC. For the six months ended July 31, 2014, CDSC fees on Class C Shares paid to the Distributor were $2,111.
NOTE 2. SIGNIFICANT ACCOUNTING POLICIES
The Fund is an investment company and follows accounting and reporting guidance under Financial Accounting Standards Board (“FASB”) Accounting Standards Codification (“ASC”) Topic 946, “Financial Services – Investment Companies”. The following is a summary of significant accounting policies consistently followed by the Fund in the preparation of its financial statements. These policies are in conformity with the generally accepted accounting principles in the United States of America (“GAAP”).
Securities Valuation – All investments in securities are recorded at their estimated fair value as described in Note 3.
Federal Income Taxes – The Fund makes no provision for federal income or excise tax. The Fund intends to qualify each year as a regulated investment company (“RIC”)
48
Angel Oak Multi-Strategy Income Fund
Notes to the Financial Statements - (continued)
July 31, 2014
(Unaudited)
NOTE 2. SIGNIFICANT ACCOUNTING POLICIES - (continued)
under subchapter M of the Internal Revenue Code of 1986, as amended, by complying with the requirements applicable to RICs and by distributing substantially all of its taxable income. The Fund also intends to distribute sufficient net investment income and net capital gains, if any, so that it will not be subject to excise tax on undistributed income and gains. If the required amount of net investment income or gains is not distributed, the Fund could incur a tax expense.
As of and during the six months ended July 31, 2014, the Fund did not have a liability for any unrecognized tax benefits. The Fund recognizes interest and penalties, if any, related to unrecognized tax benefits as income tax expense in the statement of operations. During the period, the Fund did not incur any interest or penalties. The Fund is subject to examination by U.S. federal tax authorities for all tax years since inception.
Expenses – Expenses incurred by the Trust that do not relate to a specific fund of the Trust are allocated to the individual funds based on each fund’s relative net assets or another appropriate basis (as determined by the Trustees). Expenses attributable to any class are borne by that class. Income, realized gains and losses, unrealized appreciation and depreciation, and expenses are allocated to each class based on the net assets in relation to the relative net assets of the Fund.
Security Transactions and Related Income – The Fund follows industry practice and records security transactions on the trade date for financial reporting purposes. The specific identification method is used for determining gains or losses for financial statement and income tax purposes. Dividend income is recorded on the ex-dividend date and interest income and expense is recorded on an accrual basis. Discounts and premiums on securities purchased are accreted or amortized using the effective interest method. The ability of issuers of debt securities held by the Fund to meet their obligations may be affected by economic and political developments in a specific country or region.
Dividends and Distributions – The Fund intends to distribute substantially all of its net investment income, if any, as dividends to its shareholders on a monthly basis. The Fund intends to distribute its net realized long term capital gains and its net realized short term capital gains, if any, at least once a year. Dividends to shareholders, which are determined in accordance with income tax regulations, are recorded on the ex-dividend date. The treatment for financial reporting purposes of distributions made to shareholders during the period from net investment income or net realized capital gains may differ from their ultimate treatment for federal income tax purposes. These
49
Angel Oak Multi-Strategy Income Fund
Notes to the Financial Statements - (continued)
July 31, 2014
(Unaudited)
NOTE 2. SIGNIFICANT ACCOUNTING POLICIES - (continued)
differences are caused primarily by differences in the timing of the recognition of certain components of income, expense or realized capital gain for federal income tax purposes. Where such differences are permanent in nature, they are reclassified in the components of the net assets based on their ultimate characterization for federal income tax purposes. Any such reclassifications will have no effect on net assets, results of operations or net asset values per share of the Fund. There were no such reclassifications made as of July 31, 2014.
Reverse Repurchase Agreements – A reverse repurchase agreement is the sale by the Fund of a security to a party for a specified price, with the simultaneous agreement by the Fund to repurchase that security from that party on a future date at a higher price. Securities sold under reverse repurchase agreements are reflected as a liability on the Statements of Assets and Liabilities. Interest payments made are recorded as a component of interest expense on the Statements of Operations. Reverse repurchase agreements involve the risk that the counterparty will become subject to bankruptcy or other insolvency proceedings or fail to return a security to the Fund. In such situations, the Fund may incur losses as a result of a possible decline in the value of the underlying security during the period while the Fund seeks to enforce its rights, a possible lack of access to income on the underlying security during this period, or expenses of enforcing its rights.
Futures Contracts – The Fund may enter into futures contracts to hedge various investments for risk management. Initial margin deposits are made upon entering into futures contracts and can be either cash or securities. Secondary margin limits are required to be maintained while futures are held, as defined by each contract. Cash held at the broker as of July 31, 2014, noted on the Statement of Assets and Liabilities, is held for collateral for futures transactions.
During the period a futures contract is open, changes in the value of the contract are recognized as unrealized gains or losses by “marking-to-market” on a daily basis to reflect the fair value of the contract at the end of each day’s trading. Variation margin receivables or payables represent the difference between the change in unrealized appreciation and depreciation on the open contracts and the cash deposits made on the margin accounts. When the contract is closed, the Fund records a realized gain or loss equal to the difference between the proceeds from the closing transaction and the Fund’s cost of entering into a contract. The use of futures contracts involves the risk of illiquid markets or imperfect correlation between the value of the instruments and the underlying securities, or that the counterparty will fail to perform its obligations.
50
Angel Oak Multi-Strategy Income Fund
Notes to the Financial Statements - (continued)
July 31, 2014
(Unaudited)
NOTE 2. SIGNIFICANT ACCOUNTING POLICIES - (continued)
Futures contracts are valued at the settlement price established each day by the board of trade or exchange on which they are traded. These securities will be classified as Level 1 securities as described in Note 3 below. Should market conditions move unexpectedly, the Fund may not achieve the anticipated benefits of the futures contract and may realize a loss. See Note 4 for information on futures contract activity during the six months ended July 31, 2014.
Mortgage-Backed and Asset-Backed Securities Risks – Prepayment risk is associated with mortgage-backed and asset-backed securities, including collateralized loan obligations (“CLOs”). If interest rates fall, the underlying debt may be repaid ahead of schedule, reducing the value of the Fund’s investments. If interest rates rise, there may be fewer prepayments, which would cause the average bond maturity to rise, increasing the potential for the Fund to lose money. The value of these securities may be significantly affected by changes in interest rates, the market’s perception of issuers, and the creditworthiness of the parties involved. The ability of the Fund to successfully utilize these instruments may depend on the ability of the Fund’s Adviser to forecast interest rates and other economic factors correctly. These securities may have a structure that makes their reaction to interest rate changes and other factors difficult to predict, making their value highly volatile. Certain mortgage-backed securities may be secured by pools of mortgages on single-family, multi-family properties, as well as commercial properties. Similarly, asset-backed securities may be secured by pools of loans, such as corporate loans, student loans, automobile loans and credit card receivables. The credit risk on such securities is affected by homeowners or borrowers defaulting on their loans. The values of assets underlying mortgage-backed and asset-backed securities, including CLOs, may decline and therefore may not be adequate to cover underlying investors. Mortgage-backed securities and other securities issued by participants in housing and commercial real estate finance, as well as other real estate-related markets have experienced extraordinary weakness and volatility in recent years. Possible legislation in the area of residential mortgages, credit cards, corporate loans and other loans that may collateralize the securities in which the Fund may invest could negatively impact the value of the Fund’s investments. To the extent the Fund focuses its investments in particular types of mortgage-backed or asset-backed securities, including CLOs, the Fund may be more susceptible to risk factors affecting such types of securities.
51
Angel Oak Multi-Strategy Income Fund
Notes to the Financial Statements - (continued)
July 31, 2014
(Unaudited)
NOTE 3. SECURITIES VALUATION AND FAIR VALUE MEASUREMENTS
Fair value is defined as the price that a Fund would receive upon selling an investment in a timely transaction to an independent buyer in the principal or most advantageous market of the investment. GAAP establishes a three-tier hierarchy to maximize the use of observable market data and minimize the use of unobservable inputs and to establish classification of fair value measurements for disclosure purposes.
Inputs refer broadly to the assumptions that market participants would use in pricing the asset or liability, including assumptions about risk (the risk inherent in a particular valuation technique used to measure fair value, such as pricing models and/or the risk inherent in the inputs to the valuation technique). Inputs may be observable or unobservable. Observable inputs are inputs that reflect the assumptions market participants would use in pricing the asset or liability developed based on market data obtained from sources independent of the reporting entity. Unobservable inputs are inputs that reflect the reporting entity’s own assumptions about the assumptions market participants would use in pricing the asset or liability developed based on the best information available in the circumstances.
Various inputs are used in determining the value of the Fund’s investments. These inputs are summarized in the three broad levels listed below.
| • | Level 1 – quoted prices in active markets for identical securities |
| • | Level 2 – other significant observable inputs (including, but not limited to, quoted prices for an identical security in an inactive market, quoted prices for similar securities, interest rates, prepayment speeds, credit risk, etc.) |
| • | Level 3 – significant unobservable inputs (including the Fund’s own assumptions in determining fair value of investments based on the best information available) |
The inputs used to measure fair value may fall into different levels of the fair value hierarchy. In such cases, for disclosure purposes, the level in the fair value hierarchy within which the fair value measurement falls in its entirety is determined based on the level input that is most significant to the fair value measurement in its entirety.
Equity securities, including preferred stocks, are generally valued by using market quotations, but may be valued on the basis of prices furnished by a pricing service when the Adviser believes such prices more accurately reflect the fair value of such securities. Securities that are traded on any stock exchange are generally valued by the pricing service at the last quoted sale price. Lacking a last sale price, an exchange traded security
52
Angel Oak Multi-Strategy Income Fund
Notes to the Financial Statements - (continued)
July 31, 2014
(Unaudited)
NOTE 3. SECURITIES VALUATION AND FAIR VALUE MEASUREMENTS - (continued)
is generally valued by the pricing service at its last bid price. Securities traded in the NASDAQ over-the-counter market are generally valued by the pricing service at the NASDAQ Official Closing Price. When using the market quotations or close prices provided by the pricing service and when the market is considered active, the security will be classified as a Level 1 security. Sometimes, an equity security owned by the Fund will be valued by the pricing service with factors other than market quotations or when the market is considered inactive. When this happens, the security will be classified as a Level 2 security. When market quotations are not readily available, when the Adviser determines that the market quotation or the price provided by the pricing service does not accurately reflect the current fair value, or when certain restricted or illiquid securities are being valued, such securities are valued as determined in good faith by the Adviser, in conformity with guidelines adopted by and subject to review by the Board of Trustees (the “Board”). These securities will generally be categorized as Level 3 securities.
Investments in mutual funds, including money market mutual funds, are generally priced at the ending net asset value (“NAV”) provided by the service agent of the funds. These securities will be categorized as Level 1 securities.
Fixed income securities, including collateralized mortgage obligations, collateralized loan obligations, collateralized debt obligations, corporate bonds, and asset-backed securities when valued using market quotations in an active market, will be categorized as Level 1 securities. However, they may be valued on the basis of prices furnished by a pricing service when the Fund believes such prices more accurately reflect the fair value of such securities. A pricing service utilizes electronic data processing techniques based on yield spreads relating to securities with similar characteristics to determine prices for normal institutional-size trading units of debt securities without regard to sale or bid prices. For these securities, the pricing service may also use prepayment speeds, consideration of collateral, unemployment rates, credit risk, foreclosures, and liquidations. These securities will generally be categorized as Level 2 securities. If the Adviser decides that a price provided by the pricing service does not accurately reflect the fair value of the securities, when prices are not readily available from a pricing service, or when restricted or illiquid securities are being valued, securities are valued at fair value as determined in good faith by the Adviser, in conformity with guidelines adopted by and subject to review of the Board. These securities will generally be categorized as Level 3 securities.
53
Angel Oak Multi-Strategy Income Fund
Notes to the Financial Statements - (continued)
July 31, 2014
(Unaudited)
NOTE 3. SECURITIES VALUATION AND FAIR VALUE MEASUREMENTS - (continued)
Reverse repurchase agreements are priced at their acquisition cost, which represents fair value. These securities will generally be categorized as Level 2 securities.
Short-term investments in fixed income securities, (those with maturities of less than 60 days when acquired, or which subsequently are within 60 days of maturity), may be valued by using the amortized cost method of valuation, which the Board has determined will represent fair value. These securities will be classified as Level 2 securities.
In accordance with the Trust’s good faith pricing guidelines, the Adviser is required to consider all appropriate factors relevant to the value of securities for which it has determined other pricing sources are not available or reliable as described above. No single standard exists for determining fair value, because fair value depends upon the circumstances of each individual case. As a general principle, the current fair value of an issue of securities being valued by the Adviser would appear to be the amount which the owner might reasonably expect to receive for them upon their current sale. Methods which are in accordance with this principle may, for example, be based on (i) a multiple of earnings; (ii) a discount from market of a similar freely traded security (including a derivative security or a basket of securities traded on other markets, exchanges or among dealers); or (iii) yield to maturity with respect to debt issues, or a combination of these and other methods. Good faith pricing is permitted if, in the Adviser’s opinion, the validity of market quotations appears to be questionable based on factors such as evidence of a thin market in the security based on a small number of quotations, a significant event occurs after the close of a market but before a Fund’s NAV calculation that may affect a security’s value, or the Adviser is aware of any other data that calls into question the reliability of market quotations. Good faith pricing may also be used in instances when the bonds the Fund invests in may default or otherwise cease to have market quotations readily available.
54
Angel Oak Multi-Strategy Income Fund
Notes to the Financial Statements - (continued)
July 31, 2014
(Unaudited)
NOTE 3. SECURITIES VALUATION AND FAIR VALUE MEASUREMENTS - (continued)
The following is a summary of the inputs used to value the Fund’s investments as of July 31, 2014:
| Valuation Inputs | ||||||||||||||||
| Assets | Level 1 - Quoted Prices in Active Markets | Level 2 - Other Observable | Level 3 - Significant Unobservable Inputs | Total | ||||||||||||
| Collateralized Mortgage Obligations | $ | – | $ | 2,469,069,470 | $ | – | $ | 2,469,069,470 | ||||||||
| Collateralized Loan Obligations | – | 324,399,413 | – | 324,399,413 | ||||||||||||
| Asset-Backed Securities | – | 324,965,701 | – | 324,965,701 | ||||||||||||
| Corporate Bonds | – | 12,500,000 | 10,000,000 | 22,500,000 | ||||||||||||
| Collateralized Debt Obligations | – | 13,852,900 | – | 13,852,900 | ||||||||||||
| Preferred Stocks | 3,210,983 | – | – | 3,210,983 | ||||||||||||
| Cash Equivalents | 131,248,792 | – | – | 131,248,792 | ||||||||||||
| Long Futures Contracts* | 19,760 | – | – | 19,760 | ||||||||||||
| Total | $ | 134,499,295 | $ | 3,144,787,484 | $ | 10,000,000 | $ | 3,289,286,779 | ||||||||
| Liabilities | ||||||||||||||||
| Reverse Repurchase Agreements | $ | – | $ | (232,458,075 | ) | $ | – | $ | (232,458,075 | ) | ||||||
| Short Futures Contracts* | (1,049,071 | ) | – | – | (1,049,071 | ) | ||||||||||
| Total | $ | (1,049,071 | ) | $ | (232,458,075 | ) | $ | – | $ | (233,507,146 | ) | |||||
| * | The amount shown represents the gross unrealized appreciation/(depreciation) of the futures contracts. |
During the six months ended July 31, 2014, the Fund had no transfers between Levels 1 and 2 at any time during the reporting period. The Fund’s transfers between Level 3 and Level 2 are detailed in the table below. The Trust recognizes transfers between fair value hierarchy levels at the end of the reporting period.
55
Angel Oak Multi-Strategy Income Fund
Notes to the Financial Statements - (continued)
July 31, 2014
(Unaudited)
NOTE 3. SECURITIES VALUATION AND FAIR VALUE MEASUREMENTS - (continued)
Following is a reconciliation of investments in which significant unobservable inputs (Level 3) were used in determining fair value for the Fund:
| Collateralized Mortgage Obligations | Collateralized Loan Obligations | Asset Backed Securities | Corporate Bonds | Collateralized Debt Obligation | Total Investments | |||||||||||||||||||
Balance as of January 31, 2014 | $ | 30,673,322 | $ | 9,420,000 | $ | 37,149,498 | $ | – | $ | 3,143,910 | $ | 80,386,730 | ||||||||||||
Realized gain/(loss) | – | – | 1,359 | – | – | 1,359 | ||||||||||||||||||
Accretion/ (amortization) | – | – | 396 | – | – | 396 | ||||||||||||||||||
Change in unrealized appreciation (depreciation) | – | – | (5,193 | ) | – | – | (5,193 | ) | ||||||||||||||||
Purchases | – | – | – | 10,000,000 | – | 10,000,000 | ||||||||||||||||||
Sales | – | – | (10,996,562 | ) | – | – | (10,996,562 | ) | ||||||||||||||||
Transfers in to Level 3 | – | – | – | – | – | – | ||||||||||||||||||
Transfers out of Level 3* | (30,673,322 | ) | (9,420,000 | ) | (26,149,498 | ) | – | (3,143,910 | ) | (69,386,730 | ) | |||||||||||||
|
|
|
|
|
|
|
|
|
|
|
| |||||||||||||
Balance as of July 31, 2014 | $ | – | $ | – | $ | – | $ | 10,000,000 | $ | – | $ | 10,000,000 | ||||||||||||
|
|
|
|
|
|
|
|
|
|
|
| |||||||||||||
| * | Transfers out of Level 3 were into Level 2 as a result of pricing sources beginning to price the securities on a daily basis. |
The Fund’s Level 3 investments have been valued using acquisition cost. As a result, there were no unobservable inputs that have been internally developed by the Fund in determining the fair values of its investments as of July 31, 2014.
The total change in unrealized appreciation (depreciation) attributable to Level 3 investments still held at July 31, 2014 was $0.
56
Angel Oak Multi-Strategy Income Fund
Notes to the Financial Statements - (continued)
July 31, 2014
(Unaudited)
NOTE 3. SECURITIES VALUATION AND FAIR VALUE MEASUREMENTS - (continued)
Balance Sheet Offsetting Information
The following table provides a summary of offsetting financial liabilities and derivatives and the effect of derivative instruments on the Statement of Assets and Liabilities as of July 31, 2014.
| Gross Amounts Not Offset in Statement of Assets and Liabilities | ||||||||||||||||||||||||
| Gross Amounts of Recognized Assets | Gross Amounts Offset in Statement of Assets and Liabilities | Net Amounts of Assets Presented in Statement of Assets and Liabilities | Financial Instruments | Cash Collateral Pledged | Net Amount (not less than 0) | |||||||||||||||||||
Futures Contracts | $ | 220,195 | $ | – | $ | 220,195 | $ | – | $ | 220,195 | $ | – | ||||||||||||
| Gross Amounts Not Offset in Statement of Assets and Liabilities | ||||||||||||||||||||||||
| Gross Amounts of Recognized Liabilities | Gross Amounts Offset in Statement of Assets and Liabilities | Net Amounts of Liabilities Presented in Statement of Assets and Liabilities | Financial Instruments | Cash Collateral Pledged | Net Amount (not less than 0) | |||||||||||||||||||
Reverse Repurchase Agreements | $ | 232,458,075 | $ | – | $ | 232,458,075 | $ | 232,458,075 | $ | – | $ | – | ||||||||||||
During the ordinary course of business, the Fund may enter into transactions subject to enforceable netting agreements or other similar arrangements (“netting agreements”). Generally, the right to offset in netting agreements allows the Fund to offset any exposure to a specific counterparty with any collateral received or delivered to that counterparty based on the terms of the agreement. Generally, the Fund manages its cash collateral and securities collateral on a counterparty basis. As of July 31, 2014, the Fund did not enter into any netting agreements which would require any portfolio securities to be netted.
57
Angel Oak Multi-Strategy Income Fund
Notes to the Financial Statements - (continued)
July 31, 2014
(Unaudited)
NOTE 4. DERIVATIVE TRANSACTIONS
The following tables present a summary of the fair value of derivative instruments, not accounted for as hedging instruments as of July 31, 2014 and the effect of derivative instruments on the Statement of Operations for the fiscal year ended July 31, 2014.
At July 31, 2014:
Asset | Liability | |||||||
Derivatives | Type of | Statement of Assets and Liabilities | Statement of Assets and | Variation | ||||
Futures Contracts | Interest Rate | Receivable for net variation margin on futures contracts | $220,195 |
The effect of Derivative Instruments on the Statement of Operations for the six months ended July 31, 2014:
| Derivatives | Location of Gain/(Loss) on | Contracts Opened | Contracts Closed | Realized Gain (Loss) on Derivatives | Change in Unrealized | |||||
Long Futures Contracts | Net change in unrealized appreciation on futures contracts | 152 | – | $– | $19,760 | |||||
| Derivatives | Location of Gain/(Loss) on | Contracts Sold Short | Contracts Closed | Realized Gain (Loss) on Derivatives | Change in Unrealized Appreciation/ (Depreciation) on Derivatives | |||||
Short Futures Contracts | Net realized loss on futures contracts/net change in unrealized appreciation on futures contracts | 22,555 | 19,359 | $(16,052,293) | $3,188,554 |
58
Angel Oak Multi-Strategy Income Fund
Notes to the Financial Statements - (continued)
July 31, 2014
(Unaudited)
NOTE 5. FEES AND OTHER TRANSACTIONS WITH AFFILIATES
Under the terms of the management agreement, on behalf of the Fund (the “Agreement”), the Adviser manages the Fund’s investments subject to oversight of the Trustees. As compensation for its management services, the Fund is obligated to pay the Adviser a fee computed and accrued daily and paid monthly at an annual rate of 1.50% of the average daily net assets of the Fund on the first $200 million in assets, 1.25% for the next $300 million in assets and 1.00% for any assets in excess of $500 million. For the six months ended July 31, 2014, the Adviser earned a fee of $13,331,693 from the Fund before the waiver described below. At July 31, 2014, the Fund owed the Adviser $2,218,791.
The Adviser has contractually agreed to waive or limit its fees and to assume other expenses of the Fund until May 31, 2015, so that Total Annual Fund Operating Expenses does not exceed 0.99 %. This operating expense limitation does not apply to brokerage fees and commissions, borrowing costs (such as interest and dividend expenses on securities sold short), taxes, 12b-1 fees; extraordinary expenses and indirect expenses (such as “acquired funds fees and expenses”). For the six months ended July 31, 2014, the Adviser contractually waived fees of $2,055,481.
The waiver and/or reimbursement by the Adviser with respect to the Fund is subject to repayment by the Fund within the three fiscal years following the fiscal year in which that particular waiver and/or reimbursement occurred, provided that the Fund is able to make the repayment without exceeding the expense limitations described above. The amounts subject to repayment by the Fund, pursuant to the aforementioned conditions, at July 31, 2014 are as follows:
Amount | Recoverable through January 31, | |
$100,940 | 2015 | |
$1,319,337 | 2016 | |
$3,869,799 | 2017 | |
$2,055,481 | 2018 |
The Trust retains Huntington Asset Services, Inc. (“HASI”) to manage the Fund’s business affairs and provide the Fund with administrative services, including all regulatory reporting and necessary office equipment and personnel related to that function. For the six months ended July 31, 2014, HASI earned fees of $375,357 for administrative and compliance services provided to the Fund. At July 31, 2014, HASI was owed $72,174 from the Fund for administrative services. Certain officers and one
59
Angel Oak Multi-Strategy Income Fund
Notes to the Financial Statements - (continued)
July 31, 2014
(Unaudited)
NOTE 5. FEES AND OTHER TRANSACTIONS WITH AFFILIATES - (continued)
Trustee of the Trust are members of management and/or employees of HASI. HASI is a wholly-owned subsidiary of Huntington Bancshares, Inc., the parent company of Unified Financial Securities, Inc. (the “Distributor”) and Huntington National Bank, the custodian of the Fund’s investments (the “Custodian”). For the six months ended July, 31, 2014, the Custodian earned fees of $141,194 for custody services provided to the Fund. At July 31, 2014, the Custodian was owed $36,449 from the Fund for custody services.
The Trust also retains HASI to act as the Fund’s transfer agent and to provide fund accounting services. For the six months ended July 31, 2014, HASI earned fees of $129,884 for transfer agent services and reimbursement for out-of-pocket expenses incurred in providing transfer agent services to the Fund. At July 31, 2014, the Fund owed HASI $3,289 for transfer agent services and out-of-pocket expenses.
For the six months ended July 31, 2014, HASI earned fees of $107,836 from the Fund for fund accounting services. At July 31, 2014, HASI was owed $20,320 from the Fund for fund accounting services.
The Fund has adopted a Distribution Plan (the “Plan”) pursuant to Rule 12b-1 under the 1940 Act. The Plan provides that the Fund will pay the Distributor and/or any registered securities dealer, financial institution or any other person (the “Recipient”) a shareholder servicing fee of 0.25% (Class A shares) and 1.00% (Class C shares) of each share classes’ respective average daily net assets of the Fund in connection with the promotion and distribution of the Fund’s shares or the provision of personal services to shareholders, including, but not necessarily limited to, advertising, compensation to underwriters, dealers and selling personnel, the printing and mailing of prospectuses to other than current Fund shareholders, the printing and mailing of sales literature and servicing shareholder accounts. The Fund or Adviser may pay all or a portion of these fees to any Recipient who renders assistance in distributing or promoting the sale of shares, or who provides certain shareholder services, pursuant to a written agreement. The Plan is a compensation plan, which means that compensation is paid regardless of 12b-1 expenses actually incurred. It is anticipated that the Plan will benefit shareholders because an effective sales program typically is necessary in order for the Fund to reach and maintain a sufficient size to achieve efficiently its investment objectives and to realize economies of scale. For the six months ended July 31, 2014, Class A shares 12b-1 expense incurred by the Fund was $1,077,506 and Class C shares 12b-1 expense incurred was $241,140. The Fund owed $161,721 for Class A shares and $44,998 for Class C shares 12b-1 fees as of July 31, 2014.
60
Angel Oak Multi-Strategy Income Fund
Notes to the Financial Statements - (continued)
July 31, 2014
(Unaudited)
NOTE 5. FEES AND OTHER TRANSACTIONS WITH AFFILIATES - (continued)
Unified Financial Securities, Inc. (“Unified”) acts as the principal distributor of the Fund’s shares. During the six months ended July 31, 2014, the Distributor received $137,065 from commissions earned on sales of Class A shares, of which $124,695 was re-allowed to intermediaries of the Fund, and $2,111 from contingent deferred sales charges on Class C shares held for less than one year. An officer of the Trust is an officer of the Distributor and such person may be deemed to be an affiliate of the Distributor.
NOTE 6. INVESTMENT TRANSACTIONS
For the six months ended July 31, 2014, purchases and sales of investment securities, other than short-term investments and short-term U.S. government obligations, were as follows:
| Purchases | Sales | |||||||
U.S. Government Obligations | $ | – | $ | – | ||||
Other | 1,593,767,549 | 950,501,630 | ||||||
NOTE 7. ESTIMATES
The preparation of financial statements in conformity with GAAP requires management to make estimates and assumptions that affect the reported amounts of assets and liabilities and disclosure of contingent assets and liabilities at the date of the financial statements and the reported amounts of increases and decreases in net assets from operations during the reporting period. Actual results could differ from those estimates.
NOTE 8. BENEFICIAL OWNERSHIP
The beneficial ownership, either directly or indirectly, of 25% or more of the voting securities of a fund creates a presumption of control of a fund, under Section 2(a)(9) of the Investment Company Act of 1940. At July 31, 2014, Charles Schwab & Co. (“Schwab”) and UBS owned, as record shareholder, 27% and 32%, respectively, of the outstanding shares of Fund. It is not known whether Schwab or UBS or any other underlying beneficial owners owned or controlled 25% or more of the voting securities of the Fund.
61
Angel Oak Multi-Strategy Income Fund
Notes to the Financial Statements - (continued)
July 31, 2014
(Unaudited)
NOTE 9. FEDERAL TAX INFORMATION
At July 31, 2014, the unrealized appreciation (depreciation) of investments, excluding futures contracts, for tax purposes, was as follows:
Gross Unrealized Appreciation | $ | 82,651,002 | ||
Gross Unrealized (Depreciation) | (21,058,638 | ) | ||
|
| |||
Net Unrealized Appreciation on Investments | $ | 61,592,364 | ||
|
|
At July 31, 2014, the aggregate cost of securities for federal income tax purposes was $3,227,654,895 for the Fund.
The tax characterization of distributions paid for the fiscal year ended January 31, 2014 was as follows:
| 2014 | ||||
Distributions paid from: | ||||
Ordinary Income | $ | 82,564,518 | ||
Net Long-Term Capital Gain | 137,797 | |||
|
| |||
| $ | 82,702,315 | |||
|
| |||
At January 31, 2014, the components of distributable earnings (accumulated losses) on a tax basis were as follows:
Undistributed ordinary income | $ | 1,546,079 | ||
Undistributed long-term capital gains | – | |||
Distributions payable | (1,715,217 | ) | ||
Accumulated capital and other losses | (29,695,995 | ) | ||
Unrealized appreciation | 39,321,793 | |||
|
| |||
| $ | 9,456,660 | |||
|
|
As of January 31, 2014, the Fund had short-term capital loss carryforwards available to offset future gains and not subject to expiration in the amount of $21,896,476.
Certain capital losses incurred after October 31 and within the current taxable year, are deemed to arise on the on the first business day of the Fund’s following taxable year. For the tax year ended January 31, 2014 the Fund deferred post October capital losses in the amount of $7,796,374.
62
Angel Oak Multi-Strategy Income Fund
Notes to the Financial Statements - (continued)
July 31, 2014
(Unaudited)
NOTE 10. COMMITMENTS AND CONTINGENCIES
The Fund indemnifies its officers and trustees for certain liabilities that may arise from performance of their duties to the Fund. Additionally, in the normal course of business, the Fund enters into contracts that contain a variety of representatives and warranties which provide general indemnifications. The Fund’s maximum exposure under these arrangements is unknown, as this would involve future claims that may be made against the Fund that have not yet occurred.
NOTE 11. RESTRICTED SECURITIES
Restricted securities are securities that may only be resold upon registration under federal securities laws or in transactions exempt from such registration. In some cases, the issuer of restricted securities has agreed to register such securities for resale, at the issuer’s expense, either upon demand or in connection with another registered offering of the securities. Many restricted securities may be resold in the secondary market in transactions exempt from registration. Such restricted securities may be determined by the Fund to be liquid. The Fund does not anticipate incurring any registration costs upon such resale. The Fund’s restricted securities are valued at the price provided by pricing service or dealers in the secondary market or, if no market prices are available, at the fair value price as determined by the Fund’s Adviser or pursuant to the Fund’s fair value policies and procedures. The Fund has acquired securities, the sale of which is restricted under Rule 144A of the Securities Act of 1933. It is possible that the fair value price may differ significantly from the amount that may ultimately be realized in the near term, and the difference could be material. At July 31, 2014, the Fund held restricted securities representing 25% of net assets, as listed below:
| Issuer Description | Acquisition Date | Principal Amount | Amortized Cost | Fair Value | ||||||||||
| 321 Henderson Receivables LLC, Series 2012-3A, Class A, 3.220%, 8/15/2041 | 2/11/2013* | $ | 12,338,099 | $ | 12,462,540 | $ | 12,100,177 | |||||||
| 321 Henderson Receivables LLC, Series 2012-3A, Class B, 6.170%, 8/15/2041 | 11/9/2012 | 1,000,000 | 999,985 | 1,129,547 | ||||||||||
| 321 Henderson Receivables LLC, Series 2013-3A, Class A, 4.080%, 1/17/2073 | 10/10/2013 | 4,834,519 | 4,830,659 | 5,053,772 | ||||||||||
| 321 Henderson Receivables LLC, Series 2014-1A, Class B, 4.940%, 3/16/2065 | 2/10/2014 | 1,500,000 | 1,498,810 | 1,554,783 | ||||||||||
63
Angel Oak Multi-Strategy Income Fund
Notes to the Financial Statements - (continued)
July 31, 2014
(Unaudited)
NOTE 11. RESTRICTED SECURITIES - (continued)
| Issuer Description | Acquisition Date | Principal Amount | Amortized Cost | Fair Value | ||||||||||
| 321 Henderson Receivables LLC, Series 2014-2A, Class A, 3.610%, 1/17/2073 | 7/16/2014 | $ | 6,000,000 | $ | 5,996,112 | $ | 5,996,111 | |||||||
| 321 Henderson Receivables LLC, Series 2014-2A, Class B, 4.480%, 1/15/2075 | 7/16/2014 | 1,000,000 | 999,531 | 999,531 | ||||||||||
| Acis CLO Ltd., Series 2013-1A, Class E, 5.834%, 4/18/2024 | 5/6/2013* | 12,000,000 | 11,449,609 | 11,259,600 | ||||||||||
| Acis CLO Ltd., Series 2014-3A, Class E, 4.990%, 2/1/2026 | 1/16/2014 | 4,500,000 | 3,973,780 | 3,934,800 | ||||||||||
| Adams Mill CLO Ltd., Series 2014-1A, Class E1, 5.235%, 7/15/2026 | 7/1/2014 | 3,000,000 | 2,760,000 | 2,760,000 | ||||||||||
| ALM Loan Funding, Series 2014-14A, Class D, 5.084%, 7/28/2026 | 6/6/2014 | 7,500,000 | 6,827,521 | 6,865,500 | ||||||||||
| AMMC CLO IX Ltd., Series 2011-9A, Class E, 7.684%, 1/15/2022 | 5/10/2013 | 1,000,000 | 1,014,560 | 1,000,400 | ||||||||||
| Anchorage Capital CLO Ltd., Series 2013-1A, Class D, 5.034%, 7/13/2025 | 6/5/2013 | 5,000,000 | 4,704,143 | 4,556,500 | ||||||||||
| Ares XXVII CLO Ltd., Series 2013-2A, Class E, 5.085%, 7/28/2025 | 1/17/2014 | 5,500,000 | 5,207,444 | 5,066,600 | ||||||||||
| Arrowpoint CLO Ltd., Series 2012-2A, Class D, 3.934%, 3/12/2026 | 2/6/2014 | 3,000,000 | 2,865,517 | 2,846,700 | ||||||||||
| Arrowpoint CLO Ltd., Series 2012-2A, Class E, 4.954%, 3/12/2026 | 2/6/2014 | 6,000,000 | 5,413,665 | 5,333,400 | ||||||||||
| Bayview Commercial Asset Trust, Series 2005-2A, Class A1, 0.465%, 8/25/2035 | 4/1/2013* | 12,478,536 | 10,419,132 | 11,394,613 | ||||||||||
| Bayview Commercial Asset Trust, Series 2005-4A, Class A1, 0.455%, 1/25/2036 | 4/29/2013 | 2,934,681 | 2,497,998 | 2,679,217 | ||||||||||
64
Angel Oak Multi-Strategy Income Fund
Notes to the Financial Statements - (continued)
July 31, 2014
(Unaudited)
NOTE 11. RESTRICTED SECURITIES - (continued)
| Issuer Description | Acquisition Date | Principal Amount | Amortized Cost | Fair Value | ||||||||||
| Bayview Commercial Asset Trust, Series 2005-4A, Class A2, 0.545%, 1/25/2036 | 5/3/2013 | $ | 3,172,390 | $ | 2,648,454 | $ | 2,837,506 | |||||||
| Brand Group Holdings, Inc., 8.500%, 6/27/2024 | 6/27/2014 | 10,000,000 | 10,000,000 | 10,000,000 | ||||||||||
| Brookside Mill CLO Ltd., Series 2013-1A, Class E, 4.633%, 4/17/2025 | 4/25/2013* | 7,250,000 | 6,618,674 | 6,561,250 | ||||||||||
| Cajun Global LLC, Series 2011-1A, Class A2, 5.955%, 2/20/2041 | 10/29/2013 | 7,190,284 | 7,547,967 | 7,400,959 | ||||||||||
| Canyon Capital CLO Ltd., Series 2012-1A, Class D, 4.534%, 1/15/2024 | 2/12/2013 | 3,000,000 | 3,005,872 | 2,998,800 | ||||||||||
| Carlyle Global Market Strategies CLO Ltd., Series 2012-4A, Class E, 5.734%, 1/20/2025 | 5/20/2013 | 2,850,000 | 2,855,309 | 2,783,310 | ||||||||||
| Catamaran CLO Ltd., Series 2012-1A, Class D, 4.731%, 12/20/2023 | 5/1/2013 | 8,750,000 | 8,805,230 | 8,756,125 | ||||||||||
| CFCRE Commercial Mortgage Trust, Series 2011-C1, Class F, 5.000%, 4/15/2044 | 5/14/2013 | 7,931,000 | 6,855,817 | 7,388,179 | ||||||||||
| Chevy Chase Mortgage Funding Corp., Series 2005-1A, Class A1, 0.305%, 1/25/2036 | 7/23/2013* | 11,104,035 | 9,458,223 | 9,930,949 | ||||||||||
| Chevy Chase Mortgage Funding Corp., Series 2005-1A, Class A2, 0.355%, 1/25/2036 | 11/20/2013 | 8,914,920 | 7,788,028 | 8,245,766 | ||||||||||
| Chevy Chase Mortgage Funding Corp., Series 2005-3A, Class A1, 0.335%, 7/25/2036 | 10/16/2013* | 9,011,551 | 7,832,159 | 7,887,279 | ||||||||||
| Chevy Chase Mortgage Funding Corp., Series 2005-4A, Class IO, 1.308%, 4/25/2037 (I/O) | 5/14/2014 | 85,207,395 | 5,261,918 | 5,378,717 | ||||||||||
| CIFC Funding Ltd., Series 2012-1A, Class B2L, 7.225%, 8/14/2024 | 4/25/2013* | 10,000,000 | 10,067,362 | 10,002,000 | ||||||||||
| CIFC Funding Ltd., Series 2012-2A, Class B2L, 6.227%, 12/5/2024 | 12/24/2013 | 6,630,000 | 6,630,000 | 6,625,359 | ||||||||||
65
Angel Oak Multi-Strategy Income Fund
Notes to the Financial Statements - (continued)
July 31, 2014
(Unaudited)
NOTE 11. RESTRICTED SECURITIES - (continued)
| Issuer Description | Acquisition Date | Principal Amount | Amortized Cost | Fair Value | ||||||||||
| CIFC Funding Ltd., Series 2012-2A, Class B3L, 7.227%, 12/5/2024 | 1/9/2014 | $ | 2,000,000 | $ | 2,000,000 | $ | 1,944,400 | |||||||
| CIFC Funding Ltd., Series 2012-3A, Class B2L, 6.234%, 1/29/2025 | 12/24/2013 | 9,200,000 | 9,200,000 | 9,080,400 | ||||||||||
| CIFC Funding Ltd., Series 2012-3A, Class B3L, 7.134%, 1/29/2025 | 2/3/2014 | 1,000,000 | 995,156 | 952,700 | ||||||||||
| CIFC Funding Ltd., Series 2013-1A, Class E, 6.358%, 4/16/2025 | 12/24/2013* | 4,800,000 | 4,566,341 | 4,363,200 | ||||||||||
| Citigroup Commercial Mortgage Trust, Series 2014-GC19, Class D, 4.900%, 3/10/2047 | 2/28/2014* | 9,000,000 | 8,303,331 | 8,752,536 | ||||||||||
| Citigroup Commercial Mortgage Trust, Series 2014-GC23, Class A4, 3.622%, 7/10/2024 | 7/17/2014 | 7,000,000 | 7,209,702 | 7,209,702 | ||||||||||
| Citigroup Commercial Mortgage Trust, Series 2014-GC23, Class D, 4.658%, 7/10/2024 | 7/17/2014 | 10,000,000 | 9,382,101 | 9,382,101 | ||||||||||
| ColumbusNova CLO IV Ltd., Series 2007-2A, Class D, 4.734%, 10/15/2021 | 2/11/2014 | 3,440,000 | 3,448,178 | 3,445,848 | ||||||||||
| Commercial Mortgage Trust, Series 2013-CR6, Class E, 4.314%, 3/10/2046 | 6/4/2013 | 6,146,000 | 4,945,597 | 5,235,639 | ||||||||||
| Commercial Mortgage Trust, Series 2014-CR14, Class D, 4.612%, 2/10/2047 | 5/13/2014 | 6,250,000 | 5,867,069 | 6,071,428 | ||||||||||
| Commercial Mortgage Trust, Series 2014-CR17, Class D, 4.800%, 5/10/2047 | 4/29/2014* | 8,250,000 | 7,749,721 | 7,944,111 | ||||||||||
| CountryWide Alternative Loan Trust, Series 2005-58R, Class A, 2.247%, 12/20/2035 (I/O) | 3/6/2013 | 193,698,845 | 12,728,941 | 13,316,796 | ||||||||||
| Credit Suisse Mortgage Capital Certificates, Series 2012-9, Class B1, 2.419%, 2/25/2050 | 11/21/2012* | 10,363,000 | 9,434,192 | 9,308,565 | ||||||||||
| Crown Point CLO Ltd., Series 2012-1A, Class B1L, 5.229%, 11/21/2022 | 5/8/2013 | 5,000,000 | 5,044,838 | 5,019,000 | ||||||||||
66
Angel Oak Multi-Strategy Income Fund
Notes to the Financial Statements - (continued)
July 31, 2014
(Unaudited)
NOTE 11. RESTRICTED SECURITIES - (continued)
| Issuer Description | Acquisition Date | Principal Amount | Amortized Cost | Fair Value | ||||||||||
| Crown Point CLO Ltd., Series 2012-1A, Class B2L, 6.729%, 11/21/2022 | 5/15/2013* | $ | 6,625,000 | $ | 6,659,208 | $ | 6,630,300 | |||||||
| Drug Royalty II LP, Series 2014-1, Class A2, 3.484%, 7/15/2023 | 6/18/2014 | 9,713,043 | 9,712,894 | 9,712,932 | ||||||||||
| Dryden XXVIII Senior Loan Fund, Series 2013-28A, Class B6L, 4.124%, 8/15/2025 | 5/31/2013* | 4,000,000 | 3,551,010 | 3,515,200 | ||||||||||
| Emerson Park CLO Ltd., Series 2013-1A, Class E, 5.084%, 7/15/2025 | 7/19/2013* | 3,000,000 | 2,734,917 | 2,775,600 | ||||||||||
| Finn Square CLO Ltd, Series 2012-1A, Class D, 5.281%, 12/24/2023 | 1/17/2014 | 4,600,000 | 4,434,296 | 4,373,220 | ||||||||||
| Finn Square CLO Ltd., Series 2012-1A, Class C, 3.831%, 12/24/2023 | 2/20/2013 | 3,000,000 | 2,960,116 | 2,930,100 | ||||||||||
| Fortress Credit BSL II Ltd, Series 2013-2A, Class D, 4.084%, 10/19/2025 | 4/3/2014 | 7,750,000 | 7,389,590 | 7,357,075 | ||||||||||
| Fortress Credit BSL II Ltd., Series 2013-2A, Class E, 5.384%, 10/19/2025 | 10/25/2013 | 5,000,000 | 4,472,653 | 4,515,500 | ||||||||||
| FREMF Mortgage Trust, Series 2014-K36, Class C, 4.361%, 12/25/2046 | 2/6/2014* | 6,000,000 | 5,567,271 | 6,103,518 | ||||||||||
| FREMF Mortgage Trust, Series 2014-K37, Class C, 4.558%, 1/25/2047 | 3/12/2014* | 8,500,000 | 8,233,526 | 8,760,444 | ||||||||||
| Gallatin CLO IV Ltd., Series 2012-1A, Class E, 5.484%, 10/15/2023 | 12/6/2013 | 3,000,000 | 2,842,152 | 2,838,900 | ||||||||||
| GS Mortgage Securities Corp. II, Series 2013-GC10, Class C, 4.285%, 2/10/2046 | 1/3/2014 | 5,000,000 | 4,756,661 | 5,083,535 | ||||||||||
| GS Mortgage Securities Corp. II, Series 2014-GC20, Class D, 4.866%, 4/10/2047 | 3/27/2014 | 5,000,000 | 4,523,249 | 4,827,708 | ||||||||||
67
Angel Oak Multi-Strategy Income Fund
Notes to the Financial Statements - (continued)
July 31, 2014
(Unaudited)
NOTE 11. RESTRICTED SECURITIES - (continued)
| Issuer Description | Acquisition Date | Principal Amount | Amortized Cost | Fair Value | ||||||||||
| GS Mortgage Securities Trust, Series 2013-GC13, Class C, 4.072%, 7/10/2046 | 9/26/2013 | $ | 7,500,000 | $ | 6,927,124 | $ | 7,545,026 | |||||||
| GS Mortgage Securities Trust, Series 2013-GC14, Class C, 4.775%, 8/10/2023 | 8/14/2013 | 6,600,000 | 6,293,321 | 6,943,114 | ||||||||||
| GS Mortgage Securities Trust, Series 2013-GC14, Class D, 4.775%, 8/10/2023 | 8/14/2013* | 7,260,000 | 6,268,566 | 7,077,683 | ||||||||||
| GS Mortgage Securities Trust, Series 2014-GC22, Class D, 4.646%, 6/10/2047 | 6/5/2014 | 5,000,000 | 4,569,548 | 4,724,095 | ||||||||||
| Halcyon Loan Advisors Funding Ltd., Series 2012-2A, Class E, 5.631%, 12/20/2024 | 6/26/2013 | 3,000,000 | 2,747,483 | 2,862,600 | ||||||||||
| HOA Funding LLC, Series 2014-1A, Class A2, 4.846%, 8/20/2044 | 7/22/2014 | 5,000,000 | 5,000,000 | 5,000,000 | ||||||||||
| ING IM CLO Ltd., Series 2012-1RA, Class DR, 5.431%, 3/14/2022 | 3/6/2014 | 1,750,000 | 1,750,000 | 1,737,225 | ||||||||||
| ING IM CLO Ltd., Series 2012-1RA, Class ER, 6.731%, 3/14/2022 | 3/6/2014 | 2,000,000 | 2,000,000 | 1,951,400 | ||||||||||
| ING IM CLO Ltd., Series 2014-1A, Class D, 5.169%, 4/18/2026 | 2/5/2014 | 9,500,000 | 8,988,284 | 8,975,600 | ||||||||||
| JFIN Revolver CLO Ltd., Series 2013-1A, Class D, 3.984%, 1/20/2021 | 11/26/2013 | 7,000,000 | 6,658,281 | 6,633,200 | ||||||||||
| JFIN Revolver CLO Ltd., Series 2014-2A, Class C, 2.984%, 2/20/2022 | 7/18/2014 | 5,000,000 | 4,787,500 | 4,787,500 | ||||||||||
| JMP Credit Advisors CLO II Ltd., Series 2013-1A, Class D, 4.084%, 4/30/2023 | 4/3/2013* | 4,000,000 | 3,752,134 | 3,856,000 | ||||||||||
| JMP Credit Advisors CLO II Ltd., Series 2013-1A, Class E, 5.484%, 4/30/2023 | 5/13/2013* | 13,200,000 | 12,359,083 | 12,372,360 | ||||||||||
68
Angel Oak Multi-Strategy Income Fund
Notes to the Financial Statements - (continued)
July 31, 2014
(Unaudited)
NOTE 11. RESTRICTED SECURITIES - (continued)
| Issuer Description | Acquisition Date | Principal Amount | Amortized Cost | Fair Value | ||||||||||
| JP Morgan Chase Commercial Mortgage Securities Trust, Series 2013-C16, Class D, 5.008%, 12/15/2046 | 1/7/2014* | $ | 10,000,000 | $ | 9,244,979 | $ | 9,945,015 | |||||||
| JPMBB Commercial Mortgage Securities Trust, Series 2013-C14, Class D, 4.713%, 8/15/2046 | 8/2/2013 | 5,000,000 | 4,306,750 | 4,848,218 | ||||||||||
| KCAP Senior Funding I LLC, Series 2013-1A, Class D, 5.484%, 7/20/2024 | 5/6/2013 | 2,500,000 | 2,412,553 | 2,442,500 | ||||||||||
| KVK CLO Ltd., Series 2012-1X, Class E, 6.484%, 7/15/2023 | 5/9/2013 | 3,700,000 | 3,721,106 | 3,700,000 | ||||||||||
| KVK CLO Ltd., Series 2013-1A, Class D, 4.584%, 4/14/2025 | 5/16/2013 | 2,000,000 | 2,016,579 | 1,981,400 | ||||||||||
| Longfellow Place CLO Ltd., Series 2013-1A, Class D, 4.484%, 1/15/2024 | 1/15/2013* | 9,000,000 | 8,732,458 | 8,990,100 | ||||||||||
| Morgan Stanley Bank of America Merrill Lynch Trust, Series 2013-C7, Class D, 4.303%, 2/15/2046 | 4/16/2014 | 10,000,000 | 9,137,251 | 9,542,310 | ||||||||||
| Morgan Stanley Bank of America Merrill Lynch Trust, Series 2013-C9, Class D, 4.160%, 5/15/2046 | 12/13/2013 | 6,500,000 | 5,503,398 | 6,119,152 | ||||||||||
| Morgan Stanley Bank of America Merrill Lynch Trust, Series 2014-C14, Class D, 4.835%, 2/15/2047 | 6/17/2014 | 7,500,000 | 7,084,960 | 7,313,332 | ||||||||||
| Morgan Stanley Bank of America Merrill Lynch Trust, Series 2014-C15, Class D, 4.899%, 4/15/2047 | 3/26/2014* | 15,000,000 | 13,734,159 | 14,537,310 | ||||||||||
| Morgan Stanley Bank of America Merrill Lynch Trust, Series 2014-C16, Class D, 4.758%, 6/15/2047 | 6/27/2014* | 10,500,000 | 9,927,853 | 9,970,548 | ||||||||||
| Muir Woods CLO Ltd., Series 2012-1A, Class E, 6.731%, 9/14/2023 | 5/13/2013 | 2,500,000 | 2,522,856 | 2,500,750 | ||||||||||
69
Angel Oak Multi-Strategy Income Fund
Notes to the Financial Statements - (continued)
July 31, 2014
(Unaudited)
NOTE 11. RESTRICTED SECURITIES - (continued)
| Issuer Description | Acquisition Date | Principal Amount | Amortized Cost | Fair Value | ||||||||||
| Neuberger Berman CLO XIII Ltd., Series 2012-13A, Class D, 4.733%, 1/23/2024 | 11/20/2012* | $ | 5,050,000 | $ | 4,860,180 | $ | 5,054,545 | |||||||
| NewMark Capital Funding CLO Ltd., Series 2013-1A, Class D, 3.017%, 6/2/2025 | 5/29/2013 | 1,000,000 | 907,183 | 904,600 | ||||||||||
| Ocean Trails CLO IV, Series 2013-4A, Class A, 1.524%, 8/13/2025 | 9/26/2013 | 25,000,000 | 24,824,797 | 25,007,500 | ||||||||||
| Ocean Trails CLO IV, Series 2013-4A, Class D, 4.224%, 8/13/2025 | 7/25/2013 | 4,000,000 | 3,830,896 | 3,879,200 | ||||||||||
| Octagon Investment Partners XIV Ltd., Series 2012-1A, Class E, 6.734%, 1/15/2024 | 5/29/2013* | 6,300,000 | 6,282,236 | 6,014,610 | ||||||||||
| OFSI Fund VI Ltd., Series 2014-6A, Class D, 5.213%, 3/20/2025 | 2/10/2014 | 5,000,000 | 4,475,125 | 4,374,000 | ||||||||||
| OHA Credit Partners VI Ltd., Series 2012-6A, Class D, 4.724%, 5/15/2023 | 2/7/2013 | 3,000,000 | 3,023,200 | 3,000,300 | ||||||||||
| Portola CLO Ltd., Series 2007-1A, Class E, 6.624%, 11/15/2021 | 4/15/2013 | 2,747,252 | 2,732,095 | 2,748,351 | ||||||||||
| RAIT Trust, Series 2014-FL2, Class B, 2.302%, 5/13/2031 | 5/22/2014 | 650,000 | 645,469 | 641,875 | ||||||||||
| Regatta III Funding Ltd., Series 2014-1A, Class D, 5.153%, 4/15/2026 | 2/25/2014 | 4,375,000 | 4,040,442 | 3,935,750 | ||||||||||
| Saranac CLO I Ltd., Series 2013-1A, Class D, 3.785%, 10/26/2024 | 11/7/2013 | 4,000,000 | 3,695,811 | 3,712,400 | ||||||||||
| Saratoga Investment Corp. CLO Ltd., Series 2013-1A, Class D, 3.734%, 10/20/2023 | 10/2/2013 | 8,000,000 | 7,494,240 | 7,548,000 | ||||||||||
| Saratoga Investment Corp. CLO Ltd., Series 2013-1A, Class E, 4.734%, 10/20/2023 | 10/2/2013 | 13,100,000 | 11,420,499 | 11,636,730 | ||||||||||
| Shackleton CLO Ltd., Series 2012-1A, Class D, 4.973%, 8/14/2023 | 2/25/2013 | 6,000,000 | 6,034,808 | 6,000,600 | ||||||||||
70
Angel Oak Multi-Strategy Income Fund
Notes to the Financial Statements - (continued)
July 31, 2014
(Unaudited)
NOTE 11. RESTRICTED SECURITIES - (continued)
| Issuer Description | Acquisition Date | Principal Amount | Amortized Cost | Fair Value | ||||||||||
| Shackleton CLO Ltd., Series 2013-3A, Class D, 4.034%, 4/15/2025 | 3/20/2013 | $ | 3,000,000 | $ | 2,826,140 | $ | 2,873,100 | |||||||
| SolarCity LMC LLC, Series 2014-1, Class A, 4.590%, 4/20/2044 | 4/2/2014* | 2,214,646 | 2,225,614 | 2,292,104 | ||||||||||
| Sound Point CLO Ltd., Series 2012-1A, Class D, 4.814%, 10/20/2023 | 5/6/2013 | 2,000,000 | 2,012,694 | 2,001,600 | ||||||||||
| Sound Point CLO Ltd., Series 2013-1A, Class B2L, 4.735%, 4/26/2025 | 5/6/2013* | 7,000,000 | 6,404,700 | 6,259,400 | ||||||||||
| Steele Creek CLO Ltd., Series 2014-1A, Class D, 3.634%, 8/21/2026 | 7/18/2014 | 2,000,000 | 1,831,864 | 1,831,864 | ||||||||||
| Steele Creek CLO Ltd., Series 2014-1A, Class E2, 7.184%, 8/21/2026 | 7/18/2014 | 2,000,000 | 1,982,856 | 1,982,856 | ||||||||||
| Store Master Funding LLC, Series 2012-1A, Class A, 5.770%, 8/20/2042 | 8/17/2012* | 6,376,524 | 6,772,820 | 6,855,911 | ||||||||||
| Store Master Funding LLC, Series 2013-1A, Class A1, 4.160%, 3/20/2043 | 3/20/2013 | 4,896,309 | 4,895,288 | 4,981,212 | ||||||||||
| Store Master Funding LLC, Series 2013-3A, Class A2, 5.210%, 11/20/2043 | 11/21/2013* | 14,853,694 | 14,956,807 | 15,615,837 | ||||||||||
| Sudbury Mill CLO Ltd., Series 2013-1A, Class E, 4.983%, 1/17/2026 | 11/14/2013 | 5,000,000 | 4,580,044 | 4,561,000 | ||||||||||
| TICC CLO LLC, Series 2012-1A, Class D1, 5.977%, 8/25/2023 | 11/9/2012* | 7,000,000 | 6,966,228 | 7,000,000 | ||||||||||
| Trade MAPS 1 Ltd., Series 2013-1A, Class D, 5.153%, 12/10/2018 | 12/6/2013 | 2,000,000 | 2,000,000 | 2,014,380 | ||||||||||
| Tuolumne Grove CLO Ltd., Series 2014-1A, Class E, 4.977%, 4/25/2026 | 2/28/2014 | 5,000,000 | 4,471,914 | 4,449,000 | ||||||||||
71
Angel Oak Multi-Strategy Income Fund
Notes to the Financial Statements - (continued)
July 31, 2014
(Unaudited)
NOTE 11. RESTRICTED SECURITIES - (continued)
| Issuer Description | Acquisition Date | Principal Amount | Amortized Cost | Fair Value | ||||||||||
| UBS-Barclays Commercial Mortgage Trust, Series 2012-C2, Class F, 4.890%, 5/10/2063 | 5/7/2013 | $ | 7,000,000 | $ | 5,888,317 | $ | 6,365,138 | |||||||
| UBS-Barclays Commercial Mortgage Trust, Series 2012-C3, Class C, 4.958%, 8/10/2049 | 8/28/2013 | 3,500,000 | 3,458,780 | 3,750,723 | ||||||||||
| UBS-Barclays Commercial Mortgage Trust, Series 2012-C4, Class E, 4.501%, 12/10/2045 | 5/13/2013 | 5,000,000 | 4,139,744 | 4,398,785 | ||||||||||
| UBS-Barclays Commercial Mortgage Trust, Series 2013-C5, Class B, 3.649%, 3/10/2046 | 7/2/2014 | 190,000 | 184,336 | 187,646 | ||||||||||
| Venture CDO Ltd., Series 2012-11A, Class E, 6.725%, 11/14/2022 | 4/17/2013 | 1,500,000 | 1,500,000 | 1,501,200 | ||||||||||
| Venture X CLO Ltd., Series 2012-12A, Class E, 5.529%, 2/28/2024 | 5/20/2013* | 10,000,000 | 9,760,952 | 9,394,000 | ||||||||||
| Vibrant CLO II Ltd., Series 2013-2A, Class C, 3.833%, 7/24/2024 | 8/13/2013 | 3,000,000 | 2,832,689 | 2,838,000 | ||||||||||
| Vibrant CLO II Ltd., Series 2013-2A, Class D, 5.133%, 7/24/2024 | 8/13/2013 | 3,200,000 | 2,892,053 | 2,929,920 | ||||||||||
| Vibrant CLO Ltd., Series 2012-1A, Class C, 4.733%, 7/17/2024 | 5/20/2013 | 10,200,000 | 10,294,450 | 10,200,000 | ||||||||||
| Voya CLO Ltd., Series 2014-3A, Class D, 5.233%, 7/25/2026 | 7/10/2014 | 1,750,000 | 1,591,824 | 1,591,800 | ||||||||||
| Washington Mill CLO Ltd., Series 2014-1A, Class D, 3.676%, 4/20/2026 | 4/11/2014 | 5,000,000 | 4,784,053 | 4,771,000 | ||||||||||
| Washington Mill CLO Ltd., Series 2014-1A, Class E, 5.076%, 4/20/2026 | 4/11/2014 | 5,000,000 | 4,623,727 | 4,584,000 | ||||||||||
| West CLO Ltd., Series 2012-1A, Class D, 6.736%, 10/30/2023 | 5/6/2013 | 5,000,000 | 5,029,787 | 5,003,500 | ||||||||||
| WF-RBS Commercial Mortgage Trust, Series 2012-C9, Class D, 4.803%, 11/15/2045 | 12/6/2013* | 9,000,000 | 8,152,284 | 8,944,344 | ||||||||||
72
Angel Oak Multi-Strategy Income Fund
Notes to the Financial Statements - (continued)
July 31, 2014
(Unaudited)
NOTE 11. RESTRICTED SECURITIES - (continued)
| Issuer Description | Acquisition Date | Principal Amount | Amortized Cost | Fair Value | ||||||||||
| WF-RBS Commercial Mortgage Trust, Series 2013-C14, Class D, 4.001%, 6/15/2046 | 7/25/2014 | $ | 8,470,000 | $ | 7,871,852 | $ | 7,814,236 | |||||||
| WF-RBS Commercial Mortgage Trust, Series 2013-C16, Class D, 4.984%, 9/15/2046 | 1/3/2014 | 4,000,000 | 3,625,535 | 3,962,458 | ||||||||||
| WF-RBS Commercial Mortgage Trust, Series 2013-C17, Class D, 5.127%, 12/15/2046 | 6/17/2014 | 8,229,000 | 8,003,312 | 8,165,258 | ||||||||||
| Wind River CLO Ltd., Series 2012-1A, Class D, 5.234%, 1/15/2024 | 4/18/2013 | 4,000,000 | 4,009,874 | 4,012,400 | ||||||||||
| Wind River CLO Ltd., Series 2012-1A, Class E, 5.484%, 1/15/2024 | 12/13/2013 | 5,000,000 | 4,719,682 | 4,729,000 | ||||||||||
| TOTAL | $ | 741,454,479 | ||||||||||||
| * | The security was purchased on multiple dates with the initial purchase date shown. |
NOTE 12. LINE OF CREDIT
The Fund participates in a short-term credit agreement (“Line of Credit”) with Huntington National Bank. (“Huntington”). Under the terms of the agreement, the Fund may borrow up to $100 million at an interest rate of LIBOR plus 125 basis points. The purpose of the agreement is to meet temporary or emergency cash needs, including redemption requests that might otherwise require the untimely disposition of securities. Huntington receives an annual facility fee of 0.125% on $100 million as well as an additional annual fee of 0.125% on any unused portion of the credit facility, invoiced quarterly, for providing the Line of Credit. For the six months ended July 31, 2014, the Fund did not borrow under this Line of Credit.
NOTE 13. SUBSEQUENT EVENT
Management of the Fund has evaluated the need for disclosures and/or adjustments resulting from subsequent events through the date these financial statements were issued. There were no items requiring adjustment of financial statements or additional disclosure.
73
VALUED ADVISERS TRUST
PRIVACY POLICY
The following is a description of the policies of the Valued Advisers Trust (the “Trust”) regarding disclosure of nonpublic personal information that shareholders provide to a series of the Trust (each, a “Fund”) or that the Fund collects from other sources. In the event that a shareholder holds shares of a Fund through a broker-dealer or other financial intermediary, the privacy policy of the financial intermediary would govern how shareholder nonpublic personal information would be shared with nonaffiliated third parties.
Categories of Information A Fund May Collect. A Fund may collect the following nonpublic personal information about its shareholders:
| • | Information the Fund receives from a shareholder on applications or other forms, correspondence, or conversations (such as the shareholder’s name, address, phone number, social security number, and date of birth); and |
| • | Information about the shareholder’s transactions with the Fund, its affiliates, or others (such as the shareholder’s account number and balance, payment history, cost basis information, and other financial information). |
Categories of Information A Fund May Disclose. A Fund may not disclose any nonpublic personal information about its current or former shareholders to unaffiliated third parties, except as required or permitted by law. A Fund is permitted by law to disclose all of the information it collects, as described above, to its service providers (such as the Fund’s custodian, administrator, transfer agent, accountant and legal counsel) to process shareholder transactions and otherwise provide services to the shareholder.
Confidentiality and Security. Each Fund shall restrict access to shareholder nonpublic personal information to those persons who require such information to provide products or services to the shareholder. Each Fund shall maintain physical, electronic, and procedural safeguards that comply with federal standards to guard shareholder nonpublic personal information.
Disposal of Information. The Funds, through their transfer agent, have taken steps to reasonably ensure that the privacy of a shareholder’s nonpublic personal information is maintained at all times, including in connection with the disposal of information that is no longer required to be maintained by the Funds. Such steps shall include, whenever possible, shredding paper documents and records prior to disposal, requiring off-site storage vendors to shred documents maintained in such locations prior to disposal, and erasing and/or obliterating any data contained on electronic media in such a manner that the information can no longer be read or reconstructed.
74
PROXY VOTING
A description of the policies and procedures that the Fund uses to determine how to vote proxies relating to portfolio securities and information regarding how the Fund voted those proxies during the most recent twelve month period ended June 30, is available without charge upon request by (1) calling the Fund at (877) 625-3042 and (2) from Fund documents filed with the Securities and Exchange Commission (“SEC”) on the SEC’s website at www.sec.gov.
TRUSTEES
R. Jeffrey Young, Chairman
Ira Cohen
Andrea N. Mullins
OFFICERS
R. Jeffrey Young, Principal Executive Officer and President
Bryan W. Ashmus, Principal Financial Officer and Treasurer
John C. Swhear, Chief Compliance Officer, AML Officer and Vice-President
Carol J. Highsmith, Vice President and Secretary
Matthew J. Miller, Vice President
INVESTMENT ADVISER
Angel Oak Capital Advisors, LLC
One Buckhead Plaza
3060 Peachtree Road NW
Suite 500
Atlanta, GA 30305
DISTRIBUTOR
Unified Financial Securities, Inc.
2960 North Meridian Street, Suite 300
Indianapolis, IN 46208
INDEPENDENT REGISTERED PUBLIC ACCOUNTING FIRM
Cohen Fund Audit Services, Ltd.
1350 Euclid Avenue, Suite 800
Cleveland, OH 44115
LEGAL COUNSEL
The Law Offices of John H. Lively & Associates, Inc.
A member firm of The 1940 Act Law Group TM
1130 Tomahawk Creek Parkway, Suite 310
Leawood, KS 66211
CUSTODIAN
Huntington National Bank
41 South High Street
Columbus, OH 43215
ADMINISTRATOR, TRANSFER AGENT AND FUND ACCOUNTANT
Huntington Asset Services, Inc.
2960 North Meridian Street, Suite 300
Indianapolis, IN 46208
This report is intended only for the information of shareholders or those who have received the Fund’s prospectus which contains information about the Fund’s management fee and expenses. Please read the prospectus carefully before investing.
Distributed by Unified Financial Securities, Inc.
Member FINRA/SIPC
75
Item 2. Code of Ethics. NOT APPLICABLE – disclosed with annual report
Item 3. Audit Committee Financial Expert. NOT APPLICABLE – disclosed with annual report
Item 4. Principal Accountant Fees and Services. NOT APPLICABLE – disclosed with annual report
Item 5. Audit Committee of Listed Companies. NOT APPLICABLE – applies to listed companies only
Item 6. Schedule of Investments. Schedules filed with Item 1.
Item 7. Disclosure of Proxy Voting Policies and Procedures for Closed-End Management Investment Companies. NOT APPLICABLE – applies to closed-end funds only
Item 8. Portfolio Managers of Closed-End Investment Companies. NOT APPLICABLE – applies to closed-end funds only
Item 9. Purchases of Equity Securities by Closed-End Management Investment Company and Affiliated Purchasers. NOT APPLICABLE – applies to closed-end funds only
Item 10. Submission of Matters to a Vote of Security Holders.
The guidelines applicable to shareholders desiring to submit recommendations for nominees to the Registrant’s board of trustees are contained in the statement of additional information of the Trust with respect to the Fund(s) for which this Form N-CSR is being filed.
Item 11. Controls and Procedures.
(a) Based on their evaluation of the registrant’s disclosure controls and procedures (as defined in Rule 30a-3(c) under the Investment Company Act of 1940, as amended (the “Act”)) as of a date within 90 days of the filing date of this report, the registrant’s principal executive officer and principal financial officer have concluded that such disclosure controls and procedures are reasonably designed and are operating effectively to ensure that material information relating to the registrant is made known to them by others within those entities and that the information required in filings on Form N-CSR is recorded, processed, summarized, and reported on a timely basis.
(b) There were no significant changes in the registrant’s internal control over financial reporting (as defined in Rule 30a-3(d) under the Investment Company Act of 1940) that occurred during the second fiscal quarter of the period covered by this report that have materially affected, or are reasonably likely to materially affect, the registrant’s internal control over financial reporting.
Item 12. Exhibits.
| (a) | (1) Not Applicable – filed with annual report |
| (2) | Certifications by the registrant’s principal executive officer and principal financial officer, pursuant to Section 302 of the Sarbanes- Oxley Act of 2002 and required by Rule 30a-2under the Investment Company Act of 1940 are filed herewith. |
| (3) | Not Applicable – |
| (b) | Certification pursuant to 18 U.S.C. Section 1350, as adopted pursuant to Section 906 of the Sarbanes-Oxley Act of 2002 is filed herewith |
SIGNATURES
Pursuant to the requirements of the Securities Exchange Act of 1934 and the Investment Company Act of 1940, the registrant has duly caused this report to be signed on its behalf by the undersigned, thereunto duly authorized.
| (Registrant) | Valued Advisers Trust |
| By | ||
| * | /s/ R. Jeffrey Young | |
| R. Jeffrey Young, President and Principal Executive Officer | ||
| Date | 9/26/2014 | |
Pursuant to the requirements of the Securities Exchange Act of 1934 and the Investment Company Act of 1940, this report has been signed below by the following persons on behalf of the registrant and in the capacities and on the dates indicated.
| By | ||
| * | /s/ R. Jeffrey Young | |
| R. Jeffrey Young, President and Principal Executive Officer |
| Date | 9/26/2014 | |
| By | ||
| * | /s/ Bryan W. Ashmus | |
| Bryan W. Ashmus, Treasurer and Principal Financial Officer |
| Date | 9/26/2014 | |