UNITED STATES
SECURITIES AND EXCHANGE COMMISSION
WASHINGTON, D.C. 20549
FORM N-CSR
CERTIFIED SHAREHOLDER REPORT OF REGISTERED
MANAGEMENT INVESTMENT COMPANIES
Investment Company Act file number 811-22208
Valued Advisers Trust
(Exact name of registrant as specified in charter)
Ultimus Asset Services, LLC 225 Pictoria Drive, Suite 450 Cincinnati, OH 45246
(Address of principal executive offices) (Zip code)
Capitol Services, Inc.
615 S. Dupont Hwy.
Dover, DE 19901
(Name and address of agent for service)
With a copy to:
John H. Lively, Esq.
The Law Offices of John H. Lively & Associates, Inc.
A member firm of The 1940 Act Law GroupTM
11300 Tomahawk Creek Parkway,
Suite 310
Leawood, KS 66221
Registrant’s telephone number, including area code: 513-587-3400
Date of fiscal year end: 10/31
Date of reporting period: 4/30/17
Item 1. Reports to Stockholders.
-2-

Semi-Annual Report
April 30, 2017
Fund Adviser:
Granite Investment Advisors, LLC
6 Eagle Square, 3rd Floor
Concord, New Hampshire 03301
Toll Free (888) 442-9893
INVESTMENT RESULTS – (Unaudited)
| Average Annual Total Returns* (For the periods ended April 30, 2017) | ||||||||||||||||
| Six Month | One Year | Five Years | Since Inception (December 22, 2011) | |||||||||||||
Granite Value Fund | 9.65 | % | 9.91 | % | 7.08 | % | 8.53 | % | ||||||||
S&P 500® Index** | 13.32 | % | 17.92 | % | 13.68 | % | 15.17 | % | ||||||||
Russell 1000® Value Index** | 11.69 | % | 16.55 | % | 13.32 | % | 14.44 | % | ||||||||
Total annual operating expenses, as disclosed in the Granite Fund (the “Fund”) prospectus dated February 28, 2017, were 2.88% of average daily net assets (1.36% after fee waivers/expense reimbursements by Granite Investment Advisors, LLC (the “Adviser”). The Adviser has contractually agreed to waive or limit its fees and to assume other expenses of the Fund until February 28, 2018, so that the Total Annual Fund Operating Expenses does not exceed 1.35%. This operating expense limitation does not apply to brokerage fees and commissions, borrowing costs (such as interest and dividend expenses on securities sold short), taxes, 12b-1 fees; extraordinary expenses and indirect expenses (such as “acquired fund fees and expenses”). Additional information pertaining to the Fund’s expense ratios as of April 30, 2017 can be found in the financial highlights.
The performance quoted represents past performance, which does not guarantee future results. The investment return and principal value of an investment will fluctuate so that an investor’s shares, when redeemed, may be worth more or less than their original cost. The returns shown do not reflect deduction of taxes that a shareholder would pay on Fund distributions or the redemption of Fund shares. Current performance of the Fund may be lower or higher than the performance quoted. The Fund’s investment objectives, risks, charges and expenses must be considered carefully before investing. Performance data current to the most recent month end may be obtained by calling 1-888-442-9893.
| * | Average Annual Total Returns reflect any change in price per share and assume the reinvestment of all distributions. The Fund’s returns reflect any fee reductions during the applicable periods. If such fee reductions had not occurred, the quoted performance would have been lower. Total returns for periods less than one year are not annualized. |
| ** | The S&P 500® Index and the Russell 1000® Value Index are widely recognized unmanaged indices of equity securities and are representative of a broader domestic equity market and range of securities than is found in the Fund’s portfolio. Individuals cannot invest directly in an Index; however, an individual can invest in exchange traded funds or other investment vehicles that attempt to track the performance of a benchmark index. |
The Fund’s investment objective, strategies, risks, charges and expenses must be considered carefully before investing. The prospectus contains this and other important information about the Fund and may be obtained by calling the same number as above. Please read it carefully before investing.
The Fund is distributed by Unified Financial Securities, LLC, member FINRA/SIPC.
1
FUND HOLDINGS – (Unaudited)
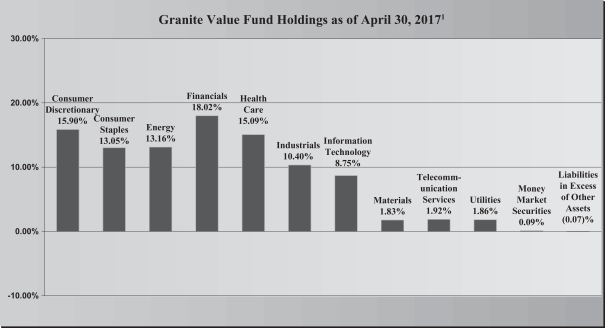
| 1 | As a percentage of net assets. |
The investment objective of the Fund is to seek long-term capital appreciation.
Availability of Portfolio Schedule – (Unaudited)
The Fund files its complete schedule of portfolio holdings with the Securities and Exchange Commission (“SEC”) for the first and third quarters of each fiscal year on Form N-Q. The Fund’s Forms N-Q are available at the SEC’s website at www.sec.gov. The Fund’s Forms N-Q may be reviewed and copied at the SEC’s Public Reference Room in Washington DC. Information on the operation of the Public Reference Room may be obtained by calling 1-800-SEC-0330.
2
GRANITE VALUE FUND
SCHEDULE OF INVESTMENTS
April 30, 2017 (Unaudited)
| Common Stocks – 99.98% | Shares | Fair Value | ||||||
Consumer Discretionary – 15.90% | ||||||||
Carnival Corp. | 4,145 | $ | 256,037 | |||||
Comcast Corp., Class A | 7,350 | 288,047 | ||||||
General Motors Co. | 11,315 | 391,952 | ||||||
Mattel, Inc. | 6,615 | 148,308 | ||||||
TJX Cos., Inc./The | 2,760 | 217,046 | ||||||
Viacom, Inc., Class B | 3,745 | 159,387 | ||||||
Whirlpool Corp. | 930 | 172,682 | ||||||
|
| |||||||
| 1,633,459 | ||||||||
|
| |||||||
Consumer Staples – 13.05% | ||||||||
Coca-Cola Co./The | 4,380 | 188,997 | ||||||
CVS Health Corp. | 2,550 | 210,222 | ||||||
Danone SA ADR | 23,575 | 331,936 | ||||||
Unilever PLC ADR | 6,840 | 351,166 | ||||||
Wal-Mart Stores, Inc. | 3,440 | 258,619 | ||||||
|
| |||||||
| 1,340,940 | ||||||||
|
| |||||||
Energy – 13.16% | ||||||||
Cimarex Energy Co. | 1,550 | 180,854 | ||||||
Royal Dutch Shell PLC ADR | 6,740 | 364,769 | ||||||
Schlumberger Ltd. | 2,755 | 199,985 | ||||||
Southwestern Energy Co. * | 23,020 | 172,880 | ||||||
Tenaris SA ADR | 7,545 | 235,630 | ||||||
Transocean Ltd. * | 17,975 | 198,264 | ||||||
|
| |||||||
| 1,352,382 | ||||||||
|
| |||||||
Financials – 18.02% | ||||||||
Alleghany Corp. * | 605 | 369,474 | ||||||
American International Group, Inc. | 2,785 | 169,634 | ||||||
Bank of New York Mellon Corp./The | 4,260 | 200,476 | ||||||
Berkshire Hathaway, Inc., Class B * | 3,120 | 515,455 | ||||||
Citigroup, Inc. | 6,855 | 405,268 | ||||||
MetLife, Inc. | 3,680 | 190,661 | ||||||
|
| |||||||
| 1,850,968 | ||||||||
|
| |||||||
Health Care – 15.09% | ||||||||
Abbott Laboratories | 6,305 | 275,150 | ||||||
C.R. Bard, Inc. | 680 | 209,086 | ||||||
Gilead Sciences, Inc. | 3,210 | 220,046 | ||||||
Johnson & Johnson | 1,580 | 195,083 | ||||||
McKesson Corp. | 1,810 | 250,305 | ||||||
Merck & Co., Inc. | 3,680 | 229,374 | ||||||
UnitedHealth Group, Inc. | 980 | 171,382 | ||||||
|
| |||||||
| 1,550,426 | ||||||||
|
| |||||||
See accompanying notes which are an integral part of these financial statements.
3
GRANITE VALUE FUND
SCHEDULE OF INVESTMENTS – (continued)
April 30, 2017 (Unaudited)
| Common Stocks – 99.98% – continued | Shares | Fair Value | ||||||
Industrials – 10.40% | ||||||||
Boeing Co./The | 1,485 | $ | 274,473 | |||||
General Electric Co. | 7,240 | 209,888 | ||||||
Honeywell International, Inc. | 2,095 | 274,738 | ||||||
United Technologies Corp. | 2,600 | 309,374 | ||||||
|
| |||||||
| 1,068,473 | ||||||||
|
| |||||||
Information Technology – 8.75% | ||||||||
Apple, Inc. | 2,265 | 325,367 | ||||||
Microsoft Corp. | 4,185 | 286,505 | ||||||
Oracle Corp. | 6,380 | 286,845 | ||||||
|
| |||||||
| 898,717 | ||||||||
|
| |||||||
Materials – 1.83% | ||||||||
Agrium, Inc. | 2,000 | 187,860 | ||||||
|
| |||||||
Telecommunication Services – 1.92% | ||||||||
AT&T, Inc. | 4,985 | 197,556 | ||||||
|
| |||||||
Utilities – 1.86% | ||||||||
Calpine Corp. * | 18,675 | 190,485 | ||||||
|
| |||||||
Total Common Stocks (Cost $8,857,927) | 10,271,266 | |||||||
|
| |||||||
Money Market Securities – 0.09% | ||||||||
Fidelity Money Market Government Portfolio, Institutional Class, 0.65% (a) | 8,820 | 8,820 | ||||||
|
| |||||||
Total Money Market Securities (Cost $8,820) | 8,820 | |||||||
|
| |||||||
Total Investments – 100.07% (Cost $8,866,747) | 10,280,086 | |||||||
|
| |||||||
Liabilities in Excess of Other Assets – (0.07)% | (6,702) | |||||||
|
| |||||||
NET ASSETS – 100.00% | $ | 10,273,384 | ||||||
|
| |||||||
| (a) | Rate disclosed is the seven day effective yield as of April 30, 2017. |
| * | Non-income producing security. |
ADR – American Depositary Receipt
The sectors shown on the portfolio of investments are based on Global Industry Classification Standard, or GICS® (“GICS”). The GICS was developed by and/or is the exclusive property of MSCI, Inc. and Standard & Poor’s Financial Services LLC (“S&P”). GICS is a service mark of MSCI, Inc. and S&P and has been licensed for use by Ultimus Asset Services, LLC.
See accompanying notes which are an integral part of these financial statements.
4
GRANITE VALUE FUND
STATEMENT OF ASSETS AND LIABILITIES
April 30, 2017 – (Unaudited)
Assets | ||||
Investments in securities at fair value (cost $8,866,747) | $ | 10,280,086 | ||
Receivable for investments sold | 99,785 | |||
Dividends receivable | 6,286 | |||
Receivable from Adviser | 3,393 | |||
Prepaid expenses | 9,778 | |||
|
| |||
Total Assets | 10,399,328 | |||
|
| |||
Liabilities | ||||
Payable for investments purchased | 103,743 | |||
Payable to Administrator | 6,547 | |||
Payable to trustees | 13 | |||
Other accrued expenses | 15,641 | |||
|
| |||
Total Liabilities | 125,944 | |||
|
| |||
Net Assets | $ | 10,273,384 | ||
|
| |||
Net Assets consist of: | ||||
Paid-in capital | $ | 8,507,406 | ||
Accumulated undistributed net investment income | 30,963 | |||
Accumulated undistributed net realized gain from investments | 321,676 | |||
Net unrealized appreciation on investments | 1,413,339 | |||
|
| |||
Net Assets | $ | 10,273,384 | ||
|
| |||
Shares outstanding (unlimited number of shares authorized, no par value) | 745,303 | |||
|
| |||
Net asset value (“NAV”) and offering price per share | $ | 13.78 | ||
|
| |||
Redemption price per share (NAV * 98%) (a) | $ | 13.50 | ||
|
| |||
| (a) | The Fund charges a 2.00% redemption fee on shares redeemed in 60 days or less of purchase. Share are redeemed at the NAV if held longer than 60 calendar days. |
See accompanying notes which are an integral part of these financial statements.
5
GRANITE VALUE FUND
STATEMENT OF OPERATIONS
For the six months ended April 30, 2017 – (Unaudited)
Investment Income | ||||
Dividend income (net of foreign taxes withheld of $559) | $ | 112,636 | ||
|
| |||
Total investment income | 112,636 | |||
|
| |||
Expenses |
| |||
Investment Adviser | 50,377 | |||
Administration | 18,596 | |||
Fund accounting | 12,397 | |||
Transfer agent | 9,951 | |||
Legal | 8,591 | |||
Registration | 8,150 | |||
Audit | 8,111 | |||
Report printing | 5,402 | |||
Trustee | 2,804 | |||
Custodian | 1,785 | |||
Miscellaneous | 14,351 | |||
|
| |||
Total expenses | 140,515 | |||
|
| |||
Fees waived and expenses reimbursed by Adviser | (72,404 | ) | ||
|
| |||
Net operating expenses | 68,111 | |||
|
| |||
Net investment income | 44,525 | |||
|
| |||
Net Realized and Unrealized Gain on Investments |
| |||
Net realized gain on investment securities transactions | 321,677 | |||
Net change in unrealized appreciation of investment securities | 560,154 | |||
|
| |||
Net realized and unrealized gain on investments | 881,831 | |||
|
| |||
Net increase in net assets resulting from operations | $ | 926,356 | ||
|
| |||
See accompanying notes which are an integral part of these financial statements.
6
GRANITE VALUE FUND
STATEMENTS OF CHANGES IN NET ASSETS
| For the Six Months Ended April 30, 2017 (Unaudited) | For the Year Ended October 31, 2016 | |||||||
Increase (Decrease) in Net Assets due to: | ||||||||
Operations | ||||||||
Net investment income | $ | 44,525 | $ | 101,076 | ||||
Net realized gain on investment transactions | 321,677 | 384,642 | ||||||
Net change in unrealized appreciation (depreciation) of investments | 560,154 | (398,113 | ) | |||||
|
|
|
| |||||
Net increase in net assets resulting from operations | 926,356 | 87,605 | ||||||
|
|
|
| |||||
Distributions | ||||||||
From net investment income | (88,414 | ) | (53,723 | ) | ||||
From net realized gains | (253,158 | ) | – | |||||
|
|
|
| |||||
Total distributions | (341,572 | ) | (53,723 | ) | ||||
|
|
|
| |||||
Capital Transactions | ||||||||
Proceeds from shares sold | 249,871 | 591,824 | ||||||
Reinvestment of distributions | 286,876 | 44,897 | ||||||
Amount paid for shares redeemed | (520,465 | ) | (1,719,950 | ) | ||||
|
|
|
| |||||
Net increase (decrease) in net assets resulting from capital transactions | 16,282 | (1,083,229 | ) | |||||
|
|
|
| |||||
Total Increase (Decrease) in Net Assets | 601,066 | (1,049,347 | ) | |||||
|
|
|
| |||||
Net Assets | ||||||||
Beginning of period | 9,672,318 | 10,721,665 | ||||||
|
|
|
| |||||
End of period | $ | 10,273,384 | $ | 9,672,318 | ||||
|
|
|
| |||||
Accumulated undistributed net investment income included in net assets at end of period | $ | 30,963 | $ | 74,852 | ||||
|
|
|
| |||||
Share Transactions | ||||||||
Shares sold | 18,260 | 45,877 | ||||||
Shares issued in reinvestment of distributions | 21,172 | 3,558 | ||||||
Shares redeemed | (38,224 | ) | (136,304 | ) | ||||
|
|
|
| |||||
Net increase (decrease) in shares outstanding | 1,208 | (86,869 | ) | |||||
|
|
|
| |||||
See accompanying notes which are an integral part of these financial statements.
7
GRANITE VALUE FUND
FINANCIAL HIGHLIGHTS
(For a share outstanding during each period)
| For the Six Months Ended April 30, 2017 (Unaudited) | For the Year Ended October 31, 2016 | For the Year Ended October 31, 2015 | For the Year Ended October 31, 2014 | For the Year Ended October 31, 2013 | For the Period Ended October 31, 2012 (a) | |||||||||||||||||||
Selected Per Share Data: | ||||||||||||||||||||||||
Net asset value, beginning of period | $ | 13.00 | $ | 12.90 | $ | 14.22 | $ | 13.84 | $ | 11.24 | $ | 10.00 | ||||||||||||
|
|
|
|
|
|
|
|
|
|
|
| |||||||||||||
Investment operations: | ||||||||||||||||||||||||
Net investment income | 0.06 | 0.14 | 0.05 | 0.02 | 0.02 | 0.05 | (b) | |||||||||||||||||
Net realized and unrealized gain (loss) on investments | 1.19 | 0.03 | (c) | (0.80 | ) | 0.74 | 2.68 | 1.19 | ||||||||||||||||
|
|
|
|
|
|
|
|
|
|
|
| |||||||||||||
Total from investment operations | 1.25 | 0.17 | (0.75 | ) | 0.76 | 2.70 | 1.24 | |||||||||||||||||
|
|
|
|
|
|
|
|
|
|
|
| |||||||||||||
Less distributions to shareholders from: | ||||||||||||||||||||||||
Net investment income | (0.12 | ) | (0.07 | ) | (0.03 | ) | (0.02 | ) | (0.10 | ) | – | |||||||||||||
Net realized gains | (0.35 | ) | – | (0.54 | ) | (0.36 | ) | – | – | |||||||||||||||
|
|
|
|
|
|
|
|
|
|
|
| |||||||||||||
Total distributions | (0.47 | ) | (0.07 | ) | (0.57 | ) | (0.38 | ) | (0.10 | ) | – | |||||||||||||
|
|
|
|
|
|
|
|
|
|
|
| |||||||||||||
Paid in capital from redemption fees | – | – | – | – | (d) | – | – | (d) | ||||||||||||||||
|
|
|
|
|
|
|
|
|
|
|
| |||||||||||||
Net asset value, end of period | $ | 13.78 | $ | 13.00 | $ | 12.90 | $ | 14.22 | $ | 13.84 | $ | 11.24 | ||||||||||||
|
|
|
|
|
|
|
|
|
|
|
| |||||||||||||
Total Return (e) | 9.65 | %(f) | 1.30 | % | (5.37 | )% | 5.65 | % | 24.21 | % | 12.40 | %(f) | ||||||||||||
Ratios and Supplemental Data: | ||||||||||||||||||||||||
Net assets, end of period (000) | $ | 10,273 | $ | 9,672 | $ | 10,722 | $ | 13,212 | $ | 10,577 | $ | 4,750 | ||||||||||||
Ratio of net expenses to average net assets | 1.35 | %(g) | 1.35 | % | 1.36 | %(h) | 1.35 | % | 1.35 | % | 1.35 | %(g) | ||||||||||||
Ratio of expenses to average net assets before waiver and reimbursement | 2.79 | %(g) | 2.87 | % | 2.53 | % | 2.39 | % | 3.32 | % | 8.11 | %(g) | ||||||||||||
Ratio of net investment income to average net assets | 0.88 | %(g) | 1.02 | % | 0.40 | % | 0.17 | % | 0.27 | % | 0.55 | %(g) | ||||||||||||
Portfolio turnover rate | 12 | %(f) | 31 | % | 32 | % | 30 | % | 33 | % | 20 | %(f) | ||||||||||||
| (a) | For the period December 22, 2011 (commencement of operations) to October 31, 2012. |
| (b) | Calculated using the average shares method. |
| (c) | The amount shown for a share outstanding throughout the period does not accord with the change in aggregate gains and losses in the portfolio of securities during the period because of the timing of sales and purchases of fund shares in relation to fluctuating market values during the period. |
| (d) | Resulted in less than $0.005 per share. |
| (e) | Total return in the above table represents the rate that the investor would have earned or lost on an investment in the Fund, assuming reinvestment of distributions. |
| (f) | Not annualized. |
| (g) | Annualized. |
| (h) | Includes 0.01% overdraft fees. |
See accompanying notes which are an integral part of these financial statements.
8
GRANITE VALUE FUND
NOTES TO THE FINANCIAL STATEMENTS
April 30, 2017 (Unaudited)
NOTE 1. ORGANIZATION
The Granite Value Fund (the “Fund”) is an open-end diversified series of the Valued Advisers Trust (the “Trust”). The Trust is a management investment company established under the laws of Delaware by an Agreement and Declaration of Trust dated June 13, 2008 (the “Trust Agreement”). The Trust Agreement permits the Board of Trustees (the “Board”) to issue an unlimited number of shares of beneficial interest of separate series without par value. The Fund is one of a series of funds authorized by the Board. The Fund commenced operations on December 22, 2011. The Fund’s investment adviser is Granite Investment Advisors, LLC. (the “Adviser”). The investment objective of the Fund is to seek long-term capital appreciation.
NOTE 2. SIGNIFICANT ACCOUNTING POLICIES
The Fund is an investment company and follows accounting and reporting guidance under Financial Accounting Standards Board Accounting Standards Codification (“ASC”) Topic 946, “Financial Services-Investment Companies”. The following is a summary of significant accounting policies followed by the Fund in the preparation of its financial statements. These policies are in conformity with generally accepted accounting principles in the United States of America (“GAAP”).
Estimates – The preparation of financial statements in conformity with GAAP requires management to make estimates and assumptions that affect the reported amounts of assets and liabilities and disclosure of contingent assets and liabilities at the date of the financial statements and the reported amounts of increases and decreases in net assets from operations during the reporting period. Actual results could differ from those estimates.
Securities Valuation – All investments in securities are recorded at their estimated fair value as described in Note 3.
Federal Income Taxes – The Fund makes no provision for federal income or excise tax. The Fund has qualified and intends to qualify each year as a regulated investment company (“RIC”) under subchapter M of the Internal Revenue Code of 1986, as amended, by complying with the requirements applicable to RICs and by distributing substantially all of its taxable income. The Fund also intends to distribute sufficient net investment income and net capital gains, if any, so that it will not be subject to excise tax on undistributed income and gains. If the required amount of net investment income or gains is not distributed, the Fund could incur a tax expense.
As of and during the six months ended April 30, 2017, the Fund did not have a liability for any unrecognized tax benefits. The Fund recognizes interest and penalties, if any, related to unrecognized tax benefits as income tax expense in the Statement of Operations. During the six months ended April 30, 2017, the Fund did not incur any interest or penalties.
Expenses – Expenses incurred by the Trust that do not relate to a specific fund of the Trust are allocated to the individual funds based on each fund’s relative net assets or other appropriate basis.
Security Transactions and Related Income – The Fund follows industry practice and records security transactions on the trade date for financial reporting purposes. The specific identification method is used for determining gains or losses for financial statements and income tax purposes. Dividend income is recorded on the ex-dividend date and interest income is recorded on an accrual basis. Discounts and premiums on securities purchased are amortized or accreted using the effective interest method. Withholding taxes on foreign dividends have been provided for in accordance with the Fund’s understanding of the applicable country’s tax rules and rates.
9
GRANITE VALUE FUND
NOTES TO THE FINANCIAL STATEMENTS – (continued)
April 30, 2017 (Unaudited)
NOTE 2. SIGNIFICANT ACCOUNTING POLICIES – continued
Redemption Fees – The Fund charges a 2.00% redemption fee for shares redeemed within 60 days of purchase. These fees are deducted from the redemption proceeds otherwise payable to the shareholder. The Fund will retain the fee charged as an increase in paid-in capital and such fees become part of the Fund’s daily NAV calculation.
Dividends and Distributions – The Fund intends to distribute substantially all of its net investment income, net realized long-term capital gains and its net realized short-term capital gains, if any, to its shareholders on at least an annual basis. Dividends to shareholders, which are determined in accordance with income tax regulations, are recorded on the ex-dividend date. The treatment for financial reporting purposes of distributions made to shareholders during the year from net investment income or net realized capital gains may differ from their ultimate treatment for federal income tax purposes. These differences are caused primarily by differences in the timing of the recognition of certain components of income, expense or realized capital gain for federal income tax purposes. Where such differences are permanent in nature, they are reclassified in the components of net assets based on their ultimate characterization for federal income tax purposes. Any such reclassifications will have no effect on net assets, results of operations or net asset values per share of the Fund. There were no such material reclassifications made as of April 30, 2017.
NOTE 3. SECURITIES VALUATION AND FAIR VALUE MEASUREMENTS
Fair value is defined as the price that the Fund would receive upon selling an investment in an orderly transaction to an independent buyer in the principal or most advantageous market of the investment. GAAP establishes a three-tier hierarchy to maximize the use of observable market data and minimize the use of unobservable inputs and to establish classification of fair value measurements for disclosure purposes.
Inputs refer broadly to the assumptions that market participants would use in pricing the asset or liability, including assumptions about risk (the risk inherent in a particular valuation technique used to measure fair value including items such as a pricing model and/or the risk inherent in the inputs to the valuation technique). Inputs may be observable or unobservable. Observable inputs are inputs that reflect the assumptions market participants would use in pricing the asset or liability developed based on market data obtained from sources independent of the reporting entity. Unobservable inputs are inputs that reflect the reporting entity’s own assumptions about the assumptions market participants would use in pricing the asset or liability developed based on the best information available in the circumstances. Various inputs are used in determining the value of the Fund’s investments. These inputs are summarized in the three broad levels listed below.
| • | Level 1 – unadjusted quoted prices in active markets for identical investments and/or registered investment companies where the value per share is determined and published and is the basis for current transactions for identical assets or liabilities at the valuation date |
| • | Level 2 – other significant observable inputs (including, but not limited to, quoted prices for an identical security in an inactive market, quoted prices for similar securities, interest rates, prepayment speeds, credit risk, etc.) |
| • | Level 3 – significant unobservable inputs (including the Fund’s own assumptions in determining fair value of investments based on the best information available) |
The inputs used to measure fair value may fall into different levels of the fair value hierarchy. In such cases, for disclosure purposes, the level in the fair value hierarchy within which the fair value measurement falls in its entirety, is determined based on the lowest level input that is significant to the fair value measurement in its entirety.
10
GRANITE VALUE FUND
NOTES TO THE FINANCIAL STATEMENTS – (continued)
April 30, 2017 (Unaudited)
NOTE 3. SECURITIES VALUATION AND FAIR VALUE MEASUREMENTS – continued
Equity securities, including common stocks, that are traded on any stock exchange are generally valued at the last quoted sale price on the security’s primary exchange. Lacking a last sale price, an exchange traded security is generally valued at its last bid price. Securities traded in the NASDAQ over-the-counter market are generally valued by the pricing agent at the NASDAQ Official Closing Price.
Equity securities, including common stocks, are generally valued by using market quotations, but may be valued on the basis of prices furnished by a pricing agent when the Adviser believes such prices more accurately reflect the fair value of such securities. When using the market quotations or close prices provided by the pricing service and when the market is considered active, the security is classified as a Level 1 security. Sometimes, an equity security owned by the Fund will be valued by the pricing service with factors other than market quotations or when the market is considered inactive. When this happens, the security is classified as a Level 2 security. When market quotations are not readily available, when the Adviser determines that the market quotation or the price provided by the pricing service does not accurately reflect the current fair value, or when restricted or illiquid securities are being valued, such securities are valued as determined by the Adviser in conformity with guidelines adopted by and subject to review by the Board. These securities may be categorized as Level 3 securities.
Investments in open-end mutual funds, including money market mutual funds, are generally priced at the ending net asset value (NAV) provided by the pricing service of the funds. These securities will be categorized as Level 1 securities.
In accordance with the Trust’s valuation policies, the Adviser is required to consider all appropriate factors relevant to the value of securities for which it has determined other pricing sources are not available or reliable as described above. No single standard exists for determining fair value, because fair value depends upon the circumstances of each individual case. As a general principle, the current fair value of an issue of securities being valued by the Adviser would be the amount which the Fund might reasonably expect to receive for them upon their current sale. Methods which are in accordance with this principle may, for example, be based on (i) a multiple of earnings; (ii) a discount from market of a similar freely traded security (including a derivative security or a basket of securities traded on other markets, exchanges or among dealers); or (iii) yield to maturity with respect to debt issues, or a combination of these and other methods. Fair value pricing is permitted if, in the Adviser’s opinion, the validity of market quotations appears to be questionable based on factors such as evidence of a thin market in the security based on a small number of quotations, a significant event occurs after the close of a market but before a Fund’s NAV calculation that may affect a security’s value, or the Adviser is aware of any other data that calls into question the reliability of market quotations.
The following is a summary of the inputs used to value the Fund’s investments as of April 30, 2017:
| Valuation Inputs | ||||||||||||||||
| Assets | Level 1 | Level 2 | Level 3 | Total | ||||||||||||
Common Stocks* | $ | 10,271,266 | $ | – | $ | – | $ | 10,271,266 | ||||||||
Money Market Securities | 8,820 | – | – | 8,820 | ||||||||||||
Total | $ | 10,280,086 | $ | – | $ | – | $ | 10,280,086 | ||||||||
| * | Refer to the Schedule of Investments for sector classifications. |
11
GRANITE VALUE FUND
NOTES TO THE FINANCIAL STATEMENTS – (continued)
April 30, 2017 (Unaudited)
NOTE 3. SECURITIES VALUATION AND FAIR VALUE MEASUREMENTS – continued
The Fund did not hold any investments during the reporting period for which significant unobservable inputs (Level 3) were used in determining fair value; therefore, no reconciliation of Level 3 securities is included for this reporting period. The Trust recognizes transfers between fair value hierarchy levels at the reporting period end. There were no transfers between any levels as of April 30, 2017 based on input levels assigned at October 31, 2016.
NOTE 4. FEES AND OTHER TRANSACTIONS WITH AFFILIATES
Under the terms of the management agreement, on behalf of the Fund (the “Agreement”), the Adviser manages the Fund’s investments subject to approval of the Board. As compensation for its management services, the Fund is obligated to pay the Adviser a fee computed and accrued daily and paid monthly at an annual rate of 1.00% of the average daily net assets of the Fund. For the six months ended April 30, 2017, the Adviser earned a fee of $50,377 from the Fund before the reimbursement described below.
The Adviser has contractually agreed to waive its management fee and/or reimburse expenses through February 28, 2018, so that total annual fund operating expenses, excluding interest, taxes, brokerage commissions, other expenditures which are capitalized in accordance with GAAP, other extraordinary expenses not incurred in the ordinary course of the Fund’s business, dividend expense on short sales, and expenses that the Fund has incurred but did not actually pay because of an expense offset arrangement, if applicable, incurred by the Fund in any fiscal year, do not exceed 1.35% of the Fund’s average daily net assets. The operating expense limitation also excludes any fees and expenses of acquired funds.
For the six months ended April 30, 2017, fees and expenses totaling $72,404 were waived or reimbursed by the Adviser. Each fee waiver or expense reimbursement by the Adviser with respect to the Fund is subject to repayment by the Fund within the three years following the date in which that particular waiver or reimbursement occurred, provided that the Fund is able to make the repayment without exceeding the expense limitation in effect at the time of the waiver and any expense limitation in place at the time of repayment.
The amounts subject to repayment by the Fund pursuant to the aforementioned conditions are as follows:
Amount | Recoverable through |
| ||||||
$ 65,882 | 2017 | |||||||
148,128 | 2018 | |||||||
150,666 | 2019 | |||||||
Amount | Recoverable through April 30, | |||||||
| $ 72,404 | 2020 | |||||||
The Trust retains Ultimus Asset Services, LLC (“the Administrator”) to provide the Fund with administration, fund accounting, transfer agent and compliance services, including all regulatory reporting. For the six months ended April 30, 2017, the Administrator earned fees of $18,596, $12,397 and $9,951 for administration, fund accounting and transfer agent services, respectively. At April 30, 2017, the Fund owed the Administrator $6,547 for such services.
12
GRANITE VALUE FUND
NOTES TO THE FINANCIAL STATEMENTS – (continued)
April 30, 2017 (Unaudited)
NOTE 4. FEES AND OTHER TRANSACTIONS WITH AFFILIATES – continued
The officers and one trustee of the Trust are members of management and/or employees of Ultimus. Unified Financial Securities, LLC (the “Distributor”), acts as the principal distributor of the Fund’s shares.
There were no payments made by the Fund to the Distributor during the six months ended April 30, 2017. An officer of the Trust is an of the Distributor and such person may be deemed to be an affiliate of the Distributor.
The Fund has adopted a 12b-1 Plan that permits the Fund to pay 0.25% of its average daily net assets to financial institutions that provide distribution and/or shareholder servicing. The 12b-1 Plan has not been activated as of April 30, 2017.
NOTE 5. PURCHASES AND SALES
For the six months ended April 30, 2017, purchases and sales of investment securities, other than short-term investments and short-term U.S. government obligations, were as follows:
Purchases | ||||
U.S. Government Obligations | $ | – | ||
Other | 1,171,041 | |||
Sales | ||||
U.S. Government Obligations | $ | – | ||
Other | 1,279,006 |
NOTE 6. BENEFICIAL OWNERSHIP
The beneficial ownership, either directly or indirectly, of more than 25% of the voting securities of a fund creates a presumption of control of a fund, under Section 2(a) (9) of the Investment Company Act of 1940. At April 30, 2017, Charles Schwab & Co., Inc. for the benefit of its customers, owned 51.65%. It is not known whether Charles Schwab & Co., Inc. or any of the underlying beneficial owners controlled more than 25% of the voting securities of the Fund.
NOTE 7. FEDERAL TAX INFORMATION
At April 30, 2017, the net unrealized appreciation (depreciation) of investments for tax purposes was as follows:
Gross appreciation | $ | 1,785,612 | ||
Gross depreciation | (372,273 | ) | ||
|
| |||
Net appreciation on investments | $ | 1,413,339 | ||
|
|
At April 30, 2017, the aggregate cost of securities, excluding U.S. government obligations, for federal income tax purposes was $8,866,747 for the Fund.
13
GRANITE VALUE FUND
NOTES TO THE FINANCIAL STATEMENTS – (continued)
April 30, 2017 (Unaudited)
NOTE 7. FEDERAL TAX INFORMATION – continued
The tax characterization of distributions for the fiscal year ended October 31, 2016, was as follows:
| Distributions paid from: | 2016 | |||
Ordinary Income* | $ | 53,723 | ||
Long-Term Capital Gains | $ | — | ||
|
| |||
Total Distributions | $ | 53,723 | ||
|
| |||
| * | Short term capital gain distributions are treated as ordinary income for tax purposes. |
At October 31, 2016, the components of distributable earnings (accumulated losses) on a tax basis were as follows:
Undistributed ordinary income | $ | 65,446 | ||
Undistributed long-term capital gain | 253,158 | |||
Accumulated capital and other losses | (2,535 | ) | ||
Net unrealized appreciation (depreciation) | 865,125 | |||
|
| |||
| $ | 1,181,194 | |||
|
|
NOTE 8. COMMITMENTS AND CONTINGENCIES
The Fund indemnifies its officers and trustees for certain liabilities that may arise from their performance of their duties to the Fund. Additionally, in the normal course of business, the Fund enters into contracts that contain a variety of representations and warranties which provide general indemnifications. The Fund’s maximum exposure under these arrangements is unknown, as this would involve future claims that may be made against the Fund that have not yet occurred.
NOTE 9. SUBSEQUENT EVENTS
Management of the Fund has evaluated the need for disclosures and/or adjustments resulting from subsequent events through the date these financial statements were issued. There were no items requiring adjustment of the financial statements or additional disclosure.
14
SUMMARY OF FUND EXPENSES – (Unaudited)
As a shareholder of the Fund, you incur two types of costs: (1) transaction costs, such as short-term redemption fees; and (2) ongoing costs, including management fees and other Fund expenses. This Example is intended to help you understand your ongoing costs (in dollars) of investing in the Fund and to compare these costs with the ongoing costs of investing in other mutual funds. The example is based on an investment of $1,000 invested at the beginning and held for the six month period, November 1, 2016 to April 30, 2017.
Actual Expenses
The first line of the table below provides information about actual account values and actual expenses. You may use the information in this line, together with the amount you invested, to estimate the expenses that you paid over the period. Simply divide your account value by $1,000 (for example, an $8,600 account value divided by $1,000 = $8.60), then multiply the result by the number in the first line under the heading entitled “Expenses Paid During the Period” to estimate the expenses you paid on your account during this period.
Hypothetical Example for Comparison Purposes
The second line of the table below provides information about hypothetical account values and hypothetical expenses based on the Fund’s actual expense ratio and an assumed rate of return of 5% per year before expenses, which is not the Fund’s actual return. The hypothetical account values and expenses may not be used to estimate the actual ending account balance or expenses you paid for the period. You may use this information to compare the ongoing costs of investing in the Fund and other funds. To do so, compare this 5% hypothetical example with the 5% hypothetical examples that appear in the shareholder reports of the other funds.
Please note that the expenses shown in the table are meant to highlight your ongoing costs only. Therefore, the second line of the table below is useful in comparing ongoing costs only and will not help you determine the relative costs of owning different funds.
| Granite Value Fund | Beginning November 1, 2016 | Ending Account Value April 30, 2017 | Expenses Paid November 1, 2016 – | |||||||||
Actual | $ | 1,000.00 | $ | 1,041.16 | $ | 6.83 | ||||||
Hypothetical** | $ | 1,000.00 | $ | 1,018.10 | $ | 6.76 | ||||||
| * | Expenses are equal to the Fund’s annualized expense ratio of 1.35%, multiplied by the average account value over the period, multiplied by 181/365 (to reflect the one-half year period). |
| ** | Assumes a 5% return before expenses. |
15
VALUED ADVISERS TRUST
PRIVACY POLICY
FACTS | WHAT DOES VALUED ADVISERS TRUST DO WITH YOUR PERSONAL INFORMATION?
| |
| Why? | Financial companies choose how they share your personal information. Federal law gives consumers the right to limit some but not all sharing. Federal law also requires us to tell you how we collect, share, and protect your personal information. Please read this notice carefully to understand what we do.
| |
| What? | The types of personal information we collect and share depend on the product or service you have with us. This information can include: ◾ Social Security number ◾ account balances and account transactions ◾ account transactions, transaction or loss history and purchase history ◾ checking account information and wire transfer instructions When you are no longer our customer, we continue to share your information as described in this notice.
| |
| How? | All financial companies need to share customers’ personal information to run their everyday business. In the section below, we list the reasons financial companies can share their customers’ personal information; the reasons Valued Advisers Trust chooses to share; and whether you can limit this sharing.
|
Reasons we can share your personal information | Does Valued Advisers Trust share?
| |
For our everyday business purposes — such as to process your transactions, maintain your account(s), respond to court orders and legal investigations, or report to credit bureaus
| Yes
| |
For our marketing purposes — to offer our products and services to you
| Yes
| |
For joint marketing with other financial companies
| No
| |
For our affiliates’ everyday business purposes — information about your transactions and experiences
| No
| |
For our affiliates’ everyday business purposes — information about your creditworthiness
| No
| |
For nonaffiliates to market to you
| No
|
| Questions? | Call (888) 442-9893 |
16
|
Page 2
|
|
Who we are | ||
Who is providing this notice?
| Valued Advisers Trust
| |
What we do
| ||
| How does Valued Advisers Trust protect my personal information? | To protect your personal information from unauthorized access and use, we use security measures that comply with federal law. These measures include computer safeguards and secured files and buildings.
| |
| How does Valued Advisers Trust collect my personal information? | We collect your personal information, for example, when you • open an account or deposit money • buy securities from us or sell securities to us • make deposits or withdrawals from your account or provide account information • give us your account information • make a wire transfer • tell us who receives the money • tell us where to send the money • show your government-issued ID • show your driver’s license
| |
Why can’t I limit all sharing? | Federal law gives you the right to limit only • sharing for affiliates’ everyday business purposes—information about your creditworthiness • affiliates from using your information to market to you • sharing for nonaffiliates to market to you State laws and individual companies may give you additional rights to limit sharing.
| |
Definitions
| ||
Affiliates | Companies related by common ownership or control. They can be financial and nonfinancial companies.
| |
Nonaffiliates | Companies not related by common ownership or control. They can be financial and nonfinancial companies. ◾ Valued Advisers Trust does not share your personal information with nonaffiliates so they can market to you.
| |
Joint marketing | A formal agreement between nonaffiliated financial companies that together market financial products or services to you. ◾ Valued Advisers Trust doesn’t jointly market financial products or services to you.
| |
17
PROXY VOTING
A description of the policies and procedures that the Fund uses to determine how to vote proxies relating to portfolio securities and information regarding how the Fund voted those proxies is available without charge upon request by (1) calling the Fund at (888) 442-9893 and (2) from Fund documents filed with the Securities and Exchange Commission (“SEC”) on the SEC’s website at www.sec.gov.
TRUSTEES
Andrea N. Mullins, Chairperson
Ira P. Cohen
Mark J. Seger
OFFICERS
Bo J. Howell, Principal Executive Officer and President
Bryan W. Ashmus, Principal Financial Officer and Treasurer
John C. Swhear, Chief Compliance Officer, AML Officer and Vice President
Carol J. Highsmith, Vice President and Secretary
Matthew J. Miller, Vice President
Stephen L. Preston, Anti-Money Laundering Officer
Courtney Moore, Assistant Secretary
INVESTMENT ADVISER
Granite Investment Advisors, LLC
6 Eagle Square, 3rd Floor
Concord, NH 03301
DISTRIBUTOR
Unified Financial Securities, LLC
9465 Counselors Row, Suite 200
Indianapolis, IN 46240
INDEPENDENT REGISTERED PUBLIC ACCOUNTING FIRM
Cohen & Company, Ltd.
1350 Euclid Avenue, Suite 800
Cleveland, OH 44115
LEGAL COUNSEL
The Law Offices of John H. Lively & Associates, Inc.
A member firm of The 1940 Act Law GroupTM
11300 Tomahawk Creek Parkway, Ste. 310
Leawood, KS 66211
CUSTODIAN
Huntington National Bank
41 South High Street
Columbus, OH 43215
ADMINISTRATOR, TRANSFER AGENT AND FUND ACCOUNTANT
Ultimus Asset Services, LLC
225 Pictoria Drive, Suite 450
Cincinnati, OH 45246
This report is intended only for the information of shareholders or those who have received the Fund’s prospectus which contains information about the Fund’s management fee and expenses. Please read the prospectus carefully before investing.
Distributed by Unified Financial Securities, LLC
Member FINRA/SIPC

SOUND MIND INVESTING FUND (SMIFX)
SMI CONSERVATIVE
ALLOCATION FUND (SMILX)
SMI DYNAMIC
ALLOCATION FUND (SMIDX)
SMI BOND FUND (SMIUX)
SMI 50/40/10 FUND (SMIRX)
| SEMI-ANNUAL REPORT |
| APRIL 30, 2017 |
Fund Adviser:
SMI Advisory Services, LLC
411 6th Street
Columbus, IN 47201
(877) 764-3863
(877) SMI-FUND
www.smifund.com
“Bull markets are born on pessimism, grow on skepticism, mature on optimism and die on euphoria.”
– Sir John Templeton
Dear Fellow Shareholder,
The stock market has soared to new highs during the early months of 2017, propelling many investors’ portfolios to new highs as well. SMI investors have also had plenty to celebrate, with several of our strategies reaching new heights this year, including our Fund Upgrading, Sector Rotation, and 50/40/10 portfolios.
A significant part of the stock market’s gain since last November has been popularly attributed to the “Trump effect,” which encompasses the belief that lower taxes, less regulation, and some measure of fiscal stimulus will be forthcoming from this administration. The open question: how much of any benefit from these initiatives is already priced into the market with such an exuberant rally having already taken place since the election? (Not to mention the other growing question: will any of this actually get passed into law?)
While stock prices have been soaring, so have market valuations. In truth, despite the recent highs, investors have no shortage of reasons to be nervous. The backdrop for the seemingly daily political soap opera headlines that threaten to derail the markets is that we’ve now entered into the 9th year of this aging bull market, with today’s median stock valuations exceeded only at the historic peaks in 1929 and the late-1990s.
We expect these historically-high valuations to become an issue – at some point. But the historical record clearly shows that valuations are a poor guide as to the timing of future market moves. Stocks can get – and stay – “expensive” for extended periods of time before suddenly changing course. Look no further than the late 1990’s bull market referenced earlier: those valuations reached levels even higher than we have today, yet that bull market continued on for years longer.
Throughout this long bull market, we’ve closely watched the Federal Reserve’s interest rate policies, believing those changes would ultimately be the trigger that makes the bull market vulnerable. With the Fed making its 2nd and 3rd rate hikes during the past six months, while going on record that they plan to continue their hiking with two more moves later in 2017, we’re starting to see this dynamic play out. Of course, these early hikes don’t mean the end of the bull market is necessarily imminent. But it does mean that the conditions are aligning where that end is a realistic option. For years, the key ingredients – Fed hikes and higher interest rates – weren’t present, and now they are. In our view, this means market risk is significantly higher than it was just a couple of years ago.
1
Thankfully, SMI’s success isn’t based on correctly predicting the market’s future. Rather, our approach begins within the context of following God’s protective principles. A strong financial foundation, established by working to become debt-free and creating a savings reserve, provides the strength to weather unexpected setbacks. Allocating your stock/bond mix (that is, setting your risk level) in a way that balances your need for growth and your emotional fear of loss is another key step. We build portfolios based on the principle of diversification, both between and within various asset classes, knowing that performance excellence rotates. Finally, we suggest taking no more risk than is absolutely necessary in order to reach your financial goals. After all, investing isn’t about building the biggest pile of money possible – it’s about meeting your specific financial goals.
Rather than build a portfolio dependent on a particular market prediction coming true, we believe in diversifying your portfolio so it can take advantage of market opportunities while also protecting against its risks. A portfolio that doesn’t fly too high when the market is rising – but also doesn’t dive too low when it’s falling – is much easier for investors to stick with emotionally than one with wider swings of performance. Since the primary struggle most investors face is emotional, we believe constructing portfolios that attempt to minimize these emotional swings gives SMI investors the best chance of long-term investing success.
Performance Review
The recent highs, both for the market and for several of SMI’s model portfolios, are a far cry from a year ago, when investors emerged from the first quarter of 2016 battered and bruised from a -12% correction. Now, looking back over the past year, investors in most of SMI’s strategies have earned strong 12-month results that will help buffer any declines from the next market pullback.
It’s just the latest example of what SMI has long preached: it’s exceedingly difficult to predict what the market will do next, so staying invested with a well-diversified portfolio generally makes the most sense.
SMI Funds
For the first time in quite a while, the SMI Funds have been getting a boost from our foreign stock holdings. Foreign markets have been stronger than U.S. stocks so far in 2017, which hasn’t often been the case in recent years. Another reversal is that small-company stocks have recently lagged large companies, the opposite of what we saw through much of 2016. Technology has been the hottest sector, with the technology-heavy NASDAQ index leading the other major indexes (and powering our Sector Rotation strategy to stand-out gains). Leading that tech charge have been the so-called “FAANG” stocks (Facebook, Apple, Amazon, Netflix, and Google/Alphabet). However, in the closing weeks of this letter’s reporting period, we’ve seen this “Fab 5” continue to rise while the remaining 495 stocks in the S&P 500® Index have fallen by a roughly corresponding amount. This type of declining market breadth is generally not a good sign for the overall health of the stock market.
Dynamic Asset Allocation (DAA) – Funds utilizing this strategy in at least part of their portfolios: SMIDX, SMILX* & SMIRX:
The surprise Trump victory and subsequent stock market rally definitely caught DAA flat-footed and hurt its relative returns in November and December. While DAA was invested in U.S. Stocks, which helped, it also held Gold as a result of the uncertainty of the period leading up to the election. Gold went on to lose roughly 10% over the last two months of 2016 before being sold at year-end. DAA exited its Bond position a month sooner, but not before the post-election scare over a Trump Presidency had spooked the bond market into a sharp sell-off.
2
Thankfully, once DAA repositioned itself into equity-oriented positions for 2017, it performed exactly as we would have hoped. When the stock market is up as strongly as it has been, we normally expect DAA to lag somewhat, but having DAA participate in the market’s upside to the extent that it has in 2017 is great. Naturally, having two-thirds of DAA’s portfolio allocated to U.S. and Foreign Stocks throughout the first four months of the year was the biggest reason for DAA’s equity-like performance.
Fund Upgrading – Funds utilizing this strategy in at least part of their portfolios: SMIFX, SMILX* & SMIRX:
Fund Upgrading had strong absolute returns over the past six months, gaining over 10% and reaching new all-time highs. It lagged the market somewhat as a result of moving from largely more conservative holdings before the election to a gradually more aggressive portfolio after it.
It’s worth noting that Fund Upgrading is up a total of 56.32% over the last five years – something few would have predicted back during the highly pessimistic investing climate of 2011. It’s a good reminder that the market is full of surprises, but tends to reward those who patiently and consistently endure its short-term gyrations in pursuit of its long-term rewards.
Bond Upgrading – Funds utilizing this strategy in at least part of their portfolios: SMIUX & SMILX*:
While the stock market was excited about the surprise Trump Presidency, the bond market most assuredly was not. The benchmark 10-year Treasury yield spiked from 1.88% the day before the election to as high as 2.60% in mid-December, just over a month’s time. This caused significant pain for bond investors, especially those holding longer-term maturities.
Meanwhile, in March the Federal Reserve hiked interest rates for the second time in just four months. Their guidance in March was that two additional hikes are likely in 2017. Despite these rate hikes, longer-term yields settled down following the initial post-election surge, with the 10-year Treasury yield actually declining to 2.29% by the end of April.
As the Fed has gradually shifted from stimulus to tightening (or “normalization,” if you prefer), the impact has been felt by fixed-income investors. Barclay’s U.S. Aggregate Bond Index, which is the broadest measure of the U.S. bond market, has returned a meager +0.83% over the past year. Bond Upgrading has been better, but its +1.82% gain over the past year is barely keeping pace with inflation. This is the downside of rock-bottom interest rates: eventually, bond investors are left with meager returns, and even those can be erased by capital losses if rates rise rapidly enough.
Going Direct With the SMI Funds
Slightly over two-thirds of the assets in the SMI Funds are owned through accounts held at other organizations (Fidelity, Schwab, TD Ameritrade, etc.). That’s perfectly fine. However, there are some advantages to having your account directly with the SMI Funds rather than through a third party.
The primary advantage of a direct account is the ability to buy or sell shares of the SMI Funds without paying any transaction fees. Most third-party accounts are charged some sort of transaction fee when the SMI Funds are bought or sold. Those fees can add up – particularly if you are regularly buying or selling
3
*Indicates this fund does not always contain the strategy being described.
shares in any of the SMI Funds. When your account is held directly with the SMI Funds, you never have to pay transaction fees. To learn more about moving your account directly to the SMI Funds, visit www.smifund.com or call 1-877-SMI-FUND.
We appreciate the confidence you have placed in us to be a faithful steward of your assets, as you strive to be a faithful steward of His assets.
Sincerely,

Mark Biller
Senior Portfolio Manager
The Sound Mind Investing Funds
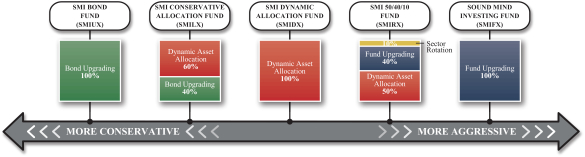
The SMI Fund lineup, shown below, now offers investors a way to mix and match professionally managed funds to custom tailor the risk level desired for their portfolio. If you’d like assistance customizing your portfolio in this manner, please call a Stewardship Advisor at (800) 796-4975.
4
PERFORMANCE RESULTS – (Unaudited)
Average Annual Total Returns(a) (For the periods ended April 30, 2017) | ||||||||||||||||||||
| Three Months | Six Months | One Year | Five Year | Ten Year | ||||||||||||||||
Sound Mind Investing Fund | 3.07% | 10.78% | 13.76% | 9.35% | 5.13% | |||||||||||||||
Wilshire 5000® Total Market Index(b) | 4.85% | 13.87% | 18.82% | 13.62% | 7.30% | |||||||||||||||
S&P 500® Index(b) | 5.16% | 13.32% | 17.92% | 13.68% | 7.15% | |||||||||||||||
SMI Custom Index(c) | 4.70% | 15.17% | 19.84% | 12.11% | 6.02% | |||||||||||||||
Total annual operating expenses, as disclosed in the Sound Mind Investing Fund’s (“SMI Fund”) prospectus dated February 28, 2017, were 1.97% of average daily net assets, which includes acquired fund fees and expenses. All expenses are reflected in performance results. SMI Advisory Services, LLC (the “Adviser”) contractually has agreed to waive its fee and reimburse expenses to the extent necessary to maintain Total Annual Fund Operating Expenses (excluding interest, taxes, brokerage commissions, other expenses which are capitalized in accordance with generally accepted accounting principles, extraordinary expenses, dividend expense on short sales, 12b-1 fees, and acquired fund fees and expenses) at 1.50% of the SMI Fund’s average daily net assets through February 28, 2018. This expense cap may not be terminated prior to this date except by the Board of Trustees (the “Board”).
Average Annual Total Returns(a) (For the periods ended April 30, 2017) | ||||||||||||||||||||
| Three Months | Six Months | One Year | Five Year | Since Inception (December 30, 2010) | ||||||||||||||||
SMI Conservative Allocation Fund | 2.92% | 1.43% | 2.95% | 4.35% | 3.98% | |||||||||||||||
Wilshire 5000® Total Market Index(b) | 4.85% | 13.87% | 18.82% | 13.62% | 12.75% | |||||||||||||||
Bloomberg Barclays U.S. Aggregate Bond Index(b) | 1.40% | -0.67% | 0.83% | 2.27% | 3.29% | |||||||||||||||
Weighted Index(c) | 3.47% | 7.90% | 11.37% | 9.10% | 9.07% | |||||||||||||||
Total annual operating expenses, as disclosed in the SMI Conservative Allocation Fund’s prospectus dated February 28, 2017, were 1.30% of average daily net assets (1.66% before fee waivers/expense reimbursements by the Adviser), which includes acquired fund fees and expenses and reflects the fee waiver/expense reimbursement discussed below. All expenses are reflected in performance results. The Adviser contractually has agreed to waive its fee and reimburse expenses to the extent necessary to maintain Total Annual Fund Operating Expenses (excluding interest, taxes, brokerage commissions, other expenses which are capitalized in accordance with generally accepted accounting principles, extraordinary expenses, dividend expense on short sales, 12b-1 fees, and acquired fund fees and expenses) at 1.15% of the SMI Conservative Allocation Fund’s average daily net assets through February 28, 2018. Each fee waiver or expense reimbursement by the Advisor is subject to repayment by the SMI Conservative Allocation Fund within the three years following the date in which the expense was incurred, provided that the SMI Conservative Allocation Fund is able to make the repayment without exceeding the expense limitation in place at the time of the fee waiver or expense reimbursement. This expense cap may not be terminated prior to this date except by the Board.
5
PERFORMANCE RESULTS – (Unaudited), (Continued)
Average Annual Total Returns(a) (For the periods ended April 30, 2017) | ||||||||||||||||
| Three Months | Six Months | One Year | Since Inception (February 28, 2013) | |||||||||||||
SMI Dynamic Allocation Fund | 4.28% | 2.82% | 4.06% | 4.18% | ||||||||||||
Wilshire 5000® Total Market Index(b) | 4.85% | 13.87% | 18.82% | 13.70% | ||||||||||||
Bloomberg Barclays U.S. Aggregate Bond Index(b) | 1.40% | -0.67% | 0.83% | 2.09% | ||||||||||||
Weighted Index(c) | 3.47% | 7.90% | 11.37% | 9.07% | ||||||||||||
Total annual operating expenses, as disclosed in the SMI Dynamic Allocation Fund’s prospectus dated February 28, 2017, were 1.29% of average daily net assets, which includes acquired fund fees and expenses. All expenses are reflected in performance results. The Adviser contractually has agreed to waive its fee and reimburse expenses to the extent necessary to maintain Total Annual Fund Operating Expenses (excluding interest, taxes, brokerage commissions, other expenses which are capitalized in accordance with generally accepted accounting principles, extraordinary expenses, dividend expense on short sales, 12b-1 fees, and acquired fund fees and expenses) at 1.45% of the SMI Dynamic Allocation Fund’s average daily net assets through February 28, 2018. This expense cap may not be terminated prior to this date except by the Board.
Average Annual Total Returns(a) (For the periods ended April 30, 2017) | ||||||||||||||||
| Three Months | Six Months | One Year | Since Inception (April 28, 2015) | |||||||||||||
SMI Bond Fund | 0.84% | -0.20% | 1.82% | 0.43% | ||||||||||||
Bloomberg Barclays U.S. Aggregate Bond Index(b) | 1.40% | -0.67% | 0.83% | 1.60% | ||||||||||||
Total annual operating expenses, as disclosed in the SMI Bond Fund’s prospectus dated February 28, 2017, were 1.05% of average daily net assets (2.42% before fee waivers/expense reimbursements by the Adviser). All expenses are reflected in performance results. The Adviser contractually has agreed to waive its fee and/or reimburse expenses to the extent necessary to maintain Total Annual Fund Operating Expenses (excluding interest, taxes, brokerage commissions, other expenses which are capitalized in accordance with generally accepted accounting principles, extraordinary expenses, dividend expense on short sales, 12b-1 fees, and acquired fund fees and expenses) at 0.85% of the SMI Bond Fund’s average daily net assets through February 28, 2018. Each fee waiver or expense reimbursement by the Adviser is subject to repayment by the SMI Bond Fund within the three years following the date in which the expense was incurred, provided that the SMI Bond Fund is able to make the repayment without exceeding the expense limitation in place at the time of the fee waiver or expense reimbursement. This expense cap may not be terminated prior to this date except by the Board.
6
PERFORMANCE RESULTS – (Unaudited), (Continued)
Average Annual Total Returns(a) (For the periods ended April 30, 2017) | ||||||||||||||||
| Three Months | Six Months | One Year | Since Inception (April 29, 2015) | |||||||||||||
SMI 50/40/10 Fund | 3.65% | 7.29% | 9.90% | 0.07% | ||||||||||||
Wilshire 5000® Total Market Index(b) | 4.85% | 13.87% | 18.82% | 8.57% | ||||||||||||
Bloomberg Barclays U.S. Aggregate Bond Index(b) | 1.40% | -0.67% | 0.83% | 1.74% | ||||||||||||
Weighted Index(c) | 3.47% | 7.90% | 11.37% | 5.96% | ||||||||||||
Total annual operating expenses, as disclosed in the SMI 50/40/10 Fund’s prospectus dated February 28, 2017, were 1.95% of average daily net assets (2.26% before fee waivers/expense reimbursements by the Adviser). All expenses are reflected in performance results. The Adviser contractually has agreed to waive its fee and reimburse expenses to the extent necessary to maintain Total Annual Fund Operating Expenses (excluding interest, taxes, brokerage commissions, other expenses which are capitalized in accordance with generally accepted accounting principles, extraordinary expenses, dividend expense on short sales, 12b-1 fees, and acquired fund fees and expenses) at 1.45% of the SMI 50/40/10 Fund’s average daily net assets through February 28, 2018. Each fee waiver or reimbursement of an expense by the Adviser is subject to repayment by the SMI 50/40/10 Fund within the three years following the date in which the expense was incurred, provided that the SMI 50/40/10 Fund is able to make the repayment without exceeding the expense limitation in place at the time of the fee waiver or reimbursement. This expense cap may not be terminated prior to this date except by the Board.
The performance quoted represents past performance, which does not guarantee future results. The investment return and principal value of an investment will fluctuate so that an investor’s shares, when redeemed, may be worth more or less than their original cost. The returns shown do not reflect deduction of taxes that a shareholder would pay on Fund distributions or the redemption of Fund shares. Current performance of the Sound Mind Investing Fund, SMI Conservative Allocation Fund, SMI Dynamic Allocation Fund, SMI Bond Fund and SMI 50/40/10 Fund (each a “Fund” and collectively the “Funds”) may be lower or higher than the performance quoted. Performance data current to the most recent month end may be obtained by calling (877) 764-3863.
| (a) | Average annual total returns reflect any change in price per share and assume the reinvestment of all distributions. The Funds’ returns reflect any fee reductions during the applicable periods. If such fee reductions had not occurred, the quoted performance would have been lower. Total returns for periods less than 1 year are not annualized. |
| (b) | The Standard & Poor’s 500® Index (“S&P 500”), Wilshire 5000® Total Market Index (“Wilshire 5000”), Bloomberg Barclays U.S. Aggregate Bond Index, Russell 1000® Value Index, Russell 1000® Growth Index, Russell 2000® Value Index, Russell 2000® Growth Index and MSCI EAFE Index (collectively, the “Indices”) are unmanaged indices that assume reinvestment of all distributions and exclude the effect of taxes and fees. These Indices are widely recognized unmanaged indices and are representative of a broader market and range of securities than is found in each Fund’s portfolio. The returns of the Indices are not reduced by any fees or operating expenses. Individuals cannot invest directly in the Indices; however, an individual can invest in exchange-traded funds or other investment vehicles that attempt to track the performance of a benchmark index. As of December 13, 2016, The Wilshire 5000 has replaced the S&P 500 as the Sound Mind Investing Fund’s primary benchmark. Given the allocation of the Sound Mind Investing Fund’s portfolio, the Adviser believes that the Wilshire 5000 provides a more accurate comparison. |
| (c) | The SMI Custom Index for the Sound Mind Investing Fund is comprised of 20% Russell 1000® Value Index, 20% Russell 1000® Growth Index, 20% Russell 2000® Value Index, 20% Russell 2000® Growth Index and 20% MSCI EAFE Index and the Weighted Index for the SMI Conservative Allocation Fund, SMI Dynamic Allocation Fund and SMI 50/40/10 Fund is comprised of 60% Wilshire 5000® Total Market Index and 40% Bloomberg Barclays U.S. Aggregate Bond Index. |
The Funds’ investment objectives, risks, charges and expenses must be considered carefully before investing. The prospectus contains this and other important information about the Funds and may be obtained by calling the same number as above. Please read it carefully before investing.
7
FUND HOLDINGS – (Unaudited)
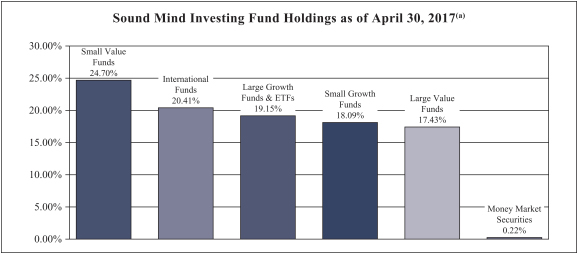
| (a) | As a percentage of investments. |
Sound Mind Investing Fund seeks long-term capital appreciation. The Fund seeks to achieve its objective by investing in a diversified portfolio of other investment companies using a “Fund Upgrading” strategy. The fund upgrading investment strategy is a systematic investment approach that is based on the belief of the Adviser that superior returns can be obtained by constantly monitoring the performance of a wide universe of other investment companies, and standing ready to move assets into the funds deemed by the Adviser to be most attractive at the time of analysis.
8
FUND HOLDINGS – (Unaudited), (Continued)
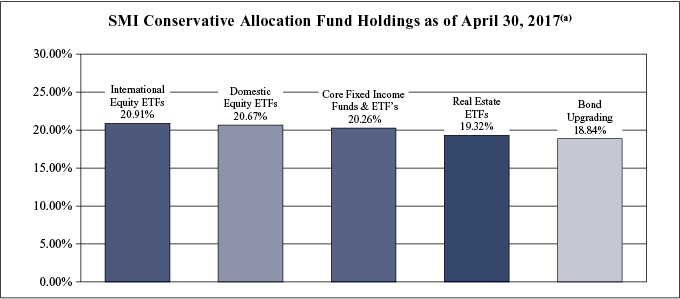
| (a) | As a percentage of investments. |
SMI Conservative Allocation Fund seeks total return. Total return is composed of both income and capital appreciation. The Fund invests in a portfolio of equities and fixed income securities, including securities of other investment companies that focus their investments on equity and fixed income investments. To the extent the Adviser invests the Fund’s assets in equity securities, such investments will consist of investments in other investment companies (i.e., mutual funds), exchange-traded funds (“ETFs”) and pooled investment vehicles, and the Adviser will select such portfolio holdings. The fixed income portion (if any) of the Fund will be comprised of fixed income investment companies and ETFs and individual fixed income securities. The Adviser will use its proprietary “Bond Upgrading” strategy to make all portfolio decisions with respect to investments in fixed income investment companies and ETFs. The Adviser’s “Bond Upgrading” strategy involves the use of momentum based performance indicators of the various bond categories to identify which categories may present the best investment opportunities. The Adviser scores the categories and uses the scores to make decisions on investments in the various categories.
9
FUND HOLDINGS – (Unaudited), (Continued)
| (a) | As a percentage of investments. |
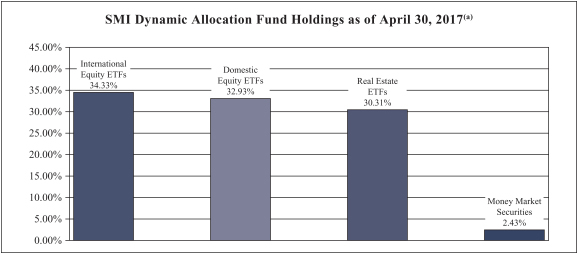
SMI Dynamic Allocation Fund seeks total return. Total return is composed of both income and capital appreciation. The Fund uses a dynamic asset allocation investment strategy to achieve its investment objective. This is done by investing in securities from the following six asset classes – U.S. Equities, International Equities, Fixed Income Securities, Real Estate, Precious Metals, and Cash.
10
FUND HOLDINGS – (Unaudited), (Continued)
| (a) | As a percentage of investments. |
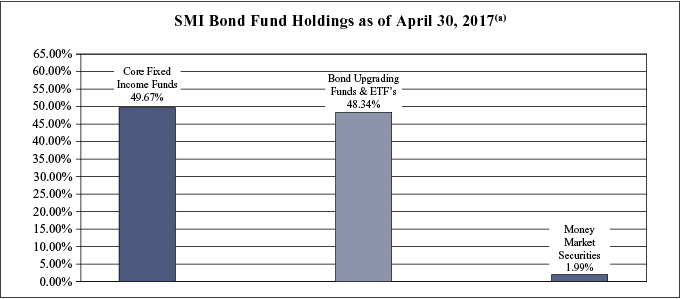
SMI Bond Fund seeks total return. Total return is composed of both income and capital appreciation. The Fund invests at least 80% of its net assets in a portfolio of fixed income securities, including securities of other investment companies that focus their investments on fixed income investments. The Fund will be comprised of fixed income investment companies and ETFs and individual fixed income securities. The Adviser will use its proprietary “Bond Upgrading” strategy to make all portfolio decisions with respect to investments in fixed income investment companies and ETFs. The Adviser’s “Bond Upgrading” strategy involves the use of momentum based performance indicators of the various bond categories to identify which categories may present the best investment opportunities. The Adviser scores the categories and uses the scores to make decisions on investments in the various categories.
11
FUND HOLDINGS – (Unaudited), (Continued)
| (a) | As a percentage of investments. |
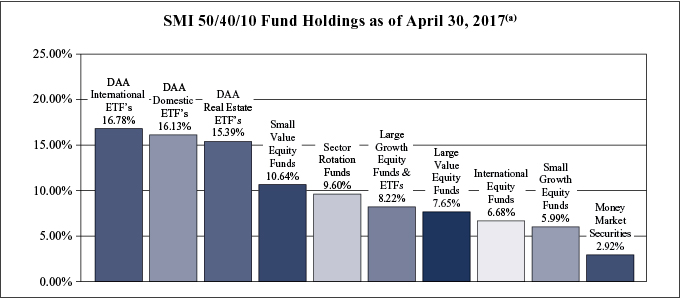
SMI 50/40/10 Fund seeks total return. Total return is composed of both income and capital appreciation. The Adviser allocates the Fund’s assets on a 50/40/10 basis among various investment strategies as follows:
| • | 50% – Dynamic Asset Allocation Strategy |
| • | 40% – Fund Upgrading Strategy |
| • | 10% – Sector Rotation Strategy |
The Sector Rotation Strategy involves the Adviser selecting from a universe of mutual funds and ETFs it has compiled using proprietary methods. This universe is specifically designed by the Adviser to balance exposure to a wide variety of market sectors and industries. This universe includes both leveraged and non-leveraged funds. The Adviser ranks these funds based on their recent performance across multiple short-term performance periods, then uses an upgrading approach to invest in the top performing market sector or sectors. Once a particular sector or sectors is identified, the Adviser purchases one or more mutual funds or ETFs to gain the desired exposure to that particular sector. This portion of the Fund may be concentrated, meaning that the Fund may be invested in as few as one or two sectors at a time and potentially as few as one underlying mutual fund or ETF.
Availability of Portfolio Schedule – (Unaudited)
Each Fund files its complete schedule of portfolio holdings with the Securities and Exchange Commission (“SEC”) for the first and third quarters of each fiscal year on Form N-Q. The Funds’ Forms N-Q are available at the SEC’s website at www.sec.gov. The Funds’ Forms N-Q may be reviewed and copied at the Public Reference Room in Washington DC. Information on the operation of the Public Reference Room may be obtained by calling 1-800-SEC-0330.
12
SOUND MIND INVESTING FUND
SCHEDULE OF INVESTMENTS
April 30, 2017 (Unaudited)
| Mutual Funds 92.87% | Shares | Fair Value | ||||||
Mutual Funds Greater Than 1% of The Sound | ||||||||
Aegis Value Fund, Inc. | 226,852 | $ | 3,804,311 | |||||
AMG Managers Fairpointe Mid Cap Fund – Institutional Class | 302,232 | 13,243,822 | ||||||
Artisan Value Fund – Advisor Class | 727,527 | 10,396,368 | ||||||
Baron Discovery Fund – Retail Class | 235,146 | 3,609,484 | ||||||
Baron Partners Fund – Institutional Class * | 114,219 | 5,190,104 | ||||||
Champlain Small Company Fund – Institutional Class | 605,116 | 12,416,986 | ||||||
Dodge & Cox Stock Fund | 38,970 | 7,432,826 | ||||||
Fidelity OTC Portfolio | 53,114 | 5,163,709 | ||||||
John Hancock – Classic Value Fund – Institutional Class | 202,725 | 6,051,356 | ||||||
JPMorgan Large Cap Value Fund – Institutional Class | 508,229 | 7,613,266 | ||||||
JPMorgan Small Cap Growth Fund – Class L | 782,768 | 12,399,040 | ||||||
Longleaf Partners International Fund | 930,494 | 14,320,298 | ||||||
Morgan Stanley Institutional Fund, Inc. – International Opportunity Portfolio – Class A * | 142,551 | 2,570,188 | ||||||
Oakmark International Fund – Investor Class | 482,673 | 12,515,712 | ||||||
PIMCO StocksPLUS International Fund (U.S. Dollar Hedged) – Institutional Class | 730,087 | 5,986,711 | ||||||
PRIMECAP Odyssey Growth Fund – Institutional Class | 416,168 | 13,259,112 | ||||||
Prudential QMA Small-Cap Value Fund – Class Z | 550,679 | 11,905,680 | ||||||
Royce Opportunity Fund – Investment Class | 1,037,117 | 14,135,910 | ||||||
Third Avenue International Value Fund – Institutional Class | 260,787 | 4,443,802 | ||||||
Towle Deep Value Fund * | 244,181 | 5,100,941 | ||||||
Virtus Small-Cap Sustainable Growth Fund – Institutional Class | 237,480 | 5,264,924 | ||||||
|
| |||||||
TOTAL MUTUAL FUNDS GREATER THAN 1% OF THE SOUND |
| 176,824,550 | ||||||
|
| |||||||
Mutual Funds Less Than 1% of The Sound | ||||||||
Allianz NFJ Dividend Value Fund – Institutional Class | 200 | 3,414 | ||||||
Allianz NFJ Small-Cap Value Fund – Institutional Class | 162 | 4,354 | ||||||
American Century Equity Income Fund – Investor Class | 100 | 916 | ||||||
American Century International Discovery Fund – Institutional Class | 250 | 3,529 | ||||||
AMG GW&K U.S. Small Cap Growth Fund – Institutional Class | 100 | 504 | ||||||
Artisan International Small Cap Fund – Investor Class | 150 | 3,313 | ||||||
Artisan International Value Fund – Investor Class | 150 | 5,428 | ||||||
Artisan Mid Cap Value Fund – Investor Class | 279 | 6,367 | ||||||
Artisan Small Cap Fund – Investor Class | 250 | 7,845 | ||||||
BBH Core Select Fund – Class N | 100 | 2,174 | ||||||
See accompanying notes which are an integral part of these financial statements.
13
SOUND MIND INVESTING FUND
SCHEDULE OF INVESTMENTS
April 30, 2017 (Unaudited) – (Continued)
| Mutual Funds 92.87% – continued | Shares | Fair Value | ||||||
Mutual Funds Less Than 1% of The Sound | ||||||||
Berwyn Fund | 100 | $ | 3,032 | |||||
BlackRock International Opportunities Portfolio – Institutional Class | 100 | 3,339 | ||||||
Bridgeway Small-Cap Growth Fund – Class N | 205 | 4,988 | ||||||
Bridgeway Small-Cap Value Fund – Class N | 179 | 4,443 | ||||||
Buffalo Small Cap Fund, Inc. | 46,716 | 802,577 | ||||||
Columbia Acorn International – Class Z | 100 | 4,327 | ||||||
Columbia Acorn Select – Class Z | 150 | 2,364 | ||||||
Columbia Contrarian Core Fund – Class Z | 91 | 2,224 | ||||||
Columbia Small Cap Growth Fund I – Class Z | 100 | 1,941 | ||||||
Davis Opportunity Fund – Class Y | 100 | 3,464 | ||||||
Delaware Select Growth Fund – Institutional Class | 100 | 3,823 | ||||||
Delaware Small Cap Value Fund – Institutional Class | 100 | 6,491 | ||||||
Delaware Smid Cap Growth Fund – Institutional Class | 100 | 2,371 | ||||||
Delaware Value Fund – Institutional Class | 144 | 2,898 | ||||||
Deutsche Small Cap Value Fund – Institutional Class | 85 | 2,205 | ||||||
DFA International Small Cap Value Portfolio – Investor Class | 100 | 2,101 | ||||||
DFA International Small Company Portfolio – Institutional Class | 100 | 1,933 | ||||||
DFA U.S. Small Cap Value Portfolio – Institutional Class | 100 | 3,704 | ||||||
Dreyfus Opportunistic Small Cap Fund | 21,625 | 768,568 | ||||||
Fairholme Fund | 34,097 | 719,449 | ||||||
Fidelity Mid-Cap Stock Fund | 150 | 5,493 | ||||||
Fidelity Small Cap Discovery Fund | 100 | 3,203 | ||||||
Fidelity Small Cap Stock Fund | 150 | 2,905 | ||||||
Fidelity Small Cap Value Fund | 150 | 2,859 | ||||||
Franklin Small Cap Value Fund – Advisor Class | 100 | 5,821 | ||||||
Hartford International Opportunities Fund/The – Class Y | 248 | 4,082 | ||||||
Heartland Value Fund | 100 | 4,003 | ||||||
Hennessy Focus Fund – Investor Class * | 100 | 7,736 | ||||||
Hotchkis and Wiley Mid-Cap Value Fund – Institutional Class | 100 | 3,711 | ||||||
Invesco American Value Fund – Class R5 | 100 | 3,885 | ||||||
Janus Overseas Fund – Class T | 100 | 2,903 | ||||||
Janus Venture Fund – Class T | 100 | 7,050 | ||||||
JOHCM International Select Fund – Institutional Class | 100 | 2,022 | ||||||
JPMorgan Disciplined Equity Fund – Institutional Class | 100 | 2,534 | ||||||
JPMorgan Mid Cap Value Fund – Institutional Class | 100 | 3,798 | ||||||
JPMorgan Small Cap Equity Fund – Select Class | 226 | 12,452 | ||||||
Longleaf Partners Fund | 150 | 4,017 | ||||||
Longleaf Partners Small-Cap Fund | 100 | 2,885 | ||||||
See accompanying notes which are an integral part of these financial statements.
14
SOUND MIND INVESTING FUND
SCHEDULE OF INVESTMENTS
April 30, 2017 (Unaudited) – (Continued)
| Mutual Funds 92.87% – continued | Shares | Fair Value | ||||||
Mutual Funds Less Than 1% of The Sound | ||||||||
Lord Abbett Developing Growth Fund, Inc. – Institutional Class * | 100 | $ | 2,238 | |||||
Mairs and Power Small Cap Fund | 100 | 2,518 | ||||||
Miller Opportunity Trust – Institutional Class * | 82,773 | 1,831,758 | ||||||
Morgan Stanley Institutional Fund, Inc. – Growth Portfolio – Institutional Class | 100 | 4,269 | ||||||
Neuberger Berman Genesis Fund – Institutional Class | 100 | 5,932 | ||||||
Nicholas Fund, Inc. | 50 | 3,304 | ||||||
Oakmark Fund – Investor Class | 13,396 | 1,017,537 | ||||||
Oakmark International Small Cap Fund – Institutional Class | 150 | 2,537 | ||||||
Oakmark Select Fund – Institutional Class | 150 | 6,700 | ||||||
Oppenheimer International Small-Mid Company Fund – Class Y | 100 | 4,229 | ||||||
Oppenheimer Mid Cap Value Fund – Class Y | 100 | 5,730 | ||||||
Perkins Mid Cap Value Fund – Class T | 200 | 3,440 | ||||||
PRIMECAP Odyssey Aggressive Growth Fund | 100 | 3,717 | ||||||
Principal SmallCap Growth Fund I – Institutional Class | 200 | 2,540 | ||||||
Royce Low-Priced Stock Fund – Investment Class | 150 | 1,242 | ||||||
Royce Premier Fund – Investment Class | 300 | 5,043 | ||||||
Royce Small-Cap Value Fund – Institutional Class | 100 | 979 | ||||||
Royce Special Equity Fund – Institutional Class | 150 | 3,309 | ||||||
T. Rowe Price International Discovery Fund | 150 | 9,150 | ||||||
T. Rowe Price Mid-Cap Growth Fund | 100 | 8,303 | ||||||
T. Rowe Price New Horizons Fund | 100 | 4,922 | ||||||
T. Rowe Price Small-Cap Value Fund | 100 | 4,629 | ||||||
Thornburg Value Fund – Institutional Class | 100 | 6,285 | ||||||
TIAA-CREF International Equity Fund – Institutional Class | 100 | 1,180 | ||||||
Touchstone Sands Capital Select Growth Fund – Class Y | 100 | 1,570 | ||||||
Tweedy Browne Global Value Fund | 150 | 4,053 | ||||||
Vanguard Strategic Equity Fund – Investor Class | 100 | 3,368 | ||||||
Victory RS Small Cap Growth Fund – Class Y | 100 | 7,555 | ||||||
Wasatch Emerging Markets Small Cap Fund | 1,000 | 2,690 | ||||||
Wasatch International Growth Fund – Investor Class | 150 | 4,560 | ||||||
Wasatch International Opportunities Fund – Institutional Class | 1,000 | 3,250 | ||||||
|
| |||||||
TOTAL MUTUAL FUNDS LESS THAN 1% OF THE SOUND |
| 5,433,982 | ||||||
|
| |||||||
TOTAL MUTUAL FUNDS (Cost $171,389,334) | 182,258,532 | |||||||
|
| |||||||
See accompanying notes which are an integral part of these financial statements.
15
SOUND MIND INVESTING FUND
SCHEDULE OF INVESTMENTS
April 30, 2017 (Unaudited) – (Continued)
| Exchange-Traded Funds – 6.52% | Shares | Fair Value | ||||||
Guggenheim S&P 500 Equal Weight Technology ETF | 104,065 | $ | 12,794,792 | |||||
|
| |||||||
TOTAL EXCHANGE-TRADED FUNDS (Cost $12,507,754) | 12,794,792 | |||||||
|
| |||||||
Money Market Securities – 0.22% | ||||||||
Fidelity Investments Money Market Government Portfolio – Institutional Class, 0.65% (b) | 429,004 | 429,004 | ||||||
|
| |||||||
TOTAL MONEY MARKET SECURITIES (Cost $429,004) | 429,004 | |||||||
|
| |||||||
TOTAL INVESTMENTS – 99.61% (Cost $184,326,092) | $ | 195,482,328 | ||||||
|
| |||||||
Other Assets in Excess of Liabilities – 0.39% | 762,783 | |||||||
|
| |||||||
NET ASSETS – 100.00% | $ | 196,245,111 | ||||||
|
| |||||||
| (a) | Small investments are occasionally retained in mutual funds that are closed to new investment, or in the manager’s opinion are at risk to close, so as to allow the Fund the flexibility to reinvest in these funds in the future. |
| (b) | Rate disclosed is the seven day effective yield as of April 30, 2017. |
| * | Non-income producing security. |
| ETF | – Exchange-Traded Fund |
See accompanying notes which are an integral part of these financial statements.
16
SMI CONSERVATIVE ALLOCATION FUND
SCHEDULE OF INVESTMENTS
April 30, 2017 (Unaudited)
| Mutual Funds – 29.41% | Shares | Fair Value | ||||||
Scout Core Plus Bond Fund – Institutional Class | 51,971 | $ | 1,639,682 | |||||
Scout Unconstrained Bond Fund – Institutional Class | 125,854 | 1,482,565 | ||||||
Vanguard Intermediate-Term Bond Index Fund – Admiral Class | 137,792 | 1,572,206 | ||||||
|
| |||||||
TOTAL MUTUAL FUNDS (Cost $4,725,226) | 4,694,453 | |||||||
|
| |||||||
Exchange-Traded Funds – 69.93% | ||||||||
iShares MSCI EAFE ETF | 51,975 | 3,316,005 | ||||||
SPDR S&P 500 ETF | 13,765 | 3,277,171 | ||||||
Vanguard Long-Term Bond ETF | 16,500 | 1,504,305 | ||||||
Vanguard REIT ETF | 37,000 | 3,063,230 | ||||||
| �� |
|
| ||||||
TOTAL EXCHANGE-TRADED FUNDS (Cost $10,552,334) | 11,160,711 | |||||||
|
| |||||||
TOTAL INVESTMENTS – 99.34% (Cost $15,277,560) | $ | 15,855,164 | ||||||
|
| |||||||
Other Assets in Excess of Liabilities – 0.66% | 105,942 | |||||||
|
| |||||||
NET ASSETS – 100.00% | $ | 15,961,106 | ||||||
|
| |||||||
| ETF | – Exchange-Traded Fund |
| REIT | – Real Estate Investment Trust |
| SPDR | – Standard & Poor’s Depositary Receipts |
See accompanying notes which are an integral part of these financial statements.
17
SMI DYNAMIC ALLOCATION FUND
SCHEDULE OF INVESTMENTS
April 30, 2017 (Unaudited)
| Exchange-Traded Funds – 100.22% | Shares | Fair Value | ||||||
iShares MSCI EAFE ETF (a) | 899,500 | $ | 57,388,100 | |||||
SPDR S&P 500 ETF (a) | 231,200 | 55,044,096 | ||||||
Vanguard REIT ETF (a) | 611,900 | 50,659,201 | ||||||
|
| |||||||
TOTAL EXCHANGE-TRADED FUNDS (Cost $152,712,655) | 163,091,397 | |||||||
|
| |||||||
Money Market Securities – 2.49% | ||||||||
Fidelity Investments Money Market Government Portfolio – Institutional Class, 0.65% (b) | 4,061,528 | 4,061,528 | ||||||
|
| |||||||
TOTAL MONEY MARKET SECURITIES (Cost $4,061,528) | 4,061,528 | |||||||
|
| |||||||
TOTAL INVESTMENTS – 102.71% (Cost $156,774,183) | $ | 167,152,925 | ||||||
|
| |||||||
Liabilities in Excess of Other Assets – (2.71)% | (4,414,190 | ) | ||||||
|
| |||||||
NET ASSETS – 100.00% | $ | 162,738,735 | ||||||
|
| |||||||
| (a) | Represents an investment greater than 25% of the Fund’s net assets. Performance of the Fund may be adversely impacted by concentrated investments in securities. The financial statements and portfolio holdings for these securities can be found at www.sec.gov. As of April 30, 2017, the percentage of net assets invested in iShares MSCI EAFE ETF, SPDR S&P 500 ETF and Vanguard REIT ETF were 35.26%, 33.83% and 31.13%, respectively, of the Fund. |
| (b) | Rate disclosed is the seven day effective yield as of April 30, 2017. |
| ETF | – Exchange-Traded Fund |
| REIT | – Real Estate Investment Trust |
| SPDR | – Standard & Poor’s Depositary Receipts |
See accompanying notes which are an integral part of these financial statements.
18
SMI BOND FUND
SCHEDULE OF INVESTMENTS
April 30, 2017 (Unaudited)
| Mutual Funds – 74.19% | Shares | Fair Value | ||||||
Scout Core Plus Bond Fund – Institutional Class | 54,604 | $ | 1,722,766 | |||||
Scout Unconstrained Bond Fund – Institutional Class | 143,296 | 1,688,025 | ||||||
Vanguard Intermediate-Term Bond Index Fund – Admiral Class | 149,651 | 1,707,515 | ||||||
|
| |||||||
TOTAL MUTUAL FUNDS (Cost $5,144,468) | 5,118,306 | |||||||
|
| |||||||
Exchange-Traded Funds – 23.92% | ||||||||
Vanguard Long-Term Bond ETF | 18,100 | 1,650,177 | ||||||
|
| |||||||
TOTAL EXCHANGE-TRADED FUNDS (Cost $1,650,537) | 1,650,177 | |||||||
|
| |||||||
Money Market Securities – 1.99% | ||||||||
Fidelity Investments Money Market Government Portfolio – Institutional Class, 0.65% (a) | 137,095 | 137,095 | ||||||
|
| |||||||
TOTAL MONEY MARKET SECURITIES (Cost $137,095) | 137,095 | |||||||
|
| �� | ||||||
TOTAL INVESTMENTS – 100.10% (Cost $6,932,100) | $ | 6,905,578 | ||||||
|
| |||||||
Liabilities in Excess of Other Assets – (0.10)% | (6,781 | ) | ||||||
|
| |||||||
NET ASSETS – 100.00% | $ | 6,898,797 | ||||||
|
| |||||||
| (a) | Rate disclosed is the seven day effective yield as of April 30, 2017. |
| ETF | – Exchange-Traded Fund |
See accompanying notes which are an integral part of these financial statements.
19
SMI 50/40/10 FUND
SCHEDULE OF INVESTMENTS
April 30, 2017 (Unaudited)
| Mutual Funds – 45.87% | Shares | Fair Value | ||||||
Aegis Value Fund, Inc. | 23,020 | $ | 386,038 | |||||
Artisan Value Fund – Advisor Class | 48,543 | 693,674 | ||||||
Baron Discovery Fund – Retail Class | 47,989 | 736,625 | ||||||
Baron Partners Fund – Institutional Class * | 18,882 | 857,994 | ||||||
Dodge & Cox Stock Fund | 2,004 | 382,175 | ||||||
John Hancock – Classic Value Fund – Institutional Class | 14,314 | 427,267 | ||||||
JPMorgan Small Cap Growth Fund – Class L | 14,520 | 230,000 | ||||||
Longleaf Partners International Fund | 57,118 | 879,050 | ||||||
Oakmark International Fund – Investor Class | 16,394 | 425,098 | ||||||
Oppenheimer International Small-Mid Company Fund – Class Y | 100 | 4,229 | ||||||
ProFunds Semiconductor UltraSector – Investor Class | 43,216 | 1,885,091 | ||||||
Royce Opportunity Fund – Investment Class | 53,690 | 731,796 | ||||||
Towle Deep Value Fund * | 46,507 | 971,530 | ||||||
Virtus Small-Cap Sustainable Growth Fund – Institutional Class | 9,477 | 210,111 | ||||||
Wasatch International Growth Fund – Investor Class | 100 | 3,040 | ||||||
|
| |||||||
TOTAL MUTUAL FUNDS (Cost $8,120,639) |
| 8,823,718 | ||||||
|
| |||||||
Exchange-Traded Funds – 53.23% | ||||||||
Guggenheim S&P 500 Equal Weight Technology ETF | 6,150 | 756,143 | ||||||
iShares MSCI EAFE ETF | 51,640 | 3,294,632 | ||||||
SPDR S&P 500 ETF | 13,300 | 3,166,464 | ||||||
Vanguard REIT ETF | 36,500 | 3,021,835 | ||||||
|
| |||||||
TOTAL EXCHANGE-TRADED FUNDS (Cost $9,656,711) |
| 10,239,074 | ||||||
|
| |||||||
Money Market Securities – 2.98% | ||||||||
Fidelity Investments Money Market Government Portfolio – Institutional Class, 0.65% (a) | 572,450 | 572,450 | ||||||
|
| |||||||
TOTAL MONEY MARKET SECURITIES (Cost $572,450) |
| 572,450 | ||||||
|
| |||||||
TOTAL INVESTMENTS – 102.08% (Cost $18,349,800) |
| $ | 19,635,242 | |||||
|
| |||||||
Liabilities in Excess of Other Assets – (2.08)% |
| (400,109 | ) | |||||
|
| |||||||
NET ASSETS – 100.00% |
| $ | 19,235,133 | |||||
|
| |||||||
| (a) | Rate disclosed is the seven day effective yield as of April 30, 2017. |
| * | Non-income producing security. |
| ETF | – Exchange-Traded Fund |
| REIT | – Real Estate Investment Trust |
| SPDR | – Standard & Poor’s Depositary Receipts |
See accompanying notes which are an integral part of these financial statements.
20
SMI FUNDS
STATEMENTS OF ASSETS AND LIABILITIES
April 30, 2017 (Unaudited)
| Sound Mind Investing Fund | SMI Conservative Allocation Fund | SMI Dynamic Allocation Fund | ||||||||||
Assets | ||||||||||||
Investment in securities: | ||||||||||||
At cost | $ | 184,326,092 | $ | 15,277,560 | $ | 156,774,183 | ||||||
|
|
|
|
|
| |||||||
At fair value | $ | 195,482,328 | $ | 15,855,164 | $ | 167,152,925 | ||||||
Receivable for investments sold | 1,769,662 | 5,603,126 | 46,434,800 | |||||||||
Receivable for fund shares sold | 10,728 | 300 | 30,013 | |||||||||
Dividend receivable | 592 | 4,389 | 2,411 | |||||||||
Prepaid expenses | 26,520 | 16,172 | 27,684 | |||||||||
|
|
|
|
|
| |||||||
Total Assets | 197,289,830 | 21,479,151 | 213,647,833 | |||||||||
|
|
|
|
|
| |||||||
Liabilities | ||||||||||||
Payable for investments purchased | 800,000 | 5,318,276 | 50,668,747 | |||||||||
Payable for fund shares redeemed | 53,521 | — | 80,061 | |||||||||
Payable to Adviser | 160,137 | 7,020 | 134,174 | |||||||||
Due to custodian | — | 181,198 | — | |||||||||
Payable to Administrator | 10,441 | 2,562 | 9,045 | |||||||||
Payable to trustees | 1,631 | 234 | 1,472 | |||||||||
Other accrued expenses | 18,989 | 8,755 | 15,599 | |||||||||
|
|
|
|
|
| |||||||
Total Liabilities | 1,044,719 | 5,518,045 | 50,909,098 | |||||||||
|
|
|
|
|
| |||||||
Net Assets | $ | 196,245,111 | $ | 15,961,106 | $ | 162,738,735 | ||||||
|
|
|
|
|
| |||||||
Net Assets consist of: | ||||||||||||
Paid-in capital | $ | 174,760,088 | $ | 16,252,130 | $ | 163,720,908 | ||||||
Accumulated undistributed net investment (loss) | (205,678 | ) | (20,250 | ) | (7,858 | ) | ||||||
Accumulated undistributed net realized gain (loss) from investment transactions | 10,534,465 | (848,378 | ) | (11,353,057 | ) | |||||||
Net unrealized appreciation (depreciation) on investment securities | 11,156,236 | 577,604 | 10,378,742 | |||||||||
|
|
|
|
|
| |||||||
Net Assets | $ | 196,245,111 | $ | 15,961,106 | $ | 162,738,735 | ||||||
|
|
|
|
|
| |||||||
Shares outstanding (unlimited number of shares authorized, no par value) | 17,196,447 | 1,677,011 | 14,532,415 | |||||||||
|
|
|
|
|
| |||||||
Net asset value (“NAV”), offering and redemption price per share | $ | 11.41 | $ | 9.52 | $ | 11.20 | ||||||
|
|
|
|
|
| |||||||
See accompanying notes which are an integral part of these financial statements.
21
SMI FUNDS
STATEMENTS OF ASSETS AND LIABILITIES
April 30, 2017 (Unaudited) – (Continued)
| SMI Bond Fund | SMI 50/40/10 Fund | |||||||
Assets | ||||||||
Investment in securities: | ||||||||
At cost | $ | 6,932,100 | $ | 18,349,800 | ||||
|
|
|
| |||||
At fair value | $ | 6,905,578 | $ | 19,635,242 | ||||
Cash | 1,336 | — | ||||||
Receivable for investments sold | 2,377,680 | 3,135,115 | ||||||
Receivable for fund shares sold | 10 | 1,435 | ||||||
Dividend receivable | 4,383 | 157 | ||||||
Receivable from Adviser | 2,646 | — | ||||||
Prepaid expenses | 17,338 | 17,501 | ||||||
|
|
|
| |||||
Total Assets | 9,308,971 | 22,789,450 | ||||||
|
|
|
| |||||
Liabilities | ||||||||
Payable for investments purchased | 2,400,537 | 3,530,088 | ||||||
Payable for fund shares redeemed | 64 | — | ||||||
Payable for distributions to shareholders | 22 | — | ||||||
Payable to Adviser | — | 13,159 | ||||||
Payable to Administrator | 1,884 | 2,435 | ||||||
Payable to trustees | 148 | 238 | ||||||
Other accrued expenses | 7,519 | 8,397 | ||||||
|
|
|
| |||||
Total Liabilities | 2,410,174 | 3,554,317 | ||||||
|
|
|
| |||||
Net Assets | $ | 6,898,797 | $ | 19,235,133 | ||||
|
|
|
| |||||
Net Assets consist of: | ||||||||
Paid-in capital | $ | 6,964,274 | $ | 18,608,499 | ||||
Accumulated undistributed net investment (loss) | (42,907 | ) | (55,008 | ) | ||||
Accumulated undistributed net realized gain (loss) from investment transactions | 3,952 | (603,800 | ) | |||||
Net unrealized appreciation (depreciation) on investment securities | (26,522 | ) | 1,285,442 | |||||
|
|
|
| |||||
Net Assets | $ | 6,898,797 | $ | 19,235,133 | ||||
|
|
|
| |||||
Shares outstanding (unlimited number of shares authorized, no par value) | 706,038 | 1,937,112 | ||||||
|
|
|
| |||||
Net asset value (“NAV”), offering and redemption price per share | $ | 9.77 | $ | 9.93 | ||||
|
|
|
| |||||
See accompanying notes which are an integral part of these financial statements.
22
SMI FUNDS
STATEMENTS OF OPERATIONS
For the six months ended April 30, 2017 (Unaudited)
| Sound Mind Investing Fund | SMI Conservative Allocation Fund | SMI Dynamic Allocation Fund | ||||||||||
Investment Income | ||||||||||||
Dividend income | $ | 1,223,165 | $ | 133,022 | $ | 1,159,550 | ||||||
|
|
|
|
|
| |||||||
Total investment income | 1,223,165 | 133,022 | 1,159,550 | |||||||||
|
|
|
|
|
| |||||||
Expenses | ||||||||||||
Investment Adviser | 985,525 | 74,436 | 834,466 | |||||||||
Registration | 13,505 | 10,283 | 14,661 | |||||||||
Administrator | 23,626 | 2,062 | 20,732 | |||||||||
Legal | 8,584 | 8,744 | 9,085 | |||||||||
Audit | 8,098 | 8,261 | 8,262 | |||||||||
Printing | 14,886 | 1,514 | 13,072 | |||||||||
Transfer agent | 16,570 | 2,165 | 7,347 | |||||||||
Fund accounting | 13,292 | 1,160 | 11,665 | |||||||||
Compliance | 4,673 | 4,673 | 4,673 | |||||||||
Trustee | 5,250 | 2,661 | 4,917 | |||||||||
Custodian | 8,643 | 1,488 | 4,702 | |||||||||
Line of credit | 3,145 | 272 | 2,754 | |||||||||
Interest expense | 2,060 | 221 | 2,022 | |||||||||
Miscellaneous | 32,143 | 6,376 | 27,741 | |||||||||
|
|
|
|
|
| |||||||
Total expenses | 1,140,000 | 124,316 | 966,099 | |||||||||
Fees contractually waived and expenses reimbursed by Adviser | — | (28,662 | ) | — | ||||||||
|
|
|
|
|
| |||||||
Net operating expenses | 1,140,000 | 95,654 | 966,099 | |||||||||
|
|
|
|
|
| |||||||
Net investment income | 83,165 | 37,368 | 193,451 | |||||||||
|
|
|
|
|
| |||||||
Net Realized and Change in Unrealized Gain (Loss) on Investments | ||||||||||||
Long-term capital gain dividends from investment companies | 3,115,069 | 369 | — | |||||||||
Net realized gain (loss) on investment transactions | 10,780,546 | (342,980 | ) | (6,297,440 | ) | |||||||
Net change in unrealized appreciation (depreciation) on investments | 6,511,305 | 490,620 | 10,288,372 | |||||||||
|
|
|
|
|
| |||||||
Net realized and change in unrealized gain on investments | 20,406,920 | 148,009 | 3,990,932 | |||||||||
|
|
|
|
|
| |||||||
Net increase in net assets resulting from operations | $ | 20,490,085 | $ | 185,377 | $ | 4,184,383 | ||||||
|
|
|
|
|
| |||||||
See accompanying notes which are an integral part of these financial statements.
23
SMI FUNDS
STATEMENTS OF OPERATIONS
April 30, 2017 (Unaudited) – (Continued)
| SMI Bond Fund | SMI 50/40/10 Fund | |||||||
Investment Income | ||||||||
Dividend income | $ | 65,714 | $ | 133,862 | ||||
|
|
|
| |||||
Total investment income | 65,714 | 133,862 | ||||||
|
|
|
| |||||
Expenses | ||||||||
Investment Adviser | 26,190 | 89,103 | ||||||
Registration | 11,760 | 12,455 | ||||||
Administrator | 844 | 2,156 | ||||||
Legal | 8,716 | 8,518 | ||||||
Audit | 8,260 | 8,260 | ||||||
Printing | 832 | 1,439 | ||||||
Transfer agent | 670 | 3,029 | ||||||
Fund accounting | 474 | 1,212 | ||||||
Compliance | 4,673 | 4,673 | ||||||
Trustee | 2,519 | 2,672 | ||||||
Custodian | 1,488 | 1,547 | ||||||
Line of credit | 112 | 288 | ||||||
Interest expense | 21 | 597 | ||||||
Miscellaneous | 4,609 | 6,266 | ||||||
|
|
|
| |||||
Total expenses | 71,168 | 142,215 | ||||||
Fees contractually waived and expenses reimbursed by Adviser | (41,295 | ) | (11,987 | ) | ||||
|
|
|
| |||||
Net operating expenses | 29,873 | 130,228 | ||||||
|
|
|
| |||||
Net investment income | 35,841 | 3,634 | ||||||
|
|
|
| |||||
Net Realized and Change in Unrealized Gain (Loss) on Investments | ||||||||
Long-term capital gain dividends from investment companies | 387 | 84,179 | ||||||
Net realized gain on investment transactions | 18,692 | 165,068 | ||||||
Net change in unrealized appreciation (depreciation) on investments | (80,170 | ) | 1,033,249 | |||||
|
|
|
| |||||
Net realized and change in unrealized gain (loss) on investments | (61,091 | ) | 1,282,496 | |||||
|
|
|
| |||||
Net increase (decrease) in net assets resulting from operations | $ | (25,250 | ) | $ | 1,286,130 | |||
|
|
|
| |||||
See accompanying notes which are an integral part of these financial statements.
24
SOUND MIND INVESTING FUND
STATEMENTS OF CHANGES IN NET ASSETS
| For the Six Months Ended April 30, 2017 (Unaudited) | Year Ended October 31, 2016 | |||||||
Increase (Decrease) in Net Assets due to: | ||||||||
Operations | ||||||||
Net investment income | $ | 83,165 | $ | 310,845 | ||||
Long-term capital gain dividends from investment companies | 3,115,069 | 9,201,713 | ||||||
Net realized gain (loss) on investment transactions | 10,780,546 | (11,925,406 | ) | |||||
Net change in unrealized appreciation on investments | 6,511,305 | 2,869,366 | ||||||
|
|
|
| |||||
Net increase in net assets resulting from operations | 20,490,085 | 456,518 | ||||||
|
|
|
| |||||
Distributions From: | ||||||||
Net realized gains | — | (28,684,023 | ) | |||||
|
|
|
| |||||
Total distributions | — | (28,684,023 | ) | |||||
|
|
|
| |||||
Capital Transactions | ||||||||
Proceeds from shares sold | 7,319,639 | 12,910,740 | ||||||
Proceeds from redemption fees (a) | 649 | 6,288 | ||||||
Reinvestment of distributions | — | 27,898,432 | ||||||
Amount paid for shares redeemed | (26,243,304 | ) | (45,249,201 | ) | ||||
|
|
|
| |||||
Net decrease in net assets resulting from capital transactions | (18,923,016 | ) | (4,433,741 | ) | ||||
|
|
|
| |||||
Total Increase (Decrease) in Net Assets | 1,567,069 | (32,661,246 | ) | |||||
|
|
|
| |||||
Net Assets | ||||||||
Beginning of period | 194,678,042 | 227,339,288 | ||||||
|
|
|
| |||||
End of period | $ | 196,245,111 | $ | 194,678,042 | ||||
|
|
|
| |||||
Accumulated net investment loss included in net assets at end of period | $ | (205,678 | ) | $ | (288,843 | ) | ||
|
|
|
| |||||
Share Transactions | ||||||||
Shares sold | 663,544 | 1,270,281 | ||||||
Shares issued in reinvestment of distributions | — | 2,727,119 | ||||||
Shares redeemed | (2,376,618 | ) | (4,414,628 | ) | ||||
|
|
|
| |||||
Net decrease in shares outstanding | (1,713,074 | ) | (417,228 | ) | ||||
|
|
|
| |||||
| (a) | Prior to February 28, 2017 the Fund charged a 2% redemption fee on shares redeemed within 60 days of purchase. |
See accompanying notes which are an integral part of these financial statements.
25
SMI CONSERVATIVE ALLOCATION FUND
STATEMENTS OF CHANGES IN NET ASSETS
| For the Six Months Ended April 30, 2017 (Unaudited) | Year Ended October 31, 2016 | |||||||
Decrease in Net Assets due to: | ||||||||
Operations | ||||||||
Net investment income | $ | 37,368 | $ | 210,208 | ||||
Long-term capital gain dividends from investment companies | 369 | 15,711 | ||||||
Net realized gain (loss) on investment transactions | (342,980 | ) | 162,196 | |||||
Net change in unrealized appreciation (depreciation) on investments | 490,620 | (145,072 | ) | |||||
|
|
|
| |||||
Net increase in net assets resulting from operations | 185,377 | 243,043 | ||||||
|
|
|
| |||||
Distributions From: | ||||||||
Net investment income | (149,639 | ) | (217,790 | ) | ||||
Net realized gains | — | (438,679 | ) | |||||
|
|
|
| |||||
Total distributions | (149,639 | ) | (656,469 | ) | ||||
|
|
|
| |||||
Capital Transactions | ||||||||
Proceeds from shares sold | 587,313 | 2,198,797 | ||||||
Proceeds from redemption fees (a) | 605 | 1,821 | ||||||
Reinvestment of distributions | 146,642 | 644,375 | ||||||
Amount paid for shares redeemed | (2,897,916 | ) | (6,545,564 | ) | ||||
|
|
|
| |||||
Net decrease in net assets resulting from capital transactions | (2,163,356 | ) | (3,700,571 | ) | ||||
|
|
|
| |||||
Total Decrease in Net Assets | (2,127,618 | ) | (4,113,997 | ) | ||||
|
|
|
| |||||
Net Assets | ||||||||
Beginning of period | 18,088,724 | 22,202,721 | ||||||
|
|
|
| |||||
End of period | $ | 15,961,106 | $ | 18,088,724 | ||||
|
|
|
| |||||
Accumulated net investment income (loss) included in net assets at end of period | $ | (20,250 | ) | $ | 92,021 | |||
|
|
|
| |||||
Share Transactions | ||||||||
Shares sold | 62,818 | 234,592 | ||||||
Shares issued in reinvestment of distributions | 16,027 | 69,512 | ||||||
Shares redeemed | (311,041 | ) | (695,959 | ) | ||||
|
|
|
| |||||
Net decrease in shares outstanding | (232,196 | ) | (391,855 | ) | ||||
|
|
|
| |||||
| (a) | Prior to February 28, 2017 the Fund charged a 2% redemption fee on shares redeemed within 60 days of purchase. |
See accompanying notes which are an integral part of these financial statements.
26
SMI DYNAMIC ALLOCATION FUND
STATEMENTS OF CHANGES IN NET ASSETS
| For the Six Months Ended April 30, 2017 (Unaudited) | Year Ended October 31, 2016 | |||||||
Decrease in Net Assets due to: | ||||||||
Operations | ||||||||
Net investment income | $ | 193,451 | $ | 1,496,457 | ||||
Long-term capital gain dividends from investment companies | — | 28,483 | ||||||
Net realized gain (loss) on investment transactions | (6,297,440 | ) | 3,992,962 | |||||
Net change in unrealized appreciation (depreciation) on investments | 10,288,372 | (4,268,680 | ) | |||||
|
|
|
| |||||
Net increase in net assets resulting from operations | 4,184,383 | 1,249,222 | ||||||
|
|
|
| |||||
Distributions From: | ||||||||
Net investment income | (414,783 | ) | (2,361,609 | ) | ||||
|
|
|
| |||||
Total distributions | (414,783 | ) | (2,361,609 | ) | ||||
|
|
|
| |||||
Capital Transactions | ||||||||
Proceeds from shares sold | 9,603,849 | 20,009,885 | ||||||
Proceeds from redemption fees (a) | 1,553 | 4,923 | ||||||
Reinvestment of distributions | 405,068 | 2,304,657 | ||||||
Amount paid for shares redeemed | (31,445,289 | ) | (38,342,055 | ) | ||||
|
|
|
| |||||
Net decrease in net assets resulting from capital transactions | (21,434,819 | ) | (16,022,590 | ) | ||||
|
|
|
| |||||
Total Decrease in Net Assets | (17,665,219 | ) | (17,134,977 | ) | ||||
|
|
|
| |||||
Net Assets | ||||||||
Beginning of period | 180,403,954 | 197,538,931 | ||||||
|
|
|
| |||||
End of period | $ | 162,738,735 | $ | 180,403,954 | ||||
|
|
|
| |||||
Accumulated net investment income (loss) included in net assets at end of period | $ | (7,858 | ) | $ | 213,474 | |||
|
|
|
| |||||
Share Transactions | ||||||||
Shares sold | 885,401 | 1,838,944 | ||||||
Shares issued in reinvestment of distributions | 38,214 | 212,607 | ||||||
Shares redeemed | (2,906,968 | ) | (3,515,353 | ) | ||||
|
|
|
| |||||
Net decrease in shares outstanding | (1,983,353 | ) | (1,463,802 | ) | ||||
|
|
|
| |||||
| (a) | Prior to February 28, 2017 the Fund charged a 2% redemption fee on shares redeemed within 60 days of purchase. |
See accompanying notes which are an integral part of these financial statements.
27
SMI BOND FUND
STATEMENTS OF CHANGES IN NET ASSETS
| For the Six Months Ended April 30, 2017 (Unaudited) | Year Ended October 31, 2016 | |||||||
Increase (Decrease) in Net Assets due to: | ||||||||
Operations | ||||||||
Net investment income | $ | 35,841 | $ | 133,069 | ||||
Long-term capital gain dividends from investment companies | 387 | 11,219 | ||||||
Net realized gain on investment transactions | 18,692 | 19,978 | ||||||
Net change in unrealized appreciation (depreciation) on investments | (80,170 | ) | 96,790 | |||||
|
|
|
| |||||
Net increase (decrease) in net assets resulting from operations | (25,250 | ) | 261,056 | |||||
|
|
|
| |||||
Distributions From: | ||||||||
Net investment income | (78,748 | ) | (152,352 | ) | ||||
|
|
|
| |||||
Total distributions | (78,748 | ) | (152,352 | ) | ||||
|
|
|
| |||||
Capital Transactions | ||||||||
Proceeds from shares sold | 877,044 | 3,264,713 | ||||||
Proceeds from redemption fees (a) | 442 | 1,930 | ||||||
Reinvestment of distributions | 77,817 | 150,481 | ||||||
Amount paid for shares redeemed | (1,515,888 | ) | (2,716,700 | ) | ||||
|
|
|
| |||||
Net increase (decrease) in net assets resulting from capital transactions | (560,585 | ) | 700,424 | |||||
|
|
|
| |||||
Total Increase (Decrease) in Net Assets | (664,583 | ) | 809,128 | |||||
|
|
|
| |||||
Net Assets | ||||||||
Beginning of period | 7,563,380 | 6,754,252 | ||||||
|
|
|
| |||||
End of period | $ | 6,898,797 | $ | 7,563,380 | ||||
|
|
|
| |||||
Accumulated net investment loss included in net assets at end of period | $ | (42,907 | ) | $ | — | |||
|
|
|
| |||||
Share Transactions | ||||||||
Shares sold | 89,930 | 334,341 | ||||||
Shares issued in reinvestment of distributions | 8,025 | 15,382 | ||||||
Shares redeemed | (155,661 | ) | (274,716 | ) | ||||
|
|
|
| |||||
Net increase (decrease) in shares outstanding | (57,706 | ) | 75,007 | |||||
|
|
|
| |||||
| (a) | Prior to February 28, 2017 the Fund charged a 2% redemption fee on shares redeemed within 60 days of purchase. |
See accompanying notes which are an integral part of these financial statements.
28
SMI 50/40/10 FUND
STATEMENTS OF CHANGES IN NET ASSETS
| For the Six Months Ended April 30, 2017 (Unaudited) | Year Ended October 31, 2016 | |||||||
Increase in Net Assets due to: | ||||||||
Operations | ||||||||
Net investment income | $ | 3,634 | $ | 51,319 | ||||
Long-term capital gain dividends from investment companies | 84,179 | 197,740 | ||||||
Net realized gain (loss) on investment transactions | 165,068 | (14,481 | ) | |||||
Net change in unrealized appreciation on investments | 1,033,249 | 47,753 | ||||||
|
|
|
| |||||
Net increase in net assets resulting from operations | 1,286,130 | 282,331 | ||||||
|
|
|
| |||||
Distributions From: | ||||||||
Net investment income | (48,002 | ) | (91,435 | ) | ||||
|
|
|
| |||||
Total distributions | (48,002 | ) | (91,435 | ) | ||||
|
|
|
| |||||
Capital Transactions | ||||||||
Proceeds from shares sold | 3,708,344 | 7,981,856 | ||||||
Proceeds from redemption fees (a) | 1,251 | 310 | ||||||
Reinvestment of distributions | 46,319 | 89,150 | ||||||
Amount paid for shares redeemed | (4,121,459 | ) | (3,046,187 | ) | ||||
|
|
|
| |||||
Net increase (decrease) in net assets resulting from capital transactions | (365,545 | ) | 5,025,129 | |||||
|
|
|
| |||||
Total Increase in Net Assets | 872,583 | 5,216,025 | ||||||
|
|
|
| |||||
Net Assets | ||||||||
Beginning of period | 18,362,550 | 13,146,525 | ||||||
|
|
|
| |||||
End of period | $ | 19,235,133 | $ | 18,362,550 | ||||
|
|
|
| |||||
Accumulated net investment loss included in net assets at end of period | $ | (55,008 | ) | $ | (10,640 | ) | ||
|
|
|
| |||||
Share Transactions | ||||||||
Shares sold | 384,738 | 876,455 | ||||||
Shares issued in reinvestment of distributions | 4,912 | 9,764 | ||||||
Shares redeemed | (432,128 | ) | (334,897 | ) | ||||
|
|
|
| |||||
Net increase (decrease) in shares outstanding | (42,478 | ) | 551,322 | |||||
|
|
|
| |||||
| (a) | Prior to February 28, 2017 the Fund charged a 2% redemption fee on shares redeemed within 60 days of purchase. |
See accompanying notes which are an integral part of these financial statements.
29
SOUND MIND INVESTING FUND
FINANCIAL HIGHLIGHTS
(For a share outstanding during each period)
| For the Six Months Ended April 30, 2017 (Unaudited) | ||||
Selected Per Share Data: | ||||
Net asset value, beginning of period | $ | 10.30 | ||
|
| |||
Income from investment operations: | ||||
Net investment income (loss)(a) | — | (b) | ||
Net realized and unrealized gain | 1.11 | |||
|
| |||
Total from investment operations | 1.11 | |||
|
| |||
Less Distributions to Shareholders: | ||||
From net investment income | — | |||
From net realized gain | — | |||
|
| |||
Total distributions | — | |||
|
| |||
Paid in capital from redemption fees(d) | — | |||
|
| |||
Net asset value, end of period | $ | 11.41 | ||
|
| |||
Total Return(e) | 10.78 | %(f) | ||
Ratios and Supplemental Data: | ||||
Net assets, end of period (000) | $ | 196,245 | ||
Ratio of expenses to average net assets(g)(h) | 1.15 | %(i) | ||
Ratio of net investment income (loss) to average net assets(a)(j) | 0.08 | %(i) | ||
Portfolio turnover rate | 96.60 | %(f) | ||
| (a) | Recognition of net investment income by the Fund is affected by the timing of the declaration of dividends by the underlying investment companies in which the Fund invests. |
| (b) | Resulted in less than $0.005 per share. |
| (c) | The amount shown for a share outstanding throughout the year does not correspond with the change in aggregate gains and losses in the portfolio of securities during the year because of the timing of sales and purchases of fund shares in relation to fluctuating market values during the year. |
| (d) | Redemption fee resulted in less than $0.005 per share. |
| (e) | Total return in the above table represents the rate that an investor would have earned or lost on an investment in the Fund, assuming reinvestment of dividends. |
| (f) | Not annualized. |
| (g) | These ratios exclude the impact of expenses of the underlying funds in which the Fund invests as represented in the Schedule of Investments. |
| (h) | These ratios do not include the effects of other expenses refunded by the underlying funds in which the Fund invests or line of credit interest expense and borrowing costs. If these refunds and borrowing costs had been included, the ratio of expenses to average net assets would have been 1.16% for the six months ended April 30, 2017, and 1.16%, 1.14%, 1.09%, 1.17%, and 1.15% for the years ended October 31, 2016, October 31, 2015, October 31, 2014, October 31, 2013, and October 31, 2012, respectively. |
| (i) | Annualized. |
| (j) | This ratio is presented net of expenses and/or expenses refunded by the underlying funds in which the Fund invests. |
See accompanying notes which are an integral part of these financial statements.
30
SOUND MIND INVESTING FUND
FINANCIAL HIGHLIGHTS
(For a share outstanding during each period) – (Continued)
| Year Ended October 31, 2016 | Year Ended October 31, 2015 | Year Ended October 31, 2014 | Year Ended October 31, 2013 | Year Ended October 31, 2012 | ||||||||||||||
| $ | 11.76 | $ | 13.94 | $ | 14.47 | $ | 11.36 | $ | 10.74 | |||||||||
|
|
|
|
|
|
|
|
|
| |||||||||
| 0.01 | (0.08 | ) | (0.09 | ) | (0.05 | ) | — | |||||||||||
| 0.04 | (c) | 0.16 | 1.12 | 3.66 | 0.62 | |||||||||||||
|
|
|
|
|
|
|
|
|
| |||||||||
| 0.05 | 0.08 | 1.03 | 3.61 | 0.62 | ||||||||||||||
|
|
|
|
|
|
|
|
|
| |||||||||
| — | (0.07 | ) | (0.05 | ) | — | (b) | — | |||||||||||
| (1.51 | ) | (2.19 | ) | (1.51 | ) | (0.50 | ) | — | ||||||||||
|
|
|
|
|
|
|
|
|
| |||||||||
| (1.51 | ) | (2.26 | ) | (1.56 | ) | (0.50 | ) | — | ||||||||||
|
|
|
|
|
|
|
|
|
| |||||||||
| — | — | — | — | — | ||||||||||||||
|
|
|
|
|
|
|
|
|
| |||||||||
| $ | 10.30 | $ | 11.76 | $ | 13.94 | $ | 14.47 | $ | 11.36 | |||||||||
|
|
|
|
|
|
|
|
|
| |||||||||
| 0.55 | % | 0.16 | % | 7.38 | % | 33.01 | % | 5.77 | % | |||||||||
| $ | 194,678 | $ | 227,339 | $ | 282,670 | $ | 293,035 | $ | 272,092 | |||||||||
| 1.15 | % | 1.13 | % | 1.11 | % | 1.17 | % | 1.15 | % | |||||||||
| 0.15 | % | (0.59 | )% | (0.64 | )% | (0.41 | )% | 0.00 | % | |||||||||
| 131.40 | % | 216.17 | % | 135.60 | % | 93.59 | % | 187.39 | % | |||||||||
See accompanying notes which are an integral part of these financial statements.
31
SMI CONSERVATIVE ALLOCATION FUND
FINANCIAL HIGHLIGHTS
(For a share outstanding during each period)
| For the Six Months Ended April 30, 2017 (Unaudited) | ||||
Selected Per Share Data: | ||||
Net asset value, beginning of period | $ | 9.47 | ||
|
| |||
Income from investment operations: | ||||
Net investment income (loss)(a) | 0.02 | |||
Net realized and unrealized gain (loss) | 0.11 | |||
|
| |||
Total from investment operations | 0.13 | |||
|
| |||
Less Distributions to Shareholders: | ||||
From net investment income | (0.08 | ) | ||
From net realized gain | — | |||
|
| |||
Total distributions | (0.08 | ) | ||
|
| |||
Paid in capital from redemption fees(c) | — | |||
|
| |||
Net asset value, end of period | $ | 9.52 | ||
|
| |||
Total Return(d) | 1.43 | %(e) | ||
Ratios and Supplemental Data: | ||||
Net assets, end of period (000) | $ | 15,961 | ||
Ratio of expenses to average net assets(f) | 1.15 | %(g)(h) | ||
Ratio of expenses to average net assets before waiver and reimbursement(f) | 1.50 | %(h) | ||
Ratio of net investment income (loss) to average net assets(a)(i) | 0.45 | %(h) | ||
Portfolio turnover rate | 107.87 | %(e) | ||
| (a) | Recognition of net investment income by the Fund is affected by the timing of the declaration of dividends by the underlying investment companies in which the Fund invests. |
| (b) | The amount shown for a share outstanding throughout the year does not correspond with the change in aggregate gains and losses in the portfolio of securities during the year because of the timing of sales and purchases of fund shares in relation to fluctuating market values during the year. |
| (c) | Redemption fees resulted in less than $0.005 per share. |
| (d) | Total return in the above table represents the rate that an investor would have earned on an investment in the Fund, assuming reinvestment of dividends. |
| (e) | Not annualized. |
| (f) | These ratios exclude the impact of expenses of the underlying funds in which the Fund may invest, as represented in the Schedule of Investments. |
| (g) | These ratios do not include the effects of other expenses refunded by the underlying funds in which the Fund invests or line of credit interest expense and borrowing costs. If these refunds and borrowing costs had been included, the ratio of expenses to average net assets would have been 1.16% for the six months ended April 30, 2017, and 1.16%, 1.16%, 1.13%, and 1.14% for the years ended October 31, 2016, October 31, 2015, October 31, 2014 and October 31, 2012, respectively. |
| (h) | Annualized. |
| (i) | This ratio is presented net of expenses and/or expenses refunded by the underlying funds in which the Fund invests. |
See accompanying notes which are an integral part of these financial statements.
32
SMI CONSERVATIVE ALLOCATION FUND
FINANCIAL HIGHLIGHTS
(For a share outstanding during each period) – (Continued)
| Year Ended October 31, 2016 | Year Ended October 31, 2015 | Year Ended October 31, 2014 | Year Ended October 31, 2013 | Year Ended October 31, 2012 | ||||||||||||||
| $ | 9.65 | $ | 11.52 | $ | 12.20 | $ | 10.31 | $ | 9.70 | |||||||||
|
|
|
|
|
|
|
|
|
| |||||||||
| 0.10 | 0.08 | (0.01 | ) | (0.02 | ) | 0.03 | ||||||||||||
| 0.02 | (b) | (0.52 | ) | 0.54 | 2.11 | 0.63 | ||||||||||||
|
|
|
|
|
|
|
|
|
| |||||||||
| 0.12 | (0.44 | ) | 0.53 | 2.09 | 0.66 | |||||||||||||
|
|
|
|
|
|
|
|
|
| |||||||||
| (0.10 | ) | (0.09 | ) | (0.06 | ) | (0.03 | ) | (0.05 | ) | |||||||||
| (0.20 | ) | (1.34 | ) | (1.15 | ) | (0.17 | ) | — | ||||||||||
|
|
|
|
|
|
|
|
|
| |||||||||
| (0.30 | ) | (1.43 | ) | (1.21 | ) | (0.20 | ) | (0.05 | ) | |||||||||
|
|
|
|
|
|
|
|
|
| |||||||||
| — | — | — | — | — | ||||||||||||||
|
|
|
|
|
|
|
|
|
| |||||||||
| $ | 9.47 | $ | 9.65 | $ | 11.52 | $ | 12.20 | $ | 10.31 | |||||||||
|
|
|
|
|
|
|
|
|
| |||||||||
| 1.30 | % | (4.58 | )% | 4.46 | % | 20.56 | % | 6.89 | % | |||||||||
| $ | 18,089 | $ | 22,203 | $ | 30,606 | $ | 29,826 | $ | 37,258 | |||||||||
| 1.15 | %(g) | 1.15 | %(g) | 1.15 | %(g) | 1.15 | % | 1.15 | %(g) | |||||||||
| 1.51 | % | 1.49 | % | 1.31 | % | 1.52 | % | 1.49 | % | |||||||||
| 1.06 | % | 0.82 | % | (0.17 | )% | (0.06 | )% | 0.29 | % | |||||||||
| 203.11 | % | 377.51 | % | 255.50 | % | 270.30 | % | 349.33 | % | |||||||||
See accompanying notes which are an integral part of these financial statements.
33
SMI DYNAMIC ALLOCATION FUND
FINANCIAL HIGHLIGHTS
(For a share outstanding during each period)
| For the Six Months Ended April 30, 2017 (Unaudited) | ||||
Selected Per Share Data: | ||||
Net asset value, beginning of period | $ | 10.92 | ||
|
| |||
Income from investment operations: | ||||
Net investment income(b) | 0.02 | |||
Net realized and unrealized gain (loss) | 0.29 | |||
|
| |||
Total from investment operations | 0.31 | |||
|
| |||
Less Distributions to Shareholders: | ||||
From net investment income | (0.03 | ) | ||
From net realized gains | — | |||
|
| |||
Total distributions | (0.03 | ) | ||
|
| |||
Paid in capital from redemption fees(c) | — | |||
|
| |||
Net asset value, end of period | $ | 11.20 | ||
|
| |||
Total Return(d) | 2.82 | %(e) | ||
Ratios and Supplemental Data: | ||||
Net assets, end of period (000) | $ | 162,739 | ||
Ratio of expenses to average net assets(f) | 1.15 | %(g)(h) | ||
Ratio of net investment income to average net assets(b)(i) | 0.23 | %(h) | ||
Portfolio turnover rate | 131.44 | %(e) | ||
| (a) | For the period February 28, 2013 (the date the Fund commenced operations) through October 31, 2013. |
| (b) | Recognition of net investment income by the Fund is affected by the timing of the declaration of dividends by the underlying investment companies in which the Fund invests. |
| (c) | Redemption fees resulted in less than $0.005 per share. |
| (d) | Total return in the above table represents the rate that an investor would have earned on an investment in the Fund, assuming reinvestment of dividends. |
| (e) | Not annualized. |
| (f) | These ratios exclude the impact of expenses of the underlying funds in which the Fund may invest, as represented in the Schedule of Investments. |
| (g) | These ratios do not include the effects of other expenses refunded by the underlying funds in which the Fund invests or line of credit interest expense and borrowing costs. If these refunds and borrowing costs had been included, the ratio of expenses to average net assets would have been 1.16% for the six months ended April 30, 2017. |
| (h) | Annualized. |
| (i) | This ratio is presented net of expenses of the funds in which the Fund invests. |
See accompanying notes which are an integral part of these financial statements.
34
SMI DYNAMIC ALLOCATION FUND
FINANCIAL HIGHLIGHTS
(For a share outstanding during each period) – (Continued)
| Year Ended October 31, 2016 | Year Ended October 31, 2015 | Year Ended October 31, 2014 | Period Ended October 31, 2013(a) | |||||||||||
| $ | 10.99 | $ | 11.81 | $ | 10.95 | $ | 10.00 | |||||||
|
|
|
|
|
|
|
| |||||||
| 0.09 | 0.19 | 0.23 | 0.05 | |||||||||||
| (0.02 | ) | (0.69 | ) | 0.81 | 0.90 | |||||||||
|
|
|
|
|
|
|
| |||||||
| 0.07 | (0.50 | ) | 1.04 | 0.95 | ||||||||||
|
|
|
|
|
|
|
| |||||||
| (0.14 | ) | (0.23 | ) | (0.18 | ) | — | ||||||||
| — | (0.09 | ) | — | — | ||||||||||
|
|
|
|
|
|
|
| |||||||
| (0.14 | ) | (0.32 | ) | (0.18 | ) | — | ||||||||
|
|
|
|
|
|
|
| |||||||
| — | — | — | — | |||||||||||
|
|
|
|
|
|
|
| |||||||
| $ | 10.92 | $ | 10.99 | $ | 11.81 | $ | 10.95 | |||||||
|
|
|
|
|
|
|
| |||||||
| 0.62 | % | (4.52 | )% | 9.64 | % | 9.50 | %(e) | |||||||
| $ | 180,404 | $ | 197,539 | $ | 147,003 | $ | 68,290 | |||||||
| 1.15 | % | 1.15 | % | 1.20 | % | 1.30 | %(h) | |||||||
| 0.80 | % | 1.62 | % | 2.13 | % | 0.94 | %(h) | |||||||
| 151.88 | % | 248.18 | % | 134.71 | % | 68.64 | %(e) | |||||||
See accompanying notes which are an integral part of these financial statements.
35
SMI BOND FUND
FINANCIAL HIGHLIGHTS
(For a share outstanding during each period)
| For the Six Months Ended April 30, 2017 (Unaudited) | Year Ended October 31, 2016 | Period Ended October 31, 2015(a) | ||||||||||
Selected Per Share Data: | ||||||||||||
Net asset value, beginning of period | $ | 9.90 | $ | 9.81 | $ | 10.00 | ||||||
|
|
|
|
|
| |||||||
Income from investment operations: | ||||||||||||
Net investment income(b) | 0.05 | 0.16 | 0.01 | |||||||||
Net realized and unrealized gain (loss) | (0.07 | ) | 0.12 | (0.19 | ) | |||||||
|
|
|
|
|
| |||||||
Total from investment operations | (0.02 | ) | 0.28 | (0.18 | ) | |||||||
|
|
|
|
|
| |||||||
Less Distributions to Shareholders: | ||||||||||||
From net investment income | (0.11 | ) | (0.19 | ) | (0.01 | ) | ||||||
|
|
|
|
|
| |||||||
Total distributions | (0.11 | ) | (0.19 | ) | (0.01 | ) | ||||||
|
|
|
|
|
| |||||||
Paid in capital from redemption fees(c) | — | — | — | |||||||||
|
|
|
|
|
| |||||||
Net asset value, end of period | $ | 9.77 | $ | 9.90 | $ | 9.81 | ||||||
|
|
|
|
|
| |||||||
Total Return(d) | (0.20 | )%(e) | 2.95 | % | (1.82 | )%(e) | ||||||
Ratios and Supplemental Data: | ||||||||||||
Net assets, end of period (000) | $ | 6,899 | $ | 7,563 | $ | 6,754 | ||||||
Ratio of expenses to average net assets(f)(g) | 0.85 | %(h) | 0.85 | % | 0.85 | %(h) | ||||||
Ratio of expenses to average net assets before waiver and reimbursement(f) | 2.04 | %(h) | 2.22 | % | 4.18 | %(h) | ||||||
Ratio of net investment income to average net | 1.03 | %(h) | 1.70 | % | 0.11 | %(h) | ||||||
Portfolio turnover rate | 71.05 | %(e) | 289.18 | % | 399.72 | %(e) | ||||||
| (a) | For the period April 28, 2015 (the date the Fund commenced operations) through October 31, 2015. |
| (b) | Recognition of net investment income by the Fund is affected by the timing of the declaration of dividends by the underlying investment companies in which the Fund invests. |
| (c) | Redemption fees resulted in less than $0.005 per share. |
| (d) | Total return in the above table represents the rate that an investor would have earned on an investment in the Fund, assuming reinvestment of dividends. |
| (e) | Not annualized. |
| (f) | These ratios exclude the impact of expenses of the underlying funds in which the Fund may invest, as represented in the Schedule of Investments. |
| (g) | These ratios do not include the effects of line of credit interest expense and borrowing costs. If these borrowing costs had been included, the ratio of expenses to average net assets would have been 0.86% for the six months ended April 30, 2017, and 0.86% for the periods ended October 31, 2016 and October 31, 2015, respectively. |
| (h) | Annualized. |
| (i) | This ratio is presented net of expenses of the funds in which the Fund invests. |
See accompanying notes which are an integral part of these financial statements.
36
SMI 50/40/10 FUND
FINANCIAL HIGHLIGHTS
(For a share outstanding during each period)
| For the Six Months Ended April 30, 2017 (Unaudited) | Year Ended October 31, 2016 | Period Ended October 31, 2015(a) | ||||||||||
Selected Per Share Data: | ||||||||||||
Net asset value, beginning of period | $ | 9.28 | $ | 9.20 | $ | 10.00 | ||||||
|
|
|
|
|
| |||||||
Income from investment operations: | ||||||||||||
Net investment income (loss)(b) | 0.01 | 0.03 | — | (c) | ||||||||
Net realized and unrealized gain (loss) | 0.67 | 0.10 | (0.80 | ) | ||||||||
|
|
|
|
|
| |||||||
Total from investment operations | 0.68 | 0.13 | (0.80 | ) | ||||||||
|
|
|
|
|
| |||||||
Less Distributions to Shareholders: | ||||||||||||
From net investment income | (0.03 | ) | (0.05 | ) | — | |||||||
|
|
|
|
|
| |||||||
Total distributions | (0.03 | ) | (0.05 | ) | — | |||||||
|
|
|
|
|
| |||||||
Paid in capital from redemption fees(d) | — | — | — | |||||||||
|
|
|
|
|
| |||||||
Net asset value, end of period | $ | 9.93 | $ | 9.28 | $ | 9.20 | ||||||
|
|
|
|
|
| |||||||
Total Return(e) | 7.29 | %(f) | 1.44 | % | (8.00 | )%(f) | ||||||
Ratios and Supplemental Data: | ||||||||||||
Net assets, end of period (000) | $ | 19,235 | $ | 18,363 | $ | 13,147 | ||||||
Ratio of expenses to average net assets(g) | 1.45 | %(h)(i) | 1.45 | % | 1.45 | %(i) | ||||||
Ratio of expenses to average net assets before waiver and reimbursement(g) | 1.59 | %(i) | 1.76 | % | 2.75 | %(i) | ||||||
Ratio of net investment income (loss) to average net assets(b)(j) | 0.04 | %(i) | 0.30 | % | (0.09 | )%(i) | ||||||
Portfolio turnover rate | 117.77 | %(f) | 146.24 | % | 184.30 | %(f) | ||||||
| (a) | For the period April 29, 2015 (the date the Fund commenced operations) through October 31, 2015. |
| (b) | Recognition of net investment income by the Fund is affected by the timing of the declaration of dividends by the underlying investment companies in which the Fund invests. |
| (c) | Amount is less than $0.005 per share. |
| (d) | Redemption fee resulted in less than $0.005 per share. |
| (e) | Total return in the above table represents the rate that an investor would have earned on an investment in the Fund, assuming reinvestment of dividends. |
| (f) | Not annualized. |
| (g) | These ratios exclude the impact of expenses of the underlying funds in which the Fund may invest, as represented in the Schedule of Investments. |
| (h) | These ratios do not include the effects of line of credit interest expense and borrowing costs. If these borrowing costs had been included, the ratio of expenses to average net assets would have been 1.46% for the six months ended April 30, 2017. |
| (i) | Annualized. |
| (j) | This ratio is presented net of expenses of the funds in which the Fund invests. |
See accompanying notes which are an integral part of these financial statements.
37
SMI FUNDS
NOTES TO THE FINANCIAL STATEMENTS
April 30, 2017 (Unaudited)
NOTE 1. ORGANIZATION
The Sound Mind Investing Fund (“SMI Fund”), SMI Conservative Allocation Fund, SMI Dynamic Allocation Fund, SMI Bond Fund and SMI 50/40/10 Fund (each a “Fund” and collectively, the “Funds”) are each a diversified series of Valued Advisers Trust (the “Trust”). Pursuant to a reorganization that took place on February 28, 2013, the SMI Fund and SMI Conservative Allocation Fund are the successors to the series of Unified Series Trust (the “Predecessor Funds”) with the same names. The Predecessor Funds had the same investment objectives and strategies and substantially the same investment policies as the Funds. The SMI Fund was organized on August 29, 2005, and commenced operations on December 2, 2005. The SMI Conservative Allocation Fund was organized on November 13, 2010, and commenced operations on December 30, 2010. The SMI Dynamic Allocation Fund was organized on December 11, 2012, and commenced operations on February 28, 2013. The SMI Bond Fund was organized on March 11, 2015, and commenced operations on April 28, 2015. The SMI 50/40/10 Fund was organized on March 11, 2015, and commenced operations on April 29, 2015. The Trust is a management investment company established under the laws of Delaware by an Agreement and Declaration of Trust dated June 13, 2008 (the “Trust Agreement”). The Trust Agreement permits the Trustees to issue an unlimited number of shares of beneficial interest of separate series without par value. Each Fund is one of a series of funds currently authorized by the Trustees. The investment adviser to the Funds is SMI Advisory Services, LLC (the “Adviser”). The SMI Fund seeks to provide long-term capital appreciation. The SMI Conservative Allocation Fund, SMI Dynamic Allocation Fund, SMI Bond Fund and SMI 50/40/10 Fund seek total return.
NOTE 2. SIGNIFICANT ACCOUNTING POLICIES
The Funds are investment companies and follow accounting and reporting guidance under Financial Accounting Standards Board Accounting Standards Codification (“ASC”) Topic 946, “Financial Services- Investment Companies”. The following is a summary of significant accounting policies followed by the Funds in the preparation of their financial statements. These policies are in conformity with the generally accepted accounting principles in the United States of America (“GAAP”).
Estimates – The preparation of financial statements in conformity with GAAP requires management to make estimates and assumptions that affect the reported amounts of assets and liabilities and disclosure of contingent assets and liabilities at the date of the financial statements and the reported amounts of increases and decreases in net assets from operations during the reporting period. Actual results could differ from those estimates.
Securities Valuations – All investments in securities are recorded at their estimated fair value as described in Note 3.
Federal Income Taxes – The Funds make no provision for federal income or excise tax. The Funds have qualified and intend to qualify each year as regulated investment companies (“RICs”) under subchapter M
38
SMI FUNDS
NOTES TO THE FINANCIAL STATEMENTS
April 30, 2017 (Unaudited) – (Continued)
NOTE 2. SIGNIFICANT ACCOUNTING POLICIES – (Continued)
of the Internal Revenue Code of 1986, as amended, by complying with the requirements applicable to RICs and by distributing substantially all of their taxable income. The Funds also intend to distribute sufficient net investment income and net capital gains, if any, so that they will not be subject to excise tax on undistributed income and gains. If the required amount of net investment income or gains is not distributed, the Funds could incur a tax expense.
As of and during the six months ended April 30, 2017, the Funds did not have a liability for any unrecognized tax benefits. The Funds recognize interest and penalties, if any, related to unrecognized tax benefits as income tax expense in the Statements of Operations. During the six months ended April 30, 2017, the Funds did not incur any interest or penalties.
Expenses – Expenses incurred by the Trust, or at the fund complex level, that do not relate to a specific fund are allocated to the individual funds based on each fund’s relative net assets or other appropriate basis.
Security Transactions and Related Income – The Funds follow industry practice and record security transactions on the trade date for financial reporting purposes. For financial statement and income tax purposes, the specific identification method is used for determining gains or losses. Dividend income is recorded on the ex-dividend date and interest income is recorded on an accrual basis. Short-term capital gain distributions from underlying funds are classified as dividend income for financial reporting purposes. Long-term capital gain distributions are broken out as such. The ability of issuers of debt securities held by the Funds to meet their obligations may be affected by economic and political developments in a specific country or region.
Dividends and Distributions – The Funds typically distribute substantially all of their net investment income in the form of dividends and taxable capital gains to their shareholders at least annually. These distributions, which are recorded on the ex-dividend date, are automatically reinvested in each Fund unless shareholders request cash distributions on their application or through a written request. The treatment for financial reporting purposes of distributions made to shareholders during the year from net investment income or net realized capital gains may differ from their ultimate treatment for federal income tax purposes. Where such differences are permanent in nature, they are reclassified in the components of the net assets based on their ultimate characterization for federal income tax purposes. Any such reclassifications will have no effect on net assets, results of operations or net asset values (“NAV”) per share of the Funds.
NOTE 3. SECURITIES VALUATION AND FAIR VALUE MEASUREMENTS
Fair value is defined as the price that a Fund would receive upon selling an investment in an orderly transaction to an independent buyer in the principal or most advantageous market of the investment. GAAP establishes a three-tier hierarchy to maximize the use of observable market data and minimize the use of unobservable inputs and to establish classification of fair value measurements for disclosure purposes.
39
SMI FUNDS
NOTES TO THE FINANCIAL STATEMENTS
April 30, 2017 (Unaudited) – (Continued)
NOTE 3. SECURITIES VALUATION AND FAIR VALUE MEASUREMENTS – (Continued)
Inputs refer broadly to the assumptions that market participants would use in pricing the asset or liability, including assumptions about risk, for example, the risk inherent in a particular valuation technique used to measure fair value including such a pricing model and the risk inherent in the inputs to the valuation technique. Inputs may be observable or unobservable. Observable inputs are inputs that reflect the assumptions market participants would use in pricing the asset or liability developed based on market data obtained from sources independent of the reporting entity. Unobservable inputs are inputs that reflect the reporting entity’s own assumptions about the assumptions market participants would use in pricing the asset or liability developed based on the best information available in the circumstances.
Various inputs are used in determining the value of the Funds’ investments. These inputs are summarized in the three broad levels listed below.
| • | Level 1 – unadjusted quoted prices in active markets for identical investments and/or registered investment companies where the value per share is determined and published and is the basis for current transactions for identical assets or liabilities at the valuation date. |
| • | Level 2 – other significant observable inputs (including, but not limited to, quoted prices for an identical security in an inactive market, quoted prices for similar securities, interest rates, prepayment speeds, credit risk, etc.) |
| • | Level 3 – significant unobservable inputs (including each Fund’s own assumptions in determining fair value of investments based on the best information available) |
The inputs used to measure fair value may fall into different levels of the fair value hierarchy. In such cases, for disclosure purposes, the level in the fair value hierarchy which is reported is determined based on the lowest level input that is significant to the fair value measurement in its entirety.
Equity securities that are traded on any stock exchange are generally valued at the last quoted sale price on the security’s primary exchange. Lacking a last sale price, an exchange traded security is generally valued at its last bid price. Securities traded in the NASDAQ over-the-counter market are generally valued at the NASDAQ Official Closing Price. When using the market quotations and when the market is considered active, the security is classified as a Level 1 security. In the event that market quotations are not readily available or are considered unreliable due to market or other events, the Fund values its securities and other assets at fair value in accordance with policies established by and under the general supervision of the Board of Trustees (the “Board”). Under these policies, the securities will be classified as Level 2 or 3 within the fair value hierarchy, depending on the inputs used.
Investments in mutual funds, including money market mutual funds, are generally priced at the ending NAV provided by the pricing service of the funds. These securities are categorized as Level 1 securities. In the event that the ending NAV for a mutual fund is unavailable at the end of day pricing time, the Adviser may, in accordance with the Trust’s valuation policies, consider all appropriate factors in determining the fair value of the mutual fund. In such cases the security will generally be categorized as a Level 2 security.
40
SMI FUNDS
NOTES TO THE FINANCIAL STATEMENTS
April 30, 2017 (Unaudited) – (Continued)
NOTE 3. SECURITIES VALUATION AND FAIR VALUE MEASUREMENTS – (Continued)
In accordance with the Trust’s valuation policies, the Adviser is required to consider all appropriate factors relevant to the value of securities for which it has determined other pricing sources are not available or reliable as described above. No single standard exists for determining fair value, because fair value depends upon the circumstances of each individual case. As a general principle, the current fair value of an issue of securities being valued by the Adviser would appear to be the amount that the Fund might reasonably expect to receive for them upon their current sale. Methods that are in accordance with this principle may, for example, be based on (i) a multiple of earnings; (ii) a discount from market prices of a similar freely traded security (including a derivative security or a basket of securities traded on other markets, exchanges or among dealers); or (iii) yield to maturity with respect to debt issues, or a combination of these and other methods. Fair-value pricing is permitted if, in the Adviser’s opinion, the validity of market quotations appears to be questionable based on factors such as evidence of a thin market in the security based on a small number of quotations, a significant event occurs after the close of a market but before a Fund’s NAV calculation that may affect a security’s value, or the Adviser is aware of any other data that calls into question the reliability of market quotations. Fair-value pricing may also be used in instances when the bonds in which the Funds may invest default or otherwise cease to have market quotations readily available.
The following is a summary of the inputs used to value the Funds’ investments as of April 30, 2017:
| Valuation Inputs | ||||||||||||||||
| SMI Fund | Level 1 | Level 2 | Level 3 | Total | ||||||||||||
| Mutual Funds – greater than 1% of net assets | $ | 176,824,550 | $ | — | $ | — | $ | 176,824,550 | ||||||||
| Mutual Funds – less than 1% of net assets | 5,433,982 | — | — | 5,433,982 | ||||||||||||
| Exchange-Traded Funds | 12,794,792 | — | — | 12,794,792 | ||||||||||||
| Money Market Securities | 429,004 | — | — | 429,004 | ||||||||||||
| Total Investments | $ | 195,482,328 | $ | — | $ | — | $ | 195,482,328 | ||||||||
| Valuation Inputs | ||||||||||||||||
SMI Conservative Allocation Fund | Level 1 | Level 2 | Level 3 | Total | ||||||||||||
| Mutual Funds | $ | 4,694,453 | $ | — | $ | — | $ | 4,694,453 | ||||||||
| Exchange-Traded Funds | 11,160,711 | — | — | 11,160,711 | ||||||||||||
| Total Investments | $ | 15,855,164 | $ | — | $ | — | $ | 15,855,164 | ||||||||
41
SMI FUNDS
NOTES TO THE FINANCIAL STATEMENTS
April 30, 2017 (Unaudited) – (Continued)
NOTE 3. SECURITIES VALUATION AND FAIR VALUE MEASUREMENTS – (Continued)
| Valuation Inputs | ||||||||||||||||
SMI Dynamic Allocation Fund | Level 1 | Level 2 | Level 3 | Total | ||||||||||||
| Exchange-Traded Funds | $ | 163,091,397 | $ | — | $ | — | $ | 163,091,397 | ||||||||
| Money Market Securities | 4,061,528 | — | — | 4,061,528 | ||||||||||||
| Total Investments | $ | 167,152,925 | $ | — | $ | — | $ | 167,152,925 | ||||||||
| Valuation Inputs | ||||||||||||||||
| SMI Bond Fund | Level 1 | Level 2 | Level 3 | Total | ||||||||||||
| Mutual Funds | $ | 5,118,306 | $ | — | $ | — | $ | 5,118,306 | ||||||||
| Exchange-Traded Funds | 1,650,177 | — | — | 1,650,177 | ||||||||||||
| Money Market Securities | 137,095 | — | — | 137,095 | ||||||||||||
| Total Investments | $ | 6,905,578 | $ | — | $ | — | $ | 6,905,578 | ||||||||
| Valuation Inputs | ||||||||||||||||
| SMI 50/40/10 Fund | Level 1 | Level 2 | Level 3 | Total | ||||||||||||
| Mutual Funds | $ | 8,823,718 | $ | — | $ | — | $ | 8,823,718 | ||||||||
| Exchange-Traded Funds | 10,239,074 | — | — | 10,239,074 | ||||||||||||
| Money Market Securities | 572,450 | — | — | 572,450 | ||||||||||||
| Total Investments | $ | 19,635,242 | $ | — | $ | — | $ | 19,635,242 | ||||||||
The Funds did not hold any investments during the reporting period for which other significant observable inputs (Level 2) were used in determining fair value.
The Funds did not hold any investments during the reporting period for which significant unobservable inputs (Level 3) were used in determining fair value; therefore, no reconciliation of Level 3 securities is included for this reporting period.
The Trust recognizes transfers between fair value hierarchy levels at the end of the reporting period. There were no transfers between any levels as of April 30, 2017 based on input levels assigned at October 31, 2016.
42
SMI FUNDS
NOTES TO THE FINANCIAL STATEMENTS
April 30, 2017 (Unaudited) – (Continued)
NOTE 4. FEES AND OTHER TRANSACTIONS WITH AFFILIATES
The Adviser, under the terms of the management agreement with respect to each Fund (each an “Agreement”), manages the Funds’ investments. As compensation for its management services, each Fund is obligated to pay the Adviser a fee based on each Fund’s average daily net assets as follows:
Fund Assets | SMI Fund Management Fee | SMI Conservative Allocation Fund Management Fee | SMI Dynamic Allocation Fund Management Fee | |||||||||
| $1 – $100 million | 1.00% | 0.90% | 1.00% | |||||||||
| $100,000,001 – $250 million | 1.00% | 0.80% | 1.00% | |||||||||
| $250,000,001 to $500 million | 0.90% | 0.70% | 0.90% | |||||||||
| Over $500 million | 0.80% | 0.60% | 0.80% | |||||||||
| Management fees earned | $ | 985,525 | $ | 74,436 | $ | 834,466 | ||||||
Fees waived by Adviser | — | (28,662 | ) | — | ||||||||
Fund Assets | SMI Bond Fund Management Fee | |
| $1 – $99,999,999 | 0.75% | |
| $100 million to $250 million | 0.70% | |
| Over $250 million | 0.65% | |
| Management fees earned | $ 26,190 | |
| Fees waived and expenses reimbursed by Adviser | (41,295) |
Fund Assets | SMI 50/40/10 Fund Management Fee | |
| $1 – $250 million | 1.00% | |
| $250,000,001 to $500 million | 0.90% | |
| Over $500 million | 0.80% | |
| Management fees earned | $ 89,103 | |
| Fees waived by Adviser | (11,987) |
The Adviser contractually has agreed to waive its management fee and reimburse certain operating expenses, but only to the extent necessary so that each Fund’s total annual operating expenses (excluding interest, taxes, brokerage commissions, other expenses which are capitalized in accordance with GAAP, extraordinary expenses, dividend expense on short sales, 12b-1 fees, and acquired fund fees and expenses) do not exceed 1.50% of the Fund’s average daily net assets with respect to the SMI Fund, 1.15% with respect to the SMI Conservative Allocation Fund, 1.45% with respect to the SMI Dynamic Allocation Fund, 0.85% with respect to the SMI Bond Fund, and 1.45% with respect to the SMI 50/40/10 Fund through February 28, 2018.
43
SMI FUNDS
NOTES TO THE FINANCIAL STATEMENTS
April 30, 2017 (Unaudited) – (Continued)
NOTE 4. FEES AND OTHER TRANSACTIONS WITH AFFILIATES – (Continued)
Each fee waiver or expense reimbursement by the Adviser is subject to repayment by the applicable Fund within the three years following the date in which the fee waiver or expense reimbursement occurred, provided that such Fund is able to make the repayment without exceeding the expense limitation that is in effect at the time of the repayment or at the time of the fee waiver or expense reimbursement, whichever is lower.
The amount subject to recoupment by the SMI Conservative Allocation Fund, SMI Bond Fund and SMI 50/40/10 Fund, pursuant to the aforementioned conditions, at April 30, 2017 is as follows:
| Recoverable through | SMI Conservative Allocation Fund | SMI Bond Fund | SMI 50/40/10 Fund | |||||||||
| October 31, 2017 | $ | 20,214 | $ | — | $ | — | ||||||
| October 31, 2018 | 88,520 | 70,768 | 54,878 | |||||||||
| October 31, 2019 | 69,388 | 104,545 | 52,177 | |||||||||
| April 30, 2020 | 28,662 | 41,295 | 11,987 | |||||||||
The Trust retains Ultimus Asset Services, LLC (the “Administrator”), to provide the Fund with administration, compliance, fund accounting, and transfer agent services, including all regulatory reporting. Expenses incurred by the Funds for these services are allocated to the individual Funds based on each Fund’s relative net assets.
The officers and one trustee of the Trust are members of management and/or employees of the Administrator. Unified Financial Securities, LLC (the “Distributor”) acts as the principal distributor of the Funds’ shares. An officer of the Trust is an officer of the Distributor and such person may be deemed to be an affiliate of the Distributor. For the six months ended April 30, 2017, fees for administration, compliance, fund accounting, and transfer agent services, and amounts due to the Administrator at April 30, 2017 were as follows:
SMI Fund | SMI Conservative Allocation Fund | SMI Dynamic | SMI Bond | SMI 50/40/10 | ||||||||||||||||
Administration expenses | $ | 23,626 | $ | 2,062 | $ | 20,732 | $ | 844 | $ | 2,156 | ||||||||||
Compliance expenses | 4,673 | 4,673 | 4,673 | 4,673 | 4,673 | |||||||||||||||
Fund accounting expenses | 13,292 | 1,160 | 11,665 | 474 | 1,212 | |||||||||||||||
Transfer agent expenses | 16,570 | 2,165 | 7,347 | 670 | 3,029 | |||||||||||||||
Payable to Administrator | 10,441 | 2,562 | 9,045 | 1,884 | 2,435 | |||||||||||||||
44
SMI FUNDS
NOTES TO THE FINANCIAL STATEMENTS
April 30, 2017 (Unaudited) – (Continued)
NOTE 5. INVESTMENTS
There were no payments made to the Distributor by the Funds for the six months ended April 30, 2017.
For the six months ended April 30, 2017, purchases and sales of investment securities, other than short- term investments and short-term U.S. government obligations were as follows:
SMI Fund | SMI Conservative | SMI Dynamic | SMI Bond | SMI 50/40/10 | ||||||||||||||||
Purchases | ||||||||||||||||||||
U.S. Government Obligations | $ | — | $ | — | $ | — | $ | — | $ | — | ||||||||||
Other | 190,034,531 | 17,505,259 | 207,939,944 | 4,977,037 | 20,781,026 | |||||||||||||||
Sales | ||||||||||||||||||||
U.S. Government Obligations | $ | — | $ | — | $ | — | $ | — | $ | — | ||||||||||
Other | 206,255,399 | 19,727,414 | 220,654,568 | 5,669,774 | 21,442,872 | |||||||||||||||
NOTE 6. LINE OF CREDIT
During the six months ended April 30, 2017, the Trust, on behalf of the Funds, entered into in a short- term credit agreement (“Line of Credit”) with Huntington National Bank (“Huntington”), expiring on February 2, 2018. Under the terms of the agreement, each of the Funds may borrow up to the lesser of 10% of a Fund’s daily market value or $5 million at an interest rate of LIBOR plus 150 basis points. The purpose of the agreement is to meet temporary or emergency cash needs, including redemption requests that might otherwise require the untimely disposition of securities. Huntington receives an annual facility fee of 0.125% on $5 million as well as an additional annual fee of 0.125% on any unused portion of the credit facility, invoiced quarterly, for providing the Line of Credit. The Funds will not borrow money, except (a) from a bank, provided that immediately after such borrowing there is an asset coverage of 300% for all borrowings of a Fund; or (b) from a bank or other persons for temporary purposes only, provided that such temporary borrowings are in an amount not exceeding 5% of a Fund’s total assets at the time when the borrowing is made. This limitation does not preclude a Fund from entering into reverse repurchase transactions, provided that the Fund has asset coverage of 300% for all borrowings and repurchase commitments of the Fund pursuant to reverse repurchase transactions. To the extent that the line of credit is utilized, it will be collateralized by securities in the Funds’ portfolios.
45
SMI FUNDS
NOTES TO THE FINANCIAL STATEMENTS
April 30, 2017 (Unaudited) – (Continued)
NOTE 6. LINE OF CREDIT – (Continued)
As of April 30, 2017, the Funds had no outstanding borrowings under this Line of Credit.
| Fund | Average Daily Loan Balance(a) | Weighted Average Interest Rate(a) | Number of Days Outstanding(b) | Interest Expense Accrued | Maximum Loan Outstanding | |||||||||||||||
| SMI Fund | $ | 695,714 | 2.26 | % | 42 | $ | 2,060 | $ | 2,200,000 | |||||||||||
| SMI Conservative Allocation Fund | 87,683 | 2.22 | % | 41 | 221 | 200,000 | ||||||||||||||
| SMI Dynamic Allocation Fund | 806,481 | 2.31 | % | 54 | 2,022 | 5,000,000 | ||||||||||||||
| SMI Bond Fund | 90,000 | 2.21 | % | 5 | 21 | 200,000 | ||||||||||||||
| SMI 50/40/10 Fund | 414,583 | 2.16 | % | 24 | 597 | 1,150,000 | ||||||||||||||
| (a) | Averages based on the number of days outstanding. |
| (b) | Number of Days Outstanding represents the total days during the six months ended April 30, 2017, that a Fund utilized the Line of Credit. |
NOTE 7. BENEFICIAL OWNERSHIP
The beneficial ownership, either directly or indirectly, of more than 25% of the voting securities of a fund creates a presumption of control of the fund, under Section 2(a)(9) of the Investment Company Act of 1940. At April 30, 2017, National Financial Services Corporation (“NFS”) for the benefit of others, held 27%, 36% and 53% of the SMI Conservative Allocation Fund, SMI Dynamic Allocation Fund and SMI Bond Fund, respectively. It is not known whether NFS or any of the underlying beneficial owners owned or controlled more than 25% of the voting securities of the Funds.
46
SMI FUNDS
NOTES TO THE FINANCIAL STATEMENTS
April 30, 2017 (Unaudited) – (Continued)
NOTE 8. FEDERAL TAX INFORMATION
At April 30, 2017, the net unrealized appreciation (depreciation) of investments for tax purposes was as follows:
| SMI Fund | SMI Conservative Allocation Fund | SMI Dynamic Allocation Fund | SMI Bond Fund | SMI 50/40/10 Fund | ||||||||||||||||
Gross appreciation | $ | 11,634,991 | $ | 619,861 | $ | 10,383,031 | $ | 11,489 | $ | 1,295,949 | ||||||||||
Gross (depreciation) | (480,283 | ) | (42,837 | ) | (9,546 | ) | (39,794 | ) | (10,507 | ) | ||||||||||
|
|
|
|
|
|
|
|
|
| |||||||||||
Net appreciation (depreciation) on investments | $ | 11,154,708 | $ | 577,024 | $ | 10,373,485 | $ | (28,305 | ) | $ | 1,285,442 | |||||||||
|
|
|
|
|
|
|
|
|
| |||||||||||
Tax cost of investments | $ | 184,327,620 | $ | 15,278,140 | $ | 156,779,440 | $ | 6,933,883 | $ | 18,349,800 | ||||||||||
|
|
|
|
|
|
|
|
|
| |||||||||||
At April 30, 2017, the difference between book basis and tax basis unrealized appreciation (depreciation) is attributable to the tax deferral of losses on wash sales.
The tax characterization of distributions for the fiscal year ended October 31, 2016, were as follows:
| SMI Fund | SMI Conservative Allocation Fund | SMI Dynamic Allocation Fund | ||||||||||
| 2016 | 2016 | 2016 | ||||||||||
Distributions paid from:* | ||||||||||||
Ordinary income | $ | — | $ | 193,531 | $ | 2,361,609 | ||||||
Long-term capital gain | 28,684,023 | 462,938 | — | |||||||||
|
|
|
|
|
| |||||||
Total taxable distributions | $ | 28,684,023 | $ | 656,469 | $ | 2,361,609 | ||||||
|
|
|
|
|
| |||||||
| SMI Bond Fund | SMI 50/40/10 Fund | |||||||
| 2016 | 2016 | |||||||
Distributions paid from:* | ||||||||
Ordinary income | $ | 152,057 | $ | 69,379 | ||||
|
|
|
| |||||
Total taxable distributions | $ | 152,057 | $ | 69,379 | ||||
|
|
|
| |||||
Tax return of capital | 295 | 22,056 | ||||||
|
|
|
| |||||
Total distributions paid | $ | 152,352 | $ | 91,435 | ||||
|
|
|
| |||||
| * | For federal income tax purposes, distributions of short-term capital gains are treated as ordinary income distributions. |
47
SMI FUNDS
NOTES TO THE FINANCIAL STATEMENTS
April 30, 2017 (Unaudited) – (Continued)
NOTE 8. FEDERAL TAX INFORMATION – (Continued)
At October 31, 2016, the Funds’ most recent fiscal year end, the components of distributable earnings (accumulated losses) on a tax basis were as follows:
| SMI Fund | SMI Conservative Allocation Fund | SMI Dynamic Allocation Fund | ||||||||||
Accumulated undistributed ordinary income | $ | — | $ | 92,021 | $ | 213,474 | ||||||
Accumulated undistributed long-term capital gains | — | — | — | |||||||||
Accumulated capital and other losses | (3,648,465 | ) | (505,187 | ) | (5,050,360 | ) | ||||||
Unrealized appreciation (depreciation) | 4,643,403 | 86,404 | 85,113 | |||||||||
|
|
|
|
|
| |||||||
| $ | 994,938 | $ | (326,762 | ) | $ | (4,751,773 | ) | |||||
|
|
|
|
|
| |||||||
| SMI Bond Fund | SMI 50/40/10 Fund | |||||||
Accumulated undistributed ordinary income | $ | — | $ | — | ||||
Accumulated undistributed long-term capital gains | — | — | ||||||
Accumulated capital and other losses | (13,344 | ) | (863,687 | ) | ||||
Unrealized appreciation (depreciation) | 51,865 | 252,193 | ||||||
|
|
|
| |||||
| $ | 38,521 | $ | (611,494 | ) | ||||
|
|
|
| |||||
At October 31, 2016, the difference between book basis and tax basis unrealized appreciation (depreciation) is attributable to the tax deferral of losses on wash sales.
At October 31, 2016, the following funds had net capital loss carryforwards which are available to offset future net capital gains, if any:
| SMI Fund | SMI Conservative Allocation Fund | SMI Dynamic Allocation Fund | ||||||||||||||||||||||
| Short-Term | Long-Term | Short-Term | Long-Term | Short-Term | Long-Term | |||||||||||||||||||
Non-Expiring | $ | 3,359,622 | $ | — | $ | 505,187 | $ | — | $ | 4,626,459 | $ | 423,901 | ||||||||||||
|
|
|
|
|
|
|
|
|
|
|
| |||||||||||||
| SMI Bond Fund | SMI 50/40/10 Fund | |||||||||||||||
| Short-Term | Long-Term | Short-Term | Long-Term | |||||||||||||
Non-Expiring | $ | 13,344 | $ | — | $ | 853,046 | $ | — | ||||||||
|
|
|
|
|
|
|
| |||||||||
For the tax year ended October 31, 2016, the following funds deferred late year ordinary losses of:
| Qualified Late Year Ordinary Losses | ||||
SMI Fund | $ | 288,843 | ||
SMI 50/40/10 Fund | 10,640 | |||
48
SMI FUNDS
NOTES TO THE FINANCIAL STATEMENTS
April 30, 2017 (Unaudited) – (Continued)
NOTE 9. COMMITMENTS AND CONTIGENCIES
The Funds indemnify their officers and trustees for certain liabilities that may arise from performance of their duties to the Funds. Additionally, in the normal course of business, the Funds enter into contracts that contain a variety of representations and warranties which provide general indemnifications. The Funds’ maximum exposure under these arrangements is unknown, as this would involve future claims that may be made against the Funds that have not yet occurred.
NOTE 10. SUBSEQUENT EVENT
Management of the Funds has evaluated the need for disclosures resulting from subsequent events through the date these financial statements were issued. Based upon this evaluation, management has determined there were no items requiring adjustment of the financial statements or additional disclosure.
49
SUMMARY OF FUND EXPENSES – (Unaudited)
As a shareholder of one of the Funds, you incur two types of costs: (1) transaction costs and (2) ongoing costs, including management fees and other Fund expenses. This example is intended to help you understand your ongoing costs (in dollars) of investing in each Fund and to compare these costs with the ongoing costs of investing in other mutual funds.
Each Fund’s example is based on an investment of $1,000 invested at the beginning of the period and held for the entire period from November 1, 2016 through April 30, 2017.
Actual Expenses
The first line of the table provides information about actual account values and actual expenses. You may use the information in this line, together with the amount you invested, to estimate the expenses that you paid over the period. Simply divide your account value by $1,000 (for example, an $8,600 account value divided by $1,000 = 8.60), then multiply the result by the number in the first line under the heading “Expenses Paid During Period November 1, 2016 – April 30, 2017” to estimate the expenses you paid on your account during this period.
Hypothetical Example for Comparison Purposes
The second line of the table provides information about hypothetical account values and hypothetical expenses based on each Fund’s actual expense ratio and an assumed rate of return of 5% per year before expenses, which is not the Fund’s actual return. The hypothetical account values and expenses may not be used to estimate the actual ending account balance or expenses you paid for the period. You may use this information to compare the ongoing costs of investing in the Funds and other funds. To do so, compare this 5% hypothetical example with the 5% hypothetical examples that appear in the shareholder reports of the other funds.
Expenses shown are meant to highlight your ongoing costs only and do not reflect any transactional costs. Therefore, the second line of the table is useful in comparing ongoing costs only and will not help you determine the relative costs of owning different funds. In addition, if these transaction costs were included, your costs would have been higher.
SMI Fund | Beginning Account Value November 1, 2016 | Ending Account Value April 30, 2017 | Expenses Paid During Period November 1, 2016 – April 30, 2017 (a) | |||||||||
Actual | $ | 1,000.00 | $ | 1,107.80 | $ | 6.04 | ||||||
Hypothetical (b) | $ | 1,000.00 | $ | 1,019.06 | $ | 5.79 | ||||||
| (a) | Expenses are equal to the Fund’s annualized expense ratio of 1.16%, multiplied by the average account value over the period, multiplied by 181/365 (to reflect the partial year period). |
| (b) | Assumes a 5% return before expenses. |
50
SUMMARY OF FUND EXPENSES – (Unaudited), (Continued)
SMI | Beginning Account Value November 1, 2016 | Ending Account Value April 30, 2017 | Expenses Paid During Period November 1, 2016 – April 30, 2017 (a) | |||||||||
Actual | $ | 1,000.00 | $ | 1,014.30 | $ | 5.77 | ||||||
Hypothetical (b) | $ | 1,000.00 | $ | 1,019.06 | $ | 5.79 | ||||||
| (a) | Expenses are equal to the Fund’s annualized expense ratio of 1.16%, multiplied by the average account value over the period, multiplied by 181/365 (to reflect the partial year period). |
| (b) | Assumes a 5% return before expenses. |
SMI | Beginning Account Value November 1, 2016 | Ending Account Value April 30, 2017 | Expenses Paid During Period November 1, 2016 – April 30, 2017 (a) | |||||||||
Actual | $ | 1,000.00 | $ | 1,028.20 | $ | 5.82 | ||||||
Hypothetical (b) | $ | 1,000.00 | $ | 1,019.06 | $ | 5.79 | ||||||
| (a) | Expenses are equal to the Fund’s annualized expense ratio of 1.16%, multiplied by the average account value over the period, multiplied by 181/365 (to reflect the partial year period). |
| (b) | Assumes a 5% return before expenses. |
SMI Bond Fund | Beginning Account Value November 1, 2016 | Ending Account Value April 30, 2017 | Expenses Paid During Period November 1, 2016 – April 30, 2017 (a) | |||||||||
Actual | $ | 1,000.00 | $ | 998.00 | $ | 4.24 | ||||||
Hypothetical (b) | $ | 1,000.00 | $ | 1,020.55 | $ | 4.28 | ||||||
| (a) | Expenses are equal to the Fund’s annualized expense ratio of 0.86%, multiplied by the average account value over the period, multiplied by 181/365 (to reflect the partial year period). |
| (b) | Assumes a 5% return before expenses. |
SMI 50/40/10 Fund | Beginning Account Value November 1, 2016 | Ending Account Value April 30, 2017 | Expenses Paid During Period November 1, 2016 – April 30, 2017 (a) | |||||||||
Actual | $ | 1,000.00 | $ | 1,072.90 | $ | 7.50 | ||||||
Hypothetical (b) | $ | 1,000.00 | $ | 1,017.55 | $ | 7.30 | ||||||
| (a) | Expenses are equal to the Fund’s annualized expense ratio of 1.46%, multiplied by the average account value over the period, multiplied by 181/365 (to reflect the partial year period). |
| (b) | Assumes a 5% return before expenses. |
51
INVESTMENT ADVISORY AGREEMENT APPROVAL
(Unaudited)
At a meeting held on December 13-14, 2016, the Board of Trustees (the “Board”) considered the renewal of the Investment Advisory Agreements (the “SMI Agreements”) between Valued Advisers Trust (the “Trust”) and SMI Advisory Services, LLC (“SMI”) with respect to the Sound Mind Investing Fund, the SMI Dynamic Allocation Fund, the SMI Conservative Allocation Fund, the SMI Bond Fund, and the SMI 50/40/10 Fund (the “SMI Funds”). SMI provided written information to the Board to assist the Board in its considerations.
The Board discussed the contractual arrangements between SMI and the Trust with respect to the SMI Funds. They reflected upon the Board’s prior experience with SMI in managing the SMI Funds, as well as their earlier discussion with the representatives of SMI. Counsel directed the Trustees to a memorandum from his firm that summarized, among other things, the fiduciary duties and responsibilities of the Board in reviewing and approving the SMI Agreements. Trust counsel discussed with the Trustees the types of information and factors that they should consider when considering the renewal of the SMI Agreements, including: (i) the nature, extent, and quality of the services to be provided by SMI; (ii) the investment performance of the SMI Funds; (iii) the costs of the services to be provided and anticipated profits to be realized by SMI from its relationship with the SMI Funds; (iv) the extent to which economies of scale would be realized if the SMI Funds grow and whether the advisory fee structure reflects those economies of scale for the benefit of the SMI Funds’ investors; and (v) SMI’s practices regarding possible conflicts of interest and potential benefits derived from its relationship with the SMI Funds.
In assessing these factors and reaching its decisions, the Board took into consideration information furnished by SMI and trust management for the Board’s review and consideration throughout the year, as well as information specifically prepared or presented in connection with the annual renewal process, including (i) reports regarding the services and support provided to the SMI Funds and their shareholders by SMI; (ii) quarterly assessments of the investment performance of the SMI Funds by personnel of SMI; (iii) commentary on the reasons for the performance; (iv) presentations by SMI addressing its investment philosophy, investment strategy, personnel, and operations; (v) compliance and audit reports concerning the SMI Funds and SMI; (vi) disclosure information contained in the registration statement of the Trust for the SMI Funds and the Form ADV of SMI; and (vii) a memorandum from counsel, that summarized the fiduciary duties and responsibilities of the Board in reviewing and approving the SMI Agreements. The Board also requested and received various informational materials including, without limitation: (a) documents containing information about SMI, including its financial information; a description of its personnel and the services it provides to the SMI Funds; information on SMI’s investment advice and performance; summaries of the SMI Funds’ expenses, compliance program, current legal matters, and other general information; (b) comparative expense and performance information for other mutual funds with strategies similar to the SMI Funds; and (c) the benefits to be realized by SMI from its relationship with the SMI Funds. The Board did not identify any particular information that was most relevant to its consideration of the SMI Agreements and each Trustee may have afforded different weight to the various Factors.
| 1. | The nature, extent, and quality of the services to be provided by SMI. In this regard, the Board considered SMI’s responsibilities under the SMI Agreements. The Trustees considered the services |
52
INVESTMENT ADVISORY AGREEMENT APPROVAL
(Unaudited), (Continued)
| being provided by SMI to the SMI Funds, including, without limitation: the quality of its investment advisory services (including research and recommendations with respect to portfolio securities), its process for formulating investment recommendations and assuring compliance with the investment objectives and limitations, its coordination of services for the SMI Funds among the service providers to the SMI Funds and its efforts to promote the SMI Funds and grow their assets. The Trustees considered SMI’s continuity of, and commitment to retain, qualified personnel and SMI’s commitment to maintain and enhance its resources and systems. The Trustees considered SMI’s personnel, including the education and experience of SMI’s personnel. After considering the foregoing information and further information in the Meeting materials provided by SMI (including SMI’s Form ADV), the Board concluded that, in light of all the facts and circumstances, the nature, extent, and quality of the services provided by SMI were satisfactory and adequate for the SMI Funds. |
| 2. | Investment Performance of the SMI Funds and SMI. In considering the investment performance of the SMI Funds and SMI, the Trustees compared the performance of the SMI Funds with the performance of funds in the same Morningstar category, as well as with peer group data. The Trustees also considered the consistency of SMI’s management of the SMI Funds with each of the SMI Fund’s investment objective, strategies, and limitations. The Trustees noted that SMI only very recently began offering separately managed accounts (“SMAs”), and performance data was not yet available for comparison purposes. The Trustees noted and gave significant consideration to SMI’s view that the “upgrading” strategy utilized by the Sound Mind Investing Fund did not allow it to be appropriately compared to any particular peer category, although data for the Morningstar category was reviewed and considered. The Trustees observed that the Sound Mind Investing Fund outperformed compared to its category for the one year period ended September 30, 2016, and underperformed for the year to date, three year, and five year periods. With respect to the SMI Conservative Allocation Fund, the Trustees observed that the SMI Conservative Allocation Fund performed below the average and median performance measures for its peer category during the most recent year-to-date, one year, and three year periods ended September 30, 2016. They also noted that the SMI Conservative Allocation Fund outperformed as compared to its peer group for the year-to-date, one year, and three year periods. The Trustees noted that the equity portion of the SMI Conservative Allocation Fund utilized the “upgrading” strategy of the Sound Mind Investing Fund and that, as such, there was likely an impact on the performance of the SMI Conservative Allocation Fund. With respect to the SMI Dynamic Allocation Fund, the Trustees noted that the SMI Dynamic Allocation Fund performed below the category average and median for the year-to-date and one year periods ended September 30, 2016, but outperformed for the three year period. They also noted that the SMI Dynamic Allocation Fund outperformed its peer group for the year-to-date, one year, and three year periods. With respect to the SMI 50/40/10 Fund, the Trustees observed that the SMI 50/40/10 Fund underperformed as compared to its category average and median for the year-to-date and one year periods ended September 30, 2016, but had outperformed its peer group average and median for those same periods. With respect to the SMI Bond Fund, the Trustees observed that the SMI Bond Fund had outperformed compared to its category average and median for the year-to-date period ended September 30, 2016, but had performed below the average and median for the one year |
53
INVESTMENT ADVISORY AGREEMENT APPROVAL
(Unaudited), (Continued)
| period. They also observed that the SMI Bond Fund had outperformed its peer group average and median for the year-to-date and one year periods ended September 30, 2016. After reviewing and discussing the investment performance of the SMI Funds further, SMI’s experience managing the SMI Funds, and other relevant factors, the Board concluded, in light of all the facts and circumstances, that the investment performance of the SMI Funds was acceptable. |
| 3. | The costs of the services to be provided and profits to be realized by SMI from the relationship with the SMI Funds. In considering the costs of services to be provided and the profits to be realized by SMI from the relationship with the SMI Funds, the Trustees considered: (1) SMI’s financial condition; (2) asset levels of the SMI Funds; (3) the overall expenses of the SMI Funds; and (4) the nature and frequency of advisory fee payments. The Trustees reviewed information provided by SMI regarding its profits associated with managing the SMI Funds. The Trustees also considered potential benefits for SMI in managing the SMI Funds. The Trustees then compared the fees and expenses of the SMI Funds (including the management fee) to other comparable mutual funds, including each of the SMI Fund’s Morningstar category averages, and each of the SMI Fund’s peer group averages. The Trustees noted that the Sound Mind Investing Fund’s management fee and net expense ratio were higher than the Morningstar category average and median, but were very comparable to the ratios of the fund considered by SMI to be the closest competitor. With respect to the SMI Conservative Allocation Fund and the SMI Dynamic Allocation Fund, the Trustees observed that the management fees were higher than the category average and median, while the net expense ratios were slightly higher than the category average and median. They also noted that the Conservative Allocation Fund’s management fee and net expense ratio were lower than those of its peer group, and the Dynamic Allocation Fund’s management fee was very comparable to its peer group, while its net expense ratio was lower than the average of its peer group. With respect to the SMI Bond Fund, the Trustees observed that the management was slightly higher than the category average, but the net expense ratio was lower than the category average. They also noted that the management fee was very close to the peer group average, and the net expense ratio was lower than the peer group average. With respect to the SMI 50/40/10 Fund, the Trustees noted that both the management fee and net expense ratio were higher than the category average and median and were higher than the peer group average and median. In light of the unique services rendered to the SMI Funds by SMI, the view of SMI that the categorization with respect to the Sound Mind Investing Fund did not provide an appropriate peer group for a comparison, the profits realized by SMI in managing the SMI Funds, and all other facts and circumstances they deemed relevant, the Trustees concluded that the management fees paid by the SMI Funds were fair and reasonable in relation to the nature and quality of the services provided by SMI. |
| 4. | The extent to which economies of scale would be realized as the SMI Funds grow and whether advisory fee levels reflect these economies of scale for the benefit of the SMI Funds’ investors. In this regard, the Trustees considered the fee arrangements with SMI for the SMI Funds. The Trustees considered that the management fee for each of the SMI Funds has breakpoints that would allow shareholders to realize economies of scale as assets grow. The Trustees noted that none of the SMI Funds were currently at an asset level to take advantage of the breakpoints; however, the Board also noted the expense limitation arrangements in place with respect to each of the SMI Funds, and that |
54
INVESTMENT ADVISORY AGREEMENT APPROVAL
(Unaudited), (Continued)
| each SMI Fund’s shareholders had experienced benefits from those arrangements. In light of its ongoing consideration of the asset levels of each of the SMI Funds, expectations for growth, and fee levels, the Board determined that the fee arrangements for each of the SMI Funds, in light of all the facts and circumstances, were fair and reasonable in relation to the nature and quality of the services provided by SMI. |
| 5. | Possible conflicts of interest and benefits to SMI. In considering SMI’s practices regarding conflicts of interest, the Trustees evaluated the potential for conflicts of interest and considered such matters as the experience and ability of the advisory personnel assigned to the SMI Funds; the basis of decisions to buy or sell securities for the SMI Funds; and the substance and administration of SMI’s code of ethics. The Trustees also considered disclosure in the registration statement of the Trust relating to SMI’s potential conflicts of interest. The Board noted that SMI recently launched its SMA product, and that if an SMI Fund is owned within an SMA, the SMA will not charge a management fee for those assets invested in an SMI Fund. The Board also noted that SMI does not engage in soft dollar arrangements and has not identified any indirect benefits from its relationship with the SMI Funds. Based on the foregoing, the Board determined that SMI’s standards and practices relating to the identification and mitigation of potential conflicts of interest were satisfactory. |
After additional consideration of the factors delineated in the memorandum provided by counsel and further discussion among the Board members, the Board determined to approve the continuation of the SMI Agreements between the Trust and SMI.
55
VALUED ADVISERS TRUST
PRIVACY POLICY
March 9, 2017
FACTS | WHAT DOES VALUED ADVISERS TRUST DO WITH YOUR PERSONAL INFORMATION?
| |
| Why? | Financial companies choose how they share your personal information. Federal law gives consumers the right to limit some but not all sharing. Federal law also requires us to tell you how we collect, share, and protect your personal information. Please read this notice carefully to understand what we do.
| |
| What? | The types of personal information we collect and share depend on the product or service you have with us. This information can include: ◾ Social Security number ◾ account balances and account transactions ◾ account transactions, transaction or loss history and purchase history ◾ checking account information and wire transfer instructions When you are no longer our customer, we continue to share your information as described in this notice.
| |
| How? | All financial companies need to share customers’ personal information to run their everyday business. In the section below, we list the reasons financial companies can share their customers’ personal information; the reasons Valued Advisers Trust chooses to share; and whether you can limit this sharing.
|
Reasons we can share your personal information | Does Valued Advisers Trust share?
| |
For our everyday business purposes — such as to process your transactions, maintain your account(s), respond to court orders and legal investigations, or report to credit bureaus
| Yes
| |
For our marketing purposes — to offer our products and services to you
| Yes
| |
For joint marketing with other financial companies
| No
| |
For our affiliates’ everyday business purposes — information about your transactions and experiences
| No
| |
For our affiliates’ everyday business purposes — information about your creditworthiness
| No
| |
For nonaffiliates to market to you
| No
|
| Questions? | Call 1-877-764-3863. |
56
VALUED ADVISERS TRUST
PRIVACY POLICY (Continued)
Who we are | ||
Who is providing this notice?
| Valued Advisers Trust
| |
What we do
| ||
| How does Valued Advisers Trust protect my personal information? | To protect your personal information from unauthorized access and use, we use security measures that comply with federal law. These measures include computer safeguards and secured files and buildings.
| |
| How does Valued Advisers Trust collect my personal information? | We collect your personal information, for example, when you open an account or deposit money buy securities from us or sell securities to us make deposits or withdrawals from your account or provide account information give us your account information make a wire transfer tell us who receives the money tell us where to send the money show your government-issued ID show your driver’s license
| |
| Why can’t I limit all sharing? | Federal law gives you the right to limit only sharing for affiliates’ everyday business purposes—information about your creditworthiness affiliates from using your information to market to you sharing for nonaffiliates to market to you State laws and individual companies may give you additional rights to limit sharing.
| |
Definitions
| ||
Affiliates | Companies related by common ownership or control. They can be financial and nonfinancial companies.
| |
Nonaffiliates | Companies not related by common ownership or control. They can be financial and nonfinancial companies. ◾ Valued Advisers Trust does not share your personal information with nonaffiliates so they can market to you.
| |
Joint marketing | A formal agreement between nonaffiliated financial companies that together market financial products or services to you. ◾ Valued Advisers Trust doesn’t jointly market financial products or services to you.
| |
57
PROXY VOTING
A description of the policies and procedures that the Funds use to determine how to vote proxies relating to portfolio securities and information regarding how the Funds voted those proxies during the most recent twelve month period ended June 30 is available without charge upon request by (1) calling the Funds at (877) 764-3863 and (2) from Fund documents filed with the Securities and Exchange Commission (“SEC”) on the SEC’s website at www.sec.gov.
TRUSTEES
Andrea N. Mullins, Chairperson
Ira P. Cohen
Mark J. Seger
OFFICERS
Bo J. Howell, Principal Executive
Officer and President
Bryan W. Ashmus, Principal Financial
Officer and Treasurer
John C. Swhear, Chief Compliance Officer,
AML Officer and Vice President
Carol J. Highsmith, Vice President and Secretary
Matthew J. Miller, Vice President
INVESTMENT ADVISER
SMI Advisory Services, LLC
P.O. Box 547
Columbus, IN 47202
DISTRIBUTOR
Unified Financial Securities, LLC
9465 Counselors Row, Suite 200
Indianapolis, IN 46240
INDEPENDENT REGISTERED PUBLIC ACCOUNTING FIRM
Cohen & Company, Ltd.
1350 Euclid Avenue, Suite 800
Cleveland, OH 44115
LEGAL COUNSEL
The Law Offices of John H. Lively &
Associates, Inc.
A member firm of The 1940 Act Law GroupTM
11300 Tomahawk Creek Pkwy, Suite 310
Leawood, KS 66211
CUSTODIAN
Huntington National Bank
41 South High Street
Columbus, OH 43215
ADMINISTRATOR, TRANSFER AGENT AND FUND ACCOUNTANT
Ultimus Asset Services, LLC
225 Pictoria Drive Suite 450
Cincinnati, OH 45246
This report is intended only for the information of shareholders or those who have received the Funds’ prospectus which contains information about each Fund’s management fee and expenses. Please read the prospectus carefully before investing.
Distributed by Unified Financial Securities, LLC
Member FINRA/SIPC

Semi-Annual Report
April 30, 2017
Fund Adviser:
Kovitz Investment Group Partners, LLC
115 South LaSalle Street, 27th Floor
Chicago, IL 60603
Toll Free (888) 695-3729
MANAGEMENT’S DISCUSSION OF FUND PERFORMANCE – (Unaudited)
Kovitz Investment Group Partners, LLC (the “Adviser”) launched the Green Owl Intrinsic Value Fund (the “Fund”) with the goal of seeking long-term capital appreciation through high risk-adjusted returns. To accomplish this, Fund management implements a fundamental, research-driven process, in order to build a diversified portfolio of equity investments through the purchase of competitively advantaged and financially strong companies at prices substantially less than our estimate of their intrinsic values.
We remain focused on the careful and patient application of our investment criteria and valuation requirements. Our bottom-up research emphasizes business quality, industry structures, growth opportunities, management skill and corporate culture. It is further augmented by our assessment of the company’s ability to sustain earnings power over the long haul through an understanding of its competitive advantages and management’s proficiency in the allocation of capital. We use absolute, rather than relative, methods to estimate companies’ intrinsic values and we use the movement of market prices around these intrinsic value estimates to construct and manage a portfolio believed to be of high-quality businesses that have the potential to create sustained shareholder value over many years.
Market and Performance Summary
The Fund increased in value by 15.98% during the first half of the fiscal year (November 1, 2016 through April 30, 2017), while our primary benchmark, the S&P 500 Index, increased 13.32% over the same period. Since inception on December 28, 2011, the Fund has compounded at an annual rate of 13.50%, versus 15.01% annually for the S&P 500 Index.
The strong showing in equities over this time period masked an underlying tension: will the Trump administration policies that are generally believed to be positive for stock prices come to fruition – these include a reduction in the statutory corporate tax rate, some enticement for companies to repatriate cash held overseas, the reversal of many regulations that hindered or delayed business investment spending, and large spending on infrastructure – or will they be derailed by political clashes in other areas, such as the debate over repealing and replacing the Affordable Care Act, or by some self-inflicted political controversy? The market has clearly priced in the enactment of some (perhaps more than some) of the administration’s agenda under the assumption that Republican control of the House, Senate, and the White House would make the process nearly seamless. As we have all recently witnessed, that’s just not the way Washington works. To the extent the administration’s purportedly pro-business plans get pushed out or watered down, current valuation multiples in the stock market would likely be negatively impacted. Whether or not interest rates will continue rising is another unsettled debate. Generally, interest rates act on asset values like gravity: the higher they are, the more they pull downward on asset values.
Our crystal ball is always fuzzy on matters such as these and that is why we remain focused on the careful and patient application of our investment criteria and valuation requirements. Recall that the Adviser equity strategy has been devised with the goal of seeking long-term capital appreciation through high risk-adjusted returns (i.e., taking on less risk to earn commensurate or better benchmark returns). The crux of the strategy leads us to be more concerned with the risk of suffering a permanent loss of capital from an investment that was bought at too high of a price. We are less concerned about the risk of missing opportunities, especially those that may be short-term in nature.
We are pleased with the Fund’s results over the prior six months and note that they were achieved while carrying a fairly large cash balance of approximately 8%, on average. The implication is that these returns were generated while employing less risk than the overall market (typically, to earn higher returns, investors need to take on even more risk). Our cash balances wax and wane based on opportunities we see in the market to deploy capital at reasonable expected returns. While steering clear of trying to time the market, we employ this disciplined approach in all market environments. In the current environment, this principle prevents us from “stretching” for average or below-average businesses for the sole purpose of appearing active and keeping cash balances low. We’re just not going to invest your hard-won capital at any price. We were close to fully invested at the time of
1
the election last November and have been trimming back holdings as they’ve risen over the last several months. Since we’ve done more selling than buying over this period, our residual cash balances have grown. As we survey the investment landscape, we mostly see equities that are, at best, fairly valued and very few that offer the significant margin of safety we require in order to initiate a purchase. In other words, because we are a price-sensitive investor, it has become a tough environment in which to put new money to work. If we can’t find qualifying opportunities that meet our criteria, the default option is to hold cash until stock price volatility gives us an opportunity to deploy capital into qualifying businesses (i.e., high quality companies whose valuations are low in comparison).
Many investors put very little value on cash, arguing that cash’s current low yield makes it a poor investment. However, we believe cash’s value comes not from its current yield, but from its optionality. In a down market, cash helps mitigate losses and affords one the opportunity to buy when others are selling out of fear. Current market conditions may lead to the kind of volatility and divergence in the markets that present opportunities for disciplined, value-conscious investors. With our current healthy cash allocation, we will be prepared to capture entry-point pricing opportunities as they emerge. The pursuit of investment returns involves incurring risk and our counter-cyclical approach – owning less not because of a hunch or feeling about the direction of the market, but because there is observably less worth doing (owning) – attempts to mitigate risk. We will own more when the valuations are clearly signaling there are more attractive opportunities.
At the end of the quarter, your portfolio was invested in what we believe to be reasonably priced, high quality businesses that we believe will compound their earnings at attractive rates for a long time to come. We remain focused on identifying companies with four key attributes:
| (1) | A commitment to maintain a strong financial position as evidenced by a solid balance sheet; |
| (2) | An ability to generate sustainable free cash flow based on one or more defensible competitive advantages; |
| (3) | Management that intelligently deploys cash balances and free cash flow from operations to grow intrinsic value per share and increase returns to shareholders; and |
| (4) | Is selling at a discount to our calculation of intrinsic value. |
We further believe that by prioritizing these factors, our portfolio of companies may be positioned to perform better than the market in most types of economic settings.
Performance Attribution
The individual positions that contributed the most to performance during the 6-month period were Apple (AAPL), Bank of America (BAC), Quanta Services (PWR), Boeing (BA), and JP Morgan (JPM).
The individual positions that detracted the most from performance during the period were CVS Health (CVS), TechnipFMC (FTI), Schlumberger (SLB), Delta Airlines (DAL), and the Fund’s cash position.
On a sector basis, the combination of sector weighting and security selection in the Financial and Industrial sectors as well as our lack of exposure to Utilities and Telecom benefitted the Fund the most during the period. The Fund’s cash balance was the largest detractor from the Fund’s performance during the period.
Portfolio Activity
We continue to look for companies that have strong balance sheets, generate significant free cash flow, have management teams that allocate capital to maximize per-share value, and that sell at a discount to our estimate of fair value. Finding candidates that meet the first three criteria has always been somewhat difficult, but it is the fourth criteria – price – that is the largest impediment to finding qualifying opportunities today. As we have lamented on more than one occasion recently, bargain-priced stocks are tough to come by these days. We
2
continue to delve into the sectors where we have less representation, but have had limited success finding candidates that offer the combination of business quality and price we require. As mentioned above, we continue to like what we currently own from a quality and price standpoint and trust we will get opportunities to deploy our cash in due time.
The following portfolio actions were taken during the period:
Initiated positions in the following 2 companies: Delta Air Lines (DAL) and Bayer AG (BAYZF).
Increased position sizes in the following 5 companies: Amerco (UHAL), Aon (AON), CBRE Group (CBG), Alphabet (GOOG), and Walgreens Boots Alliance (WBA).
Exited positions in the following 2 companies: CVS Health (CVS) and Kohl’s (KSS).
Decreased position sizes in the following 3 companies: Bank of America (BAC), Jacobs Engineering (JEC), and Quanta (PWR).
As of April 30, 2017, the Fund’s five largest positions were Berkshire Hathaway (BRKB), Apple, Quanta, JP Morgan, and Boeing, comprising 26% of the Fund’s assets.
Thank you for your continued support and trust in our ability to manage your investment in the Fund.
3
INVESTMENT RESULTS – (Unaudited)
Average Annual Total Returns*
(For the periods ended April 30, 2017)
| Six Months | One Year | Five Year | Since Inception (December 22, 2011) (a) | |||||||||||||
Green Owl Intrinsic Value Fund | 15.98 | % | 21.03 | % | 11.89 | % | 13.50 | % | ||||||||
S&P 500® Index** | 13.32 | % | 17.95 | % | 13.68 | % | 15.01 | % | ||||||||
Total annual operating expenses, as disclosed in the Green Owl Intrinsic Value Fund (the “Fund”) prospectus dated February 28, 2017, were 1.42% of average daily net assets (1.12% after fee waivers/expense reimbursements by Kovitz Investment Group Partners, LLC (the “Adviser”). The Adviser contractually agreed to waive or limit its fees and to assume other expenses of the Fund until February 28, 2018, so that the Total Annual Operating Expenses do not exceed 1.10%. This operating expense limitation does not apply to interest, taxes, brokerage commissions, other expenditures which are capitalized in accordance with generally accepted accounting principles, other extraordinary expenses not incurred in the ordinary course of the Fund’s business, dividend expense on short sales, expenses incurred under a Rule 12b-1 plan of distribution, “acquired fund fees and expenses,” and expenses that the Fund has incurred but did not actually pay because of an expense offset arrangement. Additional information pertaining to the Fund’s expense ratios as of April 30, 2017 can be found in the financial highlights.
The performance quoted represents past performance, which does not guarantee future results. The investment return and principal value of an investment will fluctuate so that an investor’s shares, when redeemed, may be worth more or less than their original cost. The returns shown do not reflect deduction of taxes that a shareholder would pay on Fund distributions or the redemption of Fund shares. Current performance of the Fund may be lower or higher than the performance quoted. The Fund’s investment objectives, risks, charges and expenses must be considered carefully before investing. Performance data current to the most recent month end may be obtained by calling 1-888-695-3729.
| (a) | The Fund commenced operations on December 22, 2011. However, the Fund did not invest in long-term securities towards the investment objective until December 28, 2011. December 28, 2011 is the performance calculation inception date. |
| * | Average Annual Total Returns reflect any change in price per share and assume the reinvestment of all distributions. The Fund’s returns reflect any fee reductions during the applicable periods. If such fee reductions had not occurred, the quoted performance would have been lower. Total returns for periods less than one year are not annualized. |
| ** | The S&P 500® Index is a widely recognized unmanaged index of equity securities and is representative of a broader domestic equity market and range of securities than is found in the Fund’s portfolio. Individuals cannot invest directly in the Index; however, an individual can invest in exchange traded funds or other investment vehicles that attempt to track the performance of a benchmark index. |
The Fund’s investment objectives, strategies, risks, charges and expenses must be considered carefully before investing. The prospectus contains this and other important information about the Fund and may be obtained by calling the same number as above. Please read it carefully before investing.
The Fund is distributed by Unified Financial Securities, LLC, member FINRA/SIPC.
4
FUND HOLDINGS – (Unaudited)
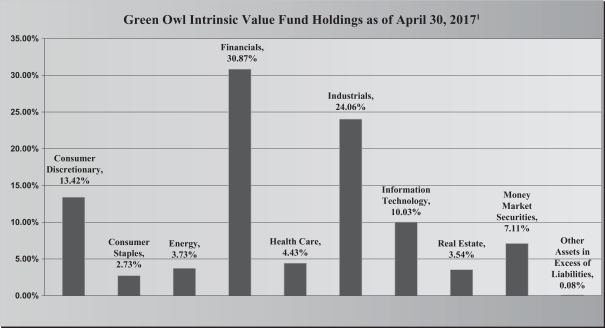
| 1As | a percentage of net assets. |
The investment objective of the Fund is long-term capital appreciation.
AVAILABILITY OF PORTFOLIO SCHEDULE – (Unaudited)
The Fund files its complete schedule of portfolio holdings with the Securities and Exchange Commission (“SEC”) for the first and third quarters of each fiscal year on Form N-Q. The Fund’s Forms N-Q are available at the SEC’s website at www.sec.gov. The Fund’s Forms N-Q may be reviewed and copied at the SEC’s Public Reference Room in Washington DC. Information on the operation of the Public Reference Room may be obtained by calling 1-800-SEC-0330.
5
GREEN OWL INTRINSIC VALUE FUND
SCHEDULE OF INVESTMENTS
April 30, 2017 (Unaudited)
| Common Stocks – 92.81% | Shares | Fair Value | ||||||
Consumer Discretionary – 13.42% | ||||||||
CarMax, Inc. * | 33,240 | $ | 1,944,540 | |||||
CBS Corp., Class B | 36,230 | 2,411,469 | ||||||
General Motors Co. | 70,600 | 2,445,584 | ||||||
Harley-Davidson, Inc. | 26,535 | 1,507,453 | ||||||
Walt Disney Co./The | 12,100 | 1,398,760 | ||||||
|
| |||||||
| 9,707,806 | ||||||||
|
| |||||||
Consumer Staples – 2.73% |
| |||||||
Coca-Cola Co./The | 12,470 | 538,081 | ||||||
Walgreens Boots Alliance, Inc. | 16,575 | 1,434,401 | ||||||
|
| |||||||
| 1,972,482 | ||||||||
|
| |||||||
Energy – 3.73% |
| |||||||
Halliburton Co. | 38,200 | 1,752,616 | ||||||
Schlumberger Ltd. | 8,895 | 645,688 | ||||||
TechnipFMC PLC * | 10,000 | 301,300 | ||||||
|
| |||||||
| 2,699,604 | ||||||||
|
| |||||||
Financials – 30.87% |
| |||||||
American Express Co. | 30,610 | 2,425,842 | ||||||
Aon PLC | 18,900 | 2,264,976 | ||||||
Bank of America Corp. | 120,175 | 2,804,884 | ||||||
Bank of New York Mellon Corp./The | 26,675 | 1,255,326 | ||||||
Berkshire Hathaway, Inc., Class B * | 28,815 | 4,760,526 | ||||||
Citigroup, Inc. | 30,000 | 1,773,600 | ||||||
JPMorgan Chase & Co. | 36,230 | 3,152,010 | ||||||
Leucadia National Corp. | 80,485 | 2,043,514 | ||||||
Wells Fargo & Co. | 34,255 | 1,844,289 | ||||||
|
| |||||||
| 22,324,967 | ||||||||
|
| |||||||
Health Care – 4.43% |
| |||||||
Bayer AG | 11,000 | 1,360,746 | ||||||
McKesson Corp. | 13,300 | 1,839,257 | ||||||
|
| |||||||
| 3,200,003 | ||||||||
|
| |||||||
Industrials – 24.06% |
| |||||||
AMERCO | 4,097 | 1,534,163 | ||||||
American Airlines Group, Inc. | 38,640 | 1,646,837 | ||||||
Boeing Co./The | 15,190 | 2,807,568 | ||||||
Delta Air Lines, Inc. | 24,000 | 1,090,560 | ||||||
Jacobs Engineering Group, Inc. | 34,724 | 1,907,042 | ||||||
Quanta Services, Inc. * | 104,955 | 3,719,605 | ||||||
Robert Half International, Inc. | 32,218 | 1,483,639 | ||||||
United Parcel Service, Inc., Class B | 11,520 | 1,237,939 | ||||||
Valmont Industries, Inc. | 12,953 | 1,973,390 | ||||||
|
| |||||||
| 17,400,743 | ||||||||
|
| |||||||
See accompanying notes which are an integral part of these financial statements.
6
GREEN OWL INTRINSIC VALUE FUND
SCHEDULE OF INVESTMENTS – (continued)
April 30, 2017 (Unaudited)
| Common Stocks – 92.81% – continued | Shares | Fair Value | ||||||
Information Technology – 10.03% |
| |||||||
Alphabet, Inc., Class A * | 773 | $ | 714,654 | |||||
Alphabet, Inc., Class C * | 2,553 | 2,312,916 | ||||||
Apple, Inc. | 29,430 | 4,227,619 | ||||||
|
| |||||||
| 7,255,189 | ||||||||
|
| |||||||
Real Estate – 3.54% | ||||||||
CBRE Group, Inc., Class A * | 71,450 | 2,558,624 | ||||||
|
| |||||||
Total Common Stocks (Cost $47,140,679) | 67,119,418 | |||||||
|
| |||||||
Money Market Securities – 7.11% | ||||||||
Federated Treasury Obligations Fund – Service Shares, 0.35% (a) | 5,138,395 | 5,138,395 | ||||||
|
| |||||||
Total Money Market Securities (Cost $5,138,395) | 5,138,395 | |||||||
|
| |||||||
Total Investments – 99.92% (Cost $52,279,074) | 72,257,813 | |||||||
|
| |||||||
Other Assets in Excess of Liabilities – 0.08% | 58,272 | |||||||
|
| |||||||
NET ASSETS – 100.00% | $ | 72,316,085 | ||||||
|
| |||||||
| (a) | Rate disclosed is the seven day effective yield as of April 30, 2017. |
| * | Non-income producing security. |
The sectors shown on the schedule of investments are based on Global Industry Classification Standard, or GICS® (“GICS”). The GICS was developed by and/or is the exclusive property of MSCI, Inc. and Standard & Poor’s Financial Services LLC (“S&P”). GICS is a service mark of MSCI, Inc. and S&P and has been licensed for use by Ultimus Asset Services, LLC.
See accompanying notes which are an integral part of these financial statements.
7
GREEN OWL INTRINSIC VALUE FUND
STATEMENT OF ASSETS AND LIABILITIES
April 30, 2017 – (Unaudited)
Assets | ||||
Investments in securities at fair value (cost $52,279,074) | $ | 72,257,813 | ||
Receivable for fund shares sold | 79,750 | |||
Dividends receivable | 46,301 | |||
Prepaid expenses | 14,792 | |||
|
| |||
Total Assets | 72,398,656 | |||
|
| |||
Liabilities | ||||
Payable for fund shares redeemed | 6,566 | |||
Payable to Adviser | 45,642 | |||
Payable to Administrator | 6,677 | |||
Other accrued expenses | 23,686 | |||
|
| |||
Total Liabilities | 82,571 | |||
|
| |||
Net Assets | $ | 72,316,085 | ||
|
| |||
Net Assets consist of: | ||||
Paid-in capital | $ | 51,455,565 | ||
Accumulated undistributed net investment income | 19,768 | |||
Accumulated undistributed net realized gain from investments | 862,013 | |||
Net unrealized appreciation on investments | 19,978,739 | |||
|
| |||
Net Assets | $ | 72,316,085 | ||
|
| |||
Shares outstanding | 4,148,399 | |||
|
| |||
Net asset value, offering and redemption price per share | $ | 17.43 | ||
|
| |||
See accompanying notes which are an integral part of these financial statements.
8
GREEN OWL INTRINSIC VALUE FUND
STATEMENT OF OPERATIONS
For the six months ended April 30, 2017 – (Unaudited)
Investment Income | ||||
Dividend income | $ | 456,977 | ||
|
| |||
Total investment income | 456,977 | |||
|
| |||
Expenses | ||||
Investment Adviser | 343,810 | |||
Administration | 26,183 | |||
Fund accounting | 13,265 | |||
Transfer agent | 11,224 | |||
Custodian | 5,280 | |||
Trustee | 3,348 | |||
Line of credit | 1,244 | |||
Miscellaneous | 53,152 | |||
|
| |||
Total expenses | 457,506 | |||
|
| |||
Fees waived by Adviser | (77,407 | ) | ||
|
| |||
Net operating expenses | 380,099 | |||
|
| |||
Net investment income | 76,878 | |||
|
| |||
Net Realized and Unrealized Gain (Loss) on Investments | ||||
Net realized gain on investment securities transactions | 1,022,221 | |||
Net realized gain on option transactions | 26,762 | |||
Net change in unrealized appreciation of investment securities | 8,716,730 | |||
Net change in unrealized depreciation of option contracts | (43,179 | ) | ||
|
| |||
Net realized and unrealized gain (loss) on investments | 9,722,534 | |||
|
| |||
Net increase in net assets resulting from operations | $ | 9,799,412 | ||
|
| |||
See accompanying notes which are an integral part of these financial statements.
9
GREEN OWL INTRINSIC VALUE FUND
STATEMENTS OF CHANGES IN NET ASSETS
| For the Six Months Ended April 30, 2017 (Unaudited) | For the Year Ended October 31, 2016 | |||||||
Increase (Decrease) in Net Assets due to: | ||||||||
Operations | ||||||||
Net investment income | $ | 76,878 | $ | 237,809 | ||||
Net realized gain (loss) on investment transactions | 1,048,983 | (168,473 | ) | |||||
Net change in unrealized appreciation of investments and written options | 8,673,551 | 1,956,875 | ||||||
|
|
|
| |||||
Net increase in net assets resulting from operations | 9,799,412 | 2,026,211 | ||||||
|
|
|
| |||||
Distributions | ||||||||
From net investment income | (230,271 | ) | (241,645 | ) | ||||
From net realized gains | — | (934,988 | ) | |||||
|
|
|
| |||||
Total distributions | (230,271 | ) | (1,176,633 | ) | ||||
|
|
|
| |||||
Capital Transactions | ||||||||
Proceeds from shares sold | 7,578,899 | 7,328,721 | ||||||
Reinvestment of distributions | 217,018 | 1,113,919 | ||||||
Amount paid for shares redeemed | (6,316,231 | ) | (7,343,220 | ) | ||||
|
|
|
| |||||
Net increase in net assets resulting from capital transactions | 1,479,686 | 1,099,420 | ||||||
|
|
|
| |||||
Total Increase in Net Assets | 11,048,827 | 1,948,998 | ||||||
|
|
|
| |||||
Net Assets | ||||||||
Beginning of period | 61,267,258 | 59,318,260 | ||||||
|
|
|
| |||||
End of period | $ | 72,316,085 | $ | 61,267,258 | ||||
|
|
|
| |||||
Accumulated undistributed net investment income included in net assets at end of period | $ | 19,768 | $ | 173,161 | ||||
|
|
|
| |||||
Share Transactions | ||||||||
Shares sold | 449,081 | 512,880 | ||||||
Shares issued in reinvestment of distributions | 12,699 | 76,663 | ||||||
Shares redeemed | (377,098 | ) | (524,224 | ) | ||||
|
|
|
| |||||
Net increase in shares outstanding | 84,682 | 65,319 | ||||||
|
|
|
| |||||
See accompanying notes which are an integral part of these financial statements.
10
GREEN OWL INTRINSIC VALUE FUND
FINANCIAL HIGHLIGHTS
(For a share outstanding during each period)
| For the Six Months Ended April 30, 2017 (Unaudited) | For the Year Ended October 31, 2016 | For the Year Ended October 31, 2015 | For the Year Ended October 31, 2014 | For the Year Ended October 31, 2013 | For the Period Ended October 31, 2012 (a) | |||||||||||||||||||
Selected Per Share Data: | ||||||||||||||||||||||||
Net asset value, beginning of period | $ | 15.08 | $ | 14.84 | $ | 15.72 | $ | 14.99 | $ | 11.67 | $ | 10.00 | ||||||||||||
|
|
|
|
|
|
|
|
|
|
|
| |||||||||||||
Investment operations: | ||||||||||||||||||||||||
Net investment income | 0.02 | 0.06 | 0.08 | 0.19 | 0.02 | 0.02 | ||||||||||||||||||
Net realized and unrealized gain (loss) on investments | 2.39 | 0.47 | (0.16 | ) | 1.11 | 3.41 | 1.65 | |||||||||||||||||
|
|
|
|
|
|
|
|
|
|
|
| |||||||||||||
Total from investment operations | 2.41 | 0.53 | (0.08 | ) | 1.30 | 3.43 | 1.67 | |||||||||||||||||
|
|
|
|
|
|
|
|
|
|
|
| |||||||||||||
Less distributions to shareholders from: | ||||||||||||||||||||||||
Net investment income | (0.06 | ) | (0.06 | ) | (0.20 | ) | (0.03 | ) | (0.05 | ) | — | |||||||||||||
Net realized gains | — | (0.23 | ) | (0.60 | ) | (0.54 | ) | (0.06 | ) | — | ||||||||||||||
|
|
|
|
|
|
|
|
|
|
|
| |||||||||||||
Total distributions | (0.06 | ) | (0.29 | ) | (0.80 | ) | (0.57 | ) | (0.11 | ) | — | |||||||||||||
|
|
|
|
|
|
|
|
|
|
|
| |||||||||||||
Net asset value, end of period | $ | 17.43 | $ | 15.08 | $ | 14.84 | $ | 15.72 | $ | 14.99 | $ | 11.67 | ||||||||||||
|
|
|
|
|
|
|
|
|
|
|
| |||||||||||||
Total Return (b) | 15.98 | %(c) | 3.65 | % | (0.60 | )% | 8.86 | % | 29.59 | % | 16.70 | %(c) | ||||||||||||
Ratios and Supplemental Data: | ||||||||||||||||||||||||
Net assets, end of period (000) | $ | 72,316 | $ | 61,267 | $ | 59,318 | $ | 60,581 | $ | 47,129 | $ | 24,756 | ||||||||||||
Ratio of net expenses to average net assets | 1.10 | %(d) | 1.10 | % | 1.10 | % | 1.11 | %(e) | 1.40 | % | 1.41 | %(d)(e) | ||||||||||||
Ratio of expenses to average net assets before waiver and reimbursement | 1.33 | %(d) | 1.40 | % | 1.37 | % | 1.38 | % | 1.52 | % | 2.11 | %(d) | ||||||||||||
Ratio of net investment income to average net assets | 0.22 | %(d) | 0.41 | % | 0.49 | % | 1.30 | % | 0.14 | % | 0.26 | %(d) | ||||||||||||
Portfolio turnover rate | 11 | %(c) | 21 | % | 33 | % | 35 | % | 20 | % | 11 | %(c) | ||||||||||||
| (a) | For the period December 22, 2011 (commencement of operations) to October 31, 2012. |
| (b) | Total return in the above table represents the rate that the investor would have earned or lost on an investment in the Fund, assuming reinvestment of distributions. |
| (c) | Not annualized. |
| (d) | Annualized. |
| (e) | Includes line of credit interest of 0.01%. |
See accompanying notes which are an integral part of these financial statements.
11
GREEN OWL INTRINSIC VALUE FUND
NOTES TO THE FINANCIAL STATEMENTS
April 30, 2017 – (Unaudited)
NOTE 1. ORGANIZATION
The Green Owl Intrinsic Value Fund (the “Fund”) is an open-end diversified series of the Valued Advisers Trust (the “Trust”). The Trust is a management investment company established under the laws of Delaware by an Agreement and Declaration of Trust dated June 13, 2008 (the “Trust Agreement”). The Trust Agreement permits the Board of Trustees (the “Board”) to issue an unlimited number of shares of beneficial interest of separate series without par value. The Fund is one of a series of funds authorized by the Board. The Fund commenced operations on December 22, 2011. The Fund’s investment adviser is Kovitz Investment Group Partners, LLC (the “Adviser”). The investment objective of the Fund is to provide long-term capital appreciation.
NOTE 2. SIGNIFICANT ACCOUNTING POLICIES
The Fund is an investment company and follows accounting and reporting guidance under Financial Accounting Standards Board Accounting Standards Codification (“ASC”) Topic 946, “Financial Services-Investment Companies”. The following is a summary of significant accounting policies followed by the Fund in the preparation of its financial statements. These polices are in conformity with generally accepted accounting principles in the United States of America (“GAAP”).
Estimates – The preparation of financial statements in conformity with GAAP requires management to make estimates and assumptions that affect the reported amounts of assets and liabilities and disclosure of contingent assets and liabilities at the date of the financial statements and the reported amounts of increases and decreases in net assets from operations during the reporting period. Actual results could differ from those estimates.
Securities Valuation – All investments in securities are recorded at their estimated fair value as described in Note 3.
Federal Income Taxes – The Fund makes no provision for federal income or excise tax. The Fund has qualified and intends to qualify each year as a regulated investment company (“RIC”) under subchapter M of the Internal Revenue Code of 1986, as amended, by complying with the requirements applicable to RICs and by distributing substantially all of its taxable income. The Fund also intends to distribute sufficient net investment income and net capital gains, if any, so that it will not be subject to excise tax on undistributed income and gains. If the required amount of net investment income or gains is not distributed, the Fund could incur a tax expense.
As of and during the six months ended April 30, 2017, the Fund did not have a liability for any unrecognized tax benefits. The Fund recognizes interest and penalties, if any, related to unrecognized tax benefits as income tax expense on the statement of operations. The Fund is subject to examination by U.S. federal tax authorities for the last three tax years and the interim tax period since then. During the period, the Fund did not incur any interest or penalties.
Expenses – Expenses incurred by the Trust that do not relate to a specific fund of the Trust are allocated to the individual funds based on each fund’s relative net assets or other appropriate basis.
Security Transactions and Related Income – The Fund follows industry practice and records security transactions on the trade date for financial reporting purposes. The specific identification method is used for determining gains or losses for financial statements and income tax purposes. Dividend income is recorded on the ex-dividend date and interest income is recorded on an accrual basis. Discounts and premiums on securities purchased are amortized or accreted using the effective interest method.
12
GREEN OWL INTRINSIC VALUE FUND
NOTES TO THE FINANCIAL STATEMENTS – (continued)
April 30, 2017 – (Unaudited)
NOTE 2. SIGNIFICANT ACCOUNTING POLICIES – continued
Dividends and Distributions – The Fund intends to distribute substantially all of its net investment income, net realized long-term capital gains and its net realized short-term capital gains, if any, to its shareholders on at least an annual basis. Dividends to shareholders, which are determined in accordance with income tax regulations, are recorded on the ex-dividend date. The treatment for financial reporting purposes of distributions made to shareholders during the year from net investment income or net realized capital gains may differ from their ultimate treatment for federal income tax purposes. These differences are caused primarily by differences in the timing of the recognition of certain components of income, expense or realized capital gain for federal income tax purposes. Where such differences are permanent in nature, they are reclassified in the components of net assets based on their ultimate characterization for federal income tax purposes. Any such reclassifications will have no effect on net assets, results of operations or net asset values per share of the Fund. There were no such material reclassifications made as of April 30, 2017.
Written Options – The Fund may write covered call options on equity securities or futures contracts that the Fund is eligible to purchase to extend a holding period to obtain long-term capital gain treatment, to earn premium income, to assure a definite price for a security it has considered selling, or to close out options previously purchased. The Fund may write covered call options if, immediately thereafter, not more than 30% of its net assets would be committed to such transactions. A call option gives the holder (buyer) the right to purchase a security or futures contract at a specified price (the exercise price) at any time until a certain date (the expiration date). A call option is “covered” if the Fund owns the underlying security subject to the call option at all times during the option period, or to the extent that some or all of the risk of the option has been offset by another option. When the Fund writes a covered call option, it maintains a segregated position within its account with its Custodian or as otherwise required by the rules of the exchange the underlying security, cash or liquid portfolio securities in an amount not less than the exercise price at all times while the option is outstanding. See Note 4 for additional disclosures.
The Fund will receive a premium from writing a call option, which increases the Fund’s return in the event the option expires unexercised or is closed out at a profit. The amount of the premium will reflect, among other things, the relationship of the market price of the underlying security to the exercise price of the option and the remaining term of the option. However, there is no assurance that a closing transaction can be affected at a favorable price. During the option period, the covered call writer has, in return for the premium received, given up the opportunity for capital appreciation above the exercise price should the market price of the underlying security increase, but has retained the risk of loss should the price of the underlying security decline.
The Fund may write put options on equity securities and futures contracts that the Fund is eligible to purchase to earn premium income or to assure a definite price for a security if it is considering acquiring the security at a lower price than the current market price or to close out options previously purchased. The Fund may not write a put option if, immediately thereafter, more than 25% of its net assets would be committed to such transactions. A put option gives the holder of the option the right to sell, and the writer has the obligation to buy, the underlying security at the exercise price at any time during the option period. The operation of put options in other respects is substantially identical to that of call options. When the Fund writes a put option, it maintains a segregated position within its account with the Custodian of cash or liquid portfolio securities in an amount not less than the exercise price at all times while the put option is outstanding.
The Fund will receive a premium from writing a put option, which increases the Fund’s return in the event the option expires unexercised or is closed out at a profit. The amount of the premium will reflect, among other things, the relationship of the market price of the underlying security to the exercise price of the option and the remaining
13
GREEN OWL INTRINSIC VALUE FUND
NOTES TO THE FINANCIAL STATEMENTS – (continued)
April 30, 2017 – (Unaudited)
NOTE 2. SIGNIFICANT ACCOUNTING POLICIES – continued
term of the option. The risks involved in writing put options include the risk that a closing transaction cannot be effected at a favorable price and the possibility that the price of the underlying security may fall below the exercise price, in which case the Fund may be required to purchase the underlying security at a higher price than the market price of the security at the time the option is exercised, resulting in a potential capital loss unless the security subsequently appreciates in value. During the six months ended April 30, 2017, the Fund utilized covered call options to extend the holding period to obtain long-term capital gain treatment and to take advantage of the option premium to garner a higher exit price than would have been available by immediately selling the stock.
NOTE 3. SECURITIES VALUATION AND FAIR VALUE MEASUREMENTS
Fair value is defined as the price that the Fund would receive upon selling an investment in an orderly transaction to an independent buyer in the principal or most advantageous market of the investment. GAAP establishes a three-tier hierarchy to maximize the use of observable market data and minimize the use of unobservable inputs and to establish classification of fair value measurements for disclosure purposes.
Inputs refer broadly to the assumptions that market participants would use in pricing the asset or liability, including assumptions about risk (the risk inherent in a particular valuation technique used to measure fair value including items such as a pricing model and/or the risk inherent in the inputs to the valuation technique). Inputs may be observable or unobservable. Observable inputs are inputs that reflect the assumptions market participants would use in pricing the asset or liability developed based on market data obtained from sources independent of the reporting entity. Unobservable inputs are inputs that reflect the reporting entity’s own assumptions about the assumptions market participants would use in pricing the asset or liability developed based on the best information available in the circumstances. Various inputs are used in determining the value of the Fund’s investments. These inputs are summarized in the three broad levels listed below.
| • | Level 1 – unadjusted quoted prices in active markets for identical investments and/or registered investment companies where the value per share is determined and published and is the basis for current transactions for identical assets or liabilities at the valuation date |
| • | Level 2 – other significant observable inputs (including, but not limited to, quoted prices for an identical security in an inactive market, quoted prices for similar securities, interest rates, prepayment speeds, credit risk, etc.) |
| • | Level 3 – significant unobservable inputs (including the Fund’s own assumptions in determining fair value of investments based on the best information available) |
The inputs used to measure fair value may fall into different levels of the fair value hierarchy. In such cases, for disclosure purposes, the level in the fair value hierarchy within which the fair value measurement falls in its entirety, is determined based on the lowest level input that is significant to the fair value measurement in its entirety.
Equity securities, including common stocks, that are traded on any stock exchange are generally valued at the last quoted sale price on the security’s primary exchange. Lacking a last sale price, an exchange traded security is generally valued at its last bid price. Securities traded in the NASDAQ over-the-counter market are generally valued by the pricing agent at the NASDAQ Official Closing Price.
Equity securities, including common stocks, are generally valued by using market quotations, but may be valued on the basis of prices furnished by a pricing agent when the Adviser believes such prices more accurately reflect the fair value of such securities. When using the market quotations or close prices provided by the pricing service
14
GREEN OWL INTRINSIC VALUE FUND
NOTES TO THE FINANCIAL STATEMENTS – (continued)
April 30, 2017 – (Unaudited)
NOTE 3. SECURITIES VALUATION AND FAIR VALUE MEASUREMENTS – continued
and when the market is considered active, the security is classified as a Level 1 security. Sometimes, an equity security owned by the Fund will be valued by the pricing service with factors other than market quotations or when the market is considered inactive. When this happens, the security is classified as a Level 2 security. When market quotations are not readily available, when the Adviser determines that the market quotation or the price provided by the pricing service does not accurately reflect the current fair value, or when restricted or illiquid securities are being valued, such securities are valued as determined by the Adviser in conformity with guidelines adopted by and subject to review by the Board. These securities may be categorized as Level 3 securities.
Investments in open-end mutual funds, including money market mutual funds, are generally priced at the ending net asset value (“NAV”) provided by the pricing service of the funds. These securities are categorized as Level 1 securities.
Written option contracts in which the Fund invests are generally traded on an exchange. The options in which the Fund invests are generally valued at the last trade price as provided by a pricing service. If the last sale price is not available, the options will be valued at the mean of the last bid and ask prices. The options will generally be categorized as Level 1 securities. If the Fund decides that a price provided by the pricing service does not accurately reflect the fair value of the securities, when prices are not readily available from a pricing service, or when restricted or illiquid securities are being valued, securities are valued at fair value as determined by the Adviser, in conformity with policies adopted by and subject to review of the Board. These securities will generally be categorized as Level 3 securities.
In accordance with the Trust’s valuation policies, the Adviser is required to consider all appropriate factors relevant to the value of securities for which it has determined other pricing sources are not available or reliable as described above. No single standard exists for determining fair value, because fair value depends upon the circumstances of each individual case. As a general principle, the current fair value of an issue of securities being valued by the Adviser would be the amount which the Fund might reasonably expect to receive for them upon their current sale. Methods which are in accordance with this principle may, for example, be based on (i) a multiple of earnings; (ii) a discount from market of a similar freely traded security (including a derivative security or a basket of securities traded on other markets, exchanges or among dealers); or (iii) yield to maturity with respect to debt issues, or a combination of these and other methods. Fair value pricing is permitted if, in the Adviser’s opinion, the validity of market quotations appears to be questionable based on factors such as evidence of a thin market in the security based on a small number of quotations, a significant event occurs after the close of a market but before the Fund’s NAV calculation that may affect a security’s value, or the Adviser is aware of any other data that calls into question the reliability of market quotations.
The following is a summary of the inputs used to value the Fund’s investments as of April 30, 2017:
| Valuation Inputs | ||||||||||||||||
| Assets | Level 1 | Level 2 | Level 3 | Total | ||||||||||||
Common Stocks* | $ | 67,119,418 | $ | – | $ | – | $ | 67,119,418 | ||||||||
Money Market Securities | 5,138,395 | – | – | 5,138,395 | ||||||||||||
Total | $ | 72,257,813 | $ | – | $ | – | $ | 72,257,813 | ||||||||
| * | Refer to the Schedule of Investments for sector classifications. |
15
GREEN OWL INTRINSIC VALUE FUND
NOTES TO THE FINANCIAL STATEMENTS – (continued)
April 30, 2017 – (Unaudited)
NOTE 3. SECURITIES VALUATION AND FAIR VALUE MEASUREMENTS – continued
The Fund did not hold any investments during the reporting period in which significant unobservable inputs were used in determining fair value; therefore, no reconciliation of Level 3 securities is included for this reporting period. The Trust recognizes transfers between fair value hierarchy levels at the reporting period end. There were no transfers between any levels as of April 30, 2017 based on input levels assigned at October 31, 2016.
NOTE 4. DERIVATIVE TRANSACTIONS
Call options written are presented separately on the Statement of Assets and Liabilities as a liability at fair value, if any are outstanding at the reporting period end, and on the Statement of Operations under net realized gain on written option transactions and change in unrealized depreciation on written option contracts, respectively.
For the six months ended April 30, 2017:
| Derivatives | Location of Gain (Loss) on Derivatives on Statement of Operations | Change in on Derivatives | ||||
Equity Risk: | ||||||
Written Call Options | Net change in unrealized appreciation/depreciation on written options | $ | (43,179 | ) | ||
Equity Risk: | ||||||
Written Call Options | Net realized gain on option transactions | $ | 26,762 | |||
Transactions in written options by the Fund during the six months ended April 30, 2017, were as follows:
| Number of Contracts | Premiums Received | |||||||
Options outstanding at October 31, 2016 | (150 | ) | $ | 46,179 | ||||
Options written | – | – | ||||||
Options exercised | – | – | ||||||
Options closed | 150 | (46,179 | ) | |||||
|
|
|
| |||||
Options outstanding at April 30, 2017 | – | $ | – | |||||
|
|
|
| |||||
NOTE 5. ADVISER FEES AND OTHER TRANSACTIONS
Under the terms of the management agreement, on behalf of the Fund (the “Agreement”), the Adviser manages the Fund’s investments subject to approval by the Board. As compensation for its management services, the Fund is obligated to pay the Adviser a fee computed and accrued daily and paid monthly at an annual rate of 1.00% of the average daily net assets of the Fund. For the six months ended April 30, 2017, the Adviser earned a fee of $343,810 from the Fund before the reimbursement described below. At April 30, 2017, the Fund owed the Adviser $45,642.
16
GREEN OWL INTRINSIC VALUE FUND
NOTES TO THE FINANCIAL STATEMENTS – (continued)
April 30, 2017 – (Unaudited)
NOTE 5. ADVISER FEES AND OTHER TRANSACTIONS – continued
The Adviser has contractually agreed to waive its management fee and/or reimburse expenses so that total annual fund operating expenses, excluding interest, taxes, brokerage commissions, other expenditures which are capitalized in accordance with GAAP, other extraordinary expenses not incurred in the ordinary course of the Fund’s business, dividend expense on short sales, and expenses that the Fund has incurred but did not actually pay because of an expense offset arrangement, if applicable, incurred by the Fund in any fiscal year, do not exceed 1.10% of the Fund’s average daily net assets through February 28, 2018. The operating expense limitation also excludes any fees and expenses of acquired funds.
For the six months ended April 30, 2017, fees totaling $77,407 were waived by the Adviser. Each fee waiver or expense reimbursement by the Adviser with respect to the Fund is subject to repayment by the Fund within the three years following the date in which that particular waiver or reimbursement occurred, provided that the Fund is able to make the repayment without exceeding the expense limitation in effect at the time of the waiver or reimbursement and any expense limitation in place at the time of repayment.
The amounts subject to repayment by the Fund pursuant to the aforementioned conditions are as follows:
Amount | Recoverable through October 31, | |||||||
| $ | 82,572 | 2017 | ||||||
| 162,284 | 2018 | |||||||
| 173,710 | 2019 | |||||||
Amount | Recoverable through April 30, | |||||||
| $ | 77,407 | 2020 | ||||||
The Trust retains Ultimus Asset Services, LLC (“the Administrator”), to provide the Fund with administration, compliance, fund accounting, and transfer agent services, including all regulatory reporting. For the six months ended April 30, 2017, the Administrator earned fees of $26,183, $13,265 and $11,224 for administration, accounting and transfer agent services, respectively. At April 30, 2017, the Administrator was owed $6,677 from the Fund for these services.
The officers and one trustee of the Trust are members of management and/or employees of Ultimus. Unified Financial Securities, LLC (the “Distributor”) acts as the principal distributor of the Fund’s shares.
There were no payments made by the Fund to the Distributor during the six months ended April 30, 2017. An officer of the Trust is an officer of the Distributor and such person may be deemed to be an affiliate of the Distributor.
During the six months ended April 30, 2017, the Fund paid $3,539 to Kovitz Securities, LLC, an affiliate of the Adviser, for the execution of purchases and sales of the Fund’s portfolio investments.
NOTE 6. LINE OF CREDIT
The Fund participates in a short-term credit agreement (“Line of Credit”) with Huntington National Bank expiring on September 6, 2017. Under the terms of the agreement, the Fund may borrow the lesser of $1,000,000 or 5% of the Fund’s daily market value at an interest rate of LIBOR plus 150 basis points. The purpose of the
17
GREEN OWL INTRINSIC VALUE FUND
NOTES TO THE FINANCIAL STATEMENTS – (continued)
April 30, 2017 – (Unaudited)
NOTE 6. LINE OF CREDIT – continued
agreement is to meet temporary or emergency cash needs, including redemption requests that might otherwise require the untimely disposition of securities. As of April 30, 2017, the Fund had no outstanding borrowings under this Line of Credit.
NOTE 7. PURCHASES AND SALES
For the six months ended April 30, 2017, purchases and sales of investment securities, other than short-term investments and short-term U.S. government obligations, were as follows:
Purchases | ||||
U.S. Government Obligations | $ | – | ||
Other | 6,867,110 | |||
Sales | ||||
U.S. Government Obligations | $ | – | ||
Other | 8,886,886 |
NOTE 8. BENEFICIAL OWNERSHIP
The beneficial ownership, either directly or indirectly, of more than 25% of the voting securities of a fund creates a presumption of control of a fund, under Section 2(a) (9) of the Investment Company Act of 1940. At April 30, 2017, there were no beneficial owners, either directly or indirectly, of more than 25% percent of the Fund.
NOTE 9. FEDERAL TAX INFORMATION
At April 30, 2017, the net unrealized appreciation (depreciation) of investments, for tax purposes was as follows:
Gross appreciation | $ | 20,277,815 | ||
Gross (depreciation) | (299,076 | ) | ||
|
| |||
Net Appreciation on Investments | $ | 19,978,739 | ||
|
|
At April 30, 2017, the aggregate cost of securities for federal income tax purposes was $52,279,074.
The tax characterization of distributions for the fiscal year ended October 31, 2016 was as follows:
| 2016 | ||||
Distributions paid from: | ||||
Ordinary Income* | $ | 241,647 | ||
Long Term Capital Gains | 934,986 | |||
|
| |||
Total Distributions | $ | 1,176,633 | ||
|
| |||
| * | Short term capital gain distributions are treated as ordinary income for tax purposes. |
18
GREEN OWL INTRINSIC VALUE FUND
NOTES TO THE FINANCIAL STATEMENTS – (continued)
April 30, 2017 – (Unaudited)
NOTE 9. FEDERAL TAX INFORMATION – continued
At October 31, 2016, the components of distributable earnings on a tax basis were as follows:
Undistributed ordinary income | $ | 175,676 | ||
Undistributed long term capital gains | – | |||
Net unrealized appreciation (depreciation) | 11,305,188 | |||
Accumulated capital and other losses | (189,485 | ) | ||
|
| |||
| $ | 11,291,379 | |||
|
|
As of October 31, 2016, the Fund had short-term capital loss carryforwards available to offset future gains and not subject to expiration in the amount of $186,968.
NOTE 10. COMMITMENTS AND CONTINGENCIES
The Fund indemnifies its officers and trustees for certain liabilities that may arise from their performance of their duties to the Fund. Additionally, in the normal course of business, the Fund enters into contracts that contain a variety of representations and warranties which provide general indemnifications. The Fund’s maximum exposure under these arrangements is unknown, as this would involve future claims that may be made against the Fund that have not yet occurred.
NOTE 11. SUBSEQUENT EVENTS
The Adviser, which has served as investment adviser to the Fund since January 1, 2016, is an indirect wholly-owned subsidiary of Focus Financial Partners, LLC (“Focus”), a Delaware limited liability company, that is a strategic and financial investor in independently-managed wealth management firms. An investor group led by Stone Point Capital and KKR is expected to acquire a majority ownership interest in Focus on or about July 1, 2017 (the “Transaction”).
Pursuant to the 1940 Act, the Transaction would result in an assignment and automatic termination of the current investment advisory agreement between the Adviser and the Trust (the “Current Agreement”). At a meeting held on June 8, 2017, the Board approved a new investment advisory agreement with the Adviser in the event the Transaction is completed. This agreement would require shareholder approval to become effective. At the same meeting, the Board approved an interim agreement with the Adviser, which would become effective upon the closing of the Transaction. Under the interim agreement, the Adviser can continue to provide investment advisory services to the Fund for up to 150 days between the termination of the Current Agreement and shareholder approval of the new agreement. If approved by shareholders of the Fund, the new agreement would become effective on the shareholder meeting date, including any adjournments or postponements (the “Effective Date”).
The Transaction is not expected to result in any changes to the organization, structure, or management of the Fund. After the Effective Date, the Adviser would continue to serve as the Fund’s investment adviser. None of the Fund’s other service providers would change in connection with the Transaction. The Fund would continue to be team-managed by same portfolio managers – Messrs. Mitchell A. Kovitz, Jonathan A. Shapiro, and Joel D. Hirsh.
19
SUMMARY OF FUND EXPENSES – (Unaudited)
As a shareholder of the Fund, you incur ongoing costs, including management fees and other Fund expenses. This example is intended to help you understand your ongoing costs (in dollars) of investing in the Fund and to compare these costs with the ongoing costs of investing in other mutual funds.
The example is based on an investment of $1,000 invested at the beginning and held for the entire period from November 1, 2016 to April 30, 2017.
Actual Expenses
The first line of the table below provides information about actual account values and actual expenses. You may use the information in this line, together with the amount you invested, to estimate the expenses that you paid over the period. Simply divide your account value by $1,000 (for example, an $8,600 account value divided by $1,000 = $8.60), then multiply the result by the number in the first line under the heading entitled “Expenses Paid During the Period” to estimate the expenses you paid on your account during this period.
Hypothetical Example for Comparison Purposes
The second line of the table below provides information about hypothetical account values and hypothetical expenses based on the Fund’s actual expense ratio and an assumed rate of return of 5% per year before expenses, which is not the Fund’s actual return. The hypothetical account values and expenses may not be used to estimate the actual ending account balance or expenses you paid for the period. You may use this information to compare the ongoing costs of investing in the Fund and other funds. To do so, compare this 5% hypothetical example with the 5% hypothetical examples that appear in the shareholder reports of the other funds.
Please note that the expenses shown in the table are meant to highlight your ongoing costs only. Therefore, the second line of the table below is useful in comparing ongoing costs only and will not help you determine the relative costs of owning different funds.
| Green Owl Intrinsic Value Fund | Beginning November 1, 2016 | Ending Account Value April 30, 2017 | Expenses Paid November 1, 2016 – | |||||||||
Actual | $ | 1,000.00 | $ | 1,159.80 | $ | 5.91 | ||||||
Hypothetical** | $ | 1,000.00 | $ | 1,019.32 | $ | 5.53 | ||||||
| * | Expenses are equal to the Fund’s annualized expense ratio of 1.10%, multiplied by the average account value over the period, multiplied by 181/365 (to reflect the one-half year period). |
| ** | Assumes a 5% return before expenses. |
20
VALUED ADVISERS TRUST
PRIVACY POLICY
FACTS | WHAT DOES VALUED ADVISERS TRUST DO WITH YOUR PERSONAL INFORMATION? | |
| Why? | Financial companies choose how they share your personal information. Federal law gives consumers the right to limit some but not all sharing. Federal law also requires us to tell you how we collect, share, and protect your personal information. Please read this notice carefully to understand what we do. | |
| What? | The types of personal information we collect and share depend on the product or service you have with us. This information can include: ◾ Social Security number ◾ account balances and account transactions ◾ account transactions, transaction or loss history and purchase history ◾ checking account information and wire transfer instructions When you are no longer our customer, we continue to share your information as described in this notice.
| |
| How? | All financial companies need to share customers’ personal information to run their everyday business. In the section below, we list the reasons financial companies can share their customers’ personal information; the reasons Valued Advisers Trust chooses to share; and whether you can limit this sharing.
|
Reasons we can share your personal information | Does Valued Advisers Trust share? | |
For our everyday business purposes — such as to process your transactions, maintain your account(s), respond to court orders and legal investigations, or report to credit bureaus | Yes | |
For our marketing purposes — to offer our products and services to you | Yes | |
For joint marketing with other financial companies | No | |
For our affiliates’ everyday business purposes — information about your transactions and experiences | No | |
For our affiliates’ everyday business purposes — information about your creditworthiness | No | |
For nonaffiliates to market to you | No |
| Questions? | Call(888) 695-3729 |
21
Who we are | ||
Who is providing this notice?
| Valued Advisers Trust
| |
What we do
| ||
| How does Valued Advisers Trust protect my personal information? | To protect your personal information from unauthorized access and use, we use security measures that comply with federal law. These measures include computer safeguards and secured files and buildings.
| |
| How does Valued Advisers Trust collect my personal information? | We collect your personal information, for example, when you ◾ open an account or deposit money ◾ buy securities from us or sell securities to us ◾ make deposits or withdrawals from your account or provide account information ◾ give us your account information ◾ make a wire transfer ◾ tell us who receives the money ◾ tell us where to send the money ◾ show your government-issued ID ◾ show your driver’s license | |
| Why can’t I limit all sharing? | Federal law gives you the right to limit only ◾ sharing for affiliates’ everyday business purposes — information about your creditworthiness ◾ affiliates from using your information to market to you ◾ sharing for nonaffiliates to market to you | |
State laws and individual companies may give you additional rights to limit sharing. | ||
Definitions
| ||
Affiliates | Companies related by common ownership or control. They can be financial and nonfinancial companies. | |
Nonaffiliates | Companies not related by common ownership or control. They can be financial and nonfinancial companies. ◾ Valued Advisers Trust does not share your personal information with nonaffiliates so they can market to you. | |
Joint marketing | A formal agreement between nonaffiliated financial companies that together market financial products or services to you. ◾ Valued Advisers Trust doesn’t jointly market financial products or services to you. | |
22
PROXY VOTING
A description of the policies and procedures that the Fund uses to determine how to vote proxies relating to portfolio securities and information regarding how the Fund voted those proxies is available without charge upon request by (1) calling the Fund at (888) 695-3729 and (2) from Fund documents filed with the Securities and Exchange Commission (“SEC”) on the SEC’s website at www.sec.gov.
TRUSTEES
Andrea N. Mullins, Chairperson
Ira P. Cohen
Mark J. Seger
OFFICERS
Bo J. Howell, Principal Executive Officer and President
Bryan W. Ashmus, Principal Financial Officer and Treasurer
John C. Swhear, Chief Compliance Officer and Vice President
Carol J. Highsmith, Vice President and Secretary
Matthew J. Miller, Vice President
Stephen L. Preston, Anti-Money Laundering Officer
Courtney Moore, Assistant Secretary
INVESTMENT ADVISER
Kovitz Investment Group Partners, LLC
115 South LaSalle Street, 27th Floor
Chicago, IL 60603
DISTRIBUTOR
Unified Financial Securities, LLC
9465 Counselors Row, Suite 200
Indianapolis, IN 46240
INDEPENDENT REGISTERED PUBLIC ACCOUNTING FIRM
Cohen & Company, Ltd.
1350 Euclid Avenue, Suite 800
Cleveland, OH 44115
LEGAL COUNSEL
The Law Offices of John H. Lively & Associates, Inc.
A member firm of The 1940 Act Law GroupTM
11300 Tomahawk Creek Parkway, Ste. 310
Leawood, KS 66211
CUSTODIAN
Huntington National Bank
41 South High Street
Columbus, OH 43215
ADMINISTRATOR, TRANSFER AGENT AND FUND ACCOUNTANT
Ultimus Asset Services, LLC
225 Pictoria Drive, Suite 450
Cincinnati, OH 45246
This report is intended only for the information of shareholders or those who have received the Fund’s prospectus which contains information about the Fund’s management fee and expenses. Please read the prospectus carefully before investing.
Distributed by Unified Financial Securities, LLC
Member FINRA/SIPC
Semi-Annual Report
April 30, 2017
| ||
Foundry Partners Fundamental Small Cap Value Fund
Fund Adviser:
Foundry Partners, LLC
510 First Avenue North, Suite 409
Minneapolis, MN 55403
Investment Results – (Unaudited)
| Average Annual Total Returns(a) As of April 30, 2017 | ||||||
| Investor Class | Institutional Class | Russell 2000® Value Index(b) | ||||
| Six Months | 16.58% | 16.72% | 18.26% | |||
| One Year | 24.54% | 24.84% | 27.18% | |||
| Three Year | 8.85% | 9.12% | 8.71% | |||
| Five Year | 13.33% | 13.57% | 12.96% | |||
| Ten Year | 7.65% | N/A | 6.02% | |||
| Since Inception (8/22/07) | N/A | 8.17% | 6.73% | |||
| Since Inception (12/31/03) | 10.83% | N/A | 8.34% | |||
| Expense Ratios(c) | ||||||
| Investor Class | Institutional Class | |||||
| 1.44% | 1.19% | |||||
The investment return and principal value of an investment will fluctuate so that an investor’s shares, when redeemed, may be worth more or less than their original cost. The returns shown do not reflect deduction of taxes that a shareholder would pay on Foundry Partners Fundamental Small Cap Value Fund (the “Fund”) distributions or the redemption of Fund shares. THE FUND’S RETURNS REPRESENT PAST PERFORMANCE AND DO NOT PREDICT FUTURE RESULTS. The returns shown are net of all recurring expenses. Current performance of the Fund may be lower or higher than the performance quoted. For more information on the Fund, and to obtain performance data current to the most recent month end, or to request a prospectus, please call 1-800-247-1014.
You should carefully consider the investment objectives, potential risk, management fees, and charges and expenses of the Fund before investing. The Fund’s prospectus contains this and other information about the Fund, and should be read carefully before investing.
| (a) | Average annual total returns reflect any change in price per share and assume the reinvestment of all distributions. The Fund’s returns reflect any fee reductions during the applicable periods. If such fee reductions had not occurred, the quoted performance would have been lower. Total returns for periods less than 1 year are not annualized. |
| (b) | The Russell 2000® Value Index (“Index”) is an unmanaged benchmark that assumes reinvestment of all distributions and excludes the effect of taxes and fees. The Index is a widely recognized unmanaged index of equity prices and is representative of a broader market and range of securities than are found in the Fund’s portfolio. Individuals cannot invest directly in the Index; however, an individual can invest in ETFs or other investment vehicles that attempt to track the performance of a benchmark index. |
| (c) | The expense ratios are from the Fund’s prospectus dated February 28, 2017. Foundry Partners, LLC (the “Adviser”) has contractually agreed to waive its management fee and/or reimburse certain operating expenses through February 28, 2018, but only to the extent necessary so that the Fund’s net expenses, excluding brokerage fees and commissions, borrowing costs (such as interest expense and dividend expense on securities sold short), taxes, extraordinary expenses, distribution and shareholder services (12b-1) fees, and indirect expenses (such as fees and expenses of acquired funds), do not exceed 1.25% of the Fund’s average daily net assets. Information pertaining to the Fund’s expense ratios as of April 30, 2017 can be found in the financial highlights. |
The Fund is distributed by Unified Financial Securities, LLC, member FINRA/SIPC.
Semi-Annual Report
1
Fund Holdings (Unaudited)
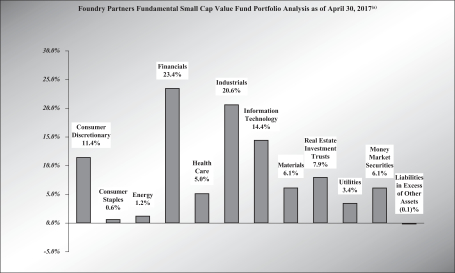
| (a) | As a percent of net assets. |
Availability of Portfolio Schedule (Unaudited)
The Fund files its complete schedule of portfolio holdings with the Securities and Exchange Commission (“SEC”) for the first and third quarters of each fiscal year on Form N-Q, which is available on the SEC’s web site at www.sec.gov. The Fund’s Form N-Q may be reviewed and copied at the SEC’s Public Reference Room in Washington, DC. Information on the operation of the Public Reference Room may be obtained by calling 1-800-SEC-0330.
Semi-Annual Report
2
| Foundry Partners Fundamental Small Cap Value Fund |
Schedule of Investments
April 30, 2017 (Unaudited)
| Shares | Fair Value | |||||||||||
Common Stocks — 94.01% | ||||||||||||
Consumer Discretionary — 11.38% | ||||||||||||
| 47,858 | Aaron’s, Inc. | $ | 1,720,017 | |||||||||
| 160,252 | American Axle & Manufacturing Holdings, Inc. * | 2,818,833 | ||||||||||
| 28,244 | Big 5 Sporting Goods Corp. | 434,958 | ||||||||||
| 24,551 | Big Lots, Inc. | 1,239,580 | ||||||||||
| 107,440 | Bloomin’ Brands, Inc. | 2,330,374 | ||||||||||
| 45,798 | Cooper Tire & Rubber Co. | 1,754,063 | ||||||||||
| 45,373 | DeVry Education Group, Inc. | 1,717,368 | ||||||||||
| 26,626 | Finish Line, Inc./The, Class A | 420,957 | ||||||||||
| 9,911 | Helen of Troy Ltd. * | 931,634 | ||||||||||
| 20,023 | John Wiley & Sons, Inc., Class A | 1,055,212 | ||||||||||
| 108,018 | KB Home | 2,225,171 | ||||||||||
| 25,509 | M/I Homes, Inc. * | 692,824 | ||||||||||
| 43,383 | Meredith Corp. | 2,540,075 | ||||||||||
| 22,582 | Movado Group, Inc. | 528,419 | ||||||||||
| 20,409,485 | ||||||||||||
Consumer Staples — 0.59% | ||||||||||||
| 28,592 | SpartanNash Co. | 1,052,186 | ||||||||||
Energy — 1.17% | ||||||||||||
| 35,163 | Aegean Marine Petroleum Network, Inc. | 392,067 | ||||||||||
| 33,059 | Alliance Resource Partners LP | 702,504 | ||||||||||
| 158,037 | Denbury Resources, Inc. * | 350,842 | ||||||||||
| 260,872 | Gran Tierra Energy, Inc. * | 657,397 | ||||||||||
| 2,102,810 | ||||||||||||
Financials — 23.40% | ||||||||||||
| 33,536 | Allied World Assurance Co. Holdings AG | 1,780,426 | ||||||||||
| Shares | Fair Value | |||||||||||
Common Stocks — (continued) | ||||||||||||
Financials — (continued) | ||||||||||||
| 33,464 | Aspen Insurance Holdings Ltd. | $ | 1,751,840 | |||||||||
| 124,674 | Associated Banc-Corp. | 3,104,383 | ||||||||||
| 14,128 | Chemical Financial Corp. | 670,374 | ||||||||||
| 28,281 | Clifton Bancorp, Inc. | 472,293 | ||||||||||
| 36,043 | Donnelley Financial Solutions, Inc. * | 800,875 | ||||||||||
| 95,036 | F.N.B. Corp. | 1,353,313 | ||||||||||
| 81,014 | First Midwest Bancorp, Inc. | 1,839,828 | ||||||||||
| 192,847 | Fulton Financial Corp. | 3,558,027 | ||||||||||
| 79,462 | Hancock Holding Co. | 3,710,875 | ||||||||||
| 21,081 | Hanover Insurance Group, Inc. | 1,860,820 | ||||||||||
| 57,957 | International Bancshares Corp. | 2,167,592 | ||||||||||
| 88,101 | Janus Capital Group, Inc. | 1,203,460 | ||||||||||
| 20,744 | Nelnet, Inc., Class A | 933,687 | ||||||||||
| 177,004 | Old National Bancorp | 2,973,667 | ||||||||||
| 24,910 | Prosperity Bancshares, Inc. | 1,673,952 | ||||||||||
| 127,771 | TCF Financial Corp. | 2,109,499 | ||||||||||
| 101,667 | Umpqua Holdings Corp. | 1,796,456 | ||||||||||
| 108,190 | Washington Federal, Inc. | 3,646,003 | ||||||||||
| 28,813 | WesBanco, Inc. | 1,147,046 | ||||||||||
| 48,276 | Wintrust Financial Corp. | 3,420,837 | ||||||||||
| 41,975,253 | ||||||||||||
Health Care — 5.05% | ||||||||||||
| 9,326 | Almost Family, Inc. * | 463,036 | ||||||||||
| 16,761 | Charles River Laboratories International, Inc. * | 1,503,462 | ||||||||||
| 34,697 | Hill-Rom Holdings, Inc. | 2,624,481 | ||||||||||
| 9,563 | Integra LifeSciences Holdings Corp. * | 439,611 | ||||||||||
| 46,249 | Owens & Minor, Inc. | 1,602,528 | ||||||||||
| 43,838 | Quality Systems, Inc. * | 625,130 | ||||||||||
| 131,368 | Select Medical Holdings Corp. * | 1,806,310 | ||||||||||
| 9,064,558 | ||||||||||||
See accompanying notes which are an integral part of these financial statements.
Semi-Annual Report
3
| Foundry Partners Fundamental Small Cap Value Fund |
Schedule of Investments (Continued)
April 30, 2017 (Unaudited)
| Shares | Fair Value | |||||||||||
Common Stocks — (continued) | ||||||||||||
Industrials — 20.62% | ||||||||||||
| 60,594 | AAR Corp. | $ | 2,180,778 | |||||||||
| 52,054 | Aegion Corp. * | 1,187,872 | ||||||||||
| 117,933 | Aircastle Ltd. | 2,785,577 | ||||||||||
| 77,661 | Barnes Group, Inc. | 4,269,025 | ||||||||||
| 23,285 | Brink’s Co./The | 1,429,699 | ||||||||||
| 37,943 | Crane Co. | 3,032,025 | ||||||||||
| 33,238 | EMCOR Group, Inc. | 2,185,066 | ||||||||||
| 29,013 | EnerSys | 2,411,270 | ||||||||||
| 36,661 | Generac Holdings, Inc. * | 1,289,367 | ||||||||||
| 46,887 | Global Brass & Copper Holdings, Inc. | 1,671,522 | ||||||||||
| 41,557 | Hillenbrand, Inc. | 1,533,453 | ||||||||||
| 18,025 | Hyster-Yale Materials Handling, Inc., Class A | 1,083,483 | ||||||||||
| 49,950 | Korn/Ferry International | 1,618,380 | ||||||||||
| 16,658 | LSC Communications, Inc. | 430,942 | ||||||||||
| 21,342 | Matthews International Corp., Class A | 1,462,994 | ||||||||||
| 33,484 | Navigant Consulting, Inc. * | 802,611 | ||||||||||
| 12,208 | Park-Ohio Holdings, Corp. | 480,385 | ||||||||||
| 30,299 | Regal-Beloit Corp. | 2,389,076 | ||||||||||
| 66,608 | Tutor Perini Corp. * | 2,054,857 | ||||||||||
| 15,012 | Universal Forest Products, Inc. | 1,430,493 | ||||||||||
| 40,919 | Wesco Aircraft Holdings, Inc. * | 497,166 | ||||||||||
| 28,072 | West Corp. | 749,242 | ||||||||||
| 36,975,283 | ||||||||||||
Information Technology — 14.44% | ||||||||||||
| 47,600 | AVX Corp. | 804,916 | ||||||||||
| 24,662 | Belden, Inc. | 1,718,941 | ||||||||||
| 100,875 | Brocade Communications Systems, Inc. | 1,267,999 | ||||||||||
| 102,454 | Celestica, Inc. * | 1,459,970 | ||||||||||
| 24,260 | ChipMOS Technology, Inc. ADR | 423,094 | ||||||||||
| Shares | Fair Value | |||||||||||
Common Stocks — (continued) | ||||||||||||
Information Technology — (continued) | ||||||||||||
| 37,733 | Convergys Corp. | $ | 849,370 | |||||||||
| 32,031 | CSG Systems International, Inc. | 1,201,483 | ||||||||||
| 36,776 | Itron, Inc. * | 2,384,924 | ||||||||||
| 46,863 | IXYS Corp. | 653,739 | ||||||||||
| 53,425 | Kulicke & Soffa Industries, Inc. * | 1,192,446 | ||||||||||
| 15,321 | Microsemi Corp. * | 719,168 | ||||||||||
| 11,504 | NETGEAR, Inc. * | 542,414 | ||||||||||
| 39,997 | Plantronics, Inc. | 2,183,836 | ||||||||||
| 79,749 | Sanmina Corp. * | 2,970,650 | ||||||||||
| 16,756 | ScanSource, Inc. * | 661,862 | ||||||||||
| 18,586 | Science Applications International Corp. | 1,356,592 | ||||||||||
| 19,749 | Sykes Enterprises, Inc. * | 588,718 | ||||||||||
| 21,188 | Tech Data Corp. * | 2,026,632 | ||||||||||
| 176,983 | Vishay Intertechnology, Inc. | 2,893,672 | ||||||||||
| 25,900,426 | ||||||||||||
Materials — 6.12% | ||||||||||||
| 37,013 | A Schulman, Inc. | 1,171,461 | ||||||||||
| 31,896 | Cabot Corp. | 1,919,820 | ||||||||||
| 110,748 | Coeur Mining, Inc. * | 1,003,377 | ||||||||||
| 27,986 | Kraton Corp. * | 915,422 | ||||||||||
| 48,979 | Mercer International, Inc. | 597,544 | ||||||||||
| 123,554 | Owens-Illinois, Inc. * | 2,695,948 | ||||||||||
| 74,845 | Pan American Silver Corp. | 1,255,151 | ||||||||||
| 16,715 | Stepan Co. | 1,417,432 | ||||||||||
| 10,976,155 | ||||||||||||
Real Estate — 7.85% | ||||||||||||
| 34,598 | Apollo Commercial Real Estate Finance, Inc. | 667,395 | ||||||||||
| 51,841 | Ashford Hospitality Prime, Inc. | 548,996 | ||||||||||
| 166,282 | Ashford Hospitality Trust, Inc. | 1,039,263 | ||||||||||
| 158,323 | Brandywine Realty Trust | 2,686,741 | ||||||||||
| 55,422 | GEO Group, Inc./The | 1,846,661 | ||||||||||
See accompanying notes which are an integral part of these financial statements.
Semi-Annual Report
4
| Foundry Partners Fundamental Small Cap Value Fund |
Schedule of Investments (Continued)
April 30, 2017 (Unaudited)
| Shares | Fair Value | |||||||||||
Common Stocks — (continued) | ||||||||||||
Real Estate — (continued) | ||||||||||||
| 26,303 | Hospitality Properties Trust | $ | 837,225 | |||||||||
| 163,318 | Lexington Realty Trust | 1,660,944 | ||||||||||
| 75,974 | Mack-Cali Realty Corp. | 2,055,097 | ||||||||||
| 84,612 | Medical Properties Trust, Inc. | 1,105,879 | ||||||||||
| 312,598 | RAIT Financial Trust | 959,676 | ||||||||||
| 27,005 | Select Income REIT | 676,745 | ||||||||||
| 14,084,622 | ||||||||||||
Utilities — 3.39% | ||||||||||||
| 34,446 | ALLETE, Inc. | 2,408,120 | ||||||||||
| 18,674 | IDACORP, Inc. | 1,578,326 | ||||||||||
| 46,273 | Portland General Electric Co. | 2,098,018 | ||||||||||
| 6,084,464 | ||||||||||||
| | Total Common Stocks | 168,625,242 | ||||||||||
Money Market Securities — 6.10% | ||||||||||||
| 10,930,706 | Federated Government Obligations Fund, Institutional Class, 0.65% (a) | 10,930,706 | ||||||||||
| | Total Money Market Securities | 10,930,706 | ||||||||||
| | Total Investments — 100.11% | 179,555,948 | ||||||||||
| | Liabilities in Excess of Other | (193,428) | ||||||||||
Net Assets — 100.00% | $ | 179,362,520 | ||||||||||
| (a) | Rate disclosed is the seven day effective yield as of April 30, 2017. |
| * | Non-income producing security. |
ADR — American Depositary Receipt
The sectors shown on the portfolio of investments are based on Global Industry Classification Standard, or GICS® (“GICS”). The GICS was developed by and/or is the exclusive property of MSCI, Inc. and Standard & Poor’s Financial Services LLC (“S&P”). GICS is a service mark of MSCI, Inc. and S&P and has been licensed for use by the Administrator.
See accompanying notes which are an integral part of these financial statements.
Semi-Annual Report
5
Foundry Partners Fundamental Small Cap Value Fund | ||
Statement of Assets and Liabilities
April 30, 2017 (Unaudited)
| Assets: | ||||
Investments in securities, at cost | $ | 148,657,065 | ||
Investments in securities, at fair value | 179,555,948 | |||
Dividends receivable | 35,067 | |||
Receivable for fund shares sold | 60,375 | |||
Prepaid expenses | 41,696 | |||
Total assets | 179,693,086 | |||
| Liabilities: | ||||
Payable for shares redeemed | 169,656 | |||
Payable to Adviser | 122,865 | |||
Payable to Administrator | 18,027 | |||
Accrued 12b-1 fees | 8,824 | |||
Other accrued expenses | 11,194 | |||
Total liabilities | 330,566 | |||
Net Assets | $ | 179,362,520 | ||
| Net Assets consist of: | ||||
Paid in capital | $ | 147,126,072 | ||
Accumulated undistributed net investment income | 51,417 | |||
Accumulated undistributed net realized gain on investments | 1,286,148 | |||
Net unrealized appreciation on investments | 30,898,883 | |||
Net Assets | $ | 179,362,520 | ||
| Investor Class: | ||||
Net Assets | $ | 43,547,960 | ||
Shares outstanding | 1,869,190 | |||
Net asset value, offering and redemption price per share | $ | 23.30 | ||
| Institutional Class: | ||||
Net Assets | $ | 135,814,560 | ||
Shares outstanding | 5,803,871 | |||
Net asset value, offering and redemption price per share | $ | 23.40 | ||
See accompanying notes which are an integral part of these financial statements.
Semi-Annual Report
6
Foundry Partners Fundamental Small Cap Value Fund | ||
Statement of Operations
For the Six Months Ended April 30, 2017 (Unaudited)
| Investment Income: | ||||
Dividend income | $ | 1,469,902 | ||
Foreign dividend taxes withheld | (6,024 | ) | ||
Total investment income | 1,463,878 | |||
| Expenses: | ||||
Investment Adviser | 665,746 | |||
Administrator | 112,838 | |||
Distribution (12b-1) Investor Class | 54,234 | |||
Registration | 28,621 | |||
Printing | 14,891 | |||
Custodian | 11,098 | |||
Legal | 9,285 | |||
Auditing | 8,840 | |||
Trustee | 3,865 | |||
Miscellaneous | 27,145 | |||
Net operating expenses | 936,563 | |||
Net investment income | 527,315 | |||
| Realized & Change in Unrealized Gain on Investments | ||||
Net realized gain on investment securities | 1,560,770 | |||
Change in unrealized appreciation on investment securities | 21,023,029 | |||
Net realized and change in unrealized gain on investment securities | 22,583,799 | |||
Net increase in net assets resulting from operations | $ | 23,111,114 | ||
See accompanying notes which are an integral part of these financial statements.
Semi-Annual Report
7
Foundry Partners Fundamental Small Cap Value Fund | ||
Statements of Changes in Net Assets
| Six Months Ended April 30, 2017 | Year Ended October 31, 2016 | |||||||
| (Unaudited) | ||||||||
| Increase (Decrease) in Net Assets due to: | ||||||||
| Operations: | ||||||||
Net investment income | $ | 527,315 | $ | 1,320,906 | ||||
Net realized gain on investment securities | 1,560,770 | 3,102,550 | ||||||
Change in unrealized appreciation on investment securities | 21,023,029 | 5,898,041 | ||||||
Net increase in net assets resulting from operations | 23,111,114 | 10,321,497 | ||||||
| Distributions: | ||||||||
Net Investment Income: | ||||||||
Class A(a) | — | (48,014 | ) | |||||
Investor Class(b) | (239,835 | ) | (718,238 | ) | ||||
Institutional Class | (848,537 | ) | (1,145,978 | ) | ||||
Realized gain: | ||||||||
Class A(a) | — | (384,616 | ) | |||||
Investor Class(b) | (870,786 | ) | (5,875,018 | ) | ||||
Institutional Class | (2,123,643 | ) | (7,745,108 | ) | ||||
Total distributions | (4,082,801 | ) | (15,916,972 | ) | ||||
| Capital Transactions—Class A: (a) | ||||||||
Proceeds from shares sold | — | 1,430,843 | ||||||
Reinvestment of distributions | — | 423,710 | ||||||
Shares redeemed in connection with class consolidation | — | (2,502,231 | ) | |||||
Amount paid for shares redeemed | — | (2,603,135 | ) | |||||
Total Capital Transactions—Class A | — | (3,250,813 | ) | |||||
| Capital Transactions—Investor Class: (b) | ||||||||
Proceeds from shares sold | 5,216,938 | 5,660,241 | ||||||
Shares issued in connection with class consolidation | — | 2,502,231 | ||||||
Reinvestment of distributions | 1,094,340 | 6,521,846 | ||||||
Amount paid for shares redeemed | (6,889,590 | ) | (30,670,094 | ) | ||||
Proceeds from redemption fees (c) | — | 1,838 | ||||||
Total Capital Transactions—Investor Class | (578,312 | ) | (15,983,938 | ) | ||||
| Capital Transactions—Institutional Class: | ||||||||
Proceeds from shares sold | 37,882,282 | 28,241,114 | ||||||
Reinvestment of distributions | 2,800,611 | 8,579,713 | ||||||
Amount paid for shares redeemed | (16,620,965 | ) | (25,850,060 | ) | ||||
Total Capital Transactions-Institutional Class | 24,061,928 | 10,970,767 | ||||||
Net change resulting from capital transactions | 23,483,616 | (8,263,984 | ) | |||||
Total Increase (Decrease) in Net Assets | 42,511,929 | (13,859,459 | ) | |||||
| Net Assets: | ||||||||
Beginning of period | 136,850,591 | 150,710,050 | ||||||
End of period | $ | 179,362,520 | $ | 136,850,591 | ||||
Accumulated net investment income included in net assets at end of period | $ | 51,417 | $ | 612,474 | ||||
See accompanying notes which are an integral part of these financial statements.
Semi-Annual Report
8
| Six Months Ended April 30, 2017 | Year Ended October 31, 2016 | |||||||
| (Unaudited) | ||||||||
| Share Transactions—Class A: (a) | ||||||||
Shares sold | — | 77,514 | ||||||
Shares issued in reinvestment of distributions | — | 23,141 | ||||||
Shares redeemed in connection with class consolidation | — | (121,309 | ) | |||||
Shares redeemed | — | (145,598 | ) | |||||
Total Share Transactions—Class A | — | (166,252 | ) | |||||
| Share Transactions—Investor Class: (b) | ||||||||
Shares sold | 227,692 | 298,860 | ||||||
Shares issued in connection with class consolidation | — | 120,985 | ||||||
Shares issued in reinvestment of distributions | 47,292 | 355,220 | ||||||
Shares redeemed | (302,559 | ) | (1,686,897 | ) | ||||
Total Share Transactions—Investor Class | (27,575 | ) | (911,832 | ) | ||||
| Share Transactions—Institutional Class: | ||||||||
Shares sold | 1,649,005 | 1,537,354 | ||||||
Shares issued in reinvestment of distributions | 120,612 | 465,783 | ||||||
Shares redeemed | (721,963 | ) | (1,290,602 | ) | ||||
Total Share Transactions—Institutional Class | 1,047,654 | 712,535 | ||||||
| (a) | Effective August 29, 2016, Class A was consolidated into Investor Class. |
| (b) | Retail Class was renamed Investor Class on August 29, 2016. |
| (c) | Prior to August 30, 2016, a redemption fee of 1.00% was charged on shares held less than 60 days. |
See accompanying notes which are an integral part of these financial statements.
Semi-Annual Report
9
Foundry Partners Fundamental Small Cap Value Fund | ||
Financial Highlights
(For a share outstanding throughout each period ended October 31 or April 30 as noted)
| Net Asset Value, beginning of period | Net investment income (loss) | Net realized and unrealized gain (loss) on investments | Total from investment operations | Distributions from net investment income | Distributions from net realized gain on investment transactions | Total distributions | ||||||||||||||||||||||
| Investor Class | ||||||||||||||||||||||||||||
| 2012 | $ | 18.11 | 0.11 | 1.47 | 1.58 | (0.17 | ) | (1.66 | ) | (1.83 | ) | |||||||||||||||||
| 2013 | $ | 17.86 | 0.17 | 6.08 | 6.25 | (0.08 | ) | (0.16 | ) | (0.24 | ) | |||||||||||||||||
| 2014 | $ | 23.87 | 0.15 | 2.13 | 2.28 | (0.16 | ) | (2.36 | ) | (2.52 | ) | |||||||||||||||||
| 2015 | $ | 23.63 | 0.19 | (0.11 | ) | 0.08 | (0.18 | ) | (2.12 | ) | (2.30 | ) | ||||||||||||||||
| 2016 | $ | 21.41 | 0.16 | 1.32 | 1.48 | (0.26 | ) | (2.14 | ) | (2.40 | ) | |||||||||||||||||
| 2017 (e) | $ | 20.49 | 0.06 | 3.34 | 3.40 | (0.13 | ) | (0.46 | )�� | (0.59 | ) | |||||||||||||||||
| Institutional Class | ||||||||||||||||||||||||||||
| 2012 | $ | 18.19 | 0.14 | 1.48 | 1.62 | (0.23 | ) | (1.66 | ) | (1.89 | ) | |||||||||||||||||
| 2013 | $ | 17.92 | 0.20 | 6.10 | 6.30 | (0.08 | ) | (0.16 | ) | (0.24 | ) | |||||||||||||||||
| 2014 | $ | 23.98 | 0.20 | (h) | 2.14 | 2.34 | (0.22 | ) | (2.36 | ) | (2.58 | ) | ||||||||||||||||
| 2015 | $ | 23.74 | 0.26 | (0.12 | ) | 0.14 | (0.24 | ) | (2.12 | ) | (2.36 | ) | ||||||||||||||||
| 2016 | $ | 21.52 | 0.25 | 1.29 | 1.54 | (0.32 | ) | (2.14 | ) | (2.46 | ) | |||||||||||||||||
| 2017 (e) | $ | 20.60 | 0.09 | 3.35 | 3.44 | (0.18 | ) | (0.46 | ) | (0.64 | ) | |||||||||||||||||
| (a) | Total return represents the rate the investor would have earned or lost on an investment in the Fund, assuming reinvestment of dividends. |
| (b) | Portfolio turnover is calculated on the basis of the Fund as a whole without distinguishing among the classes of shares. |
| (c) | Amount is less than $0.005. |
| (d) | The expense ratios shown include overdraft fees charged to the Fund. Without these overdraft fees, the expense ratios would be 1.25% for Investor Class and 1.00% for Institutional Class. |
| (e) | Six months ended April 30, 2017 (Unaudited). |
| (f) | Not annualized |
| (g) | Annualized |
| (h) | Per share amount has been calculated using the average shares method. |
See accompanying notes which are an integral part of these financial statements.
Semi-Annual Report
10
| Paid in capital from redemption fees | Net Asset Value, end of period | Total return(a) | Net Assets, end of period (000 omitted) | Ratio of net expenses to average net assets | Ratio of expenses (prior to reimbursements) to average net assets | Ratio of net investment income (loss) to average net assets | Portfolio turnover rate(b) | |||||||||||||||||||||||
| — | (c) | $ | 17.86 | 9.93 | % | $ | 69,992 | 1.25 | % | 1.74 | % | 0.56 | % | 30.19 | % | |||||||||||||||
| — | (c) | $ | 23.87 | 35.38 | % | $ | 63,976 | 1.26 | %(d) | 1.53 | % | 0.72 | % | 28.28 | % | |||||||||||||||
| — | (c) | $ | 23.63 | 9.89 | % | $ | 64,020 | 1.25 | % | 1.37 | % | 0.63 | % | 36.66 | % | |||||||||||||||
| — | (c) | $ | 21.41 | 0.21 | % | $ | 60,134 | 1.37 | % | 1.41 | % | 0.87 | % | 43.59 | % | |||||||||||||||
| — | (c) | $ | 20.49 | 8.23 | % | $ | 38,864 | 1.43 | % | 1.43 | % | 0.84 | % | 12.85 | % | |||||||||||||||
| — | $ | 23.30 | 16.58 | %(f) | $ | 43,548 | 1.37 | %(g) | 1.37 | %(g) | 0.51 | %(g) | 16.39 | %(f) | ||||||||||||||||
| — | $ | 17.92 | 10.14 | % | $ | 13,185 | 1.00 | % | 1.49 | % | 0.80 | % | 30.19 | % | ||||||||||||||||
| — | $ | 23.98 | 35.55 | % | $ | 14,689 | 1.01 | %(d) | 1.27 | % | 0.95 | % | 28.28 | % | ||||||||||||||||
| — | $ | 23.74 | 10.12 | % | $ | 82,086 | 1.00 | % | 1.12 | % | 0.85 | % | 36.66 | % | ||||||||||||||||
| — | $ | 21.52 | 0.46 | % | $ | 87,023 | 1.12 | % | 1.16 | % | 1.12 | % | 43.59 | % | ||||||||||||||||
| — | $ | 20.60 | 8.50 | % | $ | 97,987 | 1.18 | % | 1.18 | % | 1.05 | % | 12.85 | % | ||||||||||||||||
| — | $ | 23.40 | 16.72 | %(f) | $ | 135,815 | 1.12 | %(g) | 1.12 | %(g) | 0.73 | %(g) | 16.39 | %(f) | ||||||||||||||||
See accompanying notes which are an integral part of these financial statements.
Semi-Annual Report
11
| Foundry Partners Fundamental Small Cap Value Fund | ||
Notes to the Financial Statements
April 30, 2017 (Unaudited)
NOTE 1. ORGANIZATION
The Foundry Partners Fundamental Small Cap Value Fund (the “Fund”) is an open-end diversified series of Valued Advisers Trust (the “Trust”). The Trust is a management investment company established under the laws of Delaware by an Agreement and Declaration of Trust dated June 13, 2008 (the “Trust Agreement”). The Trust Agreement permits the Board of Trustees (the “Board”) to issue an unlimited number of shares of beneficial interest of separate series without par value. The Fund is one of a series of funds authorized by the Board. The Fund’s investment adviser is Foundry Partners, LLC (the “Adviser”). The investment objective of the Fund is long-term capital appreciation.
The Fund currently offers Investor Class shares (Retail Class was renamed Investor Class on August 29, 2016) and Institutional Class shares. Effective on the close of business on August 29, 2016, Class A shares were consolidated into Investor Class shares.
NOTE 2. SIGNIFICANT ACCOUNTING POLICIES
The Fund is an investment company and follows accounting and reporting guidance under Financial Accounting Standards Board Accounting Standards Codification (“ASC”) Topic 946, “Financial Services-Investment Companies”. The following is a summary of significant accounting policies followed by the Fund in the preparation of its financial statements. These policies are in conformity with the generally accepted accounting principles in the United States of America (“GAAP”).
Estimates—The preparation of financial statements in conformity with GAAP requires management to make estimates and assumptions that affect the reported amounts of assets and liabilities and disclosure of contingent assets and liabilities at the date of the financial statements and the reported amounts of increases and decreases in net assets from operations during the reporting period. Actual results could differ from those estimates.
Securities Valuation—All investments in securities are recorded at their estimated fair value as described in Note 3.
Federal Income Taxes—The Fund makes no provision for federal income or excise tax. The Fund has qualified and intends to qualify each year as a regulated investment company (“RIC”) under subchapter M of the Internal Revenue Code of 1986, as amended, by complying with the requirements applicable to RICs and by distributing substantially all of its taxable income. The Fund also intends to distribute sufficient net investment income and net capital gains, if any, so that it will not be subject to excise tax on undistributed income and gains. If the required amount of net investment income or gains is not distributed, the Fund could incur a tax expense.
As of and during the six months ended April 30, 2017, the Fund did not have a liability for any unrecognized tax benefits. The Fund recognizes interest and penalties, if any, related to unrecognized tax benefits as income tax expense in the statement of operations. During the six months ended April 30, 2017 the fund did not incur any interest or penalties.
Semi-Annual Report
12
Expenses—Expenses incurred by the Trust that do not relate to a specific fund of the Trust are allocated to the individual funds based on each fund’s relative net assets or other appropriate basis (as determined by the Board). Expenses attributable to any class are borne by that class. Income, realized gains and losses, unrealized appreciation and depreciation, and expenses are allocated to each class based on the net assets in relation to the relative net assets of the Fund.
Security Transactions and Related Income—The Fund follows industry practice and records security transactions on the trade date for financial reporting purposes. For financial statement and income tax purposes, the specific identification method is used for determining gains or losses. Dividend income is recorded on the ex-dividend date and interest income is recorded on an accrual basis. Discounts and premiums on securities purchased are accreted or amortized using the effective interest method, if applicable. Withholding taxes on foreign dividends have been provided for in accordance with the Fund’s understanding of the applicable country’s tax rules and rates.
The Fund holds Real Estate Investment Trusts (“REITs”) which pay dividends to their shareholders based upon available funds from operations. It is possible for these dividends to exceed the REIT’s underlying taxable earnings and profits resulting in the excess portion of such dividends being designated as a return of capital. Distributions received from REITs that represent a return of capital or capital gains are recorded as a reduction of the cost of the applicable REIT or as a realized gain, respectively.
Dividends and Distributions—Distributions to shareholders, which are determined in accordance with income tax regulations, are recorded on the ex-dividend date. The Fund intends to distribute substantially all of its net investment income on at least an annual basis. The Fund intends to distribute its net realized long-term capital gains and its net realized short-term capital gains, if any, at least once a year. The treatment for financial reporting purposes of distributions made to shareholders during the year from net investment income or net realized capital gains may differ from their ultimate treatment for federal income tax purposes. These differences are caused primarily by differences in the timing of the recognition of certain components of income, expense or realized capital gain for federal income tax purposes. Where such differences are permanent in nature, they are reclassified in the components of the net assets based on their ultimate characterization for federal income tax purposes. Any such reclassifications will have no effect on net assets, results of operations or net asset values per share of the Fund.
NOTE 3. SECURITIES VALUATION AND FAIR VALUE MEASUREMENTS
Fair value is defined as the price that the Fund would receive upon selling an investment in a timely transaction to an independent buyer in the principal or most advantageous market of the investment. GAAP establishes a three-tier hierarchy to maximize the use of observable market data and minimize the use of unobservable inputs and to establish classification of fair value measurements for disclosure purposes.
Semi-Annual Report
13
| Foundry Partners Fundamental Small Cap Value Fund | ||
Notes to the Financial Statements
April 30, 2017 (Unaudited)
Inputs refer broadly to the assumptions that market participants would use in pricing the asset or liability, including assumptions about risk (the risk inherent in a particular valuation technique used to measure fair value including such a pricing model and/or the risk inherent in the inputs to the valuation technique). Inputs may be observable or unobservable. Observable inputs are inputs that reflect the assumptions market participants would use in pricing the asset or liability developed based on market data obtained from sources independent of the reporting entity. Unobservable inputs are inputs that reflect the reporting entity’s own assumptions about the assumptions market participants would use in pricing the asset or liability developed based on the best information available in the circumstances.
Various inputs are used in determining the value of the Fund’s investments. These inputs are summarized in the three broad levels listed below.
| • | Level 1—unadjusted quoted prices in active markets for identical investments and/or registered investment companies where the value per share is determined and published and is the basis for current transactions for identical assets or liabilities at the valuation date. |
| • | Level 2—other significant observable inputs (including, but not limited to, quoted prices for an identical security in an inactive market, quoted prices for similar securities, interest rates, prepayment speeds, credit risk, etc.). |
| • | Level 3—significant unobservable inputs (including the Fund’s own assumptions in determining fair value of investments based on the best information available). |
The inputs used to measure fair value may fall into different levels of the fair value hierarchy. In such cases, for disclosure purposes, the level in the fair value hierarchy which is reported is determined based on the lowest level input that is significant to the fair value measurement in its entirety.
Equity securities that are traded on any stock exchange are generally valued at the last quoted sale price on the security’s primary exchange. Lacking a last sale price, an exchange traded security is generally valued at its last bid price. Securities traded in the NASDAQ over-the- counter market are generally valued at the NASDAQ Official Closing Price. When using the market quotations and when the market is considered active, the security is classified as a Level 1 security. In the event that market quotations are not readily available or are considered unreliable due to market or other events, the Fund values its securities and other assets at fair value in accordance with policies established by and under the general supervision of the Board. Under these policies, the securities will be classified as Level 2 or 3 within the fair value hierarchy, depending on the inputs used.
Investments in mutual funds, including money market mutual funds, are generally priced at the ending net asset value (“NAV”) provided by the pricing service of the funds. These securities are categorized as Level 1 securities.
Semi-Annual Report
14
In accordance with the Trust’s valuation policies, the Adviser is required to consider all appropriate factors relevant to the value of securities for which it has determined other pricing sources are not available or reliable as described above. No single standard exists for determining fair value, because fair value depends upon the circumstances of each individual case. As a general principle, the current fair value of an issue of securities being valued by the Adviser would appear to be the amount that the Fund might reasonably expect to receive for them upon their current sale. Methods that are in accordance with this principle may, for example, be based on (i) a multiple of earnings; (ii) a discount from market of a similar freely traded security (including a derivative security or a basket of securities traded on other markets, exchanges or among dealers); or (iii) yield to maturity with respect to debt issues, or a combination of these and other methods. Fair-value pricing is permitted if, in the Adviser’s opinion, the validity of market quotations appears to be questionable based on factors such as evidence of a thin market in the security based on a small number of quotations, a significant event occurs after the close of a market but before a Fund’s NAV calculation that may affect a security’s value, or the Adviser is aware of any other data that calls into question the reliability of market quotations.
The following is a summary of the inputs used to value the Fund’s investments as of April 30, 2017:
| Valuation Inputs | ||||||||||||||||
| Assets | Level 1 | Level 2 | Level 3 | Total | ||||||||||||
Common Stocks* | $ | 168,625,242 | $ | — | $ | — | $ | 168,625,242 | ||||||||
Money Market Securities | 10,930,706 | — | — | 10,930,706 | ||||||||||||
|
|
|
|
|
|
|
| |||||||||
Total | $ | 179,555,948 | $ | — | $ | — | $ | 179,555,948 | ||||||||
| * | Refer to Schedule of Investments for sector classifications. |
The Fund did not hold any investments during the reporting period for which significant unobservable inputs (Level 3) were used in determining fair value; therefore, no reconciliation of Level 3 securities is included for this reporting period. The Fund did not hold any derivative instruments during the reporting period.
The Trust recognizes transfers between fair value hierarchy levels at the end of the reporting period. The transfers from Level 1 to Level 2 represent securities which were fair valued at the end of the period that were not at the beginning of the period. Transfers from Level 2 to Level 1 represent securities which were fair valued at the beginning of the period but not at April 30, 2017. The following is a summary of the transfer between Level 1 and Level 2 of the fair value hierarchy as of April 30, 2017 based on input levels assigned at October 31, 2016:
| Transfers from Level 1 to Level 2 | Transfers from Level 2 to Level 1 | |||||||
Common Stocks | $ | — | $ | 359,348 | ||||
Semi-Annual Report
15
| Foundry Partners Fundamental Small Cap Value Fund | ||
Notes to the Financial Statements
April 30, 2017 (Unaudited)
NOTE 4. FEES AND OTHER TRANSACTIONS WITH AFFILIATES AND OTHER SERVICE PROVIDERS
Under the terms of the management agreement between the Trust and the Adviser (the “Agreement”) for the Fund, the Adviser manages the Fund’s investments subject to oversight of the Board. As compensation for its management services, the Fund is obligated to pay the Adviser a fee computed and accrued daily and paid monthly at an annual rate of 0.85% of the average daily net assets of the Fund. For the six months ended April 30, 2017, the Adviser earned fees of $665,746 from the Fund. At April 30, 2017, the Fund owed $122,865 to the Adviser.
The Adviser has contractually agreed to waive its management fee and/or reimburse certain operating expenses, but only to the extent necessary so that the Fund’s net expenses, excluding brokerage fees and commissions, borrowing costs (such as interest expense and dividends on securities sold short), taxes, distribution and service (12b-1) fees, extraordinary expenses, and any indirect expenses (such as fees and expenses of acquired funds), do not exceed 1.25% of the net assets of the Fund.
Each fee waiver or expense reimbursement by the Adviser is subject to repayment by the Fund within the three years following the date in which the fee waiver or expense reimbursement occurred, provided that the Fund is able to make the repayment without exceeding the expense limitation that is in effect at the time of the repayment or at the time of the fee waiver or expense reimbursement. As of April 30, 2017, the Adviser has made no previous reimbursements that may be recouped. The contractual agreement is in effect through February 28, 2018. The expense cap may not be terminated prior to this date except by the Board. For the six months ended April 30, 2017, the Adviser did not waive any fees from the Fund.
The Trust retains Ultimus Asset Services, LLC (the “Administrator”), to provide the Fund with administration and compliance, fund accounting and transfer agent services, including all regulatory reporting. For the six months ended April 30, 2017, the Administrator earned fees of $112,838 for administrative services. At April 30, 2017, the Administrator was owed $18,027 for administrative services.
The officers and one Trustee of the Trust are members of management and/or employees of the Administrator. Unified Financial Securities, LLC (the “Distributor” or “Unified”) acts as the principal distributor of the Fund’s shares. An officer of the Trust is an officer of the Distributor and such person may be deemed to be an affiliate of the Distributor.
The Fund has adopted a Distribution Plan (the “Plan”) pursuant to Rule 12b-1 under the Investment Company Act of 1940 as amended (the “1940 Act”). The Plan provides that the Fund will pay the Distributor or any registered securities dealer, financial institution or any other person (a “Recipient”) a fee aggregating at a rate of 0.25% of the average daily net assets of the Investor Class shares in connection with the promotion and distribution of the Fund’s shares or the
Semi-Annual Report
16
provision of personal services to shareholders, including, but not necessarily limited to, advertising, compensation to underwriters, dealers and selling personnel; the printing and mailing of prospectuses to other than current Fund shareholders; the printing and mailing of sales literature; and servicing shareholder accounts. The Fund or the Adviser may pay all or a portion of these fees to any Recipient who renders assistance in distributing or promoting the sale of shares, or who provides certain shareholder services, pursuant to a written agreement. The Plan is a compensation plan, which means that compensation is paid regardless of 12b-1 expenses actually incurred. It is anticipated that the Plan will benefit shareholders because an effective sales program typically is necessary in order for the Fund to reach and maintain a sufficient size to achieve efficiently its investment objectives and to realize economies of scale. For the six months ended April 30, 2017, Investor Class shares 12b-1 expense incurred by the Fund was $54,234. The Fund owed $8,824 for Investor Class shares 12b-1 fees as of April 30, 2017.
NOTE 5. PURCHASES AND SALES OF SECURITIES
For the six months ended April 30, 2017, purchases and sales of investment securities, other than short-term investments and short-term U.S. government obligations were as follows:
Purchases | ||||
U.S. Government Obligations | $ | — | ||
Other | 39,954,697 | |||
Sales | ||||
U.S. Government Obligations | $ | — | ||
Other | 24,439,343 |
NOTE 6. BENEFICIAL OWNERSHIP
The beneficial ownership, either directly or indirectly, of more than 25% of the voting securities of a fund creates a presumption of control of the fund, under Section 2(a)(9) of the 1940 Act. At April 30, 2017, Charles Schwab & Co. (“Schwab”) owned, as record shareholder, 56% of the outstanding shares of the Fund. It is not known whether Schwab or any of the underlying beneficial owners owned or controlled more than 25% of the voting securities of the Fund.
NOTE 7. FEDERAL INCOME TAXES
At April 30, 2017, the net unrealized appreciation (depreciation) of investments for tax purposes was as follows:
Gross Unrealized Appreciation | $ | 34,690,268 | ||
Gross Unrealized (Depreciation) | $ | (4,233,230 | ) | |
Net Unrealized Appreciation on Investments | $ | 30,457,038 |
At April 30, 2017, the aggregate cost of securities for federal income tax purposes was $149,098,910 for the Fund.
Semi-Annual Report
17
| Foundry Partners Fundamental Small Cap Value Fund | ||
Notes to the Financial Statements
April 30, 2017 (Unaudited)
At April 30, 2017, the difference between book basis and tax basis unrealized appreciation (depreciation) is attributable to the tax deferral of losses on wash sales and mark-to-market adjustments on passive foreign investment companies.
At October 31, 2016, the Fund’s most recent fiscal year end, the components of distributable earnings (accumulated losses) on a tax basis were as follows:
| Undistributed Ordinary Income | Undistributed Long-Term Capital Gains | Unrealized Appreciation/ (Depreciation)* | Total Accumulated Earnings/ (Deficit) | |||||||||
| $1,109,071 | $ | 2,665,055 | $ | 9,434,009 | $ | 13,208,135 | ||||||
| * | The difference between book basis and tax basis unrealized appreciation (depreciation) is attributable to the tax deferral of losses on wash sales and mark-to-market adjustments on passive foreign investment companies. |
The tax character of distributions paid from the Fund for the fiscal year ended October 31, 2016 was as follows:
| Distributions Paid From* | ||||||||||||||||
| Ordinary Income | Net Long-Term | Total Taxable | Tax Return of Capital | Total Distributions Paid | ||||||||||||
| $1,884,915 | $ | 14,032,057 | $ | 15,916,972 | $ | — | $ | 15,916,972 | ||||||||
| * | The tax character of distributions paid may differ from the character of distributions shown on the statements of changes in net assets due to short-term capital gains being treated as ordinary income for tax purposes. |
NOTE 8. COMMITMENTS AND CONTINGENCIES
The Fund indemnifies its officers and trustees for certain liabilities that may arise from performance of their duties to the Fund. Additionally, in the normal course of business, the Fund enters into contracts that contain a variety of representations and warranties which provide general indemnifications. The Fund’s maximum exposure under these arrangements is unknown, as this would involve future claims that may be made against the Fund that have not yet occurred.
NOTE 9. SUBSEQUENT EVENTS
Management of the Fund has evaluated the need for disclosures and/or adjustments resulting from subsequent events through the date these financial statements were issued. Based upon this evaluation, management has determined there were no items requiring adjustment of the financial statements or additional disclosure.
Semi-Annual Report
18
Summary of Fund Expenses – (Unaudited)
As a shareholder of the Fund, you incur two types of costs: (1) transaction and (2) ongoing costs, including management fees, distribution and service (12b-1) fees and other Fund expenses. These Examples are intended to help you understand your ongoing costs (in dollars) of investing in the Fund and to compare these costs with the ongoing costs of investing in other mutual funds.
The Example is based on an investment of $1,000 invested at the beginning of the period and held for the entire period from November 1, 2016 through April 30, 2017.
Actual Expenses
The first line of the table for each class provides information about actual account values and actual expenses. You may use the information on these lines, together with the amount you invested, to estimate the expenses that you paid over the period. Simply divide your account value by $1,000 (for example, an $8,600 account value divided by $1,000 = 8.60), then multiply the result by the number in the first line under the heading entitled “Expenses Paid During the Period” to estimate the expenses you paid on your account during this period.
Hypothetical Example for Comparison Purposes
The second line of the table for each class provides information about hypothetical account values and hypothetical expenses based on the Fund’s actual expense ratios and an assumed rate of return of 5% per year before expenses, which is not the Fund’s actual return. The hypothetical account values and expenses may not be used to estimate the actual ending account balances or expenses you paid for the period. You may use this information to compare the ongoing costs of investing in the Fund and other funds. To do so, compare this 5% hypothetical example with the 5% hypothetical examples that appear in the shareholder reports of the other funds.
Expenses shown in the table are meant to highlight your ongoing costs only and do not reflect any transactional costs. Therefore, the second line of the table for each class is useful in comparing ongoing costs only, and will not help you determine the relative total costs of owning different funds. In addition, if these transaction costs were included, your costs would have been higher.
| Beginning Account Value, November 1, 2016 | Ending Account Value, April 30, 2017 | Expenses Paid During the Period (a) | Annualized Expense Ratio | |||||||||||||||||
Foundry Partners Fundamental Small Cap Value Fund |
| |||||||||||||||||||
Investor Class | Actual | $ | 1,000.00 | $ | 1,165.80 | $ | 7.36 | 1.37 | % | |||||||||||
| Hypothetical | (b) | $ | 1,000.00 | $ | 1,018.00 | $ | 6.85 | 1.37 | % | |||||||||||
Institutional Class | Actual | $ | 1,000.00 | $ | 1,167.20 | $ | 6.04 | 1.12 | % | |||||||||||
| Hypothetical (b) | $ | 1,000.00 | $ | 1,019.22 | $ | 5.62 | 1.12 | % | ||||||||||||
| (a) | Expenses are equal to the Fund’s annualized expense ratios, multiplied by the average account value over the period, multiplied by 181/365 (to reflect the one-half year period). |
| (b) | Hypothetical assumes 5% annual return before expenses. |
Semi-Annual Report
19
March 9, 2017
FACTS | WHAT DOES VALUED ADVISERS TRUST DO WITH YOUR PERSONAL INFORMATION?
| |
| Why? | Financial companies choose how they share your personal information. Federal law gives consumers the right to limit some but not all sharing. Federal law also requires us to tell you how we collect, share, and protect your personal information. Please read this notice carefully to understand what we do.
| |
| What? | The types of personal information we collect and share depend on the product or service you have with us. This information can include: ◾ Social Security number ◾ account balances and account transactions ◾ account transactions, transaction or loss history and purchase history ◾ checking account information and wire transfer instructions
When you are no longer our customer, we continue to share your information as described in this notice.
| |
| How? | All financial companies need to share customers’ personal information to run their everyday business. In the section below, we list the reasons financial companies can share their customers’ personal information; the reasons Valued Advisers Trust chooses to share; and whether you can limit this sharing.
| |
Reasons we can share your personal information | Does Valued Advisers Trust share?
| |
For our everyday business purposes— such as to process your transactions, maintain your account(s), respond to court orders and legal investigations, or report to credit bureaus
| Yes
| |
For our marketing purposes— to offer our products and services to you
| Yes
| |
For joint marketing with other financial companies
| No
| |
For our affiliates’ everyday business purposes— information about your transactions and experiences
| No
| |
For our affiliates’ everyday business purposes— information about your creditworthiness
| No
| |
For nonaffiliates to market to you
| No
|
| Questions? | Call 1-800-247-1014. |
Valued Advisers Trust Privacy Policy
Page 2 |
Who we are | ||
Who is providing this notice?
| Valued Advisers Trust
|
What we do | ||
| How does Valued Advisers Trust protect my personal information? | To protect your personal information from unauthorized access and use, we use security measures that comply with federal law. These measures include computer safeguards and secured files and buildings.
| |
| How does Valued Advisers Trust collect my personal information? | We collect your personal information, for example, when you
◾ open an account or deposit money ◾ buy securities from us or sell securities to us ◾ make deposits or withdrawals from your account or provide account information ◾ give us your account information ◾ make a wire transfer ◾ tell us who receives the money ◾ tell us where to send the money ◾ show your government-issued ID ◾ show your driver’s license
| |
Why can’t I limit all sharing? | Federal law gives you the right to limit only
◾ sharing for affiliates’ everyday business purposes—information about your creditworthiness ◾ affiliates from using your information to market to you ◾ sharing for nonaffiliates to market to you
State laws and individual companies may give you additional rights to limit sharing.
| |
Definitions
| ||
Affiliates | Companies related by common ownership or control. They can be financial and nonfinancial companies.
| |
Nonaffiliates | Companies not related by common ownership or control. They can be financial and nonfinancial companies.
◾ Valued Advisers Trust does not share your personal information with nonaffiliates so they can market to you.
| |
Joint marketing | A formal agreement between nonaffiliated financial companies that together market financial products or services to you.
◾ Valued Advisers Trust doesn’t jointly market financial products or services to you.
| |
PROXY VOTING
A description of the policies and procedures that the Fund uses to determine how to vote proxies relating to portfolio securities and information regarding how the Fund voted those proxies during the most recent twelve month period ended June 30, is available without charge upon request by (1) calling the Fund at (800) 247-1014 and (2) from Fund documents filed with the Securities and Exchange Commission (“SEC”) on the SEC’s website at www.sec.gov.
TRUSTEES
Andrea N. Mullins, Chairperson
Ira P. Cohen
Mark J. Seger
OFFICERS
Bo J. Howell, Principal Executive Officer and President
Bryan W. Ashmus, Principal Financial Officer and Treasurer
John C. Swhear, Chief Compliance Officer and Vice President
Stephen L. Preston, Anti-Money Laundering Officer
Carol J. Highsmith, Vice President and Secretary
Matthew J. Miller, Vice President
INVESTMENT ADVISER
Foundry Partners, LLC
510 First Avenue North, Suite 409
Minneapolis, MN 55403
DISTRIBUTOR
Unified Financial Securities, LLC
9465 Counselors Row, Suite 200
Indianapolis, IN 46240
INDEPENDENT REGISTERED PUBLIC ACCOUNTING FIRM
Cohen & Company, Ltd.
1350 Euclid Avenue, Suite 800
Cleveland, OH 44115
LEGAL COUNSEL
The Law Offices of John H. Lively & Associates, Inc.
A member firm of The 1940 Act Law Group TM
11300 Tomahawk Creek Parkway, Suite 310
Leawood, KS 66211
CUSTODIAN
Huntington National Bank
41 South High Street
Columbus, OH 43215
ADMINISTRATOR, TRANSFER AGENT AND FUND ACCOUNTANT
Ultimus Asset Services, LLC
225 Pictoria Drive, Suite 450
Cincinnati, OH 45246
This report is intended only for the information of shareholders or those who have received the Fund’s prospectus which contains information about the Fund’s management fee and expenses. Please read the prospectus carefully before investing.
Distributed by Unified Financial Securities, LLC
Member FINRA/SIPC

DANA LARGE CAP EQUITY FUND
DANA SMALL CAP EQUITY FUND
Semi-Annual Report
April 30, 2017
Dana Investment Advisors, Inc.
20700 Swenson Drive, Suite 400
Waukesha, WI 53186
(855) 280-9648
www.danafunds.com
Dear Fellow Shareholders:
Enclosed is the Semi-Annual report for the Dana Funds. The beginning of the new fiscal year coincided with the November election period. Looking back, the results were shocking to many of the political insiders and immediate market reaction seemed to be an overreaction. The Dana Small Cap Fund (the “Small Cap Fund”) has grown to approximately $15 million in assets under management and combined with the Dana Large Cap Equity Fund (the “‘Large Cap Fund”), the assets in the Dana Funds now total approximately $155 million. In the paragraphs below, you will find a recap of the market environment and performance of each mutual fund. On behalf of the investment advisor, Dana Investment Advisors, we would like to thank you for your continued investment and support. As always, we welcome your comments and questions, and you may reach us via email at DanaFunds@danainvestment.com.
Market Recap:
Early November 2016 the market started to correct, but the surprising results of the U.S. Presidential election changed all that. The immediate market reaction was a swift and dramatic drop, quickly followed by a sharp rally over the next month. The Financial sector led the market higher in anticipation of Trump’s pro-growth platform that included fewer regulations and lower taxes that would in turn lead to a steeper yield curve and higher net interest margins. The Federal Open Market Committee followed through with an expected fed funds rate increase on December 14, only the second increase since 2006. The year finished on a strong note that carried through into the New Year.
Economic data and corporate earnings reports have been gaining strength. Consensus GDP forecasts as of early April see an average +2.6% rate of quarterly growth over the next three quarters. The Index of Small Business Optimism surged post the Trump election and remains strong. The Index posted historically record high readings for six months, a performance eclipsed only in 1983. Unit labor costs are rising and weekly unemployment claims are falling. Productivity growth at this time remains middling. The corporate earnings recession ended in Q316 and since that time, corporate earnings have shown steady progress. According to Standard & Poor’s forecasts, earnings growth will substantially accelerate through the end of 2018. Corporate profit margins as a percent of GDP are down from a 7.3% peak in 2011 as labor’s share of gross domestic income has gained ground. As of December 2016, this corporate profit margin stands at 6.1%. A tax cut or greater productivity gains would benefit this rate.
The market has continued to move higher through the end of this reporting period as investors continue to focus on potentially greater growth prospects for the economy and earnings. January and February were particularly strong as measured by the S&P 500® Index, while March-April were moderately positive. Volatility for this Index has been surprisingly low, with the VIX hovering near historic lows throughout most of the first quarter. Lying beneath the calm surface, many individual stocks are showing sizable increases in volatility, an indication of significant stock-specific risk. Investors are waiting for clearer indications of actual and potential policy changes regarding trade, healthcare, regulations, infrastructure spending, taxes and national debt. Technology stocks have been standout performers year-to-date, while many retail stocks continue to be disrupted by online giant Amazon, despite strong retail sales reports.
1
Dana Large Cap Equity Fund Performance:
During this six month period ended April 30, 2017 the Dana Large Cap Equity Fund (Institutional Class) performed well with a return of 16.70% versus the S&P 500® Index return of 13.32%. Disciplined stock selection drove the Large Cap Fund outperformance as Dana’s investment process which focuses on companies that provide steady growth and attractive valuations was rewarded. Relative performance was particularly strong in the post-Trump election period in 2016 and year-to-date.
In terms of sectors, Fund holdings in Industrials were quite strong, many with double-digit returns. These include Owens Corning (OC), Stanley Black & Decker, Inc. (SWK) and Boeing Company (BA). Tech stocks have also been strong contributors to performance, particularly year-to-date. Long term holding, Apple, Inc. (AAPL) performed well, and Lam Research Corp. (LRCX) and Broadcom Ltd. (AVGO) delivered exceptional returns. Lam, a semiconductor equipment company, is benefitting from technology transitions and is taking market share leading to increases in revenue and earnings projections. Broadcom Limited, another semiconductor company, has also seen strong upward earnings revisions. Activision Blizzard, Inc. (ATVI) was another stellar performer with strong gains during this period.
Dana Small Cap Equity Fund Performance:
The Small Cap Fund (Institutional Class) had strong performance of 14.46% for the six months ending April 30, 2017. During this period small cap stocks outpaced large cap stocks as markets were in a risk-on mode, domestic growth expectations increased and investors favored companies more likely to benefit from the new Administration’s proposed regulatory reform. Morningstar estimated that over $1 trillion dollars flowed into U.S. open-end and ETF small cap funds during the month of November, with over $9 billion flowing into passive Small Blend category alone. Despite a strong 9.35% return during the month of November the Small Cap Fund lagged the Russell 2000® Index by 1.80%. It is not surprising to see the Small Cap Fund’s investment style face headwinds when assets are flooding into passive strategies propping up lower quality names from passive funds allocations. The earnings recovery hasn’t flowed through to small caps as it has for large caps, but there were continued improvements in small cap earnings during the first four months of 2017. As the earnings recovery takes hold in small caps, our focus on attractively valued companies with solid earnings growth should be rewarded.
As always, security selection will drive the Small Cap Fund’s performance. During the six months ended April 30, 2017, the top sector contributors included Financials and Industrials. Top individual contributors were Primerica, Inc. (PRI), First Merchants Corp. (FRME), Centerstate Banks, Inc. (CSFL), and On Assignment (ASGN), Inc. Primerica, Inc. is a distributor of financial products in the United States and Canada. Smaller cap banks perceived to have interest rate sensitivity outperformed banks with lesser operating efficiency. The market was looking through the election and extrapolating deregulation of oppressive banking rules, pro-growth tax reform, and an overhaul of Obamacare. As such, higher GDP growth would give the Fed the runway to raise rates toward their equilibrium target. Smaller cap banks benefit strongly from a steepening yield curve. Primerica reported solid quarterly results, but also benefitted from the proposed scaling back of the pending Department of Labor fiduciary rules. On Assignment is a niche staffing firm that is benefitting from hiring trends and tightening labor markets.
2
The largest sector detractor was Information Technology. Despite having a strong performer in Coherent, Inc. (COHR), it was difficult to overcome poor performance from Synchronoss Technologies, Inc. (SNCR) and Gigamon, Inc (GIMO). Synchronoss found that their acquisition of Intralinks was going to cause some indigestion and potentially detract from margins during the fiscal year. Ultimately the board ousted Intralinks management and guided the fiscal year sharply lower. While very cheap on multiple levels, the company is a now a show-me story with little room for more downside. Gigamon reported a weaker than expected fourth quarter in 2016 and guided 2017 lower to a negative growth rate. The company did not communicate the changing dynamic of longer sales cycles to the street in an effective manner, and underinvested resources in the salesforce during 2015 and 2016, factors which led to a large move down in January. The company has rebounded almost 20% from those levels. The Small Cap Fund divested from both companies in May after some of the dust had settled.
Shareholders continue to be the key to our success, and we take seriously the trust you have placed in us. Peter Lynch once said, “The key to making money in stocks is not to get scared out of them.” Despite some companies’ elevated valuations and political gridlock on policies, we continue to find attractive opportunities in the equity markets, and our process, which we have successfully implemented since 1999, has led to success over full market cycles. We remain committed to our process, companies and shareholders and know that you have hired us to not get scared.
Respectfully submitted,

Mark R. Mirsberger, CPA
Chief Executive Officer – Dana Investment Advisors, Inc.

Duane Roberts, CFA
Portfolio Manager and Director of Equities – Dana Investment Advisors, Inc.
3
Investment Results (Unaudited)
Average Annual Total Returns(a) as of April 30, 2017
| Six Months | One Year | Three Year | Five Year | Since Inception (3/1/10) | Since Inception (7/28/10) | Since Inception (10/29/13) | ||||||||||||||||||||||
Dana Large Cap Equity Fund |
| |||||||||||||||||||||||||||
Class A with Load | 10.69% | 12.60% | 6.18% | 10.51% | N/A | 11.95% | N/A | |||||||||||||||||||||
Class A without Load | 16.53% | 18.54% | 8.02% | 11.64% | N/A | 12.81% | N/A | |||||||||||||||||||||
Class N | 16.49% | 18.57% | 8.01% | 11.76% | 13.59% | N/A | N/A | |||||||||||||||||||||
Institutional Class | 16.70% | 18.86% | 8.33% | N/A | N/A | N/A | 9.96% | |||||||||||||||||||||
S&P 500® Index(b) | 13.32% | 17.92% | 10.47% | 13.68% | 13.55% | 14.44% | 11.16% | |||||||||||||||||||||
| Expense Ratios(c) | ||||||||||||||||||||||||||||
| Class N | Class A | Institutional Class | ||||||||||||||||||||||||||
Gross | 1.16% | 1.16% | 0.91% | |||||||||||||||||||||||||
With Applicable Waivers | 0.98% | 0.98% | 0.73% | |||||||||||||||||||||||||
The performance quoted represents past performance, which does not guarantee future results. The investment return and principal value of an investment will fluctuate so that an investor’s shares, when redeemed, may be worth more or less than their original cost. The returns shown do not reflect deduction of taxes that a shareholder would pay on Dana Large Cap Equity Fund (the “Large Cap Fund”) distributions or the redemption of Large Cap Fund shares. Current performance of the Large Cap Fund may be lower or higher than the performance quoted. The Large Cap Fund’s investment objectives, risks, charges and expenses must be considered carefully before investing. Performance data current to the most recent month end may be obtained by calling 1-855-280-9648.
(a) Average annual total returns reflect any change in price per share and assume the reinvestment of all distributions. The Large Cap Fund’s returns reflect any fee reductions during the applicable period. If such reductions had not occurred, the quoted performance would have been lower. Returns figures for Class A with load include the maximum 5.00% sales charge. Total returns for periods less than 1 year are not annualized.
(b) The S&P 500® Index (“Index”) is a widely recognized unmanaged index of equity securities and is representative of a broader domestic equity market and range of securities than is found in the Large Cap Fund’s portfolio. Individuals cannot invest directly in the Index; however, an individual can invest in exchange traded funds or other investment vehicles that attempt to track the performance of a benchmark index.
(c) The expense ratios are from the Large Cap Fund’s prospectus dated February 28, 2017. Dana Investment Advisors, Inc. (the “Adviser”) has contractually agreed to reimburse or limit its fees and to assume other expenses of the Large Cap Fund until February 28, 2018, so that total annual fund operating expenses does not exceed 0.73% of the Large Cap Fund’s average daily net assets. This operating expense limitation does not apply to brokerage fees and commissions, borrowing costs (such as interest and dividend expenses on securities sold short), taxes, extraordinary expenses, fees and expenses paid under a distribution plan adopted pursuant to Rule 12b-1, fees and expenses paid under a shareholder services plan, and indirect expenses (such as “Acquired Funds Fees and Expenses”). Each fee waiver or expense reimbursement by the Adviser is subject to repayment by the Large Cap Fund within three years following the date in which the expense was incurred, provided that the Large Cap Fund is able to make the repayment without exceeding the expense limitation in place at the time of the fee waiver or expense reimbursement. This agreement may only be terminated by mutual consent of the Adviser and the Board of Trustees. Additional information pertaining to the Large Cap Fund’s expense ratios as of April 30, 2017 can be found in the financial highlights.
The Large Cap Fund’s investment objectives, strategies, risks, charges and expenses must be considered carefully before investing. The prospectus contains this and other important information about the Large Cap Fund and may be obtained by calling the same number as above. Please read it carefully before investing.
The Large Cap Fund is distributed by Unified Financial Securities, LLC, member FINRA/SIPC.
4
Investment Results (Unaudited)
Average Annual Total Returns(a) as of April 30, 2017
Six Months | One Year | Since Inception (11/3/15) | ||||||||||
Dana Small Cap Equity Fund |
| |||||||||||
Institutional Class | 14.46% | 17.15% | 4.38% | |||||||||
Investor Class | 14.21% | 16.85% | 4.03% | |||||||||
Russell 2000® Index(b) | 18.37% | 25.63% | 13.11% | |||||||||
| Expense Ratios(c) | ||||||||||||
| Institutional Class | Investor Class | |||||||||||
Gross | 4.23% | 4.48% | ||||||||||
With Applicable Waivers | 0.95% | 1.20% | ||||||||||
The performance quoted represents past performance, which does not guarantee future results. The investment return and principal value of an investment will fluctuate so that an investor’s shares, when redeemed, may be worth more or less than their original cost. The returns shown do not reflect deduction of taxes that a shareholder would pay on Dana Small Cap Equity Fund (the “Small Cap Fund”) distributions or the redemption of Small Cap Fund shares. Current performance of the Small Cap Fund may be lower or higher than the performance quoted. The Small Cap Fund’s investment objectives, risks, charges and expenses must be considered carefully before investing. Performance data current to the most recent month end may be obtained by calling 1-855-280-9648.
(a) Average annual total returns reflect any change in price per share and assume the reinvestment of all distributions. The Small Cap Fund’s returns reflect any fee reductions during the applicable period. If such reductions had not occurred, the quoted performance would have been lower. Total returns for periods less than 1 year are not annualized.
(b) The Russell 2000® Index (“Russell Index”) is a widely recognized unmanaged index of equity securities and is representative of a broader domestic equity market and range of securities than are found in the Small Cap Fund’s portfolio. Individuals can not invest directly in the Russell Index; however, an individual can invest in exchange-traded funds or other investment vehicles that attempt to track the performance of a benchmark index.
(c) The expense ratios are from the Small Cap Fund’s prospectus dated February 28, 2017. The Adviser has contractually agreed to waive or limit its fees and to assume other expenses of the Small Cap Fund until February 28, 2018, so that total annual fund operating expenses does not exceed 0.95% of the Small Cap Fund’s average daily net assets. This operating expense limitation does not apply to brokerage fees and commissions, borrowing costs (such as interest and dividend expenses on securities sold short), taxes, extraordinary expenses, fees and expenses paid under a distribution plan adopted pursuant to Rule 12b-1, fees and expenses paid under a shareholder services plan, and indirect expenses (such as “Acquired Funds Fees and Expenses”). Each fee waiver or expense reimbursement by the Adviser is subject to repayment by the Small Cap Fund within three years following the date in which the fee waiver or expense reimbursement occurred, provided that the Small Cap Fund is able to make the repayment without exceeding the expense limitation in place at the time of the fee waiver or expense reimbursement. This agreement may only be terminated by mutual consent of the Adviser and the Board of Trustees. Additional information pertaining to the Small Cap Fund’s expense ratios as of April 30, 2017 can be found in the financial highlights.
The Small Cap Fund’s investment objectives, strategies, risks, charges and expenses must be considered carefully before investing. The prospectus contains this and other important information about the Small Cap Fund and may be obtained by calling the same number as above. Please read it carefully before investing.
The Small Cap Fund is distributed by Unified Financial Securities, LLC, member FINRA/SIPC.
5
Portfolio Illustration (Unaudited)
April 30, 2017
The following chart gives a visual breakdown of the Large Cap Fund by sector weighting as a percentage of the fair value of portfolio investments.
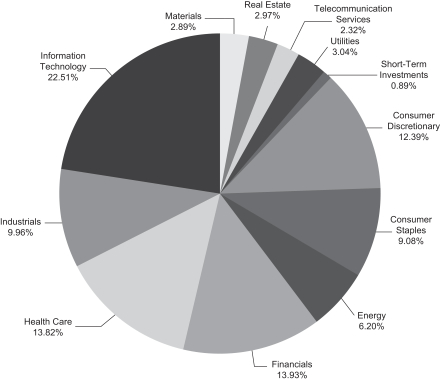
6
Portfolio Illustration (Unaudited)
April 30, 2017
The following chart gives a visual breakdown of the Small Cap Fund by sector weighting as a percentage of the fair value of portfolio investments.
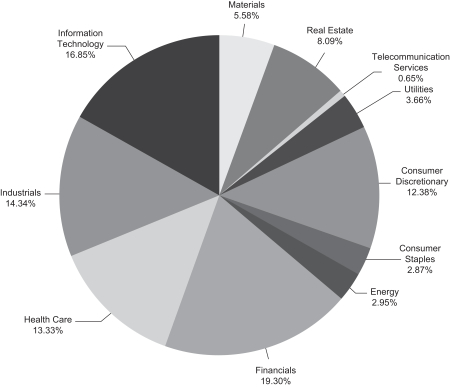
Availability of Portfolio Schedules (Unaudited)
The Large Cap Fund and the Small Cap Fund (each a “Fund” and collectively the “Funds”) file their complete schedule of portfolio holdings with the Securities and Exchange Commission (“SEC”) for the first and third quarters of each fiscal year on Form N-Q. The Funds’ Form N-Q is available at the SEC’s website at www.sec.gov. The Funds’ Form N-Q may be reviewed and copied at the Public Reference Room in Washington DC. Information on the operation of the Public Reference Room may be obtained by calling 1-800-SEC-0330.
7
Dana Large Cap Equity Fund
Schedule of Investments
April 30, 2017 (Unaudited)
| Shares | Fair Value | |||||||
| Common Stocks – 99.11% | ||||||||
| Consumer Discretionary – 12.39% | ||||||||
| 40,000 | CBS Corp., Class B | $ | 2,662,400 | |||||
| 75,000 | Comcast Corp., Class A | 2,939,250 | ||||||
| 85,000 | D.R. Horton, Inc. | 2,795,650 | ||||||
| 20,400 | Lear Corp. | 2,910,264 | ||||||
| 34,800 | Lowe’s Cos., Inc. | 2,953,824 | ||||||
| 29,500 | Royal Caribbean Cruises Ltd. | 3,144,700 | ||||||
|
| |||||||
| 17,406,088 | ||||||||
|
| |||||||
| Consumer Staples – 9.08% | ||||||||
| 35,000 | Altria Group, Inc. | 2,512,300 | ||||||
| 28,200 | Dr. Pepper Snapple Group, Inc. | 2,584,530 | ||||||
| 20,200 | Ingredion, Inc. | 2,501,164 | ||||||
| 21,000 | Kimberly-Clark Corp. | 2,724,750 | ||||||
| 46,000 | Sysco Corp. | 2,432,020 | ||||||
|
| |||||||
| 12,754,764 | ||||||||
|
| |||||||
| Energy – 6.20% | ||||||||
| 22,800 | Chevron Corp. | 2,432,760 | ||||||
| 28,600 | Exxon Mobil Corp. | 2,335,190 | ||||||
| 38,000 | Halliburton Co. | 1,743,440 | ||||||
| 34,000 | Valero Energy Corp. | 2,196,740 | ||||||
|
| |||||||
| 8,708,130 | ||||||||
|
| |||||||
| Financials – 13.93% | ||||||||
| 112,000 | Bank of America Corp. | 2,614,080 | ||||||
| 19,000 | Chubb Ltd. | 2,607,750 | ||||||
| 77,000 | Citizens Financial Group, Inc. | 2,826,670 | ||||||
| 35,000 | Discover Financial Services | 2,190,650 | ||||||
| 29,000 | JPMorgan Chase & Co. | 2,523,000 | ||||||
| 63,000 | Morgan Stanley | 2,732,310 | ||||||
| 19,000 | Prudential Financial, Inc. | 2,033,570 | ||||||
| 90,000 | Starwood Property Trust, Inc. | 2,042,100 | ||||||
|
| |||||||
| 19,570,130 | ||||||||
|
| |||||||
| Health Care – 13.82% | ||||||||
| 42,000 | AbbVie, Inc. | 2,769,480 | ||||||
| 15,800 | Amgen, Inc. | 2,580,456 | ||||||
| 50,000 | Baxter International, Inc. | 2,784,000 | ||||||
| 22,000 | Johnson & Johnson | 2,716,340 | ||||||
| 79,000 | Pfizer, Inc. | 2,679,680 | ||||||
| 20,500 | Stryker Corp. | 2,795,585 | ||||||
| 17,600 | UnitedHealth Group, Inc. | 3,077,888 | ||||||
|
| |||||||
| 19,403,429 | ||||||||
|
| |||||||
See accompanying notes which are an integral part of these financial statements.
8
Dana Large Cap Equity Fund
Schedule of Investments (continued)
April 30, 2017 (Unaudited)
| Shares | Fair Value | |||||||
| Common Stocks – (continued) | ||||||||
| Industrials – 9.96% | ||||||||
| 31,000 | Alaska Air Group, Inc. | $ | 2,637,790 | |||||
| 16,300 | Boeing Co./The | 3,012,729 | ||||||
| 21,000 | Honeywell International, Inc. | 2,753,940 | ||||||
| 44,000 | Owens Corning | 2,677,400 | ||||||
| 21,400 | Stanley Black & Decker, Inc. | 2,913,610 | ||||||
|
| |||||||
| 13,995,469 | ||||||||
|
| |||||||
| Information Technology – 22.51% | ||||||||
| 56,000 | Activision Blizzard, Inc. | 2,926,000 | ||||||
| 3,100 | Alphabet, Inc., Class A * | 2,866,012 | ||||||
| 24,000 | Apple, Inc. | 3,447,600 | ||||||
| 12,600 | Broadcom Ltd. | 2,782,206 | ||||||
| 40,000 | Broadridge Financial Solutions, Inc. | 2,797,600 | ||||||
| 49,000 | CDW Corp. | 2,895,410 | ||||||
| 1,000 | Cisco Systems, Inc. | 34,070 | ||||||
| 7,000 | Dell Technologies, Inc., Class V * | 469,770 | ||||||
| 18,600 | Facebook, Inc., Class A * | 2,794,650 | ||||||
| 95,000 | Juniper Networks, Inc. | 2,856,650 | ||||||
| 23,000 | Lam Research Corp. | 3,331,550 | ||||||
| 43,500 | Microsoft Corp. | 2,978,010 | ||||||
| 34,000 | Seagate Technology PLC | 1,432,420 | ||||||
|
| |||||||
| 31,611,948 | ||||||||
|
| |||||||
| Materials – 2.89% | ||||||||
| 18,000 | Albemarle Corp. | 1,960,380 | ||||||
| 21,200 | Packaging Corp. of America | 2,094,136 | ||||||
|
| |||||||
| 4,054,516 | ||||||||
|
| |||||||
| Real Estate – 2.97% | ||||||||
| 18,000 | American Tower Corp. | 2,266,920 | ||||||
| 35,000 | Prologis, Inc. | 1,904,350 | ||||||
|
| |||||||
| 4,171,270 | ||||||||
|
| |||||||
| Telecommunication Services – 2.32% | ||||||||
| 43,000 | AT&T, Inc. | 1,704,090 | ||||||
| 23,000 | T-Mobile US, Inc. * | 1,547,210 | ||||||
|
| |||||||
| 3,251,300 | ||||||||
|
| |||||||
| Utilities – 3.04% | ||||||||
| 61,600 | Exelon Corp. | 2,133,208 | ||||||
| 35,400 | WEC Energy Group, Inc. | 2,142,408 | ||||||
|
| |||||||
| 4,275,616 | ||||||||
|
| |||||||
Total Common Stocks (Cost $118,899,281) | 139,202,660 | |||||||
|
| |||||||
See accompanying notes which are an integral part of these financial statements.
9
Dana Large Cap Equity Fund
Schedule of Investments (continued)
April 30, 2017 (Unaudited)
| Shares | Fair Value | |||||||
| Short-Term Investments – 0.89% | ||||||||
| 1,240,668 | Federated Government Obligations Fund, Institutional Class, 0.65% (a) | $ | 1,240,668 | |||||
|
| |||||||
Total Short-Term Investments (Cost $1,240,668) | 1,240,668 | |||||||
|
| |||||||
Total Investments – 100.00% (Cost $120,121,203) | 140,443,328 | |||||||
|
| |||||||
Other Assets in Excess of Liabilities – 0.00% | 5,965 | |||||||
|
| |||||||
NET ASSETS – 100.00% | $ | 140,449,293 | ||||||
|
| |||||||
| (a) | Rate disclosed is the seven day effective yield as of April 30, 2017. |
| * | Non-income producing security. |
The sectors shown on the schedule of investments are based on Global Industry Classification Standard, or GICS® (“GICS”). The GICS was developed by and/or is the exclusive property of MSCI, Inc. and Standard & Poor’s Financial Services LLC (“S&P”). GICS is a service mark of MSCI, Inc. and S&P and has been licensed for use by the Administrator.
See accompanying notes which are an integral part of these financial statements.
10
Dana Small Cap Equity Fund
Schedule of Investments
April 30, 2017 (Unaudited)
| Shares | Fair Value | |||||||
| Common Stocks — 99.22% | ||||||||
| Consumer Discretionary — 12.29% | ||||||||
| 4,034 | Columbia Sportswear Co. | $ | 228,405 | |||||
| 6,932 | Ethan Allen Interiors, Inc. | 206,574 | ||||||
| 18,893 | Horizon Global Corp. * | 266,202 | ||||||
| 2,472 | LCI Industries | 250,043 | ||||||
| 2,640 | Lithia Motors, Inc., Class A | 252,252 | ||||||
| 2,053 | Marriott Vacations Worldwide Corp. | 226,200 | ||||||
| 5,888 | Sinclair Broadcast Group, Inc., Class A | 232,282 | ||||||
| 1,266 | Vail Resorts, Inc. | 250,238 | ||||||
|
| |||||||
| 1,912,196 | ||||||||
|
| |||||||
| Consumer Staples — 2.85% | ||||||||
| 8,598 | Blue Buffalo Pet Products, Inc. * | 211,941 | ||||||
| 6,124 | Central Garden & Pet Co. * | 231,487 | ||||||
|
| |||||||
| 443,428 | ||||||||
|
| |||||||
| Energy — 2.92% | ||||||||
| 15,715 | Callon Petroleum Co. * | 186,066 | ||||||
| 5,611 | Carrizo Oil & Gas, Inc. * | 141,117 | ||||||
| 10,892 | Matrix Service Co. * | 127,981 | ||||||
|
| |||||||
| 455,164 | ||||||||
|
| |||||||
| Financials — 19.15% | ||||||||
| 6,071 | Bank of the Ozarks, Inc. | 288,190 | ||||||
| 11,525 | CenterState Banks, Inc. | 290,776 | ||||||
| 7,414 | First Merchants Corp. | 306,791 | ||||||
| 11,522 | Home BancShares, Inc. | 293,235 | ||||||
| 7,084 | James River Group Holdings Ltd. | 308,579 | ||||||
| 4,697 | Pinnacle Financial Partners, Inc. | 300,608 | ||||||
| 3,588 | Primerica, Inc. | 300,674 | ||||||
| 7,154 | Renasant Corp. | 303,330 | ||||||
| 5,890 | Stifel Financial Corp. * | 287,844 | ||||||
| 6,284 | Western Alliance Bancorp * | 301,004 | ||||||
|
| |||||||
| 2,981,031 | ||||||||
|
| |||||||
| Health Care — 13.22% | ||||||||
| 5,562 | AMN Healthcare Services, Inc. * | 227,208 | ||||||
| 4,351 | ANI Pharmaceuticals, Inc. * | 235,476 | ||||||
| 8,543 | BioTelemetry, Inc. * | 281,065 | ||||||
| 1,904 | Ligand Pharmaceuticals, Inc., Class B * | 211,668 | ||||||
| 2,898 | Masimo Corp. * | 297,740 | ||||||
| 5,225 | Natus Medical, Inc. * | 182,875 | ||||||
| 2,775 | NuVasive, Inc. * | 201,215 | ||||||
See accompanying notes which are an integral part of these financial statements.
11
Dana Small Cap Equity Fund
Schedule of Investments (continued)
April 30, 2017 (Unaudited)
| Shares | Fair Value | |||||||
| Common Stocks — (continued) | ||||||||
| Health Care — 13.22% (continued) | ||||||||
| 16,805 | Sucampo Pharmaceuticals, Inc., Class A * | $ | 170,571 | |||||
| 7,688 | Supernus Pharmaceuticals, Inc.* | 250,629 | ||||||
|
| |||||||
| 2,058,447 | ||||||||
|
| |||||||
| Industrials — 14.23% | ||||||||
| 13,478 | Air Transport Services Group, Inc. * | 247,860 | ||||||
| 3,585 | Apogee Enterprises, Inc. | 195,382 | ||||||
| 6,297 | Comfort Systems USA, Inc. | 231,100 | ||||||
| 2,052 | Dycom Industries, Inc. * | 216,814 | ||||||
| 4,578 | Hawaiian Holdings, Inc. * | 248,585 | ||||||
| 3,558 | Lydall, Inc. * | 186,439 | ||||||
| 18,139 | Mueller Water Products, Inc. | 204,064 | ||||||
| 4,476 | On Assignment, Inc. * | 231,723 | ||||||
| 2,720 | Patrick Industries, Inc. * | 193,256 | ||||||
| 8,855 | TriNet Group, Inc. * | 260,337 | ||||||
|
| |||||||
| 2,215,560 | ||||||||
|
| |||||||
| Information Technology — 16.72% | ||||||||
| 3,720 | Advanced Energy Industries, Inc. * | 274,536 | ||||||
| 8,157 | ARRIS International PLC * | 212,000 | ||||||
| 11,252 | Ciena Corp. * | 257,783 | ||||||
| 1,520 | Coherent, Inc. * | 327,712 | ||||||
| 3,050 | Euronet Worldwide, Inc. * | 251,991 | ||||||
| 5,701 | Fabrinet * | 197,654 | ||||||
| 7,722 | Gigamon, Inc. * | 244,787 | ||||||
| 4,464 | Manhattan Associates, Inc. * | 208,424 | ||||||
| 3,502 | MKS Instruments, Inc. | 274,031 | ||||||
| 23,831 | Oclaro, Inc. * | 190,886 | ||||||
| 10,133 | Synchronoss Technologies, Inc. * | 162,128 | ||||||
|
| |||||||
| 2,601,932 | ||||||||
|
| |||||||
| Materials — 5.53% | ||||||||
| 16,704 | Ferro Corp. * | 299,336 | ||||||
| 3,217 | Neenah Paper, Inc. | 252,052 | ||||||
| 7,903 | PolyOne Corp. | 309,877 | ||||||
|
| |||||||
| 861,265 | ||||||||
|
| |||||||
| Real Estate — 8.03% | ||||||||
| 17,024 | Armada Hoffler Properties, Inc. | 242,762 | ||||||
| 2,750 | CoreSite Realty Corp. | 269,087 | ||||||
| 5,090 | LTC Properties, Inc. | 243,506 | ||||||
| 16,384 | Monmouth Real Estate Investment Corp. | 245,760 | ||||||
| 15,034 | Summit Hotel Properties, Inc. | 248,512 | ||||||
|
| |||||||
| 1,249,627 | ||||||||
|
| |||||||
See accompanying notes which are an integral part of these financial statements.
12
Dana Small Cap Equity Fund
Schedule of Investments (continued)
April 30, 2017 (Unaudited)
| Shares | Fair Value | |||||||
| Telecommunication Services — 0.65% | ||||||||
| 4,241 | Consolidated Communications Holdings, Inc. | $ | 100,384 | |||||
|
| |||||||
| Utilities — 3.63% | ||||||||
| 4,180 | Chesapeake Utilities Corp. | 306,394 | ||||||
| 3,092 | Southwest Gas Corp. | 258,986 | ||||||
|
| |||||||
| 565,380 | ||||||||
|
| |||||||
Total Common Stocks (Cost $13,775,820) | 15,444,414 | |||||||
|
| |||||||
Total Investments – 99.22% (Cost $13,775,820) | 15,444,414 | |||||||
|
| |||||||
Other Assets in Excess of Liabilities – 0.78% | 121,928 | |||||||
|
| |||||||
NET ASSETS – 100.00% | $ | 15,566,342 | ||||||
|
| |||||||
| * | Non-income producing security. |
The sectors shown on the schedule of investments are based on Global Industry Classification Standard, or GICS® (“GICS”). The GICS was developed by and/or is the exclusive property of MSCI, Inc. and Standard & Poor’s Financial Services LLC (“S&P”). GICS is a service mark of MSCI, Inc. and S&P and has been licensed for use by the Administrator.
See accompanying notes which are an integral part of these financial statements.
13
Dana Funds
Statements of Assets and Liabilities
April 30, 2017 (Unaudited)
| Dana Large Cap Equity Fund | Dana Small Cap Equity Fund | |||||||
Assets | ||||||||
Investments in securities at fair value (cost $120,121,203 and $13,775,820) | $ | 140,443,328 | $ | 15,444,414 | ||||
Receivable for fund shares sold | 125 | 5,600 | ||||||
Receivable for investments sold | — | 129,630 | ||||||
Dividends receivable | 124,460 | 1,756 | ||||||
Receivable from Adviser | — | 4,390 | ||||||
Prepaid expenses | 27,509 | 22,649 | ||||||
Total Assets | 140,595,422 | 15,608,439 | ||||||
Liabilities | ||||||||
Payable for fund shares redeemed | 42,627 | — | ||||||
Payable to Adviser | 57,091 | — | ||||||
Payable for Distribution Fees | 7,583 | 1,201 | ||||||
Payable to Administrator | 13,283 | 7,220 | ||||||
Due to custodian | — | 22,426 | ||||||
Payable to trustees | 1,087 | 514 | ||||||
Other accrued expenses | 24,458 | 10,736 | ||||||
Total Liabilities | 146,129 | 42,097 | ||||||
Net Assets | $ | 140,449,293 | $ | 15,566,342 | ||||
Net Assets consist of: | ||||||||
Paid-in capital | $ | 117,901,090 | $ | 13,943,066 | ||||
Accumulated undistributed net investment income (loss) | 170,907 | (6,926 | ) | |||||
Accumulated undistributed net realized gain (loss) from investment transactions | 2,055,171 | (38,392 | ) | |||||
Net unrealized appreciation on investments | 20,322,125 | 1,668,594 | ||||||
Net Assets | $ | 140,449,293 | $ | 15,566,342 | ||||
See accompanying notes which are an integral part of these financial statements.
14
Dana Funds
Statements of Assets and Liabilities (continued)
April 30, 2017 (Unaudited)
| Dana Large Cap Equity Fund | Dana Small Cap Equity Fund | |||||||
Class N: | ||||||||
Net Assets | $ | 35,952,034 | ||||||
Shares outstanding (unlimited number of shares authorized, no par value) | 1,759,203 | |||||||
Net asset value (“NAV”), offering and redemption price per share | $ | 20.44 | ||||||
Class A: | ||||||||
Net Assets | $ | 1,413,376 | ||||||
Shares outstanding (unlimited number of shares authorized, no par value) | 69,290 | |||||||
Net asset value (“NAV”) and redemption price per share | $ | 20.40 | ||||||
Offering price per share (NAV/0.95) (a) | $ | 21.47 | ||||||
Institutional Class: | ||||||||
Net Assets | $ | 103,083,883 | $ | 9,676,762 | ||||
Shares outstanding (unlimited number of shares authorized, no par value) | 5,043,808 | 910,501 | ||||||
Net asset value (“NAV”), offering and redemption price per share | $ | 20.44 | $ | 10.63 | ||||
Investor Class: | ||||||||
Net Assets | $ | 5,889,580 | ||||||
Shares outstanding (unlimited number of shares authorized, no par value) | 556,028 | |||||||
Net asset value (“NAV”), offering and redemption price per share | $ | 10.59 | ||||||
| (a) | Class A shares impose a maximum 5.00% sales charge on purchases. |
15
See accompanying notes which are an integral part of these financial statements.
Dana Funds
Statements of Operations
For the six months ended April 30, 2017 (Unaudited)
| Dana Large Cap Equity Fund | Dana Small Cap Equity Fund | |||||||
Investment Income | ||||||||
Dividend income | $ | 1,725,446 | $ | 79,684 | ||||
Total investment income | 1,725,446 | 79,684 | ||||||
Expenses | ||||||||
Investment Adviser | 511,966 | 54,343 | ||||||
Distribution (12b-1): | ||||||||
Class N | 42,962 | — | ||||||
Class A | 1,691 | — | ||||||
Investor Class | — | 6,225 | ||||||
Administrator | 40,651 | 18,844 | ||||||
Registration | 25,031 | 17,903 | ||||||
Fund accounting | 23,357 | 14,876 | ||||||
Transfer agent | 14,650 | 11,468 | ||||||
Interest | 18,233 | — | ||||||
Audit | 8,609 | 8,361 | ||||||
Legal | 7,939 | 8,644 | ||||||
Custodian | 11,644 | 2,388 | ||||||
Insurance | 10,352 | 1,659 | ||||||
Printing | 7,979 | 1,386 | ||||||
Trustee | 3,052 | 2,129 | ||||||
Pricing | 1,157 | 1,243 | ||||||
Miscellaneous | 8,916 | 7,152 | ||||||
Total expenses | 738,189 | 156,621 | ||||||
Fees contractually waived and expenses reimbursed by Adviser | (141,426 | ) | (85,654 | ) | ||||
Net operating expenses | 596,763 | 70,967 | ||||||
Net investment income | 1,128,683 | 8,717 | ||||||
Net Realized and Change in Unrealized Gain on Investments | ||||||||
Net realized gain on investment securities transactions | 8,792,693 | 239,264 | ||||||
Net change in unrealized appreciation of investment securities | 13,799,259 | 1,309,211 | ||||||
Net realized and change in unrealized gain on investments | 22,591,952 | 1,548,475 | ||||||
Net increase in net assets resulting from operations | $ | 23,720,635 | $ | 1,557,192 | ||||
See accompanying notes which are an integral part of these financial statements.
16
Dana Funds
Statements of Changes in Net Assets
| Dana Large Cap Equity Fund | Dana Small Cap Equity Fund | |||||||||||||||
| For the Six Months Ended April 30, 2017 (Unaudited) | For the Year Ended October 31, 2016 | For the Six Months Ended April 30, 2017 (Unaudited) | For the Period Ended October 31, 2016(a) | |||||||||||||
| Increase (Decrease) in Net Assets due to: Operations | ||||||||||||||||
Net investment income | $ | 1,128,683 | $ | 2,470,203 | $ | 8,717 | $ | 2,901 | ||||||||
Net realized gain (loss) on investment transactions | 8,792,693 | (5,226,176 | ) | 239,264 | (277,656 | ) | ||||||||||
Net change in unrealized appreciation of investments | 13,799,259 | 323,264 | 1,309,211 | 359,383 | ||||||||||||
Net increase (decrease) in net assets resulting from operations | 23,720,635 | (2,432,709 | ) | 1,557,192 | 84,628 | |||||||||||
Distributions From: |
| |||||||||||||||
Net investment income: | ||||||||||||||||
Class N | (264,672 | ) | (394,154 | ) | ||||||||||||
Class A | (10,383 | ) | (13,120 | ) | ||||||||||||
Institutional Class | (911,776 | ) | (1,966,634 | ) | (12,219 | ) | (4,145 | ) | ||||||||
Investor Class | (3,424 | ) | (587 | ) | ||||||||||||
Total distributions | (1,186,831 | ) | (2,373,908 | ) | (15,643 | ) | (4,732 | ) | ||||||||
Capital Transactions – Class N: |
| |||||||||||||||
Proceeds from shares sold | 362,376 | 2,351,765 | ||||||||||||||
Reinvestment of distributions | 259,570 | 386,214 | ||||||||||||||
Amount paid for shares redeemed | (2,166,006 | ) | (6,016,995 | ) | ||||||||||||
Proceeds from redemption fees (a) | — | 261 | ||||||||||||||
Total Class N | (1,544,060 | ) | (3,278,755 | ) | ||||||||||||
Capital Transactions – Class A: |
| |||||||||||||||
Proceeds from shares sold | 25,412 | 414,562 | ||||||||||||||
Reinvestment of distributions | 9,856 | 12,358 | ||||||||||||||
Amount paid for shares redeemed | (158,906 | ) | (1,684,118 | ) | ||||||||||||
Proceeds from redemption fees (b) | — | 42 | ||||||||||||||
Total Class A | (123,638 | ) | (1,257,156 | ) | ||||||||||||
(a) For the period November 3, 2015 (commencement of operations) through October 31, 2016. (b) Prior to February 28, 2017, the Funds charged a 2.00% redemption fee on shares redeemed within 60 days of purchase. |
| |||||||||||||||
17
See accompanying notes which are an integral part of these financial statements.
Dana Funds
Statements of Changes in Net Assets (continued)
| Dana Large Cap Equity Fund | Dana Small Cap Equity Fund | |||||||||||||||
| For the Six Months Ended April 30, 2017 (Unaudited) | For the Year Ended October 31, 2016 | For the Six Months Ended April 30, 2017 (Unaudited) | For the Period Ended October 31, 2016(a) | |||||||||||||
Capital Transactions – Institutional Class: |
| |||||||||||||||
Proceeds from shares sold | 10,090,259 | 74,899,806 | 2,469,347 | 6,935,349 | ||||||||||||
Reinvestment of distributions | 103,107 | 170,023 | 11,845 | 2,967 | ||||||||||||
Amount paid for shares redeemed | (63,008,574 | ) | (50,570,426 | ) | (368,695 | ) | (427,018 | ) | ||||||||
Proceeds from redemption fees (b) | 4,007 | 13,598 | — | 1,840 | ||||||||||||
Total Institutional Class | (52,811,201 | ) | 24,513,001 | 2,112,497 | 6,513,138 | |||||||||||
Capital Transactions – Investor Class: |
| |||||||||||||||
Proceeds from shares sold | 1,960,736 | 4,289,510 | ||||||||||||||
Reinvestment of distributions | 3,424 | 587 | ||||||||||||||
Amount paid for shares redeemed | (230,754 | ) | (704,373 | ) | ||||||||||||
Proceeds from redemption fees (b) | — | 132 | ||||||||||||||
Total Investor Class | 1,733,406 | 3,585,856 | ||||||||||||||
Net increase (decrease) in net assets resulting from capital transactions | (54,478,899 | ) | 19,977,090 | 3,845,903 | 10,098,994 | |||||||||||
Total Increase (Decrease) in Net Assets | (31,945,095 | ) | 15,170,473 | 5,387,452 | 10,178,890 | |||||||||||
Net Assets | ||||||||||||||||
Beginning of period | 172,394,388 | 157,223,915 | 10,178,890 | — | ||||||||||||
End of period | $ | 140,449,293 | $ | 172,394,388 | $ | 15,566,342 | $ | 10,178,890 | ||||||||
Accumulated net investment income (loss) included in net assets at end of period | $ | 170,907 | $ | 229,055 | $ | (6,926 | ) | $ | — | |||||||
(a) For the period November 3, 2015 (commencement of operations) through October 31, 2016. (b) Prior to February 28, 2017, the Funds charged a 2.00% redemption fee on shares redeemed within 60 days of purchase. |
| |||||||||||||||
See accompanying notes which are an integral part of these financial statements.
18
Dana Funds
Statements of Changes in Net Assets (continued)
| Dana Large Cap Equity Fund | Dana Small Cap Equity Fund | |||||||||||||||
| For the Six Months Ended April 30, 2017 (Unaudited) | For the Year Ended October 31, 2016 | For the Six Months Ended April 30, 2017 (Unaudited) | For the Period Ended October 31, 2016(a) | |||||||||||||
Share Transactions – Class N: |
| |||||||||||||||
Shares sold | 18,896 | 134,234 | ||||||||||||||
Shares issued in reinvestment of distributions | 13,356 | 21,807 | ||||||||||||||
Shares redeemed | (112,489 | ) | (341,774 | ) | ||||||||||||
Total Class N | (80,237 | ) | (185,733 | ) | ||||||||||||
Share Transactions – Class A: |
| |||||||||||||||
Shares sold | 1,312 | 22,982 | ||||||||||||||
Shares issued in reinvestment of distributions | 509 | 699 | ||||||||||||||
Shares redeemed | (8,507 | ) | (93,562 | ) | ||||||||||||
Total Class A | (6,686 | ) | (69,881 | ) | ||||||||||||
Share Transactions – Institutional Class: |
| |||||||||||||||
Shares sold | 522,734 | 4,226,099 | 237,996 | 754,430 | ||||||||||||
Shares issued in reinvestment of distributions | 5,324 | 9,607 | 1,113 | 313 | ||||||||||||
Shares redeemed | (3,322,592 | ) | (2,854,088 | ) | (35,198 | ) | (48,153 | ) | ||||||||
Total Institutional Class | (2,794,534 | ) | 1,381,618 | 203,911 | 706,590 | |||||||||||
Share Transactions – Investor Class: |
| |||||||||||||||
Shares sold | 189,482 | 465,806 | ||||||||||||||
Shares issued in reinvestment of distributions | 323 | 61 | ||||||||||||||
Shares redeemed | (22,172 | ) | (77,472 | ) | ||||||||||||
Total Investor Class | 167,633 | 388,395 | ||||||||||||||
(a) For the period November 3, 2015 (commencement of operations) through October 31, 2016. |
| |||||||||||||||
19
See accompanying notes which are an integral part of these financial statements.
Dana Large Cap Equity Fund – Class N
Financial Highlights
Selected data for a share outstanding throughout each period.
| Six Months Ended April 30, 2017 (Unaudited) | Years Ended October 31, | |||||||||||||||||||||||
| 2016 | 2015 | 2014 | 2013 | 2012 | ||||||||||||||||||||
Net asset value, at | $17.68 | $18.23 | $18.54 | $17.19 | $13.88 | $12.50 | ||||||||||||||||||
|
|
|
|
|
|
|
|
|
|
|
| |||||||||||||
Income from investment operations: | ||||||||||||||||||||||||
Net investment income | 0.13 | 0.22 | (a) | 0.18 | 0.19 | 0.21 | (a) | 0.14 | (a) | |||||||||||||||
Net realized and unrealized gain (loss) on investments | 2.78 | (0.57 | ) | 0.49 | (b) | 2.46 | 3.40 | 1.51 | ||||||||||||||||
|
|
|
|
|
|
|
|
|
|
|
| |||||||||||||
Total from investment operations | 2.91 | (0.35 | ) | 0.67 | 2.65 | 3.61 | 1.65 | |||||||||||||||||
|
|
|
|
|
|
|
|
|
|
|
| |||||||||||||
Distributions from: | ||||||||||||||||||||||||
Net investment income | (0.15 | ) | (0.20 | ) | (0.15 | ) | (0.18 | ) | (0.22 | ) | (0.14 | ) | ||||||||||||
Net realized gain | — | — | (0.83 | ) | (1.12 | ) | (0.08 | ) | (0.13 | ) | ||||||||||||||
|
|
|
|
|
|
|
|
|
|
|
| |||||||||||||
Total from distributions | (0.15 | ) | (0.20 | ) | (0.98 | ) | (1.30 | ) | (0.30 | ) | (0.27 | ) | ||||||||||||
|
|
|
|
|
|
|
|
|
|
|
| |||||||||||||
Redemption fees | — | — | (c) | — | (c) | — | (c) | — | (c) | — | (c) | |||||||||||||
Net asset value, at | $20.44 | $17.68 | $18.23 | $18.54 | $17.19 | $13.88 | ||||||||||||||||||
|
|
|
|
|
|
|
|
|
|
|
| |||||||||||||
Total Return (d) | 16.49 | %(e) | (1.91 | )% | 3.61 | % | 16.23 | % | 26.35 | % | 13.44 | % | ||||||||||||
Ratios/Supplemental Data: | ||||||||||||||||||||||||
Net assets at end of period (thousands) | $35,952 | $32,514 | $36,909 | $29,197 | $18,306 | $12,819 | ||||||||||||||||||
Before waiver | ||||||||||||||||||||||||
Ratio of expenses to average net assets | 1.17 | %(f) | 1.16 | % | 1.25 | % | 1.93 | % | 1.99 | % | 2.30 | % | ||||||||||||
After waiver | ||||||||||||||||||||||||
Ratio of expenses to average net assets | 0.98 | %(f)(g) | 0.98 | % | 0.98 | % | 0.98 | % | 0.98 | % | 1.50 | % | ||||||||||||
Ratio of net investment income to average net assets | 1.30 | %(f) | 1.22 | % | 1.00 | % | 1.09 | % | 1.33 | % | 1.04 | % | ||||||||||||
Portfolio turnover (h) | 22 | %(e) | 69 | % | 45 | % | 57 | % | 70 | % | 54 | % | ||||||||||||
| (a) | Per share net investment income has been determined on the basis of average shares outstanding during the year. |
| (b) | The amount shown for a share outstanding throughout the year does not accord with the change in aggregate gains and losses in the portfolio of securities during the year because of the timing of sales and purchases of fund shares in relation to fluctuating market values during the year. |
| (c) | The amount is less than $0.005 per share. |
| (d) | Total return in the above table represents the rate that the investor would have earned or lost on an investment in the Fund, assuming reinvestment of distributions. |
| (e) | Not annualized |
| (f) | Annualized |
| (g) | This ratio excludes the impact of overdraft fees. If this cost had been included, the ratio of expenses to average net assets would have been 1.00% for the six months ended April 30, 2017. |
| (h) | Portfolio turnover is calculated on the basis of the Fund as a whole without distinguishing among the classes of shares. |
See accompanying notes which are an integral part of these financial statements.
20
Dana Large Cap Equity Fund – Class A
Financial Highlights
Selected data for a share outstanding throughout each period.
| Six Months Ended April 30, 2017 (Unaudited) | Years Ended October 31, | |||||||||||||||||||||||
| 2016 | 2015 | 2014 | 2013 | 2012 | ||||||||||||||||||||
Net asset value, at | $17.64 | $18.18 | $18.51 | $17.17 | $13.92 | $12.52 | ||||||||||||||||||
|
|
|
|
|
|
|
|
|
|
|
| |||||||||||||
Income from investment operations: | ||||||||||||||||||||||||
Net investment income | 0.13 | 0.23 | (a) | 0.16 | 0.20 | 0.13 | (a) | 0.14 | (a) | |||||||||||||||
Net realized and unrealized gain (loss) on investments | 2.78 | (0.58 | ) | 0.50 | (b) | 2.44 | 3.39 | 1.52 | ||||||||||||||||
|
|
|
|
|
|
|
|
|
|
|
| |||||||||||||
Total from investment operations | 2.91 | (0.35 | ) | 0.66 | 2.64 | 3.52 | 1.66 | |||||||||||||||||
|
|
|
|
|
|
|
|
|
|
|
| |||||||||||||
Distributions from: | ||||||||||||||||||||||||
Net investment income | (0.15 | ) | (0.19 | ) | (0.16 | ) | (0.18 | ) | (0.19 | ) | (0.13 | ) | ||||||||||||
Net realized gain | — | — | (0.83 | ) | (1.12 | ) | (0.08 | ) | (0.13 | ) | ||||||||||||||
|
|
|
|
|
|
|
|
|
|
|
| |||||||||||||
Total from distributions | (0.15 | ) | (0.19 | ) | (0.99 | ) | (1.30 | ) | (0.27 | ) | (0.26 | ) | ||||||||||||
|
|
|
|
|
|
|
|
|
|
|
| |||||||||||||
Redemption fees | — | — | (c) | — | (c) | — | (c) | — | (c) | — | (c) | |||||||||||||
Net asset value, at | $20.40 | $17.64 | $18.18 | $18.51 | $17.17 | $13.92 | ||||||||||||||||||
|
|
|
|
|
|
|
|
|
|
|
| |||||||||||||
Total Return (d) | 16.53 | %(e) | (1.91 | )% | 3.54 | % | 16.24 | % | 25.67 | % | 13.54 | % | ||||||||||||
Ratios/Supplemental Data: | ||||||||||||||||||||||||
Net assets at end of period (thousands) | $1,413 | $1,340 | $2,652 | $1,047 | $799 | $678 | ||||||||||||||||||
Before waiver: | ||||||||||||||||||||||||
Ratio of expenses to average net assets | 1.17 | %(f) | 1.16 | % | 1.25 | % | 1.93 | % | 1.98 | % | 2.27 | % | ||||||||||||
After waiver: | ||||||||||||||||||||||||
Ratio of expenses to average net assets | 0.98 | %(f)(g) | 0.98 | % | 0.98 | % | 0.98 | % | 1.49 | % | 1.50 | % | ||||||||||||
Ratio of net investment income to average net assets | 1.31 | %(f) | 1.29 | % | 1.00 | % | 1.09 | % | 0.84 | % | 1.00 | % | ||||||||||||
Portfolio turnover (h) | 22 | %(e) | 69 | % | 45 | % | 57 | % | 70 | % | 54 | % | ||||||||||||
| (a) | Per share net investment income has been determined on the basis of average shares outstanding during the year. |
| (b) | The amount shown for a share outstanding throughout the year does not accord with the change in aggregate gains and losses in the portfolio of securities during the year because of the timing of sales and purchases of fund shares in relation to fluctuating market values during the year. |
| (c) | The amount is less than $0.005 per share. |
| (d) | Total return in the above table represents the rate that the investor would have earned or lost on an investment in the Fund, assuming reinvestment of distributions and excludes the maximum sales charge. |
| (e) | Not annualized |
| (f) | Annualized |
| (g) | This ratio excludes the impact of overdraft fees. If this cost had been included, the ratio of expenses to average net assets would have been 1.00% for the six months ended April 30, 2017. |
| (h) | Portfolio turnover is calculated on the basis of the Fund as a whole without distinguishing among the classes of shares. |
See accompanying notes which are an integral part of these financial statements.
21
Dana Large Cap Equity Fund – Institutional Class
Financial Highlights
Selected data for a share outstanding throughout each period.
| Six Months Ended April 30, 2017 (Unaudited) | Years Ended October 31, | Period Ended October 31, 2013(a) | ||||||||||||||||||
| 2016 | 2015 | 2014 | ||||||||||||||||||
Net asset value, at | $17.67 | $18.22 | $18.52 | $17.19 | $17.14 | |||||||||||||||
|
|
|
|
|
|
|
|
|
| |||||||||||
Income from investment operations: | ||||||||||||||||||||
Net investment income | 0.18 | 0.26 | (b) | 0.19 | 0.26 | — | (b)(c) | |||||||||||||
Net realized and unrealized gain (loss) on investments | 2.76 | (0.56 | ) | 0.52 | (d) | 2.44 | 0.05 | |||||||||||||
|
|
|
|
|
|
|
|
|
| |||||||||||
Total from investment operations | 2.94 | (0.30 | ) | 0.71 | 2.70 | 0.05 | ||||||||||||||
|
|
|
|
|
|
|
|
|
| |||||||||||
Distributions from: | ||||||||||||||||||||
Net investment income | (0.17 | ) | (0.25 | ) | (0.19 | ) | (0.25 | ) | — | |||||||||||
Net realized gain | — | — | (0.83 | ) | (1.12 | ) | — | |||||||||||||
|
|
|
|
|
|
|
|
|
| |||||||||||
Total from distributions | (0.17 | ) | (0.25 | ) | (1.02 | ) | (1.37 | ) | — | |||||||||||
|
|
|
|
|
|
|
|
|
| |||||||||||
Redemption fees | — | (c) | — | (c) | 0.01 | — | — | |||||||||||||
Net asset value, at end of period | $20.44 | $17.67 | $18.22 | $18.52 | $17.19 | |||||||||||||||
|
|
|
|
|
|
|
|
|
| |||||||||||
Total Return (e) | 16.70 | %(f) | (1.66 | )% | 3.89 | % | 16.60 | % | 0.29 | %(f) | ||||||||||
Ratios/Supplemental Data: | ||||||||||||||||||||
Net assets at end of period (thousands) | $103,084 | $138,540 | $117,663 | $6,919 | $273 | |||||||||||||||
Before waiver: | ||||||||||||||||||||
Ratio of expenses to average net assets | 0.92 | %(g) | 0.91 | % | 1.00 | % | 1.68 | % | 1.53 | %(g) | ||||||||||
After waiver: | ||||||||||||||||||||
Ratio of expenses to average net assets | 0.73 | %(g)(h) | 0.73 | % | 0.73 | % | 0.73 | % | 0.73 | %(g) | ||||||||||
Ratio of net investment income to average net assets | 1.62 | %(g) | 1.45 | % | 1.25 | % | 1.34 | % | 0.49 | %(g) | ||||||||||
Portfolio turnover (i) | 22 | %(f) | 69 | % | 45 | % | 57 | % | 70 | %(f) | ||||||||||
| (a) | The Dana Large Cap Equity Fund’s Institutional Class commenced operations on October 29, 2013. |
| (b) | Per share net investment income has been determined on the basis of average shares outstanding during the period. |
| (c) | The amount is less than $0.005 per share. |
| (d) | The amount shown for a share outstanding throughout the period does not accord with the change in aggregate gains and losses in the portfolio of securities during the period because of the timing of sales and purchases of fund shares in relation to fluctuating market values during the period. |
| (e) | Total return in the above table represents the rate that the investor would have earned or lost on an investment in the Fund, assuming reinvestment of distributions. |
| (f) | Not annualized |
| (g) | Annualized |
| (h) | This ratio excludes the impact of overdraft fees. If this cost had been included, the ratio of expenses to average net assets would have been 0.75% for the six months ended April 30, 2017. |
| (i) | Portfolio turnover is calculated on the basis of the Fund as a whole without distinguishing among the classes of shares. |
See accompanying notes which are an integral part of these financial statements.
22
Dana Small Cap Equity Fund – Institutional Class
Financial Highlights
Selected data for a share outstanding throughout each period.
| Six Months Ended April 30, 2017 (Unaudited) | Period Ended October 31, 2016(a) | |||||||
Net asset value, at beginning of period | $9.30 | $10.00 | ||||||
|
|
|
| |||||
Income from investment operations: | ||||||||
Net investment income | 0.01 | 0.01 | ||||||
Net realized and unrealized gain (loss) on investments | 1.33 | (0.70 | )(b) | |||||
|
|
|
| |||||
Total from investment operations | 1.34 | (0.69 | ) | |||||
|
|
|
| |||||
Distributions from: | ||||||||
Net investment income | (0.01 | ) | (0.01 | ) | ||||
|
|
|
| |||||
Total from distributions | (0.01 | ) | (0.01 | ) | ||||
|
|
|
| |||||
Redemption fees | — | — | (c) | |||||
Net asset value, at end of period | $10.63 | $9.30 | ||||||
|
|
|
| |||||
Total Return (d) | 14.46 | %(e) | (6.87 | )%(e) | ||||
Ratios/Supplemental Data: | ||||||||
Net assets at end of period (thousands) | $9,677 | $6,575 | ||||||
Before waiver: | ||||||||
Ratio of expenses to average net assets | 2.21 | %(f) | 4.11 | %(f) | ||||
After waiver: | ||||||||
Ratio of expenses to average net assets | 0.95 | %(f) | 0.95 | %(f) | ||||
Ratio of net investment income to average net assets | 0.23 | %(f) | 0.12 | %(f) | ||||
Portfolio turnover (g) | 26 | %(e) | 54 | %(e) | ||||
| (a) | For the period November 3, 2015 (commencement of operations) through October 31, 2016. |
| (b) | The amount shown for a share outstanding throughout the period does not accord with the change in aggregate gains and losses in the portfolio of securities during the period because of the timing of sales and purchases of fund shares in relation to fluctuating market values during the period. |
| (c) | The amount is less than $0.005 per share. |
| (d) | Total return in the above table represents the rate that the investor would have earned or lost on an investment in the Fund, assuming reinvestment of distributions. |
| (e) | Not annualized |
| (f) | Annualized |
| (g) | Portfolio turnover is calculated on the basis of the Fund as a whole without distinguishing among the classes of shares. |
See accompanying notes which are an integral part of these financial statements.
23
Dana Small Cap Equity Fund – Investor Class
Financial Highlights
Selected data for a share outstanding throughout each period.
| Six Months Ended April 30, 2017 (Unaudited) | Period Ended October 31, 2016(a) | |||||||
Net asset value, at beginning of period | $9.28 | $10.00 | ||||||
|
|
|
| |||||
Income from investment operations: | ||||||||
Net investment income (loss) | — | (b) | — | (b) | ||||
Net realized and unrealized gain (loss) on investments | 1.32 | (0.71 | )(c) | |||||
|
|
|
| |||||
Total from investment operations | 1.32 | (0.71 | ) | |||||
|
|
|
| |||||
Distributions from: | ||||||||
Net investment income | (0.01 | ) | (0.01 | ) | ||||
|
|
|
| |||||
Total from distributions | (0.01 | ) | (0.01 | ) | ||||
|
|
|
| |||||
Redemption fees | — | — | (b) | |||||
Net asset value, at end of period | $10.59 | $9.28 | ||||||
|
|
|
| |||||
Total Return (d) | 14.21 | %(e) | (7.13 | )%(e) | ||||
Ratios/Supplemental Data: | ||||||||
Net assets at end of period (thousands) | $5,890 | $3,604 | ||||||
Before waiver: | ||||||||
Ratio of expenses to average net assets | 2.46 | %(f) | 4.53 | %(f) | ||||
After waiver: | ||||||||
Ratio of expenses to average net assets | 1.20 | %(f) | 1.20 | %(f) | ||||
Ratio of net investment loss to average net assets | (0.05 | )%(f) | (0.10 | )%(f) | ||||
Portfolio turnover (g) | 26 | %(e) | 54 | %(e) | ||||
| (a) | For the period November 3, 2015 (commencement of operations) through October 31,2016. |
| (b) | The amount is less than $0.005 per share. |
| (c) | The amount shown for a share outstanding throughout the period does not accord with the change in aggregate gains and losses in the portfolio of securities during the period because of the timing of sales and purchases of fund shares in relation to fluctuating market values during the period. |
| (d) | Total return in the above table represents the rate that the investor would have earned or lost on an investment in the Fund, assuming reinvestment of distributions. |
| (e) | Not annualized |
| (f) | Annualized |
| (g) | Portfolio turnover is calculated on the basis of the Fund as a whole without distinguishing among the classes of shares. |
See accompanying notes which are an integral part of these financial statements.
24
Dana Funds
Notes to the Financial Statements
April 30, 2017 (Unaudited)
NOTE 1. ORGANIZATION
The Dana Large Cap Equity Fund (the “Large Cap Fund”) and the Dana Small Cap Equity Fund (the “Small Cap Fund”) (each a “Fund” and collectively, the “Funds”) are each an open-end diversified series of Valued Advisers Trust (the “Trust”). The Trust is a management investment company established under the laws of Delaware by an Agreement and Declaration of Trust dated June 13, 2008 (the “Trust Agreement”). The Trust Agreement permits the Board of Trustees (“Board”) to issue an unlimited number of shares of beneficial interest of separate series without par value. Each Fund is one of a series of funds currently authorized by the Board. The investment adviser to the Funds is Dana Investment Advisors, Inc. (the “Adviser”). Each Fund seeks long-term growth of capital.
The Large Cap Fund currently offers Class N shares, Class A shares, and Institutional Class shares, and the Small Cap Fund currently offers Investor Class shares and Institutional Class shares. Each share represents an equal proportionate interest in the assets and liabilities belonging to the Fund and is entitled to such dividends and distributions out of income belonging to the Fund as declared by the Board. Class A currently has a maximum sales charge on purchases of 5.00% as a percentage of the original purchase price. Prior to February 28, 2017, all share classes imposed a 2.00% redemption fee on shares redeemed within 60 days of purchase.
NOTE 2. SIGNIFICANT ACCOUNTING POLICIES
The Funds are investment companies and follow accounting and reporting guidance under Financial Accounting Standards Board Accounting Standards Codification (“ASC”) Topic 946, “Financial Services-Investment Companies”. The following is a summary of significant accounting policies followed by the Funds in the preparation of their financial statements. These policies are in conformity with the generally accepted accounting principles in the United States of America (“GAAP”).
Estimates – The preparation of financial statements in conformity with GAAP requires management to make estimates and assumptions that affect the reported amounts of assets and liabilities and disclosure of contingent assets and liabilities at the date of the financial statements and the reported amounts of increases and decreases in net assets from operations during the reporting period. Actual results could differ from those estimates.
Securities Valuation – All investments in securities are recorded at their estimated fair value as described in Note 3.
Federal Income Taxes – The Funds make no provision for federal income or excise tax. Each Fund has qualified and intends to qualify each year as a regulated investment company (“RIC”) under subchapter M of the Internal Revenue Code of 1986, as amended, by complying with the requirements applicable to RICs and by distributing substantially all of its taxable income. Each Fund also intends to distribute sufficient net investment income and net capital gains, if any, so that it will not be subject to excise tax on undistributed income and gains. If the required amount of net investment income or gains is not distributed, the Fund could incur a tax expense.
25
Dana Funds
Notes to the Financial Statements (continued)
April 30, 2017 (Unaudited)
For the six months ended April 30, 2017, the Funds did not have a liability for any unrecognized tax benefits. The Funds recognize interest and penalties, if any, related to unrecognized tax benefits as income tax expense on the statements of operations. During the period, the Funds did not incur any interest or penalties.
Expenses – Expenses incurred by the Trust that do not relate to a specific fund of the Trust are allocated to the individual funds based on each fund’s relative net assets or other appropriate basis. Expenses attributable to any class are borne by that class. Income, realized gains and losses, unrealized appreciation and depreciation, and expenses are allocated to each class based on the net assets in relation to the relative net assets of the Fund.
Security Transactions and Related Income – The Funds follow industry practice and record security transactions on the trade date for financial reporting purposes. The specific identification method is used for determining gains or losses for financial statement and income tax purposes. Dividend income is recorded on the ex-dividend date and interest income is recorded on an accrual basis. Discounts and premiums on securities purchased are accreted or amortized using the effective interest method, if applicable. Withholding taxes on foreign dividends have been provided for in accordance with the Funds’ understanding of the applicable country’s tax rules and rates.
Dividends and Distributions – Distributions to shareholders, which are determined in accordance with income tax regulations, are recorded on the ex-dividend date. The Funds intend to distribute substantially all of their net investment income quarterly. The Funds intend to distribute their net realized long-term and short-term capital gains, if any, annually. The treatment for financial reporting purposes of distributions made to shareholders during the year from net investment income or net realized capital gains may differ from their ultimate treatment for federal income tax purposes. These differences are caused primarily by differences in the timing of the recognition of certain components of income, expense or realized capital gain for federal income tax purposes. Where such differences are permanent in nature, they are reclassified in the components of the net assets based on their ultimate characterization for federal income tax purposes. Any such reclassifications will have no effect on net assets, results of operations or net asset value (“NAV”) per share of the Funds.
NOTE 3. SECURITIES VALUATION AND FAIR VALUE MEASUREMENTS
Fair value is defined as the price that a Fund would receive upon selling an investment in a timely transaction to an independent buyer in the principal or most advantageous market of the investment. GAAP establishes a three-tier hierarchy to maximize the use of observable market data and minimize the use of unobservable inputs and to establish classification of fair value measurements for disclosure purposes.
Inputs refer broadly to the assumptions that market participants would use in pricing the asset or liability, including assumptions about risk (the risk inherent in a particular valuation technique used to measure fair value including such a pricing model and/or the risk inherent in the inputs to the valuation technique). Inputs may be observable or unobservable. Observable inputs are inputs that reflect the assumptions market participants would use in pricing the asset or liability developed based on market data obtained and available from sources independent of the reporting entity.
26
Dana Funds
Notes to the Financial Statements (continued)
April 30, 2017 (Unaudited)
Unobservable inputs are inputs that reflect the reporting entity’s own assumptions about the assumptions market participants would use in pricing the asset or liability developed based on the best information available in the circumstances.
Various inputs are used in determining the value of the Funds’ investments. These inputs are summarized in the three broad levels listed below.
| • | Level 1 – unadjusted quoted prices in active markets for identical investments and/or registered investment companies where the value per share is determined and published and is the basis for current transactions for identical assets or liabilities at the valuation date |
| • | Level 2 – other significant observable inputs (including, but not limited to, quoted prices for an identical security in an inactive market, quoted prices for similar securities, interest rates, prepayment speeds, credit risk, etc.) |
| • | Level 3 – significant unobservable inputs (including the Funds’ own assumptions in determining fair value of investments based on the best information available) |
The inputs used to measure fair value may fall into different levels of the fair value hierarchy. In such cases, for disclosure purposes, the level in the fair value hierarchy which is reported is determined based on the lowest level input that is significant to the fair value measurement in its entirety.
Equity securities that are traded on any stock exchange are generally valued at the last quoted sale price on the security’s primary exchange. Lacking a last sale price, an exchange traded security is generally valued at its last bid price. Securities traded in the NASDAQ over-the counter market are generally valued at the NASDAQ Official Closing Price. When using the market quotations and when the market is considered active, the security is classified as a Level 1 security. In the event that market quotations are not readily available or are considered unreliable due to market or other events, the Fund values its securities and other assets at fair value in accordance with policies established by and under the general supervision of the Board. Under these policies, the securities will be classified as Level 2 or 3 within the fair value hierarchy, depending on the inputs used.
Investments in mutual funds, including money market mutual funds, are generally priced at the ending NAV provided by the pricing service of the funds. These securities are categorized as Level 1 securities.
In accordance with the Trust’s valuation policies, the Adviser is required to consider all appropriate factors relevant to the value of securities for which it has determined other pricing sources are not available or reliable as described above. No single standard exists for determining fair value, because fair value depends upon the circumstances of each individual case. As a general principle, the current fair value of an issue of securities being valued by the Adviser would appear to be the amount that the Fund might reasonably expect to receive for them upon their current sale. Methods that are in accordance with this principle may, for example, be based on (i) a multiple of earnings; (ii) a discount from market prices of a similar freely traded security (including a derivative security or a basket of securities traded on other markets, exchanges or among dealers); or (iii) yield to maturity with respect to debt issues, or a combination of these and other methods. Fair-value pricing is permitted if, in the Adviser’s opinion, the validity of market quotations appears to be
27
Dana Funds
Notes to the Financial Statements (continued)
April 30, 2017 (Unaudited)
questionable based on factors such as evidence of a thin market in the security based on a small number of quotations, a significant event occurs after the close of a market but before a Fund’s NAV calculation that may affect a security’s value, or the Adviser is aware of any other data that calls into question the reliability of market quotations.
The following is a summary of the inputs used to value the Funds’ investments as of April 30, 2017:
| Large Cap Fund | Valuation Inputs | |||||||||||||||
| Assets | Level 1 | Level 2 | Level 3 | Total | ||||||||||||
Common Stocks* | $ | 139,202,660 | $ | – | $ | – | $ | 139,202,660 | ||||||||
Short-Term Investments | 1,240,668 | – | – | 1,240,668 | ||||||||||||
Total | $ | 140,443,328 | $ | – | $ | – | $ | 140,443,328 | ||||||||
| Small Cap Fund | Valuation Inputs | |||||||||||||||
| Assets | Level 1 | Level 2 | Level 3 | Total | ||||||||||||
Common Stocks* | $ | 15,444,414 | $ | – | $ | – | $ | 15,444,414 | ||||||||
Total | $ | 15,444,414 | $ | – | $ | – | $ | 15,444,414 | ||||||||
| * | Refer to Schedule of Investments for sector classifications. |
The Funds did not hold any investments during the reporting period for which other significant observable inputs (Level 2) were used in determining fair value. The Funds did not hold any investments during the reporting period for which significant unobservable inputs (Level 3) were used in determining fair value; therefore, no reconciliation of Level 3 securities is included for this reporting period. The Funds did not hold any derivative instruments during the reporting period.
The Trust recognizes transfers between fair value hierarchy levels at the end of the reporting period. There were no transfers between any levels as of April 30, 2017 based on input levels assigned at October 31, 2016.
NOTE 4. FEES AND OTHER TRANSACTIONS WITH AFFILIATES
The Adviser, under the terms of the management agreement for each Fund (each an “Agreement”), manages the Funds’ investments subject to oversight of the Board. As compensation for its management services, the Funds are obligated to pay the Adviser a fee computed and accrued daily and paid monthly at an annual rate of 0.70% and 0.80% of the average daily net assets of the Large Cap Fund and the Small Cap Fund, respectively. For the six months ended April 30, 2017, the Adviser earned fees of $511,966 from the Large Cap Fund and $54,343 from the Small Cap Fund before the waivers described below. At April 30, 2017, the Large Cap Fund owed the Adviser $57,091 and the Adviser owed the Small Cap Fund $4,390.
The Adviser has contractually agreed to waive its management fee and/or reimburse certain operating expenses through February 28, 2018, but only to the extent necessary so that the Funds’ net expenses, excluding brokerage fees and commissions, borrowing costs (such as interest and dividend expenses on securities sold short), taxes, extraordinary expenses, fees and expenses paid under a distribution plan adopted pursuant to Rule 12b-1, fees and expenses paid under a shareholder services plan, and indirect expenses (such as “acquired funds fees and expenses”) do
28
Dana Funds
Notes to the Financial Statements (continued)
April 30, 2017 (Unaudited)
not exceed 0.73% for Class N, Class A and Institutional Class shares for the Large Cap Fund and do not exceed 0.95% for the Investor Class and Institutional Class for the Small Cap Fund.
Each fee waiver or expense reimbursement by the Adviser is subject to repayment by the Fund within the three years following the date in which the fee waiver or expense reimbursement occurred, provided that the Fund is able to make the repayment without exceeding the expense limitation that is in effect at the time of the repayment or at the time of the fee waiver or expense reimbursement, whichever is lower. The contractual agreement is in effect through February 28, 2018. The expense cap may not be terminated prior to this date except by the Board. For the six months ended April 30, 2017, the Adviser waived fees of $141,426 from the Large Cap Fund and $85,654 from the Small Cap Fund.
The amounts subject to repayment by the Funds, pursuant to the aforementioned conditions are as follows:
| Large Cap Fund | ||||||||
| Recoverable through | ||||||||
| Amount | October 31, | April 30, | ||||||
| $115,620 | 2017 | |||||||
| $268,172 | 2018 | |||||||
| $313,281 | 2019 | |||||||
| $141,426 | 2020 | |||||||
| Small Cap Fund | ||||||||||
| Recoverable through | ||||||||||
| Amount | October 31, | April 30, | ||||||||
| $153,808 | 2019 | |||||||||
| $ | 85,654 | 2020 | ||||||||
The Trust retains Ultimus Asset Services, LLC (the “Administrator”), to provide the Fund with administration, compliance, fund accounting, and transfer agent services, including all regulatory reporting. Expenses incurred by the Funds for these services are allocated to the individual Funds based on each Fund’s relative net assets.
The officers and one trustee of the Trust are members of management and/or employees of the Administrator. Unified Financial Securities, LLC (the “Distributor”) acts as the principal distributor of the Funds’ shares. An officer of the Trust is an officer of the Distributor and such person may be deemed to be an affiliate of the Distributor. For the six months ended April 30, 2017, fees for administration and compliance, fund accounting, and transfer agent services, and amounts due to the Administrator at April 30, 2017 were as follows:
| Large Cap Fund | Small Cap Fund | |||||||
Administration | $ | 40,651 | $ | 18,844 | ||||
Fund accounting | 23,357 | 14,876 | ||||||
Transfer agent | 14,650 | 11,468 | ||||||
Payable to Administrator | 13,283 | 7,220 | ||||||
The Trust, with respect to each Fund has adopted a Distribution Plan (the “Plan”) pursuant to Rule 12b-1 under the Investment Company Act of 1940 (the “1940 Act”). The Plan provides that the Funds will pay the Distributor and any registered securities dealer, financial institution or any other person (a “Recipient”) a shareholder servicing fee aggregating at a rate of 0.25% of the average daily net assets for each of the Class N, Class A and Investor Class shares in connection with the
29
Dana Funds
Notes to the Financial Statements (continued)
April 30, 2017 (Unaudited)
promotion and distribution of the Funds’ shares or the provision of personal services to shareholders, including, but not necessarily limited to, advertising, compensation to underwriters, dealers and selling personnel, the printing and mailing of prospectuses to other than current Fund shareholders, the printing and mailing of sales literature and servicing shareholder accounts. The Funds or the Adviser may pay all or a portion of these fees to any Recipient who renders assistance in distributing or promoting the sale of shares, or who provides certain shareholder services, pursuant to a written agreement. The Plan is a compensation plan, which means that compensation is paid regardless of 12b-1 expenses actually incurred. It is anticipated that the Plan will benefit shareholders because an effective sales program typically is necessary in order for the Fund to reach and maintain a sufficient size to achieve efficiently its investment objectives and to realize economies of scale. For the six months ended April 30, 2017, Class N shares 12b-1 and Class A shares 12b-1 expense incurred by the Large Cap Fund was $42,962 and $1,691, respectively and Investor Class shares 12b-1 expense incurred by the Small Cap Fund was $6,225. The Large Cap Fund owed $7,296 for Class N shares and $287 for Class A shares 12b-1 fees as of April 30, 2017 and the Small Cap Fund owed $1,201 for Investor Class shares 12b-1 fees as of April 30, 2017.
During the six months ended April 30, 2017, there were no commissions earned on sales of Class A shares of the Large Cap Fund.
NOTE 5. PURCHASES AND SALES OF SECURITIES
For the six months ended April 30, 2017, purchases and sales of investment securities, other than short-term investments and short-term U.S. government obligations were as follows:
| Large Cap Fund | Small Cap Fund | |||||||
Purchases | ||||||||
U.S. Government Obligations | $ | – | $ | – | ||||
Other | 31,954,181 | 7,249,536 | ||||||
Sales | ||||||||
U.S. Government Obligations | $ | – | $ | – | ||||
Other | 86,166,903 | 3,465,072 | ||||||
NOTE 6. BENEFICIAL OWNERSHIP
The beneficial ownership, either directly or indirectly, of more than 25% of the voting securities of a fund creates a presumption of control of a fund, under Section 2(a)(9) of the 1940 Act. At April 30, 2017, there were no beneficial owners, either directly or indirectly, of more than 25% of the Large Cap Fund. At April 30, 2017, Charles Schwab & Co., Inc. (“Schwab”) owned, as record shareholder, 69% of the outstanding shares of the Small Cap Fund. It is not known whether Schwab or any of the underlying beneficial owners owned or controlled more than 25% of the voting securities of the Small Cap Fund.
30
Dana Funds
Notes to the Financial Statements (continued)
April 30, 2017 (Unaudited)
NOTE 7. FEDERAL TAX INFORMATION
At April 30, 2017, the net unrealized appreciation (depreciation) of investments for tax purposes was as follows:
| Large Cap Fund | Small Cap Fund | |||||||
Gross Unrealized Appreciation | $ | 21,318,814 | $ | 2,418,179 | ||||
Gross Unrealized Depreciation | (1,004,570 | ) | (761,877 | ) | ||||
Net Unrealized Appreciation | $ | 20,314,244 | $ | 1,656,302 | ||||
At April 30, 2017, the aggregate cost of securities for federal income tax purposes was $120,129,084 for Large Cap Fund and $13,788,112 for Small Cap Fund.
At October 31, 2016, the difference between book basis and tax basis unrealized appreciation for the Large Cap Fund and Small Cap Fund was attributable primarily to the tax deferral of losses on wash sales and the return of capital adjustments from real estate investment trusts.
At October 31, 2016, the Funds’ most recent fiscal year end, the components of distributable earnings (accumulated losses) on a tax basis was as follows:
| Large Cap Fund | Small Cap Fund | |||||||
Undistributed Ordinary Income | $ | 229,055 | $ | – | ||||
Accumulated Capital and Other Losses | (6,729,641 | ) | (265,364 | ) | ||||
Unrealized Appreciation (Depreciation)(a) | 6,514,985 | 347,091 | ||||||
Total Accumulated Earnings (Deficit) | $ | 14,399 | $ | 81,727 | ||||
| (a) | The difference between book basis and tax basis unrealized appreciation (depreciation) is attributable to the tax deferral of losses on wash sales and income from certain investments. |
The tax character of distributions for the fiscal period ended October 31, 2016 were as follows:
| Large Cap Fund | Small Cap Fund | |||||||
| 2016 | 2016 | |||||||
Distributions paid from: | ||||||||
Ordinary Income | $ | 2,373,908 | $ | 2,906 | ||||
Return of Capital | – | 1,826 | ||||||
| $ | 2,373,908 | $ | 4,732 | |||||
As of October 31, 2016, the Large Cap Fund and Small Cap Fund have available for tax purposes an unused capital loss carryforwards of $6,729,641 and $265,364, respectively, of short-term capital losses with no expiration, which is available to offset against future taxable net capital gains. To the extent that these carryforwards are used to offset future gains, it is probable that the amount offset will not be distributed to shareholders.
31
Dana Funds
Notes to the Financial Statements (continued)
April 30, 2017 (Unaudited)
NOTE 8. COMMITMENTS AND CONTINGENCIES
The Funds indemnify their officers and trustees for certain liabilities that may arise from performance of their duties to the Funds. Additionally, in the normal course of business, the Funds enter into contracts that contain a variety of representations and warranties which provide general indemnifications. The Funds’ maximum exposure under these arrangements is unknown, as this would involve future claims that may be made against the Funds that have not yet occurred.
NOTE 9. SUBSEQUENT EVENTS
Management of the Funds has evaluated the need for disclosures and/or adjustments resulting from subsequent events through the date these financial statements were issued. Management has determined there were no items requiring adjustment of the financial statements or additional disclosure.
32
Summary of Fund Expenses (Unaudited)
As a shareholder of one of the Funds, you incur two types of costs: (1) transaction costs, including sales charges (loads) on purchases and (2) ongoing costs, including management fees; and other Fund expenses. These examples are intended to help you understand your ongoing costs (in dollars) of investing in each Fund and to compare these costs with the ongoing costs of investing in other mutual funds. Each Fund’s example is based on an investment of $1,000 invested at the beginning of the period and held for the entire period from November 1, 2016 through April 30, 2017.
Actual Expenses
The first line of the table for each class provides information about actual account values and actual expenses. You may use the information in these lines, together with the amount you invested, to estimate the expenses that you paid over the period. Simply divide your account value by $1,000 (for example, an $8,600 account value divided by $1,000 = 8.60), then multiply the result by the number in the first line under the heading “Expenses Paid During Period” to estimate the expenses you paid on your account during this period.
Hypothetical Example for Comparison Purposes
The second line of the table for each class provides information about hypothetical account values and hypothetical expenses based on each Fund’s actual expense ratios and an assumed rate of return of 5% per year before expenses, which is not the Fund’s actual return. The hypothetical account values and expenses may not be used to estimate the actual ending account balances or expenses you paid for the period. You may use this information to compare the ongoing costs of investing in the Funds and other funds. To do so, compare this 5% hypothetical example with the 5% hypothetical examples that appear in the shareholder reports of the other funds.
Expenses shown in the table are meant to highlight your ongoing costs only and do not reflect any transactional costs such as the fee imposed on sales charges. Therefore, the second line of the table for each class is useful in comparing ongoing costs only and will not help you determine the relative total costs of owning different funds. In addition, if transaction costs were included, your costs would have been higher.
33
Summary of Fund Expenses (Unaudited) (continued)
| Beginning Account Value, November 1, 2016 | Ending Account Value, April 30, 2017 | Expenses Paid During Period(a) | Annualized Expense Ratio | |||||||||||||||||
Large Cap Fund |
| |||||||||||||||||||
Class N | Actual | $ | 1,000.00 | $ | 1,164.90 | $ | 5.39 | 1.00 | % | |||||||||||
| Hypothetical | (b) | $ | 1,000.00 | $ | 1,019.81 | $ | 5.03 | 1.00 | % | |||||||||||
Class A | Actual | $ | 1,000.00 | $ | 1,165.30 | $ | 5.39 | 1.00 | % | |||||||||||
| Hypothetical | (b) | $ | 1,000.00 | $ | 1,019.81 | $ | 5.03 | 1.00 | % | |||||||||||
Institutional Class | Actual | $ | 1,000.00 | $ | 1,167.00 | $ | 4.06 | 0.75 | % | |||||||||||
| Hypothetical | (b) | $ | 1,000.00 | $ | 1,021.05 | $ | 3.78 | 0.75 | % | |||||||||||
| Beginning Account Value, November 1, 2016 | Ending Account Value, April 30, 2017 | Expenses Paid During Period(a) | Annualized Expense Ratio | |||||||||||||||||
Small Cap Fund |
| |||||||||||||||||||
Institutional Class | Actual | $ | 1,000.00 | $ | 1,144.60 | $ | 5.05 | 0.95 | % | |||||||||||
| Hypothetical | (b) | $ | 1,000.00 | $ | 1,020.08 | $ | 4.76 | 0.95 | % | |||||||||||
Investor Class | Actual | $ | 1,000.00 | $ | 1,142.10 | $ | 6.37 | 1.20 | % | |||||||||||
| Hypothetical | (b) | $ | 1,000.00 | $ | 1,018.84 | $ | 6.01 | 1.20 | % | |||||||||||
| (a) | Expenses are equal to the Fund’s annualized expense ratios, multiplied by the average account value over the period, multiplied by 181/365 (to reflect the one-half year period). The annualized expense ratios reflect reimbursement of expenses by the Fund’s investment adviser for the period beginning November 1, 2016 to April 30, 2017. The “Financial Highlights” tables in the Fund’s financial statements, included in this report, also show the gross expense ratios, without such reimbursements. |
| (b) | Hypothetical assumes 5% annual return before expenses. |
34
VALUED ADVISERS TRUST
PRIVACY POLICY
March 9, 2017
FACTS | WHAT DOES VALUED ADVISERS TRUST DO WITH YOUR PERSONAL INFORMATION?
| |
| Why? | Financial companies choose how they share your personal information. Federal law gives consumers the right to limit some but not all sharing. Federal law also requires us to tell you how we collect, share, and protect your personal information. Please read this notice carefully to understand what we do.
| |
| What? | The types of personal information we collect and share depend on the product or service you have with us. This information can include: ◾ Social Security number ◾ account balances and account transactions ◾ account transactions, transaction or loss history and purchase history ◾ checking account information and wire transfer instructions When you are no longer our customer, we continue to share your information as described in this notice.
| |
| How? | All financial companies need to share customers’ personal information to run their everyday business. In the section below, we list the reasons financial companies can share their customers’ personal information; the reasons Valued Advisers Trust chooses to share; and whether you can limit this sharing.
|
Reasons we can share your personal information | Does Valued Advisers Trust share?
| |
For our everyday business purposes — such as to process your transactions, maintain your account(s), respond to court orders and legal investigations, or report to credit bureaus
| Yes
| |
For our marketing purposes — to offer our products and services to you
| Yes
| |
For joint marketing with other financial companies
| No
| |
For our affiliates’ everyday business purposes — information about your transactions and experiences
| No
| |
For our affiliates’ everyday business purposes — information about your creditworthiness
| No
| |
For nonaffiliates to market to you
| No
|
| Questions? | Call 1-855-280-9648. |
35
|
Page 2
|
|
Who we are | ||
Who is providing this notice?
| Valued Advisers Trust
| |
What we do
| ||
| How does Valued Advisers Trust protect my personal information? | To protect your personal information from unauthorized access and use, we use security measures that comply with federal law. These measures include computer safeguards and secured files and buildings.
| |
| How does Valued Advisers Trust collect my personal information? | We collect your personal information, for example, when you open an account or deposit money buy securities from us or sell securities to us make deposits or withdrawals from your account or provide account information give us your account information make a wire transfer tell us who receives the money tell us where to send the money show your government-issued ID show your driver’s license
| |
Why can’t I limit all sharing? | Federal law gives you the right to limit only sharing for affiliates’ everyday business purposes—information about your creditworthiness affiliates from using your information to market to you sharing for nonaffiliates to market to you State laws and individual companies may give you additional rights to limit sharing.
| |
Definitions
| ||
Affiliates | Companies related by common ownership or control. They can be financial and nonfinancial companies.
| |
Nonaffiliates | Companies not related by common ownership or control. They can be financial and nonfinancial companies. ◾ Valued Advisers Trust does not share your personal information with nonaffiliates so they can market to you.
| |
Joint marketing | A formal agreement between nonaffiliated financial companies that together market financial products or services to you. ◾ Valued Advisers Trust doesn’t jointly market financial products or services to you.
| |
36
PROXY VOTING
A description of the policies and procedures that each Fund uses to determine how to vote proxies relating to portfolio securities and information regarding how each Fund voted those proxies during the most recent twelve month period ended June 30, is available without charge upon request by (1) calling the Funds at (855) 280-9648 and (2) from Fund documents filed with the Securities and Exchange Commission (“SEC”) on the SEC’s website at www.sec.gov.
TRUSTEES
Andrea N. Mullins, Chairperson
Ira P. Cohen
Mark J. Seger
OFFICERS
Bo J. Howell, Principal Executive Officer and President
Bryan W. Ashmus, Principal Financial Officer and Treasurer
John C. Swhear, Chief Compliance Officer and Vice President
Carol J. Highsmith, Vice President and Secretary
Matthew J. Miller, Vice President
Stephen L. Preston, Anti-Money Laundering Officer
INVESTMENT ADVISER
Dana Investment Advisors, Inc.
20700 Swenson Drive, Suite 400
Waukesha, WI 53186
DISTRIBUTOR
Unified Financial Securities, LLC
9465 Counselors Row, Suite 200
Indianapolis, IN 46240
INDEPENDENT REGISTERED PUBLIC ACCOUNTING FIRM
Cohen & Company, Ltd.
1350 Euclid Avenue, Suite 800
Cleveland, OH 44115
LEGAL COUNSEL
The Law Offices of John H. Lively & Associates, Inc.,
A member firm of The 1940 Act Law GroupTM
11300 Tomahawk Creek Parkway, Suite 310
Leawood, KS 66211
CUSTODIAN
Huntington National Bank
41 S. High St.
Columbus, OH 43215
ADMINISTRATOR, TRANSFER AGENT AND FUND ACCOUNTANT
Ultimus Asset Services, LLC
225 Pictoria Drive, Suite 450
Cincinnati, OH 45246
This report is intended only for the information of shareholders or those who have received the Funds’ prospectus which contains information about each Fund’s management fee and expenses. Please read the prospectus carefully before investing.
Distributed by Unified Financial Securities, LLC
Member FINRA/SIPC
Item 2. Code of Ethics. NOT APPLICABLE- disclosed with annual report
Item 3. Audit Committee Financial Expert. NOT APPLICABLE- disclosed with annual report
Item 4. Principal Accountant Fees and Services. NOT APPLICABLE- disclosed with annual report
Item 5. Audit Committee of Listed Companies. NOT APPLICABLE – applies to listed companies only
Item 6. Schedule of Investments. Schedules filed with Item 1.
Item 7. Disclosure of Proxy Voting Policies and Procedures for Closed-End Management Investment Companies. NOT APPLICABLE – applies to closed-end funds only
Item 8. Portfolio Managers of Closed-End Investment Companies. NOT APPLICABLE – applies to closed-end funds only
Item 9. Purchases of Equity Securities by Closed-End Management Investment Company and Affiliated Purchasers. NOT APPLICABLE – applies to closed-end funds only
Item 10. Submission of Matters to a Vote of Security Holders.
The guidelines applicable to shareholders desiring to submit recommendations for nominees to the Registrant’s board of trustees are contained in the statement of additional information of the Trust with respect to the Fund(s) for which this Form N-CSR is being filed.
Item 11. Controls and Procedures.
(a) Based on their evaluation of the registrant’s disclosure controls and procedures (as defined in Rule 30a-3(c) under the Investment Company Act of 1940, as amended (the “Act”)) as of a date within 90 days of the filing date of this report, the registrant’s principal executive officer and principal financial officer have concluded that such disclosure controls and procedures are reasonably designed and are operating effectively to ensure that material information relating to the registrant is made known to them by others within those entities, particularly during the period in which this report is being prepared, and that the information required in filings on Form N-CSR is recorded, processed, summarized, and reported on a timely basis.
(b) There were no changes in the registrant’s internal control over financial reporting (as defined in Rule 30a-3(d) under the Investment Company Act of 1940) that occurred during the second fiscal quarter of the period covered by this report that have materially affected, or are reasonably likely to materially affect, the registrant’s internal control over financial reporting.
Item 12. Exhibits.
(a) (1) Not Applicable – filed with annual report
| (2) | Certifications by the registrant’s principal executive officer and principal financial officer, pursuant to Section 302 of the Sarbanes- Oxley Act of 2002 and required by Rule 30a-2 under the Investment Company Act of 1940 are filed herewith. |
| (3) | Not Applicable |
-3-
| (b) | Certification pursuant to 18 U.S.C. Section 1350, as adopted pursuant to Section 906 of the Sarbanes-Oxley Act of 2002 is filed herewith. |
-4-
Pursuant to the requirements of the Securities Exchange Act of 1934 and the Investment Company Act of 1940, the registrant has duly caused this report to be signed on its behalf by the undersigned, thereunto duly authorized.
(Registrant) Valued Advisers Trust
| By | /s/ Bo J. Howell | |
| Bo J. Howell, President and Principal Executive Officer | ||
Date 7/06/2017
Pursuant to the requirements of the Securities Exchange Act of 1934 and the Investment Company Act of 1940, this report has been signed below by the following persons on behalf of the registrant and in the capacities and on the dates indicated.
| By | /s/ Bo J. Howell | |
| Bo J. Howell, President and Principal Executive Officer | ||
| Date 7/06/2017 | ||
| By | /s/ Bryan W. Ashmus | |
| Bryan W. Ashmus, Treasurer and Principal Financial Officer | ||
Date 7/06/2017
-5-