UNITED STATES
SECURITIES AND EXCHANGE COMMISSION
Washington, D.C. 20549
FORM N-CSR
CERTIFIED SHAREHOLDER REPORT OF REGISTERED
MANAGEMENT INVESTMENT COMPANIES
Investment Company Act file number: 811-22211
______________________________________________
IVA FIDUCIARY TRUST
______________________________________________________________________
(Exact name of registrant as specified in charter)
717 Fifth Avenue, 10th Floor, New York, NY 10022
______________________________________________________________________
(Address of principal executive offices) (zip code)
|
Michael W. Malafronte International Value Advisers, LLC 717 Fifth Avenue |
(Name and address of agent for service) |
Copy to: |
Clair Pagnano, Esq. Brian F. Link, Esq. |
Registrant’s telephone number, including area code: (212) 584-3570
Date of fiscal year end: September 30
Date of reporting period: March 31, 2011
Item 1. Report to Shareholders.
IVA Worldwide Fund
IVA International Fund
Semi-Annual Report
| Contents | IVA Funds | ||
| 1 | An Owner’s Manual | |||||
| 2 | Letter from the President | |||||
| 3 | Letter from the Portfolio Managers | |||||
| 6 | Management’s Discussion of Fund Performance | |||||
IVA Worldwide Fund | ||||||
| 8 | Performance | |||||
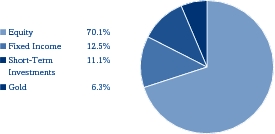
| 9 | Portfolio Composition | |||||
| 10 | Schedule of Investments | |||||
IVA International Fund | ||||||
| 18 | Performance | |||||
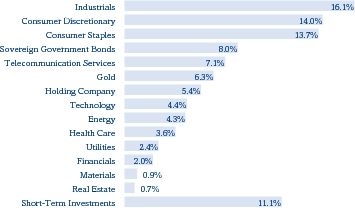
| 19 | Portfolio Composition | |||||
| 20 | Schedule of Investments | |||||
| 26 | Statements of Assets and Liabilities | |||||
| 27 | Statements of Operations | |||||
| 28 | Statements of Changes in Net Assets | |||||
| 29 | Financial Highlights | |||||
| 35 | Notes to Financial Statements | |||||
| 44 | Trustees and Officers | |||||
| 46 | Additional Information | |||||
| 47 | Fund Expenses | |||||
| An Owner’s Manual | IVA Funds | ||
| ● | We don’t hug benchmarks. In practical terms, this means we are willing to make big “negative bets,” i.e., having nothing or little in what has become big in the benchmark. Conversely, we will generally seek to avoid overly large positive bets. |
| ● | We prefer having diversified portfolios (100 to 150 names). Because we invest on a global basis, we believe that diversification helps protect against weak corporate governance or insufficient disclosure, or simply against “unknown unknowns.” |
| ● | We like the flexibility to invest in small, medium and large companies, depending on where we see value. |
| ● | We attempt to capture equity-type returns through fixed income securities but predominantly when credit markets (or sub-sets of them) are depressed and offer this potential. |
| ● | We hold some gold, either in bullion form or via gold mining securities, as we feel it provides a good hedge in either an inflationary or deflationary period. |
| ● | We are willing to hold cash when we cannot find enough cheap securities that we like or when we find some, yet the broader market (Mr. Market) seems fully priced. We will seek to use that cash as ammunition for future bargains. |
| ● | At the individual security level, we ask a lot of questions about “what can go wrong?” and will establish not only a “base case intrinsic value” but also a “worst case scenario” (What could prove us wrong? If we were wrong, are we likely to lose 25%, 30%, or even more of the money invested?). As a result, we will miss some opportunities, yet hopefully, we will also avoid instances where we experience a permanent impairment of value. |
| Letter from the President | IVA Funds | ||


| Letter from the Portfolio Managers | IVA Funds | ||

Charles de Vaulx

Chuck de Lardemelle
* *
* *
| Letter from the Portfolio Managers | IVA Funds | ||
| Letter from the Portfolio Managers | IVA Funds | ||

Charles de Vaulx, Chief Investment Officer and Portfolio Manager

Chuck de Lardemelle, Portfolio Manager
| Management’s Discussion of Fund Performance | IVA Funds | ||
| Management’s Discussion of Fund Performance | IVA Funds | ||
| IVA Worldwide Fund | IVA Funds | ||
| Average Annual Total Returns as of March 31, 2011(a) | Six Months | One Year | Since Inception | |||||||||||
| Class A | 10.94 | % | 15.93 | % | 18.63 | % | ||||||||
| Class A (with a 5% maximum initial sales charge) | 5.42 | % | 10.12 | % | 16.23 | % | ||||||||
| Class C | 10.53 | % | 15.08 | % | 17.73 | % | ||||||||
| Class I | 11.06 | % | 16.20 | % | 18.87 | % | ||||||||
MSCI All Country World Index (Net)(b) | 13.54 | % | 14.08 | % | 8.62 | % | ||||||||
Consumer Price Index(c) | 2.32 | % | 2.70 | % | 0.84 | % | ||||||||
(a) | The Fund commenced investment operations on October 1, 2008. Total returns for periods of less than one year are not annualized. |
(b) | The MSCI All Country World Index (Net) is an unmanaged, free float-adjusted market capitalization weighted index composed of stocks of companies located in countries throughout the world. It is designed to measure equity market performance in global developed and emerging markets. The index includes reinvestment of dividends, net of foreign withholding taxes. |
(c) | The Consumer Price Index examines the weighted average of prices of a basket of consumer goods and services, such as transportation, food and medical care. |
(d) | Hypothetical illustration of $10,000 invested in Class A shares on October 1, 2008, assuming the deduction of the maximum initial sales charge of 5% at the time of investment for Class A shares and the reinvestment of all distributions, including returns of capital, if any, at net asset value through March 31, 2011. Please note that an investor cannot invest directly in an index. The performance of the Fund’s other classes may be greater or less than the Class A shares’ performance indicated on this chart depending on whether greater or lesser sales charges and fees were incurred by shareholders investing in the other classes. |
| IVA Worldwide Fund | IVA Funds | ||
| POSITION NAMES(a) | ||||||
| Gold Bullion | 5.4% | |||||
| Government of Singapore, 2.25% due 7/1/2013 | 5.0% | |||||
| Astellas Pharma Inc. | 3.0% | |||||
| Secom Co., Ltd. | 2.8% | |||||
| Microsoft Corp. | 2.7% | |||||
| Nestlé SA | 2.6% | |||||
| Total SA, ADR | 2.6% | |||||
| Hewlett-Packard Co. | 2.4% | |||||
| Genting Malaysia Berhad | 2.4% | |||||
| MasterCard Inc., Class ‘A’ | 2.3% | |||||
(a) | Short-Term Investments are not included. |
| IVA Worldwide Fund | IVA Funds | ||
March 31, 2011
| SHARES | DESCRIPTION | VALUE | |||||||||||||
|---|---|---|---|---|---|---|---|---|---|---|---|---|---|---|---|
COMMON STOCKS – 69.4% | |||||||||||||||
| Australia – 0.0% | |||||||||||||||
| 249,950 | Spotless Group Ltd. | $ | 501,559 | ||||||||||||
| Belgium – 0.3% | |||||||||||||||
| 279,580 | Sofina SA | 26,693,383 | |||||||||||||
| Denmark – 0.0% | |||||||||||||||
| 50,284 | D/S Norden A/S | 1,734,689 | |||||||||||||
| France – 11.2% | |||||||||||||||
| 185,688 | Bolloré | 43,144,578 | |||||||||||||
| 348,006 | Ciments Français SA | 35,144,997 | |||||||||||||
| 39,665 | Financière de l’Odet SA | 19,224,919 | |||||||||||||
| 3,862,549 | GDF Suez SA | 157,377,563 | |||||||||||||
| 277,115 | Guyenne et Gascogne SA | 35,942,395 | |||||||||||||
| 522,444 | Publicis Groupe SA | 29,301,620 | |||||||||||||
| 72,661 | Robertet SA | 12,459,990 | |||||||||||||
| 40,590 | Séché Environnement SA | 3,884,604 | |||||||||||||
| 2,930,304 | Sodexo SA | 213,995,078 | |||||||||||||
| 5,240 | Sucrière de Pithiviers-Le-Vieil SA | 6,091,279 | |||||||||||||
| 1,436,700 | Teleperformance | 54,170,185 | |||||||||||||
| 1,304,480 | Thales SA | 52,031,895 | |||||||||||||
| 3,976,980 | Total SA, ADR | 242,476,471 | |||||||||||||
| 5,772,271 | Vivendi SA | 164,836,251 | |||||||||||||
| 1,070,081,825 | |||||||||||||||
| Germany – 0.3% | |||||||||||||||
| 1,524,983 | Wirecard AG | 27,350,050 | |||||||||||||
| Hong Kong – 0.1% | |||||||||||||||
| 14,916,640 | Clear Media Ltd. (a) | 9,339,020 | |||||||||||||
| Japan – 14.7% | |||||||||||||||
| 7,487,900 | Astellas Pharma Inc. | 277,262,948 | |||||||||||||
| 763,100 | Benesse Holdings Inc. | 31,237,743 | |||||||||||||
| 359,100 | Canon Inc. | 15,628,060 | |||||||||||||
| 2,745,600 | Cosel Co., Ltd. (b) | 42,349,180 | |||||||||||||
| 158,500 | FANUC Ltd. | 23,990,322 | |||||||||||||
| 20,760 | Fuji Media Holdings Inc. | 29,051,022 | |||||||||||||
| 678,500 | Icom Inc. | 19,976,515 | |||||||||||||
| 500 | Japan Petroleum Exploration Co., Ltd. | 25,006 | |||||||||||||
| 328,000 | Kanamoto Co., Ltd. | 2,496,081 | |||||||||||||
| 17,497 | KDDI Corp. | 108,330,789 | |||||||||||||
| 2,729,370 | Kose Corp. | 67,824,090 | |||||||||||||
| 169,300 | Kyocera Corp. | 17,157,959 | |||||||||||||
| 21,410 | Medikit Co., Ltd. | 6,421,970 | |||||||||||||
| 985,100 | Meitec Corp. | 19,706,737 | |||||||||||||
| 397,100 | Milbon Co., Ltd. | 10,970,615 | |||||||||||||
| 3,290,204 | Miura Co., Ltd. (b) | 98,690,298 | |||||||||||||
| 977,800 | Nifco Inc. | 23,416,417 | |||||||||||||
| 1,258,900 | Nippon Thompson Co., Ltd. | 10,064,541 | |||||||||||||
| IVA Worldwide Fund | IVA Funds | ||
March 31, 2011
| SHARES | DESCRIPTION | VALUE | |||||||||||||
|---|---|---|---|---|---|---|---|---|---|---|---|---|---|---|---|
| Japan – 14.7% (continued) | |||||||||||||||
| 186,800 | Nitto Kohki Co., Ltd. | $ | 4,738,495 | ||||||||||||
| 73,504 | NTT DoCoMo, Inc. | 129,193,133 | |||||||||||||
| 4,088 | Okinawa Cellular Telephone Co. | 8,920,077 | |||||||||||||
| 4,572 | Pasona Group Inc. | 3,897,028 | |||||||||||||
| 5,570,900 | Secom Co., Ltd. | 258,854,634 | |||||||||||||
| 11,900 | Secom Joshinetsu Co., Ltd. | 357,658 | |||||||||||||
| 1,722,700 | Shiseido Co., Ltd. | 29,823,130 | |||||||||||||
| 4,538,900 | Shoei Co., Ltd. (b) | 41,034,537 | |||||||||||||
| 750,688 | Shofu Inc. | 6,804,746 | |||||||||||||
| 180,800 | SMC Corp. | 29,756,576 | |||||||||||||
| 889 | Techno Medica Co., Ltd. | 3,142,174 | |||||||||||||
| 2,018,500 | Temp Holdings Co., Ltd. | 18,127,188 | |||||||||||||
| 1,862,300 | Toho Co., Ltd. | 26,709,833 | |||||||||||||
| 3,082,580 | Toshiba Machine Co., Ltd. | 16,676,617 | |||||||||||||
| 1,302,500 | Yamato Holdings Co., Ltd. | 20,199,868 | |||||||||||||
| 1,402,835,987 | |||||||||||||||
| Malaysia – 2.4% | |||||||||||||||
| 185,813,800 | Genting Malaysia Berhad | 225,767,985 | |||||||||||||
| Norway – 1.1% | |||||||||||||||
| 10,375,658 | Orkla ASA | 100,562,410 | |||||||||||||
| South Africa – 0.5% | |||||||||||||||
| 5,245,786 | Net 1 U.E.P.S. Technologies Inc. (a)(b) | 45,113,760 | |||||||||||||
| South Korea – 5.0% | |||||||||||||||
| 67,647 | Fursys Inc. | 1,705,127 | |||||||||||||
| 3,206,240 | Kangwon Land, Inc. | 74,386,989 | |||||||||||||
| 1,352,283 | KT&G Corp. | 70,390,956 | |||||||||||||
| 60,632 | Lotte Chilsung Beverage Co., Ltd. | 59,363,479 | |||||||||||||
| 44,259 | Lotte Confectionery Co., Ltd. | 60,480,643 | |||||||||||||
| 252,427 | Nong Shim Co., Ltd. | 55,918,466 | |||||||||||||
| 131,988 | SK Holdings Co., Ltd. | 19,853,248 | |||||||||||||
| 6,878,350 | SK Telecom Co., Ltd., ADR | 129,381,763 | |||||||||||||
| 38,450 | SK Telecom Co., Ltd. | 5,730,959 | |||||||||||||
| 5,882 | Teems Inc. (a) | 158,719 | |||||||||||||
| 477,370,349 | |||||||||||||||
| Switzerland – 3.1% | |||||||||||||||
| 56,862 | Affichage Holding SA (a) | 8,629,900 | |||||||||||||
| 38,253 | Banque Cantonale Vaudoise | 21,677,394 | |||||||||||||
| 4,304,160 | Nestlé SA | 246,721,855 | |||||||||||||
| 163,346 | Schindler Holding AG | 19,633,531 | |||||||||||||
| 296,662,680 | |||||||||||||||
| Taiwan – 0.0% | |||||||||||||||
| 2,603,000 | Taiwan Secom Co., Ltd. | 4,691,446 | |||||||||||||
| IVA Worldwide Fund | IVA Funds | ||
March 31, 2011
| SHARES | DESCRIPTION | VALUE | |||||||||||||
|---|---|---|---|---|---|---|---|---|---|---|---|---|---|---|---|
| Thailand – 0.2% | |||||||||||||||
| 78,197,790 | Thai Beverage Public Co., Ltd. | $ | 17,990,765 | ||||||||||||
| United Kingdom – 1.1% | |||||||||||||||
| 797,340 | Diageo Plc, ADR | 60,773,255 | |||||||||||||
| 2,893,470 | LSL Property Services Plc | 11,372,170 | |||||||||||||
| 1,026,480 | Vodafone Group Plc, ADR | 29,511,300 | |||||||||||||
| 101,656,725 | |||||||||||||||
| United States – 29.4% | |||||||||||||||
| 2,688,160 | Amdocs Ltd. (a) | 77,553,416 | |||||||||||||
| 2,545,520 | Aon Corp. | 134,810,739 | |||||||||||||
| 1,874,660 | Automatic Data Processing Inc. | 96,188,805 | |||||||||||||
| 487 | Berkshire Hathaway Inc., Class ‘A’ (a) | 61,021,100 | |||||||||||||
| 3,064,290 | CA Inc. | 74,094,532 | |||||||||||||
| 2,716,800 | CBS Corp., Class ‘B’ | 68,028,672 | |||||||||||||
| 631,837 | Cintas Corp. | 19,125,706 | |||||||||||||
| 608,630 | Colgate-Palmolive Co. | 49,152,959 | |||||||||||||
| 998,438 | Contango Oil & Gas Co. (a)(b) | 63,141,219 | |||||||||||||
| 121,807 | Contango ORE Inc. (a)(b) | 2,252,211 | |||||||||||||
| 1,470,820 | Costco Wholesale Corp. | 107,840,522 | |||||||||||||
| 13,135,470 | Dell Inc. (a) | 190,595,670 | |||||||||||||
| 413,697 | Devon Energy Corp. | 37,964,974 | |||||||||||||
| 814,130 | Energizer Holdings Inc. (a) | 57,933,491 | |||||||||||||
| 5,591,757 | Hewlett-Packard Co. | 229,094,284 | |||||||||||||
| 1,810,396 | Ingram Micro Inc., Class ‘A’ (a) | 38,072,628 | |||||||||||||
| 866,450 | Iron Mountain Inc. | 27,059,233 | |||||||||||||
| 3,690,190 | Liberty Media Corp., Interactive Group, Series ‘A’ (a) | 59,190,648 | |||||||||||||
| 3,542,288 | Marsh & McLennan Cos., Inc. | 105,595,605 | |||||||||||||
| 864,837 | MasterCard Inc., Class ‘A’ | 217,696,770 | |||||||||||||
| 10,159,960 | Microsoft Corp. | 257,656,586 | |||||||||||||
| 1,437,379 | News Corp. | 25,240,375 | |||||||||||||
| 4,654,260 | Sealed Air Corp. | 124,082,572 | |||||||||||||
| 2,334,892 | Staples Inc. | 45,343,603 | |||||||||||||
| 4,765,444 | Symantec Corp. (a) | 88,351,332 | |||||||||||||
| 753,720 | Telephone & Data Systems Inc. | 25,400,364 | |||||||||||||
| 1,407,149 | Texas Instruments Inc. | 48,631,069 | |||||||||||||
| 1,012,749 | Ultra Petroleum Corp. (a) | 49,877,888 | |||||||||||||
| 3,361,533 | ValueClick Inc. (a) | 48,607,767 | |||||||||||||
| 3,830,800 | Wal-Mart Stores, Inc. | 199,393,140 | |||||||||||||
| 336,191 | The Washington Post Co., Class ‘B’ | 147,103,734 | |||||||||||||
| 1,422,390 | Yahoo! Inc. (a) | 23,682,793 | |||||||||||||
| 2,799,784,407 | |||||||||||||||
TOTAL COMMON STOCKS (Cost — $5,818,204,528) | 6,608,137,040 | ||||||||||||||
| IVA Worldwide Fund | IVA Funds | ||
March 31, 2011
| PRINCIPAL AMOUNT | DESCRIPTION | VALUE | |||||||||||||||||
|---|---|---|---|---|---|---|---|---|---|---|---|---|---|---|---|---|---|---|---|
CORPORATE NOTES & BONDS – 6.3% | |||||||||||||||||||
| France – 2.0% | |||||||||||||||||||
| Wendel: | |||||||||||||||||||
| 56,800,000 | EUR | 4.875% due 5/26/2016 (c) | $ | 76,975,186 | |||||||||||||||
| 86,900,000 | EUR | 4.375% due 8/9/2017 | 111,300,996 | ||||||||||||||||
| 188,276,182 | |||||||||||||||||||
| Netherlands – 0.2% | |||||||||||||||||||
| 16,694,000 | EUR | UPC Holding BV, 8% due 11/1/2016 (c) | 24,783,700 | ||||||||||||||||
| Norway – 0.1% | |||||||||||||||||||
| 13,800,000 | USD | Golden Close Maritime Corp., 11% due 12/9/2015 | 14,973,000 | ||||||||||||||||
| United States – 4.0% | |||||||||||||||||||
| 6,070,000 | USD | Brandywine Operating Partnership, LP, 5.7% due 5/15/2017 | 6,295,506 | ||||||||||||||||
| Clear Channel Worldwide Holdings, Inc.: | |||||||||||||||||||
| 6,318,000 | USD | Series ‘A’, 9.25% due 12/15/2017 | 6,934,005 | ||||||||||||||||
| 11,135,000 | USD | Series ‘B’, 9.25% due 12/15/2017 | 12,262,419 | ||||||||||||||||
| Cricket Communications Inc.: | |||||||||||||||||||
| 49,376,000 | USD | 10% due 7/15/2015 | 54,437,040 | ||||||||||||||||
| 2,000 | USD | 7.75% due 5/15/2016 | 2,135 | ||||||||||||||||
| 19,016,000 | USD | Denbury Resources Inc., 9.75% due 3/1/2016 | 21,535,620 | ||||||||||||||||
| 3,408,000 | USD | Encore Acquisition Co., 9.5% due 5/1/2016 | 3,859,560 | ||||||||||||||||
| 6,114,000 | USD | Frontier Oil Corp., 8.5% due 9/15/2016 | 6,664,260 | ||||||||||||||||
| 15,517,000 | USD | Global Crossing Ltd., 12% due 9/15/2015 | 17,766,965 | ||||||||||||||||
| 15,428,000 | GBP | Global Crossing UK Finance Plc, 11.75% due 12/15/2014 | 25,615,820 | ||||||||||||||||
| Leucadia National Corp.: | |||||||||||||||||||
| 2,936,000 | USD | 8.125% due 9/15/2015 | 3,258,960 | ||||||||||||||||
| 6,764,000 | USD | 7.125% due 3/15/2017 | 7,136,020 | ||||||||||||||||
| 6,961,000 | USD | MetroPCS Wireless Inc., 7.875% due 9/1/2018 | 7,483,075 | ||||||||||||||||
| 37,016,000 | USD | Mohawk Industries Inc., 6.875% due 1/15/2016 (d) | 39,884,740 | ||||||||||||||||
| 14,840,000 | USD | Penn Virginia Corp., 10.375% due 6/15/2016 | 16,843,400 | ||||||||||||||||
| QVC Inc.: | |||||||||||||||||||
| 6,878,000 | USD | 7.125% due 4/15/2017 (c) | 7,256,290 | ||||||||||||||||
| 31,121,000 | USD | 7.5% due 10/1/2019 (c) | 32,832,655 | ||||||||||||||||
| 61,574,000 | USD | Sirius XM Radio, Inc., 8.75% due 4/1/2015 (c) | 69,578,620 | ||||||||||||||||
| 6,660,000 | USD | Vulcan Materials Co., 7% due 6/15/2018 | 6,827,732 | ||||||||||||||||
| 29,773,000 | USD | Willis North America, Inc., 6.2% due 3/28/2017 | 31,770,024 | ||||||||||||||||
| 378,244,846 | |||||||||||||||||||
TOTAL CORPORATE NOTES & BONDS (Cost — $526,595,592) | 606,277,728 | ||||||||||||||||||
| IVA Worldwide Fund | IVA Funds | ||
March 31, 2011
| PRINCIPAL AMOUNT | DESCRIPTION | VALUE | |||||||||||||||||
|---|---|---|---|---|---|---|---|---|---|---|---|---|---|---|---|---|---|---|---|
COMMERCIAL MORTGAGE BACKED SECURITIES – 0.1% | |||||||||||||||||||
| 6,273,000 | USD | Citigroup/Deutsche Bank Commercial Mortgage Trust, CD 2007 CD4 A4, 5.322% due 12/11/2049 (Cost — $4,351,709) | $ | 6,602,272 | |||||||||||||||
SOVEREIGN GOVERNMENT BONDS – 7.0% | |||||||||||||||||||
| Hong Kong – 1.0% | |||||||||||||||||||
| 700,900,000 | HKD | Government of Hong Kong, 2.66% due 12/17/2012 | 93,283,392 | ||||||||||||||||
| Norway – 1.0% | |||||||||||||||||||
| 472,015,000 | NOK | Government of Norway, 6.5% due 5/15/2013 | 91,715,623 | ||||||||||||||||
| Singapore – 4.9% | |||||||||||||||||||
| 566,178,000 | SGD | Government of Singapore, 2.25% due 7/1/2013 | 467,999,007 | ||||||||||||||||
| Taiwan – 0.1% | |||||||||||||||||||
| 353,000,000 | TWD | Government of Taiwan, 2% due 7/20/2015 | 12,477,821 | ||||||||||||||||
TOTAL SOVEREIGN GOVERNMENT BONDS (Cost — $638,878,496) | 665,475,843 | ||||||||||||||||||
| OUNCES | |||||||||||||||||||
|---|---|---|---|---|---|---|---|---|---|---|---|---|---|---|---|---|---|---|---|
COMMODITIES – 5.4% | |||||||||||||||||||
| 356,909 | Gold Bullion (a) (Cost — $402,230,885) | 512,038,863 | |||||||||||||||||
| PRINCIPAL AMOUNT | |||||||||||||||||||
|---|---|---|---|---|---|---|---|---|---|---|---|---|---|---|---|---|---|---|---|
SHORT-TERM INVESTMENTS – 10.5% | |||||||||||||||||||
| Commercial Paper – 8.6% | |||||||||||||||||||
| 6,300,000 | USD | AT&T Inc., 0.21% due 4/4/2011 (c) | 6,299,890 | ||||||||||||||||
| 9,000,000 | USD | The Clorox Co., 0.3% due 4/8/2011 (c) | 8,999,475 | ||||||||||||||||
| Consolidated Edison Inc.: | |||||||||||||||||||
| 36,400,000 | USD | 0.25% due 4/1/2011 (c) | 36,400,000 | ||||||||||||||||
| 95,000,000 | USD | 0.25% due 4/6/2011 (c) | 94,996,701 | ||||||||||||||||
| Devon Energy Corp.: | |||||||||||||||||||
| 75,000,000 | USD | 0.2% due 4/1/2011 (c) | 75,000,000 | ||||||||||||||||
| 25,000,000 | USD | 0.22% due 4/11/2011 (c) | 24,998,472 | ||||||||||||||||
| 9,700,000 | USD | 0.21% due 4/13/2011 (c) | 9,699,321 | ||||||||||||||||
| 18,200,000 | USD | 0.22% due 4/13/2011 (c) | 18,198,665 | ||||||||||||||||
| 25,000,000 | USD | 0.22% due 4/18/2011 (c) | 24,997,403 | ||||||||||||||||
| GDF Suez SA: | |||||||||||||||||||
| 55,000,000 | USD | 0.2% due 4/7/2011 (c) | 54,998,167 | ||||||||||||||||
| 54,200,000 | USD | 0.21% due 4/8/2011 (c) | 54,197,787 | ||||||||||||||||
| 25,000,000 | USD | 0.2% due 4/13/2011 (c) | 24,998,333 | ||||||||||||||||
| 25,000,000 | USD | 0.2% due 4/15/2011 (c) | 24,998,056 | ||||||||||||||||
| 10,000,000 | USD | Nestlé Capital Corp., 0.02% due 4/6/2011 (c) | 9,999,972 | ||||||||||||||||
| IVA Worldwide Fund | IVA Funds | ||
March 31, 2011
| PRINCIPAL AMOUNT | DESCRIPTION | VALUE | |||||||||||||||||
|---|---|---|---|---|---|---|---|---|---|---|---|---|---|---|---|---|---|---|---|
| Commercial Paper – 8.6% (continued) | |||||||||||||||||||
| NetJets Inc.: | |||||||||||||||||||
| 10,500,000 | USD | 0.14% due 4/11/2011 (c) | $ | 10,499,592 | |||||||||||||||
| 43,100,000 | USD | 0.13% due 4/26/2011 (c) | 43,096,109 | ||||||||||||||||
| 25,000,000 | USD | Philip Morris International, 0.14% due 4/5/2011 (c) | 24,999,611 | ||||||||||||||||
| 3,300,000 | USD | Procter & Gamble International Funding SCA, 0.1% due 4/21/2011 (c) | 3,299,817 | ||||||||||||||||
| 45,000,000 | USD | Reed Elsevier Plc 0.32% due 4/21/2011 (c) | 44,992,000 | ||||||||||||||||
| 100,000,000 | USD | Unilever Capital Corp., 0.12% due 4/5/2011 (c) | 99,998,667 | ||||||||||||||||
| United Parcel Service Inc.: | |||||||||||||||||||
| 35,000,000 | USD | 0.05% due 4/4/2011 (c) | 34,999,854 | ||||||||||||||||
| 50,000,000 | USD | 0.08% due 4/11/2011 (c) | 49,998,889 | ||||||||||||||||
| 42,700,000 | USD | 0.07% due 4/18/2011 (c) | 42,698,588 | ||||||||||||||||
| 823,365,369 | |||||||||||||||||||
| Treasury Bills – 1.9% | |||||||||||||||||||
| Canada – 1.0% | |||||||||||||||||||
| 89,482,000 | CAD | Government of Canada, due 8/4/2011 | 91,983,250 | ||||||||||||||||
| Japan – 0.7% | |||||||||||||||||||
| 5,240,000,000 | JPY | Government of Japan, due 5/13/2011 | 62,987,570 | ||||||||||||||||
| United States – 0.2% | |||||||||||||||||||
| Government of the United States: | |||||||||||||||||||
| 8,873,000 | USD | due 4/14/2011 | 8,872,776 | ||||||||||||||||
| 14,791,000 | USD | due 6/2/2011 (e) | 14,789,299 | ||||||||||||||||
| 23,662,075 | |||||||||||||||||||
| 178,632,895 | |||||||||||||||||||
TOTAL SHORT-TERM INVESTMENTS (Cost — $999,994,909) | 1,001,998,264 | ||||||||||||||||||
TOTAL INVESTMENTS — 98.7% | |||||||||||||||||||
| (Cost — $8,390,256,119) | 9,400,530,010 | ||||||||||||||||||
| Other Assets In Excess of Liabilities — 1.3% | 122,160,793 | ||||||||||||||||||
TOTAL NET ASSETS — 100.0% | $ | 9,522,690,803 | |||||||||||||||||
| IVA Worldwide Fund | IVA Funds | ||
March 31, 2011
| FOREIGN CURRENCY | | COUNTERPARTY | | SETTLEMENT DATES THROUGH | | LOCAL CURRENCY AMOUNT | | USD EQUIVALENT | | USD VALUE AT MARCH 31, 2011 | | NET UNREALIZED APPRECIATION/ (DEPRECIATION) | | ||||||||||||||||||
|---|---|---|---|---|---|---|---|---|---|---|---|---|---|---|---|---|---|---|---|---|---|---|---|---|---|---|---|---|---|---|---|
Contracts to Sell: | |||||||||||||||||||||||||||||||
| Australian dollar | State Street Bank & Trust Co. | 6/10/2011 | AUD | 95,000 | $ | 94,977 | $ | 97,452 | $ (2,475 | ) | |||||||||||||||||||||
| British pound | State Street Bank & Trust Co. | 6/10/2011 | GBP | 19,690,000 | 31,807,705 | 31,558,904 | 248,801 | ||||||||||||||||||||||||
| Euro | State Street Bank & Trust Co. | 6/10/2011 | EUR | 462,908,000 | 643,090,019 | 655,191,859 | (12,101,840 | ) | |||||||||||||||||||||||
| Japanese yen | State Street Bank & Trust Co. | 6/10/2011 | JPY | 49,318,300,000 | 597,974,668 | 593,149,982 | 4,824,686 | ||||||||||||||||||||||||
| South Korean won | State Street Bank & Trust Co. | 5/6/2011 | KRW | 155,529,769,000 | 137,771,779 | 141,496,921 | (3,725,143 | ) | |||||||||||||||||||||||
Net Unrealized Depreciation on Open Forward Foreign Currency Contracts | $(10,755,971 | ) | |||||||||||||||||||||||||||||
| DESCRIPTION | | NUMBER OF CONTRACTS | | EXPIRATION DATE | | USD MARKET VALUE OF SECURITIES UNDERLYING THE CONTRACTS | | NET UNREALIZED (DEPRECIATION) | ||||||||||
|---|---|---|---|---|---|---|---|---|---|---|---|---|---|---|---|---|---|---|
Contracts to Sell: | ||||||||||||||||||
| Japanese Government 10-Year Bond | 438 | 6/9/2011 | $ 734,826,881 | $ (2,558,719 | ) | |||||||||||||
| U.S. Treasury 10-Year Note | 6,091 | 6/21/2011 | 725,019,344 | (1,854,875 | ) | |||||||||||||
Net Unrealized Depreciation on Open Futures Contracts | $ (4,413,594 | ) | ||||||||||||||||
| IVA Worldwide Fund | IVA Funds | ||
March 31, 2011
ADR — American Depositary Receipt
AUD — Australian dollar
CAD — Canadian dollar
EUR — euro
GBP — British pound
HKD — Hong Kong dollar
JPY — Japanese yen
KRW — South Korean won
NOK — Norwegian krone
SGD — Singapore dollar
TWD — Taiwan dollar
USD — United States dollar
| (a) | Non-income producing investment. |
| (b) | Security is an affiliate of the IVA Worldwide Fund as defined by the Investment Company Act of 1940. An affiliate is deemed as a company in which the IVA Worldwide Fund indirectly or directly has ownership of at least 5% of the company’s outstanding voting securities. See Schedule of Affiliates below for additional information. |
| SECURITY | | SHARES HELD AT SEPTEMBER 30, 2010 | | SHARE ADDITIONS | | SHARE REDUCTIONS | | SHARES HELD AT MARCH 31, 2011 | | AFFILIATED SECURITY VALUE AT MARCH 31, 2011 | | REALIZED GAIN/(LOSS) | | DIVIDEND INCOME* | ||||||||||||||||
|---|---|---|---|---|---|---|---|---|---|---|---|---|---|---|---|---|---|---|---|---|---|---|---|---|---|---|---|---|---|---|
| Contango Oil & Gas Co. | 1,206,290 | 205,878 | 413,730 | 998,438 | $ | 63,141,219 | $ | 438,181 | $ | 554,893 | ||||||||||||||||||||
| Contango ORE Inc. | — | 121,807 | — | 121,807 | 2,252,211 | — | — | |||||||||||||||||||||||
| Cosel Co., Ltd. | 1,221,300 | 1,524,300 | — | 2,745,600 | 42,349,180 | — | 230,774 | |||||||||||||||||||||||
| Miura Co., Ltd. | 2,035,875 | 1,254,329 | — | 3,290,204 | 98,690,298 | — | 739,270 | |||||||||||||||||||||||
| Net 1 U.E.P.S. Technologies Inc. | 2,433,660 | 2,812,126 | — | 5,245,786 | 45,113,760 | — | — | |||||||||||||||||||||||
| Shoei Co., Ltd. | 3,945,100 | 606,100 | 12,300 | 4,538,900 | 41,034,537 | (22,405 | ) | 244,346 | ||||||||||||||||||||||
| ValueClick, Inc.** | 5,784,239 | 492,220 | 2,914,926 | 3,361,533 | — | 11,602,976 | — | |||||||||||||||||||||||
| Total | $ | 292,581,205 | $ | 12,018,752 | $ | 1,769,283 | ||||||||||||||||||||||||
| * | Dividend income is net of withholding taxes. |
| ** | Non-affiliated at March 31, 2011. |
| (c) | Security is exempt from registration under Rule 144A or Section 4(2) of the Securities Act of 1933 (the “1933 Act”). Any resale of these securities must generally be effected through a sale that is registered under the 1933 Act or otherwise exempted from such registration requirements. |
| (d) | Variable rate security. The interest rate shown reflects the rate currently in effect. |
| (e) | All or a portion of this security is held at the futures broker as collateral for open futures contracts sold. As of March 31, 2011, portfolio securities valued at $13,815,411 were segregated to cover collateral requirements. |
| IVA International Fund | IVA Funds | ||
| Average Annual Total Returns as of March 31, 2011(a) | Six Months | One Year | Since Inception | |||||||||||
| Class A | 9.81 | % | 15.67 | % | 16.75 | % | ||||||||
| Class A (with a 5% maximum initial sales charge) | 4.32 | % | 9.88 | % | 14.39 | % | ||||||||
| Class C | 9.39 | % | 14.80 | % | 15.86 | % | ||||||||
| Class I | 9.98 | % | 16.00 | % | 17.05 | % | ||||||||
MSCI All Country World Ex-U.S. Index (Net)(b) | 10.85 | % | 13.15 | % | 9.78 | % | ||||||||
Consumer Price Index(c) | 2.32 | % | 2.70 | % | 0.84 | % | ||||||||
(a) | The Fund commenced investment operations on October 1, 2008. Total returns for periods of less than one year are not annualized. |
(b) | The MSCI All Country World Ex-U.S. Index (Net) is an unmanaged, free float-adjusted, market capitalization weighted index composed of stocks of companies located in countries throughout the world, excluding the United States. It is designed to measure equity market performance in global developed and emerging markets outside the United States. The index includes reinvestment of dividends, net of foreign withholding taxes. |
(c) | The Consumer Price Index examines the weighted average of prices of a basket of consumer goods and services, such as transportation, food and medical care. |
(d) | Hypothetical illustration of $10,000 invested in Class A shares on October 1, 2008, assuming the deduction of the maximum initial sales charge of 5% at the time of investment for Class A shares and the reinvestment of all distributions, including returns of capital, if any, at net asset value through March 31, 2011. Please note that an investor cannot invest directly in an index. The performance of the Fund’s other classes may be greater or less than the Class A shares’ performance indicated on this chart depending on whether greater or lesser sales charges and fees were incurred by shareholders investing in the other classes. |
| IVA International Fund | IVA Funds | ||
| POSITION NAMES(a) | ||||||
| Gold Bullion | 6.3% | |||||
| Government of Singapore, 2.25% due 7/1/2013 | 6.0% | |||||
| Total SA, ADR | 3.5% | |||||
| Astellas Pharma Inc. | 3.1% | |||||
| Wendel, 4.375% due 8/9/2017; 4.875% due 5/26/2016 | 3.1% | |||||
| Genting Malaysia Berhad | 3.0% | |||||
| Nestlé SA | 3.0% | |||||
| Secom Co., Ltd. | 2.9% | |||||
| Sodexo SA | 2.7% | |||||
| Vivendi SA | 2.6% | |||||
(a) | Short-Term Investments are not included. |
| IVA International Fund | IVA Funds | ||
March 31, 2011
| SHARES | DESCRIPTION | VALUE | |||||||||||||
|---|---|---|---|---|---|---|---|---|---|---|---|---|---|---|---|
COMMON STOCKS – 68.5% | |||||||||||||||
| Argentina – 0.2% | |||||||||||||||
| 871 | Nortel Inversora SA, Series ‘B’, ADR (a) | $ | 25,189 | ||||||||||||
| 198,730 | Telecom Argentina SA, ADR | 4,928,504 | |||||||||||||
| 4,953,693 | |||||||||||||||
| Australia – 1.0% | |||||||||||||||
| 2,850,915 | Programmed Maintenance Services Ltd. | 5,013,033 | |||||||||||||
| 8,020,009 | Spotless Group Ltd. | 16,093,259 | |||||||||||||
| 21,106,292 | |||||||||||||||
| Belgium – 0.4% | |||||||||||||||
| 96,455 | Sofina SA | 9,209,207 | |||||||||||||
| Denmark – 0.0% | |||||||||||||||
| 19,885 | D/S Norden A/S | 685,989 | |||||||||||||
| France – 16.8% | |||||||||||||||
| 110,171 | Alten | 4,154,733 | |||||||||||||
| 66,227 | Bolloré | 15,387,833 | |||||||||||||
| 103,690 | Ciments Français SA | 10,471,615 | |||||||||||||
| 22,026 | Financière de l’Odet SA | 10,675,610 | |||||||||||||
| 1,296,547 | GDF Suez SA | 52,827,137 | |||||||||||||
| 112,989 | Guyenne et Gascogne SA | 14,654,910 | |||||||||||||
| 196,801 | Publicis Groupe SA | 11,037,715 | |||||||||||||
| 49,168 | Robertet SA | 8,431,384 | |||||||||||||
| 16,030 | Séché Environnement SA | 1,534,127 | |||||||||||||
| 182,918 | Securidev SA (b) | 9,124,941 | |||||||||||||
| 813,367 | Sodexo SA | 59,398,798 | |||||||||||||
| 3,430 | Sucrière de Pithiviers-Le-Vieil SA | 3,987,230 | |||||||||||||
| 503,110 | Teleperformance | 18,969,556 | |||||||||||||
| 441,500 | Thales SA | 17,610,145 | |||||||||||||
| 1,242,410 | Total SA, ADR | 75,749,738 | |||||||||||||
| 1,959,551 | Vivendi SA | 55,958,052 | |||||||||||||
| 369,973,524 | |||||||||||||||
| Germany – 0.4% | |||||||||||||||
| 550,830 | Wirecard AG | 9,878,948 | |||||||||||||
| Hong Kong – 0.6% | |||||||||||||||
| 22,397,030 | Clear Media Ltd. (a) | 14,022,348 | |||||||||||||
| Italy – 0.2% | |||||||||||||||
| 647,927 | Gewiss S.p.A. | 3,764,791 | |||||||||||||
| Japan – 26.5% | |||||||||||||||
| 187,400 | Arcs Co. Ltd. | 2,831,952 | |||||||||||||
| 897,600 | Ariake Japan Co., Ltd. | 14,805,328 | |||||||||||||
| 7,900 | As One Corp. | 166,681 | |||||||||||||
| 1,798,100 | Astellas Pharma Inc. | 66,580,284 | |||||||||||||
| 113,300 | The Bank of Okinawa Ltd. | 4,617,540 | |||||||||||||
| 304,300 | Benesse Holdings Inc. | 12,456,618 | |||||||||||||
| 124,100 | Canon Inc. | 5,400,842 | |||||||||||||
| IVA International Fund | IVA Funds | ||
March 31, 2011
| SHARES | DESCRIPTION | VALUE | |||||||||||||
|---|---|---|---|---|---|---|---|---|---|---|---|---|---|---|---|
| Japan – 26.5% (continued) | |||||||||||||||
| 1,253,000 | Cosel Co., Ltd. | $ | 19,326,749 | ||||||||||||
| 480,600 | Daiichikosho Co., Ltd. | 8,169,853 | |||||||||||||
| 44,700 | FANUC Ltd. | 6,765,725 | |||||||||||||
| 7,790 | Fuji Media Holdings Inc. | 10,901,130 | |||||||||||||
| 1,144,500 | Hi Lex Corp. | 19,263,044 | |||||||||||||
| 402,682 | Hitachi Tool Engineering Ltd. | 4,395,711 | |||||||||||||
| 835,700 | Icom Inc. (b) | 24,604,825 | |||||||||||||
| 1,491,100 | Iino Kaiun Kaisha Ltd. | 8,120,561 | |||||||||||||
| 190,300 | Japan Petroleum Exploration Co., Ltd. | 9,517,288 | |||||||||||||
| 546,000 | Kanamoto Co., Ltd. | 4,155,061 | |||||||||||||
| 4,417 | KDDI Corp. | 27,347,379 | |||||||||||||
| 848,540 | Kose Corp. | 21,085,984 | |||||||||||||
| 50,000 | Kyocera Corp. | 5,067,324 | |||||||||||||
| 9,540 | Medikit Co., Ltd. | 2,861,541 | |||||||||||||
| 174,500 | Meitec Corp. | 3,490,839 | |||||||||||||
| 821,900 | Milbon Co., Ltd. (b) | 22,706,494 | |||||||||||||
| 1,209,076 | Miura Co., Ltd. | 36,266,466 | |||||||||||||
| 324,300 | Nifco Inc. | 7,766,357 | |||||||||||||
| 357,300 | Nippon Thompson Co., Ltd. | 2,856,510 | |||||||||||||
| 318,300 | Nitto Kohki Co., Ltd. | 8,074,213 | |||||||||||||
| 16,475 | NTT DoCoMo, Inc. | 28,957,021 | |||||||||||||
| 5,568 | Okinawa Cellular Telephone Co. | 12,149,459 | |||||||||||||
| 1,755 | Pasona Group Inc. | 1,495,907 | |||||||||||||
| 317,000 | San-A Co. Ltd. | 12,366,735 | |||||||||||||
| 1,359,700 | Secom Co., Ltd. | 63,179,136 | |||||||||||||
| 10,600 | Secom Joshinetsu Co., Ltd. | 318,586 | |||||||||||||
| 353,900 | Shingakukai Co., Ltd. | 1,314,680 | |||||||||||||
| 593,400 | Shiseido Co., Ltd. | 10,272,854 | |||||||||||||
| 1,737,100 | Shoei Co., Ltd. | 15,704,487 | |||||||||||||
| 576,850 | Shofu Inc. | 5,228,960 | |||||||||||||
| 4,500 | SK Kaken Co., Ltd. | 156,889 | |||||||||||||
| 40,100 | SMC Corp. | 6,599,772 | |||||||||||||
| 6,790 | So-net Entertainment Corp. | 24,121,724 | |||||||||||||
| 559 | Techno Medica Co., Ltd. | 1,975,787 | |||||||||||||
| 3,108,500 | Temp Holdings Co., Ltd. (b) | 27,915,959 | |||||||||||||
| 1,402,590 | Toshiba Machine Co., Ltd. | 7,587,948 | |||||||||||||
| 386,900 | Yamato Holdings Co., Ltd. | 6,000,253 | |||||||||||||
| 584,948,456 | |||||||||||||||
| Malaysia – 3.1% | |||||||||||||||
| 1,841,800 | Aeon Co. (M) Berhad | 3,618,229 | |||||||||||||
| 53,104,800 | Genting Malaysia Berhad | 64,523,537 | |||||||||||||
| 68,141,766 | |||||||||||||||
| Netherlands – 0.2% | |||||||||||||||
| 31,068 | Hal Trust NV | 4,420,127 | |||||||||||||
| Norway – 1.9% | |||||||||||||||
| 4,228,302 | Orkla ASA | 40,981,328 | |||||||||||||
| IVA International Fund | IVA Funds | ||
March 31, 2011
| SHARES | DESCRIPTION | VALUE | |||||||||||||
|---|---|---|---|---|---|---|---|---|---|---|---|---|---|---|---|
| Singapore – 1.0% | |||||||||||||||
| 3,058,291 | Haw Par Corp. Ltd. | $ | 14,581,776 | ||||||||||||
| 7,071,000 | Super Group Ltd. | 7,236,486 | |||||||||||||
| 21,818,262 | |||||||||||||||
| South Africa – 0.6% | |||||||||||||||
| 1,498,270 | Net 1 U.E.P.S. Technologies Inc. (a) | 12,885,122 | |||||||||||||
| South Korea – 7.6% | |||||||||||||||
| 61,768 | Fursys Inc. | 1,556,940 | |||||||||||||
| 1,083,580 | Kangwon Land, Inc. | 25,139,807 | |||||||||||||
| 460,569 | KT&G Corp. | 23,974,192 | |||||||||||||
| 18,550 | Lotte Chilsung Beverage Co., Ltd. | 18,161,903 | |||||||||||||
| 14,699 | Lotte Confectionery Co., Ltd. | 20,086,422 | |||||||||||||
| 44,841 | Lotte Samkang Co. Ltd. | 11,118,786 | |||||||||||||
| 81,200 | Nong Shim Co., Ltd. | 17,987,693 | |||||||||||||
| 41,369 | SK Holdings Co., Ltd. | 6,222,603 | |||||||||||||
| 2,224,790 | SK Telecom Co., Ltd., ADR | 41,848,300 | |||||||||||||
| 16,290 | SK Telecom Co., Ltd. | 2,428,019 | |||||||||||||
| 5,371 | Teems Inc. (a) | 144,931 | |||||||||||||
| 168,669,596 | |||||||||||||||
| Switzerland – 3.8% | |||||||||||||||
| 21,840 | Affichage Holding SA (a) | 3,314,639 | |||||||||||||
| 15,962 | Banque Cantonale Vaudoise | 9,045,423 | |||||||||||||
| 1,124,660 | Nestlé SA | 64,467,446 | |||||||||||||
| 56,214 | Schindler Holding AG | 6,756,696 | |||||||||||||
| 83,584,204 | |||||||||||||||
| Taiwan – 0.5% | |||||||||||||||
| 6,537,000 | Taiwan Secom Co., Ltd. | 11,781,783 | |||||||||||||
| Thailand – 0.4% | |||||||||||||||
| 36,089,930 | Thai Beverage Public Co., Ltd. | 8,303,118 | |||||||||||||
| United Kingdom – 3.3% | |||||||||||||||
| 285,990 | Diageo Plc, ADR | 21,798,158 | |||||||||||||
| 1,411,910 | Jardine Lloyd Thompson Group Plc | 15,673,695 | |||||||||||||
| 2,331,270 | LSL Property Services Plc | 9,162,562 | |||||||||||||
| 1,845,382 | Micro Focus International Plc | 9,357,699 | |||||||||||||
| 132,408 | Next Plc | 4,205,694 | |||||||||||||
| 286,600 | Vodafone Group Plc, ADR | 8,239,750 | |||||||||||||
| 1,628,500 | Vodafone Group Plc | 4,610,954 | |||||||||||||
| 73,048,512 | |||||||||||||||
TOTAL COMMON STOCKS (Cost — $1,301,019,695) | 1,512,177,066 | ||||||||||||||
| IVA International Fund | IVA Funds | ||
March 31, 2011
| PRINCIPAL AMOUNT | DESCRIPTION | VALUE | |||||||||||||||||
|---|---|---|---|---|---|---|---|---|---|---|---|---|---|---|---|---|---|---|---|
CORPORATE NOTES & BONDS – 4.4% | |||||||||||||||||||
| France – 3.0% | |||||||||||||||||||
| Wendel: | |||||||||||||||||||
| 15,600,000 | EUR | 4.875% due 5/26/2016 (c) | $ | 21,141,072 | |||||||||||||||
| 35,800,000 | EUR | 4.375% due 8/9/2017 | 45,852,424 | ||||||||||||||||
| 66,993,496 | |||||||||||||||||||
| Netherlands – 0.4% | |||||||||||||||||||
| 5,183,000 | EUR | UPC Holding BV, 8% due 11/1/2016 (c) | 7,694,616 | ||||||||||||||||
| Norway – 0.3% | |||||||||||||||||||
| 6,500,000 | USD | Golden Close Maritime Corp., 11% due 12/9/2015 | 7,052,500 | ||||||||||||||||
| United States – 0.7% | |||||||||||||||||||
| 3,840,000 | USD | Global Crossing Ltd., 12% due 9/15/2015 | 4,396,800 | ||||||||||||||||
| 6,960,000 | GBP | Global Crossing UK Finance Plc, 11.75% due 12/15/2014 | 11,556,009 | ||||||||||||||||
| 15,952,809 | |||||||||||||||||||
TOTAL CORPORATE NOTES & BONDS (Cost — $84,649,750) | 97,693,421 | ||||||||||||||||||
SOVEREIGN GOVERNMENT BONDS – 7.9% | |||||||||||||||||||
| Hong Kong – 0.8% | |||||||||||||||||||
| 126,950,000 | HKD | Government of Hong Kong, 2.66% due 12/17/2012 | 16,895,886 | ||||||||||||||||
| Norway – 0.9% | |||||||||||||||||||
| 108,704,000 | NOK | Government of Norway, 6.5% due 5/15/2013 | 21,121,903 | ||||||||||||||||
| Singapore – 5.9% | |||||||||||||||||||
| 156,458,000 | SGD | Government of Singapore, 2.25% due 7/1/2013 | 129,327,153 | ||||||||||||||||
| Taiwan – 0.3% | |||||||||||||||||||
| 171,000,000 | TWD | Government of Taiwan, 2% due 7/20/2015 | 6,044,497 | ||||||||||||||||
TOTAL SOVEREIGN GOVERNMENT BONDS | |||||||||||||||||||
| (Cost — $167,892,592) | 173,389,439 | ||||||||||||||||||
| OUNCES | |||||||||||||||||||
|---|---|---|---|---|---|---|---|---|---|---|---|---|---|---|---|---|---|---|---|
COMMODITIES – 6.2% | |||||||||||||||||||
| 94,797 | Gold Bullion (a) (Cost — $110,443,144) | 136,000,394 | |||||||||||||||||
| PRINCIPAL AMOUNT | |||||||||||||||||||
|---|---|---|---|---|---|---|---|---|---|---|---|---|---|---|---|---|---|---|---|
SHORT-TERM INVESTMENTS – 10.8% | |||||||||||||||||||
| Commercial Paper – 7.9% | |||||||||||||||||||
| 60,000,000 | USD | Consolidated Edison, Inc., 0.25% due 4/1/2011 (c) | 60,000,000 | ||||||||||||||||
| 6,800,000 | USD | Devon Energy Corp., 0.22% due 4/13/2011 (c) | 6,799,501 | ||||||||||||||||
| IVA International Fund | IVA Funds | ||
March 31, 2011
| PRINCIPAL AMOUNT | DESCRIPTION | �� | VALUE | ||||||||||||||||
|---|---|---|---|---|---|---|---|---|---|---|---|---|---|---|---|---|---|---|---|
| Commercial Paper – 7.9% (continued) | |||||||||||||||||||
| GDF Suez SA: | |||||||||||||||||||
| 25,000,000 | USD | 0.2% due 4/5/2011 (c) | $ | 24,999,444 | |||||||||||||||
| 20,800,000 | USD | 0.21% due 4/8/2011 (c) | 20,799,151 | ||||||||||||||||
| 21,500,000 | USD | NetJets Inc., 0.14% due 4/11/2011 (c) | 21,499,164 | ||||||||||||||||
| 4,400,000 | USD | Reed Elsevier Plc, 0.27% due 4/5/2011 (c) | 4,399,868 | ||||||||||||||||
| 36,900,000 | USD | United Parcel Service, Inc., 0.01% due 4/1/2011 (c) | 36,900,000 | ||||||||||||||||
| 175,397,128 | |||||||||||||||||||
| Treasury Bills – 2.9% | |||||||||||||||||||
| Canada – 1.9% | |||||||||||||||||||
| 41,086,000 | CAD | Government of Canada, due 8/4/2011 | 42,234,459 | ||||||||||||||||
| Japan – 1.0% | |||||||||||||||||||
| 1,770,000,000 | JPY | Government of Japan, due 5/13/2011 | 21,276,440 | ||||||||||||||||
| 63,510,899 | |||||||||||||||||||
TOTAL SHORT-TERM INVESTMENTS (Cost — $238,129,450) | 238,908,027 | ||||||||||||||||||
TOTAL INVESTMENTS — 97.8% (Cost — $1,902,134,631) | 2,158,168,347 | ||||||||||||||||||
| Other Assets In Excess of Liabilities — 2.2% | 48,983,495 | ||||||||||||||||||
TOTAL NET ASSETS — 100.0% | $ | 2,207,151,842 | |||||||||||||||||
| FOREIGN CURRENCY | | COUNTERPARTY | | SETTLEMENT DATES THROUGH | | LOCAL CURRENCY AMOUNT | | USD EQUIVALENT | | USD VALUE AT MARCH 31, 2011 | | NET UNREALIZED APPRECIATION/ (DEPRECIATION) | | ||||||||||||||||||
|---|---|---|---|---|---|---|---|---|---|---|---|---|---|---|---|---|---|---|---|---|---|---|---|---|---|---|---|---|---|---|---|
Contracts to Sell: | |||||||||||||||||||||||||||||||
| Australian dollar | State Street Bank & Trust Co. | 6/10/2011 | AUD | 4,091,000 | $ | 4,091,900 | $ | 4,196,609 | $ | (104,709 | ) | ||||||||||||||||||||
| British pound | State Street Bank & Trust Co. | 6/10/2011 | GBP | 12,259,000 | 19,782,918 | 19,648,583 | 134,335 | ||||||||||||||||||||||||
| Euro | State Street Bank & Trust Co. | 6/10/2011 | EUR | 124,594,000 | 173,093,833 | 176,348,161 | (3,254,328 | ) | |||||||||||||||||||||||
| Japanese yen | State Street Bank & Trust Co. | 6/10/2011 | JPY | 20,671,229,000 | 250,275,921 | 248,612,363 | 1,663,558 | ||||||||||||||||||||||||
| South Korean won | State Street Bank & Trust Co. | 5/6/2011 | KRW | 36,905,013,000 | 32,680,483 | 33,575,160 | (894,677 | ) | |||||||||||||||||||||||
Net Unrealized Depreciation on Open Forward Foreign Currency Contracts | $ | (2,455,821 | ) | ||||||||||||||||||||||||||||
| IVA International Fund | IVA Funds | ||
March 31, 2011
| DESCRIPTION | | NUMBER OF CONTRACTS | | EXPIRATION DATE | | USD MARKET VALUE OF SECURITIES UNDERLYING THE CONTRACTS | | NET UNREALIZED DEPRECIATION | |||||||||||
|---|---|---|---|---|---|---|---|---|---|---|---|---|---|---|---|---|---|---|---|
Contracts to Sell: | |||||||||||||||||||
| Japanese Government 10-Year Bond | 148 | 6/9/2011 | $ | 248,297,668 | $ | (884,315 | ) | ||||||||||||
ADR — American Depositary Receipt
AUD — Australian dollar
CAD — Canadian dollar
EUR — euro
GBP — British pound
HKD — Hong Kong dollar
JPY — Japanese yen
KRW — South Korean won
NOK — Norwegian krone
SGD — Singapore dollar
TWD — Taiwan dollar
USD — United States dollar
| (a) | Non-income producing investment. |
| (b) | Security is an affiliate of the IVA International Fund as defined by the Investment Company Act of 1940. An affiliate is deemed as a company in which the IVA International Fund indirectly or directly has ownership of at least 5% of the company’s outstanding voting securities. See Schedule of Affiliates below for additional information. |
| SECURITY | | SHARES HELD AT SEPTEMBER 30, 2010 | | SHARE ADDITIONS | | SHARE REDUCTIONS | | SHARES HELD AT MARCH 31, 2011 | | AFFILIATED SECURITY VALUE AT MARCH 31, 2011 | | REALIZED GAIN | | DIVIDEND INCOME* | ||||||||||||||||
|---|---|---|---|---|---|---|---|---|---|---|---|---|---|---|---|---|---|---|---|---|---|---|---|---|---|---|---|---|---|---|
| Icom Inc. | 683,600 | 340,300 | 188,200 | 835,700 | $ | 24,604,825 | $ | 78,935 | $ | 94,359 | ||||||||||||||||||||
| Milbon Co., Ltd. | 515,900 | 306,090 | 90 | 821,900 | 22,706,494 | 449 | 188,454 | |||||||||||||||||||||||
| Securidev SA | 182,918 | — | — | 182,918 | 9,124,941 | — | — | |||||||||||||||||||||||
| Temp Holdings Co., Ltd. | 2,161,800 | 946,700 | — | 3,108,500 | 27,915,959 | — | 210,043 | |||||||||||||||||||||||
| Total | $ | 84,352,219 | $ | 79,384 | $ | 492,856 | ||||||||||||||||||||||||
| * | Dividend income is net of withholding taxes. |
| (c) | Security is exempt from registration under Rule 144A or Section 4(2) of the Securities Act of 1933 (the “1933 Act”). Any resale of these securities must generally be effected through a sale that is registered under the 1933 Act or otherwise exempted from such registration requirements. |
| Statements of Assets and Liabilities (unaudited) | IVA Funds | ||
| IVA Worldwide Fund | | IVA International Fund | ||||||||
|---|---|---|---|---|---|---|---|---|---|---|
Assets: | ||||||||||
| Long-term investments, at cost: | ||||||||||
| Non-affiliated investments | $ | 7,121,750,608 | $ | 1,594,425,405 | ||||||
| Affiliated investments | 268,510,602 | 69,579,776 | ||||||||
| Short-term investments, at cost | 999,994,909 | 238,129,450 | ||||||||
| Foreign currency, at cost | 28,532,597 | 9,823,464 | ||||||||
| Foreign currency collateral for open futures contracts, at cost | 12,772,412 | 4,357,097 | ||||||||
| Long-term investments, at value: | ||||||||||
| Non-affiliated investments | $ | 8,105,950,541 | $ | 1,834,908,101 | ||||||
| Affiliated investments | 292,581,205 | 84,352,219 | ||||||||
| Short-term investments, at value | 1,001,998,264 | 238,908,027 | ||||||||
| Foreign currency, at value | 27,305,788 | 9,497,690 | ||||||||
| Foreign currency collateral for open futures contracts, at value | 13,084,070 | 4,435,639 | ||||||||
| Cash | 325,468 | 75,321 | ||||||||
| Cash collateral for open futures contracts | 15,369,398 | — | ||||||||
| Receivable for investments sold | 85,435,030 | 38,592,591 | ||||||||
| Dividends and interest receivable | 54,280,009 | 14,857,196 | ||||||||
| Receivable for fund shares sold | 33,399,329 | 5,529,279 | ||||||||
| Prepaid expenses and other assets | 90,158 | 19,850 | ||||||||
Total assets | $ | 9,629,819,260 | $ | 2,231,175,913 | ||||||
Liabilities: | ||||||||||
| Payable for investments purchased | $ | 67,738,469 | $ | 13,429,176 | ||||||
| Payable for fund shares repurchased | 13,353,654 | 5,052,455 | ||||||||
| Unrealized depreciation on open forward foreign currency contracts | 10,755,971 | 2,455,821 | ||||||||
| Variation margin on open futures contracts | 4,413,594 | 884,315 | ||||||||
| Accrued investment advisory fees | 7,076,200 | 1,633,846 | ||||||||
| Accrued distribution and service fees | 2,085,177 | 148,008 | ||||||||
| Accrued expenses and other liabilities | 1,705,392 | 420,450 | ||||||||
Total liabilities | 107,128,457 | 24,024,071 | ||||||||
Net Assets | $ | 9,522,690,803 | $ | 2,207,151,842 | ||||||
Net Assets Consist of: | ||||||||||
| Par value ($0.001 per share) | $ | 551,816 | $ | 132,417 | ||||||
| Additional paid-in-capital | 8,275,222,476 | 1,922,567,694 | ||||||||
| Undistributed net investment income | 46,181,811 | 7,504,278 | ||||||||
| Accumulated net realized gain on investments, written options, futures contracts and foreign currency transactions | 205,695,633 | 24,249,530 | ||||||||
| Unrealized appreciation from investments, futures contracts and foreign currency translation | 995,039,067 | 252,697,923 | ||||||||
Net Assets | $ | 9,522,690,803 | $ | 2,207,151,842 | ||||||
Net Asset Value Per Share: | ||||||||||
Class A | ||||||||||
| Net assets | $ | 2,967,491,588 | $ | 391,476,681 | ||||||
| Shares outstanding | 171,779,153 | 23,495,658 | ||||||||
| Net asset value per share | $ | 17.28 | $ | 16.66 | ||||||
| Maximum offering price per share (with a maximum initial sales charge of 5.00%) | $ | 18.18 | $ | 17.54 | ||||||
Class C | ||||||||||
| Net assets | $ | 1,769,901,525 | $ | 83,640,367 | ||||||
| Shares outstanding | 103,146,816 | 5,069,737 | ||||||||
| Net asset value per share | $ | 17.16 | $ | 16.50 | ||||||
Class I | ||||||||||
| Net assets | $ | 4,785,297,690 | $ | 1,732,034,794 | ||||||
| Shares outstanding | 276,890,210 | 103,851,188 | ||||||||
| Net asset value per share | $ | 17.28 | $ | 16.68 | ||||||
| Statements of Operations (unaudited) | IVA Funds | ||
| IVA Worldwide Fund | | IVA International Fund | ||||||||
|---|---|---|---|---|---|---|---|---|---|---|
Investment Income: | ||||||||||
| Interest | $ | 30,210,311 | $ | 4,584,749 | ||||||
| Dividends: | ||||||||||
| Non-affiliated investments | 53,886,392 | 15,001,019 | ||||||||
| Affiliated investments | 1,860,688 | 529,953 | ||||||||
| Less: Foreign taxes withheld | (4,126,004 | ) | (1,511,064 | ) | ||||||
Total income | 81,831,387 | 18,604,657 | ||||||||
Expenses: | ||||||||||
| Investment advisory fees | 34,091,850 | 7,855,125 | ||||||||
| Distribution and service fees: | ||||||||||
| Class A | 3,031,492 | 386,991 | ||||||||
| Class C | 6,955,747 | 342,930 | ||||||||
| Custody fees | 1,628,750 | 594,364 | ||||||||
| Trustee fees | 74,365 | 16,885 | ||||||||
| Other expenses | 3,831,943 | 786,605 | ||||||||
| Reimbursement of expenses | — | 8,506 | ||||||||
Total expenses | 49,614,147 | 9,991,406 | ||||||||
Net investment income | 32,217,240 | 8,613,251 | ||||||||
Net Realized and Change in Unrealized Gain (Loss) on Investments, Futures Contracts, Written Options and Foreign Currency: | ||||||||||
Net realized gain (loss) on: | ||||||||||
| Investments from: | ||||||||||
| Non-affiliated investments | 245,792,876 | 39,159,551 | ||||||||
| Affiliated investments | 12,018,752 | 79,384 | ||||||||
| Futures contracts | 20,522,833 | 1,488,837 | ||||||||
| Written options | 1,074,619 | — | ||||||||
| Foreign currency transactions | (48,880,572 | ) | (13,286,505 | ) | ||||||
| Net realized gain | 230,528,508 | 27,441,267 | ||||||||
Net change in unrealized appreciation (depreciation) from: | ||||||||||
| Investments from: | ||||||||||
| Non-affiliated investments | 433,896,736 | 106,876,186 | ||||||||
| Affiliated investments | 21,929,880 | 13,608,281 | ||||||||
| Futures contracts | 473,949 | 321,702 | ||||||||
| Written options | (296,442 | ) | — | |||||||
| Foreign currency translation | 16,039,450 | 4,701,011 | ||||||||
| Net change in unrealized appreciation | 472,043,573 | 125,507,180 | ||||||||
Net realized and change in unrealized gain on investments, futures contracts, written options and foreign currency | 702,572,081 | 152,948,447 | ||||||||
Increase in net assets resulting from operations | $ | 734,789,321 | $ | 161,561,698 | ||||||
| Statements of Changes in Net Assets (unaudited) | IVA Funds | ||
| IVA Worldwide Fund | | IVA International Fund | | ||||||||||||||||
|---|---|---|---|---|---|---|---|---|---|---|---|---|---|---|---|---|---|---|---|
| Six Months Ended March 31, 2011 | | Year Ended September 30, 2010 | | Six Months Ended March 31, 2011 | | Year Ended September 30, 2010 | |||||||||||||
Increase in Net Assets: | |||||||||||||||||||
| Net investment income | $ | 32,217,240 | $ | 55,968,529 | $ | 8,613,251 | $ | 11,794,444 | |||||||||||
| Net realized gain | 230,528,508 | 169,245,704 | 27,441,267 | 36,925,983 | |||||||||||||||
| Net change in unrealized appreciation | 472,043,573 | 227,548,338 | 125,507,180 | 58,504,196 | |||||||||||||||
Increase in net assets resulting from operations | 734,789,321 | 452,762,571 | 161,561,698 | 107,224,623 | |||||||||||||||
Distributions to Shareholders: | |||||||||||||||||||
| Net investment income: | |||||||||||||||||||
| Class A | (8,689,962 | ) | (6,564,395 | ) | (442,652 | ) | (1,470,646 | ) | |||||||||||
| Class C | — | (22,781 | ) | — | (102,887 | ) | |||||||||||||
| Class I | (21,223,353 | ) | (13,723,417 | ) | (4,753,242 | ) | (5,797,976 | ) | |||||||||||
| Net realized gain on investments: | |||||||||||||||||||
| Class A | (56,581,235 | ) | (22,505,579 | ) | (7,517,227 | ) | (2,489,243 | ) | |||||||||||
| Class C | (32,155,518 | ) | (11,898,004 | ) | (1,672,714 | ) | (481,678 | ) | |||||||||||
| Class I | (86,335,782 | ) | (35,315,997 | ) | (31,808,976 | ) | (8,097,105 | ) | |||||||||||
Decrease in net assets resulting from distributions | (204,985,850 | ) | (90,030,173 | ) | (46,194,811 | ) | (18,439,535 | ) | |||||||||||
Capital Share Transactions: | |||||||||||||||||||
| Proceeds from shares sold | 3,500,891,355 | 3,535,354,787 | 794,723,432 | 887,447,462 | |||||||||||||||
| Reinvestment of distributions | 142,569,767 | 65,991,699 | 36,791,069 | 13,844,530 | |||||||||||||||
| Cost of shares repurchased | (515,006,505 | ) | (462,672,913 | ) | (103,224,988 | ) | (110,104,373 | ) | |||||||||||
Increase in net assets from capital share transactions | 3,128,454,617 | 3,138,673,573 | 728,289,513 | 791,187,619 | |||||||||||||||
Increase in net assets | $ | 3,658,258,088 | $ | 3,501,405,971 | $ | 843,656,400 | $ | 879,972,707 | |||||||||||
Net Assets: | |||||||||||||||||||
| Beginning of period | $ | 5,864,432,715 | $ | 2,363,026,744 | $ | 1,363,495,442 | $ | 483,522,735 | |||||||||||
| End of period | $ | 9,522,690,803 | $ | 5,864,432,715 | $ | 2,207,151,842 | $ | 1,363,495,442 | |||||||||||
| Undistributed net investment income | $ | 46,181,811 | $ | 43,877,886 | $ | 7,504,278 | $ | 4,086,921 | |||||||||||
| Financial Highlights (unaudited) | IVA Funds | ||
| Six Months Ended March 31, 2011 | | Year Ended September 30, 2010 | | Year Ended September 30, 2009 | ||||||||||
|---|---|---|---|---|---|---|---|---|---|---|---|---|---|---|
Net asset value, beginning of period | $ | 16.03 | $ | 15.00 | $ | 12.00 | ||||||||
Increase from investment operations: | ||||||||||||||
Net investment income(a) | 0.07 | 0.21 | 0.34 | |||||||||||
Net realized and unrealized gain(a) | 1.66 | 1.27 | 2.70 | |||||||||||
| Increase from investment operations | 1.73 | 1.48 | 3.04 | |||||||||||
Decrease from distributions: | ||||||||||||||
| Net investment income | (0.06 | ) | (0.10 | ) | (0.04 | ) | ||||||||
| Net realized gain on investments | (0.42 | ) | (0.35 | ) | — | |||||||||
| Decrease from distributions | (0.48 | ) | (0.45 | ) | (0.04 | ) | ||||||||
Net asset value, end of period | $ | 17.28 | $ | 16.03 | $ | 15.00 | ||||||||
Total return(b) | 10.94 | % | 10.16 | % | 25.39 | % | ||||||||
Ratios to average net assets: | ||||||||||||||
| Net operating expenses | 1.30 | %(c) | 1.31 | % | 1.36 | % | ||||||||
| Net investment income | 0.85 | %(c) | 1.41 | % | 2.51 | % | ||||||||
Supplemental data: | ||||||||||||||
| Portfolio turnover rate | 20.3 | % | 28.9 | % | 54.8 | % | ||||||||
| Net assets, end of period (000’s) | $ | 2,967,492 | $ | 1,931,625 | $ | 755,238 | ||||||||
(a) | Calculated using average daily shares outstanding. |
(b) | Total return assumes reinvestment of all distributions and does not reflect an initial sales charge. Total returns for periods of less than one year are not annualized. |
(c) | Annualized. |
| Financial Highlights (unaudited) | IVA Funds | ||
| Six Months Ended March 31, 2011 | | Year Ended September 30, 2010 | | Year Ended September 30, 2009 | ||||||||||
|---|---|---|---|---|---|---|---|---|---|---|---|---|---|---|
Net asset value, beginning of period | $ | 15.92 | $ | 14.92 | $ | 12.00 | ||||||||
Increase from investment operations: | ||||||||||||||
Net investment income(a) | 0.01 | 0.10 | 0.23 | |||||||||||
Net realized and unrealized gain(a) | 1.65 | 1.25 | 2.71 | |||||||||||
| Increase from investment operations | 1.66 | 1.35 | 2.94 | |||||||||||
Decrease from distributions: | ||||||||||||||
| Net investment income | — | (0.00 | )(b) | (0.02 | ) | |||||||||
| Net realized gain on investments | (0.42 | ) | (0.35 | ) | — | |||||||||
| Decrease from distributions | (0.42 | ) | (0.35 | ) | (0.02 | ) | ||||||||
Net asset value, end of period | $ | 17.16 | $ | 15.92 | $ | 14.92 | ||||||||
Total return(c) | 10.53 | % | 9.26 | % | 24.51 | % | ||||||||
Ratios to average net assets: | ||||||||||||||
| Net operating expenses | 2.05 | %(d) | 2.06 | % | 2.12 | % | ||||||||
| Net investment income | 0.12 | %(d) | 0.67 | % | 1.75 | % | ||||||||
Supplemental data: | ||||||||||||||
| Portfolio turnover rate | 20.3 | % | 28.9 | % | 54.8 | % | ||||||||
| Net assets, end of period (000’s) | $ | 1,769,901 | $ | 1,055,144 | $ | 340,393 | ||||||||
(a) | Calculated using average daily shares outstanding. |
(b) | Amount represents less than $0.005 per share. |
(c) | Total return assumes reinvestment of all distributions and does not reflect a contingent deferred sales charge. Total returns for periods of less than one year are not annualized. |
(d) | Annualized. |
| Financial Highlights (unaudited) | IVA Funds | ||
| Six Months Ended March 31, 2011 | | Year Ended September 30, 2010 | | Year Ended September 30, 2009 | ||||||||||
|---|---|---|---|---|---|---|---|---|---|---|---|---|---|---|
Net asset value, beginning of period | $ | 16.05 | $ | 15.02 | $ | 12.00 | ||||||||
Increase from investment operations: | ||||||||||||||
Net investment income(a) | 0.09 | 0.25 | 0.37 | |||||||||||
Net realized and unrealized gain(a) | 1.66 | 1.27 | 2.69 | |||||||||||
| Increase from investment operations | 1.75 | 1.52 | 3.06 | |||||||||||
Decrease from distributions: | ||||||||||||||
| Net investment income | (0.10 | ) | (0.14 | ) | (0.04 | ) | ||||||||
| Net realized gain on investments | (0.42 | ) | (0.35 | ) | — | |||||||||
| Decrease from distributions | (0.52 | ) | (0.49 | ) | (0.04 | ) | ||||||||
Net asset value, end of period | $ | 17.28 | $ | 16.05 | $ | 15.02 | ||||||||
Total return(b) | 11.06 | % | 10.40 | % | 25.62 | % | ||||||||
Ratios to average net assets: | ||||||||||||||
| Net operating expenses | 1.05 | %(c) | 1.06 | % | 1.14 | % | ||||||||
| Net investment income | 1.12 | %(c) | 1.65 | % | 2.78 | % | ||||||||
Supplemental data: | ||||||||||||||
| Portfolio turnover rate | 20.3 | % | 28.9 | % | 54.8 | % | ||||||||
| Net assets, end of period (000’s) | $ | 4,785,298 | $ | 2,877,664 | $ | 1,267,395 | ||||||||
(a) | Calculated using average daily shares outstanding. |
(b) | Total return assumes reinvestment of all distributions. Total returns for periods of less than one year are not annualized. |
(c) | Annualized. |
| Financial Highlights (unaudited) | IVA Funds | ||
| Six Months Ended March 31, 2011 | | Year Ended September 30, 2010 | | Year Ended September 30, 2009 | ||||||||||
|---|---|---|---|---|---|---|---|---|---|---|---|---|---|---|
Net asset value, beginning of period | $ | 15.59 | $ | 14.59 | $ | 12.00 | ||||||||
Increase from investment operations: | ||||||||||||||
Net investment income(a) | 0.07 | 0.17 | 0.27 | |||||||||||
Net realized and unrealized gain(a) | 1.43 | 1.25 | 2.36 | |||||||||||
| Increase from investment operations | 1.50 | 1.42 | 2.63 | |||||||||||
Decrease from distributions: | ||||||||||||||
| Net investment income | (0.02 | ) | (0.16 | ) | (0.04 | ) | ||||||||
| Net realized gain on investments | (0.41 | ) | (0.26 | ) | — | |||||||||
| Decrease from distributions | (0.43 | ) | (0.42 | ) | (0.04 | ) | ||||||||
Net asset value, end of period | $ | 16.66 | $ | 15.59 | $ | 14.59 | ||||||||
Total return(b) | 9.81 | % | 9.96 | % | 21.96 | % | ||||||||
Ratios to average net assets: | ||||||||||||||
Net operating expenses(c) | 1.31 | % | 1.39 | % | 1.40 | % | ||||||||
Net investment income(d) | 0.82 | % | 1.13 | % | 2.14 | % | ||||||||
Supplemental data: | ||||||||||||||
| Portfolio turnover rate | 16.4 | % | 28.1 | % | 46.6 | % | ||||||||
| Net assets, end of period (000’s) | $ | 391,477 | $ | 240,245 | $ | 104,420 | ||||||||
(a) | Calculated using average daily shares outstanding. |
(b) | The total returns include the effect of certain contractual fee waivers and/or expense reimbursements. Total return assumes reinvestment of all distributions and does not reflect an initial sales charge. Total returns for periods of less than one year are not annualized. |
(c) | Reflects certain contractual fee waivers and/or expense reimbursements (exclusive of acquired fund fees and expenses, brokerage expenses, interest expense, taxes, organizational and extraordinary expenses) to limit the amount of total operating expenses to 1.40%. The ratio of expenses to average net assets without the effect of fee waivers and/or reimbursements was 1.55% for the year ended September 30, 2009. Ratios to average net assets for a period of less than one year are annualized. |
(d) | The ratio of net investment income to average net assets without the effect of certain contractual fee waivers and/or expense reimbursements was 1.99% for the year ended September 30, 2009. Ratios to average net assets for a period of less than one year are annualized. |
| Financial Highlights (unaudited) | IVA Funds | ||
| Six Months Ended March 31, 2011 | | Year Ended September 30, 2010 | | Year Ended September 30, 2009 | ||||||||||
|---|---|---|---|---|---|---|---|---|---|---|---|---|---|---|
Net asset value, beginning of period | $ | 15.48 | $ | 14.51 | $ | 12.00 | ||||||||
Increase from investment operations: | ||||||||||||||
Net investment income(a) | 0.00 | (b) | 0.06 | 0.17 | ||||||||||
Net realized and unrealized gain(a) | 1.43 | 1.23 | 2.36 | |||||||||||
| Increase from investment operations | 1.43 | 1.29 | 2.53 | |||||||||||
Decrease from distributions: | ||||||||||||||
| Net investment income | — | (0.06 | ) | (0.02 | ) | |||||||||
| Net realized gain on investments | (0.41 | ) | (0.26 | ) | — | |||||||||
| Decrease from distributions | (0.41 | ) | (0.32 | ) | (0.02 | ) | ||||||||
Net asset value, end of period | $ | 16.50 | $ | 15.48 | $ | 14.51 | ||||||||
Total return(c) | 9.39 | % | 9.05 | % | 21.10 | % | ||||||||
Ratios to average net assets: | ||||||||||||||
Net operating expenses(d) | 2.08 | % | 2.15 | % | 2.15 | % | ||||||||
Net investment income(e) | 0.02 | % | 0.41 | % | 1.38 | % | ||||||||
Supplemental data: | ||||||||||||||
| Portfolio turnover rate | 16.4 | % | 28.1 | % | 46.6 | % | ||||||||
| Net assets, end of period (000’s) | $ | 83,640 | $ | 55,824 | $ | 19,028 | ||||||||
(a) | Calculated using average daily shares outstanding. |
(b) | Amount represents less than $0.005 per share. |
(c) | The total returns include the effect of certain contractual fee waivers and/or expense reimbursements. Total return assumes reinvestment of all distributions and does not reflect an initial sales charge. Total returns for periods of less than one year are not annualized. |
(d) | Reflects certain contractual fee waivers and/or expense reimbursements (exclusive of acquired fund fees and expenses, brokerage expenses, interest expense, taxes, organizational and extraordinary expenses) to limit the amount of total operating expenses to 2.15%. The ratio of expenses to average net assets without the effect of fee waivers and/or reimbursements was 2.17% and 2.49% for the years ended September 30, 2010 and 2009, respectively. Ratios to average net assets for a period of less than one year are annualized. |
(e) | The ratio of net investment income to average net assets without the effect of certain contractual fee waivers and/or expense reimbursements was 0.38% and 1.04% for the years ended September 30, 2010 and 2009, respectively. Ratios to average net assets for a period of less than one year are annualized. |
| Financial Highlights (unaudited) | IVA Funds | ||
| Six Months Ended March 31, 2011 | | Year Ended September 30, 2010 | | Year Ended September 30, 2009 | ||||||||||
|---|---|---|---|---|---|---|---|---|---|---|---|---|---|---|
Net asset value, beginning of period | $ | 15.62 | $ | 14.62 | $ | 12.00 | ||||||||
Increase from investment operations: | ||||||||||||||
Net investment income(a) | 0.09 | 0.21 | 0.31 | |||||||||||
Net realized and unrealized gain(a) | 1.44 | 1.24 | 2.35 | |||||||||||
| Increase from investment operations | 1.53 | 1.45 | 2.66 | |||||||||||
Decrease from distributions: | ||||||||||||||
| Net investment income | (0.06 | ) | (0.19 | ) | (0.04 | ) | ||||||||
| Net realized gain on investments | (0.41 | ) | (0.26 | ) | — | |||||||||
| Decrease from distributions | (0.47 | ) | (0.45 | ) | (0.04 | ) | ||||||||
Net asset value, end of period | $ | 16.68 | $ | 15.62 | $ | 14.62 | ||||||||
Total return(b) | 9.98 | % | 10.19 | % | 22.28 | % | ||||||||
Ratios to average net assets: | ||||||||||||||
Net operating expenses(c) | 1.06 | % | 1.13 | % | 1.15 | % | ||||||||
Net investment income(d) | 1.07 | % | 1.44 | % | 2.41 | % | ||||||||
Supplemental data: | ||||||||||||||
| Portfolio turnover rate | 16.4 | % | 28.1 | % | 46.6 | % | ||||||||
| Net assets, end of period (000’s) | $ | 1,732,035 | $ | 1,067,427 | $ | 360,075 | ||||||||
(a) | Calculated using average daily shares outstanding. |
(b) | The total returns include the effect of certain contractual fee waivers and/or expense reimbursements. Total return assumes reinvestment of all distributions. Total returns for periods of less than one year are not annualized. |
(c) | Reflects certain contractual fee waivers and/or expense reimbursements (exclusive of acquired fund fees and expenses, brokerage expenses, interest expense, taxes, organizational and extraordinary expenses) to limit the amount of total operating expenses to 1.15%. The ratio of expenses to average net assets without the effect of fee waivers and/or reimbursements was 1.28% for the year ended September 30, 2009. Ratios to average net assets for a period of less than one year are annualized. |
(d) | The ratio of net investment income to average net assets without the effect of certain contractual fee waivers and/or expense reimbursements was 2.28% for the year ended September 30, 2009. Ratios to average net assets for a period of less than one year are annualized. |
| Notes to Financial Statements (unaudited) | IVA Funds | ||
| Notes to Financial Statements (unaudited) | IVA Funds | ||
securities that do not trade during NYSE hours, fair valuation determinations are based on analyses of market movements after the close of those securities’ primary markets, and include reviews of developments in foreign markets, the performance of U.S. securities markets, and the performance of instruments trading in U.S. markets that represent foreign securities and baskets of foreign securities. Fair value pricing may require subjective determinations about the value of an asset or liability. Fair values used to determine the Funds’ NAVs may differ from quoted or published prices, or from prices that are used by others, for the same investments. The use of fair value pricing may not always result in adjustments to the prices of securities or other assets or liabilities held by the Funds.
| • | Level 1 – quoted prices in active markets for identical investments |
| • | Level 2 – other significant observable inputs (including quoted prices for similar or identical investments, interest rates, prepayment speeds, credit risk, other observable market data, etc.) |
| • | Level 3 – significant unobservable inputs (including the Funds’ own assumptions in determining the fair value of investments) |
| ASSETS | | Quoted Prices in Active Markets for Identical Investments (Level 1) | | Other Significant Observable Inputs (Level 2) | | Significant Unobservable Inputs (Level 3) | | Total | |||||||||||
|---|---|---|---|---|---|---|---|---|---|---|---|---|---|---|---|---|---|---|---|
Common stocks(a): | |||||||||||||||||||
| Foreign | $ | 3,808,352,633 | — | — | $ | 3,808,352,633 | |||||||||||||
| United States | 2,799,784,407 | — | — | 2,799,784,407 | |||||||||||||||
Corporate notes & bonds(a) | — | $ | 606,277,728 | — | 606,277,728 | ||||||||||||||
| Commercial mortgage backed securities | — | 6,602,272 | — | 6,602,272 | |||||||||||||||
Sovereign government bonds(a) | — | 665,475,843 | — | 665,475,843 | |||||||||||||||
| Commodities | 512,038,863 | — | — | 512,038,863 | |||||||||||||||
Short-term investments(a) | — | 1,001,998,264 | — | 1,001,998,264 | |||||||||||||||
| Total assets | $ | 7,120,175,903 | $ | 2,280,354,107 | — | $ | 9,400,530,010 | ||||||||||||
LIABILITIES | |||||||||||||||||||
| Unrealized depreciation on open forward foreign currency contracts | — | $ | (10,755,971 | ) | — | $ | (10,755,971 | ) | |||||||||||
| Unrealized depreciation on open futures contracts | $ | (4,413,594 | ) | — | — | (4,413,594 | ) | ||||||||||||
| Total liabilities | $ | (4,413,594 | ) | $ | (10,755,971 | ) | — | $ | (15,169,565 | ) | |||||||||
(a) | See Schedule of Investments for additional detailed categorization. |
| Notes to Financial Statements (unaudited) | IVA Funds | ||
| ASSETS | | Quoted Prices in Active Markets for Identical Investments (Level 1) | | Other Significant Observable Inputs (Level 2) | | Significant Unobservable Inputs (Level 3) | | Total | |||||||||||||||
|---|---|---|---|---|---|---|---|---|---|---|---|---|---|---|---|---|---|---|---|---|---|---|---|
Common stocks(a): | |||||||||||||||||||||||
| Foreign | $ | 1,512,177,066 | — | — | $ | 1,512,177,066 | |||||||||||||||||
Corporate notes & bonds(a) | — | $ | 97,693,421 | — | 97,693,421 | ||||||||||||||||||
Sovereign government bonds(a) | — | 173,389,439 | — | 173,389,439 | |||||||||||||||||||
| Commodities | 136,000,394 | — | — | 136,000,394 | |||||||||||||||||||
Short-term investments(a) | — | 238,908,027 | — | 238,908,027 | |||||||||||||||||||
| Total assets | $ | 1,648,177,460 | $ | 509,990,887 | — | $ | 2,158,168,347 | ||||||||||||||||
LIABILITIES | |||||||||||||||||||||||
| Unrealized depreciation on open forward foreign currency contracts | — | $ | (2,455,821 | ) | — | $ | (2,455,821 | ) | |||||||||||||||
| Unrealized depreciation on open futures contracts | $ | (884,315 | ) | — | — | (884,315 | ) | ||||||||||||||||
| Total liabilities | $ | (884,315 | ) | $ | (2,455,821 | ) | — | $ | (3,340,136 | ) | |||||||||||||
(a) | See Schedule of Investments for additional detailed categorization. |
| Notes to Financial Statements (unaudited) | IVA Funds | ||
| Notes to Financial Statements (unaudited) | IVA Funds | ||
| | Worldwide Fund | | International Fund | |||||||
|---|---|---|---|---|---|---|---|---|---|---|
| Purchases | $ | 3,761,548,478 | $ | 872,884,708 | ||||||
| Sales | $ | 1,335,137,510 | $ | 240,722,885 | ||||||
| | Worldwide Fund | | International Fund | |||||||
|---|---|---|---|---|---|---|---|---|---|---|
| Cost basis of investments | $ | 8,390,256,119 | $ | 1,902,134,631 | ||||||
| Gross unrealized appreciation | $ | 1,067,522,469 | $ | 267,700,782 | ||||||
| Gross unrealized depreciation | (57,248,578 | ) | (11,667,066 | ) | ||||||
| Net unrealized appreciation | $ | 1,010,273,891 | $ | 256,033,716 | ||||||
| Notes to Financial Statements (unaudited) | IVA Funds | ||
| | Number of Contracts | | Premiums | |||||||
|---|---|---|---|---|---|---|---|---|---|---|
| Written options, outstanding September 30, 2010 | (19,552 | ) | $ | (2,434,746 | ) | |||||
| Options written | (11,129 | ) | (926,383 | ) | ||||||
| Options exercised | 24,094 | 2,286,510 | ||||||||
| Options expired | 6,587 | 1,074,619 | ||||||||
| Written options, outstanding March 31, 2011 | — | — | ||||||||
| Notes to Financial Statements (unaudited) | IVA Funds | ||
| | Liability Derivatives | | ||||||||
|---|---|---|---|---|---|---|---|---|---|---|
| Risk-Type Category | | Statements of Assets and Liabilities Location | | Fair Value | ||||||
| Interest rate contracts | Variation margin on open futures contracts | $ | 4,413,594 | |||||||
| Foreign exchange contracts | Unrealized depreciation on forward foreign currency contracts | 10,755,971 | ||||||||
| Total | $ | 15,169,565 | ||||||||
| | Liability Derivatives | | ||||||||
|---|---|---|---|---|---|---|---|---|---|---|
| Risk-Type Category | | Statements of Assets and Liabilities Location | | Fair Value | ||||||
| Interest rate contracts | Variation margin on open futures contracts | $ | 884,315 | |||||||
| Foreign exchange contracts | Unrealized depreciation on forward foreign currency contracts | 2,455,821 | ||||||||
| Total | $ | 3,340,136 | ||||||||
| Risk-Type Category | | Derivative Instrument | | Realized Gain (Loss) | | Change in Unrealized Appreciation/ (Depreciation) | ||||||||
|---|---|---|---|---|---|---|---|---|---|---|---|---|---|---|
| Interest rate contracts | Futures Contracts | $ | 20,522,833 | $ | 473,949 | |||||||||
| Foreign exchange contracts | Forward foreign currency contracts | (52,148,972 | ) | 17,552,363 | ||||||||||
| Equity contracts | Written option contracts | 1,074,619 | (296,442 | ) | ||||||||||
| Total | $ | (30,551,520 | ) | $ | 17,729,870 | |||||||||
| Risk-Type Category | | Derivative Instrument | | Realized Gain (Loss) | | Change in Unrealized Appreciation/ (Depreciation) | ||||||||
|---|---|---|---|---|---|---|---|---|---|---|---|---|---|---|
| Interest rate contracts | Futures Contracts | $ | 1,488,837 | $ | 321,702 | |||||||||
| Foreign exchange contracts | Forward foreign currency contracts | (14,581,311 | ) | 5,304,627 | ||||||||||
| Total | $ | (13,092,474 | ) | $ | 5,626,329 | |||||||||
| Notes to Financial Statements (unaudited) | IVA Funds | ||
| | Six Months Ended March 31, 2011 | | Year Ended September 30, 2010 | | |||||||||||||||
|---|---|---|---|---|---|---|---|---|---|---|---|---|---|---|---|---|---|---|---|
| | Shares | | Amount | | Shares | | Amount | ||||||||||||
Class A | |||||||||||||||||||
| Shares sold | 58,183,607 | $ | 981,878,199 | 77,795,520 | $ | 1,174,278,323 | |||||||||||||
| Shares reinvested | 3,193,629 | 52,918,444 | 1,507,532 | 22,236,101 | |||||||||||||||
| Shares repurchased | (10,109,608 | ) | (170,265,363 | ) | (9,130,177 | ) | (137,632,053 | ) | |||||||||||
| Net Increase | 51,267,628 | $ | 864,531,280 | 70,172,875 | $ | 1,058,882,371 | |||||||||||||
Class C | |||||||||||||||||||
| Shares sold | 39,380,427 | $ | 660,518,481 | 45,884,824 | $ | 688,917,256 | |||||||||||||
| Shares reinvested | 1,080,716 | 17,831,811 | 455,739 | 6,717,583 | |||||||||||||||
| Shares repurchased | (3,587,491 | ) | (59,939,432 | ) | (2,889,049 | ) | (43,552,962 | ) | |||||||||||
| Net Increase | 36,873,652 | $ | 618,410,860 | 43,451,514 | $ | 652,081,877 | |||||||||||||
Class I | |||||||||||||||||||
| Shares sold | 110,139,645 | $ | 1,858,494,675 | 110,932,221 | $ | 1,672,159,208 | |||||||||||||
| Shares reinvested | 4,334,310 | 71,819,512 | 2,512,755 | 37,038,015 | |||||||||||||||
| Shares repurchased | (16,864,665 | ) | (284,801,710 | ) | (18,529,994 | ) | (281,487,898 | ) | |||||||||||
| Net Increase | 97,609,290 | $ | 1,645,512,477 | 94,914,982 | $ | 1,427,709,325 | |||||||||||||
| | Six Months Ended March 31, 2011 | | Year Ended September 30, 2010 | | |||||||||||||||
|---|---|---|---|---|---|---|---|---|---|---|---|---|---|---|---|---|---|---|---|
| | Shares | | Amount | | Shares | | Amount | ||||||||||||
Class A | |||||||||||||||||||
| Shares sold | 8,879,663 | $ | 143,058,025 | 11,307,887 | $ | 165,856,850 | |||||||||||||
| Shares reinvested | 447,154 | 7,091,856 | 249,054 | 3,581,392 | |||||||||||||||
| Shares repurchased | (1,239,796 | ) | (19,981,345 | ) | (3,303,420 | ) | (48,246,554 | ) | |||||||||||
| Net Increase | 8,087,021 | $ | 130,168,536 | 8,253,521 | $ | 121,191,688 | |||||||||||||
Class C | |||||||||||||||||||
| Shares sold | 1,582,924 | $ | 25,407,134 | 2,504,713 | $ | 36,434,960 | |||||||||||||
| Shares reinvested | 72,938 | 1,148,042 | 30,009 | 430,928 | |||||||||||||||
| Shares repurchased | (192,707 | ) | (3,088,362 | ) | (239,931 | ) | (3,491,252 | ) | |||||||||||
| Net Increase | 1,463,155 | $ | 23,466,814 | 2,294,791 | $ | 33,374,636 | |||||||||||||
Class I | |||||||||||||||||||
| Shares sold | 38,694,287 | $ | 626,258,273 | 47,025,199 | $ | 685,155,652 | |||||||||||||
| Shares reinvested | 1,800,199 | 28,551,171 | 683,742 | 9,832,210 | |||||||||||||||
| Shares repurchased | (4,965,356 | ) | (80,155,281 | ) | (4,011,301 | ) | (58,366,567 | ) | |||||||||||
| Net Increase | 35,529,130 | $ | 574,654,163 | 43,697,640 | $ | 636,621,295 | |||||||||||||
| Notes to Financial Statements (unaudited) | IVA Funds | ||
| Trustees and Officers (unaudited) | IVA Funds | ||
| Name (Birth Year) | Position(s) Held with the Trust | Term of Office(b) and Length of Time Served | Principal Occupation(s) During Past 5 Years | Number of Portfolios in the Fund Complex Overseen by Trustee | Other Directorships / Trusteeships Held by Trustee | |||||||||||||||||
|---|---|---|---|---|---|---|---|---|---|---|---|---|---|---|---|---|---|---|---|---|---|---|
| Adele R. Wailand (1949) | Trustee and Chair of the Board | since 2008 | Corporate Secretary, Case, Pomeroy & Company, Inc. (real estate and investments); Vice President & General Counsel, Case, Pomeroy & Company, Inc. (prior to 2011) | 2 | None. | |||||||||||||||||
| Manu Bammi (1962) | Trustee | since 2008 | Founder and Chief Executive Officer, SmartAnalyst, Inc. (provider of research and analytics and decision support to businesses) | 2 | None. | |||||||||||||||||
| Ronald S. Gutstein (1971) | Trustee | since 2008 | Institutional Trader and Market Maker, Access Securities (an institutional broker-dealer) | 2 | None. | |||||||||||||||||
(a) | Trustees who are not “interested persons” of the Trust as defined in the 1940 Act. |
(b) | Each Trustee serves until resignation or removal from the Board. |
| Trustees and Officers (unaudited) | IVA Funds | ||
| Name (Birth Year) | Position(s) Held with the Trust | Term of Office(a) and Length of Time Served | Principal Occupation(s) During Past 5 Years | Number of Portfolios in the Fund Complex Overseen by Trustee | ||||||||||||||
|---|---|---|---|---|---|---|---|---|---|---|---|---|---|---|---|---|---|---|
Michael W. Malafronte(b) (1974) | President and Trustee | since 2008 | CEO and Research Analyst, the Adviser (since 2007); Senior Research Analyst, Arnhold and S. Bleichroeder Advisers, LLC (“ASB”) (asset management advisory services) (2005-2007) | 2 | ||||||||||||||
(a) | Each Trustee serves until resignation or removal from the Board. |
(b) | Mr. Malafronte is considered an interested trustee due to his position as Managing Partner of the Adviser. |
| Name (Birth Year) and Address(a) | Position(s) Held with the Trust | Term of Office and Length of Time Served(b) | Principal Occupation(s) During Past 5 Years | |||||||||||
|---|---|---|---|---|---|---|---|---|---|---|---|---|---|---|
| Shanda Scibilia (1971) | Chief Compliance Officer and Secretary | since 2008 | Chief Operating Officer and Chief Compliance Officer, the Adviser (since 2008); acting Chief Operating Officer and head of compliance, Oppenheimer & Close (from 1998 to 2008) | |||||||||||
| Stefanie J. Hempstead (1973) | Treasurer | since 2008 | Chief Financial Officer, the Adviser (since 2008); Senior Vice President, ASB (prior to 2008); Vice President, ASB Securities LLC (prior to 2008); Vice President and Treasurer, First Eagle Funds and First Eagle Variable Funds (prior to 2008) | |||||||||||
| Christopher Hine (1978) | Assistant Treasurer | since 2010 | Director of Accounting, the Adviser (since 2009); Manager, Citco Fund Services (2008); Assistant Vice President, ASB (from 2006 to 2007) | |||||||||||
(a) | Each officer’s mailing address is c/o International Value Advisers, LLC, 717 Fifth Avenue, New York, NY 10022. |
(b) | The term of office of each officer is indefinite. Length of time served represents time served as an officer of the Trust, although various positions may have been held during the period. |
| Additional Information (unaudited) | IVA Funds | ||
| Fund Expenses (unaudited) | IVA Funds | ||
| |
|---|
Total
Return
Beginning
Account Value
Ending
Account Value
Expense
Ratio
Paid During
the Period(b)
| | | | | Hypothetical Annualized Total Return | Beginning Account Value | | Ending Account Value | | Annualized Expense Ratio | | Expenses Paid During the Period(b) | | ||||||||||
|---|---|---|---|---|---|---|---|---|---|---|---|---|---|---|---|---|---|---|---|---|---|---|
Worldwide Fund | ||||||||||||||||||||||
| Class A | 5.00 | % | $1,000.00 | $1,018.45 | 1.30% | $6.54 | ||||||||||||||||
| Class C | 5.00 | % | 1,000.00 | 1,014.71 | 2.05% | 10.30 | ||||||||||||||||
| Class I | 5.00 | % | 1,000.00 | 1,019.70 | 1.05% | 5.29 | ||||||||||||||||
International Fund | ||||||||||||||||||||||
| Class A | 5.00 | % | $1,000.00 | $1,018.40 | 1.31% | $6.59 | ||||||||||||||||
| Class C | 5.00 | % | 1,000.00 | 1,014.56 | 2.08% | 10.45 | ||||||||||||||||
| Class I | 5.00 | % | 1,000.00 | 1,019.65 | 1.06% | �� | 5.34 | |||||||||||||||
(a) | Assumes reinvestment of all dividends and capital gain distributions, if any. |
(b) | Expenses are equal to the Funds’ respective annualized expense ratio multiplied by the average account value over the period, multiplied by 182 days in the most recent fiscal half-year, then divided by 365. |

IVA Funds | |||
717 Fifth Avenue
New York, NY 10022
3 Canal Plaza, Suite 100
Portland, ME 04101
200 Newport Avenue
North Quincy, MA 02171
2000 Crown Colony Drive
Quincy, MA 02169
State Street Financial Center
One Lincoln Street
Boston, MA 02111-2950
200 Clarendon Street
Boston MA, 02116-5072

Item 2. Code of Ethics.
Not applicable.
Item 3. Audit Committee Financial Expert.
Not applicable.
Item 4. Principal Accountant Fees and Services.
Not applicable.
Item 5. Audit Committee of Listed Registrants.
Not applicable to the registrant.
Item 6. Schedule of Investments.
(a) The schedules of investments are included in the report to shareholders filed under Item 1 of this Form N-CSR.
(b) Not applicable.
Item 7. Disclosure of Proxy Voting Policies and Procedures for Closed-End Management Investment Companies.
Not applicable to the registrant.
Item 8. Portfolio Managers of Closed-End Management Investment Companies.
Not applicable to the registrant.
Item 9. Purchases of Equity Securities by Closed-End Management Investment Company and Affiliated Purchasers.
Not applicable to the registrant.
Item 10. Submission of Matters to a Vote of Security Holders.
The registrant does not have procedures by which shareholders may recommend nominees to the registrant’s Board of Trustees. The Nominating and Governance Committee may, in its sole discretion, consider nominees recommended by each Fund’s shareholders.
Item 11. Controls and Procedures.
(a) Within 90 days of the filing date of this Form N-CSR, Michael W. Malafronte, the registrant’s President and Chief Executive Officer, and Stefanie J. Hempstead, the registrant’s Treasurer and Chief Financial Officer, reviewed the registrant’s Disclosure Controls and Procedures and Internal Control over Financial Reporting (the “Procedures”) (as defined in Rule 30a-3(c) under the Investment Company Act of 1940, as amended (the “1940 Act”)) and evaluated their effectiveness. Based on their review, Mr. Malafronte and Ms. Hempstead determined that the Procedures are reasonably designed to ensure that information required to be disclosed by the registrant on Form N-CSR is accumulated and communicated to the registrant’s management to allow timely decisions regarding required disclosure.
(b) There were no changes in the registrant’s Procedures (as defined in Rule 30a-3(d) under the 1940 Act) that occurred during the second fiscal quarter of the period covered by this report that has materially affected, or is reasonably likely to materially affect, the registrant’s Procedures.
Item 12. Exhibits.
(a)(1) Not applicable.
(a)(2) The certifications required by Rule 30a-2(a) of the 1940 Act and Section 302 of the Sarbanes-Oxley Act of 2002 (“Sarbanes-Oxley Act”) are filed herewith.
(a)(3) Not applicable.
(b) The certifications required by Rule 30a-2(b) of the 1940 Act and Section 906 of the Sarbanes-Oxley Act are filed herewith.
The certifications provided pursuant to Rule 30a-2(b) of the 1940 Act and Section 906 of the Sarbanes-Oxley Act are not deemed “filed” for purposes of Section 18 of the Securities Exchange Act of 1934, as amended (the “Exchange Act”), or otherwise subject to the liability of that section. Such certifications will not be deemed to be incorporated by reference into any filing under the Securities Act of 1933 or the Exchange Act, except to the extent that the registrant specifically incorporates them by reference.
SIGNATURES
Pursuant to the requirements of the Securities Exchange Act of 1934 and the Investment Company Act of 1940, the registrant has duly caused this report to be signed on its behalf by the undersigned, thereunto duly authorized.
IVA FIDUCIARY TRUST
By:
/s/ Michael W. Malafronte
Michael W. Malafronte
President and Chief Executive Officer
Date:
May 27, 2011
Pursuant to the requirements of the Securities Exchange Act of 1934 and the Investment Company Act of 1940, this report has been signed below by the following persons on behalf of the registrant and in the capacities and on the dates indicated.
By:
/s/ Michael W. Malafronte
Michael W. Malafronte
President and Chief Executive Officer
Date:
May 27, 2011
By:
/s/ Stefanie J. Hempstead
Stefanie J. Hempstead
Treasurer and Chief Financial Officer
Date:
May 27, 2011