UNITED STATES
SECURITIES AND EXCHANGE COMMISSION
Washington, D.C. 20549
FORM N-CSR
CERTIFIED SHAREHOLDER REPORT OF REGISTERED
MANAGEMENT INVESTMENT COMPANIES
Investment Company Act file number: 811-22211
______________________________________________
IVA Fiduciary TRUST
______________________________________________________________________
(Exact name of registrant as specified in charter)
717 FifthAvenue, 10th Floor, New York, NY 10022
______________________________________________________________________
(Address of principal executive offices) (zip code)
| |
Michael W. Malafronte International Value Advisers, LLC 717 FifthAvenue
10th Floor
New York, NY 10022 |
(Name and address of agent for service) |
Copy to: |
Michael S. Caccese, Esq.
K&L Gates LLP
State Street Financial Center
One Lincoln Street
Boston, Massachusetts 02111-2950 Brian F. Link, Esq.
State Street Bank and Trust Company
Mail Code: SUM0703
100 Summer Street, 7th Floor
Boston, MA 02110 |
Registrant’s telephone number, including area code: (212) 584-3570
Date of fiscal year end: September 30
Date of reporting period: September 30, 2019
Item 1. Report to Shareholders.
| |
| | IVA Worldwide Fund IVA International Fund Annual Report September 30, 2019 Beginning in May 2021, as permitted by regulations adopted by the Securities and Exchange Commission, paper copies of the Funds’ shareholder reports will no longer be sent by mail, unless you specifically request paper copies of the reports from the Funds or from your financial intermediary, such as a broker-dealer or bank. Instead, the reports will be made available on a website, and you will be notified by mail each time a report is posted and provided with a website link to access the report. If you already elected to receive shareholder reports electronically, you will not be affected by this change and you need not take any action. You may elect to receive shareholder reports and other communications from the Funds electronically by calling Investor Services at (866) 941-4482. If you own these shares through a financial intermediary, you may contact your financial intermediary. You may elect to receive all future reports in paper free of charge. You can inform the Funds that you wish to continue receiving paper copies of your shareholder reports by following the instructions included with this disclosure. If you own these shares through a financial intermediary, you may contact your financial intermediary or follow the instructions included with this disclosure to elect to continue to receive paper copies of your shareholder reports. Your election to receive reports in paper will apply to all funds held with the fund complex or your financial intermediary. |
Advised by International Value Advisers, LLC | An investment in the Funds is not a bank deposit and is not insured or guaranteed by the Federal Deposit Insurance Corporation or any other government agency. |

| | 2 | An Owner’s Manual |
| | 3 | Letter from the President |
| | 4 | Letter from the Portfolio Managers |
| | 6 | Management’s Discussion of Fund Performance |
| | | IVA Worldwide Fund |
| | 8 | Performance |
| | 9 | Portfolio Composition |
| | 10 | Schedule of Investments |
| | | IVA International Fund |
| | 18 | Performance |
| | 19 | Portfolio Composition |
| | 20 | Schedule of Investments |
| | 27 | Statements of Assets and Liabilities |
| | 28 | Statements of Operations |
| | 29 | Statements of Changes in Net Assets |
| | 30 | Financial Highlights |
| | 36 | Notes to Financial Statements |
| | 45 | Report of Independent Registered Public Accounting Firm |
| | 46 | Trustees and Officers |
| | 48 | Additional Information |
| | 51 | Important Tax Information |
| | 52 | Fund Expenses |
| An Owner’s Manual | IVA Funds |
An Atypical Investment Strategy
We manage both the IVA Worldwide and IVA International Funds with a dual attempt that is unusual in the mutual fund world: in the short-term (12-18 months), we attempt to preserve capital, while over the longer-term (5-10 years, i.e., over a full economic cycle), we seek to perform better than the MSCI All Country World Index, in the case of your IVA Worldwide Fund, and the MSCI All Country World (ex-U.S.) Index, in the case of your IVA International Fund.
The Worldwide Fund is typically used by investors who are looking for an “all weather fund” where we are given the latitude to decide how much we should have in the U.S. versus outside the U.S. The International Fund is typically used by investors who practice asset allocation and want to decide for themselves how much should be allocated to a domestic manager and how much should be allocated to a pure “international” (i.e., non-U.S.) manager, yet at the same time are looking for a lower risk – and lower volatility – exposure to international markets than may be obtained from a more traditional international fund.
We believe our investment approach is very different from the traditional approach of most mutual funds. We are trying to deliver returns that are as absolute as possible, i.e., returns that try to be as resilient as possible in down markets, while many of our competitors try to deliver good relative performance, i.e., try to beat an index, and thus would be fine with being down 15% if their benchmark is down 20%.
Why do we have such an unusual strategy (which, incidentally, is not easy to carry out)? Because we believe this strategy makes sense for many investors. We are fond of the quote by Mark Twain: “There are two times in a man’s life when he should not speculate: the first time is when he cannot afford to; the second time is when he can.” We realize that many investors cannot tolerate high volatility and appreciate that “life’s bills do not always come at market tops.” This strategy also appeals to us at International Value Advisers since we “eat our own cooking” for a significant part of our savings (invested in IVA products) and we have an extreme aversion to losing money.
An Eclectic Investment Approach
Here is how we try to implement our strategy:
| ■ | We don’t hug benchmarks. In practical terms, this means we are willing to make big “negative bets,” i.e., having nothing or little in what has become big in the benchmark. Conversely, we will generally seek to avoid overly large positive bets. |
| ■ | We prefer having diversified portfolios (100 to 150 names). Because we invest on a global basis, we believe that diversification helps protect against weak corporate governance or insufficient disclosure, or simply against “unknown unknowns.” We like the flexibility to invest in small, medium and large companies, depending on where we see value. |
| ■ | We attempt to capture equity-type returns through fixed income securities but predominantly when credit markets (or sub-sets of them) are depressed and offer this potential. |
| ■ | We hold some gold, either in bullion form or via gold mining securities, as we believe gold provides a good hedge in either an inflationary or deflationary period, and it can help mitigate currency debasement over time. |
| ■ | We are willing to hold cash when we cannot find enough cheap securities that we like or when we find some, yet the broader market (Mr. Market) seems fully priced. We will seek to use that cash as ammunition for future bargains. |
| ■ | At the individual security level, we ask a lot of questions about “what can go wrong?” and will establish not only a “base case intrinsic value” but also a “worst case scenario” (What could prove us wrong? If we were wrong, are we likely to lose 25%, 30%, or even more of the money invested?). As a result, we will miss some opportunities, yet hopefully, we will also avoid instances where we experience a permanent impairment of value. |
| Letter from the President | IVA Funds |
 | | Dear Shareholder, This annual report covers the fiscal year ended September 30, 2019 and completes our eleventh year of operations. The Funds’ investment adviser, International Value Advisers, LLC (“IVA”), remains pleased with the performance of our two mutual funds, the IVA Worldwide Fund and the IVA International Fund (the “Funds”) since their inception on October 1, 2008. While markets continue to be challenging for value investors, we at IVA will persist with our thoughtful, honest approach to managing our clients’ assets. Central bankers globally continue to drive interest rates down (and in some cases below zero) to attempt to stimulate growth. This global policy is creating imbalances and here in the U.S. has resulted in a dramatic surge in the federal deficit (up 26% year over year). While disheartening for our performance in the short-term, we continue to scour the world for opportunities. We do not believe these extreme policies will last forever and when the music stops we feel confident our portfolios will be beneficial to our shareholders. |
In mid-September IVA announced that Chuck de Lardemelle was promoted to co-CIO after 12 years as co-portfolio manager for all the IVA investment products. As I stated for that announcement and will reiterate here, “These steps are the result of careful planning and consideration between our two portfolio managers and the firm’s owners. They are a natural reflection of IVA’s commitment to optimizing and developing talent for the benefit of clients. We are excited to see Chuck take this step up in his career.”
It is tremendously fulfilling to continue building IVA and the Funds. We expect that in the process we are nurturing a culture where everyone at IVA respects the work we are doing for our clients.
Sincerely,

Michael W. Malafronte, President
| Letter from the Portfolio Managers | IVA Funds |

Past performance does not guarantee future results.The performance data quoted represents past performance and current returns may be lower or higher. Returns are shown net of fees and expenses and assume reinvestment of dividends and other income. The investment return and principal value will fluctuate so that an investor’s shares, when redeemed may be worth more or less than the original cost. To obtain performance information current to the most recent month-end, please call 1-866-941-4482. | | October 30, 2019 Dear Shareholder, Over the period under review, October 1, 2018 to September 30, 2019, the IVA Worldwide Class A (no load) was down -2.48% while the IVA International Class A (no load) was down -4.51%. The MSCI All Country World Index (“ACWI”) over the same period was up 1.38%, while the MSCI ACWI (ex-U.S.) was down -1.23%. The period was marked by a severe correction in global markets, including the U.S., during the last calendar quarter of 2018, followed by a strong recovery in the first quarter of 2019. The recovery has continued since, with temporary declines in May and August of 2019. The Central Banks once again came to the rescue, led by the U.S. Federal Reserve, while worries related to the trade war with China and Brexit have subsided somewhat. In the meantime, the global economy has been slowing down, inflationary pressures are still muted and corporate earnings are holding up well worldwide. We are disappointed by the performance of your Funds, both down modestly in absolute terms and also trailing their benchmarks. Yet, we must draw your attention to the fact that markets have been even more bifurcated than during the last few years, with value stocks lagging growth stocks and smaller and mid cap value stocks lagging even more, not to mention international markets trailing the U.S. markets in general. For the one year period under review the MSCI ACWI Value Index was up 0.01% while the MSCI ACWI Small+Mid Cap Value Index was down -3.59% and the MSCI ACWI (ex-U.S.) Value Index was down -4.51%, while the MSCI ACWI (ex-U.S.) Small+Mid Cap Value Index was down -5.21%. There are a few factors to explain that bifurcation: many value stocks tend to be more cyclical than growth stocks, so the global economic slowdown is hurting these value stocks disproportionately more. Also, value stocks have a larger portion of their business value being derived from cash flows in the medium term, while a lot more of the value of growth stocks is derived from expected cash flows in the distant future. As a result, growth stocks tend to benefit much more from lower interest rates than value stocks. Finally, over the past ten years, a much larger proportion of both growth and quality stocks have maintained their growth and quality status than in the past, helping these stocks perform remarkably well, while at the same time so many industries where one typically finds value stocks have been disrupted (retail, media, energy, automobile, e.g.), making many value stocks “value traps.” We believe many of these factors will prove to be temporary and that value will shine again. That may happen both in absolute and relative terms, should the global economy recover and interest rates go up, or in relative terms if the global economy sinks into a recession and policy makers then resort to new tools (debt monetization and larger fiscal deficits) that may result in stagflation and higher nominal interest rates. Thanks to the heavy volatility late last year, and some reasonable volatility this year, we have been able to add a few names in both funds, including Grupo México, SAB de CV, Series ‘B’ (Mexico), Inchcape Plc (U.K.), Sina Corp. (China), Sony Corp. (Japan), Wendel SA (France) and IPSOS (France); and for the IVA Worldwide Fund only, LKQ Corp. (U.S.) and CDK Global Inc. (U.S.). In the IVA International Fund only, a few new names added were Emaar Malls PJSC (U.A.E.), Loma Negra (Argentina) and Vicat (France). We were also able to exit many names in both Funds, for instance Toho (Japan), Robertet (France), HSBC Holdings Plc (U.K.) and various Intelsat bonds. In the IVA Worldwide Fund only, U.S. names that were eliminated included Amdocs Ltd., Adtalem Global Education Inc., Omnicom Group Inc., American Express Co., Tiffany & Co., Expeditors International of Washington Inc., Marsh & McLennan Cos., Inc. and DaVita Inc. Some names that we exited in the IVA International Fund only were As One Corp. (Japan), Totvs (Brazil), and Uranium Participation Corp. (Canada). |
| Letter from the Portfolio Managers | IVA Funds |
As a result, as of September 30, 2019, the IVA Worldwide Fund has 60.9% in equities* (compared to 56.3% a year prior) and 31.5% in cash (compared to 36.1% a year prior) while the IVA International Fund had 74.7% in equities* (compared to 72.5% a year prior) and 15.5% in cash (compared to 18.1% a year prior).
We have been able to reduce our cash levels by a modest amount (especially late December of 2018 when markets corrected sharply), yet we remain cautious. Valuation levels remain elevated and the economic outlook uncertain in many parts of the world. Many cyclical stocks are down quite substantially from their highs, yet many are in industries that are going through major disruptions. We will continue to focus on valuation for each individual security, with an even heavier emphasis on worst case scenarios than in the past, and only buy when we believe Mr. Market is giving us appropriate discounts.
We continue to hold some gold bullion in both Funds (3.5% in the IVA Worldwide Fund and 5.3% in the IVA International Fund). Those levels are actually lower than a year prior (5.3% and 6.6%, respectively), but that is because towards the end of September 2019, we had to reduce our gold bullion exposure in both funds and invest 1.8% and 1.9%, respectively, in three gold mining companies. We estimate the sensitivity (or leverage) of these mining shares to be slightly less than 3:1 to the price of gold (so a 2.0% allocation to mining shares would be equivalent to roughly 6.0% in gold bullion). We had to do that (as we had done during Q3 of 2011), due to the fact that according to IRS rules for mutual funds, investments in commodities, including gold, are deemed to generate “bad income” when sold at a gain and there is a limit as to how much “bad income” may be generated in any fiscal year. Our allocation to gold is due to our expectation that the price of gold could be inversely correlated to stocks and bonds going forward, hopefully providing an adequate hedge against falling equities in a recessionary environment. This is important to our continued goal of absolute returns and dampened volatility in the Net Asset Values of your Funds. We also believe that while nominal interest rates may rise going forward, real interest rates may remain negative for the foreseeable future, thus possibly helping the price of gold. Also possibly pushing the gold price higher would be a scenario where the U.S. dollar were to weaken against most other currencies, which may happen in a U.S. recession.
Management fees were lowered for both Funds as of June 3, 2019. They were reduced from 90 to 80 basis points, with a breakpoint at $5 billion above which fees drop to 75 basis points. There have been a lot of headwinds affecting value investing over the past ten years. We believe any reduction in fees directly benefits Fund shareholders and allows IVA to remain competitive in the face of very low interest rates and the advent of the ETF marketing fad.
Our analysts continue to scour the globe for value. We do not believe the extreme discrepancy in price between value and growth will last forever. In the meantime, we remain patient and focused on protecting your capital.
* Excludes gold mining shares
We appreciate your continued confidence and thank you for your support.

Charles de Vaulx Co-Chief Investment Officer and Portfolio Manager

Chuck de Lardemelle Co-Chief Investment Officer and Portfolio Manager
| Management’s Discussion of Fund Performance(unaudited) | IVA Funds |
IVA Worldwide Fund
The IVA Worldwide Fund Class A, at net asset value, returned -2.48% over the one-year period ended September 30, 2019 compared to the MSCI All Country World Index (Net) (the “Index”) return of 1.38% over the same period.
The Fund lagged the Index for the period due to poor results for several of our larger equities. Gold’s positive 22.7% return for the period and our allocation to cash helped dampen the impact from equities which were down -7.3% over the period, compared to those in the Index* which were up 1.3%. Our names in the United States and Ireland detracted -1.6% and -1.0% from performance, respectively. Switzerland, South Korea and the U.K. contributed a total of 1.1%. Our names in energy and health care detracted a total of -2.4%. Consumer staples, technology and materials were the only positive contributing equity sectors, adding a total of 0.9%.
The top five individual equity contributors to return this period were: Nestlé SA (Switzerland, consumer staples), Bank of America Corp. (U.S., financials), LKQ Corp. (U.S., consumer discretionary), Mastercard Inc., Class ‘A’ (U.S., technology), Goldman Sachs Group Inc. (U.S., financials). The top five individual equity detractors were: Cimarex Energy Co. (U.S., energy), AIB Group Plc (Ireland, financials), Schlumberger Ltd. (U.S., energy), Qurate Retail, Inc. Series ‘A’ (U.S., consumer discretionary), Astellas Pharma Inc. (Japan, health care).
Collectively, fixed income detracted -0.3%. Gold was up 22.7% and contributed 1.2%.
In an effort to neutralize part of our foreign exchange risk, we were partially hedged against several currencies over the period which contributed 0.2%. At the end of the period, our currency hedges were: 24% Australian dollar; 52% British pound, 10% euro; 25% Japanese yen; 50% South Korean won.
| Management’s Discussion of Fund Performance(unaudited) | IVA Funds |
IVA International Fund
The IVA International Fund Class A, at net asset value, returned -4.51% over the one-year period ended September 30, 2019 compared to the MSCI All Country World Index (ex-U.S.) (Net) (the “Index”) return of -1.23% over the same period.
The Fund lagged the Index for the period due to poor results for several of our larger equities. Gold’s positive 22.6% return for the period and our allocation to cash helped dampen the impact from equities which were down -7.5% over the period, compared to those in the Index* which were down -1.4%. Equity performance was hurt the most by our names in financials and health care, which together detracted -2.5%. Japan, China and South Korea detracted -2.9% while Switzerland, France and the U.K. contributed a total of 1.0%.
The top five individual equity contributors to return this period were: Nestlé SA (Switzerland, consumer staples), Asia Satellite Telecommunications Holdings Ltd. (Hong Kong, communication services), Millennium & Copthorne Hotels Plc (U.K., consumer discretionary), Sodexo SA (France, consumer discretionary), Toho Co., Ltd. (Japan, communication services). The top five individual equity detractors were: AIB Group Plc (Ireland, financials), Schlumberger Ltd. (U.S., energy), Royal Boskalis Westminster N.V. (Netherlands, industrials), Astellas Pharma Inc. (Japan, health care), Baidu Inc., ADR (China, communication services).
Collectively, fixed income detracted -0.5%. Gold was up 22.6% and contributed 1.4%.
In an effort to neutralize part of our foreign exchange risk, we were partially hedged against several currencies over the period which contributed 0.3%. At the end of the period, our currency hedges were: 31% Australian dollar; 59% British pound, 10% euro; 35% Japanese yen; 50% South Korean won.
Investment Risks: There are risks associated with investing in securities of foreign countries, such as erratic market conditions, economic and political instability and fluctuations in currency exchange rates. Value-based investments are subject to the risk that the broad market may not recognize their intrinsic value.
*The Index equity return excludes gold mining stocks.
| IVA Worldwide Fund | IVA Funds |
| Performance (unaudited) | As of September 30, 2019 |
| Average Annual Total Returns as of September 30, 2019 | | One Year | | Five Year | | Ten Year | | Since Inception(a) |
| Class A | | -2.48% | | 2.73% | | 5.55% | | 7.21% |
| Class A (with a 5% maximum initial sales charge) | | -7.36% | | 1.68% | | 5.01% | | 6.72% |
| Class C | | -3.18% | | 1.96% | | 4.75% | | 6.41% |
| Class I | | -2.21% | | 2.99% | | 5.81% | | 7.48% |
| MSCI All Country World Index (Net)(b) | | 1.38% | | 6.65% | | 8.35% | | 7.55% |
| Consumer Price Index(c) | | 1.73% | | 1.53% | | 1.73% | | 1.45% |
| Growth of a $10,000 Initial Investment |
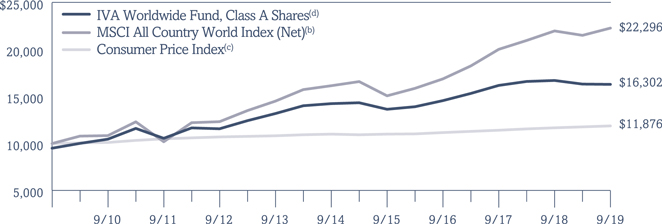
| (a) | The Fund commenced investment operations on October 1, 2008. |
| (b) | The MSCI All Country World Index (Net) is an unmanaged, free float-adjusted market capitalization weighted index composed of stocks of companies located in countries throughout the world. It is designed to measure equity market performance in global developed and emerging markets. The index includes reinvestment of dividends, net of foreign withholding taxes. Please note that an investor cannot invest directly in an index. |
| (c) | The Consumer Price Index examines the weighted average of prices of a basket of consumer goods and services, such as transportation, food and medical care. Please note that an investor cannot invest directly in an index. |
| (d) | Hypothetical illustration of $10,000 invested in Class A shares on October 1, 2009, assuming the deduction of the maximum initial sales charge of 5% at the time of investment for Class A shares and the reinvestment of all distributions, including returns of capital, if any, at net asset value through September 30, 2019. The performance of the Fund’s other classes may be greater or less than the Class A shares’ performance indicated on this chart depending on whether greater or lesser sales charges and fees were incurred by shareholders investing in the other classes. |
Past performance is no guarantee of future results.The performance data quoted represents past performance and current returns may be lower or higher. The investment return and principal value will fluctuate so that an investor’s shares, when redeemed, may be worth more or less than the original cost. The returns do not reflect the deduction of taxes that a shareholder would pay on Fund distributions or the redemption of Fund shares. To obtain performance information current to the most recent month-end, please call 866-941-4482.
The maximum sales charge for Class A shares is 5.00%. Class C shares may include a 1.00% contingent deferred sales charge for the first year only. Amounts redeemed within 30 days of purchase are subject to a 2.00% fee. The expense ratios for the Fund are as follows: 1.15% (Class A shares); 1.90% (Class C shares); and 0.90% (Class I shares). These expense ratios are as stated in the most recent Prospectus dated January 31, 2019 with supplements dated May 28, 2019 and August 1, 2019. More recent expense ratios can be found in the Financial Highlights section of this Annual Report.
| IVA Worldwide Fund | IVA Funds |
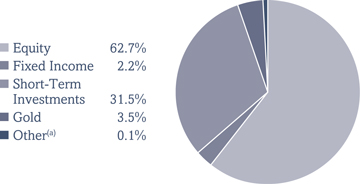
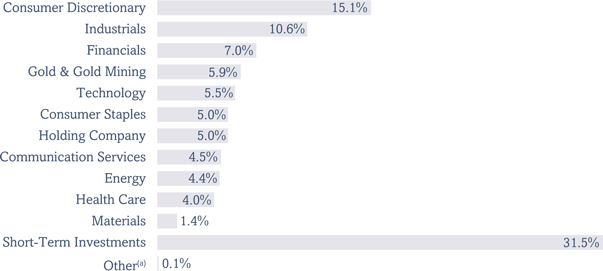
| Portfolio Composition (unaudited) | As of September 30, 2019 |
| Asset Allocation(As a Percent of Total Net Assets) |
| Sector Allocation(As a Percent of Total Net Assets) |
| Top 10 Positions(As a Percent of Total Net Assets)(b) |
| Berkshire Hathaway Inc., Class ‘A’, Class ‘B’ | 4.5% |
| Gold Bullion | 3.5% |
| Samsung Electronics Co., Ltd. | 2.5% |
| Bank of America Corp. | 2.4% |
| Bayerische Motoren Werke AG | 2.4% |
| Compagnie Financière Richemont SA | 2.4% |
| Bureau Veritas SA | 2.3% |
| Astellas Pharma Inc. | 2.3% |
| Nestlé SA | 2.2% |
| AIB Group Plc | 2.1% |
Top 10 positions represent 26.6% of total net assets.
| (a) | Other represents unrealized gains and losses on forward foreign currency contracts and other assets and liabilities. |
| (b) | Short-Term Investments are not included. |
| IVA Worldwide Fund | IVA Funds |
| Schedule of Investments |
| September 30, 2019 |
| | | SHARES | | | DESCRIPTION | | FAIR VALUE | |
| | | | | | | | | |
| COMMON STOCKS – 62.7% | | | | | | | | | | |
| | | | | | | | | | | |
| Australia|0.4% | | | | | | | | | | |
| | | | 1,005,349 | | | Newcrest Mining Ltd. | | $ | 23,579,974 | |
| | | | | | | | | | | |
| Bermuda|0.5% | | | | | | | | | | |
| | | | 1,025,000 | | | Jardine Strategic Holdings Ltd. | | | 30,627,000 | |
| | | �� | | | | | | | | |
| Canada|0.5% | | | | | | | | | | |
| | | | 1,697,907 | | | Barrick Gold Corp. | | | 29,424,728 | |
| | | | | | | | | | | |
| China|0.9% | | | | | | | | | | |
| | | | 122,607 | | | Baidu Inc., ADR (a) | | | 12,599,095 | |
| | | | 23,260,640 | | | Clear Media Ltd. | | | 11,574,377 | |
| | | | 451,331 | | | SINA Corp. (a) | | | 17,687,662 | |
| | | | 43,514,000 | | | Springland International Holdings Ltd. | | | 8,522,142 | |
| | | | | | | | | | 50,383,276 | |
| | | | | | | | | | | |
| France|6.6% | | | | | | | | | | |
| | | | 136,850 | | | Alten SA | | | 15,631,937 | |
| | | | 15,977,790 | | | Bolloré SA | | | 66,211,820 | |
| | | | 5,520,293 | | | Bureau Veritas SA | | | 132,972,279 | |
| | | | 1,453,727 | | | Criteo SA, ADR (a) | | | 27,170,158 | |
| | | | 29,933 | | | Financière de l’Odet SA | | | 26,752,896 | |
| | | | 90,979 | | | Ipsos SA | | | 2,593,102 | |
| | | | 997,464 | | | Sodexo SA | | | 111,980,180 | |
| | | | | | | | | | 383,312,372 | |
| | | | | | | | | | | |
| Germany|2.4% | | | | | | | | | | |
| | | | 2,012,624 | | | Bayerische Motoren Werke AG | | | 141,688,512 | |
| | | | | | | | | | | |
| Hong Kong|0.2% | | | | | | | | | | |
| | | | 8,479,658 | | | Hongkong & Shanghai Hotels Ltd. | | | 8,254,946 | |
| | | | | | | | | | | |
| Ireland|2.1% | | | | | | | | | | |
| | | | 41,530,732 | | | AIB Group Plc | | | 123,305,769 | |
| | | | | | | | | | | |
| Japan|7.6% | | | | | | | | | | |
| | | | 472,500 | | | ASKUL Corp. | | | 12,755,861 | |
| | | | 9,315,300 | | | Astellas Pharma Inc. | | | 132,546,488 | |
| | | | 524,200 | | | Benesse Holdings Inc. | | | 13,603,748 | |
| | | | 1,866,800 | | | F@N Communications Inc. | | | 9,288,679 | |
| | | | 101,100 | | | FANUC Corp. | | | 19,018,488 | |
| | | | 272,100 | | | Icom Inc. | | | 5,584,184 | |
| | | | 204,400 | | | Medikit Co., Ltd. | | | 13,081,600 | |
| | | | 3,639,600 | | | Miraca Holdings Inc. (b) | | | 82,873,482 | |
| 10 | See Notes to Financial Statements. | |
| IVA Worldwide Fund | IVA Funds |
| Schedule of Investments |
| September 30, 2019 |
| | | SHARES | | | DESCRIPTION | | FAIR VALUE | |
| | | | | | | | | |
| Japan|7.6% (continued) | | | | | | | | | | |
| | | | 115,100 | | | Nitto Kohki Co., Ltd. | | $ | 2,249,307 | |
| | | | 243,400 | | | Okinawa Cellular Telephone Co. | | | 7,980,143 | |
| | | | 1,900,000 | | | Rohto Pharmaceutical Co., Ltd. | | | 51,803,006 | |
| | | | 249,600 | | | Seven & i Holdings Co., Ltd. | | | 9,538,471 | |
| | | | 347,400 | | | Sony Corp. | | | 20,392,581 | |
| | | | 276,100 | | | Techno Medica Co., Ltd. | | | 5,939,501 | |
| | | | 19,723,100 | | | Yahoo Japan Corp. | | | 55,452,693 | |
| | | | | | | | | | 442,108,232 | |
| | | | | | | | | | | |
| Malaysia|0.2% | | | | | | | | | | |
| | | | 18,061,800 | | | Genting Malaysia Berhad | | | 13,070,756 | |
| | | | | | | | | | | |
| Mexico|1.3% | | | | | | | | | | |
| | | | 21,384,055 | | | Grupo México SAB de CV, Series ‘B’ | | | 50,138,858 | |
| | | | 2,352,273 | | | Promotora y Operadora de Infraestructura SAB de CV, Series ‘A’ | | | 21,035,047 | |
| | | | 481,593 | | | Promotora y Operadora de Infraestructura SAB de CV, Series ‘L’ | | | 2,830,891 | |
| | | | | | | | | | 74,004,796 | |
| | | | | | | | | | | |
| Netherlands|2.6% | | | | | | | | | | |
| | | | 731,610 | | | Airbus SE | | | 95,052,293 | |
| | | | 2,803,122 | | | Royal Boskalis Westminster N.V. | | | 58,477,748 | |
| | | | | | | | | | 153,530,041 | |
| | | | | | | | | | | |
| Singapore|0.5% | | | | | | | | | | |
| | | | 25,738,299 | | | First Resources Ltd. | | | 29,795,086 | |
| | | | | | | | | | | |
| South Africa|0.2% | | | | | | | | | | |
| | | | 2,986,316 | | | Net 1 U.E.P.S. Technologies Inc. (a)(b) | | | 10,661,148 | |
| | | | | | | | | | | |
| South Korea|6.8% | | | | | | | | | | |
| | | | 619,381 | | | Daou Technology Inc. | | | 10,304,462 | |
| | | | 218,855 | | | Hyundai Mobis Co., Ltd. | | | 46,107,478 | |
| | | | 612,884 | | | Hyundai Motor Co. | | | 68,658,994 | |
| | | | 3,005,388 | | | Kangwon Land Inc. | | | 74,245,885 | |
| | | | 88,121 | | | KIWOOM Securities Co., Ltd. | | | 5,002,229 | |
| | | | 579,580 | | | KT&G Corp. | | | 51,118,747 | |
| | | | 3,488,899 | | | Samsung Electronics Co., Ltd. | | | 143,067,756 | |
| | | | | | | | | | 398,505,551 | |
| | | | | | | | | | | |
| Switzerland|5.3% | | | | | | | | | | |
| | | | 1,926,744 | | | Compagnie Financière Richemont SA | | | 141,351,832 | |
| | | | 1,165,009 | | | Nestlé SA | | | 126,393,642 | |
| | | | 3,729,417 | | | UBS Group AG | | | 42,336,852 | |
| | | | | | | | | | 310,082,326 | |
| | | | | | | | | | | |
| Thailand|0.1% | | | | | | | | | | |
| | | | 21,373,200 | | | Thaicom PCL (a) | | | 3,312,374 | |
| | See Notes to Financial Statements. | 11 |
| IVA Worldwide Fund | IVA Funds |
| Schedule of Investments |
| September 30, 2019 |
| | | SHARES | | | DESCRIPTION | | FAIR VALUE | |
| | | | | | | | | |
| United Kingdom|3.3% | | | | | | | | | | |
| | | | 2,726,340 | | | Antofagasta Plc | | $ | 30,136,008 | |
| | | | 639,557 | | | Inchcape Plc | | | 4,965,908 | |
| | | | 8,535,810 | | | Millennium & Copthorne Hotels Plc | | | 72,311,935 | |
| | | | 1,424,942 | | | Newmont Goldcorp Corp. | | | 54,033,801 | |
| | | | 2,385,494 | | | WPP Plc | | | 29,858,785 | |
| | | | | | | | | | 191,306,437 | |
| | | | | | | | | | | |
| United States|20.9% | | | | | | | | | | |
| | | | 869,668 | | | Acuity Brands Inc. | | | 117,222,550 | |
| | | | 9,394 | | | Alphabet Inc., Class ‘A’ (a) | | | 11,471,389 | |
| | | | 29,647 | | | Alphabet Inc., Class ‘C’ (a) | | | 36,139,693 | |
| | | | 1,297,449 | | | Astronics Corp. (a)(b) | | | 38,119,052 | |
| | | | 4,884,262 | | | Bank of America Corp. | | | 142,473,923 | |
| | | | 605 | | | Berkshire Hathaway Inc., Class ‘A’ (a) | | | 188,658,360 | |
| | | | 344,474 | | | Berkshire Hathaway Inc., Class ‘B’ (a) | | | 71,657,481 | |
| | | | 478,748 | | | CDK Global Inc. | | | 23,022,991 | |
| | | | 1,652,156 | | | Cimarex Energy Co. | | | 79,204,359 | |
| | | | 400,248 | | | Goldman Sachs Group Inc. | | | 82,943,393 | |
| | | | 1,375,025 | | | Gruma SAB de CV, Series ‘B’ | | | 14,075,646 | |
| | | | 3,124,925 | | | LKQ Corp. (a) | | | 98,278,891 | |
| | | | 325,469 | | | Mastercard Inc., Class ‘A’ | | | 88,387,616 | |
| | | | 2,671,477 | | | News Corp., Class ‘A’ | | | 37,186,960 | |
| | | | 660,424 | | | Oracle Corp. | | | 36,343,133 | |
| | | | 3,269,123 | | | Qurate Retail, Inc., Series ‘A’ (a) | | | 33,721,004 | |
| | | | 2,378,130 | | | Schlumberger Ltd. | | | 81,260,702 | |
| | | | 301,870 | | | United Technologies Corp. | | | 41,211,292 | |
| | | | | | | | | | 1,221,378,435 | |
| | | | | | | | | | | |
| Uruguay|0.3% | | | | | | | | | | |
| | | | 2,715,615 | | | Arcos Dorados Holdings Inc., Class ‘A’ | | | 18,248,933 | |
| | | | | | | TOTAL COMMON STOCKS | | | | |
| | | | | | | (Cost — $3,187,144,128) | | | 3,656,580,692 | |
| | | | | | | | | | | |
| | | | PRINCIPAL | | | | | | | |
| | | | AMOUNT | | | | | | | |
| CORPORATE NOTES & BONDS – 2.1% | | | | | | | |
| | | | | | | | | | | |
| South Africa|0.6% | | | | | | | | | | |
| | | | | | | Gold Fields Orogen Holding (BVI) Ltd., | | | | |
| | | | 35,068,000 | USD | | 4.875% due 10/7/2020 (c) | | | 35,744,111 | |
| | | | | | | | | | | |
| United Kingdom|0.9% | | | | | | | | | | |
| | | | | | | Rowan Cos., Inc.: | | | | |
| | | | 16,650,000 | USD | | 4.875% due 6/1/2022 | | | 12,654,000 | |
| | | | 15,698,000 | USD | | 4.75% due 1/15/2024 | | | 9,379,555 | |
| | | | 33,535,000 | USD | | 7.375% due 6/15/2025 | | | 19,953,325 | |
| 12 | See Notes to Financial Statements. | |
| IVA Worldwide Fund | IVA Funds |
| Schedule of Investments |
| September 30, 2019 |
| | | PRINCIPAL | | | | | | |
| | | AMOUNT | | | DESCRIPTION | | FAIR VALUE | |
| | | | | | | | | |
| United Kingdom|0.9% (continued) | | | | | | | |
| | | | | | | Valaris Plc: | | | | |
| | | | 7,103,000 | USD | | 8% due 1/31/2024 | | $ | 4,721,364 | |
| | | | 8,730,000 | USD | | 4.5% due 10/1/2024 | | | 4,888,800 | |
| | | | 5,711,000 | USD | | 5.2% due 3/15/2025 | | | 3,141,050 | |
| | | | 3,358,000 | USD | | 7.75% due 2/1/2026 | | | 1,813,992 | |
| | | | | | | | | | 56,552,086 | |
| | | | | | | | | | | |
| United States|0.6% | | | | | | | | | | |
| | | | | | | Era Group Inc., | | | | |
| | | | 19,963,000 | USD | | 7.75% due 12/15/2022 | | | 20,362,260 | |
| | | | | | | Tidewater Inc., | | | | |
| | | | 13,500,753 | USD | | 8% due 8/1/2022 | | | 13,703,264 | |
| | | | | | | | | | 34,065,524 | |
| | | | | | | TOTAL CORPORATE NOTES & BONDS | | | | |
| | | | | | | (Cost — $147,478,383) | | | 126,361,721 | |
| | | | | | | | | | | |
| CONVERTIBLE BONDS – 0.1% | | | | | | | |
| | | | | | | | | | | |
| United Kingdom|0.1% | | | | | | | | | | |
| | | | | | | Ensco Jersey Finance Ltd., | | | | |
| | | | 4,587,000 | USD | | 3% due 1/31/2024 | | | 3,119,160 | |
| | | | | | | TOTAL CONVERTIBLE BONDS | | | | |
| | | | | | | (Cost — $4,867,093) | | | 3,119,160 | |
| | | | | | | | | | | |
| | | | OUNCES | | | | | | | |
| COMMODITIES – 3.5% | | | | | | | |
| | | | | | | | | | | |
| | | | 139,412 | | | Gold Bullion (a) | | | 205,430,962 | |
| | | | | | | TOTAL COMMODITIES | | | | |
| | | | | | | (Cost — $220,519,521) | | | 205,430,962 | |
| | | | | | | | | | | |
| | | | PRINCIPAL | | | | | | | |
| | | | AMOUNT | | | | | | | |
| SHORT-TERM INVESTMENTS – 31.5% | | | | | | | |
| | | | | | | | | | | |
| Commercial Paper|31.4% | | | | | | | | | | |
| | | | | | | Apple Inc.: | | | | |
| | | | 50,000,000 | USD | | 1.9% due 10/25/2019 (c) | | | 49,929,236 | |
| | | | 50,000,000 | USD | | 1.9% due 10/28/2019 (c) | | | 49,921,639 | |
| | | | 50,000,000 | USD | | 1.89% due 11/8/2019 (c) | | | 49,894,754 | |
| | | | | | | BASF SE, | | | | |
| | | | 20,000,000 | USD | | 2.0% due 10/21/2019 (c) | | | 19,975,640 | |
| | | | | | | Chevron Corp., | | | | |
| | | | 100,000,000 | USD | | 2.15% due 10/3/2019 (c) | | | 99,981,500 | |
| | | | | | | Coca-Cola Co.: | | | | |
| | | | 10,000,000 | USD | | 1.99% due 11/6/2019 (c) | | | 9,979,013 | |
| | | | 40,000,000 | USD | | 2.0% due 11/6/2019 (c) | | | 39,916,051 | |
| | | | | | | Consolidated Edison Co. Inc.: | | | | |
| | | | 15,000,000 | USD | | 2.15% due 10/7/2019 (c) | | | 14,992,825 | |
| | | | 35,000,000 | USD | | 2.19% due 10/7/2019 (c) | | | 34,983,258 | |
| | | | 50,000,000 | USD | | 2.15% due 10/8/2019 (c) | | | 49,972,778 | |
| | See Notes to Financial Statements. | 13 |
| IVA Worldwide Fund | IVA Funds |
| Schedule of Investments |
| September 30, 2019 |
| | | PRINCIPAL | | | | | | |
| | | AMOUNT | | | DESCRIPTION | | FAIR VALUE | |
| | | | | | | | | |
| Commercial Paper|31.4% (continued) | | | | | | | | | | |
| | | | | | | Dover Corp., | | | | |
| | | | 50,000,000 | USD | | 2.21% due 10/1/2019 (c) | | $ | 49,996,643 | |
| | | | | | | Duke Energy Corp., | | | | |
| | | | 50,000,000 | USD | | 2.13% due 10/2/2019 (c) | | | 49,993,316 | |
| | | | | | | Eli Lilly & Co., | | | | |
| | | | 50,000,000 | USD | | 2.0% due 10/23/2019 (c) | | | 49,934,354 | |
| | | | | | | Engie SA, | | | | |
| | | | 100,000,000 | USD | | 2.1% due 10/21/2019 (c) | | | 99,876,450 | |
| | | | | | | Exxon Mobil Corp.: | | | | |
| | | | 50,000,000 | USD | | 2.03% due 10/8/2019 | | | 49,976,100 | |
| | | | 50,000,000 | USD | | 1.96% due 11/1/2019 | | | 49,910,622 | |
| | | | 50,000,000 | USD | | 1.96% due 11/4/2019 | | | 49,902,195 | |
| | | | | | | Henkel Corp., | | | | |
| | | | 50,000,000 | USD | | 1.99% due 10/21/2019 (c) | | | 49,939,684 | |
| | | | | | | Hershey Co., | | | | |
| | | | 50,000,000 | USD | | 2.09% due 10/1/2019 (c) | | | 49,996,840 | |
| | | | | | | Intel Corp., | | | | |
| | | | 50,000,000 | USD | | 2.0% due 10/4/2019 (c) | | | 49,987,678 | |
| | | | | | | LVMH Moët Hennessy Louis Vuitton SE: | | | | |
| | | | 100,000,000 | USD | | 1.98% due 10/17/2019 (c) | | | 99,900,550 | |
| | | | 90,000,000 | USD | | 1.93% due 10/24/2019 (c) | | | 89,876,100 | |
| | | | | | | Merck & Co. Inc.: | | | | |
| | | | 50,000,000 | USD | | 1.99% due 10/3/2019 (c) | | | 49,990,833 | |
| | | | 50,000,000 | USD | | 1.90% due 11/1/2019 (c) | | | 49,910,356 | |
| | | | | | | Nestlé Capital Corp.: | | | | |
| | | | 50,000,000 | USD | | 2.0% due 10/2/2019 (c) | | | 49,993,891 | |
| | | | 100,000,000 | USD | | 1.98% due 10/22/2019 (c) | | | 99,877,411 | |
| | | | | | | Novartis Finance Corp., | | | | |
| | | | 50,000,000 | USD | | 2% due 10/18/2019 (c) | | | 49,948,150 | |
| | | | | | | Schlumberger Ltd., | | | | |
| | | | 50,000,000 | USD | | 2.12% due 10/1/2019 (c) | | | 49,996,451 | |
| | | | | | | Total Fina Elf Capital SA, | | | | |
| | | | 65,100,000 | | | 1.80% due 10/1/2019 (c) | | | 65,095,964 | |
| | | | | | | United Healthcare Co.: | | | | |
| | | | 50,000,000 | USD | | 2.15% due 10/4/2019 (c) | | | 49,988,116 | |
| | | | 50,000,000 | USD | | 2.14% due 10/10/2019 (c) | | | 49,969,986 | |
| | | | | | | United Parcel Service Inc., | | | | |
| | | | 7,400,000 | USD | | 1.75% due 10/1/2019 (c) | | | 7,399,639 | |
| | | | | | | Walmart Inc.: | | | | |
| | | | 50,000,000 | USD | | 1.92% due 10/7/2019 (c) | | | 49,978,806 | |
| | | | 50,000,000 | USD | | 1.92% due 10/8/2019 (c) | | | 49,975,922 | |
| | | | | | | Walt Disney Co., | | | | |
| | | | 50,000,000 | USD | | 2.03% due 10/9/2019 (c) | | | 49,972,725 | |
| | | | | | | | | | 1,830,935,476 | |
| 14 | See Notes to Financial Statements. | |
| IVA Worldwide Fund | IVA Funds |
| Schedule of Investments |
| September 30, 2019 |
| | | PRINCIPAL | | | | | | |
| | | AMOUNT | | | DESCRIPTION | | FAIR VALUE | |
| | | | | | | | | |
| Treasury Bills|0.1% | | | | | | | | | | |
| | | | 4,000,000 | USD | | U.S. Treasury Bill, due 12/5/2019 (d) | | $ | 3,987,172 | |
| | | | | | | TOTAL SHORT-TERM INVESTMENTS | | | | |
| | | | | | | (Cost — $1,835,093,410) | | | 1,834,922,648 | |
| | | | | | | TOTAL INVESTMENTS — 99.9% | | | | |
| | | | | | | (Cost — $5,395,102,535) | | | 5,826,415,183 | |
| | | | | | | Other Assets In Excess of | | | | |
| | | | | | | Liabilities — 0.1% | | | 3,042,838 | |
| | | | | | | TOTAL NET ASSETS — 100.0% | | $ | 5,829,458,021 | |
| |
| The IVA Worldwide Fund had the following open forward foreign currency contracts at September 30, 2019: |
| |
| | | | | | | | | | | | | | | NET | |
| | | | | SETTLEMENT | | | | | | | USD VALUE AT | | | UNREALIZED | |
| FOREIGN | | | | DATES | | LOCAL CURRENCY | | USD | | | SEPTEMBER 30, | | | APPRECIATION/ | |
| CURRENCY | | COUNTERPARTY | | THROUGH | | AMOUNT | | EQUIVALENT | | | 2019 | | | (DEPRECIATION) | |
| Contracts to Sell: | | | | | | | | | | | | | | | | |
| | | State Street | | | | | | | | | | | | | | | | |
| Australian | | Bank & | | | | | | | | | | | | | | | | |
| dollar | | Trust Co. | | 12/09/2019 | | AUD21,916,000 | | $ | 14,939,981 | | | $ | 14,824,421 | | | $ | 115,560 | |
| | | State Street | | | | | | | | | | | | | | | | |
| | | Bank & | | | | | | | | | | | | | | | | |
| British pound | | Trust Co. | | 12/09/2019 | | GBP 58,292,000 | | | 71,338,960 | | | | 71,867,904 | | | | (528,944 | ) |
| | | State Street | | | | | | | | | | | | | | | | |
| | | Bank & | | | | | | | | | | | | | | | | |
| euro | | Trust Co. | | 12/09/2019 | | EUR 70,518,000 | | | 78,337,036 | | | | 77,254,041 | | | | 1,082,995 | |
| | | State Street | | | | | | | | | | | | | | | | |
| | | Bank & | | | | | | | | | | | | | | | | |
| Japanese yen | | Trust Co. | | 12/09/2019 | | JPY12,103,500,000 | | | 114,552,835 | | | | 112,456,357 | | | | 2,096,478 | |
| Net Unrealized Appreciation on Open Forward Foreign Currency Contracts | | | | | | | $ | 2,766,089 | |
| | | | | SETTLEMENT | | | | | | | USD VALUE AT | | | NET | |
| FOREIGN | | | | DATES | | LOCAL CURRENCY | | USD | | | SEPTEMBER 30, | | | UNREALIZED | |
| CURRENCY | | COUNTERPARTY | | THROUGH | | AMOUNT | | EQUIVALENT | | | 2019 | | | DEPRECIATION | |
| Contracts to Sell: | | | | | | | | | | | | | | | | |
| | | State Street | | | | | | | | | | | | | | | | |
| South Korean | | Bank & | | | | | | | | | | | | | | | | |
| won | | Trust Co. | | 10/08/2019 | | KRW 237,758,000,000 | | $ | 197,436,986 | | | $ | 198,448,357 | | | $ | (1,011,371 | ) |
| Net Unrealized Depreciation on Open Forward Foreign Currency Contracts | | | | | | | $ | (1,011,371 | ) |
| Abbreviations used in this schedule: |
| ADR | — American Depositary Receipt |
| USD | — United States dollar |
| | See Notes to Financial Statements. | 15 |
| IVA Worldwide Fund | IVA Funds |
| Schedule of Investments |
| September 30, 2019 |
| (a) | Non-income producing investment. |
| (b) | Issuer of the security is an affiliate of the IVA Worldwide Fund as defined by the Investment Company Act of 1940. An affiliate is deemed as a company in which the IVA Worldwide Fund indirectly or directly has ownership of at least 5% of the company’s outstanding voting securities. See Schedule of Affiliates below for additional information. |
| | |
| | | SHARES | | | | | | | | | SHARES | | | FAIR | | | | | | | | | | |
| | | HELD AT | | | | | | | | | HELD AT | | | VALUE AT | | | | | | CHANGE IN | | | | |
| | | SEPTEMBER | | | SHARE | | | SHARE | | | SEPTEMBER | | | SEPTEMBER | | | REALIZED | | | UNREALIZED | | | DIVIDEND | |
| SECURITY | | 30, 2018 | | | ADDITIONS | | | REDUCTIONS | | | 30, 2019 | | | 30, 2019 | | | GAIN/(LOSS) | | | DEPRECIATION | | | INCOME* | |
| Astronics | | | | | | | | | | | | | | | | | | | | | | | | | | | | | | | | |
| Corp.** | | | 257,558 | | | | 1,202,363 | | | | 162,472 | | | | 1,297,449 | | | $ | 38,119,052 | | | $ | 672,541 | | | $ | (2,296,948 | ) | | | — | |
| Miraca | | | | | | | | | | | | | | | | | | | | | | | | | | | | | | | | |
| Holdings | | | | | | | | | | | | | | | | | | | | | | | | | | | | | | | | |
| Inc. ** | | | 2,133,000 | | | | 1,981,800 | | | | 475,200 | | | | 3,639,600 | | | | 82,873,482 | | | | (2,871,044 | ) | | | (5,875,016 | ) | | $ | 4,388,392 | |
| Net 1 U.E.P.S. | | | | | | | | | | | | | | | | | | | | | | | | | | | | | | | | |
| Technologies | | | | | | | | | | | | | | | | | | | | | | | | | | | | | | | | |
| Inc. | | | 3,290,360 | | | | — | | | | 304,044 | | | | 2,986,316 | | | | 10,661,148 | | | | (1,808,387 | ) | | | (12,770,845 | ) | | | — | |
| Total | | | | | | | | | | | | | | | | | | $ | 131,653,682 | | | $ | (4,006,890 | ) | | $ | (20,942,809 | ) | | $ | 4,388,392 | |
| * | Dividend income is gross of withholding taxes. |
| ** | Non-affiliated at September 30, 2018. |
| (c) | Security is exempt from registration under Rule 144A or Section 4(2) of the Securities Act of 1933 (the “1933 Act”). Any resale of these securities must generally be effected through a sale that is registered under the 1933 Act or otherwise exempted from such registration requirements. |
| (d) | This security is held at the custodian as collateral for forward foreign currency contracts sold. As of September 30, 2019, portfolio securities valued at $3,987,172 were segregated, of which $1,011,371 is used to cover collateral requirements. |
| | |
| 16 | See Notes to Financial Statements. | |

| IVA International Fund | IVA Funds |
| Performance (unaudited) | As of September 30, 2019 |
| Average Annual Total Returns as of September 30, 2019 | | One Year | | Five Year | | Ten Year | | Since Inception(a) |
| Class A | | -4.51% | | 1.83% | | 5.15% | | 6.58% |
| Class A (with a 5% maximum initial sales charge) | | -9.30% | | 0.79% | | 4.61% | | 6.08% |
| Class C | | -5.19% | | 1.07% | | 4.35% | | 5.78% |
| Class I | | -4.25% | | 2.09% | | 5.41% | | 6.85% |
| MSCI All Country World (ex-U.S.) Index (Net)(b) | | -1.23% | | 2.90% | | 4.45% | | 4.59% |
| Consumer Price Index(c) | | 1.73% | | 1.53% | | 1.73% | | 1.45% |
| Growth of a $10,000 Initial Investment |
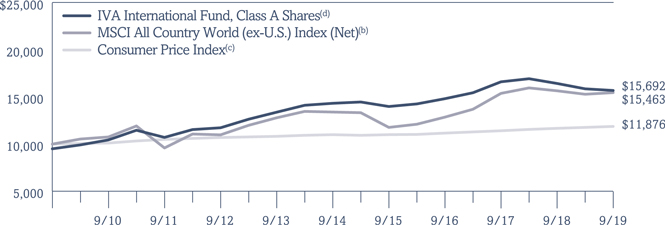
| (a) | The Fund commenced investment operations on October 1, 2008. |
| (b) | The MSCI All Country World (ex-U.S.) Index (Net) is an unmanaged, free float-adjusted, market capitalization weighted index composed of stocks of companies located in countries throughout the world, excluding the United States. It is designed to measure equity market performance in global developed and emerging markets outside the United States. The index includes reinvestment of dividends, net of foreign withholding taxes. Please note that an investor cannot invest directly in an index. |
| (c) | The Consumer Price Index examines the weighted average of prices of a basket of consumer goods and services, such as transportation, food and medical care. Please note that an investor cannot invest directly in an index. |
| (d) | Hypothetical illustration of $10,000 invested in Class A shares on October 1, 2009, assuming the deduction of the maximum initial sales charge of 5% at the time of investment for Class A shares and the reinvestment of all distributions, including returns of capital, if any, at net asset value through September 30, 2019. The performance of the Fund’s other classes may be greater or less than the Class A shares’ performance indicated on this chart depending on whether greater or lesser sales charges and fees were incurred by shareholders investing in the other classes. |
Past performance is no guarantee of future results.The performance data quoted represents past performance and current returns may be lower or higher. The investment return and principal value will fluctuate so that an investor’s shares, when redeemed, may be worth more or less than the original cost. The returns do not reflect the deduction of taxes that a shareholder would pay on Fund distributions or the redemption of Fund shares. To obtain performance information current to the most recent month-end, please call 866-941-4482.
The maximum sales charge for Class A shares is 5.00%. Class C shares may include a 1.00% contingent deferred sales charge for the first year only. Amounts redeemed within 30 days of purchase are subject to a 2.00% fee. The expense ratios for the Fund are as follows: 1.16% (Class A shares); 1.91% (Class C shares); and 0.91% (Class I shares). These expense ratios are as stated in the most recent Prospectus dated January 31, 2019 with supplements dated May 28, 2019 and August 1, 2019. More recent expense ratios can be found in the Financial Highlights section of this Annual Report.
| IVA International Fund | IVA Funds |
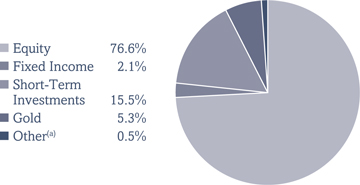
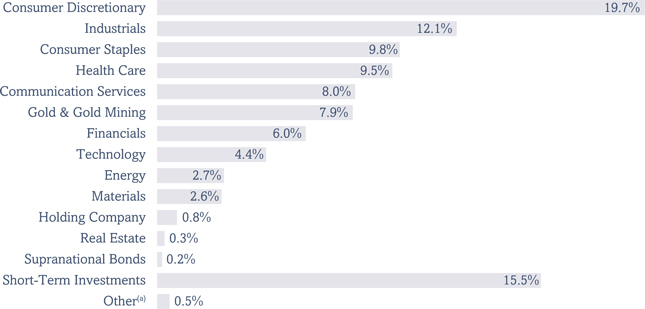
| Portfolio Composition (unaudited) | As of September 30, 2019 |
| Asset Allocation(As a Percent of Total Net Assets) |
| Sector Allocation(As a Percent of Total Net Assets) |
| Top 10 Positions(As a Percent of Total Net Assets)(b) |
| Gold Bullion | | | 5.3 | % |
| Astellas Pharma Inc. | | | 3.1 | % |
| Samsung Electronics Co., Ltd. | | | 3.1 | % |
| Bureau Veritas SA | | | 2.8 | % |
| Nestlé SA | | | 2.8 | % |
| Bayerische Motoren Werke AG | | | 2.7 | % |
| Compagnie Financière Richemont SA | | | 2.7 | % |
| AIB Group Plc | | | 2.4 | % |
| Sodexo SA | | | 2.4 | % |
| Haw Par Corp. Ltd. | | | 2.3 | % |
Top 10 positions represent 29.6% of total net assets.
| (a) | Other represents unrealized gains and losses on forward foreign currency contracts and other assets and liabilities. |
| (b) | Short-Term Investments are not included. |
| IVA International Fund | IVA Funds |
| Schedule of Investments |
| September 30, 2019 |
| | | SHARES | | | DESCRIPTION | | FAIR VALUE | |
| | | | | | | | | |
| COMMON STOCKS – 75.8% | | | | | | | | | | |
| | | | | | | | | | | |
| Argentina|0.4% | | | | | | | | | | |
| | | | 1,802,289 | | | Loma Negra Companía Industrial Argentina SA, ADR (a) | | $ | 10,363,162 | |
| | | | | | | | | | | |
| Australia|0.7% | | | | | | | | | | |
| | | | 482,308 | | | Newcrest Mining Ltd. | | | 11,312,301 | |
| | | | 26,404,995 | | | WPP AUNZ Ltd. | | | 9,178,358 | |
| | | | | | | | | | 20,490,659 | |
| | | | | | | | | | | |
| Belgium|0.4% | | | | | | | | | | |
| | | | 223,607 | | | D’Ieteren SA/NV | | | 12,125,096 | |
| | | | | | | | | | | |
| Bermuda|0.8% | | | | | | | | | | |
| | | | 788,126 | | | Jardine Strategic Holdings Ltd. | | | 23,549,205 | |
| | | | | | | | | | | |
| Canada|0.5% | | | | | | | | | | |
| | | | 814,599 | | | Barrick Gold Corp. | | | 14,117,001 | |
| | | | | | | | | | | |
| China|2.2% | | | | | | | | | | |
| | | | 120,025 | | | Baidu Inc., ADR (a) | | | 12,333,769 | |
| | | | 31,530,030 | | | Clear Media Ltd. (b) | | | 15,689,184 | |
| | | | 55,640,000 | | | Phoenix Media Investment (Holdings) Ltd. | | | 4,614,364 | |
| | | | 3,713,463 | | | Phoenix New Media Ltd., ADR (a)(b) | | | 9,506,465 | |
| | | | 289,769 | | | SINA Corp. (a) | | | 11,356,047 | |
| | | | 35,298,000 | | | Springland International Holdings Ltd. | | | 6,913,053 | |
| | | | | | | | | | 60,412,882 | |
| | | | | | | | | | | |
| France|9.4% | | | | | | | | | | |
| | | | 110,140 | | | Alten SA | | | 12,580,939 | |
| | | | 9,467,816 | | | Bolloré SA | | | 39,234,546 | |
| | | | 3,259,834 | | | Bureau Veritas SA | | | 78,522,563 | |
| | | | 1,027,123 | | | Criteo SA, ADR (a) | | | 19,196,929 | |
| | | | 26,101 | | | Financière de l’Odet SA | | | 23,328,011 | |
| | | | 1,534,140 | | | Groupe SFPI SA | | | 3,118,534 | |
| | | | 460,786 | | | Ipsos SA | | | 13,133,415 | |
| | | | 595,856 | | | Sodexo SA | | | 66,893,705 | |
| | | | 194,952 | | | Vicat SA | | | 8,457,022 | |
| | | | | | | | | | 264,465,664 | |
| | | | | | | | | | | |
| Germany|2.7% | | | | | | | | | | |
| | | | 1,090,180 | | | Bayerische Motoren Werke AG | | | 76,748,554 | |
| | | | | | | | | | | |
| Hong Kong|1.1% | | | | | | | | | | |
| | | | 54,595,000 | | | APT Satellite Holdings Ltd. (b) | | | 22,011,585 | |
| | | | 9,429,916 | | | Hongkong & Shanghai Hotels Ltd. | | | 9,180,022 | |
| | | | | | | | | | 31,191,607 | |
| | | | | | | | | | | |
| India|0.8% | | | | | | | | | | |
| | | | 321,185 | | | Bajaj Holdings and Investment Ltd. | | | 16,235,368 | |
| | | | 36,013,585 | | | South Indian Bank Ltd. | | | 5,513,673 | |
| | | | | | | | | | 21,749,041 | |
| 20 | See Notes to Financial Statements. | |
| IVA International Fund | IVA Funds |
| Schedule of Investments |
| September 30, 2019 |
| | | SHARES | | | DESCRIPTION | | FAIR VALUE | |
| | | | | | | | | |
| Indonesia|0.2% | | | | | | | | | | |
| | | | 254,753,700 | | | PT Bank Bukopin Tbk (a) | | $ | 4,809,721 | |
| | | | | | | | | | | |
| Ireland|2.4% | | | | | | | | | | |
| | | | 22,557,796 | | | AIB Group Plc | | | 66,974,653 | |
| | | | | | | | | | | |
| Japan|15.0% | | | | | | | | | | |
| | | | 430,270 | | | Arcland Sakamoto Co., Ltd. | | | 4,986,158 | |
| | | | 486,300 | | | ASKUL Corp. | | | 13,128,413 | |
| | | | 6,111,000 | | | Astellas Pharma Inc. | | | 86,952,818 | |
| | | | 65,200 | | | The Bank of Okinawa Ltd. | | | 2,041,175 | |
| | | | 393,800 | | | Benesse Holdings Inc. | | | 10,219,679 | |
| | | | 572,200 | | | Doshisha Co., Ltd. | | | 9,017,607 | |
| | | | 401,200 | | | EPS Holdings Inc. | | | 4,753,176 | |
| | | | 3,887,400 | | | F@N Communications Inc. (b) | | | 19,342,624 | |
| | | | 67,200 | | | FANUC Corp. | | | 12,641,369 | |
| | | | 1,558,400 | | | Fujitec Co., Ltd. | | | 20,062,824 | |
| | | | 1,049,100 | | | Hi-Lex Corp. | | | 16,271,359 | |
| | | | 297,200 | | | Icom Inc. | | | 6,099,300 | |
| | | | 95,600 | | | Medikit Co., Ltd. | | | 6,118,400 | |
| | | | 1,962,700 | | | Miraca Holdings Inc. | | | 44,690,566 | |
| | | | 199,400 | | | Nitto Kohki Co., Ltd. | | | 3,896,714 | |
| | | | 238,600 | | | Okinawa Cellular Telephone Co. | | | 7,822,770 | |
| | | | 494,700 | | | Retail Partners Co., Ltd. | | | 3,971,326 | |
| | | | 1,136,200 | | | Rohto Pharmaceutical Co., Ltd. | | | 30,978,197 | |
| | | | 381,700 | | | San-A Co., Ltd. | | | 16,821,276 | |
| | | | 10,295 | | | Secom Joshinetsu Co., Ltd. | | | 335,153 | |
| | | | 214,400 | | | Seven & i Holdings Co., Ltd. | | | 8,193,302 | |
| | | | 460,975 | | | Shingakukai Holdings Co., Ltd. | | | 2,229,733 | |
| | | | 277,650 | | | Shofu Inc. | | | 3,795,299 | |
| | | | 900 | | | SK Kaken Co., Ltd. | | | 363,329 | |
| | | | 207,100 | | | Sony Corp. | | | 12,156,890 | |
| | | | 319,600 | | | Sumitomo Seika Chemicals Co., Ltd. | | | 9,429,124 | |
| | | | 513,800 | | | Techno Medica Co., Ltd. (b) | | | 11,052,937 | |
| | | | 221,900 | | | Transcosmos Inc. | | | 5,346,123 | |
| | | | 10,957,700 | | | Yahoo Japan Corp. | | | 30,808,239 | |
| | | | 729,500 | | | Yondoshi Holdings Inc. | | | 17,717,151 | |
| | | | | | | | | | 421,243,031 | |
| | | | | | | | | | | |
| Malaysia|0.5% | | | | | | | | | | |
| | | | 17,895,800 | | | Genting Malaysia Berhad | | | 12,950,627 | |
| | | | | | | | | | | |
| Mexico|4.0% | | | | | | | | | | |
| | | | 1,902,799 | | | Corporativo Fragua, SAB de CV | | | 22,177,145 | |
| | | | 12,618,965 | | | Grupo Comercial Chedraui SAB de CV | | | 19,771,886 | |
| | | | 10,756,596 | | | Grupo México SAB de CV, Series ‘B’ | | | 25,220,822 | |
| | | | 2,360,203 | | | Promotora y Operadora de Infraestructura SAB de CV, Series ‘A’ | | | 21,105,960 | |
| | | | 570,816 | | | Promotora y Operadora de Infraestructura SAB de CV, Series ‘L’ | | | 3,355,359 | |
| | | | 5,455,000 | | | Quálitas Controladora, SAB de CV | | | 19,465,952 | |
| | | | | | | | | | 111,097,124 | |
| | See Notes to Financial Statements. | 21 |
| IVA International Fund | IVA Funds |
| Schedule of Investments |
| September 30, 2019 |
| | | SHARES | | | DESCRIPTION | | FAIR VALUE | |
| | | | | | | | | |
| Netherlands|3.5% | | | | | | | | | | |
| | | | 405,008 | | | Airbus SE | | $ | 52,619,482 | |
| | | | 2,144,210 | | | Royal Boskalis Westminster N.V. | | | 44,731,757 | |
| | | | | | | | | | 97,351,239 | |
| | | | | | | | | | | |
| Singapore|3.7% | | | | | | | | | | |
| | | | 35,345,700 | | | First Resources Ltd. | | | 40,916,774 | |
| | | | 6,558,720 | | | Haw Par Corp. Ltd. | | | 63,492,149 | |
| | | | | | | | | | 104,408,923 | |
| | | | | | | | | | | |
| South Africa|0.3% | | | | | | | | | | |
| | | | 2,464,032 | | | Net 1 U.E.P.S. Technologies Inc. (a) | | | 8,796,594 | |
| | | | | | | | | | | |
| South Korea|11.9% | | | | | | | | | | |
| | | | 1,136,146 | | | Daou Technology Inc. | | | 18,901,731 | |
| | | | 256,578 | | | DONGKOOK Pharmaceutical Co., Ltd. | | | 13,449,350 | |
| | | | 90,498 | | | Fursys Inc. | | | 2,413,482 | |
| | | | 171,632 | | | Hyundai Mobis Co., Ltd. | | | 36,158,729 | |
| | | | 403,285 | | | Hyundai Motor Co. | | | 45,178,439 | |
| | | | 2,199,130 | | | Kangwon Land Inc. | | | 54,327,878 | |
| | | | 124,647 | | | KIWOOM Securities Co., Ltd. | | | 7,075,644 | |
| | | | 430,281 | | | KT&G Corp. | | | 37,950,630 | |
| | | | 1,429,632 | | | Kyung Dong Pharmaceutical Co., Ltd. (b) | | | 9,298,614 | |
| | | | 2,114,518 | | | Samsung Electronics Co., Ltd. | | | 86,709,115 | |
| | | | 1,625,926 | | | WHANIN Pharmaceutical Co., Ltd. (b) | | | 21,476,931 | |
| | | | | | | | | | 332,940,543 | |
| | | | | | | | | | | |
| Switzerland|6.5% | | | | | | | | | | |
| | | | 1,041,778 | | | Compagnie Financière Richemont SA | | | 76,428,020 | |
| | | | 721,958 | | | Nestlé SA | | | 78,326,348 | |
| | | | 2,420,685 | | | UBS Group AG | | | 27,479,947 | |
| | | | | | | | | | 182,234,315 | |
| | | | | | | | | | | |
| Thailand|0.1% | | | | | | | | | | |
| | | | 22,038,400 | | | Thaicom PCL (a) | | | 3,415,466 | |
| | | | | | | | | | | |
| United Arab Emirates|0.3% | | | | | | | | | | |
| | | | 15,439,207 | | | Emaar Malls PJSC | | | 7,902,130 | |
| | | | | | | | | | | |
| United Kingdom|5.3% | | | | | | | | | | |
| | | | 1,829,836 | | | Antofagasta Plc | | | 20,226,367 | |
| | | | 32,962,172 | | | Avanti Communications Group Plc (a) | | | — | |
| | | | 1,662,765 | | | Inchcape Plc | | | 12,910,714 | |
| | | | 5,929,783 | | | Millennium & Copthorne Hotels Plc | | | 50,234,727 | |
| | | | 8,781,107 | | | Mitie Group Plc | | | 15,806,524 | |
| | | | 756,890 | | | Newmont Goldcorp Corp. | | | 28,701,269 | |
| | | | 1,602,072 | | | WPP Plc | | | 20,052,837 | |
| | | | | | | | | | 147,932,438 | |
| 22 | See Notes to Financial Statements. | |
| IVA International Fund | IVA Funds |
| Schedule of Investments |
| September 30, 2019 |
| | | SHARES | | | DESCRIPTION | | FAIR VALUE | |
| | | | | | | | | |
| United States|2.6% | | | | | | | | | | |
| | | | 946,835 | | | Gruma SAB de CV, Series ‘B’ | | $ | 9,692,416 | |
| | | | 1,699,576 | | | News Corp., Class ‘A’ | | | 23,658,098 | |
| | | | 1,191,577 | | | Schlumberger Ltd. | | | 40,716,186 | |
| | | | | | | | | | 74,066,700 | |
| | | | | | | | | | | |
| Uruguay|0.5% | | | | | | | | | | |
| | | | 2,067,039 | | | Arcos Dorados Holdings Inc., Class ‘A’ | | | 13,890,502 | |
| | | | | | | TOTAL COMMON STOCKS | | | | |
| | | | | | | (Cost — $2,132,445,819) | | | 2,125,226,877 | |
| | | | | | | | | | | |
| PREFERRED STOCKS – 0.8% | | | | | | | | | | |
| | | | | | | | | | | |
| Germany|0.8% | | | | | | | | | | |
| | | | 71,293 | | | KSB SE & Co. KgaA Vorzug | | | 21,369,103 | |
| | | | | | | TOTAL PREFERRED STOCKS | | | | |
| | | | | | | (Cost — $27,560,083) | | | 21,369,103 | |
| | | | | | | | | | | |
| | | | PRINCIPAL | | | | | | | |
| | | | AMOUNT | | | | | | | |
| CORPORATE NOTES & BONDS – 1.7% | | | | | | | |
| | | | | | | | | | | |
| South Africa|0.6% | | | | | | | | | | |
| | | | | | | Gold Fields Orogen Holding (BVI) Ltd., | | | | |
| | | | 17,291,000 | USD | | 4.875% due 10/7/2020 (c) | | | 17,624,371 | |
| | | | | | | | | | | |
| United Kingdom|1.1% | | | | | | | | | | |
| | | | | | | Avanti Communications Group Plc, 9% | | | | |
| | | | 6,666,912 | USD | | due 10/1/2022 (9% PIK) (c)(d) | | | 1,600,059 | |
| | | | | | | Rowan Cos., Inc.: | | | | |
| | | | 8,078,000 | USD | | 4.875% due 6/1/2022 | | | 6,139,280 | |
| | | | 8,746,000 | USD | | 4.75% due 1/15/2024 | | | 5,225,735 | |
| | | | 19,645,000 | USD | | 7.375% due 6/15/2025 | | | 11,688,775 | |
| | | | | | | Valaris Plc: | | | | |
| | | | 505,000 | USD | | 8% due 1/31/2024 | | | 335,673 | |
| | | | 3,777,000 | USD | | 4.5% due 10/1/2024 | | | 2,115,120 | |
| | | | 6,630,000 | USD | | 5.2% due 3/15/2025 | | | 3,646,500 | |
| | | | | | | | | | 30,751,142 | |
| | | | | | | TOTAL CORPORATE NOTES & BONDS | | | | |
| | | | | | | (Cost — $66,029,425) | | | 48,375,513 | |
| | | | | | | | | | | |
| CONVERTIBLE BONDS – 0.2% | | | | | | | | | | |
| | | | | | | | | | | |
| United Kingdom|0.2% | | | | | | | | | | |
| | | | | | | Ensco Jersey Finance Ltd., 3% | | | | |
| | | | 7,330,000 | USD | | due 1/31/2024 | | | 4,984,400 | |
| | | | | | | TOTAL CONVERTIBLE BONDS | | | | |
| | | | | | | (Cost — $9,247,157) | | | 4,984,400 | |
| | See Notes to Financial Statements. | 23 |
| IVA International Fund | IVA Funds |
| Schedule of Investments |
| September 30, 2019 |
| | | PRINCIPAL
AMOUNT | | | DESCRIPTION | | FAIR VALUE | |
| | | | | | | | | |
| SUPRANATIONAL BONDS – 0.2% | | | | | | | |
| | | | | | | | | | | |
| Luxembourg|0.2% | | | | | | | | | | |
| | | | | | | European Investment Bank, | | | | |
| | | | 35,500,000 | NOK | | 1.125% due 5/15/2020 | | $ | 3,899,609 | |
| | | | | | | TOTAL SUPRANATIONAL BONDS | | | | |
| | | | | | | (Cost — $4,306,895) | | | 3,899,609 | |
| | | | OUNCES | | | | | | | |
| COMMODITIES | 5.3% | | | | | | | |
| | | | | | | | | | | |
| | | | 101,400 | | | Gold Bullion (a) | | | 149,418,011 | |
| | | | | | | TOTAL COMMODITIES | | | | |
| | | | | | | (Cost — $161,436,929) | | | 149,418,011 | |
| | | | PRINCIPAL | | | | | | | |
| | | | AMOUNT | | | | | | | |
| SHORT-TERM INVESTMENTS — 15.5% | | | | | | | |
| | | | | | | | | | | |
| Commercial Paper|15.4% | | | | | | | | | | |
| | | | | | | AutoZone Inc., | | | | |
| | | | 25,000,000 | USD | | 2.08% due 10/1/2019 (c) | | | 24,998,321 | |
| | | | | | | BMW U.S. Capital LLC, | | | | |
| | | | 20,000,000 | USD | | 1.91% due 10/1/2019 (c) | | | 19,998,753 | |
| | | | | | | Colgate-Palmolive Co., | | | | |
| | | | 25,000,000 | USD | | 1.9% due 10/3/2019 (c) | | | 24,995,417 | |
| | | | | | | Diageo Capital Plc, | | | | |
| | | | 24,600,000 | USD | | 2.21% due 10/9/2019 (c) | | | 24,585,824 | |
| | | | | | | Duke Energy Corp.: | | | | |
| | | | 25,000,000 | USD | | 2.13% due 10/2/2019 (c) | | | 24,996,658 | |
| | | | 25,000,000 | USD | | 2.13% due 10/3/2019 (c) | | | 24,995,010 | |
| | | | 25,000,000 | USD | | 2.13% due 10/4/2019 (c) | | | 24,993,378 | |
| | | | | | | Emerson Electric Co., | | | | |
| | | | 25,000,000 | USD | | 1.92% due 10/4/2019 (c) | | | 24,993,783 | |
| | | | | | | Exxon Mobil Corp.: | | | | |
| | | | 25,000,000 | USD | | 1.96% due 11/1/2019 | | | 24,955,311 | |
| | | | 25,000,000 | USD | | 1.96% due 11/4/2019 | | | 24,951,097 | |
| | | | | | | GlaxoSmithKline LLC, | | | | |
| | | | 25,000,000 | USD | | 1.99% due 10/8/2019 (c) | | | 24,987,661 | |
| | | | | | | Nestlé Capital Corp., | | | | |
| | | | 25,000,000 | USD | | 1.83% due 10/3/2019 (c) | | | 24,995,448 | |
| | | | | | | Roche Holdings, Inc., | | | | |
| | | | 25,000,000 | USD | | 1.86% due 10/7/2019 (c) | | | 24,989,403 | |
| | | | | | | Schlumberger Ltd., | | | | |
| | | | 25,000,000 | USD | | 2.12% due 10/1/2019 (c) | | | 24,998,226 | |
| | | | | | | Total Fina Elf Capital SA, | | | | |
| | | | 5,700,000 | USD | | 1.8% due 10/1/2019 (c) | | | 5,699,647 | |
| | | | | | | United Parcel Service Inc.: | | | | |
| | | | 25,000,000 | USD | | 1.55% due 10/1/2019 (c) | | | 24,998,779 | |
| | | | 6,100,000 | USD | | 1.75% due 10/1/2019 (c) | | | 6,099,702 | |
| | | | | | | Walmart Inc.: | | | | |
| | | | 25,000,000 | USD | | 1.92% due 10/7/2019 (c) | | | 24,989,403 | |
| | | | 25,000,000 | USD | | 1.92% due 10/8/2019 (c) | | | 24,987,961 | |
| | | | | | | | | | 431,209,782 | |
| 24 | See Notes to Financial Statements. | |
| IVA International Fund | IVA Funds |
| Schedule of Investments |
| September 30, 2019 |
| | | PRINCIPAL | | | | | | |
| | | AMOUNT | | | DESCRIPTION | | FAIR VALUE | |
| | | | | | | | | |
| Treasury Bills|0.1% | | | | | | | | | | |
| | | | 4,000,000 | USD | | U.S. Treasury Bill, due 12/5/2019 (e) | | $ | 3,987,172 | |
| | | | | | | TOTAL SHORT-TERM INVESTMENTS | | | | |
| | | | | | | (Cost — $435,232,930) | | | 435,196,954 | |
| | | | | | | TOTAL INVESTMENTS — 99.5% | | | | |
| | | | | | | (Cost — $2,836,259,238) | | | 2,788,470,467 | |
| | | | | | | Other Assets In Excess of | | | | |
| | | | | | | Liabilities — 0.5% | | | 14,323,147 | |
| | | | | | | TOTAL NET ASSETS — 100.0% | | $ | 2,802,793,614 | |
| |
| The IVA International Fund had the following open forward foreign currency contracts at September 30, 2019: |
| |
| | | | | SETTLEMENT | | | | | | | | USD VALUE AT | | | NET UNREALIZED | |
| FOREIGN | | | | DATES | | LOCAL CURRENCY | | | USD | | | SEPTEMBER 30, | | | APPRECIATION/ | |
| CURRENCY | | COUNTERPARTY | | THROUGH | | AMOUNT | | | EQUIVALENT | | | 2019 | | | (DEPRECIATION) | |
| Contracts to Sell: | | | | | | | | | | | | | | | | | |
| | | State Street | | | | | | | | | | | | | | | | | | |
| Australian | | Bank & | | | | | | | | | | | | | | | | | | |
| dollar | | Trust Co. | | 12/09/2019 | | | AUD20,068,000 | | | $ | 13,684,066 | | | $ | 13,574,397 | | | $ | 109,669 | |
| | | State Street | | | | | | | | | | | | | | | | | | |
| British | | Bank & | | | | | | | | | | | | | | | | | | |
| pound | | Trust Co. | | 12/09/2019 | | | GBP57,426,000 | | | | 70,214,747 | | | | 70,800,217 | | | | (585,470 | ) |
| | | State Street | | | | | | | | | | | | | | | | | | |
| | | Bank & | | | | | | | | | | | | | | | | | | |
| euro | | Trust Co. | | 12/09/2019 | | | EUR47,406,000 | | | | 52,662,377 | | | | 51,934,330 | | | | 728,047 | |
| | | State Street | | | | | | | | | | | | | | | | | | |
| Japanese | | Bank & | | | | | | | | | | | | | | | | | | |
| yen | | Trust Co. | | 12/09/2019 | | | JPY16,076,300,000 | | | | 152,194,638 | | | | 149,368,540 | | | | 2,826,098 | |
| Net Unrealized Appreciation on Open Forward Foreign Currency Contracts | | | | | | | $ | 3,078,344 | |
| | | | | | | | | | | | | | | | | |
| | | | | SETTLEMENT | | | | | | | | USD VALUE AT | | | NET | |
| FOREIGN | | | | DATES | | LOCAL CURRENCY | �� | | USD | | | SEPTEMBER 30, | | | UNREALIZED | |
| CURRENCY | | COUNTERPARTY | | THROUGH | | AMOUNT | | | EQUIVALENT | | | 2019 | | | DEPRECIATION | |
| Contracts to Sell: | | | | | | | | | | | | | | | | | | |
| South | | State Street | | | | | | | | | | | | | | | | | | |
| Korean | | Bank & | | | | | | | | | | | | | | | | | | |
| won | | Trust Co. | | 10/08/2019 | | | KRW199,818,000,000 | | | $ | 165,910,571 | | | $ | 166,781,155 | | | $ | (870,584 | ) |
| Net Unrealized Depreciation on Open Forward Foreign Currency Contracts | | | | | | $ | (870,584 | ) |
| |
| Abbreviations used in this schedule: |
| ADR | — American Depositary Receipt |
| USD | — United States dollar |
| | See Notes to Financial Statements. | 25 |
| IVA International Fund | IVA Funds |
| Schedule of Investments |
| September 30, 2019 |
| (a) | Non-income producing investment. |
| (b) | Issuer of the security is an affiliate of the IVA International Fund as defined by the Investment Company Act of 1940. An affiliate is deemed as a company in which the IVA International Fund indirectly or directly has ownership of at least 5% of the company’s outstanding voting securities. See Schedule of Affiliates below for additional information. |
| | |
| | | SHARES | | | | | | | | | SHARES | | | FAIR | | | | | | CHANGE IN | | | | |
| | | HELD AT | | | | | | | | | HELD AT | | | VALUE AT | | | | | | UNREALIZED | | | | |
| | | SEPTEMBER | | | SHARE | | | SHARE | | | SEPTEMBER | | | SEPTEMBER | | | REALIZED | | | APPRECIATION/ | | | DIVIDEND | |
| SECURITY | | 30, 2018 | | | ADDITIONS | | | REDUCTIONS | | | 30, 2019 | | | 30, 2019 | | | GAIN/(LOSS) | | | (DEPRECIATION) | | | INCOME* | |
| APT Satellite | | | | | | | | | | | | | | | | | | | | | | | | | | | | | | | | |
| Holdings | | | | | | | | | | | | | | | | | | | | | | | | | | | | | | | | |
| Ltd. | | | 51,262,000 | | | | 6,313,000 | | | | 2,980,000 | | | | 54,595,000 | | | $ | 22,011,585 | | | $ | (1,041,101 | ) | | $ | 3,325,123 | | | $ | 1,169,132 | |
| Clear Media | | | | | | | | | | | | | | | | | | | | | | | | | | | | | | | | |
| Ltd. | | | 40,065,030 | | | | — | | | | 8,535,000 | | | | 31,530,030 | | | | 15,689,184 | | | | 2,793,657 | | | | (9,786,702 | ) | | | 706,683 | |
| F@N | | | | | | | | | | | | | | | | | | | | | | | | | | | | | | | | |
| Communications | | | | | | | | | | | | | | | | | | | | | | | | | | | | | | | | |
| Inc. | | | 4,019,800 | | | | — | | | | 132,400 | | | | 3,887,400 | | | | 19,342,624 | | | | (229,522 | ) | | | (4,373,990 | ) | | | 692,284 | |
| Kyung Dong | | | | | | | | | | | | | | | | | | | | | | | | | | | | | | | | |
| Pharmaceutical | | | | | | | | | | | | | | | | | | | | | | | | | | | | | | | | |
| Co., Ltd.** | | | 776,276 | | | | 695,209 | | | | 41,853 | | | | 1,429,632 | | | | 9,298,614 | | | | (211,776 | ) | | | (6,453,648 | ) | | | 328,957 | |
| Phoenix New | | | | | | | | | | | | | | | | | | | | | | | | | | | | | | | | |
| Media Ltd., | | | | | | | | | | | | | | | | | | | | | | | | | | | | | | | | |
| ADR** | | | 2,342,006 | | | | 1,448,028 | | | | 76,571 | | | | 3,713,463 | | | | 9,506,465 | | | | (138,787 | ) | | | (6,130,496 | ) | | | — | |
| Techno | | | | | | | | | | | | | | | | | | | | | | | | | | | | | | | | |
| Medica Co., | | | | | | | | | | | | | | | | | | | | | | | | | | | | | | | | |
| Ltd. | | | 556,900 | | | | — | | | | 43,100 | | | | 513,800 | | | | 11,052,937 | | | | (23,869 | ) | | | 1,545,734 | | | | 231,715 | |
| WHANIN | | | | | | | | | | | | | | | | | | | | | | | | | | | | | | | | |
| Pharmaceutical | | | | | | | | | | | | | | | | | | | | | | | | | | | | | | | | |
| Co., Ltd. | | | 1,607,014 | | | | 161,795 | | | | 142,883 | | | | 1,625,926 | | | | 21,476,931 | | | | (595,618 | ) | | | (9,522,126 | ) | | | 421,028 | |
| Total | | | | | | | | | | | | | | | | | | $ | 108,378,340 | | | $ | 552,984 | | | $ | (31,396,105 | ) | | $ | 3,549,799 | |
| * | Dividend income is gross of withholding taxes. |
| ** | Non-affiliated at September 30, 2018. |
| (c) | Security is exempt from registration under Rule 144A or Section 4(2) of the Securities Act of 1933 (the “1933 Act”). Any resale of these securities must generally be effected through a sale that is registered under the 1933 Act or otherwise exempted from such registration requirements. |
| (d) | Payment-in-kind security for which the issuer may pay interest with additional debt securities or cash. |
| (e) | This security is held at the custodian as collateral for forward foreign currency contracts sold. As of September 30, 2019, portfolio securities valued at $3,987,172 were segregated, of which $870,584 is used to cover collateral requirements. |
| 26 | See Notes to Financial Statements. | |
| Statements of Assets and Liabilities | IVA Funds |
September 30, 2019
| | | IVA | | | IVA | |
| | | Worldwide | | | International | |
| | | Fund | | | Fund | |
| Assets: | | | | | | | | |
| Long-term investments, at cost: | | | | | | | | |
| Non-affiliated securities | | $ | 3,164,653,450 | | | $ | 2,091,185,000 | |
| Affiliated securities | | | 174,836,154 | | | | 148,404,380 | |
| Commodities | | | 220,519,521 | | | | 161,436,928 | |
| Short-term investments, at cost | | | 1,831,107,114 | | | | 431,246,634 | |
| Collateral for open foreign forward currency contracts, at cost | | | 3,986,296 | | | | 3,986,296 | |
| Long-term investments, at fair value: | | | | | | | | |
| Non-affiliated securities | | $ | 3,654,407,891 | | | $ | 2,095,477,162 | |
| Affiliated securities | | | 131,653,682 | | | | 108,378,340 | |
| Commodities | | | 205,430,962 | | | | 149,418,011 | |
| Short-term investments, at fair value | | | 1,830,935,476 | | | | 431,209,782 | |
| Collateral for open foreign forward currency contracts, at fair value | | | 3,987,172 | | | | 3,987,172 | |
| Cash | | | 435,945 | | | | 310,941 | |
| Dividends and interest receivable | | | 14,129,072 | | | | 9,320,774 | |
| Receivable for investments sold | | | 5,431,126 | | | | 5,279,183 | |
| Unrealized appreciation on open forward foreign currency contracts | | | 2,766,089 | | | | 3,078,344 | |
| Receivable for fund shares sold | | | 2,097,524 | | | | 2,595,576 | |
| Total assets | | $ | 5,851,274,939 | | | $ | 2,809,055,285 | |
| Liabilities: | | | | | | | | |
| Payable for fund shares repurchased | | $ | 11,726,373 | | | $ | 2,725,903 | |
| Payable for investments purchased | | | 3,307,967 | | | | 87,417 | |
| Unrealized depreciation on open forward foreign currency contracts | | | 1,011,371 | | | | 870,584 | |
| Accrued investment advisory fees | | | 3,846,513 | | | | 1,864,825 | |
| Accrued distribution and service fees | | | 537,163 | | | | 49,732 | |
| Accrued expenses and other liabilities | | | 1,387,531 | | | | 663,210 | |
| Total liabilities | | | 21,816,918 | | | | 6,261,671 | |
| Net Assets | | $ | 5,829,458,021 | | | $ | 2,802,793,614 | |
| Net Assets Consist of: | | | | | | | | |
| Par value ($0.001 per share) | | $ | 345,554 | | | $ | 182,467 | |
| Additional paid-in-capital | | | 5,044,937,925 | | | | 2,790,673,071 | |
| Total distributable earnings | | | 784,174,542 | | | | 11,938,076 | |
| Net Assets | | $ | 5,829,458,021 | | | $ | 2,802,793,614 | |
| Net Asset Value Per Share: | | | | | | | | |
| Class A | | | | | | | | |
| Net assets | | $ | 950,298,116 | | | $ | 133,268,907 | |
| Shares outstanding | | | 56,431,566 | | | | 8,697,516 | |
| Net asset value per share | | $ | 16.84 | | | $ | 15.32 | |
| Maximum offering price per share (with a maximum initial sales | | | | | | | | |
| charge of 5.00%) | | $ | 17.73 | | | $ | 16.13 | |
| Class C | | | | | | | | |
| Net assets | | $ | 379,242,581 | | | $ | 23,776,789 | |
| Shares outstanding | | | 23,155,469 | | | | 1,588,425 | |
| Net asset value per share | | $ | 16.38 | | | $ | 14.97 | |
| Class I | | | | | | | | |
| Net assets | | $ | 4,499,917,324 | | | $ | 2,645,747,918 | |
| Shares outstanding | | | 265,967,175 | | | | 172,180,871 | |
| Net asset value per share | | $ | 16.92 | | | $ | 15.37 | |
| | See Notes to Financial Statements. | 27 |
| Statements of Operations | IVA Funds |
For the Year Ended September 30, 2019
| | | IVA | | | IVA | |
| | | Worldwide | | | International | |
| | | Fund | | | Fund | |
| Investment Income: | | | | | | | | |
| Interest | | $ | 65,508,599 | | | $ | 18,096,126 | |
| Dividends: | | | | | | | | |
| Non-affiliated securities | | | 93,054,018 | | | | 67,493,611 | |
| Affiliated securities | | | 4,388,392 | | | | 3,549,799 | |
| Other income | | | 171,483 | | | | 92,854 | |
| Less: Foreign taxes withheld | | | (8,540,977 | ) | | | (5,995,352 | ) |
| Total income | | | 154,581,515 | | | | 83,237,038 | |
| Expenses: | | | | | | | | |
| Investment advisory fees | | | 58,160,100 | | | | 27,497,351 | |
| Distribution and service fees: | | | | | | | | |
| Class A | | | 2,499,165 | | | | 379,354 | |
| Class C | | | 5,392,419 | | | | 326,501 | |
| Trustee fees | | | 286,331 | | | | 136,646 | |
| Other expenses | | | 7,352,673 | | | | 3,642,879 | |
| Total expenses | | | 73,690,688 | | | | 31,982,731 | |
| Net investment income | | | 80,890,827 | | | | 51,254,307 | |
| Net Realized and Change in Unrealized Gain (Loss) | | | | | |
| on Investments and Foreign Currency including | | | | | | | | |
| Forward Foreign Currency Contracts: | | | | | | | | |
| Net realized gain (loss) on: | | | | | | | | |
| Investments: | | | | | | | | |
| Non-affiliated securities | | | 510,724,397 | | | | 80,414,512 | |
| Affiliated securities | | | (4,006,890 | ) | | | 552,984 | |
| Commodities | | | 28,369,938 | | | | 13,113,106 | |
| Forward foreign currency contracts and other | | | | | | | | |
| foreign currency transactions | | | 24,462,858 | | | | 19,315,769 | |
| Net realized gain | | | 559,550,303 | | | | 113,396,371 | |
| Net change in unrealized appreciation | | | | | | | | |
| (depreciation) from: | | | | | | | | |
| Investments from: | | | | | | | | |
| Non-affiliated investments | | | (845,357,330 | ) | | | (312,846,437 | ) |
| Affiliated investments | | | (20,942,809 | ) | | | (31,396,105 | ) |
| Forward foreign currency contracts and other | | | | | | | | |
| foreign currency translation | | | (1,237,938 | ) | | | (2,069,096 | ) |
| Net change in unrealized appreciation (depreciation) | | | (867,538,077 | ) | | | (346,311,638 | ) |
| Net realized and change in unrealized gain (loss) | | | | | | | | |
| on investments and foreign currency including | | | | | | | | |
| forward foreign currency contracts | | | (307,987,774 | ) | | | (232,915,267 | ) |
| Decrease in net assets resulting from operations | | $ | (227,096,947 | ) | | $ | (181,660,960 | ) |
| 28 | See Notes to Financial Statements. | |
| Statements of Changes in Net Assets | IVA Funds |
| | | IVA Worldwide Fund | | | IVA International Fund | |
| | | Year Ended | | | Year Ended | | | Year Ended | | | Year Ended | |
| | | September 30, | | | September 30, | | | September 30, | | | September 30, | |
| | | 2019 | | | 2018 | | | 2019 | | | 2018 | |
| Operations: | | | | | | | | | | | | |
| Net investment income | | $ | 80,890,827 | | | $ | 45,665,797 | | | $ | 51,254,307 | | | $ | 39,984,949 | |
| Net realized gain | | | 559,550,303 | | | | 453,368,754 | | | | 113,396,371 | | | | 177,335,496 | |
| Net change in net unrealized | | | | | | | | | | | | | | | | |
| appreciation (depreciation) | | | (867,538,077 | ) | | | (223,855,661 | ) | | | (346,311,638 | ) | | | (247,071,278 | ) |
| Increase (decrease) in net assets | | | | | | | | | | | | | | | | |
| resulting from operations | | | (227,096,947 | ) | | | 275,178,890 | | | | (181,660,960 | ) | | | (29,750,833 | ) |
| Decrease in net assets resulting | | | | | | | | | | | | | | | | |
| from distributions | | | (639,448,284 | ) | | | (270,021,297 | ) | | | (234,693,218 | ) | | | (150,116,202 | ) |
| Capital Share Transactions: | | | | | | | | | | | | | | | | |
| Proceeds from shares sold | | | 1,214,622,428 | | | | 1,266,049,192 | | | | 611,893,146 | | | | 592,354,869 | |
| Reinvestment of distributions | | | 530,777,658 | | | | 226,638,792 | | | | 203,877,710 | | | | 129,510,998 | |
| Cost of shares repurchased | | | (3,066,709,013 | ) | | | (1,710,878,886 | ) | | | (1,445,674,304 | ) | | | (896,001,693 | ) |
| Decrease in net assets from | | | | | | | | | | | | | | | | |
| capital share transactions | | | (1,321,308,927 | ) | | | (218,190,902 | ) | | | (629,903,448 | ) | | | (174,135,826 | ) |
| Decrease in net assets | | | (2,187,854,158 | ) | | | (213,033,309 | ) | | | (1,046,257,626 | ) | | | (354,002,861 | ) |
| Net Assets: | | | | | | | | | | | | | | | | |
| Beginning of year | | $ | 8,017,312,179 | | | $ | 8,230,345,488 | | | $ | 3,849,051,240 | | | $ | 4,203,054,101 | |
| End of year | | $ | 5,829,458,021 | | | $ | 8,017,312,179 | | | $ | 2,802,793,614 | | | $ | 3,849,051,240 | |
| | See Notes to Financial Statements. | 29 |
| Financial Highlights | IVA Funds |
IVA Worldwide Fund — Class A
For a share of each class of beneficial interest outstanding:
| | | Year Ended September 30, | |
| | | 2019 | | | 2018 | | | 2017 | | | 2016 | | | 2015 | |
| Net asset value, beginning | | | | | | | | | | | | | | | |
| of year | | $ | 18.97 | | | $ | 18.96 | | | $ | 17.26 | | | $ | 16.87 | | | $ | 18.54 | |
| Increase (decrease) from | | | | | | | | | | | | | | | | | | | | |
| investment operations:(a) | | | | | | | | | | | | | | | | | | | | |
| Net investment income(b) | | | 0.19 | | | | 0.08 | | | | 0.04 | | | | 0.09 | | | | 0.02 | |
| Net realized and unrealized | | | | | | | | | | | | | | | | | | | | |
| gain (loss) | | | (0.72 | ) | | | 0.53 | | | | 1.86 | | | | 1.01 | | | | (0.77 | ) |
| Increase (decrease) from | | | | | | | | | | | | | | | | | | | | |
| investment operations | | | (0.53 | ) | | | 0.61 | | | | 1.90 | | | | 1.10 | | | | (0.75 | ) |
| Decrease from distributions: | | | | | | | | | | | | | | | | | | | | |
| Net investment income | | | (0.15 | ) | | | (0.03 | ) | | | — | | | | (0.23 | ) | | | (0.21 | ) |
| Net realized gain on | | | | | | | | | | | | | | | | | | | | |
| investments | | | (1.45 | ) | | | (0.57 | ) | | | (0.20 | ) | | | (0.48 | ) | | | (0.71 | ) |
| Decrease from distributions | | | (1.60 | ) | | | (0.60 | ) | | | (0.20 | ) | | | (0.71 | ) | | | (0.92 | ) |
| Net asset value, end of year | | $ | 16.84 | | | $ | 18.97 | | | $ | 18.96 | | | $ | 17.26 | | | $ | 16.87 | |
| Total return(c) | | | (2.48 | )% | | | 3.25 | % | | | 11.12 | % | | | 6.75 | % | | | (4.21 | )% |
| Ratios to average net assets: | | | | | | | | | | | | | | | | | | | | |
| Operating expenses | | | 1.23 | % | | | 1.25 | % | | | 1.25 | % | | | 1.25 | % | | | 1.25 | % |
| Net investment income | | | 1.09 | % | | | 0.41 | % | | | 0.21 | % | | | 0.52 | % | | | 0.09 | % |
| Supplemental data: | | | | | | | | | | | | | | | | | | | | |
| Portfolio turnover rate | | | 39.9 | % | | | 25.0 | % | | | 13.9 | % | | | 29.7 | % | | | 30.3 | % |
| Net assets, end of year (000’s) | | $ | 950,298 | | | $ | 1,159,022 | | | $ | 1,512,543 | | | $ | 1,587,209 | | | $ | 1,815,439 | |
| (a) | The amounts shown for a share outstanding may not correlate with the Statements of Operations for the period due to the timing of sales and repurchases of fund shares in relation to income earned and/or gains (losses) both realized and unrealized during the period. |
| (b) | Calculated using average daily shares outstanding. |
| (c) | Total return assumes reinvestment of all distributions and does not reflect an initial sales charge. |
| 30 | See Notes to Financial Statements. | |
| Financial Highlights | IVA Funds |
IVA Worldwide Fund — Class C
For a share of each class of beneficial interest outstanding:
| | | Year Ended September 30, | |
| | | 2019 | | | 2018 | | | 2017 | | | 2016 | | | 2015 | |
| Net asset value, beginning | | | | | | | | | | | | | | | |
| of year | | $ | 18.48 | | | $ | 18.59 | | | $ | 17.05 | | | $ | 16.67 | | | $ | 18.33 | |
| Increase (decrease) from | | | | | | | | | | | | | | | | | | | | |
| investment operations:(a) | | | | | | | | | | | | | | | | | | | | |
| Net investment income (loss)(b) | | | 0.05 | | | | (0.06 | ) | | | (0.10 | ) | | | (0.04 | ) | | | (0.12 | ) |
| Net realized and unrealized | | | | | | | | | | | | | | | | | | | | |
| gain (loss) | | | (0.68 | ) | | | 0.52 | | | | 1.84 | | | | 1.00 | | | | (0.76 | ) |
| Increase (decrease) from | | | | | | | | | | | | | | | | | | | | |
| investment operations | | | (0.63 | ) | | | 0.46 | | | | 1.74 | | | | 0.96 | | | | (0.88 | ) |
| Decrease from distributions: | | | | | | | | | | | | | | | | | | | | |
| Net investment income | | | (0.02 | ) | | | — | | | | — | | | | (0.10 | ) | | | (0.07 | ) |
| Net realized gain on investments | | | (1.45 | ) | | | (0.57 | ) | | | (0.20 | ) | | | (0.48 | ) | | | (0.71 | ) |
| Decrease from distributions | | | (1.47 | ) | | | (0.57 | ) | | | (0.20 | ) | | | (0.58 | ) | | | (0.78 | ) |
| Net asset value, end of year | | $ | 16.38 | | | $ | 18.48 | | | $ | 18.59 | | | $ | 17.05 | | | $ | 16.67 | |
| Total return(c) | | | (3.18 | )% | | | 2.47 | % | | | 10.31 | % | | | 5.93 | % | | | (4.96 | )% |
| Ratios to average net assets: | | | | | | | | | | | | | | | | | | | | |
| Operating expenses | | | 1.98 | % | | | 2.00 | % | | | 2.00 | % | | | 2.00 | % | | | 2.00 | % |
| Net investment income (loss) | | | 0.29 | % | | | (0.32 | )% | | | (0.55 | )% | | | (0.23 | )% | | | (0.67 | )% |
| Supplemental data: | | | | | | | | | | | | | | | | | | | | |
| Portfolio turnover rate | | | 39.9 | % | | | 25.0 | % | | | 13.9 | % | | | 29.7 | % | | | 30.3 | % |
| Net assets, end of year (000’s) | | $ | 379,243 | | | $ | 691,501 | | | $ | 856,801 | | | $ | 1,037,758 | | | $ | 1,201,687 | |
| (a) | The amounts shown for a share outstanding may not correlate with the Statements of Operations for the period due to the timing of sales and repurchases of fund shares in relation to income earned and/or gains (losses) both realized and unrealized during the period. |
| (b) | Calculated using average daily shares outstanding. |
| (c) | Total return assumes reinvestment of all distributions and does not reflect a contingent deferred sales charge. |
| | See Notes to Financial Statements. | 31 |
| Financial Highlights | IVA Funds |
IVA Worldwide Fund — Class I
For a share of each class of beneficial interest outstanding:
| | | Year Ended September 30, | |
| | | 2019 | | | 2018 | | | 2017 | | | 2016 | | | 2015 | |
| Net asset value, beginning | | | | | | | | | | | | | | | |
| of year | | $ | 19.05 | | | $ | 19.04 | | | $ | 17.28 | | | $ | 16.90 | | | $ | 18.57 | |
| Increase (decrease) from | | | | | | | | | | | | | | | | | | | | |
| investment operations:(a) | | | | | | | | | | | | | | | | | | | | |
| Net investment income(b) | | | 0.23 | | | | 0.13 | | | | 0.08 | | | | 0.13 | | | | 0.06 | |
| Net realized and unrealized | | | | | | | | | | | | | | | | | | | | |
| gain (loss) | | | (0.71 | ) | | | 0.53 | | | | 1.88 | | | | 1.00 | | | | (0.77 | ) |
| Increase (decrease) from | | | | | | | | | | | | | | | | | | | | |
| investment operations | | | (0.48 | ) | | | 0.66 | | | | 1.96 | | | | 1.13 | | | | (0.71 | ) |
| Decrease from distributions: | | | | | | | | | | | | | | | | | | | | |
| Net investment income | | | (0.20 | ) | | | (0.08 | ) | | | — | | | | (0.27 | ) | | | (0.25 | ) |
| Net realized gain on investments | | | (1.45 | ) | | | (0.57 | ) | | | (0.20 | ) | | | (0.48 | ) | | | (0.71 | ) |
| Decrease from distributions | | | (1.65 | ) | | | (0.65 | ) | | | (0.20 | ) | | | (0.75 | ) | | | (0.96 | ) |
| Net asset value, end of year | | $ | 16.92 | | | $ | 19.05 | | | $ | 19.04 | | | $ | 17.28 | | | $ | 16.90 | |
| Total return(c) | | | (2.21 | )% | | | 3.48 | % | | | 11.46 | % | | | 6.96 | % | | | (3.95 | )% |
| Ratios to average net assets: | | | | | | | | | | | | | | | | | | | | |
| Operating expenses | | | 0.98 | % | | | 1.00 | % | | | 1.00 | % | | | 1.00 | % | | | 1.00 | % |
| Net investment income | | | 1.32 | % | | | 0.70 | % | | | 0.47 | % | | | 0.77 | % | | | 0.34 | % |
| Supplemental data: | | | | | | | | | | | | | | | | | | | | |
| Portfolio turnover rate | | | 39.9 | % | | | 25.0 | % | | | 13.9 | % | | | 29.7 | % | | | 30.3 | % |
| Net assets, end of year (000’s) | | $ | 4,499,917 | | | $ | 6,166,789 | | | $ | 5,861,001 | | | $ | 5,651,971 | | | $ | 6,068,916 | |
| (a) | The amounts shown for a share outstanding may not correlate with the Statements of Operations for the period due to the timing of sales and repurchases of fund shares in relation to income earned and/or gains (losses) both realized and unrealized during the period. |
| (b) | Calculated using average daily shares outstanding. |
| (c) | Total return assumes reinvestment of all distributions. |
| 32 | See Notes to Financial Statements. | |
| Financial Highlights | IVA Funds |
IVA International Fund — Class A
For a share of each class of beneficial interest outstanding:
| | | Year Ended September 30, | |
| | | 2019 | | | 2018 | | | 2017 | | | 2016 | | | 2015 | |
| Net asset value, beginning | | | | | | | | | | | | | | | |
| of year | | $ | 17.23 | | | $ | 18.02 | | | $ | 16.28 | | | $ | 16.39 | | | $ | 17.84 | |
| Increase (decrease) from | | | | | | | | | | | | | | | | | | | | |
| investment operations:(a) | | | | | | | | | | | | | | | | | | | | |
| Net investment income(b) | | | 0.23 | | | | 0.12 | | | | 0.08 | | | | 0.07 | | | | 0.12 | |
| Net realized and unrealized | | | | | | | | | | | | | | | | | | | | |
| gain (loss) | | | (1.05 | ) | | | (0.30 | ) | | | 1.86 | | | | 0.86 | | | | (0.55 | ) |
| Increase (decrease) from | | | | | | | | | | | | | | | | | | | | |
| investment operations | | | (0.82 | ) | | | (0.18 | ) | | | 1.94 | | | | 0.93 | | | | (0.43 | ) |
| Decrease from distributions: | | | | | | | | | | | | | | | | | | | | |
| Net investment income | | | (0.21 | ) | | | (0.24 | ) | | | (0.03 | ) | | | (0.41 | ) | | | (0.47 | ) |
| Net realized gain on investments | | | (0.88 | ) | | | (0.37 | ) | | | (0.17 | ) | | | (0.63 | ) | | | (0.55 | ) |
| Decrease from distributions | | | (1.09 | ) | | | (0.61 | ) | | | (0.20 | ) | | | (1.04 | ) | | | (1.02 | ) |
| Net asset value, end of year | | $ | 15.32 | | | $ | 17.23 | | | $ | 18.02 | | | $ | 16.28 | | | $ | 16.39 | |
| Total return(c) | | | (4.51 | )% | | | (1.07 | )% | | | 12.09 | % | | | 5.93 | % | | | (2.37 | )% |
| Ratios to average net assets: | | | | | | | | | | | | | | | | | | | | |
| Operating expenses | | | 1.23 | % | | | 1.25 | % | | | 1.25 | % | | | 1.24 | % | | | 1.25 | % |
| Net investment income | | | 1.45 | % | | | 0.67 | % | | | 0.48 | % | | | 0.41 | % | | | 0.70 | % |
| Supplemental data: | | | | | | | | | | | | | | | | | | | | |
| Portfolio turnover rate | | | 25.3 | % | | | 19.4 | % | | | 22.7 | % | | | 34.9 | % | | | 27.6 | % |
| Net assets, end of year (000’s) | | $ | 133,269 | | | $ | 181,209 | | | $ | 269,160 | | | $ | 282,567 | | | $ | 466,336 | |
| (a) | The amounts shown for a share outstanding may not correlate with the Statements of Operations for the period due to the timing of sales and repurchases of fund shares in relation to income earned and/or gains (losses) both realized and unrealized during the period. |
| (b) | Calculated using average daily shares outstanding. |
| (c) | Total return assumes reinvestment of all distributions and does not reflect an initial sales charge. |
| | See Notes to Financial Statements. | 33 |
| Financial Highlights | IVA Funds |
IVA International Fund — Class C
For a share of each class of beneficial interest outstanding:
| | | Year Ended September 30, | |
| | | 2019 | | | 2018 | | | 2017 | | | 2016 | | | 2015 | |
| Net asset value, beginning | | | | | | | | | | | | | | | |
| of year | | $ | 16.85 | | | $ | 17.64 | | | $ | 16.03 | | | $ | 16.14 | | | $ | 17.58 | |
| Increase (decrease) from | | | | | | | | | | | | | | | | | | | | |
| investment operations:(a) | | | | | | | | | | | | | | | | | | | | |
| Net investment income (loss)(b) | | | 0.09 | | | | (0.01 | ) | | | (0.05 | ) | | | (0.03 | ) | | | (0.02 | ) |
| Net realized and unrealized | | | | | | | | | | | | | | | | | | | | |
| gain (loss) | | | (1.00 | ) | | | (0.30 | ) | | | 1.83 | | | | 0.83 | | | | (0.53 | ) |
| Increase (decrease) from | | | | | | | | | | | | | | | | | | | | |
| investment operations | | | (0.91 | ) | | | (0.31 | ) | | | 1.78 | | | | 0.80 | | | | (0.55 | ) |
| Decrease from distributions: | | | | | | | | | | | | | | | | | | | | |
| Net investment income | | | (0.09 | ) | | | (0.11 | ) | | | — | | | | (0.28 | ) | | | (0.34 | ) |
| Net realized gain on investments | | | (0.88 | ) | | | (0.37 | ) | | | (0.17 | ) | | | (0.63 | ) | | | (0.55 | ) |
| Decrease from distributions | | | (0.97 | ) | | | (0.48 | ) | | | (0.17 | ) | | | (0.91 | ) | | | (0.89 | ) |
| Net asset value, end of year | | $ | 14.97 | | | $ | 16.85 | | | $ | 17.64 | | | $ | 16.03 | | | $ | 16.14 | |
| Total return(c) | | | (5.19 | )% | | | (1.82 | )% | | | 11.24 | % | | | 5.17 | % | | | (3.14 | )% |
| Ratios to average net assets: | | | | | | | | | | | | | | | | | | | | |
| Operating expenses | | | 1.99 | % | | | 2.00 | % | | | 2.00 | % | | | 1.99 | % | | | 2.00 | % |
| Net investment income (loss) | | | 0.62 | % | | | (0.04 | )% | | | (0.29 | )% | | | (0.19 | )% | | | (0.11 | )% |
| Supplemental data: | | | | | | | | | | | | | | | | | | | | |
| Portfolio turnover rate | | | 25.3 | % | | | 19.4 | % | | | 22.7 | % | | | 34.9 | % | | | 27.6 | % |
| Net assets, end of year (000’s) | | $ | 23,777 | | | $ | 40,509 | | | $ | 59,467 | | | $ | 68,878 | | | $ | 73,818 | |
| (a) | The amounts shown for a share outstanding may not correlate with the Statements of Operations for the period due to the timing of sales and repurchases of fund shares in relation to income earned and/or gains (losses) both realized and unrealized during the period. |
| (b) | Calculated using average daily shares outstanding. |
| (c) | Total return assumes reinvestment of all distributions and does not reflect a contingent deferred sales charge. |
| 34 | See Notes to Financial Statements. | |
| Financial Highlights | IVA Funds |
IVA International Fund — Class I
For a share of each class of beneficial interest outstanding:
| | | Year Ended September 30, | |
| | | 2019 | | | 2018 | | | 2017 | | | 2016 | | | 2015 | |
| Net asset value, beginning | | | | | | | | | | | | | | | |
| of year | | $ | 17.28 | | | $ | 18.06 | | | $ | 16.32 | | | $ | 16.43 | | | $ | 17.89 | |
| Increase (decrease) from | | | | | | | | | | | | | | | | | | | | |
| investment operations:(a) | | | | | | | | | | | | | | | | | | | | |
| Net investment income(b) | | | 0.26 | | | | 0.18 | | | | 0.12 | | | | 0.13 | | | | 0.16 | |
| Net realized and unrealized | | | | | | | | | | | | | | | | | | | | |
| gain (loss) | | | (1.04 | ) | | | (0.30 | ) | | | 1.86 | | | | 0.84 | | | | (0.55 | ) |
| Increase (decrease) from | | | | | | | | | | | | | | | | | | | | |
| investment operations | | | (0.78 | ) | | | (0.12 | ) | | | 1.98 | | | | 0.97 | | | | (0.39 | ) |
| Decrease from distributions: | | | | | | | | | | | | | | | | | | | | |
| Net investment income | | | (0.25 | ) | | | (0.29 | ) | | | (0.07 | ) | | | (0.45 | ) | | | (0.52 | ) |
| Net realized gain on investments | | | (0.88 | ) | | | (0.37 | ) | | | (0.17 | ) | | | (0.63 | ) | | | (0.55 | ) |
| Decrease from distributions | | | (1.13 | ) | | | (0.66 | ) | | | (0.24 | ) | | | (1.08 | ) | | | (1.07 | ) |
| Net asset value, end of year | | $ | 15.37 | | | $ | 17.28 | | | $ | 18.06 | | | $ | 16.32 | | | $ | 16.43 | |
| Total return(c) | | | (4.25 | )% | | | (0.77 | )% | | | 12.34 | % | | | 6.20 | % | | | (2.16 | )% |
| Ratios to average net assets: | | | | | | | | | | | | | | | | | | | | |
| Operating expenses | | | 0.99 | % | | | 1.00 | % | | | 1.00 | % | | | 0.99 | % | | | 1.00 | % |
| Net investment income | | | 1.64 | % | | | 1.00 | % | | | 0.74 | % | | | 0.85 | % | | | 0.92 | % |
| Supplemental data: | | | | | | | | | | | | | | | | | | | | |
| Portfolio turnover rate | | | 25.3 | % | | | 19.4 | % | | | 22.7 | % | | | 34.9 | % | | | 27.6 | % |
| Net assets, end of year (000’s) | | $ | 2,645,748 | | | $ | 3,627,334 | | | $ | 3,874,426 | | | $ | 3,639,098 | | | $ | 3,164,053 | |
| (a) | The amounts shown for a share outstanding may not correlate with the Statements of Operations for the period due to the timing of sales and repurchases of fund shares in relation to income earned and/or gains (losses) both realized and unrealized during the period. |
| (b) | Calculated using average daily shares outstanding. |
| (c) | Total return assumes reinvestment of all distributions. |
| | See Notes to Financial Statements. | 35 |
| Notes to Financial Statements | IVA Funds |
Note 1 – Organization and Significant Accounting Policies
IVA Fiduciary Trust (the “Trust”) consists of the IVA Worldwide Fund (the “Worldwide Fund”) and IVA International Fund (the “International Fund”) (each, a “Fund” and, together, the “Funds”). The Worldwide Fund and the International Fund are each a diversified investment portfolio of the Trust, an open-end series management investment company registered under the Investment Company Act of 1940, as amended (the “1940 Act”), and organized as a Massachusetts business trust. The Funds commenced investment operations on October 1, 2008. The Worldwide Fund seeks long-term growth of capital by investing in a range of securities and asset classes from markets around the world, including U.S. markets. The International Fund seeks long-term growth of capital by investing in a range of securities and asset classes from markets around the world.
The following are significant accounting policies followed by the Funds in the preparation of their financial statements in conformity with accounting principles generally accepted in the United States of America (“U.S. GAAP”). In accordance with U.S. GAAP, each Fund has been defined as an investment company and as such complies with investment company and reporting guidance of the Financial Accounting Standards Board. As of result, there are no changes to measurement or disclosure required in the Funds’ financial statements.
Use of Estimates.Preparation of these financial statements in conformity with U.S. GAAP requires the Funds’ management to make estimates and assumptions that may affect the amounts reported in the financial statements and related notes. Actual results could differ from these estimates.
Valuation of the Funds.The net asset value per share (“NAV”) of a Fund’s shares of a particular class is calculated each day that the New York Stock Exchange (“NYSE”) is open.
Listed equity securities are generally valued at the last sale price on the exchange that is the primary market for such securities. Equity securities listed on the NASDAQ Stock Exchange (“NASDAQ”) are generally valued using the NASDAQ Official Closing Price (“NOCP”). If no sales or NOCPs are reported during the day, equity securities are generally valued at the mean of the last available bid and asked quotations on the exchange or market on which the security is primarily traded, or using other market information obtained from a quotation reporting system, established market makers, or pricing services. If there is only a bid or only an asked price on such date, valuation will be at such bid or asked price for long and short positions, respectively. Over-the-counter (“OTC”) equity securities not listed on NASDAQ are generally valued at the mean of the last available bid and asked quotations on the market on which the security is primarily traded, or using other market information obtained from a quotation reporting system, established market makers or pricing services. If there is only a bid or only an asked price on such date, valuation will be at such bid or asked price for long or short positions, respectively.
Precious metals, including gold bullion, are valued at the spot price at the time trading on the NYSE closes (normally 4:00 p.m. E.T.).
Debt securities, other than commercial paper, for which market quotations are readily available are generally valued at the evaluated mean primarily based on the last bid and asked prices received from an independent pricing service. When no asked price is available, debt securities are valued at the evaluated bid price alone. Commercial paper is generally valued at the evaluated bid price provided by an independent pricing service. An evaluated price may include a variety of factors including the issue’s coupon rate, maturity, credit rating, yield, trade data, quoted prices of similar fixed income securities, and any other relevant market or security specific information.
Forward foreign currency contracts are valued at the current cost of offsetting such contracts.
The value of any investment that is listed or traded on more than one exchange or market is based on the exchange or market determined by International Value Advisers, LLC (the “Adviser”) to be the primary trading venue for that investment. A quotation from the exchange or market deemed by the Adviser to be the secondary trading venue for a particular investment may be relied upon in instances where a quotation is not available on the primary exchange or market.
| Notes to Financial Statements | IVA Funds |
The Board of Trustees of the Trust (the “Board”) has established a Pricing and Fair Valuation Committee (the “Committee”) comprised of officers of the Adviser to which it has delegated the responsibility for overseeing the implementation of the Funds’ valuation procedures and fair value determinations made on behalf of the Board. The Committee may determine that market quotations are not readily available due to events relating to a single issuer (e.g., corporate actions or announcements) or events relating to multiple issuers (e.g., governmental actions or natural disasters). The Committee may determine that there has been a significant decrease in the volume and level of activity for an asset or liability whereby transactions or quoted prices may not be determinative of fair value. The Committee may determine the fair value of investments based on information provided by pricing services and other third parties, including broker-dealers and other market intermediaries, which may recommend fair value prices or adjustments with reference to other securities, indices or assets. For securities that do not trade during NYSE hours or securities for which there is a foreign market holiday when the NYSE is open, fair valuation determinations are based on analyses of market movements after the close of those securities’ primary markets, and include reviews of developments in foreign markets, the performance of U.S. securities markets, and the performance of instruments trading in U.S. markets that represent foreign securities or baskets of foreign securities. Fair value pricing may require subjective determinations about the value of an asset or liability. Fair values used to determine the Funds’ NAVs may differ from quoted or published prices, or from prices that are used by others, for the same investments. The use of fair value pricing may not always result in adjustments to the prices of securities or other assets or liabilities held by the Funds.
Fair Value Measurement.The Funds adhere to U.S. GAAP fair value accounting standards that establish a single definition of fair value, create a three-tier hierarchy as a framework for measuring fair value based on inputs used to value the Funds’ assets and liabilities, and require additional disclosure about fair value. The hierarchy of inputs is summarized below:
| • | Level 1 – | last traded/quoted prices in active markets for identical unrestricted investments |
| • | Level 2 – | other significant observable inputs (including quoted prices for similar or identical investments, amortized cost, interest rates, prepayment speeds, credit risk, other observable market data, etc.) |
| • | Level 3 – | significant unobservable inputs (including the Funds’ own assumptions in determining the fair value of investments) |
The following is a summary of the inputs used in valuing the Worldwide Fund’s assets and liabilities at fair value:
| | | Last Traded/Quoted | | | | | | | | | | |
| | | Prices in Active | | | Other Significant | | | Significant | | | | |
| | | Markets for | | | Observable | | | Unobservable | | | | |
| | | Identical Unrestricted | | | Inputs | | | Inputs | | | | |
| ASSETS | | Investments (Level 1) | | | (Level 2) | | | (Level 3) | | | Total | |
| Common stocks: | | | | | | | | | | | | | | | | |
| Foreign | | $ | 2,426,680,115 | | | $ | 8,522,142 | | | | — | | | $ | 2,435,202,257 | |
| United States | | | 1,221,378,435 | | | | — | | | | — | | | | 1,221,378,435 | |
| Corporate notes & bonds | | | — | | | | 126,361,721 | | | | — | | | | 126,361,721 | |
| Convertible bonds | | | — | | | | 3,119,160 | | | | — | | | | 3,119,160 | |
| Commodities | | | 205,430,962 | | | | — | | | | — | | | | 205,430,962 | |
| Short-term investments | | | — | | | | 1,834,922,648 | | | | — | | | | 1,834,922,648 | |
| Unrealized appreciation on | | | | | | | | | | | | | | | | |
| open forward foreign | | | | | | | | | | | | | | | | |
| currency contracts | | | — | | | | 2,766,089 | | | | — | | | | 2,766,089 | |
| Total assets | | $ | 3,853,489,512 | | | $ | 1,975,691,760 | | | | — | | | $ | 5,829,181,272 | |
| LIABILITIES | | | | | | | | | | | | | | | | |
| Unrealized appreciation on | | | | | | | | | | | | | | | | |
| open forward foreign | | | | | | | | | | | | | | | | |
| currency contracts | | | — | | | $ | 1,011,371 | | | | — | | | $ | 1,011,371 | |
For the years ended September 30, 2019 and September 30, 2018, there were no Level 3 assets or liabilities held in the Worldwide Fund.
| Notes to Financial Statements | IVA Funds |
The following is a summary of the inputs used in valuing the International Fund’s assets and liabilities at fair value:
| | | Last Traded/Quoted | | | | | | | | | | |
| | | Prices in Active | | | Other Significant | | | Significant | | | | |
| | | Markets for | | | Observable | | | Unobservable | | | | |
| | | Identical Unrestricted | | | Inputs | | | Inputs | | | | |
| ASSETS | | Investments (Level 1) | | | (Level 2) | | | (Level 3) | | | Total | |
| Common stocks: | | | | | | | | | | | | | | | | |
| Foreign | | $ | 2,022,069,979 | | | $ | 29,090,198 | | | | — | | | $ | 2,051,160,177 | |
| United States | | | 74,066,700 | | | | — | | | | — | | | | 74,066,700 | |
| Preferred stocks | | | 21,369,103 | | | | — | | | | — | | | | 21,369,103 | |
| Corporate notes & bonds | | | — | | | | 48,375,513 | | | | — | | | | 48,375,513 | |
| Convertible bonds | | | — | | | | 4,984,400 | | | | — | | | | 4,984,400 | |
| Supranational bonds | | | — | | | | 3,899,609 | | | | — | | | | 3,899,609 | |
| Commodities | | | 149,418,011 | | | | — | | | | — | | | | 149,418,011 | |
| Short-term investments | | | — | | | | 435,196,954 | | | | — | | | | 435,196,954 | |
| Unrealized appreciation on | | | | | | | | | | | | | | | | |
| open forward foreign | | | | | | | | | | | | | | | | |
| currency contracts | | | — | | | | 3,078,344 | | | | — | | | | 3,078,344 | |
| Total assets | | $ | 2,266,923,793 | | | $ | 524,625,018 | | | | — | | | $ | 2,791,548,811 | |
| LIABILITIES | | | | | | | | | | | | | | | | |
| Unrealized appreciation on | | | | | | | | | | | | | | | | |
| open forward foreign | | | | | | | | | | | | | | | | |
| currency contracts | | | — | | | $ | 870,584 | | | | — | | | $ | 870,584 | |
For the years ended September 30, 2019 and September 30, 2018, there were no Level 3 assets or liabilities held in the Worldwide Fund.
Foreign Currency Translation.Portfolio securities and other assets and liabilities initially valued in currencies other than the U.S. dollar are translated to U.S. dollars using exchange rates obtained from pricing services.
The Funds do not isolate that portion of the results of operations resulting from changes in foreign exchange rates on investments from the fluctuations arising from changes in market prices of investments held. Such fluctuations are included with the net realized and change in unrealized gain or loss on investments.
Net realized gains or losses on foreign currency transactions arise from sales of foreign currencies, including gains and losses on forward foreign currency contracts, currency gains or losses realized between the trade and settlement dates on securities transactions, and the difference between the amounts of dividends, interest, and foreign withholding taxes recorded on each Fund’s books and the U.S. dollar equivalent of the amounts actually received or paid. Net change in unrealized gains and losses from foreign currency translation arise from changes in the fair values of assets and liabilities, other than investments, at the date of valuation, resulting from changes in exchange rates.
Portfolio Transactions and Investment Income.Portfolio transactions are recorded on a trade date basis. Interest income, adjusted for amortization of premium and accretion of discount, is recorded on the accrual basis. Dividend income is recorded on the ex-dividend date. Realized gains and losses on investment transactions are determined by the specific identification method.
Class Allocation.Investment income, realized and unrealized gains and losses, and Fund expenses are allocated daily to the various classes of each Fund pro rata on the basis of relative net assets. Each class bears certain expenses unique to that class. Differences in class-level expenses may result in payment of different per share dividends by each share class.
Distributions to Shareholders.Distributions are recorded on the ex-dividend date and are determined in accordance with federal income tax regulations, which may differ from U.S. GAAP. Accordingly, the nature of distributions and composition of net assets for tax purposes differ from those reflected in the accompanying financial statements.
| Notes to Financial Statements | IVA Funds |
Federal and Other Taxes.It is each Fund’s policy to comply with the federal income and excise tax requirements of the Internal Revenue Code of 1986, as amended, applicable to regulated investment companies. Accordingly, each Fund intends to distribute substantially all of its taxable income and net realized gains, if any, to shareholders each year. Therefore, no federal income tax provision is required in the Funds’ financial statements.
The Funds follow the Financial Accounting Standards Board accounting standard for accounting for uncertainty in income taxes. This standard defines the threshold for recognizing tax positions in the financial statements as “more-likely-than-not” to be sustained by the applicable taxing authority and requires measurement of a tax position meeting the “more-likely-than-not” criterion, based on the largest benefit that is more than fifty percent realized. Management has analyzed each Fund’s tax positions taken on federal and state tax returns for all open tax years (generally the current and the prior three tax years) and determined that no provision for income tax would be required in the Funds’ financial statements. Tax-related interest or penalties, if applicable, are to be disclosed in the Statements of Operations. For the year ended September 30, 2019, the Funds did not incur any tax-related interest or penalties.
Under the applicable foreign tax laws, a withholding tax may be imposed on interest, dividends and capital gains at various rates. Dividend and interest withholding taxes and capital gains taxes incurred, for the year ended September 30, 2019, can be found in the Statements of Operations.
Forward Foreign Currency Contracts.Each Fund engages in buying and selling forward foreign currency contracts to seek to manage the exposure of investments denominated in non-U.S. currencies against fluctuations in relative value. A forward foreign currency contract involves a privately negotiated obligation to purchase or sell (with delivery generally required) a specific currency at a future date, at a price set at the time of the contract.
Transactions with Affiliates.The Funds are permitted to purchase and sell securities (“cross-trade”) from and to other entities managed by the Adviser pursuant to procedures approved by the Board in compliance with Rule 17a-7 under the 1940 Act. In compliance with these provisions of Rule 17a-7, each cross-trade is executed at the current market price with no brokerage commission, fee, or other remuneration paid in connection with the transaction.
Foreign Investment Risk.Each Fund invests in foreign investments. Foreign investments can involve additional risks relating to political, economic or regulatory conditions in foreign countries. These risks include fluctuations in foreign currencies; withholding or other taxes; trading, settlement, custodial, and other operational risks; and the less stringent investor protection and disclosure standards of some foreign markets. Since foreign exchanges may be open on days when a Fund does not price its shares, the value of the investments in such Fund’s portfolio may change on days when shareholders will not be able to purchase or sell the Fund’s shares.
Custodian Risk.Cash is held at the Funds’ custodian, State Street Bank and Trust Company (the “Custodian”). The Funds are subject to credit risk on any cash balance that exceeds the amount insured by the Federal Deposit Insurance Corporation to the extent that the Custodian may be unable to return cash held.
Indemnification.Under the Trust’s organizational documents, its officers and trustees are indemnified against certain liability arising out of the performance of their duties to the Funds. The Funds have a variety of indemnification obligations under contracts with their service providers. The Funds’ maximum exposure under these arrangements is unknown. However, the Funds have not had prior claims or losses pursuant to these contracts and expect the risk of loss to be remote.
Note 2 – Investment Advisory Agreement and Distribution Agreement
International Value Advisers, LLC is the investment adviser of the Funds. The Adviser’s primary business is to provide investment management services to a variety of investment vehicles, including the Funds. The Adviser is responsible for all business activities and oversight of the investment decisions made for the Funds.
In return for providing investment advisory services to the Funds, effective June 3, 2019, each Fund pays the Adviser an investment advisory fee, calculated daily and paid monthly, at an annual rate of 0.80% of each Fund’s average daily net assets annually up to $5 billion per Fund; 0.75% on average daily net assets annually between $5 billion and $10 billion per Fund; and 0.70% on average daily net assets annually greater than $10 billion per Fund. Prior to June 3, 2019 each Fund paid the Adviser 0.90% of each Fund’s average daily net assets. Investment advisory fees paid for the year ended September 30, 2019 are disclosed in the Statements of Operations.
| Notes to Financial Statements | IVA Funds |
The Funds have adopted Distribution and Services Plans (“12b-1 Plans”), pursuant to Rule 12b-1 under the 1940 Act. Under those 12b-1 Plans, the Funds pay a distribution fee with respect to Class A and C shares calculated at the annual rate of 0.25% and 0.75%, respectively, of the average daily net assets of each respective class. The Funds also pay a service fee with respect to Class C shares calculated at the annual rate of 0.25% of the average daily net assets. Class I shares do not participate in 12b-1 Plans. Fees paid under the 12b-1 Plans for the year ended September 30, 2019 are disclosed in the Statements of Operations.
Foreside Fund Services, LLC serves as the Funds’ sole and exclusive distributor, effective August 1, 2019. IVA Funds Distributors, LLC served as the Funds’ sole and exclusive distributor prior to August 1, 2019.
There is a maximum initial sales charge of 5.00% for Class A shares. Class A shares may be subject to a contingent deferred sales charge (“CDSC”) of 0.75% if $1,000,000 or more of Class A shares were initially purchased, a “finder’s fee” was paid to the dealer of record, and the Class A shares were subsequently redeemed within 18 months.
Class C shares may be subject to a CDSC of 1.00% if shares are redeemed within the first 12 months after purchase.
Note 3 – Investments
For the year ended September 30, 2019, the aggregate cost of purchases and proceeds from sales of investments (excluding short-term investments) were as follows:
| | | Worldwide | | | International | |
| | | Fund | | | Fund | |
| Purchases | | $ | 1,812,427,339 | | | $ | 677,728,193 | |
| Sales | | $ | 2,604,268,199 | | | $ | 1,226,118,627 | |
The cost basis of investments and derivatives for federal income tax purposes is substantially similar to the cost basis under U.S. GAAP. The following information is presented on a federal tax basis as of September 30, 2019.
| | | Worldwide | | | International | |
| | | Fund | | | Fund | |
| Cost basis of investments and derivatives | | $ | 5,418,837,055 | | | $ | 2,880,778,866 | |
| Gross unrealized appreciation | | $ | 826,574,695 | | | $ | 298,579,860 | |
| Gross unrealized depreciation | | $ | (418,996,567 | ) | | $ | (390,888,259 | ) |
| Net unrealized appreciation (deprecation) and derivatives | | $ | 407,578,128 | | | $ | (92,308,399 | ) |
Note 4–Derivative Instruments and Hedging Activities
The Funds enter into transactions involving derivative financial instruments in connection with their investing activities. During the year ended September 30, 2019, these instruments included forward foreign currency contracts. These instruments are subject to various risks similar to non-derivative instruments including market, credit and liquidity risks.
The use of derivative instruments may involve risks different from, or potentially greater than, the risks associated with investing directly in investments. Specifically, derivative instruments expose a Fund to the risk that the counterparty to an OTC derivatives contract will be unable or unwilling to make timely settlement payments or otherwise to honor its obligations. OTC derivatives transactions typically can only be closed out with the other party to the transaction. If the counterparty defaults, a Fund will have contractual remedies, but there is no assurance that the counterparty will meet its contractual obligations or that, in the event of default, a Fund will succeed in enforcing them. During the year ended September 30, 2019, the Funds had exposure to OTC derivatives in the form of forward foreign currency contracts.
Forward foreign currency contracts involve elements of market risk in excess of the amounts reflected in the Statements of Assets and Liabilities. The Funds bear the risk of an unfavorable change in the foreign exchange rate underlying the forward foreign currency contract, movements in foreign investment security values and changes in interest rates. Credit risks may also arise upon entering into these contracts from the potential inability of counterparties to meet the terms of their contracts.
| Notes to Financial Statements | IVA Funds |
The following summary of derivative instruments and hedging activity for each Fund is grouped by risk-type and provides information about the fair value and location of derivatives within the Statements of Assets and Liabilities at September 30, 2019.
Worldwide Fund
| | | Statements of Assets | | | |
| Risk-Type Category | | and Liabilities Location | | Fair Value | |
| Foreign exchange | | Unrealized appreciation on open forward foreign currency contracts | | $ | 2,766,089 | |
| Foreign exchange | | Unrealized depreciation on open forward foreign currency contracts | | $ | (1,011,371 | ) |
| Total | | | | $ | 1,754,718 | |
International Fund
| | | Statements of Assets | | | |
| Risk-Type Category | | and Liabilities Location | | Fair Value | |
| Foreign exchange | | Unrealized appreciation on open forward foreign currency contracts | | $ | 3,078,344 | |
| Foreign exchange | | Unrealized depreciation on open forward foreign currency contracts | | $ | (870,584 | ) |
| Total | | | | $ | 2,207,760 | |
The following is a summary for each Fund grouped by risk-type that provides information about the effect of derivatives and hedging activities on the Funds’ Statements of Operations for the year ended September 30, 2019.
Worldwide Fund
| | | | | | | | Change in | |
| | | | | | | | Unrealized | |
| | | | | | | | Appreciation/ | |
| Risk-Type Category | | Derivative Instrument | | Realized Gain | | | (Depreciation) | |
| Foreign exchange | | Forward foreign currency contracts | | $ | 25,461,123 | | | $ | (1,222,639 | ) |
International Fund
| | | | | | | | Change in | |
| | | | | | | | Unrealized | |
| | | | | | | | Appreciation/ | |
| Risk-Type Category | | Derivative Instrument | | Realized Gain | | | (Depreciation) | |
| Foreign exchange | | Forward foreign currency contracts | | $ | 19,996,154 | | | $ | (2,087,581 | ) |
During the year ended September 30, 2019, the Worldwide Fund had average notional values of $446,826,209 on forward foreign currency contracts to sell.
During the year ended September 30, 2019, the International Fund had average notional values of $424,031,549 on forward foreign currency contracts to sell.
The following tables present, by counterparty, gross amounts of derivatives eligible for offsetting, gross amounts offset in the Statements of Assets and Liabilities and related collateral received and/or pledged, if any, that the Funds have elected to offset under their legally enforceable ISDA Master Netting Agreement with such counterparty. An ISDA Master Netting Agreement is an agreement between the Fund and the counterparty that governs the terms of certain transactions and reduces the counterparty risk associated with relevant transactions by specifying offsetting mechanisms and collateral arrangements, if any. Offsetting mechanisms allow the Funds to pay or receive the net amount of all forward foreign currency contracts outstanding on a given settlement date. At September 30, 2019, the Funds elected to offset forward foreign currency contracts on the Statements of Assets and Liabilities.
| Notes to Financial Statements | IVA Funds |
Worldwide Fund
| | | | | | Gross Amount | | | | | | Net Exposure | |
| | | Gross Amount of | | | Offset in the | | | | | | Presented in the | |
| | | Recognized | | | Statements of | | | Collateral | | | Statements of Assets | |
| Counterparty | | Assets | | | Assets and Liabilities | | | Received | | | and Liabilities | |
| Forward foreign currency contracts | | | | | | | | | | | | | | | | |
| State Street Bank & Trust Co. | | $ | 3,295,033 | | | $ | (528,944 | ) | | | — | | | $ | 2,766,089 | |
| | | | | | | | | Collateral | | | | |
| | | | | | | | | Used to | | | | |
| | | | | | Gross Amount | | | Offset Gross | | | Net Exposure | |
| | | Gross Amount of | | | Offset in the | | | Amount of | | | Presented in the | |
| | | Recognized | | | Statements of | | | Recognized | | | Statements of Assets | |
| Counterparty | | Liabilities | | | Assets and Liabilities | | | Liabilities | | | and Liabilities | |
| Forward foreign currency contracts | | | | | | | | | | | | | | | | |
| State Street Bank & Trust Co. | | $ | 1,011,371 | | | | — | | | $ | 1,011,371 | | | | — | |
International Fund
| | | | | | Gross Amount | | | | | | Net Exposure | |
| | | Gross Amount of | | | Offset in the | | | | | | Presented in the | |
| | | Recognized | | | Statements of | | | Collateral | | | Statements of Assets | |
| Counterparty | | Assets | | | Assets and Liabilities | | | Received | | | and Liabilities | |
| Forward foreign currency contracts | | | | | | | | | | | | | | | | |
| State Street Bank & Trust Co. | | $ | 3,663,814 | | | $ | (585,470 | ) | | | — | | | $ | 3,078,344 | |
| | | | | | | | | Collateral | | | | |
| | | | | | | | | Used to | | | | |
| | | | | | Gross Amount | | | Offset Gross | | | Net Exposure | |
| | | Gross Amount of | | | Offset in the | | | Amount of | | | Presented in the | |
| | | Recognized | | | Statements of | | | Recognized | | | Statements of Assets | |
| Counterparty | | Liabilities | | | Assets and Liabilities | | | Liabilities | | | and Liabilities | |
| Forward foreign currency contracts | | | | | | | | | | | | | | | | |
| State Street Bank & Trust Co. | | $ | 870,584 | | | | — | | | $ | 870,584 | | | | — | |
Note 5 – Shares of Beneficial Interest
At September 30, 2019, the Trust had an unlimited number of shares of beneficial interest authorized with a par value of $0.001 per share. The Funds have the ability to issue multiple classes of shares. Each share of a class represents an identical interest and has the same rights, except that each class bears certain direct expenses specifically related to the distribution of its shares.
| Notes to Financial Statements | IVA Funds |
Transactions in shares of each class of the Worldwide Fund were as follows:
Worldwide Fund
| | | Year Ended | | | Year Ended | |
| | | September 30, 2019 | | | September 30, 2018 | |
| | | Shares | | | Amount | | | Shares | | | Amount | |
| Class A | | | | | | | | | | | | | | | | |
| Shares sold | | | 11,231,971 | | | $ | 189,770,701 | | | | 4,652,076 | | | $ | 88,259,325 | |
| Shares reinvested | | | 4,987,878 | | | | 81,053,021 | | | | 2,136,904 | | | | 40,131,113 | |
| Shares repurchased | | | (20,897,120 | ) | | | (353,920,725 | ) | | | (25,470,571 | ) | | | (485,565,498 | ) |
| Net Decrease | | | (4,677,271 | ) | | $ | (83,097,003 | ) | | | (18,681,591 | ) | | $ | (357,175,060 | ) |
| Class C | | | | | | | | | | | | | | | | |
| Shares sold | | | 1,769,750 | | | $ | 28,898,343 | | �� | | 1,476,761 | | | $ | 27,395,583 | |
| Shares reinvested | | | 2,535,020 | | | | 40,306,819 | | | | 1,074,535 | | | | 19,782,190 | |
| Shares repurchased | | | (18,568,669 | ) | | | (306,771,845 | ) | | | (11,224,432 | ) | | | (208,087,333 | ) |
| Net Decrease | | | (14,263,899 | ) | | $ | (237,566,683 | ) | | | (8,673,136 | ) | | $ | (160,909,560 | ) |
| Class I | | | | | | | | | | | | | | | | |
| Shares sold | | | 59,069,326 | | | $ | 995,953,384 | | | | 60,421,606 | | | $ | 1,150,394,284 | |
| Shares reinvested | | | 25,133,077 | | | | 409,417,818 | | | | 8,854,248 | | | | 166,725,489 | |
| Shares repurchased | | | (141,948,468 | ) | | | (2,406,016,443 | ) | | | (53,455,755 | ) | | | (1,017,226,055 | ) |
| Net Increase (Decrease) | | | (57,746,065 | ) | | $ | (1,000,645,241 | ) | | | 15,820,099 | | | $ | 299,893,718 | |
Transactions in shares of each class of the International Fund were as follows:
International Fund
| | | Year Ended | | | Year Ended | |
| | | September 30, 2019 | | | September 30, 2018 | |
| | | Shares | | | Amount | | | Shares | | | Amount | |
| Class A | | | | | | | | | | | | | | | | |
| Shares sold | | | 3,287,250 | | | $ | 48,825,398 | | | | 749,616 | | | $ | 13,348,904 | |
| Shares reinvested | | | 542,162 | | | | 8,040,267 | | | | 434,628 | | | | 7,697,265 | |
| Shares repurchased | | | (5,650,309 | ) | | | (88,119,341 | ) | | | (5,604,735 | ) | | | (99,651,839 | ) |
| Net Decrease | | | (1,820,897 | ) | | $ | (31,253,676 | ) | | | (4,420,491 | ) | | $ | (78,605,670 | ) |
| Class C | | | | | | | | | | | | | | | | |
| Shares sold | | | 692,881 | | | $ | 9,872,774 | | | | 109,817 | | | $ | 1,930,642 | |
| Shares reinvested | | | 122,641 | | | | 1,786,878 | | | | 76,549 | | | | 1,334,244 | |
| Shares repurchased | | | (1,631,010 | ) | | | (24,650,653 | ) | | | (1,153,869 | ) | | | (20,101,123 | ) |
| Net Decrease | | | (815,488 | ) | | $ | (12,991,001 | ) | | | (967,503 | ) | | $ | (16,836,237 | ) |
| Class I | | | | | | | | | | | | | | | | |
| Shares sold | | | 35,903,924 | | | $ | 553,194,974 | | | | 32,297,907 | | | $ | 577,075,323 | |
| Shares reinvested | | | 13,076,184 | | | | 194,050,565 | | | | 6,799,068 | | | | 120,479,489 | |
| Shares repurchased | | | (86,764,349 | ) | | | (1,332,904,310 | ) | | | (43,607,775 | ) | | | (776,248,731 | ) |
| Net Decrease | | | (37,784,241 | ) | | $ | (585,658,771 | ) | | | (4,510,800 | ) | | $ | (78,693,919 | ) |
Redemption Fees.The Funds impose a redemption fee of 2% of the total redemption amount on the Funds’ shares redeemed within 30 days of buying them or acquiring them by exchange. The redemption fee is credited to the applicable Fund. The purpose of the redemption fee is to deter excessive, short-term trading and other abusive trading practices, and to help offset the costs associated with the sale of portfolio securities to satisfy redemption and exchange requests made by “market timers” and other short-term shareholders, thereby insulating longer-term shareholders from such costs.
| Notes to Financial Statements | IVA Funds |
Note 6 – Income Tax Information and Distributions to Shareholders
The tax character of distributions paid during the fiscal year ended September 30, 2019 was as follows:
| | | Worldwide | | | International | |
| | | Fund | | | Fund | |
| Distributions Paid From: | | | | | | |
| Ordinary income | | $ | 84,384,284 | | | $ | 60,185,431 | |
| Long-Term gains | | $ | 555,064,000 | | | $ | 174,507,787 | |
As of September 30, 2019, the components of accumulated earnings on a tax basis were as follows:
| | | Worldwide | | | International | |
| | | Fund | | | Fund | |
| Undistributed net investment income | | $ | 71,373,250 | | | $ | 62,270,839 | |
| Undistributed realized gains | | | 305,330,600 | | | | 42,057,723 | |
| Other book/tax temporary differencesa | | | (62,792 | ) | | | (45,613 | ) |
| Unrealized appreciation/(depreciation)b | | | 407,533,484 | | | | (92,344,873 | ) |
| Total accumulated earnings | | $ | 784,174,542 | | | $ | 11,938,076 | |
| a | Other book/tax temporary differences are attributable primarily to the tax treatment of offering costs. |
| b | The difference between book-basis and tax-basis unrealized appreciation/(depreciation) is attributable primarily to the treatment of passive foreign investment companies, forward foreign currency contracts and the tax deferral of losses on wash sales. |
Reclassification.U.S. GAAP requires that certain components of net assets be adjusted to reflect permanent differences between financial and tax reporting. These reclassifications have no effect on net assets or NAV per share. For the fiscal year ended September 30, 2019, the following reclassifications have been made:
| | | Worldwide | | | International | |
| | | Fund | | | Fund | |
| Undistributed net investment loss | | $ | 11,131,677 | | | $ | 14,198,876 | |
| Accumulated net realized gain | | $ | (84,756,430 | ) | | $ | (27,280,096 | ) |
| Paid-in-capital | | $ | 73,624,753 | | | $ | 13,081,220 | |
| Report of Independent Registered Public Accounting Firm | IVA Funds |
To the Shareholders and the Board of Trustees of
IVA Fiduciary Trust:
Opinion on the Financial Statements
We have audited the accompanying statements of assets and liabilities of IVA Fiduciary Trust (the “Trust”) (comprising the IVA Worldwide Fund and IVA International Fund (collectively referred to as the “Funds”)), including the schedules of investments, as of September 30, 2019, and the related statements of operations for the year then ended, the statements of changes in net assets for each of the two years in the period then ended, the financial highlights for each of the five years in the period then ended and the related notes (collectively referred to as the “financial statements”). In our opinion, the financial statements present fairly, in all material respects, the financial position of each of the Funds comprising IVA Fiduciary Trust at September 30, 2019, the results of their operations for the year then ended, the changes in their net assets for each of the two years in the period then ended and their financial highlights for each of the five years in the period then ended, in conformity with U.S. generally accepted accounting principles.
Basis for Opinion
These financial statements are the responsibility of the Trust’s management. Our responsibility is to express an opinion on each of the Funds’ financial statements based on our audits. We are a public accounting firm registered with the Public Company Accounting Oversight Board (United States) (“PCAOB”) and are required to be independent with respect to the Trust in accordance with the U.S. federal securities laws and the applicable rules and regulations of the Securities and Exchange Commission and the PCAOB.
We conducted our audits in accordance with the standards of the PCAOB. Those standards require that we plan and perform the audit to obtain reasonable assurance about whether the financial statements are free of material misstatement, whether due to error or fraud. The Trust is not required to have, nor were we engaged to perform, and audit of the Trust’s internal control over financial reporting. As part of our audits we are required to obtain an understanding of internal control over financial reporting but not for the purpose of expressing an opinion on the effectiveness of the Trust’s internal control over financial reporting. Accordingly, we express no such opinion.
Our audits included performing procedures to access the risks of material misstatement of the financial statements, whether due to error or fraud, and performing procedures that respond to those risks. Such procedures included examining, on a test basis, evidence regarding the amounts and disclosures in the financial statements. Our procedures included confirmation of securities owned as of September 30, 2019, by correspondence with the custodian and others or by other appropriate auditing procedures where replies from others were not received. Our audits also included evaluating the accounting principles used and significant estimates made by management, as well as evaluating the overall presentation of the financial statements. We believe that our audits provide a reasonable basis for our opinion.

We have served as the auditor of one or more International Value Advisers, LLC investment companies since 2008.
Boston, Massachusetts
November 15, 2019
| Trustees and Officers(unaudited) | IVA Funds |
The business and affairs of each Fund are managed under the direction of its Board of Trustees (the “Board”). The Board approves all significant agreements between a Fund and the persons or companies that furnish services to a Fund, including agreements with its investment adviser, distributor, administrator, custodian and transfer agent. The day-to-day operations of the Funds are delegated to the Funds’ investment adviser and administrator. The name, address, age and principal occupations for the past five years of the Trustees and officers of the Trust are listed below, along with the number of portfolios in the Fund complex overseen by and the other directorships held by each Trustee. Each Trustee’s mailing address is c/o International Value Advisers, LLC, 717 Fifth Avenue, New York, NY 10022.
Independent Trustees(a)
| | | | | | | | | Number of | | |
| | | | | | | | | Portfolios | | |
| | | | | Term of | | | | in the Fund | | Other |
| | | Position(s) | | Office(b)and | | Principal | | Complex | | Directorships/ |
| | | Held with | | Length of | | Occupation(s) During | | Overseen by | | Trusteeships Held |
| Name (Birth Year) | | the Trust | | Time Served | | Past 5 Years | | Trustee | | by Trustee |
Adele R. Wailand (1949) | | Trustee and Chair of the Board | | since 2008 | | Consultant (2011 to present) and Corporate Secretary (prior to 2017), and previously Vice President and General Counsel, Case Pomeroy & Company, Inc. (real estate and investments); | | 2 | | None. |
| | | | | | | | | | | |
Manu Bammi (1962) | | Trustee | | since 2008 | | Founder and Chief Executive Officer, SmartAnalyst, Inc. (provider of research and analytics and decision support to businesses). | | 2 | | None. |
| | | | | | | | | | | |
Ronald S. Gutstein (1971) | | Trustee | | since 2008 | | Institutional Trader and Market Maker, Access Securities (an institutional broker-dealer). | | 2 | | None. |
| | | | | | | | | | | |
William M. Rose (1945) | | Trustee | | since 2013 | | Member, Investment Advisory Committee, CYMI, Inc. (family office) (prior to 2015). | | 2 | | Director, Ocean Governance Training Foundation (since 2013) (a Canadian not-for-profit organization based in Halifax, NS). |
| (a) | Trustees who are not “interested persons” of the Trust as defined in the 1940 Act. |
| (b) | Each Trustee serves until resignation or removal from the Board. The current retirement age is 75. |
| Trustees and Officers(unaudited) | IVA Funds |
Interested Trustee
| | | | | | | | | Number of | | |
| | | | | | | | | Portfolios | | |
| | | | | Term of | | | | in the Fund | | Other |
| | | Position(s) | | Office(a)and | | Principal | | Complex | | Directorships/ |
| | | Held with | | Length of | | Occupation(s) During | | Overseen by | | Trusteeships Held |
| Name (Birth Year) | | the Trust | | Time Served | | Past 5 Years | | Trustee | | by Trustee |
Michael W. Malafronte(b)
(1974) | | President and Trustee | | since 2008 | | Managing Partner, the Adviser (since 2010); | | 2 | | Director, Adtalem Global Education Inc. (since 2016) |
| (a) | Each Trustee serves until resignation or removal from the Board. |
| (b) | Mr. Malafronte is considered an interested trustee due to his position as Managing Partner of the Adviser. |
Officers of the Trust
| | | Position(s) | | Term of Office | | |
| | | Held with | | and Length of | | |
| Name (Birth Year)and Address(a) | | the Trust | | Time Served(b) | | Principal Occupation(s) During Past 5 Years |
Shanda Scibilia
(1971) | | Chief Compliance Officer and Secretary | | since 2008 | | Chief Operating Officer and Chief Compliance Officer, the Adviser (since 2008). |
| | | | | | | |
Stefanie J. Hempstead
(1973) | | Treasurer | | since 2008 | | Chief Financial Officer, the Adviser (since 2008). |
| | | | | | | |
Christopher Hine
(1978) | | Assistant Treasurer | | since 2010 | | Director of Accounting, the Adviser (since 2009). |
| | | | | | | |
Philip F. Coniglio
(1981) | | Assistant Secretary | | since 2011 | | Chief Information Security Officer, the Adviser (since 2018); Director of Fund Operations, the Adviser (since 2014); Director of Information Technology, the Adviser (2014-2018); and Fund Operations Manager, the Adviser (2009-2014). |
| (a) | Each officer’s mailing address is c/o International Value Advisers, LLC, 717 Fifth Avenue, New York, NY 10022. |
| (b) | The term of office of each officer is indefinite. Length of time served represents time served as an officer of the Trust, although various positions may have been held during the period. |
| Additional Information(unaudited) | IVA Funds |
Board Approval of Investment Advisory Agreement.At a telephonic meeting held on May 9, 2019 and at an in-person meeting held on May 21, 2019, the Board of Trustees of the Trust (the “Board”), including all of the Trustees who are not “interested persons” of the Trust (the “Independent Trustees”) discussed the Investment Advisory Agreement (the “Advisory Agreement”) related to the Funds.
To assist the Board in its evaluation of the Advisory Agreement, the Independent Trustees received comprehensive written materials and other information, in adequate time in advance of the meeting, which outlined, among other things, (i) information confirming the financial condition of the Adviser and the Adviser’s profitability derived from its relationship with each Fund; (ii) information as to the advisory fee rates paid to the Adviser by each Fund and each other fund or account managed by the Adviser; (iii) information as to the advisory fee rates paid by mutual funds to other advisers selected by Broadridge Financial Solutions, Inc. (“Broadridge”); (iv) a description of the personnel and the nature and quality of the services provided by the Adviser; (v) information on compliance matters; (vi) comparative information on investment performance of the Funds; and (vii) information regarding brokerage and portfolio transactions of the Funds.
The Independent Trustees reviewed the materials provided by the Adviser, which included, among other things, the Broadridge 15(c) Report to the Board of Trustees (the “Broadridge Report”) containing detailed advisory fee, expense ratio and performance comparisons for each Fund with other mutual funds in their “peer group” and “category.” The Independent Trustees also reviewed the memorandum prepared by Sidley Austin LLP (“Sidley Austin”), Independent Trustee Counsel, outlining the legal duties of the Independent Trustees in evaluating investment advisory arrangements.
The Adviser also had provided the Independent Trustees with an analysis of its profitability with respect to providing investment advisory services to each Fund. In addition, it was noted, the Independent Trustees took into account information furnished throughout the year at regular Board meetings, including reports on investment performance, shareholder services, distribution fees and expenses, regulatory compliance and other services provided to each Fund. The Independent Trustees also considered other matters they deemed important to the approval process, such as allocation of Fund brokerage commissions, and other direct and indirect benefits to the Adviser from its relationship with the Funds. The Trustees met throughout the year with the Portfolio Managers of the Funds (the “Portfolio Managers”). It was noted that the Independent Trustees, in their deliberations, recognized that for many of the Funds’ shareholders, the decision to purchase Fund shares included a decision to select the Adviser as the investment adviser for their investments and that there was a strong association in the minds of Fund shareholders between the Adviser and each Fund. In considering factors relating to the approval of the continuance of the Advisory Agreement, the Independent Trustees noted that Sidley Austin had provided the Independent Trustees with assistance and advice. The Independent Trustees stated that with respect to the Advisory Agreement, although it related to both Funds, the Independent Trustees had considered each Fund separately. The Independent Trustees were satisfied that the information requested provided the Independent Trustees with the information that they believed, in the exercise of their business judgment, was pertinent, sufficient and comprehensive for the purposes of their evaluation of the continuation of each agreement and each plan. Among other factors, the Trustees noted that they considered the following:
The nature, extent and quality of services provided by the Adviser:The Independent Trustees reviewed the services that the Adviser provides to each Fund, including, but not limited to, making the day-to-day investment decisions for each Fund, and generally managing each Fund’s investments in accordance with the stated policies of the Fund. The Independent Trustees noted that throughout the year they discussed with officers and Portfolio Managers of the Funds the types of transactions that were being done on behalf of each Fund. Additionally, the Independent Trustees took into account the services provided by the Adviser to its other accounts that have investment mandates similar to the Funds. In particular, they noted the greater level of portfolio management, compliance and administrative oversight services required for the Funds, mutual funds registered under the 1940 Act, as compared to the Adviser’s institutional accounts. The Independent Trustees also considered the education, background and experience of the Adviser’s personnel, noting in particular that the favorable history and reputation of the Portfolio Managers for the Funds have had, and are likely to continue to have, a favorable impact on the Funds. The Independent Trustees additionally noted the Adviser’s ability to attract quality and experienced personnel and its continued investment in the growth of its business. The Independent Trustees also considered the administrative services provided by the Adviser, including compliance and accounting services, and oversight of third party service providers. After considering the above factors, the Independent Trustees concluded that the nature, quality and extent of services provided by the Adviser were satisfactory and appropriate and would continue to be suitable for each Fund. The Independent Trustees’ evaluation of the nature and quality of the services provided to the Adviser supported continuation of the Advisory Agreement.
Investment performance of each Fund and the Adviser: The Independent Trustees considered the investment performance of each Fund compared to the peer funds, the category funds and the relevant benchmark index. The Independent Trustees noted that the Funds have been in operation since October 1, 2008, and that the Broadridge Report presented performance
| Additional Information(unaudited) | IVA Funds |
information since inception and for the one-year, three-year, five-year and ten-year periods ended December 31, 2018. It was noted that, since inception and for the ten-year period, the IVA Worldwide Fund underperformed the median of the peer group funds, but outperformed the median of the category funds on an absolute basis and outperformed the medians of the peer group and category funds on most risk-adjusted performance bases in the Broadridge Report. It was noted that the IVA Worldwide Fund for the three-year and five-year periods underperformed the median of the peer group funds and for the one-year period outperformed the median of the peer group funds on an absolute basis, for the same periods outperformed the median of the peer group funds on most risk-adjusted performance bases in the Broadridge Report, for the one-year, the three-year and five-year periods outperformed the median of the category funds on an absolute basis and for the same periods outperformed the median of the category funds on most risk-adjusted performance bases in the Broadridge Report. With respect to the IVA International Fund, the Independent Trustees noted that since inception, the Fund outperformed the median of the peer group and the category funds on an absolute basis and on most risk-adjusted performance bases in the Broadridge Report. It was noted that for the ten-year period, IVA International Fund underperformed the median of the peer group funds and outperformed the median of the category funds on an absolute basis and outperformed the medians of the peer group and category funds on most risk-adjusted performance bases in the Broadridge Report. It was noted that for the one-year and five-year periods, IVA International Fund outperformed, and for the three-year period underperformed, the median of the peer group and category funds on an absolute basis and for the same periods outperformed the median of the peer group and category funds on a number of risk-adjusted performance bases in the Broadridge Report. Since inception and for the one-year period ended December 31, 2018, the Independent Trustees also noted that the IVA Worldwide Fund outperformed the Fund’s benchmark index (the MSCI All Country World Index) and for the three-year, five-year and ten-year periods underperformed the Fund’s benchmark index. It was noted that the IVA International Fund outperformed its benchmark index (the MSCI All Country World ex-U.S. Index) since inception and for the ten-year, five-year and one-year periods ended December 31, 2018, but underperformed its benchmark index for the three-year period ended December 31, 2018. The Independent Trustees considered the performance of the Funds in light of the Adviser’s investment approach of focusing on preservation of capital over the short-term and seeking to outperform each Fund’s benchmark over the longer term representing a full market cycle as well as each Fund’s asset allocation and the overall financial market conditions. In addition, each Fund’s upside and downside capture percentages as reported by Broadridge were noted. The Independent Trustees noted the high cash levels in the Funds, especially the IVA Worldwide Fund, relative to the peer group funds, and that the high cash levels are consistent with the Funds’ stated investment strategies and the current financial market conditions. The Independent Trustees also noted that the Adviser’s interests were well-aligned with the Funds’ shareholders as a result of the significant investment in the Funds by the Adviser’s partners. The Independent Trustees determined that each Fund’s performance, in light of all the considerations noted above, was satisfactory. The Independent Trustees determined that the Adviser continued to be an appropriate investment adviser for each Fund and concluded that each Fund’s performance supported the continuation of the Advisory Agreement.
Cost of the services provided and profits realized by the Adviser from its relationship with each Fund:The Independent Trustees considered the investment advisory fee payable by each Fund as well as the expense ratio of each Fund. The Independent Trustees considered each Fund’s effective advisory fee rate pursuant to the amended fee schedule at different asset levels compared to the peer group and category funds. It was noted that each Fund’s effective advisory fee rate was above the median for the peer group and category funds, but much closer to the medians than prior to the amendment of the fee schedules. It was noted that the IVA Worldwide Fund’s administrative expenses were lower than the peer group and category funds, that the IVA International Fund’s administrative expenses were equal to the peer group median, but lower than the category median, and that when these administrative expenses are considered, the combined fee charged for advisory and administrative services for both Funds generally compares more favorably to the peer group and category medians. Additionally, the Independent Trustees noted that for both Funds the “other fee” category in the Broadridge Report was lower than the peer group and category medians. The Independent Trustees also noted that the IVA Worldwide Fund’s gross expense and net expense ratio was lower than the median of the category funds for Class A shares, and that the gross expense ratio was equal to, and net expense ratio higher than the median of the peer group funds for Class A shares. The Independent Trustees also noted that the IVA International Fund’s gross expense ratio was lower than, and net expense ratio equal to, the median of the peer group funds for Class A shares, that the gross expense ratio and net expense ratio were lower than the medians of the category funds for Class A shares. The Independent Trustees noted that the net and gross expense ratios for each Fund generally had declined in the years since the Funds commenced operations correlated with the periods in which there was a growth in the assets of the Funds, and that the amended advisory fee rate resulted in lower net and gross expense ratios. The Independent Trustees noted favorably that in addition to reducing its base fee for each Fund, the Adviser had agreed in the Advisory Agreement amendment to institute breakpoints as assets increase in each of the Funds. The Independent Trustees concluded that each Fund’s current expense structure is satisfactory.
The Independent Trustees reviewed the amended advisory fee schedule that will go into effect for the Adviser’s managed separate accounts, and considered that the fees charged to those accounts were lower than those charged to the Funds under the Funds’ amended fee schedule. The Independent Trustees were aware of the significant shareholder services, legal and
| Additional Information(unaudited) | IVA Funds |
regulatory requirements associated with the Adviser’s management of the Funds that were not required in servicing separate accounts. The Independent Trustees also reviewed the amended advisory fee schedule that will go into effect for the Adviser’s private funds and an offshore fund, and noted that the effective fees for the private funds were comparable to, and the effective fee rate of the offshore fund was higher than, the Funds’ new advisory fee rates.
The Independent Trustees had reviewed the portfolio transaction data for each Fund in the Broadridge Report, and noted that the brokerage fee and portfolio turnover ratios for each Fund were below the medians of the peer group and category funds.
The Independent Trustees also reviewed information regarding the profitability to the Adviser of its relationship with each Fund. The Independent Trustees considered the level of the Adviser’s profits, the change in profitability over a five-year period, and whether the profits were reasonable. The Independent Trustees took into consideration other benefits to be derived by the Adviser in connection with the Advisory Agreement. Since the Adviser has no affiliates with business relationships with the Funds, the Independent Trustees noted that the Adviser receives no additional revenues from providing other services to the Funds. Moreover, the Independent Trustees noted that the Adviser’s interests are well-aligned with the Funds’ shareholders in the efficient management of the services and costs of the third-party service providers to the Funds. The Independent Trustees took into consideration the “soft dollar” research the Adviser receives from brokers which benefits the Funds and other Adviser clients and which might offset expenses the Adviser would otherwise incur. The Independent Trustees also noted the Adviser’s willingness to soft close both Funds from 2011 to 2018 and its other investment products to most new investors in order to best execute its investment strategy on behalf of the existing Fund shareholders and investors, and that this limited the Adviser’s profitability while benefitting shareholders. The Independent Trustees noted that at current asset levels, the amended advisory fee schedule for the Funds will result in a lower level of profitability to the Adviser. The Independent Trustees further noted the continuing investment by the Adviser in both its infrastructure and staff. The Independent Trustees also considered the entrepreneurial risk and financial exposure assumed by the Adviser in developing and managing the Funds. The Independent Trustees noted that the development and management of the Funds requires a high degree of knowledge, sophistication and judgment and potentially subjected the Adviser to substantial financial exposure. The Independent Trustees concluded that the profits realized by the Adviser from its relationship with each Fund were reasonable and consistent with fiduciary duties. The Independent Trustees’ evaluation of the Adviser’s profitability supported continuation of the Advisory Agreement.
The extent to which economies of scale would be realized as the Funds grow and whether fee levels would reflect such economies of scale:The Independent Trustees noted that they considered whether there have been economies of scale in respect to the management of each Fund, whether each Fund appropriately benefitted from any economies of scale and whether there is potential for realization of any further economies of scale. The Independent Trustees noted that the expense ratio of each Fund had declined since the Funds commenced operations due to the growth in the assets of the Funds and that the amended advisory fee rates with breakpoints in the fee schedule as assets increase resulted in lower expense ratios. The Independent Trustees also noted, however, that since the Funds were closed to most new investors from 2011 to 2018 and that in recent years the Funds were experiencing net redemptions, it was not likely that there would be a further significant decrease in each Fund’s expense ratio in the foreseeable future. The Independent Trustees again noted the continuing investment by the Adviser in both its infrastructure and staff which are expected to benefit the Funds and their shareholders. The Independent Trustees concluded that the current amended fee structure for each Fund with breakpoints in the advisory fee schedule as assets increase was reasonable, that shareholders sufficiently participated in economies of scale and that no changes were currently necessary. The Independent Trustees’ evaluation of the economies of scale supported continuation of the Advisory Agreement.
Comparison of services rendered and fees paid to those under other investment advisory contracts, such as contracts of the same and other investment advisers or other clients:The Independent Trustees noted that they compared the services rendered and the fees paid under the Advisory Agreement with those under other investment advisory contracts of other investment advisers managing funds deemed comparable as set forth in the Broadridge Report. The Independent Trustees stated that they also considered the services rendered and fees paid under the Advisory Agreement as compared to the Adviser’s other management contracts with institutional and other accounts with similar investment mandates. As noted above, the Independent Trustees acknowledged the greater level of portfolio management, compliance and administrative oversight services required for the Funds, as well as the higher level of financial exposure assumed, as compared to the Adviser’s institutional accounts and other investment funds. The Independent Trustees determined that, on a comparative basis, the amended fee under the Advisory Agreement for each Fund was reasonable in relation to the services provided to the Funds, and was lower than or comparable to the amended fees to be charged by the Adviser to its other investment funds. The Independent Trustees’ evaluation of the Adviser’s other fee arrangements and of comparable mutual funds advised by other advisers supported continuation of the Advisory Agreement.
No single factor was cited as determinative to the decision of the Trustees. Rather, after weighing all of the considerations and conclusions discussed above, the Trustees, including the Independent Trustees, unanimously approved the continuation of the Advisory Agreement for each Fund.
| Additional Information(unaudited) | IVA Funds |
Proxy Voting.Information on how the Funds voted proxies relating to portfolio securities during the prior 12-month period ended June 30th of each year and a description of the policies and procedures that the Funds use to determine how to vote proxies relating to portfolio transactions are available (1) without charge, upon request, by calling 866-941-4482, and (2) on Securities and Exchange Commission (“SEC”) website at www.sec.gov by accessing the Funds’ Form N-PX and Statement Additional Information in the Funds’ registration statement on Form N-1A.
Schedules of Portfolio Holdings.The Funds file their complete schedules of portfolio holdings with the SEC for the first and third quarters of each fiscal year on Form N-PORT. The Funds’ Form N-PORT is available on the SEC’s website at www.sec.gov. The Funds’ Form N-PORT may be reviewed and copied at the SEC’s Public Reference Room in Washington, D.C., and information on the operation of the Public Reference Room may be obtained by calling 800-SEC-0330. To obtain the Funds’ Form N-PORT, shareholders can call 866-941-4482.
Trustees and Officers of the Funds.Additional information about Trustees and officers of the Funds is included in the Statement of Additional Information which is available, without charge, upon request, by calling 866-941-4482.
| Important Tax Information(unaudited) | IVA Funds |
For the fiscal year ended September 30, 2019, the Funds will designate up to the maximum amount allowable pursuant to the Internal Revenue Code, as qualified dividend income eligible for reduced tax rates. These lower rates range from 0% to 20% depending on an individual’s tax bracket. Complete information will be reported in conjunction with Form 1099-DIV.
The Funds may elect to pass through to shareholders the income tax credit for taxes paid to foreign countries. Foreign source income and foreign tax expense per outstanding share on September 30, 2019 are as follows:
| | Foreign Source | Foreign Tax |
| | Income | Expense |
| Worldwide Fund | $0.25 | $0.02 |
| International Fund | $0.39 | $0.03 |
If elected, the pass-through of the foreign tax credit will affect only those persons who are shareholders on the dividend record date in December 2019. These shareholders will receive more detailed information along with their 2019 Form 1099-DIV.
| Fund Expenses(unaudited) | IVA Funds |
As a shareholder of the Funds, you may incur two types of costs: (1) transaction costs, including initial sales charges and/or redemption fees; and (2) ongoing costs, including investment advisory fees, distribution and/or service (12b-1) fees and other operating fund expenses. The information on this page is intended to help you understand your ongoing costs of investing in the Funds and to compare these costs with the ongoing costs of investing in other mutual funds.
This example is based on an investment of $1,000 invested on April 1, 2019 and held for the six months ended September 30, 2019.
ACTUAL EXPENSES
The table below titled “Based on Actual Total Return” provides information about actual account values and actual expenses. You may use the information provided in this table, together with the amount you invested, to estimate the expenses that you paid over the period. To estimate the expenses you paid on your account, divide your ending account value by $1,000 (for example, an $8,600 ending account value divided by $1,000 = 8.6), then multiply the result by the number under the heading titled “Expenses Paid During the Period.”
BASED ON ACTUAL TOTAL RETURN FOR THE SIX MONTHS ENDED SEPTEMBER 30, 2019(a)
| | Actual | | | Annualized | Expenses |
| | Total | Beginning | Ending | Expense | Paid During |
| | Return | Account Value | Account Value | Ratio | the Period(b) |
| Worldwide Fund | | | | |
| Class A | -0.18% | $1,000.00 | $998.20 | 1.20% | $6.01 |
| Class C | -0.55% | 1,000.00 | 994.50 | 1.95% | 9.75 |
| Class I | -0.06% | 1,000.00 | 999.40 | 0.95% | 4.76 |
| International Fund | | | | |
| Class A | -1.10% | $1,000.00 | $989.00 | 1.20% | $5.98 |
| Class C | -1.45% | 1,000.00 | 985.50 | 1.95% | 9.71 |
| Class I | -0.97% | 1,000.00 | 990.30 | 0.95% | 4.74 |
HYPOTHETICAL EXAMPLE FOR COMPARISON PURPOSES
The table below titled “Based on Hypothetical Total Return” provides information about hypothetical account values and hypothetical expenses based on the actual expense ratio and an assumed rate of return of 5% per year before expenses, which are not the Funds’ actual returns. The hypothetical account values and expenses may not be used to estimate the actual ending account values and expenses you paid for the period. You may use the information provided in this table to compare the ongoing costs of investing in the Funds and other funds. To do so, compare the 5% hypothetical example relating to the Funds with the 5% hypothetical examples that appear in the shareholder reports of other funds.
Please note that expenses shown in the table below are meant to highlight your ongoing costs and do not reflect any transactional costs, such as initial sales charges (loads) or redemption fees, if any. Therefore, the table is useful in comparing ongoing costs only and will not help you determine your relative total costs of owning different funds. In addition, if these transactional costs were included, your costs would have been higher.
BASED ON HYPOTHETICAL TOTAL RETURN FOR THE SIX MONTHS ENDED SEPTEMBER 30, 2019
| | Hypothetical | | | Annualized | Expenses |
| | Annualized | Beginning | Ending | Expense | Paid During |
| | Total Return | Account Value | Account Value | Ratio | the Period(b) |
| Worldwide Fund | | | | |
| Class A | 5.00% | $1,000.00 | $1,019.05 | 1.20% | $6.07 |
| Class C | 5.00% | 1,000.00 | 1,015.29 | 1.95% | 9.85 |
| Class I | 5.00% | 1,000.00 | 1,020.31 | 0.95% | 4.81 |
| International Fund | | | | |
| Class A | 5.00% | $1,000.00 | $1,019.00 | 1.20% | $6. 07 |
| Class C | 5.00% | 1,000.00 | 1,015.24 | 1.95% | 9.85 |
| Class I | 5.00% | 1,000.00 | 1,020.26 | 0.95% | 4.81 |
| (a) | Assumes reinvestment of all dividends and capital gain distributions, if any. |
| (b) | Expenses are equal to the Funds’ respective annualized expense ratio multiplied by the average account value over the period, multiplied by 183 days in the most recent fiscal half-year, then divided by 365. |

www.ivafunds.com
Investment Adviser
International Value Advisers, LLC
717 Fifth Avenue
New York, NY 10022
Distributor
Foreside Fund Services, LLC
3 Canal Plaza, Suite 100
Portland, ME 04101
Custodian
State Street Bank and Trust Company
One Heritage Drive
Quincy, MA 02171-2105
Transfer Agent
DST Asset Manager Solutions, Inc.
430 W 7th Street
STE 219061
Kansas City, MO 64105-1407
Counsel
K&L Gates LLP
State Street Financial Center
One Lincoln Street
Boston, MA 02111-2950
Independent Registered Public Accounting Firm
Ernst & Young LLP
200 Clarendon Street
Boston, MA 02116-5072
This report is submitted for the general information of the Funds’ shareholders. The report is not authorized for distribution to prospective investors in the Funds unless it is accompanied or preceded by the Funds’ current prospectus, which includes information regarding the Funds’ risks, objectives, fees and expenses, experience of its management, and other information.
The commentary within An Owner’s Manual, the Letter from the President, the Letter from the Portfolio Managers, and the Management’s Discussion of Fund Performance reflects their current views and opinions as of the date of this report. Any such views are subject to change at any time based upon market or other conditions and IVA Funds disclaims any responsibility to update such views. These views may not be relied on as investment advice and, because investment decisions are based on numerous factors, may not be relied on as an indication of trading intent. References to specific securities should not be construed as recommendations or investment advice.
Item 2. Code of Ethics.
(a) As of the end of the period covered by this Form N-CSR, the registrant has adopted a code of ethics, as defined in Item 2(b) of Form N-CSR, that applies to the registrant’s principal executive officer and principal financial officer.
(c) The registrant has not amended its code of ethics during the period covered by this Form N-CSR.
(d) The registrant has not granted any waivers from any provisions of the code of ethics during the period covered by this Form N-CSR.
(e) Not applicable.
(f) A copy of the registrant’s code of ethics is filed as Exhibit 13(a)(1) to this Form N-CSR.
Item 3. Audit Committee Financial Expert.
(a)(1) The registrant’s Board of Trustees (the “Board”) has determined that the registrant has at least one member serving on the registrant’s Audit Committee that possesses the attributes identified in Form N-CSR to qualify as an “audit committee financial expert.”
(a)(2) The audit committee financial experts are Manu Bammi and William M. Rose and each has been deemed to be “independent” as that term is defined in Form N-CSR.
Item 4. Principal Accountant Fees and Services.
The firm of Ernst &Young LLP (“E&Y”) serves as the independent registered public accounting firm for the registrant.
(a)Audit Fees.
For the fiscal years ended September 30, 2018 and September 30, 2019, the aggregate fees billed for professional services rendered by E&Y for the audit of the registrant’s annual financial statements and/or for services that are normally provided by E&Y in connection with statutory and regulatory filings or engagements were $94,500 and $97,200, respectively.
(b)Audit-Related Fees.
For the fiscal years ended September 30, 2018 and September 30, 2019, the aggregate fees billed for assurance and related services rendered by E&Y that are reasonably related to the performance of the audit or review of the registrant’s financial statements and that are not reported under Audit Fees above were $0 and $0, respectively.
For the twelve month periods ended September 30, 2018 and September 30, 2019, the aggregate Audit-Related Fees billed by E&Y that were required to be approved by the registrant’s Audit Committee for audit-related services rendered to the registrant’s investment adviser and any entity controlling, controlled by or under common control with the investment adviser that provides ongoing services to the registrant (the “Affiliated Service Providers”) that relate directly to the operations and financial reporting of the registrant were $0 and $0, respectively.
(c)Tax Fees.
For the fiscal years ended September 30, 2018 and September 30, 2019, the aggregate fees billed for tax compliance, tax advice and tax planning by E&Y were $26,760 and $27,560, respectively. Services for which fees in the Tax Fees category are billed include E&Y’s review of the registrant’s U.S. federal income tax returns and the required state corporate income tax returns, as well as E&Y’s review of excise tax distribution calculations.
For the twelve month periods ended September 30, 2018 and September 30, 2019, the aggregate Tax Fees billed by E&Y that were required to be approved by the registrant’s Audit Committee for tax compliance, tax advice and tax planning services rendered on behalf of Affiliated Service Providers that relate directly to the operations and financial reporting of the registrant were $11,000 and $11,000, respectively.
(d)All Other Fees.
For the fiscal years ended September 30, 2018 and September 30, 2019, the aggregate fees billed by E&Y to the registrant for all services other than services reported under Audit Fees, Audit-Related Fees, and Tax Fees were $0 and $0, respectively.
For the twelve month periods ended September 30, 2018 and September 30, 2019, the aggregate fees in this category billed by E&Y that were required to be approved by the registrant’s Audit Committee for services rendered on behalf of Affiliated Service Providers that relate directly to the operations and financial reporting of the registrant were $0 and $0, respectively.
(e)(1)Audit Committee’s Pre-Approval Policies and Procedures.
The registrant’s Audit Committee has the sole authority to pre-approve all audit and non-audit services to be provided by E&Y to the registrant, subject to the de minimis exceptions for non-audit services described in Section 10A(i)(1)B of the Securities Exchange Act of 1934, as amended (“Exchange Act”). Pre-approval of audit and non-audit services is not required if the engagement to render the services is entered into pursuant to pre-approval policies and procedures established by the Audit Committee (the “Pre-Approval Procedures”). The registrant’s Audit Committee adopted amended Pre-Approval Procedures on November 19, 2014, which generally permit:
Audit-Related Services consisting of: (i) consultations regarding accounting, operational or regulatory implications, or regulatory/compliance matters of proposed or actual transactions affecting the operations or financial reporting and (ii) other auditing procedures and issuance of special purpose reports;
Tax Services consisting of: (i) recurring tax services and (ii) consultations regarding tax consequences of proposed or actual transactions; and
Other Non-Audit Services including: (i) business support, (ii) other control and regulatory compliance projects and (iii) training.
All such services are subject to a per calendar quarterly limitation.
(e)(2)Percentage of Services.
None of the services described in each of paragraphs (b) through (d) of this Item were approved by the registrant’s Audit Committee pursuant to paragraph (c)(7)(i)(C) of Rule 2-01 of Regulation S-X.
(f) Not applicable.
(g) For the fiscal years ended September 30, 2018 and September 30, 2019, the aggregate non-audit fees billed by E&Y for services rendered to the registrant were $26,760 and $27,560, respectively.
For the twelve month periods ended September 30, 2018 and September 30, 2019, the aggregate non-audit fees billed by E&Y for services rendered to the Affiliated Service Providers were $0 and $0, respectively.
(h) Not applicable.
Item 5. Audit Committee of Listed Registrants.
Not applicable to the registrant.
Item 6. Investments.
(a) The audited schedules of investments are included in the report to shareholders filed under Item 1 of this Form N-CSR.
(b) Not applicable.
Item 7. Disclosure of Proxy Voting Policies and Procedures for Closed-End Management Investment Companies.
Not applicable to the registrant.
Item 8. Portfolio Managers of Closed-End Management Investment Companies.
Not applicable to the registrant.
Item 9. Purchases of Equity Securities by Closed-End Management Investment Company and Affiliated Purchasers.
Not applicable to the registrant.
Item 10. Submission of Matters to a Vote of Security Holders.
The registrant does not have procedures by which shareholders may recommend nominees to the registrant’s Board of Trustees. The Nominating and Governance Committee may, in its sole discretion, consider nominees recommended by each Fund’s shareholders.
Item 11. Controls and Procedures.
(a) Within the most recent fiscal half-year of the filing date of this Form N-CSR, Michael W. Malafronte, the registrant’s President and Chief Executive Officer, and Stefanie J. Hempstead, the registrant’s Treasurer and Chief Financial Officer, reviewed the registrant’s Disclosure Controls and Procedures and Internal Control over Financial Reporting (the “Procedures”) (as defined in Rule 30a-3(c) under the Investment Company Act of 1940, as amended (the “1940 Act”)) and evaluated their effectiveness. Based on their review, Mr. Malafronte and Ms. Hempstead determined that the Procedures are reasonably designed to ensure that information required to be disclosed by the registrant on Form N-CSR is accumulated and communicated to the registrant’s management to allow timely decisions regarding required disclosure.
(b) There were no changes in the registrant’s Procedures (as defined in Rule 30a-3(d) under the 1940 Act) that occurred during the period covered by this report that has materially affected, or is reasonably likely to materially affect, the registrant’s Procedures.
Item 12. Disclosure of Securities Lending Activities for Closed-End Investment Companies.
Not applicable to the registrant.
Item 13. Exhibits.
(a)(1) Code of Ethics referred to in Item 2 is filed herewith.
(a)(2) The certifications required by Rule 30a-2(a) of the 1940 Act and Section 302 of the Sarbanes-Oxley Act of 2002 (“Sarbanes-Oxley Act”) are filed herewith.
(a)(3) Not applicable.
(b) The certifications required by Rule 30a-2(b) of the 1940 Act and Section 906 of the Sarbanes-Oxley Act are filed herewith.
The certifications provided pursuant to Rule 30a-2(b) of the 1940 Act and Section 906 of the Sarbanes-Oxley Act are not deemed “filed” for purposes of Section 18 of the Securities Exchange Act of 1934, as amended (the “Exchange Act”), or otherwise subject to the liability of that section. Such certifications will not be deemed to be incorporated by reference into any filing under the Securities Act of 1933 or the Exchange Act, except to the extent that the registrant specifically incorporates them by reference.
SIGNATURES
Pursuant to the requirements of the Securities Exchange Act of 1934 and the Investment Company Act of 1940, the registrant has duly caused this report to be signed on its behalf by the undersigned, thereunto duly authorized.
IVA FIDUCIARY TRUST
By:/s/ Michael W. Malafronte
Michael W. Malafronte
President and Chief Executive Officer
Date: November 25, 2019
Pursuant to the requirements of the Securities Exchange Act of 1934 and the Investment Company Act of 1940, this report has been signed below by the following persons on behalf of the registrant and in the capacities and on the dates indicated.
By:/s/ Michael W. Malafronte
Michael W. Malafronte
President and Chief Executive Officer
Date: November 25, 2019
By:/s/ Stefanie J. Hempstead
Stefanie J. Hempstead
Treasurer and Chief Financial Officer
Date: November 25, 2019