UNITED STATES
SECURITIES AND EXCHANGE COMMISSION
Washington, D.C. 20549
FORM N-CSR
CERTIFIED SHAREHOLDER REPORT OF REGISTERED
MANAGEMENT INVESTMENT COMPANIES
Investment Company Act file number: 811-22235
AQR Funds
(Exact name of registrant as specified in charter)
Two Greenwich Plaza, 4th Floor
Greenwich, CT 06830
(Address of principal executive offices) (Zip code)
Bradley D. Asness, Esq.
Principal and Chief Legal Officer
Two Greenwich Plaza
Greenwich, CT 06830
(Name and Address of Agent for Service)
Registrant’s telephone number, including area code: 203-742-3600
Date of fiscal year end: December 31
Date of reporting period: January 1, 2013 to December 31, 2013
Item 1. Reports to Shareholders.
The following is a copy of the report transmitted to shareholders pursuant to Rule 30e-1 under the Investment Company Act of 1940 (17 CFR 270.30e-1.)
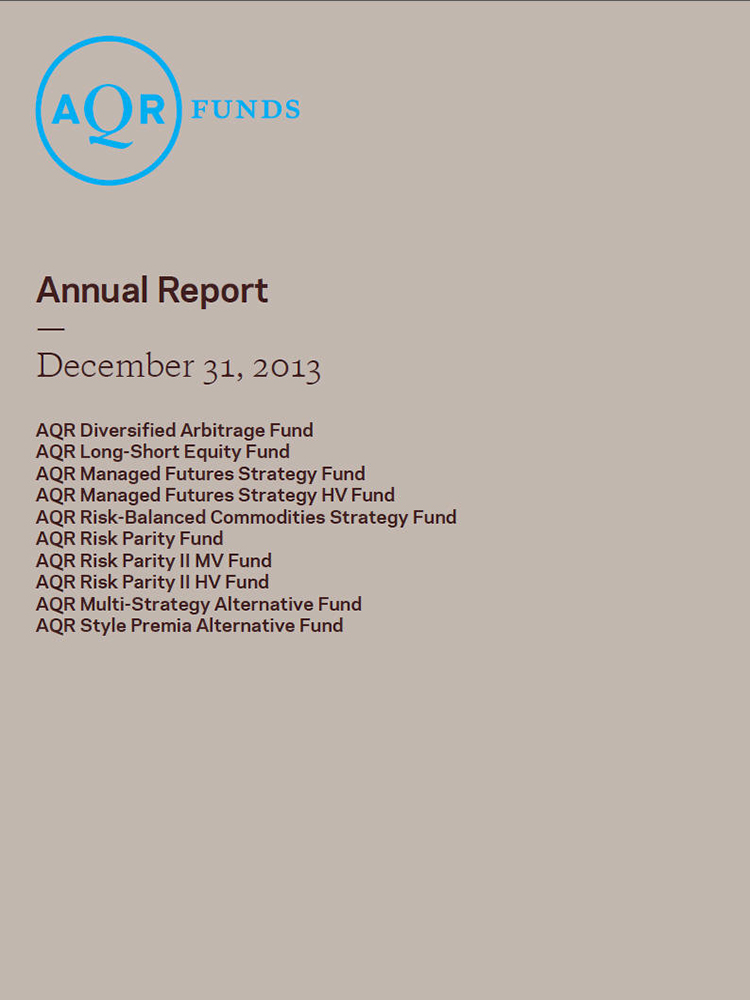
Table of Contents
Shareholder Letter (Unaudited)
| | |
| AQR DIVERSIFIED ARBITRAGE FUND | | |

Ronen Israel
Principal

Mark Mitchell Ph.D.
Founding Principal, CNH Partners

Lars Nielsen
Principal

Todd Pulvino, Ph.D.
Founding Principal, CNH Partners
Dear Shareholder:
The AQR Diversified Arbitrage Fund employs a number of arbitrage investment strategies, generally using corporate securities, with which we seek to capture liquidity premia related to corporate events. These strategies include convertible arbitrage, merger arbitrage, distressed investments, and other types of arbitrage and event strategies. In order to pursue these strategies, the Fund invests in a diversified portfolio of securities and instruments, including equities, convertible securities, debt securities, loans and restricted securities, as well as warrants, options, swaps, futures contracts, forwards and other types of derivative instruments. We tactically allocate the Fund’s assets across various corporate arbitrage strategies based on investable opportunities, anticipated returns and overall market conditions.
“Arbitrage,” in textbooks, refers to the simultaneous purchase and sale of identical securities at different prices. Unfortunately, textbook arbitrage investments are rare. When referred to in an investment context, arbitrage refers to strategies that place offsetting trades in related securities when the relative prices of the related securities diverge. The goal of arbitrage investing is to purchase undervalued securities and simultaneously sell short related overvalued securities, recognizing that there is a risk that the price difference will get larger rather than smaller.
For example, in merger arbitrage, the typical trade is to purchase shares in a firm that is the target of a takeover offer when those shares trade at a discount to the consideration being offered by the acquiring firm, and to hold the “target” shares until merger completion. We liken this discount to a liquidity premium realized from purchasing shares from various entities that do not want to bear the risk that the merger will fail to be consummated. Mutual funds and others often sell target shares soon after a merger is announced because the stock’s risk/return profile no longer fits their investment strategy. If the acquirer offers to pay for the merger with its own stock, isolating the liquidity premium associated with deal-failure risk requires the arbitrageur to short stock of the acquiring firm based on the exchange ratio provided by the merger agreement. In addition to isolating deal risk, shorting the acquirer’s stock mitigates market risk.
Similarly, in convertible-bond arbitrage, a long position in an issuer’s convertible bond is offset with a corresponding short position in the issuer’s underlying equity. For every position, across all strategies, we attempt to hedge systematic market risk either by shorting a directly linked security such as in a stock merger, or alternatively, when a direct hedge is infeasible, by using an indirect hedge such as shorting S&P 500 futures. In addition to hedging systematic equity risk, we also seek to insulate the Fund’s returns from credit and interest-rate risk by shorting credit indices and Treasury futures.
The Diversified Arbitrage Fund Class I returned 1.75% during the 2013 calendar year. During the corresponding period, the Merrill Lynch 3-Month Treasury Bill Index (the Fund’s benchmark) returned 0.07% and the S&P 500 returned 32.39%. Based on
| | | | | | | | | | | | | | | | |
| 2 | | AQR Funds | | | | | | Annual Report | | | | | | December 2013 | | |
| | | | | | | | | | |
Shareholder Letter (Unaudited)
| | |
| AQR DIVERSIFIED ARBITRAGE FUND | | |
monthly return data from inception (January 15, 2009) through December 31, 2013, the Fund’s equity market beta (relative to the S&P 500) is 0.06, the annualized volatility is 2.3%, and the Sharpe ratio is 1.7.
For the fifth straight year, the Fund outperformed its benchmark. Because of direct hedges using linked securities and indirect portfolio hedges, the Fund has exhibited low volatility and a low equity-market beta. The Fund’s annualized volatility of 2.3% compares with the S&P 500’s realized volatility of 15.2% during the past five years. Not surprisingly, the hedges have detracted considerably from the Fund’s performance during the year, an expected result in the face of raging equity and high-yield markets.
As the objective of the Fund is to capture a liquidity premium arising from temporary mispricing of securities around corporate events, the purpose of the hedges is to insulate the Fund from systematic market movements, positive and negative. Thus, even in a year in which the stock market experiences a loss, we would expect the Fund to realize a positive return. Of course, the Fund is not immune to extreme stress periods such as the financial crisis of 2008, when corporate arbitrage strategies realized losses amid the contemporaneous flight to quality. Notably, though, these flight-to-quality losses tend to be temporary, and such periods are the most promising in terms of anticipated returns for the kinds of corporate arbitrage strategies implemented by the Fund.
In the context of absolute expected returns, the realized return was below expectations. However, on a risk-adjusted basis, the returns were in line with expectations as described more fully below. Specifically, we positioned the Fund defensively throughout the year. In last year’s annual letter, we noted that 2012 was a year in which we experienced the lowest deal flow and activity in our many years of arbitrage investing through various cycles. Low deal activity continued, and even worsened, in 2013, and thus arbitrage opportunities were lacking.
In addition, the widespread search for yield caused by the prolonged low interest-rate environment spilled over to the corporate arbitrage market as crossover buyers emerged in some of our typical investment strategies causing spreads to compression and reducing expected returns. In many cases, we avoided arbitrage investments simply because expected returns did not exceed the benchmark return by a sufficient cushion. Rather, we felt it more prudent to retain excess cash in case more-attractive opportunities presented themselves.
There is a spectrum of investments in arbitrage strategies, some of which offer substantial higher potential returns (but not necessarily higher expected returns); these include wide-spread merger deals, busted convertible bonds with very risky credit, and distressed securities with extreme downside possibilities that could potentially generate a higher return. However, given the lack of deal flow in 2013, increasing position weights in these types of investments would have exposed the Fund to additional risk and would have violated our rule-of-thumb of sizing positions such that individual deal failures do not impose losses greater than 1% of the Fund’s NAV.
It is in the context of refraining from violating risk guidelines that the realized return in 2013 was below expectations in terms of returns, yet in line with expectations on a risk-adjusted basis. Throughout the year, the Fund was defensively positioned across strategies. For example, within the convertible arbitrage strategy, we purposely held equity-sensitive convertible securities that can be hedged against directional moves in equity and credit markets using short positions in the underlying equity. Specifically, we chose not to make allocations on more credit-sensitive and busted convertibles as we felt the credit-sensitive convertibles were priced fully given their downside potential in an adverse credit environment.
| | | | | | | | | | | | | | | | |
| | AQR Funds | | | | | | Annual Report | | | | | | December 2013 | | 3 |
| | | | | | | | | | |
Shareholder Letter (Unaudited)
| | |
| AQR DIVERSIFIED ARBITRAGE FUND | | |
The volatility of the Fund during the year was consistent with our defensive portfolio positioning. The Fund did not realize any substantial losses at the individual deal level – the most extreme loss was only -0.20%, and the worst monthly return was -0.45%. Moreover, the annualized volatility during the year, based on monthly returns, was only 1.0%, well below the volatility of 2.5% realized by the Fund from inception through 2012. Thus, while we would not assert that we were pleased with the return performance on an absolute return basis, we do feel that it performed as expected given the opportunity set and underlying risk.
Attributions for the Fund’s 2013 gain of 1.75% are as follows: merger arbitrage contributed +0.87%, convertible arbitrage contributed +0.45%, event-driven credit contributed +0.22%, and all other remaining strategies contributed +0.21%. The contribution from merger arbitrage resulted from successful deal closings in a stable and tight spread environment. Deals generally closed on time and without major disruptions. Merger spreads remained tight relative to historical levels, largely because of a low expected failure rate as the deal universe is of high quality, consisting of transactions that do not require substantial leverage in order to be consummated. The contribution from convertible arbitrage largely stemmed from modest richening of the convertible debentures in the portfolio. The convertible richening appears to be driven by inflows into non-arbitrage convertible funds and has resulted in the pricing of some bonds above fundamental values. When this occurs, we sell the richly priced convertibles and reallocate the capital to cheaply-priced convertibles.
In the current market, cheaper convertible bonds tend to be equity-sensitive as these behave like equities and are less attractive than balanced convertible bonds to non-arbitrage funds. For arbitrage investors, cheap in-the-money convertibles are attractive as the equity risk can be easily hedged via short sales of the underlying equity. The gain from the event-driven credit strategy was driven by several small investments in distressed securities, many involving companies in Chapter 11 bankruptcy. We tend to put small weights in distressed investments and hedge the portfolio of distressed securities using credit-defaults swaps on high-yield indices. Our credit hedge related to distressed investments generated a loss of -0.73%, but we view this as a necessary cost given our mandate to minimize not only systematic equity risk but also systematic credit and interest rate risk.
As noted above, investing opportunities in arbitrage strategies were limited in 2013 as overall deal flow continued to be depressed relative to historical levels. However, during the second half of the year for spinoffs, and the fourth quarter for convertibles, we experienced a substantial increase in activity. For example, in the convertible market, new issuance increased markedly from $7 billion in the 3rd quarter to $18 billion in the 4th quarter. Overall, companies issued $49 billion of new convertible bonds in 2013, more than double the $22 billion issued in 2012. We believe this increase in spinoff activity and in convertible issuance will continue in 2014, and are hopeful that other strategies such as merger arbitrage will also realize a pickup in deal flow.
Notwithstanding this recent increase in corporate event activity, risk premiums continue to remain tight for arbitrage strategies. Thus, we will continue to defensively position the portfolio by maintaining conservative leverage and preserving our ability to deploy capital when opportunities arise. Importantly, irrespective of where the Fund deploys capital in 2014, it will continue to hedge systematic equity, credit and interest-rate risk, with the intention of delivering uncorrelated positive returns.1
| | | | | | | | | | | | | | | | |
| 4 | | AQR Funds | | | | | | Annual Report | | | | | | December 2013 | | |
| | | | | | | | | | |
| 1 | Note that the Fund utilizes various derivatives instruments (e.g., futures, options, forwards, and swaps), primarily to hedge systematic risks including credit risk and interest rate risk. While the purpose of employing derivatives instruments is to decrease the Fund’s overall risk, hedging instruments are imperfect tools and their effectiveness depends on the degree of price correlation between the derivative instruments and the assets being hedged. Imperfect correlation may be caused by several factors, including temporary price disparities between derivative markets and markets for the underlying assets. |
Shareholder Letter (Unaudited)
| | |
| AQR DIVERSIFIED ARBITRAGE FUND | | |
| | | | | | | | | | | | |
AVERAGE ANNUAL TOTAL RETURNS AS OF 12/31/2013 AQR DIVERSIFIED ARBITRAGE FUND | | | | | | | | | |
| | | 1 Year | | | 3 Year | | | Since
Inception
(1/15/2009) | |
| Fund - Class I: ADAIX | | | 1.75% | | | | 1.95% | | | | 3.96% | |
| Fund - Class N: ADANX | | | 1.51% | | | | 1.67% | | | | 3.66% | |
| | | |
Merrill Lynch 3-Month T-Bill Index | | | 0.07% | | | | 0.10% | | | | 0.13% | |
Past performance does not guarantee future results. Investment results and principal value of an investment will fluctuate so that an investor’s shares, when redeemed, may be worth more or less than their original cost. Current performance may be lower or higher than the performance data quoted. As of the latest prospectus, the gross expense ratio for the Fund’s Class I/N shares are 2.39% and 2.69%, respectively. Call 1-866-290-2688 or visit www.aqrfunds.com for current month-end performance.
|
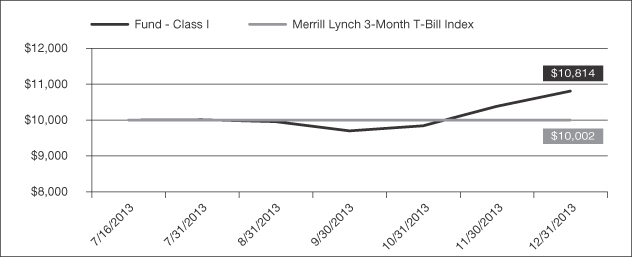
AQR DIVERSIFIED ARBITRAGE FUND VS. MERRILL LYNCH 3-MONTH T-BILL INDEX AND S&P 500 TOTAL RETURN
INDEX VALUE OF $10,000 INVESTED ON 1/15/09 |
The chart above represents historical performance of a hypothetical investment of $10,000 in the Fund over the past ten years (or since inception if shorter). Performance data quoted represents past performance and does not guarantee future results. Returns shown are total returns, which assume the reinvestment of dividends and capital gains. The table and graph presented above do not reflect the deduction of taxes a shareholder would pay on fund distributions or the redemption of fund shares.
| | | | | | | | | | | | | | | | |
| | AQR Funds | | | | | | Annual Report | | | | | | December 2013 | | 5 |
| | | | | | | | | | |
Shareholder Letter (Unaudited)
| | |
| AQR LONG-SHORT EQUITY FUND | | |

Jacques Friedman
Principal
Lars Nielsen
Principal

Andrea Frazzini
Principal
Dear Shareholder:
The AQR Long-Short Equity Fund seeks to provide higher risk-adjusted returns with lower volatility compared to global equity markets. It does so using three different sources of return: 1) the potential gains from its long-short equity positions, 2) overall exposure to equity markets, and 3) the tactical variation of its net exposure to equity markets. The strategy primarily seeks to add alpha via its long-short (market-neutral) stock portfolio. It also manages its beta relative to the MSCI World Index to a long-term target of 0.5, and within a shorter-term range between 0.3 and 0.7, depending on our market views.
Global developed equity markets performed well since inception of the Fund (July 16, 2013), driven mainly by positive growth in the U.S. and Europe. The Fund’s custom benchmark (50% MSCI World Index/50% Merrill Lynch 3-Month T-Bill Index) delivered strong returns of 5.68% over this period. The Fund handily outperformed this benchmark, returning 11.17%.
The stock selection strategy contributed to the majority of the outperformance and returned 6.5% since inception. Returns were driven by the strong performance of nearly all of our investment themes. In particular our industry-relative valuation and momentum signals contributed the most to returns, even though they tend to be negatively correlated. Geographically, stocks in the U.S. and Australia contributed the most to overall returns, while Norwegian and Finnish stocks detracted slightly from performance. At the sector level, the stock selection strategy worked best in consumer discretionary and industrials over the period.
The Fund benefitted from its static long-term beta exposure of 0.5 to the MSCI World, given this index’s strong performance. Our tactical market exposure (the desired deviation from a beta of 0.5) was flat throughout the majority of the period, and so did not contribute meaningfully to returns.
The Fund ended the year with a highly diversified stock portfolio of 464 long positions and 395 short positions. Securities remained globally diversified with over 40% of the Fund invested outside of the U.S. The stock selection strategy does make small industry allocations. As of the end of the year, our largest sector overweights were in healthcare and consumer discretionary, while our largest underweights were in materials and telecommunications.
Although our tactical market position was flat throughout most of the period, our view was moderately bearish by the end of the year. This was driven by unfavorable valuation and fundamental momentum indicators, which offset positive momentum signals from a generally bullish market. We consequently moved from our long-term beta target of 0.5 to a short-term position of 0.4.
| | | | | | | | | | | | | | | | |
| 6 | | AQR Funds | | | | | | Annual Report | | | | | | December 2013 | | |
| | | | | | | | | | |
Shareholder Letter (Unaudited)
| | |
| AQR LONG-SHORT EQUITY FUND | | |
| | | | |
TOTAL RETURNS AS OF 12/31/2013 AQR LONG-SHORT EQUITY FUND | |
| | | Since
Inception
(7/16/2013)* | |
| Fund - Class I: QLEIX | | | 11.17% | |
| Fund - Class N: QLENX | | | 11.04% | |
| |
50% MSCI World Index/50% Merrill Lynch 3-Month T-Bill Index | | | 5.68% | |
Past performance does not guarantee future results. Investment results and principal value of an investment will fluctuate so that an investor’s shares, when redeemed, may be worth more or less than their original cost. Current performance may be lower or higher than the performance data quoted. As of the latest prospectus, the gross expense ratio for the Fund’s Class I/N shares are 1.62% and 1.87%, respectively. Call 1-866-290-2688 or visit www.aqrfunds.com for current month-end performance.
| | | | |
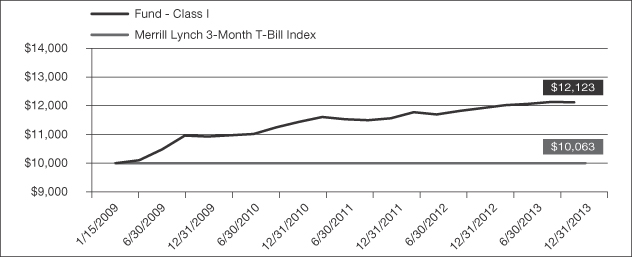
AQR LONG-SHORT EQUITY FUND VS. 50% MSCI WORLD INDEX/50% MERRILL LYNCH 3-MONTH T-BILL INDEX VALUE OF $10,000 INVESTED ON 7/16/2013 |
The chart above represents historical performance of a hypothetical investment of $10,000 in the Fund over the past ten years (or since inception if shorter). Performance data quoted represents past performance and does not guarantee future results. Returns shown are total returns, which assume the reinvestment of dividends and capital gains. The table and graph presented above do not reflect the deduction of taxes a shareholder would pay on fund distributions or the redemption of fund shares.
| | | | | | | | | | | | | | | | |
| | AQR Funds | | | | | | Annual Report | | | | | | December 2013 | | 7 |
| | | | | | | | | | |
Shareholder Letter (Unaudited)
| | |
| AQR MANAGED FUTURES STRATEGY FUND | | |

Cliff Asness
Managing & Founding Principal

John Liew
Founding Principal

Brian Hurst
Principal

Yao Hua Ooi
Principal
Dear Shareholder:
The AQR Managed Futures Strategy Fund actively invests in futures and forward contracts both long and short across the global equity, fixed income, commodity and currency markets.
Fund managers use both short- and long-term trend-following signals to attempt to profit from different trends that occur in all of these markets.
Trend-following can be simply described as going long markets that are rising in price, and going short markets that are falling in price.
In addition to trend-following signals, we also incorporate signals that seek to identify overextended trends and reduce risk when the chance of a reversal is perceived as higher than normal, since market reversals generally cause losses for trend-following strategies.
We expect that the correlation of this strategy to the equity markets will average close to zero over a full economic cycle. That said, it is the nature of the strategy to exhibit a positive beta when the markets have been rising and a negative beta when the markets have been falling.
The strategy had strong relative and absolute performance for the full year 2013, with returns of +9.40% versus returns of +0.07% for the Merrill Lynch 3-Month Treasury Bill index and returns of +2.70% for the Newedge CTA Trend Index, a benchmark comprised of trend-following managed futures hedge funds. By asset class, equities contributed +7.07%, fixed income detracted -3.08%, commodities contributed +0.75%, and currencies added +4.66%.
The Fund began the year in a bullish position following strong trends in equities and risk-sensitive currency markets. Bullish trends grew stronger and peaked mid-February, as risky assets rallied globally following a compromise over the federal budget in the U.S. The portfolio reduced risk through April, as declining growth in emerging markets and falling inflation expectations in the developed world led to a large short position in growth-sensitive commodities. In June, bearish stimulus positioning by the U.S. Federal Reserve caused global short-term trends to turn bearish, and the Fund moved to neutral positioning. During the second half of the year, equities experienced a second bull market as the Federal Reserve surprised markets with delayed tapering. Improved economic data in the U.S. and European economies furthered buoyed stocks, and the Fund finished December with an expected portfolio beta of +0.4 to the S&P 500 equity index.
The strategy’s average annualized volatility target is 10%, which we allow to vary based on the conditional attractiveness of trends in the markets we trade. The Fund entered the year targeting its long-run average of 10% volatility, as bullish high-conviction trends in global equity and currency markets were balanced by weaker and
| | | | | | | | | | | | | | | | |
| 8 | | AQR Funds | | | | | | Annual Report | | | | | | December 2013 | | |
| | | | | | | | | | |
Shareholder Letter (Unaudited)
| | |
| AQR MANAGED FUTURES STRATEGY FUND | | |
short-risk trends in fixed income and commodities. The Fund ended the year targeting a slightly low below average expected volatility of 8.7%, off conflicting long- and short-term signals.
Long-term trend-following signals performed well, contributing profitably in every asset class other than fixed income, where choppy markets throughout the year led to losses. Shorter-term signals detracted, as reversals over monetary policy in fixed income and commodities overwhelmed small gains from short-term trend-following in equity and currency markets. This does not prove that long-term trend-following is superior to short-term trend-following, they just work in different environments. Given the difficultly of predicting which environment will prevail, the strategy is diversified across many horizons of trend following in order to perform well across a greater variety of market environments. Overextended trend signals were about flat over the year, as slight losses from risk reduction in equities and currencies were balanced by contributions from identifying overextended trends in fixed income and commodities.
In equities, the Fund began the year strongly bullish on all developed and emerging markets amid the agreement of short- and long-term signals. The Fund remained positioned long throughout the first quarter across nearly all markets, and benefited from global equities rallying off budgetary compromises in the U.S. and a successful containment of the Cypriot banking crisis in the Eurozone. Global equities fell in May and June over concerns of tightening by the Federal Reserve and a credit squeeze in China, resulting in losses in the Fund’s long positions. European equities rallied in the third quarter as a result of better than expected economic statistics in the European periphery and accommodative comments from the European Central Bank, which benefitted the Fund’s long positions. In the fourth quarter, developed equities continued their year-long rally, and rose on improved data and risk sentiment. Based on agreement between long- and short-term trends, the Fund ended the year long developed markets and short in some emerging markets.
In fixed income, the Fund began the quarter with small long positions in most assets due to bearish short-term trends conflicting with long-term bullish trends. In May and June, global fixed income reversed and fell sharply on fears that the Federal Reserve would reduce bond purchases. Fixed-income markets were whipsawed again in the third quarter, as firming economic data and accommodative comments from the European Central Bank led markets to turn higher. Global fixed-income markets continued their choppiness in the fourth quarter, as supportive monetary policy early in the quarter conflicted with rising risk sentiment and plans for tapering by the Federal Reserve. The Fund ended the year generally short, except for long positions in Japanese bonds and Canadian and European rates.
In commodities, the Fund entered the year with short positions in soft commodities and metals, and mixed positions in grains and energies. After an initial January rally, commodities outside of energies declined on slowing emerging economies. During the second quarter, commodities fell broadly on further reductions in emerging markets growth and a credit squeeze in China, which strongly benefited the Fund. Shorts in precious metals led to the largest gains amid speculation of an accelerated tightening schedule by the Federal Reserve. In the last three months of the year, metals and agricultural commodities fell on weakness in emerging markets, while energies rallied on improved growth in the U.S. The Fund ended the year long all energies, with shorts in Metals and Agricultural products.
In the currency markets, the Fund’s largest positions entering the year were shorts in the U.S. Dollar, Euro, and Yen vs. long positions in other developed- and emerging-market currencies. The Fund’s short position in the Yen against other currencies was profitable, as the Yen fell during the first half of the year on efforts by the Bank of Japan to weaken the currency and increase inflation. In the final three months of the year, crosses long the Euro or short the Yen were outsize contributors to the Fund, as the Yen declined sharply
| | | | | | | | | | | | | | | | |
| | AQR Funds | | | | | | Annual Report | | | | | | December 2013 | | 9 |
| | | | | | | | | | |
Shareholder Letter (Unaudited)
| | |
| AQR MANAGED FUTURES STRATEGY FUND | | |
on stimulative government policy and the Euro rallied on improving economic data. The Fund ended the year with long positions in the Euro and emerging currencies, and shorts in the Yen and U.S. Dollar.
Overall, we believe this year continued to illustrate the importance of our fund construction, which emphasizes diversification across asset classes as well as diversification across signals. Strong performance in currencies and equities left the Fund with large gains despite choppiness in fixed income. Long term momentum signals provided large positive returns despite reversals in short-term trends.
| | | | | | | | | | | | |
AVERAGE ANNUAL TOTAL RETURNS AS OF 12/31/2013 AQR MANAGED FUTURES STRATEGY FUND | | | | |
| | | 1 Year | | | 3 Year | | | Since
Inception
(1/6/2010) | |
| Fund - Class I: AQMIX | | | 9.40% | | | | 1.80% | | | | 2.70% | |
| Fund - Class N: AQMNX | | | 9.14% | | | | 1.54% | | | | 2.43% | |
| | | |
Merrill Lynch 3-Month T-Bill Index | | | 0.07% | | | | 0.10% | | | | 0.10% | |
Past performance does not guarantee future results. Investment results and principal value of an investment will fluctuate so that an investor’s shares, when redeemed, may be worth more or less than their original cost. Current performance may be lower or higher than the performance data quoted. As of the latest prospectus, the gross expense ratio for the Fund’s Class I/N shares are 1.40% and 1.67%, respectively. Call 1-866-290-2688 or visit www.aqrfunds.com for current month-end performance.
| | | | | | | | | | | | | | | | |
| 10 | | AQR Funds | | | | | | Annual Report | | | | | | December 2013 | | |
| | | | | | | | | | |
Shareholder Letter (Unaudited)
| | |
| AQR MANAGED FUTURES STRATEGY FUND | | |
| | | | |
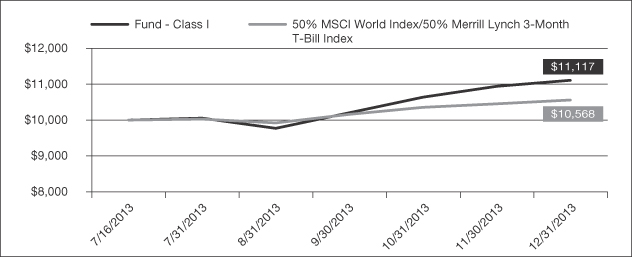
AQR MANAGED FUTURES STRATEGY FUND VS. MERRILL LYNCH 3-MONTH T-BILL INDEX SUB-INDEX VALUE OF
$10,000 INVESTED ON 1/6/2010 |
The chart above represents historical performance of a hypothetical investment of $10,000 in the Fund over the past ten years (or since inception if shorter). Performance data quoted represents past performance and does not guarantee future results. Returns shown are total returns, which assume the reinvestment of dividends and capital gains. The table and graph presented above do not reflect the deduction of taxes a shareholder would pay on fund distributions or the redemption of fund shares.
| | | | | | | | | | | | | | | | |
| | AQR Funds | | | | | | Annual Report | | | | | | December 2013 | | 11 |
| | | | | | | | | | |
Shareholder Letter (Unaudited)
| | |
| AQR MANAGED FUTURES STRATEGY HV FUND | | |
Cliff Asness
Managing & Founding Principal
John Liew
Founding Principal
Brian Hurst
Principal
Yao Hua Ooi
Principal
Dear Shareholder:
The AQR Managed Futures Strategy HV Fund actively invests in futures and forward contracts both long and short across the global equity, fixed income, commodity and currency markets.
Fund managers use both short- and long-term trend-following signals to attempt to profit from different trends that occur in all of these markets.
Trend-following can be simply described as going long markets that are rising in price, and going short markets that are falling in price.
In addition to trend-following signals, we also incorporate signals that seek to identify overextended trends and reduce risk when the chance of a reversal is perceived as higher than normal, since market reversals generally cause losses for trend-following strategies.
We expect that the correlation of this strategy to the equity markets will average close to zero over a full economic cycle. That said, it is the nature of the strategy to exhibit a positive beta when the markets have been rising and a negative beta when the markets have been falling.
The strategy had strong relative and absolute performance since inception in July through 2013, the Fund’s Class I shares returned +8.14% versus returns of +0.02% for the Merrill Lynch 3-Month Treasury Bill index and returns of +2.16% for the Newedge CTA Trend Index, a benchmark comprised of trend-following managed futures hedge funds. By asset class, equities contributed +5.28%, fixed income detracted -0.54%, commodities detracted -1.96%, and currencies added +5.36%.
The Fund launched with a bullish position following strong trends in equity markets and moderate downtrends in safe-haven fixed income markets. Although bearish trends in currency markets led to reduced risk in August, equities experienced a second bull market during the remainder of the year as the Federal Reserve surprised markets with delayed tapering. Improved economic data in the U.S. and European economies furthered buoyed stocks and risky currencies, and the Fund finished December with an expected portfolio beta of +0.64 to the S&P 500 Index.
The strategy’s average annualized volatility target is 15%, which we allow to vary based on the conditional attractiveness of trends in the markets we trade. The Fund launched targeting its long-run average of 15% volatility, as bullish high-conviction trends in global equity markets were balanced by short-risk trends in commodities and currencies. The Fund ended the year targeting a slightly low below average expected volatility of 13.0%, off conflicting long- and short-term signals.
| | | | | | | | | | | | | | | | |
| 12 | | AQR Funds | | | | | | Annual Report | | | | | | December 2013 | | |
| | | | | | | | | | |
Shareholder Letter (Unaudited)
| | |
| AQR MANAGED FUTURES STRATEGY HV FUND | | |
Long-term trend-following signals performed well, contributing strongly in equities and currencies. Shorter-term signals detracted, as reversals over monetary policy led to small losses in fixed income and commodities. This does not prove that long-term trend-following is superior to short-term trend-following, they just work in different environments. Given the difficultly of predicting which environment will prevail, the strategy is diversified across many horizons of trend following in order to perform well across a greater variety of market environments. Overextended trend signals slightly detracted over the year, on risk reduction in equities and currencies.
In equities, the Fund launched in July strongly bullish all global equity markets outside of China and Korea, on agreement of short- and long-term trend signals. Equities rallied strongly following accommodation by the U.S. Federal Reserve (“Fed”) and better than expected economic statistics in the European periphery, which benefitted the Fund’s long positions. In the fourth quarter, developed equities continued their year-long rally, and rose on improved data and risk sentiment. Emerging markets generally underperformed, on worsening fundamental data and credit squeeze in China. Based on agreement between long- and short-term trends, the Fund ended the year long developed markets and short in some emerging markets.
In fixed income, the Fund launched with short positions in all fixed-income markets on bearish short- and long-term trends. Fixed-income markets were whipsawed during the third quarter, as firming economic data and accommodative comments from the European Central Bank led markets to turn higher. Global fixed-income markets continued their choppiness during the last three months of the year, as supportive monetary policy early in the quarter conflicted with rising risk sentiment and plans for tapering by the Federal Reserve. The Fund ended the year generally short, except for long positions in Japanese bonds and Canadian and European rates.
In commodities, the Fund launched this year with short positions in metals and energies outside of natural gas, and mixed positions in grains and soft commodities. Commodities were generally choppy, and reversed on uncertainty surrounding monetary policy and growth in the emerging world. During the third quarter, base and precious metals rose as a result of dovish monetary policy and a delay in Fed tapering, which hurt the Fund’s short positions. In the last three months of the year, metals and agricultural commodities fell on weakness in emerging markets, while energies rallied on improved growth in the U.S. The Fund ended the year long all energies, with shorts in metals and agricultural products.
In the currency markets, the Fund’s largest positions at launch were longs in the Euro and U.S. dollar and shorts in the Yen and Australian dollar. During the third quarter, our short in the Yen was a large detractor, as the currency whipsawed over economic uncertainty. During the last three months of the year, crosses long the Euro or short the Yen were outsize contributors to the Fund, as the Yen declined sharply on stimulative government policy and the Euro rallied on improving economic data. The Fund ended the year with long positions in the Euro and emerging currencies, and shorts in the Yen and U.S. dollar.
Overall, we believe this year continued to illustrate the importance of our fund construction, which emphasizes diversification across asset classes as well as diversification across signals. Strong performance in currencies and equities left the Fund with large gains despite choppiness in fixed income and commodities. Long term momentum signals provided large positive returns despite reversals in short-term trends.
| | | | | | | | | | | | | | | | |
| | AQR Funds | | | | | | Annual Report | | | | | | December 2013 | | 13 |
| | | | | | | | | | |
Shareholder Letter (Unaudited)
| | |
| AQR MANAGED FUTURES STRATEGY HV FUND | | |
| | | | |
TOTAL RETURNS AS OF 12/31/2013 AQR MANAGED FUTURES STRATEGY HV FUND | | | |
| | | Since
Inception
(7/16/2013)* | |
| Fund - Class I: QMHIX | | | 8.14% | |
| Fund - Class N: QMHNX | | | 8.04% | |
| |
Merrill Lynch 3-Month T-Bill Index | | | 0.02% | |
Past performance does not guarantee future results. Investment results and principal value of an investment will fluctuate so that an investor’s shares, when redeemed, may be worth more or less than their original cost. Current performance may be lower or higher than the performance data quoted. As of the latest prospectus, the gross expense ratio for the Fund’s Class I/N shares are 2.12% and 2.37%, respectively. Call 1-866-290-2688 or visit www.aqrfunds.com for current month-end performance.
| | | | |
AQR MANAGED FUTURES STRATEGY HV FUND VS. MERRILL LYNCH 3-MONTH T-BILL INDEX VALUE OF $10,000 INVESTED ON 7/16/2013 |
The chart above represents historical performance of a hypothetical investment of $10,000 in the Fund over the past ten years (or since inception if shorter). Performance data quoted represents past performance and does not guarantee future results. Returns shown are total returns, which assume the reinvestment of dividends and capital gains. The table and graph presented above do not reflect the deduction of taxes a shareholder would pay on fund distributions or the redemption of fund shares.
| | | | | | | | | | | | | | | | |
| 14 | | AQR Funds | | | | | | Annual Report | | | | | | December 2013 | | |
| | | | | | | | | | |
Shareholder Letter (Unaudited)
| | |
| AQR RISK-BALANCED COMMODITIES STRATEGY FUND | | |
Brian Hurst
Principal
Yao Hua Ooi
Principal

Ari Levine
Vice President
Dear Shareholders:
The AQR Risk Balanced Commodities Fund’s Class I shares returned -16.0% for 2013, as commodities across the board experienced historic sell-offs on bearish fundamentals. Precious metals, in particular, exhibited one of the worst years ever in 2013, as gold and silver fell by -28.5% and -36.4%, respectively, as many lost faith in the sector as a store of value amidst Federal Reserve (“Fed”) tapering. Grains also depreciated significantly throughout 2013. Corn and wheat performed especially poorly, falling -29.4% and -26.5% respectively. Global supply outlook was extremely bearish throughout the year, as both commodities were forecast to achieve record setting harvests, as production rebounded from the 2012 drought. Soybean futures, on the other hand, were slightly positive on the year, buoyed by dry weather in major growing areas during the summer months, in addition to signs of increased global demand. Base metals also sold off, driven in large part by Fed tapering and signs of slowing emerging growth. In contrast, oil and refined products performed strongly throughout the year, benefitting from significant US inventory draws and increased geopolitical risk in the middle-east, as well as stronger economic data later in the year. Natural gas performed strongly as well, supported by colder than expected weather during the first and fourth quarters. Throughout the year, precious metals was the most significant detractor in the portfolio, detracting -5.7%. Base metals detracted -4.2%, grains -3.7%, softs -2.1%, and livestock -0.7%, while energies contributed +0.3%.
While the Class I declined -16.01% in 2013, the Dow Jones-UBS Commodity Index (“DJ-UBS”) declined -9.5%. Although we expect the Fund to outperform traditional passive indices over the long term, in any given year we expect the Fund to average a sizable tracking error of about 10% per year to its benchmark. Given this, the underperformance of -6.5% for this year, while disappointing, is within the expected range. This brings our annualized since inception (7/9/2012) underperformance to -5.14%. This also is not abnormally high given an expected annual tracking error of 10% to the benchmark.
The underperformance relative to the passive DJ-UBS benchmark was due to a number of fund features. The Fund maintained an average net exposure of slightly greater than 100% during the year in order to target steady volatility, subject to our drawdown control process. This resulted in underperformance versus the passive index given the declines across most commodity sectors during the year. Another source of underperformance was the Fund’s risk-balanced strategic allocation, which is more exposed to precious metals and less exposed to energies than the passive benchmark. Precious metals was the bottom performing sector while energies was the top performing sector, so our sector allocation tilts hurt relative performance. In contrast, tactical models helped mitigate these losses, with gains coming primarily from bearish views on precious metals, which arose from trend-following and relative value signals early in the year.
The Fund began the year at a volatility target of 17.6%, reflecting tactically neutral views and a strategic volatility target of 18.0%. Given the significant declines in
| | | | | | | | | | | | | | | | |
| | AQR Funds | | | | | | Annual Report | | | | | | December 2013 | | 15 |
| | | | | | | | | | |
Shareholder Letter (Unaudited)
| | |
| AQR RISK-BALANCED COMMODITIES STRATEGY FUND | | |
commodities in 2013, the Fund’s drawdown control system served to reduce exposures throughout the year, resulting in a Fund risk target as low as 8.5% during April, after hawkish minutes by the Fed resulted in a broad-based commodity decline. At year-end, the strategic risk target is 11.4%, reflecting both tactically bearish views and a lowered strategic risk target due to drawdown control.
Moving to return attribution, the strategic portion of the portfolio returned -18.2% while tactical tilts added +2.2%. The strategic return in this attribution is the return to a long-only portfolio with risk-balanced sector weights and a volatility target of 18% annualized (subject to drawdown control). The tactical returns are the active returns to commodity over- and underweights relative to this strategic portfolio.
The main contributor to tactical performance was an underweight to precious metals. We established our precious metals underweight during the first quarter, when precious metals looked overvalued on a long term basis and had been trending downward on multiple horizons, and remained underweight the rest of the year. Precious metals looked unattractive both directionally and relative to other commodity sectors. This underweight helped mitigate losses as trends continued and precious metals fell significantly, primarily on issues surrounding the Fed’s tapering decision.
At year-end, the Fund’s tactical positioning reflected bearish views on commodities as a whole due to technical weakness. Within energies, we prefer brent crude relative to West Texas Intermediate (“WTI”) crude, mostly due to the difference in curve shape. As of year-end, the brent futures curve was more backwardated (futures with a later expiration date were cheaper), reflecting tightness in the global oil market and providing a positive roll yield, while the front of the WTI futures curve was in contango (futures with later expiry are more expensive), reflecting a glut of inventory in the U.S. and providing a negative roll yield. Within precious metals, we prefer silver to gold due to differing seasonal demand patterns. Within the grains, we are bullish corn relative to the wheat, mostly on risk premia and long-term valuation signals. At the sector level, we are underweight precious metals and overweight energies, driven by a combination of valuation, momentum, and risk-premia signals.
The Fund finished its first full year with unfortunately poor relative and absolute returns. However, while short term results can be noisy, in the long term we believe the Fund’s broader diversification, strong risk management, and active commodity selection will ultimately deliver more steady volatility and strong returns across market environments.
| | | | | | | | |
AVERAGE ANNUAL TOTAL RETURNS AS OF 12/31/2013 AQR RISK-BALANCED COMMODITIES STRATEGY FUND | | | | | | |
| | | 1 Year | | | Since
Inception
(7/9/2012) | |
| Fund - Class I: ARCIX | | | -16.01% | | | | -11.91% | |
| Fund - Class N: ARCNX | | | -16.13% | | | | -12.12% | |
| | |
Dow Jones-UBS Commodity Index Total Return | | | -9.52% | | | | -6.77% | |
Past performance does not guarantee future results. Investment results and principal value of an investment will fluctuate so that an investor’s shares, when redeemed, may be worth more or less than their original cost. Current performance may be lower or higher than the performance data quoted. As of the latest prospectus, the gross expense ratio for the Fund’s Class I/N shares are 1.92% and 4.20%, respectively. Call 1-866-290-2688 or visit www.aqrfunds.com for current month-end performance.
| | | | | | | | | | | | | | | | |
| 16 | | AQR Funds | | | | | | Annual Report | | | | | | December 2013 | | |
| | | | | | | | | | |
Shareholder Letter (Unaudited)
| | |
| AQR RISK-BALANCED COMMODITIES STRATEGY FUND | | |
| | |
AQR RISK-BALANCED COMMODITIES STRATEGY FUND VS. DOW JONES-UBS COMMODITY INDEX TOTAL RETURN VALUE OF $10,000 INVESTED ON 7/9/2012 |
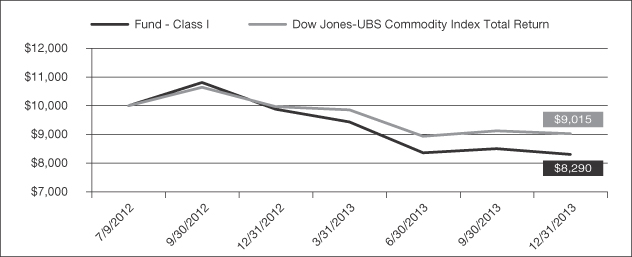
The chart above represents historical performance of a hypothetical investment of $10,000 in the Fund over the past ten years (or since inception if shorter). Performance data quoted represents past performance and does not guarantee future results. Returns shown are total returns, which assume the reinvestment of dividends and capital gains. The table and graph presented above do not reflect the deduction of taxes a shareholder would pay on fund distributions or the redemption of fund shares.
| | | | | | | | | | | | | | | | |
| | AQR Funds | | | | | | Annual Report | | | | | | December 2013 | | 17 |
| | | | | | | | | | |
Shareholder Letter (Unaudited)
John Liew
Founding Principal
Brian Hurst
Principal

Michael
Mendelson
Principal
Yao Hua Ooi
Principal
Dear Shareholder:
Through the use of derivatives such as futures and swaps, the AQR Risk Parity Fund invests across a wide variety of global markets – including: developed- and emerging-market equities, fixed income and currencies, global credit (corporate, government and mortgage), and commodities – in an attempt to build a truly diversified portfolio where all asset classes matter, but no one asset class matters too much. Risk Parity investing involves allocating investments by risk, which means that instruments with less risk will generally be allocated more capital than instruments that are deemed more risky. As markets move through different risk regimes, the portfolio is dynamically adjusted with the goal of keeping overall portfolio risk and the balance of risk across asset classes fairly steady through time. We believe this leads to more consistent results, reduces tail risks associated with investments in the capital markets, and enables the investor to remain invested through more difficult market environments.
In addition to adjusting position sizes to control for increasing or decreasing risk expectations, we also overlay modest portfolio tilts based on AQR’s proprietary expected return models, which include signals based on carry, momentum, valuation, and other important economic variables. These views determine over- and underweights across a broad array of global markets. The ultimate goal is to build a portfolio that in the long run will deliver higher returns at a risk level similar to that of traditional portfolios by combining a better asset allocation with return-boosting tactical tilts.
The Fund is expected to remain long all of the markets in which we invest while averaging a moderate (under 0.5 on average) beta to the stock market over a full market cycle. The targeted annualized volatility for the Fund is 10%, on average, which varies modestly over time based on our perceptions of tactical opportunities within the different asset classes we trade. We started and ended the year close to the 10% long term average, with a slightly lower target at the end due to more underweight tactical positions. However, the Fund targeted significantly less volatility in parts of the second and third quarters as the risk target was cut, and subsequently raised, in accordance with our drawdown control policy. Fund exposures dropped sharply in June as asset volatility rose and the Fund’s target risk was cut.
Total exposures ended the year somewhat lower than they began the year, due to decreases in developed-market bonds, emerging currencies, and inflation-linked bonds. However, credit spread, commodities and developed-market equities actually ended the year with meaningfully higher exposures than at the start of the year. With these moves, the Fund went from a 0.41 beta versus the S&P 500 Index at the end of 2012 to a 0.65 beta at the end of 2013.
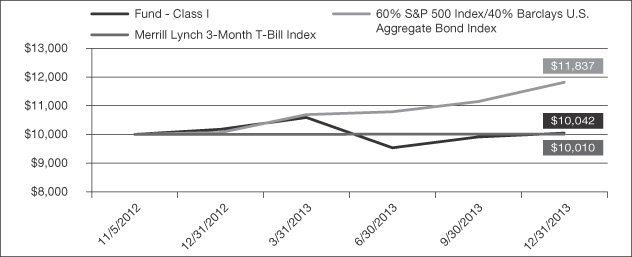
For the year ended December 31, 2013, the Fund’s Class I shares returned +0.12% and realized an annualized volatility of 9.20%. During this period, the Fund’s benchmark the Merrill Lynch 3-Month Treasury returned +0.07% and a 60/40
| | | | | | | | | | | | | | | | |
| 18 | | AQR Funds | | | | | | Annual Report | | | | | | December 2013 | | |
| | | | | | | | | | |
Shareholder Letter (Unaudited)
benchmark consisting of 60% S&P 500 Index/40% Barclays U.S. Aggregate Bond Index returned +17.57% at an average realized volatility of 6.49%. The Fund’s net assets across all share classes were over $930 million at the end of 2013.
The Fund experienced gains in two of the four major asset class buckets for the full year. To the net total return of +0.12% for 2013, equities contributed +5.89%, fixed income detracted -3.42%, inflation-linked assets detracted -5.02%, and credit assets added +2.67%. Tactical tilts contributed positively in all asset classes.
The equity bucket contributed strong returns in all but the second quarter as equity markets rallied. Developed equities were broadly up, many ended at their highs for the year, with U.S. equities doing particularly well. In the U.S., the resolution of the “fiscal cliff” and government shutdown combined with positive economic data and the Federal Reserve’s (“Fed”) postponing tapering until 2014 all buoyed equity markets. Europe also saw strong economic data after the first quarter, and Japan performed well despite some uncertainty in the second quarter regarding structural reforms. Emerging equity markets were slightly down over the year, and were particularly hurt in the second quarter, as concerns of the Fed tightening and uncertainty in Japan combined with concerns of a Chinese slowdown.
Tactically, we were overweight equities throughout the year (except for a brief neutral position in emerging-market equities at the end of the second quarter following poor performance). Trend following signals remained positive in line with bullish asset-class timing signals. On a relative value basis, we were generally overweight EuroStoxx based on strong valuation and were underweight Canadian equities, which looked expensive. Overall, tactical tilts in equities added to the Fund for the year.
The nominal bond bucket detracted from the Fund over the year, driven by losses in the second quarter. The fourth quarter also detracted while the first and third quarters saw modest gains. U.S. Treasuries led the large second quarter decline in nominal bonds as yields rose in conjunction with speculation that the Fed would begin tapering its asset purchase program by the end of the year. International bond markets generally followed the Treasury decline, with German bunds, U.K. gilts, and Japanese government bonds all realizing losses as well. The year ended with the global bond market selling off in the fourth quarter, hurt by strong economic data, especially in the U.K. and U.S.; Japan was the exception, outperforming much of the year as monetary policy remained accommodative.
Tactically, we were underweight nominal bonds throughout the year, as our asset-class timing signals continued to be negative due to the very low level of yields. On a relative-value basis, we were overweight U.S. Treasuries, driven by a steep yield curve and high real yields, and were underweight Japanese government bonds, due to a flatter yield curve and lower real bond yields. Overall, tactical tilts in nominal bonds added to the Fund for the year, driven by gains in the second quarter when nominal bonds were sharply down.
The inflation bucket detracted in 2013, with losses from both inflation-linked bonds and commodities. Inflation-linked bonds (“TIPS”) had significant losses concentrated in May and June. Losses in TIPS were most pronounced, as hawkish Fed sentiment led to a steep increase in real yields. Global inflation-linked-bond markets mirrored the U.S. decline, although to a lesser degree. U.S. TIPS were again the worst performers in the fourth quarter, driven by a combination of better economic data and the announcement of Fed tapering. U.K. TIPS rallied strongly at the start of the year after the government rejected a proposal that would have resulted in a lower official inflation rate.
| | | | | | | | | | | | | | | | |
| | AQR Funds | | | | | | Annual Report | | | | | | December 2013 | | 19 |
| | | | | | | | | | |
Shareholder Letter (Unaudited)
We added tactical tilts to inflation-linked bonds in June, implementing a large underweight. We maintained this underweight through the end of the year based on poor price and fundamental momentum in conjunction with continued poor valuations. Commodities were down in all but the third quarter, with precious metals falling the most. Weak economic data from emerging-market countries along with concerns (and eventual announcement in December) of reduced monetary stimulus caused commodities to fall. More dovish perceptions of Fed policy in the third quarter, along with inventory and production issues in energies, led commodities to have positive returns in the third quarter. Tactically, we were underweight commodities much of the year, and ended with a slight underweight. Large underweights in precious metals contributed positively in the second and fourth quarters, but hurt in the third quarter when metals rallied. Overall, however, metals were down for the year.
Credit assets performed well in 2013, with the credit bucket contributing positively in all but the second quarter. Gains were driven by credit spreads, as Markit CDX investment-grade (IG) and high-yield (HY) index spreads ended the year at their tightest levels since the summer of 2007. Primary markets remained active with both IG and HY new issuance setting records. Emerging-market currencies offset some of the gains, underperforming developed-market currencies that rallied due to U.S. and European economic improvements, more hawkish Fed sentiment and the Fed’s ultimate decision to taper. Worsening growth prospects among emerging-market countries also hurt emerging-market currencies. Tactically, we moved from overweight positions to underweight positions in both HY credit and emerging currencies. The underweight emerging currencies position contributed positively, but was largely offset by losses from our HY underweight.
This was a challenging year for the Fund. While the Fund’s performance was within the normal range of expected performance, it significantly unperformed its benchmark – 60% S&P 500 Index/40% Barclays U.S. Aggregate Bond Index – partly because equity markets had a banner year, but also because returns to other asset classes were poor. In a year like this, a more risk-diversified and risk-managed portfolio trailed typical allocation portfolios that are concentrated in equity risk. However, we remain confident that the diversification benefits of a risk parity approach provide a sound allocation for the wide variety of potential market environments we may face in the coming years.
| | | | | | | | | | | | |
AVERAGE ANNUAL TOTAL RETURNS AS OF 12/31/2013 AQR RISK PARITY FUND | | | | | | | | | |
| | | 1 Year | | | 3 Year | | | Since
Inception
(9/30/2010) | |
| Fund - Class I: AQRIX | | | 0.12% | | | | 6.42% | | | | 7.15% | |
| Fund - Class N: AQRNX | | | -0.23% | | | | 6.14% | | | | 6.86% | |
| | | |
Merrill Lynch 3-Month T-Bill Index | | | 0.07% | | | | 0.10% | | | | 0.10% | |
| | | |
60% S&P 500 Index/40% Barclays U.S. Aggregate Bond Index | | | 17.57% | | | | 11.27% | | | | 12.21% | |
Past performance does not guarantee future results. Investment results and principal value of an investment will fluctuate so that an investor’s shares, when redeemed, may be worth more or less than their original cost. Current performance may be lower or higher than the performance data quoted. As of the latest prospectus, the gross expense ratio for the Fund’s Class I/N shares are 1.04% and 1.32%, respectively. Call 1-866-290-2688 or visit www.aqrfunds.com for current month-end performance.
| | | | | | | | | | | | | | | | |
| 20 | | AQR Funds | | | | | | Annual Report | | | | | | December 2013 | | |
| | | | | | | | | | |
Shareholder Letter (Unaudited)
|
AQR RISK PARITY FUND VS. MERRILL LYNCH 3-MONTH T-BILL INDEX AND 60% S&P INDEX/40% BARCLAYS U.S.
AGGREGATE BOND INDEX VALUE OF $10,000 INVESTED ON 9/30/2010 |

The chart above represents historical performance of a hypothetical investment of $10,000 in the Fund over the past ten years (or since inception if shorter). Performance data quoted represents past performance and does not guarantee future results. Returns shown are total returns, which assume the reinvestment of dividends and capital gains. The table and graph presented above do not reflect the deduction of taxes a shareholder would pay on fund distributions or the redemption of fund shares.
| | | | | | | | | | | | | | | | |
| | AQR Funds | | | | | | Annual Report | | | | | | December 2013 | | 21 |
| | | | | | | | | | |
Shareholder Letter (Unaudited)
| | |
| AQR RISK PARITY II MV FUND | | |
John Liew
Founding Principal
Brian Hurst
Principal
Michael
Mendelson
Principal
Yao Hua Ooi
Principal
Dear Shareholder:
Through the use of derivatives such as futures and swaps, the AQR Risk Parity II MV Fund invests across a wide variety of global markets – including: developed- and emerging-market equities, fixed income, currencies and commodities in an attempt to build a truly diversified portfolio where all asset classes matter, but no one asset class matters too much. Risk Parity investing involves allocating investments by risk, which means that instruments with less risk will generally be allocated more capital than instruments that are deemed more risky. As markets move through different risk regimes, the portfolio is dynamically adjusted with the goal of keeping overall portfolio risk and the balance of risk across asset classes fairly steady through time. We believe this leads to more consistent results, reduces tail risks associated with investments in the capital markets, and enables the investor to remain invested through more difficult market environments.
In addition to adjusting position sizes to control for increasing or decreasing risk expectations, we also overlay modest portfolio tilts based on AQR’s proprietary expected return models, which include signals based on carry, momentum, valuation, and other important economic variables. These views determine over- and underweights across a broad array of global markets. The ultimate goal is to build a portfolio that in the long run will deliver higher returns at a risk level similar to that of traditional portfolios by combining a better asset allocation with return-boosting tactical tilts.
The Fund is expected to remain long all of the markets in which we invest while averaging a moderate (under 0.5 on average) beta to the stock market over a full market cycle. The targeted annualized volatility for the Fund is 10%, on average, which varies modestly over time based on our perceptions of tactical opportunities within the different asset classes we trade. We started the year close to the 10% long term average and ended with a slightly lower target at the end due to more underweight tactical positions. However, the Fund targeted significantly less volatility in parts of the second and third quarters as the risk target was cut, and subsequently raised, in accordance with our drawdown control policy. Fund exposures dropped sharply in June as asset volatility rose and the Fund’s target risk was cut.
Total exposures ended the year somewhat lower than they began the year, due to decreases in developed-market bonds and inflation-linked bonds. However, commodities and developed-market equities actually ended the year with higher exposures than at the start of the year. With these moves, the Fund went from a 0.33 beta versus the S&P 500 Index at the end of 2012 to a 0.55 beta at the end of 2013.
For the year ended December 31, 2013, the Fund’s Class I shares returned -1.32% and realized an annualized volatility of 9.25%. During this period, the Fund’s benchmark the Merrill Lynch 3-Month Treasury returned +0.07% and a 60/40 benchmark consisting of 60% S&P 500 Index/40% Barclays U.S. Aggregate Bond Index returned +17.57% at an average realized volatility of 6.49%. The Fund’s net assets across all share classes was close to $50 million at the end of 2013.
| | | | | | | | | | | | | | | | |
| 22 | | AQR Funds | | | | | | Annual Report | | | | | | December 2013 | | |
| | | | | | | | | | |
Shareholder Letter (Unaudited)
| | |
| AQR RISK PARITY II MV FUND | | |
The Fund experienced losses in two of the three major asset class buckets for the full year for a net return of -1.32%. During 2013, equities contributed +8.35%, fixed income detracted -3.30%, and inflation-linked assets detracted -6.37%. Tactical tilts contributed positively in all asset classes.
The equity bucket contributed strong returns in all but the second quarter as equity markets rallied. Developed equities were broadly up, many ended at their highs for the year, with U.S. equities doing particularly well. In the U.S., the resolution of the “fiscal cliff” and government shutdown combined with positive economic data and the Federal Reserve’s (“Fed”) postponing tapering until 2014 all buoyed equity markets. Europe also saw strong economic data after the first quarter, and Japan performed well despite some uncertainty in the second quarter regarding structural reforms. Emerging equity markets were slightly down over the year, and were particularly hurt in the second quarter, as concerns of the Fed tightening and uncertainty in Japan combined with concerns of a Chinese slowdown.
Tactically, we were overweight equities throughout the year (except for a brief neutral position in emerging-market equities at the end of the second quarter following poor performance). Trend following signals remained positive in line with bullish asset-class timing signals. On a relative value basis, we were generally overweight EuroStoxx based on strong valuation and were underweight Canadian equities, which looked expensive. Overall, tactical tilts in equities added to the Fund for the year.
The nominal bond bucket detracted from the Fund over the year, driven by losses in the second quarter. The fourth quarter also detracted while the first and third quarters saw modest gains. U.S. Treasuries led the large second quarter decline in nominal bonds as yields rose in conjunction with speculation that the Fed would begin tapering its asset purchase program by the end of the year. International bond markets generally followed the Treasury decline, with German bunds, U.K. gilts, and Japanese government bonds all realizing losses as well. The year ended with the global bond market selling off in the fourth quarter, hurt by strong economic data, especially in the U.K. and U.S.; Japan was the exception, outperforming much of the year as monetary policy remained accommodative.
Tactically, we were underweight nominal bonds throughout the year, as our asset-class timing signals continued to be negative due to the very low level of yields. On a relative value basis, we were overweight U.S. Treasuries, driven by a steep yield curve and high real yields, and were underweight Japanese government bonds, due to a flatter yield curve and lower real bond yields. Overall, tactical tilts in nominal bonds added to the Fund for the year, driven by gains in the second quarter when nominal bonds were sharply down.
The inflation bucket detracted in 2013, with losses from both inflation-linked bonds and commodities. Inflation-linked bonds (“TIPS”) had significant losses concentrated in May and June. Losses in TIPS were most pronounced, as hawkish Fed sentiment led to a steep increase in real yields. Global inflation-linked-bond markets mirrored the U.S. decline, although to a lesser degree. U.S. TIPS were again the worst performers in the fourth quarter, driven by a combination of better economic data and the announcement of Fed tapering. U.K. TIPS rallied strongly at the start of the year after the government rejected a proposal that would have resulted in a lower official inflation rate.
We added tactical tilts to inflation-linked bonds in June, implementing a large underweight. We maintained this underweight through the end of the year based on poor price and fundamental momentum in conjunction with continued poor valuations. Commodities were down in all but the third quarter, with precious metals falling the most. Weak economic data from emerging-market countries along with concerns (and eventual announcement in December) of reduced monetary stimulus caused commodities to fall. More dovish perceptions of Fed policy in the third quarter, along with inventory and production issues
| | | | | | | | | | | | | | | | |
| | AQR Funds | | | | | | Annual Report | | | | | | December 2013 | | 23 |
| | | | | | | | | | |
Shareholder Letter (Unaudited)
| | |
| AQR RISK PARITY II MV FUND | | |
in energies, led commodities to have positive returns in the third quarter. Tactically, we were underweight commodities much of the year, and ended with a slight underweight. Large underweights in precious metals contributed positively in the second and fourth quarters, but hurt in the third quarter when metals rallied. Overall, however, metals were down for the year.
This was a challenging year for the Fund. While the Fund’s performance was within the normal range of expected performance, it significantly unperformed its benchmark – 60% S&P 500 Index/40% Barclays U.S. Aggregate Bond Index – partly because equity markets had a banner year, but also because returns to other asset classes were poor. In a year like this, a more risk-diversified and risk-managed portfolio trailed typical allocation portfolios that are concentrated in equity risk. However, we remain confident that the diversification benefits of a risk parity approach provide a sound allocation for the wide variety of potential market environments we may face in the coming years.
| | | | | | | | |
AVERAGE ANNUAL TOTAL RETURNS AS OF 12/31/2013 AQR RISK PARITY II MV FUND | |
| | | 1 Year | | | Since
Inception
(11/5/2012) | |
| Fund - Class I: QRMIX | | | -1.32% | | | | 0.36% | |
| Fund - Class N: QRMNX | | | -1.71% | | | | 0.05% | |
| | |
60% S&P 500 Index/40% Barclays U.S. Aggregate Bond Index | | | 17.57% | | | | 15.76% | |
| | |
Merrill Lynch 3-Month T-Bill Index | | | 0.07% | | | | 0.09% | |
Past performance does not guarantee future results. Investment results and principal value of an investment will fluctuate so that an investor’s shares, when redeemed, may be worth more or less than their original cost. Current performance may be lower or higher than the performance data quoted. As of the latest prospectus, the gross expense ratio for the Fund’s Class I/N shares are 2.13% and 2.87%, respectively. Call 1-866-290-2688 or visit www.aqrfunds.com for current month-end performance.
| | | | | | | | | | | | | | | | |
| 24 | | AQR Funds | | | | | | Annual Report | | | | | | December 2013 | | |
| | | | | | | | | | |
Shareholder Letter (Unaudited)
| | |
| AQR RISK PARITY II MV FUND | | |
| | |
AQR RISK PARITY II MV FUND VS. 60% S&P 500 INDEX/40% BARCLAYS U.S. AGGREGATE BOND INDEX AND
MERRILL LYNCH 3-MONTH T-BILL INDEX VALUE OF $10,000 INVESTED ON 11/5/2012 |
The chart above represents historical performance of a hypothetical investment of $10,000 in the Fund over the past ten years (or since inception if shorter). Performance data quoted represents past performance and does not guarantee future results. Returns shown are total returns, which assume the reinvestment of dividends and capital gains. The table and graph presented above do not reflect the deduction of taxes a shareholder would pay on fund distributions or the redemption of fund shares.
| | | | | | | | | | | | | | | | |
| | AQR Funds | | | | | | Annual Report | | | | | | December 2013 | | 25 |
| | | | | | | | | | |
Shareholder Letter (Unaudited)
| | |
| AQR RISK PARITY II HV FUND | | |
John Liew
Founding Principal
Brian Hurst
Principal
Michael
Mendelson
Principal
Yao Hua Ooi
Principal
Dear Shareholder:
Through the use of derivatives such as futures and swaps, the AQR Risk Parity II HV Fund invests across a wide variety of global markets – including developed- and emerging-market equities, fixed income, currencies and commodities – in an attempt to build a truly diversified portfolio where all asset classes matter, but no one asset class matters too much. Risk Parity investing involves allocating investments by risk, which means that instruments with less risk will generally be allocated more capital than instruments that are deemed more risky. As markets move through different risk regimes, the portfolio is dynamically adjusted with the goal of keeping overall portfolio risk and the balance of risk across asset classes fairly steady through time. We believe this leads to more consistent results, reduces tail risks associated with investments in the capital markets, and enables the investor to remain invested through more difficult market environments.
In addition to adjusting position sizes to control for increasing or decreasing risk expectations, we also overlay modest portfolio tilts based on AQR’s proprietary expected-return models, which include signals based on carry, momentum, valuation and other important economic variables. These views determine over- and underweights across a broad array of global markets. The ultimate goal is to build a portfolio that in the long run will deliver higher returns at a risk level similar to that of traditional portfolios by combining a better asset allocation with return-boosting tactical tilts.
The Fund is expected to remain long all of the markets in which we invest while averaging a moderate (under 0.7 on average) beta to the stock market over a full market cycle. The targeted annualized volatility for the Fund is 15%, on average, which varies modestly over time based on our perceptions of tactical opportunities within the different asset classes we trade. We started the year close to the 15% long term average and ended with a slightly lower target at the end due to more underweight tactical positions. However, the Fund targeted significantly less volatility in parts of the second and third quarters as the risk target was cut, and subsequently raised, in accordance with our drawdown control policy. Fund exposures dropped sharply in June as asset volatility rose and the Fund’s target risk was cut.
Total exposures ended the year somewhat lower than they began the year, due to decreases in developed-market bonds and inflation-linked bonds. However, commodities and developed-market equities actually ended the year with higher exposures than at the start of the year. With these moves, the Fund went from a 0.53 beta versus the S&P 500 Index at the end of 2012 to a 0.81 beta at the end of 2013.
From December 31, 2012, through December 31, 2013, the Fund’s Class I shares returned -2.83% and realized an annualized volatility of 13.65%. During this period, the Fund’s benchmark the Merrill Lynch 3-Month Treasury returned +0.07% and a 60/40 benchmark consisting of 60% S&P 500 Index/40% Barclays U.S. Aggregate Bond Index returned +17.57% at an average realized volatility of 6.49%. The Fund’s net assets across all share classes were over $25 million at the end of 2013.
| | | | | | | | | | | | | | | | |
| 26 | | AQR Funds | | | | | | Annual Report | | | | | | December 2013 | | |
| | | | | | | | | | |
Shareholder Letter (Unaudited)
| | |
| AQR RISK PARITY II HV FUND | | |
The Fund experienced losses in two of the three major asset-class buckets for the full year. To the net total return of -2.83% for 2013, equities contributed +12.17%, fixed income detracted -5.52%, and inflation-linked assets detracted -9.48%. Tactical tilts contributed positively in all asset classes.
The equity bucket contributed strong returns in all but the second quarter as equity markets rallied. Developed-market equities were broadly up, many ended at their highs for the year, with U.S. equities doing particularly well. In the U.S., the resolution of the “fiscal cliff” and government shutdown combined with positive economic data and the Federal Reserve’s (“Fed”) postponing tapering until 2014 all buoyed equity markets. Europe also saw strong economic data after the first quarter, and Japan performed well despite some uncertainty in the second quarter regarding structural reforms. Emerging-market equities were slightly down over the year, and were particularly hurt in the second quarter, as concerns of the Fed tightening and uncertainty in Japan combined with concerns of a Chinese slowdown.
Tactically, we were overweight equities throughout the year (except for a brief neutral position in emerging-market equities at the end of the second quarter following poor performance). Trend-following signals remained positive, in line with bullish asset-class timing signals. On a relative-value basis, we were generally overweight EuroStoxx based on strong valuation and were underweight Canadian equities, which looked expensive. Overall, tactical tilts in equities added to the Fund for the year.
The nominal bond bucket detracted from the Fund over the year, driven by losses in the second quarter. The fourth quarter also detracted while the first and third quarters saw modest gains. U.S. Treasuries led the large second-quarter decline in nominal bonds as yields rose in conjunction with speculation that the Fed would begin tapering its asset purchase program by the end of the year. International bond markets generally followed the Treasury decline, with German bunds, U.K. gilts, and Japanese government bonds all realizing losses as well. The year ended with the global bond market selling off in the fourth quarter, hurt by strong economic data, especially in the U.K. and U.S.; Japan was the exception, outperforming much of the year as monetary policy remained accommodative.
Tactically, we were underweight nominal bonds throughout the year, as our asset-class timing signals continued to be negative due to the very low level of yields. On a relative-value basis, we were overweight U.S. Treasuries, driven by a steep yield curve and high real yields, and were underweight Japanese government bonds, due to a flatter yield curve and lower real bond yields. Overall, tactical tilts in nominal bonds added to the Fund for the year, driven by gains in the second quarter, when nominal bonds were sharply down.
The inflation bucket detracted in 2013, with losses from both inflation-linked bonds and commodities. Inflation-linked bonds (“TIPS”) had significant losses concentrated in May and June. Losses in TIPS were most pronounced, as hawkish Fed sentiment led to a steep increase in real yields. Global inflation-linked-bond markets mirrored the U.S. decline, although to a lesser degree. U.S. TIPS were again the worst performers in the fourth quarter, driven by a combination of better economic data and the announcement of Fed tapering. U.K. TIPS rallied strongly at the start of the year after the government rejected a proposal that would have resulted in a lower official inflation rate.
We added tactical tilts to inflation-linked bonds in June, implementing a large underweight. We maintained this underweight through the end of the year based on poor price and fundamental momentum in conjunction with continued poor valuations. Commodities were down in all but the third quarter, with precious metals falling the most. Weak economic data from emerging-market countries along with concerns (and eventual announcement in December) of reduced monetary stimulus caused commodities to fall. More dovish perceptions of Fed policy in the third quarter, along with inventory and production issues
| | | | | | | | | | | | | | | | |
| | AQR Funds | | | | | | Annual Report | | | | | | December 2013 | | 27 |
| | | | | | | | | | |
Shareholder Letter (Unaudited)
| | |
| AQR RISK PARITY II HV FUND | | |
in energies, led commodities to have positive returns in the third quarter. Tactically, we were underweight commodities much of the year, and ended with a slight underweight. Large underweights in precious metals contributed positively in the second and fourth quarters, but hurt in the third quarter when metals rallied. Overall, however, metals were down for the year.
This was a challenging year for the Fund. While the Fund’s performance was within the normal range of expected performance, it significantly unperformed its benchmark – 60% S&P 500 Index/40% Barclays U.S. Aggregate Bond Index – partly because equity markets had a banner year, but also because returns to other asset classes were poor. In a year like this, a more risk-diversified and risk-managed portfolio trailed typical allocation portfolios that are concentrated in equity risk. However, we remain confident that the diversification benefits of a risk parity approach provide a sound allocation for the wide variety of potential market environments we may face in the coming years.
| | | | | | | | |
AVERAGE ANNUAL TOTAL RETURNS AS OF 12/31/2013 AQR RISK PARITY II HV FUND | |
| | | 1 Year | | | Since
Inception
(11/5/2012) | |
| Fund - Class I: QRHIX | | | -2.83% | | | | -0.40% | |
| Fund - Class N: QRHNX | | | -3.12% | | | | -0.61% | |
| | |
60% S&P 500 Index/40% Barclays U.S. Aggregate Bond Index | | | 17.57% | | | | 15.76% | |
| | |
Merrill Lynch 3-Month T-Bill Index | | | 0.07% | | | | 0.09% | |
Past performance does not guarantee future results. Investment results and principal value of an investment will fluctuate so that an investor’s shares, when redeemed, may be worth more or less than their original cost. Current performance may be lower or higher than the performance data quoted. As of the latest prospectus, the gross expense ratio for the Fund’s Class I/N shares are 2.35% and 3.53%, respectively. Call 1-866-290-2688 or visit www.aqrfunds.com for current month-end performance.
| | | | | | | | | | | | | | | | |
| 28 | | AQR Funds | | | | | | Annual Report | | | | | | December 2013 | | |
| | | | | | | | | | |
Shareholder Letter (Unaudited)
| | |
| AQR RISK PARITY II HV FUND | | |
| | |
AQR RISK PARITY II HV FUND VS. 60% S&P 500 INDEX/40% BARCLAYS U.S. AGGREGATE BOND INDEX AND MERRILL
LYNCH 3-MONTH T-BILL INDEX VALUE OF $10,000 INVESTED ON 11/5/2012 |

The chart above represents historical performance of a hypothetical investment of $10,000 in the Fund over the past ten years (or since inception if shorter). Performance data quoted represents past performance and does not guarantee future results. Returns shown are total returns, which assume the reinvestment of dividends and capital gains. The table and graph presented above do not reflect the deduction of taxes a shareholder would pay on fund distributions or the redemption of fund shares.
| | | | | | | | | | | | | | | | |
| | AQR Funds | | | | | | Annual Report | | | | | | December 2013 | | 29 |
| | | | | | | | | | |
Shareholder Letter (Unaudited)
| | |
| AQR MULTI-STRATEGY ALTERNATIVE FUND | | |
John Liew
Founding Principal
Jacques Friedman
Principal
Ronen Israel
Principal
Lars Nielsen
Principal
Mark Mitchell, Ph.D.
Founding Principal, CNH Partners
Todd Pulvino, Ph.D.
Founding Principal, CNH Partners
Dear Shareholder:
The AQR Multi-Strategy Alternative Fund attempts to provide attractive risk-adjusted returns by providing exposure to a broadly-diversified portfolio of classic, relative-value alternative strategies. We include strategies that are liquid and which can be built to be low-to-uncorrelated with traditional markets, something we believe should be a key feature of alternative strategies that are meant to be a source of diversifying returns. We believe in providing a great deal of transparency, which means providing insight into our investment process and the economic themes we seek to capture in addition to positions.
Our focus on providing a broadly-diversified portfolio starts with including nine major categories in our Fund. They are Long/Short Equity, Equity Market Neutral, Dedicated Short Bias, Emerging Markets, Convertible Arbitrage, Event Driven, Global Macro, Managed Futures and Fixed Income Relative Value. We believe that each of these categories offers good long term risk-adjusted returns, but they each go through good times and bad times. The key is that they usually go through ups and downs at different times, thus allowing us to benefit by diversifying across the nine and generating more consistent long-term performance. Underlying the nine major categories are approximately 60+ strategies that make up the economic themes and classic strategies within the Fund. Each strategy is built from the bottom up by internal, experienced teams at AQR.
Our portfolio construction approach is to be as diversified and balanced as possible, starting with equal risk weighting as a baseline and then making small tactical tilts around the strategic risk allocation when we think strategies are conditionally attractive or unattractive. Because we are trading in these markets daily and because all of the strategies are managed in one portfolio, we can stay disciplined about rebalancing to our strategic weights, stay nimble by taking advantage of tactical opportunities and also provide efficient exposure by netting positions and transactions costs.
We target 10% annual volatility in the Fund.
The Fund’s Class I shares returned +4.46% in 2013. For the year, the Fund realized 5.3% annualized daily volatility and a 0.27 correlation to equities. The Fund’s benchmark, the Merrill Lynch 3 Month Treasury Bill Index, had a slight positive return of 0.07%. The hedge fund industry, as measured by its major indices, also posted positive returns, with the Credit Suisse Hedge Fund Index (“CS Index”) gaining +9.8% and the HFRI Fund Weighted Composite Index (“HFRI Index”) gaining +9.2% net of fees for the year. These two indices have had monthly correlations to global equities, as represented by the MSCI World Index, of 0.8 and 0.9 in the past twenty-four months, respectively, and betas of 0.34 and 0.24, respectively. The effect of this relationship with equity markets is quite pronounced this year when comparing beta-adjusted1 figures for the CS Index (+3.4%) and the HFRI Index (+0.7%) with the non-adjusted figures cited above.
| | | | | | | | | | | | | | | | |
| 30 | | AQR Funds | | | | | | Annual Report | | | | | | December 2013 | | |
| | | | | | | | | | |
Shareholder Letter (Unaudited)
| | |
| AQR MULTI-STRATEGY ALTERNATIVE FUND | | |
Perhaps market focus is never really about more than equity performance and the rate outlook, but that twin focus was certainly heightened in 2013. Global equity market appreciation, while not unprecedented, was certainly impressive. The MSCI World Index in local terms returned +28.9% in 2013. To put that performance in perspective, that index has achieved that return or higher only three times since 1970. Similarly, the +32.4% return for the S&P 500 Index in 2013 was only achieved three other times in the past 44 years. These indices appreciated +8.4% and +10.5% in the fourth quarter, respectively. Equity performance was driven by a combination of stronger than expected growth from the major economies and continued stimulative monetary policy from central banks. Emerging markets experienced more muted performance with the MSCI Emerging Markets (local) index up only +3.4%.
Much of the focus was on the U.S. Federal Reserve, which surprised markets in May when it signaled that it may begin tapering and then spent the rest of the year assuaging markets that the reduction in purchases would be gradual and that short-term interest rates would not increase for some time. The Fed did announce a cut in their bond purchases by $10 billion in December, taking effect in January, several months after markets initially anticipated. Ten-year U.S. Treasury yields, which began the year at 1.8%, jumped to over 2.5% in June, and gradually increased to 3.0% by the end of the year, including a 0.42% increase in the fourth quarter. Fed actions and statements decreased inflation expectations as seen by sharp declines in inflation-linked securities and precious metals. High yield bonds experienced a nearly -6% decline from mid-May to mid-June, as represented by the Barclays U.S. High Yield Index, but still managed to finish the year +7.4%.
Four of the Fund’s nine strategies had positive results for the year. Stock selection strategies were the largest source of profits. The Managed Futures, Emerging Markets and Arbitrage strategies individually produced modest losses and collectively had a -0.9% impact on the overall return.
Following is a more detailed review of the performance of the categories with notable contributions.
Equity Market Neutral (+4.7%): The strategy was the dominant source of gains for MSAF in 2013, which was quite a change from 2012 when it was the worst performing strategy. About 80% of the strategy’s gains were concentrated in the U.S. portfolio. Each of the other regional portfolios chipped in smaller gains, led by Europe. Profits were driven chiefly by value themes which represented more than 70% of the strategy’s gains, primarily derived from the U.S. portfolio. In the first quarter review letter we discussed the resurgence of value measures after more than two years of losses. That first quarter rebound turned out to be just the half of it, as the following three quarter’s gains, in aggregate, roughly equaled the first quarter gains. Accounting-oriented quality themes provided gains, and defensive themes suffered.
Long/Short Equity (+1.9%): The strategy produced gains in every quarter this year. The strategy has three sub-strategies: dynamic exposure variation, industry selection and growth-oriented stock-selection. Exposure variation, which is momentum-based, at the maximum is designed to contribute a relatively low level of equity-beta to the overall strategy. Even so, the resulting 0.09 beta was enough to produce significant profits of +2.0% this year due to the strength of equity markets. (Note, this market exposure and resulting gains were mostly offset by the net, short position in the Dedicated Short Bias strategy.) The industry- and stock-selection strategies had little additional impact as the U.K. portfolio produced gains of +0.4% that was offset by losses in the U.S. and Japanese portfolios. Gains were concentrated in accounting-oriented quality themes and industry selection.
Global Macro (+0.8%): In 2012, the strategy was one of just two strategies that experienced negative performance. In 2013 it was among the best performing strategies, driven by the Commodity Relative Value and Directional Developed Equity sub-strategies, which provided +0.5% of contribution each. The
| | | | | | | | | | | | | | | | |
| | AQR Funds | | | | | | Annual Report | | | | | | December 2013 | | 31 |
| | | | | | | | | | |
Shareholder Letter (Unaudited)
| | |
| AQR MULTI-STRATEGY ALTERNATIVE FUND | | |
Commodity Relative Value sub-strategy derived profits from each of the three themes traded. Short biased trading in precious metals produced gains of +0.8% as gold (-28.3%) and silver (-35.8%) prices dropped precipitously, largely due to falling inflation expectations. A long bias in soybean trading also added +0.4% during the second quarter when the commodity outperformed the cross-section by more than 20% on reports of a sharp decrease in inventories. The Directional Developed Equity sub-strategy earned +0.5% by being positioned long equity indices, with near equal contribution from both value and momentum themes. Developed Equity Relative Value lost -0.5% as poor performance from value themes outweighed gains from momentum themes. A short position in the S&P 500 (+32.4%), long in U.K.’s FTSE Index (+19.2%) and the Eurostoxx Index (+22.7%) contributed relative losses, but a long in the Japanese Topix Index (+54.4%) and a short in the underperforming Swiss Market Index (+23.0%) helped counter losses.
Event Driven (+0.5%): Merger Arbitrage posted reasonable returns in an environment of low spreads and a low rate of deal failures. The median annualized spread for the portfolio’s holdings averaged 4.7% and ranged from a low in July of 3.5% to a high of 5.9% at the beginning of the year. Only eight of the 162 deals the portfolio held over the period had offers withdrawn. This amounts to a mere 4.9% annual deal failure rate compared to the long-term average of 9% for the universe2. Of the eight adverse terminations held by the Fund, only five produced losses of more than ten basis points (Cooper Tire: -0.6%, Blackberry: -0.5%, GrainCorp: -0.2%, TNT Express: -0.1% and EBIX: -0.1%). The largest gains came from Men’s Wearhouse, Clearwire and Vodaphone/Verizon, each of which contributed between +0.2% and +0.3%.
Dedicated Short Bias (-1.8%): As discussed in the Long/Short Equity section, the Dedicated Short Bias strategy has a small, net short bias, representing about 20% of total strategy risk and equating to a beta of approximately -0.06 in 2013, which was still enough to produce a loss of -1.7%. The market-neutral stock selection portfolios, which represent the remaining 80% of the strategy risk, produced marginal losses as the U.S. and U.K. portfolios generated losses of -0.4% and -0.1%, respectively and the Japanese and European portfolios produced gains of +0.2% each. Investor sentiment themes produced significant profits that were concentrated in the U.K. and Japanese portfolios. These profits were largely offset by losses from management signaling, accounting-oriented quality, and high-risk stock themes.
Fixed Income Relative Value (-0.7%): Losses from the carry-oriented Relative Value Currency and the Relative Value Bond sub-strategies outweighed gains in the Interest Rate Relative Value and Directional Credit sub-strategies in 2013. The Currency sub-strategy produced losses of -0.9% as both predicted rate-based and current rate-based carry themes contributed to losses, the former more than the latter. Eight of the ten currencies traded within this strategy experienced relative losses. The most significant of these were shorts in the British pound (+1.9%) and Euro (+4.2%), both significantly outperforming the cross-sectional average of -2.7%. Long positions in the Japanese Yen (-17.6%), Norwegian Krone (-8.4%) and Australian Dollar (-14.2%) also produced relative losses as these higher carry (based on real-rate and short-term slope comparisons in addition to nominal rate comparisons) currencies significantly underperformed the average. Long positions in the New Zealand Dollar (-0.9%) and the Swiss Franc (+0.8%) both outperformed to produce small relative profits. The Interest Rate Relative Value sub-strategy earned +0.3% and generated gains through long Eurodollar and Euribor positions and short positions in the U.K.’s Short Sterling contracts. The Directional Credit sub-strategy earned +0.1% through long positioning in five-year high-yield index credit default swaps.
Tactical Positioning: As of December 31st, the Fund is tactically operating at 88% of its strategic volatility target. The current aggregate tactical position is less underweight than it had been at the end of the third quarter when it was 86%. As of year-end, there were two strategies that were tactically overweight, two were neutrally weighted and five were underweight.
| 2 | Source for long-term average is Lehman Brothers Equity Derivatives Research covering a period of 1998 to 2007. |
| | | | | | | | | | | | | | | | |
| 32 | | AQR Funds | | | | | | Annual Report | | | | | | December 2013 | | |
| | | | | | | | | | |
Shareholder Letter (Unaudited)
| | |
| AQR MULTI-STRATEGY ALTERNATIVE FUND | | |
The quarter-to-quarter increase was attributable to increases in Global Macro and Managed Futures. Global Macro, which is still quite underweight at 65% of strategic risk, saw an improvement in the alignment of value, momentum and carry themes, thus improving the strategy opportunity set. Similarly, Managed Futures saw improvement in the alignment between its shorter- and longer-term trend-following signals, bringing its tactical position to 104% of strategic.
Tactical positioning of Event Driven was raised from 60% to 80% of strategic target. The previous tactical underweight in the strategy came in response to extremely limited first quarter deal flow and low annualized deal spreads. Subsequent deal conditions have moderately improved. While the Convertible Arbitrage tactical positioning stands unchanged, there was a marked improvement in new issuance in the fourth quarter in the U.S., with nearly $20 billion of new issues adding to an already improved year for an issuance total of $49 billion, an amount that surpasses 2011 and 2012 combined. If this trend, which is likely related to a back-up in yields, continues, it will likely have an impact on valuation levels, improving the opportunity set in convertibles.
There was no tactical change within the stock-selection grouping as Long/Short Equity remains overweight at 115% of strategic risk, and both Equity Market Neutral and Dedicated Short Bias remain neutrally weighted at 100%.
| | | | | | | | |
AVERAGE ANNUAL TOTAL RETURNS AS OF 12/31/2013 AQR MULTI-STRATEGY ALTERNATIVE FUND | |
| | | 1 Year | | | Since
Inception
(7/18/2011) | |
| Fund - Class I: ASAIX | | | 4.46% | | | | 1.68% | |
| Fund - Class N: ASANX | | | 4.16% | | | | 1.44% | |
| | |
Merrill Lynch 3-Month T-Bill Index | | | 0.07% | | | | 0.08% | |
Past performance does not guarantee future results. Investment results and principal value of an investment will fluctuate so that an investor’s shares, when redeemed, may be worth more or less than their original cost. Current performance may be lower or higher than the performance data quoted. As of the latest prospectus, the gross expense ratio for the Fund’s Class I/N shares are 3.66% and 3.99%, respectively. Call 1-866-290-2688 or visit www.aqrfunds.com for current month-end performance.
| | | | | | | | | | | | | | | | |
| | AQR Funds | | | | | | Annual Report | | | | | | December 2013 | | 33 |
| | | | | | | | | | |
Shareholder Letter (Unaudited)
| | |
| AQR MULTI-STRATEGY ALTERNATIVE FUND | | |
|
AQR MULTI-STRATEGY ALTERNATIVE FUND VS. MERRILL LYNCH 3-MONTH T-BILL INDEX VALUE OF $10,000 INVESTED ON 7/18/2011 |

The chart above represents historical performance of a hypothetical investment of $10,000 in the Fund over the past ten years (or since inception if shorter). Performance data quoted represents past performance and does not guarantee future results. Returns shown are total returns, which assume the reinvestment of dividends and capital gains. The table and graph presented above do not reflect the deduction of taxes a shareholder would pay on fund distributions or the redemption of fund shares.
| | | | | | | | | | | | | | | | |
| 34 | | AQR Funds | | | | | | Annual Report | | | | | | December 2013 | | |
| | | | | | | | | | |
Shareholder Letter (Unaudited)
| | |
| AQR STYLE PREMIA ALTERNATIVE FUND | | |
Jacques Friedman
Principal
Ronen Israel
Principal
Andrea Frazzini
Principal

Michael Katz
Principal
Dear Shareholder:
The AQR Style Premia Alternative Fund attempts to provide attractive risk-adjusted returns by providing exposure to a broadly-diversified portfolio of classic, relative-value alternative strategies capturing the performance of four major styles across diverse asset groups including stocks, country equity indices, government bonds, interest rates, currencies and commodities. We include strategies that are liquid and which can be built to be low-to-uncorrelated with traditional markets, something we believe should be a key feature of alternative strategies that are meant to be a source of diversifying returns. We believe in providing a great deal of transparency, which means providing insight into our investment process and the economic themes we seek to capture in addition to positions.
The four major styles captured in the Fund are Value, Momentum, Carry and Defensive. Each of the four styles, implemented across asset groups, has an economic intuition or rationale, be it risk-based or behavioral-based. Value involves buying assets that are “cheap” relative to their fundamental value and selling “expensive” assets. Momentum entails buying assets that recently outperformed their peers and selling those that recently underperformed. Carry implies buying high-yielding assets and selling low-yielding assets. Defensive consists of buying low-risk, high-quality assets and selling high-risk, low-quality assets.
The Fund’s portfolio construction approach is to be diversified with a baseline risk weighting that is balanced across styles and asset groups, taking into consideration liquidity and breadth among other things. Small tactical tilts are implemented around the strategic risk allocation when strategies are conditionally attractive or unattractive. Because the Fund trades in these markets daily and all of the strategies are managed in one portfolio, the Fund can stay disciplined about rebalancing to strategic weights, stay nimble by taking advantage of tactical opportunities and also provide efficient exposure by netting positions and transactions costs.
The Fund targets 10% annual volatility.
The Fund’s Class I shares returned +4.08% in 2013. The Fund’s benchmark, the Merrill Lynch 3 Month Treasury Bill Index, had a slight positive return of 0.02% in 2013. Both returns reflect the Fund’s November 1, 2013 inception.
Two of the Fund’s four styles had positive results for the period. The Momentum style led performance with gains from currency, commodity, stock and equity index trading. The Value style also contributed with profits in every asset group except currencies. The Carry and Defensive styles experienced losses. Carry was unprofitable in currencies, government bonds and interest rates, and was flat in commodities. Defensive detracted in equity indices and stocks, but contributed modestly in bonds.
| | | | | | | | | | | | | | | | |
| | AQR Funds | | | | | | Annual Report | | | | | | December 2013 | | 35 |
| | | | | | | | | | |
Shareholder Letter (Unaudited)
| | |
| AQR STYLE PREMIA ALTERNATIVE FUND | | |
Performance was mostly positive across asset groups with government bonds being the only asset group that experienced modest losses, of -0.01%. Currency and commodity trading produced the best results contributing close to 40% each of the positive performance for the period. Currency trading benefited from strong performance of Momentum themes while Carry and Value themes detracted slightly. In commodities, all themes contributed, but it was again Momentum themes that dominated, accounting for more than 70% of the gains. Equity index trading was the next best contributor followed by trading in stocks and interest rates. Momentum and Value styles drove gains in equity indices and stocks with Defensive themes experiencing losses. In interest rates, Value themes contributed more than losses from Carry and Momentum.
Tactical Positioning: As of December 31, 2013, aggregate tactical risk allocation for the Fund was at 84% of the strategic 10% target. Aggregate tactical positioning is a function of individual strategies rather than a singular aggregate view, and as of quarter-end, five of the six asset groups traded were tactically underweight, although the commodities strategy was very close to a neutral weight at 98% of strategic risk. Interest rates and currencies are the assets that are most underweight, each below 50% of strategic risk. In each case the tactical attractiveness of asset groups is determined by alignment of views among the four styles traded. The stock strategy is tactically neutral relative to strategic risk weight and thus the only asset group not underweight.
| | | | | | | | | | | | | | | | |
| 36 | | AQR Funds | | | | | | Annual Report | | | | | | December 2013 | | |
| | | | | | | | | | |
Shareholder Letter (Unaudited)
| | |
| AQR STYLE PREMIA ALTERNATIVE FUND | | |
| | | | |
TOTAL RETURNS AS OF 12/31/2013 AQR STYLE PREMIA ALTERNATIVE FUND | |
| | | Since
Inception
(10/30/2013)* | |
| Fund - Class I: QSPIX | | | 4.08% | |
| Fund - Class N: QSPNX | | | 4.05% | |
| |
Merrill Lynch 3-Month T-Bill Index | | | 0.02% | |
Past performance does not guarantee future results. Investment results and principal value of an investment will fluctuate so that an investor’s shares, when redeemed, may be worth more or less than their original cost. Current performance may be lower or higher than the performance data quoted. As of the latest prospectus, the gross expense ratio for the Fund’s Class I/N shares are 1.93% and 2.18%, respectively. Call 1-866-290-2688 or visit www.aqrfunds.com for current month-end performance.
| | | | |
AQR STYLE PREMIA ALTERNATIVE FUND VS. MERRILL LYNCH 3-MONTH T-BILL INDEX VALUE OF $10,000 INVESTED ON 10/30/2013 |
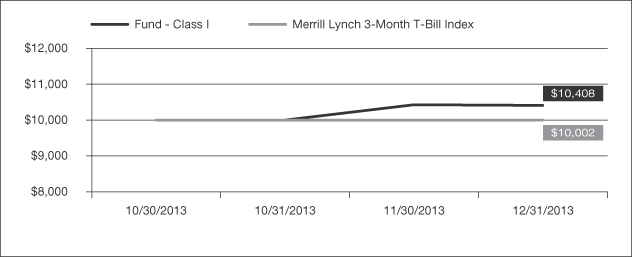
The chart above represents historical performance of a hypothetical investment of $10,000 in the Fund over the past ten years (or since inception if shorter). Performance data quoted represents past performance and does not guarantee future results. Returns shown are total returns, which assume the reinvestment of dividends and capital gains. The table and graph presented above do not reflect the deduction of taxes a shareholder would pay on fund distributions or the redemption of fund shares.
| | | | | | | | | | | | | | | | |
| | AQR Funds | | | | | | Annual Report | | | | | | December 2013 | | 37 |
| | | | | | | | | | |
Shareholder Letter (Unaudited)
RISK FACTORS:
AQR Diversified Arbitrage Fund: As the Fund employs arbitrage and alternative strategies, the Fund has the risk that the anticipated opportunities do not play out as planned, resulting in potentially reduced returns or losses to the Fund as it unwinds its trades. This Fund enters into a short sale by selling a security it has borrowed. If the market price of a security increases after the Fund borrows the security, the Fund will suffer a potentially unlimited loss when it replaces the borrowed security at the higher price. The Fund may also take a short position in a derivative instrument, which involves the risk of theoretically unlimited increase in the value of the underlying instrument. Short sales also involve transaction and other costs that will reduce potential Fund gains and increase potential Fund losses. The use of derivatives, including forward and futures contracts and swaps exposes the Fund to additional risks including increased volatility, lack of liquidity, and possible losses greater than the Fund’s initial investment as well as increased transaction costs. Derivative contracts involve exposure to counterparty credit risks, which refers to the possibility that the counterparty to a derivative instrument will not be able to make principal and interest payments when due. The Fund may invest in illiquid instruments which may be difficult to sell in a timely manner at the price that it believes the investments are worth. Foreign investing involves special risks such as currency fluctuations, political uncertainty, differences in generally accepted accounting principles, increased volatility and lower trading volume. This Fund is not suitable for all investors.
AQR Long-Short Equity Fund: The use of derivatives, including futures and forward contracts, options and swaps exposes the Fund to additional risks including increased volatility, lack of liquidity, and possible losses greater than the Fund’s initial investment as well as increased transaction costs. Derivative contracts involve exposure to counterparty credit risks, which refers to the possibility that the counterparty to a derivative instrument will not be able to make principal and interest payments when due. This Fund enters into a short sale by selling a security it has borrowed. If the market price of a security increases after the Fund borrows the security, the Fund will suffer a potentially unlimited loss when it replaces the borrowed security at the higher price. The Fund may also take a short position in a derivative instrument, which involved the risk of theoretically unlimited increase in the value of the underlying instrument. Short sales also involve transaction and other costs that will reduce potential Fund gains and increase potential Fund losses. The Fund may have exposure to the securities of mid-cap companies, the prices of which are generally more volatile than those of larger capitalization companies. Foreign investing involves special risks such as currency fluctuations, political uncertainty, differences in generally accepted accounting principles, increased volatility and lower trading volume. This Fund is not suitable for all investors.
AQR Managed Futures Strategy Fund and AQR Managed Futures Strategy HV Fund: The use of derivatives, including forward and futures contracts, swap agreements, and exposure to the commodities markets exposes the Fund to additional risks including increased volatility, lack of liquidity, and possible losses greater than the Fund’s initial investment as well as increased transaction costs. Derivative contracts involve exposure to counterparty credit risk, which refers to the possibility that the counterparty to a derivative instrument will not be able to make principal and interest payments when due. The Fund may take a short position in a derivative instrument, which involves the risk of a theoretically unlimited increase in the value of the underlying instrument. When investing in bonds, yield and share price will vary with changes in interest rates and market conditions. The Fund may lose money if short-term or long-term interest rates rise sharply or otherwise change in a manner not anticipated by the Fund’s Advisor or Sub-Advisor. There is also a chance that some of the Fund’s holdings may have their credit rating downgraded or may default. Emerging market and foreign investing involves special risks such as currency fluctuations, political uncertainty, differences in generally accepted accounting principles, increased volatility and lower trading volume. These Funds are not suitable for all investors.
| | | | | | | | | | | | | | | | |
| 38 | | AQR Funds | | | | | | Annual Report | | | | | | December 2013 | | |
| | | | | | | | | | |
Shareholder Letter (Unaudited)
AQR Risk-Balanced Commodities Strategy Fund: The use of derivatives, including forward and futures contracts, swap agreements and exposure to the commodities markets exposes the Fund to additional risks including increased volatility, lack of liquidity, and possible losses greater than the Fund’s initial investment as well as increased transaction costs. Derivative contracts involve exposure to counterparty credit risk, which refers to the possibility that the counterparty to a derivative instrument will not be able to make principal and interest payments when due. The Fund may take a short position in a derivative instrument, which involves the risk of a theoretically unlimited increase in the value of the underlying instrument. When investing in bonds, yield and share price will vary with changes in interest rates and market conditions. The Fund may lose money if short-term or long-term interest rates rise sharply or otherwise change in a manner not anticipated by the Fund’s Advisor or Sub-Advisor. There is also a chance that some of the Fund’s holdings may have their credit rating downgraded or may default. Foreign investing involves special risks such as currency fluctuations, political uncertainty, differences in generally accepted accounting principles, increased volatility and lower trading volume. This Fund is not suitable for all investors.
AQR Risk Parity Fund, AQR Risk Parity II MV Fund and AQR Risk Parity II HV Fund: The use of derivatives, including forward and futures contracts, swap agreements and exposure to the commodities markets exposes the Funds to additional risks including increased volatility, lack of liquidity, and possible losses greater than a Fund’s initial investment as well as increased transaction costs. Derivative contracts involve exposure to counterparty credit risk, which refers to the possibility that the counterparty to a derivative instrument will not be able to make principal and interest payments when due. The Fund may take a short position in a derivative instrument, which involves the risk of a theoretically unlimited increase in the value of the underlying instrument. When investing in bonds, yield and share price will vary with changes in interest rates and market conditions. The Fund may lose money if short-term or long-term interest rates rise sharply or otherwise change in a manner not anticipated by the Fund’s Advisor or Sub-Advisor. There is also a chance that some of the Fund’s holdings may have their credit rating downgraded or may default. The Fund may have exposure to the securities of mid-cap companies, the prices of which are generally more volatile than those of larger capitalization companies. Emerging market and foreign investing involves special risks such as currency fluctuations, political uncertainty, differences in generally accepted accounting principles, increased volatility and lower trading volume. These Funds are not suitable for all investors.
AQR Multi-Strategy Alternative Fund: The use of derivatives, including forward and futures contracts, swap agreements and exposure to the commodities markets exposes the Fund to additional risks including increased volatility, lack of liquidity, and possible losses greater than the Fund’s initial investment as well as increased transaction costs. Derivative contracts involve exposure to counterparty credit risk, which refers to the possibility that the counterparty to a derivative instrument will not be able to make principal and interest payments when due. The Fund employs arbitrage and alternative strategies, which carry the risk that the anticipated opportunities do not play out as planned, resulting in potentially reduced returns or losses to the Fund as it unwinds its trades. This Fund enters into a short sale by selling a security it has borrowed. If the market price of a security increases after the Fund borrows the security, the Fund will suffer a potentially unlimited loss when it replaces the borrowed security at the higher price. The Fund may also take a short position in a derivative instrument, which involves the risk of theoretically unlimited increase in the value of the underlying instrument. Short sales also involve transaction and other costs that will reduce potential Fund gains and increase potential Fund losses. When investing in bonds, yield and share price will vary with changes in interest rates and market conditions. The Fund may lose money if short-term or long-term interest rates rise sharply or otherwise change in a manner not anticipated by the Fund’s Advisor or Sub-Advisor. There is also a chance that some of the Fund’s holdings may have their credit rating downgraded or may default. Emerging market and foreign investing involves special risks such as currency fluctuations, political uncertainty, differences in generally accepted accounting principles, increased volatility and lower trading volume. This Fund is not suitable for all investors.
| | | | | | | | | | | | | | | | |
| | AQR Funds | | | | | | Annual Report | | | | | | December 2013 | | 39 |
| | | | | | | | | | |
Shareholder Letter (Unaudited)
AQR Style Premia Alternative Fund. The use of derivatives, including futures and forward contracts, options and swaps exposes the Fund to additional risks including increased volatility, lack of liquidity, and possible losses greater than the Fund’s initial investment as well as increased transaction costs. Derivative contracts involve exposure to counterparty credit risks, which refers to the possibility that the counterparty to a derivative instrument will not be able to make principal and interest payments when due. This Fund enters into a short sale by selling a security it has borrowed. If the market price of a security increases after the Fund borrows the security, the Fund will suffer a potentially unlimited loss when it replaces the borrowed security at the higher price. The Fund may also take a short position in a derivative instrument, which involves the risk of theoretically unlimited increase in the value of the underlying instrument. Short sales also involve transaction and other costs that will reduce potential Fund gains and increase potential Fund losses. The Fund may have exposure to the securities of mid-cap companies, the prices of which are generally more volatile than those of larger capitalization companies. When investing in bonds, yield and share price will vary with changes in interest rates and market conditions. The Fund may lose money if short-term or long-term interest rates rise sharply or otherwise change in a manner not anticipated by the Fund’s Advisor or Sub-Advisor. There is also a chance that some of the Fund’s holdings may have their credit rating downgraded or may default. Foreign investing involves special risks such as currency fluctuations, political uncertainty, differences in generally accepted accounting principles, increased volatility and lower trading volume. This Fund is not suitable for all investors.
An investment in any of the AQR Funds listed above (the “Funds”) involves risk, including loss of principal. Diversification does not eliminate this risk. The value of the Funds’ portfolio holdings may fluctuate in response to events specific to the companies in which the Fund invests, as well as economic, political or social events in the United States or abroad.
The Funds (other than the AQR Diversified Arbitrage Fund and the AQR Long-Short Equity Fund) are each a non-diversified fund. Because these Funds may invest in securities of a smaller number of issuers, the Fund may be more exposed to the risks associated with and developments affecting an individual issuer than a fund that invests more widely, which may therefore have a greater impact on the Fund’s performance. The Funds (other than the AQR Diversified Arbitrage Fund and the AQR Long-Short Equity Fund) also invest in a wholly-owned and controlled subsidiary and are indirectly exposed to the risks associated with the subsidiary’s investments. The Funds from time to time employ various hedging techniques, it is not possible to hedge fully or perfectly against any risk, and hedging entails its own costs.
An investor considering the Funds should be able to tolerate potentially wide price fluctuations. The Funds are subject to high portfolio turnover risk as a result of frequent trading, and thus will incur a higher level of brokerage fees and commissions and cause a higher level of tax liability to shareholders in the funds. The AQR Diversified Arbitrage Fund and the AQR Multi-Strategy Alternative Fund may attempt to increase their income or total return through the use of securities lending, and they may be subject to the possibility of additional loss as a result of this investment technique.
Please refer to each Fund’s prospectus for complete information regarding the principal risks associated with the Funds.
Cliff Asness, David Kabiller, Brian Hurst, Yao Hua Ooi and Marco Hanig are registered representatives of ALPS Distributors, Inc.
| | | | | | | | | | | | | | | | |
| 40 | | AQR Funds | | | | | | Annual Report | | | | | | December 2013 | | |
| | | | | | | | | | |
Shareholder Letter (Unaudited)
DEFINITIONS:
Alpha is a measure of performance on a risk-adjusted basis. Alpha takes the volatility (price risk) of a mutual fund and compares its risk-adjusted performance to a benchmark index. The excess return of the fund relative to the return of the benchmark index is a fund’s alpha.
Barclays U.S. Aggregate Bond Index is a broad-based bond index comprised of government, corporate, mortgage and asset-backed issues, rated investment grade or higher, and having at least one year to maturity. Indexes are unmanaged and one cannot invest directly in an index.
Bearish: A belief that a particular security, sector or the overall market will fall.
Beta is a measure of volatility of a security or portfolio in comparison to an index or the market as a whole. A beta of 1.0 means the security or portfolio will generally move in tandem with the index or market it is being compared to. A beta greater than 1.0 means the security or portfolio will be more volatile and a beta less than 1.0 means the security or portfolio will be less volatile than the index or market it is being compared to.
Bullish: A belief that a particular security, sector or the overall market will rise.
Bund: Is the German equivalent of a U.S. Treasury Bond.
Correlation is computed into what is known as the correlation coefficient, which ranges between -1 and +1. Perfect positive correlation (+1) implies that as one security moves, either up or down, the other security will move in lockstep, in the same direction. Alternatively, perfect negative correlation (-1) means that if one security moves in either direction the security that is perfectly negatively correlated will move in the opposite direction. If the correlation is 0, the movements of the securities are said to have no correlation; they are completely random.
Credit: This strategy purchases attractively priced securities on a hedged basis, typically around event induced capital flows.
Credit Suisse Hedge Fund Index is an asset-weighted benchmark that seeks to measure hedge fund performance and provide the most accurate representation of the hedge fund universe. Indexes are unmanaged and one cannot invest directly in an index.
Dow Jones-UBS Commodity Index is a broad-based index used to represent the most frequently-traded global commodity futures. Indexes are unmanaged and one cannot invest directly in an index.
Eurostoxx Index is a market capitalization-weighted index of 50 large, blue-chip European companies operating within Eurozone nations. Indexes are unmanaged and one cannot invest directly in an index.
FTSE Index is a market capitalization-weighted index of the 100 largest firms listed on the London Stock Exchange. Indexes are unmanaged and one cannot invest directly in an index.
Futures and Forwards contracts: A financial contract obligating the buyer to purchase an asset (or the seller to sell an asset) at a pre-determined future date and price.
Gilt: Is the U.K. equivalent of a U.S. Treasury Bond.
| | | | | | | | | | | | | | | | |
| | AQR Funds | | | | | | Annual Report | | | | | | December 2013 | | 41 |
| | | | | | | | | | |
Shareholder Letter (Unaudited)
Hawk: Is an individual who favors relatively high interest rates in order to keep inflation in check.
HFRI Fund Weighted Composite Index is a global, equal-weighted index of over 2,000 single-manager funds.
Merrill Lynch 3 Month Treasury Bill Index is designed to measure the performance of high-quality short-term cash-equivalent investments. Indexes are unmanaged and one cannot invest directly in an index.
Momentum: An investment style wherein an asset is deemed to have positive momentum if it has performed well in the past relative to other assets in the same universe.
MSCI World Index is a free float-adjusted market capitalization index that is designed to measure the performance of equities in developed markets, including the United States and Canada. Indexes are unmanaged and one cannot invest directly in an index.
Newedge CTA Trend Sub-Index is a subset of the Newedge CTA Index, and follows traders of trend following methodologies. The Newedge CTA Index is equal weighted, calculates the daily rate of return for a pool of CTAs selected from the larger managers that are open to new investment. Indexes are unmanaged and one cannot invest directly in an index.
S&P 500 Index is a capitalization weighted index designed to measure performance of the broad domestic economy through changes in the aggregate market value of 500 stocks representing all major industries. Indexes are unmanaged and one cannot invest directly in an index.
Swiss Market Index is a market capitalization-weighted index of 20 of the largest and most liquid stocks traded on the SIX Swiss Exchange. Indexes are unmanaged and one cannot invest directly in an index.
Tail Risk: The risk of larger or more frequent losses than would be expected if returns to an asset or portfolio followed a normal distribution.
TOPIX Index is a market capitalization-weighted index of the ‘first-section’ (largest) stocks listed on the Tokyo Stock Exchange. Currently, about 1,600 first-section stocks are listed. Indexes are unmanaged and one cannot invest directly in an index.
Tracking Error: A measure of how closely a portfolio follows the index to which it is benchmarked. It measures the standard deviation of the difference between the portfolio and index returns.
Volatility is a statistical measurement of up and down asset price fluctuations over time. If an asset has rapid dramatic price swings, its “volatility” will likely be relatively high. If prices are consistent and rarely change, “volatility” of that asset will likely be relatively low. “Volatility” can be measured as the standard deviation of an asset with a specific time horizon. It is often used to quantify the risk of such asset over a time period, typically expressed in annualized terms.
| | | | | | | | | | | | | | | | |
| 42 | | AQR Funds | | | | | | Annual Report | | | | | | December 2013 | | |
| | | | | | | | | | |
| | | | |
| Schedule of Investments | | | December 31, 2013 | |
| | |
| AQR DIVERSIFIED ARBITRAGE FUND | | |
| | | | | | | | |
| LONG INVESTMENTS - 97.6% | | SHARES | | | VALUE
(Note 3) | |
| COMMON STOCKS - 33.0% | | | | | | | | |
| | |
| Consumer Discretionary - 5.6% | | | | | | | | |
| Allison Transmission Holdings, Inc. (a) | | | 167,377 | | | $ | 4,621,279 | |
| Ark Restaurants Corp. (a) | | | 61,172 | | | | 1,354,960 | |
| China Century Dragon Media, Inc. (3)†(b) | | | 150,272 | | | | 20 | |
| China Networks International Holdings Ltd. (3)†(b) | | | 2,287,278 | | | | 11,436 | |
| Comcast Corp., Class A | | | 1,792 | | | | 89,385 | |
| Cooper Tire & Rubber Co. | | | 708,202 | | | | 17,025,176 | |
| CST Brands, Inc. | | | 662,806 | | | | 24,338,236 | |
| Del Frisco’s Restaurant Group, Inc. † | | | 11,938 | | | | 281,379 | |
Discovery Communications, Inc.,
Class C †(a) | | | 158,748 | | | | 13,312,607 | |
| FTD Cos., Inc. † | | | 168,685 | | | | 5,495,757 | |
| Groupe Fnac (France) (2)† | | | 136,172 | | | | 4,461,217 | |
| Harris Interactive, Inc. † | | | 368,099 | | | | 736,198 | |
| Jones Group, Inc./The | | | 161,875 | | | | 2,421,650 | |
| Mac-Gray Corp. | | | 17,153 | | | | 364,158 | |
| Men’s Wearhouse, Inc./The* | | | 226,537 | | | | 11,571,510 | |
| Morgans Hotel Group Co. † | | | 72,691 | | | | 590,978 | |
| MTR Gaming Group, Inc. † | | | 132,556 | | | | 683,989 | |
| Murphy USA, Inc. † | | | 316,077 | | | | 13,136,160 | |
| News Corp., Class A † | | | 238,349 | | | | 4,295,049 | |
| Noodles & Co. † | | | 72,638 | �� | | | 2,609,157 | |
| Norwegian Cruise Line Holdings Ltd. † | | | 42,771 | | | | 1,517,087 | |
| Omnicom Group, Inc. | | | 239,508 | | | | 17,812,210 | |
| Penn National Gaming, Inc. † | | | 496,266 | | | | 7,111,492 | |
| RetailMeNot, Inc. † | | | 73,619 | | | | 2,119,491 | |
| RG Barry Corp. | | | 197,890 | | | | 3,819,277 | |
| School Specialty, Inc. (2)† | | | 9,166 | | | | 724,114 | |
| SeaWorld Entertainment, Inc. | | | 5,083 | | | | 146,238 | |
| Twenty-First Century Fox, Inc., Class A | | | 316,104 | | | | 11,120,539 | |
| | | | | | | | |
| | | | | | | 151,770,749 | |
| | | | | | | | |
| Consumer Staples - 0.8% | | | | | |
| Darling International, Inc. † | | | 107,007 | | | | 2,234,306 | |
| Harris Teeter Supermarkets, Inc. | | | 121,837 | | | | 6,012,656 | |
| Pinnacle Foods, Inc. | | | 93,399 | | | | 2,564,736 | |
| Shoppers Drug Mart Corp. (Canada) | | | 219,554 | | | | 12,027,157 | |
| | | | | | | | |
| | | | | | | 22,838,855 | |
| | | | | | | | |
| Energy - 0.4% | | | | | |
| Coastal Energy Co. † | | | 388,681 | | | | 6,900,940 | |
| Equal Energy Ltd. | | | 241,246 | | | | 1,288,254 | |
| Gulf United Energy, Inc. † | | | 1,959,798 | | | | 1,764 | |
| Integrated Drilling Equipment Holdings Corp. † | | | 74,362 | | | | 316,039 | |
| Mission NewEnergy Ltd. (Australia) (2)† | | | 20,132 | | | | 221 | |
| Novus Energy, Inc. (Canada) (2)† | | | 1,419,156 | | | | 1,563,109 | |
| Platino Energy Corp. (Canada) † | | | 32,990 | | | | 15,839 | |
| Zedi, Inc. (Canada) † | | | 258,720 | | | | 250,865 | |
| | | | | | | | |
| | | | | | | 10,337,031 | |
| | | | | | | | |
| Financials - 12.6% | | | | | |
| Aquasition Corp. (United Kingdom) †(a) | | | 850,000 | | | | 8,619,000 | |
| Ashford Hospitality Prime, Inc. REIT | | | 289,843 | | | | 5,275,143 | |
| Ashford Hospitality Trust, Inc. REIT | | | 1,664,917 | | | | 13,785,513 | |
| Brookfield Asset Management, Inc., Class A (Canada) (a) | | | 176,351 | | | | 6,847,709 | |
| | | | | | | | |
| | | SHARES | | | VALUE
(Note 3) | |
| Financials - 12.6% (continued) | | | | | |
| Cambridge Capital Acquisition Corp. † | | | 1,478,400 | | | $ | 14,843,136 | |
| Camco Financial Corp. † | | | 421,610 | | | | 2,816,355 | |
| CapitalSource, Inc. | | | 239,744 | | | | 3,445,121 | |
| Capitol Acquisition Corp. II (2)† | | | 1,440,000 | | | | 13,881,600 | |
| Chart Acquisition Corp. (3)†(b) | | | 1,268,625 | | | | 12,343,721 | |
| Chatham Lodging Trust REIT | | | 213,148 | | | | 4,358,877 | |
| China VantagePoint Acquisition Co. (3)†(b) | | | 1,990 | | | | — | |
| Cis Acquisition Ltd., Class A (Russian Federation) † | | | 850,000 | | | | 8,610,500 | |
| Collabrium Japan Acquisition Corp. (United Kingdom) † | | | 595,000 | | | | 6,086,850 | |
| CommonWealth REIT | | | 565,197 | | | | 13,174,742 | |
| Eastern Insurance Holdings, Inc. | | | 34,866 | | | | 853,868 | |
| Firstbank Corp./Alma MI | | | 34,968 | | | | 676,281 | |
| FlatWorld Acquisition Corp. (Virgin Islands, British) (3)†(a)(b) | | | 219,450 | | | | — | |
| Gaming and Leisure Properties, Inc. REIT † | | | 496,266 | | | | 25,215,276 | |
| Global Defense & National Security Systems, Inc. † | | | 835,800 | | | | 8,399,790 | |
| HF2 Financial Management, Inc. † | | | 1,309,420 | | | | 13,316,801 | |
| Hudson City Bancorp, Inc. | | | 5,981,078 | | | | 56,401,566 | |
| Hyde Park Acquisition Corp. II † | | | 1,195,400 | | | | 12,276,758 | |
| Infinity Cross Border Acquisition Corp. (Israel) † | | | 287,100 | | | | 2,282,445 | |
| L&L Acquisition Corp. (3)†(b) | | | 306,000 | | | | — | |
| Levy Acquisition Corp. † | | | 1,890,000 | | | | 18,918,900 | |
| New Residential Investment Corp. REIT | | | 951,722 | | | | 6,357,503 | |
| Newcastle Investment Corp. REIT | | | 1,131,338 | | | | 6,493,880 | |
| Nicholas Financial, Inc. | | | 249,906 | | | | 3,933,520 | |
| Parkway Properties, Inc./MD REIT | | | 24,113 | | | | 465,147 | |
| Patriot National Bank ADR (3)†(b) | | | 2,000,000 | | | | 1,105,800 | |
| Prime Acquisition Corp. (China) (2)† | | | 21,209 | | | | 148,463 | |
| Quartet Merger Corp. † | | | 907,200 | | | | 9,081,072 | |
| Quinpario Acquisition Corp. (2)† | | | 1,933,070 | | | | 18,963,417 | |
| ROI Acquisition Corp. II † | | | 882,000 | | | | 8,334,900 | |
| Santa Monica Media Corp. ADR (3)†(b) | | | 15,377 | | | | — | |
| Silver Eagle Acquisition Corp. † | | | 1,971,250 | | | | 18,786,013 | |
| Starwood Property Trust, Inc. REIT | | | 265,409 | | | | 7,351,829 | |
| Sterling Financial Corp./WA | | | 114,426 | | | | 3,899,638 | |
| Taylor Capital Group, Inc. † | | | 53 | | | | 1,409 | |
| TCP Capital Corp. | | | 43,044 | | | | 722,278 | |
| Tower Financial Corp. | | | 82,235 | | | | 2,049,296 | |
| Washington Banking Co. | | | 17,779 | | | | 315,222 | |
| | | | | | | | |
| | | | | | | 340,439,339 | |
| | | | | | | | |
| Health Care - 6.0% | | | | | |
| Access Pharmaceuticals, Inc. †(a) | | | 228,024 | | | | 57,006 | |
| AdCare Health Systems, Inc. †(a) | | | 24,551 | | | | 105,569 | |
| Algeta ASA (Norway) (2)† | | | 48,705 | | | | 2,885,553 | |
| American Surgical Holdings, Inc. (3)†(b) | | | 15,747 | | | | — | |
| Authentidate Holding Corp. †(a) | | | 352,241 | | | | 472,003 | |
| Cangene Corp. (Canada) † | | | 441,554 | | | | 1,421,619 | |
| Celesio AG (Germany) (2) | | | 13,393 | | | | 424,651 | |
| Chimerix, Inc. † | | | 76,520 | | | | 1,156,217 | |
| China Medical Technologies, Inc. ADR (China) (3)†(a)(b) | | | 4,931 | | | | 49 | |
| Cornerstone Therapeutics, Inc. † | | | 64,904 | | | | 615,939 | |
| | | | |
| | The accompanying notes are an integral part of these financial statements. | | (Continued) |
| | | | | | | | | | | | | | | | |
| | AQR Funds | | | | | | Annual Report | | | | | | December 2013 | | 43 |
| | | | | | | | | | |
| | | | |
| Schedule of Investments | | | December 31, 2013 | |
| | |
| AQR DIVERSIFIED ARBITRAGE FUND | | |
| | | | | | | | |
| | | SHARES | | | VALUE
(Note 3) | |
| Health Care - 6.0% (continued) | | | | | |
| Covidien PLC (Ireland) | | | 236,691 | | | $ | 16,118,657 | |
| Ensign Group, Inc./The | | | 52,669 | | | | 2,331,657 | |
| Forest Laboratories, Inc. (3)†(b) | | | 335,833 | | | | — | |
| Given Imaging Ltd. (Israel) † | | | 4,287 | | | | 128,953 | |
| Health Management Associates, Inc., Class A † | | | 2,378,936 | | | | 31,164,062 | |
| Hi-Tech Pharmacal Co., Inc. † | | | 192,708 | | | | 8,361,600 | |
| InspireMD, Inc. † | | | 332 | | | | 817 | |
| Life Technologies Corp. † | | | 309,790 | | | | 23,482,082 | |
| Mallinckrodt PLC (Ireland) † | | | 319,919 | | | | 16,718,967 | |
| NeoStem, Inc. † | | | 32,400 | | | | 220,968 | |
| Paladin Labs, Inc. (Canada) † | | | 48,443 | | | | 5,402,723 | |
| Patheon, Inc. (Canada) † | | | 315,327 | | | | 2,912,081 | |
| Patient Safety Technologies, Inc. † | | | 299,066 | | | | 657,945 | |
| Provectus Pharmaceuticals, Inc. † | | | 1,284,362 | | | | 3,095,312 | |
| RXi Pharmaceuticals Corp. † | | | 3,161 | | | | 9,167 | |
| Santarus, Inc. † | | | 403,248 | | | | 12,887,806 | |
| Theravance, Inc. † | | | 379,902 | | | | 13,543,506 | |
| Transcept Pharmaceuticals, Inc. † | | | 122,838 | | | | 412,736 | |
| ViroPharma, Inc. † | | | 336,257 | | | | 16,762,412 | |
| XOMA Corp. † | | | 163,422 | | | | 1,099,830 | |
| | | | | | | | |
| | | | | | | 162,449,887 | |
| | | | | | | | |
| Industrials - 1.3% | | | | | |
| Allegion PLC (Ireland) † | | | 281,760 | | | | 12,450,959 | |
| Allied Defense Group, Inc./The (3)†(b) | | | 190,011 | | | | 11,401 | |
| Edwards Group Ltd. ADR (United Kingdom) † | | | 71,179 | | | | 724,602 | |
| Flow International Corp. † | | | 1,453,391 | | | | 5,871,700 | |
| Ingersoll-Rand PLC (Ireland) | | | 112,375 | | | | 6,922,300 | |
| Innotrac Corp. † | | | 665 | | | | 5,453 | |
| Kratos Defense & Security Solutions, Inc. † | | | 67,232 | | | | 516,342 | |
| MergeWorthRx Corp. † | | | 661,925 | | | | 5,381,450 | |
| Pingtan Marine Enterprise Ltd. (China) † | | | 829,474 | | | | 2,629,432 | |
| Premier Alliance Group, Inc. † | | | 91,767 | | | | 53,225 | |
| Sapphire Industry Corp. (3)†(b) | | | 25,025 | | | | — | |
| Tufco Technologies, Inc. † | | | 2,613 | | | | 15,809 | |
| US Ecology, Inc. | | | 8,124 | | | | 302,131 | |
| Vitran Corp., Inc. (Canada) † | | | 45,982 | | | | 297,963 | |
| | | | | | | | |
| | | | | | | 35,182,767 | |
| | | | | | | | |
| Information Technology - 3.3% | | | | | |
| Anaren, Inc. † | | | 62,175 | | | | 1,740,278 | |
| Compuware Corp. | | | 448,853 | | | | 5,031,642 | |
| Dynamics Research Corp. † | | | 449 | | | | 5,154 | |
| EVERTEC, Inc. (Puerto Rico) | | | 230,210 | | | | 5,676,979 | |
| Facebook, Inc., Class A † | | | 117,000 | | | | 6,395,220 | |
| Leidos Holdings, Inc. | | | 235,202 | | | | 10,934,541 | |
| Lender Processing Services, Inc. | | | 728,055 | | | | 27,214,696 | |
| LSI Corp. | | | 501,234 | | | | 5,523,599 | |
| Orckit Communications Ltd. (Israel) † | | | 15,174 | | | | 1,669 | |
| Performance Technologies, Inc. † | | | 75,652 | | | | 282,560 | |
| Science Applications International Corp. | | | 134,401 | | | | 4,444,641 | |
| SinoHub, Inc. (China) (3)†(b) | | | 190,038 | | | | 1,900 | |
| SouthPeak Interactive Corp. (2)† | | | 1,500,000 | | | | 6,000 | |
| Telestone Technologies Corp. (China) † | | | 115,818 | | | | 11,582 | |
| | | | | | | | |
| | | SHARES | | | VALUE
(Note 3) | |
| Information Technology - 3.3% (continued) | | | | | |
| Tokyo Electron Ltd. (Japan) (2) | | | 228,589 | | | $ | 12,595,876 | |
| TTM Technologies, Inc. † | | | 76,141 | | | | 653,290 | |
| Unit4 NV (Netherlands) (2) | | | 139,119 | | | | 7,342,351 | |
| United Online, Inc. | | | 120,489 | | | | 1,657,929 | |
| | | | | | | | |
| | | | | | | 89,519,907 | |
| | | | | | | | |
| Materials - 0.7% | | | | | |
| Ainsworth Lumber Co., Ltd. (Canada) † | | | 1,892,304 | | | | 7,428,485 | |
| B2Gold Corp. (Canada) † | | | 80,313 | | | | 164,823 | |
| Cereplast, Inc. † | | | 258,156 | | | | 1,317 | |
| Chaparral Gold Corp. † | | | 460,256 | | | | 138,651 | |
| China GengSheng Minerals, Inc. (China) † | | | 33,531 | | | | 6,894 | |
| Edgewater Exploration Ltd. (Canada) † | | | 417,850 | | | | 27,536 | |
| Energy Fuels, Inc. (Canada) † | | | 14,400 | | | | 82,557 | |
| Lion One Metals Ltd. (Canada) † | | | 740,315 | | | | 188,171 | |
| Mines Management, Inc. † | | | 16,120 | | | | 9,672 | |
| RTI International Metals, Inc. † | | | 97,143 | | | | 3,323,262 | |
| Southern Arc Minerals, Inc. (Canada) † | | | 248,481 | | | | 11,696 | |
| Taminco Corp. † | | | 2,043 | | | | 41,289 | |
| US Silica Holdings, Inc. | | | 176,475 | | | | 6,019,562 | |
| Vale SA ADR (Brazil) | | | 195,535 | | | | 2,739,445 | |
| Zoltek Cos., Inc. † | | | 1,539 | | | | 25,778 | |
| | | | | | | | |
| | | | | | | 20,209,138 | |
| | | | | | | | |
| Telecommunication Services - 2.2% | | | | | |
| Cleveland Unlimited ADR (3)†(b) | | | 1 | | | | 566,977 | |
| Level 3 Communications, Inc. † | | | 730,094 | | | | 24,217,218 | |
| NTS, Inc. † | | | 756,002 | | | | 1,489,324 | |
| Sprint Corp. †* | | | 554,399 | | | | 5,959,789 | |
| Telephone & Data Systems, Inc. | | | 42,940 | | | | 1,106,993 | |
| Vodafone Group PLC ADR (United Kingdom) | | | 679,756 | | | | 26,721,208 | |
| XO holdings, Inc. O Shares (3)†(b) | | | 1,366,340 | | | | — | |
| | | | | | | | |
| | | | | | | 60,061,509 | |
| | | | | | | | |
| Utilities - 0.1% | | | | | |
| UNS Energy Corp. | | | 37,741 | | | | 2,258,799 | |
| | | | | | | | |
TOTAL COMMON STOCKS
(cost $867,032,172) | | | | | | | 895,067,981 | |
| | | | | | | | |
| | | | |
| | The accompanying notes are an integral part of these financial statements. | | (Continued) |
| | | | | | | | | | | | | | | | |
| 44 | | AQR Funds | | | | | | Annual Report | | | | | | December 2013 | | |
| | | | | | | | | | |
| | | | |
| Schedule of Investments | | | December 31, 2013 | |
| | |
| AQR DIVERSIFIED ARBITRAGE FUND | | |
| | | | | | | | | | | | | | | | |
| CONVERTIBLE PREFERRED STOCKS - 4.0% | | | | | | | | SHARES | | | VALUE
(Note 3) | |
| Consumer Discretionary - 1.2% | | | | | | | | | | | | | | | | |
| Goodyear Tire & Rubber Co./The, $50.00 par, 5.875%, 04/01/14 | | | | | | | | | | | 128,800 | | | $ | 8,610,280 | |
| Sealy Corp., $25.00 par, 8.000%, 07/15/16 (3)†(b)(c) | | | | | | | | | | | 299,636 | | | | 23,671,244 | |
| | | | | | | | | | | | | | | | |
| | | | | | | | | | | | | | | 32,281,524 | |
| | | | | | | | | | | | | | | | |
| Consumer Staples - 0.2% | | | | | | | | | | | | | | | | |
| Bunge Ltd., Perpetual Preferred Stock (Bermuda), $100.00 par, 4.875%, 03/01/14 †(d) | | | | | | | | | | | 8,900 | | | | 957,195 | |
| Post Holdings, Inc., Perpetual Preferred Stock 144A, $100.00 par, 2.500%, 02/15/14 (2)†(d)(e) | | | | | | | | | | | 45,872 | | | | 4,567,131 | |
| Universal Corp., Perpetual Preferred Stock, $1,000.00 par, 6.750%, 03/15/18 (d) | | | | | | | | | | | 700 | | | | 871,367 | |
| | | | | | | | | | | | | | | | |
| | | | | | | | | | | | | | | 6,395,693 | |
| | | | | | | | | | | | | | | | |
| Energy - 0.8% | | | | | | | | | | | | | | | | |
| Chesapeake Energy Corp., Perpetual Preferred Stock 144A, $1,000.00 par, 5.750%, 02/17/14 (2)(d)(e) | | | | | | | | | | | 1,475 | | | | 1,721,141 | |
| Nabors Completion & Production Services Co., Perpetual Preferred Stock, Series A, $1,000.00 par, 4.000%, 12/01/13 (3)†(b)(d) | | | | | | | | | | | 1,169 | | | | 1,063,790 | |
| Sanchez Energy Corp., Perpetual Preferred Stock, Series A 144A, $50.00 par, 4.875%, 01/02/14 (2)(d)(e) | | | | | | | | | | | 313,300 | | | | 19,502,925 | |
| | | | | | | | | | | | | | | | |
| | | | | | | | | | | | | | | 22,287,856 | |
| | | | | | | | | | | | | | | | |
| Financials - 0.1% | | | | | | | | | | | | | | | | |
| iStar Financial, Inc., Perpetual Preferred Stock, Series J, $50.00 par, 4.500%, 03/15/18 (2)†(d) | | | | | | | | | | | 50,625 | | | | 3,138,750 | |
| | | | | | | | | | | | | | | | |
| | | | |
| Industrials - 0.1% | | | | | | | | | | | | | | | | |
| Genesee & Wyoming, Inc., $100.00 par, 5.000%, 10/01/15 | | | | | | | | | | | 13,325 | | | | 1,712,262 | |
| Stanley Black & Decker, Inc., $100.00 par, 6.250%, 11/17/16 † | | | | | | | | | | | 17,725 | | | | 1,829,220 | |
| Timberjack Corp. ADR, $188,000.00 par, 8.000%, 09/30/13 (3)†(b) | | | | | | | | | | | 188,000 | | | | 814 | |
| | | | | | | | | | | | | | | | |
| | | | | | | | | | | | | | | 3,542,296 | |
| | | | | | | | | | | | | | | | |
| Utilities - 1.6% | | | | | | | | | | | | | | | | |
| Dominion Resources, Inc., Series A, $49.00 par, 6.125%, 04/01/16 | | | | | | | | | | | 189,625 | | | | 10,262,505 | |
| Dominion Resources, Inc., Series B, $49.00 par, 6.000%, 07/01/16 | | | | | | | | | | | 228,125 | | | | 12,366,656 | |
| NextEra Energy, Inc., $50.00 par, 5.799%, 09/01/16 † | | | | | | | | | | | 270,700 | | | | 13,581,019 | |
| NextEra Energy, Inc., $50.00 par, 5.599%, 06/01/15 | | | | | | | | | | | 43,925 | | | | 2,525,688 | |
| PPL Corp., $50.00 par, 8.750%, 05/01/14 | | | | | | | | | | | 56,825 | | | | 3,004,906 | |
| | | | | | | | | | | | | | | | |
| | | | | | | | | | | | | | | 41,740,774 | |
| | | | | | | | | | | | | | | | |
TOTAL CONVERTIBLE PREFERRED STOCKS
(cost $105,567,423) | | | | | | | | | | | | | | | 109,386,893 | |
| | | | | | | | | | | | | | | | |
| | | | |
| CORPORATE BONDS - 14.5% | | INTEREST
RATE | | | MATURITY
DATE | | | PRINCIPAL
AMOUNT
(000’S) | | | | |
| Communications - 0.3% | | | | | | | | | |
| Interactive Network, Inc./FriendFinder Networks, Inc. (3)(b)(e)(f) | | | 11.500% | | | | 04/30/14 | | | $ | 3,071 | | | | 537,505 | |
| Interactive Network, Inc./FriendFinder Networks, Inc. (2)(f) | | | 14.000% | | | | 09/30/14 | | | | 775 | | | | 844,899 | |
| WCP Wireless Site Funding/WCP Wireless Site RE Funding/WCP Wireless Site Non 144A (2)(e) | | | 6.829% | | | | 11/15/15 | | | | 3,325 | | | | 3,513,497 | |
| WCP Wireless Site Funding/WCP Wireless Site RE Funding/WCP Wireless Site Non 144A (2)(e) | | | 9.247% | | | | 11/15/15 | | | | 3,000 | | | | 3,120,231 | |
| | | | | | | | | | | | | | | | |
| | | | | | | | | | | | | | | 8,016,132 | |
| | | | | | | | | | | | | | | | |
| | | | |
| | The accompanying notes are an integral part of these financial statements. | | (Continued) |
| | | | | | | | | | | | | | | | |
| | AQR Funds | | | | | | Annual Report | | | | | | December 2013 | | 45 |
| | | | | | | | | | |
| | | | |
| Schedule of Investments | | | December 31, 2013 | |
| | |
| AQR DIVERSIFIED ARBITRAGE FUND | | |
| | | | | | | | | | | | | | | | |
| | | | |
| | | INTEREST
RATE | | | MATURITY
DATE | | | PRINCIPAL
AMOUNT
(000’S) | | | VALUE
(Note 3) | |
| Consumer Discretionary - 3.0% | | | | | | | | | | | | | | | | |
| American Axle & Manufacturing, Inc. (2)(a) | | | 6.250% | | | | 03/15/21 | | | $ | 1,525 | | | $ | 1,620,312 | |
| Baker & Taylor Acquisitions Corp. 144A (2)(e) | | | 15.000% | | | | 04/01/17 | | | | 3,027 | | | | 2,572,950 | |
| Brookstone Co., Inc. 144A (2)(e) | | | 13.000% | | | | 10/15/14 | | | | 516 | | | | 389,580 | |
| Clear Channel Communications, Inc. (2)(a) | | | 4.900% | | | | 05/15/15 | | | | 4,100 | | | | 3,936,000 | |
| Empire Today LLC/Empire Today Finance Corp. 144A (2)(e) | | | 11.375% | | | | 02/01/17 | | | | 3,250 | | | | 3,233,750 | |
| Exide Technologies (2)(f) | | | 8.625% | | | | 02/01/18 | | | | 12,425 | | | | 8,883,875 | |
| Icahn Enterprises LP/Icahn Enterprises Finance Corp. (2) | | | 7.750% | | | | 01/15/16 | | | | 16,875 | | | | 17,212,500 | |
| Icahn Enterprises LP/Icahn Enterprises Finance Corp. (2) | | | 8.000% | | | | 01/15/18 | | | | 4,530 | | | | 4,711,200 | |
| IDQ Holdings, Inc. 144A (2)(e) | | | 11.500% | | | | 04/01/17 | | | | 4,325 | | | | 4,498,000 | |
| Jaguar Land Rover Automotive PLC 144A (United Kingdom) (2)(e) | | | 4.125% | | | | 12/15/18 | | | | 400 | | | | 402,500 | |
| JC Penney Corp., Inc., Series A MTN (2) | | | 6.875% | | | | 10/15/15 | | | | 4,650 | | | | 4,254,750 | |
| Landry’s, Inc. 144A (2)(e) | | | 9.375% | | | | 05/01/20 | | | | 7,356 | | | | 8,018,040 | |
| MGM Resorts International (2) | | | 5.250% | | | | 03/31/20 | | | | 6,475 | | | | 6,426,438 | |
| Michaels Stores, Inc. 144A (2)(e) | | | 5.875% | | | | 12/15/20 | | | | 400 | | | | 402,000 | |
| Roust Trading Ltd., Series AI (Bermuda) (2)(g) | | | 10.000% | | | | 05/31/16 | | | | 780 | | | | 678,357 | |
| rue21, Inc. 144A (2)(e) | | | 9.000% | | | | 10/15/21 | | | | 21,025 | | | | 15,243,125 | |
| | | | | | | | | | | | | | | | |
| | | | | | | | | | | | | | | 82,483,377 | |
| | | | | | | | | | | | | | | | |
| Consumer Staples - 0.7% | | | | | | | | | | | | | | | | |
| North Atlantic Trading Co., Inc. (3)(b)(e) | | | 11.500% | | | | 07/15/16 | | | | 13,550 | | | | 14,701,750 | |
| North Atlantic Trading Co., Inc. 144A (2)(e)(h) | | | 19.000% | | | | 01/15/17 | | | | 2,163 | | | | 2,466,048 | |
| US Foods, Inc. (2) | | | 8.500% | | | | 06/30/19 | | | | 2,658 | | | | 2,910,510 | |
| | | | | | | | | | | | | | | | |
| | | | | | | | | | | | | | | 20,078,308 | |
| | | | | | | | | | | | | | | | |
| Energy - 3.2% | | | | | | | | | | | | | | | | |
| Arch Coal, Inc. 144A (2)(e) | | | 8.000% | | | | 01/15/19 | | | | 2,875 | | | | 2,867,812 | |
| ATP Oil & Gas Corp. (2)(f) | | | 11.875% | | | | 05/01/15 | | | | 4,025 | | | | 20,125 | |
| Black Elk Energy Offshore Operations LLC/Black Elk Finance Corp. (2) | | | 13.750% | | | | 12/01/15 | | | | 5,800 | | | | 4,843,000 | |
| Copano Energy LLC/Copano Energy Finance Corp. (2) | | | 7.125% | | | | 04/01/21 | | | | 373 | | | | 429,828 | |
| EOAL Cyprus Holdings Ltd. (3)(b) | | | 0.200% | | | | 06/22/14 | | | | 238 | | | | 2,385 | |
| EOAL Cyprus Holdings Ltd. (3)(b) | | | 20.000% | | | | 06/22/14 | | | | 400 | | | | 5,997 | |
| EOAL Cyprus Holdings Ltd. (Cyprus) (3)(b)(f) | | | 15.000% | | | | 07/15/15 | | | | 4,100 | | | | 41 | |
| Forest Oil Corp. (2) | | | 7.250% | | | | 06/15/19 | | | | 2,205 | | | | 2,147,119 | |
| Global Rig Co. ASA (Norway) (3)(b) | | | 13.000% | | | | 06/09/15 | | | | 2,787 | | | | 2,946,898 | |
| Golden Close Maritime Corp. Ltd. MTN (Bermuda) (3)(b) | | | 11.000% | | | | 12/09/15 | | | | 2,139 | | | | 2,245,516 | |
| Green Field Energy Services, Inc. 144A (2)(e)(f) | | | 13.250% | | | | 11/15/16 | | | | 2,073 | | | | 352,410 | |
| Harvest Natural Resources, Inc., Series AI (2) | | | 11.000% | | | | 10/11/14 | | | | 5,975 | | | | 5,945,125 | |
| IronGate Energy Services LLC 144A (2)(e) | | | 11.000% | | | | 07/01/18 | | | | 6,200 | | | | 6,014,000 | |
| Oil States International, Inc. (2) | | | 5.125% | | | | 01/15/23 | | | | 25,850 | | | | 29,145,875 | |
| Panoro Energy ASA (Norway) (3)(b)(e) | | | 12.000% | | | | 11/15/18 | | | | 1,840 | | | | 1,941,200 | |
| Plains Exploration & Production Co. (2)(a) | | | 6.875% | | | | 02/15/23 | | | | 7,775 | | | | 8,669,125 | |
| Ship Finance International Ltd. 144A (Bermuda) (2)(e)() | | | 5.690% | | | | 04/07/14 | | | NOK | 51,000 | | | | 8,408,479 | |
| Sidewinder Drilling, Inc. 144A (2)(a)(e) | | | 9.750% | | | | 11/15/19 | | | $ | 3,750 | | | | 3,300,000 | |
| Songa Offshore (Cyprus) (3)(b)(i) | | | 9.460% | | | | 06/11/15 | | | NOK | 25,500 | | | | 3,888,926 | |
| Songa Offshore (Cyprus) (3)(b)(i) | | | 11.760% | | | | 11/17/16 | | | | 15,000 | | | | 2,473,085 | |
| | | | | | | | | | | | | | | | |
| | | | | | | | | | | | | | | 85,646,946 | |
| | | | | | | | | | | | | | | | |
| Financials - 3.4% | | | | | | | | | | | | | | | | |
| BPA Laboratories, Inc. (3)(b)(e) | | | 12.250% | | | | 04/01/17 | | | $ | 5,875 | | | | 5,963,125 | |
| CFG Holdings Ltd./CFG Finance LLC 144A (Cayman Islands) (2)(a)(e) | | | 11.500% | | | | 11/15/19 | | | | 6,412 | | | | 6,796,720 | |
| Creditcorp 144A (2)(e) | | | 12.000% | | | | 07/15/18 | | | | 8,400 | | | | 8,316,000 | |
| Emigrant Bancorp, Inc. 144A (2)(a)(e) | | | 6.250% | | | | 06/15/14 | | | | 3,450 | | | | 3,496,323 | |
| Global Investments Group Finance Ltd. (Virgin Islands, British) (3)(b) | | | 11.000% | | | | 09/24/17 | | | | 2,200 | | | | 2,079,000 | |
| Highclere Holdings Ltd. (Cayman Islands) (2) | | | 0.000% | | | | 02/26/15 | | | | 1,627 | | | | 1,512,943 | |
| ING Capital Funding Trust III, Perpetual Bond, Series 9 (2)(a)(d)(i) | | | 3.847% | | | | 03/31/14 | | | | 3,875 | | | | 3,860,469 | |
| Jasper Explorer PLC (Cyprus) (3)(b) | | | 13.500% | | | | 05/27/16 | | | | 6,000 | | | | 5,580,000 | |
| | | | |
| | The accompanying notes are an integral part of these financial statements. | | (Continued) |
| | | | | | | | | | | | | | | | |
| 46 | | AQR Funds | | | | | | Annual Report | | | | | | December 2013 | | |
| | | | | | | | | | |
| | | | |
| Schedule of Investments | | | December 31, 2013 | |
| | |
| AQR DIVERSIFIED ARBITRAGE FUND | | |
| | | | | | | | | | | | | | | | |
| | | | |
| | | INTEREST
RATE | | | MATURITY
DATE | | | PRINCIPAL
AMOUNT
(000’S) | | | VALUE
(Note 3) | |
| Financials - 3.4% (continued) | | | | | | | | | | | | | | | | |
| Kistefos AS (Norway) (3)(b)(i) | | | 11.190% | | | | 07/03/15 | | | NOK | 72,500 | | | $ | 12,550,904 | |
| Lehman Brothers Holdings, Inc. MTN (2)†(f) | | | 5.625% | | | | 01/24/16 | | | $ | 33,650 | | | | 7,150,625 | |
| MBIA Insurance Corp. 144A (2)(e)(i) | | | 11.504% | | | | 01/15/33 | | | | 3,925 | | | | 2,963,375 | |
| National Money Mart Co. (Canada) (2) | | | 10.375% | | | | 12/15/16 | | | | 12,625 | | | | 12,814,375 | |
| Opal Acquisition, Inc. 144A (2)(e) | | | 8.875% | | | | 12/15/21 | | | | 11,100 | | | | 11,044,500 | |
| Synovus Financial Corp. (2)(a) | | | 5.125% | | | | 06/15/17 | | | | 1,375 | | | | 1,419,687 | |
| Washington Mutual Bank/Debt not acquired by JPMorgan, Bank Note (2)(f) | | | 0.000% | | | | 05/01/09 | | | | 27,750 | | | | 7,735,313 | |
| | | | | | | | | | | | | | | | |
| | | | | | | | | | | | | | | 93,283,359 | |
| | | | | | | | | | | | | | | | |
| Health Care - 0.4% | | | | | | | | | | | | | | | | |
| Education Management LLC/Education Management Finance Corp. (2)(g) | | | 15.000% | | | | 07/01/18 | | | | 9,251 | | | | 10,036,792 | |
| KV Pharmaceutical Co. (3)(b) | | | 12.000% | | | | 03/15/15 | | | | 8,175 | | | | — | |
| Rotech Healthcare, Inc. (3)(b)(f) | | | 10.500% | | | | 03/15/18 | | | | 610 | | | | 167,213 | |
| | | | | | | | | | | | | | | | |
| | | | | | | | | | | | | | | 10,204,005 | |
| | | | | | | | | | | | | | | | |
| Industrials - 1.4% | | | | | | | | | | | | | | | | |
| American Airlines, Inc. 144A (2)†(e)(f) | | | 7.500% | | | | 03/15/16 | | | | 10,150 | | | | 10,530,625 | |
| American Piping Products, Inc. 144A (2)(a)(e) | | | 12.875% | | | | 11/15/17 | | | | 1,975 | | | | 1,925,625 | |
| Bluewater Holding BV (Netherlands) (3)(b)(i) | | | 3.244% | | | | 07/17/14 | | | | 4,200 | | | | 4,246,200 | |
| BOA OCV AS (Norway) (3)(b)(i) | | | 7.180% | | | | 04/27/16 | | | NOK | 16,031 | | | | 2,729,010 | |
| Darling Escrow Corp. 144A (2)(e) | | | 5.375% | | | | 01/15/22 | | | $ | 400 | | | | 403,000 | |
| Edgen Murray Corp. 144A (2)(e) | | | 8.750% | | | | 11/01/20 | | | | 6,925 | | | | 7,929,125 | |
| Harland Clarke Holdings Corp. (3)(b) | | | 9.500% | | | | 05/15/15 | | | | 1,858 | | | | 1,867,290 | |
| Kenan Advantage Group, Inc./The 144A (3)(b)(e) | | | 8.375% | | | | 12/15/18 | | | | 400 | | | | 421,000 | |
| Tempel Steel Co. 144A (2)(e) | | | 12.000% | | | | 08/15/16 | | | | 5,625 | | | | 5,428,125 | |
| United Continental Holdings, Inc. (3)(b) | | | 6.860% | | | | 04/22/14 | | | | 269 | | | | 268,995 | |
| Western Express, Inc. 144A (2)(e) | | | 12.500% | | | | 04/15/15 | | | | 2,300 | | | | 1,449,000 | |
| | | | | | | | | | | | | | | | |
| | | | | | | | | | | | | | | 37,197,995 | |
| | | | | | | | | | | | | | | | |
| Information Technology - 0.3% | | | | | | | | | | | | | | | | |
| Alcatel-Lucent USA, Inc. 144A (2)(a)(e) | | | 4.625% | | | | 07/01/17 | | | | 400 | | | | 400,500 | |
| Pegasus Solutions, Inc. 144A (3)(b)(e)(h) | | | 13.000% | | | | 04/15/14 | | | | 4,291 | | | | 3,991,076 | |
| SouthPeak Interactive Corp. (3)(b)(f) | | | 29.000% | | | | 12/31/14 | | | | 1,091 | | | | 104,546 | |
| SunEdison, Inc. (2) | | | 7.750% | | | | 04/01/19 | | | | 4,145 | | | | 4,445,513 | |
| | | | | | | | | | | | | | | | |
| | | | | | | | | | | | | | | 8,941,635 | |
| | | | | | | | | | | | | | | | |
| Materials - 0.2% | | | | | | | | | | | | | | | | |
| ArcelorMittal (Luxembourg) (2) | | | 4.250% | | | | 02/25/15 | | | | 975 | | | | 1,001,812 | |
| ArcelorMittal (Luxembourg) (2) | | | 4.250% | | | | 08/05/15 | | | | 2,575 | | | | 2,665,125 | |
| ArcelorMittal (Luxembourg) (2) | | | 9.500% | | | | 02/15/15 | | | | 775 | | | | 841,844 | |
| Northland Resources AB (Sweden) (2) | | | 4.000% | | | | 10/15/20 | | | | 895 | | | | 80,566 | |
| | | | | | | | | | | | | | | | |
| | | | | | | | | | | | | | | 4,589,347 | |
| | | | | | | | | | | | | | | | |
| Telecommunication Services - 1.0% | | | | | | | | | | | | | | | | |
| Cricket Communications, Inc. (2) | | | 7.750% | | | | 10/15/20 | | | | 9,925 | | | | 11,314,500 | |
| Sprint Corp. 144A (2)(e) | | | 7.125% | | | | 06/15/24 | | | | 4,625 | | | | 4,694,375 | |
| Virgin Media Finance PLC (United Kingdom) (2)(a) | | | 4.875% | | | | 02/15/22 | | | | 11,400 | | | | 9,918,000 | |
| | | | | | | | | | | | | | | | |
| | | | | | | | | | | | | | | 25,926,875 | |
| | | | | | | | | | | | | | | | |
| Utilities - 0.6% | | | | | | | | | | | | | | | | |
| Atlantic Offshore AS (Norway) (3)(b)(i) | | | 11.650% | | | | 06/27/15 | | | NOK | 12,000 | | | | 2,077,391 | |
| Energy Future Intermediate Holding Co. LLC/EFIH Finance, Inc. 144A (2)(e) | | | 10.000% | | | | 12/01/20 | | | $ | 12,600 | | | | 13,356,000 | |
| | | | | | | | | | | | | | | | |
| | | | | | | | | | | | | | | 15,433,391 | |
| | | | | | | | | | | | | | | | |
TOTAL CORPORATE BONDS
(cost $405,165,759) | | | | | | | | | | | | | | | 391,801,370 | |
| | | | | | | | | | | | | | | | |
| | | | |
| | The accompanying notes are an integral part of these financial statements. | | (Continued) |
| | | | | | | | | | | | | | | | |
| | AQR Funds | | | | | | Annual Report | | | | | | December 2013 | | 47 |
| | | | | | | | | | |
| | | | |
| Schedule of Investments | | | December 31, 2013 | |
| | |
| AQR DIVERSIFIED ARBITRAGE FUND | | |
| | | | | | | | | | | | | | | | |
| | | | |
| CONVERTIBLE BONDS - 17.7% | | INTEREST
RATE | | | MATURITY
DATE | | | PRINCIPAL
AMOUNT
(000’S) | | | VALUE
(Note 3) | |
| Consumer Discretionary - 2.1% | | | | | | | | | | | | | | | | |
| JAKKS Pacific, Inc. 144A (2)(a)(e) | | | 4.250% | | | | 08/01/18 | | | $ | 5,775 | | | $ | 5,540,391 | |
| M/I Homes, Inc. (2) | | | 3.000% | | | | 03/01/18 | | | | 1,800 | | | | 1,993,500 | |
| M/I Homes, Inc. (2) | | | 3.250% | | | | 09/15/17 | | | | 2,300 | | | | 2,991,437 | |
| Meritage Homes Corp. (2) | | | 1.875% | | | | 09/15/32 | | | | 2,475 | | | | 2,773,547 | |
| MGM Resorts International (2) | | | 4.250% | | | | 04/15/15 | | | | 5,250 | | | | 7,218,750 | |
| Palm Harbor Homes, Inc. (3)(b)(f) | | | 3.250% | | | | 05/15/24 | | | | 70 | | | | 3,220 | |
| Standard Pacific Corp. (2)(a) | | | 1.250% | | | | 08/01/32 | | | | 7,000 | | | | 9,266,250 | |
| Tesla Motors, Inc. (2) | | | 1.500% | | | | 06/01/18 | | | | 9,125 | | | | 12,626,719 | |
| TUI AG (Germany) (2) | | | 5.500% | | | | 11/17/14 | | | | 8,558 | | | | 14,152,377 | |
| | | | | | | | | | | | | | | | |
| | | | | | | | | | | | | | | 56,566,191 | |
| | | | | | | | | | | | | | | | |
| Consumer Staples - 0.8% | | | | | | | | | | | | | | | | |
| Vector Group Ltd. (2)(i) | | | 2.500% | | | | 01/15/19 | | | | 10,950 | | | | 12,897,687 | |
| Vector Group Ltd. (2)(i) | | | 3.750% | | | | 11/15/14 | | | | 6,504 | | | | 8,365,770 | |
| | | | | | | | | | | | | | | | |
| | | | | | | | | | | | | | | 21,263,457 | |
| | | | | | | | | | | | | | | | |
| Energy - 0.8% | | | | | | | | | | | | | | | | |
| Alpha Natural Resources, Inc. (2) | | | 3.750% | | | | 12/15/17 | | | | 2,400 | | | | 2,488,500 | |
| Alpha Natural Resources, Inc. (2) | | | 4.875% | | | | 12/15/20 | | | | 800 | | | | 863,000 | |
| Cal Dive International, Inc. 144A (2)(e) | | | 5.000% | | | | 07/15/17 | | | | 2,275 | | | | 2,404,391 | |
| Petrominerales Ltd. (Canada) (3)(b) | | | 3.250% | | | | 06/12/17 | | | | 3,200 | | | | 3,168,000 | |
| Petrominerales Ltd., Series PMG (Canada) (3)(b) | | | 2.625% | | | | 08/25/16 | | | | 2,500 | | | | 2,475,000 | |
| Polarcus Ltd. (Norway) (2) | | | 2.875% | | | | 04/27/16 | | | | 400 | | | | 384,680 | |
| Vantage Drilling Co. (Cayman Islands) (2) | | | 7.875% | | | | 09/01/42 | | | | 4,625 | | | | 5,434,375 | |
| Vantage Drilling Co. 144A (Cayman Islands) (2)(e) | | | 5.500% | | | | 07/15/43 | | | | 1,775 | | | | 1,908,125 | |
| ZaZa Energy Corp. 144A (2)(a)(e) | | | 9.000% | | | | 08/01/17 | | | | 3,550 | | | | 2,840,000 | |
| | | | | | | | | | | | | | | | |
| | | | | | | | | | | | | | | 21,966,071 | |
| | | | | | | | | | | | | | | | |
| Financials - 4.3% | | | | | | | | | | | | | | | | |
| American Equity Investment Life Holding Co. 144A (2)(e) | | | 5.250% | | | | 12/06/29 | | | | 5,600 | | | | 15,561,000 | |
| American Realty Capital Properties, Inc. (2)(a) | | | 3.000% | | | | 08/01/18 | | | | 10,700 | | | | 10,693,312 | |
| AV Homes, Inc. (2) | | | 7.500% | | | | 02/15/16 | | | | 5,900 | | | | 6,917,750 | |
| AV Homes, Inc. (2) | | | 7.500% | | | | 02/15/16 | | | | 200 | | | | 211,500 | |
| E*TRADE Financial Corp., Series A (2) | | | 0.000% | | | | 08/31/19 | | | | 1,775 | | | | 3,365,844 | |
| Encore Capital Group, Inc. 144A (2)(e) | | | 3.000% | | | | 07/01/20 | | | | 1,300 | | | | 1,633,937 | |
| Extra Space Storage LP 144A (2)(e) | | | 2.375% | | | | 07/01/33 | | | | 2,675 | | | | 2,680,016 | |
| Gain Capital Holdings, Inc. 144A (2)(a)(e) | | | 4.125% | | | | 12/01/18 | | | | 1,175 | | | | 1,093,484 | |
| iStar Financial, Inc. (2) | | | 3.000% | | | | 11/15/16 | | | | 2,800 | | | | 3,822,000 | |
| KCAP Financial, Inc. (2) | | | 8.750% | | | | 03/15/16 | | | | 4,000 | | | | 4,465,000 | |
| Meadowbrook Insurance Group, Inc. 144A (2)(e) | | | 5.000% | | | | 03/15/20 | | | | 2,575 | | | | 2,649,031 | |
| MF Global Holdings Ltd. (2)(f) | | | 3.375% | | | | 08/01/18 | | | | 2,750 | | | | 1,292,500 | |
| MGIC Investment Corp. (2) | | | 2.000% | | | | 04/01/20 | | | | 5,225 | | | | 7,210,500 | |
| MGIC Investment Corp. (2) | | | 5.000% | | | | 05/01/17 | | | | 9,675 | | | | 10,932,750 | |
| NorthStar Realty Finance LP 144A (2)(e) | | | 5.375% | | | | 06/15/33 | | | | 300 | | | | 411,750 | |
| Radian Group, Inc. (2)(a) | | | 2.250% | | | | 03/01/19 | | | | 7,650 | | | | 11,216,812 | |
| Resource Capital Corp. (2) | | | 6.000% | | | | 12/01/18 | | | | 1,350 | | | | 1,347,469 | |
| TICC Capital Corp. 144A (2)(e) | | | 7.500% | | | | 11/01/17 | | | | 3,550 | | | | 3,820,688 | |
| Volkswagen International Finance NV 144A (Netherlands) (2)(e) | | | 5.500% | | | | 11/09/15 | | | EUR | 13,500 | | | | 23,060,791 | |
| ZAIS Financial Corp. 144A (2)(e) | | | 8.000% | | | | 11/15/16 | | | $ | 3,400 | | | | 3,388,134 | |
| | | | | | | | | | | | | | | | |
| | | | | | | | | | | | | | | 115,774,268 | |
| | | | | | | | | | | | | | | | |
| Health Care - 3.9% | | | | | | | | | | | | | | | | |
| Accuray, Inc. 144A (2)(e) | | | 3.500% | | | | 02/01/18 | | | | 3,025 | | | | 5,131,156 | |
| Adcare Health Systems, Inc. (3)(b) | | | 12.000% | | | | 08/29/14 | | | | 1,450 | | | | 1,696,694 | |
| Albany Molecular Research, Inc. 144A (2)(e) | | | 2.250% | | | | 11/15/18 | | | | 1,525 | | | | 1,410,625 | |
| Exelixis, Inc. (2) | | | 4.250% | | | | 08/15/19 | | | | 3,350 | | | | 4,101,656 | |
| Gilead Sciences, Inc., Series D (2) | | | 1.625% | | | | 05/01/16 | | | | 25,075 | | | | 82,700,485 | |
| | | | |
| | The accompanying notes are an integral part of these financial statements. | | (Continued) |
| | | | | | | | | | | | | | | | |
| 48 | | AQR Funds | | | | | | Annual Report | | | | | | December 2013 | | |
| | | | | | | | | | |
| | | | |
| Schedule of Investments | | | December 31, 2013 | |
| | |
| AQR DIVERSIFIED ARBITRAGE FUND | | |
| | | | | | | | | | | | | | | | |
| | | | |
| | | INTEREST
RATE | | | MATURITY
DATE | | | PRINCIPAL
AMOUNT
(000’S) | | | VALUE
(Note 3) | |
| Health Care - 3.9% (continued) | | | | | | | | | | | | | | | | |
| Healthways, Inc. 144A (2)(e) | | | 1.500% | | | | 07/01/18 | | | $ | 2,000 | | | $ | 1,982,500 | |
| MannKind Corp. (2) | | | 5.750% | | | | 08/15/15 | | | | 1,540 | | | | 1,615,075 | |
| Orexigen Therapeutics, Inc. 144A (2)(a)(e) | | | 2.750% | | | | 12/01/20 | | | | 1,200 | | | | 1,172,250 | |
| Sequenom, Inc. (2)(a) | | | 5.000% | | | | 10/01/17 | | | | 2,825 | | | | 2,445,391 | |
| Spectrum Pharmaceuticals, Inc. 144A (2)(e) | | | 2.750% | | | | 12/15/18 | | | | 1,475 | | | | 1,524,781 | |
| Theravance, Inc. (2) | | | 2.125% | | | | 01/15/23 | | | | 1,600 | | | | 2,326,000 | |
| | | | | | | | | | | | | | | | |
| | | | | | | | | | | | | | | 106,106,613 | |
| | | | | | | | | | | | | | | | |
| Industrials - 1.2% | | | | | | | | | | | | | | | | |
| Aegean Marine Petroleum Network, Inc. (Marshall Islands) (2)(a) | | | 4.000% | | | | 11/01/18 | | | | 1,000 | | | | 1,050,000 | |
| China Linen Textile Industry Ltd. (Cayman Islands) (3)(b)(f) | | | 7.500% | | | | 12/31/14 | | | | 1,850 | | | | — | |
| FuelCell Energy, Inc. (2) | | | 8.000% | | | | 06/15/18 | | | | 1,875 | | | | 2,156,250 | |
| JetBlue Airways Corp., Series A-C (2) | | | 6.750% | | | | 10/15/39 | | | | 4,000 | | | | 7,182,500 | |
| L-3 Communications Holdings, Inc. (2)(a) | | | 3.000% | | | | 08/01/35 | | | | 4,700 | | | | 5,660,563 | |
| Layne Christensen Co. 144A (2)(e) | | | 4.250% | | | | 11/15/18 | | | | 1,700 | | | | 1,696,813 | |
| Lufthansa Malta Blues LP, Series JBLU 144A (Malta) (2)(e) | | | 0.750% | | | | 04/05/17 | | | EUR | 2,800 | | | | 5,159,700 | |
| MasTec, Inc. (2) | | | 4.000% | | | | 06/15/14 | | | $ | 2,125 | | | | 4,418,672 | |
| MasTec, Inc. (2) | | | 4.250% | | | | 12/15/14 | | | | 2,400 | | | | 5,140,500 | |
| | | | | | | | | | | | | | | | |
| | | | | | | | | | | | | | | 32,464,998 | |
| | | | | | | | | | | | | | | | |
| Information Technology - 4.3% | | | | | | | | | | | | | | | | |
| Blucora, Inc. 144A (2)(e) | | | 4.250% | | | | 04/01/19 | | | | 1,675 | | | | 2,473,766 | |
| Ciena Corp. 144A (2)(e) | | | 3.750% | | | | 10/15/18 | | | | 12,025 | | | | 17,323,516 | |
| Finisar Corp. 144A (2)(e) | | | 0.500% | | | | 12/15/33 | | | | 2,575 | | | | 2,663,516 | |
| GT Advanced Technologies, Inc. (2)(a) | | | 3.000% | | | | 10/01/17 | | | | 3,325 | | | | 4,557,328 | |
| Micron Technology, Inc. (2) | | | 2.375% | | | | 05/01/32 | | | | 1,375 | | | | 3,180,547 | |
| Micron Technology, Inc. (2) | | | 3.125% | | | | 05/01/32 | | | | 7,204 | | | | 16,402,607 | |
| NVIDIA Corp. 144A (2)(a)(e) | | | 1.000% | | | | 12/01/18 | | | | 3,700 | | | | 3,787,875 | |
| Powerwave Technologies, Inc. (3)(b)(f) | | | 3.875% | | | | 10/01/27 | | | | 4,104 | | | | 20,520 | |
| Quantum Corp. (2) | | | 4.500% | | | | 11/15/17 | | | | 1,650 | | | | 1,681,969 | |
| Rambus, Inc. 144A (2)(e) | | | 1.125% | | | | 08/15/18 | | | | 5,600 | | | | 5,869,500 | |
| Salesforce.com, Inc. 144A (2)(e) | | | 0.250% | | | | 04/01/18 | | | | 2,375 | | | | 2,581,328 | |
| SanDisk Corp. (2) | | | 1.500% | | | | 08/15/17 | | | | 12,375 | | | | 18,237,656 | |
| SouthPeak Interactive Corp. (3)(b)(f) | | | 10.000% | | | | 12/31/14 | | | | 2,500 | | | | 239,510 | |
| SunEdison, Inc. 144A (2)(e) | | | 2.000% | | | | 10/01/18 | | | | 3,575 | | | | 4,008,469 | |
| SunEdison, Inc. 144A (2)(e) | | | 2.750% | | | | 01/01/21 | | | | 1,625 | | | | 1,810,859 | |
| Web.com Group, Inc. (2) | | | 1.000% | | | | 08/15/18 | | | | 10,925 | | | | 12,263,312 | |
| WebMD Health Corp. 144A (2)(a)(e) | | | 1.500% | | | | 12/01/20 | | | | 6,025 | | | | 5,908,266 | |
| Yahoo!, Inc. 144A (2)(a)(e) | | | 0.000% | | | | 12/01/18 | | | | 13,825 | | | | 14,282,953 | |
| | | | | | | | | | | | | | | | |
| | | | | | | | | | | | | | | 117,293,497 | |
| | | | | | | | | | | | | | | | |
| Materials - 0.2% | | | | | | | | | | | | | | | | |
| Cereplast, Inc. (3)(b)(f) | | | 7.000% | | | | 06/01/16 | | | | 3,516 | | | | 232,476 | |
| Jaguar Mining, Inc. (2)(f) | | | 5.500% | | | | 03/31/16 | | | | 500 | | | | 40,000 | |
| ShengdaTech, Inc. (3)(b)(e)(f) | | | 6.000% | | | | 06/01/18 | | | | 300 | | | | 3,000 | |
| ShengdaTech, Inc. (3)(b)(e)(f) | | | 6.500% | | | | 12/15/15 | | | | 1,200 | | | | 12,000 | |
| Silver Standard Resources, Inc. 144A (Canada) (2)(e) | | | 2.875% | | | | 02/01/33 | | | | 750 | | | | 585,938 | |
| Stillwater Mining Co. (2) | | | 1.750% | | | | 10/15/32 | | | | 4,825 | | | | 5,410,031 | |
| | | | | | | | | | | | | | | | |
| | | | | | | | | | | | | | | 6,283,445 | |
| | | | | | | | | | | | | | | | |
| Telecommunication Services - 0.1% | | | | | | | | | | | | | | | | |
| Level 3 Communications, Inc., Series B (2) | | | 7.000% | | | | 03/15/15 | | | | 1,280 | | | | 1,744,000 | |
| | | | | | | | | | | | | | | | |
TOTAL CONVERTIBLE BONDS
(cost $432,363,683) | | | | | | | | | | | | | | | 479,462,540 | |
| | | | | | | | | | | | | | | | |
| | | | |
| | The accompanying notes are an integral part of these financial statements. | | (Continued) |
| | | | | | | | | | | | | | | | |
| | AQR Funds | | | | | | Annual Report | | | | | | December 2013 | | 49 |
| | | | | | | | | | |
| | | | |
| Schedule of Investments | | | December 31, 2013 | |
| | |
| AQR DIVERSIFIED ARBITRAGE FUND | | |
| | | | | | | | | | | | | | | | |
| | | | |
| LOAN PARTICIPATIONS - 0.6% | | INTEREST
RATE | | | MATURITY
DATE | | | PRINCIPAL
AMOUNT
(000’S) | | | VALUE
(Note 3) | |
| Consumer Discretionary - 0.3% | | | | | | | | | | | | | | | | |
| Dex Media West, Inc. (2)(i) | | | 8.00% | | | | 12/30/16 | | | $ | 1,551 | | | $ | 1,209,695 | |
| Exide Technologies (2) | | | 9.00% | | | | 10/09/14 | | | | 3,504 | | | | 3,556,975 | |
| RH Donnelley, Inc. (2)(i) | | | 9.75% | | | | 12/31/16 | | | | 3,731 | | | | 2,258,739 | |
| | | | | | | | | | | | | | | | |
| | | | | | | | | | | | | | | 7,025,409 | |
| | | | | | | | | | | | | | | | |
| Energy - 0.1% | | | | | | | | | | | | | | | | |
| Overseas Shipholding Group, Inc. (2) | | | 0.00% | | | | 04/22/15 | | | | 3,974 | | | | 3,908,260 | |
| | | | | | | | | | | | | | | | |
| Financials - 0.2% | | | | | | | | | | | | | | | | |
| J.G. Wentworth LLC (2) | | | 7.00% | | | | 02/08/19 | | | | 1,876 | | | | 1,894,936 | |
| Liquidnet Holdings, Inc. (3)(b) | | | 9.25% | | | | 05/08/17 | | | | 3,850 | | | | 3,792,250 | |
| | | | | | | | | | | | | | | | |
| | | | | | | | | | | | | | | 5,687,186 | |
| | | | | | | | | | | | | | | | |
TOTAL LOAN PARTICIPATIONS
(cost $17,080,914) | | | | | | | | | | | | | | | 16,620,855 | |
| | | | | | | | | | | | | | | | |
| | | | | | | | |
| CLOSED END FUNDS - 4.6% | | SHARES | | | VALUE
(Note 3) | |
| Aberdeen Global Income Fund, Inc. | | | 18,732 | | | $ | 194,251 | |
| Advent Claymore Convertible Securities and Income Fund (a) | | | 22,477 | | | | 416,499 | |
| Advent Claymore Convertible Securities and Income Fund II (a) | | | 167,224 | | | | 1,217,391 | |
| Advent Claymore Enhanced Growth & Income Fund (a) | | | 60,138 | | | | 609,198 | |
| Alliance California Municipal Income Fund, Inc. (a) | | | 14,103 | | | | 171,069 | |
| AllianceBernstein National Municipal Income Fund, Inc. (a) | | | 8,738 | | | | 109,487 | |
| Alpine Global Premier Properties Fund (a) | | | 11,386 | | | | 81,865 | |
| Avenue Income Credit Strategies Fund | | | 3,813 | | | | 67,033 | |
| Babson Capital Global Short Duration High Yield Fund | | | 863 | | | | 19,953 | |
| BlackRock Build America Bond Trust | | | 70,947 | | | | 1,358,635 | |
| BlackRock California Municipal Income Trust (a) | | | 3,485 | | | | 47,675 | |
| BlackRock Core Bond Trust | | | 172,266 | | | | 2,218,786 | |
| BlackRock Corporate High Yield Fund VI, Inc. | | | 27,006 | | | | 328,663 | |
| BlackRock Credit Allocation Income Trust (2) | | | 616,439 | | | | 8,050,693 | |
| BlackRock EcoSolutions Investment Trust (a) | | | 5,628 | | | | 44,124 | |
| BlackRock Energy and Resources Trust (a) | | | 50,593 | | | | 1,229,410 | |
| BlackRock Enhanced Capital and Income Fund, Inc. (a) | | | 141,827 | | | | 1,938,775 | |
| BlackRock Enhanced Equity Dividend Trust (a) | | | 736,424 | | | | 5,847,207 | |
| BlackRock Global Opportunities Equity Trust (a) | | | 390,031 | | | | 5,834,864 | |
| BlackRock Income Opportunity Trust, Inc. | | | 229,805 | | | | 2,229,108 | |
| BlackRock International Growth and Income Trust (a) | | | 452,158 | | | | 3,676,045 | |
| | | | | | | | |
CLOSED END FUNDS - 4.6%
(continued) | | SHARES | | | VALUE
(Note 3) | |
| BlackRock Long-Term Municipal Advantage Trust (a) | | | 8,246 | | | $ | 84,109 | |
| BlackRock Muni Intermediate Duration Fund, Inc. | | | 19,434 | | | | 270,133 | |
| BlackRock MuniAssets Fund, Inc. | | | 26,790 | | | | 309,424 | |
| BlackRock Municipal Bond Trust (a) | | | 1,836 | | | | 25,172 | |
| BlackRock Municipal Income Investment Quality Trust (a) | | | 13,960 | | | | 179,665 | |
| BlackRock Municipal Income Quality Trust (a) | | | 9,479 | | | | 120,194 | |
| BlackRock Municipal Target Term Trust | | | 52,449 | | | | 897,927 | |
| BlackRock MuniEnhanced Fund, Inc. | | | 5,694 | | | | 59,218 | |
| BlackRock MuniHoldings California Quality Fund, Inc. | | | 28,901 | | | | 382,071 | |
| BlackRock MuniHoldings Investment Quality Fund | | | 25,525 | | | | 319,573 | |
| BlackRock MuniHoldings New Jersey Quality Fund, Inc. | | | 15,278 | | | | 200,447 | |
| BlackRock MuniHoldings New York Quality Fund, Inc. | | | 4,298 | | | | 53,682 | |
| BlackRock MuniHoldings Quality Fund II, Inc. | | | 8,407 | | | | 101,641 | |
| BlackRock MuniHoldings Quality Fund, Inc. | | | 21,250 | | | | 252,025 | |
| BlackRock MuniYield California Fund, Inc. | | | 4,629 | | | | 63,788 | |
| BlackRock MuniYield California Quality Fund, Inc. | | | 20,005 | | | | 272,868 | |
| BlackRock MuniYield Investment Quality Fund | | | 11,818 | | | | 144,416 | |
| BlackRock MuniYield Michigan Quality Fund II, Inc. | | | 22,109 | | | | 254,032 | |
| BlackRock MuniYield Michigan Quality Fund, Inc. | | | 29,712 | | | | 370,212 | |
| BlackRock MuniYield New Jersey Fund, Inc. | | | 8,500 | | | | 116,110 | |
| | | | |
| | The accompanying notes are an integral part of these financial statements. | | (Continued) |
| | | | | | | | | | | | | | | | |
| 50 | | AQR Funds | | | | | | Annual Report | | | | | | December 2013 | | |
| | | | | | | | | | |
| | | | |
| Schedule of Investments | | | December 31, 2013 | |
| | |
| AQR DIVERSIFIED ARBITRAGE FUND | | |
| | | | | | | | |
CLOSED END FUNDS - 4.6%
(continued) | | SHARES | | | VALUE
(Note 3) | |
| BlackRock MuniYield New Jersey Quality Fund, Inc. | | | 5,373 | | | $ | 69,688 | |
| BlackRock MuniYield New York Quality Fund, Inc. (a) | | | 3,526 | | | | 42,594 | |
| BlackRock MuniYield Pennsylvania Quality Fund (a) | | | 13,606 | | | | 174,293 | |
| BlackRock MuniYield Quality Fund II, Inc. | | | 8,323 | | | | 97,213 | |
| BlackRock MuniYield Quality Fund III, Inc. | | | 23,280 | | | | 294,725 | |
| BlackRock Real Asset Equity Trust (a) | | | 105,057 | | | | 915,046 | |
| BlackRock Resources & Commodities Strategy Trust | | | 192,900 | | | | 2,235,711 | |
| Calamos Convertible and High Income Fund | | | 61,809 | | | | 799,190 | |
| CBRE Clarion Global Real Estate Income Fund | | | 145,590 | | | | 1,153,073 | |
| Central Securities Corp. | | | 61,049 | | | | 1,321,711 | |
| Clough Global Equity Fund | | | 8,692 | | | | 136,551 | |
| Cohen & Steers Closed-End Opportunity Fund, Inc. | | | 29,581 | | | | 371,833 | |
| Cohen & Steers Dividend Majors Fund, Inc. | | | 19,149 | | | | 279,192 | |
| Cohen & Steers Limited Duration Preferred and Income Fund, Inc. | | | 19,739 | | | | 446,496 | |
| Cohen & Steers Quality Income Realty Fund, Inc. | | | 74,101 | | | | 702,477 | |
| Cohen & Steers REIT and Preferred Income Fund, Inc. | | | 77,353 | | | | 1,214,442 | |
| Cohen & Steers Select Preferred and Income Fund, Inc. | | | 20,150 | | | | 497,503 | |
| Columbia Seligman Premium Technology Growth Fund, Inc. | | | 330 | | | | 4,749 | |
| Cushing Renaissance Fund/The | | | 500 | | | | 12,520 | |
| Cutwater Select Income Fund | | | 23,034 | | | | 421,753 | |
| Delaware Investments Minnesota Municipal Income Fund II, Inc. | | | 6,705 | | | | 82,404 | |
| Dreyfus Municipal Income, Inc. | | | 992 | | | | 8,392 | |
| DTF Tax-Free Income, Inc. | | | 8,332 | | | | 116,815 | |
| Duff & Phelps Utility and Corporate Bond Trust, Inc. | | | 32,797 | | | | 328,954 | |
| DWS High Income Opportunities Fund, Inc. | | | 38,843 | | | | 559,339 | |
| DWS High Income Trust | | | 978 | | | | 8,939 | |
| Eaton Vance California Municipal Bond Fund | | | 38,602 | | | | 394,126 | |
| Eaton Vance Enhanced Equity Income Fund | | | 57,990 | | | | 753,870 | |
| Eaton Vance Enhanced Equity Income Fund II | | | 75,021 | | | | 974,523 | |
| Eaton Vance Limited Duration Income Fund | | | 6,658 | | | | 101,867 | |
| Eaton Vance Municipal Bond Fund | | | 34,709 | | | | 392,212 | |
| Eaton Vance Municipal Bond Fund II | | | 11,276 | | | | 124,036 | |
| Eaton Vance National Municipal Opportunities Trust | | | 34,889 | | | | 644,051 | |
| Eaton Vance New York Municipal Bond Fund | | | 22,631 | | | | 256,183 | |
| | | | | | | | |
CLOSED END FUNDS - 4.6%
(continued) | | SHARES | | | VALUE
(Note 3) | |
| Eaton Vance Risk-Managed Diversified Equity Income Fund | | | 320,873 | | | $ | 3,616,239 | |
| Eaton Vance Short Duration Diversified Income Fund | | | 15,380 | | | | 234,853 | |
| Eaton Vance Tax Managed Global Buy Write Opportunities Fund | | | 143,482 | | | | 1,736,132 | |
| Eaton Vance Tax-Advantaged Bond and Options Strategies Fund | | | 11,429 | | | | 162,292 | |
| Eaton Vance Tax-Advantaged Dividend Income Fund | | | 34,380 | | | | 653,908 | |
| Eaton Vance Tax-Advantaged Global Dividend Opportunities Fund | | | 7,172 | | | | 175,714 | |
| Eaton Vance Tax-Managed Buy-Write Income Fund | | | 9,425 | | | | 140,338 | |
| Eaton Vance Tax-Managed Diversified Equity Income Fund | | | 202,984 | | | | 2,216,585 | |
| Eaton Vance Tax-Managed Global Diversified Equity Income Fund | | | 252,323 | | | | 2,523,230 | |
| Ellsworth Fund Ltd. | | | 27,901 | | | | 228,509 | |
| First Opportunity Fund, Inc. | | | 26,699 | | | | 238,689 | |
| First Trust Aberdeen Emerging Opportunity Fund | | | 1,612 | | | | 29,097 | |
| First Trust Aberdeen Global Opportunity Income Fund | | | 35,931 | | | | 504,831 | |
| First Trust Enhanced Equity Income Fund | | | 41,543 | | | | 553,353 | |
| First Trust High Income Long/Short Fund | | | 37,316 | | | | 642,582 | |
| First Trust Strategic High Income Fund II | | | 7,820 | | | | 125,511 | |
| Flaherty & Crumrine Preferred Securities Income Fund, Inc. | | | 679 | | | | 11,882 | |
| Flaherty & Crumrine Total Return Fund, Inc. | | | 919 | | | | 17,066 | |
| Fort Dearborn Income Securities, Inc. | | | 20,487 | | | | 282,721 | |
| Franklin Templeton Limited Duration Income Trust | | | 8,652 | | | | 112,389 | |
| GAMCO Global Gold Natural Resources & Income Trust by Gabelli | | | 800 | | | | 7,216 | |
| GAMCO Natural Resources Gold & Income Trust by Gabelli | | | 1,471 | | | | 14,739 | |
| Guggenheim Build America Bonds Managed Duration Trust | | | 10,130 | | | | 200,777 | |
| ING Global Advantage and Premium Opportunity Fund | | | 8,710 | | | | 102,430 | |
| ING Global Equity Dividend & Premium Opportunity Fund | | | 91,302 | | | | 817,153 | |
| ING Infrastructure Industrials and Materials Fund | | | 8,145 | | | | 139,442 | |
| ING Risk Managed Natural Resources Fund | | | 41,808 | | | | 410,136 | |
| Invesco Advantage Municipal Income Trust II | | | 46,870 | | | | 493,072 | |
| Invesco Bond Fund | | | 63,088 | | | | 1,116,027 | |
| Invesco California Value Municipal Income Trust | | | 32,304 | | | | 368,266 | |
| Invesco Dynamic Credit Opportunities Fund | | | 31,301 | | | | 403,783 | |
| | | | |
| | The accompanying notes are an integral part of these financial statements. | | (Continued) |
| | | | | | | | | | | | | | | | |
| | AQR Funds | | | | | | Annual Report | | | | | | December 2013 | | 51 |
| | | | | | | | | | |
| | | | |
| Schedule of Investments | | | December 31, 2013 | |
| | |
| AQR DIVERSIFIED ARBITRAGE FUND | | |
| | | | | | | | |
CLOSED END FUNDS - 4.6%
(continued) | | SHARES | | | VALUE
(Note 3) | |
| Invesco Municipal Income Opportunities Trust | | | 48,940 | | | $ | 303,428 | |
| Invesco Municipal Opportunity Trust | | | 85,728 | | | | 1,003,875 | |
| Invesco Municipal Trust | | | 68,223 | | | | 790,705 | |
| Invesco Pennsylvania Value Municipal Income Trust | | | 10,359 | | | | 125,758 | |
| Invesco Quality Municipal Income Trust | | | 45,080 | | | | 501,290 | |
| Invesco Trust for Investment Grade Municipals | | | 60,708 | | | | 739,423 | |
| Invesco Value Municipal Income Trust | | | 30,029 | | | | 405,391 | |
| John Hancock Hedged Equity & Income Fund | | | 40,762 | | | | 695,807 | |
| John Hancock Income Securities Trust | | | 11,824 | | | | 169,083 | |
| John Hancock Premium Dividend Fund | | | 107,299 | | | | 1,244,668 | |
| John Hancock Tax-Advantaged Dividend Income Fund | | | 69,341 | | | | 1,263,393 | |
| Lazard Global Total Return and Income Fund, Inc. | | | 7,525 | | | | 132,590 | |
| LMP Corporate Loan Fund, Inc. | | | 7,657 | | | | 93,645 | |
| LMP Real Estate Income Fund, Inc. | | | 11,336 | | | | 114,040 | |
| Macquarie Global Infrastructure Total Return Fund, Inc. | | | 8,991 | | | | 198,701 | |
| Madison Covered Call & Equity Strategy Fund | | | 71,216 | | | | 581,835 | |
| MainStay DefinedTerm Municipal Opportunities Fund | | | 10,946 | | | | 172,618 | |
| MFS Investment Grade Municipal Trust | | | 4,511 | | | | 38,840 | |
| MFS Municipal Income Trust | | | 13,103 | | | | 81,894 | |
| Montgomery Street Income Securities, Inc. | | | 14,004 | | | | 217,622 | |
| Morgan Stanley Emerging Markets Fund, Inc. | | | 14,829 | | | | 229,553 | |
| Morgan Stanley Income Securities, Inc. | | | 45,425 | | | | 764,503 | |
| Neuberger Berman High Yield Strategies Fund, Inc. | | | 3,864 | | | | 51,237 | |
| New America High Income Fund, Inc./The | | | 7,296 | | | | 70,406 | |
| Nuveen AMT-Free Municipal Income Fund | | | 100,887 | | | | 1,214,679 | |
| Nuveen AMT-Free Municipal Value Fund | | | 446 | | | | 6,779 | |
| Nuveen Arizona Premium Income Municipal Fund | | | 18,114 | | | | 219,179 | |
| Nuveen Build America Bond Opportunity Fund | | | 15,982 | | | | 310,530 | |
| Nuveen Build American Bond Term Fund | | | 48,414 | | | | 892,754 | |
| Nuveen California AMT-Free Municipal Income Fund | | | 57,957 | | | | 705,337 | |
| Nuveen California Dividend Advantage Municipal Fund | | | 14,985 | | | | 192,557 | |
| Nuveen California Dividend Advantage Municipal Fund 2 | | | 12,540 | | | | 158,255 | |
| | | | | | | | |
CLOSED END FUNDS - 4.6%
(continued) | | SHARES | | | VALUE
(Note 3) | |
| Nuveen California Dividend Advantage Municipal Fund 3 | | | 23,580 | | | $ | 269,284 | |
| Nuveen California Investment Quality Municipal Fund | | | 2,983 | | | | 39,316 | |
| Nuveen California Municipal Market Opportunity Fund, Inc. | | | 46 | | | | 624 | |
| Nuveen California Performance Plus Municipal Fund, Inc. | | | 661 | | | | 8,798 | |
| Nuveen Connecticut Premium Income Municipal Fund | | | 23,052 | | | | 267,403 | |
| Nuveen Credit Strategies Income Fund | | | 53,939 | | | | 524,826 | |
| Nuveen Diversified Dividend & Income Fund | | | 28,375 | | | | 319,786 | |
| Nuveen Dividend Advantage Municipal Fund | | | 67,690 | | | | 852,217 | |
| Nuveen Dividend Advantage Municipal Fund 2 | | | 53,928 | | | | 684,346 | |
| Nuveen Dividend Advantage Municipal Fund 3 | | | 94,193 | | | | 1,163,284 | |
| Nuveen Dividend Advantage Municipal Income Fund | | | 69,110 | | | | 865,257 | |
| Nuveen Enhanced Municipal Value Fund | | | 2,923 | | | | 37,882 | |
| Nuveen Equity Premium Advantage Fund | | | 42,380 | | | | 535,683 | |
| Nuveen Equity Premium and Growth Fund | | | 2,083 | | | | 29,412 | |
| Nuveen Equity Premium Income Fund | | | 19,820 | | | | 248,741 | |
| Nuveen Floating Rate Income Opportunity Fund | | | 6,919 | | | | 84,273 | |
| Nuveen Georgia Dividend Advantage Municipal Fund 2 | | | 13,243 | | | | 155,605 | |
| Nuveen Global Value Opportunities Fund | | | 45,059 | | | | 593,427 | |
| Nuveen Intermediate Duration Municipal Term Fund | | | 80,135 | | | | 922,354 | |
| Nuveen Investment Quality Municipal Fund, Inc. | | | 22,521 | | | | 304,709 | |
| Nuveen Maryland Premium Income Municipal Fund | | | 42,448 | | | | 506,405 | |
| Nuveen Municipal Advantage Fund, Inc. | | | 90,749 | | | �� | 1,103,508 | |
| Nuveen Municipal Market Opportunity Fund, Inc. | | | 79,057 | | | | 948,684 | |
| Nuveen Municipal Opportunity Fund, Inc. | | | 99,967 | | | | 1,321,564 | |
| Nuveen New Jersey Investment Quality Municipal Fund, Inc. | | | 19,553 | | | | 252,038 | |
| Nuveen New Jersey Premium Income Municipal Fund, Inc. | | | 7,497 | | | | 97,911 | |
| Nuveen New York AMT-Free Municipal Income Fund | | | 79,689 | | | | 978,581 | |
| Nuveen New York Dividend Advantage Municipal Fund | | | 11,574 | | | | 146,990 | |
| Nuveen New York Municipal Value Fund, Inc. | | | 5,408 | | | | 47,374 | |
| Nuveen New York Performance Plus Municipal Fund, Inc. | | | 9,979 | | | | 132,820 | |
| | | | |
| | The accompanying notes are an integral part of these financial statements. | | (Continued) |
| | | | | | | | | | | | | | | | |
| 52 | | AQR Funds | | | | | | Annual Report | | | | | | December 2013 | | |
| | | | | | | | | | |
| | | | |
| Schedule of Investments | | | December 31, 2013 | |
| | |
| AQR DIVERSIFIED ARBITRAGE FUND | | |
| | | | | | | | |
CLOSED END FUNDS - 4.6%
(continued) | | SHARES | | | VALUE
(Note 3) | |
| Nuveen North Carolina Premium Income Municipal Fund | | | 27,370 | | | | 327,345 | |
| Nuveen Ohio Quality Income Municipal Fund | | | 7,468 | | | | 103,955 | |
| Nuveen Pennsylvania Investment Quality Municipal Fund | | | 18,860 | | | | 232,732 | |
| Nuveen Pennsylvania Premium Income Municipal Fund 2 | | | 17,892 | | | | 212,736 | |
| Nuveen Performance Plus Municipal Fund, Inc. | | | 49,793 | | | | 673,699 | |
| Nuveen Preferred & Income Term Fund | | | 7,977 | | | | 176,052 | |
| Nuveen Preferred Income Opportunities Fund | | | 139,985 | | | | 1,241,667 | |
| Nuveen Premier Municipal Income Fund, Inc. | | | 23,748 | | | | 293,763 | |
| Nuveen Premium Income Municipal Fund 2 | | | 125,005 | | | | 1,568,813 | |
| Nuveen Premium Income Municipal Fund 4, Inc. | | | 29,574 | | | | 358,733 | |
| Nuveen Premium Income Municipal Fund, Inc. | | | 79,054 | | | | 974,736 | |
| Nuveen Quality Income Municipal Fund, Inc. | | | 114,285 | | | | 1,399,991 | |
| Nuveen Quality Municipal Fund, Inc. | | | 60,395 | | | | 729,572 | |
| Nuveen Quality Preferred Income Fund | | | 164,529 | | | | 1,265,228 | |
| Nuveen Quality Preferred Income Fund II | | | 383,384 | | | | 3,120,746 | |
| Nuveen Quality Preferred Income Fund III | | | 58,731 | | | | 461,038 | |
| Nuveen Select Quality Municipal Fund | | | 56,452 | | | | 700,005 | |
| Nuveen Select Tax Free | | | 2,203 | | | | 28,397 | |
| Nuveen Select Tax Free 2 | | | 2,262 | | | | 27,958 | |
| Nuveen Senior Income Fund | | | 2,162 | | | | 15,415 | |
| Nuveen Tax-Advantaged Dividend Growth Fund | | | 5,332 | | | | 83,499 | |
| Nuveen Texas Quality Income Municipal Fund | | | 3,550 | | | | 45,475 | |
| Nuveen Virginia Premium Income Municipal Fund | | | 13,905 | | | | 164,079 | |
| Petroleum & Resources Corp. | | | 71,800 | | | | 1,965,884 | |
| Prudential Global Short Duration High Yield Fund, Inc. | | | 8,316 | | | | 144,283 | |
| Putnam High Income Securities Fund | | | 36,012 | | | | 297,459 | |
| Putnam Managed Municipal Income Trust | | | 47,112 | | | | 312,824 | |
| Putnam Municipal Opportunities Trust | | | 67,030 | | | | 719,902 | |
| Royce Micro-Cap Trust, Inc. | | | 5,512 | | | | 69,506 | |
| Royce Value Trust, Inc. | | | 14,220 | | | | 227,520 | |
| Transamerica Income Shares, Inc. | | | 18,693 | | | | 390,310 | |
| Tri-Continental Corp. | | | 6,075 | | | | 121,378 | |
| Wells Fargo Advantage Global Dividend Opportunity Fund | | | 69,026 | | | | 500,439 | |
| Wells Fargo Advantage Multi-Sector Income Fund | | | 96,394 | | | | 1,355,300 | |
| Western Asset Global Corporate Defined Opportunity Fund, Inc. | | | 92,413 | | | | 1,669,903 | |
| | | | | | | | |
CLOSED END FUNDS - 4.6%
(continued) | | SHARES | | | VALUE
(Note 3) | |
| Western Asset Global High Income Fund, Inc. | | | 3,395 | | | | 41,555 | |
| Western Asset High Income Opportunity Fund, Inc. | | | 2,877 | | | | 17,061 | |
| Western Asset Income Fund | | | 24,597 | | | | 323,942 | |
| Western Asset Intermediate Muni Fund, Inc. | | | 2,589 | | | | 23,405 | |
| Western Asset Investment Grade Defined Opportunity Trust, Inc. | | | 14,982 | | | | 302,636 | |
| Western Asset Managed High Income Fund, Inc. | | | 18,047 | | | | 102,146 | |
| Western Asset Municipal High Income Fund, Inc. | | | 35,097 | | | | 236,203 | |
| Western Asset Municipal Partners Fund, Inc. | | | 10,608 | | | | 145,860 | |
| Western Asset Worldwide Income Fund, Inc. | | | 29,966 | | | | 364,986 | |
| Zweig Fund, Inc. | | | 26,489 | | | | 393,627 | |
| | | | | | | | |
TOTAL CLOSED END FUNDS
(cost $119,482,559) | | | | | | | 125,448,111 | |
| | | | | | | | |
| PREFERRED STOCKS - 0.9% | | | | | | | | |
| | |
| Energy - 0.6% | | | | | | | | |
| Black Elk Energy, Perpetual Preferred Stock, Class E (3)†(b)(d) | | | 17,117,549 | | | | 17,117,549 | |
| | | | | | | | |
| | |
| Financials - 0.2% | | | | | | | | |
| Ally Financial, Inc., Perpetual Preferred Stock, Series G 144A (2)(a)(d)(e) | | | 2,175 | | | | 2,077,329 | |
| First Bank, Inc., Perpetual Preferred Stock (3)†(b)(d) | | | 2,458 | | | | 866,821 | |
| Flagstar Bancorp, Inc., Perpetual Preferred Stock, Series C (3)†(b)(d) | | | 1,423 | | | | 1,434,254 | |
| United Community Banks, Inc., Perpetual Preferred Stock (3)†(b)(d) | | | 1,421 | | | | 1,410,273 | |
| | | | | | | | |
| | | | | | | 5,788,677 | |
| | | | | | | | |
| Utilities - 0.1% | | | | | | | | |
| Genie Energy Ltd., Perpetual Preferred Stock, Series 12-A †(d)(i) | | | 218,975 | | | | 1,745,231 | |
| | | | | | | | |
TOTAL PREFERRED STOCKS
(cost $24,395,185) | | | | | | | 24,651,457 | |
| | | | | | | | |
| RIGHTS - 0.0% (j) | | | | | | | | |
| | |
| Health Care - 0.0% (j) | | | | | | | | |
| American Medical Alert Corp. (3)†(b) | | | 283,523 | | | | 2,835 | |
| | | | | | | | |
| |
| Information Technology - 0.0% (j) | | | | | |
| Gerber Scientific, Inc. (3)†(b) | | | 879,944 | | | | — | |
| | | | | | | | |
TOTAL RIGHTS
(cost $ -) | | | | | | | 2,835 | |
| | | | | | | | |
| | | | |
| | The accompanying notes are an integral part of these financial statements. | | (Continued) |
| | | | | | | | | | | | | | | | |
| | AQR Funds | | | | | | Annual Report | | | | | | December 2013 | | 53 |
| | | | | | | | | | |
| | | | |
| Schedule of Investments | | | December 31, 2013 | |
| | |
| AQR DIVERSIFIED ARBITRAGE FUND | | |
| | | | | | | | |
| | |
| SHORT-TERM INVESTMENTS - 3.4% | |
| PRINCIPAL
AMOUNT
(000’S) |
| |
| VALUE
(Note 3) |
|
| U.S. Treasury Bills, 0.066%, 01/30/2014 (k) | | $ | 22,400 | | | $ | 22,399,387 | |
| U.S. Treasury Bills, 0.073%, 02/06/2014 (k) | | | 22,400 | | | | 22,399,364 | |
| U.S. Treasury Bills, 0.080%, 05/29/2014 (a)(k) | | | 23,800 | | | | 23,794,407 | |
| U.S. Treasury Bills, 0.084%, 06/05/2014 (a)(k) | | | 23,800 | | | | 23,794,145 | |
| | | | | | | | |
TOTAL SHORT-TERM INVESTMENTS
(cost $92,380,189) | | | | 92,387,303 | |
| | | | | | | | |
| | |
| WARRANTS - 1.5% | | | SHARES | | | | | |
| Consumer Discretionary - 0.4% | | | | | | | | |
| EveryWare Global, Inc. † | | | 756,000 | | | | 831,600 | |
| General Motors Co. †* | | | 1,315,512 | | | | 7,287,936 | |
| Hemisphere Media Group, Inc. † | | | 743,407 | | | | 929,259 | |
| IVS Group SA (Luxembourg) (3)†(b) | | | 590,301 | | | | 242,811 | |
| | | | | | | | |
| | | | | | | 9,291,606 | |
| | | | | | | | |
| Energy - 0.0%(j) | |
| Green Field Energy Services, Inc. (3)†(b) | | | 2,025 | | | | 20 | |
| Harvest Natural Resources, Inc. (3)†(b) | | | 51,454 | | | | 32,261 | |
| Integrated Drilling Equipment Holdings Corp. † | | | 680,000 | | | | 20,400 | |
| SAExploration Holdings, Inc. (Canada) † | | | 456,000 | | | | 387,600 | |
| Syntroleum Corp. (3)†(b) | | | 253,165 | | | | 2,003 | |
| | | | | | | | |
| | | | | | | 442,284 | |
| | | | | | | | |
| Financials - 1.0% | | | | | | | | |
| Aquasition Corp. (United Kingdom) †(a) | | | 850,000 | | | | 207,315 | |
| Associated Banc-Corp (2)†(a) | | | 20,065 | | | | 49,159 | |
| Boston Private Financial Holdings, Inc. † | | | 97,674 | | | | 580,184 | |
| Capitol Acquisition Corp. II † | | | 720,000 | | | | 243,000 | |
| Chart Acquisition Corp. † | | | 1,268,625 | | | | 634,312 | |
| Cis Acquisition Ltd. (Russian Federation) † | | | 850,000 | | | | 212,500 | |
| Collabrium Japan Acquisition Corp. (United Kingdom) † | | | 595,000 | | | | 65,450 | |
| Comerica, Inc. † | | | 45,508 | | | | 724,123 | |
| Gerova Financial Group Ltd. (Bermuda) (3)†(b) | | | 138,792 | | | | 1,388 | |
| Infinity Cross Border Acquisition Corp. (Israel) †(a) | | | 287,100 | | | | 118,429 | |
| Lincoln National Corp. | | | 49,759 | | | | 2,102,815 | |
| Lone Oak Acquisition Corp. (Hong Kong) † | | | 328,820 | | | | 223,598 | |
| Neostem (3)†(b) | | | 243,000 | | | | 21,036 | |
| Prime Acquisition Corp. (China) † | | | 528,984 | | | | 150,496 | |
| Quinpario Acquisition Corp. † | | | 1,933,070 | | | | 695,905 | |
| ROI Acquisition Corp. II (2)† | | | 882,000 | | | | 308,700 | |
| Signature Bank (3)†(b) | | | 107,610 | | | | 8,305,340 | |
| Silver Eagle Acquisition Corp. † | | | 1,971,250 | | | | 1,182,750 | |
| Texas Capital Bancshares, Inc. † | | | 16,077 | | | | 760,603 | |
| | | | | | | | |
| | |
| | | SHARES | | |
| VALUE
(Note 3) |
|
| Financials - 1.0% (continued) | | | | | | | | |
| Valley National Bancorp | | | 49,509 | | | $ | 22,774 | |
| Wintrust Financial Corp. | | | 415,782 | | | | 9,978,768 | |
| | | | | | | | |
| | | | | | | 26,588,645 | |
| | | | | | | | |
| Health Care - 0.0% (j) | | | | | | | | |
| Cormedix, Inc. †(a) | | | 75,400 | | | | 11,310 | |
| Healthcare Corp. of America † | | | 414,792 | | | | 12,444 | |
| Pluristem Therapeutics, Inc. (Israel) (3)†(b) | | | 63,750 | | | | 18,488 | |
| ReGeneRx Biopharmaceuticals, Inc. † | | | 240,000 | | | | 2,400 | |
| Rexahn Pharmaceuticals, Inc. (3)†(b) | | | 1,402,500 | | | | 293,108 | |
| Venaxis, Inc. (2)† | | | 24,000 | | | | 4,800 | |
| | | | | | | | |
| | | | | | | 342,550 | |
| | | | | | | | |
| Industrials - 0.0% (j) | |
| Jack Cooper Holdings Corp. (3)†(a)(b) | | | 2,223 | | | | 266,760 | |
| Pingtan Marine Enterprise Ltd. (China) † | | | 395,000 | | | | 55,300 | |
| | | | | | | | |
| | | | | | | 322,060 | |
| | | | | | | | |
| Information Technology - 0.1% | | | | | | | | |
| exceet Group SE (Germany) (2)† | | | 72,000 | | | | 3,962 | |
| Global Eagle Entertainment, Inc. † | | | 399,134 | | | | 1,796,103 | |
| Net Element International, Inc. (Bulgaria) † | | | 319,668 | | | | 38,360 | |
| RMG Networks Holding Corp. † | | | 631,210 | | | | 220,923 | |
| Transwitch Corp. (3)†(b) | | | 640,000 | | | | 13 | |
| | | | | | | | |
| | | | | | | 2,059,361 | |
| | | | | | | | |
| Materials - 0.0% (j) | | | | | | | | |
| Coeur Mining, Inc. † | | | 19,235 | | | | 25,390 | |
| Plastec Technologies Ltd. (Hong Kong) (3)†(b) | | | 56,004 | | | | 2,968 | |
| Tecnoglass, Inc. † | | | 371,009 | | | | 445,211 | |
| | | | | | | | |
| | | | | | | 473,569 | |
| | | | | | | | |
| Utilities - 0.0% (j) | | | | | | | | |
| China Hydroelectric Corp. (China) † | | | 24,500 | | | | 243 | |
| Electrawinds SE (Germany) (3)†(b) | | | 621,000 | | | | 8,543 | |
| | | | | | | | |
| | | | | | | 8,786 | |
| | | | | | | | |
TOTAL WARRANTS
(cost $17,259,478) | | | | | | | 39,528,861 | |
| | | | | | | | |
| MONEY MARKET FUNDS - 17.4% | | | | | |
| BlackRock Liquidity Funds TempFund Portfolio - Series I, Institutional Shares, Series I, 0.050% (2)(l) | | | 4,387,936 | | | | 4,387,936 | |
| Dreyfus Treasury Cash Management, Class I, 0.010% (2)(l) | | | 17,551,747 | | | | 17,551,747 | |
| J.P. Morgan Prime Money Market Fund - Capital Shares, 0.040% (2)(l)(m) | | | 252,406,620 | | | | 252,406,620 | |
| J.P. Morgan U.S. Treasury Plus Money Market Fund - Institutional Shares, 0.000% (2)(l)(m) | | | 176,186,508 | | | | 176,186,508 | |
| UBS Money Series - UBS Select Treasury Preferred Fund, Class I, 0.010% (2)(l) | | | 21,939,683 | | | | 21,939,683 | |
| | | | | | | | |
TOTAL MONEY MARKET FUNDS
(cost $472,472,494) | | | | | | | 472,472,494 | |
| | | | | | | | |
| | | | |
| | The accompanying notes are an integral part of these financial statements. | | (Continued) |
| | | | | | | | | | | | | | | | |
| 54 | | AQR Funds | | | | | | Annual Report | | | | | | December 2013 | | |
| | | | | | | | | | |
| | | | |
| Schedule of Investments | | | December 31, 2013 | |
| | |
| AQR DIVERSIFIED ARBITRAGE FUND | | |
| | | | | | | | |
| | |
| PURCHASED OPTIONS - 0.0% (j) | |
| CONTRACTS/
NOTIONAL |
| |
| VALUE
(Note 3) |
|
| Put - Sprint Nextel Corp., Expires 01/18/2014, Strike $10.00 (cost $2,790,163) | | | 5,544 | | | $ | 842,688 | |
| | | | | | | | |
TOTAL INVESTMENTS, BEFORE SECURITIES SOLD SHORT
(cost $2,555,990,019) | | | | | | | 2,647,673,388 | |
| | | | | | | | |
| | |
SECURITIES SOLD
SHORT- (22.1)% | | SHARES | | | | |
| COMMON STOCKS - (20.7)% | | | | | | | | |
| | |
| Consumer Discretionary - (3.1)% | | | | | | | | |
| Comcast Corp., Class A | | | (1,792) | | | | (93,121) | |
| Discovery Communications, Inc., Class A † | | | (158,863) | | | | (14,364,393) | |
| General Motors Co. † | | | (490,660) | | | | (20,053,274) | |
| Goodyear Tire & Rubber Co./The | | | (315,524) | | | | (7,525,248) | |
| JAKKS Pacific, Inc. | | | (292,311) | | | | (1,967,253) | |
| M/I Homes, Inc. † | | | (91,043) | | | | (2,317,044) | |
| Meritage Homes Corp. † | | | (24,688) | | | | (1,184,777) | |
| MGM Resorts International † | | | (188,756) | | | | (4,439,541) | |
| Publicis Groupe SA (France) (2) | | | (194,742) | | | | (17,843,295) | |
| Standard Pacific Corp. † | | | (626,165) | | | | (5,666,793) | |
| Tesla Motors, Inc. † | | | (58,427) | | | | (8,786,252) | |
| | | | | | | | |
| | | | | | | (84,240,991) | |
| | | | | | | | |
| Consumer Staples - (0.4)% | | | | | | | | |
| Bunge Ltd. | | | (6,408) | | | | (526,161) | |
| Loblaw Cos., Ltd. (Canada) | | | (115,001) | | | | (4,588,131) | |
| Universal Corp. | | | (12,936) | | | | (706,305) | |
| Vector Group Ltd. | | | (292,048) | | | | (4,780,826) | |
| | | | | | | | |
| | | | | | | (10,601,423) | |
| | | | | | | | |
| Energy - (0.8)% | | | | | | | | |
| Alpha Natural Resources, Inc. † | | | (168,891) | | | | (1,205,882) | |
| Cal Dive International, Inc. † | | | (736,554) | | | | (1,480,474) | |
| Chesapeake Energy Corp. | | | (38,369) | | | | (1,041,335) | |
| Polarcus Ltd. (Norway) (2)† | | | (155,079) | | | | (120,440) | |
| Sanchez Energy Corp. † | | | (652,904) | | | | (16,002,677) | |
| Vantage Drilling Co. † | | | (1,126,541) | | | | (2,072,835) | |
| ZaZa Energy Corp. † | | | (164,657) | | | | (157,346) | |
| | | | | | | | |
| | | | | | | (22,080,989) | |
| | | | | | | | |
| Financials - (6.4)% | | | | | | | | |
| American Equity Investment Life Holding Co. | | | (585,162) | | | | (15,436,574) | |
| American Realty Capital Properties, Inc. REIT | | | (277,387) | | | | (3,567,197) | |
| Associated Banc-Corp | | | (10,086) | | | | (175,496) | |
| AV Homes, Inc. † | | | (122,405) | | | | (2,224,099) | |
| Boston Private Financial Holdings, Inc. | | | (89,841) | | | | (1,133,793) | |
| Comerica, Inc. | | | (32,348) | | | | (1,537,824) | |
| E*TRADE Financial Corp. † | | | (163,100) | | | | (3,203,284) | |
| Extra Space Storage, Inc. REIT | | | (16,351) | | | | (688,868) | |
| Fidelity National Financial, Inc., Class A | | | (487,176) | | | | (15,808,861) | |
| Gain Capital Holdings, Inc. | | | (48,346) | | | | (363,078) | |
| Heritage Financial Corp./WA | | | (16,621) | | | | (284,385) | |
| Huntington Bancshares, Inc./OH | | | (252,777) | | | | (2,439,298) | |
| iStar Financial, Inc. REIT † | | | (176,111) | | | | (2,513,104) | |
| KCAP Financial, Inc. | | | (72,757) | | | | (587,149) | |
| | | | | | | | |
| | |
| | | SHARES | | | VALUE
(Note 3) | |
| Financials - (6.4)% (continued) | | | | | | | | |
| Lincoln National Corp. | | | (49,759) | | | $ | (2,568,560) | |
| M&T Bank Corp. | | | (502,658) | | | | (58,519,444) | |
| MB Financial, Inc. | | | (34) | | | | (1,091) | |
| MBIA, Inc. † | | | (192,283) | | | | (2,295,859) | |
| Meadowbrook Insurance Group, Inc. | | | (199,047) | | | | (1,385,367) | |
| Mercantile Bank Corp. | | | (35,064) | | | | (756,681) | |
| MGIC Investment Corp. † | | | (968,808) | | | | (8,176,739) | |
| NorthStar Realty Finance Corp. REIT | | | (26,820) | | | | (360,729) | |
| Old National Bancorp/IN | | | (97,203) | | | | (1,494,010) | |
| PacWest Bancorp | | | (67,839) | | | | (2,864,163) | |
| Parkway Properties, Inc./MD REIT | | | (22,351) | | | | (431,151) | |
| Radian Group, Inc. | | | (531,149) | | | | (7,499,824) | |
| Resource Capital Corp. REIT | | | (77,027) | | | | (456,770) | |
| Signature Bank † | | | (107,556) | | | | (11,553,666) | |
| Texas Capital Bancshares, Inc. † | | | (16,003) | | | | (995,387) | |
| TICC Capital Corp. | | | (71,362) | | | | (737,883) | |
| Umpqua Holdings Corp. | | | (191,579) | | | | (3,666,822) | |
| Valley National Bancorp | | | (5,530) | | | | (55,964) | |
| Wintrust Financial Corp. | | | (410,335) | | | | (18,924,650) | |
| ZAIS Financial Corp. REIT | | | (5,832) | | | | (93,487) | |
| | | | | | | | |
| | | | | | | (172,801,257) | |
| | | | | | | | |
| Health Care - (3.9)% | | | | | | | | |
| Accuray, Inc. † | | | (347,478) | | | | (3,026,533) | |
| AdCare Health Systems, Inc. † | | | (1,833) | | | | (7,882) | |
| Affymetrix, Inc. † | | | (89,948) | | | | (770,854) | |
| Community Health Systems, Inc. † | | | (166,036) | | | | (6,520,234) | |
| Endo Health Solutions, Inc. † | | | (79,026) | | | | (5,331,094) | |
| Exelixis, Inc. † | | | (420,980) | | | | (2,580,607) | |
| Gilead Sciences, Inc. † | | | (1,099,868) | | | | (82,655,080) | |
| Healthways, Inc. † | | | (74,410) | | | | (1,142,194) | |
| Sequenom, Inc. † | | | (454,955) | | | | (1,064,595) | |
| Theravance, Inc. † | | | (50,098) | | | | (1,785,994) | |
| | | | | | | | |
| | | | | | | (104,885,067) | |
| | | | | | | | |
| Industrials - (1.1)% | |
| Aegean Marine Petroleum Network, Inc. (Greece) | | | (49,188) | | | | (551,889) | |
| Allegion PLC (Ireland) † | | | (2) | | | | (88) | |
| Genesee & Wyoming, Inc., Class A † | | | (10,290) | | | | (988,355) | |
| JetBlue Airways Corp. † | | | (1,086,897) | | | | (9,292,969) | |
| L-3 Communications Holdings, Inc. | | | (35,274) | | | | (3,769,380) | |
| Layne Christensen Co. † | | | (47,445) | | | | (810,361) | |
| MasTec, Inc. † | | | (224,970) | | | | (7,361,018) | |
| Schneider Electric SA (France) (2) | | | (52,375) | | | | (4,569,276) | |
| Stanley Black & Decker, Inc. | | | (15,320) | | | | (1,236,171) | |
| | | | | | | | |
| | | | | | | (28,579,507) | |
| | | | | | | | |
| Information Technology - (2.7)% | | | | | | | | |
| Applied Materials, Inc. | | | (742,919) | | | | (13,142,237) | |
| Blucora, Inc. † | | | (31,539) | | | | (919,677) | |
| Ciena Corp. † | | | (477,032) | | | | (11,415,376) | |
| Global Eagle Entertainment, Inc. † | | | (65,928) | | | | (980,349) | |
| GT Advanced Technologies, Inc. † | | | (314,859) | | | | (2,745,570) | |
| Micron Technology, Inc. † | | | (778,011) | | | | (16,929,519) | |
| NVIDIA Corp. | | | (82,577) | | | | (1,322,884) | |
| Rambus, Inc. † | | | (315,428) | | | | (2,987,103) | |
| Salesforce.com, Inc. † | | | (2,224) | | | | (122,743) | |
| SanDisk Corp. | | | (182,132) | | | | (12,847,591) | |
| SunEdison, Inc. † | | | (93,327) | | | | (1,217,917) | |
| | | | |
| | The accompanying notes are an integral part of these financial statements. | | (Continued) |
| | | | | | | | | | | | | | | | |
| | AQR Funds | | | | | | Annual Report | | | | | | December 2013 | | 55 |
| | | | | | | | | | |
| | | | |
| Schedule of Investments | | | December 31, 2013 | |
| | |
| AQR DIVERSIFIED ARBITRAGE FUND | | |
| | | | | | | | |
| | |
| | | SHARES | | | VALUE
(Note 3) | |
| Information Technology - (2.7)% (continued) | | | | | |
| Web.com Group, Inc. † | | | (35,631) | | | $ | (1,132,710) | |
| WebMD Health Corp. † | | | (50,775) | | | | (2,005,613) | |
| Yahoo!, Inc. † | | | (129,916) | | | | (5,253,803) | |
| | | | | | | | |
| | | | | | | (73,023,092) | |
| | | | | | | | |
| Materials - (0.4)% | | | | | | | | |
| B2Gold Corp. (Canada) † | | | (80,360) | | | | (164,919) | |
| Coeur Mining, Inc. † | | | (6,686) | | | | (72,543) | |
| Louisiana-Pacific Corp. † | | | (212,910) | | | | (3,940,964) | |
| RTI International Metals, Inc. † | | | (16,610) | | | | (568,228) | |
| Stillwater Mining Co. † | | | (289,446) | | | | (3,571,764) | |
| Vale SA ADR (Brazil) | | | (195,480) | | | | (2,981,070) | |
| | | | | | | | |
| | | | | | | (11,299,488) | |
| | | | | | | | |
| Telecommunication Services - (0.9)% | |
| Level 3 Communications, Inc. † | | | (523,486) | | | | (17,364,030) | |
| United States Cellular Corp. | | | (28,202) | | | | (1,179,408) | |
| Verizon Communications, Inc. | | | (126,893) | | | | (6,235,522) | |
| | | | | | | | |
| | | | | | | (24,778,960) | |
| | | | | | | | |
| Utilities - (1.0)% | | | | | | | | |
| Dominion Resources, Inc. | | | (241,407) | | | | (15,616,619) | |
| NextEra Energy, Inc. | | | (131,630) | | | | (11,270,161) | |
| PPL Corp. | | | (45,480) | | | | (1,368,493) | |
| | | | | | | | |
| | | | | | | (28,255,273) | |
| | | | | | | | |
TOTAL COMMON STOCKS SOLD SHORT
(proceeds $484,673,209) | | | | | | | (560,546,047) | |
| | | | | | | | |
| EXCHANGE TRADED FUNDS - (0.4)% | | | | | |
| SPDR S&P 500 ETF Trust | | | | | | | | |
(proceeds $10,923,703) | | | (60,814) | | | | (11,230,521) | |
| | | | | | | | |
| PREFERRED STOCKS - (0.7)% | | | | | | | | |
| | |
| Consumer Discretionary - (0.7)% | | | | | | | | |
| Volkswagen AG (Germany) (2) | | | | | | | | |
(proceeds $13,734,005) | | | (67,195) | | | | (18,909,939) | |
| | | | | | | | |
| | | | | | | | | | | | | | | | | | | | |
| | | | | |
| | | INTEREST | | | MATURITY
DATE | | | CURRENCY | | | PRINCIPAL
AMOUNT
(000’S) | | | VALUE
(Note 3) | |
| U.S. TREASURY OBLIGATIONS - (0.3)% | | | | | | | | | | | | | |
| U.S. Treasury Notes (2) | | | 0.250 | % | | | 10/15/15 | | | | USD | | | $ | (3,077) | | | $ | (3,073,034) | |
| U.S. Treasury Notes (2) | | | 0.750 | % | | | 12/31/17 | | | | USD | | | | (4,829) | | | | (4,721,365) | |
| | | | | | | | | | | | | | | | | | | | |
| TOTAL U.S. TREASURY OBLIGATIONS | | | | | | | | | | | | | | | | | | | | |
(proceeds $7,809,356) | | | | | | | | | | | | | | | | | | | (7,794,399) | |
| | | | | | | | | | | | | | | | | | | | |
| | | | | | |
TOTAL SECURITIES SOLD SHORT
(proceeds $517,140,273) | | | | | (598,480,906) | |
| | | | | | |
TOTAL INVESTMENTS, NET OF
SECURITIES SOLD SHORT - 75.5%
(cost $2,038,849,746) | | | 2,049,192,482 | |
| | | | | | |
OTHER ASSETS IN EXCESS OF
LIABILITIES - 24.5% (n) | | | | | 663,642,869 | |
| | | | | | |
| NET ASSETS - 100.0% | | | | $ | 2,712,835,351 | |
| | | | | | |
| † | Non income-producing security. |
| (a) | All or a portion of this security has been segregated as collateral for securities sold short and can be sold or replaced subject to the broker’s right to re-hypothecate. At December 31, 2013, the value of these securities was $208,974,989. In addition, $581,619,040 of cash collateral was pledged. |
| (b) | Security fair valued at as of December 31, 2013 using procedures approved by the Board of Trustees. The total value of positions fair valued was $151,235,346 or 5.6% of total net assets. |
| (c) | Represents a Pay-in-Kind Stock. |
| | | | |
| | The accompanying notes are an integral part of these financial statements. | | (Continued) |
| | | | | | | | | | | | | | | | |
| 56 | | AQR Funds | | | | | | Annual Report | | | | | | December 2013 | | |
| | | | | | | | | | |
| | | | |
| Schedule of Investments | | | December 31, 2013 | |
| | |
| AQR DIVERSIFIED ARBITRAGE FUND | | |
| (d) | Security is perpetual and, thus, does not have a predetermined maturity date. The coupon rate for this security is fixed for a period of time and may be structured to adjust thereafter. The date shown, if applicable, reflects the next call date. The coupon rate shown is the rate in effect as of December 31, 2013. |
| (e) | Rule 144A, Section 4(2) or other security which is restricted as to resale to institutional investors. The Fund Advisor has deemed this security to be liquid based upon procedures approved by the Board of Trustees. |
| (g) | Represents a step bond. The rate shown reflects the yield at December 31, 2013. |
| (h) | Represents a Pay-in-Kind Bond. |
| (i) | Indicates a variable rate security. The interest rate shown represents the discount rate at December 31, 2013. |
| (j) | Represents less than 0.05 percent of net assets. |
| (k) | The rate shown is the effective yield at the date of purchase. |
| (l) | Represents annualized seven-day yield as of December 31, 2013. |
| (m) | A portion of the security is pledged as collateral to the brokers for forward foreign currency exchange and swap contracts. |
| (n) | Includes appreciation/(depreciation) on forward foreign currency exchange, futures and swap contracts. |
| * | All or a portion of this security has been segregated for covered call options written. |
All bonds are denominated in US dollars, unless noted otherwise.
All securities are United States companies, unless noted otherwise in parentheses.
All securities are Level 1 with respect to ASC 820, unless otherwise noted in parentheses.
| (2) | Level 2 security (See Note 5). |
| (3) | Level 3 security (See Note 5). |
The following abbreviations are used in portfolio descriptions:
144A - Restricted Security
ADR - American Depositary Receipt
EUR - Euro
MTN - Medium Term Note
NOK - Norwegian Krone
REIT - Real Estate Investment Trust
USD - United States Dollar
Credit default swap contracts buy protection as of December 31, 2013:
| | | | | | | | | | | | | | | | | | | | | | | | | | |
| COUNTERPARTY | | REFERENCE
ENTITY | | FIXED
ANNUAL
RATE
RECEIVED
BY FUND | | CURRENCY | | CREDIT
SPREAD | | | NOTIONAL
AMOUNT | | | UPFRONT
PREMIUM
(RECEIVED)
PAID | | | TERMINATION
DATE | | | UNREALIZED
APPRECIATION
(DEPRECIATION) | |
| Exchange Cleared | | | | | | | | | | | | | | | | | | | | | | | | |
| CitiBank, Inc. | | Markit CDX North America High Yield Index Series 21 | | 5.000% | | USD | | | 3.063% | | | | 230,375,000 | | | | $(12,083,767 | ) | | | 12/20/2018 | | | | $(7,939,613) | |
| Over the Counter | | | | | | | | | | | | | | | | | | | | | | | | |
| Bank of America | | Host Hotels & Resorts LP | | 1.000% | | USD | | | 0.211% | | | | 3,450,000 | | | | 77,194 | | | | 12/20/2015 | | | | (131,801) | |
| | | | | | | | | | | | | | | | | | | | | | | | | | |
| | | | | | | | | | | | | | | | | $(12,006,573 | ) | | | | | | | $(8,071,414) | |
| | | | | | | | | | | | | | | | | | | | | | | | | | |
Money Market Fund is pledged as collateral to Bank of America for credit default swap contracts in the amount of $622. Additional cash held as collateral at CitiBank for credit default swap contracts was $27,339,684 at December 31, 2013.
| | | | |
| | The accompanying notes are an integral part of these financial statements. | | (Continued) |
| | | | | | | | | | | | | | | | |
| | AQR Funds | | | | | | Annual Report | | | | | | December 2013 | | 57 |
| | | | | | | | | | |
| | | | |
| Schedule of Investments | | | December 31, 2013 | |
| | |
| AQR DIVERSIFIED ARBITRAGE FUND | | |
Open written options contracts outstanding at December 31, 2013:
Call options written
| | | | | | | | | | | | | | | | | | | | |
| SHARES | | ISSUER | | COUNTERPARTY | | EXPIRATION
DATE | | | PROCEEDS | | | VALUE AT
DECEMBER 31,
2013 | | | UNREALIZED
APPRECIATION
(DEPRECIATION) | |
| 4,000 | | General Motors Co. (Exercise price $42) | | J.P. Morgan | | | January 15, 2016 | | | | $(2,203,697) | | | | $(2,300,000) | | | | $(96,303) | |
| 557 | | Men’s Wearhouse, Inc. (Exercise price $48) | | J.P. Morgan | | | February 22, 2014 | | | | (227,756) | | | | (233,940) | | | | (6,184) | |
| 127 | | Men’s Wearhouse, Inc. (Exercise price $50) | | J.P. Morgan | | | February 22, 2014 | | | | (38,091) | | | | (34,925) | | | | 3,166 | |
| 5,545 | | Sprint Nextel Corp. (Exercise price $10)(2) | | J.P. Morgan | | | January 18, 2014 | | | | (41,551) | | | | (5,545) | | | | 36,006 | |
| | | | | | | | | | | | | | | | | | | | |
| | | | | | | | | | | $(2,511,095) | | | | $(2,574,410) | | | | $(63,315) | |
| | | | | | | | | | | | | | | | | | | | |
| (2) | Level 2 security (See Note 5). |
Open futures contracts outstanding at December 31, 2013:
Exchange Traded
| | | | | | | | | | | | | | | | | | | | | | |
NUMBER OF
CONTRACTS | | | COUNTERPARTY | | DESCRIPTION | | EXPIRATION
DATE | | | VALUE AT
TRADE DATE | | | VALUE AT
DECEMBER 31,
2013 | | | UNREALIZED
APPRECIATION
(DEPRECIATION) | |
| | Short Contracts: | | | | | |
| | 128 | | | Barclays Capital | | FTSE 100 Index Futures | | | March 21, 2014 | | | | $(13,618,458) | | | | $(14,196,129) | | | | $(577,671) | |
| | 3,359 | | | Barclays Capital | | S&P 500 E-Mini Futures | | | March 21, 2014 | | | | (297,098,802) | | | | (309,212,745) | | | | (12,113,943) | |
| | 137 | | | Barclays Capital | | U.S. Treasury 10-Year Note Futures | | | March 20, 2014 | | | | (17,165,709) | | | | (16,857,422) | | | | 308,287 | |
| | 1,499 | | | J.P. Morgan | | U.S. Treasury 2-Year Note Futures | | | March 31, 2014 | | | | (330,097,269) | | | | (329,498,938) | | | | 598,331 | |
| | 138 | | | J.P. Morgan | | U.S. Treasury 5-Year Note Futures | | | March 31, 2014 | | | | (16,681,574) | | | | (16,465,125) | | | | 216,449 | |
| | | | | | | | | | | | | | | | | | | | | | |
| | | | | | | | | | | | | $(674,661,812) | | | | $(686,230,359) | | | | $(11,568,547) | |
| | | | | | | | | | | | | | | | | | | | | | |
Cash held as collateral at Barclays Capital for futures contracts was $26,426,628 at December 31, 2013. Cash held as collateral for J.P. Morgan for futures contracts was $302,591 at December 31, 2013.
Forward foreign currency exchange contracts outstanding as of December 31, 2013:
| | | | | | | | | | | | | | | | | | | | |
PURCHASE
CONTRACTS | | COUNTERPARTY | | CURRENCY | | CURRENCY
AMOUNT
PURCHASED | | | VALUE AT
SETTLEMENT
DATE | | | VALUE AT
DECEMBER 31,
2013 | | | UNREALIZED
APPRECIATION
(DEPRECIATION) | |
Canadian Dollar,
Expiring 01/07/14 | | The Royal Bank of Scotland | | CAD | | | 10,216,828 | | | | $9,662,979 | | | | $9,617,170 | | | | $(45,809) | |
Euro,
Expiring 01/08/14 | | The Royal Bank of Scotland | | EUR | | | 9,564,304 | | | | 12,982,491 | | | | 13,157,545 | | | | 175,054 | |
Euro,
Expiring 03/21/14 | | The Royal Bank of Scotland | | EUR | | | 5,642,299 | | | | 7,591,012 | | | | 7,761,941 | | | | 170,929 | |
Euro,
Expiring 04/07/14 | | The Royal Bank of Scotland | | EUR | | | 201,521 | | | | 270,542 | | | | 277,228 | | | | 6,686 | |
| | | | | | | | | | | | | | | | | | | | |
| | | | | | | | | | | $30,507,024 | | | | $30,813,884 | | | | $306,860 | |
| | | | | | | | | | | | | | | | | | | | |
| | | | |
| | The accompanying notes are an integral part of these financial statements. | | (Continued) |
| | | | | | | | | | | | | | | | |
| 58 | | AQR Funds | | | | | | Annual Report | | | | | | December 2013 | | |
| | | | | | | | | | |
| | | | |
| Schedule of Investments | | | December 31, 2013 | |
| | |
| AQR DIVERSIFIED ARBITRAGE FUND | | |
| | | | | | | | | | | | | | | | | | | | |
| | | | | | |
SALES
CONTRACTS | | COUNTERPARTY | | CURRENCY | | CURRENCY
AMOUNT
SOLD | | | VALUE AT
SETTLEMENT
DATE | | | VALUE AT
DECEMBER 31,
2013 | | | UNREALIZED
APPRECIATION
(DEPRECIATION) | |
Canadian Dollar,
Expiring 01/07/14 | | The Royal Bank of Scotland | | CAD | | | (11,891,432) | | | | $(11,428,589) | | | | $(11,193,486) | | | | $235,103 | |
Canadian Dollar,
Expiring 02/07/14 | | The Royal Bank of Scotland | | CAD | | | (7,384,939) | | | | (6,972,269) | | | | (6,946,064) | | | | 26,205 | |
Canadian Dollar,
Expiring 02/19/14 | | The Royal Bank of Scotland | | CAD | | | (8,142,445) | | | | (7,782,877) | | | | (7,656,421) | | | | 126,456 | |
Canadian Dollar,
Expiring 03/07/14 | | The Royal Bank of Scotland | | CAD | | | (327,842) | | | | (307,669) | | | | (308,157) | | | | (488) | |
Canadian Dollar,
Expiring 03/31/14 | | The Royal Bank of Scotland | | CAD | | | (3,746,713) | | | | (3,547,032) | | | | (3,519,627) | | | | 27,405 | |
Euro,
Expiring 03/19/14 | | Credit Suisse International | | EUR | | | (2,605,188) | | | | (3,569,825) | | | | (3,583,879) | | | | (14,054) | |
Euro,
Expiring 01/08/14 | | The Royal Bank of Scotland | | EUR | | | (9,823,837) | | | | (13,076,603) | | | | (13,514,582) | | | | (437,979) | |
Euro,
Expiring 01/13/14 | | The Royal Bank of Scotland | | EUR | | | (7,492,725) | | | | (10,296,503) | | | | (10,307,657) | | | | (11,154) | |
Euro,
Expiring 02/21/14 | | The Royal Bank of Scotland | | EUR | | | (308,039) | | | | (423,521) | | | | (423,761) | | | | (240) | |
Euro,
Expiring 03/19/14 | | The Royal Bank of Scotland | | EUR | | | (2,605,187) | | | | (3,569,816) | | | | (3,583,878) | | | | (14,062) | |
Euro,
Expiring 03/21/14 | | The Royal Bank of Scotland | | EUR | | | (5,642,299) | | | | (7,514,126) | | | | (7,761,941) | | | | (247,815) | |
Euro,
Expiring 04/07/14 | | The Royal Bank of Scotland | | EUR | | | (21,000) | | | | (27,733) | | | | (28,889) | | | | (1,156) | |
Euro,
Expiring 05/07/14 | | The Royal Bank of Scotland | | EUR | | | (5,390,865) | | | | (7,354,640) | | | | (7,416,377) | | | | (61,737) | |
Euro,
Expiring 06/09/14 | | The Royal Bank of Scotland | | EUR | | | (742,500) | | | | (954,016) | | | | (1,021,523) | | | | (67,507) | |
Euro,
Expiring 06/27/14 | | The Royal Bank of Scotland | | EUR | | | (326,437) | | | | (426,548) | | | | (449,119) | | | | (22,571) | |
Euro,
Expiring 07/09/14 | | The Royal Bank of Scotland | | EUR | | | (2,139,532) | | | | (2,879,724) | | | | (2,943,686) | | | | (63,962) | |
Euro,
Expiring 04/07/15 | | The Royal Bank of Scotland | | EUR | | | (21,000) | | | | (27,804) | | | | (28,929) | | | | (1,125) | |
Euro,
Expiring 06/09/15 | | The Royal Bank of Scotland | | EUR | | | (742,500) | | | | (956,986) | | | | (1,023,299) | | | | (66,313) | |
Euro,
Expiring 11/09/15 | | The Royal Bank of Scotland | | EUR | | | (311,240) | | | | (401,619) | | | | (429,419) | | | | (27,800) | |
Euro,
Expiring 04/05/16 | | The Royal Bank of Scotland | | EUR | | | (21,000) | | | | (27,886) | | | | (29,084) | | | | (1,198) | |
Euro,
Expiring 04/05/17 | | The Royal Bank of Scotland | | EUR | | | (21,000) | | | | (28,010) | | | | (29,443) | | | | (1,433) | |
Norwegian Krone,
Expiring 03/19/14 | | Credit Suisse International | | NOK | | | (25,500,000) | | | | (4,139,148) | | | | (4,192,543) | | | | (53,395) | |
Norwegian Krone,
Expiring 03/19/14 | | The Royal Bank of Scotland | | NOK | | | (27,541,287) | | | | (4,472,016) | | | | (4,528,158) | | | | (56,142) | |
Norwegian Krone,
Expiring 03/21/14 | | The Royal Bank of Scotland | | NOK | | | (17,631,210) | | | | (2,854,253) | | | | (2,898,578) | | | | (44,325) | |
Norwegian Krone,
Expiring 03/27/14 | | The Royal Bank of Scotland | | NOK | | | (360,000) | | | | (58,013) | | | | (59,170) | | | | (1,157) | |
Norwegian Krone,
Expiring 05/19/14 | | The Royal Bank of Scotland | | NOK | | | (978,750) | | | | (164,808) | | | | (160,557) | | | | 4,251 | |
Norwegian Krone,
Expiring 06/11/14 | | The Royal Bank of Scotland | | NOK | | | (1,389,722) | | | | (222,926) | | | | (227,784) | | | | (4,858) | |
Norwegian Krone,
Expiring 06/18/14 | | The Royal Bank of Scotland | | NOK | | | (2,043,884) | | | | (332,361) | | | | (334,920) | | | | (2,559) | |
| | | | |
| | The accompanying notes are an integral part of these financial statements. | | (Continued) |
| | | | | | | | | | | | | | | | |
| | AQR Funds | | | | | | Annual Report | | | | | | December 2013 | | 59 |
| | | | | | | | | | |
| | | | |
| Schedule of Investments | | | December 31, 2013 | |
| | |
| AQR DIVERSIFIED ARBITRAGE FUND | | |
| | | | | | | | | | | | | | | | | | | | |
| | | | | | |
SALES
CONTRACTS | | COUNTERPARTY | | CURRENCY | | CURRENCY
AMOUNT
SOLD | | | VALUE AT
SETTLEMENT
DATE | | | VALUE AT
DECEMBER 31,
2013 | | | UNREALIZED
APPRECIATION
(DEPRECIATION) | |
Norwegian Krone,
Expiring 06/27/14 | | The Royal Bank of Scotland | | NOK | | | (368,000) | | | | $(59,102) | | | | $(60,282) | | | | $(1,180) | |
Norwegian Krone,
Expiring 09/17/14 | | The Royal Bank of Scotland | | NOK | | | (2,053,978) | | | | (332,973) | | | | (335,478) | | | | (2,505) | |
Norwegian Krone,
Expiring 09/29/14 | | The Royal Bank of Scotland | | NOK | | | (368,000) | | | | (58,875) | | | | (60,080) | | | | (1,205) | |
Norwegian Krone,
Expiring 11/18/14 | | The Royal Bank of Scotland | | NOK | | | (17,178,750) | | | | (2,863,290) | | | | (2,799,616) | | | | 63,674 | |
Norwegian Krone,
Expiring 12/11/14 | | The Royal Bank of Scotland | | NOK | | | (1,397,358) | | | | (222,594) | | | | (227,540) | | | | (4,946) | |
Norwegian Krone,
Expiring 12/18/14 | | The Royal Bank of Scotland | | NOK | | | (2,066,424) | | | | (333,692) | | | | (336,404) | | | | (2,712) | |
Norwegian Krone,
Expiring 12/29/14 | | The Royal Bank of Scotland | | NOK | | | (364,000) | | | | (58,017) | | | | (59,234) | | | | (1,217) | |
Norwegian Krone,
Expiring 03/19/15 | | The Royal Bank of Scotland | | NOK | | | (2,082,751) | | | | (334,977) | | | | (338,027) | | | | (3,050) | |
Norwegian Krone,
Expiring 03/27/15 | | The Royal Bank of Scotland | | NOK | | | (360,000) | | | | (57,174) | | | | (58,412) | | | | (1,238) | |
Norwegian Krone,
Expiring 06/11/15 | | The Royal Bank of Scotland | | NOK | | | (26,889,722) | | | | (4,251,474) | | | | (4,351,921) | | | | (100,447) | |
Norwegian Krone,
Expiring 06/18/15 | | The Royal Bank of Scotland | | NOK | | | (75,604,625) | | | | (12,130,511) | | | | (12,233,236) | | | | (102,725) | |
Norwegian Krone,
Expiring 06/29/15 | | The Royal Bank of Scotland | | NOK | | | (12,368,000) | | | | (1,956,652) | | | | (2,000,472) | | | | (43,820) | |
Norwegian Krone,
Expiring 04/27/16 | | The Royal Bank of Scotland | | NOK | | | (19,387,600) | | | | (3,266,931) | | | | (3,114,802) | | | | 152,129 | |
Swedish Krona,
Expiring 01/07/14 | | The Royal Bank of Scotland | | SEK | | | (24,864,720) | | | | (3,795,213) | | | | (3,865,606) | | | | (70,393) | |
| | | | | | | | | | | | | | | | | | | | |
| | | | | | | | | | | (123,538,796) | | | | (124,442,041) | | | | (903,245) | |
| | | | | | | | | | | | | | | | | | | | |
| | | | | | | | | | | $(93,031,772) | | | | $(93,628,157) | | | | $(596,385) | |
| | | | | | | | | | | | | | | | | | | | |
Money Market Fund is pledged as collateral to The Royal Bank of Scotland for forward foreign currency exchange contracts in the amount of $658,781 at December 31, 2013.
CAD - Canadian Dollar
EUR - Euro
NOK - Norwegian Krone
SEK - Swedish Krona
USD - United States Dollar
| | | | |
| | The accompanying notes are an integral part of these financial statements. | | (Continued) |
| | | | | | | | | | | | | | | | |
| 60 | | AQR Funds | | | | | | Annual Report | | | | | | December 2013 | | |
| | | | | | | | | | |
| | | | |
| Schedule of Investments | | | December 31, 2013 | |
| | |
| AQR DIVERSIFIED ARBITRAGE FUND | | |
Total Return Basket Swaps* Outstanding at December 31, 2013
Over the Counter
| | | | | | | | |
| COUNTERPARTY | | DESCRIPTION | | TERMINATION
DATE** | | VALUE
(Note 3) | |
| Deutsche Bank | | The Fund receives or pays the total return on a portfolio of long and short positions and pays or receives the London Interbank Offered Rate (“LIBOR”) (+/–40 bps), which is denominated in GBP based on the local currencies of the positions within the swap. | | 12 months maturity 06/19/2014 | | | $(464,657) | |
| | | | | | | | |
| * | See the accompanying “Additional Information — Total Return Basket Swap” for further details. |
| ** | The maturity dates are measured from the commencement of investment in each underlying portfolio swap position. |
Additional Information — Total Return Basket Swaps
The following table represents the individual long and short positions and related values within the total return basket swap as of December 31, 2013.
| | | | | | | | | | | | |
REFERENCE
ENTITY | | SHARES | | | NOTIONAL (a) | | | NET
UNREALIZED
APPRECIATION
(DEPRECIATION) | |
| Long Positions | | | | | | | | | |
| | | |
| United Kingdom | | | | | | | | | | | | |
| AZ Electronic Materials SA | | | 382,276 | | | $ | 2,484,814 | | | $ | 20,857 | |
| Invensys PLC | | | 2,013,327 | | | | 16,722,791 | | | | 295,146 | |
| | | | | | | | | | | | |
| | | | | | | | | | | 316,003 | |
| | | | | | | | | | | | |
| Total of Long Equity Positions | | | | | | | | | | | 316,003 | |
| | | | | | | | | | | | |
| | | |
| Short Positions | | | | | | | | | | | | |
| | | |
| United Kingdom | | | | | | | | | | | | |
| TUI Travel PLC | | | (1,959,241) | | | | (12,720,501) | | | | (708,948) | |
| | | | | | | | | | | | |
Total of Long and Short Equity Positions | | | | | | | | | | | (392,945) | |
| | | | | | | | | | | | |
Net Cash and Other Receivables/ (Payables) (b) | | | | | | | | | | | (71,712) | |
| | | | | | | | | | | | |
Swaps, at Value | | | | | | | | | | $ | (464,657) | |
| | | | | | | | | | | | |
| (a) | Notional value represents the market value (including any fees or commissions) of the long and short positions when they are established. |
| (b) | Cash and other receivables/(payables) includes the gains (or losses) realized within the swap when the swap resets. |
Money Market Fund is pledged as collateral to Deutsche Bank in the amount of $30,632,680 at December 31, 2013.
| | | | |
| | The accompanying notes are an integral part of these financial statements. | | (Continued) |
| | | | | | | | | | | | | | | | |
| | AQR Funds | | | | | | Annual Report | | | | | | December 2013 | | 61 |
| | | | | | | | | | |
| | | | |
| Schedule of Investments | | | December 31, 2013 | |
| | |
| AQR DIVERSIFIED ARBITRAGE FUND | | |
| | | | | | | | |
| COUNTERPARTY | | DESCRIPTION | | TERMINATION
DATE** | | VALUE
(Note 3) | |
| Deutsche Bank | | The Fund receives or pays the total return on a portfolio of long and short positions and pays or receives the AUD/USD Overnight Forward FX Swap Rate (+/–50 bps), which is denominated in AUD based on the local currencies of the positions within the swap. | | 12 months maturity 10/16/2014 | | | $(1,949,792) | |
| | | | | | | | |
| ** | The maturity dates are measured from the commencement of investment in each underlying portfolio swap position. |
Additional Information — Total Return Basket Swaps
The following table represents the individual long and short positions and related values within the total return basket swap as of December 31, 2013.
| | | | | | | | | | | | |
REFERENCE
ENTITY | | SHARES | | | NOTIONAL (a) | | | NET
UNREALIZED
APPRECIATION
(DEPRECIATION) | |
| Long Positions | | | | | | | | | |
| | | |
| Australia | | | | | | | | | | | | |
| Envestra Ltd. | | | 45,976 | | | $ | 46,297 | | | $ | 561 | |
| GrainCorp. Ltd. | | | 349,465 | | | | 3,742,040 | | | | (1,088,500) | |
| | | | | | | | | | | | |
| | | | | | | | | | | (1,087,939) | |
| | | | | | | | | | | | |
| Total of Long Equity Positions | | | | | | | | | | | (1,087,939) | |
| | | | | | | | | | | | |
| | | |
| Short Positions | | | | | | | | | | | | |
| | | |
| Australia | | | | | | | | | | | | |
| APA Group | | | (8,313) | | | | (45,445) | | | | 828 | |
| | | | | | | | | | | | |
Total of Long and Short Equity Positions | | | | | | | | | | | (1,087,111) | |
| | | | | | | | | | | | |
Net Cash and Other Receivables/(Payables) (b) | | | | | | | | | | | (862,681) | |
| | | | | | | | | | | | |
Swaps, at Value | | | | | | | | | | $ | (1,949,792) | |
| | | | | | | | | | | | |
| (a) | Notional value represents the market value (including any fees or commissions) of the long and short positions when they are established. |
| (b) | Cash and other receivables/(payables) includes the gains (or losses) realized within the swap when the swap resets. |
Additional collateral for this position pledged to Deutsche Bank is included in the collateral noted in the other Deutsche Bank total return basket swap.
| | | | |
| | The accompanying notes are an integral part of these financial statements. | | (Continued) |
| | | | | | | | | | | | | | | | |
| 62 | | AQR Funds | | | | | | Annual Report | | | | | | December 2013 | | |
| | | | | | | | | | |
| | | | |
| Schedule of Investments | | | December 31, 2013 | |
| | |
| AQR DIVERSIFIED ARBITRAGE FUND | | |
| | | | | | | | |
| COUNTERPARTY | | DESCRIPTION | | TERMINATION DATE** | | VALUE
(Note 3) | |
| J.P. Morgan | | The Fund receives or pays the total return on a portfolio of long and short positions and pays or receives the LIBOR, which is denominated in USD based on the local currencies of the positions within the swap. | | Maturity dates ranging from 01/06/2014 - 02/06/2015 | | | $33,872,527 | |
| | | | | | | | |
| ** | The maturity dates are measured from the commencement of investment in each underlying portfolio swap position. |
Additional Information — Total Return Basket Swaps
The following table represents the individual long and short positions and related values within the total return basket swap as of December 31, 2013.
| | | | | | | | | | | | |
REFERENCE
ENTITY | | SHARES | | | NOTIONAL (a) | | | NET
UNREALIZED
APPRECIATION
(DEPRECIATION) | |
| Long Positions | |
| |
| Bermuda | | | | | |
| Energy XXI, Inc. | | | 9,535 | | | $ | 2,846,198 | | | $ | (49,761) | |
| | | | | | | | | | | | |
| |
| United States | | | | | |
| 2010 Swift Mandatory Common Exchange Security Trust | | | 79,775 | | | | 1,090,333 | | | | 332,056 | |
| Alpha Natural Resources, Inc. | | | 3,661 | | | | 23,489 | | | | 2,650 | |
| American Realty Capital Properties, Inc. | | | 8,623 | | | | 107,945 | | | | 2,947 | |
| Beazer Homes USA, Inc. | | | 40,300 | | | | 1,163,058 | | | | 345,371 | |
| Bunge Ltd. | | | 1,702 | | | | 141,064 | | | | (1,313) | |
| Chesapeake Energy Corp. | | | 3,815 | | | | 102,948 | | | | 591 | |
| Extra Space Storage, Inc. | | | 260 | | | | 10,572 | | | | 382 | |
| Genesee & Wyoming, Inc. | | | 1,235 | | | | 119,223 | | | | (602) | |
| Gilead Sciences, Inc. | | | 6,539 | | | | 438,352 | | | | 53,054 | |
| Healthways, Inc. | | | 427 | | | | 6,458 | | | | 96 | |
| Layne Christensen Co. | | | 742 | | | | 12,086 | | | | 588 | |
| Meadowbrook Insurance Group, Inc. | | | 1,401 | | | | 9,920 | | | | (169) | |
| NextEra Energy, Inc. | | | 294,225 | | | | 16,108,819 | | | | 809,119 | |
| PPL Corp. | | | 14,035 | | | | 419,806 | | | | 2,507 | |
| Resource Capital Corp. | | | 15,203 | | | | 90,130 | | | | 24 | |
| Sanchez Energy Corp. | | | 97,950 | | | | 5,865,336 | | | | 232,052 | |
| Thompson Creek Metals Co., Inc. | | | 226,250 | | | | 4,400,563 | | | | (1,450,263) | |
| Universal Corp. | | | 8,350 | | | | 9,579,329 | | | | 814,835 | |
| Wintrust Financial Corp. | | | 2 | | | | 87 | | | | 5 | |
| | | | | | | | | | | | |
| | | | | | | | | | | 1,143,930 | |
| | | | | | | | | | | | |
| Total of Long Equity Positions | | | | | | | | | | | 1,094,169 | |
| | | | | | | | | | | | |
| | | |
| Short Positions | | | | | | | | | | | | |
| |
| Bermuda | | | | | |
| Energy XXI, Inc. | | | (49,869) | | | | (1,453,562) | | | | 104,106 | |
| | | | | | | | | | | | |
| | | | | | | | | | | | |
REFERENCE
ENTITY | | SHARES | | | NOTIONAL (a) | | | NET
UNREALIZED
APPRECIATION
(DEPRECIATION) | |
| United States | | | | | |
| A.M. Castle & Co. | | | (80,951) | | | $ | (1,299,647) | | | $ | 104,001 | |
| Accuray, Inc. | | | (228,445) | | | | (1,641,183) | | | | (348,573) | |
| Aegean Marine Petroleum Network, Inc. | | | (1,405) | | | | (15,633) | | | | (131) | |
| Affymetrix, Inc. | | | (305,036) | | | | (1,955,789) | | | | (658,369) | |
| AGCO Corp. | | | (79,126) | | | | (4,478,272) | | | | (205,196) | |
| Albany Molecular Research, Inc. | | | (62,449) | | | | (618,516) | | | | (10,970) | |
| Alliance Data Systems Corp. | | | (220,747) | | | | (45,749,816) | | | | (12,291,193) | |
| Alliance One International, Inc. | | | (42,403) | | | | (130,267) | | | | 937 | |
| American Equity Investment Life Holding Co. | | | (1,073,668) | | | | (23,243,542) | | | | (5,079,820) | |
| Amkor Technology, Inc. | | | (1,967,268) | | | | (8,574,568) | | | | (3,484,785) | |
| Annaly Capital Management, Inc. | | | (3,326) | | | | (37,728) | | | | 4,568 | |
| ArcelorMittal | | | (2,433) | | | | (42,248) | | | | (1,156) | |
| ARES Captial Corp. | | | (88,237) | | | | (1,571,694) | | | | 3,722 | |
| AuRico Gold, Inc. | | | (49,203) | | | | (200,333) | | | | 20,250 | |
| AV Homes, Inc. | | | (143,661) | | | | (2,409,670) | | | | (200,651) | |
| Avis Budget Group, Inc. | | | (450,831) | | | | (13,446,357) | | | | (4,776,232) | |
| Beazer Homes USA, Inc. | | | (53,431) | | | | (982,467) | | | | (322,318) | |
| BioMed Realty Trust, Inc. | | | (316,478) | | | | (5,989,480) | | | | 254,898 | |
| Blucora, Inc. | | | (35,746) | | | | (784,373) | | | | (257,980) | |
| Bristow Group, Inc. | | | (12,565) | | | | (964,559) | | | | 21,430 | |
| Cal Dive International, Inc. | | | (74,498) | | | | (144,397) | | | | (5,343) | |
| CBIZ, Inc. | | | (167,173) | | | | (1,195,681) | | | | (328,937) | |
| Cemex SAB de CV | | | (1,461,680) | | | | (16,812,108) | | | | (479,566) | |
| Cenveo, Inc. | | | (345,610) | | | | (1,029,875) | | | | (159,023) | |
| Chart Industries, Inc. | | | (86,274) | | | | (10,472,429) | | | | 2,221,184 | |
| China Medical Technologies, Inc. | | | (45,264) | | | | (115,876) | | | | 115,423 | |
| Chiquita Brands International, Inc. | | | (35,099) | | | | (476,293) | | | | 65,635 | |
| | | | |
| | The accompanying notes are an integral part of these financial statements. | | (Continued) |
| | | | | | | | | | | | | | | | |
| | AQR Funds | | | | | | Annual Report | | | | | | December 2013 | | 63 |
| | | | | | | | | | |
| | | | |
| Schedule of Investments | | | December 31, 2013 | |
| | |
| AQR DIVERSIFIED ARBITRAGE FUND | | |
| | | | | | | | | | | | |
REFERENCE
ENTITY | | SHARES | | | NOTIONAL (a) | | | NET
UNREALIZED
APPRECIATION
(DEPRECIATION) | |
| United States (continued) | |
| Ciena Corp. | | | (666,343) | | | $ | (16,523,637) | | | $ | 578,049 | |
| Concur Technologies, Inc. | | | (3,725) | | | | (394,476) | | | | 10,130 | |
| Convergys Corp. | | | (614,717) | | | | (11,352,310) | | | | (1,587,483) | |
| DDR Corp. | | | (313,347) | | | | (5,037,282) | | | | 221,139 | |
| DFC Global Corp. | | | (19,509) | | | | (226,969) | | | | 3,591 | |
| Digital Realty Trust, Inc. | | | (142,404) | | | | (7,401,633) | | | | 406,748 | |
| Dominion Resources, Inc. | | | (1,270) | | | | (81,175) | | | | (981) | |
| DR Horton, Inc. | | | (539,363) | | | | (10,545,847) | | | | (1,492,735) | |
| E*Trade Financial Corp. | | | (1,697) | | | | (30,423) | | | | (2,906) | |
| Electronic Arts, Inc. | | | (26,600) | | | | (617,059) | | | | 6,855 | |
| Encore Capital Group, Inc. | | | (24,737) | | | | (909,788) | | | | (333,494) | |
| Equinix, Inc. | | | (150,416) | | | | (26,899,333) | | | | 208,014 | |
| Exelixis, Inc. | | | (124,479) | | | | (709,942) | | | | (53,114) | |
| Exterran Holdings, Inc. | | | (153,980) | | | | (4,550,384) | | | | (715,732) | |
| Finisar Corp. | | | (34,848) | | | | (809,064) | | | | (24,500) | |
| FuelCell Energy, Inc. | | | (1,040,323) | | | | (1,329,882) | | | | (136,974) | |
| Gain Capital Holdings, Inc. | | | (1,102) | | | | (8,231) | | | | (45) | |
| GenCorp, Inc. | | | (397,156) | | | | (6,219,463) | | | | (937,288) | |
| General Cable Corp. | | | (227,802) | | | | (7,222,328) | | | | 522,672 | |
| Goodrich Petroleum Corp. | | | (4,617) | | | | (91,633) | | | | 13,052 | |
| Goodyear Tire & Rubber Co./The | | | (11,558) | | | | (271,855) | | | | (3,804) | |
| Green Plains Renewable Energy, Inc. | | | (126,195) | | | | (2,114,169) | | | | (332,752) | |
| Group 1 Automotive, Inc. | | | (59,851) | | | | (4,760,061) | | | | 509,443 | |
| GT Advanced Technologies, Inc. | | | (43,132) | | | | (418,057) | | | | 41,946 | |
| Hawaiian Holdings, Inc. | | | (32,094) | | | | (244,439) | | | | (64,626) | |
| Health Care REIT, Inc. | | | (27,003) | | | | (1,657,767) | | | | 211,216 | |
| Host Hotels & Resorts, Inc. | | | (1,230,757) | | | | (22,533,539) | | | | (1,392,377) | |
| iStar Financial, Inc. | | | (200,200) | | | | (2,428,736) | | | | (428,118) | |
| JAKKS Pacific, Inc. | | | (236,106) | | | | (1,359,370) | | | | (229,623) | |
| JetBlue Airways Corp. | | | (147,420) | | | | (1,200,030) | | | | (60,411) | |
| Kaman Corp. | | | (84,399) | | | | (3,145,229) | | | | (207,943) | |
| KCAP Financial, Inc. | | | (180,018) | | | | (1,704,319) | | | | 251,574 | |
| Kilroy Realty Corp. | | | (195,385) | | | | (10,014,534) | | | | 210,115 | |
| L-3 Communications Holdings, Inc. | | | (28,507) | | | | (2,769,438) | | | | (276,820) | |
| Lennar Corp. | | | (1,376,383) | | | | (48,017,746) | | | | (6,431,966) | |
| Leucadia National Corp. | | | (2,293) | | | | (63,999) | | | | (985) | |
| Level 3 Communications, Inc. | | | (244,060) | | | | (7,220,194) | | | | (875,276) | |
| Lexington Realty Trust | | | (916,420) | | | | (10,848,432) | | | | 1,491,784 | |
| M/I Homes, Inc. | | | (20,616) | | | | (465,994) | | | | (58,683) | |
| MasTec, Inc. | | | (63,372) | | | | (1,982,686) | | | | (90,846) | |
| Medicines Co./The | | | (24,812) | | | | (844,406) | | | | (113,834) | |
| Meritage Homes Corp. | | | (1,703) | | | | (78,523) | | | | (3,204) | |
| Meritor, Inc. | | | (36,703) | | | | (314,076) | | | | (68,737) | |
| | | | | | | | | | | | |
REFERENCE
ENTITY | | SHARES | | | NOTIONAL (a) | | | NET
UNREALIZED
APPRECIATION
(DEPRECIATION) | |
| United States (continued) | |
| MGIC Investment Corp. | | | (653,422) | | | $ | (5,071,234) | | | $ | (443,647) | |
| MGM Resorts International | | | (282,155) | | | | (5,717,748) | | | | (918,538) | |
| Microchip Technology | | | (392,164) | | | | (15,516,737) | | | | (2,032,602) | |
| Micron Technology, Inc. | | | (1,545,296) | | | | (26,823,267) | | | | (6,802,374) | |
| Molina Healthcare, Inc. | | | (42,547) | | | | (1,534,052) | | | | 55,543 | |
| Navistar International Corp. | | | (5,657) | | | | (221,078) | | | | 5,037 | |
| NextEra Energy, Inc. | | | (141,917) | | | | (11,541,777) | | | | (609,157) | |
| NorthStar Realty Finance Corp. | | | (268,521) | | | | (2,541,384) | | | | (1,070,224) | |
| Nuance Communications, Inc. | | | (6,037) | | | | (109,240) | | | | 17,478 | |
| NVIDIA Corp. | | | (24,773) | | | | (387,935) | | | | (8,929) | |
| Omnicare, Inc. | | | (11,337) | | | | (636,224) | | | | (48,078) | |
| Outerwall, Inc. | | | (51,758) | | | | (3,032,800) | | | | (448,961) | |
| Pdl Biopharma, Inc. | | | (242,855) | | | | (1,934,181) | | | | (115,515) | |
| Penson Worldwide, Inc. | | | (217,523) | | | | (25,668) | | | | 25,668 | |
| PHH Corp. | | | (603,617) | | | | (13,035,210) | | | | (1,662,864) | |
| Photronics, Inc. | | | (417,605) | | | | (3,189,690) | | | | (581,283) | |
| Prologis, Inc. | | | (1,497) | | | | (56,033) | | | | 719 | |
| Quantum Corp. | | | (751,366) | | | | (1,030,361) | | | | 128,722 | |
| Radian Group, Inc. | | | (1,476,919) | | | | (20,357,302) | | | | (496,794) | |
| Regeneron Pharmaceuticals, Inc. | | | (139,094) | | | | (38,535,219) | | | | 250,987 | |
| Regis Corp. | | | (311,609) | | | | (4,736,171) | | | | 214,724 | |
| Rite Aid Corp. | | | (110,113) | | | | (435,480) | | | | (121,691) | |
| RTI International Metals, Inc. | | | (80,967) | | | | (2,608,649) | | | | (161,232) | |
| Ryland Group, Inc./The | | | (147,187) | | | | (5,570,182) | | | | (819,206) | |
| Ryman Hospitality Properties | | | (617,462) | | | | (22,017,590) | | | | (3,779,972) | |
| Salesforce.com, Inc. | | | (950,952) | | | | (47,501,626) | | | | (4,981,415) | |
| Sanchez Energy Corp. | | | (226,760) | | | | (5,602,700) | | | | 44,812 | |
| SanDisk Corp. | | | (17,771) | | | | (1,218,397) | | | | (35,169) | |
| Sequenom, Inc. | | | (447,168) | | | | (1,176,134) | | | | 129,761 | |
| Sesa Goa Ltd. | | | (1,376) | | | | (17,154) | | | | (954) | |
| Silver Standard Resources, Inc. | | | (20,062) | | | | (140,434) | | | | 803 | |
| Sirius XM Holdings, Inc. | | | (10,376,175) | | | | (40,099,442) | | | | 3,886,591 | |
| SL Green Realty Corp. | | | (129,541) | | | | (11,816,556) | | | | (150,442) | |
| Standard Pacific Corp. | | | (427,410) | | | | (3,366,174) | | | | (501,887) | |
| Stanley Black & Decker, Inc. | | | (64) | | | | (5,172) | | | | 8 | |
| Stewart Information Services Corp. | | | (475,544) | | | | (14,557,078) | | | | (788,727) | |
| Stillwater Mining Co. | | | (20,841) | | | | (245,641) | | | | (11,537) | |
| SunPower Corp. | | | (97,875) | | | | (2,835,019) | | | | (82,635) | |
| | | | |
| | The accompanying notes are an integral part of these financial statements. | | (Continued) |
| | | | | | | | | | | | | | | | |
| 64 | | AQR Funds | | | | | | Annual Report | | | | | | December 2013 | | |
| | | | | | | | | | |
| | | | |
| Schedule of Investments | | | December 31, 2013 | |
| | |
| AQR DIVERSIFIED ARBITRAGE FUND | | |
| | | | | | | | | | | | |
REFERENCE
ENTITY | | SHARES | | | NOTIONAL (a) | | | NET
UNREALIZED
APPRECIATION
(DEPRECIATION) | |
| United States (continued) | |
| Swift Transportation Co. | | | (65,415) | | | $ | (1,087,371) | | | $ | (365,496) | |
| Terex Corp. | | | (686,470) | | | | (21,663,695) | | | | (7,161,181) | |
| Tesla Motors, Inc. | | | (3,860) | | | | (570,324) | | | | (10,142) | |
| Theravance, Inc. | | | (3,168) | | | | (118,454) | | | | 5,515 | |
| Thompson Creek M | | | (1,121,491) | | | | (3,988,464) | | | | 1,543,614 | |
| TICC Capital Corp. | | | (43,234) | | | | (449,435) | | | | 2,396 | |
| Titan International, Inc. | | | (760,846) | | | | (12,229,813) | | | | (1,450,198) | |
| Titan Machinery, Inc. | | | (23,868) | | | | (412,074) | | | | (13,254) | |
| TRW Automotive Holdings Corp. | | | (211,529) | | | | (15,025,309) | | | | (710,333) | |
| United Rentals, Inc. | | | (726,660) | | | | (40,213,364) | | | | (16,429,783) | |
| United States Steel Corp. | | | (85,363) | | | | (2,361,041) | | | | (157,167) | |
| Universal Corp. | | | (97,222) | | | | (4,917,770) | | | | (390,551) | |
| Vantage Drilling Co. | | | (391,839) | | | | (705,424) | | | | (15,560) | |
| Vector Group Ltd. | | | (243,226) | | | | (3,827,888) | | | | (153,721) | |
| VeriSign, Inc. | | | (734,274) | | | | (36,808,743) | | | | (7,086,157) | |
| Vishay Intertechnology, Inc. | | | (485,827) | | | | (6,373,162) | | | | (68,904) | |
| Web.com Group, Inc. | | | (185,990) | | | | (5,577,553) | | | | (335,069) | |
| WebMD Health Corp. | | | (35,934) | | | | (1,372,194) | | | | (47,199) | |
| Western Refining, Inc. | | | (1,938,356) | | | | (55,098,932) | | | | (27,106,746) | |
| Xilinx, Inc. | | | (352,628) | | | | (16,506,124) | | | | 313,446 | |
| Yahoo!, Inc. | | | (12,397) | | | | (489,887) | | | | (11,448) | |
| ZAIS Financial Corp. | | | (31,176) | | | | (510,792) | | | | 11,041 | |
| | | | | | | | | | | | |
| | | | | | | | | | | (118,587,001) | |
| | | | | | | | | | | | |
Total of Short Equity Positions | | | | | | | | | | | (118,482,895) | |
| | | | | | | | | | | | |
Total of Long and Short Equity Positions | | | | | | | | | | | (117,388,726) | |
| | | | | | | | | | | | |
| | | |
| | | PRINCIPAL | | | | | | | | | |
| Long Positions | |
| United States | |
| A.M. Castle & Co., 7.00%, 12/15/17 | | $ | 925,000 | | | | 1,633,853 | | | | (138,118) | |
| Accuray, Inc., 3.75%, 08/01/16 | | | 700,000 | | | | 702,226 | | | | 93,562 | |
| Affymetrix, Inc., 4.00%, 07/01/19 | | | 2,525,000 | | | | 3,167,812 | | | | 977,922 | |
| AGCO Corp., 1.25%, 12/15/36 | | | 3,200,000 | | | | 4,457,555 | | | | 210,313 | |
| Alliance Data Systems Corp., 4.75%, 05/15/14 | | | 10,500,000 | | | | 45,887,045 | | | | 12,098,334 | |
| Alliance One International, Inc., 5.50%, 07/15/14 | | | 2,132,000 | | | | 2,127,620 | | | | 91,885 | |
| | | | | | | | | | | | |
REFERENCE
ENTITY | | PRINCIPAL | | | NOTIONAL (a) | | | NET
UNREALIZED
APPRECIATION
(DEPRECIATION) | |
| United States (continued) | |
| American Equity Investment Life Holding Co., 5.25%, 12/06/29 | | $ | 10,275,000 | | | $ | 23,212,437 | | | $ | 5,377,750 | |
| Amkor Technology, Inc., 6.00%, 04/15/14 | | | 5,950,000 | | | | 8,742,533 | | | | 3,423,623 | |
| Annaly Capital Management, Inc., 5.00%, 05/15/15 | | | 3,150,000 | | | | 3,244,279 | | | | (36,423) | |
| ArcelorMittal, 5.00%, 05/15/14 | | | 6,875,000 | | | | 7,127,389 | | | | (126,118) | |
| Ares Capital Corp., 5.13%, 06/01/16 | | | 3,025,000 | | | | 3,229,145 | | | | 11,355 | |
| Ares Capital Corp., 5.75%, 02/01/16 | | | 4,425,000 | | | | 4,752,312 | | | | 118,645 | |
| AV Homes, Inc., 7.50%, 02/15/16 | | | 2,930,000 | | | | 2,967,234 | | | | 551,146 | |
| AV Homes, Inc., 7.50%, 02/15/16 | | | 6,443,000 | | | | 6,598,384 | | | | 397,611 | |
| Avis Budget Group, Inc., 3.50%, 10/01/14 | | | 7,400,000 | | | | 14,104,106 | | | | 4,576,980 | |
| BioMed Realty LP, 3.75%, 01/15/30 | | | 8,975,000 | | | | 10,282,432 | | | | (13,252) | |
| Bristow Group, Inc., 3.00%, 06/15/38 | | | 1,000,000 | | | | 1,219,634 | | | | 8,018 | |
| CBIZ, Inc., 4.88%, 10/01/15 | | | 1,400,000 | | | | 1,624,860 | | | | 251,766 | |
| Cemex SAB de CV, 4.88%, 03/15/15 | | | 2,450,000 | | | | 3,004,913 | | | | (65,984) | |
| Cemex SAB de CV, 3.25%, 03/15/16 | | | 15,375,000 | | | | 20,462,008 | | | | (56,367) | |
| Cemex SAB de CV, 3.75%, 03/15/18 | | | 1,625,000 | | | | 2,150,715 | | | | 71,372 | |
| Cenveo Corp., 7.00%, 05/15/17 | | | 1,800,000 | | | | 1,498,849 | | | | 522,260 | |
| Chart Industries, Inc., 2.00%, 08/01/18 | | | 6,925,000 | | | | 13,008,430 | | | | (2,256,051) | |
| China Medical Technologies, Inc., 6.25%, 12/15/16(f) | | | 2,625,000 | | | | 39,375 | | | | (26,250) | |
| China Medical Technologies, Inc., 4.00%, 12/15/16(f) | | | 250,000 | | | | 3,750 | | | | (2,500) | |
| Ciena Corp., 4.00%, 12/15/20 | | | 13,175,000 | | | | 14,705,935 | | | | 4,702,396 | |
| Ciena Corp., 4.00%, 03/15/15 | | | 2,900,000 | | | | 3,892,813 | | | | (95,456) | |
| Ciena Corp., 3.75%, 10/15/18 | | | 2,675,000 | | | | 3,802,959 | | | | 72,122 | |
| Coinstar, Inc., 4.00%, 09/01/14 | | | 2,150,000 | | | | 3,111,252 | | | | 528,388 | |
Concur Technologies, Inc.,
2.50%, 04/15/15 | | | 200,000 | | | | 410,185 | | | | (10,739) | |
| Convergys Corp., 5.75%, 09/15/29 | | | 7,825,000 | | | | 13,988,242 | | | | 1,522,119 | |
| | | | |
| | The accompanying notes are an integral part of these financial statements. | | (Continued) |
| | | | | | | | | | | | | | | | |
| | AQR Funds | | | | | | Annual Report | | | | | | December 2013 | | 65 |
| | | | | | | | | | |
| | | | |
| Schedule of Investments | | | December 31, 2013 | |
| | |
| AQR DIVERSIFIED ARBITRAGE FUND | | |
| | | | | | | | | | | | |
REFERENCE
ENTITY | | PRINCIPAL | | | NOTIONAL (a) | | | NET
UNREALIZED
APPRECIATION
(DEPRECIATION) | |
| United States (continued) | |
| DDR Corp., 1.75%, 11/15/40 | | $ | 8,425,000 | | | $ | 9,578,128 | | | $ | (144,048) | |
| DFC Global Corp., 3.25%, 04/15/17 | | | 800,000 | | | | 939,522 | | | | (219,951) | |
Digital Realty Trust LP,
5.50%, 04/15/29 | | | 6,125,000 | | | | 8,888,775 | | | | (1,022,348) | |
| DR Horton, Inc., 2.00%, 05/15/14 | | | 7,131,000 | | | | 10,982,329 | | | | 1,341,620 | |
| Electronic Arts, Inc., 0.75%, 07/15/16 | | | 1,925,000 | | | | 2,041,926 | | | | 12,450 | |
| Equinix, Inc., 4.75%, 06/15/16 | | | 13,075,000 | | | | 29,016,944 | | | | (435,407) | |
| Exide Technologies, 0.00%, 02/01/18(f) | | | 650,000 | | | | 554,125 | | | | (463,775) | |
Exterran Holdings, Inc.,
4.25%, 06/15/14 | | | 3,675,000 | | | | 4,838,128 | | | | 651,807 | |
| Finisar Corp., 5.00%, 10/15/29 | | | 400,000 | | | | 935,422 | | | | (22,136) | |
| Gaylord Entertainment Co., 3.75%, 10/01/14 | | | 13,200,000 | | | | 21,813,928 | | | | 4,084,182 | |
| GenCorp, Inc., 4.06%, 12/31/39 | | | 3,575,000 | | | | 6,375,903 | | | | 828,123 | |
| General Cable Corp., 5.00%, 11/15/29 | | | 9,620,000 | | | | 11,009,011 | | | | (659,173) | |
| GMX Resources, Inc., 4.50%, 05/01/15 | | | 1,140,000 | | | | 65,550 | | | | (59,850) | |
| Goodrich Petroleum Corp., 5.00%, 10/01/29 | | | 1,000,000 | | | | 1,082,620 | | | | (53,732) | |
Green Plains Renewable Energy, Inc.,
5.75%, 11/01/15 | | | 4,100,000 | | | | 5,530,424 | | | | 518,364 | |
Group 1 Automotive, Inc.,
3.00%, 03/15/20 | | | 2,350,000 | | | | 5,238,922 | | | | (498,796) | |
Hawaiian Holdings, Inc.,
5.00%, 03/15/16 | | | 300,000 | | | | 359,060 | | | | 51,540 | |
Health Care REIT, Inc.,
3.00%, 12/01/29 | | | 2,400,000 | | | | 2,963,613 | | | | (282,981) | |
Host Hotels & Resorts LP,
2.50%, 10/15/29 | | | 18,325,000 | | | | 26,369,585 | | | | 1,466,986 | |
Host Hotels & Resorts, Inc.,
3.00%, 08/01/35 | | | 2,775,000 | | | | 3,024,202 | | | | 352,551 | |
| JAKKS Pacific, Inc., 4.50%, 11/01/14 | | | 1,550,000 | | | | 1,484,978 | | | | 38,026 | |
| James River Coal Co., 10.00%, 06/01/18 | | | 310,000 | | | | 233,458 | | | | (135,033) | |
| Kaman Corp., 3.25%, 11/15/17 | | | 3,800,000 | | | | 4,705,565 | | | | 200,595 | |
| | | | | | | | | | | | |
REFERENCE
ENTITY | | PRINCIPAL | | | NOTIONAL (a) | | | NET
UNREALIZED
APPRECIATION
(DEPRECIATION) | |
| United States (continued) | |
| Kilroy Realty LP, 4.25%, 11/15/14 | | $ | 7,390,000 | | | $ | 10,706,126 | | | $ | (259,304) | |
| Lennar Corp., 2.75%, 12/15/20 | | | 16,900,000 | | | | 28,212,062 | | | | 2,916,206 | |
| Lennar Corp., 3.25%, 11/15/21 | | | 18,200,000 | | | | 29,776,490 | | | | 3,014,807 | |
| Leucadia National Corp., 3.75%, 04/15/14 | | | 50,000 | | | | 69,024 | | | | (2,185) | |
| Lexington Realty Trust, 6.00%, 01/15/30 | | | 7,550,000 | | | | 13,284,027 | | | | (1,655,386) | |
| Medicines Co./The, 1.38%, 06/01/17 | | | 825,000 | | | | 1,107,419 | | | | 134,140 | |
| Meritor, Inc., 4.63%, 03/01/26 | | | 2,000,000 | | | | 2,012,569 | | | | 62,355 | |
| MGIC Investment Corp., 2.00%, 04/01/20 | | | 1,375,000 | | | | 1,767,816 | | | | 136,635 | |
| MGIC Investment Corp., 5.00%, 05/01/17 | | | 10,850,000 | | | | 11,958,122 | | | | 393,793 | |
| MGM Resorts International, 4.25%, 04/15/15 | | | 5,550,000 | | | | 6,907,154 | | | | 774,641 | |
| Microchip Technology, Inc., 2.13%, 12/15/37 | | | 10,650,000 | | | | 16,378,540 | | | | 2,116,436 | |
Micron Technology, Inc.,
1.88%, 06/01/14 | | | 7,600,000 | | | | 8,287,709 | | | | 3,304,927 | |
Micron Technology, Inc.,
3.13%, 05/01/32 | | | 4,025,000 | | | | 5,668,515 | | | | 3,517,103 | |
Micron Technology, Inc.,
1.50%, 08/01/31 | | | 400,000 | | | | 706,010 | | | | 274,365 | |
Micron Technology, Inc.,
2.38%, 05/01/32 | | | 4,850,000 | | | | 5,207,445 | | | | 6,030,621 | |
Micron Technology, Inc.,
2.13%, 02/15/33 | | | 1,375,000 | | | | 2,203,283 | | | | 642,823 | |
Molina Healthcare, Inc.,
3.75%, 10/01/14 | | | 1,875,000 | | | | 2,392,116 | | | | (140,751) | |
| Navistar International Corp., 3.00%, 10/15/14 | | | 875,000 | | | | 898,553 | | | | 1,760 | |
| Northgate Minerals Corp., 3.50%, 10/01/16 | | | 1,800,000 | | | | 1,750,034 | | | | (10,611) | |
| NorthStar Realty Finance Corp., 7.50%, 03/15/31 | | | 1,700,000 | | | | 2,726,925 | | | | 1,147,801 | |
| | | | |
| | The accompanying notes are an integral part of these financial statements. | | (Continued) |
| | | | | | | | | | | | | | | | |
| 66 | | AQR Funds | | | | | | Annual Report | | | | | | December 2013 | | |
| | | | | | | | | | |
| | | | |
| Schedule of Investments | | | December 31, 2013 | |
| | |
| AQR DIVERSIFIED ARBITRAGE FUND | | |
| | | | | | | | | | | | |
REFERENCE
ENTITY | | PRINCIPAL | | | NOTIONAL (a) | | | NET
UNREALIZED
APPRECIATION
(DEPRECIATION) | |
| United States (continued) | |
Nuance Communications, Inc.,
2.75%, 11/01/31 | | $ | 600,000 | | | $ | 581,464 | | | $ | 7,442 | |
| Omnicare, Inc., 3.50%, 02/15/44 | | | 992,000 | | | | 573,846 | | | | 438,141 | |
Penson Worldwide, Inc.,
8.00%, 06/01/14 | | | 8,515,000 | | | | 947,720 | | | | (282,485) | |
| PHH Corp., 6.00%, 06/15/17 | | | 8,125,000 | | | | 15,360,872 | | | | 1,460,333 | |
| Photronics, Inc., 5.50%, 10/01/14 | | | 2,200,000 | | | | 3,576,378 | | | | 492,579 | |
| Powerwave Technologies, Inc., 2.75%, 07/15/41 | | | 3,900,000 | | | | 585,000 | | | | (546,000) | |
Protein Design Labs, Inc.,
2.88%, 02/15/15 | | | 1,400,000 | | | | 1,995,290 | | | | 170,663 | |
| Radian Group, Inc., 2.25%, 03/01/19 | | | 4,150,000 | | | | 5,967,063 | | | | 149,343 | |
| Radian Group, Inc., 3.00%, 11/15/17 | | | 16,100,000 | | | | 22,726,556 | | | | 178,029 | |
| Regeneron Pharmaceuticals, Inc., 1.88%, 10/01/16 | | | 11,925,000 | | | | 38,924,354 | | | | 208,893 | |
| Regis Corp., 5.00%, 07/15/14 | | | 10,000,000 | | | | 11,374,922 | | | | (411,335) | |
| Rite Aid Corp., 8.50%, 05/15/15 | | | 300,000 | | | | 500,037 | | | | 119,774 | |
| Ryland Group, Inc./The, 1.63%, 05/15/18 | | | 5,750,000 | | | | 8,087,878 | | | | 689,410 | |
| Salesforce.com, Inc., 0.75%, 01/15/15 | | | 20,100,000 | | | | 47,044,404 | | | | 4,858,111 | |
| Sequenom, Inc., 5.00%, 10/01/17 | | | 4,500,000 | | | | 3,922,135 | | | | 30,056 | |
| SL Green Operating Partnership LP, 3.00%, 10/15/17 | | | 15,150,000 | | | | 18,806,054 | | | | 143,620 | |
| Standard Pacific Corp., 1.25%, 08/01/32 | | | 4,275,000 | | | | 5,213,495 | | | | 467,752 | |
| Sterlite Industries India Ltd., 4.00%, 10/30/14 | | | 5,350,000 | | | | 5,331,662 | | | | 5,220 | |
Stewart Enterprises, Inc.,
3.13%, 07/15/14 | | | 25,000 | | | | 30,990 | | | | 653 | |
| Stewart Information Services Corp., 6.00%, 10/15/14 | | | 6,125,000 | | | | 14,996,042 | | | | 678,490 | |
| SunPower Corp., 4.50%, 03/15/15 | | | 625,000 | | | | 732,894 | | | | 150,888 | |
| SunPower Corp., 4.75%, 04/15/14 | | | 2,775,000 | | | | 2,998,781 | | | | 331,714 | |
| Terex Corp., 4.00%, 06/01/15 | | | 11,325,000 | | | | 22,260,634 | | | | 7,435,289 | |
| | | | | | | | | | | | |
REFERENCE
ENTITY | | PRINCIPAL | | | NOTIONAL (a) | | | NET
UNREALIZED
APPRECIATION
(DEPRECIATION) | |
| United States (continued) | |
Titan International, Inc.,
5.63%, 01/15/17 | | $ | 7,575,000 | | | $ | 13,007,411 | | | $ | 1,667,144 | |
| Titan Machinery, Inc., 3.75%, 05/01/19 | | | 2,785,000 | | | | 2,584,260 | | | | (199,411) | |
TRW Automotive, Inc.,
3.50%, 12/01/15 | | | 6,650,000 | | | | 16,227,225 | | | | 658,660 | |
| United Rentals, Inc., 4.00%, 11/15/15 | | | 8,500,000 | | | | 42,618,578 | | | | 16,920,253 | |
| United States Steel Corp., 4.00%, 05/15/14 | | | 6,184,000 | | | | 6,393,569 | | | | 239,967 | |
| VeriSign, Inc., 3.25%, 08/15/37 | | | 27,135,000 | | | | 41,767,326 | | | | 7,510,534 | |
| ViroPharma, Inc., 2.00%, 03/15/17 | | | 6,675,000 | | | | 11,593,587 | | | | 6,293,523 | |
| Vishay Intertechnology, Inc., 2.25%, 11/15/40 | | | 7,175,000 | | | | 7,621,002 | | | | 41,333 | |
Western Refining, Inc.,
5.75%, 06/15/14 | | | 18,547,000 | | | | 55,326,359 | | | | 27,025,760 | |
| Xilinx, Inc., 3.13%, 03/15/37 | | | 10,600,000 | | | | 17,324,831 | | | | (444,782) | |
XM Satellite Radio, Inc.,
7.00%, 12/01/14 | | | 19,594,000 | | | | 42,848,408 | | | | (4,670,253) | |
| | | | | | | | | | | | |
Total of Long Fixed Income Positions | | | | | | | | | | | 132,548,807 | |
| | | | | | | | | | | | |
Net Cash and Other Receivables/ (Payables) (b) | | | | | | | | | | | 18,712,446 | |
| | | | | | | | | | | | |
Swaps, at Value | | | | | | | | | | $ | 33,872,527 | |
| | | | | | | | | | | | |
| (a) | Notional value represents the market value (including any fees or commissions) of the long and short positions when they are established. |
| (b) | Cash and other receivables/(payables) includes the gains (or losses) realized within the swap when the swap resets. |
Money Market Fund is pledged as collateral to J.P. Morgan in the amount of $221,114,537 at December 31, 2013.
| | | | |
| | The accompanying notes are an integral part of these financial statements. | | |
| | | | | | | | | | | | | | | | |
| | AQR Funds | | | | | | Annual Report | | | | | | December 2013 | | 67 |
| | | | | | | | | | |
| | | | |
| Schedule of Investments | | | December 31, 2013 | |
| | |
| AQR LONG-SHORT EQUITY FUND | | |
| | | | | | | | |
| MONEY MARKET FUNDS - 93.1% | | SHARES | | | VALUE
(Note 3) | |
J.P. Morgan U.S. Treasury Plus Money Market Fund - Institutional Shares, 0.000% (a)(b)
(cost $5,728,596) | | | 5,728,596 | | | $ | 5,728,596 | |
| | | | | | | | |
TOTAL INVESTMENTS - 93.1%
(cost $5,728,596) | | | | | | | 5,728,596 | |
| | | | | | | | |
OTHER ASSETS IN EXCESS OF
LIABILITIES - 6.9% (c) | | | | 427,601 | |
| | | | | | | | |
NET ASSETS - 100.0% | | | $ | 6,156,197 | |
| | | | | | | | |
| (a) | Represents annualized seven-day yield as of December 31, 2013. |
| (b) | A portion of the security is pledged as collateral to the brokers for swap contracts. |
| (c) | Includes appreciation/depreciation on forward foreign currency exchange, futures and swap contracts. |
All securities are Level 2 with respect to ASC 820 (See Note 5).
Total return swap contract outstanding as of December 31, 2013:
Over the Counter
| | | | | | | | | | | | | | | | |
| COUNTERPARTY | | UNDERLYING REFERENCE
INSTRUMENT | | TERMINATION
DATE | | CURRENCY | | | NOTIONAL
VALUE | | | UNREALIZED
APPRECIATION
(DEPRECIATION) | |
| Goldman Sachs | | Swiss Market Index Futures | | 3/21/2014 | | | CHF | | | | 155,609 | | | | $7,401 | |
| | | | | | | | | | | | | | | | |
Money Market Fund is pledged as collateral to Goldman Sachs for total return swap contract in the amount of $1,100,000 at December 31, 2013.
Open futures contracts outstanding at December 31, 2013:
Exchange Traded
| | | | | | | | | | | | | | | | | | |
NUMBER OF
CONTRACTS | | COUNTERPARTY | | DESCRIPTION | | EXPIRATION
DATE | | VALUE AT
TRADE DATE | | | VALUE AT
DECEMBER 31,
2013 | | | UNREALIZED
APPRECIATION
(DEPRECIATION) | |
| Long Contracts: | | | | | |
| 2 | | Barclays Capital | | CAC40 Index Futures | | January 17, 2014 | | | $112,495 | | | | $118,269 | | | | $5,774 | |
| 1 | | Barclays Capital | | FTSE/MIB Index Futures | | March 21, 2014 | | | 130,487 | | | | 130,864 | | | | 377 | |
| 1 | | Barclays Capital | | MSCI Singapore Index Futures | | January 29, 2014 | | | 56,617 | | | | 57,879 | | | | 1,262 | |
| 2 | | Barclays Capital | | OMXS30 Index Futures | | January 17, 2014 | | | 39,208 | | | | 41,512 | | | | 2,304 | |
| 17 | | Barclays Capital | | S&P 500 E-Mini Futures | | March 21, 2014 | | | 1,508,403 | | | | 1,564,935 | | | | 56,532 | |
| 1 | | Barclays Capital | | S&P/Toronto Stock Exchange 60 Index Futures | | March 20, 2014 | | | 142,041 | | | | 147,027 | | | | 4,986 | |
| 1 | | Barclays Capital | | SPI 200 Index Futures | | March 20, 2014 | | | 113,109 | | | | 118,711 | | | | 5,602 | |
| 2 | | Barclays Capital | | TOPIX Index Futures | | March 13, 2014 | | | 238,504 | | | | 247,365 | | | | 8,861 | |
| | | | | | | | | | | | | | | | | | |
| | | | | | | | | 2,340,864 | | | | 2,426,562 | | | | 85,698 | |
| | | | | | | | | | | | | | | | | | |
| Short Contracts: | | | | | | | | | | | | | | | | |
| 2 | | Barclays Capital | | Euro Stoxx 50 Index | | March 21, 2014 | | | (81,295) | | | | (85,514) | | | | (4,219) | |
| | | | | | | | | | | | | | | | | | |
| | | | | | | | | $2,259,569 | | | | $2,341,048 | | | | $81,479 | |
| | | | | | | | | | | | | | | | | | |
Cash held as collateral at Barclays Capital for futures contracts was $43,873 at December 31, 2013.
| | | | |
| | The accompanying notes are an integral part of these financial statements. | | (Continued) |
| | | | | | | | | | | | | | | | |
| 68 | | AQR Funds | | | | | | Annual Report | | | | | | December 2013 | | |
| | | | | | | | | | |
| | | | |
| Schedule of Investments | | | December 31, 2013 | |
| | |
| AQR LONG-SHORT EQUITY FUND | | |
Forward foreign currency exchange contracts outstanding as of December 31, 2013:
Over the Counter
| | | | | | | | | | | | | | | | | | | | |
PURCHASE
CONTRACTS | | COUNTERPARTY | | CURRENCY | | CURRENCY
AMOUNT
PURCHASED | | | VALUE AT
SETTLEMENT
DATE | | | VALUE AT
DECEMBER 31,
2013 | | | UNREALIZED
APPRECIATION
(DEPRECIATION) | |
Australian Dollar,
Expiring 03/19/14 | | Credit Suisse International | | AUD | | | 54,000 | | | | $48,758 | | | | $47,981 | | | | $(777) | |
Australian Dollar,
Expiring 03/19/14 | | The Royal Bank of Scotland | | AUD | | | 54,000 | | | | 48,758 | | | | 47,981 | | | | (777) | |
Canadian Dollar,
Expiring 03/19/14 | | Credit Suisse International | | CAD | | | 68,000 | | | | 63,672 | | | | 63,898 | | | | 226 | |
Canadian Dollar,
Expiring 03/19/14 | | The Royal Bank of Scotland | | CAD | | | 67,999 | | | | 63,672 | | | | 63,897 | | | | 225 | |
Swiss Franc,
Expiring 03/19/14 | | Credit Suisse International | | CHF | | | 51,000 | | | | 56,509 | | | | 57,207 | | | | 698 | |
Swiss Franc,
Expiring 03/19/14 | | The Royal Bank of Scotland | | CHF | | | 51,000 | | | | 56,509 | | | | 57,207 | | | | 698 | |
Danish Krone,
Expiring 03/19/14 | | Credit Suisse International | | DKK | | | 40,500 | | | | 7,464 | | | | 7,473 | | | | 9 | |
Danish Krone,
Expiring 03/19/14 | | The Royal Bank of Scotland | | DKK | | | 40,500 | | | | 7,464 | | | | 7,473 | | | | 9 | |
Euro,
Expiring 03/19/14 | | Credit Suisse International | | EUR | | | 142,501 | | | | 195,200 | | | | 196,034 | | | | 834 | |
Euro,
Expiring 03/19/14 | | The Royal Bank of Scotland | | EUR | | | 142,500 | | | | 195,198 | | | | 196,033 | | | | 835 | |
British Pound,
Expiring 03/19/14 | | Credit Suisse International | | GBP | | | 85,501 | | | | 139,997 | | | | 141,510 | | | | 1,513 | |
British Pound,
Expiring 03/19/14 | | The Royal Bank of Scotland | | GBP | | | 85,500 | | | | 139,995 | | | | 141,509 | | | | 1,514 | |
Hong Kong
Dollar,
Expiring 03/19/14 | | Credit Suisse International | | HKD | | | 143,000 | | | | 18,448 | | | | 18,443 | | | | (5) | |
Hong Kong
Dollar,
Expiring 03/19/14 | | The Royal Bank of Scotland | | HKD | | | 143,000 | | | | 18,448 | | | | 18,443 | | | | (5) | |
Israeli Shekel,
Expiring 03/19/14 | | Credit Suisse International | | ILS | | | 10,000 | | | | 2,849 | | | | 2,877 | | | | 28 | |
Israeli Shekel,
Expiring 03/19/14 | | The Royal Bank of Scotland | | ILS | | | 10,000 | | | | 2,849 | | | | 2,877 | | | | 28 | |
Japanese Yen,
Expiring 03/19/14 | | Credit Suisse International | | JPY | | | 14,120,501 | | | | 137,167 | | | | 134,136 | | | | (3,031) | |
Japanese Yen,
Expiring 03/19/14 | | The Royal Bank of Scotland | | JPY | | | 14,120,500 | | | | 137,167 | | | | 134,136 | | | | (3,031) | |
Norwegian
Krone,
Expiring 03/19/14 | | Credit Suisse International | | NOK | | | 32,000 | | | | 5,194 | | | | 5,261 | | | | 67 | |
Norwegian
Krone,
Expiring 03/19/14 | | The Royal Bank of Scotland | | NOK | | | 32,000 | | | | 5,194 | | | | 5,261 | | | | 67 | |
New Zealand
Dollar,
Expiring 03/19/14 | | Credit Suisse International | | NZD | | | 1,000 | | | | 820 | | | | 818 | | | | (2) | |
New Zealand
Dollar,
Expiring 03/19/14 | | The Royal Bank of Scotland | | NZD | | | 999 | | | | 820 | | | | 817 | | | | (3) | |
Swedish Krona,
Expiring 03/19/14 | | Credit Suisse International | | SEK | | | 133,501 | | | | 20,417 | | | | 20,730 | | | | 313 | |
| | | | |
| | The accompanying notes are an integral part of these financial statements. | | (Continued) |
| | | | | | | | | | | | | | | | |
| | AQR Funds | | | | | | Annual Report | | | | | | December 2013 | | 69 |
| | | | | | | | | | |
| | | | |
| Schedule of Investments | | | December 31, 2013 | |
| | |
| AQR LONG-SHORT EQUITY FUND | | |
| | | | | | | | | | | | | | | | | | | | |
PURCHASE
CONTRACTS | | COUNTERPARTY | | CURRENCY | | CURRENCY
AMOUNT
PURCHASED | | | VALUE AT
SETTLEMENT
DATE | | | VALUE AT
DECEMBER 31,
2013 | | | UNREALIZED
APPRECIATION
(DEPRECIATION) | |
Swedish Krona,
Expiring 03/19/14 | | The Royal Bank of Scotland | | SEK | | | 133,500 | | | | $20,417 | | | | $20,729 | | | | $312 | |
Singapore Dollar,
Expiring 03/19/14 | | Credit Suisse International | | SGD | | | 12,000 | | | | 9,605 | | | | 9,509 | | | | (96) | |
Singapore Dollar,
Expiring 03/19/14 | | The Royal Bank of Scotland | | SGD | | | 12,000 | | | | 9,605 | | | | 9,509 | | | | (96) | |
| | | | | | | | | | | | | | | | | | | | |
| | | | | | | | | | | 1,412,196 | | | | 1,411,749 | | | | (447) | |
| | | | | | | | | | | | | | | | | | | | |
| | | | | | | | | | | | | | | | | | | | |
SALES
CONTRACTS | | COUNTERPARTY | | CURRENCY | | CURRENCY
AMOUNT
SOLD | | | VALUE AT
SETTLEMENT
DATE | | | VALUE AT
DECEMBER 31,
2013 | | | UNREALIZED
APPRECIATION
(DEPRECIATION) | |
Hong Kong Dollar,
Expiring 03/19/14 | | The Royal Bank of Scotland | | HKD | | | (1,000) | | | | (129) | | | | (129) | | | | — | |
| | | | | | | | | | | | | | | | | | | | |
| | | | | | | | | | | $1,412,067 | | | | $1,411,620 | | | | $(447) | |
| | | | | | | | | | | | | | | | | | | | |
AUD - Australian Dollar
CAD - Canadian Dollar
CHF - Swiss Franc
DKK - Danish Krone
EUR - Euro
GBP - British Pound
HKD - Hong Kong Dollar
ILS - Israeli Shekel
JPY - Japanese Yen
NOK - Norwegian Krone
NZD - New Zealand Dollar
SEK - Swedish Krona
SGD - Singapore Dollar
USD - United States Dollar
| | | | |
| | The accompanying notes are an integral part of these financial statements. | | (Continued) |
| | | | | | | | | | | | | | | | |
| 70 | | AQR Funds | | | | | | Annual Report | | | | | | December 2013 | | |
| | | | | | | | | | |
| | | | |
| Schedule of Investments | | | December 31, 2013 | |
| | |
| AQR LONG-SHORT EQUITY FUND | | |
Total Return Basket Swaps* Outstanding at December 31, 2013
Over the Counter
| | | | | | | | |
| COUNTERPARTY | | DESCRIPTION | | TERMINATION
DATE** | | VALUE
(Note 3) | |
| Deutsche Bank | | The Fund receives or pays the total return on a portfolio of long and short positions and pays or receives the London Interbank Offered Rate (“LIBOR”) (+/–40 bps), which is denominated in GBP based on the local currencies of the positions within the swap. | | 12 months maturity 08/22/2014 | | | $(10,295) | |
| | | | | | | | |
| * | See the accompanying “Additional Information — Total Return Basket Swap” for further details. |
| ** | The maturity dates are measured from the commencement of investment in each underlying portfolio swap position. |
Additional Information — Total Return Basket Swaps
The following table represents the individual long and short positions and related values within the total return basket swap as of December 31, 2013.
| | | | | | | | | | | | |
REFERENCE
ENTITY | | SHARES | | | NOTIONAL (a) | | | NET
UNREALIZED
APPRECIATION
(DEPRECIATION) | |
| Long Positions | | | | | | | | | |
| | | |
| Ireland | | | | | | | | | | | | |
| DCC PLC | | | 317 | | | $ | 15,086 | | | $ | 512 | |
| | | | | | | | | | | | |
| | | |
| United Kingdom | | | | | | | | | | | | |
| Antofagasta PLC | | | 2,131 | | | | 29,932 | | | | (717) | |
| ARM Holdings PLC | | | 219 | | | | 3,194 | | | | 788 | |
| ASOS PLC | | | 403 | | | | 39,042 | | | | 2,019 | |
| BAE Systems PLC | | | 6,871 | | | | 48,799 | | | | 774 | |
| Barratt Developments PLC | | | 11,991 | | | | 67,057 | | | | 2,355 | |
| Berkeley Group Holdings PLC | | | 1,376 | | | | 54,233 | | | | 6,433 | |
| British Sky Broadcasting Group PLC | | | 1,390 | | | | 19,242 | | | | 203 | |
| Centrica PLC | | | 3,548 | | | | 22,343 | | | | (1,883) | |
| Compass Group PLC | | | 629 | | | | 9,376 | | | | 722 | |
| InterContinental Hotels Group PLC | | | 162 | | | | 5,329 | | | | 74 | |
| Kazakhmys PLC | | | 2 | | | | 7 | | | | 1 | |
| Man Group PLC | | | 1,707 | | | | 2,516 | | | | (105) | |
| Marks & Spencer Group PLC | | | 4,895 | | | | 37,968 | | | | (2,818) | |
| Next PLC | | | 378 | | | | 29,971 | | | | 4,197 | |
| Persimmon PLC | | | 454 | | | | 9,132 | | | | 202 | |
| Rexam PLC | | | 2,657 | | | | 21,721 | | | | 1,656 | |
| Rolls-Royce Holdings PLC | | | 91 | | | | 1,782 | | | | 143 | |
| Rolls-Royce Holdings PLC | | | 7,826 | | | | — | | | | 13 | |
| Serco Group PLC | | | 3,208 | | | | 31,668 | | | | (5,123) | |
| Smiths Group PLC | | | 1,462 | | | | 33,331 | | | | 2,569 | |
| Taylor Wimpey PLC | | | 28,633 | | | | 52,379 | | | | 650 | |
| Travis Perkins PLC | | | 387 | | | | 11,542 | | | | 480 | |
| | | | | | | | | | | | |
REFERENCE
ENTITY | | SHARES | | | NOTIONAL (a) | | | NET
UNREALIZED
APPRECIATION
(DEPRECIATION) | |
| United Kingdom (continued) | | | | | | | | | |
| Vedanta Resources PLC | | | 293 | | | $ | 5,103 | | | $ | (555) | |
| Whitbread PLC | | | 507 | | | | 27,168 | | | | 4,385 | |
| | | | | | | | | | | | |
| | | | | | | | | | | 16,463 | |
| | | | | | | | | | | | |
| Total of Long Equity Positions | | | | | | | | 16,975 | |
| | | | | | | | | | | | |
| | |
| Short Positions | | | | | | | | | |
| | |
| United Kingdom | | | | | | | | | |
| Admiral Group PLC | | | (597) | | | | (13,509) | | | | 532 | |
| Aggreko PLC | | | (2,422) | | | | (71,157) | | | | 2,467 | |
| Anglo American PLC | | | (271) | | | | (6,054) | | | | 123 | |
| Aviva PLC | | | (799) | | | | (4,838) | | | | (1,139) | |
| Carnival PLC | | | (618) | | | | (25,201) | | | | (383) | |
| Croda International PLC | | | (610) | | | | (26,137) | | | | 1,271 | |
| Eurasian Natural Resources Corp. PLC | | | (15) | | | | (55) | | | | 3 | |
| G4S PLC | | | (5,564) | | | | (21,695) | | | | (2,514) | |
| GKN PLC | | | (5,858) | | | | (32,722) | | | | (3,579) | |
| Glencore Xstrata PLC | | | (2,275) | | | | (11,855) | | | | 19 | |
| Imperial Tobacco Group PLC | | | (181) | | | | (6,691) | | | | (326) | |
| International Consolidated Airlines Group SA | | | (3,827) | | | | (17,749) | | | | (7,749) | |
| Intertek Group PLC | | | (112) | | | | (5,653) | | | | (192) | |
| Johnson Matthey PLC | | | (940) | | | | (43,211) | | | | (7,937) | |
| Lloyds Banking Group PLC | | | (7,750) | | | | (8,947) | | | | (1,222) | |
| Pearson PLC | | | (540) | | | | (11,371) | | | | (668) | |
| Prudential PLC | | | (262) | | | | (5,186) | | | | (669) | |
| Royal Bank of Scotland Group PLC | | | (3,903) | | | | (22,107) | | | | 125 | |
| Standard Life PLC | | | (1,006) | | | | (5,671) | | | | (337) | |
| | | | |
| | The accompanying notes are an integral part of these financial statements. | | (Continued) |
| | | | | | | | | | | | | | | | |
| | AQR Funds | | | | | | Annual Report | | | | | | December 2013 | | 71 |
| | | | | | | | | | |
| | | | |
| Schedule of Investments | | | December 31, 2013 | |
| | |
| AQR LONG-SHORT EQUITY FUND | | |
| | | | | | | | | | | | |
REFERENCE
ENTITY | | SHARES | | | NOTIONAL (a) | | | NET
UNREALIZED
APPRECIATION
(DEPRECIATION) | |
| United Kingdom (continued) | | | | | | | | | |
| Telecity Group PLC | | | (4,283) | | | $ | (48,232) | | | $ | (3,292) | |
| Weir Group PLC/The | | | (134) | | | | (4,917) | | | | 173 | |
| | | | | | | | | | | | |
| | | | | | | | | | | (25,294) | |
| | | | | | | | | | | | |
Total of Short Equity Positions | | | | | | | | | | | (25,294) | |
| | | | | | | | | | | | |
Total of Long and Short Equity Positions | | | | | | | | | | | (8,319) | |
| | | | | | | | | | | | |
Net Cash and Other Receivables/ (Payables) (b) | | | | | | | | | | | (1,976) | |
| | | | | | | | | | | | |
Swaps, at Value | | | | | | | | | | $ | (10,295) | |
| | | | | | | | | | | | |
| (a) | Notional value represents the market value (including any fees or commissions) of the long and short positions when they are established. |
| (b) | Cash and other receivables/(payables) includes the gains (or losses) realized within the swap when the swap resets. |
Money Market Fund is pledged as collateral to Deutsche Bank in the amount of $400,001 at December 31, 2013.
| | | | | | | | |
| COUNTERPARTY | | DESCRIPTION | | TERMINATION
DATE** | | VALUE
(Note 3) | |
| Deutsche Bank | | The Fund receives or pays the total return on a portfolio of long and short positions and pays or receives the HKD/USD 1 Week Forward FX Swap Rate (+/– 40bps), which is denominated in HKD based on the local currencies of the positions within the swap. | | 12 months maturity 07/22/2014-08/22/2014 | | | $42,864 | |
| | | | | | | | |
| ** | The maturity dates are measured from the commencement of investment in each underlying portfolio swap position. |
Additional Information — Total Return Basket Swaps
The following table represents the individual long and short positions and related values within the total return basket swap as of December 31, 2013.
| | | | | | | | | | | | |
REFERENCE
ENTITY | | SHARES | | | NOTIONAL (a) | | | NET
UNREALIZED
APPRECIATION
(DEPRECIATION) | |
| Long Positions | | | | | | | | | |
| | | |
| Hong Kong | | | | | | | | | | | | |
| Bank of East Asia Ltd. | | | 3,600 | | | $ | 15,427 | | | $ | (144) | |
| Cheung Kong Holdings Ltd. | | | 2,000 | | | | 31,042 | | | | 600 | |
| Galaxy Entertainment Group Ltd. | | | 1,000 | | | | 5,381 | | | | 3,622 | |
| Hang Seng Bank Ltd. | | | 1,300 | | | | 21,234 | | | | (120) | |
| Hysan Development Co., Ltd. | | | 5,000 | | | | 23,166 | | | | (1,582) | |
| MGM China Holdings Ltd. | | | 18,000 | | | | 50,687 | | | | 26,350 | |
| MTR Corp. Ltd. | | | 15,500 | | | | 58,517 | | | | 231 | |
| Power Assets Holdings Ltd. | | | 4,000 | | | | 31,532 | | | | 309 | |
| Sino Land Co., Ltd. | | | 16,000 | | | | 22,391 | | | | (448) | |
| SJM Holdings Ltd. | | | 16,000 | | | | 38,116 | | | | 15,667 | |
| Sun Hung Kai Properties Ltd. | | | 1,000 | | | | 12,880 | | | | (171) | |
| Wharf Holdings Ltd. | | | 3,000 | | | | 23,669 | | | | (688) | |
| | | | | | | | | | | | |
| | | | | | | | | | | 43,626 | |
| | | | | | | | | | | | |
| | | | | | | | | | | | |
REFERENCE
ENTITY | | SHARES | | | NOTIONAL (a) | | | NET
UNREALIZED
APPRECIATION
(DEPRECIATION) | |
| United States | | | | | | | | | |
| Samsonite International SA | | | 11,400 | | | $ | 32,712 | | | $ | 2,059 | |
| | | | | | | | | | | | |
| Total of Long Equity Positions | | | | | | | | 45,685 | |
| | | | | | | | | | | | |
| | |
| Short Positions | | | | | | | | | |
| | |
| China | | | | | | | | | |
| Xinyi Solar Holdings Ltd. | | | (70,000) | | | | — | | | | (14,444) | |
| | | | | | | | | | | | |
| | | |
| Hong Kong | | | | | | | | | | | | |
| Esprit Holdings Ltd. | | | (17,900) | | | | (36,540) | | | | 1,953 | |
| First Pacific Co., Ltd. | | | (22,000) | | | | (25,713) | | | | 629 | |
| Hang Lung Properties Ltd. | | | (18,000) | | | | (61,088) | | | | 4,030 | |
| Hong Kong & China Gas Co., Ltd. | | | (13,000) | | | | (31,335) | | | | 1,487 | |
| Li & Fung Ltd. | | | (36,000) | | | | (51,481) | | | | 4,947 | |
| Melco International Development Ltd. | | | (9,000) | | | | (32,779) | | | | (420) | |
| | | | |
| | The accompanying notes are an integral part of these financial statements. | | (Continued) |
| | | | | | | | | | | | | | | | |
| 72 | | AQR Funds | | | | | | Annual Report | | | | | | December 2013 | | |
| | | | | | | | | | |
| | | | |
| Schedule of Investments | | | December 31, 2013 | |
| | |
| AQR LONG-SHORT EQUITY FUND | | |
| | | | | | | | | | | | |
REFERENCE
ENTITY | | SHARES | | | NOTIONAL (a) | | | NET
UNREALIZED
APPRECIATION
(DEPRECIATION) | |
| Hong Kong (continued) | | | | | | | | | | | | |
| New World Development Co., Ltd. | | | (22,000) | | | $ | (29,886) | | | $ | 2,028 | |
| Sands China Ltd. | | | (2,800) | | | | (14,666) | | | | (8,281) | |
| Swire Properties Ltd. | | | (15,000) | | | | (38,721) | | | | 736 | |
| Techtronic Industries Co. | | | (16,000) | | | | (41,132) | | | | (4,441) | |
| Wynn Macau Ltd. | | | (2,400) | | | | (9,120) | | | | (1,790) | |
| Xinyi Glass Holdings Ltd. | | | (78,000) | | | | (71,422) | | | | 2,423 | |
| | | | | | | | | | | | |
| | | | | | | | | | | 3,301 | |
| | | | | | | | | | | | |
Total of Short Equity Positions | | | | | | | | | | | (11,143) | |
| | | | | | | | | | | | |
Total of Long and Short Equity Positions | | | | | | | | | | | 34,542 | |
| | | | | | | | | | | | |
Net Cash and Other Receivables/ (Payables) (b) | | | | | | | | | | | 8,322 | |
| | | | | | | | | | | | |
Swaps, at Value | | | | | | | | | | $ | 42,864 | |
| | | | | | | | | | | | |
| (a) | Notional value represents the market value (including any fees or commissions) of the long and short positions when they are established. |
| (b) | Cash and other receivables/(payables) includes the gains (or losses) realized within the swap when the swap resets. |
Additional collateral for this position pledged to Deutsche Bank is included in the collateral noted in the other Deutsche Bank total return basket swaps.
| | | | | | | | |
| COUNTERPARTY | | DESCRIPTION | | TERMINATION
DATE** | | VALUE
(Note 3) | |
| Deutsche Bank | | The Fund receives or pays the total return on a portfolio of long and short positions and pays or receives the AUD/USD Overnight Forward FX Swap Rate (+/– 50 bps), which is denominated in AUD based on the local currencies of the positions within the swap. | | 12 months maturity 08/18/2014 | | | $44,723 | |
| | | | | | | | |
| ** | The maturity dates are measured from the commencement of investment in each underlying portfolio swap position. |
Additional Information — Total Return Basket Swaps
The following table represents the individual long and short positions and related values within the total return basket swap as of December 31, 2013.
| | | | | | | | | | | | |
REFERENCE
ENTITY | | SHARES | | | NOTIONAL (a) | | | NET
UNREALIZED
APPRECIATION
(DEPRECIATION) | |
| Long Positions | | | | | | | | | |
| | | |
| Australia | | | | | | | | | | | | |
| BlueScope Steel Ltd. | | | 6,513 | | | $ | 29,093 | | | $ | 4,888 | |
| Caltex Australia Ltd. | | | 895 | | | | 14,806 | | | | 1,278 | |
| Flight Centre Ltd. | | | 121 | | | | 5,339 | | | | (186) | |
| Leighton Holdings Ltd. | | | 862 | | | | 14,389 | | | | (1,941) | |
| Macquarie Group Ltd. | | | 812 | | | | 34,170 | | | | 5,685 | |
| Newcrest Mining Ltd. | | | 2,140 | | | | 16,399 | | | | (1,371) | |
| Sydney Airport | | | 861 | | | | 2,404 | | | | 523 | |
| Telstra Corp. Ltd. | | | 8,701 | | | | 37,741 | | | | 3,098 | |
| Treasury Wine Estates Ltd. | | | 10,080 | | | | 43,297 | | | | 178 | |
| WorleyParsons Ltd. | | | 1,612 | | | | 23,166 | | | | 813 | |
| | | | | | | | | | | | |
| | | | | | | | | | | 12,965 | |
| | | | | | | | | | | | |
| Total of Long Equity Positions | | | | | | | | 12,965 | |
| | | | | | | | | | | | |
| | | | | | | | | | | | |
REFERENCE
ENTITY | | SHARES | | | NOTIONAL (a) | | | NET
UNREALIZED
APPRECIATION
(DEPRECIATION) | |
| Short Positions | | | | | | | | | |
| | |
| Australia | | | | | | | | | |
| Alumina Ltd. | | | (16,344) | | | $ | (13,675) | | | $ | (2,551) | |
| AMP Ltd. | | | (2,559) | | | | (10,468) | | | | 410 | |
| Asciano Ltd. | | | (4,155) | | | | (19,936) | | | | (1,485) | |
| Cochlear Ltd. | | | (1,015) | | | | (54,112) | | | | 634 | |
| Fortescue Metals Group Ltd. | | | (1,846) | | | | (9,536) | | | | (108) | |
| Iluka Resources Ltd. | | | (2,609) | | | | (21,234) | | | | 1,017 | |
| Qantas Airways Ltd. | | | (9,525) | | | | (11,670) | | | | 2,327 | |
| QBE Insurance Group Ltd. | | | (2,379) | | | | (35,220) | | | | 10,679 | |
| | | | |
| | The accompanying notes are an integral part of these financial statements. | | (Continued) |
| | | | | | | | | | | | | | | | |
| | AQR Funds | | | | | | Annual Report | | | | | | December 2013 | | 73 |
| | | | | | | | | | |
| | | | |
| Schedule of Investments | | | December 31, 2013 | |
| | |
| AQR LONG-SHORT EQUITY FUND | | |
| | | | | | | | | | | | |
REFERENCE
ENTITY | | SHARES | | | NOTIONAL (a) | | | NET
UNREALIZED
APPRECIATION
(DEPRECIATION) | |
| Australia (continued) | | | | | | | | | |
| Seek Ltd. | | | (4,586) | | | $ | (38,839) | | | $ | (16,296) | |
| Toll Holdings Ltd. | | | (4,318) | | | | (21,884) | | | | (78) | |
| | | | | | | | | | | | |
| | | | | | | | | | | (5,451) | |
| | | | | | | | | | | | |
Total of Short Equity Positions | | | | | | | | | | | (5,451) | |
| | | | | | | | | | | | |
Total of Long and Short Equity Positions | | | | | | | | | | | 7,514 | |
| | | | | | | | | | | | |
Net Cash and Other Receivables/ (Payables) (b) | | | | | | | | | | | 37,209 | |
| | | | | | | | | | | | |
Swaps, at Value | | | | | | | | | | $ | 44,723 | |
| | | | | | | | | | | | |
| (a) | Notional value represents the market value (including any fees or commissions) of the long and short positions when they are established. |
| (b) | Cash and other receivables/(payables) includes the gains (or losses) realized within the swap when the swap resets. |
Additional collateral for this position pledged to Deutsche Bank is included in the collateral noted in the other Deutsche Bank total return basket swaps.
| | | | | | | | |
| COUNTERPARTY | | DESCRIPTION | | TERMINATION
DATE** | | VALUE
(Note 3) | |
| Deutsche Bank | | The Fund receives or pays the total return on a portfolio of long and short positions and pays or receives the JPY/USD 1 Week Forward FX Swap Rate (+/– 40 bps), which is denominated in JPY based on the local currencies of the positions within the swap. | | 12 months maturity 08/18/2014 | | | $58,986 | |
| | | | | | | | |
| ** | The maturity dates are measured from the commencement of investment in each underlying portfolio swap position. |
Additional Information — Total Return Basket Swaps
The following table represents the individual long and short positions and related values within the total return basket swap as of December 31, 2013.
| | | | | | | | | | | | |
REFERENCE
ENTITY | | SHARES | | | NOTIONAL (a) | | | NET
UNREALIZED
APPRECIATION
(DEPRECIATION) | |
| Long Positions | | | | | | | | | |
| | | |
| Japan | | | | | | | | | | | | |
| Aisin Seiki Co., Ltd. | | | 900 | | | $ | 34,491 | | | $ | 2,100 | |
| Ajinomoto Co., Inc. | | | 1,000 | | | | 13,117 | | | | 1,359 | |
| Asahi Kasei Corp. | | | 2,000 | | | | 12,501 | | | | 3,186 | |
| Bridgestone Corp. | | | 1,300 | | | | 41,605 | | | | 7,648 | |
| Central Japan Railway Co. | | | 500 | | | | 62,032 | | | | (3,106) | |
| Chugai Pharmaceutical Co., Ltd. | | | 200 | | | | 3,966 | | | | 461 | |
| Dai Nippon Printing Co., Ltd. | | | 4,000 | | | | 35,820 | | | | 6,669 | |
| Daihatsu Motor Co., Ltd. | | | 2,000 | | | | 39,693 | | | | (5,768) | |
| Daiichi Sankyo Co., Ltd. | | | 400 | | | | 6,488 | | | | 826 | |
| Daiwa Securities Group, Inc. | | | 3,000 | | | | 26,604 | | | | 3,443 | |
| Dena Co., Ltd. | | | 600 | | | | 11,178 | | | | 1,470 | |
| Denso Corp. | | | 600 | | | | 27,810 | | | | 3,888 | |
| Electric Power Development Co., Ltd. | | | 500 | | | | 15,786 | | | | (1,208) | |
| | | | | | | | | | | | |
REFERENCE
ENTITY | | SHARES | | | NOTIONAL (a) | | | NET
UNREALIZED
APPRECIATION
(DEPRECIATION) | |
| Japan (continued) | | | | | | | | | | | | |
| Fuji Electric Co., Ltd. | | | 14,000 | | | $ | 49,463 | | | $ | 16,133 | |
| Fuji Heavy Industries Ltd. | | | 3,000 | | | | 76,434 | | | | 9,783 | |
| FUJIFILM Holdings Corp. | | | 600 | | | | 13,105 | | | | 3,926 | |
| GungHo Online Entertainment, Inc. | | | 3,000 | | | | 18,068 | | | | 3,541 | |
| Hino Motors Ltd. | | | 2,000 | | | | 32,577 | | | | (1,072) | |
| Honda Motor Co., Ltd. | | | 300 | | | | 10,884 | | | | 1,499 | |
| Hoya Corp. | | | 600 | | | | 12,545 | | | | 4,143 | |
| Isuzu Motors Ltd. | | | 7,000 | | | | 52,974 | | | | (9,315) | |
| ITOCHU Corp. | | | 2,000 | | | | 23,562 | | | | 1,163 | |
| J Front Retailing Co., Ltd. | | | 3,000 | | | | 21,831 | | | | 928 | |
| JFE Holdings, Inc. | | | 500 | | | | 10,855 | | | | 1,060 | |
| JGC Corp. | | | 1,000 | | | | 33,624 | | | | 5,620 | |
| JSR Corp. | | | 800 | | | | 15,089 | | | | 417 | |
| Kao Corp. | | | 200 | | | | 6,527 | | | | (231) | |
| KDDI Corp. | | | 200 | | | | 11,907 | | | | 416 | |
| LIXIL Group Corp. | | | 900 | | | | 20,134 | | | | 4,573 | |
| Makita Corp. | | | 100 | | | | 4,811 | | | | 448 | |
| Marubeni Corp. | | | 4,000 | | | | 27,313 | | | | 1,483 | |
| | | | |
| | The accompanying notes are an integral part of these financial statements. | | (Continued) |
| | | | | | | | | | | | | | | | |
| 74 | | AQR Funds | | | | | | Annual Report | | | | | | December 2013 | | |
| | | | | | | | | | |
| | | | |
| Schedule of Investments | | | December 31, 2013 | |
| | |
| AQR LONG-SHORT EQUITY FUND | | |
| | | | | | | | | | | | |
REFERENCE
ENTITY | | SHARES | | | NOTIONAL (a) | | | NET
UNREALIZED
APPRECIATION
(DEPRECIATION) | |
| Japan (continued) | | | | | | | | | | | | |
| Mazda Motor Corp. | | | 7,000 | | | $ | 27,324 | | | $ | 8,951 | |
| Mitsubishi Electric Corp. | | | 2,000 | | | | 21,919 | | | | 3,230 | |
| Mitsubishi Heavy Industries, Ltd. | | | 4,000 | | | | 24,816 | | | | (41) | |
| Mitsubishi Materials Corp. | | | 3,000 | | | | 10,001 | | | | 1,088 | |
| Mitsubishi Motors Corp. | | | 1,000 | | | | 10,051 | | | | 707 | |
| Mitsubishi Tanabe Pharma Corp. | | | 1,100 | | | | 14,766 | | | | 576 | |
| Murata Manufacturing Co., Ltd. | | | 100 | | | | 8,080 | | | | 814 | |
| Namco Bandai Holdings, Inc. | | | 1,100 | | | | 17,368 | | | | 7,055 | |
| Nippon Telegraph & Telephone Corp. | | | 900 | | | | 44,222 | | | | 4,252 | |
| Nomura Research Institute Ltd. | | | 1,200 | | | | 38,776 | | | | (853) | |
| Omron Corp. | | | 1,700 | | | | 49,000 | | | | 26,128 | |
| Osaka Gas Co., Ltd. | | | 3,000 | | | | 12,447 | | | | (664) | |
| Otsuka Holdings Co., Ltd. | | | 500 | | | | 16,633 | | | | (2,196) | |
| Panasonic Corp. | | | 3,700 | | | | 41,022 | | | | 2,109 | |
| Resona Holdings, Inc. | | | 5,200 | | | | 25,502 | | | | 1,031 | |
| Rohm Co., Ltd. | | | 300 | | | | 11,816 | | | | 2,817 | |
| Secom Co., Ltd. | | | 400 | | | | 21,510 | | | | 2,624 | |
| Seiko Epson Corp. | | | 1,300 | | | | 28,700 | | | | 6,302 | |
| Sekisui Chemical Co., Ltd. | | | 4,000 | | | | 39,846 | | | | 9,240 | |
| Shimamura Co., Ltd. | | | 100 | | | | 11,694 | | | | (2,320) | |
| Showa Shell Sekiyu KK | | | 2,900 | | | | 28,531 | | | | 948 | |
| Sojitz Corp. | | | 4,700 | | | | 8,127 | | | | 240 | |
| Sumitomo Electric Industries Ltd. | | | 900 | | | | 11,377 | | | | 3,667 | |
| Sumitomo Metal Mining Co., Ltd. | | | 1,000 | | | | 11,728 | | | | 1,375 | |
| Sumitomo Mitsui Financial Group, Inc. | | | 500 | | | | 22,571 | | | | 3,431 | |
| Sumitomo Rubber Industries Ltd. | | | 1,600 | | | | 27,325 | | | | (4,549) | |
| Suzuki Motor Corp. | | | 2,000 | | | | 47,572 | | | | 6,322 | |
| Taisei Corp. | | | 1,000 | | | | 3,787 | | | | 764 | |
| Takashimaya Co., Ltd. | | | 3,000 | | | | 27,855 | | | | 2,078 | |
| Tokyo Electric Power Co., Inc | | | 2,900 | | | | 14,715 | | | | (427) | |
| Tokyo Gas Co., Ltd. | | | 7,000 | | | | 38,129 | | | | (3,629) | |
| Toppan Printing Co., Ltd. | | | 3,000 | | | | 22,530 | | | | 1,484 | |
| TOTO Ltd. | | | 3,000 | | | | 29,719 | | | | 17,865 | |
| Toyo Seikan Kaisha Ltd. | | | 1,800 | | | | 29,514 | | | | 9,237 | |
| Toyo Suisan Kaisha Ltd. | | | 1,000 | | | | 31,502 | | | | (1,461) | |
| Yahoo Japan Corp. | | | 2,100 | | | | 10,692 | | | | 1,018 | |
| Yamato Holdings Co., Ltd. | | | 700 | | | | 14,547 | | | | (391) | |
| | | | | | | | | | | | |
| | | | | | | | | | | 174,305 | |
| | | | | | | | | | | | |
| Total of Long Equity Positions | | | | | | | | 174,305 | |
| | | | | | | | | | | | |
| | | | | | | | | | | | |
REFERENCE
ENTITY | | SHARES | | | NOTIONAL (a) | | | NET
UNREALIZED
APPRECIATION
(DEPRECIATION) | |
| Short Positions | | | | | | | | | |
| | |
| Japan | | | | | | | | | |
| Acom Co., Ltd. | | | (6,400) | | | $ | (22,414) | | | $ | 607 | |
| Advantest Corp. | | | (5,400) | | | | (71,614) | | | | 4,327 | |
| Aeon Co., Ltd. | | | (800) | | | | (10,385) | | | | (461) | |
| Asahi Group Holdings Ltd. | | | (500) | | | | (12,877) | | | | (1,233) | |
| Casio Computer Co., Ltd. | | | (600) | | | | (5,203) | | | | (2,150) | |
| Credit Saison Co., Ltd. | | | (900) | | | | (20,886) | | | | (2,840) | |
| Daikin Industries Ltd. | | | (300) | | | | (12,913) | | | | (5,808) | |
| Disco Corp. | | | (200) | | | | (11,494) | | | | (1,780) | |
| Don Quijote Co., Ltd. | | | (100) | | | | (6,364) | | | | 302 | |
| Eisai Co., Ltd. | | | (200) | | | | (8,143) | | | | 392 | |
| Fast Retailing Co., Ltd. | | | (100) | | | | (33,537) | | | | (7,765) | |
| Fujitsu Ltd. | | | (2,000) | | | | (9,038) | | | | (1,327) | |
| Furukawa Electric Co., Ltd. | | | (30,000) | | | | (66,696) | | | | (8,722) | |
| GS Yuasa Corp. | | | (7,000) | | | | (30,261) | | | | (10,015) | |
| Hitachi Construction Machinery Co., Ltd. | | | (600) | | | | (11,508) | | | | (1,331) | |
| Hitachi Ltd. | | | (3,000) | | | | (18,917) | | | | (3,829) | |
| Hokkaido Electric Power Co., Inc. | | | (2,900) | | | | (33,536) | | | | 163 | |
| Ibiden Co., Ltd. | | | (1,500) | | | | (23,194) | | | | (4,893) | |
| Isetan Mitsukoshi Holdings Ltd. | | | (4,400) | | | | (62,192) | | | | (445) | |
| Kansai Electric Power Co., Inc./The | | | (400) | | | | (5,734) | | | | 1,130 | |
| Kawasaki Heavy Industries Ltd. | | | (4,000) | | | | (14,600) | | | | (2,199) | |
| Komatsu Ltd. | | | (1,300) | | | | (28,864) | | | | 2,174 | |
| Konami Corp. | | | (1,800) | | | | (38,350) | | | | (3,272) | |
| Kyushu Electric Power Co., Inc. | | | (2,400) | | | | (35,254) | | | | 4,601 | |
| Marui Group Co., Ltd. | | | (3,800) | | | | (39,067) | | | | 416 | |
| Mitsubishi Corp. | | | (300) | | | | (5,370) | | | | (389) | |
| Mitsubishi Gas Chemical Co., Inc. | | | (1,000) | | | | (7,123) | | | | (249) | |
| Mitsui Chemicals, Inc. | | | (14,000) | | | | (33,085) | | | | (767) | |
| Mitsui OSK Lines Ltd. | | | (6,000) | | | | (23,865) | | | | (3,214) | |
| Nabtesco Corp. | | | (400) | | | | (7,767) | | | | (1,464) | |
| NGK Insulators Ltd. | | | (1,000) | | | | (12,905) | | | | (6,126) | |
| Nidec Corp. | | | (400) | | | | (27,067) | | | | (12,339) | |
| Nikon Corp. | | | (1,800) | | | | (33,222) | | | | (1,177) | |
| Nippon Electric Glass Co., Ltd. | | | (8,000) | | | | (39,293) | | | | (2,732) | |
| Nippon Steel & Sumitomo Metal Corp. | | | (6,000) | | | | (17,130) | | | | (2,993) | |
| Nissan Motor Co., Ltd. | | | (4,900) | | | | (51,548) | | | | 10,486 | |
| Nitto Denko Corp. | | | (300) | | | | (14,743) | | | | 2,058 | |
| Nomura Holdings, Inc. | | | (3,600) | | | | (26,403) | | | | (1,417) | |
| Obayashi Corp. | | | (7,000) | | | | (37,850) | | | | (2,077) | |
| Odakyu Electric Railway Co., Ltd. | | | (3,000) | | | | (29,433) | | | | 2,301 | |
| | | | |
| | The accompanying notes are an integral part of these financial statements. | | (Continued) |
| | | | | | | | | | | | | | | | |
| | AQR Funds | | | | | | Annual Report | | | | | | December 2013 | | 75 |
| | | | | | | | | | |
| | | | |
| Schedule of Investments | | | December 31, 2013 | |
| | |
| AQR LONG-SHORT EQUITY FUND | | |
| | | | | | | | | | | | |
REFERENCE
ENTITY | | SHARES | | | NOTIONAL (a) | | | NET
UNREALIZED
APPRECIATION
(DEPRECIATION) | |
| Japan (continued) | | | | | | | | | | | | |
| Olympus Corp. | | | (400) | | | $ | (12,432) | | | $ | (254) | |
| Sega Sammy Holdings, Inc. | | | (1,300) | | | | (32,421) | | | | (710) | |
| Seven & I Holdings Co., Ltd. | | | (200) | | | | (6,718) | | | | (1,245) | |
| Sharp Corp. | | | (16,000) | | | | (50,599) | | | | (344) | |
| Shimizu Corp. | | | (8,000) | | | | (32,975) | | | | (7,450) | |
| Shiseido Co., Ltd. | | | (1,000) | | | | (14,041) | | | | (2,040) | |
| Sony Corp. | | | (900) | | | | (16,196) | | | | 682 | |
| Sumco Corp. | | | (6,800) | | | | (59,712) | | | | (277) | |
| Takeda Pharmaceutical Co., Ltd. | | | (300) | | | | (13,191) | | | | (568) | |
| TDK Corp. | | | (1,000) | | | | (35,324) | | | | (12,650) | |
| Terumo Corp. | | | (1,000) | | | | (48,479) | | | | 200 | |
| Toshiba Corp. | | | (10,000) | | | | (40,811) | | | | (1,287) | |
| Toyota Industries Corp. | | | (200) | | | | (8,476) | | | | (565) | |
| Unicharm Corp. | | | (100) | | | | (4,878) | | | | (828) | |
| Yakult Honsha Co., Ltd. | | | (500) | | | | (19,790) | | | | (5,474) | |
| Yamada Denki Co., Ltd. | | | (20,000) | | | | (67,029) | | | | 1,609 | |
| | | | | | | | | | | | |
REFERENCE
ENTITY | | SHARES | | | NOTIONAL (a) | | | NET
UNREALIZED
APPRECIATION
(DEPRECIATION) | |
| Japan (continued) | | | | | | | | | | | | |
| Yamaha Motor Co., Ltd. | | | (1,200) | | | $ | (16,379) | | | $ | (1,663) | |
| Yokogawa Electric Corp. | | | (1,800) | | | | (24,343) | | | | (3,331) | |
| | | | | | | | | | | | |
| | | | | | | | | | | (100,252) | |
| | | | | | | | | | | | |
Total of Short Equity Positions | | | | | | | | | | | (100,252) | |
| | | | | | | | | | | | |
Total of Long and Short Equity Positions | | | | | | | | | | | 74,053 | |
| | | | | | | | | | | | |
Net Cash and Other Receivables/ (Payables) (b) | | | | | | | | | | | (15,067) | |
| | | | | | | | | | | | |
Swaps, at Value | | | | | | | | | | $ | 58,986 | |
| | | | | | | | | | | | |
| (a) | Notional value represents the market value (including any fees or commissions) of the long and short positions when they are established. |
| (b) | Cash and other receivables/(payables) includes the gains (or losses) realized within the swap when the swap resets. |
Additional collateral for this position pledged to Deutsche Bank is included in the collateral noted in the other Deutsche Bank total return basket swaps.
| | | | | | | | |
| COUNTERPARTY | | DESCRIPTION | | TERMINATION
DATE** | | VALUE
(Note 3) | |
| Deutsche Bank | | The Fund receives or pays the total return on a portfolio of long and short positions and pays or receives the Association of Singapore Banks Rate, which is denominated in SGD based on the local currencies of the positions within the swap. | | 12 months maturity 08/22/2014 | | | $(670) | |
| | | | | | | | |
| ** | The maturity dates are measured from the commencement of investment in each underlying portfolio swap position. |
Additional Information — Total Return Basket Swaps
The following table represents the individual long and short positions and related values within the total return basket swap as of December 31, 2013.
| | | | | | | | | | | | |
REFERENCE
ENTITY | | SHARES | | | NOTIONAL (a) | | | NET
UNREALIZED
APPRECIATION
(DEPRECIATION) | |
| Long Positions | |
| |
| Singapore | | | | | |
| Noble Group Ltd. | | | 35,000 | | | $ | 25,116 | | | $ | 4,691 | |
| Singapore Airlines Ltd. | | | 1,000 | | | | 8,285 | | | | (25) | |
| | | | | | | | | | | | |
| | | | | | | | | | | 4,666 | |
| | | | | | | | | | | | |
| Total of Long Equity Positions | | | | | | | | | | | 4,666 | |
| | | | | | | | | | | | |
| | | | | | | | | | | | |
REFERENCE
ENTITY | | SHARES | | | NOTIONAL (a) | | | NET
UNREALIZED
APPRECIATION
(DEPRECIATION) | |
| Short Positions | | | | | | | | | | | | |
| |
| Singapore | | | | | |
| Golden Agri-Resources Ltd. | | | (29,000) | | | $ | (11,996) | | | $ | (558) | |
| Keppel | | | (320) | | | | 5 | | | | (306) | |
| Keppel Corp. Ltd. | | | (4,000) | | | | (34,140) | | | | (1,390) | |
| | | | |
| | The accompanying notes are an integral part of these financial statements. | | (Continued) |
| | | | | | | | | | | | | | | | |
| 76 | | AQR Funds | | | | | | Annual Report | | | | | | December 2013 | | |
| | | | | | | | | | |
| | | | |
| Schedule of Investments | | | December 31, 2013 | |
| | |
| AQR LONG-SHORT EQUITY FUND | | |
| | | | | | | | | | | | |
REFERENCE
ENTITY | | SHARES | | | NOTIONAL (a) | | | NET
UNREALIZED
APPRECIATION
(DEPRECIATION) | |
| Singapore (continued) | | | | | |
| Singapore Telecommunications Ltd. | | | (8,000) | | | $ | (21,891) | | | $ | (1,374) | |
| | | | | | | | | | | | |
| | | | | | | | | | | (3,628) | |
| | | | | | | | | | | | |
| Total of Short Equity Positions | | | | | | | | | | | (3,628) | |
| | | | | | | | | | | | |
Total of Long and Short Equity Positions | | | | | | | | | | | 1,038 | |
| | | | | | | | | | | | |
Net Cash and Other Receivables/ (Payables) (b) | | | | | | | | | | | (1,708) | |
| | | | | | | | | | | | |
Swaps, at Value | | | | | | | | | | $ | (670) | |
| | | | | | | | | | | | |
| (a) | Notional value represents the market value (including any fees or commissions) of the long and short positions when they are established. |
| (b) | Cash and other receivables/(payables) includes the gains (or losses) realized within the swap when the swap resets. |
Additional collateral for this position pledged to Deutsche Bank is included in the collateral noted in the other Deutsche Bank total return basket swaps.
| | | | | | | | |
| COUNTERPARTY | | DESCRIPTION | | TERMINATION
DATE** | | VALUE
(Note 3) | |
| Deutsche Bank | | The Fund receives or pays the total return on a portfolio of long and short positions and pays or receives the CAD/USD Overnight Forward FX Swap Rate (+/– 40 bps), which is denominated in CAD based on the local currencies of the positions within the swap. | | 12 months maturity 07/11/2014 | | | $(17,430) | |
| | | | | | | | |
| ** | The maturity dates are measured from the commencement of investment in each underlying portfolio swap position. |
Additional Information — Total Return Basket Swaps
The following table represents the individual long and short positions and related values within the total return basket swap as of December 31, 2013.
| | | | | | | | | | | | |
REFERENCE
ENTITY | | SHARES | | | NOTIONAL (a) | | | NET
UNREALIZED
APPRECIATION
(DEPRECIATION) | |
| Long Positions | | | | | | | | | |
| | | |
| Canada | | | | | | | | | | | | |
| Alimentation Couche Tard, Inc. | | | 500 | | | $ | 32,797 | | | $ | 4,803 | |
| Barrick Gold Corp. | | | 1,600 | | | | 26,601 | | | | 1,580 | |
| Canadian National Railway Co. | | | 328 | | | | 16,841 | | | | 1,859 | |
| Canadian Tire Corp. Ltd. | | | 558 | | | | 49,374 | | | | 2,888 | |
| CGI Group, Inc. | | | 700 | | | | 25,491 | | | | (2,071) | |
| Dollarama, Inc. | | | 300 | | | | 24,764 | | | | 148 | |
| Eldorado Gold Corp. | | | 4,100 | | | | 23,853 | | | | (579) | |
| Gildan Activewear, Inc. | | | 1,016 | | | | 45,862 | | | | 8,284 | |
| IAMGOLD Corp. | | | 5,300 | | | | 21,140 | | | | (3,527) | |
| Imperial Oil Ltd. | | | 300 | | | | 12,982 | | | | 303 | |
| Kinross Gold Corp. | | | 5,900 | | | | 27,286 | | | | (1,459) | |
| Magna International, Inc. | | | 1,163 | | | | 96,192 | | | | (831) | |
| Methanex Corp. | | | 194 | | | | 10,365 | | | | 1,108 | |
| Metro, Inc. | | | 235 | | | | 14,593 | | | | (235) | |
| Open Text Corp. | | | 234 | | | | 18,357 | | | | 3,168 | |
| Rogers Communications, Inc. | | | 229 | | | | 9,877 | | | | 486 | |
| | | | | | | | | | | | |
REFERENCE
ENTITY | | SHARES | | | NOTIONAL (a) | | | NET
UNREALIZED
APPRECIATION
(DEPRECIATION) | |
| Canada (continued) | | | | | | | | | | | | |
| Teck Resources Ltd. | | | 788 | | | $ | 20,707 | | | $ | (196) | |
| Tim Hortons, Inc. | | | 200 | | | | 11,644 | | | | 27 | |
| West Fraser Timber Co., Ltd. | | | 500 | | | | 42,338 | | | | 6,427 | |
| Yamana Gold, Inc. | | | 3,300 | | | | 29,145 | | | | (689) | |
| | | | | | | | | | | | |
| | | | | | | | | | | 21,494 | |
| | | | | | | | | | | | |
| Total of Long Equity Positions | | | | | | | | | | | 21,494 | |
| | | | | | | | | | | | |
| | | |
| Short Positions | | | | | | | | | | | | |
| | | |
| Canada | | | | | | | | | | | | |
| Bombardier, Inc. | | | (900) | | | | (4,007) | | | | 101 | |
| Bonavista Energy Corp. | | | (2,800) | | | | (34,418) | | | | (2,274) | |
| Cameco Corp. | | | (449) | | | | (7,720) | | | | (1,596) | |
| Canadian Pacific Railway Ltd. | | | (90) | | | | (11,412) | | | | (2,199) | |
| Cenovus Energy, Inc. | | | (513) | | | | (14,971) | | | | 289 | |
| Enbridge, Inc. | | | (157) | | | | (6,335) | | | | (524) | |
| Finning International, Inc. | | | (654) | | | | (14,842) | | | | (1,873) | |
| | | | |
| | The accompanying notes are an integral part of these financial statements. | | (Continued) |
| | | | | | | | | | | | | | | | |
| | AQR Funds | | | | | | Annual Report | | | | | | December 2013 | | 77 |
| | | | | | | | | | |
| | | | |
| Schedule of Investments | | | December 31, 2013 | |
| | |
| AQR LONG-SHORT EQUITY FUND | | |
| | | | | | | | | | | | |
REFERENCE
ENTITY | | SHARES | | | NOTIONAL (a) | | | NET
UNREALIZED
APPRECIATION
(DEPRECIATION) | |
| Canada (continued) | | | | | | | | | | | | |
| First Quantum Minerals Ltd. | | | (2,623) | | | $ | (45,925) | | | $ | (1,337) | |
| Lundin Mining Corp. | | | (3,205) | | | | (13,522) | | | | (357) | |
| Manulife Financial Corp. | | | (3,314) | | | | (57,079) | | | | (8,311) | |
| MEG Energy Corp. | | | (1,400) | | | | (42,031) | | | | 1,689 | |
| Pengrowth Energy Corp. | | | (3) | | | | — | | | | (19) | |
| Penn West Petroleum Ltd. | | | (2,700) | | | | (22,719) | | | | 173 | |
| Potash Corp of Saskatchewan, Inc. | | | (962) | | | | (29,792) | | | | (1,923) | |
| Power Financial Corp. | | | (748) | | | | (22,861) | | | | (2,489) | |
| Precision Drilling Corp. | | | (1,100) | | | | (9,944) | | | | (349) | |
| SNC-Lavalin Group, Inc. | | | (1,198) | | | | (47,876) | | | | (6,021) | |
| Sun Life Financial, Inc. | | | (739) | | | | (23,579) | | | | (2,523) | |
| Talisman Energy, Inc. | | | (1,000) | | | | (11,475) | | | | (152) | |
| Toronto-Dominion Bank/The | | | (192) | | | | (16,730) | | | | (1,365) | |
| TransAlta Corp. | | | (2,543) | | | | (32,920) | | | | 649 | |
| | | | | | | | | | | | |
| | | | | | | | | | | (30,411) | |
| | | | | | | | | | | | |
Total of Short
Equity Positions | | | | | | | | | | | (30,411) | |
| | | | | | | | | | | | |
Total of Long and
Short Equity Positions | | | | | | | | | | | (8,917) | |
| | | | | | | | | | | | |
Net Cash and Other Receivables/ (Payables) (b) | | | | | | | | | | | (8,513) | |
| | | | | | | | | | | | |
Swaps, at Value | | | | | | | | | | $ | (17,430) | |
| | | | | | | | | | | | |
| (a) | Notional value represents the market value (including any fees or commissions) of the long and short positions when they are established. |
| (b) | Cash and other receivables/(payables) includes the gains (or losses) realized within the swap when the swap resets. |
Additional collateral for this position pledged to Deutsche Bank is included in the collateral noted in the other Deutsche Bank total return basket swaps.
| | | | | | | | |
| COUNTERPARTY | | DESCRIPTION | | TERMINATION DATE** | | VALUE
(Note 3) | |
Goldman
Sachs | | The Fund receives or pays the total return on a portfolio of long and short positions and pays or receives the LIBOR, which is denominated in USD based on the local currencies of the positions within the swap. | | 12 months maturity ranging from 10/24/2014 - 12/22/2014 | | | $125,854 | |
| | | | | | | | |
| ** | The maturity dates are measured from the commencement of investment in each underlying portfolio swap position. |
Additional Information — Total Return Basket Swaps
The following table represents the individual long and short positions and related values within the total return basket swap as of December 31, 2013.
| | | | | | | | | | | | |
REFERENCE
ENTITY | | SHARES | | | NOTIONAL (a) | | | NET
UNREALIZED
APPRECIATION
(DEPRECIATION) | |
| Long Positions | |
| |
| Bermuda | | | | | |
| Assured Guaranty Ltd. | | | 1,200 | | | $ | 24,168 | | | $ | 4,140 | |
| Axis Capital Holdings Co. | | | 300 | | | | 14,025 | | | | 246 | |
| Marvell Technology Group Ltd. | | | 1,600 | | | | 18,800 | | | | 4,208 | |
| Signet Jewelers Ltd. | | | 400 | | | | 29,972 | | | | 1,508 | |
| Validus Holding Ltd. | | | 200 | | | | 7,832 | | | | 226 | |
| | | | | | | | | | | | |
| | | | | | | | | | | 10,328 | |
| | | | | | | | | | | | |
| | | | | | | | | | | | |
REFERENCE
ENTITY | | SHARES | | | NOTIONAL (a) | | | NET
UNREALIZED
APPRECIATION
(DEPRECIATION) | |
| Canada | | | | | |
| Domtar Corp. | | | 300 | | | $ | 25,881 | | | $ | 2,421 | |
| | | | | | | | | | | | |
| | | |
| Ireland | | | | | | | | | | | | |
| Covidien PLC | | | 100 | | | | 6,360 | | | | 450 | |
| Seagate Technology PLC | | | 400 | | | | 20,842 | | | | 1,622 | |
| | | | | | | | | | | | |
| | | | | | | | | | | 2,072 | |
| | | | | | | | | | | | |
| | | | |
| | The accompanying notes are an integral part of these financial statements. | | (Continued) |
| | | | | | | | | | | | | | | | |
| 78 | | AQR Funds | | | | | | Annual Report | | | | | | December 2013 | | |
| | | | | | | | | | |
| | | | |
| Schedule of Investments | | | December 31, 2013 | |
| | |
| AQR LONG-SHORT EQUITY FUND | | |
| | | | | | | | | | | | |
REFERENCE
ENTITY | | SHARES | | | NOTIONAL (a) | | | NET
UNREALIZED
APPRECIATION
(DEPRECIATION) | |
| Singapore | | | | | |
| Avago Technologies Ltd. | | | 300 | | | $ | 13,533 | | | $ | 2,334 | |
| Flextronics International Ltd. | | | 2,000 | | | | 17,335 | | | | (1,796) | |
| | | | | | | | | | | | |
| | | | | | | | | | | 538 | |
| | | | | | | | | | | | |
| Switzerland | | | | | |
| TE Connectivity Ltd. | | | 900 | | | | 47,232 | | | | 2,367 | |
| Tyco International Ltd. | | | 300 | | | | 10,719 | | | | 1,593 | |
| | | | | | | | | | | | |
| | | | | | | | | | | 3,960 | |
| | | | | | | | | | | | |
| United States | | | | | |
| Abbott Laboratories | | | 1,000 | | | | 37,170 | | | | 1,160 | |
| AbbVie, Inc. | | | 600 | | | | 29,314 | | | | 2,372 | |
| Activision Blizzard, Inc. | | | 3,400 | | | | 59,840 | | | | 782 | |
| Aetna, Inc. | | | 100 | | | | 6,418 | | | | 441 | |
| Aflac, Inc. | | | 300 | | | | 19,833 | | | | 207 | |
| AGCO Corp. | | | 500 | | | | 31,355 | | | | (1,760) | |
| Akamai Technologies, Inc. | | | 300 | | | | 15,609 | | | | (1,455) | |
| Alaska Air Group, Inc. | | | 700 | | | | 45,822 | | | | 5,537 | |
| Allstate Corp. | | | 700 | | | | 37,765 | | | | 413 | |
| Amazon.com, Inc. | | | 100 | | | | 36,696 | | | | 3,183 | |
| Amdocs Ltd. | | | 200 | | | | 7,386 | | | | 862 | |
| American Capital Ltd. | | | 2,100 | | | | 31,179 | | | | 1,665 | |
| American Eagle Outfitters, Inc. | | | 1,300 | | | | 17,940 | | | | 780 | |
| American International Group, Inc. | | | 100 | | | | 4,962 | | | | 143 | |
| Ameriprise Financial, Inc. | | | 300 | | | | 30,963 | | | | 3,552 | |
| AmerisourceBergen Corp. | | | 600 | | | | 38,772 | | | | 3,414 | |
| Amgen, Inc. | | | 500 | | | | 57,880 | | | | (800) | |
| AOL, Inc. | | | 100 | | | | 4,473 | | | | 189 | |
| Apollo Group, Inc. | | | 900 | | | | 18,990 | | | | 5,598 | |
| Applied Materials, Inc. | | | 1,900 | | | | 34,371 | | | | (760) | |
| Archer-Daniels-Midland Co. | | | 700 | | | | 26,530 | | | | 3,850 | |
| ARES Captial Corp. | | | 1,200 | | | | 20,880 | | | | 444 | |
| Arrow Electronics, Inc. | | | 100 | | | | 4,947 | | | | 478 | |
| Assurant, Inc. | | | 700 | | | | 41,398 | | | | 5,061 | |
| Atmel Corp. | | | 4,700 | | | | 34,310 | | | | 2,491 | |
| Atwood Oceanics, Inc. | | | 200 | | | | 10,426 | | | | 252 | |
| Autodesk, Inc. | | | 300 | | | | 12,123 | | | | 2,976 | |
| Avery Dennison Corp. | | | 200 | | | | 8,822 | | | | 1,216 | |
| Avnet, Inc. | | | 1,100 | | | | 46,123 | | | | 2,398 | |
| Baxter International, Inc. | | | 400 | | | | 26,896 | | | | 924 | |
| Best Buy Co., Inc. | | | 500 | | | | 20,339 | | | | (399) | |
| Biogen Idec, Inc. | | | 200 | | | | 52,509 | | | | 3,441 | |
| Boeing Co./The | | | 100 | | | | 12,229 | | | | 1,420 | |
| Boston Scientific Corp. | | | 4,000 | | | | 48,881 | | | | (801) | |
| Brinker International, Inc. | | | 200 | | | | 8,200 | | | | 1,068 | |
| Bristol-Myers Squibb Co. | | | 100 | | | | 5,229 | | | | 86 | |
| Broadcom Corp. | | | 600 | | | | 16,242 | | | | 1,548 | |
| Brocade Communications Systems, Inc. | | | 9,400 | | | | 76,774 | | | | 6,605 | |
| CA, Inc. | | | 1,600 | | | | 48,032 | | | | 5,808 | |
| Cabot Oil & Gas Corp. | | | 200 | | | | 7,268 | | | | 484 | |
| | | | | | | | | | | | |
REFERENCE
ENTITY | | SHARES | | | NOTIONAL (a) | | | NET
UNREALIZED
APPRECIATION
(DEPRECIATION) | |
| United States (continued) | |
| Capital One Financial Corp. | | | 300 | | | $ | 21,645 | | | $ | 1,338 | |
| Cardinal Health, Inc. | | | 500 | | | | 28,295 | | | | 5,110 | |
| CareFusion Corp. | | | 1,000 | | | | 39,420 | | | | 400 | |
| CBOE Holdings, Inc. | | | 500 | | | | 27,175 | | | | (1,195) | |
| CBS Corp. | | | 100 | | | | 5,844 | | | | 530 | |
| Celgene Corp. | | | 500 | | | | 80,522 | | | | 3,958 | |
| CF Industries Holdings, Inc. | | | 100 | | | | 20,954 | | | | 2,350 | |
| Cheesecake Factory, Inc./The | | | 100 | | | | 4,341 | | | | 486 | |
| Chevron Corp. | | | 100 | | | | 11,952 | | | | 539 | |
| Chico’s FAS, Inc. | | | 1,200 | | | | 19,524 | | | | 3,084 | |
| Chubb Corp. | | | 100 | | | | 9,221 | | | | 442 | |
| Cigna Corp. | | | 400 | | | | 30,992 | | | | 4,000 | |
| Cimarex Energy Co. | | | 200 | | | | 19,644 | | | | 1,338 | |
| Cintas Corp. | | | 100 | | | | 5,298 | | | | 661 | |
| Cisco Systems, Inc. | | | 2,000 | | | | 45,580 | | | | (680) | |
| Coach, Inc. | | | 700 | | | | 37,898 | | | | 1,393 | |
| Coca-Cola Enterprises, Inc. | | | 1,300 | | | | 54,483 | | | | 2,886 | |
| Comcast Corp. | | | 300 | | | | 14,235 | | | | 1,354 | |
| Computer Sciences Corp. | | | 800 | | | | 42,400 | | | | 2,304 | |
| CoreLogic, Inc. | | | 200 | | | | 6,912 | | | | 194 | |
| Corning, Inc. | | | 1,000 | | | | 14,830 | | | | 2,990 | |
| Cummins, Inc. | | | 200 | | | | 26,088 | | | | 2,106 | |
| CVR Energy, Inc. | | | 100 | | | | 4,081 | | | | 262 | |
| CVS Caremark Corp. | | | 100 | | | | 6,000 | | | | 1,157 | |
| Delta Air Lines, Inc. | | | 400 | | | | 9,924 | | | | 1,064 | |
| Dillards, Inc. | | | 600 | | | | 48,318 | | | | 10,008 | |
| Discover Financial Services | | | 600 | | | | 32,232 | | | | 1,338 | |
| Dominos Pizza, Inc. | | | 100 | | | | 6,663 | | | | 302 | |
| Dow Chemical Co./The | | | 300 | | | | 11,929 | | | | 1,391 | |
| DSW, Inc. | | | 200 | | | | 8,150 | | | | 396 | |
| E*Trade Financial Corp. | | | 300 | | | | 5,196 | | | | 696 | |
| Electronic Arts, Inc. | | | 300 | | | | 6,633 | | | | 249 | |
| Eli Lilly & Co. | | | 600 | | | | 29,820 | | | | 780 | |
| Exelis, Inc. | | | 1,200 | | | | 22,223 | | | | 649 | |
| Express Scripts PLC | | | 200 | | | | 12,408 | | | | 1,640 | |
| F5 Networks, Inc. | | | 200 | | | | 16,804 | | | | 1,368 | |
| Facebook, Inc. | | | 1,400 | | | | 65,785 | | | | 10,739 | |
| Fifth Third BanCorp. | | | 2,100 | | | | 39,837 | | | | 4,326 | |
| First Solar, Inc. | | | 1,100 | | | | 51,419 | | | | 8,685 | |
| FLIR Systems, Inc. | | | 1,000 | | | | 28,990 | | | | 1,110 | |
| Flowserve Corp. | | | 400 | | | | 25,400 | | | | 6,132 | |
| Fluor Corp. | | | 300 | | | | 22,766 | | | | 1,321 | |
| Foot Locker, Inc. | | | 800 | | | | 26,520 | | | | 6,632 | |
| Fossil Group, Inc. | | | 400 | | | | 47,644 | | | | 332 | |
| Franklin Resources, Inc. | | | 600 | | | | 32,106 | | | | 2,532 | |
| GameStop Corp. | | | 200 | | | | 9,589 | | | | 263 | |
| Gannett Co., Inc. | | | 800 | | | | 21,560 | | | | 2,104 | |
| Gap, Inc./The | | | 1,200 | | | | 44,376 | | | | 2,520 | |
| Gentex Corp. | | | 600 | | | | 15,834 | | | | 3,960 | |
| Genworth Financial, Inc. | | | 3,200 | | | | 43,934 | | | | 5,762 | |
| Gilead Sciences, Inc. | | | 300 | | | | 22,250 | | | | 295 | |
| | | | |
| | The accompanying notes are an integral part of these financial statements. | | (Continued) |
| | | | | | | | | | | | | | | | |
| | AQR Funds | | | | | | Annual Report | | | | | | December 2013 | | 79 |
| | | | | | | | | | |
| | | | |
| Schedule of Investments | | | December 31, 2013 | |
| | |
| AQR LONG-SHORT EQUITY FUND | | |
| | | | | | | | | | | | |
REFERENCE
ENTITY | | SHARES | | | NOTIONAL (a) | | | NET
UNREALIZED
APPRECIATION
(DEPRECIATION) | |
| United States (continued) | |
| Goodyear Tire & Rubber Co./The | | | 2,100 | | | $ | 46,509 | | | $ | 3,576 | |
| H&R Block, Inc. | | | 600 | | | | 17,448 | | | | (24) | |
| Hanesbrands, Inc. | | | 800 | | | | 50,744 | | | | 5,472 | |
| Harris Corp. | | | 800 | | | | 47,288 | | | | 8,560 | |
| Health Net, Inc. | | | 900 | | | | 28,188 | | | | (1,485) | |
| Helmerich & Payne, Inc. | | | 600 | | | | 45,504 | | | | 4,944 | |
| Hess Corp. | | | 400 | | | | 32,733 | | | | 467 | |
| Hewlett-Packard Co. | | | 2,200 | | | | 55,489 | | | | 6,067 | |
| HollyFrontier Corp. | | | 700 | | | | 30,940 | | | | 3,843 | |
| Humana, Inc. | | | 200 | | | | 18,770 | | | | 1,874 | |
| Huntsman Corp. | | | 1,400 | | | | 31,080 | | | | 3,360 | |
| IAC/InterActiveCorp. | | | 400 | | | | 21,904 | | | | 5,572 | |
| Illinois Tool Works, Inc. | | | 100 | | | | 7,686 | | | | 722 | |
| Ingredion, Inc. | | | 300 | | | | 20,385 | | | | 153 | |
| Intel Corp. | | | 900 | | | | 21,537 | | | | 1,827 | |
| International Paper Co. | | | 400 | | | | 18,112 | | | | 1,500 | |
| InvesCo., Ltd. | | | 500 | | | | 16,230 | | | | 1,970 | |
| ITT Corp. | | | 300 | | | | 11,046 | | | | 1,980 | |
| Jabil Circuit, Inc. | | | 2,000 | | | | 44,120 | | | | (9,240) | |
| Jacobs Engineering Group, Inc. | | | 900 | | | | 53,973 | | | | 2,718 | |
| Johnson & Johnson | | | 500 | | | | 45,985 | | | | (190) | |
| Johnson Controls, Inc. | | | 300 | | | | 15,072 | | | | 318 | |
| Juniper Networks, Inc. | | | 300 | | | | 5,727 | | | | 1,044 | |
| Kennametal, Inc. | | | 100 | | | | 4,457 | | | | 750 | |
| KeyCorp. | | | 1,000 | | | | 12,550 | | | | 870 | |
| KLA-Tencor Corp. | | | 600 | | | | 38,334 | | | | 342 | |
| Kroger Co./The | | | 1,200 | | | | 50,652 | | | | (3,216) | |
| Lam Research Corp. | | | 200 | | | | 10,708 | | | | 182 | |
| Lexmark International, Inc. | | | 700 | | | | 24,325 | | | | 539 | |
| Lincoln National Corp. | | | 600 | | | | 26,881 | | | | 4,091 | |
| LPL Financial Holdings, Inc. | | | 100 | | | | 4,425 | | | | 278 | |
| LSI Corp. | | | 2,900 | | | | 23,026 | | | | 8,932 | |
| LyondellBasell Industries NV | | | 900 | | | | 69,813 | | | | 2,439 | |
| Macy’s, Inc. | | | 600 | | | | 26,676 | | | | 5,364 | |
| Manpower, Inc. | | | 900 | | | | 70,155 | | | | 7,119 | |
| Marathon Oil Corp. | | | 700 | | | | 24,430 | | | | 280 | |
| Masco Corp. | | | 300 | | | | 6,459 | | | | 372 | |
| Mattel, Inc. | | | 300 | | | | 12,723 | | | | 1,551 | |
| Maxim Integrated Products, Inc. | | | 800 | | | | 23,728 | | | | (1,400) | |
| McKesson Corp. | | | 200 | | | | 28,564 | | | | 3,716 | |
| Medtronic, Inc. | | | 1,100 | | | | 61,952 | | | | 1,177 | |
| MetLife, Inc. | | | 200 | | | | 9,856 | | | | 928 | |
| Microsoft Corp. | | | 1,800 | | | | 63,008 | | | | 4,366 | |
| Myriad Genetics, Inc. | | | 1,200 | | | | 33,497 | | | | (8,321) | |
| National Oilwell Varco, Inc. | | | 100 | | | | 8,099 | | | | (146) | |
| Newell Rubbermaid, Inc. | | | 1,100 | | | | 31,548 | | | | 4,103 | |
| News Corp. | | | 500 | | | | 8,809 | | | | 201 | |
| Noble Corp. PLC | | | 200 | | | | 7,496 | | | | (2) | |
| Northrop Grumman Corp. | | | 700 | | | | 70,511 | | | | 9,716 | |
| Nu Skin Enterprises | | | 300 | | | | 32,055 | | | | 9,411 | |
| | | | | | | | | | | | |
REFERENCE
ENTITY | | SHARES | | | NOTIONAL (a) | | | NET
UNREALIZED
APPRECIATION
(DEPRECIATION) | |
| United States (continued) | |
| NVIDIA Corp. | | | 2,200 | | | $ | 34,364 | | | $ | 880 | |
| Occidental Petroleum Corp. | | | 100 | | | | 9,808 | | | | (298) | |
| Oceaneering International, Inc. | | | 300 | | | | 24,873 | | | | (1,209) | |
| Oil States International, Inc. | | | 500 | | | | 54,105 | | | | (3,245) | |
| Old Republic International Corp. | | | 1,000 | | | | 15,350 | | | | 1,920 | |
| Omnicare, Inc. | | | 200 | | | | 11,436 | | | | 636 | |
| ON Semiconductor Corp. | | | 1,400 | | | | 9,968 | | | | 1,568 | |
| Oracle Corp. | | | 1,100 | | | | 36,157 | | | | 5,929 | |
| Oshkosh Corp. | | | 300 | | | | 14,181 | | | | 933 | |
| Packaging Corp. of America | | | 200 | | | | 12,458 | | | | 198 | |
| Patterson-UTI Energy, Inc. | | | 2,100 | | | | 48,783 | | | | 4,389 | |
| Pfizer, Inc. | | | 1,200 | | | | 36,312 | | | | 444 | |
| Polycom, Inc. | | | 4,200 | | | | 45,234 | | | | 1,932 | |
| Prudential Financial, Inc. | | | 100 | | | | 8,262 | | | | 960 | |
| Pulte Group, Inc. | | | 2,600 | | | | 43,316 | | | | 9,646 | |
| Ralph Lauren Corp. | | | 100 | | | | 16,168 | | | | 1,489 | |
| Raytheon Co. | | | 300 | | | | 23,289 | | | | 3,921 | |
| Regal-Beloit Corp. | | | 400 | | | | 28,520 | | | | 968 | |
| Regions Financial Corp. | | | 2,600 | | | | 25,844 | | | | (130) | |
| Reinsurance Group of America, Inc. | | | 400 | | | | 28,788 | | | | 2,176 | |
| Reliance Steel & Aluminum Co. | | | 400 | | | | 29,960 | | | | 376 | |
| Robert Half International, Inc. | | | 1,000 | | | | 40,530 | | | | 1,460 | |
| Rock-Tenn Co. | | | 400 | | | | 43,216 | | | | (1,212) | |
| Ross Stores, Inc. | | | 100 | | | | 7,372 | | | | 121 | |
| Rowan Cos. PLC | | | 300 | | | | 11,171 | | | | (563) | |
| RR Donnelley & Sons Co. | | | 300 | | | | 5,022 | | | | 1,062 | |
| Ryder System, Inc. | | | 500 | | | | 30,355 | | | | 6,535 | |
| Schlumberger Ltd. | | | 200 | | | | 18,286 | | | | (264) | |
| Skyworks Solutions, Inc. | | | 800 | | | | 19,669 | | | | 3,179 | |
| Southwest Airlines Co. | | | 3,300 | | | | 52,833 | | | | 9,339 | |
| Spirit Aerosystems Holdings, Inc. | | | 1,200 | | | | 38,754 | | | | 2,142 | |
| State Street Corp. | | | 1,000 | | | | 69,520 | | | | 3,870 | |
| Stryker Corp. | | | 300 | | | | 21,765 | | | | 777 | |
| Superior Energy Services, Inc. | | | 1,500 | | | | 39,675 | | | | 240 | |
| Symantec Corp. | | | 1,700 | | | | 42,653 | | | | (2,567) | |
| Tesoro Corp. | | | 700 | | | | 33,488 | | | | 7,462 | |
| Thermo Fisher Scientific, Inc. | | | 100 | | | | 9,562 | | | | 1,573 | |
| Thor Industries, Inc. | | | 100 | | | | 5,328 | | | | 195 | |
| Tidewater, Inc. | | | 100 | | | | 6,126 | | | | (199) | |
| Time Warner Cable, Inc. | | | 300 | | | | 35,589 | | | | 5,061 | |
| Time Warner, Inc. | | | 200 | | | | 13,590 | | | | 354 | |
| Timken Co. | | | 500 | | | | 29,485 | | | | (1,950) | |
| TJX Cos., Inc. | | | 300 | | | | 17,268 | | | | 1,851 | |
| Towers Watson & Co. | | | 300 | | | | 33,024 | | | | 5,259 | |
| Travelers Cos., Inc./The | | | 600 | | | | 51,612 | | | | 2,712 | |
| Trinity Industries, Inc. | | | 100 | | | | 4,530 | | | | 922 | |
| | | | |
| | The accompanying notes are an integral part of these financial statements. | | (Continued) |
| | | | | | | | | | | | | | | | |
| 80 | | AQR Funds | | | | | | Annual Report | | | | | | December 2013 | | |
| | | | | | | | | | |
| | | | |
| Schedule of Investments | | | December 31, 2013 | |
| | |
| AQR LONG-SHORT EQUITY FUND | | |
| | | | | | | | | | | | |
REFERENCE
ENTITY | | SHARES | | | NOTIONAL (a) | | | NET
UNREALIZED
APPRECIATION
(DEPRECIATION) | |
| United States (continued) | |
| TRW Automotive Holdings Corp. | | | 600 | | | $ | 46,578 | | | $ | (1,944) | |
| Tupperware Brands Corp. | | | 200 | | | | 18,394 | | | | 512 | |
| Twenty-First Century Fox, Inc. | | | 600 | | | | 20,592 | | | | 516 | |
| Tyson Foods, Inc. | | | 1,000 | | | | 29,012 | | | | 4,448 | |
| Union Pacific Corp. | | | 200 | | | | 30,232 | | | | 3,368 | |
| United Therapeutics Corp. | | | 200 | | | | 17,576 | | | | 5,040 | |
| UnitedHealth Group, Inc. | | | 300 | | | | 20,415 | | | | 2,175 | |
| Universal Health Services, Inc. | | | 100 | | | | 7,913 | | | | 213 | |
| Unum Group | | | 1,100 | | | | 35,101 | | | | 3,487 | |
| Urban Outfitters, Inc. | | | 200 | | | | 7,286 | | | | 134 | |
| URS Corp. | | | 600 | | | | 33,078 | | | | (1,284) | |
| Valero Energy Corp. | | | 1,100 | | | | 42,229 | | | | 13,211 | |
| ValueClick, Inc. | | | 1,100 | | | | 23,151 | | | | 2,556 | |
| Viacom, Inc. | | | 300 | | | | 24,933 | | | | 1,269 | |
| WABCO Holdings, Inc. | | | 100 | | | | 8,610 | | | | 731 | |
| Waddell & Reed Financial, Inc. | | | 600 | | | | 34,410 | | | | 4,662 | |
| WellCare Health Plans, Inc. | | | 300 | | | | 21,704 | | | | (578) | |
| WellPoint, Inc. | | | 400 | | | | 35,436 | | | | 1,520 | |
| Wells Fargo & Co. | | | 1,000 | | | | 42,680 | | | | 2,720 | |
| Western Digital Corp. | | | 1,000 | | | | 70,890 | | | | 13,010 | |
| Whirlpool Corp. | | | 700 | | | | 94,290 | | | | 15,512 | |
| Whiting Petroleum Corp. | | | 300 | | | | 18,047 | | | | 514 | |
| WR Grace & Co. | | | 100 | | | | 9,175 | | | | 712 | |
| Yahoo!, Inc. | | | 2,200 | | | | 72,006 | | | | 16,962 | |
| | | | | | | | | | | | |
| | | | | | | | | | | 447,452 | |
| | | | | | | | | | | | |
| Total of Long Equity Positions | | | | | | | | | | | 466,771 | |
| | | | | | | | | | | | |
| | | |
| Short Positions | | | | | | | | | | | | |
| |
| Bermuda | | | | | |
| Nabors Industries Ltd. | | | (600) | | | | (10,494) | | | | 300 | |
| | | | | | | | | | | | |
| | | |
| Canada | | | | | | | | | | | | |
| Lululemon Athletica, Inc. | | | (900) | | | | (65,316) | | | | 12,189 | |
| | | | | | | | | | | | |
| | | |
| Hong Kong | | | | | | | | | | | | |
| Michael Kors Holdings Ltd. | | | (500) | | | | (40,350) | | | | (245) | |
| | | | | | | | | | | | |
| | | |
| Netherlands | | | | | | | | | | | | |
| Core Laboratories NV | | | (200) | | | | (37,970) | | | | (220) | |
| | | | | | | | | | | | |
| | | |
| Switzerland | | | | | | | | | | | | |
| Weatherford International Ltd. | | | (200) | | | | (3,240) | | | | 142 | |
| | | | | | | | | | | | |
| | | |
| United Kingdom | | | | | | | | | | | | |
| Liberty Global PLC | | | (1,100) | | | | (85,635) | | | | (12,254) | |
| | | | | | | | | | | | |
| | | | | | | | | | | | |
REFERENCE
ENTITY | | SHARES | | | NOTIONAL (a) | | | NET
UNREALIZED
APPRECIATION
(DEPRECIATION) | |
| United States | | | | | |
| Abercrombie & Fitch Co. | | | (200) | | | $ | (6,384) | | | $ | (198) | |
| Actavis PLC | | | (200) | | | | (30,207) | | | | (3,393) | |
| Acuity Brands, Inc. | | | (200) | | | | (20,656) | | | | (1,208) | |
| ADT Corp. | | | (600) | | | | (24,991) | | | | 709 | |
| Alcoa, Inc. | | | (4,900) | | | | (42,091) | | | | (9,996) | |
| Allegheny Technologies, Inc. | | | (1,700) | | | | (53,380) | | | | (7,191) | |
| Alliance Data Systems Corp. | | | (200) | | | | (45,414) | | | | (7,172) | |
| Alpha Natural Resources, Inc. | | | (6,000) | | | | (37,195) | | | | (5,645) | |
| AMETEK, Inc. | | | (400) | | | | (18,264) | | | | (2,804) | |
| Ariad Pharmaceuticals, Inc. | | | (2,000) | | | | (7,507) | | | | (6,133) | |
| Ascena Retail Group, Inc. | | | (400) | | | | (7,796) | | | | (668) | |
| AT&T, Inc. | | | (1,100) | | | | (37,884) | | | | (792) | |
| AutoNation, Inc. | | | (500) | | | | (24,835) | | | | (10) | |
| Ball Corp. | | | (200) | | | | (9,206) | | | | (1,126) | |
| Beam, Inc. | | | (500) | | | | (34,805) | | | | 775 | |
| BioMarin Pharmaceutical, Inc. | | | (100) | | | | (6,820) | | | | (207) | |
| Brookdale Senior Living, Inc. | | | (1,700) | | | | (47,889) | | | | 1,683 | |
| Brown-Forman Corp. | | | (500) | | | | (36,220) | | | | (1,565) | |
| Cabela’s, Inc. | | | (300) | | | | (18,335) | | | | (1,663) | |
| Cablevision Systems Corp. | | | (1,100) | | | | (17,303) | | | | (2,420) | |
| Cadence Design Systems, Inc. | | | (800) | | | | (10,315) | | | | (901) | |
| Calpine Corp. | | | (1,400) | | | | (27,524) | | | | 210 | |
| CarMax, Inc. | | | (500) | | | | (24,435) | | | | 925 | |
| Carnival Corp. | | | (1,100) | | | | (36,179) | | | | (8,008) | |
| Carter’s, Inc. | | | (100) | | | | (7,035) | | | | (144) | |
| Catamaran Corp. | | | (800) | | | | (36,811) | | | | (1,173) | |
| CenturyLink, Inc. | | | (2,400) | | | | (79,800) | | | | 3,360 | |
| CH Robinson Worldwide, Inc. | | | (700) | | | | (41,187) | | | | 349 | |
| Charles Schwab Corp./The | | | (1,700) | | | | (40,154) | | | | (4,046) | |
| Cheniere Energy, Inc. | | | (100) | | | | (3,930) | | | | (382) | |
| Chesapeake Energy Corp. | | | (800) | | | | (22,104) | | | | 392 | |
| Chipotle Mexican Grill, Inc. | | | (100) | | | | (43,907) | | | | (9,371) | |
| Church & Dwight Co., Inc. | | | (400) | | | | (24,940) | | | | (1,572) | |
| Ciena Corp. | | | (3,600) | | | | (95,748) | | | | 9,600 | |
| Clean Harbors, Inc. | | | (1,400) | | | | (85,162) | | | | 1,218 | |
| Clorox Co./The | | | (200) | | | | (17,050) | | | | (1,502) | |
| Coca-Cola Co./The | | | (200) | | | | (7,710) | | | | (552) | |
| Community Health Systems, Inc. | | | (100) | | | | (3,836) | | | | (91) | |
| Concho Resources, Inc. | | | (300) | | | | (35,739) | | | | 3,339 | |
| Concur Technologies, Inc. | | | (500) | | | | (53,830) | | | | 2,240 | |
| CONSOL Energy, Inc. | | | (900) | | | | (33,993) | | | | (243) | |
| Constellation Brands, Inc. | | | (800) | | | | (51,112) | | | | (5,192) | |
| | | | |
| | The accompanying notes are an integral part of these financial statements. | | (Continued) |
| | | | | | | | | | | | | | | | |
| | AQR Funds | | | | | | Annual Report | | | | | | December 2013 | | 81 |
| | | | | | | | | | |
| | | | |
| Schedule of Investments | | | December 31, 2013 | |
| | |
| AQR LONG-SHORT EQUITY FUND | | |
| | | | | | | | | | | | |
REFERENCE
ENTITY | | SHARES | | | NOTIONAL (a) | | | NET
UNREALIZED
APPRECIATION
(DEPRECIATION) | |
| United States (continued) | |
| Con-way, Inc. | | | (300) | | | $ | (12,210) | | | $ | 297 | |
| Crown Castle International Corp. | | | (500) | | | | (38,405) | | | | 1,690 | |
| Cullen/Frost Bankers, Inc. | | | (200) | | | | (14,261) | | | | (625) | |
| Cypress Semiconductor | | | (5,800) | | | | (54,880) | | | | (6,020) | |
| DaVita HealthCare Partners, Inc. | | | (700) | | | | (40,502) | | | | (3,857) | |
| Dean Foods Co. | | | (600) | | | | (11,847) | | | | 1,533 | |
| DENTSPLY International, Inc. | | | (100) | | | | (4,541) | | | | (307) | |
| Devon Energy Corp. | | | (200) | | | | (12,594) | | | | 220 | |
| Dick’s Sporting Goods, Inc. | | | (700) | | | | (36,435) | | | | (4,235) | |
| Diebold, Inc. | | | (1,000) | | | | (33,826) | | | | 816 | |
| Discovery Communications, Inc. | | | (200) | | | | (16,274) | | | | (1,810) | |
| DISH Network Corp. | | | (400) | | | | (19,556) | | | | (3,612) | |
| Dollar Tree, Inc. | | | (300) | | | | (17,706) | | | | 780 | |
| Dominion Resources, Inc. | | | (600) | | | | (38,310) | | | | (504) | |
| eBay, Inc. | | | (600) | | | | (30,852) | | | | (2,082) | |
| EMC Corp. | | | (1,300) | | | | (32,006) | | | | (689) | |
| Equinix, Inc. | | | (400) | | | | (67,180) | | | | (3,800) | |
| Exelon Corp. | | | (500) | | | | (14,520) | | | | 825 | |
| Expedia, Inc. | | | (100) | | | | (6,233) | | | | (733) | |
| Family Dollar Stores, Inc. | | | (200) | | | | (14,194) | | | | 1,200 | |
| Fastenal Co. | | | (1,600) | | | | (77,627) | | | | 1,611 | |
| First Horizon National Corp. | | | (3,200) | | | | (36,124) | | | | (1,156) | |
| FirstEnergy Corp. | | | (700) | | | | (26,299) | | | | 3,213 | |
| FMC Corp. | | | (100) | | | | (7,340) | | | | (206) | |
| FMC Technologies, Inc. | | | (200) | | | | (11,650) | | | | 1,208 | |
| Fortinet, Inc. | | | (2,200) | | | | (43,457) | | | | 1,371 | |
| Fortune Brands Home & Security, Inc. | | | (200) | | | | (8,639) | | | | (501) | |
| Freeport-McMoRan Copper & Gold, Inc. | | | (500) | | | | (17,355) | | | | (1,515) | |
| Freescale Semiconductor Ltd. | | | (1,400) | | | | (19,948) | | | | (2,522) | |
| Fresh Market, Inc. | | | (1,800) | | | | (72,015) | | | | (885) | |
| General Electric Co. | | | (600) | | | | (14,808) | | | | (2,010) | |
| Global Payments, Inc. | | | (800) | | | | (47,366) | | | | (4,626) | |
| Harley-Davidson, Inc. | | | (700) | | | | (45,836) | | | | (2,632) | |
| Hertz Global Holdings, Inc. | | | (900) | | | | (20,884) | | | | (4,874) | |
| Hologic, Inc. | | | (2,500) | | | | (55,050) | | | | (825) | |
| HomeAway, Inc. | | | (800) | | | | (30,153) | | | | (2,551) | |
| Hospira, Inc. | | | (1,100) | | | | (45,969) | | | | 561 | |
| Incyte Corp. Ltd. | | | (600) | | | | (29,502) | | | | (876) | |
| Informatica Corp. | | | (400) | | | | (14,808) | | | | (1,792) | |
| Interpublic Group of Cos., Inc./The | | | (600) | | | | (10,134) | | | | (486) | |
| Intuitive Surgical, Inc. | | | (100) | | | | (39,913) | | | | 1,505 | |
| Iron Mountain, Inc. | | | (2,300) | | | | (60,348) | | | | (9,457) | |
| JB Hunt Transport Services, Inc. | | | (500) | | | | (37,598) | | | | (1,052) | |
| JDS Uniphase Corp. | | | (2,900) | | | | (43,964) | | | | 6,322 | |
| | | | | | | | | | | | |
REFERENCE
ENTITY | | SHARES | | | NOTIONAL (a) | | | NET
UNREALIZED
APPRECIATION
(DEPRECIATION) | |
| United States (continued) | |
| JetBlue Airways Corp. | | | (3,600) | | | $ | (32,617) | | | $ | 1,837 | |
| Kansas City Southern | | | (100) | | | | (11,316) | | | | (1,067) | |
| Kellogg Co. | | | (300) | | | | (18,288) | | | | (33) | |
| Kinder Morgan, Inc. | | | (1,600) | | | | (56,630) | | | | (970) | |
| Kirby Corp. | | | (200) | | | | (17,920) | | | | (1,930) | |
| Kohl’s Corp. | | | (300) | | | | (16,474) | | | | (551) | |
| Lamar Advertising Co. | | | (300) | | | | (15,277) | | | | (398) | |
| Las Vegas Sands Corp. | | | (200) | | | | (14,194) | | | | (1,580) | |
| Legg Mason, Inc. | | | (100) | | | | (3,624) | | | | (724) | |
| Lennar Corp. | | | (1,600) | | | | (56,478) | | | | (6,818) | |
| Level 3 Communications, Inc. | | | (4,700) | | | | (131,506) | | | | (24,393) | |
| M&T Bank Corp. | | | (100) | | | | (11,378) | | | | (264) | |
| Manitowoc Co., Inc./The | | | (600) | | | | (11,208) | | | | (2,784) | |
| Marriott International, Inc. | | | (700) | | | | (30,317) | | | | (4,235) | |
| Marsh & McLennan Cos., Inc. | | | (400) | | | | (18,120) | | | | (1,224) | |
| Martin Marietta Materials, Inc. | | | (300) | | | | (29,217) | | | | (765) | |
| McCormick & Co., Inc. | | | (300) | | | | (20,418) | | | | (258) | |
| McDermott International, Inc. | | | (4,400) | | | | (32,296) | | | | (8,008) | |
| MeadWestvaco Corp. | | | (300) | | | | (11,559) | | | | 480 | |
| Medivation, Inc. | | | (800) | | | | (50,207) | | | | (849) | |
| MEDNAXX, Inc. | | | (400) | | | | (21,328) | | | | (24) | |
| MGM Resorts International | | | (2,500) | | | | (51,950) | | | | (6,850) | |
| Micron Technology, Inc. | | | (1,000) | | | | (22,077) | | | | 317 | |
| Mohawk Industries, Inc. | | | (100) | | | | (14,331) | | | | (559) | |
| Mondelez International, Inc. | | | (500) | | | | (16,145) | | | | (1,505) | |
| Monster Beverage Corp. | | | (1,000) | | | | (57,450) | | | | (10,320) | |
| Morgan Stanley | | | (400) | | | | (11,572) | | | | (972) | |
| Motorola Solutions, Inc. | | | (300) | | | | (18,276) | | | | (1,974) | |
| MSC Industrial Direct Co., Inc. | | | (400) | | | | (30,827) | | | | (1,521) | |
| Navistar International Corp. | | | (600) | | | | (22,284) | | | | (630) | |
| NCR Corp. | | | (900) | | | | (36,468) | | | | 5,814 | |
| Newfield Exploration Co. | | | (1,000) | | | | (29,960) | | | | 5,330 | |
| Nordstrom, Inc. | | | (100) | | | | (6,190) | | | | 10 | |
| Nuance Communications, Inc. | | | (2,000) | | | | (34,640) | | | | 4,240 | |
| Nucor Corp. | | | (700) | | | | (35,553) | | | | (1,813) | |
| Office Depot, Inc. | | | (1,500) | | | | (7,845) | | | | (90) | |
| ONEOK, Inc. | | | (1,100) | | | | (60,608) | | | | (7,790) | |
| Owens Corning | | | (100) | | | | (3,699) | | | | (373) | |
| Owens-Illinois, Inc. | | | (200) | | | | (6,044) | | | | (1,112) | |
| Palo Alto Networks, Inc. | | | (1,500) | | | | (67,601) | | | | (18,604) | |
| Pandora Media, Inc. | | | (600) | | | | (15,949) | | | | (11) | |
| Panera Bread Co. | | | (100) | | | | (16,059) | | | | (1,610) | |
| Paychex, Inc. | | | (600) | | | | (24,840) | | | | (2,478) | |
| Peabody Energy Corp. | | | (500) | | | | (9,222) | | | | (543) | |
| Pepco Holdings, Inc. | | | (1,000) | | | | (18,910) | | | | (220) | |
| PerkinElmer, Inc. | | | (400) | | | | (15,080) | | | | (1,412) | |
| Perrigo Co PLC | | | (300) | | | | (39,505) | | | | (6,533) | |
| Pharmacyclics, Inc. | | | (200) | | | | (20,841) | | | | (315) | |
| | | | |
| | The accompanying notes are an integral part of these financial statements. | | (Continued) |
| | | | | | | | | | | | | | | | |
| 82 | | AQR Funds | | | | | | Annual Report | | | | | | December 2013 | | |
| | | | | | | | | | |
| | | | |
| Schedule of Investments | | | December 31, 2013 | |
| | |
| AQR LONG-SHORT EQUITY FUND | | |
| | | | | | | | | | | | |
REFERENCE
ENTITY | | SHARES | | | NOTIONAL (a) | | | NET
UNREALIZED
APPRECIATION
(DEPRECIATION) | |
| United States (continued) | |
| Philip Morris International, Inc. | | | (400) | | | $ | (34,756) | | | $ | (96) | |
| Polaris Industries, Inc. | | | (100) | | | | (13,292) | | | | (1,272) | |
| Praxair, Inc. | | | (200) | | | | (24,880) | | | | (1,126) | |
| PVH Corp. | | | (300) | | | | (36,060) | | | | (4,746) | |
| QEP Resources, Inc. | | | (700) | | | | (22,618) | | | | 1,163 | |
| Rackspace Hosting, Inc. | | | (1,500) | | | | (69,199) | | | | 10,504 | |
| Range Resources Corp. | | | (400) | | | | (31,416) | | | | (2,308) | |
| Riverbed Technology, Inc. | | | (4,900) | | | | (69,286) | | | | (19,306) | |
| Rosetta Resources, Inc. | | | (300) | | | | (17,352) | | | | 2,940 | |
| Royal Caribbean Cruises Ltd. | | | (500) | | | | (21,834) | | | | (1,876) | |
| Salesforce.com, Inc. | | | (1,100) | | | | (58,311) | | | | (2,398) | |
| Sally Beauty Holdings, Inc. | | | (100) | | | | (2,614) | | | | (409) | |
| SanDisk Corp. | | | (400) | | | | (27,388) | | | | (828) | |
| SBA Communications Corp. | | | (800) | | | | (67,360) | | | | (4,512) | |
| Sealed Air Corp. | | | (1,500) | | | | (41,820) | | | | (9,255) | |
| ServiceNow, Inc. | | | (100) | | | | (5,131) | | | | (470) | |
| Sirius XM Holdings, Inc. | | | (4,400) | | | | (15,561) | | | | 205 | |
| Sotheby’s | | | (500) | | | | (25,720) | | | | (880) | |
| Southwestern Energy Co. | | | (300) | | | | (11,073) | | | | (726) | |
| Spectra Energy Corp. | | | (1,100) | | | | (38,500) | | | | (682) | |
| Stericycle, Inc. | | | (200) | | | | (23,918) | | | | 684 | |
| Stratasys Ltd. | | | (300) | | | | (35,283) | | | | (5,127) | |
| SunEdison, Inc. | | | (3,800) | | | | (35,226) | | | | (14,364) | |
| SUPERVALU, Inc. | | | (7,100) | | | | (53,442) | | | | 1,683 | |
| Sysco Corp. | | | (400) | | | | (12,840) | | | | (1,600) | |
| T Rowe Price Group, Inc. | | | (200) | | | | (15,268) | | | | (1,486) | |
| TECO Energy, Inc. | | | (400) | | | | (6,864) | | | | (32) | |
| Tempur Sealy International, Inc. | | | (1,300) | | | | (50,310) | | | | (19,838) | |
| Tenet Healthcare Corp. | | | (1,100) | | | | (51,898) | | | | 5,566 | |
| Teradata Corp. | | | (1,000) | | | | (42,837) | | | | (2,653) | |
| Teradyne, Inc. | | | (2,000) | | | | (33,822) | | | | (1,418) | |
| Textron, Inc. | | | (1,700) | | | | (46,784) | | | | (15,708) | |
| Theravance, Inc. | | | (1,300) | | | | (47,755) | | | | 1,410 | |
| TIBCO Software, Inc. | | | (400) | | | | (10,324) | | | | 1,332 | |
| Tiffany & Co. | | | (200) | | | | (15,506) | | | | (3,050) | |
| Toll Brothers, Inc. | | | (900) | | | | (29,647) | | | | (3,653) | |
| TransDigm Group, Inc. | | | (300) | | | | (42,971) | | | | (5,335) | |
| Trimble Navigation Ltd. | | | (1,900) | | | | (57,000) | | | | (8,930) | |
| Triumph Group, Inc. | | | (500) | | | | (35,403) | | | | (2,632) | |
| Ultra Salon, Inc. | | | (400) | | | | (49,476) | | | | 10,868 | |
| Under Armour, Inc. | | | (900) | | | | (73,908) | | | | (4,662) | |
| | | | | | | | | | | | |
REFERENCE
ENTITY | | SHARES | | | NOTIONAL (a) | | | NET
UNREALIZED
APPRECIATION
(DEPRECIATION) | |
| United States (continued) | |
| United Continental Holdings, Inc. | | | (1,000) | | | $ | (35,134) | | | $ | (2,696) | |
| United Rentals, Inc. | | | (500) | | | | (34,067) | | | | (4,908) | |
| United Technologies Corp. | | | (100) | | | | (10,802) | | | | (578) | |
| Vantiv, Inc. | | | (600) | | | | (17,720) | | | | (1,846) | |
| VeriFone Systems, Inc. | | | (2,000) | | | | (46,094) | | | | (7,546) | |
| VeriSign, Inc. | | | (200) | | | | (10,424) | | | | (1,532) | |
| Verisk Analytics, Inc. | | | (300) | | | | (20,613) | | | | 897 | |
| Verizon Communications, Inc. | | | (800) | | | | (39,120) | | | | (192) | |
| Visa, Inc. | | | (100) | | | | (20,794) | | | | (1,474) | |
| Vmware, Inc. | | | (100) | | | | (8,113) | | | | (858) | |
| Vulcan Materials Co | | | (900) | | | | (50,929) | | | | (2,549) | |
| Walgreen Co. | | | (300) | | | | (17,628) | | | | 396 | |
| Wendy’s Co./The | | | (2,800) | | | | (23,716) | | | | (700) | |
| WESCO International, Inc. | | | (400) | | | | (30,440) | | | | (5,988) | |
| Western Union Co./The | | | (1,200) | | | | (21,972) | | | | 1,272 | |
| Williams Cos., Inc./The | | | (1,200) | | | | (43,236) | | | | (3,048) | |
| Zions BanCorp. | | | (500) | | | | (14,635) | | | | (345) | |
| Zynga, Inc. | | | (4,700) | | | | (20,784) | | | | 2,924 | |
| | | | | | | | | | | | |
| | | | | | | | | | | (343,532) | |
| | | | | | | | | | | | |
Total of Short Equity Positions | | | | | | | | | | | (343,620) | |
| | | | | | | | | | | | |
Total of Long and Short Equity Positions | | | | | | | | | | | 123,151 | |
| | | | | | | | | | | | |
Net Cash and Other Receivables/ (Payables) (b) | | | | | | | | | | | 2,703 | |
| | | | | | | | | | | | |
Swaps, at Value | | | | | | | | | | $ | 125,854 | |
| | | | | | | | | | | | |
| (a) | Notional value represents the market value (including any fees or commissions) of the long and short positions when they are established. |
| (b) | Cash and other receivables/(payables) includes the gains (or losses) realized within the swap when the swap resets. |
Money Market Fund pledged to Goldman Sachs is included in collateral for total return swap contracts.
| | | | |
| | The accompanying notes are an integral part of these financial statements. | | (Continued) |
| | | | | | | | | | | | | | | | |
| | AQR Funds | | | | | | Annual Report | | | | | | December 2013 | | 83 |
| | | | | | | | | | |
| | | | |
| Schedule of Investments | | | December 31, 2013 | |
| | |
| AQR LONG-SHORT EQUITY FUND | | |
| | | | | | | | |
| COUNTERPARTY | | DESCRIPTION | | TERMINATION DATE** | | VALUE
(Note 3) | |
| Goldman Sachs | | The Fund receives or pays the total return on a portfolio of long and short positions and pays or receives the LIBOR, which is denominated in CHF based on the local currencies of the positions within the swap. | | 12 months ranging from 10/24/2014 - 11/27/2014 | | | $4,727 | |
| | | | | | | | |
| ** | The maturity dates are measured from the commencement of investment in each underlying portfolio swap position. |
Additional Information — Total Return Basket Swaps
The following table represents the individual long and short positions and related values within the total return basket swap as of December 31, 2013.
| | | | | | | | | | | | |
REFERENCE
ENTITY | | SHARES | | | NOTIONAL (a) | | | NET
UNREALIZED
APPRECIATION
(DEPRECIATION) | |
| Long Positions | | | | | | | | | |
| | | |
| Switzerland | | | | | | | | | | | | |
| Actelion Ltd. | | | 406 | | | $ | 34,395 | | | $ | 42 | |
| Givaudan SA | | | 3 | | | | 4,203 | | | | 89 | |
| Novartis AG | | | 345 | | | | 26,164 | | | | 1,487 | |
| Roche Holding AG | | | 317 | | | | 86,846 | | | | 1,954 | |
| Swisscom AG | | | 27 | | | | 14,053 | | | | 217 | |
| | | | | | | | | | | | |
| | | | | | | | | | | 3,789 | |
| | | | | | | | | | | | |
| Total of Long Equity Positions | | | | | | | | | | | 3,789 | |
| | | | | | | | | | | | |
| | | |
| Short Positions | | | | | | | | | | | | |
| | | |
| Switzerland | | | | | | | | | | | | |
| Cie Financiere Richemont SA | | | (331) | | | | (33,725) | | | | 659 | |
| Credit Suisse Group AG | | | (1,083) | | | | (35,522) | | | | 2,097 | |
| Dufry AG | | | (64) | | | | (10,690) | | | | (554) | |
| Julius Baer Group Ltd. | | | (485) | | | | (23,775) | | | | 468 | |
| Kuehne + Nagel International AG | | | (123) | | | | (15,446) | | | | (721) | |
| | | | | | | | | | | | |
REFERENCE
ENTITY | | SHARES | | | NOTIONAL (a) | | | NET
UNREALIZED
APPRECIATION
(DEPRECIATION) | |
| Switzerland (continued) | | | | | | | | | |
| Swiss Life Holding AG | | | (42) | | | $ | (8,476) | | | $ | (256) | |
| UBS AG | | | (1,269) | | | | (23,469) | | | | (829) | |
| | | | | | | | | | | | |
| | | | | | | | | | | 864 | |
| | | | | | | | | | | | |
| Total of Short Equity Positions | | | | | | | | | | | 864 | |
| | | | | | | | | | | | |
Total of Long and Short Equity Positions | | | | | | | | | | | 4,653 | |
| | | | | | | | | | | | |
Net Cash and Other Receivables/ (Payables) (b) | | | | | | | | | | | 74 | |
| | | | | | | | | | | | |
Swaps, at Value | | | | | | | | | | $ | 4,727 | |
| | | | | | | | | | | | |
| (a) | Notional value represents the market value (including any fees or commissions) of the long and short positions when they are established. |
| (b) | Cash and other receivables/(payables) includes the gains (or losses) realized within the swap when the swap resets. |
Money Market Fund pledged to Goldman Sachs is included in collateral for total return swap contracts.
| | | | |
| | The accompanying notes are an integral part of these financial statements. | | (Continued) |
| | | | | | | | | | | | | | | | |
| 84 | | AQR Funds | | | | | | Annual Report | | | | | | December 2013 | | |
| | | | | | | | | | |
| | | | |
| Schedule of Investments | | | December 31, 2013 | |
| | |
| AQR LONG-SHORT EQUITY FUND | | |
| | | | | | | | |
| COUNTERPARTY | | DESCRIPTION | | TERMINATION
DATE** | | VALUE
(Note 3) | |
Goldman
Sachs | | The Fund receives or pays the total return on a portfolio of long and short positions and pays or receives the Euro Interbank Offered Rate, which is denominated in EUR based on the local currencies of the positions within the swap. | | 12 months maturity ranging from 10/23/2014 - 12/22/2014 | | | $25,920 | |
| | | | | | | | |
| ** | The maturity dates are measured from the commencement of investment in each underlying portfolio swap position. |
Additional Information — Total Return Basket Swaps
The following table represents the individual long and short positions and related values within the total return basket swap as of December 31, 2013.
| | | | | | | | | | | | |
REFERENCE
ENTITY | | SHARES | | | NOTIONAL (a) | | | NET
UNREALIZED
APPRECIATION
(DEPRECIATION) | |
| Long Positions | | | | | | | | | | | | |
|
| Belgium | |
| Anheuser-Busch InBev NV | | | 138 | | | $ | 14,004 | | | $ | 670 | |
| Belgacom SA | | | 517 | | | | 15,177 | | | | 123 | |
| Delhaize Group SA | | | 524 | | | | 32,222 | | | | (1,048) | |
| | | | | | | | | | | | |
| | | | | | | | | | | (255) | |
| | | | | | | | | | | | |
| Finland | | | | | |
| Fortum OYJ | | | 494 | | | | 11,515 | | | | (224) | |
| Neste Oil OYJ | | | 1,667 | | | | 35,633 | | | | (2,665) | |
| Nokia OYJ | | | 998 | | | | 8,200 | | | | (136) | |
| | | | | | | | | | | | |
| | | | | | | | | | | (3,025) | |
| | | | | | | | | | | | |
| France | | | | | |
| Bouygues SA | | | 1,399 | | | | 56,131 | | | | (3,226) | |
| Cap Gemini SA | | | 107 | | | | 6,709 | | | | 534 | |
| Cie Generale des Etablissements Michelin | | | 44 | | | | 4,789 | | | | (107) | |
| Danone SA | | | 778 | | | | 56,218 | | | | (92) | |
| Electricite de France SA | | | 1,317 | | | | 46,497 | | | | 95 | |
| European Aeronautic Defence and Space Co. NV | | | 879 | | | | 58,624 | | | | 8,857 | |
| Eutelsat Communications SA | | | 769 | | | | 23,077 | | | | 917 | |
| Iliad SA | | | 250 | | | | 57,742 | | | | (6,520) | |
| L’Oreal SA | | | 119 | | | | 20,148 | | | | 750 | |
| Peugeot SA | | | 1,408 | | | | 18,599 | | | | (277) | |
| Safran SA | | | 285 | | | | 18,084 | | | | 1,732 | |
| Suez Environnement Co. | | | 2,740 | | | | 47,035 | | | | 2,102 | |
| Thales SA | | | 438 | | | | 26,631 | | | | 1,595 | |
| Total SA | | | 866 | | | | 52,898 | | | | 257 | |
| Vinci SA | | | 242 | | | | 15,472 | | | | 435 | |
| Vivendi SA | | | 1,191 | | | | 31,519 | | | | (104) | |
| | | | | | | | | | | | |
| | | | | | | | | | | 6,948 | |
| | | | | | | | | | | | |
| |
| Germany | | | | | |
| Axel Springer SE | | | 178 | | | | 10,640 | | | | 820 | |
| Brenntag AG | | | 111 | | | | 18,336 | | | | 2,265 | |
| | | | | | | | | | | | |
REFERENCE
ENTITY | | SHARES | | | NOTIONAL (a) | | | NET
UNREALIZED
APPRECIATION
(DEPRECIATION) | |
| Germany (continued) | | | | | |
| Deutsche Lufthansa AG | | | 2,816 | | | $ | 56,237 | | | $ | 3,453 | |
| Deutsche Post AG | | | 1,364 | | | | 45,250 | | | | 4,570 | |
| Deutsche Telekom AG | | | 6,612 | | | | 106,520 | | | | 7,406 | |
| E.ON SE | | | 2,731 | | | | 51,913 | | | | (1,422) | |
| Hannover Rueck SE | | | 109 | | | | 8,447 | | | | 923 | |
| HeidelbergCement AG | | | 325 | | | | 25,788 | | | | (1,109) | |
| Henkel AG & Co. KGaA | | | 45 | | | | 4,585 | | | | 645 | |
| Merck KGaA | | | 362 | | | | 59,121 | | | | 5,832 | |
| Metro AG | | | 136 | | | | 6,251 | | | | 342 | |
| Muenchener Rueckversicherungs AG | | | 66 | | | | 13,279 | | | | 1,279 | |
| Porsche Automobil Holding SE | | | 427 | | | | 37,574 | | | | 7,001 | |
| ProSiebenSat.1 Media AG | | | 996 | | | | 46,224 | | | | 3,234 | |
| Sky Deutschland AG | | | 1,224 | | | | 12,255 | | | | 1,274 | |
| Stada Arzneimittel AG | | | 123 | | | | 6,295 | | | | (205) | |
| United Internet AG | | | 1,450 | | | | 57,482 | | | | 4,331 | |
| | | | | | | | | | | | |
| | | | | | | | | | | 40,639 | |
| | | | | | | | | | | | |
| Italy | | | | | |
| A2A SpA | | | 12,359 | | | | 14,232 | | | | 232 | |
| Autogrill SpA | | | 4,882 | | | | 40,694 | | | | 536 | |
| Enel Green Power SpA | | | 13,679 | | | | 32,371 | | | | 2,043 | |
| Enel SpA | | | 4,185 | | | | 18,692 | | | | (431) | |
| Eni SpA | | | 1,389 | | | | 33,758 | | | | (195) | |
| Mediaset SpA | | | 4,561 | | | | 20,425 | | | | 1,205 | |
| Prysmian SpA | | | 1,551 | | | | 38,720 | | | | 1,213 | |
| Snam SpA | | | 1,648 | | | | 8,761 | | | | 451 | |
| Terna Rete Elettrica Nazionale SpA | | | 6,877 | | | | 33,680 | | | | 665 | |
| | | | | | | | | | | | |
| | | | | | | | | | | 5,719 | |
| | | | | | | | | | | | |
| Netherlands | | | | | |
| Koninklijke Ahold NV | | | 6,932 | | | | 128,548 | | | | (3,972) | |
| Koninklijke Philips NV | | | 1,810 | | | | 60,029 | | | | 6,617 | |
| | | | | | | | | | | | |
| | | | | | | | | | | 2,645 | |
| | | | | | | | | | | | |
| | | | |
| | The accompanying notes are an integral part of these financial statements. | | (Continued) |
| | | | | | | | | | | | | | | | |
| | AQR Funds | | | | | | Annual Report | | | | | | December 2013 | | 85 |
| | | | | | | | | | |
| | | | |
| Schedule of Investments | | | December 31, 2013 | |
| | |
| AQR LONG-SHORT EQUITY FUND | | |
| | | | | | | | | | | | |
REFERENCE
ENTITY | | SHARES | | | NOTIONAL (a) | | | NET
UNREALIZED
APPRECIATION
(DEPRECIATION) | |
| Spain | | | | | |
| ACS Actividades de Construccion y Servicios SA | | | 1,470 | | | $ | 50,026 | | | $ | 648 | |
| Ebro Foods SA | | | 652 | | | | 15,308 | | | | (23) | |
| Enagas SA | | | 280 | | | | 7,314 | | | | — | |
| Ferrovial SA | | | 1,551 | | | | 28,990 | | | | 1,056 | |
| Gas Natural SDG SA | | | 1,917 | | | | 45,996 | | | | 3,347 | |
| Iberdrola SA | | | 4,446 | | | | 27,973 | | | | 400 | |
| Repsol SA | | | 572 | | | | 15,153 | | | | (720) | |
| Tecnicas Reunidas SA | | | 213 | | | | 10,735 | | | | 842 | |
| Telefonica SA | | | 444 | | | | 7,853 | | | | (594) | |
| | | | | | | | | | | | |
| | | | | | | | | | | 4,956 | |
| | | | | | | | | | | | |
| Total of Long Equity Positions | | | | | | | | | | | 57,627 | |
| | | | | | | | | | | | |
| | | |
| Short Positions | | | | | | | | | | | | |
| |
| Belgium | | | | | |
| Solvay SA | | | (33) | | | | (5,219) | | | | (4) | |
| | | | | | | | | | | | |
| |
| Finland | | | | | |
| Nokian Renkaat OYJ | | | (1,319) | | | | (64,951) | | | | 1,699 | |
| Stora Enso OYJ | | | (2,560) | | | | (24,487) | | | | (1,237) | |
| | | | | | | | | | | | |
| | | | | | | | | | | 462 | |
| | | | | | | | | | | | |
| France | | | | | |
| Accor SA | | | (419) | | | | (18,627) | | | | (1,163) | |
| Air France-KLM | | | (2,112) | | | | (21,628) | | | | (444) | |
| Alcatel-Lucent | | | (6,425) | | | | (21,572) | | | | (6,941) | |
| Alstom SA | | | (908) | | | | (31,406) | | | | (1,706) | |
| Arkema SA | | | (123) | | | | (14,311) | | | | (50) | |
| CGG SA | | | (3,840) | | | | (82,404) | | | | 15,761 | |
| Credit Agricole SA | | | (808) | | | | (9,836) | | | | (522) | |
| Edenred | | | (228) | | | | (7,598) | | | | (36) | |
| GDF Suez | | | (848) | | | | (21,909) | | | | 1,965 | |
| Lafarge SA | | | (473) | | | | (31,977) | | | | (3,526) | |
| LVMH Moet Hennessy Louis Vuitton SA | | | (27) | | | | (5,124) | | | | 191 | |
| Orange SA | | | (445) | | | | (6,339) | | | | 814 | |
| Remy Cointreau SA | | | (267) | | | | (22,962) | | | | 534 | |
| Renault SA | | | (65) | | | | (5,699) | | | | 468 | |
| Technip SA | | | (39) | | | | (4,683) | | | | 929 | |
| Vallourec SA | | | (537) | | | | (31,518) | | | | 2,222 | |
| Veolia Environnement SA | | | (4,301) | | | | (79,893) | | | | 9,648 | |
| | | | | | | | | | | | |
| | | | | | | | | | | 18,144 | |
| | | | | | | | | | | | |
| Germany | | | | | |
| Bayerische Motoren Werke AG | | | (215) | | | | (24,241) | | | | (1,007) | |
| Commerzbank AG | | | (5,643) | | | | (75,760) | | | | (15,338) | |
| Continental AG | | | (47) | | | | (8,833) | | | | (1,493) | |
| Daimler AG | | | (600) | | | | (48,262) | | | | (3,808) | |
| Deutsche Bank AG | | | (843) | | | | (38,977) | | | | (1,521) | |
| Fresenius Medical Care AG & Co. KGaA | | | (139) | | | | (9,060) | | | | (854) | |
| Infineon Technologies AG | | | (4,043) | | | | (39,804) | | | | (3,382) | |
| | | | | | | | | | | | |
REFERENCE
ENTITY | | SHARES | | | NOTIONAL (a) | | | NET
UNREALIZED
APPRECIATION
(DEPRECIATION) | |
| Germany (continued) | | | | | |
| LANXESS AG | | | (559) | | | $ | (37,872) | | | $ | 520 | |
| MAN SE | | | (225) | | | | (27,303) | | | | (327) | |
| RWE AG | | | (913) | | | | (34,718) | | | | 1,267 | |
| SAP AG | | | (643) | | | | (47,215) | | | | (8,547) | |
| Siemens AG | | | (54) | | | | (6,629) | | | | (776) | |
| | | | | | | | | | | | |
| | | | | | | | | | | (35,266) | |
| | | | | | | | | | | | |
| Italy | | | | | |
| Buzzi Unicem SpA | | | (1,209) | | | | (21,490) | | | | (271) | |
| Fiat SpA | | | (7,506) | | | | (61,450) | | | | 14 | |
| Mediobanca SpA | | | (669) | | | | (5,619) | | | | (231) | |
| Pirelli & C. SpA | | | (950) | | | | (13,388) | | | | (3,047) | |
| Telecom Italia SpA | | | (43,397) | | | | (42,700) | | | | (574) | |
| Tod’s SpA | | | (16) | | | | (2,811) | | | | 140 | |
| | | | | | | | | | | | |
| | | | | | | | | | | (3,969) | |
| | | | | | | | | | | | |
| Luxembourg | | | | | |
| ArcelorMittal | | | (3,048) | | | | (49,146) | | | | (5,298) | |
| | | | | | | | | | | | |
| |
| Netherlands | | | | | |
| Aegon NV | | | (1,594) | | | | (14,292) | | | | (814) | |
| ASML Holding NV | | | (616) | | | | (57,727) | | | | 31 | |
| CNH Industrial NV | | | (2,692) | | | | (33,283) | | | | 2,523 | |
| Delta Lloyd NV | | | (240) | | | | (5,657) | | | | (303) | |
| Fugro NV | | | (97) | | | | (5,555) | | | | (231) | |
| | | | | | | | | | | | |
| | | | | | | | | | | 1,206 | |
| | | | | | | | | | | | |
| Spain | | | | | |
| Banco de Sabadell SA | | | (18,397) | | | | (45,744) | | | | (2,295) | |
| Bankia SA | | | (5,693) | | | | (7,207) | | | | (2,465) | |
| Inditex SA | | | (377) | | | | (60,127) | | | | (2,120) | |
| Obrascon Huarte Lain SA | | | (794) | | | | (31,784) | | | | (429) | |
| Red Electrica Corp. SA | | | (393) | | | | (25,018) | | | | (1,219) | |
| | | | | | | | | | | | |
| | | | | | | | | | | (8,528) | |
| | | | | | | | | | | | |
| Switzerland | | | | | |
| STMicroelectronics NV | | | (763) | | | | (5,625) | | | | (471) | |
| | | | | | | | | | | | |
Total of Short Equity Positions | | | | | | | | | | | (33,724) | |
| | | | | | | | | | | | |
Total of Long and Short Equity Positions | | | | | | | | | | | 23,903 | |
| | | | | | | | | | | | |
Net Cash and Other Receivables/ (Payables) (b) | | | | | | | | | | | 2,017 | |
| | | | | | | | | | | | |
Swaps, at Value | | | | | | | | | | $ | 25,920 | |
| | | | | | | | | | | | |
| (a) | Notional value represents the market value (including any fees or commissions) of the long and short positions when they are established. |
| (b) | Cash and other receivables/(payables) includes the gains (or losses) realized within the swap when the swap resets. |
Money Market Fund pledged to Goldman Sachs is included in collateral for total return swap contracts.
| | | | |
| | The accompanying notes are an integral part of these financial statements. | | (Continued) |
| | | | | | | | | | | | | | | | |
| 86 | | AQR Funds | | | | | | Annual Report | | | | | | December 2013 | | |
| | | | | | | | | | |
| | | | |
| Schedule of Investments | | | December 31, 2013 | |
| | |
| AQR LONG-SHORT EQUITY FUND | | |
| | | | | | | | |
| COUNTERPARTY | | DESCRIPTION | | TERMINATION DATE** | | VALUE
(Note 3) | |
| Goldman Sachs | | The Fund receives or pays the total return on a portfolio of long and short positions and pays or receives the Stockholm Interbank Offered Rate, which is denominated in SEK based on the local currencies of the positions within the swap. | | 12 months maturity ranging from 10/24/2014 - 11/27/2014 | | | $(12,645) | |
| | | | | | | | |
| ** | The maturity dates are measured from the commencement of investment in each underlying portfolio swap position. |
Additional Information — Total Return Basket Swaps
The following table represents the individual long and short positions and related values within the total return basket swap as of December 31, 2013.
| | | | | | | | | | | | |
REFERENCE
ENTITY | | SHARES | | | NOTIONAL (a) | | | NET
UNREALIZED
APPRECIATION
(DEPRECIATION) | |
| Long Positions | |
| |
| Sweden | | | | | |
| Electrolux AB | | | 1,454 | | | $ | 37,689 | | | $ | 308 | |
| Securitas AB | | | 3,804 | | | | 43,567 | | | | (3,092) | |
| Skanska AB | | | 851 | | | | 16,276 | | | | 1,134 | |
| Swedish Match AB | | | 192 | | | | 6,522 | | | | (349) | |
| Tele2 AB | | | 884 | | | | 11,567 | | | | (1,527) | |
| Telefonaktiebolaget LM Ericsson | | | 1,243 | | | | 16,280 | | | | (1,103) | |
| | | | | | | | | | | | |
| | | | | | | | | | | (4,629) | |
| | | | | | | | | | | | |
Total of Long Equity Positions | | | | | | | | | | | (4,629) | |
| | | | | | | | | | | | |
| | | |
| Short Positions | | | | | | | | | | | | |
| | | |
| Sweden | | | | | | | | | | | | |
| Elekta AB | | | (1,950) | | | | (30,484) | | | | 643 | |
| Hennes & Mauritz AB | | | (145) | | | | (6,152) | | | | (526) | |
| Hexagon AB | | | (1,799) | | | | (49,547) | | | | (7,359) | |
| Sandvik AB | | | (1,130) | | | | (15,947) | | | | (2) | |
| | | | | | | | | | | | |
REFERENCE
ENTITY | | SHARES | | | NOTIONAL (a) | | | NET
UNREALIZED
APPRECIATION
(DEPRECIATION) | |
| Sweden (continued) | | | | | | | | | | | | |
| Svenska Handelsbanken AB | | | (229) | | | $ | (10,094) | | | $ | (1,165) | |
| Volvo AB | | | (1,503) | | | | (20,264) | | | | 486 | |
| | | | | | | | | | | | |
| | | | | | | | | | | (7,923) | |
| | | | | | | | | | | | |
Total of Short Equity Positions | | | | | | | | | | | (7,923) | |
| | | | | | | | | | | | |
Total of Long and Short Equity Positions | | | | | | | | | | | (12,552) | |
| | | | | | | | | | | | |
Net Cash and Other Receivables/ (Payables) (b) | | | | | | | | | | | (93) | |
| | | | | | | | | | | | |
Swaps, at Value | | | | | | | | | | $ | (12,645) | |
| | | | | | | | | | | | |
| (a) | Notional value represents the market value (including any fees or commissions) of the long and short positions when they are established. |
| (b) | Cash and other receivables/(payables) includes the gains (or losses) realized within the swap when the swap resets. |
Money Market Fund pledged to Goldman Sachs is included in collateral for total return swap contracts.
| | | | |
| | The accompanying notes are an integral part of these financial statements. | | (Continued) |
| | | | | | | | | | | | | | | | |
| | AQR Funds | | | | | | Annual Report | | | | | | December 2013 | | 87 |
| | | | | | | | | | |
| | | | |
| Schedule of Investments | | | December 31, 2013 | |
| | |
| AQR LONG-SHORT EQUITY FUND | | |
| | | | | | | | |
| COUNTERPARTY | | DESCRIPTION | | TERMINATION DATE** | | VALUE
(Note 3) | |
| Goldman Sachs | | The Fund receives or pays the total return on a portfolio of long and short positions and pays or receives the Norway Interbank Offered Rate, which is denominated in NOK based on the local currencies of the positions within the swap. | | 12 months maturity ranging from 10/24/2014 - 12/22/2014 | | | $(9,856) | |
| | | | | | | | |
| ** | The maturity dates are measured from the commencement of investment in each underlying portfolio swap position. |
Additional Information — Total Return Basket Swaps
The following table represents the individual long and short positions and related values within the total return basket swap as of December 31, 2013.
| | | | | | | | | | | | |
REFERENCE
ENTITY | | SHARES | | | NOTIONAL (a) | | | NET
UNREALIZED
APPRECIATION
(DEPRECIATION) | |
| Long Positions | |
| |
| Norway | | | | | |
| Petroleum Geo-Services ASA | | | 333 | | | $ | 3,808 | | | $ | 126 | |
| Statoil ASA | | | 1,908 | | | | 42,915 | | | | 3,480 | |
| Telenor ASA | | | 2,057 | | | | 50,070 | | | | (921) | |
| TGS Nopec Geophysical Co. ASA | | | 662 | | | | 16,038 | | | | 1,553 | |
| Yara International ASA | | | 203 | | | | 7,910 | | | | 845 | |
| | | | | | | | | | | | |
| | | | | | | | | | | 5,083 | |
| | | | | | | | | | | | |
Total of Long Equity Positions | | | | | | | | | | | 5,083 | |
| | | | | | | | | | | | |
| | | |
| Short Positions | | | | | | | | | | | | |
| | | |
| Norway | | | | | | | | | | | | |
| Aker Solutions ASA | | | (3,390) | | | | (48,942) | | | | (11,751) | |
| Marine Harvest ASA | | | (41,396) | | | | (47,608) | | | | (2,888) | |
| Orkla ASA | | | (2,536) | | | | (18,452) | | | | (1,370) | |
| | | | | | | | | | | | |
| | | | | | | | | | | (16,009) | |
| | | | | | | | | | | | |
| | | | | | | | | | | | |
REFERENCE
ENTITY | | SHARES | | | NOTIONAL (a) | | | NET
UNREALIZED
APPRECIATION
(DEPRECIATION) | |
| United Kingdom | | | | | | | | | | | | |
| Subsea 7 SA | | | (633) | | | $ | (13,287) | | | $ | 1,151 | |
| | | | | | | | | | | | |
Total of Short Equity Positions | | | | | | | | | | | (14,858) | |
| | | | | | | | | | | | |
Total of Long and Short Equity Positions | | | | | | | | | | | (9,775) | |
| | | | | | | | | | | | |
Net Cash and Other Receivables/ (Payables) (b) | | | | | | | | | | | (81) | |
| | | | | | | | | | | | |
Swaps, at Value | | | | | | | | | | $ | (9,856) | |
| | | | | | | | | | | | |
| (a) | Notional value represents the market value (including any fees or commissions) of the long and short positions when they are established. |
| (b) | Cash and other receivables/(payables) includes the gains (or losses) realized within the swap when the swap resets. |
Money Market Fund pledged to Goldman Sachs is included in collateral for total return swap contracts.
| | | | |
| | The accompanying notes are an integral part of these financial statements. | | (Continued) |
| | | | | | | | | | | | | | | | |
| 88 | | AQR Funds | | | | | | Annual Report | | | | | | December 2013 | | |
| | | | | | | | | | |
| | | | |
| Schedule of Investments | | | December 31, 2013 | |
| | |
| AQR LONG-SHORT EQUITY FUND | | |
| | | | | | | | |
| COUNTERPARTY | | DESCRIPTION | | TERMINATION DATE** | | VALUE
(Note 3) | |
| Goldman Sachs | | The Fund receives or pays the total return on a portfolio of long and short positions and pays or receives the Copenhagen Interbank Rate, which is denominated in DKK based on the local currencies of the positions within the swap. | | 12 months maturity ranging from 10/24/2014 - 12/22/2014 | | | $4,966 | |
| | | | | | | | |
| ** | The maturity dates are measured from the commencement of investment in each underlying portfolio swap position. |
Additional Information — Total Return Basket Swaps
The following table represents the individual long and short positions and related values within the total return basket swap as of December 31, 2013.
| | | | | | | | | | | | |
REFERENCE
ENTITY | | SHARES | | | NOTIONAL (a) | | | NET
UNREALIZED
APPRECIATION
(DEPRECIATION) | |
| Long Positions | |
| |
| Denmark | | | | | |
| Carlsberg A/S | | | 104 | | | $ | 11,031 | | | $ | 477 | |
| Coloplast A/S | | | 444 | | | | 26,062 | | | | 3,373 | |
| DSV A/S | | | 179 | | | | 5,157 | | | | 720 | |
| Novo Nordisk A/S | | | 184 | | | | 32,191 | | | | 1,547 | |
| Pandora A/S | | | 424 | | | | 22,543 | | | | 504 | |
| TDC A/S | | | 2,633 | | | | 23,446 | | | | 2,106 | |
| Vestas Wind Systems A/S | | | 610 | | | | 17,201 | | | | 862 | |
| | | | | | | | | | | | |
| | | | | | | | | | | 9,589 | |
| | | | | | | | | | | | |
Total of Long Equity Positions | | | | | | | | | | | 9,589 | |
| | | | | | | | | | | | |
| | | |
| Short Positions | | | | | | | | | | | | |
| | | |
| Denmark | | | | | | | | | | | | |
| FLSmidth & Co. A/S | | | (197) | | | | (10,083) | | | | (690) | |
| Novozymes A/S | | | (950) | | | | (36,125) | | | | (4,003) | |
| | | | | | | | | | | | |
| | | | | | | | | | | (4,693) | |
| | | | | | | | | | | | |
Total of Short Equity Positions | | | | | | | | | | | (4,693) | |
| | | | | | | | | | | | |
Total of Long and Short Equity Positions | | | | | | | | | | | 4,896 | |
| | | | | | | | | | | | |
Net Cash and Other Receivables/ (Payables) (b) | | | | | | | | | | | 70 | |
| | | | | | | | | | | | |
Swaps, at Value | | | | | | | | | | $ | 4,966 | |
| | | | | | | | | | | | |
| (a) | Notional value represents the market value (including any fees or commissions) of the long and short positions when they are established. |
| (b) | Cash and other receivables/(payables) includes the gains (or losses) realized within the swap when the swap resets. |
Money Market Fund pledged to Goldman Sachs is included in collateral for total return swap contracts.
| | | | |
| | The accompanying notes are an integral part of these financial statements. | | |
| | | | | | | | | | | | | | | | |
| | AQR Funds | | | | | | Annual Report | | | | | | December 2013 | | 89 |
| | | | | | | | | | |
| | | | |
| Consolidated Schedule of Investments | | | December 31, 2013 | |
| | |
| AQR MANAGED FUTURES STRATEGY FUND | | |
| | | | | | | | |
| | | SHARES | | | VALUE
(Note 3) | |
| MONEY MARKET FUNDS - 69.1% | |
| BlackRock Liquidity Funds TempFund Portfolio - Series I, Institutional Shares, 0.050% (a) ^ | | | 314,660,695 | | | $ | 314,660,695 | |
| Dreyfus Treasury Cash Management, Class I, 0.010% (a) ^ | | | 1,258,642,781 | | | | 1,258,642,781 | |
| J.P. Morgan U.S. Treasury Plus Money Market Fund - Institutional Shares, 0.000% (a)(b) ^ | | | 954,172,844 | | | | 954,172,844 | |
| UBS Money Series - UBS Select Treasury Preferred Fund, Class I, 0.010% (a) ^ | | | 1,556,421,751 | | | | 1,556,421,751 | |
| | | | | | | | |
TOTAL MONEY MARKET FUNDS
(Cost $4,083,898,071) | | | | | | | 4,083,898,071 | |
| | | | | | | | |
| | | | | | | | |
| |
| PRINCIPAL
AMOUNT
(000’S) |
| |
| VALUE
(Note 3) |
|
| SHORT-TERM INVESTMENTS - 23.7% | |
| U.S. Treasury Bill, 0.066%, 1/30/2014 (c) ^ | | $ | 458,710 | | | $ | 458,703,578 | |
| U.S. Treasury Bill, 0.073%, 2/6/2014 (c) | | | 382,922 | | | | 382,916,356 | |
| U.S. Treasury Bill, 0.060%, 4/10/2014 (c) ^ | | | 290,700 | | | | 290,662,500 | |
| U.S. Treasury Bill, 0.080%, 5/29/2014 (c) ^ | | | 134,500 | | | | 134,468,392 | |
| U.S. Treasury Bill, 0.084%, 6/5/2014 (c) ^ | | | 134,500 | | | | 134,466,913 | |
| | | | | | | | |
TOTAL SHORT-TERM INVESTMENTS
(cost $1,401,139,169) | | | | | | | 1,401,217,739 | |
| | | | | | | | |
TOTAL INVESTMENTS - 92.8% (cost $5,485,037,240) | | | | | | | 5,485,115,810 | |
| | | | | | | | |
OTHER ASSETS IN EXCESS OF
LIABILITIES - 7.2% (d) | | | | 429,150,499 | |
| | | | | | | | |
NET ASSETS - 100.0% | | | $ | 5,914,266,309 | |
| | | | | | | | |
| (a) | Represents annualized seven-day yield as of December 31, 2013. |
| (b) | A portion of the security is pledged as collateral to the brokers for forward foreign currency exchange and swap contracts. |
| (c) | The rate shown is the effective yield at the date of purchase. |
| (d) | Includes appreciation on forward foreign currency exchange, futures and swap contracts. |
| ^ | All or a portion represents positions held in the respective Subsidiary (Note 2). |
All securities are Level 2 with respect to ASC 820 (See Note 5).
| | | | | | | | | | | | | | | | |
Total return swap contracts outstanding as of December 31, 2013: Over the Counter | |
| COUNTERPARTY | | UNDERLYING REFERENCE INSTRUMENT | | TERMINATION DATE | | CURRENCY | | | NOTIONAL
VALUE | | | UNREALIZED APPRECIATION (DEPRECIATION) | |
| Bank of America | | 10-Year Japanese Government Bond | | 3/11/2014 | | | JPY | | | | 15,831,189,000 | | | | $(624,816) | |
| Barclays Capital | | Brent Crude Futures^ | | 1/16/2014 | | | USD | | | | 6,686,820 | | | | 71,969 | |
| Barclays Capital | | Brent Crude Futures^ | | 1/16/2014 | | | USD | | | | (6,852,740) | | | | 93,925 | |
| Barclays Capital | | Brent Crude Futures^ | | 2/13/2014 | | | USD | | | | 6,832,000 | | | | (89,670) | |
| Barclays Capital | | Cocoa Futures^ | | 3/14/2014 | | | GBP | | | | 19,263,829 | | | | (902,234) | |
| Barclays Capital | | Coffee ‘C’ Futures^ | | 3/19/2014 | | | USD | | | | (1,584,619) | | | | (34,369) | |
| Barclays Capital | | Corn Futures^ | | 3/14/2014 | | | USD | | | | (11,558,225) | | | | 58,725 | |
| Bank of America | | Euro - Bobl Futures^ | | 3/6/2014 | | | EUR | | | | 72,146,117 | | | | (987,445) | |
| Barclays Capital | | Gold 100 OZ Futures^ | | 2/26/2014 | | | USD | | | | (235,088,990) | | | | 12,903,950 | |
| Barclays Capital | | Heating Oil Futures^ | | 1/31/2014 | | | USD | | | | 19,661,632 | | | | 112,450 | |
| Barclays Capital | | Heating Oil Futures^ | | 1/31/2014 | | | USD | | | | (18,471,596) | | | | (1,305,430) | |
| Barclays Capital | | Heating Oil Futures^ | | 1/31/2014 | | | USD | | | | (21,783,497) | | | | (102,031) | |
| Bank of America | | H-SHARES Index Futures | | 1/29/2014 | | | HKD | | | | 146,906,876 | | | | 263,960 | |
| Barclays Capital | | Lean Hogs Futures^ | | 2/14/2014 | | | USD | | | | 82,541,139 | | | | (5,623,641) | |
| Barclays Capital | | Lean Hogs Futures^ | | 2/14/2014 | | | USD | | | | (82,408,393) | | | | 2,484,397 | |
| Barclays Capital | | LME Aluminum Futures^ | | 3/17/2014 | | | USD | | | | 48,036,037 | | | | (71,344) | |
| Barclays Capital | | LME Aluminum Futures^ | | 3/17/2014 | | | USD | | | | (119,944,084) | | | | (3,265,503) | |
| | | | |
| | The accompanying notes are an integral part of these financial statements. | | (Continued) |
| | | | | | | | | | | | | | | | |
| 90 | | AQR Funds | | | | | | Annual Report | | | | | | December 2013 | | |
| | | | | | | | | | |
| | | | |
| Consolidated Schedule of Investments | | | December 31, 2013 | |
| | |
| AQR MANAGED FUTURES STRATEGY FUND | | |
| | | | | | | | | | | | | | | | |
| COUNTERPARTY | | UNDERLYING REFERENCE INSTRUMENT | | TERMINATION DATE | | CURRENCY | | | NOTIONAL
VALUE | | | UNREALIZED APPRECIATION (DEPRECIATION) | |
| Barclays Capital | | LME Copper Futures^ | | 3/27/2014 | | | USD | | | | (81,350) | | | | $(3,563) | |
| Bank of America | | MSCI Taiwan Stock Index Futures | | 1/28/2014 | | | USD | | | | 29,087,335 | | | | 747,545 | |
| Deutsche Bank | | Natural Gas Futures^ | | 1/29/2014 | | | USD | | | | 52,700,480 | | | | (1,052,180) | |
| Deutsche Bank | | Natural Gas Futures^ | | 1/29/2014 | | | USD | | | | (48,595,800) | | | | (3,052,500) | |
| Barclays Capital | | Platinum Futures^ | | 4/28/2014 | | | USD | | | | (75,913,365) | | | | (2,805,375) | |
| Barclays Capital | | Silver Futures^ | | 3/27/2014 | | | USD | | | | 20,600,350 | | | | (261,739) | |
| Barclays Capital | | Silver Futures^ | | 3/27/2014 | | | USD | | | | (157,422,143) | | | | 12,141,997 | |
| Barclays Capital | | Soybean Futures^ | | 3/14/2014 | | | USD | | | | 144,660,810 | | | | (3,455,185) | |
| Deutsche Bank | | Soybean Meal Futures^ | | 3/14/2014 | | | USD | | | | 21,099,516 | | | | (749,916) | |
| Barclays Capital | | Soybean Oil Futures^ | | 3/14/2014 | | | USD | | | | (40,771,842) | | | | 1,187,934 | |
| Bank of America | | Swiss Market Index Futures | | 3/21/2014 | | | CHF | | | | 42,308,009 | | | | 2,310,025 | |
| Bank of America | | U.S. Treasury 2-Year Note Futures | | 3/31/2014 | | | USD | | | | 1,177,922,987 | | | | (2,365,737) | |
| Barclays Capital | | Wheat Futures^ | | 3/14/2014 | | | USD | | | | (250,603,048) | | | | 13,677,936 | |
| Barclays Capital | | Wheat Futures^ | | 3/14/2014 | | | USD | | | | (58,987,352) | | | | 1,982,852 | |
| Deutsche Bank | | WTI Crude Oil Futures^ | | 1/21/2014 | | | USD | | | | 39,862,410 | | | | (199,150) | |
| Deutsche Bank | | WTI Crude Oil Futures^ | | 1/21/2014 | | | USD | | | | (62,558,430) | | | | (1,119,310) | |
| | | | | | | | | | | | | | | | |
| | | | | | | | | | | | | | | $19,966,527 | |
| | | | | | | | | | | | | | | | |
Money Market Fund is pledged as collateral to Bank of America, Barclays Capital, Merrill Lynch and Deutsche Bank for $5,050,655, $80,600,000, $1,052 and $12,300,000, respectively for total return swap contracts at December 31, 2013.
^ Represents positions held in the respective Subsidiary (Note 2).
Open futures contracts outstanding at December 31, 2013:
Exchange Traded
| | | | | | | | | | | | | | | | | | |
NUMBER OF
CONTRACTS | | COUNTERPARTY | | DESCRIPTION | | EXPIRATION DATE | | VALUE AT
TRADE DATE | | | VALUE AT
DECEMBER 31,
2013 | | | UNREALIZED
APPRECIATION
(DEPRECIATION) | |
| Long Contracts: | | | | | |
| 697 | | Goldman Sachs | | Brent Crude Futures^ | | March 13, 2014 | | | $77,989,975 | | | | $77,039,410 | | | | $(950,565) | |
| 1,571 | | Goldman Sachs | | Cocoa Futures^ | | March 14, 2014 | | | 43,314,683 | | | | 42,561,506 | | | | (753,177) | |
| 2 | | Goldman Sachs | | Gas Oil Futures^ | | February 12, 2014 | | | 189,915 | | | | 188,700 | | | | (1,215) | |
| 62 | | J.P. Morgan | | LME Aluminum Futures^ | | January 3, 2014 | | | 2,855,089 | | | | 2,719,862 | | | | (135,227) | |
| 81 | | J.P. Morgan | | LME Aluminum Futures^ | | January 8, 2014 | | | 3,783,234 | | | | 3,559,282 | | | | (223,952) | |
| 78 | | J.P. Morgan | | LME Aluminum Futures^ | | January 9, 2014 | | | 3,641,091 | | | | 3,428,588 | | | | (212,503) | |
| 121 | | J.P. Morgan | | LME Aluminum Futures^ | | January 10, 2014 | | | 5,698,148 | | | | 5,320,460 | | | | (377,688) | |
| 89 | | J.P. Morgan | | LME Aluminum Futures^ | | January 15, 2014 | | | 4,162,277 | | | | 3,919,893 | | | | (242,384) | |
| 16 | | J.P. Morgan | | LME Aluminum Futures^ | | January 22, 2014 | | | 749,633 | | | | 706,240 | | | | (43,393) | |
| 23 | | J.P. Morgan | | LME Aluminum Futures^ | | January 30, 2014 | | | 1,089,925 | | | | 1,017,750 | | | | (72,175) | |
| 24 | | J.P. Morgan | | LME Aluminum Futures^ | | January 31, 2014 | | | 1,132,097 | | | | 1,062,330 | | | | (69,767) | |
| 160 | | J.P. Morgan | | LME Aluminum Futures^ | | March 11, 2014 | | | 7,255,004 | | | | 7,162,440 | | | | (92,564) | |
| 169 | | J.P. Morgan | | LME Aluminum Futures^ | | March 12, 2014 | | | 7,663,378 | | | | 7,567,524 | | | | (95,854) | |
| 329 | | J.P. Morgan | | LME Aluminum Futures^ | | March 17, 2014 | | | 14,950,322 | | | | 14,761,819 | | | | (188,503) | |
| 3 | | J.P. Morgan | | LME Copper Futures^ | | February 12, 2014 | | | 534,737 | | | | 552,731 | | | | 17,994 | |
| 33 | | J.P. Morgan | | LME Copper Futures^ | | February 13, 2014 | | | 5,814,256 | | | | 6,079,945 | | | | 265,689 | |
| 246 | | J.P. Morgan | | LME Copper Futures^ | | February 14, 2014 | | | 42,861,649 | | | | 45,322,425 | | | | 2,460,776 | |
| 132 | | J.P. Morgan | | LME Copper Futures^ | | February 19, 2014 | | | 22,964,975 | | | | 24,318,525 | | | | 1,353,550 | |
| 19 | | J.P. Morgan | | LME Copper Futures^ | | February 20, 2014 | | | 3,311,739 | | | | 3,499,681 | | | | 187,942 | |
| 31 | | J.P. Morgan | | LME Copper Futures^ | | February 21, 2014 | | | 5,476,989 | | | | 5,708,843 | | | | 231,854 | |
| 73 | | J.P. Morgan | | LME Copper Futures^ | | March 3, 2014 | | | 12,683,902 | | | | 13,443,406 | | | | 759,504 | |
| 51 | | J.P. Morgan | | LME Copper Futures^ | | March 4, 2014 | | | 8,972,600 | | | | 9,391,969 | | | | 419,369 | |
| 169 | | J.P. Morgan | | LME Copper Futures^ | | March 13, 2014 | | | 30,510,208 | | | | 31,122,406 | | | | 612,198 | |
| 537 | | J.P. Morgan | | LME Copper Futures^ | | March 17, 2014 | | | 97,460,680 | | | | 98,887,281 | | | | 1,426,601 | |
| 34 | | J.P. Morgan | | LME Copper Futures^ | | March 18, 2014 | | | 6,169,180 | | | | 6,261,313 | | | | 92,133 | |
| 74 | | J.P. Morgan | | LME Nickel Futures^ | | January 24, 2014 | | | 6,457,963 | | | | 6,149,031 | | | | (308,932) | |
| 41 | | J.P. Morgan | | LME Nickel Futures^ | | January 28, 2014 | | | 3,606,117 | | | | 3,407,570 | | | | (198,547) | |
| | | | |
| | The accompanying notes are an integral part of these financial statements. | | (Continued) |
| | | | | | | | | | | | | | | | |
| | AQR Funds | | | | | | Annual Report | | | | | | December 2013 | | 91 |
| | | | | | | | | | |
| | | | |
| Consolidated Schedule of Investments | | | December 31, 2013 | |
| | |
| AQR MANAGED FUTURES STRATEGY FUND | | |
| | | | | | | | | | | | | | | | | | |
NUMBER OF
CONTRACTS | | COUNTERPARTY | | DESCRIPTION | | EXPIRATION DATE | | VALUE AT
TRADE DATE | | | VALUE AT
DECEMBER 31,
2013 | | | UNREALIZED
APPRECIATION
(DEPRECIATION) | |
| Long Contracts: (continued) | | | | | |
| 8 | | J.P. Morgan | | LME Nickel Futures^ | | January 29, 2014 | | | $701,715 | | | | $664,925 | | | | $(36,790) | |
| 41 | | J.P. Morgan | | LME Nickel Futures^ | | January 30, 2014 | | | 3,599,602 | | | | 3,407,909 | | | | (191,693) | |
| 46 | | J.P. Morgan | | LME Nickel Futures^ | | January 31, 2014 | | | 4,037,806 | | | | 3,823,696 | | | | (214,110) | |
| 33 | | J.P. Morgan | | LME Nickel Futures^ | | February 20, 2014 | | | 2,692,869 | | | | 2,745,829 | | | | 52,960 | |
| 57 | | J.P. Morgan | | LME Nickel Futures^ | | February 21, 2014 | | | 4,624,319 | | | | 4,743,075 | | | | 118,756 | |
| 49 | | J.P. Morgan | | LME Nickel Futures^ | | March 3, 2014 | | | 3,954,402 | | | | 4,079,797 | | | | 125,395 | |
| 44 | | J.P. Morgan | | LME Nickel Futures^ | | March 4, 2014 | | | 3,601,052 | | | | 3,663,708 | | | | 62,656 | |
| 57 | | J.P. Morgan | | LME Nickel Futures^ | | March 5, 2014 | | | 4,728,269 | | | | 4,746,447 | | | | 18,178 | |
| 19 | | J.P. Morgan | | LME Nickel Futures^ | | March 6, 2014 | | | 1,577,800 | | | | 1,582,243 | | | | 4,443 | |
| 34 | | J.P. Morgan | | LME Nickel Futures^ | | March 13, 2014 | | | 2,854,155 | | | | 2,832,554 | | | | (21,601) | |
| 353 | | J.P. Morgan | | LME Nickel Futures^ | | March 17, 2014 | | | 30,000,905 | | | | 29,418,252 | | | | (582,653) | |
| 41 | | J.P. Morgan | | LME Nickel Futures^ | | March 18, 2014 | | | 3,466,953 | | | | 3,416,738 | | | | (50,215) | |
| 42 | | J.P. Morgan | | LME Nickel Futures^ | | March 20, 2014 | | | 3,602,172 | | | | 3,500,490 | | | | (101,682) | |
| 39 | | J.P. Morgan | | LME Nickel Futures^ | | March 24, 2014 | | | 3,386,382 | | | | 3,251,235 | | | | (135,147) | |
| 49 | | J.P. Morgan | | LME Zinc Futures^ | | January 23, 2014 | | | 2,391,387 | | | | 2,507,220 | | | | 115,833 | |
| 84 | | J.P. Morgan | | LME Zinc Futures^ | | January 24, 2014 | | | 4,054,086 | | | | 4,298,553 | | | | 244,467 | |
| 109 | | J.P. Morgan | | LME Zinc Futures^ | | January 28, 2014 | | | 5,351,001 | | | | 5,580,228 | | | | 229,227 | |
| 42 | | J.P. Morgan | | LME Zinc Futures^ | | January 29, 2014 | | | 2,067,967 | | | | 2,150,400 | | | | 82,433 | |
| 100 | | J.P. Morgan | | LME Zinc Futures^ | | January 30, 2014 | | | 4,935,519 | | | | 5,120,525 | | | | 185,006 | |
| 126 | | J.P. Morgan | | LME Zinc Futures^ | | January 31, 2014 | | | 6,168,508 | | | | 6,452,555 | | | | 284,047 | |
| 40 | | J.P. Morgan | | LME Zinc Futures^ | | February 12, 2014 | | | 1,886,583 | | | | 2,051,000 | | | | 164,417 | |
| 85 | | J.P. Morgan | | LME Zinc Futures^ | | February 13, 2014 | | | 3,999,427 | | | | 4,358,821 | | | | 359,394 | |
| 165 | | J.P. Morgan | | LME Zinc Futures^ | | February 14, 2014 | | | 7,775,556 | | | | 8,462,149 | | | | 686,593 | |
| 95 | | J.P. Morgan | | LME Zinc Futures^ | | February 19, 2014 | | | 4,493,104 | | | | 4,874,688 | | | | 381,584 | |
| 105 | | J.P. Morgan | | LME Zinc Futures^ | | February 20, 2014 | | | 4,958,187 | | | | 5,388,259 | | | | 430,072 | |
| 241 | | J.P. Morgan | | LME Zinc Futures^ | | February 21, 2014 | | | 11,397,351 | | | | 12,368,421 | | | | 971,070 | |
| 134 | | J.P. Morgan | | LME Zinc Futures^ | | March 3, 2014 | | | 6,286,554 | | | | 6,882,843 | | | | 596,289 | |
| 147 | | J.P. Morgan | | LME Zinc Futures^ | | March 4, 2014 | | | 6,964,431 | | | | 7,551,207 | | | | 586,776 | |
| 71 | | J.P. Morgan | | LME Zinc Futures^ | | March 11, 2014 | | | 3,462,635 | | | | 3,649,329 | | | | 186,694 | |
| 131 | | J.P. Morgan | | LME Zinc Futures^ | | March 12, 2014 | | | 6,438,253 | | | | 6,733,826 | | | | 295,573 | |
| 97 | | J.P. Morgan | | LME Zinc Futures^ | | March 13, 2014 | | | 4,758,365 | | | | 4,986,552 | | | | 228,187 | |
| 1,080 | | J.P. Morgan | | LME Zinc Futures^ | | March 17, 2014 | | | 53,719,676 | | | | 55,561,050 | | | | 1,841,374 | |
| 95 | | J.P. Morgan | | LME Zinc Futures^ | | March 18, 2014 | | | 4,751,831 | | | | 4,886,562 | | | | 134,731 | |
| 92 | | J.P. Morgan | | LME Zinc Futures^ | | March 20, 2014 | | | 4,632,204 | | | | 4,721,900 | | | | 89,696 | |
| 88 | | J.P. Morgan | | LME Zinc Futures^ | | March 24, 2014 | | | 4,507,219 | | | | 4,518,206 | | | | 10,987 | |
| 1,650 | | Goldman Sachs | | Natural Gas Futures^ | | February 19, 2014 | | | 70,729,204 | | | | 69,795,000 | | | | (934,204) | |
| 1,031 | | Goldman Sachs | | Soybean Futures^ | | March 14, 2014 | | | 67,509,589 | | | | 66,628,375 | | | | (881,214) | |
| 1,141 | | Goldman Sachs | | Soybean Meal Futures^ | | March 14, 2014 | | | 47,836,967 | | | | 47,579,700 | | | | (257,267) | |
| 995 | | Barclays Capital | | Amsterdam Index Futures | | January 17, 2014 | | | 104,341,370 | | | | 110,149,067 | | | | 5,807,697 | |
| 1,245 | | Barclays Capital | | CAC40 Index Futures | | January 17, 2014 | | | 70,269,842 | | | | 73,622,409 | | | | 3,352,567 | |
| 724 | | Barclays Capital | | DAX Index Futures | | March 21, 2014 | | | 228,065,129 | | | | 239,178,585 | | | | 11,113,456 | |
| 3,370 | | Barclays Capital | | DJIA Mini E-CBOT Futures | | March 21, 2014 | | | 265,025,696 | | | | 277,923,900 | | | | 12,898,204 | |
| 1,635 | | Barclays Capital | | E-Mini Russell 2000 Futures | | March 21, 2014 | | | 180,098,524 | | | | 189,888,900 | | | | 9,790,376 | |
| 3,818 | | Barclays Capital | | Euro Stoxx 50 Index | | March 21, 2014 | | | 155,981,256 | | | | 163,245,296 | | | | 7,264,040 | |
| 964 | | Barclays Capital | | FTSE 100 Index Futures | | March 21, 2014 | | | 103,633,410 | | | | 106,914,591 | | | | 3,281,181 | |
| 925 | | J.P. Morgan | | FTSE/JSE Top 40 Index Futures | | March 20, 2014 | | | 34,663,339 | | | | 36,770,734 | | | | 2,107,395 | |
| 421 | | Barclays Capital | | FTSE/MIB Index Futures | | March 21, 2014 | | | 52,737,991 | | | | 55,093,519 | | | | 2,355,528 | |
| 134 | | Barclays Capital | | Hang Seng Index Futures | | January 29, 2014 | | | 19,832,429 | | | | 20,160,569 | | | | 328,140 | |
| 626 | | Barclays Capital | | IBEX 35 Index Futures | | January 17, 2014 | | | 80,463,507 | | | | 84,994,109 | | | | 4,530,602 | |
| 769 | | Barclays Capital | | MSCI Singapore Index Futures | | January 29, 2014 | | | 43,503,925 | | | | 44,508,704 | | | | 1,004,779 | |
| 1,014 | | Barclays Capital | | MSCI Taiwan Stock Index Futures | | January 28, 2014 | | | 30,108,512 | | | | 30,744,480 | | | | 635,968 | |
| 3,925 | | Barclays Capital | | NASDAQ 100 E-Mini Futures | | March 21, 2014 | | | 271,458,288 | | | | 281,324,375 | | | | 9,866,087 | |
| 2,739 | | Barclays Capital | | S&P 500 E-Mini Futures | | March 21, 2014 | | | 242,486,030 | | | | 252,138,645 | | | | 9,652,615 | |
| 1,528 | | Barclays Capital | | S&P MID 400 E-Mini Futures | | March 21, 2014 | | | 196,596,714 | | | | 204,660,320 | | | | 8,063,606 | |
| | | | |
| | The accompanying notes are an integral part of these financial statements. | | (Continued) |
| | | | | | | | | | | | | | | | |
| 92 | | AQR Funds | | | | | | Annual Report | | | | | | December 2013 | | |
| | | | | | | | | | |
| | | | |
| Consolidated Schedule of Investments | | | December 31, 2013 | |
| | |
| AQR MANAGED FUTURES STRATEGY FUND | | |
| | | | | | | | | | | | | | | | | | |
NUMBER OF
CONTRACTS | | COUNTERPARTY | | DESCRIPTION | | EXPIRATION DATE | | VALUE AT
TRADE DATE | | | VALUE AT
DECEMBER 31,
2013 | | | UNREALIZED
APPRECIATION
(DEPRECIATION) | |
| Long Contracts: (continued) | | | | | |
| 1,891 | | Barclays Capital | | S&P/Toronto Stock Exchange 60 Index Futures | | March 20, 2014 | | | $268,191,969 | | | | $278,029,071 | | | | $9,837,102 | |
| 1,804 | | Barclays Capital | | SGX S&P CNX Nifty Index Futures | | January 30, 2014 | | | 22,823,475 | | | | 22,914,408 | | | | 90,933 | |
| 573 | | Barclays Capital | | SPI 200 Index Futures | | March 20, 2014 | | | 65,709,063 | | | | 68,021,434 | | | | 2,312,371 | |
| 1,208 | | Barclays Capital | | TOPIX Index Futures | | March 13, 2014 | | | 143,722,895 | | | | 149,408,413 | | | | 5,685,518 | |
| 491 | | J.P. Morgan | | 10-Year Japanese Government Bond | | March 11, 2014 | | | 671,452,368 | | | | 668,218,782 | | | | (3,233,586) | |
| 272 | | J.P. Morgan | | 3-Month Euro Euribor Futures | | September 15, 2014 | | | 93,252,828 | | | | 93,248,249 | | | | (4,579) | |
| 1,071 | | J.P. Morgan | | 3-Month Euro Euribor Futures | | December 15, 2014 | | | 367,083,937 | | | | 366,980,808 | | | | (103,129) | |
| 2,314 | | J.P. Morgan | | 3-Month Euro Euribor Futures | | March 16, 2015 | | | 792,473,180 | | | | 792,261,168 | | | | (212,012) | |
| 3,038 | | J.P. Morgan | | 3-Month Euro Euribor Futures | | June 15, 2015 | | | 1,039,564,515 | | | | 1,039,097,518 | | | | (466,997) | |
| 3,095 | | J.P. Morgan | | 3-Month Euro Euribor Futures | | September 14, 2015 | | | 1,058,089,652 | | | | 1,057,369,308 | | | | (720,344) | |
| 2,962 | | J.P. Morgan | | 3-Month Euro Euribor Futures | | December 14, 2015 | | | 1,012,479,182 | | | | 1,010,607,149 | | | | (1,872,033) | |
| 792 | | J.P. Morgan | | 90-Day EURODollar Futures | | June 16, 2014 | | | 197,412,276 | | | | 197,376,300 | | | | (35,976) | |
| 758 | | J.P. Morgan | | 90-Day EURODollar Futures | | September 15, 2014 | | | 188,887,627 | | | | 188,808,325 | | | | (79,302) | |
| 3,171 | | J.P. Morgan | | 90-Day EURODollar Futures | | December 15, 2014 | | | 789,336,834 | | | | 789,341,175 | | | | 4,341 | |
| 4,118 | | J.P. Morgan | | 90-Day EURODollar Futures | | March 16, 2015 | | | 1,024,043,135 | | | | 1,024,043,650 | | | | 515 | |
| 4,807 | | J.P. Morgan | | 90-Day EURODollar Futures | | June 15, 2015 | | | 1,193,765,647 | | | | 1,193,638,188 | | | | (127,459) | |
| 3,913 | | J.P. Morgan | | 90-Day EURODollar Futures | | September 14, 2015 | | | 970,199,372 | | | | 969,739,225 | | | | (460,147) | |
| 2,724 | | J.P. Morgan | | 90-Day EURODollar Futures | | December 14, 2015 | | | 674,833,115 | | | | 673,338,750 | | | | (1,494,365) | |
| 687 | | J.P. Morgan | | Canadian 3-Month Bank Acceptance Futures | | June 16, 2014 | | | 159,629,094 | | | | 159,664,038 | | | | 34,944 | |
| 2,504 | | J.P. Morgan | | Canadian 3-Month Bank Acceptance Futures | | September 15, 2014 | | | 581,901,880 | | | | 581,889,821 | | | | (12,059) | |
| | | | | | | | | | | | | | | | | | |
| | | | | | | | | 14,229,321,777 | | | | 14,339,459,180 | | | | 110,137,403 | |
| | | | | | | | | | | | | | | | | | |
| Short Contracts: | | | | | | | | | |
| 1,200 | | Goldman Sachs | | Coffee ‘C’ Futures^ | | March 19, 2014 | | | (47,957,876) | | | | (49,815,000) | | | | (1,857,124) | |
| 11,356 | | Goldman Sachs | | Corn Futures^ | | March 14, 2014 | | | (249,456,290) | | | | (239,611,600) | | | | 9,844,690 | |
| 200 | | Goldman Sachs | | Cotton No. 2 Futures^ | | March 7, 2014 | | | (7,735,876) | | | | (8,464,000) | | | | (728,124) | |
| 955 | | Goldman Sachs | | Lean Hogs Futures^ | | February 14, 2014 | | | (32,981,672) | | | | (32,632,350) | | | | 349,322 | |
| 62 | | J.P. Morgan | | LME Aluminum Futures^ | | January 3, 2014 | | | (2,855,359) | | | | (2,719,863) | | | | 135,496 | |
| 81 | | J.P. Morgan | | LME Aluminum Futures^ | | January 8, 2014 | | | (3,786,582) | | | | (3,559,282) | | | | 227,300 | |
| 78 | | J.P. Morgan | | LME Aluminum Futures^ | | January 9, 2014 | | | (3,619,525) | | | | (3,428,587) | | | | 190,938 | |
| 121 | | J.P. Morgan | | LME Aluminum Futures^ | | January 10, 2014 | | | (5,699,623) | | | | (5,320,460) | | | | 379,163 | |
| 89 | | J.P. Morgan | | LME Aluminum Futures^ | | January 15, 2014 | | | (4,169,465) | | | | (3,919,894) | | | | 249,571 | |
| 16 | | J.P. Morgan | | LME Aluminum Futures^ | | January 22, 2014 | | | (743,300) | | | | (706,240) | | | | 37,060 | |
| 23 | | J.P. Morgan | | LME Aluminum Futures^ | | January 30, 2014 | | | (1,098,490) | | | | (1,017,750) | | | | 80,740 | |
| 24 | | J.P. Morgan | | LME Aluminum Futures^ | | January 31, 2014 | | | (1,127,350) | | | | (1,062,330) | | | | 65,020 | |
| 160 | | J.P. Morgan | | LME Aluminum Futures^ | | March 11, 2014 | | | (7,271,667) | | | | (7,162,440) | | | | 109,227 | |
| 169 | | J.P. Morgan | | LME Aluminum Futures^ | | March 12, 2014 | | | (7,646,899) | | | | (7,567,525) | | | | 79,374 | |
| 329 | | J.P. Morgan | | LME Aluminum Futures^ | | March 17, 2014 | | | (14,471,203) | | | | (14,761,819) | | | | (290,616) | |
| 3 | | J.P. Morgan | | LME Copper Futures^ | | February 12, 2014 | | | (535,274) | | | | (552,731) | | | | (17,457) | |
| 33 | | J.P. Morgan | | LME Copper Futures^ | | February 13, 2014 | | | (5,819,460) | | | | (6,079,945) | | | | (260,485) | |
| 246 | | J.P. Morgan | | LME Copper Futures^ | | February 14, 2014 | | | (42,893,177) | | | | (45,322,425) | | | | (2,429,248) | |
| 132 | | J.P. Morgan | | LME Copper Futures^ | | February 19, 2014 | | | (22,889,165) | | | | (24,318,525) | | | | (1,429,360) | |
| 19 | | J.P. Morgan | | LME Copper Futures^ | | February 20, 2014 | | | (3,323,441) | | | | (3,499,682) | | | | (176,241) | |
| 31 | | J.P. Morgan | | LME Copper Futures^ | | February 21, 2014 | | | (5,463,177) | | | | (5,708,844) | | | | (245,667) | |
| 73 | | J.P. Morgan | | LME Copper Futures^ | | March 3, 2014 | | | (12,698,682) | | | | (13,443,406) | | | | (744,724) | |
| 51 | | J.P. Morgan | | LME Copper Futures^ | | March 4, 2014 | | | (8,900,397) | | | | (9,391,968) | | | | (491,571) | |
| 169 | | J.P. Morgan | | LME Copper Futures^ | | March 13, 2014 | | | (30,537,948) | | | | (31,122,406) | | | | (584,458) | |
| 1,039 | | J.P. Morgan | | LME Copper Futures^ | | March 17, 2014 | | | (183,122,333) | | | | (191,327,444) | | | | (8,205,111) | |
| 34 | | J.P. Morgan | | LME Copper Futures^ | | March 18, 2014 | | | (6,162,429) | | | | (6,261,312) | | | | (98,883) | |
| 431 | | Goldman Sachs | | LME Copper Futures^ | | March 27, 2014 | | | (35,663,971) | | | | (36,597,287) | | | | (933,316) | |
| 74 | | J.P. Morgan | | LME Nickel Futures^ | | January 24, 2014 | | | (6,447,926) | | | | (6,149,031) | | | | 298,895 | |
| | | | |
| | The accompanying notes are an integral part of these financial statements. | | (Continued) |
| | | | | | | | | | | | | | | | |
| | AQR Funds | | | | | | Annual Report | | | | | | December 2013 | | 93 |
| | | | | | | | | | |
| | | | |
| Consolidated Schedule of Investments | | | December 31, 2013 | |
| | |
| AQR MANAGED FUTURES STRATEGY FUND | | |
| | | | | | | | | | | | | | | | | | |
NUMBER OF
CONTRACTS | | COUNTERPARTY | | DESCRIPTION | | EXPIRATION DATE | | VALUE AT
TRADE DATE | | | VALUE AT
DECEMBER 31,
2013 | | | UNREALIZED
APPRECIATION
(DEPRECIATION) | |
| Short Contracts: (continued) | | | | | |
| 41 | | J.P. Morgan | | LME Nickel Futures^ | | January 28, 2014 | | | $(3,594,713) | | | | $(3,407,570) | | | | $187,143 | |
| 8 | | J.P. Morgan | | LME Nickel Futures^ | | January 29, 2014 | | | (702,223) | | | | (664,924) | | | | 37,299 | |
| 41 | | J.P. Morgan | | LME Nickel Futures^ | | January 30, 2014 | | | (3,599,141) | | | | (3,407,910) | | | | 191,231 | |
| 46 | | J.P. Morgan | | LME Nickel Futures^ | | January 31, 2014 | | | (4,045,788) | | | | (3,823,695) | | | | 222,093 | |
| 33 | | J.P. Morgan | | LME Nickel Futures^ | | February 20, 2014 | | | (2,704,219) | | | | (2,745,829) | | | | (41,610) | |
| 57 | | J.P. Morgan | | LME Nickel Futures^ | | February 21, 2014 | | | (4,623,136) | | | | (4,743,074) | | | | (119,938) | |
| 49 | | J.P. Morgan | | LME Nickel Futures^ | | March 3, 2014 | | | (3,956,613) | | | | (4,079,797) | | | | (123,184) | |
| 44 | | J.P. Morgan | | LME Nickel Futures^ | | March 4, 2014 | | | (3,558,958) | | | | (3,663,707) | | | | (104,749) | |
| 57 | | J.P. Morgan | | LME Nickel Futures^ | | March 5, 2014 | | | (4,739,327) | | | | (4,746,447) | | | | (7,120) | |
| 19 | | J.P. Morgan | | LME Nickel Futures^ | | March 6, 2014 | | | (1,574,737) | | | | (1,582,243) | | | | (7,506) | |
| 34 | | J.P. Morgan | | LME Nickel Futures^ | | March 13, 2014 | | | (2,853,889) | | | | (2,832,554) | | | | 21,335 | |
| 645 | | J.P. Morgan | | LME Nickel Futures^ | | March 17, 2014 | | | (52,624,325) | | | | (53,753,532) | | | | (1,129,207) | |
| 41 | | J.P. Morgan | | LME Nickel Futures^ | | March 18, 2014 | | | (3,473,435) | | | | (3,416,738) | | | | 56,697 | |
| 42 | | J.P. Morgan | | LME Nickel Futures^ | | March 20, 2014 | | | (3,596,016) | | | | (3,500,490) | | | | 95,526 | |
| 39 | | J.P. Morgan | | LME Nickel Futures^ | | March 24, 2014 | | | (3,387,537) | | | | (3,251,236) | | | | 136,301 | |
| 49 | | J.P. Morgan | | LME Zinc Futures^ | | January 23, 2014 | | | (2,389,873) | | | | (2,507,220) | | | | (117,347) | |
| 84 | | J.P. Morgan | | LME Zinc Futures^ | | January 24, 2014 | | | (4,052,500) | | | | (4,298,553) | | | | (246,053) | |
| 109 | | J.P. Morgan | | LME Zinc Futures^ | | January 28, 2014 | | | (5,362,573) | | | | (5,580,227) | | | | (217,654) | |
| 42 | | J.P. Morgan | | LME Zinc Futures^ | | January 29, 2014 | | | (2,071,563) | | | | (2,150,400) | | | | (78,837) | |
| 100 | | J.P. Morgan | | LME Zinc Futures^ | | January 30, 2014 | | | (4,930,417) | | | | (5,120,525) | | | | (190,108) | |
| 126 | | J.P. Morgan | | LME Zinc Futures^ | | January 31, 2014 | | | (6,180,038) | | | | (6,452,555) | | | | (272,517) | |
| 40 | | J.P. Morgan | | LME Zinc Futures^ | | February 12, 2014 | | | (1,887,183) | | | | (2,051,000) | | | | (163,817) | |
| 85 | | J.P. Morgan | | LME Zinc Futures^ | | February 13, 2014 | | | (3,994,879) | | | | (4,358,821) | | | | (363,942) | |
| 165 | | J.P. Morgan | | LME Zinc Futures^ | | February 14, 2014 | | | (7,783,215) | | | | (8,462,149) | | | | (678,934) | |
| 95 | | J.P. Morgan | | LME Zinc Futures^ | | February 19, 2014 | | | (4,482,532) | | | | (4,874,687) | | | | (392,155) | |
| 105 | | J.P. Morgan | | LME Zinc Futures^ | | February 20, 2014 | | | (4,971,871) | | | | (5,388,259) | | | | (416,388) | |
| 241 | | J.P. Morgan | | LME Zinc Futures^ | | February 21, 2014 | | | (11,409,122) | | | | (12,368,421) | | | | (959,299) | |
| 134 | | J.P. Morgan | | LME Zinc Futures^ | | March 3, 2014 | | | (6,273,569) | | | | (6,882,843) | | | | (609,274) | |
| 147 | | J.P. Morgan | | LME Zinc Futures^ | | March 4, 2014 | | | (6,910,320) | | | | (7,551,206) | | | | (640,886) | |
| 71 | | J.P. Morgan | | LME Zinc Futures^ | | March 11, 2014 | | | (3,473,527) | | | | (3,649,329) | | | | (175,802) | |
| 131 | | J.P. Morgan | | LME Zinc Futures^ | | March 12, 2014 | | | (6,415,453) | | | | (6,733,826) | | | | (318,373) | |
| 97 | | J.P. Morgan | | LME Zinc Futures^ | | March 13, 2014 | | | (4,764,923) | | | | (4,986,552) | | | | (221,629) | |
| 1,436 | | J.P. Morgan | | LME Zinc Futures^ | | March 17, 2014 | | | (68,141,163) | | | | (73,877,250) | | | | (5,736,087) | |
| 95 | | J.P. Morgan | | LME Zinc Futures^ | | March 18, 2014 | | | (4,765,430) | | | | (4,886,563) | | | | (121,133) | |
| 92 | | J.P. Morgan | | LME Zinc Futures^ | | March 20, 2014 | | | (4,610,159) | | | | (4,721,900) | | | | (111,741) | |
| 88 | | J.P. Morgan | | LME Zinc Futures^ | | March 24, 2014 | | | (4,494,417) | | | | (4,518,206) | | | | (23,789) | |
| 603 | | Goldman Sachs | | Platinum Futures^ | | April 28, 2014 | | | (39,800,133) | | | | (41,420,070) | | | | (1,619,937) | |
| 3,000 | | Goldman Sachs | | Soybean Oil Futures^ | | March 14, 2014 | | | (73,281,303) | | | | (70,434,000) | | | | 2,847,303 | |
| 15,079 | | Goldman Sachs | | Sugar #11 (World Markets) Futures^ | | March 28, 2014 | | | (285,077,658) | | | | (277,139,957) | | | | 7,937,701 | |
| 1,372 | | Goldman Sachs | | Wheat Futures^ | | March 14, 2014 | | | (45,210,921) | | | | (41,523,675) | | | | 3,687,246 | |
| 236 | | Barclays Capital | | KOSPI Index 200 Futures | | March 13, 2014 | | | (28,964,471) | | | | (29,702,658) | | | | (738,187) | |
| 1,324 | | J.P. Morgan | | 3-Month Euro Euribor Futures | | June 16, 2014 | | | (453,793,418) | | | | (454,036,171) | | | | (242,753) | |
| 3,475 | | J.P. Morgan | | 90-Day Sterling Futures | | June 18, 2014 | | | (714,841,837) | | | | (714,627,818) | | | | 214,019 | |
| 2,334 | | J.P. Morgan | | 90-Day Sterling Futures | | September 17, 2014 | | | (479,592,174) | | | | (479,427,524) | | | | 164,650 | |
| 2,335 | | J.P. Morgan | | 90-Day Sterling Futures | | December 17, 2014 | | | (479,101,956) | | | | (478,859,606) | | | | 242,350 | |
| 2,683 | | J.P. Morgan | | 90-Day Sterling Futures | | March 18, 2015 | | | (549,616,537) | | | | (549,199,695) | | | | 416,842 | |
| 3,125 | | J.P. Morgan | | 90-Day Sterling Futures | | June 17, 2015 | | | (639,114,969) | | | | (638,381,670) | | | | 733,299 | |
| 3,394 | | J.P. Morgan | | 90-Day Sterling Futures | | September 16, 2015 | | | (692,670,955) | | | | (691,752,857) | | | | 918,098 | |
| 3,977 | | J.P. Morgan | | 90-Day Sterling Futures | | December 16, 2015 | | | (809,983,287) | | | | (808,560,942) | | | | 1,422,345 | |
| 3,596 | | J.P. Morgan | | Australia 10-Year Bond Futures | | March 17, 2014 | | | (364,985,961) | | | | (368,168,671) | | | | (3,182,710) | |
| 1,338 | | J.P. Morgan | | Australia 3-Year Bond Futures | | March 17, 2014 | | | (129,438,062) | | | | (129,679,665) | | | | (241,603) | |
| 1,967 | | J.P. Morgan | | Canadian 10-Year Bond Futures | | March 20, 2014 | | | (236,821,572) | | | | (234,688,237) | | | | 2,133,335 | |
| 203 | | J.P. Morgan | | Euro - Bund Futures | | March 6, 2014 | | | (39,038,999) | | | | (38,865,603) | | | | 173,396 | |
| 10,530 | | J.P. Morgan | | Euro - SCHATZ Futures | | March 6, 2014 | | | (1,597,665,489) | | | | (1,597,819,163) | | | | (153,674) | |
| | | | |
| | The accompanying notes are an integral part of these financial statements. | | (Continued) |
| | | | | | | | | | | | | | | | |
| 94 | | AQR Funds | | | | | | Annual Report | | | | | | December 2013 | | |
| | | | | | | | | | |
| | | | |
| Consolidated Schedule of Investments | | | December 31, 2013 | |
| | |
| AQR MANAGED FUTURES STRATEGY FUND | | |
| | | | | | | | | | | | | | | | | | |
NUMBER OF
CONTRACTS | | COUNTERPARTY | | DESCRIPTION | | EXPIRATION DATE | | VALUE AT
TRADE DATE | | | VALUE AT
DECEMBER 31,
2013 | | | UNREALIZED
APPRECIATION
(DEPRECIATION) | |
| Short Contracts: (continued) | | | | | |
| 2,586 | | J.P. Morgan | | Euro CHF 3-Month LIFFE Futures | | June 16, 2014 | | | $(724,783,981) | | | | $(724,807,634) | | | | $(23,653) | |
| 1,140 | | J.P. Morgan | | Euro CHF 3-Month LIFFE Futures | | September 15, 2014 | | | (319,450,143) | | | | (319,456,869) | | | | (6,726) | |
| 1,359 | | J.P. Morgan | | Euro-Buxl 30-Year Bond Futures | | March 6, 2014 | | | (229,912,178) | | | | (228,125,703) | | | | 1,786,475 | |
| 2,238 | | J.P. Morgan | | Long Gilt Futures | | March 27, 2014 | | | (402,418,404) | | | | (394,913,080) | | | | 7,505,324 | |
| 2,027 | | J.P. Morgan | | U.S. Long Bond Futures | | March 20, 2014 | | | (263,442,120) | | | | (260,089,438) | | | | 3,352,682 | |
| 2,777 | | J.P. Morgan | | U.S. Treasury 10-Year Note Futures | | March 20, 2014 | | | (345,304,599) | | | | (341,701,172) | | | | 3,603,427 | |
| 1,995 | | J.P. Morgan | | U.S. Treasury 5-Year Note Futures | | March 31, 2014 | | | (238,739,877) | | | | (238,028,438) | | | | 711,439 | |
| | | | | | | | | | | | | | | | | | |
| | | | | | | | | (11,206,528,345) | | | | (11,193,974,700) | | | | 12,553,645 | |
| | | | | | | | | | | | | | | | | | |
| | | | | | | | | $3,022,793,432 | | | | $3,145,484,480 | | | | $122,691,048 | |
| | | | | | | | | | | | | | | | | | |
Cash held as collateral at Goldman Sachs, J.P. Morgan and Barclays Capital for futures contracts was $96,559,941, $118,591,131 and $41,565,265, respectively at December 31, 2013.
^ Represents positions held in the respective Subsidiary (Note 2).
Forward foreign currency exchange contracts outstanding as of December 31, 2013:
Over the Counter
| | | | | | | | | | | | | | | | | | | | |
PURCHASE
CONTRACTS | | COUNTERPARTY | | CURRENCY | | CURRENCY
AMOUNT
PURCHASED | | | VALUE AT
SETTLEMENT
DATE | | | VALUE AT
DECEMBER 31,
2013 | | | UNREALIZED
APPRECIATION
(DEPRECIATION) | |
Swiss Franc,
Expiring 03/19/14 | | The Royal Bank of Scotland | | CHF | | | 4,428,000 | | | | $4,868,728 | | | | $4,966,909 | | | | $98,181 | |
Euro,
Expiring 03/19/14 | | Credit Suisse International | | EUR | | | 1,488,353,488 | | | | 2,038,000,926 | | | | 2,047,483,242 | | | | 9,482,316 | |
Euro,
Expiring 03/19/14 | | The Royal Bank of Scotland | | EUR | | | 1,488,353,484 | | | | 2,038,009,359 | | | | 2,047,483,239 | | | | 9,473,880 | |
British Pound,
Expiring 03/19/14 | | Credit Suisse International | | GBP | | | 253,144,498 | | | | 414,366,094 | | | | 418,973,134 | | | | 4,607,040 | |
British Pound,
Expiring 03/19/14 | | The Royal Bank of Scotland | | GBP | | | 253,144,496 | | | | 414,367,567 | | | | 418,973,130 | | | | 4,605,563 | |
Hong Kong Dollar,
Expiring 03/19/14 | | Credit Suisse International | | HKD | | | 4,482,000 | | | | 578,216 | | | | 578,050 | | | | (166) | |
Hong Kong Dollar,
Expiring 03/19/14 | | The Royal Bank of Scotland | | HKD | | | 35,900,000 | | | | 4,631,735 | | | | 4,630,078 | | | | (1,657) | |
Hungarian Forint,
Expiring 03/19/14 | | Credit Suisse International | | HUF | | | 6,263,000,001 | | | | 28,411,604 | | | | 28,864,550 | | | | 452,946 | |
Hungarian Forint,
Expiring 03/19/14 | | The Royal Bank of Scotland | | HUF | | | 6,263,000,001 | | | | 28,408,970 | | | | 28,864,550 | | | | 455,580 | |
Israeli Shekel,
Expiring 03/19/14 | | Credit Suisse International | | ILS | | | 278,305,000 | | | | 79,277,799 | | | | 80,060,009 | | | | 782,210 | |
Israeli Shekel,
Expiring 03/19/14 | | The Royal Bank of Scotland | | ILS | | | 281,305,001 | | | | 80,124,377 | | | | 80,923,022 | | | | 798,645 | |
Indian Rupee,
Expiring 03/19/14* | | Credit Suisse International | | INR | | | 2,315,000,000 | | | | 36,708,658 | | | | 36,767,684 | | | | 59,026 | |
Indian Rupee,
Expiring 03/19/14* | | The Royal Bank of Scotland | | INR | | | 2,315,000,000 | | | | 36,708,659 | | | | 36,767,684 | | | | 59,025 | |
Japanese Yen,
Expiring 03/19/14 | | Credit Suisse International | | JPY | | | 7,505,617,000 | | | | 72,893,918 | | | | 71,298,693 | | | | (1,595,225) | |
| | | | |
| | The accompanying notes are an integral part of these financial statements. | | (Continued) |
| | | | | | | | | | | | | | | | |
| | AQR Funds | | | | | | Annual Report | | | | | | December 2013 | | 95 |
| | | | | | | | | | |
| | | | |
| Consolidated Schedule of Investments | | | December 31, 2013 | |
| | |
| AQR MANAGED FUTURES STRATEGY FUND | | |
| | | | | | | | | | | | | | | | | | | | |
PURCHASE
CONTRACTS | | COUNTERPARTY | | CURRENCY | | CURRENCY
AMOUNT
PURCHASED | | | VALUE AT
SETTLEMENT
DATE | | | VALUE AT
DECEMBER 31,
2013 | | | UNREALIZED
APPRECIATION
(DEPRECIATION) | |
Japanese Yen,
Expiring 03/19/14 | | The Royal Bank of Scotland | | JPY | | | 7,505,617,000 | | | | $72,896,246 | | | | $71,298,693 | | | | $(1,597,553) | |
Korean Won,
Expiring 03/19/14* | | Credit Suisse International | | KRW | | | 195,466,860,000 | | | | 184,331,702 | | | | 184,346,359 | | | | 14,657 | |
Korean Won,
Expiring 03/19/14* | | The Royal Bank of Scotland | | KRW | | | 196,466,860,000 | | | | 185,275,348 | | | | 185,289,467 | | | | 14,119 | |
Mexican Peso,
Expiring 03/19/14 | | Credit Suisse International | | MXN | | | 854,500,000 | | | | 64,819,612 | | | | 65,055,165 | | | | 235,553 | |
Mexican Peso,
Expiring 03/19/14 | | The Royal Bank of Scotland | | MXN | | | 854,500,000 | | | | 64,822,723 | | | | 65,055,165 | | | | 232,442 | |
Norwegian Krone,
Expiring 03/19/14 | | Credit Suisse International | | NOK | | | 91,526,000 | | | | 14,892,806 | | | | 15,048,104 | | | | 155,298 | |
Norwegian Krone,
Expiring 03/19/14 | | The Royal Bank of Scotland | | NOK | | | 91,526,000 | | | | 14,893,408 | | | | 15,048,104 | | | | 154,696 | |
New Zealand Dollar,
Expiring 03/19/14 | | Credit Suisse International | | NZD | | | 498,234,002 | | | | 408,792,785 | | | | 407,513,066 | | | | (1,279,719) | |
New Zealand Dollar,
Expiring 03/19/14 | | The Royal Bank of Scotland | | NZD | | | 498,234,000 | | | | 408,791,146 | | | | 407,513,065 | | | | (1,278,081) | |
Philippine Peso,
Expiring 03/19/14* | | The Royal Bank of Scotland | | PHP | | | 10,000,000 | | | | 225,734 | | | | 225,555 | | | | (179) | |
Poland Zloty,
Expiring 03/19/14 | | Credit Suisse International | | PLN | | | 389,755,000 | | | | 126,835,459 | | | | 128,417,041 | | | | 1,581,582 | |
Poland Zloty,
Expiring 03/19/14 | | The Royal Bank of Scotland | | PLN | | | 389,755,000 | | | | 126,832,680 | | | | 128,417,041 | | | | 1,584,361 | |
Russian Ruble,
Expiring 03/19/14* | | Credit Suisse International | | RUB | | | 244,100,000 | | | | 7,332,127 | | | | 7,330,424 | | | | (1,703) | |
Russian Ruble,
Expiring 03/19/14* | | The Royal Bank of Scotland | | RUB | | | 244,100,000 | | | | 7,332,171 | | | | 7,330,424 | | | | (1,747) | |
Swedish Krona,
Expiring 03/19/14 | | Credit Suisse International | | SEK | | | 550,265,500 | | | | 84,076,194 | | | | 85,443,500 | | | | 1,367,306 | |
Swedish Krona,
Expiring 03/19/14 | | The Royal Bank of Scotland | | SEK | | | 550,265,500 | | | | 84,078,246 | | | | 85,443,500 | | | | 1,365,254 | |
Singapore Dollar,
Expiring 03/19/14 | | Credit Suisse International | | SGD | | | 88,045,000 | | | | 70,471,663 | | | | 69,771,220 | | | | (700,443) | |
Singapore Dollar,
Expiring 03/19/14 | | The Royal Bank of Scotland | | SGD | | | 88,045,000 | | | | 70,473,231 | | | | 69,771,220 | | | | (702,011) | |
Taiwanese Dollar,
Expiring 03/19/14* | | Credit Suisse International | | TWD | | | 528,150,000 | | | | 17,966,383 | | | | 17,759,214 | | | | (207,169) | |
Taiwanese Dollar,
Expiring 03/19/14* | | The Royal Bank of Scotland | | TWD | | | 528,149,999 | | | | 17,966,276 | | | | 17,759,214 | | | | (207,062) | |
| | | | | | | | | | | | | | | | | | | | |
| | | | | | | | | | | $7,310,462,550 | | | | $7,340,469,515 | | | | $30,006,965 | |
| | | | | | | | | | | | | | | | | | | | |
| | | | | | | | | | | | | | | | | | | | |
SALES
CONTRACTS | | COUNTERPARTY | | CURRENCY | | CURRENCY
AMOUNT
SOLD | | | VALUE AT
SETTLEMENT
DATE | | | VALUE AT
DECEMBER 31,
2013 | | | UNREALIZED
APPRECIATION
(DEPRECIATION) | |
Australian Dollar,
Expiring 03/19/14 | | Credit Suisse International | | AUD | | | (553,201,500) | | | | $(497,921,264) | | | | $(491,538,896) | | | | $6,382,368 | |
Australian Dollar,
Expiring 03/19/14 | | The Royal Bank of Scotland | | AUD | | | (553,201,500) | | | | (497,914,503) | | | | (491,538,896) | | | | 6,375,607 | |
Brazilian Real,
Expiring 03/19/14* | | Credit Suisse International | | BRL | | | (133,530,000) | | | | (55,605,261) | | | | (55,572,746) | | | | 32,515 | |
| | | | |
| | The accompanying notes are an integral part of these financial statements. | | (Continued) |
| | | | | | | | | | | | | | | | |
| 96 | | AQR Funds | | | | | | Annual Report | | | | | | December 2013 | | |
| | | | | | | | | | |
| | | | |
| Consolidated Schedule of Investments | | | December 31, 2013 | |
| | |
| AQR MANAGED FUTURES STRATEGY FUND | | |
| | | | | | | | | | | | | | | | | | | | |
SALES
CONTRACTS | | COUNTERPARTY | | CURRENCY | | CURRENCY
AMOUNT
SOLD | | | VALUE AT
SETTLEMENT
DATE | | | VALUE AT
DECEMBER 31,
2013 | | | UNREALIZED
APPRECIATION
(DEPRECIATION) | |
Brazilian Real,
Expiring 03/19/14* | | The Royal Bank of Scotland | | BRL | | | (133,530,000) | | | | $(55,604,503) | | | | $(55,572,745) | | | | $31,758 | |
Canadian Dollar,
Expiring 03/19/14 | | Credit Suisse International | | CAD | | | (472,654,501) | | | | (443,099,542) | | | | (444,140,733) | | | | (1,041,191) | |
Canadian Dollar,
Expiring 03/19/14 | | The Royal Bank of Scotland | | CAD | | | (472,654,500) | | | | (443,096,687) | | | | (444,140,732) | | | | (1,044,045) | |
Swiss Franc,
Expiring 03/19/14 | | Credit Suisse International | | CHF | | | (1,897,000) | | | | (2,101,764) | | | | (2,127,874) | | | | (26,110) | |
Swiss Franc,
Expiring 03/19/14 | | The Royal Bank of Scotland | | CHF | | | (11,441,000) | | | | (12,830,686) | | | | (12,833,426) | | | | (2,740) | |
Chilean Peso,
Expiring 03/19/14* | | Credit Suisse International | | CLP | | | (13,124,000,000) | | | | (24,342,226) | | | | (24,767,587) | | | | (425,361) | |
Chilean Peso,
Expiring 03/19/14* | | The Royal Bank of Scotland | | CLP | | | (13,124,000,000) | | | | (24,342,031) | | | | (24,767,587) | | | | (425,556) | |
Columbian Peso,
Expiring 03/19/14* | | Credit Suisse International | | COP | | | (22,515,000,000) | | | | (11,508,941) | | | | (11,619,519) | | | | (110,578) | |
Columbian Peso,
Expiring 03/19/14* | | The Royal Bank of Scotland | | COP | | | (28,515,000,000) | | | | (14,581,867) | | | | (14,715,993) | | | | (134,126) | |
Czech Republic Koruna,
Expiring 03/19/14 | | Credit Suisse International | | CZK | | | (954,916,000) | | | | (47,678,848) | | | | (48,114,842) | | | | (435,994) | |
Czech Republic Koruna,
Expiring 03/19/14 | | The Royal Bank of Scotland | | CZK | | | (954,916,000) | | | | (47,679,265) | | | | (48,114,842) | | | | (435,577) | |
Euro,
Expiring 03/19/14 | | Credit Suisse International | | EUR | | | (12,251,000) | | | | (16,797,793) | | | | (16,853,333) | | | | (55,540) | |
Euro,
Expiring 03/19/14 | | The Royal Bank of Scotland | | EUR | | | (14,677,000) | | | | (20,118,639) | | | | (20,190,709) | | | | (72,070) | |
British Pound,
Expiring 03/19/14 | | Credit Suisse International | | GBP | | | (69,596,000) | | | | (113,912,991) | | | | (115,186,600) | | | | (1,273,609) | |
British Pound,
Expiring 03/19/14 | | The Royal Bank of Scotland | | GBP | | | (69,596,000) | | | | (113,911,247) | | | | (115,186,600) | | | | (1,275,353) | |
Hong Kong Dollar,
Expiring 03/19/14 | | The Royal Bank of Scotland | | HKD | | | (17,997,000) | | | | (2,321,405) | | | | (2,321,100) | | | | 305 | |
Hungarian Forint,
Expiring 03/19/14 | | Credit Suisse International | | HUF | | | (4,750,000,000) | | | | (21,338,719) | | | | (21,891,525) | | | | (552,806) | |
Hungarian Forint,
Expiring 03/19/14 | | The Royal Bank of Scotland | | HUF | | | (4,750,000,000) | | | | (21,342,114) | | | | (21,891,524) | | | | (549,410) | |
Indonesian Rupiah,
Expiring 03/19/14* | | Credit Suisse International | | IDR | | | (389,050,000,000) | | | | (31,544,835) | | | | (31,536,004) | | | | 8,831 | |
Indonesian Rupiah,
Expiring 03/19/14* | | The Royal Bank of Scotland | | IDR | | | (409,050,000,000) | | | | (33,155,037) | | | | (33,157,184) | | | | (2,147) | |
Israeli Shekel,
Expiring 03/19/14 | | Credit Suisse International | | ILS | | | (21,500,000) | | | | (6,127,089) | | | | (6,184,906) | | | | (57,817) | |
Israeli Shekel,
Expiring 03/19/14 | | The Royal Bank of Scotland | | ILS | | | (21,500,000) | | | | (6,127,698) | | | | (6,184,906) | | | | (57,208) | |
Indian Rupee,
Expiring 03/19/14* | | Credit Suisse International | | INR | | | (2,793,800,000) | | | | (44,550,941) | | | | (44,372,162) | | | | 178,779 | |
Indian Rupee,
Expiring 03/19/14* | | The Royal Bank of Scotland | | INR | | | (2,793,800,000) | | | | (44,551,185) | | | | (44,372,162) | | | | 179,023 | |
Japanese Yen,
Expiring 03/19/14 | | Credit Suisse International | | JPY | | | (182,866,096,500) | | | | (1,777,488,913) | | | | (1,737,114,175) | | | | 40,374,738 | |
Japanese Yen,
Expiring 03/19/14 | | The Royal Bank of Scotland | | JPY | | | (182,921,985,500) | | | | (1,778,028,098) | | | | (1,737,645,085) | | | | 40,383,013 | |
| | | | |
| | The accompanying notes are an integral part of these financial statements. | | (Continued) |
| | | | | | | | | | | | | | | | |
| | AQR Funds | | | | | | Annual Report | | | | | | December 2013 | | 97 |
| | | | | | | | | | |
| | | | |
| Consolidated Schedule of Investments | | | December 31, 2013 | |
| | |
| AQR MANAGED FUTURES STRATEGY FUND | | |
| | | | | | | | | | | | | | | | | | | | |
SALES
CONTRACTS | | COUNTERPARTY | | CURRENCY | | CURRENCY
AMOUNT
SOLD | | | VALUE AT
SETTLEMENT
DATE | | | VALUE AT
DECEMBER 31,
2013 | | | UNREALIZED
APPRECIATION
(DEPRECIATION) | |
Korean Won,
Expiring 03/19/14* | | Credit Suisse International | | KRW | | | (2,500,000,000) | | | | $(2,348,963) | | | | $(2,357,770) | | | | $(8,807) | |
Korean Won,
Expiring 03/19/14* | | The Royal Bank of Scotland | | KRW | | | (2,500,000,000) | | | | (2,348,938) | | | | (2,357,770) | | | | (8,832) | |
Mexican Peso,
Expiring 03/19/14 | | Credit Suisse International | | MXN | | | (560,000,000) | | | | (42,817,633) | | | | (42,634,162) | | | | 183,471 | |
Mexican Peso,
Expiring 03/19/14 | | The Royal Bank of Scotland | | MXN | | | (560,000,000) | | | | (42,818,251) | | | | (42,634,162) | | | | 184,089 | |
Malaysian Ringgit,
Expiring 03/19/14* | | Credit Suisse International | | MYR | | | (139,155,000) | | | | (42,764,058) | | | | (42,292,213) | | | | 471,845 | |
Malaysian Ringgit,
Expiring 03/19/14* | | The Royal Bank of Scotland | | MYR | | | (139,155,000) | | | | (42,763,558) | | | | (42,292,213) | | | | 471,345 | |
Norwegian Krone,
Expiring 03/19/14 | | Credit Suisse International | | NOK | | | (1,611,175,501) | | | | (261,525,218) | | | | (264,898,905) | | | | (3,373,687) | |
Norwegian Krone,
Expiring 03/19/14 | | The Royal Bank of Scotland | | NOK | | | (1,611,175,501) | | | | (261,525,867) | | | | (264,898,905) | | | | (3,373,038) | |
New Zealand Dollar,
Expiring 03/19/14 | | Credit Suisse International | | NZD | | | (268,035,000) | | | | (219,522,707) | | | | (219,229,849) | | | | 292,858 | |
New Zealand Dollar,
Expiring 03/19/14 | | The Royal Bank of Scotland | | NZD | | | (268,035,000) | | | | (219,516,769) | | | | (219,229,849) | | | | 286,920 | |
Philippine Peso,
Expiring 03/19/14* | | Credit Suisse International | | PHP | | | (3,682,750,000) | | | | (83,365,332) | | | | (83,066,429) | | | | 298,903 | |
Philippine Peso,
Expiring 03/19/14* | | The Royal Bank of Scotland | | PHP | | | (3,682,750,000) | | | | (83,364,997) | | | | (83,066,429) | | | | 298,568 | |
Russian Ruble,
Expiring 03/19/14* | | Credit Suisse International | | RUB | | | (3,220,000,000) | | | | (95,764,146) | | | | (96,697,928) | | | | (933,782) | |
Russian Ruble,
Expiring 03/19/14* | | The Royal Bank of Scotland | | RUB | | | (3,230,000,000) | | | | (96,062,831) | | | | (96,998,232) | | | | (935,401) | |
Swedish Krona,
Expiring 03/19/14 | | Credit Suisse International | | SEK | | | (1,833,586,500) | | | | (280,170,065) | | | | (284,713,557) | | | | (4,543,492) | |
Swedish Krona,
Expiring 03/19/14 | | The Royal Bank of Scotland | | SEK | | | (1,833,586,499) | | | | (280,170,546) | | | | (284,713,556) | | | | (4,543,010) | |
Singapore Dollar,
Expiring 03/19/14 | | Credit Suisse International | | SGD | | | (83,500,000) | | | | (66,229,573) | | | | (66,169,536) | | | | 60,037 | |
Singapore Dollar,
Expiring 03/19/14 | | The Royal Bank of Scotland | | SGD | | | (83,500,000) | | | | (66,231,749) | | | | (66,169,536) | | | | 62,213 | |
Turkish Lira,
Expiring 03/19/14 | | Credit Suisse International | | TRY | | | (218,045,000) | | | | (104,661,140) | | | | (99,860,954) | | | | 4,800,186 | |
Turkish Lira,
Expiring 03/19/14 | | The Royal Bank of Scotland | | TRY | | | (218,045,000) | | | | (104,646,357) | | | | (99,860,954) | | | | 4,785,403 | |
Taiwanese Dollar,
Expiring 03/19/14* | | Credit Suisse International | | TWD | | | (1,655,000,000) | | | | (55,973,382) | | | | (55,649,909) | | | | 323,473 | |
Taiwanese Dollar,
Expiring 03/19/14* | | The Royal Bank of Scotland | | TWD | | | (1,655,000,000) | | | | (55,972,570) | | | | (55,649,909) | | | | 322,661 | |
South African Rand,
Expiring 03/19/14 | | Credit Suisse International | | ZAR | | | (1,177,300,000) | | | | (111,843,053) | | | | (111,017,412) | | | | 825,641 | |
South African Rand,
Expiring 03/19/14 | | The Royal Bank of Scotland | | ZAR | | | (1,177,300,000) | | | | (111,845,536) | | | | (111,017,412) | | | | 828,124 | |
| | | | | | | | | | | | | | | | | | | | |
| | | | | | | | | | | (8,943,877,331) | | | | (8,861,131,944) | | | | 82,745,387 | |
| | | | | | | | | | | | | | | | | | | | |
| | | | | | | | | | | $(1,633,414,781) | | | | $(1,520,662,429) | | | | $112,752,352 | |
| | | | | | | | | | | | | | | | | | | | |
| | | | |
| | The accompanying notes are an integral part of these financial statements. | | (Continued) |
| | | | | | | | | | | | | | | | |
| 98 | | AQR Funds | | | | | | Annual Report | | | | | | December 2013 | | |
| | | | | | | | | | |
| | | | |
| Consolidated Schedule of Investments | | | December 31, 2013 | |
| | |
| AQR MANAGED FUTURES STRATEGY FUND | | |
Money Market Fund is pledged as collateral to The Royal Bank of Scotland for forward foreign currency exchange contracts in the amount of $9,324.
Additional cash held as collateral for forward currency exchange contracts for Credit Suisse International and The Royal Bank of Scotland was $57,820,000 and $71,680,000, respectively, at December 31, 2013.
| * | Non deliverable forward. See Note 3 in the Notes to Financial Statements. |
AUD - Australian Dollar
BRL - Brazilian Real
CAD - Canadian Dollar
CHF - Swiss Franc
CLP - Chilean Peso
COP - Columbian Peso
CZK - Czech Republic Koruna
EUR - Euro
GBP - British Pound
HKD - Hong Kong Dollar
HUF - Hungarian Forint
IDR - Indonesian Rupiah
ILS - Israeli Shekel
INR - Indian Rupee
JPY - Japanese Yen
KRW - Korean Won
MXN - Mexican Peso
MYR - Malaysian Ringgit
NOK - Norwegian Krone
NZD - New Zealand Dollar
PHP - Philippine Peso
PLN - Poland Zloty
RUB - Russian Ruble
SEK - Swedish Krona
SGD - Singapore Dollar
TRY - Turkish Lira
TWD - Taiwanese Dollar
USD - United States Dollar
ZAR - South African Rand
| | | | |
| | The accompanying notes are an integral part of these financial statements. | | |
| | | | | | | | | | | | | | | | |
| | AQR Funds | | | | | | Annual Report | | | | | | December 2013 | | 99 |
| | | | | | | | | | |
| | | | |
| Consolidated Schedule of Investments | | | December 31, 2013 | |
| | |
| AQR MANAGED FUTURES STRATEGY HV FUND | | |
| | | | | | | | |
| MONEY MARKET FUND - 74.8% | | SHARES | | |
VALUE
(Note 3) | |
J.P. Morgan U.S. Treasury Plus Money
Market Fund - Institutional Shares, 0.000% (a)(b)^
(Cost $28,980,474) | | | 28,980,474 | | | $ | 28,980,474 | |
| | | | | | | | |
| | | PRINCIPAL
AMOUNT
(000’s) | | | | |
| SHORT-TERM INVESTMENTS - 14.7% | | | | | |
U.S. Treasury Bill,
0.066%, 01/30/2014 (c) | | $ | 2,838 | | | | 2,838,260 | |
U.S. Treasury Bill,
0.073%, 02/06/2014 (c) | | | 2,838 | | | | 2,838,257 | |
| | | | | | | | |
TOTAL SHORT-TERM INVESTMENTS
(Cost $5,676,241) | | | | | | | 5,676,517 | |
| | | | | | | | |
TOTAL INVESTMENTS - 89.5%
(Cost $34,656,715) | | | | | | | 34,656,991 | |
| | | | | | | | |
| OTHER ASSETS IN EXCESS OF LIABILITIES - 10.5% (d) | | | | | | | 4,064,414 | |
| | | | | | | | |
NET ASSETS - 100.0% | | | | | | $ | 38,721,405 | |
| | | | | | | | |
| (a) | Represents annualized seven-day yield as of December 31, 2013. |
| (b) | A portion of the security is pledged as collateral to the brokers for swap contracts. |
| (c) | The rate shown is the effective yield at the date of purchase. |
| (d) | Includes appreciation on forward foreign currency exchange, futures and swap contracts. |
| ^ | All or a portion represents positions held in the respective Subsidiary (Note 2). |
All securities are Level 2 with respect to ASC 820 (See Note 5).
Total return swap contracts outstanding as of December 31, 2013:
Over the Counter
| | | | | | | | | | | | | | | | |
| COUNTERPARTY | | UNDERLYING REFERENCE
INSTRUMENT | | TERMINATION
DATE | | CURRENCY | | | NOTIONAL
VALUE | | | UNREALIZED
APPRECIATION
(DEPRECIATION) | |
| Barclays Capital | | Brent Crude Futures^ | | 1/16/2014 | | | USD | | | | (674,040) | | | | $9,239 | |
| Barclays Capital | | Brent Crude Futures^ | | 1/16/2014 | | | USD | | | | 662,610 | | | | 2,190 | |
| Barclays Capital | | Brent Crude Futures^ | | 2/13/2014 | | | USD | | | | 672,000 | | | | (8,820) | |
| Barclays Capital | | Cocoa Futures^ | | 3/14/2014 | | | GBP | | | | 213,887 | | | | (10,411) | |
| Barclays Capital | | Cocoa Futures^ | | 3/14/2014 | | | USD | | | | 139,640 | | | | (4,190) | |
| Barclays Capital | | Coffee ‘C’ Futures^ | | 3/19/2014 | | | USD | | | | (406,312) | | | | (8,813) | |
| Barclays Capital | | Corn Futures^ | | 3/14/2014 | | | USD | | | | (1,373,207) | | | | 43,908 | |
| Bank of America | | Euro - SCHATZ Futures | | 3/6/2014 | | | EUR | | | | (2,646,052) | | | | (1,584) | |
| Barclays Capital | | Gas Oil Futures^ | | 1/10/2014 | | | USD | | | | 474,930 | | | | (3,478) | |
| Barclays Capital | | Gas Oil Futures^ | | 1/10/2014 | | | USD | | | | (465,375) | | | | (6,076) | |
| Barclays Capital | | Gas Oil Futures^ | | 2/12/2014 | | | USD | | | | 189,150 | | | | (719) | |
| Barclays Capital | | Gas Oil Futures^ | | 2/12/2014 | | | USD | | | | (191,020) | | | | 2,588 | |
| Barclays Capital | | Gasoline RBOB Futures^ | | 12/31/2013 | | | USD | | | | 1,029,668 | | | | 24,082 | |
| Barclays Capital | | Gasoline RBOB Futures^ | | 12/31/2013 | | | USD | | | | (962,842) | | | | (90,905) | |
| Barclays Capital | | Gasoline RBOB Futures^ | | 1/31/2014 | | | USD | | | | 804,577 | | | | 13,809 | |
| Barclays Capital | | Gasoline RBOB Futures^ | | 1/31/2014 | | | USD | | | | (692,950) | | | | (8,525) | |
| Barclays Capital | | Gold 100 OZ Futures^ | | 2/26/2014 | | | USD | | | | (2,153,920) | | | | 110,010 | |
| Barclays Capital | | Heating Oil Futures^ | | 1/31/2014 | | | USD | | | | 1,285,074 | | | | 7,350 | |
| Barclays Capital | | Heating Oil Futures^ | | 1/31/2014 | | | USD | | | | (1,207,542) | | | | (84,878) | |
| Barclays Capital | | Heating Oil Futures^ | | 1/31/2014 | | | USD | | | | 1,020,625 | | | | 9,040 | |
| Barclays Capital | | Heating Oil Futures^ | | 1/31/2014 | | | USD | | | | (1,285,410) | | | | (1,674) | |
| Bank of America | | H-SHARES Index Futures | | 1/29/2014 | | | HKD | | | | 1,602,620 | | | | 2,880 | |
| Barclays Capital | | Lean Hogs Futures^ | | 2/14/2014 | | | USD | | | | 440,026 | | | | (29,981) | |
| Barclays Capital | | Lean Hogs Futures^ | | 2/14/2014 | | | USD | | | | (455,957) | | | | 11,745 | |
| Barclays Capital | | LME Aluminum Futures^ | | 3/17/2014 | | | USD | | | | 449,375 | | | | (687) | |
| Barclays Capital | | LME Aluminum Futures^ | | 3/17/2014 | | | USD | | | | (1,091,629) | | | | (30,090) | |
| Barclays Capital | | LME Copper Futures^ | | 3/27/2014 | | | USD | | | | (81,350) | | | | (3,562) | |
| | | | |
| | The accompanying notes are an integral part of these financial statements. | | (Continued) |
| | | | | | | | | | | | | | | | |
| 100 | | AQR Funds | | | | | | Annual Report | | | | | | December 2013 | | |
| | | | | | | | | | |
| | | | |
| Consolidated Schedule of Investments | | | December 31, 2013 | |
| | |
| AQR MANAGED FUTURES STRATEGY HV FUND | | |
| | | | | | | | | | | | | | | | |
| COUNTERPARTY | | UNDERLYING REFERENCE
INSTRUMENT | | TERMINATION
DATE | | CURRENCY | | | NOTIONAL
VALUE | | | UNREALIZED
APPRECIATION
(DEPRECIATION) | |
| Bank of America | | Mini Japanese 10-Year Treasury Bond | | 3/10/2014 | | | JPY | | | | 129,508,830 | | | | $(5,342) | |
| Bank of America | | MSCI Taiwan Stock Index Futures | | 1/28/2014 | | | USD | | | | 147,802 | | | | 3,798 | |
| Barclays Capital | | Natural Gas Swap Futures^ | | 1/29/2014 | | | USD | | | | 515,640 | | | | $(8,038) | |
| Barclays Capital | | Natural Gas Swap Futures^ | | 1/29/2014 | | | USD | | | | (478,200) | | | | (29,393) | |
| Barclays Capital | | Natural Gas Swap Futures^ | | 1/31/2014 | | | USD | | | | 478,560 | | | | 50,278 | |
| Barclays Capital | | Natural Gas Swap Futures^ | | 1/31/2014 | | | USD | | | | (434,160) | | | | (94,676) | |
| Barclays Capital | | Platinum Futures^ | | 4/28/2014 | | | USD | | | | (1,059,817) | | | | (39,223) | |
| Barclays Capital | | Silver Futures^ | | 3/27/2014 | | | USD | | | | 391,900 | | | | (4,498) | |
| Barclays Capital | | Silver Futures^ | | 3/27/2014 | | | USD | | | | (1,550,853) | | | | 98,061 | |
| Barclays Capital | | Soybean Futures^ | | 3/14/2014 | | | USD | | | | 2,112,679 | | | | (44,679) | |
| Barclays Capital | | Soybean Meal Futures^ | | 3/14/2014 | | | USD | | | | 814,280 | | | | (21,980) | |
| Barclays Capital | | Soybean Oil Futures^ | | 3/14/2014 | | | USD | | | | (500,970) | | | | 7,932 | |
| Barclays Capital | | Sugar #11 (World Markets) Futures^ | | 2/28/2014 | | | USD | | | | (182,336) | | | | (1,456) | |
| Bank of America | | Swiss Market Index Futures | | 3/21/2014 | | | CHF | | | | 467,753 | | | | 21,220 | |
| Bank of America | | U.S. Treasury 2-Year Note Futures | | 3/31/2014 | | | USD | | | | 10,793,404 | | | | (22,592) | |
| Barclays Capital | | Wheat Futures^ | | 3/14/2014 | | | USD | | | | (2,172,592) | | | | 114,742 | |
| Barclays Capital | | Wheat Futures^ | | 3/14/2014 | | | USD | | | | (660,217) | | | | 19,717 | |
| Barclays Capital | | WTI Crude Oil Futures^ | | 1/21/2014 | | | USD | | | | 787,700 | | | | (340) | |
| Barclays Capital | | WTI Crude Oil Futures^ | | 1/21/2014 | | | USD | | | | (873,790) | | | | (11,988) | |
| | | | | | | | | | | | | | | | |
| | | | | | | | | | | | | | | $(26,009) | |
| | | | | | | | | | | | | | | | |
Money Market Fund is pledged as collateral to Bank of America and Barclays Capital for total return swap contracts in the amount of $120,001 and $1,540,000, respectively, at December 31, 2013.
^ Represents positions held in the respective Subsidiary (Note 2).
Open futures contracts outstanding at December 31, 2013:
Exchange Traded
| | | | | | | | | | | | | | | | | | | | |
NUMBER OF
CONTRACTS | | COUNTERPARTY | | DESCRIPTION | | EXPIRATION
DATE | | | VALUE AT
TRADE DATE | | | VALUE AT
DECEMBER 31,
2013 | | | UNREALIZED
APPRECIATION
(DEPRECIATION) | |
| Long Contracts: | | | | | | | | | | | | | | | | |
| 2 | | Goldman Sachs | | Brent Crude Futures^ | | | February 13, 2014 | | | | $222,347 | | | | $221,060 | | | | $(1,287) | |
| 12 | | Goldman Sachs | | Cocoa Futures^ | | | March 14, 2014 | | | | 332,134 | | | | 328,196 | | | | (3,938) | |
| 1 | | J.P. Morgan | | LME Aluminum Futures^ | | | January 3, 2014 | | | | 46,050 | | | | 43,869 | | | | (2,181) | |
| 1 | | J.P. Morgan | | LME Aluminum Futures^ | | | January 9, 2014 | | | | 46,681 | | | | 43,957 | | | | (2,724) | |
| 1 | | J.P. Morgan | | LME Aluminum Futures^ | | | January 15, 2014 | | | | 46,767 | | | | 44,044 | | | | (2,723) | |
| 1 | | J.P. Morgan | | LME Aluminum Futures^ | | | February 5, 2014 | | | | 45,427 | | | | 44,332 | | | | (1,095) | |
| 1 | | J.P. Morgan | | LME Aluminum Futures^ | | | March 5, 2014 | | | | 44,498 | | | | 44,688 | | | | 190 | |
| 1 | | J.P. Morgan | | LME Aluminum Futures^ | | | March 17, 2014 | | | | 44,433 | | | | 44,868 | | | | 435 | |
| 1 | | J.P. Morgan | | LME Copper Futures^ | | | February 7, 2014 | | | | 178,221 | | | | 184,226 | | | | 6,005 | |
| 2 | | J.P. Morgan | | LME Copper Futures^ | | | February 14, 2014 | | | | 348,410 | | | | 368,475 | | | | 20,065 | |
| 1 | | J.P. Morgan | | LME Copper Futures^ | | | February 19, 2014 | | | | 173,977 | | | | 184,231 | | | | 10,254 | |
| 4 | | J.P. Morgan | | LME Copper Futures^ | | | March 17, 2014 | | | | 727,789 | | | | 736,600 | | | | 8,811 | |
| 1 | | J.P. Morgan | | LME Nickel Futures^ | | | January 30, 2014 | | | | 87,795 | | | | 83,120 | | | | (4,675) | |
| 1 | | J.P. Morgan | | LME Nickel Futures^ | | | March 3, 2014 | | | | 80,702 | | | | 83,261 | | | | 2,559 | |
| 1 | | J.P. Morgan | | LME Nickel Futures^ | | | March 12, 2014 | | | | 85,192 | | | | 83,305 | | | | (1,887) | |
| 1 | | J.P. Morgan | | LME Nickel Futures^ | | | March 17, 2014 | | | | 84,587 | | | | 83,340 | | | | (1,247) | |
| 1 | | J.P. Morgan | | LME Zinc Futures^ | | | January 28, 2014 | | | | 49,092 | | | | 51,195 | | | | 2,103 | |
| 1 | | J.P. Morgan | | LME Zinc Futures^ | | | January 29, 2014 | | | | 49,237 | | | | 51,200 | | | | 1,963 | |
| 1 | | J.P. Morgan | | LME Zinc Futures^ | | | January 30, 2014 | | | | 49,355 | | | | 51,205 | | | | 1,850 | |
| 1 | | J.P. Morgan | | LME Zinc Futures^ | | | January 31, 2014 | | | | 48,956 | | | | 51,210 | | | | 2,254 | |
| 1 | | J.P. Morgan | | LME Zinc Futures^ | | | February 12, 2014 | | | | 47,165 | | | | 51,275 | | | | 4,110 | |
| | | | |
| | The accompanying notes are an integral part of these financial statements. | | (Continued) |
| | | | | | | | | | | | | | | | |
| | AQR Funds | | | | | | Annual Report | | | | | | December 2013 | | 101 |
| | | | | | | | | | |
| | | | |
| Consolidated Schedule of Investments | | | December 31, 2013 | |
| | |
| AQR MANAGED FUTURES STRATEGY HV FUND | | |
| | | | | | | | | | | | | | | | | | | | |
NUMBER OF
CONTRACTS | | COUNTERPARTY | | DESCRIPTION | | EXPIRATION
DATE | | | VALUE AT
TRADE DATE | | | VALUE AT
DECEMBER 31,
2013 | | | UNREALIZED
APPRECIATION
(DEPRECIATION) | |
| Long Contracts: (continued) | | | | | | | | | | | | | | | | | | |
| 1 | | J.P. Morgan | | LME Zinc Futures^ | | | February 13, 2014 | | | | $47,052 | | | | $51,280 | | | | $4,228 | |
| 1 | | J.P. Morgan | | LME Zinc Futures^ | | | February 14, 2014 | | | | 47,065 | | | | 51,286 | | | | 4,221 | |
| 1 | | J.P. Morgan | | LME Zinc Futures^ | | | February 19, 2014 | | | | 47,296 | | | | 51,313 | | | | 4,017 | |
| 1 | | J.P. Morgan | | LME Zinc Futures^ | | | February 20, 2014 | | | | 47,221 | | | | 51,317 | | | | 4,096 | |
| 1 | | J.P. Morgan | | LME Zinc Futures^ | | | February 21, 2014 | | | | 47,252 | | | | 51,321 | | | | 4,069 | |
| 1 | | J.P. Morgan | | LME Zinc Futures^ | | | March 3, 2014 | | | | 46,915 | | | | 51,365 | | | | 4,450 | |
| 1 | | J.P. Morgan | | LME Zinc Futures^ | | | March 10, 2014 | | | | 48,377 | | | | 51,395 | | | | 3,018 | |
| 2 | | J.P. Morgan | | LME Zinc Futures^ | | | March 11, 2014 | | | | 97,539 | | | | 102,798 | | | | 5,259 | |
| 1 | | J.P. Morgan | | LME Zinc Futures^ | | | March 12, 2014 | | | | 49,147 | | | | 51,403 | | | | 2,256 | |
| 1 | | J.P. Morgan | | LME Zinc Futures^ | | | March 13, 2014 | | | | 49,055 | | | | 51,407 | | | | 2,352 | |
| 6 | | J.P. Morgan | | LME Zinc Futures^ | | | March 17, 2014 | | | | 294,757 | | | | 308,699 | | | | 13,942 | |
| 1 | | J.P. Morgan | | LME Zinc Futures^ | | | March 18, 2014 | | | | 50,019 | | | | 51,437 | | | | 1,418 | |
| 20 | | Goldman Sachs | | Natural Gas Futures^ | | | January 29, 2014 | | | | 879,818 | | | | 846,000 | | | | (33,818) | |
| 10 | | Barclays Capital | | Amsterdam Index Futures | | | January 17, 2014 | | | | 1,056,403 | | | | 1,107,026 | | | | 50,623 | |
| 12 | | Barclays Capital | | CAC40 Index Futures | | | January 17, 2014 | | | | 679,560 | | | | 709,614 | | | | 30,054 | |
| 7 | | Barclays Capital | | DAX Index Futures | | | March 21, 2014 | | | | 2,215,534 | | | | 2,312,500 | | | | 96,966 | |
| 31 | | Barclays Capital | | DJIA Mini E-CBOT Futures | | | March 21, 2014 | | | | 2,446,121 | | | | 2,556,570 | | | | 110,449 | |
| 15 | | Barclays Capital | | E-Mini Russell 2000 Futures | | | March 21, 2014 | | | | 1,652,712 | | | | 1,742,100 | | | | 89,388 | |
| 36 | | Barclays Capital | | Euro Stoxx 50 Index | | | March 21, 2014 | | | | 1,474,979 | | | | 1,539,243 | | | | 64,264 | |
| 9 | | Barclays Capital | | FTSE 100 Index Futures | | | March 21, 2014 | | | | 968,876 | | | | 998,165 | | | | 29,289 | |
| 8 | | J.P. Morgan | | FTSE/JSE Top 40 Index Futures | | | March 20, 2014 | | | | 299,791 | | | | 318,017 | | | | 18,226 | |
| 4 | | Barclays Capital | | FTSE/MIB Index Futures | | | March 21, 2014 | | | | 504,129 | | | | 523,454 | | | | 19,325 | |
| 1 | | Barclays Capital | | Hang Seng Index Futures | | | January 29, 2014 | | | | 148,003 | | | | 150,452 | | | | 2,449 | |
| 6 | | Barclays Capital | | IBEX 35 Index Futures | | | January 17, 2014 | | | | 774,301 | | | | 814,640 | | | | 40,339 | |
| 6 | | Barclays Capital | | MSCI Singapore Index Futures | | | January 29, 2014 | | | | 339,700 | | | | 347,272 | | | | 7,572 | |
| 11 | | Barclays Capital | | MSCI Taiwan Stock Index Futures | | | January 28, 2014 | | | | 326,531 | | | | 333,520 | | | | 6,989 | |
| 36 | | Barclays Capital | | NASDAQ 100 E-Mini Futures | | | March 21, 2014 | | | | 2,491,878 | | | | 2,580,300 | | | | 88,422 | |
| 25 | | Barclays Capital | | S&P 500 E-Mini Futures | | | March 21, 2014 | | | | 2,217,839 | | | | 2,301,375 | | | | 83,536 | |
| 14 | | Barclays Capital | | S&P MID 400 E-Mini Futures | | | March 21, 2014 | | | | 1,805,439 | | | | 1,875,160 | | | | 69,721 | |
| 18 | | Barclays Capital | | S&P/Toronto Stock Exchange 60 Index Futures | | | March 20, 2014 | | | | 2,558,838 | | | | 2,646,496 | | | | 87,658 | |
| 15 | | Barclays Capital | | SGX S&P CNX Nifty Index Futures | | | January 30, 2014 | | | | 189,875 | | | | 190,530 | | | | 655 | |
| 6 | | Barclays Capital | | SPI 200 Index Futures | | | March 20, 2014 | | | | 692,247 | | | | 712,267 | | | | 20,020 | |
| 10 | | Barclays Capital | | TOPIX Index Futures | | | March 13, 2014 | | | | 1,190,481 | | | | 1,236,825 | | | | 46,344 | |
| 3 | | J.P. Morgan | | 3-Month Euro Euribor Futures | | | September 15, 2014 | | | | 1,028,493 | | | | 1,028,473 | | | | (20) | |
| 11 | | J.P. Morgan | | 3-Month Euro Euribor Futures | | | December 15, 2014 | | | | 3,770,146 | | | | 3,769,178 | | | | (968) | |
| 21 | | J.P. Morgan | | 3-Month Euro Euribor Futures | | | March 16, 2015 | | | | 7,192,038 | | | | 7,189,924 | | | | (2,114) | |
| 27 | | J.P. Morgan | | 3-Month Euro Euribor Futures | | | June 15, 2015 | | | | 9,239,149 | | | | 9,234,902 | | | | (4,247) | |
| 30 | | J.P. Morgan | | 3-Month Euro Euribor Futures | | | September 14, 2015 | | | | 10,256,663 | | | | 10,249,137 | | | | (7,526) | |
| 28 | | J.P. Morgan | | 3-Month Euro Euribor Futures | | | December 14, 2015 | | | | 9,570,000 | | | | 9,553,343 | | | | (16,657) | |
| 7 | | J.P. Morgan | | 90-Day EURODollar Futures | | | June 16, 2014 | | | | 1,744,775 | | | | 1,744,487 | | | | (288) | |
| | | | |
| | The accompanying notes are an integral part of these financial statements. | | (Continued) |
| | | | | | | | | | | | | | | | |
| 102 | | AQR Funds | | | | | | Annual Report | | | | | | December 2013 | | |
| | | | | | | | | | |
| | | | |
| Consolidated Schedule of Investments | | | December 31, 2013 | |
| | |
| AQR MANAGED FUTURES STRATEGY HV FUND | | |
| | | | | | | | | | | | | | | | | | | | |
NUMBER OF
CONTRACTS | | COUNTERPARTY | | DESCRIPTION | | EXPIRATION
DATE | | | VALUE AT
TRADE DATE | | | VALUE AT
DECEMBER 31,
2013 | | | UNREALIZED
APPRECIATION
(DEPRECIATION) | |
| Long Contracts: (continued) | | | | | | | | | | | | | | | | | | |
| 6 | | J.P. Morgan | | 90-Day EURODollar Futures | | | September 15, 2014 | | | | $1,495,190 | | | | $1,494,525 | | | | $(665) | |
| 29 | | J.P. Morgan | | 90-Day EURODollar Futures | | | December 15, 2014 | | | | 7,218,087 | | | | 7,218,825 | | | | 738 | |
| 38 | | J.P. Morgan | | 90-Day EURODollar Futures | | | March 16, 2015 | | | | 9,448,288 | | | | 9,449,650 | | | | 1,362 | |
| 43 | | J.P. Morgan | | 90-Day EURODollar Futures | | | June 15, 2015 | | | | 10,677,133 | | | | 10,677,437 | | | | 304 | |
| 36 | | J.P. Morgan | | 90-Day EURODollar Futures | | | September 14, 2015 | | | | 8,923,896 | | | | 8,921,700 | | | | (2,196) | |
| 25 | | J.P. Morgan | | 90-Day EURODollar Futures | | | December 14, 2015 | | | | 6,193,443 | | | | 6,179,687 | | | | (13,756) | |
| 6 | | J.P. Morgan | | Canadian 3-Month Bank Acceptance Futures | | | June 16, 2014 | | | | 1,394,192 | | | | 1,394,446 | | | | 254 | |
| 24 | | J.P. Morgan | | Canadian 3-Month Bank Acceptance Futures | | | September 15, 2014 | | | | 5,577,554 | | | | 5,577,219 | | | | (335) | |
| 38 | | J.P. Morgan | | Mini Japanese 10-Year Treasury Bond | | | March 10, 2014 | | | | 5,193,394 | | | | 5,169,747 | | | | (23,647) | |
| | | | | | | | | | | | | | | | | | | | |
| | | | | | | | | | | 127,546,006 | | | | 128,496,884 | | | | 950,878 | |
| | | | | | | | | | | | | | | | | | | | |
| Short Contracts: | | | | | | | | | | | | | | | | | | |
| 47 | | Goldman Sachs | | Corn Futures^ | | | March 14, 2014 | | | | (1,040,097) | | | | (991,700) | | | | 48,397 | |
| 8 | | Goldman Sachs | | Lean Hogs Futures^ | | | February 14, 2014 | | | | (276,413) | | | | (273,360) | | | | 3,053 | |
| 1 | | J.P. Morgan | | LME Aluminum Futures^ | | | January 3, 2014 | | | | (46,054) | | | | (43,868) | | | | 2,186 | |
| 1 | | J.P. Morgan | | LME Aluminum Futures^ | | | January 9, 2014 | | | | (46,404) | | | | (43,956) | | | | 2,448 | |
| 1 | | J.P. Morgan | | LME Aluminum Futures^ | | | January 15, 2014 | | | | (46,848) | | | | (44,044) | | | | 2,804 | |
| 1 | | J.P. Morgan | | LME Aluminum Futures^ | | | February 5, 2014 | | | | (45,504) | | | | (44,333) | | | | 1,171 | |
| 1 | | J.P. Morgan | | LME Aluminum Futures^ | | | March 5, 2014 | | | | (44,273) | | | | (44,688) | | | | (415) | |
| 1 | | J.P. Morgan | | LME Aluminum Futures^ | | | March 17, 2014 | | | | (43,985) | | | | (44,868) | | | | (883) | |
| 1 | | J.P. Morgan | | LME Copper Futures^ | | | February 7, 2014 | | | | (178,477) | | | | (184,226) | | | | (5,749) | |
| 2 | | J.P. Morgan | | LME Copper Futures^ | | | February 14, 2014 | | | | (348,781) | | | | (368,475) | | | | (19,694) | |
| 1 | | J.P. Morgan | | LME Copper Futures^ | | | February 19, 2014 | | | | (173,403) | | | | (184,231) | | | | (10,828) | |
| 8 | | J.P. Morgan | | LME Copper Futures^ | | | March 17, 2014 | | | | (1,415,333) | | | | (1,473,175) | | | | (57,842) | |
| 4 | | Goldman Sachs | | LME Copper Futures^ | | | March 27, 2014 | | | | (328,387) | | | | (339,650) | | | | (11,263) | |
| 1 | | J.P. Morgan | | LME Nickel Futures^ | | | January 30, 2014 | | | | (87,784) | | | | (83,120) | | | | 4,664 | |
| 1 | | J.P. Morgan | | LME Nickel Futures^ | | | March 3, 2014 | | | | (80,747) | | | | (83,261) | | | | (2,514) | |
| 1 | | J.P. Morgan | | LME Nickel Futures^ | | | March 12, 2014 | | | | (84,550) | | | | (83,306) | | | | 1,244 | |
| 4 | | J.P. Morgan | | LME Nickel Futures^ | | | March 17, 2014 | | | | (323,107) | | | | (333,360) | | | | (10,253) | |
| 1 | | J.P. Morgan | | LME Zinc Futures^ | | | January 28, 2014 | | | | (49,198) | | | | (51,195) | | | | (1,997) | |
| 1 | | J.P. Morgan | | LME Zinc Futures^ | | | January 29, 2014 | | | | (49,323) | | | | (51,200) | | | | (1,877) | |
| 1 | | J.P. Morgan | | LME Zinc Futures^ | | | January 30, 2014 | | | | (49,304) | | | | (51,205) | | | | (1,901) | |
| 1 | | J.P. Morgan | | LME Zinc Futures^ | | | January 31, 2014 | | | | (49,048) | | | | (51,211) | | | | (2,163) | |
| 1 | | J.P. Morgan | | LME Zinc Futures^ | | | February 12, 2014 | | | | (47,180) | | | | (51,275) | | | | (4,095) | |
| 1 | | J.P. Morgan | | LME Zinc Futures^ | | | February 13, 2014 | | | | (46,999) | | | | (51,281) | | | | (4,282) | |
| 1 | | J.P. Morgan | | LME Zinc Futures^ | | | February 14, 2014 | | | | (47,173) | | | | (51,285) | | | | (4,112) | |
| 1 | | J.P. Morgan | | LME Zinc Futures^ | | | February 19, 2014 | | | | (47,185) | | | | (51,313) | | | | (4,128) | |
| 1 | | J.P. Morgan | | LME Zinc Futures^ | | | February 20, 2014 | | | | (47,351) | | | | (51,317) | | | | (3,966) | |
| 1 | | J.P. Morgan | | LME Zinc Futures^ | | | February 21, 2014 | | | | (47,222) | | | | (51,322) | | | | (4,100) | |
| 1 | | J.P. Morgan | | LME Zinc Futures^ | | | March 3, 2014 | | | | (46,818) | | | | (51,365) | | | | (4,547) | |
| 1 | | J.P. Morgan | | LME Zinc Futures^ | | | March 10, 2014 | | | | (48,373) | | | | (51,395) | | | | (3,022) | |
| 2 | | J.P. Morgan | | LME Zinc Futures^ | | | March 11, 2014 | | | | (97,846) | | | | (102,798) | | | | (4,952) | |
| 1 | | J.P. Morgan | | LME Zinc Futures^ | | | March 12, 2014 | | | | (48,973) | | | | (51,403) | | | | (2,430) | |
| 1 | | J.P. Morgan | | LME Zinc Futures^ | | | March 13, 2014 | | | | (49,123) | | | | (51,408) | | | | (2,285) | |
| 9 | | J.P. Morgan | | LME Zinc Futures^ | | | March 17, 2014 | | | | (423,326) | | | | (463,050) | | | | (39,724) | |
| 1 | | J.P. Morgan | | LME Zinc Futures^ | | | March 18, 2014 | | | | (50,162) | | | | (51,437) | | | | (1,275) | |
| 3 | | Goldman Sachs | | Platinum Futures^ | | | April 28, 2014 | | | | (198,084) | | | | (206,070) | | | | (7,986) | |
| | | | |
| | The accompanying notes are an integral part of these financial statements. | | (Continued) |
| | | | | | | | | | | | | | | | |
| | AQR Funds | | | | | | Annual Report | | | | | | December 2013 | | 103 |
| | | | | | | | | | |
| | | | |
| Consolidated Schedule of Investments | | | December 31, 2013 | |
| | |
| AQR MANAGED FUTURES STRATEGY HV FUND | | |
| | | | | | | | | | | | | | | | | | | | |
NUMBER OF
CONTRACTS | | COUNTERPARTY | | DESCRIPTION | | EXPIRATION
DATE | | | VALUE AT
TRADE DATE | | | VALUE AT
DECEMBER 31,
2013 | | | UNREALIZED
APPRECIATION
(DEPRECIATION) | |
| Short Contracts: (continued) | | | | | | | | | | | | | | | | | | |
| 30 | | Goldman Sachs | | Soybean Oil Futures^ | | | March 14, 2014 | | | | $(733,177) | | | | $(704,340) | | | | $28,837 | |
| 124 | | Goldman Sachs | | Sugar #11 (World Markets) Futures^ | | | February 28, 2014 | | | | (2,346,680) | | | | (2,279,021) | | | | 67,659 | |
| 8 | | Goldman Sachs | | Wheat Futures^ | | | March 14, 2014 | | | | (264,297) | | | | (242,100) | | | | 22,197 | |
| 2 | | Barclays Capital | | KOSPI Index 200 Futures | | | March 13, 2014 | | | | (246,205) | | | | (251,717) | | | | (5,512) | |
| 12 | | J.P. Morgan | | 3-Month Euro Euribor Futures | | | June 16, 2014 | | | | (4,112,935) | | | | (4,115,132) | | | | (2,197) | |
| 34 | | J.P. Morgan | | 90-Day Sterling Futures | | | June 18, 2014 | | | | (6,993,921) | | | | (6,992,041) | | | | 1,880 | |
| 23 | | J.P. Morgan | | 90-Day Sterling Futures | | | September 17, 2014 | | | | (4,725,879) | | | | (4,724,436) | | | | 1,443 | |
| 23 | | J.P. Morgan | | 90-Day Sterling Futures | | | December 17, 2014 | | | | (4,719,029) | | | | (4,716,818) | | | | 2,211 | |
| 27 | | J.P. Morgan | | 90-Day Sterling Futures | | | March 18, 2015 | | | | (5,530,513) | | | | (5,526,795) | | | | 3,718 | |
| 31 | | J.P. Morgan | | 90-Day Sterling Futures | | | June 17, 2015 | | | | (6,339,232) | | | | (6,332,746) | | | | 6,486 | |
| 33 | | J.P. Morgan | | 90-Day Sterling Futures | | | September 16, 2015 | | | | (6,733,881) | | | | (6,725,941) | | | | 7,940 | |
| 39 | | J.P. Morgan | | 90-Day Sterling Futures | | | December 16, 2015 | | | | (7,941,329) | | | | (7,929,061) | | | | 12,268 | |
| 30 | | J.P. Morgan | | Australia 10-Year Bond Futures | | | March 17, 2014 | | | | (3,044,891) | | | | (3,071,485) | | | | (26,594) | |
| 11 | | J.P. Morgan | | Australia 3-Year Bond Futures | | | March 17, 2014 | | | | (1,064,139) | | | | (1,066,125) | | | | (1,986) | |
| 16 | | J.P. Morgan | | Canadian 10-Year Bond Futures | | | March 20, 2014 | | | | (1,925,158) | | | | (1,909,004) | | | | 16,154 | |
| 2 | | J.P. Morgan | | Euro - Bund Futures | | | March 6, 2014 | | | | (384,621) | | | | (382,913) | | | | 1,708 | |
| 63 | | J.P. Morgan | | Euro - SCHATZ Futures | | | March 6, 2014 | | | | (9,559,358) | | | | (9,559,602) | | | | (244) | |
| 25 | | J.P. Morgan | | Euro CHF 3-Month LIFFE Futures | | | June 16, 2014 | | | | (7,006,670) | | | | (7,007,034) | | | | (364) | |
| 11 | | J.P. Morgan | | Euro CHF 3-Month LIFFE Futures | | | September 15, 2014 | | | | (3,082,331) | | | | (3,082,479) | | | | (148) | |
| 12 | | J.P. Morgan | | Euro-Buxl 30-Year Bond Futures | | | March 6, 2014 | | | | (2,029,684) | | | | (2,014,355) | | | | 15,329 | |
| 21 | | J.P. Morgan | | Long Gilt Futures | | | March 27, 2014 | | | | (3,770,580) | | | | (3,705,618) | | | | 64,962 | |
| 19 | | J.P. Morgan | | U.S. Long Bond Futures | | | March 20, 2014 | | | | (2,469,604) | | | | (2,437,938) | | | | 31,666 | |
| 25 | | J.P. Morgan | | U.S. Treasury 10-Year Note Futures | | | March 20, 2014 | | | | (3,105,194) | | | | (3,076,172) | | | | 29,022 | |
| 18 | | J.P. Morgan | | U.S. Treasury 5-Year Note Futures | | | March 31, 2014 | | | | (2,153,365) | | | | (2,147,625) | | | | 5,740 | |
| | | | | | | | | | | | | | | | | | | | |
| | | | | | | | | | | (96,335,508) | | | | (96,205,649) | | | | 129,859 | |
| | | | | | | | | | | | | | | | | | | | |
| | | | | | | | | | | $31,210,498 | | | | $32,291,235 | | | | $1,080,737 | |
| | | | | | | | | | | | | | | | | | | | |
Cash held as collateral at Barclays Capital, J.P. Morgan and Goldman Sachs for futures contracts was $339,332, $704,659 and $131,926, respectively at December 31, 2013.
^ Represents positions held in the respective Subsidiary (Note 2).
Forward foreign currency exchange contracts outstanding as of December 31, 2013:
Over the Counter
| | | | | | | | | | | | | | | | | | | | |
PURCHASE
CONTRACTS | | COUNTERPARTY | | CURRENCY | | CURRENCY
AMOUNT
PURCHASED | | | VALUE AT
SETTLEMENT
DATE | | | VALUE AT
DECEMBER 31,
2013 | | | UNREALIZED
APPRECIATION
(DEPRECIATION) | |
Swiss Franc,
Expiring 03/19/14 | | The Royal Bank of Scotland | | CHF | | | 37,000 | | | | $40,677 | | | | $41,503 | | | | $826 | |
| Euro, Expiring 03/19/14 | | Credit Suisse International | | EUR | | | 13,922,499 | | | | 19,059,784 | | | | 19,152,763 | | | | 92,979 | |
| | | | |
| | The accompanying notes are an integral part of these financial statements. | | (Continued) |
| | | | | | | | | | | | | | | | |
| 104 | | AQR Funds | | | | | | Annual Report | | | | | | December 2013 | | |
| | | | | | | | | | |
| | | | |
| Consolidated Schedule of Investments | | | December 31, 2013 | |
| | |
| AQR MANAGED FUTURES STRATEGY HV FUND | | |
| | | | | | | | | | | | | | | | | | | | |
PURCHASE
CONTRACTS | | COUNTERPARTY | | CURRENCY | | CURRENCY
AMOUNT
PURCHASED | | | VALUE AT
SETTLEMENT
DATE | | | VALUE AT
DECEMBER 31,
2013 | | | UNREALIZED
APPRECIATION
(DEPRECIATION) | |
| Euro, Expiring 03/19/14 | | The Royal Bank of Scotland | | EUR | | | 13,922,498 | | | | $19,059,884 | | | | $19,152,762 | | | | $92,878 | |
| British Pound, Expiring 03/19/14 | | Credit Suisse International | | GBP | | | 2,338,999 | | | | 3,828,203 | | | | 3,871,220 | | | | 43,017 | |
| British Pound, Expiring 03/19/14 | | The Royal Bank of Scotland | | GBP | | | 2,338,999 | | | | 3,828,220 | | | | 3,871,220 | | | | 43,000 | |
| Hong Kong Dollar, Expiring 03/19/14 | | The Royal Bank of Scotland | | HKD | | | 262,000 | | | | 33,803 | | | | 33,791 | | | | (12) | |
| Hungarian Forint, Expiring 03/19/14 | | Credit Suisse International | | HUF | | | 56,500,000 | | | | 256,392 | | | | 260,394 | | | | 4,002 | |
| Hungarian Forint, Expiring 03/19/14 | | The Royal Bank of Scotland | | HUF | | | 56,500,000 | | | | 256,369 | | | | 260,394 | | | | 4,025 | |
| Israeli Shekel, Expiring 03/19/14 | | Credit Suisse International | | ILS | | | 2,315,000 | | | | 659,428 | | | | 665,956 | | | | 6,528 | |
| Israeli Shekel, Expiring 03/19/14 | | The Royal Bank of Scotland | | ILS | | | 2,325,000 | | | | 662,237 | | | | 668,833 | | | | 6,596 | |
| Indian Rupee, Expiring 03/19/14* | | Credit Suisse International | | INR | | | 19,550,000 | | | | 310,020 | | | | 310,501 | | | | 481 | |
| Indian Rupee, Expiring 03/19/14* | | The Royal Bank of Scotland | | INR | | | 19,550,000 | | | | 310,020 | | | | 310,501 | | | | 481 | |
| Japanese Yen, Expiring 03/19/14 | | Credit Suisse International | | JPY | | | 69,969,500 | | | | 682,289 | | | | 664,666 | | | | (17,623) | |
| Japanese Yen, Expiring 03/19/14 | | The Royal Bank of Scotland | | JPY | | | 69,969,500 | | | | 682,306 | | | | 664,666 | | | | (17,640) | |
| Korean Won, Expiring 03/19/14* | | Credit Suisse International | | KRW | | | 1,873,500,001 | | | | 1,765,504 | | | | 1,766,912 | | | | 1,408 | |
| Korean Won, Expiring 03/19/14* | | The Royal Bank of Scotland | | KRW | | | 1,886,500,000 | | | | 1,777,777 | | | | 1,779,172 | | | | 1,395 | |
| Mexican Peso, Expiring 03/19/14 | | Credit Suisse International | | MXN | | | 7,145,000 | | | | 541,948 | | | | 543,966 | | | | 2,018 | |
| Mexican Peso, Expiring 03/19/14 | | The Royal Bank of Scotland | | MXN | | | 7,145,000 | | | | 541,974 | | | | 543,966 | | | | 1,992 | |
| Norwegian Krone, Expiring 03/19/14 | | Credit Suisse International | | NOK | | | 930,000 | | | | 151,285 | | | | 152,905 | | | | 1,620 | |
| Norwegian Krone, Expiring 03/19/14 | | The Royal Bank of Scotland | | NOK | | | 930,000 | | | | 151,292 | | | | 152,905 | | | | 1,613 | |
| New Zealand Dollar, Expiring 03/19/14 | | Credit Suisse International | | NZD | | | 4,220,500 | | | | 3,462,851 | | | | 3,452,010 | | | | (10,841) | |
| New Zealand Dollar, Expiring 03/19/14 | | The Royal Bank of Scotland | | NZD | | | 4,220,500 | | | | 3,462,837 | | | | 3,452,010 | | | | (10,827) | |
| Poland Zloty, Expiring 03/19/14 | | Credit Suisse International | | PLN | | | 3,595,001 | | | | 1,170,469 | | | | 1,184,488 | | | | 14,019 | |
| Poland Zloty, Expiring 03/19/14 | | The Royal Bank of Scotland | | PLN | | | 3,595,000 | | | | 1,170,493 | | | | 1,184,487 | | | | 13,994 | |
| Russian Ruble, Expiring 03/19/14* | | Credit Suisse International | | RUB | | | 2,050,000 | | | | 61,577 | | | | 61,562 | | | | (15) | |
| Russian Ruble, Expiring 03/19/14* | | The Royal Bank of Scotland | | RUB | | | 2,050,000 | | | | 61,577 | | | | 61,562 | | | | (15) | |
| Swedish Krona, Expiring 03/19/14 | | Credit Suisse International | | SEK | | | 4,715,500 | | | | 720,523 | | | | 732,208 | | | | 11,685 | |
| Swedish Krona, Expiring 03/19/14 | | The Royal Bank of Scotland | | SEK | | | 4,715,500 | | | | 720,540 | | | | 732,208 | | | | 11,668 | |
| Singapore Dollar, Expiring 03/19/14 | | Credit Suisse International | | SGD | | | 734,500 | | | | 587,904 | | | | 582,054 | | | | (5,850) | |
| Singapore Dollar, Expiring 03/19/14 | | The Royal Bank of Scotland | | SGD | | | 734,500 | | | | 587,916 | | | | 582,054 | | | | (5,862) | |
| | | | |
| | The accompanying notes are an integral part of these financial statements. | | (Continued) |
| | | | | | | | | | | | | | | | |
| | AQR Funds | | | | | | Annual Report | | | | | | December 2013 | | 105 |
| | | | | | | | | | |
| | | | |
| Consolidated Schedule of Investments | | | December 31, 2013 | |
| | |
| AQR MANAGED FUTURES STRATEGY HV FUND | | |
| | | | | | | | | | | | | | | | | | | | |
PURCHASE
CONTRACTS | | COUNTERPARTY | | CURRENCY | | CURRENCY
AMOUNT
PURCHASED | | | VALUE AT
SETTLEMENT
DATE | | | VALUE AT
DECEMBER 31,
2013 | | | UNREALIZED
APPRECIATION
(DEPRECIATION) | |
| Taiwanese Dollar, Expiring 03/19/14* | | Credit Suisse International | | TWD | | | 4,450,000 | | | | $151,378 | | | | $149,633 | | | | $(1,745) | |
| Taiwanese Dollar, Expiring 03/19/14* | | The Royal Bank of Scotland | | TWD | | | 4,450,000 | | | | 151,378 | | | | 149,632 | | | | (1,746) | |
| | | | | | | | | | | | | | | | | | | | |
| | | | | | | | | | | 66,908,855 | | | | 67,192,904 | | | | 284,049 | |
| | | | | | | | | | | | | | | | | | | | |
| | | | | | | | | | | | | | | | | | | | |
SALES
CONTRACTS | | COUNTERPARTY | | CURRENCY | | CURRENCY
AMOUNT
SOLD | | | VALUE AT
SETTLEMENT
DATE | | | VALUE AT
DECEMBER 31,
2013 | | | UNREALIZED
APPRECIATION
(DEPRECIATION) | |
| Australian Dollar, Expiring 03/19/14 | | Credit Suisse International | | AUD | | | (5,011,500) | | | | $(4,505,804) | | | | $(4,452,894) | | | | $52,910 | |
| Australian Dollar, Expiring 03/19/14 | | The Royal Bank of Scotland | | AUD | | | (5,011,500) | | | | (4,505,738) | | | | (4,452,894) | | | | 52,844 | |
| Brazilian Real, Expiring 03/19/14* | | Credit Suisse International | | BRL | | | (1,115,000) | | | | (464,230) | | | | (464,042) | | | | 188 | |
| Brazilian Real, Expiring 03/19/14* | | The Royal Bank of Scotland | | BRL | | | (1,115,000) | | | | (464,224) | | | | (464,042) | | | | 182 | |
| Canadian Dollar, Expiring 03/19/14 | | Credit Suisse International | | CAD | | | (4,216,000) | | | | (3,952,083) | | | | (3,961,662) | | | | (9,579) | |
| Canadian Dollar, Expiring 03/19/14 | | The Royal Bank of Scotland | | CAD | | | (4,216,000) | | | | (3,952,053) | | | | (3,961,662) | | | | (9,609) | |
| Swiss Franc, Expiring 03/19/14 | | Credit Suisse International | | CHF | | | (11,000) | | | | (12,187) | | | | (12,339) | | | | (152) | |
| Swiss Franc, Expiring 03/19/14 | | The Royal Bank of Scotland | | CHF | | | (87,000) | | | | (97,616) | | | | (97,588) | | | | 28 | |
| Chilean Peso, Expiring 03/19/14* | | Credit Suisse International | | CLP | | | (107,500,000) | | | | (199,337) | | | | (202,874) | | | | (3,537) | |
| Chilean Peso, Expiring 03/19/14* | | The Royal Bank of Scotland | | CLP | | | (123,500,000) | | | | (229,410) | | | | (233,068) | | | | (3,658) | |
| Columbian Peso, Expiring 03/19/14* | | Credit Suisse International | | COP | | | (201,500,000) | | | | (103,027) | | | | (103,990) | | | | (963) | |
| Columbian Peso, Expiring 03/19/14* | | The Royal Bank of Scotland | | COP | | | (251,500,000) | | | | (128,627) | | | | (129,794) | | | | (1,167) | |
| Czech Republic Koruna, Expiring 03/19/14 | | Credit Suisse International | | CZK | | | (7,900,000) | | | | (394,453) | | | | (398,053) | | | | (3,600) | |
| Czech Republic Koruna, Expiring 03/19/14 | | The Royal Bank of Scotland | | CZK | | | (7,900,000) | | | | (394,457) | | | | (398,053) | | | | (3,596) | |
| Euro, Expiring 03/19/14 | | Credit Suisse International | | EUR | | | (70,500) | | | | (97,011) | | | | (96,985) | | | | 26 | |
| Euro, Expiring 03/19/14 | | The Royal Bank of Scotland | | EUR | | | (88,500) | | | | (121,654) | | | | (121,747) | | | | (93) | |
| British Pound, Expiring 03/19/14 | | Credit Suisse International | | GBP | | | (612,500) | | | | (1,002,499) | | | | (1,013,733) | | | | (11,234) | |
| British Pound, Expiring 03/19/14 | | The Royal Bank of Scotland | | GBP | | | (612,500) | | | | (1,002,483) | | | | (1,013,733) | | | | (11,250) | |
| Hong Kong Dollar, Expiring 03/19/14 | | Credit Suisse International | | HKD | | | (4,000) | | | | (516) | | | | (516) | | | | – | |
| Hong Kong Dollar, Expiring 03/19/14 | | The Royal Bank of Scotland | | HKD | | | (166,000) | | | | (21,412) | | | �� | (21,409) | | | | 3 | |
| Hungarian Forint, Expiring 03/19/14 | | Credit Suisse International | | HUF | | | (40,000,000) | | | | (179,631) | | | | (184,349) | | | | (4,718) | |
| Hungarian Forint, Expiring 03/19/14 | | The Royal Bank of Scotland | | HUF | | | (40,000,000) | | | | (179,664) | | | | (184,349) | | | | (4,685) | |
| | | | |
| | The accompanying notes are an integral part of these financial statements. | | (Continued) |
| | | | | | | | | | | | | | | | |
| 106 | | AQR Funds | | | | | | Annual Report | | | | | | December 2013 | | |
| | | | | | | | | | |
| | | | |
| Consolidated Schedule of Investments | | | December 31, 2013 | |
| | |
| AQR MANAGED FUTURES STRATEGY HV FUND | | |
| | | | | | | | | | | | | | | | | | | | |
SALES
CONTRACTS | | COUNTERPARTY | | CURRENCY | | CURRENCY
AMOUNT
SOLD | | | VALUE AT
SETTLEMENT
DATE | | | VALUE AT
DECEMBER 31,
2013 | | | UNREALIZED
APPRECIATION
(DEPRECIATION) | |
| Indonesian Rupiah, Expiring 03/19/14* | | Credit Suisse International | | IDR | | | (3,540,000,000) | | | | $(286,883) | | | | $(286,949) | | | | $(66) | |
| Indonesian Rupiah, Expiring 03/19/14* | | The Royal Bank of Scotland | | IDR | | | (3,870,000,000) | | | | (313,404) | | | | (313,699) | | | | (295) | |
| Indian Rupee, Expiring 03/19/14* | | Credit Suisse International | | INR | | | (24,450,000) | | | | (389,799) | | | | (388,324) | | | | 1,475 | |
| Indian Rupee, Expiring 03/19/14* | | The Royal Bank of Scotland | | INR | | | (24,450,000) | | | | (389,801) | | | | (388,324) | | | | 1,477 | |
| Japanese Yen, Expiring 03/19/14 | | Credit Suisse International | | JPY | | | (1,705,997,998) | | | | (16,566,482) | | | | (16,205,920) | | | | 360,562 | |
| Japanese Yen, Expiring 03/19/14 | | The Royal Bank of Scotland | | JPY | | | (1,706,442,998) | | | | (16,570,817) | | | | (16,210,147) | | | | 360,670 | |
| Korean Won, Expiring 03/19/14* | | Credit Suisse International | | KRW | | | (51,500,000) | | | | (48,485) | | | | (48,570) | | | | (85) | |
| Korean Won, Expiring 03/19/14* | | The Royal Bank of Scotland | | KRW | | | (51,500,000) | | | | (48,485) | | | | (48,570) | | | | (85) | |
| Mexican Peso, Expiring 03/19/14 | | Credit Suisse International | | MXN | | | (4,670,000) | | | | (357,116) | | | | (355,538) | | | | 1,578 | |
| Mexican Peso, Expiring 03/19/14 | | The Royal Bank of Scotland | | MXN | | | (4,670,000) | | | | (357,121) | | | | (355,538) | | | | 1,583 | |
| Malaysian Ringgit, Expiring 03/19/14* | | Credit Suisse International | | MYR | | | (1,310,000) | | | | (401,893) | | | | (398,138) | | | | 3,755 | |
| Malaysian Ringgit, Expiring 03/19/14* | | The Royal Bank of Scotland | | MYR | | | (1,310,000) | | | | (401,887) | | | | (398,138) | | | | 3,749 | |
| Norwegian Krone, Expiring 03/19/14 | | Credit Suisse International | | NOK | | | (14,628,500) | | | | (2,373,836) | | | | (2,405,122) | | | | (31,286) | |
| Norwegian Krone, Expiring 03/19/14 | | The Royal Bank of Scotland | | NOK | | | (14,628,500) | | | | (2,373,847) | | | | (2,405,122) | | | | (31,275) | |
| New Zealand Dollar, Expiring 03/19/14 | | Credit Suisse International | | NZD | | | (2,175,500) | | | | (1,782,418) | | | | (1,779,375) | | | | 3,043 | |
| New Zealand Dollar, Expiring 03/19/14 | | The Royal Bank of Scotland | | NZD | | | (2,175,500) | | | | (1,782,372) | | | | (1,779,375) | | | | 2,997 | |
| Philippine Peso, Expiring 03/19/14* | | Credit Suisse International | | PHP | | | (31,100,000) | | | | (703,930) | | | | (701,478) | | | | 2,452 | |
| Philippine Peso, Expiring 03/19/14* | | The Royal Bank of Scotland | | PHP | | | (38,200,000) | | | | (864,199) | | | | (861,622) | | | | 2,577 | |
| Russian Ruble, Expiring 03/19/14* | | Credit Suisse International | | RUB | | | (30,100,000) | | | | (895,890) | | | | (903,914) | | | | (8,024) | |
| Russian Ruble, Expiring 03/19/14* | | The Royal Bank of Scotland | | RUB | | | (30,100,000) | | | | (895,875) | | | | (903,914) | | | | (8,039) | |
| Swedish Krona, Expiring 03/19/14 | | Credit Suisse International | | SEK | | | (15,420,000) | | | | (2,356,198) | | | | (2,394,369) | | | | (38,171) | |
| Swedish Krona, Expiring 03/19/14 | | The Royal Bank of Scotland | | SEK | | | (15,420,000) | | | | (2,356,202) | | | | (2,394,369) | | | | (38,167) | |
| Singapore Dollar, Expiring 03/19/14 | | Credit Suisse International | | SGD | | | (694,500) | | | | (550,876) | | | | (550,357) | | | | 519 | |
| Singapore Dollar, Expiring 03/19/14 | | The Royal Bank of Scotland | | SGD | | | (694,500) | | | | (550,895) | | | | (550,357) | | | | 538 | |
| Turkish Lira, Expiring 03/19/14 | | Credit Suisse International | | TRY | | | (2,056,000) | | | | (984,478) | | | | (941,613) | | | | 42,865 | |
| Turkish Lira, Expiring 03/19/14 | | The Royal Bank of Scotland | | TRY | | | (2,056,000) | | | | (984,366) | | | | (941,613) | | | | 42,753 | |
| Taiwanese Dollar, Expiring 03/19/14* | | Credit Suisse International | | TWD | | | (15,200,000) | | | | (513,627) | | | | (511,106) | | | | 2,521 | |
| Taiwanese Dollar, Expiring 03/19/14* | | The Royal Bank of Scotland | | TWD | | | (15,200,000) | | | | (513,619) | | | | (511,106) | | | | 2,513 | |
| | | | |
| | The accompanying notes are an integral part of these financial statements. | | (Continued) |
| | | | | | | | | | | | | | | | |
| | AQR Funds | | | | | | Annual Report | | | | | | December 2013 | | 107 |
| | | | | | | | | | |
| | | | |
| Consolidated Schedule of Investments | | | December 31, 2013 | |
| | |
| AQR MANAGED FUTURES STRATEGY HV FUND | | |
| | | | | | | | | | | | | | | | | | | | |
SALES
CONTRACTS | | COUNTERPARTY | | CURRENCY | | CURRENCY
AMOUNT
SOLD | | | VALUE AT
SETTLEMENT
DATE | | | VALUE AT
DECEMBER 31,
2013 | | | UNREALIZED
APPRECIATION
(DEPRECIATION) | |
| South African Rand, Expiring 03/19/14 | | Credit Suisse International | | ZAR | | | (9,985,000) | | | | $(948,513) | | | | $(941,568) | | | | $6,945 | |
| South African Rand, Expiring 03/19/14 | | The Royal Bank of Scotland | | ZAR | | | (11,155,000) | | | | (1,060,565) | | | | (1,051,897) | | | | 8,668 | |
| | | | | | | | | | | | | | | | | | | | |
| | | | | | | | | | | (80,631,995) | | | | (79,895,908) | | | | 736,087 | |
| | | | | | | | | | | | | | | | | | | | |
| | | | | | | | | | | $(13,723,140) | | | | $(12,703,004) | | | | $1,020,136 | |
| | | | | | | | | | | | | | | | | | | | |
Cash held as collateral for Credit Suisse International and The Royal Bank of Scotland was $670,001 and $410,000, respectively, at December 31, 2013.
| * | Non deliverable forward. See Note 3 in the Notes to Financial Statements. |
AUD - Australian Dollar
BRL - Brazilian Real
CAD - Canadian Dollar
CHF - Swiss Franc
CLP - Chilean Peso
COP - Columbian Peso
CZK - Czech Republic Koruna
EUR - Euro
GBP - British Pound
HKD - Hong Kong Dollar
HUF - Hungarian Forint
IDR - Indonesian Rupiah
ILS - Israeli Shekel
INR - Indian Rupee
JPY - Japanese Yen
KRW - Korean Won
MXN - Mexican Peso
MYR - Malaysian Ringgit
NOK - Norwegian Krone
NZD - New Zealand Dollar
PHP - Philippine Peso
PLN - Poland Zloty
RUB - Russian Ruble
SEK - Swedish Krona
SGD - Singapore Dollar
TRY - Turkish Lira
TWD - Taiwanese Dollar
USD - United States Dollar
ZAR - South African Rand
| | | | |
| | The accompanying notes are an integral part of these financial statements. | | |
| | | | | | | | | | | | | | | | |
| 108 | | AQR Funds | | | | | | Annual Report | | | | | | December 2013 | | |
| | | | | | | | | | |
| | | | |
| Consolidated Schedule of Investments | | | December 31, 2013 | |
| | |
| AQR RISK-BALANCED COMMODITIES STRATEGY FUND | | |
| | | | | | | | |
| | | SHARES | | |
VALUE (Note 3) | |
| MONEY MARKET FUNDS - 95.4% | | | | | | | | |
| BlackRock Liquidity Funds TempFund Portfolio - Series I, Institutional Shares, 0.050% (a)^ | | | 2,536,199 | | | $ | 2,536,199 | |
| Dreyfus Treasury Cash Management, Class I, 0.010% (a) ^ | | | 10,144,795 | | | | 10,144,795 | |
| J.P. Morgan U.S. Treasury Plus Money Market Fund - Institutional Shares, 0.000% (a)(b) ^ | | | 5,404,503 | | | | 5,404,503 | |
| UBS Money Series - UBS Select Treasury Preferred Fund, Class I, 0.010% (a) ^ | | | 12,680,994 | | | | 12,680,994 | |
| | | | | | | | |
TOTAL MONEY MARKET FUNDS
(Cost $30,766,491) | | | | | | | 30,766,491 | |
| | | | | | | | |
| | | | | | | | |
| | | PRINCIPAL
AMOUNT (000’S) | | |
VALUE (Note 3) | |
| SHORT-TERM INVESTMENTS - 4.7% | | | | | | | | |
U.S. Treasury Bill, 0.083%, 06/05/2014 (c) ^ | | $ | 750 | | | $ | 749,815 | |
U.S. Treasury Bill, 0.080%, 05/29/2014 (c) ^ | | | 750 | | | | 749,824 | |
| | | | | | | | |
TOTAL SHORT-TERM INVESTMENTS
(Cost $1,499,484) | | | | | | | 1,499,639 | |
| | | | | | | | |
TOTAL INVESTMENTS - 100.1%
(Cost $32,265,975) | | | | | | | 32,266,130 | |
| | | | | | | | |
| LIABILITIES IN EXCESS OF OTHER ASSETS - (0.1%) (d) | | | | | | | (29,540) | |
| | | | | | | | |
NET ASSETS - 100.0% | | | | | | $ | 32,236,590 | |
| | | | | | | | |
| (a) | Represents annualized seven-day yield as of December 31, 2013. |
| (b) | A portion of the security is pledged as collateral to the brokers for swap contracts. |
| (c) | The rate shown is the effective yield at the date of purchase. |
| (d) | Includes depreciation on futures and swap contracts. |
| ^ | All or a portion represents positions held in the respective Subsidiary (Note 2). |
All securities are Level 2 with respect to ASC 820 (See Note 5).
Total return swap contracts outstanding as of December 31, 2013:
Over the Counter
| | | | | | | | | | | | | | | | |
| COUNTERPARTY | | UNDERLYING REFERENCE INSTRUMENT | | TERMINATION
DATE | | CURRENCY | | | NOTIONAL
VALUE | | | UNREALIZED
APPRECIATION
(DEPRECIATION) | |
| Deutsche Bank | | Brent Crude Futures^ | | 1/16/2014 | | | USD | | | | 3,565,980 | | | | $90,420 | |
| Deutsche Bank | | Brent Crude Futures^ | | 1/16/2014 | | | USD | | | | (3,525,310) | | | | (131,090) | |
| Deutsche Bank | | Brent Crude Futures^ | | 2/13/2014 | | | USD | | | | 2,889,910 | | | | 94,400 | |
| Deutsche Bank | | Brent Crude Futures^ | | 2/13/2014 | | | USD | | | | (2,989,100) | | | | 4,790 | |
| Deutsche Bank | | Brent Crude Futures^ | | 3/14/2014 | | | USD | | | | 1,999,080 | | | | (14,220) | |
| Barclays Capital | | Cocoa Futures^ | | 3/14/2014 | | | USD | | | | 399,950 | | | | 6,398 | |
| Barclays Capital | | Cocoa Futures^ | | 3/14/2014 | | | USD | | | | (163,290) | | | | 750 | |
| Barclays Capital | | Coffee ‘C’ Futures^ | | 3/19/2014 | | | USD | | | | 2,481,225 | | | | 51,020 | |
| Barclays Capital | | Coffee ‘C’ Futures^ | | 3/19/2014 | | | USD | | | | (1,025,513) | | | | (12,296) | |
| Barclays Capital | | Corn Futures^ | | 3/14/2014 | | | USD | | | | 4,958,118 | | | | (653,458) | |
| Barclays Capital | | Corn Futures^ | | 3/14/2014 | | | USD | | | | (4,635,575) | | | | 331,044 | |
| Deutsche Bank | | Corn Futures^ | | 3/14/2014 | | | USD | | | | 24,437 | | | | (3,338) | |
| Deutsche Bank | | Corn Futures^ | | 3/14/2014 | | | USD | | | | (22,150) | | | | 1,050 | |
| Barclays Capital | | Corn Futures^ | | 5/14/2014 | | | USD | | | | 3,464,521 | | | | (151,466) | |
| Barclays Capital | | Corn Futures^ | | 5/14/2014 | | | USD | | | | (927,773) | | | | 24,227 | |
| Deutsche Bank | | Corn Futures^ | | 5/14/2014 | | | USD | | | | 22,625 | | | | (1,112) | |
| Barclays Capital | | Cotton No. 2 Futures^ | | 3/14/2014 | | | USD | | | | 945,067 | | | | 70,592 | |
| Barclays Capital | | Cotton No. 2 Futures^ | | 3/14/2014 | | | USD | | | | (441,500) | | | | (24,013) | |
| Deutsche Bank | | Gas Oil Futures^ | | 1/10/2014 | | | USD | | | | 1,912,950 | | | | 69,975 | |
| Deutsche Bank | | Gas Oil Futures^ | | 1/10/2014 | | | USD | | | | (1,900,650) | | | | (82,275) | |
| Deutsche Bank | | Gas Oil Futures^ | | 2/12/2014 | | | USD | | | | 2,383,800 | | | | 69,300 | |
| Deutsche Bank | | Gas Oil Futures^ | | 2/12/2014 | | | USD | | | | (2,404,750) | | | | (48,350) | |
| Deutsche Bank | | Gas Oil Futures^ | | 3/12/2014 | | | USD | | | | 1,037,575 | | | | (1,650) | |
| Deutsche Bank | | Gasoline RBOB Futures^ | | 1/31/2014 | | | USD | | | | 1,598,247 | | | | 156,870 | |
| Deutsche Bank | | Gasoline RBOB Futures^ | | 1/31/2014 | | | USD | | | | (1,672,612) | | | | (82,505) | |
| Deutsche Bank | | Gasoline RBOB Futures^ | | 2/28/2014 | | | USD | | | | 1,361 ,253 | | | | 45,864 | |
| | | | |
| | The accompanying notes are an integral part of these financial statements. | | (Continued) |
| | | | | | | | | | | | | | | | |
| | AQR Funds | | | | | | Annual Report | | | | | | December 2013 | | 109 |
| | | | | | | | | | |
| | | | |
| Consolidated Schedule of Investments | | | December 31, 2013 | |
| | |
| AQR RISK-BALANCED COMMODITIES STRATEGY FUND | | |
| | | | | | | | | | | | | | | | |
| COUNTERPARTY | | UNDERLYING REFERENCE INSTRUMENT | | TERMINATION
DATE | | CURRENCY | | | NOTIONAL
VALUE | | | UNREALIZED
APPRECIATION
(DEPRECIATION) | |
| Deutsche Bank | | Gasoline RBOB Futures^ | | 2/28/2014 | | | USD | | | | (1,400,511) | | | | $(6,606) | |
| Deutsche Bank | | Gasoline RBOB Futures^ | | 3/31/2014 | | | USD | | | | 999,533 | | | | (4,637) | |
| Barclays Capital | | Gold 100 OZ Futures^ | | 2/26/2014 | | | USD | | | | 5,128,990 | | | | (319,715) | |
| Barclays Capital | | Gold 100 OZ Futures^ | | 2/26/2014 | | | USD | | | | (3,064,190) | | | | 178,628 | |
| Deutsche Bank | | Heating Oil Futures^ | | 1/31/2014 | | | USD | | | | 1,959,216 | | | | 100,598 | |
| Deutsche Bank | | Heating Oil Futures^ | | 1/31/2014 | | | USD | | | | (1,995,571) | | | | (64,243) | |
| Deutsche Bank | | Heating Oil Futures^ | | 2/28/2014 | | | USD | | | | 1,511,042 | | | | 28,073 | |
| Deutsche Bank | | Heating Oil Futures^ | | 2/28/2014 | | | USD | | | | (1,522,563) | | | | (16,552) | |
| Deutsche Bank | | Heating Oil Futures^ | | 3/31/2014 | | | USD | | | | 384,514 | | | | (1,033) | |
| Barclays Capital | | Lean Hogs Futures^ | | 2/14/2014 | | | USD | | | | 2,697,042 | | | | (168,438) | |
| Barclays Capital | | Lean Hogs Futures^ | | 2/14/2014 | | | USD | | | | (1,624,682) | | | | 87,019 | |
| Deutsche Bank | | Lean Hogs Futures^ | | 2/14/2014 | | | USD | | | | (1,059,660) | | | | 68,730 | |
| Barclays Capital | | Live Cattle Futures^ | | 2/28/2014 | | | USD | | | | 4,362,728 | | | | 52,956 | |
| Barclays Capital | | Live Cattle Futures^ | | 2/28/2014 | | | USD | | | | (2,286,270) | | | | (29,271) | |
| Deutsche Bank | | Live Cattle Futures^ | | 2/28/2014 | | | USD | | | | 587,972 | | | | 4,378 | |
| Barclays Capital | | LME Aluminum Futures^ | | 3/17/2014 | | | USD | | | | 4,353,300 | | | | (135,637) | |
| Barclays Capital | | LME Aluminum Futures^ | | 3/17/2014 | | | USD | | | | (4,149,250) | | | | (68,413) | |
| Barclays Capital | | LME Aluminum Futures^ | | 6/16/2014 | | | USD | | | | 3,349,688 | | | | 88,594 | |
| Barclays Capital | | LME Aluminum Futures^ | | 6/16/2014 | | | USD | | | | (871,338) | | | | 306 | |
| Barclays Capital | | LME Copper Futures^ | | 3/17/2014 | | | USD | | | | 8,280,475 | | | | 190,138 | |
| Barclays Capital | | LME Copper Futures^ | | 3/17/2014 | | | USD | | | | (8,065,275) | | | | (405,338) | |
| Barclays Capital | | LME Copper Futures^ | | 6/16/2014 | | | USD | | | | 5,914,300 | | | | 323,000 | |
| Barclays Capital | | LME Copper Futures^ | | 6/16/2014 | | | USD | | | | (1,783,225) | | | | (51,275) | |
| Barclays Capital | | LME Lead Futures^ | | 3/17/2014 | | | USD | | | | 859,338 | | | | 28,262 | |
| Barclays Capital | | LME Lead Futures^ | | 3/17/2014 | | | USD | | | | (834,025) | | | | (53,575) | |
| Barclays Capital | | LME Lead Futures^ | | 6/16/2014 | | | USD | | | | 623,025 | | | | 45,675 | |
| Barclays Capital | | LME Lead Futures^ | | 6/16/2014 | | | USD | | | | (320,900) | | | | (13,450) | |
| Barclays Capital | | LME Nickel Futures^ | | 3/17/2014 | | | USD | | | | 1,269,954 | | | | (19,844) | |
| Barclays Capital | | LME Nickel Futures^ | | 3/17/2014 | | | USD | | | | (1,237,020) | | | | (13,073) | |
| Barclays Capital | | LME Nickel Futures^ | | 6/16/2014 | | | USD | | | | 569,868 | | | | 16,368 | |
| Barclays Capital | | LME Nickel Futures^ | | 6/16/2014 | | | USD | | | | (251,310) | | | | 66 | |
| Barclays Capital | | LME Zinc Futures^ | | 3/17/2014 | | | USD | | | | 2,492,600 | | | | 182,800 | |
| Barclays Capital | | LME Zinc Futures^ | | 3/17/2014 | | | USD | | | | (2,455,075) | | | | (220,325) | |
| Barclays Capital | | LME Zinc Futures^ | | 6/16/2014 | | | USD | | | | 1,994,213 | | | | 169,838 | |
| Barclays Capital | | LME Zinc Futures^ | | 6/16/2014 | | | USD | | | | (490,375) | | | | (24,875) | |
| Deutsche Bank | | Natural Gas Swap Futures^ | | 2/26/2014 | | | USD | | | | 2,484,600 | | | | 156,990 | |
| Deutsche Bank | | Natural Gas Swap Futures^ | | 2/26/2014 | | | USD | | | | (2,523,160) | | | | (118,430) | |
| Deutsche Bank | | Natural Gas Swap Futures^ | | 3/27/2014 | | | USD | | | | 466,510 | | | | (14,960) | |
| Barclays Capital | | Silver Futures^ | | 3/27/2014 | | | USD | | | | 4,153,505 | | | | (376,196) | |
| Barclays Capital | | Silver Futures^ | | 3/27/2014 | | | USD | | | | (1,430,975) | | | | 75,043 | |
| Barclays Capital | | Soybean Futures^ | | 3/14/2014 | | | USD | | | | 4,335,803 | | | | 123,274 | |
| Barclays Capital | | Soybean Futures^ | | 3/14/2014 | | | USD | | | | (4,482,163) | | | | 23,028 | |
| Deutsche Bank | | Soybean Futures^ | | 3/14/2014 | | | USD | | | | 188,363 | | | | 5,512 | |
| Deutsche Bank | | Soybean Futures^ | | 3/14/2014 | | | USD | | | | (196,800) | | | | 2,925 | |
| Barclays Capital | | Soybean Futures^ | | 5/14/2014 | | | USD | | | | 3,632,775 | | | | (57,126) | |
| Barclays Capital | | Soybean Futures^ | | 5/14/2014 | | | USD | | | | (1,236,288) | | | | 23,118 | |
| Deutsche Bank | | Soybean Futures^ | | 5/14/2014 | | | USD | | | | 194,325 | | | | (2,775) | |
| Barclays Capital | | Soybean Meal Futures^ | | 3/14/2014 | | | USD | | | | 1,170,120 | | | | (2,519) | |
| Barclays Capital | | Soybean Meal Futures^ | | 3/14/2014 | | | USD | | | | (588,560) | | | | 4,758 | |
| Deutsche Bank | | Soybean Meal Futures^ | | 3/14/2014 | | | USD | | | | 83,900 | | | | (500) | |
| Barclays Capital | | Soybean Oil Futures^ | | 3/14/2014 | | | USD | | | | 2,549,664 | | | | (107,909) | |
| Barclays Capital | | Soybean Oil Futures^ | | 3/14/2014 | | | USD | | | | (703,506) | | | | 22,635 | |
| Deutsche Bank | | Soybean Oil Futures^ | | 3/14/2014 | | | USD | | | | 172,110 | | | | (7,764) | |
| Barclays Capital | | Sugar #11 (World Markets) Futures^ | | 2/28/2014 | | | USD | | | | 3,715,571 | | | | (241,811) | |
| Barclays Capital | | Sugar #11 (World Markets) Futures^ | | 2/28/2014 | | | USD | | | | (2,449,664) | | | | 170,579 | |
| Barclays Capital | | Wheat Futures^ | | 3/14/2014 | | | USD | | | | 4,323,464 | | | | (449,749) | |
| Barclays Capital | | Wheat Futures^ | | 3/14/2014 | | | USD | | | | (4,254,228) | | | | 380,531 | |
| | | | |
| | The accompanying notes are an integral part of these financial statements. | | (Continued) |
| | | | | | | | | | | | | | | | |
| 110 | | AQR Funds | | | | | | Annual Report | | | | | | December 2013 | | |
| | | | | | | | | | |
| | | | |
| Consolidated Schedule of Investments | | | December 31, 2013 | |
| | |
| AQR RISK-BALANCED COMMODITIES STRATEGY FUND | | |
| | | | | | | | | | | | | | | | |
| COUNTERPARTY | | UNDERLYING REFERENCE INSTRUMENT | | TERMINATION
DATE | | CURRENCY | | | NOTIONAL
VALUE | | | UNREALIZED
APPRECIATION
(DEPRECIATION) | |
| Deutsche Bank | | Wheat Futures^ | | 3/14/2014 | | | USD | | | | 165,687 | | | | $(14,375) | |
| Deutsche Bank | | Wheat Futures^ | | 3/14/2014 | | | USD | | | | (166,000) | | | | 14,688 | |
| Barclays Capital | | Wheat Futures^ | | 5/14/2014 | | | USD | | | | 1,835,475 | | | | (152,344) | |
| Barclays Capital | | Wheat Futures^ | | 5/14/2014 | | | USD | | | | (2,529,075) | | | | 172,727 | |
| Deutsche Bank | | Wheat Futures^ | | 5/14/2014 | | | USD | | | | 167,688 | | | | (14,688) | |
| Deutsche Bank | | WTI Crude Oil Futures^ | | 1/21/2014 | | | USD | | | | 3,779,090 | | | | 157,710 | |
| Deutsche Bank | | WTI Crude Oil Futures^ | | 1/21/2014 | | | USD | | | | (3,767,685) | | | | (169,115) | |
| Deutsche Bank | | WTI Crude Oil Futures^ | | 2/20/2014 | | | USD | | | | 3,812,560 | | | | 129,440 | |
| Deutsche Bank | | WTI Crude Oil Futures^ | | 2/20/2014 | | | USD | | | | (3,900,580) | | | | (41,420) | |
| Deutsche Bank | | WTI Crude Oil Futures^ | | 3/20/2014 | | | USD | | | | 1,893,920 | | | | (23,560) | |
| | | | | | | | | | | | | | | | |
| | | | | | | | | | | | | | | $(572,227) | |
| | | | | | | | | | | | | | | | |
Money Market Fund is pledged as collateral to Barclays Capital and Deutsche Bank for total return swap contracts in the amount of $3,851,388 and $120,000, respectively, at December 31, 2013.
^ Represents positions held in the respective Subsidiary (Note 2).
Open futures contracts outstanding at December 31, 2013:
Exchange Traded
| | | | | | | | | | | | | | | | | | |
NUMBER OF
CONTRACTS | | COUNTERPARTY | | DESCRIPTION | | EXPIRATION
DATE | | VALUE AT
TRADE DATE | | | VALUE AT
DECEMBER
31, 2013 | | | UNREALIZED
APPRECIATION
(DEPRECIATION) | |
| Long Contracts: | | | | | | | | | | | | | | | | |
| 19 | | Goldman Sachs | | Brent Crude Futures^ | | March 14, 2014 | | | $2,108,448 | | | | $2,095,130 | | | | $(13,318) | |
| 13 | | Goldman Sachs | | Cocoa Futures^ | | March 14, 2014 | | | 358,264 | | | | 352,170 | | | | (6,094) | |
| 59 | | Goldman Sachs | | Corn Futures^ | | May 14, 2014 | | | 1,304,613 | | | | 1,269,238 | | | | (35,375) | |
| 3 | | Goldman Sachs | | Cotton No. 2 Futures^ | | March 7, 2014 | | | 117,575 | | | | 126,960 | | | | 9,385 | |
| 1 | | Goldman Sachs | | Gas Oil Futures^ | | March 12, 2014 | | | 94,217 | | | | 94,175 | | | | (42) | |
| 6 | | Goldman Sachs | | Gasoline RBOB Futures^ | | March 31, 2014 | | | 747,189 | | | | 746,172 | | | | (1,017) | |
| 34 | | Goldman Sachs | | Lean Hogs Futures^ | | February 14, 2014 | | | 1,239,185 | | | | 1,161,780 | | | | (77,405) | |
| 4 | | J.P. Morgan | | LME Aluminum Futures^ | | January 3, 2014 | | | 183,815 | | | | 175,475 | | | | (8,340) | |
| 4 | | J.P. Morgan | | LME Aluminum Futures^ | | January 10, 2014 | | | 186,777 | | | | 175,883 | | | | (10,894) | |
| 4 | | J.P. Morgan | | LME Aluminum Futures^ | | January 31, 2014 | | | 188,149 | | | | 177,055 | | | | (11,094) | |
| 13 | | J.P. Morgan | | LME Aluminum Futures^ | | February 7, 2014 | | | 592,015 | | | | 576,680 | | | | (15,335) | |
| 6 | | J.P. Morgan | | LME Aluminum Futures^ | | February 14, 2014 | | | 267,913 | | | | 266,738 | | | | (1,175) | |
| 4 | | J.P. Morgan | | LME Aluminum Futures^ | | February 21, 2014 | | | 177,875 | | | | 178,129 | | | | 254 | |
| 5 | | J.P. Morgan | | LME Aluminum Futures^ | | March 5, 2014 | | | 221,260 | | | | 223,437 | | | | 2,177 | |
| 3 | | J.P. Morgan | | LME Aluminum Futures^ | | March 10, 2014 | | | 134,406 | | | | 134,257 | | | | (149) | |
| 42 | | J.P. Morgan | | LME Aluminum Futures^ | | March 17, 2014 | | | 1,951,242 | | | | 1,884,488 | | | | (66,754) | |
| 9 | | J.P. Morgan | | LME Aluminum Futures^ | | June 16, 2014 | | | 406,548 | | | | 412,594 | | | | 6,046 | |
| 3 | | J.P. Morgan | | LME Copper Futures^ | | January 3, 2014 | | | 543,161 | | | | 553,181 | | | | 10,020 | |
| 1 | | J.P. Morgan | | LME Copper Futures^ | | January 10, 2014 | | | 177,877 | | | | 184,344 | | | | 6,467 | |
| 4 | | J.P. Morgan | | LME Copper Futures^ | | January 17, 2014 | | | 721,195 | | | | 736,875 | | | | 15,680 | |
| 4 | | J.P. Morgan | | LME Copper Futures^ | | January 31, 2014 | | | 725,182 | | | | 736,804 | | | | 11,622 | |
| 6 | | J.P. Morgan | | LME Copper Futures^ | | February 7, 2014 | | | 1,066,512 | | | | 1,105,356 | | | | 38,844 | |
| 3 | | J.P. Morgan | | LME Copper Futures^ | | February 14, 2014 | | | 523,356 | | | | 552,712 | | | | 29,356 | |
| 1 | | J.P. Morgan | | LME Copper Futures^ | | March 5, 2014 | | | 177,096 | | | | 184,156 | | | | 7,060 | |
| 1 | | J.P. Morgan | | LME Copper Futures^ | | March 10, 2014 | | | 178,627 | | | | 184,156 | | | | 5,529 | |
| 16 | | J.P. Morgan | | LME Copper Futures^ | | March 17, 2014 | | | 2,900,980 | | | | 2,946,300 | | | | 45,320 | |
| 6 | | J.P. Morgan | | LME Copper Futures^ | | June 16, 2014 | | | 1,058,179 | | | | 1,100,700 | | | | 42,521 | |
| 1 | | J.P. Morgan | | LME Lead Futures^ | | January 3, 2014 | | | 52,002 | | | | 54,762 | | | | 2,760 | |
| 1 | | J.P. Morgan | | LME Lead Futures^ | | January 10, 2014 | | | 52,127 | | | | 54,871 | | | | 2,744 | |
| | | | |
| | The accompanying notes are an integral part of these financial statements. | | (Continued) |
| | | | | | | | | | | | | | | | |
| | AQR Funds | | | | | | Annual Report | | | | | | December 2013 | | 111 |
| | | | | | | | | | |
| | | | |
| Consolidated Schedule of Investments | | | December 31, 2013 | |
| | |
| AQR RISK-BALANCED COMMODITIES STRATEGY FUND | | |
| | | | | | | | | | | | | | | | | | |
NUMBER OF
CONTRACTS | | COUNTERPARTY | | DESCRIPTION | | EXPIRATION
DATE | | VALUE AT
TRADE DATE | | | VALUE AT
DECEMBER
31, 2013 | | | UNREALIZED
APPRECIATION
(DEPRECIATION) | |
| Long Contracts: (continued) | | | | | | | | | | | | | | | | |
| 2 | | J.P. Morgan | | LME Lead Futures^ | | January 31, 2014 | | | 109,642 | | | | 110,172 | | | | 530 | |
| 5 | | J.P. Morgan | | LME Lead Futures^ | | February 7, 2014 | | | 267,010 | | | | 275,755 | | | | 8,745 | |
| 9 | | J.P. Morgan | | LME Lead Futures^ | | March 17, 2014 | | | 487,044 | | | | 499,275 | | | | 12,231 | |
| 3 | | J.P. Morgan | | LME Zinc Futures^ | | January 24, 2014 | | | $144,756 | | | | $153,520 | | | | $8,764 | |
| 1 | | J.P. Morgan | | LME Zinc Futures^ | | February 7, 2014 | | | 47,602 | | | | 51,248 | | | | 3,646 | |
| 14 | | J.P. Morgan | | LME Zinc Futures^ | | March 17, 2014 | | | 671,392 | | | | 720,300 | | | | 48,908 | |
| 10 | | J.P. Morgan | | LME Zinc Futures^ | | June 16, 2014 | | | 478,083 | | | | 515,250 | | | | 37,167 | |
| 1 | | Goldman Sachs | | WTI Crude Oil Futures^ | | March 20, 2014 | | | 99,407 | | | | 98,440 | | | | (967) | |
| | | | | | | | | | | | | | | | | | |
| | | | | | | | | 20,760,721 | | | | 20,868,538 | | | | 107,817 | |
| | | | | | | | | | | | | | | | | | |
| Short Contracts: | | | | | | | | | | | | | | | | |
| 4 | | J.P. Morgan | | LME Aluminum Futures^ | | January 3, 2014 | | | (183,991) | | | | (175,474) | | | | 8,517 | |
| 4 | | J.P. Morgan | | LME Aluminum Futures^ | | January 10, 2014 | | | (186,992) | | | | (175,883) | | | | 11,109 | |
| 4 | | J.P. Morgan | | LME Aluminum Futures^ | | January 31, 2014 | | | (187,992) | | | | (177,055) | | | | 10,937 | |
| 13 | | J.P. Morgan | | LME Aluminum Futures^ | | February 7, 2014 | | | (590,392) | | | | (576,680) | | | | 13,712 | |
| 6 | | J.P. Morgan | | LME Aluminum Futures^ | | February 14, 2014 | | | (268,444) | | | | (266,738) | | | | 1,706 | |
| 4 | | J.P. Morgan | | LME Aluminum Futures^ | | February 21, 2014 | | | (177,792) | | | | (178,129) | | | | (337) | |
| 5 | | J.P. Morgan | | LME Aluminum Futures^ | | March 5, 2014 | | | (221,238) | | | | (223,438) | | | | (2,200) | |
| 3 | | J.P. Morgan | | LME Aluminum Futures^ | | March 10, 2014 | | | (133,025) | | | | (134,257) | | | | (1,232) | |
| 42 | | J.P. Morgan | | LME Aluminum Futures^ | | March 17, 2014 | | | (1,912,725) | | | | (1,884,487) | | | | 28,238 | |
| 8 | | J.P. Morgan | | LME Aluminum Futures^ | | June 16, 2014 | | | (364,403) | | | | (366,750) | | | | (2,347) | |
| 3 | | J.P. Morgan | | LME Copper Futures^ | | January 3, 2014 | | | (545,994) | | | | (553,182) | | | | (7,188) | |
| 1 | | J.P. Morgan | | LME Copper Futures^ | | January 10, 2014 | | | (177,801) | | | | (184,343) | | | | (6,542) | |
| 4 | | J.P. Morgan | | LME Copper Futures^ | | January 17, 2014 | | | (719,992) | | | | (736,875) | | | | (16,883) | |
| 4 | | J.P. Morgan | | LME Copper Futures^ | | January 31, 2014 | | | (724,492) | | | | (736,804) | | | | (12,312) | |
| 6 | | J.P. Morgan | | LME Copper Futures^ | | February 7, 2014 | | | (1,069,593) | | | | (1,105,356) | | | | (35,763) | |
| 3 | | J.P. Morgan | | LME Copper Futures^ | | February 14, 2014 | | | (522,302) | | | | (552,712) | | | | (30,410) | |
| 1 | | J.P. Morgan | | LME Copper Futures^ | | March 5, 2014 | | | (176,998) | | | | (184,156) | | | | (7,158) | |
| 1 | | J.P. Morgan | | LME Copper Futures^ | | March 10, 2014 | | | (178,934) | | | | (184,157) | | | | (5,223) | |
| 16 | | J.P. Morgan | | LME Copper Futures^ | | March 17, 2014 | | | (2,830,692) | | | | (2,946,300) | | | | (115,608) | |
| 1 | | J.P. Morgan | | LME Copper Futures^ | | June 16, 2014 | | | (178,310) | | | | (183,450) | | | | (5,140) | |
| 1 | | J.P. Morgan | | LME Lead Futures^ | | January 3, 2014 | | | (51,834) | | | | (54,763) | | | | (2,929) | |
| 1 | | J.P. Morgan | | LME Lead Futures^ | | January 10, 2014 | | | (51,891) | | | | (54,871) | | | | (2,980) | |
| 2 | | J.P. Morgan | | LME Lead Futures^ | | January 31, 2014 | | | (109,746) | | | | (110,172) | | | | (426) | |
| 5 | | J.P. Morgan | | LME Lead Futures^ | | February 7, 2014 | | | (267,564) | | | | (275,754) | | | | (8,190) | |
| 9 | | J.P. Morgan | | LME Lead Futures^ | | March 17, 2014 | | | (479,690) | | | | (499,275) | | | | (19,585) | |
| 3 | | J.P. Morgan | | LME Zinc Futures^ | | January 24, 2014 | | | (144,830) | | | | (153,520) | | | | (8,690) | |
| 1 | | J.P. Morgan | | LME Zinc Futures^ | | February 7, 2014 | | | (47,760) | | | | (51,248) | | | | (3,488) | |
| 14 | | J.P. Morgan | | LME Zinc Futures^ | | March 17, 2014 | | | (667,196) | | | | (720,300) | | | | (53,104) | |
| | | | | | | | | | | | | | | | | | |
| | | | | | | | | (13,172,613) | | | | (13,446,129) | | | | (273,516) | |
| | | | | | | | | | | | | | | | | | |
| | | | | | | | | $7,588,108 | | | | $7,422,409 | | | | $(165,699) | |
| | | | | | | | | | | | | | | | | | |
Cash held as collateral at Goldman Sachs and J.P. Morgan for futures contracts was $604,004 and $153,986, respectively at December 31, 2013.
^ Represents positions held in the respective Subsidiary (Note 2).
USD - United States Dollar
| | | | |
| | The accompanying notes are an integral part of these financial statements. | | |
| | | | | | | | | | | | | | | | |
| 112 | | AQR Funds | | | | | | Annual Report | | | | | | December 2013 | | |
| | | | | | | | | | |
| | | | |
| Consolidated Schedule of Investments | | | December 31, 2013 | |
| | | | | | | | | | | | | | | | | | | | |
| GOVERNMENT RELATED OBLIGATIONS - 14.7% | | INTEREST
RATE | | | MATURITY
DATE | | | CURRENCY | | | PRINCIPAL AMOUNT (000’S) | | | VALUE (Note 3) | |
| | | | | |
| Sovereign Debt - 14.7% | | | | | | | | | | | | | | | | | | | | |
| Deutsche Bundesrepublik Inflation Linked Bond (Germany) | | | 0.100% | | | | 04/15/23 | | | | EUR | | | | 23,237 | | | $ | 31,179,623 | |
| Deutsche Bundesrepublik Inflation Linked Bond (Germany) | | | 0.750% | | | | 04/15/18 | | | | EUR | | | | 11,872 | | | | 16,975,657 | |
| Deutsche Bundesrepublik Inflation Linked Bond (Germany) | | | 1.750% | | | | 04/15/20 | | | | EUR | | | | 7,867 | | | | 11,964,533 | |
| France Government Bond OAT (France) | | | 0.250% | | | | 07/25/18 | | | | EUR | | | | 5,705 | | | | 7,979,180 | |
| France Government Bond OAT (France) | | | 0.250% | | | | 07/25/24 | | | | EUR | | | | 1,621 | | | | 2,105,657 | |
| France Government Bond OAT (France) | | | 1.100% | | | | 07/25/22 | | | | EUR | | | | 3,679 | | | | 5,292,876 | |
| France Government Bond OAT (France) | | | 1.300% | | | | 07/25/19 | | | | EUR | | | | 13,484 | | | | 19,927,969 | |
| France Government Bond OAT (France) | | | 2.100% | | | | 07/25/23 | | | | EUR | | | | 1,531 | | | | 2,384,495 | |
| United Kingdom Index Linked Treasury Gilt (United Kingdom) | | | 0.125% | | | | 03/22/24 | | | | GBP | | | | 5,092 | | | | 8,500,040 | |
| United Kingdom Treasury Gilt (United Kingdom) | | | 1.875% | | | | 11/22/22 | | | | GBP | | | | 15,801 | | | | 31,141,496 | |
| | | | | | | | | | | | | | | | | | | | |
TOTAL GOVERNMENT RELATED OBLIGATIONS
(cost $134,049,377) | | | | | | | | | | | | | | | | | | | 137,451,526 | |
| | | | | | | | | | | | | | | | | | | | |
| U.S. TREASURY OBLIGATIONS - 21.7% | | | | | | | | | | | | | | | | | | | | |
| | | | | |
| U.S. Treasury Inflation Protected Securities - 21.7% | | | | | | | | | | | | | | | | | | | | |
| U.S. Treasury Inflation Protected Securities | | | 0.125% | | | | 04/15/18 | | | | USD | | | | 51,700 | | | | 53,274,141 | |
| U.S. Treasury Inflation Protected Securities | | | 0.125% | | | | 01/15/22 | | | | USD | | | | 17,100 | | | | 16,958,317 | |
| U.S. Treasury Inflation Protected Securities | | | 0.125% | | | | 07/15/22 | | | | USD | | | | 16,400 | | | | 15,954,165 | |
| U.S. Treasury Inflation Protected Securities | | | 0.125% | | | | 01/15/23 | | | | USD | | | | 15,800 | | | | 15,098,441 | |
| U.S. Treasury Inflation Protected Securities | | | 0.375% | | | | 07/15/23 | | | | USD | | | | 15,000 | | | | 14,518,297 | |
| U.S. Treasury Inflation Protected Securities | | | 1.375% | | | | 07/15/18 | | | | USD | | | | 11,000 | | | | 12,912,120 | |
| U.S. Treasury Inflation Protected Securities | | | 1.625% | | | | 01/15/18 | | | | USD | | | | 23,900 | | | | 28,956,315 | |
| U.S. Treasury Inflation Protected Securities | | | 2.125% | | | | 01/15/19 | | | | USD | | | | 9,700 | | | | 11,783,023 | |
| U.S. Treasury Inflation Protected Securities | | | 2.625% | | | | 07/15/17 | | | | USD | | | | 26,300 | | | | 33,336,051 | |
| | | | | | | | | | | | | | | | | | | | |
TOTAL U.S. TREASURY OBLIGATIONS
(cost $205,650,911) | | | | | | | | | | | | | | | | | | | 202,790,870 | |
| | | | | | | | | | | | | | | | | | | | |
| | | | | | | | |
| | | SHARES | | | | |
| MONEY MARKET FUNDS - 42.0% | | | | | | | | |
| BlackRock Liquidity Funds TempFund Portfolio - Series I, Institutional Shares, 0.050% (a)^ | | | 26,205,161 | | | | 26,205,161 | |
| Dreyfus Treasury Cash Management, Series I, Class I, 0.010% (a)^ | | | 104,820,642 | | | | 104,820,642 | |
| J.P. Morgan U.S. Treasury Plus Money Market Fund - Institutional Shares, 0.000% (a)(b)^ | | | 129,923,540 | | | | 129,923,540 | |
| UBS Money Series - UBS Select Treasury Preferred Fund, Class I, 0.010% (a)^ | | | 131,026,648 | | | | 131,026,648 | |
| | | | | | | | |
TOTAL MONEY MARKET FUNDS
(cost $391,975,991) | | | | | | | 391,975,991 | |
| | | | | | | | |
| | |
| | | PRINCIPAL
AMOUNT
(000’S) | | | | |
| SHORT-TERM INVESTMENTS - 17.3% | | | | | | | | |
| U.S. Treasury Bills, 0.066%, 01/30/2014 (c)^ | | | $69,477 | | | | 69,479,827 | |
| U.S. Treasury Bills, 0.073%, 02/06/2014 (c)^ | | | 69,476 | | | | 69,479,758 | |
| U.S. Treasury Bills, 0.080%, 05/29/2014 (c)^ | | | 11,546 | | | | 11,547,286 | |
| U.S. Treasury Bills, 0.084%, 06/05/2014 (c)^ | | | 11,546 | | | | 11,547,159 | |
| | | | | | | | |
TOTAL SHORT-TERM INVESTMENTS
(cost $162,044,878) | | | | | | | 162,054,030 | |
| | | | | | | | |
TOTAL INVESTMENTS - 95.7%
(cost $893,721,157) | | | | | | $ | 894,272,417 | |
| | | | | | | | |
| OTHER ASSETS IN EXCESS OF LIABILITIES - 4.3% (d) | | | | | | | 39,777,874 | |
| | | | | | | | |
NET ASSETS - 100.0% | | | | | | $ | 934,050,291 | |
| | | | | | | | |
| | | | |
| | The accompanying notes are an integral part of these financial statements. | | (Continued) |
| | | | | | | | | | | | | | | | |
| | AQR Funds | | | | | | Annual Report | | | | | | December 2013 | | 113 |
| | | | | | | | | | |
| | | | |
| Consolidated Schedule of Investments | | | December 31, 2013 | |
All securities are United States companies, unless noted otherwise in parentheses.
| (a) | Represents annualized seven-day yield as of December 31, 2013. |
| (b) | A portion of the security is pledged as collateral to the brokers for forward foreign currency exchange and swap contracts. |
| (c) | The rate shown is the effective yield at the date of purchase. |
| (d) | Includes appreciation/(depreciation) on forward foreign currency exchange, futures and swap contracts. |
| ^ | All or a portion represents positions held in the respective Subsidiary (Note 2). |
All securities are Level 2 with respect to ASC 820 (See Note 5).
The following abbreviations are used in portfolio descriptions:
EUR - Euro
GBP - British Pound
USD - United States Dollar
Credit default swap contracts sell protection as of December 31, 2013:
| | | | | | | | | | | | | | | | | | | | | | | | | | | | |
| COUNTERPARTY | | REFERENCE ENTITY | | FIXED
ANNUAL
RATE
RECEIVED
BY FUND | | CURRENCY | | | CREDIT
SPREAD | | | NOTIONAL
AMOUNT | | | UPFRONT
PREMIUM
(RECEIVED)
PAID | | | TERMINATION
DATE | | | UNREALIZED
APPRECIATION
(DEPRECIATION) | |
| Exchange Cleared | | | | | | | | | | | | | | | | | | | | | |
| CitiBank | | iTraxx Europe Crossover Series 20.V1 | | 5.000% | | | EUR | | | | 2.860% | | | | 75,975,000 | | | | $5,097,987 | | | | 12/20/2018 | | | | $4,876,884 | |
| CitiBank | | iTraxx Europe Crossover Series 20.V1 | | 1.000% | | | EUR | | | | 0.700% | | | | 133,500,000 | | | | 256,541 | | | | 12/20/2018 | | | | 2,428,777 | |
| CitiBank | | Markit CDX North America High Yield Index Series 21 | | 5.000% | | | USD | | | | 3.060% | | | | 128,050,000 | | | | 6,116,201 | | | | 12/20/2018 | | | | 5,013,452 | |
| CitiBank | | Markit CDX Emerging Market Index Series 20 | | 5.000% | | | USD | | | | 2.730% | | | | 34,375,000 | | | | 3,662,688 | | | | 12/20/2018 | | | | (116,613) | |
| CitiBank | | Markit CDX North America Investment Grade Index Series 21 | | 1.000% | | | USD | | | | 0.630% | | | | 303,125,000 | | | | 3,214,986 | | | | 12/20/2018 | | | | 2,308,135 | |
| | | | | | | | |
| Over the Counter | | | | | | | | | | | | | | | | | | | | | | | | | | | | |
| Bank of America | | Markit CMBX North America AJ 3 | | 1.470% | | | USD | | | | 1.037% | | | | 25,000 | | | | (8,045) | | | | 12/13/2049 | | | | 2,226 | |
| Bank of America | | Markit CMBX North America AJ 4 | | 0.960% | | | USD | | | | 0.863% | | | | 525,000 | | | | (145,426) | | | | 02/17/2051 | | | | 25,295 | |
| Deutsche Bank | | Markit CMBX North America AJ 3 | | 1.470% | | | USD | | | | 1.037% | | | | 1,250,000 | | | | (381,131) | | | | 12/13/2049 | | | | 90,187 | |
| Deutsche Bank | | Markit CMBX North America AJ 4 | | 0.960% | | | USD | | | | 0.863% | | | | 1,450,000 | | | | (460,864) | | | | 02/17/2051 | | | | 129,074 | |
| Deutsche Bank | | Markit CMBX North America AJ 3 | | 1.470% | | | USD | | | | 1.037% | | | | 975,000 | | | | (258,718) | | | | 12/13/2049 | | | | 31,782 | |
| Goldman Sachs | | Markit CMBX North America AJ 4 | | 0.960% | | | USD | | | | 0.863% | | | | 400,000 | | | | (110,771) | | | | 02/17/2051 | | | | 19,242 | |
| Goldman Sachs | | Markit CMBX North America AJ 3 | | 1.470% | | | USD | | | | 1.037% | | | | 525,000 | | | | (144,469) | | | | 12/13/2049 | | | | 22,273 | |
Morgan Stanley
Capital Services, Inc. | | Markit CMBX North America AJ 3 | | 1.470% | | | USD | | | | 1.037% | | | | 300,000 | | | | (86,177) | | | | 12/13/2049 | | | | 16,351 | |
The Royal Bank of
Scotland | | Markit CMBX North America AJ 3 | | 1.470% | | | USD | | | | 1.037% | | | | 100,000 | | | | (27,225) | | | | 12/13/2049 | | | | 3,951 | |
| | | | | | | | | | | | | | | | | | | | | | | | | | | | |
| | | | | | | | | | | | | | | | | | | $16,725,577 | | | | | | | | $14,851,016 | |
| | | | | | | | | | | | | | | | | | | | | | | | | | | | |
| | | | |
| | The accompanying notes are an integral part of these financial statements. | | (Continued) |
| | | | | | | | | | | | | | | | |
| 114 | | AQR Funds | | | | | | Annual Report | | | | | | December 2013 | | |
| | | | | | | | | | |
| | | | |
| Consolidated Schedule of Investments | | | December 31, 2013 | |
Money Market Fund is pledged as collateral to Goldman Sachs, Deutsche Bank, Bank of America and Morgan Stanley Capital Services, Inc. for credit default swap contracts in the amount of $360,000, $1,070,852, $3,522,079 and $9,151,558, respectively. Additional collateral for positions held at The Royal Bank of Scotland is included in the collateral for forward foreign currency exchange contracts. Cash held as collateral for CitiBank for credit default swap contracts was $10,908,365 at December 31, 2013.
lnterest rate swap contracts outstanding as of December 31, 2013:
Over the Counter
| | | | | | | | | | | | | | | | | | |
| COUNTERPARTY | | PAYMENTS MADE BY THE FUND | | PAYMENTS
RECEIVED
BY THE
FUND | | CURRENCY | | NOTIONAL
AMOUNT | | | TERMINATION
DATE | | | UNREALIZED
APPRECIATION
(DEPRECIATION) | |
| The Royal Bank of Scotland | | 0.900% | | (1) | | CZK | | | 10,000,000 | | | | 09/19/2018 | | | | $6,666 | |
| The Royal Bank of Scotland | | 1.145% | | (1) | | CZK | | | 60,000,000 | | | | 09/19/2018 | | | | 3,093 | |
| The Royal Bank of Scotland | | 1.255% | | (1) | | CZK | | | 90,000,000 | | | | 09/19/2018 | | | | (20,212) | |
| The Royal Bank of Scotland | | 1.315% | | (1) | | CZK | | | 100,000,000 | | | | 09/19/2018 | | | | (37,519) | |
| The Royal Bank of Scotland | | 1.540% | | (1) | | CZK | | | 60,000,000 | | | | 09/19/2018 | | | | (56,399) | |
| The Royal Bank of Scotland | | 1.660% | | (1) | | CZK | | | 250,000,000 | | | | 09/19/2018 | | | | (310,304) | |
| The Royal Bank of Scotland | | 1.685% | | (1) | | CZK | | | 60,000,000 | | | | 09/19/2018 | | | | (78,238) | |
| The Royal Bank of Scotland | | 1.685% | | (1) | | CZK | | | 70,000,000 | | | | 09/19/2018 | | | | (91,278) | |
| The Royal Bank of Scotland | | 1.740% | | (1) | | CZK | | | 40,000,000 | | | | 09/19/2018 | | | | (57,681) | |
| The Royal Bank of Scotland | | 1.790% | | (1) | | CZK | | | 60,000,000 | | | | 09/19/2018 | | | | (94,053) | |
| The Royal Bank of Scotland | | 6 month Prague Interbank Offered Rate | | 1.020% | | CZK | | | 570,000,000 | | | | 09/19/2018 | | | | (208,237) | |
| The Royal Bank of Scotland | | 6 month Prague Interbank Offered Rate | | 1.295% | | CZK | | | 60,000,000 | | | | 09/19/2018 | | | | 19,499 | |
| The Royal Bank of Scotland | | 6 month Prague Interbank Offered Rate | | 1.400% | | CZK | | | 40,000,000 | | | | 09/19/2018 | | | | 23,542 | |
| The Royal Bank of Scotland | | 6 month Prague Interbank Offered Rate | | 1.420% | | CZK | | | 30,000,000 | | | | 09/19/2018 | | | | 19,163 | |
| The Royal Bank of Scotland | | 6 month Prague Interbank Offered Rate | | 1.430% | | CZK | | | 30,000,000 | | | | 09/19/2018 | | | | 19,916 | |
| Citibank | | 6 month Prague Interbank Offered Rate | | 1.500% | | CZK | | | 80,000,000 | | | | 03/20/2019 | | | | (9,900) | |
| The Royal Bank of Scotland | | 6 month Prague Interbank Offered Rate | | 1.510% | | CZK | | | 60,000,000 | | | | 09/19/2018 | | | | 51,881 | |
| The Royal Bank of Scotland | | 6 month Prague Interbank Offered Rate | | 1.625% | | CZK | | | 20,000,000 | | | | 09/19/2018 | | | | 23,067 | |
| Citibank | | 6 month Prague Interbank Offered Rate | | 1.870% | | CZK | | | 250,000,000 | | | | 03/20/2019 | | | | 327,919 | |
| Citibank | | 6 month Prague Interbank Offered Rate | | 1.965% | | CZK | | | 40,000,000 | | | | 03/20/2019 | | | | 61,946 | |
| The Royal Bank of Scotland | | 1.300% | | (2) | | HKD | | | 45,000,000 | | | | 09/19/2018 | | | | 110,406 | |
| The Royal Bank of Scotland | | 1.338% | | (2) | | HKD | | | 64,000,000 | | | | 09/19/2018 | | | | 142,411 | |
| The Royal Bank of Scotland | | 1.360% | | (2) | | HKD | | | 76,000,000 | | | | 09/19/2018 | | | | 159,068 | |
| The Royal Bank of Scotland | | 1.703% | | (2) | | HKD | | | 50,000,000 | | | | 09/19/2018 | | | | 1,762 | |
| The Royal Bank of Scotland | | 1.815% | | (2) | | HKD | | | 27,000,000 | | | | 09/19/2018 | | | | (17,298) | |
| The Royal Bank of Scotland | | 1.850% | | (2) | | HKD | | | 53,000,000 | | | | 09/19/2018 | | | | (45,099) | |
| The Royal Bank of Scotland | | 1.870% | | (2) | | HKD | | | 59,000,000 | | | | 09/19/2018 | | | | (57,295) | |
| The Royal Bank of Scotland | | 1.890% | | (2) | | HKD | | | 208,000,000 | | | | 09/19/2018 | | | | (226,981) | |
| The Royal Bank of Scotland | | 2.015% | | (2) | | HKD | | | 42,000,000 | | | | 09/19/2018 | | | | (77,375) | |
| The Royal Bank of Scotland | | 3 month Hong Kong Interbank Offered Rate | | 0.875% | | HKD | | | 72,000,000 | | | | 09/19/2018 | | | | (360,496) | |
| The Royal Bank of Scotland | | 3 month Hong Kong Interbank Offered Rate | | 1.020% | | HKD | | | 271,000,000 | | | | 09/19/2018 | | | | (1,120,780) | |
| The Royal Bank of Scotland | | 3 month Hong Kong Interbank Offered Rate | | 1.045% | | HKD | | | 100,000,000 | | | | 09/19/2018 | | | | (398,552) | |
| The Royal Bank of Scotland | | 3 month Hong Kong Interbank Offered Rate | | 1.357% | | HKD | | | 44,000,000 | | | | 09/19/2018 | | | | (92,885) | |
| The Royal Bank of Scotland | | 3 month Hong Kong Interbank Offered Rate | | 1.710% | | HKD | | | 4,000,000 | | | | 09/19/2018 | | | | 39 | |
| The Royal Bank of Scotland | | 3 month Hong Kong Interbank Offered Rate | | 1.730% | | HKD | | | 29,000,000 | | | | 09/19/2018 | | | | 3,769 | |
| The Royal Bank of Scotland | | 3 month Hong Kong Interbank Offered Rate | | 1.755% | | HKD | | | 26,000,000 | | | | 09/19/2018 | | | | 7,284 | |
| The Royal Bank of Scotland | | 3 month Hong Kong Interbank Offered Rate | | 1.788% | | HKD | | | 27,000,000 | | | | 09/19/2018 | | | | 12,837 | |
| | | | |
| | The accompanying notes are an integral part of these financial statements. | | (Continued) |
| | | | | | | | | | | | | | | | |
| | AQR Funds | | | | | | Annual Report | | | | | | December 2013 | | 115 |
| | | | | | | | | | |
| | | | |
| Consolidated Schedule of Investments | | | December 31, 2013 | |
| | | | | | | | | | | | | | | | | | |
| COUNTERPARTY | | PAYMENTS MADE BY THE FUND | | PAYMENTS
RECEIVED
BY THE
FUND | | CURRENCY | | NOTIONAL
AMOUNT | | | TERMINATION
DATE | | | UNREALIZED
APPRECIATION
(DEPRECIATION) | |
| The Royal Bank of Scotland | | 3 month Hong Kong Interbank Offered Rate | | 1.813% | | HKD | | | 21,000,000 | | | | 09/19/2018 | | | | $13,138 | |
| Citibank | | 3 month Hong Kong Interbank Offered Rate | | 2.000% | | HKD | | | 29,000,000 | | | | 03/20/2019 | | | | (29,921) | |
| The Royal Bank of Scotland | | 3 month Hong Kong Interbank Offered Rate | | 2.005% | | HKD | | | 19,000,000 | | | | 09/19/2018 | | | | 33,861 | |
| The Royal Bank of Scotland | | 3 month Hong Kong Interbank Offered Rate | | 2.118% | | HKD | | | 19,000,000 | | | | 09/19/2018 | | | | 46,704 | |
| Citibank | | 3 month Hong Kong Interbank Offered Rate | | 2.195% | | HKD | | | 210,000,000 | | | | 03/20/2019 | | | | 301,387 | |
| Citibank | | 3 month Hong Kong Interbank Offered Rate | | 2.370% | | HKD | | | 22,000,000 | | | | 03/20/2019 | | | | 55,751 | |
| Citibank | | 3 Month Hong Kong Interbank Offered Rate | | 2.000% | | HKD | | | 19,000,000 | | | | 03/20/2019 | | | | (39,096) | |
| Citibank | | 3 Month Hong Kong Interbank Offered Rate | | 2.000% | | HKD | | | 19,000,000 | | | | 03/20/2019 | | | | 4,511 | |
| Citibank | | 4.500% | | (3) | | HUF | | | 100,000,000 | | | | 03/20/2019 | | | | (7,923) | |
| The Royal Bank of Scotland | | 4.740% | | (3) | | HUF | | | 1,200,000,000 | | | | 09/19/2018 | | | | (186,885) | |
| The Royal Bank of Scotland | | 4.770% | | (3) | | HUF | | | 1,200,000,000 | | | | 09/19/2018 | | | | (194,703) | |
| The Royal Bank of Scotland | | 4.930% | | (3) | | HUF | | | 1,000,000,000 | | | | 09/19/2018 | | | | (197,002) | |
| The Royal Bank of Scotland | | 5.180% | | (3) | | HUF | | | 600,000,000 | | | | 09/19/2018 | | | | (150,778) | |
| The Royal Bank of Scotland | | 5.200% | | (3) | | HUF | | | 3,400,000,000 | | | | 09/19/2018 | | | | (869,179) | |
| The Royal Bank of Scotland | | 5.560% | | (3) | | HUF | | | 600,000,000 | | | | 09/19/2018 | | | | (200,296) | |
| The Royal Bank of Scotland | | 5.750% | | (3) | | HUF | | | 400,000,000 | | | | 09/19/2018 | | | | (150,036) | |
| The Royal Bank of Scotland | | 5.860% | | (3) | | HUF | | | 900,000,000 | | | | 09/19/2018 | | | | (359,083) | |
| Citibank | | 6 month Budapest Interbank Offered Rate | | 4.500% | | HUF | | | 400,000,000 | | | | 03/20/2019 | | | | 13,173 | |
| Citibank | | 6 month Budapest Interbank Offered Rate | | 4.500% | | HUF | | | 300,000,000 | | | | 03/20/2019 | | | | 6,489 | |
| The Royal Bank of Scotland | | 6 month Budapest Interbank Offered Rate | | 4.520% | | HUF | | | 600,000,000 | | | | 09/19/2018 | | | | 64,774 | |
| The Royal Bank of Scotland | | 6 month Budapest Interbank Offered Rate | | 4.620% | | HUF | | | 400,000,000 | | | | 09/19/2018 | | | | 51,870 | |
| The Royal Bank of Scotland | | 6 month Budapest Interbank Offered Rate | | 4.655% | | HUF | | | 2,200,000,000 | | | | 09/19/2018 | | | | 302,009 | |
| The Royal Bank of Scotland | | 6 month Budapest Interbank Offered Rate | | 4.670% | | HUF | | | 400,000,000 | | | | 09/19/2018 | | | | 56,214 | |
| The Royal Bank of Scotland | | 6 month Budapest Interbank Offered Rate | | 4.750% | | HUF | | | 300,000,000 | | | | 09/19/2018 | | | | 47,373 | |
| The Royal Bank of Scotland | | 6 month Budapest Interbank Offered Rate | | 4.815% | | HUF | | | 400,000,000 | | | | 09/19/2018 | | | | 68,810 | |
| The Royal Bank of Scotland | | 6 month Budapest Interbank Offered Rate | | 4.870% | | HUF | | | 400,000,000 | | | | 09/19/2018 | | | | 73,588 | |
| The Royal Bank of Scotland | | 6 month Budapest Interbank Offered Rate | | 4.890% | | HUF | | | 4,800,000,000 | | | | 09/19/2018 | | | | 903,909 | |
| The Royal Bank of Scotland | | 6 month Budapest Interbank Offered Rate | | 4.930% | | HUF | | | 100,000,000 | | | | 09/19/2018 | | | | 19,700 | |
| The Royal Bank of Scotland | | 6 month Budapest Interbank Offered Rate | | 4.970% | | HUF | | | 500,000,000 | | | | 09/19/2018 | | | | 102,845 | |
| Citibank | | 6 month Budapest Interbank Offered Rate | | 5.470% | | HUF | | | 3,400,000,000 | | | | 03/20/2019 | | | | 930,515 | |
| Citibank | | 6 month Budapest Interbank Offered Rate | | 5.510% | | HUF | | | 500,000,000 | | | | 03/20/2019 | | | | 141,120 | |
| The Royal Bank of Scotland | | 6.350% | | (3) | | HUF | | | 700,000,000 | | | | 09/19/2018 | | | | (353,780) | |
| The Royal Bank of Scotland | | 2.650% | | (4) | | KRW | | | 3,000,000,000 | | | | 09/19/2018 | | | | 59,765 | |
| | | | |
| | The accompanying notes are an integral part of these financial statements. | | (Continued) |
| | | | | | | | | | | | | | | | |
| 116 | | AQR Funds | | | | | | Annual Report | | | | | | December 2013 | | |
| | | | | | | | | | |
| | | | |
| Consolidated Schedule of Investments | | | December 31, 2013 | |
| | | | | | | | | | | | | | | | | | |
| COUNTERPARTY | | PAYMENTS MADE BY THE FUND | | PAYMENTS
RECEIVED
BY THE
FUND | | CURRENCY | | NOTIONAL
AMOUNT | | | TERMINATION
DATE | | | UNREALIZED
APPRECIATION
(DEPRECIATION) | |
| The Royal Bank of Scotland | | 2.655% | | (4) | | KRW | | | 5,000,000,000 | | | | 09/19/2018 | | | | $98,562 | |
| The Royal Bank of Scotland | | 2.869% | | (4) | | KRW | | | 13,000,000,000 | | | | 09/19/2018 | | | | 139,788 | |
| The Royal Bank of Scotland | | 2.888% | | (4) | | KRW | | | 20,000,000,000 | | | | 09/19/2018 | | | | 199,568 | |
| The Royal Bank of Scotland | | 2.890% | | (4) | | KRW | | | 24,000,000,000 | | | | 09/19/2018 | | | | 236,970 | |
| The Royal Bank of Scotland | | 3 month Korean Certificate of Deposit | | 2.778% | | KRW | | | 35,000,000,000 | | | | 09/19/2018 | | | | (510,431) | |
| The Royal Bank of Scotland | | 3 month Korean Certificate of Deposit | | 2.780% | | KRW | | | 35,000,000,000 | | | | 09/19/2018 | | | | (506,767) | |
| The Royal Bank of Scotland | | 3 month Korean Certificate of Deposit | | 2.820% | | KRW | | | 35,000,000,000 | | | | 09/19/2018 | | | | (448,154) | |
| The Royal Bank of Scotland | | 3 month Korean Certificate of Deposit | | 2.828% | | KRW | | | 37,000,000,000 | | | | 09/19/2018 | | | | (462,145) | |
| The Royal Bank of Scotland | | 3 month Korean Certificate of Deposit | | 2.966% | | KRW | | | 14,000,000,000 | | | | 09/19/2018 | | | | (93,569) | |
| The Royal Bank of Scotland | | 3 month Korean Certificate of Deposit | | 3.045% | | KRW | | | 8,000,000,000 | | | | 09/19/2018 | | | | (27,076) | |
| The Royal Bank of Scotland | | 3 month Korean Certificate of Deposit | | 3.070% | | KRW | | | 1,000,000,000 | | | | 09/19/2018 | | | | (2,338) | |
| The Royal Bank of Scotland | | 3 month Korean Certificate of Deposit | | 3.095% | | KRW | | | 8,000,000,000 | | | | 09/19/2018 | | | | (10,329) | |
| The Royal Bank of Scotland | | 3 month Korean Certificate of Deposit | | 3.115% | | KRW | | | 5,000,000,000 | | | | 09/19/2018 | | | | (2,269) | |
| Citibank | | 3 month Korean Certificate of Deposit | | 3.165% | | KRW | | | 6,000,000,000 | | | | 03/20/2019 | | | | (7,482) | |
| Citibank | | 3 month Korean Certificate of Deposit | | 3.173% | | KRW | | | 5,000,000,000 | | | | 03/20/2019 | | | | (4,601) | |
| The Royal Bank of Scotland | | 3 month Korean Certificate of Deposit | | 3.200% | | KRW | | | 7,000,000,000 | | | | 09/19/2018 | | | | 21,734 | |
| The Royal Bank of Scotland | | 3 month Korean Certificate of Deposit | | 3.210% | | KRW | | | 6,000,000,000 | | | | 09/19/2018 | | | | 21,141 | |
| Citibank | | 3 month Korean Certificate of Deposit | | 3.245% | | KRW | | | 8,000,000,000 | | | | 03/20/2019 | | | | 17,917 | |
| Citibank | | 3 month Korean Certificate of Deposit | | 3.278% | | KRW | | | 31,000,000,000 | | | | 03/20/2019 | | | | 113,340 | |
| Citibank | | 3 month Korean Certificate of Deposit | | 3.318% | | KRW | | | 31,000,000,000 | | | | 03/20/2019 | | | | 167,384 | |
| Citibank | | 3 month Korean Certificate of Deposit | | 3.360% | | KRW | | | 5,000,000,000 | | | | 03/20/2019 | | | | 36,259 | |
| The Royal Bank of Scotland | | 3.140% | | (4) | | KRW | | | 15,000,000,000 | | | | 09/19/2018 | | | | (8,893) | |
| The Royal Bank of Scotland | | 3.190% | | (4) | | KRW | | | 31,000,000,000 | | | | 09/19/2018 | | | | (83,272) | |
| The Royal Bank of Scotland | | 3.200% | | (4) | | KRW | | | 8,000,000,000 | | | | 09/19/2018 | | | | (24,839) | |
| The Royal Bank of Scotland | | 3.215% | | (4) | | KRW | | | 18,000,000,000 | | | | 09/19/2018 | | | | (67,191) | |
| The Royal Bank of Scotland | | 3.220% | | (4) | | KRW | | | 31,000,000,000 | | | | 09/19/2018 | | | | (122,208) | |
| The Royal Bank of Scotland | | 3.220% | | (4) | | KRW | | | 16,000,000,000 | | | | 09/19/2018 | | | | (63,075) | |
| The Royal Bank of Scotland | | 3.315% | | (4) | | KRW | | | 5,000,000,000 | | | | 09/19/2018 | | | | (39,598) | |
| The Royal Bank of Scotland | | 3.265% | | (5) | | PLN | | | 28,000,000 | | | | 09/19/2018 | | | | 139,595 | |
| The Royal Bank of Scotland | | 3.280% | | (5) | | PLN | | | 3,000,000 | | | | 09/19/2018 | | | | 14,264 | |
| The Royal Bank of Scotland | | 3.310% | | (5) | | PLN | | | 36,000,000 | | | | 09/19/2018 | | | | 154,551 | |
| The Royal Bank of Scotland | | 3.320% | | (5) | | PLN | | | 18,000,000 | | | | 09/19/2018 | | | | 74,505 | |
| The Royal Bank of Scotland | | 3.445% | | (5) | | PLN | | | 24,000,000 | | | | 09/19/2018 | | | | 53,176 | |
| The Royal Bank of Scotland | | 3.860% | | (5) | | PLN | | | 19,000,000 | | | | 09/19/2018 | | | | (79,239) | |
| The Royal Bank of Scotland | | 3.975% | | (5) | | PLN | | | 27,000,000 | | | | 09/19/2018 | | | | (160,383) | |
| The Royal Bank of Scotland | | 4.010% | | (5) | | PLN | | | 12,000,000 | | | | 09/19/2018 | | | | (77,744) | |
| The Royal Bank of Scotland | | 4.060% | | (5) | | PLN | | | 92,000,000 | | | | 09/19/2018 | | | | (666,827) | |
| The Royal Bank of Scotland | | 4.135% | | (5) | | PLN | | | 5,000,000 | | | | 09/19/2018 | | | | (42,011) | |
| The Royal Bank of Scotland | | 4.205% | | (5) | | PLN | | | 21,000,000 | | | | 09/19/2018 | | | | (199,068) | |
| | | | |
| | The accompanying notes are an integral part of these financial statements. | | (Continued) |
| | | | | | | | | | | | | | | | |
| | AQR Funds | | | | | | Annual Report | | | | | | December 2013 | | 117 |
| | | | | | | | | | |
| | | | |
| Consolidated Schedule of Investments | | | December 31, 2013 | |
| | | | | | | | | | | | | | | | | | |
| COUNTERPARTY | | PAYMENTS MADE BY THE FUND | | PAYMENTS
RECEIVED
BY THE
FUND | | CURRENCY | | NOTIONAL
AMOUNT | | | TERMINATION
DATE | | | UNREALIZED
APPRECIATION
(DEPRECIATION) | |
| The Royal Bank of Scotland | | 6 month Warsaw Interbank Offered Rate | | 3.420% | | PLN | | | 17,000,000 | | | | 09/19/2018 | | | | $(44,206) | |
| The Royal Bank of Scotland | | 6 month Warsaw Interbank Offered Rate | | 3.480% | | PLN | | | 12,000,000 | | | | 09/19/2018 | | | | (20,125) | |
| The Royal Bank of Scotland | | 6 month Warsaw Interbank Offered Rate | | 3.530% | | PLN | | | 11,000,000 | | | | 09/19/2018 | | | | (9,984) | |
| The Royal Bank of Scotland | | 6 month Warsaw Interbank Offered Rate | | 3.580% | | PLN | | | 10,000,000 | | | | 09/19/2018 | | | | (1,382) | |
| The Royal Bank of Scotland | | 6 month Warsaw Interbank Offered Rate | | 3.604% | | PLN | | | 220,000,000 | | | | 09/19/2018 | | | | 50,160 | |
| The Royal Bank of Scotland | | 6 month Warsaw Interbank Offered Rate | | 3.735% | | PLN | | | 9,000,000 | | | | 09/19/2018 | | | | 20,222 | |
| The Royal Bank of Scotland | | 6 month Warsaw Interbank Offered Rate | | 3.870% | | PLN | | | 7,000,000 | | | | 09/19/2018 | | | | 30,270 | |
| Citibank | | 6 month Warsaw Interbank Offered Rate | | 4.000% | | PLN | | | 7,000,000 | | | | 03/20/2019 | | | | (5,891) | |
| Citibank | | 6 month Warsaw Interbank Offered Rate | | 4.000% | | PLN | | | 4,000,000 | | | | 03/20/2019 | | | | 13,230 | |
| Citibank | | 6 month Warsaw Interbank Offered Rate | | 4.000% | | PLN | | | 10,000,000 | | | | 03/20/2019 | | | | 6,714 | |
| Citibank | | 6 month Warsaw Interbank Offered Rate | | 4.275% | | PLN | | | 92,000,000 | | | | 03/20/2019 | | | | 688,630 | |
| Citibank | | 6 month Warsaw Interbank Offered Rate | | 4.460% | | PLN | | | 13,000,000 | | | | 03/20/2019 | | | | 133,748 | |
| The Royal Bank of Scotland | | 1.245% | | (6) | | SGD | | | 14,000,000 | | | | 09/19/2018 | | | | 171,455 | |
| The Royal Bank of Scotland | | 1.383% | | (6) | | SGD | | | 22,000,000 | | | | 09/19/2018 | | | | 152,382 | |
| The Royal Bank of Scotland | | 1.470% | | (6) | | SGD | | | 18,000,000 | | | | 09/19/2018 | | | | 63,735 | |
| The Royal Bank of Scotland | | 1.735% | | (6) | | SGD | | | 15,000,000 | | | | 09/19/2018 | | | | (100,693) | |
| The Royal Bank of Scotland | | 1.820% | | (6) | | SGD | | | 34,000,000 | | | | 09/19/2018 | | | | (340,062) | |
| The Royal Bank of Scotland | | 1.850% | | (6) | | SGD | | | 34,000,000 | | | | 09/19/2018 | | | | (379,529) | |
| The Royal Bank of Scotland | | 1.905% | | (6) | | SGD | | | 19,000,000 | | | | 09/19/2018 | | | | (252,524) | |
| The Royal Bank of Scotland | | 1.910% | | (6) | | SGD | | | 17,000,000 | | | | 09/19/2018 | | | | (229,231) | |
| The Royal Bank of Scotland | | 1.920% | | (6) | | SGD | | | 9,000,000 | | | | 09/19/2018 | | | | (124,840) | |
| The Royal Bank of Scotland | | 1.950% | | (6) | | SGD | | | 13,000,000 | | | | 09/19/2018 | | | | (195,415) | |
| The Royal Bank of Scotland | | 6 month Singapore Interbank Offered Rate | | 0.890% | | SGD | | | 25,000,000 | | | | 09/19/2018 | | | | (649,572) | |
| The Royal Bank of Scotland | | 6 month Singapore Interbank Offered Rate | | 0.930% | | SGD | | | 19,000,000 | | | | 09/19/2018 | | | | (464,268) | |
| The Royal Bank of Scotland | | 6 month Singapore Interbank Offered Rate | | 0.945% | | SGD | | | 6,000,000 | | | | 09/19/2018 | | | | (143,129) | |
| The Royal Bank of Scotland | | 6 month Singapore Interbank Offered Rate | | 0.980% | | SGD | | | 24,000,000 | | | | 09/19/2018 | | | | (540,012) | |
| The Royal Bank of Scotland | | 6 month Singapore Interbank Offered Rate | | 1.008% | | SGD | | | 23,000,000 | | | | 09/19/2018 | | | | (493,038) | |
| The Royal Bank of Scotland | | 6 month Singapore Interbank Offered Rate | | 1.090% | | SGD | | | 46,000,000 | | | | 09/19/2018 | | | | (839,235) | |
| The Royal Bank of Scotland | | 6 month Singapore Interbank Offered Rate | | 1.503% | | SGD | | | 9,000,000 | | | | 09/19/2018 | | | | (20,550) | |
| The Royal Bank of Scotland | | 6 month Singapore Interbank Offered Rate | | 1.680% | | SGD | | | 2,000,000 | | | | 09/19/2018 | | | | 9,170 | |
| The Royal Bank of Scotland | | 6 month Singapore Interbank Offered Rate | | 1.710% | | SGD | | | 1,000,000 | | | | 09/19/2018 | | | | 5,746 | |
| The Royal Bank of Scotland | | 6 month Singapore Interbank Offered Rate | | 1.740% | | SGD | | | 8,000,000 | | | | 09/19/2018 | | | | 55,251 | |
| The Royal Bank of Scotland | | 6 month Singapore Interbank Offered Rate | | 1.750% | | SGD | | | 8,000,000 | | | | 09/19/2018 | | | | 58,346 | |
| | | | |
| | The accompanying notes are an integral part of these financial statements. | | (Continued) |
| | | | | | | | | | | | | | | | |
| 118 | | AQR Funds | | | | | | Annual Report | | | | | | December 2013 | | |
| | | | | | | | | | |
| | | | |
| Consolidated Schedule of Investments | | | December 31, 2013 | |
| | | | | | | | | | | | | | | | | | |
| COUNTERPARTY | | PAYMENTS MADE BY THE FUND | | PAYMENTS
RECEIVED
BY THE
FUND | | CURRENCY | | NOTIONAL
AMOUNT | | | TERMINATION
DATE | | | UNREALIZED
APPRECIATION
(DEPRECIATION) | |
| The Royal Bank of Scotland | | 6 month Singapore Interbank Offered Rate | | 1.775% | | SGD | | | 8,000,000 | | | | 09/19/2018 | | | | $66,085 | |
| The Royal Bank of Scotland | | 6 month Singapore Interbank Offered Rate | | 1.790% | | SGD | | | 5,000,000 | | | | 09/19/2018 | | | | 44,205 | |
| The Royal Bank of Scotland | | 6 month Singapore Interbank Offered Rate | | 1.873% | | SGD | | | 7,000,000 | | | | 09/19/2018 | | | | 84,232 | |
| The Royal Bank of Scotland | | 6 month Singapore Interbank Offered Rate | | 1.980% | | SGD | | | 7,000,000 | | | | 09/19/2018 | | | | 113,349 | |
| Citibank | | 6 month Singapore Interbank Offered Rate | | 2.000% | | SGD | | | 6,000,000 | | | | 03/20/2019 | | | | (50,284) | |
| Citibank | | 6 month Singapore Interbank Offered Rate | | 2.000% | | SGD | | | 9,000,000 | | | | 03/20/2019 | | | | (55,158) | |
| Citibank | | 6 month Singapore Interbank Offered Rate | | 2.000% | | SGD | | | 6,000,000 | | | | 03/20/2019 | | | | 35,189 | |
| The Royal Bank of Scotland | | 6 month Singapore Interbank Offered Rate | | 2.020% | | SGD | | | 500,000 | | | | 09/19/2018 | | | | 8,870 | |
| Citibank | | 6 month Singapore Interbank Offered Rate | | 2.145% | | SGD | | | 35,000,000 | | | | 03/20/2019 | | | | 393,602 | |
| Citibank | | 6 month Singapore Interbank Offered Rate | | 2.150% | | SGD | | | 35,000,000 | | | | 03/20/2019 | | | | 400,389 | |
| Citibank | | 6 month Singapore Interbank Offered Rate | | 2.201% | | SGD | | | 5,000,000 | | | | 03/20/2019 | | | | 67,147 | |
| The Royal Bank of Scotland | | 3 month Johannesburg Interbank Agreed Rate | | 6.190% | | ZAR | | | 549,000,000 | | | | 09/19/2018 | | | | (2,282,668) | |
| The Royal Bank of Scotland | | 3 month Johannesburg Interbank Agreed Rate | | 6.310% | | ZAR | | | 66,000,000 | | | | 09/19/2018 | | | | (243,737) | |
| The Royal Bank of Scotland | | 3 month Johannesburg Interbank Agreed Rate | | 7.063% | | ZAR | | | 37,000,000 | | | | 09/19/2018 | | | | (28,779) | |
| The Royal Bank of Scotland | | 3 month Johannesburg Interbank Agreed Rate | | 7.170% | | ZAR | | | 40,000,000 | | | | 09/19/2018 | | | | (14,454) | |
| The Royal Bank of Scotland | | 3 month Johannesburg Interbank Agreed Rate | | 7.185% | | ZAR | | | 32,000,000 | | | | 09/19/2018 | | | | (9,704) | |
| The Royal Bank of Scotland | | 3 month Johannesburg Interbank Agreed Rate | | 7.300% | | ZAR | | | 19,000,000 | | | | 09/19/2018 | | | | 2,703 | |
| The Royal Bank of Scotland | | 3 month Johannesburg Interbank Agreed Rate | | 7.320% | | ZAR | | | 41,000,000 | | | | 09/19/2018 | | | | 9,009 | |
| The Royal Bank of Scotland | | 3 month Johannesburg Interbank Agreed Rate | | 7.410% | | ZAR | | | 54,000,000 | | | | 09/19/2018 | | | | 30,694 | |
| Citibank | | 3 month Johannesburg Interbank Agreed Rate | | 7.500% | | ZAR | | | 50,000,000 | | | | 03/20/2019 | | | | (843) | |
| The Royal Bank of Scotland | | 3 month Johannesburg Interbank Agreed Rate | | 7.510% | | ZAR | | | 41,000,000 | | | | 09/19/2018 | | | | 39,188 | |
| Citibank | | 3 month Johannesburg Interbank Agreed Rate | | 8.010% | | ZAR | | | 40,000,000 | | | | 03/20/2019 | | | | 75,667 | |
| Citibank | | 3 month Johannesburg Interbank Agreed Rate | | 8.125% | | ZAR | | | 320,000,000 | | | | 03/20/2019 | | | | 751,444 | |
| Citibank | | 3 Month Johannesburg Interbank Agreed Rate | | 7.500% | | ZAR | | | 40,000,000 | | | | 03/20/2019 | | | | (22,361) | |
| Citibank | | 3 Month Johannesburg Interbank Agreed Rate | | 7.500% | | ZAR | | | 14,000,000 | | | | 03/20/2019 | | | | (1,256) | |
| The Royal Bank of Scotland | | 7.130% | | (7) | | ZAR | | | 30,000,000 | | | | 09/19/2018 | | | | 15,490 | |
| The Royal Bank of Scotland | | 7.190% | | (7) | | ZAR | | | 104,000,000 | | | | 09/19/2018 | | | | 29,523 | |
| The Royal Bank of Scotland | | 7.570% | | (7) | | ZAR | | | 60,000,000 | | | | 09/19/2018 | | | | (71,294) | |
| The Royal Bank of Scotland | | 7.650% | | (7) | | ZAR | | | 40,000,000 | | | | 09/19/2018 | | | | (59,926) | |
| The Royal Bank of Scotland | | 7.650% | | (7) | | ZAR | | | 100,000,000 | | | | 09/19/2018 | | | | (149,816) | |
| The Royal Bank of Scotland | | 7.685% | | (7) | | ZAR | | | 50,000,000 | | | | 09/19/2018 | | | | (81,687) | |
| | | | |
| | The accompanying notes are an integral part of these financial statements. | | (Continued) |
| | | | | | | | | | | | | | | | |
| | AQR Funds | | | | | | Annual Report | | | | | | December 2013 | | 119 |
| | | | | | | | | | |
| | | | |
| Consolidated Schedule of Investments | | | December 31, 2013 | |
| | | | | | | | | | | | | | | | | | |
| COUNTERPARTY | | PAYMENTS MADE BY THE FUND | | PAYMENTS
RECEIVED
BY THE
FUND | | CURRENCY | | NOTIONAL
AMOUNT | | | TERMINATION
DATE | | | UNREALIZED
APPRECIATION
(DEPRECIATION) | |
| The Royal Bank of Scotland | | 7.700% | | (7) | | ZAR | | | 71,000,000 | | | | 09/19/2018 | | | | $(120,122) | |
| The Royal Bank of Scotland | | 7.729% | | (7) | | ZAR | | | 320,000,000 | | | | 09/19/2018 | | | | (577,345) | |
| The Royal Bank of Scotland | | 7.840% | | (7) | | ZAR | | | 80,000,000 | | | | 09/19/2018 | | | | (178,737) | |
| | | | | | | | | | | | | | | | | | |
| | | | | | | | | | | | | | | | | $(9,204,257) | |
| | | | | | | | | | | | | | | | | | |
| (1) | 6 month Prague Interbank Offered Rate |
| (2) | 3 month Hong Kong Interbank Offered Rate |
| (3) | 6 month Budapest Interbank Offered Rate |
| (4) | 3 month Korean Certificate of Deposit |
| (5) | 6 month Warsaw Interbank Offered Rate |
| (6) | 6 month Singapore Interbank Offered Rate |
| (7) | 3 month Johannesburg Interbank Agreed Rate |
Money Market Fund pledged as collateral to The Royal Bank of Scotland is included in the forward foreign currency exchange contracts. Additional cash collateral for positions held for CitiBank is included in the collateral for credit default swap contracts.
Total return swap contracts outstanding as of December 31, 2013:
Over the Counter
| | | | | | | | | | | | | | | | |
| COUNTERPARTY | | UNDERLYING REFERENCE INSTRUMENT | | TERMINATION
DATE | | CURRENCY | | | NOTIONAL
VALUE | | | UNREALIZED
APPRECIATION
(DEPRECIATION) | |
| Bank of America | | Australia 10-Year Bond Futures | | 3/17/2014 | | | AUD | | | | 681,278 | | | | $6,020 | |
| Morgan Stanley and Co., International PLC | | Bovespa Index | | 2/12/2014 | | | BRL | | | | 16,028,487 | | | | 122,148 | |
| Merrill Lynch | | Brent Crude Futures^ | | 1/16/2014 | | | USD | | | | 47,806,110 | | | | 1,167,321 | |
| Merrill Lynch | | Brent Crude Futures^ | | 1/16/2014 | | | USD | | | | (47,405,580) | | | | (1,567,793) | |
| Merrill Lynch | | Brent Crude Futures^ | | 2/13/2014 | | | USD | | | | 46,110,680 | | | | 1,416,731 | |
| Merrill Lynch | | Brent Crude Futures^ | | 2/13/2014 | | | USD | | | | (47,840,640) | | | | 312,632 | |
| Merrill Lynch | | Brent Crude Futures^ | | 3/14/2014 | | | USD | | | | 46,065,000 | | | | (302,950) | |
| Barclays Capital | | Cocoa Futures^ | | 3/14/2014 | | | USD | | | | 26,460 | | | | 630 | |
| Barclays Capital | | Corn Futures^ | | 3/14/2014 | | | USD | | | | 3,697,915 | | | | (511,612) | |
| Barclays Capital | | Corn Futures^ | | 3/14/2014 | | | USD | | | | (3,354,465) | | | | 168,298 | |
| Barclays Capital | | Corn Futures^ | | 5/14/2014 | | | USD | | | | 3,422,566 | | | | (174,178) | |
| Bank of America | | Euro-Bund Futures | | 3/6/2014 | | | EUR | | | | 44,935,817 | | | | (927,110) | |
| Merrill Lynch | | Gas Oil Futures^ | | 1/10/2014 | | | USD | | | | 11,983,050 | | | | 285,674 | |
| Merrill Lynch | | Gas Oil Futures^ | | 1/10/2014 | | | USD | | | | (11,803,400) | | | | (465,307) | |
| Merrill Lynch | | Gas Oil Futures^ | | 2/12/2014 | | | USD | | | | 14,214,375 | | | | 409,736 | |
| Merrill Lynch | | Gas Oil Futures^ | | 2/12/2014 | | | USD | | | | (14,632,000) | | | | 7,747 | |
| Merrill Lynch | | Gas Oil Futures^ | | 3/12/2014 | | | USD | | | | 14,604,875 | | | | (7,750) | |
| Merrill Lynch | | Gasoline RBOB Futures^ | | 1/31/2014 | | | USD | | | | 16,425,944 | | | | 1,019,442 | |
| Merrill Lynch | | Gasoline RBOB Futures^ | | 1/31/2014 | | | USD | | | | (15,887,424) | | | | (1,557,940) | |
| Merrill Lynch | | Gasoline RBOB Futures^ | | 1/31/2014 | | | USD | | | | 16,878,767 | | | | 1,608,062 | |
| Merrill Lynch | | Gasoline RBOB Futures^ | | 1/31/2014 | | | USD | | | | (17,702,416) | | | | (784,619) | |
| Merrill Lynch | | Gasoline RBOB Futures^ | | 2/28/2014 | | | USD | | | | 15,385,314 | | | | 561,772 | |
| Merrill Lynch | | Gasoline RBOB Futures^ | | 2/28/2014 | | | USD | | | | (15,894,984) | | | | (52,326) | |
| Merrill Lynch | | Gasoline RBOB Futures^ | | 3/31/2014 | | | USD | | | | 14,206,954 | | | | (29,686) | |
| Merrill Lynch | | Heating Oil Futures^ | | 1/31/2014 | | | USD | | | | 17,785,320 | | | | 437,841 | |
| Merrill Lynch | | Heating Oil Futures^ | | 1/31/2014 | | | USD | | | | (17,316,562) | | | | (906,580) | |
| Merrill Lynch | | Heating Oil Futures^ | | 1/31/2014 | | | USD | | | | 9,500,644 | | | | 540,816 | |
| Merrill Lynch | | Heating Oil Futures^ | | 1/31/2014 | | | USD | | | | (9,803,136) | | | | (238,399) | |
| Merrill Lynch | | Heating Oil Futures^ | | 2/28/2014 | | | USD | | | | 10,884,380 | | | | 145,882 | |
| Merrill Lynch | | Heating Oil Futures^ | | 2/28/2014 | | | USD | | | | (11,047,890) | | | | 17,557 | |
| Merrill Lynch | | Heating Oil Futures^ | | 3/31/2014 | | | USD | | | | 10,369,976 | | | | (15,989) | |
| Morgan Stanley and Co., International PLC | | H-SHARES Index Futures | | 1/29/2014 | | | HKD | | | | 28,823,044 | | | | 54,943 | |
| | | | |
| | The accompanying notes are an integral part of these financial statements. | | (Continued) |
| | | | | | | | | | | | | | | | |
| 120 | | AQR Funds | | | | | | Annual Report | | | | | | December 2013 | | |
| | | | | | | | | | |
| | | | |
| Consolidated Schedule of Investments | | | December 31, 2013 | |
| | | | | | | | | | | | | | | | |
| COUNTERPARTY | | UNDERLYING REFERENCE INSTRUMENT | | TERMINATION
DATE | | CURRENCY | | | NOTIONAL
VALUE | | | UNREALIZED
APPRECIATION
(DEPRECIATION) | |
| Barclays Capital | | Lean Hogs Futures^ | | 2/14/2014 | | | USD | | | | 7,335,980 | | | | $ (501,906) | |
| Barclays Capital | | Lean Hogs Futures^ | | 2/14/2014 | | | USD | | | | (2,638,253) | | | | 143,822 | |
| Barclays Capital | | Live Cattle Futures^ | | 2/28/2014 | | | USD | | | | 12,491,454 | | | | $163,247 | |
| Barclays Capital | | Live Cattle Futures^ | | 2/28/2014 | | | USD | | | | (3,823,884) | | | | (53,300) | |
| Morgan Stanley and Co., International PLC | | MSCI Taiwan Stock Index Futures | | 1/28/2014 | | | USD | | | | 7,967,878 | | | | 218,522 | |
| Merrill Lynch | | Natural Gas Swap Futures^ | | 1/29/2014 | | | USD | | | | 4,703,400 | | | | 964,564 | |
| Merrill Lynch | | Natural Gas Swap Futures^ | | 1/29/2014 | | | USD | | | | (4,980,950) | | | | (687,082) | |
| Merrill Lynch | | Natural Gas Swap Futures^ | | 2/26/2014 | | | USD | | | | 4,641,870 | | | | 221,914 | |
| Merrill Lynch | | Natural Gas Swap Futures^ | | 2/26/2014 | | | USD | | | | (5,104,000) | | | | 240,016 | |
| Merrill Lynch | | Natural Gas Swap Futures^ | | 3/27/2014 | | | USD | | | | 4,919,560 | | | | (157,760) | |
| Morgan Stanley and Co., International PLC | | Russian Trading System Index Futures | | 3/17/2014 | | | USD | | | | 7,724,614 | | | | 268,142 | |
| Barclays Capital | | Soybean Futures^ | | 3/14/2014 | | | USD | | | | 839,630 | | | | 495 | |
| Barclays Capital | | Soybean Futures^ | | 3/14/2014 | | | USD | | | | (854,588) | | | | 14,157 | |
| Barclays Capital | | Soybean Futures^ | | 5/14/2014 | | | USD | | | | 843,375 | | | | (13,325) | |
| Deutsche Bank | | Soybean Meal Futures^ | | 3/14/2014 | | | USD | | | | 713,150 | | | | (4,250) | |
| Barclays Capital | | Soybean Oil Futures^ | | 3/14/2014 | | | USD | | | | 3,965,292 | | | | (161,856) | |
| Morgan Stanley and Co., International PLC | | Swiss Market Index Futures | | 3/21/2014 | | | CHF | | | | 10,616,518 | | | | 646,743 | |
| Bank of America | | U.S. Treasury 10-Year Note Futures | | 3/20/2014 | | | USD | | | | 138,824,664 | | | | (2,611,773) | |
| Barclays Capital | | Wheat Futures^ | | 3/14/2014 | | | USD | | | | 1,163,050 | | | | (103,836) | |
| Barclays Capital | | Wheat Futures^ | | 3/14/2014 | | | USD | | | | (1,161,101) | | | | 101,887 | |
| Barclays Capital | | Wheat Futures^ | | 5/14/2014 | | | USD | | | | 804,540 | | | | (70,140) | |
| Merrill Lynch | | WTI Crude Oil Futures^ | | 1/21/2014 | | | USD | | | | 34,618,640 | | | | 1,206,028 | |
| Merrill Lynch | | WTI Crude Oil Futures^ | | 1/21/2014 | | | USD | | | | (34,314,240) | | | | (1,510,374) | |
| Merrill Lynch | | WTI Crude Oil Futures^ | | 2/20/2014 | | | USD | | | | 39,040,940 | | | | 1,659,570 | |
| Merrill Lynch | | WTI Crude Oil Futures^ | | 2/20/2014 | | | USD | | | | (41,199,100) | | | | 497,758 | |
| Merrill Lynch | | WTI Crude Oil Futures^ | | 3/20/2014 | | | USD | | | | 40,126,710 | | | | (455,390) | |
| | | | | | | | | | | | | | | | |
| | | | | | | | | | | | | | | $756,886 | |
| | | | | | | | | | | | | | | | |
Money Market Fund is pledged as collateral to Merrill Lynch, Barclays Capital and Deutsche Bank for total return swap contracts in the amount of $12,100,135, $3,292,141 and $100,000, respectively. Additional collateral for positions held at Bank of America is included in collateral for credit default swap contracts.
^ Represents positions held in the respective Subsidiary (Note 2).
Open futures contracts outstanding at December 31, 2013:
Exchange Traded
| | | | | | | | | | | | | | | | | | | | |
NUMBER OF
CONTRACTS | | COUNTERPARTY | | DESCRIPTION | | EXPIRATION
DATE | | | VALUE AT
TRADE DATE | | | VALUE AT
DECEMBER 31,
2013 | | | UNREALIZED
APPRECIATION
(DEPRECIATION) | |
| Long Contracts: | | | | | | | | | | | | | | | | |
| 9 | | Goldman Sachs | | Cattle Feeder Futures^ | | | March 27, 2014 | | | | $751,725 | | | | $753,300 | | | | $1,575 | |
| 84 | | Goldman Sachs | | Cocoa Futures^ | | | March 14, 2014 | | | | 2,308,147 | | | | 2,275,560 | | | | (32,587) | |
| 141 | | Goldman Sachs | | Coffee ‘C’ Futures^ | | | March 19, 2014 | | | | 5,698,038 | | | | 5,853,263 | | | | 155,225 | |
| 558 | | Goldman Sachs | | Corn Futures^ | | | May 14, 2014 | | | | 12,274,409 | | | | 12,003,975 | | | | (270,434) | |
| 88 | | Goldman Sachs | | Cotton No. 2 Futures^ | | | March 7, 2014 | | | | 3,458,156 | | | | 3,724,160 | | | | 266,004 | |
| 56 | | Goldman Sachs | | Gold 100 OZ Futures^ | | | February 26, 2014 | | | | 7,309,893 | | | | 6,732,880 | | | | (577,013) | |
| 45 | | Goldman Sachs | | Lean Hogs Futures^ | | | February 14, 2014 | | | | 1,600,679 | | | | 1,537,650 | | | | (63,029) | |
| 57 | | Goldman Sachs | | Live Cattle Futures^ | | | February 28, 2014 | | | | 3,051,805 | | | | 3,069,450 | | | | 17,645 | |
| 21 | | J.P. Morgan | | LME Aluminum Futures^ | | | January 3, 2014 | | | | 967,046 | | | | 921,243 | | | | (45,803) | |
| 10 | | J.P. Morgan | | LME Aluminum Futures^ | | | January 10, 2014 | | | | 466,245 | | | | 439,708 | | | | (26,537) | |
| 12 | | J.P. Morgan | | LME Aluminum Futures^ | | | January 17, 2014 | | | | 554,898 | | | | 528,854 | | | | (26,044) | |
| 7 | | J.P. Morgan | | LME Aluminum Futures^ | | | January 24, 2014 | | | | 322,540 | | | | 309,173 | | | | (13,367) | |
| | | | |
| | The accompanying notes are an integral part of these financial statements. | | (Continued) |
| | | | | | | | | | | | | | | | |
| | AQR Funds | | | | | | Annual Report | | | | | | December 2013 | | 121 |
| | | | | | | | | | |
| | | | |
| Consolidated Schedule of Investments | | | December 31, 2013 | |
| | | | | | | | | | | | | | | | | | | | |
NUMBER OF
CONTRACTS | | COUNTERPARTY | | DESCRIPTION | | EXPIRATION
DATE | | | VALUE AT
TRADE DATE | | | VALUE AT
DECEMBER 31,
2013 | | | UNREALIZED
APPRECIATION
(DEPRECIATION) | |
| Long Contracts (continued) | | | | | | | | | | | | | | | | |
| 17 | | J.P. Morgan | | LME Aluminum Futures^ | | | January 28, 2014 | | | | $803,925 | | | | $751,783 | | | | $(52,142) | |
| 6 | | J.P. Morgan | | LME Aluminum Futures^ | | | January 29, 2014 | | | | 284,559 | | | | 265,417 | | | | (19,142) | |
| 1 | | J.P. Morgan | | LME Aluminum Futures^ | | | January 31, 2014 | | | | 47,171 | | | | 44,264 | | | | (2,907) | |
| 25 | | J.P. Morgan | | LME Aluminum Futures^ | | | February 5, 2014 | | | | 1,136,302 | | | | 1,108,312 | | | | (27,990) | |
| 8 | | J.P. Morgan | | LME Aluminum Futures^ | | | February 7, 2014 | | | | 364,317 | | | | 354,880 | | | | (9,437) | |
| 16 | | J.P. Morgan | | LME Aluminum Futures^ | | | February 14, 2014 | | | | 714,433 | | | | 711,300 | | | | (3,133) | |
| 25 | | J.P. Morgan | | LME Aluminum Futures^ | | | February 21, 2014 | | | | 1,112,139 | | | | 1,113,306 | | | | 1,167 | |
| 5 | | J.P. Morgan | | LME Aluminum Futures^ | | | February 27, 2014 | | | | 222,260 | | | | 223,048 | | | | 788 | |
| 20 | | J.P. Morgan | | LME Aluminum Futures^ | | | March 5, 2014 | | | | 885,042 | | | | 893,750 | | | | 8,708 | |
| 348 | | J.P. Morgan | | LME Aluminum Futures^ | | | March 17, 2014 | | | | 16,120,311 | | | | 15,614,325 | | | | (505,986) | |
| 248 | | J.P. Morgan | | LME Aluminum Futures^ | | | June 16, 2014 | | | | 11,212,058 | | | | 11,369,250 | | | | 157,192 | |
| 4 | | J.P. Morgan | | LME Copper Futures^ | | | January 3, 2014 | | | | 729,558 | | | | 737,575 | | | | 8,017 | |
| 7 | | J.P. Morgan | | LME Copper Futures^ | | | January 10, 2014 | | | | 1,245,140 | | | | 1,290,407 | | | | 45,267 | |
| 15 | | J.P. Morgan | | LME Copper Futures^ | | | January 17, 2014 | | | | 2,704,175 | | | | 2,763,281 | | | | 59,106 | |
| 2 | | J.P. Morgan | | LME Copper Futures^ | | | January 24, 2014 | | | | 359,904 | | | | 368,352 | | | | 8,448 | |
| 6 | | J.P. Morgan | | LME Copper Futures^ | | | January 28, 2014 | | | | 1,081,040 | | | | 1,105,141 | | | | 24,101 | |
| 6 | | J.P. Morgan | | LME Copper Futures^ | | | January 31, 2014 | | | | 1,088,169 | | | | 1,105,206 | | | | 17,037 | |
| 8 | | J.P. Morgan | | LME Copper Futures^ | | | February 5, 2014 | | | | 1,431,517 | | | | 1,473,750 | | | | 42,233 | |
| 2 | | J.P. Morgan | | LME Copper Futures^ | | | February 7, 2014 | | | | 355,504 | | | | 368,452 | | | | 12,948 | |
| 15 | | J.P. Morgan | | LME Copper Futures^ | | | February 14, 2014 | | | | 2,616,781 | | | | 2,763,562 | | | | 146,781 | |
| 4 | | J.P. Morgan | | LME Copper Futures^ | | | February 21, 2014 | | | | 698,307 | | | | 736,625 | | | | 38,318 | |
| 8 | | J.P. Morgan | | LME Copper Futures^ | | | February 27, 2014 | | | | 1,414,537 | | | | 1,473,250 | | | | 58,713 | |
| 3 | | J.P. Morgan | | LME Copper Futures^ | | | March 12, 2014 | | | | 543,313 | | | | 552,469 | | | | 9,156 | |
| 163 | | J.P. Morgan | | LME Copper Futures^ | | | March 17, 2014 | | | | 29,317,829 | | | | 30,015,432 | | | | 697,603 | |
| 127 | | J.P. Morgan | | LME Copper Futures^ | | | June 16, 2014 | | | | 22,409,339 | | | | 23,298,150 | | | | 888,811 | |
| 4 | | J.P. Morgan | | LME Lead Futures^ | | | January 3, 2014 | | | | 208,008 | | | | 219,050 | | | | 11,042 | |
| 1 | | J.P. Morgan | | LME Lead Futures^ | | | January 10, 2014 | | | | 52,127 | | | | 54,871 | | | | 2,744 | |
| 4 | | J.P. Morgan | | LME Lead Futures^ | | | January 17, 2014 | | | | 214,897 | | | | 219,824 | | | | 4,927 | |
| 1 | | J.P. Morgan | | LME Lead Futures^ | | | January 24, 2014 | | | | 54,383 | | | | 55,021 | | | | 638 | |
| 4 | | J.P. Morgan | | LME Lead Futures^ | | | January 28, 2014 | | | | 221,164 | | | | 220,233 | | | | (931) | |
| 1 | | J.P. Morgan | | LME Lead Futures^ | | | January 31, 2014 | | | | 54,965 | | | | 55,086 | | | | 121 | |
| 4 | | J.P. Morgan | | LME Lead Futures^ | | | February 5, 2014 | | | | 215,008 | | | | 220,530 | | | | 5,522 | |
| 1 | | J.P. Morgan | | LME Lead Futures^ | | | February 7, 2014 | | | | 53,402 | | | | 55,151 | | | | 1,749 | |
| 4 | | J.P. Morgan | | LME Lead Futures^ | | | February 14, 2014 | | | | 209,308 | | | | 220,864 | | | | 11,556 | |
| 56 | | J.P. Morgan | | LME Lead Futures^ | | | March 17, 2014 | | | | 3,020,417 | | | | 3,106,600 | | | | 86,183 | |
| 40 | | J.P. Morgan | | LME Lead Futures^ | | | June 16, 2014 | | | | 2,087,833 | | | | 2,229,000 | | | | 141,167 | |
| 3 | | J.P. Morgan | | LME Nickel Futures^ | | | January 3, 2014 | | | | 248,946 | | | | 248,976 | | | | 30 | |
| 5 | | J.P. Morgan | | LME Nickel Futures^ | | | January 17, 2014 | | | | 421,398 | | | | 415,331 | | | | (6,067) | |
| 7 | | J.P. Morgan | | LME Nickel Futures^ | | | January 24, 2014 | | | | 610,585 | | | | 581,665 | | | | (28,920) | |
| 1 | | J.P. Morgan | | LME Nickel Futures^ | | | January 28, 2014 | | | | 87,954 | | | | 83,111 | | | | (4,843) | |
| 1 | | J.P. Morgan | | LME Nickel Futures^ | | | February 7, 2014 | | | | 83,702 | | | | 83,153 | | | | (549) | |
| 5 | | J.P. Morgan | | LME Nickel Futures^ | | | February 14, 2014 | | | | 411,010 | | | | 415,907 | | | | 4,897 | |
| 29 | | J.P. Morgan | | LME Nickel Futures^ | | | March 17, 2014 | | | | 2,454,240 | | | | 2,416,860 | | | | (37,380) | |
| 20 | | J.P. Morgan | | LME Nickel Futures^ | | | June 16, 2014 | | | | 1,644,072 | | | | 1,674,960 | | | | 30,888 | |
| 11 | | J.P. Morgan | | LME Zinc Futures^ | | | January 3, 2014 | | | | 518,398 | | | | 564,575 | | | | 46,177 | |
| 3 | | J.P. Morgan | | LME Zinc Futures^ | | | January 10, 2014 | | | | 142,131 | | | | 153,503 | | | | 11,372 | |
| 2 | | J.P. Morgan | | LME Zinc Futures^ | | | January 17, 2014 | | | | 96,254 | | | | 102,271 | | | | 6,017 | |
| 10 | | J.P. Morgan | | LME Zinc Futures^ | | | January 24, 2014 | | | | 482,521 | | | | 511,733 | | | | 29,212 | |
| 8 | | J.P. Morgan | | LME Zinc Futures^ | | | January 31, 2014 | | | | 391,651 | | | | 409,686 | | | | 18,035 | |
| 6 | | J.P. Morgan | | LME Zinc Futures^ | | | February 21, 2014 | | | | 283,018 | | | | 307,928 | | | | 24,910 | |
| 8 | | J.P. Morgan | | LME Zinc Futures^ | | | February 27, 2014 | | | | 377,629 | | | | 410,776 | | | | 33,147 | |
| 7 | | J.P. Morgan | | LME Zinc Futures^ | | | March 12, 2014 | | | | 344,029 | | | | 359,823 | | | | 15,794 | |
| 173 | | J.P. Morgan | | LME Zinc Futures^ | | | March 17, 2014 | | | | 8,281,264 | | | | 8,900,850 | | | | 619,586 | |
| 154 | | J.P. Morgan | | LME Zinc Futures^ | | | June 16, 2014 | | | | 7,372,326 | | | | 7,934,850 | | | | 562,524 | |
| 92 | | Goldman Sachs | | Silver Futures^ | | | March 27, 2014 | | | | 9,824,110 | | | | 8,910,200 | | | | (913,910) | |
| 158 | | Goldman Sachs | | Soybean Futures^ | | | May 14, 2014 | | | | 10,178,164 | | | | 10,088,300 | | | | (89,864) | |
| | | | |
| | The accompanying notes are an integral part of these financial statements. | | (Continued) |
| | | | | | | | | | | | | | | | |
| 122 | | AQR Funds | | | | | | Annual Report | | | | | | December 2013 | | |
| | | | | | | | | | |
| | | | |
| Consolidated Schedule of Investments | | | December 31, 2013 | |
| | | | | | | | | | | | | | | | | | | | |
NUMBER OF
CONTRACTS | | COUNTERPARTY | | DESCRIPTION | | EXPIRATION
DATE | | | VALUE AT
TRADE DATE | | | VALUE AT
DECEMBER 31,
2013 | | | UNREALIZED
APPRECIATION
(DEPRECIATION) | |
| Long Contracts (continued) | | | | | | | | | | | | | | | | |
| 76 | | Goldman Sachs | | Soybean Meal Futures^ | | | March 14, 2014 | | | | $3,189,674 | | | | $3,169,200 | | | | $(20,474) | |
| 121 | | Goldman Sachs | | Soybean Oil Futures^ | | | March 14, 2014 | | | | 2,955,213 | | | | 2,840,838 | | | | (114,375) | |
| 254 | | Goldman Sachs | | Sugar #11 (World Markets) Futures^ | | | March 28, 2014 | | | | 5,065,983 | | | | 4,668,317 | | | | (397,666) | |
| 55 | | Goldman Sachs | | Wheat Futures^ | | | May 14, 2014 | | | | 1,842,390 | | | | 1,683,000 | | | | (159,390) | |
| 47 | | Barclays Capital | | Amsterdam Index Futures | | | January 17, 2014 | | | | 4,911,163 | | | | 5,203,021 | | | | 291,858 | |
| 128 | | Barclays Capital | | CAC40 Index Futures | | | January 17, 2014 | | | | 7,199,405 | | | | 7,569,212 | | | | 369,807 | |
| 36 | | Barclays Capital | | DAX Index Futures | | | March 21, 2014 | | | | 11,340,088 | | | | 11,892,858 | | | | 552,770 | |
| 95 | | Barclays Capital | | E-Mini Russell 2000 Futures | | | March 21, 2014 | | | | 10,437,356 | | | | 11,033,300 | | | | 595,944 | |
| 505 | | Barclays Capital | | Euro Stoxx 50 Index | | | March 21, 2014 | | | | 20,568,641 | | | | 21,592,162 | | | | 1,023,521 | |
| 245 | | Barclays Capital | | FTSE 100 Index Futures | | | March 21, 2014 | | | | 26,147,421 | | | | 27,172,277 | | | | 1,024,856 | |
| 151 | | J.P. Morgan | | FTSE/JSE Top 40 Index Futures | | | March 20, 2014 | | | | 5,658,556 | | | | 6,002,574 | | | | 344,018 | |
| 29 | | Barclays Capital | | FTSE/MIB Index Futures | | | March 21, 2014 | | | | 3,632,783 | | | | 3,795,040 | | | | 162,257 | |
| 48 | | Barclays Capital | | Hang Seng Index Futures | | | January 29, 2014 | | | | 7,091,296 | | | | 7,221,696 | | | | 130,400 | |
| 174 | | Barclays Capital | | H-SHARES Index Futures | | | January 29, 2014 | | | | 11,934,817 | | | | 12,154,173 | | | | 219,356 | |
| 47 | | Barclays Capital | | IBEX 35 Index Futures | | | January 17, 2014 | | | | 6,031,705 | | | | 6,381,347 | | | | 349,642 | |
| 70 | | Barclays Capital | | KOSPI Index 200 Futures | | | March 13, 2014 | | | | 8,676,912 | | | | 8,810,110 | | | | 133,198 | |
| 91 | | Barclays Capital | | MSCI Taiwan Stock Index Futures | | | January 28, 2014 | | | | 2,702,109 | | | | 2,759,120 | | | | 57,011 | |
| 1,672 | | Barclays Capital | | S&P 500 E-Mini Futures | | | March 21, 2014 | | | | 147,870,214 | | | | 153,915,960 | | | | 6,045,746 | |
| 99 | | Barclays Capital | | S&P MID 400 E-Mini Futures | | | March 21, 2014 | | | | 12,736,528 | | | | 13,260,060 | | | | 523,532 | |
| 80 | | Barclays Capital | | S&P/Toronto Stock Exchange 60 Index Futures | | | March 20, 2014 | | | | 11,303,428 | | | | 11,762,203 | | | | 458,775 | |
| 173 | | Barclays Capital | | SGX S&P CNX Nifty Index Futures | | | January 30, 2014 | | | | 2,188,696 | | | | 2,197,446 | | | | 8,750 | |
| 78 | | Barclays Capital | | SPI 200 Index Futures | | | March 20, 2014 | | | | 8,835,535 | | | | 9,259,462 | | | | 423,927 | |
| 261 | | Barclays Capital | | TOPIX Index Futures | | | March 13, 2014 | | | | 31,105,236 | | | | 32,281,123 | | | | 1,175,887 | |
| 28 | | J.P. Morgan | | 10-Year Japanese Government Bond | | | March 11, 2014 | | | | 38,322,900 | | | | 38,106,163 | | | | (216,737) | |
| 183 | | J.P. Morgan | | Australia 10-Year Bond Futures | | | March 17, 2014 | | | | 18,562,301 | | | | 18,736,059 | | | | 173,758 | |
| 220 | | J.P. Morgan | | Canadian 10-Year Bond Futures | | | March 20, 2014 | | | | 26,596,866 | | | | 26,248,811 | | | | (348,055) | |
| 211 | | J.P. Morgan | | Euro - Bund Futures | | | March 6, 2014 | | | | 40,971,996 | | | | 40,397,252 | | | | (574,744) | |
| 1,650 | | J.P. Morgan | | U.S. Treasury 10-Year Note Futures | | | March 20, 2014 | | | | 207,114,349 | | | | 203,027,344 | | | | (4,087,005) | |
| | | | | | | | | | | | | | | | | | | | |
| | | | | | | | | | | 873,299,686 | | | | 883,021,319 | | | | 9,721,633 | |
| | | | | | | | | | | | | | | | | | | | |
| Short Contracts: | | | | | | | | | | | | | | | | | | |
| 21 | | J.P. Morgan | | LME Aluminum Futures^ | | | January 3, 2014 | | | | (965,956) | | | | (921,243) | | | | 44,713 | |
| 10 | | J.P. Morgan | | LME Aluminum Futures^ | | | January 10, 2014 | | | | (467,479) | | | | (439,707) | | | | 27,772 | |
| 12 | | J.P. Morgan | | LME Aluminum Futures^ | | | January 17, 2014 | | | | (552,575) | | | | (528,855) | | | | 23,720 | |
| 7 | | J.P. Morgan | | LME Aluminum Futures^ | | | January 24, 2014 | | | | (324,082) | | | | (309,172) | | | | 14,910 | |
| 17 | | J.P. Morgan | | LME Aluminum Futures^ | | | January 28, 2014 | | | | (806,190) | | | | (751,783) | | | | 54,407 | |
| 6 | | J.P. Morgan | | LME Aluminum Futures^ | | | January 29, 2014 | | | | (284,688) | | | | (265,418) | | | | 19,270 | |
| 1 | | J.P. Morgan | | LME Aluminum Futures^ | | | January 31, 2014 | | | | (46,998) | | | | (44,264) | | | | 2,734 | |
| 25 | | J.P. Morgan | | LME Aluminum Futures^ | | | February 5, 2014 | | | | (1,137,598) | | | | (1,108,313) | | | | 29,285 | |
| 8 | | J.P. Morgan | | LME Aluminum Futures^ | | | February 7, 2014 | | | | (363,264) | | | | (354,880) | | | | 8,384 | |
| 16 | | J.P. Morgan | | LME Aluminum Futures^ | | | February 14, 2014 | | | | (717,179) | | | | (711,300) | | | | 5,879 | |
| 25 | | J.P. Morgan | | LME Aluminum Futures^ | | | February 21, 2014 | | | | (1,111,198) | | | | (1,113,306) | | | | (2,108) | |
| | | | |
| | The accompanying notes are an integral part of these financial statements. | | (Continued) |
| | | | | | | | | | | | | | | | |
| | AQR Funds | | | | | | Annual Report | | | | | | December 2013 | | 123 |
| | | | | | | | | | |
| | | | |
| Consolidated Schedule of Investments | | | December 31, 2013 | |
| | | | | | | | | | | | | | | | | | | | |
NUMBER OF
CONTRACTS | | COUNTERPARTY | | DESCRIPTION | | EXPIRATION
DATE | | | VALUE AT
TRADE DATE | | | VALUE AT
DECEMBER 31,
2013 | | | UNREALIZED
APPRECIATION
(DEPRECIATION) | |
| Short Contracts (continued) | | | | | | | | | | | | | | | | |
| 5 | | J.P. Morgan | | LME Aluminum Futures^ | | | February 27, 2014 | | | | $(222,059) | | | | $(223,049) | | | | $(990) | |
| 20 | | J.P. Morgan | | LME Aluminum Futures^ | | | March 5, 2014 | | | | (890,002) | | | | (893,750) | | | | (3,748) | |
| 348 | | J.P. Morgan | | LME Aluminum Futures^ | | | March 17, 2014 | | | | (15,556,462) | | | | (15,614,325) | | | | (57,863) | |
| 20 | | J.P. Morgan | | LME Aluminum Futures^ | | | June 16, 2014 | | | | (907,438) | | | | (916,875) | | | | (9,437) | |
| 4 | | J.P. Morgan | | LME Copper Futures^ | | | January 3, 2014 | | | | (727,992) | | | | (737,575) | | | | (9,583) | |
| 7 | | J.P. Morgan | | LME Copper Futures^ | | | January 10, 2014 | | | | (1,243,881) | | | | (1,290,407) | | | | (46,526) | |
| 15 | | J.P. Morgan | | LME Copper Futures^ | | | January 17, 2014 | | | | (2,699,969) | | | | (2,763,281) | | | | (63,312) | |
| 2 | | J.P. Morgan | | LME Copper Futures^ | | | January 24, 2014 | | | | (357,996) | | | | (368,352) | | | | (10,356) | |
| 6 | | J.P. Morgan | | LME Copper Futures^ | | | January 28, 2014 | | | | (1,082,988) | | | | (1,105,142) | | | | (22,154) | |
| 6 | | J.P. Morgan | | LME Copper Futures^ | | | January 31, 2014 | | | | (1,086,738) | | | | (1,105,206) | | | | (18,468) | |
| 8 | | J.P. Morgan | | LME Copper Futures^ | | | February 5, 2014 | | | | (1,432,135) | | | | (1,473,750) | | | | (41,615) | |
| 2 | | J.P. Morgan | | LME Copper Futures^ | | | February 7, 2014 | | | | (356,640) | | | | (368,452) | | | | (11,812) | |
| 15 | | J.P. Morgan | | LME Copper Futures^ | | | February 14, 2014 | | | | (2,617,517) | | | | (2,763,562) | | | | (146,045) | |
| 4 | | J.P. Morgan | | LME Copper Futures^ | | | February 21, 2014 | | | | (699,492) | | | | (736,625) | | | | (37,133) | |
| 8 | | J.P. Morgan | | LME Copper Futures^ | | | February 27, 2014 | | | | (1,416,183) | | | | (1,473,250) | | | | (57,067) | |
| 3 | | J.P. Morgan | | LME Copper Futures^ | | | March 12, 2014 | | | | (540,894) | | | | (552,469) | | | | (11,575) | |
| 163 | | J.P. Morgan | | LME Copper Futures^ | | | March 17, 2014 | | | | (28,793,336) | | | | (30,015,431) | | | | (1,222,095) | |
| 4 | | J.P. Morgan | | LME Lead Futures^ | | | January 3, 2014 | | | | (208,058) | | | | (219,050) | | | | (10,992) | |
| 1 | | J.P. Morgan | | LME Lead Futures^ | | | January 10, 2014 | | | | (51,954) | | | | (54,871) | | | | (2,917) | |
| 4 | | J.P. Morgan | | LME Lead Futures^ | | | January 17, 2014 | | | | (215,992) | | | | (219,824) | | | | (3,832) | |
| 1 | | J.P. Morgan | | LME Lead Futures^ | | | January 24, 2014 | | | | (54,160) | | | | (55,021) | | | | (861) | |
| 4 | | J.P. Morgan | | LME Lead Futures^ | | | January 28, 2014 | | | | (220,492) | | | | (220,233) | | | | 259 | |
| 1 | | J.P. Morgan | | LME Lead Futures^ | | | January 31, 2014 | | | | (54,873) | | | | (55,086) | | | | (213) | |
| 4 | | J.P. Morgan | | LME Lead Futures^ | | | February 5, 2014 | | | | (214,706) | | | | (220,530) | | | | (5,824) | |
| 1 | | J.P. Morgan | | LME Lead Futures^ | | | February 7, 2014 | | | | (53,660) | | | | (55,151) | | | | (1,491) | |
| 4 | | J.P. Morgan | | LME Lead Futures^ | | | February 14, 2014 | | | | (210,267) | | | | (220,864) | | | | (10,597) | |
| 56 | | J.P. Morgan | | LME Lead Futures^ | | | March 17, 2014 | | | | (2,927,073) | | | | (3,106,600) | | | | (179,527) | |
| 2 | | J.P. Morgan | | LME Lead Futures^ | | | June 16, 2014 | | | | (108,571) | | | | (111,450) | | | | (2,879) | |
| 3 | | J.P. Morgan | | LME Nickel Futures^ | | | January 3, 2014 | | | | (250,110) | | | | (248,976) | | | | 1,134 | |
| 5 | | J.P. Morgan | | LME Nickel Futures^ | | | January 17, 2014 | | | | (420,590) | | | | (415,332) | | | | 5,258 | |
| 7 | | J.P. Morgan | | LME Nickel Futures^ | | | January 24, 2014 | | | | (610,665) | | | | (581,665) | | | | 29,000 | |
| 1 | | J.P. Morgan | | LME Nickel Futures^ | | | January 28, 2014 | | | | (87,778) | | | | (83,112) | | | | 4,666 | |
| 1 | | J.P. Morgan | | LME Nickel Futures^ | | | February 7, 2014 | | | | (84,345) | | | | (83,152) | | | | 1,193 | |
| 5 | | J.P. Morgan | | LME Nickel Futures^ | | | February 14, 2014 | | | | (413,019) | | | | (415,907) | | | | (2,888) | |
| 29 | | J.P. Morgan | | LME Nickel Futures^ | | | March 17, 2014 | | | | (2,382,600) | | | | (2,416,860) | | | | (34,260) | |
| 11 | | J.P. Morgan | | LME Zinc Futures^ | | | January 3, 2014 | | | | (519,521) | | | | (564,575) | | | | (45,054) | |
| 3 | | J.P. Morgan | | LME Zinc Futures^ | | | January 10, 2014 | | | | (141,954) | | | | (153,503) | | | | (11,549) | |
| 2 | | J.P. Morgan | | LME Zinc Futures^ | | | January 17, 2014 | | | | (95,540) | | | | (102,272) | | | | (6,732) | |
| 10 | | J.P. Morgan | | LME Zinc Futures^ | | | January 24, 2014 | | | | (484,081) | | | | (511,732) | | | | (27,651) | |
| 8 | | J.P. Morgan | | LME Zinc Futures^ | | | January 31, 2014 | | | | (390,783) | | | | (409,686) | | | | (18,903) | |
| 6 | | J.P. Morgan | | LME Zinc Futures^ | | | February 21, 2014 | | | | (283,225) | | | | (307,927) | | | | (24,702) | |
| 8 | | J.P. Morgan | | LME Zinc Futures^ | | | February 27, 2014 | | | | (377,583) | | | | (410,776) | | | | (33,193) | |
| 7 | | J.P. Morgan | | LME Zinc Futures^ | | | March 12, 2014 | | | | (342,985) | | | | (359,822) | | | | (16,837) | |
| 173 | | J.P. Morgan | | LME Zinc Futures^ | | | March 17, 2014 | | | | (8,205,728) | | | | (8,900,850) | | | | (695,122) | |
| | | | | | | | | | | | | | | | | | | | |
| | | | | | | | | | | (86,819,242) | | | | (89,454,569) | | | | (2,635,327) | |
| | | | | | | | | | | | | | | | | | | | |
| | | | | | | | | | | $786,480,444 | | | | $793,566,750 | | | | $7,086,306 | |
| | | | | | | | | | | | | | | | | | | | |
Cash held as collateral for futures contracts at Barclays Capital, J.P. Morgan and Goldman Sachs was $6,981,247, $11,872,656 and $5,516,986, respectively at December 31, 2013.
^ Represents positions held in the respective Subsidiary (Note 2)
| | | | |
| | The accompanying notes are an integral part of these financial statements. | | (Continued) |
| | | | | | | | | | | | | | | | |
| 124 | | AQR Funds | | | | | | Annual Report | | | | | | December 2013 | | |
| | | | | | | | | | |
| | | | |
| Consolidated Schedule of Investments | | | December 31, 2013 | |
Forward foreign currency exchange contracts outstanding as of December 31, 2013:
Over the Counter
| | | | | | | | | | | | | | | | | | | | |
PURCHASE
CONTRACTS | | COUNTERPARTY | | CURRENCY | | CURRENCY
AMOUNT
PURCHASED | | | VALUE AT
SETTLEMENT
DATE | | | VALUE AT
DECEMBER 31,
2013 | | | UNREALIZED
APPRECIATION
(DEPRECIATION) | |
Brazilian Real,
Expiring 03/19/14* | | Credit Suisse International | | BRL | | | 29,836,500 | | | | $12,358,051 | | | | $12,417,407 | | | | $59,356 | |
Brazilian Real,
Expiring 03/19/14* | | The Royal Bank of Scotland | | BRL | | | 29,836,500 | | | | 12,358,067 | | | | 12,417,406 | | | | 59,339 | |
Czech Republic
Koruna, Expiring
03/19/14 | | Credit Suisse International | | CZK | | | 10,964,000 | | | | 547,403 | | | | 552,437 | | | | 5,034 | |
Czech Republic
Koruna, Expiring
03/19/14 | | The Royal Bank of Scotland | | CZK | | | 10,964,000 | | | | 547,406 | | | | 552,437 | | | | 5,031 | |
Euro, Expiring
03/19/14 | | Credit Suisse International | | EUR | | | 7,128,500 | | | | 9,759,720 | | | | 9,806,464 | | | | 46,744 | |
Euro, Expiring
03/19/14 | | The Royal Bank of Scotland | | EUR | | | 8,738,754 | | | | 11,954,229 | | | | 12,021,642 | | | | 67,413 | |
British Pound,
Expiring 03/19/14 | | The Royal Bank of Scotland | | GBP | | | 843,239 | | | | 1,377,718 | | | | 1,395,624 | | | | 17,906 | |
Hong Kong Dollar,
Expiring 03/19/14 | | Credit Suisse International | | HKD | | | 2,738,500 | | | | 353,290 | | | | 353,188 | | | | (102) | |
Hong Kong Dollar,
Expiring 03/19/14 | | The Royal Bank of Scotland | | HKD | | | 6,105,500 | | | | 787,567 | | | | 787,435 | | | | (132) | |
Hungarian Forint,
Expiring 03/19/14 | | The Royal Bank of Scotland | | HUF | | | 405,860,000 | | | | 1,853,068 | | | | 1,870,504 | | | | 17,436 | |
Israeli Shekel,
Expiring 03/19/14 | | Credit Suisse International | | ILS | | | 74,291,500 | | | | 21,169,054 | | | | 21,371,438 | | | | 202,384 | |
Israeli Shekel,
Expiring 03/19/14 | | The Royal Bank of Scotland | | ILS | | | 74,291,500 | | | | 21,168,748 | | | | 21,371,438 | | | | 202,690 | |
Korean Won,
Expiring 03/19/14* | | Credit Suisse International | | KRW | | | 21,397,409,000 | | | | 20,186,573 | | | | 20,180,068 | | | | (6,505) | |
Korean Won,
Expiring 03/19/14* | | The Royal Bank of Scotland | | KRW | | | 21,397,408,999 | | | | 20,186,476 | | | | 20,180,068 | | | | (6,408) | |
Mexican Peso,
Expiring 03/19/14 | | Credit Suisse International | | MXN | | | 270,340,500 | | | | 20,320,477 | | | | 20,581,680 | | | | 261,203 | |
Mexican Peso,
Expiring 03/19/14 | | The Royal Bank of Scotland | | MXN | | | 270,340,500 | | | | 20,320,516 | | | | 20,581,680 | | | | 261,164 | |
Singapore Dollar,
Expiring 03/19/14 | | Credit Suisse International | | SGD | | | 15,410,500 | | | | 12,330,428 | | | | 12,212,044 | | | | (118,384) | |
Singapore Dollar,
Expiring 03/19/14 | | The Royal Bank of Scotland | | SGD | | | 15,410,500 | | | | 12,330,464 | | | | 12,212,044 | | | | (118,420) | |
Turkish Lira,
Expiring 03/19/14 | | Credit Suisse International | | TRY | | | 21,941,500 | | | | 10,596,006 | | | | 10,048,839 | | | | (547,167) | |
Turkish Lira,
Expiring 03/19/14 | | The Royal Bank of Scotland | | TRY | | | 21,941,500 | | | | 10,595,923 | | | | 10,048,839 | | | | (547,084) | |
Taiwanese Dollar,
Expiring 03/19/14* | | Credit Suisse International | | TWD | | | 330,351,500 | | | | 11,237,758 | | | | 11,108,176 | | | | (129,582) | |
Taiwanese Dollar,
Expiring 03/19/14* | | The Royal Bank of Scotland | | TWD | | | 330,351,500 | | | | 11,237,690 | | | | 11,108,176 | | | | (129,514) | |
South African
Rand, Expiring
03/19/14 | | Credit Suisse International | | ZAR | | | 55,797,000 | | | | 5,305,974 | | | | 5,261,563 | | | | (44,411) | |
South African
Rand, Expiring
03/19/14 | | The Royal Bank of Scotland | | ZAR | | | 55,796,999 | | | | 5,305,999 | | | | 5,261,563 | | | | (44,436) | |
| | | | | | | | | | | | | | | | | | | | |
| | | | | | | | | | | | | | | | | | | | |
| | | | | | | | | | | $254,188,605 | | | | $253,702,160 | | | | $(486,445) | |
| | | | | | | | | | | | | | | | | | | | |
| | | | | | | | | | | | | | | | | | | | |
| | | | |
| | The accompanying notes are an integral part of these financial statements. | | (Continued) |
| | | | | | | | | | | | | | | | |
| | AQR Funds | | | | | | Annual Report | | | | | | December 2013 | | 125 |
| | | | | | | | | | |
| | | | |
| Consolidated Schedule of Investments | | | December 31, 2013 | |
| | | | | | | | | | | | | | | | | | | | |
SALES
CONTRACTS | | COUNTERPARTY | | CURRENCY | | CURRENCY
AMOUNT
SOLD | | | VALUE AT
SETTLEMENT
DATE | | | VALUE AT
DECEMBER 31,
2013 | | | UNREALIZED
APPRECIATION
(DEPRECIATION) | |
Australian Dollar,
Expiring 03/19/14 | | Credit Suisse International | | AUD | | | (20,000) | | | | $(18,072) | | | | $(17,771) | | | | $301 | |
Australian Dollar,
Expiring 03/19/14 | | The Royal Bank of Scotland | | AUD | | | (24,000) | | | | (21,625) | | | | (21,325) | | | | 300 | |
Brazilian Real,
Expiring 03/19/14* | | Credit Suisse International | | BRL | | | (3,473,000) | | | | (1,452,587) | | | | (1,445,399) | | | | 7,188 | |
Brazilian Real,
Expiring 03/19/14* | | The Royal Bank of Scotland | | BRL | | | (3,473,000) | | | | (1,452,555) | | | | (1,445,399) | | | | 7,156 | |
Swiss Franc,
Expiring 03/19/14 | | Credit Suisse International | | CHF | | | (55,500) | | | | (61,491) | | | | (62,255) | | | | (764) | |
Swiss Franc,
Expiring 03/19/14 | | The Royal Bank of Scotland | | CHF | | | (207,500) | | | | (230,990) | | | | (232,755) | | | | (1,765) | |
Euro, Expiring
03/19/14 | | Credit Suisse International | | EUR | | | (74,304,379) | | | | (101,817,474) | | | | (102,218,305) | | | | (400,831) | |
Euro, Expiring
03/19/14 | | The Royal Bank of Scotland | | EUR | | | (77,333,936) | | | | (105,959,511) | | | | (106,385,975) | | | | (426,464) | |
British Pound,
Expiring 03/19/14 | | Credit Suisse International | | GBP | | | (11,203,110) | | | | (18,339,322) | | | | (18,541,987) | | | | (202,665) | |
British Pound,
Expiring 03/19/14 | | The Royal Bank of Scotland | | GBP | | | (14,092,403) | | | | (23,059,564) | | | | (23,323,983) | | | | (264,419) | |
Hong Kong Dollar,
Expiring 03/19/14 | | The Royal Bank of Scotland | | HKD | | | (747,000) | | | | (96,363) | | | | (96,342) | | | | 21 | |
Hungarian Forint,
Expiring 03/19/14 | | Credit Suisse International | | HUF | | | (101,433,001) | | | | (457,982) | | | | (467,478) | | | | (9,496) | |
Hungarian Forint,
Expiring 03/19/14 | | The Royal Bank of Scotland | | HUF | | | (101,433,001) | | | | (457,979) | | | | (467,478) | | | | (9,499) | |
Israeli Shekel,
Expiring 03/19/14 | | Credit Suisse International | | ILS | | | (3,412,500) | | | | (971,276) | | | | (981,674) | | | | (10,398) | |
Israeli Shekel,
Expiring 03/19/14 | | The Royal Bank of Scotland | | ILS | | | (3,412,500) | | | | (971,381) | | | | (981,674) | | | | (10,293) | |
Japanese Yen,
Expiring 03/19/14 | | Credit Suisse International | | JPY | | | (56,440,000) | | | | (548,741) | | | | (536,145) | | | | 12,596 | |
Japanese Yen,
Expiring 03/19/14 | | The Royal Bank of Scotland | | JPY | | | (56,440,000) | | | | (548,744) | | | | (536,145) | | | | 12,599 | |
Korean Won,
Expiring 03/19/14* | | The Royal Bank of Scotland | | KRW | | | (574,293,000) | | | | (542,502) | | | | (541,620) | | | | 882 | |
Mexican Peso,
Expiring 03/19/14 | | Credit Suisse International | | MXN | | | (27,427,500) | | | | (2,079,660) | | | | (2,088,122) | | | | (8,462) | |
Mexican Peso,
Expiring 03/19/14 | | The Royal Bank of Scotland | | MXN | | | (27,427,500) | | | | (2,079,350) | | | | (2,088,122) | | | | (8,772) | |
Poland Zloty,
Expiring 03/19/14 | | Credit Suisse International | | PLN | | | (1,202,000) | | | | (391,060) | | | | (396,037) | | | | (4,977) | |
Poland Zloty,
Expiring 03/19/14 | | The Royal Bank of Scotland | | PLN | | | (1,202,000) | | | | (391,057) | | | | (396,037) | | | | (4,980) | |
Russian Ruble,
Expiring 03/19/14* | | Credit Suisse International | | RUB | | | (120,635,500) | | | | (3,623,576) | | | | (3,622,734) | | | | 842 | |
Russian Ruble,
Expiring 03/19/14* | | The Royal Bank of Scotland | | RUB | | | (120,635,500) | | | | (3,623,597) | | | | (3,622,734) | | | | 863 | |
Singapore Dollar,
Expiring 03/19/14 | | Credit Suisse International | | SGD | | | (4,426,500) | | | | (3,530,989) | | | | (3,507,778) | | | | 23,211 | |
Singapore Dollar,
Expiring 03/19/14 | | The Royal Bank of Scotland | | SGD | | | (4,426,500) | | | | (3,531,059) | | | | (3,507,778) | | | | 23,281 | |
Turkish Lira,
Expiring 03/19/14 | | Credit Suisse International | | TRY | | | (3,461,000) | | | | (1,665,524) | | | | (1,585,080) | | | | 80,444 | |
Turkish Lira,
Expiring 03/19/14 | | The Royal Bank of Scotland | | TRY | | | (3,461,000) | | | | (1,663,665) | | | | (1,585,080) | | | | 78,585 | |
| | | | |
| | The accompanying notes are an integral part of these financial statements. | | (Continued) |
| | | | | | | | | | | | | | | | |
| 126 | | AQR Funds | | | | | | Annual Report | | | | | | December 2013 | | |
| | | | | | | | | | |
| | | | |
| Consolidated Schedule of Investments | | | December 31, 2013 | |
| | | | | | | | | | | | | | | | | | | | |
SALES
CONTRACTS | | COUNTERPARTY | | CURRENCY | | CURRENCY
AMOUNT
SOLD | | | VALUE AT
SETTLEMENT
DATE | | | VALUE AT
DECEMBER 31,
2013 | | | UNREALIZED
APPRECIATION
(DEPRECIATION) | |
Taiwanese Dollar,
Expiring 03/19/14* | | Credit Suisse International | | TWD | | | (72,769,000) | | | | $(2,472,263) | | | | $(2,446,881) | | | | $25,382 | |
Taiwanese Dollar,
Expiring 03/19/14* | | The Royal Bank of Scotland | | TWD | | | (72,769,000) | | | | (2,472,212) | | | | (2,446,881) | | | | 25,331 | |
South African
Rand, Expiring
03/19/14 | | Credit Suisse International | | ZAR | | | (27,013,500) | | | | (2,567,504) | | | | (2,547,328) | | | | 20,176 | |
South African
Rand, Expiring
03/19/14 | | The Royal Bank of Scotland | | ZAR | | | (29,261,500) | | | | (2,781,850) | | | | (2,759,311) | | | | 22,539 | |
| | | | | | | | | | | | | | | | | | | | |
| | | | | | | | | | | (289,881,525) | | | | (290,903,613) | | | | (1,022,088) | |
| | | | | | | | | | | | | | | | | | | | |
| | | | | | | | | | | $(35,692,920) | | | | $(37,201,453) | | | | $(1,508,533) | |
| | | | | | | | | | | | | | | | | | | | |
Money Market Fund is pledged as collateral to The Royal Bank of Scotland and Credit Suisse International for forward foreign currency exchange contracts in the amount of $18,556,251 and $950,002, respectively, at December 31, 2013.
| * | Non deliverable forward. See Note 3 in the Notes to Financial Statements. |
AUD - Australian Dollar
BRL - Brazilian Real
CHF - Swiss Franc
CZK - Czech Republic Koruna
EUR - Euro
GBP - British Pound
HKD - Hong Kong Dollar
HUF - Hungarian Forint
ILS - Israeli Shekel
JPY - Japanese Yen
KRW - Korean Won
MXN - Mexican Peso
PLN - Poland Zloty
RUB - Russian Ruble
SGD - Singapore Dollar
TRY - Turkish Lira
TWD - Taiwanese Dollar
USD - United States Dollar
ZAR - South African Rand
| | | | |
| | The accompanying notes are an integral part of these financial statements. | | |
| | | | | | | | | | | | | | | | |
| | AQR Funds | | | | | | Annual Report | | | | | | December 2013 | | 127 |
| | | | | | | | | | |
| | | | |
| Consolidated Schedule of Investments | | | December 31, 2013 | |
| | |
| AQR RISK PARITY II MV FUND | | |
| | | | | | | | | | | | | | | | | | | | |
| | | | | |
| GOVERNMENT RELATED OBLIGATIONS - 17.8% | | INTEREST
RATE | | | MATURITY
DATE | | | CURRENCY | | | PRINCIPAL
AMOUNT
(000’S) | | | VALUE
(Note 3) | |
| | | | | |
| Sovereign Debt - 17.8% | | | | | | | | | | | | | | | | | | | | |
| Deutsche Bundesrepublik Inflation Linked Bond (Germany) | | | 0.100% | | | | 04/15/23 | | | | EUR | | | | 1,446 | | | $ | 1,940,065 | |
| Deutsche Bundesrepublik Inflation Linked Bond (Germany) | | | 0.750% | | | | 04/15/18 | | | | EUR | | | | 742 | | | | 1,060,978 | |
| Deutsche Bundesrepublik Inflation Linked Bond (Germany) | | | 1.750% | | | | 04/15/20 | | | | EUR | | | | 437 | | | | 664,696 | |
| France Government Bond OAT (France) | | | 0.250% | | | | 07/25/18 | | | | EUR | | | | 311 | | | | 435,228 | |
| France Government Bond OAT (France) | | | 0.250% | | | | 07/25/24 | | | | EUR | | | | 101 | | | | 131,604 | |
| France Government Bond OAT (France) | | | 1.100% | | | | 07/25/22 | | | | EUR | | | | 216 | | | | 311,346 | |
| France Government Bond OAT (France) | | | 1.300% | | | | 07/25/19 | | | | EUR | | | | 849 | | | | 1,255,305 | |
| France Government Bond OAT (France) | | | 2.100% | | | | 07/25/23 | | | | EUR | | | | 109 | | | | 170,321 | |
| United Kingdom Index Linked Treasury Gilt (United Kingdom) | | | 0.125% | | | | 03/22/24 | | | | GBP | | | | 312 | | | | 520,411 | |
| United Kingdom Treasury Gilt (United Kingdom) | | | 1.875% | | | | 11/22/22 | | | | GBP | | | | 980 | | | | 1,931,256 | |
| | | | | | | | | | | | | | | | | | | | |
TOTAL GOVERNMENT RELATED OBLIGATIONS
(cost $8,317,192) | | | | | | | | | | | | | | | | | | | 8,421,210 | |
| | | | | | | | | | | | | | | | | | | | |
| | | | | |
| U.S. TREASURY OBLIGATIONS - 26.2% | | | | | | | | | | | | | | | |
| | | | | |
| U.S. Treasury Inflation Protected Securities - 26.2% | | | | | | | | | | | | | | | | | | | | |
| U.S. Treasury Inflation Protected Securities | | | 0.125% | | | | 04/15/18 | | | | USD | | | $ | 3,100 | | | | 3,194,387 | |
| U.S. Treasury Inflation Protected Securities | | | 0.125% | | | | 01/15/22 | | | | USD | | | | 1,000 | | | | 991,714 | |
| U.S. Treasury Inflation Protected Securities | | | 0.125% | | | | 07/15/22 | | | | USD | | | | 1,000 | | | | 972,815 | |
| U.S. Treasury Inflation Protected Securities | | | 0.125% | | | | 01/15/23 | | | | USD | | | | 1,000 | | | | 955,598 | |
| U.S. Treasury Inflation Protected Securities | | | 0.375% | | | | 07/15/23 | | | | USD | | | | 900 | | | | 871,098 | |
| U.S. Treasury Inflation Protected Securities | | | 1.375% | | | | 07/15/18 | | | | USD | | | | 700 | | | | 821,680 | |
| U.S. Treasury Inflation Protected Securities | | | 1.625% | | | | 01/15/18 | | | | USD | | | | 1,500 | | | | 1,817,342 | |
| U.S. Treasury Inflation Protected Securities | | | 2.125% | | | | 01/15/19 | | | | USD | | | | 600 | | | | 728,847 | |
| U.S. Treasury Inflation Protected Securities | | | 2.625% | | | | 07/15/17 | | | | USD | | | | 1,600 | | | | 2,028,049 | |
| | | | | | | | | | | | | | | | | | | | |
TOTAL U.S. TREASURY OBLIGATIONS
(cost $12,556,374) | | | | | | | | | | | | | | | | | | | 12,381,530 | |
| | | | | | | | | | | | | | | | | | | | |
| | | | | | | | |
| MONEY MARKET FUNDS - 34.8% | | SHARES | | | | |
| BlackRock Liquidity Funds TempFund Portfolio - Series I, Institutional Shares, 0.050% (a)^ | | | 857,621 | | | | 857,621 | |
| Dreyfus Treasury Cash Management, Class I, 0.010% (a)^ | | | 3,430,485 | | | | 3,430,485 | |
| J.P. Morgan U.S. Treasury Plus Money Market Fund - Institutional Shares, 0.000% (a)(b)^ | | | 7,851,842 | | | | 7,851,842 | |
| UBS Money Series - UBS Select Treasury Preferred Fund, Class I, 0.010% (a)^ | | | 4,288,107 | | | | 4,288,107 | |
| | | | | | | | |
TOTAL MONEY MARKET FUNDS
(cost $16,428,055) | | | | | | | 16,428,055 | |
| | | | | | | | |
| | |
| | | PRINCIPAL
AMOUNT
(000’S) | | | | |
| SHORT-TERM INVESTMENTS - 16.3% | | | | | | | | |
| U.S. Treasury Bills, 0.066%, 01/30/2014 (c) | | | $2,945 | | | | 2,944,659 | |
| U.S. Treasury Bills, 0.073%, 02/06/2014 (c) | | | 2,944 | | | | 2,944,656 | |
| U.S. Treasury Bills, 0.066%, 01/30/2014 (c)^ | | | 901 | | | | 900,787 | |
| U.S. Treasury Bills, 0.073%, 02/06/2014 (c)^ | | | 901 | | | | 900,786 | |
| | | | | | | | |
TOTAL SHORT-TERM INVESTMENTS
(cost $7,690,515) | | | | | | | 7,690,888 | |
| | | | | | | | |
TOTAL INVESTMENTS - 95.1%
(cost $44,992,136) | | | | | | $ | 44,921,683 | |
| | | | | | | | |
| OTHER ASSETS IN EXCESS OF LIABILITIES - 4.9% (d) | | | | | | | 2,323,440 | |
| | | | | | | | |
| NET ASSETS - 100.0% | | | | | | $ | 47,245,123 | |
| | | | | | | | |
All securities are United States companies, unless noted otherwise in parentheses.
| (a) | Represents annualized seven-day yield as of December 31, 2013. |
| (b) | A portion of the security is pledged as collateral to the brokers for forward foreign currency exchange and swap contracts. |
| (c) | The rate shown is the effective yield at the date of purchase. |
| | | | |
| | The accompanying notes are an integral part of these financial statements. | | (Continued) |
| | | | | | | | | | | | | | | | |
| 128 | | AQR Funds | | | | | | Annual Report | | | | | | December 2013 | | |
| | | | | | | | | | |
| | | | |
| Consolidated Schedule of Investments | | | December 31, 2013 | |
| | |
| AQR RISK PARITY II MV FUND | | |
| (d) | Includes appreciation/(depreciation) on forward foreign currency exchange, futures and swap contracts. |
| ^ | All or a portion represents positions held in the respective Subsidiary (Note 2). |
All securities are Level 2 with respect to ASC 820 (See Note 5).
The following abbreviations are used in portfolio descriptions:
EUR - Euro
GBP - British Pound
USD - United States Dollar
Total return swap contracts outstanding as of December 31, 2013:
Over the Counter
| | | | | | | | | | | | | | | | |
| COUNTERPARTY | | UNDERLYING REFERENCE INSTRUMENT | | TERMINATION
DATE | | CURRENCY | | | NOTIONAL
VALUE | | | UNREALIZED
APPRECIATION
(DEPRECIATION) | |
| Goldman Sachs | | Bovespa Index | | 2/12/2014 | | | BRL | | | | 1,268,688 | | | | $11,145 | |
| Deutsche Bank | | Brent Crude Futures^ | | 1/16/2014 | | | USD | | | | 3,566,370 | | | | 90,030 | |
| Deutsche Bank | | Brent Crude Futures^ | | 1/16/2014 | | | USD | | | | (3,540,010) | | | | (116,390) | |
| Deutsche Bank | | Brent Crude Futures^ | | 2/13/2014 | | | USD | | | | 3,317,860 | | | | 108,570 | |
| Deutsche Bank | | Brent Crude Futures^ | | 2/13/2014 | | | USD | | | | (3,429,400) | | | | 2,970 | |
| Deutsche Bank | | Brent Crude Futures^ | | 3/14/2014 | | | USD | | | | 2,665,440 | | | | (18,960) | |
| Barclays Capital | | Cocoa Futures^ | | 3/14/2014 | | | USD | | | | 107,340 | | | | 1,020 | |
| Barclays Capital | | Cocoa Futures^ | | 3/14/2014 | | | USD | | | | (27,420) | | | | 330 | |
| Barclays Capital | | Coffee ‘C’ Futures^ | | 3/19/2014 | | | USD | | | | 243,788 | | | | 5,288 | |
| Barclays Capital | | Corn Futures^ | | 3/14/2014 | | | USD | | | | 416,322 | | | | (57,599) | |
| Barclays Capital | | Corn Futures^ | | 3/14/2014 | | | USD | | | | (379,288) | | | | 20,579 | |
| Barclays Capital | | Corn Futures^ | | 5/14/2014 | | | USD | | | | 362,656 | | | | (18,456) | |
| Deutsche Bank | | Gas Oil Futures ^ | | 1/10/2014 | | | USD | | | | 922,500 | | | | 21,750 | |
| Deutsche Bank | | Gas Oil Futures ^ | | 1/10/2014 | | | USD | | | | (907,750) | | | | (36,500) | |
| Deutsche Bank | | Gas Oil Futures ^ | | 2/12/2014 | | | USD | | | | 1,004,225 | | | | 33,625 | |
| Deutsche Bank | | Gas Oil Futures ^ | | 2/12/2014 | | | USD | | | | (1,036,850) | | | | (1,000) | |
| Deutsche Bank | | Gas Oil Futures^ | | 3/12/2014 | | | USD | | | | 943,250 | | | | (1,500) | |
| Deutsche Bank | | Gasoline RBOB Futures^ | | 1/31/2014 | | | USD | | | | 1,172,073 | | | | 115,013 | |
| Deutsche Bank | | Gasoline RBOB Futures^ | | 1/31/2014 | | | USD | | | | (1,238,366) | | | | (48,720) | |
| Deutsche Bank | | Gasoline RBOB Futures^ | | 2/28/2014 | | | USD | | | | 907,502 | | | | 30,576 | |
| Deutsche Bank | | Gasoline RBOB Futures^ | | 2/28/2014 | | | USD | | | | (939,721) | | | | 1,642 | |
| Deutsche Bank | | Gasoline RBOB Futures^ | | 3/31/2014 | | | USD | | | | 874,591 | | | | (4,057) | |
| Barclays Capital | | Gold 100 OZ Futures^ | | 2/26/2014 | | | USD | | | | 772,080 | | | | (50,688) | |
| Barclays Capital | | Gold 100 OZ Futures^ | | 2/26/2014 | | | USD | | | | (246,310) | | | | 5,849 | |
| Deutsche Bank | | Heating Oil Futures ^ | | 1/31/2014 | | | USD | | | | 724,374 | | | | 48,057 | |
| Deutsche Bank | | Heating Oil Futures ^ | | 1/31/2014 | | | USD | | | | (752,254) | | | | (20,177) | |
| Deutsche Bank | | Heating Oil Futures ^ | | 2/28/2014 | | | USD | | | | 629,601 | | | | 11,697 | |
| Deutsche Bank | | Heating Oil Futures ^ | | 2/28/2014 | | | USD | | | | (640,987) | | | | (311) | |
| Deutsche Bank | | Heating Oil Futures ^ | | 3/31/2014 | | | USD | | | | 512,686 | | | | (1,378) | |
| Goldman Sachs | | H-SHARES Index Futures | | 1/29/2014 | | | HKD | | | | 3,182,412 | | | | 8,703 | |
| Barclays Capital | | Lean Hogs Futures^ | | 2/14/2014 | | | USD | | | | 513,610 | | | | (35,225) | |
| Barclays Capital | | Lean Hogs Futures^ | | 2/14/2014 | | | USD | | | | (145,108) | | | | 8,426 | |
| Barclays Capital | | Live Cattle Futures^ | | 2/28/2014 | | | USD | | | | 1,065,152 | | | | 11,844 | |
| Barclays Capital | | Live Cattle Futures^ | | 2/28/2014 | | | USD | | | | (211,969) | | | | (3,430) | |
| Barclays Capital | | LME Aluminum Futures^ | | 3/17/2014 | | | USD | | | | 139,275 | | | | (4,669) | |
| Barclays Capital | | LME Aluminum Futures^ | | 3/17/2014 | | | USD | | | | (131,025) | | | | (3,581) | |
| Barclays Capital | | LME Aluminum Futures^ | | 6/16/2014 | | | USD | | | | 133,988 | | | | 3,544 | |
| Barclays Capital | | LME Copper Futures^ | | 3/17/2014 | | | USD | | | | 540,000 | | | | 12,431 | |
| Barclays Capital | | LME Copper Futures^ | | 3/17/2014 | | | USD | | | | (522,000) | | | | (30,431) | |
| Barclays Capital | | LME Copper Futures^ | | 6/16/2014 | | | USD | | | | 521,850 | | | | 28,500 | |
| Goldman Sachs | | MSCI Taiwan Stock Index Futures | | 1/28/2014 | | | USD | | | | 740,292 | | | | 17,708 | |
| Deutsche Bank | | Natural Gas Swap Futures^ | | 2/26/2014 | | | USD | | | | 313,810 | | | | 21,630 | |
| Deutsche Bank | | Natural Gas Swap Futures^ | | 2/26/2014 | | | USD | | | | (353,280) | | | | 17,840 | |
| Deutsche Bank | | Natural Gas Swap Futures^ | | 3/27/2014 | | | USD | | | | 339,280 | | | | (10,880) | |
| Bank of America | | Russian Depository Index | | 3/19/2014 | | | USD | | | | 76,737 | | | | 2,058 | |
| Bank of America | | Russian Trading System Index Futures | | 3/17/2014 | | | USD | | | | 512,733 | | | | 18,769 | |
| Barclays Capital | | Silver Futures^ | | 3/27/2014 | | | USD | | | | 107,270 | | | | (10,420) | |
| | | | |
| | The accompanying notes are an integral part of these financial statements. | | (Continued) |
| | | | | | | | | | | | | | | | |
| | AQR Funds | | | | | | Annual Report | | | | | | December 2013 | | 129 |
| | | | | | | | | | |
| | | | |
| Consolidated Schedule of Investments | | | December 31, 2013 | |
| | |
| AQR RISK PARITY II MV FUND | | |
| | | | | | | | | | | | | | | | |
| COUNTERPARTY | | UNDERLYING REFERENCE INSTRUMENT | | TERMINATION
DATE | | CURRENCY | | | NOTIONAL
VALUE | | | UNREALIZED
APPRECIATION
(DEPRECIATION) | |
| Barclays Capital | | Soybean Futures^ | | 3/14/2014 | | | USD | | | | 315,858 | | | | $7,265 | |
| Barclays Capital | | Soybean Futures^ | | 3/14/2014 | | | USD | | | | (328,688) | | | | 5,560 | |
| Barclays Capital | | Soybean Futures^ | | 5/14/2014 | | | USD | | | | 324,375 | | | | (5,125) | |
| Barclays Capital | | Soybean Meal Futures^ | | 3/14/2014 | | | USD | | | | 125,370 | | | | (270) | |
| Barclays Capital | | Soybean Oil Futures^ | | 3/14/2014 | | | USD | | | | 317,808 | | | | (12,594) | |
| Barclays Capital | | Sugar #11 (World Markets) Futures^ | | 2/28/2014 | | | USD | | | | 19,591 | | | | (1,212) | |
| Goldman Sachs | | Swiss Market Index Futures | | 3/21/2014 | | | CHF | | | | 544,630 | | | | 25,901 | |
| Bank of America | | U.S. Treasury 10-Year Note Futures | | 3/20/2014 | | | USD | | | | 1,630,499 | | | | (30,890) | |
| Barclays Capital | | Wheat Futures^ | | 3/14/2014 | | | USD | | | | 266,860 | | | | (24,754) | |
| Barclays Capital | | Wheat Futures^ | | 3/14/2014 | | | USD | | | | (265,730) | | | | 23,624 | |
| Barclays Capital | | Wheat Futures^ | | 5/14/2014 | | | USD | | | | 167,613 | | | | (14,600) | |
| Barclays Capital | | Wheat Futures^ | | 5/14/2014 | | | USD | | | | (32,800) | | | | 2,198 | |
| Deutsche Bank | | WTI Crude Oil Futures^ | | 1/21/2014 | | | USD | | | | 2,847,430 | | | | 105,170 | |
| Deutsche Bank | | WTI Crude Oil Futures^ | | 1/21/2014 | | | USD | | | | (2,823,830) | | | | (128,770) | |
| Deutsche Bank | | WTI Crude Oil Futures^ | | 2/20/2014 | | | USD | | | | 2,360,960 | | | | 102,790 | |
| Deutsche Bank | | WTI Crude Oil Futures^ | | 2/20/2014 | | | USD | | | | (2,496,270) | | | | 32,520 | |
| Deutsche Bank | | WTI Crude Oil Futures^ | | 3/20/2014 | | | USD | | | | 2,392,320 | | | | (29,760) | |
| | | | | | | | | | | | | | | | |
| | | | | | | | | | | | | | | $242,275 | |
| | | | | | | | | | | | | | | | |
Money Market Fund is pledged to Goldman Sachs and Barclays Capital as collateral to brokers for total return swap contracts in the amount of $560,000 and $110,000, respectively at December 31, 2013.
| ^ | Represents positions held in the respective Subsidiary (Note 2). |
Open futures contracts outstanding at December 31, 2013:
Exchange Traded
| | | | | | | | | | | | | | | | | | |
NUMBER OF
CONTRACTS | | COUNTERPARTY | | DESCRIPTION | | EXPIRATION
DATE | | VALUE AT
TRADE DATE | | | VALUE AT
DECEMBER 31,
2013 | | | UNREALIZED
APPRECIATION
(DEPRECIATION) | |
| Long Contracts: | | | | | |
| 1 | | Goldman Sachs | | Cattle Feeder Futures^ | | March 27, 2014 | | | $83,518 | | | | $83,700 | | | | $182 | |
| 2 | | Goldman Sachs | | Cocoa Futures^ | | March 14, 2014 | | | 55,423 | | | | 54,181 | | | | (1,242) | |
| 2 | | Goldman Sachs | | Coffee ‘C’ Futures^ | | March 19, 2014 | | | 80,114 | | | | 83,025 | | | | 2,911 | |
| 26 | | Goldman Sachs | | Corn Futures^ | | May 14, 2014 | | | 574,468 | | | | 559,325 | | | | (15,143) | |
| 5 | | Goldman Sachs | | Cotton No. 2 Futures^ | | March 7, 2014 | | | 197,317 | | | | 211,600 | | | | 14,283 | |
| 1 | | Goldman Sachs | | Lean Hogs Futures^ | | February 14, 2014 | | | 36,525 | | | | 34,170 | | | | (2,355) | |
| 1 | | J.P. Morgan | | LME Aluminum Futures^ | | January 3, 2014 | | | 46,050 | | | | 43,869 | | | | (2,181) | |
| 2 | | J.P. Morgan | | LME Aluminum Futures^ | | January 17, 2014 | | | 92,483 | | | | 88,142 | | | | (4,341) | |
| 2 | | J.P. Morgan | | LME Aluminum Futures^ | | January 22, 2014 | | | 93,923 | | | | 88,280 | | | | (5,643) | |
| 2 | | J.P. Morgan | | LME Aluminum Futures^ | | January 29, 2014 | | | 94,853 | | | | 88,472 | | | | (6,381) | |
| 1 | | J.P. Morgan | | LME Aluminum Futures^ | | February 5, 2014 | | | 45,452 | | | | 44,332 | | | | (1,120) | |
| 1 | | J.P. Morgan | | LME Aluminum Futures^ | | February 7, 2014 | | | 45,540 | | | | 44,360 | | | | (1,180) | |
| 1 | | J.P. Morgan | | LME Aluminum Futures^ | | February 14, 2014 | | | 44,652 | | | | 44,456 | | | | (196) | |
| 4 | | J.P. Morgan | | LME Aluminum Futures^ | | February 21, 2014 | | | 177,875 | | | | 178,129 | | | | 254 | |
| 4 | | J.P. Morgan | | LME Aluminum Futures^ | | March 5, 2014 | | | 177,009 | | | | 178,751 | | | | 1,742 | |
| 22 | | J.P. Morgan | | LME Aluminum Futures^ | | March 17, 2014 | | | 1,021,609 | | | | 987,113 | | | | (34,496) | |
| 15 | | J.P. Morgan | | LME Aluminum Futures^ | | June 16, 2014 | | | 678,576 | | | | 687,656 | | | | 9,080 | |
| 1 | | J.P. Morgan | | LME Copper Futures^ | | January 17, 2014 | | | 180,278 | | | | 184,218 | | | | 3,940 | |
| 2 | | J.P. Morgan | | LME Copper Futures^ | | January 22, 2014 | | | 366,848 | | | | 368,338 | | | | 1,490 | |
| 1 | | J.P. Morgan | | LME Copper Futures^ | | January 31, 2014 | | | 181,362 | | | | 184,201 | | | | 2,839 | |
| 2 | | J.P. Morgan | | LME Copper Futures^ | | February 5, 2014 | | | 357,879 | | | | 368,437 | | | | 10,558 | |
| 1 | | J.P. Morgan | | LME Copper Futures^ | | February 21, 2014 | | | 174,627 | | | | 184,156 | | | | 9,529 | |
| 8 | | J.P. Morgan | | LME Copper Futures^ | | March 17, 2014 | | | 1,448,441 | | | | 1,473,150 | | | | 24,709 | |
| 5 | | J.P. Morgan | | LME Copper Futures^ | | June 16, 2014 | | | 881,248 | | | | 917,250 | | | | 36,002 | |
| | | | |
| | The accompanying notes are an integral part of these financial statements. | | (Continued) |
| | | | | | | | | | | | | | | | |
| 130 | | AQR Funds | | | | | | Annual Report | | | | | | December 2013 | | |
| | | | | | | | | | |
| | | | |
| Consolidated Schedule of Investments | | | December 31, 2013 | |
| | |
| AQR RISK PARITY II MV FUND | | |
| | | | | | | | | | | | | | | | | | |
NUMBER OF
CONTRACTS | | COUNTERPARTY | | DESCRIPTION | | EXPIRATION
DATE | | VALUE AT
TRADE DATE | | | VALUE AT
DECEMBER 31,
2013 | | | UNREALIZED
APPRECIATION
(DEPRECIATION) | |
| Long Contracts (continued) | | | | | |
| 1 | | J.P. Morgan | | LME Lead Futures^ | | January 22, 2014 | | | $55,058 | | | | $55,002 | | | | $(56) | |
| 1 | | J.P. Morgan | | LME Lead Futures^ | | January 29, 2014 | | | 55,127 | | | | 55,067 | | | | (60) | |
| 1 | | J.P. Morgan | | LME Lead Futures^ | | January 31, 2014 | | | 54,877 | | | | 55,086 | | | | 209 | |
| 1 | | J.P. Morgan | | LME Lead Futures^ | | February 21, 2014 | | | 51,933 | | | | 55,277 | | | | 3,344 | |
| 5 | | J.P. Morgan | | LME Lead Futures^ | | March 17, 2014 | | | 272,611 | | | | 277,376 | | | | 4,765 | |
| 3 | | J.P. Morgan | | LME Lead Futures^ | | June 16, 2014 | | | 156,381 | | | | 167,175 | | | | 10,794 | |
| 1 | | J.P. Morgan | | LME Nickel Futures^ | | January 22, 2014 | | | 88,520 | | | | 83,087 | | | | (5,433) | |
| 1 | | J.P. Morgan | | LME Nickel Futures^ | | February 14, 2014 | | | 82,202 | | | | 83,181 | | | | 979 | |
| 2 | | J.P. Morgan | | LME Nickel Futures^ | | March 17, 2014 | | | 171,514 | | | | 166,680 | | | | (4,834) | |
| 1 | | J.P. Morgan | | LME Nickel Futures^ | | June 16, 2014 | | | 81,260 | | | | 83,748 | | | | 2,488 | |
| 1 | | J.P. Morgan | | LME Zinc Futures^ | | January 3, 2014 | | | 47,127 | | | | 51,325 | | | | 4,198 | |
| 1 | | J.P. Morgan | | LME Zinc Futures^ | | January 22, 2014 | | | 49,065 | | | | 51,163 | | | | 2,098 | |
| 12 | | J.P. Morgan | | LME Zinc Futures^ | | March 17, 2014 | | | 577,057 | | | | 617,401 | | | | 40,344 | |
| 10 | | J.P. Morgan | | LME Zinc Futures^ | | June 16, 2014 | | | 478,084 | | | | 515,251 | | | | 37,167 | |
| 5 | | Goldman Sachs | | Silver Futures^ | | March 27, 2014 | | | 542,598 | | | | 484,250 | | | | (58,348) | |
| 6 | | Goldman Sachs | | Soybean Futures^ | | May 14, 2014 | | | 386,376 | | | | 383,100 | | | | (3,276) | |
| 3 | | Goldman Sachs | | Soybean Meal Futures^ | | March 14, 2014 | | | 125,905 | | | | 125,100 | | | | (805) | |
| 5 | | Goldman Sachs | | Soybean Oil Futures^ | | March 14, 2014 | | | 121,813 | | | | 117,390 | | | | (4,423) | |
| 20 | | Goldman Sachs | | Sugar #11 (World Markets) Futures^ | | March 28, 2014 | | | 409,108 | | | | 367,584 | | | | (41,524) | |
| 1 | | Goldman Sachs | | Wheat Futures^ | | May 14, 2014 | | | 33,498 | | | | 30,600 | | | | (2,898) | |
| 2 | | Barclays Capital | | Amsterdam Index Futures | | January 17, 2014 | | | 208,986 | | | | 221,406 | | | | 12,420 | |
| 10 | | Barclays Capital | | CAC40 Index Futures | | January 17, 2014 | | | 562,435 | | | | 591,344 | | | | 28,909 | |
| 2 | | Barclays Capital | | DAX Index Futures | | March 21, 2014 | | | 630,466 | | | | 660,715 | | | | 30,249 | |
| 7 | | Barclays Capital | | E-Mini Russell 2000 Futures | | March 21, 2014 | | | 769,068 | | | | 812,980 | | | | 43,912 | |
| 33 | | Barclays Capital | | Euro Stoxx 50 Index | | March 21, 2014 | | | 1,344,066 | | | | 1,410,973 | | | | 66,907 | |
| 14 | | Barclays Capital | | FTSE 100 Index Futures | | March 21, 2014 | | | 1,494,023 | | | | 1,552,701 | | | | 58,678 | |
| 10 | | J.P. Morgan | | FTSE/JSE Top 40 Index Futures | | March 20, 2014 | | | 374,739 | | | | 397,522 | | | | 22,783 | |
| 3 | | Barclays Capital | | FTSE/MIB Index Futures | | March 21, 2014 | | | 375,805 | | | | 392,590 | | | | 16,785 | |
| 3 | | Barclays Capital | | Hang Seng Index Futures | | January 29, 2014 | | | 443,091 | | | | 451,356 | | | | 8,265 | |
| 10 | | Barclays Capital | | H-SHARES Index Futures | | January 29, 2014 | | | 685,903 | | | | 698,516 | | | | 12,613 | |
| 3 | | Barclays Capital | | IBEX 35 Index Futures | | January 17, 2014 | | | 384,775 | | | | 407,321 | | | | 22,546 | |
| 5 | | Barclays Capital | | KOSPI Index 200 Futures | | March 13, 2014 | | | 619,869 | | | | 629,294 | | | | 9,425 | |
| 115 | | Barclays Capital | | S&P 500 E-Mini Futures | | March 21, 2014 | | | 10,170,499 | | | | 10,586,325 | | | | 415,826 | |
| 7 | | Barclays Capital | | S&P MID 400 E-Mini Futures | | March 21, 2014 | | | 901,598 | | | | 937,580 | | | | 35,982 | |
| 2 | | Barclays Capital | | S&P/Toronto Stock Exchange 60 Index Futures | | March 20, 2014 | | | 282,212 | | | | 294,056 | | | | 11,844 | |
| 11 | | Barclays Capital | | SGX S&P CNX Nifty Index Futures | | January 30, 2014 | | | 139,226 | | | | 139,722 | | | | 496 | |
| 4 | | Barclays Capital | | SPI 200 Index Futures | | March 20, 2014 | | | 452,968 | | | | 474,844 | | | | 21,876 | |
| 18 | | Barclays Capital | | TOPIX Index Futures | | March 13, 2014 | | | 2,145,019 | | | | 2,226,284 | | | | 81,265 | |
| 12 | | J.P. Morgan | | Australia 10-Year Bond Futures | | March 17, 2014 | | | 1,217,200 | | | | 1,228,594 | | | | 11,394 | |
| 14 | | J.P. Morgan | | Canadian 10-Year Bond Futures | | March 20, 2014 | | | 1,692,528 | | | | 1,670,379 | | | | (22,149) | |
| 42 | | J.P. Morgan | | Euro—Bund Futures | | March 6, 2014 | | | 8,165,244 | | | | 8,041,159 | | | | (124,085) | |
| 39 | | J.P. Morgan | | Mini Japanese 10-Year Treasury Bond | | March 10, 2014 | | | 5,330,108 | | | | 5,305,792 | | | | (24,316) | |
| 176 | | J.P. Morgan | | U.S. Treasury 10-Year Note Futures | | March 20, 2014 | | | 22,095,625 | | | | 21,656,251 | | | | (439,374) | |
| | | | | | | | | | | | | | �� | | | | |
| | | | | | | | | 71,461,637 | | | | 71,791,858 | | | | 330,221 | |
| | | | | | | | | | | | | | | | | | |
| | | | |
| | The accompanying notes are an integral part of these financial statements. | | (Continued) |
| | | | | | | | | | | | | | | | |
| | AQR Funds | | | | | | Annual Report | | | | | | December 2013 | | 131 |
| | | | | | | | | | |
| | | | |
| Consolidated Schedule of Investments | | | December 31, 2013 | |
| | |
| AQR RISK PARITY II MV FUND | | |
| | | | | | | | | | | | | | | | | | |
NUMBER OF
CONTRACTS | | COUNTERPARTY | | DESCRIPTION | | EXPIRATION
DATE | | VALUE AT
TRADE DATE | | | VALUE AT
DECEMBER 31,
2013 | | | UNREALIZED
APPRECIATION
(DEPRECIATION) | |
| Short Contracts: | | | | | |
| 1 | | J.P. Morgan | | LME Aluminum Futures^ | | January 3, 2014 | | | $(45,998) | | | | $(43,869) | | | | $2,129 | |
| 2 | | J.P. Morgan | | LME Aluminum Futures^ | | January 17, 2014 | | | (92,096) | | | | (88,143) | | | | 3,953 | |
| 2 | | J.P. Morgan | | LME Aluminum Futures^ | | January 22, 2014 | | | (93,896) | | | | (88,280) | | | | 5,616 | |
| 2 | | J.P. Morgan | | LME Aluminum Futures^ | | January 29, 2014 | | | (94,896) | | | | (88,473) | | | | 6,423 | |
| 1 | | J.P. Morgan | | LME Aluminum Futures^ | | February 5, 2014 | | | (45,504) | | | | (44,333) | | | | 1,171 | |
| 1 | | J.P. Morgan | | LME Aluminum Futures^ | | February 7, 2014 | | | (45,408) | | | | (44,360) | | | | 1,048 | |
| 1 | | J.P. Morgan | | LME Aluminum Futures^ | | February 14, 2014 | | | (44,824) | | | | (44,457) | | | | 367 | |
| 4 | | J.P. Morgan | | LME Aluminum Futures^ | | February 21, 2014 | | | (177,729) | | | | (178,129) | | | | (400) | |
| 4 | | J.P. Morgan | | LME Aluminum Futures^ | | March 5, 2014 | | | (178,000) | | | | (178,750) | | | | (750) | |
| 22 | | J.P. Morgan | | LME Aluminum Futures^ | | March 17, 2014 | | | (982,560) | | | | (987,112) | | | | (4,552) | |
| 4 | | J.P. Morgan | | LME Aluminum Futures^ | | June 16, 2014 | | | (181,487) | | | | (183,374) | | | | (1,887) | |
| 1 | | J.P. Morgan | | LME Copper Futures^ | | January 17, 2014 | | | (179,998) | | | | (184,219) | | | | (4,221) | |
| 2 | | J.P. Morgan | | LME Copper Futures^ | | January 22, 2014 | | | (365,746) | | | | (368,338) | | | | (2,592) | |
| 1 | | J.P. Morgan | | LME Copper Futures^ | | January 31, 2014 | | | (181,123) | | | | (184,201) | | | | (3,078) | |
| 2 | | J.P. Morgan | | LME Copper Futures^ | | February 5, 2014 | | | (358,034) | | | | (368,438) | | | | (10,404) | |
| 1 | | J.P. Morgan | | LME Copper Futures^ | | February 21, 2014 | | | (174,510) | | | | (184,156) | | | | (9,646) | |
| 8 | | J.P. Morgan | | LME Copper Futures^ | | March 17, 2014 | | | (1,414,471) | | | | (1,473,150) | | | | (58,679) | |
| 1 | | J.P. Morgan | | LME Lead Futures^ | | January 22, 2014 | | | (54,998) | | | | (55,003) | | | | (5) | |
| 1 | | J.P. Morgan | | LME Lead Futures^ | | January 29, 2014 | | | (55,248) | | | | (55,068) | | | | 180 | |
| 1 | | J.P. Morgan | | LME Lead Futures^ | | January 31, 2014 | | | (54,829) | | | | (55,086) | | | | (257) | |
| 1 | | J.P. Morgan | | LME Lead Futures^ | | February 21, 2014 | | | (51,923) | | | | (55,278) | | | | (3,355) | |
| 5 | | J.P. Morgan | | LME Lead Futures^ | | March 17, 2014 | | | (262,781) | | | | (277,375) | | | | (14,594) | |
| 1 | | J.P. Morgan | | LME Nickel Futures^ | | January 22, 2014 | | | (88,618) | | | | (83,087) | | | | 5,531 | |
| 1 | | J.P. Morgan | | LME Nickel Futures^ | | February 14, 2014 | | | (82,604) | | | | (83,182) | | | | (578) | |
| 2 | | J.P. Morgan | | LME Nickel Futures^ | | March 17, 2014 | | | (163,238) | | | | (166,680) | | | | (3,442) | |
| 1 | | J.P. Morgan | | LME Zinc Futures^ | | January 3, 2014 | | | (47,229) | | | | (51,325) | | | | (4,096) | |
| 1 | | J.P. Morgan | | LME Zinc Futures^ | | January 22, 2014 | | | (49,023) | | | | (51,163) | | | | (2,140) | |
| 12 | | J.P. Morgan | | LME Zinc Futures^ | | March 17, 2014 | | | (570,555) | | | | (617,400) | | | | (46,845) | |
| 1 | | J.P. Morgan | | LME Zinc Futures^ | | June 16, 2014 | | | (49,723) | | | | (51,525) | | | | (1,802) | |
| | | | | | | | | | | | | | | | | | |
| | | | | | | | | (6,187,049) | | | | (6,333,954) | | | | (146,905) | |
| | | | | | | | | | | | | | | | | | |
| | | | | | | | | $65,274,588 | | | | $65,457,904 | | | | $183,316 | |
| | | | | | | | | | | | | | | | | | |
Cash held as collateral at Barclays Capital, J.P. Morgan and Goldman Sachs for futures contracts was $342,076, $1,208,597 and $400,790, respectively at December 31, 2013.
| ^ | Represents positions held in the respective Subsidiary (Note 2). |
Forward foreign currency exchange contracts outstanding as of December 31, 2013:
Over the Counter
| | | | | | | | | | | | | | | | | | | | |
PURCHASE
CONTRACTS | | COUNTERPARTY | | CURRENCY | | CURRENCY
AMOUNT
PURCHASED | | | VALUE AT
SETTLEMENT
DATE | | | VALUE AT
DECEMBER 31,
2013 | | | UNREALIZED
APPRECIATION
(DEPRECIATION) | |
Swiss Franc,
Expiring 03/19/14 | | Credit Suisse International | | CHF | | | 13,500 | | | | $14,957 | | | | $15,143 | | | | $186 | |
Swiss Franc,
Expiring 03/19/14 | | The Royal Bank of Scotland | | CHF | | | 17,500 | | | | 19,349 | | | | 19,630 | | | | 281 | |
Euro,
Expiring 03/19/14 | | The Royal Bank of Scotland | | EUR | | | 337,084 | | | | 460,484 | | | | 463,716 | | | | 3,232 | |
British Pound,
Expiring 03/19/14 | | The Royal Bank of Scotland | | GBP | | | 147,434 | | | | 240,884 | | | | 244,014 | | | | 3,130 | |
| | | | |
| | The accompanying notes are an integral part of these financial statements. | | (Continued) |
| | | | | | | | | | | | | | | | |
| 132 | | AQR Funds | | | | | | Annual Report | | | | | | December 2013 | | |
| | | | | | | | | | |
| | | | |
| Consolidated Schedule of Investments | | | December 31, 2013 | |
| | |
| AQR RISK PARITY II MV FUND | | |
| | | | | | | | | | | | | | | | | | | | |
PURCHASE
CONTRACTS | | COUNTERPARTY | | CURRENCY | | CURRENCY
AMOUNT
PURCHASED | | | VALUE AT
SETTLEMENT
DATE | | | VALUE AT
DECEMBER 31,
2013 | | | UNREALIZED
APPRECIATION
(DEPRECIATION) | |
Hong Kong Dollar,
Expiring 03/19/14 | | The Royal Bank of Scotland | | HKD | | | 377,000 | | | | $48,640 | | | | $48,622 | | | | $(18) | |
Russian Ruble,
Expiring 03/19/14* | | Credit Suisse International | | RUB | | | 231,000 | | | | 6,905 | | | | 6,937 | | | | 32 | |
Russian Ruble,
Expiring 03/19/14* | | The Royal Bank of Scotland | | RUB | | | 879,000 | | | | 26,410 | | | | 26,397 | | | | (13) | |
| | | | | | | | | | | | | | | | | | | | |
| | | | | | | | | | | $817,629 | | | | $824,459 | | | | $6,830 | |
| | | | | | | | | | | | | | | | | | | | |
| | | | | | | | | | | | | | | | | | | | |
| | | | | | | | | | | | | | | | | | | | |
SALES
CONTRACTS | | COUNTERPARTY | | CURRENCY | | CURRENCY
AMOUNT
SOLD | | | VALUE AT
SETTLEMENT
DATE | | | VALUE AT
DECEMBER 31,
2013 | | | UNREALIZED
APPRECIATION
(DEPRECIATION) | |
Swiss Franc,
Expiring 03/19/14 | | The Royal Bank of Scotland | | CHF | | | (13,000) | | | | $(14,596) | | | | $(14,582) | | | | $14 | |
Euro,
Expiring 03/19/14 | | Credit Suisse International | | EUR | | | (2,314,062) | | | | (3,170,903) | | | | (3,183,386) | | | | (12,483) | |
Euro,
Expiring 03/19/14 | | The Royal Bank of Scotland | | EUR | | | (2,438,398) | | | | (3,341,516) | | | | (3,354,431) | | | | (12,915) | |
British Pound,
Expiring 03/19/14 | | Credit Suisse International | | GBP | | | (787,530) | | | | (1,289,175) | | | | (1,303,421) | | | | (14,246) | |
British Pound,
Expiring 03/19/14 | | The Royal Bank of Scotland | | GBP | | | (893,602) | | | | (1,462,718) | | | | (1,478,978) | | | | (16,260) | |
Hong Kong Dollar,
Expiring 03/19/14 | | Credit Suisse International | | HKD | | | (82,000) | | | | (10,579) | | | | (10,576) | | | | 3 | |
Hong Kong Dollar,
Expiring 03/19/14 | | The Royal Bank of Scotland | | HKD | | | (340,000) | | | | (43,853) | | | | (43,851) | | | | 2 | |
Russian Ruble,
Expiring 03/19/14* | | Credit Suisse International | | RUB | | | (11,155,500) | | | | (335,082) | | | | (335,004) | | | | 78 | |
Russian Ruble,
Expiring 03/19/14* | | The Royal Bank of Scotland | | RUB | | | (11,155,500) | | | | (335,084) | | | | (335,004) | | | | 80 | |
| | | | | | | | | | | | | | | | | | | | |
| | | | | | | | | | | (10,003,506) | | | | (10,059,233) | | | | (55,727) | |
| | | | | | | | | | | | | | | | | | | | |
| | | | | | | | | | | $(9,185,877) | | | | $(9,234,774) | | | | $(48,897) | |
| | | | | | | | | | | | | | | | | | | | |
Money Market Fund is pledged to The Royal Bank of Scotland as collateral for forward foreign currency exchange contracts in the amount of $30,001 at December 31, 2013.
| * | Non deliverable forward. See Note 3 in the Notes to Financial Statements. |
BRL - Brazilian Real
CHF - Swiss Franc
EUR - Euro
GBP - British Pound
HKD - Hong Kong Dollar
RUB - Russian Ruble
USD - United States Dollar
| | | | |
| | The accompanying notes are an integral part of these financial statements. | | |
| | | | | | | | | | | | | | | | |
| | AQR Funds | | | | | | Annual Report | | | | | | December 2013 | | 133 |
| | | | | | | | | | |
| | | | |
| Consolidated Schedule of Investments | | | December 31, 2013 | |
| | |
| AQR RISK PARITY II HV FUND | | |
| | | | | | | | | | | | | | | | | | | | |
| | | INTEREST
RATE | | | MATURITY
DATE | | | CURRENCY | | | PRINCIPAL
AMOUNT
(000’S) | | | VALUE (Note 3) | |
| GOVERNMENT RELATED OBLIGATIONS - 22.4% | | | | | | | | | | | | | | | | | | | | |
| Sovereign Debt - 22.4% | | | | | | | | | | | | | | | | | | | | |
| Deutsche Bundesrepublik Inflation Linked Bond (Germany) | | | 0.100% | | | | 04/15/23 | | | | EUR | | | | 1,136 | | | $ | 1,524,337 | |
| Deutsche Bundesrepublik Inflation Linked Bond (Germany) | | | 0.750% | | | | 04/15/18 | | | | EUR | | | | 530 | | | | 757,842 | |
| Deutsche Bundesrepublik Inflation Linked Bond (Germany) | | | 1.750% | | | | 04/15/20 | | | | EUR | | | | 437 | | | | 664,696 | |
| France Government Bond OAT (France) | | | 0.250% | | | | 07/25/18 | | | | EUR | | | | 311 | | | | 435,228 | |
| France Government Bond OAT (France) | | | 1.300% | | | | 07/25/19 | | | | EUR | | | | 637 | | | | 941,479 | |
| United Kingdom Index Linked Treasury Gilt (United Kingdom) | | | 0.125% | | | | 03/22/24 | | | | GBP | | | | 208 | | | | 346,940 | |
| United Kingdom Treasury Gilt (United Kingdom) | | | 1.875% | | | | 11/22/22 | | | | GBP | | | | 612 | | | | 1,207,035 | |
| | | | | | | | | | | | | | | | | | | | |
TOTAL GOVERNMENT RELATED OBLIGATIONS
(cost $5,792,220) | | | | | | | | | | | | | | | | | | | 5,877,557 | |
| | | | | | | | | | | | | | | | | | | | |
| U.S. TREASURY OBLIGATIONS - 36.7% | | | | | | | | | | | | | | | | | | | | |
| U.S. Treasury Inflation Protected Securities - 36.7% | | | | | | | | | | | | | | | | | | | | |
| U.S. Treasury Inflation Protected Securities (a) | | | 0.125% | | | | 04/15/18 | | | | USD | | | $ | 2,600 | | | | 2,679,164 | |
| U.S. Treasury Inflation Protected Securities (a) | | | 0.125% | | | | 01/15/22 | | | | USD | | | | 700 | | | | 694,200 | |
| U.S. Treasury Inflation Protected Securities (a) | | | 0.125% | | | | 07/15/22 | | | | USD | | | | 700 | | | | 680,970 | |
| U.S. Treasury Inflation Protected Securities (a) | | | 0.125% | | | | 01/15/23 | | | | USD | | | | 600 | | | | 573,359 | |
| U.S. Treasury Inflation Protected Securities (a) | | | 0.375% | | | | 07/15/23 | | | | USD | | | | 600 | | | | 580,732 | |
| U.S. Treasury Inflation Protected Securities (a) | | | 1.375% | | | | 07/15/18 | | | | USD | | | | 600 | | | | 704,297 | |
| U.S. Treasury Inflation Protected Securities (a) | | | 1.625% | | | | 01/15/18 | | | | USD | | | | 1,200 | | | | 1,453,874 | |
| U.S. Treasury Inflation Protected Securities (a) | | | 2.125% | | | | 01/15/19 | | | | USD | | | | 500 | | | | 607,372 | |
| U.S. Treasury Inflation Protected Securities (a) | | | 2.625% | | | | 07/15/17 | | | | USD | | | | 1,300 | | | | 1,647,790 | |
| | | | | | | | | | | | | | | | | | | | |
TOTAL U.S. TREASURY OBLIGATIONS
(cost $9,749,117) | | | | | | | | | | | | | | | | | | | 9,621,758 | |
| | | | | | | | | | | | | | | | | | | | |
| | | | | | | | |
| | | SHARES | | | | | |
| MONEY MARKET FUNDS - 53.8% | | | | | | | | |
| BlackRock Liquidity Funds TempFund Portfolio - Series I, Institutional Shares, 0.050% (b)^ | | | 240,105 | | | | 240,105 | |
| Dreyfus Treasury Cash Management, Class I, 0.010% (b)^ | | | 960,423 | | | | 960,423 | |
| J.P. Morgan U.S. Treasury Plus Money Market Fund - Institutional Shares, 0.000% (b)(c)^ | | | 11,700,383 | | | | 11,700,383 | |
| UBS Money Series - UBS Select Treasury Preferred Fund, Class I, 0.010% (b)^ | | | 1,200,529 | | | | 1,200,529 | |
| | | | | | | | |
TOTAL MONEY MARKET FUNDS
(cost $14,101,440) | | | | | | | 14,101,440 | |
| | | | | | | | |
| | |
| |
| PRINCIPAL
AMOUNT
(000’S) |
| | | | |
| SHORT-TERM INVESTMENTS - 17.7% | | | | | | | | |
| U.S. Treasury Bill, 0.066%, 01/30/2014 (d) | | $ | 1,275 | | | | 1,274,782 | |
| U.S. Treasury Bill, 0.073%, 02/06/2014 (d) | | | 1,275 | | | | 1,274,781 | |
| U.S. Treasury Bills, 0.080%, 05/29/2014 (d)^ | | | 1,050 | | | | 1,049,753 | |
| U.S. Treasury Bills, 0.084%, 06/05/2014 (d)^ | | | 1,050 | | | | 1,049,742 | |
| | | | | | | | |
TOTAL SHORT-TERM INVESTMENTS
(cost $4,648,715) | | | | | | | 4,649,058 | |
| | | | | | | | |
| | |
| |
| PRINCIPAL
AMOUNT
(000’S) |
| | | | |
| REPURCHASE AGREEMENT - 0.7% | | | | | | | | |
Barclays Capital, 0.03%, dated 12/27/13, due 01/03/14, repurchase price $191,001, collateralized by U.S. Treasury Inflation Indexed Note, 0.125%, due 01/15/23, total to be received $188,891 (a)
(cost $191,000) | | $ | 191 | | | | 191,000 | |
| | | | | | | | |
TOTAL INVESTMENTS - 131.3%
(cost $34,482,492) | | | | | | | 34,440,813 | |
| | | | | | | | |
| LIABILITIES IN EXCESS OF OTHER ASSETS - (31.3%) (e) | | | | | | | (8,211,775) | |
| | | | | | | | |
| NET ASSETS - 100.0% | | | | | | $ | 26,229,038 | |
| | | | | | | | |
| | | | |
| | The accompanying notes are an integral part of these financial statements. | | (Continued) |
| | | | | | | | | | | | | | | | |
| 134 | | AQR Funds | | | | | | Annual Report | | | | | | December 2013 | | |
| | | | | | | | | | |
| | | | |
| Consolidated Schedule of Investments | | | December 31, 2013 | |
| | |
| AQR RISK PARITY II HV FUND | | |
All securities are United States companies, unless noted otherwise in parentheses.
| (a) | On December 31, 2013, securities valued at $9,812,758 were pledged as collateral for reverse repurchase agreements outstanding. |
| (b) | Represents annualized seven-day yield as of December 31, 2013. |
| (c) | A portion of the security is pledged as collateral to the brokers for forward foreign currency exchange and swap contracts. |
| (d) | The rate shown is the effective yield at the date of purchase. |
| (e) | Includes appreciation/(depreciation) on forward foreign currency exchange, futures and swap contracts. |
| ^ | All or a portion represents positions held in the respective Subsidiary (Note 2). |
All securities are Level 2 with respect to ASC 820 (See Note 5).
The following abbreviations are used in portfolio descriptions:
EUR - Euro
GBP - British Pound
USD - United States Dollar
Open reverse repurchase agreements at December 31, 2013:
| | | | | | | | | | | | | | | | |
| COUNTERPARTY | | TRADE DATE | | | RATE | | | DUE
DATE | | | PRINCIPAL AMOUNT
OF REVERSE
REPURCHASE
AGREEMENT | |
| Barclays Capital | | | 12/06/2013 | | | | 0.14% | | | | 1/15/2014 | | | $ | 96,250 | |
| Barclays Capital | | | 11/20/2013 | | | | 0.16% | | �� | | 1/15/2014 | | | | 1,398,250 | |
J.P. Morgan | | | 11/20/2013 | | | | 0.12% | | | | 1/15/2014 | | | | 591,000 | |
J.P. Morgan | | | 11/20/2013 | | | | 0.13% | | | | 1/15/2014 | | | | 693,000 | |
| Morgan Stanley & Co., Inc. | | | 12/20/2013 | | | | 0.16% | | | | 1/15/2014 | | | | 2,481,000 | |
| Morgan Stanley & Co., Inc. | | | 11/20/2013 | | | | 0.20% | | | | 1/15/2014 | | | | 204,750 | |
| BNP Paribas Corp. | | | 11/20/2013 | | | | 0.16% | | | | 1/15/2014 | | | | 3,723,500 | |
| BNP Paribas Corp. | | | 12/06/2013 | | | | 0.19% | | | | 1/15/2014 | | | | 749,500 | |
| | | | | | | | | | | | | | | | |
| | | | | | | | | | | | | | $ | 9,937,250 | |
| | | | | | | | | | | | | | | | |
Cash held as collateral at Barclays Capital for open reverse repurchase agreements was $90,000 at December 31, 2013.
Total return swap contracts outstanding as of December 31, 2013:
Over the Counter
| | | | | | | | | | | | | | | | |
| COUNTERPARTY | | UNDERLYING REFERENCE INSTRUMENT | | TERMINATION
DATE | | CURRENCY | | | NOTIONAL
VALUE | | | UNREALIZED
APPRECIATION
(DEPRECIATION) | |
| Goldman Sachs | | Bovespa Index | | 2/12/2014 | | | BRL | | | | 1,014,951 | | | | $8,916 | |
| Deutsche Bank | | Brent Crude Futures^ | | 1/16/2014 | | | USD | | | | 2,269,160 | | | | 57,640 | |
| Deutsche Bank | | Brent Crude Futures^ | | 1/16/2014 | | | USD | | | | (2,251,390) | | | | (75,410) | |
| Deutsche Bank | | Brent Crude Futures^ | | 2/13/2014 | | | USD | | | | 2,248,920 | | | | 72,210 | |
| Deutsche Bank | | Brent Crude Futures^ | | 2/13/2014 | | | USD | | | | (2,337,650) | | | | 16,520 | |
| Deutsche Bank | | Brent Crude Futures^ | | 3/14/2014 | | | USD | | | | 2,221,200 | | | | (15,800) | |
| Barclays Capital | | Cocoa Futures^ | | 3/14/2014 | | | USD | | | | 26,680 | | | | 410 | |
| Barclays Capital | | Coffee ‘C’ Futures^ | | 3/19/2014 | | | USD | | | | 81,262 | | | | 1,763 | |
| Barclays Capital | | Corn Futures^ | | 3/14/2014 | | | USD | | | | 146,937 | | | | (20,329) | |
| Barclays Capital | | Corn Futures^ | | 3/14/2014 | | | USD | | | | (133,290) | | | | 6,687 | |
| Barclays Capital | | Corn Futures^ | | 5/14/2014 | | | USD | | | | 135,996 | | | | (6,921) | |
| Barclays Capital | | Cotton No. 2 Futures^ | | 3/7/2014 | | | USD | | | | 39,403 | | | | 2,917 | |
| Deutsche Bank | | Gas Oil Futures^ | | 1/10/2014 | | | USD | | | | 736,525 | | | | 18,875 | |
| Deutsche Bank | | Gas Oil Futures^ | | 1/10/2014 | | | USD | | | | (724,700) | | | | (30,700) | |
| Deutsche Bank | | Gas Oil Futures^ | | 2/12/2014 | | | USD | | | | 731,250 | | | | 23,550 | |
| Deutsche Bank | | Gas Oil Futures^ | | 2/12/2014 | | | USD | | | | (756,200) | | | | 1,400 | |
| Deutsche Bank | | Gas Oil Futures^ | | 3/12/2014 | | | USD | | | | 754,600 | | | | (1,200) | |
| | | | |
| | The accompanying notes are an integral part of these financial statements. | | (Continued) |
| | | | | | | | | | | | | | | | |
| | AQR Funds | | | | | | Annual Report | | | | | | December 2013 | | 135 |
| | | | | | | | | | |
| | | | |
| Consolidated Schedule of Investments | | | December 31, 2013 | |
| | |
| AQR RISK PARITY II HV FUND | | |
| | | | | | | | | | | | | | | | |
| COUNTERPARTY | | UNDERLYING REFERENCE INSTRUMENT | | TERMINATION
DATE | | CURRENCY | | | NOTIONAL
VALUE | | | UNREALIZED
APPRECIATION
(DEPRECIATION) | |
| Deutsche Bank | | Gasoline RBOB Futures^ | | 1/31/2014 | | | USD | | | | 851,869 | | | | $84,193 | |
| Deutsche Bank | | Gasoline RBOB Futures^ | | 1/31/2014 | | | USD | | | | (900,799) | | | | (35,263) | |
| Deutsche Bank | | Gasoline RBOB Futures^ | | 2/28/2014 | | | USD | | | | 794,342 | | | | 26,476 | |
| Deutsche Bank | | Gasoline RBOB Futures^ | | 2/28/2014 | | | USD | | | | (820,126) | | | | (693) | |
| Deutsche Bank | | Gasoline RBOB Futures^ | | 3/31/2014 | | | USD | | | | 749,650 | | | | (3,478) | |
| Barclays Capital | | Gold 100 OZ Futures^ | | 2/26/2014 | | | USD | | | | 643,400 | | | | (42,240) | |
| Barclays Capital | | Gold 100 OZ Futures^ | | 2/26/2014 | | | USD | | | | (128,580) | | | | 8,348 | |
| Deutsche Bank | | Heating Oil Futures^ | | 1/31/2014 | | | USD | | | | 607,286 | | | | 36,406 | |
| Deutsche Bank | | Heating Oil Futures^ | | 1/31/2014 | | | USD | | | | (626,896) | | | | (16,796) | |
| Deutsche Bank | | Heating Oil Futures^ | | 2/28/2014 | | | USD | | | | 503,681 | | | | 9,358 | |
| Deutsche Bank | | Heating Oil Futures^ | | 2/28/2014 | | | USD | | | | (514,752) | | | | 1,714 | |
| Deutsche Bank | | Heating Oil Futures^ | | 3/31/2014 | | | USD | | | | 512,686 | | | | (1,378) | |
| Goldman Sachs | | H-SHARES Index Futures | | 1/29/2014 | | | HKD | | | | 3,182,412 | | | | 8,703 | |
| Barclays Capital | | Lean Hogs Futures^ | | 2/14/2014 | | | USD | | | | 366,097 | | | | (24,393) | |
| Barclays Capital | | Lean Hogs Futures^ | | 2/14/2014 | | | USD | | | | (143,482) | | | | 6,801 | |
| Barclays Capital | | Live Cattle Futures^ | | 2/28/2014 | | | USD | | | | 744,372 | | | | 9,525 | |
| Barclays Capital | | Live Cattle Futures^ | | 2/28/2014 | | | USD | | | | (105,980) | | | | (1,719) | |
| Barclays Capital | | LME Aluminum Futures^ | | 3/17/2014 | | | USD | | | | 185,700 | | | | (6,225) | |
| Barclays Capital | | LME Aluminum Futures^ | | 3/17/2014 | | | USD | | | | (174,700) | | | | (4,775) | |
| Barclays Capital | | LME Aluminum Futures^ | | 6/16/2014 | | | USD | | | | 178,650 | | | | 4,725 | |
| Barclays Capital | | LME Copper Futures^ | | 3/17/2014 | | | USD | | | | 540,000 | | | | 12,431 | |
| Barclays Capital | | LME Copper Futures^ | | 3/17/2014 | | | USD | | | | (522,000) | | | | (30,431) | |
| Barclays Capital | | LME Copper Futures^ | | 6/16/2014 | | | USD | | | | 521,850 | | | | 28,500 | |
| Goldman Sachs | | MSCI Taiwan Stock Index Futures | | 1/28/2014 | | | USD | | | | 533,010 | | | | 12,750 | |
| Deutsche Bank | | Natural Gas Swap Futures^ | | 2/26/2014 | | | USD | | | | 236,640 | | | | 14,940 | |
| Deutsche Bank | | Natural Gas Swap Futures^ | | 2/26/2014 | | | USD | | | | (264,960) | | | | 13,380 | |
| Deutsche Bank | | Natural Gas Swap Futures^ | | 3/27/2014 | | | USD | | | | 254,460 | | | | (8,160) | |
| Bank of America | | Russian Trading System Index Futures | | 3/17/2014 | | | USD | | | | 401,269 | | | | 14,689 | |
| Goldman Sachs | | SGX S&P CNX Nifty Index Futures | | 1/30/2014 | | | USD | | | | 24,854 | | | | 550 | |
| Barclays Capital | | Silver Futures^ | | 3/27/2014 | | | USD | | | | 214,540 | | | | (20,840) | |
| Barclays Capital | | Soybean Futures^ | | 3/14/2014 | | | USD | | | | 315,858 | | | | 7,265 | |
| Barclays Capital | | Soybean Futures^ | | 3/14/2014 | | | USD | | | | (328,688) | | | | 5,560 | |
| Barclays Capital | | Soybean Futures^ | | 5/14/2014 | | | USD | | | | 324,375 | | | | (5,125) | |
| Barclays Capital | | Soybean Meal Futures^ | | 3/14/2014 | | | USD | | | | 41,790 | | | | (90) | |
| Barclays Capital | | Soybean Oil Futures^ | | 3/14/2014 | | | USD | | | | 244,260 | | | | (9,480) | |
| Goldman Sachs | | Swiss Market Index Futures | | 3/21/2014 | | | CHF | | | | 466,826 | | | | 22,201 | |
| Bank of America | | U.S. Treasury 10-Year Note Futures | | 3/20/2014 | | | USD | | | | 10,659,527 | | | | (200,543) | |
| Barclays Capital | | Wheat Futures^ | | 3/14/2014 | | | USD | | | | 99,690 | | | | (8,900) | |
| Barclays Capital | | Wheat Futures^ | | 3/14/2014 | | | USD | | | | (99,629) | | | | 8,839 | |
| Barclays Capital | | Wheat Futures^ | | 5/14/2014 | | | USD | | | | 100,567 | | | | (8,767) | |
| Deutsche Bank | | WTI Crude Oil Futures^ | | 1/21/2014 | | | USD | | | | 1,898,390 | | | | 70,010 | |
| Deutsche Bank | | WTI Crude Oil Futures^ | | 1/21/2014 | | | USD | | | | (1,881,440) | | | | (86,960) | |
| Deutsche Bank | | WTI Crude Oil Futures^ | | 2/20/2014 | | | USD | | | | 1,985,450 | | | | 84,100 | |
| Deutsche Bank | | WTI Crude Oil Futures^ | | 2/20/2014 | | | USD | | | | (2,097,130) | | | | 27,580 | |
| Deutsche Bank | | WTI Crude Oil Futures^ | | 3/20/2014 | | | USD | | | | 1,993,600 | | | | (24,800) | |
| | | | | | | | | | | | | | | | |
| | | | | | | | | | | | | | | $38,516 | |
| | | | | | | | | | | | | | | | |
Money Market Fund is pledged as collateral to Bank of America, Barclays Capital and Goldman Sachs for $110,000, $110,001 and $450,000, respectively for total return swap contracts at December 31, 2013.
| ^ | Represents positions held in the respective Subsidiary (Note 2). |
| | | | |
| | The accompanying notes are an integral part of these financial statements. | | (Continued) |
| | | | | | | | | | | | | | | | |
| 136 | | AQR Funds | | | | | | Annual Report | | | | | | December 2013 | | |
| | | | | | | | | | |
| | | | |
| Consolidated Schedule of Investments | | | December 31, 2013 | |
| | |
| AQR RISK PARITY II HV FUND | | |
Open futures contracts outstanding at December 31, 2013:
Exchange Traded
| | | | | | | | | | | | | | | | | | | | |
NUMBER OF
CONTRACTS | | COUNTERPARTY | | DESCRIPTION | | EXPIRATION
DATE | | | VALUE AT
TRADE DATE | | | VALUE AT
DECEMBER 31,
2013 | | | UNREALIZED
APPRECIATION
(DEPRECIATION) | |
| Long Contracts: | | | | | |
| 3 | | Goldman Sachs | | Cocoa Futures^ | | | March 14, 2014 | | | | $82,787 | | | | $81,270 | | | | $(1,517) | |
| 5 | | Goldman Sachs | | Coffee ‘C’ Futures^ | | | March 19, 2014 | | | | 201,153 | | | | 207,562 | | | | 6,409 | |
| 29 | | Goldman Sachs | | Corn Futures^ | | | May 14, 2014 | | | | 638,894 | | | | 623,863 | | | | (15,031) | |
| 4 | | Goldman Sachs | | Cotton No. 2 Futures^ | | | March 7, 2014 | | | | 159,330 | | | | 169,280 | | | | 9,950 | |
| 3 | | Goldman Sachs | | Lean Hogs Futures^ | | | February 14, 2014 | | | | 105,644 | | | | 102,510 | | | | (3,134) | |
| 1 | | Goldman Sachs | | Live Cattle Futures^ | | | February 28, 2014 | | | | 53,555 | | | | 53,850 | | | | 295 | |
| 1 | | J.P. Morgan | | LME Aluminum Futures^ | | | January 3, 2014 | | | | 46,050 | | | | 43,869 | | | | (2,181) | |
| 1 | | J.P. Morgan | | LME Aluminum Futures^ | | | January 28, 2014 | | | | 47,290 | | | | 44,223 | | | | (3,067) | |
| 1 | | J.P. Morgan | | LME Aluminum Futures^ | | | January 29, 2014 | | | | 47,427 | | | | 44,237 | | | | (3,190) | |
| 1 | | J.P. Morgan | | LME Aluminum Futures^ | | | January 31, 2014 | | | | 47,171 | | | | 44,264 | | | | (2,907) | |
| 2 | | J.P. Morgan | | LME Aluminum Futures^ | | | February 5, 2014 | | | | 90,904 | | | | 88,665 | | | | (2,239) | |
| 1 | | J.P. Morgan | | LME Aluminum Futures^ | | | February 7, 2014 | | | | 45,540 | | | | 44,360 | | | | (1,180) | |
| 1 | | J.P. Morgan | | LME Aluminum Futures^ | | | February 21, 2014 | | | | 44,486 | | | | 44,533 | | | | 47 | |
| 1 | | J.P. Morgan | | LME Aluminum Futures^ | | | March 5, 2014 | | | | 44,252 | | | | 44,687 | | | | 435 | |
| 13 | | J.P. Morgan | | LME Aluminum Futures^ | | | March 17, 2014 | | | | 603,533 | | | | 583,294 | | | | (20,239) | |
| 9 | | J.P. Morgan | | LME Aluminum Futures^ | | | June 16, 2014 | | | | 406,548 | | | | 412,594 | | | | 6,046 | |
| 1 | | J.P. Morgan | | LME Copper Futures^ | | | January 3, 2014 | | | | 182,390 | | | | 184,394 | | | | 2,004 | |
| 1 | | J.P. Morgan | | LME Copper Futures^ | | | January 10, 2014 | | | | 177,877 | | | | 184,344 | | | | 6,467 | |
| 1 | | J.P. Morgan | | LME Copper Futures^ | | | January 15, 2014 | | | | 181,038 | | | | 184,318 | | | | 3,280 | |
| 1 | | J.P. Morgan | | LME Copper Futures^ | | | January 31, 2014 | | | | 181,362 | | | | 184,201 | | | | 2,839 | |
| 1 | | J.P. Morgan | | LME Copper Futures^ | | | February 7, 2014 | | | | 177,752 | | | | 184,226 | | | | 6,474 | |
| 1 | | J.P. Morgan | | LME Copper Futures^ | | | February 26, 2014 | | | | 177,694 | | | | 184,156 | | | | 6,462 | |
| 7 | | J.P. Morgan | | LME Copper Futures^ | | | March 17, 2014 | | | | 1,266,590 | | | | 1,289,007 | | | | 22,417 | |
| 4 | | J.P. Morgan | | LME Copper Futures^ | | | June 16, 2014 | | | | 706,221 | | | | 733,800 | | | | 27,579 | |
| 1 | | J.P. Morgan | | LME Lead Futures^ | | | January 3, 2014 | | | | 52,002 | | | | 54,762 | | | | 2,760 | |
| 1 | | J.P. Morgan | | LME Lead Futures^ | | | January 10, 2014 | | | | 51,946 | | | | 54,872 | | | | 2,926 | |
| 3 | | J.P. Morgan | | LME Lead Futures^ | | | March 17, 2014 | | | | 159,584 | | | | 166,425 | | | | 6,841 | |
| 2 | | J.P. Morgan | | LME Lead Futures^ | | | June 16, 2014 | | | | 104,392 | | | | 111,450 | | | | 7,058 | |
| 1 | | J.P. Morgan | | LME Nickel Futures^ | | | March 17, 2014 | | | | 82,976 | | | | 83,340 | | | | 364 | |
| 1 | | J.P. Morgan | | LME Nickel Futures^ | | | June 16, 2014 | | | | 81,260 | | | | 83,748 | | | | 2,488 | |
| 1 | | J.P. Morgan | | LME Zinc Futures^ | | | March 12, 2014 | | | | 49,147 | | | | 51,403 | | | | 2,256 | |
| 7 | | J.P. Morgan | | LME Zinc Futures^ | | | March 17, 2014 | | | | 334,815 | | | | 360,150 | | | | 25,335 | |
| 8 | | J.P. Morgan | | LME Zinc Futures^ | | | June 16, 2014 | | | | 384,304 | | | | 412,200 | | | | 27,896 | |
| 3 | | Goldman Sachs | | Silver Futures^ | | | March 27, 2014 | | | | 313,170 | | | | 290,550 | | | | (22,620) | |
| 3 | | Goldman Sachs | | Soybean Futures^ | | | May 14, 2014 | | | | 193,146 | | | | 191,550 | | | | (1,596) | |
| 4 | | Goldman Sachs | | Soybean Meal Futures^ | | | March 14, 2014 | | | | 167,881 | | | | 166,800 | | | | (1,081) | |
| 5 | | Goldman Sachs | | Soybean Oil Futures^ | | | March 14, 2014 | | | | 122,109 | | | | 117,390 | | | | (4,719) | |
| 17 | | Goldman Sachs | | Sugar #11 (World Markets) Futures^ | | | March 28, 2014 | | | | 337,204 | | | | 312,447 | | | | (24,757) | |
| 1 | | Goldman Sachs | | Wheat Futures^ | | | May 14, 2014 | | | | 33,498 | | | | 30,600 | | | | (2,898) | |
| 2 | | Barclays Capital | | Amsterdam Index Futures | | | January 17, 2014 | | | | 208,986 | | | | 221,405 | | | | 12,419 | |
| 8 | | Barclays Capital | | CAC40 Index Futures | | | January 17, 2014 | | | | 450,149 | | | | 473,076 | | | | 22,927 | |
| 2 | | Barclays Capital | | DAX Index Futures | | | March 21, 2014 | | | | 639,889 | | | | 660,714 | | | | 20,825 | |
| 6 | | Barclays Capital | | E-Mini Russell 2000 Futures | | | March 21, 2014 | | | | 660,146 | | | | 696,840 | | | | 36,694 | |
| 28 | | Barclays Capital | | Euro Stoxx 50 Index | | | March 21, 2014 | | | | 1,140,689 | | | | 1,197,189 | | | | 56,500 | |
| 11 | | Barclays Capital | | FTSE 100 Index Futures | | | March 21, 2014 | | | | 1,174,010 | | | | 1,219,981 | | | | 45,971 | |
| 9 | | J.P. Morgan | | FTSE/JSE Top 40 Index Futures | | | March 20, 2014 | | | | 337,265 | | | | 357,769 | | | | 20,504 | |
| 2 | | Barclays Capital | | FTSE/MIB Index Futures | | | March 21, 2014 | | | | 250,537 | | | | 261,727 | | | | 11,190 | |
| 1 | | Barclays Capital | | Hang Seng Index Futures | | | January 29, 2014 | | | | 148,003 | | | | 150,452 | | | | 2,449 | |
| 8 | | Barclays Capital | | H-SHARES Index Futures | | | January 29, 2014 | | | | 548,932 | | | | 558,812 | | | | 9,880 | |
| 2 | | Barclays Capital | | IBEX 35 Index Futures | | | January 17, 2014 | | | | 256,140 | | | | 271,546 | | | | 15,406 | |
| 4 | | Barclays Capital | | KOSPI Index 200 Futures | | | March 13, 2014 | | | | 495,519 | | | | 503,435 | | | | 7,916 | |
| | | | |
| | The accompanying notes are an integral part of these financial statements. | | (Continued) |
| | | | | | | | | | | | | | | | |
| | AQR Funds | | | | | | Annual Report | | | | | | December 2013 | | 137 |
| | | | | | | | | | |
| | | | |
| Consolidated Schedule of Investments | | | December 31, 2013 | |
| | |
| AQR RISK PARITY II HV FUND | | |
| | | | | | | | | | | | | | | | | | | | |
NUMBER OF
CONTRACTS | | COUNTERPARTY | | DESCRIPTION | | EXPIRATION
DATE | | | VALUE AT
TRADE DATE | | | VALUE AT
DECEMBER 31,
2013 | | | UNREALIZED
APPRECIATION
(DEPRECIATION) | |
| Long Contracts: (continued) | | | | | |
| 3 | | Barclays Capital | | MSCI Taiwan Stock Index Futures | | | January 28, 2014 | | | | $89,069 | | | | $90,960 | | | | $1,891 | |
| 90 | | Barclays Capital | | S&P 500 E-Mini Futures | | | March 21, 2014 | | | | 7,960,044 | | | | 8,284,950 | | | | 324,906 | |
| 6 | | Barclays Capital | | S&P MID 400 E-Mini Futures | | | March 21, 2014 | | | | 773,027 | | | | 803,640 | | | | 30,613 | |
| 3 | | Barclays Capital | | S&P/Toronto Stock Exchange 60 Index Futures | | | March 20, 2014 | | | | 424,253 | | | | 441,083 | | | | 16,830 | |
| 11 | | Barclays Capital | | SGX S&P CNX Nifty Index Futures | | | January 30, 2014 | | | | 139,226 | | | | 139,722 | | | | 496 | |
| 3 | | Barclays Capital | | SPI 200 Index Futures | | | March 20, 2014 | | | | 339,593 | | | | 356,133 | | | | 16,540 | |
| 14 | | Barclays Capital | | TOPIX Index Futures | | | March 13, 2014 | | | | 1,668,652 | | | | 1,731,555 | | | | 62,903 | |
| 10 | | J.P. Morgan | | Australia 10-Year Bond Futures | | | March 17, 2014 | | | | 1,014,333 | | | | 1,023,828 | | | | 9,495 | |
| 11 | | J.P. Morgan | | Canadian 10-Year Bond Futures | | | March 20, 2014 | | | | 1,330,226 | | | | 1,312,441 | | | | (17,785) | |
| 32 | | J.P. Morgan | | Euro - Bund Futures | | | March 6, 2014 | | | | 6,222,503 | | | | 6,126,597 | | | | (95,906) | |
| 22 | | J.P. Morgan | | Mini Japanese 10-Year Treasury Bond | | | March 10, 2014 | | | | 3,008,023 | | | | 2,993,011 | | | | (15,012) | |
| 58 | | J.P. Morgan | | U.S. Treasury 10-Year Note Futures | | | March 20, 2014 | | | | 7,276,559 | | | | 7,136,719 | | | | (139,840) | |
| | | | | | | | | | | | | | | | | | | | |
| | | | | | | | | | | 44,738,695 | | | | 45,262,779 | | | | 524,084 | |
| | | | | | | | | | | | | | | | | | | | |
| Short Contracts: | | | | | |
| 1 | | J.P. Morgan | | LME Aluminum Futures^ | | | January 3, 2014 | | | | (45,998) | | | | (43,869) | | | | 2,129 | |
| 1 | | J.P. Morgan | | LME Aluminum Futures^ | | | January 28, 2014 | | | | (47,423) | | | | (44,223) | | | | 3,200 | |
| 1 | | J.P. Morgan | | LME Aluminum Futures^ | | | January 29, 2014 | | | | (47,448) | | | | (44,236) | | | | 3,212 | |
| 1 | | J.P. Morgan | | LME Aluminum Futures^ | | | January 31, 2014 | | | | (46,998) | | | | (44,264) | | | | 2,734 | |
| 2 | | J.P. Morgan | | LME Aluminum Futures^ | | | February 5, 2014 | | | | (91,008) | | | | (88,665) | | | | 2,343 | |
| 1 | | J.P. Morgan | | LME Aluminum Futures^ | | | February 7, 2014 | | | | (45,408) | | | | (44,360) | | | | 1,048 | |
| 1 | | J.P. Morgan | | LME Aluminum Futures^ | | | February 21, 2014 | | | | (44,448) | | | | (44,532) | | | | (84) | |
| 1 | | J.P. Morgan | | LME Aluminum Futures^ | | | March 5, 2014 | | | | (44,500) | | | | (44,687) | | | | (187) | |
| 13 | | J.P. Morgan | | LME Aluminum Futures^ | | | March 17, 2014 | | | | (581,798) | | | | (583,294) | | | | (1,496) | |
| 1 | | J.P. Morgan | | LME Aluminum Futures^ | | | June 16, 2014 | | | | (45,372) | | | | (45,844) | | | | (472) | |
| 1 | | J.P. Morgan | | LME Copper Futures^ | | | January 3, 2014 | | | | (181,998) | | | | (184,394) | | | | (2,396) | |
| 1 | | J.P. Morgan | | LME Copper Futures^ | | | January 10, 2014 | | | | (177,697) | | | | (184,344) | | | | (6,647) | |
| 1 | | J.P. Morgan | | LME Copper Futures^ | | | January 15, 2014 | | | | (181,548) | | | | (184,319) | | | | (2,771) | |
| 1 | | J.P. Morgan | | LME Copper Futures^ | | | January 31, 2014 | | | | (181,123) | | | | (184,201) | | | | (3,078) | |
| 1 | | J.P. Morgan | | LME Copper Futures^ | | | February 7, 2014 | | | | (178,320) | | | | (184,226) | | | | (5,906) | |
| 1 | | J.P. Morgan | | LME Copper Futures^ | | | February 26, 2014 | | | | (177,023) | | | | (184,156) | | | | (7,133) | |
| 7 | | J.P. Morgan | | LME Copper Futures^ | | | March 17, 2014 | | | | (1,243,717) | | | | (1,289,007) | | | | (45,290) | |
| 1 | | J.P. Morgan | | LME Copper Futures^ | | | June 16, 2014 | | | | (179,498) | | | | (183,450) | | | | (3,952) | |
| 1 | | J.P. Morgan | | LME Lead Futures^ | | | January 3, 2014 | | | | (52,015) | | | | (54,763) | | | | (2,748) | |
| 1 | | J.P. Morgan | | LME Lead Futures^ | | | January 10, 2014 | | | | (52,123) | | | | (54,872) | | | | (2,749) | |
| 3 | | J.P. Morgan | | LME Lead Futures^ | | | March 17, 2014 | | | | (156,244) | | | | (166,425) | | | | (10,181) | |
| 1 | | J.P. Morgan | | LME Nickel Futures^ | | | March 17, 2014 | | | | (80,908) | | | | (83,340) | | | | (2,432) | |
| 1 | | J.P. Morgan | | LME Zinc Futures^ | | | March 12, 2014 | | | | (48,998) | | | | (51,403) | | | | (2,405) | |
| 7 | | J.P. Morgan | | LME Zinc Futures^ | | | March 17, 2014 | | | | (331,385) | | | | (360,150) | | | | (28,765) | |
| | | | | | | | | | | | | | | | | | | | |
| | | | | | | | | | | (4,262,998) | | | | (4,377,024) | | | | (114,026) | |
| | | | | | | | | | | | | | | | | | | | |
| | | | | | | | | | | $40,475,697 | | | | $40,885,755 | | | | $410,058 | |
| | | | | | | | | | | | | | | | | | | | |
Cash held as collateral at Barclays Capital, J.P. Morgan and Goldman Sachs for futures contracts was $275,467, $593,712 and $315,840, respectively at December 31, 2013.
| ^ | Represents positions held in the respective Subsidiary (Note 2). |
| | | | |
| | The accompanying notes are an integral part of these financial statements. | | (Continued) |
| | | | | | | | | | | | | | | | |
| 138 | | AQR Funds | | | | | | Annual Report | | | | | | December 2013 | | |
| | | | | | | | | | |
| | | | |
| Consolidated Schedule of Investments | | | December 31, 2013 | |
| | |
| AQR RISK PARITY II HV FUND | | |
Forward foreign currency exchange contracts outstanding as of December 31, 2013:
Over the Counter
| | | | | | | | | | | | | | | | | | | | |
PURCHASE
CONTRACTS | | COUNTERPARTY | | CURRENCY | | CURRENCY
AMOUNT
PURCHASED | | | VALUE AT
SETTLEMENT
DATE | | | VALUE AT
DECEMBER 31,
2013 | | | UNREALIZED
APPRECIATION
(DEPRECIATION) | |
Swiss Franc,
Expiring 03/19/14 | | Credit Suisse International | | CHF | | | 11,500 | | | | $12,741 | | | | $12,900 | | | | $159 | |
Swiss Franc,
Expiring 03/19/14 | | The Royal Bank of Scotland | | CHF | | | 11,500 | | | | 12,741 | | | | 12,900 | | | | 159 | |
Euro,
Expiring 03/19/14 | | The Royal Bank of Scotland | | EUR | | | 235,625 | | | | 321,739 | | | | 324,142 | | | | 2,403 | |
British Pound,
Expiring 03/19/14 | | The Royal Bank of Scotland | | GBP | | | 147,389 | | | | 240,619 | | | | 243,940 | | | | 3,321 | |
Hong Kong Dollar,
Expiring 03/19/14 | | The Royal Bank of Scotland | | HKD | | | 377,000 | | | | 48,640 | | | | 48,622 | | | | (18) | |
| | | | | | | | | | | | | | | | | | | | |
| | | | | | | | | | | $636,480 | | | | $642,504 | | | | $6,024 | |
| | | | | | | | | | | | | | | | | | | | |
| | | | | | | | | | | | | | | | | | | | |
SALES
CONTRACTS | | COUNTERPARTY | | CURRENCY | | CURRENCY
AMOUNT
SOLD | | | VALUE AT
SETTLEMENT
DATE | | | VALUE AT
DECEMBER 31,
2013 | | | UNREALIZED
APPRECIATION
(DEPRECIATION) | |
Swiss Franc,
Expiring 03/19/14 | | The Royal Bank of Scotland | | CHF | | | (11,000) | | | | $(12,350) | | | | $(12,339) | | | | $11 | |
Euro,
Expiring 03/19/14 | | Credit Suisse International | | EUR | | | (1,710,862) | | | | (2,344,352) | | | | (2,353,582) | | | | (9,230) | |
Euro,
Expiring 03/19/14 | | The Royal Bank of Scotland | | EUR | | | (1,719,861) | | | | (2,356,665) | | | | (2,365,961) | | | | (9,296) | |
British Pound,
Expiring 03/19/14 | | Credit Suisse International | | GBP | | | (554,150) | | | | (907,135) | | | | (917,160) | | | | (10,025) | |
British Pound,
Expiring 03/19/14 | | The Royal Bank of Scotland | | GBP | | | (554,149) | | | | (907,132) | | | | (917,158) | | | | (10,026) | |
Hong Kong Dollar,
Expiring 03/19/14 | | Credit Suisse International | | HKD | | | (57,500) | | | | (7,418) | | | | (7,416) | | | | 2 | |
Hong Kong Dollar,
Expiring 03/19/14 | | The Royal Bank of Scotland | | HKD | | | (315,500) | | | | (40,692) | | | | (40,691) | | | | 1 | |
Japanese Yen,
Expiring 03/19/14 | | Credit Suisse International | | JPY | | | (6,000) | | | | (59) | | | | (57) | | | | 2 | |
Japanese Yen,
Expiring 03/19/14 | | The Royal Bank of Scotland | | JPY | | | (5,999) | | | | (59) | | | | (57) | | | | 2 | |
Russian Ruble,
Expiring 03/19/14* | | Credit Suisse International | | RUB | | | (7,315,000) | | | | (219,723) | | | | (219,672) | | | | 51 | |
Russian Ruble,
Expiring 03/19/14* | | The Royal Bank of Scotland | | RUB | | | (7,315,000) | | | | (219,725) | | | | (219,672) | | | | 53 | |
| | | | | | | | | | | | | | | | | | | | |
| | | | | | | | | | | (7,015,310) | | | | (7,053,765) | | | | (38,455) | |
| | | | | | | | | | | | | | | | | | | | |
| | | | | | | | | | | $(6,378,830) | | | | $(6,411,261) | | | | $(32,431) | |
| | | | | | | | | | | | | | | | | | | | |
Money Market Fund is pledged as collateral to The Royal Bank of Scotland for forward foreign currency exchange contracts in the amount of $20,001 at December 31, 2013.
| * | Non deliverable forward. See Note 3 in the Notes to Financial Statements. |
BRL - Brazilian Real
CHF - Swiss Franc
EUR - Euro
GBP - British Pound
HKD - Hong Kong Dollar
JPY - Japanese Yen
RUB - Russian Ruble
USD - United States Dollar
| | | | |
| | The accompanying notes are an integral part of these financial statements. | | |
| | | | | | | | | | | | | | | | |
| | AQR Funds | | | | | | Annual Report | | | | | | December 2013 | | 139 |
| | | | | | | | | | |
| | | | |
| Consolidated Schedule of Investments | | | December 31, 2013 | |
| | |
| AQR MULTI-STRATEGY ALTERNATIVE FUND | | |
| | | | | | | | |
| | | SHARES | | | VALUE
(Note 3) | |
| LONG INVESTMENTS - 125.6% | | | | | | | | |
| COMMON STOCKS - 52.4% | | | | | | | | |
| | |
| Belgium - 0.3% | | | | | | | | |
| Belgacom SA | | | 31,615 | | | $ | 935,560 | |
| Colruyt SA | | | 1,437 | | | | 80,290 | |
| KBC Groep NV | | | 3,083 | | | | 175,286 | |
| Solvay SA | | | 16,418 | | | | 2,598,465 | |
| UCB SA | | | 2,898 | | | | 215,906 | |
| Umicore SA | | | 4,597 | | | | 214,794 | |
| | | | | | | | |
| | | | | | | 4,220,301 | |
| | | | | | | | |
| Brazil - 1.3% | | | | | | | | |
| AMBEV SA ADR (1)(a) | | | 181,000 | | | | 1,330,350 | |
| Banco Bradesco SA ADR (1)(a) | | | 94,660 | | | | 1,186,090 | |
| Banco do Brasil SA (1) | | | 138,900 | | | | 1,436,541 | |
| BR Malls Participacoes SA (1) | | | 30,100 | | | | 217,529 | |
| Braskem SA ADR (1)†(a) | | | 19,500 | | | | 348,075 | |
| Cia Brasileira de Distribuicao Grupo Pao de Acucar ADR (1)(a) | | | 44,800 | | | | 2,001,216 | |
| Cia Energetica de Minas Gerais ADR (1)(a) | | | 82,635 | | | | 643,727 | |
| Cielo SA (1) | | | 96 | | | | 2,671 | |
| Fibria Celulose SA ADR (1)†(a) | | | 32,400 | | | | 378,432 | |
| Itau Unibanco Holding SA ADR (1)(a) | | | 114,640 | | | | 1,555,665 | |
| JBS SA (1) | | | 573,993 | | | | 2,133,694 | |
| Kroton Educacional SA (1) | | | 39,900 | | | | 663,971 | |
| Multiplan Empreendimentos Imobiliarios SA (1) | | | 5,700 | | | | 120,560 | |
| Petroleo Brasileiro SA ADR (1)(a) | | | 142,100 | | | | 2,087,449 | |
| Porto Seguro SA (1) | | | 80,000 | | | | 1,008,795 | |
| Telefonica Brasil SA ADR (1)(a) | | | 50,500 | | | | 970,610 | |
| Tim Participacoes SA ADR (1)(a) | | | 81,500 | | | | 2,138,560 | |
| Vale SA ADR (1)(a) | | | 99,000 | | | | 1,386,990 | |
| | | | | | | | |
| | | | | | | 19,610,925 | |
| | | | | | | | |
| Chile - 0.1% | | | | | | | | |
| Banco Santander Chile ADR (1)(a) | | | 36 | | | | 848 | |
| Enersis SA ADR (1)(a) | | | 27,300 | | | | 409,227 | |
| ENTEL Chile SA (1) | | | 49,936 | | | | 677,655 | |
| | | | | | | | |
| | | | | | | 1,087,730 | |
| | | | | | | | |
| China - 1.5% | | | | | | | | |
| Agricultural Bank of China Ltd., H Shares | | | 1,516,000 | | | | 747,834 | |
| ANTA Sports Products Ltd. | | | 108,000 | | | | 134,003 | |
| Bank of China Ltd., H Shares | | | 5,054,000 | | | | 2,333,046 | |
| Bank of Communications Co., Ltd., H Shares | | | 596,000 | | | | 421,765 | |
| China BlueChemical Ltd., H Shares | | | 542,000 | | | | 339,574 | |
| China CITIC Bank Corp. Ltd., H Shares | | | 1,033,000 | | | | 562,483 | |
| China Construction Bank Corp., H Shares | | | 4,752,000 | | | | 3,597,795 | |
| China Mengniu Dairy Co., Ltd. | | | 471,000 | | | | 2,240,105 | |
| China Merchants Bank Co., Ltd., H Shares | | | 151,500 | | | | 323,992 | |
| China Oilfield Services Ltd., H Shares | | | 184,000 | | | | 573,147 | |
| China Petroleum & Chemical Corp. ADR (1)(a) | | | 5,720 | | | | 470,012 | |
| | | | | | | | |
| | | SHARES | | | VALUE
(Note 3) | |
| China - 1.5% (continued) | | | | | | | | |
| China Railway Construction Corp. Ltd., H Shares | | | 389,000 | | | $ | 388,341 | |
| China Railway Group Ltd., H Shares | | | 1,314,000 | | | | 680,345 | |
| China Telecom Corp. Ltd., H Shares | | | 678,000 | | | | 342,535 | |
| China Zhongwang Holdings Ltd. † | | | 186 | | | | 58 | |
| Chongqing Rural Commercial Bank, H Shares | | | 598,000 | | | | 290,955 | |
| CNOOC Ltd. ADR (1)(a) | | | 6,800 | | | | 1,276,088 | |
| Country Garden Holdings Co., Ltd. | | | 329,000 | | | | 199,439 | |
| Dongfeng Motor Group Co., Ltd., H Shares | | | 36,000 | | | | 56,537 | |
| Evergrande Real Estate Group Ltd. | | | 295,000 | | | | 113,014 | |
| Industrial & Commercial Bank of China Ltd., H Shares | | | 4,116,000 | | | | 2,791,103 | |
| Longfor Properties Co., Ltd. | | | 73,000 | | | | 102,294 | |
| PetroChina Co., Ltd. ADR (1)(a) | | | 5,800 | | | | 636,492 | |
| Sihuan Pharmaceutical Holdings Group Ltd. | | | 803,000 | | | | 734,862 | |
| Sino-Ocean Land Holdings Ltd. | | | 136,500 | | | | 89,827 | |
| Sinopec Shanghai Petrochemical Co., Ltd., H Shares | | | 2,637,000 | | | | 760,681 | |
| SOHO China Ltd. | | | 39,000 | | | | 33,670 | |
| Tencent Holdings Ltd. | | | 28,400 | | | | 1,818,380 | |
| Zhejiang Expressway Co., Ltd., H Shares | | | 514,000 | | | | 486,638 | |
| | | | | | | | |
| | | | | | | 22,545,015 | |
| | | | | | | | |
| Denmark - 1.0% | | | | | | | | |
| AP Moeller - Maersk A/S, Class B | | | 179 | | | | 1,937,130 | |
| Carlsberg A/S, Class B | | | 11,738 | | | | 1,298,854 | |
| Chr Hansen Holding A/S | | | 7,324 | | | | 290,327 | |
| Coloplast A/S, Class B | | | 26,961 | | | | 1,787,395 | |
| Danske Bank A/S † | | | 5,625 | | | | 129,216 | |
| DSV A/S | | | 36,888 | | | | 1,211,126 | |
| GN Store Nord A/S | | | 109,046 | | | | 2,679,912 | |
| Jyske Bank A/S † | | | 6,208 | | | | 335,663 | |
| Novo Nordisk A/S, Class B | | | 7,368 | | | | 1,350,961 | |
| TDC A/S | | | 64,157 | | | | 622,619 | |
| Vestas Wind Systems A/S † | | | 99,493 | | | | 2,946,133 | |
| | | | | | | | |
| | | | | | | 14,589,336 | |
| | | | | | | | |
| Finland - 0.8% | | | | | | | | |
| Fortum OYJ | | | 49,110 | | | | 1,122,490 | |
| Kesko OYJ, B Shares | | | 5,068 | | | | 186,960 | |
| Kone OYJ, Class B | | | 18,188 | | | | 820,254 | |
| Metso OYJ | | | 52,769 | | | | 2,256,509 | |
| Neste Oil OYJ | | | 108,743 | | | | 2,150,553 | |
| Nokia OYJ † | | | 475,615 | | | | 3,842,971 | |
| Sampo, A Shares | | | 757 | | | | 37,208 | |
| UPM-Kymmene OYJ | | | 27,149 | | | | 460,450 | |
| Wartsila OYJ | | | 11,444 | | | | 564,202 | |
| | | | | | | | |
| | | | | | | 11,441,597 | |
| | | | | | | | |
| Germany - 5.5% | | | | | | | | |
| Adidas AG | | | 5,501 | | | | 701,476 | |
| Aurubis AG | | | 71,886 | | | | 4,386,640 | |
| Bayer AG | | | 42,393 | | | | 5,952,429 | |
| Beiersdorf AG | | | 12,395 | | | | 1,256,663 | |
| | | | |
| | The accompanying notes are an integral part of these financial statements. | | (Continued) |
| | | | | | | | | | | | | | | | |
| 140 | | AQR Funds | | | | | | Annual Report | | | | | | December 2013 | | |
| | | | | | | | | | |
| | | | |
| Consolidated Schedule of Investments | | | December 31, 2013 | |
| | |
| AQR MULTI-STRATEGY ALTERNATIVE FUND | | |
| | | | | | | | |
| | | SHARES | | | VALUE
(Note 3) | |
| Germany - 5.5% (continued) | | | | | | | | |
| Bilfinger SE | | | 29,619 | | | $ | 3,327,053 | |
| Brenntag AG | | | 15,525 | | | | 2,881,377 | |
| Continental AG | | | 12,354 | | | | 2,714,044 | |
| Deutsche Lufthansa AG † | | | 241,422 | | | | 5,117,317 | |
| Deutsche Post AG | | | 233,242 | | | | 8,519,166 | |
| Deutsche Telekom AG | | | 235,097 | | | | 4,050,768 | |
| E.ON SE | | | 283,704 | | | | 5,245,094 | |
| Freenet AG † | | | 130,357 | | | | 3,916,705 | |
| GEA Group AG | | | 54,387 | | | | 2,593,471 | |
| Hannover Rueck SE | | | 6,699 | | | | 575,918 | |
| HeidelbergCement AG | | | 92,508 | | | | 7,024,618 | |
| Hochtief AG | | | 13,197 | | | | 1,129,427 | |
| Kloeckner & Co. SE † | | | 15,600 | | | | 214,038 | |
| Leoni AG | | | 53,927 | | | | 4,040,284 | |
| Linde AG | | | 928 | | | | 194,310 | |
| Merck KGaA | | | 53,832 | | | | 9,658,967 | |
| MTU Aero Engines AG | | | 2,005 | | | | 197,033 | |
| Muenchener Rueckversicherungs AG | | | 8,673 | | | | 1,913,004 | |
| ProSiebenSat.1 Media AG | | | 80,899 | | | | 4,017,114 | |
| Rheinmetall AG | | | 23,068 | | | | 1,423,170 | |
| Rhoen Klinikum AG | | | 34,604 | | | | 1,011,511 | |
| Salzgitter AG | | | 3,001 | | | | 127,978 | |
| Suedzucker AG | | | 5,411 | | | | 146,178 | |
| ThyssenKrupp AG † | | | 14,948 | | | | 364,508 | |
| TUI AG † | | | 91,340 | | | | 1,506,895 | |
| United Internet AG | | | 6,456 | | | | 275,220 | |
| | | | | | | | |
| | | | | | | 84,482,376 | |
| | | | | | | | |
| Hong Kong - 0.8% | | | | | | | | |
| China Agri-Industries Holdings Ltd. | | | 139,000 | | | | 69,472 | |
| China Gas Holdings Ltd. | | | 524,000 | | | | 771,394 | |
| China Mobile Ltd. ADR (1)(a) | | | 59,100 | | | | 3,090,339 | |
| China Overseas Land & Investment Ltd. | | | 296,000 | | | | 835,504 | |
| China Resources Land Ltd. | | | 146,000 | | | | 363,241 | |
| China Resources Power Holdings Co., Ltd. | | | 540,000 | | | | 1,281,667 | |
| COSCO Pacific Ltd. | | | 50,000 | | | | 68,820 | |
| Geely Automobile Holdings Ltd. | | | 2,700,000 | | | | 1,310,960 | |
| GOME Electrical Appliances Holding Ltd. | | | 11,474,000 | | | | 2,121,608 | |
| Shimao Property Holdings Ltd. | | | 38,000 | | | | 87,598 | |
| Shougang Fushan Resources Group Ltd. | | | 3,054,000 | | | | 1,073,762 | |
| Sino Biopharmaceutical Ltd. | | | 2,108,000 | | | | 1,675,709 | |
| | | | | | | | |
| | | | | | | 12,750,074 | |
| | | | | | | | |
| India - 0.4% | | | | | | | | |
| HDFC Bank Ltd. ADR (1)(a) | | | 1,900 | | | | 65,436 | |
| Infosys Ltd. ADR (1)(a) | | | 42,200 | | | | 2,388,520 | |
| Tata Motors Ltd. ADR (1)(a) | | | 65,500 | | | | 2,017,400 | |
| Wipro Ltd. ADR (1)(a) | | | 157,457 | | | | 1,982,383 | |
| | | | | | | | |
| | | | | | | 6,453,739 | |
| | | | | | | | |
| Indonesia - 0.2% | | | | | | | | |
| Astra Agro Lestari Tbk PT | | | 11,000 | | | | 22,709 | |
| Bank Negara Indonesia Persero Tbk PT | | | 740,500 | | | | 241,199 | |
| Bank Rakyat Indonesia Persero Tbk PT | | | 349,500 | | | | 208,903 | |
| Bumi Resources Tbk PT † | | | 1,392,500 | | | | 34,384 | |
| | | | | | | | |
| | | SHARES | | | VALUE
(Note 3) | |
| Indonesia - 0.2% (continued) | | | | | | | | |
| Global Mediacom Tbk PT | | | 1,041,000 | | | $ | 162,693 | |
| Indocement Tunggal Prakarsa Tbk PT | | | 153,500 | | | | 252,854 | |
| Indofood Sukses Makmur Tbk PT | | | 1,634,000 | | | | 887,985 | |
| Perusahaan Gas Negara Persero Tbk PT | | | 2,307,000 | | | | 850,390 | |
| Telekomunikasi Indonesia Persero Tbk PT ADR (1)(a) | | | 16,300 | | | | 584,355 | |
| Unilever Indonesia Tbk PT | | | 231,500 | | | | 495,951 | |
| | | | | | | | |
| | | | | | | 3,741,423 | |
| | | | | | | | |
| Italy - 2.1% | |
| Autogrill SpA † | | | 45,965 | | | | 388,190 | |
| Banca Monte dei Paschi di Siena SpA † | | | 6,681,154 | | | | 1,608,021 | |
| Banca Popolare dell’Emilia Romagna SC † | | | 290,230 | | | | 2,769,281 | |
| Banco Popolare SC † | | | 325,269 | | | | 622,928 | |
| Buzzi Unicem SpA | | | 38,162 | | | | 686,876 | |
| Davide Campari-Milano SpA | | | 7,836 | | | | 65,428 | |
| Enel Green Power SpA | | | 343,895 | | | | 865,180 | |
| Enel SpA | | | 1,915,603 | | | | 8,358,539 | |
| Eni SpA | | | 176,562 | | | | 4,266,385 | |
| Gtech Spa | | | 19,782 | | | | 602,889 | |
| Intesa Sanpaolo SpA | | | 342,589 | | | | 842,667 | |
| Mediolanum SpA | | | 188,983 | | | | 1,637,628 | |
| Prysmian SpA | | | 169,173 | | | | 4,355,709 | |
| Snam SpA | | | 56,817 | | | | 317,571 | |
| Telecom Italia SpA | | | 2,389,134 | | | | 2,382,341 | |
| Terna Rete Elettrica Nazionale SpA | | | 163,802 | | | | 818,041 | |
| UniCredit SpA | | | 172,598 | | | | 1,273,195 | |
| Unione di Banche Italiane SCPA | | | 71,639 | | | | 485,661 | |
| | | | | | | | |
| | | | | | | 32,346,530 | |
| | | | | | | | |
| Japan - 21.4% | | | | | | | | |
| Aeon Co., Ltd. | | | 37,600 | | | | 509,731 | |
| Aisin Seiki Co., Ltd. | | | 36,800 | | | | 1,496,143 | |
| Ajinomoto Co., Inc. | | | 100,000 | | | | 1,447,669 | |
| Alfresa Holdings Corp. | | | 5,100 | | | | 253,137 | |
| ANA Holdings, Inc. | | | 457,000 | | | | 913,026 | |
| Asahi Kasei Corp. | | | 363,000 | | | | 2,847,305 | |
| Astellas Pharma, Inc. | | | 87,000 | | | | 5,157,955 | |
| Ateam, Inc. | | | 1,000 | | | | 71,759 | |
| Azbil Corp. | | | 51,400 | | | | 1,198,028 | |
| Bank of Yokohama Ltd./The | | | 109,000 | | | | 608,136 | |
| Benesse Holdings, Inc. | | | 11,200 | | | | 449,952 | |
| Bridgestone Corp. | | | 98,300 | | | | 3,724,282 | |
| Brother Industries Ltd. | | | 49,600 | | | | 678,454 | |
| Calbee, Inc. | | | 14,800 | | | | 359,422 | |
| Calsonic Kansei Corp. | | | 235,000 | | | | 1,214,321 | |
| Casio Computer Co., Ltd. | | | 41,200 | | | | 504,860 | |
| Central Japan Railway Co. | | | 42,200 | | | | 4,973,360 | |
| Chiba Bank Ltd./The | | | 265,000 | | | | 1,788,394 | |
| Chiyoda Corp. | | | 81,000 | | | | 1,175,838 | |
| Chubu Electric Power Co., Inc. | | | 288,600 | | | | 3,730,970 | |
| Chugai Pharmaceutical Co., Ltd. | | | 119,800 | | | | 2,651,781 | |
| Citizen Holdings Co., Ltd. | | | 248,400 | | | | 2,095,761 | |
| COMSYS Holdings Corp. | | | 201,900 | | | | 3,174,411 | |
| Dai Nippon Printing Co., Ltd. | | | 327,000 | | | | 3,473,448 | |
| Daicel Corp. | | | 195,000 | | | | 1,589,214 | |
| Daihatsu Motor Co., Ltd. | | | 102,600 | | | | 1,740,379 | |
| | | | |
| | The accompanying notes are an integral part of these financial statements. | | (Continued) |
| | | | | | | | | | | | | | | | |
| | AQR Funds | | | | | | Annual Report | | | | | | December 2013 | | 141 |
| | | | | | | | | | |
| | | | |
| Consolidated Schedule of Investments | | | December 31, 2013 | |
| | |
| AQR MULTI-STRATEGY ALTERNATIVE FUND | | |
| | | | | | | | |
| | | SHARES | | | VALUE
(Note 3) | |
| Japan - 21.4% (continued) | | | | | | | | |
| Daiichi Sankyo Co., Ltd. | | | 119,100 | | | $ | 2,177,739 | |
| Daiwa House Industry Co., Ltd. | | | 8,000 | | | | 155,002 | |
| Denki Kagaku Kogyo KK | | | 93,852 | | | | 387,917 | |
| Denso Corp. | | | 102,000 | | | | 5,388,527 | |
| Dentsu, Inc. | | | 37,400 | | | | 1,529,609 | |
| DIC Corp. | | | 683,000 | | | | 2,082,217 | |
| Dowa Holdings Co., Ltd. | | | 61,000 | | | | 596,822 | |
| East Japan Railway Co. | | | 36,600 | | | | 2,915,476 | |
| Ebara Corp. | | | 548,000 | | | | 3,527,711 | |
| FamilyMart Co., Ltd. | | | 6,500 | | | | 296,962 | |
| Fuji Electric Co., Ltd. | | | 843,000 | | | | 3,949,816 | |
| Fuji Heavy Industries Ltd. | | | 457,000 | | | | 13,133,704 | |
| Fuji Media Holdings, Inc. | | | 207,800 | | | | 4,255,524 | |
| FUJIFILM Holdings Corp. | | | 31,900 | | | | 905,483 | |
| Fujikura Ltd. | | | 218,000 | | | | 1,023,317 | |
| Fujitsu Ltd. † | | | 939,000 | | | | 4,866,535 | |
| Fukuoka Financial Group, Inc. | | | 671,000 | | | | 2,945,321 | |
| Gree, Inc. | | | 50,400 | | | | 496,902 | |
| GungHo Online Entertainment, Inc. † | | | 283,900 | | | | 2,044,918 | |
| Hamamatsu Photonics KK | | | 1,200 | | | | 48,018 | |
| Hankyu Hanshin Holdings, Inc. | | | 37,000 | | | | 199,928 | |
| Hino Motors Ltd. | | | 365,000 | | | | 5,749,753 | |
| Hirose Electric Co., Ltd. | | | 8,400 | | | | 1,197,431 | |
| Hitachi Chemical Co., Ltd. | | | 12,400 | | | | 197,759 | |
| Hitachi High-Technologies Corp. | | | 73,700 | | | | 1,855,542 | |
| Hokuetsu Kishu Paper Co., Ltd. | | | 163,000 | | | | 768,335 | |
| Hoya Corp. | | | 93,900 | | | | 2,611,537 | |
| Idemitsu Kosan Co., Ltd. | | | 4,000 | | | | 91,063 | |
| IHI Corp. | | | 785,000 | | | | 3,394,843 | |
| Isetan Mitsukoshi Holdings Ltd. | | | 38,600 | | | | 549,497 | |
| ITOCHU Corp. | | | 8,100 | | | | 100,137 | |
| J Front Retailing Co., Ltd. | | | 488,000 | | | | 3,702,102 | |
| Japan Airlines Co., Ltd. | | | 28,700 | | | | 1,415,808 | |
| Japan Petroleum Exploration Co. | | | 2,700 | | | | 102,402 | |
| Japan Steel Works Ltd./The | | | 28,000 | | | | 156,899 | |
| Japan Tobacco, Inc. | | | 130,400 | | | | 4,243,054 | |
| JGC Corp. | | | 227,000 | | | | 8,908,350 | |
| Jin Co., Ltd. | | | 3,400 | | | | 143,842 | |
| Joyo Bank Ltd./The | | | 35,000 | | | | 178,961 | |
| JSR Corp. | | | 44,400 | | | | 860,601 | |
| JTEKT Corp. | | | 252,200 | | | | 4,303,268 | |
| Kajima Corp. | | | 826,000 | | | | 3,106,592 | |
| Kaken Pharmaceutical Co., Ltd. | | | 173 | | | | 2,597 | |
| Kandenko Co., Ltd. | | | 292 | | | | 1,647 | |
| Kaneka Corp. | | | 28,000 | | | | 183,852 | |
| Kansai Electric Power Co., Inc./The † | | | 210,200 | | | | 2,419,260 | |
| Kao Corp. | | | 48,200 | | | | 1,517,424 | |
| KDDI Corp. | | | 49,100 | | | | 3,025,310 | |
| Keio Corp. | | | 71,000 | | | | 473,141 | |
| Keisei Electric Railway Co., Ltd. | | | 114,000 | | | | 1,048,956 | |
| Keyence Corp. | | | 3,700 | | | | 1,584,286 | |
| Koito Manufacturing Co., Ltd. | | | 20,000 | | | | 382,153 | |
| Konica Minolta, Inc. | | | 391,500 | | | | 3,912,375 | |
| KYB Co., Ltd. | | | 196,000 | | | | 1,032,268 | |
| Kyocera Corp. | | | 29,300 | | | | 1,464,753 | |
| Kyowa Hakko Kirin Co., Ltd. | | | 129,000 | | | | 1,423,521 | |
| Lintec Corp. | | | 18,800 | | | | 348,548 | |
| Mabuchi Motor Co., Ltd. | | | 7,000 | | | | 416,548 | |
| | | | | | | | |
| | | SHARES | | | VALUE
(Note 3) | |
| Japan - 21.4% (continued) | | | | | | | | |
| Marubeni Corp. | | | 28,000 | | | $ | 201,574 | |
| Marui Group Co., Ltd. | | | 44,300 | | | | 450,590 | |
| Mazda Motor Corp. † | | | 110,000 | | | | 570,027 | |
| Medipal Holdings Corp. | | | 1,700 | | | | 22,443 | |
| Miraca Holdings, Inc. | | | 39,800 | | | | 1,877,617 | |
| Mitsubishi Chemical Holdings Corp. | | | 147,500 | | | | 682,591 | |
| Mitsubishi Electric Corp. | | | 320,000 | | | | 4,023,827 | |
| Mitsubishi Heavy Industries, Ltd. | | | 1,285,000 | | | | 7,958,740 | |
| Mitsubishi Materials Corp. | | | 284,000 | | | | 1,049,791 | |
| Mitsubishi Tanabe Pharma Corp. | | | 15,800 | | | | 220,363 | |
| Mitsubishi UFJ Financial Group, Inc. | | | 679,000 | | | | 4,508,150 | |
| Mitsubishi UFJ Lease & Finance Co., Ltd. | | | 165,100 | | | | 1,015,009 | |
| Mitsui & Co., Ltd. | | | 69,700 | | | | 971,698 | |
| Mitsui Engineering & Shipbuilding Co., Ltd. | | | 884,000 | | | | 1,825,845 | |
| Mitsui Mining & Smelting Co., Ltd. | | | 356,000 | | | | 1,094,702 | |
| Mizuho Financial Group, Inc. | | | 405,600 | | | | 880,570 | |
| Modec, Inc. | | | 800 | | | | 22,987 | |
| MS&AD Insurance Group Holdings | | | 30,600 | | | | 822,497 | |
| Namco Bandai Holdings, Inc. | | | 219,000 | | | | 4,862,344 | |
| NET One Systems Co., Ltd. | | | 225,900 | | | | 1,484,423 | |
| NGK Spark Plug Co., Ltd. | | | 6,000 | | | | 142,204 | |
| NHK Spring Co., Ltd. | | | 167,200 | | | | 1,889,129 | |
| Nintendo Co., Ltd. | | | 6,900 | | | | 923,590 | |
| Nippon Express Co., Ltd. | | | 208,000 | | | | 1,006,848 | |
| Nippon Kayaku Co., Ltd. | | | 117,000 | | | | 1,663,841 | |
| Nippon Meat Packers, Inc. | | | 30,000 | | | | 515,628 | |
| Nippon Shokubai Co., Ltd. | | | 24,000 | | | | 265,157 | |
| Nippon Television Holdings, Inc. | | | 99,500 | | | | 1,796,496 | |
| Nissan Chemical Industries Ltd. | | | 27,000 | | | | 429,068 | |
| Nisshin Seifun Group, Inc. | | | 48,950 | | | | 506,253 | |
| Nisshinbo Holdings, Inc. | | | 69,000 | | | | 664,420 | |
| NKSJ Holdings, Inc. | | | 2,500 | | | | 69,584 | |
| North Pacific Bank Ltd. | | | 34 | | | | 138 | |
| NSK Ltd. | | | 170,000 | | | | 2,118,599 | |
| NTT DOCOMO, Inc. | | | 77,500 | | | | 1,276,137 | |
| Obayashi Corp. | | | 155,000 | | | | 884,085 | |
| Odakyu Electric Railway Co., Ltd. | | | 29,000 | | | | 262,271 | |
| Okinawa Electric Power Co., Inc./The | | | 2 | | | | 67 | |
| OKUMA Corp. | | | 28,000 | | | | 309,225 | |
| Omron Corp. | | | 87,400 | | | | 3,862,493 | |
| Osaka Gas Co., Ltd. | | | 886,000 | | | | 3,479,873 | |
| Otsuka Corp. | | | 5,900 | | | | 753,750 | |
| Otsuka Holdings Co., Ltd. | | | 78,900 | | | | 2,278,153 | |
| Pacific Metals Co., Ltd. | | | 83,000 | | | | 303,254 | |
| Panasonic Corp. | | | 578,000 | | | | 6,737,868 | |
| Park24 Co., Ltd. | | | 20,400 | | | | 384,722 | |
| Rengo Co., Ltd. | | | 17,000 | | | | 102,319 | |
| Resona Holdings, Inc. | | | 1,043,700 | | | | 5,325,446 | |
| Rohm Co., Ltd. | | | 50,800 | | | | 2,477,875 | |
| Ryohin Keikaku Co., Ltd. | | | 24,400 | | | | 2,639,165 | |
| Sankyo Co., Ltd. | | | 13,600 | | | | 627,247 | |
| Santen Pharmaceutical Co., Ltd. | | | 17,200 | | | | 801,387 | |
| Secom Co., Ltd. | | | 41,100 | | | | 2,479,768 | |
| Seiko Epson Corp. | | | 74,800 | | | | 2,013,955 | |
| Sekisui Chemical Co., Ltd. | | | 314,000 | | | | 3,853,255 | |
| | | | |
| | The accompanying notes are an integral part of these financial statements. | | (Continued) |
| | | | | | | | | | | | | | | | |
| 142 | | AQR Funds | | | | | | Annual Report | | | | | | December 2013 | | |
| | | | | | | | | | |
| | | | |
| Consolidated Schedule of Investments | | | December 31, 2013 | |
| | |
| AQR MULTI-STRATEGY ALTERNATIVE FUND | | |
| | | | | | | | |
| | | SHARES | | | VALUE
(Note 3) | |
| Japan - 21.4% (continued) | | | | | | | | |
| Seven & I Holdings Co., Ltd. | | | 155,000 | | | $ | 6,171,546 | |
| Shimadzu Corp. | | | 27,000 | | | | 235,064 | |
| Shimamura Co., Ltd. | | | 17,000 | | | | 1,593,522 | |
| Shimizu Corp. | | | 290,000 | | | | 1,465,388 | |
| Shin Nippon Biomedical Laboratories Ltd. † | | | 5,400 | | | | 68,597 | |
| Shin-Etsu Chemical Co., Ltd. | | | 20,300 | | | | 1,187,333 | |
| Shinko Electric Industries Co., Ltd. | | | 40,000 | | | | 332,874 | |
| Shinsei Bank Ltd. | | | 811,000 | | | | 1,985,251 | |
| Shionogi & Co., Ltd. | | | 85,600 | | | | 1,858,348 | |
| Ship Healthcare Holdings, Inc. | | | 800 | | | | 31,065 | |
| Shizuoka Bank Ltd./The | | | 33,000 | | | | 352,485 | |
| Showa Shell Sekiyu KK | | | 34,900 | | | | 354,754 | |
| SoftBank Corp. | | | 28,100 | | | | 2,465,796 | |
| Stanley Electric Co., Ltd. | | | 7,600 | | | | 174,235 | |
| Sumitomo Bakelite Co., Ltd. | | | 140,000 | | | | 503,616 | |
| Sumitomo Corp. | | | 1,900 | | | | 23,879 | |
| Sumitomo Electric Industries Ltd. | | | 76,200 | | | | 1,273,763 | |
| Sumitomo Heavy Industries Ltd. | | | 407,000 | | | | 1,875,400 | |
| Sumitomo Metal Mining Co., Ltd. | | | 81,000 | | | | 1,061,366 | |
| Sumitomo Mitsui Financial Group, Inc. | | | 119,000 | | | | 6,188,403 | |
| Sumitomo Osaka Cement Co., Ltd. | | | 398,000 | | | | 1,530,040 | |
| Suzuki Motor Corp. | | | 133,000 | | | | 3,583,903 | |
| Taisei Corp. | | | 852,000 | | | | 3,877,373 | |
| Takara Holdings, Inc. | | | 24 | | | | 224 | |
| Takashimaya Co., Ltd. | | | 294,000 | | | | 2,933,439 | |
| Teijin Ltd. | | | 40,000 | | | | 89,098 | |
| THK Co., Ltd. | | | 33,800 | | | | 844,174 | |
| Tobu Railway Co., Ltd. | | | 62,000 | | | | 300,634 | |
| Toho Co., Ltd. | | | 200 | | | | 4,400 | |
| Tohoku Electric Power Co., Inc. † | | | 73,000 | | | | 822,358 | |
| Tokyo Electric Power Co., Inc † | | | 119,000 | | | | 586,323 | |
| Tokyo Electron Ltd. | | | 43,091 | | | | 2,374,431 | |
| Tokyo Gas Co., Ltd. | | | 686,000 | | | | 3,381,092 | |
| Tokyo Steel Manufacturing Co., Ltd. † | | | 289,300 | | | | 1,502,141 | |
| Tokyotokeiba Co., Ltd. | | | 7,000 | | | | 28,376 | |
| Tokyu Corp. | | | 133,000 | | | | 861,721 | |
| Toppan Printing Co., Ltd. | | | 251,000 | | | | 2,009,156 | |
| Tosoh Corp. | | | 735,000 | | | | 3,424,499 | |
| TOTO Ltd. | | | 66,000 | | | | 1,046,835 | |
| Toyo Seikan Kaisha Ltd. | | | 168,000 | | | | 3,616,739 | |
| Toyo Suisan Kaisha Ltd. | | | 19,000 | | | | 570,775 | |
| Toyoda Gosei Co., Ltd. | | | 9,800 | | | | 228,297 | |
| Toyota Boshoku Corp. | | | 35,100 | | | | 438,866 | |
| Toyota Motor Corp. | | | 4,000 | | | | 243,900 | |
| Toyota Tsusho Corp. | | | 78,700 | | | | 1,951,673 | |
| Ube Industries Ltd. | | | 355,000 | | | | 760,348 | |
| UNY Group Holdings Co., Ltd. | | | 170,200 | | | | 1,044,093 | |
| Ushio, Inc. | | | 48,500 | | | | 644,656 | |
| USS Co., Ltd. | | | 136,300 | | | | 1,869,558 | |
| West Japan Railway Co. | | | 48,800 | | | | 2,114,429 | |
| Yamaguchi Financial Group, Inc. | | | 56 | | | | 519 | |
| Yamaha Corp. | | | 116,300 | | | | 1,848,991 | |
| Yamato Holdings Co., Ltd. | | | 27,600 | | | | 558,163 | |
| Yamazaki Baking Co., Ltd. | | | 11,000 | | | | 112,840 | |
| Yokohama Rubber Co., Ltd./The | | | 159,000 | | | | 1,563,529 | |
| | | | | | | | |
| | | | | | | 326,988,935 | |
| | | | | | | | |
| | | | | | | | |
| | | SHARES | | | VALUE
(Note 3) | |
| Korea, Republic of - 1.3% | | | | | | | | |
| Daelim Industrial Co., Ltd. † | | | 14,024 | | | $ | 1,252,957 | |
| DGB Financial Group, Inc. † | | | 6,960 | | | | 109,038 | |
| Dongbu Insurance Co., Ltd. | | | 5,516 | | | | 293,899 | |
| Hana Financial Group, Inc. | | | 1,981 | | | | 82,543 | |
| Hanwha Corp. † | | | 590 | | | | 21,952 | |
| Hanwha Life Insurance Co., Ltd. | | | 82,450 | | | | 594,142 | |
| Hyosung Corp. † | | | 19,445 | | | | 1,297,431 | |
| Hyundai Mobis † | | | 4,819 | | | | 1,341,629 | |
| Hyundai Motor Co. † | | | 4,750 | | | | 1,066,217 | |
| Hyundai Wia Corp. † | | | 11,539 | | | | 2,082,409 | |
| KCC Corp. | | | 677 | | | | 301,039 | |
| Kia Motors Corp. † | | | 11,394 | | | | 606,748 | |
| Korea Zinc Co., Ltd. † | | | 1,406 | | | | 424,131 | |
| Korean Air Lines Co., Ltd. † | | | 1 | | | | 30 | |
| KT Corp. ADR (1)(a) | | | 54,800 | | | | 814,876 | |
| LG Chem Ltd. † | | | 1,460 | | | | 415,285 | |
| LG Display Co., Ltd. ADR (1)(a) | | | 92,500 | | | | 1,122,950 | |
| LG Electronics, Inc. † | | | 5,486 | | | | 354,730 | |
| Mirae Asset Securities Co., Ltd. | | | 12,370 | | | | 451,181 | |
| NAVER Corp. † | | | 1,183 | | | | 815,238 | |
| NHN Entertainment Corp. † | | | 1,131 | | | | 103,513 | |
| Samsung Card Co., Ltd. † | | | 12,767 | | | | 452,829 | |
| Shinhan Financial Group Co. Ltd. † | | | 9,780 | | | | 439,072 | |
| SK Holdings Co., Ltd. † | | | 7,811 | | | | 1,416,168 | |
| SK Telecom Co., Ltd. ADR (1)(a) | | | 135,100 | | | | 3,326,162 | |
| Woori Finance Holdings Co., Ltd. † | | | 42,830 | | | | 541,062 | |
| | | | | | | | |
| | | | | | | 19,727,231 | |
| | | | | | | | |
| Luxembourg - 0.1% | |
| APERAM † | | | 63,966 | | | | 1,183,258 | |
| Millicom International Cellular SA SDR | | | 1,326 | | | | 132,130 | |
| | | | | | | | |
| | | | | | | 1,315,388 | |
| | | | | | | | |
| Malaysia - 0.3% | | | | | | | | |
| Alliance Financial Group Bhd | | | 200,700 | | | | 291,919 | |
| Hong Leong Bank Bhd | | | 3,900 | | | | 17,162 | |
| Malayan Banking Bhd | | | 304,600 | | | | 925,740 | |
| MISC Bhd † | | | 74,000 | | | | 128,910 | |
| Petronas Chemicals Group Bhd | | | 52,800 | | | | 111,642 | |
| Tenaga Nasional Bhd | | | 632,900 | | | | 2,200,970 | |
| UMW Holdings Bhd | | | 302,100 | | | | 1,113,784 | |
| | | | | | | | |
| | | | | | | 4,790,127 | |
| | | | | | | | |
| Mexico - 0.7% | | | | | | | | |
| Alfa SAB de CV, Class A (1) | | | 771,300 | | | | 2,163,291 | |
| America Movil SAB de CV, Series L ADR (1)(a) | | | 108,700 | | | | 2,540,319 | |
| Arca Continental SAB de CV (1) | | | 163,200 | | | | 1,020,586 | |
| Cemex SAB de CV ADR (1)†(a) | | | 45,300 | | | | 535,899 | |
| Compartamos SAB de CV (1) | | | 268,400 | | | | 501,997 | |
| Fibra Uno Administracion SA de CV REIT (1) | | | 65,000 | | | | 208,195 | |
| Fomento Economico Mexicano SAB de CV ADR (1)(a) | | | 7,700 | | | | 753,599 | |
| Grupo Bimbo SAB de CV, Series A (1) | | | 9,044 | | | | 27,846 | |
| Grupo Financiero Banorte SAB de CV (1) | | | 158,200 | | | | 1,106,970 | |
| Grupo Mexico SAB de CV, Series B (1) | | | 287,100 | | | | 950,586 | |
| | | | |
| | The accompanying notes are an integral part of these financial statements. | | (Continued) |
| | | | | | | | | | | | | | | | |
| | AQR Funds | | | | | | Annual Report | | | | | | December 2013 | | 143 |
| | | | | | | | | | |
| | | | |
| Consolidated Schedule of Investments | | | December 31, 2013 | |
| | |
| AQR MULTI-STRATEGY ALTERNATIVE FUND | | |
| | | | | | | | |
| | | SHARES | | | VALUE
(Note 3) | |
| Mexico - 0.7% (continued) | | | | | | | | |
| Kimberly-Clark de Mexico SAB de CV, Class A (1) | | | 532,700 | | | $ | 1,512,849 | |
| | | | | | | | |
| | | | | | | 11,322,137 | |
| | | | | | | | |
| Netherlands - 2.1% | | | | | | | | |
| Aegon NV | | | 709,965 | | | | 6,728,005 | |
| Akzo Nobel NV | | | 44,474 | | | | 3,448,781 | |
| Koninklijke Ahold NV | | | 221,010 | | | | 3,971,802 | |
| Koninklijke Boskalis Westminster NV | | | 23,981 | | | | 1,268,442 | |
| Koninklijke DSM NV | | | 22,937 | | | | 1,805,106 | |
| Koninklijke Philips NV | | | 270,704 | | | | 9,967,647 | |
| Nutreco NV | | | 73,141 | | | | 3,636,894 | |
| Royal Dutch Shell PLC, A Shares | | | 19,773 | | | | 705,951 | |
| TNT Express NV | | | 15,408 | | | | 143,317 | |
| Unilever NV CVA | | | 13,928 | | | | 559,979 | |
| | | | | | | | |
| | | | | | | 32,235,924 | |
| | | | | | | | |
| Norway - 1.0% | |
| DNB ASA | | | 253,920 | | | | 4,557,397 | |
| Gjensidige Forsikring ASA | | | 4,562 | | | | 87,252 | |
| Orkla ASA | | | 56,304 | | | | 440,093 | |
| Petroleum Geo-Services ASA | | | 210,160 | | | | 2,482,536 | |
| Statoil ASA | | | 108,879 | | | | 2,647,558 | |
| Telenor ASA | | | 144,687 | | | | 3,457,093 | |
| Yara International ASA | | | 39,058 | | | | 1,684,502 | |
| | | | | | | | |
| | | | | | | 15,356,431 | |
| | | | | | | | |
| Peru - 0.0%(b) | | | | | | | | |
| Cia de Minas Buenaventura SAA ADR (1)(a) | | | 7,400 | | | | 83,028 | |
| Credicorp Ltd. (1)(a) | | | 1,300 | | | | 172,549 | |
| | | | | | | | |
| | | | | | | 255,577 | |
| | | | | | | | |
| Poland - 0.3% | | | | | | | | |
| Bank Zachodni WBK SA | | | 1,906 | | | | 245,034 | |
| Grupa Lotos SA † | | | 34,590 | | | | 406,282 | |
| PGE SA | | | 124,015 | | | | 667,868 | |
| Polskie Gornictwo Naftowe i Gazownictwo SA | | | 373,963 | | | | 634,961 | |
| Powszechny Zaklad Ubezpieczen SA | | | 10,689 | | | | 1,588,365 | |
| Synthos SA | | | 75,589 | | | | 136,626 | |
| Tauron Polska Energia SA | | | 423,744 | | | | 614,111 | |
| | | | | | | | |
| | | | | | | 4,293,247 | |
| | | | | | | | |
| Portugal - 0.1% | | | | | | | | |
| Banco Espirito Santo SA † | | | 218,227 | | | | 311,656 | |
| EDP - Energias de Portugal SA | | | 76,711 | | | | 281,767 | |
| Galp Energia SGPS SA | | | 18,185 | | | | 298,039 | |
| Jeronimo Martins SGPS SA | | | 10,164 | | | | 198,744 | |
| | | | | | | | |
| | | | | | | 1,090,206 | |
| | | | | | | | |
| South Africa - 0.8% | | | | | | | | |
| African Rainbow Minerals Ltd. | | | 15,370 | | | | 277,547 | |
| Discovery Ltd. | | | 51,206 | | | | 413,002 | |
| FirstRand Ltd. | | | 410,455 | | | | 1,406,600 | |
| Growthpoint Properties Ltd. REIT | | | 53,458 | | | | 123,889 | |
| Harmony Gold Mining Co., Ltd. ADR (1)(a) | | | 7,100 | | | | 17,963 | |
| Imperial Holdings Ltd. | | | 57,771 | | | | 1,117,151 | |
| | | | | | | | |
| | | SHARES | | | VALUE
(Note 3) | |
| South Africa - 0.8% (continued) | | | | | | | | |
| Investec Ltd. | | | 107,728 | | | $ | 766,615 | |
| Liberty Holdings Ltd. | | | 56,145 | | | | 651,780 | |
| MMI Holdings Ltd. | | | 429,460 | | | | 1,037,021 | |
| Naspers Ltd., N Shares | | | 15,533 | | | | 1,625,909 | |
| Redefine Properties Ltd. REIT | | | 197,093 | | | | 183,045 | |
| Remgro Ltd. | | | 19,213 | | | | 381,106 | |
| Reunert Ltd. | | | 19,263 | | | | 125,821 | |
| RMB Holdings Ltd. | | | 162,799 | | | | 751,915 | |
| Sanlam Ltd. | | | 247,922 | | | | 1,259,873 | |
| Sasol Ltd. ADR (1)(a) | | | 15,500 | | | | 766,475 | |
| Woolworths Holdings Ltd. | | | 267,808 | | | | 1,908,468 | |
| | | | | | | | |
| | | | | | | 12,814,180 | |
| | | | | | | | |
| Spain - 2.1% | | | | | | | | |
| Acerinox SA | | | 82,980 | | | | 1,057,226 | |
| ACS Actividades de Construccion y Servicios SA | | | 44,139 | | | | 1,521,536 | |
| Banco Bilbao Vizcaya Argentaria SA | | | 27,036 | | | | 334,450 | |
| Banco Santander SA | | | 99,591 | | | | 895,572 | |
| Bankia SA † | | | 915,358 | | | | 1,555,224 | |
| Bankinter SA | | | 78,742 | | | | 541,088 | |
| Distribuidora Internacional de Alimentacion SA | | | 253,924 | | | | 2,273,615 | |
| Ebro Foods SA | | | 10,518 | | | | 246,575 | |
| Enagas SA | | | 186,671 | | | | 4,876,192 | |
| Endesa SA † | | | 87,630 | | | | 2,810,920 | |
| Ferrovial SA | | | 153,169 | | | | 2,967,162 | |
| Fomento de Construcciones y Contratas SA † | | | 13,539 | | | | 301,997 | |
| Gas Natural SDG SA | | | 251,463 | | | | 6,472,491 | |
| Iberdrola SA | | | 526,272 | | | | 3,358,544 | |
| Inditex SA | | | 4,744 | | | | 783,287 | |
| Indra Sistemas SA | | | 24,837 | | | | 415,768 | |
| Repsol SA | | | 52,652 | | | | 1,328,574 | |
| Tecnicas Reunidas SA | | | 11,505 | | | | 625,321 | |
| | | | | | | | |
| | | | | | | 32,365,542 | |
| | | | | | | | |
| Sweden - 2.2% | | | | | | | | |
| Boliden AB | | | 52,064 | | | | 798,222 | |
| Electrolux AB, Series B | | | 117,380 | | | | 3,067,442 | |
| Meda AB, A Shares | | | 121,741 | | | | 1,546,062 | |
| NCC AB, B Shares | | | 50,271 | | | | 1,641,856 | |
| Nordea Bank AB | | | 205,118 | | | | 2,765,565 | |
| Securitas AB, B Shares | | | 82,768 | | | | 880,685 | |
| Skandinaviska Enskilda Banken AB, Class A | | | 410,799 | | | | 5,427,178 | |
| Skanska AB, B Shares | | | 6,651 | | | | 136,067 | |
| Svenska Cellulosa AB SCA, Class B | | | 110,976 | | | | 3,418,933 | |
| Swedbank AB, A Shares | | | 190,856 | | | | 5,376,283 | |
| Swedish Match AB | | | 50,737 | | | | 1,631,250 | |
| Tele2 AB, B Shares | | | 41,590 | | | | 472,367 | |
| Telefonaktiebolaget LM Ericsson, B Shares | | | 380,616 | | | | 4,647,130 | |
| TeliaSonera AB | | | 52,529 | | | | 438,113 | |
| Trelleborg AB, B Shares | | | 60,580 | | | | 1,206,410 | |
| | | | | | | | |
| | | | | | | 33,453,563 | |
| | | | | | | | |
| | | | |
| | The accompanying notes are an integral part of these financial statements. | | (Continued) |
| | | | | | | | | | | | | | | | |
| 144 | | AQR Funds | | | | | | Annual Report | | | | | | December 2013 | | |
| | | | | | | | | | |
| | | | |
| Consolidated Schedule of Investments | | | December 31, 2013 | |
| | |
| AQR MULTI-STRATEGY ALTERNATIVE FUND | | |
| | | | | | | | |
| | | SHARES | | | VALUE
(Note 3) | |
| Switzerland - 2.6% | | | | | | | | |
| ABB Ltd. † | | | 14,864 | | | $ | 393,004 | |
| Actelion Ltd. † | | | 3,075 | | | | 260,824 | |
| Adecco SA † | | | 8,249 | | | | 654,861 | |
| Aryzta AG † | | | 12,993 | | | | 998,368 | |
| Baloise Holding AG | | | 6,951 | | | | 886,351 | |
| DKSH Holding AG | | | 2,820 | | | | 219,390 | |
| EMS-Chemie Holding AG | | | 1,906 | | | | 679,630 | |
| Galenica AG | | | 725 | | | | 729,857 | |
| Georg Fischer AG † | | | 523 | | | | 368,210 | |
| Helvetia Holding AG | | | 147 | | | | 73,797 | |
| Logitech International SA | | | 45,970 | | | | 632,753 | |
| Lonza Group AG † | | | 4,677 | | | | 444,470 | |
| Nestle SA | | | 19,921 | | | | 1,460,011 | |
| Novartis AG | | | 41,078 | | | | 3,292,376 | |
| OC Oerlikon Corp. AG † | | | 336,564 | | | | 5,041,900 | |
| Panalpina Welttransport Holding AG | | | 208 | | | | 34,872 | |
| Partners Group Holding AG | | | 739 | | | | 196,883 | |
| Roche Holding AG | | | 35,603 | | | | 9,973,336 | |
| Schindler Holding AG | | | 2,890 | | | | 425,448 | |
| Sika AG | | | 46 | | | | 163,919 | |
| STMicroelectronics NV | | | 50,255 | | | | 401,517 | |
| Straumann Holding AG | | | 1,312 | | | | 246,148 | |
| Sulzer AG | | | 18,078 | | | | 2,921,066 | |
| Swiss Life Holding AG † | | | 17,028 | | | | 3,540,117 | |
| Swiss Re AG † | | | 26,474 | | | | 2,440,597 | |
| Swisscom AG | | | 2,847 | | | | 1,504,622 | |
| Syngenta AG | | | 1,155 | | | | 460,495 | |
| Transocean Ltd. | | | 9,980 | | | | 488,417 | |
| | | | | | | | |
| | | | | | | 38,933,239 | |
| | | | | | | | |
| Taiwan - 1.0% | | | | | | | | |
| Asustek Computer, Inc. | | | 220 | | | | 1,981 | |
| Cheng Shin Rubber Industry Co., Ltd. | | | 64,400 | | | | 168,707 | |
| Chicony Electronics Co., Ltd. | | | 299,420 | | | | 753,916 | |
| China Motor Corp. | | | 211,000 | | | | 204,331 | |
| China Petrochemical Development Corp. | | | 932 | | | | 426 | |
| Delta Electronics, Inc. | | | 26,000 | | | | 148,889 | |
| E.Sun Financial Holding Co., Ltd. | | | 825 | | | | 549 | |
| Eva Airways Corp. † | | | 100,500 | | | | 56,110 | |
| Far Eastern Department Stores Ltd. | | | 77,250 | | | | 76,568 | |
| Far EasTone Telecommunications Co., Ltd. | | | 321,000 | | | | 705,196 | |
| Foxconn Technology Co., Ltd. | | | 577 | | | | 1,350 | |
| Fubon Financial Holding Co., Ltd. | | | 1,265,297 | | | | 1,855,726 | |
| Hon Hai Precision Industry Co., Ltd. | | | 393,690 | | | | 1,061,901 | |
| Innolux Corp. † | | | 2,050,000 | | | | 783,289 | |
| Inventec Corp. | | | 2,482,000 | | | | 2,197,827 | |
| Kinsus Interconnect Technology Corp. | | | 88,000 | | | | 292,608 | |
| Lite-On Technology Corp. | | | 103,020 | | | | 165,560 | |
| MStar Semiconductor, Inc. | | | 4,000 | | | | 46,613 | |
| President Chain Store Corp. | | | 140,000 | | | | 972,025 | |
| Realtek Semiconductor Corp. | | | 560,833 | | | | 1,509,428 | |
| SinoPac Financial Holdings Co., Ltd. | | | 661 | | | | 330 | |
| Taiwan Business Bank † | | | 499 | | | | 152 | |
| Taiwan Cooperative Financial Holding Co., Ltd. | | | 108,385 | | | | 59,349 | |
| | | | | | | | |
| | | SHARES | | | VALUE
(Note 3) | |
| Taiwan - 1.0% (continued) | | | | | | | | |
| Taiwan Semiconductor Manufacturing Co., Ltd. ADR (1)(a) | | | 152,100 | | | $ | 2,652,624 | |
| Tripod Technology Corp. | | | 330 | | | | 593 | |
| Uni-President Enterprises Corp. | | | 1,176,851 | | | | 2,123,668 | |
| Walsin Lihwa Corp. † | | | 486,000 | | | | 156,235 | |
| Yang Ming Marine Transport Corp. † | | | 100 | | | | 47 | |
| | | | | | | | |
| | | | | | | 15,995,998 | |
| | | | | | | | |
| Thailand - 0.2% | | | | | | | | |
| Airports of Thailand PCL NVDR | | | 123,600 | | | | 598,282 | |
| BEC World PCL NVDR | | | 255,000 | | | | 393,096 | |
| PTT Exploration & Production PCL NVDR | | | 161,100 | | | | 818,291 | |
| PTT Global Chemical PCL NVDR | | | 467,300 | | | | 1,128,553 | |
| | | | | | | | |
| | | | | | | 2,938,222 | |
| | | | | | | | |
| Turkey - 0.3% | | | | | | | | |
| Enka Insaat ve Sanayi AS | | | 194,276 | | | | 544,730 | |
| Eregli Demir ve Celik Fabrikalari TAS | | | 405,083 | | | | 486,664 | |
| TAV Havalimanlari Holding AS | | | 161,050 | | | | 1,159,518 | |
| Turk Hava Yollari | | | 540,184 | | | | 1,619,522 | |
| Turkiye Halk Bankasi AS | | | 9,735 | | | | 55,076 | |
| Turkiye Is Bankasi, Class C | | | 370,278 | | | | 801,687 | |
| | | | | | | | |
| | | | | | | 4,667,197 | |
| | | | | | | | |
| United Kingdom - 0.0% (b) | | | | | | | | |
| CNH Industrial NV † | | | 65,345 | | | | 746,671 | |
| | | | | | | | |
| | |
| United States - 1.9% | | | | | | | | |
| Responsys, Inc. (1)†(a) | | | 124,563 | | | | 3,414,272 | |
| Southern Copper Corp. (1)(a) | | | 6,301 | | | | 180,901 | |
| Sprint Corp. (1)†(a)* | | | 143,197 | | | | 1,539,368 | |
| ViroPharma, Inc. (1)†(a) | | | 475,058 | | | | 23,681,640 | |
| | | | | | | | |
| | | | | | | 28,816,181 | |
| | | | | | | | |
TOTAL COMMON STOCKS
(Cost $669,803,935) | | | | | | | 801,375,042 | |
| | | | | | | | |
| | |
| PREFERRED STOCKS - 0.5% | | | | | | | | |
| | |
| Brazil - 0.1% | | | | | | | | |
| Cia Energetica de Sao Paulo (1) | | | 124,500 | | | | 1,183,126 | |
| Lojas Americanas SA (1) | | | 49 | | | | 327 | |
| Metalurgica Gerdau SA (1) | | | 42,100 | | | | 417,565 | |
| Usinas Siderurgicas de Minas Gerais SA, Series A (1)† | | | 29 | | | | 174 | |
| | | | | | | | |
| | | | | | | 1,601,192 | |
| | | | | | | | |
| Germany - 0.4% | | | | | | | | |
| Henkel AG & Co. KGaA | | | 5,835 | | | | 678,229 | |
| Porsche Automobil Holding SE | | | 47,541 | | | | 4,962,879 | |
| | | | | | | | |
| | | | | | | 5,641,108 | |
| | | | | | | | |
TOTAL PREFERRED STOCKS
(Cost $6,141,939) | | | | | | | 7,242,300 | |
| | | | | | | | |
| | | | |
| | The accompanying notes are an integral part of these financial statements. | | (Continued) |
| | | | | | | | | | | | | | | | |
| | AQR Funds | | | | | | Annual Report | | | | | | December 2013 | | 145 |
| | | | | | | | | | |
| | | | |
| Consolidated Schedule of Investments | | | December 31, 2013 | |
| | |
| AQR MULTI-STRATEGY ALTERNATIVE FUND | | |
| | | | | | | | | | | | | | | | |
| CONVERTIBLE PREFERRED STOCKS - 1.8% | | | | | | | | SHARES | | | VALUE
(Note 3) | |
| Bermuda - 0.0%(b) | | | | | | | | | | | | | | | | |
| Bunge Ltd., Perpetual Preferred Stock, $100.00 par, 4.875%, 03/01/14 (1) †(a)(c) | | | | | | | | | | | 2,450 | | | $ | 263,498 | |
| | | | | | | | | | | | | | | | |
| United States - 1.8% | | | | | | | | | | | | | | | | |
| 2010 Swift Mandatory Common Exchange Security Trust 144A, $11.00 par, 6.000%, 12/31/13 †(d) | | | | | | | | | | | 36,800 | | | | 656,144 | |
| Chesapeake Energy Corp., Perpetual Preferred Stock 144A, $1,000.00 par, 5.750%, 02/07/14 (a)(c)(d) | | | | | | | | | | | 400 | | | | 466,750 | |
| Dominion Resources, Inc., Series A, $49.00 par, 6.125%, 04/01/16 (1) (a) | | | | | | | | | | | 73,900 | | | | 3,999,468 | |
| Dominion Resources, Inc., Series B, $49.00 par, 6.000%, 07/01/16 (1) (a) | | | | | | | | | | | 61,925 | | | | 3,356,954 | |
| Goodyear Tire & Rubber Co./The, $50.00 par, 5.875%, 04/01/14 (1) †(a) | | | | | | | | | | | 35,225 | | | | 2,354,791 | |
| NextEra Energy, Inc., $50.00 par, 5.599%, 06/01/15 (1) † | | | | | | | | | | | 842,500 | | | | 484,438 | |
| NextEra Energy, Inc., $50.00 par, 5.799%, 09/01/16 (1) †(a) | | | | | | | | | | | 81,400 | | | | 4,083,838 | |
| NextEra Energy, Inc., $50.00 par, 5.599%, 06/01/15 (1) †(a) | | | | | | | | | | | 130,825 | | | | 7,522,438 | |
Post Holdings, Inc., Perpetual Preferred Stock 144A, $100.00 par,
2.500%, 02/15/14 †(a)(c)(d) | | | | | | | | | | | 12,877 | | | | 1,282,066 | |
| PPL Corp., $50.00 par, 8.750% 05/01/14 (1) †(a) | | | | | | | | | | | 35,350 | | | | 1,869,308 | |
| Stanley Black & Decker, Inc., $100.00 par, 6.250%, 11/17/16 (1) †(a) | | | | | | | | | | | 4,975 | | | | 513,420 | |
| | | | | | | | | | | | | | | | |
| | | | | | | | | | | | | | | 26,589,615 | |
| | | | | | | | | | | | | | | | |
TOTAL CONVERTIBLE PREFERRED STOCKS
(Cost $26,203,417) | | | | | | | | | | | | | | | 26,853,113 | |
| | | | | | | | | | | | | | | | |
| | | | |
| CORPORATE BONDS - 1.6% | | INTEREST
RATE | | | MATURITY
DATE | | | PRINCIPAL
AMOUNT
(000’S) | | | | |
| United Kingdom - 0.2% | | | | | | | | | | | | | | | | |
| Virgin Media Finance PLC (a) | | | 4.875% | | | | 02/15/22 | | | $ | 3,125 | | | | 2,718,750 | |
| | | | | | | | | | | | | | | | |
| United States - 1.4% | | | | | | | | | | | | | | | | |
| American Airlines, Inc. 144A †(a)(d) | | | 7.500% | | | | 03/15/16 | | | | 2,825 | | | | 2,930,937 | |
| Copano Energy LLC/Copano Energy Finance Corp. | | | 7.125% | | | | 04/01/21 | | | | 81 | | | | 93,341 | |
| Cricket Communications, Inc. (a) | | | 7.750% | | | | 10/15/20 | | | | 4,300 | | | | 4,902,000 | |
| Edgen Murray Corp. 144A (a)(d) | | | 8.750% | | | | 11/01/20 | | | | 7,700 | | | | 8,816,500 | |
| Plains Exploration & Production Co. (a) | | | 6.875% | | | | 02/15/23 | | | | 1,025 | | | | 1,142,875 | |
| US Foods, Inc. | | | 8.500% | | | | 06/30/19 | | | | 3,075 | | | | 3,367,125 | |
| | | | | | | | | | | | | | | | |
| | | | | | | | | | | | | | | 21,252,778 | |
| | | | | | | | | | | | | | | | |
TOTAL CORPORATE BONDS
(Cost $24,875,868) | | | | | | | | | | | | | | | 23,971,528 | |
| | | | | | | | | | | | | | | | |
| | | | |
| CONVERTIBLE BONDS - 31.5% | | | | | | | | | | | | |
| Canada - 0.1% | | | | | | | | | | | | | | | | |
| Petrominerales Ltd. (3)(f) | | | 3.250% | | | | 06/12/17 | | | | 400 | | | | 396,000 | |
| Petrominerales Ltd., Series PMG (3)(f) | | | 2.625% | | | | 08/25/16 | | | | 700 | | | | 693,000 | |
| Silver Standard Resources, Inc. 144A (a)(d) | | | 2.875% | | | | 02/01/33 | | | | 125 | | | | 97,656 | |
| | | | | | | | | | | | | | | | |
| | | | | | | | | | | | | | | 1,186,656 | |
| | | | | | | | | | | | | | | | |
| India - 0.0%(b) | | | | | | | | | | | | | | | | |
| Sterlite Industries India Ltd. (a) | | | 4.000% | | | | 10/30/14 | | | | 225 | | | | 222,891 | |
| | | | | | | | | | | | | | | | |
| Malta - 0.1% | | | | | | | | | | | | | | | | |
| Lufthansa Malta Blues LP, Series JBLU 144A (d) | | | 0.750% | | | | 04/05/17 | | | | 475 | | | | 875,306 | |
| | | | | | | | | | | | | | | | |
| Mexico - 0.9% | | | | | | | | | | | | | | | | |
| Cemex SAB de CV (a) | | | 3.750% | | | | 03/15/18 | | | | 350 | | | | 474,688 | |
| Cemex SAB de CV (a) | | | 3.250% | | | | 03/15/16 | | | | 9,750 | | | | 12,845,625 | |
| Cemex SAB de CV (a) | | | 4.875% | | | | 03/15/15 | | | | 250 | | | | 296,250 | |
| | | | | | | | | | | | | | | | |
| | | | | | | | | | | | | | | 13,616,563 | |
| | | | | | | | | | | | | | | | |
| Netherlands - 0.2% | | | | | | | | | | | | | | | | |
| Volkswagen International Finance NV 144A (d) | | | 5.500% | | | | 11/09/15 | | | | 2,000 | | | | 3,416,413 | |
| | | | | | | | | | | | | | | | |
| | | | |
| | The accompanying notes are an integral part of these financial statements. | | (Continued) |
| | | | | | | | | | | | | | | | |
| 146 | | AQR Funds | | | | | | Annual Report | | | | | | December 2013 | | |
| | | | | | | | | | |
| | | | |
| Consolidated Schedule of Investments | | | December 31, 2013 | |
| | |
| AQR MULTI-STRATEGY ALTERNATIVE FUND | | |
| | | | | | | | | | | | | | | | |
| | | | |
| | | INTEREST
RATE | | | MATURITY
DATE | | | PRINCIPAL
AMOUNT
(000’S) | | | VALUE
(Note 3) | |
| United States - 30.2% | | | | | | | | | | | | | | | | |
| Alpha Natural Resources, Inc. (a) | | | 4.875% | | | | 12/15/20 | | | $ | 200 | | | $ | 215,750 | |
| Alpha Natural Resources, Inc. (a) | | | 3.750% | | | | 12/15/17 | | | | 1,100 | | | | 1,140,562 | |
| American Realty Capital Properties, Inc. (a) | | | 3.000% | | | | 08/01/18 | | | | 3,250 | | | | 3,247,969 | |
| Amkor Technology, Inc. | | | 6.000% | | | | 04/15/14 | | | | 3,475 | | | | 7,060,766 | |
| Annaly Capital Management, Inc. (a) | | | 5.000% | | | | 05/15/15 | | | | 2,650 | | | | 2,681,469 | |
| Ares Capital Corp. 144A (a)(d) | | | 5.750% | | | | 02/01/16 | | | | 1,625 | | | | 1,749,922 | |
| Avis Budget Group, Inc. (a) | | | 3.500% | | | | 10/01/14 | | | | 8,575 | | | | 21,571,484 | |
| Chart Industries, Inc. (a) | | | 2.000% | | | | 08/01/18 | | | | 2,275 | | | | 3,513,453 | |
| Ciena Corp. 144A (a)(d) | | | 3.750% | | | | 10/15/18 | | | | 2,125 | | | | 3,061,328 | |
| Ciena Corp. (a) | | | 4.000% | | | | 12/15/20 | | | | 1,166 | | | | 1,715,477 | |
| Covanta Holding Corp. (a) | | | 3.250% | | | | 06/01/14 | | | | 3,850 | | | | 4,511,719 | |
| DDR Corp. (a) | | | 1.750% | | | | 11/15/40 | | | | 1,895 | | | | 2,117,662 | |
| Digital Realty Trust LP 144A (a)(d) | | | 5.500% | | | | 04/15/29 | | | | 1,075 | | | | 1,367,937 | |
| DR Horton, Inc., Series DHI | | | 2.000% | | | | 05/15/14 | | | | 1,500 | | | | 2,588,437 | |
| Electronic Arts, Inc. (a) | | | 0.750% | | | | 07/15/16 | | | | 625 | | | | 664,844 | |
| Equinix, Inc. | | | 4.750% | | | | 06/15/16 | | | | 4,450 | | | | 9,717,687 | |
| Exelixis, Inc. (a) | | | 4.250% | | | | 08/15/19 | | | | 650 | | | | 795,844 | |
| Exterran Holdings, Inc. (a) | | | 4.250% | | | | 06/15/14 | | | | 3,000 | | | | 4,475,625 | |
| Extra Space Storage LP 144A (a)(d) | | | 2.375% | | | | 07/01/33 | | | | 700 | | | | 701,312 | |
| General Cable Corp. (a)(g) | | | 5.000% | | | | 11/15/29 | | | | 9,325 | | | | 9,971,922 | |
| Gilead Sciences, Inc., Series D | | | 1.625% | | | | 05/01/16 | | | | 11,275 | | | | 37,186,359 | |
| Health Care REIT, Inc. | | | 3.000% | | | | 12/01/29 | | | | 4,550 | | | | 5,070,406 | |
| Host Hotels & Resorts LP 144A (a)(d) | | | 2.500% | | | | 10/15/29 | | | | 4,425 | | | | 6,698,344 | |
| L-3 Communications Holdings, Inc. (a) | | | 3.000% | | | | 08/01/35 | | | | 2,975 | | | | 3,583,016 | |
| Lennar Corp. 144A (a)(d) | | | 2.750% | | | | 12/15/20 | | | | 4,800 | | | | 8,835,000 | |
| Lennar Corp. 144A (a)(d) | | | 3.250% | | | | 11/15/21 | | | | 6,625 | | | | 11,908,437 | |
| MGIC Investment Corp. (a) | | | 2.000% | | | | 04/01/20 | | | | 9,250 | | | | 12,765,000 | |
| MGIC Investment Corp. (a) | | | 5.000% | | | | 05/01/17 | | | | 3,250 | | | | 3,672,500 | |
| MGM Resorts International (a) | | | 4.250% | | | | 04/15/15 | | | | 5,000 | | | | 6,875,000 | |
| Microchip Technology, Inc. | | | 2.125% | | | | 12/15/37 | | | | 11,725 | | | | 20,350,203 | |
| Micron Technology, Inc. (a) | | | 2.375% | | | | 05/01/32 | | | | 9,875 | | | | 22,842,109 | |
| Micron Technology, Inc. | | | 3.125% | | | | 05/01/32 | | | | 2,275 | | | | 5,179,891 | |
| Micron Technology, Inc. (a) | | | 1.875% | | | | 06/01/14 | | | | 2,300 | | | | 3,504,625 | |
| Micron Technology, Inc., Series F 144A (a)(d) | | | 2.125% | | | | 02/15/33 | | | | 1,300 | | | | 2,680,437 | |
| Navistar International Corp. (a) | | | 3.000% | | | | 10/15/14 | | | | 50 | | | | 51,125 | |
| NorthStar Realty Finance LP 144A (a)(d) | | | 5.375% | | | | 06/15/33 | | | | 100 | | | | 137,250 | |
| Novellus Systems, Inc. (a) | | | 2.625% | | | | 05/15/41 | | | | 7,075 | | | | 11,824,094 | |
| NVIDIA Corp. 144A (a)(d) | | | 1.000% | | | | 12/01/18 | | | | 8,425 | | | | 8,625,094 | |
| Omnicare, Inc. (a) | | | 3.500% | | | | 02/15/44 | | | | 304 | | | | 306,470 | |
| PHH Corp. (a) | | | 4.000% | | | | 09/01/14 | | | | 600 | | | | 640,125 | |
| PHH Corp. | | | 6.000% | | | | 06/15/17 | | | | 14,402 | | | | 29,776,135 | |
| Radian Group, Inc. (a) | | | 2.250% | | | | 03/01/19 | | | | 6,525 | | | | 9,567,281 | |
| Radian Group, Inc. (a) | | | 3.000% | | | | 11/15/17 | | | | 6,425 | | | | 9,115,469 | |
| Regeneron Pharmaceuticals, Inc. (a) | | | 1.875% | | | | 10/01/16 | | | | 6,550 | | | | 21,463,531 | |
| Ryman Hospitality Properties, Inc. 144A (d) | | | 3.750% | | | | 10/01/14 | | | | 2,800 | | | | 5,467,000 | |
| Salesforce.com, Inc. | | | 0.750% | | | | 01/15/15 | | | | 4,650 | | | | 11,991,188 | |
| Salesforce.com, Inc. 144A (a)(d) | | | 0.250% | | | | 04/01/18 | | | | 1,475 | | | | 1,603,141 | |
| SanDisk Corp. (a) | | | 1.500% | | | | 08/15/17 | | | | 12,790 | | | | 18,849,263 | |
| SL Green Operating Partnership LP 144A (a)(d) | | | 3.000% | | | | 10/15/17 | | | | 5,325 | | | | 6,626,297 | |
| Standard Pacific Corp. (a) | | | 1.250% | | | | 08/01/32 | | | | 2,175 | | | | 2,879,156 | |
| Stillwater Mining Co. (a) | | | 1.750% | | | | 10/15/32 | | | | 2,100 | | | | 2,354,625 | |
| SunEdison, Inc. 144A (d) | | | 2.750% | | | | 01/01/21 | | | | 450 | | | | 501,469 | |
| SunEdison, Inc. 144A (d) | | | 2.000% | | | | 10/01/18 | | | | 975 | | | | 1,093,219 | |
| SunPower Corp. (a) | | | 4.500% | | | | 03/15/15 | | | | 1,300 | | | | 1,820,813 | |
| Tesla Motors, Inc. (a) | | | 1.500% | | | | 06/01/18 | | | | 4,350 | | | | 6,019,313 | |
| Theravance, Inc. (a) | | | 2.125% | | | | 01/15/23 | | | | 325 | | | | 472,469 | |
| | | | |
| | The accompanying notes are an integral part of these financial statements. | | (Continued) |
| | | | | | | | | | | | | | | | |
| | AQR Funds | | | | | | Annual Report | | | | | | December 2013 | | 147 |
| | | | | | | | | | |
| | | | |
| Consolidated Schedule of Investments | | | December 31, 2013 | |
| | |
| AQR MULTI-STRATEGY ALTERNATIVE FUND | | |
| | | | | | | | | | | | | | | | |
| | | | |
| | | INTEREST
RATE | | | MATURITY
DATE | | | PRINCIPAL
AMOUNT
(000’S) | | | VALUE
(Note 3) | |
| United States - 30.2% (continued) | | | | | | | | | | | | | | | | |
| United States Steel Corp. (a) | | | 4.000% | | | | 05/15/14 | | | $ | 1,425 | | | $ | 1,521,188 | |
| VeriSign, Inc. (a) | | | 3.250% | | | | 08/15/37 | | | | 19,969 | | | | 36,019,084 | |
| Vishay Intertechnology, Inc. 144A (a)(d) | | | 2.250% | | | | 11/15/40 | | | | 2,425 | | | | 2,582,625 | |
| Web.com Group, Inc. (a) | | | 1.000% | | | | 08/15/18 | | | | 2,750 | | | | 3,086,875 | |
| WebMD Health Corp. 144A (a)(d) | | | 1.500% | | | | 12/01/20 | | | | 1,775 | | | | 1,740,609 | |
| Xilinx, Inc. | | | 3.125% | | | | 03/15/37 | | | | 5,600 | | | | 8,865,500 | |
| XM Satellite Radio, Inc. 144A (d) | | | 7.000% | | | | 12/01/14 | | | | 6,500 | | | | 12,626,250 | |
| Yahoo!, Inc. 144A (a)(d) | | | 0.000% | | | | 12/01/18 | | | | 10,175 | | | | 10,512,047 | |
| | | | | | | | | | | | | | | | |
| | | | | | | | | | | | | | | 462,161,201 | |
| | | | | | | | | | | | | | | | |
TOTAL CONVERTIBLE BONDS
(Cost $377,508,812) | | | | | | | | | | | | | | | 481,479,030 | |
| | | | | | | | | | | | | | | | |
| | | | | | | | |
| PURCHASED OPTIONS - 0.0%(b) | | CONTRACTS/
NOTIONAL | | | VALUE
(Note 3) | |
| Put - Sprint Nextel Corp., Expires 01/18/2014, Strike $10.00 (Cost $721,829) | | | 1,432 | | | $ | 217,664 | |
| | | | | | | | |
| | |
| MONEY MARKET FUNDS - 34.0% | | | | | | | | |
| BlackRock Liquidity Funds TempFund Portfolio - Series I, Institutional Shares, 0.050% (h)^ | | | 1,000,085 | | | | 1,000,085 | |
| Dreyfus Treasury Cash Management, Class I, 0.010% (h)^ | | | 4,000,338 | | | | 4,000,338 | |
| J.P. Morgan U.S. Treasury Plus Money Market Fund - Institutional Shares, 0.000% (h)^ | | | 510,428,217 | | | | 510,428,217 | |
| UBS Money Series - UBS Select Treasury Preferred Fund, Class I, 0.010% (h)^ | | | 5,000,757 | | | | 5,000,757 | |
| | | | | | | | |
TOTAL MONEY MARKET FUNDS
(Cost $520,429,397) | | | | | | | 520,429,397 | |
| | | | | | | | |
| | |
| SHORT-TERM INVESTMENTS - 3.8% | | PRINCIPAL
AMOUNT
(000’S) | | | | |
U.S. Treasury Bill,
0.066%, 01/30/2014 (i)^ | | $ | 18,023 | | | | 18,022,448 | |
U.S. Treasury Bill,
0.084%, 06/05/2014 (i)^ | | | 11,300 | | | | 11,297,220 | |
U.S. Treasury Bill,
0.073%, 02/06/2014 (i)^ | | | 18,023 | | | | 18,022,430 | |
U.S. Treasury Bill,
0.080%, 05/29/2014 (i)^ | | | 11,300 | | | | 11,297,344 | |
| | | | | | | | |
TOTAL SHORT-TERM INVESTMENTS
(cost $58,635,346) | | | | 58,639,442 | |
| | | | | | | | |
TOTAL INVESTMENTS, BEFORE SECURITIES SOLD SHORT
(Cost $1,684,320,543) | | | | 1,920,207,516 | |
| | | | | | | | |
| | | | | | | | |
| SECURITIES SOLD SHORT - (64.0)% | | SHARES | | | VALUE
(Note 3) | |
| | |
| COMMON STOCKS - (63.5)% | | | | | | | | |
| | |
| Belgium - (0.2)% | | | | | | | | |
| Anheuser-Busch InBev NV | | | (10,458) | | | $ | (1,112,065) | |
| Delhaize Group SA | | | (9,516) | | | | (566,126) | |
| Mobistar SA | | | (22,168) | | | | (421,507) | |
| Telenet Group Holding NV | | | (11,467) | | | | (684,641) | |
| | | | | | | | |
| | | | | | | (2,784,339) | |
| | | | | | | | |
| Bermuda - (0.2)% | | | | | | | | |
| Seadrill Ltd. | | | (83,097) | | | | (3,405,687) | |
| | | | | | | | |
| | |
| Canada - 0.0% (b) | | | | | | | | |
| Silver Standard Resources, Inc. (1) | | | (3,344) | | | | (23,274) | |
| | | | | | | | |
| Denmark - (0.8)% | | | | | | | | |
| FLSmidth & Co. A/S | | | (78,988) | | | | (4,319,577) | |
| Novozymes A/S, B Shares | | | (181,531) | | | | (7,667,913) | |
| Pandora A/S | | | (2,572) | | | | (139,806) | |
| William Demant Holding A/S † | | | (3,522) | | | | (342,145) | |
| | | | | | | | |
| | | | | | | (12,469,441) | |
| | | | | | | | |
| Finland - (0.8)% | | | | | | | | |
| Cargotec OYJ, B Shares | | | (46,267) | | | | (1,722,023) | |
| Elisa OYJ | | | (45,682) | | | | (1,211,422) | |
| Konecranes OYJ | | | (36,218) | | | | (1,284,988) | |
| Nokian Renkaat OYJ | | | (143,252) | | | | (6,869,566) | |
| Orion OYJ, Class B | | | (1,660) | | | | (46,658) | |
| Outotec OYJ | | | (48,968) | | | | (513,779) | |
| Stora Enso OYJ, R Shares | | | (18,966) | | | | (190,585) | |
| YIT OYJ | | | (35,030) | | | | (489,795) | |
| | | | | | | | |
| | | | | | | (12,328,816) | |
| | | | | | | | |
| Germany - (4.8)% | | | | | | | | |
| Aixtron SE † | | | (263,753) | | | | (3,826,329) | |
| Allianz SE | | | (20,676) | | | | (3,720,145) | |
| Axel Springer SE | | | (4,936) | | | | (317,784) | |
| BASF SE | | | (30,951) | | | | (3,303,522) | |
| Bayerische Motoren Werke AG | | | (35,310) | | | | (4,146,549) | |
| Commerzbank AG † | | | (491,796) | | | | (7,939,258) | |
| Daimler AG | | | (70,274) | | | | (6,098,695) | |
| | | | |
| | The accompanying notes are an integral part of these financial statements. | | (Continued) |
| | | | | | | | | | | | | | | | |
| 148 | | AQR Funds | | | | | | Annual Report | | | | | | December 2013 | | |
| | | | | | | | | | |
| | | | |
| Consolidated Schedule of Investments | | | December 31, 2013 | |
| | |
| AQR MULTI-STRATEGY ALTERNATIVE FUND | | |
| | | | | | | | |
| | | SHARES | | | VALUE
(Note 3) | |
| Germany - (4.8)% (continued) | | | | | | | | |
| Deutsche Bank AG | | | (15,901) | | | $ | (763,907) | |
| Dialog Semiconductor PLC † | | | (24,556) | | | | (529,493) | |
| Fraport AG Frankfurt Airport Services Worldwide | | | (30,530) | | | | (2,287,786) | |
| Fresenius Medical Care AG & Co. KGaA | | | (43,743) | | | | (3,120,005) | |
| Hugo Boss AG | | | (2,339) | | | | (333,135) | |
| Infineon Technologies AG | | | (973,200) | | | | (10,395,255) | |
| K+S AG | | | (98,689) | | | | (3,040,868) | |
| LANXESS AG | | | (8,433) | | | | (563,487) | |
| MAN SE | | | (31,501) | | | | (3,868,283) | |
| Metro AG | | | (599) | | | | (29,039) | |
| RWE AG | | | (175,602) | | | | (6,433,887) | |
| SAP AG | | | (60,310) | | | | (5,230,183) | |
| Siemens AG | | | (7,808) | | | | (1,070,622) | |
| Sky Deutschland AG † | | | (288,299) | | | | (3,186,581) | |
| Software AG | | | (27,307) | | | | (956,710) | |
| Stada Arzneimittel AG | | | (36,252) | | | | (1,794,834) | |
| Symrise AG | | | (6,425) | | | | (296,436) | |
| Wacker Chemie AG | | | (5,416) | | | | (600,405) | |
| | | | | | | | |
| | | | | | | (73,853,198) | |
| | | | | | | | |
| India - 0.0%(b) | | | | | |
| Sesa Sterlite Ltd. ADR (1) | | | (58) | | | | (763) | |
| | | | | | | | |
| Italy - (1.7)% | | | | | |
| A2A SpA | | | (438,906) | | | | (513,678) | |
| Assicurazioni Generali SpA | | | (28,545) | | | | (670,644) | |
| Atlantia SpA | | | (122,118) | | | | (2,735,426) | |
| Fiat SpA † | | | (175,085) | | | | (1,433,059) | |
| Finmeccanica SpA † | | | (509,101) | | | | (3,864,350) | |
| Luxottica Group SpA | | | (6,245) | | | | (334,678) | |
| Mediaset SpA † | | | (351,304) | | | | (1,666,033) | |
| Mediobanca SpA † | | | (43,261) | | | | (378,309) | |
| Pirelli & C. SpA | | | (351,453) | | | | (6,080,184) | |
| Saipem SpA | | | (16,659) | | | | (357,263) | |
| Salvatore Ferragamo SpA | | | (21,522) | | | | (818,678) | |
| Tenaris SA | | | (228,992) | | | | (4,989,844) | |
| Tod’s SpA | | | (13,557) | | | | (2,263,611) | |
| | | | | | | | |
| | | | | | | (26,105,757) | |
| | | | | | | | |
| Japan - (18.9)% | | | | | |
| ABC-Mart, Inc. | | | (45,649) | | | | (1,994,333) | |
| Acom Co., Ltd. † | | | (598,630) | | | | (2,039,673) | |
| Advantest Corp. | | | (469,496) | | | | (5,850,137) | |
| Aeon Credit Service Co., Ltd. | | | (170,100) | | | | (4,561,296) | |
| Amada Co., Ltd. | | | (25,000) | | | | (220,783) | |
| Aozora Bank Ltd. | | | (194,000) | | | | (549,774) | |
| Asahi Glass Co., Ltd. | | | (525,000) | | | | (3,269,064) | |
| Asics Corp. | | | (125,000) | | | | (2,136,533) | |
| Canon, Inc. | | | (36,200) | | | | (1,155,084) | |
| Capcom Co., Ltd. | | | (40,287) | | | | (722,482) | |
| Chugoku Electric Power Co., Inc./The | | | (32,400) | | | | (504,478) | |
| Credit Saison Co., Ltd. | | | (39,813) | | | | (1,049,550) | |
| CyberAgent, Inc. | | | (29,100) | | | | (1,185,335) | |
| Daido Steel Co., Ltd. | | | (74,000) | | | | (368,268) | |
| Dai-ichi Life Insurance Co., Ltd./The | | | (96,400) | | | | (1,613,063) | |
| Daikin Industries Ltd. | | | (74,900) | | | | (4,673,965) | |
| Dainippon Screen Manufacturing Co., Ltd. † | | | (399,000) | | | | (2,261,033) | |
| | | | | | | | |
| | | SHARES | | | VALUE
(Note 3) | |
| Japan - (18.9)% (continued) | | | | | |
| Dainippon Sumitomo Pharma Co., Ltd. | | | (51,300) | | | $ | (803,510) | |
| Daiwa Securities Group, Inc. | | | (1,000) | | | | (10,016) | |
| Dena Co., Ltd. | | | (55,600) | | | | (1,172,073) | |
| Disco Corp. | | | (48,100) | | | | (3,192,545) | |
| Don Quijote Holdings Co., Ltd. | | | (9,100) | | | | (551,643) | |
| Eisai Co., Ltd. | | | (22,900) | | | | (887,537) | |
| Electric Power Development Co., Ltd. | | | (34,800) | | | | (1,014,656) | |
| FANUC Corp. | | | (16,500) | | | | (3,023,471) | |
| Fast Retailing Co., Ltd. | | | (22,100) | | | | (9,127,806) | |
| Furukawa Electric Co., Ltd. | | | (593,000) | | | | (1,490,751) | |
| GS Yuasa Corp. | | | (1,033,853) | | | | (5,948,551) | |
| Hisamitsu Pharmaceutical Co., Inc. | | | (7,800) | | | | (393,060) | |
| Hitachi Capital Corp. | | | (11,400) | | | | (332,528) | |
| Hitachi Construction Machinery Co., Ltd. | | | (169,495) | | | | (3,626,912) | |
| Hitachi Ltd. | | | (630,000) | | | | (4,776,756) | |
| Hitachi Metals Ltd. | | | (429,000) | | | | (6,070,047) | |
| Hokkaido Electric Power Co., Inc. † | | | (143,334) | | | | (1,649,439) | |
| Hokuriku Electric Power Co. | | | (29,824) | | | | (405,023) | |
| Honda Motor Co., Ltd. | | | (59,800) | | | | (2,468,372) | |
| Ibiden Co., Ltd. | | | (82,300) | | | | (1,541,055) | |
| Inpex Corp. | | | (132,100) | | | | (1,694,337) | |
| Isuzu Motors Ltd. | | | (76,000) | | | | (474,008) | |
| Itochu Techno-Solutions Corp. | | | (13,800) | | | | (559,361) | |
| JFE Holdings, Inc. | | | (97,700) | | | | (2,328,196) | |
| JX Holdings, Inc. | | | (111,400) | | | | (573,649) | |
| Kakaku.com, Inc. | | | (220,100) | | | | (3,866,368) | |
| Kansai Paint Co., Ltd. | | | (160,000) | | | | (2,366,069) | |
| Kawasaki Heavy Industries Ltd. | | | (595,868) | | | | (2,502,513) | |
| Kawasaki Kisen Kaisha Ltd. | | | (413,646) | | | | (1,047,687) | |
| Keikyu Corp. | | | (139,000) | | | | (1,146,071) | |
| Kikkoman Corp. | | | (82,000) | | | | (1,550,485) | |
| Kintetsu Corp. | | | (98,000) | | | | (343,868) | |
| Kobe Steel Ltd. † | | | (2,125,116) | | | | (3,643,268) | |
| Komatsu Ltd. | | | (475,200) | | | | (9,756,469) | |
| Konami Corp. | | | (8,900) | | | | (205,802) | |
| K’s Holdings Corp. | | | (15,104) | | | | (436,479) | |
| Kubota Corp. | | | (237,000) | | | | (3,931,173) | |
| Kuraray Co., Ltd. | | | (47,800) | | | | (570,579) | |
| Kurita Water Industries Ltd. | | | (5,600) | | | | (116,173) | |
| Kyushu Electric Power Co., Inc. † | | | (92,300) | | | | (1,178,835) | |
| Lawson, Inc. | | | (10,900) | | | | (815,712) | |
| LIXIL Group Corp. | | | (157,600) | | | | (4,326,489) | |
| M3, Inc. | | | (153) | | | | (383,168) | |
| Makita Corp. | | | (82,700) | | | | (4,349,413) | |
| MEIJI Holdings Co., Ltd. | | | (3,500) | | | | (224,970) | |
| Minebea Co., Ltd. | | | (586,649) | | | | (4,298,025) | |
| Mitsubishi Corp. | | | (23,900) | | | | (458,830) | |
| Mitsubishi Gas Chemical Co., Inc. | | | (261,000) | | | | (1,924,025) | |
| Mitsubishi Logistics Corp. | | | (82,000) | | | | (1,298,092) | |
| Mitsubishi Motors Corp. † | | | (28,924) | | | | (311,173) | |
| Mitsui Chemicals, Inc. | | | (1,223,025) | | | | (2,957,291) | |
| Mitsui OSK Lines Ltd. | | | (1,091,000) | | | | (4,923,896) | |
| Mori Seiki Co., Ltd. | | | (115,900) | | | | (2,088,650) | |
| Murata Manufacturing Co., Ltd. | | | (9,873) | | | | (878,039) | |
| Nabtesco Corp. | | | (217,303) | | | | (5,015,089) | |
| Nachi-Fujikoshi Corp. | | | (212,000) | | | | (1,197,538) | |
| Nexon Co., Ltd. | | | (2,900) | | | | (26,796) | |
| NGK Insulators Ltd. | | | (207,000) | | | | (3,939,393) | |
| | | | |
| | The accompanying notes are an integral part of these financial statements. | | (Continued) |
| | | | | | | | | | | | | | | | |
| | AQR Funds | | | | | | Annual Report | | | | | | December 2013 | | 149 |
| | | | | | | | | | |
| | | | |
| Consolidated Schedule of Investments | | | December 31, 2013 | |
| | |
| AQR MULTI-STRATEGY ALTERNATIVE FUND | | |
| | | | | | | | |
| | | SHARES | | | VALUE
(Note 3) | |
| Japan - (18.9)% (continued) | | | | | |
| Nidec Corp. | | | (91,800) | | | $ | (9,043,645) | |
| Nikon Corp. | | | (255,495) | | | | (4,882,695) | |
| Nippon Electric Glass Co., Ltd. | | | (399,000) | | | | (2,096,008) | |
| Nippon Sheet Glass Co., Ltd. † | | | (1,152,236) | | | | (1,502,355) | |
| Nippon Steel & Sumitomo Metal Corp. | | | (911,071) | | | | (3,055,556) | |
| Nippon Yusen KK | | | (245,000) | | | | (783,370) | |
| Nissan Motor Co., Ltd. | | | (650,800) | | | | (5,453,709) | |
| Nissin Foods Holdings Co., Ltd. | | | (3,300) | | | | (139,264) | |
| Nitori Holdings Co., Ltd. | | | (31,250) | | | | (2,958,660) | |
| Nitto Denko Corp. | | | (7,900) | | | | (334,049) | |
| NOK Corp. | | | (37,400) | | | | (612,575) | |
| Nomura Research Institute Ltd. | | | (2,000) | | | | (63,206) | |
| NTN Corp. † | | | (1,263,402) | | | | (5,746,163) | |
| NTT Data Corp. | | | (17,000) | | | | (628,040) | |
| Oji Holdings Corp. | | | (22,000) | | | | (112,847) | |
| Olympus Corp. † | | | (22,000) | | | | (697,768) | |
| Ono Pharmaceutical Co., Ltd. | | | (15,145) | | | | (1,327,542) | |
| Oriental Land Co., Ltd. | | | (2,600) | | | | (374,957) | |
| OSAKA Titanium Technologies Co., Ltd. | | | (5,300) | | | | (92,304) | |
| Rakuten, Inc. | | | (390,068) | | | | (5,821,153) | |
| Ricoh Co., Ltd. | | | (203,000) | | | | (2,158,868) | |
| Rinnai Corp. | | | (9,600) | | | | (747,919) | |
| Saizeriya Co., Ltd. | | | (5) | | | | (61) | |
| Sanrio Co., Ltd. | | | (7,300) | | | | (307,383) | |
| Sawai Pharmaceutical Co., Ltd. | | | (18,400) | | | | (1,188,089) | |
| Sega Sammy Holdings, Inc. | | | (5,700) | | | | (145,266) | |
| Seven Bank Ltd. | | | (168,672) | | | | (659,687) | |
| Sharp Corp. † | | | (132,000) | | | | (420,275) | |
| Shikoku Electric Power Co., Inc. † | | | (282,173) | | | | (4,231,588) | |
| Shimano, Inc. | | | (7,100) | | | | (609,529) | |
| Shiseido Co., Ltd. | | | (9,300) | | | | (149,557) | |
| Showa Denko KK | | | (150,000) | | | | (212,747) | |
| SMC Corp. | | | (15,700) | | | | (3,962,500) | |
| Sojitz Corp. | | | (18,300) | | | | (32,582) | |
| Sony Corp. | | | (33,500) | | | | (577,484) | |
| Sony Financial Holdings, Inc. | | | (11,500) | | | | (209,481) | |
| Start Today Co., Ltd. | | | (86,064) | | | | (2,140,026) | |
| Sumco Corp. | | | (59,300) | | | | (523,139) | |
| Sumitomo Chemical Co., Ltd. | | | (1,354,362) | | | | (5,315,648) | |
| Sumitomo Mitsui Trust Holdings, Inc. | | | (403,000) | | | | (2,132,360) | |
| Sumitomo Rubber Industries Ltd. | | | (57,200) | | | | (814,226) | |
| Suruga Bank Ltd. | | | (108,000) | | | | (1,939,381) | |
| Sysmex Corp. | | | (22,500) | | | | (1,328,967) | |
| T&D Holdings, Inc. | | | (20,400) | | | | (285,531) | |
| Taiheiyo Cement Corp. | | | (1,692,923) | | | | (6,510,559) | |
| Taiyo Nippon Sanso Corp. | | | (333,680) | | | | (2,375,984) | |
| Takeda Pharmaceutical Co., Ltd. | | | (12,400) | | | | (568,727) | |
| TDK Corp. | | | (88,100) | | | | (4,226,507) | |
| Terumo Corp. | | | (90,700) | | | | (4,378,964) | |
| Toho Gas Co., Ltd. | | | (21,000) | | | | (102,226) | |
| Toho Titanium Co., Ltd. | | | (11,300) | | | | (78,930) | |
| Tokai Carbon Co., Ltd. | | | (280,000) | | | | (978,083) | |
| Tokuyama Corp. | | | (246,068) | | | | (935,519) | |
| TonenGeneral Sekiyu KK | | | (36,000) | | | | (330,338) | |
| Toray Industries, Inc. | | | (70,000) | | | | (484,891) | |
| Toshiba Corp. | | | (1,356,398) | | | | (5,710,183) | |
| Toyota Industries Corp. | | | (28,900) | | | | (1,306,412) | |
| Trend Micro, Inc. | | | (7,200) | | | | (252,310) | |
| | | | | | | | |
| | | SHARES | | | VALUE
(Note 3) | |
| Japan - (18.9)% (continued) | | | | | |
| Tsumura & Co. | | | (67,300) | | | $ | (1,783,442) | |
| Unicharm Corp. | | | (23,500) | | | | (1,340,875) | |
| Yahoo Japan Corp. | | | (765,600) | | | | (4,269,293) | |
| Yakult Honsha Co., Ltd. | | | (23,168) | | | | (1,170,638) | |
| Yamada Denki Co., Ltd. | | | (1,622,670) | | | | (5,307,716) | |
| Yamaha Motor Co., Ltd. | | | (385,119) | | | | (5,790,029) | |
| Yaskawa Electric Corp. | | | (297,000) | | | | (4,706,143) | |
| Yokogawa Electric Corp. | | | (49,100) | | | | (754,903) | |
| | | | | | | | |
| | | | | | | (289,529,413) | |
| | | | | | | | |
| Luxembourg - (0.8)% | | | | | | | | |
| ArcelorMittal | | | (682,384) | | | | (12,188,854) | |
| Oriflame Cosmetics SA | | | (10,340) | | | | (317,888) | |
| | | | | | | | |
| | | | | | | (12,506,742) | |
| | | | | | | | |
| Mexico - (0.6)% | | | | | | | | |
| Cemex SAB de CV ADR (1) | | | (800,518) | | | | (9,470,128) | |
| | | | | | | | |
| Netherlands - (1.8)% | | | | | | | | |
| ASML Holding NV | | | (124,851) | | | | (11,693,758) | |
| Delta Lloyd NV | | | (8,120) | | | | (201,651) | |
| Fugro NV CVA | | | (128,639) | | | | (7,673,520) | |
| Heineken NV | | | (2,844) | | | | (192,216) | |
| Koninklijke KPN NV † | | | (698,826) | | | | (2,257,972) | |
| Koninklijke Vopak NV | | | (16,707) | | | | (978,066) | |
| PostNL NV † | | | (239,285) | | | | (1,367,977) | |
| QIAGEN NV † | | | (7,820) | | | | (182,567) | |
| Randstad Holding NV | | | (31,666) | | | | (2,054,906) | |
| SBM Offshore NV † | | | (24,873) | | | | (506,776) | |
| Wolters Kluwer NV | | | (11,897) | | | | (339,711) | |
| | | | | | | | |
| | | | | | | (27,449,120) | |
| | | | | | | | |
| Norway - (0.5)% | | | | | | | | |
| Aker Solutions ASA | | | (144,165) | | | | (2,581,079) | |
| Marine Harvest ASA | | | (578,092) | | | | (705,170) | |
| Norsk Hydro ASA | | | (347,275) | | | | (1,553,544) | |
| Schibsted ASA | | | (5,694) | | | | (377,345) | |
| Storebrand ASA † | | | (245,416) | | | | (1,538,415) | |
| TGS Nopec Geophysical Co. ASA | | | (28,027) | | | | (744,725) | |
| | | | | | | | |
| | | | | | | (7,500,278) | |
| | | | | | | | |
| Spain - (1.1)% | | | | | | | | |
| Abertis Infraestructuras SA | | | (145,008) | | | | (3,225,395) | |
| Acciona SA | | | (28,093) | | | | (1,618,300) | |
| Amadeus IT Holding SA, A Shares | | | (22,856) | | | | (979,044) | |
| Banco de Sabadell SA | | | (160,035) | | | | (417,886) | |
| Banco Popular Espanol SA † | | | (171,178) | | | | (1,033,942) | |
| Grifols SA | | | (16,756) | | | | (801,832) | |
| Mapfre SA | | | (227,747) | | | | (976,894) | |
| Mediaset Espana Comunicacion SA † | | | (175,825) | | | | (2,031,404) | |
| Obrascon Huarte Lain SA | | | (5,354) | | | | (217,217) | |
| Red Electrica Corp. SA | | | (24,495) | | | | (1,635,279) | |
| Telefonica SA | | | (223,534) | | | | (3,654,953) | |
| | | | | | | | |
| | | | | | | (16,592,146) | |
| | | | | | | | |
| Sweden - (2.4)% | | | | | | | | |
| Alfa Laval AB | | | (56,252) | | | | (1,445,294) | |
| Assa Abloy AB, Class B | | | (31,409) | | | | (1,662,921) | |
| Atlas Copco AB, A Shares | | | (93,616) | | | | (2,599,347) | |
| | | | |
| | The accompanying notes are an integral part of these financial statements. | | (Continued) |
| | | | | | | | | | | | | | | | |
| 150 | | AQR Funds | | | | | | Annual Report | | | | | | December 2013 | | |
| | | | | | | | | | |
| | | | |
| Consolidated Schedule of Investments | | | December 31, 2013 | |
| | |
| AQR MULTI-STRATEGY ALTERNATIVE FUND | | |
| | | | | | | | |
| | | SHARES | | | VALUE
(Note 3) | |
| Sweden - (2.4)% (continued) | | | | | | | | |
| Elekta AB, B Shares | | | (261,558) | | | $ | (4,002,656) | |
| Getinge AB, B Shares | | | (1,933) | | | | (66,259) | |
| Hennes & Mauritz AB, B Shares | | | (56,903) | | | | (2,620,752) | |
| Hexagon AB, B Shares | | | (132,458) | | | | (4,189,944) | |
| Husqvarna AB, B Shares | | | (331,409) | | | | (1,995,553) | |
| ICA Gruppen AB † | | | (231) | | | | (7,225) | |
| Lundin Petroleum AB † | | | (31,762) | | | | (618,104) | |
| Modern Times Group AB, B Shares | | | (38,861) | | | | (2,014,538) | |
| Sandvik AB | | | (278,071) | | | | (3,924,609) | |
| Scania AB, B Shares | | | (36,864) | | | | (722,511) | |
| SKF AB, B Shares | | | (36,699) | | | | (962,446) | |
| SSAB AB, A Shares | | | (430,427) | | | | (3,306,566) | |
| Svenska Handelsbanken AB, A Shares | | | (45,327) | | | | (2,228,584) | |
| Volvo AB, B Shares | | | (262,861) | | | | (3,458,829) | |
| | | | | | | | |
| | | | | | | (35,826,138) | |
| | | | | | | | |
| Switzerland - (2.2)% | | | | | | | | |
| Cie Financiere Richemont SA | | | (10,354) | | | | (1,034,338) | |
| Clariant AG † | | | (163,115) | | | | (2,985,504) | |
| Credit Suisse Group AG † | | | (230,812) | | | | (7,123,638) | |
| Dufry AG † | | | (4,816) | | | | (846,073) | |
| GAM Holding AG † | | | (24,666) | | | | (480,257) | |
| Geberit AG | | | (2,724) | | | | (826,410) | |
| Givaudan SA † | | | (342) | | | | (489,253) | |
| Holcim Ltd. † | | | (22,543) | | | | (1,685,420) | |
| Julius Baer Group Ltd. † | | | (84,639) | | | | (4,067,414) | |
| Kuehne + Nagel International AG | | | (25,126) | | | | (3,302,547) | |
| SGS SA | | | (149) | | | | (343,036) | |
| Sonova Holding AG † | | | (30,837) | | | | (4,158,211) | |
| Swatch Group AG/The | | | (5,832) | | | | (3,865,472) | |
| UBS AG † | | | (35,060) | | | | (671,306) | |
| Zurich Insurance Group AG † | | | (3,978) | | | | (1,153,875) | |
| | | | | | | | |
| | | | | | | (33,032,754) | |
| | | | | | | | |
| United Kingdom - (0.3)% | | | | | | | | |
| Subsea 7 SA | | | (210,043) | | | | (4,026,711) | |
| | | | | | | | |
| United States - (26.4)% | | | | | | | | |
| Alpha Natural Resources, Inc. (1)† | | | (75,731) | | | | (540,719) | |
| American Realty Capital Properties, Inc. REIT (1) | | | (81,634) | | | | (1,049,813) | |
| Amkor Technology, Inc. (1)† | | | (1,148,950) | | | | (7,043,063) | |
| Annaly Capital Management, Inc. REIT (1) | | | (2,798) | | | | (27,896) | |
| Applied Materials, Inc. (1) | | | (140,047) | | | | (2,477,431) | |
| Ares Capital Corp. (1) | | | (18,689) | | | | (332,104) | |
| Avis Budget Group, Inc. (1)† | | | (522,416) | | | | (21,116,055) | |
| Bunge Ltd. (1) | | | (1,295) | | | | (106,332) | |
| Chart Industries, Inc. (1)† | | | (28,343) | | | | (2,710,725) | |
| Chesapeake Energy Corp. (1) | | | (9,371) | | | | (254,329) | |
| Ciena Corp. (1)† | | | (126,354) | | | | (3,023,651) | |
| Covanta Holding Corp. (1) | | | (203,447) | | | | (3,611,184) | |
| DDR Corp. REIT (1) | | | (70,480) | | | | (1,083,278) | |
| Digital Realty Trust, Inc. REIT (1) | | | (24,993) | | | | (1,227,656) | |
| Dominion Resources, Inc. (1) | | | (78,792) | | | | (5,097,054) | |
| DR Horton, Inc. (1)† | | | (113,455) | | | | (2,532,316) | |
| Electronic Arts, Inc. (1)† | | | (8,637) | | | | (198,133) | |
| Equinix, Inc. (1)† | | | (51,193) | | | | (9,084,198) | |
| Exelixis, Inc. (1)† | | | (105,835) | | | | (648,769) | |
| Exterran Holdings, Inc. (1)† | | | (125,698) | | | | (4,298,872) | |
| | | | | | | | |
| | | SHARES | | | VALUE
(Note 3) | |
| United States - (26.4)% (continued) | | | | | | | | |
| Extra Space Storage, Inc. REIT (1) | | | (4,211) | | | $ | (177,409) | |
| General Cable Corp. (1) | | | (220,817) | | | | (6,494,228) | |
| Gilead Sciences, Inc. (1)† | | | (491,617) | | | | (36,945,018) | |
| Goodyear Tire & Rubber Co./The (1) | | | (89,452) | | | | (2,133,430) | |
| Health Care REIT, Inc. REIT (1) | | | (51,193) | | | | (2,742,409) | |
| Host Hotels & Resorts, Inc. REIT (1) | | | (297,506) | | | | (5,783,517) | |
| JetBlue Airways Corp. (1)† | | | (73,332) | | | | (626,989) | |
| L-3 Communications Holdings, Inc. (1) | | | (25,384) | | | | (2,712,534) | |
| Lam Research Corp. (1)† | | | (187,379) | | | | (10,202,787) | |
| Lennar Corp., Class A (1) | | | (445,443) | | | | (17,621,725) | |
| MGIC Investment Corp. (1)† | | | (1,248,189) | | | | (10,534,715) | |
| MGM Resorts International (1)† | | | (218,014) | | | | (5,127,689) | |
| Microchip Technology, Inc. (1) | | | (431,749) | | | | (19,320,768) | |
| Micron Technology, Inc. (1)† | | | (1,451,412) | | | | (31,582,725) | |
| Navistar International Corp. (1)† | | | (323) | | | | (12,335) | |
| NextEra Energy, Inc. (1) | | | (100,646) | | | | (8,617,311) | |
| NorthStar Realty Finance Corp. REIT (1) | | | (8,526) | | | | (114,675) | |
| NVIDIA Corp. (1) | | | (244,439) | | | | (3,915,913) | |
| Omnicare, Inc. (1) | | | (3,474) | | | | (209,691) | |
| PHH Corp. (1)† | | | (1,081,570) | | | | (26,336,229) | |
| PPL Corp. (1) | | | (19,561) | | | | (588,590) | |
| Prologis, Inc. REIT (1) | | | (247) | | | | (9,127) | |
| Radian Group, Inc. (1) | | | (941,839) | | | | (13,298,767) | |
| Regeneron Pharmaceuticals, Inc. (1)† | | | (76,400) | | | | (21,028,336) | |
| Ryman Hospitality Properties, Inc. REIT (1) | | | (130,977) | | | | (5,472,219) | |
| Salesforce.com, Inc. (1)† | | | (228,590) | | | | (12,615,882) | |
| SanDisk Corp. (1) | | | (206,607) | | | | (14,574,058) | |
| Sirius XM Holdings, Inc. (1)† | | | (3,442,132) | | | | (12,013,041) | |
| SL Green Realty Corp. REIT (1) | | | (45,532) | | | | (4,206,246) | |
| Standard Pacific Corp. (1)† | | | (203,240) | | | | (1,839,322) | |
| Stanley Black & Decker, Inc. (1) | | | (4,318) | | | | (348,419) | |
| Stillwater Mining Co. (1)† | | | (134,029) | | | | (1,653,918) | |
| SunEdison, Inc. (1)† | | | (25,127) | | | | (327,907) | |
| SunPower Corp. (1)† | | | (46,161) | | | | (1,376,059) | |
| Swift Transportation Co. (1)† | | | (30,176) | | | | (670,209) | |
| Tesla Motors, Inc. (1)† | | | (29,693) | | | | (4,465,233) | |
| Theravance, Inc. (1)† | | | (10,820) | | | | (385,733) | |
| United States Steel Corp. (1) | | | (19,671) | | | | (580,294) | |
| VeriSign, Inc. (1)† | | | (540,362) | | | | (32,302,840) | |
| Vishay Intertechnology, Inc. (1)† | | | (164,199) | | | | (2,177,279) | |
| Web.com Group, Inc. (1)† | | | (55,786) | | | | (1,773,437) | |
| WebMD Health Corp. (1)† | | | (25,545) | | | | (1,009,028) | |
| Xilinx, Inc. (1) | | | (186,294) | | | | (8,554,620) | |
| Yahoo!, Inc. (1)† | | | (104,740) | | | | (4,235,686) | |
| | | | | | | | |
| | | | | | | (403,181,925) | |
| | | | | | | | |
| TOTAL COMMON STOCKS SOLD SHORT | | | | | |
(proceeds $817,398,298) | | | | | | | (970,086,630) | |
| | | | | | | | |
| | |
| PREFERRED STOCKS - (0.3)% | | | | | | | | |
| Germany - (0.3)% | | | | | | | | |
| Fuchs Petrolub SE | | | (3,908) | | | | (382,851) | |
| Volkswagen AG | | | (16,827) | | | | (4,735,435) | |
| | | | | | | | |
| TOTAL PREFERRED STOCKS SOLD SHORT | | | | | |
(proceeds $4,181,007) | | | | | | | (5,118,286) | |
| | | | | | | | |
| | | | |
| | The accompanying notes are an integral part of these financial statements. | | (Continued) |
| | | | | | | | | | | | | | | | |
| | AQR Funds | | | | | | Annual Report | | | | | | December 2013 | | 151 |
| | | | | | | | | | |
| | | | |
| Consolidated Schedule of Investments | | | December 31, 2013 | |
| | |
| AQR MULTI-STRATEGY ALTERNATIVE FUND | | |
| | | | | | | | |
| | | SHARES | | | VALUE
(Note 3) | |
|
| EXCHANGE TRADED FUNDS - (0.1)% | |
| Germany - (0.1)% | | | | | | | | |
SPDR S&P 500 ETF Trust (1)
(proceeds $1,903,100) | | | (10,587) | | | $ | (1,955,101) | |
| | | | | | | | |
| | |
| | | PRINCIPAL
AMOUNT
(000’S) | | | | |
|
| U.S. TREASURY OBLIGATIONS - (0.1)% | |
U.S. Treasury Note, 0.477%, 10/15/15 (proceeds $1,326,754) | | $ | (1,333,000) | | | | (1,331,282) | |
| | | | | | | | |
| TOTAL SECURITIES SOLD SHORT | | | | | | | | |
(proceeds $824,809,159) | | | | | | | (978,491,299) | |
| | | | | | | | |
| TOTAL INVESTMENTS, NET OF SECURITIES SOLD SHORT - 61.6% | | | | | | | | |
(Cost $859,511,384) | | | | | | | 941,716,217 | |
| | | | | | | | |
| OTHER ASSETS IN EXCESS OF LIABILITIES - 38.4% (j) | | | | | | | 586,901,749 | |
| | | | | | | | |
| NET ASSETS - 100.0% | | | | | | $ | 1,528,617,966 | |
| | | | | | | | |
| | | | | | | | |
| SECTOR | | VALUE | | | % OF NET
ASSETS | |
| Consumer Discretionary | | $ | 15,802,500 | | | | 1.0 | % |
| Consumer Staples | | | 51,921,669 | | | | 3.4 | |
| Energy | | | (703,927) | | | | 0.0 | |
| Exchange Traded Fund | | | (1,955,101) | | | | (0.1) | |
| Financials | | | 95,981,606 | | | | 6.3 | |
| Health Care | | | 49,150,342 | | | | 3.2 | |
| Industrials | | | 46,835,998 | | | | 3.1 | |
| Information Technology | | | 17,380,356 | | | | 1.1 | |
| Materials | | | 2,567,767 | | | | 0.2 | |
| Telecommunication Services | | | 41,484,434 | | | | 2.7 | |
| Utilities | | | 45,295,351 | | | | 3.0 | |
| Money Market Funds^ | | | 520,429,397 | | | | 34.0 | |
| Other Investments | | | 57,525,825 | | | | 3.7 | |
| | | | | | | | |
| Total Investments | | | 941,716,217 | | | | 61.6 | |
| Other Assets in Excess of Liabilities (j) | | | 586,901,749 | | | | 38.4 | |
| | | | | | | | |
| Net Assets | | $ | 1,528,617,966 | | | | 100.0 | % |
| | | | | | | | |
| † | Non income-producing security. |
| (a) | All or a portion of this security has been segregated as collateral for securities sold short and can be sold or replaced subject to the broker’s right to re-hypothecate. At December 31, 2013, the value of these securities was $433,398,284. In addition, $505,981,024 of cash collateral was pledged. |
| (b) | Represents less than 0.05 percent of net assets. |
| (c) | Security is perpetual and, thus, does not have a predetermined maturity date. The coupon rate for this security is fixed for a period of time and may be structured to adjust thereafter. The date shown, if applicable, reflects the next call date. The coupon rate shown is the rate in effect as of December 31, 2013. |
| (d) | Rule 144A, Section 4(2) or other security which is restricted as to resale to institutional investors. The Fund Advisor has deemed this |
| | security to be liquid based upon procedures approved by the Board of Trustees. |
| (f) | Security fair valued at as of December 31, 2013 using procedures approved by the Board of Trustees. The total value of positions fair valued was $1,089,000 or 0.1% of total net assets. |
| (g) | Represents a step bond. The rate shown reflects the yield at December 31, 2013. |
| (h) | Represents annualized seven-day yield as of December 31, 2013. |
| (i) | The rate shown is the effective yield at the date of purchase. |
| (j) | Includes appreciation/(depreciation) on forward foreign currency exchange, futures and swap contracts. |
| ^ | All or a portion represents positions held in the respective Subsidiary (Note 2). |
| * | All or a portion of this security has been segregated for covered call options written. |
All securities are Level 2 with respect to ASC 820, unless otherwise noted in parentheses.
| (1) | Level 1 security (See Note 5). |
| (3) | Level 3 security (See Note 5). |
The following abbreviations are used in portfolio descriptions:
144A - Restricted Security
ADR - American Depositary Receipt
CVA - Dutch Certification
EUR - Euro
NVDR - Non-Voting Depository Receipt
REIT - Real Estate Investment Trust
SDR - Special Drawing Rights
USD - United States Dollar
| | | | |
| | The accompanying notes are an integral part of these financial statements. | | (Continued) |
| | | | | | | | | | | | | | | | |
| 152 | | AQR Funds | | | | | | Annual Report | | | | | | December 2013 | | |
| | | | | | | | | | |
| | | | |
| Consolidated Schedule of Investments | | | December 31, 2013 | |
| | |
| AQR MULTI-STRATEGY ALTERNATIVE FUND | | |
Credit default swap contracts sell protection as of December 31, 2013:
Exchange Cleared
| | | | | | | | | | | | | | | | | | | | | | | | | | | | |
| COUNTERPARTY | | REFERENCE
ENTITY | | FIXED
ANNUAL
RATE
RECEIVED
BY FUND | | CURRENCY | | | CREDIT
SPREAD | | | NOTIONAL
AMOUNT | | | UPFRONT
PREMIUM
(RECEIVED)
PAID | | | TERMINATION
DATE | | | UNREALIZED
APPRECIATION
(DEPRECIATION) | |
| CitiBank | | Markit CDX North America High Yield Index Series 21 | | 5.000% | | | USD | | | | 3.060% | | | | 15,975,000 | | | | $698,003 | | | | 12/20/2018 | | | | $690,487 | |
| | | | | | | | | | | | | | | | | | | | | | | | | | | | |
Cash held as collateral at CitiBank was $662,813 at December 31, 2013.
Open written options contracts outstanding at December 31, 2013:
Call options written
| | | | | | | | | | | | | | | | | | | | | | |
| SHARES | | | ISSUER | | COUNTERPARTY | | EXPIRATION
DATE | | | PROCEEDS | | | VALUE AT
DECEMBER 31,
2013 | | | UNREALIZED
APPRECIATION
(DEPRECIATION) | |
| | 1,432 | | | Sprint Nextel Corp. (Exercise price $10) | | J.P. Morgan | | | January 18, 2014 | | | | $(10,237) | | | | $(1,432) | | | | $8,805 | |
| | | | | | | | | | | | | | | | | | | | | | |
Total return swap contracts outstanding as of December 31, 2013:
Over the Counter
| | | | | | | | | | | | | | | | |
| COUNTERPARTY | | UNDERLYING REFERENCE
INSTRUMENT | | TERMINATION
DATE | | CURRENCY | | | NOTIONAL
VALUE | | | UNREALIZED
APPRECIATION
(DEPRECIATION) | |
| Bank of America | | 10-Year Canadian Bond | | 3/20/2014 | | | CAD | | | | (4,619,279) | | | | $52,740 | |
| Bank of America | | 10-Year Japanese Government Bond | | 3/11/2014 | | | JPY | | | | (1,583,543,800) | | | | 66,882 | |
| Bank of America | | 30-Year Euro Buxl Bond | | 3/6/2014 | | | EUR | | | | (10,670,252) | | | | 240,101 | |
| Morgan Stanley and Co., International PLC | | Bovespa Index | | 2/12/2014 | | | BRL | | | | (49,513,834) | | | | (420,174) | |
| Deutsche Bank | | Brent Crude Futures^ | | 1/16/2014 | | | USD | | | | 40,987,990 | | | | 562,010 | |
| Deutsche Bank | | Brent Crude Futures^ | | 1/16/2014 | | | USD | | | | (42,037,500) | | | | 487,500 | |
| Deutsche Bank | | Brent Crude Futures^ | | 3/13/2014 | | | USD | | | | 41,910,000 | | | | (461,250) | |
| Barclays Capital | | Cocoa Futures^ | | 3/14/2014 | | | GBP | | | | 17,300 | | | | — | |
| Barclays Capital | | Corn Futures^ | | 3/14/2014 | | | USD | | | | 4,287,075 | | | | (172,507) | |
| Barclays Capital | | Corn Futures^ | | 3/14/2014 | | | USD | | | | (12,905,688) | | | | 393,232 | |
| Deutsche Bank | | Corn Futures^ | | 3/14/2014 | | | USD | | | | 1,777,000 | | | | (89,000) | |
| Bank of America | | Euro—Bobl Futures | | 3/6/2014 | | | EUR | | | | 5,907,435 | | | | (80,853) | |
| Bank of America | | Euro—Bund Futures | | 3/6/2014 | | | EUR | | | | 42,816,203 | | | | (883,379) | |
| Bank of America | | Euro—SCHATZ Futures | | 3/6/2014 | | | EUR | | | | (70,358,821) | | | | (17,470) | |
| Deutsche Bank | | Gas Oil Futures^ | | 1/10/2014 | | | USD | | | | 5,292,075 | | | | (4,275) | |
| Deutsche Bank | | Gas Oil Futures^ | | 1/10/2014 | | | USD | | | | (5,135,200) | | | | (152,600) | |
| Deutsche Bank | | Gas Oil Futures^ | | 2/12/2014 | | | USD | | | | (1,517,600) | | | | 8,000 | |
| Deutsche Bank | | Gasoline RBOB Futures^ | | 1/31/2014 | | | USD | | | | 6,991,723 | | | | 145,752 | |
| Deutsche Bank | | Gasoline RBOB Futures^ | | 1/31/2014 | | | USD | | | | (7,258,798) | | | | (112,693) | |
| | | | |
| | The accompanying notes are an integral part of these financial statements. | | (Continued) |
| | | | | | | | | | | | | | | | |
| | AQR Funds | | | | | | Annual Report | | | | | | December 2013 | | 153 |
| | | | | | | | | | |
| | | | |
| Consolidated Schedule of Investments | | | December 31, 2013 | |
| | |
| AQR MULTI-STRATEGY ALTERNATIVE FUND | | |
| | | | | | | | | | | | | | | | |
| COUNTERPARTY | | UNDERLYING REFERENCE
INSTRUMENT | | TERMINATION
DATE | | CURRENCY | | | NOTIONAL
VALUE | | | UNREALIZED
APPRECIATION
(DEPRECIATION) | |
| Deutsche Bank | | Heating Oil Futures^ | | 1/31/2014 | | | USD | | | | 9,436,362 | | | | $90,279 | |
| Deutsche Bank | | Heating Oil Futures^ | | 1/31/2014 | | | USD | | | | (13,229,587) | | | | (30,468) | |
| Morgan Stanley and Co., International PLC | | H-SHARES Index Futures | | 1/29/2014 | | | HKD | | | | 97,678,095 | | | | 186,197 | |
| Barclays Capital | | Lean Hogs Futures^ | | 2/14/2014 | | | USD | | | | 7,553,777 | | | | (514,681) | |
| Barclays Capital | | Lean Hogs Futures^ | | 2/14/2014 | | | USD | | | | (7,519,894) | | | | 241,648 | |
| Barclays Capital | | LME Aluminum Futures^ | | 3/17/2014 | | | USD | | | | (872,960) | | | | (24,415) | |
| Barclays Capital | | LME Copper Futures^ | | 3/17/2014 | | | USD | | | | (350,500) | | | | (17,788) | |
| Barclays Capital | | LME Copper Futures^ | | 3/27/2014 | | | USD | | | | (81,350) | | | | (3,562) | |
| Barclays Capital | | LME Nickel Futures^ | | 3/17/2014 | | | USD | | | | (565,614) | | | | (17,766) | |
| Bank of America | | Long Gilt Futures | | 3/27/2014 | | | GBP | | | | (80,397,480) | | | | 2,703,318 | |
| Morgan Stanley and Co., International PLC | | MSCI Taiwan Stock Index Futures | | 1/28/2014 | | | USD | | | | 118,043 | | | | 3,237 | |
| Deutsche Bank | | Natural Gas Futures^ | | 1/29/2014 | | | USD | | | | 22,216,980 | | | | (474,780) | |
| Deutsche Bank | | Natural Gas Futures^ | | 1/29/2014 | | | USD | | | | (32,536,480) | | | | (1,980,320) | |
| Barclays Capital | | Platinum Futures^ | | 4/28/2014 | | | USD | | | | (66,075) | | | | (2,615) | |
| Morgan Stanley and Co., International PLC | | Russian Depository Index | | 3/19/2014 | | | USD | | | | 10,864,003 | | | | 187,886 | |
| Morgan Stanley and Co., International PLC | | Russian Trading System Index Futures | | 3/17/2014 | | | USD | | | | 20,786,945 | | | | 721,570 | |
| Morgan Stanley and Co., International PLC | | SGX S&P CNX Nifty Index Futures | | 1/30/2014 | | | USD | | | | (8,636,268) | | | | (115,410) | |
| Merrill Lynch | | Silver Futures^ | | 3/27/2014 | | | USD | | | | (429,100) | | | | 41,700 | |
| Barclays Capital | | Soybean Futures^ | | 3/14/2014 | | | USD | | | | 19,836,000 | | | | (189,925) | |
| Barclays Capital | | Soybean Futures^ | | 3/14/2014 | | | USD | | | | (11,680,912) | | | | 242,191 | |
| Deutsche Bank | | Soybean Meal Futures^ | | 3/14/2014 | | | USD | | | | 43,225 | | | | (1,525) | |
| Barclays Capital | | Soybean Oil Futures^ | | 3/14/2014 | | | USD | | | | (2,010,312) | | | | 85,116 | |
| Morgan Stanley and Co., International PLC | | Swiss Market Index Futures | | 3/21/2014 | | | CHF | | | | (95,362,645) | | | | (5,481,164) | |
| Bank of America | | U.S. Treasury 10-Year Note Futures | | 3/20/2014 | | | USD | | | | 307,536,371 | | | | (5,579,339) | |
| Bank of America | | U.S. Treasury 2-Year Note Futures | | 3/31/2014 | | | USD | | | | 19,379,473 | | | | (35,973) | |
| Bank of America | | U.S. Treasury 5-Year Note Futures | | 3/31/2014 | | | USD | | | | (14,367,632) | | | | 50,132 | |
| Bank of America | | U.S. Treasury Long Bond Futures | | 3/20/2014 | | | USD | | | | (14,581,787) | | | | 210,787 | |
| Barclays Capital | | Wheat Futures^ | | 3/14/2014 | | | USD | | | | (11,776,678) | | | | 488,766 | |
| Barclays Capital | | Wheat Futures^ | | 3/14/2014 | | | USD | | | | (34,775) | | | | 2,750 | |
| Deutsche Bank | | WTI Crude Oil Futures^ | | 1/21/2014 | | | USD | | | | 52,357,710 | | | | 690,670 | |
| Deutsche Bank | | WTI Crude Oil Futures^ | | 1/21/2014 | | | USD | | | | (43,764,750) | | | | (819,510) | |
| | | | | | | | | | | | | | | | |
| | | | | | | | | | | | | | | $(9,780,978) | |
| | | | | | | | | | | | | | | | |
Money Market is pledged as collateral to Bank of America, Morgan Stanley and Co., International PLC, Merrill Lynch, Deutsche Bank and Barclays Capital for total return swap contracts in the amount of $2,870,193, $44,808,260, $10,000, $6,900,000 and $2,260,000, respectively at December 31, 2013.
| ^ | Represents positions held in the respective Subsidiary (Note 2). |
| | | | |
| | The accompanying notes are an integral part of these financial statements. | | (Continued) |
| | | | | | | | | | | | | | | | |
| 154 | | AQR Funds | | | | | | Annual Report | | | | | | December 2013 | | |
| | | | | | | | | | |
| | | | |
| Consolidated Schedule of Investments | | | December 31, 2013 | |
| | |
| AQR MULTI-STRATEGY ALTERNATIVE FUND | | |
Open futures contracts outstanding at December 31, 2013:
Exchange Traded
| | | | | | | | | | | | | | | | | | |
NUMBER OF
CONTRACTS | | COUNTERPARTY | | DESCRIPTION | | EXPIRATION
DATE | | VALUE AT
TRADE DATE | | | VALUE AT
DECEMBER 31,
2013 | | | UNREALIZED
APPRECIATION
(DEPRECIATION) | |
| Long Contracts: | | | | | | | | | | | | | | |
| 275 | | Goldman Sachs | | Cocoa Futures^ | | March 14, 2014 | | | $7,742,821 | | | | $7,607,101 | | | | $(135,720) | |
| 5 | | J.P. Morgan | | LME Aluminum Futures^ | | January 3, 2014 | | | 230,249 | | | | 219,344 | | | | (10,905) | |
| 7 | | J.P. Morgan | | LME Aluminum Futures^ | | January 8, 2014 | | | 326,946 | | | | 307,592 | | | | (19,354) | |
| 6 | | J.P. Morgan | | LME Aluminum Futures^ | | January 9, 2014 | | | 280,084 | | | | 263,738 | | | | (16,346) | |
| 9 | | J.P. Morgan | | LME Aluminum Futures^ | | January 10, 2014 | | | 424,049 | | | | 395,737 | | | | (28,312) | |
| 12 | | J.P. Morgan | | LME Aluminum Futures^ | | January 15, 2014 | | | 561,206 | | | | 528,525 | | | | (32,681) | |
| 18 | | J.P. Morgan | | LME Aluminum Futures^ | | February 5, 2014 | | | 817,687 | | | | 797,985 | | | | (19,702) | |
| 22 | | J.P. Morgan | | LME Aluminum Futures^ | | February 6, 2014 | | | 1,001,871 | | | | 975,618 | | | | (26,253) | |
| 29 | | J.P. Morgan | | LME Aluminum Futures^ | | February 7, 2014 | | | 1,315,592 | | | | 1,286,440 | | | | (29,152) | |
| 11 | | J.P. Morgan | | LME Aluminum Futures^ | | February 11, 2014 | | | 497,773 | | | | 488,565 | | | | (9,208) | |
| 14 | | J.P. Morgan | | LME Aluminum Futures^ | | February 12, 2014 | | | 631,167 | | | | 622,003 | | | | (9,164) | |
| 14 | | J.P. Morgan | | LME Aluminum Futures^ | | February 13, 2014 | | | 627,404 | | | | 622,195 | | | | (5,209) | |
| 22 | | J.P. Morgan | | LME Aluminum Futures^ | | February 14, 2014 | | | 981,946 | | | | 978,038 | | | | (3,908) | |
| 6 | | J.P. Morgan | | LME Aluminum Futures^ | | February 25, 2014 | | | 266,900 | | | | 267,504 | | | | 604 | |
| 11 | | J.P. Morgan | | LME Aluminum Futures^ | | February 26, 2014 | | | 490,348 | | | | 490,567 | | | | 219 | |
| 10 | | J.P. Morgan | | LME Aluminum Futures^ | | February 27, 2014 | | | 444,771 | | | | 446,098 | | | | 1,327 | |
| 4 | | J.P. Morgan | | LME Aluminum Futures^ | | March 3, 2014 | | | 174,108 | | | | 178,646 | | | | 4,538 | |
| 12 | | J.P. Morgan | | LME Aluminum Futures^ | | March 4, 2014 | | | 528,025 | | | | 536,094 | | | | 8,069 | |
| 4 | | J.P. Morgan | | LME Aluminum Futures^ | | March 11, 2014 | | | 181,375 | | | | 179,061 | | | | (2,314) | |
| 32 | | J.P. Morgan | | LME Aluminum Futures^ | | March 12, 2014 | | | 1,451,054 | | | | 1,432,904 | | | | (18,150) | |
| 22 | | J.P. Morgan | | LME Aluminum Futures^ | | March 13, 2014 | | | 986,934 | | | | 985,402 | | | | (1,532) | |
| 199 | | J.P. Morgan | | LME Aluminum Futures^ | | March 17, 2014 | | | 8,962,074 | | | | 8,927,737 | | | | (34,337) | |
| 25 | | J.P. Morgan | | LME Aluminum Futures^ | | March 18, 2014 | | | 1,125,569 | | | | 1,121,394 | | | | (4,175) | |
| 2 | | J.P. Morgan | | LME Copper Futures^ | | January 10, 2014 | | | 355,610 | | | | 368,688 | | | | 13,078 | |
| 25 | | J.P. Morgan | | LME Copper Futures^ | | January 16, 2014 | | | 4,512,539 | | | | 4,606,094 | | | | 93,555 | |
| 6 | | J.P. Morgan | | LME Copper Futures^ | | January 17, 2014 | | | 1,081,793 | | | | 1,105,312 | | | | 23,519 | |
| 1 | | J.P. Morgan | | LME Copper Futures^ | | January 22, 2014 | | | 181,388 | | | | 184,169 | | | | 2,781 | |
| 3 | | J.P. Morgan | | LME Copper Futures^ | | January 24, 2014 | | | 537,839 | | | | 552,528 | | | | 14,689 | |
| 5 | | J.P. Morgan | | LME Copper Futures^ | | January 31, 2014 | | | 906,478 | | | | 921,005 | | | | 14,527 | |
| 20 | | J.P. Morgan | | LME Copper Futures^ | | February 6, 2014 | | | 3,592,469 | | | | 3,684,445 | | | | 91,976 | |
| 10 | | J.P. Morgan | | LME Copper Futures^ | | February 7, 2014 | | | 1,781,496 | | | | 1,842,260 | | | | 60,764 | |
| 1 | | J.P. Morgan | | LME Copper Futures^ | | February 11, 2014 | | | 179,327 | | | | 184,240 | | | | 4,913 | |
| 2 | | J.P. Morgan | | LME Copper Futures^ | | February 12, 2014 | | | 356,492 | | | | 368,488 | | | | 11,996 | |
| 4 | | J.P. Morgan | | LME Copper Futures^ | | February 13, 2014 | | | 704,758 | | | | 736,963 | | | | 32,205 | |
| 41 | | J.P. Morgan | | LME Copper Futures^ | | February 14, 2014 | | | 7,140,910 | | | | 7,553,737 | | | | 412,827 | |
| 6 | | J.P. Morgan | | LME Copper Futures^ | | February 19, 2014 | | | 1,043,862 | | | | 1,105,387 | | | | 61,525 | |
| 1 | | J.P. Morgan | | LME Copper Futures^ | | February 20, 2014 | | | 174,302 | | | | 184,194 | | | | 9,892 | |
| 16 | | J.P. Morgan | | LME Copper Futures^ | | February 21, 2014 | | | 2,794,355 | | | | 2,946,500 | | | | 152,145 | |
| 6 | | J.P. Morgan | | LME Copper Futures^ | | March 4, 2014 | | | 1,055,600 | | | | 1,104,937 | | | | 49,337 | |
| 10 | | J.P. Morgan | | LME Copper Futures^ | | March 10, 2014 | | | 1,784,146 | | | | 1,841,563 | | | | 57,417 | |
| 2 | | J.P. Morgan | | LME Copper Futures^ | | March 12, 2014 | | | 360,804 | | | | 368,312 | | | | 7,508 | |
| 21 | | J.P. Morgan | | LME Copper Futures^ | | March 13, 2014 | | | 3,791,209 | | | | 3,867,281 | | | | 76,072 | |
| 46 | | J.P. Morgan | | LME Copper Futures^ | | March 17, 2014 | | | 8,340,700 | | | | 8,470,750 | | | | 130,050 | |
| 3 | | J.P. Morgan | | LME Copper Futures^ | | March 18, 2014 | | | 544,339 | | | | 552,468 | | | | 8,129 | |
| 1 | | J.P. Morgan | | LME Nickel Futures^ | | January 23, 2014 | | | 88,163 | | | | 83,091 | | | | (5,072) | |
| 7 | | J.P. Morgan | | LME Nickel Futures^ | | January 24, 2014 | | | 610,738 | | | | 581,665 | | | | (29,073) | |
| 2 | | J.P. Morgan | | LME Nickel Futures^ | | January 28, 2014 | | | 175,908 | | | | 166,223 | | | | (9,685) | |
| 1 | | J.P. Morgan | | LME Nickel Futures^ | | January 29, 2014 | | | 87,714 | | | | 83,115 | | | | (4,599) | |
| 1 | | J.P. Morgan | | LME Nickel Futures^ | | January 31, 2014 | | | 87,778 | | | | 83,123 | | | | (4,655) | |
| 12 | | J.P. Morgan | | LME Nickel Futures^ | | February 14, 2014 | | | 985,669 | | | | 998,177 | | | | 12,508 | |
| 1 | | J.P. Morgan | | LME Nickel Futures^ | | February 19, 2014 | | | 81,893 | | | | 83,202 | | | | 1,309 | |
| | | | |
| | The accompanying notes are an integral part of these financial statements. | | (Continued) |
| | | | | | | | | | | | | | | | |
| | AQR Funds | | | | | | Annual Report | | | | | | December 2013 | | 155 |
| | | | | | | | | | |
| | | | |
| Consolidated Schedule of Investments | | | December 31, 2013 | |
| | |
| AQR MULTI-STRATEGY ALTERNATIVE FUND | | |
| | | | | | | | | | | | | | | | | | |
NUMBER OF
CONTRACTS | | COUNTERPARTY | | DESCRIPTION | | EXPIRATION
DATE | | VALUE AT
TRADE DATE | | | VALUE AT
DECEMBER 31,
2013 | | | UNREALIZED
APPRECIATION
(DEPRECIATION) | |
| Long Contracts: (continued) | | | | |
| 3 | | J.P. Morgan | | LME Nickel Futures^ | | February 20, 2014 | | | $ 244,806 | | | | $ 249,621 | | | | $ 4,815 | |
| 2 | | J.P. Morgan | | LME Nickel Futures^ | | February 21, 2014 | | | 162,304 | | | | 166,423 | | | | 4,119 | |
| 1 | | J.P. Morgan | | LME Nickel Futures^ | | February 25, 2014 | | | 81,182 | | | | 83,231 | | | | 2,049 | |
| 1 | | J.P. Morgan | | LME Nickel Futures^ | | February 26, 2014 | | | 81,326 | | | | 83,236 | | | | 1,910 | |
| 2 | | J.P. Morgan | | LME Nickel Futures^ | | February 27, 2014 | | | 161,920 | | | | 166,483 | | | | 4,563 | |
| 1 | | J.P. Morgan | | LME Nickel Futures^ | | March 3, 2014 | | | 80,702 | | | | 83,261 | | | | 2,559 | |
| 2 | | J.P. Morgan | | LME Nickel Futures^ | | March 4, 2014 | | | 163,684 | | | | 166,532 | | | | 2,848 | |
| 3 | | J.P. Morgan | | LME Nickel Futures^ | | March 13, 2014 | | | 251,837 | | | | 249,931 | | | | (1,906) | |
| 27 | | J.P. Morgan | | LME Nickel Futures^ | | March 17, 2014 | | | 2,294,232 | | | | 2,250,121 | | | | (44,111) | |
| 3 | | J.P. Morgan | | LME Nickel Futures^ | | March 18, 2014 | | | 253,679 | | | | 250,005 | | | | (3,674) | |
| 3 | | J.P. Morgan | | LME Nickel Futures^ | | March 20, 2014 | | | 257,298 | | | | 250,035 | | | | (7,263) | |
| 3 | | J.P. Morgan | | LME Nickel Futures^ | | March 24, 2014 | | | 260,491 | | | | 250,095 | | | | (10,396) | |
| 2 | | J.P. Morgan | | LME Zinc Futures^ | | January 17, 2014 | | | 96,537 | | | | 102,272 | | | | 5,735 | |
| 13 | | J.P. Morgan | | LME Zinc Futures^ | | January 23, 2014 | | | 634,450 | | | | 665,181 | | | | 30,731 | |
| 1 | | J.P. Morgan | | LME Zinc Futures^ | | January 24, 2014 | | | 48,424 | | | | 51,173 | | | | 2,749 | |
| 5 | | J.P. Morgan | | LME Zinc Futures^ | | January 28, 2014 | | | 245,459 | | | | 255,974 | | | | 10,515 | |
| 8 | | J.P. Morgan | | LME Zinc Futures^ | | January 29, 2014 | | | 393,899 | | | | 409,600 | | | | 15,701 | |
| 5 | | J.P. Morgan | | LME Zinc Futures^ | | January 30, 2014 | | | 246,776 | | | | 256,026 | | | | 9,250 | |
| 5 | | J.P. Morgan | | LME Zinc Futures^ | | January 31, 2014 | | | 244,782 | | | | 256,054 | | | | 11,272 | |
| 7 | | J.P. Morgan | | LME Zinc Futures^ | | February 11, 2014 | | | 332,646 | | | | 358,888 | | | | 26,242 | |
| 16 | | J.P. Morgan | | LME Zinc Futures^ | | February 12, 2014 | | | 754,633 | | | | 820,400 | | | | 65,767 | |
| 10 | | J.P. Morgan | | LME Zinc Futures^ | | February 13, 2014 | | | 470,521 | | | | 512,803 | | | | 42,282 | |
| 21 | | J.P. Morgan | | LME Zinc Futures^ | | February 14, 2014 | | | 989,369 | | | | 1,077,001 | | | | 87,632 | |
| 9 | | J.P. Morgan | | LME Zinc Futures^ | | February 19, 2014 | | | 425,662 | | | | 461,812 | | | | 36,150 | |
| 7 | | J.P. Morgan | | LME Zinc Futures^ | | February 20, 2014 | | | 330,546 | | | | 359,217 | | | | 28,671 | |
| 10 | | J.P. Morgan | | LME Zinc Futures^ | | February 21, 2014 | | | 472,896 | | | | 513,213 | | | | 40,317 | |
| 3 | | J.P. Morgan | | LME Zinc Futures^ | | February 27, 2014 | | | 141,231 | | | | 154,041 | | | | 12,810 | |
| 4 | | J.P. Morgan | | LME Zinc Futures^ | | March 3, 2014 | | | 187,658 | | | | 205,458 | | | | 17,800 | |
| 3 | | J.P. Morgan | | LME Zinc Futures^ | | March 4, 2014 | | | 142,131 | | | | 154,106 | | | | 11,975 | |
| 7 | | J.P. Morgan | | LME Zinc Futures^ | | March 11, 2014 | | | 341,387 | | | | 359,793 | | | | 18,406 | |
| 8 | | J.P. Morgan | | LME Zinc Futures^ | | March 12, 2014 | | | 393,176 | | | | 411,226 | | | | 18,050 | |
| 9 | | J.P. Morgan | | LME Zinc Futures^ | | March 13, 2014 | | | 441,498 | | | | 462,670 | | | | 21,172 | |
| 100 | | J.P. Morgan | | LME Zinc Futures^ | | March 17, 2014 | | | 4,980,566 | | | | 5,144,575 | | | | 164,009 | |
| 9 | | J.P. Morgan | | LME Zinc Futures^ | | March 18, 2014 | | | 450,173 | | | | 462,937 | | | | 12,764 | |
| 11 | | J.P. Morgan | | LME Zinc Futures^ | | March 20, 2014 | | | 553,851 | | | | 564,575 | | | | 10,724 | |
| 10 | | J.P. Morgan | | LME Zinc Futures^ | | March 24, 2014 | | | 512,184 | | | | 513,433 | | | | 1,249 | |
| 223 | | Goldman Sachs | | Soybean Futures^ | | March 14, 2014 | | | 14,738,979 | | | | 14,411,375 | | | | (327,604) | |
| 127 | | Goldman Sachs | | Soybean Meal Futures^ | | March 14, 2014 | | | 5,346,597 | | | | 5,295,900 | | | | (50,697) | |
| 221 | | Barclays Capital | | CAC40 Index Futures | | January 17, 2014 | | | 12,443,964 | | | | 13,068,717 | | | | 624,753 | |
| 219 | | Barclays Capital | | DAX Index Futures | | March 21, 2014 | | | 68,990,662 | | | | 72,348,219 | | | | 3,357,557 | |
| 218 | | Barclays Capital | | DJIA Mini E-CBOT Futures | | March 21, 2014 | | | 17,144,594 | | | | 17,978,460 | | | | 833,866 | |
| 846 | | Barclays Capital | | Euro Stoxx 50 Index | | March 21, 2014 | | | 34,448,662 | | | | 36,172,216 | | | | 1,723,554 | |
| 16 | | Barclays Capital | | FTSE 100 Index Futures | | March 21, 2014 | | | 1,740,647 | | | | 1,774,516 | | | | 33,869 | |
| 301 | | J.P. Morgan | | FTSE/JSE Top 40 Index Futures | | March 20, 2014 | | | 11,287,833 | | | | 11,965,396 | | | | 677,563 | |
| 9 | | Barclays Capital | | Hang Seng Index Futures | | January 29, 2014 | | | 1,332,029 | | | | 1,354,068 | | | | 22,039 | |
| 91 | | Barclays Capital | | H-SHARES Index Futures | | January 29, 2014 | | | 6,241,875 | | | | 6,356,493 | | | | 114,618 | |
| 125 | | Barclays Capital | | IBEX 35 Index Futures | | January 17, 2014 | | | 16,042,609 | | | | 16,971,667 | | | | 929,058 | |
| 207 | | Barclays Capital | | MSCI Taiwan Stock Index Futures | | January 28, 2014 | | | 6,146,363 | | | | 6,276,240 | | | | 129,877 | |
| 253 | | Barclays Capital | | NASDAQ 100 E-Mini Futures | | March 21, 2014 | | | 17,499,081 | | | | 18,133,775 | | | | 634,694 | |
| 98 | | Barclays Capital | | S&P MID 400 E-Mini Futures | | March 21, 2014 | | | 12,616,100 | | | | 13,126,120 | | | | 510,020 | |
| 122 | | Barclays Capital | | S&P/Toronto Stock Exchange 60 Index Futures | | March 20, 2014 | | | 17,294,659 | | | | 17,937,359 | | | | 642,700 | |
| 716 | | Barclays Capital | | TOPIX Index Futures | | March 13, 2014 | | | 85,251,241 | | | | 88,556,642 | | | | 3,305,401 | |
| | | | |
| | The accompanying notes are an integral part of these financial statements. | | (Continued) |
| | | | | | | | | | | | | | | | |
| 156 | | AQR Funds | | | | | | Annual Report | | | | | | December 2013 | | |
| | | | | | | | | | |
| | | | |
| Consolidated Schedule of Investments | | | December 31, 2013 | |
| | |
| AQR MULTI-STRATEGY ALTERNATIVE FUND | | |
| | | | | | | | | | | | | | | | | | |
NUMBER OF
CONTRACTS | | COUNTERPARTY | | DESCRIPTION | | EXPIRATION
DATE | | VALUE AT
TRADE DATE | | | VALUE AT
DECEMBER 31,
2013 | | | UNREALIZED
APPRECIATION
(DEPRECIATION) | |
| Long Contracts: (continued) | | | | |
| 153 | | J.P. Morgan | | 3-Month Euro Euribor Futures | | March 16, 2015 | | | $ 52,400,447 | | | | $ 52,383,734 | | | | $ (16,713) | |
| 201 | | J.P. Morgan | | 3-Month Euro Euribor Futures | | June 15, 2015 | | | 68,788,253 | | | | 68,748,717 | | | | (39,536) | |
| 205 | | J.P. Morgan | | 3-Month Euro Euribor Futures | | September 14, 2015 | | | 70,089,263 | | | | 70,035,770 | | | | (53,493) | |
| 196 | | J.P. Morgan | | 3-Month Euro Euribor Futures | | December 14, 2015 | | | 66,998,434 | | | | 66,873,397 | | | | (125,037) | |
| 1,589 | | J.P. Morgan | | 90-Day EURODollar Futures | | June 16, 2014 | | | 395,541,246 | | | | 395,998,662 | | | | 457,416 | |
| 1,314 | | J.P. Morgan | | 90-Day EURODollar Futures | | September 15, 2014 | | | 327,132,813 | | | | 327,300,975 | | | | 168,162 | |
| 1,191 | | J.P. Morgan | | 90-Day EURODollar Futures | | December 15, 2014 | | | 296,705,277 | | | | 296,469,675 | | | | (235,602) | |
| 271 | | J.P. Morgan | | 90-Day EURODollar Futures | | March 16, 2015 | | | 67,390,910 | | | | 67,390,925 | | | | 15 | |
| 316 | | J.P. Morgan | | 90-Day EURODollar Futures | | June 15, 2015 | | | 78,475,281 | | | | 78,466,750 | | | | (8,531) | |
| 257 | | J.P. Morgan | | 90-Day EURODollar Futures | | September 14, 2015 | | | 63,728,156 | | | | 63,691,025 | | | | (37,131) | |
| 179 | | J.P. Morgan | | 90-Day EURODollar Futures | | December 14, 2015 | | | 44,344,584 | | | | 44,246,563 | | | | (98,021) | |
| 38 | | J.P. Morgan | | Canadian 3-Month Bank Acceptance Futures | | June 16, 2014 | | | 8,830,848 | | | | 8,831,489 | | | | 641 | |
| | | | | | | | | | | | | | | | | | |
| | | | | | | | | 1,960,503,555 | | | | 1,975,232,452 | | | | 14,728,897 | |
| | | | | | | | | | | | | | | | | | |
| Short Contracts: | | | | | | | | | | | | | | |
| 130 | | Goldman Sachs | | Coffee ‘C’ Futures^ | | March 19, 2014 | | | (5,199,425) | | | | (5,396,625) | | | | (197,200) | |
| 999 | | Goldman Sachs | | Corn Futures^ | | March 14, 2014 | | | (21,692,547) | | | | (21,078,900) | | | | 613,647 | |
| 50 | | Goldman Sachs | | Cotton No. 2 Futures^ | | March 7, 2014 | | | (1,967,332) | | | | (2,116,000) | | | | (148,668) | |
| 302 | | Goldman Sachs | | Gold 100 OZ Futures^ | | February 26, 2014 | | | (37,929,510) | | | | (36,309,460) | | | | 1,620,050 | |
| 77 | | Goldman Sachs | | Lean Hogs Futures^ | | February 14, 2014 | | | (2,659,441) | | | | (2,631,090) | | | | 28,351 | |
| 5 | | J.P. Morgan | | LME Aluminum Futures^ | | January 3, 2014 | | | (230,271) | | | | (219,344) | | | | 10,927 | |
| 7 | | J.P. Morgan | | LME Aluminum Futures^ | | January 8, 2014 | | | (327,235) | | | | (307,592) | | | | 19,643 | |
| 6 | | J.P. Morgan | | LME Aluminum Futures^ | | January 9, 2014 | | | (278,425) | | | | (263,737) | | | | 14,688 | |
| 9 | | J.P. Morgan | | LME Aluminum Futures^ | | January 10, 2014 | | | (424,106) | | | | (395,736) | | | | 28,370 | |
| 12 | | J.P. Morgan | | LME Aluminum Futures^ | | January 15, 2014 | | | (562,175) | | | | (528,525) | | | | 33,650 | |
| 18 | | J.P. Morgan | | LME Aluminum Futures^ | | February 5, 2014 | | | (819,070) | | | | (797,985) | | | | 21,085 | |
| 22 | | J.P. Morgan | | LME Aluminum Futures^ | | February 6, 2014 | | | (1,002,516) | | | | (975,617) | | | | 26,899 | |
| 29 | | J.P. Morgan | | LME Aluminum Futures^ | | February 7, 2014 | | | (1,317,309) | | | | (1,286,440) | | | | 30,869 | |
| 11 | | J.P. Morgan | | LME Aluminum Futures^ | | February 11, 2014 | | | (498,331) | | | | (488,565) | | | | 9,766 | |
| 14 | | J.P. Morgan | | LME Aluminum Futures^ | | February 12, 2014 | | | (631,007) | | | | (622,002) | | | | 9,005 | |
| 14 | | J.P. Morgan | | LME Aluminum Futures^ | | February 13, 2014 | | | (627,247) | | | | (622,195) | | | | 5,052 | |
| 22 | | J.P. Morgan | | LME Aluminum Futures^ | | February 14, 2014 | | | (985,606) | | | | (978,037) | | | | 7,569 | |
| 6 | | J.P. Morgan | | LME Aluminum Futures^ | | February 25, 2014 | | | (266,716) | | | | (267,504) | | | | (788) | |
| 11 | | J.P. Morgan | | LME Aluminum Futures^ | | February 26, 2014 | | | (488,505) | | | | (490,567) | | | | (2,062) | |
| 10 | | J.P. Morgan | | LME Aluminum Futures^ | | February 27, 2014 | | | (444,117) | | | | (446,097) | | | | (1,980) | |
| 4 | | J.P. Morgan | | LME Aluminum Futures^ | | March 3, 2014 | | | (173,918) | | | | (178,646) | | | | (4,728) | |
| 12 | | J.P. Morgan | | LME Aluminum Futures^ | | March 4, 2014 | | | (522,974) | | | | (536,094) | | | | (13,120) | |
| 4 | | J.P. Morgan | | LME Aluminum Futures^ | | March 11, 2014 | | | (181,792) | | | | (179,061) | | | | 2,731 | |
| 32 | | J.P. Morgan | | LME Aluminum Futures^ | | March 12, 2014 | | | (1,447,933) | | | | (1,432,904) | | | | 15,029 | |
| 22 | | J.P. Morgan | | LME Aluminum Futures^ | | March 13, 2014 | | | (990,504) | | | | (985,402) | | | | 5,102 | |
| 303 | | J.P. Morgan | | LME Aluminum Futures^ | | March 17, 2014 | | | (13,369,832) | | | | (13,594,087) | | | | (224,255) | |
| 25 | | J.P. Morgan | | LME Aluminum Futures^ | | March 18, 2014 | | | (1,124,323) | | | | (1,121,394) | | | | 2,929 | |
| 2 | | J.P. Morgan | | LME Copper Futures^ | | January 10, 2014 | | | (355,808) | | | | (368,687) | | | | (12,879) | |
| 25 | | J.P. Morgan | | LME Copper Futures^ | | January 16, 2014 | | | (4,520,573) | | | | (4,606,094) | | | | (85,521) | |
| 6 | | J.P. Morgan | | LME Copper Futures^ | | January 17, 2014 | | | (1,080,738) | | | | (1,105,313) | | | | (24,575) | |
| 1 | | J.P. Morgan | | LME Copper Futures^ | | January 22, 2014 | | | (181,835) | | | | (184,168) | | | | (2,333) | |
| 3 | | J.P. Morgan | | LME Copper Futures^ | | January 24, 2014 | | | (537,800) | | | | (552,528) | | | | (14,728) | |
| 5 | | J.P. Morgan | | LME Copper Futures^ | | January 31, 2014 | | | (906,240) | | | | (921,005) | | | | (14,765) | |
| 20 | | J.P. Morgan | | LME Copper Futures^ | | February 6, 2014 | | | (3,587,458) | | | | (3,684,445) | | | | (96,987) | |
| 10 | | J.P. Morgan | | LME Copper Futures^ | | February 7, 2014 | | | (1,783,664) | | | | (1,842,260) | | | | (58,596) | |
| 1 | | J.P. Morgan | | LME Copper Futures^ | | February 11, 2014 | | | (179,314) | | | | (184,240) | | | | (4,926) | |
| 2 | | J.P. Morgan | | LME Copper Futures^ | | February 12, 2014 | | | (356,849) | | | | (368,487) | | | | (11,638) | |
| 4 | | J.P. Morgan | | LME Copper Futures^ | | February 13, 2014 | | | (705,389) | | | | (736,963) | | | | (31,574) | |
| 41 | | J.P. Morgan | | LME Copper Futures^ | | February 14, 2014 | | | (7,144,641) | | | | (7,553,737) | | | | (409,096) | |
| | | | |
| | The accompanying notes are an integral part of these financial statements. | | (Continued) |
| | | | | | | | | | | | | | | | |
| | AQR Funds | | | | | | Annual Report | | | | | | December 2013 | | 157 |
| | | | | | | | | | |
| | | | |
| Consolidated Schedule of Investments | | | December 31, 2013 | |
| | |
| AQR MULTI-STRATEGY ALTERNATIVE FUND | | |
| | | | | | | | | | | | | | | | | | |
NUMBER OF
CONTRACTS | | COUNTERPARTY | | DESCRIPTION | | EXPIRATION
DATE | | VALUE AT
TRADE DATE | | | VALUE AT
DECEMBER 31,
2013 | | | UNREALIZED
APPRECIATION
(DEPRECIATION) | |
| Short Contracts: (continued) | | | | |
| 6 | | J.P. Morgan | | LME Copper Futures^ | | February 19, 2014 | | | $ (1,040,417) | | | | $ (1,105,388) | | | | $ (64,971) | |
| 1 | | J.P. Morgan | | LME Copper Futures^ | | February 20, 2014 | | | (174,918) | | | | (184,194) | | | | (9,276) | |
| 16 | | J.P. Morgan | | LME Copper Futures^ | | February 21, 2014 | | | (2,795,967) | | | | (2,946,500) | | | | (150,533) | |
| 6 | | J.P. Morgan | | LME Copper Futures^ | | March 4, 2014 | | | (1,047,106) | | | | (1,104,938) | | | | (57,832) | |
| 10 | | J.P. Morgan | | LME Copper Futures^ | | March 10, 2014 | | | (1,789,337) | | | | (1,841,562) | | | | (52,225) | |
| 2 | | J.P. Morgan | | LME Copper Futures^ | | March 12, 2014 | | | (361,250) | | | | (368,312) | | | | (7,062) | |
| 21 | | J.P. Morgan | | LME Copper Futures^ | | March 13, 2014 | | | (3,794,656) | | | | (3,867,281) | | | | (72,625) | |
| 63 | | J.P. Morgan | | LME Copper Futures^ | | March 17, 2014 | | | (11,180,155) | | | | (11,601,194) | | | | (421,039) | |
| 3 | | J.P. Morgan | | LME Copper Futures^ | | March 18, 2014 | | | (543,744) | | | | (552,469) | | | | (8,725) | |
| 56 | | Goldman Sachs | | LME Copper Futures^ | | March 27, 2014 | | | (4,631,733) | | | | (4,755,100) | | | | (123,367) | |
| 1 | | J.P. Morgan | | LME Nickel Futures^ | | January 23, 2014 | | | (88,348) | | | | (83,091) | | | | 5,257 | |
| 7 | | J.P. Morgan | | LME Nickel Futures^ | | January 24, 2014 | | | (610,998) | | | | (581,665) | | | | 29,333 | |
| 2 | | J.P. Morgan | | LME Nickel Futures^ | | January 28, 2014 | | | (175,352) | | | | (166,223) | | | | 9,129 | |
| 1 | | J.P. Morgan | | LME Nickel Futures^ | | January 29, 2014 | | | (87,778) | | | | (83,116) | | | | 4,662 | |
| 1 | | J.P. Morgan | | LME Nickel Futures^ | | January 31, 2014 | | | (87,952) | | | | (83,124) | | | | 4,828 | |
| 12 | | J.P. Morgan | | LME Nickel Futures^ | | February 14, 2014 | | | (989,933) | | | | (998,177) | | | | (8,244) | |
| 1 | | J.P. Morgan | | LME Nickel Futures^ | | February 19, 2014 | | | (81,855) | | | | (83,202) | | | | (1,347) | |
| 3 | | J.P. Morgan | | LME Nickel Futures^ | | February 20, 2014 | | | (245,838) | | | | (249,621) | | | | (3,783) | |
| 2 | | J.P. Morgan | | LME Nickel Futures^ | | February 21, 2014 | | | (162,236) | | | | (166,424) | | | | (4,188) | |
| 1 | | J.P. Morgan | | LME Nickel Futures^ | | February 25, 2014 | | | (81,148) | | | | (83,232) | | | | (2,084) | |
| 1 | | J.P. Morgan | | LME Nickel Futures^ | | February 26, 2014 | | | (81,256) | | | | (83,236) | | | | (1,980) | |
| 2 | | J.P. Morgan | | LME Nickel Futures^ | | February 27, 2014 | | | (161,862) | | | | (166,483) | | | | (4,621) | |
| 1 | | J.P. Morgan | | LME Nickel Futures^ | | March 3, 2014 | | | (80,747) | | | | (83,261) | | | | (2,514) | |
| 2 | | J.P. Morgan | | LME Nickel Futures^ | | March 4, 2014 | | | (161,771) | | | | (166,532) | | | | (4,761) | |
| 3 | | J.P. Morgan | | LME Nickel Futures^ | | March 13, 2014 | | | (251,814) | | | | (249,931) | | | | 1,883 | |
| 61 | | J.P. Morgan | | LME Nickel Futures^ | | March 17, 2014 | | | (4,953,605) | | | | (5,083,681) | | | | (130,076) | |
| 3 | | J.P. Morgan | | LME Nickel Futures^ | | March 18, 2014 | | | (254,154) | | | | (250,005) | | | | 4,149 | |
| 3 | | J.P. Morgan | | LME Nickel Futures^ | | March 20, 2014 | | | (256,858) | | | | (250,035) | | | | 6,823 | |
| 3 | | J.P. Morgan | | LME Nickel Futures^ | | March 24, 2014 | | | (260,580) | | | | (250,095) | | | | 10,485 | |
| 2 | | J.P. Morgan | | LME Zinc Futures^ | | January 17, 2014 | | | (97,096) | | | | (102,272) | | | | (5,176) | |
| 13 | | J.P. Morgan | | LME Zinc Futures^ | | January 23, 2014 | | | (634,048) | | | | (665,181) | | | | (31,133) | |
| 1 | | J.P. Morgan | | LME Zinc Futures^ | | January 24, 2014 | | | (48,223) | | | | (51,173) | | | | (2,950) | |
| 5 | | J.P. Morgan | | LME Zinc Futures^ | | January 28, 2014 | | | (245,990) | | | | (255,974) | | | | (9,984) | |
| 8 | | J.P. Morgan | | LME Zinc Futures^ | | January 29, 2014 | | | (394,583) | | | | (409,600) | | | | (15,017) | |
| 5 | | J.P. Morgan | | LME Zinc Futures^ | | January 30, 2014 | | | (246,521) | | | | (256,026) | | | | (9,505) | |
| 5 | | J.P. Morgan | | LME Zinc Futures^ | | January 31, 2014 | | | (245,240) | | | | (256,054) | | | | (10,814) | |
| 7 | | J.P. Morgan | | LME Zinc Futures^ | | February 11, 2014 | | | (333,042) | | | | (358,888) | | | | (25,846) | |
| 16 | | J.P. Morgan | | LME Zinc Futures^ | | February 12, 2014 | | | (754,873) | | | | (820,400) | | | | (65,527) | |
| 10 | | J.P. Morgan | | LME Zinc Futures^ | | February 13, 2014 | | | (469,986) | | | | (512,803) | | | | (42,817) | |
| 21 | | J.P. Morgan | | LME Zinc Futures^ | | February 14, 2014 | | | (990,601) | | | | (1,077,001) | | | | (86,400) | |
| 9 | | J.P. Morgan | | LME Zinc Futures^ | | February 19, 2014 | | | (424,661) | | | | (461,813) | | | | (37,152) | |
| 7 | | J.P. Morgan | | LME Zinc Futures^ | | February 20, 2014 | | | (331,458) | | | | (359,217) | | | | (27,759) | |
| 10 | | J.P. Morgan | | LME Zinc Futures^ | | February 21, 2014 | | | (473,338) | | | | (513,213) | | | | (39,875) | |
| 3 | | J.P. Morgan | | LME Zinc Futures^ | | February 27, 2014 | | | (141,607) | | | | (154,041) | | | | (12,434) | |
| 4 | | J.P. Morgan | | LME Zinc Futures^ | | March 3, 2014 | | | (187,271) | | | | (205,458) | | | | (18,187) | |
| 3 | | J.P. Morgan | | LME Zinc Futures^ | | March 4, 2014 | | | (141,027) | | | | (154,106) | | | | (13,079) | |
| 7 | | J.P. Morgan | | LME Zinc Futures^ | | March 11, 2014 | | | (342,460) | | | | (359,793) | | | | (17,333) | |
| 8 | | J.P. Morgan | | LME Zinc Futures^ | | March 12, 2014 | | | (391,783) | | | | (411,226) | | | | (19,443) | |
| 9 | | J.P. Morgan | | LME Zinc Futures^ | | March 13, 2014 | | | (442,106) | | | | (462,669) | | | | (20,563) | |
| 143 | | J.P. Morgan | | LME Zinc Futures^ | | March 17, 2014 | | | (6,773,610) | | | | (7,356,925) | | | | (583,315) | |
| 9 | | J.P. Morgan | | LME Zinc Futures^ | | March 18, 2014 | | | (451,462) | | | | (462,938) | | | | (11,476) | |
| 11 | | J.P. Morgan | | LME Zinc Futures^ | | March 20, 2014 | | | (551,215) | | | | (564,575) | | | | (13,360) | |
| 10 | | J.P. Morgan | | LME Zinc Futures^ | | March 24, 2014 | | | (510,729) | | | | (513,432) | | | | (2,703) | |
| 149 | | Goldman Sachs | | Platinum Futures^ | | April 28, 2014 | | | (9,855,798) | | | | (10,234,810) | | | | (379,012) | |
| 83 | | Goldman Sachs | | Silver Futures^ | | March 27, 2014 | | | (8,277,453) | | | | (8,038,550) | | | | 238,903 | |
| 304 | | Goldman Sachs | | Soybean Oil Futures^ | | March 14, 2014 | | | (7,427,547) | | | | (7,137,312) | | | | 290,235 | |
| | | | |
| | The accompanying notes are an integral part of these financial statements. | | (Continued) |
| | | | | | | | | | | | | | | | |
| 158 | | AQR Funds | | | | | | Annual Report | | | | | | December 2013 | | |
| | | | | | | | | | |
| | | | |
| Consolidated Schedule of Investments | | | December 31, 2013 | |
| | |
| AQR MULTI-STRATEGY ALTERNATIVE FUND | | |
| | | | | | | | | | | | | | | | | | |
NUMBER OF
CONTRACTS | | COUNTERPARTY | | DESCRIPTION | | EXPIRATION
DATE | | VALUE AT
TRADE DATE | | | VALUE AT
DECEMBER 31,
2013 | | | UNREALIZED
APPRECIATION
(DEPRECIATION) | |
| Short Contracts: (continued) | | | | |
| 1,327 | | Goldman Sachs | | Sugar #11 (World Markets) Futures^ | | March 28, 2014 | | | $ (25,329,900) | | | | $ (24,389,199) | | | | $ 940,701 | |
| 536 | | Goldman Sachs | | Wheat Futures^ | | March 14, 2014 | | | (17,732,794) | | | | (16,497,412) | | | | 1,235,382 | |
| 314 | | Barclays Capital | | Amsterdam Index Futures | | January 17, 2014 | | | (32,914,046) | | | | (34,760,610) | | | | (1,846,564) | |
| 668 | | Barclays Capital | | E-Mini Russell 2000 Futures | | March 21, 2014 | | | (73,526,018) | | | | (77,581,520) | | | | (4,055,502) | |
| 151 | | Barclays Capital | | FTSE/MIB Index Futures | | March 21, 2014 | | | (18,874,768) | | | | (19,760,383) | | | | (885,615) | |
| 69 | | Barclays Capital | | KOSPI Index 200 Futures | | March 13, 2014 | | | (8,501,536) | | | | (8,684,252) | | | | (182,716) | |
| 1,637 | | Barclays Capital | | MSCI Emerging Markets E-Mini Futures | | March 21, 2014 | | | (81,268,169) | | | | (83,225,080) | | | | (1,956,911) | |
| 42 | | Barclays Capital | | MSCI Singapore Index Futures | | January 29, 2014 | | | (2,368,095) | | | | (2,430,905) | | | | (62,810) | |
| 3,280 | | Barclays Capital | | S&P 500 E-Mini Futures | | March 21, 2014 | | | (294,282,346) | | | | (301,940,400) | | | | (7,658,054) | |
| 1,587 | | Barclays Capital | | SGX S&P CNX Nifty Index Futures | | January 30, 2014 | | | (20,070,933) | | | | (20,158,074) | | | | (87,141) | |
| 61 | | Barclays Capital | | SPI 200 Index Futures | | March 20, 2014 | | | (6,910,993) | | | | (7,241,374) | | | | (330,381) | |
| 33 | | J.P. Morgan | | 10-Year Japanese Government Bond | | March 11, 2014 | | | (45,097,305) | | | | (44,910,835) | | | | 186,470 | |
| 602 | | J.P. Morgan | | 3-Month Euro Euribor Futures | | June 16, 2014 | | | (206,354,371) | | | | (206,442,428) | | | | (88,057) | |
| 651 | | J.P. Morgan | | 3-Month Euro Euribor Futures | | September 15, 2014 | | | (223,033,347) | | | | (223,178,713) | | | | (145,366) | |
| 645 | | J.P. Morgan | | 3-Month Euro Euribor Futures | | December 15, 2014 | | | (221,093,600) | | | | (221,010,851) | | | | 82,749 | |
| 1,378 | | J.P. Morgan | | 90-Day Sterling Futures | | June 18, 2014 | | | (283,308,814) | | | | (283,383,348) | | | | (74,534) | |
| 755 | | J.P. Morgan | | 90-Day Sterling Futures | | September 17, 2014 | | | (155,129,619) | | | | (155,084,739) | | | | 44,880 | |
| 273 | | J.P. Morgan | | 90-Day Sterling Futures | | December 17, 2014 | | | (56,035,019) | | | | (55,986,584) | | | | 48,435 | |
| 177 | | J.P. Morgan | | 90-Day Sterling Futures | | March 18, 2015 | | | (36,258,737) | | | | (36,231,213) | | | | 27,524 | |
| 206 | | J.P. Morgan | | 90-Day Sterling Futures | | June 17, 2015 | | | (42,130,589) | | | | (42,082,120) | | | | 48,469 | |
| 223 | | J.P. Morgan | | 90-Day Sterling Futures | | September 16, 2015 | | | (45,512,079) | | | | (45,451,057) | | | | 61,022 | |
| 262 | | J.P. Morgan | | 90-Day Sterling Futures | | December 16, 2015 | | | (53,361,040) | | | | (53,267,027) | | | | 94,013 | |
| 2,449 | | J.P. Morgan | | Australia 10-Year Bond Futures | | March 17, 2014 | | | (248,609,103) | | | | (250,735,561) | | | | (2,126,458) | |
| 84 | | J.P. Morgan | | Australia 3-Year Bond Futures | | March 17, 2014 | | | (8,126,156) | | | | (8,141,324) | | | | (15,168) | |
| 112 | | J.P. Morgan | | Bank Acceptance Futures | | December 15, 2014 | | | (26,004,738) | | | | (26,013,838) | | | | (9,100) | |
| 123 | | J.P. Morgan | | Canadian 3-Month Bank Acceptance Futures | | September 15, 2014 | | | (28,572,543) | | | | (28,583,246) | | | | (10,703) | |
| 170 | | J.P. Morgan | | Euro CHF 3-Month LIFFE Futures | | June 16, 2014 | | | (47,647,028) | | | | (47,647,833) | | | | (805) | |
| 75 | | J.P. Morgan | | Euro CHF 3-Month LIFFE Futures | | September 15, 2014 | | | (21,016,648) | | | | (21,016,900) | | | | (252) | |
| 12 | | J.P. Morgan | | Mini Japanese 10-Year Treasury Bond | | March 10, 2014 | | | (1,638,617) | | | | (1,632,552) | | | | 6,065 | |
| 8 | | J.P. Morgan | | U.S. Treasury 2-Year Note Futures | | March 31, 2014 | | | (1,761,735) | | | | (1,758,500) | | | | 3,235 | |
| 7 | | J.P. Morgan | | U.S. Treasury 5-Year Note Futures | | March 31, 2014 | | | (846,167) | | | | (835,188) | | | | 10,979 | |
| | | | | | | | | | | | | | | | | | |
| | | | | | | | | (2,528,436,425) | | | | (2,546,064,121) | | | | (17,627,696) | |
| | | | | | | | | | | | | | | | | | |
| | | | | | | | | $(567,932,870) | | | | $(570,831,669) | | | | $(2,898,799) | |
| | | | | | | | | | | | | | | | | | |
Cash held as collateral at Barclays Capital, J.P. Morgan and Goldman Sachs for futures contracts was $45,567,514, $13,718,557 and $12,234,159, respectively at December 31, 2013.
| ^ | Represents positions held in the respective Subsidiary (Note 2). |
| | | | |
| | The accompanying notes are an integral part of these financial statements. | | (Continued) |
| | | | | | | | | | | | | | | | |
| | AQR Funds | | | | | | Annual Report | | | | | | December 2013 | | 159 |
| | | | | | | | | | |
| | | | |
| Consolidated Schedule of Investments | | | December 31, 2013 | |
| | |
| AQR MULTI-STRATEGY ALTERNATIVE FUND | | |
Forward foreign currency exchange contracts outstanding as of December 31, 2013:
Over the Counter
| | | | | | | | | | | | | | | | | | | | |
PURCHASE
CONTRACTS | | COUNTERPARTY | | CURRENCY | | CURRENCY
AMOUNT
PURCHASED | | | VALUE AT
SETTLEMENT
DATE | | | VALUE AT
DECEMBER 31,
2013 | | | UNREALIZED
APPRECIATION
(DEPRECIATION) | |
Australian Dollar,
Expiring 03/19/14 | | Credit Suisse International | | AUD | | | 11,062,500 | | | | $9,826,360 | | | | $9,829,419 | | | | $3,059 | |
Australian Dollar,
Expiring 03/19/14 | | The Royal Bank of Scotland | | AUD | | | 11,062,500 | | | | 9,826,419 | | | | 9,829,418 | | | | 2,999 | |
Brazilian Real,
Expiring 03/19/14* | | Credit Suisse International | | BRL | | | 50,961,500 | | | | 21,069,790 | | | | 21,209,245 | | | | 139,455 | |
Brazilian Real,
Expiring 03/19/14* | | The Royal Bank of Scotland | | BRL | | | 50,961,500 | | | | 21,069,790 | | | | 21,209,245 | | | | 139,455 | |
Canadian Dollar,
Expiring 03/19/14 | | Credit Suisse International | | CAD | | | 13,139,500 | | | | 12,377,729 | | | | 12,346,835 | | | | (30,894) | |
Canadian Dollar,
Expiring 03/19/14 | | The Royal Bank of Scotland | | CAD | | | 13,139,500 | | | | 12,378,027 | | | | 12,346,835 | | | | (31,192) | |
Swiss Franc,
Expiring 03/19/14 | | Credit Suisse International | | CHF | | | 32,195,000 | | | | 35,882,334 | | | | 36,113,293 | | | | 230,959 | |
Swiss Franc,
Expiring 03/19/14 | | The Royal Bank of Scotland | | CHF | | | 33,255,000 | | | | 37,056,571 | | | | 37,302,300 | | | | 245,729 | |
Czech Republic
Koruna,
Expiring 03/19/14 | | Credit Suisse International | | CZK | | | 6,000,000 | | | | 300,028 | | | | 302,319 | | | | 2,291 | |
Czech Republic
Koruna,
Expiring 03/19/14 | | The Royal Bank of Scotland | | CZK | | | 6,000,000 | | | | 300,140 | | | | 302,319 | | | | 2,179 | |
Danish Krone,
Expiring 03/19/14 | | The Royal Bank of Scotland | | DKK | | | 15,227,000 | | | | 2,778,317 | | | | 2,809,620 | | | | 31,303 | |
Euro,
Expiring 03/19/14 | | Credit Suisse International | | EUR | | | 137,167,228 | | | | 188,006,970 | | | | 188,696,841 | | | | 689,871 | |
Euro,
Expiring 03/19/14 | | The Royal Bank of Scotland | | EUR | | | 137,167,225 | | | | 188,008,059 | | | | 188,696,836 | | | | 688,777 | |
British Pound,
Expiring 03/19/14 | | Credit Suisse International | | GBP | | | 26,182,999 | | | | 42,841,203 | | | | 43,334,827 | | | | 493,624 | |
British Pound,
Expiring 03/19/14 | | The Royal Bank of Scotland | | GBP | | | 26,182,997 | | | | 42,841,296 | | | | 43,334,824 | | | | 493,528 | |
Hungarian Forint,
Expiring 03/19/14 | | Credit Suisse International | | HUF | | | 3,536,199,999 | | | | 15,975,020 | | | | 16,297,434 | | | | 322,414 | |
Hungarian Forint,
Expiring 03/19/14 | | The Royal Bank of Scotland | | HUF | | | 3,536,199,999 | | | | 15,974,763 | | | | 16,297,434 | | | | 322,671 | |
Israeli Shekel,
Expiring 03/19/14 | | Credit Suisse International | | ILS | | | 5,500,000 | | | | 1,564,971 | | | | 1,582,185 | | | | 17,214 | |
Israeli Shekel,
Expiring 03/19/14 | | The Royal Bank of Scotland | | ILS | | | 6,500,000 | | | | 1,847,813 | | | | 1,869,855 | | | | 22,042 | |
Indian Rupee,
Expiring 03/19/14* | | Credit Suisse International | | INR | | | 460,000,000 | | | | 7,276,397 | | | | 7,305,890 | | | | 29,493 | |
Indian Rupee,
Expiring 03/19/14* | | The Royal Bank of Scotland | | INR | | | 460,000,000 | | | | 7,276,391 | | | | 7,305,890 | | | | 29,499 | |
Japanese Yen,
Expiring 03/19/14 | | Credit Suisse International | | JPY | | | 2,680,672,500 | | | | 26,125,112 | | | | 25,464,721 | | | | (660,391) | |
Japanese Yen,
Expiring 03/19/14 | | The Royal Bank of Scotland | | JPY | | | 2,680,672,500 | | | | 26,125,646 | | | | 25,464,721 | | | | (660,925) | |
Korean Won,
Expiring 03/19/14* | | Credit Suisse International | | KRW | | | 51,353,177,500 | | | | 48,420,029 | | | | 48,431,593 | | | | 11,564 | |
Korean Won,
Expiring 03/19/14* | | The Royal Bank of Scotland | | KRW | | | 51,553,177,499 | | | | 48,608,715 | | | | 48,620,214 | | | | 11,499 | |
| | | | |
| | The accompanying notes are an integral part of these financial statements. | | (Continued) |
| | | | | | | | | | | | | | | | |
| 160 | | AQR Funds | | | | | | Annual Report | | | | | | December 2013 | | |
| | | | | | | | | | |
| | | | |
| Consolidated Schedule of Investments | | | December 31, 2013 | |
| | |
| AQR MULTI-STRATEGY ALTERNATIVE FUND | | |
| | | | | | | | | | | | | | | | | | | | |
PURCHASE
CONTRACTS | | COUNTERPARTY | | CURRENCY | | CURRENCY
AMOUNT
PURCHASED | | | VALUE AT
SETTLEMENT
DATE | | | VALUE AT
DECEMBER 31,
2013 | | | UNREALIZED
APPRECIATION
(DEPRECIATION) | |
Mexican Peso,
Expiring 03/19/14 | | Credit Suisse International | | MXN | | | 97,000,000 | | | | $7,445,876 | | | | $7,384,846 | | | | $(61,030) | |
Mexican Peso,
Expiring 03/19/14 | | The Royal Bank of Scotland | | MXN | | | 97,000,000 | | | | 7,446,576 | | | | 7,384,846 | | | | (61,730) | |
Malaysian Ringgit,
Expiring 03/19/14* | | Credit Suisse International | | MYR | | | 45,435,000 | | | | 14,051,422 | | | | 13,808,678 | | | | (242,744) | |
Malaysian Ringgit,
Expiring 03/19/14* | | The Royal Bank of Scotland | | MYR | | | 45,435,000 | | | | 14,051,338 | | | | 13,808,678 | | | | (242,660) | |
Norwegian Krone,
Expiring 03/19/14 | | Credit Suisse International | | NOK | | | 29,529,500 | | | | 4,809,794 | | | | 4,855,047 | | | | 45,253 | |
Norwegian Krone,
Expiring 03/19/14 | | The Royal Bank of Scotland | | NOK | | | 32,989,500 | | | | 5,375,414 | | | | 5,423,917 | | | | 48,503 | |
New Zealand
Dollar,
Expiring 03/19/14 | | Credit Suisse International | | NZD | | | 139,116,000 | | | | 114,096,781 | | | | 113,785,064 | | | | (311,717) | |
New Zealand
Dollar,
Expiring 03/19/14 | | The Royal Bank of Scotland | | NZD | | | 139,115,998 | | | | 114,096,297 | | | | 113,785,062 | | | | (311,235) | |
Philippine Peso,
Expiring 03/19/14* | | The Royal Bank of Scotland | | PHP | | | 10,000,000 | | | | 228,938 | | | | 225,555 | | | | (3,383) | |
Poland Zloty,
Expiring 03/19/14 | | Credit Suisse International | | PLN | | | 111,874,500 | | | | 36,403,539 | | | | 36,860,572 | | | | 457,033 | |
Poland Zloty,
Expiring 03/19/14 | | The Royal Bank of Scotland | | PLN | | | 111,874,499 | | | | 36,403,303 | | | | 36,860,572 | | | | 457,269 | |
Russian Ruble,
Expiring 03/19/14* | | Credit Suisse International | | RUB | | | 497,457,000 | | | | 14,942,310 | | | | 14,938,839 | | | | (3,471) | |
Russian Ruble,
Expiring 03/19/14* | | The Royal Bank of Scotland | | RUB | | | 497,457,000 | | | | 14,942,400 | | | | 14,938,839 | | | | (3,561) | |
Swedish Krona,
Expiring 03/19/14 | | Credit Suisse International | | SEK | | | 31,356,000 | | | | 4,790,635 | | | | 4,868,861 | | | | 78,226 | |
Swedish Krona,
Expiring 03/19/14 | | The Royal Bank of Scotland | | SEK | | | 51,733,000 | | | | 7,912,977 | | | | 8,032,938 | | | | 119,961 | |
Singapore Dollar,
Expiring 03/19/14 | | Credit Suisse International | | SGD | | | 100,000 | | | | 79,860 | | | | 79,245 | | | | (615) | |
Singapore Dollar,
Expiring 03/19/14 | | The Royal Bank of Scotland | | SGD | | | 100,000 | | | | 79,866 | | | | 79,245 | | | | (621) | |
Turkish Lira,
Expiring 03/19/14 | | Credit Suisse International | | TRY | | | 71,450,000 | | | | 34,408,662 | | | | 32,722,902 | | | | (1,685,760) | |
Turkish Lira,
Expiring 03/19/14 | | The Royal Bank of Scotland | | TRY | | | 71,450,000 | | | | 34,399,729 | | | | 32,722,902 | | | | (1,676,827) | |
Taiwanese Dollar,
Expiring 03/19/14* | | Credit Suisse International | | TWD | | | 374,882,499 | | | | 12,752,594 | | | | 12,605,545 | | | | (147,049) | |
Taiwanese Dollar,
Expiring 03/19/14* | | The Royal Bank of Scotland | | TWD | | | 374,882,499 | | | | 12,752,518 | | | | 12,605,545 | | | | (146,973) | |
| | | | | | | | | | | | | | | | | | | | |
| | | | | | | | | | | 1,315,228,719 | | | | 1,314,081,811 | | | | (1,146,908) | |
| | | | | | | | | | | | | | | | | | | | |
| | | | | | | | | | | | | | | | | | | | |
SALES
CONTRACTS | | COUNTERPARTY | | CURRENCY | | CURRENCY
AMOUNT
SOLD | | | VALUE AT
SETTLEMENT
DATE | | | VALUE AT
DECEMBER 31,
2013 | | | UNREALIZED
APPRECIATION
(DEPRECIATION) | |
Australian Dollar,
Expiring 03/19/14 | | Credit Suisse International | | AUD | | | (61,470,500) | | | | $(55,199,995) | | | | $(54,618,691) | | | | $581,304 | |
Australian Dollar,
Expiring 03/19/14 | | The Royal Bank of Scotland | | AUD | | | (61,780,500) | | | | (55,480,251) | | | | (54,894,137) | | | | 586,114 | |
Brazilian Real,
Expiring 03/19/14* | | Credit Suisse International | | BRL | | | (65,950,000) | | | | (27,399,827) | | | | (27,447,185) | | | | (47,358) | |
| | | | |
| | The accompanying notes are an integral part of these financial statements. | | (Continued) |
| | | | | | | | | | | | | | | | |
| | AQR Funds | | | | | | Annual Report | | | | | | December 2013 | | 161 |
| | | | | | | | | | |
| | | | |
| Consolidated Schedule of Investments | | | December 31, 2013 | |
| | |
| AQR MULTI-STRATEGY ALTERNATIVE FUND | | |
| | | | | | | | | | | | | | | | | | | | |
SALES
CONTRACTS | | COUNTERPARTY | | CURRENCY | | CURRENCY
AMOUNT
SOLD | | | VALUE AT
SETTLEMENT
DATE | | | VALUE AT
DECEMBER 31,
2013 | | | UNREALIZED
APPRECIATION
(DEPRECIATION) | |
Brazilian Real,
Expiring 03/19/14* | | The Royal Bank of Scotland | | BRL | | | (65,950,000) | | | | $(27,399,454) | | | | $(27,447,185) | | | | $(47,731) | |
Canadian Dollar,
Expiring 03/19/14 | | Credit Suisse International | | CAD | | | (116,963,999) | | | | (109,600,996) | | | | (109,907,927) | | | | (306,931) | |
Canadian Dollar,
Expiring 03/19/14 | | The Royal Bank of Scotland | | CAD | | | (117,060,998) | | | | (109,692,037) | | | | (109,999,074) | | | | (307,037) | |
Swiss Franc,
Expiring 03/19/14 | | Credit Suisse International | | CHF | | | (19,456,000) | | | | (21,664,428) | | | | (21,823,893) | | | | (159,465) | |
Swiss Franc,
Expiring 03/19/14 | | The Royal Bank of Scotland | | CHF | | | (23,420,000) | | | | (26,119,131) | | | | (26,270,331) | | | | (151,200) | |
Chilean Peso,
Expiring 03/19/14* | | Credit Suisse International | | CLP | | | (8,402,074,000) | | | | (15,573,989) | | | | (15,856,377) | | | | (282,388) | |
Chilean Peso,
Expiring 03/19/14* | | The Royal Bank of Scotland | | CLP | | | (8,402,074,000) | | | | (15,573,991) | | | | (15,856,377) | | | | (282,386) | |
Columbian Peso,
Expiring 03/19/14* | | Credit Suisse International | | COP | | | (1,557,000,000) | | | | (795,855) | | | | (803,535) | | | | (7,680) | |
Columbian Peso,
Expiring 03/19/14* | | The Royal Bank of Scotland | | COP | | | (1,657,000,000) | | | | (847,056) | | | | (855,143) | | | | (8,087) | |
Czech Republic
Koruna,
Expiring 03/19/14 | | Credit Suisse International | | CZK | | | (191,473,000) | | | | (9,559,731) | | | | (9,647,648) | | | | (87,917) | |
Czech Republic
Koruna,
Expiring 03/19/14 | | The Royal Bank of Scotland | | CZK | | | (194,473,000) | | | | (9,708,031) | | | | (9,798,807) | | | | (90,776) | |
Danish Krone,
Expiring 03/19/14 | | Credit Suisse International | | DKK | | | (9,591,500) | | | | (1,769,134) | | | | (1,769,782) | | | | (648) | |
Danish Krone,
Expiring 03/19/14 | | The Royal Bank of Scotland | | DKK | | | (16,234,500) | | | | (2,995,541) | | | | (2,995,519) | | | | 22 | |
Euro,
Expiring 03/19/14 | | Credit Suisse International | | EUR | | | (15,816,500) | | | | (21,624,243) | | | | (21,758,284) | | | | (134,041) | |
Euro,
Expiring 03/19/14 | | The Royal Bank of Scotland | | EUR | | | (41,314,500) | | | | (56,575,317) | | | | (56,835,118) | | | | (259,801) | |
Euro,
Expiring 04/07/14 | | The Royal Bank of Scotland | | EUR | | | (3,562) | | | | (4,704) | | | | (4,900) | | | | (196) | |
Euro,
Expiring 06/09/14 | | The Royal Bank of Scotland | | EUR | | | (110,000) | | | | (141,336) | | | | (151,337) | | | | (10,001) | |
Euro,
Expiring 04/07/15 | | The Royal Bank of Scotland | | EUR | | | (3,562) | | | | (4,716) | | | | (4,907) | | | | (191) | |
Euro,
Expiring 06/09/15 | | The Royal Bank of Scotland | | EUR | | | (110,000) | | | | (141,776) | | | | (151,600) | | | | (9,824) | |
Euro,
Expiring 11/09/15 | | The Royal Bank of Scotland | | EUR | | | (46,110) | | | | (59,499) | | | | (63,618) | | | | (4,119) | |
Euro,
Expiring 04/05/16 | | The Royal Bank of Scotland | | EUR | | | (3,562) | | | | (4,730) | | | | (4,933) | | | | (203) | |
Euro,
Expiring 04/05/17 | | The Royal Bank of Scotland | | EUR | | | (3,562) | | | | (4,751) | | | | (4,994) | | | | (243) | |
British Pound,
Expiring 03/19/14 | | Credit Suisse International | | GBP | | | (14,768,000) | | | | (24,087,141) | | | | (24,442,148) | | | | (355,007) | |
British Pound,
Expiring 03/19/14 | | The Royal Bank of Scotland | | GBP | | | (16,076,000) | | | | (26,223,719) | | | | (26,606,986) | | | | (383,267) | |
Hong Kong Dollar,
Expiring 03/19/14 | | Credit Suisse International | | HKD | | | (71,383,000) | | | | (9,209,009) | | | | (9,206,374) | | | | 2,635 | |
Hong Kong Dollar,
Expiring 03/19/14 | | The Royal Bank of Scotland | | HKD | | | (71,383,000) | | | | (9,209,046) | | | | (9,206,374) | | | | 2,672 | |
Hungarian Forint,
Expiring 03/19/14 | | Credit Suisse International | | HUF | | | (325,000,000) | | | | (1,458,086) | | | | (1,497,841) | | | | (39,755) | |
| | | | |
| | The accompanying notes are an integral part of these financial statements. | | (Continued) |
| | | | | | | | | | | | | | | | |
| 162 | | AQR Funds | | | | | | Annual Report | | | | | | December 2013 | | |
| | | | | | | | | | |
| | | | |
| Consolidated Schedule of Investments | | | December 31, 2013 | |
| | |
| AQR MULTI-STRATEGY ALTERNATIVE FUND | | |
| | | | | | | | | | | | | | | | | | | | |
SALES
CONTRACTS | | COUNTERPARTY | | CURRENCY | | CURRENCY
AMOUNT
SOLD | | | VALUE AT
SETTLEMENT
DATE | | | VALUE AT
DECEMBER 31,
2013 | | | UNREALIZED
APPRECIATION
(DEPRECIATION) | |
Hungarian Forint,
Expiring 03/19/14 | | The Royal Bank of Scotland | | HUF | | | (325,000,000) | | | | $(1,458,404) | | | | $(1,497,841) | | | | $(39,437) | |
Indonesian Rupiah,
Expiring 03/19/14* | | Credit Suisse International | | IDR | | | (41,389,380,500) | | | | (3,358,473) | | | | (3,354,982) | | | | 3,491 | |
Indonesian Rupiah,
Expiring 03/19/14* | | The Royal Bank of Scotland | | IDR | | | (41,389,380,500) | | | | (3,358,493) | | | | (3,354,982) | | | | 3,511 | |
Israeli Shekel,
Expiring 03/19/14 | | Credit Suisse International | | ILS | | | (52,712,501) | | | | (15,021,142) | | | | (15,163,807) | | | | (142,665) | |
Israeli Shekel,
Expiring 03/19/14 | | The Royal Bank of Scotland | | ILS | | | (52,712,500) | | | | (15,021,167) | | | | (15,163,807) | | | | (142,640) | |
Indian Rupee,
Expiring 03/19/14* | | Credit Suisse International | | INR | | | (301,853,000) | | | | (4,815,026) | | | | (4,794,141) | | | | 20,885 | |
Indian Rupee,
Expiring 03/19/14* | | The Royal Bank of Scotland | | INR | | | (301,853,000) | | | | (4,815,054) | | | | (4,794,141) | | | | 20,913 | |
Japanese Yen,
Expiring 03/19/14 | | Credit Suisse International | | JPY | | | (16,224,880,499) | | | | (157,684,185) | | | | (154,126,273) | | | | 3,557,912 | |
Japanese Yen,
Expiring 03/19/14 | | The Royal Bank of Scotland | | JPY | | | (17,401,102,497) | | | | (168,879,592) | | | | (165,299,650) | | | | 3,579,942 | |
Korean Won,
Expiring 03/19/14* | | Credit Suisse International | | KRW | | | (1,150,000,000) | | | | (1,077,949) | | | | (1,084,574) | | | | (6,625) | |
Korean Won,
Expiring 03/19/14* | | The Royal Bank of Scotland | | KRW | | | (1,150,000,000) | | | | (1,077,955) | | | | (1,084,574) | | | | (6,619) | |
Mexican Peso,
Expiring 03/19/14 | | Credit Suisse International | | MXN | | | (370,429,500) | | | | (27,856,112) | | | | (28,201,699) | | | | (345,587) | |
Mexican Peso,
Expiring 03/19/14 | | The Royal Bank of Scotland | | MXN | | | (370,429,500) | | | | (27,856,035) | | | | (28,201,699) | | | | (345,664) | |
Malaysian Ringgit,
Expiring 03/19/14* | | Credit Suisse International | | MYR | | | (16,320,500) | | | | (5,008,247) | | | | (4,960,153) | | | | 48,094 | |
Malaysian Ringgit,
Expiring 03/19/14* | | The Royal Bank of Scotland | | MYR | | | (16,320,500) | | | | (5,008,193) | | | | (4,960,153) | | | | 48,040 | |
Norwegian Krone,
Expiring 03/19/14 | | Credit Suisse International | | NOK | | | (152,136,999) | | | | (24,692,375) | | | | (25,013,367) | | | | (320,992) | |
Norwegian Krone,
Expiring 03/19/14 | | The Royal Bank of Scotland | | NOK | | | (171,263,998) | | | | (27,814,653) | | | | (28,158,103) | | | | (343,450) | |
New Zealand
Dollar,
Expiring 03/19/14 | | Credit Suisse International | | NZD | | | (16,553,000) | | | | (13,565,480) | | | | (13,538,947) | | | | 26,533 | |
New Zealand
Dollar,
Expiring 03/19/14 | | The Royal Bank of Scotland | | NZD | | | (16,553,000) | | | | (13,565,248) | | | | (13,538,947) | | | | 26,301 | |
Peru Nuevo Sol,
Expiring 03/19/14* | | Credit Suisse International | | PEN | | | (294,000) | | | | (102,779) | | | | (103,953) | | | | (1,174) | |
Peru Nuevo Sol,
Expiring 03/19/14* | | The Royal Bank of Scotland | | PEN | | | (294,000) | | | | (102,780) | | | | (103,953) | | | | (1,173) | |
Philippine Peso,
Expiring 03/19/14* | | Credit Suisse International | | PHP | | | (277,400,000) | | | | (6,280,262) | | | | (6,256,908) | | | | 23,354 | |
Philippine Peso,
Expiring 03/19/14* | | The Royal Bank of Scotland | | PHP | | | (277,400,000) | | | | (6,280,234) | | | | (6,256,908) | | | | 23,326 | |
Russian Ruble,
Expiring 03/19/14* | | Credit Suisse International | | RUB | | | (820,000,000) | | | | (24,346,553) | | | | (24,624,939) | | | | (278,386) | |
Russian Ruble,
Expiring 03/19/14* | | The Royal Bank of Scotland | | RUB | | | (820,000,000) | | | | (24,346,192) | | | | (24,624,939) | | | | (278,747) | |
Swedish Krona,
Expiring 03/19/14 | | Credit Suisse International | | SEK | | | (341,581,500) | | | | (52,078,184) | | | | (53,039,703) | | | | (961,519) | |
Swedish Krona,
Expiring 03/19/14 | | The Royal Bank of Scotland | | SEK | | | (377,095,498) | | | | (57,565,920) | | | | (58,554,205) | | | | (988,285) | |
| | | | |
| | The accompanying notes are an integral part of these financial statements. | | (Continued) |
| | | | | | | | | | | | | | | | |
| | AQR Funds | | | | | | Annual Report | | | | | | December 2013 | | 163 |
| | | | | | | | | | |
| | | | |
| Consolidated Schedule of Investments | | | December 31, 2013 | |
| | |
| AQR MULTI-STRATEGY ALTERNATIVE FUND | | |
| | | | | | | | | | | | | | | | | | | | |
SALES
CONTRACTS | | COUNTERPARTY | | CURRENCY | | CURRENCY
AMOUNT
SOLD | | | VALUE AT
SETTLEMENT
DATE | | | VALUE AT
DECEMBER 31,
2013 | | | UNREALIZED
APPRECIATION
(DEPRECIATION) | |
Singapore Dollar,
Expiring 03/19/14 | | Credit Suisse International | | SGD | | | (100,384,000) | | | | $(80,290,924) | | | | $(79,549,255) | | | | $741,669 | |
Singapore Dollar,
Expiring 03/19/14 | | The Royal Bank of Scotland | | SGD | | | (100,384,000) | | | | (80,291,854) | | | | (79,549,255) | | | | 742,599 | |
Thailand Baht,
Expiring 03/19/14 | | Credit Suisse International | | THB | | | (25,503,000) | | | | (786,154) | | | | (773,463) | | | | 12,691 | |
Thailand Baht,
Expiring 03/19/14 | | The Royal Bank of Scotland | | THB | | | (25,503,000) | | | | (786,159) | | | | (773,463) | | | | 12,696 | |
Turkish Lira,
Expiring 03/19/14 | | Credit Suisse International | | TRY | | | (47,931,000) | | | | (23,115,031) | | | | (21,951,594) | | | | 1,163,437 | |
Turkish Lira,
Expiring 03/19/14 | | The Royal Bank of Scotland | | TRY | | | (47,931,000) | | | | (23,115,853) | | | | (21,951,594) | | | | 1,164,259 | |
Taiwanese Dollar,
Expiring 03/19/14* | | Credit Suisse International | | TWD | | | (108,500,000) | | | | (3,670,385) | | | | (3,648,347) | | | | 22,038 | |
Taiwanese Dollar,
Expiring 03/19/14* | | The Royal Bank of Scotland | | TWD | | | (108,500,000) | | | | (3,670,332) | | | | (3,648,348) | | | | 21,984 | |
South African
Rand,
Expiring 03/19/14 | | Credit Suisse International | | ZAR | | | (264,492,501) | | | | (25,149,979) | | | | (24,941,198) | | | | 208,781 | |
South African
Rand,
Expiring 03/19/14 | | The Royal Bank of Scotland | | ZAR | | | (264,492,498) | | | | (25,150,283) | | | | (24,941,198) | | | | 209,085 | |
| | | | | | | | | | | | | | | | | | | | |
| | | | | | | | | | | (1,597,191,161) | | | | (1,591,516,088) | | | | 5,675,073 | |
| | | | | | | | | | | | | | | | | | | | |
| | | | | | | | | | | $(281,962,442) | | | | $(277,434,277) | | | | $4,528,165 | |
| | | | | | | | | | | | | | | | | | | | |
Money Market Fund is pledged as collateral to The Royal Bank of Scotland for forward foreign currency exchange contracts was $848,380 at December 31, 2013. Cash held as collateral for Credit Suisse International for forward foreign currency exchange contracts was $3,040,000 at December 31, 2013.
| * | Non deliverable forward. See Note 3 in the Notes to Financial Statements. |
AUD - Australian Dollar
BRL - Brazilian Real
CAD - Canadian Dollar
CHF - Swiss Franc
CLP - Chilean Peso
COP - Columbian Peso
CZK - Czech Republic Koruna
DKK - Danish Krone
EUR - Euro
GBP - British Pound
HKD - Hong Kong Dollar
HUF - Hungarian Forint
IDR - Indonesian Rupiah
ILS - Israeli Shekel
INR - Indian Rupee
JPY - Japanese Yen
KRW - Korean Won
MXN - Mexican Peso
MYR - Malaysian Ringgit
NOK - Norwegian Krone
NZD - New Zealand Dollar
PEN - Peruvian Nuevo Sol
PHP - Philippine Peso
PLN - Poland Zloty
RUB - Russian Ruble
SEK - Swedish Krona
SGD - Singapore Dollar
THB - Thailand Baht
TRY - Turkish Lira
TWD - Taiwan Dollar
USD - United States Dollar
ZAR - South African Rand
| | | | |
| | The accompanying notes are an integral part of these financial statements. | | (Continued) |
| | | | | | | | | | | | | | | | |
| 164 | | AQR Funds | | | | | | Annual Report | | | | | | December 2013 | | |
| | | | | | | | | | |
| | | | |
| Consolidated Schedule of Investments | | | December 31, 2013 | |
| | |
| AQR MULTI-STRATEGY ALTERNATIVE FUND | | |
Total Return Basket Swaps* Outstanding at December 31, 2013
Over the Counter
| | | | | | | | |
| COUNTERPARTY | | DESCRIPTION | | TERMINATION
DATE** | | VALUE
(Note 3) | |
| Deutsche Bank | | The Fund receives or pays the total return on a portfolio of long and short positions and pays or receives the London Interbank Offered Rate (“LIBOR”) (+/– 40 bps), which is denominated in GBP based on the local currencies of the positions within the swap. | | 24 months maturity 12/22/2014 | | | $5,907,968 | |
| | | | | | | | |
| * | See the accompanying “Additional Information — Total Return Basket Swap” for further details. |
| ** | The maturity dates are measured from the commencement of investment in each underlying portfolio swap position. |
Additional Information — Total Return Basket Swaps
The following table represents the individual long and short positions and related values within the total return basket swap as of December 31, 2013.
| | | | | | | | | | | | |
REFERENCE
ENTITY | | SHARES | | | NOTIONAL (a) | | | NET
UNREALIZED
APPRECIATION
(DEPRECIATION) | |
| | | | | | | | | | | | |
| Long Positions | | | | | | | | | |
| | | |
| Ireland | | | | | | | | | | | | |
| DCC PLC | | | 7,442 | | | $ | 350,009 | | | $ | 16,184 | |
| | | | | | | | | | | | |
| | | |
| Switzerland | | | | | | | | | | | | |
| Coca-Cola HBC AG | | | 10,191 | | | | 288,659 | | | | 9,608 | |
| Wolseley PLC | | | 72,415 | | | | 3,784,577 | | | | 332,447 | |
| | | | | | | | | | | | |
| | | | | | | | | | | 342,055 | |
| | | | | | | | | | | | |
| United Kingdom | | | | | | | | | | | | |
| Alent PLC | | | 10,575 | | | | 55,007 | | | | 7,284 | |
| AMEC PLC | | | 80,188 | | | | 1,555,907 | | | | (108,130) | |
| Antofagasta PLC | | | 15,379 | | | | 212,383 | | | | (1,545) | |
| ARM Holdings PLC | | | 71,777 | | | | 1,196,480 | | | | 108,633 | |
| Associated British Foods PLC | | | 23,902 | | | | 864,842 | | | | 104,520 | |
| AstraZeneca PLC | | | 17,543 | | | | 918,716 | | | | 122,057 | |
| Aviva PLC | | | 462,752 | | | | 3,167,162 | | | | 294,897 | |
| Babcock International Group PLC | | | 350,335 | | | | 5,975,703 | | | | 1,896,338 | |
| BAE Systems PLC | | | 561,886 | | | | 3,601,794 | | | | 452,098 | |
| Balfour Beatty PLC | | | 24,191 | | | | 117,712 | | | | (2,461) | |
| Barratt Developments PLC | | | 766,824 | | | | 3,851,470 | | | | 587,441 | |
| Berkeley Group Holdings PLC | | | 10,937 | | | | 391,520 | | | | 90,673 | |
| BP PLC | | | 609,700 | | | | 4,714,467 | | | | 226,612 | |
| British Sky Broadcasting Group PLC | | | 82,561 | | | | 1,143,589 | | | | 11,370 | |
| Centrica PLC | | | 404,035 | | | | 2,437,920 | | | | (108,001) | |
| Compass Group PLC | | | 71,620 | | | | 1,042,416 | | | | 107,434 | |
| Darty PLC | | | 52,703 | | | | 50,895 | | | | 52,394 | |
| Direct Line Insurance Group PLC | | | 125,726 | | | | 470,894 | | | | 49,227 | |
| Drax Group PLC | | | 202,034 | | | | 2,080,878 | | | | 599,802 | |
| DS Smith PLC | | | 238,300 | | | | 1,127,924 | | | | 186,026 | |
| Experian PLC | | | 40,782 | | | | 780,372 | | | | (27,032) | |
| G4S PLC | | | 169,310 | | | | 701,548 | | | | 35,145 | |
| | | | | | | | | | | | |
REFERENCE
ENTITY | | SHARES | | | NOTIONAL (a) | | | NET
UNREALIZED
APPRECIATION
(DEPRECIATION) | |
| United Kingdom (continued) | | | | | | | | | |
| GKN PLC | | | 975,846 | | | $ | 4,417,360 | | | $ | 1,629,690 | |
| GlaxoSmithKline PLC | | | 30,430 | | | | 846,114 | | | | (33,100) | |
| Glencore Xstrata PLC | | | 131,908 | | | | 689,512 | | | | (3,253) | |
| HSBC Holdings PLC | | | 157,671 | | | | 1,879,020 | | | | (148,714) | |
| Inchcape PLC | | | 322,514 | | | | 2,595,520 | | | | 697,948 | |
| Inmarsat PLC | | | 110,882 | | | | 1,320,978 | | | | 69,290 | |
| Invensys PLC | | | 99,814 | | | | 829,153 | | | | 14,539 | |
| Investec PLC | | | 403,784 | | | | 2,975,232 | | | | (42,640) | |
| ITV PLC | | | 1,069,941 | | | | 2,698,153 | | | | 745,072 | |
| J Sainsbury PLC | | | 562,070 | | | | 3,493,305 | | | | (91,529) | |
| John Wood Group PLC | | | 57,127 | | | | 757,537 | | | | (106,287) | |
| Kingfisher PLC | | | 363,461 | | | | 2,155,023 | | | | 165,328 | |
| Ladbrokes PLC | | | 40,751 | | | | 119,437 | | | | 1,667 | |
| Legal & General Group PLC | | | 892,404 | | | | 2,376,876 | | | | 921,859 | |
| Lloyds Banking Group PLC | | | 4,990,746 | | | | 4,979,015 | | | | 1,569,782 | |
| Meggitt PLC | | | 14,984 | | | | 119,585 | | | | 11,607 | |
| Michael Page International PLC | | | 44,018 | | | | 321,971 | | | | 34,350 | |
| Mondi PLC | | | 84,001 | | | | 1,378,307 | | | | 79,825 | |
| National Grid PLC | | | 168,378 | | | | 2,177,120 | | | | 25,132 | |
| Next PLC | | | 69,549 | | | | 4,929,593 | | | | 1,357,051 | |
| Premier Oil PLC | | | 20,171 | | | | 105,221 | | | | (259) | |
| Reckitt Benckiser Group PLC | | | 25,992 | | | | 1,989,749 | | | | 74,949 | |
| Rexam PLC | | | 112,286 | | | | 953,886 | | | | 34,028 | |
| Rolls-Royce Holdings PLC | | | 28,771 | | | | 431,289 | | | | 177,258 | |
| Rolls-Royce Holdings PLC | | | 2,474,306 | | | | 97 | | | | 4,000 | |
| Royal Bank of Scotland Group PLC | | | 13,225 | | | | 74,469 | | | | 12 | |
| RSA Insurance Group PLC | | | 1,940,632 | | | | 3,802,919 | | | | (864,216) | |
| Serco Group PLC | | | 295,431 | | | | 2,650,912 | | | | (206,341) | |
| Severn Trent PLC | | | 43,861 | | | | 1,242,880 | | | | (2,802) | |
| | | | |
| | The accompanying notes are an integral part of these financial statements. | | (Continued) |
| | | | | | | | | | | | | | | | |
| | AQR Funds | | | | | | Annual Report | | | | | | December 2013 | | 165 |
| | | | | | | | | | |
| | | | |
| Consolidated Schedule of Investments | | | December 31, 2013 | |
| | |
| AQR MULTI-STRATEGY ALTERNATIVE FUND | | |
| | | | | | | | | | | | |
REFERENCE
ENTITY | | SHARES | | | NOTIONAL (a) | | | NET
UNREALIZED
APPRECIATION
(DEPRECIATION) | |
| United Kingdom (continued) | | | | | | | | | |
| Smith & Nephew PLC | | | 16,885 | | | $ | 193,515 | | | $ | 47,648 | |
| Smiths Group PLC | | | 15,916 | | | | 370,014 | | | | 20,814 | |
| Spirax-Sarco Engineering PLC | | | 12,657 | | | | 601,053 | | | | 27,124 | |
| Sports Direct International PLC | | | 1,110 | | | | 13,737 | | | | (560) | |
| SSE PLC | | | 28,752 | | | | 653,351 | | | | 16 | |
| Standard Life PLC | | | 296,399 | | | | 1,747,661 | | | | 22,404 | |
| Tate & Lyle PLC | | | 231,248 | | | | 3,020,970 | | | | 81,081 | |
| Tesco PLC | | | 791,317 | | | | 4,552,448 | | | | (157,997) | |
| Travis Perkins PLC | | | 138,942 | | | | 3,662,752 | | | | 653,346 | |
| UBM PLC | | | 11,539 | | | | 126,261 | | | | (607) | |
| United Utilities Group PLC | | | 45,781 | | | | 505,033 | | | | 4,672 | |
| Vedanta Resources PLC | | | 20,615 | | | | 311,346 | | | | 8,668 | |
| Whitbread PLC | | | 6,852 | | | | 400,944 | | | | 25,486 | |
| William Hill PLC | | | 897,105 | | | | 5,724,496 | | | | 255,907 | |
| WM Morrison Supermarkets PLC | | | 133,886 | | | | 590,835 | | | | (11,267) | |
| WPP PLC | | | 91,236 | | | | 1,872,689 | | | | 216,976 | |
| | | | | | | | | | | | |
| | | | | | | | 11,992,739 | |
| | | | | | | | | | | | |
| Total of Long Equity Positions | | | | | | | | | | | 12,350,978 | |
| | | | | | | | | | | | |
| | |
| Short Positions | | | | | | | | | |
| | | |
| Switzerland | | | | | | | | | | | | |
| Informa PLC | | | (35,589) | | | | (306,824) | | | | (31,892) | |
| | | | | | | | | | | | |
| | | |
| United Kingdom | | | | | | | | | | | | |
| Admiral Group PLC | | | (103,228) | | | | (2,024,838) | | | | (219,050) | |
| Aggreko PLC | | | (234,776) | | | | (6,537,275) | | | | (121,122) | |
| Anglo American PLC | | | (73,031) | | | | (1,568,635) | | | | (29,671) | |
| Ashtead Group PLC | | | (59,754) | | | | (659,909) | | | | (93,872) | |
| Barclays PLC | | | (48,710) | | | | (211,885) | | | | (8,376) | |
| BG Group PLC | | | (236,882) | | | | (4,359,419) | | | | (737,895) | |
| British American Tobacco PLC | | | (66,581) | | | | (3,668,506) | | | | 94,829 | |
| Bunzl PLC | | | (72,706) | | | | (1,622,797) | | | | (124,406) | |
| Burberry Group PLC | | | (370,826) | | | | (8,595,307) | | | | (747,768) | |
| Capita PLC | | | (211,258) | | | | (2,847,390) | | | | (789,041) | |
| Carnival PLC | | | (53,010) | | | | (2,062,582) | | | | (131,930) | |
| Cobham PLC | | | (106,950) | | | | (456,904) | | | | (29,948) | |
| Croda International PLC | | | (41,912) | | | | (1,749,785) | | | | 41,328 | |
| Diageo PLC | | | (140,878) | | | | (4,401,726) | | | | (266,771) | |
| Eurasian Natural Resources Corp. PLC | | | (2,433) | | | | (8,961) | | | | 488 | |
| | | | | | | | | | | | |
REFERENCE
ENTITY | | SHARES | | | NOTIONAL (a) | | | NET
UNREALIZED
APPRECIATION
(DEPRECIATION) | |
| United Kingdom (continued) | | | | | | | | | |
| ICAP PLC | | | (411,865) | | | $ | (2,329,514) | | | $ | (755,318) | |
| IMI PLC | | | (175,715) | | | | (3,692,121) | | | | (757,678) | |
| Imperial Tobacco Group PLC | | | (10,421) | | | | (405,441) | | | | 1,438 | |
| InterContinental Hotels Group PLC | | | (102,401) | | | | (3,153,817) | | | | (261,909) | |
| Intertek Group PLC | | | (94,531) | | | | (4,970,860) | | | | 37,157 | |
| Johnson Matthey PLC | | | (65,537) | | | | (2,746,928) | | | | (819,130) | |
| Kazakhmys PLC | | | (20,283) | | | | (85,413) | | | | 11,824 | |
| Lonmin PLC | | | (130,289) | | | | (615,475) | | | | (52,464) | |
| Man Group PLC | | | (910,534) | | | | (1,334,423) | | | | 48,129 | |
| Marks & Spencer Group PLC | | | (155,514) | | | | (1,034,011) | | | | (82,718) | |
| Mitchells & Butlers PLC | | | (10,426) | | | | (57,106) | | | | (15,845) | |
| Old Mutual PLC | | | (416,645) | | | | (1,326,034) | | | | 18,766 | |
| Pearson PLC | | | (189,396) | | | | (4,016,074) | | | | (206,666) | |
| Pennon Group PLC | | | (85,403) | | | | (911,249) | | | | (21,949) | |
| Petrofac Ltd. | | | (198,151) | | | | (4,340,839) | | | | 322,746 | |
| Prudential PLC | | | (171,307) | | | | (3,116,829) | | | | (710,857) | |
| SABMiller PLC | | | (58,719) | | | | (2,836,796) | | | | (185,769) | |
| Shire PLC | | | (45,338) | | | | (1,593,821) | | | | (542,832) | |
| Standard Chartered PLC | | | (336,150) | | | | (8,501,236) | | | | 908,631 | |
| Taylor Wimpey PLC | | | (245,991) | | | | (437,345) | | | | (18,230) | |
| Telecity Group PLC | | | (42,767) | | | | (483,797) | | | | (30,680) | |
| Weir Group PLC/The | | | (215,878) | | | | (7,081,037) | | | | (562,363) | |
| | | | | | | | | | | | |
| | | | | | | | | | | (6,838,922) | |
| | | | | | | | | | | | |
| Total of Short Equity Positions | | | | | | | | | | | (6,870,814) | |
| | | | | | | | | | | | |
| Total of Long and Short Equity Positions | | | | | | | | | | | 5,480,164 | |
| | | | | | | | | | | | |
| Net Cash and Other Receivables/ (Payables) (b) | | | | | | | | | | | 427,804 | |
| | | | | | | | | | | | |
| Swaps, at Value | | | | | | | $ | 5,907,968 | |
| | | | | | | | | | | | |
| (a) | Notional value represents the market value (including any fees or commissions) of the long and short positions when they are established. |
| (b) | Cash and other receivables/(payables) includes the gains (or losses) realized within the swap when the swap resets. |
Money Market Fund is pledged as collateral to Deutsche Bank in the amount of 28,412,220 for total return basket swaps at December 31, 2013.
| | | | |
| | The accompanying notes are an integral part of these financial statements. | | (Continued) |
| | | | | | | | | | | | | | | | |
| 166 | | AQR Funds | | | | | | Annual Report | | | | | | December 2013 | | |
| | | | | | | | | | |
| | | | |
| Consolidated Schedule of Investments | | | December 31, 2013 | |
| | |
| AQR MULTI-STRATEGY ALTERNATIVE FUND | | |
| | | | | | | | |
| COUNTERPARTY | | DESCRIPTION | | TERMINATION DATE** | | VALUE
(Note 3) | |
| Deutsche Bank | | The Fund receives or pays the total return on a portfolio of long and short positions and pays or receives the Euro Interbank Offered Rate (+/– 40 bps), which is denominated in EUR based on the local currencies of the positions within the swap. | | 12-24 months maturity ranging from 11/10/2014 - 12/22/2014 | | | $6,987,302 | |
| | | | | | | | |
| ** | The maturity dates are measured from the commencement of investment in each underlying portfolio swap position. |
Additional Information — Total Return Basket Swaps
The following table represents the individual long and short positions and related values within the total return basket swap as of December 31, 2013.
| | | | | | | | | | | | |
REFERENCE
ENTITY | | SHARES | | | NOTIONAL (a) | | | NET
UNREALIZED
APPRECIATION
(DEPRECIATION) | |
| Long Positions | | | | | | | | | |
| | | |
| France | | | | | | | | | | | | |
| Aeroports de Paris | | | 1,648 | | | $ | 178,931 | | | $ | 8,200 | |
| Air France-KLM | | | 31,606 | | | | 324,739 | | | | 5,573 | |
| Arkema SA | | | 60,916 | | | | 6,649,461 | | | | 462,979 | |
| AtoS | | | 55,580 | | | | 4,082,931 | | | | 952,824 | |
| Bureau Veritas SA | | | 8,264 | | | | 242,172 | | | | (907) | |
| Cap Gemini SA | | | 38,825 | | | | 1,893,099 | | | | 734,787 | |
| Casino Guichard Perrachon SA | | | 2,111 | | | | 246,913 | | | | (3,333) | |
| Christian Dior SA | | | 783 | | | | 146,490 | | | | 1,717 | |
| Cie Generale des Etablissements Michelin | | | 66,755 | | | | 6,523,098 | | | | 579,685 | |
| Danone SA | | | 433 | | | | 31,115 | | | | 123 | |
| Dassault Systemes SA | | | 11,717 | | | | 1,397,060 | | | | 57,857 | |
| Essilor International SA | | | 6,117 | | | | 647,175 | | | | 3,719 | |
| Etablissements Maurel et Prom | | | 22,692 | | | | 388,956 | | | | (9,377) | |
| European Aeronautic Defence and Space Co. NV | | | 104,097 | | | | 5,536,702 | | | | 2,454,849 | |
| Groupe Eurotunnel SA | | | 6,551 | | | | 64,130 | | | | 4,742 | |
| Iliad SA | | | 12,820 | | | | 2,914,875 | | | | (288,174) | |
| JCDecaux SA | | | 7,812 | | | | 313,544 | | | | 8,960 | |
| Kering | | | 9,064 | | | | 1,945,682 | | | | (29,728) | |
| Lagardere SCA | | | 95,618 | | | | 3,190,639 | | | | 363,828 | |
| L’Oreal SA | | | 1,660 | | | | 290,398 | | | | 1,119 | |
| Orange SA | | | 24,943 | | | | 308,562 | | | | 1,109 | |
| Publicis Groupe SA | | | 19,434 | | | | 1,503,626 | | | | 277,020 | |
| Renault SA | | | 103,732 | | | | 7,268,834 | | | | 1,079,146 | |
| Rexel SA | | | 97,994 | | | | 2,268,509 | | | | 303,207 | |
| Safran SA | | | 3,469 | | | | 198,697 | | | | 42,497 | |
| Sanofi | | | 46,809 | | | | 4,578,406 | | | | 420,558 | |
| SES SA | | | 28,033 | | | | 851,317 | | | | 56,852 | |
| Societe BIC SA | | | 18,286 | | | | 2,171,857 | | | | 69,166 | |
| Suez Environnement Co. | | | 284,317 | | | | 3,867,396 | | | | 1,231,284 | |
| Thales SA | | | 18,153 | | | | 886,094 | | | | 283,750 | |
| Total SA | | | 54,424 | | | | 2,948,964 | | | | 391,553 | |
| | | | | | | | | | | | |
REFERENCE
ENTITY | | SHARES | | | NOTIONAL (a) | | | NET
UNREALIZED
APPRECIATION
(DEPRECIATION) | |
| France (continued) | | | | | | | | | | | | |
| Valeo SA | | | 83,654 | | | $ | 5,212,779 | | | $ | 4,057,873 | |
| Vivendi SA | | | 304,203 | | | | 7,166,724 | | | | 857,364 | |
| | | | | | | | | | | | |
| | | | | | | | | | | 14,380,822 | |
| | | | | | | | | | | | |
| Total of Long Equity Positions | | | | | | | | | | | 14,380,822 | |
| | | | | | | | | | | | |
| | |
| Short Positions | | | | | | | | | |
| | |
| France | | | | | | | | | |
| Accor SA | | | (50,186) | | | | (1,853,073) | | | | (517,207) | |
| Air Liquide SA | | | (2,536) | | | | (351,883) | | | | (7,047) | |
| France (Continued) | | | | | | | | | | | | |
| Alcatel-Lucent | | | (1,388,586) | | | | (2,576,482) | | | | (3,585,682) | |
| Alstom SA | | | (54,023) | | | | (1,988,671) | | | | 18,639 | |
| Bouygues SA | | | (69,419) | | | | (2,073,655) | | | | (551,483) | |
| Carrefour SA | | | (52,490) | | | | (1,425,979) | | | | (657,524) | |
| CGG SA | | | (87,112) | | | | (1,917,573) | | | | 405,757 | |
| Cie de St-Gobain | | | (23,984) | | | | (1,108,338) | | | | (212,871) | |
| CNP Assurances | | | (4,481) | | | | (83,062) | | | | (8,826) | |
| Edenred | | | (4,596) | | | | (158,163) | | | | 4,277 | |
| Electricite de France SA | | | (46,143) | | | | (995,115) | | | | (637,293) | |
| Eutelsat Communications SA | | | (81,413) | | | | (2,771,064) | | | | 230,784 | |
| Faurecia | | | (41,626) | | | | (919,121) | | | | (669,005) | |
| GDF Suez | | | (87,086) | | | | (2,213,633) | | | | 165,420 | |
| Hermes International | | | (4,690) | | | | (1,621,311) | | | | (79,495) | |
| Lafarge SA | | | (25,960) | | | | (1,867,671) | | | | (80,884) | |
| LVMH Moet Hennessy Louis Vuitton SA | | | (38,831) | | | | (7,319,184) | | | | 224,988 | |
| Neopost SA | | | (12,452) | | | | (708,999) | | | | (251,891) | |
| Nexans SA | | | (11,731) | | | | (633,837) | | | | 38,489 | |
| Pernod Ricard SA | | | (7,559) | | | | (905,092) | | | | 43,886 | |
| Peugeot SA | | | (69,439) | | | | (732,063) | | | | (171,559) | |
| Remy Cointreau SA | | | (8,409) | | | | (825,608) | | | | 119,245 | |
| Schneider Electric SA | | | (11,694) | | | | (974,157) | | | | (46,046) | |
| Sodexo | | | (1,521) | | | | (133,972) | | | | (20,270) | |
| Technip SA | | | (24,304) | | | | (2,564,111) | | | | 224,591 | |
| | | | |
| | The accompanying notes are an integral part of these financial statements. | | (Continued) |
| | | | | | | | | | | | | | | | |
| | AQR Funds | | | | | | Annual Report | | | | | | December 2013 | | 167 |
| | | | | | | | | | |
| | | | |
| Consolidated Schedule of Investments | | | December 31, 2013 | |
| | |
| AQR MULTI-STRATEGY ALTERNATIVE FUND | | |
| | | | | | | | | | | | |
REFERENCE
ENTITY | | SHARES | | | NOTIONAL (a) | | | NET
UNREALIZED
APPRECIATION
(DEPRECIATION) | |
| France (continued) | | | | | | | | | | | | |
| Vallourec SA | | | (163,625) | | | $ | (8,865,394) | | | $ | (61,364) | |
| Veolia Environnement SA | | | (477,011) | | | | (6,003,981) | | | | (1,786,751) | |
| Zodiac Aerospace | | | (798) | | | | (99,866) | | | | (41,548) | |
| | | | | | | | | | | | |
| | | | | | | | | | | (7,910,670) | |
| | | | | | | | | | | | |
| Netherlands | | | | | | | | | |
| Gemalto NV | | | (6,218) | | | | (684,214) | | | | (111) | |
| | | | | | | | | | | | |
Total of Short Equity Positions | | | | | | | | | | | (7,910,781) | |
| | | | | | | | | | | | |
Total of Long and Short Equity Positions | | | | | | | | | | | 6,470,041 | |
| | | | | | | | | | | | |
Net Cash and Other Receivables/ (Payables) (b) | | | | | | | | | | | 517,261 | |
| | | | | | | | | | | | |
Swaps, at Value | | | | | | | | | | $ | 6,987,302 | |
| | | | | | | | | | | | |
| (a) | Notional value represents the market value (including any fees or commissions) of the long and short positions when they are established. |
| (b) | Cash and other receivables/(payables) includes the gains (or losses) realized within the swap when the swap resets. |
Additional collateral for this position pledged to Deutsche Bank is included in the collateral noted in the other Deutsche Bank total return basket swaps.
| | | | | | | | |
| COUNTERPARTY | | DESCRIPTION | | TERMINATION
DATE** | | VALUE
(Note 3) | |
| Deutsche Bank | | The Fund receives or pays the total return on a portfolio of long and short positions and pays or receives the Federal Funds Effective Rate, which is denominated in USD based on the local currencies of the positions within the swap. | | 24 months maturity 12/22/2014 | | | $(644,077) | |
| | | | | | | | |
| ** | The maturity dates are measured from the commencement of investment in each underlying portfolio swap position. |
Additional Information — Total Return Basket Swaps
The following table represents the individual long and short positions and related values within the total return basket swap as of December 31, 2013.
| | | | | | | | | | | | |
REFERENCE
ENTITY | | SHARES | | | NOTIONAL (a) | | | NET
UNREALIZED
APPRECIATION
(DEPRECIATION) | |
| Long Positions | | | | | | | | | |
| | | |
| India | | | | | | | | | | | | |
| Reliance Industries Ltd. | | | 34,566 | | | $ | 982,286 | | | $ | 23,664 | |
| State Bank of India | | | 6,510 | | | | 564,135 | | | | (190,488) | |
| | | | | | | | | | | | |
| | | | | | | | | | | (166,824) | |
| | | | | | | | | | | | |
| Korea, Republic of | | | | | | | | | | | | |
| Samsung Electronics Co., Ltd. | | | 12,227 | | | | 8,321,605 | | | | (320,968) | |
| | | | | | | | | | | | |
| | | |
| Russia | | | | | | | | | | | | |
| Gazprom OAO | | | 336,637 | | | | 3,104,150 | | | | (219,372) | |
| Lukoil OAO | | | 38,094 | | | | 2,494,459 | | | | (111,405) | |
| | | | | | | | | | | | |
REFERENCE
ENTITY | | SHARES | | | NOTIONAL (a) | | | NET
UNREALIZED
APPRECIATION
(DEPRECIATION) | |
| Russia (continued) | | | | | | | | | | | | |
| Rosneft OAO | | | 40,251 | | | $ | 321,855 | | | $ | (14,604) | |
| Sistema JSFC | | | 42,327 | | | | 1,185,713 | | | | 176,390 | |
| Surgutneftegas OAO | | | 134,541 | | | | 1,020,596 | | | | 144,372 | |
| Tatneft OAO | | | 17,068 | | | | 623,803 | | | | 30,303 | |
| VTB Bank OJSC | | | 161,724 | | | | 452,777 | | | | 33,008 | |
| | | | | | | | | | | | |
| | | | | | | | | | | 38,692 | |
| | | | | | | | | | | | |
Total of Long Equity Positions | | | | | | | | | | | (449,100) | |
| | | | | | | | | | | | |
Net Cash and Other Receivables/ (Payables) (b) | | | | | | | | | | | (194,977) | |
| | | | | | | | | | | | |
Swaps, at Value | | | | | | | | | | $ | (644,077) | |
| | | | | | | | | | | | |
| | | | |
| | The accompanying notes are an integral part of these financial statements. | | (Continued) |
| | | | | | | | | | | | | | | | |
| 168 | | AQR Funds | | | | | | Annual Report | | | | | | December 2013 | | |
| | | | | | | | | | |
| | | | |
| Consolidated Schedule of Investments | | | December 31, 2013 | |
| | |
| AQR MULTI-STRATEGY ALTERNATIVE FUND | | |
| (a) | Notional value represents the market value (including any fees or commissions) of the long and short positions when they are established. |
| (b) | Cash and other receivables/(payables) includes the gains (or losses) realized within the swap when the swap resets. |
Additional collateral for this position pledged to Deutsche Bank is included in the collateral noted in the other Deutsche Bank total return basket swaps.
| | | | | | | | |
| COUNTERPARTY | | DESCRIPTION | | TERMINATION
DATE** | | VALUE
(Note 3) | |
| Deutsche Bank | | The Fund receives or pays the total return on a portfolio of long and short positions and pays or receives the AUD/USD Overnight Forward FX Swap Rate (+/– 50 bps), which is denominated in AUD based on the local currencies of the positions within the swap. | | 12 months maturity 10/16/2014 | | | $(1,857,490) | |
| | | | | | | | |
| ** | The maturity dates are measured from the commencement of investment in each underlying portfolio swap position. |
Additional Information — Total Return Basket Swaps
The following table represents the individual long and short positions and related values within the total return basket swap as of December 31, 2013.
| | | | | | | | | | | | |
REFERENCE
ENTITY | | SHARES | | | NOTIONAL (a) | | | NET
UNREALIZED
APPRECIATION
(DEPRECIATION) | |
| Long Positions | | | | | | | | | | | | |
| | | |
| Australia | | | | | | | | | | | | |
| Commonwealth Property Office Fund | | | 2,579,550 | | | $ | 2,928,522 | | | $ | (56,018) | |
| Envestra Ltd. | | | 133,791 | | | | 134,725 | | | | 1,632 | |
| GrainCorp. Ltd. | | | 355,638 | | | | 3,826,903 | | | | (1,126,490) | |
| | | | | | | | | | | | |
| | | | | | | | | | | (1,180,876) | |
| | | | | | | | | | | | |
| Total of Long Equity Positions | | | | | | | | | | | (1,180,876) | |
| | | | | | | | | | | | |
| Short Positions | | | | | | | | | | | | |
| Australia | | | | | | | | | | | | |
| APA Group | | | (24,190) | | | | (132,241) | | | | 2,409 | |
| Dexus Property Group | | | (782,850) | | | | (715,567) | | | | 11,485 | |
| GPT Group | | | (119,294) | | | | (372,780) | | | | 9,989 | |
| | | | | | | | | | | | |
| | | | | | | | | | | 23,883 | |
| | | | | | | | | | | | |
Total of Short Equity Positions | | | | | | | | | | | 23,883 | |
| | | | | | | | | | | | |
Total of Long and Short Equity Positions | | | | | | | | | | | (1,156,993) | |
| | | | | | | | | | | | |
Net Cash and Other Receivables/ (Payables) (b) | | | | | | | | | | | (700,497) | |
| | | | | | | | | | | | |
Swaps, at Value | | | | | | | | | | $ | (1,857,490) | |
| | | | | | | | | | | | |
| (a) | Notional value represents the market value (including any fees or commissions) of the long and short positions when they are established. |
| (b) | Cash and other receivables/(payables) includes the gains (or losses) realized within the swap when the swap resets. |
Additional collateral for this position pledged to Deutsche Bank is included in the collateral noted in the other Deutsche Bank total return basket swaps.
| | | | |
| | The accompanying notes are an integral part of these financial statements. | | (Continued) |
| | | | | | | | | | | | | | | | |
| | AQR Funds | | | | | | Annual Report | | | | | | December 2013 | | 169 |
| | | | | | | | | | |
| | | | |
| Consolidated Schedule of Investments | | | December 31, 2013 | |
| | |
| AQR MULTI-STRATEGY ALTERNATIVE FUND | | |
| | | | | | | | |
| COUNTERPARTY | | DESCRIPTION | | TERMINATION
DATE** | | VALUE
(Note 3) | |
| Deutsche Bank | | The Fund receives or pays the total return on a portfolio of long and short positions and pays or receives the LIBOR (+/– 40 bps), which is denominated in GBP based on the local currencies of the positions within the swap. | | 24 months maturity 12/22/2014 | | | $663,418 | |
| | | | | | | | |
| ** | The maturity dates are measured from the commencement of investment in each underlying portfolio swap position. |
Additional Information — Total Return Basket Swaps
The following table represents the individual long and short positions and related values within the total return basket swap as of December 31, 2013.
| | | | | | | | | | | | |
REFERENCE
ENTITY | | SHARES | | | NOTIONAL (a) | | | NET
UNREALIZED
APPRECIATION
(DEPRECIATION) | |
| Long Positions | | | | | | | | | | | | |
| | | |
| Luxembourg | | | | | | | | | | | | |
| AZ Electronic Materials SA | | | 557,999 | | | $ | 3,617,565 | | | $ | 39,902 | |
| | | | | | | | | | | | |
| | | |
| United Kingdom | | | | | | | | | | | | |
| Invensys PLC | | | 3,485,338 | | | | 28,780,115 | | | | 680,209 | |
| | | | | | | | | | | | |
Total of Long Equity Positions | | | | | | | | | | | 720,111 | |
| | | | | | | | | | | | |
Net Cash and Other Receivables/ (Payables) (b) | | | | | | | | | | | (56,693) | |
| | | | | | | | | | | | |
Swaps, at Value | | | | | | | | | | $ | 663,418 | |
| | | | | | | | | | | | |
| (a) | Notional value represents the market value (including any fees or commissions) of the long and short positions when they are established. |
| (b) | Cash and other receivables/(payables) includes the gains (or losses) realized within the swap when the swap resets. |
Additional collateral for this position pledged to Deutsche Bank is included in the collateral noted in the other Deutsche Bank total return basket swaps.
Total Return Basket Swaps* Outstanding at December 31, 2013
Over the Counter
| | | | | | | | |
| COUNTERPARTY | | DESCRIPTION | | TERMINATION DATE** | | VALUE
(Note 3) | |
| Morgan Stanley Capital Services, Inc. | | The Fund receives or pays the total return on a portfolio of long and short positions and pays or receives the Federal Funds Effective Rate, which is denominated in USD based on the local currencies of the positions within the swap. | | 12 to 24 months maturity ranging from 07/24/2014 - 07/23/2015 | | | $24,693,811 | |
| | | | | | | | |
| * | See the accompanying “Additional Information — Total Return Basket Swap” for further details. |
| ** | The maturity dates are measured from the commencement of investment in each underlying portfolio swap position. |
| | | | |
| | The accompanying notes are an integral part of these financial statements. | | (Continued) |
| | | | | | | | | | | | | | | | |
| 170 | | AQR Funds | | | | | | Annual Report | | | | | | December 2013 | | |
| | | | | | | | | | |
| | | | |
| Consolidated Schedule of Investments | | | December 31, 2013 | |
| | |
| AQR MULTI-STRATEGY ALTERNATIVE FUND | | |
Additional Information — Total Return Basket Swaps
The following table represents the individual long and short positions and related values within the total return basket swap as of December 31, 2013.
| | | | | | | | | | | | |
REFERENCE
ENTITY | | SHARES | | | NOTIONAL (a) | | | NET
UNREALIZED
APPRECIATION
(DEPRECIATION) | |
| Long Positions | |
| |
| Bermuda | | | | | |
| Axis Capital Holdings Co. | | | 59,500 | | | $ | 2,740,202 | | | $ | 90,213 | |
| Everest Re Group Ltd. | | | 35,800 | | | | 4,646,840 | | | | 933,306 | |
| Marvell Technology Group Ltd. | | | 337,000 | | | | 4,117,432 | | | | 728,628 | |
| Nabors Industries Ltd. | | | 122,734 | | | | 1,937,836 | | | | 147,414 | |
| RenaissanceRe Holdings Ltd. | | | 7,900 | | | | 712,008 | | | | 56,978 | |
| Seadrill Ltd. | | | 400 | | | | 16,290 | | | | 142 | |
| Signet Jewelers Ltd. | | | 72,400 | | | | 5,251,346 | | | | 446,534 | |
| Validus Holding Ltd. | | | 23,501 | | | | 839,221 | | | | 107,635 | |
| | | | | | | | | | | | |
| | | | | | | | | | | 2,510,850 | |
| | | | | | | | | | | | |
| China | | | | | | | | | | | | |
| Sohu.com, Inc. | | | 20,644 | | | | 1,292,586 | | | | 212,981 | |
| | | | | | | | | | | | |
| | | |
| Hong Kong | | | | | | | | | | | | |
| Michael Kors Holdings Ltd. | | | 4,700 | | | | 369,726 | | | | 11,867 | |
| | | | | | | | | | | | |
| | | |
| Ireland | | | | | | | | | | | | |
| Alkermes PLC | | | 30,700 | | | | 1,091,781 | | | | 156,481 | |
| Allegion PLC | | | 26,466 | | | | 1,008,787 | | | | 160,745 | |
| Covidien PLC | | | 37,000 | | | | 2,291,638 | | | | 228,062 | |
| Ingersoll-Rand PLC | | | 79,400 | | | | 3,989,887 | | | | 901,153 | |
| Seagate Technology PLC | | | 126,500 | | | | 5,890,721 | | | | 1,213,519 | |
| | | | | | | | | | | | |
| | | | | | | | | | | 2,659,960 | |
| | | | | | | | | | | | |
| Panama | | | | | | | | | | | | |
| Copa Holdings SA | | | 5,400 | | | | 765,350 | | | | 99,244 | |
| | | | | | | | | | | | |
| | | |
| Singapore | | | | | | | | | | | | |
| Avago Technologies Ltd. | | | 57,000 | | | | 2,157,450 | | | | 857,280 | |
| Flextronics International Ltd. | | | 962,200 | | | | 7,706,557 | | | | (230,263) | |
| | | | | | | | | | | | |
| | | | | | | | | | | 627,017 | |
| | | | | | | | | | | | |
| Sweden | | | | | | | | | | | | |
| Autoliv, Inc. | | | 24,100 | | | | 2,009,365 | | | | 203,015 | |
| | | | | | | | | | | | |
| | | |
| Switzerland | | | | | | | | | | | | |
| Allied World Assurance Co. Holdings AG | | | 21,854 | | | | 2,086,183 | | | | 379,167 | |
| TE Connectivity Ltd. | | | 203,200 | | | | 9,912,407 | | | | 1,285,945 | |
| Tyco International Ltd. | | | 241,800 | | | | 8,588,846 | | | | 1,334,626 | |
| | | | | | | | | | | | |
| | | | | | | | | | | 2,999,738 | |
| | | | | | | | | | | | |
| United Kingdom | | | | | | | | | | | | |
| Aon PLC | | | 22,500 | | | | 1,664,090 | | | | 223,436 | |
| Delphi Automotive PLC | | | 20,400 | | | | 1,180,416 | | | | 46,236 | |
| | | | | | | | | | | | |
| | | | | | | | | | | 269,672 | |
| | | | | | | | | | | | |
| | | | | | | | | | | | |
REFERENCE
ENTITY | | SHARES | | | NOTIONAL (a) | | | NET
UNREALIZED
APPRECIATION
(DEPRECIATION) | |
| United States | | | | | | | | | | | | |
| 3M Co. | | | 7,100 | | | $ | 829,928 | | | $ | 165,847 | |
| Abbott Laboratories | | | 170,400 | | | | 6,120,801 | | | | 410,631 | |
| AbbVie, Inc. | | | 32,000 | | | | 1,478,436 | | | | 211,484 | |
| Abercrombie & Fitch Co. | | | 15,000 | | | | 517,825 | | | | (24,175) | |
| Accenture PLC | | | 34,400 | | | | 2,587,568 | | | | 240,800 | |
| ACE Ltd. | | | 25,900 | | | | 2,453,766 | | | | 227,661 | |
| Actavis PLC | | | 20,772 | | | | 2,579,638 | | | | 910,058 | |
| Activision Blizzard, Inc. | | | 257,100 | | | | 4,312,763 | | | | 271,330 | |
| Acxiom Corp. | | | 10,700 | | | | 313,130 | | | | 82,556 | |
| ADT Corp./The | | | 22,700 | | | | 956,711 | | | | (38,042) | |
| Advance Auto Parts, Inc. | | | 46,100 | | | | 3,952,011 | | | | 1,150,337 | |
| Advent Software, Inc. | | | 10,600 | | | | 356,324 | | | | 14,570 | |
| AECOM Technology Corp. | | | 166,001 | | | | 5,516,570 | | | | (631,160) | |
| AES Corp. | | | 83,286 | | | | 1,068,791 | | | | 139,689 | |
| Aetna, Inc. | | | 39,600 | | | | 2,549,456 | | | | 166,708 | |
| AGCO Corp. | | | 37,300 | | | | 2,096,149 | | | | 111,638 | |
| Agilent Technologies, Inc. | | | 24,100 | | | | 1,203,578 | | | | 174,701 | |
| AGL Resources, Inc. | | | 3,800 | | | | 179,358 | | | | 116 | |
| Airgas, Inc. | | | 1,804 | | | | 198,904 | | | | 2,873 | |
| AK Steel Holding Corp. | | | 223,188 | | | | 747,680 | | | | 1,082,462 | |
| Akamai Technologies, Inc. | | | 1,500 | | | | 70,212 | | | | 558 | |
| Alaska Air Group, Inc. | | | 66,700 | | | | 4,085,375 | | | | 808,404 | |
| Alliant Energy Corp. | | | 6,100 | | | | 319,455 | | | | (4,695) | |
| Alliant Techsystems, Inc. | | | 33,400 | | | | 3,121,721 | | | | 942,391 | |
| Allscripts Healthcare | | | 2,800 | | | | 41,377 | | | | 1,911 | |
| Allstate Corp./The | | | 26,300 | | | | 1,370,230 | | | | 64,172 | |
| Alpha Natural Resources, Inc. | | | 573,900 | | | | 3,524,872 | | | | 572,774 | |
| Altria Group, Inc. | | | 34,800 | | | | 1,295,262 | | | | 40,710 | |
| Amazon.com, Inc. | | | 31,100 | | | | 10,205,048 | | | | 2,197,321 | |
| AMDOCS Ltd. | | | 58,400 | | | | 2,275,512 | | | | 132,904 | |
| Ameren Corp. | | | 42,397 | | | | 1,530,207 | | | | 2,868 | |
| American Capital Ltd. | | | 610,160 | | | | 8,112,547 | | | | 1,430,355 | |
| American Eagle Outfitters, Inc. | | | 281,400 | | | | 4,727,256 | | | | (675,096) | |
| American Electric Power Co., Inc. | | | 63,400 | | | | 2,984,295 | | | | (20,979) | |
| American Financial Group, Inc. | | | 49,500 | | | | 2,587,860 | | | | 269,280 | |
| American International Group, Inc. | | | 11,900 | | | | 580,697 | | | | 26,798 | |
| American Water Works Co., Inc. | | | 31,400 | | | | 1,335,317 | | | | (8,353) | |
| Ameriprise Financial, Inc. | | | 17,900 | | | | 1,690,370 | | | | 369,025 | |
| AmerisourceBergen Corp. | | | 13,900 | | | | 861,289 | | | | 116,020 | |
| Amgen, Inc. | | | 77,500 | | | | 8,497,316 | | | | 350,084 | |
| Anadarko Petroleum Corp. | | | 83,000 | | | | 7,662,713 | | | | (1,079,153) | |
| Analog Devices, Inc. | | | 19,900 | | | | 955,142 | | | | 58,365 | |
| Anixter International, Inc. | | | 14,400 | | | | 1,175,472 | | | | 118,224 | |
| Applied Industrial Technologies, Inc. | | | 8,800 | | | | 454,256 | | | | (22,264) | |
| | | | |
| | The accompanying notes are an integral part of these financial statements. | | (Continued) |
| | | | | | | | | | | | | | | | |
| | AQR Funds | | | | | | Annual Report | | | | | | December 2013 | | 171 |
| | | | | | | | | | |
| | | | |
| Consolidated Schedule of Investments | | | December 31, 2013 | |
| | |
| AQR MULTI-STRATEGY ALTERNATIVE FUND | | |
| | | | | | | | | | | | |
REFERENCE
ENTITY | | SHARES | | | NOTIONAL (a) | | | NET
UNREALIZED
APPRECIATION
(DEPRECIATION) | |
| United States (continued) | | | | | | | | | |
| Applied Materials, Inc. | | | 326,200 | | | $ | 5,407,391 | | | $ | 363,087 | |
| Archer-Daniels-Midland Co. | | | 176,600 | | | | 6,556,873 | | | | 1,107,567 | |
| Ares Captial Corp. | | | 7,600 | | | | 133,851 | | | | 1,201 | |
| Ariad Pharmaceuticals, Inc. | | | 329,900 | | | | 1,387,373 | | | | 862,545 | |
| Armstrong World Industries, Inc. | | | 26,800 | | | | 1,396,146 | | | | 147,802 | |
| ARRIS Group, Inc. | | | 134,700 | | | | 2,068,644 | | | | 1,213,321 | |
| Arrow Electronics, Inc. | | | 51,600 | | | | 2,227,332 | | | | 571,968 | |
| Arthur J. & Gallager Corp. | | | 2,300 | | | | 103,988 | | | | 3,951 | |
| Associated Banc-Corp. | | | 48,700 | | | | 810,368 | | | | 37,012 | |
| Assurant, Inc. | | | 77,400 | | | | 4,116,701 | | | | 1,020,337 | |
| AT&T, Inc. | | | 18,900 | | | | 651,924 | | | | 12,600 | |
| Atmos Energy Corp. | | | 8,000 | | | | 350,923 | | | | 12,437 | |
| Autodesk, Inc. | | | 55,300 | | | | 2,186,594 | | | | 596,655 | |
| Avery Dennison Corp. | | | 2,500 | | | | 111,087 | | | | 14,388 | |
| Avnet, Inc. | | | 102,700 | | | | 3,747,791 | | | | 782,306 | |
| Ball Corp. | | | 38,000 | | | | 1,753,526 | | | | 209,554 | |
| Barnes Group, Inc. | | | 324 | | | | 10,472 | | | | 1,941 | |
| BE Aerospace, Inc. | | | 5,900 | | | | 409,496 | | | | 103,981 | |
| Beam, Inc. | | | 7,900 | | | | 526,235 | | | | 11,439 | |
| Becton Dickinson and Co. | | | 1,300 | | | | 135,083 | | | | 8,554 | |
| Bemis Co., Inc. | | | 7,300 | | | | 298,851 | | | | 157 | |
| Best Buy Co., Inc. | | | 280,500 | | | | 8,157,677 | | | | 3,028,663 | |
| Big Lots, Inc. | | | 58,887 | | | | 2,126,944 | | | | (225,483) | |
| Biogen Idec, Inc. | | | 22,900 | | | | 5,273,183 | | | | 1,133,092 | |
| BlackRock, Inc. | | | 5,700 | | | | 1,562,687 | | | | 241,192 | |
| Bob Evans Farms, Inc. | | | 6,000 | | | | 333,555 | | | | (30,015) | |
| Boeing Co./The | | | 26,100 | | | | 3,467,632 | | | | 94,757 | |
| Boston Scientific Corp. | | | 660,500 | | | | 6,582,163 | | | | 1,357,047 | |
| Brinker International, Inc. | | | 29,000 | | | | 1,155,930 | | | | 187,930 | |
| Bristow Group, Inc. | | | 20,800 | | | | 1,444,768 | | | | 116,480 | |
| Broadridge Financial Solutions, Inc. | | | 24,400 | | | | 770,065 | | | | 194,223 | |
| Brocade Communications Systems, Inc. | | | 1,398,900 | | | | 9,201,725 | | | | 3,206,518 | |
| Brown & Brown, Inc. | | | 29,500 | | | | 987,141 | | | | (61,136) | |
| Brown-Forman Corp. | | | 2,600 | | | | 195,741 | | | | 741 | |
| Bruker Corp. | | | 23,100 | | | | 440,553 | | | | 16,134 | |
| Buckle, Inc./The | | | 13,900 | | | | 775,342 | | | | (44,758) | |
| Bunge Ltd. | | | 24,400 | | | | 1,825,121 | | | | 178,363 | |
| CA, Inc. | | | 148,800 | | | | 4,412,105 | | | | 595,015 | |
| Cabot Corp. | | | 9,461 | | | | 377,305 | | | | 108,991 | |
| Cabot Oil & Gas Corp. | | | 178,800 | | | | 6,602,529 | | | | 327,759 | |
| Capital One Financial Corp. | | | 20,000 | | | | 1,402,053 | | | | 130,147 | |
| CapitalSource, Inc. | | | 108,396 | | | | 1,050,357 | | | | 507,293 | |
| Cardinal Health, Inc. | | | 93,900 | | | | 5,138,112 | | | | 1,135,347 | |
| Career Education Corp. | | | 211,942 | | | | 784,185 | | | | 423,884 | |
| Carefusion Corp. | | | 107,700 | | | | 4,164,950 | | | | 123,664 | |
| Carlisle Cos., Inc. | | | 15,300 | | | | 1,015,665 | | | | 199,155 | |
| Carter’s, Inc. | | | 26,200 | | | | 1,907,867 | | | | (26,969) | |
| Catamaran Corp. | | | 16,800 | | | | 781,358 | | | | 16,306 | |
| | | | | | | | | | | | |
REFERENCE
ENTITY | | SHARES | | | NOTIONAL (a) | | | NET
UNREALIZED
APPRECIATION
(DEPRECIATION) | |
| United States (continued) | | | | | | | | | |
| CBOE Holdings, Inc. | | | 8,700 | | | $ | 442,289 | | | $ | 9,763 | |
| CBS Corp. | | | 34,800 | | | | 1,844,058 | | | | 374,094 | |
| Celanese Corp. | | | 23,000 | | | | 1,124,682 | | | | 147,448 | |
| Celgene Corp. | | | 48,400 | | | | 7,184,947 | | | | 992,717 | |
| CenterPoint Energy, Inc. | | | 56,100 | | | | 1,372,660 | | | | (72,262) | |
| CF Industries Holdings, Inc. | | | 21,500 | | | | 4,008,673 | | | | 1,001,687 | |
| Charles River Laboratories International, Inc. | | | 37,300 | | | | 1,716,603 | | | | 261,789 | |
| Chevron Corp. | | | 57,100 | | | | 7,241,226 | | | | (108,865) | |
| Chico’s FAS, Inc. | | | 121,100 | | | | 2,062,058 | | | | 219,466 | |
| Chubb Corp./The | | | 1,100 | | | | 98,409 | | | | 7,884 | |
| Church & Dwight Co., Inc. | | | 5,700 | | | | 362,850 | | | | 14,946 | |
| Cigna Corp | | | 98,900 | | | | 7,910,995 | | | | 740,777 | |
| Cimarex Energy Co. | | | 20,200 | | | | 1,994,567 | | | | 124,615 | |
| Cinemark Holdings, Inc. | | | 32,800 | | | | 954,480 | | | | 138,744 | |
| Cintas Corp. | | | 24,300 | | | | 1,155,951 | | | | 292,086 | |
| Cisco Systems, Inc. | | | 284,730 | | | | 6,858,505 | | | | (466,316) | |
| Citigroup, Inc. | | | 41,400 | | | | 2,182,855 | | | | (25,501) | |
| CLARCOR, Inc. | | | 400 | | | | 22,032 | | | | 3,708 | |
| Cleco Corp. | | | 3,400 | | | | 166,226 | | | | (7,718) | |
| CMS Energy Corp. | | | 6,800 | | | | 181,635 | | | | 401 | |
| Cobalt International Energy, Inc. | | | 94,300 | | | | 1,954,275 | | | | (403,040) | |
| Coca-Cola Enterprises, Inc. | | | 127,000 | | | | 4,720,985 | | | | 883,525 | |
| Colfax Corp. | | | 9,100 | | | | 511,107 | | | | 68,472 | |
| Colgate-Palmolive Co. | | | 1,800 | | | | 105,984 | | | | 11,394 | |
| Comcast Corp. | | | 87,000 | | | | 3,891,830 | | | | 629,125 | |
| Commercial Metals Co. | | | 200,500 | | | | 3,068,278 | | | | 1,007,887 | |
| Community Health Systems, Inc. | | | 51,000 | | | | 2,201,160 | | | | (198,390) | |
| Commvault Systems, Inc. | | | 38,700 | | | | 3,076,178 | | | | (178,322) | |
| Computer Sciences Corp. | | | 172,400 | | | | 8,238,910 | | | | 1,394,802 | |
| Compuware Corp. | | | 219,955 | | | | 2,444,643 | | | | 21,053 | |
| Comtech Telecommunications Corp. | | | 8,740 | | | | 240,700 | | | | 34,785 | |
| ConAgra Foods, Inc. | | | 12,000 | | | | 418,101 | | | | (13,701) | |
| ConocoPhillips | | | 100,200 | | | | 6,613,200 | | | | 465,930 | |
| Consolidated Edison, Inc. | | | 20,900 | | | | 1,230,371 | | | | (75,019) | |
| Convergys Corp. | | | 67,234 | | | | 1,297,531 | | | | 117,745 | |
| Con-way, Inc. | | | 52,600 | | | | 2,146,080 | | | | (57,334) | |
| Cooper Cos., Inc./The | | | 18,800 | | | | 2,384,592 | | | | (56,400) | |
| Copart, Inc. | | | 9,600 | | | | 333,054 | | | | 18,786 | |
| CoreLogic, Inc. | | | 22,100 | | | | 727,077 | | | | 58,136 | |
| Corrections Corp. of America | | | 36,200 | | | | 1,201,116 | | | | (40,182) | |
| Costco Wholesale Corp. | | | 11,200 | | | | 1,328,060 | | | | 4,852 | |
| Covance, Inc. | | | 4,400 | | | | 350,372 | | | | 37,092 | |
| Crane Co. | | | 42,053 | | | | 2,675,373 | | | | 152,691 | |
| Crocs, Inc. | | | 164,751 | | | | 2,521,593 | | | | 101,243 | |
| | | | |
| | The accompanying notes are an integral part of these financial statements. | | (Continued) |
| | | | | | | | | | | | | | | | |
| 172 | | AQR Funds | | | | | | Annual Report | | | | | | December 2013 | | |
| | | | | | | | | | |
| | | | |
| Consolidated Schedule of Investments | | | December 31, 2013 | |
| | |
| AQR MULTI-STRATEGY ALTERNATIVE FUND | | |
| | | | | | | | | | | | |
REFERENCE
ENTITY | | SHARES | | | NOTIONAL (a) | | | NET
UNREALIZED
APPRECIATION
(DEPRECIATION) | |
| United States (continued) | | | | | | | | | |
| Crown Holdings, Inc. | | | 66,300 | | | $ | 2,923,725 | | | $ | 31,266 | |
| Cummins, Inc. | | | 25,200 | | | | 2,977,128 | | | | 575,316 | |
| CVS Caremark Corp. | | | 78,200 | | | | 4,925,467 | | | | 671,307 | |
| Cytec Industries, Inc. | | | 43,200 | | | | 3,247,344 | | | | 777,168 | |
| Darling International, Inc. | | | 10,900 | | | | 223,232 | | | | 4,360 | |
| DaVita HealthCare Partners, Inc. | | | 14,000 | | | | 845,356 | | | | 41,824 | |
| Dean Foods Co. | | | 32,569 | | | | 587,094 | | | | (27,233) | |
| Delta Air Lines, Inc. | | | 274,200 | | | | 5,580,657 | | | | 1,951,617 | |
| Deluxe Corp. | | | 6,800 | | | | 323,665 | | | | 31,227 | |
| Devon Energy Corp. | | | 10,400 | | | | 616,068 | | | | 27,380 | |
| Diamond Offshore Drilling, Inc. | | | 9,091 | | | | 522,048 | | | | (4,589) | |
| Dillards, Inc. | | | 72,800 | | | | 6,046,713 | | | | 1,030,175 | |
| Discover Financial Services | | | 167,400 | | | | 8,469,784 | | | | 896,246 | |
| DISH Network Corp. | | | 90,500 | | | | 4,121,370 | | | | 1,120,390 | |
| Dolby Laboratories, Inc. | | | 7,400 | | | | 250,120 | | | | 35,224 | |
| Dollar General Corp. | | | 9,497 | | | | 538,722 | | | | 34,137 | |
| Dollar Tree, Inc. | | | 40,248 | | | | 2,168,409 | | | | 102,384 | |
| Dominos Pizza, Inc. | | | 64,800 | | | | 4,117,611 | | | | 395,709 | |
| Donaldson Co., Inc. | | | 11,000 | | | | 422,047 | | | | 56,013 | |
| Dover Corp. | | | 16,100 | | | | 1,399,529 | | | | 154,765 | |
| Dr Pepper Snapple Group, Inc. | | | 25,000 | | | | 1,210,564 | | | | 7,436 | |
| Dresser-Rand Group, Inc. | | | 28,100 | | | | 1,797,467 | | | | (121,864) | |
| Dril-Quip, Inc. | | | 8,200 | | | | 903,102 | | | | (1,676) | |
| DST Systems, Inc. | | | 22,000 | | | | 1,530,315 | | | | 465,965 | |
| DTE Energy Co. | | | 67,100 | | | | 4,698,717 | | | | (243,948) | |
| Duke Energy Corp. | | | 3,500 | | | | 241,812 | | | | (277) | |
| Dun & Bradstreet Corp./The | | | 3,800 | | | | 406,600 | | | | 59,850 | |
| E*TRADE Financial Corp. | | | 33,300 | | | | 586,891 | | | | 67,121 | |
| East West BanCorp., Inc. | | | 37,100 | | | | 1,161,042 | | | | 136,345 | |
| Eastman Chemical Co. | | | 7,500 | | | | 586,334 | | | | 18,916 | |
| Edison International | | | 72,200 | | | | 3,562,965 | | | | (220,105) | |
| Electronic Arts, Inc. | | | 3,400 | | | | 74,074 | | | | 3,922 | |
| Eli Lilly & Co. | | | 68,100 | | | | 3,449,132 | | | | 23,968 | |
| EMCOR Group, Inc. | | | 44,300 | | | | 1,916,025 | | | | (35,933) | |
| Energen Corp. | | | 2,300 | | | | 165,286 | | | | (2,561) | |
| Energizer Holdings, Inc. | | | 10,200 | | | | 1,024,707 | | | | 79,341 | |
| Entergy Corp. | | | 20,700 | | | | 1,431,961 | | | | (122,272) | |
| EOG Resources, Inc. | | | 17,700 | | | | 2,867,947 | | | | 102,821 | |
| Equifax, Inc. | | | 33,500 | | | | 2,058,240 | | | | 256,275 | |
| Era Group, Inc. | | | 5,976 | | | | 150,834 | | | | 33,585 | |
| Estee Lauder Cos., Inc./The | | | 1,900 | | | | 126,268 | | | | 16,839 | |
| Esterline Technologies Corp. | | | 9,200 | | | | 753,112 | | | | 184,920 | |
| Exelis, Inc. | | | 6,000 | | | | 96,522 | | | | 17,838 | |
| Express Scripts PLC | | | 73,200 | | | | 4,762,406 | | | | 379,162 | |
| Exxon Mobil Corp. | | | 16,200 | | | | 1,548,558 | | | | 90,882 | |
| EzCorp., Inc. | | | 32,800 | | | | 609,096 | | | | (225,664) | |
| Facebook, Inc. | | | 244,300 | | | | 12,031,991 | | | | 1,321,447 | |
| | | | | | | | | | | | |
REFERENCE
ENTITY | | SHARES | | | NOTIONAL (a) | | | NET
UNREALIZED
APPRECIATION
(DEPRECIATION) | |
| United States (continued) | | | | | | | | | |
| Fair Isaac Corp. | | | 19,423 | | | $ | 987,849 | | | $ | 232,693 | |
| FedEx Corp. | | | 11,900 | | | | 1,353,319 | | | | 357,544 | |
| Fidelity National Information Services, Inc. | | | 43,300 | | | | 1,922,031 | | | | 402,313 | |
| Fifth Third BanCorp. | | | 119,667 | | | | 2,275,859 | | | | 240,738 | |
| First Niagara Financial Group, Inc. | | | 16,300 | | | | 179,733 | | | | (6,627) | |
| First Republic Bank | | | 7,100 | | | | 356,960 | | | | 14,725 | |
| First Solar, Inc. | | | 177,200 | | | | 7,860,363 | | | | 1,821,845 | |
| Fiserv, Inc. | | | 21,600 | | | | 992,494 | | | | 282,986 | |
| FleetCor Technologies, Inc. | | | 14,500 | | | | 1,693,406 | | | | 5,559 | |
| Foot Locker, Inc. | | | 136,200 | | | | 4,956,138 | | | | 687,990 | |
| Forest Laboratories, Inc. | | | 121,700 | | | | 5,325,592 | | | | 1,980,059 | |
| Fortinet, Inc. | | | 25,500 | | | | 484,827 | | | | 2,988 | |
| Freescale Semiconductor Ltd. | | | 2,400 | | | | 35,616 | | | | 2,904 | |
| Frontier Communications Corp. | | | 146,700 | | | | 645,502 | | | | 36,653 | |
| Fulton Financial Corp. | | | 48,200 | | | | 599,608 | | | | 30,848 | |
| GameStop Corp. | | | 104,300 | | | | 4,596,191 | | | | 541,627 | |
| Gap, Inc./The | | | 204,200 | | | | 9,172,260 | | | | (1,192,124) | |
| Gartner, Inc. | | | 29,900 | | | | 1,796,093 | | | | 328,302 | |
| General Cable Corp. | | | 28,600 | | | | 900,627 | | | | (59,501) | |
| General Dynamics Corp. | | | 5,500 | | | | 464,466 | | | | 61,059 | |
| Genuine Parts Co. | | | 20,800 | | | | 1,711,186 | | | | 19,166 | |
| Genworth Financial, Inc. | | | 192,300 | | | | 2,531,056 | | | | 455,363 | |
| GNC Holdings, Inc. | | | 2,300 | | | | 132,689 | | | | 1,746 | |
| Goldman Sachs Group, Inc./The | | | 44,800 | | | | 7,314,209 | | | | 627,039 | |
| Goodyear Tire & Rubber Co./The | | | 191,600 | | | | 3,331,196 | | | | 1,238,464 | |
| Google, Inc. | | | 3,400 | | | | 3,104,633 | | | | 705,781 | |
| Graco, Inc. | | | 3,400 | | | | 231,785 | | | | 33,823 | |
| Graham Holdings Co. | | | 2,432 | | | | 1,371,827 | | | | 241,368 | |
| Groupon, Inc. | | | 284,000 | | | | 2,804,542 | | | | 538,138 | |
| Guess?, Inc. | | | 104,100 | | | | 3,324,639 | | | | (90,252) | |
| H&R Block, Inc. | | | 23,000 | | | | 663,921 | | | | 3,999 | |
| Halliburton Co. | | | 5,600 | | | | 298,394 | | | | (14,194) | |
| Hanesbrands, Inc. | | | 20,300 | | | | 1,383,220 | | | | 43,261 | |
| Hanover Insurance Group, Inc./The | | | 26,100 | | | | 1,389,252 | | | | 169,179 | |
| Harman International Industries, Inc. | | | 56,800 | | | | 3,184,208 | | | | 1,464,872 | |
| Harsco Corp. | | | 45,486 | | | | 1,160,650 | | | | 114,322 | |
| Hartford Financial Services Group, Inc. | | | 34,200 | | | | 1,084,398 | | | | 154,668 | |
| Hasbro, Inc. | | | 28,000 | | | | 1,270,640 | | | | 269,640 | |
| HCA Holdings, Inc. | | | 17,000 | | | | 766,539 | | | | 44,531 | |
| HCC Insurance Holdings, Inc. | | | 23,900 | | | | 1,095,098 | | | | 7,648 | |
| Health Net, Inc. | | | 88,700 | | | | 2,875,368 | | | | (243,639) | |
| Helix Energy Solutions Group, Inc. | | | 146,300 | | | | 3,785,753 | | | | (394,519) | |
| Helmerich & Payne, Inc. | | | 4,600 | | | | 326,749 | | | | 60,019 | |
| | | | |
| | The accompanying notes are an integral part of these financial statements. | | (Continued) |
| | | | | | | | | | | | | | | | |
| | AQR Funds | | | | | | Annual Report | | | | | | December 2013 | | 173 |
| | | | | | | | | | |
| | | | |
| Consolidated Schedule of Investments | | | December 31, 2013 | |
| | |
| AQR MULTI-STRATEGY ALTERNATIVE FUND | | |
| | | | | | | | | | | | |
REFERENCE
ENTITY | | SHARES | | | NOTIONAL (a) | | | NET
UNREALIZED
APPRECIATION
(DEPRECIATION) | |
| United States (continued) | | | | | | | | | |
| Henry Schein, Inc. | | | 3,100 | | | $ | 321,067 | | | $ | 33,139 | |
| Hershey Co./The | | | 11,900 | | | | 1,103,129 | | | | 53,908 | |
| Hess Corp. | | | 97,700 | | | | 7,238,195 | | | | 870,905 | |
| Hewlett-Packard Co. | | | 220,400 | | | | 5,811,762 | | | | 355,030 | |
| Hill-Rom Holdings, Inc. | | | 46,700 | | | | 1,656,916 | | | | 273,662 | |
| Hillshire Brands Co. | | | 100,900 | | | | 3,371,002 | | | | 3,094 | |
| HollyFrontier Corp. | | | 38,048 | | | | 1,664,622 | | | | 225,983 | |
| Home Depot, Inc./The | | | 71,100 | | | | 5,644,279 | | | | 210,095 | |
| Honeywell International, Inc. | | | 30,600 | | | | 2,540,225 | | | | 255,697 | |
| Hormel Foods Corp. | | | 12,800 | | | | 529,536 | | | | 48,640 | |
| HSN, Inc. | | | 4,000 | | | | 219,219 | | | | 29,981 | |
| Hubbell, Inc. | | | 12,000 | | | | 1,276,680 | | | | 30,120 | |
| Humana, Inc. | | | 33,600 | | | | 2,993,088 | | | | 475,104 | |
| Huntington Bancshares, Inc. | | | 184,700 | | | | 1,574,356 | | | | 207,999 | |
| Huntsman Corp. | | | 86,400 | | | | 1,529,076 | | | | 596,364 | |
| Hyatt Hotels Corp. | | | 700 | | | | 33,478 | | | | 1,144 | |
| IAC/InterActiveCorp. | | | 96,400 | | | | 5,015,660 | | | | 1,606,056 | |
| Ingram Micro, Inc. | | | 184,525 | | | | 3,733,834 | | | | 595,123 | |
| Ingredion, Inc. | | | 61,100 | | | | 3,802,265 | | | | 380,641 | |
| Integrated Device Technology, Inc. | | | 38,700 | | | | 386,313 | | | | 8,040 | |
| Integrys Energy Group, Inc. | | | 1,229 | | | | 76,702 | | | | (9,832) | |
| International Flavors & Fragrances, Inc. | | | 300 | | | | 23,970 | | | | 1,824 | |
| International Game Technology | | | 2,600 | | | | 48,696 | | | | (1,480) | |
| International Rectifier Corp. | | | 24,300 | | | | 598,825 | | | | 34,676 | |
| Interpublic Group of Cos., Inc./The | | | 198,400 | | | | 3,112,265 | | | | 399,415 | |
| Intuit, Inc. | | | 13,400 | | | | 859,383 | | | | 163,305 | |
| InvesCo., Ltd. | | | 58,800 | | | | 1,910,412 | | | | 229,908 | |
| Itron, Inc. | | | 26,300 | | | | 1,126,679 | | | | (37,070) | |
| ITT Corp. | | | 121,200 | | | | 3,945,811 | | | | 1,316,693 | |
| Jabil Circuit, Inc. | | | 344,900 | | | | 7,598,716 | | | | (1,583,660) | |
| Jack Henry & Associates, Inc. | | | 5,600 | | | | 272,963 | | | | 58,613 | |
| Jacobs Engineering Group, Inc. | | | 12,701 | | | | 744,308 | | | | 55,728 | |
| Jarden Corp. | | | 15,200 | | | | 685,064 | | | | 247,456 | |
| JDS Uniphase Corp. | | | 181,600 | | | | 2,576,463 | | | | (219,295) | |
| JM Smucker Co./The | | | 13,500 | | | | 1,452,432 | | | | (53,562) | |
| Johnson & Johnson | | | 36,900 | | | | 3,217,833 | | | | 161,838 | |
| Johnson Controls, Inc. | | | 42,300 | | | | 2,073,140 | | | | 96,850 | |
| Jones Lang LaSalle, Inc. | | | 4,100 | | | | 368,556 | | | | 51,243 | |
| JPMorgan Chase & Co. | | | 44,800 | | | | 2,515,968 | | | | 103,936 | |
| Kansas City Southern | | | 4,100 | | | | 485,030 | | | | 22,673 | |
| KBR, Inc. | | | 129,200 | | | | 4,298,131 | | | | (177,943) | |
| KeyCorp. | | | 263,800 | | | | 3,176,152 | | | | 364,044 | |
| Kimberly-Clark Corp. | | | 28,400 | | | | 2,825,516 | | | | 141,148 | |
| KLA-Tencor Corp. | | | 57,100 | | | | 3,458,473 | | | | 222,193 | |
| Kraft Foods Group, Inc. | | | 5,000 | | | | 267,257 | | | | 2,343 | |
| | | | | | | | | | | | |
REFERENCE
ENTITY | | SHARES | | | NOTIONAL (a) | | | NET
UNREALIZED
APPRECIATION
(DEPRECIATION) | |
| United States (continued) | | | | | | | | | |
| Kroger Co./The | | | 75,400 | | | $ | 2,917,998 | | | $ | 62,564 | |
| L-3 Communications Holdings, Inc. | | | 38,800 | | | | 3,583,956 | | | | 562,212 | |
| Landstar System, Inc. | | | 14,600 | | | | 766,500 | | | | 72,270 | |
| Lear Corp. | | | 6,400 | | | | 519,219 | | | | (1,011) | |
| Leidos Holdings, Inc. | | | 1,600 | | | | 74,952 | | | | (568) | |
| Lender Processing Services, Inc. | | | 44,700 | | | | 1,453,644 | | | | 217,242 | |
| Lennox International, Inc. | | | 15,400 | | | | 1,084,378 | | | | 225,546 | |
| Leucadia National Corp. | | | 66,300 | | | | 1,844,759 | | | | 34,183 | |
| LifePoint Hospitals, Inc. | | | 2,500 | | | | 127,894 | | | | 4,206 | |
| Lincoln Electric Holdings, Inc. | | | 7,500 | | | | 530,306 | | | | 4,744 | |
| Lincoln National Corp. | | | 16,300 | | | | 666,507 | | | | 174,899 | |
| LinkedIn Corp. | | | 31,400 | | | | 7,509,733 | | | | (701,271) | |
| LKQ Corp. | | | 5,000 | | | | 162,834 | | | | 1,666 | |
| Loews Corp. | | | 68,700 | | | | 3,202,028 | | | | 112,060 | |
| Lowe’s Cos., Inc. | | | 140,100 | | | | 6,222,634 | | | | 719,321 | |
| LSI Corp. | | | 642,500 | | | | 4,947,550 | | | | 2,132,800 | |
| LyondellBasell Industries NV | | | 213,400 | | | | 14,598,740 | | | | 2,533,012 | |
| M&T Bank Corp. | | | 5,900 | | | | 693,426 | | | | (6,548) | |
| Macy’s, Inc. | | | 72,300 | | | | 3,568,160 | | | | 292,660 | |
| Madison Square Garden Co./The | | | 6,200 | | | | 350,393 | | | | 6,603 | |
| Magellan Health Services, Inc. | | | 12,179 | | | | 718,561 | | | | 11,083 | |
| Manpower, Inc. | | | 99,100 | | | | 6,680,659 | | | | 1,828,067 | |
| Marathon Oil Corp. | | | 161,000 | | | | 5,989,779 | | | | (306,479) | |
| Marathon Petroleum Corp. | | | 17,200 | | | | 1,301,582 | | | | 276,174 | |
| Marsh & McLennan Cos., Inc. | | | 21,400 | | | | 908,380 | | | | 126,524 | |
| Masco Corp. | | | 68,900 | | | | 1,436,766 | | | | 132,087 | |
| Mastercard, Inc. | | | 1,100 | | | | 827,600 | | | | 91,406 | |
| Mattel, Inc. | | | 51,300 | | | | 2,176,739 | | | | 264,115 | |
| Maxim Integrated Products, Inc. | | | 128,500 | | | | 3,553,300 | | | | 33,135 | |
| McGraw-Hill Cos., Inc. | | | 25,000 | | | | 1,481,902 | | | | 473,098 | |
| McKesson Corp. | | | 55,700 | | | | 7,170,880 | | | | 1,819,100 | |
| MeadWestvaco Corp. | | | 35,600 | | | | 1,303,732 | | | | 10,976 | |
| Medtronic, Inc. | | | 32,700 | | | | 1,771,030 | | | | 105,623 | |
| Meredith Corp. | | | 600 | | | | 31,359 | | | | (279) | |
| Microsoft Corp. | | | 73,000 | | | | 2,642,856 | | | | 89,534 | |
| MKS Instruments, Inc. | | | 70,472 | | | | 1,958,933 | | | | 150,999 | |
| Mohawk Industries, Inc. | | | 19,900 | | | | 2,390,633 | | | | 572,477 | |
| Mondelez International, Inc. | | | 119,400 | | | | 3,706,096 | | | | 508,724 | |
| Monsanto Co. | | | 16,400 | | | | 1,708,224 | | | | 203,196 | |
| Motorola Solutions, Inc. | | | 9,600 | | | | 587,991 | | | | 60,009 | |
| MRC Global, Inc. | | | 11,100 | | | | 341,417 | | | | 16,669 | |
| Murphy Oil Corp. | | | 40,500 | | | | 2,338,217 | | | | 289,423 | |
| Murphy USA, Inc. | | | 25,750 | | | | 1,064,560 | | | | 5,610 | |
| Myriad Genetics, Inc. | | | 26,900 | | | | 624,981 | | | | (60,619) | |
| National Oilwell Varco, Inc. | | | 11,500 | | | | 866,685 | | | | 47,910 | |
| | | | |
| | The accompanying notes are an integral part of these financial statements. | | (Continued) |
| | | | | | | | | | | | | | | | |
| 174 | | AQR Funds | | | | | | Annual Report | | | | | | December 2013 | | |
| | | | | | | | | | |
| | | | |
| Consolidated Schedule of Investments | | | December 31, 2013 | |
| | |
| AQR MULTI-STRATEGY ALTERNATIVE FUND | | |
| | | | | | | | | | | | |
REFERENCE
ENTITY | | SHARES | | | NOTIONAL (a) | | | NET
UNREALIZED
APPRECIATION
(DEPRECIATION) | |
| United States (continued) | | | | | | | | | |
| Nationstar Mortgage Holdings, Inc. | | | 6,300 | | | $ | 231,925 | | | $ | 923 | |
| NCR Corp. | | | 154,217 | | | | 5,416,101 | | | | (163,470) | |
| NetApp, Inc. | | | 12,600 | | | | 514,841 | | | | 3,523 | |
| Netflix, Inc. | | | 11,300 | | | | 3,374,950 | | | | 785,371 | |
| Neustar, Inc. | | | 9,200 | | | | 470,584 | | | | (11,872) | |
| New York Times Co./The | | | 10,400 | | | | 141,066 | | | | 23,982 | |
| Newell Rubbermaid, Inc. | | | 52,700 | | | | 1,430,805 | | | | 277,202 | |
| Newfield Exploration Co. | | | 37,400 | | | | 985,756 | | | | (64,594) | |
| News Corp. | | | 11,600 | | | | 203,049 | | | | 5,983 | |
| NIKE, Inc. | | | 900 | | | | 70,494 | | | | 282 | |
| NiSource, Inc. | | | 14,400 | | | | 446,256 | | | | 27,216 | |
| Noble Energy, Inc. | | | 34,300 | | | | 2,249,564 | | | | 86,609 | |
| Northrop Grumman Corp. | | | 74,200 | | | | 6,556,312 | | | | 1,947,750 | |
| NorthWestern Corp. | | | 1,000 | | | | 42,936 | | | | 384 | |
| NVIDIA Corp. | | | 164,700 | | | | 2,345,647 | | | | 292,847 | |
| NVR, Inc. | | | 400 | | | | 405,002 | | | | 5,402 | |
| Occidental Petroleum Corp. | | | 23,400 | | | | 2,222,267 | | | | 3,073 | |
| Oceaneering International, Inc. | | | 63,900 | | | | 5,143,292 | | | | (102,860) | |
| OGE Energy Corp. | | | 53,100 | | | | 1,946,792 | | | | (146,702) | |
| Oil States International, Inc. | | | 15,400 | | | | 1,622,964 | | | | (56,476) | |
| Old Dominion Freight Line, Inc. | | | 41,800 | | | | 1,839,000 | | | | 377,236 | |
| Old Republic International Corp. | | | 53,746 | | | | 761,854 | | | | 166,340 | |
| Olin Corp. | | | 2,300 | | | | 53,567 | | | | 12,788 | |
| Omnicare, Inc. | | | 40,000 | | | | 2,004,400 | | | | 410,000 | |
| ON Semiconductor Corp. | | | 382,000 | | | | 3,049,426 | | | | 98,254 | |
| Oracle Corp. | | | 78,600 | | | | 2,647,271 | | | | 359,965 | |
| O’Reilly Automotive, Inc. | | | 17,000 | | | | 2,013,140 | | | | 174,930 | |
| OSH 1 Liquidating Corp. | | | 99 | | | | 16 | | | | (15) | |
| Oshkosh Corp. | | | 44,900 | | | | 2,072,210 | | | | 189,852 | |
| Owens-Illinois, Inc. | | | 168,000 | | | | 5,025,199 | | | | 985,841 | |
| PACCAR, Inc. | | | 4,600 | | | | 254,912 | | | | 17,270 | |
| Packaging Corp. of America | | | 28,400 | | | | 1,514,449 | | | | 282,703 | |
| Pall Corp. | | | 7,400 | | | | 523,772 | | | | 107,818 | |
| Panera Bread Co. | | | 7,500 | | | | 1,379,999 | | | | (54,824) | |
| Parker Hannifin Corp. | | | 15,200 | | | | 1,568,520 | | | | 386,808 | |
| Patterson Cos., Inc. | | | 32,000 | | | | 1,295,135 | | | | 23,265 | |
| Patterson-UTI Energy, Inc. | | | 111,300 | | | | 2,468,634 | | | | 349,482 | |
| Paychex, Inc. | | | 8,000 | | | | 314,800 | | | | 49,440 | |
| Penn National Gaming, Inc. | | | 1,700 | | | | 23,854 | | | | 507 | |
| PepsiCo, Inc. | | | 3,000 | | | | 250,625 | | | | (1,805) | |
| PerkinElmer, Inc. | | | 23,900 | | | | 815,796 | | | | 169,601 | |
| PetSmart, Inc. | | | 49,600 | | | | 3,557,135 | | | | 51,265 | |
| Pfizer, Inc. | | | 148,486 | | | | 4,569,195 | | | | (21,069) | |
| PG&E Corp. | | | 58,300 | | | | 2,473,196 | | | | (124,872) | |
| Pharmacyclics, Inc. | | | 300 | | | | 39,169 | | | | (7,435) | |
| Phillips 66 | | | 66,100 | | | | 4,188,427 | | | | 909,866 | |
| | | | | | | | | | | | |
REFERENCE
ENTITY | | SHARES | | | NOTIONAL (a) | | | NET
UNREALIZED
APPRECIATION
(DEPRECIATION) | |
| United States (continued) | | | | | | | | | |
| Pinnacle West Capital Corp. | | | 34,300 | | | $ | 2,015,279 | | | $ | (200,123) | |
| PMC - Sierra, Inc. | | | 35,669 | | | | 248,970 | | | | (19,618) | |
| PNC Financial Services Group, Inc./The | | | 25,000 | | | | 1,929,359 | | | | 10,141 | |
| PNM Resources, Inc. | | | 28,200 | | | | 675,618 | | | | 4,566 | |
| Polaris Industries, Inc. | | | 17,300 | | | | 1,796,780 | | | | 722,792 | |
| Polycom, Inc. | | | 232,000 | | | | 2,624,332 | | | | (18,972) | |
| Popular, Inc. | | | 62,926 | | | | 1,767,790 | | | | 40,074 | |
| Portland General Electric Co. | | | 12,200 | | | | 392,962 | | | | (24,522) | |
| PPG Industries, Inc. | | | 30,742 | | | | 4,892,897 | | | | 937,631 | |
| ProAssurance Corp. | | | 15,100 | | | | 798,888 | | | | (66,840) | |
| Procter & Gamble Co. | | | 32,300 | | | | 2,580,450 | | | | 49,093 | |
| Protective Life Corp. | | | 54,701 | | | | 2,358,707 | | | | 412,446 | |
| Prudential Financial, Inc. | | | 50,400 | | | | 4,039,078 | | | | 608,810 | |
| Pulte Group, Inc. | | | 290,400 | | | | 5,539,072 | | | | 376,376 | |
| PVH Corp. | | | 2,583 | | | | 341,063 | | | | 10,277 | |
| QLogic Corp. | | | 58,021 | | | | 632,530 | | | | 53,858 | |
| Questar Corp. | | | 1,200 | | | | 27,602 | | | | (14) | |
| Ralph Lauren Corp. | | | 5,300 | | | | 915,843 | | | | 19,978 | |
| Raytheon Co. | | | 67,500 | | | | 4,711,500 | | | | 1,410,750 | |
| Red Hat, Inc. | | | 5,600 | | | | 314,154 | | | | (330) | |
| Regal Entertainment Group | | | 43,500 | | | | 811,988 | | | | 34,087 | |
| Regal-Beloit Corp. | | | 15,500 | | | | 1,063,907 | | | | 78,753 | |
| Regions Financial Corp. | | | 295,700 | | | | 2,938,494 | | | | (14,021) | |
| Reinsurance Group of America, Inc. | | | 41,400 | | | | 2,813,130 | | | | 391,644 | |
| Reliance Steel & Aluminum Co. | | | 106,200 | | | | 7,393,490 | | | | 660,718 | |
| ResMed, Inc. | | | 37,300 | | | | 1,808,230 | | | | (52,146) | |
| Reynolds American, Inc. | | | 2,700 | | | | 141,145 | | | | (6,172) | |
| Robert Half International, Inc. | | | 75,400 | | | | 2,749,259 | | | | 416,787 | |
| Rock-Tenn Co. | | | 14,500 | | | | 1,572,206 | | | | (49,561) | |
| Rockwell Automation, Inc. | | | 11,000 | | | | 1,092,528 | | | | 207,232 | |
| Rockwood Holdings, Inc. | | | 4,896 | | | | 321,599 | | | | 30,521 | |
| Ross Stores, Inc. | | | 61,079 | | | | 4,230,171 | | | | 346,478 | |
| Rovi Corp. | | | 24,200 | | | | 397,224 | | | | 79,274 | |
| Royal Caribbean Cruises Ltd. | | | 900 | | | | 38,546 | | | | 4,132 | |
| RPC, Inc. | | | 53,900 | | | | 823,592 | | | | 138,523 | |
| RPM International, Inc. | | | 39,000 | | | | 1,330,680 | | | | 288,210 | |
| RR Donnelley & Sons Co. | | | 23,500 | | | | 376,552 | | | | 100,028 | |
| Ryder System, Inc. | | | 46,600 | | | | 2,941,922 | | | | 496,226 | |
| Safeway, Inc. | | | 24,700 | | | | 713,144 | | | | 91,335 | |
| Sally Beauty Holdings, Inc. | | | 42,878 | | | | 1,226,194 | | | | 70,008 | |
| Sanderson Farms, Inc. | | | 23,205 | | | | 1,614,945 | | | | 63,473 | |
| SandRidge Energy, Inc. | | | 52,300 | | | | 310,639 | | | | 6,822 | |
| SCANA Corp. | | | 6,100 | | | | 287,064 | | | | (791) | |
| SEACOR Holdings, Inc. | | | 25,900 | | | | 2,239,626 | | | | 122,454 | |
| Sears Holdings Corp. | | | 40,086 | | | | 2,105,594 | | | | (139,777) | |
| Seattle Genetics, Inc. | | | 14,300 | | | | 622,430 | | | | (52,003) | |
| | | | |
| | The accompanying notes are an integral part of these financial statements. | | (Continued) |
| | | | | | | | | | | | | | | | |
| | AQR Funds | | | | | | Annual Report | | | | | | December 2013 | | 175 |
| | | | | | | | | | |
| | | | |
| Consolidated Schedule of Investments | | | December 31, 2013 | |
| | |
| AQR MULTI-STRATEGY ALTERNATIVE FUND | | |
| | | | | | | | | | | | |
REFERENCE
ENTITY | | SHARES | | | NOTIONAL (a) | | | NET
UNREALIZED
APPRECIATION
(DEPRECIATION) | |
| United States (continued) | | | | | | | | | |
| SEI Investments Co. | | | 19,800 | | | $ | 623,725 | | | $ | 63,929 | |
| Sempra Energy | | | 1,300 | | | | 113,751 | | | | 2,936 | |
| Semtech Corp. | | | 13,300 | | | | 334,523 | | | | 1,701 | |
| Service Corp. International | | | 151,200 | | | | 2,819,880 | | | | (78,624) | |
| Sherwin-Williams Co./The | | | 17,500 | | | | 3,033,916 | | | | 177,334 | |
| Sirona Dental Systems, Inc. | | | 11,900 | | | | 824,838 | | | | 10,542 | |
| SLM Corp. | | | 140,900 | | | | 3,457,686 | | | | 245,166 | |
| SM Energy Co. | | | 47,700 | | | | 3,787,877 | | | | 176,470 | |
| Smith Corp. | | | 57,000 | | | | 2,298,810 | | | | 775,770 | |
| Snap-on, Inc. | | | 14,200 | | | | 1,355,248 | | | | 199,936 | |
| Sonoco Products Co. | | | 1,127 | | | | 42,646 | | | | 4,373 | |
| Southwest Airlines Co. | | | 16,700 | | | | 232,053 | | | | 82,575 | |
| Splunk, Inc. | | | 28,600 | | | | 1,895,305 | | | | 68,657 | |
| SPX Corp. | | | 22,300 | | | | 1,866,132 | | | | 355,171 | |
| St. Jude Medical, Inc. | | | 2,200 | | | | 113,718 | | | | 22,572 | |
| StanCorp Financial Group, Inc. | | | 8,300 | | | | 458,277 | | | | 91,598 | |
| Starbucks Corp. | | | 84,300 | | | | 6,425,384 | | | | 182,893 | |
| Starwood Hotels & Resorts Worldwide, Inc. | | | 7,300 | | | | 505,283 | | | | 74,702 | |
| Steel Dynamics, Inc. | | | 359,600 | | | | 5,469,516 | | | | 1,557,068 | |
| STERIS Corp. | | | 5,700 | | | | 253,650 | | | | 20,235 | |
| Stryker Corp. | | | 1,100 | | | | 78,255 | | | | 4,399 | |
| SunTrust Banks, Inc. | | | 18,996 | | | | 661,631 | | | | 37,612 | |
| Superior Energy Services, Inc. | | | 139,900 | | | | 3,755,889 | | | | (33,150) | |
| Symantec Corp. | | | 331,400 | | | | 7,930,466 | | | | (116,054) | |
| Synopsys, Inc. | | | 60,600 | | | | 2,270,682 | | | | 187,860 | |
| Tech Data Corp. | | | 44,732 | | | | 2,223,180 | | | | 84,991 | |
| Techne Corp. | | | 2,200 | | | | 185,702 | | | | 22,572 | |
| Teleflex, Inc. | | | 14,600 | | | | 1,159,386 | | | | 210,970 | |
| Telephone & Data System | | | 72,400 | | | | 1,954,559 | | | | (88,087) | |
| Thermo Fisher Scientific, Inc. | | | 33,500 | | | | 3,000,930 | | | | 729,295 | |
| Thoratec Corp. | | | 62,064 | | | | 2,040,010 | | | | 231,532 | |
| TIBCO Software, Inc. | | | 21,300 | | | | 486,359 | | | | (7,535) | |
| Time Warner Cable, Inc. | | | 28,700 | | | | 3,388,989 | | | | 499,861 | |
| Time Warner, Inc. | | | 28,000 | | | | 1,782,157 | | | | 170,003 | |
| Timken Co. | | | 129,000 | | | | 7,535,877 | | | | (431,847) | |
| TJX Cos., Inc. | | | 83,600 | | | | 4,499,040 | | | | 828,788 | |
| T-Mobile US, Inc. | | | 4,800 | | | | 135,564 | | | | 25,908 | |
| Torchmark Corp. | | | 14,900 | | | | 1,036,765 | | | | 127,670 | |
| Toro Co./The | | | 2,300 | | | | 134,931 | | | | 11,349 | |
| Total System Services, Inc. | | | 57,200 | | | | 1,457,285 | | | | 446,331 | |
| Towers Watson & Co. | | | 43,000 | | | | 4,377,855 | | | | 1,109,375 | |
| Tractor Supply Co. | | | 26,720 | | | | 1,636,493 | | | | 436,444 | |
| Transdigm, Inc. | | | 2,100 | | | | 309,625 | | | | 28,517 | |
| Travelers Cos., Inc./The | | | 21,500 | | | | 1,820,382 | | | | 126,228 | |
| TRW Automotive Holdings Corp. | | | 46,600 | | | | 3,283,876 | | | | 182,698 | |
| | | | | | | | | | | | |
REFERENCE
ENTITY | | SHARES | | | NOTIONAL (a) | | | NET
UNREALIZED
APPRECIATION
(DEPRECIATION) | |
| United States (continued) | | | | | | | | | |
| Tupperware Brands Corp. | | | 48,900 | | | $ | 4,088,479 | | | $ | 534,038 | |
| tw telecom, Inc. | | | 2,200 | | | | 67,499 | | | | (465) | |
| Twenty-First Century Fox, Inc. | | | 96,900 | | | | 2,972,892 | | | | 436,050 | |
| Tyson Foods, Inc. | | | 115,800 | | | | 3,309,902 | | | | 564,766 | |
| UGI Corp. | | | 6,400 | | | | 265,280 | | | | 64 | |
| Union Pacific Corp. | | | 25,200 | | | | 4,079,559 | | | | 154,041 | |
| Unit Corp. | | | 28,300 | | | | 1,301,381 | | | | 159,465 | |
| United Parcel Service, Inc. | | | 17,000 | | | | 1,546,706 | | | | 239,654 | |
| United States Steel Corp. | | | 148,103 | | | | 3,548,722 | | | | 820,316 | |
| United Technologies Corp. | | | 3,500 | | | | 375,398 | | | | 22,902 | |
| Universal Health Services, Inc. | | | 57,200 | | | | 3,935,516 | | | | 712,556 | |
| Unum Group | | | 91,800 | | | | 2,888,028 | | | | 332,316 | |
| URS Corp. | | | 31,700 | | | | 1,594,764 | | | | 85,019 | |
| US BanCorp. | | | 19,300 | | | | 722,997 | | | | 56,723 | |
| Valero Energy Corp. | | | 28,900 | | | | 1,035,535 | | | | 421,025 | |
| Valmont Industries, Inc. | | | 9,800 | | | | 1,419,487 | | | | 41,889 | |
| Valspar Corp./The | | | 43,600 | | | | 2,969,856 | | | | 138,388 | |
| ValueClick, Inc. | | | 8,500 | | | | 198,527 | | | | 118 | |
| VeriFone Systems, Inc. | | | 18,100 | | | | 448,788 | | | | 36,654 | |
| Verisk Analytics, Inc. | | | 23,700 | | | | 1,466,319 | | | | 91,245 | |
| Verizon Communications, Inc. | | | 42,200 | | | | 2,108,944 | | | | (35,236) | |
| Vertex Pharmaceuticals, Inc. | | | 91,273 | | | | 7,920,755 | | | | (1,139,171) | |
| Viacom, Inc. | | | 39,800 | | | | 3,047,735 | | | | 428,397 | |
| Visa, Inc. | | | 1,200 | | | | 235,264 | | | | 31,952 | |
| Vishay Intertechnology, Inc. | | | 93,954 | | | | 1,364,871 | | | | (119,041) | |
| Visteon Corp. | | | 8,700 | | | | 662,470 | | | | 49,973 | |
| Vulcan Materials Co. | | | 4,000 | | | | 236,053 | | | | 1,627 | |
| WABCO Holdings, Inc. | | | 45,300 | | | | 3,660,822 | | | | 570,651 | |
| Wabtec Corp. | | | 10,000 | | | | 566,200 | | | | 176,500 | |
| Walgreen Co. | | | 30,100 | | | | 1,803,017 | | | | (74,073) | |
| Wal-Mart Stores, Inc. | | | 11,600 | | | | 907,144 | | | | 5,660 | |
| Walt Disney Co./The | | | 10,800 | | | | 703,728 | | | | 121,392 | |
| Waste Management, Inc. | | | 12,700 | | | | 538,353 | | | | 31,496 | |
| Waters Corp. | | | 3,200 | | | | 320,196 | | | | (196) | |
| WellCare Health Plans, Inc. | | | 1,900 | | | | 141,136 | | | | (7,338) | |
| WellPoint, Inc. | | | 29,200 | | | | 2,628,333 | | | | 69,455 | |
| Wells Fargo & Co. | | | 74,900 | | | | 3,320,150 | | | | 80,310 | |
| Werner Enterprises, Inc. | | | 11,600 | | | | 285,043 | | | | 1,825 | |
| Western Digital Corp. | | | 192,600 | | | | 13,397,614 | | | | 2,761,526 | |
| WGL Holdings, Inc. | | | 1,000 | | | | 45,607 | | | | (5,547) | |
| Whirlpool Corp. | | | 48,300 | | | | 6,226,353 | | | | 1,349,985 | |
| WhiteWave Foods Co. | | | 53,954 | | | | 998,689 | | | | 239,016 | |
| Whiting Petroleum Corp. | | | 57,400 | | | | 3,347,326 | | | | 204,012 | |
| Whole Foods Market, Inc. | | | 19,500 | | | | 1,085,855 | | | | 41,830 | |
| Williams-Sonoma, Inc. | | | 27,800 | | | | 1,618,516 | | | | 1,668 | |
| | | | |
| | The accompanying notes are an integral part of these financial statements. | | (Continued) |
| | | | | | | | | | | | | | | | |
| 176 | | AQR Funds | | | | | | Annual Report | | | | | | December 2013 | | |
| | | | | | | | | | |
| | | | |
| Consolidated Schedule of Investments | | | December 31, 2013 | |
| | |
| AQR MULTI-STRATEGY ALTERNATIVE FUND | | |
| | | | | | | | | | | | |
REFERENCE
ENTITY | | SHARES | | | NOTIONAL (a) | | | NET
UNREALIZED
APPRECIATION
(DEPRECIATION) | |
| United States (continued) | | | | | | | | | |
| Windstream Holdings, Inc. | | | 44,100 | | | $ | 354,979 | | | $ | (3,061) | |
| Wisconsin Energy Corp. | | | 23,800 | | | | 1,019,000 | | | | (35,108) | |
| Worthington Industries, Inc. | | | 84,700 | | | | 3,002,454 | | | | 561,722 | |
| WPX Energy, Inc. | | | 35,100 | | | | 780,206 | | | | (64,868) | |
| WR Grace & Co. | | | 65,200 | | | | 5,457,866 | | | | 988,458 | |
| Wyndham Worldwide Corp. | | | 65,600 | | | | 3,925,504 | | | | 908,560 | |
| Xcel Energy, Inc. | | | 23,700 | | | | 689,435 | | | | (27,257) | |
| Xerox Corp. | | | 212,100 | | | | 2,062,768 | | | | 518,489 | |
| Xilinx, Inc. | | | 5,300 | | | | 237,692 | | | | 5,684 | |
| Yahoo!, Inc. | | | 457,700 | | | | 13,329,219 | | | | 5,180,169 | |
| Zimmer Holdings, Inc. | | | 17,400 | | | | 1,473,258 | | | | 148,248 | |
| | | | | | | | | | | | |
| | | | | | | | | | | 122,621,986 | |
| | | | | | | | | | | | |
Total of Long Equity Positions | | | | | | | | | | | 132,216,330 | |
| | | | | | | | | | | | |
| | |
| Short Positions | | | | | | | | | |
| | |
| Bermuda | | | | | | | | | |
| ARCH Capital Group, Inc. | | | (14,100) | | | | (781,422) | | | | (60,207) | |
| Assured Guaranty Ltd. | | | (161,700) | | | | (3,635,382) | | | | (179,121) | |
| Genpact Ltd. | | | (9,700) | | | | (174,716) | | | | (3,473) | |
| Golar LNG Ltd. | | | (15,200) | | | | (544,330) | | | | (7,278) | |
| Teekay Corp. | | | (100) | | | | (4,421) | | | | (380) | |
| | | | | | | | | | | | |
| | | | | | | | | | | (250,459) | |
| | | | | | | | | | | | |
| Canada | | | | | | | | | | | | |
| Baytex Energy Corp. | | | (13,800) | | | | (570,381) | | | | 29,973 | |
| Brookfield Asset Management, Inc. | | | (16,100) | | | | (578,872) | | | | (46,291) | |
| Domtar Corp. | | | (7,300) | | | | (616,990) | | | | (71,692) | |
| Enerplus Corp. | | | (29,500) | | | | (487,930) | | | | (48,380) | |
| Lululemon Athletica, Inc. | | | (142,900) | | | | (9,811,815) | | | | 1,376,428 | |
| Penn West Petroleum Corp. | | | (136,100) | | | | (1,670,415) | | | | 532,619 | |
| | | | | | | | | | | | |
| | | | | | | | | | | 1,772,657 | |
| | | | | | | | | | | | |
| Ireland | | | | | | | | | | | | |
| Jazz Pharmaceuticals Co. | | | (71,000) | | | | (5,126,396) | | | | (3,859,364) | |
| Mallinckrodt PLC | | | (4,800) | | | | (210,741) | | | | (40,107) | |
| | | | | | | | | | | | |
| | | | | | | | | | | (3,899,471) | |
| | | | | | | | | | | | |
| Israel | | | | | | | | | | | | |
| Check Point Software Technologies Ltd. | | | (10,900) | | | | (615,196) | | | | (88,072) | |
| | | | | | | | | | | | |
| Netherlands | | | | | | | | | | | | |
| Chicago Bridge & Iron Co. NV | | | (5,500) | | | | (388,670) | | | | (68,600) | |
| Core Laboratories NV | | | (31,200) | | | | (4,833,192) | | | | (1,124,448) | |
| QIAGEN NV | | | (1,600) | | | | (36,750) | | | | (1,346) | |
| Sensata Technologies Holding NV | | | (59,500) | | | | (2,196,145) | | | | (110,670) | |
| | | | | | | | | | | | |
| | | | | | | | | | | (1,305,064) | |
| | | | | | | | | | | | |
| | | | | | | | | | | | |
REFERENCE
ENTITY | | SHARES | | | NOTIONAL (a) | | | NET
UNREALIZED
APPRECIATION
(DEPRECIATION) | |
| Switzerland | | | | | | | | | | | | |
| Garmin, Ltd. | | | (17,700) | | | $ | (649,590) | | | $ | (168,504) | |
| Pentair Ltd. | | | (45,610) | | | | (2,770,351) | | | | (772,177) | |
| Weatherford International Ltd. | | | (127,900) | | | | (1,872,368) | | | | (108,804) | |
| | | | | | | | | | | | |
| | | | | | | | | | | (1,049,485) | |
| | | | | | | | | | | | |
| United Kingdom | | | | | | | | | | | | |
| Ensco PLC | | | (6,500) | | | | (384,446) | | | | 12,776 | |
| Liberty Global PLC | | | (74,500) | | | | (5,993,996) | | | | (635,759) | |
| Noble Corp PLC | | | (9,100) | | | | (346,334) | | | | 5,357 | |
| | | | | | | | | | | | |
| | | | | | | | | | | (617,626) | |
| | | | | | | | | | | | |
| United States | | | | | | | | | | | | |
| 3D Systems Corp. | | | (600) | | | | (40,377) | | | | (15,381) | |
| Actuant Corp. | | | (27,801) | | | | (976,093) | | | | (42,536) | |
| Acuity Brands, Inc. | | | (13,500) | | | | (1,366,278) | | | | (109,542) | |
| Adobe Systems, Inc. | | | (20,800) | | | | (999,856) | | | | (245,648) | |
| ADTRAN, Inc. | | | (225,000) | | | | (5,942,087) | | | | (135,163) | |
| Advanced Micro Device, Inc. | | | (751,982) | | | | (2,970,724) | | | | 60,554 | |
| Aeropostale, Inc. | | | (16,188) | | | | (155,426) | | | | 8,277 | |
| Aflac, Inc. | | | (35,000) | | | | (2,260,675) | | | | (77,325) | |
| Air Lease Corp. | | | (8,100) | | | | (245,292) | | | | (6,456) | |
| Air Products & Chemicals, Inc. | | | (7,700) | | | | (750,784) | | | | (109,922) | |
| Albemarle Corp. | | | (4,200) | | | | (262,466) | | | | (3,772) | |
| Alcoa, Inc. | | | (305,800) | | | | (2,735,938) | | | | (514,716) | |
| Alere, Inc. | | | (58,700) | | | | (1,682,185) | | | | (442,755) | |
| Alexion Pharmaceuticals, Inc. | | | (5,100) | | | | (615,147) | | | | (63,459) | |
| Allegheny Technologies, Inc. | | | (151,300) | | | | (4,166,852) | | | | (1,223,967) | |
| Allergan, Inc. | | | (19,421) | | | | (1,779,048) | | | | (378,237) | |
| Alliance Data Systems Corp. | | | (24,300) | | | | (4,590,390) | | | | (1,798,809) | |
| Altera Corp. | | | (55,200) | | | | (1,964,513) | | | | 168,857 | |
| AMC Networks, Inc. | | | (7,700) | | | | (537,450) | | | | 13,003 | |
| American Express Co. | | | (60,700) | | | | (4,495,526) | | | | (1,011,785) | |
| AMETEK, Inc. | | | (3,400) | | | | (155,919) | | | | (23,159) | |
| Amphenol Corp. | | | (13,999) | | | | (1,074,843) | | | | (173,588) | |
| ANN, Inc. | | | (14,700) | | | | (520,208) | | | | (17,224) | |
| ANSYS, Inc. | | | (6,100) | | | | (482,510) | | | | (49,410) | |
| AOL, Inc. | | | (43,500) | | | | (1,714,825) | | | | (313,145) | |
| Apache Corp. | | | (30,100) | | | | (2,533,422) | | | | (53,372) | |
| Apollo Group, Inc. | | | (147,400) | | | | (2,727,954) | | | | (1,299,014) | |
| Apple, Inc. | | | (20,300) | | | | (8,741,582) | | | | (2,648,951) | |
| Arch Coal, Inc. | | | (325,253) | | | | (1,337,466) | | | | (109,910) | |
| Aruba Networks, Inc. | | | (167,387) | | | | (2,959,318) | | | | (36,910) | |
| Ascena Retail Group, Inc. | | | (20,900) | | | | (393,576) | | | | (48,668) | |
| Ashland, Inc. | | | (9,300) | | | | (817,825) | | | | (84,647) | |
| athenahealth, Inc. | | | (38,700) | | | | (4,267,449) | | | | (937,701) | |
| Atmel Corp. | | | (335,200) | | | | (2,577,688) | | | | (46,928) | |
| Atwood Oceanics, Inc. | | | (42,000) | | | | (2,394,189) | | | | 151,809 | |
| Automatic Data Processing, Inc. | | | (2,387) | | | | (173,965) | | | | (18,929) | |
| Autonation, Inc. | | | (20,900) | | | | (967,354) | | | | (71,167) | |
| | | | |
| | The accompanying notes are an integral part of these financial statements. | | (Continued) |
| | | | | | | | | | | | | | | | |
| | AQR Funds | | | | | | Annual Report | | | | | | December 2013 | | 177 |
| | | | | | | | | | |
| | | | |
| Consolidated Schedule of Investments | | | December 31, 2013 | |
| | |
| AQR MULTI-STRATEGY ALTERNATIVE FUND | | |
| | | | | | | | | | | | |
REFERENCE
ENTITY | | SHARES | | | NOTIONAL (a) | | | NET
UNREALIZED
APPRECIATION
(DEPRECIATION) | |
| United States (continued) | | | | | | | | | |
| AutoZone, Inc. | | | (2,200) | | | $ | (941,588) | | | $ | (109,880) | |
| Avis Budget Group, Inc. | | | (24,600) | | | | (759,414) | | | | (234,918) | |
| Avon Products, Inc. | | | (185,600) | | | | (4,108,037) | | | | 912,005 | |
| Babcock & Wilcox Co./The | | | (900) | | | | (28,604) | | | | (2,167) | |
| Baker Hughes, Inc. | | | (115,000) | | | | (5,493,368) | | | | (861,532) | |
| Bally Technologies, Inc. | | | (50,200) | | | | (3,519,482) | | | | (418,708) | |
| BancorpSouth, Inc. | | | (1,400) | | | | (31,360) | | | | (4,228) | |
| Bank of America Corp | | | (235,000) | | | | (3,354,345) | | | | (304,605) | |
| Bank of Hawaii Corp. | | | (4,300) | | | | (236,113) | | | | (18,189) | |
| Bank of New York Mellon Corp./The | | | (41,965) | | | | (1,333,419) | | | | (132,838) | |
| Barnes & Noble, Inc. | | | (17,500) | | | | (262,464) | | | | 839 | |
| Baxter International, Inc. | | | (8,200) | | | | (552,028) | | | | (18,282) | |
| BB&T Corp. | | | (28,200) | | | | (967,160) | | | | (85,264) | |
| Bed Bath & Beyond, Inc. | | | (22,600) | | | | (1,726,105) | | | | (88,675) | |
| Bill Barrett Corp. | | | (122,834) | | | | (2,890,284) | | | | (399,211) | |
| BioMarin Pharmaceutical, Inc. | | | (58,900) | | | | (3,832,079) | | | | (306,824) | |
| Black Hills Corp. | | | (9,283) | | | | (492,370) | | | | 4,920 | |
| BorgWarner, Inc. | | | (39,800) | | | | (1,814,283) | | | | (410,935) | |
| Bristol-Myers Squibb Co. | | | (158,800) | | | | (7,030,445) | | | | (1,409,775) | |
| Broadcom Corp. | | | (15,600) | | | | (413,563) | | | | (48,976) | |
| Brookdale Senior Living, Inc. | | | (77,200) | | | | (2,217,765) | | | | 119,469 | |
| Cabela’s, Inc. | | | (18,000) | | | | (1,122,851) | | | | (77,029) | |
| Cablevision Systems Corp. | | | (105,900) | | | | (1,932,950) | | | | 34,163 | |
| CACI International, Inc. | | | (4,300) | | | | (284,963) | | | | (29,883) | |
| Cadence Design Systems, Inc. | | | (6,200) | | | | (80,705) | | | | (6,219) | |
| Calpine Corp. | | | (41,255) | | | | (796,072) | | | | (8,813) | |
| Cameron International Corp. | | | (4,600) | | | | (255,481) | | | | (18,357) | |
| Campbell Soup Co. | | | (25,800) | | | | (1,187,797) | | | | 71,173 | |
| CARBO Ceramics, Inc. | | | (9,300) | | | | (722,889) | | | | (360,840) | |
| CarMax, Inc. | | | (203,601) | | | | (9,740,272) | | | | 166,953 | |
| Carnival Corp. | | | (115,300) | | | | (3,965,107) | | | | (666,494) | |
| Carpenter Technology Corp. | | | (3,400) | | | | (205,067) | | | | (6,413) | |
| Casey’s General Stores, Inc. | | | (1,600) | | | | (110,928) | | | | (1,472) | |
| Cash America International, Inc. | | | (53,413) | | | | (2,408,650) | | | | 362,932 | |
| Caterpillar, Inc. | | | (72,900) | | | | (6,241,281) | | | | (378,768) | |
| Cavium, Inc. | | | (114,100) | | | | (4,267,340) | | | | 329,749 | |
| Centene Corp. | | | (11,600) | | | | (643,568) | | | | (40,252) | |
| CenturyLink, Inc. | | | (182,900) | | | | (6,185,810) | | | | 360,445 | |
| Cepheid, Inc. | | | (137,800) | | | | (4,848,497) | | | | (1,589,519) | |
| Cerner Corp. | | | (5,700) | | | | (283,803) | | | | (33,915) | |
| CH Robinson Worldwide, Inc. | | | (38,000) | | | | (2,302,891) | | | | 85,971 | |
| Charles Schwab Corp./The | | | (742,400) | | | | (16,104,561) | | | | (3,197,839) | |
| Chart Industries, Inc. | | | (40,600) | | | | (4,131,050) | | | | 248,066 | |
| | | | | | | | | | | | |
REFERENCE
ENTITY | | SHARES | | | NOTIONAL (a) | | | NET
UNREALIZED
APPRECIATION
(DEPRECIATION) | |
| United States (continued) | | | | | | | | | |
| Charter Communications, Inc. | | | (13,200) | | | $ | (1,749,227) | | | $ | (56,005) | |
| Cheesecake Factory, Inc./The | | | (8,689) | | | | (376,147) | | | | (43,271) | |
| Cheniere Energy, Inc. | | | (71,900) | | | | (2,692,115) | | | | (408,213) | |
| Chesapeake Energy Corp. | | | (254,700) | | | | (5,751,126) | | | | (1,161,432) | |
| Childrens Place Retail Stores, Inc./The | | | (26,800) | | | | (1,487,765) | | | | (39,031) | |
| Chipotle Mexican Grill, Inc. | | | (23,000) | | | | (9,406,310) | | | | (2,847,630) | |
| Ciena Corp. | | | (297,600) | | | | (6,794,665) | | | | (326,903) | |
| Cinncinnati Financial Corp. | | | (35,900) | | | | (1,778,849) | | | | (101,234) | |
| CIT Group, Inc. | | | (20,700) | | | | (1,011,614) | | | | (67,477) | |
| Citrix Systems, Inc. | | | (23,200) | | | | (1,430,584) | | | | (36,816) | |
| City National Corp. | | | (6,900) | | | | (479,698) | | | | (66,920) | |
| Clean Harbors, Inc. | | | (21,400) | | | | (1,187,214) | | | | (95,930) | |
| Cliffs Natural Resources, Inc. | | | (399,300) | | | | (7,317,921) | | | | (3,147,732) | |
| Clorox Co./The | | | (17,300) | | | | (1,536,265) | | | | (68,483) | |
| Coach, Inc. | | | (318,200) | | | | (18,872,442) | | | | 1,011,876 | |
| Coca-Cola Co./The | | | (78,700) | | | | (3,208,162) | | | | (42,935) | |
| Cognizant Technology Solutions Corp. | | | (27,125) | | | | (2,100,975) | | | | (638,107) | |
| Comerica, Inc. | | | (78,400) | | | | (3,306,912) | | | | (420,224) | |
| Commerce Bancshares, Inc. | | | (105) | | | | (4,552) | | | | (163) | |
| Compass Minerals International, Inc. | | | (12,600) | | | | (1,068,014) | | | | 59,384 | |
| Concho Resources, Inc. | | | (40,100) | | | | (3,588,900) | | | | (741,900) | |
| Concur Technologies, Inc. | | | (69,000) | | | | (6,127,200) | | | | (992,220) | |
| Consol Energy, Inc. | | | (324,300) | | | | (9,483,385) | | | | (2,852,987) | |
| Continental Resources, Inc. | | | (23,100) | | | | (2,219,679) | | | | (379,533) | |
| Corning, Inc. | | | (114,100) | | | | (1,900,678) | | | | (132,584) | |
| Covanta Holding Corp. | | | (36,800) | | | | (647,358) | | | | (5,842) | |
| CR Bard, Inc. | | | (1,500) | | | | (168,924) | | | | (31,986) | |
| Cree, Inc. | | | (45,667) | | | | (2,969,063) | | | | 111,679 | |
| Crown Castle International Corp. | | | (42,900) | | | | (3,234,491) | | | | 84,344 | |
| CSX Corp. | | | (21,500) | | | | (549,420) | | | | (69,135) | |
| Cubist Pharmaceutical, Inc. | | | (25,200) | | | | (1,594,744) | | | | (140,780) | |
| Cullen/Frost Bankers, Inc. | | | (4,400) | | | | (316,503) | | | | (10,989) | |
| CVR Energy, Inc. | | | (14,600) | | | | (586,018) | | | | (48,060) | |
| Cypress Semiconductor | | | (128,400) | | | | (1,455,568) | | | | 107,368 | |
| Dana Holding Corp. | | | (12,613) | | | | (280,093) | | | | 32,626 | |
| Danaher Corp. | | | (22,799) | | | | (1,566,063) | | | | (194,020) | |
| Darden Restaurants, Inc. | | | (57,600) | | | | (2,794,058) | | | | (337,654) | |
| Deckers Outdoor Corp. | | | (52,900) | | | | (3,045,718) | | | | (1,422,216) | |
| Deere & Co. | | | (9,900) | | | | (826,826) | | | | (77,341) | |
| Denbury Resources, Inc. | | | (13,199) | | | | (220,954) | | | | 4,094 | |
| DENTSPLY International, Inc. | | | (29,000) | | | | (1,231,121) | | | | (174,799) | |
| DeVry, Inc. | | | (83,400) | | | | (2,605,224) | | | | (355,476) | |
| | | | |
| | The accompanying notes are an integral part of these financial statements. | | (Continued) |
| | | | | | | | | | | | | | | | |
| 178 | | AQR Funds | | | | | | Annual Report | | | | | | December 2013 | | |
| | | | | | | | | | |
| | | | |
| Consolidated Schedule of Investments | | | December 31, 2013 | |
| | |
| AQR MULTI-STRATEGY ALTERNATIVE FUND | | |
| | | | | | | | | | | | |
REFERENCE
ENTITY | | SHARES | | | NOTIONAL (a) | | | NET
UNREALIZED
APPRECIATION
(DEPRECIATION) | |
| United States (continued) | | | | | |
| Dick’s Sporting Goods, Inc. | | | (54,600) | | | $ | (2,804,056) | | | $ | (368,204) | |
| Diebold, Inc. | | | (9,700) | | | | (298,257) | | | | (21,940) | |
| Discovery Communications, Inc. | | | (26,100) | | | | (2,194,931) | | | | (165,031) | |
| Dominion Resources, Inc. | | | (43,400) | | | | (2,590,112) | | | | (217,434) | |
| Dow Chemical Co./The | | | (135,501) | | | | (4,697,820) | | | | (1,318,425) | |
| DR Horton, Inc. | | | (143,000) | | | | (2,756,444) | | | | (435,316) | |
| DreamWorks Animation SKG, Inc. | | | (76,100) | | | | (1,953,908) | | | | (747,642) | |
| DSW, Inc. | | | (14,600) | | | | (576,882) | | | | (46,976) | |
| Eagle Materials, Inc. | | | (10,900) | | | | (840,307) | | | | (3,680) | |
| eBay, Inc. | | | (17,659) | | | | (946,678) | | | | (22,625) | |
| Ecolab, Inc. | | | (38,800) | | | | (3,623,920) | | | | (421,756) | |
| Edwards Lifesciences Corp. | | | (22,100) | | | | (1,574,740) | | | | 121,444 | |
| EI du Pont de Nemours & Co. | | | (48,800) | | | | (2,788,432) | | | | (382,104) | |
| EMC Corp. | | | (113,600) | | | | (2,859,339) | | | | 2,299 | |
| Emerson Electric Co. | | | (9,900) | | | | (594,929) | | | | (99,853) | |
| Endo Pharmaceuticals Holdings, Inc. | | | (7,100) | | | | (474,824) | | | | (4,142) | |
| EQT Corp. | | | (11,400) | | | | (952,128) | | | | (71,364) | |
| Equinix, Inc. | | | (54,100) | | | | (9,954,803) | | | | 354,758 | |
| Exelon Corp. | | | (195,100) | | | | (6,226,411) | | | | 882,622 | |
| Expedia, Inc. | | | (37,800) | | | | (2,265,693) | | | | (367,455) | |
| Expeditors International of Washington, Inc. | | | (3,300) | | | | (135,960) | | | | (10,065) | |
| F5 Networks, Inc. | | | (57,100) | | | | (4,645,974) | | | | (542,132) | |
| Factset Research Systems, Inc. | | | (8,300) | | | | (907,937) | | | | 6,723 | |
| Fairchild Semiconductor International, Inc. | | | (31,600) | | | | (383,487) | | | | (38,373) | |
| Family Dollar Stores, Inc. | | | (29,900) | | | | (2,025,999) | | | | 83,396 | |
| Fastenal Co. | | | (160,300) | | | | (7,483,467) | | | | (132,386) | |
| Federated Investors, Inc. | | | (29,200) | | | | (886,804) | | | | 45,844 | |
| Fidelity National Financial, Inc. | | | (63,100) | | | | (1,579,721) | | | | (467,874) | |
| Finisar Corp. | | | (381,137) | | | | (7,094,200) | | | | (2,022,598) | |
| First American Financial Corp. | | | (18,600) | | | | (478,045) | | | | (46,475) | |
| First Horizon National Corp. | | | (273,900) | | | | (3,315,504) | | | | 124,569 | |
| FirstEnergy Corp. | | | (82,200) | | | | (2,933,968) | | | | 223,012 | |
| FirstMerit Corp. | | | (60,700) | | | | (1,306,871) | | | | (42,490) | |
| FLIR Systems, Inc. | | | (56,400) | | | | (1,640,274) | | | | (57,366) | |
| Flowers Foods, Inc. | | | (73,350) | | | | (1,721,255) | | | | 146,430 | |
| Flowserve Corp. | | | (3,300) | | | | (189,255) | | | | (70,884) | |
| Fluor Corp. | | | (9,200) | | | | (578,128) | | | | (160,540) | |
| FMC Corp. | | | (12,100) | | | | (778,056) | | | | (135,010) | |
| FMC Technologies, Inc. | | | (98,600) | | | | (5,701,052) | | | | 553,146 | |
| Ford Motor Co. | | | (158,700) | | | | (2,697,531) | | | | 248,790 | |
| Forest City Enterprises, Inc. | | | (337,700) | | | | (6,198,051) | | | | (252,019) | |
| Fortune Brands Home & Security, Inc. | | | (5,600) | | | | (236,007) | | | | (19,913) | |
| | | | | | | | | | | | |
REFERENCE
ENTITY | | SHARES | | | NOTIONAL (a) | | | NET
UNREALIZED
APPRECIATION
(DEPRECIATION) | |
| United States (continued) | | | | | |
| Fossil Group, Inc. | | | (21,100) | | | $ | (2,358,769) | | | $ | (171,965) | |
| Franklin Resources, Inc. | | | (10,550) | | | | (544,362) | | | | (64,689) | |
| Freeport-McMoRan Copper & Gold, Inc. | | | (343,100) | | | | (10,033,595) | | | | (2,914,999) | |
| Fresh Market, Inc./The | | | (5,600) | | | | (249,839) | | | | 23,039 | |
| FTI Consulting, Inc. | | | (79,006) | | | | (2,960,482) | | | | (289,825) | |
| Gaming and Leisure Properties, Inc. | | | (12,600) | | | | (515,684) | | | | (124,522) | |
| Gannett Co., Inc. | | | (9,934) | | | | (261,860) | | | | (31,988) | |
| GATX Corp. | | | (34,600) | | | | (1,565,307) | | | | (239,775) | |
| General Electric Co. | | | (2,000) | | | | (52,793) | | | | (3,267) | |
| General Mills, Inc. | | | (9,800) | | | | (506,310) | | | | 17,192 | |
| General Motors Co. | | | (52,900) | | | | (1,973,325) | | | | (188,698) | |
| Genesee & Wyoming, Inc. | | | (13,400) | | | | (1,261,450) | | | | (25,620) | |
| Gentex Corp. | | | (120,810) | | | | (2,826,954) | | | | (1,158,568) | |
| Gilead Sciences, Inc. | | | (97,800) | | | | (5,970,366) | | | | (1,379,304) | |
| Global Payments, Inc. | | | (58,000) | | | | (3,094,904) | | | | (674,516) | |
| GrafTech International Ltd. | | | (205,900) | | | | (1,605,953) | | | | (706,304) | |
| Great Plains Energy, Inc. | | | (4,700) | | | | (115,051) | | | | 1,123 | |
| Green Mountain Coffee Roasters, Inc. | | | (61,288) | | | | (4,429,984) | | | | (202,163) | |
| Greenhill & Co., Inc. | | | (62,100) | | | | (3,059,241) | | | | (538,833) | |
| Gulfport Energy Corp. | | | (89,200) | | | | (4,634,887) | | | | (998,093) | |
| Hain Celestial Group, Inc./The | | | (40,700) | | | | (2,960,923) | | | | (733,823) | |
| Hancock Holding Co. | | | (26,000) | | | | (849,159) | | | | (104,521) | |
| Harley-Davidson, Inc. | | | (34,300) | | | | (1,942,269) | | | | (432,663) | |
| Harris Corp. | | | (3,200) | | | | (183,328) | | | | (40,064) | |
| Hawaiian Electric Industries, Inc. | | | (2,758) | | | | (74,107) | | | | 2,234 | |
| Hertz Global Holdings, Inc. | | | (122,500) | | | | (3,347,925) | | | | (158,025) | |
| Hexcel Corp. | | | (60,900) | | | | (2,136,981) | | | | (584,640) | |
| HMS Holdings Corp. | | | (28,500) | | | | (623,244) | | | | (24,561) | |
| Hologic, Inc. | | | (178,100) | | | | (3,890,241) | | | | (90,294) | |
| HomeAway, Inc. | | | (26,500) | | | | (891,260) | | | | (192,060) | |
| Hospira, Inc. | | | (70,200) | | | | (2,817,302) | | | | (80,554) | |
| Huntington Ingalls Industries, Inc. | | | (7,700) | | | | (558,156) | | | | (134,921) | |
| IDEX Corp. | | | (7,022) | | | | (411,489) | | | | (107,086) | |
| IDEXX Laboratories, Inc. | | | (11,400) | | | | (1,093,574) | | | | (119,044) | |
| IHS, Inc. | | | (18,600) | | | | (1,994,923) | | | | (231,497) | |
| Illinois Tool Works, Inc. | | | (2,499) | | | | (183,152) | | | | (26,964) | |
| Illumina, Inc. | | | (1,600) | | | | (153,585) | | | | (23,407) | |
| Incyte Corp Ltd. | | | (8,600) | | | | (403,202) | | | | (32,216) | |
| Informatica Corp. | | | (101,400) | | | | (3,959,670) | | | | (248,430) | |
| Intel Corp. | | | (65,900) | | | | (1,511,096) | | | | (199,668) | |
| InterDigital, Inc. | | | (34,100) | | | | (1,164,787) | | | | 159,178 | |
| International Business Machines Corp. | | | (300) | | | | (58,062) | | | | 1,791 | |
| International Paper Co. | | | (21,000) | | | | (925,413) | | | | (104,217) | |
| Intersil Corp. | | | (22,148) | | | | (191,137) | | | | (62,900) | |
| Intrepid Potash, Inc. | | | (242,300) | | | | (4,482,828) | | | | 644,796 | |
| Intuitive Surgical, Inc. | | | (24,800) | | | | (9,641,413) | | | | 116,229 | |
| IPG Photonics Corp. | | | (74,869) | | | | (4,441,087) | | | | (1,369,496) | |
| Iron Mountain, Inc. | | | (95,397) | | | | (2,634,258) | | | | (261,041) | |
| | | | |
| | The accompanying notes are an integral part of these financial statements. | | (Continued) |
| | | | | | | | | | | | | | | | |
| | AQR Funds | | | | | | Annual Report | | | | | | December 2013 | | 179 |
| | | | | | | | | | |
| | | | |
| Consolidated Schedule of Investments | | | December 31, 2013 | |
| | |
| AQR MULTI-STRATEGY ALTERNATIVE FUND | | |
| | | | | | | | | | | | |
REFERENCE
ENTITY | | SHARES | | | NOTIONAL (a) | | | NET
UNREALIZED
APPRECIATION
(DEPRECIATION) | |
| United States (continued) | | | | | |
| ITC Holdings Corp. | | | (12,300) | | | $ | (1,163,703) | | | $ | (14,883) | |
| Janus Capital Group, Inc. | | | (79,700) | | | | (846,988) | | | | (138,901) | |
| JB Hunt Transport Services, Inc. | | | (11,417) | | | | (861,527) | | | | (21,007) | |
| JC Penney Co., Inc. | | | (203,700) | | | | (3,019,930) | | | | 1,156,075 | |
| JetBlue Airways Corp. | | | (293,600) | | | | (2,024,393) | | | | (485,887) | |
| Joy Global, Inc. | | | (77,600) | | | | (3,899,926) | | | | (638,898) | |
| Juniper Networks, Inc. | | | (151,000) | | | | (3,205,989) | | | | (202,081) | |
| KAR Auction Services, Inc. | | | (3,400) | | | | (98,160) | | | | (2,310) | |
| Kellogg Co. | | | (26,700) | | | | (1,750,173) | | | | 119,604 | |
| Kennametal, Inc. | | | (26,700) | | | | (1,103,640) | | | | (286,629) | |
| Key Energy Services, Inc. | | | (129,637) | | | | (906,670) | | | | (117,462) | |
| Kinder Morgan, Inc. | | | (3,600) | | | | (126,072) | | | | (3,528) | |
| Kirby Corp. | | | (50,900) | | | | (4,250,503) | | | | (801,322) | |
| Knight Transportation, Inc. | | | (23,900) | | | | (404,907) | | | | (33,419) | |
| Kohl’s Corp. | | | (114,700) | | | | (6,135,754) | | | | (373,471) | |
| L Brands, Inc. | | | (85,900) | | | | (4,572,116) | | | | (740,799) | |
| Laboratory Corp. of America Holdings | | | (30,800) | | | | (2,990,221) | | | | 176,025 | |
| Lam Research Corp. | | | (24,500) | | | | (1,236,355) | | | | (97,670) | |
| Lamar Advertising Co. | | | (95,300) | | | | (4,235,788) | | | | (743,637) | |
| Laredo Petroleum, Inc. | | | (3,300) | | | | (98,633) | | | | 7,256 | |
| Las Vegas Sands Corp. | | | (68,700) | | | | (3,844,452) | | | | (1,573,917) | |
| Leap Wireless International, Inc. | | | (115,387) | | | | (2,006,580) | | | | (1,154) | |
| Legg Mason, Inc. | | | (41,200) | | | | (1,408,216) | | | | (383,160) | |
| Leggett & Platt, Inc. | | | (30,600) | | | | (967,487) | | | | 20,723 | |
| Lennar Corp. | | | (148,400) | | | | (5,238,312) | | | | (632,392) | |
| Level 3 Communications, Inc. | | | (30,200) | | | | (651,716) | | | | (350,018) | |
| Lexmark International, Inc. | | | (27,000) | | | | (919,328) | | | | (39,712) | |
| Life Time Fitness, Inc. | | | (50,803) | | | | (2,809,487) | | | | 421,746 | |
| Linear Technology Corp. | | | (7,800) | | | | (311,090) | | | | (44,200) | |
| Lions Gate Entertainment Corp. | | | (9,600) | | | | (350,517) | | | | 46,581 | |
| Lockheed Martin Corp. | | | (11,500) | | | | (1,347,726) | | | | (361,864) | |
| Lorillard, Inc. | | | (55,038) | | | | (2,623,843) | | | | (165,483) | |
| Louisiana-Pacific Corp. | | | (21,200) | | | | (367,872) | | | | (24,540) | |
| Manitowoc Co., Inc./The | | | (104,801) | | | | (2,138,373) | | | | (305,586) | |
| Markel Corp. | | | (2,000) | | | | (1,094,040) | | | | (66,660) | |
| Marriott International, Inc. | | | (53,500) | | | | (2,268,984) | | | | (371,776) | |
| Martin Marietta Materials, Inc. | | | (36,400) | | | | (3,833,679) | | | | 195,863 | |
| Masimo Corp. | | | (66,900) | | | | (1,593,705) | | | | (361,782) | |
| McCormick & Co., Inc. | | | (6,300) | | | | (454,821) | | | | 20,625 | |
| McDermott International, Inc. | | | (28,400) | | | | (221,881) | | | | (38,263) | |
| McDonald’s Corp. | | | (13,462) | | | | (1,346,975) | | | | 40,757 | |
| MDC Holdings, Inc. | | | (3,000) | | | | (87,805) | | | | (8,915) | |
| MDU Resources Group, Inc. | | | (21,321) | | | | (601,679) | | | | (49,678) | |
| Mead Johnson Nutrition Co. | | | (28,700) | | | | (2,111,174) | | | | (292,738) | |
| Medivation, Inc. | | | (14,800) | | | | (943,001) | | | | (1,535) | |
| MEDNAXX, Inc. | | | (73,000) | | | | (3,479,384) | | | | (417,356) | |
| | | | | | | | | | | | |
REFERENCE
ENTITY | | SHARES | | | NOTIONAL (a) | | | NET
UNREALIZED
APPRECIATION
(DEPRECIATION) | |
| United States (continued) | | | | | |
| Men’s Wearhouse, Inc./The | | | (22,583) | | | $ | (837,389) | | | $ | (316,150) | |
| Mentor Graphics Corp. | | | (400) | | | | (8,757) | | | | (871) | |
| Merck & Co., Inc. | | | (15,480) | | | | (739,107) | | | | (35,667) | |
| MetLife, Inc. | | | (54,500) | | | | (2,654,096) | | | | (284,544) | |
| Mettler-Toledo International, Inc. | | | (6,900) | | | | (1,497,024) | | | | (176,847) | |
| MGM Resorts International | | | (13,800) | | | | (266,079) | | | | (58,497) | |
| Micro Devices, Inc. | | | (129,874) | | | | (635,546) | | | | (34,603) | |
| Microchip Technology, Inc. | | | (28,000) | | | | (1,117,403) | | | | (135,597) | |
| Micron Technology, Inc. | | | (242,300) | | | | (4,594,826) | | | | (677,622) | |
| MICROS Systems, Inc. | | | (53,100) | | | | (2,490,491) | | | | (555,856) | |
| Monster Beverage Corp. | | | (98,900) | | | | (6,205,496) | | | | (496,957) | |
| Monster Worldwide, Inc. | | | (437,454) | | | | (2,396,800) | | | | (722,247) | |
| Mosaic Co./The | | | (159,552) | | | | (7,518,560) | | | | (23,463) | |
| MSC Industrial Direct Co., Inc. | | | (14,499) | | | | (1,143,969) | | | | (28,565) | |
| Mylan, Inc. | | | (135,600) | | | | (4,454,674) | | | | (1,430,366) | |
| National Fuel Gas Co. | | | (5,600) | | | | (352,352) | | | | (47,488) | |
| Navistar International Corp. | | | (188,400) | | | | (6,469,173) | | | | (725,823) | |
| NewMarket Corp. | | | (1,300) | | | | (405,062) | | | | (29,333) | |
| NextEra Energy, Inc. | | | (2,999) | | | | (254,795) | | | | (1,979) | |
| NII Holdings, Inc. | | | (79,600) | | | | (593,751) | | | | 374,851 | |
| Nordson Corp. | | | (100) | | | | (7,373) | | | | (57) | |
| Nordstrom, Inc. | | | (77,700) | | | | (4,773,850) | | | | (28,010) | |
| Norfolk Southern Corp. | | | (7,200) | | | | (535,031) | | | | (133,345) | |
| Northeast Utilities | | | (12,500) | | | | (560,375) | | | | 30,500 | |
| Northern Trust Corp. | | | (9,800) | | | | (579,572) | | | | (26,950) | |
| NRG Energy, Inc. | | | (169,706) | | | | (4,765,957) | | | | (107,999) | |
| Nu Skin Enterprises | | | (15,881) | | | | (1,298,113) | | | | (896,959) | |
| Nuance Communications, Inc. | | | (594,100) | | | | (10,791,861) | | | | 1,761,541 | |
| Nucor Corp. | | | (58,700) | | | | (2,747,257) | | | | (386,149) | |
| Oasis Petroleum, Inc. | | | (21,900) | | | | (1,149,537) | | | | 120,894 | |
| Ocwen Financial Corp. | | | (16,800) | | | | (901,974) | | | | (29,586) | |
| Office Depot, Inc. | | | (103,500) | | | | (544,112) | | | | (3,403) | |
| ONEOK, Inc. | | | (33,000) | | | | (1,677,778) | | | | (374,162) | |
| Owens & Minor, Inc. | | | (2,100) | | | | (72,217) | | | | (4,559) | |
| Owens Corning | | | (121,800) | | | | (4,776,106) | | | | (183,590) | |
| Palo Alto Networks, Inc. | | | (31,800) | | | | (1,557,209) | | | | (270,337) | |
| Pandora Media, Inc. | | | (45,100) | | | | (1,219,094) | | | | 19,434 | |
| Peabody Energy Corp. | | | (50,900) | | | | (935,944) | | | | (58,133) | |
| Penske Automotive Group, Inc. | | | (48,000) | | | | (1,586,400) | | | | (677,280) | |
| Pepco Holdings, Inc. | | | (32,840) | | | | (604,358) | | | | (23,871) | |
| Perrigo Co. PLC | | | (43,000) | | | | (5,524,751) | | | | (1,074,029) | |
| Philip Morris International, Inc. | | | (48,800) | | | | (4,268,110) | | | | 16,166 | |
| Pitney Bowes, Inc. | | | (167,300) | | | | (2,585,386) | | | | (1,312,704) | |
| Plantronics, Inc. | | | (7,200) | | | | (342,343) | | | | 7,903 | |
| Polypore International, Inc. | | | (27,100) | | | | (1,181,939) | | | | 127,749 | |
| Post Holdings, Inc. | | | (3,700) | | | | (174,902) | | | | (7,397) | |
| | | | |
| | The accompanying notes are an integral part of these financial statements. | | (Continued) |
| | | | | | | | | | | | | | | | |
| 180 | | AQR Funds | | | | | | Annual Report | | | | | | December 2013 | | |
| | | | | | | | | | |
| | | | |
| Consolidated Schedule of Investments | | | December 31, 2013 | |
| | |
| AQR MULTI-STRATEGY ALTERNATIVE FUND | | |
| | | | | | | | | | | | |
REFERENCE
ENTITY | | SHARES | | | NOTIONAL (a) | | | NET
UNREALIZED
APPRECIATION
(DEPRECIATION) | |
| United States (continued) | | | | | |
| PPL Corp. | | | (65,800) | | | $ | (2,061,256) | | | $ | 81,334 | |
| Praxair, Inc. | | | (10,400) | | | | (1,219,572) | | | | (132,740) | |
| Precision Castparts Corp. | | | (10,200) | | | | (2,322,478) | | | | (424,382) | |
| priceline.com, Inc. | | | (3,093) | | | | (2,843,243) | | | | (752,060) | |
| Principal Financial Group, Inc. | | | (58,700) | | | | (2,349,621) | | | | (544,876) | |
| Progressive Corp./The | | | (185,600) | | | | (4,881,259) | | | | (180,053) | |
| Prosperity Bancshares, Inc. | | | (3,200) | | | | (188,416) | | | | (14,432) | |
| PTC, Inc. | | | (23,200) | | | | (666,819) | | | | (154,229) | |
| Public Service Enterprise Group, Inc. | | | (10,100) | | | | (343,262) | | | | 19,658 | |
| QEP Resources, Inc. | | | (66,900) | | | | (1,988,251) | | | | (62,234) | |
| QUALCOMM, Inc. | | | (84,100) | | | | (5,197,743) | | | | (1,046,682) | |
| Quality Systems, Inc. | | | (71,132) | | | | (1,539,307) | | | | 41,267 | |
| Quanta Services, Inc. | | | (30,300) | | | | (855,486) | | | | (100,782) | |
| Quest Diagnostics, Inc. | | | (18,200) | | | | (1,091,833) | | | | 117,405 | |
| Quicksilver Resources, Inc. | | | (585) | | | | (1,076) | | | | (720) | |
| Rackspace Hosting, Inc. | | | (267,400) | | | | (11,592,444) | | | | 1,129,082 | |
| Rambus, Inc. | | | (33,399) | | | | (334,658) | | | | 18,369 | |
| Range Resources Corp. | | | (66,900) | | | | (5,254,369) | | | | (385,970) | |
| Regeneron Pharmaceuticals, Inc. | | | (17,800) | | | | (5,370,311) | | | | 471,039 | |
| Rent-A-Center, Inc. | | | (26,137) | | | | (1,026,312) | | | | 154,904 | |
| Republic Services, Inc. | | | (10,100) | | | | (356,406) | | | | 21,086 | |
| Riverbed Technology, Inc. | | | (202,500) | | | | (3,207,731) | | | | (453,469) | |
| Rockwell Collins, Inc. | | | (40,400) | | | | (2,853,304) | | | | (133,064) | |
| Roper Industries, Inc. | | | (7,900) | | | | (1,040,430) | | | | (55,142) | |
| Rosetta Resources, Inc. | | | (42,700) | | | | (2,031,236) | | | | (20,072) | |
| Rowan Cos. PLC | | | (57,000) | | | | (2,015,821) | | | | 301 | |
| Salesforce.com, Inc. | | | (232,200) | | | | (10,116,477) | | | | (2,698,641) | |
| Salix Pharmaceutical Ltd. | | | (73,152) | | | | (5,210,617) | | | | (1,368,674) | |
| SanDisk Corp. | | | (53,770) | | | | (3,284,465) | | | | (508,471) | |
| SBA Communications Corp. | | | (30,700) | | | | (2,484,373) | | | | (273,715) | |
| Schlumberger Ltd. | | | (25,400) | | | | (2,101,596) | | | | (187,198) | |
| Schnitzer Steel Industries, Inc. | | | (9,742) | | | | (244,427) | | | | (73,844) | |
| Science Applications International Corp. | | | (1,503) | | | | (46,790) | | | | (2,914) | |
| Scotts Miracle-Gro Co./The | | | (14,500) | | | | (727,487) | | | | (174,703) | |
| Scripps Networks Interactive, Inc. | | | (11,800) | | | | (853,022) | | | | (166,616) | |
| Sealed Air Corp. | | | (113,500) | | | | (3,126,925) | | | | (737,750) | |
| ServiceNow, Inc. | | | (2,100) | | | | (109,048) | | | | (8,573) | |
| Sigma-Aldrich Corp. | | | (10,100) | | | | (853,046) | | | | (96,455) | |
| Signature Bank Co. | | | (7,200) | | | | (652,032) | | | | (121,392) | |
| Silicon Laboratories, Inc. | | | (2,403) | | | | (108,932) | | | | 4,858 | |
| Sirius XM Holdings, Inc. | | | (144,100) | | | | (569,988) | | | | 67,079 | |
| Six Flags Entertainment Corp. | | | (4,000) | | | | (148,337) | | | | 1,057 | |
| Skyworks Solutions, Inc. | | | (135,600) | | | | (3,260,609) | | | | (612,127) | |
| SolarWinds, Inc. | | | (16,800) | | | | (554,408) | | | | (81,136) | |
| | | | | | | | | | | | |
REFERENCE
ENTITY | | SHARES | | | NOTIONAL (a) | | | NET
UNREALIZED
APPRECIATION
(DEPRECIATION) | |
| United States (continued) | | | | | |
| Solera Holdings, Inc. | | | (400) | | | $ | (21,959) | | | $ | (6,345) | |
| Sotheby’s | | | (100,700) | | | | (4,154,882) | | | | (1,202,358) | |
| Southern Co./The | | | (47,400) | | | | (2,098,448) | | | | 149,834 | |
| Southwestern Energy Co. | | | (123,600) | | | | (4,836,813) | | | | (24,375) | |
| Spectra Energy Corp. | | | (71,100) | | | | (2,525,924) | | | | (6,658) | |
| Spirit Aerosystems Holdings, Inc. | | | (30,100) | | | | (825,006) | | | | (200,802) | |
| Sprint Corp. | | | (83,000) | | | | (603,372) | | | | (288,878) | |
| Stanley Black & Decker, Inc. | | | (37,100) | | | | (3,072,504) | | | | 78,905 | |
| Staples, Inc. | | | (56,855) | | | | (936,402) | | | | 32,976 | |
| State Street Corp. | | | (8,000) | | | | (554,240) | | | | (32,880) | |
| Stericycle, Inc. | | | (4,100) | | | | (483,307) | | | | 7,010 | |
| Stifel Financial Corp. | | | (63,281) | | | | (2,370,971) | | | | (661,455) | |
| Stratasys Ltd. | | | (10,800) | | | | (1,115,158) | | | | (339,602) | |
| Strayer Education, Inc. | | | (22,000) | | | | (1,044,607) | | | | 286,267 | |
| SunEdison, Inc. | | | (569,400) | | | | (5,354,919) | | | | (2,075,751) | |
| SUPERVALU, Inc. | | | (243,300) | | | | (1,782,999) | | | | 9,342 | |
| SVB Financial Group | | | (7,000) | | | | (617,610) | | | | (116,410) | |
| Swift Energy Co. | | | (3,400) | | | | (40,231) | | | | (5,669) | |
| Synovus Financial Corp. | | | (2,036,600) | | | | (6,650,668) | | | | (681,092) | |
| Sysco Corp. | | | (30,600) | | | | (1,079,484) | | | | (25,176) | |
| T Rowe Price Group, Inc. | | | (30,500) | | | | (2,414,990) | | | | (139,995) | |
| Take-Two Interactive Software, Inc. | | | (37,129) | | | | (619,312) | | | | (25,619) | |
| Target Corp. | | | (38,600) | | | | (2,659,969) | | | | 217,747 | |
| TCF Financial Corp. | | | (179,900) | | | | (2,834,281) | | | | (89,094) | |
| TECO Energy, Inc. | | | (32,500) | | | | (578,317) | | | | 18,017 | |
| Tempur Sealy International, Inc. | | | (69,000) | | | | (2,999,519) | | | | (723,721) | |
| Tenet Healthcare Corp. | | | (197,375) | | | | (8,349,621) | | | | 36,186 | |
| Tenneco, Inc. | | | (15,074) | | | | (749,415) | | | | (103,321) | |
| Teradata Corp. | | | (89,500) | | | | (4,650,771) | | | | 579,416 | |
| Teradyne, Inc. | | | (83,500) | | | | (1,423,649) | | | | (47,621) | |
| Terex Corp. | | | (13,000) | | | | (467,947) | | | | (77,923) | |
| Tesla Motors, Inc. | | | (6,300) | | | | (878,277) | | | | (69,117) | |
| Tesoro Corp. | | | (17,900) | | | | (830,543) | | | | (216,607) | |
| Texas Instruments, Inc. | | | (10,900) | | | | (406,134) | | | | (72,485) | |
| Textron, Inc. | | | (211,703) | | | | (5,996,418) | | | | (1,785,784) | |
| Theravance, Inc. | | | (30,100) | | | | (1,123,865) | | | | 50,800 | |
| Tidewater, Inc. | | | (31,900) | | | | (1,949,091) | | | | 58,378 | |
| Tiffany & Co. | | | (96,300) | | | | (7,590,366) | | | | (1,344,348) | |
| Toll Brothers, Inc. | | | (24,300) | | | | (801,968) | | | | (97,132) | |
| TreeHouse Foods, Inc. | | | (13,150) | | | | (914,056) | | | | 7,758 | |
| Trimble Navigation Ltd. | | | (133,300) | | | | (3,827,290) | | | | (798,220) | |
| Trinity Industries, Inc. | | | (19,000) | | | | (750,516) | | | | (285,364) | |
| TripAdvisor, Inc. | | | (45,600) | | | | (3,903,645) | | | | 126,597 | |
| Triumph Group, Inc. | | | (30,400) | | | | (2,397,748) | | | | 85,220 | |
| Ultra Petroleum Corp. | | | (239,000) | | | | (5,147,681) | | | | (26,669) | |
| Ultra Salon, Inc. | | | (30,000) | | | | (2,973,392) | | | | 77,792 | |
| Under Armour, Inc. | | | (90,600) | | | | (5,663,114) | | | | (2,246,266) | |
| United Continental Holdings, Inc. | | | (90,500) | | | | (2,912,218) | | | | (511,397) | |
| | | | |
| | The accompanying notes are an integral part of these financial statements. | | (Continued) |
| | | | | | | | | | | | | | | | |
| | AQR Funds | | | | | | Annual Report | | | | | | December 2013 | | 181 |
| | | | | | | | | | |
| | | | |
| Consolidated Schedule of Investments | | | December 31, 2013 | |
| | |
| AQR MULTI-STRATEGY ALTERNATIVE FUND | | |
| | | | | | | | | | | | |
REFERENCE
ENTITY | | SHARES | | | NOTIONAL (a) | | | NET
UNREALIZED
APPRECIATION
(DEPRECIATION) | |
| United States (continued) | | | | | |
| United Natural Foods, Inc. | | | (14,547) | | | $ | (867,617) | | | $ | (229,082) | |
| United Rentals, Inc. | | | (22,700) | | | | (1,367,170) | | | | (402,295) | |
| United Therapeutics Corp. | | | (2,800) | | | | (233,052) | | | | (83,572) | |
| UnitedHealth Group, Inc. | | | (25,100) | | | | (1,793,395) | | | | (96,635) | |
| Universal Corp. | | | (4,100) | | | | (254,610) | | | | 30,750 | |
| Urban Outfitters, Inc. | | | (82,918) | | | | (3,552,489) | | | | 476,232 | |
| Vail Resorts, Inc. | | | (11,800) | | | | (776,794) | | | | (110,920) | |
| Valley National Bancorp. | | | (60,899) | | | | (593,765) | | | | (22,533) | |
| Vantiv, Inc. | | | (5,300) | | | | (158,242) | | | | (14,591) | |
| Varian Medical Systems, Inc. | | | (28,500) | | | | (2,059,460) | | | | (154,705) | |
| VCA Antech, Inc. | | | (65,200) | | | | (1,830,816) | | | | (213,856) | |
| Vectren Corp. | | | (400) | | | | (14,552) | | | | 352 | |
| VeriSign, Inc. | | | (54,500) | | | | (2,586,937) | | | | (671,073) | |
| VF Corp. | | | (6,400) | | | | (330,372) | | | | (68,604) | |
| Viropharma, Inc. | | | (34,200) | | | | (1,214,747) | | | | (490,123) | |
| VMware, Inc. | | | (25,200) | | | | (2,048,630) | | | | (212,062) | |
| Volcano Corp. | | | (122,200) | | | | (2,418,642) | | | | (251,428) | |
| Waddell & Reed Financial, Inc. | | | (1,800) | | | | (89,298) | | | | (27,918) | |
| Walter Energy, Inc. | | | (71,607) | | | | (982,248) | | | | (208,577) | |
| Waste Connections, Inc. | | | (2,700) | | | | (116,478) | | | | (1,323) | |
| Watsco, Inc. | | | (15,000) | | | | (1,424,100) | | | | (16,800) | |
| Webster Financial Corp. | | | (14,800) | | | | (376,499) | | | | (84,965) | |
| Weight Watchers International, Inc. | | | (26,067) | | | | (1,110,627) | | | | 252,241 | |
| Wendy’s Co./The | | | (19,700) | | | | (139,906) | | | | (31,878) | |
| WESCO International, Inc. | | | (22,600) | | | | (1,708,015) | | | | (350,167) | |
| Westar Energy, Inc. | | | (2,201) | | | | (72,326) | | | | 1,520 | |
| Western Union Co./The | | | (605,800) | | | | (10,597,921) | | | | 147,871 | |
| Westlake Chemical Corp. | | | (1,100) | | | | (118,235) | | | | (16,042) | |
| Williams Cos., Inc./The | | | (88,200) | | | | (3,121,626) | | | | (280,248) | |
| | | | | | | | | | | | |
REFERENCE
ENTITY | | SHARES | | | NOTIONAL (a) | | | NET
UNREALIZED
APPRECIATION
(DEPRECIATION) | |
| United States (continued) | | | | | |
| Woodward, Inc. | | | (40,800) | | | $ | (1,715,521) | | | $ | (145,367) | |
| World Fuel Services Corp. | | | (7,410) | | | | (276,119) | | | | (43,696) | |
| WR Berkley Corp. | | | (1,501) | | | | (66,434) | | | | 1,306 | |
| WW Grainger, Inc. | | | (1,900) | | | | (498,788) | | | | 13,490 | |
| Wynn Resorts Ltd. | | | (4,500) | | | | (609,816) | | | | (264,129) | |
| Xylem, Inc. | | | (30,100) | | | | (1,008,693) | | | | (32,767) | |
| Yum! Brands, Inc. | | | (12,300) | | | | (888,043) | | | | (41,960) | |
| Zions BanCorp. | | | (203,200) | | | | (6,149,731) | | | | 61,859 | |
| Zynga, Inc. | | | (311,000) | | | | (1,209,717) | | | | 27,917 | |
| | | | | | | | | | | | |
| | | | | | | | | | | (98,831,845) | |
| | | | | | | | | | | | |
Total of Short Equity Positions | | | | | | | | | | | (104,269,365) | |
| | | | | | | | | | | | |
Total of Long and Short Equity Positions | | | | | | | | | | | 27,946,965 | |
| | | | | | | | | | | | |
Net Cash and Other Receivables/ (Payables) (b) | | | | | | | | | | | (3,253,154) | |
| | | | | | | | | | | | |
Swaps, at Value | | | | | | | | | | $ | 24,693,811 | |
| | | | | | | | | | | | |
| (a) | Notional value represents the market value (including any fees or commissions) of the long and short positions when they are established. |
| (b) | Cash and other receivables/(payables) includes the gains (or losses) realized within the swap when the swap resets. |
Money Market Fund is pledged as collateral to Morgan Stanley Capital Services, Inc. in the amount of $239,978,327 for total return basket swaps at December 31, 2013.
| | | | |
| | The accompanying notes are an integral part of these financial statements. | | (Continued) |
| | | | | | | | | | | | | | | | |
| 182 | | AQR Funds | | | | | | Annual Report | | | | | | December 2013 | | |
| | | | | | | | | | |
| | | | |
| Consolidated Schedule of Investments | | | December 31, 2013 | |
| | |
| AQR MULTI-STRATEGY ALTERNATIVE FUND | | |
| | | | | | | | |
| COUNTERPARTY | | DESCRIPTION | | TERMINATION DATE** | | VALUE
(Note 3) | |
| Morgan Stanley Capital Services, Inc. | | The Fund receives or pays the total return on a portfolio of long and short positions and pays or receives the Federal Funds Effective Rate, which is denominated in USD based on the local currencies of the positions within the swap. | | 12 to 24 months maturity ranging from 07/24/2014 - 07/23/2015 | | | $4,244,746 | |
| | | | | | | | |
| ** | The maturity dates are measured from the commencement of investment in each underlying portfolio swap position. |
Additional Information — Total Return Basket Swaps
The following table represents the individual long and short positions and related values within the total return basket swap as of December 31, 2013.
| | | | | | | | | | | | |
REFERENCE
ENTITY | | SHARES | | | NOTIONAL (a) | | | NET
UNREALIZED
APPRECIATION
(DEPRECIATION) | |
| Long Positions | | | | | | | | | | | | |
| | | |
| Israel | | | | | | | | | | | | |
| Given Imaging Ltd. | | | 279,546 | | | $ | 8,355,637 | | | $ | 53,107 | |
| | | | | | | | | | | | |
| | | |
| Italy | | | | | | | | | | | | |
| Gentium SpA | | | 77,671 | | | | 4,457,375 | | | | (22,361) | |
| | | | | | | | | | | | |
| | | |
| United Kingdom | | | | | | | | | | | | |
| Edwards Group Ltd. | | | 89,121 | | | | 893,394 | | | | 13,858 | |
| Vodafone Group PLC | | | 842,519 | | | | 30,790,791 | | | | 2,328,631 | |
| | | | | | | | | | | | |
| | | | | | | | | | | 2,342,489 | |
| | | | | | | | | | | | |
| United States | | | | | | | | | | | | |
| CapitalSource, Inc. | | | 734,001 | | | | 9,056,797 | | | | 1,490,798 | |
| CommonWealth REIT | | | 660,393 | | | | 15,712,195 | | | | (318,434) | �� |
| Compuware Corp. | | | 110,554 | | | | 1,210,566 | | | | 28,744 | |
| Consolidated Graphics, Inc. | | | 42,380 | | | | 2,696,609 | | | | 161,498 | |
| Cooper Tire & Rubber Co. | | | 699,445 | | | | 20,816,182 | | | | (4,001,524) | |
| Harris Teeter Supermarkets, Inc. | | | 545,381 | | | | 26,845,587 | | | | 68,965 | |
| Health Management Associates, Inc. | | | 2,616,255 | | | | 33,661,208 | | | | 611,732 | |
| Hi-Tech Pharmacal Co., Inc. | | | 177,045 | | | | 7,626,703 | | | | 55,279 | |
| Hudson City BanCorp., Inc. | | | 3,656,343 | | | | 34,135,509 | | | | 343,805 | |
| Jones Group, Inc./The | | | 571,325 | | | | 8,473,803 | | | | 73,219 | |
| Jos A Bank Clothiers, Inc. | | | 127,276 | | | | 7,157,641 | | | | (191,826) | |
| Leap Wireless International, Inc. | | | 247,452 | | | | 3,939,856 | | | | 365,809 | |
| Lender Processing Services, Inc. | | | 643,718 | | | | 21,267,194 | | | | 2,794,985 | |
| Life Technologies Corp. | | | 434,025 | | | | 32,504,738 | | | | 394,357 | |
| LSI Corp. | | | 2,532,602 | | | | 27,763,424 | | | | 145,850 | |
| Men’s Wearhouse, Inc./The | | | 249,823 | | | | 11,273,913 | | | | 1,487,046 | |
| Omnicom Group, Inc. | | | 458,867 | | | | 29,589,484 | | | | 4,536,455 | |
| Santarus, Inc. | | | 620,231 | | | | 19,834,308 | | | | (11,725) | |
| Sterling Financial Corp. | | | 79,762 | | | | 2,289,527 | | | | 428,762 | |
| Taylor Capital Group, Inc. | | | 6,333 | | | | 135,633 | | | | 32,698 | |
| | | | | | | | | | | | |
REFERENCE
ENTITY | | SHARES | | | NOTIONAL (a) | | | NET
UNREALIZED
APPRECIATION
(DEPRECIATION) | |
| United States (continued) | | | | | | | | | |
| UNS Energy Corp. | | | 251,954 | | | $ | 14,903,282 | | | $ | 176,165 | |
| Valassis Communications, Inc. | | | 205,013 | | | | 7,070,706 | | | | (49,010) | |
| Zoltek Cos., Inc. | | | 168,352 | | | | 2,810,715 | | | | 9,181 | |
| | | | | | | | | | | | |
| | | | | | | | | | | 8,632,829 | |
| | | | | | | | | | | | |
Total of Long Equity Positions | | | | | | | | | | | 11,006,064 | |
| | | | | | | | | | | | |
| Short Positions | | | | | | | | | | | | |
| | | |
| United States | | | | | | | | | | | | |
| Applied Materials, Inc. | | | (605,041) | | | | (10,631,340) | | | | (71,835) | |
| Community Health Systems, Inc. | | | (182,237) | | | | (7,535,816) | | | | 379,369 | |
| Endo Health Solutions Inc | | | (239,109) | | | | (14,771,657) | | | | (1,358,636) | |
| Fidelity National Financial, Inc. | | | (430,057) | | | | (11,678,691) | | | | (2,276,659) | |
| Louisiana-Pacific Corp. | | | (197,632) | | | | (3,361,447) | | | | (296,721) | |
| M&T Bank Corp. | | | (307,446) | | | | (35,343,602) | | | | (449,261) | |
| MB Financial, Inc. | | | (4,073) | | | | (111,772) | | | | (18,930) | |
| PacWest Bancorp. | | | (207,264) | | | | (7,390,731) | | | | (1,359,955) | |
| RR Donnelley & Sons Co. | | | (71,487) | | | | (1,287,833) | | | | (161,924) | |
| Umpqua Holdings Corp. | | | (134,555) | | | | (2,188,095) | | | | (387,288) | |
| Verizon Communications, Inc. | | | (168,749) | | | | (8,347,394) | | | | 55,068 | |
| | | | | | | | | | | | |
| | | | | | | | | | | (5,946,772) | |
| | | | | | | | | | | | |
Total of Short Equity Positions | | | | | | | | | | | (5,946,772) | |
| | | | | | | | | | | | |
Total of Long and Short Equity Positions | | | | | | | | | | | 5,059,292 | |
| | | | | | | | | | | | |
Net Cash and Other Receivables/ (Payables) (b) | | | | | | | | | | | (814,546) | |
| | | | | | | | | | | | |
Swaps, at Value | | | | | | | | | | $ | 4,244,746 | |
| | | | | | | | | | | | |
| (a) | Notional value represents the market value (including any fees or commissions) of the long and short positions when they are established. |
| | | | |
| | The accompanying notes are an integral part of these financial statements. | | (Continued) |
| | | | | | | | | | | | | | | | |
| | AQR Funds | | | | | | Annual Report | | | | | | December 2013 | | 183 |
| | | | | | | | | | |
| | | | |
| Consolidated Schedule of Investments | | | December 31, 2013 | |
| | |
| AQR MULTI-STRATEGY ALTERNATIVE FUND | | |
| (b) | Cash and other receivables/(payables) includes the gains (or losses) realized within the swap when the swap resets. |
Money Market Fund pledged as collateral to Morgan Stanley Capital Services, Inc. is included in the collateral noted in the other Morgan Stanley total return basket swaps.
| | | | | | | | |
| COUNTERPARTY | | DESCRIPTION | | TERMINATION DATE** | | VALUE
(Note 3) | |
| Morgan Stanley Capital Services, Inc. | | The Fund receives or pays the total return on a portfolio of long and short positions and pays or receives the USD Discount Rate, which is denominated in CAD based on the local currencies of the positions within the swap. | | 12 to 24 months maturity ranging from 07/30/2014 - 10/20/2015 | | | $2,444,463 | |
| | | | | | | | |
| ** | The maturity dates are measured from the commencement of investment in each underlying portfolio swap position. |
Additional Information — Total Return Basket Swaps
The following table represents the individual long and short positions and related values within the total return basket swap as of December 31, 2013.
| | | | | | | | | | | | |
REFERENCE
ENTITY | | SHARES | | | NOTIONAL (a) | | | NET
UNREALIZED
APPRECIATION
(DEPRECIATION) | |
| Long Positions | |
| |
| Canada | | | | | |
| Ainsworth Lumber Co., Ltd. | | | 1,773,922 | | | $ | 6,536,845 | | | $ | 426,915 | |
| Atrium Innovations, Inc. | | | 49,985 | | | | 1,141,648 | | | | 1,807 | |
| Paladin Labs, Inc. | | | 146,923 | | | | 14,663,335 | | | | 1,722,608 | |
| Patheon, Inc. | | | 203,527 | | | | 1,853,393 | | | | 26,202 | |
| Platino Energy Corp. | | | 47,188 | | | | 53,807 | | | | (31,151) | |
| Shoppers Drug Mart Corp. | | | 354,842 | | | | 19,865,589 | | | | (427,363) | |
| | | | | | | | | | | | |
| | | | | | | | | | | 1,719,018 | |
| | | | | | | | | | | | |
| United States | | | | | | | | | | | | |
| Coastal Energy Co. | | | 842,395 | | | | 14,944,789 | | | | 11,737 | |
| | | | | | | | | | | | |
Total of Long Equity Positions | | | | | | | | | | | 1,730,755 | |
| | | | | | | | | | | | |
| Short Positions | | | | | | | | | | | | |
| | | |
| Canada | | | | | | | | | | | | |
| Loblaw Cos., Ltd. | | | (183,641) | | | | (7,817,582) | | | | 490,959 | |
| | | | | | | | | | | | |
Total of Long and Short Equity Positions | | | | | | | | | | | 2,221,714 | |
| | | | | | | | | | | | |
Net Cash and Other Receivables/ (Payables) (b) | | | | | | | | | | | 222,749 | |
| | | | | | | | | | | | |
Swaps, at Value | | | | | | | | | | $ | 2,444,463 | |
| | | | | | | | | | | | |
| (a) | Notional value represents the market value (including any fees or commissions) of the long and short positions when they are established. |
| (b) | Cash and other receivables/(payables) includes the gains (or losses) realized within the swap when the swap resets. |
Additional collateral for this position pledged to Morgan Stanley Capital Services, Inc. is included in the collateral noted in the other Morgan Stanley total return basket swaps.
| | | | |
| | The accompanying notes are an integral part of these financial statements. | | (Continued) |
| | | | | | | | | | | | | | | | |
| 184 | | AQR Funds | | | | | | Annual Report | | | | | | December 2013 | | |
| | | | | | | | | | |
| | | | |
| Consolidated Schedule of Investments | | | December 31, 2013 | |
| | |
| AQR MULTI-STRATEGY ALTERNATIVE FUND | | |
| | | | | | | | |
| COUNTERPARTY | | DESCRIPTION | | TERMINATION
DATE** | | VALUE
(Note 3) | |
| Morgan Stanley Capital Services, Inc. | | The Fund receives or pays the total return on a portfolio of long and short positions and pays or receives the Norway Interbank Offered Rate, which is denominated in NOK based on the local currencies of the positions within the swap. | | 12 months maturity 12/2/2015 | | | $79,112 | |
| | | | | | | | |
| ** | The maturity dates are measured from the commencement of investment in each underlying portfolio swap position. |
Additional Information — Total Return Basket Swaps
The following table represents the individual long and short positions and related values within the total return basket swap as of December 31, 2013.
| | | | | | | | | | | | |
REFERENCE
ENTITY | | SHARES | | | NOTIONAL (a) | | | NET
UNREALIZED
APPRECIATION
(DEPRECIATION) | |
| Long Positions | |
| |
| Norway | | | | | |
| Algeta ASA | | | 165,023 | | | $ | 9,691,206 | | | $ | 85,667 | |
| | | | | | | | | | | | |
Net Cash and Other Receivables/ (Payables) (b) | | | | | | | | | | | (6,555) | |
| | | | | | | | | | | | |
Swaps, at Value | | | | | | | | | | $ | 79,112 | |
| | | | | | | | | | | | |
| (a) | Notional value represents the market value (including any fees or commissions) of the long and short positions when they are established. |
| (b) | Cash and other receivables/(payables) includes the gains (or losses) realized within the swap when the swap resets. |
Additional collateral for this position pledged to Morgan Stanley Capital Services, Inc. is included in the collateral noted in the other Morgan Stanley total return basket swaps.
| | | | |
| | The accompanying notes are an integral part of these financial statements. | | (Continued) |
| | | | | | | | | | | | | | | | |
| | AQR Funds | | | | | | Annual Report | | | | | | December 2013 | | 185 |
| | | | | | | | | | |
| | | | |
| Consolidated Schedule of Investments | | | December 31, 2013 | |
| | |
| AQR MULTI-STRATEGY ALTERNATIVE FUND | | |
| | | | | | | | |
| COUNTERPARTY | | DESCRIPTION | | TERMINATION DATE** | | VALUE
(Note 3) | |
| Morgan Stanley Capital Services, Inc. | | The Fund receives or pays the total return on a portfolio of long and short positions and pays or receives the Effective Overnight Index Average, which is denominated in EUR based on the local currencies of the positions within the swap. | | 12 to 24 months maturity ranging from 04/30/2014 - 06/29/2015 | | | $(4,088,233) | |
| | | | | | | | |
| ** | The maturity dates are measured from the commencement of investment in each underlying portfolio swap position. |
Additional Information — Total Return Basket Swaps
The following table represents the individual long and short positions and related values within the total return basket swap as of December 31, 2013.
| | | | | | | | | | | | |
REFERENCE
ENTITY | | SHARES | | | NOTIONAL (a) | | | NET
UNREALIZED
APPRECIATION
(DEPRECIATION) | |
| Long Positions | |
| |
| Germany | | | | | |
| Celesio AG | | | 932,329 | | | $ | 29,742,152 | | | $ | (180,854) | |
| | | | | | | | | | | | |
| Netherlands | | | | | | | | | | | | |
| Unit4 NV | | | 224,113 | | | | 11,738,782 | | | | 89,338 | |
| | | | | | | | | | | | |
Total of Long Equity Positions | | | | | | | | | | | (91,516) | |
| | | | | | | | | | | | |
| Short Positions | | | | | | | | | | | | |
| | | |
| France | | | | | | | | | | | | |
| Publicis Groupe SA | | | (373,061) | | | | (30,448,422) | | | | (3,733,405) | |
| Schneider Electric SA | | | (88,933) | | | | (7,532,419) | | | | (226,234) | |
| | | | | | | | | | | | |
| | | | | | | | | | | (3,959,639) | |
| | | | | | | | | | | | |
Total of Short Equity Positions | | | | | | | | | | | (3,959,639) | |
| | | | | | | | | | | | |
Total of Long and Short Equity Positions | | | | | | | | | | | (4,051,155) | |
| | | | | | | | | | | | |
Net Cash and Other Receivables/ (Payables) (b) | | | | | | | | | | | (37,078) | |
| | | | | | | | | | | | |
Swaps, at Value | | | | | | | | | | $ | (4,088,233) | |
| | | | | | | | | | | | |
| (a) | Notional value represents the market value (including any fees or commissions) of the long and short positions when they are established. |
| (b) | Cash and other receivables/(payables) includes the gains (or losses) realized within the swap when the swap resets. |
Additional collateral for this position pledged to Morgan Stanley Capital Services, Inc. is included in the collateral noted in the other Morgan Stanley total return basket swaps.
| | | | |
| | The accompanying notes are an integral part of these financial statements. | | (Continued) |
| | | | | | | | | | | | | | | | |
| 186 | | AQR Funds | | | | | | Annual Report | | | | | | December 2013 | | |
| | | | | | | | | | |
| | | | |
| Consolidated Schedule of Investments | | | December 31, 2013 | |
| | |
| AQR MULTI-STRATEGY ALTERNATIVE FUND | | |
| | | | | | | | |
| COUNTERPARTY | | DESCRIPTION | | TERMINATION
DATE** | | VALUE
(Note 3) | |
| Morgan Stanley Capital Services, Inc. | | The Fund receives or pays the total return on a portfolio of long and short positions and pays or receives the Bank of Japan Estimate Unsecured Overnight Call Rate, which is denominated in JPY based on the local currencies of the positions within the swap. | | 12 months maturity 10/14/2015 | | | $634,853 | |
| | | | | | | | |
��
| ** | The maturity dates are measured from the commencement of investment in each underlying portfolio swap position. |
Additional Information — Total Return Basket Swaps
The following table represents the individual long and short positions and related values within the total return basket swap as of December 31, 2013.
| | | | | | | | | | | | |
REFERENCE
ENTITY | | SHARES | | | NOTIONAL (a) | | | NET
UNREALIZED
APPRECIATION
(DEPRECIATION) | |
| Long Positions | |
| |
| Japan | | | | | |
| Tokyo Electron Ltd. | | | 186,168 | | | $ | 9,620,306 | | | $ | 638,058 | |
| | | | | | | | | | | | |
Net Cash and Other Receivables/ (Payables) (b) | | | | | | | | | | | (3,205) | |
| | | | | | | | | | | | |
Swaps, at Value | | | | | | | | | | $ | 634,853 | |
| | | | | | | | | | | | |
| (a) | Notional value represents the market value (including any fees or commissions) of the long and short positions when they are established. |
| (b) | Cash and other receivables/(payables) includes the gains (or losses) realized within the swap when the swap resets. |
Additional collateral for this position to Morgan Stanley Capital Services, Inc. is included in the collateral noted in the other Morgan Stanley total return basket swaps.
| | | | | | | | |
| COUNTERPARTY | | DESCRIPTION | | TERMINATION DATE** | | VALUE
(Note
3) | |
| Morgan Stanley and Co., International PLC | | The Fund receives or pays the total return on a portfolio of long and short positions and pays or receives the Federal Funds Effective Rate, which is denominated in USD based on the local currencies of the positions within the swap. | | maturity 11/27/2015 | | | $(2,903) | |
| | | | | | | | |
| ** | The maturity dates are measured from the commencement of investment in each underlying portfolio swap position. |
Additional Information — Total Return Basket Swaps
The following table represents the individual long and short positions and related values within the total return basket swap as of December 31, 2013.
| | | | | | | | | | | | | | | | |
| SHARES | | ISSUER | | EXPIRATION DATE | | PROCEEDS | | | VALUE AT
DECEMBER 31,
2013 | | | NET
UNREALIZED
APPRECIATION
(DEPRECIATION) | |
| 14,500 | | Mens Wearhouse, Inc. (Exercise price $48) | | February 22, 2014 | | | (54,372) | | | | $(60,900) | | | | $(6,528) | |
| 14,500 | | Mens Wearhouse, Inc. (Exercise price $50) | | February 22, 2014 | | | (43,500) | | | | (39,875) | | | | 3,625 | |
| | | | | | | | | | | | | | | | |
| | | | | | | | | | | | | | | (2,903) | |
| | | | | | | | | | | | | | | | |
| Net Cash and Other Receivables/ Payables (b) | | | | | | | | | | | | | — | |
| | | | | | | | | | | | | | | | |
| Swaps, at Value | | | | | | | | | | | | | $(2,903) | |
| | | | | | | | | | | | | | | | |
| (a) | Notional value represents the market value (including any fees or commissions) of the long and short positions when they are established. |
| (b) | Cash and other receivables/(payables) includes the gains (or losses) realized within the swap when the swap resets. |
Money Market Fund pledged as collateral to Morgan Stanley and Co., International PLC is included in the collateral for total return swap contracts.
| | | | |
| | The accompanying notes are an integral part of these financial statements. | | |
| | | | | | | | | | | | | | | | |
| | AQR Funds | | | | | | Annual Report | | | | | | December 2013 | | 187 |
| | | | | | | | | | |
| | | | |
| Consolidated Schedule of Investments | | | December 31, 2013 | |
| | |
| AQR STYLE PREMIA ALTERNATIVE FUND | | |
| | | | | | | | |
| LONG INVESTMENTS - 116.5% | | SHARES | | | VALUE (Note 3) | |
| COMMON STOCKS - 45.9% | | | | | | | | |
| | |
| Belgium - 0.5% | | | | | | | | |
| Belgacom SA (a) | | | 18,606 | | | $ | 550,594 | |
| Colruyt SA (a) | | | 7,138 | | | | 398,824 | |
| Delhaize Group SA (a) | | | 11,957 | | | | 711,346 | |
| KBC Groep NV (a) | | | 1,126 | | | | 64,019 | |
| Solvay SA (a) | | | 142 | | | | 22,474 | |
| Umicore SA (a) | | | 8,426 | | | | 393,703 | |
| | | | | | | | |
| | | | | | | 2,140,960 | |
| | | | | | | | |
| Denmark - 1.0% | | | | | | | | |
| AP Moeller - Maersk A/S, Class B (a) | | | 133 | | | | 1,439,320 | |
| Coloplast A/S, Class B (a) | | | 4,009 | | | | 265,779 | |
| Jyske Bank A/S †(a) | | | 21,722 | | | | 1,174,497 | |
| TDC A/S (a) | | | 100,752 | | | | 977,760 | |
| Tryg A/S (a) | | | 3,173 | | | | 306,828 | |
| | | | | | | | |
| | | | | | | 4,164,184 | |
| | | | | | | | |
| Finland - 1.7% | | | | | | | | |
| Elisa OYJ (a) | | | 18,697 | | | | 495,818 | |
| Fortum OYJ (a) | | | 22,230 | | | | 508,103 | |
| Neste Oil OYJ (a) | | | 115,221 | | | | 2,278,665 | |
| Orion OYJ, Class B (a) | | | 15,485 | | | | 435,238 | |
| Sampo, A Shares (a) | | | 11,494 | | | | 564,961 | |
| Stora Enso OYJ, R Shares (a) | | | 142,981 | | | | 1,436,782 | |
| UPM-Kymmene OYJ (a) | | | 75,514 | | | | 1,280,725 | |
| YIT OYJ (a) | | | 10,545 | | | | 147,442 | |
| | | | | | | | |
| | | | | | | 7,147,734 | |
| | | | | | | | |
| Germany - 4.3% | | | | | | | | |
| Allianz SE (a) | | | 1,267 | | | | 227,966 | |
| Aurubis AG (a) | | | 826 | | | | 50,404 | |
| Axel Springer SE (a) | | | 3,918 | | | | 252,244 | |
| Bayer AG (a) | | | 5,063 | | | | 710,899 | |
| Bilfinger SE (a) | | | 1,498 | | | | 168,268 | |
| Brenntag AG (a) | | | 6,420 | | | | 1,191,526 | |
| Continental AG (a) | | | 4,352 | | | | 956,089 | |
| Deutsche Lufthansa AG †(a) | | | 21,249 | | | | 450,406 | |
| Deutsche Post AG (a) | | | 66,795 | | | | 2,439,688 | |
| Deutsche Telekom AG (a) | | | 94,814 | | | | 1,633,664 | |
| Fresenius Medical Care AG & Co. KGaA (a) | | | 2,399 | | | | 171,111 | |
| GEA Group AG (a) | | | 9,047 | | | | 431,411 | |
| Hannover Rueck SE (a) | | | 1,624 | | | | 139,617 | |
| Hochtief AG (a) | | | 5,971 | | | | 511,011 | |
| K+S AG (a) | | | 22,416 | | | | 690,696 | |
| Linde AG (a) | | | 4,166 | | | | 872,303 | |
| Merck KGaA (a) | | | 11,896 | | | | 2,134,475 | |
| Muenchener Rueckversicherungs AG (a) | | | 10,194 | | | | 2,248,491 | |
| ProSiebenSat.1 Media AG (a) | | | 11,291 | | | | 560,665 | |
| Siemens AG (a) | | | 1,663 | | | | 228,028 | |
| Stada Arzneimittel AG (a) | | | 10,311 | | | | 510,497 | |
| Suedzucker AG (a) | | | 29,777 | | | | 804,426 | |
| Symrise AG (a) | | | 4,153 | | | | 191,611 | |
| TUI AG †(a) | | | 5,632 | | | | 92,915 | |
| United Internet AG (a) | | | 2,496 | | | | 106,405 | |
| Wirecard AG (a) | | | 2,480 | | | | 98,164 | |
| | | | | | | | |
| | | | | | | 17,872,980 | |
| | | | | | | | |
| | | | | | | | |
| | | SHARES | | | VALUE (Note 3) | |
| Italy - 1.5% | | | | | | | | |
| A2A SpA | | | 1,224,865 | | | $ | 1,433,533 | |
| Atlantia SpA | | | 21,829 | | | | 488,966 | |
| Autogrill SpA † | | | 76,780 | | | | 648,434 | |
| Banca Monte dei Paschi di Siena SpA † | | | 555,134 | | | | 133,610 | |
| Enel SpA | | | 75,056 | | | | 327,499 | |
| Eni SpA (a) | | | 16,346 | | | | 394,979 | |
| Gtech Spa | | | 23,732 | | | | 723,272 | |
| Luxottica Group SpA | | | 8,165 | | | | 437,574 | |
| Prysmian SpA | | | 5,130 | | | | 132,082 | |
| Snam SpA | | | 9,198 | | | | 51,411 | |
| Terna Rete Elettrica Nazionale SpA | | | 282,088 | | | | 1,408,771 | |
| Tod’s SpA | | | 1,350 | | | | 225,409 | |
| | | | | | | | |
| | | | | | | 6,405,540 | |
| | | | | | | | |
| Japan - 25.1% | | | | | | | | |
| Aeon Co., Ltd. (a) | | | 77,000 | | | | 1,043,864 | |
| Aisin Seiki Co., Ltd. (a) | | | 34,400 | | | | 1,398,569 | |
| Alfresa Holdings Corp. (a) | | | 15,000 | | | | 744,520 | |
| Asahi Kasei Corp. (a) | | | 71,000 | | | | 556,911 | |
| Bank of Kyoto Ltd./The (a) | | | 12,000 | | | | 100,317 | |
| Bank of Yokohama Ltd./The (a) | | | 165,000 | | | | 920,573 | |
| Benesse Holdings, Inc. (a) | | | 12,700 | | | | 510,213 | |
| Bridgestone Corp. (a) | | | 51,400 | | | | 1,947,387 | |
| Brother Industries Ltd. (a) | | | 43,100 | | | | 589,543 | |
| Calbee, Inc. (a) | | | 4,800 | | | | 116,569 | |
| Canon, Inc. (a) | | | 6,300 | | | | 201,023 | |
| Central Japan Railway Co. (a) | | | 22,700 | | | | 2,675,243 | |
| Chiba Bank Ltd./The (a) | | | 92,000 | | | | 620,876 | |
| Chiyoda Corp. (a) | | | 10,000 | | | | 145,165 | |
| Chubu Electric Power Co., Inc. (a) | | | 26,800 | | | | 346,466 | |
| Chugoku Bank Ltd./The (a) | | | 6,700 | | | | 85,158 | |
| Coca-Cola West Co., Ltd. (a) | | | 33,300 | | | | 705,289 | |
| Dai Nippon Printing Co., Ltd. (a) | | | 66,000 | | | | 701,063 | |
| Daicel Corp. (a) | | | 137,000 | | | | 1,116,525 | |
| Daihatsu Motor Co., Ltd. (a) | | | 70,100 | | | | 1,189,089 | |
| Daiichi Sankyo Co., Ltd. (a) | | | 29,000 | | | | 530,264 | |
| Daiwa House Industry Co., Ltd. (a) | | | 44,000 | | | | 852,509 | |
| Denso Corp. (a) | | | 51,200 | | | | 2,704,829 | |
| East Japan Railway Co. (a) | | | 17,100 | | | | 1,362,149 | |
| Electric Power Development Co., Ltd. (a) | | | 14,700 | | | | 428,605 | |
| FamilyMart Co., Ltd. (a) | | | 4,800 | | | | 219,295 | |
| Fuji Electric Co., Ltd. | | | 401,000 | | | | 1,878,857 | |
| FUJIFILM Holdings Corp. | | | 18,000 | | | | 510,931 | |
| Fukuoka Financial Group, Inc. (a) | | | 155,000 | | | | 680,365 | |
| Gunma Bank Ltd./The (a) | | | 22,000 | | | | 122,922 | |
| Hachijuni Bank Ltd./The (a) | | | 13,000 | | | | 75,890 | |
| Hakuhodo DY Holdings, Inc. (a) | | | 4,800 | | | | 37,213 | |
| Hikari Tsushin, Inc. (a) | | | 10,000 | | | | 754,357 | |
| Hino Motors Ltd. (a) | | | 86,000 | | | | 1,354,736 | |
| Hirose Electric Co., Ltd. (a) | | | 2,000 | | | | 285,103 | |
| Hiroshima Bank Ltd./The (a) | | | 31,000 | | | | 128,456 | |
| Hisamitsu Pharmaceutical Co., Inc. (a) | | | 1,700 | | | | 85,667 | |
| Hitachi Chemical Co., Ltd. (a) | | | 16,100 | | | | 256,768 | |
| Hokuhoku Financial Group, Inc. | | | 92,000 | | | | 183,939 | |
| Hokuriku Electric Power Co. (a) | | | 15,400 | | | | 209,138 | |
| Hoya Corp. (a) | | | 33,000 | | | | 917,793 | |
| Idemitsu Kosan Co., Ltd. (a) | | | 10,400 | | | | 236,763 | |
| IHI Corp. (a) | | | 5,000 | | | | 21,623 | |
| | | | |
| | The accompanying notes are an integral part of these financial statements. | | (Continued) |
| | | | | | | | | | | | | | | | |
| 188 | | AQR Funds | | | | | | Annual Report | | | | | | December 2013 | | |
| | | | | | | | | | |
| | | | |
| Consolidated Schedule of Investments | | | December 31, 2013 | |
| | |
| AQR STYLE PREMIA ALTERNATIVE FUND | | |
| | | | | | | | |
| | | SHARES | | | VALUE (Note 3) | |
| Japan - 25.1% (continued) | | | | | | | | |
| ITOCHU Corp. (a) | | | 68,700 | | | $ | 849,313 | |
| Itochu Techno-Solutions Corp. (a) | | | 3,900 | | | | 158,080 | |
| Iyo Bank Ltd./The (a) | | | 12,000 | | | | 117,732 | |
| J Front Retailing Co., Ltd. (a) | | | 21,000 | | | | 159,312 | |
| Japan Airlines Co., Ltd. (a) | | | 81,800 | | | | 4,035,299 | |
| Japan Petroleum Exploration Co. (a) | | | 6,100 | | | | 231,353 | |
| Japan Tobacco, Inc. (a) | | | 31,100 | | | | 1,011,955 | |
| JFE Holdings, Inc. (a) | | | 19,100 | | | | 455,154 | |
| JGC Corp. (a) | | | 27,000 | | | | 1,059,583 | |
| Joyo Bank Ltd./The (a) | | | 58,000 | | | | 296,564 | |
| JSR Corp. (a) | | | 31,600 | | | | 612,500 | |
| JTEKT Corp. (a) | | | 31,100 | | | | 530,657 | |
| JX Holdings, Inc. (a) | | | 9,400 | | | | 48,405 | |
| Kamigumi Co., Ltd. (a) | | | 17,000 | | | | 155,983 | |
| Kaneka Corp. (a) | | | 75,000 | | | | 492,461 | |
| KDDI Corp. (a) | | | 29,500 | | | | 1,817,650 | |
| Keyence Corp. (a) | | | 1,500 | | | | 642,278 | |
| Kinden Corp. (a) | | | 25,000 | | | | 261,741 | |
| Koito Manufacturing Co., Ltd. (a) | | | 26,000 | | | | 496,798 | |
| Konica Minolta, Inc. (a) | | | 40,000 | | | | 399,732 | |
| Kuraray Co., Ltd. (a) | | | 31,000 | | | | 370,041 | |
| Kurita Water Industries Ltd. (a) | | | 46,500 | | | | 964,651 | |
| Kyocera Corp. (a) | | | 4,700 | | | | 234,960 | |
| Lawson, Inc. (a) | | | 6,300 | | | | 471,466 | |
| LIXIL Group Corp. (a) | | | 900 | | | | 24,707 | |
| Mabuchi Motor Co., Ltd. (a) | | | 1,800 | | | | 107,112 | |
| Makita Corp. (a) | | | 4,500 | | | | 236,667 | |
| Marubeni Corp. (a) | | | 122,000 | | | | 878,287 | |
| Maruichi Steel Tube Ltd. (a) | | | 7,100 | | | | 179,342 | |
| Medipal Holdings Corp. (a) | | | 20,100 | | | | 265,349 | |
| MEIJI Holdings Co., Ltd. (a) | | | 2,300 | | | | 147,838 | |
| Miraca Holdings, Inc. (a) | | | 12,200 | | | | 575,551 | |
| Mitsubishi Electric Corp. (a) | | | 35,000 | | | | 440,106 | |
| Mitsubishi Heavy Industries, Ltd. (a) | | | 92,000 | | | | 569,809 | |
| Mitsubishi Tanabe Pharma Corp. (a) | | | 45,000 | | | | 627,615 | |
| Mitsubishi UFJ Financial Group, Inc. (a) | | | 224,800 | | | | 1,492,536 | |
| Mitsui & Co., Ltd. (a) | | | 13,200 | | | | 184,023 | |
| Mizuho Financial Group, Inc. (a) | | | 650,400 | | | | 1,412,039 | |
| MS&AD Insurance Group Holdings (a) | | | 61,000 | | | | 1,639,618 | |
| Murata Manufacturing Co., Ltd. (a) | | | 10,500 | | | | 933,800 | |
| Namco Bandai Holdings, Inc. (a) | | | 107,600 | | | | 2,388,987 | |
| Nexon Co., Ltd. (a) | | | 43,000 | | | | 397,321 | |
| NGK Spark Plug Co., Ltd. (a) | | | 9,000 | | | | 213,306 | |
| NHK Spring Co., Ltd. (a) | | | 40,700 | | | | 459,854 | |
| Nippon Express Co., Ltd. (a) | | | 90,000 | | | | 435,655 | |
| Nippon Telegraph & Telephone Corp. (a) | | | 65,200 | | | | 3,511,698 | |
| Nishi-Nippon City Bank Ltd./The (a) | | | 64,000 | | | | 172,412 | |
| Nissin Foods Holdings Co., Ltd. (a) | | | 200 | | | | 8,440 | |
| Nitori Holdings Co., Ltd. (a) | | | 2,300 | | | | 217,757 | |
| NKSJ Holdings, Inc. (a) | | | 2,400 | | | | 66,801 | |
| Nomura Research Institute Ltd. (a) | | | 20,100 | | | | 635,217 | |
| Omron Corp. (a) | | | 35,700 | | | | 1,577,700 | |
| Ono Pharmaceutical Co., Ltd. (a) | | | 800 | | | | 70,124 | |
| Oracle Corp. Japan (a) | | | 3,300 | | | | 120,629 | |
| Oriental Land Co., Ltd. (a) | | | 8,700 | | | | 1,254,662 | |
| Osaka Gas Co., Ltd. (a) | | | 213,000 | | | | 836,583 | |
| Otsuka Corp. (a) | | | 9,300 | | | | 1,188,114 | |
| | | | | | | | |
| | | SHARES | | | VALUE (Note 3) | |
| Japan - 25.1% (continued) | | | | | | | | |
| Otsuka Holdings Co., Ltd. (a) | | | 82,600 | | | $ | 2,384,987 | |
| Park24 Co., Ltd. (a) | | | 13,700 | | | | 258,367 | |
| Resona Holdings, Inc. (a) | | | 481,600 | | | | 2,457,349 | |
| Ricoh Co., Ltd. (a) | | | 137,000 | | | | 1,456,970 | |
| Rinnai Corp. (a) | | | 4,700 | | | | 366,169 | |
| Rohm Co., Ltd. (a) | | | 16,300 | | | | 795,066 | |
| Sankyo Co., Ltd. (a) | | | 17,000 | | | | 784,059 | |
| Santen Pharmaceutical Co., Ltd. (a) | | | 1,600 | | | | 74,548 | |
| Secom Co., Ltd. (a) | | | 10,900 | | | | 657,651 | |
| Sega Sammy Holdings, Inc. (a) | | | 26,900 | | | | 685,551 | |
| Seiko Epson Corp. (a) | | | 67,900 | | | | 1,828,176 | |
| Sekisui Chemical Co., Ltd. (a) | | | 217,000 | | | | 2,662,918 | |
| Seven & I Holdings Co., Ltd. (a) | | | 25,300 | | | | 1,007,356 | |
| Shimadzu Corp. (a) | | | 26,000 | | | | 226,358 | |
| Shimamura Co., Ltd. (a) | | | 8,800 | | | | 824,882 | |
| Shimano, Inc. (a) | | | 100 | | | | 8,585 | |
| Shinsei Bank Ltd. | | | 56,000 | | | | 137,083 | |
| Shionogi & Co., Ltd. (a) | | | 54,000 | | | | 1,172,323 | |
| Showa Shell Sekiyu KK (a) | | | 24,600 | | | | 250,056 | |
| SMC Corp. (a) | | | 2,200 | | | | 555,255 | |
| SoftBank Corp. (a) | | | 7,300 | | | | 640,581 | |
| Stanley Electric Co., Ltd. (a) | | | 2,200 | | | | 50,436 | |
| Sumitomo Metal Mining Co., Ltd. (a) | | | 26,000 | | | | 340,686 | |
| Sumitomo Mitsui Financial Group, Inc. (a) | | | 44,300 | | | | 2,303,750 | |
| Sumitomo Rubber Industries Ltd. (a) | | | 56,600 | | | | 805,685 | |
| Suruga Bank Ltd. (a) | | | 24,000 | | | | 430,974 | |
| Suzuken Co., Ltd. (a) | | | 2,400 | | | | 77,743 | |
| Suzuki Motor Corp. (a) | | | 6,500 | | | | 175,153 | |
| T&D Holdings, Inc. (a) | | | 900 | | | | 12,597 | |
| Taisei Corp. (a) | | | 205,000 | | | | 932,936 | |
| Taisho Pharmaceutical Holdings Co., Ltd. (a) | | | 1,200 | | | | 82,486 | |
| Takashimaya Co., Ltd. (a) | | | 22,000 | | | | 219,509 | |
| Takeda Pharmaceutical Co., Ltd. (a) | | | 3,100 | | | | 142,182 | |
| THK Co., Ltd. (a) | | | 13,700 | | | | 342,165 | |
| Toho Gas Co., Ltd. (a) | | | 29,000 | | | | 141,169 | |
| Tokio Marine Holdings, Inc. (a) | | | 13,900 | | | | 465,229 | |
| Tokyo Gas Co., Ltd. (a) | | | 283,000 | | | | 1,394,824 | |
| TonenGeneral Sekiyu KK (a) | | | 21,000 | | | | 192,697 | |
| Toppan Printing Co., Ltd. (a) | | | 17,000 | | | | 136,078 | |
| TOTO Ltd. (a) | | | 163,000 | | | | 2,585,365 | |
| Toyo Seikan Kaisha Ltd. (a) | | | 68,400 | | | | 1,472,529 | |
| Toyo Suisan Kaisha Ltd. (a) | | | 19,000 | | | | 570,775 | |
| Toyoda Gosei Co., Ltd. (a) | | | 15,000 | | | | 349,434 | |
| Toyota Industries Corp. (a) | | | 9,400 | | | | 424,923 | |
| Toyota Motor Corp. (a) | | | 29,800 | | | | 1,817,058 | |
| Unicharm Corp. (a) | | | 100 | | | | 5,706 | |
| USS Co., Ltd. (a) | | | 700 | | | | 9,602 | |
| West Japan Railway Co. (a) | | | 12,700 | | | | 550,271 | |
| Yamaguchi Financial Group, Inc. (a) | | | 15,000 | | | | 139,098 | |
| Yamato Holdings Co., Ltd. (a) | | | 45,100 | | | | 912,071 | |
| Yamato Kogyo Co., Ltd. (a) | | | 300 | | | | 9,594 | |
| Yokohama Rubber Co., Ltd./The (a) | | | 5,000 | | | | 49,168 | |
| | | | | | | | |
| | | | | | | 105,072,045 | |
| | | | | | | | |
| Netherlands - 1.8% | | | | | | | | |
| Akzo Nobel NV (a) | | | 2,430 | | | | 188,437 | |
| Heineken NV (a) | | | 687 | | | | 46,432 | |
| | | | |
| | The accompanying notes are an integral part of these financial statements. | | (Continued) |
| | | | | | | | | | | | | | | | |
| | AQR Funds | | | | | | Annual Report | | | | | | December 2013 | | 189 |
| | | | | | | | | | |
| | | | |
| Consolidated Schedule of Investments | | | December 31, 2013 | |
| | |
| AQR STYLE PREMIA ALTERNATIVE FUND | | |
| | | | | | | | |
| | | SHARES | | | VALUE (Note 3) | |
| Netherlands - 1.8% (continued) | | | | | | | | |
| Koninklijke Ahold NV (a) | | | 111,380 | | | $ | 2,001,626 | |
| Koninklijke DSM NV (a) | | | 7,361 | | | | 579,299 | |
| Koninklijke Philips NV (a) | | | 23,445 | | | | 863,273 | |
| Nutreco NV (a) | | | 18,033 | | | | 896,681 | |
| Randstad Holding NV (a) | | | 3,900 | | | | 253,083 | |
| Royal Dutch Shell PLC, A Shares (a) | | | 45,022 | | | | 1,607,411 | |
| Wolters Kluwer NV (a) | | | 32,389 | | | | 924,847 | |
| | | | | | | | |
| | | | | | | 7,361,089 | |
| | | | | | | | |
| Norway - 1.4% | | | | | | | | |
| DNB ASA (a) | | | 82,892 | | | | 1,487,759 | |
| Gjensidige Forsikring ASA (a) | | | 22,148 | | | | 423,598 | |
| Statoil ASA (a) | | | 77,565 | | | | 1,886,111 | |
| Telenor ASA (a) | | | 80,699 | | | | 1,928,190 | |
| Yara International ASA (a) | | | 5,510 | | | | 237,637 | |
| | | | | | | | |
| | | | | | | 5,963,295 | |
| | | | | | | | |
| Portugal - 0.1% | | | | | | | | |
| EDP - Energias de Portugal SA | | | 141,221 | | | | 518,718 | |
| | | | | | | | |
| | |
| Spain - 2.8% | | | | | | | | |
| ACS Actividades de Construccion y Servicios SA (a) | | | 18,798 | | | | 647,995 | |
| Amadeus IT Holding SA, A Shares (a) | | | 6,541 | | | | 280,186 | |
| Banco Bilbao Vizcaya Argentaria SA (a) | | | 1,585 | | | | 19,607 | |
| Banco Santander SA (a) | | | 83,095 | | | | 747,232 | |
| Bankinter SA (a) | | | 78,552 | | | | 539,782 | |
| Bolsas y Mercados Espanoles SA (a) | | | 23,140 | | | | 881,022 | |
| Distribuidora Internacional de Alimentacion SA (a) | | | 69,790 | | | | 624,894 | |
| Ebro Foods SA (a) | | | 10,150 | | | | 237,948 | |
| Enagas SA (a) | | | 49,390 | | | | 1,290,158 | |
| Endesa SA † | | | 19,902 | | | | 638,399 | |
| Ferrovial SA (a) | | | 44,575 | | | | 863,499 | |
| Gas Natural SDG SA (a) | | | 74,346 | | | | 1,913,617 | |
| Iberdrola SA (a) | | | 112,741 | | | | 719,486 | |
| Repsol SA (a) | | | 86,486 | | | | 2,182,312 | |
| | | | | | | | |
| | | | | | | 11,586,137 | |
| | | | | | | | |
| Sweden - 2.3% | | | | | | | | |
| Alfa Laval AB (a) | | | 5,898 | | | | 151,538 | |
| Assa Abloy AB, Class B (a) | | | 7,836 | | | | 414,870 | |
| Atlas Copco AB, A Shares (a) | | | 1,320 | | | | 36,651 | |
| Getinge AB, B Shares (a) | | | 4,546 | | | | 155,828 | |
| ICA Gruppen AB † | | | 15,258 | | | | 477,240 | |
| Modern Times Group AB, B Shares (a) | | | 6,079 | | | | 315,133 | |
| Nordea Bank AB (a) | | | 144,411 | | | | 1,947,064 | |
| Securitas AB, B Shares (a) | | | 79,055 | | | | 841,177 | |
| Skandinaviska Enskilda Banken AB, Class A (a) | | | 107,531 | | | | 1,420,621 | |
| Skanska AB, B Shares (a) | | | 16,396 | | | | 335,432 | |
| SKF AB, B Shares (a) | | | 18,805 | | | | 493,169 | |
| Svenska Cellulosa AB SCA, B Shares (a) | | | 33,665 | | | | 1,037,147 | |
| Swedbank AB, A Shares (a) | | | 8,868 | | | | 249,805 | |
| Telefonaktiebolaget LM Ericsson, B Shares (a) | | | 89,503 | | | | 1,092,787 | |
| TeliaSonera AB (a) | | | 101,444 | | | | 846,084 | |
| Trelleborg AB, B Shares | | | 519 | | | | 10,336 | |
| | | | | | | | |
| | | | | | | 9,824,882 | |
| | | | | | | | |
| | | | | | | | |
| | | SHARES | | | VALUE (Note 3) | |
| Switzerland - 3.4% | | | | | | | | |
| Actelion Ltd. †(a) | | | 2,055 | | | $ | 174,307 | |
| Aryzta AG †(a) | | | 1,422 | | | | 109,265 | |
| Baloise Holding AG (a) | | | 1,926 | | | | 245,592 | |
| Credit Suisse Group AG †(a) | | | 10,158 | | | | 313,510 | |
| DKSH Holding AG (a) | | | 6,349 | | | | 493,938 | |
| EMS-Chemie Holding AG | | | 241 | | | | 85,934 | |
| Galenica AG (a) | | | 451 | | | | 454,021 | |
| Givaudan SA †(a) | | | 811 | | | | 1,160,188 | |
| Helvetia Holding AG (a) | | | 21 | | | | 10,542 | |
| Lonza Group AG †(a) | | | 3,474 | | | | 330,145 | |
| Nestle SA (a) | | | 4,071 | | | | 298,364 | |
| Novartis AG (a) | | | 39,558 | | | | 3,170,549 | |
| OC Oerlikon Corp. AG †(a) | | | 6,449 | | | | 96,609 | |
| Roche Holding AG (a) | | | 12,447 | | | | 3,486,732 | |
| Sika AG (a) | | | 86 | | | | 306,456 | |
| Straumann Holding AG (a) | | | 392 | | | | 73,544 | |
| Swiss Re AG †(a) | | | 24,922 | | | | 2,297,521 | |
| Swisscom AG (a) | | | 1,557 | | | | 822,865 | |
| Transocean Ltd. (a) | | | 5,726 | | | | 280,228 | |
| | | | | | | | |
| | | | | | | 14,210,310 | |
| | | | | | | | |
TOTAL COMMON STOCKS
(Cost $186,359,456) | | | | | | | 192,267,874 | |
| | | | | | | | |
| | |
| PREFERRED STOCKS - 1.4% | | | | | | | | |
| | |
| Germany - 1.4% | | | | | | | | |
| Fuchs Petrolub SE (a) | | | 104 | | | | 10,188 | |
| Henkel AG & Co. KGaA (a) | | | 11,728 | | | | 1,363,200 | |
| Porsche Automobil Holding SE | | | 20,407 | | | | 2,130,318 | |
| Volkswagen AG | | | 8,373 | | | | 2,356,320 | |
| | | | | | | | |
TOTAL PREFERRED STOCKS
(Cost $5,343,656) | | | | | | | 5,860,026 | |
| | | | | | | | |
| MONEY MARKET FUNDS - 69.2% | | | | | |
| BlackRock Liquidity Funds TempFund Portfolio - Series I, Institutional Shares, 0.050% (b) | | | 8,170,434 | | | | 8,170,434 | |
| Dreyfus Treasury Cash Management, Class I, 0.010% (b) | | | 32,625,413 | | | | 32,625,413 | |
J.P. Morgan U.S. Treasury Plus Money Market
Fund - Institutional Shares, 0.000% (b)^ | | | 208,379,091 | | | | 208,379,091 | |
| UBS Money Series - UBS Select Treasury Preferred Fund, Class I, 0.010% (b) | | | 40,767,686 | | | | 40,767,686 | |
| | | | | | | | |
TOTAL MONEY MARKET FUNDS
(Cost $289,942,624) | | | | | | | 289,942,624 | |
| | | | | | | | |
TOTAL INVESTMENTS, BEFORE SECURITIES SOLD SHORT
(Cost $481,645,736) | | | | | | | 488,070,524 | |
| | | | | | | | |
| SECURITIES SOLD SHORT- (39.6)% | | | | | | | | |
| | |
| COMMON STOCKS - (39.6)% | | | | | | | | |
| | |
| Belgium - (0.4)% | | | | | | | | |
| Anheuser-Busch InBev NV | | | (3,025) | | | | (321,667) | |
| UCB SA | | | (17,425) | | | | (1,298,193) | |
| | | | | | | | |
| | | | | | | (1,619,860) | |
| | | | | | | | |
| | | | |
| | The accompanying notes are an integral part of these financial statements. | | (Continued) |
| | | | | | | | | | | | | | | | |
| 190 | | AQR Funds | | | | | | Annual Report | | | | | | December 2013 | | |
| | | | | | | | | | |
| | | | |
| Consolidated Schedule of Investments | | | December 31, 2013 | |
| | |
| AQR STYLE PREMIA ALTERNATIVE FUND | | |
| | | | | | | | |
| | | SHARES | | | VALUE (Note 3) | |
| Bermuda - (0.1)% | | | | | | | | |
| Seadrill Ltd. | | | (4,909) | | | $ | (201,193) | |
| | | | | | | | |
| | |
| Denmark - (0.9)% | | | | | | | | |
| Carlsberg A/S, Class B | | | (1,511) | | | | (167,198) | |
| Danske Bank A/S † | | | (11,324) | | | | (260,131) | |
| FLSmidth & Co. A/S | | | (14,700) | | | | (803,892) | |
| GN Store Nord A/S | | | (2,178) | | | | (53,527) | |
| Novo Nordisk A/S, Class B | | | (6,423) | | | | (1,177,690) | |
| Vestas Wind Systems A/S † | | | (22,469) | | | | (665,340) | |
| William Demant Holding A/S † | | | (4,869) | | | | (472,999) | |
| | | | | | | | |
| | | | | | | (3,600,777) | |
| | | | | | | | |
| Finland - (1.2)% | | | | | | | | |
| Cargotec OYJ, B Shares | | | (19,957) | | | | (742,785) | |
| Kone OYJ, Class B | | | (1,036) | | | | (46,722) | |
| Metso OYJ | | | (39,639) | | | | (1,695,043) | |
| Nokia OYJ † | | | (213,746) | | | | (1,727,068) | |
| Nokian Renkaat OYJ | | | (10,767) | | | | (516,325) | |
| Wartsila OYJ | | | (4,935) | | | | (243,301) | |
| | | | | | | | |
| | | | | | | (4,971,244) | |
| | | | | | | | |
| Germany - (5.1)% | | | | | | | | |
| Adidas AG | | | (4,189) | | | | (534,173) | |
| Aixtron SE † | | | (83,750) | | | | (1,214,982) | |
| Bayerische Motoren Werke AG | | | (8,230) | | | | (966,471) | |
| Beiersdorf AG | | | (2,169) | | | | (219,903) | |
| Commerzbank AG † | | | (136,183) | | | | (2,198,456) | |
| Daimler AG | | | (6,981) | | | | (605,843) | |
| Deutsche Bank AG | | | (23,724) | | | | (1,139,735) | |
| Deutsche Boerse AG | | | (3,354) | | | | (277,959) | |
| E.ON SE | | | (8,612) | | | | (159,218) | |
| HeidelbergCement AG | | | (6,699) | | | | (508,690) | |
| Infineon Technologies AG | | | (32,571) | | | | (347,908) | |
| LANXESS AG | | | (37,653) | | | | (2,515,948) | |
| Metro AG | | | (4,724) | | | | (229,019) | |
| MTU Aero Engines AG | | | (4,515) | | | | (443,694) | |
| Rheinmetall AG | | | (3,401) | | | | (209,823) | |
| RWE AG | | | (55,254) | | | | (2,024,453) | |
| Salzgitter AG | | | (16,169) | | | | (689,531) | |
| SAP AG | | | (34,284) | | | | (2,973,165) | |
| Sky Deutschland AG † | | | (21,124) | | | | (233,484) | |
| Software AG | | | (19,380) | | | | (678,985) | |
| ThyssenKrupp AG † | | | (61,257) | | | | (1,493,757) | |
| Wacker Chemie AG | | | (15,854) | | | | (1,757,536) | |
| | | | | | | | |
| | | | | | | (21,422,733) | |
| | | | | | | | |
| Italy - (0.7)% | | | | | | | | |
Banca Popolare dell’Emilia Romagna
SC † | | | (3,745) | | | | (35,734) | |
| Buzzi Unicem SpA | | | (4,779) | | | | (86,017) | |
| Fiat SpA † | | | (6,418) | | | | (52,531) | |
| Mediaset SpA † | | | (218,266) | | | | (1,035,110) | |
| Mediobanca SpA † | | | (6,149) | | | | (53,772) | |
| Salvatore Ferragamo SpA | | | (6,438) | | | | (244,896) | |
| Telecom Italia SpA | | | (647,608) | | | | (645,767) | |
| UniCredit SpA | | | (55,468) | | | | (409,168) | |
| Unione di Banche Italiane SCPA | | | (36,457) | | | | (247,153) | |
| | | | | | | | |
| | | | | | | (2,810,148) | |
| | | | | | | | |
| | | | | | | | |
| | | SHARES | | | VALUE (Note 3) | |
| Japan - (20.8)% | | | | | | | | |
| ABC-Mart, Inc. | | | (3,300) | | | $ | (144,172) | |
| Acom Co., Ltd. † | | | (378,600) | | | | (1,289,979) | |
| Advantest Corp. | | | (184,000) | | | | (2,292,725) | |
| Aeon Credit Service Co., Ltd. | | | (38,200) | | | | (1,024,348) | |
| Ajinomoto Co., Inc. | | | (26,000) | | | | (376,394) | |
| Amada Co., Ltd. | | | (201,000) | | | | (1,775,097) | |
| Aozora Bank Ltd. | | | (416,000) | | | | (1,178,898) | |
| Asahi Glass Co., Ltd. | | | (90,000) | | | | (560,411) | |
| Asahi Group Holdings Ltd. | | | (8,500) | | | | (239,867) | |
| Asics Corp. | | | (8,100) | | | | (138,447) | |
| Astellas Pharma, Inc. | | | (2,300) | | | | (136,360) | |
| Casio Computer Co., Ltd. | | | (45,900) | | | | (562,453) | |
| Chugai Pharmaceutical Co., Ltd. | | | (5,200) | | | | (115,102) | |
| Chugoku Electric Power Co., Inc./The | | | (600) | | | | (9,342) | |
| Citizen Holdings Co., Ltd. | | | (29,200) | | | | (246,362) | |
| Credit Saison Co., Ltd. | | | (53,400) | | | | (1,407,730) | |
| Daido Steel Co., Ltd. | | | (34,000) | | | | (169,204) | |
| Dai-ichi Life Insurance Co., Ltd./The | | | (76,200) | | | | (1,275,056) | |
| Daikin Industries Ltd. | | | (9,800) | | | | (611,547) | |
| Dainippon Sumitomo Pharma Co., Ltd. | | | (12,100) | | | | (189,522) | |
| Dentsu, Inc. | | | (16,300) | | | | (666,648) | |
| Disco Corp. | | | (1,800) | | | | (119,472) | |
| Don Quijote Holdings Co., Ltd. | | | (500) | | | | (30,310) | |
| Eisai Co., Ltd. | | | (19,100) | | | | (740,260) | |
| FANUC Corp. | | | (15,200) | | | | (2,785,258) | |
| Fast Retailing Co., Ltd. | | | (2,000) | | | | (826,046) | |
| Fuji Heavy Industries Ltd. | | | (8,200) | | | | (235,659) | |
| Fujitsu Ltd. † | | | (132,000) | | | | (684,114) | |
| Furukawa Electric Co., Ltd. | | | (660,000) | | | | (1,659,183) | |
| GS Yuasa Corp. | | | (364,000) | | | | (2,094,372) | |
| Hamamatsu Photonics KK | | | (2,000) | | | | (80,030) | |
| Hankyu Hanshin Holdings, Inc. | | | (56,000) | | | | (302,594) | |
| Hitachi Capital Corp. | | | (9,700) | | | | (282,941) | |
| Hitachi Construction Machinery Co., Ltd. | | | (43,300) | | | | (926,548) | |
| Hitachi High-Technologies Corp. | | | (6,300) | | | | (158,615) | |
| Hitachi Ltd. | | | (104,000) | | | | (788,544) | |
| Hitachi Metals Ltd. | | | (88,000) | | | | (1,245,138) | |
| Hokkaido Electric Power Co., Inc. † | | | (95,500) | | | | (1,098,981) | |
| Honda Motor Co., Ltd. | | | (2,100) | | | | (86,682) | |
| Ibiden Co., Ltd. | | | (5,200) | | | | (97,369) | |
| Inpex Corp. | | | (36,400) | | | | (466,873) | |
| Isetan Mitsukoshi Holdings Ltd. | | | (56,400) | | | | (802,892) | |
| Isuzu Motors Ltd. | | | (68,000) | | | | (424,112) | |
| Japan Steel Works Ltd./The | | | (188,000) | | | | (1,053,463) | |
| Kajima Corp. | | | (11,000) | | | | (41,371) | |
| Kansai Electric Power Co., Inc./The † | | | (800) | | | | (9,208) | |
| Kansai Paint Co., Ltd. | | | (19,000) | | | | (280,971) | |
| Kao Corp. | | | (23,400) | | | | (736,675) | |
| Kawasaki Heavy Industries Ltd. | | | (260,000) | | | | (1,091,942) | |
| Keikyu Corp. | | | (48,000) | | | | (395,765) | |
| Keio Corp. | | | (31,000) | | | | (206,583) | |
| Keisei Electric Railway Co., Ltd. | | | (6,000) | | | | (55,208) | |
| Kikkoman Corp. | | | (12,000) | | | | (226,900) | |
| Kintetsu Corp. | | | (309,000) | | | | (1,084,238) | |
| Kobe Steel Ltd. † | | | (194,000) | | | | (332,591) | |
| Komatsu Ltd. | | | (4,200) | | | | (86,231) | |
| Konami Corp. | | | (29,100) | | | | (672,902) | |
| | | | |
| | The accompanying notes are an integral part of these financial statements. | | (Continued) |
| | | | | | | | | | | | | | | | |
| | AQR Funds | | | | | | Annual Report | | | | | | December 2013 | | 191 |
| | | | | | | | | | |
| | | | |
| Consolidated Schedule of Investments | | | December 31, 2013 | |
| | |
| AQR STYLE PREMIA ALTERNATIVE FUND | | |
| | | | | | | | |
| | | SHARES | | | VALUE (Note 3) | |
| Japan - (20.8)% (continued) | | | | | | | | |
| Kubota Corp. | | | (10,000) | | | $ | (165,872) | |
| Kyowa Hakko Kirin Co., Ltd. | | | (31,000) | | | | (342,086) | |
| Kyushu Electric Power Co., Inc. † | | | (34,400) | | | | (439,349) | |
| M3, Inc. | | | (267) | | | | (668,666) | |
| Marui Group Co., Ltd. | | | (46,400) | | | | (471,949) | |
| Mazda Motor Corp. † | | | (259,000) | | | | (1,342,155) | |
| Mitsubishi Chemical Holdings Corp. | | | (118,500) | | | | (548,387) | |
| Mitsubishi Corp. | | | (34,100) | | | | (654,649) | |
| Mitsubishi Logistics Corp. | | | (71,000) | | | | (1,123,958) | |
| Mitsubishi Materials Corp. | | | (74,000) | | | | (273,537) | |
| Mitsubishi UFJ Lease & Finance Co., Ltd. | | | (40,500) | | | | (248,988) | |
| Mitsui Chemicals, Inc. | | | (345,000) | | | | (834,215) | |
| Mitsui OSK Lines Ltd. | | | (84,000) | | | | (379,108) | |
| Nabtesco Corp. | | | (15,400) | | | | (355,413) | |
| NGK Insulators Ltd. | | | (65,000) | | | | (1,237,007) | |
| Nidec Corp. | | | (14,900) | | | | (1,467,868) | |
| Nintendo Co., Ltd. | | | (4,900) | | | | (655,883) | |
| Nippon Electric Glass Co., Ltd. | | | (191,000) | | | | (1,003,352) | |
| Nippon Shokubai Co., Ltd. | | | (46,000) | | | | (508,217) | |
| Nippon Steel & Sumitomo Metal Corp. | | | (478,000) | | | | (1,603,119) | |
| Nippon Yusen KK | | | (3,000) | | | | (9,592) | |
| Nissan Motor Co., Ltd. | | | (70,000) | | | | (586,601) | |
| Nitto Denko Corp. | | | (7,600) | | | | (321,363) | |
| NOK Corp. | | | (14,000) | | | | (229,306) | |
| NSK Ltd. | | | (16,000) | | | | (199,398) | |
| NTT Data Corp. | | | (8,800) | | | | (325,103) | |
| NTT DOCOMO, Inc. | | | (30,600) | | | | (503,868) | |
| Obayashi Corp. | | | (253,000) | | | | (1,443,055) | |
| Odakyu Electric Railway Co., Ltd. | | | (103,000) | | | | (931,516) | |
| Olympus Corp. † | | | (60,900) | | | | (1,931,550) | |
| Panasonic Corp. | | | (4,100) | | | | (47,795) | |
| Rakuten, Inc. | | | (113,500) | | | | (1,693,810) | |
| Sanrio Co., Ltd. | | | (2,500) | | | | (105,268) | |
| Seven Bank Ltd. | | | (96,400) | | | | (377,027) | |
| Sharp Corp. † | | | (674,000) | | | | (2,145,951) | |
| Shikoku Electric Power Co., Inc. † | | | (36,100) | | | | (541,371) | |
| Shimizu Corp. | | | (6,000) | | | | (30,318) | |
| Shin-Etsu Chemical Co., Ltd. | | | (17,000) | | | | (994,318) | |
| Shiseido Co., Ltd. | | | (38,600) | | | | (620,742) | |
| Shizuoka Bank Ltd./The | | | (1,000) | | | | (10,681) | |
| Showa Denko KK | | | (561,000) | | | | (795,673) | |
| Sojitz Corp. | | | (132,900) | | | | (236,618) | |
| Sony Corp. | | | (33,500) | | | | (577,484) | |
| Sony Financial Holdings, Inc. | | | (37,400) | | | | (681,267) | |
| Sumco Corp. | | | (46,800) | | | | (412,865) | |
| Sumitomo Chemical Co., Ltd. | | | (324,000) | | | | (1,271,647) | |
| Sumitomo Electric Industries Ltd. | | | (25,600) | | | | (427,931) | |
| Sumitomo Heavy Industries Ltd. | | | (250,000) | | | | (1,151,965) | |
| Sumitomo Mitsui Trust Holdings, Inc. | | | (163,000) | | | | (862,468) | |
| Sysmex Corp. | | | (300) | | | | (17,720) | |
| Taiheiyo Cement Corp. | | | (502,000) | | | | (1,930,566) | |
| Taiyo Nippon Sanso Corp. | | | (49,000) | | | | (348,907) | |
| TDK Corp. | | | (50,000) | | | | (2,398,699) | |
| Teijin Ltd. | | | (208,000) | | | | (463,307) | |
| Terumo Corp. | | | (10,800) | | | | (521,420) | |
| Tobu Railway Co., Ltd. | | | (65,000) | | | | (315,181) | |
| Toho Co., Ltd. | | | (6,800) | | | | (149,598) | |
| | | | | | | | |
| | | SHARES | | | VALUE (Note 3) | |
| Japan - (20.8)% (continued) | | | | | | | | |
| Tokyo Electric Power Co., Inc † | | | (37,600) | | | $ | (185,258) | |
| Toray Industries, Inc. | | | (82,000) | | | | (568,015) | |
| Toshiba Corp. | | | (392,000) | | | | (1,650,247) | |
| Toyota Tsusho Corp. | | | (22,700) | | | | (562,935) | |
| Trend Micro, Inc. | | | (14,000) | | | | (490,604) | |
| Tsumura & Co. | | | (5,900) | | | | (156,349) | |
| Ube Industries Ltd. | | | (261,000) | | | | (559,016) | |
| Yahoo Japan Corp. | | | (160,200) | | | | (893,340) | |
| Yakult Honsha Co., Ltd. | | | (13,300) | | | | (672,026) | |
| Yamada Denki Co., Ltd. | | | (671,400) | | | | (2,196,134) | |
| Yamaha Corp. | | | (26,600) | | | | (422,899) | |
| Yamaha Motor Co., Ltd. | | | (45,900) | | | | (690,078) | |
| Yaskawa Electric Corp. | | | (102,000) | | | | (1,616,251) | |
| Yokogawa Electric Corp. | | | (7,900) | | | | (121,461) | |
| | | | | | | | |
| | | | | | | (87,340,045) | |
| | | | | | | | |
| Luxembourg - (0.6)% | | | | | | | | |
| ArcelorMittal | | | (120,778) | | | | (2,157,356) | |
| Millicom International Cellular SA SDR | | | (4,468) | | | | (445,218) | |
| | | | | | | | |
| | | | | | | (2,602,574) | |
| | | | | | | | |
| Netherlands - (1.2)% | | | | | | | | |
| Aegon NV | | | (4,369) | | | | (41,403) | |
| ASML Holding NV | | | (18,220) | | | | (1,706,516) | |
| Delta Lloyd NV | | | (27,311) | | | | (678,237) | |
| Fugro NV CVA | | | (24,617) | | | | (1,468,443) | |
| Koninklijke Boskalis Westminster NV | | | (200) | | | | (10,579) | |
| Koninklijke Vopak NV | | | (3,670) | | | | (214,850) | |
| SBM Offshore NV † | | | (10,405) | | | | (211,997) | |
| TNT Express NV | | | (91,023) | | | | (846,646) | |
| | | | | | | | |
| | | | | | | (5,178,671) | |
| | | | | | | | |
| Norway - (0.8)% | | | | | | | | |
| Aker Solutions ASA | | | (99,913) | | | | (1,788,807) | |
| Norsk Hydro ASA | | | (58,383) | | | | (261,178) | |
| Petroleum Geo-Services ASA | | | (75,010) | | | | (886,063) | |
| Schibsted ASA | | | (1,734) | | | | (114,913) | |
| TGS Nopec Geophysical Co. ASA | | | (16,544) | | | | (439,602) | |
| | | | | | | | |
| | | | | | | (3,490,563) | |
| | | | | | | | |
| Portugal - (0.1)% | | | | | | | | |
| Banco Espirito Santo SA | | | (321,253) | | | | (458,790) | |
| | | | | | | | |
| | |
| Spain - (2.4)% | | | | | | | | |
| Banco de Sabadell SA | | | (513,090) | | | | (1,339,789) | |
| Banco Popular Espanol SA † | | | (59,507) | | | | (359,431) | |
| Bankia SA † | | | (956,998) | | | | (1,625,972) | |
| CaixaBank SA | | | (185,182) | | | | (964,575) | |
| Grifols SA | | | (37,400) | | | | (1,789,718) | |
| Inditex SA | | | (11,554) | | | | (1,907,695) | |
| Indra Sistemas SA | | | (7,997) | | | | (133,869) | |
| Mapfre SA | | | (271,166) | | | | (1,163,135) | |
| Mediaset Espana Comunicacion SA † | | | (44,934) | | | | (519,148) | |
| Red Electrica Corp. SA | | | (221) | | | | (14,754) | |
| Telefonica SA | | | (11,005) | | | | (179,940) | |
| | | | | | | | |
| | | | | | | (9,998,026) | |
| | | | | | | | |
| | | | |
| | The accompanying notes are an integral part of these financial statements. | | (Continued) |
| | | | | | | | | | | | | | | | |
| 192 | | AQR Funds | | | | | | Annual Report | | | | | | December 2013 | | |
| | | | | | | | | | |
| | | | |
| Consolidated Schedule of Investments | | | December 31, 2013 | |
| | |
| AQR STYLE PREMIA ALTERNATIVE FUND | | |
| | | | | | | | |
| | | SHARES | | | VALUE (Note 3) | |
| Sweden - (1.8)% | | | | | | | | |
| Boliden AB | | | (75,336) | | | $ | (1,155,018) | |
| Electrolux AB, Series B | | | (6,204) | | | | (162,127) | |
| Hennes & Mauritz AB, B Shares | | | (15,907) | | | | (732,620) | |
| Hexagon AB, B Shares | | | (713) | | | | (22,554) | |
| Husqvarna AB, B Shares | | | (8,306) | | | | (50,014) | |
| Sandvik AB | | | (153,160) | | | | (2,161,653) | |
| Scania AB, B Shares | | | (58,190) | | | | (1,140,487) | |
| SSAB AB, A Shares | | | (192,886) | | | | (1,481,762) | |
| Svenska Handelsbanken AB, A Shares | | | (8,536) | | | | (419,688) | |
| Swedish Match AB | | | (5,170) | | | | (166,221) | |
| | | | | | | | |
| | | | | | | (7,492,144) | |
| | | | | | | | |
| Switzerland - (3.1)% | | | | | | | | |
| ABB Ltd. † | | | (2,295) | | | | (60,680) | |
| Adecco SA † | | | (2,067) | | | | (164,092) | |
| Barry Callebaut AG † | | | (73) | | | | (91,734) | |
| Cie Financiere Richemont SA | | | (8,739) | | | | (873,004) | |
| Dufry AG † | | | (3,835) | | | | (673,731) | |
| GAM Holding AG † | | | (22,366) | | | | (435,475) | |
| Geberit AG | | | (1,491) | | | | (452,341) | |
| Holcim Ltd. † | | | (8,801) | | | | (658,004) | |
| Julius Baer Group Ltd. † | | | (20,253) | | | | (973,279) | |
| Kuehne + Nagel International AG | | | (4,891) | | | | (642,870) | |
| Panalpina Welttransport Holding AG | | | (246) | | | | (41,242) | |
| Partners Group Holding AG | | | (442) | | | | (117,757) | |
| Schindler Holding AG | | | (6,110) | | | | (899,476) | |
| SGS SA | | | (276) | | | | (635,422) | |
| Sonova Holding AG † | | | (2,866) | | | | (386,465) | |
| STMicroelectronics NV | | | (114,096) | | | | (911,581) | |
| Sulzer AG | | | (1,707) | | | | (275,819) | |
| Swatch Group AG/The | | | (731) | | | | (484,510) | |
| Syngenta AG | | | (3,671) | | | | (1,463,617) | |
| UBS AG † | | | (110,151) | | | | (2,109,100) | |
| Zurich Insurance Group AG † | | | (2,801) | | | | (812,470) | |
| | | | | | | | |
| | | | | | | (13,162,669) | |
| | | | | | | | |
| United Kingdom - (0.4)% | | | | | | | | |
| CNH Industrial NV † | | | (55,905) | | | | (638,804) | |
| Subsea 7 SA | | | (53,550) | | | | (1,026,601) | |
| | | | | | | | |
| | | | | | | (1,665,405) | |
| | | | | | | | |
TOTAL COMMON STOCKS SOLD SHORT
(proceeds $158,579,762) | | | | | | | (166,014,842) | |
| | | | | | | | |
TOTAL SECURITIES SOLD SHORT
(proceeds $158,579,762) | | | | | | | (166,014,842) | |
| | | | | | | | |
TOTAL INVESTMENTS, NET OF SECURITIES SOLD SHORT - 76.9%
(Cost $323,065,974) | | | | | | | 322,055,682 | |
| | | | | | | | |
| OTHER ASSETS IN EXCESS OF LIABILITIES - 23.1% (c) | | | | | | | 97,159,287 | |
| | | | | | | | |
| NET ASSETS - 100.0% | | | | | | $ | 419,214,969 | |
| | | | | | | | |
| | | | | | | | |
| SECTOR | | VALUE | | | % OF NET
ASSETS | |
| Consumer Discretionary | | $ | 8,305,641 | | | | 2.0 | % |
| Consumer Staples | | | 10,247,599 | | | | 2.4 | |
| Energy | | | 2,884,549 | | | | 0.7 | |
| Financials | | | 5,597,839 | | | | 1.3 | |
| Health Care | | | 8,908,857 | | | | 2.1 | |
| Industrials | | | (960,847) | | | | (0.3) | |
| Information Technology | | | (8,097,983) | | | | (1.9) | |
| Materials | | | (13,907,254) | | | | (3.2) | |
| Telecommunication Services | | | 11,450,111 | | | | 2.8 | |
| Utilities | | | 7,684,546 | | | | 1.8 | |
| Money Market Funds^ | | | 289,942,624 | | | | 69.2 | |
| | | | | | | | |
Total Investments | | | 322,055,682 | | | | 76.9 | |
| Other Assets in Excess of Liabilities (c) | | | 97,159,287 | | | | 23.1 | |
| | | | | | | | |
Net Assets | | $ | 419,214,969 | | | | 100.0 | % |
| | | | | | | | |
| † | Non income-producing security. |
| (a) | All or a portion of this security has been segregated as collateral for securities sold short and can be sold or replaced subject to the broker’s right to re-hypothecate. At December 31, 2013, the value of these securities was $182,589,040. |
| (b) | Represents annualized seven-day yield as of December 31, 2013. |
| (c) | Includes appreciation/(depreciation) on forward foreign currency exchange, futures and swap contracts. |
| ^ | All of a portion represents positions held in the respective Subsidiary (Note 2). |
All securities are Level 2 with respect to ASC 820 (See Note 5).
The following abbreviations are used in portfolio descriptions:
CVA - Dutch Certification
SDR - Special Drawing Rights
| | | | |
| | The accompanying notes are an integral part of these financial statements. | | (Continued) |
| | | | | | | | | | | | | | | | |
| | AQR Funds | | | | | | Annual Report | | | | | | December 2013 | | 193 |
| | | | | | | | | | |
| | | | |
| Consolidated Schedule of Investments | | | December 31, 2013 | |
| | |
| AQR STYLE PREMIA ALTERNATIVE FUND | | |
Total return swap contracts outstanding as of December 31, 2013:
Over the Counter
| | | | | | | | | | | | | | | | |
| COUNTERPARTY | | UNDERLYING REFERENCE INSTRUMENT | | TERMINATION
DATE | | CURRENCY | | | NOTIONAL
VALUE | | | UNREALIZED
APPRECIATION
(DEPRECIATION) | |
| Barclays Capital | | 10-Year Canadian Bond | | 3/20/2014 | | | CAD | | | | 81,683,338 | | | | $(883,606) | |
| Barclays Capital | | 10-Year Japanese Government Bond | | 3/11/2014 | | | JPY | | | | (13,671,337,700) | | | | 529,643 | |
| Bank of America | | 30-Year Euro Buxl Bond | | 3/6/2014 | | | EUR | | | | (13,151,706) | | | | 295,938 | |
| Bank of America | | Bovespa Index | | 2/12/2014 | | | BRL | | | | (42,233,792) | | | | (431,821) | |
| Barclays Capital | | Corn Futures^ | | 3/14/2014 | | | USD | | | | 7,596,450 | | | | (295,733) | |
| Barclays Capital | | Corn Futures^ | | 3/14/2014 | | | USD | | | | (17,278,913) | | | | 567,488 | |
| Bank of America | | Euro - Bobl Futures | | 3/6/2014 | | | EUR | | | | 17,470,924 | | | | (239,120) | |
| Bank of America | | Euro - Bund Futures | | 3/6/2014 | | | EUR | | | | 6,217,534 | | | | (128,279) | |
| Bank of America | | Euro - SCHATZ Futures | | 3/6/2014 | | | EUR | | | | 114,941,632 | | | | (313,415) | |
| Barclays Capital | | Gold 100 OZ Futures^ | | 2/26/2014 | | | USD | | | | (14,748,540) | | | | 922,090 | |
| Barclays Capital | | Long Gilt Futures | | 3/27/2014 | | | GBP | | | | (17,516,092) | | | | 589,981 | |
| Bank of America | | MSCI Taiwan Stock Index Futures | | 1/28/2014 | | | USD | | | | 3,931,520 | | | | 101,040 | |
| Bank of America | | Russian Depository Index | | 3/19/2014 | | | USD | | | | 12,980,264 | | | | 348,122 | |
| Barclays Capital | | Soybean Futures^ | | 3/14/2014 | | | USD | | | | 35,887,500 | | | | (343,750) | |
| Bank of America | | Swiss Market Index Futures | | 3/21/2014 | | | CHF | | | | (34,712,910) | | | | (2,003,128) | |
| Bank of America | | U.S. Treasury 10-Year Note Futures | | 3/20/2014 | | | USD | | | | 141,357,123 | | | | (2,560,248) | |
| Bank of America | | U.S. Treasury 2-Year Note Futures | | 3/31/2014 | | | USD | | | | 138,767,706 | | | | (285,831) | |
| Bank of America | | U.S. Treasury 5-Year Note Futures | | 3/31/2014 | | | USD | | | | 10,637,854 | | | | (138,353) | |
| Bank of America | | U.S. Treasury Long Bond Futures | | 3/20/2014 | | | USD | | | | (23,879,103) | | | | 397,915 | |
| | | | | | | | | | | | | | | | |
| | | | | | | | | | | | | | | $(3,871,067) | |
| | | | | | | | | | | | | | | | |
Money Market Fund is pledged as collateral to Bank of America for total return swap contracts in the amount of $10,930,026. Additional cash held as collateral for Barclays Capital was $2,400,000.
| ^ | Represents positions held in the respective Subsidiary (Note 2). |
Open futures contracts outstanding at December 31, 2013:
Exchange Traded
| | | | | | | | | | | | | | | | | | | | |
NUMBER OF
CONTRACTS | | COUNTERPARTY | | DESCRIPTION | | EXPIRATION
DATE | | | VALUE AT
TRADE DATE | | | VALUE AT
DECEMBER 31,
2013 | | | UNREALIZED
APPRECIATION
(DEPRECIATION) | |
| Long Contracts: | | | | | |
| 101 | | J.P. Morgan | | LME Copper Futures^ | | | January 31, 2014 | | | | $18,336,661 | | | | $18,604,301 | | | | $267,640 | |
| 8 | | J.P. Morgan | | LME Copper Futures^ | | | February 14, 2014 | | | | 1,392,717 | | | | 1,473,900 | | | | 81,183 | |
| 12 | | J.P. Morgan | | LME Copper Futures^ | | | February 20, 2014 | | | | 2,098,294 | | | | 2,210,325 | | | | 112,031 | |
| 1 | | J.P. Morgan | | LME Copper Futures^ | | | February 21, 2014 | | | | 174,647 | | | | 184,156 | | | | 9,509 | |
| 18 | | J.P. Morgan | | LME Copper Futures^ | | | March 5, 2014 | | | | 3,187,162 | | | | 3,314,812 | | | | 127,650 | |
| 20 | | J.P. Morgan | | LME Copper Futures^ | | | March 12, 2014 | | | | 3,608,042 | | | | 3,683,125 | | | | 75,083 | |
| 106 | | J.P. Morgan | | LME Copper Futures^ | | | March 17, 2014 | | | | 18,579,371 | | | | 19,519,238 | | | | 939,867 | |
| 228 | | Goldman Sachs | | Natural Gas Futures^ | | | February 19, 2014 | | | | 9,209,632 | | | | 9,644,400 | | | | 434,768 | |
| 31 | | Goldman Sachs | | Soybean Futures^ | | | March 14, 2014 | | | | 2,044,519 | | | | 2,003,375 | | | | (41,144) | |
| 189 | | Barclays Capital | | DAX Index Futures | | | March 21, 2014 | | | | 59,540,841 | | | | 62,437,504 | | | | 2,896,663 | |
| 348 | | Barclays Capital | | Euro Stoxx 50 Index | | | March 21, 2014 | | | | 14,175,959 | | | | 14,879,351 | | | | 703,392 | |
| 66 | | Barclays Capital | | FTSE 100 Index Futures | | | March 21, 2014 | | | | 7,046,837 | | | | 7,319,879 | | | | 273,042 | |
| 106 | | Barclays Capital | | FTSE/JSE Top 40 Index Futures | | | March 20, 2014 | | | | 3,975,543 | | | | 4,213,728 | | | | 238,185 | |
| | | | |
| | The accompanying notes are an integral part of these financial statements. | | (Continued) |
| | | | | | | | | | | | | | | | |
| 194 | | AQR Funds | | | | | | Annual Report | | | | | | December 2013 | | |
| | | | | | | | | | |
| | | | |
| Consolidated Schedule of Investments | | | December 31, 2013 | |
| | |
| AQR STYLE PREMIA ALTERNATIVE FUND | | |
| | | | | | | | | | | | | | | | | | | | |
NUMBER OF
CONTRACTS | | COUNTERPARTY | | DESCRIPTION | | EXPIRATION DATE | | | VALUE AT
TRADE DATE | | | VALUE AT
DECEMBER 31,
2013 | | | UNREALIZED
APPRECIATION
(DEPRECIATION) | |
| Long Contracts: (continued) | | | | | |
| 479 | | Barclays Capital | | Hang Seng Index Futures | | | January 29, 2014 | | | | $70,762,206 | | | | $72,066,511 | | | | $1,304,305 | |
| 22 | | Barclays Capital | | H-SHARES Index Futures | | | January 29, 2014 | | | | 1,508,776 | | | | 1,536,734 | | | | 27,958 | |
| 228 | | Barclays Capital | | IBEX 35 Index Futures | | | January 17, 2014 | | | | 29,261,470 | | | | 30,956,321 | | | | 1,694,851 | |
| 240 | | Barclays Capital | | S&P/Toronto Stock Exchange 60 Index Futures | | | March 20, 2014 | | | | 33,910,281 | | | | 35,286,608 | | | | 1,376,327 | |
| 121 | | Barclays Capital | | SPI 200 Index Futures | | | March 20, 2014 | | | | 13,702,153 | | | | 14,364,038 | | | | 661,885 | |
| 291 | | Barclays Capital | | TOPIX Index Futures | | | March 13, 2014 | | | | 34,613,753 | | | | 35,991,597 | | | | 1,377,844 | |
| 1,488 | | J.P. Morgan | | 90-Day EURODollar Futures | | | June 16, 2014 | | | | 370,843,422 | | | | 370,828,200 | | | | (15,222) | |
| 1,800 | | J.P. Morgan | | 90-Day EURODollar Futures | | | September 15, 2014 | | | | 448,390,764 | | | | 448,357,500 | | | | (33,264) | |
| 733 | | J.P. Morgan | | 90-Day EURODollar Futures | | | December 15, 2014 | | | | 182,614,108 | | | | 182,462,025 | | | | (152,083) | |
| 1,385 | | J.P. Morgan | | Australia 3-Year Bond Futures | | | March 17, 2014 | | | | 134,013,564 | | | | 134,234,930 | | | | 221,366 | |
| 941 | | J.P. Morgan | | Bank Acceptance Futures | | | December 15, 2014 | | | | 218,551,296 | | | | 218,562,697 | | | | 11,401 | |
| 196 | | J.P. Morgan | | Canadian 3-Month Bank Acceptance Futures | | | June 16, 2014 | | | | 45,555,602 | | | | 45,551,894 | | | | (3,708) | |
| 41 | | J.P. Morgan | | Canadian 3-Month Bank Acceptance Futures | | | September 15, 2014 | | | | 9,526,316 | | | | 9,527,748 | | | | 1,432 | |
| | | | | | | | | | | | | | | | | | | | |
| | | | | | | | | | | 1,736,623,936 | | | | 1,749,214,897 | | | | 12,590,961 | |
| | | | | | | | | | | | | | | | | | | | |
| Short Contracts: | | | | | |
| 8 | | Goldman Sachs | | Brent Crude Futures^ | | | March 13, 2014 | | | | (894,865) | | | | (884,240) | | | | 10,625 | |
| 156 | | Goldman Sachs | | Gold 100 OZ Futures^ | | | February 26, 2014 | | | | (20,127,259) | | | | (18,755,880) | | | | 1,371,379 | |
| 101 | | J.P. Morgan | | LME Copper Futures^ | | | January 31, 2014 | | | | (18,381,790) | | | | (18,604,301) | | | | (222,511) | |
| 8 | | J.P. Morgan | | LME Copper Futures^ | | | February 14, 2014 | | | | (1,392,807) | | | | (1,473,900) | | | | (81,093) | |
| 12 | | J.P. Morgan | | LME Copper Futures^ | | | February 20, 2014 | | | | (2,091,575) | | | | (2,210,325) | | | | (118,750) | |
| 1 | | J.P. Morgan | | LME Copper Futures^ | | | February 21, 2014 | | | | (174,748) | | | | (184,156) | | | | (9,408) | |
| 18 | | J.P. Morgan | | LME Copper Futures^ | | | March 5, 2014 | | | | (3,184,740) | | | | (3,314,812) | | | | (130,072) | |
| 20 | | J.P. Morgan | | LME Copper Futures^ | | | March 12, 2014 | | | | (3,612,502) | | | | (3,683,124) | | | | (70,622) | |
| 49 | | J.P. Morgan | | LME Copper Futures^ | | | March 17, 2014 | | | | (8,779,499) | | | | (9,023,043) | | | | (243,544) | |
| 73 | | Goldman Sachs | | Silver Futures^ | | | March 27, 2014 | | | | (7,655,278) | | | | (7,070,050) | | | | 585,228 | |
| 26 | | Goldman Sachs | | WTI Crude Futures^ | | | January 21, 2014 | | | | (2,488,760) | | | | (2,558,920) | | | | (70,160) | |
| 424 | | Barclays Capital | | Amsterdam Index Futures | | | January 17, 2014 | | | | (44,450,989) | | | | (46,937,893) | | | | (2,486,904) | |
| 131 | | Barclays Capital | | CAC40 Index Futures | | | January 17, 2014 | | | | (7,394,067) | | | | (7,746,615) | | | | (352,548) | |
| 331 | | Barclays Capital | | FTSE/MIB Index Futures | | | March 21, 2014 | | | | (41,412,360) | | | | (43,315,807) | | | | (1,903,447) | |
| 1 | | Barclays Capital | | KOSPI Index 200 Futures | | | March 13, 2014 | | | | (122,641) | | | | (125,859) | | | | (3,218) | |
| 2,574 | | Barclays Capital | | OMXS30 Index Futures | | | January 17, 2014 | | | | (50,799,120) | | | | (53,426,152) | | | | (2,627,032) | |
| 509 | | Barclays Capital | | S&P 500 E-Mini Futures | | | March 21, 2014 | | | | (45,058,501) | | | | (46,855,995) | | | | (1,797,494) | |
| 212 | | J.P. Morgan | | 3-Month Euro Euribor Futures | | | September 15, 2014 | | | | (72,676,155) | | | | (72,678,782) | | | | (2,627) | |
| | | | |
| | The accompanying notes are an integral part of these financial statements. | | (Continued) |
| | | | | | | | | | | | | | | | |
| | AQR Funds | | | | | | Annual Report | | | | | | December 2013 | | 195 |
| | | | | | | | | | |
| | | | |
| Consolidated Schedule of Investments | | | December 31, 2013 | |
| | |
| AQR STYLE PREMIA ALTERNATIVE FUND | | |
| | | | | | | | | | | | | | | | | | | | |
NUMBER OF
CONTRACTS | | COUNTERPARTY | | DESCRIPTION | | EXPIRATION
DATE | | | VALUE AT
TRADE DATE | | | VALUE AT
DECEMBER 31,
2013 | | | UNREALIZED
APPRECIATION
(DEPRECIATION) | |
| Short Contracts: (continued) | | | | | |
| 720 | | J.P. Morgan | | 3-Month Euro Euribor Futures | | | December 15, 2014 | | | | $(246,866,188) | | | | $(246,709,787) | | | | $156,401 | |
| 1,521 | | J.P. Morgan | | 90-Day Sterling Futures | | | June 18, 2014 | | | | (312,933,935) | | | | (312,791,054) | | | | 142,881 | |
| 1,317 | | J.P. Morgan | | 90-Day Sterling Futures | |
| September 17,
2014 |
| | | (270,802,978) | | | | (270,525,300) | | | | 277,678 | |
| 685 | | J.P. Morgan | | 90-Day Sterling Futures | | | December 17, 2014 | | | | (140,712,070) | | | | (140,479,157) | | | | 232,913 | |
| 1,998 | | J.P. Morgan | | Australia 10-Year Bond Futures | | | March 17, 2014 | | | | (203,003,727) | | | | (204,560,903) | | | | (1,557,176) | |
| | | | | | | | | | | | | | | | | | | | |
| | | | | | | | | | | (1,505,016,554) | | | | (1,513,916,055) | | | | (8,899,501) | |
| | | | | | | | | | | | | | | | | | | | |
| | | | | | | | | | | $231,607,382 | | | | $235,298,842 | | | | $3,691,460 | |
| | | | | | | | | | | | | | | | | | | | |
Cash held as collateral at Barclays Capital and J.P. Morgan for futures contracts was $28,467,753 and $8,231,094, respectively at December 31, 2013. Cash held as collateral for Goldman Sachs for futures contracts was $80,427 at December 31, 2013.
| ^ | Represents positions held in the respective Subsidiary (Note 2). |
Forward foreign currency exchange contracts outstanding as of December 31, 2013:
Over the Counter
| | | | | | | | | | | | | | | | | | | | |
PURCHASE
CONTRACTS | | COUNTERPARTY | | CURRENCY | | CURRENCY
AMOUNT
PURCHASED | | | VALUE AT
SETTLEMENT
DATE | | | VALUE AT
DECEMBER 31,
2013 | | | UNREALIZED
APPRECIATION
(DEPRECIATION) | |
Brazilian Real,
Expiring 03/19/14* | | Credit Suisse International | | BRL | | | 3,160,000 | | | | $1,297,475 | | | | $1,315,134 | | | | $17,659 | |
Canadian Dollar,
Expiring 03/19/14 | | Credit Suisse International | | CAD | | | 13,311,999 | | | | 12,493,595 | | | | 12,508,927 | | | | 15,332 | |
Swiss Franc,
Expiring 03/19/14 | | Credit Suisse International | | CHF | | | 9,872,000 | | | | 11,101,409 | | | | 11,073,473 | | | | (27,936) | |
Euro,
Expiring 03/19/14 | | Credit Suisse International | | EUR | | | 35,714,000 | | | | 48,936,940 | | | | 49,130,678 | | | | 193,738 | |
British Pound,
Expiring 03/19/14 | | Credit Suisse International | | GBP | | | 31,647,999 | | | | 51,803,429 | | | | 52,379,812 | | | | 576,383 | |
Hungarian Forint,
Expiring 03/19/14 | | Credit Suisse International | | HUF | | | 2,640,000,000 | | | | 11,922,653 | | | | 12,167,079 | | | | 244,426 | |
Indian Rupee,
Expiring 03/19/14* | | Credit Suisse International | | INR | | | 785,000,000 | | | | 12,462,815 | | | | 12,467,658 | | | | 4,843 | |
Japanese Yen,
Expiring 03/19/14 | | Credit Suisse International | | JPY | | | 417,035,000 | | | | 4,064,499 | | | | 3,961,573 | | | | (102,926) | |
Korean Won,
Expiring 03/19/14* | | Credit Suisse International | | KRW | | | 3,730,000,000 | | | | 3,518,279 | | | | 3,517,793 | | | | (486) | |
Mexican Peso,
Expiring 03/19/14 | | Credit Suisse International | | MXN | | | 149,000,000 | | | | 11,178,700 | | | | 11,343,733 | | | | 165,033 | |
Norwegian Krone,
Expiring 03/19/14 | | Credit Suisse International | | NOK | | | 78,907,000 | | | | 12,859,903 | | | | 12,973,371 | | | | 113,468 | |
New Zealand Dollar,
Expiring 03/19/14 | | Credit Suisse International | | NZD | | | 39,255,000 | | | | 32,198,349 | | | | 32,107,254 | | | | (91,095) | |
Poland Zloty,
Expiring 03/19/14 | | Credit Suisse International | | PLN | | | 66,300,000 | | | | 21,539,114 | | | | 21,844,619 | | | | 305,505 | |
| | | | |
| | The accompanying notes are an integral part of these financial statements. | | (Continued) |
| | | | | | | | | | | | | | | | |
| 196 | | AQR Funds | | | | | | Annual Report | | | | | | December 2013 | | |
| | | | | | | | | | |
| | | | |
| Consolidated Schedule of Investments | | | December 31, 2013 | |
| | |
| AQR STYLE PREMIA ALTERNATIVE FUND | | |
| | | | | | | | | | | | | | | | | | | | |
PURCHASE
CONTRACTS | | COUNTERPARTY | | CURRENCY | | CURRENCY
AMOUNT
PURCHASED | | | VALUE AT
SETTLEMENT
DATE | | | VALUE AT
DECEMBER 31,
2013 | | | UNREALIZED
APPRECIATION
(DEPRECIATION) | |
Singapore Dollar,
Expiring 03/19/14 | | Credit Suisse International | | SGD | | | 2,750,000 | | | | $2,192,897 | | | | $2,179,236 | | | | $(13,661) | |
Turkish Lira,
Expiring 03/19/14 | | Credit Suisse International | | TRY | | | 59,000,000 | | | | 28,273,694 | | | | 27,021,012 | | | | (1,252,682) | |
Taiwanese Dollar,
Expiring 03/19/14* | | Credit Suisse International | | TWD | | | 87,000,000 | | | | 2,946,584 | | | | 2,925,403 | | | | (21,181) | |
South African Rand,
Expiring 03/19/14 | | Credit Suisse International | | ZAR | | | 25,300,000 | | | | 2,399,724 | | | | 2,385,748 | | | | (13,976) | |
| | | | | | | | | | | | | | | | | | | | |
| | | | | | | | | | | $271,190,059 | | | | $271,302,503 | | | | $112,444 | |
| | | | | | | | | | | | | | | | | | | | |
| | | | | | | | | | | | | | | | | | | | |
SALES
CONTRACTS | | COUNTERPARTY | | CURRENCY | | CURRENCY
AMOUNT
SOLD | | | VALUE AT
SETTLEMENT
DATE | | | VALUE AT
DECEMBER 31,
2013 | | | UNREALIZED
APPRECIATION
(DEPRECIATION) | |
Australian Dollar,
Expiring 03/19/14 | | Credit Suisse International | | AUD | | | (30,555,000) | | | | $(27,562,007) | | | | $(27,149,187) | | | | $412,820 | |
Brazilian Real,
Expiring 03/19/14* | | Credit Suisse International | | BRL | | | (58,540,000) | | | | (24,249,648) | | | | (24,363,279) | | | | (113,631) | |
Canadian Dollar,
Expiring 03/19/14 | | Credit Suisse International | | CAD | | | (2,022,000) | | | | (1,899,300) | | | | (1,900,019) | | | | (719) | |
Swiss Franc,
Expiring 03/19/14 | | Credit Suisse International | | CHF | | | (42,332,000) | | | | (46,924,250) | | | | (47,484,016) | | | | (559,766) | |
Danish Krone,
Expiring 03/19/14 | | Credit Suisse International | | DKK | | | (2,977,000) | | | | (547,567) | | | | (549,303) | | | | (1,736) | |
Euro,
Expiring 03/19/14 | | Credit Suisse International | | EUR | | | (7,323,000) | | | | (10,045,900) | | | | (10,074,033) | | | | (28,133) | |
British Pound,
Expiring 03/19/14 | | Credit Suisse International | | GBP | | | (7,498,000) | | | | (12,287,688) | | | | (12,409,752) | | | | (122,064) | |
Israeli Shekel,
Expiring 03/19/14 | | Credit Suisse International | | ILS | | | (25,300,000) | | | | (7,202,710) | | | | (7,278,052) | | | | (75,342) | |
Indian Rupee,
Expiring 03/19/14* | | Credit Suisse International | | INR | | | (21,000,000) | | | | (332,487) | | | | (333,530) | | | | (1,043) | |
Japanese Yen,
Expiring 03/19/14 | | Credit Suisse International | | JPY | | | (6,327,508,999) | | | | (61,555,972) | | | | (60,107,401) | | | | 1,448,571 | |
Korean Won,
Expiring 03/19/14* | | Credit Suisse International | | KRW | | | (8,360,000,000) | | | | (7,838,837) | | | | (7,884,383) | | | | (45,546) | |
Mexican Peso,
Expiring 03/19/14 | | Credit Suisse International | | MXN | | | (121,000,000) | | | | (9,179,211) | | | | (9,212,024) | | | | (32,813) | |
Norwegian Krone,
Expiring 03/19/14 | | Credit Suisse International | | NOK | | | (223,868,999) | | | | (36,338,088) | | | | (36,807,072) | | | | (468,984) | |
Russian Ruble,
Expiring 03/19/14* | | Credit Suisse International | | RUB | | | (867,556,000) | | | | (25,995,657) | | | | (26,053,065) | | | | (57,408) | |
Swedish Krona,
Expiring 03/19/14 | | Credit Suisse International | | SEK | | | (182,621,999) | | | | (27,870,151) | | | | (28,356,971) | | | | (486,820) | |
Singapore Dollar,
Expiring 03/19/14 | | Credit Suisse International | | SGD | | | (43,130,000) | | | | (34,522,239) | | | | (34,178,348) | | | | 343,891 | |
South African Rand,
Expiring 03/19/14 | | Credit Suisse International | | ZAR | | | (63,900,000) | | | | (6,076,701) | | | | (6,025,662) | | | | 51,039 | |
| | | | | | | | | | | | | | | | | | | | |
| | | | | | | | | | | (340,428,413) | | | | (340,166,097) | | | | 262,316 | |
| | | | | | | | | | | | | | | | | | | | |
| | | | | | | | | | | $(69,238,354) | | | | $(68,863,594) | | | | $374,760 | |
| | | | | | | | | | | | | | | | | | | | |
| | | | |
| | The accompanying notes are an integral part of these financial statements. | | (Continued) |
| | | | | | | | | | | | | | | | |
| | AQR Funds | | | | | | Annual Report | | | | | | December 2013 | | 197 |
| | | | | | | | | | |
| | | | |
| Consolidated Schedule of Investments | | | December 31, 2013 | |
| | |
| AQR STYLE PREMIA ALTERNATIVE FUND | | |
Cash is held as collateral for Credit Suisse International for forward foreign currency exchange contracts in the amount of $600,000 at December 31, 2013.
| * | Non deliverable forward. See Note 3 in the Notes to Financial Statements. |
AUD - Australian Dollar
BRL - Brazilian Real
CAD - Canadian Dollar
CHF - Swiss Franc
DKK - Danish Krone
EUR - Euro
GBP - British Pound
HUF - Hungarian Forint
ILS - Israeli Shekel
INR - Indian Rupee
JPY - Japanese Yen
KRW - Korean Won
MXN - Mexican Peso
NOK - Norwegian Krone
NZD - New Zealand Dollar
PLN - Poland Zloty
RUB - Russian Ruble
SEK - Swedish Krona
SGD - Singapore Dollar
TRY - Turkish Lira
TWD - Taiwanese Dollar
USD - United States Dollar
ZAR - South African Rand
| | | | |
| | The accompanying notes are an integral part of these financial statements. | | (Continued) |
| | | | | | | | | | | | | | | | |
| 198 | | AQR Funds | | | | | | Annual Report | | | | | | December 2013 | | |
| | | | | | | | | | |
| | | | |
| Consolidated Schedule of Investments | | | December 31, 2013 | |
| | |
| AQR STYLE PREMIA ALTERNATIVE FUND | | |
Total Return Basket Swaps* Outstanding at December 31, 2013
Over the Counter
| | | | | | | | |
| COUNTERPARTY | | DESCRIPTION | | TERMINATION DATE** | | VALUE
(Note 3) | |
| Goldman Sachs | | The Fund receives or pays the total return on a portfolio of long and short positions and pays or receives the London Interbank Offered Rate (“LIBOR”), which is denominated in USD based on the local currencies of the positions within the swap. | | 12 to 13 months maturity ranging from
11/10/2014 -01/02/2015 | | | $251,129 | |
| | | | | | | | |
| * | See the accompanying “Additional Information — Total Return Basket Swap” for further details. |
| ** | The maturity dates are measured from the commencement of investment in each underlying portfolio swap position. |
Additional Information — Total Return Basket Swaps
The following table represents the individual long and short positions and related values within the total return basket swap as of December 31, 2013.
| | | | | | | | | | | | |
REFERENCE
ENTITY | | SHARES | | | NOTIONAL (a) | | | NET
UNREALIZED
APPRECIATION
(DEPRECIATION) | |
| Long Positions | | | | | | | | | |
| | | |
| Bermuda | | | | | | | | | | | | |
| Aspen Insurance Holdings Ltd. | | | 2,600 | | | $ | 104,946 | | | $ | 2,460 | |
| Axis Capital Holdings Ltd. | | | 7,900 | | | | 376,038 | | | | (235) | |
| Endurance Specialty Holdings Ltd. | | | 1,100 | | | | 61,725 | | | | 2,812 | |
| Marvell Technology Group Ltd. | | | 22,400 | | | | 311,106 | | | | 11,006 | |
| PartnerRe Ltd. | | | 6,200 | | | | 620,183 | | | | 33,483 | |
| Signet Jewelers Ltd. | | | 21,500 | | | | 1,612,874 | | | | 79,176 | |
| | | | | | | | | | | | |
| | | | | | | | | | | 128,702 | |
| | | | | | | | | | | | |
| | | |
| Ireland | | | | | | | | | | | | |
| Covidien PLC | | | 5,800 | | | | 370,764 | | | | 24,216 | |
| Eaton Corp. PLC | | | 4,600 | | | | 323,091 | | | | 27,061 | |
| Mallinckrodt PLC | | | 21,500 | | | | 1,107,864 | | | | 15,726 | |
| Seagate Technology PLC | | | 28,100 | | | | 1,381,224 | | | | 196,872 | |
| | | | | | | | | | | | |
| | | | | | | | | | | 263,875 | |
| | | | | | | | | | | | |
| | | |
| Panama | | | | | | | | | | | | |
| Copa Holdings SA | | | 5,600 | | | | 842,695 | | | | 53,921 | |
| | | | | | | | | | | | |
| | | |
| Switzerland | | | | | | | | | | | | |
| Noble Corp. PLC | | | 5,000 | | | | 189,395 | | | | (2,045) | |
| TE Connectivity Ltd. | | | 35,300 | | | | 1,816,473 | | | | 128,910 | |
| | | | | | | | | | | | |
| | | | | | | | | | | 126,865 | |
| | | | | | | | | | | | |
| | | |
| United Kingdom | | | | | | | | | | | | |
| Delphi Automotive PLC | | | 58,000 | | | | 3,313,557 | | | | 173,983 | |
| Ensco PLC | | | 16,500 | | | | 959,309 | | | | (15,839) | |
| | | | | | | | | | | | |
| | | | | | | | | | | 158,144 | |
| | | | | | | | | | | | |
| | | | | | | | | | | | |
REFERENCE
ENTITY | | SHARES | | | NOTIONAL (a) | | | NET
UNREALIZED
APPRECIATION
(DEPRECIATION) | |
| | | |
| United States | | | | | | | | | | | | |
| 3M Co. | | | 13,800 | | | $ | 1,732,930 | | | $ | 202,520 | |
| Aaron’s, Inc. | | | 1,300 | | | | 36,648 | | | | 1,572 | |
| Abbott Laboratories | | | 15,600 | | | | 575,267 | | | | 22,681 | |
| AbbVie, Inc. | | | 13,500 | | | | 659,133 | | | | 53,802 | |
| Abercrombie & Fitch Co. | | | 32,800 | | | | 1,208,021 | | | | (128,573) | |
| Accenture PLC | | | 1,300 | | | | 95,315 | | | | 11,571 | |
| ACE Ltd. | | | 32,600 | | | | 3,123,719 | | | | 251,359 | |
| Activision Blizzard, Inc. | | | 119,500 | | | | 1,996,313 | | | | 134,372 | |
| Advent Software, Inc. | | | 3,900 | | | | 128,762 | | | | 7,699 | |
| AECOM Technology Corp. | | | 19,700 | | | | 593,492 | | | | (13,721) | |
| Aetna, Inc. | | | 44,300 | | | | 2,767,554 | | | | 270,983 | |
| Aflac, Inc. | | | 7,600 | | | | 494,884 | | | | 12,796 | |
| AGCO Corp. | | | 24,700 | | | | 1,437,363 | | | | 24,630 | |
| Agilent Technologies, Inc. | | | 10,500 | | | | 536,547 | | | | 63,948 | |
| AGL Resources, Inc. | | | 9,500 | | | | 453,710 | | | | (5,025) | |
| Air Lease Corp. | | | 10,200 | | | | 303,453 | | | | 13,563 | |
| Akamai Technologies, Inc. | | | 16,400 | | | | 738,274 | | | | 35,478 | |
| Alaska Air Group, Inc. | | | 23,000 | | | | 1,658,683 | | | | 28,827 | |
| Alliant Energy Corp. | | | 13,600 | | | | 713,683 | | | | (11,923) | |
| Alliant Techsystems, Inc. | | | 11,600 | | | | 1,296,881 | | | | 114,607 | |
| Allied World Assurance Co. Holdings AG | | | 1,200 | | | | 130,102 | | | | 5,270 | |
| Allstate Corp./The | | | 25,100 | | | | 1,334,233 | | | | 34,721 | |
| Altria Group, Inc. | | | 9,900 | | | | 369,017 | | | | 11,044 | |
| Amdocs Ltd. | | | 5,900 | | | | 235,797 | | | | 7,519 | |
| American Electric Power Co., Inc. | | | 28,200 | | | | 1,328,042 | | | | (9,974) | |
| American Express Co. | | | 4,600 | | | | 377,947 | | | | 39,411 | |
| American Financial Group, Inc. | | | 12,000 | | | | 673,423 | | | | 19,217 | |
| | | | |
| | The accompanying notes are an integral part of these financial statements. | | (Continued) |
| | | | | | | | | | | | | | | | |
| | AQR Funds | | | | | | Annual Report | | | | | | December 2013 | | 199 |
| | | | | | | | | | |
| | | | |
| Consolidated Schedule of Investments | | | December 31, 2013 | |
| | |
| AQR STYLE PREMIA ALTERNATIVE FUND | | |
| | | | | | | | | | | | |
REFERENCE
ENTITY | | SHARES | | | NOTIONAL (a) | | | NET
UNREALIZED
APPRECIATION
(DEPRECIATION) | |
| United States (continued) | | | | | | | | | |
| Ameriprise Financial, Inc. | | | 36,000 | | | $ | 3,652,478 | | | $ | 489,322 | |
| AmerisourceBergen Corp. | | | 22,700 | | | | 1,494,632 | | | | 101,405 | |
| Amgen, Inc. | | | 30,100 | | | | 3,558,536 | | | | (122,320) | |
| Anadarko Petroleum Corp. | | | 1,800 | | | | 169,614 | | | | (26,838) | |
| Analog Devices, Inc. | | | 600 | | | | 29,361 | | | | 1,197 | |
| AO Smith Corp. | | | 700 | | | | 36,463 | | | | 1,295 | |
| Aon PLC | | | 20,700 | | | | 1,631,125 | | | | 105,398 | |
| Apache Corp. | | | 1,100 | | | | 97,856 | | | | (3,322) | |
| Apollo Education Group, Inc. | | | 9,900 | | | | 248,365 | | | | 22,103 | |
| Archer-Daniels-Midland Co. | | | 79,400 | | | | 3,247,847 | | | | 198,113 | |
| Ares Capital Corp. | | | 47,900 | | | | 870,043 | | | | (18,860) | |
| Arrow Electronics, Inc. | | | 20,200 | | | | 995,845 | | | | 100,005 | |
| Assurant, Inc. | | | 30,100 | | | | 1,820,006 | | | | 177,731 | |
| Atmos Energy Corp. | | | 9,500 | | | | 422,204 | | | | 9,286 | |
| Atwood Oceanics, Inc. | | | 6,000 | | | | 313,611 | | | | 6,729 | |
| Autoliv, Inc. | | | 8,000 | | | | 713,166 | | | | 21,234 | |
| AutoZone, Inc. | | | 1,100 | | | | 476,291 | | | | 49,443 | |
| Avnet, Inc. | | | 39,400 | | | | 1,565,672 | | | | 172,262 | |
| Babcock & Wilcox Co./The | | | 16,100 | | | | 515,966 | | | | 34,493 | |
| Baker Hughes, Inc. | | | 6,600 | | | | 356,985 | | | | 7,731 | |
| Ball Corp. | | | 17,100 | | | | 834,589 | | | | 48,797 | |
| Bank of New York Mellon Corp./The | | | 18,100 | | | | 585,414 | | | | 47,000 | |
| BankUnited, Inc. | | | 7,500 | | | | 229,573 | | | | 17,327 | |
| Becton Dickinson and Co. | | | 14,000 | | | | 1,470,580 | | | | 76,280 | |
| Bed Bath & Beyond, Inc. | | | 7,200 | | | | 552,553 | | | | 25,607 | |
| Bemis Co, Inc. | | | 800 | | | | 31,907 | | | | 861 | |
| Berkshire Hathaway, Inc. | | | 3,100 | | | | 357,867 | | | | 9,669 | |
| Best Buy Co., Inc. | | | 13,600 | | | | 582,722 | | | | (40,354) | |
| Big Lots, Inc. | | | 5,000 | | | | 181,650 | | | | (20,200) | |
| Biogen Idec, Inc. | | | 9,000 | | | | 2,181,089 | | | | 336,661 | |
| BlackRock, Inc. | | | 5,700 | | | | 1,714,588 | | | | 89,291 | |
| Bob Evans Farms, Inc. | | | 2,900 | | | | 160,359 | | | | (13,648) | |
| Boeing Co./The | | | 8,800 | | | | 1,165,915 | | | | 35,197 | |
| Broadridge Financial Solutions, Inc. | | | 20,900 | | | | 747,506 | | | | 78,462 | |
| Brocade Communications Systems, Inc. | | | 298,900 | | | | 2,464,886 | | | | 186,357 | |
| Bunge Ltd. | | | 400 | | | | 32,241 | | | | 603 | |
| CA, Inc. | | | 69,800 | | | | 2,217,220 | | | | 131,550 | |
| Capital One Financial Corp. | | | 23,500 | | | | 1,631,515 | | | | 168,820 | |
| Cardinal Health, Inc. | | | 14,600 | | | | 882,801 | | | | 92,625 | |
| CareFusion Corp. | | | 34,100 | | | | 1,331,669 | | | | 26,193 | |
| Carlisle Cos., Inc. | | | 2,300 | | | | 166,640 | | | | 15,980 | |
| Carter’s, Inc. | | | 8,100 | | | | 566,014 | | | | 15,485 | |
| CBS Corp. | | | 9,000 | | | | 539,455 | | | | 34,205 | |
| Celanese Corp. | | | 2,500 | | | | 139,153 | | | | (878) | |
| Celgene Corp. | | | 13,200 | | | | 1,986,760 | | | | 243,512 | |
| | | | | | | | | | | | |
REFERENCE
ENTITY | | SHARES | | | NOTIONAL (a) | | | NET
UNREALIZED
APPRECIATION
(DEPRECIATION) | |
| United States (continued) | | | | | | | | | |
| Chevron Corp. | | | 34,900 | | | $ | 4,105,716 | | | $ | 253,643 | |
| Chubb Corp./The | | | 9,800 | | | | 902,179 | | | | 44,795 | |
| Church & Dwight Co., Inc. | | | 500 | | | | 32,491 | | | | 649 | |
| Cigna Corp. | | | 12,400 | | | | 963,047 | | | | 121,705 | |
| Cimarex Energy Co. | | | 1,400 | | | | 143,996 | | | | 2,878 | |
| Cintas Corp. | | | 17,200 | | | | 925,081 | | | | 99,867 | |
| Cisco Systems, Inc. | | | 146,400 | | | | 3,287,129 | | | | (449) | |
| Cleco Corp. | | | 700 | | | | 32,276 | | | | 358 | |
| Clorox Co./The | | | 4,200 | | | | 377,210 | | | | 12,382 | |
| CMS Energy Corp. | | | 1,100 | | | | 30,247 | | | | (800) | |
| Coca-Cola Enterprises, Inc. | | | 24,400 | | | | 1,015,579 | | | | 61,193 | |
| Comcast Corp. | | | 48,300 | | | | 2,334,156 | | | | 175,754 | |
| Commerce Bancshares, Inc. | | | 1,785 | | | | 77,931 | | | | 2,234 | |
| Commercial Metals Co. | | | 29,300 | | | | 539,146 | | | | 56,523 | |
| Computer Sciences Corp. | | | 24,200 | | | | 1,208,979 | | | | 143,317 | |
| ConocoPhillips | | | 39,400 | | | | 2,869,029 | | | | (85,419) | |
| Consolidated Edison, Inc. | | | 12,100 | | | | 706,392 | | | | (37,504) | |
| Cooper Cos., Inc./The | | | 2,700 | | | | 345,759 | | | | (11,391) | |
| Corning, Inc. | | | 72,400 | | | | 1,226,253 | | | | 63,915 | |
| Crane Co. | | | 11,200 | | | | 709,601 | | | | 43,599 | |
| Crown Holdings, Inc. | | | 13,000 | | | | 562,797 | | | | 16,613 | |
| CST Brands, Inc. | | | 11,600 | | | | 383,758 | | | | 42,194 | |
| CSX Corp. | | | 10,900 | | | | 285,778 | | | | 27,815 | |
| Cubist Pharmaceuticals, Inc. | | | 1,200 | | | | 74,285 | | | | 8,359 | |
| Cummins, Inc. | | | 12,700 | | | | 1,630,431 | | | | 159,888 | |
| CVS Caremark Corp. | | | 54,500 | | | | 3,415,095 | | | | 485,470 | |
| Danaher Corp. | | | 3,300 | | | | 239,332 | | | | 15,428 | |
| Deckers Outdoor Corp. | | | 3,600 | | | | 249,072 | | | | 54,984 | |
| Delta Air Lines, Inc. | | | 150,300 | | | | 4,010,635 | | | | 118,106 | |
| Deluxe Corp. | | | 11,100 | | | | 519,159 | | | | 60,150 | |
| DeVry Education Group, Inc. | | | 3,400 | | | | 120,323 | | | | 377 | |
| Diamond Offshore Drilling, Inc. | | | 4,200 | | | | 254,214 | | | | (15,150) | |
| Dillard’s, Inc. | | | 11,900 | | | | 976,658 | | | | 180,141 | |
| DIRECTV | | | 10,300 | | | | 654,529 | | | | 57,098 | |
| Discover Financial Services | | | 17,000 | | | | 884,389 | | | | 66,761 | |
| Dollar Tree, Inc. | | | 1,100 | | | | 64,084 | | | | (2,023) | |
| Domino’s Pizza ,Inc. | | | 500 | | | | 33,411 | | | | 1,414 | |
| Dover Corp. | | | 18,200 | | | | 1,659,603 | | | | 97,425 | |
| Dow Chemical Co./The | | | 18,600 | | | | 726,137 | | | | 99,703 | |
| Dr Pepper Snapple Group, Inc. | | | 800 | | | | 37,850 | | | | 1,126 | |
| DST Systems, Inc. | | | 11,700 | | | | 1,005,692 | | | | 55,966 | |
| DTE Energy Co. | | | 22,000 | | | | 1,523,350 | | | | (62,770) | |
| Duke Energy Corp. | | | 8,600 | | | | 622,685 | | | | (29,199) | |
| Dun & Bradstreet Corp./The | | | 3,300 | | | | 357,001 | | | | 48,074 | |
| Eastman Chemical Co. | | | 8,300 | | | | 647,968 | | | | 21,842 | |
| | | | |
| | The accompanying notes are an integral part of these financial statements. | | (Continued) |
| | | | | | | | | | | | | | | | |
| 200 | | AQR Funds | | | | | | Annual Report | | | | | | December 2013 | | |
| | | | | | | | | | |
| | | | |
| Consolidated Schedule of Investments | | | December 31, 2013 | |
| | |
| AQR STYLE PREMIA ALTERNATIVE FUND | | |
| | | | | | | | | | | | |
REFERENCE
ENTITY | | SHARES | | | NOTIONAL (a) | | | NET
UNREALIZED
APPRECIATION
(DEPRECIATION) | |
| United States (continued) | | | | | | | | | |
| eBay, Inc. | | | 900 | | | $ | 47,129 | | | $ | 2,272 | |
| Edison International | | | 35,500 | | | | 1,721,455 | | | | (77,805) | |
| Electronic Arts, Inc. | | | 19,200 | | | | 483,328 | | | | (42,880) | |
| Eli Lilly & Co. | | | 51,500 | | | | 2,587,829 | | | | 38,671 | |
| Emerson Electric Co. | | | 3,100 | | | | 207,515 | | | | 10,043 | |
| Energen Corp. | | | 3,100 | | | | 234,151 | | | | (14,826) | |
| Energizer Holdings, Inc. | | | 9,400 | | | | 916,594 | | | | 100,862 | |
| Entergy Corp. | | | 12,800 | | | | 828,349 | | | | (18,493) | |
| EOG Resources, Inc. | | | 1,700 | | | | 301,798 | | | | (16,470) | |
| Equifax, Inc. | | | 3,100 | | | | 201,123 | | | | 13,056 | |
| Exelis, Inc. | | | 33,600 | | | | 527,033 | | | | 113,383 | |
| Exxon Mobil Corp. | | | 6,800 | | | | 605,974 | | | | 82,186 | |
| Fidelity National Information Services, Inc. | | | 20,900 | | | | 1,017,523 | | | | 104,389 | |
| Fifth Third Bancorp. | | | 13,400 | | | | 253,906 | | | | 27,896 | |
| First Niagara Financial Group, Inc. | | | 7,000 | | | | 76,498 | | | | (2,158) | |
| First Solar, Inc. | | | 20,500 | | | | 1,204,301 | | | | (84,181) | |
| Fiserv, Inc. | | | 18,000 | | | | 941,171 | | | | 121,729 | |
| FleetCor Technologies, Inc. | | | 1,100 | | | | 125,394 | | | | 3,493 | |
| FLIR Systems, Inc. | | | 29,000 | | | | 828,016 | | | | 44,884 | |
| Flowers Foods, Inc. | | | 2,200 | | | | 55,340 | | | | (8,106) | |
| Fluor Corp. | | | 400 | | | | 30,892 | | | | 1,224 | |
| Foot Locker, Inc. | | | 18,700 | | | | 724,059 | | | | 50,869 | |
| Ford Motor Co. | | | 13,100 | | | | 221,750 | | | | (19,617) | |
| Franklin Resources, Inc. | | | 12,600 | | | | 679,605 | | | | 47,793 | |
| GameStop Corp. | | | 35,500 | | | | 1,871,217 | | | | (122,487) | |
| Gannett Co., Inc. | | | 34,800 | | | | 943,479 | | | | 85,905 | |
| Gap, Inc./The | | | 48,900 | | | | 1,793,730 | | | | 117,282 | |
| General Mills, Inc. | | | 28,300 | | | | 1,422,517 | | | | (10,064) | |
| Genuine Parts Co. | | | 18,100 | | | | 1,425,151 | | | | 80,588 | |
| Gilead Sciences, Inc. | | | 21,900 | | | | 1,562,532 | | | | 83,253 | |
| Google, Inc. | | | 200 | | | | 206,050 | | | | 18,092 | |
| Graham Holdings Co. | | | 1,800 | | | | 1,139,631 | | | | 54,345 | |
| Great Plains Energy, Inc. | | | 9,200 | | | | 219,244 | | | | 3,764 | |
| Green Mountain Coffee Roasters, Inc. | | | 9,500 | | | | 592,926 | | | | 125,084 | |
| Guess?, Inc. | | | 9,000 | | | | 290,828 | | | | (11,198) | |
| H&R Block, Inc. | | | 12,900 | | | | 370,329 | | | | 4,287 | |
| Hanesbrands, Inc. | | | 27,000 | | | | 1,851,564 | | | | 45,726 | |
| Hanover Insurance Group, Inc./The | | | 500 | | | | 29,984 | | | | (129) | |
| Harris Corp. | | | 16,400 | | | | 1,055,682 | | | | 89,202 | |
| Hasbro, Inc. | | | 6,700 | | | | 346,152 | | | | 22,415 | |
| HCA Holdings, Inc. | | | 600 | | | | 28,210 | | | | 416 | |
| HCC Insurance Holdings, Inc. | | | 4,500 | | | | 203,888 | | | | 3,742 | |
| Helmerich & Payne, Inc. | | | 34,100 | | | | 2,647,742 | | | | 219,386 | |
| Henry Schein, Inc. | | | 4,400 | | | | 494,181 | | | | 8,563 | |
| Hershey Co./The | | | 3,200 | | | | 316,456 | | | | (5,320) | |
| Hess Corp. | | | 33,000 | | | | 2,664,790 | | | | 74,210 | |
| Hewlett-Packard Co. | | | 91,200 | | | | 2,404,298 | | | | 147,478 | |
| Hill-Rom Holdings, Inc. | | | 4,300 | | | | 176,883 | | | | 879 | |
| HollyFrontier Corp. | | | 4,600 | | | | 210,706 | | | | 17,868 | |
| | | | | | | | | | | | |
REFERENCE
ENTITY | | SHARES | | | NOTIONAL (a) | | | NET
UNREALIZED
APPRECIATION
(DEPRECIATION) | |
| United States (continued) | | | | | | | | | |
| Home Depot, Inc./The | | | 9,500 | | | $ | 734,353 | | | $ | 47,877 | |
| Honeywell International, Inc. | | | 26,700 | | | | 2,318,780 | | | | 120,799 | |
| Hormel Foods Corp. | | | 18,600 | | | | 805,659 | | | | 34,503 | |
| Howard Hughes Corp./The | | | 3,100 | | | | 353,186 | | | | 19,124 | |
| Hubbell, Inc. | | | 1,600 | | | | 171,657 | | | | 2,583 | |
| Humana, Inc. | | | 19,900 | | | | 1,937,998 | | | | 116,080 | |
| IAC/InterActiveCorp. | | | 16,600 | | | | 909,232 | | | | 231,022 | |
| IDACORP, Inc. | | | 3,900 | | | | 200,788 | | | | 1,388 | |
| IDEX Corp. | | | 400 | | | | 27,767 | | | | 1,773 | |
| Illinois Tool Works, Inc. | | | 6,000 | | | | 473,111 | | | | 31,369 | |
| Incyte Corp Ltd. | | | 17,300 | | | | 687,006 | | | | 188,893 | |
| Ingram Micro, Inc. | | | 37,100 | | | | 856,014 | | | | 14,352 | |
| Ingredion, Inc. | | | 1,900 | | | | 124,905 | | | | 5,169 | |
| Integrys Energy Group, Inc. | | | 2,900 | | | | 170,861 | | | | (13,072) | |
| Intel Corp. | | | 57,200 | | | | 1,392,797 | | | | 92,115 | |
| International Business Machines Corp. | | | 2,800 | | | | 502,389 | | | | 22,807 | |
| International Flavors & Fragrances, Inc. | | | 500 | | | | 41,327 | | | | 1,663 | |
| International Paper Co. | | | 20,900 | | | | 936,575 | | | | 88,152 | |
| International Rectifier Corp. | | | 3,900 | | | | 98,045 | | | | 3,628 | |
| Intuit, Inc. | | | 400 | | | | 28,563 | | | | 1,965 | |
| ITC Holdings Corp. | | | 300 | | | | 30,279 | | | | (1,533) | |
| ITT Corp. | | | 2,300 | | | | 91,950 | | | | 7,916 | |
| Jack Henry & Associates, Inc. | | | 5,000 | | | | 271,944 | | | | 24,106 | |
| Jacobs Engineering Group, Inc. | | | 14,000 | | | | 833,491 | | | | 48,369 | |
| JM Smucker Co./The | | | 6,300 | | | | 697,347 | | | | (44,541) | |
| Johnson & Johnson | | | 32,600 | | | | 3,036,739 | | | | (50,905) | |
| Johnson Controls, Inc. | | | 15,400 | | | | 704,639 | | | | 85,381 | |
| JPMorgan Chase & Co. | | | 70,600 | | | | 3,689,358 | | | | 439,330 | |
| Juniper Networks, Inc. | | | 11,800 | | | | 252,432 | | | | 13,894 | |
| Kimberly-Clark Corp. | | | 20,800 | | | | 2,234,017 | | | | (61,249) | |
| KLA-Tencor Corp. | | | 2,100 | | | | 136,029 | | | | (663) | |
| Kroger Co./The | | | 54,100 | | | | 2,309,264 | | | | (170,691) | |
| L-3 Communications Holdings, Inc. | | | 7,900 | | | | 797,026 | | | | 47,168 | |
| Lam Research Corp. | | | 8,300 | | | | 439,292 | | | | 12,643 | |
| Lear Corp. | | | 19,100 | | | | 1,513,022 | | | | 33,505 | |
| Leggett & Platt, Inc. | | | 1,900 | | | | 55,980 | | | | 2,806 | |
| Leidos Holdings, Inc. | | | 25,700 | | | | 1,178,034 | | | | 16,759 | |
| Lennox International, Inc. | | | 700 | | | | 54,470 | | | | 5,072 | |
| Leucadia National Corp. | | | 4,000 | | | | 114,405 | | | | (1,045) | |
| Lexmark International, Inc. | | | 51,200 | | | | 1,808,159 | | | | 10,465 | |
| Liberty Interactive Corp. | | | 3,300 | | | | 89,055 | | | | 7,800 | |
| Liberty Media Corp. | | | 24,000 | | | | 3,715,450 | | | | (200,650) | |
| Lincoln Electric Holdings, Inc. | | | 10,300 | | | | 729,396 | | | | 5,406 | |
| Lincoln National Corp. | | | 42,500 | | | | 1,941,579 | | | | 252,271 | |
| | | | |
| | The accompanying notes are an integral part of these financial statements. | | (Continued) |
| | | | | | | | | | | | | | | | |
| | AQR Funds | | | | | | Annual Report | | | | | | December 2013 | | 201 |
| | | | | | | | | | |
| | | | |
| Consolidated Schedule of Investments | | | December 31, 2013 | |
| | |
| AQR STYLE PREMIA ALTERNATIVE FUND | | |
| | | | | | | | | | | | |
REFERENCE
ENTITY | | SHARES | | | NOTIONAL (a) | | | NET
UNREALIZED
APPRECIATION
(DEPRECIATION) | |
| United States (continued) | | | | | | | | | |
| Lockheed Martin Corp. | | | 8,700 | | | $ | 1,173,655 | | | $ | 119,687 | |
| Loews Corp. | | | 5,800 | | | | 278,480 | | | | 1,312 | |
| Lorillard, Inc. | | | 2,100 | | | | 107,836 | | | | (1,408) | |
| Lowe’s Cos., Inc. | | | 16,200 | | | | 801,399 | | | | 1,311 | |
| LyondellBasell Industries NV | | | 55,800 | | | | 4,125,199 | | | | 354,425 | |
| M&T Bank Corp. | | | 7,900 | | | | 883,988 | | | | 35,730 | |
| Manpowergroup, Inc. | | | 23,400 | | | | 1,858,601 | | | | 150,523 | |
| Marathon Oil Corp. | | | 63,800 | | | | 2,245,498 | | | | 6,642 | |
| Marathon Petroleum Corp. | | | 1,000 | | | | 70,837 | | | | 20,893 | |
| Marsh & McLennan Cos., Inc. | | | 5,400 | | | | 247,742 | | | | 13,402 | |
| MasterCard, Inc. | | | 600 | | | | 440,111 | | | | 61,165 | |
| Mattel, Inc. | | | 19,400 | | | | 867,624 | | | | 55,428 | |
| Maxim Integrated Products, Inc. | | | 1,000 | | | | 28,226 | | | | (316) | |
| McDonald’s Corp. | | | 7,300 | | | | 707,767 | | | | 552 | |
| McKesson Corp. | | | 14,900 | | | | 2,364,287 | | | | 40,573 | |
| Medtronic, Inc. | | | 44,400 | | | | 2,537,821 | | | | 10,295 | |
| Mentor Graphics Corp. | | | 14,100 | | | | 309,832 | | | | 29,555 | |
| Merck & Co., Inc. | | | 9,300 | | | | 417,919 | | | | 47,546 | |
| Meredith Corp. | | | 1,200 | | | | 62,074 | | | | 86 | |
| MetLife, Inc. | | | 17,100 | | | | 811,373 | | | | 110,659 | |
| Micron Technology, Inc. | | | 81,600 | | | | 1,432,553 | | | | 343,063 | |
| Microsoft Corp. | | | 58,400 | | | | 2,073,971 | | | | 111,941 | |
| Mohawk Industries, Inc. | | | 1,800 | | | | 248,363 | | | | 19,657 | |
| Morgan Stanley | | | 74,200 | | | | 2,215,165 | | | | 111,747 | |
| Murphy Oil Corp. | | | 35,400 | | | | 2,110,778 | | | | 185,974 | |
| Murphy USA, Inc. | | | 5,300 | | | | 231,125 | | | | (10,857) | |
| Myriad Genetics, Inc. | | | 47,700 | | | | 1,160,158 | | | | (159,412) | |
| Nationstar Mortgage Holdings, Inc. | | | 28,300 | | | | 1,428,782 | | | | (382,814) | |
| NetApp, Inc. | | | 5,500 | | | | 227,260 | | | | (990) | |
| Netflix, Inc. | | | 800 | | | | 262,827 | | | | 31,709 | |
| NeuStar, Inc. | | | 3,200 | | | | 146,288 | | | | 13,264 | |
| New York Community Bancorp., Inc. | | | 3,000 | | | | 48,447 | | | | 2,103 | |
| Newell Rubbermaid, Inc. | | | 1,000 | | | | 29,678 | | | | 2,732 | |
| NewMarket Corp. | | | 500 | | | | 154,395 | | | | 12,680 | |
| NextEra Energy, Inc. | | | 7,700 | | | | 684,495 | | | | (25,221) | |
| Noble Energy, Inc. | | | 7,500 | | | | 559,016 | | | | (48,191) | |
| Nordstrom, Inc. | | | 500 | | | | 30,451 | | | | 449 | |
| Norfolk Southern Corp. | | | 13,900 | | | | 1,210,289 | | | | 80,048 | |
| Northeast Utilities | | | 3,000 | | | | 127,485 | | | | (315) | |
| Northrop Grumman Corp. | | | 30,500 | | | | 3,307,753 | | | | 187,852 | |
| Nu Skin Enterprises, Inc. | | | 7,900 | | | | 924,428 | | | | 167,510 | |
| Nucor Corp. | | | 9,700 | | | | 510,492 | | | | 7,294 | |
| NVIDIA Corp. | | | 2,900 | | | | 44,299 | | | | 2,159 | |
| Occidental Petroleum Corp. | | | 11,500 | | | | 1,096,427 | | | | (2,777) | |
| Oceaneering International, Inc. | | | 1,800 | | | | 153,692 | | | | (11,708) | |
| OGE Energy Corp. | | | 3,300 | | | | 122,662 | | | | (10,792) | |
| | | | | | | | | | | | |
REFERENCE
ENTITY | | SHARES | | | NOTIONAL (a) | | | NET
UNREALIZED
APPRECIATION
(DEPRECIATION) | |
| United States (continued) | | | | | | | | | |
| Oil States International, Inc. | | | 1,500 | | | $ | 161,581 | | | $ | (9,001) | |
| Old Dominion Freight Line, Inc. | | | 6,400 | | | | 300,995 | | | | 38,333 | |
| Olin Corp. | | | 8,100 | | | | 181,762 | | | | 51,923 | |
| Omnicare, Inc. | | | 13,000 | | | | 717,198 | | | | 67,482 | |
| Oracle Corp. | | | 54,000 | | | | 1,812,834 | | | | 253,206 | |
| O’Reilly Automotive, Inc. | | | 6,800 | | | | 844,218 | | | | 31,010 | |
| Owens & Minor, Inc. | | | 6,100 | | | | 226,834 | | | | (3,818) | |
| Owens-Illinois, Inc. | | | 11,000 | | | | 347,999 | | | | 45,581 | |
| PACCAR, Inc. | | | 16,400 | | | | 915,681 | | | | 54,707 | |
| Packaging Corp. of America | | | 12,700 | | | | 792,684 | | | | 10,972 | |
| Parker Hannifin Corp. | | | 2,000 | | | | 232,185 | | | | 25,095 | |
| Patterson Cos., Inc. | | | 5,300 | | | | 225,175 | | | | (6,815) | |
| Penn National Gaming, Inc. | | | 20,200 | | | | 286,295 | | | | 3,171 | |
| PepsiCo, Inc. | | | 6,100 | | | | 513,489 | | | | (7,555) | |
| PetSmart, Inc. | | | 2,800 | | | | 200,094 | | | | 3,606 | |
| Pfizer, Inc. | | | 48,900 | | | | 1,519,621 | | | | (21,814) | |
| PG&E Corp. | | | 16,100 | | | | 680,433 | | | | (31,925) | |
| Phillips 66 | | | 36,500 | | | | 2,375,922 | | | | 439,323 | |
| Pinnacle West Capital Corp. | | | 24,700 | | | | 1,390,864 | | | | (83,740) | |
| Plantronics, Inc. | | | 3,300 | | | | 144,339 | | | | 8,946 | |
| PNC Financial Services Group, Inc./The | | | 28,300 | | | | 2,086,603 | | | | 108,911 | |
| Polaris Industries, Inc. | | | 2,700 | | | | 353,264 | | | | 39,964 | |
| PPG Industries, Inc. | | | 1,300 | | | | 237,488 | | | | 9,070 | |
| priceline.com, Inc. | | | 1,300 | | | | 1,363,548 | | | | 147,572 | |
| ProAssurance Corp. | | | 600 | | | | 27,099 | | | | 1,989 | |
| Procter & Gamble Co./The | | | 24,600 | | | | 1,992,691 | | | | 9,995 | |
| Prosperity Bancshares, Inc. | | | 900 | | | | 55,841 | | | | 1,210 | |
| Protective Life Corp. | | | 9,800 | | | | 447,553 | | | | 48,915 | |
| Public Service Enterprise Group, Inc. | | | 49,300 | | | | 1,655,433 | | | | (75,861) | |
| Raytheon Co. | | | 24,900 | | | | 2,078,620 | | | | 179,810 | |
| Regal Entertainment Group | | | 21,000 | | | | 403,130 | | | | 5,320 | |
| Reinsurance Group of America, Inc. | | | 14,200 | | | | 1,007,013 | | | | 92,209 | |
| Reliance Steel & Aluminum Co. | | | 23,300 | | | | 1,725,853 | | | | 41,219 | |
| Rent-A-Center, Inc. | | | 13,700 | | | | 466,184 | | | | (9,426) | |
| Republic Services, Inc. | | | 900 | | | | 30,960 | | | | (1,080) | |
| Reynolds American, Inc. | | | 7,600 | | | | 390,251 | | | | (10,327) | |
| Rock Tenn Co. | | | 19,200 | | | | 1,948,373 | | | | 67,819 | |
| Rockwell Automation, Inc. | | | 5,100 | | | | 558,493 | | | | 44,123 | |
| Ross Stores, Inc. | | | 2,200 | | | | 170,457 | | | | (5,611) | |
| Rovi Corp. | | | 5,800 | | | | 96,437 | | | | 17,765 | |
| RR Donnelley & Sons Co. | | | 20,500 | | | | 385,863 | | | | 29,877 | |
| Ryder System, Inc. | | | 21,500 | | | | 1,431,347 | | | | 154,923 | |
| | | | |
| | The accompanying notes are an integral part of these financial statements. | | (Continued) |
| | | | | | | | | | | | | | | | |
| 202 | | AQR Funds | | | | | | Annual Report | | | | | | December 2013 | | |
| | | | | | | | | | |
| | | | |
| Consolidated Schedule of Investments | | | December 31, 2013 | |
| | |
| AQR STYLE PREMIA ALTERNATIVE FUND | | |
| | | | | | | | | | | | |
REFERENCE
ENTITY | | SHARES | | | NOTIONAL (a) | | | NET
UNREALIZED
APPRECIATION
(DEPRECIATION) | |
| United States (continued) | | | | | | | | | |
| SCANA Corp. | | | 8,200 | | | $ | 386,257 | | | $ | (1,431) | |
| SEI Investments Co. | | | 3,500 | | | | 115,906 | | | | 5,649 | |
| Sempra Energy | | | 4,800 | | | | 438,882 | | | | (8,034) | |
| Silgan Holdings, Inc. | | | 1,500 | | | | 67,599 | | | | 4,431 | |
| Skyworks Solutions, Inc. | | | 2,900 | | | | 81,151 | | | | 1,673 | |
| SLM Corp. | | | 78,800 | | | | 1,999,721 | | | | 71,143 | |
| Snap-on, Inc. | | | 3,300 | | | | 341,657 | | | | 19,759 | |
| Sonoco Products Co. | | | 11,900 | | | | 482,551 | | | | 13,917 | |
| Southwest Airlines Co. | | | 145,400 | | | | 2,575,264 | | | | 164,072 | |
| StanCorp Financial Group, Inc. | | | 4,700 | | | | 279,036 | | | | 32,339 | |
| Staples, Inc. | | | 13,900 | | | | 223,816 | | | | (2,945) | |
| Starbucks Corp. | | | 900 | | | | 72,012 | | | | (1,461) | |
| State Street Corp. | | | 2,800 | | | | 197,151 | | | | 8,341 | |
| Steel Dynamics, Inc. | | | 130,900 | | | | 2,429,293 | | | | 128,493 | |
| STERIS Corp. | | | 5,200 | | | | 236,429 | | | | 13,431 | |
| Stryker Corp. | | | 12,500 | | | | 923,009 | | | | 16,241 | |
| Symantec Corp. | | | 51,500 | | | | 1,173,381 | | | | 40,989 | |
| Synopsys, Inc. | | | 8,300 | | | | 300,372 | | | | 36,359 | |
| Tech Data Corp. | | | 7,200 | | | | 372,315 | | | | (795) | |
| Techne Corp. | | | 300 | | | | 26,418 | | | | 1,983 | |
| Telephone & Data Systems, Inc. | | | 4,800 | | | | 131,371 | | | | (7,627) | |
| Texas Instruments, Inc. | | | 12,000 | | | | 503,407 | | | | 23,513 | |
| Thermo Fisher Scientific, Inc. | | | 9,500 | | | | 930,722 | | | | 127,103 | |
| Time Warner Cable, Inc. | | | 12,800 | | | | 1,569,100 | | | | 165,300 | |
| Time Warner, Inc. | | | 11,100 | | | | 762,159 | | | | 11,733 | |
| Timken Co. | | | 17,100 | | | | 900,985 | | | | 40,712 | |
| TJX Cos., Inc. | | | 6,500 | | | | 394,840 | | | | 19,405 | |
| Torchmark Corp. | | | 6,700 | | | | 487,716 | | | | 35,889 | |
| Toro Co./The | | | 1,600 | | | | 93,342 | | | | 8,418 | |
| Total System Services, Inc. | | | 10,500 | | | | 312,091 | | | | 37,349 | |
| Towers Watson & Co. | | | 14,000 | | | | 1,621,333 | | | | 165,207 | |
| Tractor Supply Co. | | | 1,000 | | | | 71,012 | | | | 6,568 | |
| Travelers Cos., Inc./The | | | 40,300 | | | | 3,483,258 | | | | 165,504 | |
| Trinity Industries, Inc. | | | 1,700 | | | | 88,935 | | | | 3,749 | |
| TripAdvisor, Inc. | | | 8,200 | | | | 678,670 | | | | 536 | |
| Tupperware Brands Corp. | | | 11,400 | | | | 1,030,552 | | | | 47,090 | |
| Twenty-First Century Fox, Inc. | | | 2,300 | | | | 78,493 | | | | 1,087 | |
| Twenty-First Century Fox, Inc. | | | 11,200 | | | | 383,181 | | | | 10,835 | |
| Tyson Foods, Inc. | | | 93,100 | | | | 2,577,930 | | | | 537,196 | |
| UGI Corp. | | | 8,000 | | | | 332,129 | | | | (449) | |
| Union Pacific Corp. | | | 23,900 | | | | 3,648,830 | | | | 366,370 | |
| United Rentals, Inc. | | | 1,900 | | | | 124,298 | | | | 23,807 | |
| United Technologies Corp. | | | 24,000 | | | | 2,573,062 | | | | 158,138 | |
| United Therapeutics Corp. | | | 24,800 | | | | 2,223,808 | | | | 580,576 | |
| UnitedHealth Group, Inc. | | | 47,700 | | | | 3,260,586 | | | | 331,224 | |
| Universal Health Services, Inc. | | | 700 | | | | 56,123 | | | | 759 | |
| | | | | | | | | | | | |
REFERENCE
ENTITY | | SHARES | | | NOTIONAL (a) | | | NET
UNREALIZED
APPRECIATION
(DEPRECIATION) | |
| United States (continued) | | | | | | | | | |
| Unum Group | | | 41,400 | | | $ | 1,307,768 | | | $ | 144,544 | |
| URS Corp. | | | 23,800 | | | | 1,281,917 | | | | (20,755) | |
| Valero Energy Corp. | | | 22,600 | | | | 933,642 | | | | 205,398 | |
| Valmont Industries, Inc. | | | 9,800 | | | | 1,388,727 | | | | 72,649 | |
| ValueClick, Inc. | | | 6,000 | | | | 117,457 | | | | 22,763 | |
| Vectren Corp. | | | 3,700 | | | | 129,192 | | | | 2,158 | |
| VeriSign, Inc. | | | 2,300 | | | | 129,470 | | | | 8,024 | |
| Verizon Communications, Inc. | | | 2,600 | | | | 131,868 | | | | (4,104) | |
| VF Corp. | | | 3,600 | | | | 199,642 | | | | 24,782 | |
| Viacom, Inc. | | | 20,300 | | | | 1,691,067 | | | | 81,935 | |
| Wabtec Corp. | | | 2,800 | | | | 183,493 | | | | 24,463 | |
| Waddell & Reed Financial, Inc. | | | 1,800 | | | | 113,066 | | | | 4,150 | |
| Walgreen Co. | | | 28,200 | | | | 1,701,684 | | | | (81,876) | |
| Wal-Mart Stores, Inc. | | | 8,300 | | | | 638,287 | | | | 14,840 | |
| Walt Disney Co./The | | | 3,100 | | | | 213,158 | | | | 23,682 | |
| Waste Connections, Inc. | | | 6,000 | | | | 255,541 | | | | 6,239 | |
| Waste Management, Inc. | | | 31,200 | | | | 1,360,588 | | | | 39,356 | |
| WellPoint, Inc. | | | 48,300 | | | | 4,136,292 | | | | 326,145 | |
| Wells Fargo & Co. | | | 27,300 | | | | 1,166,715 | | | | 72,705 | |
| WESCO International, Inc. | | | 800 | | | | 68,022 | | | | 4,834 | |
| Westar Energy, Inc. | | | 20,900 | | | | 664,135 | | | | 8,218 | |
| Western Digital Corp. | | | 32,000 | | | | 2,487,831 | | | | 196,969 | |
| Westlake Chemical Corp. | | | 10,600 | | | | 1,132,566 | | | | 161,376 | |
| WGL Holdings, Inc. | | | 1,400 | | | | 63,176 | | | | (7,092) | |
| Whirlpool Corp. | | | 15,600 | | | | 2,281,904 | | | | 165,112 | |
| Whiting Petroleum Corp. | | | 12,900 | | | | 847,538 | | | | (49,415) | |
| Whole Foods Market, Inc. | | | 1,800 | | | | 113,696 | | | | (9,602) | |
| Wisconsin Energy Corp. | | | 700 | | | | 29,503 | | | | (565) | |
| Worthington Industries, Inc. | | | 20,200 | | | | 837,312 | | | | 12,704 | |
| WR Berkley Corp. | | | 1,100 | | | | 47,958 | | | | (229) | |
| Wynn Resorts Ltd. | | | 3,600 | | | | 601,778 | | | | 97,378 | |
| Xcel Energy, Inc. | | | 34,000 | | | | 982,913 | | | | (32,953) | |
| Xerox Corp. | | | 93,000 | | | | 924,299 | | | | 207,511 | |
| Yahoo!, Inc. | | | 15,900 | | | | 527,937 | | | | 115,059 | |
| Zimmer Holdings, Inc. | | | 12,700 | | | | 1,113,560 | | | | 69,953 | |
| | | | | | | | | | | | |
| | | | | | | | | | | 18,375,269 | |
| | | | | | | | | | | | |
| Total of Long Equity Positions | | | | | | | | | | | 19,106,776 | |
| | | | | | | | | | | | |
| | | |
| Short Positions | | | | | | | | | | | | |
| | | |
| Bermuda | | | | | | | | | | | | |
| Assured Guaranty Ltd. | | | (68,500) | | | | (1,401,352) | | | | (214,563) | |
| Genpact Ltd. | | | (7,600) | | | | (151,012) | | | | 11,400 | |
| Nabors Industries Ltd. | | | (57,500) | | | | (1,011,086) | | | | 34,161 | |
| Teekay Corp. | | | (13,000) | | | | (574,099) | | | | (50,031) | |
| | | | | | | | | | | | |
| | | | | | | | | | | (219,033) | |
| | | | | | | | | | | | |
| | | |
| Canada | | | | | | | | | | | | |
| Domtar Corp. | | | (2,800) | | | | (237,052) | | | | (27,100) | |
| Lululemon Athletica, Inc. | | | (44,000) | | | | (3,005,525) | | | | 408,205 | |
| | | | | | | | | | | | |
| | | | | | | | | | | 381,105 | |
| | | | | | | | | | | | |
| | | | |
| | The accompanying notes are an integral part of these financial statements. | | (Continued) |
| | | | | | | | | | | | | | | | |
| | AQR Funds | | | | | | Annual Report | | | | | | December 2013 | | 203 |
| | | | | | | | | | |
| | | | |
| Consolidated Schedule of Investments | | | December 31, 2013 | |
| | |
| AQR STYLE PREMIA ALTERNATIVE FUND | | |
| | | | | | | | | | | | |
REFERENCE
ENTITY | | SHARES | | | NOTIONAL (a) | | | NET
UNREALIZED
APPRECIATION
(DEPRECIATION) | |
| United States (continued) | | | | | | | | | |
| | | |
| Hong Kong | | | | | | | | | | | | |
| Michael Kors Holdings Ltd. | | | (16,900) | | | $ | (1,279,507) | | | $ | (92,604) | |
| | | | | | | | | | | | |
| | | |
| Ireland | | | | | | | | | | | | |
| Alkermes PLC | | | (1,600) | | | | (56,816) | | | | (8,240) | |
| Jazz Pharmaceuticals PLC | | | (20,500) | | | | (1,849,775) | | | | (744,705) | |
| | | | | | | | | | | | |
| | | | | | | | | | | (752,945) | |
| | | | | | | | | | | | |
| | | |
| Netherlands | | | | | | | | | | | | |
| Chicago Bridge & Iron Co. NV | | | (4,300) | | | | (316,325) | | | | (41,177) | |
| | | | | | | | | | | | |
| | | |
| Singapore | | | | | | | | | | | | |
| Flextronics International Ltd. | | | (25,500) | | | | (200,876) | | | | 2,741 | |
| | | | | | | | | | | | |
| | | |
| Switzerland | | | | | | | | | | | | |
| Weatherford International Ltd. | | | (99,100) | | | | (1,620,890) | | | | 85,831 | |
| | | | | | | | | | | | |
| | | |
| United Kingdom | | | | | | | | | | | | |
| Liberty Global PLC | | | (32,300) | | | | (2,524,901) | | | | (349,476) | |
| Willis Group Holdings PLC | | | (13,400) | | | | (601,866) | | | | 1,412 | |
| | | | | | | | | | | | |
| | | | | | | | | | | (348,064) | |
| | | | | | | | | | | | |
| United States | | | | | | | | | |
| Adobe Systems, Inc. | | | (5,500) | | | | (299,510) | | | | (29,830) | |
| ADTRAN, Inc. | | | (23,200) | | | | (551,751) | | | | (74,881) | |
| Aeropostale, Inc. | | | (75,500) | | | | (686,078) | | | | (217) | |
| AES Corp. | | | (2,400) | | | | (33,582) | | | | (1,242) | |
| Alcoa, Inc. | | | (8,900) | | | | (82,152) | | | | (12,455) | |
| Alere, Inc. | | | (11,100) | | | | (371,491) | | | | (30,329) | |
| Alexion Pharmaceuticals, Inc. | | | (13,500) | | | | (1,662,410) | | | | (133,900) | |
| Allegheny Technologies, Inc. | | | (15,300) | | | | (508,938) | | | | (36,201) | |
| Allergan, Inc. | | | (22,700) | | | | (2,052,577) | | | | (468,939) | |
| Alliance Data Systems Corp. | | | (800) | | | | (189,036) | | | | (21,308) | |
| Allscripts Healthcare Solutions, Inc. | | | (20,700) | | | | (291,273) | | | | (28,749) | |
| Alpha Natural Resources, Inc. | | | (40,700) | | | | (296,980) | | | | 6,382 | |
| Altera Corp. | | | (37,700) | | | | (1,256,628) | | | | 30,247 | |
| Amazon.com, Inc. | | | (2,800) | | | | (1,004,000) | | | | (112,612) | |
| American Capital Ltd. | | | (52,300) | | | | (732,922) | | | | (85,050) | |
| American Eagle Outfitters, Inc. | | | (74,400) | | | | (1,122,882) | | | | 51,522 | |
| American International Group, Inc. | | | (31,200) | | | | (1,510,810) | | | | (81,950) | |
| AMETEK, Inc. | | | (7,100) | | | | (338,375) | | | | (35,582) | |
| ANN, Inc. | | | (5,100) | | | | (179,745) | | | | (6,711) | |
| Apollo Investment Corp. | | | (16,000) | | | | (135,194) | | | | (486) | |
| | | | | | | | | | | | |
REFERENCE
ENTITY | | SHARES | | | NOTIONAL (a) | | | NET
UNREALIZED
APPRECIATION
(DEPRECIATION) | |
| United States (continued) | | | | | | | | | |
| Apple, Inc. | | | (2,500) | | | $ | (1,299,425) | | | $ | (103,350) | |
| Arch Coal, Inc. | | | (422,300) | | | | (1,805,126) | | | | (74,109) | |
| Armstrong World Industries, Inc. | | | (2,500) | | | | (130,834) | | | | (13,191) | |
| Ascena Retail Group, Inc. | | | (3,100) | | | | (61,282) | | | | (4,314) | |
| Ashland, Inc. | | | (1,100) | | | | (101,584) | | | | (5,160) | |
| Atmel Corp. | | | (24,300) | | | | (176,105) | | | | (14,164) | |
| Autodesk, Inc. | | | (9,300) | | | | (398,806) | | | | (69,263) | |
| AutoNation, Inc. | | | (3,400) | | | | (164,259) | | | | (4,687) | |
| Avis Budget Group, Inc. | | | (6,100) | | | | (190,538) | | | | (56,024) | |
| Avon Products, Inc. | | | (76,500) | | | | (1,341,562) | | | | 24,232 | |
| Bally Technologies, Inc. | | | (3,000) | | | | (216,195) | | | | (19,155) | |
| BancorpSouth, Inc. | | | (9,600) | | | | (211,372) | | | | (32,660) | |
| Bank of America Corp. | | | (65,700) | | | | (922,191) | | | | (100,758) | |
| Barnes & Noble, Inc. | | | (83,000) | | | | (1,262,069) | | | | 21,219 | |
| Beam, Inc. | | | (4,900) | | | | (326,422) | | | | (7,072) | |
| BioMarin Pharmaceutical, Inc. | | | (20,200) | | | | (1,331,183) | | | | (88,271) | |
| Boston Scientific Corp. | | | (15,000) | | | | (175,902) | | | | (4,398) | |
| Bristol-Myers Squibb Co. | | | (18,800) | | | | (987,462) | | | | (11,758) | |
| Broadcom Corp. | | | (19,300) | | | | (518,242) | | | | (54,003) | |
| Brookdale Senior Living, Inc. | | | (86,700) | | | | (2,412,627) | | | | 56,121 | |
| Brown & Brown, Inc. | | | (1,000) | | | | (31,862) | | | | 472 | |
| Bruker Corp. | | | (23,000) | | | | (431,621) | | | | (23,089) | |
| Cabela’s, Inc. | | | (16,200) | | | | (957,218) | | | | (122,674) | |
| Cablevision Systems Corp. | | | (39,300) | | | | (622,944) | | | | (81,705) | |
| Cabot Oil & Gas Corp. | | | (7,400) | | | | (260,259) | | | | (26,565) | |
| Calpine Corp. | | | (107,300) | | | | (2,131,381) | | | | 37,958 | |
| Cameron International Corp. | | | (25,800) | | | | (1,407,132) | | | | (128,742) | |
| CarMax, Inc. | | | (6,900) | | | | (333,055) | | | | 8,617 | |
| Carnival Corp. | | | (63,900) | | | | (2,215,253) | | | | (351,610) | |
| Catamaran Corp. | | | (16,700) | | | | (774,025) | | | | (18,891) | |
| Caterpillar, Inc. | | | (9,600) | | | | (799,397) | | | | (72,379) | |
| CenterPoint Energy, Inc. | | | (11,500) | | | | (281,360) | | | | 14,790 | |
| CenturyLink, Inc. | | | (16,100) | | | | (542,013) | | | | 29,228 | |
| Cerner Corp. | | | (500) | | | | (27,991) | | | | 121 | |
| CF Industries Holdings, Inc. | | | (500) | | | | (107,512) | | | | (9,008) | |
| CH Robinson Worldwide, Inc. | | | (8,400) | | | | (503,199) | | | | 13,143 | |
| Charles Schwab Corp./The | | | (78,600) | | | | (1,815,416) | | | | (228,184) | |
| Charter Communications, Inc. | | | (200) | | | | (27,059) | | | | (293) | |
| Cheniere Energy, Inc. | | | (59,400) | | | | (2,430,311) | | | | (131,017) | |
| Chesapeake Energy Corp. | | | (34,000) | | | | (947,658) | | | | 24,898 | |
| Chico’s FAS, Inc. | | | (30,700) | | | | (525,037) | | | | (53,351) | |
| Chipotle Mexican Grill, Inc. | | | (2,600) | | | | (1,368,825) | | | | (16,403) | |
| Ciena Corp. | | | (1,300) | | | | (30,152) | | | | (957) | |
| Cincinnati Financial Corp. | | | (600) | | | | (30,123) | | | | (1,299) | |
| | | | |
| | The accompanying notes are an integral part of these financial statements. | | (Continued) |
| | | | | | | | | | | | | | | | |
| 204 | | AQR Funds | | | | | | Annual Report | | | | | | December 2013 | | |
| | | | | | | | | | |
| | | | |
| Consolidated Schedule of Investments | | | December 31, 2013 | |
| | |
| AQR STYLE PREMIA ALTERNATIVE FUND | | |
| | | | | | | | | | | | |
REFERENCE
ENTITY | | SHARES | | | NOTIONAL (a) | | | NET
UNREALIZED
APPRECIATION
(DEPRECIATION) | |
| United States (continued) | | | | | | | | | |
| CIT Group, Inc. | | | (36,600) | | | $ | (1,772,475) | | | $ | (135,483) | |
| Citigroup, Inc. | | | (17,500) | | | | (854,317) | | | | (57,608) | |
| Citrix Systems, Inc. | | | (8,000) | | | | (454,234) | | | | (51,766) | |
| Clean Harbors, Inc. | | | (10,800) | | | | (657,210) | | | | 9,642 | |
| Coach, Inc. | | | (23,400) | | | | (1,178,487) | | | | (134,955) | |
| Coca-Cola Co./The | | | (34,200) | | | | (1,351,553) | | | | (61,249) | |
| Cognizant Technology Solutions Corp. | | | (2,000) | | | | (173,891) | | | | (28,069) | |
| Colfax Corp. | | | (4,000) | | | | (223,778) | | | | (30,982) | |
| Colgate-Palmolive Co. | | | (4,700) | | | | (305,797) | | | | (690) | |
| Community Health Systems, Inc. | | | (5,900) | | | | (249,104) | | | | 17,411 | |
| Compass Minerals International, Inc. | | | (7,500) | | | | (559,016) | | | | (41,359) | |
| Concho Resources, Inc. | | | (12,200) | | | | (1,315,644) | | | | (1,956) | |
| Concur Technologies, Inc. | | | (3,100) | | | | (296,214) | | | | (23,644) | |
| CONSOL Energy, Inc. | | | (87,500) | | | | (3,181,847) | | | | (146,653) | |
| Con-way, Inc. | | | (8,100) | �� | | | (331,998) | | | | 10,347 | |
| Copart, Inc. | | | (17,400) | | | | (565,365) | | | | (72,345) | |
| CoreLogic, Inc. | | | (1,900) | | | | (63,124) | | | | (4,383) | |
| Costco Wholesale Corp. | | | (7,200) | | | | (858,047) | | | | 1,175 | |
| Covance, Inc. | | | (400) | | | | (35,130) | | | | (94) | |
| Covanta Holding Corp. | | | (44,100) | | | | (763,100) | | | | (19,675) | |
| CR Bard, Inc. | | | (2,100) | | | | (284,204) | | | | 2,930 | |
| Crown Castle International Corp. | | | (26,300) | | | | (1,971,511) | | | | 40,302 | |
| CVR Energy, Inc. | | | (29,200) | | | | (1,146,892) | | | | (121,264) | |
| Cypress Semiconductor Corp. | | | (212,000) | | | | (1,992,491) | | | | (233,509) | |
| Cytec Industries, Inc. | | | (3,400) | | | | (294,385) | | | | (22,359) | |
| Darden Restaurants, Inc. | | | (7,500) | | | | (385,265) | | | | (22,510) | |
| DaVita HealthCare Partners, Inc. | | | (18,300) | | | | (1,030,361) | | | | (129,310) | |
| Dean Foods Co. | | | (70,900) | | | | (1,352,001) | | | | 133,230 | |
| Denbury Resources, Inc. | | | (9,000) | | | | (168,414) | | | | 20,544 | |
| Devon Energy Corp. | | | (20,300) | | | | (1,287,812) | | | | 31,851 | |
| Dick’s Sporting Goods, Inc. | | | (11,700) | | | | (624,126) | | | | (55,644) | |
| Diebold, Inc. | | | (28,900) | | | | (861,571) | | | | (92,418) | |
| Discovery Communications, Inc. | | | (3,900) | | | | (343,652) | | | | (8,986) | |
| Donaldson Co., Inc. | | | (2,700) | | | | (107,136) | | | | (10,206) | |
| DR Horton, Inc. | | | (25,600) | | | | (475,210) | | | | (96,182) | |
| DreamWorks Animation SKG, Inc. | | | (25,000) | | | | (842,199) | | | | (45,301) | |
| Dresser-Rand Group, Inc. | | | (5,700) | | | | (325,107) | | | | (14,784) | |
| Dunkin’ Brands Group, Inc. | | | (5,300) | | | | (252,620) | | | | (2,840) | |
| E*TRADE Financial Corp. | | | (103,900) | | | | (1,775,277) | | | | (265,319) | |
| Eagle Materials, Inc. | | | (6,800) | | | | (515,064) | | | | (11,460) | |
| Ecolab, Inc. | | | (4,800) | | | | (508,503) | | | | 8,007 | |
| Edwards Lifesciences Corp. | | | (25,100) | | | | (1,615,270) | | | | (35,306) | |
| | | | | | | | | | | | |
REFERENCE
ENTITY | | SHARES | | | NOTIONAL (a) | | | NET
UNREALIZED
APPRECIATION
(DEPRECIATION) | |
| United States (continued) | | | | | | | | | |
| EI du Pont de Nemours & Co. | | | (4,400) | | | $ | (268,842) | | | $ | (17,026) | |
| Endo Health Solutions, Inc. | | | (1,900) | | | | (83,567) | | | | (44,607) | |
| Equinix, Inc. | | | (22,100) | | | | (3,635,030) | | | | (286,615) | |
| Estee Lauder Cos., Inc./The | | | (1,700) | | | | (118,968) | | | | (9,076) | |
| Expedia, Inc. | | | (1,000) | | | | (58,653) | | | | (11,007) | |
| Expeditors International of Washington, Inc. | | | (25,800) | | | | (1,168,492) | | | | 26,842 | |
| F5 Networks, Inc. | | | (15,800) | | | | (1,254,166) | | | | (181,422) | |
| Facebook, Inc. | | | (28,100) | | | | (1,423,973) | | | | (111,973) | |
| Fairchild Semiconductor International, Inc. | | | (37,800) | | | | (474,428) | | | | (30,202) | |
| Family Dollar Stores, Inc. | | | (18,200) | | | | (1,256,821) | | | | 74,367 | |
| Fastenal Co. | | | (18,800) | | | | (915,102) | | | | 21,914 | |
| Fidelity National Financial, Inc. | | | (33,500) | | | | (931,736) | | | | (155,339) | |
| First American Financial Corp. | | | (12,300) | | | | (315,595) | | | | (31,265) | |
| First Horizon National Corp. | | | (84,200) | | | | (904,611) | | | | (76,319) | |
| FirstEnergy Corp. | | | (30,600) | | | | (1,163,134) | | | | 153,946 | |
| FMC Corp. | | | (4,500) | | | | (325,658) | | | | (13,912) | |
| FMC Technologies, Inc. | | | (9,100) | | | | (456,233) | | | | (18,878) | |
| Forest City Enterprises, Inc. | | | (38,800) | | | | (756,713) | | | | 15,633 | |
| Forest Laboratories, Inc. | | | (23,800) | | | | (1,121,223) | | | | (307,491) | |
| Fortinet, Inc. | | | (91,300) | | | | (1,770,803) | | | | 24,234 | |
| Freeport-McMoRan Copper & Gold, Inc. | | | (45,500) | | | | (1,666,506) | | | | (50,664) | |
| Freescale Semiconductor Ltd. | | | (45,700) | | | | (691,791) | | | | (41,694) | |
| Fresh Market, Inc./The | | | (8,200) | | | | (415,563) | | | | 83,463 | |
| Gartner, Inc. | | | (1,700) | | | | (100,767) | | | | (20,018) | |
| General Cable Corp. | | | (1,100) | | | | (34,730) | | | | 2,379 | |
| General Electric Co. | | | (35,900) | | | | (942,598) | | | | (63,679) | |
| Genesee & Wyoming, Inc. | | | (2,100) | | | | (206,421) | | | | 4,716 | |
| Gentex Corp. | | | (2,700) | | | | (78,336) | | | | (10,737) | |
| Genworth Financial, Inc. | | | (48,500) | | | | (702,492) | | | | (50,713) | |
| Global Payments, Inc. | | | (3,700) | | | | (219,769) | | | | (20,694) | |
| GNC Holdings, Inc. | | | (3,400) | | | | (198,949) | | | | 219 | |
| Goodyear Tire & Rubber Co./The | | | (8,500) | | | | (176,693) | | | | (26,032) | |
| Greenhill & Co, Inc. | | | (18,800) | | | | (987,138) | | | | (102,134) | |
| Groupon, Inc. | | | (58,400) | | | | (569,604) | | | | (117,764) | |
| Halliburton Co. | | | (600) | | | | (31,522) | | | | 1,072 | |
| Harley-Davidson, Inc. | | | (2,000) | | | | (128,736) | | | | (9,744) | |
| Harman International Industries, Inc. | | | (8,200) | | | | (677,010) | | | | 5,840 | |
| Harsco Corp. | | | (13,700) | | | | (376,177) | | | | (7,834) | |
| Health Net, Inc. | | | (3,100) | | | | (92,613) | | | | 636 | |
| Helix Energy Solutions Group, Inc. | | | (49,000) | | | | (1,128,048) | | | | (7,772) | |
| | | | |
| | The accompanying notes are an integral part of these financial statements. | | (Continued) |
| | | | | | | | | | | | | | | | |
| | AQR Funds | | | | | | Annual Report | | | | | | December 2013 | | 205 |
| | | | | | | | | | |
| | | | |
| Consolidated Schedule of Investments | | | December 31, 2013 | |
| | |
| AQR STYLE PREMIA ALTERNATIVE FUND | | |
| | | | | | | | | | | | |
REFERENCE
ENTITY | | SHARES | | | NOTIONAL (a) | | | NET
UNREALIZED
APPRECIATION
(DEPRECIATION) | |
| United States (continued) | | | | | | | | | |
| Hexcel Corp. | | | (3,200) | | | $ | (135,311) | | | $ | (7,697) | |
| Hillshire Brands Co. | | | (19,800) | | | | (637,334) | | | | (24,778) | |
| HMS Holdings Corp. | | | (49,200) | | | | (1,060,973) | | | | (57,343) | |
| Hologic, Inc. | | | (51,000) | | | | (1,138,325) | | | | (1,525) | |
| HomeAway, Inc. | | | (14,300) | | | | (486,642) | | | | (97,942) | |
| Hospira, Inc. | | | (7,400) | | | | (297,662) | | | | (7,810) | |
| HSN, Inc. | | | (1,700) | | | | (89,650) | | | | (16,260) | |
| Huntington Bancshares, Inc. | | | (64,000) | | | | (565,229) | | | | (52,371) | |
| Huntington Ingalls Industries, Inc. | | | (1,200) | | | | (85,875) | | | | (22,137) | |
| Huntsman Corp. | | | (3,800) | | | | (87,975) | | | | (5,505) | |
| IDEXX Laboratories, Inc. | | | (3,300) | | | | (355,130) | | | | 4,109 | |
| IHS, Inc. | | | (1,600) | | | | (173,010) | | | | (18,510) | |
| Illumina, Inc. | | | (9,200) | | | | (875,852) | | | | (141,852) | |
| Informatica Corp. | | | (5,500) | | | | (209,905) | | | | (18,345) | |
| Ingersoll-Rand PLC | | | (6,100) | | | | (308,154) | | | | (67,606) | |
| Integrated Device Technology, Inc. | | | (3,100) | | | | (32,042) | | | | 453 | |
| InterDigital, Inc. | | | (10,600) | | | | (348,060) | | | | 35,466 | |
| International Game Technology | | | (2,000) | | | | (37,395) | | | | 1,075 | |
| Intuitive Surgical, Inc. | | | (8,100) | | | | (3,002,540) | | | | (108,508) | |
| Iron Mountain, Inc. | | | (43,100) | | | | (1,118,001) | | | | (190,084) | |
| Itron, Inc. | | | (19,300) | | | | (794,508) | | | | (5,091) | |
| Janus Capital Group, Inc. | | | (87,400) | | | | (863,608) | | | | (217,530) | |
| Jarden Corp. | | | (500) | | | | (27,399) | | | | (3,276) | |
| JB Hunt Transport Services, Inc. | | | (1,300) | | | | (97,404) | | | | (3,086) | |
| JC Penney Co., Inc. | | | (177,100) | | | | (1,413,400) | | | | (207,065) | |
| JDS Uniphase Corp. | | | (104,500) | | | | (1,358,814) | | | | 2,404 | |
| JetBlue Airways Corp. | | | (65,300) | | | | (472,139) | | | | (86,176) | |
| Joy Global, Inc. | | | (3,700) | | | | (208,529) | | | | (7,884) | |
| KB Home | | | (1,700) | | | | (28,260) | | | | (2,816) | |
| KBR, Inc. | | | (900) | | | | (30,912) | | | | 2,211 | |
| KeyCorp. | | | (9,800) | | | | (123,016) | | | | (8,500) | |
| Kinder Morgan, Inc. | | | (36,500) | | | | (1,284,515) | | | | (29,485) | |
| Kohl’s Corp. | | | (10,400) | | | | (590,536) | | | | 336 | |
| Laboratory Corp of America Holdings | | | (800) | | | | (80,446) | | | | 7,350 | |
| Lamar Advertising Co. | | | (35,000) | | | | (1,648,125) | | | | (180,625) | |
| Laredo Petroleum, Inc. | | | (35,700) | | | | (1,098,606) | | | | 110,073 | |
| Las Vegas Sands Corp. | | | (28,200) | | | | (1,975,396) | | | | (248,738) | |
| Legg Mason, Inc. | | | (15,400) | | | | (593,183) | | | | (76,409) | |
| Lennar Corp. | | | (68,300) | | | | (2,368,422) | | | | (333,526) | |
| Level 3 Communications, Inc. | | | (39,900) | | | | (1,196,804) | | | | (126,678) | |
| Linear Technology Corp. | | | (8,400) | | | | (342,561) | | | | (40,059) | |
| LinkedIn Corp. | | | (7,100) | | | | (1,578,219) | | | | 38,726 | |
| Lions Gate Entertainment Corp. | | | (10,400) | | | | (318,144) | | | | (11,120) | |
| Louisiana-Pacific Corp. | | | (43,000) | | | | (725,371) | | | | (70,559) | |
| LSI Corp. | | | (90,800) | | | | (766,670) | | | | (233,946) | |
| Macy’s, Inc. | | | (15,900) | | | | (728,963) | | | | (120,097) | |
| Manitowoc Co., Inc./The | | | (44,700) | | | | (866,858) | | | | (175,546) | |
| | | | | | | | | | | | |
REFERENCE
ENTITY | | SHARES | | | NOTIONAL (a) | | | NET
UNREALIZED
APPRECIATION
(DEPRECIATION) | |
| United States (continued) | | | | | | | | | |
| Markel Corp. | | | (500) | | | $ | (265,956) | | | $ | (24,219) | |
| Martin Marietta Materials, Inc. | | | (10,600) | | | | (1,039,002) | | | | (20,362) | |
| Masco Corp. | | | (61,800) | | | | (1,286,639) | | | | (120,547) | |
| Masimo Corp. | | | (3,200) | | | | (82,874) | | | | (10,662) | |
| MBIA, Inc. | | | (61,200) | | | | (683,818) | | | | (46,910) | |
| McDermott International, Inc. | | | (370,500) | | | | (2,798,483) | | | | (595,297) | |
| MDU Resources Group, Inc. | | | (1,300) | | | | (39,238) | | | | (477) | |
| Mead Johnson Nutrition Co. | | | (24,400) | | | | (1,996,403) | | | | (47,341) | |
| Medivation, Inc. | | | (51,900) | | | | (3,341,236) | | | | 28,978 | |
| MEDNAX, Inc. | | | (600) | | | | (32,367) | | | | 339 | |
| MGM Resorts International | | | (49,700) | | | | (952,018) | | | | (216,926) | |
| Mondelez International, Inc. | | | (24,700) | | | | (827,764) | | | | (44,146) | |
| Monsanto Co. | | | (14,300) | | | | (1,499,554) | | | | (167,111) | |
| Monster Beverage Corp. | | | (44,200) | | | | (2,507,351) | | | | (488,083) | |
| Monster Worldwide, Inc. | | | (191,500) | | | | (961,080) | | | | (404,315) | |
| Mosaic Co./The | | | (21,400) | | | | (985,618) | | | | (25,960) | |
| Motorola Solutions, Inc. | | | (4,400) | | | | (274,214) | | | | (22,786) | |
| MSCI, Inc. | | | (700) | | | | (28,741) | | | | (1,863) | |
| National Oilwell Varco, Inc. | | | (1,000) | | | | (80,401) | | | | 871 | |
| Navistar International Corp. | | | (26,000) | | | | (934,500) | | | | (58,440) | |
| NCR Corp. | | | (1,400) | | | | (45,495) | | | | (2,189) | |
| NetSuite, Inc. | | | (3,100) | | | | (306,656) | | | | (12,706) | |
| New York Times Co./The | | | (13,900) | | | | (188,845) | | | | (31,748) | |
| Newfield Exploration Co. | | | (59,300) | | | | (1,777,396) | | | | 316,837 | |
| News Corp. | | | (41,500) | | | | (735,280) | | | | (12,550) | |
| Nielsen Holdings NV | | | (9,400) | | | | (375,527) | | | | (55,839) | |
| NIKE, Inc. | | | (11,600) | | | | (880,547) | | | | (31,677) | |
| Nordson Corp. | | | (1,900) | | | | (135,981) | | | | (5,189) | |
| NRG Energy, Inc. | | | (47,800) | | | | (1,358,500) | | | | (14,316) | |
| Nuance Communications, Inc. | | | (101,300) | | | | (1,576,451) | | | | 36,691 | |
| Office Depot, Inc. | | | (257,900) | | | | (1,448,961) | | | | 84,670 | |
| Old Republic International Corp. | | | (6,400) | | | | (107,725) | | | | (2,803) | |
| ON Semiconductor Corp. | | | (84,700) | | | | (642,416) | | | | (55,512) | |
| ONEOK, Inc. | | | (18,900) | | | | (1,064,851) | | | | (110,351) | |
| Owens Corning | | | (39,700) | | | | (1,414,630) | | | | (201,954) | |
| Pall Corp. | | | (1,300) | | | | (105,294) | | | | (5,661) | |
| Palo Alto Networks, Inc. | | | (57,300) | | | | (2,654,104) | | | | (638,927) | |
| Panera Bread Co. | | | (2,400) | | | | (389,902) | | | | (34,154) | |
| Peabody Energy Corp. | | | (160,800) | | | | (3,140,156) | | | | (268) | |
| Pepco Holdings, Inc. | | | (20,600) | | | | (397,559) | | | | 3,481 | |
| PerkinElmer, Inc. | | | (16,900) | | | | (640,348) | | | | (56,439) | |
| Pharmacyclics, Inc. | | | (12,200) | | | | (1,581,657) | | | | 291,141 | |
| Philip Morris International, Inc. | | | (21,400) | | | | (1,917,667) | | | | 53,085 | |
| Post Holdings, Inc. | | | (11,100) | | | | (533,477) | | | | (13,420) | |
| | | | |
| | The accompanying notes are an integral part of these financial statements. | | (Continued) |
| | | | | | | | | | | | | | | | |
| 206 | | AQR Funds | | | | | | Annual Report | | | | | | December 2013 | | |
| | | | | | | | | | |
| | | | |
| Consolidated Schedule of Investments | | | December 31, 2013 | |
| | |
| AQR STYLE PREMIA ALTERNATIVE FUND | | |
| | | | | | | | | | | | |
REFERENCE
ENTITY | | SHARES | | | NOTIONAL (a) | | | NET
UNREALIZED
APPRECIATION
(DEPRECIATION) | |
| United States (continued) | | | | | | | | | |
| Praxair, Inc. | | | (1,300) | | | $ | (161,480) | | | $ | (7,559) | |
| Precision Castparts Corp. | | | (3,700) | | | | (935,273) | | | | (61,137) | |
| Principal Financial Group, Inc. | | | (11,900) | | | | (565,412) | | | | (21,377) | |
| Progressive Corp./The | | | (1,100) | | | | (28,688) | | | | (1,309) | |
| PVH Corp. | | | (9,700) | | | | (1,208,641) | | | | (110,753) | |
| QEP Resources, Inc. | | | (33,000) | | | | (1,073,411) | | | | 61,961 | |
| QUALCOMM, Inc. | | | (13,700) | | | | (954,658) | | | | (62,567) | |
| Quanta Services, Inc. | | | (6,800) | | | | (207,942) | | | | (6,666) | |
| Quest Diagnostics, Inc. | | | (500) | | | | (30,264) | | | | 3,494 | |
| Questar Corp. | | | (7,100) | | | | (168,522) | | | | 5,293 | |
| Rackspace Hosting, Inc. | | | (39,100) | | | | (1,663,562) | | | | 133,579 | |
| Range Resources Corp. | | | (37,700) | | | | (2,823,323) | | | | (355,164) | |
| Red Hat, Inc. | | | (29,700) | | | | (1,281,513) | | | | (382,875) | |
| Regions Financial Corp. | | | (48,500) | | | | (464,712) | | | | (14,953) | |
| RF Micro Devices, Inc. | | | (84,100) | | | | (439,380) | | | | 5,424 | |
| Riverbed Technology, Inc. | | | (144,900) | | | | (2,170,399) | | | | (449,393) | |
| Rockwell Collins, Inc. | | | (4,700) | | | | (328,395) | | | | (19,029) | |
| Rockwood Holdings, Inc. | | | (17,700) | | | | (1,146,521) | | | | (126,463) | |
| Roper Industries, Inc. | | | (900) | | | | (114,580) | | | | (10,232) | |
| Rosetta Resources, Inc. | | | (7,300) | | | | (425,420) | | | | 74,728 | |
| Rowan Cos. PLC | | | (3,100) | | | | (111,131) | | | | 1,515 | |
| Royal Caribbean Cruises Ltd. | | | (14,100) | | | | (596,180) | | | | (72,442) | |
| Salesforce.com, Inc. | | | (25,600) | | | | (1,380,084) | | | | (32,780) | |
| Salix Pharmaceuticals Ltd. | | | (19,600) | | | | (1,600,120) | | | | (162,704) | |
| Sally Beauty Holdings, Inc. | | | (25,500) | | | | (661,420) | | | | (109,445) | |
| SanDisk Corp. | | | (3,100) | | | | (212,985) | | | | (5,689) | |
| SandRidge Energy, Inc. | | | (57,100) | | | | (361,683) | | | | 15,086 | |
| SBA Communications Corp. | | | (8,500) | | | | (739,016) | | | | (24,624) | |
| Schlumberger Ltd. | | | (3,700) | | | | (343,074) | | | | 9,667 | |
| Scripps Networks Interactive, Inc. | | | (2,600) | | | | (207,649) | | | | (17,017) | |
| Sealed Air Corp. | | | (45,800) | | | | (1,414,762) | | | | (144,728) | |
| Seattle Genetics, Inc. | | | (22,400) | | | | (864,844) | | | | (28,692) | |
| Semtech Corp. | | | (6,500) | | | | (201,912) | | | | 37,592 | |
| Sensata Technologies Holding NV | | | (23,400) | | | | (880,615) | | | | (26,603) | |
| Service Corp. International | | | (42,500) | | | | (770,015) | | | | (510) | |
| ServiceNow, Inc. | | | (17,100) | | | | (918,480) | | | | (39,291) | |
| Sherwin-Williams Co./The | | | (2,100) | | | | (389,944) | | | | 4,594 | |
| Silicon Laboratories, Inc. | | | (5,700) | | | | (227,586) | | | | (19,281) | |
| Sirius XM Holdings, Inc. | | | (885,500) | | | | (3,351,665) | | | | 261,270 | |
| Sirona Dental Systems, Inc. | | | (1,500) | | | | (107,632) | | | | 2,332 | |
| Six Flags Entertainment Corp. | | | (19,900) | | | | (734,931) | | | | 2,213 | |
| SolarWinds, Inc. | | | (25,700) | | | | (929,756) | | | | (42,475) | |
| | | | | | | | | | | | |
REFERENCE
ENTITY | | SHARES | | | NOTIONAL (a) | | | NET
UNREALIZED
APPRECIATION
(DEPRECIATION) | |
| United States (continued) | | | | | | | | | |
| Solera Holdings, Inc. | | | (600) | | | $ | (33,745) | | | $ | (8,711) | |
| Sotheby’s | | | (21,200) | | | | (1,102,334) | | | | (25,506) | |
| Southwestern Energy Co. | | | (40,000) | | | | (1,522,253) | | | | (50,947) | |
| Spirit Aerosystems Holdings, Inc. | | | (23,400) | | | | (666,696) | | | | (130,776) | |
| Splunk, Inc. | | | (9,900) | | | | (619,214) | | | | (60,619) | |
| Sprint Corp. | | | (195,700) | | | | (1,339,508) | | | | (764,267) | |
| SPX Corp. | | | (3,800) | | | | (347,578) | | | | (30,940) | |
| Stanley Black & Decker, Inc. | | | (4,300) | | | | (337,678) | | | | (9,289) | |
| Stratasys Ltd. | | | (15,700) | | | | (1,846,608) | | | | (268,182) | |
| SunEdison, Inc. | | | (191,500) | | | | (1,820,801) | | | | (678,274) | |
| SunTrust Banks, Inc. | | | (19,100) | | | | (642,579) | | | | (60,492) | |
| SUPERVALU, Inc. | | | (89,800) | | | | (627,029) | | | | (27,613) | |
| SVB Financial Group | | | (300) | | | | (28,594) | | | | (2,864) | |
| Synovus Financial Corp. | | | (306,300) | | | | (1,014,935) | | | | (87,745) | |
| T Rowe Price Group, Inc. | | | (1,400) | | | | (108,016) | | | | (9,262) | |
| Target Corp. | | | (20,300) | | | | (1,312,298) | | | | 27,917 | |
| TCF Financial Corp. | | | (15,900) | | | | (240,608) | | | | (17,767) | |
| Tempur Sealy International, Inc. | | | (23,200) | | | | (889,989) | | | | (361,883) | |
| Tenet Healthcare Corp. | | | (35,900) | | | | (1,642,538) | | | | 130,430 | |
| Teradata Corp. | | | (29,300) | | | | (1,292,335) | | | | (40,522) | |
| Teradyne, Inc. | | | (23,200) | | | | (403,432) | | | | (5,352) | |
| Terex Corp. | | | (2,100) | | | | (72,913) | | | | (15,266) | |
| Tesla Motors, Inc. | | | (3,100) | | | | (471,345) | | | | 5,167 | |
| Tesoro Corp. | | | (45,200) | | | | (2,152,935) | | | | (491,265) | |
| Textron, Inc. | | | (30,700) | | | | (885,370) | | | | (243,163) | |
| Theravance, Inc. | | | (67,300) | | | | (2,460,285) | | | | 61,040 | |
| Thor Industries, Inc. | | | (700) | | | | (39,105) | | | | 444 | |
| Thoratec Corp. | | | (23,600) | | | | (972,938) | | | | 109,178 | |
| TIBCO Software, Inc. | | | (57,500) | | | | (1,401,919) | | | | 109,319 | |
| Tiffany & Co. | | | (14,100) | | | | (1,112,118) | | | | (196,080) | |
| T-Mobile US, Inc. | | | (2,000) | | | | (55,664) | | | | (11,616) | |
| Toll Brothers, Inc. | | | (14,700) | | | | (474,920) | | | | (68,980) | |
| TransDigm Group, Inc. | | | (6,600) | | | | (970,189) | | | | (92,543) | |
| Trimble Navigation Ltd. | | | (56,400) | | | | (1,854,852) | | | | (102,228) | |
| Triumph Group, Inc. | | | (17,600) | | | | (1,271,696) | | | | (67,136) | |
| tw telecom, inc. | | | (18,100) | | | | (569,945) | | | | 18,438 | |
| Ulta Salon Cosmetics & Fragrance, Inc. | | | (5,600) | | | | (718,634) | | | | 178,122 | |
| Ultra Petroleum Corp. | | | (26,900) | | | | (506,323) | | | | (76,062) | |
| Under Armour, Inc. | | | (15,100) | | | | (1,211,369) | | | | (106,861) | |
| United Natural Foods, Inc. | | | (1,800) | | | | (128,114) | | | | (7,588) | |
| United Parcel Service, Inc. | | | (4,400) | | | | (431,467) | | | | (30,885) | |
| Urban Outfitters, Inc. | | | (16,800) | | | | (643,821) | | | | 20,541 | |
| Valspar Corp./The | | | (3,100) | | | | (216,386) | | | | (4,613) | |
| Vantiv, Inc. | | | (25,200) | | | | (681,670) | | | | (140,102) | |
| VeriFone Systems, Inc. | | | (47,800) | | | | (1,107,011) | | | | (174,985) | |
| Vertex Pharmaceuticals, Inc. | | | (33,500) | | | | (2,248,159) | | | | (240,891) | |
| Visa, Inc. | | | (100) | | | | (20,003) | | | | (2,265) | |
| Visteon Corp. | | | (700) | | | | (54,586) | | | | (2,737) | |
| | | | |
| | The accompanying notes are an integral part of these financial statements. | | (Continued) |
| | | | | | | | | | | | | | | | |
| | AQR Funds | | | | | | Annual Report | | | | | | December 2013 | | 207 |
| | | | | | | | | | |
| | | | |
| Consolidated Schedule of Investments | | | December 31, 2013 | |
| | |
| AQR STYLE PREMIA ALTERNATIVE FUND | | |
| | | | | | | | | | | | |
REFERENCE
ENTITY | | SHARES | | | NOTIONAL (a) | | | NET
UNREALIZED
APPRECIATION
(DEPRECIATION) | |
| United States (continued) | | | | | | | | | |
| VMware, Inc. | | | (17,200) | | | $ | (1,385,006) | | | $ | (158,006) | |
| Vulcan Materials Co. | | | (22,800) | | | | (1,229,352) | | | | (125,424) | |
| WABCO Holdings, Inc. | | | (2,500) | | | | (212,769) | | | | (20,756) | |
| Webster Financial Corp. | | | (22,200) | | | | (619,933) | | | | (72,263) | |
| Wendy’s Co./The | | | (104,400) | | | | (913,761) | | | | 3,393 | |
| Western Union Co./The | | | (131,700) | | | | (2,275,960) | | | | 4,135 | |
| WEX, Inc. | | | (3,400) | | | | (317,171) | | | | (19,531) | |
| Williams Cos., Inc./The | | | (94,100) | | | | (3,337,567) | | | | (291,870) | |
| WPX Energy, Inc. | | | (55,700) | | | | (1,222,882) | | | | 87,716 | |
| Xylem, Inc. | | | (29,300) | | | | (974,357) | | | | (39,423) | |
| Yum! Brands, Inc. | | | (12,200) | | | | (831,725) | | | | (90,717) | |
| Zions Bancorporation | | | (43,000) | | | | (1,224,214) | | | | (64,066) | |
| Zynga, Inc. | | | (306,800) | | | | (1,089,232) | | | | (76,608) | |
| | | | | | | | | | | | |
| | | | | | | | | | | (18,127,664) | |
| | | | | | | | | | | | |
Total of Short Equity Positions | | | | | | | | | | | (19,111,810) | |
| | | | | | | | | | | | |
Total of Long and Short Equity Positions | | | | | | | | | | | (5,034) | |
| | | | | | | | | | | | |
Net Cash and Other Receivables/ (Payables) (b) | | | | | | | | | | | 256,163 | |
| | | | | | | | | | | | |
Swaps, at Value | | | | | | | | | | $ | 251,129 | |
| | | | | | | | | | | | |
| (a) | Notional value represents the market value (including any fees or commissions) of the long and short positions when they are established. |
| (b) | Cash and other receivables/(payables) includes the gains (or losses) realized within the swap when the swap resets. |
Money Market Fund is pledged as collateral to Goldman Sachs in the amount of $61,730,000 at December 31, 2013.
| | | | |
| | The accompanying notes are an integral part of these financial statements. | | (Continued) |
| | | | | | | | | | | | | | | | |
| 208 | | AQR Funds | | | | | | Annual Report | | | | | | December 2013 | | |
| | | | | | | | | | |
| | | | |
| Consolidated Schedule of Investments | | | December 31, 2013 | |
| | |
| AQR STYLE PREMIA ALTERNATIVE FUND | | |
| | | | | | | | |
COUNTERPARTY | | DESCRIPTION | | TERMINATION DATE** | | VALUE
(Note 3) | |
| Goldman Sachs | | The Fund receives or pays the total return on a portfolio of long and short positions and pays or receives the LIBOR, which is denominated in GBP based on the local currencies of the positions within the swap. | | 12 months maturity ranging from 11/06/2014 - 12/11/2014 | | | $169,811 | |
| | | | | | | | |
| ** | The maturity dates are measured from the commencement of investment in each underlying portfolio swap position. |
Additional Information — Total Return Basket Swaps
The following table represents the individual long and short positions and related values within the total return basket swap as of December 31, 2013.
| | | | | | | | | | | | |
REFERENCE
ENTITY | | SHARES | | | NOTIONAL (a) | | | NET
UNREALIZED
APPRECIATION
(DEPRECIATION) | |
| Long Positions | | | | | | | | | |
| | | |
| Ireland | | | | | | | | | | | | |
| DCC PLC | | | 37,852 | | | $ | 1,773,813 | | | $ | 88,745 | |
| | | | | | | | | | | | |
| | | |
| United Kingdom | | | | | | | | | | | | |
| Admiral Group PLC | | | 4,840 | | | | 102,480 | | | | 2,728 | |
| Anglo American PLC | | | 3,023 | | | | 65,598 | | | | 561 | |
| Ashtead Group PLC | | | 32,426 | | | | 357,456 | | | | 51,589 | |
| ASOS PLC | | | 5,976 | | | | 573,057 | | | | 35,827 | |
| Associated British Foods PLC | | | 40,944 | | | | 1,528,323 | | | | 132,189 | |
| AstraZeneca PLC | | | 11,171 | | | | 610,382 | | | | 52,360 | |
| Aviva PLC | | | 170,812 | | | | 1,268,225 | | | | 9,697 | |
| Babcock International Group PLC | | | 129,301 | | | | 2,722,548 | | | | 182,851 | |
| BAE Systems PLC | | | 229,571 | | | | 1,725,902 | | | | (69,594) | |
| Berkeley Group Holdings PLC | | | 3,152 | | | | 122,387 | | | | 16,579 | |
| BP PLC | | | 95,558 | | | | 769,827 | | | | 4,586 | |
| British Sky Broadcasting Group PLC | | | 84,102 | | | | 1,308,575 | | | | (132,060) | |
| Capita PLC | | | 101,959 | | | | 1,666,318 | | | | 88,725 | |
| Centrica PLC | | | 480,922 | | | | 2,826,570 | | | | (53,272) | |
| Compass Group PLC | | | 39,580 | | | | 590,335 | | | | 45,117 | |
| Direct Line Insurance Group PLC | | | 316,153 | | | | 1,190,452 | | | | 117,453 | |
| Drax Group PLC | | | 63,956 | | | | 682,461 | | | | 166,137 | |
| GKN PLC | | | 324,581 | | | | 1,983,249 | | | | 28,091 | |
| GlaxoSmithKline PLC | | | 49,367 | | | | 1,350,609 | | | | (31,647) | |
| Hargreaves Lansdown PLC | | | 13,300 | | | | 259,313 | | | | 39,428 | |
| HSBC Holdings PLC | | | 46,550 | | | | 532,525 | | | | (21,678) | |
| ICAP PLC | | | 41,336 | | | | 271,980 | | | | 37,623 | |
| Inchcape PLC | | | 19,454 | | | | 204,243 | | | | (5,582) | |
| Investec PLC | | | 281,994 | | | | 2,004,904 | | | | 43,155 | |
| ITV PLC | | | 214,795 | | | | 683,085 | | | | 8,156 | |
| | | | | | | | | | | | |
REFERENCE
ENTITY | | SHARES | | | NOTIONAL (a) | | | NET
UNREALIZED
APPRECIATION
(DEPRECIATION) | |
| United Kingdom (continued) | | | | | | | | | |
| J Sainsbury PLC | | | 465,327 | | | $ | 3,041,112 | | | $ | (224,848) | |
| Kingfisher PLC | | | 286,088 | | | | 1,799,331 | | | | 27,066 | |
| London Stock Exchange Group PLC | | | 353 | | | | 9,600 | | | | 555 | |
| Marks & Spencer Group PLC | | | 110,796 | | | | 912,583 | | | | (116,969) | |
| Meggitt PLC | | | 15,692 | | | | 132,129 | | | | 5,262 | |
| Mitchells & Butlers PLC | | | 11,158 | | | | 75,132 | | | | 2,940 | |
| Mondi PLC | | | 101,654 | | | | 1,733,908 | | | | 30,654 | |
| National Grid PLC | | | 219,594 | | | | 2,847,315 | | | | 24,802 | |
| Next PLC | | | 32,821 | | | | 2,994,145 | | | | (27,403) | |
| Reckitt Benckiser Group PLC | | | 17,068 | | | | 1,354,504 | | | | 1,308 | |
| Resolution Ltd. | | | 51,769 | | | | 307,615 | | | | (3,742) | |
| Rexam PLC | | | 19,137 | | | | 164,718 | | | | 3,653 | |
| Rightmove PLC | | | 26,520 | | | | 1,135,784 | | | | 68,610 | |
| RSA Insurance Group PLC | | | 171,274 | | | | 361,381 | | | | (102,020) | |
| Sage Group PLC/The | | | 21,642 | | | | 133,094 | | | | 11,781 | |
| Schroders PLC | | | 7,251 | | | | 314,634 | | | | (1,904) | |
| Serco Group PLC | | | 11,173 | | | | 101,758 | | | | (9,306) | |
| Smith & Nephew PLC | | | 19,428 | | | | 258,382 | | | | 19,102 | |
| Smiths Group PLC | | | 49,196 | | | | 1,166,618 | | | | 41,420 | |
| Sports Direct International PLC | | | 40,942 | | | | 502,783 | | | | (16,749) | |
| Tesco PLC | | | 408,473 | | | | 2,455,898 | | | | (187,509) | |
| Thomas Cook Group PLC | | | 10,070 | | | | 23,656 | | | | 4,294 | |
| Travis Perkins PLC | | | 42,743 | | | | 1,302,809 | | | | 24,961 | |
| William Hill PLC | | | 293,844 | | | | 1,942,021 | | | | 16,842 | |
| WM Morrison Supermarkets PLC | | | 288,951 | | | | 1,342,921 | | | | (92,106) | |
| WPP PLC | | | 104,358 | | | | 2,301,130 | | | | 89,081 | |
| | | | | | | | | | | | |
| | | | | | | | | | | 338,794 | |
| | | | | | | | | | | | |
Total of Long Equity Positions | | | | | | | | | | | 427,539 | |
| | | | | | | | | | | | |
| | | | |
| | The accompanying notes are an integral part of these financial statements. | | (Continued) |
| | | | | | | | | | | | | | | | |
| | AQR Funds | | | | | | Annual Report | | | | | | December 2013 | | 209 |
| | | | | | | | | | |
| | | | |
| Consolidated Schedule of Investments | | | December 31, 2013 | |
| | |
| AQR STYLE PREMIA ALTERNATIVE FUND | | |
| | | | | | | | | | | | |
REFERENCE
ENTITY | | SHARES | | | NOTIONAL (a) | | | NET
UNREALIZED
APPRECIATION
(DEPRECIATION) | |
| | | |
| Short Positions | | | | | | | | | | | | |
| | | |
| Switzerland | | | | | | | | | | | | |
| Informa PLC | | | (94,950) | | | $ | (877,663) | | | $ | (26,017) | |
| Wolseley PLC | | | (49,181) | | | | (2,749,730) | | | | (46,367) | |
| | | | | | | | | | | | |
| | | | | | | | | | | (72,384) | |
| | | | | | | | | | | | |
| | | |
| United Kingdom | | | | | | | | | | | | |
| Aggreko PLC | | | (95,422) | | | | (2,491,744) | | | | (214,484) | |
| AMEC PLC | | | (23,998) | | | | (466,313) | | | | 33,034 | |
| ARM Holdings PLC | | | (115,873) | | | | (1,875,163) | | | | (231,742) | |
| Barclays PLC | | | (46,561) | | | | (203,733) | | | | (6,810) | |
| British American Tobacco PLC | | | (29,012) | | | | (1,647,310) | | | | 90,116 | |
| Burberry Group PLC | | | (132,196) | | | | (3,323,096) | | | | (7,623) | |
| Carnival PLC | | | (39,037) | | | | (1,449,330) | | | | (166,727) | |
| Croda International PLC | | | (33,254) | | | | (1,287,789) | | | | (67,743) | |
| Diageo PLC | | | (59,666) | | | | (1,951,803) | | | | (25,443) | |
| Evraz PLC | | | (161,111) | | | | (297,739) | | | | (2,047) | |
| Experian PLC | | | (27,438) | | | | (568,746) | | | | 61,902 | |
| G4S PLC | | | (136,268) | | | | (576,650) | | | | (16,273) | |
| IMI PLC | | | (17,680) | | | | (445,661) | | | | (2,066) | |
| Imperial Tobacco Group PLC | | | (68,686) | | | | (2,628,152) | | | | (34,675) | |
| InterContinental Hotels Group PLC | | | (30,684) | | | | (918,956) | | | | (104,551) | |
| Intertek Group PLC | | | (11,905) | | | | (650,728) | | | | 29,389 | |
| John Wood Group PLC | | | (133,334) | | | | (1,749,407) | | | | 229,394 | |
| Johnson Matthey PLC | | | (42,958) | | | | (2,141,675) | | | | (195,794) | |
| Kazakhmys PLC | | | (32,039) | | | | (113,885) | | | | (2,357) | |
| Ladbrokes PLC | | | (40,170) | | | | (126,400) | | | | 7,023 | |
| Lonmin PLC | | | (25,757) | | | | (136,832) | | | | 4,787 | |
| Man Group PLC | | | (538,572) | | | | (792,180) | | | | 31,350 | |
| Melrose Industries PLC | | | (26,537) | | | | (139,736) | | | | 5,106 | |
| Old Mutual PLC | | | (302,268) | | | | (1,010,848) | | | | 62,449 | |
| Pearson PLC | | | (87,817) | | | | (1,893,752) | | | | (64,201) | |
| Pennon Group PLC | | | (89,154) | | | | (987,083) | | | | 12,897 | |
| Premier Oil PLC | | | (34,733) | | | | (197,738) | | | | 17,000 | |
| Prudential PLC | | | (27,809) | | | | (592,160) | | | | (29,205) | |
| | | | | | | | | | | | |
REFERENCE
ENTITY | | SHARES | | | NOTIONAL (a) | | | NET
UNREALIZED
APPRECIATION
(DEPRECIATION) | |
| United Kingdom (continued) | | | | | | | | | |
| Royal Bank of Scotland Group PLC | | | (263,222) | | | $ | (1,483,996) | | | $ | 1,578 | |
| Severn Trent PLC | | | (51,114) | | | | (1,566,819) | | | | 121,677 | |
| Spirax-Sarco Engineering PLC | | | (7,760) | | | | (373,537) | | | | (11,598) | |
| Standard Chartered PLC | | | (69,466) | | | | (1,648,403) | | | | 79,377 | |
| Tate & Lyle PLC | | | (6,301) | | | | (82,018) | | | | (2,506) | |
| UBM PLC | | | (22,131) | | | | (249,642) | | | | 8,645 | |
| United Utilities Group PLC | | | (93,798) | | | | (1,083,775) | | | | 39,470 | |
| Vedanta Resources PLC | | | (27,154) | | | | (479,151) | | | | 57,629 | |
| Weir Group PLC/The | | | (64,372) | | | | (2,330,084) | | | | 50,922 | |
| | | | | | | | | | | | |
| | | | | | | | | | | (242,100) | |
| | | | | | | | | | | | |
Total of Short Equity Positions | | | | | | | | | | | (314,484) | |
| | | | | | | | | | | | |
Total of Long and Short Equity Positions | | | | | | | | | | | 113,055 | |
| | | | | | | | | | | | |
Net Cash and Other Receivables/ (Payables) (b) | | | | | | | | | | | 56,756 | |
| | | | | | | | | | | | |
Swaps, at Value | | | | | | | | | | $ | 169,811 | |
| | | | | | | | | | | | |
| (a) | Notional value represents the market value (including any fees or commissions) of the long and short positions when they are established. |
| (b) | Cash and other receivables/(payables) includes the gains (or losses) realized within the swap when the swap resets. |
Additional collateral for this position pledged to Goldman Sachs is included in the collateral noted in the other Goldman Sachs total return basket swap.
| | | | |
| | The accompanying notes are an integral part of these financial statements. | | (Continued) |
| | | | | | | | | | | | | | | | |
| 210 | | AQR Funds | | | | | | Annual Report | | | | | | December 2013 | | |
| | | | | | | | | | |
| | | | |
| Consolidated Schedule of Investments | | | December 31, 2013 | |
| | |
| AQR STYLE PREMIA ALTERNATIVE FUND | | |
| | | | | | | | |
| COUNTERPARTY | | DESCRIPTION | | TERMINATION DATE** | | VALUE
(Note 3) | |
| Goldman Sachs | | The Fund receives or pays the total return on a portfolio of long and short positions and pays or receives the Euro Interbank Offered Rate, which is denominated in EUR based on the local currencies of the positions within the swap. | | 12 months maturity ranging from 11/06/2014 - 12/11/2014 | | | $705,210 | |
| | | | | | | | |
| ** | The maturity dates are measured from the commencement of investment in each underlying portfolio swap position. |
Additional Information — Total Return Basket Swaps
The following table represents the individual long and short positions and related values within the total return basket swap as of December 31, 2013.
| | | | | | | | | | | | |
REFERENCE
ENTITY | | SHARES | | | NOTIONAL (a) | | | NET
UNREALIZED
APPRECIATION
(DEPRECIATION) | |
| Long Positions | | | | | | | | | |
| | | |
| France | | | | | | | | | | | | |
| Aeroports de Paris | | | 2,916 | | | $ | 317,932 | | | $ | 13,180 | |
| AtoS | | | 1,334 | | | | 115,986 | | | | 4,880 | |
| AXA SA | | | 23,395 | | | | 593,029 | | | | 58,467 | |
| BNP Paribas SA | | | 8,637 | | | | 648,556 | | | | 25,193 | |
| Bouygues SA | | | 56,138 | | | | 2,181,534 | | | | (58,629) | |
| Bureau Veritas SA | | | 3,706 | | | | 113,262 | | | | (5,067) | |
| Cap Gemini SA | | | 10,290 | | | | 683,281 | | | | 13,202 | |
| Christian Dior SA | | | 53 | | | | 10,146 | | | | (114) | |
| Cie Generale des Etablissements Michelin | | | 11,563 | | | | 1,225,144 | | | | 5,168 | |
| CNP Assurances | | | 11,354 | | | | 206,881 | | | | 25,946 | |
| Danone SA | | | 8,953 | | | | 668,997 | | | | (23,110) | |
| Electricite de France | | | 55,390 | | | | 1,991,398 | | | | (31,858) | |
| European Aeronautic Defence and Space Co. NV | | | 25,118 | | | | 1,760,986 | | | | 167,329 | |
| GDF Suez | | | 10,743 | | | | 270,539 | | | | (17,869) | |
| Iliad SA | | | 4,802 | | | | 1,115,337 | | | | (131,451) | |
| Imerys SA | | | 3,670 | | | | 298,286 | | | | 21,179 | |
| Kering | | | 298 | | | | 68,697 | | | | (5,705) | |
| Lagardere SCA | | | 23,919 | | | | 868,666 | | | | 20,490 | |
| Legrand SA | | | 8,338 | | | | 478,771 | | | | (19,243) | |
| L’Oreal SA | | | 7,510 | | | | 1,290,679 | | | | 28,174 | |
| Natixis | | | 18,390 | | | | 100,356 | | | | 7,836 | |
| Neopost SA | | | 9,382 | | | | 730,986 | | | | (7,000) | |
| Orange SA | | | 24,793 | | | | 315,403 | | | | (7,594) | |
| Publicis Groupe SA | | | 13,170 | | | | 1,121,516 | | | | 85,189 | |
| Rexel SA | | | 23,724 | | | | 609,516 | | | | 13,087 | |
| Safran SA | | | 22,953 | | | | 1,489,571 | | | | 106,317 | |
| SCOR SE | | | 9,498 | | | | 335,409 | | | | 11,995 | |
| SES SA | | | 22,984 | | | | 681,184 | | | | 63,415 | |
| Societe BIC SA | | | 84 | | | | 10,455 | | | | (161) | |
| Societe Generale SA | | | 12,334 | | | | 682,988 | | | | 34,241 | |
| Suez Environnement Co. | | | 54,719 | | | | 962,095 | | | | 19,185 | |
| Thales SA | | | 16,791 | | | | 1,039,956 | | | | 42,116 | |
| Total SA | | | 46,440 | | | | 2,870,986 | | | | (20,524) | |
| Valeo SA | | | 4,951 | | | | 501,064 | | | | 47,613 | |
| Vinci SA | | | 14,292 | | | | 929,274 | | | | 10,157 | |
| | | | | | | | | | | | |
REFERENCE
ENTITY | | SHARES | | | NOTIONAL (a) | | | NET
UNREALIZED
APPRECIATION
(DEPRECIATION) | |
| France (continued) | | | | | | | | | | | | |
| Vivendi SA | | | 8,615 | | | $ | 221,486 | | | $ | 5,756 | |
| Zodiac Aerospace | | | 2,029 | | | | 329,637 | | | | 29,922 | |
| | | | | | | | | | | | |
| | | | | | | | | | | 531,712 | |
| | | | | | | | | | | | |
Total of Long Equity Positions | | | | | | | | | | | 531,712 | |
| | | | | | | | | | | | |
| | | |
| Short Positions | | | | | | | | | | | | |
| | |
| France | | | | | | | | | |
| Accor SA | | | (15,737) | | | | (715,567) | | | | (27,690) | |
| Air France-KLM | | | (62,067) | | | | (636,408) | | | | (12,250) | |
| Air Liquide SA | | | (99) | | | | (13,494) | | | | (518) | |
| Alcatel-Lucent | | | (198,666) | | | | (797,539) | | | | (84,087) | |
| Alstom SA | | | (20,563) | | | | (768,416) | | | | 18,554 | |
| Arkema SA | | | (5,517) | | | | (618,158) | | | | (25,997) | |
| Carrefour SA | | | (18,188) | | | | (675,899) | | | | (46,043) | |
| CGG SA | | | (73,196) | | | | (1,581,171) | | | | 310,865 | |
| Cie de St-Gobain | | | (23,965) | | | | (1,269,239) | | | | (50,923) | |
| Credit Agricole SA | | | (42,297) | | | | (522,031) | | | | (20,171) | |
| Dassault Systemes SA | | | (1,983) | | | | (229,595) | | | | (16,637) | |
| Edenred | | | (26,596) | | | | (914,938) | | | | 24,439 | |
| Eiffage SA | | | (3,855) | | | | (230,989) | | | | 8,805 | |
| Essilor International SA | | | (7,759) | | | | (833,336) | | | | 7,721 | |
| Etablissements Maurel et Prom | | | (12,382) | | | | (198,316) | | | | (8,803) | |
| Eutelsat Communications SA | | | (18,660) | | | | (584,230) | | | | 1,993 | |
| Faurecia | | | (33,035) | | | | (1,002,517) | | | | (257,843) | |
| Lafarge SA | | | (30,622) | | | | (2,139,403) | | | | (159,082) | |
| LVMH Moet Hennessy Louis Vuitton SA | | | (16,332) | | | | (3,117,813) | | | | 134,053 | |
| Pernod-Ricard SA | | | (9,397) | | | | (1,079,721) | | | | 9,109 | |
| Peugeot SA | | | (13,964) | | | | (190,597) | | | | 8,881 | |
| Remy Cointreau SA | | | (14,810) | | | | (1,327,771) | | | | 83,720 | |
| Renault SA | | | (3,278) | | | | (278,934) | | | | 15,132 | |
| Sanofi | | | (5,532) | | | | (595,854) | | | | 5,064 | |
| Technip SA | | | (13,605) | | | | (1,425,091) | | | | 115,464 | |
| Vallourec SA | | | (4,533) | | | | (266,738) | | | | 19,435 | |
| | | | |
| | The accompanying notes are an integral part of these financial statements. | | (Continued) |
| | | | | | | | | | | | | | | | |
| | AQR Funds | | | | | | Annual Report | | | | | | December 2013 | | 211 |
| | | | | | | | | | |
| | | | |
| Consolidated Schedule of Investments | | | December 31, 2013 | |
| | |
| AQR STYLE PREMIA ALTERNATIVE FUND | | |
| | | | | | | | | | | | |
REFERENCE
ENTITY | | SHARES | | | NOTIONAL (a) | | | NET
UNREALIZED
APPRECIATION
(DEPRECIATION) | |
| France (continued) | | | | | | | | | | | | |
| Veolia Environnement SA | | | (106,906) | | | $ | (1,821,058) | | | $ | 75,027 | |
| Wendel SA | | | (1,295) | | | | (182,067) | | | | (6,695) | |
| | | | | | | | | | | | |
| | | | | | | | | | | 121,523 | |
| | | | | | | | | | | | |
Total of Short Equity Positions | | | | | | | | | | | 121,523 | |
| | | | | | | | | | | | |
Total of Long and Short Equity Positions | | | | | | | | | | | 653,235 | |
| | | | | | | | | | | | |
Net Cash and Other Receivables/ (Payables) (b) | | | | | | | | | | | 51,975 | |
| | | | | | | | | | | | |
Swaps, at Value | | | | | | | | | | $ | 705,210 | |
| | | | | | | | | | | | |
| (a) | Notional value represents the market value (including any fees or commissions) of the long and short positions when they are established. |
| (b) | Cash and other receivables/(payables) includes the gains (or losses) realized within the swap when the swap resets. |
Additional collateral for this position pledged to Goldman Sachs is included in the collateral noted in the other Goldman Sachs total return basket swap.
| | | | |
| | The accompanying notes are an integral part of these financial statements. | | |
| | | | | | | | | | | | | | | | |
| 212 | | AQR Funds | | | | | | Annual Report | | | | | | December 2013 | | |
| | | | | | | | | | |
| | | | |
| Statements of Assets and Liabilities | | | December 31, 2013 | |
| | | | | | | | | | | | |
| | | AQR
DIVERSIFIED
ARBITRAGE
FUND | | | AQR
LONG-SHORT
EQUITY
FUND | | | AQR
MANAGED
FUTURES
STRATEGY
FUND** | |
| ASSETS: | | | | | | | | | | | | |
| Investments in securities, at cost | | | $2,555,990,019 | | | | $5,728,596 | | | | $5,485,037,240 | |
| | | | | | | | | | | | | |
| Investments in securities, at value | | | $2,647,673,388 | | | | $5,728,596 | | | | $5,485,115,810 | |
| Cash | | | 1,110,865 | | | | — | | | | 249,484 | |
| Foreign currency, at value | | | 4,684,353 | | | | 17,296 | | | | 26,511,757 | |
| Due from brokers | | | 635,385,353 | | | | 43,873 | | | | 256,870,457 | |
| Unrealized appreciation on forward foreign currency exchange contracts | | | — | | | | — | | | | 112,752,352 | |
| Swaps, at value | | | 33,872,527 | | | | 264,545 | | | | 26,796,051 | |
| Unrealized appreciation on futures contracts | | | 814,780 | | | | 81,479 | | | | 122,882,702 | |
| Receivables: | | | | | | | | | | | | |
Securities sold | | | 97,418,486 | | | | — | | | | — | |
Foreign tax reclaim | | | 72,534 | | | | — | | | | — | |
Dividends and interest | | | 14,474,001 | | | | 3 | | | | 38,665 | |
Capital shares sold | | | 4,552,498 | | | | 20 | | | | 35,679,058 | |
Due from Investment Advisor | | | — | | | | 27,763 | | | | — | |
| Prepaid expenses | | | 153,048 | | | | 30,040 | | | | 207,031 | |
| Total Assets | | | 3,440,211,833 | | | | 6,193,615 | | | | 6,067,103,367 | |
| LIABILITIES: | | | | | | | | | | | | |
| Securities sold short, at value (proceeds $517,140,273, $— and $—, respectively) | | | 598,480,906 | | | | — | | | | — | |
| Options written, at value (proceeds $2,511,095, $— and $—, respectively) | | | 2,574,410 | | | | — | | | | — | |
| Due to custodian | | | — | | | | 177 | | | | — | |
| Due to brokers | | | 302,591 | | | | — | | | | 134,141,117 | |
| Unrealized depreciation on forward foreign currency exchange contracts | | | 596,385 | | | | 447 | | | | — | |
| Swaps, at value | | | 22,492,436 | | | | — | | | | 6,829,524 | |
| Unrealized depreciation on futures contracts | | | 12,383,327 | | | | — | | | | 191,654 | |
| Payables: | | | | | | | | | | | | |
Securities purchased | | | 80,891,578 | | | | — | | | | — | |
Accrued Investment advisory fees | | | 2,450,774 | | | | — | | | | 5,012,834 | |
Accrued Distribution fees — Class N | | | 177,603 | | | | 187 | | | | 282,419 | |
Distributions | | | — | | | | — | | | | 131,316 | |
Capital shares redeemed | | | 5,605,726 | | | | — | | | | 4,665,040 | |
Dividends and interest payable on securities sold short | | | 190,884 | | | | — | | | | — | |
Other accrued expenses and liabilities | | | 1,229,862 | | | | 36,607 | | | | 1,583,154 | |
| Total Liabilities | | | 727,376,482 | | | | 37,418 | | | | 152,837,058 | |
| Net Assets | | | $2,712,835,351 | | | | $6,156,197 | | | | $5,914,266,309 | |
| | | | | | | | | | | | | |
| NET ASSETS CONSIST OF: | | | | | | | | | | | | |
| Paid-in capital ($0.001 par value common stock, unlimited authorized shares) | | | $2,709,972,972 | | | | $6,024,144 | | | | $5,559,571,632 | |
| Undistributed (accumulated) net investment income (loss) | | | (14,073,713) | | | | (252,842) | | | | (46,677) | |
| Undistributed (accumulated) net realized gain (loss) | | | (4,528,382) | | | | 40,468 | | | | 98,797,726 | |
| Net unrealized appreciation (depreciation) | | | 21,464,474 | | | | 344,427 | | | | 255,943,628 | |
| Net Assets | | | $2,712,835,351 | | | | $6,156,197 | | | | $5,914,266,309 | |
| | | | | | | | | | | | | |
| NET ASSETS: | | | | | | | | | | | | |
| Class I | | | $1,876,480,736 | | | | $5,245,981 | | | | $4,506,180,876 | |
| Class N | | | 836,354,615 | | | | 910,216 | | | | 1,408,085,433 | |
| SHARES OUTSTANDING: | | | | | | | | | | | | |
| Class I | | | 172,057,279 | | | | 513,771 | | | | 425,328,151 | |
| Class N | | | 76,969,086 | | | | 89,144 | | | | 133,922,115 | |
| NET ASSET VALUE AND PUBLIC OFFERING PRICE PER SHARE: | | | | | | | | | | | | |
| Class I | | | $10.91 | | | | $10.21 | | | | $10.59 | |
| Class N | | | $10.87 | | | | $10.21 | | | | $10.51 | |
| | | Foreign currency at cost of $4,736,151, $17,362 and $26,418,813, respectively. |
| | ** | Consolidated financial statement, see Note 2 in the Notes to Financial Statements for additional information. |
| | | | |
| | The accompanying notes are an integral part of these financial statements. | | |
| | | | | | | | | | | | | | | | |
| | AQR Funds | | | | | | Annual Report | | | | | | December 2013 | | 213 |
| | | | | | | | | | |
| | | | |
| Statements of Assets and Liabilities | | | December 31, 2013 | |
| | | | | | | | | | | | |
| | | AQR MANAGED
FUTURES
STRATEGY HV
FUND** | | | AQR
RISK-BALANCED
COMMODITIES
STRATEGY
FUND** | | | AQR RISK
PARITY
FUND** | |
| ASSETS: | | | | | | | | | | | | |
| Investments in securities, at cost | | | $34,656,715 | | | | $32,265,975 | | | | $893,721,157 | |
| | | | | | | | | | | | | |
| Investments in securities, at value | | | $34,656,991 | | | | $32,266,130 | | | | $894,272,417 | |
| Cash | | | — | | | | 1,837,496 | | | | 294,633 | |
| Foreign currency, at value | | | 133,295 | | | | — | | | | 1,690,672 | |
| Due from brokers | | | 1,185,058 | | | | 757,990 | | | | 24,400,538 | |
| Unrealized appreciation on forward foreign currency exchange contracts | | | 1,020,136 | | | | — | | | | — | |
| Swaps, at value | | | — | | | | 336,515 | | | | 43,060,163 | |
| Unrealized appreciation on futures contracts | | | 1,080,737 | | | | — | | | | 13,547,237 | |
| Receivables: | | | | | | | | | | | | |
Dividends and interest | | | 19 | | | | 417 | | | | 1,276,844 | |
Capital shares sold | | | 1,783,700 | | | | 117,894 | | | | 1,038,422 | |
Due from Investment Advisor | | | 30,574 | | | | — | | | | — | |
| Prepaid expenses | | | 31,191 | | | | 25,401 | | | | 61,397 | |
| Total Assets | | | 39,921,701 | | | | 35,341,843 | | | | 979,642,323 | |
| LIABILITIES: | | | | | | | | | | | | |
| Due to custodian | | | 4 | | | | — | | | | — | |
| Due to brokers | | | 1,080,001 | | | | 382,120 | | | | 12,314,582 | |
| Unrealized depreciation on forward foreign currency exchange contracts | | | — | | | | — | | | | 1,508,533 | |
| Swaps, at value | | | 26,009 | | | | 908,742 | | | | 19,530,187 | |
| Unrealized depreciation on futures contracts | | | — | | | | 165,699 | | | | 6,460,931 | |
| Payables: | | | | | | | | | | | | |
Accrued Investment advisory fees | | | — | | | | 37,377 | | | | 590,419 | |
Accrued Shareholder servicing fees | | | — | | | | 9,091 | | | | — | |
Accrued Distribution fees — Class N | | | 373 | | | | 1,068 | | | | 17,054 | |
Capital shares redeemed | | | — | | | | 1,496,955 | | | | 4,749,837 | |
Other accrued expenses and liabilities | | | 93,909 | | | | 104,201 | | | | 420,489 | |
| Total Liabilities | | | 1,200,296 | | | | 3,105,253 | | | | 45,592,032 | |
| Net Assets | | | $38,721,405 | | | | $32,236,590 | | | | $934,050,291 | |
| | | | | | | | | | | | | |
| NET ASSETS CONSIST OF: | | | | | | | | | | | | |
| Paid-in capital ($0.001 par value common stock, unlimited authorized shares) | | | $35,604,471 | | | | $32,986,411 | | | | $932,466,108 | |
| Undistributed (accumulated) net investment income (loss) | | | — | | | | — | | | | (5,931,952) | |
| Undistributed (accumulated) net realized gain (loss) | | | 1,039,183 | | | | (12,050) | | | | (5,357,552) | |
| Net unrealized appreciation (depreciation) | | | 2,077,751 | | | | (737,771) | | | | 12,873,687 | |
| Net Assets | | | $38,721,405 | | | | $32,236,590 | | | | $934,050,291 | |
| | | | | | | | | | | | | |
| NET ASSETS: | | | | | | | | | | | | |
| Class I | | | $37,077,791 | | | | $28,375,483 | | | | $855,024,124 | |
| Class N | | | 1,643,614 | | | | 3,861,107 | | | | 79,026,167 | |
| SHARES OUTSTANDING: | | | | | | | | | | | | |
| Class I | | | 3,432,251 | | | | 3,422,135 | | | | 79,392,512 | |
| Class N | | | 152,311 | | | | 467,151 | | | | 7,343,876 | |
| NET ASSET VALUE AND PUBLIC OFFERING PRICE PER SHARE: | | | | | | | | | | | | |
| Class I | | | $10.80 | | | | $8.29 | | | | $10.77 | |
| Class N | | | $10.79 | | | | $8.27 | | | | $10.76 | |
| | | | | | | | | | | | |
| Premiums paid on interest rate swaps | | | — | | | | — | | | | 406,540 | |
| Premiums received on interest rate swaps | | | — | | | | — | | | | 5,786 | |
| | | Foreign currency at cost of $132,966, $— and $1,407,439, respectively. |
| | ** | Consolidated financial statement, see Note 2 in the Notes to Financial Statements for additional information. |
| | | | |
| | The accompanying notes are an integral part of these financial statements. | | |
| | | | | | | | | | | | | | | | |
| 214 | | AQR Funds | | | | | | Annual Report | | | | | | December 2013 | | |
| | | | | | | | | | |
| | | | |
| Statements of Assets and Liabilities | | | December 31, 2013 | |
| | | | | | | | | | | | |
| | | AQR RISK
PARITY II MV
FUND** | | | AQR RISK
PARITY II HV
FUND** | | | AQR MULTI-
STRATEGY
ALTERNATIVE
FUND** | |
| ASSETS: | | | | | | | | | | | | |
| Investments in securities, at cost | | | $44,992,136 | | | | $34,482,492 | | | | $1,684,320,543 | |
| | | | | | | | | | | | | |
| Investments in securities, at value | | | $44,921,683 | | | | $34,440,813 | | | | $1,920,207,516 | |
| Cash | | | 17 | | | | 60,379 | | | | — | |
| Foreign currency, at value | | | 62,668 | | | | 5,028 | | | | 9,882,650 | |
| Due from brokers | | | 1,993,018 | | | | 1,306,132 | | | | 581,488,718 | |
| Unrealized appreciation on forward foreign currency exchange contracts | | | — | | | | — | | | | 4,528,165 | |
| Swaps, at value | | | 388,934 | | | | 310,834 | | | | 38,864,297 | |
| Unrealized appreciation on futures contracts | | | 877,998 | | | | 696,356 | | | | 3,605,001 | |
| Receivables: | | | | | | | | | | | | |
Securities sold | | | — | | | | — | | | | 21,586,558 | |
Foreign tax reclaim | | | — | | | | — | | | | 613,509 | |
Dividends and interest | | | 78,133 | | | | 60,589 | | | | 2,117,859 | |
Capital shares sold | | | 8,148 | | | | 8,586 | | | | 2,703,345 | |
| Prepaid expenses | | | 15,612 | | | | 14,929 | | | | 51,578 | |
| Total Assets | | | 48,346,211 | | | | 36,903,646 | | | | 2,585,649,196 | |
| LIABILITIES: | | | | | | | | | | | | |
| Securities sold short, at value (proceeds $—, $— and $824,809,159, respectively) | | | — | | | | — | | | | 978,491,299 | |
| Options written, at value (proceeds $—, $— and $10,237, respectively) | | | — | | | | — | | | | 1,432 | |
| Due to custodian | | | — | | | | — | | | | 1,025,978 | |
| Reverse repurchase agreements, at value | | | — | | | | 9,937,250 | | | | — | |
| Due to brokers | | | 90,218 | | | | 28,413 | | | | 6,894,535 | |
| Unrealized depreciation on forward foreign currency exchange contracts | | | 48,897 | | | | 32,431 | | | | — | |
| Swaps, at value | | | 146,659 | | | | 272,318 | | | | 8,193,815 | |
| Unrealized depreciation on futures contracts | | | 694,682 | | | | 286,298 | | | | 6,503,800 | |
| Payables: | | | | | | | | | | | | |
Securities purchased | | | — | | | | — | | | | 49,830,308 | |
Accrued Investment advisory fees | | | — | | | | 9,704 | | | | 2,382,851 | |
Accrued Shareholder servicing fees | | | 9,973 | | | | 5,671 | | | | — | |
Accrued Distribution fees — Class N | | | 2,210 | | | | 1,977 | | | | 16,522 | |
Capital shares redeemed | | | 200 | | | | 1,598 | | | | 2,557,836 | |
Dividends and interest payable on securities sold short | | | — | | | | — | | | | 467,347 | |
Interest payable for reverse repurchase agreements | | | — | | | | 1,733 | | | | — | |
Other accrued expenses and liabilities | | | 108,249 | | | | 97,215 | | | | 665,507 | |
| Total Liabilities | | | 1,101,088 | | | | 10,674,608 | | | | 1,057,031,230 | |
| Net Assets | | | $47,245,123 | | | | $26,229,038 | | | | $1,528,617,966 | |
| | | | | | | | | | | | | |
| NET ASSETS CONSIST OF: | | | | | | | | | | | | |
| Paid-in capital ($0.001 par value common stock, unlimited authorized shares) | | | $47,869,049 | | | | $26,638,976 | | | | $1,553,881,533 | |
| Undistributed (accumulated) net investment income (loss) | | | (45,004) | | | | (8,332) | | | | (37,359,639) | |
| Undistributed (accumulated) net realized gain (loss) | | | (886,219) | | | | (776,598) | | | | (102,154,636) | |
| Net unrealized appreciation (depreciation) | | | 307,297 | | | | 374,992 | | | | 114,250,708 | |
| Net Assets | | | $47,245,123 | | | | $26,229,038 | | | | $1,528,617,966 | |
| | | | | | | | | | | | | |
| NET ASSETS: | | | | | | | | | | | | |
| Class I | | | $37,848,351 | | | | $17,577,063 | | | | $1,453,976,567 | |
| Class N | | | 9,396,772 | | | | 8,651,975 | | | | 74,641,399 | |
| SHARES OUTSTANDING: | | | | | | | | | | | | |
| Class I | | | 3,779,116 | | | | 1,780,470 | | | | 148,651,004 | |
| Class N | | | 940,172 | | | | 877,168 | | | | 7,646,878 | |
| NET ASSET VALUE AND PUBLIC OFFERING PRICE PER SHARE: | | | | | | | | | | | | |
| Class I | | | $10.02 | | | | $9.87 | | | | $9.78 | |
| Class N | | | $9.99 | | | | $9.86 | | | | $9.76 | |
| | | Foreign currency at cost of $62,176, $4,976 and $6,984,955, respectively. |
| | ** | Consolidated financial statement, see Note 2 in the Notes to Financial Statements for additional information. |
| | | | |
| | The accompanying notes are an integral part of these financial statements. | | |
| | | | | | | | | | | | | | | | |
| | AQR Funds | | | | | | Annual Report | | | | | | December 2013 | | 215 |
| | | | | | | | | | |
| | | | |
| Statements of Assets and Liabilities | | | December 31, 2013 | |
| | | | |
| | | AQR
STYLE PREMIA
ALTERNATIVE
FUND** | |
| ASSETS: | | | | |
| Investments in securities, at cost | | | $481,645,736 | |
| | | | | |
| Investments in securities, at value | | | $488,070,524 | |
| Cash | | | 19,656,351 | |
| Foreign currency, at value | | | 55,332 | |
| Due from brokers | | | 36,698,847 | |
| Unrealized appreciation on forward foreign currency exchange contracts | | | 374,760 | |
| Swaps, at value | | | 2,212,263 | |
| Unrealized appreciation on futures contracts | | | 3,691,460 | |
| Receivables: | | | | |
Securities sold | | | 59,102 | |
Foreign tax reclaim | | | 5,298 | |
Dividends and interest | | | 66,201 | |
Capital shares sold | | | 41,607,690 | |
| Prepaid expenses | | | 15,629 | |
| Total Assets | | | 592,513,457 | |
| LIABILITIES: | | | | |
| Securities sold short, at value (proceeds $158,579,762) | | | 166,014,842 | |
| Due to brokers | | | 1,578,641 | |
| Swaps, at value | | | 4,957,180 | |
| Payables: | | | | |
Securities purchased | | | 97 | |
Accrued Investment advisory fees | | | 354,827 | |
Accrued Distribution fees — Class N | | | 2,913 | |
Capital shares redeemed | | | 7,791 | |
Dividends and interest payable on securities sold short | | | 184,871 | |
Other accrued expenses and liabilities | | | 197,326 | |
| Total Liabilities | | | 173,298,488 | |
| Net Assets | | | $419,214,969 | |
| | | | | |
| NET ASSETS CONSIST OF: | | | | |
| Paid-in capital ($0.001 par value common stock, unlimited authorized shares) | | | $414,749,139 | |
| Undistributed (accumulated) net investment income (loss) | | | (943,313) | |
| Undistributed (accumulated) net realized gain (loss) | | | 5,131,554 | |
| Net unrealized appreciation (depreciation) | | | 277,589 | |
| Net Assets | | | $419,214,969 | |
| | | | | |
| NET ASSETS: | | | | |
| Class I | | | $403,242,880 | |
| Class N | | | 15,972,089 | |
| SHARES OUTSTANDING: | | | | |
| Class I | | | 39,620,574 | |
| Class N | | | 1,568,834 | |
| NET ASSET VALUE AND PUBLIC OFFERING PRICE PER SHARE: | | | | |
| Class I | | | $10.18 | |
| Class N | | | $10.18 | |
| | | Foreign currency at cost of $45,746. |
| | ** | Consolidated financial statement, see Note 2 in the Notes to Financial Statements for additional information. |
| | | | |
| | The accompanying notes are an integral part of these financial statements. | | |
| | | | | | | | | | | | | | | | |
| 216 | | AQR Funds | | | | | | Annual Report | | | | | | December 2013 | | |
| | | | | | | | | | |
| | | | |
| Statements of Operations | | | December 31, 2013 | |
| | | | | | | | | | | | |
| | | AQR
DIVERSIFIED
ARBITRAGE
FUND | | | AQR
LONG-SHORT
EQUITY
FUND | | | AQR
MANAGED
FUTURES
STRATEGY
FUND** | |
| | | FOR THE
YEAR ENDED
DECEMBER 31,
2013 | | | FOR THE PERIOD
07/16/13*-12/31/13 | | | FOR THE
YEAR ENDED
DECEMBER 31,
2013 | |
| INVESTMENT INCOME: | | | | | | | | | | | | |
| Dividend income† | | | $40,281,445 | | | | $18 | | | | $200,176 | |
| Interest income | | | 43,554,233 | | | | 171 | | | | 430,429 | |
| Securities lending income, net | | | 77,968 | | | | — | | | | — | |
| Total Income | | | 83,913,646 | | | | 189 | | | | 630,605 | |
| | | |
| EXPENSES: | | | | | | | | | | | | |
| Investment advisory fees | | | 26,707,997 | | | | 27,974 | | | | 42,561,597 | |
| Custody, administration & accounting fees | | | 872,301 | | | | 2,445 | | | | 1,702,547 | |
| Legal fees | | | 252,794 | | | | 1,275 | | | | 184,769 | |
| Audit & tax fees | | | 327,963 | | | | 39,621 | | | | 141,626 | |
| Shareholder reporting fees | | | 409,883 | | | | 20,597 | | | | 428,881 | |
| Transfer agent fees | | | 2,751,655 | | | | 8,683 | | | | 3,772,295 | |
| Trustee fees | | | 126,801 | | | | 324 | | | | 172,212 | |
| Organization and offering costs | | | — | | | | 12,500 | | | | — | |
| Distribution fees—Class N | | | 2,035,884 | | | | 987 | | | | 2,348,595 | |
| Dividends and interest on securities sold short | | | 11,694,157 | | | | — | | | | — | |
| Recoupment of waiver | | | 187,072 | | | | — | | | | 372,808 | |
| Registration fees | | | — | | | | 16,050 | | | | — | |
| Pricing fee | | | 110,268 | | | | 2,122 | | | | — | |
| Other fees | | | 348,434 | | | | 4,907 | | | | 812,474 | |
| Total Expenses | | | 45,825,209 | | | | 137,485 | | | | 52,497,804 | |
| | | |
| Less fee waivers and/or reimbursements | | | — | | | | (103,434) | | | | (2,060) | |
| Net Expenses | | | 45,825,209 | | | | 34,051 | | | | 52,495,744 | |
| Net Investment Income (Loss) | | | 38,088,437 | | | | (33,862) | | | | (51,865,139) | |
| | | |
| REALIZED AND UNREALIZED GAIN (LOSS): | | | | | | | | | | | | |
| Net realized gain (loss) from: | | | | | | | | | | | | |
Investments in securities | | | 133,995,471 | | | | — | | | | (6,933) | |
Foreign currency and foreign currency translations | | | 694,248 | | | | 1,483 | | | | 994,932 | |
Forward foreign currency exchange contracts | | | 1,596,781 | | | | 10,662 | | | | 168,217,992 | |
Futures contracts | | | (37,981,759) | | | | 160,849 | | | | 94,937,272 | |
Securities sold short | | | (73,518,383) | | | | — | | | | — | |
Swap contracts | | | (40,271,035) | | | | 112,663 | | | | (9,866,069) | |
Written options | | | (1,569,916) | | | | — | | | | — | |
| Net realized gain (loss) | | | (17,054,593) | | | | 285,657 | | | | 254,277,194 | |
| | | |
| Net change in unrealized appreciation (depreciation) on: | | | | | | | | | | | | |
Investments in securities | | | 77,878,923 | | | | — | | | | 89,175 | |
Foreign currency and foreign currency translations | | | (5,588,085) | | | | (1,150) | | | | 339,519 | |
Forward foreign currency exchange contracts | | | 736,196 | | | | (447) | | | | 50,904,444 | |
Futures contracts | | | (12,390,081) | | | | 81,479 | | | | 109,764,982 | |
Securities sold short | | | (60,794,908) | | | | — | | | | — | |
Swap contracts | | | 22,838,048 | | | | 264,545 | | | | 18,115,367 | |
Written options | | | (100,156) | | | | — | | | | — | |
| Net change in unrealized appreciation (depreciation) | | | 22,579,937 | | | | 344,427 | | | | 179,213,487 | |
| Net gain (loss) and change in unrealized appreciation (depreciation) | | | 5,525,344 | | | | 630,084 | | | | 433,490,681 | |
| Net increase (decrease) in net assets resulting from operations | | | $43,613,781 | | | | $596,222 | | | | $381,625,542 | |
| | | | | | | | | | | | | |
† Net of foreign taxes withheld of | | | $66,447 | | | | $— | | | | $— | |
| | * | Commencement of operations. |
| | ** | Consolidated financial statement, see Note 2 in the Notes to Financial Statements for additional information. |
| | | | |
| | The accompanying notes are an integral part of these financial statements. | | |
| | | | | | | | | | | | | | | | |
| | AQR Funds | | | | | | Annual Report | | | | | | December 2013 | | 217 |
| | | | | | | | | | |
| | | | |
| Statements of Operations | | | December 31, 2013 | |
| | | | | | | | | | | | |
| | | AQR
MANAGED
FUTURES
STRATEGY HV
FUND** | | | AQR
RISK-BALANCED
COMMODITIES
STRATEGY
FUND** | | | AQR RISK
PARITY
FUND** | |
| | | FOR THE PERIOD
07/16/13*-12/31/13 | | | FOR THE
YEAR ENDED
DECEMBER 31,
2013 | | | FOR THE
YEAR ENDED
DECEMBER 31,
2013 | |
| INVESTMENT INCOME: | | | | | | | | | | | | |
| Dividend income | | | $71 | | | | $1,079 | | | | $12,488 | |
| Interest income | | | 2,274 | | | | 1,962 | | | | 2,843,706 | |
| Total Income | | | 2,345 | | | | 3,041 | | | | 2,856,194 | |
| | | |
| EXPENSES: | | | | | | | | | | | | |
| Investment advisory fees | | | 193,996 | | | | 363,072 | | | | 8,601,695 | |
| Shareholder servicing fees | | | — | | | | 151,279 | | | | — | |
| Custody, administration & accounting fees | | | 6,433 | | | | 23,323 | | | | 522,761 | |
| Legal fees | | | 10,931 | | | | 14,847 | | | | 76,136 | |
| Audit & tax fees | | | 114,939 | | | | 140,657 | | | | 167,615 | |
| Shareholder reporting fees | | | 18,578 | | | | 9,474 | | | | 35,334 | |
| Transfer agent fees | | | 15,326 | | | | 71,297 | | | | 702,218 | |
| Trustee fees | | | 353 | | | | 3,059 | | | | 56,411 | |
| Organization and offering costs | | | 12,500 | | | | — | | | | — | |
| Distribution fees—Class N | | | 1,554 | | | | 11,180 | | | | 347,665 | |
| Interest expense | | | 4,223 | | | | — | | | | — | |
| Recoupment of waiver | | | — | | | | — | | | | 18,271 | |
| Pricing fee | | | — | | | | — | | | | 33,411 | |
| Other fees | | | 44,996 | | | | 28,350 | | | | 126,606 | |
| Total Expenses | | | 423,829 | | | | 816,538 | | | | 10,688,123 | |
| | | |
| Less fee waivers and/or reimbursements | | | (197,079) | | | | (167,979) | | | | — | |
| Net Expenses | | | 226,750 | | | | 648,559 | | | | 10,688,123 | |
| Net Investment Income (Loss) | | | (224,405) | | | | (645,518) | | | | (7,831,929) | |
| | | |
| REALIZED AND UNREALIZED GAIN (LOSS): | | | | | | | | | | | | |
| Net realized gain (loss) from: | | | | | | | | | | | | |
Investments in securities | | | (37) | | | | 20 | | | | (15,241,369) | |
Foreign currency and foreign currency translations | | | 9,093 | | | | — | | | | (441,265) | |
Forward foreign currency exchange contracts | | | 703,466 | | | | — | | | | (19,647,291) | |
Futures contracts | | | 593,776 | | | | (334,442) | | | | 14,280,020 | |
Swap contracts | | | (544,368) | | | | (11,415,980) | | | | 13,292,078 | |
| Net realized gain (loss) | | | 761,930 | | | | (11,750,402) | | | | (7,757,827) | |
| | | |
| Net change in unrealized appreciation (depreciation) on: | | | | | | | | | | | | |
Investments in securities | | | 276 | | | | 266 | | | | (20,458,839) | |
Foreign currency and foreign currency translations | | | 2,611 | | | | — | | | | 228,437 | |
Forward foreign currency exchange contracts | | | 1,020,136 | | | | — | | | | 1,844,015 | |
Futures contracts | | | 1,080,737 | | | | (427,234) | | | | 9,456,904 | |
Swap contracts | | | (26,009) | | | | 1,120,387 | | | | 7,530,271 | |
| Net change in unrealized appreciation (depreciation) | | | 2,077,751 | | | | 693,419 | | | | (1,399,212) | |
| Net gain (loss) and change in unrealized appreciation (depreciation) | | | 2,839,681 | | | | (11,056,983) | | | | (9,157,039) | |
| Net increase (decrease) in net assets resulting from operations | | | $2,615,276 | | | | $(11,702,501) | | | | $(16,988,968) | |
| | | | | | | | | | | | | |
| | * | Commencement of operations. |
| | ** | Consolidated financial statement, see Note 2 in the Notes to Financial Statements for additional information. |
| | | | |
| | The accompanying notes are an integral part of these financial statements. | | |
| | | | | | | | | | | | | | | | |
| 218 | | AQR Funds | | | | | | Annual Report | | | | | | December 2013 | | |
| | | | | | | | | | |
| | | | |
| Statements of Operations | | | December 31, 2013 | |
| | | | | | | | | | | | |
| | | AQR RISK
PARITY II MV
FUND** | | | AQR
RISK
PARITY II HV
FUND** | | | AQR MULTI-
STRATEGY
ALTERNATIVE
FUND** | |
| | | FOR THE
YEAR ENDED
DECEMBER 31,
2013 | | | FOR THE
YEAR ENDED
DECEMBER 31,
2013 | | | FOR THE
YEAR ENDED
DECEMBER 31,
2013 | |
| INVESTMENT INCOME: | | | | | | | | | | | | |
| Dividend income† | | | $275 | | | | $— | | | | $13,777,847 | |
| Interest income | | | 269,713 | | | | 224,180 | | | | 7,370,854 | |
| Securities lending income, net | | | — | | | | — | | | | 1,043 | |
| Total Income | | | 269,988 | | | | 224,180 | | | | 21,149,744 | |
| | | |
| EXPENSES: | | | | | | | | | | | | |
| Investment advisory fees | | | 359,469 | | | | 252,815 | | | | 23,280,543 | |
| Shareholder servicing fees | | | 179,735 | | | | 90,291 | | | | — | |
| Custody, administration & accounting fees | | | 41,817 | | | | 34,160 | | | | 623,582 | |
| Legal fees | | | 27,815 | | | | 31,080 | | | | 77,254 | |
| Audit & tax fees | | | 115,918 | | | | 115,913 | | | | 248,945 | |
| Shareholder reporting fees | | | 9,021 | | | | 8,354 | | | | 39,719 | |
| Transfer agent fees | | | 50,233 | | | | 35,287 | | | | 831,562 | |
| Trustee fees | | | 3,315 | | | | 1,677 | | | | 55,187 | |
| Organization and offering costs | | | 31,172 | | | | 32,723 | | | | — | |
| Distribution fees—Class N | | | 37,789 | | | | 32,608 | | | | 147,545 | |
| Dividends and interest on securities sold short and reverse repurchase agreements | | | — | | | | 29,040 | | | | 17,219,508 | |
| Pricing fee | | | 505 | | | | 505 | | | | 29,713 | |
| Other fees | | | 55,427 | | | | 50,551 | | | | 216,819 | |
| Total Expenses | | | 912,216 | | | | 715,004 | | | | 42,770,377 | |
| | | |
| Less fee waivers and/or reimbursements | | | (189,256) | | | | (237,421) | | | | (303,787) | |
| Net Expenses | | | 722,960 | | | | 477,583 | | | | 42,466,590 | |
| Net Investment Income (Loss) | | | (452,972) | | | | (253,403) | | | | (21,316,846) | |
| | | |
| REALIZED AND UNREALIZED GAIN (LOSS): | | | | | | | | | | | | |
| Net realized gain (loss) from: | | | | | | | | | | | | |
Investments in securities | | | (3,203,080) | | | | (2,276,309) | | | | 37,686,256 | |
Foreign currency and foreign currency translations | | | 13,162 | | | | 42,563 | | | | 1,067,913 | |
Forward foreign currency exchange contracts | | | (121,580) | | | | (305,018) | | | | 27,378,682 | |
Futures contracts | | | 619,402 | | | | 1,149,472 | | | | (17,643,017) | |
Securities sold short | | | — | | | | — | | | | (82,109,183) | |
Swap contracts | | | (1,486,207) | | | | (2,118,182) | | | | 32,609,996 | |
Written options | | | — | | | | — | | | | (716,720) | |
| Net realized gain (loss) | | | (4,178,303) | | | | (3,507,474) | | | | (1,726,073) | |
| | | |
| Net change in unrealized appreciation (depreciation) on: | | | | | | | | | | | | |
Investments in securities | | | (192,986) | | | | (219,758) | | | | 174,222,888 | |
Foreign currency and foreign currency translations | | | (274) | | | | (1,462) | | | | (31,284) | |
Forward foreign currency exchange contracts | | | (4,499) | | | | 65,800 | | | | (3,606,788) | |
Futures contracts | | | 191,595 | | | | 425,484 | | | | (6,843,558) | |
Securities sold short | | | — | | | | — | | | | (113,428,824) | |
Swap contracts | | | 248,992 | | | | 94,312 | | | | 28,665,042 | |
Written options | | | — | | | | — | | | | 1,745 | |
| Net change in unrealized appreciation (depreciation) | | | 242,828 | | | | 364,376 | | | | 78,979,221 | |
| Net gain (loss) and change in unrealized appreciation (depreciation) | | | (3,935,475) | | | | (3,143,098) | | | | 77,253,148 | |
| Net increase (decrease) in net assets resulting from operations | | | $(4,388,447) | | | | $(3,396,501) | | | | $55,936,302 | |
| | | | | | | | | | | | | |
† Net of foreign taxes withheld of | | | $— | | | | $— | | | | $1,368,445 | |
| | ** | Consolidated financial statement, see Note 2 in the Notes to Financial Statements for additional information. |
| | | | |
| | The accompanying notes are an integral part of these financial statements. | | |
| | | | | | | | | | | | | | | | |
| | AQR Funds | | | | | | Annual Report | | | | | | December 2013 | | 219 |
| | | | | | | | | | |
| | | | |
| Statements of Operations | | | December 31, 2013 | |
| | | | |
| | | AQR
STYLE PREMIA
ALTERNATIVE
FUND** | |
| | | FOR THE PERIOD
10/30/13*-12/31/13 | |
| INVESTMENT INCOME: | | | | |
| Dividend income† | | | $173,828 | |
| Total Income | | | 173,828 | |
| |
| EXPENSES: | | | | |
| Investment advisory fees | | | 783,550 | |
| Custody, administration & accounting fees | | | 36,460 | |
| Legal fees | | | 5,062 | |
| Audit & tax fees | | | 88,464 | |
| Shareholder reporting fees | | | 1,100 | |
| Transfer agent fees | | | 2,604 | |
| Trustee fees | | | 503 | |
| Organization and offering costs | | | 25,000 | |
| Distribution fees—Class N | | | 4,833 | |
| Dividends and interest on securities sold short | | | 330,452 | |
| Pricing fee | | | 2,681 | |
| Other fees | | | 50,765 | |
| Total Expenses | | | 1,331,474 | |
| |
| Less fee waivers and/or reimbursements | | | (125,276) | |
| Net Expenses | | | 1,206,198 | |
| Net Investment Income (Loss) | | | (1,032,370) | |
| |
| REALIZED AND UNREALIZED GAIN (LOSS): | | | | |
| Net realized gain (loss) from: | | | | |
Investments in securities | | | 91,261 | |
Foreign currency and foreign currency translations | | | (43,598) | |
Forward foreign currency exchange contracts | | | 6,488,383 | |
Futures contracts | | | 3,365,863 | |
Securities sold short | | | (51,896) | |
Swap contracts | | | 4,268,330 | |
| Net realized gain (loss) | | | 14,118,343 | |
| |
| Net change in unrealized appreciation (depreciation) on: | | | | |
Investments in securities | | | 6,424,788 | |
Foreign currency and foreign currency translations | | | (33,422) | |
Forward foreign currency exchange contracts | | | 374,760 | |
Futures contracts | | | 3,691,460 | |
Securities sold short | | | (7,435,080) | |
Swap contracts | | | (2,744,917) | |
| Net change in unrealized appreciation (depreciation) | | | 277,589 | |
| Net gain (loss) and change in unrealized appreciation (depreciation) | | | 14,395,932 | |
| Net increase (decrease) in net assets resulting from operations | | | $13,363,562 | |
| | | | | |
| | | | |
† Net of foreign taxes withheld of | | | $26,920 | |
| | * | Commencement of operations. |
| | ** | Consolidated financial statement, see Note 2 in the Notes to Financial Statements for additional information. |
| | | | |
| | The accompanying notes are an integral part of these financial statements. | | |
| | | | | | | | | | | | | | | | |
| 220 | | AQR Funds | | | | | | Annual Report | | | | | | December 2013 | | |
| | | | | | | | | | |
| | | | |
| Statements of Changes in Net Assets | | | December 31, 2013 | |
| | | | | | | | | | | | |
| | | AQR DIVERSIFIED
ARBITRAGE FUND | | | AQR
LONG-SHORT
EQUITY FUND | |
| | | FOR THE
YEAR ENDED
DECEMBER 31,
2013 | | | FOR THE
YEAR ENDED
DECEMBER 31,
2012 | | | FOR THE PERIOD
7/16/13*-12/31/13 | |
| OPERATIONS: | |
| Net investment income (loss) | | | $38,088,437 | | | | $18,967,706 | | | | $(33,862) | |
| Net realized gain (loss) | | | (17,054,593) | | | | 61,270,840 | | | | 285,657 | |
| Net change in unrealized appreciation (depreciation) | | | 22,579,937 | | | | (11,053,088) | | | | 344,427 | |
Net increase (decrease) in net assets resulting from operations | | | 43,613,781 | | | | 69,185,458 | | | | 596,222 | |
| | |
| DISTRIBUTIONS TO SHAREHOLDERS: | | | | | | | | | |
| Net investment income: | | | | | | | | | | | | |
Class I | | | (29,570,772) | | | | (20,054,461) | | | | (316,646) | |
Class N | | | (10,955,754) | | | | (6,424,707) | | | | (52,907) | |
Total | | | (40,526,526) | | | | (26,479,168) | | | | (369,553) | |
| Net realized gain: | | | | | | | | | | | | |
Class I | | | (12,468,588) | | | | (8,252,742) | | | | (107,112) | |
Class N | | | (5,475,329) | | | | (3,609,101) | | | | (18,230) | |
Total | | | (17,943,917) | | | | (11,861,843) | | | | (125,342) | |
| Return of capital: | | | | | | | | | | | | |
Class I | | | (15,100,534) | | | | — | | | | — | |
Class N | | | (6,624,075) | | | | — | | | | — | |
Total | | | (21,724,609) | | | | — | | | | — | |
Total distributions | | | (80,195,052) | | | | (38,341,011) | | | | (494,895) | |
| | |
| CAPITAL TRANSACTIONS: | | | | | | | | | |
| CLASS I | | | | | | | | | | | | |
| Proceeds from shares sold | | | 853,020,321 | | | | 1,015,619,538 | | | | 4,751,453 | |
| Reinvestment of distributions | | | 47,464,198 | | | | 24,177,205 | | | | 423,758 | |
| Cost of shares redeemed | | | (751,220,427) | | | | (765,520,230) | | | | (11,827) | |
| Net increase (decrease) from capital transactions | | | 149,264,092 | | | | 274,276,513 | | | | 5,163,384 | |
| CLASS N | | | | | | | | | | | | |
| Proceeds from shares sold | | | 298,155,480 | | | | 313,184,408 | | | | 1,087,057 | |
| Reinvestment of distributions | | | 20,315,353 | | | | 9,826,792 | | | | 71,137 | |
| Cost of shares redeemed | | | (232,413,627) | | | | (222,575,477) | | | | (266,708) | |
| Net increase (decrease) from capital transactions | | | 86,057,206 | | | | 100,435,723 | | | | 891,486 | |
| Net increase (decrease) in net assets resulting from capital transactions | | | 235,321,298 | | | | 374,712,236 | | | | 6,054,870 | |
| Total increase (decrease) in net assets | | | 198,740,027 | | | | 405,556,683 | | | | 6,156,197 | |
| | | |
| NET ASSETS: | | | | | | | | | | | | |
| Beginning of period | | | 2,514,095,324 | | | | 2,108,538,641 | | | | — | |
| End of period | | | $2,712,835,351 | | | | $2,514,095,324 | | | | $6,156,197 | |
| | | | | | | | | | | | | |
| Undistributed accumulated net investment income (loss) | | | $(14,073,713) | | | | $417,982 | | | | $(252,842) | |
| | | |
| CHANGES IN SHARES OUTSTANDING: | | | | | | | | | | | | |
| CLASS I | | | | | | | | | | | | |
| Shares outstanding, beginning of period | | | 158,688,997 | | | | 133,778,788 | | | | — | |
| Shares sold | | | 76,411,318 | | | | 91,852,169 | | | | 473,112 | |
| Shares issued on reinvestment of distributions | | | 4,354,773 | | | | 2,195,928 | | | | 41,832 | |
| Shares redeemed | | | (67,397,809) | | | | (69,137,888) | | | | (1,173) | |
| Shares outstanding, end of period | | | 172,057,279 | | | | 158,688,997 | | | | 513,771 | |
| CLASS N | | | | | | | | | | | | |
| Shares outstanding, beginning of period | | | 69,181,212 | | | | 60,071,714 | | | | — | |
| Shares sold | | | 26,829,009 | | | | 28,441,266 | | | | 108,364 | |
| Shares issued on reinvestment of distributions | | | 1,870,652 | | | | 894,936 | | | | 7,022 | |
| Shares redeemed | | | (20,911,787) | | | | (20,226,704) | | | | (26,242) | |
| Shares outstanding, end of period | | | 76,969,086 | | | | 69,181,212 | | | | 89,144 | |
| | * | Commencement of operations. |
| | | | |
| | The accompanying notes are an integral part of these financial statements. | | |
| | | | | | | | | | | | | | | | |
| | AQR Funds | | | | | | Annual Report | | | | | | December 2013 | | 221 |
| | | | | | | | | | |
| | | | |
| Statements of Changes in Net Assets | | | December 31, 2013 | |
| | | | | | | | | | | | |
| | | AQR MANAGED FUTURES
STRATEGY FUND** | | | AQR MANAGED
FUTURES STRATEGY
HV FUND** | |
| | | FOR THE
YEAR ENDED
DECEMBER 31,
2013 | | | FOR THE
YEAR ENDED
DECEMBER 31,
2012 | | | FOR THE PERIOD
7/16/13*-12/31/13 | |
| OPERATIONS: | |
| Net investment income (loss) | | | $(51,865,139) | | | | $(23,819,486) | | | | $(224,405) | |
| Net realized gain (loss) | | | 254,277,194 | | | | 43,049,129 | | | | 761,930 | |
| Net change in unrealized appreciation (depreciation) | | | 179,213,487 | | | | 49,331,383 | | | | 2,077,751 | |
Net increase (decrease) in net assets resulting from operations | | | 381,625,542 | | | | 68,561,026 | | | | 2,615,276 | |
| | | |
| DISTRIBUTIONS TO SHAREHOLDERS: | | | | | | | | | | | | |
| Net investment income: | | | | | | | | | | | | |
Class I | | | — | | | | (13,405,142) | | | | — | |
Class N | | | — | | | | (3,993,493) | | | | — | |
Total | | | — | | | | (17,398,635) | | | | — | |
| Net realized gain: | | | | | | | | | | | | |
Class I | | | (44,703,867) | | | | — | | | | (37,471) | |
Class N | | | (13,828,173) | | | | — | | | | (2,323) | |
Total | | | (58,532,040) | | | | — | | | | (39,794) | |
Total distributions | | | (58,532,040) | | | | (17,398,635) | | | | (39,794) | |
| | | |
| CAPITAL TRANSACTIONS: | | | | | | | | | | | | |
| CLASS I | | | | | | | | | | | | |
| Proceeds from shares sold | | | 2,963,680,604 | | | | 1,395,656,377 | | | | 37,265,431 | |
| Reinvestment of distributions | | | 35,641,387 | | | | 10,360,005 | | | | 37,471 | |
| Cost of shares redeemed | | | (888,754,364) | | | | (387,573,411) | | | | (2,656,317) | |
| Net increase (decrease) from capital transactions | | | 2,110,567,627 | | | | 1,018,442,971 | | | | 34,646,585 | |
| CLASS N | | | | | | | | | | | | |
| Proceeds from shares sold | | | 1,012,924,117 | | | | 330,844,230 | | | | 2,502,670 | |
| Reinvestment of distributions | | | 13,776,405 | | | | 3,925,643 | | | | 2,323 | |
| Cost of shares redeemed | | | (210,372,539) | | | | (295,614,412) | | | | (1,005,655) | |
| Net increase (decrease) from capital transactions | | | 816,327,983 | | | | 39,155,461 | | | | 1,499,338 | |
| Net increase (decrease) in net assets resulting from capital transactions | | | 2,926,895,610 | | | | 1,057,598,432 | | | | 36,145,923 | |
| Total increase (decrease) in net assets | | | 3,249,989,112 | | | | 1,108,760,823 | | | | 38,721,405 | |
| | | |
| NET ASSETS: | | | | | | | | | | | | |
| Beginning of period | | | 2,664,277,197 | | | | 1,555,516,374 | | | | — | |
| End of period | | | $5,914,266,309 | | | | $2,664,277,197 | | | | $38,721,405 | |
| | | | | | | | | | | | | |
| Undistributed accumulated net investment income (loss) | | | $(46,677) | | | | $(1,795,380) | | | | $— | |
| | | |
| CHANGES IN SHARES OUTSTANDING: | | | | | | | | | | | | |
| CLASS I | | | | | | | | | | | | |
| Shares outstanding, beginning of period | | | 218,555,645 | | | | 112,731,031 | | | | — | |
| Shares sold | | | 290,847,133 | | | | 145,328,092 | | | | 3,683,449 | |
| Shares issued on reinvestment of distributions | | | 3,427,066 | | | | 1,075,795 | | | | 3,562 | |
| Shares redeemed | | | (87,501,693) | | | | (40,579,273) | | | | (254,760) | |
| Shares outstanding, end of period | | | 425,328,151 | | | | 218,555,645 | | | | 3,432,251 | |
| CLASS N | | | | | | | | | | | | |
| Shares outstanding, beginning of period | | | 54,190,271 | | | | 49,946,509 | | | | — | |
| Shares sold | | | 99,221,038 | | | | 34,790,824 | | | | 246,459 | |
| Shares issued on reinvestment of distributions | | | 1,334,923 | | | | 409,770 | | | | 221 | |
| Shares redeemed | | | (20,824,117) | | | | (30,956,832) | | | | (94,369) | |
| Shares outstanding, end of period | | | 133,922,115 | | | | 54,190,271 | | | | 152,311 | |
| | * | Commencement of operations. |
| | ** | Consolidated financial statement, see Note 2 in the Notes to Financial Statements for additional information. |
| | | | |
| | The accompanying notes are an integral part of these financial statements. | | |
| | | | | | | | | | | | | | | | |
| 222 | | AQR Funds | | | | | | Annual Report | | | | | | December 2013 | | |
| | | | | | | | | | |
| | | | |
| Statements of Changes in Net Assets | | | December 31, 2013 | |
| | | | | | | | | | | | | | | | |
| | | AQR RISK-BALANCED
COMMODITIES STRATEGY FUND** | | | AQR RISK PARITY FUND** | |
| | | FOR THE
YEAR ENDED
DECEMBER 31,
2013 | | | FOR THE PERIOD
7/09/12*-12/31/12 | | | FOR THE
YEAR ENDED
DECEMBER 31,
2013 | | | FOR THE
YEAR ENDED
DECEMBER 31,
2012 | |
| OPERATIONS: | | | | | | | | | | | | | | | | |
| Net investment income (loss) | | | $(645,518) | | | | $(169,935) | | | | $(7,831,929) | | | | $(476,291) | |
| Net realized gain (loss) | | | (11,750,402) | | | | (749,368) | | | | (7,757,827) | | | | 81,873,863 | |
| Net change in unrealized appreciation (depreciation) | | | 693,419 | | | | (1,431,190) | | | | (1,399,212) | | | | 7,410,873 | |
Net increase (decrease) in net assets resulting from operations | | | (11,702,501) | | | | (2,350,493) | | | | (16,988,968) | | | | 88,808,445 | |
| | | | |
| DISTRIBUTIONS TO SHAREHOLDERS: | | | | | | | | | | | | | | | | |
| Net investment income: | | | | | | | | | | | | | | | | |
Class I | | | — | | | | — | | | | (21,096,377) | | | | (9,796,702) | |
Class N | | | — | | | | — | | | | (1,568,986) | | | | (1,584,812) | |
Total | | | — | | | | — | | | | (22,665,363) | | | | (11,381,514) | |
| Net realized gain: | | | | | | | | | | | | | | | | |
Class I | | | — | | | | — | | | | (35,650,580) | | | | (32,256,921) | |
Class N | | | — | | | | — | | | | (3,239,083) | | | | (6,624,667) | |
Total | | | — | | | | — | | | | (38,889,663) | | | | (38,881,588) | |
Total distributions | | | — | | | | — | | | | (61,555,026) | | | | (50,263,102) | |
| | | | |
| CAPITAL TRANSACTIONS: | | | | | | | | | | | | | | | | |
| CLASS I | | | | | | | | | | | | | | | | |
| Proceeds from shares sold | | | 23,425,236 | | | | 77,004,032 | | | | 522,146,729 | | | | 669,000,824 | |
| Reinvestment of distributions | | | — | | | | — | | | | 48,021,450 | | | | 35,264,133 | |
| Cost of shares redeemed | | | (47,521,978) | | | | (11,390,971) | | | | (514,099,505) | | | | (206,439,327) | |
| Net increase (decrease) from capital transactions | | | (24,096,742) | | | | 65,613,061 | | | | 56,068,674 | | | | 497,825,630 | |
| CLASS N | | | | | | | | | | | | | | | | |
| Proceeds from shares sold | | | 5,602,455 | | | | 3,507,402 | | | | 37,388,598 | | | | 132,332,404 | |
| Reinvestment of distributions | | | — | | | | — | | | | 4,729,810 | | | | 8,172,729 | |
| Cost of shares redeemed | | | (3,103,737) | | | | (1,232,855) | | | | (125,206,912) | | | | (26,348,713) | |
| Net increase (decrease) from capital transactions | | | 2,498,718 | | | | 2,274,547 | | | | (83,088,504) | | | | 114,156,420 | |
| Net increase (decrease) in net assets resulting from capital transactions | | | (21,598,024) | | | | 67,887,608 | | | | (27,019,830) | | | | 611,982,050 | |
| Total increase (decrease) in net assets | | | (33,300,525) | | | | 65,537,115 | | | | (105,563,824) | | | | 650,527,393 | |
| | | | |
| NET ASSETS: | | | | | | | | | | | | | | | | |
| Beginning of period | | | 65,537,115 | | | | — | | | | 1,039,614,115 | | | | 389,086,722 | |
| End of period | | | $32,236,590 | | | | $65,537,115 | | | | $934,050,291 | | | | $1,039,614,115 | |
| | | | | | | | | | | | | | | | | |
| Undistributed accumulated net investment income (loss) | | | $— | | | | $— | | | | $(5,931,952) | | | | $12,558,291 | |
| | | | |
| CHANGES IN SHARES OUTSTANDING: | | | | | | | | | | | | | | | | |
| | | | |
| CLASS I | | | | | | | | | | | | | | | | |
| Shares outstanding, beginning of period | | | 6,413,854 | | | | — | | | | 75,596,068 | | | | 31,791,062 | |
| Shares sold | | | 2,602,548 | | | | 7,499,229 | | | | 44,822,715 | | | | 58,917,029 | |
| Shares issued on reinvestment of distributions | | | — | | | | — | | | | 4,471,363 | | | | 3,071,788 | |
| Shares redeemed | | | (5,594,267) | | | | (1,085,375) | | | | (45,497,634) | | | | (18,183,811) | |
| Shares outstanding, end of period | | | 3,422,135 | | | | 6,413,854 | | | | 79,392,512 | | | | 75,596,068 | |
| | | | |
| CLASS N | | | | | | | | | | | | | | | | |
| Shares outstanding, beginning of period | | | 223,691 | | | | — | | | | 14,906,004 | | | | 4,868,266 | |
| Shares sold | | | 606,741 | | | | 340,691 | | | | 3,211,181 | | | | 11,658,773 | |
| Shares issued on reinvestment of distributions | | | — | | | | — | | | | 440,803 | | | | 713,153 | |
| Shares redeemed | | | (363,281) | | | | (117,000) | | | | (11,214,112) | | | | (2,334,188) | |
| Shares outstanding, end of period | | | 467,151 | | | | 223,691 | | | | 7,343,876 | | | | 14,906,004 | |
| | * | Commencement of operations. |
| | ** | Consolidated financial statement, see Note 2 in the Notes to Financial Statements for additional information. |
| | | | |
| | The accompanying notes are an integral part of these financial statements. | | |
| | | | | | | | | | | | | | | | |
| | AQR Funds | | | | | | Annual Report | | | | | | December 2013 | | 223 |
| | | | | | | | | | |
| | | | |
| Statements of Changes in Net Assets | | | December 31, 2013 | |
| | | | | | | | | | | | | | | | |
| | | AQR RISK PARITY II MV FUND** | | | AQR RISK PARITY II HV FUND** | |
| | | FOR THE
YEAR ENDED
DECEMBER 31,
2013 | | | FOR THE PERIOD
11/05/12*-12/31/12 | | | FOR THE
YEAR ENDED
DECEMBER 31,
2013 | | | FOR THE PERIOD
11/05/12*-12/31/12 | |
| OPERATIONS: | | | | | | | | | | | | | | | | |
| Net investment income (loss) | | | $(452,972) | | | | $2,578 | | | | $(253,403) | | | | $5,591 | |
| Net realized gain (loss) | | | (4,178,303) | | | | 160,027 | | | | (3,507,474) | | | | 290,719 | |
| Net change in unrealized appreciation (depreciation) | | | 242,828 | | | | 64,469 | | | | 364,376 | | | | 10,616 | |
Net increase (decrease) in net assets resulting from operations | | | (4,388,447) | | | | 227,074 | | | | (3,396,501) | | | | 306,926 | |
| | | | |
| DISTRIBUTIONS TO SHAREHOLDERS: | | | | | | | | | | | | | | | | |
| Net investment income: | | | | | | | | | | | | | | | | |
Class I | | | (51,310) | | | | (16,427) | | | | (49,264) | | | | (36,666) | |
Class N | | | (12,869) | | | | — | | | | (24,033) | | | | (4,075) | |
Total | | | (64,179) | | | | (16,427) | | | | (73,297) | | | | (40,741) | |
| Net realized gain: | | | | | | | | | | | | | | | | |
Class I | | | (8,622) | | | | — | | | | (41,465) | | | | — | |
Class N | | | (2,163) | | | | — | | | | (20,229) | | | | — | |
Total | | | (10,785) | | | | — | | | | (61,694) | | | | — | |
Total distributions | | | (74,964) | | | | (16,427) | | | | (134,991) | | | | (40,741) | |
| | | | |
| CAPITAL TRANSACTIONS: | | | | | | | | | | | | | | | | |
| CLASS I | | | | | | | | | | | | | | | | |
| Proceeds from shares sold | | | 93,026,269 | | | | 38,864,832 | | | | 57,186,061 | | | | 15,978,772 | |
| Reinvestment of distributions | | | 42,081 | | | | 16,427 | | | | 89,047 | | | | 36,666 | |
| Cost of shares redeemed | | | (81,847,252) | | | | (9,067,579) | | | | (54,453,441) | | | | (1,270) | |
| Net increase (decrease) from capital transactions | | | 11,221,098 | | | | 29,813,680 | | | | 2,821,667 | | | | 16,014,168 | |
| CLASS N | | | | | | | | | | | | | | | | |
| Proceeds from shares sold | | | 29,862,796 | | | | 3,242,604 | | | | 24,623,879 | | | | 6,140,990 | |
| Reinvestment of distributions | | | 14,991 | | | | — | | | | 44,262 | | | | 4,075 | |
| Cost of shares redeemed | | | (21,642,916) | | | | (1,014,366) | | | | (19,787,752) | | | | (366,944) | |
| Net increase (decrease) from capital transactions | | | 8,234,871 | | | | 2,228,238 | | | | 4,880,389 | | | | 5,778,121 | |
| Net increase (decrease) in net assets resulting from capital transactions | | | 19,455,969 | | | | 32,041,918 | | | | 7,702,056 | | | | 21,792,289 | |
| Total increase (decrease) in net assets | | | 14,992,558 | | | | 32,252,565 | | | | 4,170,564 | | | | 22,058,474 | |
| | | | |
| NET ASSETS: | | | | | | | | | | | | | | | | |
| Beginning of period | | | 32,252,565 | | | | — | | | | 22,058,474 | | | | — | |
| End of period | | | $47,245,123 | | | | $32,252,565 | | | | $26,229,038 | | | | $22,058,474 | |
| | | | | | | | | | | | | | | | | |
| Undistributed accumulated net investment income (loss) | | | $(45,004) | | | | $64,137 | | | | $(8,332) | | | | $73,283 | |
| | | | |
| CHANGES IN SHARES OUTSTANDING: | | | | | | | | | | | | | | | | |
| | | | |
| CLASS I | | | | | | | | | | | | | | | | |
| Shares outstanding, beginning of period | | | 2,950,196 | | | | — | | | | 1,591,812 | | | | — | |
| Shares sold | | | 9,091,173 | | | | 3,844,193 | | | | 5,572,364 | | | | 1,588,338 | |
| Shares issued on reinvestment of distributions | | | 4,212 | | | | 1,620 | | | | 9,058 | | | | 3,599 | |
| Shares redeemed | | | (8,266,465) | | | | (895,617) | | | | (5,392,764) | | | | (125) | |
| Shares outstanding, end of period | | | 3,779,116 | | | | 2,950,196 | | | | 1,780,470 | | | | 1,591,812 | |
| | | | |
| CLASS N | | | | | | | | | | | | | | | | |
| Shares outstanding, beginning of period | | | 221,957 | | | | — | | | | 567,306 | | | | — | |
| Shares sold | | | 2,885,341 | | | | 321,962 | | | | 2,325,030 | | | | 602,901 | |
| Shares issued on reinvestment of distributions | | | 1,504 | | | | — | | | | 4,503 | | | | 399 | |
| Shares redeemed | | | (2,168,630) | | | | (100,005) | | | | (2,019,671) | | | | (35,994) | |
| Shares outstanding, end of period | | | 940,172 | | | | 221,957 | | | | 877,168 | | | | 567,306 | |
| | * | Commencement of operations. |
| | ** | Consolidated financial statement, see Note 2 in the Notes to Financial Statements for additional information. |
| | | | |
| | The accompanying notes are an integral part of these financial statements. | | |
| | | | | | | | | | | | | | | | |
| 224 | | AQR Funds | | | | | | Annual Report | | | | | | December 2013 | | |
| | | | | | | | | | |
| | | | |
| Statements of Changes in Net Assets | | | December 31, 2013 | |
| | | | | | | | | | | | |
| | | AQR MULTI-STRATEGY ALTERNATIVE FUND** | | | AQR STYLE PREMIA
ALTERNATIVE FUND** | |
| | | FOR THE
YEAR ENDED
DECEMBER 31,
2013 | | | FOR THE
YEAR ENDED
DECEMBER 31,
2012 | | | FOR THE PERIOD
10/30/13*-12/31/13 | |
| OPERATIONS: | | | | | | | | | | | | |
| Net investment income (loss) | | | $(21,316,846) | | | | $(9,845,563) | | | | $(1,032,370) | |
| Net realized gain (loss) | | | (1,726,073) | | | | (11,666,874) | | | | 14,118,343 | |
| Net change in unrealized appreciation (depreciation) | | | 78,979,221 | | | | 34,480,693 | | | | 277,589 | |
Net increase (decrease) in net assets resulting from operations | | | 55,936,302 | | | | 12,968,256 | | | | 13,363,562 | |
| | | |
| DISTRIBUTIONS TO SHAREHOLDERS: | | | | | | | | | | | | |
| Net investment income: | | | | | | | | | | | | |
Class I | | | (63,777,345) | | | | (1,085,248) | | | | (6,574,253) | |
Class N | | | (3,214,925) | | | | — | | | | (253,100) | |
Total | | | (66,992,270) | | | | (1,085,248) | | | | (6,827,353) | |
| Net realized gain: | | | | | | | | | | | | |
Class I | | | (17,108,033) | | | | (1,191,421) | | | | (992,985) | |
Class N | | | (901,984) | | | | (54,608) | | | | (38,950) | |
Total | | | (18,010,017) | | | | (1,246,029) | | | | (1,031,935) | |
Total distributions | | | (85,002,287) | | | | (2,331,277) | | | | (7,859,288) | |
| | | |
| CAPITAL TRANSACTIONS: | | | | | | | | | | | | |
| CLASS I | | | | | | | | | | | | |
| Proceeds from shares sold | | | 924,993,719 | | | | 682,299,842 | | | | 390,642,419 | |
| Reinvestment of distributions | | | 66,445,405 | | | | 1,825,572 | | | | 7,567,238 | |
| Cost of shares redeemed | | | (318,011,140) | | | | (142,988,282) | | | | (318,591) | |
| Net increase (decrease) from capital transactions | | | 673,427,984 | | | | 541,137,132 | | | | 397,891,066 | |
| CLASS N | | | | | | | | | | | | |
| Proceeds from shares sold | | | 53,142,617 | | | | 39,666,094 | | | | 15,941,402 | |
| Reinvestment of distributions | | | 4,089,028 | | | | 54,570 | | | | 292,050 | |
| Cost of shares redeemed | | | (24,341,705) | | | | (41,973,512) | | | | (413,823) | |
| Net increase (decrease) from capital transactions | | | 32,889,940 | | | | (2,252,848) | | | | 15,819,629 | |
| Net increase (decrease) in net assets resulting from capital transactions | | | 706,317,924 | | | | 538,884,284 | | | | 413,710,695 | |
| Total increase (decrease) in net assets | | | 677,251,939 | | | | 549,521,263 | | | | 419,214,969 | |
| | | |
| NET ASSETS: | | | | | | | | | | | | |
| Beginning of period | | | 851,366,027 | | | | 301,844,764 | | | | — | |
| End of period | | | $1,528,617,966 | | | | $851,366,027 | | | | $419,214,969 | |
| | | | | | | | | | | | | |
| Undistributed accumulated net investment income (loss) | | | $(37,359,639) | | | | $(5,193,502) | | | | $(943,313) | |
| | | |
| CHANGES IN SHARES OUTSTANDING: | | | | | | | | | | | | |
| | | |
| CLASS I | | | | | | | | | | | | |
| Shares outstanding, beginning of period | | | 81,626,174 | | | | 26,521,933 | | | | — | |
| Shares sold | | | 91,941,333 | | | | 69,512,527 | | | | 38,910,297 | |
| Shares issued on reinvestment of distributions | | | 6,814,913 | | | | 184,399 | | | | 741,160 | |
| Shares redeemed | | | (31,731,416) | | | | (14,592,685) | | | | (30,883) | |
| Shares outstanding, end of period | | | 148,651,004 | | | | 81,626,174 | | | | 39,620,574 | |
| | | |
| CLASS N | | | | | | | | | | | | |
| Shares outstanding, beginning of period | | | 4,359,055 | | | | 4,608,787 | | | | — | |
| Shares sold | | | 5,303,536 | | | | 4,042,219 | | | | 1,580,201 | |
| Shares issued on reinvestment of distributions | | | 420,250 | | | | 5,529 | | | | 28,604 | |
| Shares redeemed | | | (2,435,963) | | | | (4,297,480) | | | | (39,971) | |
| Shares outstanding, end of period | | | 7,646,878 | | | | 4,359,055 | | | | 1,568,834 | |
| | * | Commencement of operations. |
| | ** | Consolidated financial statement, see Note 2 in the Notes to Financial Statements for additional information. |
| | | | |
| | The accompanying notes are an integral part of these financial statements. | | |
| | | | | | | | | | | | | | | | |
| | AQR Funds | | | | | | Annual Report | | | | | | December 2013 | | 225 |
| | | | | | | | | | |
| | | | |
| Statement of Cash Flows | | | December 31, 2013 | |
| | | | |
| | | AQR
DIVERSIFIED
ARBITRAGE
FUND | |
| | | FOR THE
YEAR ENDED
DECEMBER 31,
2013 | |
| CASH FLOWS FROM OPERATING ACTIVITIES: | | | | |
| Net increase (decrease) in net assets resulting from operations | | | $43,613,781 | |
| Adjustments to reconcile net increase (decrease) in net assets resulting from operations to net cash provided (used) in operating activities: | | | | |
Payments to purchase securities | | | (7,644,336,470) | |
Payments to cover short securities | | | (1,596,595,215) | |
Payments to close written options | | | (3,821,859) | |
Proceeds from sale of securities | | | 7,317,466,289 | |
Proceeds from securities sold short | | | 1,571,947,446 | |
Proceeds from written options | | | 4,579,445 | |
Return of cash collateral for securities loaned | | | 161,950 | |
Sales of short-term investments, net | | | 427,865,282 | |
Realized gain on investments in securities | | | (133,995,471) | |
Realized loss on securities sold short | | | 73,518,383 | |
Realized loss on written options | | | 1,569,916 | |
Change in unrealized appreciation on investments in securities | | | (77,878,923) | |
Change in unrealized depreciation on securities sold short | | | 60,794,908 | |
Change in unrealized appreciation on written options | | | 100,156 | |
Amortization of bond premium | | | 215,991 | |
Realized gain on paydowns | | | (54,811) | |
| (Increases) decreases in operating assets: | | | | |
Due from brokers | | | (219,542,866) | |
Swaps, at value | | | (33,594,303) | |
Unrealized appreciation on futures contracts | | | 6,754 | |
Receivable for securities sold | | | (44,950,483) | |
Foreign tax reclaim | | | (44,590) | |
Dividends and interest | | | (4,415,356) | |
Prepaid expenses | | | 53,897 | |
| Increases (decreases) in operating liabilities: | | | | |
Due to custodian/broker | | | 302,591 | |
Unrealized depreciation on forward foreign currency exchange contracts | | | (736,196) | |
Swaps, at value | | | 17,039,302 | |
Unrealized depreciation on futures contracts | | | 12,383,327 | |
Payable for securities purchased | | | 43,456,601 | |
Collateral received on securities loaned | | | (161,950) | |
Accrued Investment advisory fees | | | 322,466 | |
Accrued Distribution fees — Class N | | | 16,482 | |
Dividends and interest payable on securities sold short | | | (310,297) | |
Other accrued expenses and liabilities | | | 293,128 | |
Net cash used in operating activities | | | $(184,730,695) | |
| |
| CASH FLOWS FROM FINANCING ACTIVITIES | | | | |
Proceeds from shares sold | | | 1,151,749,009 | |
Payments on shares redeemed | | | (983,529,869) | |
Cash distributions paid | | | (12,415,501) | |
Net cash provided by financing activities | | | $155,803,639 | |
| Net change in cash | | | (28,927,056) | |
Cash, beginning of period | | | 34,722,274 | |
Cash, end of period | | | $5,795,218 | |
Supplemental disclosure of cash flow information:
Cash paid during the period for interest in the amount of $2,230,201.
| | | | |
| | The accompanying notes are an integral part of these financial statements. | | |
| | | | | | | | | | | | | | | | |
| 226 | | AQR Funds | | | | | | Annual Report | | | | | | December 2013 | | |
| | | | | | | | | | |
| | | | |
| Statement of Cash Flows | | | December 31, 2013 | |
| | | | |
| | | AQR RISK
PARITY II HV
FUND** | |
| | | FOR THE
YEAR ENDED
DECEMBER 31,
2013 | |
| CASH FLOWS FROM OPERATING ACTIVITIES: | | | | |
| Net increase (decrease) in net assets resulting from operations | | | $(3,396,501) | |
| Adjustments to reconcile net increase (decrease) in net assets resulting from operations to net cash provided (used) in operating activities: | | | | |
Payments to purchase securities | | | (65,468,668) | |
Proceeds from sale of securities | | | 68,123,951 | |
Purchases of short-term investments, net | | | (8,174,586) | |
Realized loss on investments in securities | | | 2,276,309 | |
Change in unrealized depreciation on investments in securities | | | 219,758 | |
Amortization of bond premium | | | 236,917 | |
| (Increases) decreases in operating assets: | | | | |
Due from brokers | | | 619,813 | |
Swaps, at value | | | (306,128) | |
Unrealized appreciation on futures contracts | | | (696,356) | |
Dividends and interest | | | 28,728 | |
Expense reimbursement due from Advisor | | | 90,647 | |
Prepaid expenses | | | 14,372 | |
| Increases (decreases) in operating liabilities: | | | | |
Due to custodian/broker | | | 28,413 | |
Unrealized depreciation on forward foreign currency exchange contracts | | | (65,800) | |
Swaps, at value | | | 211,816 | |
Unrealized depreciation on futures contracts | | | 270,872 | |
Payable for securities purchased | | | (2,300,456) | |
Accrued Investment advisory fees | | | 9,704 | |
Accrued Shareholder servicing fees | | | 5,671 | |
Accrued Distribution fees — Class N | | | 1,094 | |
Interest payable for reverse repurchase agreements | | | 843 | |
Other accrued expenses and liabilities | | | 46,902 | |
Net cash used in operating activities | | | $(8,222,685) | |
| |
| CASH FLOWS FROM FINANCING ACTIVITIES | | | | |
Proceeds from shares sold | | | 81,880,836 | |
Net change in reverse repurchase agreements | | | (652,640) | |
Payments on shares redeemed | | | (74,239,595) | |
Cash distributions paid | | | (1,682) | |
Net cash provided by financing activities | | | $6,986,919 | |
| Net change in cash | | | (1,235,766) | |
Cash, beginning of period | | | 1,301,173 | |
Cash, end of period | | | $65,407 | |
Supplemental disclosure of cash flow information:
Cash paid during the period for interest in the amount of $29,040.
| | ** | Consolidated financial statement, see Note 2 in the Notes to Financial Statements for additional information. |
| | | | |
| | The accompanying notes are an integral part of these financial statements. | | |
| | | | | | | | | | | | | | | | |
| | AQR Funds | | | | | | Annual Report | | | | | | December 2013 | | 227 |
| | | | | | | | | | |
| | | | |
| Statement of Cash Flows | | | December 31, 2013 | |
| | | | |
| | | AQR MULTI-
STRATEGY
ALTERNATIVE
FUND** | |
| | | FOR THE
YEAR ENDED
DECEMBER 31,
2013 | |
| CASH FLOWS FROM OPERATING ACTIVITIES: | | | | |
| Net increase (decrease) in net assets resulting from operations | | | $55,936,302 | |
| Adjustments to reconcile net increase (decrease) in net assets resulting from operations to net cash provided (used) in operating activities: | | | | |
Payments to purchase securities | | | (1,010,004,196) | |
Payments to cover short securities | | | (557,226,995) | |
Payments to close written options | | | (1,214,926) | |
Proceeds from sale of securities | | | 537,919,085 | |
Proceeds from securities sold short | | | 820,221,454 | |
Proceeds from written options | | | 472,527 | |
Return of cash collateral for securities loaned | | | 1,238,191 | |
Purchases of short-term investments, net | | | (282,085,419) | |
Realized gain on investments in securities | | | (37,686,256) | |
Realized loss on securities sold short | | | 82,109,183 | |
Realized loss on written options | | | 716,720 | |
Change in unrealized appreciation on investments in securities | | | (174,222,888) | |
Change in unrealized depreciation on securities sold short | | | 113,428,824 | |
Change in unrealized appreciation on written options | | | (1,745) | |
Amortization of bond premium | | | 712,247 | |
| (Increases) decreases in operating assets: | | | | |
Due from brokers | | | (182,955,179) | |
Unrealized appreciation on forward foreign currency exchange contracts | | | 3,606,788 | |
Swaps, at value | | | (34,241,057) | |
Unrealized appreciation on futures contracts | | | 339,758 | |
Receivable for securities sold | | | (21,016,671) | |
Foreign tax reclaim | | | (450,209) | |
Dividends and interest | | | (1,218,254) | |
Prepaid expenses | | | (5,743) | |
| Increases (decreases) in operating liabilities: | | | | |
Due to broker | | | 6,894,535 | |
Swaps, at value | | | 6,245,616 | |
Unrealized depreciation on futures contracts | | | 6,503,800 | |
Payable for securities purchased | | | 45,636,189 | |
Collateral received on securities loaned | | | (1,238,191) | |
Accrued Investment advisory fees | | | 1,094,495 | |
Accrued Distribution fees — Class N | | | 8,821 | |
Dividends and interest payable on securities sold short | | | 192,878 | |
Other accrued expenses and liabilities | | | 245,106 | |
Net cash used in operating activities | | | $(620,045,210) | |
| |
| CASH FLOWS FROM FINANCING ACTIVITIES | | | | |
Proceeds from shares sold | | | 985,014,928 | |
Payments on shares redeemed | | | (340,705,904) | |
Cash distributions paid | | | (14,467,854) | |
Due to custodian | | | (1,742,030) | |
Net cash provided by financing activities | | | $628,099,140 | |
| Net change in cash | | | 8,053,930 | |
Cash, beginning of period | | | 1,828,720 | |
Cash, end of period | | | $9,882,650 | |
Supplemental disclosure of cash flow information:
Cash paid during the period for interest in the amount of $5,836,938.
| | ** | Consolidated financial statement, see Note 2 in the Notes to Financial Statements for additional information. |
| | | | |
| | The accompanying notes are an integral part of these financial statements. | | |
| | | | | | | | | | | | | | | | |
| 228 | | AQR Funds | | | | | | Annual Report | | | | | | December 2013 | | |
| | | | | | | | | | |
| | | | |
| Statement of Cash Flows | | | December 31, 2013 | |
| | | | |
| | | AQR STYLE PREMIA
ALTERNATIVE FUND** | |
| | | FOR THE PERIOD
10/30/2013* - 12/31/2013 | |
| CASH FLOWS FROM OPERATING ACTIVITIES: | | | | |
| Net increase (decrease) in net assets resulting from operations | | | $13,363,562 | |
| Adjustments to reconcile net increase (decrease) in net assets resulting from operations to net cash provided (used) in operating activities: | | | | |
Payments to purchase securities | | | (192,448,009) | |
Payments to cover short securities | | | (964,166) | |
Proceeds from sale of securities | | | 836,158 | |
Proceeds from securities sold short | | | 159,492,032 | |
Purchases of short-term investments, net | | | (289,942,624) | |
Realized gain on investments in securities | | | (91,261) | |
Realized loss on securities sold short | | | 51,896 | |
Change in unrealized appreciation on investments in securities | | | (6,424,788) | |
Change in unrealized depreciation on securities sold short | | | 7,435,080 | |
| (Increases) decreases in operating assets: | | | | |
Due from brokers | | | (36,698,847) | |
Unrealized appreciation on forward foreign currency exchange contracts | | | (374,760) | |
Swaps, at value | | | (2,212,263) | |
Unrealized appreciation on futures contracts | | | (3,691,460) | |
Receivable for securities sold | | | (59,102) | |
Foreign tax reclaim | | | (5,298) | |
Dividends and interest | | | (66,201) | |
Prepaid expenses | | | (15,629) | |
| Increases (decreases) in operating liabilities: | | | | |
Due to custodian/broker | | | 1,578,641 | |
Swaps, at value | | | 4,957,180 | |
Payable for securities purchased | | | 97 | |
Accrued Investment advisory fees | | | 354,827 | |
Accrued Distribution fees — Class N | | | 2,913 | |
Dividends and interest payable on securities sold short | | | 184,871 | |
Other accrued expenses and liabilities | | | 197,326 | |
Net cash used in operating activities | | | $(344,539,825) | |
| |
| CASH FLOWS FROM FINANCING ACTIVITIES | | | | |
Proceeds from shares sold | | | 364,976,131 | |
Payments on shares redeemed | | | (724,623) | |
Net cash provided by financing activities | | | $364,251,508 | |
| Net change in cash | | | 19,711,683 | |
Cash, beginning of period | | | — | |
Cash, end of period | | | $19,711,683 | |
Supplemental disclosure of cash flow information:
Cash paid during the period for interest in the amount of $237,444.
| | * | Commencement of operations. |
| | ** | Consolidated financial statement, see Note 2 in the Notes to Financial Statements for additional information. |
| | | | |
| | The accompanying notes are an integral part of these financial statements. | | |
| | | | | | | | | | | | | | | | |
| | AQR Funds | | | | | | Annual Report | | | | | | December 2013 | | 229 |
| | | | | | | | | | |
| | | | |
| Financial Highlights | | | December 31, 2013 | |
| | | | | | | | | | | | | | | | | | | | | | | | | | | | | | | | |
| | | PER SHARE OPERATING PERFORMANCE | |
| | | | | | Change in Net Assets Resulting
from Operations | | | Less Dividends and Distributions | |
| | | Net Asset
Value,
Beginning
of Period | | | Net
Investment
Income
(Loss) | | | Net
Realized
and
Unrealized
Gain
(Loss) | | | Net
Increase
(Decrease)
in Net
Asset
Value from
Operations | | | Distributions
from Net
Investment
Income | | | Distributions
from Net
Realized
Gains | | | Return of
Capital | | | Total
Distributions | |
| AQR DIVERSIFIED ARBITRAGE FUND CLASS I | | | | | | | | | | | | | | | | | | | | | | | | | | | | | | | | |
| FOR THE YEAR ENDED DECEMBER 31, 20135 | | | $11.05 | | | | 0.17 | | | | 0.02 | | | | 0.19 | | | | (0.18) | | | | (0.06) | | | | (0.09) | | | | (0.33) | |
| FOR THE YEAR ENDED DECEMBER 31, 20125 | | | $10.89 | | | | 0.10 | 6 | | | 0.24 | | | | 0.34 | | | | (0.13) | | | | (0.05) | | | | — | | | | (0.18) | |
| FOR THE YEAR ENDED DECEMBER 31, 20115 | | | $11.15 | | | | 0.13 | | | | (0.02) | | | | 0.11 | | | | (0.09) | | | | (0.28) | | | | — | | | | (0.37) | |
| FOR THE YEAR ENDED DECEMBER 31, 2010† | | | $10.80 | | | | 0.06 | | | | 0.46 | | | | 0.52 | | | | (0.04) | | | | (0.13) | | | | — | | | | (0.17) | |
| FOR THE PERIOD 1/15/098—12/31/09†,5 | | | $10.00 | | | | 0.13 | | | | 0.79 | | | | 0.92 | | | | (0.03) | | | | (0.09) | | | | — | | | | (0.12) | |
| AQR DIVERSIFIED ARBITRAGE FUND CLASS N | | | | | | | | | | | | | | | | | | | | | | | | | | | | | | | | |
| FOR THE YEAR ENDED DECEMBER 31, 20135 | | | $11.01 | | | | 0.13 | | | | 0.04 | | | | 0.17 | | | | (0.16) | | | | (0.06) | | | | (0.09) | | | | (0.31) | |
| FOR THE YEAR ENDED DECEMBER 31, 20125 | | | $10.85 | | | | 0.06 | 6 | | | 0.24 | | | | 0.30 | | | | (0.09) | | | | (0.05) | | | | — | | | | (0.14) | |
| FOR THE YEAR ENDED DECEMBER 31, 2011†,5 | | | $11.12 | | | | 0.10 | | | | (0.02) | | | | 0.08 | | | | (0.07) | | | | (0.28) | | | | — | | | | (0.35) | |
| FOR THE YEAR ENDED DECEMBER 31, 2010† | | | $10.78 | | | | 0.05 | | | | 0.43 | | | | 0.48 | | | | (0.01) | | | | (0.13) | | | | — | | | | (0.14) | |
| FOR THE PERIOD 1/15/098—12/31/09†,5 | | | $10.00 | | | | 0.10 | | | | 0.79 | | | | 0.89 | | | | (0.02) | | | | (0.09) | | | | — | | | | (0.11) | |
| AQR LONG-SHORT EQUITY FUND CLASS I | | | | | | | | | | | | | | | | | | | | | | | | | | | | | | | | |
| FOR THE PERIOD 7/16/138—12/31/135 | | | $10.00 | | | | (0.06) | | | | 1.17 | | | | 1.11 | | | | (0.67) | | | | (0.23) | | | | — | | | | (0.90) | |
| AQR LONG-SHORT EQUITY FUND CLASS N | | | | | | | | | | | | | | | | | | | | | | | | | | | | | | | | |
| FOR THE PERIOD 7/16/138—12/31/135 | | | $10.00 | | | | (0.07) | | | | 1.17 | | | | 1.10 | | | | (0.66) | | | | (0.23) | | | | — | | | | (0.89) | |
| AQR MANAGED FUTURES STRATEGY FUND CLASS I | | | | | | | | | | | | | | | | | | | | | | | | | | | | | |
| FOR THE YEAR ENDED DECEMBER 31, 20135 | | | $9.78 | | | | (0.12) | | | | 1.04 | | | | 0.92 | | | | — | | | | (0.11) | | | | — | | | | (0.11) | |
| FOR THE YEAR ENDED DECEMBER 31, 20125 | | | $9.57 | | | | (0.12) | | | | 0.40 | | | | 0.28 | | | | (0.07) | | | | — | | | | — | | | | (0.07) | |
| FOR THE YEAR ENDED DECEMBER 31, 2011†,5 | | | $10.30 | | | | (0.12) | | | | (0.53) | | | | (0.65) | | | | (0.04) | | | | (0.04) | | | | — | | | | (0.08) | |
| FOR THE PERIOD 1/06/108—12/31/10†,5 | | | $10.00 | | | | (0.12) | | | | 0.66 | | | | 0.54 | | | | (0.09) | | | | (0.15) | | | | — | | | | (0.24) | |
| AQR MANAGED FUTURES STRATEGY FUND CLASS N | | | | | | | | | | | | | | | | | | | | | | | | | | | | | |
| FOR THE YEAR ENDED DECEMBER 31, 20135 | | | $9.73 | | | | (0.15) | | | | 1.04 | | | | 0.89 | | | | — | | | | (0.11) | | | | — | | | | (0.11) | |
| FOR THE YEAR ENDED DECEMBER 31, 20125 | | | $9.55 | | | | (0.14) | | | | 0.39 | | | | 0.25 | | | | (0.07) | | | | — | | | | — | | | | (0.07) | |
| FOR THE YEAR ENDED DECEMBER 31, 2011†,5 | | | $10.28 | | | | (0.15) | | | | (0.52) | | | | (0.67) | | | | (0.02) | | | | (0.04) | | | | — | | | | (0.06) | |
| FOR THE PERIOD 1/06/108—12/31/10†,5 | | | $10.00 | | | | (0.15) | | | | 0.66 | | | | 0.51 | | | | (0.08) | | | | (0.15) | | | | — | | | | (0.23) | |
| AQR MANAGED FUTURES STRATEGY HV FUND CLASS I | | | | | | | | | | | | | | | | | | | | | |
| FOR THE PERIOD 7/16/138—12/31/135 | | | $10.00 | | | | (0.08) | | | | 0.89 | | | | 0.81 | | | | — | | | | (0.01) | | | | — | | | | (0.01) | |
| AQR MANAGED FUTURES STRATEGY HV FUND CLASS N | | | | | | | | | | | | | | | | | | | | | |
| FOR THE PERIOD 7/16/138—12/31/135 | | | $10.00 | | | | (0.09) | | | | 0.89 | | | | 0.80 | | | | — | | | | (0.01) | | | | — | | | | (0.01) | |
| * | Annualized for periods less than one year. |
| † | Redemption fees of less than $0.005 per share were incurred by the share class. |
| 1 | Total investment return is calculated assuming an initial investment made at the net asset value at the beginning of the period, reinvestment of all dividends and distributions at net asset value during the period and redemption on the last day of the period and is not annualized. |
| 2 | Includes adjustments in accordance with accounting principles generally accepted in the United States of America and as such, the net asset value for financial reporting purposes and the returns based upon those net asset values may differ from the net asset value and returns for shareholder transactions. |
| 3 | Ratios do not include the impact of the expenses of the underlying funds in which the Fund invests. |
| 4 | Portfolio turnover is not annualized. |
| 5 | Per share net investment income (loss) and net realized and unrealized gain (loss) are based on average shares outstanding. |
| 6 | For the year ended December 31, 2012 certain Funds received special dividends which materially impacted the Net Investment Income Per Share and Net Investment Income Ratio. These dividends are not expected to continue in the future. Had these special dividends not been received the Net Investment Income Per Share and Net Investment Income Ratio would have been as follows: |
| | | | | | | | |
| FUND | | NET INVESTMENT
INCOME PER SHARE | | | NET INVESTMENT
INCOME RATIO | |
AQR Diversified Arbitrage Fund—Class I | | $ | 0.08 | | | | 0.73% | |
AQR Diversified Arbitrage Fund—Class N | | $ | 0.04 | | | | 0.42% | |
| 7 | For the year ended December 31, 2010, the Advisor contributed $544,199 into the Fund to compensate the Fund for a loss incurred due to trade processing errors. The impact of the Advisor’s contribution increased the total return by 0.08%. |
| 8 | Commencement of operations. |
| 9 | Certain expenses incurred by the Fund were not annualized for the period ended December 31, 2013. |
| | | | |
| | The accompanying notes are an integral part of these financial statements. | | |
| | | | | | | | | | | | | | | | |
| 230 | | AQR Funds | | | | | | Annual Report | | | | | | December 2013 | | |
| | | | | | | | | | |
| | | | |
| Financial Highlights | | | December 31, 2013 | |
| | | | | | | | | | | | | | | | | | | | | | | | | | | | | | | | |
| | | | | | | RATIOS/SUPPLEMENTAL DATA |
| | | | | |
| | | | | | | | | | Ratios to Average Net Assets of:* | | | | | | |
| | | | | | | | |
Net
Asset
Value,
End of
Period | | | Total
Return1,2 | | | Net Assets,
End of Period | | | Expenses, Net of
Reimbursements
and/or Waivers3 | | | Expenses, Net of
Reimbursements
and/or Waivers
(Excluding Dividend
Short Expense &
Interest Expense)3 | | | Expenses, Before
Reimbursements
and/or Waivers3 | | | Net Investment
Income (Loss) | | | Portfolio
Turnover
Rate4 | | | |
| | | | | | | | | | | | | | | | | | | | | | | | | | | | | | | | |
| $ | 10.91 | | | | 1.75 | % | | $ | 1,876,480,736 | | | | 1.64 | % | | | 1.20 | % | | | 1.64 | % | | | 1.52 | % | | | 349 | % | | |
| $ | 11.05 | | | | 3.13 | % | | $ | 1,752,723,858 | | | | 2.30 | % | | | 1.21 | % | | | 2.32 | % | | | 0.88 | %6 | | | 312 | % | | |
| $ | 10.89 | | | | 0.99 | % | | $ | 1,456,748,122 | | | | 2.75 | % | | | 1.20 | % | | | 2.84 | % | | | 1.18 | % | | | 298 | % | | |
| $ | 11.15 | | | | 4.81 | %7 | | $ | 824,237,659 | | | | 2.59 | % | | | 1.20 | % | | | 2.62 | % | | | 1.13 | % | | | 361 | % | | |
| $ | 10.80 | | | | 9.24 | % | | $ | 160,026,814 | | | | 2.46 | % | | | 1.20 | % | | | 3.25 | % | | | 1.30 | % | | | 482 | % | | |
| | | | | | | | | | | | | | | | | | | | | | | | | | | | | | | | |
| $ | 10.87 | | | | 1.51 | % | | $ | 836,354,615 | | | | 1.88 | % | | | 1.44 | % | | | 1.88 | % | | | 1.21 | % | | | 349 | % | | |
| $ | 11.01 | | | | 2.83 | % | | $ | 761,371,466 | | | | 2.62 | % | | | 1.52 | % | | | 2.62 | % | | | 0.57 | %6 | | | 312 | % | | |
| $ | 10.85 | | | | 0.68 | % | | $ | 651,790,519 | | | | 3.05 | % | | | 1.50 | % | | | 3.08 | % | | | 0.89 | % | | | 298 | % | | |
| $ | 11.12 | | | | 4.52 | %7 | | $ | 382,758,131 | | | | 2.89 | % | | | 1.50 | % | | | 2.92 | % | | | 0.85 | % | | | 361 | % | | |
| $ | 10.78 | | | | 8.88 | % | | $ | 79,054,890 | | | | 2.69 | % | | | 1.50 | % | | | 3.42 | % | | | 0.98 | % | | | 482 | % | | |
| | | | | | | | | | | | | | | | | | | | | | | | | | | | | | | | |
| $ | 10.21 | | | | 11.17 | % | | $ | 5,245,981 | | | | 1.30 | % | | | 1.30 | % | | | 3.56 | %9 | | | (1.29 | )% | | | 0 | % | | |
| | | | | | | | | | | | | | | | | | | | | | | | | | | | | | | | |
| $ | 10.21 | | | | 11.04 | % | | $ | 910,216 | | | | 1.55 | % | | | 1.55 | % | | | 5.49 | %9 | | | (1.54 | )% | | | 0 | % | | |
| | | | | | | | | | | | | | | | | | | | | | | | | | | | | | | | |
| $ | 10.59 | | | | 9.40 | % | | $ | 4,506,180,876 | | | | 1.23 | % | | | 1.23 | % | | | 1.23 | % | | | (1.22 | )% | | | 0 | % | | |
| $ | 9.78 | | | | 2.99 | % | | $ | 2,136,959,054 | | | | 1.25 | % | | | 1.25 | % | | | 1.25 | % | | | (1.24 | )% | | | 0 | % | | |
| $ | 9.57 | | | | (6.37 | )% | | $ | 1,078,662,373 | | | | 1.25 | % | | | 1.25 | % | | | 1.30 | % | | | (1.22 | )% | | | 0 | % | | |
| $ | 10.30 | | | | 5.41 | % | | $ | 657,237,349 | | | | 1.25 | % | | | 1.25 | % | | | 1.28 | % | | | (1.27 | )% | | | 0 | % | | |
| | | | | | | | | | | | | | | | | | | | | | | | | | | | | | | | |
| $ | 10.51 | | | | 9.14 | % | | $ | 1,408,085,433 | | | | 1.50 | % | | | 1.50 | % | | | 1.50 | % | | | (1.48 | )% | | | 0 | % | | |
| $ | 9.73 | | | | 2.68 | % | | $ | 527,318,143 | | | | 1.50 | % | | | 1.50 | % | | | 1.52 | % | | | (1.48 | )% | | | 0 | % | | |
| $ | 9.55 | | | | (6.59 | )% | | $ | 476,854,001 | | | | 1.50 | % | | | 1.50 | % | | | 1.57 | % | | | (1.47 | )% | | | 0 | % | | |
| $ | 10.28 | | | | 5.12 | % | | $ | 271,043,038 | | | | 1.50 | % | | | 1.50 | % | | | 1.56 | % | | | (1.54 | )% | | | 0 | % | | |
| | | | | | | | | | | | | | | | | | | | | | | | | | | | | | | | |
| | $10.80 | | | | 8.14 | % | | $ | 37,077,791 | | | | 1.68 | % | | | 1.65 | % | | | 2.51 | %9 | | | (1.66 | )% | | | 0 | % | | |
| | | | | | | | | | | | | | | | | | | | | | | | | | | | | | | | |
| | $10.79 | | | | 8.04 | % | | $ | 1,643,614 | | | | 1.93 | % | | | 1.90 | % | | | 4.03 | %9 | | | (1.92 | )% | | | 0 | % | | |
| | | | |
| | The accompanying notes are an integral part of these financial statements. | | |
| | | | | | | | | | | | | | | | |
| | AQR Funds | | | | | | Annual Report | | | | | | December 2013 | | 231 |
| | | | | | | | | | |
| | | | |
| Financial Highlights | | | December 31, 2013 | |
| | | | | | | | | | | | | | | | | | | | | | | | | | | | |
| | | PER SHARE OPERATING PERFORMANCE | |
| | | | | | Change in Net Assets Resulting
from Operations | | | Less Dividends and Distributions | |
| | | Net Asset
Value,
Beginning
of Period | | | Net
Investment
Income
(Loss) | | | Net
Realized
and
Unrealized
Gain
(Loss) | | | Net
Increase
(Decrease)
in Net
Asset
Value from
Operations | | | Distributions
from Net
Investment
Income | | | Distributions
from Net
Realized
Gains | | | Total
Distributions | |
| AQR RISK-BALANCED COMMODITIES STRATEGY FUND CLASS I | | | | | | | | | | | | | | | | | | | | | | | | | | | | |
| FOR THE YEAR ENDED DECEMBER 31, 20135 | | | $9.87 | | | | (0.09) | | | | (1.49) | | | | (1.58) | | | | — | | | | — | | | | — | |
| FOR THE PERIOD 7/09/126—12/31/125 | | | $10.00 | | | | (0.05) | | | | (0.08) | | | | (0.13) | | | | — | | | | — | | | | — | |
| AQR RISK-BALANCED COMMODITIES STRATEGY FUND CLASS N | | | | | | | | | | | | | | | | | | | | | | | | | | | | |
| FOR THE YEAR ENDED DECEMBER 31, 20135 | | | $9.86 | | | | (0.11) | | | | (1.48) | | | | (1.59) | | | | — | | | | — | | | | — | |
| FOR THE PERIOD 7/09/126—12/31/125 | | | $10.00 | | | | (0.06) | | | | (0.08) | | | | (0.14) | | | | — | | | | — | | | | — | |
| AQR RISK PARITY FUND CLASS I | | | | | | | | | | | | | | | | | | | | | | | | | | | | |
| FOR THE YEAR ENDED DECEMBER 31, 20135 | | | $11.49 | | | | (0.07) | | | | 0.08 | 7 | | | 0.01 | | | | (0.27) | | | | (0.46) | | | | (0.73) | |
| FOR THE YEAR ENDED DECEMBER 31, 20125 | | | $10.62 | | | | — | | | | 1.49 | | | | 1.49 | | | | (0.14) | | | | (0.48) | | | | (0.62) | |
| FOR THE YEAR ENDED DECEMBER 31, 2011†,5 | | | $10.28 | | | | 0.04 | | | | 0.51 | | | | 0.55 | | | | (0.21) | | | | (0.00) | 8 | | | (0.21) | |
| FOR THE PERIOD 9/30/106—12/31/10 | | | $10.00 | | | | 0.02 | | | | 0.38 | | | | 0.40 | | | | (0.12) | | | | — | | | | (0.12) | |
| AQR RISK PARITY FUND CLASS N | | | | | | | | | | | | | | | | | | | | | | | | | | | | |
| FOR THE YEAR ENDED DECEMBER 31, 20135 | | | $11.47 | | | | (0.11) | | | | 0.08 | 7 | | | (0.03) | | | | (0.22) | | | | (0.46) | | | | (0.68) | |
| FOR THE YEAR ENDED DECEMBER 31, 20125 | | | $10.59 | | | | (0.03) | | | | 1.50 | | | | 1.47 | | | | (0.11) | | | | (0.48) | | | | (0.59) | |
| FOR THE YEAR ENDED DECEMBER 31, 2011†,5 | | | $10.27 | | | | 0.03 | | | | 0.49 | | | | 0.52 | | | | (0.20) | | | | (0.00) | 8 | | | (0.20) | |
| FOR THE PERIOD 9/30/106—12/31/10† | | | $10.00 | | | | 0.01 | | | | 0.38 | | | | 0.39 | | | | (0.12) | | | | — | | | | (0.12) | |
| AQR RISK PARITY II MV FUND CLASS I | | | | | | | | | | | | | | | | | | | | | | | | | | | | |
| FOR THE YEAR ENDED DECEMBER 31, 20135 | | | $10.17 | | | | (0.06) | | | | (0.08) | | | | (0.14) | | | | (0.01) | | | | (0.00) | 8 | | | (0.01) | |
| FOR THE PERIOD 11/05/126—12/31/125 | | | $10.00 | | | | — | | | | 0.19 | | | | 0.19 | | | | (0.02) | | | | — | | | | (0.02) | |
| AQR RISK PARITY II MV FUND CLASS N | | | | | | | | | | | | | | | | | | | | | | | | | | | | |
| FOR THE YEAR ENDED DECEMBER 31, 20135 | | | $10.18 | | | | (0.07) | | | | (0.11) | | | | (0.18) | | | | (0.01) | | | | (0.00) | 8 | | | (0.01) | |
| FOR THE PERIOD 11/05/126—12/31/125 | | | $10.00 | | | | — | | | | 0.18 | | | | 0.18 | | | | — | | | | — | | | | — | |
| AQR RISK PARITY II HV FUND CLASS I | | | | | | | | | | | | | | | | | | | | | | | | | | | | |
| FOR THE YEAR ENDED DECEMBER 31, 20135 | | | $10.21 | | | | (0.06) | | | | (0.23) | | | | (0.29) | | | | (0.03) | | | | (0.02) | | | | (0.05) | |
| FOR THE PERIOD 11/05/126—12/31/125 | | | $10.00 | | | | 0.01 | | | | 0.23 | | | | 0.24 | | | | (0.03) | | | | — | | | | (0.03) | |
| AQR RISK PARITY II HV FUND CLASS N | | | | | | | | | | | | | | | | | | | | | | | | | | | | |
| FOR THE YEAR ENDED DECEMBER 31, 20135 | | | $10.23 | | | | (0.09) | | | | (0.23) | | | | (0.32) | | | | (0.03) | | | | (0.02) | | | | (0.05) | |
| FOR THE PERIOD 11/05/126—12/31/125 | | | $10.00 | | | | (0.01) | | | | 0.25 | | | | 0.24 | | | | (0.01) | | | | — | | | | (0.01) | |
| * | Annualized for periods less than one year. |
| † | Redemption fees of less than $0.005 per share were incurred by the share class. |
| 1 | Total investment return is calculated assuming an initial investment made at the net asset value at the beginning of the period, reinvestment of all dividends and distributions at net asset value during the period and redemption on the last day of the period and is not annualized. |
| 2 | Includes adjustments in accordance with accounting principles generally accepted in the United States of America and as such, the net asset value for financial reporting purposes and the returns based upon those net asset values may differ from the net asset value and returns for shareholder transactions. |
| 3 | Ratios do not include the impact of the expenses of the underlying funds in which the Fund invests. |
| 4 | Portfolio turnover is not annualized. |
| 5 | Per share net investment income (loss) and net realized and unrealized gain (loss) are based on average shares outstanding. |
| 6 | Commencement of operations. |
| 7 | The amount shown for a share outstanding throughout the period is not in accordance with the aggregate net realized and unrealized gain (loss) for that period because of the timing of sales and repurchases of the Fund shares in relation to fluctuating market value of the investments in the Fund. |
| 8 | Amount is less than $.005 per share. |
| 9 | For the year ended December 31, 2011, a service provider contributed $354,026 into the Fund to compensate the Fund for a loss incurred due to a valuation error. The impact of this contribution increased the Fund’s total return by 0.21%. |
| 10 | For the year ended December 31, 2011, the Advisor contributed $208,438 into the Fund to compensate the Fund for a loss incurred due to a trade processing error. The impact of the Advisor’s contribution increased the Fund’s total return by 0.14%. |
| | | | |
| | The accompanying notes are an integral part of these financial statements. | | |
| | | | | | | | | | | | | | | | |
| 232 | | AQR Funds | | | | | | Annual Report | | | | | | December 2013 | | |
| | | | | | | | | | |
| | | | |
| Financial Highlights | | | December 31, 2013 | |
| | | | | | | | | | | | | | | | | | | | | | | | | | | | | | |
| | | | | | RATIOS/SUPPLEMENTAL DATA |
| | | | | |
| | | | | | | | | Ratios to Average Net Assets of:* | | | | | | |
| | | | | | | | |
Net
Asset
Value,
End of
Period | | Total
Return1,2 | | | Net Assets,
End of Period | | | Expenses, Net of
Reimbursements
and/or Waivers3 | | | Expenses, Net of
Reimbursements
and/or Waivers
(Excluding Dividend
Short Expense &
Interest Expense)3 | | | Expenses, Before
Reimbursements
and/or Waivers3 | | | Net Investment
Income (Loss) | | | Portfolio
Turnover
Rate4 | | | |
| | | | | | | | | | | | | | | | | | | | | | | | | | | | | | |
| $8.29 | | | (16.01 | )% | | $ | 28,375,483 | | | | 1.05 | % | | | 1.05 | % | | | 1.32 | % | | | (1.05 | )% | | | 0 | % | | |
| $9.87 | | | (1.30 | )% | | $ | 63,330,812 | | | | 1.05 | % | | | 1.05 | % | | | 1.72 | % | | | (1.04 | )% | | | 0 | % | | |
| | | | | | | | | | | | | | | | | | | | | | | | | | | | | | |
| $8.27 | | | (16.13 | )% | | $ | 3,861,107 | | | | 1.30 | % | | | 1.30 | % | | | 1.70 | % | | | (1.28 | )% | | | 0 | % | | |
| $9.86 | | | (1.40 | )% | | $ | 2,206,303 | | | | 1.30 | % | | | 1.30 | % | | | 4.00 | % | | | (1.30 | )% | | | 0 | % | | |
| | | | | | | | | | | | | | | | | | | | | | | | | | | | | | |
| $10.77 | | | 0.12 | % | | $ | 855,024,124 | | | | 0.89 | % | | | 0.88 | % | | | 0.89 | % | | | (0.64 | )% | | | 167 | % | | |
| $11.49 | | | 14.05 | % | | $ | 868,660,662 | | | | 0.95 | % | | | 0.95 | % | | | 0.95 | % | | | (0.03 | )% | | | 72 | % | | |
| $10.62 | | | 5.45 | %10 | | $ | 337,526,380 | | | | 0.95 | % | | | 0.95 | % | | | 1.06 | % | | | 0.41 | % | | | 66 | % | | |
| $10.28 | | | 3.98 | % | | $ | 12,747,565 | | | | 0.95 | % | | | 0.95 | % | | | 3.80 | % | | | 0.44 | % | | | 19 | % | | |
| | | | | | | | | | | | | | | | | | | | | | | | | | | | | | |
| $10.76 | | | (0.23 | )% | | $ | 79,026,167 | | | | 1.20 | % | | | 1.20 | % | | | 1.20 | % | | | (0.92 | )% | | | 167 | % | | |
| $11.47 | | | 13.89 | % | | $ | 170,953,453 | | | | 1.20 | % | | | 1.20 | % | | | 1.23 | % | | | (0.26 | )% | | | 72 | % | | |
| $10.59 | | | 5.12 | %9 | | $ | 51,560,342 | | | | 1.20 | % | | | 1.20 | % | | | 1.42 | % | | | 0.30 | % | | | 66 | % | | |
| $10.27 | | | 3.88 | % | | $ | 11,234,980 | | | | 1.20 | % | | | 1.20 | % | | | 3.96 | % | | | 0.22 | % | | | 19 | % | | |
| | | | | | | | | | | | | | | | | | | | | | | | | | | | | | |
| $10.02 | | | (1.32 | )% | | $ | 37,848,351 | | | | 0.95 | % | | | 0.95 | % | | | 1.18 | % | | | (0.61 | )% | | | 234 | % | | |
| $10.17 | | | 1.87 | % | | $ | 29,993,223 | | | | 0.95 | % | | | 0.95 | % | | | 2.07 | % | | | 0.18 | % | | | 0 | % | | |
| | | | | | | | | | | | | | | | | | | | | | | | | | | | | | |
| $9.99 | | | (1.71 | )% | | $ | 9,396,772 | | | | 1.20 | % | | | 1.20 | % | | | 1.59 | % | | | (0.71 | )% | | | 234 | % | | |
| $10.18 | | | 1.80 | % | | $ | 2,259,342 | | | | 1.20 | % | | | 1.20 | % | | | 2.81 | % | | | (0.29 | )% | | | 0 | % | | |
| | | | | | | | | | | | | | | | | | | | | | | | | | | | | | |
| $9.87 | | | (2.83 | )% | | $ | 17,577,063 | | | | 1.23 | % | | | 1.15 | % | | | 1.85 | % | | | (0.62 | )% | | | 257 | % | | |
| $10.21 | | | 2.44 | % | | $ | 16,253,630 | | | | 1.28 | % | | | 1.15 | % | | | 2.26 | % | | | 0.53 | % | | | 0 | % | | |
| | | | | | | | | | | | | | | | | | | | | | | | | | | | | | |
| $9.86 | | | (3.12 | )% | | $ | 8,651,975 | | | | 1.48 | % | | | 1.40 | % | | | 2.22 | % | | | (0.84 | )% | | | 257 | % | | |
| $10.23 | | | 2.38 | % | | $ | 5,804,844 | | | | 1.53 | % | | | 1.40 | % | | | 3.44 | % | | | (0.62 | )% | | | 0 | % | | |
| | | | |
| | The accompanying notes are an integral part of these financial statements. | | |
| | | | | | | | | | | | | | | | |
| | AQR Funds | | | | | | Annual Report | | | | | | December 2013 | | 233 |
| | | | | | | | | | |
| | | | |
| Financial Highlights | | | December 31, 2013 | |
| | | | | | | | | | | | | | | | | | | | | | | | | | | | |
| | | PER SHARE OPERATING PERFORMANCE | |
| | | | | | Change in Net Assets Resulting
from Operations | | | Less Dividends and Distributions | |
| | | Net Asset
Value,
Beginning
of Period | | | Net
Investment
Income
(Loss) | | | Net
Realized
and
Unrealized
Gain
(Loss) | | | Net
Increase
(Decrease)
in Net
Asset
Value from
Operations | | | Distributions
from Net
Investment
Income | | | Distributions
from Net
Realized
Gains | | | Total
Distributions | |
| AQR MULTI-STRATEGY ALTERNATIVE FUND CLASS I | | | | | | | | | | | | | | | | | | | | | | | | | | | | |
| FOR THE YEAR ENDED DECEMBER 31, 20135 | | | $9.90 | | | | (0.17) | | | | 0.61 | | | | 0.44 | | | | (0.44) | | | | (0.12) | | | | (0.56) | |
| FOR THE YEAR ENDED DECEMBER 31, 20125 | | | $9.70 | | | | (0.17) | | | | 0.40 | | | | 0.23 | | | | (0.01) | | | | (0.02) | | | | (0.03) | |
| FOR THE PERIOD 7/18/116—12/31/115 | | | $10.00 | | | | (0.05) | | | | (0.21) | | | | (0.26) | | | | (0.04) | | | | — | | | | (0.04) | |
| AQR MULTI-STRATEGY ALTERNATIVE FUND CLASS N | | | | | | | | | | | | | | | | | | | | | | | | | | | | |
| FOR THE YEAR ENDED DECEMBER 31, 20135 | | | $9.89 | | | | (0.20) | | | | 0.61 | | | | 0.41 | | | | (0.42) | | | | (0.12) | | | | (0.54) | |
| FOR THE YEAR ENDED DECEMBER 31, 20125 | | | $9.69 | | | | (0.23) | | | | 0.45 | | | | 0.22 | | | | — | | | | (0.02) | | | | (0.02) | |
| FOR THE PERIOD 7/18/116—12/31/115 | | | $10.00 | | | | (0.06) | | | | (0.21) | | | | (0.27) | | | | (0.04) | | | | — | | | | (0.04) | |
| AQR STYLE PREMIA ALTERNATIVE FUND—CLASS I | | | | | | | | | | | | | | | | | | | | | | | | | | | | |
| FOR THE PERIOD 10/30/136—12/31/135 | | | $10.00 | | | | (0.03) | | | | 0.44 | | | | 0.41 | | | | (0.20) | | | | (0.03) | | | | (0.23) | |
| AQR STYLE PREMIA ALTERNATIVE FUND—CLASS N | | | | | | | | | | | | | | | | | | | | | | | | | | | | |
| FOR THE PERIOD 10/30/136—12/31/135 | | | $10.00 | | | | (0.04) | | | | 0.45 | | | | 0.41 | | | | (0.20) | | | | (0.03) | | | | (0.23) | |
| * | Annualized for periods less than one year. |
| 1 | Total investment return is calculated assuming an initial investment made at the net asset value at the beginning of the period, reinvestment of all dividends and distributions at net asset value during the period and redemption on the last day of the period and is not annualized. |
| 2 | Includes adjustments in accordance with accounting principles generally accepted in the United States of America and as such, the net asset value for financial reporting purposes and the returns based upon those net asset values may differ from the net asset value and returns for shareholder transactions. |
| 3 | Ratios do not include the impact of the expenses of the underlying funds in which the Fund invests. |
| 4 | Portfolio turnover is not annualized. |
| 5 | Per share net investment income (loss) and net realized and unrealized gain (loss) are based on average shares outstanding. |
| 6 | Commencement of operations. |
| 7 | Certain expenses incurred by the Fund were not annualized for the period ended December 31, 2013. |
| 8 | For the year ended December 31, 2011, the Advisor contributed $208,438 into the Fund to compensate the Fund for a loss incurred due to a trade processing error. The impact of the Advisor’s contribution increased the Fund’s total return by 0.14%. |
| | | | |
| | The accompanying notes are an integral part of these financial statements. | | |
| | | | | | | | | | | | | | | | |
| 234 | | AQR Funds | | | | | | Annual Report | | | | | | December 2013 | | |
| | | | | | | | | | |
| | | | |
| Financial Highlights | | | December 31, 2013 | |
| | | | | | | | | | | | | | | | | | | | | | | | | | | | | | |
| | | | | | RATIOS/SUPPLEMENTAL DATA |
| | | | | |
| | | | | | | | | Ratios to Average Net Assets of:* | | | | | | |
| | | | | | | | |
Net
Asset
Value,
End of
Period | | Total
Return1,2 | | | Net Assets,
End of Period | | | Expenses, Net of
Reimbursements
and/or Waivers3 | | | Expenses, Net of
Reimbursements
and/or Waivers
(Excluding Dividend
Short Expense &
Interest Expense)3 | | | Expenses, Before
Reimbursements
and/or Waivers3 | | | Net Investment
Income (Loss) | | | Portfolio
Turnover
Rate4 | | | |
| | | | | | | | | | | | | | | | | | | | | | | | | | | | | | |
| $9.78 | | | 4.46 | % | | $ | 1,453,976,567 | | | | 3.34 | % | | | 1.98 | % | | | 3.37 | % | | | (1.67 | )% | | | 137 | % | | |
| $9.90 | | | 2.36 | % | | $ | 808,261,775 | | | | 3.52 | % | | | 1.98 | % | | | 3.60 | % | | | (1.73 | )% | | | 208 | % | | |
| $9.70 | | | (2.57 | )%8 | | $ | 257,168,435 | | | | 2.23 | % | | | 1.98 | % | | | 2.59 | % | | | (1.09 | )% | | | 133 | % | | |
| | | | | | | | | | | | | | | | | | | | | | | | | | | | | | |
| $9.76 | | | 4.16 | % | | $ | 74,641,399 | | | | 3.59 | % | | | 2.23 | % | | | 3.66 | % | | | (1.95 | )% | | | 137 | % | | |
| $9.89 | | | 2.22 | % | | $ | 43,104,252 | | | | 3.76 | % | | | 2.23 | % | | | 3.93 | % | | | (2.32 | )% | | | 208 | % | | |
| $9.69 | | | (2.73 | )%8 | | $ | 44,676,329 | | | | 2.48 | % | | | 2.23 | % | | | 2.85 | % | | | (1.37 | )% | | | 133 | % | | |
| | | | | | | | | | | | | | | | | | | | | | | | | | | | | | |
| $10.18 | | | 4.08 | % | | $ | 403,242,880 | | | | 2.07 | % | | | 1.50 | % | | | 2.11 | %7 | | | (1.77 | )% | | | 133 | % | | |
| | | | | | | | | | | | | | | | | | | | | | | | | | | | | | |
| $10.18 | | | 4.05 | % | | $ | 15,972,089 | | | | 2.44 | % | | | 1.75 | % | | | 2.70 | %7 | | | (2.05 | )% | | | 133 | % | | |
| | | | |
| | The accompanying notes are an integral part of these financial statements. | | |
| | | | | | | | | | | | | | | | |
| | AQR Funds | | | | | | Annual Report | | | | | | December 2013 | | 235 |
| | | | | | | | | | |
| | | | |
| Notes to Financial Statements | | | December 31, 2013 | |
1. Organization
AQR Funds (the “Trust”), organized as a Delaware statutory trust on September 4, 2008, is an open-end management investment company, under the Investment Company Act of 1940, as amended (the “1940 Act”). As of December 31, 2013, the Trust consists of twenty-four active series, ten of which are presented in this book (collectively, the “Funds” and each individually a “Fund”): AQR Diversified Arbitrage Fund, AQR Long-Short Equity Fund, AQR Managed Futures Strategy Fund, AQR Managed Futures Strategy HV Fund, AQR Risk-Balanced Commodities Strategy Fund, AQR Risk Parity Fund, AQR Risk Parity II MV Fund, AQR Risk Parity II HV Fund, AQR Multi-Strategy Alternative Fund and AQR Style Premia Alternative Fund. The remaining fourteen active series are reported in a separate book at September 30, 2013. AQR Capital Management, LLC (the “Advisor”) serves as the investment Advisor of each Fund. The Advisor has retained CNH Partners, LLC (the “Sub-Advisor”), an affiliate of the Advisor, to serve as an investment sub-advisor to the AQR Diversified Arbitrage Fund and certain strategies of the AQR Multi-Strategy Alternative Fund.
The AQR Long-Short Equity Fund and the AQR Managed Futures Strategy HV Fund commenced operations on July 16, 2013. The AQR Style Premia Alternative Fund commenced operations on October 30, 2013.
The investment objective of the AQR Diversified Arbitrage Fund, the AQR Managed Futures Strategy Fund, the AQR Managed Futures Strategy HV Fund, the AQR Multi-Strategy Alternative Fund and the AQR Style Premia Alternative Fund is to seek positive absolute returns. The investment objective of the AQR Risk-Balanced Commodities Strategy Fund, the AQR Risk Parity Fund, the AQR Risk Parity II MV Fund and the AQR Risk Parity II HV Fund is to seek total return. The investment objective of the AQR Long-Short Equity Fund is to seek capital appreciation. Each of these funds offer Class I and Class N shares.
2. Consolidation of Subsidiaries
The consolidated Schedules of Investments, Statements of Assets and Liabilities, of Operations, of Changes in Net Assets, of Cash Flows and the Financial Highlights of the AQR Managed Futures Strategy Fund, AQR Managed Futures Strategy HV Fund, AQR Risk-Balanced Commodities Strategy Fund, AQR Risk Parity Fund, AQR Risk Parity II MV Fund, AQR Risk Parity II HV Fund, AQR Multi-Strategy Alternative Fund and AQR Style Premia Alternative Fund (“CFC Funds”) include the accounts of AQR Managed Futures Strategy Offshore Fund Ltd., AQR Managed Futures Strategy HV Offshore Fund Ltd., AQR Risk-Balanced Commodities Strategy Offshore Fund Ltd., AQR Risk Parity Offshore Fund Ltd., AQR Risk Parity II MV Offshore Fund Ltd., AQR Risk Parity II HV Offshore Fund Ltd., AQR Multi-Strategy Alternative Offshore Fund Ltd., and AQR Style Premia Alternative Offshore Fund Ltd., respectively, wholly-owned and controlled subsidiaries (the “Subsidiaries”). All inter-company accounts and transactions have been eliminated in consolidation for the CFC Funds.
For Federal tax purposes, taxable income for each CFC Fund and its Subsidiary are calculated separately. The Subsidiaries are classified as controlled foreign corporations under the Internal Revenue Code of 1986 (“the Code”) and each Subsidiary’s taxable income is included in the calculation of the relevant CFC Fund’s taxable income. Net losses of the Subsidiaries are not deductible by the CFC Funds either in the current period or future periods. Each of the Subsidiaries has a fiscal year end of December 31st for financial statement consolidation purposes and a nonconforming tax year end of November 30th.
The CFC Funds may each invest up to 25% of their total assets in its respective Subsidiary, each of which acts as an investment vehicle in order to effect certain investments consistent with the CFC Funds’ investment objectives and policies. The CFC Funds expect that they will achieve a significant portion of their exposure to commodities and commodities-related investments through investment in the Subsidiaries. Unlike the CFC Funds, the Subsidiaries may invest without limitation in commodities and commodities-related investments.
| | | | | | | | | | | | | | | | |
| 236 | | AQR Funds | | | | | | Annual Report | | | | | | December 2013 | | |
| | | | | | | | | | |
| | | | |
| Notes to Financial Statements | | | December 31, 2013 | |
| | | | | | | | | | | | | | | | |
| | | INCEPTION DATE
OF SUBSIDIARY | | | SUBSIDIARY NET
ASSETS AT
DECEMBER 31, 2013 | | | % OF TOTAL NET
ASSETS AT
DECEMBER 31, 2013 | | | NET REALIZED
GAIN(LOSS)
ON INVESTMENTS
HELD IN
SUBSIDIARY | |
AQR Managed Futures Strategy Offshore Fund Ltd. | | | January 6, 2010 | | | $ | 1,331,203,793 | | | | 22.5 | % | | $ | 4,357,050 | |
AQR Managed Futures Strategy HV Offshore Fund Ltd. | | | July 16, 2013 | | | | 8,552,470 | | | | 22.1 | % | | | (482,722 | ) |
AQR Risk-Balanced Commodities Strategy Offshore Fund Ltd. | | | July 9, 2012 | | | | 7,520,143 | | | | 23.3 | % | | | (11,738,352 | ) |
AQR Risk Parity Offshore Fund Ltd. | | | September 30, 2010 | | | | 188,149,602 | | | | 20.1 | % | | | (28,789,122 | ) |
AQR Risk Parity II MV Offshore Fund Ltd. | | | November 5, 2012 | | | | 7,088,257 | | | | 15.0 | % | | | (2,729,359 | ) |
AQR Risk Parity II HV Offshore Fund Ltd. | | | November 5, 2012 | | | | 5,999,909 | | | | 22.9 | % | | | (2,232,452 | ) |
AQR Multi-Strategy Alternative Offshore Fund Ltd. | | | July 18, 2011 | | | | 245,356,598 | | | | 16.1 | % | | | 12,629,757 | |
AQR Style Premia Alternative Offshore Fund Ltd. | | | October 30, 2013 | | | | 86,517,740 | | | | 20.6 | % | | | 1,726,663 | |
3. Significant Accounting Policies
The following summarizes the significant accounting policies of the Funds:
Use of Estimates: The preparation of the financial statements in conformity with accounting principles generally accepted in the United States of America (“GAAP”) requires the Advisor to make estimates and assumptions that affect the reported amounts of assets and liabilities and disclosure of contingent assets and liabilities, if any, at the date of the financial statements and the reported amounts of increases and decreases in net assets from operations during the reported period. Actual results could differ from those estimates and such differences could be material.
Valuation of Investments: Each Fund’s portfolio securities are valued as of the close of business of the regular session of trading on the New York Stock Exchange (“NYSE”) (normally 4:00 p.m. Eastern time). The Funds’ Board of Trustees has adopted procedures for the valuation of the Fund’s securities and has delegated the day-to-day responsibility for valuation determinations under those procedures to the Advisor. Equity securities, including securities sold short, rights and warrants, are valued at the latest quoted sales prices or official closing prices taken from the primary market in which each security trades. The value of securities listed on the NASDAQ Stock Market LLC (“NASDAQ”) are generally the NASDAQ Official Closing Price. In accordance with procedures adopted by the Board of Trustees, the Funds apply fair value factors to international securities traded outside of the Western Hemisphere on a daily basis utilizing the quotations of an independent pricing service, unless the Advisor determines that use of another valuation methodology is appropriate. The pricing service uses statistical analysis and quantitative models to adjust local market prices using factors such as subsequent movement and changes in the prices of indices, securities and exchange rates in other markets in determining fair value as of the time the Funds calculate their net asset value. Securities traded in the over-the-counter market, and which are not quoted by NASDAQ, are valued at the last sale price, if available, otherwise at the last quoted bid price (in the case of short sales, at the ask price). Bonds are valued using the latest bid prices or evaluated quotes furnished by independent pricing services. Evaluated quotes are based on a matrix system, which may consider such factors as quoted prices, yields, maturities and ratings and are not necessarily reliant on quoted prices. The Funds value debt securities maturing less than 61 days from the date of purchase at amortized cost, which approximates market value. The value of futures contracts purchased and sold by the Funds is accounted for using the unrealized gain or loss on the contracts that is determined by marking the contracts to their current settlement prices. Option contracts are valued at the last quoted sales price on the valuation date. In the event that the exchange for a specific futures contract closes earlier than 4:00 p.m., the futures contract is valued at the Official Settlement Price of the exchange. Investments in open-end investment companies are valued at such investment company’s current day closing net asset value per share. Exchange-Traded Funds (“ETFs”) and closed-end investment companies are valued at the last quoted sales price. Total return swap contracts are valued at fair value, based on the price of the underlying referenced instrument.
| | | | | | | | | | | | | | | | |
| | AQR Funds | | | | | | Annual Report | | | | | | December 2013 | | 237 |
| | | | | | | | | | |
| | | | |
| Notes to Financial Statements | | | December 31, 2013 | |
The Funds may use pricing services to obtain readily available market quotations. Where market quotations are not readily available, or if an available market quotation is determined not to reflect fair value, a security will be valued based on its fair value as determined in accordance with the valuation procedures approved by the Funds’ Board of Trustees, which may include the use of proprietary valuation models which may consider market transactions in comparable securities and the various relationships between securities in determining value and/or market characteristics such as benchmark yield curves, credit spreads, estimated default rates, underlying collateral, and other unique security features. The Funds may also use an income-based valuation approach in which the anticipated future cash flows of the investment are discounted to calculate fair value. Discounts may also be applied due to the nature or duration of any restrictions on the disposition of the investments. Using fair value to price securities may result in a value that is different from a security’s most recent closing price and from the prices used by other mutual funds to calculate their net assets. It is possible the estimated values may differ significantly from the values which would have been used had a ready market for the investments existed. These differences could be material.
Loan Participations and Assignments: Certain Funds invest in loan participations and assignments. When the Fund purchases a loan participation, the Fund typically enters into a contractual relationship with the lender or a third party selling such participations (“Selling Participant”), but not the borrower. In this case, the Fund assumes the credit risk of the borrower and the Selling Participant and any other persons inter-positioned between the Fund and the borrower (“Intermediate Participants”). In contrast, when the Fund purchases an assignment, the contractual relationship is with the borrower and the credit risk assumed by the Fund is only with the borrower. Although certain loan participations or assignments are secured by collateral, the Fund could experience delays or limitations in realizing on such collateral or have its interest subordinated to other indebtedness of the obligor. The Fund may also enter into unfunded loan commitments, which are contractual obligations for future funding. These unfunded commitments represent a future obligation in full, even though a percentage of the loan may not be utilized by the borrower. These types of investments may include standby financing commitments, such as revolving credit facilities, which obligate the Fund to supply additional cash to the borrower on demand. The value of the unfunded portion of the investment is determined using a pro-rata allocation, based on its par value relative to the par value of the entire investment. The unrealized appreciation (depreciation) from unfunded commitments is reported in the Statements of Assets and Liabilities. In addition, loan participations and assignments are vulnerable to market conditions such that economic conditions or other events may reduce the demand for loan participations and assignments and certain loan participations and assignments which were liquid, when purchased, may become illiquid.
Convertible Securities: Certain Funds invest in preferred stocks and fixed-income securities which are convertible into common stock. Convertible securities may be converted either at a stated price or rate within a specified period of time into a specified number of shares of common stock. By investing in a convertible security, the Funds may participate in any capital appreciation or depreciation of a company’s stock, but to a lesser degree than if it had invested in that company’s common stock. Convertible securities rank senior to common stock in a corporation’s capital structure and, therefore, entail less risk than the corporation’s common stock. The Funds may attempt to hedge some of their investments in convertible debt securities by selling short the issuer’s common stock.
Short Sales: Certain Funds sell securities it does not own as a hedge against some of its long positions and/or in anticipation of a decline in the market value of that security (short sale). When the Fund makes a short sale, it must borrow the security sold short and deliver it to the broker-dealer through which it made the short sale. The Fund may have to pay a fee to borrow the particular security and may be obligated to remit any interest or dividends received on such borrowed securities. Dividends declared on short positions open are recorded on the ex-date as an expense. A gain, limited to the price at which the Fund sold the security short, or a loss, unlimited in magnitude, will be recognized upon the termination of a short sale if the market price at termination is less than or greater than, respectively, the proceeds originally received. The Fund is also subject to the risk that they may be unable to reacquire a security to terminate a short position except at a price substantially in excess of the last quoted price. The Fund is also subject to risk of loss if the broker were to fail to perform its obligations under the contractual terms. Liabilities for securities sold short are reported at market value on the Statements of Assets and Liabilities and the change in market value is recorded as unrealized gain or loss on the Statement of Operations.
The Funds are required to pledge cash or securities to the broker as collateral for the securities sold short. Collateral requirements are calculated daily based on the current market value of the short positions. Cash deposited with broker
| | | | | | | | | | | | | | | | |
| 238 | | AQR Funds | | | | | | Annual Report | | | | | | December 2013 | | |
| | | | | | | | | | |
| | | | |
| Notes to Financial Statements | | | December 31, 2013 | |
for collateral for securities sold short is recorded as an asset on the Statements of Assets and Liabilities and securities segregated as collateral are denoted in the Schedules of Investments. The Funds may receive or pay the net of the following amounts: (i) a portion of the income from the investment of cash collateral; (ii) the broker’s fee on the borrowed securities; and (iii) a financing charge for the difference in the market value of the short position and cash collateral deposited with the broker. This income or fee is calculated daily based upon the market value of each borrowed security and a variable rate that is dependent on the availability of the security.
The net amount of fees incurred are included in dividend and interest on securities sold short in the Statements of Operations are as follows:
| | | | |
| FUND | | | |
AQR Diversified Arbitrage Fund | | $ | 1,924,497 | |
AQR Multi-Strategy Alternative Fund | | | 2,816,826 | |
AQR Style Premia Alternative Fund | | | 121,014 | |
Master Agreements: Certain Funds are a party to ISDA (International Swap and Derivatives Association, Inc.) Master Agreements (“Master Agreements”) with certain counterparties that govern over-the-counter derivative (including Total Return, Credit Default and Interest Rate Swaps) and foreign exchange contracts entered into by the Funds. The Master Agreements may contain provisions regarding, among other things, the parties’ general obligations, representations, agreements, collateral requirements, events of default and early termination. Termination events applicable to the Fund may occur upon a decline in the Fund’s net assets below a specified threshold over a certain period of time. Termination events applicable to counterparties may occur upon a decline in the counterparty’s long-term and short-term credit ratings below a specified level. In each case, upon occurrence, the other party may elect to terminate early and cause settlement of all derivative and foreign exchange contracts outstanding, including the payment of any losses and costs resulting from such early termination, as reasonably determined by the terminating party. Any decision by one or more of the Fund’s counterparties to elect early termination could impact a Fund’s future derivative activity. Collateral and margin requirements differ between exchange traded derivatives and over-the-counter (“OTC”) derivatives. Margin requirements are established by the broker or clearing house for exchange-traded and centrally cleared derivatives (futures contracts, options and centrally cleared swaps) pursuant to the governing agreements for those investment types. For OTC derivatives traded under an ISDA Master Agreement, posting of collateral is required by either the fund or the applicable counterparty if the total net exposure of all OTC derivatives with the applicable counterparty exceeds the minimum transfer amount and can vary depending on the counterparty and the type of the agreement. For swaps, futures and forward foreign currency exchange contracts, the Funds may be required to post collateral if a Fund is in a net liability position with the counterparty exceeding certain amounts. Generally, collateral is determined at the close of fund business each day. Collateral posted for the benefit of a Fund is held in a segregated account by a custodian of the Fund’s custodian and with respect to those amounts which can be sold or repledged, are presented in the Fund’s Schedule of Investments. Collateral pledged by the Fund is segregated by the Fund’s custodian and identified in the Fund’s Schedule of Investments. Collateral can be in the form of cash, debt securities issued by the U.S. Government and related agencies, other securities or money market funds as agreed to by the Fund and the applicable counterparty. Collateral requirements are generally determined based on the Fund’s net position with each counterparty. The Funds’ derivative assets and liabilities on the Statements of Assets and Liabilities are presented net only within a derivative type when a legally enforceable master netting agreement exists between the Funds and a derivative counterparty.
Futures Contracts: Certain Funds invest in futures contracts as part of their primary investment strategy. Investments in futures may increase or decrease exposure to a particular market. In the event of a bankruptcy or insolvency of a futures commission merchant that holds margin on behalf of the Funds, the Funds may not be entitled to the return of all of the margin owed to the Funds, potentially resulting in a loss. No monies are paid to or received by a Fund upon the purchase or sale of a futures contract. Initially, a Fund will be required to deposit with the broker an amount of cash or cash equivalents, known as initial margin, based on the value of the contract. Subsequent payments to and from the broker, will be made on a periodic basis as the price of the underlying instruments fluctuates. Changes in market value of open futures contracts are recorded as unrealized appreciation or depreciation in the Statements of Operations. Realized gains or losses represent the difference between the value of the contract at the time it was opened and the value at the time it was closed or expired, and are reported on the Statements of Operations. Securities deposited as initial margin are designated in the Schedules of Investments and cash deposited is presented as Due from Broker on the Statements of Assets and Liabilities. The use of long futures contracts subjects the Funds to risk of loss in excess of the amounts
| | | | | | | | | | | | | | | | |
| | AQR Funds | | | | | | Annual Report | | | | | | December 2013 | | 239 |
| | | | | | | | | | |
| | | | |
| Notes to Financial Statements | | | December 31, 2013 | |
shown on the Statements of Assets and Liabilities, up to the contract amount of the futures contracts. The use of short futures contracts subjects the Funds to unlimited risk of loss. Futures contracts outstanding at period end, if any, are listed after each Fund’s Schedule of Investments.
Forward Foreign Currency Exchange Contracts: Certain Funds buy and sell forward foreign currency exchange contracts, which are agreements between two parties to buy and sell currencies at a set price on a future date. These contracts are used to protect against a decline in value relative to the U.S. dollar of the currencies in which portfolio securities are denominated or quoted (or an increase in the value of a currency in which securities a Fund intends to buy are denominated, when a Fund holds cash reserves and short term investments), or for other investment purposes. The U.S. dollar value of forward foreign currency exchange contracts is determined using current forward currency exchange rates supplied by a quotation service. The market value of the contract will fluctuate with changes in currency exchange rates. The contract is marked to market daily and the change in market value is recorded as an unrealized appreciation or depreciation. When the contract is closed, the Funds record a realized gain or loss equal to the difference between the value of the contract at the time it was opened and the value at the time it was closed. The Funds could be exposed to risk if the value of the currency changes unfavorably, if the counterparties to the contracts are unable to meet the terms of their contracts or if the Fund is unable to enter into a closing position. Risks may exceed amounts recognized on the Statements of Assets and Liabilities. Non-deliverable forward foreign currency exchange contracts are settled with the counterparty in U.S. dollar without the delivery of foreign currency. Forward foreign currency exchange contracts outstanding at period end, if any, are listed after each Fund’s Schedule of Investments.
Swap Contracts: Certain Funds engage in various swap transactions to manage risks within their portfolios or as alternatives to direct investments. Swap transactions are privately negotiated in the OTC market and payments are settled through direct payments between a Fund and the counterparty. By contrast, certain swap transactions are subject to mandatory central clearing (“centrally cleared swaps”). These swaps are executed through a derivatives clearing member (“DCM”), acting in an agency capacity, and submitted to a central counterparty (“CCP”), in which case all payments are settled with the CCP through the DCM. For credit default and interest rate contracts, an up-front payment received by a Fund is recorded as a liability on the Fund’s Statement of Assets and Liabilities. An up-front payment made by a Fund is recorded as an asset on the Fund’s Statement of Assets and Liabilities. Up-front payments are amortized over the term of the contract. Periodic payments received or paid by a Fund are recorded as realized gains or losses.
Total Return Swap Contracts: Certain Funds invest in total return swaps to obtain exposure to the underlying referenced instrument, obtain leverage or attain the returns from ownership without actually owning the underlying position. Total return swaps are two-party contracts that generally obligate one party to pay the positive return and the other party to pay the negative return on a specified reference security, security index or index component during the period of the swap. Total return swap contracts are marked to market daily based on the value of the underlying reference entity and the change, if any, is recorded as an unrealized gain or loss. Total return swaps normally do not involve the delivery of securities or other underlying assets. If the other party to a total return swap defaults, a Fund’s risk of loss consists of the net amount of payments that such Fund is contractually entitled to receive, if any. Total return swaps are derivatives and their value can be volatile. To the extent that the Advisor or Sub-Advisor, as applicable, does not accurately analyze and predict future market trends, the values of assets or economic factors, a Fund may suffer a loss, which may exceed the related amounts shown in the Statements of Assets and Liabilities. Periodic payments received or paid by the Funds are recorded as realized gains or losses. Total return swap contracts outstanding at period end, if any, are listed after each Fund’s Schedule of Investments.
Total Return Basket Swaps: Certain Funds may enter into an equity basket swap agreement to obtain exposure to a portfolio of long and short securities. Under the terms of the agreement, the swap is designed to function as a portfolio of direct investments in long and short equity or fixed income positions. This means that the Fund has the ability to trade in and out of long and short positions within the swap and will receive all of the economic benefits and risks equivalent to direct investments in these positions such as: capital appreciation (depreciation), corporate actions, and dividends and interest received and paid, all of which are reflected in the swap value. The swap value also includes interest charges and credits related to the notional values of the long and short positions and cash balances within the swap. These interest charges and credits are based on defined market rates plus or minus a specified spread and are referred to herein as “financing costs”. Positions within the swap are reset periodically, and financing costs are reset monthly.
| | | | | | | | | | | | | | | | |
| 240 | | AQR Funds | | | | | | Annual Report | | | | | | December 2013 | | |
| | | | | | | | | | |
| | | | |
| Notes to Financial Statements | | | December 31, 2013 | |
During a reset, any unrealized gains (losses) on positions and accrued financing costs become available for cash settlement between the Fund and the swap counterparty. Cash settlement in and out of the swap may occur at a reset date or any other date, at the discretion of the Fund and the counterparty, over the life of the agreement, and is generally determined based on limits and thresholds established as part of the Master Agreement between the Fund and the counterparty.
The value of the swap is derived from a combination of (i) the net value of the underlying positions, which are valued daily using the last sale or closing prices on the principal exchange on which the securities are traded; (ii) financing costs; (iii) the value of dividends or accrued interest; (iv) cash balances within the swap; and (v) other factors, as applicable. The value of the swap is reflected on the Statements of Assets and Liabilities as swaps, at value. Changes in the swap are recognized as changes in unrealized gains or losses in the Statements of Operations. Cash settlements between the Fund and the counterparty are recognized as realized gains or losses in the Statements of Operations. Total return basket swap contracts outstanding at period end, if any, are listed after each Fund’s Schedule of Investments.
The swap involves additional risks than if the Fund has invested in the underlying positions directly, including: the risk that changes in the swap may not correlate perfectly with the underlying long and short securities; credit risk related to the counterparty’s failure to perform under contract terms; and liquidity risk related to the lack of a liquid market for the swap contract, which may limit the ability of the Fund to close out its position(s).
Credit Default Swap Contracts: Certain Funds enter into credit default swap contracts to provide a measure of protection against risk of loss following a default, or other credit event in respect of issuers within an underlying index or a single issuer, or to gain credit exposure to an underlying index or issuer. In a credit default contract, the protection buyer typically makes an up-front payment and a periodic stream of payments to a counterparty, the protection seller, in exchange for the right to receive a contingent payment upon the occurrence of a credit event on the reference obligation or all other equally ranked obligations of the reference entity. Credit events are contract specific but may include bankruptcy, failure to pay, restructuring and obligation acceleration. The credit default contracts are marked to market daily based upon quotations from an independent pricing service or market makers and the change, if any, is recorded as an unrealized gain or loss. Upon entering into a centrally cleared swap, the Funds are required to deposit with the Futures Commission Merchant (“FCM”) cash or securities, which is referred to as the initial margin deposit. Securities deposited as initial margin are designated on the Schedule of Investments and cash deposited is recorded on the Statements of Assets and Liabilities. Subsequent payments, known as variation margin, are made or received by the Fund, depending on fluctuations in the value of the underlying referenced debt obligation. Such variation margin is accounted for as unrealized appreciation or depreciation until the contract is closed, at which time the gains or losses are realized. Upon the occurrence of a credit event, the difference between the par value and market value of the reference obligation, net of any proportional amount of the up-front payment, is recorded as a realized gain or loss.
In addition to bearing the risk that the credit event will occur, a Fund could be exposed to market risk due to unfavorable changes in interest rates or in the price of the underlying security or index or the possibility that the Fund may be unable to close out its position at the same time or at the same price as if it had purchased the underlying reference obligations. In certain circumstances, a Fund may enter into offsetting credit default contracts which would mitigate its risk of loss. Risks of loss may exceed amounts recognized on the Statements of Assets and Liabilities. The Fund’s maximum risk of loss from counterparty risk, either as the protection seller or as the protection buyer, is the fair value of the contract. This risk may be mitigated by having a master netting arrangement between the Fund and the counterparty. The central clearing house acts as the counterparty to each centrally cleared swap transaction, therefore credit risk is limited to the failure of the clearing house. Where a Fund is a seller of protection, the maximum potential amount of future payments the Fund may be required to make is equal to the notional amount of the relevant credit default contract. The Fund’s risk of loss associated with these instruments may exceed their value, as recorded in the Statements of Assets and Liabilities. Credit default contracts outstanding, including their respective notional amounts at period end, if any, are listed after the Fund’s Schedule of Investments.
Implied credit spreads are an indication of the seller’s performance risk, related to the likelihood of a credit event occurring that would require a seller to make payment to a buyer. Implied credit spreads are used to determine the value of swap contracts and reflect the cost of buying/selling protection, which may include up-front payments made to enter into the contract. Therefore, higher spreads would indicate a greater likelihood that a seller will be obligated to perform
| | | | | | | | | | | | | | | | |
| | AQR Funds | | | | | | Annual Report | | | | | | December 2013 | | 241 |
| | | | | | | | | | |
| | | | |
| Notes to Financial Statements | | | December 31, 2013 | |
(i.e., make payment) under the swap contract. Increasing values, in absolute terms and relative to notional amounts, are also indicative of greater performance risk. Implied credit spreads for credit default swaps on credit indexes are linked to the weighted average spread across the underlying reference obligations included in a particular index.
Interest Rate Swaps: Certain Funds enter into interest rate swaps as part of its investment strategy. Interest rate swaps generally involve agreements to exchange fixed and floating payment obligations, without the exchange of the underlying notional amounts. Interest rate swap agreements are privately negotiated in the OTC market or may be executed in a multilateral or other trade facility platform, such as a registered exchange (centrally cleared swaps). Interest rate swaps are marked to market daily based on quotations as provided by an independent pricing service and the change is recorded as unrealized gain or loss. The Fund’s risk of loss associated with these instruments may exceed their value, as recorded in the Statements of Assets and Liabilities. Interest rate contracts outstanding, including their respective notional amounts at period end, if any, are listed after the Fund’s Schedule of Investments. Non-deliverable interest rate swaps are settled with the counterparty in U.S. dollars without the delivery of foreign currency.
High Yield Securities: Certain Funds invest in lower-quality debt securities. Investments in lower-rated securities or unrated securities of comparable quality tend to be more sensitive to economic conditions than higher rated securities causing greater price volatility. These instruments involve a greater risk of loss due to default by the issuer because such securities are generally unsecured and are often subordinated to other creditors’ claims.
Repurchase Agreements: Certain Funds may enter into repurchase agreements. In a repurchase agreement, a Fund takes possession of an underlying debt obligation (collateral) subject to an obligation of the seller to repurchase, and a Fund to resell, the obligation at an agreed-upon price and time. Under the terms of a master repurchase agreement, the underlying securities for all repurchase agreements are held in safekeeping at the Fund’s custodian or designated sub-custodians under tri-party repurchase agreements. Master repurchase agreements govern transactions between a Fund and select counterparties. The master repurchase agreements maintain provisions for, among other things, initiation, income payments, events of default, maintenance of collateral for repurchase agreements and the disposition of such collateral following an event of default. The market value of the collateral must be equal to or exceed the total amount of the repurchase obligations, including interest. Securities purchased under repurchase agreements are reflected as an asset on the Statements of Assets and Liabilities. Interest earned is recorded as a component of interest income on the Statements of Operations. In periods of increased demand for collateral, a Fund may pay a fee for receipt of collateral, which may result in interest expense to the Fund. Generally, in the event of counterparty default, a Fund has the right to use the collateral to offset losses incurred. If the counterparty should default, a Fund may seek to sell the securities which it holds as collateral. This could involve procedural costs or delays in addition to a loss on the securities if their value should fall below their repurchase price.
Reverse Repurchase Agreements: Certain Funds may enter into, under the terms of the Master Repurchase Agreement, reverse repurchase agreements. The Fund sells to a counterparty a security that it holds with a contemporaneous agreement to repurchase the same security at an agreed-upon price and date. Reverse repurchase agreements are valued based on the amount of cash received plus accrued interest, which represents fair value.
Reverse repurchase agreements are reflected as a liability on the Statements of Assets and Liabilities. Interest payments made are recorded as a component of interest expense on the Statements of Operations. In periods of increased demand for the security, the Fund may receive a fee for use of the security by the counterparty, which may result in interest income to the Fund. The Fund monitors collateral market value for the reverse repurchase agreement, including accrued interest, throughout the lives of the agreements, and when necessary, delivers or receives cash or securities in order to manage credit exposure and liquidity. If the counterparty defaults or enters insolvency proceeding, realization or return of the collateral to the Fund may be delayed or limited.
Options: Certain Funds may write and purchase put and call options from time to time. When a Fund writes an option, an amount equal to the premium received by the Fund is reflected as an asset and an equivalent liability. The amount of the liability is subsequently marked to market to reflect the current market value of the option written. When a security is purchased or sold through an exercise of an option, the related premium paid (or received) is added to (or deducted from) the basis of the security acquired or deducted from (or added to) the proceeds of the security sold. When an option expires, the Fund realizes a gain or loss on the option to the extent of the premiums received or paid. When a
| | | | | | | | | | | | | | | | |
| 242 | | AQR Funds | | | | | | Annual Report | | | | | | December 2013 | | |
| | | | | | | | | | |
| | | | |
| Notes to Financial Statements | | | December 31, 2013 | |
Fund enters into a closing transaction, the Fund realizes a gain or loss to the extent the cost of the closing transaction exceeds the premiums paid or received. Written uncovered call options subject the Funds to unlimited risk of loss. Written covered call options limit the upside potential of a security above the strike price. Put options written subject the Funds to risk of loss if the value of the security declines below the exercise price minus the put premium. The Fund, as writer of an option, bears the market risk of an unfavorable change in the price of the security underlying the written option. Written and purchased options are non-income producing investments.
Transactions in call and put options written during the year ended December 31, 2013 for AQR Diversified Arbitrage Fund and the AQR Multi-Strategy Alternative Fund were as follows:
| | | | | | | | |
| | | CALL OPTIONS | |
| AQR DIVERSIFIED ARBITRAGE FUND | | SHARES
SUBJECT
TO CALL | | | PREMIUM | |
| | |
Options outstanding, December 31, 2012 | | | (3,986 | ) | | $ | (183,593 | ) |
Options written | | | (122,096 | ) | | | (4,579,445 | ) |
Options expired | | | 63,797 | | | | 405,329 | |
| Options exercised | | | 52,056 | | | | 1,846,614 | |
Options outstanding, December 31, 2013 | | | (10,229 | ) | | $ | (2,511,095 | ) |
| | | | | | | | |
| | | CALL OPTIONS | |
| AQR MULTI-STRATEGY ALTERNATIVE FUND | | SHARES
SUBJECT
TO CALL | | | PREMIUM | |
| | |
Options outstanding, December 31, 2012 | | | (725 | ) | | $ | (35,916 | ) |
Options written | | | (16,764 | ) | | | (472,526 | ) |
Options expired | | | 1,689 | | | | 18,450 | |
| Options exercised | | | 14,368 | | | | 479,755 | |
Options outstanding, December 31, 2013 | | | (1,432 | ) | | $ | (10,237 | ) |
Securities Lending: The AQR Diversified Arbitrage Fund and the AQR Multi-Strategy Alternative Fund may lend securities to brokers approved by the Advisor in order to generate additional income. Securities loaned are collateralized by cash, which is invested in various J.P. Morgan Money Market Funds. Upon termination of a loan, the Funds are required to return to the borrower the posted cash collateral. Loans are subject to termination by the Funds or the borrower at any time. Securities lending income is comprised of income earned on cash collateral investments, net of a rebate received from or paid to borrowers for use of cash collateral and lending agent fees. This amount is recorded as Securities lending income, net on the Statements of Operations. The Funds also receive payments from the borrower during the period of the loan, equivalent to dividends and interest earned on the securities loaned, which are recorded as Dividend or Interest income, respectively, on the Statements of Operations.
The Funds bear the risk of loss associated with the collateral investments and are not entitled to additional collateral from the borrower to cover any such losses. To the extent that the value of the collateral investments declines below the amount owed to a borrower, a Fund may incur losses that exceed the amount it earned on lending the security. Upon termination of a loan, a Fund may use leverage (borrow money) to repay the borrower for cash collateral posted if the Advisor does not believe that it is prudent to sell the collateral investments to fund the payment of this liability.
Securities lending also involves counterparty risks, including the risk that the loaned securities may not be returned in a timely manner or at all.
In the event of a default by a borrower with respect to any loan, the lending agent will exercise any and all remedies provided under the applicable borrower agreement to make the Funds whole. These remedies include purchasing replacement securities by applying the collateral held from the defaulting broker against the purchase cost of the
| | | | | | | | | | | | | | | | |
| | AQR Funds | | | | | | Annual Report | | | | | | December 2013 | | 243 |
| | | | | | | | | | |
| | | | |
| Notes to Financial Statements | | | December 31, 2013 | |
replacement securities. If, despite such efforts by the lending agent to exercise these remedies, the Funds sustain losses as a result of a borrower’s default, the Securities Lending Agent indemnifies the Funds by purchasing replacement securities at its expense, or paying the Funds an amount equal to the market value of the replacement securities, subject to certain limitations which are set forth in detail in the Securities Lending Agency Agreement between the Funds and the lending agent.
At December 31, 2013, neither of the Funds had any securities out on loan.
Securities Transactions and Investment Income: Investment transactions are accounted for on trade date (the date the order to buy or sell is executed). Securities gains and losses are calculated on a specifically identified cost basis. Interest income is determined on the basis of coupon interest accrued using the effective interest method adjusted for amortization of premiums and accretion of discounts using the effective yield method. Dividend income/expense is recorded on the ex-dividend date or when the Fund first learns of the ex-date dividend notification.
Allocation of Income and Expenses: In calculating the net asset value per share of each class, investment income, realized and unrealized gains and losses and expenses other than class specific expenses are allocated daily to each class of shares based upon the proportion of net assets of each class at the beginning of each day. Each Fund is charged for those expenses that are directly attributable to each Fund, such as advisory fees and registration costs. Trust level expenses are allocated among the Funds based on the ratio of average net assets or other reasonable methodology.
The Funds record distributions received in excess of income from underlying investments as a reduction of cost of investments and/or realized gain. Such amounts are based on estimates (if actual amounts are not available) and actual amounts of income, realized gain and return of capital may differ from the estimated amounts. The Funds adjust the estimated amounts of components of distributions (and consequently net investment income) as necessary once the issuers provide information about the actual composition of the distributions.
The Funds may be subject to foreign taxes on income, capital gains on investments or currency repatriation, a portion of which may be recoverable. The Funds will accrue such taxes and recoveries as applicable, based upon their current interpretation of tax rules and regulations that exist in the markets in which they invest.
Organization and Offering Costs: Organizational costs incurred by the relevant funds, including professional and incorporation fees, are fully expensed by the end of the fiscal period. Offering costs, including professional fees, printing fees and the offering of the initial registration, are amortized over a period not longer than twelve months from the date the Funds commenced operations.
Foreign Currency Translation: The books and records of the Funds are maintained in U.S. dollars. Foreign currency amounts are translated into U.S. dollars at the prevailing exchange rates of such currencies against the U.S. dollar. The market value of investment securities and the other assets and liabilities are translated at the exchange rate as of the valuation date. Purchases and sales of investment securities, income and expenses are translated at the exchange rate prevailing on the respective dates of such transactions.
Although the net assets of the Funds are presented at the foreign exchange rates and market values at the close of the period, the Funds do not isolate that portion of the results of operations arising as a result of changes in the foreign exchange rates from the fluctuations arising from changes in the market prices of securities held or sold during the period. Accordingly, such foreign currency gains (losses) are included in the reported net realized and unrealized gains (losses) on investment transactions.
Reported realized foreign currency gains or losses arise from the disposition of foreign currency and forward foreign currency exchange contracts, currency gains or losses realized between the trade and settlement dates on securities transactions, and the difference between the amounts of dividends, interest and foreign withholding taxes recorded on each Fund’s books on the transaction date and the U.S. dollar equivalent of the amounts actually received or paid. Unrealized foreign exchange gains and losses arise from changes (due to the changes in the exchange rate) in the value of foreign currency and assets and liabilities (other than investments) denominated in foreign currencies, which are held at period end.
| | | | | | | | | | | | | | | | |
| 244 | | AQR Funds | | | | | | Annual Report | | | | | | December 2013 | | |
| | | | | | | | | | |
| | | | |
| Notes to Financial Statements | | | December 31, 2013 | |
Cash and Cash Equivalents: Cash and cash equivalents include U.S. dollar and foreign currency deposited at bank accounts at amounts which may exceed insured limits. The Funds are subject to risk to the extent that the institutions may be unable to fulfill their obligations.
Due to/from Broker: Due to/from Broker represents cash balances on deposit with the Funds’ prime brokers and counterparties. The Funds are subject to credit risk should the prime brokers and counterparties be unable to meet their obligations to the Funds.
Federal Income Taxes: Each Fund is treated as a separate taxable entity for federal income tax purposes. Each Fund intends to qualify as a “regulated investment company” under Subchapter M of the Internal Revenue Code of 1986, as amended (the “Code”). If so qualified, each Fund will not be subject to federal income tax to the extent it distributes substantially all of its net investment income and capital gains to shareholders.
The Advisor evaluates tax positions taken or expected to be taken in the course of preparing the Funds’ tax returns to determine whether the tax positions are “more-likely-than-not” of being sustained by the applicable tax authority. Tax positions deemed to meet the more-likely-than-not threshold would be recorded as a tax benefit or expense in the current year. The Funds are required to analyze all open tax years. Open tax years are those years that are open for examination by the relevant income taxing authority. The returns of the Funds for the prior three fiscal years, or since inception if shorter, are open for examination. As of December 31, 2013, the Funds had no examinations in progress.
The Funds have concluded that there is no tax liability/benefit resulting from uncertain income tax positions taken or expected to be taken. The Funds are also not aware of any tax positions for which it is reasonably possible that the total amounts of unrecognized tax expense will significantly change in twelve months.
Distributions to Shareholders: The Funds intend to declare and distribute substantially all of their net investment income and net realized capital gains, if any, at least annually. Income and capital gain distributions will be determined in accordance with federal income tax regulations which may differ from GAAP. Distributions to shareholders are recorded on the ex-dividend date. To the extent these “book/tax” differences are permanent in nature (i.e., that they result from other than timing of recognition — “temporary differences”), such amounts are reclassified within the capital accounts based on their Federal tax-basis treatment.
Indemnification: In the normal course of business, the Funds may enter into various agreements that provide for general indemnifications. The Funds’ maximum exposure under these arrangements is unknown as any potential exposure involves future claims that may be made against the Funds. However, based on experience, the Funds expect the risk of loss to be remote.
4. Federal Income Tax Matters
At December 31, 2013, the cost of long security positions and aggregate gross unrealized appreciation (depreciation) of investments for federal income tax purposes were as follows:
| | | | | | | | | | | | | | | | |
| FUND | | COST OF
INVESTMENTS | | | GROSS
UNREALIZED
APPRECIATION | | | GROSS
UNREALIZED
DEPRECIATION | | | NET UNREALIZED
APPRECIATION
(DEPRECIATION) | |
AQR Diversified Arbitrage Fund | | $ | 2,554,047,341 | | | $ | 172,910,385 | | | $ | (79,284,338 | ) | | $ | 93,626,047 | |
AQR Long-Short Equity Fund | | | 5,728,596 | | | | — | | | | — | | | | — | |
AQR Managed Futures Strategy Fund | | | 5,485,037,240 | | | | 78,570 | | | | — | | | | 78,570 | |
AQR Managed Futures Strategy HV Fund | | | 34,656,715 | | | | 276 | | | | — | | | | 276 | |
AQR Risk-Balanced Commodities Strategy Fund | | | 32,265,975 | | | | 155 | | | | — | | | | 155 | |
AQR Risk Parity Fund | | | 897,461,578 | | | | 2,050,037 | | | | (5,239,198 | ) | | | (3,189,161 | ) |
AQR Risk Parity II MV Fund | | | 45,478,553 | | | | — | | | | (556,870 | ) | | | (556,870 | ) |
AQR Risk Parity II HV Fund | | | 34,843,944 | | | | — | | | | (403,131 | ) | | | (403,131 | ) |
AQR Multi-Strategy Alternative Fund | | | 1,720,631,436 | | | | 213,028,828 | | | | (13,452,748 | ) | | | 199,576,080 | |
AQR Style Premia Alternative Fund | | | 482,513,846 | | | | 8,632,975 | | | | (3,076,297 | ) | | | 5,556,678 | |
The differences between book basis and tax basis appreciation (depreciation) on investments are primarily attributable to wash sale loss deferrals, PFICs mark to market, straddles loss deferral and return of capital from securities.
| | | | | | | | | | | | | | | | |
| | AQR Funds | | | | | | Annual Report | | | | | | December 2013 | | 245 |
| | | | | | | | | | |
| | | | |
| Notes to Financial Statements | | | December 31, 2013 | |
As of December 31, 2013, the components of net assets (excluding paid in capital) on a tax basis were as follows:
| | | | | | | | | | | | | | | | | | | | | | | | |
| FUND | | CURRENT
DISTRIBUTABLE
ORDINARY
INCOME | | | CURRENT
DISTRIBUTABLE
LONG TERM
CAPITAL GAIN OR
TAX BASIS
CAPITAL LOSS
CARRYFORWARDS | | | NET UNREALIZED
APPRECIATION
(DEPRECIATION) | | | POST
OCTOBER
CAPITAL
OR LATE
YEAR
ORDINARY
LOSS
DEFERRALS | | | OTHER
TEMPORARY
DIFFERENCES | | | TOTAL
ACCUMULATED
EARNINGS | |
AQR Diversified Arbitrage Fund | | | $— | | | | $— | | | | $2,862,379 | | | | $ — | | | | $ — | | | | $2,862,379 | |
AQR Long-Short Equity Fund | | | 47,073 | | | | 49,744 | | | | 35,236 | | | | — | | | | — | | | | 132,053 | |
AQR Managed Futures Strategy Fund | | | 107,050,504 | | | | 193,000,364 | | | | 54,643,809 | | | | — | | | | — | | | | 354,694,677 | |
AQR Managed Futures Strategy HV Fund | | | 1,247,702 | | | | 1,588,564 | | | | 280,668 | | | | — | | | | — | | | | 3,116,934 | |
AQR Risk-Balanced Commodities Strategy Fund | | | — | | | | — | | | | (737,771) | | | | (12,050) | | | | — | | | | (749,821) | |
AQR Risk Parity Fund | | | 4,208,195 | | | | — | | | | 6,377,964 | | | | (9,001,976) | | | | — | | | | 1,584,183 | |
AQR Risk Parity II MV Fund | | | — | | | | (149,623) | | | | (225,091) | | | | (249,212) | | | | — | | | | (623,926) | |
AQR Risk Parity II HV Fund | | | — | | | | (149,828) | | | | (260,110) | | | | — | | | | — | | | | (409,938) | |
AQR Multi-Strategy Alternative Fund | | | 13,763,456 | | | | (25,605,943) | | | | (13,421,080) | | | | — | | | | — | | | | (25,263,567) | |
AQR Style Premia Alternative Fund | | | 6,323,551 | | | | 5,032,183 | | | | (6,889,904) | | | | — | | | | — | | | | 4,465,830 | |
The differences between book basis and tax basis components of net assets are primarily attributable to tax deferral losses on wash sales and other book and tax differences including capital loss carryforwards, passive foreign investment companies (“PFIC”), forward foreign currency exchange contracts, swap contracts, the use of equalization, amortization of organizational costs, unamortized organizational costs, and the tax treatment of income and gain or loss from the subsidiary.
At December 31, 2013, the effect of permanent book/tax reclassifications resulted in increase (decrease) to the components of net assets as follows:
| | | | | | | | | | | | |
| FUND | | UNDISTRIBUTED
NET INVESTMENT
INCOME | | | ACCUMULATED
NET REALIZED
GAIN(LOSS) ON
INVESTMENTS | | | PAID-IN CAPITAL | |
AQR Diversified Arbitrage Fund | | $ | (12,053,606 | ) | | $ | 30,269,570 | | | $ | (18,215,964 | ) |
AQR Long-Short Equity Fund | | | 150,573 | | | | (119,847 | ) | | | (30,726 | ) |
AQR Managed Futures Strategy Fund | | | 53,613,842 | | | | (81,525,444 | ) | | | 27,911,602 | |
AQR Managed Futures Strategy HV Fund | | | 224,405 | | | | 317,047 | | | | (541,452 | ) |
AQR Risk-Balanced Commodities Strategy Fund | | | 645,518 | | | | 11,738,352 | | | | (12,383,870 | ) |
AQR Risk Parity Fund | | | 12,007,241 | | | | 18,978,012 | | | | (30,985,253 | ) |
AQR Risk Parity II MV Fund | | | 408,010 | | | | 3,236,783 | | | | (3,644,793 | ) |
AQR Risk Parity II HV Fund | | | 245,085 | | | | 2,642,844 | | | | (2,887,929 | ) |
AQR Multi-Strategy Alternative Fund | | | 56,142,979 | | | | (68,250,129 | ) | | | 12,107,150 | |
AQR Style Premia Alternative Fund | | | 6,916,410 | | | | (7,954,854 | ) | | | 1,038,444 | |
| | | | | | | | | | | | | | | | |
| 246 | | AQR Funds | | | | | | Annual Report | | | | | | December 2013 | | |
| | | | | | | | | | |
| | | | |
| Notes to Financial Statements | | | December 31, 2013 | |
For financial reporting purposes, capital accounts are adjusted to reflect the tax character of permanent book/tax differences. Reclassifications are primarily due to the tax treatment of swap contracts, distribution reclassifications, foreign currency reclassifications, sale of Real Estate Investment Trusts, PFICs, paydowns and the tax treatment of income and gain or loss from the subsidiary. The result of operations and net assets were not affected by these reclassifications.
The tax character of the distributions paid during the years ended December 31, 2013 and December 31, 2012, were are follows:
| | | | | | | | | | | | | | | | | | | | |
| FUND | | DECEMBER 31, 2013
ORDINARY INCOME | | | CAPITAL
GAINS | | | RETURN
OF
CAPITAL | | | DECEMBER 31, 2012
ORDINARY INCOME | | | CAPITAL
GAINS | |
AQR Diversified Arbitrage Fund | | $ | 44,059,462 | | | $ | 14,410,981 | | | $ | 21,724,609 | | | $ | 38,341,011 | | | $ | — | |
AQR Long-Short Equity Fund | | | 439,168 | | | | 55,727 | | | | — | | | | — | | | | — | |
AQR Managed Futures Strategy Fund | | | 6,115,369 | | | | 52,416,671 | | | | — | | | | 17,396,750 | | | | 1,885 | |
AQR Managed Futures Strategy HV Fund | | | 39,794 | | | | — | | | | — | | | | — | | | | — | |
AQR Risk Parity Fund | | | 49,971,618 | | | | 11,583,408 | | | | — | | | | 49,637,112 | | | | 625,990 | |
AQR Risk Parity II MV Fund | | | 74,964 | | | | — | | | | — | | | | 16,427 | | | | — | |
AQR Risk Parity II HV Fund | | | 134,991 | | | | — | | | | — | | | | 40,741 | | | | — | |
AQR Multi-Strategy Alternative Fund | | | 77,873,599 | | | | 7,128,688 | | | | — | | | | 2,331,277 | | | | — | |
AQR Style Premia Alternative Fund | | | 7,859,288 | | | | — | | | | — | | | | — | | | | — | |
As of December 31, 2013, for federal income tax purposes, the following Funds have capital loss carryforwards available to offset capital gains, if any, to the extent provided by the U.S. Treasury regulations.
| | | | | | | | |
| FUND | | SHORT-TERM | | | LONG TERM | |
AQR Risk Parity II MV Fund | | $ | 149,623 | | | $ | — | |
AQR Risk Parity II HV Fund | | | 149,828 | | | | — | |
AQR Multi-Strategy Alternative Fund | | | 6,331,656 | | | | 19,274,287 | |
Under the Regulated Investment Company Modernization Act of 2010, the Funds are permitted to carry forward capital losses incurred in taxable years beginning after December 22, 2010 for an unlimited period. Post-enactment capital loss carryforwards retain their character as either short-term or long-term capital losses rather than being considered short-term as under previous law. Any post-enactment capital losses generated will be required to be utilized prior to the losses incurred in pre-enactment tax years.
5. Fair Value Measurements
The Funds utilize various inputs in determining the value of each Fund’s investments. GAAP establishes a hierarchy for inputs used in measuring fair value that maximizes the use of observable inputs and minimizes the use of unobservable inputs by requiring the most observable inputs be used when available. These inputs are summarized in the three broad levels as follows:
Level 1 — quoted prices in active markets for identical securities
Level 2 — other significant observable inputs (including quoted prices for similar securities, interest rates, pre-payment speeds, credit risk, etc.)
Level 3 — significant unobservable inputs (including the Fund’s own assumptions in determining the fair value of investments)
Valuation methodology and inputs
An investment asset’s or liability’s level within the fair value hierarchy is based on the lowest level input, individually or in aggregate, that is significant to fair value measurement. The objective of fair value measurement remains the same even
| | | | | | | | | | | | | | | | |
| | AQR Funds | | | | | | Annual Report | | | | | | December 2013 | | 247 |
| | | | | | | | | | |
| | | | |
| Notes to Financial Statements | | | December 31, 2013 | |
when there is a significant decrease in the volume and level of activity for an asset or liability and regardless of the valuation technique used. The valuation techniques used by the Funds to measure fair value maximize the use of observable inputs and minimize the use of unobservable inputs.
The inputs or methodology used for valuing securities are not necessarily an indication of the risk associated with investing in those securities. The following inputs and techniques may be used by the Funds to evaluate how to classify each major category of assets and liabilities for Level 2 and Level 3, in accordance with GAAP.
Equities traded outside North America are fair valued daily based on the application of a fair value factor, and therefore are considered Level 2 (Note 2). Investments that trade in markets that are not considered to be active, but are valued based on quoted market prices, dealer quotations or alternative pricing sources supported by observable inputs are also classified within Level 2. These include certain U.S. government and sovereign obligations, most government agency securities, investment-grade corporate bonds, money market funds and less liquid listed equities. Corporate and sovereign bonds and other fixed-income instruments are valued at estimated fair value based on quotations (including evaluated quotes) from an independent pricing service, as well as quotations from counterparties and other market participants. Investments classified within Level 3 have significant unobservable inputs, as they trade infrequently or not at all. Level 3 instruments include illiquid securities. When observable prices are not available for these securities, the Funds use one or more valuation techniques (e.g., the market approach, the income approach, or the cost approach) for which sufficient and reliable data is available. Within Level 3, the use of the market approach generally consists of using comparable market transactions, while the use of the income approach generally consists of the net present value of estimated future cash flows, adjusted as appropriate for liquidity, credit, market and/or other risk factors. The inputs used by the Funds in estimating the value of Level 3 investments include the original transaction price, recent transactions in the same or similar instruments, completed or pending third-party transactions in the underlying investment or comparable issuers, subsequent rounds of financing, recapitalizations and other transactions across the capital structure, offerings in the equity or debt capital markets, and changes in financial ratios or cash flows. Level 3 investments may also be adjusted to reflect illiquidity and/or non-transferability, with the amount of such discount estimated by the Advisor in the absence of market information. Assumptions used by the Funds due to the lack of observable inputs may significantly impact the resulting fair value and therefore the Funds’ results of operations.
The Funds invest in derivative instruments. Derivative instruments can be exchange traded or privately negotiated over-the-counter (“OTC”). Exchange-traded derivatives, such as futures contracts and exchange traded option contracts, are typically classified within Level 1 or Level 2 of the fair value hierarchy depending on whether or not they are deemed to be actively traded. Futures and option contracts that are listed on national exchanges and are freely transferable are valued at fair value based on their last sales price on the date of determination on the exchange that constitutes the principal market. OTC derivatives, including futures, forwards, and swaps, are valued by the Funds using observable inputs, such as quotations received from the counterparty, or dealers and brokers, whenever available and considered reliable. Generally, a valuation model is used consistently for similar derivative types and model inputs, including, but not limited to, market prices, yield curves, credit spreads, volatilities and implied correlations which are obtained from outside brokers and/or pricing services when available. In instances where models are used, the value of an OTC derivative depends upon the contractual terms of, and specific risks inherent in, the instrument as well as the availability and reliability of observable inputs. Such inputs include market prices for reference securities, yield curves, credit curves, measures of volatility, prepayment rates and correlations of such inputs. Certain OTC derivatives, such as generic forwards, swaps and options, have inputs which can generally be corroborated by market data and are therefore classified within Level 2.
Credit default swaps are carried at their estimated fair value, as determined in good faith by pricing services approved by the Board of Trustees. In addition to credit quality, the Funds monitor a variety of factors including cash flow assumptions, market activity, market sentiment and valuation as part of their ongoing process of assessing payment and performance risk. As payment and performance risk increases, the value of a credit default swap contract increases, resulting in recognition of unrealized gains for long positions and unrealized losses for short positions. Conversely, as payment and performance risk decreases, unrealized gains are recognized for short positions and unrealized losses are recognized for long positions. The change in value is recorded within unrealized appreciation/(depreciation) until the occurrence of a credit event or the termination of the swap, at which time a realized gain/(loss) is recorded. Those OTC derivatives that have less liquidity or for which inputs are unobservable are classified within Level 3. While the valuations of these less liquid OTC derivatives may utilize some Level 1 and/or Level 2 inputs, they also include other unobservable
| | | | | | | | | | | | | | | | |
| 248 | | AQR Funds | | | | | | Annual Report | | | | | | December 2013 | | |
| | | | | | | | | | |
| | | | |
| Notes to Financial Statements | | | December 31, 2013 | |
inputs which are considered significant to the fair value determination. At each measurement date, the Funds update the Level 1 and Level 2 inputs to reflect observable inputs, though the resulting gains and losses are reflected within Level 3 due to the significance of the unobservable inputs.
Securities, for which market quotations or independent pricing service quotations are not readily available, are not readily marketable, or model priced and all other assets of the Funds are valued at fair value using valuation procedures for the Funds, which have been approved by the Board of Trustees. The Advisor has established a Valuation Committee (the “VC”) which is responsible for overseeing the pricing and valuation of all securities held in the Funds. The VC operates under the valuation procedures approved by the Funds’ Board of Trustees. The VC meets quarterly and on an as-needed basis. The VC is responsible for valuing any securities or other assets for which prices or valuations are not readily determinable by the Funds’ pricing services. The VC considers time-sensitive valuation issues, including those relating to market closures, changes in illiquid security values, model prices and other events that may have a potentially material impact on security values. On a quarterly basis the VC meets to review the results of back test reports generated by the Advisor’s internal risk department. The VC prepares for the Funds’ Board of Trustees an analysis relating to Level 3 positions. On a daily basis, the Trust’s fund accounting agent compares trade execution prices to the prior night’s valuation price for all positions which were traded and held the previous day. On a monthly basis, third party model prices are reviewed against internal model prices.
Quantitative Information
These tables include a description of unobservable and quantitative inputs and the interrelationship of such inputs, as used in determining the value of Level 3 financial instruments, except for Level 3 instruments for which prior transaction or third party pricing information was used without adjustment.
Transfers
Transfers into, and out of, Level 3 are valued utilizing values as of the beginning of the period. Transfers from Level 2 to Level 3 or from Level 3 to Level 2 are due to a decline or an increase in market activity (e.g. frequency of trades), which resulted in a lack of or increase in available market inputs to determine price.
| | | | | | | | | | | | | | | | |
| | AQR Funds | | | | | | Annual Report | | | | | | December 2013 | | 249 |
| | | | | | | | | | |
| | | | |
| Notes to Financial Statements | | | December 31, 2013 | |
The following summarizes inputs used as of December 31, 2013 in valuing the Funds’ assets carried at fair value:
| | | | | | | | | | | | | | | | |
| AQR DIVERSIFIED ARBITRAGE FUND | | QUOTED PRICES
IN ACTIVE
MARKET
(LEVEL 1) | | | OTHER SIGNIFICANT
OBSERVABLE
INPUTS
(LEVEL 2) | | | SIGNIFICANT
UNOBSERVABLE
INPUTS
(LEVEL 3) | | | TOTALS | |
ASSETS | |
Common Stocks† | | $ | 818,030,105 | | | $ | 62,996,572 | | | $ | 14,041,304 | | | $ | 895,067,981 | |
Convertible Preferred Stocks† | | | 55,721,098 | | | | 28,929,947 | | | | 24,735,848 | | | | 109,386,893 | |
Corporate Bonds† | | | — | | | | 321,012,317 | | | | 70,789,053 | | | | 391,801,370 | |
Convertible Bonds† | | | — | | | | 471,612,120 | | | | 7,850,420 | | | | 479,462,540 | |
Loan Participations† | | | — | | | | 12,828,605 | | | | 3,792,250 | | | | 16,620,855 | |
Closed End Funds | | | 117,397,418 | | | | 8,050,693 | | | | — | | | | 125,448,111 | |
Preferred Stocks† | | | 1,745,231 | | | | 2,077,329 | | | | 20,828,897 | | | | 24,651,457 | |
Rights† | | | — | | | | — | | | | 2,835 | | | | 2,835 | |
Short-Term Investments | | | — | | | | 92,387,303 | | | | — | | | | 92,387,303 | |
Warrants† | | | 29,967,501 | | | | 366,621 | | | | 9,194,739 | | | | 39,528,861 | |
Money Market Funds | | | — | | | | 472,472,494 | | | | — | | | | 472,472,494 | |
Purchased Options | | | 842,688 | | | | — | | | | — | | | | 842,688 | |
Futures Contracts* | | | 814,780 | | | | — | | | | — | | | | 814,780 | |
| Total Return Basket Swaps Contracts* | | | — | | | | 33,872,527 | | | | — | | | | 33,872,527 | |
| | | | |
Total Assets | | $ | 1,024,518,821 | | | $ | 1,506,606,528 | | | $ | 151,235,346 | | | $ | 2,682,360,695 | |
| | | | |
LIABILITIES | | | | | | | | | | | | | | | | |
Common Stocks (Sold Short)† | | $ | (538,013,036 | ) | | $ | (22,533,011 | ) | | $ | — | | | $ | (560,546,047 | ) |
Exchange-Traded Funds (Sold Short) | | | (11,230,521 | ) | | | – | | | | — | | | | (11,230,521 | ) |
Preferred Stocks (Sold Short)† | | | — | | | | (18,909,939 | ) | | | — | | | | (18,909,939 | ) |
U.S. Treasury Obligations (Sold Short) | | | — | | | | (7,794,399 | ) | | | — | | | | (7,794,399 | ) |
Written Options (Sold Short)* | | | (2,568,865 | ) | | | (5,545 | ) | | | — | | | | (2,574,410 | ) |
Forward Foreign Currency Exchange Contracts* | | | — | | | | (596,385 | ) | | | — | | | | (596,385 | ) |
Futures Contracts* | | | (12,383,327 | ) | | | – | | | | — | | | | (12,383,327 | ) |
Credit Default Swap Contracts* | | | — | | | | (20,077,987 | ) | | | — | | | | (20,077,987 | ) |
| Total Return Basket Swaps Contracts * | | | — | | | | (2,414,449 | ) | | | — | | | | (2,414,449 | ) |
| | | | |
Total Liabilities | | $ | (564,195,749 | ) | | $ | (72,331,715 | ) | | $ | — | | | $ | (636,527,464 | ) |
| | * | Derivative instruments, including futures, total return basket swaps and forward foreign currency exchange contracts, are valued at the unrealized appreciation (depreciation) of the instrument. Credit default swap and option contracts are reported at market value. |
| | † | Please refer to the Schedule of Investments to view securities segregated by industry type. |
| | | | | | | | | | | | | | | | |
| 250 | | AQR Funds | | | | | | Annual Report | | | | | | December 2013 | | |
| | | | | | | | | | |
| | | | |
| Notes to Financial Statements | | | December 31, 2013 | |
Quantitative Information about Level 3 Fair Value Measurements*
| | | | | | | | | | |
| | | FAIR VALUE AT
12/31/2013 | | VALUATION
TECHNIQUE(S) | | UNOBSERVABLE
INPUT(S) | | RANGE | | WEIGHTED
AVERAGE |
| | | | | | | | | | | | |
| | | | | |
| Common Stocks | | | $566,976 | | | Enterprise Value Waterfall | | Volatility | | 70.57% | | N/A |
| | | $1,105,800 | | | As Converted Equivalent | | Conversion Price | | $1.55 | | N/A |
| | | | Discount for lack of marketability** | | 18.23% | | N/A |
| | | | Volatility | | 33.41% | | N/A |
| | | | | |
| Preferred Stocks | | | $2,844,527 | | | Discounted Cash Flows | | Discounted Rates | | 7.09% | | 7.09% |
| | | | | | | | Discount for lack of marketability | | 0%—0.51% | | 0.25% |
| | | | | | | | Volatility | | 30.83% | | 30.83% |
| | | $866,821 | | | Enterprise Value Waterfall | | Discount for lack of marketability** | | 6.57% | | N/A |
| | | | Volatility | | 40.36% | | N/A |
| | | | | |
| Convertible Preferred Stocks | | | $814 | | | Options Pricing Model | | Conversion Strike Price | | $4.00 | | N/A |
| | | | Discount for lack of marketability** | | 15.19% | | N/A |
| | | | Volatility | | 46.87% | | N/A |
| | | | | |
| Corporate Bonds | | | $104,546 | | | Liquidation Analysis | | Volatility | | 50.00% | | N/A |
| | | $167,213 | | | Recovery Value | | Discount for lack of marketability** | | 26.90% | | N/A |
| | | | Volatility | | 49.53% | | N/A |
| | | | | |
| Convertible Bonds | | | $239,510 | | | Liquidation Analysis | | Volatility | | 58.56% | | N/A |
| | | | | | | | Recovery Estimate | | $0—$900,000 | | N/A |
| | | | | | | | Discount for Estimated Recovery Costs | | 0%—75% | | N/A |
| | | $1,929,170 | | | Options Pricing Model | | Enterprise Value | | $18,000—$5,074,000 | | $5,073,996 |
| | | | Conversion Price | | $1.00—$5.32 | | $3.40 |
| | | | Discount for lack of marketability** | | 0%—18.60% | | 2.24% |
| | | | Volatility | | 40.63%—56.96% | | 42.60% |
| | | | | |
| Warrants | | | $348,421 | | | Black Scholes Model | | Strike Price | | $0.47—$23.60 | | $2.33 |
| | | | Discount for lack of marketability** | | 24.66%—50.88% | | 27.60% |
| | | | Volatility | | 67.57%—90.67% | | 74.07% |
| | * | The table above does not include Level 3 securities that are valued by pricing vendors or brokers. At December 31, 2013, the value of these securities was $143,061,547. The inputs for these securities are not readily available or cannot be reasonably estimated and are generally those inputs described in Note 5. The appropriateness of fair values for these securities is monitored on an ongoing basis which may include results of back testing, results of pricing vendor and/or broker due diligence, unchanged price review and consideration of macro or security specific events. |
| | ** | Represents amounts used when the reporting entity has determined that market participants would take into account discounts, as applicable, when pricing the investments. |
| | | | | | | | | | | | | | | | |
| | AQR Funds | | | | | | Annual Report | | | | | | December 2013 | | 251 |
| | | | | | | | | | |
| | | | |
| Notes to Financial Statements | | | December 31, 2013 | |
Level 3 values are based on significant unobservable inputs that reflect the Advisor’s determination of assumptions that market participants might reasonably use in valuing the securities. Changes in significant unobservable inputs could cause significant changes in valuation to individual securities and in aggregate. Fair value determinations and valuation of investments that are not actively trading involve judgment and may differ materially from valuations that would have been used had greater market activity occurred.
The significant unobservable inputs used in the fair value measurement of the Fund’s investments in common stocks, corporate bonds, convertible bonds, convertible preferred stocks and warrants potentially include credit spread, liquidity discount and volatility. Significant increases in the credit spread or liquidity discount inputs in isolation would potentially result in a significantly lower fair value measurement, whereas an increase in volatility generally results in a higher fair value measurement. Generally, a change in the assumption used for the credit spread would be accompanied by a directionally-similar change in the assumptions used for the volatility and liquidity discount. Investments in common stocks potentially include liquidity discount, theoretical value, book to value analysis and/or broker quotes. Significant changes in any of these inputs would significantly change the fair value measurement of the position.
The following is a reconciliation of assets and liabilities in which significant unobservable inputs (Level 3) were used in determining fair value:
| | | | | | | | | | | | | | | | | | | | | | | | | | | | | | | | |
AQR DIVERSIFIED
ARBITRAGE FUND | | COMMON
STOCKS | | | CONVERTIBLE
PREFERRED
STOCKS | | | LOAN
PARTICIPATIONS/
CORPORATE
BONDS | | | CONVERTIBLE
BONDS | | | PREFERRED
STOCKS | | | RIGHTS | | | WARRANTS | | | SHORT
COMMON
STOCKS | |
Balance as of December 31, 2012 | | $ | 24,333,266 | | | $ | 8,469,674 | | | $ | 89,519,605 | | | $ | 26,292,911 | | | $ | — | | | $ | 2,835 | | | $ | 2,824,399 | | | $ | (32,207 | ) |
Accrued discounts/ (premiums) | | | — | | | | — | | | | 94,192 | | | | (1,417 | ) | | | — | | | | — | | | | — | | | | — | |
Realized gain/(loss) | | | 362,457 | | | | 159,021 | | | | (2,453,157 | ) | | | (143,149 | ) | | | 3 | | | | — | | | | 742,724 | | | | 890,423 | |
Change in unrealized appreciation/(depreciation) | | | (1,271,918 | ) | | | 537,978 | | | | 2,315,930 | | | | (1,149,516 | ) | | | 177,784 | | | | — | | | | 2,015,089 | | | | (858,216 | ) |
Purchases 1 | | | 12,686,250 | | | | 11,682,706 | | | | 33,382,831 | | | | 761,160 | | | | 20,651,113 | | | | — | | | | 6 | | | | — | |
Sales 2 | | | (21,382,522 | ) | | | (2,776,950 | ) | | | (53,152,400 | ) | | | (22,416,549 | ) | | | (3 | ) | | | — | | | | (1,135,421 | ) | | | — | |
Transfers in to Level 3 | | | 1,900 | | | | 11,991,291 | | | | 29,681,927 | | | | 4,506,980 | | | | — | | | | — | | | | 4,847,615 | | | | — | |
| Transfers out of Level 3 | | | (688,129 | ) | | | (5,327,872 | ) | | | (24,807,625 | ) | | | — | | | | — | | | | — | | | | (99,673 | ) | | | — | |
Balance as of December 31, 2013 | | $ | 14,041,304 | | | $ | 24,735,848 | | | $ | 74,581,303 | | | $ | 7,850,420 | | | $ | 20,828,897 | | | $ | 2,835 | | | $ | 9,194,739 | | | $ | — | |
Change in Unrealized appreciation/(depreciation) for securities still held at December 31, 2013 | | $ | (1,446,653 | ) | | $ | 607,003 | | | $ | (476,673 | ) | | $ | (1,303,649 | ) | | $ | 177,785 | | | $ | — | | | $ | 3,600,492 | | | $ | — | |
| | 1 | Purchases include all purchases of securities and securities received in corporate actions. |
| | 2 | Sales include all sales of securities, maturities, paydowns and securities tendered in a corporate action. |
There were no transfers between Levels 1 and 2 during the period.
| | | | | | | | | | | | | | | | |
| 252 | | AQR Funds | | | | | | Annual Report | | | | | | December 2013 | | |
| | | | | | | | | | |
| | | | |
| Notes to Financial Statements | | | December 31, 2013 | |
| | | | | | | | | | | | | | | | |
| AQR LONG-SHORT EQUITY FUND | | QUOTED PRICES
IN ACTIVE
MARKET
(LEVEL 1) | | | OTHER SIGNIFICANT
OBSERVABLE
INPUTS
(LEVEL 2) | | | SIGNIFICANT
UNOBSERVABLE
INPUTS
(LEVEL 3) | | | TOTALS | |
ASSETS | |
Money Market Funds | | $ | — | | | $ | 5,728,596 | | | $ | — | | | $ | 5,728,596 | |
Futures Contracts* | | | 81,479 | | | | — | | | | — | | | | 81,479 | |
Total Return Basket Swaps Contracts* | | | — | | | | 257,144 | | | | — | | | | 257,144 | |
| Total Return Swap Contracts* | | | — | | | | 7,401 | | | | — | | | | 7,401 | |
| | | | |
Total Assets | | $ | 81,479 | | | $ | 5,993,141 | | | $ | — | | | $ | 6,074,620 | |
| | | | |
LIABILITIES | | | | | | | | | | | | | | | | |
Forward Foreign Currency Exchange Contracts* | | $ | — | | | $ | (447 | ) | | $ | — | | | $ | (447 | ) |
| | | | |
Total Liabilities | | $ | — | | | $ | (447 | ) | | $ | — | | | $ | (447 | ) |
| | * | Derivative instruments, including futures, total return swap, total return basket swap and forward foreign currency exchange contracts, are valued at the unrealized appreciation (depreciation) of the instrument. |
There were no transfers between Levels 1 and 2 during the period. There were no Level 3 securities held during the period.
| | | | | | | | | | | | | | | | |
| AQR MANAGED FUTURES STRATEGY FUND | | QUOTED PRICES
IN ACTIVE
MARKET
(LEVEL 1) | | | OTHER SIGNIFICANT
OBSERVABLE
INPUTS
(LEVEL 2) | | | SIGNIFICANT
UNOBSERVABLE
INPUTS
(LEVEL 3) | | | TOTALS | |
ASSETS | |
Short-Term Investments | | $ | — | | | $ | 1,401,217,739 | | | $ | — | | | $ | 1,401,217,739 | |
Money Market Funds | | | — | | | | 4,083,898,071 | | | | — | | | | 4,083,898,071 | |
Forward Foreign Currency Exchange Contracts* | | | — | | | | 112,752,352 | | | | — | | | | 112,752,352 | |
Futures Contracts* | | | 122,882,702 | | | | — | | | | — | | | | 122,882,702 | |
| Total Return Swap Contracts* | | | — | | | | 26,796,051 | | | | — | | | | 26,796,051 | |
| | | | |
Total Assets | | $ | 122,882,702 | | | $ | 5,624,664,213 | | | $ | — | | | $ | 5,747,546,915 | |
| | | | |
LIABILITIES | | | | | | | | | | | | | | | | |
Futures Contracts* | | $ | (191,654 | ) | | $ | — | | | $ | — | | | $ | (191,654 | ) |
| Total Return Swap Contracts* | | | — | | | | (6,829,524 | ) | | | — | | | | (6,829,524 | ) |
| | | | |
Total Liabilities | | $ | (191,654 | ) | | $ | (6,829,524 | ) | | $ | — | | | $ | (7,021,178 | ) |
| | * | Derivative instruments, including futures, forward foreign currency exchange and total return swap contracts, are valued at the unrealized appreciation (depreciation) of the instrument. |
There were no transfers between Levels 1 and 2 during the period. There were no Level 3 securities held during the period.
| | | | | | | | | | | | | | | | |
| | AQR Funds | | | | | | Annual Report | | | | | | December 2013 | | 253 |
| | | | | | | | | | |
| | | | |
| Notes to Financial Statements | | | December 31, 2013 | |
| | | | | | | | | | | | | | | | |
AQR MANAGED FUTURES
STRATEGY HV FUND | | QUOTED PRICES
IN ACTIVE
MARKET
(LEVEL 1) | | | OTHER SIGNIFICANT
OBSERVABLE
INPUTS
(LEVEL 2) | | | SIGNIFICANT
UNOBSERVABLE
INPUTS
(LEVEL 3) | | | TOTALS | |
ASSETS | | | | | | | | | | | | | | | | |
Short-Term Investments | | $ | — | | | $ | 5,676,517 | | | $ | — | | | $ | 5,676,517 | |
Money Market Fund | | | — | | | | 28,980,474 | | | | — | | | | 28,980,474 | |
Forward Foreign Currency Exchange Contracts* | | | — | | | | 1,020,136 | | | | — | | | | 1,020,136 | |
| Futures Contracts* | | | 1,080,737 | | | | — | | | | — | | | | 1,080,737 | |
| | | | |
Total Assets | | $ | 1,080,737 | | | $ | 35,677,127 | | | $ | — | | | $ | 36,757,864 | |
| | | | |
LIABILITIES | | | | | | | | | | | | | | | | |
| Total Return Swap Contracts* | | $ | — | | | $ | (26,009 | ) | | $ | — | | | $ | (26,009 | ) |
| | | | |
Total Liabilities | | $ | — | | | $ | (26,009 | ) | | $ | — | | | $ | (26,009 | ) |
| | * | Derivative instruments, including futures, total return swaps and forward foreign currency exchange contracts, are valued at the unrealized appreciation (depreciation) of the instrument. |
There were no transfers between Levels 1 and 2 during the period. There were no Level 3 securities held during the period.
| | | | | | | | | | | | | | | | |
AQR RISK-BALANCED COMMODITIES
STRATEGY FUND | | QUOTED PRICES
IN ACTIVE
MARKET
(LEVEL 1) | | | OTHER SIGNIFICANT
OBSERVABLE
INPUTS
(LEVEL 2) | | | SIGNIFICANT
UNOBSERVABLE
INPUTS
(LEVEL 3) | | | TOTALS | |
ASSETS | | | | | | | | | | | | | | | | |
Short-Term Investments | | $ | — | | | $ | 1,499,639 | | | $ | — | | | $ | 1,499,639 | |
Money Market Funds | | | — | | | | 30,766,491 | | | | — | | | | 30,766,491 | |
| Total Return Swap Contracts* | | $ | — | | | | 336,515 | | | | — | | | | 336,515 | |
| | | | |
Total Assets | | $ | — | | | $ | 32,602,645 | | | $ | — | | | $ | 32,602,645 | |
| | | | |
LIABILITIES | | | | | | | | | | | | | | | | |
Futures Contracts* | | $ | (165,699 | ) | | $ | — | | | $ | — | | | $ | (165,699 | ) |
| Total Return Swap Contracts* | | | — | | | | (908,742 | ) | | | — | | | | (908,742 | ) |
| | | | |
Total Liabilities | | $ | (165,699 | ) | | $ | (908,742 | ) | | $ | — | | | $ | (1,074,441 | ) |
| | * | Derivative instruments, including futures and total return swap contracts, are valued at the unrealized appreciation (depreciation) of the instrument. |
There were no transfers between Levels 1 and 2 during the period. There were no Level 3 securities held during the period.
| | | | | | | | | | | | | | | | |
| 254 | | AQR Funds | | | | | | Annual Report | | | | | | December 2013 | | |
| | | | | | | | | | |
| | | | |
| Notes to Financial Statements | | | December 31, 2013 | |
| | | | | | | | | | | | | | | | |
| AQR RISK PARITY FUND | | QUOTED PRICES
IN ACTIVE
MARKET
(LEVEL 1) | | | OTHER SIGNIFICANT
OBSERVABLE
INPUTS
(LEVEL 2) | | | SIGNIFICANT
UNOBSERVABLE
INPUTS
(LEVEL 3) | | | TOTALS | |
ASSETS | | | | | | | | | | | | | | | | |
Government Related Obligations | | $ | — | | | $ | 137,451,526 | | | $ | — | | | $ | 137,451,526 | |
Short-Term Investments | | | — | | | | 162,054,030 | | | | — | | | | 162,054,030 | |
U.S. Treasury Obligations | | | — | | | | 202,790,870 | | | | — | | | | 202,790,870 | |
Money Market Funds | | | — | | | | 391,975,991 | | | | — | | | | 391,975,991 | |
Interest Rate Swap Contracts* | | | — | | | | 4,508,755 | | | | — | | | | 4,508,755 | |
Credit Default Swap Contracts* | | | — | | | | 32,859,038 | | | | — | | | | 32,859,038 | |
Futures Contracts* | | | 13,547,237 | | | | — | | | | — | | | | 13,547,237 | |
| Total Return Swap Contracts* | | | — | | | | 5,291,616 | | | | — | | | | 5,291,616 | |
| | | | |
Total Assets | | $ | 13,547,237 | | | $ | 936,931,826 | | | $ | — | | | $ | 950,479,063 | |
| | | | |
LIABILITIES | | | | | | | | | | | | | | | | |
Forward Foreign Currency Exchange Contracts* | | $ | — | | | $ | (1,508,533 | ) | | $ | — | | | $ | (1,508,533 | ) |
Interest Rate Swap Contracts* | | | — | | | | (13,713,012 | ) | | | — | | | | (13,713,012 | ) |
Credit Default Swap Contracts* | | | — | | | | (1,282,445 | ) | | | — | | | | (1,282,445 | ) |
Futures Contracts* | | | (6,460,931 | ) | | | — | | | | — | | | | (6,460,931 | ) |
| Total Return Swap Contracts* | | | — | | | | (4,534,730 | ) | | | — | | | | (4,534,730 | ) |
| | | | |
Total Liabilities | | $ | (6,460,931 | ) | | $ | (21,038,720 | ) | | $ | — | | | $ | (27,499,651 | ) |
| | * | Derivative instruments, including futures, forward foreign currency exchange and total return swap contracts, are valued at the unrealized appreciation (depreciation) of the instrument. Credit default swap and interest rate swap contracts are reported at market value. |
There were no transfers between Levels 1 and 2 during the period. There were no Level 3 securities held during the period.
| | | | | | | | | | | | | | | | |
| AQR RISK PARITY II MV FUND | | QUOTED PRICES
IN ACTIVE
MARKET
(LEVEL 1) | | | OTHER SIGNIFICANT
OBSERVABLE
INPUTS
(LEVEL 2) | | | SIGNIFICANT
UNOBSERVABLE
INPUTS
(LEVEL 3) | | | TOTALS | |
ASSETS | | | | | | | | | | | | | | | | |
Government Related Obligations | | $ | — | | | $ | 8,421,210 | | | $ | — | | | $ | 8,421,210 | |
Short-Term Investments | | | — | | | | 7,690,888 | | | | — | | | | 7,690,888 | |
U.S. Treasury Obligations | | | — | | | | 12,381,530 | | | | — | | | | 12,381,530 | |
Money Market Funds | | | — | | | | 16,428,055 | | | | — | | | | 16,428,055 | |
Futures Contracts* | | | 877,998 | | | | — | | | | — | | | | 877,998 | |
| Total Return Swap Contracts* | | | — | | | | 388,934 | | | | — | | | | 388,934 | |
| | | | |
Total Assets | | $ | 877,998 | | | $ | 45,310,617 | | | $ | — | | | $ | 46,188,615 | |
| | | | |
LIABILITIES | | | | | | | | | | | | | | | | |
Forward Foreign Currency Exchange Contracts* | | $ | — | | | $ | (48,897 | ) | | $ | — | | | $ | (48,897 | ) |
Futures Contracts* | | | (694,682 | ) | | | — | | | | — | | | | (694,682 | ) |
| Total Return Swap Contracts* | | | — | | | | (146,659 | ) | | | — | | | | (146,659 | ) |
| | | | |
Total Liabilities | | $ | (694,682 | ) | | $ | (195,556 | ) | | $ | — | | | $ | (890,238 | ) |
| | * | Derivative instruments, including futures, total return swap and forward foreign currency exchange contracts, are valued at the unrealized appreciation (depreciation) of the instrument. |
There were no transfers between Levels 1 and 2 during the period. There were no Level 3 securities held during the period.
| | | | | | | | | | | | | | | | |
| | AQR Funds | | | | | | Annual Report | | | | | | December 2013 | | 255 |
| | | | | | | | | | |
| | | | |
| Notes to Financial Statements | | | December 31, 2013 | |
| | | | | | | | | | | | | | | | |
| AQR RISK PARITY II HV FUND | | QUOTED PRICES
IN ACTIVE
MARKET
(LEVEL 1) | | | OTHER SIGNIFICANT
OBSERVABLE
INPUTS
(LEVEL 2) | | | SIGNIFICANT
UNOBSERVABLE
INPUTS
(LEVEL 3) | | | TOTALS | |
ASSETS | | | | | | | | | | | | | | | | |
Government Related Obligations | | $ | — | | | $ | 5,877,557 | | | $ | — | | | $ | 5,877,557 | |
Repurchase Agreement | | | — | | | | 191,000 | | | | — | | | | 191,000 | |
Short-Term Investment | | | — | | | | 4,649,058 | | | | — | | | | 4,649,058 | |
U.S. Treasury Obligations | | | — | | | | 9,621,758 | | | | — | | | | 9,621,758 | |
Money Market Funds | | | — | | | | 14,101,440 | | | | — | | | | 14,101,440 | |
Futures Contracts* | | | 696,356 | | | | — | | | | — | | | | 696,356 | |
| Total Return Swap Contracts* | | | — | | | | 310,834 | | | | — | | | | 310,834 | |
| | | | |
Total Assets | | $ | 696,356 | | | $ | 34,751,647 | | | $ | — | | | $ | 35,448,003 | |
| | | | |
LIABILITIES | | | | | | | | | | | | | | | | |
Reverse Repurchase Agreements (Sold Short) | | $ | — | | | $ | (9,937,250 | ) | | $ | — | | | $ | (9,937,250 | ) |
Forward Foreign Currency Exchange Contracts* | | | — | | | | (32,431 | ) | | | — | | | | (32,431 | ) |
Futures Contracts* | | | (286,298 | ) | | | — | | | | — | | | | (286,298 | ) |
| Total Return Swap Contracts* | | | — | | | | (272,318 | ) | | | — | | | | (272,318 | ) |
| | | | |
Total Liabilities | | $ | (286,298 | ) | | $ | (10,241,999 | ) | | $ | — | | | $ | (10,528,297 | ) |
| | * | Derivative instruments, including futures, total return swap and forward foreign currency exchange contracts, are valued at the unrealized appreciation (depreciation) of the instrument. |
There were no transfers between Levels 1 and 2 during the period. There were no Level 3 securities held during the period.
| | | | | | | | | | | | | | | | |
| 256 | | AQR Funds | | | | | | Annual Report | | | | | | December 2013 | | |
| | | | | | | | | | |
| | | | |
| Notes to Financial Statements | | | December 31, 2013 | |
| | | | | | | | | | | | | | | | |
AQR MULTI-STRATEGY
ALTERNATIVE FUND | | QUOTED PRICES
IN ACTIVE
MARKET
(LEVEL 1) | | | OTHER SIGNIFICANT
OBSERVABLE
INPUTS
(LEVEL 2) | | | SIGNIFICANT
UNOBSERVABLE
INPUTS
(LEVEL 3) | | | TOTALS | |
ASSETS | | | | | | | | | | | | | | | | |
Common Stocks† | | $ | 82,304,625 | | | $ | 719,070,417 | | | $ | — | | | $ | 801,375,042 | |
Convertible Preferred Stocks† | | | 24,448,153 | | | | 2,404,960 | | | | — | | | | 26,853,113 | |
Corporate Bonds† | | | — | | | | 23,971,528 | | | | — | | | | 23,971,528 | |
Convertible Bonds† | | | — | | | | 480,390,030 | | | | 1,089,000 | | | | 481,479,030 | |
Preferred Stocks† | | | 1,601,192 | | | | 5,641,108 | | | | — | | | | 7,242,300 | |
Short-Term Investments | | | — | | | | 58,639,442 | | | | — | | | | 58,639,442 | |
Money Market Funds | | | — | | | | 520,429,397 | | | | — | | | | 520,429,397 | |
Purchased Options | | | 217,664 | | | | — | | | | — | | | | 217,664 | |
Forward Foreign Currency Exchange Contracts* | | | — | | | | 4,528,165 | | | | — | | | | 4,528,165 | |
Futures Contracts* | | | 3,605,001 | | | | — | | | | — | | | | 3,605,001 | |
Credit Default Swap Contracts* | | | — | | | | 1,388,490 | | | | — | | | | 1,388,490 | |
Total Return Basket Swaps Contracts* | | | — | | | | 39,062,970 | | | | — | | | | 39,062,970 | |
| Total Return Swap Contracts* | | | — | | | | 552,144 | | | | — | | | | 552,144 | |
| | | | |
Total Assets | | $ | 112,176,635 | | | $ | 1,856,078,651 | | | $ | 1,089,000 | | | $ | 1,969,344,286 | |
| | | | |
LIABILITIES | | | | | | | | | | | | | | | | |
Common Stocks (Sold Short)† | | $ | (412,676,090 | ) | | $ | (557,410,540 | ) | | $ | — | | | $ | (970,086,630 | ) |
Exchange-Traded Funds (Sold Short) | | | (1,955,101 | ) | | | — | | | | — | | | | (1,955,101 | ) |
Preferred Stocks (Sold Short)† | | | — | | | | (5,118,286 | ) | | | — | | | | (5,118,286 | ) |
U.S. Treasury Obligations (Sold Short)† | | | — | | | | (1,331,282 | ) | | | — | | | | (1,331,282 | ) |
Written Options (Sold Short)* | | | — | | | | (1,432 | ) | | | — | | | | (1,432 | ) |
Futures Contracts* | | | (6,503,800 | ) | | | — | | | | — | | | | (6,503,800 | ) |
| Total Return Swap Contracts* | | | — | | | | (10,333,122 | ) | | | — | | | | (10,333,122 | ) |
| | | | |
Total Liabilities | | $ | (421,134,991 | ) | | $ | (574,194,662 | ) | | $ | — | | | $ | (995,329,653 | ) |
| | * | Derivative instruments, including futures, total return swap, total return basket swap and forward foreign currency exchange contracts, are valued at the unrealized appreciation (depreciation) of the instrument. Credit default swap contracts and written options are reported at market value. |
| | † | Please refer to the Schedule of Investments to view securities segregated by country. |
There were no transfers between Levels 1 and 2 during the period.
The following is a reconciliation of assets and liabilities in which significant unobservable inputs (level 3) were used in determining fair values.
| | | | | | | | | | | | |
| AQR MULTI-STRATEGY ALTERNATIVE FUND | | COMMON
STOCKS | | | CORPORATE
BONDS | | | CONVERTIBLE
BONDS | |
| Balance as of December 31, 2012 | | $ | 10,461 | | | $ | 1,253,906 | | | $ | 1,995,309 | |
Accrued discounts/(premiums) | | | — | | | | — | | | | 314 | |
Realized gain/(loss) | | | 212 | | | | (9,375 | ) | | | 23,922 | |
Change in unrealized appreciation/(depreciation) | | | 458 | | | | 5,469 | | | | 35,504 | |
Purchases | | | — | | | | — | | | | 696,500 | |
Sales | | | (11,131 | ) | | | (1,250,000 | ) | | | (1,995,309 | ) |
Transfers in to Level 3 | | | — | | | | — | | | | 332,760 | |
| Transfers out of Level 3 | | | — | | | | — | | | | — | |
| | | |
| Balance as of December 31, 2013 | | $ | — | | | $ | — | | | $ | 1,089,000 | |
| | | |
Change in Unrealized appreciation/(depreciation) for securities still held at December 31, 2013 | | $ | — | | | $ | — | | | $ | 59,422 | |
| | | | | | | | | | | | | | | | |
| | AQR Funds | | | | | | Annual Report | | | | | | December 2013 | | 257 |
| | | | | | | | | | |
| | | | |
| Notes to Financial Statements | | | December 31, 2013 | |
| | | | | | | | | | | | | | | | |
| AQR STYLE PREMIA ALTERNATIVE FUND | | QUOTED PRICES
IN ACTIVE
MARKET
(LEVEL 1) | | | OTHER SIGNIFICANT
OBSERVABLE
INPUTS
(LEVEL 2) | | | SIGNIFICANT
UNOBSERVABLE
INPUTS
(LEVEL 3) | | | TOTALS | |
ASSETS | | | | | | | | | | | | | | | | |
Common Stocks† | | $ | — | | | $ | 192,267,874 | | | $ | — | | | $ | 192,267,874 | |
Preferred Stocks† | | | — | | | | 5,860,026 | | | | — | | | | 5,860,026 | |
Money Market Funds | | | — | | | | 289,942,624 | | | | — | | | | 289,942,624 | |
Futures Contracts* | | | 3,691,460 | | | | — | | | | — | | | | 3,691,460 | |
Forward Foreign Currency Exchange Contracts* | | | — | | | | 374,760 | | | | — | | | | 374,760 | |
Total Return Swap Contracts* | | | — | | | | 1,086,113 | | | | — | | | | 1,086,113 | |
| Total Return Basket Swap Contracts* | | | — | | | | 1,126,150 | | | | — | | | | 1,126,150 | |
| | | | |
Total Assets | | $ | 3,691,460 | | | $ | 490,657,547 | | | $ | — | | | $ | 494,349,007 | |
| | | | |
LIABILITIES | | | | | | | | | | | | | | | | |
Common Stocks (Sold Short)† | | $ | — | | | $ | (166,014,842 | ) | | $ | — | | | $ | (166,014,842 | ) |
| Total Return Swap Contracts* | | | — | | | | (4,957,180 | ) | | | — | | | | (4,957,180 | ) |
| | | | |
Total Liabilities | | $ | — | | | $ | (170,972,022 | ) | | $ | — | | | $ | (170,972,022 | ) |
| * | Derivative instruments, including futures, total return swap, total return basket swap and forward foreign currency exchange contracts, are valued at the unrealized appreciation (depreciation) of the instrument. |
| † | Please refer to the Schedule of Investments to view securities segregated by country. |
There were no transfers between Levels 1 and 2 during the period. There were no Level 3 securities held during the period.
6. Investment Transactions
During the year ended December 31, 2013, the cost of purchases and the proceeds from sales of investments (excluding swap contracts, forward foreign currency exchange contracts, futures contracts and short-term investments) were as follows:
| | | | | | | | | | | | | | | | |
| FUND | | PURCHASES | | | SALES | | | SECURITIES
SOLD SHORT | | | COVERS ON
SECURITIES SOLD
SHORT | |
AQR Diversified Arbitrage Fund | | $ | 5,164,329,346 | | | $ | 4,967,130,975 | | | $ | 1,571,947,446 | | | $ | 1,573,923,403 | |
AQR Long-Short Equity Fund | | | — | | | | — | | | | — | | | | — | |
AQR Managed Futures Strategy Fund | | | — | | | | — | | | | — | | | | — | |
AQR Managed Futures Strategy HV Fund | | | — | | | | — | | | | — | | | | — | |
AQR Risk-Balanced Commodities Strategy Fund | | | — | | | | — | | | | — | | | | — | |
AQR Risk Parity Fund | | | 790,022,131 | | | | 1,014,066,088 | | | | — | | | | — | |
AQR Risk Parity II MV Fund | | | 86,101,265 | | | | 76,951,644 | | | | — | | | | — | |
AQR Risk Parity II HV Fund | | | 65,065,696 | | | | 67,956,928 | | | | — | | | | — | |
AQR Multi-Strategy Alternative Fund | | | 984,053,339 | | | | 498,228,665 | | | | 820,221,453 | | | | 545,031,253 | |
AQR Style Premia Alternative Fund | | | 192,434,665 | | | | 776,983 | | | | 159,492,030 | | | | 964,166 | |
During the year ended December 31, 2013, the Funds had purchases and sales of long-term U.S. Government obligations as follows:
| | | | | | | | |
| Fund | | PURCHASES | | | SALES | |
AQR Diversified Arbitrage Fund | | | $13,769,430 | | | | $6,055,058 | |
AQR Risk Parity Fund | | | 446,578,788 | | | | 510,416,468 | |
AQR Risk Parity II MV Fund | | | 46,377,190 | | | | 39,923,536 | |
AQR Risk Parity II HV Fund | | | 35,006,443 | | | | 34,225,101 | |
AQR Multi-Strategy Alternative Fund | | | 1,326,754 | | | | — | |
| | | | | | | | | | | | | | | | |
| 258 | | AQR Funds | | | | | | Annual Report | | | | | | December 2013 | | |
| | | | | | | | | | |
| | | | |
| Notes to Financial Statements | | | December 31, 2013 | |
7. Derivative Instruments and Hedging Activities
Certain Funds use derivative instruments as part of their principal investment strategy to achieve their investment objectives. The values of such derivative instruments reflected in the Statements of Assets and Liabilities at December 31, 2013 are as follows:
| | | | | | | | | | | | | | | | | | | | | | | | | | | | |
| | | ASSETS | | | | LIABILITIES | |
| FUND | |
| UNREALIZED
APPRECIATION
ON FUTURES
CONTRACTS |
| |
| SWAPS
AT VALUE |
| |
| UNREALIZED
APPRECIATION
ON FORWARD
CURRENCY
EXCHANGE
CONTRACTS |
| |
| UNREALIZED
DEPRECIATION
ON FUTURES
CONTRACTS |
| |
| SWAPS
AT VALUE |
| |
| UNREALIZED
DEPRECIATION
ON FORWARD
CURRENCY
EXCHANGE
CONTRACTS |
| |
| WRITTEN
OPTIONS
AT
MARKET
VALUE |
|
| Equity Risk Exposure: | | | | | | | | | | | | | | | | | | | | | | | | | | | | |
AQR Diversified Arbitrage Fund | | | $— | | | | $8,788,717 | | | | $— | | | | $12,691,614 | | | | $119,803,175 | | | | $— | | | | $2,574,410 | |
AQR Long-Short Equity Fund | | | 85,698 | | | | 315,441 | | | | — | | | | 4,219 | | | | 50,896 | | | | — | | | | — | |
AQR Managed Futures Strategy Fund | | | 109,978,165 | | | | 3,321,530 | | | | — | | | | 738,187 | | | | — | | | | — | | | | — | |
AQR Managed Futures Strategy HV Fund | | | 962,289 | | | | 27,898 | | | | — | | | | 5,512 | | | | — | | | | — | | | | — | |
AQR Risk Parity Fund | | | 13,891,255 | | | | 1,310,498 | | | | — | | | | — | | | | — | | | | — | | | | — | |
AQR Risk Parity II MV Fund | | | 900,781 | | | | 84,284 | | | | — | | | | — | | | | — | | | | — | | | | — | |
AQR Risk Parity II HV Fund | | | 716,860 | | | | 67,809 | | | | — | | | | — | | | | — | | | | — | | | | — | |
AQR Multi-Strategy Alternative Fund | | | 13,539,569 | | | | 46,470,343 | | | | — | | | | 17,065,694 | | | | 12,325,231 | | | | — | | | | 1,432 | |
AQR Style Premia Alternative Fund | | | 10,554,452 | | | | 1,575,312 | | | | — | | | | 9,170,643 | | | | 2,434,949 | | | | — | | | | — | |
| | | | | | | |
| Foreign Exchange Rate Risk Exposure: | | | | | | | | | | | | | | | | | | | | | | | | | | | | |
AQR Diversified Arbitrage Fund | | | — | | | | — | | | | 987,892 | | | | — | | | | — | | | | 1,584,277 | | | | — | |
AQR Long-Short Equity Fund | | | — | | | | — | | | | 7,376 | | | | — | | | | — | | | | 7,823 | | | | — | |
AQR Managed Futures Strategy Fund | | | — | | | | — | | | | 146,022,354 | | | | — | | | | — | | | | 33,270,002 | | | | — | |
AQR Managed Futures Strategy HV Fund | | | — | | | | — | | | | 1,315,646 | | | | — | | | | — | | | | 295,510 | | | | — | |
AQR Risk Parity Fund | | | — | | | | — | | | | 1,547,397 | | | | — | | | | — | | | | 3,055,930 | | | | — | |
AQR Risk Parity II MV Fund | | | — | | | | — | | | | 7,038 | | | | — | | | | — | | | | 55,935 | | | | — | |
AQR Risk Parity II HV Fund | | | — | | | | — | | | | 6,164 | | | | — | | | | — | | | | 38,595 | | | | — | |
AQR Multi-Strategy Alternative Fund | | | — | | | | — | | | | 17,990,158 | | | | — | | | | — | | | | 13,461,993 | | | | — | |
AQR Style Premia Alternative Fund | | | — | | | | — | | | | 3,892,708 | | | | — | | | | — | | | | 3,517,948 | | | | — | |
| | | | | | | |
| Interest Rate Risk Exposure: | | | | | | | | | | | | | | | | | | | | | | | | | | | | |
AQR Diversified Arbitrage Fund | | | 1,123,067 | | | | 142,472,536 | | | | — | | | | — | | | | — | | | | — | | | | — | |
AQR Managed Futures Strategy Fund | | | 23,417,481 | | | | — | | | | — | | | | 12,673,107 | | | | 3,977,998 | | | | — | | | | — | |
AQR Managed Futures Strategy HV Fund | | | 203,185 | | | | — | | | | — | | | | 103,952 | | | | 29,518 | | | | — | | | | — | |
AQR Risk Parity Fund | | | 173,758 | | | | 9,612,264 | | | | — | | | | 5,226,541 | | | | 21,948,630 | | | | — | | | | — | |
AQR Risk Parity II MV Fund | | | 11,394 | | | | — | | | | — | | | | 609,924 | | | | 30,890 | | | | — | | | | — | |
AQR Risk Parity II HV Fund | | | 9,495 | | | | — | | | | — | | | | 268,543 | | | | 200,543 | | | | — | | | | — | |
AQR Multi-Strategy Alternative Fund | | | 1,240,075 | | | | 3,323,960 | | | | — | | | | 3,084,507 | | | | 6,597,014 | | | | — | | | | — | |
AQR Style Premia Alternative Fund | | | 1,044,072 | | | | 1,813,477 | | | | — | | | | 1,764,080 | | | | 4,548,852 | | | | — | | | | — | |
| | | | | | | |
| Credit Risk Exposure: | | | | | | | | | | | | | | | | | | | | | | | | | | | | |
AQR Diversified Arbitrage Fund | | | — | | | | — | | | | — | | | | — | | | | 20,077,987 | | | | — | | | | — | |
AQR Risk Parity Fund | | | — | | | | 32,859,038 | | | | — | | | | — | | | | 1,282,445 | | | | — | | | | — | |
AQR Multi-Strategy Alternative Fund | | | — | | | | 1,388,490 | | | | — | | | | — | | | | — | | | | — | | | | — | |
| | | | | | | |
| Commodity Risk Exposure: | | | | | | | | | | | | | | | | | | | | | | | | | | | | |
AQR Managed Futures Strategy Fund | | | 43,781,119 | | | | 44,716,135 | | | | — | | | | 41,074,423 | | | | 24,093,140 | | | | — | | | | — | |
AQR Managed Futures Strategy HV Fund | | | 298,657 | | | | 524,691 | | | | — | | | | 273,930 | | | | 549,080 | | | | — | | | | — | |
AQR Risk-Balanced Commodities Strategy Fund | | | 429,995 | | | | 4,045,087 | | | | — | | | | 595,694 | | | | 4,617,314 | | | | — | | | | — | |
AQR Risk Parity Fund | | | 4,605,665 | | | | 13,313,599 | | | | — | | | | 6,357,831 | | | | 10,334,348 | | | | — | | | | — | |
AQR Risk Parity II MV Fund | | | 250,323 | | | | 880,338 | | | | — | | | | 369,258 | | | | 691,457 | | | | — | | | | — | |
AQR Risk Parity II HV Fund | | | 193,294 | | | | 662,123 | | | | — | | | | 241,048 | | | | 490,873 | | | | — | | | | — | |
AQR Multi-Strategy Alternative Fund | | | 7,369,447 | | | | 3,479,614 | | | | — | | | | 4,897,689 | | | | 5,069,680 | | | | — | | | | — | |
AQR Style Premia Alternative Fund | | | 4,014,963 | | | | 1,489,578 | | | | — | | | | 987,304 | | | | 639,483 | | | | — | | | | — | |
| | | | | | | | | | | | | | | | |
| | AQR Funds | | | | | | Annual Report | | | | | | December 2013 | | 259 |
| | | | | | | | | | |
| | | | |
| Notes to Financial Statements | | | December 31, 2013 | |
| | | | | | | | | | | | | | | | | | | | | | | | | | | | |
| | | ASSETS | | | | LIABILITIES | |
| FUND | |
| UNREALIZED
APPRECIATION
ON FUTURES
CONTRACTS |
| |
| SWAPS
AT VALUE |
| |
| UNREALIZED
APPRECIATION
ON FORWARD
CURRENCY
EXCHANGE
CONTRACTS |
| |
| UNREALIZED
DEPRECIATION
ON FUTURES
CONTRACTS |
| |
| SWAPS
AT VALUE |
| |
| UNREALIZED
DEPRECIATION
ON FORWARD
CURRENCY
EXCHANGE
CONTRACTS |
| |
| WRITTEN
OPTIONS
AT
MARKET
VALUE |
|
| Netting: | | | | | | | | | | | | | | | | | | | | | | | | | | | | |
AQR Diversified Arbitrage Fund | | | $(1,123,067) | | | | $(139,881,162) | | | | $(987,892) | | | | $(1,123,067) | | | | $(139,881,162) | | | | $(987,892) | | | | $— | |
AQR Long-Short Equity Fund | | | (4,219) | | | | (50,896) | | | | (7,376) | | | | (4,219) | | | | (50,896) | | | | (7,376) | | | | — | |
AQR Managed Futures Strategy Fund | | | (54,580,762) | | | | (28,071,138) | | | | (33,270,002) | | | | (54,580,762) | | | | (28,071,138) | | | | (33,270,002) | | | | — | |
AQR Managed Futures Strategy HV Fund | | | (383,394) | | | | (552,589) | | | | (295,510) | | | | (383,394) | | | | (552,589) | | | | (295,510) | | | | — | |
AQR Risk-Balanced Commodities Strategy Fund | | | (429,995) | | | | (4,045,087) | | | | — | | | | (429,995) | | | | (4,045,087) | | | | — | | | | — | |
AQR Risk Parity Fund | | | (11,584,372) | | | | (33,565,423) | | | | (1,547,397) | | | | (11,584,372) | | | | (33,565,423) | | | | (1,547,397) | | | | — | |
AQR Risk Parity II MV Fund | | | (979,182) | | | | (722,347) | | | | (7,038) | | | | (979,182) | | | | (722,347) | | | | (7,038) | | | | — | |
AQR Risk Parity II HV Fund | | | (509,591) | | | | (691,416) | | | | (6,164) | | | | (509,591) | | | | (691,416) | | | | (6,164) | | | | — | |
AQR Multi-Strategy Alternative Fund | | | (22,149,091) | | | | (23,991,925) | | | | (13,461,993) | | | | (22,149,091) | | | | (23,991,925) | | | | (13,461,993) | | | | — | |
| AQR Style Premia Alternative Fund | | | (11,922,027) | | | | (4,878,367) | | | | (3,517,948) | | | | (11,922,027) | | | | (4,878,367) | | | | (3,517,948) | | | | — | |
| | | | | | | |
| Net Fair Value of Derivative Contracts: | | | | | | | | | | | | | | | | | | | | | | | | | | | | |
AQR Diversified Arbitrage Fund | | | — | | | | 11,380,091 | | | | — | | | | 11,568,547 | | | | — | | | | 596,385 | | | | 2,574,410 | |
AQR Long-Short Equity Fund | | | 81,479 | | | | 264,545 | | | | — | | | | — | | | | — | | | | 447 | | | | — | |
AQR Managed Futures Strategy Fund | | | 122,691,048 | | | | 19,966,527 | | | | 112,752,352 | | | | — | | | | — | | | | — | | | | — | |
AQR Managed Futures Strategy HV Fund | | | 1,080,737 | | | | — | | | | 1,020,136 | | | | — | | | | 26,009 | | | | — | | | | — | |
AQR Risk-Balanced Commodities Strategy Fund | | | — | | | | — | | | | — | | | | 165,699 | | | | 572,227 | | | | — | | | | — | |
AQR Risk Parity Fund | | | 7,086,305 | | | | 23,529,976 | | | | — | | | | — | | | | — | | | | 1,508,533 | | | | — | |
AQR Risk Parity II MV Fund | | | 183,316 | | | | 242,275 | | | | — | | | | — | | | | — | | | | 48,897 | | | | — | |
AQR Risk Parity II HV Fund | | | 410,058 | | | | 38,516 | | | | — | | | | — | | | | — | | | | 32,431 | | | | — | |
AQR Multi-Strategy Alternative Fund | | | — | | | | 30,670,482 | | | | 4,528,165 | | | | 2,898,799 | | | | — | | | | — | | | | 1,432 | |
AQR Style Premia Alternative Fund | | | 3,691,460 | | | | — | | | | 374,760 | | | | — | | | | 2,744,917 | | | | — | | | | — | |
The following is the effect of Derivative Instruments on the Statements of Operations for the period ended December 31, 2013:
| | | | | | | | | | | | | | | | | | | | | | | | | | | | | | | | |
| |
| REALIZED GAIN (LOSS) ON DERIVATIVES RECOGNIZED
AS A RESULT FROM OPERATIONS |
| |
| NET CHANGE IN UNREALIZED APPRECIATION
(DEPRECIATION) ON DERIVATIVES RECOGNIZED AS A
RESULT FROM OPERATIONS |
|
| FUND | |
| FUTURES
CONTRACTS |
| |
| SWAP
CONTRACTS |
| |
| FORWARD
CURRENCY
EXCHANGE
CONTRACTS |
| |
| WRITTEN
OPTIONS |
| |
| FUTURES
CONTRACTS |
| |
| SWAP
CONTRACTS |
| |
| FORWARD
CURRENCY
EXCHANGE
CONTRACTS |
| |
| WRITTEN
OPTIONS |
|
| Equity Risk Exposure: | | | | | | | | | | | | | | | | | | | | | | | | | | | | | | | | |
AQR Diversified Arbitrage Fund | | | $(37,423,596) | | | | $(16,078,785) | | | | $— | | | | $(1,569,916) | | | | $(13,584,310) | | | | $(106,752,934) | | | | $— | | | | $(100,156) | |
AQR Long-Short Equity Fund | | | 160,849 | | | | 112,663 | | | | — | | | | — | | | | 81,479 | | | | 264,545 | | | | — | | | | — | |
AQR Managed Futures Strategy Fund | | | 178,735,621 | | | | 7,565,122 | | | | — | | | | — | | | | 98,970,560 | | | | 4,419,297 | | | | — | | | | — | |
AQR Managed Futures Strategy HV Fund | | | 744,157 | | | | (51,595) | | | | — | | | | — | | | | 956,777 | | | | 27,898 | | | | — | | | | — | |
AQR Risk Parity Fund | | | 52,105,249 | | | | (213,528) | | | | — | | | | — | | | | 12,042,545 | | | | 1,070,196 | | | | — | | | | — | |
AQR Risk Parity II MV Fund | | | 4,083,170 | | | | (212,900) | | | | — | | | | — | | | | 844,016 | | | | 81,454 | | | | — | | | | — | |
AQR Risk Parity II HV Fund | | | 3,137,718 | | | | (113,767) | | | | — | | | | — | | | | 622,736 | | | | 60,367 | | | | — | | | | — | |
AQR Multi-Strategy Alternative Fund | | | (41,707,797) | | | | 38,487,647 | | | | — | | | | (716,720) | | | | (6,101,563) | | | | 31,573,579 | | | | — | | | | 1,745 | |
AQR Style Premia Alternative Fund | | | (405,106) | | | | 2,493,482 | | | | — | | | | — | | | | 1,383,809 | | | | (859,637) | | | | — | | | | — | |
| | | | | | | | | | | | | | | | |
| 260 | | AQR Funds | | | | | | Annual Report | | | | | | December 2013 | | |
| | | | | | | | | | |
| | | | |
| Notes to Financial Statements | | | December 31, 2013 | |
| | | | | | | | | | | | | | | | | | | | | | | | | | | | | | | | |
| |
| REALIZED GAIN (LOSS) ON DERIVATIVES RECOGNIZED
AS A RESULT FROM OPERATIONS |
| |
| NET CHANGE IN UNREALIZED APPRECIATION
(DEPRECIATION) ON DERIVATIVES RECOGNIZED AS A
RESULT FROM OPERATIONS |
|
| FUND | |
| FUTURES
CONTRACTS |
| |
| SWAP
CONTRACTS |
| |
| FORWARD
CURRENCY
EXCHANGE
CONTRACTS |
| |
| WRITTEN
OPTIONS |
| |
| FUTURES
CONTRACTS |
| |
| SWAP
CONTRACTS |
| |
| FORWARD
CURRENCY
EXCHANGE
CONTRACTS |
| |
| WRITTEN
OPTIONS |
|
| | | | | | | | |
| Foreign Exchange Rate Risk Exposure: | | | | | | | | | | | | | | | | | | | | | | | | | | | | | | | | |
AQR Diversified Arbitrage Fund | | | $— | | | | $— | | | | $1,596,781 | | | | $— | | | | $— | | | | $— | | | | $736,196 | | | | $— | |
AQR Long-Short Equity Fund | | | — | | | | — | | | | 10,662 | | | | — | | | | — | | | | — | | | | (447) | | | | — | |
AQR Managed Futures Strategy Fund | | | — | | | | — | | | | 168,217,992 | | | | — | | | | — | | | | — | | | | 50,904,444 | | | | — | |
AQR Managed Futures Strategy HV Fund | | | — | | | | — | | | | 703,466 | | | | — | | | | — | | | | — | | | | 1,020,136 | | | | — | |
AQR Risk Parity Fund | | | — | | | | — | | | | (19,647,291) | | | | — | | | | — | | | | — | | | | 1,844,015 | | | | — | |
AQR Risk Parity II MV Fund | | | — | | | | — | | | | (121,580) | | | | — | | | | — | | | | — | | | | (4,499) | | | | — | |
AQR Risk Parity II HV Fund | | | — | | | | — | | | | (305,018) | | | | — | | | | — | | | | — | | | | 65,800 | | | | — | |
AQR Multi-Strategy Alternative Fund | | | — | | | | — | | | | 27,378,682 | | | | — | | | | — | | | | — | | | | (3,606,788) | | | | — | |
AQR Style Premia Alternative Fund | | | — | | | | — | | | | 6,488,383 | | | | — | | | | — | | | | — | | | | 374,760 | | | | — | |
| | | | | | | | |
| Interest Rate Risk Exposure: | | | | | | | | | | | | | | | | | | | | | | | | | | | | | | | | |
AQR Diversified Arbitrage Fund | | | (558,163) | | | | (8,545,936) | | | | — | | | | — | | | | 1,194,229 | | | | 142,472,536 | | | | — | | | | — | |
AQR Managed Futures Strategy Fund | | | (78,017,568) | | | | (27,292,737) | | | | — | | | | — | | | | 13,448,886 | | | | (6,385,981) | | | | — | | | | — | |
AQR Managed Futures Strategy HV Fund | | | (56,864) | | | | (103,568) | | | | — | | | | — | | | | 99,233 | | | | (29,518) | | | | — | | | | — | |
AQR Risk Parity Fund | | | (12,976,980) | | | | (8,100,500) | | | | — | | | | — | | | | (4,008,271) | | | | (15,878,794) | | | | — | | | | — | |
AQR Risk Parity II MV Fund | | | (1,643,967) | | | | (355,403) | | | | — | | | | — | | | | (572,421) | | | | (30,570) | | | | — | | | | — | |
AQR Risk Parity II HV Fund | | | (694,419) | | | | (1,058,824) | | | | — | | | | — | | | | (195,924) | | | | (176,428) | | | | — | | | | — | |
AQR Multi-Strategy Alternative Fund | | | 9,091,779 | | | | (6,287,753) | | | | — | | | | — | | | | (2,142,196) | | | | (3,231,037) | | | | — | | | | — | |
AQR Style Premia Alternative Fund | | | 3,348,170 | | | | 470,983 | | | | — | | | | — | | | | (720,008) | | | | (2,735,375) | | | | — | | | | — | |
| | | | | | | | |
| Credit Risk Exposure: | | | | | | | | | | | | | | | | | | | | | | | | | | | | | | | | |
AQR Diversified Arbitrage Fund | | | — | | | | (15,646,314) | | | | — | | | | — | | | | — | | | | (12,881,554) | | | | — | | | | — | |
AQR Risk Parity Fund | | | — | | | | 25,647,282 | | | | — | | | | — | | | | — | | | | 19,314,772 | | | | — | | | | — | |
AQR Multi-Strategy Alternative Fund | | | — | | | | 2,812,573 | | | | — | | | | — | | | | — | | | | 1,873,316 | | | | — | | | | — | |
| | | | | | | | |
| Commodity Risk Exposure: | | | | | | | | | | | | | | | | | | | | | | | | | | | | | | | | |
AQR Managed Futures Strategy Fund | | | (5,780,781) | | | | 9,861,546 | | | | — | | | | — | | | | (2,654,464) | | | | 20,082,051 | | | | — | | | | — | |
AQR Managed Futures Strategy HV Fund | | | (93,517) | | | | (389,205) | | | | — | | | | — | | | | 24,727 | | | | (24,389) | | | | — | | | | — | |
AQR Risk-Balanced Commodities Strategy Fund | | | (334,442) | | | | (11,415,980) | | | | — | | | | — | | | | (427,234) | | | | 1,120,387 | | | | — | | | | — | |
AQR Risk Parity Fund | | | (24,848,249) | | | | (4,041,176) | | | | — | | | | — | | | | 1,422,630 | | | | 3,024,097 | | | | — | | | | — | |
AQR Risk Parity II MV Fund | | | (1,819,801) | | | | (917,904) | | | | — | | | | — | | | | (80,000) | | | | 198,108 | | | | — | | | | — | |
AQR Risk Parity II HV Fund | | | (1,293,827) | | | | (945,591) | | | | — | | | | — | | | | (1,328) | | | | 210,373 | | | | — | | | | — | |
AQR Multi-Strategy Alternative Fund | | | 14,973,001 | | | | (2,402,471) | | | | — | | | | — | | | | 1,400,201 | | | | (1,550,816) | | | | — | | | | — | |
AQR Style Premia Alternative Fund | | | 422,799 | | | | 1,303,865 | | | | — | | | | — | | | | 3,027,659 | | | | 850,095 | | | | — | | | | — | |
In December 2011, the Financial Accounting Standards Board (“FASB”) issued an Accounting Standards Update (“ASU”) No. 2011-11: Disclosures about Offsetting Assets and Liabilities (“netting”) on the Statements of Assets and Liabilities that are subject to master netting arrangements or similar agreements. ASU 2011-11, was amended by ASU No. 2013-01, clarifying which investments and transactions are subject to the netting disclosure. The scope of the disclosure requirements is limited to derivative instruments, repurchase agreements and reverse repurchase agreements, and securities borrowing and securities lending transactions to the extent they are subject to an enforceable master
| | | | | | | | | | | | | | | | |
| | AQR Funds | | | | | | Annual Report | | | | | | December 2013 | | 261 |
| | | | | | | | | | |
| | | | |
| Notes to Financial Statements | | | December 31, 2013 | |
netting arrangement or similar agreement. This information will enable users of the Funds’ financial statements to evaluate the effect or potential effect of netting arrangements on the Funds’ financial position. The ASU is effective for financial statements with fiscal years beginning on or after January 1, 2013, and interim periods within those fiscal years. The Funds adopted the disclosure requirement on netting for the current reporting period.
For financial reporting purposes, the Funds do not offset financial assets and financial liabilities across derivative types that are subject to master netting arrangements or similar agreements on the Statement of Assets and Liabilities.
The following tables present, by counterparty and contract type, the Funds’ derivative asset and liabilities as of December 31, 2013.
AQR DIVERSIFIED ARBITRAGE FUND
| | | | | | | | | | | | | | | | | | | | | | | | | | |
| | | | | | | | | | | | | | | |
| GROSS AMOUNTS NOT
OFFSET IN THE STATEMENT
OF ASSETS & LIABILITIES |
| | | | |
| COUNTERPARTY | | INVESTMENT TYPE | |
| GROSS
AMOUNTS OF
RECOGNIZED
ASSETS |
| |
| GROSS
AMOUNTS
OFFSET IN THE
STATEMENT
OF ASSETS &
LIABILITIES |
| |
| NET AMOUNTS
OF ASSETS
PRESENTED IN
THE STATEMENT
OF ASSETS &
LIABILITIES |
| |
| FINANCIAL
INSTRUMENTS |
| |
| COLLATERAL
RECEIVED |
| |
| NET
AMOUNT |
|
Barclays Capital | | Futures Contracts | | | $308,287 | | | | $(308,287) | | | | $ — | | | | $ — | | | | $ — | | | | $ — | |
J.P. Morgan | | Futures Contracts | | | 814,780 | | | | — | | | | 814,780 | | | | — | | | | (302,591) | | | | 512,189 | |
| | Total Return Basket
Swap Contracts | | | 33,872,527 | | | | — | | | | 33,872,527 | | | | — | | | | — | | | | 33,872,527 | |
| The Royal Bank of Scotland | | Forward Foreign
Currency Exchange
Contracts | | | 987,892 | | | | (987,892) | | | | — | | | | — | | | | — | | | | — | |
| Total financial instruments subject to a master netting arrangement or similar arrangement | | | 35,983,486 | | | | (1,296,179) | | | | 34,687,307 | | | | — | | | | (302,591) | | | | 34,384,716 | |
| Total financial instruments not subject to a master netting arrangement or similar arrangement | | | — | | | | — | | | | — | | | | — | | | | — | | | | — | |
| | | | | | |
Total financial instruments | | | $35,983,486 | | | | $(1,296,179) | | | | $34,687,307 | | | | $ — | | | | $(302,591) | | | | $34,384,716 | |
| | | | | | | | | | | | | | | | |
| 262 | | AQR Funds | | | | | | Annual Report | | | | | | December 2013 | | |
| | | | | | | | | | |
| | | | |
| Notes to Financial Statements | | | December 31, 2013 | |
| | | | | | | | | | | | | | | | | | | | | | | | | | |
| | | | | | | | | | | | | | | |
| GROSS AMOUNTS NOT
OFFSET IN THE STATEMENT
OF ASSETS & LIABILITIES |
| | | | |
| COUNTERPARTY | | INVESTMENT TYPE | |
| GROSS
AMOUNTS OF
RECOGNIZED
LIABILITIES |
| |
| GROSS
AMOUNTS
OFFSET IN THE
STATEMENT
OF ASSETS &
LIABILITIES |
| |
| NET AMOUNTS
OF LIABILITIES
PRESENTED IN
THE STATEMENT
OF ASSETS &
LIABILITIES |
| |
| FINANCIAL
INSTRUMENTS |
| |
| COLLATERAL
PLEDGED (a) |
| |
| NET
AMOUNT |
|
Bank of America | | Credit Default
Swap Contracts | | | $54,607 | | | | $ — | | | | $54,607 | | | | $ — | | | | $(622) | | | | $53,985 | |
Barclays Capital | | Futures Contracts | | | 12,691,614 | | | | (308,287) | | | | 12,383,327 | | | | — | | | | (12,383,327) | | | | — | |
CitiBank | | Credit Default
Swap Contracts | | | 20,023,380 | | | | — | | | | 20,023,380 | | | | — | | | | (20,023,380) | | | | — | |
Credit Suisse International | | Forward Foreign
Currency Exchange
Contracts | | | 67,449 | | | | — | | | | 67,449 | | | | — | | | | — | | | | 67,449 | |
Deutsche Bank | | Total Return
Basket Swap
Contracts | | | 2,414,449 | | | | — | | | | 2,414,449 | | | | — | | | | (2,414,449) | | | | — | |
J.P. Morgan | | Written Options | | | 2,574,410 | | | | — | | | | 2,574,410 | | | | (2,574,410) | | | | — | | | | — | |
| The Royal Bank of Scotland | | Forward Foreign
Currency Exchange
Contracts | | | 1,516,828 | | | | (987,892) | | | | 528,936 | | | | — | | | | (528,936) | | | | — | |
| Total financial instruments subject to a master netting arrangement or similar arrangement | | | 39,342,737 | | | | (1,296,179) | | | | 38,046,558 | | | | — | | | | (35,350,714) | | | | 121,434 | |
| Total financial instruments not subject to a master netting arrangement or similar arrangement | | | — | | | | — | | | | — | | | | — | | | | — | | | | — | |
| | | | | | |
Total financial instruments | | | $39,342,737 | | | | $(1,296,179) | | | | $38,046,558 | | | | $(2,574,410) | | | | $(35,350,714) | | | | $121,434 | |
| (a) | Per GAAP disclosure requirements, the table above does not include the additional collateral pledged to the counterparty. Total additional collateral pledged was $270,822,218. |
| | | | | | | | | | | | | | | | |
| | AQR Funds | | | | | | Annual Report | | | | | | December 2013 | | 263 |
| | | | | | | | | | |
| | | | |
| Notes to Financial Statements | | | December 31, 2013 | |
LONG-SHORT EQUITY FUND
| | | | | | | | | | | | | | | | | | | | | | | | | | |
| | | | | | | | | | | | | | | |
| GROSS AMOUNTS NOT
OFFSET IN THE STATEMENT
OF ASSETS & LIABILITIES |
| | | | |
| COUNTERPARTY | | INVESTMENT TYPE | |
| GROSS
AMOUNTS OF
RECOGNIZED
ASSETS |
| |
| GROSS
AMOUNTS
OFFSET IN THE
STATEMENT
OF ASSETS &
LIABILITIES |
| |
| NET AMOUNTS
OF ASSETS
PRESENTED IN
THE STATEMENT
OF ASSETS &
LIABILITIES |
| |
| FINANCIAL
INSTRUMENTS |
| |
| COLLATERAL
RECEIVED |
| |
| NET
AMOUNT |
|
Barclays Capital | | Futures Contracts | | | $85,698 | | | | $(4,219) | | | | $81,479 | | | | $ — | | | | $ — | | | | $81,479 | |
Credit Suisse International | | Forward Foreign
Currency Exchange
Contracts | | | 3,688 | | | | (3,688) | | | | — | | | | — | | | | — | | | | — | |
Deutsche Bank | | Total Return Basket
Swap Contracts | | | 146,573 | | | | (28,395) | | | | 118,178 | | | | — | | | | — | | | | 118,178 | |
Goldman Sachs | | Total Return Basket
Swap Contracts | | | 161,467 | | | | (22,501) | | | | 138,966 | | | | — | | | | — | | | | 138,966 | |
| | Total Return Swap
Contracts | | | 7,401 | | | | — | | | | 7,401 | | | | — | | | | — | | | | 7,401 | |
| The Royal Bank of Scotland | | Forward Foreign
Currency Exchange
Contracts | | | 3,688 | | | | (3,688) | | | | — | | | | — | | | | — | | | | — | |
| Total financial instruments subject to a master netting agreement or similar arrangement | | | 408,515 | | | | (62,491) | | | | 346,024 | | | | — | | | | — | | | | 346,024 | |
| Total financial instruments not subject to a master netting agreement or similar arrangement | | | — | | | | — | | | | — | | | | — | | | | — | | | | — | |
| | | | | | |
Total financial instruments | | | $408,515 | | | | $(62,491) | | | | $346,024 | | | | $ — | | | | $ — | | | | $346,024 | |
| | | | | | | | | | | | | | | | | | | | | | | | | | |
| | | | | | | | | | | | | | | |
| GROSS AMOUNTS NOT
OFFSET IN THE STATEMENT
OF ASSETS & LIABILITIES |
| | | | |
| COUNTERPARTY | | INVESTMENT TYPE | |
| GROSS
AMOUNTS OF
RECOGNIZED
LIABILITIES |
| |
| GROSS
AMOUNTS
OFFSET IN THE
STATEMENT
OF ASSETS &
LIABILITIES |
| |
| NET AMOUNTS
OF LIABILITIES
PRESENTED IN
THE STATEMENT
OF ASSETS &
LIABILITIES |
| |
| FINANCIAL
INSTRUMENTS |
| |
| COLLATERAL
PLEDGED (a) |
| |
| NET
AMOUNT |
|
Barclays Capital | | Futures Contracts | | | $4,219 | | | | $(4,219) | | | | $ — | | | | $ — | | | | $ — | | | | $ — | |
Credit Suisse International | | Forward Foreign
Currency Exchange
Contracts | | | 3,911 | | | | (3,688) | | | | 223 | | | | — | | | | — | | | | 223 | |
Deutsche Bank | | Total Return Basket
Swap Contracts | | | 28,395 | | | | (28,395) | | | | — | | | | — | | | | — | | | | — | |
Goldman Sachs | | Total Return Basket
Swap Contracts | | | 22,501 | | | | (22,501) | | | | — | | | | — | | | | — | | | | — | |
| The Royal Bank of Scotland | | Forward Foreign
Currency Exchange
Contracts | | | 3,912 | | | | (3,688) | | | | 224 | | | | — | | | | — | | | | 224 | |
| Total financial instruments subject to a master netting agreement or similar arrangement | | | 62,938 | | | | (62,491) | | | | 447 | | | | — | | | | — | | | | 447 | |
| Total financial instruments not subject to a master netting agreement or similar arrangement | | | — | | | | — | | | | — | | | | — | | | | — | | | | — | |
| | | | | | |
Total financial instruments | | | $62,938 | | | | $(62,491) | | | | $447 | | | | $ — | | | | $ — | | | | $447 | |
| (a) | Per GAAP disclosure requirements, the table above does not include the additional collateral pledged to the counterparty. Total additional collateral pledged was $1,543,874. |
| | | | | | | | | | | | | | | | |
| 264 | | AQR Funds | | | | | | Annual Report | | | | | | December 2013 | | |
| | | | | | | | | | |
| | | | |
| Notes to Financial Statements | | | December 31, 2013 | |
AQR MANAGED FUTURES STRATEGY FUND
| | | | | | | | | | | | | | | | | | | | | | | | | | |
| | | | | | | | | | | | | | | |
| GROSS AMOUNTS NOT OFFSET
IN THE STATEMENT OF ASSETS
& LIABILITIES |
| | | | |
| COUNTERPARTY | | INVESTMENT TYPE | |
| GROSS
AMOUNTS OF
RECOGNIZED
ASSETS |
| |
| GROSS
AMOUNTS
OFFSET IN THE
STATEMENT
OF ASSETS &
LIABILITIES |
| |
| NET AMOUNTS
OF ASSETS
PRESENTED IN
THE STATEMENT
OF ASSETS &
LIABILITIES |
| |
| FINANCIAL
INSTRUMENTS |
| |
| COLLATERAL
RECEIVED (a) |
| |
| NET
AMOUNT |
|
Barclays Capital | | Futures Contracts | | | $107,870,770 | | | | $(738,187) | | | | $107,132,583 | | | | $ — | | | | $ — | | | | $107,132,583 | |
| | Total Return Swap
Contracts | | | 44,716,135 | | | | (17,920,084) | | | | 26,796,051 | | | | — | | | | — | | | | 26,796,051 | |
Bank of America | | Total Return Swap
Contracts | | | 3,321,530 | | | | (3,321,530) | | | | — | | | | — | | | | — | | | | — | |
Credit Suisse International | | Forward Foreign
Currency Exchange
Contracts | | | 72,971,579 | | | | (16,623,199) | | | | 56,348,380 | | | | — | | | | (56,348,380) | | | | — | |
Goldman Sachs | | Futures Contracts | | | 24,666,262 | | | | (8,916,143) | | | | 15,750,119 | | | | — | | | | — | | | | 15,750,119 | |
J.P. Morgan | | Futures Contracts | | | 44,639,733 | | | | (44,639,733) | | | | — | | | | — | | | | — | | | | — | |
| The Royal Bank of Scotland | | Forward Foreign
Currency Exchange
Contracts | | | 73,050,775 | | | | (16,646,803) | | | | 56,403,972 | | | | — | | | | (56,403,972) | | | | — | |
| Total financial instruments subject to a master netting agreement or similar arrangement | | | 371,236,784 | | | | (108,805,679) | | | | 262,431,105 | | | | — | | | | (112,752,352) | | | | 149,678,753 | |
| Total financial instruments not subject to a master netting agreement or similar arrangement | | | — | | | | — | | | | — | | | | — | | | | — | | | | — | |
| | | | | | |
| Total financial instruments | | | $371,236,784 | | | | $(108,805,679) | | | | $262,431,105 | | | | $ — | | | | $(112,752,352) | | | | $149,678,753 | |
| | | | | | | | | | | | | | | | | | | | | | | | | | |
| | | | | | | | | | | | | | | |
| GROSS AMOUNTS NOT OFFSET
IN THE STATEMENT OF ASSETS
& LIABILITIES |
| | | | |
| COUNTERPARTY | | INVESTMENT TYPE | |
| GROSS
AMOUNTS OF
RECOGNIZED
LIABILITIES |
| |
| GROSS
AMOUNTS
OFFSET IN THE
STATEMENT
OF ASSETS &
LIABILITIES |
| |
| NET AMOUNTS
OF LIABILITIES
PRESENTED IN
THE STATEMENT
OF ASSETS &
LIABILITIES |
| |
| FINANCIAL
INSTRUMENTS |
| |
| COLLATERAL
PLEDGED (b) |
| |
| NET
AMOUNT |
|
Barclays Capital | | Futures Contracts | | | $738,187 | | | | $(738,187) | | | | $ — | | | | $ — | | | | $ — | | | | $ — | |
| | Total Return Swap
Contracts | | | 17,920,084 | | | | (17,920,084) | | | | — | | | | — | | | | — | | | | — | |
Bank of America | | Total Return Swap
Contracts | | | 3,977,998 | | | | (3,321,530) | | | | 656,468 | | | | — | | | | (656,468) | | | | — | |
Credit Suisse International | | Forward Foreign
Currency Exchange
Contracts | | | 16,623,199 | | | | (16,623,199) | | | | — | | | | — | | | | — | | | | — | |
Deutsche Bank | | Total Return Swap
Contracts | | | 6,173,056 | | | | — | | | | 6,173,056 | | | | — | | | | (6,173,056) | | | | — | |
Goldman Sachs | | Futures Contracts | | | 8,916,143 | | | | (8,916,143) | | | | — | | | | — | | | | — | | | | — | |
J.P. Morgan | | Futures Contracts | | | 44,831,387 | | | | (44,639,733) | | | | 191,654 | | | | — | | | | (191,654) | | | | — | |
| The Royal Bank of Scotland | | Forward Foreign
Currency Exchange
Contracts | | | 16,646,803 | | | | (16,646,803) | | | | — | | | | — | | | | — | | | | — | |
| Total financial instruments subject to a master netting agreement or similar arrangement | | | 115,826,857 | | | | (108,805,679) | | | | 7,021,178 | | | | — | | | | (7,021,178) | | | | — | |
| Total financial instruments not subject to a master netting agreement or similar arrangement | | | — | | | | — | | | | — | | | | — | | | | — | | | | — | |
| | | | | | |
| Total financial instruments | | | $115,826,857 | | | | $(108,805,679) | | | | $7,021,178 | | | | $ — | | | | $(7,021,178) | | | | $ — | |
| (a) | Per GAAP disclosure requirements, the table above does not include the additional collateral received from the counterparty. Total additional collateral received was $16,747,648. |
| (b) | Per GAAP disclosure requirements, the table above does not include the additional collateral pledged to the counterparty. Total additional collateral pledged was $347,656,190. |
| | | | | | | | | | | | | | | | |
| | AQR Funds | | | | | | Annual Report | | | | | | December 2013 | | 265 |
| | | | | | | | | | |
| | | | |
| Notes to Financial Statements | | | December 31, 2013 | |
AQR MANAGED FUTURES STRATEGY HV FUND
| | | | | | | | | | | | | | | | | | | | | | | | | | |
| | | | | | | | | | | | | | | |
| GROSS AMOUNTS NOT
OFFSET IN THE STATEMENT
OF ASSETS & LIABILITIES |
| | | | |
| COUNTERPARTY | | INVESTMENT TYPE | |
| GROSS
AMOUNTS OF
RECOGNIZED
ASSETS |
| |
| GROSS
AMOUNTS
OFFSET IN THE
STATEMENT
OF ASSETS &
LIABILITIES |
| |
| NET AMOUNTS
OF ASSETS
PRESENTED IN
THE STATEMENT
OF ASSETS &
LIABILITIES |
| |
| FINANCIAL
INSTRUMENTS |
| |
| COLLATERAL
RECEIVED (a) |
| |
| NET
AMOUNT |
|
Barclays Capital | | Futures Contracts | | | $944,063 | | | | $(5,512) | | | | $938,551 | | | | $ — | | | | $ — | | | | $938,551 | |
| | Total Return Swap
Contracts | | | 524,691 | | | | (524,691) | | | | — | | | | — | | | | — | | | | — | |
Bank of America | | Total Return Swap
Contracts | | | 27,898 | | | | (27,898) | | | | — | | | | — | | | | — | | | | — | |
Credit Suisse International | | Forward Foreign
Currency Exchange
Contracts | | | 656,596 | | | | (147,489) | | | | 509,107 | | | | — | | | | (509,107) | | | | — | |
Goldman Sachs | | Futures Contracts | | | 170,143 | | | | (58,292) | | | | 111,851 | | | | — | | | | — | | | | 111,851 | |
J.P. Morgan | | Futures Contracts | | | 349,853 | | | | (319,518) | | | | 30,335 | | | | — | | | | — | | | | 30,335 | |
| The Royal Bank of Scotland | | Forward Foreign
Currency Exchange
Contracts | | | 659,050 | | | | (148,021) | | | | 511,029 | | | | — | | | | (410,000) | | | | 101,029 | |
| Total financial instruments subject to a master netting agreement or similar arrangement | | | 3,332,294 | | | | (1,231,421) | | | | 2,100,873 | | | | — | | | | (919,107) | | | | 1,181,766 | |
| Total financial instruments not subject to a master netting agreement or similar arrangement | | | — | | | | — | | | | — | | | | — | | | | — | | | | — | |
| | | | | | |
Total financial instruments | | | $3,332,294 | | | | $(1,231,421) | | | | $2,100,873 | | | | $ — | | | | $(919,107) | | | | $1,181,766 | |
| | | | | | | | | | | | | | | | | | | | | | | | | | |
| | | | | | | | | | | | | | | |
| GROSS AMOUNTS NOT
OFFSET IN THE STATEMENT
OF ASSETS & LIABILITIES |
| | | | |
| COUNTERPARTY | | INVESTMENT TYPE | |
| GROSS
AMOUNTS OF
RECOGNIZED
LIABILITIES |
| |
| GROSS
AMOUNTS
OFFSET IN THE
STATEMENT
OF ASSETS &
LIABILITIES |
| |
| NET AMOUNTS
OF LIABILITIES
PRESENTED IN
THE STATEMENT
OF ASSETS &
LIABILITIES |
| |
| FINANCIAL
INSTRUMENTS |
| |
| COLLATERAL
PLEDGED (b) |
| |
| NET
AMOUNT |
|
Barclays Capital | | Futures Contracts | | | $5,512 | | | | $(5,512) | | | | $ — | | | | $ — | | | | $ — | | | | $ — | |
| | Total Return Swap
Contracts | | | 549,080 | | | | (524,691) | | | | 24,389 | | | | — | | | | (24,389) | | | | — | |
Bank of America | | Total Return Swap
Contracts | | | 29,518 | | | | (27,898) | | | | 1,620 | | | | — | | | | (1,620) | | | | — | |
Credit Suisse International | | Forward Foreign
Currency Exchange
Contracts | | | 147,489 | | | | (147,489) | | | | — | | | | — | | | | — | | | | — | |
Goldman Sachs | | Futures Contracts | | | 58,292 | | | | (58,292) | | | | — | | | | — | | | | | | | | — | |
J.P. Morgan | | Futures Contracts | | | 319,518 | | | | (319,518) | | | | — | | | | — | | | | — | | | | — | |
| The Royal Bank of Scotland | | Forward Foreign
Currency Exchange
Contracts | | | 148,021 | | | | (148,021) | | | | — | | | | — | | | | — | | | | — | |
| Total financial instruments subject to a master netting agreement or similar arrangement | | | 1,257,430 | | | | (1,231,421) | | | | 26,009 | | | | — | | | | (26,009) | | | | — | |
| Total financial instruments not subject to a master netting agreement or similar arrangement | | | — | | | | — | | | | — | | | | — | | | | — | | | | — | |
| | | | | | |
Total financial instruments | | | $1,257,430 | | | | $(1,231,421) | | | | $26,009 | | | | $ — | | | | $(26,009) | | | | $ — | |
| (a) | Per GAAP disclosure requirements, the table above does not include the additional collateral received from the counterparty. Total additional collateral received was $160,894. |
| (b) | Per GAAP disclosure requirements, the table above does not include the additional collateral pledged to the counterparty. Total additional collateral pledged was $2,809,909. |
| | | | | | | | | | | | | | | | |
| 266 | | AQR Funds | | | | | | Annual Report | | | | | | December 2013 | | |
| | | | | | | | | | |
| | | | |
| Notes to Financial Statements | | | December 31, 2013 | |
AQR RISK-BALANCED COMMODITIES STRATEGY FUND
| | | | | | | | | | | | | | | | | | | | | | | | | | |
| | | | | | | | | | | | | | | |
| GROSS AMOUNTS NOT
OFFSET IN THE STATEMENT
OF ASSETS & LIABILITIES |
| | | | |
| COUNTERPARTY | | INVESTMENT TYPE | |
| GROSS
AMOUNTS OF
RECOGNIZED
ASSETS |
| |
| GROSS
AMOUNTS
OFFSET IN THE
STATEMENT
OF ASSETS &
LIABILITIES |
| |
| NET AMOUNTS
OF ASSETS
PRESENTED IN
THE STATEMENT
OF ASSETS &
LIABILITIES |
| |
| FINANCIAL
INSTRUMENTS |
| |
| COLLATERAL
RECEIVED |
| |
| NET
AMOUNT |
|
Barclays Capital | | Total Return
Swap Contracts | | | $2,843,374 | | | | $(2,843,374) | | | | $ — | | | | $ — | | | | $ — | | | | $ — | |
Deutsche Bank | | Total Return
Swap Contracts | | | 1,201,713 | | | | (865,198) | | | | 336,515 | | | | — | | | | — | | | | 336,515 | |
Goldman Sachs | | Futures Contracts | | | 9,385 | | | | (9,385) | | | | — | | | | — | | | | — | | | | — | |
| J.P. Morgan | | Futures Contracts | | | 420,610 | | | | (420,610) | | | | — | | | | — | | | | — | | | | — | |
| Total financial instruments subject to a master netting agreement or similar arrangement | | | 4,475,082 | | | | (4,138,567) | | | | 336,515 | | | | — | | | | — | | | | 336,515 | |
| Total financial instruments not subject to a master netting agreement or similar arrangement | | | — | | | | — | | | | — | | | | — | | | | — | | | | — | |
| | | | | | |
Total financial instruments | | | $4,475,082 | | | | $(4,138,567) | | | | $336,515 | | | | $ — | | | | $ — | | | | $336,515 | |
| | | | | | | | | | | | | | | | | | | | | | | | | | |
| | | | | | | | | | | | | | | |
| GROSS AMOUNTS NOT
OFFSET IN THE STATEMENT
OF ASSETS & LIABILITIES |
| | | | |
| COUNTERPARTY | | INVESTMENT TYPE | |
| GROSS
AMOUNTS OF
RECOGNIZED
LIABILITIES |
| |
| GROSS
AMOUNTS
OFFSET IN
THE STATEMENT
OF ASSETS &
LIABILITIES |
| |
| NET AMOUNTS
OF LIABILITIES
PRESENTED IN
THE STATEMENT
OF ASSETS &
LIABILITIES |
| |
| FINANCIAL
INSTRUMENTS |
| |
| COLLATERAL
PLEDGED (a) |
| |
| NET
AMOUNT |
|
Barclays Capital | | Total Return
Swap Contracts | | | $3,752,116 | | | | $(2,843,374) | | | | $908,742 | | | | $ — | | | | $(908,742) | | | | $ — | |
Deutsche Bank | | Total Return
Swap Contracts | | | 865,198 | | | | (865,198) | | | | — | | | | — | | | | — | | | | — | |
Goldman Sachs | | Futures Contracts | | | 134,218 | | | | (9,385) | | | | 124,833 | | | | — | | | | (124,833) | | | | — | |
| J.P. Morgan | | Futures Contracts | | | 461,476 | | | | (420,610) | | | | 40,866 | | | | — | | | | (40,866) | | | | — | |
| Total financial instruments subject to a master netting agreement or similar arrangement | | | 5,213,008 | | | | (4,138,567) | | | | 1,074,441 | | | | — | | | | (1,074,441) | | | | — | |
| Total financial instruments not subject to a master netting agreement or similar arrangement | | | — | | | | — | | | | — | | | | — | | | | — | | | | — | |
| | | | | | |
Total financial instruments | | | $5,213,008 | | | | $(4,138,567) | | | | $1,074,441 | | | | $ — | | | | $(1,074,441) | | | | $ — | |
| (a) | Per GAAP disclosure requirements, the table above does not include the additional collateral pledged to the counterparty. Total additional collateral pledged was $3,654,937. |
| | | | | | | | | | | | | | | | |
| | AQR Funds | | | | | | Annual Report | | | | | | December 2013 | | 267 |
| | | | | | | | | | |
| | | | |
| Notes to Financial Statements | | | December 31, 2013 | |
AQR RISK PARITY FUND
| | | | | | | | | | | | | | | | | | | | | | | | | | |
| | | | | | | | | | | | | | | |
| GROSS AMOUNTS NOT
OFFSET IN THE STATEMENT OF ASSETS & LIABILITIES |
| | | | |
| COUNTERPARTY | | INVESTMENT TYPE | |
| GROSS
AMOUNTS OF
RECOGNIZED
ASSETS |
| |
| GROSS
AMOUNTS
OFFSET IN THE
STATEMENT
OF ASSETS &
LIABILITIES |
| |
| NET AMOUNTS
OF ASSETS
PRESENTED IN
THE STATEMENT
OF ASSETS &
LIABILITIES |
| |
| FINANCIAL
INSTRUMENTS |
| |
| COLLATERAL
RECEIVED |
| |
| NET
AMOUNT |
|
Bank of America | | Total Return
Swap Contracts | | | $6,020 | | | | $(6,020) | | | | $ — | | | | $ — | | | | $ — | | | | $ — | |
Barclays Capital | | Futures Contracts | | | 13,547,237 | | | | — | | | | 13,547,237 | | | | — | | | | — | | | | 13,547,237 | |
| | Total Return
Swap Contracts | | | 592,536 | | | | (592,536) | | | | — | | | | — | | | | — | | | | — | |
CitiBank | | Credit Default
Swap Contracts | | | 32,859,038 | | | | | | | | | | | | | | | | | | | | | |
| | | Interest Rate
Swap Contracts | | | 4,943,343 | | | | | | | | | | | | | | | | | | | | | |
| | | | | 37,802,381 | | | | (33,834) | | | | 37,768,547 | | | | — | | | | (10,908,365) | | | | 26,860,182 | |
Credit Suisse International | | Forward Foreign
Currency Exchange
Contracts | | | 744,861 | | | | (744,861) | | | | — | | | | — | | | | — | | | | — | |
Goldman Sachs | | Futures Contracts | | | 440,449 | | | | (440,449) | | | | — | | | | — | | | | — | | | | — | |
J.P. Morgan | | Futures Contracts | | | 4,682,992 | | | | (4,682,992) | | | | — | | | | — | | | | — | | | | — | |
Merrill Lynch | | Total Return
Swap Contracts | | | 12,721,063 | | | | (8,739,945) | | | | 3,981,118 | | | | — | | | | — | | | | 3,981,118 | |
Morgan Stanley and Co., International PLC | | Total Return
Swap Contracts | | | 1,310,498 | | | | — | | | | 1,310,498 | | | | — | | | | — | | | | 1,310,498 | |
The Royal Bank of Scotland | | Interest Rate
Swap Contracts | | | 4,662,902 | | | | (4,662,902) | | | | — | | | | — | | | | — | | | | — | |
| | | Forward Foreign
Currency Exchange
Contracts | | | 802,536 | | | | (802,536) | | | | — | | | | — | | | | — | | | | — | |
| Total financial instruments subject to a master netting agreement or similar arrangement | | | 77,313,475 | | | | (20,706,075) | | | | 56,607,400 | | | | — | | | | (10,908,365) | | | | 45,699,035 | |
| Total financial instruments not subject to a master netting agreement or similar arrangement | | | — | | | | — | | | | — | | | | — | | | | — | | | | — | |
| | | | | | |
Total financial instruments | | | $77,313,475 | | | | $(20,706,075) | | | | $56,607,400 | | | | $ — | | | | $(10,908,365) | | | | $45,699,035 | |
| | | | | | | | | | | | | | | | |
| 268 | | AQR Funds | | | | | | Annual Report | | | | | | December 2013 | | |
| | | | | | | | | | |
| | | | |
| Notes to Financial Statements | | | December 31, 2013 | |
| | | | | | | | | | | | | | | | | | | | | | | | | | |
| | | | | | | | | | | | | | | |
| GROSS AMOUNTS NOT
OFFSET IN THE STATEMENT
OF ASSETS & LIABILITIES |
| | | | |
| COUNTERPARTY | | INVESTMENT TYPE | |
| GROSS
AMOUNTS OF
RECOGNIZED
LIABILITIES |
| |
| GROSS
AMOUNTS
OFFSET IN THE
STATEMENT
OF ASSETS &
LIABILITIES |
| |
| NET AMOUNTS
OF LIABILITIES
PRESENTED IN
THE STATEMENT
OF ASSETS &
LIABILITIES |
| |
| FINANCIAL
INSTRUMENTS |
| |
| COLLATERAL
PLEDGED (a) |
| |
| NET
AMOUNT |
|
Bank of America | | Credit Default
Swap Contracts | | | $125,950 | | | | $ — | | | | $125,950 | | | | $ — | | | | $(125,950) | | | | $ — | |
| | Total Return Swap
Contracts | | | 3,538,883 | | | | (6,020) | | | | 3,532,863 | | | | — | | | | (3,396,129) | | | | 136,734 | |
Barclays Capital | | Total Return Swap
Contracts | | | 1,590,153 | | | | (592,536) | | | | 997,617 | | | | — | | | | (997,617) | | | | — | |
CitiBank | | Interest Rate Swap
Contracts | | | 33,834 | | | | (33,834) | | | | — | | | | — | | | | — | | | | — | |
Credit Suisse International | | Forward Foreign
Currency Exchange
Contracts | | | 1,483,744 | | | | (744,861) | | | | 738,883 | | | | — | | | | (738,883) | | | | — | |
Deutsche Bank | | Credit Default
Swap Contracts | | | 849,670 | | | | — | | | | 849,670 | | | | — | | | | (849,670) | | | | — | |
| | Total Return Swap
Contracts | | | 4,250 | | | | — | | | | 4,250 | | | | — | | | | (4,250) | | | | — | |
Goldman Sachs | | Credit Default
Swap Contracts | | | 213,725 | | | | — | | | | 213,725 | | | | — | | | | (213,725) | | | | — | |
| | Futures Contracts | | | 2,638,742 | | | | (440,449) | | | | 2,198,293 | | | | — | | | | (2,198,293) | | | | — | |
J.P. Morgan | | Futures Contracts | | | 8,945,630 | | | | (4,682,992) | | | | 4,262,638 | | | | — | | | | (4,262,638) | | | | — | |
Merrill Lynch | | Total Return Swap
Contracts | | | 8,739,945 | | | | (8,739,945) | | | | — | | | | — | | | | — | | | | — | |
Morgan Stanley Capital Services, Inc. | | Credit Default
Swap Contracts | | | 69,826 | | | | — | | | | 69,826 | | | | — | | | | (69,826) | | | | — | |
The Royal Bank of Scotland | | Credit Default
Swap Contracts | | | 23,274 | | | | — | | | | 23,274 | | | | — | | | | (23,274) | | | | — | |
| | Interest Rate Swap
Contracts | | | 18,375,914 | | | | (4,662,902) | | | | 13,713,012 | | | | — | | | | (13,713,012) | | | | — | |
| | | Forward Foreign
Currency Exchange
Contracts | | | 1,572,186 | | | | (802,536) | | | | 769,650 | | | | — | | | | (769,650) | | | | — | |
| Total financial instruments subject to a master netting agreement or similar arrangement | | | 48,205,726 | | | | (20,706,075) | | | | 27,499,651 | | | | — | | | | (27,362,917) | | | | 136,734 | |
| Total financial instruments not subject to a master netting agreement or similar arrangement | | | — | | | | — | | | | — | | | | — | | | | — | | | | — | |
| | | | | | |
Total financial instruments | | | $48,205,726 | | | | $(20,706,075) | | | | $27,499,651 | | | | $ — | | | | $(27,362,917) | | | | $136,734 | |
| (a) | Per GAAP disclosure requirements, the table above does not include the additional collateral pledged to the counterparty. Total additional collateral pledged was $46,110,990. |
| | | | | | | | | | | | | | | | |
| | AQR Funds | | | | | | Annual Report | | | | | | December 2013 | | 269 |
| | | | | | | | | | |
| | | | |
| Notes to Financial Statements | | | December 31, 2013 | |
AQR RISK PARITY II MV FUND
| | | | | | | | | | | | | | | | | | | | | | | | | | |
| | | | | | | | | | | | | | | |
| GROSS AMOUNTS NOT
OFFSET IN THE STATEMENT
OF ASSETS & LIABILITIES |
| | | | |
| COUNTERPARTY | | INVESTMENT TYPE | |
| GROSS
AMOUNTS OF
RECOGNIZED
ASSETS |
| |
| GROSS
AMOUNTS
OFFSET IN THE
STATEMENT
OF ASSETS &
LIABILITIES |
| |
| NET AMOUNTS
OF ASSETS
PRESENTED IN
THE STATEMENT
OF ASSETS &
LIABILITIES |
| |
| FINANCIAL
INSTRUMENTS |
| |
| COLLATERAL
RECEIVED |
| |
| NET
AMOUNT |
|
Bank of America | | Total Return Swap
Contracts | | | $20,827 | | | | $(20,827) | | | | $ — | | | | $ — | | | | $ — | | | | $ — | |
Barclays Capital | | Futures Contracts | | | 877,998 | | | | — | | | | 877,998 | | | | — | | | | — | | | | 877,998 | |
| | Total Return Swap
Contracts | | | 136,458 | | | | (136,458) | | | | — | | | | — | | | | — | | | | — | |
Credit Suisse International | | Forward Foreign
Currency Exchange
Contracts | | | 299 | | | | (299) | | | | — | | | | — | | | | — | | | | — | |
Deutsche Bank | | Total Return Swap
Contracts | | | 743,880 | | | | (418,403) | | | | 325,477 | | | | — | | | | — | | | | 325,477 | |
Goldman Sachs | | Futures Contracts | | | 17,376 | | | | (17,376) | | | | — | | | | — | | | | — | | | | — | |
| | Total Return Swap
Contracts | | | 63,457 | | | | — | | | | 63,457 | | | | — | | | | — | | | | 63,457 | |
J.P. Morgan | | Futures Contracts | | | 267,124 | | | | (267,124) | | | | — | | | | — | | | | — | | | | — | |
| The Royal Bank of Scotland | | Forward Foreign
Currency Exchange
Contracts | | | 6,739 | | | | (6,739) | | | | — | | | | — | | | | — | | | | — | |
| Total financial instruments subject to a master netting agreement or similar arrangement | | | 2,134,158 | | | | (867,226) | | | | 1,266,932 | | | | — | | | | — | | | | 1,266,932 | |
| Total financial instruments not subject to a master netting agreement or similar arrangement | | | — | | | | — | | | | — | | | | — | | | | — | | | | — | |
| | | | | | |
Total financial instruments | | | $2,134,158 | | | | $(867,226) | | | | $1,266,932 | | | | $ — | | | | $ — | | | | $1,266,932 | |
| | | | | | | | | | | | | | | | | | | | | | | | | | |
| | | | | | | | | | | | | | | |
| GROSS AMOUNTS NOT
OFFSET IN THE STATEMENT OF
ASSETS & LIABILITIES |
| | | | |
| COUNTERPARTY | | INVESTMENT TYPE | |
| GROSS
AMOUNTS OF
RECOGNIZED
LIABILITIES |
| |
| GROSS
AMOUNTS
OFFSET IN THE
STATEMENT
OF ASSETS &
LIABILITIES |
| |
| NET AMOUNTS
OF LIABILITIES
PRESENTED IN
THE STATEMENT
OF ASSETS &
LIABILITIES |
| |
| FINANCIAL
INSTRUMENTS |
| |
| COLLATERAL
PLEDGED (a) |
| |
| NET
AMOUNT |
|
Bank of America | | Total Return Swap
Contracts | | | $30,890 | | | | $(20,827) | | | | $10,063 | | | | $ — | | | | $ — | | | | $10,063 | |
Barclays Capital | | Total Return Swap
Contracts | | | 273,054 | | | | (136,458) | | | | 136,596 | | | | — | | | | (110,000) | | | | 26,596 | |
Credit Suisse International | | Forward Foreign
Currency Exchange
Contracts | | | 26,729 | | | | (299) | | | | 26,430 | | | | — | | | | — | | | | 26,430 | |
Deutsche Bank | | Total Return Swap
Contracts | | | 418,403 | | | | (418,403) | | | | — | | | | — | | | | — | | | | — | |
Goldman Sachs | | Futures Contracts | | | 130,014 | | | | (17,376) | | | | 112,638 | | | | — | | | | (112,638) | | | | — | |
J.P. Morgan | | Futures Contracts | | | 849,168 | | | | (267,124) | | | | 582,044 | | | | — | | | | (582,044) | | | | — | |
| The Royal Bank of Scotland | | Forward Foreign
Currency Exchange
Contracts | | | 29,206 | | | | (6,739) | | | | 22,467 | | | | — | | | | (22,467) | | | | — | |
| Total financial instruments subject to a master netting agreement or similar arrangement | | | 1,757,464 | | | | (867,226) | | | | 890,238 | | | | — | | | | (827,149) | | | | 63,089 | |
| Total financial instruments not subject to a master netting agreement or similar arrangement | | | — | | | | — | | | | — | | | | — | | | | — | | | | — | |
| | | | | | |
Total financial instruments | | | $1,757,464 | | | | $(867,226) | | | | $890,238 | | | | $ — | | | | $(827,149) | | | | $63,089 | |
| (a) | Per GAAP disclosure requirements, the table above does not include the additional collateral pledged to the counterparty. Total additional collateral pledged was $1,824,315. |
| | | | | | | | | | | | | | | | |
| 270 | | AQR Funds | | | | | | Annual Report | | | | | | December 2013 | | |
| | | | | | | | | | |
| | | | |
| Notes to Financial Statements | | | December 31, 2013 | |
AQR RISK PARITY II HV FUND
| | | | | | | | | | | | | | | | | | | | | | | | | | |
| | | | | | | | | | | | | | | |
| GROSS AMOUNTS NOT
OFFSET IN THE STATEMENT
OF ASSETS & LIABILITIES |
| | | | |
| COUNTERPARTY | | INVESTMENT TYPE | |
| GROSS
AMOUNTS OF
RECOGNIZED
ASSETS |
| |
| GROSS
AMOUNTS
OFFSET IN THE
STATEMENT
OF ASSETS &
LIABILITIES |
| |
| NET AMOUNTS
OF ASSETS
PRESENTED IN
THE STATEMENT
OF ASSETS &
LIABILITIES |
| |
| FINANCIAL
INSTRUMENTS |
| |
| COLLATERAL
RECEIVED |
| |
| NET
AMOUNT |
|
Bank of America | | Total Return Swap
Contracts | | | $14,689 | | | | $(14,689) | | | | $ — | | | | $ — | | | | $— | | | | $ — | |
Barclays Capital | | Futures Contracts | | | 696,356 | | | | — | | | | 696,356 | | | | — | | | | — | | | | 696,356 | |
| | Repurchase Agreements | | | 191,000 | | | | — | | | | 191,000 | | | | (191,000) | | | | — | | | | — | |
| | Total Return Swap
Contracts | | | 103,771 | | | | (103,771) | | | | — | | | | — | | | | — | | | | — | |
Credit Suisse International | | Forward Foreign
Currency Exchange
Contracts | | | 214 | | | | (214) | | | | — | | | | — | | | | — | | | | — | |
Deutsche Bank | | Total Return Swap
Contracts | | | 558,352 | | | | (300,638) | | | | 257,714 | | | | — | | | | — | | | | 257,714 | |
Goldman Sachs | | Futures Contracts | | | 16,654 | | | | (16,654) | | | | — | | | | — | | | | — | | | | — | |
| | Total Return Swap
Contracts | | | 53,120 | | | | — | | | | 53,120 | | | | — | | | | — | | | | 53,120 | |
J.P. Morgan | | Futures Contracts | | | 206,639 | | | | (206,639) | | | | — | | | | — | | | | — | | | | — | |
The Royal Bank of Scotland | | Forward Foreign
Currency Exchange
Contracts | | | 5,950 | | | | (5,950) | | | | — | | | | — | | | | — | | | | — | |
| Total financial instruments subject to a master netting agreement or similar arrangement | | | 1,846,745 | | | | (648,555) | | | | 1,198,190 | | | | (191,000) | | | | — | | | | 1,007,190 | |
| Total financial instruments not subject to a master netting agreement or similar arrangement | | | — | | | | — | | | | — | | | | — | | | | — | | | | — | |
| | | | | | |
Total financial instruments | | | $1,846,745 | | | | $(648,555) | | | | $1,198,190 | | | | $(191,000) | | | | $— | | | | $1,007,190 | |
| | | | | | | | | | | | | | | | |
| | AQR Funds | | | | | | Annual Report | | | | | | December 2013 | | 271 |
| | | | | | | | | | |
| | | | |
| Notes to Financial Statements | | | December 31, 2013 | |
| | | | | | | | | | | | | | | | | | | | | | | | | | |
| | | | | | | | | | | | | | | |
| GROSS AMOUNTS NOT
OFFSET IN THE STATEMENT
OF ASSETS & LIABILITIES |
| | | | |
| COUNTERPARTY | | INVESTMENT TYPE | |
| GROSS
AMOUNTS OF
RECOGNIZED
LIABILITIES |
| |
| GROSS
AMOUNTS
OFFSET IN THE
STATEMENT
OF ASSETS &
LIABILITIES |
| |
| NET AMOUNTS
OF LIABILITIES
PRESENTED IN
THE STATEMENT
OF ASSETS &
LIABILITIES |
| |
| FINANCIAL
INSTRUMENTS |
| |
| COLLATERAL
PLEDGED (a) |
| |
| NET
AMOUNT |
|
Bank of America | | Total Return Swap
Contracts | | | $200,543 | | | | $(14,689) | | | | $185,854 | | | | $ — | | | | $(110,000) | | | | $75,854 | |
Barclays Capital | | Reverse Repurchase
Agreements | | | 1,494,500 | | | | — | | | | 1,494,500 | | | | (1,404,500) | | | | (90,000) | | | | — | |
| | Total Return Swap
Contracts | | | 190,235 | | | | (103,771) | | | | 86,464 | | | | — | | | | (86,464) | | | | — | |
BNP Paribas Corp. | | Reverse Repurchase
Agreements | | | 4,473,000 | | | | — | | | | 4,473,000 | | | | (4,413,333) | | | | — | | | | 59,667 | |
Credit Suisse International | | Forward Foreign
Currency Exchange
Contracts | | | 19,255 | | | | (214) | | | | 19,041 | | | | — | | | | — | | | | 19,041 | |
Deutsche Bank | | Total Return Swap
Contracts | | | 300,638 | | | | (300,638) | | | | — | | | | — | | | | — | | | | — | |
Goldman Sachs | | Futures Contracts | | | 77,353 | | | | (16,654) | | | | 60,699 | | | | — | | | | (60,699) | | | | — | |
J.P. Morgan | | Futures Contracts | | | 432,238 | | | | (206,639) | | | | 225,599 | | | | — | | | | (225,599) | | | | — | |
| | Reverse Repurchase
Agreements | | | 1,284,000 | | | | — | | | | 1,284,000 | | | | (1,261,702) | | | | — | | | | 22,298 | |
Morgan Stanley & Co., Inc. | | Reverse Repurchase
Agreements | | | 2,685,750 | | | | — | | | | 2,685,750 | | | | (2,679,164) | | | | — | | | | 6,586 | |
| The Royal Bank of Scotland | | Forward Foreign
Currency Exchange
Contracts | | | 19,340 | | | | (5,950) | | | | 13,390 | | | | — | | | | (13,390) | | | | — | |
| Total financial instruments subject to a master netting agreement or similar arrangement | | | 11,176,852 | | | | (648,555) | | | | 10,528,297 | | | | (9,758,699) | | | | (586,152) | | | | 183,446 | |
| Total financial instruments not subject to a master netting agreement or similar arrangement | | | — | | | | — | | | | — | | | | — | | | | — | | | | — | |
| | | | | | |
Total financial instruments | | | $11,176,852 | | | | $(648,555) | | | | $10,528,297 | | | | $(9,758,699) | | | | $(586,152) | | | | $183,446 | |
| (a) | Per GAAP disclosure requirements, the table above does not include the additional collateral pledged to the counterparty. Total additional collateral pledged was $1,432,928. |
| | | | | | | | | | | | | | | | |
| 272 | | AQR Funds | | | | | | Annual Report | | | | | | December 2013 | | |
| | | | | | | | | | |
| | | | |
| Notes to Financial Statements | | | December 31, 2013 | |
AQR MULTI-STRATEGY ALTERNATIVE FUND
| | | | | | | | | | | | | | | | | | | | | | | | | | |
| | | | | | | | | | | | | | | |
| GROSS AMOUNTS NOT
OFFSET IN THE STATEMENT
OF ASSETS & LIABILITIES |
| | | | |
| COUNTERPARTY | | INVESTMENT TYPE | |
| GROSS
AMOUNTS OF
RECOGNIZED
ASSETS |
| |
| GROSS
AMOUNTS
OFFSET IN THE
STATEMENT
OF ASSETS &
LIABILITIES |
| |
| NET AMOUNTS
OF ASSETS
PRESENTED IN
THE STATEMENT
OF ASSETS &
LIABILITIES |
| |
| FINANCIAL
INSTRUMENTS |
| |
| COLLATERAL
RECEIVED (a) |
| |
| NET
AMOUNT |
|
Bank of America | | Total Return
Swap Contracts | | | $3,323,960 | | | | $(3,323,960) | | | | $ — | | | | $ — | | | | $ — | | | | $ — | |
Barclays Capital | | Futures
Contracts | | | 12,862,006 | | | | (12,862,006) | | | | — | | | | — | | | | — | | | | — | |
| | Total Return
Swap Contracts | | | 1,453,703 | | | | (943,259) | | | | 510,444 | | | | — | | | | — | | | | 510,444 | |
CitiBank | | Credit Default
Swap Contracts | | | 1,388,490 | | | | — | | | | 1,388,490 | | | | — | | | | — | | | | 1,388,490 | |
Credit Suisse International | | Forward Foreign
Currency
Exchange
Contracts | | | 8,933,280 | | | | (6,621,809) | | | | 2,311,471 | | | | — | | | | (2,311,471) | | | | — | |
Deutsche Bank | | Total Return
Basket Swaps
Contracts | | | 13,558,688 | | | | (2,501,567) | | | | 11,057,121 | | | | — | | | | — | | | | 11,057,121 | |
| | Total Return
Swap Contracts | | | 1,984,211 | | | | (1,984,211) | | | | — | | | | — | | | | — | | | | — | |
Goldman Sachs | | Futures
Contracts | | | 4,967,269 | | | | (1,362,268) | | | | 3,605,001 | | | | — | | | | — | | | | 3,605,001 | |
J.P. Morgan | | Futures
Contracts | | | 4,319,816 | | | | (4,319,816) | | | | — | | | | — | | | | — | | | | — | |
Merrill Lynch | | Total Return
Swap Contracts | | | 41,700 | | | | — | | | | 41,700 | | | | — | | | | — | | | | 41,700 | |
Morgan Stanley and Co., International PLC | | Total Return
Swap Contracts | | | 1,098,890 | | | | (1,098,890) | | | | — | | | | — | | | | — | | | | — | |
Morgan Stanley Capital Services, Inc. | | Total Return
Basket Swaps
Contracts | | | 32,096,985 | | | | (4,088,233) | | | | 28,008,752 | | | | — | | | | — | | | | 28,008,752 | |
| The Royal Bank of Scotland | | Forward Foreign
Currency
Exchange
Contracts | | | 9,056,878 | | | | (6,840,184) | | | | 2,216,694 | | | | — | | | | — | | | | 2,216,694 | |
| Total financial instruments subject to a master netting arrangement or similar arrangement | | | 95,085,876 | | | | (45,946,203) | | | | 49,139,673 | | | | — | | | | (2,311,471) | | | | 46,828,202 | |
| Total financial instruments not subject to a master netting arrangement or similar arrangement | | | — | | | | — | | | | — | | | | — | | | | — | | | | — | |
| | | | | | |
Total financial instruments | | | $95,085,876 | | | | $(45,946,203) | | | | $49,139,673 | | | | $ — | | | | $(2,311,471) | | | | $46,828,202 | |
| | | | | | | | | | | | | | | | |
| | AQR Funds | | | | | | Annual Report | | | | | | December 2013 | | 273 |
| | | | | | | | | | |
| | | | |
| Notes to Financial Statements | | | December 31, 2013 | |
| | | | | | | | | | | | | | | | | | | | | | | | | | |
| | | | | | | | | | | | | | | |
| GROSS AMOUNTS NOT
OFFSET IN THE STATEMENT
OF ASSETS & LIABILITIES |
| | | | |
| COUNTERPARTY | | INVESTMENT TYPE | |
| GROSS
AMOUNTS OF
RECOGNIZED
LIABILITIES |
| |
| GROSS
AMOUNTS
OFFSET IN THE
STATEMENT
OF ASSETS &
LIABILITIES |
| |
| NET AMOUNTS
OF LIABILITIES
PRESENTED IN
THE STATEMENT
OF ASSETS &
LIABILITIES |
| |
| FINANCIAL
INSTRUMENTS |
| |
| COLLATERAL
PLEDGED (b) |
| |
| NET
AMOUNT |
|
Bank of America | | Total Return Swap
Contracts | | | $6,597,014 | | | | $(3,323,960) | | | | $3,273,054 | | | | $ — | | | | $(2,870,193) | | | | $402,861 | |
Barclays Capital | | Futures Contracts | | | 17,065,694 | | | | (12,862,006) | | | | 4,203,688 | | | | — | | | | (4,203,688) | | | | — | |
| | Total Return Swap
Contracts | | | 943,259 | | | | (943,259) | | | | — | | | | — | | | | — | | | | — | |
Credit Suisse International | | Forward Foreign
Currency Exchange
Contracts | | | 6,621,809 | | | | (6,621,809) | | | | — | | | | — | | | | — | | | | — | |
Deutsche Bank | | Total Return
Basket Swaps
Contracts | | | 2,501,567 | | | | (2,501,567) | | | | — | | | | — | | | | — | | | | — | |
| | Total Return Swap
Contracts | | | 4,126,421 | | | | (1,984,211) | | | | 2,142,210 | | | | — | | | | (2,142,210) | | | | — | |
Goldman Sachs | | Futures Contracts | | | 1,362,268 | | | | (1,362,268) | | | | — | | | | — | | | | — | | | | — | |
J.P. Morgan | | Futures Contracts | | | 6,619,928 | | | | (4,319,816) | | | | 2,300,112 | | | | — | | | | (2,300,112) | | | | — | |
| | Written Options | | | 1,432 | | | | — | | | | 1,432 | | | | (1,432) | | | | — | | | | — | |
Morgan Stanley and Co., International PLC | | Total Return
Basket Swaps
Contracts | | | 2,903 | | | | — | | | | 2,903 | | | | — | | | | (2,903) | | | | — | |
Morgan Stanley Capital Services, Inc. | | Total Return
Basket Swaps
Contracts | | | 4,088,233 | | | | (4,088,233) | | | | — | | | | — | | | | — | | | | — | |
| | Total Return Swap
Contracts | | | 6,016,748 | | | | (1,098,890) | | | | 4,917,858 | | | | — | | | | (4,917,858) | | | | — | |
| The Royal Bank of Scotland | | Forward Foreign
Currency Exchange
Contracts | | | 6,840,184 | | | | (6,840,184) | | | | — | | | | — | | | | — | | | | — | |
| Total financial instruments subject to a master netting arrangement or similar arrangement | | | 62,787,460 | | | | (45,946,203) | | | | 16,841,257 | | | | (1,432) | | | | (16,436,964) | | | | 402,861 | |
| Total financial instruments not subject to a master netting arrangement or similar arrangement | | | — | | | | — | | | | — | | | | — | | | | — | | | | — | |
| | | | | | |
Total financial instruments | | | $62,787,460 | | | | $(45,946,203) | | | | $16,841,257 | | | | $(1,432) | | | | $(16,436,964) | | | | $402,861 | |
| (a) | Per GAAP disclosure requirements, the table above does not include the additional collateral received from the counterparty. Total additional collateral received was $728,529. |
| (b) | Per GAAP disclosure requirements, the table above does not include the additional collateral pledged to the counterparty. Total additional collateral pledged was $381,833,459. |
| | | | | | | | | | | | | | | | |
| 274 | | AQR Funds | | | | | | Annual Report | | | | | | December 2013 | | |
| | | | | | | | | | |
| | | | |
| Notes to Financial Statements | | | December 31, 2013 | |
AQR STYLE PREMIA ALTERNATIVE FUND
| | | | | | | | | | | | | | | | | | | | | | | | | | |
| | | | | | | | | | | | | | | |
| GROSS AMOUNTS NOT
OFFSET IN THE STATEMENT
OF ASSETS & LIABILITIES |
| | | | |
| COUNTERPARTY | | INVESTMENT TYPE | |
| GROSS
AMOUNTS OF
RECOGNIZED
ASSETS |
| |
| GROSS
AMOUNTS
OFFSET IN THE
STATEMENT
OF ASSETS &
LIABILITIES |
| |
| NET AMOUNTS
OF ASSETS
PRESENTED IN
THE STATEMENT
OF ASSETS &
LIABILITIES |
| |
| FINANCIAL
INSTRUMENTS |
| |
| COLLATERAL
RECEIVED (a) |
| |
| NET
AMOUNT |
|
Bank of America | | Total Return
Swap Contracts | | | $1,143,015 | | | | $(1,143,015) | | | | $ — | | | | $ — | | | | $ — | | | | $ — | |
Barclays Capital | | Futures Contracts | | | 10,554,452 | | | | (9,170,643) | | | | 1,383,809 | | | | — | | | | — | | | | 1,383,809 | |
| | Total Return
Swap Contracts | | | 2,609,202 | | | | (1,523,089) | | | | 1,086,113 | | | | — | | | | (1,086,113) | | | | — | |
Credit Suisse International | | Forward Foreign
Currency
Exchange
Contracts | | | 3,892,708 | | | | (3,517,948) | | | | 374,760 | | | | — | | | | (374,760) | | | | — | |
Goldman Sachs | | Futures Contracts | | | 2,402,000 | | | | (111,304) | | | | 2,290,696 | | | | — | | | | (80,427) | | | | 2,210,269 | |
| | Total Return
Basket Swap
Contracts | | | 1,126,150 | | | | — | | | | 1,126,150 | | | | — | | | | — | | | | 1,126,150 | |
| J.P. Morgan | | Futures Contracts | | | 2,657,035 | | | | (2,640,080) | | | | 16,955 | | | | — | | | | — | | | | 16,955 | |
| Total financial instruments subject to a master netting arrangement or similar arrangement | | | 24,384,562 | | | | (18,106,079) | | | | 6,278,483 | | | | — | | | | (1,541,300) | | | | 4,737,183 | |
| Total financial instruments not subject to a master netting arrangement or similar arrangement | | | — | | | | — | | | | — | | | | — | | | | — | | | | — | |
| | | | | | |
Total financial instruments | | | $24,384,562 | | | | $(18,106,079) | | |
| $ 6,278,483
|
| | | $ — | | | | $(1,541,300) | | | | $4,737,183 | |
| | | | | | | | | | | | | | | | | | | | | | | | | | |
| | | | | | | | | | | | | | | |
| GROSS AMOUNTS NOT
OFFSET IN THE STATEMENT
OF ASSETS & LIABILITIES |
| | | | |
| COUNTERPARTY | | INVESTMENT TYPE | |
| GROSS
AMOUNTS OF
RECOGNIZED
LIABILITIES |
| |
| GROSS
AMOUNTS
OFFSET IN THE
STATEMENT
OF ASSETS &
LIABILITIES |
| |
| NET AMOUNTS
OF LIABILITIES
PRESENTED IN
THE STATEMENT
OF ASSETS &
LIABILITIES |
| |
| FINANCIAL
INSTRUMENTS |
| |
| COLLATERAL
PLEDGED (b) |
| |
| NET
AMOUNT |
|
Bank of America | | Total Return Swap
Contracts | | | $6,100,195 | | | | $(1,143,015) | | | | $4,957,180 | | | | $ — | | | | $(4,957,180) | | | | $ — | |
Barclays Capital | | Futures Contracts | | | 9,170,643 | | | | (9,170,643) | | | | — | | | | — | | | | — | | | | — | |
| | Total Return Swap
Contracts | | | 1,523,089 | | | | (1,523,089) | | | | — | | | | — | | | | — | | | | — | |
Credit Suisse International | | Forward Foreign
Currency Exchange
Contracts | | | 3,517,948 | | | | (3,517,948) | | | | — | | | | — | | | | — | | | | — | |
Goldman Sachs | | Futures Contracts | | | 111,304 | | | | (111,304) | | | | — | | | | — | | | | — | | | | — | |
| J.P. Morgan | | Futures Contracts | | | 2,640,080 | | | | (2,640,080) | | | | — | | | | — | | | | — | | | | — | |
| Total financial instruments subject to a master netting arrangement or similar arrangement | | | 23,063,259 | | | | (18,106,079) | | | | 4,957,180 | | | | — | | | | (4,957,180) | | | | — | |
| Total financial instruments not subject to a master netting arrangement or similar arrangement | | | — | | | | — | | | | — | | | | — | | | | — | | | | — | |
| | | | | | |
Total financial instruments | | | $23,063,259 | | | | $(18,106,079) | | | | $4,957,180 | | | | $ — | | | | $(4,957,180) | | | | $ — | |
| (a) | Per GAAP disclosure requirements, the table above does not include the additional collateral received from the counterparty. Total additional collateral received was $1,539,127. |
| (b) | Per GAAP disclosure requirements, the table above does not include the additional collateral pledged to the counterparty. Total additional collateral pledged was $104,401,693. |
| | | | | | | | | | | | | | | | |
| | AQR Funds | | | | | | Annual Report | | | | | | December 2013 | | 275 |
| | | | | | | | | | |
| | | | |
| Notes to Financial Statements | | | December 31, 2013 | |
For the year ended December 31, 2013, the quarterly average values of the derivatives held by the Funds were as follows:
Derivatives Volume Disclosure*
| | | | | | | | | | | | | | | | | | | | | | | | | | | | | | | | | | | | | | | | |
| | |
| AQR
DIVERSIFIED
ARBITRAGE
FUND |
| |
| AQR LONG-
SHORT
EQUITY FUND |
| |
| AQR
MANAGED
FUTURES
STRATEGY
FUND |
| |
| AQR MANAGED
FUTURES
STRATEGY HV
FUND |
| |
| AQR RISK-
BALANCED
COMMODITIES
STRATEGY
FUND |
| |
| AQR RISK
PARITY FUND |
| |
| AQR RISK
PARITY II
MV FUND |
| |
| AQR RISK
PARITY II
HV FUND |
| |
| AQR MULTI-
STRATEGY
ALTERNATIVE
FUND |
| |
| AQR STYLE
PREMIA
ALTERNATIVE
FUND |
|
| Futures Contracts: | | | | | | | | | | | | | | | | | | | | | | | | | | | | | | | | | | | | | |
Average Notional Balance Long | | | $ — | | | | $2,588,199(a) | | | | $9,776,737,047 | | | | $117,073,268(a) | | | | $35,055,102 | | | | $1,086,616,578 | | | | $96,479,462 | | | | $65,925,345 | | | | $1,730,413,449 | | | | $1,749,214,897(b) | |
Average Notional Balance Short | | | 550,964,216 | | | | 101,180(a) | | | | 6,528,589,791 | | | | 69,081,457(a) | | | | 17,401,536 | | | | 138,345,125 | | | | 8,810,833 | | | | 6,844,439 | | | | 1,973,847,480 | | | | 1,513,916,055(b) | |
Ending Notional Balance Long | | | — | | | | 2,426,562 | | | | 14,339,459,180 | | | | 128,496,884 | | | | 20,868,538 | | | | 883,021,319 | | | | 71,791,858 | | | | 45,262,779 | | | | 1,975,232,452 | | | | 1,749,214,897 | |
Ending Notional Balance Short | | | 686,230,359 | | | | 85,514 | | | | 11,193,974,700 | | | | 96,205,649 | | | | 13,446,129 | | | | 89,454,569 | | | | 6,333,954 | | | | 4,377,024 | | | | 2,546,064,121 | | | | 1,513,916,055 | |
| | | | | | | | |
| Forward Foreign Currency Exchange Contracts: | | | | | | | | | | | | | | | | | | | | | | | | | | | | | | | | | |
Average Settlement Value Purchased | | | 27,219,046 | | | | 1,297,864(a) | | | | 6,074,364,251 | | | | 77,240,192(a) | | | | — | | | | 408,588,163 | | | | 5,501,391 | | | | 5,099,099 | | | | 1,143,503,250 | | | | 271,190,059(b) | |
Average Settlement Value Sold | | | 137,941,097 | | | | 4,931(a) | | | | 5,987,702,503 | | | | 78,264,298(a) | | | | — | | | | 484,809,235 | | | | 17,564,553 | | | | 15,428,168 | | | | 1,253,372,719 | | | | 340,428,413(b) | |
Ending Value Purchased | | | 30,507,024 | | | | 1,412,196 | | | | 7,310,462,550 | | | | 66,908,855 | | | | — | | | | 254,188,605 | | | | 817,629 | | | | 636,480 | | | | 1,315,228,719 | | | | 271,190,059 | |
Ending Value Sold | | | 123,538,796 | | | | 129 | | | | 8,943,877,331 | | | | 80,631,995 | | | | — | | | | 289,881,525 | | | | 10,003,506 | | | | 7,015,310 | | | | 1,597,191,161 | | | | 340,428,413 | |
| | | | | | | | | |
| Exchange-Traded Options: | | | | | | | | | | | | | | | | | | | | | | | | | | | | | | | | | | | | | |
Average Number of Contracts Written | | | 23,732 | | | | — | | | | — | | | | — | | | | — | | | | — | | | | — | | | | — | | | | 3,520 | | | | — | |
Ending Number of Contracts Written | | | 10,229 | | | | — | | | | — | | | | — | | | | — | | | | — | | | | — | | | | — | | | | 1,432 | | | | — | |
| | | | | | | | | |
| Credit Default Swaps: | | | | | | | | | | | | | | | | | | | | | | | | | | | | | | | | | | | | | |
Average Notional Balance—Buy Protection | | | 432,082,400 | | | | — | | | | — | | | | — | | | | — | | | | 1,588,680,154 | | | | — | | | | — | | | | 73,356,500 | | | | — | |
Average Notional Balance—Sell Protection | | | 257,828,000 | | | | — | | | | — | | | | — | | | | — | | | | 1,579,369,873 | | | | — | | | | — | | | | 109,115,200 | | | | — | |
Ending Notional Balance—Buy Protection | | | 233,825,000 | | | | — | | | | — | | | | — | | | | — | | | | — | | | | — | | | | — | | | | — | | | | — | |
Ending Notional Balance—Sell Protection | | | — | | | | — | | | | — | | | | — | | | | — | | | | 759,274,761 | | | | — | | | | — | | | | 15,975,000 | | | | — | |
| | | | | | | | | |
| Total Return Swaps: | | | | | | | | | | | | | | | | | | | | | | | | | | | | | | | | | | | | | |
Average Notional Balance Long | | | — | | | | 131,691(a) | | | | 1,396,009,477 | | | | 22,743,742(a) | | | | 123,178,898 | | | | 505,707,891 | | | | 21,849,231 | | | | 30,436,208 | | | | 416,023,788 | | | | 618,768,364(b) | |
Average Notional Balance Short | | | — | | | | — | | | | 1,217,621,121 | | | | 21,944,448(a) | | | | 68,834,652 | | | | 143,129,653 | | | | 12,399,667 | | | | 10,331,552 | | | | 351,001,885 | | | | 289,640,070(b) | |
Ending Notional Balance Long | | | — | | | | 174,439 | | | | 1,997,545,327 | | | | 25,524,645 | | | | 115,507,666 | | | | 694,931,783 | | | | 36,474,033 | | | | 37,283,721 | | | | 651,029,145 | | | | 618,768,364 | |
Ending Notional Balance Short | | | — | | | | — | | | | 1,192,625,475 | | | | 22,594,664 | | | | 81,348,147 | | | | 306,764,613 | | | | 20,449,055 | | | | 14,812,392 | | | | 623,240,830 | | | | 289,640,070 | |
| | | | | | | | | |
| Interest Rate-Related Swaps (Interest Rate Swaps): | | | | | | | | | | | | | | | | | | | | | | | | | | | | | | | | | | | | | |
Average Notional Balance—Pays Fixed rate | | | — | | | | — | | | | — | | | | — | | | | — | | | | 804,655,204 | | | | — | | | | — | | | | — | | | | — | |
Average Notional Balance—Receives Fixed rate | | | — | | | | — | | | | — | | | | — | | | | — | | | | 681,025,798 | | | | — | | | | — | | | | — | | | | — | |
Ending Notional Balance—Pays Fixed Rate | | | — | | | | — | | | | — | | | | — | | | | — | | | | 704,859,142 | | | | — | | | | — | | | | — | | | | — | |
Ending Notional Balance—Receives Fixed Rate | | | — | | | | — | | | | — | | | | — | | | | — | | | | 979,847,490 | | | | — | | | | — | | | | — | | | | — | |
| | | | | | | | | | | | | | | | |
| 276 | | AQR Funds | | | | | | Annual Report | | | | | | December 2013 | | |
| | | | | | | | | | |
| | | | |
| Notes to Financial Statements | | | December 31, 2013 | |
| | | | | | | | | | | | | | | | | | | | | | | | | | | | | | | | | | | | | | | | |
| | |
| AQR
DIVERSIFIED
ARBITRAGE
FUND |
| |
| AQR LONG-
SHORT
EQUITY FUND |
| |
| AQR
MANAGED
FUTURES
STRATEGY
FUND |
| |
| AQR MANAGED
FUTURES
STRATEGY HV
FUND |
| |
| AQR RISK-
BALANCED
COMMODITIES
STRATEGY
FUND |
| |
| AQR RISK
PARITY FUND |
| |
| AQR RISK
PARITY II
MV FUND |
| |
| AQR RISK
PARITY II
HV FUND |
| |
| AQR MULTI-
STRATEGY
ALTERNATIVE
FUND |
| |
| AQR STYLE
PREMIA
ALTERNATIVE
FUND |
|
| Total Return Basket Swaps: | | | | | | | | | | | | | | | | | | | | | | | | | | | | | | | | | | | | | |
Average Notional of Underlying Positions—Long | | | $1,166,138,850 | | | | $11,332,154(a) | | | | $ — | | | | $ — | | | | $ — | | | | $ — | | | | $ — | | | | $ — | | | | $1,354,645,712 | | | | $432,952,549(b) | |
Average Notional of Underlying Positions—Short | | | 908,214,865 | | | | 10,446,951(a) | | | | — | | | | — | | | | — | | | | — | | | | — | | | | — | | | | 1,025,476,377 | | | | 355,622,904(b) | |
Ending Notional Balance—Long | | | 1,090,595,024 | | | | 11,895,698 | | | | — | | | | — | | | | — | | | | — | | | | — | | | | — | | | | 1,928,166,317 | | | | 432,952,549 | |
Ending Notional Balance—Short | | | 929,575,319 | | | | 11,033,692 | | | | — | | | | — | | | | — | | | | — | | | | — | | | | — | | | | 1,304,409,437 | | | | 355,622,904 | |
| | (a) | For the period July 16, 2013 through December 31, 2013. |
| | (b) | For the period October 30, 2013 through December 31, 2013. |
| | * | Values as of each quarter end are used to calculate the average represented. |
The Funds’ derivative contracts held at December 31, 2013, are not accounted for as hedging instruments under GAAP.
8. Investment Advisory and Other Agreements
The Advisor serves as the investment advisor to each of the Funds pursuant to an Investment Advisory Agreement, dated December 4, 2008, as amended, or an Investment Management Agreement, dated June 10, 2010, as amended, entered into by the Trust, on behalf of the Funds (together, the “Advisory Agreement”). Under the Advisory Agreement, the Advisor furnishes a continuous investment program for each Fund’s portfolio, makes day-to-day investment decisions for the Funds, and manages the Funds’ investments in accordance with the stated policies of each Fund. The Advisor is also responsible for selecting brokers and dealers to execute purchase and sale orders for the portfolio transactions of each Fund, subject to its obligation to seek best execution. The Advisor provides persons satisfactory to the Funds’ Board of Trustees to serve as officers of the Funds. Pursuant to the Advisory Agreement, the Funds pay the Advisor an Advisory fee calculated on the average daily net assets for each Fund, in the annual ratios below:
| | | | |
| FUND | | RATIO | |
AQR Diversified Arbitrage Fund | | | 1.00 | % |
AQR Long-Short Equity Fund | | | 1.10 | |
AQR Managed Futures Strategy Fund | | | 1.05 | |
AQR Managed Futures Strategy HV Fund | | | 1.45 | |
AQR Risk-Balanced Commodities Strategy Fund | | | 0.60 | * |
AQR Risk Parity Fund | | | 0.75 | ** |
AQR Risk Parity II MV Fund | | | 0.50 | *** |
AQR Risk Parity II HV Fund | | | 0.70 | **** |
AQR Multi-Strategy Alternative Fund | | | 1.85 | ***** |
AQR Style Premia Alternative Fund | | | 1.35 | |
| | * | The AQR Risk-Balanced Commodities Strategy Fund Advisory Fee is based on the following three tier structure. The first tier charges 0.60% on the first $1 billion of net assets; the second tier charges 0.575% on net assets in excess of $1 billion, up to $3 billion; and the third tier charges 0.55% on net assets in excess of $3 billion. |
| | ** | The AQR Risk Parity Fund Advisory Fee is based on the following two tier structure. The first tier charges 0.75% on the first $1 billion of net assets and the second tier charges 0.70% on net assets in excess of $1 billion. |
| | *** | The AQR Risk Parity II MV Fund Advisory Fee is based on the following three tier structure. The first tier charges 0.50% on the first $1 billion of net assets; the second tier charges 0.475% on net assets in excess of $1 billion, up to $3 billion; and the third tier charges 0.45% on net assets in excess of $3 billion. |
| | **** | The AQR Risk Parity II HV Fund Advisory Fee is based on the following three tier structure. The first tier charges 0.70% on the first $1 billion of net assets; the second tier charges 0.675% on net assets in excess of $1 billion, up to $3 billion; and the third tier charges 0.65% on net assets in excess of $3 billion. |
| | ***** | The AQR Multi-Strategy Alternative Fund Advisory Fee is based on the following two tier structure. The first tier charges 1.85% on the first $1 billion of net assets and the second tier charges 1.80% on net assets in excess of $1 billion. |
| | | | | | | | | | | | | | | | |
| | AQR Funds | | | | | | Annual Report | | | | | | December 2013 | | 277 |
| | | | | | | | | | |
| | | | |
| Notes to Financial Statements | | | December 31, 2013 | |
The Trust and the Advisor have entered into a Fee Waiver and Expense Reimbursement Agreement whereby the Advisor has agreed to waive its fee and/or reimburse each Fund at least through April 30, 2015, unless otherwise noted. The Advisor has agreed to waive and/or reimburse each Fund to the extent that the total annual fund operating expense ratios (including the consolidated expenses of the Subsidiaries), exclusive of interest, taxes, borrowing costs, acquired fund fees and expenses, dividend and interest expense related to short sales, and extraordinary expenses exceed the following ratios:
| | | | | | | | |
| FUND | | CLASS I | | | CLASS N | |
AQR Diversified Arbitrage Fund | | | 1.20 | % | | | 1.50 | % |
AQR Long-Short Equity Fund | | | 1.30 | | | | 1.55 | |
AQR Managed Futures Strategy Fund | | | 1.25 | | | | 1.50 | |
AQR Managed Futures Strategy HV Fund | | | 1.65 | | | | 1.90 | |
AQR Risk-Balanced Commodities Strategy Fund* | | | 1.05 | | | | 1.30 | |
AQR Risk Parity Fund | | | 0.95 | | | | 1.20 | |
AQR Risk Parity II MV Fund | | | 0.95 | | | | 1.20 | |
AQR Risk Parity II HV Fund | | | 1.15 | | | | 1.40 | |
AQR Multi-Strategy Alternative Fund | | | 1.98 | | | | 2.23 | |
AQR Style Premia Alternative Fund | | | 1.50 | | | | 1.75 | |
| | * | This arrangement will continue at least through April 30, 2014 for Class I and Class N. |
For the period ended December 31, 2013, the Funds’ Advisor waived fees and/or reimbursed expenses for each of the Funds as follows:
| | | | | | | | | | | | | | | | |
| | | AQR
LONG-SHORT
EQUITY FUND | | | AQR MANAGED
FUTURES
STRATEGY
FUND | | | AQR
MANAGED
FUTURES
STRATEGY HV
FUND | | | AQR RISK
BALANCED
COMMODITIES
STRATEGY
FUND | |
| Waivers and reimbursements: | | | | | | | | | | | | | | | | |
| Investment advisory and shareholder services fees waived | | | $27,974 | | | | — | | | | $189,139 | | | | $167,979 | |
| Expense reimbursements | | | 75,460 | | | | $2,060 | | | | 7,940 | | | | — | |
| Total | | | $103,434 | | | | $2,060 | | | | $197,079 | | | | $167,979 | |
| | | | | | | | | | | | | | | | |
| | | AQR RISK
PARITY II MV FUND | | | AQR RISK
PARITY II HV FUND | | | AQR
MULTI-STRATEGY
ALTERNATIVE
FUND | | | AQR
STYLE PREMIA
ALTERNATIVE
FUND | |
| Waivers and reimbursements: | | | | | | | | | | | | | | | | |
| Investment advisory and shareholder services fees waived | | | $189,256 | | | | $237,421 | | | | $276,890 | | | | $119,587 | |
| Expense reimbursements | | | — | | | | — | | | | 26,897 | | | | 5,689 | |
| Total | | | $189,256 | | | | $237,421 | | | | $303,787 | | | | $125,276 | |
The Trust, in turn, agreed that the Funds will repay the fee waiver/expense reimbursement to the Advisor. Such repayment shall be made only out of the class of the Fund for which the applicable fee waiver and expense reimbursement was made. Repayments with respect to a Fund must be limited to amounts that do not cause the aggregate operating expenses of the Fund attributable to a share class during a year in which such repayment is made to exceed the applicable ratios when the waiver was generated. A repayment shall be payable only to the extent it can be made during the thirty six months following the applicable period during which the Advisor waived fees or reimbursed the applicable Fund for its operating expenses under the Agreement.
| | | | | | | | | | | | | | | | |
| 278 | | AQR Funds | | | | | | Annual Report | | | | | | December 2013 | | |
| | | | | | | | | | |
| | | | |
| Notes to Financial Statements | | | December 31, 2013 | |
For the year ended December 31, 2013, the amounts waived and reimbursed by the Advisor, as well as the amounts available for potential future recoupment by the Advisor and the expiration schedule at December 31, 2013 are as follows:
| | | | | | | | | | | | | | | | | | | | |
| | | FEES WAIVED/
REIMBURSED
FOR THE
PERIOD ENDED
DECEMBER 31,
2013 | | | TOTAL
POTENTIAL
RECOUPMENT
AMOUNT
DECEMBER 31,
2013 | | | POTENTIAL RECOUPMENT
AMOUNTS EXPIRING
DECEMBER 31 | |
| | | | | 2014 | | | 2015 | | | 2016 | |
AQR DIVERSIFIED ARBITRAGE FUND | | | | | | | | | | | | | | | | | | | | |
Class I | | | $— | | | | $1,227,354 | | | | $999,764 | | | | $227,590 | | | | $— | |
| Class N | | | — | | | | — | | | | — | | | | — | | | | — | |
| | | | | |
Totals | | | $— | | | | $1,227,354 | | | | $999,764 | | | | $227,590 | | | | $— | |
| | | | | |
AQR LONG-SHORT EQUITY FUND | | | | | | | | | | | | | | | | | | | | |
Class I | | | $81,653 | | | | $81,653 | | | | $— | | | | $— | | | | $81,653 | |
| Class N | | | 21,781 | | | | 21,781 | | | | — | | | | — | | | | 21,781 | |
| | | | | |
Totals | | | $103,434 | | | | $103,434 | | | | $— | | | | $— | | | | $103,434 | |
| | | | | |
AQR MANAGED FUTURES STRATEGY FUND | | | | | | | | | | | | | | | | | | | | |
Class I | | | $— | | | | $— | | | | $— | | | | $— | | | | $— | |
| Class N | | | 2,060 | | | | 387,133 | | | | 307,475 | | | | 77,598 | | | | 2,060 | |
| | | | | |
Totals | | | $2,060 | | | | $387,133 | | | | $307,475 | | | | $77,598 | | | | $2,060 | |
| | | | | |
AQR MANAGED FUTURES STRATEGY HV FUND | | | | | | | | | | | | | | | | | | | | |
Class I | | | $180,370 | | | | $180,370 | | | | $— | | | | $ — | | | | $180,370 | |
| Class N | | | 16,709 | | | | 16,709 | | | | — | | | | — | | | | 16,709 | |
| | | | | |
Totals | | | $197,079 | | | | $197,079 | | | | $— | | | | $— | | | | $197,079 | |
| | | | | |
AQR RISK-BALANCED COMMODITIES STRATEGY FUND | | | | | | | | | | | | | | | | | | | | |
Class I | | | $150,384 | | | | $332,194 | | | | $— | | | | $181,810 | | | | $150,384 | |
| Class N | | | 17,595 | | | | 36,695 | | | | — | | | | 19,100 | | | | 17,595 | |
| | | | | |
Totals | | | $167,979 | | | | $368,889 | | | | $— | | | | $200,910 | | | | $167,979 | |
| | | | | |
AQR RISK PARITY FUND | | | | | | | | | | | | | | | | | | | | |
Class I | | | $— | | | | $— | | | | $— | | | | $— | | | | $ — | |
| Class N | | | — | | | | 131,497 | | | | 96,564 | | | | 34,933 | | | | — | |
| | | | | |
Totals | | | $— | | | | $131,497 | | | | $96,564 | | | | $34,933 | | | | $— | |
| | | | | |
AQR RISK PARITY II MV FUND | | | | | | | | | | | | | | | | | | | | |
Class I | | | $130,853 | | | | $233,191 | | | | $— | | | | $102,338 | | | | $130,853 | |
| Class N | | | 58,403 | | | | 71,960 | | | | — | | | | 13,557 | | | | 58,403 | |
| | | | | |
Totals | | | $189,256 | | | | $305,151 | | | | $— | | | | $115,895 | | | | $189,256 | |
| | | | | |
AQR RISK PARITY II HV FUND | | | | | | | | | | | | | | | | | | | | |
Class I | | | $141,678 | | | | $221,331 | | | | $— | | | | $79,653 | | | | $141,678 | |
| Class N | | | 95,743 | | | | 132,015 | | | | — | | | | 36,272 | | | | 95,743 | |
| | | | | |
Totals | | | $237,421 | | | | $353,346 | | | | $— | | | | $115,925 | | | | $237,421 | |
| | | | | | | | | | | | | | | | |
| | AQR Funds | | | | | | Annual Report | | | | | | December 2013 | | 279 |
| | | | | | | | | | |
| | | | |
| Notes to Financial Statements | | | December 31, 2013 | |
| | | | | | | | | | | | | | | | | | | | |
| | | FEES WAIVED/
REIMBURSED
FOR THE
PERIOD ENDED
DECEMBER 31,
2013 | | | TOTAL
POTENTIAL
RECOUPMENT
AMOUNT
DECEMBER 31,
2013 | | | POTENTIAL RECOUPMENT
AMOUNTS EXPIRING
DECEMBER 31 | |
| | | | | 2014 | | | 2015 | | | 2016 | |
| | | | | |
AQR MULTI-STRATEGY ALTERNATIVE FUND | | | | | | | | | | | | | | | | | | | | |
Class I | | | $263,977 | | | | $1,036,910 | | | | $322,982 | | | | $449,951 | | | | $263,977 | |
| Class N | | | 39,810 | | | | 154,858 | | | | 59,491 | | | | 55,557 | | | | 39,810 | |
| | | | | |
Totals | | | $303,787 | | | | $1,191,768 | | | | $382,473 | | | | $505,508 | | | | $303,787 | |
| | | | | |
AQR STYLE PREMIA ALTERNATIVE FUND | | | | | | | | | | | | | | | | | | | | |
Class I | | | $115,604 | | | | $115,604 | | | | $— | | | | $— | | | | $115,604 | |
| Class N | | | 9,672 | | | | 9,672 | | | | — | | | | — | | | | 9,672 | |
| | | | | |
Totals | | | $125,276 | | | | $125,276 | | | | $— | | | | $— | | | | $125,276 | |
During the year ended December 31, 2013, the Funds recouped amounts as follow:
| | | | | | | | |
| FUND | | CLASS I | | | CLASS N | |
AQR Diversified Arbitrage Fund | | $ | 141,503 | | | $ | 45,569 | |
AQR Managed Futures Strategy Fund | | | 372,808 | | | | — | |
AQR Risk Parity Fund | | | 14,138 | | | | 4,133 | |
Pursuant to the Sub-Advisory Agreements between the Sub-Advisor, the Advisor and the Trust, the Advisor will pay the Sub-Advisor an annual fee, payable monthly, at the annual rate of 1.00% and 0.35% of the average daily nets assets for the AQR Diversified Arbitrage Fund and AQR Multi-Strategy Alternative Fund, respectively.
J.P. Morgan Chase Bank, N.A., serves as the Funds’ Administrator, Accounting Agent and Custodian.
State Street Bank and Trust Company, together with JPMorgan Chase Bank, N.A., serve as Custodian of the AQR Style Premia Alternative Fund.
ALPS Fund Services, Inc. serves as the Funds’ Transfer Agent, and ALPS Distributors, Inc. serves as the Funds’ Distributor.
During the year ended December 31, 2013, the Advisor contributed $90,124 into the AQR Diversified Arbitrage Fund for a loss incurred due to a trade processing error. The impact of the Advisor’s contribution on the Fund’s total return was immaterial. This amount has been included in realized gain (loss) on investments on the Statement of Operations.
9. Distribution Plan
The Trust has adopted a Plan of Distribution (the “Plan”) pursuant to Rule 12b-1 under the 1940 Act with respect to the Class N shares of the Funds, as applicable. The Plan allows for the payment of services related to the distribution and servicing of these shares at a rate of up to 0.25% per annum of the average daily net asset value of the Class N shares of the Funds, as applicable.
10. Shareholder Servicing Arrangements
Pursuant to a Shareholder Services Agreement, between the Trust (excluding the AQR Diversified Arbitrage Fund, AQR Long-Short Equity Fund, AQR Managed Futures Strategy Fund, AQR Managed Futures Strategy HV Fund, AQR Risk Parity Fund, AQR Multi-Strategy Alternative Fund and AQR Style Premia Alternative Fund) and the Advisor, the Advisor provides a wide range of services to the Funds and their shareholders. These services include, among others, access to performance information reporting, analysis and explanations of Fund reports as well as assisting in the preparation and
| | | | | | | | | | | | | | | | |
| 280 | | AQR Funds | | | | | | Annual Report | | | | | | December 2013 | | |
| | | | | | | | | | |
| | | | |
| Notes to Financial Statements | | | December 31, 2013 | |
distribution of shareholder communications, such as proxies, shareholder reports and prospectuses. Under this agreement the Advisor receives an annual fee, payable monthly, calculated on the average daily net assets of each Class at the following rates:
| | | | | | | | |
| FUND | | CLASS I | | | CLASS N | |
AQR Risk-Balanced Commodities Strategy Fund | | | 0.25 | % | | | 0.25 | % |
AQR Risk Parity II MV Fund | | | 0.25 | | | | 0.25 | |
AQR Risk Parity II HV Fund | | | 0.25 | | | | 0.25 | |
In addition, the Advisor may, from time to time, compensate third parties (including financial intermediaries) from the fees the Advisor receives under the Shareholder Services Agreement for non-distribution shareholder services such third parties provide to clients or customers that are shareholders of the Funds. Fees incurred by the Funds under the Plan and/or the shareholder services agreement for the year ended December 31, 2013, were as follows:
| | | | | | | | |
| FUND | | CLASS I | | | CLASS N | |
AQR Risk-Balanced Commodities Strategy Fund | | $ | 140,099 | | | $ | 11,180 | |
AQR Risk Parity II MV Fund | | | 141,946 | | | | 37,789 | |
AQR Risk Parity II HV Fund | | | 57,683 | | | | 32,608 | |
11. Risks and Concentrations
The Funds, at times, utilize substantial leverage in their investment program. Such leverage may take the form of trading on margin, investing in derivative instruments that are inherently leveraged, entering into repurchase transactions and entering into other forms of direct and indirect borrowing.
There is no guarantee that the Funds’ borrowing arrangement or other arrangements for obtaining leverage will continue to be available, or if available, will be available on terms and conditions acceptable to the Funds. Unfavorable economic conditions also could increase funding costs, limit access to the capital markets or result in a decision by lenders not to extend credit to the Funds. In addition, a decline in market value of the Funds’ assets may have particular adverse consequences in instances where they have borrowed money based on the market value of those assets. A decrease in market value of those assets may result in the lender (including derivative counterparties) requiring the Funds to post additional collateral or otherwise sell assets at a time when it may not be in the Funds’ best interest to do so.
The counterparties to the Funds’ with respect to the following transactions: securities sold short, currency forward, futures, option and swap contracts and reverse repurchase agreements, include clearing brokers and other major financial institutions. While the Funds utilize multiple clearing brokers and counterparties, a concentration of credit risk exists because of balances held and transactions with a limited number of clearing brokers and counterparties.
By using derivative instruments, the Funds are exposed to the counterparty’s credit risk, the risk that derivative counterparties may not perform in accordance with the contractual provisions offset by the value of any collateral received. The Funds’ exposure to credit risk associated with counterparty non-performance is limited to the unrealized gains inherent in such transactions that are recognized in the Statements of Assets and Liabilities. The Funds minimize counterparty credit risk through credit limits and approvals, credit monitoring procedures, executing master netting arrangements and managing margin and collateral requirements, as appropriate.
The Funds may have elements of risk not typically associated with investments in the United States of America due to concentrated investments in a limited number of countries or regions, which may vary throughout the year. Such concentrations may subject the Funds to additional risks resulting from political or economic conditions in such countries or regions and the possible imposition of adverse governmental laws or currency exchange restrictions could cause the securities and their markets to be less liquid and their prices to be more volatile than those of comparable U.S. companies.
Swap agreements involve, to varying degrees, elements of market risk (generally equity price risk related to equity index swap agreements, interest rate risk related to bond swap agreements and commodity risk related to synthetic swap agreements utilizing futures) and exposure to loss in excess of the amount reflected on the Statements of Assets and
| | | | | | | | | | | | | | | | |
| | AQR Funds | | | | | | Annual Report | | | | | | December 2013 | | 281 |
| | | | | | | | | | |
| | | | |
| Notes to Financial Statements | | | December 31, 2013 | |
Liabilities. The notional amounts, which are disclosed as of period end in the swap tables included in the Schedules of Investments, reflect the current investment exposure each Fund has under the swap agreement which may exceed the net asset value of the Fund.
The Funds are not limited in the percentage of their assets that may be invested in convertible securities. Convertible securities generally offer lower interest or dividend yields than non-convertible securities of similar quality. The market values of convertible securities tend to decline as interest rates increase and, conversely, to increase as interest rates decline. However, the convertible security’s market value tends to reflect the market price of the common stock of the issuing company when that stock price is greater than the convertible’s “conversion price,” which is the predetermined price at which the convertible security could be exchanged for the associated stock.
Convertible securities and non-convertible income producing securities are subject to certain risks, including (i) if interest rates go up, the value of convertible securities and non-convertible income-producing securities in the Funds’ portfolio generally will decline; (ii) during periods of declining interest rates, the issuer of a security may exercise its option to prepay principal earlier than scheduled, forcing the Funds to reinvest in lower yielding securities (call or prepayment risk); and (iii) during periods of rising interest rates, the average life of certain types of securities may be extended because of slower than expected principal payments (extension risk).
Credit risk is the risk that one or more securities in the Funds’ portfolio will decline in price, or fail to pay interest or principal when due, because the issuer of the security experiences a decline in its financial status. The Funds’ investments in convertible and nonconvertible debt securities involve credit risk. However, in general, lower rated securities carry a greater degree of risk that the issuer will lose its ability to make interest and principal payments, which could have a negative impact on the Funds’ net asset value or dividends.
If a Fund invests in illiquid investments, it may experience difficulty in selling the investments in a timely manner at the price that it believes the investments are worth. In addition, market conditions may cause the Fund to experience temporary mark-to-market losses, especially in less liquid positions, even in the absence of any selling of investments by the Fund.
Each Fund is subject to market risk, which is the risk that the markets on which the Fund’s investments trade will increase or decrease in value. Market risk applies to every Fund investment. Prices may fluctuate widely over short or extended periods in response to company, market or economic news. Markets also tend to move in cycles, with periods of rising and falling prices. If there is a general decline in the securities and other markets, your investment in a Fund may lose value, regardless of the individual results of the securities and other instruments in which the Fund invests.
A Fund may have investments that appreciate or decrease significantly in value over short periods of time. This volatility may cause the Fund’s net asset value per share to experience significant increases or declines in value over short periods of time.
Securities sold short represent obligations of the Fund to deliver specified securities at a future date and thereby create a liability to repurchase the securities at prevailing future market prices. Accordingly, these transactions result in off-balance-sheet risk as the Fund’s ultimate obligation to satisfy the sale of securities sold short may exceed the amount recognized in the Statement of Assets & Liabilities.
As of December 31, 2013, the AQR Diversified Arbitrage Fund and AQR Multi-Strategy Alternative Fund pledged a substantial portion of its assets for securities sold short to JPMorgan Chase Bank, N.A.
12. Line of Credit
Effective March 1, 2013 and terminating on March 1, 2014, the Trust had renewed a committed $175,000,000 syndicated line of credit with Bank of America, N.A., as the Administrative Agent. Borrowing, if any, under this arrangement bore interest at the sum of (a) 1.0% per annum plus (b) the higher of (i) the Federal Funds Rate or (ii) the Eurodollar Rate, the amount of such excess, which was paid quarterly. The maximum loan amount outstanding per Fund was the lesser of an amount which did not exceed the borrowing limits set forth in the Funds’ Prospectus and/or Registration Statement and did not cause the Asset Coverage Ratio for all borrowings to drop below 500%. The
| | | | | | | | | | | | | | | | |
| 282 | | AQR Funds | | | | | | Annual Report | | | | | | December 2013 | | |
| | | | | | | | | | |
| | | | |
| Notes to Financial Statements | | | December 31, 2013 | |
agreement is subject to an annual commitment fee which is payable in arrears on a quarterly basis. In the event of a draw upon the line of credit, investments of the responsible Fund may be designated as collateral until its loan is repaid in full. Funds with less than $25,000,000 in assets are ineligible to draw upon the line of credit. For the year ended December 31, 2013, the Funds did not have any outstanding borrowings under this agreement.
13. Principal Ownership
As of December 31, 2013, the Funds had individual shareholder accounts owning more than 5% of the total shares outstanding of the Fund as follows:
| | | | | | | | |
| FUND | | NUMBER OF
SHAREHOLDERS | | | TOTAL
PERCENTAGE
INTEREST
HELD | |
AQR Long-Short Equity Fund* | | | 5 | | | | 86.20% | |
AQR Managed Futures Strategy HV Fund* | | | 4 | | | | 60.90% | |
AQR Risk Parity II HV Fund* | | | 3 | | | | 42.00% | |
AQR Style Premia Alternative Fund | | | 1 | | | | 88.70% | |
* The percentage shown is owned by the Advisor and its affiliates.
Significant shareholder transactions by these shareholders, if any, may impact the Fund’s Performance.
14. Subsequent Events
On December 3-4, 2013, the Board of Trustees of the Trust approved (i) an amendment and restatement of the Investment Advisory Agreement of the AQR Funds removing the AQR Managed Futures Strategy Fund (“MF Fund”), AQR Risk-Balanced Commodities Strategy Fund (“Commodities Fund”), AQR Risk Parity II MV Fund (“RP II MV Fund”) and AQR Risk Parity II HV Fund (“RP II HV Fund”, and together with the RP II MV Fund, the “RP II Funds”), effective May 1, 2014 (the “Amended Investment Advisory Agreement”); and (ii) an amendment and restatement of the Investment Management Agreement, effective May 1, 2014, reflecting: (a) the addition of MF Fund, Commodities Fund and the RP II Funds, (b) the bundling of the shareholder servicing fees and contractual advisory fees for the Commodities Fund and RP II Funds for services currently provided separately under the Investment Advisory Agreement and Shareholder Services Agreement (these advisory and shareholder services are currently provided in combination under the Investment Management Agreement for other series of the Trust), and (c) the removal of advisory fee breakpoints for the Commodities Funds and the AQR Multi-Strategy Alternative Fund (“Multi-Strat Fund”), setting the fee rate for advisory services at the lowest rate under the to-be-removed breakpoint schedule (the “Amended Investment Management Agreement” and, together with the Amended Investment Advisory Agreement, the “Amendments”). Under the Amendments, the fee structure for the Commodities Fund, RP II Funds and Multi-Strat Fund will be revised as follows, effective May 1, 2014:
AQR Risk-Balanced Commodities Strategy Fund, AQR Risk Parity II HV Fund and AQR Risk Parity II MV Fund:
| | | | | | | | |
| | | BEFORE AMENDMENTS | | AFTER AMENDMENTS |
| | | ADVISORY FEE (UNDER
INVESTMENT
ADVISORY
AGREEMENT) | | SHAREHOLDER
SERVICES FEE (UNDER SEPARATE
SHAREHOLDER
SERVICES
AGREEMENT) | | INVESTMENT
MANAGEMENT FEE
(UNDER INVESTMENT
MANAGEMENT
AGREEMENT)* | | SHAREHOLDER
SERVICES FEE (UNDER SEPARATE
SHAREHOLDER
SERVICES
AGREEMENT) |
AQR Risk-Balanced Commodities Strategy Fund | | 0.60% of the first $1 billion of net assets 0.575% on net assets in excess of $1 billion up to $3 billion 0.55% on net assets in excess of $3 billion | | 0.25% | | 0.80% | | None |
| | | | | | | | | | | | | | | | |
| | AQR Funds | | | | | | Annual Report | | | | | | December 2013 | | 283 |
| | | | | | | | | | |
| | | | |
| Notes to Financial Statements | | | December 31, 2013 | |
| | | | | | | | |
| | | BEFORE AMENDMENTS | | AFTER AMENDMENTS |
| | | ADVISORY FEE (UNDER
INVESTMENT
ADVISORY
AGREEMENT) | | SHAREHOLDER
SERVICES FEE (UNDER SEPARATE
SHAREHOLDER
SERVICES
AGREEMENT) | | INVESTMENT
MANAGEMENT FEE
(UNDER INVESTMENT
MANAGEMENT
AGREEMENT)* | | SHAREHOLDER
SERVICES FEE (UNDER SEPARATE
SHAREHOLDER
SERVICES
AGREEMENT) |
AQR Risk Parity II HV Fund | | 0.70% of the first $1 billion of net assets 0.675% on net assets in excess of $1 billion up to $3 billion 0.65% on net assets in excess of $3 billion | | 0.25% | | 0.95% of the first $1 billion of net assets 0.925% on net assets in excess of $1 billion up to $3 billion 0.90% on net assets in excess of $3 billion | | None |
| | | | |
AQR Risk Parity II MV Fund | | 0.50% of the first $1 billion of net assets 0.475% on net assets in excess of $1 billion up to $3 billion 0.45% on net assets in excess of $3 billion | | 0.25% | | 0.75% of the first $1 billion of net assets 0.725% on net assets in excess of $1 billion up to $3 billion 0.70% on net assets in excess of $3 billion | | None |
| | * | Reflects the fee under the Investment Management Agreement under which AQR provides a combination of advisory and shareholder services. |
AQR Multi-Strategy Alternative Fund:
| | | | | | | | |
| | | BEFORE AMENDMENTS | | AFTER AMENDMENTS |
| | | INVESTMENT
MANAGEMENT
FEE (UNDER
INVESTMENT
MANAGEMENT
AGREEMENT)* | | SHAREHOLDER
SERVICES FEE
(UNDER SEPARATE
SHAREHOLDER
SERVICES
AGREEMENT) | | INVESTMENT
MANAGEMENT FEE
(UNDER INVESTMENT
MANAGEMENT
AGREEMENT)* | | SHAREHOLDER
SERVICES FEE
(UNDER SEPARATE
SHAREHOLDER
SERVICES
AGREEMENT) |
AQR Multi-Strategy Alternative Fund | | 1.85% on the first $1 billion of assets 1.80% on assets in excess of $1 billion | | None | | 1.80% | | None |
| | * | Reflects the fee under the Investment Management Agreement under which AQR provides a combination of advisory and shareholder services. |
The Funds have evaluated subsequent events through the date of issuance of this report and have determined that there are no additional material events that would require accrual or disclosure.
| | | | | | | | | | | | | | | | |
| 284 | | AQR Funds | | | | | | Annual Report | | | | | | December 2013 | | |
| | | | | | | | | | |
| | |
| Report of Independent Registered Public Accounting Firm |
To the Board of Trustees and Shareholders of AQR Funds:
In our opinion, the accompanying statements of assets and liabilities, including the schedules of investments, and the related statements of operations, of changes in net assets and of cash flows and the financial highlights as well as the accompanying consolidated statements of assets and liabilities, including the consolidated schedules of investments, and the related consolidated statements of operations, of changes in net assets and of cash flows and the financial highlights present fairly, in all material respects, the financial position of each of the ten portfolios that are included in AQR Funds (as listed in Note 1 to the financial statements and collectively referred to as the “Funds”) at December 31, 2013, and the results of each of their operations, the changes in each of their net assets, the cash flows of AQR Diversified Arbitrage Fund, AQR Risk Parity II HV Fund, AQR Multi-Strategy Alternative Fund and AQR Style Premia Alternative Fund and the financial highlights for each of the periods presented, in conformity with accounting principles generally accepted in the United States of America. These financial statements and financial highlights (hereafter referred to as “financial statements”) are the responsibility of the Funds’ management; our responsibility is to express an opinion on these financial statements based on our audits. We conducted our audits of these financial statements in accordance with the standards of the Public Company Accounting Oversight Board (United States). Those standards require that we plan and perform the audit to obtain reasonable assurance about whether the financial statements are free of material misstatement. An audit includes examining, on a test basis, evidence supporting the amounts and disclosures in the financial statements, assessing the accounting principles used and significant estimates made by management, and evaluating the overall financial statement presentation. We believe that our audits, which included confirmation of securities at December 31, 2013 by correspondence with the custodian, brokers and transfer agents and the application of alternative procedures where confirmation of securities purchased had not been received, provide a reasonable basis for our opinion.
PricewaterhouseCoopers LLP
New York, New York
February 25, 2014
| | | | | | | | | | | | | | | | |
| | AQR Funds | | | | | | Annual Report | | | | | | December 2013 | | 285 |
| | | | | | | | | | |
|
| Other Federal Tax Information (Unaudited) |
The Funds intend to designate the maximum allowable as taxed at the 20% rate. The following represents the percentage of ordinary income distributions treated as qualifying dividends:
| | | | |
| FUND | | PERCENTAGE | |
AQR Diversified Arbitrage Fund | | | 30.85% | |
AQR Multi-Strategy Alternative Fund | | | 17.55% | |
The Funds designate the following amounts, or the maximum allowable under the Internal Revenue Code, as long term capital gain distributions qualifying the maximum 20% income tax rate for individuals:
| | | | |
| FUND | | TOTAL | |
AQR Diversified Arbitrage Fund AQR Long-Short Equity Fund AQR Managed Futures Strategy Fund AQR Risk Parity Fund AQR Multi-Strategy Alternative Fund | | $
| 14,410,981
55,727 75,611,975 11,583,408 7,128,688 |
|
For the taxable year ended December 31, 2013, the following percentages of income dividends paid by the Fund qualify for the 70% dividends received deductions available to corporations:
| | | | |
| FUND | | PERCENTAGE | |
AQR Diversified Arbitrage Fund | | | 25.27% | |
AQR Multi-Strategy Alternative Fund | | | 1.02% | |
| | | | | | | | | | | | | | | | |
| 286 | | AQR Funds | | | | | | Annual Report | | | | | | December 2013 | | |
| | | | | | | | | | |
| | |
| Fund Expense Examples (Unaudited) |
As a shareholder of the Trust, you incur two types of costs: (1) transaction costs and (2) ongoing costs, including management fees; and other Fund expenses. This example is intended to help you understand your ongoing costs (in dollars) of investing in the Fund and to compare these costs with the ongoing costs of investing in other mutual funds The Example is based on an investment of $1,000 invested at the beginning of the period and held for the entire period as indicated below.
Actual Expenses
The table below provides information about actual account values and actual expenses. You may use the information together with the amount you invested, to estimate the expenses that you paid over the period. Simply divide your account value by $1,000 (for example, an $8,600 account value divided by $1,000 = 8.6), then multiply the result by the number under the heading entitled “Expenses Paid for the Period Ending 12/31/13” to estimate the expenses you paid on your account during this period. Each Fund will indirectly bear its pro rata share of the expenses incurred by the underlying investments in which the Fund invests. These expenses are not included in the table.
Hypothetical Example for Comparison Purposes
The table below also provides information about hypothetical account values and hypothetical expenses based on each Fund’s actual expense ratio and an assumed annual rate of return of 5% before expenses, which is not the Fund’s actual return. The hypothetical account values and expenses may not be used to estimate the actual ending account balance or expenses you paid for the period. You may use this information to compare the ongoing costs of investing in a Fund and other funds by comparing this 5% hypothetical example with the 5% hypothetical examples that appear in the shareholder reports of other funds. The Fund will indirectly bear its pro rata share of the expenses incurred by the underlying investments in which the Fund invests. These expenses are not included in the table.
Please note that the expenses shown in the table are meant to highlight your ongoing costs only and do not reflect any transactional costs. Therefore, the hypothetical example is useful in comparing ongoing costs only, and will not help you determine the relative total costs of owning different funds. In addition, if these transactional costs were included, your costs would have been higher.
| | | | | | | | | | | | | | | | |
| | | BEGINNING
ACCOUNT
DATE
VALUE | | | ENDING
ACCOUNT
VALUE
12/31/13 | | | ANNUALIZED
EXPENSE
RATIO FOR
THE PERIOD | | | EXPENSES
PAID FOR THE
PERIOD
ENDING
12/31/13 | |
| | | | |
AQR Diversified Arbitrage Fund | | | | | | | | | | | | | | | | |
| | | | |
Class I | | | | | | | | | | | | | | | | |
Actual Return | | | $1,000.00 | | | | $1,005.70 | | | | 1.60% | | | | $8.09 | |
Hypothetical Return | | | $1,000.00 | | | | $1,017.14 | | | | 1.60% | | | | $8.13 | |
| | | | |
Class N | | | | | | | | | | | | | | | | |
Actual Return | | | $1,000.00 | | | | $1,005.10 | | | | 1.83% | | | | $9.25 | |
Hypothetical Return | | | $1,000.00 | | | | $1,015.98 | | | | 1.83% | | | | $9.30 | |
| | | | |
AQR Long-Short Equity Fund | | | | | | | | | | | | | | | | |
| | | | |
Class I (1) | | | | | | | | | | | | | | | | |
Actual Return | | | $1,000.00 | | | | $1,111.70 | | | | 1.30% | | | | $6.32 | (a) |
Hypothetical Return | | | $1,000.00 | | | | $1,018.65 | | | | 1.30% | | | | $6.61 | |
| | | | |
Class N (1) | | | | | | | | | | | | | | | | |
Actual Return | | | $1,000.00 | | | | $1,110.40 | | | | 1.55% | | | | $7.53 | (a) |
Hypothetical Return | | | $1,000.00 | | | | $1,017.39 | | | | 1.55% | | | | $7.88 | |
| | | | | | | | | | | | | | | | |
| | AQR Funds | | | | | | Annual Report | | | | | | December 2013 | | 287 |
| | | | | | | | | | |
|
| Funds Expense Example (Unaudited) |
| | | | | | | | | | | | | | | | |
| | | BEGINNING
ACCOUNT
DATE
VALUE | | | ENDING
ACCOUNT
VALUE
12/31/13 | | | ANNUALIZED
EXPENSE
RATIO FOR
THE PERIOD | | | EXPENSES
PAID FOR THE
PERIOD
ENDING
12/31/13 | |
| | | | |
AQR Managed Futures Strategy Fund | | | | | | | | | | | | | | | | |
| | | | |
Class I | | | | | | | | | | | | | | | | |
Actual Return | | | $1,000.00 | | | | $1,058.30 | | | | 1.22% | | | | $6.33 | |
Hypothetical Return | | | $1,000.00 | | | | $1,019.06 | | | | 1.22% | | | | $6.21 | |
| | | | |
Class N | | | | | | | | | | | | | | | | |
Actual Return | | | $1,000.00 | | | | $1,056.70 | | | | 1.50% | | | | $7.78 | |
Hypothetical Return | | | $1,000.00 | | | | $1,017.64 | | | | 1.50% | | | | $7.63 | |
| | | | |
AQR Managed Futures Strategy HV Fund | | | | | | | | | | | | | | | | |
| | | | |
Class I (1) | | | | | | | | | | | | | | | | |
Actual Return | | | $1,000.00 | | | | $1,081.40 | | | | 1.68% | | | | $8.05 | (a) |
Hypothetical Return | | | $1,000.00 | | | | $1,016.74 | | | | 1.68% | | | | $8.54 | |
| | | | |
Class N (1) | | | | | | | | | | | | | | | | |
Actual Return | | | $1,000.00 | | | | $1,080.40 | | | | 1.93% | | | | $9.24 | (a) |
Hypothetical Return | | | $1,000.00 | | | | $1,015.48 | | | | 1.93% | | | | $9.80 | |
| | | |
AQR Risk-Balanced Commodities Strategy Fund | | | | | | | | | | | | | |
| | | | |
Class I | | | | | | | | | | | | | | | | |
Actual Return | | | $1,000.00 | | | | $994.00 | | | | 1.05% | | | | $5.28 | |
Hypothetical Return | | | $1,000.00 | | | | $1,019.91 | | | | 1.05% | | | | $5.35 | |
| | | | |
Class N | | | | | | | | | | | | | | | | |
Actual Return | | | $1,000.00 | | | | $994.00 | | | | 1.30% | | | | $6.53 | |
Hypothetical Return | | | $1,000.00 | | | | $1,018.65 | | | | 1.30% | | | | $6.61 | |
| | | | |
AQR Risk Parity Fund | | | | | | | | | | | | | | | | |
| | | | |
Class I | | | | | | | | | | | | | | | | |
Actual Return | | | $1,000.00 | | | | $1,057.30 | | | | 0.89% | | | | $4.62 | |
Hypothetical Return | | | $1,000.00 | | | | $1,020.72 | | | | 0.89% | | | | $4.53 | |
| | | | |
Class N | | | | | | | | | | | | | | | | |
Actual Return | | | $1,000.00 | | | | $1,055.70 | | | | 1.20% | | | | $6.22 | |
Hypothetical Return | | | $1,000.00 | | | | $1,019.16 | | | | 1.20% | | | | $6.11 | |
| | | | |
AQR Risk Parity II MV Fund | | | | | | | | | | | | | | | | |
| | | | |
Class I | | | | | | | | | | | | | | | | |
Actual Return | | | $1,000.00 | | | | $1,054.20 | | | | 0.95% | | | | $4.92 | |
Hypothetical Return | | | $1,000.00 | | | | $1,020.42 | | | | 0.95% | | | | $4.84 | |
| | | | |
Class N | | | | | | | | | | | | | | | | |
Actual Return | | | $1,000.00 | | | | $1,052.10 | | | | 1.20% | | | | $6.21 | |
Hypothetical Return | | | $1,000.00 | | | | $1,019.16 | | | | 1.20% | | | | $6.11 | |
| | | | |
AQR Risk Parity II HV Fund | | | | | | | | | | | | | | | | |
| | | | |
Class I | | | | | | | | | | | | | | | | |
Actual Return | | | $1,000.00 | | | | $1,074.90 | | | | 1.19% | | | | $6.22 | |
Hypothetical Return | | | $1,000.00 | | | | $1,019.21 | | | | 1.19% | | | | $6.06 | |
| | | | |
Class N | | | | | | | | | | | | | | | | |
Actual Return | | | $1,000.00 | | | | $1,072.60 | | | | 1.44% | | | | $7.52 | |
Hypothetical Return | | | $1,000.00 | | | | $1,017.95 | | | | 1.44% | | | | $7.32 | |
| | | | | | | | | | | | | | | | |
| 288 | | AQR Funds | | | | | | Annual Report | | | | | | December 2013 | | |
| | | | | | | | | | |
| | |
| Funds Expense Example (Unaudited) |
| | | | | | | | | | | | | | | | |
| | | BEGINNING
ACCOUNT
DATE
VALUE | | | ENDING
ACCOUNT
VALUE
12/31/13 | | | ANNUALIZED
EXPENSE
RATIO FOR
THE PERIOD | | | EXPENSES
PAID FOR THE
PERIOD
ENDING
12/31/13 | |
| | | | |
AQR Multi-Strategy Alternative Fund | | | | | | | | | | | | | | | | |
| | | | |
Class I | | | | | | | | | | | | | | | | |
Actual Return | | | $1,000.00 | | | | $1,019.80 | | | | 3.01% | | | | $15.32 | |
Hypothetical Return | | | $1,000.00 | | | | $1,010.03 | | | | 3.01% | | | | $15.25 | |
| | | | |
Class N | | | | | | | | | | | | | | | | |
Actual Return | | | $1,000.00 | | | | $1,019.00 | | | | 3.27% | | | | $16.64 | |
Hypothetical Return | | | $1,000.00 | | | | $1,008.72 | | | | 3.27% | | | | $16.56 | |
| | | | |
AQR Style Premia Alternative Fund | | | | | | | | | | | | | | | | |
| | | | |
Class I (2) | | | | | | | | | | | | | | | | |
Actual Return | | | $1,000.00 | | | | $1,040.90 | | | | 2.07% | | | | $3.59 | (b) |
Hypothetical Return | | | $1,000.00 | | | | $1,014.77 | | | | 2.07% | | | | $10.51 | |
| | | | |
Class N (2) | | | | | | | | | | | | | | | | |
Actual Return | | | $1,000.00 | | | | $1,040.90 | | | | 2.44% | | | | $4.23 | (b) |
Hypothetical Return | | | $1,000.00 | | | | $1,012.91 | | | | 2.44% | | | | $12.38 | |
| | Expenses are calculated using each Class’ annualized expense ratio, multiplied by the average account value for the period, multiplied by 184/365 (to reflect the one-half year period unless stated otherwise). |
| (1) | Commencement of operations was July 16, 2013. |
| (2) | Commencement of operations was October 30, 2013. |
| (a) | Expenses are calculated using each Class’ annualized expense ratio, multiplied by the average account value for the period, multiplied by 168/365 (to reflect the period since commencement of operations). |
| (b) | Expenses are calculated using each Class’ annualized expense ratio, multiplied by the average account value for the period, multiplied by 62/365 (to reflect the period since commencement of operations). |
| | | | | | | | | | | | | | | | |
| | AQR Funds | | | | | | Annual Report | | | | | | December 2013 | | 289 |
| | | | | | | | | | |
| | | | |
| Trustees and Officers (Unaudited) | | | December 31, 2013 | |
Listed in the chart below is basic information regarding the Trustees and Officers of the Trust. The address of each Officer and Trustee is Two Greenwich Plaza, 3rd Floor, Greenwich CT 06830.
| | | | | | | | |
| NAME AND YEAR OF BIRTH | | CURRENT
POSITION WITH
THE TRUST,
TERM OF
OFFICE1 AND
LENGTH OF
TIME SERVED | | PRINCIPAL OCCUPATION(S)
DURING PAST 5 YEARS | | NUMBER
OF FUNDS
IN FUND
COMPLEX
OVERSEEN
BY TRUSTEE | | OTHER
PRESENT OR
PAST
DIRECTORSHIPS
HELD BY
TRUSTEE (DURING
THE PAST 5 YEARS) |
Disinterested Trustees2 | | | | | | | | |
| Timothy K. Armour, M.B.A., 1948 | | Chairman of the
Board since
2010 and Trustee,since 2008 | | Interim Chief Executive Officer of
Janus Capital Group (2009 to
2010) (financial services) | | 34 | | Janus Capital
Group (since
1998); ETF
Securities
(2010-2013) |
| | | | |
| L. Joe Moravy, M.B.A., CPA, 1950 | | Trustee,
since 2008 | | Managing Director, Finance
Scholars Group (since 2010)
(consulting); Managing Director
and Owner, LJM Advisory
(2008-2010) (consulting) | | 34 | | Nuveen
Exchange
Traded
Commodities
Funds (since
2012) |
| | | | |
| William L. Atwell, M.B.A., 1950 | | Trustee,
since 2011 | | Managing Director, Atwell
Partners LLC (since 2012)
(consulting); President (CIGNA
International), CIGNA (2008 to
2012) (insurance) | | 34 | | None |
| | | | |
| Gregg D. Behrens, M.M., 1952 | | Trustee,
since 2011 | | Chief Executive Officer and
Executive Vice President (Asia-
Pacific Region), Northern Trust
Company (1974 to 2009)
(banking). | | 34 | | None |
| | | | |
| Brian Posner, M.B.A., 1961 | | Trustee,
since 2011 | | President, Point Rider Group
LLC (since 2008) (consulting) | | 34 | | Biogen Idec
(since 2008);
Arch Capital
Group (since
2011); BG
Medicine
(since 2012);
RiverPark
Funds Trust
(2010 to 2012) |
| | | | |
Interested Trustee3 | | | | | | | | |
| David Kabiller, CFA, 1963 | | Trustee,
since 2010 | | Founding Principal, AQR Capital
Management, LLC (since 1998). | | 34 | | None |
Officers | | | | | | | | |
| Marco Hanig, Ph.D., 1958 | | Chief Executive
Officer, since
2009; President,
since 2008 | | Principal, AQR Capital
Management, LLC (since 2008). | | N/A | | N/A |
| | | | | | | | | | | | | | | | |
| 290 | | AQR Funds | | | | | | Annual Report | | | | | | December 2013 | | |
| | | | | | | | | | |
| | | | |
| Trustees and Officers (Unaudited) | | | December 31, 2013 | |
| | | | | | | | |
| NAME AND YEAR OF BIRTH | | CURRENT
POSITION WITH
THE TRUST, TERM
OF OFFICE1 AND
LENGTH OF
TIME SERVED | | PRINCIPAL OCCUPATION(S)
DURING PAST 5 YEARS | | NUMBER
OF FUNDS
IN FUND
COMPLEX
OVERSEEN
BY TRUSTEE | | OTHER
PRESENT OR
PAST
DIRECTORSHIPS
HELD BY
TRUSTEE (DURING
THE PAST 5 YEARS) |
| | | | |
H.J. Willcox, J.D., 1966 | | Chief Compliance
Officer, since 2013 | | Chief Compliance Officer,
AQR Capital Management,
LLC (since 2013); Global
Head of Compliance and
Counsel KKR & Co., L.P.
(2008-2013). | | N/A | | N/A |
| | | | |
John Howard, CPA, 1969 | | Chief Financial
Officer, since 2013 | | Principal, Chief Operating
Officer and Chief Financial
Officer, AQR Capital
Management, LLC (since
2011) Chief Financial
Officer, AllianceBernstein
(2010-2011); Principal,
Chief Operating Officer
and Chief Financial
Officer, AQR Capital
Management, LLC (2007-
2010). | | N/A | | N/A |
| | | | |
| Aaron Masek, CPA, 1974 | | Vice President
and Treasurer,
since 2010 | | Vice President, AQR
Capital Management, LLC
(since 2010); Audit
Manager, Cohen Fund
Audit Services, Ltd. (2008
to 2009). | | N/A | | N/A |
| | | | |
| Bradley Asness, J.D., M.B.A. 1969 | | Vice President
and Chief
Legal Officer,
since 2009 | | Principal and Chief Legal
Officer, AQR Capital
Management, LLC (since
1998). | | N/A | | N/A |
| | | | |
| Brendan R. Kalb, J.D. 1975 | | Executive
Vice President,
since 2009;
Secretary,
since 2008 | | Managing Director and
General Counsel, AQR
Capital Management, LLC
(since 2004). | | N/A | | N/A |
| | | | |
| Nicole DonVito, J.D. 1979 | | Vice President,
since 2009 | | Senior Counsel—Head of
Registered Products, AQR
Capital Management, LLC
(since 2007). | | N/A | | N/A |
| (1) | Each Trustee serves until the election and qualification of a successor, or until death, resignation or removal as provided in the Trust’s Declaration of Trust. |
| (2) | A Disinterested Trustee is any Trustee that is not an “interested person” of the Trust within the meaning of Section 2(a)(19) of the 1940 Act. |
| (3) | An Interested Trustee is a Trustee that is an “interested person” of the Trust within the meaning of Section 2(a)(19) of the 1940 Act. Mr. Kabiller is an interested person of the Trust because of his position with the Advisor. |
| | | | | | | | | | | | | | | | |
| | AQR Funds | | | | | | Annual Report | | | | | | December 2013 | | 291 |
| | | | | | | | | | |
| | |
| Board Approval of Investment Advisory Agreements (Unaudited) |
| | |
| AQR Long-Short Equity Fund and AQR Managed Futures Strategy HV Fund | | |
The Board of Trustees (the “Board,” and the members of which are referred to as “Board Members”) of the AQR Funds (the “Trust”) met in person on May 29-30, 2013, to consider the approval of the investment management agreement between the Trust, on behalf of the AQR Long-Short Equity Fund and AQR Managed Futures Strategy HV Fund (together, the “Funds”), and AQR Capital Management, LLC (“AQR”) (the “Investment Management Agreement”). In addition, the Board Members who are not “interested persons” as defined in the Investment Company Act of 1940, as amended (the “1940 Act”) (the “Independent Board Members”), held a separate call in advance of the in person meeting held on May 29-30, 2013 with independent legal counsel to review the materials provided and the relevant legal considerations (together with the in person meeting held on May 29-30, 2013, the “Meetings”). In accordance with Section 15(c) of the 1940 Act, the Board requested, reviewed and considered materials furnished by AQR relevant to the Board’s consideration of whether to approve the Investment Management Agreement. These materials included: (1) memoranda and materials provided by AQR, describing the personnel and services to be provided to the Funds; (2) performance information for strategies and model portfolios relevant to the consideration of the Investment Management Agreement; (3) information independently compiled and prepared by Morningstar Associates, LLC (“Morningstar”) relating to the Funds’ proposed fees and expenses; (4) a discussion of the financial statements of AQR; and (5) a discussion of the compliance program and the regulatory exam history of AQR. AQR is referred to herein as the “Advisor,” as applicable.
At the in person meeting held on May 29-30, 2013, the Board, including the Independent Board Members, unanimously approved the Investment Management Agreement for an initial two-year period. The Board considered all factors it believed to be relevant with respect to the Funds, including, among other factors: (a) the nature, extent and quality of the services to be provided by the Advisor; (b) the investment performance of the Advisor and the Advisor’s portfolio management; (c) the advisory fee and the cost of the services and profits to be realized by the Advisor from the relationship with the Funds; (d) economies of scale; and (e) other factors.
The Board also considered other matters it deemed important to the approval process, such as the services related to the valuation and pricing of the Funds’ portfolio holdings, direct and indirect benefits to the Advisor and its affiliates from their relationship with the Funds and advice from independent legal counsel with respect to the review process and materials submitted for the Board’s review. The Board did not identify any particular information as controlling, and each Board Member may have attributed different weightings to the various items considered.
The following is a summary of the Board’s discussion and views regarding the factors it considered in evaluating the Investment Management Agreement:
The Nature, Extent and Quality of the Services to be Provided by the Advisor. The Board Members reviewed the services that the Advisor would provide to the Funds under the Investment Management Agreement. The Board considered the size and experience of the Advisor’s staff, its use of technology, and the Funds’ stated investment objectives, strategies and processes. The Board reviewed the overall qualifications of the Advisor as an investment Advisor. In connection with the investment advisory services to be provided to the Funds, the Board Members took into account discussions they had with officers of the Advisor regarding the management of the Funds’ investments in accordance with the Funds’ stated investment objectives and policies and the types of transactions that would be entered into on behalf of the Funds. During these discussions, the Board Members asked questions of, and received answers from, the officers of the Advisor regarding the formulation and proposed implementation of the Funds’ investment strategies, their efficacy and potential risks.
In addition to the investment advisory services to be provided to the Funds, the Board Members considered that AQR also will provide shareholder and administrative services, oversight of Fund accounting, marketing services, and assistance in meeting legal and regulatory requirements and other services necessary for the operation of the Funds. In particular, the Board Members reviewed the compliance, shareholder and administrative services to be provided to the Funds by AQR.
Finally, the Independent Board Members had an opportunity to meet outside the presence of management in executive session separately with independent legal counsel to discuss and consider the Investment Management Agreement. Based on the presentations and materials at the Meetings, the Board concluded that the services to be provided to the Funds by AQR pursuant to the Investment Management Agreement were likely to be of a high quality and would benefit the Funds.
| | | | | | | | | | | | | | | | |
| 292 | | AQR Funds | | | | | | Annual Report | | | | | | December 2013 | | |
| | | | | | | | | | |
| | |
| Board Approval of Investment Advisory Agreements (Unaudited) |
Investment Performance and the Advisor’s Portfolio Management. Because the Funds are newly formed, the Board did not consider the investment performance of the Funds. The Board based its review of the Advisor’s performance primarily on the experience of the Advisor in managing other registered investment companies and private funds, noting that other funds the Advisor manages might have investment objectives, policies or restrictions different from those of the Funds. The Board also considered the experience, resources and strengths of the Advisor and its affiliates with respect to the investment strategies proposed for the Funds. Based on these factors, the Board Members determined that the AQR would be an appropriate investment adviser for the Funds.
The Advisory Fee and the Cost of the Services and Profits to be Realized by the Advisor from the Relationship with the Funds. The Board, including the Independent Board Members, received and reviewed information regarding the management fees to be paid by the Funds to the Advisor pursuant to the Investment Management Agreement. The Board examined this information in order to determine the reasonableness of the fees in light of the nature and quality of services to be provided to the Funds.
To assist in this analysis, the Board received a report independently prepared by Morningstar. The report showed comparative fee information for each Fund’s respective Morningstar category, including expense comparisons of contractual investment advisory fees and actual net expenses.
The Board also received and reviewed information regarding the profitability of the Advisor with respect to Fund-related activities. The Board took into consideration the Advisor’s profits from the management of other private accounts. The Board also reviewed the Advisor’s methodology of determining profitability. The Board recognized that profitability may be affected by numerous factors including, among other things, fee waivers and expense reimbursements by the Advisor, the types of funds managed, expense allocations and business mix, and therefore comparability of profitability is somewhat limited.
The Board reviewed the Advisor’s unaudited financial information. The purpose of the review was to help the Independent Board Members determine whether the firm has the necessary resources to continue to provide high quality services to the Funds and attract and retain high quality employees.
The Board concluded that the proposed management fees are reasonable.
Economies of Scale. Because the Funds are newly formed and had not commenced operations as of May 30, 2013, and the eventual aggregate amount of the Funds’ assets was uncertain, the Advisor was not able to provide the Board Members with specific information concerning the extent to which economies of scale would be realized as the Funds grow and whether fee levels would reflect such economies of scale, if any. The Advisor presented information to show that the fees were set at a level that is competitive relative to comparable funds of similar, actual or anticipated size. The Board considered that the funds in the AQR fund complex share some common resources and, as a result, an increase in the overall size of the complex could permit each fund to incur lower expenses than it would otherwise as a stand-alone entity. The Board also considered the Advisor’s overall operations and its efforts to expand the scale of, and further enhance the quality of, its operations.
Other Factors. The Board also took into account other ancillary or “fall out” benefits that the Advisor or its affiliates may derive from its relationship with the Funds, both tangible and intangible. The Board also received information regarding the Advisor’s brokerage and soft dollar practices. The Board considered that the Advisor is responsible for decisions to buy and sell securities for the Funds, selection of broker-dealers and best execution, and aggregation and allocation of trade orders among the firm’s various advisory clients. The Board noted that the Advisor does not presently intend to make use of soft dollars to acquire third-party research.
Conclusion. Counsel advised the Board concerning the statutory and regulatory requirements for approval and disclosure of an investment management agreement. No single factor was determinative to the decision of the Board. Based on the foregoing and such other matters as were deemed relevant, all of the Board Members, including all of the Independent Board Members, concluded that the proposed advisory fee rates and projected total expense ratios were reasonable in relation to the services to be provided by the Advisor to the Funds, as well as the costs incurred and benefits to be gained by the Advisor in providing such services, including the investment advisory and administrative components. The Board also found the proposed investment advisory fees to be reasonable in comparison to the fees charged by advisers to other comparable funds of similar, actual or anticipated size. As a result, all of the Board Members, including the Independent Board Members, approved the Investment Management Agreement with respect to the Funds. The Independent Board Members were represented by independent legal counsel who assisted them in their deliberations.
| | | | | | | | | | | | | | | | |
| | AQR Funds | | | | | | Annual Report | | | | | | December 2013 | | 293 |
| | | | | | | | | | |
|
| Board Approval of Investment Advisory Agreements (Unaudited) |
| | |
| AQR STYLE PREMIA ALTERNATIVE FUND | | |
The Board of Trustees (the “Board,” and the members of which are referred to as “Board Members”) of the AQR Funds (the “Trust”) met in person on August 13-14, 2013, to consider the approval of the investment management agreement between the Trust, on behalf of the AQR Style Premia Alternative Fund (the “Fund”), and AQR Capital Management, LLC (“AQR”) (the “Investment Management Agreement”). In addition, the Board Members who are not “interested persons” as defined in the Investment Company Act of 1940, as amended (the “1940 Act”) (the “Independent Board Members”), held a separate call in advance of the in person meeting held on August 13-14, 2013 with independent legal counsel to review the materials provided and the relevant legal considerations (together with the in person meeting held on August 13-14, 2013, the “Meetings”). In accordance with Section 15(c) of the 1940 Act, the Board requested, reviewed and considered materials furnished by AQR relevant to the Board’s consideration of whether to approve the Investment Management Agreement. These materials included: (1) memoranda and materials provided by AQR, describing the personnel and services to be provided to the Fund; (2) performance information for strategies and model portfolios relevant to the consideration of the Investment Management Agreement; (3) information independently compiled and prepared by Morningstar Associates, LLC (“Morningstar”) relating to the Fund’s proposed fees and expenses; (4) a discussion of the financial statements of AQR; and (5) a discussion of the compliance program and the regulatory exam history of AQR. AQR is referred to herein as the “Advisor,” as applicable.
At the in person meeting held on August 13-14, 2013, the Board, including the Independent Board Members, unanimously approved the Investment Management Agreement for an initial two-year period. The Board considered all factors it believed to be relevant with respect to the Fund, including, among other factors: (a) the nature, extent and quality of the services to be provided by the Advisor; (b) the investment performance of the Advisor and the Advisor’s portfolio management; (c) the advisory fee and the cost of the services and profits to be realized by the Advisor from the relationship with the Fund; (d) economies of scale; and (e) other factors.
The Board also considered other matters it deemed important to the approval process, such as the services related to the valuation and pricing of the Fund’s portfolio holdings, direct and indirect benefits to the Advisor and its affiliates from their relationship with the Fund and advice from independent legal counsel with respect to the review process and materials submitted for the Board’s review. The Board did not identify any particular information as controlling, and each Board Member may have attributed different weightings to the various items considered.
The following is a summary of the Board’s discussion and views regarding the factors it considered in evaluating the Investment Management Agreement:
The Nature, Extent and Quality of the Services to be Provided by the Advisor. The Board Members reviewed the services that the Advisor would provide to the Fund under the Investment Management Agreement. The Board considered the size and experience of the Advisor’s staff, its use of technology, and the Fund’s stated investment objective, strategies and processes. The Board reviewed the overall qualifications of the Advisor as an investment adviser. In connection with the investment advisory services to be provided to the Fund, the Board Members took into account discussions they had with officers of the Advisor regarding the management of the Fund’s investments in accordance with the Fund’s stated investment objective and policies and the types of transactions that would be entered into on behalf of the Fund. During these discussions, the Board Members asked questions of, and received answers from, the officers of the Advisor regarding the formulation and proposed implementation of the Fund’s investment strategies, its efficacy and potential risks.
In addition to the investment advisory services to be provided to the Fund, the Board Members considered that AQR also will provide shareholder and administrative services, oversight of Fund accounting, marketing services, and assistance in meeting legal and regulatory requirements and other services necessary for the operation of the Fund. In particular, the Board Members reviewed the compliance, shareholder and administrative services to be provided to the Fund by AQR.
Finally, the Independent Board Members had an opportunity to meet outside the presence of management in executive session separately with independent legal counsel to discuss and consider the Investment Management Agreement. Based on the presentations and materials at the Meetings, the Board concluded that it was satisfied with the services to be provided to the Fund by AQR pursuant to the Investment Management Agreement.
Investment Performance and the Advisor’s Portfolio Management. Because the Fund is newly formed, the Board did not consider the investment performance of the Fund. The Board based its review of the Advisor’s performance primarily
| | | | | | | | | | | | | | | | |
| 294 | | AQR Funds | | | | | | Annual Report | | | | | | December 2013 | | |
| | | | | | | | | | |
| | |
| Board Approval of Investment Advisory Agreements (Unaudited) |
on the experience of the Advisor in managing other registered investment companies and private funds, noting that other funds the Advisor manages might have investment objectives, policies or restrictions different from those of the Fund. The Board also considered the experience, resources and strengths of the Advisor and its affiliates with respect to the investment strategies proposed for the Fund. Based on these factors, the Board Members determined that the AQR would be an appropriate investment adviser for the Fund.
The Advisory Fee and the Cost of the Services and Profits to be Realized by the Advisor from the Relationship with the Fund. The Board, including the Independent Board Members, received and reviewed information regarding the management fee to be paid by the Fund to the Advisor pursuant to the Investment Management Agreement. The Board examined this information in order to determine the reasonableness of the fee in light of the nature and quality of services to be provided to the Fund.
To assist in this analysis, the Board received a report independently prepared by Morningstar. The report showed comparative fee information for the Fund’s Morningstar category, including expense comparisons of contractual investment advisory fees and actual net expenses.
The Board also received and reviewed information regarding the profitability of the Advisor with respect to Fund-related activities. The Board took into consideration the Advisor’s profits from the management of other private accounts. The Board also reviewed the Advisor’s methodology of determining profitability. The Board recognized that profitability may be affected by numerous factors including, among other things, fee waivers and expense reimbursements by the Advisor, the types of funds managed, expense allocations and business mix, and therefore comparability of profitability is somewhat limited.
The Board reviewed the Advisor’s audited financial information. The purpose of the review was to help the Independent Board Members determine whether the firm has the necessary resources to continue to provide high quality services to the Fund and attract and retain high quality employees.
The Board concluded that the proposed management fee is reasonable.
Economies of Scale. Because the Fund is newly formed and had not commenced operations as of July 31, 2013, and the eventual aggregate amount of the Fund’s assets was uncertain, the Advisor was not able to provide the Board Members with specific information concerning the extent to which economies of scale would be realized as the Fund grows and whether fee levels would reflect such economies of scale, if any. The Advisor presented information to show that the fees were set at a level that is competitive relative to comparable funds of similar, actual or anticipated size. The Board considered that the funds in the AQR fund complex share some common resources and, as a result, an increase in the overall size of the complex could permit each fund to incur lower expenses than it would otherwise as a stand-alone entity. The Board also considered the Advisor’s overall operations and its efforts to expand the scale of, and further enhance the quality of, its operations.
Other Factors. The Board also took into account other ancillary or “fall out” benefits that the Advisor or its affiliates may derive from its relationship with the Fund, both tangible and intangible. The Board also received information regarding the Advisor’s brokerage and soft dollar practices. The Board considered that the Advisor is responsible for decisions to buy and sell securities for the Fund, selection of broker-dealers and best execution, and aggregation and allocation of trade orders among the firm’s various advisory clients. The Board noted that the Advisor does not presently intend to make use of soft dollars to acquire third-party research.
Conclusion. Counsel advised the Board concerning the statutory and regulatory requirements for approval and disclosure of an investment management agreement. No single factor was determinative to the decision of the Board. Based on the foregoing and such other matters as were deemed relevant, all of the Board Members, including all of the Independent Board Members, concluded that the proposed advisory fee rates and projected total expense ratios were reasonable in relation to the services to be provided by the Advisor to the Fund, as well as the costs incurred and benefits to be gained by the Advisor in providing such services, including the investment advisory and administrative components. The Board also found the proposed investment advisory fee to be reasonable in comparison to the fees charged by advisers to other comparable funds of similar, actual or anticipated size. As a result, all of the Board Members, including the Independent Board Members, approved the Investment Management Agreement with respect to the Fund. The Independent Board Members were represented by independent legal counsel who assisted them in their deliberations.
| | | | | | | | | | | | | | | | |
| | AQR Funds | | | | | | Annual Report | | | | | | December 2013 | | 295 |
| | | | | | | | | | |
| | |
| Board Approval of Investment Advisory Agreements (Unaudited) |
| | |
| AQR Diversified Arbitrage Fund, AQR Managed Futures Strategy Fund, AQR Risk Parity Fund, AQR Risk Parity II MV Fund, AQR Risk Parity II HV Fund, AQR Risk-Balanced Commodities Strategy Fund and AQR Multi-Strategy Alternative Fund |
The Board of Trustees (the “Board,” and the members of which are referred to as “Board Members”) of the AQR Funds (the “Trust”) met in person on December 3-4, 2013, to consider the continuation of the: (i) Investment Advisory Agreement between the Trust, on behalf of AQR Managed Futures Strategy Fund, AQR Risk-Balanced Commodities Strategy Fund, AQR Risk Parity II MV Fund and AQR Risk Parity II HV Fund (each, a “Fund”), and AQR Capital Management, LLC (“AQR”) (the “Investment Advisory Agreement”); (ii) Investment Management Agreement between the Trust, on behalf of the AQR Diversified Arbitrage Fund, AQR Risk Parity Fund and AQR Multi-Strategy Alternative Fund (each a “Fund”), and AQR (the “Investment Management Agreement”); (iii) the Amended and Restated Investment Sub-Advisory Agreement between CNH Partners, LLC (“CNH”), on behalf of the AQR Diversified Arbitrage Fund, and AQR; and (iv) the Investment Sub-Advisory Agreement between CNH, on behalf of the AQR Multi-Strategy Alternative Fund, and AQR, presented at this meeting (collectively, the “Sub-Advisory Agreements”). In connection with these considerations, the Board Members also considered: (i) an amendment and restatement of the Investment Advisory Agreement removing the AQR Managed Futures Strategy Fund, AQR Risk-Balanced Commodities Strategy Fund, AQR Risk Parity II MV Fund and AQR Risk Parity II HV Fund, effective May 1, 2014 (the “Amended Investment Advisory Agreement”); and (ii) an amendment and restatement of the Investment Management Agreement, effective May 1, 2014, reflecting: (a) the addition of the AQR Managed Futures Strategy Fund, AQR Risk-Balanced Commodities Strategy Fund, AQR Risk Parity II MV Fund and AQR Risk Parity II HV Fund, (b) the bundling of the shareholder servicing fees and contractual advisory fees for the AQR Risk-Balanced Commodities Strategy Fund, AQR Risk Parity II MV Fund and AQR Risk Parity II HV Fund, and (c) the change in management fee structure for the AQR Risk-Balanced Commodities Strategy Fund and the AQR Multi-Strategy Alternative Fund (the “Amended Investment Management Agreement” and, together with the Amended Investment Advisory Agreement, the “Amendments”). In addition, the Board Members who are not “interested persons” as defined in the Investment Company Act of 1940, as amended (the “1940 Act”) (the “Independent Board Members”), held a separate call in advance of the in person meeting held on December 3-4, 2013 with independent legal counsel to review the materials provided and the relevant legal considerations (together with the in person meeting held on December 3-4, 2013, the “Meetings”). In accordance with Section 15(c) of the 1940 Act, the Board requested, reviewed, and considered materials furnished by AQR and CNH relevant to the Board’s consideration of whether to approve the continuation of the Investment Advisory Agreement, the Investment Management Agreement and the Sub-Advisory Agreements, and to approve the Amendments. These materials included: (i) memoranda and materials provided by AQR, describing the personnel and services provided to the Funds; (ii) memoranda and materials provided by CNH, describing the personnel and services provided to the AQR Diversified Arbitrage Fund and AQR Multi-Strategy Alternative Fund; (iii) performance information for the Funds relevant to the consideration of the Investment Advisory Agreement, Investment Management Agreement and Sub-Advisory Agreements; (iv) information independently compiled and prepared by Morningstar Associates, LLC (“Morningstar”) relating to the Funds’ fees and expenses and certain Funds’ proposed fees and expenses; (v) a discussion of the financial information of AQR and CNH; (vi) a discussion of the compliance programs of AQR and CNH and the regulatory exam histories of each. AQR and CNH are referred to herein as the “Advisor,” as applicable; and (vii) memoranda and materials provided by AQR, describing the proposed changes to the fee structure for certain Funds. The Investment Advisory Agreement (including the Amended Investment Advisory Agreement), the Investment Management Agreement (including the Amended Investment Management Agreement) and the Sub-Advisory Agreements are referred to collectively herein as the “Advisory Agreement,” as applicable and as the context suggests.
At the in person meeting held on December 3-4, 2013, the Board, including the Independent Board Members, unanimously approved the continuation of the Advisory Agreement for an additional one-year period. The Board, including the Independent Board Members, also unanimously approved the Amendments for a one-year period commencing on the effective date of each Amendment. In approving the continuation of the Advisory Agreement and approving the Amendments, the Board considered all factors it believed to be relevant with respect to the Funds, including, among other factors: (a) the nature, extent and quality of the services provided by the Advisor; (b) the investment performance of the Funds and the Advisor’s portfolio management; (c) the advisory fee and the cost of the services and profits to be realized by the Advisor from the relationship with the Funds; (d) economies of scale; and (e) other factors.
The Board also considered other matters it deemed important to the approval process, such as services related to the valuation and pricing of the Funds’ portfolio holdings, direct and indirect benefits to the Advisor and its affiliates from
| | | | | | | | | | | | | | | | |
| 296 | | AQR Funds | | | | | | Annual Report | | | | | | December 2013 | | |
| | | | | | | | | | |
|
| Board Approval of Investment Advisory Agreements (Unaudited) |
their relationship with the Funds and advice from independent legal counsel with respect to the review process and materials submitted for the Board’s review. The Board did not identify any particular information as controlling, and each Board Member may have attributed different weightings to the various items considered.
The following is a summary of the Board’s discussion and views regarding the factors it considered in evaluating the Advisory Agreement:
The Nature, Extent and Quality of the Services Provided by the Advisor. The Board Members reviewed the services that the Advisor provides to the Funds under the Advisory Agreement. The Board considered the size and experience of the Advisor’s staff, its use of technology, and the Funds’ stated investment objectives, strategies and processes. The Board reviewed the overall qualifications of the Advisor as an investment Advisor. In connection with the investment advisory services provided to the Funds, the Board Members took into account discussions they had with officers of the Advisor regarding the management of each Fund’s investments in accordance with the Funds’ stated investment objectives and policies and the types of transactions that are entered into on behalf of the Funds. During these discussions, the Board Members asked questions of, and received answers from, the officers of the Advisor regarding the formulation and implementation of the Funds’ investment strategies, their efficacy and potential risks.
In addition to the investment advisory services provided to the Funds, the Board Members considered that AQR also provides shareholder and administrative services, has responsibility for overseeing CNH with respect to the AQR Diversified Arbitrage Fund and AQR Multi-Strategy Alternative Fund, provides oversight of Fund accounting, provides marketing services, and provides assistance in meeting legal and regulatory requirements and other services necessary for the operation of the Funds. In particular, the Board Members reviewed the compliance, shareholder and administrative services provided to the Funds by AQR. The Board also reviewed a wide range of services provided to certain of the Funds’ shareholders currently provided under a shareholder services agreement between the Trust, on behalf of the Funds, and AQR, and which for certain Funds, as described below, have been, or will prospectively be provided pursuant to the Amended Investment Management Agreement. These services include providing information and services to Fund shareholders, including professional and informative reporting, access to analysis and explanations of Fund reports, and electronic access to Fund information.
Finally, the Independent Board Members had an opportunity to meet outside the presence of management in executive session separately with independent legal counsel to discuss and consider the Advisory Agreement. Based on the presentations and materials at the Meetings, the Board concluded that the services provided to the Funds by AQR pursuant to the Advisory Agreement were of a high quality and benefit the Funds.
Investment Performance of the Funds and the Advisor’s Portfolio Management. The Board considered the investment performance of each Fund. In particular, the Independent Board Members considered the investment performance of the Funds relative to their stated objectives and the Advisor’s success in reaching such goals as well as the performance of the Funds relative to their peers. The Board also considered the Advisor’s performance in managing other registered investment companies and private funds, noting that other funds the Advisor manages might have investment objectives, policies or restrictions different from those of the Funds. Based on these factors, the Board Members determined that AQR is an appropriate investment Advisor for the Funds.
The Advisory Fee and the Cost of the Services and Profits to be Realized by the Advisor from the Relationship with the Funds. The Board, including the Independent Board Members, received and reviewed information regarding the management fees to be paid by the Funds to the Advisor pursuant to the Advisory Agreement. The Board examined this information in order to determine the reasonableness of the fees in light of the nature and quality of services provided to the Funds.
The Board further examined the proposed changes to the fee structure in the Amendments. The Board noted that the Amendments would remove advisory fee breakpoints totaling 0.05%, and simultaneously set the contractual advisory fee at the lowest rate under the to-be-removed breakpoint schedule, for the AQR Multi-Strategy Alternative Fund. The Board further noted that the Amendments would (i) remove advisory fee breakpoints totaling 0.05% for the AQR Risk-Balanced Commodities Strategy Fund and simultaneously bundle the Fund’s advisory fee and the shareholder services fee into one management fee that would be 0.05% less than the sum of the advisory fee at the highest rate under the to-be-removed breakpoint schedule and shareholder services fee of the Fund prior to the Amendments, and (ii) move the AQR Risk-Balanced Commodities Strategy Fund from the Investment Advisory Agreement (an agreement that does not provide for shareholder services) to the Investment Management Agreement (an agreement that provides for shareholder services). Finally, the Board noted that the Amendments would (i) bundle the respective advisory fees and shareholder
| | | | | | | | | | | | | | | | |
| | AQR Funds | | | | | | Annual Report | | | | | | December 2013 | | 297 |
| | | | | | | | | | |
| | |
| Board Approval of Investment Advisory Agreements (Unaudited) |
services fees for the AQR Risk Parity II MV Fund and AQR Risk Parity II HV Fund into one management fee that would equal the sum of the advisory fee and shareholder services fee of these Funds prior to the Amendments, and (ii) move the AQR Risk Parity II MV Fund and AQR Risk Parity II HV Fund from the Investment Advisory Agreement (an agreement that does not provide for shareholder services) to the Investment Management Agreement (an agreement that provides for shareholder services).
To assist in this analysis, the Board received two reports independently prepared by Morningstar (“Morningstar Report”) — one report reflecting the current contractual advisory fees and actual net expenses for the Funds and the second report reflecting the proposed changes to the contractual advisory fees and actual net expenses for the Funds. The Morningstar Report illustrated comparative fee information for each Fund’s Morningstar category, including expense comparisons of contractual investment advisory fees and actual net expenses.
The Board also received and reviewed information regarding the profitability of the Advisor with respect to Fund-related activities. The Board took into consideration the Advisor’s profits from the management of other private accounts. The Board also reviewed the Advisor’s methodology of determining profitability. The Board recognized that profitability may be affected by numerous factors including, among other things, fee waivers and expense reimbursements by the Advisor, the types of funds managed, expense allocations and business mix, and therefore comparability of profitability is somewhat limited.
The Board reviewed the Advisor’s unaudited financial information. The purpose of the review was to help the Independent Board Members determine whether the firm has the necessary resources to continue to provide high quality services to the Funds and attract and retain high quality employees.
Based on their review of the materials presented at the Meeting, the Board concluded that the management fees under the Advisory Agreement and the Amendments are reasonable.
Economies of Scale. The Advisor provided to the Board with information concerning the extent to which economies of scale were realized as the Funds grew and whether fee levels were reflective of such economies of scale. The Board noted that, under the current Advisory Agreement, none of the Funds, except for the AQR Risk Parity Fund, AQR Risk Parity II MV Fund, AQR Risk Parity II HV Fund, AQR Multi-Strategy Alternative Fund and AQR Risk-Balanced Commodities Strategy Fund, would have breakpoints in their advisory fees that would allow investors to benefit directly in the form of lower fees as fund assets grew. However, the Advisor presented information to show that the fees were set at a level that is competitive relative to comparable funds of similar size. The Board considered that, under the Amendments, except for the AQR Risk Parity Fund, AQR Risk Parity II MV Fund and AQR Risk Parity II HV Fund, existing breakpoints would be removed with a corresponding lowering of the overall advisory fee. The Board considered that the funds in the AQR fund complex share some common resources and, as a result, an increase in the overall size of the complex could permit each Fund to incur lower expenses than it would otherwise as a stand-alone entity. The Board also considered the Advisor’s overall operations and its efforts to expand the scale of, and further enhance the quality of, its operations.
Other Factors. The Board also took into account other ancillary or “fall-out” benefits that the Advisor or its affiliates may derive from its relationship with the Funds, both tangible and intangible. The Board also received information regarding the Advisor’s brokerage and soft dollar practices. The Board considered that the Advisor is responsible for decisions to buy and sell securities for the Funds, selection of broker-dealers and best execution, and aggregation and allocation of trade orders among the firms’ various advisory clients. The Board noted that the Advisor does not presently intend to make use of soft dollars to acquire third-party research.
Conclusion. Counsel advised the Board concerning the statutory and regulatory requirements for approval and disclosure of investment advisory agreements. No single factor was determinative to the decision of the Board. Based on the foregoing and such other matters as were deemed relevant, all of the Board Members, including all of the Independent Board Members, concluded that the advisory fee rates (under the existing Investment Advisory Agreement and under the Amendments), the management fee rates (under the existing Investment Management Agreement and under the Amendments) and total expense ratios are reasonable in relation to the services provided by the Advisor to the Funds, as well as the costs incurred and benefits to be gained by the Advisor in providing such services, including the investment advisory and shareholder servicing components. The Board also found the investment advisory and management fees to be reasonable in comparison to the fees charged by Advisors to other comparable funds of similar size. As a result, all of the Board Members, including the Independent Board Members, approved the continuation of the Advisory Agreement with respect to the Funds. The Independent Board Members were represented by independent legal counsel who assisted them in their deliberations.
| | | | | | | | | | | | | | | | |
| 298 | | AQR Funds | | | | | | Annual Report | | | | | | December 2013 | | |
| | | | | | | | | | |
Investment Advisor
AQR Capital Management, LLC
Two Greenwich Plaza, 3rd Floor
Greenwich, CT 06830
Sub-Advisor
CNH Partners, LLC
Two Greenwich Plaza, 1st Floor,
Greenwich, CT 06830
Transfer Agent
ALPS Fund Services, Inc.
1290 Broadway, Suite 1100
Denver, CO 80203
Custodian
JPMorgan Chase Bank, N.A.
4 Metro Tech Center
Brooklyn, NY 11245
State Street Bank
and Trust Company
One Lincoln Street
Boston, MA 02111
Distributor
ALPS Distributors, Inc.
1290 Broadway, Suite 1100
Denver, CO 80203
Administrator
J.P. Morgan Investor Services Co.
70 Fargo Street
Boston, MA 02210
Independent Registered Public Accounting Firm
PricewaterhouseCoopers LLP
300 Madison Avenue
New York, NY 10017
You may obtain a description of the AQR Funds proxy voting, policies, procedures and information regarding how each Fund voted proxies relating to portfolio securities during the 12-month period ending June 30th of each year (available by August 31st of that year) without charge, upon request, by calling 1-866-290-2688 or visiting the funds website www.aqrfunds.com, or by accessing the SEC’s website at www.SEC.Gov. Such reports may be reviewed and copied at the SEC’s Public Reference Room in Washington, DC. Information on the operation of the Public Reference Room may be obtained by calling 202-942-8090.
The Fund files complete schedules of the portfolio holdings with the SEC for the first and third quarters on Form N-Q. The Form N-Q is available without charge, upon request, by calling 1-800-SEC-0330, or by accessing the SEC’s website, at www.SEC.Gov. It may also be reviewed and copied at the SEC’s Public Reference Room in Washington, DC.
This report has been prepared for shareholders and may be distributed to others only if preceded or accompanied by an effective prospectus, which includes information regarding the Funds’ objectives and policies, experienced of its management, marketability of shares and other information.
Item 2. Code of Ethics.
| a). | As of the end of the period, December 31, 2013, the Registrant has adopted a code of ethics, as defined in Item 2 of Form N-CSR, that applies to its principal executive officer, principal financial officer, principal accounting officer or controller, or persons performing similar functions. This code of ethics is included as Exhibit 12 (a)(1). |
| c). | There has been no substantive amendments to the Registrant’s Code of Ethics during the fiscal year ended December 31, 2013 (“Reporting Period”). |
| d). | Registrant granted no waivers from the provisions of its Code of Ethics during the Reporting Period. |
Item 3. Audit Committee Financial Expert.
| a). | The Registrant’s Board of Trustees has determined that its Audit Committee has one “audit committee financial expert”, as that term is defined under Items 3(b) and 3(c), serving on its Audit Committee. Mr. L. Joe Moravy, the Registrant’s audit committee financial expert, is “independent”, as that term is defined under Item 3(a)(2). |
Item 4. Principal Accountant Fees and Services.
Aggregate fees for professional services rendered for the AQR Funds by PricewaterhouseCoopers LLP for the years ended December 31, 2012 and December 31, 2013 were:
| | | | | | | | |
| | | 2012 | | | 2013 | |
Audit Fees (a) | | $ | 1,194,300 | | | $ | 1,501,015 | |
Audit Related Fees (b) | | $ | 74,500 | | | $ | 82,500 | |
Tax Fees (c) | | $ | 187,950 | | | $ | 243,700 | |
All Other Fees (d) | | $ | 0 | | | $ | 0 | |
Total: | | $ | 1,456,750 | | | $ | 1,827,215 | |
| (a) | Audit Fees: These fees relate to professional services rendered by PricewaterhouseCoopers LLP for the audits of the Registrant’s annual financial statements or services normally provided by the independent registered public accounting firm in connection with statutory and regulatory filings or engagements. These services include the audits of the financial statements of the Registrant, issuance of consents and assistance with review of documents filed with the SEC. |
| (b) | Audit Related Fees: These fees relate to assurance and related services by PricewaterhouseCoopers LLP that are reasonably related to the performance of the audit of the Registrant’s December 31, 2012 and December 31, 2013 annual financial statements that are not reported under “Audit Fees” above. The audit related services provided by PricewaterhouseCoopers LLP for the year-ended December 31, 2012 and December 31, 2013 relate to services provided in connection with the review of the June 30, 2012 and June 30, 2013 semi-annual financial statements, respectively, review of amendments to the Registrant’s Registration Statement and year-end valuation work. |
| (c) | Tax Fees: These fees relate to professional services rendered by PricewaterhouseCoopers LLP for tax compliance, tax advice and tax planning. The tax services provided by PricewaterhouseCoopers LLP relate to the review of the Registrant’s federal and state income tax returns, excise tax calculations and the completion of an international taxation review. |
| (d) | All Other Fees: These fees relate to products and services provided by PricewaterhouseCoopers LLP other than those reported under “Audit Fees,” “Audit-Related Fees,” and “Tax Fees” above. |
| (e) | Audit Committee Pre-approval Policies and Procedures: |
| | (i) | Per Rule 2-01(c)(7)(A) and the charter of the Registrant’s Audit Committee, the Audit Committee approves and recommends the principal accountant for the Registrant, pre-approves (i) the principal accountant’s provision of all audit and permissible non-audit services to the Registrant (including the fees and other compensation to be paid to the principal accountant), and (ii) the principal accountant’s provision of any permissible non-audit services to the Registrant’s investment adviser (the “Adviser”), sub-adviser or any entity controlling, controlled by, or under common control with any investment adviser or sub-adviser, if the engagement relates directly to the operations of the financial reporting of the Trust. |
| | (ii) | 100% of services described in each of Items 4(b) through (d) were approved by the Audit Committee pursuant to paragraph (c)(7)(A) of Rule 2-01 of Regulation S-X. |
| (f) | Less than 50% of the hours expended on the principal accountant’s engagement to audit Registrant’s financial statements were attributed to work performed by persons other than the accountant’s full-time, permanent employees. |
| (g) | Disclose the aggregate non-audit fees billed by the Registrant’s accountant for services rendered to the Registrant, and rendered to the Registrant’s investment adviser (not including any sub-adviser whose role is primarily portfolio management and is subcontracted with or overseen by another investment adviser), and any entity controlling, controlled by, or under common control with the adviser that provides ongoing services to the Registrant for the fiscal years ended December 31, 2012 and December 31, 2013: $329,724 and $671,340, respectively. |
Item 5. Audit Committee of Listed Registrants.
| (a) | The Registrant is an issuer as defined in Section 10A-3 of the Securities Exchange Act of 1934 and has a separately-designated standing Audit Committee in accordance with Section 3(a)(58)(A) of such Act. All of the Board’s independent Trustees, Timothy K. Armour, William L. Atwell, Gregg D. Behrens, L. Joe Moravy and Brian S. Posner, are members of Audit Committee. |
Item 6. Investments
| (a) | Schedule is included as part of the report to shareholders filed under Item 1 of this Form. |
| (b) | The Registrant made no divestments of securities in accordance with Section 13(c) of the Investment Company Act of 1940. |
Item 7. Disclosure of Proxy Voting Policies and Procedures for Closed-End Management Investment Companies.
Not applicable.
Item 8. Portfolio Managers of Closed-End Management Investment Companies.
Not applicable.
Item 9. Purchases of Equity Securities by Closed-End Management Investment Company & Affiliated Purchasers.
Not applicable.
Item 10. Submission of Matters to a Vote of Security Holders.
Not applicable.
Item 11. Controls and Procedures.
| (a) | The Registrant’s principal executive officer and principal financial officer have concluded, based on their evaluation of the Registrant’s disclosure controls and procedures as conducted within 90 days of the filing date of this report, that those disclosure controls and procedures provide reasonable assurance that the material information required to be disclosed by the Registrant on this report is recorded, processed, summarized and reported within the time periods specified in the Securities and Exchange Commission’s rules and forms. |
| (b) | There have not been any changes in registrant’s control over financial reporting (as defined in Rule 30a-3(d) under the Investment Company Act of 1940) that occurred during the last fiscal quarter of the period covered by this report that has materially affected, or is reasonably likely to materially affect, the registrant’s control over financial reporting. |
Item 12. Exhibits.
| | |
| |
| (a)(1) | | The code of ethics that is the subject of the disclosure required by Item 2 is attached hereto. |
| |
| (a)(2) | | Certifications pursuant to Rule 30a-2(a) under the 1940 Act and Section 302 of the Sarbanes-Oxley Act of 2002 are attached hereto. |
| |
| (a)(3) | | Any written solicitation to purchase securities under Rule 23c-1 under the 1940 Act – Not Applicable. |
| |
| (b) | | Certification required by Rule 30a-2(b) under the 1940 Act and Section 906 of the Sarbanes-Oxley Act of 2002 is attached hereto. |
SIGNATURES
Pursuant to the requirements of the Securities Exchange Act of 1934 and the Investment Company Act of 1940, the Registrant has duly caused this report to be signed on its behalf by the undersigned, thereunto duly authorized.
AQR Funds
| | |
| By: | | /s/ Marco Hanig |
| | Marco Hanig, |
| | Principal Executive Officer |
| | March 5, 2014 |
Pursuant to the requirements of the Securities Exchange Act of 1934 and the Investment Company Act of 1940, this report has been signed below by the following persons on behalf of the Registrant and in the capacities and on the dates indicated.
| | |
| By: | | /s/ Marco Hanig |
| | Marco Hanig, |
| | Principal Executive Officer |
| | March 5, 2014 |
| | |
| By: | | /s/ John Howard |
| | John Howard, |
| | Principal Financial Officer |
| | March 5, 2014 |