UNITED STATES
SECURITIES AND EXCHANGE COMMISSION
Washington, D.C. 20549
FORM N-CSR
CERTIFIED SHAREHOLDER REPORT OF REGISTERED
MANAGEMENT INVESTMENT COMPANIES
Investment Company Act file number: 811-22235
AQR Funds
(Exact name of registrant as specified in charter)
Two Greenwich Plaza, 3rd Floor
Greenwich, CT 06830
(Address of principal executive offices) (Zip code)
Bradley D. Asness, Esq.
Principal and Chief Legal Officer
Two Greenwich Plaza
3rd Floor
Greenwich, CT 06830
(Name and Address of Agent for Service)
Registrant’s telephone number, including area code: 203-742-3600
Date of fiscal year end: December 31
Date of reporting period: January 1, 2011 to December 31, 2011
Item 1. Reports to Shareholders.
The following is a copy of the report transmitted to shareholders pursuant to Rule 30e-1 under the Investment Company Act of 1940 (17 CFR 270.30e-1.)
AQR FUNDS Annual Report December 31, 2011
Table of Contents
Shareholder Letter (Unaudited)

Cliff Asness
Managing & Founding Principal

Ronen Israel
Principal

Oktay Kurbanov
Principal

John Liew
Founding Principal

Lars Nielsen
Principal
Dear Shareholder:
Global equity markets experienced significant headwinds in 2011, particularly during the second half of the year. During the first half of the year, the MSCI World Index (the “Index”) posted a positive return of +5.29%, but this was followed by a sharp decline of -10.29% in the second half of the year. For the full year, the index finished down -5.54%. In particular the third quarter was challenging for markets as we faced not only the resurgence of the European sovereign debt crisis, a crisis surrounding the United States debt ceiling, and the downgrade of the country’s long term credit by Standard and Poor’s, but also a rapidly deteriorating world economic outlook. Not surprisingly, these events were followed by a spike in risk-aversion and a significant deterioration in market sentiment. Towards the end of the year, however, equity markets rebounded after a series of surprisingly strong economic data releases in the US, changing governments in a number of European countries, and a coordinated effort by central banks, particularly the European Central Bank (“ECB”), to support the viability of the financial system. During this period, the AQR Global Equity Fund Class I shares (the “Fund”) returned -6.68% for the year, underperforming its benchmark index by -1.14%.
The Fund is actively managed, and it seeks to outperform its benchmark in three ways: by selecting stocks within each country and by using futures and forwards contracts to over-and under-weight countries and currencies relative to the benchmark. Details on each of the strategies are provided below.
The stock selection strategies had a good year driven by positive performance in the US, continental Europe and Japan. The UK strategy detracted while the Canada strategy was flat for the period. The US strategy performed well in 2011 driven by the momentum, valuation and industry valuation signals, outweighing detraction from industry momentum factors. In continental Europe outperformance came from the positive performance in momentum oriented investment themes, both within and across industries, outweighing negative performance in valuation signals. The positive performance in Japan was mainly driven by valuation and industry valuation signals. The negative performance in the UK was due to valuation and earnings quality signals, outweighing positive performance of momentum factors.
Tactically, we now are underweight value in continental Europe and Japan, while being overweight value in the UK and the US.
The country selection strategy contributed positively to fund performance in 2011. Both value and fundamental momentum added, while price momentum detracted. The high volatility in equity markets was challenging for price momentum, but moves in exchange rates and trade based indicators performed well during 2011. Overall, value performed well in the first half of the year, while momentum based signals contributed in the second half. The third quarter was the only down quarter in the year.
The portfolio’s gains were concentrated in our overweights of the UK and US equity markets. The UK overweight, which was motivated by strong price momentum and
| | | | | | | | | | | | | | | | |
| | AQR Funds | | | | | | Annual Report | | | | | | December 2011 | | 1 |
| | | | | | | | | | |
Shareholder Letter (Unaudited)
attractive valuation, outperformed as the UK equity market proved relatively immune to the eurozone financial and sovereign debt problems. Gains to the US overweight occurred mainly during the third quarter, when US markets held up relatively well in a de-risking environment marked by a global economic slowdown and an escalating crisis in Europe. Germany and France were also positive contributors, primarily because of outperformance during the first half of the year. By contrast, an overweight in Italy detracted from performance as its equity market was hit by a worsening economic outlook and concerns about the country’s ability to finance its national debt. Our positioning in Japan, where we were underweight during the first half of the year, and overweight during the second half, also contributed negatively. Japanese equities rallied early in the year due to positive earnings announcements, but declined during the second half as exporting firms were hurt by an appreciating Japanese Yen.
The UK remains the top overweight position in the portfolio as strong price momentum more than offsets the decline in economic fundamentals and worsening valuation we have seen in recent months. France is now the second-largest overweight based on a combination of attractive value and an improving sentiment view. Improving sentiment is driven by companies in the CAC 40 index experiencing lower deterioration in earnings expectations than companies in other European indices. Meanwhile, Australia continues to be our largest underweight due to expensive valuations and deteriorating fundamentals. The US and Japan are additional underweights. The US positioning is motivated by expensive valuations, while Japanese positioning is driven principally by negative price momentum and a strengthening currency.
We continue to favor European equity markets. Over the recent quarter, our overweight in eurozone countries has moderately increased as we continue to see attractive value opportunities in the region. Valuation spreads across developed equity markets widened over the course of the year, particularly during the third quarter. This widening was caused by a flight to quality associated with de-risking moves, which favored expensive equity markets and hurt cheap ones, especially those in Europe.
The currency selection strategy detracted significantly from fund performance in 2011, as interest rate and price momentum related factors underperformed. Fluctuations in sentiment created risk-on and risk-off moves that prevented clear trends from emerging in currency markets, making momentum trading very challenging. Heightened volatility associated with these moves also created an unfavorable environment for carry trades. In addition, the sharp changes in monetary policy over the year proved a challenging environment for our attempts to predict the direction of interest rates. An example of this is the interest rate increases by the ECB mid-year that were later reversed. Valuation themes had relatively flat performance over the course of the year as we saw mixed performance from our different indicators. Losses were concentrated in the second and third quarters, while we saw some positive contributions at the start and at the end of the year.
Our least successful positions were our underweights in the over-valued Japanese yen and Swiss franc. Both of these low yielding currencies appreciated significantly during the first three quarters of 2011, as investors sought a safe haven from the ongoing European sovereign credit crisis. In response to this move, the Swiss National Bank intervened meaningfully in the currency markets in early September to devalue the currency and effectively cap its exchange rate versus the euro. This caused a reversal in the franc appreciation trend, and resulted in some gains to our short position during the fourth quarter. Similar attempts to intervene by the Bank of Japan proved less successful however, and the yen continued to outperform into the end of the year. One currency that contributed positively throughout the year was the U.S. dollar, which benefited on both an underweight position during the first half, and an overweight during the second half.
Going forward, we see attractive opportunities in the British pound and U.S. dollar, where cheap valuation is coupled with improving fundamentals. We also favor the Scandinavian currencies, which offer high and
| | | | | | | | | | | | | | | | |
| 2 | | AQR Funds | | | | | | Annual Report | | | | | | December 2011 | | |
| | | | | | | | | | |
Shareholder Letter (Unaudited)
improving levels of carry. Conversely, we continue to hold a large underweight in the euro, where the ongoing sovereign credit crisis has driven weakening economic fundamentals, poor price momentum and forced the ECB to lower interest rates. Additionally, we continue to view the Japanese yen and Swiss franc as expensive at current levels, and maintain our underweights in these two currencies.
| | | | | | | | |
AVERAGE ANNUAL TOTAL RETURNS AS OF 12/31/2011 AQR GLOBAL EQUITY FUND PERFORMANCE SINCE COMMENCEMENT OF OPERATIONS AS A MUTUAL FUND | |
| | | 1 Year | | | Since
Inception
(12/31/2009) | |
| Fund - Class I: AQGIX | | | -6.68% | | | | 3.20% | |
| Fund - Class N: AQGNX | | | -7.03% | | | | 2.87% | |
| Fund - Class Y: AQGYX | | | -6.22% | | | | 3.64% | |
| | |
MSCI World Total Return (net of dividends) Index | | | -5.54% | | | | 2.75% | |
Performance data quoted represents past performance and does not guarantee future results. Investment results and principal value of an investment will fluctuate so that an investor’s shares, when redeemed, may be worth more or less than their original cost. Class Y shares are subject to a 0.10% redemption fee. If reflected, the redemption fee would reduce the performance quoted. Current performance may be lower or higher than the performance data quoted. As of the latest prospectus, the gross expense ratio for the Fund’s Class I/N/Y shares are 0.79%, 1.10% and 0.71%, respectively. Call 1-866-290-2688 or visit www.aqrfunds.com for current month-end performance.
|
AQR GLOBAL EQUITY FUND VS. MSCI WORLD TOTAL RETURN INDEX VALUE OF $10,000 INVESTED ON 12/31/09 |
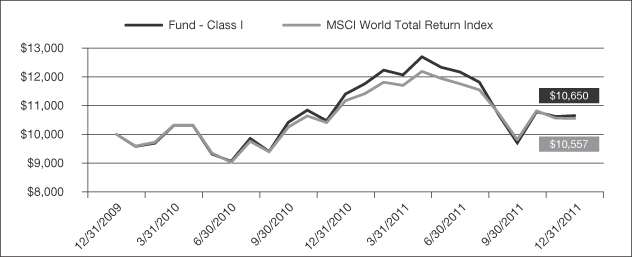
The chart above represents historical performance of a hypothetical investment of $10,000 in the Fund over the past ten years (or since inception if shorter). Performance data quoted represents past performance and does not guarantee future results. Returns shown are total returns, which assume the reinvestment of dividends and capital gains. The table and graph presented above do not reflect the deduction of taxes a shareholder would pay on fund distributions or the redemption of fund shares.
| | | | | | | | | | | | | | | | |
| | AQR Funds | | | | | | Annual Report | | | | | | December 2011 | | 3 |
| | | | | | | | | | |
Shareholder Letter (Unaudited)
| | | | | | | | | | | | | | | | |
AVERAGE ANNUAL TOTAL RETURNS AS OF 12/31/2011 AQR GLOBAL EQUITY FUND PERFORMANCE SINCE INCEPTION OF PREDECESSOR LIMITED PARTNERSHIP | |
| | | 1 Year | | | 3 Year | | | 5 Year | | | Since
Inception
(6/30/2006) | |
| Fund - Class I: AQGIX | | | -6.68% | | | | 11.77% | | | | -3.33% | | | | -0.78% | |
| Fund - Class N: AQGNX | | | -7.03% | | | | 11.41% | | | | -3.65% | | | | -1.11% | |
| Fund - Class Y: AQGYX | | | -6.22% | | | | 12.22% | | | | -2.96% | | | | -0.40% | |
| | | | |
MSCI World Total Return (net of dividends) Index | | | -5.54% | | | | 11.13% | | | | -2.37% | | | | 0.08% | |
Performance data quoted represents past performance and does not guarantee future results. Investment results and principal value of an investment will fluctuate so that an investor’s shares, when redeemed, may be worth more or less than their original cost. Class Y shares are subject to a 0.10% redemption fee. If reflected, the redemption fee would reduce the performance quoted. Current performance may be lower or higher than the performance data quoted. As of the latest prospectus, the gross expense ratio for the Fund’s Class I/N/Y shares are 0.79%, 1.10% and 0.71%, respectively. Call 1-866-290-2688 or visit www.aqrfunds.com for current month-end performance.
|
AQR GLOBAL EQUITY FUND VS. MSCI WORLD TOTAL RETURN INDEX VALUE OF $10,000 INVESTED ON 6/30/06 |
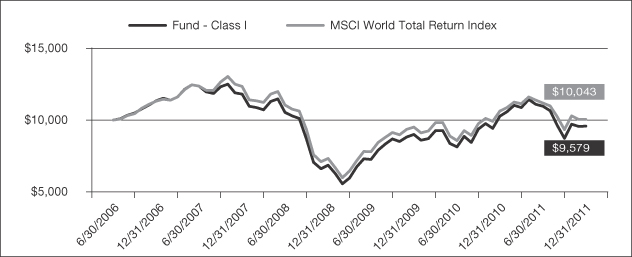
The chart above represents historical performance of a hypothetical investment of $10,000 in the Fund over the past ten years (or since inception if shorter). Performance data quoted represents past performance and does not guarantee future results. Returns shown are total returns, which assume the reinvestment of dividends and capital gains. The table and graph presented above do not reflect the deduction of taxes a shareholder would pay on fund distributions or the redemption of fund shares.
| | | | | | | | | | | | | | | | |
| 4 | | AQR Funds | | | | | | Annual Report | | | | | | December 2011 | | |
| | | | | | | | | | |
Shareholder Letter (Unaudited)
| | |
| AQR INTERNATIONAL EQUITY FUND | | |
Cliff Asness
Managing & Founding Principal
Ronen Israel
Principal
Oktay Kurbanov
Principal
John Liew
Founding Principal
Lars Nielsen
Principal
Dear Shareholder:
International equity markets experienced significant headwinds in 2011, particularly during the second half of the year. During the first half of the year, the MSCI EAFE Index (the “Index”) posted a positive return of +4.98%, but this was followed by a sharp decline of -16.31% in the second half of the year. For the full year, the index finished down -12.14%. In particular the third quarter was challenging for markets as we faced not only the resurgence of the European sovereign debt crisis, a crisis surrounding the United States debt ceiling, and the downgrade of the country’s long term credit by Standard and Poor’s, but also a rapidly deteriorating world economic outlook. Not surprisingly, these events were followed by a spike in risk-aversion and a significant deterioration in market sentiment. Towards the end of the year, however, equity markets rebounded after a series of surprisingly strong economic data releases in the US, changing governments in a number of European countries, and a coordinated effort by central banks, particularly the ECB, to support the viability of the financial system. During this period, the AQR International Equity Fund Class I shares (the “Fund”) returned -15.00% for the year, underperforming its benchmark index by -2.86%.
The Fund is actively managed, and it seeks to outperform its benchmark in three ways: by selecting stocks within each country and by using futures and forwards contracts to over-and under-weight countries and currencies relative to the benchmark. Details on each of the strategies are provided below.
The stock selection strategies had a good year driven by positive performance in continental Europe and Japan, while the UK strategy detracted. In continental Europe, outperformance came from positive performance in momentum oriented investment themes, both within and across industries, outweighing negative performance in valuation signals. The positive performance in Japan was driven mainly by valuation and industry valuation factors, outweighing negative performance in our management signaling theme. The negative performance in the UK was due to valuation signals, both within and across industries, while momentum worked well also both within and across industries.
Tactically, we now are underweight value in continental Europe and Japan, and overweight value in the UK.
The country selection strategy contributed positively to fund performance in 2011 driven by strong performance of valuation signals during the first half of the year in particular. Momentum had a negative contribution as volatile equity markets resulted in losses to our price based signals, though we saw some gains to our fundamental momentum signals based on exchange rates and trade. The third quarter was the only down quarter in the year.
The portfolio’s gains were concentrated in our overweight of the UK equity market, which was motivated by strong price momentum and attractive valuation. The UK was one of the top performing equity markets in the developed world, as it continued to be
| | | | | | | | | | | | | | | | |
| | AQR Funds | | | | | | Annual Report | | | | | | December 2011 | | 5 |
| | | | | | | | | | |
Shareholder Letter (Unaudited)
| | |
| AQR INTERNATIONAL EQUITY FUND | | |
relatively immune to the eurozone financial and sovereign debt problems. Germany and France were also positive contributors, primarily because of outperformance during the first half of the year. By contrast, an overweight in Italy detracted from performance as its equity market was hit by a worsening economic outlook and concerns about the country’s ability to finance its national debt. Our positioning in Japan, where we were underweight during the first half of the year, and overweight during the second half, also contributed negatively. Japanese equities rallied early in the year due to positive earnings announcements, but declined during the second half as exporting firms were hurt by an appreciating Japanese Yen.
The UK remains the top overweight position in the portfolio as strong price momentum more than offsets the decline in economic fundamentals and worsening valuation we have seen in recent months. France is now the second-largest overweight based on a combination of attractive value and an improving sentiment view. Improving sentiment is driven by companies in the CAC 40 index experiencing lower deterioration in earnings expectations than companies in other European indices. Meanwhile, Australia continues to be our largest underweight due to expensive valuations and deteriorating fundamentals. Japan is a modest underweight driven principally by negative price momentum and the strengthening of the Japanese Yen.
We continue to favor European equity markets. Over the recent quarter, our overweight in eurozone countries has moderately increased as we continue to see attractive value opportunities in the region. Valuation spreads across developed equity markets widened over the course of 2011, particularly during the third quarter. This widening was caused by a flight to quality associated with de-risking moves, which favored expensive equity markets and hurt cheap ones, especially those in Europe.
The currency selection strategy detracted significantly from fund performance in 2011, as interest rate and price momentum related factors underperformed. Fluctuations in sentiment created risk-on and risk-off moves that prevented clear trends from emerging in currency markets, making momentum trading very challenging. Heightened volatility associated with these moves also created an unfavorable environment for carry trades. In addition, the sharp changes in monetary policy over the year proved a challenging environment for our attempts to predict the direction of interest rates. An example of this is the interest rate increases by the ECB mid-year that were later reversed. Valuation themes had relatively flat performance over the course of the year as we saw mixed performance from our different signals. Losses were concentrated in the second and third quarters, while we saw some positive contributions at the start and at the end of the year.
Our least successful positions were our underweights in the over-valued Japanese yen and Swiss franc. Both of these low yielding currencies appreciated significantly during the first three quarters of 2011, as investors sought a safe haven from the ongoing European sovereign credit crisis. In response to this move, the Swiss National Bank intervened meaningfully in the currency markets in early September to devalue the currency and effectively cap its exchange rate versus the euro. This caused a reversal in the franc appreciation trend, and resulted in some gains to our short position during the fourth quarter. Similar attempts to intervene by the Bank of Japan proved less successful however, and the yen continued to outperform into the end of the year. The biggest positive contributor was the U.S. dollar, which benefited on an overweight position during the second half.
Going forward, we see attractive opportunities in the British pound and U.S. dollar, where cheap valuation is coupled with improving fundamentals. We also favor the Scandinavian currencies, which offer high and improving levels of carry. Conversely, we continue to hold a large underweight in the euro, where the ongoing sovereign credit crisis has driven weakening economic fundamentals, poor price momentum and forced the ECB to lower interest rates. Additionally, we continue to view the Japanese yen and Swiss franc as expensive at current levels, and maintain our underweights in these two currencies.
| | | | | | | | | | | | | | | | |
| 6 | | AQR Funds | | | | | | Annual Report | | | | | | December 2011 | | |
| | | | | | | | | | |
Shareholder Letter (Unaudited)
| | |
| AQR INTERNATIONAL EQUITY FUND | | |
| | | | | | | | | | | | |
AVERAGE ANNUAL TOTAL RETURNS AS OF 12/31/2011 AQR INTERNATIONAL EQUITY FUND PERFORMANCE SINCE COMMENCEMENT OF OPERATIONS AS A MUTUAL FUND | |
| | | 1 Year | | | Since
9/29/2009 | | | Since
Inception
(8/28/2009) | |
| Fund - Class I: AQIIX | | | -15.00% | | | | -1.84% | | | | na | |
| Fund - Class N: AQINX | | | -15.27% | | | | -2.04% | | | | na | |
| Fund - Class Y: AQIYX | | | -14.66% | | | | -1.45% | | | | 0.15% | |
| | | |
MSCI EAFE Index | | | -12.14% | | | | -1.26% | | | | -0.05% | |
Performance data quoted represents past performance and does not guarantee future results. Investment results and principal value of an investment will fluctuate so that an investor’s shares, when redeemed, may be worth more or less than their original cost. Class Y shares are subject to a 0.10% redemption fee. If reflected, the redemption fee would reduce the performance quoted. Current performance may be lower or higher than the performance data quoted. As of the latest prospectus, the gross expense ratio for the Fund’s Class I/N/Y shares are 1.03%, 3.50% and 0.77%, respectively. Call 1-866-290-2688 or visit www.aqrfunds.com for current month-end performance.
|
AQR INTERNATIONAL EQUITY FUND VS. MSCI EAFE INDEX VALUE OF $10,000 INVESTED ON 9/29/09 |
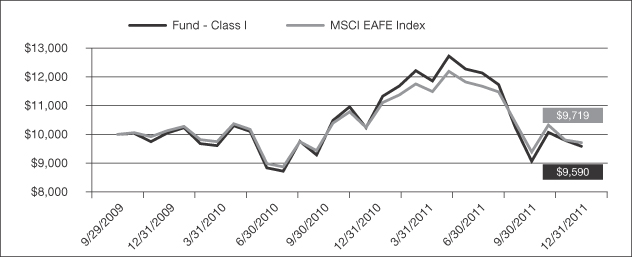
The chart above represents historical performance of a hypothetical investment of $10,000 in the Fund over the past ten years (or since inception if shorter). Performance data quoted represents past performance and does not guarantee future results. Returns shown are total returns, which assume the reinvestment of dividends and capital gains. The table and graph presented above do not reflect the deduction of taxes a shareholder would pay on fund distributions or the redemption of fund shares.
| | | | | | | | | | | | | | | | |
| | AQR Funds | | | | | | Annual Report | | | | | | December 2011 | | 7 |
| | | | | | | | | | |
Shareholder Letter (Unaudited)
| | |
| AQR INTERNATIONAL EQUITY FUND | | |
| | | | | | | | | | | | | | | | |
AVERAGE ANNUAL TOTAL RETURNS AS OF 12/31/2011 AQR INTERNATIONAL EQUITY FUND PERFORMANCE SINCE INCEPTION OF PREDECESSOR LIMITED PARTNERSHIP | |
| | | 1 Year | | | 3 Year | | | 5 Year | | | Since
Inception
(7/31/2004) | |
| Fund - Class I: AQIIX | | | -15.00% | | | | 8.72% | | | | -5.51% | | | | 3.58% | |
| Fund - Class N: AQINX | | | -15.27% | | | | 8.46% | | | | -5.78% | | | | 3.27% | |
| Fund - Class Y: AQIYX | | | -14.66% | | | | 9.10% | | | | -5.17% | | | | 3.95% | |
| | | | |
MSCI EAFE Index | | | -12.14% | | | | 7.65% | | | | -4.72% | | | | 4.01% | |
Performance data quoted represents past performance and does not guarantee future results. Investment results and principal value of an investment will fluctuate so that an investor’s shares, when redeemed, may be worth more or less than their original cost. Class Y shares are subject to a 0.10% redemption fee. If reflected, the redemption fee would reduce the performance quoted. Current performance may be lower or higher than the performance data quoted. As of the latest prospectus, the gross expense ratio for the Fund’s Class I/N/Y shares are 1.03%, 3.50% and 0.77%, respectively. Call 1-866-290-2688 or visit www.aqrfunds.com for current month-end performance.
|
AQR INTERNATIONAL EQUITY FUND VS. MSCI EAFE INDEX VALUE OF $10,000 INVESTED ON 7/31/2004 |

The chart above represents historical performance of a hypothetical investment of $10,000 in the Fund over the past ten years (or since inception if shorter). Performance data quoted represents past performance and does not guarantee future results. Returns shown are total returns, which assume the reinvestment of dividends and capital gains. The table and graph presented above do not reflect the deduction of taxes a shareholder would pay on fund distributions or the redemption of fund shares.
| | | | | | | | | | | | | | | | |
| 8 | | AQR Funds | | | | | | Annual Report | | | | | | December 2011 | | |
| | | | | | | | | | |
Shareholder Letter (Unaudited)
| | |
| AQR DIVERSIFIED ARBITRAGE FUND | | |
Ronen Israel
Principal

Mark Mitchell, Ph.D.
Founding Principal, CNH Partners
Lars Nielsen
Principal

Todd Pulvino, Ph.D.
Founding Principal, CNH Partners
Dear Shareholder:
The Diversified Arbitrage Fund Class I returned 0.99% during the 2011 calendar year. During the corresponding period, the BofA Merrill Lynch 3 Month Treasury Bill Index (the Fund’s benchmark) returned 0.10% and the S&P 500 returned 2.11%. Based on monthly return data, the Fund’s equity market beta (relative to the S&P 500) since inception (January 15, 2009) through December 31, 2011 is 0.06 and its annualized volatility is 2.8%.
Arbitrage strategies involving corporate securities were stable through the first half of 2011. However, beginning in early August, increased uncertainty involving European sovereign debt caused an increase in risk aversion and a commensurate widening of arbitrage spreads. Spread widening first affected the merger market and was likely exacerbated by redemption-related selling by one or more large merger arbitrage hedge funds. This resulted in a doubling of annualized merger spreads, from roughly 5% to more than 10%. Cheapening in the convertible bond market followed approximately one month later as long-only convertible funds and Wall Street trading desks reduced their convertible exposures. By the end of 2011, the discount of convertible bonds relative to their theoretical values was in the 90th percentile.
The Fund invests in multiple arbitrage and alternative investment strategies, and tactically allocates to strategies based on relative attractiveness. The long-run strategic allocations to merger arbitrage, convertible arbitrage, and event arbitrage are 33% each. However, as displayed in the table below, strategy weights have varied significantly since the Fund’s inception. For example, the allocation to merger arbitrage decreased to 23% at the end of 2010 and subsequently rebounded to 35% by year-end 2011. Other notable changes in strategy weights during the year include a reduction in credit-related trades reflecting fewer corporate bond issuances and a reduction in secondary market trading, a reduction in dual-class arbitrage trades caused by tightening dual-class spreads, a reduction in price-pressure trades caused by abnormally low corporate security issuance, and an increase in SPAC (Special Purpose Acquisition Corporations) holdings resulting from increased activity in the SPAC IPO market. While the convertible arbitrage strategy displays only minor year-end variations, as discussed below, intra-year variations have been significant.
| | | | | | | | | | | | | | | | |
| | AQR Funds | | | | | | Annual Report | | | | | | December 2011 | | 9 |
| | | | | | | | | | |
Shareholder Letter (Unaudited)
| | |
| AQR DIVERSIFIED ARBITRAGE FUND | | |
| | | | | | | | | | | | |
ARBITRAGE STRATEGY WEIGHTS
AS PERCENTAGE OF TOTAL LONG MARKET VALUE | |
| Strategy | | 12/31/09 | | | 12/31/10 | | | 12/31/11 | |
| Convertible Arbitrage | | | 44% | | | | 38% | | | | 36% | |
| Merger Arbitrage | | | 34% | | | | 23% | | | | 35% | |
| Credit | | | 1% | | | | 15% | | | | 10% | |
| Dual-Class Arbitrage | | | 12% | | | | 8% | | | | 5% | |
| Price Pressure | | | 4% | | | | 6% | | | | 1% | |
| SPACs | | | 1% | | | | 3% | | | | 6% | |
| Private Investment in Public Equity (“PIPEs”) | | | 0% | | | | 3% | | | | 2% | |
| Closed-End Fund Arbitrage | | | 2% | | | | 0% | | | | 2% | |
| Other Arbitrage and Alternative Investment Strategies | | | 2% | | | | 4% | | | | 3% | |
As measured by the percentage of long market value, convertible arbitrage continues to have the largest strategy weight. Convertible arbitrage involves the purchase of a convertible security at a price below its fundamental or intrinsic value, and the contemporaneous hedging of the convertible’s risk via shorting the underlying stock. In addition to hedging equity risk, convertible arbitrage investments often require hedging of credit and interest rate risk. With a fully hedged position, the arbitrageur profits when the difference between the convertible security’s fundamental value and its traded value converges. As discussed in prior letters, the convertible bond market unraveled during the 2008 financial crisis causing convertible bonds to trade at significant discounts to fundamental values. As financial markets stabilized in 2009, convertibles richened and as of mid-2011, the median discount of convertible prices relative to their theoretical values was roughly at the long-term historical average. In response to systematic richening in the convertible market, we took two actions. First, we reduced the Fund’s allocation to convertible arbitrage. Second, we repositioned the convertible portfolio to hold equity-sensitive convertibles where the equity short provides a direct hedge to the long convertible position. Both of these actions helped to insulate the Fund from losses during the second half of 2011 when convertible securities cheapened considerably as the European sovereign risk crisis unfolded. Although bond cheapening causes losses even if positions are perfectly hedged (this is essentially the definition of “cheapening”), cheapening episodes are often accompanied by unexpectedly high volatility in the underlying stocks. Because of the convexity inherent in a convertible security’s structure, this volatility allows the arbitrageur to create trading profits as the convertible’s hedge ratio changes with stock price changes. That is, as the stock price underlying the convertible security falls, the arbitrageur reduces the short position by buying stock (buy low) and as the stock price rises, the arbitrageur increases the short position by selling stock (sell high). These trading profits are more likely to be obtained with equity-sensitive convertible bonds where the equity option embedded in the convertible security comprises more of the bond’s value. Whereas, convertible arbitrage funds, as reported by various hedge-fund indices, suffered portfolio losses in 2011, the Fund actually profited. Convertible arbitrage contributed -0.01% to the Fund’s return in the second half of 2011 and contributed +0.32% to the Fund’s return for the year. Importantly, in light of the substantial cheapening that occurred due to selling by long-only holders and by Wall Street market makers, the Fund’s year-end portfolio of hedged convertible securities are attractively cheap relative to historical measures.1
Merger arbitrage involves the assumption of deal failure risk following publicly announced mergers and acquisitions. The most common merger arbitrage trade involves the purchase of the target company’s
| 1 | It is important to note that the Fund’s investment in a convertible bond is based on the cheapness of the bond relative to its fundamental value rather than on a view about the underlying stock price. Specifically, we hedge our long position and attempt to capture the cheapness of the convertible by shorting the stock of the underlying issuer, and by hedging systematic credit and interest rate risk. |
| | | | | | | | | | | | | | | | |
| 10 | | AQR Funds | | | | | | Annual Report | | | | | | December 2011 | | |
| | | | | | | | | | |
Shareholder Letter (Unaudited)
| | |
| AQR DIVERSIFIED ARBITRAGE FUND | | |
equity. Depending on the structure of the transaction, additional trades are used to hedge market and industry risk. For example, in a merger where the consideration is the acquirer’s stock, the Fund seeks to hedge market and industry exposure by shorting the stock of the acquiring company in an amount based on the exchange ratio specified in the merger agreement. Conditions for investing in merger arbitrage are especially attractive when deal spreads (the percentage difference between the consideration offered by the acquiring firm and the stock price of the target firm) are wide and when merger activity is robust. The Fund began 2011 with a low weight in merger arbitrage, a result of the large number of merger closings in December 2010.2 Because of strong deal flow at the beginning of 2011, the Fund quickly increased its allocation to merger arbitrage back to long-term target levels. During the third quarter of 2011, annualized merger spreads, which began the year around 5%, more than doubled to over 10%. This was caused by significant selling in the merger market in part caused by greater fundamental risk related to increased macroeconomic uncertainty but also caused by redemption-induced selling by some large funds. In our view, since spread widening was in excess of that due solely to declining fundamentals, the Fund increased its exposure to merger arbitrage to 40% during the fourth quarter. By year-end, merger deal spreads had contracted to their beginning-of-year levels. Overall, the Fund realized +0.95% from the merger arbitrage strategy for the year, a result of a substantial number of investable mergers, frequent increased offers, few adverse merger failures, and the tactical allocation towards merger arbitrage when spreads widened during the third quarter. Looking forward to 2012, we expect merger activity and spreads to be similar to those observed in 2011.
As shown in the table above, within the credit event driven/alternative investments category, credit has the largest sub-strategy weight at 10% of total long market value. The credit sub-strategy consists primarily of short-term (average duration of 12-15 months) corporate debentures. Historically, as we have documented using our proprietary corporate debenture database, short-dated corporate debentures, particularly in the high-yield arena, produce excess returns after accounting for systematic credit and interest rate risk. We postulate that the reason for the excess returns is that fixed-income investors often choose to exchange short-term debentures for longer-term debentures in order to generate higher-expected returns associated with bearing greater systematic credit risk. We focus on short-dated debentures issued by companies that have stable near-term cash flow and sufficient assets to retire the debenture at maturity. We view this trade as similar to a long-dated cash merger trade, but one in which the downside is contractually protected by the underlying indenture. This is not to say that the trade is absent risk. Rather, the systematic component of risk is minimal, a direct result of the short-dated nature of the investments. Our analysis using our proprietary database shows that the modest systematic credit and interest rate risk that remains can be hedged at the portfolio level using credit default swaps and Treasury futures. The Fund’s exposure to Credit declined in 2011 from 15% as of year-end 2010 because of a reduction in the issuance of new debentures which resulted in a contraction in portfolio rebalancing by investors that choose to exchange short-term debentures for newly issued longer-term debentures.
The second largest sub-strategy within the event-driven/alternative investment category is SPACs. SPACs are corporations that raise cash through an initial public offering, and place the cash in a trust to be used to acquire an operating company. The number of SPAC initial public offerings has increased during the past year allowing the Fund to increase its exposure from 3% a year ago to its current 6%. Because SPAC assets are held in trust accounts invested in Treasury securities while the SPAC sponsors search for assets to acquire, these investments have very little risk. On the low side, SPACs will generate Treasury bill returns. However, if the SPAC sponsor finds a good acquisition at a great price, the embedded call option on the acquisition target provides significant upside to SPAC investors.
| 2 | It is not uncommon for a disproportionate number of pending mergers to close in December as merging companies often prefer to avoid having multiple legal entities in the ensuing year. |
| | | | | | | | | | | | | | | | |
| | AQR Funds | | | | | | Annual Report | | | | | | December 2011 | | 11 |
| | | | | | | | | | |
Shareholder Letter (Unaudited)
| | |
| AQR DIVERSIFIED ARBITRAGE FUND | | |
Dual-class arbitrage represents the third largest sub-strategy within the event-driven/alternative investment category. Dual-class arbitrage involves trading two classes of stocks issued by the same firm where each class has identical rights to the underlying cash flows of the firm. When the prices of the two classes of stock diverge, buying the low-price share class and shorting the high-price share class generates excess returns on average. In addition, because the dual-class arbitrage strategy has a negative beta, it helps to reduce the systematic equity market risk in the portfolio. As dual-class spreads tightened during the year, the Fund reduced its exposure to dual-class arbitrage from 8% to 5%.
Other sub-strategies (price pressure, PIPEs, closed-end-funds, and other arbitrage and alternative investments) collectively account for 8% of the Fund’s portfolio. The price pressure sub-strategy saw a reduction in exposure from 6% to 1%, a direct result of the decrease in corporate security issuances, particularly in the convertible market. The event-driven/alternative investments category contributed -0.19% to the Fund’s return in 2011, with positive contributions from credit, SPACs, and closed-end-fund arbitrage, offset by negative contributions from dual-class arbitrage, price pressure and other arbitrage and alternative investments.
Overall, the Fund realized a modest +0.99% return in 2011. As of year-end, arbitrage markets in corporate securities are largely stable, especially in the context of current worldwide economic and financial uncertainty. An exception is convertible arbitrage. As noted above, convertible securities are trading well below fundamental values relative to historical levels as a result of widespread selling by long-only holders and by Wall Street market makers seeking to reduce their inventories of convertibles in response to changing regulations and increased macro-economic uncertainty. As of year-end, strategy weights are near long-run expected levels. We anticipate increasing the exposure to convertible arbitrage, however, our ability to do so is constrained by the weak new-issue market and thin secondary market trading. In addition, our leverage is constrained as a 40-Act fund which forces us to focus on less equity-sensitive convertibles that are slightly cheaper but less efficiently hedged. We are exploring various ways to loosen this leverage constraint to allow us to increase the Fund’s exposure in well-hedged equity sensitive convertibles. With respect to the merger market, predicting the deal pipeline with any degree of reliability is difficult due to shocks from the macro-economic environment. If anything, we expect a continuation of the current environment, that is, a steady but less than robust flow of high-quality mergers and somewhat tight spreads and roughly average expected returns. Opportunities in event-driven/alternative investments will depend on the level of corporate activity related to new capital issues and restructuring events. Importantly, irrespective of where the Fund deploys capital in 2012, we will continue to hedge systematic equity, credit, and interest rate risk, with the intention of delivering uncorrelated positive returns.3
| 3 | Note that the Fund utilizes various derivatives instruments (e.g., futures, options, forwards, and swaps), primarily to hedge against systematic risks including credit risk and interest rate risk. While the purpose of employing derivatives instruments is to decrease the Fund’s overall risk, hedging instruments are imperfect tools and their success depends on the degree of price correlation between the derivative instruments and the assets being hedged. Imperfect correlation may be caused by several factors, including temporary price disparities between derivative markets and markets for the underlying assets. |
| | | | | | | | | | | | | | | | |
| 12 | | AQR Funds | | | | | | Annual Report | | | | | | December 2011 | | |
| | | | | | | | | | |
Shareholder Letter (Unaudited)
| | |
| AQR DIVERSIFIED ARBITRAGE FUND | | |
| | | | | | | | |
AVERAGE ANNUAL TOTAL RETURNS AS OF 12/31/2011 AQR DIVERSIFIED ARBITRAGE FUND | |
| | | 1 Year | | | Since
Inception
(1/15/2009) | |
| Fund - Class I: ADAIX | | | 0.99% | | | | 5.03% | |
| Fund - Class N: ADANX | | | 0.68% | | | | 4.71% | |
| | |
Merrill Lynch 3-Month T-Bill Index | | | 0.10% | | | | 0.15% | |
Performance data quoted represents past performance and does not guarantee future results. Investment results and principal value of an investment will fluctuate so that an investor’s shares, when redeemed, may be worth more or less than their original cost. Current performance may be lower or higher than the performance data quoted. As of the latest prospectus, the gross expense ratio for the Fund’s Class I/N shares are 2.63% and 2.93%, respectively. Call 1-866-290-2688 or visit www.aqrfunds.com for current month-end performance.
| | | | | | | | |
AQR DIVERSIFIED ARBITRAGE FUND VS MERRILL LYNCH 3-MONTH T-BILL INDEX VALUE OF $10,000 INVESTED ON 1/15/2009 |
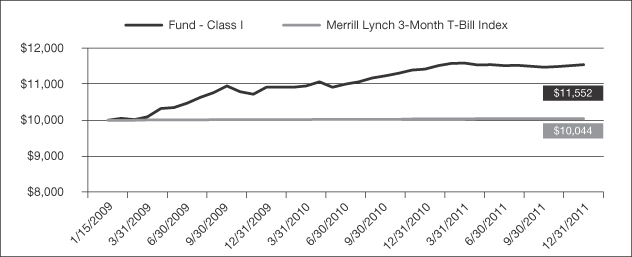
The chart above represents historical performance of a hypothetical investment of $10,000 in the Fund over the past ten years (or since inception if shorter). Performance data quoted represents past performance and does not guarantee future results. Returns shown are total returns, which assume the reinvestment of dividends and capital gains. The table and graph presented above do not reflect the deduction of taxes a shareholder would pay on fund distributions or the redemption of fund shares.
| | | | | | | | | | | | | | | | |
| | AQR Funds | | | | | | Annual Report | | | | | | December 2011 | | 13 |
| | | | | | | | | | |
Shareholder Letter (Unaudited)
| | |
| AQR MANAGED FUTURES STRATEGY FUND | | |
Cliff Asness
Managing & Founding Principal
John Liew
Founding Principal

Brian Hurst
Principal

Yao Hua Ooi
Principal
Dear Shareholder:
In 2011, the Fund’s Class I shares returned -6.37% and realized an annualized volatility of 9.0%. During this same period, the BofA Merrill Lynch 3 Month Treasury Bill Index (the Fund’s benchmark) returned 0.10%. The Barclay BTOP50 index, which contains 28 of the largest Managed Futures hedge funds by AUM, was down -4.11% over this same period. The Fund’s assets grew to $1.6 B by the end of December, reflecting strong investor demand for an actively run managed futures fund in the mutual fund space.
The Fund invests both long and short across a portfolio of futures contracts and futures-related instruments, utilizing more than 100 contracts across four major asset classes: commodities, currencies, fixed income, and equity markets. The Fund pursues a trend-following strategy, and as such, it tends to perform well when there are persistent trends in markets and suffers when there is a lack of trends or when trends reverse sharply. In 2011, the Fund realized gains in fixed income markets, benefiting from a consistent decline in global interest rates throughout the year. Those gains were offset by losses in equity, currency, and commodity markets, where choppy markets and sharp reversals resulted in losses for trend following strategies. For example, global equity and commodity markets declined sharply in mid-March following the Japanese earthquake, only to rebound back strongly by the end of the month, leading to losses for short-term trend-following strategies. In the third quarter of 2011, there was a reversal in long-standing bullish trends in equities, commodities and carry-sensitive currencies due to the European sovereign debt crisis, which led to losses for long-term trend following strategies. Additionally, both short-term and long-term trend following strategies suffered losses in October, as risky markets rebounded very sharply following bearish trends that had been building up throughout Q3.
By design, the Fund tactically changes the amount of risk it takes in pursuing trends across the four major asset classes depending on the relative attractiveness of the trend-following opportunities within each asset class. The Fund will invest more in an asset class when there are perceived strong trends across many assets within that particular asset class. The Fund began the year with a reduced allocation to fixed income, and ended the year with its largest risk allocation in fixed income and commodities.
| | | | | | | | | | | | | | | | |
| 14 | | AQR Funds | | | | | | Annual Report | | | | | | December 2011 | | |
| | | | | | | | | | |
Shareholder Letter (Unaudited)
| | |
| AQR MANAGED FUTURES STRATEGY FUND | | |
In addition, the Fund also tactically changes the level of risk it targets depending on the strength and correlation of trends across the four asset classes. The Fund started 2011 targeting 13% annualized volatility (the maximum ex-ante risk the Fund will target), as there were strong and correlated trends in equity, risk currency, and commodity markets following the strong performance of those markets in late 2010. The Fund reduced its risk target over May and June as the performance of different markets diverged, and did not take risk back up until September. The Fund ended the year at a reduced target of 7% annualized volatility. Below is a summary of the asset class risk exposures throughout 2011:
| | | | | | | | | | | | | | | | | | | | |
Asset Class Exposure
(% of Risk Allocation) | |
| | | 12/31/2010 | | | 3/31/2011 | | | 6/30/2011 | | | 9/30/2011 | | | 12/31/2011 | |
| Fixed Income | | | 7% | | | | 15% | | | | 30% | | | | 28% | | | | 30% | |
| Commodities | | | 32% | | | | 16% | | | | 13% | | | | 19% | | | | 32% | |
| Currencies | | | 29% | | | | 39% | | | | 38% | | | | 22% | | | | 17% | |
| Equities | | | 32% | | | | 30% | | | | 19% | | | | 31% | | | | 21% | |
Within each of the asset classes, the fund pursues short-term trend strategies, long-term trend strategies and over-extended trend strategies. Overall, short-term trend strategies were slightly positive in 2011. Within short term trend strategies, the shorter horizon signals (a month or less) performed very poorly, while longer horizon signals (around three months) performed very well. Long-term trend strategies performed poorly, detracting in every asset class outside of fixed income. Long-term trend following strategies were particularly hurt in Q3, when long-standing bullish trends in a number of markets reversed sharply. The over-extended trend strategies helped dampen volatility and even added to performance over this period, especially in commodities, where the Fund’s long exposures were reduced on long-term overextended trend indicators.
The Fund gained 7.0% in the fixed income markets in 2011. The Fund started the year with small long positions in most fixed income instruments. The first quarter saw fixed income losses, as optimism about economic recovery led to increases in global bond yields. However, sovereign debt fears resurfaced and macro fears led to worldwide yield declines over the course of the rest of the year, especially in the third quarter. By the end of the year, central banks such as the European Central Bank (“ECB”) and Reserve Bank of Australia (“RBA”) were cutting interest rates and turning increasingly dovish. The Fund benefitted from these yield declines as it increased its fixed income longs throughout the year.
The Fund lost -6.8% in equities in 2011. The Fund suffered losses in long term trend following signals, particularly in the third quarter when equity markets dropped sharply following a choppy but generally up-trending period over the prior 12 months. Short term trend signals did not help to mitigate the losses, as uncertainty over the year led to very choppy markets. The largest losses were in European countries, where worries over the sovereign debt crisis alternating with proposed solutions to the crisis led to extreme choppiness in those markets.
The Fund lost -4.0% in currencies over the course of the year. Most of the losses came in the third quarter, when risk aversion led to a strong carry unwind, as growing economies which had started to raise interest rates saw their currencies depreciate relative to low yielding (or safe-haven) currencies like the U.S. Dollar, Japanese Yen, and Swiss Franc. The Fund lost money over the quarter due to long positions in high carry, high growth currencies as well as from U.S. Dollar strengthening. Over the course of the year, the Swiss
| | | | | | | | | | | | | | | | |
| | AQR Funds | | | | | | Annual Report | | | | | | December 2011 | | 15 |
| | | | | | | | | | |
Shareholder Letter (Unaudited)
| | |
| AQR MANAGED FUTURES STRATEGY FUND | | |
Franc and British Pound were large positive contributors, while the Fund suffered losses in the Swedish Krona, Japanese Yen, Norwegian Krone, and the Euro.
In commodities, the Fund lost -2.6% in 2011. The Fund profited from a bearish trend in natural gas and bullish trends in gold, and brent crude oil, but lost money in the agricultural commodities, industrial metals, and the other energies. Commodities markets generally suffered from choppiness, for example exhibiting sharp sell-offs in the first week of May and in September. Long term overextended trend signals helped to mitigate some of those losses
The Fund’s performance in 2011 was disappointing. While we are always disappointed by negative performance, the Fund did behave as expected in this environment. Trend following strategies tend to do poorly in sharp reversals and choppy markets, which characterized the markets this year. However, losses were mitigated by the Fund’s construction which emphasizes diversification across assets, asset classes, and signals. In particular, strong trends in fixed income markets helped to offset the losses from trend following in other markets. Short-term trend-following and overextended strategies were positive throughout the year, helping offset losses from long-term trend following. We continue to pursue a risk-balanced approach in investing across the major asset classes, and trust that doing so will benefit the Fund in the long-run.
| | | | | | | | |
AVERAGE ANNUAL TOTAL RETURNS AS OF 12/31/2011 AQR MANAGED FUTURES STRATEGY FUND | |
| | | 1 Year | | | Since
Inception
(1/6/2010) | |
| Fund - Class I: AQMIX | | | -6.37% | | | | -0.66% | |
| Fund - Class N: AQMNX | | | -6.59% | | | | -0.91% | |
| | |
Merrill Lynch 3-Month T-Bill Index | | | 0.10% | | | | 0.12% | |
Performance data quoted represents past performance and does not guarantee future results. Investment results and principal value of an investment will fluctuate so that an investor’s shares, when redeemed, may be worth more or less than their original cost. Current performance may be lower or higher than the performance data quoted. As of the latest prospectus, the gross expense ratio for the Fund’s Class I/N shares are 1.28% and 1.56%, respectively. Call 1-866-290-2688 or visit www.aqrfunds.com for current month-end performance.
| | | | | | | | | | | | | | | | |
| 16 | | AQR Funds | | | | | | Annual Report | | | | | | December 2011 | | |
| | | | | | | | | | |
Shareholder Letter (Unaudited)
| | |
| AQR MANAGED FUTURES STRATEGY FUND | | |
| | | | | | | | |
AQR MANAGED FUTURES STRATEGY FUND VS. MERRILL LYNCH 3-MONTH T-BILL INDEX VALUE OF $10,000 INVESTED ON 1/6/10 |
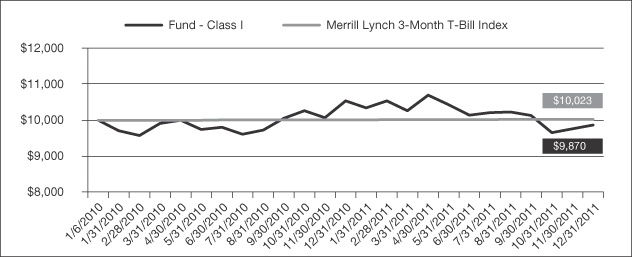
The chart above represents historical performance of a hypothetical investment of $10,000 in the Fund over the past ten years (or since inception if shorter). Performance data quoted represents past performance and does not guarantee future results. Returns shown are total returns, which assume the reinvestment of dividends and capital gains. The table and graph presented above do not reflect the deduction of taxes a shareholder would pay on fund distributions or the redemption of fund shares.
| | | | | | | | | | | | | | | | |
| | AQR Funds | | | | | | Annual Report | | | | | | December 2011 | | 17 |
| | | | | | | | | | |
Shareholder Letter (Unaudited)
John Liew
Founding Principal
Brian Hurst
Principal

Michael
Mendelson
Principal
Yao Hua Ooi
Principal
Dear Shareholder:
On December 31, 2011, the AQR Risk Parity Fund completed its first full fiscal year. From December 31, 2010 through December 31, 2011, the Fund’s Class I shares returned +5.45% and realized an annualized volatility of 8.24%. During this same period, the Fund’s benchmark the BofA Merrill Lynch 3 Month Treasury returned 0.10% and a 60/40 benchmark consisting of 60% S&P 500 Index/40% Barclays U.S. Aggregate Bond Index returned 5.19% at an average realized volatility of 13.21%. The Fund’s net assets across all share classes grew to $389 million by the end of 2011.
Through the use of derivatives such as futures and swaps, the Fund invests across a wide variety of global markets, including: developed and emerging market equities, fixed income and currencies, global credit (corporate, government, and mortgage), and commodities in an attempt to build a truly diversified portfolio where all asset classes matter, but no one asset class matters too much. Risk Parity investing involves allocating investments by risk which means that instruments which have lower risk will generally be allocated larger capital than instruments which are deemed more risky. As markets move through different risk regimes, the portfolio is dynamically adjusted to help keep the overall portfolio risk and balance of risks across asset classes fairly steady through time. We believe this leads to more consistent results, reduces tail risk associated with investments in the capital markets, and enables the investor to remain invested through more difficult market environments.
In addition to varying position sizes to control for increasing or decreasing risk expectations, we also overlay modest portfolio tilts based on AQR’s proprietary expected return models, which include signals based on carry, momentum, valuation, and other important economic variables. These views determine over- and underweights across a broad array of global markets. The ultimate goal is to build a portfolio that in the long run will deliver higher returns at a risk level similar to that of traditional portfolios by combining a better asset allocation with return-boosting tactical tilts. The Fund will remain long all of the markets in which we invest while averaging a moderate (under 0.5 on average) beta to the stock market over a full market cycle.
The targeted annualized volatility for the Fund is 10%, on average, which varies modestly over time based on our perceptions of tactical opportunities within the different asset classes we trade. Over the first half of the year, our tactical signals indicated an attractive environment for all four major risk premia in the Fund. In addition, our estimates of market risk were moderate, leading to Fund exposure levels that were higher than normal.
The resurgence of European sovereign concerns in the third quarter led to a big increase in volatility of all risky assets, and our tactical models picked up on the negative trends in equities and commodities, leading to a more bearish stance on those markets. As a result, we reduced exposures in all asset classes during the third
| | | | | | | | | | | | | | | | |
| 18 | | AQR Funds | | | | | | Annual Report | | | | | | December 2011 | | |
| | | | | | | | | | |
Shareholder Letter (Unaudited)
quarter, with the largest reductions in equities and credit. Overall, Fund exposures were reduced by about one-third over the third quarter. Due to persisting higher volatility in equities, credit, and commodities, exposure levels remained low toward the end of the year. In order to maintain portfolio risk at a steady target, the Fund moved from a 0.45 beta versus the S&P 500 Index in the second quarter to a 0.20 beta in the third and fourth quarters. However, given the recovery in markets in the fourth quarter, the Fund ended the year with bullish tilts toward fixed-income, credit, and equities and a bearish tilt toward commodities.
The Fund experienced gains in only two of the four major asset class buckets for the full year. To a net return of 5.4% for 2011, fixed income contributed 10.1%, inflation-linked assets contributed 1.7%, equities detracted -3.5%, and credit assets detracted -3.1%. Returns to cash in the portfolio added another 0.1%. The tactical tilts we made in the Fund added to returns in fixed income and credit, but detracted in equities and inflation, on net adding 0.1% to the Fund’s return. Like risk, returns for the year were shaped heavily by the declining global economic outlook and fiscal problems in the European periphery. These dual trends took hold in the third quarter, generating poor returns for nearly all risky assets, especially for markets outside the U.S.
In the equity bucket, the Fund was tactically overweight equities through the first half due to short- and long-term momentum signals. With the global market declines and rising volatility in August, we trimmed notional positions by over 50%, largely driven by higher estimates of equity volatility, and partially due to increasingly bearish views in our trend-following signals. Despite the rapid reduction in position size through August, third quarter equities losses were still large enough to outweigh gains from the rest of the year. Our tactical tilts in equities detracted for the year, with a -0.6% return to trend-following strategies and -0.3% return to macro timing strategies. Both tactical tilts were hurt by overweights in equities going into the third quarter based on positive momentum in both prices and fundamental economic data up to that point. Capital allocation to equities rose slightly from the lows of August, but still finished the year well below our expected long-term average due to elevated risk expectations.
In the nominal bond bucket, the Fund entered the year with a weak tactical overweight on bonds that grew stronger through the year based mostly on positive price trends. Nominal rates continued to fall in the second half as economic news turned more negative and central banks coordinated to provide greater liquidity to markets. Tactical overweights to bonds from asset-timing and trend-following models contributed 1.3% to performance, mostly in the second and third quarters. Relative value trades in fixed-income were flat for the year. The Fund finished the year bullish on fixed-income, and especially bullish on Japanese bonds due to positive price momentum. U.K. gilts were underweight at year-end due to high relative valuation.
In the inflation bucket, the Fund began the year with an overweight on commodities based on strong macroeconomic growth indicators as well as positive market momentum. This contributed modestly to performance in the first quarter as improving economic forecasts and political turmoil in the Middle East pushed most commodity sectors higher, but detracted heavily during the third quarter as assets sensitive to macro economic growth declined. For the year, commodities detracted 1.7% from Fund performance, of which 0.3% was due to poor trend-following performance. The Fund ended the year with a tactical underweight in commodities driven by deteriorating global economic growth. Inflation-linked bonds performed well throughout the year, contributing 3.5%, as real rates fell in the U.S., UK, and France on expectations of lower growth.
In the credit bucket, the Fund suffered from large losses during the third quarter as credit spreads widened drastically and emerging market currencies fell in value. A strong fundamental environment for credit spreads and positive credit market momentum led us to overweight high yield credit at the start of
| | | | | | | | | | | | | | | | |
| | AQR Funds | | | | | | Annual Report | | | | | | December 2011 | | 19 |
| | | | | | | | | | |
Shareholder Letter (Unaudited)
the year. Although notional exposure to credit assets fell nearly 60% due to rising risk estimates in the third quarter’s resurgence of European debt worries, we maintained a tactical overweight on high yield debt due to attractive spreads and strong corporate balance sheets through the end of the year. While our tactical overweight to high yield credit hurt us throughout the year, we benefited from tactical underweights to emerging currencies and commercial mortgage backed spreads throughout the year.
This has been a good first full year for the Fund, as it managed to beat the benchmark’s return at a much lower level of volatility. We believe the Fund’s especially strong relative performance in the third quarter’s adverse environment showed the benefits of broad risk-based diversification and volatility targeting. We remain significantly concerned about the health of the European economy and, in particular, its financial system. Further, the potential global spillover effects of a bad resolution of the current crisis adds risk to all markets, something we believe is reflected in our current elevated risk estimates. We remain confident, however, that the diversification of a risk parity approach provides a sound allocation for the unusually wide variety of potential market environments we may face in the coming year.
| | | | | | | | |
AVERAGE ANNUAL TOTAL RETURNS AS OF 12/31/2011 AQR RISK PARITY FUND |
| | | | | | | | |
| | | 1 Year | | | Since
Inception
(9/29/2010) | |
| Fund - Class I: AQRIX | | | 5.45% | | | | 7.62% | |
| Fund - Class N: AQRNX | | | 5.12% | | | | 7.27% | |
| | |
Merrill Lynch 3-Month T-Bill Index | | | 0.10% | | | | 0.12% | |
Performance data quoted represents past performance and does not guarantee future results. Investment results and principal value of an investment will fluctuate so that an investor’s shares, when redeemed, may be worth more or less than their original cost. Current performance may be lower or higher than the performance data quoted. As of the latest prospectus, the gross expense ratio for the Fund’s Class I/N shares are 3.80% and 3.96%, respectively. Call 1-866-290-2688 or visit www.aqrfunds.com for current month-end performance.
| | | | | | | | | | | | | | | | |
| 20 | | AQR Funds | | | | | | Annual Report | | | | | | December 2011 | | |
| | | | | | | | | | |
Shareholder Letter (Unaudited)
|
AQR RISK PARITY FUND VS. MERRILL LYNCH 3-MONTH T-BILL INDEX VALUE OF $10,000 INVESTED ON 9/30/10 |
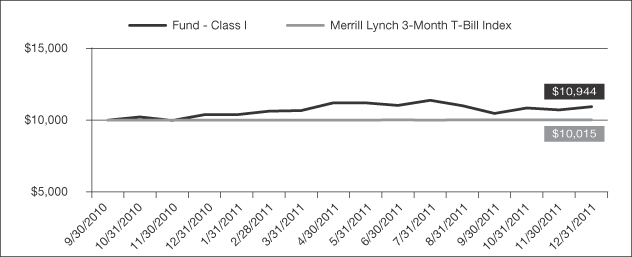
The chart above represents historical performance of a hypothetical investment of $10,000 in the Fund over the past ten years (or since inception if shorter). Performance data quoted represents past performance and does not guarantee future results. Returns shown are total returns, which assume the reinvestment of dividends and capital gains. The table and graph presented above do not reflect the deduction of taxes a shareholder would pay on fund distributions or the redemption of fund shares.
| | | | | | | | | | | | | | | | |
| | AQR Funds | | | | | | Annual Report | | | | | | December 2011 | | 21 |
| | | | | | | | | | |
Shareholder Letter (Unaudited)
| | |
| AQR MULTI-STRATEGY ALTERNATIVE FUND | | |
John Liew
Founding Principal

Jacques Friedman
Principal
Ronen Israel
Principal
Lars Nielsen
Principal
Mark Mitchell, Ph.D.
Founding Principal, CNH Partners
Todd Pulvino, Ph.D.
Founding Principal, CNH Partners
Dear Shareholder:
The Multi-Strategy Alternative Fund attempts to provide attractive risk-adjusted returns by providing exposure to a broadly-diversified portfolio of classic, relative-value alternative strategies. We include strategies that are liquid and which can be built to be low-to-uncorrelated with traditional markets, something we believe should be a key feature of alternative strategies that are meant to be a source of diversifying returns. We believe in providing a great deal of transparency, which means providing insight into our investment process and the economic themes we seek to capture in addition to positions.
Our focus on providing a broadly-diversified portfolio starts with including nine major categories in our Fund. They are Long/Short Equity, Equity Market Neutral, Dedicated Short Bias, Emerging Markets, Convertible Arbitrage, Event Driven, Global Macro, Managed Futures and Fixed Income Relative Value. We believe that each of these categories offers good long term risk-adjusted returns, but they each go through good times and bad times. The key is that they usually go through ups and downs at different times, thus allowing us to benefit by diversifying across the nine and generating more consistent long-term performance. Underlying the nine major categories are approximately 60+ strategies that make up the economic themes and classic strategies within the Fund. Each strategy is built from the bottom up by internal, experienced teams at AQR.
Our portfolio construction approach is to be as diversified and balanced as possible, starting with equal risk weighting as a baseline and then making small tactical tilts around the strategic risk allocation when we think strategies are conditionally attractive or unattractive. Because we are trading in these markets daily and because all of the strategies are managed in one portfolio, we can stay disciplined about rebalancing to our strategic weights, stay nimble by taking advantage of tactical opportunities and also provide efficient exposure by netting positions and transactions costs.
We target 10% annual volatility in the Fund and an annual return of 7-8% net of fees in excess of cash.
The Multi-Strategy Alternative Fund’s I shares returned -2.6% in 2011. This was a partial year for the Fund as it launched on July 18, 2011. While during the same period the Fund’s benchmark, the Bank of America Merrill Lynch 3 Month Treasury Index, had a slight positive return of 0.02%, the MSCI World Index lost 8.0% and the S&P 500 Index lost 2.6%. The year was challenging for funds like ours, which employ hedge fund-like investment strategies. The hedge fund industry, as measured by its major indices, posted its second worst annual performance ever. The Dow Jones Credit Suisse (DJCS) Hedge Fund Index lost 2.5% net of fees for the year and 4.1% over the July to December period. The investable DJCS Core Index lost 7.4% net of fees in 2011 and 6.5% since the Fund’s inception. The HFRI Fund Weighted Composite Index lost 5.0% net of fees in 2011 and 5.7% over the July to December period. The investable HFRX Global Hedge Fund Index lost 8.9% net of fees in 2011 and 6.9% since the Fund’s inception.
| | | | | | | | | | | | | | | | |
| 22 | | AQR Funds | | | | | | Annual Report | | | | | | December 2011 | | |
| | | | | | | | | | |
Shareholder Letter (Unaudited)
| | |
| AQR MULTI-STRATEGY ALTERNATIVE FUND | | |
The main themes developing over the year were the sovereign debt crisis in Europe, US budget issues accompanied by a downgrade by S&P, and renewed uncertainty about the global economic recovery. Prices reacted sharply to these themes, which in some cases may have created price dislocations unrelated to fundamentals, such as excessive flow into perceived safe-havens. This was particularly true in the third quarter when global equity and commodity markets fell sharply and a strong flight-to-quality scenario played out across and within asset classes. The fourth quarter started with renewed optimism and risk appetite which saw global stock and commodity markets recover much of their third quarter losses. This rebound proved difficult to sustain, however, as concerns about the sovereign debt crisis in Europe and the threat of contagion for the global economy triggered a new wave of risk aversion for the remainder of the year. These developments affected adversely strategies with a beta to de-risking and flight-to-quality scenarios. Policymakers globally took active steps to accommodate economic growth by reducing or keeping stable key interest rates which helped sustain the rally in fixed income securities.
On a relative basis the Fund’s performance was slightly better than the performance of the major hedge fund indices and global equity markets. The Fund’s realized volatility was below target, realizing 5.5% volatility based on daily returns. The Fund’s realized beta to the MSCI World index was less than 0.1. Of the nine major categories, four had positive returns and five had negative returns. The estimated contributions were as follows:
Long/Short Equity: -1.1%
Equity Market Neutral: -1.1%
Dedicated Short Bias: 1.6%
Emerging Markets: -1.1%
Event Driven: 0.6%
Convertible Arbitrage: 0.5%
Global Macro: -2.1%
Managed Futures: -0.1%
Fixed Income Relative Value: 0.2%
Following is a more detailed review of the performance of the categories with notable contributions.
Dedicated Short Bias: The Fund profited from shorting stocks based on investor sentiment in US, Japanese and European markets. The UK portfolio detracted slightly. The category also benefited from being slightly net short the equity market (recall for the most part we hedge out the market exposure via a long portfolio) as stock markets fell on a net basis during the period since the Fund’s inception. The strategy contributed both in the third quarter and in the fourth quarter with September, October and particularly November contributing, and August and December detracting. Portfolio gains were driven largely by the US region, particularly in the month of November when heavily shorted stocks underperformed with the strong market reversal. The Japanese portfolio had modest contributions in both quarters, while the region of Europe detracted in the third quarter but contributed in the fourth quarter with heavily shorted stocks underperforming during both the rally and the subsequent reversal.
Event Driven: The category provided a strong contribution during the period, particularly in the fourth quarter. Returns were driven by merger deal spreads contracting from a high of above 15% in early August to below 7% at year-end accompanied by a very low incidence of deal failure. The Fund tactically increased its exposure to the category in mid-August to take advantage of merger spreads increasing sharply with the global de-risking early in the month. The Fund ended the year with a tactical underweight in the strategy to reflect normal spread levels but very slow deal flow.
| | | | | | | | | | | | | | | | |
| | AQR Funds | | | | | | Annual Report | | | | | | December 2011 | | 23 |
| | | | | | | | | | |
Shareholder Letter (Unaudited)
| | |
| AQR MULTI-STRATEGY ALTERNATIVE FUND | | |
Convertible Arbitrage: Converts cheapened in the third quarter due to increased market volatility around the US debt ceiling vote and later due to continuing macroeconomic uncertainty worldwide. However, the increased volatility benefited the strategy as the option component of equity sensitive names strengthened and gamma trading yielded some gains. New issuance remained very slow during this period. Cheapness continued to increase in the fourth quarter as high as 6.5% and remains above 5.5% levels, making converts attractively priced. We increased our tactical weight to 90% as a result with a view towards increasing it further to 100% once new issuance improves.
Emerging Markets: The category detracted significantly during the period with losses in the currency, equity directional and stock selection components. The currency relative value strategy drove the bulk of the performance with losses due mostly to carry and trend themes. Carry underperformed as high-yielding emerging currencies in Eastern Europe and Latin America sold off due to high beta to the global economic downturn. These losses were mitigated somewhat by our systematic carry drawdown control process. Trend factors took a hit as prior positive trends in Eastern European and Latin American currencies reversed in the third quarter. The equity directional and stock selection components, which were long throughout the period, also detracted with the global sell-off. The equity index relative value component contributed modestly.
Long/Short Equity: The category detracted significantly during the period with losses concentrated in the third quarter and positive performance in the fourth quarter. In the third quarter, losses came from being net long the market (recall again here for the most part we hedge out the market exposure of this strategy) while global equity markets sold off sharply. The UK portfolio also detracted with losses in most themes. In the fourth quarter, positive performance was concentrated in the month of October when global equity markets rallied on optimism about the global economic recovery. October saw positive performance from all geographical regions and from the directional component of the strategy. Renewed risk aversion in November and December resulted in negative performance. Our growth indicators in the stock portfolio contributed in all regions except the US, while our industry selection model contributed in all regions.
Equity Market Neutral: The category underperformed during the period, both in the third quarter and in the fourth quarter. In the third quarter, value themes suffered, particularly in Europe and the UK. The Japanese portfolio’s strong performance helped partially offset losses in the other regions. In the fourth quarter, losses were concentrated mostly in the region of Europe where valuation themes struggled with continuing risk aversion and uncertainty about reliable solutions to the region’s sovereign debt crisis leading investors towards safer, more expensive stocks. Earnings quality themes also detracted in Europe, the UK and the US.
Global Macro: The category was the biggest detractor in the Fund during the period. The primary source of underperformance was the developed currencies relative value strategy where trend and carry themes detracted significantly, while value was flat. Carry was hit especially hard in the third quarter when global de-risking directed funds into low-yielding (or safe-haven) currencies such as the Japanese Yen. Rate predicting factors also took a hit as we saw a complete re-pricing of expected policy moves. Trend losses were entirely driven by price momentum themes with the worsening risk environment causing a reversal in the general trend of outperformance in high-yielding and risk-sensitive currencies. Position-wise, the biggest detractors were our value-driven shorts in Japanese Yen and Swiss Francs as both of them appreciated with the risk-off moves in the third quarter, and our trend and carry driven long in New Zealand Dollars which depreciated with the carry-trade unwind. The developed equity relative value strategy also detracted for the period with the losses concentrated in the third quarter when European debt concerns hurt our value-driven long European positions while our value and trend driven short in Australia lost as Gross Domestic Product growth positively surprised markets and the global slowdown led to speculation
| | | | | | | | | | | | | | | | |
| 24 | | AQR Funds | | | | | | Annual Report | | | | | | December 2011 | | |
| | | | | | | | | | |
Shareholder Letter (Unaudited)
| | |
| AQR MULTI-STRATEGY ALTERNATIVE FUND | | |
of rate cuts by the RBA. The developed equity directional strategy also detracted as its long position in the basket of developed equity markets was hurt during the sell-off in the third quarter. We saw some gains from our long positions in the fixed income directional category which benefited from aggressive monetary policy actions globally.
While we attempt to build each strategy to be uncorrelated either at all points in time or on average over time, we also recognize that strategies can take on conditional correlations to traditional markets, either because of changing tactical views, as in managed futures, or because a relative value strategy is trading with more correlation than expected. As such, we monitor the Fund’s positions on a daily basis and estimate the conditional beta of the Fund to traditional markets, specifically equity markets. If that beta is beyond a threshold we’ll put on a hedge overlay at the Fund-level to attempt to bring the beta back down to within the threshold. During the period, the overlay contributed 3.8% to the Fund’s return, mostly in the third quarter when the position was relatively large. In the fourth quarter, the Fund’s estimated residual long market exposure was small on average and our overlay position was modest. The overlay return is incorporated in the contributions presented above for each of the underlying categories as we allocate the contribution to each category on the basis of its contribution to the estimated beta of the Fund.
As of the end of the year, the Fund was tactically underweight managed futures due to the misalignment of trends at different time horizons in equities and currencies. The Fund was also underweight global macro strategies and fixed income relative value strategies, as we are seeing relatively fewer opportunities to invest in cheap and improving asset classes while earning carry. The Fund reduced its tactical underweight in convertible arbitrage to reflect improved cheapness (prices relative to fair value) levels in the aggregate convertible bond space, while new issuance remains slow but is expected to improve in the first quarter of 2012. Finally, we implemented a tactical underweight in the event driven category as merger deal flow is relatively weak and median deal spreads have reverted to moderate levels from the peaks early in the fourth quarter.
The Fund makes extensive use of derivative instruments such as futures, forwards and swaps in order to implement investment ideas in a diverse array of markets. Derivatives account for the majority of positions in the Fund with -3.1% of performance during the period attributable to these positions.
| | | | |
AVERAGE ANNUAL TOTAL RETURNS AS OF 12/31/2011 AQR MULTI-STRATEGY ALTERNATIVE FUND | |
| | | Since
Inception
(7/18/2011) | |
| Fund - Class I: ASAIX | | | -2.57% | |
| Fund - Class N: ASANX | | | -2.73% | |
| |
Merrill Lynch 3-Month T-Bill Index | | | 0.02% | |
Performance data quoted represents past performance and does not guarantee future results. Investment results and principal value of an investment will fluctuate so that an investor’s shares, when redeemed, may be worth more or less than their original cost. Current performance may be lower or higher than the performance data quoted. As of the latest prospectus, the gross expense ratio for the Fund’s Class I/N shares are 7.38% and 7.63%, respectively. Call 1-866-290-2688 or visit www.aqrfunds.com for current month-end performance.
| | | | | | | | | | | | | | | | |
| | AQR Funds | | | | | | Annual Report | | | | | | December 2011 | | 25 |
| | | | | | | | | | |
Shareholder Letter (Unaudited)
| | |
| AQR MULTI-STRATEGY ALTERNATIVE FUND | | |
| | | | | | | | |
AQR MULTI-STRATEGY ALTERNATIVE FUND VS. MERRILL LYNCH 3-MONTH T-BILL INDEX VALUE OF $10,000 INVESTED ON 7/18/11 |
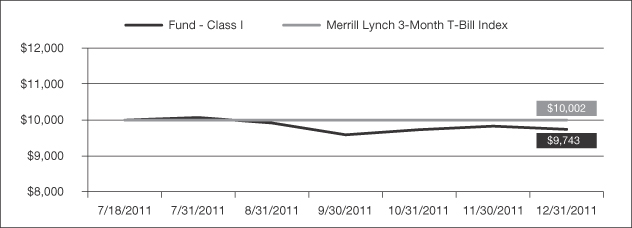
The chart above represents historical performance of a hypothetical investment of $10,000 in the Fund over the past ten years (or since inception if shorter). Performance data quoted represents past performance and does not guarantee future results. Returns shown are total returns, which assume the reinvestment of dividends and capital gains. The table and graph presented above do not reflect the deduction of taxes a shareholder would pay on fund distributions or the redemption of fund shares.
| | | | | | | | | | | | | | | | |
| 26 | | AQR Funds | | | | | | Annual Report | | | | | | December 2011 | | |
| | | | | | | | | | |
Shareholder Letter (Unaudited)
Cliff Asness
Managing & Founding Principal
Jacques Friedman
Principal
Ronen Israel
Principal
Lars Nielsen
Principal
Markets ended 2011 on a stronger note, after what had been a volatile year by historical standards. Despite a -15% drop in the third quarter on European sovereign debt troubles, US equity markets rebounded in the fourth quarter encouraged by an improved outlook on the US economy due to a decrease in unemployment and positive changes in manufacturing production, as well as some progress on the European crises. For the full year, the Russell 1000 Index returned 1.50% while the Russell 1000 Growth Index returned 2.64%. The AQR Momentum Fund (the “Fund”) underperformed the market, losing -2.68% for the year.
Most of the underperformance to the Russell 1000 Index was driven by stock-level underweights of past losers and overweights of past winners within sectors, particularly in the Information Technology, Energy, and Healthcare sectors. In Information Technology, large negative contributors were overweights in Juniper Networks, a provider of Internet infrastructure solutions for telecommunication services companies, and EMC Corporation, a provider of enterprise storage, who both experienced large price drops at the end of July on poor second quarter performance results. Underweights in IBM and Google, especially in the third quarter, further detracted from performance. Large contributors to underperformance in Energy include the Fund’s overweights in oil servicing companies that performed particularly poorly compared to other Energy companies in the third quarter due to higher sensitivities to drops in oil prices.
Relative exposures across sectors played a smaller role in underperformance. The Fund’s overweight in the Energy sector detracted, particularly in the second and third quarters, as declining oil prices underscored investor concerns of global economic weakness.
The AQR Momentum Fund invests in stocks of large and mid-cap U.S. companies with positive momentum. A stock is considered to have positive momentum if it has performed well in the prior twelve months (excluding the most recent month) relative to other stocks in the Fund’s investment universe, which is comprised of the 1000 largest U.S. companies by market capitalization. The Fund is not actively managed to outperform a growth, value or core benchmark. Rather, it seeks to provide systematic exposure to stocks that share the common characteristic of positive momentum.
Note that the Fund sometimes uses derivatives, such as S&P500 EMini futures, to gain market exposure and equitize daily flows. The Fund’s derivatives positions in 2011 contributed about 0.05% over the year, consistent with market performance for the year.
| | | | | | | | | | | | | | | | |
| | AQR Funds | | | | | | Annual Report | | | | | | December 2011 | | 27 |
| | | | | | | | | | |
Shareholder Letter (Unaudited)
| | | | | | | | |
AVERAGE ANNUAL TOTAL RETURNS AS OF 12/31/2011 AQR MOMENTUM FUND | |
| | | 1 Year | | | Since
Inception
(7/9/2009) | |
| Fund - Class L: AMOMX | | | -2.68% | | | | 16.15% | |
| | |
Russell 1000® Index | | | 1.50% | | | | 18.13% | |
Performance data quoted represents past performance and does not guarantee future results. Investment results and principal value of an investment will fluctuate so that an investor’s shares, when redeemed, may be worth more or less than their original cost. Current performance may be lower or higher than the performance data quoted. As of the latest prospectus, the gross expense ratio for the Fund’s Class L shares is 0.98%. Call 1-866-290-2688 or visit www.aqrfunds.com for current month-end performance.
|
AQR MOMENTUM FUND VS. RUSSELL 1000® INDEX VALUE OF $10,000 INVESTED ON 7/9/09 |
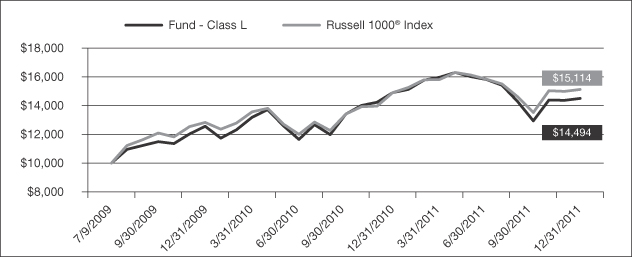
The chart above represents historical performance of a hypothetical investment of $10,000 in the Fund over the past ten years (or since inception if shorter). Performance data quoted represents past performance and does not guarantee future results. Returns shown are total returns, which assume the reinvestment of dividends and capital gains. The table and graph presented above do not reflect the deduction of taxes a shareholder would pay on fund distributions or the redemption of fund shares.
| | | | | | | | | | | | | | | | |
| 28 | | AQR Funds | | | | | | Annual Report | | | | | | December 2011 | | |
| | | | | | | | | | |
Shareholder Letter (Unaudited)
| | |
| AQR SMALL CAP MOMENTUM FUND | | |
Cliff Asness
Managing & Founding Principal
Jacques Friedman
Principal
Ronen Israel
Principal
Lars Nielsen
Principal
US small cap stocks fared worse than their large- and mid-cap peers, particularly in the third quarter. The Russell 2000 Index finished down -4.18% for the year and the Russell 2000 Growth Index returned -2.91% for the year. The AQR Small Cap Momentum Fund (the “Fund”) outperformed both Russell indices, down -2.62% in 2011.
Outperformance relative to the Russell 2000 Index was driven by relative exposures within the Health Care and Consumer Discretionary sectors, while defensive sector exposures, like Utilities detracted. In Health Care, the Fund benefitted from its overweight in Pharmasset, the developer of the first all-oral regimen for treating hepatitis C. Returning almost 500% for the year, the stock was trending up even before the announcement of its acquisition by Gilead in mid November. In Consumer Discretionary, large contributors to outperformance included the Fund’s overweight in retailers, Crocs and Select Comfort, who both reported strong sales growth and earnings ahead of expectations in the second quarter, and underweight in Eastman Kodak, who lost a major patent battle in the second quarter.
The AQR Small Cap Momentum Fund invests in stocks of small-cap U.S. companies with positive momentum. A stock is considered to have positive momentum if it has performed well in the prior twelve months (excluding the most recent month) relative to other stocks in the investment universe, which is comprised of U.S. companies smaller than the 1000th largest and larger than the 3000th smallest company by market capitalization. The Fund is not actively managed to outperform a growth, value or core benchmark. Rather, it seeks to provide systematic exposure to stocks that share the common characteristic of positive momentum.
Note that the Fund sometimes uses derivatives, such as Russell 2000 Mini futures, to gain market exposure and equitize daily flows. The Fund’s derivatives positions in 2011 contributed about -0.22% to performance over the year, consistent with market performance for the year.
| | | | | | | | |
AVERAGE ANNUAL TOTAL RETURNS AS OF 12/31/2011 AQR SMALL CAP MOMENTUM FUND | |
| | | 1 Year | | | Since
Inception
(7/9/2009) | |
| Fund - Class L: ASMOX | | | -2.62% | | | | 18.01% | |
| | |
Russell 2000® Index | | | -4.18% | | | | 20.77% | |
Performance data quoted represents past performance and does not guarantee future results. Investment results and principal value of an investment will fluctuate so that an investor’s shares, when redeemed, may be worth more or less than their original cost. Current performance may be lower or higher than the performance data quoted. As of the latest prospectus, the gross expense ratio for the Fund’s Class L shares is 1.85%. Call 1-866-290-2688 or visit www.aqrfunds.com for current month-end performance.
| | | | | | | | | | | | | | | | |
| | AQR Funds | | | | | | Annual Report | | | | | | December 2011 | | 29 |
| | | | | | | | | | |
Shareholder Letter (Unaudited)
| | |
| AQR SMALL CAP MOMENTUM FUND | | |
|
AQR SMALL CAP MOMENTUM FUND VS. RUSSELL 2000® INDEX VALUE OF $10,000 INVESTED ON 7/9/09 |
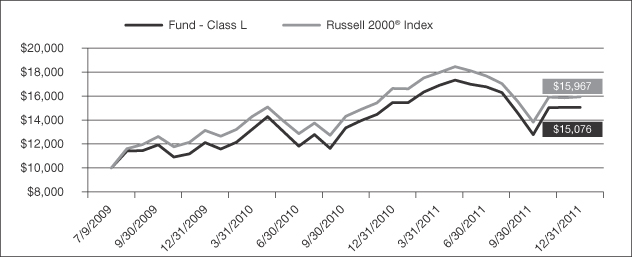
The chart above represents historical performance of a hypothetical investment of $10,000 in the Fund over the past ten years (or since inception if shorter). Performance data quoted represents past performance and does not guarantee future results. Returns shown are total returns, which assume the reinvestment of dividends and capital gains. The table and graph presented above do not reflect the deduction of taxes a shareholder would pay on fund distributions or the redemption of fund shares.
| | | | | | | | | | | | | | | | |
| 30 | | AQR Funds | | | | | | Annual Report | | | | | | December 2011 | | |
| | | | | | | | | | |
Shareholder Letter (Unaudited)
| | |
| AQR INTERNATIONAL MOMENTUM FUND | | |
Cliff Asness
Managing & Founding Principal
Jacques Friedman
Principal
Ronen Israel
Principal
Lars Nielsen
Principal
Similar to the US market, global markets also suffered a dismal third quarter on European debt concerns and general economic weakness, but lacking strengthening global economic indicators, did not recover in the fourth quarter. The MSCI World ex-USA Index fell by -12.21%, while the MSCI World ex-USA Growth Index fell by a similar -12.71% for the year. The AQR International Momentum Fund (the “Fund”) underperformed both benchmarks, returning -14.36%.
The Fund’s underperformance relative to the broader MSCI World ex-USA Index, was primarily driven by over and underweights across sectors. Specifically, in the third quarter, the fund was underweight Consumer Staples and Health Care, defensive sectors that outperformed during the volatile third quarter, and overweight Materials and Industrials, two sectors that underperformed relative to the market due to higher sensitivities to the perceived economic slowdown.
Stock-level overweights of past winners and underweights of past losers in Materials, Industrials, and Energy detracted from performance. Within the Materials sector, underperformance was due primarily to the fund’s overweights of Xstrata and Rio Tinto, mining companies whose prices fell relative to those of peers in August, after missing analysts’ estimates and on higher sensitivity to the general perceived downturn in that month. In Industrials, a large contributor to negative performance was an overweight in Siemens, a German industrial conglomerate whose price dropped in August on below consensus second quarter earnings.
Stock exposures within countries also detracted from performance. As mentioned above, overweights in UK mining companies such as Rio Tinto, Xstrata, and Anglo American, hurt the Fund relative to the broader markets as UK mining companies underperformed the rest of the UK market. In Canada, Energy companies also underperformed the broader markets in Canada, especially in August on concerns of an economic slowdown. Here, the Fund’s underweight in Barrick Gold, a Canadian gold mining company that gained significantly versus the rest of the market in the third quarter on strengthening gold prices, further decreased performance.
The AQR International Momentum Fund invests in stocks of large and mid-cap non-U.S. companies with positive momentum. A stock is considered to have positive momentum if it has performed well in the prior twelve months (excluding the most recent month) relative to other stocks in the investment universe, which is comprised of approximately the top 85% of stocks by market capitalization of each of the 20 major developed markets outside the U.S. The Fund is not actively managed to outperform a growth, value or core benchmark. Rather, it seeks to provide systematic exposure to stocks that share the common characteristic of positive momentum.
Note that the Fund sometimes uses derivatives to implement its strategy. In particular, the Fund will sometimes trade swaps in UK securities to minimize certain trading costs. Its derivatives positions in 2011 contributed about -0.07% to performance over the year, consistent with UK equity markets being down for the year.
| | | | | | | | | | | | | | | | |
| | AQR Funds | | | | | | Annual Report | | | | | | December 2011 | | 31 |
| | | | | | | | | | |
Shareholder Letter (Unaudited)
| | |
| AQR INTERNATIONAL MOMENTUM FUND | | |
| | | | | | | | |
AVERAGE ANNUAL TOTAL RETURNS AS OF 12/31/2011 AQR INTERNATIONAL MOMENTUM FUND | |
| | | 1 Year | | | Since
Inception
(7/9/2009) | |
| Fund - Class L: AIMOX | | | -14.42% | | | | 7.74% | |
| | |
MSCI World ex-USA Index | | | -12.21% | | | | 8.15% | |
Performance data quoted represents past performance and does not guarantee future results. Investment results and principal value of an investment will fluctuate so that an investor’s shares, when redeemed, may be worth more or less than their original cost. Current performance may be lower or higher than the performance data quoted. As of the latest prospectus, the gross expense ratio for the Fund’s Class L shares is 1.46%. Call 1-866-290-2688 or visit www.aqrfunds.com for current month-end performance.
| | | | | | | | |
AQR INTERNATIONAL MOMENTUM FUND VS. WORLD ex-USA INDEX VALUE OF $10,000 INVESTED ON 7/9/09 |
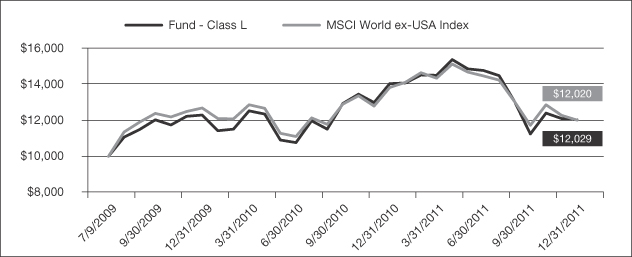
The chart above represents historical performance of a hypothetical investment of $10,000 in the Fund over the past ten years (or since inception if shorter). Performance data quoted represents past performance and does not guarantee future results. Returns shown are total returns, which assume the reinvestment of dividends and capital gains. The table and graph presented above do not reflect the deduction of taxes a shareholder would pay on fund distributions or the redemption of fund shares.
| | | | | | | | | | | | | | | | |
| 32 | | AQR Funds | | | | | | Annual Report | | | | | | December 2011 | | |
| | | | | | | | | | |
Shareholder Letter (Unaudited)
PRINCIPAL RISKS:
AQR Global Equity Fund and AQR International Equity Fund: The AQR Global Equity Fund and the AQR International Equity Fund use derivatives to manage their country and currency exposures. The use of derivatives exposes the Fund to additional risks including increased volatility, lack of liquidity, and possible losses greater than the Fund’s initial investment as well as increased transaction costs. Foreign investing involves special risks such as currency fluctuations and political uncertainty. The Funds are not suitable for all investors.
AQR Diversified Arbitrage Fund: As the AQR Diversified Arbitrage Fund (the “Fund”) employs arbitrage and alternative strategies, the Fund has the risk that the anticipated opportunities do not play out as planned, resulting in potentially reduced returns or losses to the Fund as it unwinds its trades. This Fund enters into a short sale by selling a security it has borrowed. If the market price of a security increases after the Fund borrows the security, the Fund will suffer a potentially unlimited loss when it replaces the borrowed security at the higher price. Short sales also involve transaction and other costs that will reduce potential Fund gains and increase potential Fund losses. The Fund uses derivatives to hedge certain economic exposures. The use of derivatives exposes the Fund to additional risks including increased volatility, lack of liquidity, and possible losses greater than the Fund’s initial investment as well as increased transaction costs. This Fund is not suitable for all investors.
AQR Managed Futures Strategy Fund: The use of derivatives, forward and futures contracts, and commodities exposes the Fund to additional risks including increased volatility, lack of liquidity, and possible losses greater than the Fund’s initial investment as well as increased transaction costs. Concentration generally will lead to greater price volatility. The Fund enters into a short sale by selling a security it has borrowed. If the market price of a security increases after the Fund borrows the security, the Fund will suffer a potentially unlimited loss when it replaces the borrowed security at the higher price. Short sales also involve transaction and other costs that will reduce potential Fund gains and increase potential Fund losses. This Fund is not suitable for all investors.
AQR Risk Parity Fund: Foreign investing involves special risks such as currency fluctuations and political uncertainty. The use of derivatives, forward and futures contracts, and commodities exposes the Fund to additional risks including increased volatility, lack of liquidity, and possible losses greater than the Fund’s initial investment as well as increased transaction costs. This Fund enters into a short sale by selling a security it has borrowed. If the market price of a security increases after the Fund borrows the security, the Fund will suffer a potentially unlimited loss when it replaces the borrowed security at the higher price. Short sales also involve transaction and other costs that will reduce potential Fund gains and increase potential Fund losses. When investing in bonds, yield and share price will vary with changes in interest rates and market conditions. Investors should note that if interest rates rise significantly from current levels, bond total returns will decline and may even turn negative in the short term. There is also a chance that some of the Fund’s holdings may have their credit rating downgraded or may default. Actual or realized volatility can and will differ from the forecasted or target volatility. This Fund is not suitable for all investors.
AQR Momentum Fund: Securities with positive momentum generally will be more volatile than a broad crosssection of securities. In addition, there may be periods when the momentum style is out of favor, and during which the investment performance of a Fund, which uses a momentum strategy, generally will suffer. Derivatives are generally more sensitive to changes in economic or market conditions than other types of investments, which could result in losses that significantly exceed the Fund’s original investment. The use of derivatives exposes the Fund to additional risks including increased volatility, lack of liquidity, and possible losses greater than the Fund’s initial investment as well as increased transaction costs. This Fund is not suitable for all investors.
| | | | | | | | | | | | | | | | |
| | AQR Funds | | | | | | Annual Report | | | | | | December 2011 | | 33 |
| | | | | | | | | | |
Shareholder Letter (Unaudited)
AQR Small Cap Momentum Fund: Securities with positive momentum generally will be more volatile than a broad crosssection of securities. In addition, there may be periods when the momentum style is out of favor, and during which the investment performance of a Fund, which uses a momentum strategy, generally will suffer. Derivatives are generally more sensitive to changes in economic or market conditions than other types of investments, which could result in losses that significantly exceed the Fund’s original investment. The use of derivatives exposes the Fund to additional risks including increased volatility, lack of liquidity, and possible losses greater than the Fund’s initial investment as well as increased transaction costs. Funds that emphasize investments in smaller companies generally will experience greater price volatility. This Fund is not suitable for all investors.
AQR International Momentum Fund: Securities with positive momentum generally will be more volatile than a broad crosssection of securities. In addition, there may be periods when the momentum style is out of favor, and during which the investment performance of a Fund, which uses a momentum strategy, generally will suffer. Derivatives are generally more sensitive to changes in economic or market conditions than other types of investments, which could result in losses that significantly exceed the Fund’s original investment. The use of derivatives exposes the Fund to additional risks including increased volatility, lack of liquidity, and possible losses greater than the Fund’s initial investment as well as increased transaction costs. Foreign investing involves special risks such as currency fluctuations and political uncertainty. This Fund is not suitable for all investors.
An investment in any of the AQR Funds (the “Funds”) involves risk, including loss of principal. Diversification does not eliminate this risk. The value of the Funds’ portfolio holdings may fluctuate in response to events specific to the companies in which the Fund invests, as well as economic, political or social events in the United States or abroad. Please refer to the prospectus for complete information regarding all risks associated with the Funds.
An investor considering the Funds should be able to tolerate potentially wide price fluctuations. The funds are subject to high portfolio turnover risk as a result of frequent trading, and thus will incur a higher level of brokerage fees and commissions and cause a higher level of tax liability to shareholders in the funds. The Funds may attempt to increase their income or total return through the use of securities lending, and they may be subject to the possibility of additional loss as a result of this investment technique.
Cliff Asness, David Kabiller, Brian Hurst, Yao Hua Ooi and Marco Hanig are registered representatives of ALPS Distributors, Inc.
DEFINITIONS:
Arbitrage: The simultaneous purchase and sale of an asset or two related assets in order to profit from a difference in price.
Bearish: A belief that a particular security, sector or the overall market will fall.
Beta is a measure of the volatility of a security or portfolio in comparison to an index or the market as a whole, where a security with a beta of 1.0 has equivalent volatility to the index or market it is compared to.
Carry: The return obtained from holding an asset (if positive), or the cost of holding it (if negative).
Cheapness: A measure of the discount a security price relative to its fundamental value.
| | | | | | | | | | | | | | | | |
| 34 | | AQR Funds | | | | | | Annual Report | | | | | | December 2011 | | |
| | | | | | | | | | |
Shareholder Letter (Unaudited)
Closed-end fund arbitrage is the practice of buying (selling) closed-end funds that trade at abnormally wide discounts (or premiums) to their underlying net asset values. Positions are unwound when the discount or premium converges to expected levels.
Convertible Bonds: Fixed-income securities that are convertible into common stock.
Correlation: A measurement to identify the relationship and impact on return of two or more assets.
Credit: This strategy purchases attractively priced securities on a hedged basis, typically around event-induced capital flows.
Dovish: A monetary policy that involves the maintenance of low interest rates in the belief that inflation and its negative effects will have a minimal impact on society.
Dual-Class Arbitrage: An investment strategy that takes advantage of inefficiencies in the prices at which different classes of a publicly traded company’s stock are trading.
Futures and Forwards contracts: A financial contract obligating the buyer to purchase an asset (or the seller to sell an asset) at a pre-determined future date and price.
Momentum: An investment style wherein an asset is deemed to have positive momentum if it has performed well in the past relative to other assets in the same universe.
Price to Book: A valuation ratio of a company’s current share price compared to its book value.
Price Pressure: This strategy captures a risk premium by providing liquidity around different types of securities issues and restructuring events. The Fund may employ additional arbitrage and alternative strategies as they arise.
Quantitative Easing: The term quantitative easing describes an extreme form of monetary policy used to stimulate an economy when the interbank interest rate (which in the US is called the federal funds rate) is either at, or close to zero.
Richness: A measure of the premium of a security price relative to its fundamental value.
Sovereign Risk: The probability that the government of a country will refuse to comply with the terms of a loan agreement during economically difficult or politically volatile times.
Special Purpose Acquisition Companies (SPACs): SPACs, often called “blank check” companies, are publicly traded companies whose primary asset is a trust invested in short-term high-grade securities. The Fund seeks to capture a liquidity premium when these securities, which are typically thinly traded, are selling at a discount.
Spread: The percentage difference between two related securities.
S&P 500 Index: An Index of 500 stocks chosen for market size, liquidity and industry grouping, among other factors. Indexes are unmanaged and one cannot invest directly in an index.
The CAC 40 Index is a free float-adjusted market capitalization index that is designed to measure the performance of the 40 most significant values among the 100 highest market caps on the Euronext Paris. Indexes are unmanaged and one cannot invest directly in an index.
The Merrill Lynch 3 Month Treasury Bill Index is designed to measure the performance of high-quality short-term cash-equivalent investments. Indexes are unmanaged and one cannot invest directly in an index.
| | | | | | | | | | | | | | | | |
| | AQR Funds | | | | | | Annual Report | | | | | | December 2011 | | 35 |
| | | | | | | | | | |
Shareholder Letter (Unaudited)
The Morgan Stanley Capital International EAFE Index is a free float-adjusted market capitalization index that is designed to measure the performance of equities in developed markets, excluding the United States and Canada. Indexes are unmanaged and one cannot invest directly in an index.
The Morgan Stanley Capital International World Index is a free float-adjusted market capitalization index that is designed to measure the performance of equities in developed markets, including the United States and Canada. Indexes are unmanaged and one cannot invest directly in an index.
The MSCI World ex-USA Index is a free float-adjusted market capitalization index that is designed to measure the performance of equities in developed markets, excluding the United States. Indexes are unmanaged and one cannot invest directly in an index.
The Russell 1000® Index measures the performance of the large and mid-cap segment of the U.S. equity universe. It is a subset of the Russell 3000® Index and includes approximately 1,000 of the largest securities based on a combination of their market cap and current index membership. The Russell 1000 represents approximately 90% of the U.S. market. Indexes are unmanaged and one cannot invest directly in an index.
The Russell 2000® Index measures the performance of the small-cap segment of the U.S. equity universe. The Russell 2000® Index is a subset of the Russell 3000® Index representing approximately 8% of the total market capitalization of that index. It includes approximately 2,000 of the smallest securities based on a combination of their market cap and current index membership. Indexes are unmanaged and one cannot invest directly in an index.
Tracking Error: A measure of how closely a portfolio follows the index to which it is benchmarked. It measures the standard deviation of the difference between the portfolio and index returns.
Valuation: A process of determining the current worth of an asset or company.
Volatility is a statistical measurement of up and down asset price fluctuations over time. If an asset has rapid dramatic price swings, its “volatility” will likely be relatively high. If prices are consistent and rarely change, “volatility” of that asset will likely be relatively low. “Volatility” can be measured as the standard deviation of an asset with a specific time horizon. It is often used to quantify the risk of such asset over a time period, typically expressed in annualized terms.
| | | | | | | | | | | | | | | | |
| 36 | | AQR Funds | | | | | | Annual Report | | | | | | December 2011 | | |
| | | | | | | | | | |
| | | | |
| Schedule of Investments | | | December 31, 2011 | |
| | | | | | | | |
| COMMON STOCKS - 89.4% | | SHARES | | | VALUE
(Note 3) | |
| Australia - 3.3% | | | | | | | | |
| AGL Energy Ltd. | | | 9,138 | | | $ | 133,706 | |
| Alumina Ltd. | | | 37,995 | | | | 43,499 | |
| Amcor Ltd. | | | 32,520 | | | | 239,400 | |
| Ansell Ltd. | | | 4,330 | | | | 64,291 | |
| Asciano Ltd. | | | 13,184 | | | | 60,585 | |
| ASX Ltd. | | | 2,722 | | | | 84,966 | |
| Australia & New Zealand Banking Group Ltd. | | | 30,372 | | | | 636,138 | |
| BHP Billiton Ltd. | | | 61,290 | | | | 2,163,454 | |
| Caltex Australia Ltd. | | | 12,553 | | | | 150,732 | |
| CFS Retail Property Trust REIT | | | 36,456 | | | | 62,773 | |
| Coca-Cola Amatil Ltd. | | | 4,321 | | | | 50,770 | |
| Commonwealth Bank of Australia (a) | | | 21,370 | | | | 1,073,445 | |
| Computershare Ltd. | | | 7,001 | | | | 57,226 | |
| CSL Ltd. | | | 9,106 | | | | 296,881 | |
| Dexus Property Group REIT (a) | | | 74,910 | | | | 63,484 | |
| Downer EDI Ltd. † | | | 44,189 | | | | 144,239 | |
| Fortescue Metals Group Ltd. (a) | | | 19,404 | | | | 84,883 | |
| Goodman Group REIT | | | 93,620 | | | | 54,434 | |
| GPT Group - In Specie REIT (3)†(b) | | | 96,388 | | | | — | |
| GPT Group REIT (a) | | | 29,672 | | | | 93,000 | |
| Incitec Pivot Ltd. | | | 78,566 | | | | 249,415 | |
| Lend Lease Group | | | 8,523 | | | | 62,414 | |
| Mirvac Group REIT | | | 51,825 | | | | 62,441 | |
| Mount Gibson Iron Ltd. | | | 21,558 | | | | 24,637 | |
| National Australia Bank Ltd. | | | 53,942 | | | | 1,284,982 | |
| Newcrest Mining Ltd. | | | 12,358 | | | | 376,611 | |
| Nufarm Ltd. † | | | 49,826 | | | | 211,259 | |
| Orica Ltd. | | | 3,687 | | | | 91,231 | |
| Origin Energy Ltd. | | | 34,214 | | | | 466,563 | |
| OZ Minerals Ltd. | | | 5,222 | | | | 53,417 | |
| Pacific Brands Ltd. | | | 756,439 | | | | 425,197 | |
| Paladin Energy Ltd. † | | | 10,415 | | | | 14,646 | |
| Primary Health Care Ltd. | | | 24,228 | | | | 76,244 | |
| Qantas Airways Ltd. † | | | 55,973 | | | | 83,316 | |
| QBE Insurance Group Ltd. | | | 2,557 | | | | 33,840 | |
| QR National Ltd. | | | 27,325 | | | | 95,453 | |
| Rio Tinto Ltd. (a) | | | 10,357 | | | | 638,501 | |
| Santos Ltd. | | | 27,891 | | | | 349,044 | |
| Sonic Healthcare Ltd. | | | 14,263 | | | | 164,399 | |
| SP AusNet | | | 258,686 | | | | 248,244 | |
| Stockland REIT | | | 43,746 | | | | 142,909 | |
| TABCORP Holdings Ltd. | | | 37,593 | | | | 104,716 | |
| Telstra Corp. Ltd. | | | 69,795 | | | | 237,374 | |
| Wesfarmers Ltd. | | | 7,310 | | | | 220,750 | |
| Westfield Group REIT | | | 35,184 | | | | 280,712 | |
| Westfield Retail Trust REIT | | | 46,500 | | | | 118,505 | |
| Westpac Banking Corp. | | | 29,734 | | | | 606,997 | |
| Woolworths Ltd. (a) | | | 32,414 | | | | 832,015 | |
| | | | | | | | |
| | | | | | | 13,113,738 | |
| | | | | | | | |
| Belgium - 0.2% | | | | | | | | |
| Solvay SA | | | 8,432 | | | | 692,228 | |
| | | | | | | | |
| | |
| Canada - 4.5% (1) | | | | | | | | |
| AGF Management Ltd., Class B | | | 1,618 | | | | 25,126 | |
| AltaGas Ltd. (a) | | | 4,000 | | | | 125,016 | |
| ARC Resources Ltd. (a) | | | 4,700 | | | | 115,799 | |
| | | | | | | | |
| | | SHARES | | | VALUE
(Note 3) | |
| Canada - 4.5% (1) (continued) | | | | | | | | |
| Atco Ltd., Class I | | | 1,849 | | | $ | 109,334 | |
| Bank of Montreal | | | 5,180 | | | | 284,131 | |
| Bank of Nova Scotia | | | 2,999 | | | | 149,634 | |
| Barrick Gold Corp. | | | 12,005 | | | | 543,834 | |
| BCE, Inc. | | | 22,909 | | | | 955,038 | |
| Bombardier, Inc., Class B | | | 52,791 | | | | 210,387 | |
| Bonavista Energy Corp. | | | 1,300 | | | | 33,267 | |
| Brookfield Asset Management, Inc., Class A | | | 8,102 | | | | 222,999 | |
| Brookfield Office Properties, Inc. | | | 2,845 | | | | 44,598 | |
| Canadian Imperial Bank of Commerce | | | 9,500 | | | | 688,103 | |
| Canadian National Railway Co. | | | 15,300 | | | | 1,203,725 | |
| Canadian Oil Sands Ltd. | | | 7,934 | | | | 181,070 | |
| Canadian Tire Corp. Ltd., Class A | | | 4,500 | | | | 291,092 | |
| Canadian Utilities Ltd., Class A | | | 3,100 | | | | 187,263 | |
| Celestica, Inc. † | | | 23,111 | | | | 169,915 | |
| Cenovus Energy, Inc. | | | 19,500 | | | | 647,544 | |
| CGI Group, Inc., Class A † | | | 12,700 | | | | 239,352 | |
| Enerplus Corp. | | | 2,951 | | | | 74,879 | |
| Ensign Energy Services, Inc. | | | 34,700 | | | | 553,497 | |
| Finning International, Inc. | | | 14,700 | | | | 320,478 | |
| Goldcorp, Inc. | | | 14,088 | | | | 625,196 | |
| Great-West Lifeco, Inc. | | | 3,145 | | | | 62,977 | |
| Groupe Aeroplan, Inc. | | | 21,800 | | | | 255,501 | |
| IAMGOLD Corp. | | | 6,000 | | | | 95,293 | |
| Imperial Oil Ltd. | | | 13,400 | | | | 597,032 | |
| Industrial Alliance Insurance & Financial Services, Inc. | | | 4,300 | | | | 110,966 | |
| Inmet Mining Corp. | | | 8,780 | | | | 564,506 | |
| Intact Financial Corp. | | | 4,800 | | | | 275,773 | |
| Ivanhoe Mines Ltd. † | | | 4,885 | | | | 86,743 | |
| Laurentian Bank of Canada | | | 4,937 | | | | 231,791 | |
| Magna International, Inc. | | | 5,634 | | | | 188,030 | |
| Manulife Financial Corp. | | | 45,600 | | | | 485,654 | |
| Methanex Corp. | | | 2,400 | | | | 54,938 | |
| National Bank of Canada (a) | | | 5,514 | | | | 390,459 | |
| Nexen, Inc. | | | 32,800 | | | | 521,902 | |
| Niko Resources Ltd. | | | 700 | | | | 33,140 | |
| Onex Corp. | | | 11,700 | | | | 381,061 | |
| Pacific Rubiales Energy Corp. | | | 4,000 | | | | 73,541 | |
| Penn West Petroleum Ltd. | | | 7,500 | | | | 148,638 | |
| Petrobank Energy & Resources Ltd. † | | | 1,600 | | | | 16,616 | |
| Potash Corp of Saskatchewan, Inc. | | | 9,500 | | | | 392,682 | |
| Power Corp. of Canada | | | 4,746 | | | | 110,969 | |
| Precision Drilling Corp. † | | | 32,600 | | | | 336,000 | |
| Research In Motion Ltd. † | | | 4,900 | | | | 71,185 | |
| RioCan Real Estate Investment Trust REIT (a) | | | 2,100 | | | | 54,482 | |
| Rogers Communications, Inc., Class B | | | 7,700 | | | | 296,663 | |
| Royal Bank of Canada (a) | | | 5,824 | | | | 297,160 | |
| Russel Metals, Inc. | | | 21,400 | | | | 470,958 | |
| Sherritt International Corp. | | | 52,300 | | | | 280,302 | |
| Silver Wheaton Corp. | | | 5,300 | | | | 153,472 | |
| Suncor Energy, Inc. | | | 35,382 | | | | 1,020,391 | |
| Teck Resources Ltd., Class B | | | 4,493 | | | | 158,374 | |
| TELUS Corp., Class A | | | 2,307 | | | | 123,734 | |
| TMX Group, Inc. | | | 1,200 | | | | 49,107 | |
| | | | |
| | The accompanying notes are an integral part of these financial statements. | | (Continued) |
| | | | | | | | | | | | | | | | |
| | AQR Funds | | | | | | Annual Report | | | | | | December 2011 | | 37 |
| | | | | | | | | | |
| | | | |
| Schedule of Investments | | | December 31, 2011 | |
| | | | | | | | |
| | | SHARES | | | VALUE
(Note 3) | |
| Canada - 4.5% (1) (continued) | | | | | | | | |
| Toronto-Dominion Bank/The | | | 5,612 | | | $ | 420,260 | |
| TransCanada Corp. (a) | | | 12,800 | | | | 559,494 | |
| Valeant Pharmaceuticals International, Inc. † | | | 4,574 | | | | 213,985 | |
| Yamana Gold, Inc. | | | 49,800 | | | | 734,229 | |
| Yellow Media, Inc. (a) | | | 8,100 | | | | 1,471 | |
| | | | | | | | |
| | | | | | | 18,320,756 | |
| | | | | | | | |
| Denmark - 0.6% | | | | | | | | |
| AP Moeller - Maersk A/S, Class B | | | 24 | | | | 157,864 | |
| Carlsberg A/S, Class B | | | 3,798 | | | | 267,431 | |
| Danske Bank A/S † | | | 10,597 | | | | 133,903 | |
| DSV A/S | | | 6,431 | | | | 114,922 | |
| Novo Nordisk A/S, Class B | | | 16,084 | | | | 1,847,782 | |
| | | | | | | | |
| | | | | | | 2,521,902 | |
| | | | | | | | |
| Finland - 0.3% | | | | | | | | |
| Metso OYJ | | | 16,997 | | | | 627,751 | |
| Wartsila OYJ | | | 17,030 | | | | 489,829 | |
| | | | | | | | |
| | | | | | | 1,117,580 | |
| | | | | | | | |
| France - 3.4% | | | | | | | | |
| Alcatel-Lucent †(a) | | | 172,350 | | | | 267,836 | |
| Arkema SA | | | 6,610 | | | | 464,477 | |
| AXA SA | | | 30,119 | | | | 389,324 | |
| BNP Paribas SA | | | 16,706 | | | | 650,522 | |
| Bouygues SA (a) | | | 4,316 | | | | 135,741 | |
| Christian Dior SA | | | 3,779 | | | | 446,065 | |
| Cie Generale de Geophysique - Veritas † | | | 33,400 | | | | 775,280 | |
| Cie Generale d’Optique Essilor International SA | | | 4,974 | | | | 350,625 | |
| Compagnie de Saint-Gobain | | | 21,523 | | | | 822,732 | |
| Eramet (a) | | | 1,508 | | | | 183,663 | |
| European Aeronautic Defence and Space Co NV | | | 19,724 | | | | 614,187 | |
| Faurecia | | | 13,077 | | | | 246,464 | |
| Hermes International (a) | | | 2,290 | | | | 680,636 | |
| Klepierre REIT | | | 1,740 | | | | 49,439 | |
| Legrand SA | | | 8,172 | | | | 261,755 | |
| L’Oreal SA | | | 4,180 | | | | 435,346 | |
| LVMH Moet Hennessy Louis Vuitton SA | | | 2,897 | | | | 408,085 | |
| PPR | | | 3,504 | | | | 500,158 | |
| Safran SA | | | 17,853 | | | | 533,913 | |
| Sanofi | | | 6,600 | | | | 482,445 | |
| Schneider Electric SA | | | 5,872 | | | | 306,996 | |
| Societe BIC SA | | | 7,938 | | | | 702,256 | |
| Societe Generale SA | | | 16,650 | | | | 367,559 | |
| Societe Television Francaise 1 | | | 712 | | | | 6,926 | |
| Total SA | | | 46,230 | | | | 2,359,019 | |
| Unibail-Rodamco SE REIT | | | 1,690 | | | | 302,465 | |
| Valeo SA | | | 18,407 | | | | 728,476 | |
| Vivendi SA | | | 9,021 | | | | 196,924 | |
| | | | | | | | |
| | | | | | | 13,669,314 | |
| | | | | | | | |
| Germany - 2.9% | | | | | | | | |
| Adidas AG | | | 7,561 | | | | 491,261 | |
| Allianz SE | | | 1,462 | | | | 139,627 | |
| Aurubis AG | | | 14,113 | | | | 751,055 | |
| | | | | | | | |
| | | SHARES | | | VALUE
(Note 3) | |
| Germany - 2.9% (continued) | | | | | | | | |
| BASF SE | | | 15,928 | | | $ | 1,108,882 | |
| Bayer AG | | | 26,363 | | | | 1,683,632 | |
| Bayerische Motoren Werke AG | | | 2,931 | | | | 195,932 | |
| Bilfinger Berger SE | | | 5,899 | | | | 502,284 | |
| Daimler AG | | | 12,534 | | | | 549,096 | |
| Deutsche Boerse AG | | | 2,471 | | | | 137,752 | |
| Deutsche Post AG | | | 13,671 | | | | 210,181 | |
| Deutsche Telekom AG | | | 44,861 | | | | 514,595 | |
| Fresenius SE & Co. KGaA | | | 1,761 | | | | 162,843 | |
| Infineon Technologies AG | | | 4,285 | | | | 32,183 | |
| K+S AG | | | 11,175 | | | | 504,012 | |
| Kloeckner & Co. SE | | | 12,498 | | | | 159,969 | |
| Linde AG | | | 1,819 | | | | 270,326 | |
| Merck KGaA | | | 7,345 | | | | 731,446 | |
| SAP AG | | | 31,663 | | | | 1,674,708 | |
| Siemens AG | | | 15,279 | | | | 1,461,831 | |
| Suedzucker AG | | | 9,499 | | | | 302,598 | |
| TUI AG †(a) | | | 31,794 | | | | 197,217 | |
| | | | | | | | |
| | | | | | | 11,781,430 | |
| | | | | | | | |
| Hong Kong - 1.1% | | | | | | | | |
| AIA Group Ltd. | | | 134,800 | | | | 419,622 | |
| ASM Pacific Technology Ltd. (a) | | | 2,982 | | | | 33,399 | |
| Cheung Kong Holdings Ltd. | | | 35,201 | | | | 417,568 | |
| Cheung Kong Infrastructure Holdings Ltd. | | | 5,749 | | | | 33,613 | |
| Chinese Estates Holdings Ltd. | | | 25,000 | | | | 40,192 | |
| CLP Holdings Ltd. | | | 24,511 | | | | 208,242 | |
| Esprit Holdings Ltd. (a) | | | 98,800 | | | | 127,195 | |
| Foxconn International Holdings Ltd. † | | | 32,101 | | | | 20,643 | |
| Hang Lung Group Ltd. | | | 11,791 | | | | 64,528 | |
| Hang Seng Bank Ltd. (a) | | | 17,057 | | | | 202,047 | |
| Hong Kong & China Gas Co., Ltd. | | | 33,000 | | | | 76,407 | |
| Hong Kong Exchanges and Clearing Ltd. | | | 16,169 | | | | 257,281 | |
| Hopewell Holdings Ltd. | | | 65,695 | | | | 167,808 | |
| Hutchison Whampoa Ltd. | | | 56,489 | | | | 471,392 | |
| Hysan Development Co., Ltd. | | | 59,823 | | | | 195,894 | |
| Li & Fung Ltd. | | | 1,468 | | | | 2,705 | |
| Lifestyle International Holdings Ltd. | | | 9,000 | | | | 19,810 | |
| Link REIT/The REIT (a) | | | 34,329 | | | | 126,252 | |
| Mongolia Energy Corp. Ltd. † | | | 48,885 | | | | 4,385 | |
| New World Development Co., Ltd. | | | 40,173 | | | | 32,256 | |
| NWS Holdings Ltd. | | | 19,500 | | | | 28,672 | |
| PCCW Ltd. | | | 65,406 | | | | 22,443 | |
| Power Assets Holdings Ltd. | | | 42,500 | | | | 314,246 | |
| Sands China Ltd. † | | | 41,200 | | | | 115,590 | |
| SJM Holdings Ltd. | | | 25,000 | | | | 40,569 | |
| Sun Hung Kai Properties Ltd. | | | 19,022 | | | | 237,716 | |
| Swire Pacific Ltd., Class A | | | 11,818 | | | | 142,390 | |
| Television Broadcasts Ltd. | | | 14,442 | | | | 87,454 | |
| Wharf Holdings Ltd. | | | 24,604 | | | | 110,907 | |
| Wheelock & Co., Ltd. | | | 54,844 | | | | 135,613 | |
| Wynn Macau Ltd. | | | 25,600 | | | | 63,907 | |
| Yue Yuen Industrial Holdings Ltd. | | | 31,623 | | | | 99,791 | |
| | | | | | | | |
| | | | | | | 4,320,537 | |
| | | | | | | | |
| Italy - 0.7% | | | | | | | | |
| Assicurazioni Generali SpA | | | 18,525 | | | | 278,085 | |
| Enel SpA | | | 94,899 | | | | 384,980 | |
| | | | |
| | The accompanying notes are an integral part of these financial statements. | | (Continued) |
| | | | | | | | | | | | | | | | |
| 38 | | AQR Funds | | | | | | Annual Report | | | | | | December 2011 | | |
| | | | | | | | | | |
| | | | |
| Schedule of Investments | | | December 31, 2011 | |
| | | | | | | | |
| | | SHARES | | | VALUE
(Note 3) | |
| Italy - 0.7% (continued) | | | | | | | | |
| ENI SpA | | | 68,444 | | | $ | 1,411,153 | |
| Intesa Sanpaolo SpA | | | 181,257 | | | | 301,886 | |
| Telecom Italia SpA | | | 84,774 | | | | 90,612 | |
| UniCredit SpA (a) | | | 23,340 | | | | 192,508 | |
| | | | | | | | |
| | | | | | | 2,659,224 | |
| | | | | | | | |
| Japan - 8.1% | | | | | | | | |
| Aeon Co., Ltd. (a) | | | 17,300 | | | | 236,978 | |
| Aeon Mall Co., Ltd. | | | 900 | | | | 19,093 | |
| Aisin Seiki Co., Ltd. | | | 1,300 | | | | 36,842 | |
| Ajinomoto Co., Inc. | | | 9,000 | | | | 108,041 | |
| Asahi Glass Co., Ltd. | | | 236 | | | | 1,973 | |
| Asahi Kasei Corp. | | | 78,000 | | | | 470,067 | |
| Astellas Pharma, Inc. | | | 5,100 | | | | 207,097 | |
| Brother Industries Ltd. | | | 32,800 | | | | 401,456 | |
| Canon, Inc. (a) | | | 13,345 | | | | 587,278 | |
| Central Japan Railway Co. | | | 51 | | | | 430,403 | |
| Chiyoda Corp. | | | 45,000 | | | | 456,880 | |
| Chubu Electric Power Co., Inc. | | | 54 | | | | 1,011 | |
| Credit Saison Co., Ltd. | | | 15,075 | | | | 301,063 | |
| Daicel Corp. | | | 60,000 | | | | 364,446 | |
| Daido Steel Co., Ltd. | | | 49,000 | | | | 305,901 | |
| Daihatsu Motor Co., Ltd. | | | 27,000 | | | | 480,136 | |
| Dai-ichi Life Insurance Co., Ltd./The | | | 129 | | | | 126,639 | |
| Daiichi Sankyo Co., Ltd. | | | 4,300 | | | | 85,162 | |
| Daito Trust Construction Co., Ltd. | | | 1,586 | | | | 135,804 | |
| Daiwa House Industry Co., Ltd. | | | 8,151 | | | | 97,443 | |
| Dena Co., Ltd. | | | 15,200 | | | | 455,338 | |
| DIC Corp. | | | 495 | | | | 897 | |
| East Japan Railway Co. | | | 512 | | | | 32,634 | |
| Ebara Corp. | | | 70,000 | | | | 240,227 | |
| FANUC Corp. | | | 2,000 | | | | 305,065 | |
| Fuji Heavy Industries Ltd. | | | 733 | | | | 4,396 | |
| Fuji Media Holdings, Inc. | | | 220 | | | | 332,621 | |
| FUJIFILM Holdings Corp. | | | 44 | | | | 1,038 | |
| Fujitsu Ltd. | | | 36,115 | | | | 187,254 | |
| Hakuhodo DY Holdings, Inc. | | | 7,090 | | | | 406,497 | |
| Hino Motors Ltd. | | | 975 | | | | 5,903 | |
| Hitachi High-Technologies Corp. | | | 10,758 | | | | 233,049 | |
| Hitachi Ltd. | | | 37,000 | | | | 192,473 | |
| Hokuhoku Financial Group, Inc. | | | 146,000 | | | | 283,886 | |
| Honda Motor Co., Ltd. | | | 13,597 | | | | 414,177 | |
| Hoya Corp. | | | 6 | | | | 129 | |
| Idemitsu Kosan Co., Ltd. | | | 1,800 | | | | 185,503 | |
| IHI Corp. | | | 4,000 | | | | 9,698 | |
| Inpex Corp. | | | 75 | | | | 472,217 | |
| Isuzu Motors Ltd. | | | 67,000 | | | | 308,437 | |
| ITOCHU Corp. | | | 41,588 | | | | 421,680 | |
| Japan Petroleum Exploration Co. | | | 3,700 | | | | 144,383 | |
| Japan Real Estate Investment Corp. REIT | | | 7 | | | | 54,500 | |
| Japan Retail Fund Investment Corp. REIT | | | 18 | | | | 26,627 | |
| Japan Tobacco, Inc. | | | 71 | | | | 333,879 | |
| JGC Corp. | | | 21,000 | | | | 504,182 | |
| JS Group Corp. | | | 3,100 | | | | 59,414 | |
| JTEKT Corp. | | | 47,488 | | | | 464,112 | |
| JX Holdings, Inc. | | | 35,614 | | | | 214,916 | |
| Kaneka Corp. | | | 354 | | | | 1,879 | |
| Kansai Electric Power Co., Inc./The | | | 4,600 | | | | 70,661 | |
| | | | | | | | |
| | | SHARES | | | VALUE
(Note 3) | |
| Japan - 8.1% (continued) | | | | | | | | |
| KDDI Corp. | | | 115 | | | $ | 738,565 | |
| Keisei Electric Railway Co., Ltd. | | | 461 | | | | 3,389 | |
| Keyence Corp. | | | 700 | | | | 168,728 | |
| Kinden Corp. | | | 22,284 | | | | 187,857 | |
| Kobe Steel Ltd. | | | 158,759 | | | | 245,365 | |
| Koito Manufacturing Co., Ltd. | | | 11,000 | | | | 153,752 | |
| Konami Corp. | | | 2,800 | | | | 83,731 | |
| Konica Minolta Holdings, Inc. | | | 31,500 | | | | 234,227 | |
| Kubota Corp. | | | 343 | | | | 2,870 | |
| Kuraray Co., Ltd. | | | 32,800 | | | | 465,487 | |
| Makita Corp. | | | 46 | | | | 1,484 | |
| Marubeni Corp. | | | 60,000 | | | | 365,207 | |
| Miraca Holdings, Inc. | | | 10,228 | | | | 407,765 | |
| Mitsubishi Chemical Holdings Corp. | | | 59,000 | | | | 323,346 | |
| Mitsubishi Corp. | | | 19,136 | | | | 385,682 | |
| Mitsubishi Electric Corp. | | | 71,000 | | | | 680,452 | |
| Mitsubishi Estate Co., Ltd. | | | 18,764 | | | | 279,798 | |
| Mitsubishi Heavy Industries, Ltd. | | | 26,000 | | | | 110,427 | |
| Mitsubishi Materials Corp. | | | 51,000 | | | | 137,885 | |
| Mitsubishi UFJ Financial Group, Inc. | | | 168,249 | | | | 712,279 | |
| Mitsubishi UFJ Lease & Finance Co., Ltd. | | | 7,988 | | | | 316,167 | |
| Mitsui & Co., Ltd. | | | 56,889 | | | | 881,737 | |
| Mitsui Chemicals, Inc. | | | 68,000 | | | | 206,470 | |
| Mitsui Fudosan Co., Ltd. | | | 17,598 | | | | 256,609 | |
| Mitsui Mining & Smelting Co., Ltd. | | | 53,000 | | | | 136,285 | |
| Mitsumi Electric Co., Ltd. | | | 16,040 | | | | 118,790 | |
| Mizuho Financial Group, Inc. | | | 155,841 | | | | 211,026 | |
| Namco Bandai Holdings, Inc. | | | 5,400 | | | | 76,640 | |
| NHK Spring Co., Ltd. | | | 22,400 | | | | 197,977 | |
| Nikon Corp. | | | 13,700 | | | | 303,599 | |
| Nippon Building Fund, Inc. REIT | | | 8 | | | | 65,471 | |
| Nippon Electric Glass Co., Ltd. | | | 26,000 | | | | 255,950 | |
| Nippon Kayaku Co., Ltd. | | | 546 | | | | 5,250 | |
| Nippon Meat Packers, Inc. | | | 97 | | | | 1,202 | |
| Nippon Sheet Glass Co., Ltd. | | | 86,000 | | | | 160,276 | |
| Nippon Shokubai Co., Ltd. | | | 20,000 | | | | 214,274 | |
| Nippon Telegraph & Telephone Corp. | | | 7,948 | | | | 404,632 | |
| Nishi-Nippon City Bank Ltd./The | | | 125,363 | | | | 359,594 | |
| Nissan Motor Co., Ltd. | | | 14,900 | | | | 133,431 | |
| Nisshin Steel Co., Ltd. | | | 103,000 | | | | 157,594 | |
| Nitto Denko Corp. | | | 12,094 | | | | 430,188 | |
| NTT DoCoMo, Inc. | | | 422 | | | | 774,800 | |
| OJI Paper Co., Ltd. | | | 682 | | | | 3,501 | |
| Omron Corp. | | | 31 | | | | 622 | |
| ORIX Corp. | | | 1,599 | | | | 131,824 | |
| Osaka Gas Co., Ltd. | | | 129,446 | | | | 511,428 | |
| Otsuka Corp. | | | 2,300 | | | | 158,279 | |
| Pacific Metals Co., Ltd. | | | 16,720 | | | | 80,812 | |
| Rengo Co., Ltd. | | | 884 | | | | 6,164 | |
| Sankyo Co., Ltd. | | | 6,300 | | | | 318,511 | |
| Sapporo Hokuyo Holdings, Inc. | | | 14,068 | | | | 50,310 | |
| SBI Holdings, Inc. | | | 261 | | | | 19,054 | |
| Sega Sammy Holdings, Inc. | | | 6,600 | | | | 142,582 | |
| Seino Holdings Corp. | | | 30,100 | | | | 232,760 | |
| Sekisui Chemical Co., Ltd. | | | 52,000 | | | | 428,354 | |
| Sekisui House Ltd. | | | 9,000 | | | | 79,978 | |
| Seven & I Holdings Co., Ltd. | | | 25,030 | | | | 697,579 | |
| | | | |
| | The accompanying notes are an integral part of these financial statements. | | (Continued) |
| | | | | | | | | | | | | | | | |
| | AQR Funds | | | | | | Annual Report | | | | | | December 2011 | | 39 |
| | | | | | | | | | |
| | | | |
| Schedule of Investments | | | December 31, 2011 | |
| | | | | | | | |
| | | SHARES | | | VALUE
(Note 3) | |
| Japan - 8.1% (continued) | | | | | | | | |
| Showa Shell Sekiyu KK (a) | | | 36,700 | | | $ | 246,760 | |
| Softbank Corp. | | | 14,500 | | | | 425,837 | |
| Sojitz Corp. | | | 47,016 | | | | 72,615 | |
| Sony Corp. | | | 8,817 | | | | 158,979 | |
| Sumitomo Corp. | | | 17,000 | | | | 229,791 | |
| Sumitomo Heavy Industries Ltd. | | | 69,000 | | | | 402,704 | |
| Sumitomo Metal Industries Ltd. | | | 36,493 | | | | 66,182 | |
| Sumitomo Mitsui Financial Group, Inc. | | | 12,449 | | | | 345,245 | |
| Sumitomo Realty & Development Co., Ltd. | | | 5,624 | | | | 98,264 | |
| Taiheiyo Cement Corp. | | | 42,000 | | | | 80,382 | |
| Taisei Corp. | | | 14,000 | | | | 35,488 | |
| Taisho Pharmaceutical Holdings Co., Ltd. † | | | 1,100 | | | | 84,890 | |
| Takeda Pharmaceutical Co., Ltd. | | | 10,369 | | | | 455,463 | |
| THK Co., Ltd. | | | 7,200 | | | | 141,824 | |
| Tohoku Electric Power Co., Inc. | | | 6,900 | | | | 66,292 | |
| Tokai Rika Co., Ltd. | | | 15,865 | | | | 242,270 | |
| Tokuyama Corp. (a) | | | 55,000 | | | | 174,435 | |
| Tokyo Electric Power Co., Inc./The † | | | 26,870 | | | | 64,484 | |
| Tokyo Electron Ltd. | | | 9,800 | | | | 496,543 | |
| Tokyu Land Corp. | | | 5,000 | | | | 18,868 | |
| TonenGeneral Sekiyu KK (a) | | | 37,000 | | | | 403,439 | |
| Toshiba Corp. | | | 21,000 | | | | 85,702 | |
| Tosoh Corp. | | | 30,000 | | | | 79,722 | |
| Toyota Motor Corp. | | | 34,041 | | | | 1,125,646 | |
| Ube Industries Ltd. | | | 129,000 | | | | 352,595 | |
| UNY Co., Ltd. | | | 9,300 | | | | 83,660 | |
| USS Co., Ltd. | | | 5 | | | | 452 | |
| Yamada Denki Co., Ltd. | | | 6,450 | | | | 439,369 | |
| Yamaguchi Financial Group, Inc. | | | 5,000 | | | | 47,644 | |
| Yamaha Motor Co., Ltd. | | | 32,400 | | | | 409,785 | |
| Yamatake Corp. | | | 17,100 | | | | 371,618 | |
| | | | | | | | |
| | | | | | | 32,746,349 | |
| | | | | | | | |
| Netherlands - 1.3% | | | | | | | | |
| ASML Holding NV | | | 45,315 | | | | 1,892,874 | |
| Corio NV REIT | | | 1,027 | | | | 44,470 | |
| Delta Lloyd NV | | | 11,563 | | | | 193,720 | |
| ING Groep NV CVA † | | | 79,880 | | | | 571,270 | |
| Koninklijke Ahold NV | | | 68,517 | | | | 920,909 | |
| Koninklijke DSM NV | | | 5,904 | | | | 272,892 | |
| Koninklijke KPN NV | | | 27,946 | | | | 333,596 | |
| Unilever NV CVA | | | 24,960 | | | | 858,213 | |
| | | | | | | | |
| | | | | | | 5,087,944 | |
| | | | | | | | |
| Singapore - 0.6% | | | | | | | | |
| Ascendas Real Estate Investment Trust REIT | | | 22,478 | | | | 31,739 | |
| CapitaLand Ltd. | | | 99,000 | | | | 168,483 | |
| CapitaMall Trust REIT | | | 34,494 | | | | 45,163 | |
| DBS Group Holdings Ltd. | | | 30,054 | | | | 266,768 | |
| Genting Singapore PLC †(a) | | | 73,000 | | | | 84,942 | |
| Golden Agri-Resources Ltd. | | | 354,000 | | | | 195,052 | |
| Jardine Cycle & Carriage Ltd. | | | 6,291 | | | | 233,417 | |
| Keppel Corp. Ltd. | | | 18,000 | | | | 128,841 | |
| Oversea-Chinese Banking Corp. Ltd. | | | 11,422 | | | | 68,884 | |
| SembCorp Industries Ltd. | | | 11,777 | | | | 36,733 | |
| | | | | | | | |
| | | SHARES | | | VALUE
(Note 3) | |
| Singapore - 0.6% (continued) | | | | | | | | |
| SembCorp Marine Ltd. | | | 61,000 | | | $ | 179,272 | |
| Singapore Airlines Ltd. | | | 18,000 | | | | 140,859 | |
| Singapore Exchange Ltd. | | | 10,967 | | | | 51,838 | |
| Singapore Technologies Engineering Ltd. | | | 25,103 | | | | 52,070 | |
| Singapore Telecommunications Ltd. | | | 129,635 | | | | 308,758 | |
| StarHub Ltd. | | | 7,476 | | | | 16,773 | |
| United Overseas Bank Ltd. | | | 30,201 | | | | 355,422 | |
| UOL Group Ltd. | | | 10,340 | | | | 31,851 | |
| Yangzijiang Shipbuilding Holdings Ltd. | | | 24,404 | | | | 17,080 | |
| | | | | | | | |
| | | | | | | 2,413,945 | |
| | | | | | | | |
| Spain - 1.3% | | | | | | | | |
| Acciona SA | | | 4,976 | | | | 427,660 | |
| Amadeus IT Holding SA, A Shares | | | 34,957 | | | | 564,493 | |
| Banco Bilbao Vizcaya Argentaria SA | | | 68,218 | | | | 587,644 | |
| Banco Santander SA | | | 134,231 | | | | 1,014,068 | |
| Endesa SA | | | 14,781 | | | | 302,558 | |
| Inditex SA | | | 15,320 | | | | 1,250,646 | |
| Repsol YPF SA (a) | | | 28,033 | | | | 857,678 | |
| Telefonica SA | | | 20,829 | | | | 358,845 | |
| | | | | | | | |
| | | | | | | 5,363,592 | |
| | | | | | | | |
| Sweden - 1.2% | | | | | | | | |
| Boliden AB | | | 29,363 | | | | 425,984 | |
| Investor AB, B Shares | | | 9,034 | | | | 168,021 | |
| Lundin Petroleum AB † | | | 48,860 | | | | 1,196,710 | |
| Nordea Bank AB | | | 30,297 | | | | 233,519 | |
| Sandvik AB | | | 39,133 | | | | 478,419 | |
| Skandinaviska Enskilda Banken AB, Class A | | | 22,123 | | | | 128,358 | |
| Swedbank AB | | | 18,603 | | | | 240,064 | |
| Swedish Match AB | | | 23,242 | | | | 823,313 | |
| Telefonaktiebolaget LM Ericsson, B Shares | | | 90,528 | | | | 918,010 | |
| TeliaSonera AB | | | 34,247 | | | | 232,057 | |
| | | | | | | | |
| | | | | | | 4,844,455 | |
| | | | | | | | |
| Switzerland - 3.5% | | | | | | | | |
| ABB Ltd. † | | | 32,755 | | | | 615,344 | |
| Compagnie Financiere Richemont SA, Class A | | | 21,302 | | | | 1,071,548 | |
| Nestle SA | | | 75,867 | | | | 4,356,551 | |
| Novartis AG | | | 37,718 | | | | 2,153,437 | |
| Panalpina Welttransport Holding AG † | | | 2,228 | | | | 227,356 | |
| Roche Holding AG | | | 16,074 | | | | 2,718,408 | |
| Sulzer AG | | | 1,351 | | | | 143,863 | |
| Swiss Life Holding AG † | | | 3,509 | | | | 321,384 | |
| Syngenta AG † | | | 3,435 | | | | 1,009,377 | |
| Synthes, Inc. (United States) 144A (c) | | | 1,002 | | | | 167,714 | |
| Transocean Ltd. | | | 6,407 | | | | 246,593 | |
| UBS AG † | | | 76,957 | | | | 912,917 | |
| | | | | | | | |
| | | | | | | 13,944,492 | |
| | | | | | | | |
| United Kingdom - 8.7% | | | | | | | | |
| Anglo American PLC | | | 6,428 | | | | 237,451 | |
| AstraZeneca PLC | | | 44,835 | | | | 2,071,019 | |
| Aviva PLC | | | 41,784 | | | | 194,351 | |
| BAE Systems PLC | | | 39,696 | | | | 175,409 | |
| | | | |
| | The accompanying notes are an integral part of these financial statements. | | (Continued) |
| | | | | | | | | | | | | | | | |
| 40 | | AQR Funds | | | | | | Annual Report | | | | | | December 2011 | | |
| | | | | | | | | | |
| | | | |
| Schedule of Investments | | | December 31, 2011 | |
| | | | | | | | |
| | | SHARES | | | VALUE
(Note 3) | |
| United Kingdom - 8.7% (continued) | | | | | | | | |
| Barclays PLC | | | 203,838 | | | $ | 558,249 | |
| Berkeley Group Holdings PLC † | | | 24,755 | | | | 490,464 | |
| BG Group PLC | | | 4,517 | | | | 96,500 | |
| BHP Billiton PLC | | | 35,178 | | | | 1,028,453 | |
| BP PLC | | | 305,475 | | | | 2,175,987 | |
| British American Tobacco PLC | | | 27,563 | | | | 1,307,599 | |
| British Land Co. PLC REIT | | | 13,261 | | | | 95,179 | |
| British Sky Broadcasting Group PLC | | | 34,200 | | | | 389,104 | |
| BT Group PLC | | | 180,206 | | | | 534,164 | |
| Cairn Energy PLC † | | | 23,881 | | | | 98,182 | |
| Capital Shopping Centres Group PLC REIT | | | 6,502 | | | | 31,503 | |
| Eurasian Natural Resources Corp PLC | | | 12,647 | | | | 124,731 | |
| Ferrexpo PLC | | | 81,780 | | | | 341,376 | |
| GKN PLC | | | 46,670 | | | | 132,530 | |
| GlaxoSmithKline PLC | | | 129,214 | | | | 2,944,261 | |
| Glencore International PLC | | | 14,355 | | | | 87,650 | |
| Hammerson PLC REIT | | | 10,329 | | | | 57,679 | |
| HSBC Holdings PLC | | | 339,032 | | | | 2,588,186 | |
| Imperial Tobacco Group PLC | | | 23,724 | | | | 897,729 | |
| Inchcape PLC | | | 44,795 | | | | 203,806 | |
| Intermediate Capital Group PLC | | | 172,658 | | | | 612,990 | |
| ITV PLC | | | 495,170 | | | | 523,115 | |
| Kazakhmys PLC | | | 12,715 | | | | 183,589 | |
| Kesa Electricals PLC | | | 80,984 | | | | 84,843 | |
| Ladbrokes PLC | | | 109,087 | | | | 220,036 | |
| Land Securities Group PLC REIT | | | 12,541 | | | | 123,692 | |
| Legal & General Group PLC | | | 454,004 | | | | 725,533 | |
| Misys PLC † | | | 51,333 | | | | 185,110 | |
| Mondi PLC | | | 40,119 | | | | 283,387 | |
| National Grid PLC | | | 41,526 | | | | 401,381 | |
| Pearson PLC | | | 20,882 | | | | 391,928 | |
| Persimmon PLC | | | 99,972 | | | | 729,331 | |
| Prudential PLC | | | 13,299 | | | | 131,583 | |
| Randgold Resources Ltd. | | | 1,514 | | | | 154,789 | |
| Reed Elsevier PLC | | | 20,306 | | | | 163,466 | |
| Rentokil Initial PLC † | | | 140,758 | | | | 136,952 | |
| Resolution Ltd. | | | 24,269 | | | | 94,606 | |
| Rio Tinto PLC | | | 23,550 | | | | 1,150,336 | |
| Royal Bank of Scotland Group PLC † | | | 2,904,920 | | | | 915,653 | |
| Royal Dutch Shell PLC, A Shares | | | 56,073 | | | | 2,057,278 | |
| Royal Dutch Shell PLC, B Shares | | | 69,242 | | | | 2,633,819 | |
| Segro PLC REIT | | | 13,080 | | | | 42,353 | |
| Shire PLC | | | 2,839 | | | | 98,667 | |
| SSE PLC | | | 18,098 | | | | 362,273 | |
| Standard Life PLC | | | 116,674 | | | | 373,823 | |
| Tate & Lyle PLC | | | 55,485 | | | | 606,591 | |
| Tesco PLC | | | 208,210 | | | | 1,302,737 | |
| Tullow Oil PLC | | | 14,217 | | | | 308,910 | |
| Vodafone Group PLC | | | 834,653 | | | | 2,327,102 | |
| William Hill PLC | | | 120,008 | | | | 377,217 | |
| WM Morrison Supermarkets PLC | | | 23,454 | | | | 118,630 | |
| Wolseley PLC | | | 11,597 | | | | 383,574 | |
| | | | | | | | |
| | | | | | | 35,066,856 | |
| | | | | | | | |
| United States - 47.7% (1) | | | | | | | | |
| 3M Co. | | | 6,600 | | | | 539,418 | |
| Abbott Laboratories | | | 42,484 | | | | 2,388,875 | |
| | | | | | | | |
| | | SHARES | | | VALUE
(Note 3) | |
| United States - 47.7% (1) (continued) | | | | | | | | |
| Accenture PLC, Class A | | | 7,574 | | | $ | 403,164 | |
| ACE Ltd. | | | 16,496 | | | | 1,156,700 | |
| Aflac, Inc. | | | 2,400 | | | | 103,824 | |
| Alcoa, Inc. | | | 30,000 | | | | 259,500 | |
| Allstate Corp./The | | | 10,000 | | | | 274,100 | |
| Altria Group, Inc. | | | 56,596 | | | | 1,678,071 | |
| Ameren Corp. | | | 13,100 | | | | 434,003 | |
| American Eagle Outfitters, Inc. | | | 56,300 | | | | 860,827 | |
| American Electric Power Co., Inc. | | | 9,100 | | | | 375,921 | |
| American Financial Group, Inc. | | | 33,825 | | | | 1,247,804 | |
| Ameriprise Financial, Inc. | | | 27,100 | | | | 1,345,244 | |
| AmerisourceBergen Corp. | | | 17,300 | | | | 643,387 | |
| Amgen, Inc. | | | 38,249 | | | | 2,455,968 | |
| Annaly Capital Management, Inc. REIT | | | 14,918 | | | | 238,091 | |
| Apollo Group, Inc., Class A † | | | 14,200 | | | | 764,954 | |
| Apple, Inc. † | | | 12,828 | | | | 5,195,340 | |
| Applied Materials, Inc. | | | 29,300 | | | | 313,803 | |
| Archer-Daniels-Midland Co. | | | 8,433 | | | | 241,184 | |
| Assurant, Inc. | | | 34,700 | | | | 1,424,782 | |
| AT&T, Inc. | | | 152,997 | | | | 4,626,629 | |
| AvalonBay Communities, Inc. REIT | | | 1,311 | | | | 171,217 | |
| Baker Hughes, Inc. | | | 3,100 | | | | 150,784 | |
| Bank of America Corp. | | | 116,538 | | | | 647,951 | |
| Bank of New York Mellon Corp/The | | | 9,200 | | | | 183,172 | |
| Becton Dickinson and Co. | | | 4,786 | | | | 357,610 | |
| Bed Bath & Beyond, Inc. † | | | 4,300 | | | | 249,271 | |
| Berkshire Hathaway, Inc., Class B † | | | 13,150 | | | | 1,003,345 | |
| Best Buy Co., Inc. | | | 32,400 | | | | 757,188 | |
| Big Lots, Inc. † | | | 7,500 | | | | 283,200 | |
| Biogen Idec, Inc. † | | | 5,300 | | | | 583,265 | |
| BlackRock, Inc. | | | 2,000 | | | | 356,480 | |
| Boston Properties, Inc. REIT | | | 1,463 | | | | 145,715 | |
| Bristol-Myers Squibb Co. | | | 23,832 | | | | 839,840 | |
| Capella Education Co. † | | | 1,600 | | | | 57,680 | |
| Cardinal Health, Inc. | | | 15,700 | | | | 637,577 | |
| Career Education Corp. † | | | 34,259 | | | | 273,044 | |
| Caterpillar, Inc. | | | 5,000 | | | | 453,000 | |
| CBS Corp., Class B | | | 16,700 | | | | 453,238 | |
| CF Industries Holdings, Inc. | | | 4,500 | | | | 652,410 | |
| Chemed Corp. | | | 380 | | | | 19,460 | |
| Chevron Corp. | | | 45,800 | | | | 4,873,120 | |
| Chubb Corp/The | | | 6,649 | | | | 460,244 | |
| Cimarex Energy Co. | | | 3,200 | | | | 198,080 | |
| Cisco Systems, Inc. | | | 108,489 | | | | 1,961,481 | |
| Citigroup, Inc. | | | 66,419 | | | | 1,747,484 | |
| Coca-Cola Co./The | | | 32,880 | | | | 2,300,614 | |
| Colgate-Palmolive Co. | | | 1,828 | | | | 168,889 | |
| Comerica, Inc. | | | 27,100 | | | | 699,180 | |
| Commercial Metals Co. | | | 1,600 | | | | 22,128 | |
| Computer Sciences Corp. | | | 11,831 | | | | 280,395 | |
| ConAgra Foods, Inc. | | | 46,074 | | | | 1,216,354 | |
| ConocoPhillips | | | 35,175 | | | | 2,563,202 | |
| Convergys Corp. † | | | 12,000 | | | | 153,240 | |
| Corning, Inc. | | | 10,400 | | | | 134,992 | |
| Covance, Inc. † | | | 9,600 | | | | 438,912 | |
| CSX Corp. | | | 19,594 | | | | 412,650 | |
| CVS Caremark Corp. | | | 29,700 | | | | 1,211,166 | |
| | | | |
| | The accompanying notes are an integral part of these financial statements. | | (Continued) |
| | | | | | | | | | | | | | | | |
| | AQR Funds | | | | | | Annual Report | | | | | | December 2011 | | 41 |
| | | | | | | | | | |
| | | | |
| Schedule of Investments | | | December 31, 2011 | |
| | | | | | | | |
| | | SHARES | | | VALUE
(Note 3) | |
| United States - 47.7% (1) (continued) | | | | | | | | |
| Dell, Inc. † | | | 67,000 | | | $ | 980,210 | |
| Devon Energy Corp. | | | 8,390 | | | | 520,180 | |
| Diamond Offshore Drilling, Inc. | | | 3,200 | | | | 176,832 | |
| DIRECTV, Class A † | | | 13,869 | | | | 593,038 | |
| Discover Financial Services | | | 69,000 | | | | 1,656,000 | |
| DISH Network Corp., Class A | | | 21,374 | | | | 608,732 | |
| Dr Pepper Snapple Group, Inc. | | | 26,432 | | | | 1,043,535 | |
| DTE Energy Co. | | | 17,400 | | | | 947,430 | |
| Eastman Chemical Co. | | | 13,200 | | | | 515,592 | |
| Edison International | | | 12,156 | | | | 503,258 | |
| Eli Lilly & Co. | | | 13,000 | | | | 540,280 | |
| Entergy Corp. | | | 13,700 | | | | 1,000,785 | |
| Equity Residential REIT | | | 4,548 | | | | 259,372 | |
| Exelon Corp. | | | 9,800 | | | | 425,026 | |
| Exxon Mobil Corp. | | | 92,789 | | | | 7,864,796 | |
| FedEx Corp. | | | 6,100 | | | | 509,411 | |
| Fifth Third Bancorp | | | 21,700 | | | | 276,024 | |
| Fluor Corp. | | | 4,600 | | | | 231,150 | |
| Foot Locker, Inc. | | | 16,900 | | | | 402,896 | |
| Ford Motor Co. † | | | 47,100 | | | | 506,796 | |
| Forest Laboratories, Inc. † | | | 7,786 | | | | 235,604 | |
| Freeport-McMoRan Copper & Gold, Inc. | | | 50,000 | | | | 1,839,500 | |
| Gap, Inc./The | | | 35,219 | | | | 653,312 | |
| General Dynamics Corp. | | | 12,938 | | | | 859,213 | |
| General Electric Co. | | | 206,102 | | | | 3,691,287 | |
| Goldman Sachs Group, Inc./The | | | 1,205 | | | | 108,968 | |
| Google, Inc., Class A † | | | 2,302 | | | | 1,486,862 | |
| Guess?, Inc. | | | 20,800 | | | | 620,256 | |
| Harman International Industries, Inc. | | | 7,000 | | | | 266,280 | |
| Hartford Financial Services Group, Inc. | | | 51,200 | | | | 832,000 | |
| HCP, Inc. REIT | | | 5,972 | | | | 247,420 | |
| Health Care REIT, Inc. REIT | | | 2,485 | | | | 135,507 | |
| Health Net, Inc. † | | | 20,100 | | | | 611,442 | |
| Helix Energy Solutions Group, Inc. † | | | 19,100 | | | | 301,780 | |
| Hess Corp. | | | 3,200 | | | | 181,760 | |
| Hewlett-Packard Co. | | | 21,352 | | | | 550,028 | |
| Hill-Rom Holdings, Inc. | | | 13,600 | | | | 458,184 | |
| Home Depot, Inc./The | | | 18,206 | | | | 765,380 | |
| Honeywell International, Inc. | | | 9,802 | | | | 532,739 | |
| Host Hotels & Resorts, Inc. REIT | | | 9,300 | | | | 137,361 | |
| Humana, Inc. | | | 17,000 | | | | 1,489,370 | |
| Huntington Bancshares, Inc. | | | 41,800 | | | | 229,482 | |
| Ingersoll-Rand PLC | | | 5,600 | | | | 170,632 | |
| Intel Corp. | | | 87,867 | | | | 2,130,775 | |
| International Business Machines Corp. | | | 17,023 | | | | 3,130,189 | |
| International Paper Co. | | | 13,200 | | | | 390,720 | |
| ITT Corp. | | | 1,900 | | | | 36,727 | |
| ITT Educational Services, Inc. † | | | 10,500 | | | | 597,345 | |
| Johnson & Johnson | | | 68,896 | | | | 4,518,200 | |
| Jones Lang LaSalle, Inc. | | | 6,800 | | | | 416,568 | |
| JPMorgan Chase & Co. | | | 101,873 | | | | 3,387,277 | |
| KBR, Inc. | | | 10,900 | | | | 303,783 | |
| KeyCorp | | | 199,700 | | | | 1,535,693 | |
| Kimberly-Clark Corp. | | | 25,563 | | | | 1,880,414 | |
| Kimco Realty Corp. REIT | | | 6,500 | | | | 105,560 | |
| Kohl’s Corp. | | | 10,200 | | | | 503,370 | |
| Kraft Foods, Inc., Class A | | | 5,321 | | | | 198,793 | |
| | | | | | | | |
| | | SHARES | | | VALUE
(Note 3) | |
| United States - 47.7% (1) (continued) | | | | | | | | |
| L-3 Communications Holdings, Inc. | | | 21,653 | | | $ | 1,443,822 | |
| Lexmark International, Inc., Class A | | | 18,400 | | | | 608,488 | |
| Lincoln National Corp. | | | 9,700 | | | | 188,374 | |
| Lockheed Martin Corp. | | | 15,743 | | | | 1,273,609 | |
| Loews Corp. | | | 14,300 | | | | 538,395 | |
| Lorillard, Inc. | | | 1,000 | | | | 114,000 | |
| Lowe’s Cos., Inc. | | | 44,200 | | | | 1,121,796 | |
| Ltd. Brands, Inc. | | | 9,661 | | | | 389,821 | |
| Macerich Co./The REIT | | | 2,100 | | | | 106,260 | |
| Macy’s, Inc. | | | 32,600 | | | | 1,049,068 | |
| Marathon Oil Corp. | | | 48,229 | | | | 1,411,663 | |
| McDermott International, Inc. † | | | 32,200 | | | | 370,622 | |
| McDonald’s Corp. | | | 20,525 | | | | 2,059,273 | |
| McKesson Corp. | | | 2,700 | | | | 210,357 | |
| Medco Health Solutions, Inc. † | | | 11,921 | | | | 666,384 | |
| Medtronic, Inc. | | | 6,082 | | | | 232,636 | |
| Merck & Co., Inc. | | | 75,219 | | | | 2,835,756 | |
| MGM Resorts International † | | | 17,400 | | | | 181,482 | |
| Microsoft Corp. | | | 163,550 | | | | 4,245,758 | |
| Monsanto Co. | | | 2,600 | | | | 182,182 | |
| Morgan Stanley | | | 12,700 | | | | 192,151 | |
| Motorola Solutions, Inc. | | | 24,700 | | | | 1,143,363 | |
| Murphy Oil Corp. | | | 10,394 | | | | 579,362 | |
| National Oilwell Varco, Inc. | | | 3,300 | | | | 224,367 | |
| Navistar International Corp. † | | | 7,500 | | | | 284,100 | |
| Newmont Mining Corp. | | | 5,161 | | | | 309,712 | |
| News Corp., Class A | | | 83,900 | | | | 1,496,776 | |
| Noble Energy, Inc. | | | 2,300 | | | | 217,097 | |
| Norfolk Southern Corp. | | | 9,323 | | | | 679,274 | |
| Northrop Grumman Corp. | | | 35,479 | | | | 2,074,812 | |
| Nucor Corp. | | | 12,700 | | | | 502,539 | |
| Occidental Petroleum Corp. | | | 15,090 | | | | 1,413,933 | |
| Omnicare, Inc. | | | 55,000 | | | | 1,894,750 | |
| Omnicom Group, Inc. | | | 4,200 | | | | 187,236 | |
| Oracle Corp. | | | 52,386 | | | | 1,343,701 | |
| Patriot Coal Corp. † | | | 13,000 | | | | 110,110 | |
| PDL BioPharma, Inc. | | | 103,643 | | | | 642,587 | |
| PepsiCo, Inc. | | | 20,772 | | | | 1,378,222 | |
| PetSmart, Inc. | | | 1,554 | | | | 79,705 | |
| Pfizer, Inc. | | | 183,043 | | | | 3,961,050 | |
| Philip Morris International, Inc. | | | 43,493 | | | | 3,413,331 | |
| Plum Creek Timber Co., Inc. REIT | | | 2,131 | | | | 77,909 | |
| PNC Financial Services Group, Inc. | | | 22,500 | | | | 1,297,575 | |
| Popular, Inc. † | | | 214,400 | | | | 298,016 | |
| Procter & Gamble Co./The | | | 68,108 | | | | 4,543,485 | |
| ProLogis, Inc. REIT | | | 5,980 | | | | 170,968 | |
| Protective Life Corp. | | | 29,398 | | | | 663,219 | |
| Public Storage REIT | | | 1,669 | | | | 224,414 | |
| PulteGroup, Inc. † | | | 68,300 | | | | 430,973 | |
| RadioShack Corp. | | | 23,900 | | | | 232,069 | |
| Rayonier, Inc. REIT | | | 3,871 | | | | 172,763 | |
| Raytheon Co. | | | 13,067 | | | | 632,181 | |
| Reinsurance Group of America, Inc. | | | 5,500 | | | | 287,375 | |
| Reynolds American, Inc. | | | 18,374 | | | | 761,051 | |
| Sara Lee Corp. | | | 8,136 | | | | 153,933 | |
| SEACOR Holdings, Inc. † | | | 2,100 | | | | 186,816 | |
| Sealed Air Corp. | | | 9,599 | | | | 165,199 | |
| | | | |
| | The accompanying notes are an integral part of these financial statements. | | (Continued) |
| | | | | | | | | | | | | | | | |
| 42 | | AQR Funds | | | | | | Annual Report | | | | | | December 2011 | | |
| | | | | | | | | | |
| | | | |
| Schedule of Investments | | | December 31, 2011 | |
| | | | | | | | |
| | | SHARES | | | VALUE
(Note 3) | |
| United States - 47.7% (1) (continued) | | | | | | | | |
| Service Corp. International | | | 57,000 | | | $ | 607,050 | |
| Simon Property Group, Inc. REIT | | | 4,342 | | | | 559,857 | |
| Smithfield Foods, Inc. † | | | 22,600 | | | | 548,728 | |
| Southwest Airlines Co. | | | 19,200 | | | | 164,352 | |
| Sprint Nextel Corp. † | | | 65,800 | | | | 153,972 | |
| Starbucks Corp. | | | 4,700 | | | | 216,247 | |
| State Street Corp. | | | 5,500 | | | | 221,705 | |
| Steel Dynamics, Inc. | | | 36,600 | | | | 481,290 | |
| Target Corp. | | | 26,300 | | | | 1,347,086 | |
| TE Connectivity Ltd. | | | 19,860 | | | | 611,887 | |
| Tekelec † | | | 15,100 | | | | 165,043 | |
| Thomas & Betts Corp. † | | | 914 | | | | 49,904 | |
| Time Warner Cable, Inc. | | | 5,300 | | | | 336,921 | |
| Time Warner, Inc. | | | 22,266 | | | | 804,693 | |
| Timken Co. | | | 5,833 | | | | 225,795 | |
| Torchmark Corp. | | | 9,300 | | | | 403,527 | |
| Travelers Cos., Inc./The | | | 35,301 | | | | 2,088,760 | |
| Tyco International Ltd. | | | 14,200 | | | | 663,282 | |
| Tyson Foods, Inc., Class A | | | 25,800 | | | | 532,512 | |
| United Technologies Corp. | | | 17,449 | | | | 1,275,347 | |
| UnitedHealth Group, Inc. | | | 15,000 | | | | 760,200 | |
| Unum Group | | | 38,309 | | | | 807,171 | |
| URS Corp. † | | | 22,000 | | | | 772,640 | |
| Valero Energy Corp. | | | 40,500 | | | | 852,525 | |
| Ventas, Inc. REIT | | | 2,400 | | | | 132,312 | |
| Verizon Communications, Inc. | | | 66,912 | | | | 2,684,509 | |
| Viacom, Inc., Class B | | | 6,637 | | | | 301,386 | |
| Visa, Inc., Class A | | | 7,500 | | | | 761,475 | |
| Vishay Intertechnology, Inc. † | | | 29,200 | | | | 262,508 | |
| Vornado Realty Trust REIT | | | 2,748 | | | | 211,211 | |
| W&T Offshore, Inc. | | | 10,900 | | | | 231,189 | |
| Walgreen Co. | | | 33,040 | | | | 1,092,302 | |
| Wal-Mart Stores, Inc. | | | 62,205 | | | | 3,717,371 | |
| Warnaco Group, Inc./The † | | | 1,700 | | | | 85,068 | |
| Waste Management, Inc. | | | 2,373 | | | | 77,621 | |
| WellPoint, Inc. | | | 26,191 | | | | 1,735,154 | |
| Wells Fargo & Co. | | | 88,670 | | | | 2,443,745 | |
| Western Digital Corp. † | | | 35,000 | | | | 1,083,250 | |
| Weyerhaeuser Co. REIT | | | 8,600 | | | | 160,562 | |
| Whirlpool Corp. | | | 3,500 | | | | 166,075 | |
| Williams Cos., Inc./The | | | 13,000 | | | | 429,260 | |
| Wyndham Worldwide Corp. | | | 7,544 | | | | 285,390 | |
| Wynn Resorts Ltd. | | | 2,000 | | | | 220,980 | |
| | | | | | | | |
| | | | | | | 191,578,023 | |
| | | | | | | | |
TOTAL COMMON STOCKS
(cost $331,671,575) | | | | | | | 359,242,365 | |
| | | | | | | | |
| | |
| PREFERRED STOCKS - 0.2% | | | | | | | | |
| | |
| Germany - 0.2% | | | | | | | | |
| Porsche Automobil Holding SE | | | 10,215 | | | | 545,329 | |
| ProSiebenSat.1 Media AG | | | 8,908 | | | | 162,308 | |
| Volkswagen AG | | | 2,748 | | | | 410,857 | |
| | | | | | | | |
TOTAL PREFERRED STOCKS
(cost $1,056,849) | | | | | | | 1,118,494 | |
| | | | | | | | |
| | | | | | | | |
| | | SHARES | | | VALUE
(Note 3) | |
| |
| MONEY MARKET FUNDS - 8.0% | | | | | |
| J.P. Morgan Prime Money Market Fund - Capital Shares, 0.130% (d)(e) | | | 910,611 | | | $ | 910,611 | |
| J.P. Morgan Treasury Plus Money Market Fund - Institutional Shares, 0.000% (d) | | | 31,035,686 | | | | 31,035,686 | |
| | | | | | | | |
TOTAL MONEY MARKET FUNDS
(cost $31,946,297) | | | | 31,946,297 | |
| | | | | | | | |
| INVESTMENTS OF CASH COLLATERAL FOR SECURITIES ON LOAN - 1.7% | |
| J.P. Morgan Prime Money Market Fund - | | | | | |
Capital Shares, 0.130% (d)(f)
(cost $6,787,138) | | | 6,787,138 | | | | 6,787,138 | |
| | | | | | | | |
TOTAL INVESTMENTS - 99.3%
(cost $371,461,859) | | | | | | | 399,094,294 | |
| | | | | | | | |
| OTHER ASSETS IN EXCESS OF LIABILITIES - 0.7% (g) | | | | | | | 2,690,107 | |
| | | | | | | | |
NET ASSETS - 100.0% | | | | | | $ | 401,784,401 | |
| | | | | | | | |
| † | Non income-producing security. |
| (a) | All or a portion of the security on loan. The aggregate market value of such securities is $6,517,796; cash collateral of $6,787,138 was received with which the Fund purchased a money market fund. |
| (b) | Security fair valued at $0 as of December 31, 2011 using procedures approved by the Board of Trustees. |
| (c) | Rule 144A, Section 4(2) or other security which is restricted as to resale to institutional investors. The Fund Adviser has deemed this security to be liquid based upon procedures approved by the Board of Trustees. |
| (d) | Represents annualized seven-day yield as of December 31, 2011. |
| (e) | A portion of the security is pledged as collateral to the brokers for forward foreign exchange contracts. |
| (f) | Represents security, or portion thereof, purchased with the cash collateral received for securities on loan. |
| (g) | Includes appreciation (depreciation) on forward foreign currency exchange, futures and swap contracts. |
All securities are Level 2, with respect to ASC 820 unless otherwise noted in parentheses.
| (1) | Level 1 security (See Note 5). |
| (3) | Level 3 security (See Note 5). |
The following abbreviations are used in portfolio descriptions:
CVA - Dutch Certificate of Shares
REIT - Real Estate Investment Trust
| | | | |
| | The accompanying notes are an integral part of these financial statements. | | (Continued) |
| | | | | | | | | | | | | | | | |
| | AQR Funds | | | | | | Annual Report | | | | | | December 2011 | | 43 |
| | | | | | | | | | |
| | | | |
| Schedule of Investments | | | December 31, 2011 | |
| | | | | | | | |
| SECTOR | | VALUE | | | % OF NET
ASSETS | |
| Consumer Discretionary | | $ | 40,748,567 | | | | 10.1 | % |
| Consumer Staples | | | 41,151,526 | | | | 10.2 | |
| Energy | | | 44,764,999 | | | | 11.1 | |
| Financials | | | 62,156,437 | | | | 15.5 | |
| Health Care | | | 46,625,305 | | | | 11.6 | |
| Industrials | | | 37,090,671 | | | | 9.2 | |
| Information Technology | | | 37,105,089 | | | | 9.2 | |
| Materials | | | 26,770,434 | | | | 6.7 | |
| | | | | | | | |
| SECTOR | | VALUE | | | % OF NET
ASSETS | |
| Telecommunication Services | | $ | 16,357,624 | | | | 4.1 | % |
| Utilities | | | 7,590,207 | | | | 1.9 | |
| Money Market Funds | | | 38,733,435 | | | | 9.7 | |
| | | | | | | | |
Total Investments | | | 399,094,294 | | | | 99.3 | |
| Other Assets in Excess of Liabilities (g) | | | 2,690,107 | | | | 0.7 | |
| | | | | | | | |
Net Assets | | $ | 401,784,401 | | | | 100.0 | % |
| | | | | | | | |
Total return swap contract outstanding as of December 31, 2011:
| | | | | | | | | | | | | | |
| COUNTERPARTY | | UNDERLYING REFERENCE INSTRUMENT | | TERMINATION
DATE | | CURRENCY | | NOTIONAL
VALUE | | | UNREALIZED
APPRECIATION
(DEPRECIATION) | |
The Royal Bank
of Scotland | | Swiss Market Index Futures | | 3/16/2012 | | CHF | | | (2,316,393) | | | | $(104,972) | |
| | | | | | | | | | | | | | |
Money Market Fund investment pledged as collateral for total return swap contract is included in the collateral for forward foreign currency exchange contracts.
Open futures contracts outstanding at December 31, 2011:
| | | | | | | | | | | | | | | | |
NUMBER OF
CONTRACTS | | TYPE | | EXPIRATION
DATE | | VALUE AT
TRADE DATE | | | VALUE AT
DECEMBER 31,
2011 | | | UNREALIZED
APPRECIATION
(DEPRECIATION) | |
| Long Contracts: | | | | | | | | | | | | | | | | |
| 455 | | CAC40 10 Euro Futures | | January 20, 2012 | | | $17,903,703 | | | | $18,641,115 | | | | $737,412 | |
| 1 | | DAX Index Futures | | March 16, 2012 | | | 186,954 | | | | 190,902 | | | | 3,948 | |
| 347 | | FTSE 100 Index Futures | | March 16, 2012 | | | 29,174,371 | | | | 29,833,005 | | | | 658,634 | |
| 104 | | FTSE/MIB Index Futures | | March 16, 2012 | | | 10,014,250 | | | | 10,171,200 | | | | 156,950 | |
| 43 | | IBEX 35 Index Futures | | January 20, 2012 | | | 4,590,097 | | | | 4,717,127 | | | | 127,030 | |
| 9 | | MSCI Singapore Index Futures | | January 30, 2012 | | | 423,817 | | | | 416,746 | | | | (7,071) | |
| 71 | | S&P 500 E-Mini Futures | | March 16, 2012 | | | 4,363,845 | | | | 4,446,730 | | | | 82,885 | |
| | | | | | | | | | | | | | | | |
| | | | | | | 66,657,037 | | | | 68,416,825 | | | | 1,759,788 | |
| | | | | | | | | | | | | | | | |
| Short Contracts: | | | | | | | | | | | | | | | | |
| 12 | | Amsterdam Index Futures | | January 20, 2012 | | | $(916,340) | | | | $(973,017) | | | | $(56,677) | |
| 207 | | OMXS30 Index Futures | | January 20, 2012 | | | (2,865,438) | | | | (2,974,738) | | | | (109,300) | |
| 41 | | S&P/Toronto Stock Exchange 60 Index Futures | | March 15, 2012 | | | (5,388,974) | | | | (5,464,521) | | | | (75,547) | |
| 185 | | SPI 200 Index Futures | | March 15, 2012 | | | (19,788,373) | | | | (19,011,678) | | | | 776,695 | |
| 43 | | TOPIX Index Futures | | March 8, 2012 | | | (4,079,577) | | | | (4,067,039) | | | | 12,538 | |
| | | | | | | | | | | | | | | | |
| | | | | | | (33,038,702) | | | | (32,490,993) | | | | 547,709 | |
| | | | | | | | | | | | | | | | |
| | | | | | | $33,618,335 | | | | $35,925,832 | | | | $2,307,497 | |
| | | | | | | | | | | | | | | | |
Cash held as collateral with broker for futures contracts was $5,583,765 at December 31, 2011.
| | | | |
| | The accompanying notes are an integral part of these financial statements. | | (Continued) |
| | | | | | | | | | | | | | | | |
| 44 | | AQR Funds | | | | | | Annual Report | | | | | | December 2011 | | |
| | | | | | | | | | |
| | | | |
| Schedule of Investments | | | December 31, 2011 | |
Forward foreign currency exchange contracts outstanding as of December 31, 2011:
| | | | | | | | | | | | | | | | | | | | |
PURCHASE
CONTRACTS | | COUNTERPARTY | | CURRENCY | | CURRENCY
AMOUNT
PURCHASED | | | VALUE AT
SETTLEMENT
DATE | | | VALUE AT
DECEMBER 31,
2011 | | | UNREALIZED
APPRECIATION
(DEPRECIATION) | |
Australian Dollar,
Expiring 03/21/12 | | The Royal Bank of Scotland | | AUD | | | 7,300,000 | | | | $7,307,130 | | | | $7,402,131 | | | | $95,001 | |
Canadian Dollar,
Expiring 03/21/12 | | The Royal Bank of Scotland | | CAD | | | 9,697,000 | | | | 9,462,040 | | | | 9,502,167 | | | | 40,127 | |
Swiss Franc,
Expiring 03/21/12 | | The Royal Bank of Scotland | | CHF | | | 6,472,000 | | | | 6,902,961 | | | | 6,901,643 | | | | (1,318) | |
Danish Krone,
Expiring 03/21/12 | | The Royal Bank of Scotland | | DKK | | | 260,000 | | | | 46,183 | | | | 45,311 | | | | (872) | |
Euro,
Expiring 03/21/12 | | The Royal Bank of Scotland | | EUR | | | 2,377,000 | | | | 3,095,512 | | | | 3,078,573 | | | | (16,939) | |
British Pound,
Expiring 03/21/12 | | The Royal Bank of Scotland | | GBP | | | 40,162,000 | | | | 62,647,021 | | | | 62,324,574 | | | | (322,447) | |
Hong Kong Dollar,
Expiring 03/21/12 | | The Royal Bank of Scotland | | HKD | | | 3,422,000 | | | | 439,804 | | | | 440,742 | | | | 938 | |
Israeli Shekel,
Expiring 03/21/12 | | The Royal Bank of Scotland | | ILS | | | 4,389,000 | | | | 1,163,510 | | | | 1,150,189 | | | | (13,321) | |
Japanese Yen,
Expiring 03/21/12 | | The Royal Bank of Scotland | | JPY | | | 315,076,000 | | | | 4,054,623 | | | | 4,099,316 | | | | 44,693 | |
Norwegian Krone,
Expiring 03/21/12 | | The Royal Bank of Scotland | | NOK | | | 181,860,000 | | | | 31,068,703 | | | | 30,322,054 | | | | (746,649) | |
New Zealand Dollar,
Expiring 03/21/12 | | The Royal Bank of Scotland | | NZD | | | 10,883,000 | | | | $8,217,438 | | | | $8,426,845 | | | | $209,407 | |
Swedish Krona,
Expiring 03/21/12 | | The Royal Bank of Scotland | | SEK | | | 242,859,000 | | | | 35,363,480 | | | | 35,164,059 | | | | (199,421) | |
Singapore Dollar,
Expiring 03/21/12 | | The Royal Bank of Scotland | | SGD | | | 544,000 | | | | 416,612 | | | | 419,412 | | | | 2,800 | |
| | | | | | | | | | | | | | | | | | | | |
| | | | | | | | | | | 170,185,017 | | | | 169,277,016 | | | | (908,001) | |
| | | | | | | | | | | | | | | | | | | | |
| | | | | | | | | | | | | | | | | | | | |
| SALES CONTRACTS | | COUNTERPARTY | | CURRENCY | | CURRENCY
AMOUNT SOLD | | | VALUE AT
SETTLEMENT
DATE | | | VALUE AT
DECEMBER 31,
2011 | | | UNREALIZED
APPRECIATION
(DEPRECIATION) | |
Australian Dollar,
Expiring 03/21/12 | | The Royal Bank of Scotland | | AUD | | | (5,589,000) | | | | $(5,525,905) | | | | $(5,667,193) | | | | $(141,288) | |
Canadian Dollar,
Expiring 03/21/12 | | The Royal Bank of Scotland | | CAD | | | (13,888,000) | | | | (13,541,734) | | | | (13,608,961) | | | | (67,227) | |
Swiss Franc,
Expiring 03/21/12 | | The Royal Bank of Scotland | | CHF | | | (27,513,000) | | | | (29,696,192) | | | | (29,339,448) | | | | 356,744 | |
Danish Krone,
Expiring 03/21/12 | | The Royal Bank of Scotland | | DKK | | | (4,511,000) | | | | (805,694) | | | | (786,143) | | | | 19,551 | |
Euro,
Expiring 03/21/12 | | The Royal Bank of Scotland | | EUR | | | (53,136,000) | | | | (69,851,495) | | | | (68,819,124) | | | | 1,032,371 | |
British Pound,
Expiring 03/21/12 | | The Royal Bank of Scotland | | GBP | | | (2,809,000) | | | | (4,369,861) | | | | (4,359,089) | | | | 10,772 | |
Hong Kong Dollar,
Expiring 03/21/12 | | The Royal Bank of Scotland | | HKD | | | (293,000) | | | | (37,664) | | | | (37,737) | | | | (73) | |
Israeli Shekel,
Expiring 03/21/12 | | The Royal Bank of Scotland | | ILS | | | (58,000) | | | | (15,321) | | | | (15,200) | | | | 121 | |
Japanese Yen,
Expiring 03/21/12 | | The Royal Bank of Scotland | | JPY | | | (2,897,786,000) | | | | (37,252,150) | | | | (37,701,824) | | | | (449,674) | |
| | | | |
| | The accompanying notes are an integral part of these financial statements. | | (Continued) |
| | | | | | | | | | | | | | | | |
| | AQR Funds | | | | | | Annual Report | | | | | | December 2011 | | 45 |
| | | | | | | | | | |
| | | | |
| Schedule of Investments | | | December 31, 2011 | |
| | | | | | | | | | | | | | | | | | | | |
| SALES CONTRACTS | | COUNTERPARTY | | CURRENCY | | CURRENCY
AMOUNT SOLD | | | VALUE AT
SETTLEMENT
DATE | | | VALUE AT
DECEMBER 31,
2011 | | | UNREALIZED
APPRECIATION
(DEPRECIATION) | |
Norwegian Krone,
Expiring 03/21/12 | | The Royal Bank of Scotland | | NOK | | | (40,771,000) | | | | $(6,815,293) | | | | $(6,797,869) | | | | $17,424 | |
New Zealand
Dollar, Expiring
03/21/12 | | The Royal Bank of Scotland | | NZD | | | (4,209,000) | | | | (3,232,933) | | | | (3,259,082) | | | | (26,149) | |
Swedish Krona,
Expiring 03/21/12 | | The Royal Bank of Scotland | | SEK | | | (14,127,000) | | | | (2,025,196) | | | | (2,045,478) | | | | (20,282) | |
Singapore Dollar,
Expiring 03/21/12 | | The Royal Bank of Scotland | | SGD | | | (20,000) | | | | (15,334) | | | | (15,420) | | | | (86) | |
| | | | | | | | | | | | | | | | | | | | |
| | | | | | | | | | | (173,184,772) | | | | (172,452,568) | | | | 732,204 | |
| | | | | | | | | | | | | | | | | | | | |
| | | | | | | | | | | $(2,999,755) | | | | $(3,175,552) | | | | $(175,797) | |
| | | | | | | | | | | | | | | | | | | | |
Money Market Fund is pledged as collateral for total return swap and forward foreign currency exchange contracts in the amount of $910,611.
AUD - Australian Dollar
CAD - Canadian Dollar
CHF - Swiss Franc
DKK - Danish Krone
EUR - Euro
GBP - British Pound
HKD - Hong Kong Dollar
ILS - Israeli Shekel
JPY - Japanese Yen
NOK - Norwegian Krone
NZD - New Zealand Dollar
SEK - Swedish Krona
SGD - Singapore Dollar
| | | | |
| | The accompanying notes are an integral part of these financial statements. | | |
| | | | | | | | | | | | | | | | |
| 46 | | AQR Funds | | | | | | Annual Report | | | | | | December 2011 | | |
| | | | | | | | | | |
| | | | |
| Schedule of Investments | | | December 31, 2011 | |
| | |
| AQR INTERNATIONAL EQUITY FUND | | |
| | | | | | | | |
| COMMON STOCKS - 86.6% | | SHARES | | | VALUE
(Note 3) | |
| Australia - 7.6% | | | | | | | | |
| AGL Energy Ltd. | | | 22,459 | | | $ | 328,616 | |
| Alumina Ltd. | | | 85,028 | | | | 97,345 | |
| Amcor Ltd. | | | 28,354 | | | | 208,732 | |
| Ansell Ltd. (a) | | | 53,827 | | | | 799,209 | |
| Asciano Ltd. | | | 92,252 | | | | 423,931 | |
| ASX Ltd. | | | 5,817 | | | | 181,576 | |
| Australia & New Zealand Banking Group Ltd. | | | 61,472 | | | | 1,287,525 | |
| Bendigo and Adelaide Bank Ltd. | | | 28,235 | | | | 231,094 | |
| BHP Billiton Ltd. | | | 174,625 | | | | 6,164,026 | |
| Caltex Australia Ltd. | | | 85,269 | | | | 1,023,881 | |
| CFS Retail Property Trust REIT | | | 69,740 | | | | 120,085 | |
| Commonwealth Bank of Australia (a) | | | 59,000 | | | | 2,963,653 | |
| Computershare Ltd. | | | 15,439 | | | | 126,198 | |
| CSL Ltd. (a) | | | 23,476 | | | | 765,384 | |
| CSR Ltd. (a) | | | 50,104 | | | | 100,316 | |
| Dexus Property Group REIT (a) | | | 186,006 | | | | 157,633 | |
| Downer EDI Ltd. † | | | 222,310 | | | | 725,650 | |
| Fortescue Metals Group Ltd. (a) | | | 45,904 | | | | 200,807 | |
| Goodman Group REIT | | | 275,420 | | | | 160,138 | |
| GPT Group - In Specie REIT (3)†(b) | | | 143,427 | | | | — | |
| GPT Group REIT (a) | | | 79,625 | | | | 249,567 | |
| Incitec Pivot Ltd. | | | 209,634 | | | | 665,502 | |
| Lend Lease Group | | | 21,131 | | | | 154,742 | |
| Mirvac Group REIT | | | 133,089 | | | | 160,350 | |
| Mount Gibson Iron Ltd. | | | 91,914 | | | | 105,042 | |
| National Australia Bank Ltd. | | | 143,368 | | | | 3,415,247 | |
| Newcrest Mining Ltd. | | | 31,842 | | | | 970,388 | |
| Nufarm Ltd. † | | | 61,567 | | | | 261,040 | |
| Origin Energy Ltd. | | | 83,107 | | | | 1,133,297 | |
| OZ Minerals Ltd. | | | 11,735 | | | | 120,040 | |
| Pacific Brands Ltd. | | | 1,284,563 | | | | 722,057 | |
| Paladin Energy Ltd. † | | | 24,740 | | | | 34,791 | |
| Qantas Airways Ltd. † | | | 227,188 | | | | 338,169 | |
| QBE Insurance Group Ltd. | | | 5,873 | | | | 77,726 | |
| QR National Ltd. | | | 64,128 | | | | 224,016 | |
| Rio Tinto Ltd. (a) | | | 24,800 | | | | 1,528,899 | |
| Santos Ltd. | | | 63,385 | | | | 793,236 | |
| Sonic Healthcare Ltd. | | | 82,946 | | | | 956,056 | |
| SP AusNet | | | 558,015 | | | | 535,491 | |
| Stockland REIT | | | 108,979 | | | | 356,012 | |
| Suncorp Group Ltd. | | | 28,819 | | | | 246,320 | |
| TABCORP Holdings Ltd. (a) | | | 198,302 | | | | 552,373 | |
| Tatts Group Ltd. | | | 18,460 | | | | 46,015 | |
| Telstra Corp. Ltd. | | | 197,228 | | | | 670,777 | |
| Wesfarmers Ltd. | | | 21,915 | | | | 660,162 | |
| Westfield Group REIT | | | 96,725 | | | | 771,710 | |
| Westfield Retail Trust REIT | | | 109,594 | | | | 279,300 | |
| Westpac Banking Corp. (a) | | | 118,311 | | | | 2,415,229 | |
| Woodside Petroleum Ltd. | | | 4,852 | | | | 151,883 | |
| Woolworths Ltd. | | | 85,614 | | | | 2,197,572 | |
| | | | | | | | |
| | | | | | | 36,858,808 | |
| | | | | | | | |
| Belgium - 0.4% | | | | | | | | |
| Anheuser-Busch InBev NV | | | 7,392 | | | | 451,158 | |
| Groupe Bruxelles Lambert SA | | | 2,641 | | | | 175,691 | |
| Solvay SA | | | 17,514 | | | | 1,437,817 | |
| | | | | | | | |
| | | | | | | 2,064,666 | |
| | | | | | | | |
| | | | | | | | |
| | | SHARES | | | VALUE
(Note 3) | |
| Denmark - 1.6% | | | | | | | | |
| Carlsberg A/S, Class B | | | 24,258 | | | $ | 1,708,092 | |
| Danske Bank A/S † | | | 31,768 | | | | 401,420 | |
| DSV A/S | | | 13,807 | | | | 246,731 | |
| Novo Nordisk A/S, Class B | | | 48,099 | | | | 5,525,768 | |
| | | | | | | | |
| | | | | | | 7,882,011 | |
| | | | | | | | |
| Finland - 0.7% | | | | | | | | |
| Metso OYJ | | | 51,246 | | | | 1,892,670 | |
| Sampo OYJ, A Shares | | | 16,756 | | | | 414,478 | |
| UPM-Kymmene OYJ | | | 33,428 | | | | 366,326 | |
| Wartsila OYJ | | | 25,720 | | | | 739,777 | |
| | | | | | | | |
| | | | | | | 3,413,251 | |
| | | | | | | | |
| France - 7.8% | | | | | | | | |
| Alcatel-Lucent †(a) | | | 479,720 | | | | 745,495 | |
| Arkema SA | | | 23,890 | | | | 1,678,721 | |
| AXA SA | | | 78,177 | | | | 1,010,532 | |
| BNP Paribas SA | | | 44,081 | | | | 1,716,488 | |
| Bouygues SA (a) | | | 5,418 | | | | 170,400 | |
| Christian Dior SA | | | 13,165 | | | | 1,553,967 | |
| Cie Generale de Geophysique - Veritas † | | | 108,050 | | | | 2,508,055 | |
| Cie Generale d’Optique Essilor International SA | | | 14,586 | | | | 1,028,190 | |
| Compagnie de Saint-Gobain | | | 41,017 | | | | 1,567,905 | |
| Credit Agricole SA | | | 59,088 | | | | 331,057 | |
| European Aeronautic Defence and Space Co. NV | | | 77,381 | | | | 2,409,570 | |
| Faurecia | | | 48,792 | | | | 919,590 | |
| France Telecom SA | | | 78,349 | | | | 1,226,291 | |
| Hermes International | | | 5,726 | | | | 1,701,889 | |
| Klepierre REIT | | | 3,675 | | | | 104,418 | |
| Legrand SA | | | 20,624 | | | | 660,601 | |
| L’Oreal SA | | | 10,722 | | | | 1,116,694 | |
| LVMH Moet Hennessy Louis Vuitton SA | | | 6,597 | | | | 929,284 | |
| PPR | | | 8,171 | | | | 1,166,323 | |
| Safran SA | | | 50,764 | | | | 1,518,151 | |
| Sanofi | | | 15,188 | | | | 1,110,208 | |
| Schneider Electric SA | | | 6,425 | | | | 335,908 | |
| Societe BIC SA | | | 7,961 | | | | 704,291 | |
| Societe Generale SA | | | 45,655 | | | | 1,007,862 | |
| Thales SA | | | 5,928 | | | | 186,594 | |
| Total SA | | | 120,598 | | | | 6,153,861 | |
| Unibail-Rodamco SE REIT | | | 3,619 | | | | 647,704 | |
| Valeo SA | | | 55,452 | | | | 2,194,570 | |
| Vivendi SA | | | 42,381 | | | | 925,157 | |
| Zodiac Aerospace | | | 6,731 | | | | 568,625 | |
| | | | | | | | |
| | | | | | | 37,898,401 | |
| | | | | | | | |
| Germany - 6.7% | | | | | | | | |
| Adidas AG | | | 15,045 | | | | 977,520 | |
| Allianz SE | | | 6,725 | | | | 642,265 | |
| Aurubis AG | | | 7,693 | | | | 409,400 | |
| BASF SE | | | 47,708 | | | | 3,321,354 | |
| Bayer AG | | | 82,372 | | | | 5,260,558 | |
| Bayerische Motoren Werke AG | | | 8,717 | | | | 582,715 | |
| Bilfinger Berger SE | | | 14,040 | | | | 1,195,469 | |
| Daimler AG | | | 40,399 | | | | 1,769,820 | |
| Deutsche Boerse AG | | | 5,256 | | | | 293,008 | |
| | | | |
| | The accompanying notes are an integral part of these financial statements. | | (Continued) |
| | | | | | | | | | | | | | | | |
| | AQR Funds | | | | | | Annual Report | | | | | | December 2011 | | 47 |
| | | | | | | | | | |
| | | | |
| Schedule of Investments | | | December 31, 2011 | |
| | |
| AQR INTERNATIONAL EQUITY FUND | | |
| | | | | | | | |
| | | SHARES | | | VALUE
(Note 3) | |
| Germany - 6.7% (continued) | | | | | | | | |
| Deutsche Post AG | | | 29,931 | | | $ | 460,166 | |
| Deutsche Telekom AG | | | 104,618 | | | | 1,200,061 | |
| Fresenius SE & Co. KGaA | | | 4,600 | | | | 425,371 | |
| GEA Group AG | | | 37,411 | | | | 1,056,149 | |
| Infineon Technologies AG | | | 41,937 | | | | 314,969 | |
| K+S AG | | | 27,426 | | | | 1,236,960 | |
| Kloeckner & Co. SE | | | 31,926 | | | | 408,639 | |
| Linde AG | | | 7,752 | | | | 1,152,044 | |
| Merck KGaA | | | 22,921 | | | | 2,282,569 | |
| SAP AG | | | 78,031 | | | | 4,127,188 | |
| Siemens AG | | | 43,820 | | | | 4,192,516 | |
| Software AG | | | 31,167 | | | | 1,149,039 | |
| Suedzucker AG | | | 9,548 | | | | 304,158 | |
| | | | | | | | |
| | | | | | | 32,761,938 | |
| | | | | | | | |
| Hong Kong - 2.5% | | | | | | | | |
| AIA Group Ltd. | | | 368,400 | | | | 1,146,801 | |
| ASM Pacific Technology Ltd. | | | 6,404 | | | | 71,726 | |
| BOC Hong Kong Holdings Ltd. | | | 64,553 | | | | 152,322 | |
| Cheung Kong Holdings Ltd. | | | 110,278 | | | | 1,308,160 | |
| Cheung Kong Infrastructure Holdings Ltd. | | | 14,827 | | | | 86,691 | |
| CLP Holdings Ltd. | | | 53,509 | | | | 454,606 | |
| Foxconn International Holdings Ltd. † | | | 69,406 | | | | 44,633 | |
| Hang Lung Group Ltd. | | | 30,276 | | | | 165,691 | |
| Hang Seng Bank Ltd. (a) | | | 14,935 | | | | 176,911 | |
| Hong Kong & China Gas Co., Ltd. | | | 266,000 | | | | 615,889 | |
| Hong Kong Exchanges and Clearing Ltd. | | | 43,054 | | | | 685,075 | |
| Hopewell Holdings Ltd. | | | 103,500 | | | | 264,375 | |
| Hutchison Whampoa Ltd. | | | 155,832 | | | | 1,300,393 | |
| Hysan Development Co., Ltd. | | | 211,000 | | | | 690,931 | |
| Li & Fung Ltd. | | | 1,336 | | | | 2,462 | |
| Lifestyle International Holdings Ltd. | | | 20,500 | | | | 45,123 | |
| Link REIT/The REIT (a) | | | 100,382 | | | | 369,174 | |
| Mongolia Energy Corp. Ltd. † | | | 95,406 | | | | 8,557 | |
| New World Development Co., Ltd. | | | 154,896 | | | | 124,372 | |
| NWS Holdings Ltd. | | | 39,000 | | | | 57,343 | |
| Orient Overseas International Ltd. | | | 52,500 | | | | 305,197 | |
| PCCW Ltd. | | | 131,000 | | | | 44,950 | |
| Power Assets Holdings Ltd. | | | 114,000 | | | | 842,920 | |
| Sands China Ltd. † | | | 95,200 | | | | 267,092 | |
| Shanghai Industrial Urban Development Group Ltd. † | | | 8 | | | | 1 | |
| Shangri-La Asia Ltd. | | | 102,000 | | | | 175,704 | |
| SJM Holdings Ltd. | | | 56,000 | | | | 90,874 | |
| Sun Hung Kai Properties Ltd. | | | 70,046 | | | | 875,359 | |
| Swire Pacific Ltd., Class A | | | 31,530 | | | | 379,891 | |
| Television Broadcasts Ltd. | | | 50,403 | | | | 305,217 | |
| Wharf Holdings Ltd. | | | 67,243 | | | | 303,110 | |
| Wheelock & Co., Ltd. | | | 183,621 | | | | 454,040 | |
| Wing Hang Bank Ltd. | | | 16,500 | | | | 134,992 | |
| Wynn Macau Ltd. | | | 56,800 | | | | 141,793 | |
| Yue Yuen Industrial Holdings Ltd. | | | 29,109 | | | | 91,858 | |
| | | | | | | | |
| | | | | | | 12,184,233 | |
| | | | | | | | |
| Italy - 1.6% | | | | | | | | |
| Assicurazioni Generali SpA | | | 52,361 | | | | 786,008 | |
| Banca Monte dei Paschi di Siena SpA | | | 192,544 | | | | 62,532 | |
| Enel SpA | | | 355,437 | | | | 1,441,914 | |
| | | | | | | | |
| | | SHARES | | | VALUE
(Note 3) | |
| Italy - 1.6% (continued) | | | | | | | | |
| ENI SpA | | | 196,048 | | | $ | 4,042,046 | |
| Intesa Sanpaolo SpA | | | 450,059 | | | | 749,580 | |
| Parmalat Finanziaria SpA (3)†(b) | | | 45,800 | | | | — | |
| UniCredit SpA (a) | | | 59,948 | | | | 494,460 | |
| | | | | | | | |
| | | | | | | 7,576,540 | |
| | | | | | | | |
| Japan - 18.9% | | | | | | | | |
| Acom Co., Ltd. † | | | 12,810 | | | | 227,928 | |
| Aeon Co., Ltd. (a) | | | 78,700 | | | | 1,078,046 | |
| Aeon Mall Co., Ltd. | | | 2,900 | | | | 61,523 | |
| Ajinomoto Co., Inc. | | | 48,000 | | | | 576,218 | |
| Asahi Glass Co., Ltd. | | | 413 | | | | 3,453 | |
| Asahi Kasei Corp. | | | 190,000 | | | | 1,145,036 | |
| Brother Industries Ltd. | | | 83,600 | | | | 1,023,223 | |
| Canon, Inc. (a) | | | 27,215 | | | | 1,197,660 | |
| Central Japan Railway Co. | | | 124 | | | | 1,046,471 | |
| Chiba Bank Ltd./The | | | 49,000 | | | | 315,037 | |
| Chiyoda Corp. | | | 49,000 | | | | 497,491 | |
| Chubu Electric Power Co., Inc. | | | 18,797 | | | | 351,747 | |
| Cosmo Oil Co., Ltd. | | | 248,000 | | | | 692,246 | |
| Credit Saison Co., Ltd. | | | 44,612 | | | | 890,947 | |
| Daicel Corp. | | | 193,000 | | | | 1,172,302 | |
| Daido Steel Co., Ltd. | | | 148,000 | | | | 923,947 | |
| Daihatsu Motor Co., Ltd. | | | 58,000 | | | | 1,031,403 | |
| Dai-ichi Life Insurance Co., Ltd./The | | | 288 | | | | 282,729 | |
| Daito Trust Construction Co., Ltd. | | | 2,787 | | | | 238,641 | |
| Daiwa House Industry Co., Ltd. | | | 17,295 | | | | 206,756 | |
| Dena Co., Ltd. | | | 42,300 | | | | 1,267,157 | |
| DIC Corp. | | | 125,000 | | | | 226,623 | |
| East Japan Railway Co. | | | 7,813 | | | | 497,988 | |
| Ebara Corp. | | | 233,000 | | | | 799,612 | |
| Elpida Memory, Inc. †(a) | | | 105,200 | | | | 486,717 | |
| FamilyMart Co., Ltd. | | | 7,200 | | | | 290,757 | |
| FANUC Corp. | | | 2,800 | | | | 427,090 | |
| Fuji Heavy Industries Ltd. | | | 101,721 | | | | 610,104 | |
| Fuji Media Holdings, Inc. | | | 221 | | | | 334,133 | |
| FUJIFILM Holdings Corp. | | | 43 | | | | 1,014 | |
| Fujitsu Ltd. | | | 210,000 | | | | 1,088,839 | |
| Fukuoka Financial Group, Inc. | | | 164,046 | | | | 687,327 | |
| Hino Motors Ltd. | | | 161,000 | | | | 974,829 | |
| Hitachi High-Technologies Corp. | | | 13,800 | | | | 298,947 | |
| Hitachi Ltd. | | | 169,000 | | | | 879,133 | |
| Honda Motor Co., Ltd. | | | 20,797 | | | | 633,495 | |
| Idemitsu Kosan Co., Ltd. | | | 6,400 | | | | 659,565 | |
| IHI Corp. | | | 432,000 | | | | 1,047,369 | |
| Inpex Corp. | | | 172 | | | | 1,082,951 | |
| Isuzu Motors Ltd. | | | 311,000 | | | | 1,431,701 | |
| ITOCHU Corp. | | | 184,044 | | | | 1,866,107 | |
| Japan Petroleum Exploration Co. | | | 5,900 | | | | 230,232 | |
| Japan Prime Realty Investment Corp. REIT | | | 21 | | | | 49,350 | |
| Japan Real Estate Investment Corp. REIT | | | 17 | | | | 132,356 | |
| Japan Retail Fund Investment Corp. REIT | | | 48 | | | | 71,005 | |
| Japan Tobacco, Inc. | | | 363 | | | | 1,707,013 | |
| JGC Corp. | | | 72,000 | | | | 1,728,625 | |
| JS Group Corp. | | | 45,300 | | | | 868,215 | |
| JTEKT Corp. | | | 122,570 | | | | 1,197,906 | |
| JX Holdings, Inc. | | | 84,695 | | | | 511,100 | |
| | | | |
| | The accompanying notes are an integral part of these financial statements. | | (Continued) |
| | | | | | | | | | | | | | | | |
| 48 | | AQR Funds | | | | | | Annual Report | | | | | | December 2011 | | |
| | | | | | | | | | |
| | | | |
| Schedule of Investments | | | December 31, 2011 | |
| | |
| AQR INTERNATIONAL EQUITY FUND | | |
| | | | | | | | |
| | | SHARES | | | VALUE
(Note 3) | |
| Japan - 18.9% (continued) | | | | | | | | |
| Kaneka Corp. | | | 82,625 | | | $ | 438,457 | |
| Kansai Electric Power Co., Inc./The | | | 41,832 | | | | 642,588 | |
| Kao Corp. | | | 7,085 | | | | 193,321 | |
| Kawasaki Kisen Kaisha Ltd. | | | 141,000 | | | | 253,893 | |
| KDDI Corp. | | | 315 | | | | 2,023,026 | |
| Kinden Corp. | | | 70,564 | | | | 594,862 | |
| Kobe Steel Ltd. | | | 639,000 | | | | 987,587 | |
| Komatsu Ltd. | | | 38 | | | | 886 | |
| Konica Minolta Holdings, Inc. | | | 95,500 | | | | 710,118 | |
| Kuraray Co., Ltd. | | | 65,000 | | | | 922,458 | |
| Lawson, Inc. | | | 5,500 | | | | 342,680 | |
| Marubeni Corp. | | | 96,974 | | | | 590,260 | |
| Maruichi Steel Tube Ltd. | | | 23,400 | | | | 520,381 | |
| Miraca Holdings, Inc. | | | 25,606 | | | | 1,020,847 | |
| Mitsubishi Chemical Holdings Corp. | | | 147,000 | | | | 805,624 | |
| Mitsubishi Corp. | | | 19,100 | | | | 384,956 | |
| Mitsubishi Electric Corp. | | | 229,000 | | | | 2,194,699 | |
| Mitsubishi Estate Co., Ltd. | | | 56,020 | | | | 835,337 | |
| Mitsubishi Heavy Industries, Ltd. | | | 161,000 | | | | 683,800 | |
| Mitsubishi UFJ Financial Group, Inc. | | | 503,291 | | | | 2,130,673 | |
| Mitsui & Co., Ltd. | | | 156,743 | | | | 2,429,398 | |
| Mitsui Chemicals, Inc. | | | 195,000 | | | | 592,083 | |
| Mitsui Fudosan Co., Ltd. | | | 35,205 | | | | 513,349 | |
| Mitsumi Electric Co., Ltd. | | | 34,989 | | | | 259,124 | |
| Mizuho Financial Group, Inc. | | | 148,210 | | | | 200,693 | |
| Namco Bandai Holdings, Inc. | | | 62,600 | | | | 888,453 | |
| NHK Spring Co., Ltd. | | | 83,000 | | | | 733,577 | |
| Nikon Corp. | | | 18,300 | | | | 405,538 | |
| Nippon Building Fund, Inc. REIT | | | 19 | | | | 155,495 | |
| Nippon Electric Glass Co., Ltd. | | | 71,000 | | | | 698,941 | |
| Nippon Kayaku Co., Ltd. | | | 31,000 | | | | 298,093 | |
| Nippon Meat Packers, Inc. | | | 42,000 | | | | 520,437 | |
| Nippon Sheet Glass Co., Ltd. | | | 282,000 | | | | 525,558 | |
| Nippon Telegraph & Telephone Corp. | | | 19,019 | | | | 968,256 | |
| Nishi-Nippon City Bank Ltd./The | | | 97,737 | | | | 280,351 | |
| Nisshin Seifun Group, Inc. | | | 84 | | | | 1,017 | |
| Nisshin Steel Co., Ltd. | | | 147,000 | | | | 224,916 | |
| Nitto Denko Corp. | | | 34,583 | | | | 1,230,131 | |
| Nomura Real Estate Holdings, Inc. | | | 3,300 | | | | 48,967 | |
| Nomura Real Estate Office Fund, Inc. REIT | | | 10 | | | | 51,320 | |
| NSK Ltd. | | | 35,000 | | | | 226,074 | |
| NTN Corp. | | | 19,000 | | | | 76,213 | |
| NTT DoCoMo, Inc. | | | 1,043 | | | | 1,914,969 | |
| ORIX Corp. | | | 4,549 | | | | 375,026 | |
| Osaka Gas Co., Ltd. | | | 323,802 | | | | 1,279,309 | |
| Pacific Metals Co., Ltd. | | | 107,000 | | | | 517,157 | |
| Rengo Co., Ltd. | | | 24,299 | | | | 169,443 | |
| Resona Holdings, Inc. | | | 54,800 | | | | 241,230 | |
| Sankyo Co., Ltd. | | | 4,100 | | | | 207,285 | |
| Sapporo Hokuyo Holdings, Inc. | | | 55,600 | | | | 198,838 | |
| SBI Holdings, Inc. | | | 600 | | | | 43,803 | |
| Sega Sammy Holdings, Inc. | | | 82,800 | | | | 1,788,759 | |
| Seino Holdings Corp. | | | 68,837 | | | | 532,309 | |
| Sekisui Chemical Co., Ltd. | | | 109,000 | | | | 897,897 | |
| Sekisui House Ltd. | | | 26,000 | | | | 231,046 | |
| Seven & I Holdings Co., Ltd. | | | 62,339 | | | | 1,737,370 | |
| | | | | | | | |
| | | SHARES | | | VALUE
(Note 3) | |
| Japan - 18.9% (continued) | | | | | | | | |
| Shionogi & Co. Ltd. | | | 23,900 | | | $ | 306,601 | |
| Showa Shell Sekiyu KK (a) | | | 69,800 | | | | 469,314 | |
| Softbank Corp. | | | 29,900 | | | | 878,105 | |
| Sojitz Corp. | | | 62 | | | | 96 | |
| Sony Corp. | | | 71 | | | | 1,280 | |
| Sumitomo Heavy Industries Ltd. | | | 200,000 | | | | 1,167,259 | |
| Sumitomo Metal Industries Ltd. | | | 123,000 | | | | 223,068 | |
| Sumitomo Mitsui Financial Group, Inc. | | | 36,236 | | | | 1,004,925 | |
| Sumitomo Mitsui Trust Holdings, Inc. | | | 341 | | | | 1,000 | |
| Sumitomo Realty & Development Co., Ltd. | | | 13,261 | | | | 231,699 | |
| T&D Holdings, Inc. | | | 38,800 | | | | 361,264 | |
| Taisei Corp. | | | 426,000 | | | | 1,079,846 | |
| Takeda Pharmaceutical Co., Ltd. | | | 36,081 | | | | 1,584,876 | |
| THK Co., Ltd. | | | 40,200 | | | | 791,849 | |
| Toho Co., Ltd. | | | 4,000 | | | | 71,232 | |
| Tohoku Electric Power Co., Inc. | | | 15,700 | | | | 150,837 | |
| Tokai Rika Co., Ltd. | | | 7,799 | | | | 119,096 | |
| Tokyo Electric Power Co., Inc./The † | | | 62,373 | | | | 149,685 | |
| Tokyo Electron Ltd. | | | 13,900 | | | | 704,280 | |
| Tokyo Gas Co., Ltd. | | | 71 | | | | 327 | |
| Tokyo Tatemono Co., Ltd. (a) | | | 14,000 | | | | 42,182 | |
| Tokyu Corp. | | | 52,000 | | | | 256,078 | |
| Tokyu Land Corp. | | | 26,483 | | | | 99,937 | |
| TonenGeneral Sekiyu KK (a) | | | 38,000 | | | | 414,343 | |
| Tosoh Corp. | | | 179,000 | | | | 475,671 | |
| Toyo Suisan Kaisha Ltd. | | | 11,000 | | | | 266,197 | |
| Toyota Motor Corp. | | | 78,079 | | | | 2,581,836 | |
| Ube Industries Ltd. | | | 388,000 | | | | 1,060,519 | |
| UNY Co., Ltd. | | | 52,800 | | | | 474,975 | |
| USS Co., Ltd. | | | 16,584 | | | | 1,498,837 | |
| West Japan Railway Co. | | | 9,200 | | | | 399,753 | |
| Yamada Denki Co., Ltd. | | | 24,050 | | | | 1,638,267 | |
| Yamaha Motor Co., Ltd. | | | 74,500 | | | | 942,252 | |
| Yamatake Corp. | | | 7,537 | | | | 163,795 | |
| | | | | | | | |
| | | | | | | 92,400,223 | |
| | | | | | | | |
| Netherlands - 2.9% | | | | | | | | |
| ASML Holding NV | | | 122,478 | | | | 5,116,086 | |
| Corio NV REIT | | | 2,174 | | | | 94,136 | |
| Delta Lloyd NV | | | 40,175 | | | | 673,068 | |
| ING Groep NV CVA † | | | 159,010 | | | | 1,137,176 | |
| Koninklijke Ahold NV | | | 156,082 | | | | 2,097,835 | |
| Koninklijke DSM NV | | | 15,145 | | | | 700,024 | |
| Koninklijke KPN NV | | | 206,778 | | | | 2,468,343 | |
| Unilever NV CVA | | | 59,667 | | | | 2,051,563 | |
| | | | | | | | |
| | | | | | | 14,338,231 | |
| | | | | | | | |
| Singapore - 1.4% | | | | | | | | |
| Ascendas Real Estate Investment Trust REIT | | | 80,637 | | | | 113,861 | |
| CapitaLand Ltd. | | | 197,000 | | | | 335,264 | |
| CapitaMall Trust REIT | | | 71,994 | | | | 94,261 | |
| Cosco Corp. Singapore Ltd. (a) | | | 580,000 | | | | 390,318 | |
| DBS Group Holdings Ltd. | | | 77,128 | | | | 684,610 | |
| Fraser and Neave Ltd. | | | 106,000 | | | | 506,018 | |
| Genting Singapore PLC †(a) | | | 628,000 | | | | 730,738 | |
| Golden Agri-Resources Ltd. | | | 905,000 | | | | 498,649 | |
| | | | |
| | The accompanying notes are an integral part of these financial statements. | | (Continued) |
| | | | | | | | | | | | | | | | |
| | AQR Funds | | | | | | Annual Report | | | | | | December 2011 | | 49 |
| | | | | | | | | | |
| | | | |
| Schedule of Investments | | | December 31, 2011 | |
| | |
| AQR INTERNATIONAL EQUITY FUND | | |
| | | | | | | | |
| | | SHARES | | | VALUE
(Note 3) | |
| Singapore - 1.4% (continued) | | | | | | | | |
| Jardine Cycle & Carriage Ltd. | | | 15,066 | | | $ | 559,000 | |
| Keppel Corp. Ltd. | | | 41,728 | | | | 298,682 | |
| Oversea-Chinese Banking Corp. Ltd. | | | 21,479 | | | | 129,537 | |
| SembCorp Industries Ltd. | | | 32,017 | | | | 99,863 | |
| Singapore Airlines Ltd. | | | 27,000 | | | | 211,289 | |
| Singapore Exchange Ltd. | | | 29,472 | | | | 139,305 | |
| Singapore Press Holdings Ltd. | | | 45,000 | | | | 127,910 | |
| Singapore Technologies Engineering Ltd. | | | 63,265 | | | | 131,227 | |
| Singapore Telecommunications Ltd. | | | 351,524 | | | | 837,242 | |
| StarHub Ltd. | | | 23,988 | | | | 53,820 | |
| United Overseas Bank Ltd. | | | 68,097 | | | | 801,403 | |
| UOL Group Ltd. | | | 18,000 | | | | 55,446 | |
| Yangzijiang Shipbuilding Holdings Ltd. | | | 63,319 | | | | 44,316 | |
| | | | | | | | |
| | | | | | | 6,842,759 | |
| | | | | | | | |
| Spain - 3.2% | | | | | | | | |
| Acciona SA | | | 7,635 | | | | 656,186 | |
| Amadeus IT Holding SA, A Shares | | | 95,131 | | | | 1,536,195 | |
| Banco Bilbao Vizcaya Argentaria SA | | | 196,454 | | | | 1,692,294 | |
| Banco Santander SA | | | 424,844 | | | | 3,209,548 | |
| Endesa SA | | | 56,918 | | | | 1,165,076 | |
| Inditex SA | | | 38,099 | | | | 3,110,208 | |
| Repsol YPF SA (a) | | | 103,109 | | | | 3,154,650 | |
| Telefonica SA | | | 57,668 | | | | 993,513 | |
| | | | | | | | |
| | | | | | | 15,517,670 | |
| | | | | | | | |
| Sweden - 2.9% | | | | | | | | |
| Atlas Copco AB, A Shares | | | 15,690 | | | | 336,182 | |
| Boliden AB | | | 74,676 | | | | 1,083,363 | |
| Getinge AB, B Shares | | | 18,745 | | | | 473,999 | |
| Investor AB, B Shares | | | 19,364 | | | | 360,146 | |
| Lundin Petroleum AB † | | | 116,880 | | | | 2,862,698 | |
| NCC AB, Class B | | | 19,576 | | | | 342,917 | |
| Nordea Bank AB | | | 121,593 | | | | 937,195 | |
| Sandvik AB | | | 139,873 | | | | 1,710,013 | |
| Scania AB, B Shares | | | 28,826 | | | | 425,505 | |
| Skandinaviska Enskilda Banken AB, Class A | | | 143,341 | | | | 831,666 | |
| Swedbank AB | | | 53,455 | | | | 689,816 | |
| Swedish Match AB | | | 41,164 | | | | 1,458,174 | |
Telefonaktiebolaget LM Ericsson,
B Shares | | | 196,839 | | | | 1,996,068 | |
| TeliaSonera AB | | | 90,089 | | | | 610,442 | |
| | | | | | | | |
| | | | | | | 14,118,184 | |
| | | | | | | | |
| Switzerland - 8.0% | | | | | | | | |
| ABB Ltd. † | | | 83,894 | | | | 1,576,055 | |
| Compagnie Financiere Richemont SA, Class A | | | 69,122 | | | | 3,477,024 | |
| Nestle SA | | | 176,041 | | | | 10,108,895 | |
| Novartis AG | | | 112,540 | | | | 6,425,256 | |
| Roche Holding AG | | | 52,104 | | | | 8,811,742 | |
| Sulzer AG | | | 7,563 | | | | 805,355 | |
| Swiss Life Holding AG † | | | 10,426 | | | | 954,901 | |
| Swisscom AG | | | 843 | | | | 318,846 | |
| Syngenta AG † | | | 13,101 | | | | 3,849,736 | |
| Synthes, Inc. (United States) 144A (c) | | | 2,591 | | | | 433,681 | |
| Transocean Ltd. | | | 11,824 | | | | 455,083 | |
| | | | | | | | |
| | | SHARES | | | VALUE
(Note 3) | |
| Switzerland - 8.0% (continued) | | | | | | | | |
| UBS AG † | | | 140,294 | | | $ | 1,664,264 | |
| | | | | | | | |
| | | | | | | 38,880,838 | |
| | | | | | | | |
| United Kingdom - 20.4% | | | | | | | | |
| Anglo American PLC | | | 17,662 | | | | 652,437 | |
| AstraZeneca PLC | | | 161,783 | | | | 7,473,084 | |
| Aviva PLC | | | 124,093 | | | | 577,198 | |
| Babcock International Group PLC | | | 20,635 | | | | 235,417 | |
| BAE Systems PLC | | | 93,248 | | | | 412,046 | |
| Berkeley Group Holdings PLC † | | | 40,037 | | | | 793,243 | |
| BG Group PLC | | | 34,458 | | | | 736,148 | |
| BHP Billiton PLC | | | 97,117 | | | | 2,839,282 | |
| BP PLC | | | 998,678 | | | | 7,113,872 | |
| British American Tobacco PLC | | | 64,385 | | | | 3,054,449 | |
| British Land Co. PLC REIT | | | 29,205 | | | | 209,615 | |
| BT Group PLC | | | 240,564 | | | | 713,076 | |
| Cairn Energy PLC † | | | 56,625 | | | | 232,802 | |
| Cookson Group PLC | | | 33,568 | | | | 264,931 | |
| Drax Group PLC | | | 64,147 | | | | 542,530 | |
| easyJet PLC † | | | 51,296 | | | | 311,986 | |
| Eurasian Natural Resources Corp PLC | | | 57,584 | | | | 567,921 | |
| Experian PLC | | | 124,392 | | | | 1,690,805 | |
| Ferrexpo PLC | | | 143,901 | | | | 600,688 | |
| GKN PLC | | | 679,063 | | | | 1,928,348 | |
| GlaxoSmithKline PLC | | | 346,273 | | | | 7,890,152 | |
| Glencore International PLC | | | 35,733 | | | | 218,183 | |
| Hammerson PLC REIT | | | 28,872 | | | | 161,225 | |
| Home Retail Group plc | | | 192,174 | | | | 247,726 | |
| HSBC Holdings PLC | | | 509,333 | | | | 3,888,272 | |
| Imperial Tobacco Group PLC | | | 60,782 | | | | 2,300,023 | |
| Inchcape PLC | | | 145,688 | | | | 662,843 | |
| Intermediate Capital Group PLC | | | 306,321 | | | | 1,087,536 | |
| Investec PLC | | | 60,893 | | | | 320,459 | |
| ITV PLC | | | 1,312,343 | | | | 1,386,406 | |
| Kazakhmys PLC | | | 108,062 | | | | 1,560,286 | |
| Kesa Electricals PLC | | | 308,926 | | | | 323,648 | |
| Ladbrokes PLC | | | 329,851 | | | | 665,331 | |
| Land Securities Group PLC REIT | | | 24,126 | | | | 237,954 | |
| Legal & General Group PLC | | | 832,979 | | | | 1,331,164 | |
| Lloyds Banking Group PLC † | | | 3,765,916 | | | | 1,512,694 | |
| Misys PLC † | | | 215,424 | | | | 776,831 | |
| Mondi PLC | | | 268,609 | | | | 1,897,361 | |
| National Grid PLC | | | 69,697 | | | | 673,676 | |
| Pearson PLC | | | 54,048 | | | | 1,014,410 | |
| Persimmon PLC | | | 270,264 | | | | 1,971,671 | |
| Prudential PLC | | | 8,343 | | | | 82,547 | |
| Randgold Resources Ltd. | | | 3,761 | | | | 384,520 | |
| Reed Elsevier PLC | | | 49,673 | | | | 399,873 | |
| Rentokil Initial PLC † | | | 629,339 | | | | 612,321 | |
| Resolution Ltd. | | | 60,324 | | | | 235,157 | |
| Rio Tinto PLC | | | 65,621 | | | | 3,205,360 | |
| Royal Bank of Scotland Group PLC † | | | 6,438,979 | | | | 2,029,616 | |
| Royal Dutch Shell PLC, A Shares | | | 162,255 | | | | 5,953,021 | |
| Royal Dutch Shell PLC, B Shares | | | 230,716 | | | | 8,775,948 | |
| Sage Group PLC/The | | | 139,260 | | | | 636,330 | |
| Segro PLC REIT | | | 49,428 | | | | 160,047 | |
| SSE PLC | | | 124,542 | | | | 2,492,995 | |
| Tate & Lyle PLC | | | 115,956 | | | | 1,267,692 | |
| | | | |
| | The accompanying notes are an integral part of these financial statements. | | (Continued) |
| | | | | | | | | | | | | | | | |
| 50 | | AQR Funds | | | | | | Annual Report | | | | | | December 2011 | | |
| | | | | | | | | | |
| | | | |
| Schedule of Investments | | | December 31, 2011 | |
| | |
| AQR INTERNATIONAL EQUITY FUND | | |
| | | | | | | | |
| | | SHARES | | | VALUE
(Note 3) | |
| United Kingdom - 20.4% (continued) | | | | | | | | |
| Tesco PLC | | | 621,574 | | | $ | 3,889,089 | |
| TUI Travel PLC | | | 133,608 | | | | 344,617 | |
| Tullow Oil PLC | | | 33,537 | | | | 728,698 | |
| Vedanta Resources PLC | | | 24,161 | | | | 381,197 | |
| Vodafone Group PLC | | | 2,016,778 | | | | 5,622,993 | |
| William Hill PLC | | | 86,074 | | | | 270,554 | |
| Wolseley PLC | | | 29,720 | | | | 982,996 | |
| | | | | | | | |
| | | | | | | 99,533,300 | |
| | | | | | | | |
TOTAL COMMON STOCKS
(cost $432,335,070) | | | | | | | 422,271,053 | |
| | | | | | | | |
| | |
| PREFERRED STOCKS - 0.6% | | | | | | | | |
| | |
| Germany - 0.6% | | | | | | | | |
| Porsche Automobil Holding SE | | | 26,333 | | | | 1,405,789 | |
| ProSiebenSat.1 Media AG | | | 25,049 | | | | 456,404 | |
| Volkswagen AG | | | 6,683 | | | | 999,184 | |
| | | | | | | | |
| | | | | | | 2,861,377 | |
| | | | | | | | |
| Switzerland - 0.0% (d) | | | | | | | | |
| Schindler Holding AG | | | 613 | | | | 71,255 | |
| | | | | | | | |
TOTAL PREFERRED STOCKS
(cost $2,685,925) | | | | | | | 2,932,632 | |
| | | | | | | | |
| | |
| MONEY MARKET FUNDS - 9.7% | | | | | | | | |
J.P. Morgan Prime Money Market
Fund - Capital Shares, 0.130% (e)(f) | | | 3,821,179 | | | | 3,821,179 | |
| J.P. Morgan Treasury Plus Money Market Fund - Institutional Shares, 0.000% (e) | | | 43,579,548 | | | | 43,579,548 | |
| | | | | | | | |
TOTAL MONEY MARKET FUNDS
(cost $47,400,727) | | | | | | | 47,400,727 | |
| | | | | | | | |
| INVESTMENTS OF CASH COLLATERAL FOR SECURITIES ON LOAN - 2.7% | |
J.P. Morgan Prime Money Market Fund - Capital Shares, 0.130% (e)(g)
(cost $13,302,060) | | | 13,302,060 | | | | 13,302,060 | |
| | | | | | | | |
TOTAL INVESTMENTS - 99.6%
(cost $495,723,782) | | | | | | | 485,906,472 | |
| | | | | | | | |
| OTHER ASSETS IN EXCESS OF LIABILITIES - 0.4% (h) | | | | | | | 2,170,903 | |
| | | | | | | | |
NET ASSETS - 100.0% | | | | | | $ | 488,077,375 | |
| | | | | | | | |
| † | Non income-producing security. |
| (a) | All or a portion of the security on loan. The aggregate market value of such securities is $12,763,613; cash collateral of $13,302,060 was received with which the Fund purchased a money market fund. |
| (b) | Security fair valued at $0 as of December 31, 2011 using procedures approved by the Board of Trustees. |
| (c) | Rule 144A, Section 4(2) or other security which is restricted as to resale to institutional investors. The Fund Adviser has deemed this security to be liquid based upon procedures approved by the Board of Trustees. |
| (d) | Represents less than 0.05 percent of net assets. |
| (e) | Represents annualized seven-day yield as of December 31, 2011. |
| (f) | A portion of the security is pledged as collateral to the brokers for forward foreign exchange contracts. |
| (g) | Represents security, or portion thereof, purchased with the cash collateral received for securities on loan. |
| (h) | Includes appreciation (depreciation) on forward foreign currency exchange, futures and swap contracts. |
All securities are Level 2, with respect to ASC 820 unless otherwise noted in parentheses.
| (3) | Level 3 security (See Note 5). |
The following abbreviations are used in portfolio descriptions:
CVA - Dutch Certificate of Shares
REIT - Real Estate Investment Trust
| | | | | | | | |
| SECTOR | | VALUE | | | % OF NET
ASSETS | |
| Consumer Discretionary | | $ | 51,157,365 | | | | 10.5 | % |
| Consumer Staples | | | 40,352,234 | | | | 8.3 | |
| Energy | | | 49,922,279 | | | | 10.2 | |
| Financials | | | 65,707,686 | | | | 13.5 | |
| Health Care | | | 52,573,550 | | | | 10.8 | |
| Industrials | | | 56,391,618 | | | | 11.6 | |
| Information Technology | | | 25,419,705 | | | | 5.2 | |
| Materials | | | 49,798,299 | | | | 10.2 | |
| Telecommunication Services | | | 21,469,867 | | | | 4.4 | |
| Utilities | | | 12,411,082 | | | | 2.5 | |
| Money Market Funds | | | 60,702,787 | | | | 12.4 | |
| | | | | | | | |
Total Investments | | | 485,906,472 | | | | 99.6 | |
| Other Assets in Excess of Liabilities (h) | | | 2,170,903 | | | | 0.4 | |
| | | | | | | | |
Net Assets | | $ | 488,077,375 | | | | 100.0 | % |
| | | | | | | | |
Total return swap contract outstanding as of December 31, 2011:
| | | | | | | | | | | | | | |
| COUNTERPARTY | | UNDERLYING REFERENCE INSTRUMENT | | TERMINATION
DATE | | CURRENCY | | NOTIONAL
VALUE | | | UNREALIZED
APPRECIATION
(DEPRECIATION) | |
The Royal Bank
of Scotland | | Swiss Market Index Futures | | 3/16/2012 | | CHF | | | (18,079,168) | | | | $(819,294) | |
| | | | | | | | | | | | | | |
| | | | |
| | The accompanying notes are an integral part of these financial statements. | | (Continued) |
| | | | | | | | | | | | | | | | |
| | AQR Funds | | | | | | Annual Report | | | | | | December 2011 | | 51 |
| | | | | | | | | | |
| | | | |
| Schedule of Investments | | | December 31, 2011 | |
| | |
| AQR INTERNATIONAL EQUITY FUND | | |
Money Market Fund investment pledged as collateral for the total return swap contract is included in the collateral for forward foreign currency exchange contracts.
Open futures contracts outstanding at December 31, 2011:
| | | | | | | | | | | | | | | | |
NUMBER OF
CONTRACTS | | DESCRIPTION | | EXPIRATION
DATE | | VALUE AT
TRADE DATE | | | VALUE AT
DECEMBER 31,
2011 | | | UNREALIZED
APPRECIATION
(DEPRECIATION) | |
| Long Contracts: | | | | | | | | | | | | | | |
| 836 | | CAC40 10 Euro Futures | | January 20, 2012 | | | $32,794,077 | | | | $34,250,488 | | | | $1,456,411 | |
| 4 | | DAX Index Futures | | March 16, 2012 | | | 747,816 | | | | 763,608 | | | | 15,792 | |
| 616 | | FTSE 100 Index Futures | | March 16, 2012 | | | 51,728,432 | | | | 52,960,031 | | | | 1,231,599 | |
| 188 | | FTSE/MIB Index Futures | | March 16, 2012 | | | 18,079,819 | | | | 18,386,400 | | | | 306,581 | |
| 70 | | IBEX 35 Index Futures | | January 20, 2012 | | | 7,452,965 | | | | 7,679,045 | | | | 226,080 | |
| 27 | | MSCI Singapore Index Futures | | January 30, 2012 | | | 1,271,653 | | | | 1,250,237 | | | | (21,416) | |
| 85 | | TOPIX Index Futures | | March 8, 2012 | | | 8,169,868 | | | | 8,039,496 | | | | (130,372) | |
| | | | | | | | | | | | | | | | |
| | | | | | | 120,244,630 | | | | 123,329,305 | | | | 3,084,675 | |
| | | | | | | | | | | | | | | | |
| Short Contracts: | | | | | | | | | | | | | | |
| 44 | | Amsterdam Index Futures | | January 20, 2012 | | | (3,359,913) | | | | (3,567,729) | | | | (207,816) | |
| 37 | | Hang Seng Index Futures | | January 30, 2012 | | | (4,430,368) | | | | (4,396,210) | | | | 34,158 | |
| 594 | | OMXS30 Index Futures | | January 20, 2012 | | | (8,222,551) | | | | (8,536,207) | | | | (313,656) | |
| 335 | | SPI 200 Index Futures | | March 15, 2012 | | | (35,875,333) | | | | (34,426,552) | | | | 1,448,781 | |
| | | | | | | | | | | | | | | | |
| | | | | | | (51,888,165) | | | | (50,926,698) | | | | 961,467 | |
| | | | | | | | | | | | | | | | |
| | | | | | | $68,356,465 | | | | $72,402,607 | | | | $4,046,142 | |
| | | | | | | | | | | | | | | | |
Cash held as collateral with broker for futures contracts was $10,142,877 at December 31, 2011.
Forward foreign currency exchange contracts outstanding as of December 31, 2011:
| | | | | | | | | | | | | | | | | | | | |
PURCHASE
CONTRACTS | | COUNTERPARTY | | CURRENCY | | CURRENCY
AMOUNT
PURCHASED | | | VALUE AT
SETTLEMENT
DATE | | | VALUE AT
DECEMBER 31,
2011 | | | UNREALIZED
APPRECIATION
(DEPRECIATION) | |
Australian Dollar,
Expiring 03/21/12 | | The Royal Bank of Scotland | | AUD | | | 15,673,000 | | | | $15,649,703 | | | | $15,892,275 | | | | $242,572 | |
Swiss Franc,
Expiring 03/21/12 | | The Royal Bank of Scotland | | CHF | | | 7,729,000 | | | | 8,243,554 | | | | 8,242,089 | | | | (1,465) | |
Danish Krone,
Expiring 03/21/12 | | The Royal Bank of Scotland | | DKK | | | 581,000 | | | | 102,912 | | | | 101,252 | | | | (1,660) | |
Euro,
Expiring 03/21/12 | | The Royal Bank of Scotland | | EUR | | | 6,826,000 | | | | 8,909,774 | | | | 8,840,698 | | | | (69,076) | |
British Pound,
Expiring 03/21/12 | | The Royal Bank of Scotland | | GBP | | | 72,943,300 | | | | 113,751,534 | | | | 113,195,560 | | | | (555,974) | |
Hong Kong Dollar,
Expiring 03/21/12 | | The Royal Bank of Scotland | | HKD | | | 12,741,000 | | | | 1,637,490 | | | | 1,641,000 | | | | 3,510 | |
Israeli Shekel,
Expiring 03/21/12 | | The Royal Bank of Scotland | | ILS | | | 12,828,000 | | | | 3,400,536 | | | | 3,361,728 | | | | (38,808) | |
Japanese Yen,
Expiring 03/21/12 | | The Royal Bank of Scotland | | JPY | | | 630,892,000 | | | | 8,119,501 | | | | 8,208,259 | | | | 88,758 | |
Norwegian Krone,
Expiring 03/21/12 | | The Royal Bank of Scotland | | NOK | | | 282,847,000 | | | | 48,321,135 | | | | 47,159,914 | | | | (1,161,221) | |
New Zealand Dollar,
Expiring 03/21/12 | | The Royal Bank of Scotland | | NZD | | | 13,222,000 | | | | 10,016,918 | | | | 10,237,962 | | | | 221,044 | |
Swedish Krona,
Expiring 03/21/12 | | The Royal Bank of Scotland | | SEK | | | 375,908,000 | | | | 54,715,191 | | | | 54,428,500 | | | | (286,691) | |
Singapore Dollar,
Expiring 03/21/12 | | The Royal Bank of Scotland | | SGD | | | 1,810,300 | | | | 1,386,185 | | | | 1,395,703 | | | | 9,518 | |
| | | | | | | | | | | | | | | | | | | | |
| | | | | | | | | | | 274,254,433 | | | | 272,704,940 | | | | (1,549,493) | |
| | | | | | | | | | | | | | | | | | | | |
| | | | |
| | The accompanying notes are an integral part of these financial statements. | | (Continued) |
| | | | | | | | | | | | | | | | |
| 52 | | AQR Funds | | | | | | Annual Report | | | | | | December 2011 | | |
| | | | | | | | | | |
| | | | |
| Schedule of Investments | | | December 31, 2011 | |
| | |
| AQR INTERNATIONAL EQUITY FUND | | |
| | | | | | | | | | | | | | | | | | | | |
SALES
CONTRACTS | | COUNTERPARTY | | CURRENCY | | CURRENCY
AMOUNT
SOLD | | | VALUE AT
SETTLEMENT
DATE | | | VALUE AT
DECEMBER 31,
2011 | | | UNREALIZED
APPRECIATION
(DEPRECIATION) | |
Australian Dollar,
Expiring 03/21/12 | | The Royal Bank of Scotland | | AUD | | | (14,379,900) | | | | $(14,241,470) | | | | $(14,581,083) | | | | $(339,613) | |
Swiss Franc,
Expiring 03/21/12 | | The Royal Bank of Scotland | | CHF | | | (42,067,800) | | | | (45,397,399) | | | | (44,860,468) | | | | 536,931 | |
Danish Krone,
Expiring 03/21/12 | | The Royal Bank of Scotland | | DKK | | | (16,367,000) | | | | (2,923,894) | | | | (2,852,317) | | | | 71,577 | |
Euro,
Expiring 03/21/12 | | The Royal Bank of Scotland | | EUR | | | (80,479,600) | | | | (105,749,247) | | | | (104,233,205) | | | | 1,516,042 | |
British Pound,
Expiring 03/21/12 | | The Royal Bank of Scotland | | GBP | | | (4,149,000) | | | | (6,449,162) | | | | (6,438,540) | | | | 10,622 | |
Hong Kong Dollar,
Expiring 03/21/12 | | The Royal Bank of Scotland | | HKD | | | (1,385,000) | | | | (177,979) | | | | (178,384) | | | | (405) | |
Israeli Shekel,
Expiring 03/21/12 | | The Royal Bank of Scotland | | ILS | | | (344,000) | | | | (90,871) | | | | (90,149) | | | | 722 | |
Japanese Yen,
Expiring 03/21/12 | | The Royal Bank of Scotland | | JPY | | | (5,027,782,200) | | | | (64,636,337) | | | | (65,414,272) | | | | (777,935) | |
Norwegian Krone,
Expiring 03/21/12 | | The Royal Bank of Scotland | | NOK | | | (72,254,000) | | | | (12,076,623) | | | | (12,047,122) | | | | 29,501 | |
Swedish Krona,
Expiring 03/21/12 | | The Royal Bank of Scotland | | SEK | | | (3,489,000) | | | | (505,144) | | | | (505,180) | | | | (36) | |
Singapore Dollar,
Expiring 03/21/12 | | The Royal Bank of Scotland | | SGD | | | (143,000) | | | | (109,688) | | | | (110,249) | | | | (561) | |
| | | | | | | | | | | | | | | | | | | | |
| | | | | | | | | | | (252,357,814) | | | | (251,310,969) | | | | 1,046,845 | |
| | | | | | | | | | | | | | | | | | | | |
| | | | | | | | | | | $21,896,619 | | | | $21,393,971 | | | | $(502,648) | |
| | | | | | | | | | | | | | | | | | | | |
Money Market Fund is pledged as collateral for total return swap and forward foreign currency exchange contracts in the amount of $3,821,179.
AUD - Australian Dollar
CHF - Swiss Franc
DKK - Danish Krone
EUR - Euro
GBP - British Pound
HKD - Hong Kong Dollar
ILS - Israeli Shekel
JPY - Japanese Yen
NOK - Norwegian Krone
NZD - New Zealand Dollar
SEK - Swedish Krona
SGD - Singapore Dollar
| | | | |
| | The accompanying notes are an integral part of these financial statements. | | |
| | | | | | | | | | | | | | | | |
| | AQR Funds | | | | | | Annual Report | | | | | | December 2011 | | 53 |
| | | | | | | | | | |
| | | | |
| Schedule of Investments | | | December 31, 2011 | |
| | |
| AQR DIVERSIFIED ARBITRAGE FUND | | |
| | | | | | | | |
| LONG INVESTMENTS - 121.5% | | SHARES | | | VALUE
(Note 3) | |
| COMMON STOCKS - 54.8% | | | | | | | | |
| | |
| Consumer Discretionary - 3.2% | | | | | | | | |
| 99 Cents Only Stores † | | | 1,087,339 | | | $ | 23,867,091 | |
| AMC Networks, Inc., Class A † | | | 116,903 | | | | 4,393,215 | |
| China Century Dragon Media, Inc. (3)†(a)(b) | | | 150,272 | | | | 150 | |
| China Networks International Holdings Ltd. (3)†(a) | | | 2,287,278 | | | | 11,436 | |
| Cumulus Media, Inc., Class A † | | | 33,276 | | | | 111,142 | |
| Emmis Communications Corp., Class A † | | | 305,531 | | | | 201,620 | |
| Express, Inc. † | | | 97,205 | | | | 1,938,268 | |
| Jakks Pacific, Inc. | | | 562,893 | | | | 7,942,420 | |
| Lennar Corp. B Shares, Class B | | | 87,399 | | | | 1,361,677 | |
| Little Sheep Group Ltd. (China) (2) | | | 12,885,344 | | | | 10,659,813 | |
| McCormick & Schmick’s Seafood Restaurants, Inc. † | | | 665,110 | | | | 5,813,061 | |
| Morton’s Resturant Group, Inc. † | | | 570,490 | | | | 3,924,971 | |
| Talbots, Inc. † | | | 717,099 | | | | 1,907,483 | |
| TripAdvisor, Inc. † | | | 124,027 | | | | 3,126,721 | |
| Viacom, Inc., Class B | | | 71,249 | | | | 3,235,417 | |
| | | | | | | | |
| | | | | | | 68,494,485 | |
| | | | | | | | |
| Consumer Staples - 0.9% | | | | | | | | |
| Celsius Holdings, Inc. † | | | 161,622 | | | | 33,941 | |
| Central Garden and Pet Co. † | | | 675,146 | | | | 5,509,191 | |
| Embotelladora Andina SA, Class A ADR (Chile) | | | 3,000 | | | | 61,710 | |
| Green Mountain Coffee Roasters, Inc. † | | | 31,981 | | | | 1,434,348 | |
| Molson Coors Brewing Co., Class B | | | 2,626 | | | | 114,336 | |
| Susser Holdings Corp. † | | | 65,412 | | | | 1,479,619 | |
| Winn-Dixie Stores, Inc. † | | | 995,996 | | | | 9,342,443 | |
| | | | | | | | |
| | | | | | | 17,975,588 | |
| | | | | | | | |
| Energy - 7.5% | | | | | | | | |
| Complete Production Services, Inc. † | | | 725,760 | | | | 24,356,506 | |
| Compton Petroleum Corp. (Canada) † | | | 239,381 | | | | 1,017,369 | |
| GreenHouse Holdings, Inc. † | | | 92,130 | | | | 6,449 | |
| Gulf United Energy, Inc. † | | | 1,959,798 | | | | 431,156 | |
| Mission NewEnergy Ltd. (Australia) † | | | 20,132 | | | | 45,700 | |
| Royal Dutch Shell PLC, Class A ADR (Netherlands) | | | 742,443 | | | | 54,265,159 | |
| Sevan Marine ASA (Norway) † | | | 90,199 | | | | 124,910 | |
| Southern Union Co. | | | 786,673 | | | | 33,126,800 | |
| Superior Energy Services, Inc. † | | | 19,200 | | | | 546,048 | |
| SV Unsecured Ltd. (Cayman Islands) † | | | 360 | | | | 498 | |
| TGC Industries, Inc. † | | | 70,249 | | | | 501,578 | |
| Venoco, Inc. † | | | 643,177 | | | | 4,354,308 | |
| Williams Cos., Inc./The | | | 1,169,061 | | | | 38,602,394 | |
| | | | | | | | |
| | | | | | | 157,378,875 | |
| | | | | | | | |
| Financials - 11.5% | | | | | | | | |
| Australia Acquisition Corp. (Australia) (2)† | | | 612,000 | | | | 5,997,600 | |
| Azteca Acquisition Corp. (2)† | | | 800,000 | | | | 8,000,000 | |
| Bancorp Rhode Island, Inc. | | | 112,282 | | | | 4,947,567 | |
| BBCN Bancorp, Inc. † | | | 2,997 | | | | 28,322 | |
| Blue Wolf Mongolia Holdings Corp. (2)† | | | 526,500 | | | | 5,265,000 | |
| | | | | | | | |
| | | SHARES | | | VALUE
(Note 3) | |
| Financials - 11.5% (continued) | | | | | | | | |
| Cazador Acquisition Corp. Ltd. (Cayman Islands) (2)† | | | 306,257 | | | $ | 2,995,193 | |
| China Growth Equity Investment Ltd. (Cayman Islands) (2)† | | | 395,000 | | | | 3,890,750 | |
| China VantagePoint Acquisition Co. (2)† | | | 199,098 | | | | 1,178,660 | |
| Delphi Financial Group, Inc., Class A | | | 270,652 | | | | 11,989,884 | |
| Empeiria Acquisition Corp. (2)† | | | 680,000 | | | | 6,806,800 | |
| European CleanTech SE, Class A (Luxembourg) (2)† | | | 621,000 | | | | 7,837,968 | |
| FlatWorld Acquisition Corp. (Virgin Islands, British) (2)† | | | 219,450 | | | | 2,157,193 | |
| General American Investors Co., Inc. | | | 7,047 | | | | 175,541 | |
| General Growth Properties, Inc. REIT | | | 95,138 | | | | 1,428,973 | |
| Global Cornerstone Holdings Ltd. (2)† | | | 632,000 | | | | 6,320,000 | |
| Global Eagle Acquisition Corp. (2)† | | | 1,382,500 | | | | 13,755,875 | |
| Harleysville Group, Inc. | | | 280,616 | | | | 15,874,447 | |
| Herald National Bank † | | | 120,341 | | | | 422,397 | |
| Hicks Acquisition Co. II, Inc. (2)† | | | 810,000 | | | | 7,832,700 | |
| IFM Investments Ltd. ADR (China) † | | | 10,475 | | | | 3,352 | |
| Italy1 Investment SA (Luxembourg) (2)† | | | 590,301 | | | | 7,493,472 | |
| Janus Capital Group, Inc. | | | 2,500 | | | | 15,775 | |
| JWC Acquisition Corp. (2)† | | | 1,032,750 | | | | 10,069,312 | |
| Kennedy-Wilson Holdings, Inc. | | | 66,959 | | | | 708,426 | |
| L&L Acquisition Corp. (2)† | | | 306,000 | | | | 3,023,280 | |
| Loews Corp. | | | 7,700 | | | | 289,905 | |
| Lone Oak Acquisition Corp. (Hong Kong) (2)† | | | 328,820 | | | | 2,548,355 | |
| Nautilus Marine Acquisition Corp. (Greece) (2)† | | | 777,600 | | | | 7,449,408 | |
| NYSE Euronext | | | 233,938 | | | | 6,105,782 | |
| Parkvale Financial Corp. | | | 230,039 | | | | 5,654,359 | |
| Patriot National Bank ADR (3)†(a) | | | 2,000,000 | | | | 1,754,400 | |
| PMI Group, Inc./The † | | | 263 | | | | 7 | |
| Prime Acquisition Corp. (China) (2)† | | | 423,935 | | | | 4,040,101 | |
| Primerica, Inc. | | | 116,000 | | | | 2,695,840 | |
| Retail Opportunity Investments Corp. REIT | | | 221,168 | | | | 2,618,629 | |
| RLJ Acquisition, Inc. (2)† | | | 974,044 | | | | 9,282,639 | |
| Santa Monica Media Corp. (3)†(a) | | | 15,377 | | | | — | |
| SCG Financial Acquistion Corp. (2)† | | | 631,210 | | | | 6,248,979 | |
| Selway Capital Acquisition Corp., Class A (2)† | | | 414,792 | | | | 3,992,373 | |
| Solar Senior Capital Ltd. | | | 175 | | | | 2,756 | |
| SP Acquisition Holdings, Inc. (3)†(a) | | | 27,000 | | | | — | |
| State Bancorp, Inc. | | | 341,430 | | | | 4,165,446 | |
| SWS Group, Inc. | | | 134,338 | | | | 922,902 | |
| TMX Group, Inc. (Canada) | | | 239,750 | | | | 9,811,217 | |
| Tower Bancorp, Inc. | | | 466,051 | | | | 13,301,096 | |
| Transatlantic Holdings, Inc. | | | 410,490 | | | | 22,466,118 | |
| Trian Acquisition I Corp. (3)†(a) | | | 15,200 | | | | — | |
| Trio Merger Corp. (2)† | | | 456,000 | | | | 4,377,600 | |
| Universal Business Payment Solutions Acquisition Corp. (2)† | | | 947,052 | | | | 5,634,959 | |
| Wells Fargo & Co. | | | 190 | | | | 5,236 | |
| | | | | | | | |
| | | | | | | 241,586,594 | |
| | | | | | | | |
| Health Care - 5.9% | | | | | | | | |
| Acadia Healthcare Co., Inc. † | | | 79,000 | | | | 787,630 | |
| | | | |
| | The accompanying notes are an integral part of these financial statements. | | (Continued) |
| | | | | | | | | | | | | | | | |
| 54 | | AQR Funds | | | | | | Annual Report | | | | | | December 2011 | | |
| | | | | | | | | | |
| | | | |
| Schedule of Investments | | | December 31, 2011 | |
| | |
| AQR DIVERSIFIED ARBITRAGE FUND | | |
| | | | | | | | |
| | | SHARES | | | VALUE
(Note 3) | |
| Health Care - 5.9% (continued) | | | | | | | | |
| Access Pharmaceuticals, Inc. †(b) | | | 228,024 | | | $ | 328,355 | |
| American Dental Partners, Inc. †(b) | | | 681,164 | | | | 12,826,318 | |
| Amgen, Inc. | | | 49,600 | | | | 3,184,816 | |
| Antares Pharma, Inc. †(b) | | | 365,000 | | | | 803,000 | |
| Ariad Pharmaceuticals, Inc. † | | | 236,000 | | | | 2,891,000 | |
| AVI BioPharma, Inc. † | | | 376,250 | | | | 280,306 | |
| Cormedix, Inc. † | | | 144,641 | | | | 40,485 | |
| CryoPort, Inc. † | | | 412,654 | | | | 280,605 | |
| Delcath Systems, Inc. † | | | 75,000 | | | | 228,750 | |
| Exact Sciences Corp. † | | | 329,345 | | | | 2,674,281 | |
| Forest Laboratories, Inc. (3)†(a) | | | 335,833 | | | | 319,041 | |
| Healthspring, Inc. † | | | 479,147 | | | | 26,132,677 | |
| Indevus Pharmaceuticals, Inc. (3)†(a) | | | 6,006 | | | | — | |
InspireMD, Inc. (United
Kingdom) (3)†(a)(b) | | | 135,823 | | | | 296,094 | |
| ISTA Pharmaceuticals, Inc. † | | | 173,218 | | | | 1,221,187 | |
| Kips Bay Medical, Inc. † | | | 85,121 | | | | 108,955 | |
| MannKind Corp. † | | | 7 | | | | 18 | |
| Medco Health Solutions, Inc. † | | | 387,656 | | | | 21,669,970 | |
| Neostem, Inc. † | | | 324,000 | | | | 164,268 | |
| Pacira Pharmaceuticals, Inc. † | | | 129,165 | | | | 1,117,277 | |
| Pharmasset, Inc. † | | | 165,544 | | | | 21,222,741 | |
| PharMerica Corp. † | | | 412,562 | | | | 6,262,691 | |
| Provectus Pharmaceuticals, Inc. † | | | 706,665 | | | | 572,399 | |
| Rosetta Genomics Ltd. (Israel) † | | | 261,279 | | | | 47,030 | |
| SonoSite, Inc. † | | | 277,890 | | | | 14,967,156 | |
| Synovis Life Technologies, Inc. † | | | 194,898 | | | | 5,424,011 | |
| Unilife Corp. † | | | 83,957 | | | | 261,946 | |
| | | | | | | | |
| | | | | | | 124,113,007 | |
| | | | | | | | |
| Industrials - 3.9% | | | | | | | | |
| Allied Defense Group, Inc./The †(b)(2) | | | 190,011 | | | | 598,535 | |
| Barnes Group, Inc. | | | 374 | | | | 9,017 | |
| Broadwind Energy, Inc. † | | | 410,000 | | | | 278,800 | |
| China Dredging Group Co., Ltd. ADR (China) (2)† | | | 1,000,000 | | | | 5,000,000 | |
| China Electric Motor, Inc. (China) † | | | 2,400 | | | | 192 | |
| Dollar Thrifty Automotive Group, Inc. † | | | 149,296 | | | | 10,489,537 | |
| Goodrich Corp. | | | 224,236 | | | | 27,737,993 | |
| HEICO Corp., Class A | | | 224,069 | | | | 8,817,115 | |
| Huntington Ingalls Industries, Inc. † | | | 19,129 | | | | 598,355 | |
| Kratos Defense & Security Solutions, Inc. † | | | 67,232 | | | | 401,375 | |
| RSC Holdings, Inc. † | | | 1,223,532 | | | | 22,635,342 | |
| Sapphire Industry Corp. (3)†(a) | | | 25,025 | | | | — | |
| TNT Express NV (Netherlands) (2) | | | 304,208 | | | | 2,265,732 | |
| WCA Waste Corp. † | | | 556,186 | | | | 3,620,771 | |
| | | | | | | | |
| | | | | | | 82,452,764 | |
| | | | | | | | |
| Information Technology - 11.5% | | | | | | | | |
| Advanced Analogic Technologies, Inc. † | | | 1,705,108 | | | | 9,855,524 | |
| Bankrate, Inc. † | | | 106,561 | | | | 2,291,061 | |
| Blue Coat Systems, Inc. † | | | 747,584 | | | | 19,026,013 | |
| DemandTec, Inc. † | | | 630,492 | | | | 8,303,580 | |
| Equinix, Inc. † | | | 7,162 | | | | 726,227 | |
| Fundtech Ltd. (Israel) (3)(a) | | | 372,242 | | | | 8,684,406 | |
| Gerber Scientific, Inc. (3)†(a) | | | 879,944 | | | | — | |
| | | | | | | | |
| | | SHARES | | | VALUE
(Note 3) | |
| Information Technology - 11.5% (continued) | | | | | |
| Identive Group, Inc. †(c) | | | 158,000 | | | $ | 352,340 | |
| Intel Corp. | | | 8,120 | | | | 196,910 | |
| INX, Inc. † | | | 455,987 | | | | 3,989,886 | |
| LoopNet, Inc. † | | | 1,069,724 | | | | 19,554,555 | |
| Magic Software Enterprises Ltd. (Israel) † | | | 238,075 | | | | 1,230,848 | |
| Magma Design Automation, Inc. † | | | 1,938,220 | | | | 13,916,420 | |
| Mentor Graphics Corp. † | | | 111,827 | | | | 1,516,374 | |
| Micron Technology, Inc. † | | | 31,163 | | | | 196,015 | |
| Molex, Inc., Class A | | | 126,649 | | | | 2,505,117 | |
| Motorola Mobility Holdings, Inc. † | | | 603,420 | | | | 23,412,696 | |
| Neonode, Inc. † | | | 155,625 | | | | 739,219 | |
| Netlogic Microsystems, Inc. † | | | 540,199 | | | | 26,777,664 | |
| Novellus Systems, Inc. † | | | 347,293 | | | | 14,339,728 | |
| Orckit Communications Ltd. (Israel) † | | | 15,174 | | | | 15,326 | |
| Pinnacle Data Systems, Inc. † | | | 68,723 | | | | 163,561 | |
| Procera Networks, Inc. † | | | 51,800 | | | | 807,044 | |
| RightNow Technologies, Inc. † | | | 537,675 | | | | 22,974,853 | |
| S1 Corp. † | | | 1,980,902 | | | | 18,957,232 | |
| Shanda Interactive Entertainment Ltd. ADR (Cayman Islands) † | | | 302,697 | | | | 12,110,907 | |
| SinoHub, Inc. (China) † | | | 577,161 | | | | 220,879 | |
| SouthPeak Interactive Corp. (3)†(a) | | | 1,500,000 | | | | 22,650 | |
| SuccessFactors, Inc. † | | | 704,122 | | | | 28,073,344 | |
| Tekelec † | | | 41,318 | | | | 451,606 | |
| Telestone Technologies Corp. (China) †(c) | | | 115,818 | | | | 481,803 | |
| Trunkbow International Holdings Ltd. (China) † | | | 142,819 | | | | 285,638 | |
| Uni-Pixel, Inc. † | | | 38,764 | | | | 193,820 | |
| Visa, Inc., Class A | | | 6,452 | | | | 655,071 | |
| | | | | | | | |
| | | | | | | 243,028,317 | |
| | | | | | | | |
| Materials - 3.0% | | | | | | | | |
| A.M. Castle & Co. † | | | 49,135 | | | | 464,817 | |
| Agnico-Eagle Mines Ltd. (Canada) | | | 1 | | | | 36 | |
| Anvil Mining Ltd. (Canada) † | | | 828,191 | | | | 5,967,040 | |
| Aurcana Corp. (Canada) † | | | 1,246,774 | | | | 868,917 | |
| B2Gold Corp. (Canada) † | | | 376,072 | | | | 1,144,367 | |
| Calvista Gold Corp. (Canada) † | | | 200,000 | | | | 98,160 | |
| Cereplast, Inc. † | | | 258,156 | | | | 247,830 | |
| China GengSheng Minerals, Inc. (China) †(c) | | | 193,262 | | | | 133,158 | |
| Commercial Metals Co. | | | 143,384 | | | | 1,983,001 | |
| Edgewater Exploration Ltd. (Canada) † | | | 417,850 | | | | 180,470 | |
| Energy Fuels, Inc. (Canada) † | | | 720,000 | | | | 197,890 | |
| Grande Cache Coal Corp. (Canada) † | | | 2,426,089 | | | | 23,600,041 | |
| Independence Gold Corp. (Canada) † | | | 179,440 | | | | 77,500 | |
| Kangaroo Resources Ltd. (Australia) (2)† | | | 307,701 | | | | 45,687 | |
| Lion One Metals Ltd. (Canada) (3)†(a) | | | 775,282 | | | | 852,335 | |
| Mines Management, Inc. † | | | 16,120 | | | | 32,240 | |
| Monsanto Co. | | | 3,820 | | | | 267,667 | |
| New Gold, Inc. (Canada) † | | | 48,449 | | | | 488,886 | |
| Quaker Chemical Corp. | | | 3,650 | | | | 141,948 | |
| Sealed Air Corp. | | | 132,750 | | | | 2,284,627 | |
| Solitario Exploration & Royalty Corp. † | | | 59,250 | | | | 83,542 | |
| | | | |
| | The accompanying notes are an integral part of these financial statements. | | (Continued) |
| | | | | | | | | | | | | | | | |
| | AQR Funds | | | | | | Annual Report | | | | | | December 2011 | | 55 |
| | | | | | | | | | |
| | | | |
| Schedule of Investments | | | December 31, 2011 | |
| | |
| AQR DIVERSIFIED ARBITRAGE FUND | | |
| | | | | | | | |
| | | SHARES | | | VALUE
(Note 3) | |
| Materials - 3.0% (continued) | | | | | | | | |
| Southern Arc Minerals, Inc. (Canada) (3)†(a) | | | 248,481 | | | $ | 165,857 | |
| Temple-Inland, Inc. | | | 780,401 | | | | 24,746,516 | |
| | | | | | | | |
| | | | | | | 64,072,532 | |
| | | | | | | | |
| Telecommunication Services - 2.8% | | | | | | | | |
| Clearwire Corp., Class A † | | | 1,580,000 | | | | 3,065,200 | |
| Cleveland Unlimited (3)†(a) | | | 1 | | | | 1,296,111 | |
| Telephone & Data Systems, Inc. Special Shares, Class L | | | 2,253,386 | | | | 53,653,121 | |
| Towerstream Corp. † | | | 75,000 | | | | 157,500 | |
| Windstream Corp. | | | 2 | | | | 23 | |
| XO holdings, Inc. O Shares (3)†(a) | | | 1,366,340 | | | | — | |
| | | | | | | | |
| | | | | | | 58,171,955 | |
| | | | | | | | |
| | | | | | | | |
| | | SHARES | | | VALUE
(Note 3) | |
| Utilities - 4.6% | | | | | | | | |
| Central Vermont Public Service Corp. | | | 242,442 | | | $ | 8,509,714 | |
| China Hydroelectric Corp. ADR (China) † | | | 6,651 | | | | 7,582 | |
| Constellation Energy Group, Inc. | | | 982,153 | | | | 38,962,010 | |
| Genie Energy Ltd., Class B | | | 49,936 | | | | 395,993 | |
| Northeast Utilities | | | 38,287 | | | | 1,381,012 | |
| Pennichuck Corp. | | | 107,341 | | | | 3,094,641 | |
| Progress Energy, Inc. | | | 800,153 | | | | 44,824,571 | |
| | | | | | | | |
| | | | | | | 97,175,523 | |
| | | | | | | | |
TOTAL COMMON STOCKS
(cost $1,134,363,291) | | | | | | | 1,154,449,640 | |
| | | | | | | | |
| | | | | | | | | | | | | | | | |
| CONVERTIBLE PREFERRED STOCKS - 3.7% | | MOODY’S
RATING*
(UNAUDITED) | | | | | | | SHARES | | | VALUE
(Note 3) | |
| Consumer Discretionary - 0.0% (d) | | | | | | | | | | | | | | | | |
| Beazer Homes USA, Inc., $25.00 par, 7.250% | | | NR | | | | | | | | 52,875 | | | $ | 637,144 | |
| Beazer Homes USA, Inc., $25.00 par, 7.500% | | | CCC | ** | | | | | | | 5,000 | | | | 67,100 | |
| | | | | | | | | | | | | | | | |
| | | | | | | | | | | | | | | 704,244 | |
| | | | | | | | | | | | | | | | |
| Consumer Staples - 0.4% | | | | | | | | | | | | | | | | |
| Universal Corp., Perpetual, $1,000.00 par, 6.750% | | | BB | ** | | | | | | | 8,350 | | | | 8,642,250 | |
| | | | | | | | | | | | | | | | |
| | | | | |
| Energy - 0.7% | | | | | | | | | | | | | | | | |
| Chesapeake Energy Corp., Perpetual 144A, $1,000.00 par, 5.750% (2)(e) | | | B+ | ** | | | | | | | 10,000 | | | | 9,800,000 | |
| Energy XXI Bermuda Ltd., Perpetual (Bermuda), $250.00 par, 5.625% (2) | | | NR | | | | | | | | 9,535 | | | | 3,229,981 | |
| Superior Well Services, Inc., Perpetual, Series A, $1,000.00 par, 4.000% (2) | | | NR | | | | | | | | 1,169 | | | | 1,038,072 | |
| Whiting Petroleum Corp., Perpetual, $100.00 par, 6.250% | | | B | ** | | | | | | | 1,144 | | | | 251,737 | |
| | | | | | | | | | | | | | | | |
| | | | | | | | | | | | | | | 14,319,790 | |
| | | | | | | | | | | | | | | | |
| Financials - 2.1% | | | | | | | | | | | | | | | | |
| Ally Financial, Inc., Perpetual 144A, $1,000.00 par, 7.000% (2)(e) | | | B3 | | | | | | | | 2,175 | | | | 1,559,135 | |
| Boston Private Capital Trust I, $50.00 par, 4.875% (2) | | | NR | | | | | | | | 3,750 | | | | 115,547 | |
| Citigroup, Inc., $100.00 par, 7.500% | | | NR | | | | | | | | 40,000 | | | | 3,250,000 | |
| Dole Food Automatic Common Exchange 144A, $12.50 par, 7.000% (2)†(e) | | | NR | | | | | | | | 62,250 | | | | 532,045 | |
| Jack Cooper Holdings Corp. 144A, $99.08 par, 12.750% (2)(e) | | | NR | | | | | | | | 6,950,000 | | | | 6,915,250 | |
| Jack Cooper Holdings Corp., Perpetual 144A, $100.00 par, 0.000% (2)†(e)(f) | | | NR | | | | | | | | 2,000 | | | | 200,000 | |
| MetLife, Inc., $82.88 par, 5.000% | | | BBB- | ** | | | | | | | 105,250 | | | | 6,485,505 | |
| MF Global Holdings Ltd., Perpetual, $100.00 par, 9.750% (2) | | | NR | | | | | | | | 19,550 | | | | 178,394 | |
| SLM Corp., Perpetual, Series A, $50.00 par, 6.970% | | | Ba3 | | | | | | | | 12,500 | | | | 501,250 | |
| Sovereign Capital Trust IV, $50.00 par, 4.375% (2) | | | Baa3 | | | | | | | | 455,495 | | | | 21,636,012 | |
| UBS AG (Switzerland), $25.00 par, 9.375% (2) | | | NR | | | | | | | | 26,000 | | | | 351,520 | |
| Wells Fargo & Co., Perpetual, Series L, $1,000.00 par, 7.500% | | | Baa3 | | | | | | | | 500 | | | | 527,000 | |
| Wintrust Financial Corp., $50.00 par, 7.500% (2) | | | NR | | | | | | | | 24,300 | | | | 1,095,930 | |
| | | | | | | | | | | | | | | | |
| | | | | | | | | | | | | | | 43,347,588 | |
| | | | | | | | | | | | | | | | |
| Industrials - 0.1% | | | | | | | | | | | | | | | | |
| Nielsen Holdings NV (Netherlands), $50.00 par, 6.250% (2) | | | B | ** | | | | | | | 6,800 | | | | 393,125 | |
| Timberjack Corp. $188,000.00 par, 8.000% (3)†(a) | | | NR | | | | | | | | 188,000 | | | | 736,772 | |
| | | | | | | | | | | | | | | | |
| | | | | | | | | | | | | | | 1,129,897 | |
| | | | | | | | | | | | | | | | |
| | | | |
| | The accompanying notes are an integral part of these financial statements. | | (Continued) |
| | | | | | | | | | | | | | | | |
| 56 | | AQR Funds | | | | | | Annual Report | | | | | | December 2011 | | |
| | | | | | | | | | |
| | | | |
| Schedule of Investments | | | December 31, 2011 | |
| | |
| AQR DIVERSIFIED ARBITRAGE FUND | | |
| | | | | | | | | | | | | | | | | | | | |
| | | MOODY’S
RATING*
(UNAUDITED) | | | | | | | | | SHARES | | | VALUE
(Note 3) | |
| Information Technology - 0.0% (d) | | | | | | | | | | | | | | | | | | | | |
| Authentidate Holding Corp., Series C, ADR $1.60 par, 15.000% (3)†(a) | | | NR | | | | | | | | | | | | 218,000 | | | $ | 444,720 | |
| | | | | | | | | | | | | | | | | | | | |
| Materials - 0.3% | | | | | | | | | | | | | | | | | | | | |
North Atlantic Trading Co. 144A, $97.00 par,
19.000% (2)(b)(e)(g) | | | Caa2 | | | | | | | | | | | | 2,000,000 | | | | 1,880,000 | |
| North Atlantic Trading Co. 144A, $98.00 par, 11.500% (2)(b)(e) | | | B2 | | | | | | | | | | | | 5,625,000 | | | | 5,371,875 | |
| | | | | | | | | | | | | | | | | | | | |
| | | | | | | | | | | | | | | | | | | 7,251,875 | |
| | | | | | | | | | | | | | | | | | | | |
| Utilities - 0.1% | | | | | | | | | | | | | | | | | | | | |
| PPL Corp., $50.00 par, 8.750% | | | | | | | | | | | | | | | 44,700 | | | | 2,480,850 | |
| | | | | | | | | | | | | | | | | | | | |
TOTAL CONVERTIBLE PREFERRED STOCKS
(cost $83,209,624) | | | | | | | | | | | | | | | | | | | 78,321,214 | |
| | | | | | | | | | | | | | | | | | | | |
| | | | | |
| CORPORATE BONDS - 18.0% | | | | | INTEREST
RATE | | | MATURITY
DATE | | | PRINCIPAL
AMOUNT
(000’S) | | | | |
| Communications - 0.5% | | | | | | | | | | | | | | | | | | | | |
Interactive Network, Inc./FriendFinder Networks, Inc.
144A (2)(e)(g) | | | CCC+ | ** | | | 11.500% | | | | 04/30/14 | | | $ | 2,544 | | | | 1,399,281 | |
Interactive Network, Inc./FriendFinder Networks, Inc.
144A (2)(b)(e) | | | B | ** | | | 14.000% | | | | 09/30/13 | | | | 831 | | | | 756,334 | |
| Primus Telecommunications Holding, Inc./Primus Telecommunications Canada, Inc. 144A (2)(e) | | | WR | | | | 13.000% | | | | 12/15/16 | | | | 1,150 | | | | 1,127,000 | |
| WCP Wireless Site Funding LLC/WCP Wireless Site RE Funding LLC 144A (2)(e) | | | NR | | | | 9.247% | | | | 11/15/15 | | | | 3,000 | | | | 3,070,965 | |
| WCP Wireless Site Funding LLC/WCP Wireless Site RE Funding LLC 144A (2)(e) | | | NR | | | | 6.829% | | | | 11/15/15 | | | | 3,325 | | | | 3,458,485 | |
| | | | | | | | | | | | | | | | | | | | |
| | | | | | | | | | | | | | | | | | | 9,812,065 | |
| | | | | | | | | | | | | | | | | | | | |
| Consumer Discretionary - 2.3% | | | | | | | | | | | | | | | | | | | | |
| American Airlines Equipment Trust 1990, Series 90-Y (2)(b)(h) | | | Caa1 | | | | 11.000% | | | | 05/07/14 | | | | 1,851 | | | | 1,166,398 | |
| Baker & Taylor, Inc. 144A (2)(b)(e) | | | B3 | | | | 11.500% | | | | 07/01/13 | | | | 3,250 | | | | 2,535,000 | |
| Broder Brothers Co. 144A (2)(b)(e)(g) | | | NR | | | | 12.000% | | | | 10/15/13 | | | | 3,975 | | | | 3,895,500 | |
| Brookstone Co., Inc. 144A (2)(e) | | | CCC+ | ** | | | 13.000% | | | | 10/15/14 | | | | 516 | | | | 412,155 | |
| Continental Airlines, Inc., Series 02G2 (2) | | | Ba1 | | | | 6.563% | | | | 02/15/12 | | | | 9,650 | | | | 9,674,125 | |
| Eastman Kodak Co. (2) | | | NR | | | | 7.000% | | | | 04/01/17 | | | | 3,500 | | | | 918,750 | |
| Empire Today LLC/Empire Today Finance Corp. 144A (2)(e) | | | B3 | | | | 11.375% | | | | 02/01/17 | | | | 3,250 | | | | 3,030,625 | |
| Goodyear Tire & Rubber Co./The (2)(b) | | | B1 | | | | 10.500% | | | | 05/15/16 | | | | 2,976 | | | | 3,281,040 | |
| MGM Resorts International (2)(b) | | | Caa1 | | | | 4.250% | | | | 04/15/15 | | | | 6,375 | | | | 6,048,281 | |
| Pegasus Solutions, Inc. 144A (2)(e)(g) | | | NR | | | | 13.000% | | | | 04/15/14 | | | | 3,336 | | | | 3,160,735 | |
| TRW Automotive, Inc. (2)(b) | | | BB- | ** | | | 3.500% | | | | 12/01/15 | | | | 5,850 | | | | 7,882,875 | |
| Unifi, Inc. (2)(b) | | | Caa1 | | | | 11.500% | | | | 05/15/14 | | | | 2,721 | | | | 2,741,408 | |
| Wallace Theater Holdings, Inc., Series UNIT 144A (2)(e)(f) | | | CCC | ** | | | 12.500% | | | | 06/15/13 | | | | 4,675 | | | | 4,534,750 | |
| | | | | | | | | | | | | | | | | | | | |
| | | | | | | | | | | | | | | | | | | 49,281,642 | |
| | | | | | | | | | | | | | | | | | | | |
| Consumer Staples - 1.9% | | | | | | | | | | | | | | | | | | | | |
| Archer-Daniels-Midland Co. (2) | | | A | ** | | | 0.875% | | | | 02/15/14 | | | | 1,500 | | | | 1,507,500 | |
| Great Atlantic & Pacific Tea Co., Inc./The 144A (2)(e) | | | WR | | | | 11.375% | | | | 08/01/15 | | | | 22,492 | | | | 25,978,260 | |
| Smithfield Foods, Inc. (2)(b) | | | BB- | ** | | | 4.000% | | | | 06/30/13 | | | | 7,975 | | | | 9,779,344 | |
| Vector Group Ltd. (2)(b) | | | B1 | | | | 11.000% | | | | 08/15/15 | | | | 1,700 | | | | 1,759,500 | |
| | | | | | | | | | | | | | | | | | | | |
| | | | | | | | | | | | | | | | | | | 39,024,604 | |
| | | | | | | | | | | | | | | | | | | | |
| Energy - 2.6% | | | | | | | | | | | | | | | | | | | | |
| Black Elk Energy Offshore Operations LLC and Black Elk Finance Corp. (2)(b) | | | B | ** | | | 13.750% | | | | 12/01/15 | | | | 5,800 | | | | 5,894,250 | |
| CCS, Inc. 144A (Canada) (2)(b)(e) | | | Caa2 | | | | 11.000% | | | | 11/15/15 | | | | 4,800 | | | | 4,680,000 | |
| | | | |
| | The accompanying notes are an integral part of these financial statements. | | (Continued) |
| | | | | | | | | | | | | | | | |
| | AQR Funds | | | | | | Annual Report | | | | | | December 2011 | | 57 |
| | | | | | | | | | |
| | | | |
| Schedule of Investments | | | December 31, 2011 | |
| | |
| AQR DIVERSIFIED ARBITRAGE FUND | | |
| | | | | | | | | | | | | | | | | | | | |
| | | | | |
| | | MOODY’S
RATING*
(UNAUDITED) | | | INTEREST
RATE | | | MATURITY
DATE | | | PRINCIPAL
AMOUNT
(000’S) | | | VALUE
(Note 3) | |
| Energy - 2.6% (continued) | | | | | | | | | | | | | | | | | | | | |
| Chesapeake Energy Corp. (2)(b) | | | Ba3 | | | | 7.625% | | | | 07/15/13 | | | $ | 7,250 | | | $ | 7,666,875 | |
| Global Industries Ltd. (2)(b) | | | NR | | | | 2.750% | | | | 08/01/27 | | | | 12,600 | | | | 12,568,500 | |
| Global Rig Co. ASA (Norway) (2) | | | NR | | | | 13.000% | | | | 06/15/15 | | | | 3,800 | | | | 3,724,000 | |
| Golden Close Maritime Corp. Ltd. MTN (Bermuda) (2) | | | NR | | | | 11.000% | | | | 12/09/15 | | | | 2,500 | | | | 2,612,500 | |
| Green Field Energy Services, Inc.144A (2)(b)(e) | | | Caa2 | | | | 13.000% | | | | 11/15/16 | | | | 2,025 | | | | 1,964,250 | |
| Harvest Operations Corp. (Canada) (2)(b) | | | NR | | | | 7.500% | | | | 05/31/15 | | | CAD | 275 | | | | 280,088 | |
| InterOil Exploration and Production ASA (Norway) (2) | | | NR | | | | 15.000% | | | | 03/14/14 | | | NOK | 6,500 | | | | 1,037,896 | |
| James River Coal Co. (2)(b) | | | B2 | | | | 4.500% | | | | 12/01/15 | | | $ | 500 | | | | 388,750 | |
| Panoro Energy ASA 144A (Norway) (2)(e) | | | NR | | | | 12.000% | | | | 11/15/18 | | | | 2,300 | | | | 2,300,000 | |
| Polarcus Alima AS (Norway) (2) | | | NR | | | | 12.500% | | | | 10/29/15 | | | | 3,800 | | | | 3,610,000 | |
| RDS Ultra-Deepwater Ltd. 144A (Cayman Islands) (2)(b)(e) | | | B3 | | | | 11.875% | | | | 03/15/17 | | | | 845 | | | | 891,475 | |
| Regency Energy Partners LP/Regency Energy Finance Corp. (2)(b) | | | B1 | | | | 9.375% | | | | 06/01/16 | | | | 5,786 | | | | 6,364,600 | |
| | | | | | | | | | | | | | | | | | | | |
| | | | | | | | | | | | | | | | | | | 53,983,184 | |
| | | | | | | | | | | | | | | | | | | | |
| Financials - 4.2% | | | | | | | | | | | | | | | | | | | | |
| Avatar Holdings, Inc. (2)(b) | | | NR | | | | 7.500% | | | | 02/15/16 | | | | 5,900 | | | | 5,310,000 | |
| CIT Group, Inc. (2)(b) | | | B2 | | | | 7.000% | | | | 05/01/15 | | | | 12,970 | | | | 12,995,765 | |
| CNG Holdings, Inc. 144A (2)(b)(e) | | | B3 | | | | 12.250% | | | | 02/15/15 | | | | 5,975 | | | | 6,139,312 | |
| CNO Financial Group, Inc. (2)(b) | | | B2 | | | | 7.000% | | | | 12/30/16 | | | | 3,635 | | | | 4,802,744 | |
| CNO Financial Group, Inc., Series UNRE (2)(b) | | | NR | | | | 7.000% | | | | 12/30/16 | | | | 2,367 | | | | 3,127,399 | |
| Health Care REIT, Inc. (2)(b) | | | Baa2 | | | | 3.000% | | | | 12/01/29 | | | | 1,275 | | | | 1,458,281 | |
| Icahn Enterprises LP/Icahn Enterprises Finance Corp. (2)(b) | | | Ba3 | | | | 8.000% | | | | 01/15/18 | | | | 2,055 | | | | 2,137,200 | |
| ING Capital Funding Trust III, Perpetual Bond, Series 9 (2)(b)(f) | | | B1 | | | | 3.969% | | | | 12/29/49 | | | | 3,875 | | | | 3,048,203 | |
| Jasper Explorer Ltd. (Cyprus) (2) | | | NR | | | | 13.500% | | | | 05/27/16 | | | | 6,000 | | | | 4,978,268 | |
| Landry’s Holdings, Inc. 144A (2)(b)(e) | | | Caa1 | | | | 11.500% | | | | 06/01/14 | | | | 1,545 | | | | 1,514,100 | |
| Liberty Mutual Group, Inc. 144A (2)(b)(e)(f) | | | Baa3 | | | | 10.750% | | | | 06/15/58 | | | | 3,550 | | | | 4,455,250 | |
| MF Global Holdings Ltd. (2)(h) | | | Baa2 | | | | 3.375% | | | | 08/01/18 | | | | 2,750 | | | | 893,750 | |
| Offshore Group Investments Ltd. (Cayman Islands) (2)(b) | | | B3 | | | | 11.500% | | | | 08/01/15 | | | | 2,400 | | | | 2,595,000 | |
| PHH Corp. (2)(b) | | | Ba2 | | | | 4.000% | | | | 04/15/12 | | | | 1,350 | | | | 1,277,437 | |
| Rare Restaurant Group LLC/RRG Finance Corp. 144A (2)(b)(e) | | | WR | | | | 9.250% | | | | 05/15/14 | | | | 1,300 | | | | 1,040,000 | |
| Rouse Co. LP (2)(b) | | | WR | | | | 7.200% | | | | 09/15/12 | | | | 2,700 | | | | 2,743,875 | |
| Rouse Co. LP (The) (2)(b) | | | BB+ | ** | | | 6.750% | | | | 11/09/15 | | | | 4,045 | | | | 4,090,506 | |
| Speedy Cash, Inc. 144A (2)(b)(e) | | | B3 | | | | 10.750% | | | | 05/15/18 | | | | 9,175 | | | | 9,220,875 | |
| Synovus Financial Corp. (2)(b) | | | B3 | | | | 5.125% | | | | 06/15/17 | | | | 1,375 | | | | 1,161,875 | |
| TMX Finance LLC/TitleMax Finance Corp. 144A (2)(b)(e) | | | B2 | | | | 13.250% | | | | 07/15/15 | | | | 1,375 | | | | 1,512,500 | |
| TMX Finance LLC/TitleMax Finance Corp. (2)(b) | | | B2 | | | | 13.250% | | | | 07/15/15 | | | | 5,905 | | | | 6,495,500 | |
| Unicredit Luxembourg Finance SA (Luxembourg) (2)(b) | | | NR | | | | 5.584% | | | | 01/13/17 | | | | 4,275 | | | | 4,277,638 | |
| Washington Mutual, Inc. (2)(b)(h) | | | WR | | | | 4.000% | | | | 01/15/09 | | | | 3,050 | | | | 3,339,750 | |
| | | | | | | | | | | | | | | | | | | | |
| | | | | | | | | | | | | | | | | | | 88,615,228 | |
| | | | | | | | | | | | | | | | | | | | |
| Health Care - 1.2% | | | | | | | | | | | | | | | | | | | | |
| Adcare Health Systems, Inc. (3)(a) | | | NR | | | | 10.000% | | | | 10/26/13 | | | | 1,850 | | | | 1,879,837 | |
| Amgen, Inc., Series B (2) | | | Baa1 | | | | 0.375% | | | | 02/01/13 | | | | 5,825 | | | | 5,846,843 | |
| Incyte Corp. Ltd. (2)(b) | | | NR | | | | 4.750% | | | | 10/01/15 | | | | 1,000 | | | | 1,875,000 | |
| KV Pharmaceutical Co. (2)(b) | | | NR | | | | 12.000% | | | | 03/15/15 | | | | 8,175 | | | | 5,599,875 | |
| MannKind Corp. (2)(b) | | | NR | | | | 5.750% | | | | 08/15/15 | | | | 1,540 | | | | 935,550 | |
| Merge Healthcare, Inc. (2)(b) | | | B2 | | | | 11.750% | | | | 05/01/15 | | | | 1,930 | | | | 2,045,800 | |
| Omnicare, Inc. (2)(b) | | | Ba3 | | | | 3.750% | | | | 12/15/25 | | | | 2,400 | | | | 3,336,000 | |
| PDL BioPharma, Inc. 144A (2)(b)(e) | | | NR | | | | 2.875% | | | | 02/15/15 | | | | 1,400 | | | | 1,470,000 | |
| Viropharma, Inc. (2) | | | NR | | | | 2.000% | | | | 03/15/17 | | | | 1,500 | | | | 2,373,750 | |
| | | | | | | | | | | | | | | | | | | | |
| | | | | | | | | | | | | | | | | | | 25,362,655 | |
| | | | | | | | | | | | | | | | | | | | |
| | | | |
| | The accompanying notes are an integral part of these financial statements. | | (Continued) |
| | | | | | | | | | | | | | | | |
| 58 | | AQR Funds | | | | | | Annual Report | | | | | | December 2011 | | |
| | | | | | | | | | |
| | | | |
| Schedule of Investments | | | December 31, 2011 | |
| | |
| AQR DIVERSIFIED ARBITRAGE FUND | | |
| | | | | | | | | | | | | | | | | | | | |
| | | | | |
| | | MOODY’S
RATING*
(UNAUDITED) | | | INTEREST
RATE | | | MATURITY
DATE | | | PRINCIPAL
AMOUNT
(000’S) | | | VALUE
(Note 3) | |
| Industrials - 1.7% | | | | | | | | | | | | | | | | | | | | |
| Boa Deep C AS (Norway) (2)(f) | | | NR | | | | 8.510% | | | | 04/27/16 | | | NOK | 18,406 | | | $ | 2,831,328 | |
| Chart Industries, Inc. (2) | | | B+ | ** | | | 2.000% | | | | 08/01/18 | | | $ | 1,325 | | | | 1,399,531 | |
| Chloe Marine Corp. Ltd. (Bermuda) (2) | | | NR | | | | 12.000% | | | | 12/28/16 | | | | 1,400 | | | | 1,372,000 | |
| EOAL Cyprus Holdings Ltd. (Cyprus) (2) | | | NR | | | | 15.000% | | | | 07/15/14 | | | | 4,000 | | | | 2,800,000 | |
| Floatel Superior Ltd. (Bahamas) (2) | | | NR | | | | 13.000% | | | | 09/02/15 | | | | 1,100 | | | | 1,221,000 | |
| GenCorp, Inc. (2)(b) | | | CCC+ | ** | | | 4.063% | | | | 12/31/39 | | | | 3,575 | | | | 3,221,969 | |
| General Cable Corp. (2)(b)(i) | | | B2 | | | | 4.500% | | | | 11/15/29 | | | | 3,475 | | | | 3,288,219 | |
| Hawaiian Holdings, Inc. (2)(b) | | | NR | | | | 5.000% | | | | 03/15/16 | | | | 300 | | | | 299,625 | |
| MasTec, Inc. (2)(b) | | | NR | | | | 4.250% | | | | 12/15/14 | | | | 2,400 | | | | 3,237,000 | |
| Ship Finance International Ltd. (Bermuda) (2) | | | B1 | | | | 8.500% | | | | 12/15/13 | | | | 3,250 | | | | 3,055,000 | |
| Songa Offshore SE (Cyprus) (2)(f) | | | NR | | | | 13.130% | | | | 11/17/16 | | | NOK | 15,000 | | | | 2,470,385 | |
| Tempel Steel Co. 144A (2)(e) | | | B3 | | | | 12.000% | | | | 08/15/16 | | | $ | 5,625 | | | | 5,343,750 | |
| United Continental Holdings, Inc. (2) | | | NR | | | | 6.860% | | | | 04/22/14 | | | | 4,109 | | | | 4,108,517 | |
| Western Express, Inc. 144A (2)(b)(e) | | | Caa2 | | | | 12.500% | | | | 04/15/15 | | | | 2,300 | | | | 977,500 | |
| | | | | | | | | | | | | | | | | | | | |
| | | | | | | | | | | | | | | | | | | 35,625,824 | |
| | | | | | | | | | | | | | | | | | | | |
| Information Technology - 2.4% | | | | | | | | | | | | | | | | | | | | |
| Bankrate, Inc. (2)(b) | | | B1 | | | | 11.750% | | | | 07/15/15 | | | | 1,077 | | | | 1,229,126 | |
| CDW LLC/CDW Finance Corp. (2)(g) | | | Caa1 | | | | 11.500% | | | | 10/12/15 | | | | 4,506 | | | | 4,731,184 | |
| CDW LLC/CDW Finance Corp. (2)(b) | | | Caa1 | | | | 11.000% | | | | 10/12/15 | | | | 8,565 | | | | 8,993,250 | |
| LDK Solar Co. Ltd., Series EXCH (Cayman Islands) (2)(b) | | | NR | | | | 4.750% | | | | 04/15/13 | | | | 625 | | | | 387,500 | |
| NCO Group, Inc. (2)(f) | | | Caa2 | | | | 5.332% | | | | 11/15/13 | | | | 4,500 | | | | 4,196,250 | |
| Salesforce.com, Inc. (2)(b) | | | NR | | | | 0.750% | | | | 01/15/15 | | | | 12,975 | | | | 17,727,094 | |
| SouthPeak Interactive Corp. (3)(a) | | | NR | | | | 10.000% | | | | 07/19/13 | | | | 2,500 | | | | 1,177,495 | |
| SouthPeak Interactive Corp. (3)(a) | | | NR | | | | 29.000% | | | | 01/31/12 | | | | 1,091 | | | | 1,094,942 | |
| Xilinx, Inc. (2)(b) | | | BB+ | ** | | | 3.125% | | | | 03/15/37 | | | | 10,250 | | | | 11,633,750 | |
| | | | | | | | | | | | | | | | | | | | |
| | | | | | | | | | | | | | | | | | | 51,170,591 | |
| | | | | | | | | | | | | | | | | | | | |
| Materials - 0.5% | | | | | | | | | | | | | | | | | | | | |
| Appleton Papers, Inc. (2)(b) | | | B3 | | | | 11.250% | | | | 12/15/15 | | | | 1,810 | | | | 1,629,000 | |
| Appleton Papers, Inc. 144A (2)(b)(e) | | | B1 | | | | 10.500% | | | | 06/15/15 | | | | 600 | | | | 591,750 | |
| Cemex SAB de CV (Mexico) (2)(b) | | | NR | | | | 4.875% | | | | 03/15/15 | | | | 3,200 | | | | 2,088,000 | |
| Standard Steel LLC/Standard Steel Finance Corp. 144A (2)(b)(e) | | | B3 | | | | 12.000% | | | | 05/01/15 | | | | 5,631 | | | | 6,531,960 | |
| | | | | | | | | | | | | | | | | | | | |
| | | | | | | | | | | | | | | | | | | 10,840,710 | |
| | | | | | | | | | | | | | | | | | | | |
| Telecommunication Services - 0.7% | | | | | | | | | | | | | | | | | | | | |
| Clear Channel Communications, Inc. (2) | | | Ca | | | | 5.000% | | | | 03/15/12 | | | | 10,375 | | | | 10,349,062 | |
| FiberTower Corp. (2)(b) | | | NR | | | | 9.000% | | | | 01/01/16 | | | | 4,189 | | | | 2,272,518 | |
| MediMedia USA, Inc. 144A (2)(b)(e) | | | Caa2 | | | | 11.375% | | | | 11/15/14 | | | | 2,350 | | | | 2,068,000 | |
| Morris Publishing Group LLC (2)(b) | | | NR | | | | 10.000% | | | | 09/01/14 | | | | 792 | | | | 673,254 | |
| | | | | | | | | | | | | | | | | | | | |
| | | | | | | | | | | | | | | | | | | 15,362,834 | |
| | | | | | | | | | | | | | | | | | | | |
TOTAL CORPORATE BONDS
(cost $403,682,495) | | | | | | | | | | | | | | | | | | | 379,079,337 | |
| | | | | | | | | | | | | | | | | | | | |
| | | | | |
| CONVERTIBLE BONDS - 36.3% | | | | | | | | | | | | | | | |
| Communications - 0.0% (d) | | | | | | | | | | | | | | | | | | | | |
| Clearwire Communications LLC/Clearwire Finance, Inc. 144A (2)(e) | | | NR | | | | 8.250% | | | | 12/01/40 | | | | 700 | | | | 444,500 | |
| | | | | | | | | | | | | | | | | | | | |
| Consumer Discretionary - 6.2% | | | | | | | | | | | | | | | | | | | | |
| Coinstar, Inc. (2)(b) | | | BB- | ** | | | 4.000% | | | | 09/01/14 | | | | 2,150 | | | | 2,803,063 | |
| DR Horton, Inc., Series DHI (2)(b) | | | Ba3 | | | | 2.000% | | | | 05/15/14 | | | | 14,481 | | | | 16,906,568 | |
| Exide Technologies (2)(b)(f) | | | CCC+ | ** | | | 0.000% | | | | 09/18/13 | | | | 650 | | | | 485,466 | |
| Ford Motor Co. (2)(b) | | | Ba2 | | | | 4.250% | | | | 11/15/16 | | | | 3,500 | | | | 5,018,125 | |
| Gaylord Entertainment Co.144A (2)(b)(e) | | | NR | | | | 3.750% | | | | 10/01/14 | | | | 5,425 | | | | 6,035,312 | |
| Jakks Pacific, Inc. 144A (2)(b)(e) | | | NR | | | | 4.500% | | | | 11/01/14 | | | | 3,925 | | | | 4,577,531 | |
| | | | |
| | The accompanying notes are an integral part of these financial statements. | | (Continued) |
| | | | | | | | | | | | | | | | |
| | AQR Funds | | | | | | Annual Report | | | | | | December 2011 | | 59 |
| | | | | | | | | | |
| | | | |
| Schedule of Investments | | | December 31, 2011 | |
| | |
| AQR DIVERSIFIED ARBITRAGE FUND | | |
| | | | | | | | | | | | | | | | | | | | |
| | | | | |
| | | MOODY’S
RATING*
(UNAUDITED) | | | INTEREST
RATE | | | MATURITY
DATE | | | PRINCIPAL
AMOUNT
(000’S) | | | VALUE
(Note 3) | |
| Consumer Discretionary - 6.2% (continued) | | | | | | | | | | | | | | | | | | | | |
| Lennar Corp. (2) | | | B3 | | | | 3.250% | | | | 11/15/21 | | | $ | 1,700 | | | $ | 1,859,375 | |
| Lennar Corp.144A (2)(b)(e) | | | B3 | | | | 2.750% | | | | 12/15/20 | | | | 12,400 | | | | 13,826,000 | |
| Lennar Corp.144A (2)(b)(e) | | | B3 | | | | 2.000% | | | | 12/01/20 | | | | 600 | | | | 603,000 | |
| Liz Claiborne, Inc. 144A (2)(b)(e) | | | CCC | ** | | | 6.000% | | | | 06/15/14 | | | | 6,250 | | | | 15,812,500 | |
| Palm Harbor Homes, Inc. (3)(a)(b)(h) | | | NR | | | | 3.250% | | | | 05/15/24 | | | | 70 | | | | 7,000 | |
| priceline.com, Inc.144A (2)(b)(e) | | | BBB- | ** | | | 1.250% | | | | 03/15/15 | | | | 12,400 | | | | 20,413,500 | |
| Regis Corp. (2)(b) | | | NR | | | | 5.000% | | | | 07/15/14 | | | | 10,000 | | | | 12,487,500 | |
| Saks, Inc. 144A (2)(b)(e) | | | NR | ** | | | 7.500% | | | | 12/01/13 | | | | 800 | | | | 1,531,000 | |
| Sonic Automotive, Inc. (2)(b) | | | B+ | ** | | | 5.000% | | | | 10/01/29 | | | | 14,250 | | | | 18,863,437 | |
| Stewart Enterprises, Inc. (2)(b) | | | B1 | | | | 3.125% | | | | 07/15/14 | | | | 25 | | | | 23,781 | |
| Virgin Media, Inc. (2)(b) | | | B+ | ** | | | 6.500% | | | | 11/15/16 | | | | 7,000 | | | | 9,686,250 | |
| | | | | | | | | | | | | | | | | | | | |
| | | | | | | | | | | | | | | | | | | 130,939,408 | |
| | | | | | | | | | | | | | | | | | | | |
| Consumer Staples - 1.4% | | | | | | | | | | | | | | | | | | | | |
| Alliance One International, Inc. (2)(b) | | | Caa1 | | | | 5.500% | | | | 07/15/14 | | | | 4,500 | | | | 3,436,875 | |
| American Oriental Bioengineering, Inc. 144A (2)(b)(e) | | | NR | | | | 5.000% | | | | 07/15/15 | | | | 1,000 | | | | 490,000 | |
| Central European Distribution Corp. (2) | | | CCC | ** | | | 3.000% | | | | 03/15/13 | | | | 2,475 | | | | 1,980,000 | |
| Chiquita Brands International, Inc. (2)(b) | | | B- | ** | | | 4.250% | | | | 08/15/16 | | | | 5,000 | | | | 4,281,250 | |
| Nash Finch Co. (2)(b)(i) | | | B3 | | | | 1.631% | | | | 03/15/35 | | | | 4,275 | | | | 1,966,500 | |
| Rite Aid Corp. (2)(b) | | | Ca | | | | 8.500% | | | | 05/15/15 | | | | 300 | | | | 271,500 | |
| Tyson Foods, Inc. (2)(b) | | | BB+ | ** | | | 3.250% | | | | 10/15/13 | | | | 6,600 | | | | 8,753,250 | |
| Vector Group Ltd. (2)(b)(f) | | | NR | | | | 3.750% | | | | 11/15/14 | | | | 6,504 | | | | 8,617,800 | |
| Vector Group Ltd. (2)(b)(f) | | | NR | | | | 3.875% | | | | 06/15/26 | | | | 383 | | | | 433,269 | |
| | | | | | | | | | | | | | | | | | | | |
| | | | | | | | | | | | | | | | | | | 30,230,444 | |
| | | | | | | | | | | | | | | | | | | | |
| Energy - 1.7% | | | | | | | | | | | | | | | | | | | | |
| Bristow Group, Inc. (2)(b) | | | BB | ** | | | 3.000% | | | | 06/15/38 | | | | 1,000 | | | | 1,021,250 | |
| Exterran Holdings, Inc. (2)(b) | | | BB | ** | | | 4.250% | | | | 06/15/14 | | | | 3,675 | | | | 3,261,563 | |
| GMX Resources, Inc. (2)(b) | | | NR | | | | 4.500% | | | | 05/01/15 | | | | 1,875 | | | | 897,656 | |
| Goodrich Petroleum Corp. (2)(b) | | | CCC+ | ** | | | 5.000% | | | | 10/01/29 | | | | 1,000 | | | | 926,250 | |
| Green Plains Renewable Energy, Inc. 144A (2)(b)(e) | | | NR | | | | 5.750% | | | | 11/01/15 | | | | 4,100 | | | | 3,930,875 | |
| Harvest Natural Resources, Inc. (2)(b) | | | NR | | | | 8.250% | | | | 03/01/13 | | | | 475 | | | | 632,938 | |
| PetroBakken Energy Ltd., Reg S (Canada) (2)(b) | | | NR | | | | 3.125% | | | | 02/08/16 | | | | 5,900 | | | | 5,457,500 | |
| Petrominerales Ltd., Series PMG (Canada) (2) | | | NR | | | | 2.625% | | | | 08/25/16 | | | | 1,900 | | | | 1,706,200 | |
| Pioneer Natural Resources Co. (2)(b) | | | BBB- | ** | | | 2.875% | | | | 01/15/38 | | | | 750 | | | | 1,150,312 | |
| Polarcus Ltd. MTN (Cayman Islands) (2) | | | NR | | | | 2.875% | | | | 04/27/16 | | | | 400 | | | | 301,800 | |
| Western Refining, Inc. (2)(b) | | | CCC+ | ** | | | 5.750% | | | | 06/15/14 | | | | 11,375 | | | | 16,351,562 | |
| | | | | | | | | | | | | | | | | | | | |
| | | | | | | | | | | | | | | | | | | 35,637,906 | |
| | | | | | | | | | | | | | | | | | | | |
| Financials - 7.4% | | | | | | | | | | | | | | | | | | | | |
| American Equity Investment Life Holding Co. 144A (2)(b)(e) | | | NR | | | | 5.250% | | | | 12/06/29 | | | | 5,525 | | | | 6,788,844 | |
| American Equity Investment Life Holding Co. 144A (2)(b)(e) | | | NR | | | | 3.500% | | | | 09/15/15 | | | | 8,925 | | | | 9,070,031 | |
| Ares Capital Corp.144A (2)(e) | | | BBB | ** | | | 5.750% | | | | 02/01/16 | | | | 3,725 | | | | 3,585,313 | |
| Ares Capital Corp. 144A (2)(b)(e) | | | BBB | ** | | | 5.125% | | | | 06/01/16 | | | | 1,200 | | | | 1,114,500 | |
| BGC Partners, Inc. 144A (2)(b)(e) | | | BBB- | ** | | | 4.500% | | | | 07/15/16 | | | | 1,400 | | | | 1,225,000 | |
| BioMed Realty LP 144A (2)(b)(e) | | | NR | | | | 3.750% | | | | 01/15/30 | | | | 5,150 | | | | 5,928,938 | |
| Boston Properties LP 144A (2)(b)(e) | | | A- | ** | | | 3.625% | | | | 02/15/14 | | | | 3,750 | | | | 4,045,312 | |
| Boston Properties LP (2)(b) | | | A- | ** | | | 3.750% | | | | 05/15/36 | | | | 5,750 | | | | 6,569,375 | |
| CNO Financial Group, Inc., Series 1 (2)(b) | | | NR | | | | 7.000% | | | | 12/30/16 | | | | 3,963 | | | | 5,236,114 | |
| DDR Corp. (2) | | | NR | | | | 1.750% | | �� | | 11/15/40 | | | | 8,775 | | | | 8,599,500 | |
| DFC Global Corp. (2)(b) | | | NR | | | | 2.875% | | | | 06/30/27 | | | | 150 | | | | 161,625 | |
| Digital Realty Trust LP 144A (2)(b)(e) | | | NR | | | | 5.500% | | | | 04/15/29 | | | | 8,450 | | | | 14,021,719 | |
| Hilltop Holdings, Inc. (2)(b) | | | NR | | | | 7.500% | | | | 08/15/25 | | | | 998 | | | | 1,055,385 | |
| Host Hotels & Resorts LP 144A (2)(b)(e) | | | BB+ | ** | | | 2.500% | | | | 10/15/29 | | | | 15,250 | | | | 18,890,938 | |
| Janus Capital Group, Inc. (2)(b) | | | Baa3 | | | | 3.250% | | | | 07/15/14 | | | | 250 | | | | 245,625 | |
| Kilroy Realty LP 144A (2)(b)(e) | | | NR | | | | 4.250% | | | | 11/15/14 | | | | 7,390 | | | | 8,683,250 | |
| | | | |
| | The accompanying notes are an integral part of these financial statements. | | (Continued) |
| | | | | | | | | | | | | | | | |
| 60 | | AQR Funds | | | | | | Annual Report | | | | | | December 2011 | | |
| | | | | | | | | | |
| | | | |
| Schedule of Investments | | | December 31, 2011 | |
| | |
| AQR DIVERSIFIED ARBITRAGE FUND | | |
| | | | | | | | | | | | | | | | | | | | |
| | | | | |
| | | MOODY’S
RATING*
(UNAUDITED) | | | INTEREST
RATE | | | MATURITY
DATE | | | PRINCIPAL
AMOUNT
(000’S) | | | VALUE
(Note 3) | |
| Financials - 7.4% (continued) | | | | | | | | | | | | | | | | | | | | |
| KKR Financial Holdings LLC (2) | | | NR | | | | 7.000% | | | | 07/15/12 | | | $ | 125 | | | $ | 129,062 | |
| Kohlberg Capital Corp. 144A (2)(b)(e) | | | NR | | | | 8.750% | | | | 03/15/16 | | | | 4,000 | | | | 3,660,000 | |
| Leucadia National Corp. (2)(b) | | | B2 | | | | 3.750% | | | | 04/15/14 | | | | 250 | | | | 277,188 | |
| Lexington Realty Trust 144A (2)(b)(e) | | | NR | | | | 6.000% | | | | 01/15/30 | | | | 7,550 | | | | 8,984,500 | |
| MGIC Investment Corp. (2)(b) | | | CCC+ | ** | | | 5.000% | | | | 05/01/17 | | | | 10,850 | | | | 6,523,562 | |
| National Financial Partners Corp. (2)(b) | | | NR | | | | 4.000% | | | | 06/15/17 | | | | 4,025 | | | | 4,960,812 | |
| NorthStar Realty Finance LP 144A (2)(b)(e) | | | NR | | | | 7.500% | | | | 03/15/31 | | | | 3,400 | | | | 3,085,500 | |
| Penson Worldwide, Inc. 144A (2)(b)(e) | | | NR | | | | 8.000% | | | | 06/01/14 | | | | 8,515 | | | | 2,724,800 | |
| ProLogis LP (2)(b) | | | BBB- | ** | | | 3.250% | | | | 03/15/15 | | | | 8,275 | | | | 8,533,594 | |
| Radian Group, Inc. (2) | | | CCC+ | ** | | | 3.000% | | | | 11/15/17 | | | | 5,175 | | | | 2,231,719 | |
| SL Green Operating Partnership LP 144A (2)(b)(e) | | | NR | | | | 3.000% | | | | 10/15/17 | | | | 11,825 | | | | 12,194,531 | |
| Stewart Information Services Corp. (2) | | | NR | | | | 6.000% | | | | 10/15/14 | | | | 6,125 | | | | 6,844,687 | |
| | | | | | | | | | | | | | | | | | | | |
| | | | | | | | | | | | | | | | | | | 155,371,424 | |
| | | | | | | | | | | | | | | | | | | | |
| Health Care - 0.5% | | | | | | | | | | | | | | | | | | | | |
| Accuray, Inc. 144A (2)(b)(e) | | | NR | | | | 3.750% | | | | 08/01/16 | | | | 700 | | | | 561,750 | |
China Medical Technologies, Inc. 144A (Cayman
Islands) (2)(b)(e) | | | B+ | ** | | | 6.250% | | | | 12/15/16 | | | | 2,625 | | | | 826,875 | |
| China Medical Technologies, Inc., Series CMT (Cayman Islands) (2)(b) | | | NR | | | | 4.000% | | | | 08/15/13 | | | | 250 | | | | 143,125 | |
| Enzon Pharmaceuticals, Inc. (2)(b) | | | NR | | | | 4.000% | | | | 06/01/13 | | | | 1,850 | | | | 1,863,875 | |
| MannKind Corp. (2)(b) | | | NR | | | | 3.750% | | | | 12/15/13 | | | | 500 | | | | 260,625 | |
| Molina Healthcare, Inc., Series MOH (2)(b) | | | NR | | | | 3.750% | | | | 10/01/14 | | | | 3,375 | | | | 3,522,656 | |
| SonoSite, Inc. (2)(b) | | | NR | | | | 3.750% | | | | 07/15/14 | | | | 1,000 | | | | 1,463,750 | |
| West Pharmaceutical Services, Inc. (2)(b) | | | NR | | | | 4.000% | | | | 03/15/47 | | | | 2,000 | | | | 1,697,500 | |
| | | | | | | | | | | | | | | | | | | | |
| | | | | | | | | | | | | | | | | | | 10,340,156 | |
| | | | | | | | | | | | | | | | | | | | |
| Industrials - 5.8% | | | | | | | | | | | | | | | | | | | | |
| Avis Budget Group, Inc. (2)(b) | | | NR | | | | 3.500% | | | | 10/01/14 | | | | 9,575 | | | | 9,766,500 | |
| CBIZ, Inc. 144A (2)(b)(e) | | | NR | | | | 4.875% | | | | 10/01/15 | | | | 1,400 | | | | 1,494,500 | |
| China Linen Textile Industry Ltd. (Cayman Islands) (3)(a) | | | NR | | | | 7.500% | | | | 11/12/12 | | | | 1,850 | | | | 1,423,027 | |
| EnPro Industries, Inc. (2)(b) | | | NR | | | | 3.938% | | | | 10/15/15 | | | | 3,575 | | | | 4,236,375 | |
| FTI Consulting, Inc. (2)(b) | | | B1 | | | | 3.750% | | | | 07/15/12 | | | | 1,325 | | | | 1,825,188 | |
| Genco Shipping & Trading Ltd. (Marshall Islands) (2)(b) | | | NR | | | | 5.000% | | | | 08/15/15 | | | | 500 | | | | 316,875 | |
| General Cable Corp. (2)(b) | | | Ba3 | | | | 0.875% | | | | 11/15/13 | | | | 3,000 | | | | 2,760,000 | |
| Hertz Global Holdings, Inc. (2)(b) | | | B- | ** | | | 5.250% | | | | 06/01/14 | | | | 14,500 | | | | 22,565,625 | |
| Kaman Corp. 144A (2)(e) | | | NR | | | | 3.250% | | | | 11/15/17 | | | | 3,800 | | | | 3,971,000 | |
| MasTec, Inc. (2)(b) | | | NR | | | | 4.000% | | | | 06/15/14 | | | | 2,125 | | | | 2,767,812 | |
| Meritor, Inc. (2)(b)(i) | | | CCC+ | ** | | | 4.625% | | | | 03/01/26 | | | | 2,000 | | | | 1,475,000 | |
| Navistar International Corp. (2)(b) | | | B | ** | | | 3.000% | | | | 10/15/14 | | | | 6,875 | | | | 7,407,812 | |
| Terex Corp. (2)(b) | | | Caa1 | | | | 4.000% | | | | 06/01/15 | | | | 9,500 | | | | 10,568,750 | |
| Textron, Inc., Series TXT (2)(b) | | | Baa3 | | | | 4.500% | | | | 05/01/13 | | | | 4,400 | | | | 6,754,000 | |
| Titan International, Inc. 144A (2)(b)(e) | | | B+ | ** | | | 5.625% | | | | 01/15/17 | | | | 5,475 | | | | 11,880,750 | |
| Trex Co., Inc. (2)(b) | | | NR | | | | 6.000% | | | | 07/01/12 | | | | 6,970 | | | | 7,780,263 | |
| Ultrapetrol Bahamas Ltd. 144A (Bahamas) (2)(b)(e) | | | NR | | | | 7.250% | | | | 01/15/17 | | | | 900 | | | | 644,625 | |
| United Rentals, Inc. (2)(b) | | | NR | | | | 4.000% | | | | 11/15/15 | | | | 8,500 | | | | 23,375,000 | |
| | | | | | | | | | | | | | | | | | | | |
| | | | | | | | | | | | | | | | | | | 121,013,102 | |
| | | | | | | | | | | | | | | | | | | | |
| Information Technology - 7.3% | | | | | | | | | | | | | | | | | | | | |
| 3D Systems Corp.144A (2)(e) | | | NR | | | | 5.500% | | | | 12/15/16 | | | | 11,725 | | | | 10,874,938 | |
| Alliance Data Systems Corp. (2)(b) | | | NR | | | | 4.750% | | | | 05/15/14 | | | | 10,500 | | | | 23,703,750 | |
| Alliance Data Systems Corp. (2)(b) | | | NR | | | | 1.750% | | | | 08/01/13 | | | | 3,000 | | | | 4,113,750 | |
| Amkor Technology, Inc. (2)(b) | | | NR | | | | 6.000% | | | | 04/15/14 | | | | 5,950 | | | | 9,386,125 | |
| Arris Group, Inc. (2)(b) | | | NR | | | | 2.000% | | | | 11/15/26 | | | | 650 | | | | 654,875 | |
| Cadence Design Systems, Inc. (2)(b) | | | NR | | | | 2.625% | | | | 06/01/15 | | | | 6,925 | | | | 10,465,406 | |
| Ciena Corp.144A (2)(b)(e) | | | NR | | | | 4.000% | | | | 03/15/15 | | | | 16,075 | | | | 15,793,687 | |
| | | | |
| | The accompanying notes are an integral part of these financial statements. | | (Continued) |
| | | | | | | | | | | | | | | | |
| | AQR Funds | | | | | | Annual Report | | | | | | December 2011 | | 61 |
| | | | | | | | | | |
| | | | |
| Schedule of Investments | | | December 31, 2011 | |
| | |
| AQR DIVERSIFIED ARBITRAGE FUND | | |
| | | | | | | | | | | | | | | | | | | | |
| | | | | |
| | | MOODY’S
RATING*
(UNAUDITED) | | | INTEREST
RATE | | | MATURITY
DATE | | | PRINCIPAL
AMOUNT
(000’S) | | | VALUE
(Note 3) | |
| Information Technology - 7.3% (continued) | | | | | | | | | | | | | | | | | | | | |
| Concur Technologies, Inc. 144A (2)(b)(e) | | | NR | | | | 2.500% | | | | 04/15/15 | | | $ | 200 | | | $ | 239,250 | |
| Convergys Corp. (2)(b) | | | BB- | ** | | | 5.750% | | | | 09/15/29 | | | | 7,825 | | | | 10,700,688 | |
| Digital River, Inc. 144A (2)(b)(e) | | | NR | | | | 2.000% | | | | 11/01/30 | | | | 2,600 | | | | 2,128,750 | |
| DST Systems, Inc., Series C (2)(b)(f) | | | NR | | | | 0.000% | | | | 08/15/23 | | | | 975 | | | | 1,104,187 | |
| Equinix, Inc. (2)(b) | | | B | ** | | | 4.750% | | | | 06/15/16 | | | | 11,050 | | | | 15,552,875 | |
| Finisar Corp. 144A (2)(b)(e) | | | NR | | | | 5.000% | | | | 10/15/29 | | | | 400 | | | | 739,000 | |
| Hutchinson Technology, Inc. (2)(b) | | | NR | | | | 8.500% | | | | 01/15/26 | | | | 195 | | | | 138,206 | |
| Micron Technology, Inc., Series A 144A (2)(b)(e) | | | NR | | | | 1.500% | | | | 08/01/31 | | | | 400 | | | | 359,000 | |
| Nuance Communications, Inc.144A (2)(b)(e) | | | BB- | ** | | | 2.750% | | | | 11/01/31 | | | | 600 | | | | 644,250 | |
| ON Semiconductor Corp. (2)(b) | | | Ba2 | | | | 1.875% | | | | 12/15/25 | | | | 250 | | | | 304,062 | |
| Photronics, Inc. (2)(b) | | | NR | | | | 5.500% | | | | 10/01/14 | | | | 2,200 | | | | 3,110,250 | |
| Powerwave Technologies, Inc. 144A (2)(b)(e) | | | NR | | | | 2.750% | | | | 07/15/41 | | | | 3,900 | | | | 2,149,875 | |
| Rambus, Inc. (2)(b) | | | NR | | | | 5.000% | | | | 06/15/14 | | | | 6,450 | | | | 6,312,937 | |
| SYNNEX Corp. (2)(b) | | | NR | | | | 4.000% | | | | 05/15/18 | | | | 2,750 | | | | 3,220,938 | |
| Take-Two Interactive Software, Inc. (2)(b) | | | NR | | | | 4.375% | | | | 06/01/14 | | | | 3,825 | | | | 5,498,438 | |
| Take-Two Interactive Software, Inc. 144A (2)(b)(e) | | | NR | | | | 1.750% | | | | 12/01/16 | | | | 2,200 | | | | 2,136,750 | |
| THQ, Inc. (2)(b) | | | NR | | | | 5.000% | | | | 08/15/14 | | | | 1,525 | | | | 716,750 | |
| TTM Technologies, Inc. (2)(b) | | | BB- | ** | | | 3.250% | | | | 05/15/15 | | | | 2,450 | | | | 2,554,125 | |
| VeriFone Systems, Inc. (2) | | | BB- | ** | | | 1.375% | | | | 06/15/12 | | | | 600 | | | | 615,000 | |
| VeriSign, Inc. (2)(b) | | | NR | | | | 3.250% | | | | 08/15/37 | | | | 17,435 | | | | 20,834,825 | |
| | | | | | | | | | | | | | | | | | | | |
| | | | | | | | | | | | | | | | | | | 154,052,687 | |
| | | | | | | | | | | | | | | | | | | | |
| Materials - 3.7% | | | | | | | | | | | | | | | | | | | | |
| A.M. Castle & Co.144A (2)(e) | | | NR | | | | 7.000% | | | | 12/15/17 | | | | 925 | | | | 1,003,625 | |
| Alcoa, Inc. (2)(b) | | | Baa3 | | | | 5.250% | | | | 03/15/14 | | | | 6,900 | | | | 10,436,250 | |
| Allegheny Technologies, Inc. (2)(b) | | | BBB- | ** | | | 4.250% | | | | 06/01/14 | | | | 17,650 | | | | 24,687,937 | |
| ArcelorMittal (Luxembourg) (2)(b) | | | Baa3 | | | | 5.000% | | | | 05/15/14 | | | | 6,875 | | | | 7,227,344 | |
| Cemex SAB de CV 144A(Mexico) (2)(b)(e) | | | NR | | | | 3.250% | | | | 03/15/16 | | | | 900 | | | | 586,125 | |
| Cemex SAB de CV 144A (Mexico) (2)(b)(e) | | | NR | | | | 3.750% | | | | 03/15/18 | | | | 500 | | | | 324,375 | |
| Cereplast, Inc.144A (3)(a)(e) | | | NR | | | | 7.000% | | | | 06/01/16 | | | | 4,450 | | | | 2,942,149 | |
| Jaguar Mining, Inc. 144A (Canada) (2)(b)(e) | | | NR | | | | 5.500% | | | | 03/31/16 | | | | 500 | | | | 528,750 | |
| Kaiser Aluminum Corp. 144A (2)(b)(e) | | | NR | | | | 4.500% | | | | 04/01/15 | | | | 300 | | | | 348,570 | |
| Northgate Minerals Corp. (Canada) (2)(b) | | | NR | | | | 3.500% | | | | 10/01/16 | | | | 2,825 | | | | 2,923,875 | |
| RTI International Metals, Inc. (2) | | | NR | | | | 3.000% | | | | 12/01/15 | | | | 5,250 | | | | 5,256,562 | |
| ShengdaTech, Inc. 144A (2)(b)(e)(h) | | | NR | | | | 6.500% | | | | 12/15/15 | | | | 1,200 | | | | 90,000 | |
| ShengdaTech, Inc. 144A (2)(b)(e)(h) | | | NR | | | | 6.000% | | | | 06/01/18 | | | | 200 | | | | 30,000 | |
| Sino-Forest Corp. 144A (Canada) (2)(b)(e) | | | NR | ** | | | 4.250% | | | | 12/15/16 | | | CAD | 1,525 | | | | 396,500 | |
| Sterlite Industries India Ltd. (India) (2)(b) | | | NR | | | | 4.000% | | | | 10/30/14 | | | $ | 5,350 | | | | 4,226,500 | |
| Stillwater Mining Co. (2)(b) | | | B+ | ** | | | 1.875% | | | | 03/15/28 | | | | 1,000 | | | | 956,250 | |
| United States Steel Corp. (2)(b) | | | Ba2 | | | | 4.000% | | | | 05/15/14 | | | | 14,934 | | | | 16,520,738 | |
| | | | | | | | | | | | | | | | | | | | |
| | | | | | | | | | | | | | | | | | | 78,485,550 | |
| | | | | | | | | | | | | | | | | | | | |
| Telecommunication Services - 2.3% | | | | | | | | | | | | | | | | | | | | |
| Level 3 Communications, Inc. (2)(b) | | | NR | | | | 6.500% | | | | 10/01/16 | | | | 8,525 | | | | 10,368,531 | |
| Level 3 Communications, Inc. (2)(b) | | | CCC | ** | | | 15.000% | | | | 01/15/13 | | | | 10,975 | | | | 12,580,094 | |
| Level 3 Communications, Inc., Series B (2)(b) | | | NR | | | | 7.000% | | | | 03/15/15 | | | | 1,280 | | | | 1,387,200 | |
| NII Holdings, Inc. (2)(b) | | | B- | ** | | | 3.125% | | | | 06/15/12 | | | | 1,980 | | | | 1,992,375 | |
| tw telecom inc (2)(b) | | | B3 | | | | 2.375% | | | | 04/01/26 | | | | 1,075 | | | | 1,265,813 | |
| XM Satellite Radio, Inc.144A (2)(b)(e) | | | BB | ** | | | 7.000% | | | | 12/01/14 | | | | 16,100 | | | | 20,809,250 | |
| | | | | | | | | | | | | | | | | | | | |
| | | | | | | | | | | | | | | | | | | 48,403,263 | |
| | | | | | | | | | | | | | | | | | | | |
TOTAL CONVERTIBLE BONDS
(cost $777,204,926) | | | | | | | | | | | | | | | | | | | 764,918,440 | |
| | | | | | | | | | | | | | | | | | | | |
| | | | |
| | The accompanying notes are an integral part of these financial statements. | | (Continued) |
| | | | | | | | | | | | | | | | |
| 62 | | AQR Funds | | | | | | Annual Report | | | | | | December 2011 | | |
| | | | | | | | | | |
| | | | |
| Schedule of Investments | | | December 31, 2011 | |
| | |
| AQR DIVERSIFIED ARBITRAGE FUND | | |
| | | | | | | | |
| CLOSED END FUNDS - 2.7% | | SHARES | | | VALUE
(Note 3) | |
| Adams Express Co. (b) | | | 9,080 | | | $ | 87,531 | |
| Advent Claymore Convertible Securities and Income Fund (b) | | | 8,929 | | | | 131,524 | |
| Advent Claymore Enhanced Growth & Income Fund (b) | | | 4,481 | | | | 40,239 | |
| Advent Claymore Global Convertible Securities & Income Fund (b) | | | 26,923 | | | | 169,615 | |
| Alpine Global Premier Properties Fund | | | 4,755 | | | | 25,202 | |
| Apollo Senior Floating Rate Fund, Inc. (b) | | | 28,539 | | | | 456,909 | |
| ASA Gold and Precious Metals Ltd. (Bermuda) (b) | | | 33,440 | | | | 875,794 | |
| Avenue Income Credit Strategies Fund (b) | | | 3,979 | | | | 61,237 | |
| Blackrock Core Bond Trust | | | 190,391 | | | | 2,574,086 | |
| BlackRock Corporate High Yield Fund III, Inc. | | | 14,825 | | | | 104,961 | |
| BlackRock Corporate High Yield Fund V, Inc. | | | 10,893 | | | | 127,339 | |
| BlackRock Credit Allocation Income Trust II, Inc. | | | 299,422 | | | | 2,943,318 | |
| Blackrock Credit Allocation Income Trust III, Inc. | | | 163,105 | | | | 1,719,127 | |
| Blackrock Credit Allocation Income Trust IV | | | 274,593 | | | | 3,336,305 | |
| BlackRock Defined Opportunity Credit Trust | | | 3,459 | | | | 43,065 | |
| BlackRock Diversified Income Strategies Fund, Inc. | | | 13,104 | | | | 124,488 | |
| BlackRock EcoSolutions Investment Trust | | | 3,840 | | | | 30,029 | |
| BlackRock Energy and Resources Trust | | | 478 | | | | 11,687 | |
| BlackRock Enhanced Capital and Income Fund, Inc. | | | 25,877 | | | | 318,287 | |
| BlackRock Enhanced Equity Dividend Trust | | | 36,524 | | | | 258,225 | |
| BlackRock Equity Dividend Trust | | | 12,823 | | | | 116,176 | |
| BlackRock Floating Rate Income | | | 15,286 | | | | 205,902 | |
| BlackRock Floating Rate Income Strategies Fund II, Inc. | | | 15,209 | | | | 187,527 | |
| BlackRock Floating Rate Income Strategies Fund, Inc. | | | 24,096 | | | | 321,923 | |
| BlackRock Global Opportunities Equity Trust | | | 9,369 | | | | 123,765 | |
| BlackRock Income Opportunity Trust, Inc. | | | 224,796 | | | | 2,297,415 | |
| BlackRock International Growth and Income Trust | | | 46,562 | | | | 333,384 | |
| BlackRock Limited Duration Income Trust (b) | | | 400 | | | | 6,388 | |
| Blackrock Resources & Commodities Strategy Trust | | | 49,715 | | | | 660,215 | |
| BlackRock Strategic Equity Dividend Trust | | | 13,611 | | | | 133,388 | |
| Blackstone/GSO Long-Short Credit Income Fund | | | 2,413 | | | | 41,166 | |
| Blackstone/GSO Senior Floating Rate Term Fund | | | 33 | | | | 606 | |
| Calamos Convertible and High Income Fund | | | 11,581 | | | | 133,876 | |
| | | | | | | | |
CLOSED END FUNDS - 2.7%
(continued) | | SHARES | | | VALUE
(Note 3) | |
| CBRE Clarion Global Real Estate Income Fund | | | 113,366 | | | $ | 775,423 | |
| Central Securities Corp. | | | 217 | | | | 4,440 | |
| Clough Global Equity Fund | | | 11,146 | | | | 134,086 | |
| Cohen & Steers Closed-End Opportunity Fund, Inc. | | | 995 | | | | 11,910 | |
| Cohen & Steers Global Income Builder, Inc. | | | 25,967 | | | | 241,493 | |
| Columbia Seligman Premium Technology Growth Fund | | | 288 | | | | 4,510 | |
| Eaton Vance Enhanced Equity Income Fund | | | 93,219 | | | | 948,969 | |
| Eaton Vance Enhanced Equity Income Fund II | | | 94,935 | | | | 969,286 | |
| Eaton Vance Floating-Rate Income Trust | | | 26,452 | | | | 376,412 | |
| Eaton Vance Limited Duration Income Fund | | | 86,614 | | | | 1,319,131 | |
| Eaton Vance Risk-Managed Diversified Equity Income Fund | | | 349,871 | | | | 3,656,152 | |
| Eaton Vance Senior Floating-Rate Trust | | | 13,008 | | | | 187,055 | |
| Eaton Vance Senior Income Trust | | | 40,621 | | | | 265,255 | |
| Eaton Vance Short Duration Diversified Income Fund | | | 3,959 | | | | 64,136 | |
| Eaton Vance Tax Managed Global Buy Write Opportunities Fund | | | 252,203 | | | | 2,592,647 | |
| Eaton Vance Tax-Advantaged Dividend Income Fund | | | 56,095 | | | | 818,987 | |
| Eaton Vance Tax-Advantaged Global Dividend Income Fund | | | 19,969 | | | | 244,221 | |
| Eaton Vance Tax-Advantaged Global Dividend Opportunities Fund | | | 21,864 | | | | 371,688 | |
| Eaton Vance Tax-Managed Buy-Write Income Fund | | | 53,421 | | | | 685,926 | |
| Eaton Vance Tax-Managed Buy-Write Opportunities Fund | | | 130,550 | | | | 1,530,046 | |
| Eaton Vance Tax-Managed Diversified Equity Income Fund | | | 306,239 | | | | 2,716,340 | |
| Eaton Vance Tax-Managed Global Diversified Equity Income Fund | | | 522,080 | | | | 4,307,160 | |
| First Opportunity Fund, Inc. † | | | 19,292 | | | | 119,996 | |
| First Trust Aberdeen Emerging Opportunity Fund | | | 5,205 | | | | 92,753 | |
| First Trust Aberdeen Global Opportunity Income Fund | | | 3,607 | | | | 56,846 | |
| First Trust Enhanced Equity Income Fund | | | 16,073 | | | | 174,071 | |
| First Trust High Income Long/Short Fund | | | 53,513 | | | | 817,144 | |
| Fort Dearborn Income Securities, Inc. | | | 474 | | | | 7,565 | |
| Gabelli Global Multimedia Trust, Inc. | | | 11,493 | | | | 71,716 | |
| GAMCO Natural Resources Gold & Income Trust by Gabelli | | | 3,323 | | | | 44,661 | |
| Guggenheim Enhanced Equity, Inc. | | | 2,412 | | | | 19,682 | |
| ING Emerging Markets High Dividend Equity Fund | | | 14,218 | | | | 185,829 | |
| ING Global Equity Dividend & Premium Opportunity Fund | | | 5,688 | | | | 49,144 | |
| ING Infrastructure Industrials and Materials Fund | | | 4,139 | | | | 63,699 | |
| ING Prime Rate Trust | | | 110,923 | | | | 565,707 | |
| | | | |
| | The accompanying notes are an integral part of these financial statements. | | (Continued) |
| | | | | | | | | | | | | | | | |
| | AQR Funds | | | | | | Annual Report | | | | | | December 2011 | | 63 |
| | | | | | | | | | |
| | | | |
| Schedule of Investments | | | December 31, 2011 | |
| | |
| AQR DIVERSIFIED ARBITRAGE FUND | | |
| | | | | | | | |
CLOSED END FUNDS - 2.7%
(continued) | | SHARES | | | VALUE
(Note 3) | |
| ING Risk Managed Natural Resources Fund | | | 2,487 | | | $ | 28,352 | |
| Invesco Van Kampen Bond Fund | | | 69,437 | | | | 1,451,233 | |
| Invesco Van Kampen Dynamic Credit Opportunities Fund | | | 111,071 | | | | 1,174,020 | |
| John Hancock Hedged Equity & Income Fund | | | 16,306 | | | | 239,372 | |
| Kayne Anderson Midsteam/Energy Fund, Inc. | | | 12,166 | | | | 303,420 | |
| Lazard Global Total Return and Income Fund, Inc. | | | 5,284 | | | | 70,753 | |
| LMP Corporate Loan Fund, Inc. | | | 3,601 | | | | 40,007 | |
| LMP Real Estate Income Fund, Inc. | | | 8,600 | | | | 79,550 | |
| Madison/Claymore Covered Call & Equity Strategy Fund | | | 34,274 | | | | 256,027 | |
| MLP & Strategic Equity Fund, Inc. | | | 4,357 | | | | 74,418 | |
| Montgomery Street Income Securities, Inc. | | | 6,794 | | | | 104,764 | |
| Morgan Stanley Emerging Markets Fund, Inc. † | | | 7,344 | | | | 94,885 | |
| Morgan Stanley Income Securities, Inc. | | | 30,032 | | | | 520,755 | |
| Nuveen Core Equity Alpha Fund | | | 1,077 | | | | 13,430 | |
| Nuveen Equity Premium Advantage Fund | | | 32,758 | | | | 375,407 | |
| Nuveen Equity Premium and Growth Fund | | | 24,909 | | | | 300,652 | |
| Nuveen Equity Premium Income Fund | | | 45,450 | | | | 508,131 | |
| Nuveen Equity Premium Opportunity Fund | | | 48,603 | | | | 555,046 | |
| Nuveen Quality Preferred Income Fund | | | 139,343 | | | | 1,054,827 | |
| Nuveen Quality Preferred Income Fund II | | | 381,955 | | | | 2,990,708 | |
| Nuveen Quality Preferred Income Fund III | | | 47,462 | | | | 372,102 | |
| Nuveen Short Duration Credit Opportunities Fund | | | 8,506 | | | | 148,770 | |
| Nuveen Tax-Advantaged Dividend Growth Fund | | | 6,124 | | | | 75,264 | |
| Nuveen Tax-Advantaged Total Return Strategy Fund | | | 8,843 | | | | 84,539 | |
| Petroleum & Resources Corp. | | | 23,657 | | | | 579,123 | |
| Royce Focus Trust, Inc. | | | 83,209 | | | | 524,217 | |
| Source Capital, Inc. | | | 2,214 | | | | 104,014 | |
| Wells Fargo Advantage Global Dividend Opportunity Fund | | | 1,393 | | | | 10,573 | |
| Wells Fargo Advantage Multi-Sector Income Fund | | | 22,813 | | | | 337,176 | |
| Western Asset Global Corporate Defined Opportunity Fund, Inc. | | | 124,980 | | | | 2,249,640 | |
| Western Asset Income Fund | | | 26,204 | | | | 361,877 | |
| Western Asset Investment Grade Defined Opportunity Trust, Inc. | | | 1,755 | | | | 38,487 | |
| | | | | | | | |
TOTAL CLOSED END FUNDS
(cost $57,774,215) | | | | | | | 57,616,324 | |
| | | | | | | | |
| EXCHANGE TRADED FUNDS - 0.2% | | | | | | |
Sprott Physical Gold Trust (Canada) †
(cost $3,545,866) | | | 303,963 | | | | 4,194,689 | |
| | | | | | | | |
| | | | | | | | |
| | | SHARES | | | VALUE
(Note 3) | |
| RIGHTS - 0.0% (d) | | | | | | | | |
| | |
| Energy - 0.0% (d) | | | | | | | | |
Sevan Marine ASA (Norway) (2)†
(cost $129,341) | | | 90,160 | | | $ | 124,856 | |
| | | | | | | | |
| WARRANTS - 0.8% | | | | | | | | |
| | |
| Consumer Discretionary - 0.0% (d) | | | | | | | | |
| Kandi Technologies Corp. (3)†(a) | | | 169,478 | | | | 80,316 | |
| | | | | | | | |
| | |
| Consumer Staples - 0.0% (d) | | | | | | | | |
| Celsius Holdings, Inc. † | | | 52,500 | | | | 525 | |
| HQ Sustainable Maritime Industries, Inc. (3)†(a) | | | 62,284 | | | | 6 | |
| | | | | | | | |
| | | | | | | 531 | |
| | | | | | | | |
| Energy - 0.0% (d) | | | | | | | | |
| Camac Energy, Inc. (3)†(a) | | | 88,191 | | | | 15,089 | |
| China Integrated Energy, Inc. (China) (3)†(a) | | | 195,194 | | | | 20 | |
| Green Field Energy Services, Inc. † | | | 2,025 | | | | 91,125 | |
| Plug Power, Inc. (3)†(a) | | | 88,875 | | | | 44,926 | |
| Syntroleum Corp. (3)†(a) | | | 253,165 | | | | 40,228 | |
| | | | | | | | |
| | | | | | | 191,388 | |
| | | | | | | | |
| Financials - 0.6% | | | | | | | | |
| Associated Banc-Corp † | | | 20,065 | | | | 24,279 | |
| Australia Acquisition Corp. (Australia) (2)†(b) | | | 612,000 | | | | 177,480 | |
| Boston Private Financial Holdings, Inc. † | | | 97,674 | | | | 312,557 | |
| Cazador Acquisition Corp. Ltd. (Cayman Islands) (2)† | | | 319,668 | | | | 63,934 | |
| Comerica, Inc. † | | | 35,800 | | | | 192,604 | |
| Comerica, Inc. † | | | 9,708 | | | | 11,358 | |
| European CleanTech SE (Germany) (2)† | | | 621,000 | | | | 217,007 | |
| exceet Group SE (Germany) (2)† | | | 72,000 | | | | 13,978 | |
| FlatWorld Acquisition Corp. (Virgin Islands, British) (2)† | | | 219,450 | | | | 54,862 | |
| Gerova Financial Group Ltd. (3)†(a) | | | 138,792 | | | | 1,388 | |
| Hicks Acquisition Co. II, Inc. (2)† | | | 810,000 | | | | 251,100 | |
| Italy1 Investment SA (Luxembourg) (2)† | | | 590,301 | | | | 168,079 | |
| Jack Cooper Holdings Corp. † | | | 448 | | | | 26,880 | |
| Jack Cooper Holdings Corp. † | | | 1,775 | | | | 106,500 | |
| JWC Acquisition Corp. (2)† | | | 1,032,750 | | | | 516,375 | |
| L&L Acquisition Corp. (2)† | | | 306,000 | | | | 168,300 | |
| Lincoln National Corp. † | | | 50,433 | | | | 620,326 | |
| Lone Oak Acquisition Corp. (2)† | | | 328,820 | | | | 82,205 | |
| MSCIR (3)†(a) | | | 243,000 | | | | 22,745 | |
| Nautilus Marine Acquisition Corp. (Greece) (2)† | | | 777,600 | | | | 194,400 | |
| Prime Acquisition Corp. (2)† | | | 423,935 | | | | 105,984 | |
| RLJ Acquisition, Inc. (2)† | | | 974,044 | | | | 340,915 | |
| Selway Capital Acquisition Corp.(2)† | | | 414,792 | | | | 107,846 | |
| Signature Bank † | | | 107,610 | | | | 3,787,872 | |
| Texas Capital Bancshares, Inc. † | | | 16,077 | | | | 281,990 | |
| Trio Merger Corp. (2)† | | | 456,000 | | | | 342,000 | |
| Valley National Bancorp † | | | 49,509 | | | | 75,254 | |
| | | | |
| | The accompanying notes are an integral part of these financial statements. | | (Continued) |
| | | | | | | | | | | | | | | | |
| 64 | | AQR Funds | | | | | | Annual Report | | | | | | December 2011 | | |
| | | | | | | | | | |
| | | | |
| Schedule of Investments | | | December 31, 2011 | |
| | |
| AQR DIVERSIFIED ARBITRAGE FUND | | |
| | | | | | | | |
| | | SHARES | | | VALUE
(Note 3) | |
| Financials - 0.6%(continued) | | | | | | | | |
| Wintrust Financial Corp. † | | | 415,782 | | | $ | 5,164,012 | |
| | | | | | | | |
| | | | | | | 13,432,230 | |
| | | | | | | | |
| Health Care - 0.1% | | | | | | | | |
| Access Pharmaceuticals, Inc. (3)†(a) | | | 68,407 | | | | 4,234 | |
| ADVENTRX Pharmaceuticals, Inc. (3)†(a) | | | 103,750 | | | | 23,458 | |
| American Medical Alert Corp. (2)† | | | 283,523 | | | | 2,835 | |
| Bionovo, Inc. (3)†(a) | | | 39,373 | | | | 870 | |
| Cormedix, Inc. †(b) | | | 75,400 | | | | 3,016 | |
| CryoPort, Inc. (3)†(a) | | | 571,428 | | | | 96,686 | |
| CryoPort, Inc. (3)†(a) | | | 1,133,397 | | | | 203,671 | |
| CytRx Corp. (3)†(a) | | | 2,268,000 | | | | 63,277 | |
| InspireMD, Inc. (3)†(a) | | | 67,911 | | | | 46,159 | |
| IntelliPharmaCeutics International, Inc., Series A (3)†(a) | | | 220,000 | | | | 194,590 | |
| IntelliPharmaCeutics International, Inc., Series B (3)†(a) | | | 220,000 | | | | 114,774 | |
| Opexa Therapeutics, Inc. (3)†(a) | | | 47,362 | | | | 7,270 | |
| Pluristem Therapeutics, Inc. (3)†(a) | | | 173,242 | | | | 93,533 | |
| Provectus Pharmaceuticals, Inc., Series A (3)†(a) | | | 881,558 | | | | 79,164 | |
| Provectus Pharmaceuticals, Inc., Series C (3)†(a) | | | 617,090 | | | | 55,415 | |
| ReGeneRx Biopharmaceuticals, Inc. † | | | 240,000 | | | | 7,200 | |
| Repros Therapeutics, Inc. (3)†(a) | | | 92,675 | | | | 156,269 | |
| Rosetta Genomics Ltd. (Israel) (3)†(a) | | | 496,961 | | | | 2,783 | |
| Rosetta Genomics Ltd. (Israel) (3)†(a) | | | 191,250 | | | | 689 | |
| RXi Pharmaceuticals Corp. (3)†(a) | | | 144,175 | | | | 16,551 | |
| RXi Pharmaceuticals Corp. (3)†(a) | | | 144,175 | | | | 1,615 | |
| Synergy Pharmaceuticals, Inc. (3)†(a) | | | 82,000 | | | | 95,719 | |
| | | | | | | | |
| | | | | | | 1,269,778 | |
| | | | | | | | |
| Industrials - 0.0% (d) | | | | | | | | |
| China Wood, Inc. (3)†(a) | | | 94,000 | | | | 168,824 | |
| Greenhouse Holdings (3)†(a) | | | 256,092 | | | | 26 | |
| Plastec Technologies Ltd. (Cayman Islands) † | | | 56,004 | | | | 5,600 | |
| Spherix, Inc. (3)†(a) | | | 196,441 | | | | 6,915 | |
| | | | | | | | |
| | | | | | | 181,365 | |
| | | | | | | | |
| Information Technology - 0.0% (d) | | | | | | | | |
| Authentidate Holding Corp. (3)†(a) | | | 1,090,000 | | | | 185,518 | |
| Magic Software Enterprises Ltd. (Israel) (3)†(a) | | | 132,782 | | | | 55,370 | |
| Orckit Communications Ltd. (Israel) (3)†(a) | | | 84,282 | | | | 5,217 | |
| SinoHub, Inc. (China) (3)†(a) | | | 267,392 | | | | 161 | |
| | | | | | | | |
| | | | | | | 246,266 | |
| | | | | | | | |
| Materials - 0.1% | | | | | | | | |
| Aurcana Corp. (Canada) (3)†(a) | | | 623,387 | | | | 132,968 | |
| Calvista Gold Corp. (Canada) †(b) | | | 100,000 | | | | 6,871 | |
| Cereplast, Inc. (3)†(a) | | | 64,539 | | | | 2,033 | |
| China GengSheng Minerals, Inc. (China) (3)†(a) | | | 195,194 | | | | 20 | |
| China Shen Zhou Mining & Resources, Inc. (China) (3)†(a) | | | 66,762 | | | | 1,676 | |
| | | | | | | | |
| | | SHARES | | | VALUE
(Note 3) | |
| Materials - 0.1% (continued) | | | | | | | | |
| Edgewater Exploration Ltd. (Canada) (3)†(a) | | | 250,000 | | | $ | 5,178 | |
| Energy Fuels, Inc. (Canada) (3)†(a) | | | 360,000 | | | | 15,018 | |
| Kangaroo Resources Ltd. (Australia) (3)†(a) | | | 24,137,931 | | | | 943,793 | |
| Kinross Gold Corp. (Canada) † | | | 37,797 | | | | 53,797 | |
| Lion One Metals Ltd. (3)†(a) | | | 387,641 | | | | 39 | |
Pretium Resources, Inc.
(Canada) † | | | 18,750 | | | | 23,006 | |
| | | | | | | | |
| | | | | | | 1,184,399 | |
| | | | | | | | |
| Utilities - 0.0% (d) | | | | | | | | |
| China Hydroelectric Corp. † | | | 24,500 | | | | 1,029 | |
| | | | | | | | |
TOTAL WARRANTS
(cost $13,741,305) | | | | | | | 16,587,302 | |
| | | | | | | | |
| MONEY MARKET FUNDS - 5.0% | | | | | | | | |
| J.P. Morgan Prime Money Market Fund Capital Shares, 0.130% (2)(j)(k) | | | 898 | | | | 898 | |
| JPMorgan U.S. Treasury Plus Money Market Fund, 0.000% (2)(j) | | | 106,249,285 | | | | 106,249,285 | |
| | | | | | | | |
TOTAL MONEY MARKET FUNDS
(cost $106,250,183) | | | | | | | 106,250,183 | |
| | | | | | | | |
| INVESTMENTS OF CASH COLLATERAL FOR SECURITIES ON LOAN - 0.0% (d) | |
J.P. Morgan Prime Money Market Fund - Capital Shares,
0.130%(2)(j)(l)
(cost $686,099) | | | 686,099 | | | | 686,099 | |
| | | | | | | | |
TOTAL INVESTMENTS, BEFORE SECURITIES SOLD SHORT
(cost $2,580,587,345) | | | | | | | 2,562,228,084 | |
| | | | | | | | |
| SECURITIES SOLD SHORT - (46.4)% | |
| | |
| COMMON STOCKS - (44.1)% | | | | | | | | |
| | |
| Consumer Discretionary - (5.4)% | | | | | | | | |
| Beazer Homes USA, Inc. † | | | (224,471) | | | | (556,688) | |
| Coinstar, Inc. † | | | (41,036) | | | | (1,872,883) | |
| DR Horton, Inc. | | | (676,382) | | | | (8,529,177) | |
| Eastman Kodak Co. † | | | (39) | | | | (25) | |
| Exide Technologies † | | | (3,457) | | | | (9,092) | |
| Expedia, Inc. | | | (1) | | | | (29) | |
| Ford Motor Co. † | | | (291,667) | | | | (3,138,337) | |
| Gaylord Entertainment Co. † | | | (137,319) | | | | (3,314,881) | |
| Goodyear Tire & Rubber Co./The † | | | (137) | | | | (1,941) | |
| Jakks Pacific, Inc. | | | (156,292) | | | | (2,205,280) | |
| Lennar Corp., Class A | | | (526,683) | | | | (10,349,321) | |
| Liz Claiborne, Inc. † | | | (1,625,378) | | | | (14,027,012) | |
| MGM Resorts International † | | | (193,977) | | | | (2,023,180) | |
| priceline.com, Inc. † | | | (35,597) | | | | (16,649,073) | |
| Regis Corp. | | | (472,181) | | | | (7,814,596) | |
| Saks, Inc. † | | | (130,121) | | | | (1,268,680) | |
| Sirius XM Radio, Inc. † | | | (6,268,226) | | | | (11,408,171) | |
| Sonic Automotive, Inc., Class A | | | (819,896) | | | | (12,142,660) | |
| Stewart Enterprises, Inc., Class A | | | (559) | | | | (3,220) | |
| TripAdvisor, Inc. † | | | (124,028) | | | | (3,126,746) | |
| TRW Automotive Holdings Corp. † | | | (148,500) | | | | (4,841,100) | |
| Viacom, Inc., Class A | | | (71,249) | | | | (3,799,709) | |
| | | | |
| | The accompanying notes are an integral part of these financial statements. | | (Continued) |
| | | | | | | | | | | | | | | | |
| | AQR Funds | | | | | | Annual Report | | | | | | December 2011 | | 65 |
| | | | | | | | | | |
| | | | |
| Schedule of Investments | | | December 31, 2011 | |
| | |
| AQR DIVERSIFIED ARBITRAGE FUND | | |
| | | | | | | | |
| | | SHARES | | | VALUE
(Note 3) | |
| Consumer Discretionary - (5.4)% (continued) | |
| Virgin Media, Inc. | | | (287,685) | | | $ | (6,150,705) | |
| | | | | | | | |
| | | | | | | (113,232,506) | |
| | | | | | | | |
| Consumer Staples - (1.5)% | | | | | | | | |
| Alliance One International, Inc. † | | | (458,292) | | | | (1,246,554) | |
| American Oriental Bioengineering, Inc. (China) † | | | (9,522) | | | | (5,340) | |
| Archer-Daniels-Midland Co. | | | (7,909) | | | | (226,197) | |
| Central Garden and Pet Co., Class A † | | | (675,146) | | | | (5,617,215) | |
| Chiquita Brands International, Inc. † | | | (93,635) | | | | (780,916) | |
| Dole Food Co., Inc. † | | | (54,682) | | | | (472,999) | |
| Embotelladora Andina SA, Class B ADR (Chile) | | | (3,000) | | | | (78,090) | |
| Green Mountain Coffee Roasters, Inc. † | | | (31,981) | | | | (1,434,348) | |
| Nash Finch Co. | | | (8,110) | | | | (237,461) | |
| Rite Aid Corp. † | | | (64,321) | | | | (81,044) | |
| Smithfield Foods, Inc. † | | | (244,410) | | | | (5,934,275) | |
| Tyson Foods, Inc., Class A | | | (296,876) | | | | (6,127,521) | |
| Universal Corp. | | | (122,701) | | | | (5,639,338) | |
| Vector Group Ltd. | | | (277,100) | | | | (4,921,296) | |
| | | | | | | | |
| | | | | | | (32,802,594) | |
| | | | | | | | |
| Energy - (7.1)% | | | | | | | | |
| Boardwalk Pipeline Partners LP | | | (2,300) | | | | (63,641) | |
| Bristow Group, Inc. | | | (9,698) | | | | (459,588) | |
| Chesapeake Energy Corp. | | | (279,231) | | | | (6,224,059) | |
| Dawson Geophysical Co. † | | | (13,314) | | | | (526,302) | |
| Diamond Offshore Drilling, Inc. | | | (1,240) | | | | (68,522) | |
| Energy Transfer Equity LP | | | (193,422) | | | | (7,849,065) | |
Energy XXI Bermuda Ltd.
(Bermuda) † | | | (83,373) | | | | (2,657,931) | |
| Exterran Holdings, Inc. † | | | (58,648) | | | | (533,697) | |
| GMX Resources, Inc. † | | | (12,546) | | | | (15,683) | |
| Goodrich Petroleum Corp. † | | | (12,174) | | | | (167,149) | |
| Green Plains Renewable Energy, Inc. † | | | (183,138) | | | | (1,787,427) | |
| Harvest Natural Resources, Inc. † | | | (55,430) | | | | (409,073) | |
| James River Coal Co. † | | | (10,300) | | | | (71,276) | |
| PetroBakken Energy Ltd., Class A (Canada) | | | (28,152) | | | | (354,543) | |
| Petrominerales Ltd. (Canada) | | | (22,719) | | | | (369,302) | |
| Pioneer Natural Resources Co. | | | (12,775) | | | | (1,143,107) | |
| Polarcus Ltd. (United Arab Emirates) (2)† | | | (113,725) | | | | (52,976) | |
| Royal Dutch Shell PLC, Class B ADR (Netherlands) | | | (742,443) | | | | (56,433,092) | |
| Superior Energy Services, Inc. † | | | (704,857) | | | | (20,046,133) | |
| Western Refining, Inc. † | | | (868,865) | | | | (11,547,216) | |
| Whiting Petroleum Corp. † | | | (4,950) | | | | (231,116) | |
| Williams Cos., Inc./The † | | | (1,169,061) | | | | (31,576,338) | |
| WPX Energy, Inc., Class W † | | | (389,672) | | | | (7,080,340) | |
| | | | | | | | |
| | | | | | | (149,667,576) | |
| | | | | | | | |
| Financials - (7.3)% | | | | | | | | |
| Alleghany Corp. † | | | (47,821) | | | | (13,642,853) | |
| American Equity Investment Life Holding Co. | | | (882,083) | | | | (9,173,663) | |
| Ares Capital Corp. | | | (85,682) | | | | (1,323,787) | |
| Associated Banc-Corp | | | (6,988) | | | | (78,056) | |
| Avatar Holdings, Inc. † | | | (32,547) | | | | (233,687) | |
| | | | | | | | |
| | | SHARES | | | VALUE
(Note 3) | |
| Financials - (7.3)% (continued) | | | | | | | | |
| BankUnited, Inc. | | | (12,467) | | | $ | (274,149) | |
| BGC Partners, Inc., Class A | | | (41,199) | | | | (244,722) | |
| BioMed Realty Trust, Inc. REIT | | | (177,696) | | | | (3,212,744) | |
| Boston Private Financial Holdings, Inc. | | | (70,941) | | | | (563,272) | |
| Boston Properties, Inc. REIT | | | (44,402) | | | | (4,422,439) | |
| Brookline Bancorp, Inc. | | | (253,083) | | | | (2,136,021) | |
| Citigroup, Inc. | | | (95,200) | | | | (2,504,712) | |
| CNA Financial Corp. | | | (4,275) | | | | (114,356) | |
| CNO Financial Group, Inc. † | | | (1,415,690) | | | | (8,933,004) | |
| Comerica, Inc. | | | (23,668) | | | | (610,634) | |
| DDR Corp. REIT | | | (307,311) | | | | (3,739,975) | |
| Deutsche Boerse AG (Germany) (2)† | | | (109,944) | | | | (5,755,431) | |
| DFC Global Corp. † | | | (2,733) | | | | (49,358) | |
| Digital Realty Trust, Inc. REIT | | | (181,850) | | | | (12,123,940) | |
| FNB Corp. | | | (502,588) | | | | (5,684,270) | |
| Health Care REIT, Inc. REIT | | | (14,116) | | | | (769,745) | |
| Hilltop Holdings, Inc.† | | | (30,675) | | | | (259,204) | |
| Host Hotels & Resorts, Inc. REIT | | | (788,842) | | | | (11,651,196) | |
| Kilroy Realty Corp. REIT | | | (121,308) | | | | (4,618,196) | |
| KKR Financial Holdings LLC | | | (700) | | | | (6,111) | |
| Leucadia National Corp. | | | (7,462) | | | | (169,686) | |
| Lexington Realty Trust REIT | | | (713,851) | | | | (5,346,744) | |
| Lincoln National Corp. | | | (44,633) | | | | (866,773) | |
| MetLife, Inc. | | | (172,938) | | | | (5,392,207) | |
| MGIC Investment Corp. † | | | (565,210) | | | | (2,108,233) | |
| National Financial Partners Corp. † | | | (265,689) | | | | (3,592,115) | |
| NorthStar Realty Finance Corp. REIT | | | (263,169) | | | | (1,255,316) | |
| Penson Worldwide, Inc. † | | | (217,998) | | | | (252,878) | |
| PHH Corp. † | | | (420) | | | | (4,494) | |
| PMI Group, Inc./The † | | | (263) | | | | (7) | |
| ProLogis, Inc. REIT | | | (98,363) | | | | (2,812,198) | |
| Radian Group, Inc. | | | (402,681) | | | | (942,274) | |
| Signature Bank † | | | (98,452) | | | | (5,906,136) | |
| SL Green Realty Corp. REIT | | | (92,295) | | | | (6,150,539) | |
| Stewart Information Services Corp. | | | (290,148) | | | | (3,351,209) | |
| Susquehanna Bancshares, Inc. | | | (1,182,224) | | | | (9,907,037) | |
| Texas Capital Bancshares, Inc. † | | | (14,595) | | | | (446,753) | |
| Valley National Bancorp | | | (361,371) | | | | (4,470,159) | |
| Wells Fargo & Co. | | | (1,500) | | | | (41,340) | |
| Wintrust Financial Corp. | | | (353,004) | | | | (9,901,762) | |
| | | | | | | | |
| | | | | | | (155,043,385) | |
| | | | | | | | |
| Health Care - (1.4)% | | | | | | | | |
| Accuray, Inc. † | | | (44,333) | | | | (187,529) | |
| Amgen, Inc. | | | (64,400) | | | | (4,135,124) | |
| China Medical Technologies, Inc. ADR (China) † | | | (122,810) | | | | (348,780) | |
| Enzon Pharmaceuticals, Inc. † | | | (59,979) | | | | (401,859) | |
| Express Scripts, Inc. † | | | (313,252) | | | | (13,999,232) | |
| Incyte Corp. Ltd. † | | | (103,687) | | | | (1,556,342) | |
| Molina Healthcare, Inc. † | | | (60,334) | | | | (1,347,258) | |
| Omnicare, Inc. | | | (78,233) | | | | (2,695,127) | |
| PDL BioPharma, Inc. | | | (167,454) | | | | (1,038,215) | |
| ViroPharma, Inc. † | | | (70,800) | | | | (1,939,212) | |
| West Pharmaceutical Services, Inc. | | | (27,208) | | | | (1,032,544) | |
| | | | | | | | |
| | | | | | | (28,681,222) | |
| | | | | | | | |
| | | | |
| | The accompanying notes are an integral part of these financial statements. | | (Continued) |
| | | | | | | | | | | | | | | | |
| 66 | | AQR Funds | | | | | | Annual Report | | | | | | December 2011 | | |
| | | | | | | | | | |
| | | | |
| Schedule of Investments | | | December 31, 2011 | |
| | |
| AQR DIVERSIFIED ARBITRAGE FUND | | |
| | | | | | | | |
| | | SHARES | | | VALUE
(Note 3) | |
| Industrials - (5.5)% | | | | | | | | |
| Avis Budget Group, Inc. † | | | (341,754) | | | $ | (3,663,603) | |
| CBIZ, Inc. † | | | (124,623) | | | | (761,447) | |
| Chart Industries, Inc. † | | | (15,606) | | | | (843,816) | |
| CoStar Group, Inc. † | | | (39,953) | | | | (2,666,064) | |
| EnPro Industries, Inc. † | | | (81,450) | | | | (2,686,221) | |
| FTI Consulting, Inc. † | | | (39,522) | | | | (1,676,523) | |
| GenCorp, Inc. † | | | (205,629) | | | | (1,093,946) | |
| General Cable Corp. † | | | (109,100) | | | | (2,728,591) | |
| Hawaiian Holdings, Inc. † | | | (27,474) | | | | (159,349) | |
| HEICO Corp. | | | (223,671) | | | | (13,080,280) | |
| Hertz Global Holdings, Inc. † | | | (1,615,498) | | | | (18,933,637) | |
| Kaman Corp. | | | (70,536) | | | | (1,927,043) | |
| MasTec, Inc. † | | | (224,764) | | | | (3,904,151) | |
| Meritor, Inc. † | | | (33,900) | | | | (180,348) | |
| Navistar International Corp. † | | | (82,750) | | | | (3,134,570) | |
| Nielsen Holdings NV † | | | (100) | | | | (2,969) | |
| Nielsen Holdings NV (Netherlands) † | | | (9,016) | | | | (267,685) | |
| Terex Corp. † | | | (441,288) | | | | (5,961,801) | |
| Textron, Inc. | | | (278,222) | | | | (5,144,325) | |
| Titan International, Inc. | | | (519,307) | | | | (10,105,714) | |
| Trex Co., Inc. † | | | (223,954) | | | | (5,130,786) | |
| Ultrapetrol Bahamas Ltd. (Bahamas) † | | | (105,789) | | | | (315,251) | |
| United Rentals, Inc. † | | | (1,067,896) | | | | (31,556,327) | |
| | | | | | | | |
| | | | | | | (115,924,447) | |
| | | | | | | | |
| Information Technology - (6.8)% | | | | | | | | |
| 3D Systems Corp. † | | | (313,626) | | | | (4,516,214) | |
| ACI Worldwide, Inc. † | | | (189,396) | | | | (5,424,301) | |
| Alliance Data Systems Corp. † | | | (247,311) | | | | (25,680,774) | |
| Amkor Technology, Inc. † | | | (1,691,805) | | | | (7,376,270) | |
| Arris Group, Inc. † | | | (13,665) | | | | (147,855) | |
| Cadence Design Systems, Inc. † | | | (770,908) | | | | (8,017,443) | |
| Ciena Corp. † | | | (441,597) | | | | (5,343,324) | |
| Concur Technologies, Inc. † | | | (2,700) | | | | (137,133) | |
| Convergys Corp. † | | | (596,173) | | | | (7,613,129) | |
| Digital River, Inc. † | | | (12,661) | | | | (190,168) | |
| DST Systems, Inc. | | | (10,474) | | | | (476,777) | |
| Equinix, Inc. † | | | (117,255) | | | | (11,889,657) | |
| Finisar Corp. † | | | (32,912) | | | | (551,112) | |
| Lam Research Corp. † | | | (390,280) | | | | (14,448,166) | |
| Micron Technology, Inc. † | | | (59,785) | | | | (376,048) | |
| Molex, Inc. | | | (126,649) | | | | (3,021,845) | |
| Novellus Systems, Inc. † | | | (25) | | | | (1,032) | |
| Nuance Communications, Inc. † | | | (13,304) | | | | (334,729) | |
| ON Semiconductor Corp. † | | | (22,801) | | | | (176,024) | |
| Photronics, Inc. † | | | (363,559) | | | | (2,210,439) | |
| Powerwave Technologies, Inc. † | | | (112,451) | | | | (233,898) | |
| Rambus, Inc. † | | | (106,933) | | | | (807,344) | |
| Salesforce.com, Inc. † | | | (115,503) | | | | (11,718,934) | |
| SYNNEX Corp. † | | | (60,700) | | | | (1,848,922) | |
| Take-Two Interactive Software, Inc. † | | | (341,183) | | | | (4,623,030) | |
| THQ, Inc. † | | | (19,644) | | | | (14,929) | |
| TTM Technologies, Inc. † | | | (95,949) | | | | (1,051,601) | |
| VeriFone Systems, Inc. † | | | (4,120) | | | | (146,342) | |
| VeriSign, Inc. | | | (441,377) | | | | (15,765,986) | |
| | | | | | | | |
| | | SHARES | | | VALUE
(Note 3) | |
| Information Technology - (6.8)% (continued) | | | | | |
| Visa, Inc., Class A | | | (6,452) | | | $ | (655,072) | |
| Xilinx, Inc. | | | (273,428) | | | | (8,766,102) | |
| | | | | | | | |
| | | | | | | (143,564,600) | |
| | | | | | | | |
| Materials - (1.9)% | | | | | | | | |
| Agnico-Eagle Mines Ltd. (Canada) | | | (1) | | | | (36) | |
| Alcoa, Inc. | | | (831,578) | | | | (7,193,150) | |
| Allegheny Technologies, Inc. | | | (304,006) | | | | (14,531,487) | |
| ArcelorMittal NYRS ADR (Luxembourg) | | | (104,639) | | | | (1,903,383) | |
| AuRico Gold, Inc. (Canada) † | | | (199,528) | | | | (1,598,219) | |
| B2Gold Corp. (Canada) † | | | (382,658) | | | | (1,164,407) | |
Cemex SAB de CV ADR
(Mexico) † | | | (252,030) | | | | (1,358,442) | |
| Commercial Metals Co. | | | (6,500) | | | | (89,895) | |
| Jaguar Mining, Inc. † | | | (3,900) | | | | (24,882) | |
| Jaguar Mining, Inc. (Canada) † | | | (47,777) | | | | (304,817) | |
| Kaiser Aluminum Corp. | | | (4,143) | | | | (190,081) | |
| Kinross Gold Corp. (Canada) | | | (13,335) | | | | (152,019) | |
| Monsanto Co. | | | (3,820) | | | | (267,667) | |
| New Gold, Inc. (Canada) † | | | (48,076) | | | | (485,125) | |
| RTI International Metals, Inc. † | | | (95,055) | | | | (2,206,227) | |
| Sino-Forest Corp. (Hong Kong) (3)†(a) | | | (46,847) | | | | (64,415) | |
| Sterlite Industries India Ltd. ADR (India) | | | (23,022) | | | | (159,543) | |
| Stillwater Mining Co. † | | | (38,367) | | | | (401,319) | |
| United States Steel Corp. | | | (302,122) | | | | (7,994,148) | |
| | | | | | | | |
| | | | | | | (40,089,262) | |
| | | | | | | | |
| Telecommunication Services - (3.0)% | | | | | |
| Clearwire Corp., Class A † | | | (80,144) | | | | (155,479) | |
| Level 3 Communications, Inc. † | | | (498,535) | | | | (8,470,110) | |
| Telephone & Data Systems, Inc. | | | (2,073,032) | | | | (53,670,799) | |
| tw telecom inc † | | | (38,117) | | | | (738,707) | |
| Windstream Corp. | | | (2) | | | | (23) | |
| | | | | | | | |
| | | | | | | (63,035,118) | |
| | | | | | | | |
| Utilities - (4.2)% | | | | | | | | |
| Duke Energy Corp. | | | (2,085,727) | | | | (45,885,994) | |
| Exelon Corp. | | | (915,122) | | | | (39,688,841) | |
| NSTAR | | | (29,304) | | | | (1,376,116) | |
| PPL Corp. | | | (54,771) | | | | (1,611,363) | |
| | | | | | | | |
| | | | | | | (88,562,314) | |
| | | | | | | | |
TOTAL COMMON STOCKS SOLD SHORT
(proceeds $961,578,659) | | | | | | | (930,603,024) | |
| | | | | | | | |
| | | | |
| | The accompanying notes are an integral part of these financial statements. | | (Continued) |
| | | | | | | | | | | | | | | | |
| | AQR Funds | | | | | | Annual Report | | | | | | December 2011 | | 67 |
| | | | | | | | | | |
| | | | |
| Schedule of Investments | | | December 31, 2011 | |
| | |
| AQR DIVERSIFIED ARBITRAGE FUND | | |
| | | | | | | | | | | | | | | | | | | | |
| CONVERTIBLE BONDS - (0.1)% | | MOODY’S
RATING*
(UNAUDITED) | | | INTEREST
RATE | | | MATURITY
DATE | | | PRINCIPAL
AMOUNT
(000’S) | | | VALUE
(Note 3) | |
| Consumer Staples - (0.1)% | | | | | | | | | | | | | | | | | | | | |
| Molson Coors Brewing Co. (2) | | | BBB- | ** | | | 2.500% | | | | 07/30/13 | | | $ | (550) | | | $ | (582,313) | |
| | | | | | | | | | | | | | | | | | | | |
| | | | | |
| Information Technology - 0.0% (d) | | | | | | | | | | | | | | | | | | | | |
| Intel Corp. (2) | | | A- | ** | | | 2.950% | | | | 12/15/35 | | | | (500) | | | | (520,625) | |
| | | | | | | | | | | | | | | | | | | | |
TOTAL CONVERTIBLE BONDS SOLD SHORT
(proceeds $1,100,168) | | | | | | | | | | | | | | | | | | $ | (1,102,938) | |
| | | | | | | | | | | | | | | | | | | | |
| | | | | | | | |
| EXCHANGE TRADED FUNDS - (2.2)% | | SHARES | | | VALUE
(Note 3) | |
| iShares Silver Trust † | | | (21,824) | | | $ | (587,939) | |
| SPDR Barclays Capital High Yield Bond ETF | | | (1,045,019) | | | | (40,180,980) | |
| SPDR Gold Shares † | | | (33,601) | | | | (5,107,016) | |
| SPDR S&P 500 ETF Trust | | | (4,164) | | | | (522,582) | |
| | | | | | | | |
TOTAL EXCHANGE TRADED FUNDS SOLD SHORT
(proceeds $47,396,469) | | | | | | | (46,398,517) | |
| | | | | | | | |
TOTAL SECURITIES SOLD SHORT
(proceeds $1,010,075,296) | | | | | | | (978,104,479) | |
| | | | | | | | |
TOTAL INVESTMENTS, NET OF SECURITIES SOLD SHORT - 75.1%
(cost $1,570,512,049) | | | | | | | 1,584,123,605 | |
| | | | | | | | |
| OTHER ASSETS IN EXCESS OF LIABILITIES - 24.9% (m) | | | | | | | 524,415,036 | |
| | | | | | | | |
NET ASSETS - 100.0% | | | | | | $ | 2,108,538,641 | |
| | | | | | | | |
| † | Non income-producing security. |
| (a) | Security fair valued at December 31, 2011 using procedures approved by the Board of Trustees. The total value of positions fair valued was $26,028,208 or 1.2% of total net assets. |
| (b) | All or a portion of this security has been segregated as collateral for securities sold short and can be sold or replaced subject to the broker’s right to re-hypothecate. At December 31, 2011, the value of these securities was $956,762,705. In addition, $468,516,712 of cash collateral was pledged. |
| (c) | All or a portion of the security on loan. The aggregate market value of such securities is $592,984; cash collateral of $686,099 was received with which the Fund purchased a money market fund. |
| (d) | Represents less than 0.05 percent of net assets. |
| (e) | Rule 144A, Section 4(2) or other security which is restricted as to resale to institutional investors. The Fund Adviser has deemed this security to be liquid based upon procedures approved by the Board of Trustees. |
| (f) | Indicates a variable rate security. The interest rate shown represents the discount rate at December 31, 2011. |
| (g) | Represents a Pay-In-Kind Bond. |
| (h) | Defaulted security. It is the Fund’s policy to cease accruing interest and write off interest receivable for positions in default. |
| (i) | Represents a step bond. The rate shown reflects the yield at December 31, 2011. |
| (j) | Represents annualized seven-day yield as of December 31, 2011. |
| (k) | A portion of the security is pledged as collateral to the brokers for forward foreign currency exchange, futures, and swap contracts. |
| (l) | Represents security, or a portion thereof, purchased with the cash collateral received for securities on loan. |
| (m) | Includes appreciation (depreciation) on forward foreign currency exchange, futures and swap contracts. |
| * | The rating reflected is as of December 31, 2011 and is unaudited. Rating of certain bonds may have changed subsequent to the date. |
| ** | S & P Rating provided and is unaudited. |
All bonds are denominated in US dollars, unless noted otherwise.
All securities are United States companies, unless noted otherwise in parentheses.
All securities are Level 1, with respect to ASC 820 unless otherwise noted in parentheses.
| (2) | Level 2 security (See Note 5). |
| (3) | Level 3 security (See Note 5). |
The following abbreviations are used in portfolio descriptions:
144A - Restricted
ADR - American Depositary Receipt
CAD - Canadian Dollar
MTN - Medium Term Note
NOK - Norwegian Krone
NR - Not Rated by Moody’s
NYRS - New York Registry Shares
REIT - Real Estate Investment Trust
WR - Withheld Ratings
| | | | |
| | The accompanying notes are an integral part of these financial statements. | | (Continued) |
| | | | | | | | | | | | | | | | |
| 68 | | AQR Funds | | | | | | Annual Report | | | | | | December 2011 | | |
| | | | | | | | | | |
| | | | |
| Schedule of Investments | | | December 31, 2011 | |
| | |
| AQR DIVERSIFIED ARBITRAGE FUND | | |
Open Written Options contracts outstanding at December 31, 2011:
Call Options Written
| | | | | | | | | | | | | | | | | | |
| SHARES | | ISSUER | | COUNTERPARTY | | EXPIRATION DATE | | PROCEEDS | | | VALUE AT
DECEMBER 31,
2011 | | | UNREALIZED
APPRECIATION
(DEPRECIATION) | |
| 374 | | Comerica, Inc.
(Exercise price $45) | | J.P. Morgan | | January 21, 2012 | | | $(261,422) | | | | $(1,122) | | | | $260,300 | |
| 899 | | Motorola Mobility Holdings (Exercise price $40) | | J.P. Morgan | | January 21, 2012 | | | (25,531) | | | | (4,495) | | | | 21,036 | |
| 946 | | Synovis Life Technologies, Inc.
(Exercise price $30) | | J.P. Morgan | | January 21, 2012 | | | (13,244) | | | | (4,730) | | | | 8,514 | |
| 322 | | Wells Fargo & Co.
(Exercise price $35) | | J.P. Morgan | | January 21, 2012 | | | (118,816) | | | | (644) | | | | 118,172 | |
| | | | | | | | | | | | | | | | | | |
| | | | | | | | | $(419,013) | | | | $(10,991) | | | | $408,022 | |
| | | | | | | | | | | | | | | | | | |
Credit default swap contracts buy protection as of December 31, 2011
| | | | | | | | | | | | | | | | | | | | | | |
| COUNTERPARTY | | REFERENCE ENTITY | | FIXED
ANNUAL
RATE
RECEIVED
BY FUND | | CURRENCY | | NOTIONAL
AMOUNT | | | UPFRONT
PREMIUM
(RECEIVED)
PAID | | | TERMINATION
DATE | | | UNREALIZED
APPRECIATION
(DEPRECIATION) | |
The
Royal
Bank of
Scotland | | Markit CDX North America High Yield Index Series 17 | | 5.00% | | USD | | | 150,850,000 | | | | $14,155,733 | | | | 12/20/16 | | | | $(4,009,741) | |
Bank of
America | | Host Hotels & Resorts LP | | 1.00% | | USD | | | 3,450,000 | | | | 155,784 | | | | 12/20/15 | | | | 46,297 | |
| | | | | | | | | | | | | | | | | | | | | | |
| | | | | | | | | | | | | $14,311,517 | | | | | | | | $(3,963,444) | |
| | | | | | | | | | | | | | | | | | | | | | |
Money Market Fund is pledged as collateral to brokers for credit default swap contracts in the amount of $621. Additional collateral for positions held at the Royal Bank of Scotland is included in the collateral for forward foreign currency exchange contracts.
Open futures contracts outstanding at December 31, 2011:
| | | | | | | | | | | | | | | | |
NUMBER OF
CONTRACTS | | DESCRIPTION | | EXPIRATION
DATE | | VALUE AT
TRADE DATE | | | VALUE AT
DECEMBER 31,
2011 | | | UNREALIZED
DEPRECIATION | |
| Short Contracts: | | | | | | | | | | | | | | |
| 1,301 | | S&P 500 E-Mini Futures | | March 16, 2012 | | | $(80,727,343) | | | | $(81,481,630) | | | | $(754,287) | |
| 1,148 | | U.S. Treasury 2-Year Note Futures | | March 30, 2012 | | | (253,067,519) | | | | (253,187,813) | | | | (120,294) | |
| 564 | | U.S. Treasury 5-Year Note Futures | | March 30, 2012 | | | (69,204,528) | | | | (69,517,407) | | | | (312,879) | |
| | | | | | | | | | | | | | | | |
| | | | | | | $(402,999,390) | | | | $(404,186,850) | | | | $(1,187,460) | |
| | | | | | | | | | | | | | | | |
Cash held as collateral with broker for futures contracts was $7,510,453 at December 31, 2011.
| | | | |
| | The accompanying notes are an integral part of these financial statements. | | (Continued) |
| | | | | | | | | | | | | | | | |
| | AQR Funds | | | | | | Annual Report | | | | | | December 2011 | | 69 |
| | | | | | | | | | |
| | | | |
| Schedule of Investments | | | December 31, 2011 | |
| | |
| AQR DIVERSIFIED ARBITRAGE FUND | | |
Forward foreign currency exchange contracts outstanding as of December 31, 2011:
| | | | | | | | | | | | | | | | | | | | |
PURCHASE
CONTRACTS | | COUNTERPARTY | | CURRENCY | | CURRENCY
AMOUNT
PURCHASED | | | VALUE AT
SETTLEMENT
DATE | | | VALUE AT
DECEMBER 31,
2011 | | | UNREALIZED
APPRECIATION
(DEPRECIATION) | |
| Canadian Dollar, Expiring 01/17/12 | | The Royal Bank of Scotland | | CAD | | | 3,573,395 | | | | $3,472,695 | | | | $3,506,562 | | | | $33,867 | |
| Canadian Dollar, Expiring 02/29/12 | | The Royal Bank of Scotland | | CAD | | | 4,625,289 | | | | 4,544,708 | | | | 4,534,342 | | | | (10,366) | |
| Norwegian Krone, Expiring 06/22/12 | | The Royal Bank of Scotland | | NOK | | | 840,000 | | | | 148,494 | | | | 139,656 | | | | (8,838) | |
| Norwegian Krone, Expiring 12/21/12 | | The Royal Bank of Scotland | | NOK | | | 12,840,000 | | | | 2,242,756 | | | | 2,123,143 | | | | (119,613) | |
| | | | | | | | | | | | | | | | | | | | |
| | | | | | | | | | | 10,408,653 | | | | 10,303,703 | | | | (104,950) | |
| | | | | | | | | | | | | | | | | | | | |
| | | | | | | | | | | | | | | | | | | | |
SALES
CONTRACTS | | COUNTERPARTY | | CURRENCY | | CURRENCY
AMOUNT
SOLD | | | VALUE AT
SETTLEMENT
DATE | | | VALUE AT
DECEMBER 31,
2011 | | | UNREALIZED
APPRECIATION
(DEPRECIATION) | |
| Australian Dollar, Expiring 01/31/12 | | The Royal Bank of Scotland | | AUD | | | (59,407) | | | | $(59,999) | | | | $(60,558) | | | | $(559) | |
Canadian Dollar,
Expiring 01/17/12 | | The Royal Bank of Scotland | | CAD | | | (36,225,373) | | | | (35,522,707) | | | | (35,547,848) | | | | (25,141) | |
Canadian Dollar,
Expiring 01/31/12 | | The Royal Bank of Scotland | | CAD | | | (7,599,178) | | | | (7,315,159) | | | | (7,454,668) | | | | (139,509) | |
Canadian Dollar,
Expiring 02/29/12 | | The Royal Bank of Scotland | | CAD | | | (28,947,979) | | | | (28,614,272) | | | | (28,378,778) | | | | 235,494 | |
Canadian Dollar,
Expiring 03/30/12 | | The Royal Bank of Scotland | | CAD | | | (11,987,500) | | | | (11,727,157) | | | | (11,744,488) | | | | (17,331) | |
Euro,
Expiring 01/31/12 | | The Royal Bank of Scotland | | EUR | | | (1,654,892) | | | | (2,183,696) | | | | (2,142,237) | | | | 41,459 | �� |
Euro,
Expiring 04/30/12 | | The Royal Bank of Scotland | | EUR | | | (725,040) | | | | (984,517) | | | | (939,587) | | | | 44,930 | |
Euro,
Expiring 10/22/12 | | The Royal Bank of Scotland | | EUR | | | (6,210,000) | | | | (8,471,372) | | | | (8,073,342) | | | | 398,030 | |
Euro,
Expiring 01/28/13 | | The Royal Bank of Scotland | | EUR | | | (5,855,786) | | | | (7,902,383) | | | | (7,627,363) | | | | 275,020 | |
| Hong Kong Dollar, Expiring 01/31/12 | | The Royal Bank of Scotland | | HKD | | | (801,756) | | | | (103,024) | | | | (103,238) | | | | (214) | |
| Hong Kong Dollar, Expiring 02/15/12 | | The Royal Bank of Scotland | | HKD | | | (82,952,986) | | | | (10,665,552) | | | | (10,682,192) | | | | (16,640) | |
| Norwegian Krone, Expiring 03/14/12 | | The Royal Bank of Scotland | | NOK | | | (245,753) | | | | (40,887) | | | | (40,985) | | | | (98) | |
| Norwegian Krone, Expiring 05/18/12 | | The Royal Bank of Scotland | | NOK | | | (978,750) | | | | (170,327) | | | | (162,896) | | | | 7,431 | |
| Norwegian Krone, Expiring 06/14/12 | | The Royal Bank of Scotland | | NOK | | | (245,753) | | | | (40,775) | | | | (40,868) | | | | (93) | |
| Norwegian Krone, Expiring 06/22/12 | | The Royal Bank of Scotland | | NOK | | | (840,000) | | | | (138,326) | | | | (139,656) | | | | (1,330) | |
| Norwegian Krone, Expiring 09/14/12 | | The Royal Bank of Scotland | | NOK | | | (6,745,753) | | | | (1,056,697) | | | | (1,118,652) | | | | (61,955) | |
| Norwegian Krone, Expiring 11/19/12 | | The Royal Bank of Scotland | | NOK | | | (978,750) | | | | (169,318) | | | | (161,991) | | | | 7,327 | |
| Norwegian Krone, Expiring 12/21/12 | | The Royal Bank of Scotland | | NOK | | | (12,840,000) | | | | (2,095,711) | | | | (2,123,143) | | | | (27,432) | |
| Norwegian Krone, Expiring 05/21/13 | | The Royal Bank of Scotland | | NOK | | | (978,750) | | | | (168,040) | | | | (161,034) | | | | 7,006 | |
| | | | |
| | The accompanying notes are an integral part of these financial statements. | | (Continued) |
| | | | | | | | | | | | | | | | |
| 70 | | AQR Funds | | | | | | Annual Report | | | | | | December 2011 | | |
| | | | | | | | | | |
| | | | |
| Schedule of Investments | | | December 31, 2011 | |
| | |
| AQR DIVERSIFIED ARBITRAGE FUND | | |
| | | | | | | | | | | | | | | | | | | | |
SALES
CONTRACTS | | COUNTERPARTY | | CURRENCY | | CURRENCY
AMOUNT
SOLD | | | VALUE AT
SETTLEMENT
DATE | | | VALUE AT
DECEMBER 31,
2011 | | | UNREALIZED
APPRECIATION
(DEPRECIATION) | |
Norwegian Krone,
Expiring 11/18/13 | | The Royal Bank of
Scotland | | NOK | | | (978,750) | | | | $(166,612) | | | | $(160,061) | | | | $6,551 | |
Norwegian Krone,
Expiring 05/19/14 | | The Royal Bank of
Scotland | | NOK | | | (978,750) | | | | (164,808) | | | | (158,913) | | | | 5,895 | |
Norwegian Krone,
Expiring 11/18/14 | | The Royal Bank of
Scotland | | NOK | | | (17,178,750) | | | | (2,863,290) | | | | (2,768,182) | | | | 95,108 | |
Norwegian Krone,
Expiring 04/27/16 | | The Royal Bank of
Scotland | | NOK | | | (19,387,600) | | | | (3,266,931) | | | | (3,055,963) | | | | 210,968 | |
| | | | | | | | | | | | | | | | | | | | |
| | | | | | | | | | | (123,891,560) | | | | (122,846,643) | | | | 1,044,917 | |
| | | | | | | | | | | | | | | | | | | | |
| | | | | | | | | | | $(113,482,907) | | | | $(112,542,940) | | | | $939,967 | |
| | | | | | | | | | | | | | | | | | | | |
Money Market Fund is pledged as collateral to the broker for forward foreign currency exchange contracts in the amount of $269.
AUD - Australian Dollar
CAD - Canadian Dollar
EUR - Euro
HKD - Hong Kong Dollar
NOK - Norwegian Krone
| | | | |
| | The accompanying notes are an integral part of these financial statements. | | |
| | | | | | | | | | | | | | | | |
| | AQR Funds | | | | | | Annual Report | | | | | | December 2011 | | 71 |
| | | | | | | | | | |
| | | | |
| Consolidated Schedule of Investments | | | December 31, 2011 | |
| | |
| AQR MANAGED FUTURES STRATEGY FUND | | |
| | | | | | | | |
| | | SHARES | | | VALUE (Note 3) | |
| MONEY MARKET FUNDS - 83.4% | |
| BlackRock Liquidity Funds TempFund Portfolio, Class I, 0.110% (2)(a) | | | 92,424,148 | | | $ | 92,424,148 | |
| Dreyfus Treasury Cash Management, Class I, 0.010% (2)(a) | | | 369,696,590 | | | | 369,696,590 | |
| J.P. Morgan Prime Money Market Fund - Capital Shares, 0.130% (2)(a)(b)(c) | | | 29,908,909 | | | | 29,908,909 | |
| J.P. Morgan Treasury Plus Money Market Fund - Institutional Shares, 0.000% (2)(a) | | | 342,552,938 | | | | 342,552,938 | |
| UBS Money Series - UBS Select Treasury Preferred Fund, Class I, 0.010% (2)(a) | | | 462,120,737 | | | | 462,120,737 | |
| | | | | | | | |
TOTAL INVESTMENTS - 83.4%
(cost $1,296,703,322) | | | | | | | 1,296,703,322 | |
| | | | | | | | |
| OTHER ASSETS IN EXCESS OF LIABILITIES - 16.6% (d) | | | | | | | 258,813,052 | |
| | | | | | | | |
NET ASSETS - 100.0% | | | | | | $ | 1,555,516,374 | |
| | | | | | | | |
| (a) | Represents annualized seven-day yield as of December 31, 2011. |
| (b) | A portion of the security is pledged as collateral to the brokers for forward foreign exchange contracts. |
| (c) | A portion of the security is pledged as collateral to the brokers for forward foreign currency exchange and swap contracts. |
| (d) | Includes appreciation (depreciation) on forward foreign currency exchange, futures and swap contracts. |
All securities are Level 2, with respect to ASC 820 unless otherwise noted in parentheses.
Total return swap contracts outstanding as of December 31, 2011:
| | | | | | | | | | | | | | |
| COUNTERPARTY | | UNDERLYING REFERENCE INSTRUMENT | | TERMINATION
DATE | | CURRENCY | | NOTIONAL
VALUE | | | UNREALIZED
APPRECIATION
(DEPRECIATION) | |
| Barclays Capital | | Cocoa Future | | 3/15/2012 | | USD | | | (5,370,190) | | | | $646,030 | |
| Barclays Capital | | Coffee ‘C’ Futures | | 3/20/2012 | | USD | | | (17,990,344) | | | | (214,369) | |
| Bank of America | | Euro-Bobl Futures | | 3/8/2012 | | EUR | | | 29,196,006 | | | | 595,134 | |
| Bank of America | | Euro-SCHATZ Futures | | 3/8/2012 | | EUR | | | 118,476,139 | | | | 472,193 | |
| Barclays Capital | | Gold 100 OZ Futures | | 2/27/2012 | | USD | | | (642,880) | | | | 16,160 | |
| Merrill Lynch | | LME Aluminum Futures | | 3/19/2012 | | USD | | | (5,150,225) | | | | 53,513 | |
| Merrill Lynch | | LME Copper Futures | | 3/19/2012 | | USD | | | (12,582,700) | | | | 421,100 | |
| Merrill Lynch | | LME Nickel Futures | | 3/19/2012 | | USD | | | (1,383,486) | | | | (76,284) | |
| Barclays Capital | | Silver Futures | | 3/28/2012 | | USD | | | (2,333,600) | | | | 100,400 | |
| Merrill Lynch | | Silver Futures | | 3/28/2012 | | USD | | | (166,250) | | | | 26,675 | |
| Barclays Capital | | Soybean Futures | | 3/14/2012 | | USD | | | (33,723,125) | | | | (2,328,213) | |
| Barclays Capital | | Soybean Oil Futures | | 3/14/2012 | | USD | | | (10,747,692) | | | | (606,480) | |
The Royal Bank
of Scotland | | Swiss Market Index Futures | | 3/16/2012 | | CHF | | | 11,084,572 | | | | 301,473 | |
| Bank of America | | U.S. Treasury 2-Year Note Futures | | 3/30/2012 | | USD | | | 451,509,957 | | | | 170,043 | |
| Bank of America | | U.S. Treasury 5-Year Note Futures | | 3/30/2012 | | USD | | | 13,762,907 | | | | 41,968 | |
| Barclays Capital | | Wheat Futures | | 3/14/2012 | | USD | | | (20,735,239) | | | | (446,498) | |
| | | | | | | | | | | | | | |
| | | | | | | | | | | | | $(827,155) | |
| | | | | | | | | | | | | | |
Money Market Fund is pledged as collateral to brokers for total return swap contracts in the amount of $25,072,477. Additional collateral for positions held at Royal Bank of Scotland is included in the collateral for forward foreign currency exchange contracts.
| | | | |
| | The accompanying notes are an integral part of these financial statements. | | (Continued) |
| | | | | | | | | | | | | | | | |
| 72 | | AQR Funds | | | | | | Annual Report | | | | | | December 2011 | | |
| | | | | | | | | | |
| | | | |
| Consolidated Schedule of Investments | | | December 31, 2011 | |
| | |
| AQR MANAGED FUTURES STRATEGY FUND | | |
Open futures contracts outstanding at December 31, 2011:
| | | | | | | | | | | | | | | | |
NUMBER OF
CONTRACTS | | DESCRIPTION | | EXPIRATION
DATE | | VALUE AT
TRADE DATE | | | VALUE AT
DECEMBER 31,
2011 | | | UNREALIZED
APPRECIATION
(DEPRECIATION) | |
| Long Contracts: | | | | | | | | | | | | | | | | |
| 146 | | 10-Year Japanese Government Bond Futures | | March 9, 2012 | | | $269,469,519 | | | | $270,129,401 | | | | $659,882 | |
| 707 | | 3-Month Euro Euribor Futures | | June 18, 2012 | | | 226,504,300 | | | | 226,608,353 | | | | 104,053 | |
| 797 | | 3-Month Euro Euribor Futures | | September 17, 2012 | | | 255,426,299 | | | | 255,571,290 | | | | 144,991 | |
| 778 | | 3-Month Euro Euribor Futures | | December 17, 2012 | | | 249,227,828 | | | | 249,428,278 | | | | 200,450 | |
| 780 | | 3-Month Euro Euribor Futures | | March 18, 2013 | | | 249,734,840 | | | | 249,993,768 | | | | 258,928 | |
| 782 | | 3-Month Euro Euribor Futures | | June 17, 2013 | | | 250,179,787 | | | | 250,482,962 | | | | 303,175 | |
| 765 | | 3-Month Euro Euribor Futures | | September 16, 2013 | | | 244,503,203 | | | | 244,864,413 | | | | 361,210 | |
| 744 | | 3-Month Euro Euribor Futures | | December 16, 2013 | | | 237,387,044 | | | | 237,913,951 | | | | 526,907 | |
| 279 | | 90-Day EURODollar Futures | | March 18, 2013 | | | 69,285,217 | | | | 69,226,875 | | | | (58,342) | |
| 326 | | 90-Day EURODollar Futures | | June 17, 2013 | | | 80,929,662 | | | | 80,876,525 | | | | (53,137) | |
| 420 | | 90-Day EURODollar Futures | | September 16, 2013 | | | 104,222,955 | | | | 104,170,500 | | | | (52,455) | |
| 554 | | 90-Day EURODollar Futures | | December 16, 2013 | | | 137,337,828 | | | | 137,329,675 | | | | (8,153) | |
| 899 | | 90-Day GBP LIBOR Futures | | December 18, 2013 | | | 172,417,816 | | | | 172,493,958 | | | | 76,142 | |
| 125 | | 90-Day Sterling Futures | | June 20, 2012 | | | 24,000,850 | | | | 24,001,129 | | | | 279 | |
| 482 | | 90-Day Sterling Futures | | September 19, 2012 | | | 92,618,881 | | | | 92,576,424 | | | | (42,457) | |
| 767 | | 90-Day Sterling Futures | | December 19, 2012 | | | 147,368,297 | | | | 147,315,596 | | | | (52,701) | |
| 753 | | 90-Day Sterling Futures | | March 20, 2013 | | | 144,687,939 | | | | 144,641,272 | | | | (46,667) | |
| 843 | | 90-Day Sterling Futures | | June 19, 2013 | | | 161,906,106 | | | | 161,896,343 | | | | (9,763) | |
| 844 | | 90-Day Sterling Futures | | September 18, 2013 | | | 162,010,374 | | | | 162,022,855 | | | | 12,481 | |
| 109 | | Amsterdam Index Futures | | January 20, 2012 | | | 8,615,388 | | | | 8,838,239 | | | | 222,851 | |
| 488 | | Australia 10-Year Bond Futures | | March 15, 2012 | | | 58,719,306 | | | | 59,343,607 | | | | 624,301 | |
| 1,517 | | Australia 3-Year Bond Futures | | March 15, 2012 | | | 168,445,869 | | | | 168,093,472 | | | | (352,397) | |
| 117 | | CAC40 10 Euro Futures | | January 20, 2012 | | | 4,673,445 | | | | 4,793,429 | | | | 119,984 | |
| 592 | | Canadian 10-Year Bond Futures | | March 21, 2012 | | | 76,835,788 | | | | 77,774,999 | | | | 939,211 | |
| 59 | | Canadian 3-Month Bank Acceptance Futures | | June 18, 2012 | | | 14,341,059 | | | | 14,306,233 | | | | (34,826) | |
| 117 | | Canadian 3-Month Bank Acceptance Futures | | September 17, 2012 | | | 28,438,527 | | | | 28,390,086 | | | | (48,441) | |
| 161 | | Corn Futures | | March 14, 2012 | | | 5,175,527 | | | | 5,204,325 | | | | 28,798 | |
| 169 | | Crude Oil Financial Futures | | January 19, 2012 | | | 16,877,540 | | | | 16,702,270 | | | | (175,270) | |
| 734 | | DJIA Mini E-CBOT Futures | | March 16, 2012 | | | 43,959,037 | | | | 44,590,500 | | | | 631,463 | |
| 187 | | E-Mini Russell 2000 Futures | | March 16, 2012 | | | 13,668,018 | | | | 13,815,560 | | | | 147,542 | |
| 156 | | Euro - Bund Futures | | March 8, 2012 | | | 27,909,005 | | | | 28,072,593 | | | | 163,588 | |
| 308 | | Euro CHF 3-Month LIFFE Futures | | June 18, 2012 | | | 82,107,865 | | | | 82,049,718 | | | | (58,147) | |
| 280 | | Euro CHF 3-Month LIFFE Futures | | September 17, 2012 | | | 74,660,239 | | | | 74,605,558 | | | | (54,681) | |
| 383 | | Euro - Bobl Futures | | March 8, 2012 | | | 61,175,818 | | | | 62,016,745 | | | | 840,927 | |
| 247 | | Euro-Buxl 30-Year Bond Futures | | March 8, 2012 | | | 39,175,473 | | | | 40,899,827 | | | | 1,724,354 | |
| 2,732 | | Euro-SCHATZ Futures | | March 8, 2012 | | | 389,101,393 | | | | 390,150,209 | | | | 1,048,816 | |
| 183 | | FTSE 100 Index Futures | | March 16, 2012 | | | 15,444,816 | | | | 15,733,256 | | | | 288,440 | |
| 680 | | FTSE/JSE Top 40 Index Futures | | March 15, 2012 | | | 24,241,532 | | | | 24,083,097 | | | | (158,435) | |
| 5 | | FTSE/MIB Index Futures | | March 16, 2012 | | | 491,256 | | | | 489,000 | | | | (2,256) | |
| 246 | | Globex Brent FCL Futures | | January 13, 2012 | | | 26,687,700 | | | | 26,415,480 | | | | (272,220) | |
| 81 | | Globex Heat Oil Futures | | January 30, 2012 | | | 9,953,055 | | | | 9,914,108 | | | | (38,947) | |
| 259 | | Globex RBOB Gas Futures | | January 30, 2012 | | | 28,730,033 | | | | 28,907,197 | | | | 177,164 | |
| 236 | | ICE Euro Gasoil Futures | | January 11, 2012 | | | 22,141,100 | | | | 21,806,400 | | | | (334,700) | |
| 38 | | KOSPI Index 200 Futures | | March 8, 2012 | | | 3,997,476 | | | | 3,935,243 | | | | (62,233) | |
| | | | |
| | The accompanying notes are an integral part of these financial statements. | | (Continued) |
| | | | | | | | | | | | | | | | |
| | AQR Funds | | | | | | Annual Report | | | | | | December 2011 | | 73 |
| | | | | | | | | | |
| | | | |
| Consolidated Schedule of Investments | | | December 31, 2011 | |
| | |
| AQR MANAGED FUTURES STRATEGY FUND | | |
| | | | | | | | | | | | | | | | |
NUMBER OF
CONTRACTS | | DESCRIPTION | | EXPIRATION
DATE | | VALUE AT
TRADE DATE | | | VALUE AT
DECEMBER 31,
2011 | | | UNREALIZED
APPRECIATION
(DEPRECIATION) | |
| Long Contracts: (continued) | | | | | | | | | | | | | | |
| 4 | | LME Aluminum Futures | | January 12, 2012 | | | $224,005 | | | | $199,585 | | | | $(24,420) | |
| 16 | | LME Aluminum Futures | | January 13, 2012 | | | 887,020 | | | | 798,416 | | | | (88,604) | |
| 55 | | LME Aluminum Futures | | January 17, 2012 | | | 3,093,819 | | | | 2,745,614 | | | | (348,205) | |
| 77 | | LME Aluminum Futures | | January 20, 2012 | | | 4,113,821 | | | | 3,845,591 | | | | (268,230) | |
| 13 | | LME Aluminum Futures | | January 24, 2012 | | | 706,566 | | | | 649,720 | | | | (56,846) | |
| 88 | | LME Aluminum Futures | | January 25, 2012 | | | 4,924,594 | | | | 4,398,900 | | | | (525,694) | |
| 28 | | LME Aluminum Futures | | January 26, 2012 | | | 1,571,781 | | | | 1,399,902 | | | | (171,879) | |
| 114 | | LME Aluminum Futures | | January 27, 2012 | | | 6,414,305 | | | | 5,700,599 | | | | (713,706) | |
| 45 | | LME Aluminum Futures | | February 1, 2012 | | | 2,458,181 | | | | 2,252,250 | | | | (205,931) | |
| 163 | | LME Aluminum Futures | | February 2, 2012 | | | 8,661,616 | | | | 8,159,617 | | | | (501,999) | |
| 21 | | LME Aluminum Futures | | February 3, 2012 | | | 1,125,101 | | | | 1,051,422 | | | | (73,679) | |
| 60 | | LME Aluminum Futures | | February 10, 2012 | | | 3,191,775 | | | | 3,007,815 | | | | (183,960) | |
| 6 | | LME Aluminum Futures | | February 29, 2012 | | | 303,366 | | | | 301,740 | | | | (1,626) | |
| 8 | | LME Aluminum Futures | | March 1, 2012 | | | 418,858 | | | | 402,386 | | | | (16,472) | |
| 171 | | LME Aluminum Futures | | March 15, 2012 | | | 8,481,758 | | | | 8,620,666 | | | | 138,908 | |
| 171 | | LME Aluminum Futures | | March 19, 2012 | | | 8,499,983 | | | | 8,629,088 | | | | 129,105 | |
| 25 | | LME Aluminum Futures | | March 28, 2012 | | | 1,254,250 | | | | 1,262,294 | | | | 8,044 | |
| 33 | | LME Aluminum Futures | | March 29, 2012 | | | 1,641,791 | | | | 1,666,360 | | | | 24,569 | |
| 1 | | LME Copper Futures | | January 5, 2012 | | | 170,001 | | | | 189,759 | | | | 19,758 | |
| 3 | | LME Copper Futures | | January 13, 2012 | | | 553,504 | | | | 569,491 | | | | 15,987 | |
| 4 | | LME Copper Futures | | January 17, 2012 | | | 762,505 | | | | 759,464 | | | | (3,041) | |
| 10 | | LME Copper Futures | | January 20, 2012 | | | 1,743,763 | | | | 1,898,830 | | | | 155,067 | |
| 19 | | LME Copper Futures | | January 25, 2012 | | | 3,656,559 | | | | 3,608,162 | | | | (48,397) | |
| 45 | | LME Copper Futures | | January 27, 2012 | | | 8,995,192 | | | | 8,546,006 | | | | (449,186) | |
| 9 | | LME Copper Futures | | February 2, 2012 | | | 1,780,099 | | | | 1,709,418 | | | | (70,681) | |
| 3 | | LME Copper Futures | | February 10, 2012 | | | 558,754 | | | | 569,903 | | | | 11,149 | |
| 18 | | LME Copper Futures | | February 15, 2012 | | | 3,486,195 | | | | 3,419,775 | | | | (66,420) | |
| 20 | | LME Copper Futures | | February 29, 2012 | | | 3,740,025 | | | | 3,800,305 | | | | 60,280 | |
| 6 | | LME Copper Futures | | March 1, 2012 | | | 1,171,808 | | | | 1,140,102 | | | | (31,706) | |
| 56 | | LME Copper Futures | | March 19, 2012 | | | 10,614,870 | | | | 10,641,400 | | | | 26,530 | |
| 56 | | LME Copper Futures | | March 28, 2012 | | | 10,561,222 | | | | 10,640,406 | | | | 79,184 | |
| 9 | | LME Copper Futures | | March 29, 2012 | | | 1,658,374 | | | | 1,710,032 | | | | 51,658 | |
| 5 | | LME Nickel Futures | | January 24, 2012 | | | 570,006 | | | | 561,611 | | | | (8,395) | |
| 16 | | LME Nickel Futures | | February 10, 2012 | | | 1,740,020 | | | | 1,795,644 | | | | 55,624 | |
| 25 | | LME Zinc Futures | | January 12, 2012 | | | 1,221,875 | | | | 1,143,281 | | | | (78,594) | |
| 43 | | LME Zinc Futures | | January 13, 2012 | | | 2,071,525 | | | | 1,966,712 | | | | (104,813) | |
| 16 | | LME Zinc Futures | | January 17, 2012 | | | 778,100 | | | | 732,200 | | | | (45,900) | |
| 10 | | LME Zinc Futures | | March 1, 2012 | | | 507,426 | | | | 459,855 | | | | (47,571) | |
| 19 | | LME Zinc Futures | | March 29, 2012 | | | 860,724 | | | | 876,290 | | | | 15,566 | |
| 342 | | Long Gilt Futures | | March 28, 2012 | | | 60,828,178 | | | | 62,115,184 | | | | 1,287,006 | |
| 265 | | NASDAQ 100 E-Mini Futures | | March 16, 2012 | | | 12,071,886 | | | | 12,054,850 | | | | (17,036) | |
| 424 | | S&P 500 E-Mini Futures | | March 16, 2012 | | | 26,172,231 | | | | 26,555,120 | | | | 382,889 | |
| 209 | | S&P MID 400 E-Mini Futures | | March 16, 2012 | | | 18,086,983 | | | | 18,335,570 | | | | 248,587 | |
| 5 | | U.S. Long Bond Futures | | March 21, 2012 | | | 722,220 | | | | 724,062 | | | | 1,842 | |
| 174 | | U.S. Treasury 10-Year Note Futures | | March 21, 2012 | | | 22,780,682 | | | | 22,815,750 | | | | 35,068 | |
| 99 | | U.S. Treasury 2-Year Note Futures | | March 30, 2012 | | | 21,844,258 | | | | 21,834,141 | | | | (10,117) | |
| 955 | | U.S. Treasury 5-Year Note Futures | | March 30, 2012 | | | 117,184,413 | | | | 117,711,211 | | | | 526,798 | |
| | | | | | | | | | | | | | | | |
| | | | | | | 4,919,650,998 | | | | 4,926,451,218 | | | | 6,800,220 | |
| | | | | | | | | | | | | | | | |
| | | | |
| | The accompanying notes are an integral part of these financial statements. | | (Continued) |
| | | | | | | | | | | | | | | | |
| 74 | | AQR Funds | | | | | | Annual Report | | | | | | December 2011 | | |
| | | | | | | | | | |
| | | | |
| Consolidated Schedule of Investments | | | December 31, 2011 | |
| | |
| AQR MANAGED FUTURES STRATEGY FUND | | |
| | | | | | | | | | | | | | | | |
NUMBER OF
CONTRACTS | | DESCRIPTION | | EXPIRATION
DATE | | VALUE AT
TRADE DATE | | | VALUE AT
DECEMBER 31,
2011 | | | UNREALIZED
APPRECIATION
(DEPRECIATION) | |
| Short Contracts: | | | | | | | | | | | | | | | | |
| 286 | | 90-Day EURODollar Futures | | June 18, 2012 | | | $(70,976,055) | | | | $(70,995,925) | | | | $(19,870) | |
| 313 | | 90-Day EURODollar Futures | | September 17, 2012 | | | (77,674,147) | | | | (77,674,863) | | | | (716) | |
| 58 | | 90-Day EURODollar Futures | | December 17, 2012 | | | (14,380,468) | | | | (14,390,525) | | | | (10,057) | |
| 1,114 | | Cocoa Futures | | March 15, 2012 | | | (29,955,761) | | | | (23,494,260) | | | | 6,461,501 | |
| 163 | | Coffee ‘C’ Futures | | March 20, 2012 | | | (13,691,752) | | | | (13,866,207) | | | | (174,455) | |
| 992 | | Cotton No. 2 Futures | | March 8, 2012 | | | (45,533,200) | | | | (45,532,800) | | | | 400 | |
| 3 | | DAX Index Futures | | March 16, 2012 | | | (563,974) | | | | (572,706) | | | | (8,732) | |
| 59 | | Gold 100 OZ Futures | | February 27, 2012 | | | (9,493,717) | | | | (9,244,120) | | | | 249,597 | |
| 36 | | Hang Seng Index Futures | | January 30, 2012 | | | (4,253,137) | | | | (4,277,393) | | | | (24,256) | |
| 7 | | H-SHARES Index Futures | | January 30, 2012 | | | (455,430) | | | | (449,341) | | | | 6,089 | |
| 649 | | Lean Hogs Futures | | February 14, 2012 | | | (21,985,035) | | | | (21,884,280) | | | | 100,755 | |
| 4 | | LME Aluminum Futures | | January 12, 2012 | | | (222,815) | | | | (199,585) | | | | 23,230 | |
| 16 | | LME Aluminum Futures | | January 13, 2012 | | | (893,776) | | | | (798,416) | | | | 95,360 | |
| 55 | | LME Aluminum Futures | | January 17, 2012 | | | (3,099,540) | | | | (2,745,613) | | | | 353,927 | |
| 77 | | LME Aluminum Futures | | January 20, 2012 | | | (4,158,214) | | | | (3,845,592) | | | | 312,622 | |
| 13 | | LME Aluminum Futures | | January 24, 2012 | | | (710,222) | | | | (649,720) | | | | 60,502 | |
| 88 | | LME Aluminum Futures | | January 25, 2012 | | | (4,901,490) | | | | (4,398,900) | | | | 502,590 | |
| 28 | | LME Aluminum Futures | | January 26, 2012 | | | (1,565,865) | | | | (1,399,902) | | | | 165,963 | |
| 114 | | LME Aluminum Futures | | January 27, 2012 | | | (6,383,858) | | | | (5,700,599) | | | | 683,259 | |
| 45 | | LME Aluminum Futures | | February 1, 2012 | | | (2,452,624) | | | | (2,252,250) | | | | 200,374 | |
| 163 | | LME Aluminum Futures | | February 2, 2012 | | | (8,682,506) | | | | (8,159,617) | | | | 522,889 | |
| 21 | | LME Aluminum Futures | | February 3, 2012 | | | (1,113,166) | | | | (1,051,422) | | | | 61,744 | |
| 60 | | LME Aluminum Futures | | February 10, 2012 | | | (3,188,530) | | | | (3,007,815) | | | | 180,715 | |
| 6 | | LME Aluminum Futures | | February 29, 2012 | | | (303,142) | | | | (301,739) | | | | 1,403 | |
| 8 | | LME Aluminum Futures | | March 1, 2012 | | | (419,990) | | | | (402,386) | | | | 17,604 | |
| 171 | | LME Aluminum Futures | | March 15, 2012 | | | (8,489,936) | | | | (8,620,666) | | | | (130,730) | |
| 843 | | LME Aluminum Futures | | March 19, 2012 | | | (43,675,552) | | | | (42,539,887) | | | | 1,135,665 | |
| 25 | | LME Aluminum Futures | | March 28, 2012 | | | (1,255,515) | | | | (1,262,294) | | | | (6,779) | |
| 33 | | LME Aluminum Futures | | March 29, 2012 | | | (1,641,871) | | | | (1,666,360) | | | | (24,489) | |
| 1 | | LME Copper Futures | | January 5, 2012 | | | (174,053) | | | | (189,759) | | | | (15,706) | |
| 3 | | LME Copper Futures | | January 13, 2012 | | | (555,127) | | | | (569,490) | | | | (14,363) | |
| 4 | | LME Copper Futures | | January 17, 2012 | | | (759,328) | | | | (759,464) | | | | (136) | |
| 10 | | LME Copper Futures | | January 20, 2012 | | | (1,741,790) | | | | (1,898,830) | | | | (157,040) | |
| 19 | | LME Copper Futures | | January 25, 2012 | | | (3,640,851) | | | | (3,608,161) | | | | 32,690 | |
| 45 | | LME Copper Futures | | January 27, 2012 | | | (9,041,794) | | | | (8,546,006) | | | | 495,788 | |
| 9 | | LME Copper Futures | | February 2, 2012 | | | (1,790,730) | | | | (1,709,417) | | | | 81,313 | |
| 3 | | LME Copper Futures | | February 10, 2012 | | | (554,696) | | | | (569,902) | | | | (15,206) | |
| 18 | | LME Copper Futures | | February 15, 2012 | | | (3,468,127) | | | | (3,419,774) | | | | 48,353 | |
| 20 | | LME Copper Futures | | February 29, 2012 | | | (3,709,626) | | | | (3,800,305) | | | | (90,679) | |
| 6 | | LME Copper Futures | | March 1, 2012 | | | (1,173,742) | | | | (1,140,102) | | | | 33,640 | |
| 78 | | LME Copper Futures | | March 19, 2012 | | | (15,141,443) | | | | (14,821,951) | | | | 319,492 | |
| 56 | | LME Copper Futures | | March 28, 2012 | | | (10,611,930) | | | | (10,640,406) | | | | (28,476) | |
| 9 | | LME Copper Futures | | March 29, 2012 | | | (1,664,665) | | | | (1,710,031) | | | | (45,366) | |
| 5 | | LME Nickel Futures | | January 24, 2012 | | | (571,044) | | | | (561,611) | | | | 9,433 | |
| 16 | | LME Nickel Futures | | February 10, 2012 | | | (1,734,788) | | | | (1,795,645) | | | | (60,857) | |
| 154 | | LME Nickel Futures | | March 19, 2012 | | | (16,734,834) | | | | (17,292,661) | | | | (557,827) | |
| 25 | | LME Zinc Futures | | January 12, 2012 | | | (1,210,625) | | | | (1,143,281) | | | | 67,344 | |
| 43 | | LME Zinc Futures | | January 13, 2012 | | | (2,082,228) | | | | (1,966,713) | | | | 115,515 | |
| 16 | | LME Zinc Futures | | January 17, 2012 | | | (779,561) | | | | (732,200) | | | | 47,361 | |
| 10 | | LME Zinc Futures | | March 1, 2012 | | | (509,988) | | | | (459,855) | | | | 50,133 | |
| 483 | | LME Zinc Futures | | March 19, 2012 | | | (24,187,696) | | | | (22,263,281) | | | | 1,924,415 | |
| 19 | | LME Zinc Futures | | March 29, 2012 | | | (861,822) | | | | (876,290) | | | | (14,468) | |
| 375 | | MSCI Singapore Index Futures | | January 30, 2012 | | | (17,660,887) | | | | (17,364,404) | | | | 296,483 | |
| 487 | | MSCI Taiwan Stock Index Futures | | January 30, 2012 | | | (12,376,828) | | | | (12,345,450) | | | | 31,378 | |
| | | | |
| | The accompanying notes are an integral part of these financial statements. | | (Continued) |
| | | | | | | | | | | | | | | | |
| | AQR Funds | | | | | | Annual Report | | | | | | December 2011 | | 75 |
| | | | | | | | | | |
| | | | |
| Consolidated Schedule of Investments | | | December 31, 2011 | |
| | |
| AQR MANAGED FUTURES STRATEGY FUND | | |
| | | | | | | | | | | | | | | | |
NUMBER OF
CONTRACTS | | DESCRIPTION | | EXPIRATION
DATE | | VALUE AT
TRADE DATE | | | VALUE AT
DECEMBER 31,
2011 | | | UNREALIZED
APPRECIATION
(DEPRECIATION) | |
| Short Contracts: (continued) | | | | | | | | | | | | | | |
| 3,881 | | Natural Gas Swap Futures | | January 27, 2012 | | | $(31,693,365) | | | | $(29,000,772) | | | | $2,692,593 | |
| 94 | | S&P/Toronto Stock Exchange 60 Index Futures | | March 15, 2012 | | | (12,272,103) | | | | (12,528,413) | | | | (256,310) | |
| 2,480 | | SGX S&P CNX Nifty Index Futures | | January 25, 2012 | | | (23,636,584) | | | | (22,944,960) | | | | 691,624 | |
| 139 | | Silver Futures | | March 28, 2012 | | | (19,632,807) | | | | (19,400,925) | | | | 231,882 | |
| 57 | | Soybean Futures | | March 14, 2012 | | | (3,283,629) | | | | (3,442,087) | | | | (158,458) | |
| 1,273 | | Soybean Meal Futures | | March 14, 2012 | | | (36,445,801) | | | | (39,857,630) | | | | (3,411,829) | |
| 610 | | Soybean Oil Futures | | March 14, 2012 | | | (18,191,380) | | | | (19,185,720) | | | | (994,340) | |
| 79 | | SPI 200 Index Futures | | March 15, 2012 | | | (8,135,602) | | | | (8,118,501) | | | | 17,101 | |
| 1,049 | | Sugar #11 (World Markets) Futures | | February 29, 2012 | | | (28,299,016) | | | | (27,374,704) | | | | 924,312 | |
| 320 | | TOPIX Index Futures | | March 8, 2012 | | | (30,186,707) | | | | (30,266,338) | | | | (79,631) | |
| | | | | | | | | | | | | | | | |
| | | | | | | (726,636,485) | | | | (713,690,222) | | | | 12,946,263 | |
| | | | | | | | | | | | | | | | |
| | | | | | | $4,193,014,513 | | | | $4,212,760,996 | | | | $19,746,483 | |
| | | | | | | | | | | | | | | | |
Cash held as collateral with broker for futures contracts was $88,048,261 at December 31, 2011.
Forward foreign currency exchange contracts outstanding as of December 31, 2011:
| | | | | | | | | | | | | | | | | | | | |
PURCHASE
CONTRACTS | | COUNTERPARTY | | CURRENCY | | CURRENCY
AMOUNT
PURCHASED | | | VALUE AT
SETTLEMENT
DATE | | | VALUE AT
DECEMBER 31,
2011 | | | UNREALIZED
APPRECIATION
(DEPRECIATION) | |
Australian Dollar,
Expiring 03/21/12 | | The Royal Bank of Scotland | | AUD | | | 334,036,000 | | | | $334,141,502 | | | | $338,709,363 | | | | $4,567,861 | |
Brazilian Real,
Expiring 03/21/12 | | The Royal Bank of Scotland | | BRL | | | 5,100,000 | | | | 2,698,467 | | | | 2,688,327 | | | | (10,140) | |
Canadian Dollar,
Expiring 03/21/12 | | The Royal Bank of Scotland | | CAD | | | 103,857,000 | | | | 101,599,744 | | | | 101,770,295 | | | | 170,551 | |
Czech Republic Koruna,
Expiring 03/21/12 | | The Royal Bank of Scotland | | CZK | | | 34,000,000 | | | | 1,753,662 | | | | 1,722,480 | | | | (31,182) | |
Euro,
Expiring 03/21/12 | | The Royal Bank of Scotland | | EUR | | | 133,466,000 | | | | 176,908,842 | | | | 172,858,574 | | | | (4,050,268) | |
British Pound,
Expiring 03/21/12 | | The Royal Bank of Scotland | | GBP | | | 112,509,000 | | | | 176,164,242 | | | | 174,594,778 | | | | (1,569,464) | |
Indonesian Rupiah,
Expiring 03/21/12 | | The Royal Bank of Scotland | | IDR | | | 30,900,000,000 | | | | 3,352,625 | | | | 3,381,171 | | | | 28,546 | |
Indian Rupee,
Expiring 03/21/12 | | The Royal Bank of Scotland | | INR | | | 560,000,000 | | | | 10,321,188 | | | | 10,390,036 | | | | 68,848 | |
Japanese Yen,
Expiring 03/21/12 | | The Royal Bank of Scotland | | JPY | | | 31,714,733,000 | | | | 408,248,519 | | | | 412,626,500 | | | | 4,377,981 | |
Korean Won,
Expiring 03/21/12 | | The Royal Bank of Scotland | | KRW | | | 41,800,000,000 | | | | 35,960,972 | | | | 36,099,692 | | | | 138,720 | |
Mexican Peso,
Expiring 03/21/12 | | The Royal Bank of Scotland | | MXN | | | 29,000,000 | | | | 2,090,841 | | | | 2,065,350 | | | | (25,491) | |
Malaysian Ringgit,
Expiring 03/21/12 | | The Royal Bank of Scotland | | MYR | | | 39,300,000 | | | | 12,336,503 | | | | 12,347,394 | | | | 10,891 | |
Norwegian Krone,
Expiring 03/21/12 | | The Royal Bank of Scotland | | NOK | | | 304,745,000 | | | | 51,828,289 | | | | 50,811,033 | | | | (1,017,256) | |
New Zealand Dollar,
Expiring 03/21/12 | | The Royal Bank of Scotland | | NZD | | | 145,978,000 | | | | 111,186,376 | | | | 113,032,614 | | | | 1,846,238 | |
Philippine Peso,
Expiring 03/21/12 | | The Royal Bank of Scotland | | PHP | | | 430,000,000 | | | | 9,833,740 | | | | 9,766,756 | | | | (66,984) | |
| | | | |
| | The accompanying notes are an integral part of these financial statements. | | (Continued) |
| | | | | | | | | | | | | | | | |
| 76 | | AQR Funds | | | | | | Annual Report | | | | | | December 2011 | | |
| | | | | | | | | | |
| | | | |
| Consolidated Schedule of Investments | | | December 31, 2011 | |
| | |
| AQR MANAGED FUTURES STRATEGY FUND | | |
| | | | | | | | | | | | | | | | | | | | |
PURCHASE
CONTRACTS | | COUNTERPARTY | | CURRENCY | | CURRENCY
AMOUNT
PURCHASED | | | VALUE AT
SETTLEMENT
DATE | | | VALUE AT
DECEMBER 31,
2011 | | | UNREALIZED
APPRECIATION
(DEPRECIATION) | |
| (continued) | | | | | | | | | | | | | | | | | | | | |
Polish Zloty,
Expiring 03/21/12 | | The Royal Bank of Scotland | | PLN | | | 40,000,000 | | | | $11,763,596 | | | | $11,506,934 | | | | $(256,662) | |
Russian Ruble,
Expiring 03/21/12 | | The Royal Bank of Scotland | | RUB | | | 1,668,200,000 | | | | 52,334,711 | | | | 51,224,602 | | | | (1,110,109) | |
Swedish Krona,
Expiring 03/21/12 | | The Royal Bank of Scotland | | SEK | | | 912,674,000 | | | | 132,953,525 | | | | 132,147,963 | | | | (805,562) | |
Singapore Dollar,
Expiring 03/21/12 | | The Royal Bank of Scotland | | SGD | | | 27,900,000 | | | | 21,590,307 | | | | 21,510,306 | | | | (80,001) | |
Turkish Lira,
Expiring 03/21/12 | | The Royal Bank of Scotland | | TRY | | | 2,300,000 | | | | 1,196,320 | | | | 1,193,093 | | | | (3,227) | |
Taiwanese Dollar,
Expiring 03/21/12 | | The Royal Bank of Scotland | | TWD | | | 1,420,000,000 | | | | 46,952,557 | | | | 46,969,171 | | | | 16,614 | |
South African
Rand,
Expiring 03/22/12 | | The Royal Bank of Scotland | | ZAR | | | 73,000,000 | | | | 8,867,908 | | | | 8,934,194 | | | | 66,286 | |
| | | | | | | | | | | | | | | | | | | | |
| | | | | | | | | | | 1,714,084,436 | | | | 1,716,350,626 | | | | 2,266,190 | |
| | | | | | | | | | | | | | | | | | | | |
| | | | | | | | | | | | | | | | | | | | |
SALES
CONTRACTS | | COUNTERPARTY | | CURRENCY | | CURRENCY
AMOUNT
SOLD | | | VALUE AT
SETTLEMENT
DATE | | | VALUE AT
DECEMBER 31,
2011 | | | UNREALIZED
APPRECIATION
(DEPRECIATION) | |
Australian Dollar,
Expiring 03/21/12 | | The Royal Bank of Scotland | | AUD | | | (86,516,000) | | | | $(86,096,813) | | | | $(87,726,411) | | | | $(1,629,598) | |
Brazilian Real,
Expiring 03/21/12 | | The Royal Bank of Scotland | | BRL | | | (14,860,000) | | | | (7,996,975) | | | | (7,833,048) | | | | 163,927 | |
Canadian Dollar,
Expiring 03/21/12 | | The Royal Bank of Scotland | | CAD | | | (81,659,000) | | | | (79,532,545) | | | | (80,018,299) | | | | (485,754) | |
Chilean Peso,
Expiring 03/21/12 | | The Royal Bank of Scotland | | CLP | | | (2,748,000,000) | | | | (5,283,022) | | | | (5,240,365) | | | | 42,657 | |
Colombian Peso,
Expiring 03/21/12 | | The Royal Bank of Scotland | | COP | | | (10,230,000,000) | | | | (5,291,471) | | | | (5,284,378) | | | | 7,093 | |
Czech Republic Koruna,
Expiring 03/21/12 | | The Royal Bank of Scotland | | CZK | | | (661,832,000) | | | | (34,274,850) | | | | (33,529,195) | | | | 745,655 | |
Euro,
Expiring 03/21/12 | | The Royal Bank of Scotland | | EUR | | | (504,792,026) | | | | (667,251,151) | | | | (653,781,710) | | | | 13,469,441 | |
British Pound,
Expiring 03/21/12 | | The Royal Bank of Scotland | | GBP | | | (7,087,001) | | | | (11,063,614) | | | | (10,997,817) | | | | 65,797 | |
Hungarian Forint,
Expiring 03/21/12 | | The Royal Bank of Scotland | | HUF | | | (3,304,000,000) | | | | (14,061,875) | | | | (13,460,000) | | | | 601,875 | |
Israeli Shekel,
Expiring 03/21/12 | | The Royal Bank of Scotland | | ILS | | | (87,390,000) | | | | (23,118,417) | | | | (22,901,574) | | | | 216,843 | |
Indian Rupee,
Expiring 03/21/12 | | The Royal Bank of Scotland | | INR | | | (4,597,600,000) | | | | (85,163,903) | | | | (85,302,197) | | | | (138,294) | |
Japanese Yen,
Expiring 03/21/12 | | The Royal Bank of Scotland | | JPY | | | (29,719,329,000) | | | | (382,012,318) | | | | (386,665,173) | | | | (4,652,855) | |
Korean Won,
Expiring 03/21/12 | | The Royal Bank of Scotland | | KRW | | | (24,066,280,000) | | | | (20,675,083) | | | | (20,784,337) | | | | (109,254) | |
Mexican Peso,
Expiring 03/21/12 | | The Royal Bank of Scotland | | MXN | | | (423,000,000) | | | | (30,518,810) | | | | (30,125,618) | | | | 393,192 | |
Malaysian Ringgit,
Expiring 03/21/12 | | The Royal Bank of Scotland | | MYR | | | (53,210,000) | | | | (16,675,390) | | | | (16,717,681) | | | | (42,291) | |
Norwegian Krone,
Expiring 03/21/12 | | The Royal Bank of Scotland | | NOK | | | (30,652,000) | | | | (5,132,240) | | | | (5,110,698) | | | | 21,542 | |
New Zealand Dollar,
Expiring 03/21/12 | | The Royal Bank of Scotland | | NZD | | | (221,127,000) | | | | (170,016,036) | | | | (171,221,436) | | | | (1,205,400) | |
| | | | |
| | The accompanying notes are an integral part of these financial statements. | | (Continued) |
| | | | | | | | | | | | | | | | |
| | AQR Funds | | | | | | Annual Report | | | | | | December 2011 | | 77 |
| | | | | | | | | | |
| | | | |
| Consolidated Schedule of Investments | | | December 31, 2011 | |
| | |
| AQR MANAGED FUTURES STRATEGY FUND | | |
| | | | | | | | | | | | | | | | | | | | |
SALES
CONTRACTS | | COUNTERPARTY | | CURRENCY | | CURRENCY
AMOUNT
SOLD | | | VALUE AT
SETTLEMENT
DATE | | | VALUE AT
DECEMBER 31,
2011 | | | UNREALIZED
APPRECIATION
(DEPRECIATION) | |
| (continued) | | | | | | | | | | | | | | | | | | | | |
Philippine Peso,
Expiring 03/21/12 | | The Royal Bank of Scotland | | PHP | | | (355,500,000) | | | | $(8,004,954) | | | | $(8,074,608) | | | | $(69,654) | |
Polish Zloty,
Expiring 03/21/12 | | The Royal Bank of Scotland | | PLN | | | (91,190,000) | | | | (26,422,694) | | | | (26,232,934) | | | | 189,760 | |
Russian Ruble,
Expiring 03/21/12 | | The Royal Bank of Scotland | | RUB | | | (790,000,000) | | | | (24,386,097) | | | | (24,258,144) | | | | 127,953 | |
Swedish Krona,
Expiring 03/21/12 | | The Royal Bank of Scotland | | SEK | | | (485,462,000) | | | | (69,844,472) | | | | (70,291,051) | | | | (446,579) | |
Singapore Dollar,
Expiring 03/21/12 | | The Royal Bank of Scotland | | SGD | | | (63,510,000) | | | | (48,698,627) | | | | (48,964,859) | | | | (266,232) | |
Turkish Lira,
Expiring 03/21/12 | | The Royal Bank of Scotland | | TRY | | | (31,390,000) | | | | (16,414,870) | | | | (16,283,123) | | | | 131,747 | |
Taiwanese Dollar,
Expiring 03/21/12 | | The Royal Bank of Scotland | | TWD | | | (2,149,700,000) | | | | (70,911,112) | | | | (71,105,371) | | | | (194,259) | |
South African
Rand,
Expiring 03/22/12 | | The Royal Bank of Scotland | | ZAR | | | (245,600,000) | | | | (29,391,293) | | | | (30,058,057) | | | | (666,764) | |
| | | | | | | | | | | | | | | | | | | | |
| | | | | | | | | | | (1,938,238,632) | | | | (1,931,968,084) | | | | 6,270,548 | |
| | | | | | | | | | | | | | | | | | | | |
| | | | | | | | | | | $(224,154,196) | | | | $(215,617,458) | | | | $8,536,738 | |
| | | | | | | | | | | | | | | | | | | | |
Money Market Fund is pledged as collateral to the broker for forward foreign currency exchange contracts in the amount of $4,836,432.
AUD - Australian Dollar
BRL - Brazilian Real
CAD - Canadian Dollar
CHF - Swiss Franc
CLP - Chilean Peso
COP - Colombian Peso
CZK - Czech Republic Koruna
EUR - Euro
GBP - British Pound
HUF - Hungarian Forint
IDR - Indonesian Rupiah
ILS - Israeli Shekel
INR - Indian Rupee
JPY - Japanese Yen
KRW - Korean Won
MXN - Mexican Peso
MYR - Malaysian Ringgit
NOK - Norwegian Krone
NZD - New Zealand Dollar
PHP - Philippine Peso
PLN - Polish Zloty
RUB - Russian Ruble
SEK - Swedish Krona
SGD - Singapore Dollar
TRY - Turkish Lira
TWD - Taiwan Dollar
ZAR - South African Rand
| | | | |
| | The accompanying notes are an integral part of these financial statements. | | |
| | | | | | | | | | | | | | | | |
| 78 | | AQR Funds | | | | | | Annual Report | | | | | | December 2011 | | |
| | | | | | | | | | |
| | | | |
| Consolidated Schedule of Investments | | | December 31, 2011 | |
| | | | | | | | | | | | | | | | | | | | | | |
| | | | | | |
| | | MOODY’S
RATING*
(UNAUDITED) | | | INTEREST
RATE | | | MATURITY
DATE | | | CURRENCY | | PRINCIPAL
AMOUNT
(000’S) | | | VALUE
(Note 3) | |
| GOVERNMENT RELATED OBLIGATIONS - 22.2% | | | | | | | | | | | | | | | | | | | |
| Sovereign Debt - 22.2% | | | | | | | | | | | | | | | | | | | | | | |
| France Government Bond OAT (France) | | | NR | | | | 1.600% | | | | 07/25/15 | | | EUR | | | 29,966 | | | $ | 40,470,387 | |
| France Government Bond OAT (France) | | | NR | | | | 2.250% | | | | 07/25/20 | | | EUR | | | 12,752 | | | | 17,693,690 | |
| United Kingdom Treasury Gilt (United Kingdom) | | | NR | | | | 1.875% | | | | 11/22/22 | | | GBP | | | 14,236 | | | | 28,250,779 | |
| | | | | | | | | | | | | | | | | | | | | | |
TOTAL GOVERNMENT RELATED OBLIGATIONS
(cost $88,786,237) | | | | | | | | | | | | | | | | | | | | | 86,414,856 | |
| | | | | | | | | | | | | | | | | | | | | | |
| | | | | | |
| U.S. TREASURY OBLIGATIONS - 15.7% | | | | | | | | | | | | | | | | | | | | | | |
| U.S. Treasury Inflation Protected Securities Bonds - 15.7% | | | | | | | | | | | | | | | | | | | |
| U.S. Treasury Bond | | | NR | | | | 1.250% | | | | 07/15/20 | | | USD | | | 14,900 | | | | 17,497,434 | |
| U.S. Treasury Bond | | | NR | | | | 0.500% | | | | 04/15/15 | | | USD | | | 39,700 | | | | 43,400,178 | |
| | | | | | | | | | | | | | | | | | | | | | |
TOTAL U.S. TREASURY OBLIGATIONS
(cost $59,847,715) | | | | | | | | | | | | | | | | | | | | | 60,897,612 | |
| | | | | | | | | | | | | | | | | | | | | | |
| | | | | | |
| MONEY MARKET FUNDS - 56.5% | | | | | | | | | | | | | SHARES | | | | |
| BlackRock Liquidity Funds TempFund Portfolio, Series I, Class I, 0.110% (a) | | | | | | | | | | | | | | | | | 4,000,858 | | | | 4,000,858 | |
| Dreyfus Treasury Cash Management, Series I, Class I, 0.010% (a) | | | | | | | | | | | | | | | | | 16,003,433 | | | | 16,003,433 | |
| J.P. Morgan Prime Money Market Fund - Capital Shares, 0.123% (a)(b) | | | | | | | | | | | | | | | | | 16,971,293 | | | | 16,971,293 | |
| J.P. Morgan Treasury Plus Money Market Fund - Institutional Shares, 0.000% (a) | | | | | | | | | | | | | | | | | 162,987,098 | | | | 162,987,098 | |
| UBS Money Series - UBS Select Treasury Preferred Fund, Series I, Class I, 0.010% (a) | | | | | | | | | | | | | | | | | 20,004,292 | | | | 20,004,292 | |
| | | | | | | | | | | | | | | | | | | | | | |
TOTAL MONEY MARKET FUNDS
(cost $219,966,974) | | | | | | | | | | | | | | | | | | | | | 219,966,974 | |
| | | | | | | | | | | | | | | | | | | | | | |
TOTAL INVESTMENTS - 94.4%
(cost $368,600,926) | | | | | | | | | | | | | | | | | | | | | 367,279,442 | |
| | | | | | | | | | | | | | | | | | | | | | |
OTHER ASSETS IN EXCESS OF
LIABILITIES - 5.6% (c) | | | | | | | | | | | | | | | | | | | | | 21,807,280 | |
| | | | | | | | | | | | | | | | | | | | | | |
NET ASSETS - 100.0% | | | | | | | | | | | | | | | | | | | | $ | 389,086,722 | |
| | | | | | | | | | | | | | | | | | | | | | |
All securities are United States companies, unless noted otherwise in parentheses.
| (a) | Represents annualized seven-day yield as of December 31, 2011. |
| (b) | A portion of the security is pledged as collateral to the brokers for forward foreign currency exchange and swap contracts. |
| (c) | Includes appreciation (depreciation) on forward foreign currency exchange, futures and swap contracts. |
| * | The rating reflected is as December 31, 2011 and is unaudited. Rating of certain bonds may have changed subsequent to the date. |
All securities are Level 2, with respect to ASC 820 unless otherwise noted in parentheses.
The following abbreviations are used in portfolio descriptions:
EUR - Euro
GBP - British Pound
NR - Not Rated by Moody’s
USD - United States Dollar
| | | | |
| | The accompanying notes are an integral part of these financial statements. | | (Continued) |
| | | | | | | | | | | | | | | | |
| | AQR Funds | | | | | | Annual Report | | | | | | December 2011 | | 79 |
| | | | | | | | | | |
| | | | |
| Consolidated Schedule of Investments | | | December 31, 2011 | |
Credit default swap contracts sell protection as of December 31, 2011
| | | | | | | | | | | | | | | | | | | | | | |
| COUNTERPARTY | | REFERENCE ENTITY | | FIXED
ANNUAL
RATE
RECEIVED
BY FUND | | CURRENCY | | NOTIONAL
AMOUNT | | | UPFRONT
PREMIUM
(RECEIVED)
PAID | | | TERMINATION
DATE | | | UNREALIZED
APPRECIATION
(DEPRECIATION) | |
| Bank Of America | | Markit CMBX North America AJ 3 | | 1.470% | | USD | | | 225,000 | | | | $(45,932) | | | | 12/13/2049 | | | | $(40,910) | |
| Bank Of America | | Markit CMBX North America AJ 4 | | 0.960% | | USD | | | 325,000 | | | | (81,719) | | | | 2/17/2051 | | | | (59,339) | |
| Bank Of America | | Markit CMBX North America AJ 5 | | 0.980% | | USD | | | 150,000 | | | | (27,618) | | | | 2/15/2051 | | | | (35,815) | |
| Morgan Stanley Capital Services Inc. | | Markit CMBX North America AJ 3 | | 1.470% | | USD | | | 450,000 | | | | (177,809) | | | | 12/13/2049 | | | | 4,126 | |
| Morgan Stanley Capital Services Inc. | | Markit CMBX North America AJ 4 | | 0.960% | | USD | | | 500,000 | | | | (227,118) | | | | 2/17/2051 | | | | 10,106 | |
| Morgan Stanley Capital Services Inc. | | Markit CMBX North America AJ 5 | | 0.980% | | USD | | | 550,000 | | | | (207,295) | | | | 2/15/2051 | | | | (25,293) | |
| Royal Bank Of Scotland | | iTraxx Europe Crossover Series 16.V1 | | 1.000% | | EUR | | | 22,500,000 | | | | (1,228,959) | | | | 12/20/2016 | | | | 272,270 | |
| Royal Bank Of Scotland | | iTraxx Europe Crossover Series 16.V1 | | 5.000% | | EUR | | | 14,975,000 | | | | (2,327,714) | | | | 12/20/2016 | | | | 583,536 | |
| Royal Bank Of Scotland | | Markit CDX Emerging Market Index Series 16 | | 5.000% | | USD | | | 14,700,000 | | | | 1,006,965 | | | | 12/20/2016 | | | | 276,485 | |
| Royal Bank Of Scotland | | Markit CDX North America High Yield Index Series 17 | | 5.000% | | USD | | | 48,950,000 | | | | (4,469,597) | | | | 12/20/2016 | | | | 1,177,277 | |
| Royal Bank Of Scotland | | Markit CDX North America Investment Grade Index Series 17 | | 1.000% | | USD | | | 56,875,000 | | | | (929,287) | | | | 12/20/2016 | | | | 412,964 | |
| Royal Bank Of Scotland | | Markit CMBX North America AJ 3 | | 1.470% | | USD | | | 175,000 | | | | (23,036) | | | | 12/13/2049 | | | | (44,507) | |
| Royal Bank Of Scotland | | Markit CMBX North America AJ 4 | | 0.960% | | USD | | | 100,000 | | | | (22,740) | | | | 2/17/2051 | | | | (20,662) | |
| Royal Bank Of Scotland | | Markit CMBX North America AJ 5 | | 0.980% | | USD | | | 150,000 | | | | (25,318) | | | | 2/15/2051 | | | | (38,115) | |
| | | | | | | | | | | | | | | | | | | | | | |
| | | | | | | | | | | | | $(8,787,177) | | | | | | | | $2,472,123 | |
| | | | | | | | | | | | | | | | | | | | | | |
Money Market Fund is pledged as collateral to brokers for credit default swap contracts in the amount of $1,577,189. Additional
collateral for positions held at the Royal Bank of Scotland is included in the collateral for forward foreign currency exchange contracts.
Interest rate swap contracts outstanding as of December 31, 2011
| | | | | | | | | | | | | | | | | | |
| COUNTERPARTY | | PAYMENTS MADE BY THE FUND | | PAYMENTS
RECEIVED BY
THE FUND | | CURRENCY | | NOTIONAL
AMOUNT | | | TERMINATION
DATE | | | UNREALIZED
APPRECIATION
(DEPRECIATION) | |
| The Royal Bank of Scotland | | 1.922% | | (1) | | CZK | | | 68,000,000 | | | | 9/21/2016 | | | | $(48,793) | |
| The Royal Bank of Scotland | | 2.010% | | (1) | | CZK | | | 38,000,000 | | | | 9/21/2016 | | | | (35,601) | |
| The Royal Bank of Scotland | | 6 month Prague Interbank Offered Rate | | 2.690% | | CZK | | | 51,000,000 | | | | 9/21/2016 | | | | 134,709 | |
| The Royal Bank of Scotland | | 6 month Prague Interbank Offered Rate | | 3.110% | | CZK | | | 9,000,000 | | | | 9/21/2016 | | | | 33,247 | |
| The Royal Bank of Scotland | | 6 month Prague Interbank Offered Rate | | 3.225% | | CZK | | | 6,000,000 | | | | 9/21/2016 | | | | 23,894 | |
| The Royal Bank of Scotland | | 6 month Prague Interbank Offered Rate | | 3.268% | | CZK | | | 37,000,000 | | | | 9/21/2016 | | | | 151,290 | |
| | | | |
| | The accompanying notes are an integral part of these financial statements. | | (Continued) |
| | | | | | | | | | | | | | | | |
| 80 | | AQR Funds | | | | | | Annual Report | | | | | | December 2011 | | |
| | | | | | | | | | |
| | | | |
| Consolidated Schedule of Investments | | | December 31, 2011 | |
| | | | | | | | | | | | | | | | | | |
| COUNTERPARTY | | PAYMENTS MADE BY THE FUND | | PAYMENTS
RECEIVED BY
THE FUND | | CURRENCY | | NOTIONAL
AMOUNT | | | TERMINATION
DATE | | | UNREALIZED
APPRECIATION
(DEPRECIATION) | |
| (continued) | | | | | | | | | | | | | | | | | | |
| The Royal Bank of Scotland | | 6 month Prague Interbank Offered Rate | | 1.680% | | CZK | | | 20,000,000 | | | | 3/15/2017 | | | | $(1,586) | |
| The Royal Bank of Scotland | | 6 month Prague Interbank Offered Rate | | 1.724% | | CZK | | | 18,000,000 | | | | 3/15/2017 | | | | 537 | |
| The Royal Bank of Scotland | | 6 month Prague Interbank Offered Rate | | 1.750% | | CZK | | | 4,000,000 | | | | 3/15/2017 | | | | 377 | |
| The Royal Bank of Scotland | | 6 month Prague Interbank Offered Rate | | 1.810% | | CZK | | | 11,000,000 | | | | 3/15/2017 | | | | 2,674 | |
| The Royal Bank of Scotland | | 6 month Prague Interbank Offered Rate | | 1.890% | | CZK | | | 12,000,000 | | | | 3/15/2017 | | | | 5,298 | |
| The Royal Bank of Scotland | | 6 month Prague Interbank Offered Rate | | 1.920% | | CZK | | | 13,000,000 | | | | 3/15/2017 | | | | 6,707 | |
| The Royal Bank of Scotland | | 6 month Prague Interbank Offered Rate | | 1.960% | | CZK | | | 40,000,000 | | | | 3/15/2017 | | | | 24,606 | |
| The Royal Bank of Scotland | | 6 month Prague Interbank Offered Rate | | 2.043% | | CZK | | | 69,000,000 | | | | 3/15/2017 | | | | 56,563 | |
| The Royal Bank of Scotland | | 6 month Prague Interbank Offered Rate | | 2.050% | | CZK | | | 7,000,000 | | | | 3/15/2017 | | | | 5,869 | |
| The Royal Bank of Scotland | | 2.495% | | (2) | | HKD | | | 15,800,000 | | | | 3/16/2016 | | | | (121,351) | |
| The Royal Bank of Scotland | | 3 month Hong Kong Interbank Offered Rate | | 1.630% | | HKD | | | 1,590,000 | | | | 3/16/2016 | | | | 4,758 | |
| The Royal Bank of Scotland | | 3 month Hong Kong Interbank Offered Rate | | 1.748% | | HKD | | | 2,760,959 | | | | 3/16/2016 | | | | 10,020 | |
| The Royal Bank of Scotland | | 3 month Hong Kong Interbank Offered Rate | | 2.145% | | HKD | | | 1,550,000 | | | | 3/16/2016 | | | | 8,964 | |
| The Royal Bank of Scotland | | 3 month Hong Kong Interbank Offered Rate | | 2.205% | | HKD | | | 7,400,000 | | | | 3/16/2016 | | | | 45,204 | |
| The Royal Bank of Scotland | | 3 month Hong Kong Interbank Offered Rate | | 2.210% | | HKD | | | 1,320,000 | | | | 3/16/2016 | | | | 8,099 | |
| The Royal Bank of Scotland | | 3 month Hong Kong Interbank Offered Rate | | 2.235% | | HKD | | | 1,300,000 | | | | 3/16/2016 | | | | 8,153 | |
| The Royal Bank of Scotland | | 1.180% | | (2) | | HKD | | | 35,100,000 | | | | 9/21/2016 | | | | 2,834 | |
| The Royal Bank of Scotland | | 3 month Hong Kong Interbank Offered Rate | | 1.990% | | HKD | | | 13,700,000 | | | | 9/21/2016 | | | | 66,193 | |
| The Royal Bank of Scotland | | 3 month Hong Kong Interbank Offered Rate | | 2.530% | | HKD | | | 1,800,000 | | | | 9/21/2016 | | | | 14,592 | |
| The Royal Bank of Scotland | | 3 month Hong Kong Interbank Offered Rate | | 2.880% | | HKD | | | 2,500,000 | | | | 9/21/2016 | | | | 25,573 | |
| The Royal Bank of Scotland | | 3 month Hong Kong Interbank OfferedRate | | 2.915% | | HKD | | | 15,900,000 | | | | 9/21/2016 | | | | 166,019 | |
| The Royal Bank of Scotland | | 3 month Hong Kong Interbank Offered Rate | | 1.300% | | HKD | | | 13,000,000 | | | | 3/15/2017 | | | | (3,492) | |
| The Royal Bank of Scotland | | 3 month Hong Kong Interbank Offered Rate | | 1.370% | | HKD | | | 10,500,000 | | | | 3/15/2017 | | | | 1,835 | |
| The Royal Bank of Scotland | | 3 month Hong Kong Interbank Offered Rate | | 1.390% | | HKD | | | 35,400,000 | | | | 3/15/2017 | | | | 10,673 | |
| The Royal Bank of Scotland | | 3 month Hong Kong Interbank Offered Rate | | 1.410% | | HKD | | | 12,000,000 | | | | 3/15/2017 | | | | 5,138 | |
| The Royal Bank of Scotland | | 3 month Hong Kong Interbank Offered Rate | | 1.415% | | HKD | | | 3,700,000 | | | | 3/15/2017 | | | | 1,702 | |
| The Royal Bank of Scotland | | 3 month Hong Kong Interbank Offered Rate | | 1.470% | | HKD | | | 5,000,000 | | | | 3/15/2017 | | | | 4,041 | |
| The Royal Bank of Scotland | | 3 month Hong Kong Interbank Offered Rate | | 1.490% | | HKD | | | 2,800,000 | | | | 3/15/2017 | | | | 2,618 | |
| The Royal Bank of Scotland | | 3 month Hong Kong Interbank Offered Rate | | 1.500% | | HKD | | | 7,500,000 | | | | 3/15/2017 | | | | 7,488 | |
| The Royal Bank of Scotland | | 3 month Hong Kong Interbank Offered Rate | | 1.505% | | HKD | | | 7,900,000 | | | | 3/15/2017 | | | | 8,137 | |
| The Royal Bank of Scotland | | 6.050% | | (3) | | HUF | | | 630,000,000 | | | | 9/21/2016 | | | | 178,424 | |
| The Royal Bank of Scotland | | 6 month Budapest Interbank Offered Rate | | 6.150% | | HUF | | | 70,000,000 | | | | 9/21/2016 | | | | (18,534) | |
| The Royal Bank of Scotland | | 6 month Budapest Interbank Offered Rate | | 6.580% | | HUF | | | 100,000,000 | | | | 9/21/2016 | | | | (18,544) | |
| The Royal Bank of Scotland | | 6 month Budapest Interbank Offered Rate | | 6.730% | | HUF | | | 70,000,000 | | | | 9/21/2016 | | | | (11,043) | |
| The Royal Bank of Scotland | | 6 month Budapest Interbank Offered Rate | | 6.930% | | HUF | | | 50,000,000 | | | | 9/21/2016 | | | | (6,043) | |
| The Royal Bank of Scotland | | 6 month Budapest Interbank Offered Rate | | 7.110% | | HUF | | | 320,000,000 | | | | 9/21/2016 | | | | (28,051) | |
| The Royal Bank of Scotland | | 6 month Budapest Interbank Offered Rate | | 6.110% | | HUF | | | 640,000,000 | | | | 3/16/2017 | | | | (192,408) | |
| The Royal Bank of Scotland | | 6 month Budapest Interbank Offered Rate | | 6.160% | | HUF | | | 130,000,000 | | | | 3/16/2017 | | | | (37,912) | |
| The Royal Bank of Scotland | | 6 month Budapest Interbank Offered Rate | | 6.220% | | HUF | | | 80,000,000 | | | | 3/16/2017 | | | | (20,929) | |
| The Royal Bank of Scotland | | 6 month Budapest Interbank Offered Rate | | 6.880% | | HUF | | | 120,000,000 | | | | 3/16/2017 | | | | (19,425) | |
| The Royal Bank of Scotland | | 6 month Budapest Interbank Offered Rate | | 6.880% | | HUF | | | 90,000,000 | | | | 3/16/2017 | | | | (14,569) | |
| The Royal Bank of Scotland | | 6 month Budapest Interbank Offered Rate | | 7.030% | | HUF | | | 210,000,000 | | | | 3/16/2017 | | | | (28,318) | |
| The Royal Bank of Scotland | | 6 month Budapest Interbank Offered Rate | | 7.130% | | HUF | | | 70,000,000 | | | | 3/16/2017 | | | | (8,178) | |
| The Royal Bank of Scotland | | 6 month Budapest Interbank Offered Rate | | 7.270% | | HUF | | | 200,000,000 | | | | 3/16/2017 | | | | (18,319) | |
| The Royal Bank of Scotland | | 6 month Budapest Interbank Offered Rate | | 7.565% | | HUF | | | 400,000,000 | | | | 3/16/2017 | | | | (15,374) | |
| The Royal Bank of Scotland | | 3.950% | | (4) | | KRW | | | 220,000,000 | | | | 3/16/2016 | | | | (4,614) | |
| The Royal Bank of Scotland | | 4.270% | | (4) | | KRW | | | 5,100,000,000 | | | | 3/16/2016 | | | | (162,793) | |
| The Royal Bank of Scotland | | 4.270% | | (4) | | KRW | | | 5,100,000,000 | | | | 3/16/2016 | | | | (162,793) | |
| The Royal Bank of Scotland | | 3 month Korean Certificate of Deposit | | 3.680% | | KRW | | | 200,000,000 | | | | 3/16/2016 | | | | 2,346 | |
| The Royal Bank of Scotland | | 3 month Korean Certificate of Deposit | | 3.690% | | KRW | | | 380,000,000 | | | | 3/16/2016 | | | | 4,588 | |
| The Royal Bank of Scotland | | 3 month Korean Certificate of Deposit | | 3.690% | | KRW | | | 330,000,000 | | | | 3/16/2016 | | | | 3,985 | |
| The Royal Bank of Scotland | | 3 month Korean Certificate of Deposit | | 3.700% | | KRW | | | 200,000,000 | | | | 3/16/2016 | | | | 2,483 | |
| The Royal Bank of Scotland | | 3 month Korean Certificate of Deposit | | 3.750% | | KRW | | | 1,455,153,531 | | | | 3/16/2016 | | | | 20,562 | |
| The Royal Bank of Scotland | | 3 month Korean Certificate of Deposit | | 3.930% | | KRW | | | 860,000,000 | | | | 3/16/2016 | | | | 17,446 | |
| The Royal Bank of Scotland | | 3 month Korean Certificate of Deposit | | 4.115% | | KRW | | | 490,000,000 | | | | 3/16/2016 | | | | 13,042 | |
| The Royal Bank of Scotland | | 3 month Korean Certificate of Deposit | | 4.240% | | KRW | | | 5,100,000,000 | | | | 3/16/2016 | | | | 157,558 | |
| | | | |
| | The accompanying notes are an integral part of these financial statements. | | (Continued) |
| | | | | | | | | | | | | | | | |
| | AQR Funds | | | | | | Annual Report | | | | | | December 2011 | | 81 |
| | | | | | | | | | |
| | | | |
| Consolidated Schedule of Investments | | | December 31, 2011 | |
| | | | | | | | | | | | | | | | | | |
| COUNTERPARTY | | PAYMENTS MADE BY THE FUND | �� | PAYMENTS
RECEIVED BY
THE FUND | | CURRENCY | | NOTIONAL
AMOUNT | | | TERMINATION
DATE | | | UNREALIZED
APPRECIATION
(DEPRECIATION) | |
| (continued) | | | | | | | | | | | | | | | | | | |
| The Royal Bank of Scotland | | 3 month Korean Certificate of Deposit | | 4.255% | | KRW | | | 630,000,000 | | | | 3/16/2016 | | | | $19,786 | |
| The Royal Bank of Scotland | | 3 month Korean Certificate of Deposit | | 4.285% | | KRW | | | 700,000,000 | | | | 3/16/2016 | | | | 22,703 | |
| The Royal Bank of Scotland | | 3.405% | | (4) | | KRW | | | 22,400,000,000 | | | | 9/21/2016 | | | | (39,464) | |
| The Royal Bank of Scotland | | 3 month Korean Certificate of Deposit | | 3.490% | | KRW | | | 5,200,000,000 | | | | 9/21/2016 | | | | 25,969 | |
| The Royal Bank of Scotland | | 3 month Korean Certificate of Deposit | | 4.035% | | KRW | | | 3,500,000,000 | | | | 9/21/2016 | | | | 90,101 | |
| The Royal Bank of Scotland | | 3 month Korean Certificate of Deposit | | 4.265% | | KRW | | | 1,800,000,000 | | | | 9/21/2016 | | | | 62,099 | |
| The Royal Bank of Scotland | | 3 month Korean Certificate of Deposit | | 4.395% | | KRW | | | 5,100,000,000 | | | | 9/21/2016 | | | | 201,189 | |
| The Royal Bank of Scotland | | 3 month Korean Certificate of Deposit | | 4.400% | | KRW | | | 1,400,000,000 | | | | 9/21/2016 | | | | 55,495 | |
| The Royal Bank of Scotland | | 3 month Korean Certificate of Deposit | | 4.405% | | KRW | | | 5,000,000,000 | | | | 9/21/2016 | | | | 199,148 | |
| The Royal Bank of Scotland | | 3 month Korean Certificate of Deposit | | 3.340% | | KRW | | | 7,000,000,000 | | | | 3/15/2017 | | | | (8,617) | |
| The Royal Bank of Scotland | | 3 month Korean Certificate of Deposit | | 3.370% | | KRW | | | 3,700,000,000 | | | | 3/15/2017 | | | | (178) | |
| The Royal Bank of Scotland | | 3 month Korean Certificate of Deposit | | 3.370% | | KRW | | | 5,000,000,000 | | | | 3/15/2017 | | | | (241) | |
| The Royal Bank of Scotland | | 3 month Korean Certificate of Deposit | | 3.388% | | KRW | | | 22,500,000,000 | | | | 3/15/2017 | | | | 14,902 | |
| The Royal Bank of Scotland | | 3 month Korean Certificate of Deposit | | 3.440% | | KRW | | | 3,000,000,000 | | | | 3/15/2017 | | | | 8,136 | |
| The Royal Bank of Scotland | | 3 month Korean Certificate of Deposit | | 3.440% | | KRW | | | 3,500,000,000 | | | | 3/15/2017 | | | | 9,492 | |
| The Royal Bank of Scotland | | 3 month Korean Certificate of Deposit | | 3.450% | | KRW | | | 5,400,000,000 | | | | 3/15/2017 | | | | 16,775 | |
| The Royal Bank of Scotland | | 3 month Korean Certificate of Deposit | | 3.515% | | KRW | | | 4,600,000,000 | | | | 3/15/2017 | | | | 26,079 | |
| The Royal Bank of Scotland | | 3 month Korean Certificate of Deposit | | 3.550% | | KRW | | | 4,000,000,000 | | | | 3/15/2017 | | | | 28,198 | |
| The Royal Bank of Scotland | | 3 month Korean Certificate of Deposit | | 3.380% | | KRW | | | 7,000,000,000 | | | | 3/15/2017 | | | | 2,423 | |
| The Royal Bank of Scotland | | 5.600% | | (5) | | PLN | | | 14,400,000 | | | | 3/16/2016 | | | | (268,038) | |
| The Royal Bank of Scotland | | 6 month Warsaw Interbank Offered Rate | | 4.940% | | PLN | | | 2,060,979 | | | | 3/16/2016 | | | | 19,485 | |
| The Royal Bank of Scotland | | 6 month Warsaw Interbank Offered Rate | | 4.980% | | PLN | | | 990,000 | | | | 3/16/2016 | | | | 10,105 | |
| The Royal Bank of Scotland | | 6 month Warsaw Interbank Offered Rate | | 5.270% | | PLN | | | 590,000 | | | | 3/16/2016 | | | | 8,342 | |
| The Royal Bank of Scotland | | 6 month Warsaw Interbank Offered Rate | | 5.560% | | PLN | | | 1,780,000 | | | | 3/16/2016 | | | | 32,167 | |
| The Royal Bank of Scotland | | 6 month Warsaw Interbank Offered Rate | | 5.600% | | PLN | | | 500,000 | | | | 3/16/2016 | | | | 9,307 | |
| The Royal Bank of Scotland | | 6 month Warsaw Interbank Offered Rate | | 5.640% | | PLN | | | 1,280,000 | | | | 3/16/2016 | | | | 24,520 | |
| The Royal Bank of Scotland | | 6 month Warsaw Interbank Offered Rate | | 5.690% | | PLN | | | 7,200,000 | | | | 3/16/2016 | | | | 142,805 | |
| The Royal Bank of Scotland | | 4.560% | | (5) | | PLN | | | 16,500,000 | | | | 9/21/2016 | | | | 49,354 | |
| The Royal Bank of Scotland | | 4.600% | | (5) | | PLN | | | 16,500,000 | | | | 9/21/2016 | | | | 40,557 | |
| The Royal Bank of Scotland | | 6 month Warsaw Interbank Offered Rate | | 4.700% | | PLN | | | 11,600,000 | | | | 9/21/2016 | | | | (43,497) | |
| The Royal Bank of Scotland | | 6 month Warsaw Interbank Offered Rate | | 5.550% | | PLN | | | 3,500,000 | | | | 9/21/2016 | | | | 35,715 | |
| The Royal Bank of Scotland | | 6 month Warsaw Interbank Offered Rate | | 5.690% | | PLN | | | 2,400,000 | | | | 9/21/2016 | | | | 28,969 | |
| The Royal Bank of Scotland | | 6 month Warsaw Interbank Offered Rate | | 5.740% | | PLN | | | 14,500,000 | | | | 9/21/2016 | | | | 184,685 | |
| The Royal Bank of Scotland | | 6 month Warsaw Interbank Offered Rate | | 4.554% | | PLN | | | 16,600,000 | | | | 3/15/2017 | | | | (53,124) | |
| The Royal Bank of Scotland | | 6 month Warsaw Interbank Offered Rate | | 4.600% | | PLN | | | 7,300,000 | | | | 3/15/2017 | | | | (18,972) | |
| The Royal Bank of Scotland | | 6 month Warsaw Interbank Offered Rate | | 4.615% | | PLN | | | 16,600,000 | | | | 3/15/2017 | | | | (39,887) | |
| The Royal Bank of Scotland | | 6 month Warsaw Interbank Offered Rate | | 4.670% | | PLN | | | 4,600,000 | | | | 3/15/2017 | | | | (7,746) | |
| The Royal Bank of Scotland | | 6 month Warsaw Interbank Offered Rate | | 4.740% | | PLN | | | 3,600,000 | | | | 3/15/2017 | | | | (2,768) | |
| The Royal Bank of Scotland | | 6 month Warsaw Interbank Offered Rate | | 4.780% | | PLN | | | 7,000,000 | | | | 3/15/2017 | | | | 20,514 | |
| The Royal Bank of Scotland | | 6 month Warsaw Interbank Offered Rate | | 4.840% | | PLN | | | 8,800,000 | | | | 3/15/2017 | | | | 4,738 | |
| The Royal Bank of Scotland | | 6 month Warsaw Interbank Offered Rate | | 4.850% | | PLN | | | 5,000,000 | | | | 3/15/2017 | | | | 3,345 | |
| The Royal Bank of Scotland | | 6 month Warsaw Interbank Offered Rate | | 4.880% | | PLN | | | 1,900,000 | | | | 3/15/2017 | | | | 2,016 | |
| The Royal Bank of Scotland | | 6 month Warsaw Interbank Offered Rate | | 4.900% | | PLN | | | 15,000,000 | | | | 3/15/2017 | | | | 19,840 | |
| The Royal Bank of Scotland | | 6 month Warsaw Interbank Offered Rate | | 5.023% | | PLN | | | 7,000,000 | | | | 3/15/2017 | | | | (1,722) | |
| The Royal Bank of Scotland | | 2.185% | | (6) | | SGD | | | 2,300,000 | | | | 3/16/2016 | | | | (87,327) | |
| The Royal Bank of Scotland | | 6 month Singapore Interbank Offered Rate | | 1.750% | | SGD | | | 220,000 | | | | 3/16/2016 | | | | 5,042 | |
| The Royal Bank of Scotland | | 6 month Singapore Interbank Offered Rate | | 1.815% | | SGD | | | 365,898 | | | | 3/16/2016 | | | | 9,423 | |
| The Royal Bank of Scotland | | 6 month Singapore Interbank Offered Rate | | 2.055% | | SGD | | | 1,200,000 | | | | 3/16/2016 | | | | 40,165 | |
| The Royal Bank of Scotland | | 6 month Singapore Interbank Offered Rate | | 2.145% | | SGD | | | 260,000 | | | | 3/16/2016 | | | | 9,512 | |
| The Royal Bank of Scotland | | 6 month Singapore Interbank Offered Rate | | 2.190% | | SGD | | | 220,000 | | | | 3/16/2016 | | | | 8,391 | |
| The Royal Bank of Scotland | | 0.940% | | (6) | | SGD | | | 400,000 | | | | 9/21/2016 | | | | 4,805 | |
| The Royal Bank of Scotland | | 1.040% | | (6) | | SGD | | | 4,800,000 | | | | 9/21/2016 | | | | 39,162 | |
| The Royal Bank of Scotland | | 6 month Singapore Interbank Offered Rate | | 1.945% | | SGD | | | 2,200,000 | | | | 9/21/2016 | | | | 58,766 | |
| The Royal Bank of Scotland | | 6 month Singapore Interbank Offered Rate | | 2.250% | | SGD | | | 200,000 | | | | 9/21/2016 | | | | 7,693 | |
| The Royal Bank of Scotland | | 6 month Singapore Interbank Offered Rate | | 2.540% | | SGD | | | 2,300,000 | | | | 9/21/2016 | | | | 114,167 | |
| The Royal Bank of Scotland | | 6 month Singapore Interbank Offered Rate | | 2.550% | | SGD | | | 300,000 | | | | 9/21/2016 | | | | 15,007 | |
| | | | |
| | The accompanying notes are an integral part of these financial statements. | | (Continued) |
| | | | | | | | | | | | | | | | |
| 82 | | AQR Funds | | | | | | Annual Report | | | | | | December 2011 | | |
| | | | | | | | | | |
| | | | |
| Consolidated Schedule of Investments | | | December 31, 2011 | |
| | | | | | | | | | | | | | | | | | | | |
| COUNTERPARTY | | PAYMENTS MADE BY THE FUND | | PAYMENTS
RECEIVED BY
THE FUND | | CURRENCY | | | NOTIONAL
AMOUNT | | | TERMINATION
DATE | | | UNREALIZED
APPRECIATION
(DEPRECIATION) | |
| (continued) | | | | | | | | | | | | | | | | | | | | |
| The Royal Bank of Scotland | | 6 month Singapore Interbank Offered Rate | | 1.290% | | | SGD | | | | 600,000 | | | | 3/15/2017 | | | | $(3,792) | |
| The Royal Bank of Scotland | | 6 month Singapore Interbank Offered Rate | | 1.295% | | | SGD | | | | 1,500,000 | | | | 3/15/2017 | | | | (9,191) | |
| The Royal Bank of Scotland | | 6 month Singapore Interbank Offered Rate | | 1.298% | | | SGD | | | | 1,400,000 | | | | 3/15/2017 | | | | (8,445) | |
| The Royal Bank of Scotland | | 6 month Singapore Interbank Offered Rate | | 1.300% | | | SGD | | | | 4,900,000 | | | | 3/15/2017 | | | | (29,090) | |
| The Royal Bank of Scotland | | 6 month Singapore Interbank Offered Rate | | 1.320% | | | SGD | | | | 900,000 | | | | 3/15/2017 | | | | (4,654) | |
| The Royal Bank of Scotland | | 6 month Singapore Interbank Offered Rate | | 1.340% | | | SGD | | | | 900,000 | | | | 3/15/2017 | | | | (3,964) | |
| The Royal Bank of Scotland | | 6 month Singapore Interbank Offered Rate | | 1.400% | | | SGD | | | | 2,000,000 | | | | 3/15/2017 | | | | (4,190) | |
| The Royal Bank of Scotland | | 6 month Singapore Interbank Offered Rate | | 1.410% | | | SGD | | | | 900,000 | | | | 3/15/2017 | | | | (1,551) | |
| The Royal Bank of Scotland | | 6 month Singapore Interbank Offered Rate | | 1.460% | | | SGD | | | | 3,000,000 | | | | 3/15/2017 | | | | 575 | |
| The Royal Bank of Scotland | | 6.955% | | (7) | | | ZAR | | | | 1,560,000 | | | | 3/16/2016 | | | | (2,860) | |
| The Royal Bank of Scotland | | 7.930% | | (7) | | | ZAR | | | | 25,700,000 | | | | 3/16/2016 | | | | (165,083) | |
| The Royal Bank of Scotland | | 3 month Johannesburg Interbank Agreed Rate | | 7.040% | | | ZAR | | | | 1,320,000 | | | | 3/16/2016 | | | | 2,948 | |
| The Royal Bank of Scotland | | 3 month Johannesburg Interbank Agreed Rate | | 7.080% | | | ZAR | | | | 1,320,000 | | | | 3/16/2016 | | | | 3,196 | |
| The Royal Bank of Scotland | | 3 month Johannesburg Interbank Agreed Rate | | 7.155% | | | ZAR | | | | 3,282,843 | | | | 3/16/2016 | | | | 9,109 | |
| The Royal Bank of Scotland | | 3 month Johannesburg Interbank Offered Rate | | 7.350% | | | ZAR | | | | 1,370,000 | | | | 3/16/2016 | | | | 5,060 | |
| The Royal Bank of Scotland | | 3 month Johannesburg Interbank Agreed Rate | | 7.390% | | | ZAR | | | | 2,390,000 | | | | 3/16/2016 | | | | 9,276 | |
| The Royal Bank of Scotland | | 3 month Johannesburg Interbank Agreed Rate | | 7.610% | | | ZAR | | | | 2,810,000 | | | | 3/16/2016 | | | | 13,816 | |
| The Royal Bank of Scotland | | 3 month Johannesburg Interbank Agreed Rate | | 7.785% | | | ZAR | | | | 1,800,000 | | | | 3/16/2016 | | | | 10,333 | |
| The Royal Bank of Scotland | | 3 month Johannesburg Interbank Agreed Rate | | 7.990% | | | ZAR | | | | 13,100,000 | | | | 3/16/2016 | | | | 87,848 | |
| The Royal Bank of Scotland | | 6.470% | | (7) | | | ZAR | | | | 29,400,000 | | | | 9/21/2016 | | | | 36,698 | |
| The Royal Bank of Scotland | | 6.500% | | (7) | | | ZAR | | | | 29,400,000 | | | | 9/21/2016 | | | | 32,867 | |
| The Royal Bank of Scotland | | 3 month Johannesburg Interbank Agreed Rate | | 6.790% | | | ZAR | | | | 10,800,000 | | | | 9/21/2016 | | | | 4,533 | |
| The Royal Bank of Scotland | | 3 month Johannesburg Interbank Agreed Rate | | 7.750% | | | ZAR | | | | 5,300,000 | | | | 9/21/2016 | | | | 28,746 | |
| The Royal Bank of Scotland | | 3 month Johannesburg Interbank Agreed Rate | | 7.840% | | | ZAR | | | | 8,000,000 | | | | 9/21/2016 | | | | 47,143 | |
| The Royal Bank of Scotland | | 3 month Johannesburg Interbank Agreed Rate | | 8.275% | | | ZAR | | | | 5,100,000 | | | | 9/21/2016 | | | | 41,617 | |
| The Royal Bank of Scotland | | 3 month Johannesburg Interbank Agreed Rate | | 8.310% | | | ZAR | | | | 1,700,000 | | | | 9/21/2016 | | | | 14,183 | |
| The Royal Bank of Scotland | | 3 month Johannesburg Interbank Agreed Rate | | 8.332% | | | ZAR | | | | 25,900,000 | | | | 9/21/2016 | | | | 219,046 | |
| The Royal Bank of Scotland | | 3 month Johannesburg Interbank Agreed Rate | | 6.620% | | | ZAR | | | | 11,700,000 | | | | 3/15/2017 | | | | (18,324) | |
| The Royal Bank of Scotland | | 3 month Johannesburg Interbank Agreed Rate | | 6.720% | | | ZAR | | | | 29,700,000 | | | | 3/15/2017 | | | | (30,606) | |
| The Royal Bank of Scotland | | 3 month Johannesburg Interbank Agreed Rate | | 6.750% | | | ZAR | | | | 29,700,000 | | | | 3/15/2017 | | | | (25,834) | |
| The Royal Bank of Scotland | | 3 month Johannesburg Interbank Agreed Rate | | 6.830% | | | ZAR | | | | 16,300,000 | | | | 3/15/2017 | | | | (7,193) | |
| The Royal Bank of Scotland | | 3 month Johannesburg Interbank Agreed Rate | | 6.960% | | | ZAR | | | | 6,700,000 | | | | 3/15/2017 | | | | 1,710 | |
| The Royal Bank of Scotland | | 3 month Johannesburg Interbank Agreed Rate | | 6.990% | | | ZAR | | | | 14,500,000 | | | | 3/15/2017 | | | | 6,029 | |
| The Royal Bank of Scotland | | 3 month Johannesburg Interbank Agreed Rate | | 6.990% | | | ZAR | | | | 18,000,000 | | | | 3/15/2017 | | | | 7,484 | |
| The Royal Bank of Scotland | | 3 month Johannesburg Interbank Agreed Rate | | 7.000% | | | ZAR | | | | 9,600,000 | | | | 3/15/2017 | | | | 4,506 | |
| The Royal Bank of Scotland | | 3 month Johannesburg Interbank Agreed Rate | | 7.190% | | | ZAR | | | | 19,000,000 | | | | 3/15/2017 | | | | 28,254 | |
| The Royal Bank of Scotland | | 3 month Johannesburg Interbank Agreed Rate | | 7.190% | | | ZAR | | | | 21,000,000 | | | | 3/15/2017 | | | | 31,228 | |
| The Royal Bank of Scotland | | 3 month Johannesburg Interbank Agreed Rate | | 7.300% | | | ZAR | | | | 17,500,000 | | | | 3/15/2017 | | | | 36,298 | |
| | | | | | | | | | | | | | | | | | | | |
| | | | | | | | | | | | | | | | | | | $1,796,813 | |
| | | | | | | | | | | | | | | | | | | | |
| (1) | 6 month Prague Interbank Offered Rate |
| (2) | 3 month Hong Kong Interbank Offered Rate |
| (3) | 6 month Budapest Interbank Offered Rate |
| (4) | 3 month Korean Certificate of Deposit |
| (5) | 6 month Warsaw Interbank Offered Rate |
| (6) | 6 month Singapore Interbank Offered Rate |
| (7) | 3 month Johannesburg Interbank Agreed Rate |
Money Market Fund pledged as collateral to broker is included in the forward foreign currency exchange contracts.
| | | | |
| | The accompanying notes are an integral part of these financial statements. | | (Continued) |
| | | | | | | | | | | | | | | | |
| | AQR Funds | | | | | | Annual Report | | | | | | December 2011 | | 83 |
| | | | | | | | | | |
| | | | |
| Consolidated Schedule of Investments | | | December 31, 2011 | |
Total return swap contracts outstanding as of December 31, 2011:
| | | | | | | | | | | | | | |
| COUNTERPARTY | | UNDERLYING REFERENCE INSTRUMENT | | TERMINATION
DATE | | CURRENCY | | NOTIONAL
VALUE | | | UNREALIZED
APPRECIATION
(DEPRECIATION) | |
Morgan Stanley and
Co., International PLC | | Bovespa Index | | 2/15/2012 | | BRL | | | 3,791,800 | | | | $(42,051) | |
| Bank of America | | Euro - Bund Futures | | 3/8/2012 | | EUR | | | 57,206,710 | | | | 1,735,509 | |
| Bank of America | | Long Gilt Futures | | 3/28/2012 | | GBP | | | 12,514,101 | | | | 363,522 | |
| Bank of America | | Mini Japanese 10-Year Treasury Bond | | 3/9/2012 | | JPY | | | 14,335,144,600 | | | | 622,529 | |
Morgan Stanley and
Co., International PLC | | Russian Depository Index | | 6/15/2050 | | USD | | | 524,617 | | | | (6,117) | |
Morgan Stanley and
Co., International PLC | | Russian Trading System Index Futures | | 3/15/2012 | | USD | | | 709,885 | | | | 3,689 | |
| Barclays Capital | | Soybean Futures | | 3/14/2012 | | USD | | | 63,963 | | | | (3,575) | |
Morgan Stanley and
Co., International PLC | | Swiss Market Index Futures | | 3/16/2012 | | CHF | | | 2,222,972 | | | | 78,991 | |
| Bank of America | | U.S. Treasury 10-Year Note Futures | | 3/21/2012 | | USD | | | 127,647,464 | | | | 986,161 | |
| | | | | | | | | | | | | | |
| | | | | | | | | | | | | $3,738,658 | |
| | | | | | | | | | | | | | |
Money Market Fund is pledged as collateral to brokers for total return swap contracts in the amount of $291,375.
Open futures contracts outstanding at December 31, 2011:
| | | | | | | | | | | | | | | | |
NUMBER OF
CONTRACTS | | TYPE | | EXPIRATION
DATE | | VALUE AT
TRADE DATE | | | VALUE AT
DECEMBER 31,
2011 | | | UNREALIZED
APPRECIATION
(DEPRECIATION) | |
| Long Contracts: | | | | | | | | | | | | | | |
| 17 | | Amsterdam Index Futures | | January 20, 2012 | | | $1,331,640 | | | | $1,378,441 | | | | $46,801 | |
| 18 | | Australia 10-Year Bond Futures | | March 15, 2012 | | | 2,168,702 | | | | 2,188,904 | | | | 20,202 | |
| 68 | | CAC40 10 Euro Futures | | January 20, 2012 | | | 2,674,894 | | | | 2,785,925 | | | | 111,031 | |
| 1 | | Cattle Feeder Futures | | January 26, 2012 | | | 71,938 | | | | 73,175 | | | | 1,237 | |
| 1 | | Cocoa Futures | | May 15, 2012 | | | 25,168 | | | | 21,310 | | | | (3,858) | |
| 3 | | Coffee ‘C’ Futures | | May 18, 2012 | | | 266,138 | | | | 258,356 | | | | (7,782) | |
| 100 | | Corn Futures | | May 14, 2012 | | | 3,225,395 | | | | 3,273,750 | | | | 48,355 | |
| 33 | | Cotton No. 2 Futures | | March 8, 2012 | | | 1,654,677 | | | | 1,514,700 | | | | (139,977) | |
| 132 | | Crude Oil Financial Futures | | February 17, 2012 | | | 12,635,740 | | | | 13,068,000 | | | | 432,260 | |
| 12 | | DAX Index Futures | | March 16, 2012 | | | 2,259,892 | | | | 2,290,822 | | | | 30,930 | |
| 27 | | E-Mini Russell 2000 Futures | | March 16, 2012 | | | 1,970,947 | | | | 1,994,760 | | | | 23,813 | |
| 71 | | FTSE 100 Index Futures | | March 16, 2012 | | | 5,967,208 | | | | 6,104,160 | | | | 136,952 | |
| 46 | | FTSE/JSE Top 40 Index Futures | | March 15, 2012 | | | 1,645,055 | | | | 1,629,150 | | | | (15,905) | |
| 10 | | FTSE/MIB Index Futures | | March 16, 2012 | | | 962,410 | | | | 978,000 | | | | 15,590 | |
| 33 | | Globex Brent FCL Futures | | February 13, 2012 | | | 3,631,460 | | | | 3,526,710 | | | | (104,750) | |
| 9 | | Globex Heat Oil Futures | | February 28, 2012 | | | 1,070,328 | | | | 1,098,430 | | | | 28,102 | |
| 9 | | Globex RBOB Gas Futures | | February 28, 2012 | | | 968,528 | | | | 1,003,665 | | | | 35,137 | |
| 47 | | Gold 100 OZ Futures | | February 27, 2012 | | | 8,076,733 | | | | 7,363,960 | | | | (712,773) | |
| 32 | | H-SHARES Index Futures | | January 30, 2012 | | | 2,081,736 | | | | 2,054,129 | | | | (27,607) | |
| 18 | | IBEX 35 Index Futures | | January 20, 2012 | | | 1,930,108 | | | | 1,974,611 | | | | 44,503 | |
| 16 | | ICE Euro Gasoil Futures | | February 9, 2012 | | | 1,526,225 | | | | 1,468,800 | | | | (57,425) | |
| 23 | | KOSPI Index 200 Futures | | March 8, 2012 | | | 2,464,208 | | | | 2,381,858 | | | | (82,350) | |
| 8 | | Lean Hogs Futures | | April 16, 2012 | | | 293,407 | | | | 280,640 | | | | (12,767) | |
| 12 | | Live Cattle Futures | | April 30, 2012 | | | 615,008 | | | | 602,160 | | | | (12,848) | |
| 3 | | LME Aluminum Futures | | January 4, 2012 | | | 165,641 | | | | 149,587 | | | | (16,054) | |
| 1 | | LME Aluminum Futures | | January 5, 2012 | | | 55,065 | | | | 49,862 | | | | (5,203) | |
| 2 | | LME Aluminum Futures | | January 19, 2012 | | | 110,103 | | | | 99,868 | | | | (10,235) | |
| 3 | | LME Aluminum Futures | | January 25, 2012 | | | 167,884 | | | | 149,963 | | | | (17,921) | |
| | | | |
| | The accompanying notes are an integral part of these financial statements. | | (Continued) |
| | | | | | | | | | | | | | | | |
| 84 | | AQR Funds | | | | | | Annual Report | | | | | | December 2011 | | |
| | | | | | | | | | |
| | | | |
| Consolidated Schedule of Investments | | | December 31, 2011 | |
| | | | | | | | | | | | | | | | |
NUMBER OF
CONTRACTS | | TYPE | | EXPIRATION
DATE | | VALUE AT
TRADE
DATE | | | VALUE AT
DECEMBER 31,
2011 | | | UNREALIZED
APPRECIATION
(DEPRECIATION) | |
| Long Contracts: (continued) | | | | | | | | | | | | | | |
| 7 | | LME Aluminum Futures | | January 27, 2012 | | | $393,745 | | | | $350,037 | | | | $(43,708) | |
| 14 | | LME Aluminum Futures | | February 2, 2012 | | | 743,768 | | | | 700,826 | | | | (42,942) | |
| 2 | | LME Aluminum Futures | | February 3, 2012 | | | 107,203 | | | | 100,136 | | | | (7,067) | |
| 9 | | LME Aluminum Futures | | February 17, 2012 | | | 479,849 | | | | 451,724 | | | | (28,125) | |
| 4 | | LME Aluminum Futures | | February 29, 2012 | | | 202,244 | | | | 201,160 | | | | (1,084) | |
| 1 | | LME Aluminum Futures | | March 1, 2012 | | | 52,357 | | | | 50,298 | | | | (2,059) | |
| 5 | | LME Aluminum Futures | | March 8, 2012 | | | 260,631 | | | | 251,778 | | | | (8,853) | |
| 3 | | LME Aluminum Futures | | March 15, 2012 | | | 148,803 | | | | 151,240 | | | | 2,437 | |
| 71 | | LME Aluminum Futures | | March 19, 2012 | | | 4,111,573 | | | | 3,582,838 | | | | (528,735) | |
| 1 | | LME Aluminum Futures | | March 22, 2012 | | | 50,039 | | | | 50,467 | | | | 428 | |
| 3 | | LME Aluminum Futures | | March 29, 2012 | | | 149,404 | | | | 151,488 | | | | 2,084 | |
| 29 | | LME Aluminum Futures | | June 18, 2012 | | | 1,535,886 | | | | 1,482,806 | | | | (53,080) | |
| 2 | | LME Copper Futures | | January 4, 2012 | | | 340,503 | | | | 379,501 | | | | 38,998 | |
| 1 | | LME Copper Futures | | January 5, 2012 | | | 174,217 | | | | 189,759 | | | | 15,542 | |
| 1 | | LME Copper Futures | | January 19, 2012 | | | 183,376 | | | | 189,879 | | | | 6,503 | |
| 1 | | LME Copper Futures | | January 20, 2012 | | | 174,121 | | | | 189,883 | | | | 15,762 | |
| 1 | | LME Copper Futures | | January 25, 2012 | | | 192,450 | | | | 189,903 | | | | (2,547) | |
| 2 | | LME Copper Futures | | January 27, 2012 | | | 398,713 | | | | 379,823 | | | | (18,890) | |
| 1 | | LME Copper Futures | | February 2, 2012 | | | 197,876 | | | | 189,935 | | | | (7,941) | |
| 1 | | LME Copper Futures | | February 10, 2012 | | | 186,501 | | | | 189,967 | | | | 3,466 | |
| 2 | | LME Copper Futures | | February 17, 2012 | | | 379,965 | | | | 379,983 | | | | 18 | |
| 2 | | LME Copper Futures | | February 29, 2012 | | | 373,753 | | | | 380,031 | | | | 6,278 | |
| 1 | | LME Copper Futures | | March 1, 2012 | | | 195,301 | | | | 190,017 | | | | (5,284) | |
| 2 | | LME Copper Futures | | March 15, 2012 | | | 362,853 | | | | 380,051 | | | | 17,198 | |
| 24 | | LME Copper Futures | | March 19, 2012 | | | 5,176,953 | | | | 4,560,600 | | | | (616,353) | |
| 2 | | LME Copper Futures | | March 22, 2012 | | | 375,380 | | | | 380,043 | | | | 4,663 | |
| 5 | | LME Copper Futures | | March 28, 2012 | | | 942,966 | | | | 950,036 | | | | 7,070 | |
| 1 | | LME Copper Futures | | March 29, 2012 | | | 184,376 | | | | 190,003 | | | | 5,627 | |
| 13 | | LME Copper Futures | | June 18, 2012 | | | 2,508,404 | | | | 2,473,250 | | | | (35,154) | |
| 1 | | LME Lead Futures | | March 19, 2012 | | | 60,675 | | | | 50,831 | | | | (9,844) | |
| 1 | | LME Lead Futures | | June 18, 2012 | | | 52,840 | | | | 51,262 | | | | (1,578) | |
| 1 | | LME Nickel Futures | | March 19, 2012 | | | 127,452 | | | | 112,290 | | | | (15,162) | |
| 1 | | LME Nickel Futures | | June 18, 2012 | | | 107,791 | | | | 112,410 | | | | 4,619 | |
| 1 | | LME Zinc Futures | | March 19, 2012 | | | 56,000 | | | | 46,094 | | | | (9,906) | |
| 1 | | LME Zinc Futures | | June 18, 2012 | | | 50,976 | | | | 46,568 | | | | (4,408) | |
| 65 | | MSCI Taiwan Stock Index Futures | | January 30, 2012 | | | 1,652,241 | | | | 1,647,750 | | | | (4,491) | |
| 396 | | Natural Gas Swap Futures | | February 27, 2012 | | | 3,135,838 | | | | 2,985,840 | | | | (149,998) | |
| 423 | | S&P 500 E-Mini Futures | | March 16, 2012 | | | 26,184,410 | | | | 26,492,490 | | | | 308,080 | |
| 26 | | S&P MID 400 E-Mini Futures | | March 16, 2012 | | | 2,263,117 | | | | 2,280,980 | | | | 17,863 | |
| 9 | | S&P/Toronto Stock Exchange 60 Index Futures | | March 15, 2012 | | | 1,188,208 | | | | 1,199,529 | | | | 11,321 | |
| 1 | | Silver Futures | | March 28, 2012 | | | 171,602 | | | | 139,575 | | | | (32,027) | |
| 7 | | Soybean Futures | | May 14, 2012 | | | 402,244 | | | | 426,125 | | | | 23,881 | |
| 3 | | SPI 200 Index Futures | | March 15, 2012 | | | 319,887 | | | | 308,297 | | | | (11,590) | |
| 27 | | Sugar #11 (World Markets) Futures | | February 29, 2012 | | | 803,491 | | | | 704,592 | | | | (98,899) | |
| 22 | | TOPIX Index Futures | | March 8, 2012 | | | 2,118,418 | | | | 2,080,811 | | | | (37,607) | |
| 54 | | Wheat Futures | | May 14, 2012 | | | 1,772,022 | | | | 1,812,375 | | | | 40,353 | |
| | | | | | | | | | | | | | | | |
| | | | | | | 121,066,660 | | | | 119,568,977 | | | | (1,497,683) | |
| | | | | | | | | | | | | | | | |
| Short Contracts: | | | | | | | | | | | | | | | | |
| 16 | | Cotton No. 2 Futures | | May 8, 2012 | | | (730,312) | | | | (733,440) | | | | (3,128) | |
| 3 | | LME Aluminum Futures | | January 4, 2012 | | | (165,371) | | | | (149,587) | | | | 15,784 | |
| 1 | | LME Aluminum Futures | | January 5, 2012 | | | (54,299) | | | | (49,863) | | | | 4,436 | |
| 2 | | LME Aluminum Futures | | January 19, 2012 | | | (110,065) | | | | (99,867) | | | | 10,198 | |
| 3 | | LME Aluminum Futures | | January 25, 2012 | | | (167,096) | | | | (149,962) | | | | 17,134 | |
| | | | |
| | The accompanying notes are an integral part of these financial statements. | | (Continued) |
| | | | | | | | | | | | | | | | |
| | AQR Funds | | | | | | Annual Report | | | | | | December 2011 | | 85 |
| | | | | | | | | | |
| | | | |
| Consolidated Schedule of Investments | | | December 31, 2011 | |
| | | | | | | | | | | | | | | | |
NUMBER OF
CONTRACTS | | TYPE | | EXPIRATION
DATE | | VALUE AT
TRADE DATE | | | VALUE AT
DECEMBER 31,
2011 | | | UNREALIZED
APPRECIATION
(DEPRECIATION) | |
| Short Contracts: (continued) | | | | | | | | | | | | | | |
| 7 | | LME Aluminum Futures | | January 27, 2012 | | | $(392,741) | | | | $(350,037) | | | | $42,704 | |
| 14 | | LME Aluminum Futures | | February 2, 2012 | | | (745,737) | | | | (700,826) | | | | 44,911 | |
| 2 | | LME Aluminum Futures | | February 3, 2012 | | | (106,016) | | | | (100,136) | | | | 5,880 | |
| 9 | | LME Aluminum Futures | | February 17, 2012 | | | (474,614) | | | | (451,724) | | | | 22,890 | |
| 4 | | LME Aluminum Futures | | February 29, 2012 | | | (201,995) | | | | (201,160) | | | | 835 | |
| 1 | | LME Aluminum Futures | | March 1, 2012 | | | (52,624) | | | | (50,299) | | | | 2,325 | |
| 5 | | LME Aluminum Futures | | March 8, 2012 | | | (260,860) | | | | (251,779) | | | | 9,081 | |
| 3 | | LME Aluminum Futures | | March 15, 2012 | | | (148,721) | | | | (151,240) | | | | (2,519) | |
| 71 | | LME Aluminum Futures | | March 19, 2012 | | | (3,861,847) | | | | (3,582,838) | | | | 279,009 | |
| 1 | | LME Aluminum Futures | | March 22, 2012 | | | (49,874) | | | | (50,467) | | | | (593) | |
| 3 | | LME Aluminum Futures | | March 29, 2012 | | | (149,261) | | | | (151,487) | | | | (2,226) | |
| 8 | | LME Aluminum Futures | | June 18, 2012 | | | (415,377) | | | | (409,050) | | | | 6,327 | |
| 2 | | LME Copper Futures | | January 4, 2012 | | | (344,348) | | | | (379,499) | | | | (35,151) | |
| 1 | | LME Copper Futures | | January 5, 2012 | | | (169,749) | | | | (189,759) | | | | (20,010) | |
| 1 | | LME Copper Futures | | January 19, 2012 | | | (183,578) | | | | (189,879) | | | | (6,301) | |
| 1 | | LME Copper Futures | | January 20, 2012 | | | (174,374) | | | | (189,883) | | | | (15,509) | |
| 1 | | LME Copper Futures | | January 25, 2012 | | | (191,124) | | | | (189,903) | | | | 1,221 | |
| 2 | | LME Copper Futures | | January 27, 2012 | | | (401,872) | | | | (379,822) | | | | 22,050 | |
| 1 | | LME Copper Futures | | February 2, 2012 | | | (198,970) | | | | (189,935) | | | | 9,035 | |
| 1 | | LME Copper Futures | | February 10, 2012 | | | (184,899) | | | | (189,968) | | | | (5,069) | |
| 2 | | LME Copper Futures | | February 17, 2012 | | | (377,551) | | | | (379,983) | | | | (2,432) | |
| 2 | | LME Copper Futures | | February 29, 2012 | | | (370,963) | | | | (380,031) | | | | (9,068) | |
| 1 | | LME Copper Futures | | March 1, 2012 | | | (195,374) | | | | (190,017) | | | | 5,357 | |
| 2 | | LME Copper Futures | | March 15, 2012 | | | (362,390) | | | | (380,050) | | | | (17,660) | |
| 24 | | LME Copper Futures | | March 19, 2012 | | | (4,735,551) | | | | (4,560,600) | | | | 174,951 | |
| 2 | | LME Copper Futures | | March 22, 2012 | | | (376,247) | | | | (380,043) | | | | (3,796) | |
| 5 | | LME Copper Futures | | March 28, 2012 | | | (947,494) | | | | (950,037) | | | | (2,543) | |
| 1 | | LME Copper Futures | | March 29, 2012 | | | (184,963) | | | | (190,004) | | | | (5,041) | |
| 3 | | LME Copper Futures | | June 18, 2012 | | | (548,221) | | | | (570,750) | | | | (22,529) | |
| 1 | | LME Lead Futures | | March 19, 2012 | | | (52,385) | | | | (50,832) | | | | 1,553 | |
| 1 | | LME Nickel Futures | | March 19, 2012 | | | (107,699) | | | | (112,290) | | | | (4,591) | |
| 1 | | LME Zinc Futures | | March 19, 2012 | | | (50,542) | | | | (46,093) | | | | 4,449 | |
| 11 | | Sugar #11 (World Markets) Futures | | April 30, 2012 | | | (280,845) | | | | (282,744) | | | | (1,899) | |
| | | | | | | | | | | | | | | | |
| | | | | | | (18,525,949) | | | | (18,005,884) | | | | 520,065 | |
| | | | | | | | | | | | | | | | |
| | | | | | | $102,540,711 | | | | $101,563,093 | | | | $(977,618) | |
| | | | | | | | | | | | | | | | |
Cash held as collateral with broker for futures contracts was $10,907,942 at December 31, 2011.
Forward foreign currency exchange contracts outstanding as of December 31, 2011:
| | | | | | | | | | | | | | | | | | | | |
PURCHASE
CONTRACTS | | COUNTERPARTY | | CURRENCY | | CURRENCY
AMOUNT
PURCHASED | | | VALUE AT
SETTLEMENT
DATE | | | VALUE AT
DECEMBER 31,
2011 | | | UNREALIZED
APPRECIATION
(DEPRECIATION) | |
Brazilian Real,
Expiring 03/21/12 | | The Royal Bank of Scotland | | BRL | | | 15,487,000 | | | | $8,289,453 | | | | $8,163,554 | | | | $(125,899) | |
Israeli Shekel,
Expiring 03/21/12 | | The Royal Bank of Scotland | | ILS | | | 17,770,000 | | | | 4,704,536 | | | | 4,656,837 | | | | (47,699) | |
Korean Won,
Expiring 03/21/12 | | The Royal Bank of Scotland | | KRW | | | 9,713,198,000 | | | | 8,365,547 | | | | 8,388,599 | | | | 23,052 | |
Mexican Peso,
Expiring 03/21/12 | | The Royal Bank of Scotland | | MXN | | | 158,645,000 | | | | 11,473,267 | | | | 11,298,531 | | | | (174,736) | |
Singapore Dollar,
Expiring 03/21/12 | | The Royal Bank of Scotland | | SGD | | | 7,288,000 | | | | 5,590,160 | | | | 5,618,893 | | | | 28,733 | |
| | | | |
| | The accompanying notes are an integral part of these financial statements. | | (Continued) |
| | | | | | | | | | | | | | | | |
| 86 | | AQR Funds | | | | | | Annual Report | | | | | | December 2011 | | |
| | | | | | | | | | |
| | | | |
| Consolidated Schedule of Investments | | | December 31, 2011 | |
| | | | | | | | | | | | | | | | | | | | |
PURCHASE
CONTRACTS | | COUNTERPARTY | | CURRENCY | | CURRENCY
AMOUNT
PURCHASED | | | VALUE AT
SETTLEMENT
DATE | | | VALUE AT
DECEMBER 31,
2011 | | | UNREALIZED
APPRECIATION
(DEPRECIATION) | |
| (Continued) | | | | | | | | | | | | | | | | | | | | |
Turkish Lira,
Expiring 03/21/12 | | The Royal Bank of Scotland | | TRY | | | 9,954,000 | | | | $5,194,730 | | | | $5,163,499 | | | | $(31,231) | |
Taiwanese Dollar,
Expiring 03/21/12 | | The Royal Bank of Scotland | | TWD | | | 136,598,000 | | | | 4,514,046 | | | | 4,518,236 | | | | 4,190 | |
South African Rand,
Expiring 03/22/12 | | The Royal Bank of Scotland | | ZAR | | | 14,788,000 | | | | 1,775,436 | | | | 1,809,847 | | | | 34,411 | |
| | | | | | | | | | | | | | | | | | | | |
| | | | | | | | | | | 49,907,175 | | | | 49,617,996 | | | | (289,179) | |
| | | | | | | | | | | | | | | | | | | | |
| | | | | | | | | | | | | | | | | | | | |
SALES
CONTRACTS | | COUNTERPARTY | | CURRENCY | | CURRENCY
AMOUNT
SOLD | | | VALUE AT
SETTLEMENT
DATE | | | VALUE AT
DECEMBER 31,
2011 | | | UNREALIZED
APPRECIATION
(DEPRECIATION) | |
Brazilian Real,
Expiring 03/21/12 | | The Royal Bank of Scotland | | BRL | | | (24,000) | | | | $(12,735) | | | | $(12,651) | | | | $84 | |
Euro,
Expiring 03/21/12 | | The Royal Bank of Scotland | | EUR | | | (64,617,000) | | | | (85,020,456) | | | | (83,688,748) | | | | 1,331,708 | |
British Pound,
Expiring 03/21/12 | | The Royal Bank of Scotland | | GBP | | | (18,550,000) | | | | (28,909,870) | | | | (28,786,436) | | | | 123,434 | |
Hong Kong Dollar,
Expiring 03/21/12 | | The Royal Bank of Scotland | | HKD | | | (33,000) | | | | (4,241) | | | | (4,250) | | | | (9) | |
Hungarian Forint,
Expiring 03/21/12 | | The Royal Bank of Scotland | | HUF | | | (4,008,000) | | | | (17,252) | | | | (16,328) | | | | 924 | |
Israeli Shekel,
Expiring 03/21/12 | | The Royal Bank of Scotland | | ILS | | | (2,911,000) | | | | (769,195) | | | | (762,862) | | | | 6,333 | |
Japanese Yen,
Expiring 03/21/12 | | The Royal Bank of Scotland | | JPY | | | (4,126,000) | | | | (53,055) | | | | (53,682) | | | | (627) | |
Russian Ruble,
Expiring 03/21/12 | | The Royal Bank of Scotland | | RUB | | | (41,220,000) | | | | (1,286,216) | | | | (1,265,722) | | | | 20,494 | |
Singapore Dollar,
Expiring 03/21/12 | | The Royal Bank of Scotland | | SGD | | | (1,034,000) | | | | (797,173) | | | | (797,192) | | | | (19) | |
Taiwanese Dollar,
Expiring 03/21/12 | | The Royal Bank of Scotland | | TWD | | | (41,310,000) | | | | (1,367,425) | | | | (1,366,405) | | | | 1,020 | |
South African Rand,
Expiring 03/22/12 | | The Royal Bank of Scotland | | ZAR | | | (727,000) | | | | (88,566) | | | | (88,975) | | | | (409) | |
| | | | | | | | | | | | | | | | | | | | |
| | | | | | | | | | | (118,326,184) | | | | (116,843,251) | | | | 1,482,933 | |
| | | | | | | | | | | | | | | | | | | | |
| | | | | | | | | | | $(68,419,009) | | | | $(67,225,255) | | | | $1,193,754 | |
| | | | | | | | | | | | | | | | | | | | |
Money Market Fund is pledged as collateral to the broker for forward foreign currency exchange, credit default swap and interest rate swap contracts in the amount of $15,102,650.
BRL - Brazilian Real
EUR - Euro
GBP - British Pound
HKD - Hong Kong Dollar
HUF - Hungarian Forint
ILS - Israeli Shekel
JPY - Japanese Yen
KRW - Korean Won
MXN - Mexican Peso
RUB - Russian Ruble
SGD - Singapore Dollar
TRY - Turkish Lira
TWD - Taiwan Dollar
ZAR - South African Rand
| | | | |
| | The accompanying notes are an integral part of these financial statements. | | |
| | | | | | | | | | | | | | | | |
| | AQR Funds | | | | | | Annual Report | | | | | | December 2011 | | 87 |
| | | | | | | | | | |
| | | | |
| Consolidated Schedule of Investments | | | December 31, 2011 | |
| | |
| AQR MULTI-STRATEGY ALTERNATIVE FUND | | |
| | | | | | | | |
| LONG INVESTMENTS - 37.6% | | SHARES | | | VALUE
(Note 3) | |
| | |
| COMMON STOCKS - 1.3% | | | | | | | | |
| | |
| Energy - 0.0% (a) | | | | | | | | |
| Superior Energy Services, Inc. † | | | 1,500 | | | $ | 42,660 | |
| | | | | | | | |
| | |
| Health Care - 0.6% | | | | | | | | |
| Pharmasset, Inc. † | | | 13,257 | | | | 1,699,548 | |
| | | | | | | | |
| | |
| Information Technology - 0.7% | | | | | | | | |
| SuccessFactors, Inc. † | | | 55,291 | | | | 2,204,452 | |
| | | | | | | | |
TOTAL COMMON STOCKS
(Cost $4,009,209) | | | | | | | 3,946,660 | |
| | | | | | | | |
| | | | | | | | | | | | | | | | | | | | |
| CONVERTIBLE PREFERRED STOCKS - 0.5% | | MOODY’S
RATING* (UNAUDITED) | | | | | | | | | SHARES | | | VALUE
(Note 3) | |
| Financials - 0.5% | | | | | | | | | | | | | | | | | | | | |
| Citigroup, Inc., $100.00 par, 7.500% | | | NR | | | | | | | | | | | | 10,000 | | | $ | 812,500 | |
| MetLife, Inc., $82.88 par, 5.000% | | | BBB- | ** | | | | | | | | | | | 9,560 | | | | 589,087 | |
| | | | | | | | | | | | | | | | | | | | |
TOTAL CONVERTIBLE PREFERRED STOCKS
(Cost $1,509,735) | | | | | | | | | | | | | | | | | | | 1,401,587 | |
| | | | | | | | | | | | | | | | | | | | |
| | | | | |
| CORPORATE BONDS - 14.2% | | | | | INTEREST
RATE | | | MATURITY
DATE | | | PRINCIPAL
AMOUNT
(000’S) | | | | |
| Consumer Staples - 1.4% | | | | | | | | | | | | | | | | | | | | |
| Archer-Daniels-Midland Co. (2) | | | A | ** | | | 0.875% | | | | 02/15/14 | | | $ | 600 | | | | 603,000 | |
| Smithfield Foods, Inc. (2)(b) | | | BB- | ** | | | 4.000% | | | | 06/30/13 | | | | 3,075 | | | | 3,770,719 | |
| | | | | | | | | | | | | | | | | | | | |
| | | | | | | | | | | | | | | | | | | 4,373,719 | |
| | | | | | | | | | | | | | | | | | | | |
| Energy - 0.1% | | | | | | | | | | | | | | | | | | | | |
| Global Industries Ltd. (2) | | | NR | | | | 2.750% | | | | 08/01/27 | | | | 375 | | | | 374,062 | |
| | | | | | | | | | | | | | | | | | | | |
| | | | | |
| Financials - 2.4% | | | | | | | | | | | | | | | | | | | | |
| Health Care REIT, Inc. (2)(b) | | | Baa2 | | | | 3.000% | | | | 12/01/29 | | | | 2,525 | | | | 2,887,969 | |
| PHH Corp. (2)(b) | | | Ba2 | | | | 4.000% | | | | 04/15/12 | | | | 1,175 | | | | 1,111,843 | |
| SL Green Operating Partnership LP 144A (2)(b) | | | NR | | | | 3.000% | | | | 10/15/17 | | | | 3,000 | | | | 3,093,750 | |
| | | | | | | | | | | | | | | | | | | | |
| | | | | | | | | | | | | | | | | | | 7,093,562 | |
| | | | | | | | | | | | | | | | | | | | |
| Health Care - 2.3% | | | | | | | | | | | | | | | | | | | | |
| Amgen, Inc., Series B (2)(b) | | | Baa1 | | | | 0.375% | | | | 02/01/13 | | | | 2,500 | | | | 2,509,375 | |
| Gilead Sciences, Inc. (2) | | | Baa1 | | | | 1.625% | | | | 05/01/16 | | | | 3,000 | | | | 3,416,250 | |
| Omnicare, Inc. (2)(b) | | | Ba3 | | | | 3.750% | | | | 12/15/25 | | | | 725 | | | | 1,007,750 | |
| | | | | | | | | | | | | | | | | | | | |
| | | | | | | | | | | | | | | | | | | 6,933,375 | |
| | | | | | | | | | | | | | | | | | | | |
| Industrials - 1.7% | | | | | | | | | | | | | | | | | | | | |
| Chart Industries, Inc. (2) | | | B+ | ** | | | 2.000% | | | | 08/01/18 | | | | 2,225 | | | | 2,350,156 | |
| General Cable Corp. (2)(b)(c) | | | B2 | | | | 4.500% | | | | 11/15/29 | | | | 1,650 | | | | 1,561,313 | |
| L-3 Communications Holdings, Inc. (2) | | | Ba1 | | | | 3.000% | | | | 08/01/35 | | | | 1,400 | | | | 1,340,500 | |
| | | | | | | | | | | | | | | | | | | | |
| | | | | | | | | | | | | | | | | | | 5,251,969 | |
| | | | | | | | | | | | | | | | | | | | |
| Information Technology - 5.0% | | | | | | | | | | | | | | | | | | | | |
| Equinix, Inc. (2) | | | NR | | | | 4.750% | | | | 06/15/16 | | | | 1,675 | | | | 2,357,563 | |
| Microchip Technology, Inc. (2) | | | NR | | | | 2.125% | | | | 12/15/37 | | | | 2,050 | | | | 2,767,500 | |
| NetApp, Inc. (2) | | | NR | | | | 1.750% | | | | 06/01/13 | | | | 2,500 | | | | 3,156,250 | |
| Salesforce.com, Inc. (2)(b) | | | NR | | | | 0.750% | | | | 01/15/15 | | | | 1,725 | | | | 2,356,781 | |
| Xilinx, Inc. (2)(b) | | | BB+** | | | | 3.125% | | | | 03/15/37 | | | | 4,000 | | | | 4,540,000 | |
| | | | | | | | | | | | | | | | | | | | |
| | | | | | | | | | | | | | | | | | | 15,178,094 | |
| | | | | | | | | | | | | | | | | | | | |
| | | | |
| | The accompanying notes are an integral part of these financial statements. | | (Continued) |
| | | | | | | | | | | | | | | | |
| 88 | | AQR Funds | | | | | | Annual Report | | | | | | December 2011 | | |
| | | | | | | | | | |
| | | | |
| Consolidated Schedule of Investments | | | December 31, 2011 | |
| | |
| AQR MULTI-STRATEGY ALTERNATIVE FUND | | |
| | | | | | | | | | | | | | | | | | | | |
| | | | | |
| | | MOODY’S
RATING* (UNAUDITED) | | | INTEREST
RATE | | | MATURITY
DATE | | | PRINCIPAL
AMOUNT
(000’S) | | | VALUE
(Note 3) | |
| Materials - 1.3% | | | | | | | | | | | | | | | | | | | | |
| United States Steel Corp. (2) | | | NR | | | | 4.000% | | | | 05/15/14 | | | $ | 3,450 | | | $ | 3,816,563 | |
| | | | | | | | | | | | | | | | | | | | |
TOTAL CORPORATE BONDS
(Cost $43,147,080) | | | | | | | | | | | | | | | | | | | 43,021,344 | |
| | | | | | | | | | | | | | | | | | | | |
| | | | | |
| CONVERTIBLE BONDS - 21.6% | | | | | | | | | | | | | | | |
| Consumer Discretionary - 2.8% | | | | | | | | | | | | | | | | | | | | |
| DR Horton, Inc., Series DHI (2)(b) | | | Ba3 | | | | 2.000% | | | | 05/15/14 | | | | 2,800 | | | | 3,269,000 | |
| Ford Motor Co. (2)(b) | | | Ba2 | | | | 4.250% | | | | 11/15/16 | | | | 1,250 | | | | 1,792,187 | |
| Gaylord Entertainment Co. 144A (2)(b)(d) | | | NR | | | | 3.750% | | | | 10/01/14 | | | | 1,175 | | | | 1,307,188 | |
| Lennar Corp. 144A (2)(d) | | | B3 | | | | 3.250% | | | | 11/15/21 | | | | 100 | | | | 109,375 | |
| Lennar Corp. 144A (2)(b)(d) | | | B3 | | | | 2.750% | | | | 12/15/20 | | | | 500 | | | | 557,500 | |
| Lennar Corp. 144A (2)(b)(d) | | | B3 | | | | 2.000% | | | | 12/01/20 | | | | 1,000 | | | | 1,005,000 | |
| priceline.com, Inc. 144A (2)(b)(d) | | | BBB- | ** | | | 1.250% | | | | 03/15/15 | | | | 275 | | | | 452,719 | |
| | | | | | | | | | | | | | | | | | | | |
| | | | | | | | | | | | | | | | | | | 8,492,969 | |
| | | | | | | | | | | | | | | | | | | | |
| Consumer Staples - 1.3% | | | | | | | | | | | | | | | | | | | | |
| Tyson Foods, Inc. (2)(b) | | | BB+ | ** | | | 3.250% | | | | 10/15/13 | | | | 2,975 | | | | 3,945,593 | |
| | | | | | | | | | | | | | | | | | | | |
| | | | | |
| Financials - 4.1% | | | | | | | | | | | | | | | | | | | | |
| Ares Capital Corp. 144A (2)(d) | | | BBB | ** | | | 5.750% | | | | 02/01/16 | | | | 800 | | | | 770,000 | |
| Boston Properties LP 144A (2)(b)(d) | | | A- | ** | | | 3.625% | | | | 02/15/14 | | | | 1,500 | | | | 1,618,125 | |
| Boston Properties LP (2)(b) | | | A- | ** | | | 3.750% | | | | 05/15/36 | | | | 750 | | | | 856,875 | |
| DDR Corp. (2) | | | NR | | | | 1.750% | | | | 11/15/40 | | | | 820 | | | | 803,600 | |
| Digital Realty Trust LP 144A (2)(b)(d) | | | NR | | | | 5.500% | | | | 04/15/29 | | | | 1,650 | | | | 2,737,969 | |
| Host Hotels & Resorts LP 144A (2)(b)(d) | | | BB+ | ** | | | 2.500% | | | | 10/15/29 | | | | 2,150 | | | | 2,663,312 | |
| PHH Corp. (2) | | | Ba2 | | | | 4.000% | | | | 09/01/14 | | | | 600 | | | | 483,000 | |
| ProLogis LP (2)(b) | | | BBB- | ** | | | 3.250% | | | | 03/15/15 | | | | 2,250 | | | | 2,320,313 | |
| | | | | | | | | | | | | | | | | | | | |
| | | | | | | | | | | | | | | | | | | 12,253,194 | |
| | | | | | | | | | | | | | | | | | | | |
| Health Care - 0.3% | | | | | | | | | | | | | | | | | | | | |
| Mylan, Inc. (2) | | | BB | ** | | | 1.250% | | | | 03/15/12 | | | | 1,000 | | | | 1,002,500 | |
| | | | | | | | | | | | | | | | | | | | |
| | | | | |
| Industrials - 4.0% | | | | | | | | | | | | | | | | | | | | |
| Avis Budget Group, Inc. (2)(b) | | | NR | | | | 3.500% | | | | 10/01/14 | | | | 3,300 | | | | 3,366,000 | |
| Hertz Global Holdings, Inc. (2)(b) | | | B- | ** | | | 5.250% | | | | 06/01/14 | | | | 4,000 | | | | 6,225,000 | |
| Navistar International Corp. (2)(b) | | | B | ** | | | 3.000% | | | | 10/15/14 | | | | 1,000 | | | | 1,077,500 | |
| Textron, Inc., Series TXT (2)(b) | | | Baa3 | | | | 4.500% | | | | 05/01/13 | | | | 875 | | | | 1,343,125 | |
| | | | | | | | | | | | | | | | | | | | |
| | | | | | | | | | | | | | | | | | | 12,011,625 | |
| | | | | | | | | | | | | | | | | | | | |
| Information Technology - 3.9% | | | | | | | | | | | | | | | | | | | | |
| Amkor Technology, Inc. (2)(b) | | | NR | | | | 6.000% | | | | 04/15/14 | | | | 1,175 | | | | 1,853,563 | |
| Cadence Design Systems, Inc. (2)(b) | | | NR | | | | 2.625% | | | | 06/01/15 | | | | 2,900 | | | | 4,382,625 | |
| Ciena Corp. 144A (2)(b)(d) | | | NR | | | | 4.000% | | | | 03/15/15 | | | | 500 | | | | 491,250 | |
| SanDisk Corp. (2) | | | BB | ** | | | 1.500% | | | | 08/15/17 | | | | 1,475 | | | | 1,736,812 | |
| Take-Two Interactive Software, Inc. 144A (2)(b)(d) | | | NR | | | | 1.750% | | | | 12/01/16 | | | | 200 | | | | 194,250 | |
| VeriFone Systems, Inc. (2) | | | BB- | ** | | | 1.375% | | | | 06/15/12 | | | | 175 | | | | 179,375 | |
| VeriSign, Inc. (2)(b) | | | NR | | | | 3.250% | | | | 08/15/37 | | | | 2,344 | | | | 2,801,080 | |
| | | | | | | | | | | | | | | | | | | | |
| | | | | | | | | | | | | | | | | | | 11,638,955 | |
| | | | | | | | | | | | | | | | | | | | |
| Materials - 3.5% | | | | | | | | | | | | | | | | | | | | |
| Alcoa, Inc.(2)(b) | | | Baa3 | | | | 5.250% | | | | 03/15/14 | | | | 3,550 | | | | 5,369,375 | |
| Allegheny Technologies, Inc.(2)(b) | | | BBB- | ** | | | 4.250% | | | | 06/01/14 | | | | 3,425 | | | | 4,790,719 | |
| Cemex SAB de CV 144A (Mexico)(2)(b)(d) | | | NR | | | | 3.250% | | | | 03/15/16 | | | | 500 | | | | 325,625 | |
| Sterlite Industries India Ltd. (India)(2)(b) | | | NR | | | | 4.000% | | | | 10/30/14 | | | | 225 | | | | 177,750 | |
| | | | | | | | | | | | | | | | | | | | |
| | | | | | | | | | | | | | | | | | | 10,663,469 | |
| | | | | | | | | | | | | | | | | | | | |
| | | | |
| | The accompanying notes are an integral part of these financial statements. | | (Continued) |
| | | | | | | | | | | | | | | | |
| | AQR Funds | | | | | | Annual Report | | | | | | December 2011 | | 89 |
| | | | | | | | | | |
| | | | |
| Consolidated Schedule of Investments | | | December 31, 2011 | |
| | |
| AQR MULTI-STRATEGY ALTERNATIVE FUND | | |
| | | | | | | | | | | | | | | | | | | | |
| | | | | |
| | | MOODY’S
RATING* (UNAUDITED) | | | INTEREST
RATE | | | MATURITY
DATE | | | PRINCIPAL
AMOUNT
(000’S) | | | VALUE
(Note 3) | |
| Materials - 3.5% (continued) | | | | | | | | | | | | | | | | | | | | |
| Telecommunication Services - 1.7% | | | | | | | | | | | | | | | | | | | | |
| Level 3 Communications, Inc. (2)(b) | | | CCC | ** | | | 15.000% | | | | 01/15/13 | | | $ | 1,550 | | | $ | 1,776,687 | |
| XM Satellite Radio, Inc. 144A (2)(d) | | | BB | ** | | | 7.000% | | | | 12/01/14 | | | | 2,550 | | | | 3,295,875 | |
| | | | | | | | | | | | | | | | | | | | |
| | | | | | | | | | | | | | | | | | | 5,072,562 | |
| | | | | | | | | | | | | | | | | | | | |
TOTAL CONVERTIBLE BONDS
(Cost $65,550,711) | | | | | | | | | | | | | | | | | | | 65,080,867 | |
| | | | | | | | | | | | | | | | | | | | |
TOTAL INVESTMENTS, BEFORE
SECURITIES SOLD SHORT
(Cost $114,216,735) | | | | | | | | | | | | | | | | | | | 113,450,458 | |
| | | | | | | | | | | | | | | | | | | | |
| | | | | | | | |
| | | SHARES | | | VALUE
(Note 3) | |
| SECURITIES SOLD SHORT - (21.1)% | | | | | | | | |
| | |
| COMMON STOCKS - (21.1)% | | | | | | | | |
| | |
| Consumer Discretionary - (2.1)% | | | | | | | | |
| DR Horton, Inc. | | | (130,774) | | | $ | (1,649,060) | |
| Ford Motor Co. † | | | (104,264) | | | | (1,121,881) | |
| Gaylord Entertainment Co. † | | | (29,698) | | | | (716,910) | |
| Lennar Corp., Class A | | | (33,713) | | | | (662,460) | |
| priceline.com, Inc. † | | | (803) | | | | (375,571) | |
| Sirius XM Radio, Inc. † | | | (992,737) | | | | (1,806,781) | |
| | | | | | | | |
| | | | | | | (6,332,663) | |
| | | | | | | | |
| Consumer Staples - (1.7)% | | | | | | | | |
| Archer-Daniels-Midland Co. | | | (3,165) | | | | (90,519) | |
| Smithfield Foods, Inc. † | | | (94,216) | | | | (2,287,565) | |
| Tyson Foods, Inc., Class A | | | (133,825) | | | | (2,762,148) | |
| | | | | | | | |
| | | | | | | (5,140,232) | |
| | | | | | | | |
| Energy - 0.0% (a) | | | | | | | | |
| Superior Energy Services, Inc. † | | | (1,500) | | | | (42,660) | |
| | | | | | | | |
| | |
| Financials - (3.5)% | | | | | | | | |
| Ares Capital Corp. | | | (13,775) | | | | (212,824) | |
| Boston Properties, Inc. REIT | | | (9,415) | | | | (937,734) | |
| Citigroup, Inc. | | | (23,800) | | | | (626,178) | |
| DDR Corp. REIT | | | (28,625) | | | | (348,366) | |
| Digital Realty Trust, Inc. REIT | | | (35,505) | | | | (2,367,118) | |
| Health Care REIT, Inc. REIT | | | (28,125) | | | | (1,533,656) | |
| Host Hotels & Resorts, Inc. REIT | | | (112,214) | | | | (1,657,401) | |
| MetLife, Inc. | | | (15,618) | | | | (486,969) | |
| PHH Corp. † | | | (7,244) | | | | (77,511) | |
| ProLogis, Inc. REIT | | | (26,764) | | | | (765,183) | |
| SL Green Realty Corp. REIT | | | (23,370) | | | | (1,557,377) | |
| | | | | | | | |
| | | | | | | (10,570,317) | |
| | | | | | | | |
| Health Care - (1.0)% | | | | | | | | |
| Amgen, Inc. | | | (6,300) | | | | (404,523) | |
| Gilead Sciences, Inc. † | | | (39,300) | | | | (1,608,549) | |
| | | | | | | | |
| | | SHARES | | | VALUE
(Note 3) | |
| Health Care - (1.0)% (continued) | | | | | | | | |
| Mylan, Inc. † | | | (12,846) | | | $ | (275,675) | |
| Omnicare, Inc. | | | (23,605) | | | | (813,192) | |
| | | | | | | | |
| | | | | | | (3,101,939) | |
| | | | | | | | |
| Industrials - (3.3)% | | | | | | | | |
| Avis Budget Group, Inc. † | | | (117,803) | | | | (1,262,848) | |
| Chart Industries, Inc. † | | | (26,207) | | | | (1,417,012) | |
| General Cable Corp. † | | | (41,781) | | | | (1,044,943) | |
| Hertz Global Holdings, Inc. † | | | (410,246) | | | | (4,808,083) | |
| L-3 Communications Holdings, Inc. | | | (424) | | | | (28,272) | |
| Navistar International Corp. † | | | (12,036) | | | | (455,924) | |
| Textron, Inc. | | | (55,273) | | | | (1,021,998) | |
| | | | | | | | |
| | | | | | | (10,039,080) | |
| | | | | | | | |
| Information Technology - (6.5)% | | | | | | | | |
| Amkor Technology, Inc. † | | | (334,053) | | | | (1,456,471) | |
| Cadence Design Systems, Inc. † | | | (322,857) | | | | (3,357,713) | |
| Ciena Corp. † | | | (13,713) | | | | (165,927) | |
| Equinix, Inc. † | | | (16,779) | | | | (1,701,391) | |
| Microchip Technology, Inc. | | | (69,022) | | | | (2,528,276) | |
| NetApp, Inc. † | | | (56,465) | | | | (2,047,986) | |
| Salesforce.com, Inc. † | | | (15,300) | | | | (1,552,338) | |
| SanDisk Corp. † | | | (22,182) | | | | (1,091,576) | |
| Take-Two Interactive Software, Inc. † | | | (6,921) | | | | (93,780) | |
| VeriFone Systems, Inc. † | | | (1,197) | | | | (42,517) | |
| VeriSign, Inc. | | | (59,400) | | | | (2,121,768) | |
| Xilinx, Inc. | | | (106,705) | | | | (3,420,962) | |
| | | | | | | | |
| | | | | | | (19,580,705) | |
| | | | | | | | |
| Materials - (2.9)% | | | | | | | | |
| Alcoa, Inc. | | | (427,802) | | | | (3,700,488) | |
| Allegheny Technologies, Inc. | | | (58,944) | | | | (2,817,523) | |
| Cemex SAB de CV ADR (Mexico) † | | | (33,485) | | | | (180,484) | |
| Sterlite Industries India Ltd. ADR (India) | | | (975) | | | | (6,757) | |
| United States Steel Corp. | | | (69,724) | | | | (1,844,897) | |
| | | | | | | | |
| | | | | | | (8,550,149) | |
| | | | | | | | |
| | | | |
| | The accompanying notes are an integral part of these financial statements. | | (Continued) |
| | | | | | | | | | | | | | | | |
| 90 | | AQR Funds | | | | | | Annual Report | | | | | | December 2011 | | |
| | | | | | | | | | |
| | | | |
| Consolidated Schedule of Investments | | | December 31, 2011 | |
| | |
| AQR MULTI-STRATEGY ALTERNATIVE FUND | | |
| | | | | | | | |
| | | SHARES | | | VALUE
(Note 3) | |
| Telecommunication Services - (0.1)% | | | | | |
| Level 3 Communications, Inc. † | | | (18,169) | | | $ | (308,691) | |
| | | | | | | | |
TOTAL COMMON STOCKS SOLD SHORT
(proceeds $64,254,023) | | | | | | | (63,666,436) | |
| | | | | | | | |
TOTAL SECURITIES SOLD SHORT
(proceeds $64,254,023) | | | | | | | (63,666,436) | |
| | | | | | | | |
TOTAL INVESTMENTS, NET OF SECURITIES SOLD SHORT - 16.5%
(Cost $49,962,712) | | | | | | | 49,784,022 | |
| | | | | | | | |
| OTHER ASSETS IN EXCESS OF LIABILITIES - 83.5% (e) | | | | | | | 252,060,742 | |
| | | | | | | | |
NET ASSETS - 100.0% | | | | | | $ | 301,844,764 | |
| | | | | | | | |
| † | Non income-producing security. |
| (a) | Represents less than 0.05 percent of net assets. |
| (b) | All or a portion of this security has been segregated as collateral for securities sold short and can be sold or replaced subject to the broker’s right to re-hypothecate. At December 31, 2011, the value of these securities was $15,088,763. In addition, $64,600,150 of cash collateral was pledged. |
| (c) | Represents a step bond. The rate shown reflects the yield at December 31, 2011. |
| (d) | Rule 144A, Section 4(2) or other security which is restricted as to resale to institutional investors. The Fund Adviser has deemed this security to be liquid based upon procedures approved by the Board of Trustees. |
| (e) | Includes appreciation (depreciation) on forward foreign currency exchange, futures contracts and swap contracts. |
| * | The rating reflected is as of December 31, 2011 and is unaudited. Rating of certain bonds may have changed subsequent to the date. |
| ** | S & P Rating provided and is unaudited. |
All securities are United States companies, unless noted otherwise in parentheses.
All securities are Level 1 with respect to ASC 820, unless noted otherwise in parentheses.
(2) Level 2 security (See Note 5).
The following abbreviations are used in portfolio descriptions:
144A - Restricted Security
ADR - American Depositary Receipt
NR - Not Rated by Moody’s
REIT - Real Estate Investment Trust
Credit default swap contracts sell protections as of December 31, 2011:
| | | | | | | | | | | | | | | | | | | | | | |
| COUNTERPARTY | | REFERENCE ENTITY | | FIXED
ANNUAL
RATE
RECEIVED
BY FUND | | CURRENCY | | NOTIONAL
AMOUNT | | | UPFRONT
PREMIUM
(RECEIVED)
PAID | | | TERMINATION
DATE | | | UNREALIZED
APPRECIATION
(DEPRECIATION) | |
The
Royal
Bank of
Scotland | | Markit CDX North America High Yield Index Series 17 | | 5.000% | | USD | | | 2,950,000 | | | | $(253,457) | | | | 12/20/2016 | | | | $55,043 | |
| | | | | | | | | | | | | | | | | | | | | | |
| | | | | | | | | | | | | $(253,457) | | | | | | | | $55,043 | |
| | | | | | | | | | | | | | | | | | | | | | |
Collateral for positions held at the Royal Bank of Scotland is included in the collateral for forward foreign currency exchange contracts.
Total return swap contracts outstanding as of December 31, 2011:
| | | | | | | | | | | | | | |
| COUNTERPARTY | | UNDERLYING REFERENCE
INSTRUMENT | | TERMINATION
DATE | | CURRENCY | | NOTIONAL
VALUE | | | UNREALIZED
APPRECIATION
(DEPRECIATION) | |
| Bank of America | | Canadian 10-Year Bond Futures | | 3/21/2012 | | CAD | | | 11,495,978 | | | | $13,281 | |
| Barclays Capital | | Coffee ‘C’ Futures | | 3/20/2012 | | USD | | | (173,325) | | | | 3,187 | |
| Bank of America | | Euro - Bund Futures | | 3/8/2012 | | EUR | | | (6,769,130) | | | | (56,654) | |
| Bank of America | | Euro-Bobl Futures | | 3/8/2012 | | EUR | | | 2,347,642 | | | | 38,481 | |
| Bank of America | | Euro-Buxl 30-Year Bond Futures | | 3/8/2012 | | EUR | | | 982,662 | | | | 53,399 | |
| Bank of America | | Euro-SCHATZ Futures | | 3/8/2012 | | EUR | | | 15,313,632 | | | | 30,973 | |
| Bank of America | | Long Gilt Futures | | 3/28/2012 | | GBP | | | 3,123,568 | | | | 52,893 | |
| | | | |
| | The accompanying notes are an integral part of these financial statements. | | (Continued) |
| | | | | | | | | | | | | | | | |
| | AQR Funds | | | | | | Annual Report | | | | | | December 2011 | | 91 |
| | | | | | | | | | |
| | | | |
| Consolidated Schedule of Investments | | | December 31, 2011 | |
| | |
| AQR MULTI-STRATEGY ALTERNATIVE FUND | | |
| | | | | | | | | | | | | | |
| COUNTERPARTY | | UNDERLYING REFERENCE
INSTRUMENT | | TERMINATION
DATE | | CURRENCY | | NOTIONAL
VALUE | | | UNREALIZED
APPRECIATION
(DEPRECIATION) | |
Morgan Stanley and Co.,
International PLC | | Russian Trading System Index Futures | | 3/15/2012 | | USD | | | 21,712 | | | | $160 | |
| Barclays Capital | | Soybean Futures | | 3/14/2012 | | USD | | | (225,600) | | | | (15,950) | |
| Barclays Capital | | Soybean Oil Futures | | 3/14/2012 | | USD | | | (535,896) | | | | (30,240) | |
Morgan Stanley and Co.,
International PLC | | Swiss Market Index Futures | | 3/16/2012 | | CHF | | | (2,204,409) | | | | (98,780) | |
| Bank of America | | U.S. Long Bond Futures | | 3/21/2012 | | USD | | | 577,998 | | | | 1,252 | |
| Bank of America | | U.S. Treasury 10-Year Note Futures | | 3/21/2012 | | USD | | | 17,254,448 | | | | 54,052 | |
| Bank of America | | U.S. Treasury 2-Year Note Futures | | 3/30/2012 | | USD | | | 1,985,323 | | | | (401) | |
| Bank of America | | U.S. Treasury 5-Year Note Futures | | 3/30/2012 | | USD | | | 1,477,738 | | | | 1,355 | |
| Barclays Capital | | Wheat Futures | | 3/14/2012 | | USD | | | (976,071) | | | | (35,692) | |
| | | | | | | | | | | | | | |
| | | | | | | | | | | | | $11,316 | |
| | | | | | | | | | | | | | |
Cash pledged as collateral for total return swap contracts is included in the collateral for the total return basket swaps.
Open futures contracts outstanding at December 31, 2011:
| | | | | | | | | | | | | | | | |
NUMBER OF
CONTRACTS | | DESCRIPTION | | EXPIRATION DATE | | VALUE AT
TRADE DATE | | | VALUE AT
DECEMBER 31,
2011 | | | UNREALIZED
APPRECIATION
(DEPRECIATION) | |
| Long Contracts: | |
| 11 | | Corn Futures | | March 14, 2012 | | | $353,608 | | | | $355,576 | | | | $1,968 | |
| 11 | | Crude Oil Financial Futures | | January 19, 2012 | | | 1,100,000 | | | | 1,087,130 | | | | (12,870) | |
| 17 | | Globex Brent FCL Futures | | January 13, 2012 | | | 1,843,980 | | | | 1,825,460 | | | | (18,520) | |
| 5 | | Globex Heat Oil Futures | | January 30, 2012 | | | 614,565 | | | | 611,982 | | | | (2,583) | |
| 17 | | Globex RBOB Gas Futures | | January 30, 2012 | | | 1,888,043 | | | | 1,897,384 | | | | 9,341 | |
| 16 | | ICE Euro Gasoil Futures | | January 11, 2012 | | | 1,495,550 | | | | 1,478,400 | | | | (17,150) | |
| 1 | | LME Aluminum Futures | | January 12, 2012 | | | 56,001 | | | | 49,896 | | | | (6,105) | |
| 1 | | LME Aluminum Futures | | January 13, 2012 | | | 55,439 | | | | 49,901 | | | | (5,538) | |
| 5 | | LME Aluminum Futures | | January 17, 2012 | | | 281,256 | | | | 249,601 | | | | (31,655) | |
| 1 | | LME Aluminum Futures | | January 20, 2012 | | | 53,426 | | | | 49,942 | | | | (3,484) | |
| 6 | | LME Aluminum Futures | | January 24, 2012 | | | 326,107 | | | | 299,870 | | | | (26,237) | |
| 1 | | LME Aluminum Futures | | January 26, 2012 | | | 56,135 | | | | 49,996 | | | | (6,139) | |
| 6 | | LME Aluminum Futures | | January 27, 2012 | | | 337,595 | | | | 300,032 | | | | (37,563) | |
| 1 | | LME Aluminum Futures | | February 1, 2012 | | | 54,626 | | | | 50,050 | | | | (4,576) | |
| 8 | | LME Aluminum Futures | | February 2, 2012 | | | 425,110 | | | | 400,472 | | | | (24,638) | |
| 1 | | LME Aluminum Futures | | February 3, 2012 | | | 53,576 | | | | 50,068 | | | | (3,508) | |
| 4 | | LME Aluminum Futures | | February 10, 2012 | | | 212,355 | | | | 200,521 | | | | (11,834) | |
| 1 | | LME Aluminum Futures | | February 15, 2012 | | | 53,676 | | | | 50,175 | | | | (3,501) | |
| 7 | | LME Aluminum Futures | | February 23, 2012 | | | 362,259 | | | | 351,686 | | | | (10,573) | |
| 4 | | LME Aluminum Futures | | March 1, 2012 | | | 210,005 | | | | 201,193 | | | | (8,812) | |
| 7 | | LME Aluminum Futures | | March 8, 2012 | | | 364,884 | | | | 352,490 | | | | (12,394) | |
| 13 | | LME Aluminum Futures | | March 15, 2012 | | | 644,812 | | | | 655,372 | | | | 10,560 | |
| 13 | | LME Aluminum Futures | | March 19, 2012 | | | 646,198 | | | | 656,013 | | | | 9,815 | |
| 4 | | LME Aluminum Futures | | March 22, 2012 | | | 198,540 | | | | 201,867 | | | | 3,327 | |
| 6 | | LME Aluminum Futures | | March 28, 2012 | | | 301,020 | | | | 302,951 | | | | 1,931 | |
| 2 | | LME Aluminum Futures | | March 29, 2012 | | | 99,503 | | | | 100,992 | | | | 1,489 | |
| 1 | | LME Copper Futures | | January 17, 2012 | | | 190,626 | | | | 189,866 | | | | (760) | |
| 1 | | LME Copper Futures | | January 24, 2012 | | | 184,476 | | | | 189,899 | | | | 5,423 | |
| 3 | | LME Copper Futures | | January 27, 2012 | | | 600,753 | | | | 569,734 | | | | (31,019) | |
| 1 | | LME Copper Futures | | February 2, 2012 | | | 197,789 | | | | 189,935 | | | | (7,854) | |
| 2 | | LME Copper Futures | | February 10, 2012 | | | 374,427 | | | | 379,934 | | | | 5,507 | |
| 1 | | LME Copper Futures | | February 29, 2012 | | | 191,376 | | | | 190,015 | | | | (1,361) | |
| | | | |
| | The accompanying notes are an integral part of these financial statements. | | (Continued) |
| | | | | | | | | | | | | | | | |
| 92 | | AQR Funds | | | | | | Annual Report | | | | | | December 2011 | | |
| | | | | | | | | | |
| | | | |
| Consolidated Schedule of Investments | | | December 31, 2011 | |
| | |
| AQR MULTI-STRATEGY ALTERNATIVE FUND | | |
| | | | | | | | | | | | | | | | |
NUMBER OF
CONTRACTS | | DESCRIPTION | | EXPIRATION DATE | | VALUE AT
TRADE DATE | | | VALUE AT
DECEMBER 31,
2011 | | | UNREALIZED
APPRECIATION
(DEPRECIATION) | |
| Long Contracts: (continued) | |
| 3 | | LME Copper Futures | | March 19, 2012 | | | $568,654 | | | | $570,075 | | | | $1,421 | |
| 3 | | LME Copper Futures | | March 28, 2012 | | | 565,780 | | | | 570,022 | | | | 4,242 | |
| 1 | | LME Copper Futures | | March 29, 2012 | | | 184,264 | | | | 190,004 | | | | 5,740 | |
| 1 | | LME Nickel Futures | | January 17, 2012 | | | 114,619 | | | | 112,383 | | | | (2,236) | |
| 1 | | LME Nickel Futures | | January 24, 2012 | | | 114,001 | | | | 112,322 | | | | (1,679) | |
| 2 | | LME Nickel Futures | | February 10, 2012 | | | 217,503 | | | | 224,456 | | | | 6,953 | |
| 1 | | LME Nickel Futures | | March 1, 2012 | | | 103,081 | | | | 112,211 | | | | 9,130 | |
| 1 | | LME Zinc Futures | | January 12, 2012 | | | 48,875 | | | | 45,731 | | | | (3,144) | |
| 2 | | LME Zinc Futures | | January 13, 2012 | | | 96,350 | | | | 91,475 | | | | (4,875) | |
| 3 | | LME Zinc Futures | | January 17, 2012 | | | 145,894 | | | | 137,288 | | | | (8,606) | |
| 1 | | LME Zinc Futures | | January 25, 2012 | | | 46,876 | | | | 45,802 | | | | (1,074) | |
| 4 | | LME Zinc Futures | | March 22, 2012 | | | 186,505 | | | | 184,375 | | | | (2,130) | |
| 1 | | LME Zinc Futures | | March 28, 2012 | | | 45,914 | | | | 46,116 | | | | 202 | |
| 5 | | LME Zinc Futures | | March 29, 2012 | | | 226,506 | | | | 230,602 | | | | 4,096 | |
| 18 | | CAC40 10 Euro Futures | | January 20, 2012 | | | 713,588 | | | | 737,451 | | | | 23,863 | |
| 3 | | DAX Index Futures | | March 16, 2012 | | | 565,210 | | | | 572,705 | | | | 7,495 | |
| 31 | | DJIA Mini E-CBOT Futures | | March 16, 2012 | | | 1,861,163 | | | | 1,883,250 | | | | 22,087 | |
| 41 | | Euro Stoxx 50 Index | | March 16, 2012 | | | 1,217,611 | | | | 1,224,723 | | | | 7,112 | |
| 50 | | FTSE 100 Index Futures | | March 16, 2012 | | | 4,199,638 | | | | 4,298,704 | | | | 99,066 | |
| 54 | | FTSE/JSE Top 40 Index Futures | | March 15, 2012 | | | 1,924,477 | | | | 1,912,481 | | | | (11,996) | |
| 6 | | FTSE/MIB Index Futures | | March 16, 2012 | | | 578,709 | | | | 586,800 | | | | 8,091 | |
| 25 | | H-SHARES Index Futures | | January 30, 2012 | | | 1,626,713 | | | | 1,604,788 | | | | (21,925) | |
| 31 | | IBEX 35 Index Futures | | January 20, 2012 | | | 3,339,204 | | | | 3,400,719 | | | | 61,515 | |
| 50 | | KOSPI Index 200 Futures | | March 8, 2012 | | | 5,349,075 | | | | 5,177,952 | | | | (171,123) | |
| 11 | | NASDAQ 100 E-Mini Futures | | March 16, 2012 | | | 501,798 | | | | 500,390 | | | | (1,408) | |
| 267 | | S&P 500 E-Mini Futures | | March 16, 2012 | | | 16,602,017 | | | | 16,722,210 | | | | 120,193 | |
| 9 | | S&P MID 400 E-Mini Futures | | March 16, 2012 | | | 782,731 | | | | 789,570 | | | | 6,839 | |
| 169 | | 3-Month Euro Euribor Futures | | June 18, 2012 | | | 54,121,219 | | | | 54,168,050 | | | | 46,831 | |
| 125 | | 3-Month Euro Euribor Futures | | September 17, 2012 | | | 40,048,798 | | | | 40,083,327 | | | | 34,529 | |
| 32 | | 3-Month Euro Euribor Futures | | December 17, 2012 | | | 10,253,026 | | | | 10,259,261 | | | | 6,235 | |
| 32 | | 3-Month Euro Euribor Futures | | March 18, 2013 | | | 10,247,988 | | | | 10,256,154 | | | | 8,166 | |
| 32 | | 3-Month Euro Euribor Futures | | June 17, 2013 | | | 10,239,848 | | | | 10,249,942 | | | | 10,094 | |
| 32 | | 3-Month Euro Euribor Futures | | September 16, 2013 | | | 10,230,321 | | | | 10,242,694 | | | | 12,373 | |
| 31 | | 3-Month Euro Euribor Futures | | December 16, 2013 | | | 9,893,915 | | | | 9,913,082 | | | | 19,167 | |
| 119 | | 90-Day EURODollar Futures | | June 18, 2012 | | | 29,544,785 | | | | 29,540,262 | | | | (4,523) | |
| 11 | | 90-Day EURODollar Futures | | March 18, 2013 | | | 2,730,964 | | | | 2,729,375 | | | | (1,589) | |
| 13 | | 90-Day EURODollar Futures | | June 17, 2013 | | | 3,226,781 | | | | 3,225,138 | | | | (1,643) | |
| 17 | | 90-Day EURODollar Futures | | September 16, 2013 | | | 4,217,937 | | | | 4,216,425 | | | | (1,512) | |
| 23 | | 90-Day EURODollar Futures | | December 16, 2013 | | | 5,700,515 | | | | 5,701,413 | | | | 898 | |
| 36 | | 90-Day GBP LIBOR Futures | | December 18, 2013 | | | 6,904,533 | | | | 6,907,434 | | | | 2,901 | |
| 31 | | 90-Day Sterling Futures | | December 19, 2012 | | | 5,954,915 | | | | 5,954,085 | | | | (830) | |
| 31 | | 90-Day Sterling Futures | | March 20, 2013 | | | 5,955,420 | | | | 5,954,687 | | | | (733) | |
| 35 | | 90-Day Sterling Futures | | June 19, 2013 | | | 6,721,566 | | | | 6,721,675 | | | | 109 | |
| 34 | | 90-Day Sterling Futures | | September 18, 2013 | | | 6,526,941 | | | | 6,526,987 | | | | 46 | |
| 154 | | Australia 10-Year Bond Futures | | March 15, 2012 | | | 18,546,613 | | | | 18,727,286 | | | | 180,673 | |
| 53 | | Australia 3-Year Bond Futures | | March 15, 2012 | | | 5,884,280 | | | | 5,872,745 | | | | (11,535) | |
| 13 | | Euro CHF 3-Month LIFFE Futures | | June 18, 2012 | | | 3,464,753 | | | | 3,463,138 | | | | (1,615) | |
| 11 | | Euro CHF 3-Month LIFFE Futures | | September 17, 2012 | | | 2,932,374 | | | | 2,930,932 | | | | (1,442) | |
| | | | | | | | | | | | | | | | |
| | | | | | | 309,101,964 | | | | 309,317,100 | | | | 215,136 | |
| | | | | | | | | | | | | | | | |
| Short Contracts: | |
| 88 | | Cocoa Futures | | March 15, 2012 | | | (2,211,704) | | | | (1,855,920) | | | | 355,784 | |
| 23 | | Coffee ‘C’ Futures | | March 20, 2012 | | | (1,920,204) | | | | (1,956,581) | | | | (36,377) | |
| 63 | | Cotton No. 2 Futures | | March 8, 2012 | | | (2,868,923) | | | | (2,891,700) | | | | (22,777) | |
| 4 | | Gold 100 OZ Futures | | February 27, 2012 | | | (642,945) | | | | (626,720) | | | | 16,225 | |
| | | | |
| | The accompanying notes are an integral part of these financial statements. | | (Continued) |
| | | | | | | | | | | | | | | | |
| | AQR Funds | | | | | | Annual Report | | | | | | December 2011 | | 93 |
| | | | | | | | | | |
| | | | |
| Consolidated Schedule of Investments | | | December 31, 2011 | |
| | |
| AQR MULTI-STRATEGY ALTERNATIVE FUND | | |
| | | | | | | | | | | | | | | | |
NUMBER OF
CONTRACTS | | DESCRIPTION | | EXPIRATION DATE | | VALUE AT
TRADE DATE | | | VALUE AT
DECEMBER 31,
2011 | | | UNREALIZED
APPRECIATION
(DEPRECIATION) | |
| Short Contracts: (continued) | |
| 41 | | Lean Hogs Futures | | February 14, 2012 | | | $(1,392,284) | | | | $(1,382,520) | | | | $9,764 | |
| 1 | | LME Aluminum Futures | | January 12, 2012 | | | (55,704) | | | | (49,896) | | | | 5,808 | |
| 1 | | LME Aluminum Futures | | January 13, 2012 | | | (55,861) | | | | (49,901) | | | | 5,960 | |
| 5 | | LME Aluminum Futures | | January 17, 2012 | | | (281,776) | | | | (249,601) | | | | 32,175 | |
| 1 | | LME Aluminum Futures | | January 20, 2012 | | | (54,003) | | | | (49,943) | | | | 4,060 | |
| 6 | | LME Aluminum Futures | | January 24, 2012 | | | (327,795) | | | | (299,871) | | | | 27,924 | |
| 1 | | LME Aluminum Futures | | January 26, 2012 | | | (55,924) | | | | (49,997) | | | | 5,927 | |
| 6 | | LME Aluminum Futures | | January 27, 2012 | | | (335,992) | | | | (300,031) | | | | 35,961 | |
| 1 | | LME Aluminum Futures | | February 1, 2012 | | | (54,503) | | | | (50,050) | | | | 4,453 | |
| 8 | | LME Aluminum Futures | | February 2, 2012 | | | (426,135) | | | | (400,472) | | | | 25,663 | |
| 1 | | LME Aluminum Futures | | February 3, 2012 | | | (53,008) | | | | (50,068) | | | | 2,940 | |
| 4 | | LME Aluminum Futures | | February 10, 2012 | | | (212,153) | | | | (200,521) | | | | 11,632 | |
| 1 | | LME Aluminum Futures | | February 15, 2012 | | | (54,092) | | | | (50,175) | | | | 3,917 | |
| 7 | | LME Aluminum Futures | | February 23, 2012 | | | (357,866) | | | | (351,685) | | | | 6,181 | |
| 4 | | LME Aluminum Futures | | March 1, 2012 | | | (209,514) | | | | (201,193) | | | | 8,321 | |
| 7 | | LME Aluminum Futures | | March 8, 2012 | | | (365,204) | | | | (352,491) | | | | 12,713 | |
| 13 | | LME Aluminum Futures | | March 15, 2012 | | | (645,434) | | | | (655,373) | | | | (9,939) | |
| 64 | | LME Aluminum Futures | | March 19, 2012 | | | (3,289,991) | | | | (3,229,600) | | | | 60,391 | |
| 4 | | LME Aluminum Futures | | March 22, 2012 | | | (200,036) | | | | (201,867) | | | | (1,831) | |
| 6 | | LME Aluminum Futures | | March 28, 2012 | | | (301,323) | | | | (302,950) | | | | (1,627) | |
| 2 | | LME Aluminum Futures | | March 29, 2012 | | | (99,507) | | | | (100,991) | | | | (1,484) | |
| 1 | | LME Copper Futures | | January 17, 2012 | | | (189,832) | | | | (189,866) | | | | (34) | |
| 1 | | LME Copper Futures | | January 24, 2012 | | | (185,543) | | | | (189,900) | | | | (4,357) | |
| 3 | | LME Copper Futures | | January 27, 2012 | | | (602,821) | | | | (569,733) | | | | 33,088 | |
| 1 | | LME Copper Futures | | February 2, 2012 | | | (198,970) | | | | (189,935) | | | | 9,035 | |
| 2 | | LME Copper Futures | | February 10, 2012 | | | (372,564) | | | | (379,935) | | | | (7,371) | |
| 1 | | LME Copper Futures | | February 29, 2012 | | | (183,799) | | | | (190,016) | | | | (6,217) | |
| 9 | | LME Copper Futures | | March 19, 2012 | | | (1,743,771) | | | | (1,710,225) | | | | 33,546 | |
| 3 | | LME Copper Futures | | March 28, 2012 | | | (568,496) | | | | (570,021) | | | | (1,525) | |
| 1 | | LME Copper Futures | | March 29, 2012 | | | (184,963) | | | | (190,004) | | | | (5,041) | |
| 1 | | LME Nickel Futures | | January 17, 2012 | | | (113,935) | | | | (112,383) | | | | 1,552 | |
| 1 | | LME Nickel Futures | | January 24, 2012 | | | (114,209) | | | | (112,323) | | | | 1,886 | |
| 2 | | LME Nickel Futures | | February 10, 2012 | | | (216,848) | | | | (224,455) | | | | (7,607) | |
| 1 | | LME Nickel Futures | | March 1, 2012 | | | (103,713) | | | | (112,212) | | | | (8,499) | |
| 9 | | LME Nickel Futures | | March 19, 2012 | | | (977,743) | | | | (1,010,610) | | | | (32,867) | |
| 1 | | LME Zinc Futures | | January 12, 2012 | | | (48,425) | | | | (45,731) | | | | 2,694 | |
| 2 | | LME Zinc Futures | | January 13, 2012 | | | (96,848) | | | | (91,475) | | | | 5,373 | |
| 3 | | LME Zinc Futures | | January 17, 2012 | | | (146,168) | | | | (137,288) | | | | 8,880 | |
| 1 | | LME Zinc Futures | | January 25, 2012 | | | (47,424) | | | | (45,802) | | | | 1,622 | |
| 32 | | LME Zinc Futures | | March 19, 2012 | | | (1,556,971) | | | | (1,474,999) | | | | 81,972 | |
| 4 | | LME Zinc Futures | | March 22, 2012 | | | (187,072) | | | | (184,375) | | | | 2,697 | |
| 1 | | LME Zinc Futures | | March 28, 2012 | | | (46,099) | | | | (46,116) | | | | (17) | |
| 5 | | LME Zinc Futures | | March 29, 2012 | | | (226,795) | | | | (230,602) | | | | (3,807) | |
| 260 | | Natural Gas Swap Futures | | January 27, 2012 | | | (2,101,250) | | | | (1,942,850) | | | | 158,400 | |
| 10 | | Silver Futures | | March 28, 2012 | | | (1,414,399) | | | | (1,395,750) | | | | 18,649 | |
| 40 | | Soybean Futures | | March 14, 2012 | | | (2,273,257) | | | | (2,415,500) | | | | (142,243) | |
| 79 | | Soybean Meal Futures | | March 14, 2012 | | | (2,283,516) | | | | (2,473,490) | | | | (189,974) | |
| 47 | | Soybean Oil Futures | | March 14, 2012 | | | (1,403,312) | | | | (1,478,244) | | | | (74,932) | |
| 70 | | Sugar #11 (World Markets) Futures | | February 29, 2012 | | | (1,870,357) | | | | (1,826,720) | | | | 43,637 | |
| 13 | | Wheat Futures | | March 14, 2012 | | | (400,212) | | | | (424,288) | | | | (24,076) | |
| 11 | | Amsterdam Index Futures | | January 20, 2012 | | | (839,455) | | | | (891,933) | | | | (52,478) | |
| 87 | | E-Mini Russell 2000 Futures | | March 16, 2012 | | | (6,378,472) | | | | (6,427,560) | | | | (49,088) | |
| 2 | | Hang Seng Index Futures | | January 30, 2012 | | | (235,647) | | | | (237,633) | | | | (1,986) | |
| 18 | | MSCI Singapore Index Futures | | January 30, 2012 | | | (847,255) | | | | (833,491) | | | | 13,764 | |
| 108 | | MSCI Taiwan Stock Index Futures | | January 30, 2012 | | | (2,748,731) | | | | (2,737,800) | | | | 10,931 | |
| | | | |
| | The accompanying notes are an integral part of these financial statements. | | (Continued) |
| | | | | | | | | | | | | | | | |
| 94 | | AQR Funds | | | | | | Annual Report | | | | | | December 2011 | | |
| | | | | | | | | | |
| | | | |
| Consolidated Schedule of Investments | | | December 31, 2011 | |
| | |
| AQR MULTI-STRATEGY ALTERNATIVE FUND | | |
| | | | | | | | | | | | | | | | |
NUMBER OF
CONTRACTS | | DESCRIPTION | | EXPIRATION DATE | | VALUE AT
TRADE DATE | | | VALUE AT
DECEMBER 31,
2011 | | | UNREALIZED
APPRECIATION
(DEPRECIATION) | |
| Short Contracts: (continued) | |
| 4 | | S&P/Toronto Stock Exchange 60 Index Futures | | March 15, 2012 | | | $(522,144) | | | | $(533,124) | | | | $(10,980) | |
| 762 | | SGX S&P CNX Nifty Index Futures | | January 25, 2012 | | | (7,254,958) | | | | (7,050,024) | | | | 204,934 | |
| 68 | | SPI 200 Index Futures | | March 15, 2012 | | | (7,165,617) | | | | (6,988,076) | | | | 177,541 | |
| 59 | | TOPIX Index Futures | | March 8, 2012 | | | (5,579,199) | | | | (5,580,356) | | | | (1,157) | |
| 13 | | 90-Day EURODollar Futures | | September 17, 2012 | | | (3,225,034) | | | | (3,226,113) | | | | (1,079) | |
| 3 | | 90-Day EURODollar Futures | | December 17, 2012 | | | (743,817) | | | | (744,337) | | | | (520) | |
| 133 | | 90-Day Sterling Futures | | June 20, 2012 | | | (25,532,564) | | | | (25,537,201) | | | | (4,637) | |
| 95 | | 90-Day Sterling Futures | | September 19, 2012 | | | (18,243,250) | | | | (18,246,391) | | | | (3,141) | |
| 162 | | Canadian 3-Month Bank Acceptance Futures | | June 18, 2012 | | | (39,338,708) | | | | (39,281,522) | | | | 57,186 | |
| 71 | | Canadian 3-Month Bank Acceptance Futures | | September 17, 2012 | | | (17,246,651) | | | | (17,228,172) | | | | 18,479 | |
| 131 | | Mini Japanese 10-Year Treasury Bond Futures | | March 8, 2012 | | | (24,135,451) | | | | (24,254,657) | | | | (119,206) | |
| 20 | | U.S. Treasury 2-Year Note Futures | | March 30, 2012 | | | (4,411,888) | | | | (4,410,937) | | | | 951 | |
| 7 | | U.S. Treasury 5-Year Note Futures | | March 30, 2012 | | | (861,891) | | | | (862,805) | | | | (914) | |
| | | | | | | | | | | | | | | | |
| | | | | | | (201,641,925) | | | | (200,947,097) | | | | 694,828 | |
| | | | | | | | | | | | | | | | |
| | | | | | | $107,460,039 | | | | $108,370,003 | | | | $909,964 | |
| | | | | | | | | | | | | | | | |
Cash held as collateral with broker for futures contracts was $10,116,955 at December 31, 2011.
Forward foreign currency exchange contracts outstanding as of December 31, 2011:
| | | | | | | | | | | | | | | | | | | | |
PURCHASE
CONTRACTS | | COUNTERPARTY | | CURRENCY | | CURRENCY
AMOUNT
PURCHASED | | | VALUE AT
SETTLEMENT
DATE | | | VALUE AT
DECEMBER 31,
2011 | | | UNREALIZED
APPRECIATION
(DEPRECIATION) | |
Australian Dollar,
Expiring 03/21/12 | | The Royal Bank of Scotland | | AUD | | | 17,518,000 | | | | $17,530,933 | | | | $17,763,087 | | | | $232,154 | |
Brazilian Real,
Expiring 03/21/12 | | The Royal Bank of Scotland | | BRL | | | 100,000 | | | | 52,911 | | | | 52,712 | | | | (199) | |
Canadian Dollar,
Expiring 03/21/12 | | The��Royal Bank of Scotland | | CAD | | | 4,147,000 | | | | 4,052,761 | | | | 4,063,678 | | | | 10,917 | |
Swiss Franc,
Expiring 03/21/12 | | The Royal Bank of Scotland | | CHF | | | 10,000 | | | | 10,817 | | | | 10,664 | | | | (153) | |
Czech Republic Koruna,
Expiring 03/21/12 | | The Royal Bank of Scotland | | CZK | | | 16,400,000 | | | | 848,392 | | | | 830,843 | | | | (17,549) | |
Euro,
Expiring 03/21/12 | | The Royal Bank of Scotland | | EUR | | | 11,597,000 | | | | 15,296,301 | | | | 15,019,862 | | | | (276,439) | |
British Pound,
Expiring 03/21/12 | | The Royal Bank of Scotland | | GBP | | | 7,693,000 | | | | 12,033,472 | | | | 11,938,224 | | | | (95,248) | |
Hungarian Forint,
Expiring 03/21/12 | | The Royal Bank of Scotland | | HUF | | | 1,912,400,000 | | | | 8,206,626 | | | | 7,790,831 | | | | (415,795) | |
Indonesian Rupiah,
Expiring 03/21/12 | | The Royal Bank of Scotland | | IDR | | | 700,000,000 | | | | 75,340 | | | | 76,596 | | | | 1,256 | |
Indian Rupee,
Expiring 03/21/12 | | The Royal Bank of Scotland | | INR | | | 17,000,000 | | | | 306,253 | | | | 315,412 | | | | 9,159 | |
Japanese Yen,
Expiring 03/21/12 | | The Royal Bank of Scotland | | JPY | | | 648,845,000 | | | | 8,372,202 | | | | 8,441,838 | | | | 69,636 | |
| | | | |
| | The accompanying notes are an integral part of these financial statements. | | (Continued) |
| | | | | | | | | | | | | | | | |
| | AQR Funds | | | | | | Annual Report | | | | | | December 2011 | | 95 |
| | | | | | | | | | |
| | | | |
| Consolidated Schedule of Investments | | | December 31, 2011 | |
| | |
| AQR MULTI-STRATEGY ALTERNATIVE FUND | | |
| | | | | | | | | | | | | | | | | | | | |
PURCHASE
CONTRACTS | | COUNTERPARTY | | CURRENCY | | CURRENCY
AMOUNT
PURCHASED | | | VALUE AT
SETTLEMENT
DATE | | | VALUE AT
DECEMBER 31,
2011 | | | UNREALIZED
APPRECIATION
(DEPRECIATION) | |
Korean Won,
Expiring 03/21/12 | | The Royal Bank of Scotland | | KRW | | | 11,871,193,000 | | | | $10,212,492 | | | | $10,252,306 | | | | $39,814 | |
Mexican Peso,
Expiring 03/21/12 | | The Royal Bank of Scotland | | MXN | | | 13,678,000 | | | | 986,207 | | | | 974,133 | | | | (12,074) | |
Malaysian Ringgit,
Expiring 03/21/12 | | The Royal Bank of Scotland | | MYR | | | 1,500,000 | | | | 470,815 | | | | 471,275 | | | | 460 | |
Norwegian Krone,
Expiring 03/21/12 | | The Royal Bank of Scotland | | NOK | | | 104,798,000 | | | | 17,893,868 | | | | 17,473,280 | | | | (420,588) | |
New Zealand
Dollar,
Expiring 03/21/12 | | The Royal Bank of Scotland | | NZD | | | 14,273,000 | | | | 10,932,429 | | | | 11,051,765 | | | | 119,336 | |
Philippine Peso,
Expiring 03/21/12 | | The Royal Bank of Scotland | | PHP | | | 14,000,000 | | | | 320,259 | | | | 317,987 | | | | (2,272) | |
Polish Zloty,
Expiring 03/21/12 | | The Royal Bank of Scotland | | PLN | | | 28,467,000 | | | | 8,288,788 | | | | 8,189,198 | | | | (99,590) | |
Russian Ruble,
Expiring 03/21/12 | | The Royal Bank of Scotland | | RUB | | | 186,707,000 | | | | 5,824,760 | | | | 5,733,121 | | | | (91,639) | |
Swedish Krona,
Expiring 03/21/12 | | The Royal Bank of Scotland | | SEK | | | 69,900,000 | | | | 10,188,757 | | | | 10,120,966 | | | | (67,791) | |
Singapore Dollar,
Expiring 03/21/12 | | The Royal Bank of Scotland | | SGD | | | 990,000 | | | | 764,910 | | | | 763,269 | | | | (1,641) | |
Turkish Lira,
Expiring 03/21/12 | | The Royal Bank of Scotland | | TRY | | | 9,522,000 | | | | 4,953,732 | | | | 4,939,405 | | | | (14,327) | |
Taiwanese Dollar,
Expiring 03/21/12 | | The Royal Bank of Scotland | | TWD | | | 43,000,000 | | | | 1,421,158 | | | | 1,422,306 | | | | 1,148 | |
South African
Rand,
Expiring 03/22/12 | | The Royal Bank of Scotland | | ZAR | | | 1,700,000 | | | | 203,095 | | | | 208,057 | | | | 4,962 | |
| | | | | | | | | | | | | | | | | | | | |
| | | | | | | | | | | 139,247,278 | | | | 138,220,815 | | | | (1,026,463) | |
| | | | | | | | | | | | | | | | | | | | |
| | | | | | | | | | | | | | | | | | | | |
SALES
CONTRACTS | | COUNTERPARTY | | CURRENCY | | CURRENCY
AMOUNT
SOLD | | | VALUE AT
SETTLEMENT
DATE | | | VALUE AT
DECEMBER 31,
2011 | | | UNREALIZED
APPRECIATION
(DEPRECIATION) | |
Australian Dollar,
Expiring 03/21/12 | | The Royal Bank of Scotland | | AUD | | | (4,139,000) | | | | $(4,125,627) | | | | $(4,196,907) | | | | $(71,280) | |
Brazilian Real,
Expiring 03/21/12 | | The Royal Bank of Scotland | | BRL | | | (3,459,000) | | | | (1,850,643) | | | | (1,823,318) | | | | 27,325 | |
Canadian Dollar,
Expiring 03/21/12 | | The Royal Bank of Scotland | | CAD | | | (12,804,000) | | | | (12,474,730) | | | | (12,546,741) | | | | (72,011) | |
Chilean Peso,
Expiring 03/21/12 | | The Royal Bank of Scotland | | CLP | | | (204,067,000) | | | | (392,076) | | | | (389,150) | | | | 2,926 | |
Colombian Peso,
Expiring 03/21/12 | | The Royal Bank of Scotland | | COP | | | (214,000,000) | | | | (110,692) | | | | (110,543) | | | | 149 | |
Czech Republic Koruna,
Expiring 03/21/12 | | The Royal Bank of Scotland | | CZK | | | (42,346,000) | | | | (2,195,906) | | | | (2,145,299) | | | | 50,607 | |
Euro,
Expiring 03/21/12 | | The Royal Bank of Scotland | | EUR | | | (45,898,000) | | | | (60,405,017) | | | | (59,444,824) | | | | 960,193 | |
British Pound,
Expiring 03/21/12 | | The Royal Bank of Scotland | | GBP | | | (2,846,000) | | | | (4,398,033) | | | | (4,416,507) | | | | (18,474) | |
Hong Kong Dollar,
Expiring 03/21/12 | | The Royal Bank of Scotland | | HKD | | | (15,031,000) | | | | (1,932,370) | | | | (1,935,944) | | | | (3,574) | |
Hungarian Forint,
Expiring 03/21/12 | | The Royal Bank of Scotland | | HUF | | | (70,000,000) | | | | (290,564) | | | | (285,169) | | | | 5,395 | |
| | | | |
| | The accompanying notes are an integral part of these financial statements. | | (Continued) |
| | | | | | | | | | | | | | | | |
| 96 | | AQR Funds | | | | | | Annual Report | | | | | | December 2011 | | |
| | | | | | | | | | |
| | | | |
| Consolidated Schedule of Investments | | | December 31, 2011 | |
| | |
| AQR MULTI-STRATEGY ALTERNATIVE FUND | | |
| | | | | | | | | | | | | | | | | | | | |
SALES
CONTRACTS | | COUNTERPARTY | | CURRENCY | | CURRENCY
AMOUNT
SOLD | | | VALUE AT
SETTLEMENT
DATE | | | VALUE AT
DECEMBER 31,
2011 | | | UNREALIZED
APPRECIATION
(DEPRECIATION) | |
Indonesian Rupiah,
Expiring 03/21/12 | | The Royal Bank of Scotland | | IDR | | | (5,714,000,000) | | | | $(621,192) | | | | $(625,243) | | | | $(4,051) | |
Israeli Shekel,
Expiring 03/21/12 | | The Royal Bank of Scotland | | ILS | | | (17,325,000) | | | | (4,584,350) | | | | (4,540,219) | | | | 44,131 | |
Indian Rupee,
Expiring 03/21/12 | | The Royal Bank of Scotland | | INR | | | (896,148,000) | | | | (16,594,378) | | | | (16,626,804) | | | | (32,426) | |
Japanese Yen,
Expiring 03/21/12 | | The Royal Bank of Scotland | | JPY | | | (1,049,728,000) | | | | (13,505,100) | | | | (13,657,551) | | | | (152,451) | |
Korean Won,
Expiring 03/21/12 | | The Royal Bank of Scotland | | KRW | | | (630,986,000) | | | | (541,183) | | | | (544,938) | | | | (3,755) | |
Mexican Peso,
Expiring 03/21/12 | | The Royal Bank of Scotland | | MXN | | | (9,018,000) | | | | (644,397) | | | | (642,253) | | | | 2,144 | |
Malaysian Ringgit,
Expiring 03/21/12 | | The Royal Bank of Scotland | | MYR | | | (8,117,000) | | | | (2,541,316) | | | | (2,550,224) | | | | (8,908) | |
Norwegian Krone,
Expiring 03/21/12 | | The Royal Bank of Scotland | | NOK | | | (1,832,000) | | | | (304,636) | | | | (305,455) | | | | (819) | |
New Zealand
Dollar,
Expiring 03/21/12 | | The Royal Bank of Scotland | | NZD | | | (2,663,000) | | | | (2,033,546) | | | | (2,061,995) | | | | (28,449) | |
Peru Nuevo Sol,
Expiring 03/21/12 | | The Royal Bank of Scotland | | PEN | | | (84,000) | | | | (30,976) | | | | (30,978) | | | | (2) | |
Philippine Peso,
Expiring 03/21/12 | | The Royal Bank of Scotland | | PHP | | | (334,500,000) | | | | (7,538,321) | | | | (7,597,627) | | | | (59,306) | |
Polish Zloty,
Expiring 03/21/12 | | The Royal Bank of Scotland | | PLN | | | (96,000) | | | | (27,963) | | | | (27,617) | | | | 346 | |
Russian Ruble,
Expiring 03/21/12 | | The Royal Bank of Scotland | | RUB | | | (21,044,000) | | | | (645,997) | | | | (646,188) | | | | (191) | |
Swedish Krona,
Expiring 03/21/12 | | The Royal Bank of Scotland | | SEK | | | (10,484,000) | | | | (1,506,053) | | | | (1,518,000) | | | | (11,947) | |
Singapore Dollar,
Expiring 03/21/12 | | The Royal Bank of Scotland | | SGD | | | (11,768,000) | | | | (9,037,410) | | | | (9,072,878) | | | | (35,468) | |
Thailand Baht,
Expiring 03/21/12 | | The Royal Bank of Scotland | | THB | | | (2,582,000) | | | | (82,875) | | | | (81,432) | | | | 1,443 | |
Turkish Lira,
Expiring 03/21/12 | | The Royal Bank of Scotland | | TRY | | | (530,000) | | | | (273,694) | | | | (274,930) | | | | (1,236) | |
Taiwanese Dollar,
Expiring 03/21/12 | | The Royal Bank of Scotland | | TWD | | | (171,761,000) | | | | (5,667,436) | | | | (5,681,318) | | | | (13,882) | |
South African Rand,
Expiring 03/22/12 | | The Royal Bank of Scotland | | ZAR | | | (64,733,000) | | | | (7,749,924) | | | | (7,922,428) | | | | (172,504) | |
| | | | | | | | | | | | | | | | | | | | |
| | | | | | | | | | | (162,106,405) | | | | (161,702,480) | | | | 403,925 | |
| | | | | | | | | | | | | | | | | | | | |
| | | | | | | | | | | $(22,859,127) | | | | $(23,481,665) | | | | $(622,538) | |
| | | | | | | | | | | | | | | | | | | | |
Cash held as collateral with broker for forward foreign currency exchange contracts was $3,860,600 at December 31, 2011.
AUD - Australian Dollar
BRL - Brazilian Real
CAD - Canadian Dollar
CHF - Swiss Franc
CLP - Chilean Peso
COP - Colombian Peso
CZK - Czech Republic Koruna
EUR - Euro
GBP - British Pound
HKD - Hong Kong Dollar
| | | | |
| | The accompanying notes are an integral part of these financial statements. | | (Continued) |
| | | | | | | | | | | | | | | | |
| | AQR Funds | | | | | | Annual Report | | | | | | December 2011 | | 97 |
| | | | | | | | | | |
| | | | |
| Consolidated Schedule of Investments | | | December 31, 2011 | |
| | |
| AQR MULTI-STRATEGY ALTERNATIVE FUND | | |
HUF - Hungarian Forint
IDR - Indonesian Rupiah
ILS - Israeli Shekel
INR - Indian Rupee
JPY - Japanese Yen
KRW - Korean Won
MXN - Mexican Peso
MYR - Malaysian Ringgit
NOK - Norwegian Krone
NZD - New Zealand Dollar
PEN - Peruvian Nuevo Sol
PHP - Philippine Peso
PLN - Polish Zloty
RUB - Russian Ruble
SEK - Swedish Krona
SGD - Singapore Dollar
THB - Thai Baht
TRY - Turkish Lira
TWD - Taiwan Dollar
ZAR - South African Rand
Total Return Basket Swap* Outstanding at December 31, 2011
| | | | | | | | |
| COUNTERPARTY | | DESCRIPTION | | TERMINATION
DATE | | VALUE ($) | |
| Deutsche Bank | | The Fund receives or pays the total return on a portfolio of long and short positions and pays or receives a specified LIBOR or Federal Funds floating rate, which is denominated in various foreign currencies based on the local currencies of the positions within the portfolio. | | 07/23/12 | | | $(108,302) | |
| Total | | | | | | | | |
| * | See the accompanying “Additional Information — Total Return Basket Swap” for further details. |
Additional Information — Total Return Basket Swap
The following table represents the individual long and short positions and related values within the total return basket swap as of December 31, 2011.
| | | | | | | | | | | | |
REFERENCE
ENTITY | | SHARES | | | NOTIONAL (a) | | | NET
UNREALIZED
APPRECIATION
(DEPRECIATION) | |
| | | |
| Long Positions | | | | | | | | | | | | |
| | | |
| Australia | | | | | | | | | | | | |
| Alfresa Holdings Corp. | | | 12,800 | | | JPY | 39,696,367 | | | $ | 23,027 | |
| | | | | | | | | | | | |
| | | |
| Austria | | | | | | | | | | | | |
| Andritz AG | | | 8,701 | | | EUR | 564,535 | | | | (11,067) | |
| OMV AG | | | 22,749 | | | | 548,597 | | | | (20,909) | |
| Voestalpine AG | | | 19,445 | | | | 426,343 | | | | (6,988) | |
| Wienerberger AG | | | 4,924 | | | | 44,687 | | | | (13,513) | |
| | | | | | | | | | | | |
| | | | | | | | | | | (52,477) | |
| | | | | | | | | | | | |
| Belgium | | | | | | | | | | | | |
| Belgacom SA | | | 3,192 | | | EUR | 75,601 | | | | 2,030 | |
| Delhaize Group SA | | | 942 | | | | 42,470 | | | | (2,165) | |
| Mobistar SA | | | 10,571 | | | | 463,016 | | | | (47,417) | |
| | | | | | | | | | | | |
REFERENCE
ENTITY | | SHARES | | | NOTIONAL (a) | | | NET
UNREALIZED
APPRECIATION
(DEPRECIATION) | |
| Belgium (continued) | | | | | | | | | | | | |
| Solvay SA | | | 9,277 | | | EUR | 745,269 | | | $ | (202,967) | |
| | | | | | | | | | | | |
| | | | | | | | | | | (250,519) | |
| | | | | | | | | | | | |
| Bermuda | | | | | | | | | | | | |
| Catlin Group Ltd. | | | 52,879 | | | GBP | 204,441 | | | | 9,954 | |
| | | | | | | | | | | | |
| | | |
| Denmark | | | | | | | | | | | | |
| AP Moller - Maersk A/S | | | 68 | | | DKK | 2,364,173 | | | | 35,642 | |
| DSV A/S | | | 20,987 | | | | 2,171,020 | | | | (2,971) | |
| FLSmidth & Co. A/S | | | 496 | | | | 168,843 | | | | (400) | |
| H Lundbeck A/S | | | 33,296 | | | | 3,786,471 | | | | (34,865) | |
| Novo Nordisk A/S | | | 3,399 | | | | 2,036,149 | | | | 35,962 | |
| Topdanmark A/S | | | 1,046 | | | | 913,786 | | | | 3,614 | |
| | | | | | | | | | | | |
| | | | | | | | | | | 36,982 | |
| | | | | | | | | | | | |
| | | | |
| | The accompanying notes are an integral part of these financial statements. | | (Continued) |
| | | | | | | | | | | | | | | | |
| 98 | | AQR Funds | | | | | | Annual Report | | | | | | December 2011 | | |
| | | | | | | | | | |
| | | | |
| Schedule of Investments | | | December 31, 2011 | |
| | |
| AQR MULTI-STRATEGY ALTERNATIVE FUND | | |
| | | | | | | | | | | | |
REFERENCE
ENTITY | | SHARES | | | NOTIONAL (a) | | | NET
UNREALIZED
APPRECIATION
(DEPRECIATION) | |
| Finland | | | | | | | | | | | | |
| Kesko OYJ | | | 27,002 | | | EUR | 697,408 | | | $ | 2,548 | |
| Metso OYJ | | | 37,902 | | | | 1,003,418 | | | | 101,161 | |
| Neste Oil OYJ | | | 2,786 | | | | 20,352 | | | | 1,679 | |
| Nokia OYJ | | | 46,574 | | | | 171,891 | | | | 2,055 | |
| Orion OYJ | | | 1,678 | | | | 25,540 | | | | (451) | |
| Sampo OYJ | | | 6,052 | | | | 117,818 | | | | (2,783) | |
| Stora Enso OYJ | | | 11,080 | | | | 45,502 | | | | 7,100 | |
| Wartsila OYJ | | | 20,537 | | | | 433,438 | | | | 29,723 | |
| YIT OYJ | | | 10,465 | | | | 117,462 | | | | 15,045 | |
| | | | | | | | | | | | |
| | | | | | | | | | | 156,077 | |
| | | | | | | | | | | | |
| France | | | | | | | | | | | | |
| Aeroports de Paris | | | 2,258 | | | EUR | 127,389 | | | | (10,412) | |
| Alcatel-Lucent/France | | | 280,486 | | | | 485,650 | | | | (192,671) | |
| Arkema SA | | | 24,731 | | | | 1,257,064 | | | | 110,862 | |
| AtoS | | | 16,390 | | | | 559,189 | | | | (7,665) | |
| BioMerieux | | | 3,737 | | | | 212,558 | | | | (8,387) | |
| Cap Gemini SA | | | 14,496 | | | | 377,937 | | | | (38,462) | |
| Cie de St-Gobain | | | 87 | | | | 3,577 | | | | (1,304) | |
| Cie Generale de Geophysique - Veritas | | | 15,667 | | | | 231,842 | | | | 63,600 | |
| Cie Generale des Etablissements Michelin | | | 3,507 | | | | 157,958 | | | | 2,199 | |
| Cie Generale d’Optique Essilor International SA | | | 903 | | | | 46,936 | | | | 2,907 | |
| Danone | | | 497 | | | | 23,604 | | | | 638 | |
| Dassault Systemes SA | | | 3,318 | | | | 194,492 | | | | 13,329 | |
| Eramet | | | 3,570 | | | | 355,079 | | | | (24,762) | |
| Hermes International | | | 1,646 | | | | 395,017 | | | | (22,024) | |
| Imerys SA | | | 1,297 | | | | 45,488 | | | | 615 | |
| Ipsen SA | | | 23,297 | | | | 519,230 | | | | 58,330 | |
| Lagardere SCA | | | 1,818 | | | | 32,278 | | | | 6,088 | |
| LVMH Moet Hennessy Louis Vuitton SA | | | 1,029 | | | | 116,180 | | | | (5,416) | |
| Nexans SA | | | 10,880 | | | | 482,864 | | | | (63,096) | |
| PPR | | | 1,216 | | | | 129,461 | | | | 6,016 | |
| Safran SA | | | 8,613 | | | | 208,862 | | | | (12,738) | |
| Sanofi | | | 1,314 | | | | 70,102 | | | | 5,321 | |
| Societe BIC SA | | | 3,288 | | | | 215,146 | | | | 12,429 | |
| Societe Television Francaise 1 | | | 33,155 | | | | 302,556 | | | | (69,070) | |
| Technip SA | | | 5,702 | | | | 386,046 | | | | 34,922 | |
| Teleperformance SA | | | 35,858 | | | | 595,685 | | | | 25,623 | |
| Thales SA | | | 1,202 | | | | 28,755 | | | | 619 | |
| Total SA | | | 4,330 | | | | 163,171 | | | | 9,767 | |
| UBISOFT Entertainment | | | 26,401 | | | | 121,276 | | | | 18,679 | |
| Valeo SA | | | 27,217 | | | | 926,571 | | | | (122,074) | |
| Vivendi SA | | | 6,634 | | | | 108,249 | | | | 4,716 | |
| | | | | | | | | | | | |
| | | | | | | | | | | (201,421) | |
| | | | | | | | | | | | |
| Germany | | | | | | | | | | | | |
| Adidas AG | | | 1,874 | | | EUR | 94,053 | | | | 31 | |
| Aurubis AG | | | 20,803 | | | | 847,159 | | | | 10,643 | |
| Bayer AG | | | 3,455 | | | | 157,063 | | | | 17,369 | |
| Bilfinger Berger SE | | | 11,452 | | | | 679,711 | | | | 95,391 | |
| Celesio AG | | | 12,157 | | | | 139,015 | | | | 12,379 | |
| | | | | | | | | | | | |
REFERENCE
ENTITY | | SHARES | | | NOTIONAL (a) | | | NET
UNREALIZED
APPRECIATION
(DEPRECIATION) | |
| Germany (continued) | | | | | | | | | | | | |
| Deutsche Lufthansa AG | | | 31,814 | | | EUR | 346,088 | | | $ | (69,511) | |
| Deutsche Post AG | | | 40,746 | | | | 449,799 | | | | 44,287 | |
| GEA Group AG | | | 25,861 | | | | 518,253 | | | | 59,332 | |
| Henkel AG & Co. KGaA | | | 251 | | | | 11,255 | | | | (97) | |
| Hochtief AG | | | 1,146 | | | | 47,775 | | | | 4,337 | |
| Infineon Technologies AG | | | 36,578 | | | | 212,139 | | | | 159 | |
| K+S AG | | | 10,175 | | | | 424,336 | | | | (90,287) | |
| Linde AG | | | 314 | | | | 32,013 | | | | 5,231 | |
| Merck KGaA | | | 3,552 | | | | 261,067 | | | | 15,837 | |
| Metro AG | | | 13,010 | | | | 404,652 | | | | (49,335) | |
| Rheinmetall AG | | | 7 | | | | 219 | | | | 27 | |
| Rhoen Klinikum AG | | | 5,345 | | | | 79,754 | | | | (1,496) | |
| Salzgitter AG | | | 15,584 | | | | 617,406 | | | | (21,791) | |
| SAP AG | | | 9,543 | | | | 407,486 | | | | (22,644) | |
| Siemens AG | | | 1,942 | | | | 140,097 | | | | 4,483 | |
| Software AG | | | 1,801 | | | | 46,632 | | | | 6,045 | |
| Suedzucker AG | | | 10,674 | | | | 225,094 | | | | 48,701 | |
| ThyssenKrupp AG | | | 21,822 | | | | 432,003 | | | | (58,463) | |
| Tognum AG | | | 361 | | | | 9,440 | | | | (65) | |
| WInc.or Nixdorf AG | | | 7,089 | | | | 250,366 | | | | (7,411) | |
| | | | | | | | | | | | |
| | | | | | | | | | | 3,152 | |
| | | | | | | | | | | | |
| India | | | | | | | | | | | | |
| Reliance Industries Ltd. | | | 1,464 | | | $ | 48,221 | | | | (9,339) | |
| State Bank of India | | | 2,937 | | | | 207,859 | | | | (20,102) | |
| | | | | | | | | | | | |
| | | | | | | | | | | (29,441) | |
| | | | | | | | | | | | |
| Italy | | | | | | | | | | | | |
| A2A SpA | | | 117,340 | | | EUR | 96,588 | | | | (15,048) | |
| Davide Campari-Milano SpA | | | 11,242 | | | | 59,032 | | | | (1,680) | |
| Enel SpA | | | 163,266 | | | | 537,940 | | | | (33,902) | |
| ENI SpA | | | 11,247 | | | | 175,580 | | | | 4,642 | |
| ERG SpA | | | 30,959 | | | | 271,007 | | | | 111 | |
| Fiat SpA | | | 156,819 | | | | 597,778 | | | | (57,938) | |
| Impregilo SpA | | | 319,062 | | | | 598,913 | | | | 209,414 | |
| Lottomatica SpA | | | 4,475 | | | | 52,442 | | | | (903) | |
| Prysmian SpA | | | 32 | | | | 312 | | | | (9) | |
| Saipem SpA | | | 11,133 | | | | 351,100 | | | | 16,557 | |
| Saras SpA | | | 29,742 | | | | 29,016 | | | | (431) | |
| Telecom Italia SpA | | | 125,389 | | | | 102,896 | | | | 850 | |
| | | | | | | | | | | | |
| | | | | | | | | | | 121,663 | |
| | | | | | | | | | | | |
| Japan | | | | | | | | | | | | |
| Acom Co., Ltd. | | | 25,280 | | | JPY | 35,403,166 | | | | (10,155) | |
| Advantest Corp. | | | 1,200 | | | | 1,057,620 | | | | (2,344) | |
| Aisin Seiki Co., Ltd. | | | 8,200 | | | | 18,295,776 | | | | (5,311) | |
| Ajinomoto Co., Inc. | | | 13,000 | | | | 11,984,448 | | | | 356 | |
| All Nippon Airways Co., Ltd. | | | 21,000 | | | | 4,752,833 | | | | (3,071) | |
| Alps Electric Co., Ltd. | | | 56,200 | | | | 36,367,332 | | | | (87,714) | |
| Amada Co., Ltd. | | | 8,000 | | | | 3,997,697 | | | | (1,302) | |
| Aozora Bank Ltd. | | | 74,000 | | | | 13,590,449 | | | | 27,040 | |
| Asahi Kasei Corp. | | | 84,000 | | | | 40,748,284 | | | | (23,178) | |
| Astellas Pharma, Inc. | | | 7,300 | | | | 22,606,956 | | | | 2,722 | |
| | | | |
| | The accompanying notes are an integral part of these financial statements. | | (Continued) |
| | | | | | | | | | | | | | | | |
| | AQR Funds | | | | | | Annual Report | | | | | | December 2011 | | 99 |
| | | | | | | | | | |
| | | | |
| Consolidated Schedule of Investments | | | December 31, 2011 | |
| | |
| AQR MULTI-STRATEGY ALTERNATIVE FUND | | |
| | | | | | | | | | | | |
REFERENCE
ENTITY | | SHARES | | | NOTIONAL (a) | | | NET
UNREALIZED
APPRECIATION
(DEPRECIATION) | |
| Japan (continued) | | | | | | | | | | | | |
Bank of Yokohama
Ltd./The | | | 11,000 | | | JPY | 4,086,000 | | | $ | (1,188) | |
| Brother Industries Ltd. | | | 20,400 | | | | 20,099,898 | | | | (11,454) | |
| Canon Marketing Japan, Inc. | | | 34,000 | | | | 30,668,754 | | | | (2,350) | |
| Capcom Co., Ltd. | | | 2,400 | | | | 4,808,539 | | | | (5,720) | |
| Casio Computer Co., Ltd. | | | 16,400 | | | | 7,627,012 | | | | 149 | |
| Central Japan Railway Co. | | | 38 | | | | 24,705,542 | | | | (284) | |
| Chiyoda Corp. | | | 72,000 | | | | 57,421,761 | | | | (15,021) | |
| Chubu Electric Power Co., Inc. | | | 8,600 | | | | 12,067,212 | | | | 4,153 | |
| Circle K Sunkus Co., Ltd. | | | 34,000 | | | | 43,740,694 | | | | (5,839) | |
| Citizen Holdings Co., Ltd. | | | 8,700 | | | | 3,578,056 | | | | 3,936 | |
| Coca-Cola West Co., Ltd. | | | 8,500 | | | | 12,134,764 | | | | (10,346) | |
| COMSYS Holdings Corp. | | | 2,800 | | | | 2,070,062 | | | | 2,470 | |
| Credit Saison Co., Ltd. | | | 14,500 | | | | 21,295,580 | | | | 12,906 | |
| Daihatsu Motor Co., Ltd. | | | 28,000 | | | | 37,623,726 | | | | 9,108 | |
| Daiichi Sankyo Co., Ltd. | | | 600 | | | | 908,059 | | | | 85 | |
| Daiseki Co., Ltd. | | | 11,800 | | | | 15,617,230 | | | | (11,170) | |
| Daiwa House Industry Co., Ltd. | | | 4,000 | | | | 3,882,350 | | | | (2,621) | |
| Dena Co., Ltd. | | | 13,400 | | | | 36,303,902 | | | | (70,247) | |
| Dentsu, Inc. | | | 3,500 | | | | 8,111,319 | | | | 1,092 | |
| DIC Corp. | | | 152,000 | | | | 23,156,542 | | | | (25,278) | |
| East Japan Railway Co. | | | 2,500 | | | | 11,590,749 | | | | 8,758 | |
| Ebara Corp. | | | 169,000 | | | | 54,821,115 | | | | (132,264) | |
| FANUC Corp. | | | 2,200 | | | | 27,111,745 | | | | (16,667) | |
| Fast Retailing Co., Ltd. | | | 2,400 | | | | 32,520,191 | | | | 14,067 | |
| Fuji Heavy Industries Ltd. | | | 83,000 | | | | 41,355,308 | | | | (39,472) | |
| Fuji Media Holdings, Inc. | | | 414 | | | | 46,893,506 | | | | 16,689 | |
| Fujikura Ltd. | | | 26,000 | | | | 6,221,157 | | | | (5,096) | |
| Fujitsu Ltd. | | | 39,000 | | | | 15,488,097 | | | | 990 | |
| Fukuoka Financial Group, Inc. | | | 50,000 | | | | 15,624,601 | | | | 6,496 | |
| Glory Ltd. | | | 1,100 | | | | 1,878,929 | | | | (750) | |
| Gunma Bank Ltd./The | | | 3,000 | | | | 1,272,152 | | | | (80) | |
| Hachijuni Bank Ltd./The | | | 2,000 | | | | 893,158 | | | | (210) | |
| Hakuhodo DY Holdings, Inc. | | | 7,050 | | | | 30,355,553 | | | | 9,822 | |
| Hamamatsu Photonics KK | | | 1,500 | | | | 4,814,507 | | | | (10,253) | |
| Heiwa Corp. | | | 20,900 | | | | 27,781,189 | | | | (184) | |
| Hikari Tsushin, Inc. | | | 300 | | | | 528,150 | | | | 591 | |
| Hitachi Capital Corp. | | | 2,800 | | | | 2,682,321 | | | | 3,816 | |
| Hitachi High-Technologies Corp. | | | 30,700 | | | | 47,412,118 | | | | 49,067 | |
| | | | | | | | | | | | |
REFERENCE
ENTITY | | SHARES | | | NOTIONAL (a) | | | NET
UNREALIZED
APPRECIATION
(DEPRECIATION) | |
| Japan (continued) | | | | | | | | | | | | |
| Hitachi Ltd. | | | 1,000 | | | JPY | 410,470 | | | $ | (131) | |
| Hitachi Transport System Ltd. | | | 400 | | | | 562,752 | | | | (451) | |
| Hokuetsu Kishu Paper Co., Ltd. | | | 22,000 | | | | 11,316,480 | | | | 714 | |
| Hokuhoku Financial Group, Inc. | | | 127,000 | | | | 19,548,021 | | | | (7,027) | |
| Hosiden Corp. | | | 40,700 | | | | 23,638,248 | | | | (36,020) | |
| House Foods Corp. | | | 200 | | | | 276,900 | | | | 158 | |
| Idemitsu Kosan Co., Ltd. | | | 2,400 | | | | 19,005,671 | | | | 414 | |
| IHI Corp. | | | 140,000 | | | | 25,296,466 | | | | 10,772 | |
| Isetan Mitsukoshi Holdings Ltd. | | | 2,700 | | | | 2,099,865 | | | | 926 | |
| Isuzu Motors Ltd. | | | 82,000 | | | | 28,109,354 | | | | 12,292 | |
| Ito En Ltd. | | | 300 | | | | 423,120 | | | | (343) | |
| ITOCHU Corp. | | | 12,100 | | | | 9,654,600 | | | | (2,746) | |
| Japan TobacCo., Inc. | | | 190 | | | | 69,340,629 | | | | (7,401) | |
| JGC Corp. | | | 39,000 | | | | 76,847,337 | | | | (62,068) | |
| JS Group Corp. | | | 21,700 | | | | 31,718,451 | | | | 3,812 | |
| JSR Corp. | | | 13,100 | | | | 17,792,842 | | | | 10,270 | |
| JTEKT Corp. | | | 75,900 | | | | 64,209,533 | | | | (92,426) | |
| Kajima Corp. | | | 99,000 | | | | 23,928,643 | | | | (7,052) | |
| Kaken Pharmaceutical Co., Ltd. | | | 27,000 | | | | 28,517,762 | | | | (12,070) | |
| Kandenko Co., Ltd. | | | 78,000 | | | | 27,968,208 | | | | 14,604 | |
| Kaneka Corp. | | | 4,000 | | | | 1,707,211 | | | | (954) | |
| Kansai Electric Power Co., Inc./The | | | 12,200 | | | | 16,398,423 | | | | (25,643) | |
| Kao Corp. | | | 900 | | | | 1,838,636 | | | | 670 | |
| Kawasaki Kisen Kaisha Ltd. | | | 117,000 | | | | 17,773,612 | | | | (20,239) | |
| KDDI Corp. | | | 31 | | | | 17,402,850 | | | | (27,008) | |
| Keisei Electric Railway Co., Ltd. | | | 6,000 | | | | 3,003,091 | | | | 5,098 | |
| Keyence Corp. | | | 1,100 | | | | 21,534,076 | | | | (14,629) | |
| Kinden Corp. | | | 21,000 | | | | 13,426,772 | | | | 2,591 | |
| Kintetsu Corp. | | | 13,000 | | | | 3,648,580 | | | | 3,375 | |
| Kissei Pharmaceutical Co., Ltd. | | | 5,600 | | | | 8,406,082 | | | | 5,964 | |
| Kobayashi Pharmaceutical Co., Ltd. | | | 2,000 | | | | 7,946,714 | | | | 1,971 | |
| Kobe Steel Ltd. | | | 274,000 | | | | 35,344,190 | | | | (35,722) | |
| Koito Manufacturing Co., Ltd. | | | 31,000 | | | | 34,232,703 | | | | (11,451) | |
| Konami Corp. | | | 6,500 | | | | 15,500,815 | | | | (7,013) | |
| Kose Corp. | | | 3,900 | | | | 7,565,628 | | | | (867) | |
| K’s Holdings Corp. | | | 4,800 | | | | 15,122,471 | | | | (6,541) | |
| Kuraray Co., Ltd. | | | 20,000 | | | | 21,942,319 | | | | (1,243) | |
| Kyocera Corp. | | | 500 | | | | 3,748,118 | | | | (8,599) | |
| Lawson, Inc. | | | 2,100 | | | | 9,623,189 | | | | 5,816 | |
| Lintec Co., Inc. | | | 2,700 | | | | 3,852,074 | | | | (1,186) | |
| Makita Corp. | | | 5,400 | | | | 15,260,961 | | | | (24,060) | |
| Marubeni Corp. | | | 7,000 | | | | 3,216,077 | | | | 824 | |
| Maruichi Steel Tube Ltd. | | | 2,400 | | | | 4,320,809 | | | | (2,764) | |
| Medipal Holdings Corp. | | | 36,800 | | | | 27,120,789 | | | | 31,859 | |
| | | | |
| | The accompanying notes are an integral part of these financial statements. | | (Continued) |
| | | | | | | | | | | | | | | | |
| 100 | | AQR Funds | | | | | | Annual Report | | | | | | December 2011 | | |
| | | | | | | | | | |
| | | | |
| Consolidated Schedule of Investments | | | December 31, 2011 | |
| | |
| AQR MULTI-STRATEGY ALTERNATIVE FUND | | |
| | | | | | | | | | | | |
REFERENCE
ENTITY | | SHARES | | | NOTIONAL (a) | | | NET
UNREALIZED
APPRECIATION
(DEPRECIATION) | |
| Japan (continued) | | | | | | | | | | | | |
| Miraca Holdings, Inc. | | | 9,700 | | | JPY | 30,247,054 | | | $ | (6,257) | |
| Mitsubishi Chemical Holdings Corp. | | | 26,000 | | | | 12,347,072 | | | | (17,923) | |
| Mitsubishi Electric Corp. | | | 74,000 | | | | 54,639,384 | | | | (675) | |
| Mitsubishi Gas Chemical Co., Inc. | | | 27,000 | | | | 12,519,306 | | | | (12,936) | |
| Mitsubishi Materials Corp. | | | 24,000 | | | | 4,952,101 | | | | 549 | |
| Mitsubishi UFJ Financial Group, Inc. | | | 28,700 | | | | 9,537,727 | | | | (2,414) | |
| Mitsubishi UFJ Lease & Finance Co., Ltd. | | | 17,000 | | | | 51,374,104 | | | | 5,407 | |
| Mitsui & Co., Ltd. | | | 8,400 | | | | 11,157,268 | | | | (14,762) | |
| Mitsui Chemicals, Inc. | | | 56,000 | | | | 14,069,652 | | | | (12,760) | |
| Mitsui Engineering & Shipbuilding Co., Ltd. | | | 24,000 | | | | 2,880,504 | | | | (148) | |
| Mitsui Mining & Smelting Co., Ltd. | | | 187,000 | | | | 39,880,549 | | | | (37,278) | |
| Mitsumi Electric Co., Ltd. | | | 76,500 | | | | 44,654,874 | | | | (13,610) | |
| Mizuho Financial Group, Inc. | | | 182,900 | | | | 19,413,140 | | | | (4,550) | |
| Nabtesco Corp. | | | 7,800 | | | | 11,774,257 | | | | (11,087) | |
| Namco Bandai Holdings, Inc. | | | 11,300 | | | | 12,202,675 | | | | 1,838 | |
| NET One Systems Co., Ltd. | | | 213 | | | | 41,586,831 | | | | 39,477 | |
| NHK Spring Co Ltd. | | | 70,800 | | | | 50,135,310 | | | | (25,612) | |
| Nikon Corp. | | | 18,800 | | | | 31,746,912 | | | | 4,160 | |
| Nippon Kayaku Co., Ltd. | | | 25,000 | | | | 19,456,536 | | | | (12,383) | |
| Nippon Meat Packers, Inc. | | | 26,000 | | | | 25,639,507 | | | | (10,935) | |
| Nippon Paper Group, Inc. | | | 3,400 | | | | 6,517,938 | | | | (10,441) | |
| Nippon Sheet Glass Co., Ltd. | | | 379,000 | | | | 61,616,613 | | | | (94,193) | |
| Nippon Shokubai Co., Ltd. | | | 31,000 | | | | 27,852,391 | | | | (29,736) | |
| Nippon Suisan Kaisha, Inc. | | | 7,200 | | | | 1,909,834 | | | | (159) | |
| Nippon Television Network Corp. | | | 2,590 | | | | 29,004,979 | | | | 18,630 | |
| Nishi-Nippon City Bank Ltd./The | | | 152,000 | | | | 34,367,212 | | | | (10,501) | |
| Nissha Printing Co., Ltd. | | | 9,900 | | | | 9,305,928 | | | | 1,494 | |
| Nisshin Seifun Group, Inc. | | | 8,000 | | | | 7,725,251 | | | | (3,520) | |
| Nisshin Steel Co., Ltd. | | | 73,000 | | | | 8,615,511 | | | | (240) | |
| Nisshinbo Holdings, Inc. | | | 6,000 | | | | 4,133,358 | | | | 248 | |
| Nitto Denko Corp. | | | 12,900 | | | | 39,764,768 | | | | (57,769) | |
| NSK Ltd. | | | 18,000 | | | | 9,989,701 | | | | (13,520) | |
| NTT DoCoMo, Inc. | | | 24 | | | | 3,415,500 | | | | (310) | |
| Obayashi Corp. | | | 114,000 | | | | 39,997,946 | | | | (12,748) | |
| Okinawa Electric Power Co., Inc./The | | | 7,300 | | | | 25,110,818 | | | | (15,086) | |
| | | | | | | | | | | | |
REFERENCE
ENTITY | | SHARES | | | NOTIONAL (a) | | | NET
UNREALIZED
APPRECIATION
(DEPRECIATION) | |
| Japan (continued) | | | | | | | | | | | | |
| Omron Corp. | | | 2,600 | | | JPY | 4,526,626 | | | $ | (6,620) | |
| Onward Holdings Co., Ltd. | | | 3,000 | | | | 1,857,325 | | | | (2,158) | |
| Osaka Gas Co., Ltd. | | | 20,000 | | | | 6,026,399 | | | | 722 | |
| Otsuka Corp. | | | 3,900 | | | | 20,776,893 | | | | (1,550) | |
| Pacific Metals Co., Ltd. | | | 18,000 | | | | 8,006,451 | | | | (17,022) | |
| Point, Inc. | | | 4,570 | | | | 15,077,540 | | | | (2,042) | |
| Renesas Electronics Corp. | | | 106,900 | | | | 55,867,319 | | | | (75,583) | |
| Rengo Co., Ltd. | | | 25,000 | | | | 13,564,054 | | | | (1,894) | |
| Rohto Pharmaceutical Co., Ltd. | | | 5,000 | | | | 4,541,796 | | | | 5,167 | |
| Ryohin Keikaku Co., Ltd. | | | 8,500 | | | | 30,984,422 | | | | 12,498 | |
| Sankyo Co., Ltd. | | | 4,900 | | | | 20,399,508 | | | | (17,301) | |
| Sankyu, Inc. | | | 39,000 | | | | 12,141,324 | | | | (10,811) | |
| Santen Pharmaceutical Co., Ltd. | | | 12,500 | | | | 38,432,079 | | | | 16,905 | |
| Sapporo Hokuyo Holdings, Inc. | | | 50,500 | | | | 14,135,944 | | | | (3,056) | |
| Sapporo Holdings Ltd. | | | 6,000 | | | | 1,723,288 | | | | 236 | |
| Secom Co., Ltd. | | | 4,900 | | | | 17,539,257 | | | | (2,548) | |
| Sega Sammy Holdings, Inc. | | | 19,100 | | | | 32,275,187 | | | | (6,697) | |
| Seiko Epson Corp. | | | 2,100 | | | | 2,166,470 | | | | (390) | |
| Seino Holdings Corp. | | | 1,000 | | | | 560,000 | | | | 457 | |
| Sekisui Chemical Co., Ltd. | | | 42,000 | | | | 27,809,114 | | | | (15,320) | |
| Seven & I Holdings Co., Ltd. | | | 10,000 | | | | 21,329,632 | | | | 1,581 | |
| Shimachu Co., Ltd. | | | 10,600 | | | | 19,353,732 | | | | (8,699) | |
| Shimadzu Corp. | | | 29,000 | | | | 18,611,031 | | | | 2,762 | |
| Shimizu Corp. | | | 45,000 | | | | 14,380,105 | | | | 2,305 | |
| Shinko Electric Industries Co., Ltd. | | | 32,400 | | | | 19,363,746 | | | | (31,893) | |
| Shionogi & Co., Ltd. | | | 2,600 | | | | 2,572,150 | | | | (63) | |
| Showa Shell Sekiyu KK | | | 20,900 | | | | 12,183,638 | | | | (17,766) | |
| Softbank Corp. | | | 800 | | | | 1,846,575 | | | | (496) | |
| Sojitz Corp. | | | 20,100 | | | | 2,440,102 | | | | (658) | |
| Sony Corp | | | 19,000 | | | | 26,052,558 | | | | 4,112 | |
| Square Enix Holdings Co., Ltd. | | | 4,200 | | | | 6,486,019 | | | | (1,953) | |
| Sugi Holdings Co., Ltd. | | | 17,300 | | | | 36,609,479 | | | | 27,781 | |
| Sumitomo Bakelite Co., Ltd. | | | 75,000 | | | | 34,099,933 | | | | (24,635) | |
| Sumitomo Heavy Industries Ltd. | | | 94,000 | | | | 41,850,805 | | | | 4,883 | |
| Sumitomo Metal Mining Co., Ltd. | | | 4,000 | | | | 3,931,688 | | | | 128 | |
| Sundrug Co., Ltd. | | | 3,400 | | | | 8,256,479 | | | | (4,500) | |
| Suzuken Co., Ltd. | | | 12,100 | | | | 24,206,805 | | | | 20,553 | |
| Suzuki Motor Corp | | | 17,600 | | | | 28,341,772 | | | | (5,833) | |
| T&D Holdings, Inc. | | | 6,400 | | | | 4,552,690 | | | | 441 | |
| Taisei Corp. | | | 62,000 | | | | 12,605,347 | | | | (6,609) | |
| Takara Holdings, Inc. | | | 16,000 | | | | 7,336,412 | | | | 7,412 | |
| | | | |
| | The accompanying notes are an integral part of these financial statements. | | (Continued) |
| | | | | | | | | | | | | | | | |
| | AQR Funds | | | | | | Annual Report | | | | | | December 2011 | | 101 |
| | | | | | | | | | |
| | | | |
| Consolidated Schedule of Investments | | | December 31, 2011 | |
| | |
| AQR MULTI-STRATEGY ALTERNATIVE FUND | | |
| | | | | | | | | | | | |
REFERENCE
ENTITY | | SHARES | | | NOTIONAL (a) | | | NET
UNREALIZED
APPRECIATION
(DEPRECIATION) | |
| Japan (continued) | | | | | | | | | | | | |
| Takashimaya Co., Ltd. | | | 5,000 | | | JPY | 2,776,700 | | | $ | (62) | |
| Teijin Ltd. | | | 61,000 | | | | 16,935,109 | | | | (32,873) | |
| THK Co., Ltd. | | | 13,300 | | | | 18,901,392 | | | | 16,411 | |
| Tokai Rika Co., Ltd. | | | 37,400 | | | | 48,644,929 | | | | (60,875) | |
| Tokuyama Corp. | | | 87,000 | | | | 24,082,399 | | | | (36,956) | |
| Tokyo Electron Ltd. | | | 16,700 | | | | 66,285,360 | | | | (15,035) | |
| Tokyo Gas Co., Ltd. | | | 24,000 | | | | 8,373,083 | | | | 1,822 | |
| Tokyu Co., Ltd. | | | 6,000 | | | | 2,282,400 | | | | (106) | |
| TonenGeneral Sekiyu KK | | | 3,000 | | | | 2,834,000 | | | | (4,108) | |
| Toray Industries, Inc. | | | 24,000 | | | | 13,234,315 | | | | (230) | |
| Toshiba Corp. | | | 128,000 | | | | 41,840,829 | | | | (21,226) | |
| Toyo Suisan Kaisha Ltd. | | | 14,000 | | | | 27,237,082 | | | | (15,070) | |
| Toyota Boshoku Corp. | | | 26,300 | | | | 20,848,948 | | | | 2,917 | |
| Toyota Tsusho Corp. | | | 9,300 | | | | 12,099,962 | | | | 6,726 | |
| Trend Micro, Inc. | | | 3,700 | | | | 8,711,724 | | | | (2,851) | |
| UNY Co., Ltd. | | | 9,500 | | | | 6,833,259 | | | | (3,319) | |
| USS Co., Ltd. | | | 530 | | | | 3,435,219 | | | | 3,270 | |
| West Japan Railway Co. | | | 4,700 | | | | 15,478,410 | | | | 3,125 | |
| Yamada Denki Co., Ltd. | | | 1,880 | | | | 10,178,100 | | | | (4,171) | |
| Yamaguchi Financial Group, Inc. | | | 14,000 | | | | 10,268,291 | | | | (3) | |
| Yamaha Corp. | | | 400 | | | | 282,049 | | | | (11) | |
| Yamaha Motor Co., Ltd. | | | 40,700 | | | | 43,387,530 | | | | (48,933) | |
| Yamatake Corp. | | | 19,000 | | | | 31,244,102 | | | | 6,984 | |
| Yamato Kogyo Co., Ltd. | | | 12,300 | | | | 24,065,008 | | | | 39,389 | |
| Yamazaki Baking Co., Ltd. | | | 9,000 | | | | 9,590,496 | | | | (6,349) | |
| | | | | | | | | | | | |
| | | | | | | | | | | (1,318,218) | |
| | | | | | | | | | | | |
| Jersey, Channel Islands | | | | | | | | | |
| WPP PLC | | | 4,263 | | | GBP | 25,949 | | | | 4,408 | |
| | | | | | | | | | | | |
| Luxembourg | | | | | | | | | | | | |
| SES SA | | | 637 | | | EUR | 11,737 | | | | 70 | |
| | | | | | | | | | | | |
| | | |
| Netherlands | | | | | | | | | | | | |
| Aegon NV | | | 36,517 | | | EUR | 113,942 | | | | (1,522) | |
| Akzo Nobel NV | | | 335 | | | | 12,094 | | | | 491 | |
| ASML Holding NV | | | 9,164 | | | | 237,843 | | | | 74,966 | |
| CSM | | | 1,960 | | | | 21,212 | | | | 3,013 | |
| European Aeronautic Defence and Space Co. NV | | | 24,483 | | | | 538,176 | | | | 65,842 | |
| Imtech NV | | | 3,196 | | | | 61,649 | | | | 2,637 | |
| ING Groep NV | | | 46,838 | | | | 252,367 | | | | 8,340 | |
| Koninklijke Ahold NV | | | 32,457 | | | | 316,359 | | | | 26,794 | |
| Koninklijke BAM Groep NV | | | 126,605 | | | | 389,975 | | | | 26,871 | |
| Koninklijke Boskalis Westminster NV | | | 9,712 | | | | 243,763 | | | | 40,230 | |
| Koninklijke DSM NV | | | 12,235 | | | | 430,134 | | | | 8,818 | |
| Nutreco NV | | | 7,017 | | | | 329,948 | | | | 33,776 | |
| SBM Offshore NV | | | 6,851 | | | | 97,109 | | | | 14,754 | |
| SNS REAAL NV | | | 157,508 | | | | 315,829 | | | | (66,497) | |
| USG People NV | | | 5,080 | | | | 33,604 | | | | (1,611) | |
| | | | | | | | | | | | |
| | | | | | | | | | | 236,902 | |
| | | | | | | | | | | | |
| | | | | | | | | | | | |
REFERENCE
ENTITY | | SHARES | | | NOTIONAL (a) | | | NET
UNREALIZED
APPRECIATION
(DEPRECIATION) | |
| Norway | | | | | | | | | | | | |
| Aker Solutions ASA | | | 60,242 | | | NOK | 3,826,527 | | | $ | (8,347) | |
| DnB NOR ASA | | | 17,282 | | | | 1,000,937 | | | | 1,087 | |
| Marine Harvest ASA | | | 1,358,054 | | | | 3,765,642 | | | | (43,941) | |
| Orkla ASA | | | 6,634 | | | | 277,437 | | | | 3,013 | |
| Seadrill Ltd. | | | 5,051 | | | | 1,009,514 | | | | (345) | |
| Statoil ASA | | | 14,449 | | | | 2,156,335 | | | | 9,503 | |
| Telenor ASA | | | 17,684 | | | | 1,710,497 | | | | 3,381 | |
| Yara International ASA | | | 5,046 | | | | 1,327,363 | | | | (20,501) | |
| | | | | | | | | | | | |
| | | | | | | | | | | (56,150) | |
| | | | | | | | | | | | |
| Portugal | | | | | | | | | | | | |
| Banco Comercial Portugues SA | | | 3,947 | | | EUR | 509 | | | | 33 | |
| Jeronimo Martins SGPS SA | | | 17,329 | | | | 222,897 | | | | (2,255) | |
| | | | | | | | | | | | |
| | | | | | | | | | | (2,222) | |
| | | | | | | | | | | | |
| Russia | | | | | | | | | | | | |
| Gazprom OAO | | | 42,849 | | | $ | 497,860 | | | | (41,350) | |
| Lukoil OAO | | | 7,200 | | | | 399,713 | | | | (18,622) | |
| MMC Norilsk Nickel OJSC | | | 11,456 | | | | 205,152 | | | | (30,095) | |
| Rosneft Oil Co. | | | 22,723 | | | | 161,187 | | | | (11,645) | |
| Surgutneftegas OJSC | | | 20,880 | | | | 166,508 | | | | (3,418) | |
| Tatneft | | | 1,454 | | | | 43,943 | | | | (968) | |
| | | | | | | | | | | | |
| | | | | | | | | | | (106,098) | |
| | | | | | | | | | | | |
| Spain | | | | | | | | | | | | |
| Ebro Foods SA | | | 3,942 | | | EUR | 52,813 | | | | 4,651 | |
| Endesa SA | | | 9,897 | | | | 173,686 | | | | (22,208) | |
| Ferrovial SA | | | 50,736 | | | | 442,051 | | | | 38,014 | |
| Fomento de Construcciones y Contratas SA | | | 304 | | | | 5,278 | | | | 1,017 | |
| Gamesa Corp. Tecnologica SA | | | 1 | | | | 3 | | | | (1) | |
| Gas Natural SDG SA | | | 19,290 | | | | 234,365 | | | | 27,282 | |
| Inditex SA | | | 10,129 | | | | 643,694 | | | | (6,221) | |
| Indra Sistemas SA | | | 32,048 | | | | 320,105 | | | | (7,992) | |
| Obrascon Huarte Lain SA | | | 6,437 | | | | 120,849 | | | | 4,135 | |
| Red Electrica Corp. SA | | | 287 | | | | 9,543 | | | | (96) | |
| Repsol YPF SA | | | 9,502 | | | | 204,233 | | | | 26,388 | |
| Sacyr Vallehermoso SA | | | 18,619 | | | | 89,364 | | | | (20,651) | |
| Tecnicas Reunidas SA | | | 21,073 | | | | 525,983 | | | | 73,538 | |
| | | | | | | | | | | | |
| | | | | | | | | | | 117,856 | |
| | | | | | | | | | | | |
| Sweden | | | | | | | | | | | | |
| Boliden AB | | | 70,919 | | | SEK | 6,286,939 | | | | 115,332 | |
| Electrolux AB | | | 19,815 | | | | 2,083,342 | | | | 12,121 | |
| Getinge AB | | | 8,757 | | | | 1,486,642 | | | | 5,418 | |
| Lundin Petroleum AB | | | 3,892 | | | | 638,777 | | | | 2,508 | |
| Nordea Bank AB | | | 35,546 | | | | 1,875,630 | | | | 1,436 | |
| Skandinaviska Enskilda Banken AB | | | 42,024 | | | | 1,630,302 | | | | 6,932 | |
| Skanska AB | | | 50,520 | | | | 5,122,703 | | | | 89,466 | |
| | | | |
| | The accompanying notes are an integral part of these financial statements. | | (Continued) |
| | | | | | | | | | | | | | | | |
| 102 | | AQR Funds | | | | | | Annual Report | | | | | | December 2011 | | |
| | | | | | | | | | |
| | | | |
| Consolidated Schedule of Investments | | | December 31, 2011 | |
| | |
| AQR MULTI-STRATEGY ALTERNATIVE FUND | | |
| | | | | | | | | | | | |
REFERENCE
ENTITY | | SHARES | | | NOTIONAL (a) | | | NET
UNREALIZED
APPRECIATION
(DEPRECIATION) | |
| Sweden (continued) | | | | | | | | | | | | |
| SKF AB | | | 18,687 | | | SEK | 2,617,704 | | | $ | 13,564 | |
| Swedbank AB | | | 45,837 | | | | 3,962,194 | | | | 15,780 | |
| Swedish Match AB | | | 9,380 | | | | 2,136,990 | | | | 21,756 | |
| Tele2 AB | | | 40,988 | | | | 5,334,780 | | | | 19,156 | |
| Telefonaktiebolaget LM Ericsson | | | 102,881 | | | | 7,255,493 | | | | (10,987) | |
| Volvo AB | | | 9,806 | | | | 744,352 | | | | (1,332) | |
| | | | | | | | | | | | |
| | | | | | | | | | | 291,150 | |
| | | | | | | | | | | | |
| Switzerland | | | | | | | | | | | | |
| ABB Ltd. | | | 20,918 | | | CHF | 357,233 | | | | 12,653 | |
| Actelion Ltd. | | | 15,379 | | | | 482,002 | | | | 12,918 | |
| Aryzta AG | | | 233 | | | | 9,621 | | | | 998 | |
| Baloise Holding AG | | | 1,299 | | | | 90,992 | | | | (8,002) | |
| Cie Financiere Richemont SA | | | 6,394 | | | | 296,057 | | | | 6,446 | |
| Logitech International SA | | | 50,575 | | | | 361,137 | | | | 7,873 | |
| Nestle SA | | | 502 | | | | 26,009 | | | | 1,137 | |
| Panalpina Welttransport Holding AG | | | 2,310 | | | | 195,832 | | | | 27,236 | |
| Petroplus Holdings AG | | | 191,052 | | | | 559,071 | | | | (244,052) | |
| Roche Holding AG | | | 3,446 | | | | 497,714 | | | | 52,904 | |
| Schindler Holding AG | | | 905 | | | | 96,690 | | | | 2,259 | |
| SGS SA | | | 45 | | | | 69,577 | | | | 147 | |
| Sulzer AG | | | 15,358 | | | | 1,556,816 | | | | (22,007) | |
| Swiss Life Holding AG | | | 7,902 | | | | 797,942 | | | | (125,775) | |
| Swiss Reinsurance Co., Ltd. | | | 669 | | | | 31,499 | | | | 478 | |
| Swisscom AG | | | 69 | | | | 23,806 | | | | 753 | |
| Syngenta AG | | | 4,765 | | | | 1,263,575 | | | | 54,968 | |
| UBS AG | | | 8,379 | | | | 92,130 | | | | 1,314 | |
| | | | | | | | | | | | |
| | | | | | | | | | | (217,752) | |
| | | | | | | | | | | | |
| United Kingdom | |
| Aegis Group PLC | | | 84,191 | | | GBP | 120,695 | | | | 1,249 | |
| Arpechim Pitesti | | | 34,336 | | | | 113,784 | | | | 32,127 | |
| ASA Gold and Precious Metals Ltd. | | | 12,276 | | | | 71,462 | | | | 8,157 | |
| Aveva Group PLC | | | 30,906 | | | | 480,276 | | | | (58,816) | |
| Babcock International Group PLC | | | 77,951 | | | | 502,023 | | | | 109,672 | |
| Barclays PLC | | | 471,706 | | | | 821,300 | | | | 16,376 | |
| Bearing Power Canada Ltd. | | | 45,330 | | | | 177,691 | | | | 7,669 | |
| Berkeley Group Holdings PLC | | | 32,551 | | | | 393,995 | | | | 33,050 | |
| BGL BNP Paribas SA | | | 50,806 | | | | 146,737 | | | | 4,269 | |
| British American Tobacco PLC | | | 4,861 | | | | 147,418 | | | | 1,668 | |
| Britvic PLC | | | 15,849 | | | | 49,203 | | | | 2,704 | |
| BT Group PLC | | | 63,096 | | | | 114,188 | | | | 9,695 | |
| Burberry Group PLC | | | 37,555 | | | | 472,838 | | | | (43,769) | |
| Cascade Bancorp | | | 1,300 | | | | 5,045 | | | | (720) | |
| Charter International PLC | | | 1,933 | | | | 16,849 | | | | 2,174 | |
| De La Rue PLC | | | 26,503 | | | | 222,690 | | | | 20,700 | |
| | | | | | | | | | | | |
REFERENCE
ENTITY | | SHARES | | | NOTIONAL (a) | | | NET
UNREALIZED
APPRECIATION
(DEPRECIATION) | |
| United Kingdom (continued) | | | | | | | | | |
| Dixons Retail PLC | | | 354,136 | | | GBP | 41,293 | | | $ | (10,224) | |
| Drax Group PLC | | | 26,568 | | | | 138,474 | | | | 9,651 | |
| Ferrexpo PLC | | | 210,538 | | | | 634,663 | | | | (106,779) | |
| FIH Erhvervsbank A/S | | | 9,859 | | | | 53,951 | | | | 9,763 | |
| G4S PLC | | | 10,371 | | | | 27,633 | | | | 863 | |
| GKN PLC | | | 354,034 | | | | 657,947 | | | | (16,435) | |
| Goldman Sachs Global Technology Portfolio | | | 1,562 | | | | 45,231 | | | | 1,909 | |
| Hays PLC | | | 574,893 | | | | 406,637 | | | | (60,416) | |
| Hong Kong Exchanges and Clearing Ltd. | | | 31,841 | | | | 290,080 | | | | (2,065) | |
| HSBC Holdings PLC | | | 109,595 | | | | 531,250 | | | | 11,622 | |
| IMI PLC | | | 49,561 | | | | 410,141 | | | | (51,943) | |
| Inc.hcape PLC | | | 189,346 | | | | 579,150 | | | | (37,944) | |
| Inmarsat PLC | | | 5,529 | | | | 22,610 | | | | (487) | |
| Intercontinental Hotels Group PLC | | | 6,858 | | | | 77,288 | | | | 3,277 | |
| Intermediate Capital Group PLC | | | 262,153 | | | | 628,193 | | | | (44,858) | |
| Investec PLC | | | 26,283 | | | | 97,545 | | | | (13,169) | |
| ITV PLC | | | 375,098 | | | | 234,335 | | | | 32,345 | |
| John Wood Group PLC | | | 64,906 | | | | 374,065 | | | | 64,680 | |
| Kesa Electricals PLC | | | 354,340 | | | | 230,648 | | | | 13,030 | |
| Kingfisher PLC | | | 82,107 | | | | 196,381 | | | | 14,088 | |
| Legal & General Group PLC | | | 668,738 | | | | 673,673 | | | | 22,479 | |
| Michael Page International PLC | | | 32,776 | | | | 117,755 | | | | (5,307) | |
| Misys PLC | | | 106,669 | | | | 278,513 | | | | (47,876) | |
| Mondi PLC | | | 9,799 | | | | 45,761 | | | | (1,851) | |
| National Grid PLC | | | 3,395 | | | | 20,386 | | | | 1,155 | |
| Pearson PLC | | | 20,375 | | | | 222,664 | | | | 36,615 | |
| Petrofac Ltd. | | | 3,856 | | | | 52,534 | | | | 4,656 | |
| ProLogis LP | | | 16,294 | | | | 284,689 | | | | 14,020 | |
| Provident Financial PLC | | | 1,766 | | | | 19,560 | | | | (4,564) | |
| Rolls-Royce Holdings PLC | | | 9,388 | | | | 67,097 | | | | 4,495 | |
| Serco Group PLC | | | 42,769 | | | | 210,769 | | | | (12,634) | |
| Shinsei Bank Ltd. | | | 12,078 | | | | 283,848 | | | | 16,221 | |
| Shire PLC | | | 7,933 | | | | 161,350 | | | | 25,128 | |
| SSE PLC | | | 43,668 | | | | 566,791 | | | | (6,111) | |
| Stagecoach Group PLC | | | 13,740 | | | | 33,937 | | | | 5,329 | |
| Stagecoach Group PLC | | | 17,176 | | | | 7,975 | | | | 151 | |
| Tate & Lyle PLC | | | 107,409 | | | | 648,999 | | | | 166,356 | |
| TUI Travel PLC | | | 120,213 | | | | 184,708 | | | | 23,215 | |
| UBS AG | | | 249,666 | | | | 50,682 | | | | (13) | |
| Unilever PLC | | | 2,407 | | | | 50,170 | | | | 2,802 | |
| United Utilities Group PLC | | | 4,122 | | | | 24,953 | | | | 8 | |
| Vedanta Resources PLC | | | 33,282 | | | | 396,115 | | | | (90,064) | |
| William Hill PLC | | | 100,016 | | | | 221,208 | | | | (29,158) | |
| Wolseley PLC | | | 19,933 | | | | 334,220 | | | | 140,246 | |
| Xstrata PLC | | | 24,528 | | | | 242,898 | | | | (3,778) | |
| | | | | | | | | | | | |
| | | | | | | | | | | 224,633 | |
| | | | | | | | | | | | |
| | | | |
| | The accompanying notes are an integral part of these financial statements. | | (Continued) |
| | | | | | | | | | | | | | | | |
| | AQR Funds | | | | | | Annual Report | | | | | | December 2011 | | 103 |
| | | | | | | | | | |
| | | | |
| Consolidated Schedule of Investments | | | December 31, 2011 | |
| | |
| AQR MULTI-STRATEGY ALTERNATIVE FUND | | |
| | | | | | | | | | | | |
REFERENCE
ENTITY | | SHARES | | | NOTIONAL (a) | | | NET
UNREALIZED
APPRECIATION
(DEPRECIATION) | |
| United States | |
| Samsung Electronics Co., Ltd. | | | 1,712 | | | $ | 694,295 | | | $ | 92,947 | |
| | | | | | | | | | | | |
Total Long Positions | | | | | | | | | | | (915,477) | |
| | | | | | | | | | | | |
| | | |
| Short Positions | | | | | | | | | | | | |
| | | |
| Austria | | | | | | | | | | | | |
| Erste Group Bank AG | | | (27,644) | | | EUR | (430,717) | | | | 72,181 | |
| Telekom Austria AG | | | (37,082) | | | | (319,502) | | | | (30,109) | |
| Vienna Insurance Group AG Wiener Versicherung Gruppe | | | (9,215) | | | | (267,967) | | | | (17,148) | |
| | | | | | | | | | | | |
| | | | | | | | | | | 24,924 | |
| | | | | | | | | | | | |
| Belgium | | | | | | | | | | | | |
| Anheuser-Busch InBev NV | | | (14,474) | | | EUR | (558,248) | | | | (160,883) | |
| Colruyt SA | | | (15,964) | | | | (491,204) | | | | 32,637 | |
| Telenet Group Holding NV | | | (10,896) | | | | (303,038) | | | | (22,696) | |
| UCB SA | | | (730) | | | | (23,423) | | | | (310) | |
| | | | | | | | | | | | |
| | | | | | | | | | | (151,252) | |
| | | | | | | | | | | | |
| Bermuda | | | | | | | | | | | | |
| Frontline Ltd. | | | (15,180) | | | NOK | (473,841) | | | | 14,972 | |
| | | | | | | | | | | | |
| | | |
| Denmark | | | | | | | | | | | | |
| Carlsberg A/S | | | (817) | | | DKK | (327,377) | | | | (526) | |
| Coloplast A/S | | | (518) | | | | (419,210) | | | | (1,342) | |
| D/S Norden | | | (1,566) | | | | (241,060) | | | | 5,400 | |
| NKT Holding A/S | | | (13,804) | | | | (2,545,035) | | | | (13,439) | |
| Novozymes A/S | | | (13,453) | | | | (2,160,820) | | | | (38,227) | |
| Tryg A/S | | | (17,101) | | | | (4,784,381) | | | | (114,254) | |
| Vestas Wind Systems A/S | | | (50,172) | | | | (3,324,852) | | | | 39,305 | |
| William Demant Holding A/S | | | (2,565) | | | | (1,191,100) | | | | (5,358) | |
| | | | | | | | | | | | |
| | | | | | | | | | | (128,441) | |
| | | | | | | | | | | | |
| Finland | | | | | | | | | | | | |
| Elisa OYJ | | | (26,814) | | | EUR | (400,721) | | | | (39,660) | |
| Fortum OYJ | | | (2,054) | | | | (36,608) | | | | 3,634 | |
| Kone OYJ | | | (366) | | | | (15,001) | | | | 467 | |
| Konecranes OYJ | | | (15,016) | | | | (241,206) | | | | 31,358 | |
| Nokian Renkaat OYJ | | | (24,903) | | | | (599,326) | | | | (23,892) | |
| Outokumpu OYJ | | | (20,064) | | | | (142,906) | | | | 53,713 | |
| Pohjola Bank PLC | | | (262) | | | | (1,983) | | | | 27 | |
| Rautaruukki OYJ | | | (82,546) | | | | (754,604) | | | | 220,646 | |
| Tieto OYJ | | | (4,023) | | | | (40,994) | | | | (4,042) | |
| UPM-Kymmene OYJ | | | (12,606) | | | | (105,401) | | | | (1,729) | |
| | | | | | | | | | | | |
| | | | | | | | | | | 240,522 | |
| | | | | | | | | | | | |
| France | | | | | | | | | | | | |
| Accor SA | | | (8,274) | | | EUR | (167,271) | | | | 7,973 | |
| Alstom SA | | | (1,011) | | | | (32,773) | | | | 11,875 | |
| Bouygues SA | | | (8,044) | | | | (206,485) | | | | 14,253 | |
| Bureau Veritas SA | | | (4,937) | | | | (267,997) | | | | (11,746) | |
| | | | | | | | | | | | |
REFERENCE
ENTITY | | SHARES | | | NOTIONAL (a) | | | NET
UNREALIZED
APPRECIATION
(DEPRECIATION) | |
| France (continued) | | | | | | | | | | | | |
| Carrefour SA | | | (11,962) | | | EUR | (221,251) | | | $ | 14,198 | |
| Casino Guichard Perrachon SA | | | (2,125) | | | | (132,586) | | | | (7,091) | |
| Christian Dior SA | | | (218) | | | | (21,198) | | | | 1,704 | |
| EDF SA | | | (33,215) | | | | (708,761) | | | | 111,358 | |
| Eiffage SA | | | (33,218) | | | | (739,027) | | | | 156,148 | |
| Eutelsat Communications SA | | | (7,836) | | | | (232,992) | | | | (3,670) | |
| France Telecom SA | | | (2,757) | | | | (33,023) | | | | (411) | |
| GDF Suez | | | (12,195) | | | | (250,717) | | | | (6,886) | |
| Iliad SA | | | (2,887) | | | | (248,799) | | | | (33,329) | |
| JCDecaux SA | | | (4,258) | | | | (79,891) | | | | 5,636 | |
| Lafarge SA | | | (39,666) | | | | (1,115,647) | | | | 55,330 | |
| Legrand SA | | | (21,032) | | | | (521,145) | | | | 822 | |
| L’Oreal SA | | | (314) | | | | (25,950) | | | | 883 | |
| Metropole Television SA | | | (2,441) | | | | (28,156) | | | | 139 | |
| Neopost SA | | | (11,960) | | | | (639,377) | | | | 23,218 | |
| Pernod-Ricard SA | | | (10,911) | | | | (709,636) | | | | (91,463) | |
| Peugeot SA | | | (46,788) | | | | (611,996) | | | | 63,197 | |
| Publicis Groupe SA | | | (3,467) | | | | (110,888) | | | | (15,599) | |
| Renault SA | | | (10,460) | | | | (275,046) | | | | (5,241) | |
| Schneider Electric SA | | | (358) | | | | (14,169) | | | | (379) | |
| Sodexo | | | (3,421) | | | | (185,209) | | | | (5,141) | |
| Suez Environnement Co. | | | (16,884) | | | | (153,412) | | | | 4,574 | |
| Vallourec SA | | | (28,408) | | | | (1,547,988) | | | | 168,415 | |
| Veolia Environnement SA | | | (15,618) | | | | (173,756) | | | | 53,768 | |
| Zodiac Aerospace | | | (2,325) | | | | (131,701) | | | | (25,959) | |
| | | | | | | | | | | | |
| | | | | | | | | | | 486,576 | |
| | | | | | | | | | | | |
| Germany | | | | | | | | | | | | |
| Allianz SE | | | (3,827) | | | EUR | (283,783) | | | | 1,792 | |
| BASF SE | | | (2,316) | | | | (116,707) | | | | (10,188) | |
| Bayerische Motoren Werke AG | | | (5,974) | | | | (321,436) | | | | 16,668 | |
| Beiersdorf AG | | | (1,290) | | | | (53,021) | | | | (4,480) | |
| Commerzbank AG | | | (100,714) | | | | (150,272) | | | | 24,977 | |
| Continental AG | | | (5,433) | | | | (292,404) | | | | 41,063 | |
| Deutsche Telekom AG | | | (8,933) | | | | (78,677) | | | | (642) | |
| E.ON AG | | | (22,575) | | | | (357,225) | | | | (24,157) | |
| Fraport AG Frankfurt Airport Services Worldwide | | | (4,858) | | | | (227,931) | | | | 56,252 | |
| Fresenius Medical Care AG & Co. KGaA | | | (13,681) | | | | (705,897) | | | | (15,663) | |
| Hamburger Hafen und Logistik AG | | | (26,735) | | | | (593,169) | | | | (21,019) | |
| Hannover Rueckversicherung AG | | | (2,730) | | | | (92,313) | | | | (15,797) | |
| Lanxess AG | | | (4,790) | | | | (189,596) | | | | (2,003) | |
| MTU Aero Engines Holding AG | | | (130) | | | | (5,874) | | | | (699) | |
| Muenchener Rueckversicherungs AG | | | (2,747) | | | | (257,558) | | | | (3,280) | |
| Porsche Automobil Holding SE | | | (2,342) | | | | (96,856) | | | | 328 | |
| | | | |
| | The accompanying notes are an integral part of these financial statements. | | (Continued) |
| | | | | | | | | | | | | | | | |
| 104 | | AQR Funds | | | | | | Annual Report | | | | | | December 2011 | | |
| | | | | | | | | | |
| | | | |
| Consolidated Schedule of Investments | | | December 31, 2011 | |
| | |
| AQR MULTI-STRATEGY ALTERNATIVE FUND | | |
| | | | | | | | | | | | |
REFERENCE
ENTITY | | SHARES | | | NOTIONAL (a) | | | NET
UNREALIZED
APPRECIATION
(DEPRECIATION) | |
| Germany (continued) | | | | | | | | | | | | |
| RWE AG | | | (23,357) | | | EUR | (643,163) | | | $ | 12,504 | |
| Stada Arzneimittel AG | | | (21,240) | | | | (433,418) | | | | 32,474 | |
| Symrise AG | | | (22,527) | | | | (414,105) | | | | (63,973) | |
| TUI AG | | | (11,388) | | | | (47,318) | | | | (9,398) | |
| United Internet AG | | | (2,398) | | | | (30,184) | | | | (3,679) | |
| Vossloh AG | | | (2,971) | | | | (240,590) | | | | 26,904 | |
| Wacker Chemie AG | | | (2,082) | | | | (211,235) | | | | 106,154 | |
| | | | | | | | | | | | |
| | | | | | | | | | | 144,138 | |
| | | | | | | | | | | | |
| Italy | | | | | | | | | | | | |
| Atlantia SpA | | | (41,429) | | | EUR | (484,614) | | | | (34,052) | |
| Autogrill SpA | | | (8,314) | | | | (60,500) | | | | (2,518) | |
| Buzzi Unicem SpA | | | (1,040) | | | | (6,889) | | | | (143) | |
| Finmeccanica SpA | | | (85,364) | | | | (284,738) | | | | 54,205 | |
| Geox S.P.A. PLC | | | (41,517) | | | | (90,116) | | | | 573 | |
| Italcementi SpA | | | (7,340) | | | | (34,602) | | | | 1,617 | |
| Luxottica Group SpA | | | (17,816) | | | | (378,486) | | | | (8,320) | |
| Mediaset SpA | | | (209,156) | | | | (498,477) | | | | 68,229 | |
| Pirelli & C SpA | | | (22,925) | | | | (156,651) | | | | 10,570 | |
| Snam Rete Gas SpA | | | (4,496) | | | | (17,251) | | | | 2,524 | |
| Terna Rete Elettrica Nazionale SpA | | | (257,442) | | | | (710,561) | | | | 53,260 | |
| | | | | | | | | | | | |
| | | | | | | | | | | 145,945 | |
| | | | | | | | | | | | |
| Japan | | | | | | | | | | | | |
| 77 Bank Ltd./The | | | (50,000) | | | JPY | (16,305,101) | | | | (2,760) | |
| ABC-Mart, Inc. | | | (2,500) | | | | (7,266,128) | | | | (568) | |
| Aeon Co., Ltd. | | | (2,000) | | | | (2,126,128) | | | | 226 | |
| Aeon Credit Service Co., Ltd. | | | (18,000) | | | | (20,471,295) | | | | (17,663) | |
| Air Water, Inc. | | | (5,000) | | | | (4,593,838) | | | | (3,777) | |
| Asahi Glass Co., Ltd. | | | (104,000) | | | | (71,945,197) | | | | 65,288 | |
| Asahi Group Holdings Ltd. | | | (1,300) | | | | (2,185,779) | | | | (120) | |
| Asics Corp. | | | (14,400) | | | | (15,879,368) | | | | 44,448 | |
| Bank of Kyoto Ltd./The | | | (36,000) | | | | (23,922,047) | | | | 1,280 | |
| Benesse Holdings, Inc. | | | (4,900) | | | | (16,543,104) | | | | (21,946) | |
| Bridgestone Corp. | | | (400) | | | | (671,933) | | | | (329) | |
| Canon, Inc. | | | (6,700) | | | | (23,158,893) | | | | 6,033 | |
| Chiba Bank Ltd./The | | | (1,000) | | | | (504,667) | | | | 127 | |
| Chugai Pharmaceutical Co., Ltd. | | | (6,500) | | | | (8,466,204) | | | | 2,851 | |
| Chugoku Bank Ltd./The | | | (15,000) | | | | (15,347,082) | | | | (9,334) | |
| Chugoku Electric Power Co., Inc./The | | | (21,800) | | | | (27,833,378) | | | | (20,361) | |
| Cosmo Oil Co., Ltd. | | | (23,000) | | | | (4,888,144) | | | | (693) | |
| Dai Nippon Printing Co., Ltd. | | | (22,000) | | | | (16,786,484) | | | | 6,895 | |
| Daicel Corp. | | | (9,000) | | | | (3,987,302) | | | | (2,864) | |
| Daido Steel Co., Ltd. | | | (2,000) | | | | (941,835) | | | | (249) | |
| Daikin Industries Ltd. | | | (25,400) | | | | (59,363,139) | | | | 77,904 | |
| | | | | | | | | | | | |
REFERENCE
ENTITY | | SHARES | | | NOTIONAL (a) | | | NET
UNREALIZED
APPRECIATION
(DEPRECIATION) | |
| Japan (continued) | | | | | | | | | | | | |
| Dainippon Sumitomo Pharma Co., Ltd. | | | (27,600) | | | JPY | (22,956,171) | | | $ | (15,865) | |
| Daiwa Securities Group, Inc. | | | (83,000) | | | | (23,881,052) | | | | 52,188 | |
| Denki Kagaku Kogyo KK | | | (4,000) | | | | (1,133,802) | | | | (10) | |
| Denso Corp. | | | (800) | | | | (1,665,436) | | | | (339) | |
| Don Quijote Co., Ltd. | | | (13,100) | | | | (36,684,473) | | | | 26,836 | |
| Dowa Holdings Co., Ltd. | | | (94,000) | | | | (44,513,659) | | | | (13,486) | |
| Eisai Co., Ltd. | | | (8,500) | | | | (26,935,112) | | | | (1,627) | |
| Elpida Memory, Inc. | | | (11,000) | | | | (4,898,992) | | | | 12,756 | |
| FamilyMart Co., Ltd. | | | (800) | | | | (2,328,448) | | | | (2,055) | |
| Fuji Electric Co., Ltd. | | | (7,000) | | | | (1,468,743) | | | | (86) | |
| Furukawa Electric Co., Ltd. | | | (159,000) | | | | (36,289,417) | | | | 106,669 | |
| Hankyu Hanshin Holdings, Inc. | | | (39,000) | | | | (12,490,021) | | | | (1,925) | |
| Hino Motors Ltd. | | | (7,000) | | | | (3,161,944) | | | | (1,304) | |
| Hirose Electric Co., Ltd. | | | (1,900) | | | | (13,359,276) | | | | 7,378 | |
| Hiroshima Bank Ltd./The | | | (13,000) | | | | (4,768,893) | | | | 1,661 | |
| Hisamitsu Pharmaceutical Co., Inc. | | | (13,100) | | | | (44,025,845) | | | | 16,730 | |
| Hitachi Chemical Co., Ltd. | | | (15,600) | | | | (21,116,503) | | | | 1,273 | |
| Hitachi Construction Machinery Co., Ltd. | | | (7,900) | | | | (10,711,517) | | | | 6,645 | |
| Hitachi Metals Ltd. | | | (79,000) | | | | (72,594,393) | | | | 85,839 | |
| Hokkaido Electric Power Co., Inc. | | | (400) | | | | (421,626) | | | | (208) | |
| Hokuriku Electric Power Co. | | | (10,200) | | | | (13,745,053) | | | | (11,915) | |
| Honda Motor Co., Ltd. | | | (23,600) | | | | (56,213,334) | | | | 11,451 | |
| Hoya Corp. | | | (500) | | | | (810,158) | | | | (224) | |
| Ibiden Co., Ltd. | | | (6,100) | | | | (10,136,149) | | | | 11,592 | |
| Inpex Corp. | | | (3) | | | | (1,495,238) | | | | 538 | |
| IT Holdings Corp. | | | (16,800) | | | | (15,212,738) | | | | (3,486) | |
| Itochu Techno-Solutions Corp. | | | (500) | | | | (1,678,706) | | | | (618) | |
| Iyo Bank Ltd./The | | | (3,000) | | | | (2,229,000) | | | | (603) | |
| J Front Retailing Co., Ltd. | | | (39,000) | | | | (13,650,611) | | | | (10,653) | |
| Jafco Co., Ltd. | | | (33,500) | | | | (49,278,349) | | | | 28,320 | |
| Japan Petroleum Exploration Co. | | | (900) | | | | (2,970,250) | | | | 3,470 | |
| JFE Holdings, Inc. | | | (40,900) | | | | (65,664,883) | | | | 113,652 | |
| Joyo Bank Ltd./The | | | (23,000) | | | | (7,672,743) | | | | (1,817) | |
| Jupiter Telecommunications Co., Ltd. | | | (125) | | | | (9,701,883) | | | | (478) | |
| Kakaku.com, Inc. | | | (7,500) | | | | (21,650,511) | | | | 6,274 | |
| Kamigumi Co., Ltd. | | | (10,000) | | | | (6,555,852) | | | | (1,141) | |
| | | | |
| | The accompanying notes are an integral part of these financial statements. | | (Continued) |
| | | | | | | | | | | | | | | | |
| | AQR Funds | | | | | | Annual Report | | | | | | December 2011 | | 105 |
| | | | | | | | | | |
| | | | |
| Consolidated Schedule of Investments | | | December 31, 2011 | |
| | |
| AQR MULTI-STRATEGY ALTERNATIVE FUND | | |
| | | | | | | | | | | | |
REFERENCE
ENTITY | | SHARES | | | NOTIONAL (a) | | | NET
UNREALIZED
APPRECIATION
(DEPRECIATION) | |
| Japan (continued) | | | | | | | | | | | | |
| Kansai Paint Co., Ltd. | | | (21,000) | | | JPY | (14,723,669) | | | $ | 4,252 | |
| Kawasaki Heavy Industries Ltd. | | | (47,000) | | | | (9,133,401) | | | | 2,061 | |
| Keikyu Corp. | | | (26,000) | | | | (16,862,161) | | | | (14,428) | |
| Keio Corp. | | | (10,000) | | | | (4,695,000) | | | | (9,535) | |
| Kewpie Corp. | | | (6,100) | | | | (6,474,187) | | | | (2,591) | |
| Kikkoman Corp. | | | (34,000) | | | | (28,850,156) | | | | (15,172) | |
| Kirin Holdings Co., Ltd. | | | (50,000) | | | | (50,311,104) | | | | 46,109 | |
| Komatsu Ltd. | | | (36,400) | | | | (68,969,459) | | | | 47,285 | |
| Konica Minolta Holdings, Inc. | | | (18,500) | | | | (10,049,882) | | | | (6,993) | |
| Kubota Corp. | | | (89,000) | | | | (55,779,646) | | | | (20,107) | |
| Kurita Water Industries Ltd. | | | (12,800) | | | | (27,010,868) | | | | 18,667 | |
| Kyowa Exeo Corp. | | | (4,400) | | | | (3,262,533) | | | | 910 | |
| Kyowa Hakko Kirin Co., Ltd. | | | (37,000) | | | | (30,906,693) | | | | (50,108) | |
| Kyushu Electric Power Co., Inc. | | | (19,100) | | | | (22,819,512) | | | | 22,869 | |
| Mabuchi Motor Co., Ltd. | | | (3,200) | | | | (10,878,296) | | | | 8,425 | |
| Marui Group Co., Ltd. | | | (72,600) | | | | (43,531,690) | | | | 1,189 | |
| Matsui Securities Co., Ltd. | | | (45,900) | | | | (16,826,260) | | | | (4,573) | |
| Matsumotokiyoshi Holdings Co., Ltd. | | | (2,600) | | | | (4,092,801) | | | | 562 | |
| Mazda Motor Corp. | | | (148,000) | | | | (23,726,727) | | | | 48,034 | |
| McDonald’s Holdings Co., Japan Ltd. | | | (20,500) | | | | (42,198,423) | | | | (3,759) | |
| Minebea Co., Ltd. | | | (195,000) | | | | (60,511,789) | | | | (26,011) | |
| MISUMI Group, Inc. | | | (5,400) | | | | (9,295,735) | | | | (2,810) | |
| Mitsubishi Corp. | | | (3,000) | | | | (4,715,475) | | | | 800 | |
| Mitsubishi Heavy Industries Ltd. | | | (55,000) | | | | (18,557,769) | | | | 7,508 | |
| Mitsubishi Tanabe Pharma Corp. | | | (23,800) | | | | (30,590,471) | | | | 21,439 | |
| Mitsui OSK Lines Ltd. | | | (138,000) | | | | (44,084,791) | | | | 40,643 | |
| Mori Seiki Co., Ltd. | | | (48,200) | | | | (37,335,069) | | | | 56,948 | |
| MS&AD Insurance Group Holdings | | | (2,300) | | | | (3,745,544) | | | | 6,208 | |
| Murata Manufacturing Co., Ltd. | | | (13,000) | | | | (55,722,719) | | | | 58,201 | |
| NEC Corp. | | | (127,000) | | | | (20,804,723) | | | | 13,262 | |
| NGK Insulators Ltd. | | | (9,000) | | | | (9,000,426) | | | | 10,379 | |
| NGK Spark Plug Co., Ltd. | | | (8,000) | | | | (8,232,977) | | | | 8,092 | |
| Nichirei Corp. | | | (19,000) | | | | (6,649,196) | | | | (5,449) | |
| Nidec Corp. | | | (12,600) | | | | (81,980,200) | | | | (28,914) | |
| Nintendo Co., Ltd. | | | (400) | | | | (4,404,296) | | | | 2,304 | |
| Nippon Electric Glass Co., Ltd. | | | (26,000) | | | | (19,736,545) | | | | 469 | |
| Nippon Express Co., Ltd. | | | (10,000) | | | | (3,005,142) | | | | 170 | |
| Nippon Steel Corp. | | | (287,000) | | | | (64,323,578) | | | | 121,762 | |
| Nippon Yusen KK | | | (21,000) | | | | (4,176,367) | | | | 733 | |
| | | | | | | | | | | | |
REFERENCE
ENTITY | | SHARES | | | NOTIONAL (a) | | | NET
UNREALIZED
APPRECIATION
(DEPRECIATION) | |
| Japan (continued) | | | | | | | | | | | | |
| Nissan Chemical Industries Ltd. | | | (39,500) | | | JPY | (31,844,582) | | | $ | 32,346 | |
| Nissan Motor Co., Ltd. | | | (18,100) | | | | (12,810,925) | | | | 4,353 | |
| Nissin Foods Holdings Co., Ltd. | | | (1,700) | | | | (5,028,438) | | | | (1,323) | |
| Nitori Holdings Co., Ltd. | | | (7,050) | | | | (53,787,261) | | | | 37,746 | |
| NKSJ Holdings, Inc. | | | (3,350) | | | | (5,247,844) | | | | 2,648 | |
| NOK Corp. | | | (15,300) | | | | (19,877,821) | | | | (2,751) | |
| Nomura Holdings, Inc. | | | (500) | | | | (118,079) | | | | 29 | |
| Nomura Research Institute Ltd. | | | (11,600) | | | | (20,281,213) | | | | 1,802 | |
| NTN Corp. | | | (54,000) | | | | (16,930,291) | | | | 3,355 | |
| NTT Data Corp. | | | (204) | | | | (51,416,690) | | | | 18,433 | |
| Obic Co., Ltd. | | | (1,070) | | | | (15,316,699) | | | | (4,896) | |
| OJI Paper Co Ltd. | | | (3,000) | | | | (1,193,991) | | | | 110 | |
| Ono Pharmaceutical Co., Ltd. | | | (1,500) | | | | (6,390,381) | | | | (1,101) | |
| Oracle Corp. Japan | | | (15,800) | | | | (40,716,137) | | | | 6,704 | |
| Oriental Land Co., Ltd. | | | (4,400) | | | | (33,527,344) | | | | (28,938) | |
| Panasonic Corp. | | | (4,600) | | | | (3,157,179) | | | | 2,196 | |
| Rakuten, Inc. | | | (555) | | | | (46,299,536) | | | | 4,430 | |
| Resona Holdings, Inc. | | | (17,200) | | | | (5,783,089) | | | | (580) | |
| Ricoh Co., Ltd. | | | (84,000) | | | | (59,222,515) | | | | 38,760 | |
| Rinnai Corp. | | | (1,800) | | | | (10,163,838) | | | | 3,161 | |
| Rohm Co., Ltd. | | | (5,300) | | | | (20,110,984) | | | | 14,828 | |
| Saizeriya Co., Ltd. | | | (10,400) | | | | (13,680,352) | | | | 4,925 | |
| Seven Bank Ltd. | | | (183,300) | | | | (27,566,082) | | | | (563) | |
| Sharp Corp. | | | (70,000) | | | | (45,840,176) | | | | (14,635) | |
| Shikoku Electric Power Co., Inc. | | | (19,300) | | | | (37,326,410) | | | | (68,729) | |
| Shimano, Inc. | | | (9,400) | | | | (36,867,554) | | | | 21,470 | |
| Shin-Etsu Chemical Co., Ltd. | | | (4,700) | | | | (18,108,962) | | | | 4,410 | |
| Shiseido Co Ltd. | | | (14,900) | | | | (21,764,269) | | | | 9,158 | |
| Shizuoka Bank Ltd./The | | | (11,000) | | | | (8,520,436) | | | | (5,025) | |
| Showa Denko KK | | | (34,000) | | | | (5,311,452) | | | | 387 | |
| SMC Corp. | | | (1,000) | | | | (12,208,862) | | | | (2,267) | |
| Sony Financial Holdings, Inc. | | | (10,300) | | | | (11,896,696) | | | | 2,657 | |
| Stanley Electric Co., Ltd. | | | (29,700) | | | | (33,206,650) | | | | (3,819) | |
| Sumco Corp. | | | (67,300) | | | | (54,665,747) | | | | 214,807 | |
| Sumitomo Chemical Co., Ltd. | | | (210,000) | | | | (60,858,390) | | | | 28,206 | |
| Sumitomo Corp. | | | (21,100) | | | | (20,983,132) | | | | (12,597) | |
| Sumitomo Electric Industries Ltd. | | | (10,500) | | | | (8,719,073) | | | | (401) | |
| Sumitomo Mitsui Financial Group, Inc. | | | (5,400) | | | | (11,575,882) | | | | 638 | |
| Sumitomo Mitsui Trust Holdings, Inc. | | | (108,000) | | | | (27,748,248) | | | | 43,793 | |
| Sumitomo Rubber Industries Ltd. | | | (19,200) | | | | (18,273,370) | | | | 6,849 | |
| | | | |
| | The accompanying notes are an integral part of these financial statements. | | (Continued) |
| | | | | | | | | | | | | | | | |
| 106 | | AQR Funds | | | | | | Annual Report | | | | | | December 2011 | | |
| | | | | | | | | | |
| | | | |
| Consolidated Schedule of Investments | | | December 31, 2011 | |
| | |
| AQR MULTI-STRATEGY ALTERNATIVE FUND | | |
| | | | | | | | | | | | |
REFERENCE
ENTITY | | SHARES | | | NOTIONAL (a) | | | NET
UNREALIZED
APPRECIATION
(DEPRECIATION) | |
| Japan (continued) | | | | | | | | | | | | |
| Suruga Bank Ltd. | | | (32,000) | | | JPY | (22,014,280) | | | $ | 398 | |
| Sysmex Corp. | | | (5,000) | | | | (13,017,871) | | | | 6,569 | |
| Taiheiyo Cement Corp. | | | (249,000) | | | | (36,763,238) | | | | 1,083 | |
| Taiyo Nippon Sanso Corp. | | | (104,000) | | | | (58,348,733) | | | | 34,834 | |
| Takeda Pharmaceutical Co., Ltd. | | | (8,500) | | | | (28,066,902) | | | | (8,719) | |
| TDK Corp. | | | (10,300) | | | | (33,663,675) | | | | (16,904) | |
| Terumo Corp. | | | (10,700) | | | | (41,977,565) | | | | 42,374 | |
| Tobu Railway Co., Ltd. | | | (16,000) | | | | (5,470,937) | | | | (10,560) | |
| Toho Gas Co., Ltd. | | | (20,000) | | | | (9,300,753) | | | | (6,511) | |
| Tokai Carbon Co., Ltd. | | | (153,000) | | | | (62,686,595) | | | | (14,254) | |
| Tokio Marine Holdings, Inc. | | | (7,800) | | | | (14,977,065) | | | | 21,861 | |
| Tokyo Broadcasting System Holdings, Inc. | | | (12,900) | | | | (12,436,803) | | | | (4,197) | |
| Tokyo Steel Manufacturing Co., Ltd. | | | (10,000) | | | | (6,728,534) | | | | 6,417 | |
| Toppan Printing Co., Ltd. | | | (16,000) | | | | (9,111,314) | | | | 910 | |
| Tosoh Corp. | | | (3,000) | | | | (739,071) | | | | 1,630 | |
| TOTO Ltd. | | | (12,000) | | | | (7,565,559) | | | | 5,664 | |
| Toyo Seikan Kaisha Ltd. | | | (2,600) | | | | (2,725,366) | | | | 24 | |
| Toyoda Gosei Co., Ltd. | | | (8,800) | | | | (11,411,077) | | | | 8,888 | |
| Toyota Industries Corp. | | | (15,500) | | | | (34,816,110) | | | | 32,969 | |
| Toyota Motor Corp. | | | (22,300) | | | | (61,079,360) | | | | 56,151 | |
| Tsumura & Co. | | | (20,300) | | | | (47,018,226) | | | | 12,415 | |
| Ube Industries Ltd. | | | (16,000) | | | | (3,391,407) | | | | 329 | |
| Unicharm Corp. | | | (7,000) | | | | (25,304,678) | | | | (16,369) | |
| Ushio, Inc. | | | (20,300) | | | | (23,036,682) | | | | 7,528 | |
| Wacoal Holdings Corp. | | | (9,000) | | | | (8,811,476) | | | | (4,850) | |
| Yahoo Japan Corp. | | | (3,554) | | | | (88,299,599) | | | | 3,823 | |
| Yakult Honsha Co., Ltd. | | | (24,200) | | | | (55,201,167) | | | | (43,634) | |
| Yamato Holdings Co., Ltd. | | | (5,700) | | | | (7,402,824) | | | | 243 | |
| Yaskawa Electric Corp. | | | (1,000) | | | | (618,892) | | | | (428) | |
| Yokogawa Electric Corp. | | | (9,700) | | | | (6,886,538) | | | | 2,370 | |
| | | | | | | | | | | | |
| | | | | | | | | | | 1,389,281 | |
| | | | | | | | | | | | |
| Luxembourg | | | | | | | | | | | | |
| ArcelorMittal | | | (12,406) | | | EUR | (168,313) | | | | (7,584) | |
| Oriflame Cosmetics SA | | | (18,380) | | | SEK | (4,672,740) | | | | 100,090 | |
| Subsea 7 SA | | | (19,545) | | | NOK | (2,222,321) | | | | 10,769 | |
| Tenaris SA | | | (60,906) | | | | (750,060) | | | | (149,367) | |
| | | | | | | | | | | | |
| | | | | | | | | | | (46,092) | |
| | | | | | | | | | | | |
| Netherlands | | | | | | | | | | | | |
| Aalberts Industries NV | | | (40,708) | | | EUR | (495,866) | | | | (39,290) | |
| Fugro NV | | | (19,623) | | | | (836,119) | | | | (53,737) | |
| Gemalto NV | | | (6,573) | | | | (221,958) | | | | (31,301) | |
| | | | | | | | | | | | |
REFERENCE
ENTITY | | SHARES | | | NOTIONAL (a) | | | NET
UNREALIZED
APPRECIATION
(DEPRECIATION) | |
| Netherlands (continued) | | | | | | | | | |
| Heineken NV | | | (5,078) | | | EUR | (193,029) | | | $ | 15,000 | |
| Koninklijke KPN NV | | | (6,965) | | | | (69,242) | | | | 6,474 | |
| Koninklijke Philips Electronics NV | | | (11,994) | | | | (189,720) | | | | (6,110) | |
| Koninklijke Vopak NV | | | (4,772) | | | | (157,256) | | | | (48,113) | |
| PostNL NV | | | (219,219) | | | | (643,366) | | | | 137,123 | |
| Randstad Holding NV | | | (22,011) | | | | (502,819) | | | | 3,266 | |
| Wolters Kluwer NV | | | (10,034) | | | | (130,515) | | | | (4,117) | |
| | | | | | | | | | | | |
| | | | | | | | | | | (20,805) | |
| | | | | | | | | | | | |
| Norway | | | | | | | | | | | | |
| Fred Olsen Energy ASA | | | (5,709) | | | NOK | (1,102,291) | | | | (7,085) | |
| Norsk Hydro ASA | | | (82,779) | | | | (2,305,085) | | | | 3,291 | |
| Petroleum Geo-Services ASA | | | (58,475) | | | | (3,891,047) | | | | 13,294 | |
| Storebrand ASA | | | (91,902) | | | | (2,841,380) | | | | (358) | |
| | | | | | | | | | | | |
| | | | | | | | | | | 9,142 | |
| | | | | | | | | | | | |
| Portugal | | | | | | | | | | | | |
| EDP - Energias de Portugal SA | | | (645) | | | EUR | (1,525) | | | | (18) | |
| Galp Energia SGPS SA | | | (25,844) | | | | (302,530) | | | | 11,836 | |
| Portugal Telecom SGPS SA | | | (95,496) | | | | (460,414) | | | | 45,890 | |
| | | | | | | | | | | | |
| | | | | | | | | | | 57,708 | |
| | | | | | | | | | | | |
| Spain | | | | | | | | | | | | |
| Abertis Infraestructuras SA | | | (49,957) | | | EUR | (578,850) | | | | (44,727) | |
| Acciona SA | | | (4,891) | | | | (312,824) | | | | (15,482) | |
| Acerinox SA | | | (3,460) | | | | (32,441) | | | | (2,240) | |
| ACS Actividades de Construccion y Servicios SA | | | (5,106) | | | | (136,813) | | | | 26,312 | |
| Enagas SA | | | (7,221) | | | | (100,176) | | | | (3,668) | |
| Grifols SA | | | (20,654) | | | | (286,134) | | | | 24,255 | |
| Telefonica SA | | | (7,360) | | | | (112,175) | | | | 18,384 | |
| Zardoya Otis SA | | | (8,689) | | | | (88,345) | | | | (4,483) | |
| | | | | | | | | | | | |
| | | | | | | | | | | (1,649) | |
| | | | | | | | | | | | |
| Sweden | | | | | | | | | | | | |
| Alfa Laval AB | | | (19,027) | | | SEK | (2,303,030) | | | | (24,690) | |
| Assa Abloy AB | | | (32,326) | | | | (4,666,555) | | | | (130,257) | |
| Atlas Copco AB | | | (6,573) | | | | (925,553) | | | | (6,348) | |
| Elekta AB | | | (7,873) | | | | (2,332,777) | | | | (1,457) | |
| Hennes & Mauritz AB | | | (4,654) | | | | (1,013,269) | | | | (2,066) | |
| Hexagon AB | | | (88,297) | | | | (8,683,127) | | | | (52,760) | |
| Holmen AB | | | (21,697) | | | | (3,834,993) | | | | (64,115) | |
| Husqvarna AB | | | (202,037) | | | | (6,302,850) | | | | (11,778) | |
| Meda AB | | | (16,050) | | | | (1,010,835) | | | | (19,670) | |
| Modern Times Group AB | | | (5,925) | | | | (1,909,537) | | | | (4,747) | |
| Sandvik AB | | | (8,926) | | | | (748,177) | | | | (410) | |
| Scania AB | | | (13,965) | | | | (1,365,105) | | | | (7,782) | |
| Securitas AB | | | (16,248) | | | | (878,702) | | | | (12,076) | |
| SSAB AB | | | (146,480) | | | | (8,834,008) | | | | 924 | |
| | | | |
| | The accompanying notes are an integral part of these financial statements. | | (Continued) |
| | | | | | | | | | | | | | | | |
| | AQR Funds | | | | | | Annual Report | | | | | | December 2011 | | 107 |
| | | | | | | | | | |
| | | | |
| Consolidated Schedule of Investments | | | December 31, 2011 | |
| | |
| AQR MULTI-STRATEGY ALTERNATIVE FUND | | |
| | | | | | | | | | | | |
REFERENCE
ENTITY | | SHARES | | | NOTIONAL (a) | | | NET
UNREALIZED
APPRECIATION
(DEPRECIATION) | |
| Sweden (continued) | | | | | | | | | | | | |
| Svenska Cellulosa AB | | | (15,662) | | | SEK | (1,313,171) | | | $ | (40,395) | |
| Svenska Handelsbanken AB | | | (12,751) | | | | (2,335,047) | | | | 5,148 | |
| Trelleborg AB | | | (7,343) | | | | (358,979) | | | | (11,297) | |
| | | | | | | | | | | | |
| | | | | | | | | | | (383,776) | |
| | | | | | | | | | | | |
| Switzerland | | | | | | | | | | | | |
| Adecco SA | | | (3,934) | | | CHF | (153,069) | | | | (994) | |
| Clariant AG | | | (52,739) | | | | (493,004) | | | | 7,073 | |
| Credit Suisse Group AG | | | (24,588) | | | | (582,528) | | | | 43,874 | |
| Galenica AG | | | (420) | | | | (219,738) | | | | (11,377) | |
| Geberit AG | | | (103) | | | | (17,214) | | | | (1,473) | |
| Givaudan SA | | | (531) | | | | (437,300) | | | | (39,011) | |
| Holcim Ltd. | | | (15,021) | | | | (749,923) | | | | (2,311) | |
| Julius Baer Group Ltd. | | | (33,802) | | | | (1,161,180) | | | | (80,451) | |
| Kuehne + Nagel International AG | | | (57) | | | | (6,458) | | | | 493 | |
| Lonza Group AG | | | (8,810) | | | | (490,933) | | | | 3,550 | |
| Nobel Biocare Holding AG | | | (14,715) | | | | (156,555) | | | | (4,079) | |
| Novartis AG | | | (3,787) | | | | (183,132) | | | | (21,245) | |
| Sika AG | | | (13) | | | | (22,970) | | | | 11 | |
| Sonova Holding AG | | | (15,012) | | | | (1,165,349) | | | | (323,330) | |
| Straumann Holding AG | | | (1,240) | | | | (192,122) | | | | (9,029) | |
| Swatch Group AG/The | | | (93) | | | | (30,532) | | | | (2,111) | |
| Temenos Group AG | | | (90,148) | | | | (1,325,767) | | | | (60,243) | |
| Zurich Financial Services AG | | | (192) | | | | (34,047) | | | | (7,012) | |
| | | | | | | | | | | | |
| | | | | | | | | | | (507,665) | |
| | | | | | | | | | | | |
| United Kingdom | | | | | | | | | | | | |
| Admiral Group PLC | | | (67,942) | | | GBP | (648,651) | | | | 106,584 | |
| Aggreko PLC | | | (20,857) | | | | (405,832) | | | | (22,376) | |
| Amlin PLC | | | (60,412) | | | | (186,420) | | | | (4,713) | |
| Anglo American PLC | | | (11,514) | | | | (269,460) | | | | (6,859) | |
| Banca Popolare di Crema SpA | | | (55,728) | | | | (365,678) | | | | (66,136) | |
| Barloworld Ltd. | | | (7,562) | | | | (105,704) | | | | (1,242) | |
| BG Group PLC | | | (31,099) | | | | (408,688) | | | | (29,695) | |
| BP PLC | | | (15,651) | | | | (67,849) | | | | (6,116) | |
| Bunzl PLC | | | (12,360) | | | | (92,922) | | | | (25,291) | |
| Capita Group PLC/The | | | (68,790) | | | | (474,804) | | | | 66,552 | |
| Carnival PLC | | | (23,646) | | | | (485,117) | | | | (26,033) | |
| Centrica PLC | | | (11,643) | | | | (33,245) | | | | (664) | |
| Chemring Group PLC | | | (11,537) | | | | (59,932) | | | | 21,387 | |
| Cobham PLC | | | (66,099) | | | | (117,485) | | | | (5,758) | |
| Consumers Packaging, Inc. | | | (7,761) | | | | (99,885) | | | | (21,721) | |
| Cookson Group PLC | | | (64,846) | | | | (319,730) | | | | (15,247) | |
| Daily Mail & General Trust PLC | | | (65,397) | | | | (255,192) | | | | (9,410) | |
| Depfa Funding III LP | | | (42,377) | | | | (499,108) | | | | (26,343) | |
| Diageo PLC | | | (26,158) | | | | (325,679) | | | | (65,776) | |
| Dresdner Bank AG | | | (75,344) | | | | (222,547) | | | | (35,474) | |
| Eurasian Natural Resources Corp. PLC | | | (17,963) | | | | (119,545) | | | | 8,493 | |
| Experian PLC | | | (9,635) | | | GBP | (79,064) | | | | (8,178) | |
| | | | | | | | | | | | |
REFERENCE
ENTITY | | SHARES | | | NOTIONAL (a) | | | NET
UNREALIZED
APPRECIATION
(DEPRECIATION) | |
| United Kingdom (continued) | | | | | | | | | |
| Home Retail Group PLC | | | (194,598) | | | | (207,754) | | | $ | 71,791 | |
| HSBC Fund Administration Ltd. | | | (10,141) | | | | (59,626) | | | | (1,007) | |
| ICAP PLC | | | (29,717) | | | | (101,579) | | | | (2,318) | |
| Informa PLC | | | (22,267) | | | | (75,687) | | | | (7,305) | |
| International Power PLC | | | (65,803) | | | | (213,164) | | | | (13,038) | |
| Intertek Group PLC | | | (23,833) | | | | (470,008) | | | | (22,701) | |
| Invensys PLC | | | (19,337) | | | | (38,173) | | | | (3,954) | |
| J Sainsbury PLC | | | (42,079) | | | | (126,599) | | | | (1,226) | |
| Johnson Matthey PLC | | | (6,555) | | | | (115,951) | | | | (6,693) | |
| Kazakhmys PLC | | | (25,880) | | | | (230,727) | | | | (15,357) | |
| Kotak Mahindra Prime Ltd. | | | (16,826) | | | | (297,501) | | | | (69,073) | |
| Kreis-Und Stadtsparkasse Erding | | | (167,231) | | | | (336,058) | | | | 33,333 | |
| Ladbrokes PLC | | | (172,360) | | | | (221,232) | | | | (4,089) | |
| Lloyds Banking Group PLC | | | (2,272,841) | | | | (670,907) | | | | 128,963 | |
| Lonmin PLC | | | (43,231) | | | | (464,662) | | | | 62,935 | |
| Man Group PLC | | | (540,095) | | | | (684,570) | | | | 9,122 | |
| Marks & Spencer Group PLC | | | (283,117) | | | | (931,733) | | | | 79,582 | |
| Mitchells & Butlers PLC | | | (105,904) | | | | (248,303) | | | | 1,215 | |
| Next PLC | | | (11,502) | | | | (299,299) | | | | (23,152) | |
| Northwest Equity Corp. | | | (15,590) | | | | (42,815) | | | | (2,398) | |
| Old Mutual PLC | | | (12,101) | | | | (13,688) | | | | (4,195) | |
| Pennon Group PLC | | | (1,401) | | | | (9,768) | | | | (346) | |
| Persimmon PLC | | | (56,133) | | | | (259,745) | | | | (6,125) | |
| Prudential PLC | | | (13,526) | | | | (83,160) | | | | (4,681) | |
| Reckitt Benckiser Group PLC | | | (4,569) | | | | (151,751) | | | | 10,326 | |
| Rentokil Initial PLC | | | (141,022) | | | | (110,767) | | | | 34,813 | |
| Rexam PLC | | | (29,054) | | | | (99,039) | | | | (5,200) | |
| Rolls-Royce Holdings PLC | | | (499,353) | | | | — | | | | (776) | |
| Royal Dutch Shell PLC | | | (3,534) | | | | (77,113) | | | | (14,669) | |
| SABMiller PLC | | | (21,279) | | | | (467,782) | | | | (21,631) | |
| Severn Trent PLC | | | (8,606) | | | | (127,652) | | | | (1,465) | |
| Signature Metals Ltd. | | | (58,535) | | | | (635,868) | | | | (18,009) | |
| Smiths Group PLC | | | (70,645) | | | | (664,538) | | | | 29,450 | |
| Standard Life PLC | | | (180,354) | | | | (357,478) | | | | (22,690) | |
| UBM PLC | | | (20,257) | | | | (97,021) | | | | 340 | |
| UBS AG | | | (52,458) | | | | (414,152) | | | | (4,191) | |
| UBS AG | | | (6,682) | | | | (22,846) | | | | 459 | |
| Vodafone Group PLC | | | (26,620) | | | | (45,786) | | | | (3,113) | |
| Whitbread PLC | | | (4,519) | | | | (70,012) | | | | (986) | |
| | | | | | | | | | | | |
| | | | | | | | | | | 7,925 | |
| | | | | | | | | | | | |
Total Short Positions | | | | | | | | | | | 1,281,453 | |
| | | | | | | | | | | | |
Total of Long and Short Positions of Portfolio Swap | | | | | | | | | | | 365,976 | |
| | | | | | | | | | | | |
Net Cash and Other Receivables (b) | | | | | | | | | | | (474,278) | |
| | | | | | | | | | | | |
Swaps, at Value | | | | | | | | | | $ | (108,302) | |
| | | | | | | | | | | | |
| | | | |
| | The accompanying notes are an integral part of these financial statements. | | (Continued) |
| | | | | | | | | | | | | | | | |
| 108 | | AQR Funds | | | | | | Annual Report | | | | | | December 2011 | | |
| | | | | | | | | | |
| | | | |
| Consolidated Schedule of Investments | | | December 31, 2011 | |
| | |
| AQR MULTI-STRATEGY ALTERNATIVE FUND | | |
| (a) | Notional value represents the market value (including any fees or commissions) of the long and short positions when they are established. |
| (b) | Cash and other receivables includes the gains (or losses) realized within the swap when the swap resets. Gains (or losses) will be |
| | realized on the swap, and reflected on the Statement of Operations, when cash is settled with the counterparty. |
Cash held as collateral was $18,930,000 at December 31, 2011.
Total Return Basket Swap* Outstanding at December 31, 2011
| | | | | | | | |
| COUNTERPARTY | | DESCRIPTION | | TERMINATION
DATE | | VALUE ($) | |
| Morgan Stanley | | The Fund receives or pays the total return on a portfolio of long and short positions and pays or receives a specified LIBOR or Federal Funds floating rate, which is denominated in various foreign currencies based on the local currencies of the positions within the portfolio. | | 07/24/13 | | | $175,120 | |
| Total | | | | | | | | |
| * | See the accompanying “Additional Information – Total Return Basket Swap” for further details. |
Additional Information – Total Return Basket Swap
The following table represents the individual long and short positions and related values within the total return basket swap as of December 31, 2011.
| | | | |
| | The accompanying notes are an integral part of these financial statements. | | (Continued) |
| | | | | | | | | | | | |
REFERENCE
ENTITY | | SHARES | | | NOTIONAL (a) | | | NET
UNREALIZED
APPRECIATION
(DEPRECIATION) | |
| | | |
| Long Positions | | | | | | | | | | | | |
| | | |
| Bermuda | | | | | | | | | | | | |
| Accenture PLC | | | 11,200 | | | $ | 615,388 | | | $ | (19,212) | |
| Bunge Ltd. | | | 4,800 | | | | 283,208 | | | | (8,648) | |
| CrediCorp. Ltd. | | | 100 | | | | 8,356 | | | | 2,591 | |
| Everest Re Group Ltd. | | | 2,200 | | | | 177,526 | | | | 7,472 | |
| GOME Electrical Appliances Holding Ltd. | | | 586,000 | | | HKD | 1,225,084 | | | | (22,938) | |
| InvesCo., Ltd. | | | 18,400 | | | $ | 340,317 | | | | 29,339 | |
| Marvell Technology Group Ltd. | | | 36,900 | | | | 508,993 | | | | 2,072 | |
| Nabors Industries Ltd. | | | 25,300 | | | | 470,643 | | | | (31,941) | |
| Sinofert Holdings Ltd. | | | 462,000 | | | HKD | 977,831 | | | | 3,056 | |
| | | | | | | | | | | | |
| | | | | | | | | | | (38,209) | |
| | | | | | | | | | | | |
| Brazil | | | | | | | | | | | | |
| Amil Participacoes SA | | | 4,900 | | | BRL | 78,874 | | | | 875 | |
| Banco Bradesco SA | | | 9,700 | | | $ | 165,898 | | | | (4,102) | |
| Banco do Brasil SA | | | 14,900 | | | BRL | 364,262 | | | | (5,968) | |
| Banco do Estado do Rio Grande do Sul | | | 4,900 | | | | 80,822 | | | | 9,209 | |
| BR Malls Participacoes SA | | | 3,200 | | | | 57,987 | | | | (1) | |
| Brasil Telecom SA | | | 7,200 | | | $ | 151,379 | | | | (23,291) | |
| Centrais Eletricas Brasileiras SA | | | 17,100 | | | | 165,224 | | | | 817 | |
| Cia de Saneamento Basico do Estado de Sao Paulo | | | 2,700 | | | | 143,788 | | | | 6,467 | |
| | | | | | | | | | | | |
REFERENCE
ENTITY | | SHARES | | | NOTIONAL (a) | | | NET
UNREALIZED
APPRECIATION
(DEPRECIATION) | |
| Brazil (continued) | | | | | | | | | | | | |
| Cia Energetica de Minas Gerais | | | 5,400 | | | $ | 92,648 | | | $ | 3,418 | |
| Cia Paranaense de Energia | | | 1,300 | | | | 28,308 | | | | (1,034) | |
| Cielo SA | | | 4,900 | | | BRL | 204,154 | | | | 17,170 | |
| Cosan SA Industria e Comercio | | | 14,200 | | | | 352,917 | | | | 16,342 | |
| Eletropaulo Metropolitana Eletricidade de Sao Paulo SA | | | 10,100 | | | | 311,180 | | | | 30,811 | |
| Embraer SA | | | 4,600 | | | $ | 122,478 | | | | (6,466) | |
| Energias Do Brasil SA | | | 1,000 | | | BRL | 36,157 | | | | 2,865 | |
| Itau Unibanco Holding SA | | | 11,500 | | | $ | 205,663 | | | | 7,777 | |
| Metalurgica Gerdau SA | | | 6,300 | | | BRL | 112,589 | | | | 131 | |
| Multiplan Empreendimentos Imobilirios SA | | | 400 | | | | 14,277 | | | | 553 | |
| OGX Petroleo e Gas Participacoes SA | | | 2,800 | | | | 37,755 | | | | 204 | |
| Tim Participacoes SA | | | 17,500 | | | $ | 435,839 | | | | 15,661 | |
| | | | | | | | | | | | |
| | | | | | | | | | | 71,438 | |
| | | | | | | | | | | | |
| Canada | | | | | | | | | | | | |
| Tim Hortons, Inc. | | | 2,000 | | | $ | 96,548 | | | | 292 | |
| | | | | | | | | | | | |
| | | | | | | | | | | | | | | | |
| | AQR Funds | | | | | | Annual Report | | | | | | December 2011 | | 109 |
| | | | | | | | | | |
| | | | |
| Consolidated Schedule of Investments | | | December 31, 2011 | |
| | |
| AQR MULTI-STRATEGY ALTERNATIVE FUND | | |
| | | | | | | | | | | | |
REFERENCE
ENTITY | | SHARES | | | NOTIONAL (a) | | | NET
UNREALIZED
APPRECIATION
(DEPRECIATION) | |
| Cayman Islands | | | | | | | | | | | | |
| China Resources Land Ltd. | | | 12,000 | | | HKD | 145,997 | | | $ | 397 | |
| China Shanshui Cement Group Ltd. | | | 224,000 | | | | 1,284,582 | | | | (17,251) | |
| China Zhongwang Holdings Ltd. | | | 186 | | | | 475 | | | | 2 | |
| Country Garden Holdings Co. | | | 26,000 | | | | 67,725 | | | | 992 | |
| Dongyue Group Limited | | | 174,000 | | | | 1,119,708 | | | | (30,141) | |
| Evergrande Real Estate Group Ltd. | | | 20,000 | | | | 78,110 | | | | (1,828) | |
| GCL-Poly Energy Holdings Ltd. | | | 624,000 | | | | 1,342,963 | | | | 338 | |
| Longfor Properties Co., Ltd. | | | 8,000 | | | | 69,514 | | | | 64 | |
| Semiconductor Manufacturing International Co. | | | 1,482,000 | | | | 547,747 | | | | 676 | |
| Shimao Property Holdings Ltd. | | | 5,000 | | | | 37,644 | | | | (596) | |
| SoHo China Limited | | | 13,000 | | | | 66,798 | | | | 30 | |
| | | | | | | | | | | | |
| | | | | | | | | | | (47,317) | |
| | | | | | | | | | | | |
| China | | | | | | | | | | | | |
| Bank of China Ltd. | | | 311,000 | | | HKD | 901,049 | | | | (1,973) | |
| Bank of Communications Co., Ltd. | | | 23,000 | | | | 132,160 | | | | (1,014) | |
| China Bluechemical Ltd. | | | 72,000 | | | | 395,280 | | | | 3,495 | |
| China Citic Bank Corp. Ltd. | | | 22,000 | | | | 94,575 | | | | 145 | |
| China Communications Construction Co., Ltd. | | | 255,000 | | | | 1,508,537 | | | | 4,450 | |
| China Life Insurance Co., Ltd. | | | 2,400 | | | $ | 89,517 | | | | (789) | |
| China Minsheng Banking Corp. Ltd. | | | 15,000 | | | HKD | 97,065 | | | | 457 | |
| China Railway Construction Corp. Ltd. | | | 121,500 | | | | 507,688 | | | | 1,291 | |
| China Shenhua Energy Co., Ltd. | | | 9,500 | | | | 347,175 | | | | (3,620) | |
| China Southern Airlines, H Shares | | | 142,000 | | | | 591,998 | | | | (4,667) | |
| China Telecom Corp. Ltd. | | | 320,000 | | | | 1,545,742 | | | | (17,012) | |
| Great Wall Motor Co., Ltd. | | | 19,500 | | | | 179,876 | | | | 5,197 | |
| Industrial & Commercial Bank of China | | | 389,000 | | | | 1,780,068 | | | | 570 | |
| Jiangsu Expressway Co., H Shares | | | 118,000 | | | | 839,912 | | | | 147 | |
| Ping An Insurance Group Co. | | | 11,000 | | | | 559,986 | | | | 67 | |
| Sinopec Shanghai Petrochemical Co., Ltd. | | | 124,000 | | | | 371,230 | | | | (6,586) | |
| Zhejiang Expressway Co., Ltd. | | | 164,000 | | | | 830,609 | | | | (726) | |
| | | | | | | | | | | | |
| | | | | | | | | | | (20,568) | |
| | | | | | | | | | | | |
| | | | | | | | | | | | |
REFERENCE
ENTITY | | SHARES | | | NOTIONAL (a) | | | NET
UNREALIZED
APPRECIATION
(DEPRECIATION) | |
| Colombia | | | | | | | | | | | | |
| CAP SA | | | 3,307 | | | CLP | 60,996,303 | | | $ | 3,440 | |
| Empresa Nacional de Electricidad SA | | | 300 | | | $ | 14,411 | | | | (1,106) | |
| Enersis SA | | | 5,300 | | | | 98,002 | | | | (4,563) | |
| ENTEL Chile SA | | | 6,720 | | | CLP | 64,665,963 | | | | 1,247 | |
| | | | | | | | | | | | |
| | | | | | | | | | | (982) | |
| | | | | | | | | | | | |
| Hong Kong | | | | | | | | | | | | |
| Beijing Enterprise Holdings | | | 8,000 | | | HKD | 371,298 | | | | 89 | |
| China Mobile Ltd. | | | 10,300 | | | $ | 502,643 | | | | (3,196) | |
| China Overseas Land & Investment Ltd. | | | 26,000 | | | HKD | 334,246 | | | | 113 | |
| CNOOC Ltd. | | | 1,800 | | | $ | 332,111 | | | | (17,687) | |
| Guangdong Investment Ltd. | | | 6,000 | | | HKD | 25,390 | | | | 363 | |
| Lenovo Group Ltd. | | | 180,000 | | | | 937,727 | | | | (996) | |
| Sino-Ocean Land Holdings Ltd. | | | 27,000 | | | | 96,014 | | | | 95 | |
| | | | | | | | | | | | |
| | | | | | | | | | | (21,219) | |
| | | | | | | | | | | | |
| India | | | | | | | | | | | | |
| HDFC Bank Ltd. | | | 5,000 | | | $ | 137,792 | | | | (6,392) | |
| ICICI Bank Ltd. | | | 1,800 | | | | 61,924 | | | | (14,350) | |
| Infosys Ltd. | | | 5,600 | | | | 299,681 | | | | (11,953) | |
| Tata Motors Ltd. | | | 11,500 | | | | 191,898 | | | | 2,452 | |
| | | | | | | | | | | | |
| | | | | | | | | | | (30,243) | |
| | | | | | | | | | | | |
| Indonesia | | | | | | | | | | | | |
| Aneka Tambang Tbk PT | | | 48,500 | | | IDR | 91,945,000 | | | | (1,493) | |
| Astra Agro Lestari Tbk PT | | | 44,500 | | | | 978,284,700 | | | | (1,542) | |
| Bank Rakyat Indonesia Persero Tbk PT | | | 66,000 | | | | 413,327,948 | | | | 3,476 | |
| Indofood Sukses Makmur Tbk PT | | | 315,000 | | | | 1,575,633,338 | | | | (14,133) | |
| Kalbe Farma Tbk PT | | | 451,000 | | | | 1,549,427,788 | | | | (1,885) | |
| Telekomunikasi Indonesia Tbk PT | | | 800 | | | $ | 26,673 | | | | (2,081) | |
| United Tractors Tbk PT | | | 7,500 | | | IDR | 175,739,770 | | | | 2,380 | |
| | | | | | | | | | | | |
| | | | | | | | | | | (15,278) | |
| | | | | | | | | | | | |
| Ireland | | | | | | | | | | | | |
| Covidien PLC | | | 5,400 | | | $ | 249,861 | | | | (6,807) | |
| Ingersoll-Rand PLC | | | 11,000 | | | | 338,601 | | | | (3,431) | |
| Seagate Technology PLC | | | 13,100 | | | | 205,560 | | | | 9,280 | |
| | | | | | | | | | | | |
| | | | | | | | | | | (958) | |
| | | | | | | | | | | | |
| | | | |
| | The accompanying notes are an integral part of these financial statements. | | (Continued) |
| | | | | | | | | | | | | | | | |
| 110 | | AQR Funds | | | | | | Annual Report | | | | | | December 2011 | | |
| | | | | | | | | | |
| | | | |
| Consolidated Schedule of Investments | | | December 31, 2011 | |
| | |
| AQR MULTI-STRATEGY ALTERNATIVE FUND | | |
| | | | | | | | | | | | |
REFERENCE
ENTITY | | SHARES | | | NOTIONAL (a) | | | NET
UNREALIZED
APPRECIATION
(DEPRECIATION) | |
| Korea | | | | | | | | | | | | |
| BS Financial Group, Inc. | | | 7,740 | | | KRW | 95,168,074 | | | $ | (8,308) | |
| Daelim Industrial Co., Ltd. | | | 1,211 | | | | 116,376,157 | | | | (6,378) | |
| DGB Financial Group, Inc. | | | 1,320 | | | | 18,609,000 | | | | (1,315) | |
| Dongbu Insurance | | | 676 | | | | 33,723,824 | | | | 2,140 | |
| Dongkuk Steel Mill Co., Ltd. | | | 5,460 | | | | 127,780,338 | | | | (13,547) | |
| GS Engineering & Construction Corp. | | | 113 | | | | 12,206,060 | | | | (1,540) | |
| Hanwha Corp. | | | 2,320 | | | | 76,328,514 | | | | 612 | |
| Hyundai Department Store Co. | | | 557 | | | | 90,556,387 | | | | 335 | |
| Hyundai Motor Co. | | | 2,187 | | | | 476,018,332 | | | | (8,117) | |
| Hyundai Securities Co. | | | 19,100 | | | | 166,981,026 | | | | (1,674) | |
| Industrial Bank of Korea | | | 1,830 | | | | 30,068,500 | | | | (6,236) | |
| Kia Motors Corp. | | | 1,286 | | | | 94,776,198 | | | | (7,647) | |
| Korea Investment Holdings Co., Ltd. | | | 3,070 | | | | 103,946,473 | | | | 6,805 | |
| Korean Air Lines Co., Ltd. | | | 3,739 | | | | 172,661,948 | | | | (8,376) | |
| KP Chemical | | | 4,390 | | | | 62,265,273 | | | | (73) | |
| LG Display Co., Ltd. | | | 16,200 | | | $ | 164,812 | | | | 5,774 | |
| Lotte Shopping Co. | | | 216 | | | KRW | 72,211,223 | | | | 1,074 | |
| Mirae Asset Securities Co. | | | 1,830 | | | | 55,661,494 | | | | 1,923 | |
| Samsung Card Co. | | | 7 | | | | 413,113 | | | | (122) | |
| Samsung Heavy Industries Co., Ltd. | | | 4,320 | | | | 129,679,539 | | | | (7,623) | |
| Shinhan Financial Group Co., Ltd. | | | 900 | | | $ | 69,451 | | | | (8,062) | |
| Shinsegae Co. | | | 875 | | | KRW | 223,945,693 | | | | (8,107) | |
| SK Holdings Co., Ltd. | | | 161 | | | | 21,773,160 | | | | (1,978) | |
| SK Innovation Co., Ltd. | | | 62 | | | | 10,179,867 | | | | (1,182) | |
| SK Telecom Co., Ltd. | | | 25,500 | | | $ | 353,633 | | | | (6,578) | |
| Woori Finance Holdings Co., Ltd. | | | 3,928 | | | KRW | 137,861,635 | | | | (8,090) | |
| | | | | | | | | | | | |
| | | | | | | | | | | (86,290) | |
| | | | | | | | | | | | |
| Malyasia | | | | | | | | | | | | |
| AirAsia BHD | | | 1,600 | | | MYR | 6,194 | | | | (53) | |
| Alliance Financial Group | | | 31,300 | | | | 110,276 | | | | 4,201 | |
| AMMB Holdings Bhd | | | 33,900 | | | | 215,804 | | | | (4,467) | |
| Axiata Group Bhd | | | 4,900 | | | | 24,843 | | | | 109 | |
| DiGi.Com Bhd | | | 132,400 | | | | 502,802 | | | | 3,325 | |
| Genting Bhd | | | 1,200 | | | | 12,696 | | | | 155 | |
| Hong Leong Bank Bhd | | | 19,200 | | | | 208,362 | | | | 278 | |
| | | | | | | | | | | | |
REFERENCE
ENTITY | | SHARES | | | NOTIONAL (a) | | | NET
UNREALIZED
APPRECIATION
(DEPRECIATION) | |
| Malyasia (continued) | | | | | | | | | | | | |
| Petronas Chemicals Group | | | 52,800 | | | MYR | 325,127 | | | $ | 567 | |
| Petronas Gas BHD | | | 17,600 | | | | 253,047 | | | | 4,530 | |
| RHB Capital Bhd | | | 9,600 | | | | 70,492 | | | | 398 | |
| SP Setia Bhd | | | 6,900 | | | | 26,610 | | | | (8) | |
| Telekom Malaysia Bhd | | | 6,300 | | | | 25,194 | | | | 1,914 | |
| | | | | | | | | | | | |
| | | | | | | | | | | 10,949 | |
| | | | | | | | | | | | |
| Mexico | | | | | | | | | | | | |
| Alfa SAB de CV | | | 24,700 | | | MXN | 3,996,241 | | | | (17,171) | |
| Coca-Cola Femsa SAB de CV | | | 1,100 | | | $ | 101,748 | | | | 2,982 | |
| Grupo Mexico SA | | | 23,300 | | | MXN | 861,434 | | | | (470) | |
| Grupo Modelo SAB de CV | | | 33,800 | | | | 2,778,567 | | | | 14,034 | |
| Kimberly-Clark de Mexico SAB de CV | | | 9,400 | | | | 682,001 | | | | 2,254 | |
| Wal-Mart de Mexico SAB de CV | | | 27,400 | | | | 953,682 | | | | 6,861 | |
| | | | | | | | | | | | |
| | | | | | | | | | | 8,490 | |
| | | | | | | | | | | | |
| Peru | | | | | | | | | | | | |
| Cia de Minas Buenaventura SA | | | 1,300 | | | $ | 53,209 | | | | (3,367) | |
| | | | | | | | | | | | |
| | | |
| Poland | | | | | | | | | | | | |
| KGHM Polska Miedz SA | | | 872 | | | PLN | 149,724 | | | | (15,573) | |
| Polskie Gornictwo Naftowe i Gazownictwo SA | | | 12,540 | | | | 51,301 | | | | (68) | |
| Powszechny Zaklad Ubezpieczen SA | | | 281 | | | | 90,049 | | | | (1,022) | |
| Tauron Polska Energia SA | | | 89,177 | | | | 473,506 | | | | 545 | |
| | | | | | | | | | | | |
| | | | | | | | | | | (16,118) | |
| | | | | | | | | | | | |
| South Africa | |
| ABSA Group | | | 1,522 | | | ZAR | 214,762 | | | | (61) | |
| Arrowhead Properties Ltd., A Shares | | | 418 | | | | — | | | | 294 | |
| Arrowhead Properties Ltd., B Shares | | | 418 | | | | — | | | | 210 | |
| Barlowworld Ltd. | | | 14,425 | | | | 1,066,611 | | | | 1,968 | |
| Discovery Holdings Ltd. | | | 873 | | | | 34,945 | | | | 369 | |
| Growthpoint Properties Ltd. | | | 12,545 | | | | 232,342 | | | | 44 | |
| Imperial Holdings | | | 4,855 | | | | 590,141 | | | | 1,175 | |
| Investec Ltd. | | | 11,387 | | | | 514,837 | | | | (1,748) | |
| Liberty Holdings Ltd. | | | 17,673 | | | | 1,403,542 | | | | 79 | |
| Naspers Ltd. | | | 1,765 | | | | 625,116 | | | | (339) | |
| Nedbank Group Ltd. | | | 4,640 | | | | 664,851 | | | | 835 | |
| Redefine Properties Ltd. | | | 13,262 | | | | 106,426 | | | | (1,023) | |
| Sanlam Ltd. | | | 49,748 | | | | 1,428,825 | | | | 272 | |
| Sasol Ltd. | | | 700 | | | $ | 32,590 | | | | 590 | |
| Woolworths Holdings Ltd. | | | 45,244 | | | ZAR | 1,738,631 | | | | 2,879 | |
| | | | | | | | | | | | |
| | | | | | | | | | | 5,544 | |
| | | | | | | | | | | | |
| | | | |
| | The accompanying notes are an integral part of these financial statements. | | (Continued) |
| | | | | | | | | | | | | | | | |
| | AQR Funds | | | | | | Annual Report | | | | | | December 2011 | | 111 |
| | | | | | | | | | |
| | | | |
| Consolidated Schedule of Investments | | | December 31, 2011 | |
| | |
| AQR MULTI-STRATEGY ALTERNATIVE FUND | | |
| | | | | | | | | | | | |
REFERENCE
ENTITY | | SHARES | | | NOTIONAL (a) | | | NET
UNREALIZED
APPRECIATION
(DEPRECIATION) | |
| Switzerland | |
| ACE Ltd. | | | 1,900 | | | $ | 121,438 | | | $ | 11,790 | |
| TE Connectivity Ltd. | | | 15,400 | | | | 454,764 | | | | 19,710 | |
| Tyco International Ltd. | | | 3,600 | | | | 165,891 | | | | 2,265 | |
| | | | | | | | | | | | |
| | | | | | | | | | | 33,765 | |
| | | | | | | | | | | | |
| Taiwan | |
| Acer, Inc. | | | 131,000 | | | TWD | 4,557,590 | | | | 1,087 | |
| Advanced Semiconductor Engineering | | | 108,000 | | | | 3,011,267 | | | | (6,924) | |
| Asustek Computer, Inc. | | | 16,220 | | | | 3,631,132 | | | | (4,669) | |
| Catcher Technology Co., Ltd. | | | 6,000 | | | | 1,000,700 | | | | (5,261) | |
| China Life Insurance | | | 61,000 | | | | 1,474,730 | | | | 531 | |
| China Motor Corp. | | | 211,000 | | | | 6,124,594 | | | | (10,890) | |
| China Petrochemical Development Corp. | | | 177,900 | | | | 5,590,338 | | | | (26,518) | |
| Chunghwa Telecom Co., Ltd. | | | 1,000 | | | $ | 34,446 | | | | (1,166) | |
| E Sun Financial Holdings | | | 35,000 | | | TWD | 484,911 | | | | (945) | |
| Eva Airways Corp. | | | 30,500 | | | | 598,332 | | | | (453) | |
| Evergreen Marine Corp. | | | 125,000 | | | | 1,947,763 | | | | (1,245) | |
| Formosa Chemical & Fire Co. | | | 23,000 | | | | 1,964,892 | | | | (4,284) | |
| Formosa Plastics Corp. | | | 7,000 | | | | 606,600 | | | | (1,374) | |
| Fubon Financial Holding Co., Ltd. | | | 46,000 | | | | 1,469,272 | | | | 70 | |
| HTC Corp. | | | 9,000 | | | | 5,490,961 | | | | (33,829) | |
| Lite-On Technology Corp. | | | 18,000 | | | | 518,650 | | | | 3,122 | |
| Nan Ya Plastics Corp. | | | 37,000 | | | | 2,410,513 | | | | (6,232) | |
| Pegatron Corp. | | | 54,000 | | | | 1,647,352 | | | | 4,270 | |
| President Chain Store Corp. | | | 28,000 | | | | 4,745,063 | | | | (4,226) | |
| Realtek Semiconductor Corp. | | | 62,100 | | | | 2,838,539 | | | | (2,889) | |
| SinoPac Financial Holdings Co., Ltd. | | | 146,000 | | | | 1,344,534 | | | | (1) | |
| Taishin Financial Holding Co., Ltd. | | | 32,000 | | | | 357,475 | | | | (726) | |
| Taiwan Business Bank | | | 162,000 | | | | 1,474,411 | | | | 1,168 | |
| Taiwan Cooperative Financial Holding | | | 25,000 | | | | 451,760 | | | | 107 | |
| Taiwan Semiconductor Manufacturing Co., Ltd. | | | 25,900 | | | $ | 321,893 | | | | 12,476 | |
| Teco Electric and Machinery Co., Ltd. | | | 149,000 | | | TWD | 2,508,356 | | | | 4,892 | |
| Tripod Technology Corp. | | | 44,330 | | | | 3,332,550 | | | | (3,286) | |
| Uni-President Enterprises Corp. | | | 195,960 | | | | 8,271,837 | | | | 12,758 | |
| Yang Ming Marine Transport Corp. | | | 78,100 | | | | 1,181,400 | | | | (7,853) | |
| | | | | | | | | | | | |
| | | | | | | | | | | (82,290) | |
| | | | | | | | | | | | |
| | | | | | | | | | | | |
REFERENCE
ENTITY | | SHARES | | | NOTIONAL (a) | | | NET
UNREALIZED
APPRECIATION
(DEPRECIATION) | |
| Thailand | |
| Advanced Info Service PCL | | | 11,000 | | | THB | 1,452,314 | | | $ | 2,871 | |
| Bangkok Bank PCL | | | 1,000 | | | | 167,250 | | | | (443) | |
| Charoen Pokphand Foods PCL | | | 88,300 | | | | 2,897,203 | | | | 410 | |
| Krung Thai Bank PCL | | | 14,800 | | | | 300,740 | | | | (2,556) | |
| PTT PCL | | | 400 | | | | 140,400 | | | | (426) | |
| Thai Oil PCL | | | 3,400 | | | | 257,100 | | | | (1,859) | |
| | | | | | | | | | | | |
| | | | | | | | | | �� | (2,003) | |
| | | | | | | | | | | | |
| Turkey | | | | | | | | | | | | |
| Asya Katilim Bankasi AS | | | 56,248 | | | TRY | 105,946 | | | | (8,825) | |
| BIM Birlesik Magazalar AS | | | 1,158 | | | | 63,448 | | | | (1,436) | |
| Turkiye Vakiflar Bankasi Tao | | | 94,876 | | | | 286,051 | | | | (28,566) | |
| | | | | | | | | | | | |
| | | | | | | | | | | (38,827) | |
| | | | | | | | | | | | |
| United Kingdom | |
| China Construction Bank Corp. | | | 375,000 | | | HKD | 2,033,975 | | | | (1,409) | |
| Ensco PLC | | | 100 | | | $ | 4,162 | | | | 530 | |
| | | | | | | | | | | | |
| | | | | | | | | | | (879) | |
| | | | | | | | | | | | |
| United States | |
| 99 Cents Only Stores | | | 13,600 | | | $ | 273,833 | | | | 24,687 | |
| Acxiom Corp. | | | 10,700 | | | | 121,403 | | | | 9,244 | |
| Advance Auto Parts, Inc. | | | 2,600 | | | | 143,733 | | | | 37,305 | |
| AECOM Technology Corp. | | | 15,100 | | | | 320,716 | | | | (10,109) | |
| Aeropostale, Inc. | | | 49,200 | | | | 690,250 | | | | 60,050 | |
| AES Corp./The | | | 46,900 | | | | 530,336 | | | | 24,959 | |
| Aetna, Inc. | | | 9,800 | | | | 393,368 | | | | 20,094 | |
| AGCO Corp. | | | 10,900 | | | | 466,586 | | | | 1,787 | |
| Agilent Technologies, Inc. | | | 22,700 | | | | 818,181 | | | | (25,270) | |
| AK Steel Holding Corp. | | | 82,700 | | | | 683,268 | | | | (166) | |
| Alaska Air Group, Inc. | | | 4,500 | | | | 273,621 | | | | 64,284 | |
| Albemarle Corp. | | | 3,600 | | | | 175,373 | | | | 10,063 | |
| Alexander & Baldwin, Inc. | | | 600 | | | | 24,670 | | | | (178) | |
| Alexandria Real Estate Equities, Inc. | | | 8,600 | | | | 593,862 | | | | (720) | |
| Alliant Energy Corp. | | | 200 | | | | 8,068 | | | | 754 | |
| Alliant Techsystems, Inc. | | | 6,700 | | | | 399,159 | | | | (16,187) | |
| Alpha Natural Resources, Inc. | | | 8,300 | | | | 163,539 | | | | 6,030 | |
| Altera Corp. | | | 3,400 | | | | 127,505 | | | | (1,365) | |
| Amazon.com, Inc. | | | 1,000 | | | | 173,625 | | | | (525) | |
| American Capital Ltd. | | | 203,300 | | | | 1,429,017 | | | | (60,808) | |
| American Eagle Outfitters, Inc. | | | 51,300 | | | | 630,289 | | | | 154,088 | |
| American Electric Power Co., Inc. | | | 1,500 | | | | 56,253 | | | | 5,712 | |
| | | | |
| | The accompanying notes are an integral part of these financial statements. | | (Continued) |
| | | | | | | | | | | | | | | | |
| 112 | | AQR Funds | | | | | | Annual Report | | | | | | December 2011 | | |
| | | | | | | | | | |
| | | | |
| Consolidated Schedule of Investments | | | December 31, 2011 | |
| | |
| AQR MULTI-STRATEGY ALTERNATIVE FUND | | |
| | | | | | | | | | | | |
REFERENCE
ENTITY | | SHARES | | | NOTIONAL (a) | | | NET
UNREALIZED
APPRECIATION
(DEPRECIATION) | |
| United States (continued) | |
| American Financial Group, Inc. | | | 11,400 | | | $ | 387,074 | | | $ | 33,472 | |
| Ameriprise Financial, Inc. | | | 26,000 | | | | 1,188,308 | | | | 102,332 | |
| AmerisourceBergen Corp. | | | 10,600 | | | | 397,876 | | | | (3,662) | |
| Anadarko Petroleum Corp. | | | 800 | | | | 61,156 | | | | (92) | |
| Analog Devices, Inc. | | | 1,300 | | | | 45,446 | | | | 1,068 | |
| AO Smith Corp. | | | 4,300 | | | | 163,817 | | | | 8,699 | |
| Aon Corp. | | | 5,900 | | | | 284,617 | | | | (8,497) | |
| Apartment Investment & Management Co. | | | 3,600 | | | | 83,900 | | | | (1,424) | |
| Apollo Group, Inc. | | | 8,200 | | | | 387,788 | | | | 53,946 | |
| Applied Industrial Technologies, Inc. | | | 6,100 | | | | 198,496 | | | | 16,041 | |
| Applied Materials, Inc. | | | 30,300 | | | | 332,308 | | | | (7,795) | |
| AptarGroup, Inc. | | | 3,000 | | | | 146,871 | | | | 9,639 | |
| Archer-Daniels-Midland Co | | | 15,300 | | | | 439,891 | | | | (2,311) | |
| Ariba , Inc. | | | 300 | | | | 9,544 | | | | (1,120) | |
| Armstrong World Industries, Inc. | | | 4,700 | | | | 173,497 | | | | 32,692 | |
| Arris Group, Inc. | | | 800 | | | | 8,682 | | | | (26) | |
| Arrow Electronics, Inc. | | | 10,700 | | | | 359,719 | | | | 40,568 | |
| Associated Banc-Corp. | | | 23,900 | | | | 265,053 | | | | 1,910 | |
| Assurant, Inc. | | | 23,200 | | | | 860,144 | | | | 92,448 | |
| AT&T, Inc. | | | 9,600 | | | | 278,606 | | | | 11,698 | |
| Atmel Corp. | | | 32,600 | | | | 319,954 | | | | (55,894) | |
| Atmos Energy Corp. | | | 500 | | | | 16,779 | | | | (104) | |
| Autodesk, Inc. | | | 9,400 | | | | 262,230 | | | | 22,872 | |
| Autoliv, Inc. | | | 1,300 | | | | 65,481 | | | | 4,056 | |
| Automatic Data Processing, Inc. | | | 700 | | | | 32,392 | | | | 5,415 | |
| AutoNation, Inc. | | | 1,500 | | | | 49,100 | | | | 6,205 | |
| AutoZone, Inc. | | | 1,500 | | | | 493,336 | | | | (5,881) | |
| Avista Corp. | | | 2,600 | | | | 63,590 | | | | 3,360 | |
| Avnet, Inc. | | | 20,800 | | | | 597,078 | | | | 49,594 | |
| Avon Products, Inc. | | | 9,900 | | | | 219,691 | | | | (46,738) | |
| Baker Hughes, Inc. | | | 3,600 | | | | 185,976 | | | | (10,872) | |
| Ball Corp. | | | 100 | | | | 3,490 | | | | 81 | |
| Banco Santander Chile | | | 200 | | | | 15,176 | | | | (36) | |
| Bank of America Corp. | | | 1,500 | | | | 7,967 | | | | 373 | |
| Barnes & Noble, Inc. | | | 28,300 | | | | 388,118 | | | | 21,666 | |
| BB&T Corp. | | | 1,500 | | | | 34,164 | | | | 3,591 | |
| Bed Bath & Beyond, Inc. | | | 11,400 | | | | 664,721 | | | | (3,863) | |
| Belden, Inc. | | | 5,600 | | | | 153,336 | | | | 33,032 | |
| Benchmark Electronics, Inc. | | | 10,000 | | | | 132,120 | | | | 2,580 | |
| Best Buy Co., Inc. | | | 4,600 | | | | 106,639 | | | | 863 | |
| Big Lots, Inc. | | | 21,700 | | | | 764,762 | | | | 54,630 | |
| Biogen Idec, Inc. | | | 8,000 | | | | 814,490 | | | | 65,910 | |
| Bio-Rad Laboratories, Inc. | | | 4,900 | | | | 488,366 | | | | (17,770) | |
| BMC Software, Inc. | | | 31,400 | | | | 1,194,097 | | | | (164,805) | |
| Brady Corp. | | | 900 | | | | 28,503 | | | | (90) | |
| | | | | | | | | | | | |
REFERENCE
ENTITY | | SHARES | | | NOTIONAL (a) | | | NET
UNREALIZED
APPRECIATION
(DEPRECIATION) | |
| United States (continued) | |
| BRE Properties, Inc. | | | 300 | | | $ | 15,287 | | | $ | (143) | |
| Brinker International, Inc. | | | 1,100 | | | | 25,660 | | | | 3,776 | |
| Brink’s Co/The | | | 14,500 | | | | 377,213 | | | | 12,547 | |
| Broadridge Financial Solutions, Inc. | | | 6,100 | | | | 125,017 | | | | 12,538 | |
| Brocade Communications Systems, Inc. | | | 172,900 | | | | 784,457 | | | | 112,894 | |
| Brown & Brown, Inc. | | | 5,800 | | | | 119,059 | | | | 12,195 | |
| Buckle, Inc./The | | | 1,900 | | | | 75,733 | | | | 1,920 | |
| CA, Inc. | | | 100 | | | | 2,106 | | | | (85) | |
| Cabot Corp. | | | 15,500 | | | | 511,313 | | | | (13,143) | |
| Cabot Oil & Gas Corp. | | | 5,300 | | | | 392,928 | | | | 9,342 | |
| Cadence Design Systems, Inc. | | | 600 | | | | 6,022 | | | | 218 | |
| Camden Property Trust | | | 4,100 | | | | 244,129 | | | | 11,055 | |
| Cameron International Corp. | | | 6,900 | | | | 338,921 | | | | 490 | |
| Capella Education Co. | | | 8,700 | | | | 283,665 | | | | 29,970 | |
| Capital One Financial Corp. | | | 1,300 | | | | 54,625 | | | | 352 | |
| CapitalSource, Inc. | | | 57,900 | | | | 374,289 | | | | 13,641 | |
| Cardinal Health, Inc. | | | 22,900 | | | | 957,084 | | | | (27,115) | |
| Career Education Corp. | | | 29,895 | | | | 228,217 | | | | 10,047 | |
| Carlisle Cos, Inc. | | | 4,900 | | | | 204,755 | | | | 12,315 | |
| Carpenter Technology Corp. | | | 4,400 | | | | 221,660 | | | | 4,852 | |
| Catalyst Health Solutions, Inc. | | | 11,900 | | | | 652,692 | | | | (33,892) | |
| CBS Corp. | | | 20,400 | | | | 504,898 | | | | 48,758 | |
| Celanese Corp. | | | 12,400 | | | | 534,355 | | | | 14,593 | |
| CenterPoint Energy, Inc. | | | 21,300 | | | | 424,183 | | | | 3,734 | |
| Central European Distribution Corp. | | | 1,700 | | | | 10,301 | | | | (2,863) | |
| CF Industries Holdings, Inc. | | | 3,300 | | | | 475,079 | | | | 3,355 | |
| Charles River Laboratories International, Inc. | | | 6,300 | | | | 169,478 | | | | 2,701 | |
| Chemed Corp. | | | 2,700 | | | | 139,783 | | | | (1,516) | |
| China Petroleum & Chemical Corp. | | | 2,700 | | | | 273,312 | | | | 10,323 | |
| Church & Dwight Co., Inc. | | | 400 | | | | 18,480 | | | | (176) | |
| Cia de Bebidas das Americas | | | 2,100 | | | | 71,719 | | | | 4,070 | |
| CIGNA Corp. | | | 18,800 | | | | 834,009 | | | | (44,409) | |
| Cimarex Energy Co. | | | 3,100 | | | | 210,224 | | | | (18,334) | |
| Cisco Systems, Inc. | | | 8,300 | | | | 131,891 | | | | 18,173 | |
| Citrix Systems, Inc. | | | 400 | | | | 24,453 | | | | (165) | |
| CLARCOR, Inc. | | | 2,700 | | | | 133,196 | | | | 1,777 | |
| Clean Harbors , Inc. | | | 5,700 | | | | 313,274 | | | | 49,987 | |
| CNA Financial Corp. | | | 8,600 | | | | 215,777 | | | | 14,273 | |
| Coach, Inc. | | | 4,200 | | | | 257,698 | | | | (1,330) | |
| | | | |
| | The accompanying notes are an integral part of these financial statements. | | (Continued) |
| | | | | | | | | | | | | | | | |
| | AQR Funds | | | | | | Annual Report | | | | | | December 2011 | | 113 |
| | | | | | | | | | |
| | | | |
| Consolidated Schedule of Investments | | | December 31, 2011 | |
| | |
| AQR MULTI-STRATEGY ALTERNATIVE FUND | | |
| | | | | | | | | | | | |
REFERENCE
ENTITY | | SHARES | | | NOTIONAL (a) | | | NET
UNREALIZED
APPRECIATION
(DEPRECIATION) | |
| United States (continued) | |
| Coca-Cola Enterprises , Inc. | | | 10,300 | | | $ | 276,554 | | | $ | (11,020) | |
| Colgate-Palmolive Co. | | | 900 | | | | 82,948 | | | | 203 | |
| Columbia Sportswear Co. | | | 600 | | | | 30,427 | | | | (2,497) | |
| Commerce Bancshares, Inc. | | | 2,505 | | | | 93,018 | | | | 2,473 | |
| CommonWealth REIT | | | 24,700 | | | | 477,461 | | | | (66,453) | |
| Community Health Systems, Inc. | | | 22,500 | | | | 414,648 | | | | (22,023) | |
| Computer Sciences Corp. | | | 19,300 | | | | 548,811 | | | | (91,401) | |
| Compuware Corp. | | | 57,300 | | | | 490,682 | | | | (13,946) | |
| Comtech Telecommunications Corp. | | | 3,600 | | | | 101,348 | | | | 1,684 | |
| ConAgra Foods, Inc. | | | 9,500 | | | | 235,341 | | | | 15,459 | |
| Consol Energy, Inc. | | | 22,100 | | | | 871,529 | | | | (60,459) | |
| Constellation Brands, Inc. | | | 5,200 | | | | 101,379 | | | | 6,105 | |
| Continental Resources , Inc. | | | 100 | | | | 6,902 | | | | (231) | |
| Convergys Corp. | | | 7,800 | | | | 77,877 | | | | 21,729 | |
| Con-way, Inc. | | | 35,700 | | | | 961,912 | | | | 79,100 | |
| Cooper Cos., Inc./The | | | 6,900 | | | | 484,886 | | | | 1,702 | |
| Copart, Inc. | | | 3,500 | | | | 161,638 | | | | 5,978 | |
| CoreLogic, Inc. | | | 22,900 | | | | 247,007 | | | | 49,090 | |
| Corn Products International, Inc. | | | 11,800 | | | | 566,371 | | | | 54,191 | |
| Corning, Inc. | | | 6,800 | | | | 88,115 | | | | 149 | |
| Corporate Executive Board Co./The | | | 4,200 | | | | 133,870 | | | | 26,150 | |
| Corrections Corp. of America | | | 15,800 | | | | 337,089 | | | | (15,243) | |
| Costco Wholesale Corp. | | | 2,200 | | | | 175,040 | | | | 8,264 | |
| Covance, Inc. | | | 11,100 | | | | 521,737 | | | | (14,245) | |
| Coventry Health Care, Inc. | | | 11,800 | | | | 367,405 | | | | (9,039) | |
| CR Bard, Inc. | | | 1,500 | | | | 134,103 | | | | (5,853) | |
| Crane Co. | | | 13,300 | | | | 579,902 | | | | 41,341 | |
| Crown Holdings, Inc. | | | 26,400 | | | | 889,802 | | | | (3,290) | |
| CSX Corp. | | | 16,700 | | | | 358,669 | | | | (6,967) | |
| Cummins, Inc. | | | 8,600 | | | | 785,107 | | | | (28,135) | |
| Curtiss-Wright Corp. | | | 800 | | | | 24,122 | | | | 4,142 | |
| Cytec Industries, Inc. | | | 8,100 | | | | 325,586 | | | | 36,079 | |
| DaVita, Inc. | | | 6,900 | | | | 509,061 | | | | 14,028 | |
| Dell, Inc. | | | 10,900 | | | | 162,215 | | | | (2,748) | |
| Delta Air Lines, Inc. | | | 19,600 | | | | 152,309 | | | | 6,255 | |
| Denbury Resources, Inc. | | | 23,400 | | | | 355,926 | | | | (2,586) | |
| Devon Energy Corp. | | | 3,200 | | | | 205,397 | | | | (6,997) | |
| DeVry, Inc. | | | 30,000 | | | | 1,211,325 | | | | (57,525) | |
| Digital River, Inc. | | | 10,500 | | | | 158,881 | | | | (1,171) | |
| Discover Financial Services | | | 40,500 | | | | 968,676 | | | | 3,324 | |
| DISH Network Corp. | | | 65,100 | | | | 1,685,962 | | | | 168,086 | |
| | | | | | | | | | | | |
REFERENCE
ENTITY | | SHARES | | | NOTIONAL (a) | | | NET
UNREALIZED
APPRECIATION
(DEPRECIATION) | |
| United States (continued) | |
| Dolby Laboratories, Inc. | | | 15,200 | | | $ | 462,730 | | | $ | 1,022 | |
| Dollar Tree, Inc. | | | 2,000 | | | | 149,678 | | | | 16,542 | |
| Donaldson Co., Inc. | | | 1,300 | | | | 71,334 | | | | 17,170 | |
| Dr Pepper Snapple Group, Inc. | | | 1,100 | | | | 43,627 | | | | (198) | |
| DreamWorks Animation SKG, Inc. | | | 1,600 | | | | 28,216 | | | | (1,664) | |
| Dresser-Rand Group, Inc. | | | 10,500 | | | | 497,266 | | | | 26,789 | |
| DST Systems, Inc. | | | 8,800 | | | | 405,765 | | | | (5,189) | |
| DTE Energy Co. | | | 1,300 | | | | 68,458 | | | | 2,327 | |
| Dun & Bradstreet Corp./The | | | 2,400 | | | | 159,800 | | | | 19,792 | |
| Earthlink, Inc. | | | 24,200 | | | | 172,956 | | | | (17,108) | |
| East West BanCorp., Inc. | | | 20,500 | | | | 370,759 | | | | 34,116 | |
| Eastman Chemical Co. | | | 11,500 | | | | 465,067 | | | | (15,877) | |
| Eastman Kodak Co. | | | 171,000 | | | | 219,369 | | | | (108,305) | |
| eBay, Inc. | | | 6,300 | | | | 189,351 | | | | 1,728 | |
| Edison International | | | 9,300 | | | | 349,270 | | | | 35,750 | |
| Edwards Lifesciences Corp. | | | 800 | | | | 54,784 | | | | 1,776 | |
| Electronic Arts, Inc. | | | 24,800 | | | | 569,073 | | | | (58,193) | |
| EMCOR Group, Inc. | | | 7,200 | | | | 170,020 | | | | 23,012 | |
| Endo Pharmaceuticals Holdings, Inc. | | | 13,300 | | | | 389,638 | | | | 69,611 | |
| Energen Corp. | | | 3,200 | | | | 164,408 | | | | (4,408) | |
| Entergy Corp. | | | 1,300 | | | | 85,289 | | | | 9,676 | |
| EQT Corp. | | | 4,500 | | | | 246,479 | | | | 76 | |
| Expeditors International of Washington, Inc. | | | 1,300 | | | | 64,930 | | | | (11,682) | |
| EzCorp., Inc. | | | 18,200 | | | | 491,754 | | | | (11,820) | |
| Family Dollar Stores, Inc. | | | 1,400 | | | | 76,732 | | | | 3,992 | |
| Fidelity National Financial, Inc. | | | 15,400 | | | | 238,142 | | | | 7,180 | |
| Fifth Third BanCorp. | | | 56,400 | | | | 645,061 | | | | 72,347 | |
| FirstEnergy Corp. | | | 900 | | | | 39,427 | | | | 443 | |
| Fiserv, Inc. | | | 3,900 | | | | 212,828 | | | | 16,258 | |
| Flowserve Corp. | | | 200 | | | | 16,964 | | | | 2,900 | |
| Fluor Corp. | | | 4,000 | | | | 203,739 | | | | (2,739) | |
| FMC Corp. | | | 2,000 | | | | 155,028 | | | | 17,052 | |
| Fomento Economico Mexcano SAB de CV | | | 900 | | | | 58,592 | | | | 4,147 | |
| Foot Locker, Inc. | | | 19,800 | | | | 426,289 | | | | 45,743 | |
| Forest Laboratories, Inc. | | | 12,300 | | | | 395,193 | | | | (22,995) | |
| Forest Oil Corp. | | | 20,000 | | | | 242,202 | | | | 28,798 | |
| Fossil, Inc. | | | 400 | | | | 32,422 | | | | (678) | |
| Fulton Financial Corp. | | | 42,400 | | | | 390,394 | | | | 25,550 | |
| GameStop Corp. | | | 12,300 | | | | 294,189 | | | | 2,610 | |
| Gardner Denver, Inc. | | | 6,700 | | | | 516,691 | | | | (389) | |
| Gartner, Inc. | | | 8,900 | | | | 326,174 | | | | (16,721) | |
| General Cable Corp. | | | 8,500 | | | | 217,340 | | | | (4,755) | |
| General Dynamics Corp. | | | 2,400 | | | | 151,649 | | | | 7,735 | |
| GenOn Energy, Inc. | | | 54,100 | | | | 147,810 | | | | (6,609) | |
| Gen-Probe, Inc. | | | 2,200 | | | | 130,218 | | | | (154) | |
| Genuine Parts Co. | | | 3,100 | | | | 175,353 | | | | 14,367 | |
| | | | |
| | The accompanying notes are an integral part of these financial statements. | | (Continued) |
| | | | | | | | | | | | | | | | |
| 114 | | AQR Funds | | | | | | Annual Report | | | | | | December 2011 | | |
| | | | | | | | | | |
| | | | |
| Consolidated Schedule of Investments | | | December 31, 2011 | |
| | |
| AQR MULTI-STRATEGY ALTERNATIVE FUND | | |
| | | | | | | | | | | | |
REFERENCE
ENTITY | | SHARES | | | NOTIONAL (a) | | | NET
UNREALIZED
APPRECIATION
(DEPRECIATION) | |
| United States (continued) | |
| Global Payments, Inc. | | | 7,400 | | | $ | 325,709 | | | $ | 24,903 | |
| Gold Fields Ltd. | | | 3,900 | | | | 65,632 | | | | (6,157) | |
| Graco, Inc. | | | 4,500 | | | | 172,796 | | | | 11,209 | |
| GrafTech International Ltd. | | | 12,700 | | | | 169,968 | | | | 3,387 | |
| Greif, Inc. | | | 2,900 | | | | 137,207 | | | | (5,112) | |
| Grupo Televisa SAB | | | 800 | | | | 14,919 | | | | 1,929 | |
| Guess?, Inc. | | | 38,400 | | | | 1,267,773 | | | | (122,685) | |
| Halliburton Co. | | | 16,200 | | | | 560,386 | | | | (1,324) | |
| Hanover Insurance Group, Inc./The | | | 9,500 | | | | 334,479 | | | | (2,454) | |
| Hansen Natural Corp. | | | 13,900 | | | | 1,229,273 | | | | 51,473 | |
| Harman International Industries, Inc. | | | 29,400 | | | | 1,095,969 | | | | 22,407 | |
| Hartford Financial Services Group, Inc. | | | 17,000 | | | | 286,470 | | | | (10,220) | |
| Hasbro, Inc. | | | 4,200 | | | | 151,951 | | | | (18,013) | |
| HB Fuller Co. | | | 3,600 | | | | 81,982 | | | | 1,214 | |
| HCC Insurance Holdings, Inc. | | | 21,600 | | | | 590,386 | | | | 3,614 | |
| Health Net, Inc. | | | 25,100 | | | | 640,032 | | | | 123,510 | |
| Heartland Express, Inc. | | | 4,900 | | | | 68,490 | | | | 1,531 | |
| Helix Energy Solutions Group, Inc. | | | 10,000 | | | | 158,681 | | | | (681) | |
| Herman Miller, Inc. | | | 3,500 | | | | 65,937 | | | | (1,362) | |
| Hershey Co./The | | | 2,400 | | | | 138,765 | | | | 9,507 | |
| Hess Corp. | | | 13,600 | | | | 814,834 | | | | (42,354) | |
| Hill-Rom Holdings, Inc. | | | 10,800 | | | | 335,221 | | | | 28,631 | |
| HollyFrontier Corp. | | | 22,400 | | | | 633,535 | | | | (109,375) | |
| Honeywell International, Inc. | | | 1,100 | | | | 50,567 | | | | 9,218 | |
| Hormel Foods Corp. | | | 7,000 | | | | 195,992 | | | | 9,038 | |
| Hospitality Properties Trust | | | 7,700 | | | | 175,792 | | | | 1,154 | |
| HUB Group, Inc. | | | 12,500 | | | | 410,131 | | | | (4,756) | |
| Hubbell, Inc. | | | 1,300 | | | | 80,527 | | | | 6,391 | |
| Humana, Inc. | | | 13,000 | | | | 1,041,679 | | | | 97,251 | |
| Huntington Bancshares, Inc. | | | 128,900 | | | | 677,586 | | | | 30,075 | |
| IAC/InterActiveCorp. | | | 6,700 | | | | 278,183 | | | | 7,237 | |
| IHS, Inc. | | | 1,300 | | | | 101,367 | | | | 10,641 | |
| Informatica Corp. | | | 500 | | | | 19,964 | | | | (1,499) | |
| Ingram Micro, Inc. | | | 51,500 | | | | 904,610 | | | | 32,175 | |
| Integrated Device Technology, Inc. | | | 43,000 | | | | 260,512 | | | | (25,732) | |
| Integrys Energy Group, Inc. | | | 600 | | | | 31,117 | | | | 1,391 | |
| International Game Technology | | | 12,000 | | | | 187,951 | | | | 18,449 | |
| International Rectifier Corp. | | | 12,400 | | | | 247,932 | | | | (7,124) | |
| Interpublic Group of Cos, Inc./The | | | 124,500 | | | | 1,100,837 | | | | 110,548 | |
| Itron, Inc. | | | 6,900 | | | | 244,573 | | | | 2,240 | |
| ITT Corp. | | | 69,100 | | | | 1,342,179 | | | | (6,476) | |
| | | | | | | | | | | | |
REFERENCE
ENTITY | | SHARES | | | NOTIONAL (a) | | | NET
UNREALIZED
APPRECIATION
(DEPRECIATION) | |
| United States (continued) | |
| ITT Educational Services, Inc. | | | 12,400 | | | $ | 743,243 | | | $ | (37,807) | |
| Jabil Circuit, Inc. | | | 47,500 | | | | 835,988 | | | | 97,862 | |
| Jacobs Engineering Group, Inc. | | | 1,200 | | | | 46,419 | | | | 2,277 | |
| JDS Uniphase Corp. | | | 32,400 | | | | 345,936 | | | | (7,680) | |
| JM Smucker Co./The | | | 5,600 | | | | 423,735 | | | | 14,017 | |
| Jones Lang LaSalle, Inc. | | | 9,100 | | | | 546,035 | | | | 11,431 | |
| Joy Global, Inc. | | | 1,900 | | | | 155,400 | | | | (12,957) | |
| JPMorgan Chase & Co. | | | 1,300 | | | | 42,642 | | | | 583 | |
| KBR, Inc. | | | 47,400 | | | | 1,376,083 | | | | (55,045) | |
| Kennametal, Inc. | | | 3,800 | | | | 135,365 | | | | 3,411 | |
| KeyCorp. | | | 103,200 | | | | 728,609 | | | | 64,999 | |
| Knight Capital Group, Inc. | | | 19,400 | | | | 255,736 | | | | (26,428) | |
| Kroger Co./The | | | 14,800 | | | | 345,636 | | | | 12,820 | |
| L, Inc.are Holdings, Inc. | | | 1,000 | | | | 23,530 | | | | 2,180 | |
| L, Inc.oln Electric Holdings, Inc. | | | 6,300 | | | | 227,572 | | | | 18,884 | |
| L, Inc.oln National Corp. | | | 8,700 | | | | 171,635 | | | | (2,681) | |
| Lam Research Corp. | | | 11,400 | | | | 439,800 | | | | (17,772) | |
| Landstar System, Inc. | | | 9,800 | | | | 432,931 | | | | 36,685 | |
| Las Vegas Sands Corp. | | | 2,400 | | | | 98,568 | | | | 3,984 | |
| Leucadia National Corp. | | | 3,200 | | | | 82,252 | | | | (9,484) | |
| Lexmark International, Inc. | | | 1,900 | | | | 60,825 | | | | 2,008 | |
| Liberty Interactive Corp. | | | 29,700 | | | | 464,891 | | | | 16,694 | |
| Liberty Property Trust | | | 1,300 | | | | 43,497 | | | | (3,353) | |
| Life Technologies Corp. | | | 5,800 | | | | 227,570 | | | | (1,892) | |
| LKQ Corp. | | | 1,100 | | | | 32,485 | | | | 603 | |
| Loews Corp. | | | 10,100 | | | | 380,150 | | | | 115 | |
| Lorillard, Inc. | | | 1,700 | | | | 189,850 | | | | 3,950 | |
| LSI Corp. | | | 124,300 | | | | 775,196 | | | | (35,611) | |
| Mack-Cali Realty Corp. | | | 1,400 | | | | 43,184 | | | | (5,818) | |
| Macy’s, Inc. | | | 15,700 | | | | 448,312 | | | | 56,914 | |
| Magellan Health Services, Inc. | | | 3,100 | | | | 152,877 | | | | 480 | |
| Manitowoc Co., Inc./The | | | 7,600 | | | | 67,705 | | | | 2,139 | |
| Manpower, Inc. | | | 15,200 | | | | 598,458 | | | | (55,058) | |
| Marathon Oil Corp. | | | 33,000 | | | | 870,839 | | | | 95,071 | |
| Marsh & McLennan Cos., Inc. | | | 5,100 | | | | 147,066 | | | | 14,196 | |
| Mattel, Inc. | | | 3,100 | | | | 83,007 | | | | 3,049 | |
| McDermott International, Inc. | | | 129,200 | | | | 1,720,809 | | | | (233,717) | |
McGraw-Hill Cos.,
Inc./The | | | 2,500 | | | | 105,337 | | | | 7,088 | |
| McKesson Corp. | | | 8,400 | | | | 651,251 | | | | 3,193 | |
| MeadWestvaco Corp. | | | 4,500 | | | | 130,916 | | | | 3,859 | |
| Medicis Pharmaceutical Corp. | | | 3,000 | | | | 97,846 | | | | 1,904 | |
| Meredith Corp. | | | 1,100 | | | | 30,172 | | | | 5,743 | |
| MetroPCS Communications , Inc. | | | 73,100 | | | | 685,239 | | | | (50,731) | |
| MICROS Systems, Inc. | | | 5,300 | | | | 246,155 | | | | 719 | |
| | | | |
| | The accompanying notes are an integral part of these financial statements. | | (Continued) |
| | | | | | | | | | | | | | | | |
| | AQR Funds | | | | | | Annual Report | | | | | | December 2011 | | 115 |
| | | | | | | | | | |
| | | | |
| Consolidated Schedule of Investments | | | December 31, 2011 | |
| | |
| AQR MULTI-STRATEGY ALTERNATIVE FUND | | |
| | | | | | | | | | | | |
REFERENCE
ENTITY | | SHARES | | | NOTIONAL (a) | | | NET
UNREALIZED
APPRECIATION
(DEPRECIATION) | |
| United States (continued) | |
| Microsemi Corp. | | | 100 | | | $ | 1,626 | | | $ | 49 | |
| Microsoft Corp. | | | 1,700 | | | | 44,831 | | | | (699) | |
| Minerals Technologies, Inc. | | | 7,800 | | | | 441,959 | | | | (1,025) | |
| MKS Instruments, Inc. | | | 39,200 | | | | 948,731 | | | | 141,813 | |
| Molex, Inc. | | | 3,900 | | | | 92,146 | | | | 908 | |
| Monsanto Co. | | | 1,600 | | | | 116,898 | | | | (4,786) | |
| Monster Worldwide, Inc. | | | 13,500 | | | | 120,938 | | | | (13,883) | |
| Mosaic Co./The | | | 1,600 | | | | 98,838 | | | | (18,150) | |
| Motorola Solutions, Inc. | | | 14,100 | | | | 632,802 | | | | 19,887 | |
| Murphy Oil Corp. | | | 13,500 | | | | 716,043 | | | | 36,447 | |
| Myriad Genetics, Inc. | | | 21,800 | | | | 432,890 | | | | 23,602 | |
| National Fuel Gas Co. | | | 1,100 | | | | 72,850 | | | | (11,712) | |
| National Instruments Corp. | | | 2,300 | | | | 59,525 | | | | 160 | |
| Navistar International Corp. | | | 26,400 | | | | 1,005,447 | | | | (5,415) | |
| NCR Corp. | | | 46,700 | | | | 820,856 | | | | (52,174) | |
| NeuStar, Inc. | | | 400 | | | | 13,462 | | | | 206 | |
| New York Times Co./The | | | 43,400 | | | | 320,540 | | | | 14,942 | |
| Newfield Exploration Co. | | | 10,600 | | | | 434,548 | | | | (34,610) | |
| News Corp. | | | 19,900 | | | | 335,913 | | | | 19,103 | |
| NII Holdings, Inc. | | | 20,900 | | | | 636,606 | | | | (191,436) | |
| NIKE, Inc. | | | 2,800 | | | | 236,506 | | | | 33,330 | |
| NiSource, Inc. | | | 400 | | | | 9,458 | | | | 66 | |
| Noble Energy, Inc. | | | 1,800 | | | | 168,382 | | | | 1,520 | |
| Nordson Corp. | | | 5,000 | | | | 217,852 | | | | (11,952) | |
| Norfolk Southern Corp. | | | 1,600 | | | | 113,451 | | | | 3,124 | |
| Northeast Utilities | | | 500 | | | | 17,322 | | | | 713 | |
| NRG Energy, Inc. | | | 3,700 | | | | 76,836 | | | | (9,792) | |
| NuVasive, Inc. | | | 1,200 | | | | 14,699 | | | | 409 | |
| NV Energy, Inc. | | | 12,300 | | | | 184,420 | | | | 16,685 | |
| NVIDIA Corp. | | | 500 | | | | 6,925 | | | | 5 | |
| Oceaneering International, Inc. | | | 12,300 | | | | 516,416 | | | | 50,983 | |
| OGE Energy Corp. | | | 6,700 | | | | 337,980 | | | | 41,977 | |
| Oil States International, Inc. | | | 500 | | | | 37,357 | | | | 828 | |
| Old Dominion Freight Line, Inc. | | | 6,200 | | | | 212,032 | | | | 39,254 | |
| Old National BanCorp. | | | 4,800 | | | | 55,355 | | | | 565 | |
| Olin Corp. | | | 200 | | | | 3,859 | | | | 71 | |
| Omnicare, Inc. | | | 800 | | | | 27,707 | | | | (147) | |
| Omnicom Group, Inc. | | | 1,300 | | | | 52,004 | | | | 5,950 | |
| ON Semiconductor Corp. | | | 45,900 | | | | 342,154 | | | | 12,194 | |
| ONEOK, Inc. | | | 900 | | | | 75,800 | | | | 2,221 | |
| Onyx Pharmaceuticals, Inc. | | | 6,700 | | | | 216,913 | | | | 77,552 | |
| Orbital Sciences Corp. | | | 42,000 | | | | 632,427 | | | | (22,167) | |
| Owens & Minor, Inc. | | | 600 | | | | 17,350 | | | | (676) | |
| Owens-Illinois, Inc. | | | 39,100 | | | | 723,041 | | | | 34,717 | |
| Packaging Corp. of America | | | 2,600 | | | | 68,358 | | | | (2,734) | |
| Pall Corp. | | | 5,500 | | | | 270,784 | | | | 43,541 | |
| Panera Bread Co. | | | 200 | | | | 27,946 | | | | 344 | |
| | | | | | | | | | | | |
REFERENCE
ENTITY | | SHARES | | | NOTIONAL (a) | | | NET
UNREALIZED
APPRECIATION
(DEPRECIATION) | |
| United States (continued) | |
| Parker Hannifin Corp. | | | 1,500 | | | $ | 114,918 | | | $ | (543) | |
| Patriot Coal Corp. | | | 36,200 | | | | 362,266 | | | | (55,652) | |
| Patterson-UTI Energy, Inc. | | | 64,300 | | | | 1,372,007 | | | | (87,293) | |
| Penn National Gaming, Inc. | | | 1,500 | | | | 56,959 | | | | 146 | |
| PerkinElmer, Inc. | | | 10,000 | | | | 219,600 | | | | (19,600) | |
| Perrigo Co. | | | 1,500 | | | | 148,792 | | | | (2,842) | |
| Petroleo Brasileiro SA | | | 15,300 | | | | 374,238 | | | | (14,841) | |
| PetSmart, Inc. | | | 1,400 | | | | 59,472 | | | | 12,334 | |
| Plains Exploration & Production Co. | | | 12,500 | | | | 357,179 | | | | 101,821 | |
| Plexus Corp. | | | 8,100 | | | | 223,941 | | | | (2,163) | |
| PMC - Sierra, Inc. | | | 36,700 | | | | 210,417 | | | | (8,200) | |
| PNC Financial Services Group, Inc. | | | 7,000 | | | | 365,175 | | | | 38,515 | |
| PNM Resources, Inc. | | | 1,200 | | | | 21,992 | | | | (116) | |
| Polaris Industries, Inc. | | | 2,800 | | | | 166,434 | | | | (9,690) | |
| Polycom, Inc. | | | 29,800 | | | | 487,926 | | | | (2,186) | |
| Pool Corp. | | | 3,500 | | | | 94,302 | | | | 11,048 | |
| Popular, Inc. | | | 289,000 | | | | 517,940 | | | | (116,230) | |
| Portland General Electric Co. | | | 4,700 | | | | 110,408 | | | | 8,455 | |
| ProAssurance Corp. | | | 600 | | | | 45,304 | | | | 2,588 | |
| Protective Life Corp. | | | 40,000 | | | | 752,033 | | | | 150,367 | |
| Public Service Enterprise Group, Inc. | | | 2,900 | | | | 93,732 | | | | 1,997 | |
| Pulte Group, Inc. | | | 71,500 | | | | 364,038 | | | | 87,127 | |
| PVH Corp. | | | 7,600 | | | | 518,736 | | | | 16,988 | |
| QLogic Corp. | | | 40,700 | | | | 602,175 | | | | 8,325 | |
| Quest Software, Inc. | | | 17,900 | | | | 304,310 | | | | 28,630 | |
| RadioShack Corp. | | | 40,400 | | | | 476,847 | | | | (84,563) | |
| RalCorp. Holdings, Inc. | | | 3,600 | | | | 291,656 | | | | 16,144 | |
| Rayonier, Inc. | | | 4,200 | | | | 179,332 | | | | 8,114 | |
| Raytheon Co. | | | 4,900 | | | | 213,026 | | | | 24,036 | |
| Red Hat, Inc. | | | 9,000 | | | | 377,447 | | | | (5,837) | |
| Reinsurance Group of America, Inc. | | | 14,100 | | | | 731,760 | | | | 4,965 | |
| Reliance Steel & Aluminum Co. | | | 7,000 | | | | 304,531 | | | | 36,299 | |
| Republic Services, Inc. | | | 1,300 | | | | 37,380 | | | | (1,565) | |
| Reynolds American, Inc. | | | 1,100 | | | | 40,569 | | | | 4,993 | |
| Rock-Tenn Co. | | | 1,600 | | | | 89,212 | | | | 3,108 | |
| Rockwell Automation, Inc. | | | 5,400 | | | | 325,695 | | | | 70,503 | |
| Rockwood Holdings, Inc. | | | 11,500 | | | | 454,962 | | | | (2,207) | |
| Ross Stores, Inc. | | | 24,900 | | | | 999,895 | | | | 183,602 | |
| Rowan Cos., Inc. | | | 23,900 | | | | 783,409 | | | | (58,522) | |
| RPM International, Inc. | | | 5,100 | | | | 113,717 | | | | 11,488 | |
| Ruddick Corp. | | | 2,300 | | | | 98,588 | | | | (516) | |
| Ryder System, Inc. | | | 8,600 | | | | 392,796 | | | | 64,208 | |
| SAIC, Inc. | | | 2,500 | | | | 30,913 | | | | (188) | |
| Sara Lee Corp. | | | 25,000 | | | | 447,480 | | | | 25,520 | |
| Scripps Networks Interactive, Inc. | | | 2,900 | | | | 124,682 | | | | (1,664) | |
| | | | |
| | The accompanying notes are an integral part of these financial statements. | | (Continued) |
| | | | | | | | | | | | | | | | |
| 116 | | AQR Funds | | | | | | Annual Report | | | | | | December 2011 | | |
| | | | | | | | | | |
| | | | |
| Consolidated Schedule of Investments | | | December 31, 2011 | |
| | |
| AQR MULTI-STRATEGY ALTERNATIVE FUND | | |
| | | | | | | | | | | | |
REFERENCE
ENTITY | | SHARES | | | NOTIONAL (a) | | | NET
UNREALIZED
APPRECIATION
(DEPRECIATION) | |
| United States (continued) | |
| SEACOR Holdings, Inc. | | | 7,900 | | | $ | 703,087 | | | $ | (303) | |
| Sealed Air Corp. | | | 26,100 | | | | 467,618 | | | | (18,437) | |
| Sears Holdings Corp. | | | 13,100 | | | | 550,538 | | | | (134,220) | |
| SEI Investments Co. | | | 2,700 | | | | 43,498 | | | | 3,347 | |
| Sempra Energy | | | 600 | | | | 31,059 | | | | 1,941 | |
| Semtech Corp. | | | 1,000 | | | | 22,220 | | | | 2,600 | |
| Sensient Technologies Corp. | | | 400 | | | | 14,191 | | | | 969 | |
| Service Corp. International | | | 39,300 | | | | 404,353 | | | | 14,192 | |
| Shaw Group, Inc./The | | | 34,300 | | | | 825,387 | | | | 97,283 | |
| Silgan Holdings, Inc. | | | 2,700 | | | | 101,586 | | | | 2,742 | |
| Skyworks Solutions, Inc. | | | 3,800 | | | | 61,205 | | | | 431 | |
| SLM Corp. | | | 36,300 | | | | 494,636 | | | | (8,216) | |
| SM Energy Co. | | | 8,800 | | | | 670,061 | | | | (26,781) | |
| Snap-on, Inc. | | | 7,900 | | | | 409,481 | | | | (9,583) | |
| Sohu.com , Inc. | | | 3,800 | | | | 209,556 | | | | (19,556) | |
| Solera Holdings, Inc. | | | 400 | | | | 18,020 | | | | (204) | |
| Sotheby’s | | | 18,400 | | | | 550,105 | | | | (25,153) | |
| Southern Copper Corp. | | | 100 | | | | 3,546 | | | | (528) | |
| Southwestern Energy Co. | | | 8,800 | | | | 285,944 | | | | (4,872) | |
| Sprint Nextel Corp. | | | 51,400 | | | | 122,192 | | | | (1,916) | |
| SPX Corp. | | | 15,000 | | | | 836,903 | | | | 67,147 | |
| St Jude Medical, Inc. | | | 1,300 | | | | 46,162 | | | | (1,572) | |
| Staples, Inc. | | | 21,100 | | | | 311,347 | | | | (18,268) | |
| Starbucks Corp. | | | 13,100 | | | | 544,372 | | | | 58,359 | |
| State Street Corp. | | | 6,300 | | | | 231,085 | | | | 22,868 | |
| Steel Dynamics, Inc. | | | 58,400 | | | | 699,750 | | | | 68,210 | |
| Stifel Financial Corp. | | | 1,300 | | | | 41,451 | | | | 214 | |
| Stryker Corp. | | | 300 | | | | 14,625 | | | | 288 | |
| SunTrust Banks, Inc. | | | 5,300 | | | | 104,250 | | | | (10,440) | |
| SUPERVALU, Inc. | | | 2,100 | | | | 16,128 | | | | 924 | |
| Symantec Corp. | | | 10,400 | | | | 177,524 | | | | (14,764) | |
| Synopsys, Inc. | | | 21,500 | | | | 551,882 | | | | 32,918 | |
| Taubman Centers, Inc. | | | 1,800 | | | | 106,370 | | | | 5,410 | |
| Tech Data Corp. | | | 14,100 | | | | 667,200 | | | | 29,481 | |
| Techne Corp. | | | 2,700 | | | | 189,113 | | | | (4,811) | |
| Tekelec | | | 57,600 | | | | 477,504 | | | | 152,064 | |
| Teledyne Technologies, Inc. | | | 10,000 | | | | 539,733 | | | | 8,767 | |
| Tellabs, Inc. | | | 256,300 | | | | 1,080,628 | | | | (45,176) | |
| Teradata Corp. | | | 15,000 | | | | 757,898 | | | | (30,248) | |
| Teradyne, Inc. | | | 5,100 | | | | 68,789 | | | | 724 | |
| Tetra Tech, Inc. | | | 4,400 | | | | 86,940 | | | | 8,056 | |
| Thermo Fisher Scientific, Inc. | | | 900 | | | | 40,043 | | | | 430 | |
| Thomas & Betts Corp. | | | 8,100 | | | | 383,045 | | | | 59,215 | |
| Thoratec Corp. | | | 14,800 | | | | 486,560 | | | | 10,128 | |
| TIBCO Software, Inc. | | | 27,100 | | | | 633,117 | | | | 14,844 | |
| Time Warner Cable, Inc. | | | 5,000 | | | | 316,441 | | | | 1,409 | |
| Timken Co. | | | 23,000 | | | | 901,503 | | | | (11,173) | |
| TJX Cos., Inc. | | | 1,000 | | | | 58,948 | | | | 5,602 | |
| Toro Co./The | | | 5,000 | | | | 268,531 | | | | 34,769 | |
| Total System Services, Inc. | | | 8,900 | | | | 173,683 | | | | 401 | |
| | | | | | | | | | | | |
REFERENCE
ENTITY | | SHARES | | | NOTIONAL (a) | | | NET
UNREALIZED
APPRECIATION
(DEPRECIATION) | |
| United States (continued) | |
| Towers Watson & Co. | | | 10,500 | | | $ | 624,613 | | | $ | 4,652 | |
| Tractor Supply Co. | | | 5,700 | | | | 397,120 | | | | 2,735 | |
| Travelers Cos., Inc./The | | | 3,200 | | | | 163,004 | | | | 26,340 | |
| Trimble Navigation Ltd. | | | 2,400 | | | | 86,750 | | | | 17,410 | |
| Tupperware Brands Corp. | | | 17,200 | | | | 995,201 | | | | (32,517) | |
| Tutor Perini Corp. | | | 49,400 | | | | 680,195 | | | | (70,599) | |
| tw telecom, Inc. | | | 8,600 | | | | 157,176 | | | | 9,492 | |
| Tyson Foods, Inc. | | | 26,500 | | | | 505,347 | | | | 41,613 | |
| UDR, Inc. | | | 5,800 | | | | 142,623 | | | | 2,957 | |
| UGI Corp. | | | 5,500 | | | | 153,005 | | | | 8,695 | |
| Unit Corp. | | | 16,400 | | | | 789,160 | | | | (28,200) | |
| United Continental Holdings, Inc. | | | 5,300 | | | | 109,017 | | | | (9,006) | |
| United Microelectronics Corp. | | | 6,100 | | | | 11,696 | | | | 1,358 | |
| United States Steel Corp. | | | 20,400 | | | | 523,550 | | | | 16,234 | |
| Universal Health Services, Inc. | | | 19,100 | | | | 723,431 | | | | 18,795 | |
| Unum Group | | | 21,000 | | | | 452,580 | | | | (10,110) | |
| URS Corp. | | | 13,100 | | | | 462,203 | | | | (2,131) | |
| US BanCorp. | | | 1,600 | | | | 37,265 | | | | 6,015 | |
| Vale SA | | | 27,300 | | | | 627,285 | | | | (64,905) | |
| Valero Energy Corp. | | | 21,100 | | | | 473,827 | | | | (29,672) | |
| Varian Medical Systems, Inc. | | | 600 | | | | 33,673 | | | | 6,605 | |
| VeriSign, Inc. | | | 5,500 | | | | 163,938 | | | | 32,522 | |
| Verizon Communications, Inc. | | | 400 | | | | 15,938 | | | | 110 | |
| Vertex Pharmaceuticals, Inc. | | | 2,100 | | | | 68,090 | | | | 1,651 | |
| Viacom, Inc. | | | 4,700 | | | | 218,032 | | | | (4,605) | |
| Vishay Intertechnology, Inc. | | | 2,600 | | | | 26,480 | | | | (3,106) | |
| Vornado Realty Trust | | | 300 | | | | 22,880 | | | | 178 | |
| WABCO Holdings, Inc. | | | 20,500 | | | | 937,382 | | | | (47,682) | |
| Wabtec Corp. | | | 3,200 | | | | 194,238 | | | | 29,602 | |
| Walter Energy, Inc. | | | 10,000 | | | | 721,312 | | | | (115,712) | |
| Warnaco Group, Inc./The | | | 3,700 | | | | 180,941 | | | | 4,207 | |
| Washington Federal, Inc. | | | 7,300 | | | | 98,033 | | | | 4,094 | |
| Washington Post Co./The | | | 100 | | | | 41,382 | | | | (3,701) | |
| Waters Corp. | | | 2,500 | | | | 212,660 | | | | (27,535) | |
| Watson Pharmaceuticals, Inc. | | | 9,500 | | | | 617,982 | | | | (44,752) | |
| Websense, Inc. | | | 4,700 | | | | 88,848 | | | | (817) | |
| Webster Financial Corp. | | | 1,900 | | | | 34,847 | | | | 3,894 | |
| WellPoint, Inc. | | | 2,100 | | | | 137,032 | | | | 2,093 | |
| Wells Fargo & Co. | | | 3,600 | | | | 94,058 | | | | 5,158 | |
| Werner Enterprises, Inc. | | | 2,300 | | | | 54,165 | | | | 1,265 | |
| Western Digital Corp. | | | 18,200 | | | | 542,055 | | | | 21,235 | |
| WGL Holdings, Inc. | | | 800 | | | | 34,617 | | | | 759 | |
| Whiting Petroleum Corp. | | | 11,100 | | | | 498,785 | | | | 19,474 | |
| Whole Foods Market, Inc. | | | 500 | | | | 34,015 | | | | 775 | |
| | | | |
| | The accompanying notes are an integral part of these financial statements. | | (Continued) |
| | | | | | | | | | | | | | | | |
| | AQR Funds | | | | | | Annual Report | | | | | | December 2011 | | 117 |
| | | | | | | | | | |
| | | | |
| Consolidated Schedule of Investments | | | December 31, 2011 | |
| | |
| AQR MULTI-STRATEGY ALTERNATIVE FUND | | |
| | | | | | | | | | | | |
REFERENCE
ENTITY | | SHARES | | | NOTIONAL (a) | | | NET
UNREALIZED
APPRECIATION
(DEPRECIATION) | |
| United States (continued) | |
| Williams-Sonoma, Inc. | | | 24,000 | | | $ | 851,037 | | | $ | 72,963 | |
| Wolverine World Wide, Inc. | | | 7,300 | | | | 265,154 | | | | (4,982) | |
| Wyndham Worldwide Corp. | | | 17,900 | | | | 560,793 | | | | 116,364 | |
| Yahoo!, Inc. | | | 18,100 | | | | 285,066 | | | | 6,887 | |
| Yum! Brands, Inc. | | | 3,500 | | | | 182,191 | | | | 24,344 | |
| Zebra Technologies Corp. | | | 15,100 | | | | 524,136 | | | | 16,142 | |
| Zimmer Holdings, Inc. | | | 300 | | | | 16,188 | | | | (162) | |
| | | | | | | | | | | | |
| | | | | | | | | | | 2,490,213 | |
| | | | | | | | | | | | |
Total Long Positions | | | | | | | | | | | 2,216,143 | |
| | | | | | | | | | | | |
| | | |
| Short Positions | | | | | | | | | | | | |
| | | |
| Netherlands | | | | | | | | | | | | |
| Schlumberger Ltd. | | | (8,900) | | | | (627,353) | | | | 19,394 | |
| | | | | | | | | | | | |
| | | |
| Panama | | | | | | | | | | | | |
| Carnival Corp. | | | (8,700) | | | | (288,535) | | | | 4,567 | |
| | | | | | | | | | | | |
| | | |
| Switzerland | | | | | | | | | | | | |
| Noble Corp. | | | (16,600) | | | | (551,305) | | | | 49,653 | |
| Transocean Ltd. | | | (19,100) | | | | (856,202) | | | | 122,953 | |
| Weatherford International Ltd. | | | (48,300) | | | | (758,257) | | | | 51,145 | |
| | | | | | | | | | | | |
| | | | | | | | | | | 223,751 | |
| | | | | | | | | | | | |
| | | |
| United States | | | | | | | | | | | | |
| 3M Co. | | | (4,900) | | | | (399,294) | | | | (1,183) | |
| Abbott Laboratories | | | (1,700) | | | | (90,058) | | | | (5,533) | |
| Abercrombie & Fitch Co. | | | (1,700) | | | | (104,144) | | | | 21,116 | |
| Activision Blizzard, Inc. | | | (5,800) | | | | (67,929) | | | | (3,527) | |
| Actuant Corp. | | | (32,400) | | | | (688,622) | | | | (46,534) | |
| Acuity Brands, Inc. | | | (15,900) | | | | (736,300) | | | | (106,400) | |
| Adobe Systems, Inc. | | | (13,800) | | | | (383,085) | | | | (7,041) | |
| ADTRAN, Inc. | | | (18,900) | | | | (576,605) | | | | 6,581 | |
| Advent Software, Inc. | | | (6,700) | | | | (157,757) | | | | (5,455) | |
| Aflac, Inc. | | | (7,900) | | | | (315,969) | | | | (25,785) | |
| Air Products & Chemicals, Inc. | | | (2,900) | | | | (243,373) | | | | (3,678) | |
| Airgas, Inc. | | | (700) | | | | (48,050) | | | | (6,606) | |
| Akamai Technologies, Inc. | | | (9,200) | | | | (289,459) | | | | (7,517) | |
| Alcoa, Inc. | | | (51,000) | | | | (466,189) | | | | 25,039 | |
| Alere, Inc. | | | (10,100) | | | | (253,689) | | | | 20,480 | |
| Alexion Pharmaceuticals, Inc. | | | (2,000) | | | | (112,691) | | | | (30,309) | |
| Alkermes Plc | | | (5,600) | | | | (97,105) | | | | (111) | |
| Allegheny Technologies, Inc. | | | (25,300) | | | | (1,183,776) | | | | (25,564) | |
| Allegiant Travel Co | | | (1,500) | | | | (66,988) | | | | (13,022) | |
| Alliance Data Systems Corp. | | | (6,400) | | | | (626,658) | | | | (37,918) | |
| Allstate Corp./The | | | (900) | | | | (22,869) | | | | (1,800) | |
| Altria Group, Inc. | | | (8,200) | | | | (228,103) | | | | (15,027) | |
| | | | | | | | | | | | |
REFERENCE
ENTITY | | SHARES | | | NOTIONAL (a) | | | NET
UNREALIZED
APPRECIATION
(DEPRECIATION) | |
| United States (continued) | | | | | | | | | |
| Amedisys, Inc. | | | (54,900) | | | $ | (723,611) | | | $ | 124,652 | |
| Ameren Corp. | | | (500) | | | | (14,840) | | | | (1,725) | |
| American Express Co. | | | (12,200) | | | | (588,545) | | | | 13,071 | |
| American Public Education, Inc. | | | (13,600) | | | | (496,409) | | | | (92,199) | |
| American Tower Corp. | | | (200) | | | | (11,634) | | | | (368) | |
| American Water Works Co., Inc. | | | (400) | | | | (11,695) | | | | (1,049) | |
| AMERIGROUP Corp. | | | (13,000) | | | | (685,154) | | | | (82,886) | |
| AMETEK, Inc. | | | (1,600) | | | | (63,399) | | | | (3,961) | |
| Amgen, Inc. | | | (3,200) | | | | (181,946) | | | | (23,526) | |
| Amphenol Corp. | | | (18,200) | | | | (812,261) | | | | (13,837) | |
| Anixter International, Inc. | | | (6,400) | | | | (363,916) | | | | (17,780) | |
| Annaly Capital Management, Inc. | | | (1,000) | | | | (17,866) | | | | 1,906 | |
| ANSYS, Inc. | | | (2,400) | | | | (139,377) | | | | 1,905 | |
| Apache Copr. | | | (1,800) | | | | (173,785) | | | | 10,741 | |
| Apple, Inc. | | | (1,200) | | | | (466,246) | | | | (19,754) | |
| Arch Coal, Inc. | | | (5,600) | | | | (101,279) | | | | 20,023 | |
| Arthur J Gallagher & Co. | | | (2,500) | | | | (82,440) | | | | (1,160) | |
| Ashland, Inc. | | | (7,000) | | | | (379,570) | | | | (20,550) | |
| Astoria Financial Corp. | | | (3,000) | | | | (26,001) | | | | 531 | |
| athenahealth, Inc. | | | (2,700) | | | | (154,242) | | | | 21,618 | |
| Atwood Oceanics, Inc. | | | (7,400) | | | | (302,149) | | | | 7,703 | |
| AvalonBay Communities, Inc. | | | (300) | | | | (39,494) | | | | 314 | |
| Avery Dennison Corp. | | | (1,600) | | | | (45,288) | | | | (600) | |
| Bally Technologies, Inc. | | | (15,900) | | | | (545,137) | | | | (83,867) | |
| BanCorp.South, Inc. | | | (20,500) | | | | (210,422) | | | | (15,488) | |
| Bank of Hawaii Corp. | | | (2,800) | | | | (117,675) | | | | (6,897) | |
| Bank of New York Mellon Corp./The | | | (28,000) | | | | (551,708) | | | | (5,772) | |
| Barnes Group, Inc. | | | (15,000) | | | | (322,905) | | | | (38,745) | |
| Baxter International, Inc. | | | (1,200) | | | | (58,738) | | | | (638) | |
| BE Aerospace, Inc. | | | (8,300) | | | | (309,759) | | | | (11,534) | |
| Beam, Inc. | | | (4,300) | | | | (211,765) | | | | (8,524) | |
| Becton Dickinson & Co. | | | (2,100) | | | | (153,704) | | | | (3,208) | |
| Bemis Co., Inc. | | | (2,500) | | | | (77,089) | | | | 1,889 | |
| Berry Petroleum Co. | | | (10,000) | | | | (412,548) | | | | (7,652) | |
| Bill Barrett Corp. | | | (22,300) | | | | (876,358) | | | | 116,597 | |
| BioMarin Pharmaceutical, Inc. | | | (26,500) | | | | (809,734) | | | | (101,336) | |
| Black Hills Corp. | | | (19,300) | | | | (604,859) | | | | (43,235) | |
| Boeing Co./The | | | (1,300) | | | | (95,750) | | | | 395 | |
| BorgWarner, Inc. | | | (10,500) | | | | (707,891) | | | | 38,621 | |
| Boston Properties, Inc. | | | (200) | | | | (20,990) | | | | 1,070 | |
| Boston Scientific Corp. | | | (62,700) | | | | (402,637) | | | | 67,819 | |
| Briggs & Stratton Corp. | | | (36,000) | | | | (538,923) | | | | (18,717) | |
| Bristol-Myers Squibb Co. | | | (29,600) | | | | (896,181) | | | | (146,923) | |
| Bristow Group, Inc. | | | (3,500) | | | | (171,842) | | | | 5,977 | |
| Broadcom Corp. | | | (4,700) | | | | (157,722) | | | | 19,730 | |
| Brown-Forman Corp. | | | (700) | | | | (51,855) | | | | (4,502) | |
| CACI International, Inc. | | | (600) | | | | (30,136) | | | | (3,416) | |
| Calpine Corp. | | | (27,200) | | | | (387,158) | | | | (57,018) | |
| Campbell Soup Co. | | | (5,200) | | | | (169,774) | | | | (3,074) | |
| | | | |
| | The accompanying notes are an integral part of these financial statements. | | (Continued) |
| | | | | | | | | | | | | | | | |
| 118 | | AQR Funds | | | | | | Annual Report | | | | | | December 2011 | | |
| | | | | | | | | | |
| | | | |
| Consolidated Schedule of Investments | | | December 31, 2011 | |
| | |
| AQR MULTI-STRATEGY ALTERNATIVE FUND | | |
| | | | | | | | | | | | |
REFERENCE
ENTITY | | SHARES | | | NOTIONAL (a) | | | NET
UNREALIZED
APPRECIATION
(DEPRECIATION) | |
| United States (continued) | | | | | | | | | |
| CARBO Ceramics, Inc. | | | (7,700) | | | $ | (989,554) | | | $ | 39,913 | |
| CarMax, Inc. | | | (46,700) | | | | (1,334,044) | | | | (89,372) | |
| Carter’s, Inc. | | | (2,700) | | | | (87,570) | | | | (19,917) | |
| Casey’s General Stores, Inc. | | | (1,900) | | | | (84,888) | | | | (12,981) | |
| Cash America International, Inc. | | | (16,700) | | | | (861,589) | | | | 82,868 | |
| Caterpillar, Inc. | | | (8,700) | | | | (786,821) | | | | (1,399) | |
| Cathay General BanCorp. | | | (8,100) | | | | (106,197) | | | | (14,736) | |
| Celgene Corp. | | | (8,500) | | | | (537,901) | | | | (36,699) | |
| Centene Corp. | | | (5,000) | | | | (163,582) | | | | (34,368) | |
| CenturyLink, Inc. | | | (7,100) | | | | (248,722) | | | | (15,398) | |
| Cerner Corp. | | | (4,200) | | | | (266,193) | | | | 8,943 | |
| CH Robinson Worldwide, Inc. | | | (6,200) | | | | (424,860) | | | | (7,776) | |
| Charles Schwab Corp./The | | | (95,800) | | | | (1,164,024) | | | | 85,316 | |
| Chesapeake Energy Corp. | | | (1,900) | | | | (43,579) | | | | 1,228 | |
| Chevron Corp. | | | (900) | | | | (90,403) | | | | (5,357) | |
| Childrens Place Retail Stores, Inc./The | | | (8,500) | | | | (372,839) | | | | (78,681) | |
| Chipotle Mexican Gril , Inc. | | | (1,700) | | | | (533,378) | | | | (40,780) | |
| Choice Hotels International, Inc. | | | (2,000) | | | | (58,090) | | | | (18,010) | |
| Ciena Corp. | | | (178,200) | | | | (2,231,543) | | | | 75,323 | |
| Cincinnati Financial Corp. | | | (37,400) | | | | (1,070,003) | | | | (69,201) | |
| Cintas Corp. | | | (3,500) | | | | (109,059) | | | | (12,776) | |
| CitiGroup, Inc. | | | (31,500) | | | | (882,519) | | | | 53,754 | |
| Cliffs Natural Resources, Inc. | | | (10,300) | | | | (678,623) | | | | 36,418 | |
| Clorox Co./The | | | (800) | | | | (52,261) | | | | (987) | |
| CMS Energy Corp. | | | (8,600) | | | | (175,158) | | | | (14,730) | |
| Coca-Cola Co./The | | | (11,400) | | | | (775,874) | | | | (21,784) | |
| Cognizant Technology Solutions Corp. | | | (1,100) | | | | (74,710) | | | | 3,969 | |
| Comcast Corp. | | | (1,200) | | | | (29,544) | | | | 1,092 | |
| Comerica, Inc. | | | (1,000) | | | | (25,203) | | | | (597) | |
| Compass Minerals International, Inc. | | | (900) | | | | (65,964) | | | | 3,999 | |
| Comstock Resources, Inc. | | | (53,600) | | | | (1,022,105) | | | | 202,025 | |
| Concho Resources, Inc. | | | (5,200) | | | | (468,678) | | | | (18,822) | |
| Concur Technologies, Inc. | | | (19,300) | | | | (838,397) | | | | (141,850) | |
| ConocoPhillips | | | (4,000) | | | | (279,602) | | | | (11,878) | |
| Consolidated Edison, Inc. | | | (200) | | | | (12,479) | | | | 73 | |
| Cree, Inc. | | | (57,600) | | | | (1,430,731) | | | | 161,227 | |
| Crown Castle International Corp. | | | (2,800) | | | | (118,043) | | | | (7,397) | |
| | | | | | | | | | | | |
REFERENCE
ENTITY | | SHARES | | | NOTIONAL (a) | | | NET
UNREALIZED
APPRECIATION
(DEPRECIATION) | |
| United States (continued) | | | | | | | | | |
| Cubist Pharmaceuticals, Inc. | | | (7,900) | | | $ | (283,387) | | | $ | (29,611) | |
| Cullen/Frost Bankers, Inc. | | | (2,400) | | | | (120,592) | | | | (6,392) | |
| CVS Caremark Corp. | | | (11,700) | | | | (419,981) | | | | (57,145) | |
| Cymer, Inc. | | | (700) | | | | (29,084) | | | | (5,748) | |
| Danaher Corp. | | | (10,700) | | | | (502,701) | | | | (627) | |
| Darden Restaurants, Inc. | | | (3,400) | | | | (155,646) | | | | 674 | |
| Dean Foods Co. | | | (3,600) | | | | (34,740) | | | | (5,580) | |
| Deckers Outdoor Corp. | | | (2,400) | | | | (204,153) | | | | 22,785 | |
| Deere & Co. | | | (3,900) | | | | (295,180) | | | | (6,485) | |
| Deluxe Corp. | | | (1,200) | | | | (25,221) | | | | (2,091) | |
| DENTSPLY International, Inc. | | | (13,100) | | | | (453,905) | | | | (4,464) | |
| Diamond Offshore Drilling, Inc. | | | (1,500) | | | | (83,351) | | | | 461 | |
| Dick’s Sporting Goods, Inc. | | | (100) | | | | (3,661) | | | | (27) | |
| Diebold, Inc. | | | (16,700) | | | | (482,358) | | | | (19,810) | |
| Discovery Communications, Inc. | | | (11,200) | | | | (455,186) | | | | (3,678) | |
| Dominion Resources, Inc. | | | (4,500) | | | | (221,498) | | | | (17,362) | |
| Douglas Emmett, Inc. | | | (28,500) | | | | (522,184) | | | | 2,344 | |
| Dover Corp. | | | (1,300) | | | | (75,497) | | | | 32 | |
| Dow Chemical Co./The | | | (47,500) | | | | (1,317,331) | | | | (48,769) | |
| DR Horton, Inc. | | | (46,800) | | | | (499,644) | | | | (90,504) | |
| Dril-Quip, Inc. | | | (500) | | | | (32,531) | | | | (379) | |
| Duke Realty Corp. | | | (10,800) | | | | (128,313) | | | | (1,827) | |
| Eagle Materials, Inc. | | | (21,200) | | | | (392,837) | | | | (151,155) | |
| Ecolab, Inc. | | | (7,000) | | | | (351,544) | | | | (53,126) | |
| EI du Pont de Nemours & Co. | | | (15,100) | | | | (679,333) | | | | (11,945) | |
| Eli Lilly & Co. | | | (10,100) | | | | (383,060) | | | | (36,696) | |
| EMC Corp. | | | (23,700) | | | | (546,265) | | | | 35,767 | |
| Emerson Electric Co. | | | (10,200) | | | | (506,022) | | | | 30,804 | |
| Energizer Holdings, Inc. | | | (1,600) | | | | (121,271) | | | | (2,697) | |
| EOG Resources, Inc. | | | (3,100) | | | | (277,026) | | | | (28,355) | |
| Equifax, Inc. | | | (3,400) | | | | (120,019) | | | | (11,697) | |
| Equinix, Inc. | | | (8,800) | | | | (845,682) | | | | (46,638) | |
| Estee Lauder Cos., Inc./The | | | (900) | | | | (102,125) | | | | 1,037 | |
| Esterline Technologies Corp. | | | (300) | | | | (16,355) | | | | (436) | |
| EXCO Resources, Inc. | | | (24,700) | | | | (303,136) | | | | 45,021 | |
| Exelon Corp. | | | (5,900) | | | | (256,074) | | | | 191 | |
| Expedia, Inc. | | | (4,750) | | | | (130,986) | | | | (6,859) | |
| Express Scripts, Inc. | | | (26,500) | | | | (1,165,508) | | | | (18,777) | |
| Exterran Holdings, Inc. | | | (51,700) | | | | (512,368) | | | | 41,898 | |
| Exxon Mobil Corp. | | | (7,500) | | | | (582,169) | | | | (53,531) | |
| F5 Networks, Inc. | | | (1,300) | | | | (128,889) | | | | (9,067) | |
| Factset Research Systems, Inc. | | | (1,500) | | | | (136,570) | | | | 5,650 | |
| Fair Isaac Corp. | | | (600) | | | | (15,437) | | | | (6,067) | |
| | | | |
| | The accompanying notes are an integral part of these financial statements. | | (Continued) |
| | | | | | | | | | | | | | | | |
| | AQR Funds | | | | | | Annual Report | | | | | | December 2011 | | 119 |
| | | | | | | | | | |
| | | | |
| Consolidated Schedule of Investments | | | December 31, 2011 | |
| | |
| AQR MULTI-STRATEGY ALTERNATIVE FUND | | |
| | | | | | | | | | | | |
REFERENCE
ENTITY | | SHARES | | | NOTIONAL (a) | | | NET
UNREALIZED
APPRECIATION
(DEPRECIATION) | |
| United States (continued) | | | | | | | | | |
| Fastenal Co. | | | (17,600) | | | $ | (671,978) | | | $ | (95,558) | |
| FedEx Corp. | | | (1,600) | | | | (126,575) | | | | (7,041) | |
| Fidelity National Information Services, Inc. | | | (200) | | | | (5,055) | | | | (263) | |
| First Horizon National Corp. | | | (27,100) | | | | (178,534) | | | | (38,266) | |
| First Midwest BanCorp., Inc. | | | (10,400) | | | | (96,172) | | | | (9,180) | |
| First Niagara Financial Group, Inc. | | | (5,400) | | | | (45,862) | | | | (740) | |
| First Solar, Inc. | | | (9,300) | | | | (441,968) | | | | 128,000 | |
| FirstMerit Corp. | | | (11,600) | | | | (166,749) | | | | (8,759) | |
| FLIR Systems, Inc. | | | (37,400) | | | | (967,078) | | | | 29,460 | |
| Flowers Foods, Inc. | | | (10,500) | | | | (202,604) | | | | 3,314 | |
| FMC Technologies, Inc. | | | (4,000) | | | | (172,848) | | | | (36,072) | |
| FNB Corp. | | | (15,100) | | | | (141,561) | | | | (29,220) | |
| Forest City Enterprises, Inc. | | | (68,000) | | | | (903,709) | | | | 99,949 | |
| Franklin Resources, Inc. | | | (3,500) | | | | (365,450) | | | | 29,240 | |
| Freeport-McMoRan Copper & Gold, Inc. | | | (3,800) | | | | (141,450) | | | | 1,648 | |
| Frontier Communications Corp. | | | (58,800) | | | | (399,012) | | | | 96,192 | |
| FTI Consulting, Inc. | | | (14,100) | | | | (530,520) | | | | (67,602) | |
| Gannett Co., Inc. | | | (53,600) | | | | (577,641) | | | | (138,991) | |
| Gap, Inc./The | | | (10,600) | | | | (201,410) | | | | 4,780 | |
| GATX Corp. | | | (19,200) | | | | (739,395) | | | | (98,877) | |
| General Electric Co. | | | (69,400) | | | | (1,173,575) | | | | (69,379) | |
| General Mills, Inc. | | | (4,000) | | | | (155,441) | | | | (6,199) | |
| Genesee & Wyoming, Inc. | | | (4,100) | | | | (222,121) | | | | (26,257) | |
| Gentex Corp. | | | (500) | | | | (14,640) | | | | (155) | |
| Geo Group, Inc./The | | | (19,300) | | | | (361,452) | | | | 38,177 | |
| Glacier BanCorp., Inc. | | | (32,300) | | | | (373,429) | | | | (15,140) | |
| Goldman Sachs Group, Inc./The | | | (3,000) | | | | (335,014) | | | | 63,724 | |
| Goodyear Tire & Rubber Co./The | | | (9,300) | | | | (125,723) | | | | (6,058) | |
| Google, Inc. | | | (100) | | | | (60,765) | | | | (3,825) | |
| Granite Construction, Inc. | | | (6,600) | | | | (135,971) | | | | (20,581) | |
| Great Plains Energy, Inc. | | | (3,900) | | | | (79,493) | | | | (5,449) | |
| Green Mountain Coffee Roasters, Inc. | | | (32,000) | | | | (2,063,047) | | | | 627,847 | |
| H&R Block, Inc. | | | (35,700) | | | | (521,854) | | | | (61,127) | |
| Haemonetics Corp. | | | (300) | | | | (17,652) | | | | (714) | |
| Hain Celestial Group, Inc./The | | | (1,000) | | | | (30,192) | | | | (6,468) | |
| Hancock Holding Co. | | | (2,400) | | | | (74,396) | | | | (2,332) | |
| Hanesbrands, Inc. | | | (9,300) | | | | (234,709) | | | | 31,411 | |
| Harley-Davidson, Inc. | | | (9,300) | | | | (337,234) | | | | (24,257) | |
| Harris Corp. | | | (28,500) | | | | (1,080,519) | | | | 53,379 | |
| Harsco Corp. | | | (6,000) | | | | (130,218) | | | | 6,738 | |
| HCP, Inc. | | | (4,900) | | | | (183,293) | | | | (19,714) | |
| HealthSouth Corp. | | | (2,400) | | | | (42,657) | | | | 249 | |
| | | | | | | | | | | | |
REFERENCE
ENTITY | | SHARES | | | NOTIONAL (a) | | | NET
UNREALIZED
APPRECIATION
(DEPRECIATION) | |
| United States (continued) | | | | | | | | | |
| Helmerich & Payne, Inc. | | | (2,900) | | | $ | (142,767) | | | $ | (26,477) | |
| Hertz Global Holdings, Inc. | | | (105,600) | | | | (1,197,185) | | | | (40,447) | |
| Hexcel Corp. | | | (28,300) | | | | (653,320) | | | | (31,823) | |
| Hologic, Inc. | | | (12,000) | | | | (192,372) | | | | (17,748) | |
| Home Depot, Inc. | | | (25,200) | | | | (925,075) | | | | (134,333) | |
| Hospira, Inc. | | | (13,100) | | | | (410,683) | | | | 12,836 | |
| Host Hotels & Resorts, Inc. | | | (12,500) | | | | (177,701) | | | | (6,924) | |
| Hudson City BanCorp., Inc. | | | (62,200) | | | | (390,075) | | | | 1,325 | |
| Huntsman Corp. | | | (4,500) | | | | (47,977) | | | | 2,977 | |
| IDEX Corp. | | | (4,200) | | | | (149,466) | | | | (6,396) | |
| IDEXX Laboratories, Inc. | | | (800) | | | | (62,967) | | | | 1,398 | |
| Illinois Tool Works, Inc. | | | (3,900) | | | | (189,928) | | | | 7,759 | |
| Illumina, Inc. | | | (28,400) | | | | (907,666) | | | | 42,034 | |
| Intel Corp. | | | (22,100) | | | | (483,901) | | | | (52,023) | |
| InterDigital, Inc. | | | (100) | | | | (4,479) | | | | 122 | |
| International Business Machines Corp. | | | (600) | | | | (102,390) | | | | (7,938) | |
| International Flavors & Fragrances, Inc. | | | (100) | | | | (5,306) | | | | 64 | |
| International Paper Co. | | | (17,200) | | | | (471,873) | | | | (37,247) | |
| Intersil Corp. | | | (13,600) | | | | (141,266) | | | | (718) | |
| Intrepid Potash, Inc. | | | (30,700) | | | | (839,911) | | | | 145,170 | |
| Intuit, Inc. | | | (1,700) | | | | (89,305) | | | | (98) | |
| Intuitive Surgical, Inc. | | | (100) | | | | (39,716) | | | | (6,585) | |
| Iron Mountain, Inc. | | | (11,100) | | | | (364,397) | | | | 22,517 | |
| iShares MSCI Emerging Markets Index Fund | | | (259,300) | | | | (10,041,890) | | | | 204,048 | |
| ITC Holdings Corp. | | | (700) | | | | (51,080) | | | | (2,036) | |
| Jack Henry & Associates, Inc. | | | (3,700) | | | | (112,575) | | | | (11,782) | |
| Jack in the Box, Inc. | | | (1,300) | | | | (27,092) | | | | (78) | |
| Jarden Corp. | | | (2,700) | | | | (78,093) | | | | (2,583) | |
| JB Hunt Transport Services, Inc. | | | (4,500) | | | | (189,635) | | | | (13,180) | |
| JC Penney Co., Inc. | | | (3,700) | | | | (108,069) | | | | (21,986) | |
| JetBlue Airways Corp. | | | (104,200) | | | | (480,322) | | | | (61,518) | |
| John Wiley & Sons, Inc. | | | (300) | | | | (13,970) | | | | 650 | |
| Johnson & Johnson | | | (4,300) | | | | (275,633) | | | | (6,361) | |
| Johnson Controls, Inc. | | | (16,100) | | | | (509,266) | | | | 5,980 | |
| Juniper Networks, Inc. | | | (17,400) | | | | (381,941) | | | | 26,807 | |
| Kansas City Southern | | | (1,000) | | | | (65,169) | | | | (2,841) | |
| Kaydon Corp. | | | (2,000) | | | | (63,589) | | | | 2,589 | |
| KB Home | | | (8,400) | | | | (57,486) | | | | 1,038 | |
| Kellogg Co | | | (6,600) | | | | (347,837) | | | | 14,075 | |
| Kimberly-Clark Corp. | | | (700) | | | | (46,758) | | | | (4,734) | |
| Kirby Corp. | | | (7,900) | | | | (436,187) | | | | (83,949) | |
| KLA-Tencor Corp. | | | (3,800) | | | | (174,862) | | | | (8,488) | |
| Knight Transportation, Inc. | | | (17,700) | | | | (262,184) | | | | (14,644) | |
| Kraft Foods, Inc. | | | (4,200) | | | | (146,226) | | | | (10,686) | |
| L-3 Communications Holdings, Inc. | | | (1,900) | | | | (127,004) | | | | 312 | |
| | | | |
| | The accompanying notes are an integral part of these financial statements. | | (Continued) |
| | | | | | | | | | | | | | | | |
| 120 | | AQR Funds | | | | | | Annual Report | | | | | | December 2011 | | |
| | | | | | | | | | |
| | | | |
| Consolidated Schedule of Investments | | | December 31, 2011 | |
| | |
| AQR MULTI-STRATEGY ALTERNATIVE FUND | | |
| | | | | | | | | | | | |
REFERENCE
ENTITY | | SHARES | | | NOTIONAL (a) | | | NET
UNREALIZED
APPRECIATION
(DEPRECIATION) | |
| United States (continued) | | | | | | | | | |
| Laboratory Corp. of America Holdings | | | (2,600) | | | $ | (216,024) | | | $ | (7,498) | |
| Lamar Advertising Co. | | | (25,400) | | | | (521,582) | | | | (176,918) | |
| Leap Wireless International, Inc. | | | (145,400) | | | | (1,092,181) | | | | (258,585) | |
| Legg Mason, Inc. | | | (36,500) | | | | (980,426) | | | | 102,601 | |
| Leggett & Platt, Inc. | | | (22,900) | | | | (493,520) | | | | (34,096) | |
| Lender Processing Services, Inc. | | | (15,800) | | | | (257,314) | | | | 19,208 | |
| Lennar Corp. | | | (64,400) | | | | (1,037,034) | | | | (228,426) | |
| Lennox International, Inc. | | | (2,600) | | | | (78,246) | | | | (9,504) | |
| Liberty Global, Inc. | | | (5,200) | | | | (210,250) | | | | (3,106) | |
| Life Time Fitness, Inc. | | | (24,100) | | | | (970,255) | | | | (156,420) | |
| LifePoint Hospitals, Inc. | | | (7,600) | | | | (266,006) | | | | (16,334) | |
| Linear Technology Corp. | | | (2,500) | | | | (71,713) | | | | (3,362) | |
| Lockheed Martin Corp. | | | (3,400) | | | | (265,387) | | | | (9,673) | |
| Lowe’s Cos, Inc. | | | (19,700) | | | | (483,537) | | | | (16,449) | |
| Ltd. Brands, Inc. | | | (5,100) | | | | (201,215) | | | | (4,570) | |
| Lufkin Industries, Inc. | | | (4,900) | | | | (324,514) | | | | (5,305) | |
| Lululemon Athletica, Inc. | | | (8,900) | | | | (466,719) | | | | 51,445 | |
| Macerich Co./The | | | (2,900) | | | | (139,172) | | | | (7,568) | |
| Mantech International Corp. | | | (3,900) | | | | (135,714) | | | | 13,878 | |
| Markel Corp. | | | (400) | | | | (157,320) | | | | (8,548) | |
| Marriott International, Inc. | | | (14,800) | | | | (421,428) | | | | (10,288) | |
| Martin Marietta Materials, Inc. | | | (7,800) | | | | (558,963) | | | | (29,235) | |
| Masco Corp. | | | (24,100) | | | | (202,322) | | | | (50,246) | |
| Masimo Corp. | | | (12,100) | | | | (243,771) | | | | 17,682 | |
| Mastercard, Inc. | | | (700) | | | | (235,557) | | | | (25,417) | |
| Maxim Integrated Products, Inc. | | | (400) | | | | (10,476) | | | | 60 | |
| McCormick & Co., Inc. | | | (2,000) | | | | (98,059) | | | | (2,781) | |
| McDonald’s Corp. | | | (2,000) | | | | (179,305) | | | | (21,355) | |
| McMoRan Exploration Co. | | | (25,100) | | | | (312,719) | | | | (52,486) | |
| MDC Holdings, Inc. | | | (2,000) | | | | (38,975) | | | | 3,715 | |
| MDU Resources Group, Inc. | | | (800) | | | | (17,038) | | | | (130) | |
| Mednax, Inc. | | | (800) | | | | (56,625) | | | | (983) | |
| Medtronic, Inc. | | | (8,200) | | | | (279,492) | | | | (34,158) | |
| MEMC Electronic Materials, Inc. | | | (91,700) | | | | (586,436) | | | | 225,138 | |
| Men’s Wearhouse, Inc./The | | | (2,100) | | | | (63,620) | | | | (4,441) | |
| Merck & Co., Inc. | | | (18,700) | | | | (649,845) | | | | (55,145) | |
| Mercury General Corp. | | | (4,400) | | | | (178,027) | | | | (22,701) | |
| MetLife, Inc. | | | (26,000) | | | | (851,946) | | | | 41,266 | |
| Mettler-Toledo International, Inc. | | | (400) | | | | (61,456) | | | | 2,372 | |
| MGM Resorts International | | | (9,500) | | | | (97,033) | | | | (2,052) | |
| Microchip Technology, Inc. | | | (400) | | | | (13,992) | | | | (660) | |
| | | | | | | | | | | | |
REFERENCE
ENTITY | | SHARES | | | NOTIONAL (a) | | | NET
UNREALIZED
APPRECIATION
(DEPRECIATION) | |
| United States (continued) | | | | | | | | | |
| Micron Technology, Inc. | | | (148,900) | | | $ | (891,626) | | | $ | (44,955) | |
| Mohawk Industries, Inc. | | | (7,400) | | | | (370,907) | | | | (71,983) | |
| Molson Coors Brewing Co. | | | (4,300) | | | | (184,752) | | | | (2,470) | |
| Moody’s Corp. | | | (25,200) | | | | (820,135) | | | | (28,601) | |
| MSC Industrial Direct Co., Inc. | | | (600) | | | | (39,726) | | | | (3,204) | |
| MSCI, Inc. | | | (700) | | | | (23,043) | | | | (8) | |
| Mylan, Inc. | | | (40,600) | | | | (823,930) | | | | (47,346) | |
| National Oilwell Varco, Inc. | | | (3,100) | | | | (208,935) | | | | (1,834) | |
| NetApp, Inc. | | | (19,400) | | | | (711,479) | | | | 7,841 | |
| Netflix, Inc. | | | (300) | | | | (20,731) | | | | (56) | |
| New York Community BanCorp., Inc. | | | (27,100) | | | | (336,696) | | | | 1,469 | |
| Newell Rubbermaid, Inc. | | | (8,500) | | | | (110,729) | | | | (26,546) | |
| NextEra Energy, Inc. | | | (6,700) | | | | (386,257) | | | | (21,639) | |
| Nordstrom, Inc. | | | (8,500) | | | | (427,839) | | | | 5,304 | |
| Northern Trust Corp. | | | (1,700) | | | | (66,432) | | | | (990) | |
| Northrop Grumman Corp. | | | (100) | | | | (5,872) | | | | 24 | |
| Nuance Communications, Inc. | | | (23,300) | | | | (522,537) | | | | (63,691) | |
| Nucor Corp. | | | (15,200) | | | | (575,087) | | | | (26,377) | |
| Occidental Petroleum Corp. | | | (800) | | | | (75,053) | | | | 93 | |
| Old Republic International Corp. | | | (157,300) | | | | (1,493,956) | | | | 35,785 | |
| OM Group, Inc. | | | (200) | | | | (4,408) | | | | (70) | |
| Oracle Corp. | | | (4,800) | | | | (156,288) | | | | 33,168 | |
| O’Reilly Automotive, Inc. | | | (2,500) | | | | (161,093) | | | | (38,782) | |
| Oshkosh Corp. | | | (21,500) | | | | (429,035) | | | | (30,635) | |
| Owens Corning | | | (22,700) | | | | (614,522) | | | | (37,422) | |
| PACCAR, Inc. | | | (6,600) | | | | (259,314) | | | | 12,012 | |
| Parametric Technology Corp. | | | (13,500) | | | | (253,562) | | | | 7,052 | |
| Patterson Cos., Inc. | | | (800) | | | | (23,316) | | | | (300) | |
| Paychex, Inc. | | | (100) | | | | (2,694) | | | | (317) | |
| Peabody Energy Corp. | | | (1,200) | | | | (51,893) | | | | 12,161 | |
| Penn Virginia Corp. | | | (88,000) | | | | (657,028) | | | | 191,508 | |
| Penske Automotive Group, Inc. | | | (16,600) | | | | (308,701) | | | | (10,849) | |
| Pentair, Inc. | | | (5,600) | | | | (199,143) | | | | 12,719 | |
| People’s United Financial, Inc. | | | (10,600) | | | | (127,046) | | | | (9,164) | |
| Pepco Holdings, Inc. | | | (700) | | | | (13,713) | | | | (497) | |
| PepsiCo., Inc. | | | (6,100) | | | | (388,153) | | | | (16,582) | |
| Pfizer, Inc. | | | (41,600) | | | | (842,526) | | | | (57,698) | |
| PG&E Corp. | | | (700) | | | | (28,400) | | | | (454) | |
| Piedmont Natural Gas Co., Inc. | | | (600) | | | | (18,041) | | | | (2,347) | |
| Pioneer Natural Resources Co. | | | (1,600) | | | | (133,753) | | | | (9,415) | |
| Pitney Bowes , Inc. | | | (68,000) | | | | (1,343,317) | | | | 82,597 | |
| Plantronics, Inc. | | | (14,300) | | | | (476,713) | | | | (32,939) | |
| | | | |
| | The accompanying notes are an integral part of these financial statements. | | (Continued) |
| | | | | | | | | | | | | | | | |
| | AQR Funds | | | | | | Annual Report | | | | | | December 2011 | | 121 |
| | | | | | | | | | |
| | | | |
| Consolidated Schedule of Investments | | | December 31, 2011 | |
| | |
| AQR MULTI-STRATEGY ALTERNATIVE FUND | | |
| | | | | | | | | | | | |
REFERENCE
ENTITY | | SHARES | | | NOTIONAL (a) | | | NET
UNREALIZED
APPRECIATION
(DEPRECIATION) | |
| United States (continued) | | | | | | | | | |
| Power Integrations, Inc. | | | (13,100) | | | $ | (443,590) | | | $ | 9,194 | |
| PPG Industries, Inc. | | | (3,200) | | | | (267,400) | | | | 232 | |
| PPL Corp. | | | (3,100) | | | | (87,327) | | | | (3,875) | |
| Praxair, Inc. | | | (5,400) | | | | (543,891) | | | | (33,369) | |
| Precision Castparts Corp. | | | (2,400) | | | | (383,590) | | | | (11,906) | |
| priceline.com, Inc. | | | (1,900) | | | | (936,544) | | | | 47,895 | |
| Principal Financial Group, Inc. | | | (2,800) | | | | (71,616) | | | | 2,736 | |
| PrivateBanCorp., Inc. | | | (20,300) | | | | (191,830) | | | | (31,064) | |
| Progressive Corp./The | | | (15,000) | | | | (275,218) | | | | (17,432) | |
| Prosperity Bancshares, Inc. | | | (1,500) | | | | (63,612) | | | | 3,087 | |
| Prudential Financial, Inc. | | | (3,100) | | | | (154,240) | | | | (1,132) | |
| PSS World Medical, Inc. | | | (8,700) | | | | (203,015) | | | | (7,438) | |
| QUALCOMM, Inc. | | | (8,300) | | | | (424,179) | | | | (29,831) | |
| Quality Systems, Inc. | | | (7,700) | | | | (323,982) | | | | 39,159 | |
| Quanta Services, Inc. | | | (11,300) | | | | (219,470) | | | | (23,932) | |
| Quest Diagnostics, Inc. | | | (9,100) | | | | (466,578) | | | | (61,768) | |
| Questar Corp. | | | (3,300) | | | | (60,522) | | | | (5,016) | |
| Quicksilver Resources, Inc. | | | (33,900) | | | | (303,932) | | | | 76,463 | |
| Ralph Lauren Corp. | | | (1,300) | | | | (187,187) | | | | 7,683 | |
| Rambus, Inc. | | | (46,800) | | | | (495,536) | | | | 142,196 | |
| Range Resources Corp. | | | (8,700) | | | | (563,088) | | | | 24,210 | |
| Regal-Beloit Corp. | | | (4,100) | | | | (209,157) | | | | 180 | |
| Regency Centers Corp. | | | (8,100) | | | | (301,566) | | | | (3,156) | |
| Regions Financial Corp. | | | (91,800) | | | | (404,077) | | | | 9,337 | |
| Rent-A-Center, Inc. | | | (10,700) | | | | (351,276) | | | | (44,624) | |
| ResMed, Inc. | | | (6,900) | | | | (184,925) | | | | 9,665 | |
| Riverbed Technology, Inc. | | | (17,200) | | | | (425,863) | | | | 21,663 | |
| Robert Half International, Inc. | | | (16,500) | | | | (405,384) | | | | (64,206) | |
| Rockwell Collins, Inc. | | | (2,200) | | | | (121,592) | | | | (222) | |
| Roper Industries, Inc. | | | (5,700) | | | | (462,905) | | | | (32,254) | |
| Rovi Corp. | | | (9,800) | | | | (368,385) | | | | 127,501 | |
| RR Donnelley & Sons Co. | | | (31,700) | | | | (489,510) | | | | 32,079 | |
| Safeway, Inc. | | | (16,900) | | | | (337,212) | | | | (18,364) | |
| Saks, Inc. | | | (9,300) | | | | (88,582) | | | | (2,093) | |
| Salesforce.com, Inc. | | | (14,700) | | | | (1,725,710) | | | | 234,248 | |
| Sanderson Farms, Inc. | | | (4,900) | | | | (247,267) | | | | 1,630 | |
| SanDisk Corp. | | | (16,300) | | | | (742,668) | | | | (59,455) | |
| SandRidge Energy, Inc. | | | (73,100) | | | | (539,938) | | | | (56,558) | |
| SBA Communications Corp. | | | (8,400) | | | | (311,060) | | | | (49,804) | |
| SCANA Corp. | | | (1,200) | | | | (51,100) | | | | (2,972) | |
| Schnitzer Steel Industries, Inc. | | | (5,000) | | | | (214,073) | | | | 2,673 | |
| Scientific Games Corp. | | | (3,900) | | | | (36,231) | | | | (1,599) | |
| Sherwin-Williams Co./The | | | (700) | | | | (53,985) | | | | (8,504) | |
| Silicon Laboratories, Inc. | | | (9,100) | | | | (342,022) | | | | (53,100) | |
| Simon Property Group, Inc. | | | (100) | | | | (11,898) | | | | (996) | |
| | | | | | | | | | | | |
REFERENCE
ENTITY | | SHARES | | | NOTIONAL (a) | | | NET
UNREALIZED
APPRECIATION
(DEPRECIATION) | |
| United States (continued) | | | | | | | | | |
| Simpson Manufacturing Co., Inc. | | | (1,200) | | | $ | (36,247) | | | $ | (4,145) | |
| Skechers U.S.A., Inc. | | | (34,900) | | | | (484,229) | | | | 61,241 | |
| SL Green Realty Corp. | | | (3,300) | | | | (221,510) | | | | 1,598 | |
| Smithfield Foods, Inc. | | | (19,900) | | | | (416,960) | | | | (66,212) | |
| Sonoco Products Co. | | | (400) | | | | (12,739) | | | | (445) | |
| Southern Co. | | | (11,600) | | | | (494,077) | | | | (42,887) | |
| StanCorp. Financial Group, Inc. | | | (11,200) | | | | (385,844) | | | | (25,756) | |
| Starwood Hotels & Resorts Worldwide, Inc. | | | (3,600) | | | | (163,494) | | | | (9,198) | |
| Stericycle, Inc. | | | (2,000) | | | | (156,241) | | | | 401 | |
| STERIS Corp. | | | (8,200) | | | | (240,430) | | | | (4,094) | |
| Sunoco, Inc. | | | (7,700) | | | | (297,725) | | | | (18,129) | |
| Susquehanna Bancshares, Inc. | | | (59,000) | | | | (387,031) | | | | (107,389) | |
| SVB Financial Group | | | (7,900) | | | | (361,530) | | | | (15,221) | |
| Swift Energy Co. | | | (3,900) | | | | (116,535) | | | | 627 | |
| Synovus Financial Corp. | | | (730,200) | | | | (1,001,346) | | | | (28,236) | |
| Sysco Corp. | | | (13,000) | | | | (367,021) | | | | (14,269) | |
| T Rowe Price Group, Inc. | | | (22,200) | | | | (1,180,240) | | | | (84,050) | |
| Take-Two Interactive Software, Inc. | | | (11,300) | | | | (148,677) | | | | (4,438) | |
| Target Corp. | | | (3,300) | | | | (165,887) | | | | (3,139) | |
| TCF Financial Corp. | | | (13,200) | | | | (135,276) | | | | (948) | |
| TECO Energy, Inc. | | | (300) | | | | (5,580) | | | | (162) | |
| Teleflex, Inc. | | | (1,100) | | | | (64,031) | | | | (3,388) | |
| Telephone & Data Systems, Inc. | | | (3,600) | | | | (91,858) | | | | (1,346) | |
| Terex Corp. | | | (12,200) | | | | (174,612) | | | | 9,790 | |
| Tesoro Corp. | | | (3,500) | | | | (78,658) | | | | (3,102) | |
| Texas Industries, Inc. | | | (500) | | | | (15,001) | | | | (389) | |
| Texas Instruments, Inc. | | | (18,900) | | | | (555,573) | | | | 5,394 | |
| Textron, Inc. | | | (29,100) | | | | (523,637) | | | | (14,422) | |
| Tidewater, Inc. | | | (10,100) | | | | (525,604) | | | | 27,674 | |
| Tiffany & Co. | | | (10,100) | | | | (707,356) | | | | 38,130 | |
| Time Warner, Inc. | | | (14,300) | | | | (478,343) | | | | (38,459) | |
| Titanium Metals Corp. | | | (44,300) | | | | (685,854) | | | | 22,240 | |
| Toll Brothers, Inc. | | | (9,700) | | | | (157,242) | | | | (40,832) | |
| Torchmark Corp. | | | (1,100) | | | | (46,903) | | | | (826) | |
| TransDigm Group, Inc. | | | (1,800) | | | | (168,213) | | | | (4,011) | |
| TreeHouse Foods, Inc. | | | (6,900) | | | | (387,559) | | | | (63,563) | |
| Trinity Industries, Inc. | | | (2,900) | | | | (75,697) | | | | (11,477) | |
| TripAdvisor, Inc. | | | (6,350) | | | | (193,132) | | | | 33,048 | |
| Triumph Group, Inc. | | | (16,300) | | | | (847,082) | | | | (105,653) | |
| Trustmark Corp. | | | (3,100) | | | | (68,339) | | | | (6,960) | |
| UMB Financial Corp. | | | (800) | | | | (29,751) | | | | (49) | |
| Under Armour, Inc. | | | (14,800) | | | | (1,117,956) | | | | 55,464 | |
| Union Pacific Corp. | | | (100) | | | | (9,978) | | | | (616) | |
| United Natural Foods, Inc. | | | (2,900) | | | | (111,221) | | | | (4,808) | |
| United Parcel Service, Inc. | | | (7,300) | | | | (496,206) | | | | (38,081) | |
| United Technologies Corp. | | | (1,600) | | | | (121,883) | | | | 4,939 | |
| | | | |
| | The accompanying notes are an integral part of these financial statements. | | (Continued) |
| | | | | | | | | | | | | | | | |
| 122 | | AQR Funds | | | | | | Annual Report | | | | | | December 2011 | | |
| | | | | | | | | | |
| | | | |
| Consolidated Schedule of Investments | | | December 31, 2011 | |
| | |
| AQR MULTI-STRATEGY ALTERNATIVE FUND | | |
| | | | | | | | | | | | |
REFERENCE
ENTITY | | SHARES | | | NOTIONAL (a) | | | NET
UNREALIZED
APPRECIATION
(DEPRECIATION) | |
| United States (continued) | | | | | | | | | |
| United Therapeutics Corp. | | | (1,800) | | | $ | (77,490) | | | $ | (7,560) | |
| UnitedHealth Group, Inc. | | | (8,900) | | | | (417,265) | | | | (33,787) | |
| Universal Corp. | | | (1,100) | | | | (43,971) | | | | (6,585) | |
| Urban Outfitters, Inc. | | | (50,200) | | | | (1,357,412) | | | | (26,100) | |
| US Airways Group, Inc. | | | (28,100) | | | | (149,731) | | | | 7,264 | |
| USG Corp. | | | (44,500) | | | | (400,706) | | | | (51,414) | |
| Vail Resorts, Inc. | | | (11,900) | | | | (505,098) | | | | 1,014 | |
| Valmont Industries, Inc. | | | (200) | | | | (17,608) | | | | (550) | |
| Valspar Corp. | | | (1,300) | | | | (41,064) | | | | (9,597) | |
| ValueClick, Inc. | | | (33,700) | | | | (557,702) | | | | 8,729 | |
| VCA Antech, Inc. | | | (16,200) | | | | (279,217) | | | | (40,733) | |
| Vectren Corp. | | | (400) | | | | (11,700) | | | | (392) | |
| VF Corp. | | | (1,200) | | | | (138,315) | | | | (14,073) | |
| Virgin Media, Inc. | | | (30,900) | | | | (744,481) | | | | 83,839 | |
| Viropharma, Inc. | | | (200) | | | | (5,477) | | | | (1) | |
| Visa, Inc. | | | (8,200) | | | | (708,111) | | | | (124,435) | |
| VMware, Inc. | | | (900) | | | | (88,637) | | | | 13,766 | |
| Volcano Corp. | | | (9,400) | | | | (248,944) | | | | 25,318 | |
| Waddell & Reed Financial, Inc. | | | (1,700) | | | | (42,716) | | | | 607 | |
| Walgreen Co. | | | (2,100) | | | | (70,118) | | | | 692 | |
| Wal-Mart Stores, Inc. | | | (9,900) | | | | (543,138) | | | | (48,486) | |
| Walt Disney Co./The | | | (3,600) | | | | (123,041) | | | | (11,959) | |
| Waste Management, Inc. | | | (8,700) | | | | (276,270) | | | | (8,307) | |
| Watsco, Inc. | | | (10,000) | | | | (592,343) | | | | (64,257) | |
| Watts Water Technologies, Inc. | | | (7,800) | | | | (229,465) | | | | (37,373) | |
| Weight Watchers International, Inc. | | | (6,200) | | | | (427,235) | | | | 86,173 | |
| Weingarten Realty Investors | | | (7,400) | | | | (174,727) | | | | 13,259 | |
| WESCO International, Inc. | | | (13,900) | | | | (681,437) | | | | (55,402) | |
| West Pharmaceutical Services, Inc. | | | (2,300) | | | | (91,377) | | | | 4,092 | |
| | | | | | | | | | | | |
REFERENCE
ENTITY | | SHARES | | | NOTIONAL (a) | | | NET
UNREALIZED
APPRECIATION
(DEPRECIATION) | |
| United States (continued) | | | | | | | | | |
| Westamerica BanCorporation | | | (4,300) | | | $ | (177,895) | | | $ | (10,875) | |
| Westar Energy, Inc. | | | (3,900) | | | | (101,230) | | | | (11,012) | |
| Western Union Co./The | | | (41,700) | | | | (735,174) | | | | (26,268) | |
| Whirlpool Corp. | | | (7,800) | | | | (370,851) | | | | 741 | |
| Williams Cos, Inc./The | | | (2,400) | | | | (75,888) | | | | (3,360) | |
| Windstream Corp. | | | (9,800) | | | | (115,483) | | | | 431 | |
| WMS Industries, Inc. | | | (19,000) | | | | (379,681) | | | | (10,199) | |
| Woodward, Inc. | | | (15,200) | | | | (494,405) | | | | (127,731) | |
| Worthington Industries, Inc. | | | (5,700) | | | | (96,396) | | | | 3,030 | |
| WR Berkley Corp. | | | (4,200) | | | | (137,606) | | | | (6,832) | |
| Wynn Resorts Ltd. | | | (3,800) | | | | (470,611) | | | | 50,749 | |
| Xcel Energy, Inc. | | | (400) | | | | (10,095) | | | | (961) | |
| Xerox Corp. | | | (38,200) | | | | (309,111) | | | | 5,039 | |
| Xilinx, Inc. | | | (3,800) | | | | (122,619) | | | | 791 | |
| Zions BanCorporation | | | (54,400) | | | | (913,725) | | | | 28,093 | |
| | | | | | | | | | | | |
| | | | | | | | | | | (2,541,568) | |
| | | | | | | | | | | | |
Total Short Positions | | | | | | | | | | | (2,293,856) | |
| | | | | | | | | | | | |
Total of Long and Short Positions of Portfolio Swap | | | | | | | | | | | (77,713) | |
| | | | | | | | | | | | |
Net Cash and Other Receivables (b) | | | | | | | | | | | 252,833 | |
| | | | | | | | | | | | |
Swaps, at Value | | | | | | | | | | $ | 175,120 | |
| | | | | | | | | | | | |
| (a) | Notional value represents the market value (including any fees or commissions) of the long and short positions when they are established. |
| (b) | Cash and other receivables includes the gains (or losses) realized within the swap when the swap resets. Gains (or losses) will be realized on the swap, and reflected on the Statement of Operations, when cash is settled with the counterparty. |
Total Return Basket Swap* Outstanding at December 31, 2011
| | | | | | | | |
| COUNTERPARTY | | DESCRIPTION | | TERMINATION
DATE | | VALUE ($) | |
| Morgan Stanley | | The Fund receives or pays the total return on a portfolio of long and short positions and pays or receives a specified LIBOR or Federal Funds floating rate, which is denominated in various foreign currencies based on the local currencies of the positions within the portfolio. | | 07/24/13—08/08/13 | | | $565,691 | |
| Total | | | | | | | | |
| * | See the accompanying “Additional Information – Total Return Basket Swap” for further details. |
| | | | |
| | The accompanying notes are an integral part of these financial statements. | | (Continued) |
| | | | | | | | | | | | | | | | |
| | AQR Funds | | | | | | Annual Report | | | | | | December 2011 | | 123 |
| | | | | | | | | | |
| | | | |
| Consolidated Schedule of Investments | | | December 31, 2011 | |
| | |
| AQR MULTI-STRATEGY ALTERNATIVE FUND | | |
Additional Information – Total Return Basket Swap
The following table represents the individual long and short positions and related values within the total return basket swap as of December 31, 2011.
| | | | | | | | | | | | |
REFERENCE
ENTITY | | SHARES | | | NOTIONAL (a) | | | NET
UNREALIZED
APPRECIATION
(DEPRECIATION) | |
| | | |
| Long Positions | | | | | | | | | | | | |
| | | |
| Canada | | | | | | | | | | | | |
| Anvil Mining Ltd. | | | 55,400 | | | CAD | 423,550 | | | $ | (16,603) | |
| Daylight Energy Ltd. | | | 113,735 | | | | 1,116,474 | | | | 28,306 | |
| Grande Cache Coal Corp. | | | 156,018 | | | | 1,527,935 | | | | 17,869 | |
| TMX Group, Inc. | | | 22,880 | | | | 982,577 | | | | (28,181) | |
| | | | | | | | | | | | |
| | | | | | | | | | | 1,391 | |
| | | | | | | | | | | | |
| Cayman Islands | | | | | | | | | | | | |
| Little Sheep Group Ltd. | | | 1,084,718 | | | HKD | 6,432,519 | | | | 69,139 | |
| Shanda Interactive | | | 23,637 | | | $ | 951,630 | | | | (5,913) | |
| | | | | | | | | | | | |
| | | | | | | | | | | 63,226 | |
| | | | | | | | | | | | |
| United States | | | | | | | | | | | | |
| 99 Cents Only Stores | | | 68,153 | | | | 1,467,276 | | | | 28,683 | |
| Blue Coat Systems, Inc. | | | 78,362 | | | | 1,984,594 | | | | 9,719 | |
| Central Vermont Public Service Corp. | | | 25,840 | | | | 903,358 | | | | 3,626 | |
| Commercial Metals Co. | | | 16,895 | | | | 234,608 | | | | (950) | |
| Complete Production Services, Inc. | | | 68,906 | | | | 2,280,607 | | | | 31,879 | |
| Constellation Energy Group, Inc. | | | 125,233 | | | | 4,839,813 | | | | 128,180 | |
| Delphi Financial Group, Inc. | | | 51,877 | | | | 2,287,086 | | | | 11,065 | |
| Dollar Thrifty Automotive Group, Inc. | | | 11,481 | | | | 730,424 | | | | 76,231 | |
| Goodrich Corp. | | | 23,967 | | | | 2,944,799 | | | | 19,919 | |
| Harleysville Group, Inc. | | | 23,956 | | | | 1,415,145 | | | | (59,954) | |
| Healthspring, Inc. | | | 65,217 | | | | 3,542,731 | | | | 14,204 | |
| Jakks Pacific, Inc. | | | 49,387 | | | | 959,662 | | | | (262,811) | |
| LoopNet, Inc. | | | 94,135 | | | | 1,671,836 | | | | 48,952 | |
| Magma Design Automation, Inc. | | | 184,600 | | | | 1,323,238 | | | | 2,190 | |
| Medco Health Solutions, Inc. | | | 31,323 | | | | 1,595,334 | | | | 155,622 | |
| Motorola Mobility Holdings, Inc. | | | 53,521 | | | | 2,079,345 | | | | (2,730) | |
| | | | | | | | | | | | |
REFERENCE
ENTITY | | SHARES | | | NOTIONAL (a) | | | NET
UNREALIZED
APPRECIATION
(DEPRECIATION) | |
| United States (continued) | | | | | | | | | |
| Netlogic Microsystems, Inc. | | | 50,579 | | | $ | 2,498,318 | | | $ | 8,883 | |
| Northeast Utilities | | | 1,774 | | | | 59,753 | | | | 4,235 | |
| Novellus Systems, Inc. | | | 44,556 | | | | 1,816,041 | | | | 23,676 | |
| NYSE Euronext | | | 33,159 | | | | 911,712 | | | | (46,262) | |
| Progress Energy, Inc. | | | 82,704 | | | | 4,275,276 | | | | 357,802 | |
| RightNow Technologies, Inc. | | | 110,360 | | | | 4,718,628 | | | | (2,946) | |
| RSC Holdings, Inc. | | | 94,403 | | | | 1,713,550 | | | | 32,906 | |
| S1 Corp. | | | 69,663 | | | | 628,475 | | | | 38,200 | |
| Sonosite, Inc. | | | 42,666 | | | | 2,295,004 | | | | 2,987 | |
| Southern Union Co. | | | 50,808 | | | | 2,123,625 | | | | 15,900 | |
| Tekelec | | | 23,377 | | | | 255,487 | | | | 23 | |
| Temple-Inland, Inc. | | | 77,448 | | | | 2,372,467 | | | | 83,409 | |
| Transatlantic Holdings, Inc. | | | 75,323 | | | | 4,036,845 | | | | 85,582 | |
| Venoco, Inc. | | | 44,400 | | | | 459,343 | | | | (158,756) | |
| Winn-Dixie Stores, Inc. | | | 198,606 | | | | 1,850,663 | | | | 12,261 | |
| | | | | | | | | | | | |
| | | | | | | | | | | 661,725 | |
| | | | | | | | | | | | |
Total Long Positions | | | | | | | | 726,342 | |
| | | | | | | | | | | | |
| Short Positions | | | | | | | | | | | | |
| | | |
| Denmark | | | | | | | | | | | | |
| Deutsche Boerse AG | | | (15,609) | | | EUR | (649,330) | | | | 23,454 | |
| | | | | | | | | | | | |
| | | |
| United States | | | | | | | | | | | | |
| ACI Worldwide, Inc. | | | (6,661) | | | $ | (175,198) | | | | (15,573) | |
| Alleghany Corp. | | | (10,966) | | | | (3,139,198) | | | | 10,708 | |
| Colfax Corp. | | | (221) | | | | (4,756) | | | | (1,538) | |
| CoStar Group, Inc. | | | (3,547) | | | | (186,250) | | | | (50,441) | |
| Duke Energy Corp. | | | (217,356) | | | | (4,379,338) | | | | (402,494) | |
| Energy Transfer Equity LP | | | (14,503) | | | | (558,358) | | | | (30,173) | |
| Exelon Corp. | | | (115,742) | | | | (4,967,521) | | | | (52,209) | |
| Express Scripts, Inc. | | | (27,892) | | | | (1,161,660) | | | | (84,834) | |
| Hertz Global Holdings, Inc. | | | (9,890) | | | | (103,351) | | | | (12,560) | |
| Lam Research Corp. | | | (49,666) | | | | (1,827,002) | | | | (11,633) | |
| NSTAR | | | (1,352) | | | | (59,668) | | | | (3,822) | |
| | | | |
| | The accompanying notes are an integral part of these financial statements. | | (Continued) |
| | | | | | | | | | | | | | | | |
| 124 | | AQR Funds | | | | | | Annual Report | | | | | | December 2011 | | |
| | | | | | | | | | |
| | | | |
| Consolidated Schedule of Investments | | | December 31, 2011 | |
| | |
| AQR MULTI-STRATEGY ALTERNATIVE FUND | | |
| | | | | | | | | | | | |
REFERENCE
ENTITY | | SHARES | | | NOTIONAL (a) | | | NET
UNREALIZED
APPRECIATION
(DEPRECIATION) | |
| United States (continued) | | | | | | | | | |
| Superior Energy Services, Inc. | | | (66,652) | | | $ | (1,881,607) | | | $ | (13,976) | |
| United Rentals, Inc. | | | (26,024) | | | | (737,712) | | | | (31,298) | |
| | | | | | | | | | | | |
| | | | | | | | | | | (699,843) | |
| | | | | | | | | | | | |
Total Short Positions | | | | | | | | (676,389) | |
| | | | | | | | | | | | |
Total of Long and Short Positions of Portfolio
Swap | | | | | | | | 49,953 | |
| | | | | | | | | | | | |
Net Cash and Other Receivables (b) | | | | | | | | 515,738 | |
| | | | | | | | | | | | |
Swaps, at Value | | | | | | | $ | 565,691 | |
| | | | | | | | | | | | |
| (a) | Notional value represents the market value (including any fees or commissions) of the long and short positions when they are established. |
| (b) | Cash and other receivables includes the gains (or losses) realized within the swap when the swap resets. Gains (or losses) will be realized on the swap, and reflected on the Statement of Operations, when cash is settled with the counterparty. |
Cash held as collateral was $40,000 for both Morgan Stanley total return basket swaps at December 31, 2011.
| | | | |
| | The accompanying notes are an integral part of these financial statements. | | |
| | | | | | | | | | | | | | | | |
| | AQR Funds | | | | | | Annual Report | | | | | | December 2011 | | 125 |
| | | | | | | | | | |
| | | | |
| Schedule of Investments | | | December 31, 2011 | |
| | | | | | | | |
| COMMON STOCKS - 99.5% | | SHARES | | | VALUE
(Note 3) | |
| Consumer Discretionary - 17.8% | | | | | | | | |
| Abercrombie & Fitch Co., Class A | | | 6,400 | | | $ | 312,576 | |
| Advance Auto Parts, Inc. | | | 2,300 | | | | 160,149 | |
| Amazon.com, Inc. † | | | 23,400 | | | | 4,050,540 | |
| Apollo Group, Inc., Class A † | | | 8,300 | | | | 447,121 | |
| AutoNation, Inc. †(a) | | | 14,700 | | | | 541,989 | |
| AutoZone, Inc. † | | | 2,900 | | | | 942,413 | |
| Bed Bath & Beyond, Inc. † | | | 18,700 | | | | 1,084,039 | |
| Big Lots, Inc. † | | | 7,800 | | | | 294,528 | |
| BorgWarner, Inc. †(a) | | | 8,700 | | | | 554,538 | |
| Brinker International, Inc. (a) | | | 12,400 | | | | 331,824 | |
| Buckle, Inc./The | | | 7,400 | | | | 302,438 | |
| Carter’s, Inc. † | | | 7,700 | | | | 306,537 | |
| CBS Corp., Class B (a) | | | 45,800 | | | | 1,243,012 | |
| Chipotle Mexican Grill, Inc. † | | | 2,500 | | | | 844,350 | |
| Cinemark Holdings, Inc. | | | 15,800 | | | | 292,142 | |
| Clear Channel Outdoor Holdings, Inc., Class A †(a) | | | 9,300 | | | | 116,715 | |
| Coach, Inc. | | | 8,107 | | | | 494,851 | |
| Comcast Corp., Class A | | | 43,300 | | | | 1,026,643 | |
| Deckers Outdoor Corp. † | | | 5,600 | | | | 423,192 | |
| Dick’s Sporting Goods, Inc. | | | 4,600 | | | | 169,648 | |
| Dillard’s, Inc., Class A (a) | | | 10,500 | | | | 471,240 | |
| DIRECTV, Class A † | | | 7,800 | | | | 333,528 | |
| Discovery Communications, Inc., Class A † | | | 3,166 | | | | 129,711 | |
| DISH Network Corp., Class A | | | 29,800 | | | | 848,704 | |
| Dollar General Corp. † | | | 19,600 | | | | 806,344 | |
| Dollar Tree, Inc. †(a) | | | 10,800 | | | | 897,588 | |
| Domino’s Pizza, Inc. †(a) | | | 10,800 | | | | 366,660 | |
| DSW, Inc., Class A | | | 6,600 | | | | 291,786 | |
| Family Dollar Stores, Inc. | | | 4,900 | | | | 282,534 | |
| Foot Locker, Inc. | | | 7,900 | | | | 188,336 | |
| Fossil, Inc. †(a) | | | 6,900 | | | | 547,584 | |
| Gentex Corp. (a) | | | 13,000 | | | | 384,670 | |
| Genuine Parts Co. | | | 10,000 | | | | 612,000 | |
| Goodyear Tire & Rubber Co./The † | | | 21,900 | | | | 310,323 | |
| H&R Block, Inc. | | | 25,400 | | | | 414,782 | |
| Harley-Davidson, Inc. (a) | | | 13,200 | | | | 513,084 | |
| Hasbro, Inc. (a) | | | 3,200 | | | | 102,048 | |
| Home Depot, Inc./The | | | 66,700 | | | | 2,804,068 | |
| HSN, Inc. | | | 8,000 | | | | 290,080 | |
| Hyatt Hotels Corp., Class A † | | | 10,100 | | | | 380,164 | |
| Liberty Global, Inc., Class A † | | | 4,300 | | | | 176,429 | |
| Liberty Media Corp. - Liberty Capital, Class A † | | | 6,300 | | | | 491,715 | |
| LKQ Corp. † | | | 10,700 | | | | 321,856 | |
| Ltd. Brands, Inc. | | | 20,900 | | | | 843,315 | |
| Macy’s, Inc. | | | 23,900 | | | | 769,102 | |
| Mattel, Inc. (a) | | | 20,700 | | | | 574,632 | |
| McDonald’s Corp. | | | 49,400 | | | | 4,956,302 | |
| McGraw-Hill Cos., Inc./The | | | 24,400 | | | | 1,097,268 | |
| News Corp., Class A (a) | | | 53,500 | | | | 954,440 | |
| NIKE, Inc., Class B | | | 12,800 | | | | 1,233,536 | |
| Nordstrom, Inc. | | | 11,100 | | | | 551,781 | |
| O’Reilly Automotive, Inc. † | | | 7,800 | | | | 623,610 | |
| Panera Bread Co., Class A † | | | 2,400 | | | | 339,480 | |
| PetSmart, Inc. | | | 9,200 | | | | 471,868 | |
| Polaris Industries, Inc. (a) | | | 10,200 | | | | 570,996 | |
| | | | | | | | |
| | | SHARES | | | VALUE
(Note 3) | |
| Consumer Discretionary - 17.8% (continued) | | | | | |
| priceline.com, Inc. † | | | 2,226 | | | $ | 1,041,123 | |
| Ralph Lauren Corp. | | | 5,700 | | | | 787,056 | |
| Rent-A-Center, Inc. | | | 8,000 | | | | 296,000 | |
| Ross Stores, Inc. | | | 17,600 | | | | 836,528 | |
| Sally Beauty Holdings, Inc. † | | | 22,600 | | | | 477,538 | |
| Signet Jewelers Ltd. (Bermuda) | | | 3,900 | | | | 171,444 | |
| Sirius XM Radio, Inc. †(a) | | | 148,900 | | | | 270,998 | |
| Six Flags Entertainment Corp. | | | 7,600 | | | | 313,424 | |
| Starbucks Corp. | | | 42,734 | | | | 1,966,191 | |
| Tempur-Pedic International, Inc. †(a) | | | 8,800 | | | | 462,264 | |
| Tenneco, Inc. † | | | 3,100 | | | | 92,318 | |
| Tiffany & Co. (a) | | | 5,500 | | | | 364,430 | |
| Time Warner Cable, Inc. | | | 6,400 | | | | 406,848 | |
| Time Warner, Inc. | | | 13,700 | | | | 495,118 | |
| TJX Cos., Inc. | | | 21,300 | | | | 1,374,915 | |
| Tractor Supply Co. | | | 8,000 | | | | 561,200 | |
| Tupperware Brands Corp. | | | 4,600 | | | | 257,462 | |
| Ulta Salon Cosmetics & Fragrance, Inc. † | | | 8,300 | | | | 538,836 | |
| Under Armour, Inc., Class A † | | | 6,900 | | | | 495,351 | |
| VF Corp. | | | 8,600 | | | | 1,092,114 | |
| Viacom, Inc., Class B | | | 13,100 | | | | 594,871 | |
| Weight Watchers International, Inc. (a) | | | 8,600 | | | | 473,086 | |
| Wolverine World Wide, Inc. | | | 8,400 | | | | 299,376 | |
| Wyndham Worldwide Corp. | | | 8,300 | | | | 313,989 | |
| Wynn Resorts Ltd. | | | 6,900 | | | | 762,381 | |
| Yum! Brands, Inc. | | | 6,000 | | | | 354,060 | |
| | | | | | | | |
| | | | | | | 53,989,730 | |
| | | | | | | | |
| Consumer Staples - 13.1% | | | | | | | | |
| Altria Group, Inc. | | | 92,200 | | | | 2,733,730 | |
| Beam, Inc. | | | 5,400 | | | | 276,642 | |
| Brown-Forman Corp., Class B | | | 3,800 | | | | 305,938 | |
| Casey’s General Stores, Inc. | | | 5,900 | | | | 303,909 | |
| Church & Dwight Co., Inc. (a) | | | 12,500 | | | | 572,000 | |
| Coca-Cola Co./The | | | 38,300 | | | | 2,679,851 | |
| Coca-Cola Enterprises, Inc. | | | 6,823 | | | | 175,897 | |
| Colgate-Palmolive Co. | | | 22,500 | | | | 2,078,775 | |
| ConAgra Foods, Inc. | | | 20,200 | | | | 533,280 | |
| Corn Products International, Inc. | | | 4,600 | | | | 241,914 | |
| Costco Wholesale Corp. | | | 26,600 | | | | 2,216,312 | |
| CVS Caremark Corp. | | | 60,100 | | | | 2,450,878 | |
| Darling International, Inc. † | | | 15,500 | | | | 205,995 | |
| Dr Pepper Snapple Group, Inc. (a) | | | 2,700 | | | | 106,596 | |
| Estee Lauder Cos., Inc./The, Class A (a) | | | 12,800 | | | | 1,437,696 | |
| General Mills, Inc. | | | 9,300 | | | | 375,813 | |
| Green Mountain Coffee Roasters, Inc. †(a) | | | 15,500 | | | | 695,175 | |
| Hansen Natural Corp. † | | | 8,900 | | | | 820,046 | |
| Herbalife Ltd. (Cayman Islands) | | | 12,700 | | | | 656,209 | |
| Hershey Co./The (a) | | | 15,800 | | | | 976,124 | |
| HJ Heinz Co. (a) | | | 5,600 | | | | 302,624 | |
| Hormel Foods Corp. | | | 19,500 | | | | 571,155 | |
| JM Smucker Co./The | | | 6,800 | | | | 531,556 | |
| Kellogg Co. (a) | | | 6,500 | | | | 328,705 | |
| Kimberly-Clark Corp. | | | 15,100 | | | | 1,110,756 | |
| Kraft Foods, Inc., Class A | | | 78,500 | | | | 2,932,760 | |
| Lorillard, Inc. | | | 8,500 | | | | 969,000 | |
| McCormick & Co., Inc. (a) | | | 3,300 | | | | 166,386 | |
| | | | |
| | The accompanying notes are an integral part of these financial statements. | | (Continued) |
| | | | | | | | | | | | | | | | |
| 126 | | AQR Funds | | | | | | Annual Report | | | | | | December 2011 | | |
| | | | | | | | | | |
| | | | |
| Schedule of Investments | | | December 31, 2011 | |
| | | | | | | | |
| | | SHARES | | | VALUE
(Note 3) | |
| Consumer Staples - 13.1% (continued) | | | | | |
| Mead Johnson Nutrition Co. | | | 13,100 | | | $ | 900,363 | |
| Nu Skin Enterprises, Inc., Class A (a) | | | 5,900 | | | | 286,563 | |
| Philip Morris International, Inc. | | | 86,200 | | | | 6,764,976 | |
| Pricesmart, Inc. | | | 7,900 | | | | 549,761 | |
| Reynolds American, Inc. | | | 38,600 | | | | 1,598,812 | |
| Sara Lee Corp. | | | 44,800 | | | | 847,616 | |
| Smithfield Foods, Inc. † | | | 14,000 | | | | 339,920 | |
| TreeHouse Foods, Inc. † | | | 4,700 | | | | 307,286 | |
| Tyson Foods, Inc., Class A | | | 22,700 | | | | 468,528 | |
| Whole Foods Market, Inc. | | | 10,200 | | | | 709,716 | |
| | | | | | | | |
| | | | | | | 39,529,263 | |
| | | | | | | | |
| Energy - 13.6% | | | | | | | | |
| Anadarko Petroleum Corp. | | | 10,600 | | | | 809,098 | |
| Atwood Oceanics, Inc. † | | | 7,100 | | | | 282,509 | |
| Berry Petroleum Co., Class A | | | 3,600 | | | | 151,272 | |
| Cabot Oil & Gas Corp. | | | 10,400 | | | | 789,360 | |
| Cameron International Corp. † | | | 1,800 | | | | 88,542 | |
| CARBO Ceramics, Inc. (a) | | | 3,900 | | | | 480,987 | |
| Chesapeake Energy Corp. | | | 22,900 | | | | 510,441 | |
| Chevron Corp. | | | 92,700 | | | | 9,863,280 | |
| Concho Resources, Inc. †(a) | | | 5,200 | | | | 487,500 | |
| ConocoPhillips | | | 44,800 | | | | 3,264,576 | |
| Consol Energy, Inc. | | | 2,500 | | | | 91,750 | |
| Continental Resources, Inc. † | | | 4,500 | | | | 300,195 | |
| CVR Energy, Inc. †(a) | | | 16,300 | | | | 305,299 | |
| Dresser-Rand Group, Inc. †(a) | | | 3,600 | | | | 179,676 | |
| El Paso Corp. | | | 31,000 | | | | 823,670 | |
| Energen Corp. | | | 2,800 | | | | 140,000 | |
| Energy XXI Bermuda Ltd. (Bermuda) † | | | 4,500 | | | | 143,460 | |
| EOG Resources, Inc. | | | 4,200 | | | | 413,742 | |
| EQT Corp. | | | 14,200 | | | | 778,018 | |
| Exxon Mobil Corp. | | | 143,200 | | | | 12,137,632 | |
| FMC Technologies, Inc. †(a) | | | 6,600 | | | | 344,718 | |
| Golar LNG Ltd. (Bermuda) | | | 10,300 | | | | 457,835 | |
| Helmerich & Payne, Inc. | | | 2,800 | | | | 163,408 | |
| HollyFrontier Corp. | | | 18,200 | | | | 425,880 | |
| Key Energy Services, Inc. †(a) | | | 18,800 | | | | 290,836 | |
| Lufkin Industries, Inc. (a) | | | 1,900 | | | | 127,889 | |
| Marathon Oil Corp. | | | 32,100 | | | | 939,567 | |
| National Oilwell Varco, Inc. | | | 1,300 | | | | 88,387 | |
| Noble Energy, Inc. | | | 3,200 | | | | 302,048 | |
| Oceaneering International, Inc. | | | 7,300 | | | | 336,749 | |
| Oil States International, Inc. † | | | 2,600 | | | | 198,562 | |
| Range Resources Corp. | | | 15,400 | | | | 953,876 | |
| Rosetta Resources, Inc. †(a) | | | 10,000 | | | | 435,000 | |
| SM Energy Co. | | | 8,300 | | | | 606,730 | |
| Spectra Energy Corp. | | | 28,100 | | | | 864,075 | |
| Sunoco, Inc. | | | 4,400 | | | | 180,488 | |
| Superior Energy Services, Inc. †(a) | | | 3,800 | | | | 108,072 | |
| Tesoro Corp. † | | | 20,700 | | | | 483,552 | |
| Tidewater, Inc. | | | 2,900 | | | | 142,970 | |
| Valero Energy Corp. | | | 14,500 | | | | 305,225 | |
| Williams Cos., Inc./The | | | 31,100 | | | | 1,026,922 | |
| World Fuel Services Corp. (a) | | | 7,000 | | | | 293,860 | |
| | | | | | | | |
| | | | | | | 41,117,656 | |
| | | | | | | | |
| | | | | | | | |
| | | SHARES | | | VALUE
(Note 3) | |
| Financials - 7.0% | | | | | | | | |
| American Campus Communities, Inc. REIT | | | 7,300 | | | $ | 306,308 | |
| American Capital Ltd. †(a) | | | 17,800 | | | | 119,794 | |
| American Express Co. | | | 54,400 | | | | 2,566,048 | |
| American Financial Group, Inc. | | | 8,200 | | | | 302,498 | |
| American Tower Corp. | | | 5,000 | | | | 300,050 | |
| Aon Corp. | | | 11,400 | | | | 533,520 | |
| Arch Capital Group Ltd. (Bermuda) † | | | 13,000 | | | | 483,990 | |
| AvalonBay Communities, Inc. REIT (a) | | | 7,300 | | | | 953,380 | |
| BGC Partners, Inc., Class A (a) | | | 14,300 | | | | 84,942 | |
| Boston Properties, Inc. REIT (a) | | | 7,000 | | | | 697,200 | |
| Camden Property Trust REIT | | | 3,800 | | | | 236,512 | |
| Capital One Financial Corp. | | | 16,300 | | | | 689,327 | |
| Capitol Federal Financial, Inc. (a) | | | 26,600 | | | | 306,964 | |
| Chubb Corp. | | | 12,600 | | | | 872,172 | |
| Digital Realty Trust, Inc. REIT | | | 4,400 | | | | 293,348 | |
| Discover Financial Services | | | 39,000 | | | | 936,000 | |
| Douglas Emmett, Inc. REIT (a) | | | 8,500 | | | | 155,040 | |
| Equity Residential REIT | | | 13,200 | | | | 752,796 | |
| Erie Indemnity Co., Class A | | | 1,200 | | | | 93,792 | |
| Essex Property Trust, Inc. REIT (a) | | | 1,800 | | | | 252,918 | |
| Extra Space Storage, Inc. REIT (a) | | | 11,900 | | | | 288,337 | |
| Fidelity National Financial, Inc., Class A | | | 21,800 | | | | 347,274 | |
| General Growth Properties, Inc. REIT (a) | | | 8,100 | | | | 121,662 | |
| HCP, Inc. REIT | | | 7,500 | | | | 310,725 | |
| Leucadia National Corp. | | | 7,700 | | | | 175,098 | |
| Marsh & McLennan Cos., Inc. | | | 39,900 | | | | 1,261,638 | |
| Mid-America Apartment Communities, Inc. REIT | | | 1,800 | | | | 112,590 | |
| Moody’s Corp. (a) | | | 18,400 | | | | 619,712 | |
| NASDAQ OMX Group, Inc./The † | | | 5,000 | | | | 122,550 | |
| Post Properties, Inc. REIT | | | 5,900 | | | | 257,948 | |
| ProLogis, Inc. REIT | | | 8,130 | | | | 232,437 | |
| Public Storage REIT | | | 11,800 | | | | 1,586,628 | |
| Rayonier, Inc. REIT | | | 13,850 | | | | 618,126 | |
| RenaissanceRe Holdings Ltd. (Bermuda) | | | 4,100 | | | | 304,917 | |
| Signature Bank † | | | 5,800 | | | | 347,942 | |
| Simon Property Group, Inc. REIT | | | 16,000 | | | | 2,063,040 | |
| SL Green Realty Corp. REIT (a) | | | 1,200 | | | | 79,968 | |
| Taubman Centers, Inc. REIT | | | 6,500 | | | | 403,650 | |
| UDR, Inc. REIT | | | 7,900 | | | | 198,290 | |
| Weingarten Realty Investors REIT | | | 5,400 | | | | 117,828 | |
| Weyerhaeuser Co. REIT | | | 7,100 | | | | 132,557 | |
| WR Berkley Corp. | | | 13,700 | | | | 471,143 | |
| | | | | | | | |
| | | | | | | 21,110,659 | |
| | | | | | | | |
| Health Care - 12.8% | | | | | | | | |
| Abbott Laboratories | | | 45,100 | | | | 2,535,973 | |
| Aetna, Inc. | | | 25,600 | | | | 1,080,064 | |
| Alexion Pharmaceuticals, Inc. † | | | 15,700 | | | | 1,122,550 | |
| Allergan, Inc. | | | 18,400 | | | | 1,614,416 | |
| AMERIGROUP Corp. † | | | 5,100 | | | | 301,308 | |
| AmerisourceBergen Corp. (a) | | | 15,000 | | | | 557,850 | |
| Ariad Pharmaceuticals, Inc. † | | | 25,500 | | | | 312,375 | |
| athenahealth, Inc. † | | | 6,800 | | | | 334,016 | |
| Baxter International, Inc. | | | 7,300 | | | | 361,204 | |
| Biogen Idec, Inc. † | | | 15,300 | | | | 1,683,765 | |
| BioMarin Pharmaceutical, Inc. †(a) | | | 13,400 | | | | 460,692 | |
| | | | |
| | The accompanying notes are an integral part of these financial statements. | | (Continued) |
| | | | | | | | | | | | | | | | |
| | AQR Funds | | | | | | Annual Report | | | | | | December 2011 | | 127 |
| | | | | | | | | | |
| | | | |
| Schedule of Investments | | | December 31, 2011 | |
| | | | | | | | |
| | | SHARES | | | VALUE
(Note 3) | |
| Health Care - 12.8% (continued) | | | | | | | | |
| Bristol-Myers Squibb Co. | | | 77,500 | | | $ | 2,731,100 | |
| Cardinal Health, Inc. | | | 22,500 | | | | 913,725 | |
| Catalyst Health Solutions, Inc. †(a) | | | 5,500 | | | | 286,000 | |
| Cepheid, Inc. † | | | 11,200 | | | | 385,392 | |
| Cerner Corp. †(a) | | | 10,100 | | | | 618,625 | |
| CIGNA Corp. | | | 22,700 | | | | 953,400 | |
| Cooper Cos., Inc./The | | | 1,500 | | | | 105,780 | |
| Coventry Health Care, Inc. † | | | 8,000 | | | | 242,960 | |
| Cubist Pharmaceuticals, Inc. † | | | 8,600 | | | | 340,732 | |
| Eli Lilly & Co. | | | 32,200 | | | | 1,338,232 | |
| Gen-Probe, Inc. † | | | 3,700 | | | | 218,744 | |
| Healthspring, Inc. † | | | 6,100 | | | | 332,694 | |
| Henry Schein, Inc. † | | | 4,600 | | | | 296,378 | |
| Hill-Rom Holdings, Inc. | | | 3,500 | | | | 117,915 | |
| HMS Holdings Corp. †(a) | | | 5,700 | | | | 182,286 | |
| Humana, Inc. | | | 13,000 | | | | 1,138,930 | |
| IDEXX Laboratories, Inc. † | | | 4,000 | | | | 307,840 | |
| Intuitive Surgical, Inc. † | | | 2,700 | | | | 1,250,127 | |
| Jazz Pharmaceuticals, Inc. † | | | 8,000 | | | | 309,040 | |
| McKesson Corp. | | | 16,300 | | | | 1,269,933 | |
| Medicis Pharmaceutical Corp., Class A | | | 9,100 | | | | 302,575 | |
| Omnicare, Inc. (a) | | | 8,700 | | | | 299,715 | |
| Onyx Pharmaceuticals, Inc. † | | | 7,100 | | | | 312,045 | |
| Perrigo Co. (a) | | | 9,300 | | | | 904,890 | |
| Pfizer, Inc. | | | 221,100 | | | | 4,784,604 | |
| Pharmasset, Inc. † | | | 5,200 | | | | 666,640 | |
| Questcor Pharmaceuticals, Inc. †(a) | | | 15,400 | | | | 640,332 | |
| Regeneron Pharmaceuticals, Inc. †(a) | | | 11,900 | | | | 659,617 | |
| SXC Health Solutions Corp. † | | | 5,900 | | | | 333,232 | |
| UnitedHealth Group, Inc. | | | 56,200 | | | | 2,848,216 | |
| Vertex Pharmaceuticals, Inc. † | | | 13,300 | | | | 441,693 | |
| ViroPharma, Inc. † | | | 10,700 | | | | 293,073 | |
| Watson Pharmaceuticals, Inc. † | | | 11,800 | | | | 712,012 | |
| WellCare Health Plans, Inc. † | | | 10,500 | | | | 551,250 | |
| WellPoint, Inc. | | | 20,200 | | | | 1,338,250 | |
| | | | | | | | |
| | | | | | | 38,792,190 | |
| | | | | | | | |
| Industrials - 6.0% | | | | | | | | |
| Acacia Research - Acacia Technologies † | | | 8,700 | | | | 317,637 | |
| Acuity Brands, Inc. (a) | | | 2,600 | | | | 137,800 | |
| Alaska Air Group, Inc. † | | | 3,900 | | | | 292,851 | |
| Amerco, Inc. (a) | | | 1,900 | | | | 167,960 | |
| AMETEK, Inc. (a) | | | 4,600 | | | | 193,660 | |
| Chart Industries, Inc. † | | | 5,200 | | | | 281,164 | |
| Clean Harbors, Inc. † | | | 4,800 | | | | 305,904 | |
| Copa Holdings SA, Class A | | | 5,000 | | | | 293,350 | |
| Copart, Inc. † | | | 7,200 | | | | 344,808 | |
| CSX Corp. | | | 12,300 | | | | 259,038 | |
| Dollar Thrifty Automotive Group, Inc. † | | | 4,300 | | | | 302,118 | |
| Donaldson Co., Inc. | | | 4,400 | | | | 299,552 | |
| Fastenal Co. (a) | | | 19,100 | | | | 832,951 | |
| Fluor Corp. | | | 2,700 | | | | 135,675 | |
| Fortune Brands Home & Security, Inc. † | | | 5,400 | | | | 91,962 | |
| Gardner Denver, Inc. | | | 2,100 | | | | 161,826 | |
| Genesee & Wyoming, Inc., Class A † | | | 2,300 | | | | 139,334 | |
| Goodrich Corp. | | | 5,200 | | | | 643,240 | |
| Hexcel Corp. † | | | 15,700 | | | | 380,097 | |
| Hubbell, Inc., Class B | | | 3,700 | | | | 247,382 | |
| | | | | | | | |
| | | SHARES | | | VALUE
(Note 3) | |
| Industrials - 6.0% (continued) | | | | | | | | |
| IHS, Inc., Class A † | | | 4,100 | | | $ | 353,256 | |
| Iron Mountain, Inc. (a) | | | 17,400 | | | | 535,920 | |
| JB Hunt Transport Services, Inc. | | | 6,700 | | | | 301,969 | |
| Kansas City Southern †(a) | | | 7,900 | | | | 537,279 | |
| KBR, Inc. | | | 3,900 | | | | 108,693 | |
| Kennametal, Inc. (a) | | | 7,500 | | | | 273,900 | |
| Kirby Corp. †(a) | | | 4,600 | | | | 302,864 | |
| Lockheed Martin Corp. | | | 6,600 | | | | 533,940 | |
| Mueller Industries, Inc. | | | 6,500 | | | | 249,730 | |
| Nordson Corp. (a) | | | 3,200 | | | | 131,776 | |
| Norfolk Southern Corp. | | | 13,000 | | | | 947,180 | |
| Old Dominion Freight Line, Inc. † | | | 7,400 | | | | 299,922 | |
| Pall Corp. | | | 7,000 | | | | 400,050 | |
| Polypore International, Inc. †(a) | | | 10,200 | | | | 448,698 | |
| Precision Castparts Corp. | | | 7,500 | | | | 1,235,925 | |
| Robbins & Myers, Inc. | | | 6,700 | | | | 325,285 | |
| SPX Corp. | | | 4,900 | | | | 295,323 | |
| Stericycle, Inc. † | | | 7,700 | | | | 599,984 | |
| Timken Co. | | | 3,700 | | | | 143,227 | |
| Towers Watson & Co., Class A | | | 5,000 | | | | 299,650 | |
| TransDigm Group, Inc. † | | | 4,900 | | | | 468,832 | |
| Triumph Group, Inc. | | | 6,300 | | | | 368,235 | |
| Union Pacific Corp. | | | 8,000 | | | | 847,520 | |
| United Parcel Service, Inc., Class B | | | 1,300 | | | | 95,147 | |
| Verisk Analytics, Inc., Class A † | | | 8,300 | | | | 333,079 | |
| WABCO Holdings, Inc. † | | | 2,900 | | | | 125,860 | |
| Wabtec Corp. | | | 4,400 | | | | 307,780 | |
| Waste Connections, Inc. | | | 8,300 | | | | 275,062 | |
| Werner Enterprises, Inc. (a) | | | 10,900 | | | | 262,690 | |
| Woodward, Inc. | | | 3,200 | | | | 130,976 | |
| WW Grainger, Inc. | | | 4,600 | | | | 861,074 | |
| | | | | | | | |
| | | | | | | 18,229,135 | |
| | | | | | | | |
| Information Technology - 19.5% | | | | | | | | |
| Acme Packet, Inc. †(a) | | | 6,600 | | | | 204,006 | |
| Alliance Data Systems Corp. † | | | 4,600 | | | | 477,664 | |
| Altera Corp. | | | 2,500 | | | | 92,750 | |
| ANSYS, Inc. † | | | 5,600 | | | �� | 320,768 | |
| Apple, Inc. † | | | 41,300 | | | | 16,726,500 | |
| Ariba, Inc. † | | | 14,400 | | | | 404,352 | |
| Arrow Electronics, Inc. † | | | 8,600 | | | | 321,726 | |
| Automatic Data Processing, Inc. | | | 28,800 | | | | 1,555,488 | |
| Cadence Design Systems, Inc. †(a) | | | 23,600 | | | | 245,440 | |
| Citrix Systems, Inc. † | | | 1,300 | | | | 78,936 | |
| Cypress Semiconductor Corp. † | | | 6,900 | | | | 116,541 | |
| Dell, Inc. †(a) | | | 56,200 | | | | 822,206 | |
| Electronic Arts, Inc. † | | | 30,800 | | | | 634,480 | |
| Equinix, Inc. † | | | 2,900 | | | | 294,060 | |
| Factset Research Systems, Inc. (a) | | | 1,300 | | | | 113,464 | |
| Fairchild Semiconductor International, Inc. † | | | 7,700 | | | | 92,708 | |
| Fortinet, Inc. † | | | 19,300 | | | | 420,933 | |
| Gartner, Inc. † | | | 6,200 | | | | 215,574 | |
| IAC/InterActiveCorp | | | 6,700 | | | | 285,420 | |
| Informatica Corp. † | | | 2,300 | | | | 84,939 | |
| Intel Corp. (a) | | | 239,700 | | | | 5,812,725 | |
| InterDigital, Inc. (a) | | | 6,200 | | | | 270,134 | |
| International Business Machines Corp. | | | 56,900 | | | | 10,462,772 | |
| Intuit, Inc. | | | 8,200 | | | | 431,238 | |
| | | | |
| | The accompanying notes are an integral part of these financial statements. | | (Continued) |
| | | | | | | | | | | | | | | | |
| 128 | | AQR Funds | | | | | | Annual Report | | | | | | December 2011 | | |
| | | | | | | | | | |
| | | | |
| Schedule of Investments | | | December 31, 2011 | |
| | | | | | | | |
| | | SHARES | | | VALUE
(Note 3) | |
| Information Technology - 19.5% (continued) | | | | | |
| IPG Photonics Corp. †(a) | | | 3,700 | | | $ | 125,319 | |
| Jabil Circuit, Inc. (a) | | | 15,000 | | | | 294,900 | |
| Jack Henry & Associates, Inc. | | | 8,800 | | | | 295,768 | |
| KLA-Tencor Corp. (a) | | | 11,300 | | | | 545,225 | |
| Mastercard, Inc., Class A | | | 7,000 | | | | 2,609,740 | |
| Maxim Integrated Products, Inc. | | | 21,200 | | | | 552,048 | |
| Molex, Inc. | | | 9,000 | | | | 214,740 | |
| Motorola Solutions, Inc. | | | 19,400 | | | | 898,026 | |
| NCR Corp. † | | | 8,300 | | | | 136,618 | |
| Netlogic Microsystems, Inc. † | | | 6,000 | | | | 297,420 | |
| NetSuite, Inc. † | | | 8,500 | | | | 344,675 | |
| NeuStar, Inc., Class A † | | | 8,700 | | | | 297,279 | |
| Nuance Communications, Inc. † | | | 23,600 | | | | 593,776 | |
| Oracle Corp. | | | 80,100 | | | | 2,054,565 | |
| Polycom, Inc. † | | | 7,200 | | | | 117,360 | |
| QUALCOMM, Inc. | | | 23,100 | | | | 1,263,570 | |
| Rackspace Hosting, Inc. †(a) | | | 11,300 | | | | 486,013 | |
| Riverbed Technology, Inc. † | | | 4,500 | | | | 105,750 | |
| SanDisk Corp. † | | | 6,100 | | | | 300,181 | |
| SolarWinds, Inc. † | | | 12,600 | | | | 352,170 | |
| Solera Holdings, Inc. | | | 5,700 | | | | 253,878 | |
| Teradata Corp. † | | | 14,100 | | | | 683,991 | |
| TIBCO Software, Inc. † | | | 20,000 | | | | 478,200 | |
| Total System Services, Inc. | | | 15,100 | | | | 295,356 | |
| Trimble Navigation Ltd. † | | | 3,400 | | | | 147,560 | |
| Universal Display Corp. †(a) | | | 8,600 | | | | 315,534 | |
| VeriFone Systems, Inc. † | | | 8,300 | | | | 294,816 | |
| Visa, Inc., Class A | | | 31,600 | | | | 3,208,348 | |
| Vishay Intertechnology, Inc. †(a) | | | 8,200 | | | | 73,718 | |
| VMware, Inc., Class A † | | | 7,300 | | | | 607,287 | |
| Xilinx, Inc. | | | 9,300 | | | | 298,158 | |
| Zebra Technologies Corp., Class A † | | | 3,200 | | | | 114,496 | |
| | | | | | | | |
| | | | | | | 59,141,309 | |
| | | | | | | | |
| Materials - 1.7% | | | | | | | | |
| Albemarle Corp. (a) | | | 4,000 | | | | 206,040 | |
| Allied Nevada Gold Corp. † | | | 15,600 | | | | 472,368 | |
| Ball Corp. | | | 5,200 | | | | 185,692 | |
| Carpenter Technology Corp. | | | 5,700 | | | | 293,436 | |
| Celanese Corp., Series A | | | 7,000 | | | | 309,890 | |
| CF Industries Holdings, Inc. | | | 2,100 | | | | 304,458 | |
| Cliffs Natural Resources, Inc. | | | 1,400 | | | | 87,290 | |
| Eastman Chemical Co. | | | 2,500 | | | | 97,650 | |
| International Flavors & Fragrances, Inc. | | | 6,500 | | | | 340,730 | |
| International Paper Co. | | | 3,100 | | | | 91,760 | |
| MeadWestvaco Corp. | | | 5,200 | | | | 155,740 | |
| Monsanto Co. | | | 11,800 | | | | 826,826 | |
| NewMarket Corp. | | | 1,600 | | | | 316,976 | |
| Newmont Mining Corp. | | | 4,800 | | | | 288,048 | |
| Rockwood Holdings, Inc. † | | | 5,700 | | | | 224,409 | |
| Royal Gold, Inc. (a) | | | 9,900 | | | | 667,557 | |
| Stillwater Mining Co. †(a) | | | 5,700 | | | | 59,622 | |
| WR Grace & Co. † | | | 3,700 | | | | 169,904 | |
| | | | | | | | |
| | | | | | | 5,098,396 | |
| | | | | | | | |
| Telecommunication Services - 1.2% | | | | | | | | |
| Level 3 Communications, Inc. †(a) | | | 21,386 | | | | 363,348 | |
| Verizon Communications, Inc. (a) | | | 83,700 | | | | 3,358,044 | |
| | | | | | | | |
| | | | | | | 3,721,392 | |
| | | | | | | | |
| | | | | | | | |
| | | SHARES | | | VALUE
(Note 3) | |
| Utilities - 6.8% | | | | | | | | |
| AGL Resources, Inc. | | | 7,100 | | | $ | 300,046 | |
| Alliant Energy Corp. | | | 7,000 | | | | 308,770 | |
| Ameren Corp. | | | 10,100 | | | | 334,613 | |
| American Electric Power Co., Inc. | | | 16,200 | | | | 669,222 | |
| American Water Works Co., Inc. | | | 20,500 | | | | 653,130 | |
| Atmos Energy Corp. | | | 9,100 | | | | 303,485 | |
| Calpine Corp. † | | | 27,100 | | | | 442,543 | |
| CenterPoint Energy, Inc. | | | 25,700 | | | | 516,313 | |
| Cleco Corp. | | | 8,100 | | | | 308,610 | |
| CMS Energy Corp. | | | 14,000 | | | | 309,120 | |
| Consolidated Edison, Inc. | | | 23,400 | | | | 1,451,502 | |
| Dominion Resources, Inc. | | | 28,000 | | | | 1,486,240 | |
| DTE Energy Co. | | | 9,300 | | | | 506,385 | |
| Duke Energy Corp. (a) | | | 68,300 | | | | 1,502,600 | |
| Edison International | | | 7,500 | | | | 310,500 | |
| Exelon Corp. | | | 13,200 | | | | 572,484 | |
| FirstEnergy Corp. | | | 33,900 | | | | 1,501,770 | |
| Hawaiian Electric Industries, Inc. | | | 11,500 | | | | 304,520 | |
| ITC Holdings Corp. (a) | | | 7,500 | | | | 569,100 | |
| National Fuel Gas Co. | | | 5,400 | | | | 300,132 | |
| NiSource, Inc. (a) | | | 25,700 | | | | 611,917 | |
| Northeast Utilities | | | 14,800 | | | | 533,836 | |
| OGE Energy Corp. | | | 7,300 | | | | 413,983 | |
| Oneok, Inc. | | | 11,200 | | | | 970,928 | |
| Pinnacle West Capital Corp. | | | 7,600 | | | | 366,168 | |
| Portland General Electric Co. | | | 12,000 | | | | 303,480 | |
| PPL Corp. | | | 28,600 | | | | 841,412 | |
| Public Service Enterprise Group, Inc. (a) | | | 8,800 | | | | 290,488 | |
| Questar Corp. | | | 15,300 | | | | 303,858 | |
| Southern Co. | | | 40,300 | | | | 1,865,487 | |
| UIL Holdings Corp. | | | 7,700 | | | | 272,349 | |
| WGL Holdings, Inc. | | | 6,900 | | | | 305,118 | |
| Wisconsin Energy Corp. | | | 8,700 | | | | 304,152 | |
| Xcel Energy, Inc. | | | 15,400 | | | | 425,656 | |
| | | | | | | | |
| | | | | | | 20,459,917 | |
| | | | | | | | |
TOTAL COMMON STOCKS
(cost $284,019,961) | | | | | | | 301,189,647 | |
| | | | | | | | |
| | |
| MONEY MARKET FUNDS - 0.6% | | | | | | | | |
| J.P. Morgan Treasury Plus Money Market Fund - Institutional Shares, 0.000% (2)(b) | | | | | | | | |
(cost $1,766,980) | | | 1,766,980 | | | | 1,766,980 | |
| | | | | | | | |
|
| INVESTMENTS OF CASH COLLATERAL FOR SECURITIES ON LOAN - 2.4% | |
J.P. Morgan Prime Money Market
Fund - Capital Shares, 0.130% (2)(b)(c) | | | | | | | | |
(cost $7,396,308) | | | 7,396,308 | | | | 7,396,308 | |
| | | | | | | | |
TOTAL INVESTMENTS - 102.5%
(cost $293,183,249) | | | | | | | 310,352,935 | |
| | | | | | | | |
| LIABILITIES IN EXCESS OF OTHER ASSETS - (2.5)% (d) | | | | | | | (7,597,651) | |
| | | | | | | | |
NET ASSETS - 100.0% | | | | | | $ | 302,755,284 | |
| | | | | | | | |
| | | | |
| | The accompanying notes are an integral part of these financial statements. | | (Continued) |
| | | | | | | | | | | | | | | | |
| | AQR Funds | | | | | | Annual Report | | | | | | December 2011 | | 129 |
| | | | | | | | | | |
| | | | |
| Schedule of Investments | | | December 31, 2011 | |
All securities are United States companies, unless noted otherwise in parentheses.
| † | Non income-producing security. |
| (a) | All or a portion of the security on loan. The aggregate market value of such securities is $7,154,113; cash collateral of $7,396,308 was received with which the Fund purchased a money market fund. |
| (b) | Represents annualized seven-day yield as of December 31, 2011. |
| (c) | Represents security, or portion thereof, purchased with the cash collateral received for securities on loan. |
| (d) | Includes appreciation on futures contracts. |
All securities are Level 1, with respect to ASC 820 unless otherwise noted in parentheses.
| (2) | Level 2 security (See Note 5). |
The following abbreviations are used in portfolio descriptions:
REIT - Real Estate Investment Trust
Open futures contracts outstanding at December 31, 2011:
| | | | | | | | | | | | | | | | |
NUMBER OF
CONTRACTS | | DESCRIPTION | | EXPIRATION
DATE | | VALUE AT
TRADE DATE | | | VALUE AT
DECEMBER 31,
2011 | | | UNREALIZED
APPRECIATION | |
| Long Contracts: | | | | | | | | | | | | | | | | |
| 40 | | S&P 500 E-Mini Futures | | March 16, 2012 | | | $2,466,452 | | | | $2,505,200 | | | | $38,748 | |
| | | | | | | | | | | | | | | | |
Cash held as collateral with broker for futures contracts was $112,350 at December 31, 2011.
| | | | |
| | The accompanying notes are an integral part of these financial statements. | | |
| | | | | | | | | | | | | | | | |
| 130 | | AQR Funds | | | | | | Annual Report | | | | | | December 2011 | | |
| | | | | | | | | | |
| | | | |
| Schedule of Investments | | | December 31, 2011 | |
| | |
| AQR SMALL CAP MOMENTUM FUND | | |
| | | | | | | | |
| COMMON STOCKS - 99.8% | | SHARES | | | VALUE
(Note 3) | |
| Consumer Discretionary - 13.5% | | | | | | | | |
| 99 Cents Only Stores † | | | 15,600 | | | $ | 342,420 | |
| A. H. Belo Corp., Class A | | | 3,400 | | | | 16,150 | |
| AFC Enterprises, Inc. † | | | 5,000 | | | | 73,500 | |
| American Public Education, Inc. †(a) | | | 3,300 | | | | 142,824 | |
| America’s Car-Mart, Inc. † | | | 3,100 | | | | 121,458 | |
| Amerigon, Inc. † | | | 8,800 | | | | 125,488 | |
| Ameristar Casinos, Inc. | | | 3,700 | | | | 63,973 | |
| Arbitron, Inc. | | | 5,000 | | | | 172,050 | |
| Arctic Cat, Inc. † | | | 8,600 | | | | 193,930 | |
| Asbury Automotive Group, Inc. † | | | 7,200 | | | | 155,232 | |
| Ascent Capital Group, Inc., Class A † | | | 4,800 | | | | 243,456 | |
| Barnes & Noble, Inc. † | | | 3,200 | | | | 46,336 | |
| Bebe Stores, Inc. | | | 15,100 | | | | 125,783 | |
| BJ’s Restaurants, Inc. † | | | 7,200 | | | | 326,304 | |
| Blyth, Inc. | | | 3,400 | | | | 193,120 | |
| Bob Evans Farms, Inc. | | | 5,800 | | | | 194,532 | |
| Body Central Corp. † | | | 4,000 | | | | 99,840 | |
| Bridgepoint Education, Inc. †(a) | | | 11,000 | | | | 253,000 | |
| Buffalo Wild Wings, Inc. †(a) | | | 4,400 | | | | 297,044 | |
| Build-A-Bear Workshop, Inc. † | | | 3,600 | | | | 30,456 | |
| Cabela’s, Inc. † | | | 8,100 | | | | 205,902 | |
| Caribou Coffee Co., Inc. † | | | 11,000 | | | | 153,450 | |
| Carrols Restaurant Group, Inc. † | | | 1,900 | | | | 21,983 | |
| Cavco Industries, Inc. † | | | 1,300 | | | | 52,078 | |
| Charming Shoppes, Inc. † | | | 8,800 | | | | 43,120 | |
| Children’s Place Retail Stores, Inc./The † | | | 3,200 | | | | 169,984 | |
| Churchill Downs, Inc. | | | 3,600 | | | | 187,668 | |
| Collectors Universe | | | 4,900 | | | | 71,393 | |
| Conn’s, Inc. † | | | 12,400 | | | | 137,640 | |
| Core-Mark Holding Co., Inc. | | | 2,900 | | | | 114,840 | |
| Cost Plus, Inc. † | | | 9,800 | | | | 95,550 | |
| CSS Industries, Inc. | | | 1,000 | | | | 19,920 | |
| Delta Apparel, Inc. † | | | 900 | | | | 17,181 | |
| Denny’s Corp. †(a) | | | 18,100 | | | | 68,056 | |
| Dorman Products, Inc. † | | | 1,332 | | | | 49,191 | |
| Drew Industries, Inc. † | | | 2,600 | | | | 63,778 | |
| Einstein Noah Restaurant Group, Inc. | | | 3,600 | | | | 56,952 | |
| Ethan Allen Interiors, Inc. (a) | | | 4,400 | | | | 104,324 | |
| Express, Inc. † | | | 14,600 | | | | 291,124 | |
| Finish Line, Inc./The, Class A | | | 12,800 | | | | 246,848 | |
| Fisher Communications, Inc. † | | | 1,800 | | | | 51,894 | |
| Geeknet, Inc. † | | | 1,800 | | | | 30,690 | |
| Genesco, Inc. † | | | 5,700 | | | | 351,918 | |
| Global Sources Ltd. (Bermuda) † | | | 2,900 | | | | 14,065 | |
| Group 1 Automotive, Inc. | | | 5,100 | | | | 264,180 | |
| Helen of Troy Ltd. (Bermuda) † | | | 3,500 | | | | 107,450 | |
| Hibbett Sports, Inc. † | | | 6,300 | | | | 284,634 | |
| Hillenbrand, Inc. | | | 6,100 | | | | 136,152 | |
| Hot Topic, Inc. | | | 24,900 | | | | 164,589 | |
| International Speedway Corp., Class A | | | 3,500 | | | | 88,725 | |
| iRobot Corp. † | | | 7,100 | | | | 211,935 | |
| Jakks Pacific, Inc. | | | 2,800 | | | | 39,508 | |
| Jos. A. Bank Clothiers, Inc. † | | | 6,300 | | | | 307,188 | |
| K12, Inc. †(a) | | | 2,600 | | | | 46,644 | |
| Kenneth Cole Productions, Inc., Class A † | | | 1,900 | | | | 20,121 | |
| Kingold Jewelry, Inc. (China) † | | | 9,300 | | | | 10,602 | |
| Kona Grill, Inc. † | | | 2,300 | | | | 14,076 | |
| | | | | | | | |
| | | SHARES | | | VALUE
(Note 3) | |
| Consumer Discretionary - 13.5% (continued) | | | | | |
| Krispy Kreme Doughnuts, Inc. † | | | 21,300 | | | $ | 139,302 | |
| La-Z-Boy, Inc. † | | | 9,100 | | | | 108,290 | |
| Libbey, Inc. † | | | 4,300 | | | | 54,782 | |
| Life Time Fitness, Inc. † | | | 2,100 | | | | 98,175 | |
| Lions Gate Entertainment Corp. † | | | 7,800 | | | | 64,896 | |
| Lithia Motors, Inc., Class A | | | 7,300 | | | | 159,578 | |
| Liz Claiborne, Inc. † | | | 5,800 | | | | 50,054 | |
| Mac-Gray Corp. | | | 1,900 | | | | 26,201 | |
| Men’s Wearhouse, Inc./The | | | 5,400 | | | | 175,014 | |
| Monro Muffler Brake, Inc. | | | 7,600 | | | | 294,804 | |
| Motorcar Parts of America, Inc. † | | | 4,400 | | | | 33,000 | |
| Movado Group, Inc. | | | 6,900 | | | | 125,373 | |
| Multimedia Games Holding Co., Inc. † | | | 8,900 | | | | 70,666 | |
| Nexstar Broadcasting Group, Inc., Class A † | | | 1,700 | | | | 13,328 | |
| Oxford Industries, Inc. (a) | | | 4,300 | | | | 194,016 | |
| Papa John’s International, Inc. † | | | 7,200 | | | | 271,296 | |
| Peet’s Coffee & Tea, Inc. † | | | 4,400 | | | | 275,792 | |
| Penske Automotive Group, Inc. | | | 13,400 | | | | 257,950 | |
| Pier 1 Imports, Inc. †(a) | | | 24,500 | | | | 341,285 | |
| Pool Corp. | | | 12,700 | | | | 382,270 | |
| Red Robin Gourmet Burgers, Inc. † | | | 5,500 | | | | 152,350 | |
| RG Barry Corp. | | | 2,100 | | | | 25,368 | |
| Ruth’s Hospitality Group, Inc. †(a) | | | 11,400 | | | | 56,658 | |
| Saga Communications, Inc., Class A † | | | 200 | | | | 7,476 | |
| Select Comfort Corp. † | | | 12,600 | | | | 273,294 | |
| Shoe Carnival, Inc. † | | | 2,800 | | | | 71,960 | |
| Sinclair Broadcast Group, Inc., Class A | | | 15,400 | | | | 174,482 | |
| Sonic Automotive, Inc., Class A | | | 11,200 | | | | 165,872 | |
| Sonic Corp. † | | | 400 | | | | 2,692 | |
| Standard Motor Products, Inc. | | | 7,000 | | | | 140,350 | |
| Steiner Leisure Ltd. † | | | 1,700 | | | | 77,163 | |
| Steinway Musical Instruments, Inc. † | | | 3,000 | | | | 75,120 | |
| Steven Madden Ltd. † | | | 9,536 | | | | 328,992 | |
| Stewart Enterprises, Inc., Class A (a) | | | 15,600 | | | | 89,856 | |
| Sturm, Ruger & Co., Inc. | | | 7,600 | | | | 254,296 | |
| Systemax, Inc. † | | | 1,200 | | | | 19,692 | |
| Town Sports International Holdings, Inc. † | | | 10,200 | | | | 74,970 | |
| True Religion Apparel, Inc. † | | | 7,000 | | | | 242,060 | |
| U.S. Auto Parts Network, Inc. †(a) | | | 2,500 | | | | 10,925 | |
| Unifi, Inc. †(a) | | | 3,700 | | | | 28,120 | |
| Vera Bradley, Inc. †(a) | | | 3,200 | | | | 103,200 | |
| Vitamin Shoppe, Inc. † | | | 6,900 | | | | 275,172 | |
| Wet Seal, Inc./The, Class A † | | | 24,700 | | | | 80,522 | |
| Winmark Corp. | | | 200 | | | | 11,474 | |
| ZAGG, Inc. † | | | 15,800 | | | | 111,706 | |
| Zale Corp. † | | | 14,700 | | | | 56,007 | |
| | | | | | | | |
| | | | | | | 13,578,098 | |
| | | | | | | | |
| Consumer Staples - 5.2% | | | | | | | | |
| Andersons, Inc./The | | | 3,300 | | | | 144,078 | |
| B&G Foods, Inc. | | | 14,200 | | | | 341,794 | |
| Boston Beer Co., Inc./The, Class A †(a) | | | 2,200 | | | | 238,832 | |
| Calavo Growers, Inc. | | | 2,000 | | | | 51,360 | |
| Cal-Maine Foods, Inc. | | | 8,400 | | | | 307,188 | |
| Coca-Cola Bottling Co. Consolidated | | | 700 | | | | 40,985 | |
| Craft Brewers Alliance, Inc. † | | | 4,500 | | | | 27,090 | |
| Cyanotech Corp. † | | | 1,300 | | | | 9,035 | |
| | | | |
| | The accompanying notes are an integral part of these financial statements. | | (Continued) |
| | | | | | | | | | | | | | | | |
| | AQR Funds | | | | | | Annual Report | | | | | | December 2011 | | 131 |
| | | | | | | | | | |
| | | | |
| Schedule of Investments | | | December 31, 2011 | |
| | |
| AQR SMALL CAP MOMENTUM FUND | | |
| | | | | | | | |
| | | SHARES | | | VALUE
(Note 3) | |
| Consumer Staples - 5.2% (continued) | | | | | | | | |
| Darling International, Inc. † | | | 8,000 | | | $ | 106,320 | |
| Dean Foods Co. † | | | 8,400 | | | | 94,080 | |
| Dole Food Co., Inc. †(a) | | | 10,100 | | | | 87,365 | |
| Elizabeth Arden, Inc. † | | | 9,300 | | | | 344,472 | |
| Fresh Del Monte Produce, Inc. | | | 10,800 | | | | 270,108 | |
| Hain Celestial Group, Inc./The † | | | 10,900 | | | | 399,594 | |
| Heckmann Corp. † | | | 30,700 | | | | 204,155 | |
| Ingles Markets, Inc., Class A | | | 2,200 | | | | 33,132 | |
| J&J Snack Foods Corp. | | | 4,700 | | | | 250,416 | |
| Lancaster Colony Corp. (a) | | | 5,100 | | | | 353,634 | |
| Limoneira Co. | | | 1,600 | | | | 27,056 | |
| National Beverage Corp. † | | | 1,200 | | | | 19,284 | |
| Omega Protein Corp. † | | | 16,200 | | | | 115,506 | |
| Pizza Inn Holdings, Inc. † | | | 6,300 | | | | 34,650 | |
| Revlon, Inc., Class A † | | | 1,800 | | | | 26,766 | |
| Rite Aid Corp. †(a) | | | 193,800 | | | | 244,188 | |
| Sanderson Farms, Inc. | | | 6,000 | | | | 300,780 | |
| Smart Balance, Inc. † | | | 21,200 | | | | 113,632 | |
| Snyders-Lance, Inc. (a) | | | 7,300 | | | | 164,250 | |
| Spartan Stores, Inc. | | | 3,300 | | | | 61,050 | |
| Star Scientific, Inc. †(a) | | | 31,700 | | | | 69,106 | |
| Susser Holdings Corp. † | | | 9,000 | | | | 203,580 | |
| Universal Corp. | | | 1,800 | | | | 82,728 | |
| Vector Group Ltd. | | | 19,800 | | | | 351,648 | |
| WD-40 Co. | | | 2,000 | | | | 80,820 | |
| | | | | | | | |
| | | | | | | 5,198,682 | |
| | | | | | | | |
| Energy - 6.3% | | | | | | | | |
| Alon USA Energy, Inc. | | | 14,500 | | | | 126,295 | |
| Approach Resources, Inc. †(a) | | | 8,100 | | | | 238,221 | |
| Basic Energy Services, Inc. †(a) | | | 10,100 | | | | 198,970 | |
| Bristow Group, Inc. | | | 5,000 | | | | 236,950 | |
| Callon Petroleum Co. † | | | 7,900 | | | | 39,263 | |
| Cheniere Energy, Inc. † | | | 26,800 | | | | 232,892 | |
| Contango Oil & Gas Co. † | | | 3,900 | | | | 226,902 | |
| Crosstex Energy, Inc. | | | 12,400 | | | | 156,736 | |
| CVR Energy, Inc. † | | | 5,400 | | | | 101,142 | |
| Dawson Geophysical Co. † | | | 3,100 | | | | 122,543 | |
| Delek US Holdings, Inc. | | | 16,700 | | | | 190,547 | |
| Double Eagle Petroleum Co. † | | | 9,500 | | | | 65,360 | |
| Enbridge Energy Management LLC † | | | 4,653 | | | | 161,738 | |
| Energy Partners Ltd. † | | | 4,800 | | | | 70,080 | |
| Evolution Petroleum Corp. †(a) | | | 10,800 | | | | 86,940 | |
| FX Energy, Inc. † | | | 4,600 | | | | 22,080 | |
| GeoResources, Inc. † | | | 2,800 | | | | 82,068 | |
| Gulf Island Fabrication, Inc. | | | 3,100 | | | | 90,551 | |
| Gulfmark Offshore, Inc., Class A † | | | 7,200 | | | | 302,472 | |
| Gulfport Energy Corp. † | | | 12,600 | | | | 371,070 | |
| Helix Energy Solutions Group, Inc. † | | | 6,600 | | | | 104,280 | |
| Hercules Offshore, Inc. † | | | 35,700 | | | | 158,508 | |
| Hornbeck Offshore Services, Inc. †(a) | | | 7,400 | | | | 229,548 | |
| Houston American Energy Corp. †(a) | | | 4,600 | | | | 56,074 | |
| Hyperdynamics Corp. †(a) | | | 10,100 | | | | 24,745 | |
| Kodiak Oil & Gas Corp. † | | | 26,600 | | | | 252,700 | |
| Matrix Service Co. † | | | 3,700 | | | | 34,928 | |
| Miller Energy Resources, Inc. †(a) | | | 5,300 | | | | 14,787 | |
| Mitcham Industries, Inc. †(a) | | | 8,200 | | | | 179,088 | |
| Newpark Resources, Inc. † | | | 23,900 | | | | 227,050 | |
| | | | | | | | |
| | | SHARES | | | VALUE
(Note 3) | |
| Energy - 6.3% (continued) | | | | | | | | |
| Panhandle Oil and Gas, Inc., Class A | | | 900 | | | $ | 29,529 | |
| Parker Drilling Co. † | | | 29,100 | | | | 208,647 | |
| PHI, Inc. † | | | 1,400 | | | | 34,790 | |
| Pioneer Drilling Co. † | | | 20,500 | | | | 198,440 | |
| Rentech, Inc. † | | | 52,300 | | | | 68,513 | |
| REX American Resources Corp. † | | | 1,600 | | | | 35,376 | |
| Rex Energy Corp. † | | | 11,600 | | | | 171,216 | |
| Royale Energy, Inc. † | | | 18,600 | | | | 85,188 | |
| Stone Energy Corp. † | | | 11,600 | | | | 306,008 | |
| Tesco Corp. † | | | 8,200 | | | | 103,648 | |
| TGC Industries, Inc. † | | | 5,000 | | | | 35,700 | |
| Union Drilling, Inc. † | | | 13,300 | | | | 82,992 | |
| Uranerz Energy Corp. †(a) | | | 14,800 | | | | 26,936 | |
| Uranium Resources, Inc. †(a) | | | 12,500 | | | | 9,075 | |
| W&T Offshore, Inc. | | | 14,000 | | | | 296,940 | |
| Warren Resources, Inc. †(a) | | | 9,100 | | | | 29,666 | |
| Western Refining, Inc. † | | | 18,500 | | | | 245,865 | |
| | | | | | | | |
| | | | | | | 6,373,057 | |
| | | | | | | | |
| Financials - 17.0% | | | | | | | | |
| 1st Source Corp. | | | 2,000 | | | | 50,660 | |
| Acadia Realty Trust REIT | | | 8,500 | | | | 171,190 | |
| Advance America Cash Advance Centers, Inc. | | | 20,900 | | | | 187,055 | |
| American Safety Insurance Holdings Ltd. † | | | 1,900 | | | | 41,325 | |
| Ameris Bancorp † | | | 4,001 | | | | 41,130 | |
| AMERISAFE, Inc. † | | | 2,100 | | | | 48,825 | |
| Amtrust Financial Services, Inc. | | | 18,300 | | | | 434,625 | |
| Arlington Asset Investment Corp., Class A | | | 4,600 | | | | 98,118 | |
| Associated Estates Realty Corp. REIT | | | 13,900 | | | | 221,705 | |
| Banco Latinoamericano de Comercio Exterior SA, Class E (Panama) | | | 10,900 | | | | 174,945 | |
| Bancorp, Inc. † | | | 2,800 | | | | 20,244 | |
| Bank of Marin Bancorp | | | 500 | | | | 18,795 | |
| Bank of the Ozarks, Inc. | | | 13,100 | | | | 388,153 | |
| Banner Corp. | | | 6,300 | | | | 108,045 | |
| Beneficial Mutual Bancorp, Inc. † | | | 2,600 | | | | 21,736 | |
| Berkshire Hills Bancorp, Inc. | | | 3,500 | | | | 77,665 | |
| BofI Holding, Inc. † | | | 1,600 | | | | 26,000 | |
| Boston Private Financial Holdings, Inc. | | | 19,800 | | | | 157,212 | |
| Bryn Mawr Bank Corp. | | | 1,000 | | | | 19,490 | |
| Cardinal Financial Corp. | | | 6,300 | | | | 67,662 | |
| Cash America International, Inc. | | | 7,200 | | | | 335,736 | |
| Citizens & Northern Corp. | | | 3,000 | | | | 55,410 | |
| Citizens Republic Bancorp, Inc. † | | | 8,000 | | | | 91,200 | |
| Citizens, Inc. † | | | 3,200 | | | | 31,008 | |
| CNB Financial Corp. | | | 900 | | | | 14,202 | |
| CNO Financial Group, Inc. † | | | 20,800 | | | | 131,248 | |
| Cohen & Steers, Inc. (a) | | | 2,300 | | | | 66,470 | |
| Columbia Banking System, Inc. | | | 4,700 | | | | 90,569 | |
| Community Bank System, Inc. | | | 9,700 | | | | 269,660 | |
| Coresite Realty Corp. REIT | | | 4,300 | | | | 76,626 | |
| Crawford & Co., Class B (a) | | | 4,500 | | | | 27,720 | |
| Credit Acceptance Corp. † | | | 400 | | | | 32,912 | |
| CubeSmart REIT | | | 22,700 | | | | 241,528 | |
| CVB Financial Corp. | | | 33,400 | | | | 335,002 | |
| DFC Global Corp. † | | | 7,300 | | | | 131,838 | |
| Diamond Hill Investment Group, Inc. (a) | | | 500 | | | | 36,990 | |
| | | | |
| | The accompanying notes are an integral part of these financial statements. | | (Continued) |
| | | | | | | | | | | | | | | | |
| 132 | | AQR Funds | | | | | | Annual Report | | | | | | December 2011 | | |
| | | | | | | | | | |
| | | | |
| Schedule of Investments | | | December 31, 2011 | |
| | |
| AQR SMALL CAP MOMENTUM FUND | | |
| | | | | | | | |
| | | SHARES | | | VALUE
(Note 3) | |
| Financials - 17.0% (continued) | | | | | | | | |
| Eagle Bancorp, Inc. † | | | 4,400 | | | $ | 63,976 | |
| EastGroup Properties, Inc. REIT | | | 6,200 | | | | 269,576 | |
| Education Realty Trust, Inc. REIT | | | 22,900 | | | | 234,267 | |
| eHealth, Inc. † | | | 4,600 | | | | 67,620 | |
| Enstar Group Ltd. (Bermuda) † | | | 2,500 | | | | 245,500 | |
| Enterprise Financial Services Corp. | | | 2,600 | | | | 38,480 | |
| Epoch Holding Corp. | | | 5,200 | | | | 115,596 | |
| ESB Financial Corp. | | | 700 | | | | 9,849 | |
| Ezcorp, Inc., Class A † | | | 12,400 | | | | 326,988 | |
| FBL Financial Group, Inc., Class A | | | 5,500 | | | | 187,110 | |
| Federal Agricultural Mortgage Corp., Class C | | | 7,100 | | | | 127,942 | |
| Financial Engines, Inc. †(a) | | | 9,200 | | | | 205,436 | |
| First Busey Corp. | | | 6,900 | | | | 34,500 | |
| First Cash Financial Services, Inc. † | | | 7,600 | | | | 266,684 | |
| First Defiance Financial Corp. | | | 800 | | | | 11,672 | |
| First Financial Corp. | | | 1,000 | | | | 33,280 | |
| First Industrial Realty Trust, Inc. REIT † | | | 22,200 | | | | 227,106 | |
| First Merchants Corp. | | | 5,800 | | | | 49,126 | |
| FNB Corp. | | | 29,200 | | | | 330,252 | |
| Fox Chase Bancorp, Inc. | | | 1,900 | | | | 23,997 | |
| GAMCO Investors, Inc., Class A | | | 1,600 | | | | 69,584 | |
| German American Bancorp, Inc. | | | 800 | | | | 14,552 | |
| Gladstone Capital Corp. | | | 7,300 | | | | 55,699 | |
| Gladstone Commercial Corp. REIT | | | 4,400 | | | | 77,220 | |
| Gladstone Investment Corp. | | | 9,900 | | | | 71,973 | |
| Glimcher Realty Trust REIT | | | 16,400 | | | | 150,880 | |
| Global Indemnity PLC (Ireland) †(a) | | | 1,500 | | | | 29,745 | |
| Gramercy Capital Corp. REIT † | | | 20,400 | | | | 51,000 | |
| Gyrodyne Co. of America, Inc. REIT † | | | 100 | | | | 10,163 | |
| Harleysville Group, Inc. | | | 2,200 | | | | 124,454 | |
| HFF, Inc., Class A † | | | 9,100 | | | | 94,003 | |
| Home Bancshares, Inc. | | | 8,300 | | | | 215,053 | |
| Horizon Technology Finance Corp. | | | 900 | | | | 14,652 | |
| Hudson Valley Holding Corp. | | | 1,300 | | | | 27,586 | |
| Infinity Property & Casualty Corp. | | | 3,300 | | | | 187,242 | |
| INTL FCStone, Inc. † | | | 3,000 | | | | 70,710 | |
| Investors Bancorp, Inc. † | | | 17,800 | | | | 239,944 | |
| Kansas City Life Insurance Co. | | | 500 | | | | 16,410 | |
| Kemper Corp. | | | 5,500 | | | | 160,655 | |
| Ladenburg Thalmann Financial Services, Inc. †(a) | | | 39,400 | | | | 97,712 | |
| Lakeland Financial Corp. | | | 4,500 | | | | 116,415 | |
| LTC Properties, Inc. REIT | | | 5,800 | | | | 178,988 | |
| Maiden Holdings Ltd. (Bermuda) | | | 15,800 | | | | 138,408 | |
| Main Street Capital Corp. | | | 8,500 | | | | 180,540 | |
| MainSource Financial Group, Inc. | | | 3,300 | | | | 29,139 | |
| MarketAxess Holdings, Inc. | | | 10,282 | | | | 309,591 | |
| MB Financial, Inc. | | | 10,600 | | | | 181,260 | |
| Meadowbrook Insurance Group, Inc. | | | 7,800 | | | | 83,304 | |
| Medallion Financial Corp. | | | 2,900 | | | | 33,002 | |
| Mission West Properties, Inc. REIT | | | 3,300 | | | | 29,766 | |
| Monmouth Real Estate Investment Corp., Class A REIT | | | 5,700 | | | | 52,155 | |
| MVC Capital, Inc. | | | 4,300 | | | | 49,837 | |
| National Financial Partners Corp. † | | | 5,800 | | | | 78,416 | |
| National Penn Bancshares, Inc. | | | 37,800 | | | | 319,032 | |
| | | | | | | | |
| | | SHARES | | | VALUE
(Note 3) | |
| Financials - 17.0% (continued) | | | | | | | | |
| NewStar Financial, Inc. † | | | 11,100 | | | $ | 112,887 | |
| Northfield Bancorp, Inc. | | | 1,300 | | | | 18,408 | |
| Northwest Bancshares, Inc. | | | 32,000 | | | | 398,080 | |
| OceanFirst Financial Corp. | | | 1,500 | | | | 19,605 | |
| Ocwen Financial Corp. † | | | 14,000 | | | | 202,720 | |
| Old National Bancorp | | | 14,300 | | | | 166,595 | |
| OmniAmerican Bancorp, Inc. † | | | 1,000 | | | | 15,700 | |
| One Liberty Properties, Inc. REIT | | | 1,300 | | | | 21,450 | |
| OneBeacon Insurance Group Ltd., Class A | | | 9,000 | | | | 138,510 | |
| Oritani Financial Corp. | | | 27,300 | | | | 348,621 | |
| Pacific Capital Bancorp NA † | | | 600 | | | | 16,944 | |
| Penns Woods Bancorp, Inc. | | | 300 | | | | 11,634 | |
| Pinnacle Financial Partners, Inc. † | | | 11,500 | | | | 185,725 | |
| Presidential Life Corp. | | | 1,800 | | | | 17,982 | |
| Primerica, Inc. | | | 8,300 | | | | 192,892 | |
| Retail Opportunity Investments Corp. REIT | | | 18,200 | | | | 215,488 | |
| RLI Corp. (a) | | | 6,200 | | | | 451,732 | |
| Rockville Financial, Inc. | | | 4,100 | | | | 42,476 | |
| Safeguard Scientifics, Inc. † | | | 6,700 | | | | 105,793 | |
| Safety Insurance Group, Inc. | | | 1,900 | | | | 76,912 | |
| Seacoast Banking Corp of Florida † | | | 8,500 | | | | 12,920 | |
| Solar Capital Ltd. | | | 6,500 | | | | 143,585 | |
| Southside Bancshares, Inc. (a) | | | 3,600 | | | | 77,976 | |
| Sovran Self Storage, Inc. REIT | | | 5,100 | | | | 217,617 | |
| Sun Communities, Inc. REIT | | | 8,109 | | | | 296,222 | |
| SWS Group, Inc. | | | 6,300 | | | | 43,281 | |
| Tejon Ranch Co. † | | | 2,500 | | | | 61,200 | |
| Territorial Bancorp, Inc. | | | 2,500 | | | | 49,375 | |
| Texas Capital Bancshares, Inc. † | | | 13,200 | | | | 404,052 | |
| TICC Capital Corp. | | | 6,600 | | | | 57,090 | |
| Tompkins Financial Corp. | | | 800 | | | | 30,808 | |
| Triangle Capital Corp. | | | 7,200 | | | | 137,664 | |
| Umpqua Holdings Corp. | | | 17,500 | | | | 216,825 | |
| United Financial Bancorp, Inc. | | | 5,100 | | | | 82,059 | |
| Universal Health Realty Income Trust REIT | | | 1,400 | | | | 54,600 | |
| ViewPoint Financial Group | | | 12,300 | | | | 160,023 | |
| Virginia Commerce Bancorp, Inc. † | | | 11,900 | | | | 91,987 | |
| Virtus Investment Partners, Inc. † | | | 2,800 | | | | 212,828 | |
| Walter Investment Management Corp. | | | 8,820 | | | | 180,898 | |
| Washington Trust Bancorp, Inc. | | | 2,100 | | | | 50,106 | |
| Webster Financial Corp. | | | 5,600 | | | | 114,184 | |
| WesBanco, Inc. | | | 9,200 | | | | 179,124 | |
| West Bancorporation, Inc. | | | 1,100 | | | | 10,538 | |
| West Coast Bancorp † | | | 10,120 | | | | 157,872 | |
| WisdomTree Investments, Inc. † | | | 18,800 | | | | 113,740 | |
| World Acceptance Corp. † | | | 4,500 | | | | 330,750 | |
| WSFS Financial Corp. | | | 2,000 | | | | 71,920 | |
| | | | | | | | |
| | | | | | | 17,090,144 | |
| | | | | | | | |
| Health Care - 16.3% | | | | | | | | |
| Aastrom Biosciences, Inc. † | | | 16,500 | | | | 30,030 | |
| ABIOMED, Inc. †(a) | | | 11,600 | | | | 214,252 | |
| Achillion Pharmaceuticals, Inc. † | | | 22,600 | | | | 172,212 | |
| Acura Pharmaceuticals, Inc. †(a) | | | 2,400 | | | | 8,376 | |
| Aegerion Pharmaceuticals, Inc. † | | | 2,500 | | | | 41,850 | |
| Affymetrix, Inc. † | | | 17,700 | | | | 72,393 | |
| Air Methods Corp. †(a) | | | 3,400 | | | | 287,130 | |
| Akorn, Inc. †(a) | | | 25,800 | | | | 286,896 | |
| | | | |
| | The accompanying notes are an integral part of these financial statements. | | (Continued) |
| | | | | | | | | | | | | | | | |
| | AQR Funds | | | | | | Annual Report | | | | | | December 2011 | | 133 |
| | | | | | | | | | |
| | | | |
| Schedule of Investments | | | December 31, 2011 | |
| | |
| AQR SMALL CAP MOMENTUM FUND | | |
| | | | | | | | |
| | | SHARES | | | VALUE
(Note 3) | |
| Health Care - 16.3% (continued) | | | | | | | | |
| Alexza Pharmaceuticals, Inc. † | | | 62,200 | | | $ | 51,626 | |
| Align Technology, Inc. † | | | 4,600 | | | | 109,135 | |
| Alkermes PLC (Ireland) † | | | 13,700 | | | | 237,832 | |
| Amsurg Corp. † | | | 8,000 | | | | 208,320 | |
| Analogic Corp. | | | 3,500 | | | | 200,620 | |
| AngioDynamics, Inc. † | | | 3,100 | | | | 45,911 | |
| Antares Pharma, Inc. †(a) | | | 83,900 | | | | 184,580 | |
| Anthera Pharmaceuticals, Inc. † | | | 5,900 | | | | 36,226 | |
| Apricus Biosciences, Inc. † | | | 7,900 | | | | 40,764 | |
| Ariad Pharmaceuticals, Inc. † | | | 22,200 | | | | 271,950 | |
| Arqule, Inc. † | | | 6,200 | | | | 34,968 | |
| ArthroCare Corp. † | | | 2,900 | | | | 91,872 | |
| AtriCure, Inc. † | | | 6,300 | | | | 69,930 | |
| Atrion Corp. | | | 200 | | | | 48,046 | |
| AVEO Pharmaceuticals, Inc. † | | | 7,800 | | | | 134,160 | |
| BioLase Technology, Inc. †(a) | | | 20,783 | | | | 53,412 | |
| BioSante Pharmaceuticals, Inc. †(a) | | | 222,400 | | | | 111,667 | |
| BioScrip, Inc. † | | | 15,900 | | | | 86,814 | |
| BSD Medical Corp. † | | | 8,200 | | | | 19,434 | |
| Cambrex Corp. †(a) | | | 8,300 | | | | 59,594 | |
| Cantel Medical Corp. (a) | | | 3,100 | | | | 86,583 | |
| Capital Senior Living Corp. † | | | 12,300 | | | | 97,662 | |
| Cardiovascular Systems, Inc. †(a) | | | 7,900 | | | | 77,815 | |
| Celsion Corp. †(a) | | | 24,300 | | | | 41,796 | |
| Centene Corp. † | | | 7,000 | | | | 277,130 | |
| Cerus Corp. †(a) | | | 13,000 | | | | 36,400 | |
| Columbia Laboratories, Inc. † | | | 38,100 | | | | 95,250 | |
| Computer Programs & Systems, Inc. | | | 2,200 | | | | 112,442 | |
| CONMED Corp. † | | | 5,500 | | | | 141,185 | |
| Corcept Therapeutics, Inc. † | | | 9,500 | | | | 32,490 | |
| Corvel Corp. † | | | 1,600 | | | | 82,736 | |
| Curis, Inc. † | | | 40,700 | | | | 190,476 | |
| Cyberonics, Inc. † | | | 2,400 | | | | 80,400 | |
| Delcath Systems, Inc. † | | | 3,900 | | | | 11,895 | |
| Depomed, Inc. †(a) | | | 10,900 | | | | 56,462 | |
| Dusa Pharmaceuticals, Inc. † | | | 3,600 | | | | 15,768 | |
| Dynavax Technologies Corp. † | | | 28,700 | | | | 95,284 | |
| Echo Therapeutics, Inc. † | | | 6,500 | | | | 14,690 | |
| Endologix, Inc. † | | | 18,700 | | | | 214,676 | |
| Ensign Group, Inc./The | | | 3,500 | | | | 85,750 | |
| Exact Sciences Corp. † | | | 14,000 | | | | 113,680 | |
| Exelixis, Inc. † | | | 16,400 | | | | 77,654 | |
| Five Star Quality Care, Inc. † | | | 3,000 | | | | 9,000 | |
| Furiex Pharmaceuticals, Inc. † | | | 3,000 | | | | 50,130 | |
| Genomic Health, Inc. † | | | 7,700 | | | | 195,503 | |
| GTx, Inc. † | | | 12,200 | | | | 40,992 | |
| Halozyme Therapeutics, Inc. † | | | 16,300 | | | | 155,013 | |
| Hanger Orthopedic Group, Inc. † | | | 3,100 | | | | 57,939 | |
| Hansen Medical, Inc. † | | | 19,600 | | | | 50,568 | |
| HealthStream, Inc. † | | | 12,100 | | | | 223,245 | |
| Hi-Tech Pharmacal Co., Inc. † | | | 4,700 | | | | 182,783 | |
| ICU Medical, Inc. † | | | 1,600 | | | | 72,000 | |
| Idenix Pharmaceuticals, Inc. † | | | 27,400 | | | | 203,993 | |
| Immunogen, Inc. † | | | 19,300 | | | | 223,494 | |
| Immunomedics, Inc. † | | | 19,800 | | | | 65,934 | |
| Infinity Pharmaceuticals, Inc. † | | | 3,200 | | | | 28,288 | |
| Inhibitex, Inc. † | | | 36,900 | | | | 403,686 | |
| | | | | | | | |
| | | SHARES | | | VALUE
(Note 3) | |
| Health Care - 16.3% (continued) | | | | | | | | |
| Insulet Corp. †(a) | | | 9,300 | | | $ | 175,119 | |
| InterMune, Inc. † | | | 14,700 | | | | 185,220 | |
| IPC The Hospitalist Co., Inc. † | | | 4,800 | | | | 219,456 | |
| Ironwood Pharmaceuticals, Inc. † | | | 15,100 | | | | 180,747 | |
| Jazz Pharmaceuticals, Inc. † | | | 3,800 | | | | 146,794 | |
| Lexicon Pharmaceuticals, Inc. †(a) | | | 13,400 | | | | 17,286 | |
| Ligand Pharmaceuticals, Inc., Class B †(a) | | | 8,400 | | | | 99,708 | |
| Luminex Corp. † | | | 9,900 | | | | 210,177 | |
| Magellan Health Services, Inc. † | | | 3,400 | | | | 168,198 | |
| MAKO Surgical Corp. †(a) | | | 11,600 | | | | 292,436 | |
| Maxygen, Inc. † | | | 6,300 | | | | 35,469 | |
| MedCath Corp. † | | | 10,300 | | | | 75,087 | |
| Medicines Co./The † | | | 12,700 | | | | 236,728 | |
| Medivation, Inc. † | | | 9,200 | | | | 424,212 | |
| Medtox Scientific, Inc. † | | | 800 | | | | 11,240 | |
| MELA Sciences, Inc. † | | | 19,800 | | | | 73,062 | |
| Merge Healthcare, Inc. †(a) | | | 30,200 | | | | 146,470 | |
| Merit Medical Systems, Inc. † | | | 7,600 | | | | 101,688 | |
| Metropolitan Health Networks, Inc. † | | | 19,700 | | | | 147,159 | |
| Molina Healthcare, Inc. † | | | 5,300 | | | | 118,349 | |
| MWI Veterinary Supply, Inc. † | | | 3,400 | | | | 225,896 | |
| Myriad Genetics, Inc. † | | | 8,400 | | | | 175,896 | |
| Neogen Corp. †(a) | | | 2,300 | | | | 70,472 | |
| Neoprobe Corp. † | | | 46,100 | | | | 120,782 | |
| Neurocrine Biosciences, Inc. †(a) | | | 7,100 | | | | 60,350 | |
| NxStage Medical, Inc. † | | | 4,100 | | | | 72,898 | |
| Omnicell, Inc. † | | | 6,600 | | | | 109,032 | |
| Oncothyreon, Inc. † | | | 19,600 | | | | 148,568 | |
| OPKO Health, Inc. † | | | 69,700 | | | | 341,530 | |
| Optimer Pharmaceuticals, Inc. † | | | 10,800 | | | | 132,192 | |
| OraSure Technologies, Inc. †(a) | | | 19,300 | | | | 175,823 | |
| Pain Therapeutics, Inc. †(a) | | | 10,200 | | | | 38,760 | |
| PAREXEL International Corp. † | | | 3,300 | | | | 68,442 | |
| PDL BioPharma, Inc. | | | 34,900 | | | | 216,380 | |
| Pharmacyclics, Inc. † | | | 18,900 | | | | 280,098 | |
| Progenics Pharmaceuticals, Inc. † | | | 14,200 | | | | 121,268 | |
| PSS World Medical, Inc. † | | | 3,300 | | | | 79,827 | |
| Quidel Corp. † | | | 9,600 | | | | 145,248 | |
| Rigel Pharmaceuticals, Inc. † | | | 6,000 | | | | 47,340 | |
| Rockwell Medical Technologies, Inc. † | | | 5,100 | | | | 43,197 | |
| RTI Biologics, Inc. † | | | 21,000 | | | | 93,240 | |
| Sangamo Biosciences, Inc. † | | | 14,700 | | | | 41,748 | |
| Santarus, Inc. † | | | 7,200 | | | | 23,832 | |
| SciClone Pharmaceuticals, Inc. †(a) | | | 20,600 | | | | 88,374 | |
| Select Medical Holdings Corp. † | | | 11,200 | | | | 94,976 | |
Skilled Healthcare Group, Inc.,
Class A †(a) | | | 3,700 | | | | 20,202 | |
| Solta Medical, Inc. † | | | 10,900 | | | | 34,226 | |
| Spectranetics Corp. † | | | 4,600 | | | | 33,212 | |
| Spectrum Pharmaceuticals, Inc. † | | | 16,500 | | | | 241,395 | |
| Staar Surgical Co. †(a) | | | 14,800 | | | | 155,252 | |
| Sunrise Senior Living, Inc. † | | | 16,100 | | | | 104,328 | |
| SurModics, Inc. † | | | 2,000 | | | | 29,320 | |
| Synergetics USA, Inc. † | | | 7,300 | | | | 53,874 | |
| Synovis Life Technologies, Inc. † | | | 1,600 | | | | 44,528 | |
| Team Health Holdings, Inc. † | | | 12,300 | | | | 271,461 | |
| Transcend Services, Inc. † | | | 6,900 | | | | 163,737 | |
| | | | |
| | The accompanying notes are an integral part of these financial statements. | | (Continued) |
| | | | | | | | | | | | | | | | |
| 134 | | AQR Funds | | | | | | Annual Report | | | | | | December 2011 | | |
| | | | | | | | | | |
| | | | |
| Schedule of Investments | | | December 31, 2011 | |
| | |
| AQR SMALL CAP MOMENTUM FUND | | |
| | | | | | | | |
| | | SHARES | | | VALUE
(Note 3) | |
| Health Care - 16.3% (continued) | | | | | | | | |
| Transcept Pharmaceuticals, Inc. † | | | 6,100 | | | $ | 47,763 | |
| Trius Therapeutics, Inc. † | | | 3,500 | | | | 25,025 | |
| Universal American Corp. | | | 19,100 | | | | 242,761 | |
| Uroplasty, Inc. † | | | 11,800 | | | | 50,150 | |
| US Physical Therapy, Inc. | | | 3,000 | | | | 59,040 | |
| Vascular Solutions, Inc. † | | | 2,200 | | | | 24,486 | |
| Vical, Inc. † | | | 32,800 | | | | 144,648 | |
| ViroPharma, Inc. † | | | 9,300 | | | | 254,727 | |
| Vivus, Inc. † | | | 22,000 | | | | 214,500 | |
| Volcano Corp. † | | | 4,400 | | | | 104,676 | |
| West Pharmaceutical Services, Inc. | | | 7,000 | | | | 265,650 | |
| Wright Medical Group, Inc. † | | | 5,900 | | | | 97,350 | |
| Young Innovations, Inc. | | | 700 | | | | 20,741 | |
| Zalicus, Inc. †(a) | | | 29,600 | | | | 35,816 | |
| ZIOPHARM Oncology, Inc. † | | | 24,900 | | | | 109,809 | |
| Zoll Medical Corp. †(a) | | | 3,700 | | | | 233,766 | |
| | | | | | | | |
| | | | | | | 16,374,009 | |
| | | | | | | | |
| Industrials - 13.6% | | | | | | | | |
| AAON, Inc. (a) | | | 4,700 | | | | 96,303 | |
| AAR Corp. (a) | | | 300 | | | | 5,751 | |
| Acacia Research - Acacia Technologies † | | | 3,026 | | | | 110,479 | |
| ACCO Brands Corp. †(a) | | | 6,200 | | | | 59,830 | |
| Aceto Corp. (a) | | | 7,400 | | | | 51,060 | |
| Active Power, Inc. †(a) | | | 14,200 | | | | 9,372 | |
| Advisory Board Co./The † | | | 4,100 | | | | 304,261 | |
| Aerovironment, Inc. † | | | 5,400 | | | | 169,938 | |
| Air Transport Services Group, Inc. † | | | 3,200 | | | | 15,104 | |
| Aircastle Ltd. | | | 15,800 | | | | 200,976 | |
| Alamo Group, Inc. | | | 2,500 | | | | 67,325 | |
| Albany International Corp., Class A | | | 3,800 | | | | 87,856 | |
| Allegiant Travel Co. † | | | 2,700 | | | | 144,018 | |
| American Railcar Industries, Inc. † | | | 6,000 | | | | 143,580 | |
| Applied Industrial Technologies, Inc. | | | 3,100 | | | | 109,027 | |
| Argan, Inc. | | | 1,100 | | | | 16,731 | |
| Astec Industries, Inc. † | | | 4,900 | | | | 157,829 | |
| Astronics Corp. †(a) | | | 5,400 | | | | 193,374 | |
| Astronics Corp., Class B † | | | 210 | | | | 7,613 | |
| AT Cross Co., Class A † | | | 900 | | | | 10,152 | |
| AZZ, Inc. | | | 2,600 | | | | 118,144 | |
| Barnes Group, Inc. | | | 11,200 | | | | 270,032 | |
| Barrett Business Services, Inc. | | | 2,800 | | | | 55,888 | |
| Beacon Roofing Supply, Inc. † | | | 7,000 | | | | 141,610 | |
| Belden, Inc. | | | 2,800 | | | | 93,184 | |
| Blount International, Inc. †(a) | | | 4,400 | | | | 63,888 | |
| Brink’s Co./The | | | 4,700 | | | | 126,336 | |
| Capstone Turbine Corp. †(a) | | | 93,200 | | | | 108,112 | |
| Cascade Corp. | | | 2,500 | | | | 117,925 | |
| Casella Waste Systems, Inc., Class A † | | | 10,100 | | | | 64,640 | |
| CBIZ, Inc. † | | | 10,400 | | | | 63,544 | |
| Ceradyne, Inc. † | | | 4,200 | | | | 112,476 | |
| Chart Industries, Inc. † | | | 4,600 | | | | 248,722 | |
| Coleman Cable, Inc. † | | | 6,900 | | | | 60,030 | |
| Colfax Corp. †(a) | | | 9,200 | | | | 262,016 | |
| Consolidated Graphics, Inc. † | | | 1,500 | | | | 72,420 | |
| CoStar Group, Inc. †(a) | | | 3,300 | | | | 220,209 | |
| Covenant Transportation Group, Inc., Class A † | | | 2,600 | | | | 7,722 | |
| | | | | | | | |
| | | SHARES | | | VALUE
(Note 3) | |
| Industrials - 13.6% (continued) | | | | | | | | |
| CPI Aerostructures, Inc. † | | | 1,800 | | | $ | 21,150 | |
| CRA International, Inc. † | | | 2,200 | | | | 43,648 | |
| Deluxe Corp. | | | 8,000 | | | | 182,080 | |
| Douglas Dynamics, Inc. | | | 6,500 | | | | 95,030 | |
| DXP Enterprises, Inc. † | | | 3,700 | | | | 119,140 | |
| Dycom Industries, Inc. † | | | 9,100 | | | | 190,372 | |
| Dynamic Materials Corp. | | | 5,600 | | | | 110,768 | |
| Encore Capital Group, Inc. † | | | 5,074 | | | | 107,873 | |
| Encore Wire Corp. | | | 2,900 | | | | 75,110 | |
| EnPro Industries, Inc. †(a) | | | 2,300 | | | | 75,854 | |
| Exponent, Inc. † | | | 4,900 | | | | 225,253 | |
| Flow International Corp. † | | | 11,400 | | | | 39,900 | |
| Forward Air Corp. | | | 4,300 | | | | 137,815 | |
| Franklin Electric Co., Inc. | | | 5,300 | | | | 230,868 | |
| FTI Consulting, Inc. † | | | 4,700 | | | | 199,374 | |
| Furmanite Corp. † | | | 7,300 | | | | 46,063 | |
| G&K Services, Inc., Class A | | | 4,000 | | | | 116,440 | |
| GATX Corp. | | | 6,500 | | | | 283,790 | |
| Generac Holdings, Inc. † | | | 9,200 | | | | 257,876 | |
| Global Power Equipment Group, Inc. † | | | 5,200 | | | | 123,500 | |
| Gorman-Rupp Co./The | | | 3,500 | | | | 95,025 | |
| GP Strategies Corp. † | | | 3,300 | | | | 44,484 | |
| Graham Corp. | | | 1,900 | | | | 42,636 | |
| Great Lakes Dredge & Dock Corp. | | | 2,400 | | | | 13,344 | |
| H&E Equipment Services, Inc. † | | | 4,900 | | | | 65,758 | |
| Hardinge, Inc. | | | 4,300 | | | | 34,615 | |
| Healthcare Services Group, Inc. | | | 14,800 | | | | 261,812 | |
| Heritage-Crystal Clean, Inc. † | | | 500 | | | | 8,280 | |
| Houston Wire & Cable Co. | | | 4,500 | | | | 62,190 | |
| Hudson Highland Group, Inc. † | | | 5,400 | | | | 25,866 | |
| Hurco Cos., Inc. † | | | 4,400 | | | | 92,400 | |
| Huron Consulting Group, Inc. † | | | 5,900 | | | | 228,566 | |
| Innerworkings, Inc. † | | | 12,900 | | | | 120,099 | |
| Insteel Industries, Inc. | | | 3,700 | | | | 40,663 | |
| Intersections, Inc. | | | 2,300 | | | | 25,507 | |
| Kadant, Inc. †(a) | | | 3,300 | | | | 74,613 | |
| Kaman Corp. | | | 7,100 | | | | 193,972 | |
| LMI Aerospace, Inc. † | | | 1,000 | | | | 17,550 | |
| Lydall, Inc. † | | | 8,800 | | | | 83,512 | |
| Macquarie Infrastructure Co. LLC | | | 11,600 | | | | 324,220 | |
| MasTec, Inc. † | | | 3,800 | | | | 66,006 | |
| McGrath RentCorp. | | | 2,100 | | | | 60,879 | |
| Metalico, Inc. †(a) | | | 10,700 | | | | 35,203 | |
| Middleby Corp. † | | | 2,400 | | | | 225,696 | |
| Miller Industries, Inc. | | | 7,800 | | | | 122,694 | |
| Mine Safety Appliances Co. | | | 6,100 | | | | 202,032 | |
| Mistras Group, Inc. † | | | 8,900 | | | | 226,861 | |
| Mobile Mini, Inc. †(a) | | | 4,600 | | | | 80,270 | |
| Mueller Industries, Inc. | | | 2,600 | | | | 99,892 | |
| Multi-Color Corp. | | | 6,200 | | | | 159,526 | |
| MYR Group, Inc. † | | | 5,800 | | | | 111,012 | |
| Navigant Consulting, Inc. † | | | 7,300 | | | | 83,293 | |
| Northwest Pipe Co. † | | | 2,800 | | | | 64,008 | |
| Odyssey Marine Exploration, Inc. †(a) | | | 41,200 | | | | 112,888 | |
| On Assignment, Inc. † | | | 14,100 | | | | 157,638 | |
| Park-Ohio Holdings Corp. † | | | 2,600 | | | | 46,384 | |
| PMFG, Inc. † | | | 3,900 | | | | 76,089 | |
| | | | |
| | The accompanying notes are an integral part of these financial statements. | | (Continued) |
| | | | | | | | | | | | | | | | |
| | AQR Funds | | | | | | Annual Report | | | | | | December 2011 | | 135 |
| | | | | | | | | | |
| | | | |
| Schedule of Investments | | | December 31, 2011 | |
| | |
| AQR SMALL CAP MOMENTUM FUND | | |
| | | | | | | | |
| | | SHARES | | | VALUE
(Note 3) | |
| Industrials - 13.6% (continued) | | | | | | | | |
| Portfolio Recovery Associates, Inc. † | | | 1,200 | | | $ | 81,024 | |
| Powell Industries, Inc. † | | | 1,200 | | | | 37,536 | |
| Primoris Services Corp. | | | 13,000 | | | | 194,090 | |
| Quality Distribution, Inc. † | | | 12,000 | | | | 135,000 | |
| Raven Industries, Inc. | | | 4,800 | | | | 297,120 | |
| RBC Bearings, Inc. † | | | 2,800 | | | | 116,760 | |
| Roadrunner Transportation Systems, Inc. † | | | 3,000 | | | | 42,390 | |
| RSC Holdings, Inc. † | | | 4,800 | | | | 88,800 | |
| Rush Enterprises, Inc., Class A † | | | 8,400 | | | | 175,728 | |
| SeaCube Container Leasing Ltd. | | | 2,600 | | | | 38,506 | |
| Seaspan Corp. (Hong Kong) | | | 3,700 | | | | 50,616 | |
| Simpson Manufacturing Co., Inc. | | | 4,300 | | | | 144,738 | |
| Standex International Corp. | | | 3,500 | | | | 119,595 | |
| Sun Hydraulics Corp. | | | 6,700 | | | | 156,981 | |
| SYKES Enterprises, Inc. † | | | 1,000 | | | | 15,660 | |
| Taser International, Inc. † | | | 20,400 | | | | 104,448 | |
| Team, Inc. † | | | 6,600 | | | | 196,350 | |
| Tennant Co. | | | 5,000 | | | | 194,350 | |
| Titan International, Inc. | | | 6,400 | | | | 124,544 | |
| Titan Machinery, Inc. † | | | 3,900 | | | | 84,747 | |
| TRC Cos., Inc. † | | | 1,100 | | | | 6,611 | |
| TriMas Corp. †(a) | | | 400 | | | | 7,180 | |
| Twin Disc, Inc. | | | 4,800 | | | | 174,336 | |
| Unifirst Corp. | | | 2,100 | | | | 119,154 | |
| United Rentals, Inc. † | | | 3,300 | | | | 97,515 | |
| United Stationers, Inc. | | | 3,500 | | | | 113,960 | |
| US Ecology, Inc. | | | 3,900 | | | | 73,242 | |
| Valence Technology, Inc. †(a) | | | 9,700 | | | | 9,506 | |
| Xerium Technologies, Inc. † | | | 2,500 | | | | 16,350 | |
| XPO Logistics, Inc. † | | | 4,300 | | | | 53,105 | |
| | | | | | | | |
| | | | | | | 13,704,806 | |
| | | | | | | | |
| Information Technology - 18.4% | | | | | | | | |
| 3D Systems Corp. † | | | 8,500 | | | | 122,400 | |
| Accelrys, Inc. † | | | 7,200 | | | | 48,384 | |
| ACI Worldwide, Inc. † | | | 7,900 | | | | 226,256 | |
| Actuate Corp. † | | | 14,700 | | | | 86,142 | |
| Agilysys, Inc. † | | | 10,000 | | | | 79,500 | |
| Alliance Fiber Optic Products, Inc. †(a) | | | 3,000 | | | | 22,980 | |
| American Software, Inc., Class A | | | 5,400 | | | | 51,030 | |
| Anaren, Inc. † | | | 4,700 | | | | 78,114 | |
| Aspen Technology, Inc. † | | | 21,200 | | | | 367,820 | |
| ATMI, Inc. † | | | 5,200 | | | | 104,156 | |
| AuthenTec, Inc. † | | | 10,100 | | | | 32,421 | |
| Axcelis Technologies, Inc. †(a) | | | 25,300 | | | | 33,649 | |
| Blackbaud, Inc. | | | 5,500 | | | | 152,350 | |
| Bottomline Technologies, Inc. † | | | 9,800 | | | | 227,066 | |
| Brightpoint, Inc. † | | | 18,300 | | | | 196,908 | |
| BroadSoft, Inc. †(a) | | | 7,300 | | | | 220,460 | |
| Brooks Automation, Inc. | | | 16,100 | | | | 165,347 | |
| BSQUARE Corp. † | | | 6,800 | | | | 23,256 | |
| CACI International, Inc., Class A †(a) | | | 3,300 | | | | 184,536 | |
| CalAmp Corp. † | | | 3,200 | | | | 13,600 | |
| Callidus Software, Inc. † | | | 16,900 | | | | 108,498 | |
| Cardtronics, Inc. † | | | 11,300 | | | | 305,778 | |
| CEVA, Inc. †(a) | | | 6,700 | | | | 202,742 | |
| CIBER, Inc. † | | | 10,100 | | | | 38,986 | |
| Cirrus Logic, Inc. † | | | 7,800 | | | | 123,630 | |
| | | | | | | | |
| | | SHARES | | | VALUE
(Note 3) | |
| Information Technology - 18.4% (continued) | | | | | |
| Cognex Corp. (a) | | | 9,500 | | | $ | 340,005 | |
| Coherent, Inc. † | | | 4,900 | | | | 256,123 | |
| CommVault Systems, Inc. † | | | 7,200 | | | | 307,584 | |
| Computer Task Group, Inc. † | | | 2,800 | | | | 39,424 | |
| Comtech Telecommunications Corp. | | | 4,000 | | | | 114,480 | |
| Convio, Inc. † | | | 1,800 | | | | 19,908 | |
| CVD Equipment Corp. † | | | 11,300 | | | | 135,939 | |
| Cymer, Inc. † | | | 3,300 | | | | 164,208 | |
| Daktronic, Inc. | | | 4,800 | | | | 45,936 | |
| Datalink Corp. † | | | 11,900 | | | | 98,294 | |
| DDi Corp. | | | 8,200 | | | | 76,506 | |
| DealerTrack Holdings, Inc. † | | | 5,400 | | | | 147,204 | |
| Digi International, Inc. † | | | 7,200 | | | | 80,352 | |
| Digimarc Corp. † | | | 2,200 | | | | 52,558 | |
| Diodes, Inc. †(a) | | | 500 | | | | 10,650 | |
| Dot Hill Systems Corp. † | | | 19,100 | | | | 25,403 | |
| EasyLink Services International Corp., Class A † | | | 18,400 | | | | 73,232 | |
| Echo Global Logistics, Inc. † | | | 2,600 | | | | 41,990 | |
| eGain Communications Corp. † | | | 2,200 | | | | 15,202 | |
| Electro Rent Corp. | | | 3,100 | | | | 53,165 | |
| Electro Scientific Industries, Inc. † | | | 4,300 | | | | 62,264 | |
| Electronics for Imaging, Inc. † | | | 9,400 | | | | 133,950 | |
| eMagin Corp. † | | | 6,100 | | | | 22,570 | |
| Emcore Corp. †(a) | | | 29,000 | | | | 25,007 | |
| Entegris, Inc. † | | | 31,000 | | | | 270,475 | |
| EPIQ Systems, Inc. | | | 4,100 | | | | 49,282 | |
| ePlus, Inc. †(a) | | | 2,300 | | | | 65,044 | |
| Euronet Worldwide, Inc. † | | | 6,900 | | | | 127,512 | |
| ExlService Holdings, Inc. † | | | 9,000 | | | | 201,330 | |
| Fabrinet † | | | 3,300 | | | | 45,144 | |
| Fair Isaac Corp. | | | 4,900 | | | | 175,616 | |
| FalconStor Software, Inc. † | | | 9,600 | | | | 24,768 | |
| FARO Technologies, Inc. † | | | 5,300 | | | | 243,800 | |
| FEI Co. † | | | 9,100 | | | | 371,098 | |
| Forrester Research, Inc. † | | | 3,800 | | | | 128,972 | |
| Global Cash Access Holdings, Inc. † | | | 21,200 | | | | 94,340 | |
| Globecomm Systems, Inc. † | | | 5,100 | | | | 69,768 | |
| Glu Mobile, Inc. † | | | 36,800 | | | | 115,552 | |
| GSI Group, Inc. † | | | 6,900 | | | | 70,587 | |
| GSI Technology, Inc. † | | | 5,000 | | | | 23,400 | |
| GT Advanced Technologies, Inc. †(a) | | | 7,500 | | | | 54,300 | |
| Hackett Group, Inc./The † | | | 3,700 | | | | 13,838 | |
| Heartland Payment Systems, Inc. | | | 9,500 | | | | 231,420 | |
| iGO, Inc. †(a) | | | 12,500 | | | | 9,650 | |
| Immersion Corp. †(a) | | | 13,500 | | | | 69,930 | |
| InfoSpace, Inc. † | | | 8,300 | | | | 91,217 | |
| Insight Enterprises, Inc. † | | | 11,200 | | | | 171,248 | |
| Integrated Silicon Solution, Inc. † | | | 7,500 | | | | 68,550 | |
| Internap Network Services Corp. † | | | 7,800 | | | | 46,332 | |
| IXYS Corp. † | | | 8,400 | | | | 90,972 | |
| j2 Global, Inc. (a) | | | 6,200 | | | | 174,468 | |
| JDA Software Group, Inc. † | | | 5,400 | | | | 174,906 | |
| Kenexa Corp. † | | | 4,700 | | | | 125,490 | |
| Keynote Systems, Inc. | | | 7,200 | | | | 147,888 | |
| Kulicke & Soffa Industries, Inc. † | | | 19,000 | | | | 175,750 | |
| Lattice Semiconductor Corp. † | | | 35,200 | | | | 209,088 | |
| LeCroy Corp. † | | | 7,300 | | | | 61,393 | |
| Liquidity Services, Inc. † | | | 7,100 | | | | 261,990 | |
| | | | |
| | The accompanying notes are an integral part of these financial statements. | | (Continued) |
| | | | | | | | | | | | | | | | |
| 136 | | AQR Funds | | | | | | Annual Report | | | | | | December 2011 | | |
| | | | | | | | | | |
| | | | |
| Schedule of Investments | | | December 31, 2011 | |
| | |
| AQR SMALL CAP MOMENTUM FUND | | |
| | | | | | | | |
| | | SHARES | | | VALUE
(Note 3) | |
| Information Technology - 18.4% (continued) | | | | | |
| LivePerson, Inc. †(a) | | | 13,451 | | | $ | 168,810 | |
| Magma Design Automation, Inc. † | | | 13,000 | | | | 93,340 | |
| Majesco Entertainment Co. † | | | 42,600 | | | | 103,944 | |
| Manhattan Associates, Inc. † | | | 5,800 | | | | 234,784 | |
| Marchex, Inc., Class B (a) | | | 13,700 | | | | 85,625 | |
| MAXIMUS, Inc. | | | 9,200 | | | | 380,420 | |
| Maxwell Technologies, Inc. †(a) | | | 6,400 | | | | 103,936 | |
| Measurement Specialties, Inc. † | | | 3,900 | | | | 109,044 | |
| Mercury Computer Systems, Inc. † | | | 4,500 | | | | 59,805 | |
| MicroStrategy, Inc., Class A † | | | 2,600 | | | | 281,632 | |
| Mitek Systems, Inc. † | | | 15,900 | | | | 115,275 | |
| MKS Instruments, Inc. | | | 11,400 | | | | 317,148 | |
| Monotype Imaging Holdings, Inc. † | | | 10,400 | | | | 162,136 | |
| MoSys, Inc. †(a) | | | 5,300 | | | | 22,260 | |
| MTS Systems Corp. | | | 2,200 | | | | 89,650 | |
| Nanometrics, Inc. † | | | 8,800 | | | | 162,096 | |
| Netgear, Inc. † | | | 4,867 | | | | 163,385 | |
| NetList, Inc. † | | | 13,900 | | | | 34,889 | |
| NIC, Inc. | | | 20,500 | | | | 272,855 | |
| NVE Corp. † | | | 2,400 | | | | 133,272 | |
| OCZ Technology Group, Inc. †(a) | | | 20,700 | | | | 136,827 | |
| Opnet Technologies, Inc. | | | 6,200 | | | | 227,354 | |
| Opnext, Inc. †(a) | | | 28,800 | | | | 23,264 | |
| ORBCOMM, Inc. † | | | 4,000 | | | | 11,960 | |
| OSI Systems, Inc. † | | | 3,800 | | | | 185,364 | |
| PC Connection, Inc. | | | 6,800 | | | | 75,412 | |
| PDF Solutions, Inc. † | | | 12,000 | | | | 83,640 | |
| Pegasystems, Inc. | | | 4,800 | | | | 141,120 | |
| PFSweb, Inc. † | | | 9,900 | | | | 32,571 | |
| Procera Networks, Inc. † | | | 9,600 | | | | 149,568 | |
| PROS Holdings, Inc. † | | | 8,200 | | | | 122,016 | |
| QuickLogic Corp. † | | | 5,700 | | | | 14,820 | |
| RealNetworks, Inc. | | | 4,000 | | | | 30,000 | |
| Richardson Electronics Ltd. | | | 9,500 | | | | 116,755 | |
| RightNow Technologies, Inc. † | | | 5,100 | | | | 217,923 | |
| Rogers Corp. † | | | 4,500 | | | | 165,870 | |
| Saba Software, Inc. †(a) | | | 13,200 | | | | 104,148 | |
| Scansource, Inc. † | | | 3,700 | | | | 133,200 | |
| SciQuest, Inc. † | | | 2,000 | | | | 28,540 | |
| Seachange International, Inc. † | | | 4,300 | | | | 30,229 | |
| Silicon Graphics International Corp. †(a) | | | 14,500 | | | | 166,170 | |
| Sourcefire, Inc. † | | | 4,400 | | | | 142,472 | |
| SPS Commerce, Inc. †(a) | | | 4,000 | | | | 103,800 | |
| Stamps.com, Inc. † | | | 6,000 | | | | 156,780 | |
| Super Micro Computer, Inc. † | | | 9,400 | | | | 147,392 | |
| support.com, Inc. † | | | 12,700 | | | | 28,575 | |
| Sycamore Networks, Inc. † | | | 3,300 | | | | 59,070 | |
| Synaptics, Inc. † | | | 4,800 | | | | 144,720 | |
| Synchronoss Technologies, Inc. † | | | 7,400 | | | | 223,554 | |
| Take-Two Interactive Software, Inc. †(a) | | | 18,400 | | | | 249,320 | |
| Taleo Corp., Class A † | | | 1,900 | | | | 73,511 | |
| TeleNav, Inc. † | | | 9,300 | | | | 72,633 | |
| TeleTech Holdings, Inc. † | | | 4,600 | | | | 74,520 | |
| TiVo, Inc. †(a) | | | 20,800 | | | | 186,576 | |
| Tyler Technologies, Inc. †(a) | | | 8,700 | | | | 261,957 | |
| Ultimate Software Group, Inc. † | | | 3,900 | | | | 253,968 | |
| Ultratech, Inc. † | | | 5,100 | | | | 125,307 | |
| | | | | | | | |
| | | SHARES | | | VALUE
(Note 3) | |
| Information Technology - 18.4% (continued) | | | | | |
| Universal Display Corp. † | | | 3,700 | | | $ | 135,753 | |
| ValueClick, Inc. † | | | 9,900 | | | | 161,271 | |
| VASCO Data Security International, Inc. † | | | 5,200 | | | | 33,904 | |
| VirnetX Holding Corp. †(a) | | | 6,800 | | | | 169,796 | |
| Virtusa Corp. † | | | 4,600 | | | | 66,608 | |
| Vocus, Inc. † | | | 1,300 | | | | 28,717 | |
| Web.com Group, Inc. † | | | 11,500 | | | | 131,675 | |
| Westell Technologies, Inc., Class A †(a) | | | 19,600 | | | | 43,512 | |
| Wright Express Corp. † | | | 2,400 | | | | 130,272 | |
| X-Rite, Inc. † | | | 7,900 | | | | 36,656 | |
| Zix Corp. †(a) | | | 14,200 | | | | 40,044 | |
| Zygo Corp. † | | | 7,800 | | | | 137,670 | |
| | | | | | | | |
| | | | | | | 18,524,171 | |
| | | | | | | | |
| Materials - 3.9% | | | | | | | | |
| ADA-ES, Inc. † | | | 2,400 | | | | 54,336 | |
| AMCOL International Corp. (a) | | | 2,800 | | | | 75,180 | |
| American Vanguard Corp. | | | 8,800 | | | | 117,392 | |
| Balchem Corp. | | | 8,500 | | | | 344,590 | |
| Buckeye Technologies, Inc. | | | 9,700 | | | | 324,368 | |
| Deltic Timber Corp. | | | 1,900 | | | | 114,741 | |
| Flotek Industries, Inc. † | | | 17,800 | | | | 177,288 | |
| Gold Resource Corp. | | | 1,600 | | | | 34,000 | |
| Graphic Packaging Holding Co. † | | | 20,800 | | | | 88,608 | |
| Handy & Harman Ltd. † | | | 4,800 | | | | 47,520 | |
| Hawkins, Inc. | | | 1,700 | | | | 62,662 | |
| Haynes International, Inc. | | | 4,100 | | | | 223,860 | |
| Innophos Holdings, Inc. | | | 6,000 | | | | 291,360 | |
| Innospec, Inc. † | | | 6,700 | | | | 188,069 | |
| Kaiser Aluminum Corp. | | | 2,000 | | | | 91,760 | |
| KapStone Paper and Packaging Corp. † | | | 10,900 | | | | 171,566 | |
| Koppers Holdings, Inc. | | | 5,600 | | | | 192,416 | |
| LSB Industries, Inc. † | | | 6,400 | | | | 179,392 | |
| Material Sciences Corp. † | | | 6,600 | | | | 53,856 | |
| Midway Gold Corp. (Canada) † | | | 30,700 | | | | 64,777 | |
| Myers Industries, Inc. | | | 8,000 | | | | 98,720 | |
| Paramount Gold and Silver Corp. †(a) | | | 40,300 | | | | 86,242 | |
| PH Glatfelter Co. | | | 12,300 | | | | 173,676 | |
| Quaker Chemical Corp. | | | 1,000 | | | | 38,890 | |
| Schweitzer-Mauduit International, Inc. | | | 2,200 | | | | 146,212 | |
| Senomyx, Inc. † | | | 8,600 | | | | 29,928 | |
| Stepan Co. | | | 2,400 | | | | 192,384 | |
| UFP Technologies, Inc. † | | | 3,400 | | | | 50,218 | |
| Universal Stainless & Alloy † | | | 2,600 | | | | 97,136 | |
| Vista Gold Corp. † | | | 33,900 | | | | 104,073 | |
| | | | | | | | |
| | | | | | | 3,915,220 | |
| | | | | | | | |
| Telecommunication Services - 1.5% | | | | | | | | |
| 8x8, Inc. † | | | 33,400 | | | | 105,878 | |
| AboveNet, Inc. † | | | 3,800 | | | | 247,038 | |
| Atlantic Tele-Network, Inc. | | | 1,300 | | | | 50,765 | |
| Cincinnati Bell, Inc. †(a) | | | 42,200 | | | | 127,866 | |
| Cogent Communications Group, Inc. † | | | 12,400 | | | | 209,436 | |
| Consolidated Communications Holdings, Inc. | | | 4,700 | | | | 89,535 | |
| Elephant Talk Communications, Inc. † | | | 14,600 | | | | 38,690 | |
| General Communication, Inc., Class A † | | | 4,600 | | | | 45,034 | |
| HickoryTech Corp. | | | 1,000 | | | | 11,080 | |
| | | | |
| | The accompanying notes are an integral part of these financial statements. | | (Continued) |
| | | | | | | | | | | | | | | | |
| | AQR Funds | | | | | | Annual Report | | | | | | December 2011 | | 137 |
| | | | | | | | | | |
| | | | |
| Schedule of Investments | | | December 31, 2011 | |
| | |
| AQR SMALL CAP MOMENTUM FUND | | |
| | | | | | | | |
| | | SHARES | | | VALUE
(Note 3) | |
| Telecommunication Services - 1.5% (continued) | | | | | |
| IDT Corp., Class B | | | 12,100 | | | $ | 113,498 | |
| inContact, Inc. † | | | 9,500 | | | | 42,085 | |
| Lumos Networks Corp. | | | 1,850 | | | | 28,379 | |
| NTELOS Holdings Corp. | | | 6,450 | | | | 131,451 | |
| Premiere Global Services, Inc. † | | | 10,600 | | | | 89,782 | |
| SureWest Communications | | | 3,000 | | | | 36,090 | |
| Towerstream Corp. † | | | 7,900 | | | | 16,590 | |
| Vonage Holdings Corp. † | | | 53,700 | | | | 131,565 | |
| | | | | | | | |
| | | | | | | 1,514,762 | |
| | | | | | | | |
| Utilities - 4.1% | | | | | | | | |
| Allete, Inc. | | | 7,700 | | | | 323,246 | |
| Artesian Resources Corp., Class A | | | 1,900 | | | | 35,777 | |
| Avista Corp. | | | 14,500 | | | | 373,375 | |
| Black Hills Corp. | | | 7,600 | | | | 255,208 | |
| CH Energy Group, Inc. | | | 5,400 | | | | 315,252 | |
| Chesapeake Utilities Corp. (a) | | | 7,400 | | | | 320,790 | |
| Connecticut Water Service, Inc. | | | 1,300 | | | | 35,269 | |
| El Paso Electric Co. | | | 10,900 | | | | 377,576 | |
| Genie Energy Ltd., Class B | | | 5,900 | | | | 46,787 | |
| Laclede Group, Inc./The | | | 8,600 | | | | 348,042 | |
| MGE Energy, Inc. | | | 3,300 | | | | 154,341 | |
| Middlesex Water Co. | | | 4,300 | | | | 80,238 | |
| NorthWestern Corp. | | | 10,400 | | | | 372,216 | |
| PNM Resources, Inc. | | | 22,700 | | | | 413,821 | |
| South Jersey Industries, Inc. | | | 3,400 | | | | 193,154 | |
| Unisource Energy Corp. | | | 8,500 | | | | 313,820 | |
| Unitil Corp. | | | 3,100 | | | | 87,978 | |
| York Water Co. (a) | | | 2,800 | | | | 49,392 | |
| | | | | | | | |
| | | | | | | 4,096,282 | |
| | | | | | | | |
TOTAL COMMON STOCKS
(cost $93,462,972) | | | | | | | 100,369,231 | |
| | | | | | | | |
| | |
| RIGHTS - 0.0% (b) | | | | | | | | |
| | |
| Information Technology - 0.0% (b) | | | | | | | | |
Gerber Scientific, Inc., Expires (3)†(c)
(cost $-) | | | 4,000 | | | | — | |
| | | | | | | | |
| | |
| WARRANTS - 0.0% (b) | | | | | | | | |
| | |
| Energy - 0.0% (b) | | | | | | | | |
| Magnum Hunter Resources Corp. (3)†(c) (cost $-) | | | 2,980 | | | | — | |
| | | | | | | | |
| | | | | | | | |
| | | SHARES | | | VALUE
(Note 3) | |
| MONEY MARKET FUNDS - 0.2% | | | | | | | | |
J.P. Morgan Treasury Plus Money Market Fund - Institutional Shares,
0.000% (2)(d)
| | | | | | | | |
(cost $230,578) | | | 230,578 | | | $ | 230,578 | |
| | | | | | | | |
|
| INVESTMENTS OF CASH COLLATERAL FOR SECURITIES ON LOAN - 2.0% | |
J.P. Morgan Prime Money Market Fund - Capital Shares, 0.130% (2)(d)(e)
(cost $1,982,597) | | | 1,982,597 | | | | 1,982,597 | |
| | | | | | | | |
TOTAL INVESTMENTS - 102.0%
(cost $95,676,147) | | | | | | | 102,582,406 | |
| | | | | | | | |
| LIABILITIES IN EXCESS OF OTHER ASSETS - (2.0)% (f) | | | | | | | (2,048,052) | |
| | | | | | | | |
NET ASSETS - 100.0% | | | | | | $ | 100,534,354 | |
| | | | | | | | |
All securities are United States companies, unless noted otherwise in parentheses.
| † | Non income-producing security. |
| (a) | All or a portion of the security on loan. The aggregate market value of such securities is $1,902,367; cash collateral of $1,982,597 was received with which the Fund purchased a money market fund. |
| (b) | Represents less than 0.05 percent of net assets. |
| (c) | Securities fair valued at $0 as of December 31, 2011 using procedures approved by the Board of Trustees. |
| (d) | Represents annualized seven-day yield as of December 31, 2011. |
| (e) | Represents security, or portion thereof, purchased with the cash collateral received for securities on loan. |
| (f) | Includes appreciation on futures. |
All securities are Level 1, with respect to ASC 820 unless otherwise noted in parentheses.
| (2) | Level 2 security (See Note 5). |
| (3) | Level 3 security (See Note 5). |
The following abbreviations are used in portfolio descriptions:
REIT - Real Estate Investment Trust
Open futures contracts outstanding at December 31, 2011:
| | | | | | | | | | | | | | | | |
NUMBER OF
CONTRACTS | | DESCRIPTION | | EXPIRATION
DATE | | VALUE AT
TRADE DATE | | | VALUE AT
DECEMBER 31,
2011 | | | UNREALIZED
APPRECIATION | |
| Long Contracts: | | | | | | | | | | | | | | | | |
| 7 | | E-Mini Russell 2000 Futures | | March 16, 2012 | | | $500,972 | | | | $517,160 | | | | $16,188 | |
| | | | | | | | | | | | | | | | |
Cash held as collateral with broker for futures contracts was $30,560 at December 31, 2011.
| | | | |
| | The accompanying notes are an integral part of these financial statements. | | |
| | | | | | | | | | | | | | | | |
| 138 | | AQR Funds | | | | | | Annual Report | | | | | | December 2011 | | |
| | | | | | | | | | |
| | | | |
| Schedule of Investments | | | December 31, 2011 | |
| | |
| AQR INTERNATIONAL MOMENTUM FUND | | |
| | | | | | | | |
| COMMON STOCKS - 98.5% | | SHARES | | | VALUE
(Note 3) | |
| Australia - 5.6% | | | | | | | | |
| Amcor Ltd. | | | 30,438 | | | $ | 224,073 | |
| Aston Resources Ltd. † | | | 4,440 | | | | 41,290 | |
| Atlas Iron Ltd. | | | 18,245 | | | | 50,357 | |
| Brambles Ltd. (a) | | | 28,216 | | | | 206,012 | |
| Caltex Australia Ltd. | | | 4,085 | | | | 49,051 | |
| Campbell Brothers Ltd. (a) | | | 2,345 | | | | 117,425 | |
| CFS Retail Property Trust REIT | | | 41,469 | | | | 71,405 | |
| Coca-Cola Amatil Ltd. | | | 10,216 | | | | 120,033 | |
| Commonwealth Property Office Fund REIT | | | 75,980 | | | | 74,183 | |
| Dexus Property Group REIT | | | 90,954 | | | | 77,080 | |
| GPT Group REIT | | | 38,389 | | | | 120,322 | |
| Iluka Resources Ltd. | | | 10,979 | | | | 173,897 | |
| Mesoblast Ltd. † | | | 10,394 | | | | 73,068 | |
| Mirvac Group REIT | | | 60,599 | | | | 73,012 | |
| National Australia Bank Ltd. | | | 27,347 | | | | 651,448 | |
| New Hope Corp. Ltd. | | | 7,835 | | | | 44,271 | |
| Oil Search Ltd. | | | 12,347 | | | | 78,917 | |
| Orica Ltd. | | | 4,011 | | | | 99,248 | |
| OZ Minerals Ltd. | | | 4,289 | | | | 43,873 | |
| Paladin Energy Ltd. † | | | 12,165 | | | | 17,107 | |
| QR National Ltd. | | | 27,946 | | | | 97,623 | |
| Ramsay Health Care Ltd. | | | 3,907 | | | | 76,898 | |
| Santos Ltd. | | | 8,185 | | | | 102,432 | |
| Sonic Healthcare Ltd. | | | 6,491 | | | | 74,817 | |
| Telecom Corp of New Zealand Ltd. | | | 36,210 | | | | 57,828 | |
| Telstra Corp. Ltd. | | | 231,576 | | | | 787,595 | |
| Wesfarmers Ltd. | | | 6,797 | | | | 204,751 | |
| Westpac Banking Corp. | | | 21,215 | | | | 433,088 | |
| WorleyParsons Ltd. | | | 2,954 | | | | 77,354 | |
| | | | | | | | |
| | | | | | | 4,318,458 | |
| | | | | | | | |
| Austria - 0.2% | | | | | | | | |
| Andritz AG | | | 915 | | | | 75,672 | |
| Lenzing AG | | | 606 | | | | 50,036 | |
| | | | | | | | |
| | | | | | | 125,708 | |
| | | | | | | | |
| Belgium - 1.0% | | | | | | | | |
| Anheuser-Busch InBev NV | | | 7,378 | | | | 450,303 | |
| RTL Group SA | | | 766 | | | | 76,323 | |
| Telenet Group Holding NV † | | | 2,042 | | | | 77,756 | |
| UCB SA | | | 3,497 | | | | 146,710 | |
| | | | | | | | |
| | | | | | | 751,092 | |
| | | | | | | | |
| Canada - 16.1% (1) | | | | | | | | |
| Alimentation Couche Tard, Inc., Class B | | | 3,800 | | | | 118,243 | |
| Atco Ltd., Class I | | | 1,000 | | | | 59,131 | |
| Bank of Montreal | | | 3,600 | | | | 197,466 | |
| Barrick Gold Corp. | | | 3,700 | | | | 167,612 | |
| Baytex Energy Corp. (a) | | | 800 | | | | 44,737 | |
| BCE, Inc. | | | 14,700 | | | | 612,819 | |
| Boardwalk Real Estate Investment Trust REIT | | | 1,500 | | | | 74,268 | |
| Brookfield Asset Management, Inc., Class A | | | 1,400 | | | | 38,534 | |
| Brookfield Office Properties, Inc. | | | 7,200 | | | | 112,868 | |
| Calloway Real Estate Investment Trust REIT | | | 3,200 | | | | 84,087 | |
| Canadian National Railway Co. | | | 8,000 | | | | 629,399 | |
| | | | | | | | |
| | | SHARES | | | VALUE
(Note 3) | |
| Canada - 16.1% (1) (continued) | | | | | | | | |
| Canadian Utilities Ltd., Class A | | | 3,500 | | | $ | 211,426 | |
| Cenovus Energy, Inc. | | | 18,800 | | | | 624,298 | |
| Centerra Gold, Inc. | | | 4,900 | | | | 86,577 | |
| CGI Group, Inc., Class A † | | | 10,200 | | | | 192,236 | |
| CI Financial Corp. | | | 3,300 | | | | 68,349 | |
| Crescent Point Energy Corp. (a) | | | 4,500 | | | | 198,331 | |
| Detour Gold Corp. † | | | 1,600 | | | | 39,499 | |
| Dollarama, Inc. | | | 2,100 | | | | 91,730 | |
| Domtar Corp. | | | 900 | | | | 71,994 | |
| Eldorado Gold Corp. | | | 10,200 | | | | 140,372 | |
| Emera, Inc. | | | 2,100 | | | | 68,107 | |
| Empire Co., Ltd., Class A | | | 1,100 | | | | 63,824 | |
| Enbridge, Inc. | | | 14,900 | | | | 557,095 | |
| Enerplus Corp. | | | 1,900 | | | | 48,211 | |
| Fairfax Financial Holdings Ltd. | | | 200 | | | | 85,793 | |
| First Capital Realty, Inc. | | | 2,200 | | | | 37,360 | |
| First Majestic Silver Corp. † | | | 4,300 | | | | 72,514 | |
| First Quantum Minerals Ltd. | | | 3,700 | | | | 72,820 | |
| Fortis, Inc. | | | 4,800 | | | | 157,228 | |
| Franco-Nevada Corp. | | | 3,600 | | | | 137,039 | |
| Gabriel Resources Ltd. † | | | 8,100 | | | | 49,932 | |
| Gildan Activewear, Inc. | | | 3,000 | | | | 56,422 | |
| Goldcorp, Inc. | | | 17,300 | | | | 767,738 | |
| H&R Real Estate Investment Trust REIT | | | 5,400 | | | | 123,292 | |
| Husky Energy, Inc. | | | 3,200 | | | | 77,114 | |
| IAMGOLD Corp. | | | 10,900 | | | | 173,116 | |
| IGM Financial, Inc. | | | 4,500 | | | | 195,372 | |
| Imperial Oil Ltd. | | | 6,600 | | | | 294,060 | |
| Intact Financial Corp. | | | 2,700 | | | | 155,122 | |
| Jean Coutu Group PJC, Inc./The, Class A | | | 3,400 | | | | 42,552 | |
| Keyera Corp. (a) | | | 1,700 | | | | 83,436 | |
| Lululemon Athletica, Inc. † | | | 3,000 | | | | 139,936 | |
| MEG Energy Corp. † | | | 3,100 | | | | 126,495 | |
| Methanex Corp. | | | 2,000 | | | | 45,782 | |
| Metro, Inc., Class A | | | 2,300 | | | | 121,914 | |
| National Bank of Canada (a) | | | 2,300 | | | | 162,868 | |
| New Gold, Inc. † | | | 12,200 | | | | 123,108 | |
| Onex Corp. | | | 2,400 | | | | 78,166 | |
| Open Text Corp. † | | | 2,300 | | | | 117,918 | |
| Paramount Resources Ltd., Class A † | | | 2,400 | | | | 100,123 | |
| Pembina Pipeline Corp. (a) | | | 4,600 | | | | 133,925 | |
| Pengrowth Energy Corp. (a) | | | 5,300 | | | | 55,978 | |
| Precision Drilling Corp. † | | | 5,700 | | | | 58,749 | |
| Progress Energy Resources Corp. | | | 5,900 | | | | 76,678 | |
| RioCan Real Estate Investment Trust REIT (a) | | | 8,000 | | | | 207,549 | |
| Rogers Communications, Inc., Class B | | | 2,700 | | | | 104,025 | |
| Saputo, Inc. | | | 5,700 | | | | 218,376 | |
| Shaw Communications, Inc., Class B | | | 3,900 | | | | 77,521 | |
| Shoppers Drug Mart Corp. | | | 4,300 | | | | 173,646 | |
| Silver Wheaton Corp. | | | 3,000 | | | | 86,871 | |
| TELUS Corp. | | | 7,300 | | | | 413,028 | |
| Tim Hortons, Inc. | | | 5,100 | | | | 247,103 | |
| TMX Group, Inc. | | | 2,200 | | | | 90,030 | |
| Toronto-Dominion Bank/The | | | 9,300 | | | | 696,439 | |
| Tourmaline Oil Corp. † | | | 2,900 | | | | 75,806 | |
| TransAlta Corp. | | | 5,500 | | | | 113,482 | |
| | | | |
| | The accompanying notes are an integral part of these financial statements. | | (Continued) |
| | | | | | | | | | | | | | | | |
| | AQR Funds | | | | | | Annual Report | | | | | | December 2011 | | 139 |
| | | | | | | | | | |
| | | | |
| Schedule of Investments | | | December 31, 2011 | |
| | |
| AQR INTERNATIONAL MOMENTUM FUND | | |
| | | | | | | | |
| | | SHARES | | | VALUE
(Note 3) | |
| Canada - 16.1% (1) (continued) | | | | | | | | |
| TransCanada Corp. (a) | | | 12,300 | | | $ | 537,638 | |
| Trilogy Energy Corp. | | | 4,600 | | | | 169,641 | |
| Valeant Pharmaceuticals International, Inc. † | | | 6,529 | | | | 305,445 | |
| Vermilion Energy, Inc. | | | 1,300 | | | | 57,895 | |
| Viterra, Inc. | | | 5,500 | | | | 57,983 | |
| Yamana Gold, Inc. | | | 20,600 | | | | 303,717 | |
| | | | | | | | |
| | | | | | | 12,459,958 | |
| | | | | | | | |
| Denmark - 1.0% | | | | | | | | |
| Coloplast A/S, Class B | | | 894 | | | | 128,288 | |
| DSV A/S | | | 2,710 | | | | 48,428 | |
| H Lundbeck A/S | | | 3,734 | | | | 70,026 | |
| Novo Nordisk A/S, Class B | | | 2,276 | | | | 261,474 | |
| Novozymes A/S, B Shares | | | 5,195 | | | | 160,048 | |
| William Demant Holding A/S † | | | 1,394 | | | | 115,622 | |
| | | | | | | | |
| | | | | | | 783,886 | |
| | | | | | | | |
| Finland - 0.5% | | | | | | | | |
| Elisa OYJ | | | 3,629 | | | | 75,559 | |
| Kesko OYJ, B Shares | | | 1,282 | | | | 42,975 | |
| Kone OYJ, Class B | | | 1,926 | | | | 99,710 | |
| Nokian Renkaat OYJ | | | 1,747 | | | | 56,092 | |
| Sampo OYJ, A Shares | | | 4,733 | | | | 117,076 | |
| | | | | | | | |
| | | | | | | 391,412 | |
| | | | | | | | |
| France - 7.1% | | | | | | | | |
| Air Liquide SA | | | 2,554 | | | | 315,362 | |
| AXA SA | | | 8,862 | | | | 114,552 | |
| Bureau Veritas SA | | | 591 | | | | 42,928 | |
| Cie Generale d’Optique Essilor International SA | | | 3,545 | | | | 249,893 | |
| Danone | | | 10,033 | | | | 629,595 | |
| Dassault Systemes SA | | | 716 | | | | 57,196 | |
| Edenred | | | 3,620 | | | | 88,799 | |
| European Aeronautic Defence and Space Co NV | | | 14,081 | | | | 438,469 | |
| Eutelsat Communications SA | | | 3,108 | | | | 121,059 | |
| Hermes International | | | 842 | | | | 250,260 | |
| Pernod-Ricard SA | | | 1,984 | | | | 183,637 | |
| Rexel SA (a) | | | 4,367 | | | | 74,369 | |
| Safran SA | | | 2,192 | | | | 65,554 | |
| Sanofi | | | 17,840 | | | | 1,304,063 | |
| SCOR SE | | | 2,421 | | | | 56,451 | |
| SEB SA | | | 592 | | | | 44,360 | |
| Sodexo | | | 1,964 | | | | 140,567 | |
| Technip SA | | | 1,542 | | | | 144,562 | |
| Total SA | | | 19,611 | | | | 1,000,708 | |
| Unibail-Rodamco SE REIT | | | 738 | | | | 132,082 | |
| | | | | | | | |
| | | | | | | 5,454,466 | |
| | | | | | | | |
| Germany - 2.9% | | | | | | | | |
| Adidas AG | | | 2,841 | | | | 184,588 | |
| Fresenius Medical Care AG & Co. KGaA | | | 4,011 | | | | 272,444 | |
| Fresenius SE & Co. KGaA | | | 2,724 | | | | 251,893 | |
| GEA Group AG | | | 2,796 | | | | 78,934 | |
| Kabel Deutschland Holding AG † | | | 2,893 | | | | 146,662 | |
| Linde AG | | | 1,914 | | | | 284,444 | |
| Merck KGaA | | | 1,708 | | | | 170,090 | |
| | | | | | | | |
| | | SHARES | | | VALUE
(Note 3) | |
| Germany - 2.9% (continued) | | | | | | | | |
| SAP AG | | | 15,595 | | | $ | 824,845 | |
| Suedzucker AG | | | 2,234 | | | | 71,166 | |
| | | | | | | | |
| | | | | | | 2,285,066 | |
| | | | | | | | |
| Hong Kong - 3.5% | | | | | | | | |
| AIA Group Ltd. | | | 40,800 | | | | 127,007 | |
| ASM Pacific Technology Ltd. | | | 9,700 | | | | 108,642 | |
| Cheung Kong Infrastructure Holdings Ltd. | | | 16,000 | | | | 93,550 | |
| China Metal Recycling Holdings Ltd. | | | 56,400 | | | | 60,749 | |
| CLP Holdings Ltd. | | | 26,000 | | | | 220,893 | |
| First Pacific Co., Ltd. | | | 72,000 | | | | 74,707 | |
| Galaxy Entertainment Group Ltd. †(a) | | | 92,000 | | | | 167,237 | |
| Giordano International Ltd. | | | 64,000 | | | | 46,236 | |
| Global Bio-Chem Technology Group Co., Ltd. | | | 198,000 | | | | 40,031 | |
| Great Wall Motor Co., Ltd. (a) | | | 250 | | | | 364 | |
| Hang Seng Bank Ltd. (a) | | | 2,800 | | | | 33,167 | |
| Hong Kong & China Gas Co., Ltd. | | | 57,000 | | | | 131,976 | |
| International Mining Machinery Holdings Ltd. | | | 36,500 | | | | 40,174 | |
| Lifestyle International Holdings Ltd. | | | 33,500 | | | | 73,737 | |
| Link REIT/The REIT (a) | | | 37,500 | | | | 137,914 | |
| Luk Fook Holdings International Ltd. | | | 22,000 | | | | 76,281 | |
| Melco International Development Ltd. † | | | 103,000 | | | | 76,011 | |
| NWS Holdings Ltd. | | | 33,000 | | | | 48,521 | |
| Power Assets Holdings Ltd. | | | 31,500 | | | | 232,912 | |
| Sands China Ltd. † | | | 73,600 | | | | 206,491 | |
| Shangri-La Asia Ltd. | | | 24,000 | | | | 41,342 | |
| Silver base Group Holdings Ltd. | | | 93,000 | | | | 75,205 | |
| SJM Holdings Ltd. | | | 38,000 | | | | 61,665 | |
| SmarTone Telecommunications Holding Ltd. | | | 31,500 | | | | 54,314 | |
| Stella International Holdings Ltd. | | | 32,500 | | | | 70,546 | |
| Swire Pacific Ltd., Class A | | | 1,500 | | | | 18,073 | |
| Television Broadcasts Ltd. | | | 10,000 | | | | 60,555 | |
| Towngas China Co., Ltd. | | | 18,000 | | | | 9,721 | |
| Vinda International Holdings Ltd. | | | 37,000 | | | | 47,370 | |
| Wheelock & Co., Ltd. | | | 16,000 | | | | 39,563 | |
| Wynn Macau Ltd. | | | 58,800 | | | | 146,786 | |
| Yingde Gases | | | 63,500 | | | | 64,572 | |
| | | | | | | | |
| | | | | | | 2,686,312 | |
| | | | | | | | |
| Israel - 0.2% | | | | | | | | |
| Bezeq The Israeli Telecommunication Corp. Ltd. | | | 22,496 | | | | 41,280 | |
| Israel Corp. Ltd./The | | | 62 | | | | 38,830 | |
| Mellanox Technologies Ltd. † | | | 1,786 | | | | 58,389 | |
| | | | | | | | |
| | | | | | | 138,499 | |
| | | | | | | | |
| Italy - 1.0% | | | | | | | | |
| Davide Campari-Milano SpA | | | 11,007 | | | | 73,160 | |
| ENI SpA | | | 21,812 | | | | 449,712 | |
| Mediobanca SpA | | | 12,085 | | | | 69,365 | |
| Snam Rete Gas SpA | | | 22,123 | | | | 97,441 | |
| Tenaris SA | | | 1,525 | | | | 28,046 | |
| Terna Rete Elettrica Nazionale SpA | | | 16,361 | | | | 55,061 | |
| | | | | | | | |
| | | | | | | 772,785 | |
| | | | | | | | |
| | | | |
| | The accompanying notes are an integral part of these financial statements. | | (Continued) |
| | | | | | | | | | | | | | | | |
| 140 | | AQR Funds | | | | | | Annual Report | | | | | | December 2011 | | |
| | | | | | | | | | |
| | | | |
| Schedule of Investments | | | December 31, 2011 | |
| | |
| AQR INTERNATIONAL MOMENTUM FUND | | |
| | | | | | | | |
| | | SHARES | | | VALUE
(Note 3) | |
| Japan - 21.2% | | | | | | | | |
| ABC-Mart, Inc. | | | 2,700 | | | $ | 102,567 | |
| Acom Co., Ltd. † | | | 4,470 | | | | 79,534 | |
| Aeon Co., Ltd. (a) | | | 11,200 | | | | 153,420 | |
| Aeon Credit Service Co., Ltd. | | | 5,400 | | | | 85,088 | |
| Ajinomoto Co., Inc. | | | 24,000 | | | | 288,109 | |
| Alps Electric Co., Ltd. | | | 7,400 | | | | 50,664 | |
| Aozora Bank Ltd. | | | 58,000 | | | | 159,585 | |
| Asahi Glass Co., Ltd. | | | 7,000 | | | | 58,519 | |
| Asics Corp. | | | 5,100 | | | | 57,325 | |
| Autobacs Seven Co., Ltd. | | | 1,100 | | | | 50,301 | |
| Bridgestone Corp. | | | 9,600 | | | | 217,423 | |
| Calsonic Kansei Corp. | | | 14,000 | | | | 79,557 | |
| Capcom Co., Ltd. | | | 3,500 | | | | 82,764 | |
| Central Japan Railway Co. | | | 35 | | | | 295,375 | |
| Century Tokyo Leasing Corp. | | | 2,600 | | | | 48,952 | |
| Chiba Bank Ltd./The | | | 12,000 | | | | 77,152 | |
| Chiyoda Corp. | | | 7,000 | | | | 71,070 | |
| Chugoku Bank Ltd./The | | | 5,000 | | | | 69,575 | |
| Credit Saison Co., Ltd. | | | 3,800 | | | | 75,890 | |
| CyberAgent, Inc. | | | 27 | | | | 87,469 | |
| Daido Steel Co., Ltd. | | | 12,000 | | | | 74,915 | |
| Daihatsu Motor Co., Ltd. | | | 5,000 | | | | 88,914 | |
| Dainippon Screen Manufacturing Co., Ltd. | | | 7,000 | | | | 58,818 | |
| Dainippon Sumitomo Pharma Co., Ltd. | | | 6,800 | | | | 77,390 | |
| Daito Trust Construction Co., Ltd. | | | 3,700 | | | | 316,819 | |
| Daiwa House Industry Co., Ltd. | | | 9,000 | | | | 107,592 | |
| Dena Co., Ltd. | | | 3,200 | | | | 95,861 | |
| Dentsu, Inc. | | | 5,900 | | | | 179,486 | |
| Don Quijote Co., Ltd. | | | 2,100 | | | | 72,101 | |
| Eisai Co., Ltd. | | | 6,400 | | | | 264,711 | |
| FANUC Corp. | | | 1,000 | | | | 152,532 | |
| Fast Retailing Co., Ltd. | | | 1,100 | | | | 200,095 | |
| Fuji Electric Co., Ltd. | | | 17,000 | | | | 46,551 | |
| Fuji Heavy Industries Ltd. | | | 15,000 | | | | 89,967 | |
| Gree, Inc. | | | 4,700 | | | | 161,569 | |
| Gunma Bank Ltd./The | | | 15,000 | | | | 82,241 | |
| Hachijuni Bank Ltd./The | | | 12,000 | | | | 68,362 | |
| Heiwa Corp. | | | 3,300 | | | | 56,961 | |
| Hino Motors Ltd. | | | 17,000 | | | | 102,932 | |
| Hiroshima Bank Ltd./The | | | 10,000 | | | | 46,382 | |
| Hitachi Ltd. | | | 54,660 | | | | 284,340 | |
| Hitachi Transport System Ltd. | | | 3,200 | | | | 54,881 | |
| Hokuhoku Financial Group, Inc. | | | 23,000 | | | | 44,722 | |
| Hoshizaki Electric Co., Ltd. | | | 2,000 | | | | 46,921 | |
| House Foods Corp. | | | 3,600 | | | | 67,607 | |
| Idemitsu Kosan Co., Ltd. | | | 500 | | | | 51,529 | |
| IHI Corp. | | | 27,000 | | | | 65,461 | |
| Inpex Corp. | | | 43 | | | | 270,738 | |
| Isuzu Motors Ltd. | | | 24,000 | | | | 110,485 | |
| Ito En Ltd. | | | 2,600 | | | | 44,673 | |
| ITOCHU Corp. | | | 24,300 | | | | 246,389 | |
| Itochu Techno-Solutions Corp. | | | 1,700 | | | | 76,255 | |
| Iyo Bank Ltd./The | | | 6,000 | | | | 59,124 | |
| Japan Retail Fund Investment Corp. REIT | | | 33 | | | | 48,816 | |
| Japan Tobacco, Inc. | | | 90 | | | | 423,226 | |
| JGC Corp. | | | 4,000 | | | | 96,035 | |
| Joyo Bank Ltd./The | | | 19,000 | | | | 83,849 | |
| | | | | | | | |
| | | SHARES | | | VALUE
(Note 3) | |
| Japan - 21.2% (continued) | | | | | | | | |
| JS Group Corp. | | | 6,700 | | | $ | 128,412 | |
| Kajima Corp. | | | 30,000 | | | | 92,070 | |
| Kakaku.com, Inc. | | | 2,100 | | | | 77,003 | |
| Kao Corp. | | | 4,000 | | | | 109,144 | |
| KDDI Corp. | | | 60 | | | | 385,338 | |
| Kewpie Corp. | | | 4,700 | | | | 66,804 | |
| Keyence Corp. | | | 700 | | | | 168,728 | |
| Kintetsu Corp. | | | 41,000 | | | | 160,143 | |
| Kobayashi Pharmaceutical Co., Ltd. | | | 900 | | | | 47,347 | |
| Komeri Co., Ltd. | | | 2,500 | | | | 76,863 | |
| Konami Corp. | | | 4,500 | | | | 134,567 | |
| K’s Holdings Corp. | | | 1,800 | | | | 71,224 | |
| Kyowa Hakko Kirin Co., Ltd. | | | 6,000 | | | | 73,241 | |
| Lawson, Inc. | | | 3,300 | | | | 205,608 | |
| M3, Inc. | | | 23 | | | | 103,558 | |
| Makita Corp. | | | 1,700 | | | | 54,844 | |
| McDonald’s Holdings Co., Japan Ltd. | | | 3,700 | | | | 99,630 | |
| Miraca Holdings, Inc. | | | 1,700 | | | | 67,775 | |
| Mitsubishi Chemical Holdings Corp. | | | 29,500 | | | | 161,673 | |
| Mitsubishi Heavy Industries, Ltd. | | | 59,000 | | | | 250,585 | |
| Mitsubishi Materials Corp. | | | 19,000 | | | | 51,369 | |
| Mitsubishi Tanabe Pharma Corp. | | | 7,500 | | | | 118,486 | |
| Mizuho Financial Group, Inc. | | | 121,700 | | | | 164,795 | |
| Namco Bandai Holdings, Inc. | | | 12,300 | | | | 174,568 | |
| NHK Spring Co., Ltd. | | | 12,500 | | | | 110,478 | |
| Nikon Corp. | | | 4,800 | | | | 106,371 | |
| Nippon Building Fund, Inc. REIT | | | 8 | | | | 65,471 | |
| Nippon Shokubai Co., Ltd. | | | 7,000 | | | | 74,996 | |
| Nippon Telegraph & Telephone Corp. | | | 11,600 | | | | 590,555 | |
| Nippon Television Network Corp. | | | 510 | | | | 77,872 | |
| Nishi-Nippon City Bank Ltd./The | | | 21,000 | | | | 60,237 | |
| Nissin Foods Holdings Co., Ltd. | | | 1,900 | | | | 74,494 | |
| Nitori Holdings Co., Ltd. | | | 750 | | | | 70,326 | |
| Nitto Denko Corp. | | | 2,600 | | | | 92,483 | |
| Nomura Research Institute Ltd. | | | 3,500 | | | | 78,959 | |
| NTT DoCoMo, Inc. | | | 157 | | | | 288,255 | |
| OJI Paper Co., Ltd. | | | 15,000 | | | | 77,012 | |
| Ono Pharmaceutical Co., Ltd. | | | 2,500 | | | | 140,208 | |
| Oriental Land Co., Ltd. | | | 1,300 | | | | 137,247 | |
| Osaka Gas Co., Ltd. | | | 37,000 | | | | 146,183 | |
| Park24 Co., Ltd. | | | 5,400 | | | | 71,423 | |
| Rakuten, Inc. | | | 101 | | | | 108,661 | |
| Rinnai Corp. | | | 2,000 | | | | 143,210 | |
| Sanrio Co., Ltd. (a) | | | 2,600 | | | | 133,357 | |
| Santen Pharmaceutical Co., Ltd. | | | 2,100 | | | | 86,725 | |
| Sawai Pharmaceutical Co., Ltd. | | | 700 | | | | 72,620 | |
| Secom Co., Ltd. | | | 2,700 | | | | 124,158 | |
| Sega Sammy Holdings, Inc. | | | 6,700 | | | | 144,743 | |
| Sekisui Chemical Co., Ltd. | | | 10,000 | | | | 82,376 | |
| Seven & I Holdings Co., Ltd. | | | 12,700 | | | | 353,945 | |
| Shimano, Inc. | | | 1,600 | | | | 77,875 | |
| Shizuoka Bank Ltd./The | | | 16,000 | | | | 168,324 | |
| SKY Perfect JSAT Holdings, Inc. | | | 133 | | | | 66,339 | |
| Start Today Co., Ltd. (a) | | | 3,600 | | | | 84,456 | |
| Sugi Holdings Co., Ltd. | | | 2,600 | | | | 75,658 | |
| Sumitomo Forestry Co., Ltd. | | | 5,000 | | | | 44,307 | |
| Sumitomo Realty & Development Co., Ltd. | | | 3,000 | | | | 52,417 | |
| | | | |
| | The accompanying notes are an integral part of these financial statements. | | (Continued) |
| | | | | | | | | | | | | | | | |
| | AQR Funds | | | | | | Annual Report | | | | | | December 2011 | | 141 |
| | | | | | | | | | |
| | | | |
| Schedule of Investments | | | December 31, 2011 | |
| | |
| AQR INTERNATIONAL MOMENTUM FUND | | |
| | | | | | | | |
| | | SHARES | | | VALUE
(Note 3) | |
| Japan - 21.2% (continued) | | | | | | | | |
| Sumitomo Rubber Industries Ltd. | | | 6,400 | | | $ | 76,853 | |
| Suruga Bank Ltd. | | | 8,000 | | | | 71,403 | |
| Sysmex Corp. | | | 3,100 | | | | 100,787 | |
| Taiheiyo Cement Corp. | | | 49,000 | | | | 93,778 | |
| Taisei Corp. | | | 28,000 | | | | 70,976 | |
| Toho Gas Co., Ltd. | | | 17,000 | | | | 108,245 | |
| Tokyu Corp. | | | 19,000 | | | | 93,567 | |
| TonenGeneral Sekiyu KK | | | 7,000 | | | | 76,326 | |
| Toray Industries, Inc. | | | 34,000 | | | | 243,258 | |
| TOTO Ltd. | | | 12,000 | | | | 92,628 | |
| Toyo Suisan Kaisha Ltd. | | | 3,000 | | | | 72,599 | |
| Toyota Industries Corp. | | | 2,800 | | | | 75,756 | |
| Ube Industries Ltd. | | | 25,000 | | | | 68,332 | |
| Unicharm Corp. | | | 5,900 | | | | 290,895 | |
| USS Co., Ltd. | | | 1,250 | | | | 112,973 | |
| West Japan Railway Co. | | | 7,900 | | | | 343,266 | |
| Yakult Honsha Co., Ltd. | | | 2,400 | | | | 75,452 | |
| Yamada Denki Co., Ltd. | | | 1,270 | | | | 86,511 | |
| Yamaguchi Financial Group, Inc. | | | 5,000 | | | | 47,644 | |
| Yamato Holdings Co., Ltd. | | | 14,600 | | | | 245,728 | |
| Yamazaki Baking Co., Ltd. | | | 5,000 | | | | 65,695 | |
| Yokogawa Electric Corp. † | | | 8,300 | | | | 74,529 | |
| Zensho Holdings Co., Ltd. | | | 4,900 | | | | 66,034 | |
| | | | | | | | |
| | | | | | | 16,388,340 | |
| | | | | | | | |
| Netherlands - 5.6% | | | | | | | | |
| ASML Holding NV | | | 6,895 | | | | 288,014 | |
| Koninklijke DSM NV | | | 1,137 | | | | 52,554 | |
| Koninklijke Vopak NV | | | 762 | | | | 40,182 | |
| Royal Dutch Shell PLC, Class A | | | 95,419 | | | | 3,478,103 | |
| Unilever NV CVA | | | 14,529 | | | | 499,559 | |
| | | | | | | | |
| | | | | | | 4,358,412 | |
| | | | | | | | |
| Norway - 1.2% | | | | | | | | |
| Golar LNG Ltd. | | | 2,009 | | | | 88,190 | |
| Seadrill Ltd. | | | 5,490 | | | | 183,086 | |
| Statoil ASA | | | 15,572 | | | | 398,804 | |
| Telenor ASA | | | 9,487 | | | | 155,243 | |
| TGS Nopec Geophysical Co. ASA | | | 3,376 | | | | 74,563 | |
| | | | | | | | |
| | | | | | | 899,886 | |
| | | | | | | | |
| Portugal - 0.3% | | | | | | | | |
| Galp Energia SGPS SA, Class B | | | 4,497 | | | | 66,072 | |
| Jeronimo Martins SGPS SA † | | | 6,068 | | | | 100,228 | |
| Portugal Telecom SGPS SA (a) | | | 7,413 | | | | 42,694 | |
| | | | | | | | |
| | | | | | | 208,994 | |
| | | | | | | | |
| Singapore - 2.3% | | | | | | | | |
| Ascendas Real Estate Investment Trust REIT | | | 52,000 | | | | 73,425 | |
| Dairy Farm International Holdings, Ltd. | | | 6,300 | | | | 58,863 | |
| Fraser and Neave Ltd. | | | 11,000 | | | | 52,511 | |
| Jardine Cycle & Carriage Ltd. | | | 2,000 | | | | 74,207 | |
| Jardine Matheson Holdings Ltd. | | | 9,600 | | | | 451,035 | |
| Jardine Strategic Holdings Ltd. | | | 7,000 | | | | 193,602 | |
| Noble Group Ltd. | | | 19,363 | | | | 16,824 | |
| SembCorp Industries Ltd. | | | 13,000 | | | | 40,548 | |
| SembCorp Marine Ltd. | | | 17,000 | | | | 49,961 | |
| | | | | | | | |
| | | SHARES | | | VALUE
(Note 3) | |
| Singapore - 2.3% (continued) | | | | | | | | |
| Singapore Telecommunications Ltd. | | | 285,000 | | | $ | 678,799 | |
| StarHub Ltd. | | | 33,000 | | | | 74,039 | |
| | | | | | | | |
| | | | | | | 1,763,814 | |
| | | | | | | | |
| Spain - 2.0% | | | | | | | | |
| Abertis Infraestructuras SA | | | 4,681 | | | | 74,389 | |
| CaixaBank | | | 13,314 | | | | 65,065 | |
| Ferrovial SA | | | 11,268 | | | | 135,506 | |
| Gas Natural SDG SA | | | 7,628 | | | | 130,736 | |
| Iberdrola SA | | | 22,830 | | | | 142,606 | |
| Inditex SA | | | 3,993 | | | | 325,968 | |
| Mapfre SA | | | 29,275 | | | | 92,596 | |
| Red Electrica Corp. SA | | | 2,354 | | | | 100,522 | |
| Repsol YPF SA (a) | | | 15,623 | | | | 477,990 | |
| | | | | | | | |
| | | | | | | 1,545,378 | |
| | | | | | | | |
| Sweden - 1.2% | | | | | | | | |
| Alfa Laval AB | | | 2,024 | | | | 38,224 | |
| Assa Abloy AB, Class B | | | 2,745 | | | | 68,640 | |
| Elekta AB, Class B | | | 1,681 | | | | 72,685 | |
| Getinge AB, B Shares | | | 4,444 | | | | 112,374 | |
| Industrivarden AB, Class C | | | 4,099 | | | | 48,721 | |
| Kinnevik Investment AB, Class B | | | 2,074 | | | | 40,311 | |
| Lundin Petroleum AB † | | | 3,113 | | | | 76,246 | |
| Meda AB, A Shares | | | 7,554 | | | | 78,388 | |
| Swedbank AB | | | 5,826 | | | | 75,182 | |
| Swedish Match AB | | | 4,571 | | | | 161,921 | |
| Tele2 AB, B Shares | | | 8,069 | | | | 156,374 | |
| | | | | | | | |
| | | | | | | 929,066 | |
| | | | | | | | |
| Switzerland - 2.4% | | | | | | | | |
| Geberit AG † | | | 236 | | | | 45,364 | |
| Roche Holding AG | | | 10,758 | | | | 1,819,375 | |
| | | | | | | | |
| | | | | | | 1,864,739 | |
| | | | | | | | |
| United Kingdom - 23.2% | | | | | | | | |
| Aggreko PLC | | | 7,624 | | | | 238,562 | |
| ARM Holdings PLC | | | 32,854 | | | | 303,258 | |
| Associated British Foods PLC | | | 4,384 | | | | 75,308 | |
| AstraZeneca PLC | | | 11,674 | | | | 539,246 | |
| BG Group PLC | | | 56,345 | | | | 1,203,734 | |
| BP PLC | | | 173,436 | | | | 1,235,435 | |
| British American Tobacco PLC | | | 32,025 | | | | 1,519,278 | |
| British Land Co. PLC REIT | | | 7,565 | | | | 54,297 | |
| British Sky Broadcasting Group PLC | | | 8,943 | | | | 101,747 | |
| BT Group PLC | | | 130,732 | | | | 387,514 | |
| Bunzl PLC | | | 7,883 | | | | 108,167 | |
| Burberry Group PLC | | | 10,227 | | | | 188,050 | |
| Compass Group PLC | | | 31,671 | | | | 300,519 | |
| CRH PLC | | | 13,354 | | | | 265,059 | |
| Croda International PLC | | | 3,164 | | | | 88,574 | |
| Diageo PLC | | | 42,091 | | | | 919,692 | |
| Experian PLC | | | 10,667 | | | | 144,992 | |
| Fresnillo PLC | | | 4,192 | | | | 99,328 | |
| G4S PLC | | | 22,026 | | | | 92,973 | |
| GlaxoSmithKline PLC | | | 79,897 | | | | 1,820,527 | |
| Hammerson PLC REIT | | | 10,324 | | | | 57,651 | |
| IMI PLC | | | 4,267 | | | | 50,367 | |
| | | | |
| | The accompanying notes are an integral part of these financial statements. | | (Continued) |
| | | | | | | | | | | | | | | | |
| 142 | | AQR Funds | | | | | | Annual Report | | | | | | December 2011 | | |
| | | | | | | | | | |
| | | | |
| Schedule of Investments | | | December 31, 2011 | |
| | |
| AQR INTERNATIONAL MOMENTUM FUND | | |
| | | | | | | | |
| | | SHARES | | | VALUE
(Note 3) | |
| United Kingdom - 23.2% (continued) | | | | | | | | |
| Imperial Tobacco Group PLC | | | 16,750 | | | $ | 633,829 | |
| International Power PLC | | | 27,719 | | | | 144,942 | |
| Intertek Group PLC | | | 2,171 | | | | 68,558 | |
| Kingfisher PLC | | | 42,770 | | | | 166,204 | |
| Land Securities Group PLC REIT | | | 11,094 | | | | 109,420 | |
| Legal & General Group PLC | | | 62,913 | | | | 100,540 | |
| Meggitt PLC | | | 17,966 | | | | 98,342 | |
| Mondi PLC | | | 7,018 | | | | 49,573 | |
| National Grid PLC | | | 66,060 | | | | 638,522 | |
| Next PLC | | | 4,208 | | | | 178,521 | |
| Pearson PLC | | | 15,946 | | | | 299,286 | |
| Petrofac Ltd. | | | 2,329 | | | | 52,089 | |
| Prudential PLC | | | 9,540 | | | | 94,390 | |
| Randgold Resources Ltd. | | | 1,618 | | | | 165,422 | |
| Reed Elsevier PLC | | | 9,377 | | | | 75,486 | |
| Resolution Ltd. | | | 18,139 | | | | 70,710 | |
| Rexam PLC | | | 12,637 | | | | 69,160 | |
| Rolls-Royce Holdings PLC † | | | 19,168 | | | | 221,930 | |
| Rolls-Royce Holdings PLC, Class C (3)†(b) | | | 690,966 | | | | 1,073 | |
| SABMiller PLC | | | 13,117 | | | | 461,149 | |
| Sage Group PLC/The | | | 14,253 | | | | 65,127 | |
| Severn Trent PLC | | | 3,568 | | | | 82,798 | |
| Shire PLC | | | 11,684 | | | | 406,067 | |
| Smith & Nephew PLC | | | 13,747 | | | | 133,413 | |
| SSE PLC | | | 20,596 | | | | 412,276 | |
| Standard Life PLC | | | 35,622 | | | | 114,133 | |
| Tate & Lyle PLC | | | 14,485 | | | | 158,358 | |
| Tullow Oil PLC | | | 15,029 | | | | 326,553 | |
| United Utilities Group PLC | | | 13,217 | | | | 124,280 | |
| Vodafone Group PLC | | | 800,723 | | | | 2,232,501 | |
| Weir Group PLC/The | | | 3,452 | | | | 108,958 | |
| WM Morrison Supermarkets PLC | | | 42,179 | | | | 213,341 | |
| Wolseley PLC | | | 2,380 | | | | 78,719 | |
| | | | | | | | |
| | | | | | | 17,949,948 | |
| | | | | | | | |
TOTAL COMMON STOCKS
(cost $73,318,116) | | | | | | | 76,076,219 | |
| | | | | | | | |
| | |
| PREFERRED STOCKS - 0.1% | | | | | | | | |
| | |
| Switzerland - 0.1% | | | | | | | | |
Schindler Holding AG
(cost $54,580) | | | 631 | | | | 73,347 | |
| | | | | | | | |
| | |
| EXCHANGE-TRADED FUNDS - 0.7% | | | | | | | | |
iShares MSCI EAFE Index Fund
(cost $550,117) | | | 11,271 | | | | 558,253 | |
| | | | | | | | |
| | |
| MONEY MARKET FUNDS - 0.0% (c) | | | | | | | | |
J.P. Morgan Prime Money Market
Fund - Capital Shares, 0.130% (d)
| | | | | | | | |
(cost $987) | | | 987 | | | | 987 | |
| | | | | | | | |
| | | | | | | | |
| | | SHARES | | | VALUE
(Note 3) | |
|
| INVESTMENTS OF CASH COLLATERAL FOR SECURITIES ON LOAN - 2.8% | |
J.P. Morgan Prime Money Market
Fund - Capital Shares, 0.130% (d)(e)
| | | | | | | | |
(cost $2,153,886) | | | 2,153,886 | | | $ | 2,153,886 | |
| | | | | | | | |
TOTAL INVESTMENTS - 102.1%
(cost $76,077,686) | | | | | | | 78,862,692 | |
| | | | | | | | |
| LIABILITIES IN EXCESS OF OTHER ASSETS - (2.1)% | | | | | | | (1,637,781) | |
| | | | | | | | |
NET ASSETS - 100.0% | | | | | | $ | 77,224,911 | |
| | | | | | | | |
| † | Non income-producing security. |
| (a) | All or a portion of the security on loan. The aggregate market value of such securities is $2,065,517; cash collateral of $2,153,886 was received with which the Fund purchased a money market fund. |
| (b) | Security fair valued at December 31, 2011 using procedures approved by the Board of Trustees. The total value of positions fair valued was $1,073 or 0.0% of total net assets. |
| (c) | Represents less than 0.05 percent of net assets. |
| (d) | Represents annualized seven-day yield as of December 31, 2011. |
| (e) | Represents security, or portion thereof, purchased with the cash collateral received for securities on loan. |
All securities are Level 2, with respect to ASC 820 unless otherwise noted in parentheses.
| (1) | Level 1 security (See Note 5). |
| (3) | Level 3 security (See Note 5). |
The following abbreviations are used in portfolio descriptions:
CVA - Dutch Certificate of Shares
REIT - Real Estate Investment Trust
| | | | | | | | |
| SECTOR | | VALUE | | | % OF NET
ASSETS | |
| Consumer Discretionary | | $ | 8,065,749 | | | | 10.4 | % |
| Consumer Staples | | | 9,875,763 | | | | 12.8 | |
| Energy | | | 13,371,830 | | | | 17.3 | |
| Financials | | | 7,908,469 | | | | 10.2 | |
| Health Care | | | 9,588,307 | | | | 12.4 | |
| Industrials | | | 7,609,258 | | | | 9.9 | |
| Information Technology | | | 3,359,681 | | | | 4.4 | |
| Materials | | | 5,672,955 | | | | 7.4 | |
| Mutual Fund | | | 558,253 | | | | 0.7 | |
| Telecommunication Services | | | 7,215,517 | | | | 9.3 | |
| Utilities | | | 3,482,037 | | | | 4.5 | |
| Money Market Funds | | | 2,154,873 | | | | 2.8 | |
| | | | | | | | |
Total Investments | | | 78,862,692 | | | | 102.1 | |
| Liabilities in Excess of Other Assets | | | (1,637,781) | | | | (2.1) | |
| | | | | | | | |
Net Assets | | $ | 77,224,911 | | | | 100.0 | % |
| | | | | | | | |
| | | | |
| | The accompanying notes are an integral part of these financial statements. | | |
| | | | | | | | | | | | | | | | |
| | AQR Funds | | | | | | Annual Report | | | | | | December 2011 | | 143 |
| | | | | | | | | | |
| | | | |
| Statements of Assets and Liabilities | | | December 31, 2011 | |
| | | | | | | | | | | | |
| | | AQR
GLOBAL
EQUITY
FUND | | | AQR
INTERNATIONAL
EQUITY
FUND | | | AQR
DIVERSIFIED
ARBITRAGE
FUND | |
| ASSETS: | | | | | | | | | | | | |
| Investments in securities, at cost | | | $371,461,859 | | | | $495,723,782 | | | | $2,580,587,345 | |
| | | | | | | | | | | | | |
| Investments in securities, at value* | | | $399,094,294 | | | | $485,906,472 | | | | $2,562,228,084 | |
| Cash (including foreign currency of $1,086,459, $1,169,530 and $—, respectively) | | | 1,087,219 | | | | 1,169,724 | | | | 1,117,766 | |
| Due from brokers | | | 5,583,765 | | | | 10,142,877 | | | | 476,027,165 | |
| Unrealized appreciation on forward foreign currency exchange contracts | | | — | | | | — | | | | 939,967 | |
| Swaps, at value | | | — | | | | — | | | | 10,348,073 | |
| Unrealized appreciation on futures contracts | | | 2,307,497 | | | | 4,046,142 | | | | — | |
| Receivables: | | | | | | | | | | | | |
Securities sold | | | 67,016 | | | | 252,744 | | | | 93,898,382 | |
Foreign tax reclaim | | | 475,460 | | | | 796,880 | | | | — | |
Dividends and interest | | | 624,442 | | | | 560,385 | | | | 13,783,393 | |
Capital shares sold | | | — | | | | 747,869 | | | | 4,249,070 | |
Prepaid expenses | | | 36,478 | | | | 45,207 | | | | 198,318 | |
| | | |
| Total Assets | | | 409,276,171 | | | | 503,668,300 | | | | 3,162,790,218 | |
| LIABILITIES: | | | | | | | | | | | | |
| Securities sold short, at value (proceeds $—, $— and $1,010,075,296, respectively) | | | — | | | | — | | | | 978,104,479 | |
| Options written, at value (proceeds $—, $— and $419,013, respectively) | | | — | | | | — | | | | 10,991 | |
| Due to brokers | | | — | | | | — | | | | 1,640,000 | |
| Unrealized depreciation on forward foreign currency exchange contracts | | | 175,797 | | | | 502,648 | | | | — | |
| Swaps, at value | | | 104,972 | | | | 819,294 | | | | — | |
| Unrealized depreciation on futures contracts | | | — | | | | — | | | | 1,187,460 | |
| Payables: | | | | | | | | | | | | |
Securities purchased | | | 134,153 | | | | 505,945 | | | | 67,153,005 | |
Collateral received on securities loaned | | | 6,787,138 | | | | 13,302,060 | | | | 686,099 | |
Accrued Investment advisory fees | | | 120,775 | | | | 178,883 | | | | 1,328,189 | |
Accrued Shareholder servicing fees | | | 1,067 | | | | 35,520 | | | | — | |
Accrued Distribution fees—Class N | | | 377 | | | | 246 | | | | 137,637 | |
Capital shares redeemed | | | 34,075 | | | | 16,208 | | | | 2,089,802 | |
Dividends and interest payable on securities sold short | | | — | | | | — | | | | 838,553 | |
Other accrued expenses and liabilities | | | 133,416 | | | | 230,121 | | | | 1,075,362 | |
| | | |
| Total Liabilities | | | 7,491,770 | | | | 15,590,925 | | | | 1,054,251,577 | |
| | | |
| Net Assets | | | $401,784,401 | | | | $488,077,375 | | | | $2,108,538,641 | |
| | | | | | | | | | | | | |
| NET ASSETS CONSIST OF: | | | | | | | | | | | | |
| Paid-in capital ($0.001 par value common stock, unlimited authorized shares) | | | $384,119,027 | | | | $519,281,644 | | | | $2,139,363,520 | |
| Undistributed (accumulated) net investment income (loss) | | | 3,812,624 | | | | 5,593,024 | | | | (1,386,575) | |
| Undistributed (accumulated) net realized gain (loss) | | | (16,174,225) | | | | (29,758,443) | | | | (39,375,929) | |
| Net unrealized appreciation (depreciation) | | | 30,026,975 | | | | (7,038,850) | | | | 9,937,625 | |
| | | |
| Net Assets | | | $401,784,401 | | | | $488,077,375 | | | | $2,108,538,641 | |
| | | | | | | | | | | | | |
| NET ASSETS: | | | | | | | | | | | | |
| Class I | | | $2,102,815 | | | | $138,229,387 | | | | $1,456,748,122 | |
| Class N | | | 2,019,253 | | | | 1,166,515 | | | | 651,790,519 | |
| Class Y | | | 397,662,333 | | | | 348,681,473 | | | | — | |
| SHARES OUTSTANDING: | | | | | | | | | | | | |
| Class I | | | 210,532 | | | | 16,066,790 | | | | 133,778,788 | |
| Class N | | | 202,461 | | | | 133,174 | | | | 60,071,714 | |
| Class Y | | | 39,780,661 | | | | 38,834,729 | | | | — | |
| NET ASSET VALUE AND PUBLIC OFFERING PRICE PER SHARE: | | | | | | | | | | | | |
| Class I | | | $9.99 | | | | $8.60 | | | | $10.89 | |
| Class N | | | $9.97 | | | | $8.76 | | | | $10.85 | |
| Class Y | | | $10.00 | | | | $8.98 | | | | — | |
| | | Foreign currency at cost of $1,081,726, $1,164,122 and $—, respectively. |
| | * | Investments in securities includes the market value of securities out on loan of $6,517,796, $12,763,613 and $592,984, respectively. |
| | | | |
| | The accompanying notes are an integral part of these financial statements. | | |
| | | | | | | | | | | | | | | | |
| 144 | | AQR Funds | | | | | | Annual Report | | | | | | December 2011 | | |
| | | | | | | | | | |
| | | | |
| Statements of Assets and Liabilities | | | December 31, 2011 | |
| | | | | | | | | | | | |
| | | AQR
MANAGED
FUTURES
STRATEGY
FUND** | | | AQR
RISK
PARITY
FUND** | | | AQR MULTI-
STRATEGY
ALTERNATIVE
FUND** | |
| ASSETS: | | | | | | | | | | | | |
| Investments in securities, at cost | | | $1,296,703,322 | | | | $368,600,926 | | | | $114,216,735 | |
| | | | | | | | | | | | | |
| Investments in securities, at value | | | $1,296,703,322 | | | | $367,279,442 | | | | $113,450,458 | |
| Cash (including foreign currency of $1,885,289, $6,901,852 and $90,402, respectively) | | | 148,578,215 | | | | 18,313,217 | | | | 157,162,815 | |
| Due from brokers | | | 88,048,261 | | | | 10,907,942 | | | | 97,547,705 | |
| Unrealized appreciation on forward foreign currency exchange contracts | | | 8,536,738 | | | | 1,193,754 | | | | — | |
| Swaps, at value | | | 2,005,815 | | | | 3,416,388 | | | | 830,822 | |
| Unrealized appreciation on futures contracts | | | 19,746,483 | | | | — | | | | 909,964 | |
| Receivables: | | | | | | | | | | | | |
Securities sold | | | — | | | | — | | | | 962,755 | |
Dividends and interest | | | 26,646 | | | | 519,906 | | | | 697,590 | |
Capital shares sold | | | 3,290,677 | | | | 1,039,357 | | | | 906,259 | |
Contributions from service provider | | | — | | | | 354,026 | | | | — | |
Prepaid expenses | | | 124,212 | | | | 37,678 | | | | 38,150 | |
| | | |
| Total Assets | | | 1,567,060,369 | | | | 403,061,710 | | | | 372,506,518 | |
| LIABILITIES: | | | | | | | | | | | | |
| Securities sold short, at value (proceeds $—, $— and $64,254,023, respectively) | | | — | | | | — | | | | 63,666,436 | |
| Due to brokers | | | 511 | | | | 2,560,000 | | | | 423,371 | |
| Unrealized depreciation on forward foreign currency exchange contracts | | | — | | | | — | | | | 622,538 | |
| Swaps, at value | | | 2,832,970 | | | | 4,195,971 | | | | 385,411 | |
| Unrealized depreciation on futures contracts | | | — | | | | 977,618 | | | | — | |
| Payables: | | | | | | | | | | | | |
Securities purchased | | | — | | | | 5,732,409 | | | | 1,025,622 | |
Accrued Investment advisory fees | | | 1,302,147 | | | | 172,911 | | | | 216,764 | |
Accrued Distribution fees—Class N | | | 102,661 | | | | 14,930 | | | | 6,480 | |
Capital shares redeemed | | | 6,532,255 | | | | 130,388 | | | | 4,063,654 | |
Dividends and interest payable on securities sold short | | | — | | | | — | | | | 43,177 | |
Other accrued expenses and liabilities | | | 773,451 | | | | 190,761 | | | | 208,301 | |
| | | |
| Total Liabilities | | | 11,543,995 | | | | 13,974,988 | | | | 70,661,754 | |
| | | |
| Net Assets | | | $1,555,516,374 | | | | $389,086,722 | | | | $301,844,764 | |
| | | | | | | | | | | | | |
| NET ASSETS CONSIST OF: | | | | | | | | | | | | |
| Paid-in capital ($0.001 par value common stock, unlimited authorized shares) | | | $1,600,188,241 | | | | $385,974,463 | | | | $306,248,985 | |
| Undistributed (accumulated) net investment income (loss) | | | 17,343,520 | | | | (3,415,164) | | | | (1,092,123) | |
| Undistributed (accumulated) net realized gain (loss) | | | (89,414,145) | | | | (334,603) | | | | (4,102,892) | |
| Net unrealized appreciation (depreciation) | | | 27,398,758 | | | | 6,862,026 | | | | 790,794 | |
| | | |
| Net Assets | | | $1,555,516,374 | | | | $389,086,722 | | | | $301,844,764 | |
| | | | | | | | | | | | | |
| NET ASSETS: | | | | | | | | | | | | |
| Class I | | | $1,078,662,373 | | | | $337,526,380 | | | | $257,168,435 | |
| Class N | | | 476,854,001 | | | | 51,560,342 | | | | 44,676,329 | |
| SHARES OUTSTANDING: | | | | | | | | | | | | |
| Class I | | | 112,731,031 | | | | 31,791,062 | | | | 26,521,933 | |
| Class N | | | 49,946,509 | | | | 4,868,266 | | | | 4,608,787 | |
| NET ASSET VALUE AND PUBLIC OFFERING PRICE PER SHARE: | | | | | | | | | | | | |
| Class I | | | $9.57 | | | | $10.62 | | | | $9.70 | |
| Class N | | | $9.55 | | | | $10.59 | | | | $9.69 | |
| | | Foreign currency at cost of $1,913,796, $6,902,994 and $94,056, respectively. |
| | ** | Consolidated financial statement, see Note 2 in the Notes to Financial Statements for additional information. |
| | | | |
| | The accompanying notes are an integral part of these financial statements. | | |
| | | | | | | | | | | | | | | | |
| | AQR Funds | | | | | | Annual Report | | | | | | December 2011 | | 145 |
| | | | | | | | | | |
| | | | |
| Statements of Assets and Liabilities | | | December 31, 2011 | |
| | | | | | | | | | | | |
| | | AQR
MOMENTUM
FUND | | | AQR
SMALL CAP
MOMENTUM
FUND | | | AQR
INTERNATIONAL
MOMENTUM
FUND | |
| ASSETS: | | | | | | | | | | | | |
| Investments in securities, at cost | | | $293,183,249 | | | | $95,676,147 | | | | $76,077,686 | |
| | | | | | | | | | | | | |
| Investments in securities, at value* | | | $310,352,935 | | | | $102,582,406 | | | | $78,862,692 | |
| Cash (including foreign currency of $—, $— and $31,813, respectively) | | | — | | | | — | | | | 163,825 | |
| Due from brokers | | | 112,350 | | | | 30,560 | | | | — | |
| Unrealized appreciation on futures contracts | | | 38,748 | | | | 16,188 | | | | — | |
| Receivables: | | | | | | | | | | | | |
Securities sold | | | — | | | | 767 | | | | — | |
Foreign tax reclaim | | | — | | | | — | | | | 16,548 | |
Dividends and interest | | | 383,060 | | | | 73,477 | | | | 242,883 | |
Capital shares sold | | | 121,235 | | | | 137,164 | | | | 181,324 | |
Due from Investment Advisor | | | — | | | | — | | | | 17,822 | |
Prepaid expenses | | | 25,908 | | | | 12,695 | | | | 11,684 | |
| | | |
| Total Assets | | | 311,034,236 | | | | 102,853,257 | | | | 79,496,778 | |
| LIABILITIES: | | | | | | | | | | | | |
| Due to custodian | | | — | | | | 9 | | | | — | |
| Payables: | | | | | | | | | | | | |
Collateral received on securities loaned | | | 7,396,308 | | | | 1,982,597 | | | | 2,153,886 | |
Accrued Investment advisory fees | | | 26,356 | | | | 6,978 | | | | — | |
Accrued Shareholder servicing fees | | | 38,164 | | | | 12,786 | | | | 10,058 | |
Capital shares redeemed | | | 654,573 | | | | 221,384 | | | | 10,520 | |
Other accrued expenses and liabilities | | | 163,551 | | | | 95,149 | | | | 97,403 | |
| | | |
| Total Liabilities | | | 8,278,952 | | | | 2,318,903 | | | | 2,271,867 | |
| | | |
| Net Assets | | | $302,755,284 | | | | $100,534,354 | | | | $77,224,911 | |
| | | | | | | | | | | | | |
| NET ASSETS CONSIST OF: | | | | | | | | | | | | |
| Paid-in capital ($0.001 par value common stock, unlimited authorized shares) | | | $306,818,095 | | | | $99,303,595 | | | | $86,975,005 | |
| Undistributed (accumulated) net investment income (loss) | | | 716,277 | | | | 30,383 | | | | 92,674 | |
| Undistributed (accumulated) net realized gain (loss) | | | (21,987,522) | | | | (5,722,071) | | | | (12,625,362) | |
| Net unrealized appreciation (depreciation) | | | 17,208,434 | | | | 6,922,447 | | | | 2,782,594 | |
| | | |
| Net Assets | | | $302,755,284 | | | | $100,534,354 | | | | $77,224,911 | |
| | | | | | | | | | | | | |
| NET ASSETS: | | | | | | | | | | | | |
| Class L | | | $302,755,284 | | | | $100,534,354 | | | | $77,224,911 | |
| SHARES OUTSTANDING: | | | | | | | | | | | | |
| Class L | | | 21,793,766 | | | | 7,238,497 | | | | 6,789,578 | |
| NET ASSET VALUE AND PUBLIC OFFERING PRICE PER SHARE: | | | | | | | | | | | | |
| Class L | | | $13.89 | | | | $13.89 | | | | $11.37 | |
| | | Foreign currency at cost of $—, $— and $31,814, respectively. |
| | * | Investments in securities includes the market value of securities out on loan of $7,154,113, $1,902,367 and $2,065,517, respectively. |
| | | | |
| | The accompanying notes are an integral part of these financial statements. | | |
| | | | | | | | | | | | | | | | |
| 146 | | AQR Funds | | | | | | Annual Report | | | | | | December 2011 | | |
| | | | | | | | | | |
| | | | |
| Statements of Operations | | | December 31, 2011 | |
| | | | | | | | | | | | |
| | | AQR
GLOBAL
EQUITY FUND | | | AQR
INTERNATIONAL
EQUITY FUND | | | AQR
DIVERSIFIED
ARBITRAGE FUND | |
| | | FOR THE
YEAR ENDED
DECEMBER 31,
2011 | | | FOR THE
YEAR ENDED
DECEMBER 31,
2011 | | | FOR THE
YEAR ENDED
DECEMBER 31,
2011 | |
| INVESTMENT INCOME: | | | | | | | | | | | | |
| Dividend income† | | | $11,386,761 | | | | $14,826,305 | | | | $15,958,855 | |
| Interest income | | | — | | | | — | | | | 50,256,791 | |
| Securities lending income, net | | | 267,732 | | | | 614,372 | | | | 1,224,371 | |
| Total Income | | | 11,654,493 | | | | 15,440,677 | | | | 67,440,017 | |
| | | |
| EXPENSES: | | | | | | | | | | | | |
| Investment advisory fees | | | 1,706,563 | | | | 2,189,627 | | | | 17,148,478 | |
| Shareholder servicing fees | | | 14,200 | | | | 394,697 | | | | — | |
| Custody, administration & accounting fees | | | 184,834 | | | | 231,607 | | | | 684,342 | |
| Legal fees | | | 49,669 | | | | 51,380 | | | | 412,229 | |
| Audit & tax fees | | | 44,627 | | | | 61,950 | | | | 197,060 | |
| Shareholder reporting fees | | | 13,709 | | | | 22,248 | | | | 803,280 | |
| Transfer agent fees | | | 14,493 | | | | 77,822 | | | | 2,204,058 | |
| Trustee fees | | | 32,637 | | | | 37,578 | | | | 111,585 | |
| Distribution fees—Class N | | | 4,086 | | | | 3,435 | | | | 1,227,046 | |
| Dividends and interest on securities sold short | | | — | | | | — | | | | 26,371,476 | |
| Other fees | | | 255,136 | | | | 240,859 | | | | 674,800 | |
| Total Expenses | | | 2,319,954 | | | | 3,311,203 | | | | 49,834,354 | |
| | | |
| Less waivers: | | | | | | | | | | | | |
Investment advisory fees waived | | | (47,932) | | | | (6,668) | | | | (1,170,872) | |
Shareholder servicing fees waived | | | (14,200) | | | | (4,809) | | | | — | |
| Net Expenses | | | 2,257,822 | | | | 3,299,726 | | | | 48,663,482 | |
| Net Investment Income (Loss) | | | 9,396,671 | | | | 12,140,951 | | | | 18,776,535 | |
| | | |
| REALIZED AND UNREALIZED GAIN (LOSS): | | | | | | | | | | | | |
| Net realized gain (loss) from: | | | | | | | | | | | | |
Investments in securities | | | 5,185,684 | | | | 1,532,860 | | | | 25,861,544 | |
Foreign currency and foreign currency translations | | | (265,440) | | | | (242,730) | | | | (860,729) | |
Forward foreign currency exchange contracts | | | (7,081,866) | | | | (10,271,626) | | | | (1,018,934) | |
Futures contracts | | | (9,506,900) | | | | (16,835,104) | | | | (11,070,615) | |
Securities sold short | | | — | | | | — | | | | (7,350,687) | |
Swap and swaps on futures contracts | | | 6,655,849 | | | | 4,549,756 | | | | 4,520,901 | |
Written options | | | — | | | | — | | | | 3,905,864 | |
| Net realized gain (loss) | | | (5,012,673) | | | | (21,266,844) | | | | 13,987,344 | |
| | | |
| Net change in unrealized appreciation (depreciation) on: | | | | | | | | | | | | |
Investments in securities | | | (30,776,087) | | | | (67,359,573) | | | | (124,770,226) | |
Foreign currency and foreign currency translations | | | (804,925) | | | | (44,984) | | | | 149,446 | |
Forward foreign currency exchange contracts | | | (2,466,542) | | | | (5,071,763) | | | | 1,226,432 | |
Futures contracts | | | 2,875,365 | | | | 5,304,818 | | | | (641,513) | |
Securities sold short | | | — | | | | — | | | | 103,880,201 | |
Swap and swaps on futures contracts | | | (598,500) | | | | (1,259,017) | | | | (1,540,741) | |
Written options | | | — | | | | — | | | | 272,061 | |
| Net change in unrealized appreciation (depreciation) | | | (31,770,689) | | | | (68,430,519) | | | | (21,424,340) | |
| Net gain (loss) and change in unrealized appreciation (depreciation) | | | (36,783,362) | | | | (89,697,363) | | | | (7,436,996) | |
| Net increase (decrease) in net assets resulting from operations | | | $(27,386,691) | | | | $(77,556,412) | | | | $11,339,539 | |
| | | | | | | | | | | | | |
† Net of foreign taxes withheld of | | | $615,667 | | | | $1,272,922 | | | | $32,608 | |
| | | | |
| | The accompanying notes are an integral part of these financial statements. | | |
| | | | | | | | | | | | | | | | |
| | AQR Funds | | | | | | Annual Report | | | | | | December 2011 | | 147 |
| | | | | | | | | | |
| | | | |
| Statements of Operations | | | December 31, 2011 | |
| | | | | | | | | | | | |
| | | AQR
MANAGED FUTURES
STRATEGY FUND** | | | AQR
RISK PARITY
FUND** | | | AQR
MULTI-STRATEGY
ALTERNATIVE FUND** | |
| | | FOR THE
YEAR ENDED
DECEMBER 31,
2011 | | | FOR THE
YEAR ENDED
DECEMBER 31,
2011 | | | FOR THE PERIOD
07/18/11*-12/31/11 | |
| INVESTMENT INCOME: | | | | | | | | | | | | |
| Dividend income | | | $361,550 | | | | $22,046 | | | | $27,713 | |
| Interest income | | | — | | | | 2,369,048 | | | | 781,128 | |
| Total Income | | | 361,550 | | | | 2,391,094 | | | | 808,841 | |
| | | |
| EXPENSES: | | | | | | | | | | | | |
| Investment advisory fees | | | 14,093,811 | | | | 1,283,044 | | | | 1,302,627 | |
| Custody, administration & accounting fees | | | 742,522 | | | | 95,470 | | | | 35,562 | |
| Legal fees | | | 178,030 | | | | 16,587 | | | | 22,932 | |
| Audit & tax fees | | | 125,578 | | | | 137,249 | | | | 140,746 | |
| Shareholder reporting fees | | | 376,832 | | | | 70,161 | | | | 62,764 | |
| Transfer agent fees | | | 1,550,212 | | | | 122,009 | | | | 48,562 | |
| Trustee fees | | | 79,548 | | | | 8,930 | | | | 3,397 | |
| Organization and offering costs | | | — | | | | — | | | | 101,582 | |
| Distribution fees—Class N | | | 1,065,682 | | | | 110,899 | | | | 24,772 | |
| Dividends and interest on securities sold short | | | — | | | | — | | | | 182,598 | |
| Other fees | | | 366,144 | | | | 134,065 | | | | 61,517 | |
| Total Expenses | | | 18,578,359 | | | | 1,978,414 | | | | 1,987,059 | |
| | | |
| Less waivers: | | | | | | | | | | | | |
Investment advisory fees waived | | | (737,986) | | | | (241,718) | | | | (382,473) | |
| Net Expenses | | | 17,840,373 | | | | 1,736,696 | | | | 1,604,586 | |
| Net Investment Income (Loss) | | | (17,478,823) | | | | 654,398 | | | | (795,745) | |
| | | |
| REALIZED AND UNREALIZED GAIN (LOSS): | | | | | | | | | | | | |
| Net realized gain (loss) from: | | | | | | | | | | | | |
Investments in securities | | | (15,411) | | | | (14,245) | | | | (110,118) | |
Foreign currency and foreign currency translations | | | (223,625) | | | | (135,451) | | | | (38,587) | |
Forward foreign currency exchange contracts | | | (54,819,534) | | | | 728,764 | | | | (3,663,069) | |
Futures contracts | | | (30,306,211) | | | | (6,842,183) | | | | 1,400,310 | |
Securities sold short | | | — | | | | — | | | | 436,184 | |
Swap and swaps on futures contracts | | | 8,804,432 | | | | 5,425,098 | | | | (1,114,099) | |
Voluntary reimbursement by Adviser for investment transaction losses | | | — | | | | — | | | | 208,438 | |
| Net realized gain (loss) | | | (76,560,349) | | | | (838,017) | | | | (2,880,941) | |
| | | |
| Net change in unrealized appreciation (depreciation) on: | | | | | | | | | | | | |
Investments in securities | | | — | | | | (1,167,733) | | | | (766,277) | |
Foreign currency and foreign currency translations | | | (56,522) | | | | (8,177) | | | | (16,810) | |
Forward foreign currency exchange contracts | | | 2,289,329 | | | | 1,148,132 | | | | (622,538) | |
Futures contracts | | | 8,959,326 | | | | (1,337,796) | | | | 909,964 | |
Securities sold short | | | — | | | | — | | | | 587,587 | |
Swap and swaps on futures contracts | | | (4,104,481) | | | | 8,014,935 | | | | 698,868 | |
| Net change in unrealized appreciation (depreciation) | | | 7,087,652 | | | | 6,649,361 | | | | 790,794 | |
| Net gain (loss) and change in unrealized appreciation (depreciation) | | | (69,472,697) | | | | 5,811,344 | | | | (2,090,147) | |
| Net increase (decrease) in net assets resulting from operations | | | $(86,951,520) | | | | $6,465,742 | | | | $(2,885,892) | |
| | | | | | | | | | | | | |
| | * | Commencement of operations |
| | ** | Consolidated financial statement, see Note 2 in the Notes to Financial Statements for additional information. |
| | | | |
| | The accompanying notes are an integral part of these financial statements. | | |
| | | | | | | | | | | | | | | | |
| 148 | | AQR Funds | | | | | | Annual Report | | | | | | December 2011 | | |
| | | | | | | | | | |
| | | | |
| Statements of Operations | | | December 31, 2011 | |
| | | | | | | | | | | | |
| | | AQR
MOMENTUM
FUND | | | AQR
SMALL CAP
MOMENTUM FUND | | | AQR
INTERNATIONAL
MOMENTUM
FUND | |
| | | FOR THE
YEAR ENDED
DECEMBER 31,
2011 | | | FOR THE
YEAR ENDED
DECEMBER 31,
2011 | | | FOR THE
YEAR ENDED
DECEMBER 31,
2011 | |
| INVESTMENT INCOME: | | | | | | | | | | | | |
| Dividend income† | | | $3,679,770 | | | | $757,224 | | | | $2,108,121 | |
| Interest income | | | 1,842 | | | | 1,780 | | | | — | |
| Securities lending income, net | | | 11,029 | | | | 47,461 | | | | 56,414 | |
| | | |
| Total Income | | | 3,692,641 | | | | 806,465 | | | | 2,164,535 | |
| | | |
| EXPENSES: | | | | | | | | | | | | |
| Investment advisory fees | | | 588,539 | | | | 308,523 | | | | 262,162 | |
| Shareholder servicing fees | | | 353,125 | | | | 132,225 | | | | 112,356 | |
| Custody, administration & accounting fees | | | 91,909 | | | | 76,874 | | | | 66,838 | |
| Legal fees | | | 19,875 | | | | 2,198 | | | | 3,180 | |
| Audit & tax fees | | | 59,139 | | | | 59,139 | | | | 66,976 | |
| Shareholder reporting fees | | | 98,829 | | | | 31,248 | | | | 29,822 | |
| Transfer agent fees | | | 281,624 | | | | 94,259 | | | | 86,975 | |
| Trustee fees | | | 13,632 | | | | 5,407 | | | | 5,178 | |
| Other fees | | | 81,740 | | | | 40,989 | | | | 89,887 | |
| Total Expenses | | | 1,588,412 | | | | 750,862 | | | | 723,374 | |
| | | |
| Less waivers: | | | | | | | | | | | | |
Investment advisory fees waived | | | (65,231) | | | | (39,405) | | | | (118,251) | |
Shareholder servicing fees waived | | | (353,125) | | | | (132,225) | | | | (112,356) | |
| | | |
| Net Expenses | | | 1,170,056 | | | | 579,232 | | | | 492,767 | |
| | | |
| Net Investment Income (Loss) | | | 2,522,585 | | | | 227,233 | | | | 1,671,768 | |
| | | |
| REALIZED AND UNREALIZED GAIN (LOSS): | | | | | | | | | | | | |
| Net realized gain (loss) from: | | | | | | | | | | | | |
Investments in securities | | | (21,196,557) | | | | (5,164,687) | | | | (12,204,603) | |
Foreign currency and foreign currency translations | | | — | | | | — | | | | 285,327 | |
Forward foreign currency exchange contracts | | | — | | | | — | | | | (260,164) | |
Futures contracts | | | (644,981) | | | | (522,699) | | | | — | |
Swap and swaps on futures contracts | | | — | | | | — | | | | 7,848 | |
| | | |
| Net realized gain (loss) | | | (21,841,538) | | | | (5,687,386) | | | | (12,171,592) | |
| | | |
| Net change in unrealized appreciation (depreciation) on: | | | | | | | | | | | | |
Investments in securities | | | 6,981,783 | | | | 1,206,056 | | | | (3,040,622) | |
Foreign currency and foreign currency translations | | | — | | | | — | | | | (38,658) | |
Forward foreign currency exchange contracts | | | — | | | | — | | | | (10,442) | |
Futures contracts | | | 40,182 | | | | 27,497 | | | | — | |
Swap and swaps on futures contracts | | | — | | | | — | | | | (72,399) | |
| | | |
| Net change in unrealized appreciation (depreciation) | | | 7,021,965 | | | | 1,233,553 | | | | (3,162,121) | |
| | | |
| Net gain (loss) and change in unrealized appreciation (depreciation) | | | (14,819,573) | | | | (4,453,833) | | | | (15,333,713) | |
| | | |
| Net increase (decrease) in net assets resulting from operations | | | $(12,296,988) | | | | $(4,226,600) | | | | $(13,661,945) | |
| | | | | | | | | | | | | |
† Net of foreign taxes withheld of | | | $— | | | | $— | | | | $181,126 | |
| | | | |
| | The accompanying notes are an integral part of these financial statements. | | |
| | | | | | | | | | | | | | | | |
| | AQR Funds | | | | | | Annual Report | | | | | | December 2011 | | 149 |
| | | | | | | | | | |
| | | | |
| Statements of Changes in Net Assets | | | December 31, 2011 | |
| | | | | | | | | | | | | | | | |
| | | AQR GLOBAL
EQUITY FUND | | | AQR INTERNATIONAL
EQUITY FUND | |
| | | FOR THE
YEAR ENDED
DECEMBER 31,
2011 | | | FOR THE
YEAR ENDED
DECEMBER 31,
2010 | | | FOR THE
YEAR ENDED
DECEMBER 31,
2011 | | | FOR THE
YEAR ENDED
DECEMBER 31,
2010 | |
| OPERATIONS: | | | | | | | | | | | | | | | | |
| Net investment income (loss) | | | $9,396,671 | | | | $6,758,950 | | | | $12,140,951 | | | | $8,347,504 | |
| Net realized gain (loss) | | | (5,012,673) | | | | 19,174,656 | | | | (21,266,844) | | | | 10,063,553 | |
| Net change in unrealized appreciation (depreciation) | | | (31,770,689) | | | | 28,446,319 | | | | (68,430,519) | | | | 27,034,263 | |
Net increase (decrease) in net assets resulting from operations | | | (27,386,691) | | | | 54,379,925 | | | | (77,556,412) | | | | 45,445,320 | |
| | | |
| DISTRIBUTIONS TO SHAREHOLDERS: | | | | | | | | | | | | | |
| Net investment income: | | | | | | | | | | | | | | | | |
Class I | | | (22,319) | | | | (57,496) | | | | (3,204,118) | | | | (1,939,218) | |
Class N | | | (14,377) | | | | (43,413) | | | | (20,121) | | | | (30,891) | |
Class Y | | | (6,318,978) | | | | (14,066,551) | | | | (8,730,438) | | | | (8,858,115) | |
Total | | | (6,355,674) | | | | (14,167,460) | | | | (11,954,677) | | | | (10,828,224) | |
| Net realized gain: | | | | | | | | | | | | | | | | |
Class I | | | (27,548) | | | | (12,252) | | | | (1,042,406) | | | | (751,420) | |
Class N | | | (21,102) | | | | (10,061) | | | | (8,687) | | | | (12,796) | |
Class Y | | | (5,068,282) | | | | (2,827,146) | | | | (2,482,902) | | | | (3,126,673) | |
Total | | | (5,116,932) | | | | (2,849,459) | | | | (3,533,995) | | | | (3,890,889) | |
Total distributions | | | (11,472,606) | | | | (17,016,919) | | | | (15,488,672) | | | | (14,719,113) | |
| | | | |
| CAPITAL TRANSACTIONS: | | | | | | | | | | | | | | | | |
| CLASS I | | | | | | | | | | | | | | | | |
| Proceeds from shares sold | | | 2,662,793 | | | | 1,656,523 | | | | 100,254,223 | | | | 44,905,053 | |
| Reinvestment of distributions | | | 49,867 | | | | 69,748 | | | | 4,080,915 | | | | 2,584,353 | |
| Cost of shares redeemed | | | (1,826,180) | | | | — | | | | (19,241,187) | | | | (12,356,169) | |
| Redemption fees | | | — | | | | — | | | | 2,037 | | | | 92 | |
| | | | |
| Net increase (decrease) from capital transactions | | | 886,480 | | | | 1,726,271 | | | | 85,095,988 | | | | 35,133,329 | |
| CLASS N | | | | | | | | | | | | | | | | |
| Proceeds from shares sold | | | 1,035,527 | | | | 2,068,625 | | | | 92,400 | | | | 1,454,807 | |
| Reinvestment of distributions | | | 35,479 | | | | 52,615 | | | | 28,595 | | | | 42,682 | |
| Cost of shares redeemed | | | (392,823) | | | | (754,495) | | | | (178,203) | | | | (97,610) | |
| Redemption fees | | | — | | | | 2 | | | | — | | | | — | |
| | | | |
| Net increase (decrease) from capital transactions | | | 678,183 | | | | 1,366,747 | | | | (57,208) | | | | 1,399,879 | |
| CLASS Y | | | | | | | | | | | | | | | | |
| Proceeds from shares sold | | | 6,057 | | | | — | | | | 49,085,024 | | | | 3,598,979 | |
| In-kind subscription (See Note 11) | | | — | | | | 370,340,997 | | | | — | | | | — | |
| Reinvestment of distributions | | | 11,387,260 | | | | 16,893,697 | | | | 11,213,340 | | | | 11,984,789 | |
| Cost of shares redeemed | | | — | | | | (5,000) | | | | (23,486,766) | | | | (28,131,786) | |
| Redemption fees | | | — | | | | — | | | | 31,881 | | | | 15,873 | |
| | | | |
| Net increase (decrease) from capital transactions | | | 11,393,317 | | | | 387,229,694 | | | | 36,843,479 | | | | (12,532,145) | |
| | | | |
| Net increase (decrease) in net assets resulting from capital transactions | | | 12,957,980 | | | | 390,322,712 | | | | 121,882,259 | | | | 24,001,063 | |
| Total increase (decrease) in net assets | | | (25,901,317) | | | | 427,685,718 | | | | 28,837,175 | | | | 54,727,270 | |
| | | | |
| NET ASSETS: | | | | | | | | | | | | | | | | |
| Beginning of period | | | 427,685,718 | | | | — | | | | 459,240,200 | | | | 404,512,930 | |
| End of period | | | $401,784,401 | | | | $427,685,718 | | | | $488,077,375 | | | | $459,240,200 | |
| | | | | | | | | | | | | | | | | |
| Undistributed accumulated net investment income (loss) at end of year | | | $3,812,624 | | | | $1,172,016 | | | | $5,593,024 | | | | $5,785,081 | |
| | | | |
| | The accompanying notes are an integral part of these financial statements. | | (continued on p. 151) |
| | | | | | | | | | | | | | | | |
| 150 | | AQR Funds | | | | | | Annual Report | | | | | | December 2011 | | |
| | | | | | | | | | |
| | | | |
| Statements of Changes in Net Assets | | | December 31, 2011 | |
| | | | | | | | | | | | | | | | |
| | | AQR GLOBAL
EQUITY FUND | | | AQR INTERNATIONAL
EQUITY FUND | |
| | | FOR THE
YEAR ENDED
DECEMBER 31,
2011 | | | FOR THE
YEAR ENDED
DECEMBER 31,
2010 | | | FOR THE
YEAR ENDED
DECEMBER 31,
2011 | | | FOR THE
YEAR ENDED
DECEMBER 31,
2010 | |
| CHANGES IN SHARES OUTSTANDING: | | | | | | | | | | | | | |
| CLASS I | | | | | | | | | | | | | | | | |
| Shares outstanding, beginning of period | | | 167,896 | | | | — | | | | 8,227,394 | | | | 4,502,376 | |
| Shares sold | | | 226,766 | | | | 161,426 | | | | 9,343,360 | | | | 4,730,717 | |
| Shares issued on reinvestment of distributions | | | 5,184 | | | | 6,470 | | | | 492,270 | | | | 253,120 | |
| Shares redeemed | | | (189,314) | | | | — | | | | (1,996,234) | | | | (1,258,819) | |
| | | | |
| Shares outstanding, end of period | | | 210,532 | | | | 167,896 | | | | 16,066,790 | | | | 8,227,394 | |
| CLASS N | | | | | | | | | | | | | | | | |
| Shares outstanding, beginning of period | | | 136,540 | | | | — | | | | 138,711 | | | | 584 | |
| Shares sold | | | 100,038 | | | | 203,862 | | | | 9,129 | | | | 144,573 | |
| Shares issued on reinvestment of distributions | | | 3,692 | | | | 4,880 | | | | 3,388 | | | | 4,116 | |
| Shares redeemed | | | (37,809) | | | | (72,202) | | | | (18,054) | | | | (10,562) | |
| | | | |
| Shares outstanding, end of period | | | 202,461 | | | | 136,540 | | | | 133,174 | | | | 138,711 | |
| CLASS Y | | | | | | | | | | | | | | | | |
| Shares outstanding, beginning of period | | | 38,596,429 | | | | — | | | | 34,152,071 | | | | 35,486,692 | |
| Shares sold | | | 525 | | | | — | | | | 5,482,006 | | | | 343,970 | |
| Shares issued in connection with in-kind subscription (See Note 11) | | | — | | | | 37,034,100 | | | | — | | | | — | |
| Shares issued on reinvestment of distributions | | | 1,183,707 | | | | 1,562,784 | | | | 1,296,340 | | | | 1,126,390 | |
| Shares redeemed | | | — | | | | (455) | | | | (2,095,688) | | | | (2,804,981) | |
| | | | |
| Shares outstanding, end of period | | | 39,780,661 | | | | 38,596,429 | | | | 38,834,729 | | | | 34,152,071 | |
| | | | |
| | The accompanying notes are an integral part of these financial statements. | | |
| | | | | | | | | | | | | | | | |
| | AQR Funds | | | | | | Annual Report | | | | | | December 2011 | | 151 |
| | | | | | | | | | |
| | | | |
| Statements of Changes in Net Assets | | | December 31, 2011 | |
| | | | | | | | | | | | | | | | |
| | | AQR DIVERSIFIED
ARBITRAGE FUND | | | AQR MANAGED FUTURES
STRATEGY FUND** | |
| | | FOR THE
YEAR ENDED
DECEMBER 31,
2011 | | | FOR THE
YEAR ENDED
DECEMBER 31,
2010 | | | FOR THE
YEAR ENDED
DECEMBER 31,
2011 | | | FOR THE PERIOD
1/06/10*-12/31/10 | |
| OPERATIONS: | | | | | | | | | | | | | | | | |
| Net investment income (loss) | | | $18,776,535 | | | | $6,921,419 | | | | $(17,478,823) | | | | $(3,689,893) | |
| Net realized gain (loss) | | | 13,987,344 | | | | 6,466,867 | | | | (76,560,349) | | | | 26,125,282 | |
| Net change in unrealized appreciation (depreciation) | | | (21,424,340) | | | | 26,362,020 | | | | 7,087,652 | | | | 20,311,106 | |
Net increase (decrease) in net assets resulting from operations | | | 11,339,539 | | | | 39,750,306 | | | | (86,951,520) | | | | 42,746,495 | |
| | | | |
| DISTRIBUTIONS TO SHAREHOLDERS: | | | | | | | | | | | | | | | | |
| Net investment income: | | | | | | | | | | | | | | | | |
Class I | | | (11,719,651) | | | | (2,529,523) | | | | (4,266,973) | | | | (4,988,075) | |
Class N | | | (3,932,191) | | | | (496,243) | | | | (878,801) | | | | (1,283,887) | |
Total | | | (15,651,842) | | | | (3,025,766) | | | | (5,145,774) | | | | (6,271,962) | |
| Net realized gain: | | | | | | | | | | | | | | | | |
Class I | | | (35,178,186) | | | | (9,148,432) | | | | (4,032,084) | | | | (8,519,610) | |
Class N | | | (16,128,531) | | | | (4,389,758) | | | | (1,840,539) | | | | (2,443,893) | |
Total | | | (51,306,717) | | | | (13,538,190) | | | | (5,872,623) | | | | (10,963,503) | |
Total distributions | | | (66,958,559) | | | | (16,563,956) | | | | (11,018,397) | | | | (17,235,465) | |
| | | | |
| CAPITAL TRANSACTIONS: | | | | | | | | | | | | | | | | |
| CLASS I | | | | | | | | | | | | | | | | |
| Proceeds from shares sold | | | 1,014,567,810 | | | | 744,268,095 | | | | 729,947,536 | | | | 658,743,237 | |
| Contributions from Adviser | | | — | | | | 354,186 | | | | — | | | | — | |
| Reinvestment of distributions | | | 41,800,931 | | | | 10,961,113 | | | | 7,389,845 | | | | 13,031,535 | |
| Cost of shares redeemed | | | (385,285,948) | | | | (105,043,527) | | | | (246,691,399) | | | | (33,812,899) | |
| Redemption fees | | | — | | | | 29 | | | | 20,254 | | | | 12,633 | |
| | | | |
| Net increase (decrease) from capital transactions | | | 671,082,793 | | | | 650,539,896 | | | | 490,666,236 | | | | 637,974,506 | |
| CLASS N | | | | | | | | | | | | | | | | |
| Proceeds from shares sold | | | 452,133,887 | | | | 366,554,088 | | | | 423,947,640 | | | | 289,880,071 | |
| Contributions from Adviser | | | — | | | | 190,013 | | | | — | | | | — | |
| Reinvestment of distributions | | | 19,853,899 | | | | 4,779,404 | | | | 2,697,407 | | | | 3,704,252 | |
| Cost of shares redeemed | | | (185,908,766) | | | | (77,340,720) | | | | (192,116,250) | | | | (28,806,659) | |
| Redemption fees | | | 58 | | | | 5,055 | | | | 10,871 | | | | 17,187 | |
| | | | |
| Net increase (decrease) from capital transactions | | | 286,079,078 | | | | 294,187,840 | | | | 234,539,668 | | | | 264,794,851 | |
| | | | |
| Net increase (decrease) in net assets resulting from capital transactions | | | 957,161,871 | | | | 944,727,736 | | | | 725,205,904 | | | | 902,769,357 | |
| Total increase (decrease) in net assets | | | 901,542,851 | | | | 967,914,086 | | | | 627,235,987 | | | | 928,280,387 | |
| | | | |
| NET ASSETS: | | | | | | | | | | | | | | | | |
| Beginning of period | | | 1,206,995,790 | | | | 239,081,704 | | | | 928,280,387 | | | | — | |
| End of period | | | $2,108,538,641 | | | | $1,206,995,790 | | | | $1,555,516,374 | | | | $928,280,387 | |
| | | | | | | | | | | | | | | | | |
| Undistributed accumulated net investment income (loss) at end of year | | | $(1,386,575) | | | | $2,523,534 | | | | $17,343,520 | | | | $2,742,185 | |
| | | | |
| | The accompanying notes are an integral part of these financial statements. | | (continued on p. 153) |
| | | | | | | | | | | | | | | | |
| 152 | | AQR Funds | | | | | | Annual Report | | | | | | December 2011 | | |
| | | | | | | | | | |
| | | | |
| Statements of Changes in Net Assets | | | December 31, 2011 | |
| | | | | | | | | | | | | | | | |
| | | AQR DIVERSIFIED
ARBITRAGE FUND | | | AQR MANAGED FUTURES
STRATEGY FUND** | |
| | | FOR THE
YEAR ENDED
DECEMBER 31,
2011 | | | FOR THE
YEAR ENDED
DECEMBER 31,
2010 | | | FOR THE
YEAR ENDED
DECEMBER 31,
2011 | | | FOR THE PERIOD
1/06/10*-12/31/10 | |
| CHANGES IN SHARES OUTSTANDING: | | | | | | | | | | | | | | | | |
| CLASS I | | | | | | | | | | | | | | | | |
| Shares outstanding, beginning of period | | | 73,942,810 | | | | 14,819,735 | | | | 63,824,670 | | | | — | |
| Shares sold | | | 90,365,152 | | | | 67,644,901 | | | | 73,078,580 | | | | 65,937,073 | |
| Shares issued on reinvestment of distributions | | | 3,838,469 | | | | 990,163 | | | | 763,414 | | | | 1,286,430 | |
| Shares redeemed | | | (34,367,643) | | | | (9,511,989) | | | | (24,935,633) | | | | (3,398,833) | |
| | | | |
| Shares outstanding, end of period | | | 133,778,788 | | | | 73,942,810 | | | | 112,731,031 | | | | 63,824,670 | |
| CLASS N | | | | | | | | | | | | | | | | |
| Shares outstanding, beginning of period | | | 34,430,118 | | | | 7,332,864 | | | | 26,365,662 | | | | — | |
| Shares sold | | | 40,438,007 | | | | 33,746,669 | | | | 42,737,324 | | | | 28,893,378 | |
| Shares issued on reinvestment of distributions | | | 1,829,852 | | | | 432,917 | | | | 279,235 | | | | 366,394 | |
| Shares redeemed | | | (16,626,263) | | | | (7,082,332) | | | | (19,435,712) | | | | (2,894,110) | |
| | | | |
| Shares outstanding, end of period | | | 60,071,714 | | | | 34,430,118 | | | | 49,946,509 | | | | 26,365,662 | |
| | * | Commencement of operations. |
| | ** | Consolidated financial statement, see Note 2 in the Notes to Financial Statements for additional information. |
| | | | |
| | The accompanying notes are an integral part of these financial statements. | | |
| | | | | | | | | | | | | | | | |
| | AQR Funds | | | | | | Annual Report | | | | | | December 2011 | | 153 |
| | | | | | | | | | |
| | | | |
| Statements of Changes in Net Assets | | | December 31, 2011 | |
| | | | | | | | | | | | |
| | | AQR RISK
PARITY FUND** | | | AQR
MULTI-STRATEGY
ALTERNATIVE FUND** | |
| | | FOR THE
YEAR ENDED
DECEMBER 31,
2011 | | | FOR THE PERIOD
9/30/10*-12/31/10 | | | FOR THE PERIOD
7/18/11*-12/31/11 | |
| OPERATIONS: | | | | | | | | | | | | |
| Net investment income (loss) | | | $654,398 | | | | $15,932 | | | | $(795,745) | |
| Net realized gain (loss) | | | (838,017) | | | | 404,456 | | | | (2,880,941) | |
| Net change in unrealized appreciation (depreciation) | | | 6,649,361 | | | | 212,665 | | | | 790,794 | |
Net increase (decrease) in net assets resulting from operations | | | 6,465,742 | | | | 633,053 | | | | (2,885,892) | |
| | | |
| DISTRIBUTIONS TO SHAREHOLDERS: | | | | | | | | | | | | |
| Net investment income: | | | | | | | | | | | | |
Class I | | | (5,049,564) | | | | (127,380) | | | | (937,657) | |
Class N | | | (1,569,186) | | | | (121,230) | | | | (105,452) | |
Total | | | (6,618,750) | | | | (248,610) | | | | (1,043,109) | |
| Net realized gain: | | | | | | | | | | | | |
Class I | | | (66,070) | | | | — | | | | — | |
Class N | | | (21,926) | | | | — | | | | — | |
Total | | | (87,996) | | | | — | | | | — | |
Total distributions | | | (6,706,746) | | | | (248,610) | | | | (1,043,109) | |
| | | |
| CAPITAL TRANSACTIONS: | | | | | | | | | | | | |
| CLASS I | | | | | | | | | | | | |
| Proceeds from shares sold | | | 353,204,416 | | | | 12,413,848 | | | | 294,713,422 | |
| Contributions from service provider or Adviser | | | 305,701 | | | | — | | | | — | |
| Reinvestment of distributions | | | 4,940,908 | | | | 127,380 | | | | 908,123 | |
| Cost of shares redeemed | | | (34,286,993) | | | | (12,269) | | | | (35,134,145) | |
| Redemption fees | | | 2,899 | | | | — | | | | — | |
| | | |
| Net increase (decrease) from capital transactions | | | 324,166,931 | | | | 12,528,959 | | | | 260,487,400 | |
| CLASS N | | | | | | | | | | | | |
| Proceeds from shares sold | | | 96,623,560 | | | | 11,092,756 | | | | 56,013,187 | |
| Contributions from service provider or Adviser | | | 48,325 | | | | — | | | | — | |
| Reinvestment of distributions | | | 729,224 | | | | 120,969 | | | | 105,452 | |
| Cost of shares redeemed | | | (56,223,377) | | | | (145,014) | | | | (10,832,274) | |
| Redemption fees | | | 518 | | | | 432 | | | | — | |
| | | |
| Net increase (decrease) from capital transactions | | | 41,178,250 | | | | 11,069,143 | | | | 45,286,365 | |
| | | |
| Net increase (decrease) in net assets resulting from capital transactions | | | 365,345,181 | | | | 23,598,102 | | | | 305,773,765 | |
| Total increase (decrease) in net assets | | | 365,104,177 | | | | 23,982,545 | | | | 301,844,764 | |
| | | |
| NET ASSETS: | | | | | | | | | | | | |
| Beginning of period | | | 23,982,545 | | | | — | | | | — | |
| End of period | | | $389,086,722 | | | | $23,982,545 | | | | $301,844,764 | |
| | | | | | | | | | | | | |
| Undistributed accumulated net investment income (loss) at end of year | | | $(3,415,164) | | | | $47,308 | | | | $(1,092,123) | |
| | | | |
| | The accompanying notes are an integral part of these financial statements. | | (continued on p. 155) |
| | | | | | | | | | | | | | | | |
| 154 | | AQR Funds | | | | | | Annual Report | | | | | | December 2011 | | |
| | | | | | | | | | |
| | | | |
| Statements of Changes in Net Assets | | | December 31, 2011 | |
| | | | | | | | | | | | |
| | | AQR RISK
PARITY FUND** | | | AQR
MULTI-STRATEGY
ALTERNATIVE FUND** | |
| | | FOR THE
YEAR ENDED
DECEMBER 31,
2011 | | | FOR THE PERIOD
9/30/10*-12/31/10 | | | FOR THE PERIOD
7/18/11*-12/31/11 | |
| CHANGES IN SHARES OUTSTANDING: | | | | | | | | | | | | |
| CLASS I | | | | | | | | | | | | |
| Shares outstanding, beginning of period | | | 1,240,567 | | | | — | | | | — | |
| Shares sold | | | 33,312,865 | | | | 1,229,100 | | | | 30,030,309 | |
| Shares issued on reinvestment of distributions | | | 473,267 | | | | 12,687 | | | | 93,141 | |
| Shares redeemed | | | (3,235,637) | | | | (1,220) | | | | (3,601,517) | |
| | | |
| Shares outstanding, end of period | | | 31,791,062 | | | | 1,240,567 | | | | 26,521,933 | |
| CLASS N | | | | | | | | | | | | |
| Shares outstanding, beginning of period | | | 1,094,489 | | | | — | | | | — | |
| Shares sold | | | 9,042,347 | | | | 1,096,773 | | | | 5,701,028 | |
| Shares issued on reinvestment of distributions | | | 70,051 | | | | 12,061 | | | | 10,815 | |
| Shares redeemed | | | (5,338,621) | | | | (14,345) | | | | (1,103,056) | |
| | | |
| Shares outstanding, end of period | | | 4,868,266 | | | | 1,094,489 | | | | 4,608,787 | |
| | * | Commencement of operations. |
| | ** | Consolidated financial statement, see Note 2 in the Notes to Financial Statements for additional information. |
| | | | |
| | The accompanying notes are an integral part of these financial statements. | | |
| | | | | | | | | | | | | | | | |
| | AQR Funds | | | | | | Annual Report | | | | | | December 2011 | | 155 |
| | | | | | | | | | |
| | | | |
| Statements of Changes in Net Assets | | | December 31, 2011 | |
| | | | | | | | | | | | | | | | |
| | | AQR MOMENTUM FUND | | | AQR SMALL CAP
MOMENTUM FUND | |
| | | FOR THE
YEAR ENDED
DECEMBER 31,
2011 | | | FOR THE
YEAR ENDED
DECEMBER 31,
2010 | | | FOR THE
YEAR ENDED
DECEMBER 31,
2011 | | | FOR THE YEAR ENDED
DECEMBER 31,
2010 | |
| OPERATIONS: | | | | | | | | | | | | | | | | |
| Net investment income (loss) | | | $2,522,585 | | | | $476,664 | | | | $227,233 | | | | $93,134 | |
| Net realized gain (loss) | | | (21,841,538) | | | | 296,966 | | | | (5,687,386) | | | | 1,019,454 | |
| Net change in unrealized appreciation (depreciation) | | | 7,021,965 | | | | 9,823,731 | | | | 1,233,553 | | | | 5,493,162 | |
Net increase (decrease) in net assets resulting from operations | | | (12,296,988) | | | | 10,597,361 | | | | (4,226,600) | | | | 6,605,750 | |
| | | | |
| DISTRIBUTIONS TO SHAREHOLDERS: | | | | | | | | | | | | | | | | |
| Net investment income: | | | | | | | | | | | | | | | | |
Class L | | | (2,025,248) | | | | (134,564) | | | | (150,004) | | | | (88,580) | |
Total | | | (2,025,248) | | | | (134,564) | | | | (150,004) | | | | (88,580) | |
| Net realized gain: | | | | | | | | | | | | | | | | |
Class L | | | (566,418) | | | | (309,664) | | | | (713,111) | | | | (487,666) | |
Total | | | (566,418) | | | | (309,664) | | | | (713,111) | | | | (487,666) | |
Total distributions | | | (2,591,666) | | | | (444,228) | | | | (863,115) | | | | (576,246) | |
| | | | |
| CAPITAL TRANSACTIONS: | | | | | | | | | | | | | | | | |
| CLASS L | | | | | | | | | | | | | | | | |
| Proceeds from shares sold | | | 234,799,847 | | | | 113,707,968 | | | | 69,908,520 | | | | 47,944,290 | |
| Reinvestment of distributions | | | 2,589,299 | | | | 443,920 | | | | 860,975 | | | | 576,046 | |
| Cost of shares redeemed | | | (44,238,993) | | | | (6,747,740) | | | | (19,650,773) | | | | (3,285,924) | |
| Redemption fees | | | 2,432 | | | | 1,497 | | | | 765 | | | | 1,061 | |
| | | | |
| Net increase (decrease) from capital transactions | | | 193,152,585 | | | | 107,405,645 | | | | 51,119,487 | | | | 45,235,473 | |
| | | | |
| Net increase (decrease) in net assets resulting from capital transactions | | | 193,152,585 | | | | 107,405,645 | | | | 51,119,487 | | | | 45,235,473 | |
| Total increase (decrease) in net assets | | | 178,263,931 | | | | 117,558,778 | | | | 46,029,772 | | | | 51,264,977 | |
| | | | |
| NET ASSETS: | | | | | | | | | | | | | | | | |
| Beginning of period | | | 124,491,353 | | | | 6,932,575 | | | | 54,504,582 | | | | 3,239,605 | |
| End of period | | | $302,755,284 | | | | $124,491,353 | | | | $100,534,354 | | | | $54,504,582 | |
| | | | | | | | | | | | | | | | | |
| Undistributed accumulated net investment income (loss) at end of year | | | $716,277 | | | | $322,578 | | | | $30,383 | | | | $— | |
| | | | |
| CHANGES IN SHARES OUTSTANDING: | | | | | | | | | | | | | | | | |
| CLASS L | | | | | | | | | | | | | | | | |
| Shares outstanding, beginning of period | | | 8,646,886 | | | | 568,597 | | | | 3,788,903 | | | | 284,134 | |
| Shares sold | | | 16,107,289 | | | | 8,561,328 | | | | 4,790,883 | | | | 3,707,891 | |
| Shares issued on reinvestment of distributions | | | 192,513 | | | | 31,043 | | | | 63,354 | | | | 40,199 | |
| Shares redeemed | | | (3,152,922) | | | | (514,082) | | | | (1,404,643) | | | | (243,321) | |
| | | | |
| Shares outstanding, end of period | | | 21,793,766 | | | | 8,646,886 | | | | 7,238,497 | | | | 3,788,903 | |
| | | | |
| | The accompanying notes are an integral part of these financial statements. | | |
| | | | | | | | | | | | | | | | |
| 156 | | AQR Funds | | | | | | Annual Report | | | | | | December 2011 | | |
| | | | | | | | | | |
| | | | |
| Statements of Changes in Net Assets | | | December 31, 2011 | |
| | | | | | | | |
| | | AQR INTERNATIONAL
MOMENTUM FUND | |
| | | FOR THE
YEAR ENDED
DECEMBER 31,
2011 | | | FOR THE
YEAR ENDED
DECEMBER 31,
2010 | |
| OPERATIONS: | | | | | | | | |
| Net investment income (loss) | | | $1,671,768 | | | | $485,477 | |
| Net realized gain (loss) | | | (12,171,592) | | | | (517,845) | |
| Net change in unrealized appreciation (depreciation) | | | (3,162,121) | | | | 5,421,094 | |
Net increase (decrease) in net assets resulting from operations | | | (13,661,945) | | | | 5,388,726 | |
| | |
| DISTRIBUTIONS TO SHAREHOLDERS: | | | | | | | | |
| Net investment income: | | | | | | | | |
Class L | | | (1,944,737) | | | | (198,118) | |
Total | | | (1,944,737) | | | | (198,118) | |
| Net realized gain: | | | | | | | | |
Class L | | | — | | | | (61,012) | |
Total | | | — | | | | (61,012) | |
Total distributions | | | (1,944,737) | | | | (259,130) | |
| | |
| CAPITAL TRANSACTIONS: | | | | | | | | |
| CLASS L | | | | | | | | |
| Proceeds from shares sold | | | 57,657,994 | | | | 45,816,669 | |
| Reinvestment of distributions | | | 1,943,164 | | | | 259,022 | |
| Cost of shares redeemed | | | (28,862,650) | | | | (18,877,307) | |
| Redemption fees | | | 1,706 | | | | 1,346 | |
| | |
| Net increase (decrease) from capital transactions | | | 30,740,214 | | | | 27,199,730 | |
| | |
| Net increase (decrease) in net assets resulting from capital transactions | | | 30,740,214 | | | | 27,199,730 | |
| Total increase (decrease) in net assets | | | 15,133,532 | | | | 32,329,326 | |
| | |
| NET ASSETS: | | | | | | | | |
| Beginning of period | | | 62,091,379 | | | | 29,762,053 | |
| End of period | | | $77,224,911 | | | | $62,091,379 | |
| | | | | | | | | |
| Undistributed accumulated net investment income (loss) at end of year | | | $92,674 | | | | $72,009 | |
| | |
| CHANGES IN SHARES OUTSTANDING: | | | | | | | | |
| CLASS L | | | | | | | | |
| Shares outstanding, beginning of period | | | 4,559,775 | | | | 2,485,331 | |
| Shares sold | | | 4,299,973 | | | | 3,653,199 | |
| Shares issued on reinvestment of distributions | | | 176,171 | | | | 19,417 | |
| Shares redeemed | | | (2,246,341) | | | | (1,598,172) | |
| | |
| Shares outstanding, end of period | | | 6,789,578 | | | | 4,559,775 | |
| | | | |
| | The accompanying notes are an integral part of these financial statements. | | |
| | | | | | | | | | | | | | | | |
| | AQR Funds | | | | | | Annual Report | | | | | | December 2011 | | 157 |
| | | | | | | | | | |
| | | | |
| Statement of Cash Flows | | | December 31, 2011 | |
| | | | |
| | | AQR
DIVERSIFIED
ARBITRAGE FUND | |
| CASH FLOWS FROM OPERATING ACTIVITIES: | | | | |
| Net increase in net assets resulting from operations | | | $11,339,539 | |
| Adjustments to reconcile net increase in net assets resulting from operations to net cash provided (used) in operating activities: | | | | |
Payments to purchase securities | | | (5,322,815,457) | |
Payments to cover short securities | | | (1,576,754,988) | |
Proceeds from securities sold short | | | 2,000,122,991 | |
Proceeds from sale of securities | | | 4,184,909,979 | |
Realized gain on investments in securities | | | (25,861,544) | |
Realized loss on securities sold short and written options | | | 3,444,823 | |
Change in unrealized depreciation on investments in securities | | | 124,770,226 | |
Change in unrealized appreciation on securities sold short and written options | | | (104,152,262) | |
Amortization of bond premium | | | (1,120,927) | |
| Decreases in operating assets: | | | | |
Restricted cash | | | 4,797,323 | |
Due from brokers | | | (139,397,874) | |
Unrealized appreciation on forward foreign contracts | | | (939,967) | |
Swaps, at value | | | (10,348,073) | |
Receivable for securities sold | | | (84,052,038) | |
Dividends and interest | | | (6,370,754) | |
Prepaid expenses | | | (88,192) | |
| Increases in operating liabilities | | | | |
Due to custodian/broker | | | (840,977) | |
Unrealized depreciation on forward foreign currency exchange contracts | | | (286,465) | |
Swaps, at value | | | (1,452,422) | |
Unrealized depreciation on futures contracts | | | 641,513 | |
Payable for securities purchased | | | 52,695,911 | |
Collateral received on securities loaned | | | 686,099 | |
Accrued Investment advisory fees | | | 574,212 | |
Accrued Distribution fees—Class N | | | 59,014 | |
Dividends on securities sold short | | | 219,337 | |
Other accrued expenses | | | 855,709 | |
Net cash used in operating activities | | | $(889,365,264) | |
| |
| CASH FLOWS FROM FINANCING ACTIVITIES | | | | |
Proceeds from shares sold | | | 1,465,482,251 | |
Payments on shares redeemed | | | (569,695,492) | |
Cash distributions paid | | | (5,303,729) | |
Net cash provided by financing activities | | | $890,483,030 | |
| Net change in cash | | | 1,117,766 | |
Cash, beginning of period | | | — | |
Cash, end of period | | | $1,117,766 | |
| | | | |
| | The accompanying notes are an integral part of these financial statements. | | |
| | | | | | | | | | | | | | | | |
| 158 | | AQR Funds | | | | | | Annual Report | | | | | | December 2011 | | |
| | | | | | | | | | |
[Intentionally Left Blank]
| | | | | | | | | | | | | | | | |
| | AQR Funds | | | | | | Annual Report | | | | | | December 2011 | | 159 |
| | | | | | | | | | |
| | | | |
| Financial Highlights | | | December 31, 2011 | |
| | | | | | | | | | | | | | | | | | | | | | | | | | | | |
| | | PER SHARE OPERATING PERFORMANCE | |
| | | | | | Change in Net Assets Resulting
from Operations | | | Less Dividends and Distributions | |
| | | Net Asset
Value,
Beginning
of Period | | | Net
Investment
Income
(Loss) | | | Net
Realized
and
Unrealized
Gain
(Loss) | | | Net
Increase
(Decrease)
in Net
Asset
Value from
Operations | | | Distributions
from Net
Investment
Income | | | Distributions
from Net
Realized
Gains | | | Total
Distributions | |
| AQR GLOBAL EQUITY FUND CLASS I | | | | | | | | | | | | | | | | | | | | | | | | | | | | |
| FOR THE YEAR ENDED DECEMBER 31, 20115 | | | $10.97 | | | | 0.21 | | | | (0.95 | ) | | | (0.74 | ) | | | (0.11 | ) | | | (0.13 | ) | | | (0.24 | ) |
| FOR THE YEAR ENDED 12/31/20105 | | | $10.00 | | | | 0.16 | | | | 1.25 | | | | 1.41 | | | | (0.36 | ) | | | (0.08 | ) | | | (0.44 | ) |
| AQR GLOBAL EQUITY FUND CLASS N | | | | | | | | | | | | | | | | | | | | | | | | | | | | |
| FOR THE YEAR ENDED DECEMBER 31, 20115 | | | $10.97 | | | | 0.16 | | | | (0.94 | ) | | | (0.78 | ) | | | (0.09 | ) | | | (0.13 | ) | | | (0.22 | ) |
| FOR THE YEAR ENDED 12/31/2010†,5 | | | $10.00 | | | | 0.13 | | | | 1.25 | | | | 1.38 | | | | (0.33 | ) | | | (0.08 | ) | | | (0.41 | ) |
| AQR GLOBAL EQUITY FUND CLASS Y | | | | | | | | | | | | | | | | | | | | | | | | | | | | |
| FOR THE YEAR ENDED DECEMBER 31, 20115 | | | $10.99 | | | | 0.24 | | | | (0.94 | ) | | | (0.70 | ) | | | (0.16 | ) | | | (0.13 | ) | | | (0.29 | ) |
| FOR THE YEAR ENDED 12/31/20105 | | | $10.00 | | | | 0.18 | | | | 1.27 | | | | 1.45 | | | | (0.38 | ) | | | (0.08 | ) | | | (0.46 | ) |
| AQR INTERNATIONAL EQUITY FUND CLASS I | | | | | | | | | | | | | | | | | | | | | | | | | | | | |
| FOR THE YEAR ENDED DECEMBER 31, 2011†,5 | | | $10.45 | | | | 0.21 | | | | (1.78 | ) | | | (1.57 | ) | | | (0.21 | ) | | | (0.07 | ) | | | (0.28 | ) |
| FOR THE YEAR ENDED DECEMBER 31, 2010†,5 | | | $9.78 | | | | 0.16 | | | | 0.84 | | | | 1.00 | | | | (0.24 | ) | | | (0.09 | ) | | | (0.33 | ) |
| FOR THE PERIOD ENDED 9/30/096—12/31/09†,5 | | | $10.00 | | | | (0.01 | ) | | | 0.22 | | | | 0.21 | | | | (0.14 | ) | | | (0.29 | ) | | | (0.43 | ) |
| AQR INTERNATIONAL EQUITY FUND CLASS N | | | | | | | | | | | | | | | | | | | | | | | | | | | | |
| FOR THE YEAR ENDED DECEMBER 31, 20115 | | | $10.61 | | | | 0.20 | | | | (1.83 | ) | | | (1.63 | ) | | | (0.15 | ) | | | (0.07 | ) | | | (0.22 | ) |
| FOR THE YEAR ENDED DECEMBER 31, 20105 | | | $9.91 | | | | 0.14 | | | | 0.88 | | | | 1.02 | | | | (0.23 | ) | | | (0.09 | ) | | | (0.32 | ) |
| FOR THE PERIOD ENDED 9/30/096—12/31/09†,5 | | | $10.00 | | | | — | | | | 0.20 | | | | 0.20 | | | | — | | | | (0.29 | ) | | | (0.29 | ) |
| AQR INTERNATIONAL EQUITY FUND CLASS Y | | | | | | | | | | | | | | | | | | | | | | | | | | | | |
| FOR THE YEAR ENDED DECEMBER 31, 2011†,5 | | | $10.89 | | | | 0.28 | | | | (1.88 | ) | | | (1.60 | ) | | | (0.24 | ) | | | (0.07 | ) | | | (0.31 | ) |
| FOR THE YEAR ENDED DECEMBER 31, 2010†,5 | | | $10.16 | | | | 0.20 | | | | 0.89 | | | | 1.09 | | | | (0.27 | ) | | | (0.09 | ) | | | (0.36 | ) |
| FOR THE PERIOD ENDED 8/28/098—12/31/09†,5 | | | $10.00 | | | | 0.03 | | | | 0.57 | | | | 0.60 | | | | (0.15 | ) | | | (0.29 | ) | | | (0.44 | ) |
| AQR DIVERSIFIED ARBITRAGE FUND CLASS I | | | | | | | | | | | | | | | | | | | | | | | | | | | | |
| FOR THE YEAR ENDED DECEMBER 31, 20115 | | | $11.15 | | | | 0.13 | | | | (0.02 | ) | | | 0.11 | | | | (0.09 | ) | | | (0.28 | ) | | | (0.37 | ) |
| FOR THE YEAR ENDED DECEMBER 31, 2010† | | | $10.80 | | | | 0.06 | | | | 0.46 | | | | 0.52 | | | | (0.04 | ) | | | (0.13 | ) | | | (0.17 | ) |
| FOR THE PERIOD ENDED 1/15/098—12/31/09†,5 | | | $10.00 | | | | 0.13 | | | | 0.79 | | | | 0.92 | | | | (0.03 | ) | | | (0.09 | ) | | | (0.12 | ) |
| AQR DIVERSIFIED ARBITRAGE FUND CLASS N | | | | | | | | | | | | | | | | | | | | | | | | | | | | |
| FOR THE YEAR ENDED DECEMBER 31, 2011†,5 | | | $11.12 | | | | 0.10 | | | | (0.02 | ) | | | 0.08 | | | | (0.07 | ) | | | (0.28 | ) | | | (0.35 | ) |
| FOR THE YEAR ENDED DECEMBER 31, 2010† | | | $10.78 | | | | 0.05 | | | | 0.43 | | | | 0.48 | | | | (0.01 | ) | | | (0.13 | ) | | | (0.14 | ) |
| FOR THE PERIOD ENDED 1/15/098—12/31/09†,5 | | | $10.00 | | | | 0.10 | | | | 0.79 | | | | 0.89 | | | | (0.02 | ) | | | (0.09 | ) | | | (0.11 | ) |
| * | Annualized for periods less than one year. |
| † | Redemption fees of less than $0.005 per share were incurred by the share class. |
| 1 | Total investment return is calculated assuming an initial investment made at the net asset value at the beginning of the period, reinvestment of all dividends and distributions at net asset value during the period and redemption on the last day of the period and is not annualized. |
| 2 | Includes adjustments in accordance with accounting principles generally accepted in the United States of America and as such, the net asset value for financial reporting purposes and the returns based upon those net asset values may differ from the net asset value and returns for shareholder transactions. |
| 3 | Ratios do not include the impact of the expenses of the underlying funds in which the Fund invests. |
| 4 | Portfolio turnover is not annualized. |
| 5 | Per share net investment income (loss) and net realized and unrealized gain (loss) are based on average shares outstanding. |
| 6 | Commencement of offering of shares. |
| 7 | The ratio is annualized for a short period of time and is not representative of what the ratio would be if the Fund class has operated for a longer period of time. |
| 8 | Commencement of operations. |
| 9 | For the year ended December 31, 2010, the Adviser contributed $544,199 into the AQR Diversified Arbitrage Fund to compensate the Fund for a loss incurred due to trade processing errors. The impact of the Adviser’s contribution increased the total return by 0.08%. |
| | | | |
| | The accompanying notes are an integral part of these financial statements. | | |
| | | | | | | | | | | | | | | | |
| 160 | | AQR Funds | | | | | | Annual Report | | | | | | December 2011 | | |
| | | | | | | | | | |
| | | | |
| Financial Highlights | | | December 31, 2011 | |
| | | | | | | | | | | | | | | | | | | | | | | | | | | | | | | | |
| | | | | | | RATIOS/SUPPLEMENTAL DATA |
| | | | | |
| | | | | | | | | | Ratios to Average Net Assets of:* | | | | | | |
| | | | | | | | |
Net
Asset
Value,
End of
Period | | | Total
Return1,2 | | | Net Assets, End of Period | | | Expenses, Net of
Reimbursements
and/or Waivers3 | | | Expenses, Net of
Reimbursements
and/or Waivers
(Excluding Dividend
Short Expense &
Interest Expense)3 | | | Expenses, Before
Reimbursements
and/or Waivers3 | | | Net Investment
Income (Loss) | | | Portfolio
Turnover
Rate4 | | | |
| | | | | | | | | | | | | | | | | | | | | | | | | | | | | | | | |
| | $9.99 | | | | (6.68 | )% | | | $2,102,815 | | | | 0.96 | % | | | 0.95 | % | | | 2.03 | % | | | 1.90 | % | | | 59 | % | | |
| | $10.97 | | | | 14.12 | % | | | $1,841,838 | | | | 0.79 | % | | | 0.79 | % | | | 0.79 | % | | | 1.41 | % | | | 72 | % | | |
| | | | | | | | | | | | | | | | | | | | | | | | | | | | | | | | |
| | $9.97 | | | | (7.03 | )% | | | $2,019,253 | | | | 1.27 | % | | | 1.26 | % | | | 3.22 | % | | | 1.46 | % | | | 59 | % | | |
| | $10.97 | | | | 13.83 | % | | | $1,497,723 | | | | 1.10 | % | | | 1.10 | % | | | 1.10 | % | | | 1.28 | % | | | 72 | % | | |
| | | | | | | | | | | | | | | | | | | | | | | | | | | | | | | | |
| | $10.00 | | | | (6.22 | )% | | | $397,662,333 | | | | 0.52 | % | | | 0.51 | % | | | 0.52 | % | | | 2.21 | % | | | 59 | % | | |
| | $10.99 | | | | 14.54 | % | | | $424,346,157 | | | | 0.50 | % | | | 0.50 | % | | | 0.71 | % | | | 1.81 | % | | | 72 | % | | |
| | | | | | | | | | | | | | | | | | | | | | | | | | | | | | | | |
| | $8.60 | | | | (15.00 | )% | | | $138,229,387 | | | | 0.94 | % | | | 0.93 | % | | | 0.94 | % | | | 2.13 | % | | | 60 | % | | |
| | $10.45 | | | | 10.40 | % | | | $85,968,655 | | | | 0.90 | % | | | 0.90 | % | | | 1.03 | % | | | 1.72 | % | | | 93 | % | | |
| | $9.78 | | | | 2.20 | % | | | $44,016,038 | | | | 0.90 | % | | | 0.90 | % | | | 1.01 | % | | | (0.47 | )% | | | 29 | % | | |
| | | | | | | | | | | | | | | | | | | | | | | | | | | | | | | | |
| | $8.76 | | | | (15.27 | )% | | | $1,166,515 | | | | 1.35 | % | | | 1.34 | % | | | 2.18 | % | | | 1.96 | % | | | 60 | % | | |
| | $10.61 | | | | 10.40 | % | | | $1,472,368 | | | | 1.25 | % | | | 1.25 | % | | | 3.50 | % | | | 1.51 | % | | | 93 | % | | |
| | $9.91 | | | | 2.04 | % | | | $5,785 | | | | 1.25 | % | | | 1.25 | % | | | 472.86 | %7 | | | (0.07 | )% | | | 29 | % | | |
| | | | | | | | | | | | | | | | | | | | | | | | | | | | | | | | |
| | $8.98 | | | | (14.66 | )% | | | $348,681,473 | | | | 0.58 | % | | | 0.57 | % | | | 0.58 | % | | | 2.63 | % | | | 60 | % | | |
| | $10.89 | | | | 10.84 | % | | | $371,799,177 | | | | 0.55 | % | | | 0.55 | % | | | 0.77 | % | | | 2.02 | % | | | 93 | % | | |
| | $10.16 | | | | 6.08 | % | | | $360,491,107 | | | | 0.55 | % | | | 0.55 | % | | | 0.98 | % | | | 0.99 | % | | | 29 | % | | |
| | | | | | | | | | | | | | | | | | | | | | | | | | | | | | | | |
| | $10.89 | | | | 0.99 | % | | | $1,456,748,122 | | | | 2.75 | % | | | 1.20 | % | | | 2.84 | % | | | 1.18 | % | | | 298 | % | | |
| | $11.15 | | | | 4.81 | %9 | | | $824,237,659 | | | | 2.59 | % | | | 1.20 | % | | | 2.62 | % | | | 1.13 | % | | | 361 | % | | |
| | $10.80 | | | | 9.24 | % | | | $160,026,814 | | | | 2.46 | % | | | 1.20 | % | | | 3.25 | % | | | 1.30 | % | | | 482 | % | | |
| | | | | | | | | | | | | | | | | | | | | | | | | | | | | | | | |
| | $10.85 | | | | 0.68 | % | | | $651,790,519 | | | | 3.05 | % | | | 1.50 | % | | | 3.08 | % | | | 0.89 | % | | | 298 | % | | |
| | $11.12 | | | | 4.52 | %9 | | | $382,758,131 | | | | 2.89 | % | | | 1.50 | % | | | 2.92 | % | | | 0.85 | % | | | 361 | % | | |
| | $10.78 | | | | 8.88 | % | | | $79,054,890 | | | | 2.69 | % | | | 1.50 | % | | | 3.42 | % | | | 0.98 | % | | | 482 | % | | |
| | | | |
| | The accompanying notes are an integral part of these financial statements. | | |
| | | | | | | | | | | | | | | | |
| | AQR Funds | | | | | | Annual Report | | | | | | December 2011 | | 161 |
| | | | | | | | | | |
| | | | |
| Financial Highlights | | | December 31, 2011 | |
| | | | | | | | | | | | | | | | | | | | | | | | | | | | |
| | | PER SHARE OPERATING PERFORMANCE | |
| | | | | | Change in Net Assets Resulting
from Operations | | | Less Dividends and Distributions | |
| | | Net Asset
Value,
Beginning
of Period | | | Net
Investment
Income
(Loss) | | | Net
Realized
and
Unrealized
Gain
(Loss) | | | Net
Increase
(Decrease)
in Net
Asset
Value from
Operations | | | Distributions
from Net
Investment
Income | | | Distributions
from Net
Realized
Gains | | | Total
Distributions | |
| AQR MANAGED FUTURES STRATEGY FUND CLASS I | | | | | | | | | | | | | | | | | | | | | | | | | | | | |
| FOR THE YEAR ENDED DECEMBER 31, 2011†,5 | | | $10.30 | | | | (0.12 | ) | | | (0.53 | ) | | | (0.65 | ) | | | (0.04 | ) | | | (0.04 | ) | | | (0.08 | ) |
| FOR THE PERIOD ENDED 1/06/108—12/31/10†,5 | | | $10.00 | | | | (0.12 | ) | | | 0.66 | | | | 0.54 | | | | (0.09 | ) | | | (0.15 | ) | | | (0.24 | ) |
| AQR MANAGED FUTURES STRATEGY FUND CLASS N | | | | | | | | | | | | | | | | | | | | | | | | | | | | |
| FOR THE YEAR ENDED DECEMBER 31, 2011†,5 | | | $10.28 | | | | (0.15 | ) | | | (0.52 | ) | | | (0.67 | ) | | | (0.02 | ) | | | (0.04 | ) | | | (0.06 | ) |
| FOR THE PERIOD ENDED 1/06/108—12/31/10†,5 | | | $10.00 | | | | (0.15 | ) | | | 0.66 | | | | 0.51 | | | | (0.08 | ) | | | (0.15 | ) | | | (0.23 | ) |
| AQR RISK PARITY FUND CLASS I | | | | | | | | | | | | | | | | | | | | | | | | | | | | |
| FOR THE YEAR ENDED DECEMBER 31, 2011†,5 | | | $10.28 | | | | 0.04 | | | | 0.51 | | | | 0.55 | | | | (0.21 | ) | | | (0.00 | )9 | | | (0.21 | ) |
| FOR THE PERIOD ENDED 9/30/108—12/31/10 | | | $10.00 | | | | 0.02 | | | | 0.38 | | | | 0.40 | | | | (0.12 | ) | | | — | | | | (0.12 | ) |
| AQR RISK PARITY FUND CLASS N | | | | | | | | | | | | | | | | | | | | | | | | | | | | |
| FOR THE YEAR ENDED DECEMBER 31, 2011†,5 | | | $10.27 | | | | 0.03 | | | | 0.49 | | | | 0.52 | | | | (0.20 | ) | | | (0.00 | )9 | | | (0.20 | ) |
| FOR THE PERIOD ENDED 9/30/108—12/31/10† | | | $10.00 | | | | 0.01 | | | | 0.38 | | | | 0.39 | | | | (0.12 | ) | | | — | | | | (0.12 | ) |
| AQR MULTI-STRATEGY ALTERNATIVE FUND CLASS I | | | | | | | | | | | | | | | | | | | | | | | | | | | | |
| FOR THE PERIOD ENDED 7/18/118—12/31/115 | | | $10.00 | | | | (0.05 | ) | | | (0.21 | ) | | | (0.26 | ) | | | (0.04 | ) | | | — | | | | (0.04 | ) |
| AQR MULTI-STRATEGY ALTERNATIVE FUND CLASS N | | | | | | | | | | | | | | | | | | | | | | | | | | | | |
| FOR THE PERIOD ENDED 7/18/118—12/31/115 | | | $10.00 | | | | (0.06 | ) | | | (0.21 | ) | | | (0.27 | ) | | | (0.04 | ) | | | — | | | | (0.04 | ) |
| AQR MOMENTUM FUND CLASS L | | | | | | | | | | | | | | | | | | | | | | | | | | | | |
| FOR THE YEAR ENDED DECEMBER 31, 2011†,5 | | | $14.40 | | | | 0.15 | | | | (0.54 | ) | | | (0.39 | ) | | | (0.09 | ) | | | (0.03 | ) | | | (0.12 | ) |
| FOR THE YEAR ENDED DECEMBER 31, 2010† | | | $12.19 | | | | 0.06 | | | | 2.21 | | | | 2.27 | | | | (0.02 | ) | | | (0.04 | ) | | | (0.06 | ) |
| FOR THE PERIOD ENDED 7/09/098—12/31/09†,5 | | | $10.00 | | | | 0.07 | | | | 2.48 | | | | 2.55 | | | | (0.05 | ) | | | (0.31 | ) | | | (0.36 | ) |
| AQR SMALL CAP MOMENTUM FUND CLASS L | | | | | | | | | | | | | | | | | | | | | | | | | | | | |
| FOR THE YEAR ENDED DECEMBER 31, 2011†,5 | | | $14.39 | | | | 0.04 | | | | (0.42 | ) | | | (0.38 | ) | | | (0.02 | ) | | | (0.10 | ) | | | (0.12 | ) |
| FOR THE YEAR ENDED DECEMBER 31, 2010† | | | $11.40 | | | | 0.03 | | | | 3.13 | | | | 3.16 | | | | (0.03 | ) | | | (0.14 | ) | | | (0.17 | ) |
| FOR THE PERIOD ENDED 7/09/098—12/31/09†,5 | | | $10.00 | | | | 0.04 | | | | 2.06 | | | | 2.10 | | | | (0.03 | ) | | | (0.67 | ) | | | (0.70 | ) |
| AQR INTERNATIONAL MOMENTUM FUND CLASS L | | | | | | | | | | | | | | | | | | | | | | | | | | | | |
| FOR THE YEAR ENDED DECEMBER 31, 2011†,5 | | | $13.62 | | | | 0.29 | | | | (2.26 | ) | | | (1.97 | ) | | | (0.28 | ) | | | — | | | | (0.28 | ) |
| FOR THE YEAR ENDED DECEMBER 31, 2010† | | | $11.98 | | | | 0.08 | | | | 1.62 | | | | 1.70 | | | | (0.05 | ) | | | (0.01 | ) | | | (0.06 | ) |
| FOR THE PERIOD ENDED 7/09/098—12/31/09†,5 | | | $10.00 | | | | 0.04 | | | | 2.26 | | | | 2.30 | | | | (0.09 | ) | | | (0.23 | ) | | | (0.32 | ) |
| * | Annualized for periods less than one year. |
| † | Redemption fees of less than $0.005 per share were incurred by the share class. |
| 1 | Total investment return is calculated assuming an initial investment made at the net asset value at the beginning of the period, reinvestment of all dividends and distributions at net asset value during the period and redemption on the last day of the period and is not annualized. |
| 2 | Includes adjustments in accordance with accounting principles generally accepted in the United States of America and as such, the net asset value for financial reporting purposes and the returns based upon those net asset values may differ from the net asset value and returns for shareholder transactions. |
| 3 | Ratios do not include the impact of the expenses of the underlying funds in which the Fund invests. |
| 4 | Portfolio turnover is not annualized. |
| 5 | Per share net investment income (loss) and net realized and unrealized gain (loss) are based on average shares outstanding. |
| 6 | For the year ended December 31, 2011, a service provider contributed $354,026 into the Fund to compensate the Fund for a loss incurred due to a valuation error. The impact of this contribution increased the Fund’s total return by 0.21%. |
| 7 | For the year ended December 31, 2011, the Adviser contributed $208,438 into the Fund to compensate the Fund for a loss incurred due to a trade processing error. The impact of the Adviser’s contribution increased the Fund’s total return by 0.14%. |
| 8 | Commencement of operations. |
| 9 | Amount is less than $.005 per share. |
| | | | |
| | The accompanying notes are an integral part of these financial statements. | | |
| | | | | | | | | | | | | | | | |
| 162 | | AQR Funds | | | | | | Annual Report | | | | | | December 2011 | | |
| | | | | | | | | | |
| | | | |
| Financial Highlights | | | December 31, 2011 | |
| | | | | | | | | | | | | | | | | | | | | | | | | | | | | | | | |
| | | | | | | RATIOS/SUPPLEMENTAL DATA |
| | | | | |
| | | | | | | | | | Ratios to Average Net Assets of:* | | | | | | |
| | | | | | | | |
Net
Asset
Value,
End of
Period | | | Total
Return1,2 | | | Net Assets, End of Period | | | Expenses, Net of
Reimbursements
and/or Waivers3 | | | Expenses, Net of
Reimbursements
and/or Waivers
(Excluding Dividend
Short Expense &
Interest Expense)3 | | | Expenses, Before
Reimbursements
and/or Waivers3 | | | Net Investment
Income (Loss) | | | Portfolio
Turnover
Rate4 | | | |
| | | | | | | | | | | | | | | | | | | | | | | | | | | | | | | | |
| | $9.57 | | | | (6.37 | )% | | | $1,078,662,373 | | | | 1.25 | % | | | 1.25 | % | | | 1.30 | % | | | (1.22 | )% | | | 0 | % | | |
| | $10.30 | | | | 5.41 | % | | | $657,237,349 | | | | 1.25 | % | | | 1.25 | % | | | 1.28 | % | | | (1.27 | )% | | | 0 | % | | |
| | | | | | | | | | | | | | | | | | | | | | | | | | | | | | | | |
| | $9.55 | | | | (6.59 | )% | | | $476,854,001 | | | | 1.50 | % | | | 1.50 | % | | | 1.57 | % | | | (1.47 | )% | | | 0 | % | | |
| | $10.28 | | | | 5.12 | % | | | $271,043,038 | | | | 1.50 | % | | | 1.50 | % | | | 1.56 | % | | | (1.54 | )% | | | 0 | % | | |
| | | | | | | | | | | | | | | | | | | | | | | | | | | | | | | | |
| | $10.62 | | | | 5.45 | %6 | | | $337,526,380 | | | | 0.95 | % | | | 0.95 | % | | | 1.06 | % | | | 0.41 | % | | | 66 | % | | |
| | $10.28 | | | | 3.98 | % | | | $12,747,565 | | | | 0.95 | % | | | 0.95 | % | | | 3.80 | % | | | 0.44 | % | | | 19 | % | | |
| | | | | | | | | | | | | | | | | | | | | | | | | | | | | | | | |
| | $10.59 | | | | 5.12 | %6 | | | $51,560,342 | | | | 1.20 | % | | | 1.20 | % | | | 1.42 | % | | | 0.30 | % | | | 66 | % | | |
| | $10.27 | | | | 3.88 | % | | | $11,234,980 | | | | 1.20 | % | | | 1.20 | % | | | 3.96 | % | | | 0.22 | % | | | 19 | % | | |
| | | | | | | | | | | | | | | | | | | | | | | | | | | | | | | | |
| | $9.70 | | | | (2.57 | )%7 | | | $257,168,435 | | | | 2.23 | % | | | 1.98 | % | | | 2.59 | % | | | (1.09 | )% | | | 133 | % | | |
| | | | | | | | | | | | | | | | | | | | | | | | | | | | | | | | |
| | $9.69 | | | | (2.73 | )%7 | | | $44,676,329 | | | | 2.48 | % | | | 2.23 | % | | | 2.85 | % | | | (1.37 | )% | | | 133 | % | | |
| | | | | | | | | | | | | | | | | | | | | | | | | | | | | | | | |
| | $13.89 | | | | (2.68 | )% | | | $302,755,284 | | | | 0.50 | % | | | 0.49 | % | | | 0.67 | % | | | 1.07 | % | | | 162 | % | | |
| | $14.40 | | | | 18.60 | % | | | $124,491,353 | | | | 0.49 | % | | | 0.49 | % | | | 0.98 | % | | | 1.37 | % | | | 180 | % | | |
| | $12.19 | | | | 25.58 | % | | | $6,932,575 | | | | 0.49 | % | | | 0.49 | % | | | 5.08 | % | | | 1.23 | % | | | 163 | % | | |
| | | | | | | | | | | | | | | | | | | | | | | | | | | | | | | | |
| | $13.89 | | | | (2.62 | )% | | | $100,534,354 | | | | 0.66 | % | | | 0.65 | % | | | 0.85 | % | | | 0.26 | % | | | 121 | % | | |
| | $14.39 | | | | 27.69 | % | | | $54,504,582 | | | | 0.65 | % | | | 0.65 | % | | | 1.85 | % | | | 0.66 | % | | | 380 | % | | |
| | $11.40 | | | | 21.24 | % | | | $3,239,605 | | | | 0.65 | % | | | 0.65 | % | | | 7.53 | % | | | 0.65 | % | | | 136 | % | | |
| | | | | | | | | | | | | | | | | | | | | | | | | | | | | | | | |
| | $11.37 | | | | (14.42 | )% | | | $77,224,911 | | | | 0.66 | % | | | 0.65 | % | | | 0.97 | % | | | 2.23 | % | | | 203 | % | | |
| | $13.62 | | | | 14.20 | % | | | $62,091,379 | | | | 0.65 | % | | | 0.65 | % | | | 1.46 | % | | | 1.44 | % | | | 269 | % | | |
| | $11.98 | | | | 23.08 | % | | | $29,762,053 | | | | 0.65 | % | | | 0.65 | % | | | 2.22 | % | | | 0.63 | % | | | 160 | % | | |
| | | | |
| | The accompanying notes are an integral part of these financial statements. | | |
| | | | | | | | | | | | | | | | |
| | AQR Funds | | | | | | Annual Report | | | | | | December 2011 | | 163 |
| | | | | | | | | | |
| | | | |
| Notes to Financial Statements | | | December 31, 2011 | |
1. Organization
AQR Funds (the “Trust”), organized as a Delaware statutory trust on September 4, 2008, is an open-end management investment company, under the Investment Company Act of 1940, as amended (the “1940 Act”). As of December 31, 2011, the Trust consists of nine active series (collectively, the “Funds” and each individually a “Fund”): AQR Global Equity Fund, AQR International Equity Fund, AQR Diversified Arbitrage Fund, AQR Managed Futures Strategy Fund, AQR Risk Parity Fund, AQR Multi-Strategy Alternative Fund, AQR Momentum Fund, AQR Small Cap Momentum Fund, and AQR International Momentum Fund. AQR Capital Management, LLC (“the Adviser”) serves as the investment adviser of each Fund. The Adviser has retained CNH Partners, LLC (“the Sub-Adviser”) an affiliate of the Adviser, to serve as an investment sub-adviser to the AQR Diversified Arbitrage Fund and AQR Multi-Strategy Alternative Fund.
The investment objective of the AQR Global Equity Fund is long-term capital appreciation. The principal investment strategies of the AQR Global Equity Fund include seeking to outperform the MSCI World Total Return Index (the “Global Equity Benchmark”) while seeking to control its tracking error relative to this benchmark. The Global Equity Benchmark is a free float-adjusted market capitalization index that is designed to measure the performance of equities in developed markets, including the United States and Canada. The AQR Global Equity Fund commenced operations on December 31, 2009. The Fund offers Class I, Class N and Class Y shares.
The investment objective of the AQR International Equity Fund is long-term capital appreciation. The principal investment strategies of the AQR International Equity Fund include seeking to outperform the MSCI EAFE Total Return Index (the “International Equity Benchmark”) while seeking to control its tracking error relative to this benchmark. The International Equity Benchmark is a free float-adjusted market capitalization index that is designed to measure the performance of equities in developed markets, excluding the United States and Canada. The AQR International Equity Fund Class Y shares commenced operations on August 28, 2009. Class I and Class N shares commenced operations on September 30, 2009.
The investment objective of the AQR Diversified Arbitrage Fund is long-term absolute returns. The principal investment strategies of the AQR Diversified Arbitrage Fund include seeking to outperform the Merrill Lynch 3-Month Treasury Bill Index (the “Absolute Return Benchmark”) using arbitrage and alternative investment strategies such as merger arbitrage, convertible arbitrage, other forms of arbitrage (including, but not limited to, when-issued trading arbitrage, stub-trading arbitrage and dual-class arbitrage) and other types of non-arbitrage alternative investment strategies. The AQR Diversified Arbitrage Fund commenced operations on January 15, 2009. The Fund offers Class I and Class N shares.
The investment objective of the AQR Managed Futures Strategy Fund is to seek long-term absolute returns. The Fund invests primarily in a portfolio of futures contracts and futures-related instruments. The Fund’s universe of investments includes more than 100 global developed and emerging market exchange-traded futures, futures related instruments and forward contracts across four major asset classes (commodities, currencies, fixed income and equities); however this universe of investments is subject to change under varying market conditions as these instruments evolve over time. The AQR Managed Futures Strategy Fund commenced operations on January 6, 2010. The Fund offers Class I and Class N shares.
The investment objective of the AQR Risk Parity Fund is to seek total return. Total return consists of capital appreciation and income. The Fund pursues its investment objective by allocating assets among major liquid asset classes (including global developed and emerging market equities, global nominal and inflation-linked government bonds, emerging market bonds, mortgage-backed securities, corporate and sovereign debt, the credit spreads of mortgage-backed securities and corporate and sovereign debt, developed and emerging market currencies, and commodities). The AQR Risk Parity Fund commenced operations on September 30, 2010. The Fund offers Class I and Class N shares.
The investment objective of the AQR Multi-Strategy Alternative Fund is to seek positive absolute returns. A “positive absolute return” seeks to earn a positive total return over a reasonable period of time regardless of market conditions or general market direction. However, while seeking to generate positive performance over a multi-year period of time, the Fund may have positive or negative returns over shorter time periods. The Fund invests globally (including in emerging markets) in a broad range of instruments, including, but not limited to, equities, bonds, currencies, commodities, credit derivatives, convertible securities, futures, forwards, options and swaps. The AQR Multi-Strategy Alternative Fund commenced operations on July 18, 2011. The Fund offers Class I and Class N shares.
| | | | | | | | | | | | | | | | |
| 164 | | AQR Funds | | | | | | Annual Report | | | | | | December 2011 | | |
| | | | | | | | | | |
| | | | |
| Notes to Financial Statements | | | December 31, 2011 | |
The investment objective of the AQR Momentum Fund is to seek long-term capital appreciation. The Fund invests primarily in equity or equity-related securities (including, but not limited to, exchange-traded funds, equity index futures, and depository receipts) of large and mid-sized companies traded on a principal U.S. exchange or over-the-counter market that the Adviser determines to have positive momentum. The Adviser considers a security to have positive momentum primarily if it has a return over the prior twelve months, that ranks in the top third of its relevant universe at the time of purchase. The AQR Momentum Fund commenced operations on July 9, 2009. The Fund offers Class L shares.
The investment objective of the AQR Small Cap Momentum Fund is to seek long-term capital appreciation. The Fund invests primarily in equity or equity-related securities (including, but not limited to, exchange-traded funds, equity index futures and depository receipts) of small cap companies traded on a principal U.S. exchange or over-the-counter market that the Adviser determines to have positive momentum. The Adviser considers a security to have positive momentum primarily if it has a return over the prior twelve months, that ranks in the top third of its relevant universe at the time of purchase. The AQR Small Cap Momentum Fund commenced operations on July 9, 2009. The Fund offers Class L shares.
The investment objective of the AQR International Momentum Fund is to seek long-term capital appreciation. The Fund invests primarily in equity or equity-related securities (including, but not limited to, exchange-traded funds, equity index futures and depositary receipts) of non-U.S. companies that the Adviser determines to have positive momentum. The Adviser considers a security to have positive momentum primarily if it has a return over the prior twelve months, that ranks in the top third of its relevant universe at the time of purchase. The AQR International Momentum Fund commenced operations on July 9, 2009. The Fund offers Class L shares.
2. Consolidation of Subsidiaries — AQR Managed Futures Strategy Offshore Fund Ltd., AQR Risk Parity Offshore Fund Ltd. and AQR Multi-Strategy Alternative Offshore Fund Ltd.
The consolidated Schedules of Investments, Statements of Assets and Liabilities, of Operations, of Changes in Net Assets and the Financial Highlights of the AQR Managed Futures Strategy Fund, AQR Risk Parity Fund and AQR Multi-Strategy Alternative Fund include the accounts of AQR Managed Futures Strategy Offshore Fund Ltd., AQR Risk Parity Offshore Fund Ltd., and AQR Multi-Strategy Alternative Offshore Fund Ltd., respectively, wholly-owned and controlled subsidiaries (the “Subsidiaries”). All inter-company accounts and transactions have been eliminated in consolidation for the Funds. Each of the Subsidiaries has a fiscal year end of December 31st for financial statement consolidation purposes and a nonconforming tax year end of November 30th.
The Subsidiaries are classified as controlled foreign corporations under the Code. Each Subsidiary’s taxable income is included in the calculation of the relevant Fund’s taxable income. Net losses of the Subsidiaries are not deductible by the Funds either in the current period or carried forward to future periods.
AQR Managed Futures Strategy Fund, AQR Risk Parity Fund and AQR Multi-Strategy Alternative Fund may each invest up to 25% of their total assets in its respective Subsidiary each of which acts as an investment vehicle in order to effect certain investments consistent with the Funds’ investment objectives and policies.
A summary of the Funds’ investments in the Subsidiaries are as follows:
| | | | | | | | | | |
| | | INCEPTION DATE
OF SUBSIDIARY | | SUBSIDIARY NET
ASSETS AT
DECEMBER 31, 2011 | | | % OF TOTAL NET
ASSETS AT
DECEMBER 31, 2011 | |
AQR Managed Futures Strategy Offshore Fund, Ltd. | | January 6, 2010 | | $ | 351,568,733 | | | | 22.6 | % |
AQR Risk Parity Offshore Fund, Ltd. | | September 30, 2010 | | | 75,805,197 | | | | 19.5 | % |
AQR Multi-Strategy Alternative Offshore Fund, Ltd. | | July 18, 2011 | | | 30,215,982 | | | | 10.0 | % |
| | | | | | | | | | | | | | | | |
| | AQR Funds | | | | | | Annual Report | | | | | | December 2011 | | 165 |
| | | | | | | | | | |
| | | | |
| Notes to Financial Statements | | | December 31, 2011 | |
3. Significant Accounting Policies
The following summarizes the significant accounting policies of the Funds:
Use of Estimates: The preparation of the financial statements in conformity with accounting principles generally accepted in the United States of America (“GAAP”) requires management to make estimates and assumptions that affect the reported amounts of assets and liabilities and disclosure of contingent assets and liabilities at the date of the financial statements and the reported amounts of increases and decreases in net assets from operations during the reported period. Actual results could differ from those estimates.
Securities Valuation: Each Fund’s portfolio securities are valued as of the close of business of the regular session of trading on the NYSE (normally 4:00 p.m. Eastern time). Equity securities, including securities sold short and warrants, are valued at the latest quoted sales prices or official closing prices taken from the primary market in which each security trades. The value of securities listed on the NASDAQ shall generally be the NASDAQ Official Closing Price. In accordance with procedures adopted by the Board of Trustees, the Funds apply fair value pricing to international securities on a daily basis utilizing the quotations of an independent pricing service, unless the Adviser determines that use of another valuation methodology is appropriate. The pricing service uses statistical analysis and quantitative models to adjust local market prices using factors such as subsequent movement and changes in the prices of indices, securities and exchange rates in other markets, in determining fair value as of the time the Funds calculate their net asset value. Securities traded in the over-the-counter market, and which are not quoted by NASDAQ, are valued at the last sale price, if available, otherwise at the last quoted bid price (in the case of short sales, at the ask price). Bonds are valued using the latest bid prices or using valuations based on a matrix system (which considers such factors as security prices, yields, maturities, and ratings), both as furnished by independent pricing services. The Funds value debt securities maturing less than 61 days from the date of purchase at amortized cost, which approximates market value. The value of futures contracts purchased and sold by the Funds is accounted for using the unrealized gain or loss on the contracts that is determined by marking the contracts to their current settlement prices. Futures and options contracts are valued at the last quoted sales price on the valuation date. In the event that the exchange for a specific futures contract closes earlier than 4:00 p.m., the futures contract is valued at the Official Settlement Price of the exchange. Prices of futures contracts are monitored until 4:00 p.m. to determine if fair valuation would provide a more accurate valuation. Investments in open-end investment companies are valued at such investment company’s current day closing net asset value per share. Exchange-Traded Funds (“ETFs”) and closed-end investment companies are valued at the last quoted sales price. Equity, total return and commodity swap contracts are valued at fair value, based on the price of the underlying referenced instrument. Credit default swaps are valued daily primarily using independent pricing services or market makers. Interest rate swap contracts are valued at fair value as determined by an independent pricing service based on various valuation models which consider the terms of underlying contracts and market data inputs received from third parties.
The Funds may use pricing services to obtain readily available market quotations. Where market quotations are not readily available, or if an available market quotation is determined not to be reliable, a security will be valued based on its fair value as determined in accordance with the valuation procedures approved by the Funds’ Board of Trustees, which may include the use of proprietary valuation models which may consider market transactions in comparable securities and the various relationships between securities in determining value and/or market characteristics such as benchmark yield curves, credit spreads, estimated default rates, underlying collateral, and other unique security features. Using fair value to price securities may result in a value that is different from a security’s most recent closing price and from the prices used by other mutual funds to calculate their net assets.
Convertible Securities: The Funds invest in preferred stocks and fixed-income securities which are convertible into common stock. Convertible securities may be converted either at a stated price or rate within a specified period of time into a specified number of shares of common stock. Traditionally, convertible securities have paid dividends or interest greater than on the related common stocks, but less than fixed income non-convertible securities. By investing in a convertible security, the Funds may participate in any capital appreciation or depreciation of a company’s stock, but to a lesser degree than if it had invested in that company’s common stock. Convertible securities rank senior to common stock in a corporation’s capital structure and, therefore, entail less risk than the corporation’s common stock. The Funds may attempt to hedge certain of their investments in convertible debt securities by selling short the issuer’s common stock.
| | | | | | | | | | | | | | | | |
| 166 | | AQR Funds | | | | | | Annual Report | | | | | | December 2011 | | |
| | | | | | | | | | |
| | | | |
| Notes to Financial Statements | | | December 31, 2011 | |
Short Sales: The AQR Diversified Arbitrage Fund and AQR Multi-Strategy Alternative Fund sell securities they do not own as a hedge against some of their long positions and/or in anticipation of a decline in the market value of that security (short sale). When the Funds make a short sale, they must borrow the security sold short and deliver it to the broker-dealer through which it made the short sale. The Funds may have to pay a fee to borrow the particular security and may be obligated to remit any interest or dividends received on such borrowed securities. Dividends declared on short positions open are recorded on the ex-date as an expense. A gain, limited to the price at which the Fund sold the security short, or a loss, unlimited in magnitude, will be recognized upon the termination of a short sale if the market price at termination is less than or greater than, respectively, the proceeds originally received. The Funds are also subject to the risk that they may be unable to reacquire a security to terminate a short position except at a price substantially in excess of the last quoted price. The Fund is also subject to risk of loss if the broker were to fail to perform its obligations under the contractual terms. Liabilities for securities sold short are reported at market value on the Statements of Assets and Liabilities and the change in market value is recorded as unrealized gain or loss on the Statements of Operations.
The Funds are required to pledge cash or securities to the broker as collateral for the securities sold short. Collateral requirements are calculated daily based on the current market value of the short positions. Cash deposited with broker for collateral for securities sold short is recorded as an asset on the Statements of Assets and Liabilities and securities segregated as collateral are denoted in the Schedule of Investments. The Funds may receive or pay the net of the following amounts: (i) a portion of the income from the investment of cash collateral; (ii) the broker’s fee on the borrowed securities; and (iii) a financing charge for the difference in the market value of the short position and cash collateral deposited with the broker. This income or fee is calculated daily based upon the market value of each borrowed security and a variable rate that is dependent on the availability of the security. The net amount of fees of $5,015,807 and $34,744 are included in dividend and interest on securities sold short in the Statements of Operations for AQR Diversified Arbitrage Fund and AQR Multi-Strategy Alternative Fund, respectively.
Futures Contracts: The Funds invest in futures contracts. The Funds, excluding AQR Managed Futures Strategy Fund, AQR Risk Parity Fund and AQR Multi-Strategy Alternative Fund, invest in futures in order to hedge their investments or equitize their cash flows against fluctuations in value caused by changes in prevailing interest rates or market conditions. The AQR Managed Futures Strategy Fund, AQR Risk Parity Fund and AQR Multi-Strategy Alternative Fund invest in futures as part of their primary investment strategy. Investments in futures may increase or decrease exposure to a particular market. In the event of a bankruptcy or insolvency of a futures commission merchant that holds margin on behalf of the Funds, the Funds may not be entitled to the return of all of the margin owed to the Funds, potentially resulting in a loss. No monies are paid to or received by a Fund upon the purchase or sale of a futures contract. Initially, a Fund will be required to deposit with the broker an amount of cash or cash equivalents, known as initial margin, based on the value of the contract. Subsequent payments to and from the broker, will be made on a periodic basis as the price of the underlying instruments fluctuates. Changes in the market value of open futures contracts are recorded as unrealized appreciation or depreciation in the Statements of Operations. Realized gains or losses, representing the difference between the value of the contract at the time it was opened and the value at the time it was closed, are reported in the Statements of Operations at the closing or expiration of futures contracts. Securities deposited as initial margin are designated in the Schedules of Investments and cash deposited are recorded on the Statements of Assets and Liabilities. The use of long futures contracts subjects the Funds to risk of loss in excess of the amounts shown on the Statements of Assets and Liabilities, up to the contract amount of the futures contracts. The use of short futures contracts subjects the Funds to unlimited risk of loss. Futures contracts outstanding at period end, if any, are listed after each Fund’s Schedule of Investments.
Forward Currency Contracts: The Funds buy and sell forward currency contracts, which are agreements between two parties to buy and sell currencies at a set price on a future date. These contracts are used to protect against a decline in value relative to the U.S. dollar of the currencies in which portfolio securities are denominated or quoted (or an increase in the value of a currency in which securities a Fund intends to buy are denominated, when a Fund holds cash reserves and short term investments), or for other investment purposes. The U.S. dollar value of forward currency contracts is determined using current forward currency exchange rates supplied by a quotation service. The market value of the contract will fluctuate with changes in currency exchange rates. The contract is marked to market daily and the change in market value is recorded as an unrealized gain or loss. When the contract is closed, the Funds record a realized gain or loss equal to the difference between the value of the contract at the time it was opened and the value at the time it was closed. The Funds could be exposed to risk if the value of the currency changes unfavorably, if the counterparties to the contracts are unable to meet the terms of their contracts or if the Fund is unable to enter into a closing position.
| | | | | | | | | | | | | | | | |
| | AQR Funds | | | | | | Annual Report | | | | | | December 2011 | | 167 |
| | | | | | | | | | |
| | | | |
| Notes to Financial Statements | | | December 31, 2011 | |
Risks may exceed amounts recognized on the Statements of Assets and Liabilities. Forward currency contracts outstanding at period end, if any, are listed after each Fund’s Schedule of Investments.
Equity (including total return and commodity) Swap Contracts: The Funds invest in equity swaps to obtain exposure to the underlying referenced instrument, obtain leverage or enjoy the returns from ownership without actually owning the underlying position. Equity swaps are two-party contracts that generally obligate one party to pay the positive return and the other party to pay the negative return on a specified reference security, basket of securities, security index or index component during the period of the swap. Equity swap contracts are marked to market daily based on the value of the underlying reference entity and the change, if any, is recorded as an unrealized gain or loss. Equity swaps normally do not involve the delivery of securities or other underlying assets. If the other party to an equity swap defaults, a Fund’s risk of loss consists of the net amount of payments that such Fund is contractually entitled to receive, if any. Equity swaps are derivatives and their value can be very volatile. To the extent that the Adviser or Sub-Adviser, as applicable, do not accurately analyze and predict future market trends, the values of assets or economic factors, a Fund may suffer a loss, which may exceed the related amounts shown in the Statements of Assets and Liabilities. Periodic payments received or paid by the Funds are recorded as realized gains or losses. Equity swap contracts outstanding at period end, if any, are listed after each Fund’s Schedule of Investments.
Credit Default Swap Contracts: Certain Funds enter into credit default swap contracts to provide a measure of protection against risk of loss following a default, or other credit event in respect of issuers within an underlying index or a single issuer, or to gain credit exposure to an underlying index or issuer. In a credit default contract, the protection buyer typically makes an up front payment and a periodic stream of payments to a counterparty, the protection seller, in exchange for the right to receive a contingent payment upon the occurrence of a credit event on the reference obligation or all other equally ranked obligations of the reference entity. Credit events are contract specific but may include bankruptcy, failure to pay, restructuring and obligation acceleration. An upfront payment received by a Fund, as the protection seller, or an upfront payment made by a Fund, as the protection buyer, is recorded on the Statements of Assets and Liabilities. Upfront payments are amortized over the term of the contract. Periodic payments received or paid by a Fund are recorded as realized gains or losses. The credit default contracts are marked to market daily based upon quotations from an independent pricing service or market makers and the change, if any, is recorded as an unrealized gain or loss. Upon the occurrence of a credit event, the difference between the par value and market value of the reference obligation, net of any proportional amount of the upfront payment, is recorded as a realized gain or loss.
In addition to bearing the risk that the credit event will occur, a Fund could be exposed to market risk due to unfavorable changes in interest rates or in the price of the underlying security or index or the possibility that the Fund may be unable to close out its position at the same time or at the same price as if it had purchased the underlying reference obligations. In certain circumstances, a Fund may enter into offsetting credit default contracts which would mitigate its risk of loss. Risks of loss may exceed amounts recognized on the Statements of Assets and Liabilities. The Fund’s maximum risk of loss from counterparty risk, either as the protection seller or as the protection buyer, is the fair value of the contract. This risk may be mitigated by having a master netting arrangement between the Fund and the counterparty. Where a Fund is a seller of protection, the maximum potential amount of future payments the Fund may be required to make is equal to the notional amount of the relevant credit default contract. The Funds’ risk of loss associated with these instruments may exceed their value, as recorded in the Statements of Assets and Liabilities. Credit default contracts outstanding, including their respective notional amounts at period end, if any, are listed after each Fund’s Schedule of Investments.
The credit default swaps in which the AQR Risk Parity Fund is providing protection at December 31, 2011 are summarized as follows:
| | | | | | | | | | | | | | | | |
| | | MAXIMUM PAYOUT/NOTIONAL
AMOUNT BY PERIOD OF
EXPIRATION
($ IN THOUSANDS) | | | | |
CREDIT SPREAD
ON UNDERLYING
(BASIS POINTS) | | 0-5
YEARS
USD | | | 0-5
YEARS
EUR | | | 35-40
YEARS
USD | | | WRITTEN CREDIT
DERIVATIVES AT
FAIR VALUE | |
0-250 | | | 56,875 | | | | 22,500 | | | | 2,625 | | | | $(2,562,006) | |
251 or greater | | | 63,650 | | | | 14,975 | | | | — | | | | (3,753,048) | |
| | | | |
Total | | | 120,525 | | | | 37,475 | | | | 2,625 | | | | $(6,315,054) | |
| | | | |
| | | | | | | | | | | | | | | | |
| 168 | | AQR Funds | | | | | | Annual Report | | | | | | December 2011 | | |
| | | | | | | | | | |
| | | | |
| Notes to Financial Statements | | | December 31, 2011 | |
The credit default swaps in which the AQR Multi-Strategy Alternative Fund is providing protection at December 31, 2011 are summarized as follows:
| | | | | | | | | | |
| | | MAXIMUM PAYOUT/NOTIONAL
AMOUNT BY PERIOD OF
EXPIRATION
($ IN THOUSANDS) | | | |
CREDIT SPREAD
ON UNDERLYING
(BASIS POINTS) | | 0-5
YEARS
USD | | | | | WRITTEN CREDIT
DERIVATIVES AT
FAIR VALUE | |
251-500 | | | 2,950 | | | | | | (198,414) | |
| | | | |
Total | | | 2,950 | | | | | | $(198,414) | |
| | | | |
Implied credit spreads are an indication of the seller’s performance risk, related to the likelihood of a credit event occurring that would require a seller to make payment to a buyer. Implied credit spreads are used to determine the value of swap contracts and reflect the cost of buying/selling protection, which may include upfront payments made to enter into the contract. Therefore, higher spreads would indicate a greater likelihood that a seller will be obligated to perform (i.e., make payment) under the swap contract. Increasing values, in absolute terms and relative to notional amounts, are also indicative of greater performance risk. Implied credit spreads for credit default swaps on credit indexes are linked to the weighted average spread across the underlying reference obligations included in a particular index.
Interest Rate Swaps: The AQR Risk Parity Fund enters into interest rate swaps as part of its investment strategy. Interest rate swaps generally involve agreements to exchange fixed and floating payment obligations, without the exchange of the underlying notional amounts. Periodic payments received or paid by the Fund are recorded as realized gains and losses. Interest rate swaps are marked to market daily based on quotations as provided by an independent pricing service and the change is recorded as unrealized gain or loss. The Fund’s risk of loss associated with these instruments may exceed their value, as recorded in the Statements of Assets and Liabilities. Interest rate contracts outstanding, including their respective notional amounts at period end, if any, are listed after the Fund’s Schedule of Investments.
High Yield Securities: Certain Funds may invest in lower-quality debt securities. Investments in lower-rated securities or unrated securities of comparable quality tend to be more sensitive to economic conditions than higher rated securities causing greater price volatility. These instruments involve a greater risk of loss due to default by the issuer because such securities are generally unsecured and are often subordinated to other creditors’ claims.
Master Agreements: The Funds are a party to ISDA (International Swap and Derivatives Association, Inc.) Master Agreements (“Master Agreements”) with certain counterparties that govern over-the-counter derivative and foreign exchange contracts entered into from time to time. The Master Agreements may contain provisions regarding, among other things, the parties’ general obligations, representations, agreements, collateral requirements, events of default and early termination. With respect to certain counterparties, in accordance with the terms of the Master Agreements, collateral posted for the benefit of a Fund is held in a segregated account by the Fund’s custodian and with respect to those amounts which can be sold or repledged, are presented in the Fund’s Schedule of Investments. Collateral pledged by the Fund is segregated by the Fund’s custodian and identified in the Fund’s Schedule of Investments. Collateral can be in the form of cash or debt securities issued by the U.S. Government or related agencies or other securities as agreed to by the Fund and the applicable counterparty. Collateral requirements are generally determined based on the Fund’s net position with each counterparty. Termination events applicable to the Fund may occur upon a decline in the Fund’s net assets below a specified threshold over a certain period of time. Termination events applicable to counterparties may occur upon a decline in the counterparty’s long-term and short-term credit ratings below a specified level. In each case, upon occurrence, the other party may elect to terminate early and cause settlement of all derivative and foreign exchange contracts outstanding, including the payment of any losses and costs resulting from such early termination, as reasonably determined by the terminating party. Any decision by one or more of the Fund’s counterparties to elect early termination could impact a Fund’s future derivative activity. The Funds’ derivative assets and liabilities on the Statements of Assets and Liabilities are presented net when a legally enforceable master netting agreement exists between the Funds and a derivative counterparty.
| | | | | | | | | | | | | | | | |
| | AQR Funds | | | | | | Annual Report | | | | | | December 2011 | | 169 |
| | | | | | | | | | |
| | | | |
| Notes to Financial Statements | | | December 31, 2011 | |
Options: The Funds are authorized to write and purchase put and call options. When a Fund writes an option, an amount equal to the premium received by the Fund is reflected as an asset and an equivalent liability. The amount of the liability is subsequently marked to market to reflect the current market value of the option written. When a security is purchased or sold through an exercise of an option, the related premium paid (or received) is added to (or deducted from) the basis of the security acquired or deducted from (or added to) the proceeds of the security sold. When an option expires, the Fund realizes a gain or loss on the option to the extent of the premiums received or paid. When a Fund enters into a closing transaction, the Fund realizes a gain or loss to the extent the cost of the closing transaction exceeds the premiums paid or received. Written uncovered call options subject the Funds to unlimited risk of loss. Written covered call options limit the upside potential of a security above the strike price. Put options written subject the Funds to risk of loss if the value of the security declines below the exercise price minus the put premium.
The Fund, as writer of an option, bears the market risk of an unfavorable change in the price of the security underlying the written option. Written and purchased options are non-income producing investments.
Transactions in call and put options written during the period ended December 31, 2011 for the AQR Diversified Arbitrage Fund were as follows:
| | | | | | | | | | | | | | | | |
| | | CALL OPTIONS | | | PUT OPTIONS | |
| | | SHARES
SUBJECT TO
CALL | | | PREMIUM | | | SHARES
SUBJECT TO
PUT | | | PREMIUM | |
| | | | |
Options outstanding, December 31, 2010 | | | (6,130 | ) | | $ | (1,113,694 | ) | | | — | | | $ | — | |
Options written | | | (39,105 | ) | | | (3,782,605 | ) | | | (8,583 | ) | | | (86,455 | ) |
Options expired | | | 26,110 | | | | 470,491 | | | | 8,187 | | | | 67,051 | |
Options exercised | | | 16,584 | | | | 4,006,795 | | | | 396 | | | | 19,404 | |
| | | | | | | | | | | | | | | | |
Options outstanding, December 31, 2011 | | | (2,541 | ) | | $ | (419,013 | ) | | | — | | | $ | — | |
| | | | | | | | | | | | | | | | |
Securities Lending: The Trust (excluding the AQR Managed Futures Strategy Fund and AQR Risk Parity Fund) may lend securities to brokers approved by the Adviser in order to generate additional income. Securities loaned are collateralized by cash, which is invested in various JPMorgan Money Market Funds. Upon termination of a loan, the Funds are required to return to the borrower the posted cash collateral. Loans are subject to termination by the Funds or the borrower at any time. Securities lending income is comprised of income earned on cash collateral investments (“Collateral Investments”), net of a rebate received from or paid to borrowers for use of cash collateral and lending agent fees. This amount is recorded as Income from securities lending (net) on the Statements of Operations. The Funds also receive payments from the borrower during the period of the loan, equivalent to dividends and interest earned on the securities loaned, which are recorded as Dividend or Interest income, respectively, on the Statements of Operations.
The Funds bear the risk of loss associated with the Collateral Investments and are not entitled to additional collateral from the borrower to cover any such losses. To the extent that the value of the Collateral Investments decline below the amount owed to a borrower, a Fund may incur losses that exceed the amount it earned on lending the security. Upon termination of a loan, a Fund may use leverage (borrow money) to repay the borrower for cash collateral posted if the Adviser does not believe that it is prudent to sell the Collateral Investments to fund the payment of this liability.
Securities lending also involves counterparty risks, including the risk that the loaned securities may not be returned in a timely manner or at all.
Federal Income Taxes: Each Fund is treated as a separate taxable entity for federal income tax purposes. Each Fund intends to qualify as a “regulated investment company” under Subchapter M of the Internal Revenue Code of 1986 (“the Code”), as amended. If so qualified, each Fund will not be subject to federal income tax to the extent it distributes substantially all of its net investment income and capital gains to shareholders.
Management evaluates tax positions taken or expected to be taken in the course of preparing the Funds’ tax returns to determine whether the tax positions are “more-likely-than-not” of being sustained by the applicable tax authority. Tax
| | | | | | | | | | | | | | | | |
| 170 | | AQR Funds | | | | | | Annual Report | | | | | | December 2011 | | |
| | | | | | | | | | |
| | | | |
| Notes to Financial Statements | | | December 31, 2011 | |
positions not deemed to meet the more-likely-than-not threshold would be recorded as a tax benefit or expense in the current year. The Funds are required to analyze all open tax years. Open tax years are those years that are open for examination by the relevant income taxing authority. The returns of the Funds for the period from commencement of operations through December 31, 2011 are open for examination. As of December 31, 2011, the Funds had no examinations in progress.
The Funds have concluded that there is no tax liability/benefit resulting from uncertain income tax positions taken or expected to be taken. The Funds are also not aware of any tax positions for which it is reasonably possible that the total amounts of unrecognized tax expense will significantly change in twelve months.
Securities Transactions and Investment Income: Investment transactions are accounted for on trade date (the date the order to buy or sell is executed). Securities gains and losses are calculated on a specifically identified cost basis. Interest income is determined on the basis of coupon interest accrued using effective interest method adjusted for amortization of premiums and accretion of discounts using the effective yield method. Dividend income/expense is recorded on the ex-dividend date.
Allocation of Income and Expenses: In calculating the net asset value per share of each class, investment income, realized and unrealized gains and losses and expenses other than class specific expenses are allocated daily to each class of shares based upon the proportion of net assets of each class at the beginning of each day. Each Fund is charged for those expenses that are directly attributable to each Series, such as advisory fees and registration costs. Trust level expenses are allocated among the Funds based on the ratio of average net assets or some other reasonable methodology.
The Funds record distributions received in excess of income from underlying investments as a reduction of cost of investments and/or realized gain. Such amounts are based on estimates (if actual amounts are not available) and actual amounts of income, realized gain and return of capital may differ from the estimated amounts. The Funds adjust the estimated amounts of components of distributions (and consequently net investment income) as necessary once the issuers provide information about the actual composition of the distributions.
The Funds may be subject to foreign taxes on income, gains on investments or currency repatriation, a portion of which may be recoverable. The Funds will accrue such taxes and recoveries as applicable, based upon their current interpretation of tax rules and regulations that exist in the markets in which they invest.
Organization and Offering Costs: Costs incurred by the AQR Multi-Strategy Alternative Fund in connection with the organization of the Fund, professional fees, printing fees and the offering of the initial registration were $101,582. All costs were expensed during the initial reporting period.
Foreign Currency Translation: The books and records of the Funds are maintained in U.S. dollars. Foreign currency amounts are translated into U.S. dollars at the prevailing exchange rates of such currencies against the U.S. dollar. The market value of investment securities and the other assets and liabilities are translated at the exchange rate as of the valuation date. Purchases and sales of investment securities, income and expenses are translated at the exchange rate prevailing on the respective dates of such transactions.
Although the net assets of the Funds are presented at the foreign exchange rates and market values at the close of the period, the Funds do not isolate that portion of the results of operations arising as a result of changes in the foreign exchange rates from the fluctuations arising from changes in the market prices of securities held or sold during the period. Accordingly, such foreign currency gains (losses) are included in the reported net realized and unrealized gains (losses) on investment transactions.
Reported realized foreign currency gains or losses arise from the disposition of foreign currency, currency gains or losses realized between the trade and settlement dates on securities transactions, and the difference between the amounts of dividends, interest and foreign withholding taxes recorded on each Fund’s books on the transaction date and the U.S. dollar equivalent of the amounts actually received or paid. Unrealized foreign exchange gains and losses arise from changes (due to the changes in the exchange rate) in the value of foreign currency and assets and liabilities (other than investments) denominated in foreign currencies, which are held at period end.
| | | | | | | | | | | | | | | | |
| | AQR Funds | | | | | | Annual Report | | | | | | December 2011 | | 171 |
| | | | | | | | | | |
| | | | |
| Notes to Financial Statements | | | December 31, 2011 | |
Cash and Cash Equivalents: Cash and cash equivalents includes U.S. dollar and foreign currency at bank accounts at amounts which may exceed insured limits. The Funds are subject to risk to the extent that the institutions may be unable to fulfill their obligations.
Due to/from Broker: Due to/from Broker represents cash balances on deposit with the Funds’ prime brokers and counterparties. The Funds are subject to credit risk should the prime brokers and counterparties be unable to meet their obligations to the Funds.
Distributions to Shareholders: The Funds intend to declare and distribute substantially all of their net investment income and net realized capital gains, if any, at least annually. Income and capital gain distributions will be determined in accordance with federal income tax regulations which may differ from GAAP. Distributions to shareholders are recorded on the ex-dividend date. To the extent these “book/tax” differences are permanent in nature (i.e., that they result from other than timing of recognition — “temporary differences”), such amounts are reclassified within the capital accounts based on their Federal tax-basis treatment.
Indemnification: In the normal course of business, the Funds may enter into various agreements that provide for general indemnifications. The Funds’ maximum exposure under these arrangements is unknown as any potential exposure involves future claims that may be made against the Funds. However, based on experience, the Funds expect the risk of loss to be remote.
4. Federal Income Tax Matters
At December 31, 2011, the cost of long security positions and aggregate gross unrealized appreciation (depreciation) of investments for federal income tax purposes were as follows:
| | | | | | | | | | | | | | | | |
| FUND | | COST OF
INVESTMENTS | | | GROSS
UNREALIZED
APPRECIATION | | | GROSS
UNREALIZED
DEPRECIATION | | | NET
UNREALIZED
APPRECIATION
(DEPRECIATION) | |
AQR Global Equity Fund | | $ | 377,765,901 | | | $ | 46,011,736 | | | $ | (24,683,343 | ) | | $ | 21,328,393 | |
AQR International Equity Fund | | | 499,539,050 | | | | 36,007,876 | | | | (49,640,454 | ) | | | (13,632,578 | ) |
AQR Diversified Arbitrage Fund | | | 2,594,045,910 | | | | 115,133,053 | | | | (146,950,879 | ) | | | (31,817,826 | ) |
AQR Managed Futures Strategy Fund | | | 1,296,703,322 | | | | — | | | | — | | | | — | |
AQR Risk Parity Fund | | | 369,010,864 | | | | 482,960,887 | | | | (484,692,309 | ) | | | (1,731,422 | ) |
AQR Multi-Strategy Alternative Fund | | | 114,259,073 | | | | 11,947,159 | | | | (12,755,774 | ) | | | (808,615 | ) |
AQR Momentum Fund | | | 294,651,033 | | | | 20,875,138 | | | | (5,173,236 | ) | | | 15,701,902 | |
AQR Small Cap Momentum Fund | | | 95,681,000 | | | | 11,025,942 | | | | (4,124,536 | ) | | | 6,901,406 | |
AQR International Momentum Fund | | | 76,586,843 | | | | 4,689,959 | | | | (2,414,110 | ) | | | 2,275,849 | |
The differences between book basis and tax basis appreciation (depreciation) on investments is primarily attributable to loss deferrals and passive foreign investment companies (AQR Global Equity Fund, AQR International Equity Fund and AQR International Momentum Fund).
At December 31, 2011, the components of accumulated earnings / (loss) on a tax basis were as follows:
| | | | | | | | | | | | | | | | | | | | | | | | |
| FUND | | CURRENT
DISTRIBUTABLE
ORDINARY
INCOME | | | CURRENT
DISTRIBUTABLE
LONG TERM
CAPITAL GAIN OR
TAX BASIS
CAPITAL LOSS
CARRYFORWARDS | | | NET UNREALIZED
APPRECIATION
(DEPRECIATION) | | | POST OCTOBER
CAPITAL OR LATE YEAR
ORDINARY
LOSS
DEFERRALS | | | OTHER
TEMPORARY
DIFFERENCES | | | TOTAL
ACCUMULATED
EARNINGS | |
AQR Global Equity Fund | | $ | 3,952,909 | | | $ | (5,220,654 | ) | | $ | 23,170,816 | | | $ | (4,237,697 | ) | | $ | — | | | $ | 17,665,374 | |
AQR International Equity Fund | | | 6,115,323 | | | | (18,796,207 | ) | | | (11,501,092 | ) | | | (7,022,293 | ) | | | — | | | | (31,204,269 | ) |
| | | | | | | | | | | | | | | | |
| 172 | | AQR Funds | | | | | | Annual Report | | | | | | December 2011 | | |
| | | | | | | | | | |
| | | | |
| Notes to Financial Statements | | | December 31, 2011 | |
| | | | | | | | | | | | | | | | | | | | | | | | |
| FUND | | CURRENT
DISTRIBUTABLE
ORDINARY
INCOME | | | CURRENT
DISTRIBUTABLE
LONG TERM
CAPITAL GAIN OR
TAX BASIS
CAPITAL LOSS
CARRYFORWARDS | | | NET UNREALIZED
APPRECIATION
(DEPRECIATION) | | | POST OCTOBER
CAPITAL OR LATE YEAR
ORDINARY
LOSS
DEFERRALS | | | OTHER
TEMPORARY
DIFFERENCES | | | TOTAL
ACCUMULATED
EARNINGS | |
AQR Diversified Arbitrage Fund | | $ | 13,078,133 | | | $ | — | | | $ | (43,734,534 | ) | | $ | — | | | $ | (168,478 | ) | | $ | (30,824,879 | ) |
AQR Managed Futures Strategy Fund | | | 17,398,683 | | | | (69,776,826 | ) | | | 12,349,743 | | | | (4,643,467 | ) | | | — | | | | (44,671,867 | ) |
AQR Risk Parity Fund | | | 1,011,540 | | | | 705,851 | | | | 2,486,269 | | | | (1,091,401 | ) | | | — | | | | 3,112,259 | |
AQR Multi-Strategy Alternative Fund | | | — | | | | (1,801,175 | ) | | | (1,478,556 | ) | | | (1,124,490 | ) | | | — | | | | (4,404,221 | ) |
AQR Momentum Fund | | | 716,277 | | | | (15,780,193 | ) | | | 15,701,902 | | | | (4,700,797 | ) | | | — | | | | (4,062,811 | ) |
AQR Small Cap Momentum Fund | | | 45,444 | | | | (2,555,158 | ) | | | 6,901,406 | | | | (3,160,933 | ) | | | — | | | | 1,230,759 | |
AQR International Momentum Fund | | | 126,796 | | | | (9,384,337 | ) | | | 2,273,437 | | | | (2,765,990 | ) | | | — | | | | (9,750,094 | ) |
The differences between book basis and tax basis components of net assets are primarily attributable to tax deferral losses on wash sales and other book and tax differences including capital loss carryforwards, passive foreign investment companies (“PFIC”), forward foreign currency exchange contracts, swap contracts and the tax treatment of income and gain or loss from the subsidiary.
At December 31, 2011, the effect of permanent book/tax reclassifications resulted in increase (decrease) to the components of net assets as follows:
| | | | | | | | | | | | |
| FUND | | UNDISTRIBUTED
NET INVESTMENT
INCOME | | | ACCUMULATED
NET REALIZED
GAIN(LOSS) ON
INVESTMENTS | | | PAID-IN CAPITAL | |
AQR Global Equity Fund | | $ | (400,389 | ) | | $ | (636,327 | ) | | $ | 1,036,716 | |
AQR International Equity Fund | | | (378,331 | ) | | | (64,957 | ) | | | 443,288 | |
AQR Diversified Arbitrage Fund | | | (7,034,802 | ) | | | 6,190,586 | | | | 844,216 | |
AQR Managed Futures Strategy Fund | | | 37,225,932 | | | | (2,515,953 | ) | | | (34,709,979 | ) |
AQR Risk Parity Fund | | | 2,501,880 | | | | 714,962 | | | | (3,216,842 | ) |
AQR Multi-Strategy Alternative Fund | | | 746,731 | | | | (1,221,951 | ) | | | 475,220 | |
AQR Momentum Fund | | | (103,638 | ) | | | 103,638 | | | | — | |
AQR Small Cap Momentum Fund | | | (46,846 | ) | | | 48,155 | | | | (1,309 | ) |
AQR International Momentum Fund | | | 293,634 | | | | (293,632 | ) | | | (2 | ) |
For financial reporting purposes, capital accounts are adjusted to reflect the tax character of permanent book/tax differences. Reclassifications are primarily due to the tax treatment of swap contracts, distribution reclassifications, foreign currency reclassifications, sale of Real Estate Investment Trusts, PFIC’s and the tax treatment of income and gain or loss from the subsidiary. Results of operations and net assets were not affected by these reclassifications.
The tax character of the distributions paid during the periods ended December 31, 2011 and December 31, 2010, were as follows:
| | | | | | | | | | | | | | | | |
| FUND | | DECEMBER 31, 2011
ORDINARY INCOME | | | CAPITAL GAINS | | | DECEMBER 31, 2010
ORDINARY INCOME | | | CAPITAL GAINS | |
AQR Global Equity Fund | | $ | 9,967,013 | | | $ | 1,505,593 | | | $ | 14,994,426 | | | $ | 2,022,493 | |
AQR International Equity Fund | | | 13,160,157 | | | | 2,328,515 | | | | 14,719,113 | | | | — | |
AQR Diversified Arbitrage Fund | | | 66,958,559 | | | | — | | | | 16,563,956 | | | | — | |
| | | | | | | | | | | | | | | | |
| | AQR Funds | | | | | | Annual Report | | | | | | December 2011 | | 173 |
| | | | | | | | | | |
| | | | |
| Notes to Financial Statements | | | December 31, 2011 | |
| | | | | | | | | | | | | | | | |
| FUND | | DECEMBER 31, 2011
ORDINARY INCOME | | | CAPITAL GAINS | | | DECEMBER 31, 2010
ORDINARY INCOME | | | CAPITAL GAINS | |
AQR Managed Futures Strategy Fund | | $ | 10,675,579 | | | $ | 342,818 | | | $ | 9,578,985 | | | $ | 7,656,480 | |
AQR Risk Parity Fund | | | 6,618,750 | | | | 87,996 | | | | 248,610 | | | | — | |
AQR Multi-Strategy Alternative Fund | | | 1,043,109 | | | | — | | | | N/A | | | | N/A | |
AQR Momentum Fund | | | 2,360,576 | | | | 231,090 | | | | 431,429 | | | | 12,799 | |
AQR Small Cap Momentum Fund | | | 596,501 | | | | 266,614 | | | | 546,289 | | | | 29,957 | |
AQR International Momentum Fund | | | 1,944,737 | | | | — | | | | 259,130 | | | | — | |
| | | | | | |
|
The AQR Managed Futures Strategy Fund, AQR Risk Parity Fund and AQR Multi-Strategy Alternative Fund commenced operations on January 6, 2010, September 30, 2010 and July 18, 2011, respectively. |
As of December 31, 2011, for federal income tax purposes, the following Funds have capital loss carryforwards available to offset capital gains, if any, to the extent provided by the Treasury regulations.
| | | | | | | | | | | | |
| FUND | | SHORT-TERM | | | LONG TERM | | | YEAR OF EXPIRATION | |
AQR Global Equity Fund | | $ | 2,953,779 | | | $ | 2,266,875 | | | | N/A | |
AQR International Equity Fund | | | 14,000,520 | | | | 4,795,687 | | | | N/A | |
AQR Managed Futures Strategy Fund | | | 49,365,405 | | | | 20,411,421 | | | | N/A | |
AQR Multi-Strategy Alternative Fund | | | 566,262 | | | | 1,234,913 | | | | N/A | |
AQR Momentum Fund | | | 15,780,193 | | | | — | | | | N/A | |
AQR Small Cap Momentum Fund | | | 2,555,158 | | | | — | | | | N/A | |
AQR International Momentum Fund | | | 107,993 | | | | — | | | | 2018 | |
AQR International Momentum Fund | | | 7,610,865 | | | | 1,665,479 | | | | N/A | |
| | | | | | | | |
| FUND | | POST OCTOBER
CAPITAL LOSSES | | | LATE YEAR ORDINARY
LOSS DEFERRALS | |
AQR Global Equity Fund | | $ | 4,237,697 | | | $ | — | |
AQR International Equity Fund | | | 7,022,293 | | | | — | |
AQR Managed Futures Strategy Fund | | | 4,643,467 | | | | — | |
AQR Risk Parity Fund | | | — | | | | 1,091,401 | |
AQR Multi-Strategy Alternative Fund | | | 698,457 | | | | 426,033 | |
AQR Momentum Fund | | | 4,700,797 | | | | — | |
AQR Small Cap Momentum Fund | | | 3,160,933 | | | | — | |
AQR International Momentum Fund | | | 2,765,990 | | | | — | |
Under the Regulated Investment Company Modernization Act of 2010, the Funds will be permitted to carry forward capital losses incurred in taxable years beginning after December 22, 2010 for an unlimited period. Post-enactment capital loss carryforwards will retain their character as either short-term or long-term capital losses rather than being considered short-term as under previous law. Any post-enactment capital losses generated will be required to be utilized prior to the losses incurred in pre-enactment tax years.
5. Fair Value Measurements
The Funds utilize various inputs in determining the value of each Fund’s investments. GAAP establishes a hierarchy for inputs used in measuring fair value that maximizes the use of observable inputs and minimizes the use of unobservable inputs by requiring the most observable inputs be used when available. These inputs are summarized in the three broad levels as follows:
Level 1 — quoted prices in active markets for identical securities
Level 2 — other significant observable inputs (including quoted prices for similar securities, interest rates, pre-payment speeds, credit risk, etc.)
Level 3 — significant unobservable inputs (including the Fund’s own assumptions in determining the fair value of investments)
| | | | | | | | | | | | | | | | |
| 174 | | AQR Funds | | | | | | Annual Report | | | | | | December 2011 | | |
| | | | | | | | | | |
| | | | |
| Notes to Financial Statements | | | December 31, 2011 | |
Valuation methodology and inputs
An investment asset’s or liability’s level within the fair value hierarchy is based on the lowest level input, individually or in aggregate, that is significant to fair value measurement. The objective of fair value measurement remains the same even when there is a significant decrease in the volume and level of activity for an asset or liability and regardless of the valuation technique used.
The valuation techniques used by the Funds to measure fair value maximize the use of observable inputs and minimize the use of unobservable inputs.
The inputs or methodology used for valuing securities are not necessarily an indication of the risk associated with investing in those securities. The following are certain inputs and techniques that the Funds use to evaluate how to classify each major category of assets and liabilities for Level 2 and Level 3, in accordance with GAAP.
Investments that trade in markets that are not considered to be active, but are valued based on quoted market prices, dealer quotations or alternative pricing sources supported by observable inputs are classified within Level 2. These include certain U.S. government and sovereign obligations, most government agency securities, investment-grade corporate bonds, money market funds and less liquid listed equities. Corporate and sovereign bonds and other fixed income instruments are valued at estimated fair value based on quotations from counterparties and other market participants, as well as pricing models using quoted inputs as provided by an independent pricing service. As Level 2 investments include positions that are not traded in active markets and/or are subject to transfer restrictions, valuations may be adjusted to reflect illiquidity and/or non-transferability, which are generally based on available market information. Investments classified within Level 3 have significant unobservable inputs, as they trade infrequently or not at all. Level 3 instruments include less liquid corporate debt securities, illiquid warrants and illiquid securities. When observable prices are not available for these securities, the Funds use one or more valuation techniques (e.g., the market approach, the income approach, or the cost approach) for which sufficient and reliable data is available. Within Level 3, the use of the market approach generally consists of using comparable market transactions, while the use of the income approach generally consists of the net present value of estimated future cash flows, adjusted as appropriate for liquidity, credit, market and/or other risk factors. The inputs used by the Funds in estimating the value of Level 3 investments include the original transaction price, recent transactions in the same or similar instruments, completed or pending third-party transactions in the underlying investment or comparable issuers, subsequent rounds of financing, recapitalizations and other transactions across the capital structure, offerings in the equity or debt capital markets, and changes in financial ratios or cash flows. Level 3 investments may also be adjusted to reflect illiquidity and/or non-transferability, with the amount of such discount estimated by the Funds in the absence of market information. Assumptions used by the Funds due to the lack of observable inputs may significantly impact the resulting fair value and therefore the Funds’ results of operations.
The Funds invest in derivative instruments. Derivative instruments can be exchange traded or privately negotiated over-the-counter (“OTC”). Exchange-traded derivatives, such as futures contracts and exchange traded option contracts, are typically classified within Level 1 or Level 2 of the fair value hierarchy depending on whether or not they are deemed to be actively traded. Futures and option contracts that are listed on national exchanges and are freely transferable are valued at fair value based on their last sales price on the date of determination on the exchange that constitutes the principal market. OTC derivatives, including forwards, credit default swaps, total return swaps, and interest rate swaps, are valued by the Funds using observable inputs, such as quotations received from the counterparty, dealers or brokers, whenever available and considered reliable. Generally, a valuation model is used consistently for similar derivative types and model inputs, including, but not limited to, market prices, yield curves, credit spreads, volatilities and implied correlations which are obtained from outside brokers and/or pricing services when available. In instances where models are used, the value of an OTC derivative depends upon the contractual terms of, and specific risks inherent in, the instrument as well as the availability and reliability of observable inputs. Such inputs include market prices for reference securities, yield curves, credit curves, measures of volatility, prepayment rates and correlations of such inputs. Certain OTC derivatives, such as generic forwards, swaps and options, have inputs which can generally be corroborated by market data and are therefore classified within Level 2. Equity total return swap transactions are valued at fair value, based on the price of the underlying security. Interest rate swap contracts are valued at estimated fair value as determined by the Funds based on various valuation models which consider the terms of underlying contracts and market data inputs received from third parties.
| | | | | | | | | | | | | | | | |
| | AQR Funds | | | | | | Annual Report | | | | | | December 2011 | | 175 |
| | | | | | | | | | |
| | | | |
| Notes to Financial Statements | | | December 31, 2011 | |
Credit default swaps are carried at their estimated fair value, as determined in good faith by pricing services approved by the Board of Trustees. In addition to credit quality, the Funds monitor a variety of factors including cash flow assumptions, market activity, market sentiment and valuation as part of their ongoing process of assessing payment and performance risk. As payment and performance risk increases, the value of a credit default swap increases, resulting in recognition of unrealized gains for long positions and unrealized losses for short positions. Conversely, as payment and performance risk decreases, unrealized gains are recognized for short positions and unrealized losses are recognized for long positions. The change in value is recorded within unrealized appreciation/(depreciation) until the occurrence of a credit event or the termination of the swap, at which time a realized gain/(loss) is recorded. Those OTC derivatives that have less liquidity or for which inputs are unobservable are classified within Level 3. While the valuations of these less liquid OTC derivatives may utilize some Level 1 and/or Level 2 inputs, they also include other unobservable inputs which are considered significant to the fair value determination. At each measurement date, the Funds update the Level 1 and Level 2 inputs to reflect observable inputs, though the resulting gains and losses are reflected within Level 3 due to the significance of the unobservable inputs.
Transfers
Transfers into, and out of, Level 3 are valued utilizing values as of the beginning of the period. Transfers from Level 2 to Level 3 or from Level 3 to Level 2 are due to a decline or an increase in market activity (e.g. frequency of trades), which resulted in a lack of or increase in available market inputs to determine price.
The following summarizes inputs used as of December 31, 2011 in valuing the Funds’ assets carried at fair value:
| | | | | | | | | | | | | | | | |
| AQR GLOBAL EQUITY FUND | | QUOTED PRICES
IN ACTIVE
MARKET
(LEVEL 1) | | | OTHER SIGNIFICANT
OBSERVABLE
INPUTS
(LEVEL 2) | | | SIGNIFICANT
UNOBSERVABLE
INPUTS
(LEVEL 3) | | | TOTALS | |
ASSETS | | | | | | | | | | | | | | | | |
Common Stocks† | | $ | 209,898,779 | | | $ | 149,343,586 | | | $ | — | | | $ | 359,242,365 | |
Preferred Stocks† | | | — | | | | 1,118,494 | | | | — | | | | 1,118,494 | |
Money Market Funds | | | — | | | | 38,733,435 | | | | — | | | | 38,733,435 | |
| Futures Contracts* | | | 2,307,497 | | | | — | | | | — | | | | 2,307,497 | |
| | | | |
Total Assets | | $ | 212,206,276 | | | $ | 189,195,515 | | | $ | — | | | $ | 401,401,791 | |
| | | | |
LIABILITIES | | | | | | | | | | | | | | | | |
Total Return Swap Contracts* | | $ | — | | | $ | (104,972 | ) | | $ | — | | | | (104,972 | ) |
| Forward Foreign Currency Exchange Contracts* | | | | | | | (175,797 | ) | | | | | | | (175,797 | ) |
| | | | |
Total Liabilities | | $ | — | | | $ | (280,769 | ) | | $ | — | | | $ | (280,769 | ) |
|
* Derivative instruments, including futures, forward foreign currency exchange and total return swap contracts, are valued at the net unrealized appreciation (depreciation) on the instrument. † Please refer to the Schedule of Investments to view securities segregated by country. | |
There were no material transfers between Levels 1 and 2 during the period. All securities listed in the Schedule of Investments with a market value of zero are classified as Level 3. There were no transfers into Level 3.
| | | | | | | | | | | | | | | | |
| 176 | | AQR Funds | | | | | | Annual Report | | | | | | December 2011 | | |
| | | | | | | | | | |
| | | | |
| Notes to Financial Statements | | | December 31, 2011 | |
| | | | | | | | | | | | | | | | |
| AQR INTERNATIONAL EQUITY FUND | | QUOTED PRICES
IN ACTIVE
MARKET
(LEVEL 1) | | | OTHER SIGNIFICANT
OBSERVABLE
INPUTS
(LEVEL 2) | | | SIGNIFICANT
UNOBSERVABLE
INPUTS (LEVEL 3) | | | TOTALS | |
ASSETS | | | | | | | | | | | | | | | | |
Common Stocks† | | $ | — | | | $ | 422,271,053 | | | $ | — | | | $ | 422,271,053 | |
Preferred Stocks† | | | — | | | | 2,932,632 | | | | — | | | | 2,932,632 | |
Money Market Funds | | | — | | | | 60,702,787 | | | | — | | | | 60,702,787 | |
| Futures Contracts* | | | 4,046,142 | | | | — | | | | — | | | | 4,046,142 | |
| | | | |
Total Assets | | $ | 4,046,142 | | | $ | 485,906,472 | | | $ | — | | | $ | 489,952,614 | |
| | | | |
LIABILITIES | | | | | | | | | | | | | | | | |
Total Return Swap Contracts* | | $ | — | | | $ | (819,294 | ) | | $ | — | | | $ | (819,294 | ) |
| Forward Foreign Currency Exchange Contracts* | | | | | | | (502,648 | ) | | | | | | | (502,648 | ) |
| | | | |
Total Liabilities | | $ | — | | | $ | (1,321,942 | ) | | $ | — | | | $ | (1,321,942 | ) |
|
† Please refer to the Schedule of Investments to view securities segregated by country. | |
The following is a reconciliation of assets in which significant unobservable inputs (Level 3) were used in determining fair value:
| | | | |
| AQR INTERNATIONAL EQUITY FUND | | COMMON STOCKS | |
| |
| Balance as of December 31, 2010 | | $ | 8,335 | |
Accrued discounts/(premiums) | | | — | |
Realized gain/(loss) | | | 8,258 | |
Change in unrealized appreciation/(depreciation) | | | (8,335 | ) |
Purchases | | | — | |
Sales | | | (8,258 | ) |
Transfers in to Level 3 | | | — | |
| Transfers out of Level 3 | | | — | |
| |
| Balance as of December 31, 2011 | | $ | — | |
|
* Derivative instruments, including futures, forward foreign currency exchange and total return swap contracts, are valued at the net unrealized appreciation (depreciation) on the instrument. | |
There were no material transfers between Levels 1 and 2 during the period.
| | | | | | | | | | | | | | | | |
| | AQR Funds | | | | | | Annual Report | | | | | | December 2011 | | 177 |
| | | | | | | | | | |
| | | | |
| Notes to Financial Statements | | | December 31, 2011 | |
| | | | | | | | | | | | | | | | |
| AQR DIVERSIFIED ARBITRAGE FUND | | QUOTED PRICES
IN ACTIVE
MARKET
(LEVEL 1) | | | OTHER SIGNIFICANT
OBSERVABLE
INPUTS
(LEVEL 2) | | | SIGNIFICANT
UNOBSERVABLE
INPUTS
(LEVEL 3) | | | TOTALS | |
ASSETS | | | | | | | | | | | | | | | | |
Common Stocks† | | $ | 986,279,176 | | | $ | 154,767,984 | | | $ | 13,402,480 | | | $ | 1,154,449,640 | |
Convertible Preferred Stocks† | | | 22,842,836 | | | | 54,296,886 | | | | 1,181,492 | | | | 78,321,214 | |
Corporate Bonds† | | | — | | | | 374,927,063 | | | | 4,152,274 | | | | 379,079,337 | |
Convertible Bonds† | | | — | | | | 760,546,264 | | | | 4,372,176 | | | | 764,918,440 | |
Closed End Funds | | | 57,616,324 | | | | — | | | | — | | | | 57,616,324 | |
Exchange Traded Funds | | | 4,194,689 | | | | — | | | | — | | | | 4,194,689 | |
Rights† | | | — | | | | 124,856 | | | | — | | | | 124,856 | |
Warrants† | | | 10,795,801 | | | | 2,807,300 | | | | 2,984,201 | | | | 16,587,302 | |
Money Market Funds | | | — | | | | 106,936,282 | | | | — | | | | 106,936,282 | |
Forward Foreign Currency Exchange Contracts* | | | — | | | | 939,967 | | | | — | | | | 939,967 | |
| Credit Default Swap Contracts* | | | — | | | | 10,348,073 | | | | — | | | | 10,348,073 | |
| | | | |
Total Assets | | $ | 1,081,728,826 | | | $ | 1,465,694,675 | | | $ | 26,092,623 | | | $ | 2,573,516,124 | |
| | | | |
LIABILITIES | | | | | | | | | | | | | | | | |
Common Stocks (Sold Short)† | | $ | (924,730,202 | ) | | $ | (5,808,407 | ) | | $ | (64,415 | ) | | $ | (930,603,024 | ) |
Convertible Bonds (Sold Short)† | | | — | | | | (1,102,938 | ) | | | — | | | | (1,102,938 | ) |
Exchange Traded Funds (Sold Short) | | | (46,398,517 | ) | | | — | | | | — | | | | (46,398,517 | ) |
Futures Contracts* | | | (1,187,460 | ) | | | — | | | | — | | | | (1,187,460 | ) |
| Written Option Contracts* | | | (10,991 | ) | | | — | | | | — | | | | (10,991 | ) |
| | | | |
Total Liabilities | | $ | (972,327,170 | ) | | $ | (6,911,345 | ) | | $ | (64,415 | ) | | $ | (979,302,930 | ) |
|
† Please refer to the Schedule of Investments to view securities segregated by industry type. | |
The following is a reconciliation of assets and liabilities in which significant unobservable inputs (Level 3) were used in determining fair value:
| | | | | | | | | | | | | | | | | | | | | | | | |
AQR DIVERSIFIED ARBITRAGE
FUND | | COMMON
STOCKS | | | CONVERTIBLE
PREFERRED
STOCK | | | CORPORATE
BONDS | | | CONVERTIBLE
BONDS | | | WARRANTS | | | SHORT
COMMON
STOCK | |
| Balance as of December 31, 2010 | | $ | 3,323,774 | | | $ | 580,905 | | | $ | 3,240,078 | | | $ | 1,864,435 | | | $ | 3,543,581 | | | $ | — | |
Accrued discounts/(premiums) | | | — | | | | — | | | | (84,872 | ) | | | — | | | | — | | | | — | |
Realized gain/(loss) | | | 659,560 | | | | — | | | | — | | | | — | | | | 572 | | | | — | |
Change in unrealized appreciation/(depreciation) | | | (1,122,896 | ) | | | 278,939 | | | | (946,091 | ) | | | (1,954,859 | ) | | | 145,933 | | | | — | |
Purchases | | | 12,300,581 | | | | — | | | | 1,943,159 | | | | 4,450,000 | | | | 26,322 | | | | — | |
Sales | | | (1,436,891 | ) | | | — | | | | — | | | | — | | | | (814,095 | ) | | | — | |
Transfers in to Level 3 | | | — | | | | 321,648 | | | | — | | | | 12,600 | | | | 81,888 | | | | (64,415 | ) |
| Transfers out of Level 3 | | | (321,648 | ) | | | — | | | | — | | | | — | | | | — | | | | — | |
| | | | | | |
| Balance as of December 31, 2011 | | $ | 13,402,480 | | | $ | 1,181,492 | | | $ | 4,152,274 | | | $ | 4,372,176 | | | $ | 2,984,201 | | | $ | (64,415 | ) |
The total change in unrealized appreciation (depreciation) included in the Statements of Operations attributable to Level 3 investments still held at December 31, 2011 is $(1,122,896), $278,939, $(946,091), $(1,954,859), $20,852, and $— for common stocks, convertible preferred stock, corporate bonds, convertible bonds, warrants, and short common stock respectively.
|
|
* Derivative instruments, including futures and forward foreign currencies exchange contracts, are valued at the unrealized appreciation (depreciation) on the instrument. Written options and credit default swap contracts are reported at market value. |
| | | | | | | | | | | | | | | | |
| 178 | | AQR Funds | | | | | | Annual Report | | | | | | December 2011 | | |
| | | | | | | | | | |
| | | | |
| Notes to Financial Statements | | | December 31, 2011 | |
There were no material transfers between Levels 1 and 2 during the period.
| | | | | | | | | | | | | | | | |
| AQR MANAGED FUTURES STRATEGY | | QUOTED PRICES
IN ACTIVE
MARKET
(LEVEL 1) | | | OTHER SIGNIFICANT
OBSERVABLE
INPUTS
(LEVEL 2) | | | SIGNIFICANT
UNOBSERVABLE
INPUTS
(LEVEL 3) | | | TOTALS | |
ASSETS | | | | | | | | | | | | | | | | |
Money Market Funds | | $ | — | | | $ | 1,296,703,322 | | | $ | — | | | $ | 1,296,703,322 | |
Forward Foreign Currency Exchange Contracts* | | | — | | | | 8,536,738 | | | | — | | | | 8,536,738 | |
Total Return Swap Contracts* | | | — | | | | 2,005,815 | | | | — | | | | 2,005,815 | |
| Futures Contracts* | | | 19,746,483 | | | | — | | | | — | | | | 19,746,483 | |
| | | | |
Total Assets | | $ | 19,746,483 | | | $ | 1,307,245,875 | | | $ | — | | | $ | 1,326,992,358 | |
| | | | |
LIABILITIES | | | | | | | | | | | | | | | | |
| Total Return Swap Contracts* | | $ | — | | | $ | (2,832,970 | ) | | $ | — | | | $ | (2,832,970 | ) |
| | | | |
Total Liabilities | | $ | — | | | $ | (2,832,970 | ) | | $ | — | | | $ | (2,832,970 | ) |
There were no material transfers between Levels 1 and 2 during the period.
There were no Level 3 securities held during the period.
| * | Derivative instruments, including futures, forward foreign currency exchange and total return swap contracts, are valued at the unrealized appreciation (depreciation) on the instrument. |
| | | | | | | | | | | | | | | | |
| AQR RISK PARITY FUND | | QUOTED PRICES
IN ACTIVE
MARKET
(LEVEL 1) | | | OTHER SIGNIFICANT
OBSERVABLE
INPUTS
(LEVEL 2) | | | SIGNIFICANT
UNOBSERVABLE
INPUTS
(LEVEL 3) | | | TOTALS | |
ASSETS | | | | | | | | | | | | | | | | |
Government Related Obligations | | $ | — | | | $ | 86,414,856 | | | $ | — | | | $ | 86,414,856 | |
U.S. Treasury Obligations | | | — | | | | 60,897,612 | | | | — | | | | 60,897,612 | |
Money Market Funds | | | — | | | | 219,966,974 | | | | — | | | | 219,966,974 | |
Forward Foreign Currency Exchange Contracts* | | | — | | | | 1,193,754 | �� | | | — | | | | 1,193,754 | |
Interest Rate Swap Contracts* | | | — | | | | 1,796,813 | | | | — | | | | 1,796,813 | |
| Total Return Swap Contracts* | | | — | | | | 3,742,233 | | | | — | | | | 3,742,233 | |
| | | | |
Total Assets | | $ | — | | | $ | 374,012,242 | | | $ | — | | | $ | 374,012,242 | |
| | | | |
LIABILITIES | | | | | | | | | | | | | | | | |
Credit Default Swap Contracts* | | $ | — | | | $ | (6,315,054 | ) | | $ | — | | | $ | (6,315,054 | ) |
Total Return Swap Contracts* | | | — | | | | (3,575 | ) | | | — | | | | (3,575 | ) |
| Futures Contracts* | | | (977,618 | ) | | | — | | | | — | | | | (977,618 | ) |
| | | | |
Total Liabilities | | $ | (977,618 | ) | | $ | (6,318,629 | ) | | $ | — | | | $ | (7,296,247 | ) |
|
* Derivative instruments, including futures, forward foreign currency exchange, interest rate swap and total return swap contracts, are valued at the unrealized appreciation (depreciation) on the instrument. Credit default swap contracts are reported at market value. | |
There were no material transfers between Levels 1 and 2 during the period.
There were no Level 3 securities held during the period.
| | | | | | | | | | | | | | | | |
| | AQR Funds | | | | | | Annual Report | | | | | | December 2011 | | 179 |
| | | | | | | | | | |
| | | | |
| Notes to Financial Statements | | | December 31, 2011 | |
| | | | | | | | | | | | | | | | |
| AQR MULTI-STRATEGY ALTERNATIVE FUND | | QUOTED PRICES
IN ACTIVE
MARKET
(LEVEL 1) | | | OTHER SIGNIFICANT
OBSERVABLE
INPUTS
(LEVEL 2) | | | SIGNIFICANT
UNOBSERVABLE
INPUTS
(LEVEL 3) | | | TOTALS | |
ASSETS | | | | | | | | | | | | | | | | |
Common Stocks† | | $ | 3,946,660 | | | $ | — | | | $ | — | | | $ | 3,946,660 | |
Convertible Preferred Stock† | | | 1,401,587 | | | | — | | | | — | | | | 1,401,587 | |
Corporate Bonds† | | | — | | | | 43,021,344 | | | | — | | | | 43,021,344 | |
Convertible Bonds† | | | — | | | | 65,080,867 | | | | — | | | | 65,080,867 | |
Futures Contracts* | | | 909,964 | | | | — | | | | — | | | | 909,964 | |
Total Return Swap Contracts* | | | — | | | | 188,631 | | | | — | | | | 188,631 | |
| Total Return Basket Swaps* | | | — | | | | 740,811 | | | | — | | | | 740,811 | |
| | | | |
Total Assets | | $ | 6,258,211 | | | $ | 109,031,653 | | | $ | — | | | $ | 115,289,864 | |
| | | | |
LIABILITIES | | | | | | | | | | | | | | | | |
Common Stocks (Sold Short)† | | $ | (63,666,436 | ) | | $ | — | | | $ | — | | | $ | (63,666,436 | ) |
Forward Foreign Currency Exchange Contracts* | | | — | | | | (622,538 | ) | | | — | | | | (622,538 | ) |
Credit Default Swaps Contracts* | | | — | | | | (198,414 | ) | | | — | | | | (198,414 | ) |
Total Return Swap Contracts* | | | — | | | | (177,315 | ) | | | — | | | | (177,315 | ) |
| Total Return Basket Swaps* | | | — | | | | (108,302 | ) | | | — | | | | (108,302 | ) |
| | | | |
Total Liabilities | | $ | (63,666,436 | ) | | $ | (1,106,569 | ) | | $ | — | | | $ | (64,773,005 | ) |
|
* Derivative instruments, including futures, total return swap, equity basket swap and forward foreign currency exchange contracts, are valued at the unrealized appreciation (depreciation) on the instrument. Credit default swap contracts are reported at market value. † Please refer to the Schedule of Investments to view securities segregated by industry type. | |
There were no material transfers between Levels 1 and 2 during the period.
There were no Level 3 securities held during the period.
| | | | | | | | | | | | | | | | |
| AQR MOMENTUM FUND | | QUOTED PRICES
IN ACTIVE
MARKET
(LEVEL 1) | | | OTHER SIGNIFICANT
OBSERVABLE
INPUTS
(LEVEL 2) | | | SIGNIFICANT
UNOBSERVABLE
INPUTS
(LEVEL 3) | | | TOTALS | |
ASSETS | | | | | | | | | | | | | | | | |
Common Stocks† | | $ | 301,189,647 | | | $ | — | | | $ | — | | | $ | 301,189,647 | |
Money Market Funds | | | — | | | | 9,163,288 | | | | — | | | | 9,163,288 | |
| Futures Contracts* | | | 38,748 | | | | — | | | | — | | | | 38,748 | |
| | | | |
Total Assets | | $ | 301,228,395 | | | $ | 9,163,288 | | | $ | — | | | $ | 310,391,683 | |
|
* Derivative instruments, including futures contracts, are valued at the unrealized appreciation (depreciation) on the instrument. † Please refer to the Schedule of Investments to view securities segregated by industry type. | |
There were no material transfers between Levels 1 and 2 during the period.
There were no Level 3 securities held during the period.
| | | | | | | | | | | | | | | | |
| 180 | | AQR Funds | | | | | | Annual Report | | | | | | December 2011 | | |
| | | | | | | | | | |
| | | | |
| Notes to Financial Statements | | | December 31, 2011 | |
| | | | | | | | | | | | | | | | |
| AQR SMALL CAP MOMENTUM FUND | | QUOTED PRICES
IN ACTIVE
MARKET
(LEVEL 1) | | | OTHER SIGNIFICANT
OBSERVABLE
INPUTS
(LEVEL 2) | | | SIGNIFICANT
UNOBSERVABLE
INPUTS
(LEVEL 3) | | | TOTALS | |
ASSETS | | | | | | | | | | | | | | | | |
Common Stocks† | | $ | 100,369,231 | | | $ | — | | | $ | — | | | $ | 100,369,231 | |
Warrants | | | — | | | | — | | | | — | | | | — | |
Rights† | | | — | | | | — | | | | — | | | | — | |
Money Market Funds | | | — | | | | 2,213,175 | | | | — | | | | 2,213,175 | |
| Futures Contracts* | | | 16,188 | | | | — | | | | — | | | | 16,188 | |
| | | | |
Total Assets | | $ | 100,385,419 | | | $ | 2,213,175 | | | $ | — | | | $ | 102,598,594 | |
|
* Derivative instruments, including futures contracts, are valued at the unrealized appreciation (depreciation) on the instrument. † Please refer to the Schedule of Investments to view securities segregated by industry type. | |
There were no material transfers between Levels 1 and 2 during the period.
| | | | | | | | | | | | | | | | |
| AQR INTERNATIONAL MOMENTUM FUND | | QUOTED PRICES
IN ACTIVE
MARKET
(LEVEL 1) | | | OTHER SIGNIFICANT
OBSERVABLE
INPUTS
(LEVEL 2) | | | SIGNIFICANT
UNOBSERVABLE
INPUTS
(LEVEL 3) | | | TOTALS | |
ASSETS | | | | | | | | | | | | | | | | |
Common Stocks† | | $ | 12,459,958 | | | $ | 63,615,188 | | | $ | 1,073 | | | $ | 76,076,219 | |
Preferred Stocks† | | | — | | | | 73,347 | | | | — | | | | 73,347 | |
Exchange Traded Funds | | | 558,253 | | | | — | | | | — | | | | 558,253 | |
| Money Market Funds | | | — | | | | 2,154,873 | | | | — | | | | 2,154,873 | |
| | | | |
Total Assets | | $ | 13,018,211 | | | $ | 65,843,408 | | | $ | 1,073 | | | $ | 78,862,692 | |
|
† Please refer to the Schedule of Investments to view securities segregated by country. | |
The following is a reconciliation of assets in which significant unobservable inputs (Level 3) were used in determining fair value:
| | | | |
| AQR INTERNATIONAL MOMENTUM FUND | | COMMON
STOCKS | |
| Balance as of December 31, 2010 | | $ | — | |
Accrued discounts/(premiums) | | | — | |
Realized gain/(loss) | | | — | |
Change in unrealized appreciation/(depreciation) | | | 1,073 | |
Purchases | | | — | |
Sales | | | — | |
Transfers in to Level 3 | | | — | |
| Transfers out of Level 3 | | | — | |
| |
| Balance as of December 31, 2011 | | $ | 1,073 | |
There were no material transfers between Levels 1 and 2 during the period.
New Accounting Pronouncement
In May 2011, the Financial Accounting Standards Board issued Accounting Standard Update No. 2011-04, Fair Value Measurement (Topic 820) — Amendments to Achieve Common Fair Value Measurement and Disclosure Requirements in U.S. GAAP and IFRSs. The update changes the wording used to describe the requirements in GAAP for measuring fair value and for disclosing information about fair value measurements. The update is effective during interim and annual periods beginning after December 15, 2011. Management is currently evaluating the impact of the update’s adoption on the Funds’ financial statement disclosures.
| | | | | | | | | | | | | | | | |
| | AQR Funds | | | | | | Annual Report | | | | | | December 2011 | | 181 |
| | | | | | | | | | |
| | | | |
| Notes to Financial Statements | | | December 31, 2011 | |
6. Investment Transactions
During the period ended December 31, 2011, the cost of purchases and the proceeds from sales of investments (excluding swap contracts, forward foreign currency exchange contracts, futures contracts and short-term investments) were as follows:
| | | | | | | | | | | | | | | | |
| FUND | | PURCHASES | | | SALES | | | SECURITIES
SOLD SHORT | | | COVERS ON
SECURITIES
SOLD SHORT | |
AQR Global Equity Fund | | $ | 229,974,407 | | | $ | 226,925,406 | | | $ | — | | | $ | — | |
AQR International Equity Fund | | | 344,717,605 | | | | 254,808,475 | | | | — | | | | — | |
AQR Diversified Arbitrage Fund | | | 5,234,741,675 | | | | 4,184,909,979 | | | | 1,993,708,778 | | | | 1,574,289,246 | |
AQR Managed Futures Strategy Fund | | | — | | | | — | | | | — | | | | — | |
AQR Risk Parity Fund | | | 185,826,682 | | | | 48,026,289 | | | | — | | | | — | |
AQR Multi-Strategy Alternative Fund | | | 117,176,432 | | | | 3,082,025 | | | | 82,330,240 | | | | 17,646,682 | |
AQR Momentum Fund | | | 563,203,753 | | | | 368,966,924 | | | | — | | | | — | |
AQR Small Cap Momentum Fund | | | 155,300,359 | | | | 104,111,867 | | | | — | | | | — | |
AQR International Momentum Fund | | | 182,626,476 | | | | 151,485,903 | | | | — | | | | — | |
The AQR Risk Parity Fund had purchases and sales of long-term U.S. Government obligations of $75,166,010 and $19,869,106, respectively.
7. Derivative Instruments and Hedging Activities
Certain Funds use derivative instruments as part of their principal investment strategy to achieve their investment objectives. The effect of such derivative instruments on the Funds’ financial position and financial performance as reflected in the Statements of Assets and Liabilities and Statements of Operations for the period ended December 31, 2011 are as follows:
| | | | | | | | | | | | | | | | | | | | | | | | | | | | |
| | | ASSETS | | | LIABILITIES | |
| FUND | | UNREALIZED
APPRECIATION
ON FUTURES
CONTRACTS | | | SWAPS
AT VALUE | | | UNREALIZED
APPRECIATION
ON FORWARD
CURRENCY
EXCHANGE
CONTRACTS | | | WRITTEN
OPTIONS
AT
MARKET
VALUE | | | UNREALIZED
DEPRECIATION
ON FUTURES
CONTRACTS | | | SWAPS
AT VALUE | | | UNREALIZED
DEPRECIATION
ON FORWARD
CURRENCY
EXCHANGE
CONTRACTS | |
| Equity Risk Exposure: | | | | | | | | | | | | | | | | | | | | | | | | | | | | |
AQR Global Equity Fund | | | $2,556,092 | | | | $— | | | | $— | | | | $— | | | | $248,595 | | | | $104,972 | | | | $— | |
AQR International Equity Fund | | | 4,719,402 | | | | — | | | | — | | | | — | | | | 673,260 | | | | 819,294 | | | | — | |
AQR Diversified Arbitrage Fund | | | — | | | | — | | | | — | | | | 10,991 | | | | 754,287 | | | | — | | | | — | |
AQR Managed Futures Strategy Fund | | | 3,084,431 | | | | 301,473 | | | | — | | | | — | | | | 608,889 | | | | — | | | | — | |
AQR Risk Parity Fund | | | 746,884 | | | | 82,680 | | | | — | | | | — | | | | 179,550 | | | | 48,168 | | | | — | |
AQR Multi-Strategy Alternative Fund | | | 763,431 | | | | 740,971 | | | | — | | | | — | | | | 322,141 | | | | 207,082 | | | | — | |
AQR Momentum Fund | | | 38,748 | | | | — | | | | — | | | | — | | | | — | | | | — | | | | — | |
AQR Small Cap Momentum Fund | | | 16,188 | | | | — | | | | — | | | | — | | | | — | | | | — | | | | — | |
AQR International Momentum Fund | | | — | | | | — | | | | — | | | | — | | | | — | | | | — | | | | — | |
| | | | | | | |
| Foreign Exchange Rate Risk Exposure: | | | | | | | | | | | | | | | | | | | | | | | | | | | | |
AQR Global Equity Fund | | | — | | | | — | | | | 1,829,949 | | | | — | | | | — | | | | — | | | | 2,005,746 | |
AQR International Equity Fund | | | — | | | | — | | | | 2,730,797 | | | | — | | | | — | | | | — | | | | 3,233,445 | |
AQR Diversified Arbitrage Fund | | | — | | | | — | | | | 1,369,086 | | | | — | | | | — | | | | — | | | | 429,119 | |
AQR Managed Futures Strategy Fund | | | — | | | | — | | | | 27,470,018 | | | | — | | | | — | | | | — | | | | 18,933,280 | |
AQR Risk Parity Fund | | | — | | | | — | | | | 1,574,383 | | | | — | | | | — | | | | — | | | | 380,629 | |
AQR Multi-Strategy Alternative Fund | | | — | | | | — | | | | 1,583,501 | | | | — | | | | — | | | | — | | | | 2,206,039 | |
AQR International Momentum Fund | | | — | | | | — | | | | — | | | | — | | | | — | | | | — | | | | — | |
| | | | | | | |
| Interest Rate Risk Exposure: | | | | | | | | | | | | | | | | | | | | | | | | | | | | |
AQR Diversified Arbitrage Fund | | | — | | | | — | | | | — | | | | — | | | | 433,173 | | | | — | | | | — | |
AQR Managed Futures Strategy Fund | | | 9,840,409 | | | | 1,279,338 | | | | — | | | | — | | | | 912,927 | | | | — | | | | — | |
AQR Risk Parity Fund | | | 20,202 | | | | 7,369,562 | | | | — | | | | — | | | | — | | | | 1,865,028 | | | | — | |
AQR Multi-Strategy Alternative Fund | | | 398,638 | | | | 245,686 | | | | — | | | | — | | | | 154,919 | | | | 57,055 | | | | — | |
| | | | | | | | | | | | | | | | |
| 182 | | AQR Funds | | | | | | Annual Report | | | | | | December 2011 | | |
| | | | | | | | | | |
| | | | |
| Notes to Financial Statements | | | December 31, 2011 | |
| | | | | | | | | | | | | | | | | | | | | | | | | | | | |
| | | ASSETS | | | LIABILITIES | |
| FUND | | UNREALIZED
APPRECIATION
ON FUTURES
CONTRACTS | | | SWAPS
AT VALUE | | | UNREALIZED
APPRECIATION
ON FORWARD
CURRENCY
EXCHANGE
CONTRACTS | | | WRITTEN
OPTIONS
AT
MARKET
VALUE | | | UNREALIZED
DEPRECIATION
ON FUTURES
CONTRACTS | | | SWAPS
AT VALUE | | | UNREALIZED
DEPRECIATION
ON FORWARD
CURRENCY
EXCHANGE
CONTRACTS | |
| | | | | | | |
| Credit Risk Exposure: | | | | | | | | | | | | | | | | | | | | | | | | | | | | |
AQR Diversified Arbitrage Fund | | | $— | | | | $10,348,073 | | | | $— | | | | $— | | | | $— | | | | $— | | | | $— | |
AQR Risk Parity Fund | | | — | | | | 1,283,450 | | | | — | | | | — | | | | — | | | | 7,598,504 | | | | — | |
AQR Multi-Strategy Alternative Fund | | | — | | | | — | | | | — | | | | — | | | | — | | | | 198,414 | | | | — | |
| | | | | | | |
| Commodity Exposure: | | | | | | | | | | | | | | | | | | | | | | | | | | | | |
AQR Managed Futures Strategy Fund | | | 19,201,755 | | | | 1,263,878 | | | | — | | | | — | | | | 10,858,296 | | | | 3,671,844 | | | | — | |
AQR Risk Parity Fund | | | 1,420,148 | | | | — | | | | — | | | | — | | | | 2,985,302 | | | | 3,575 | | | | — | |
| AQR Multi-Strategy Alternative Fund | | | 1,119,975 | | | | 3,187 | | | | — | | | | — | | | | 895,020 | | | | 81,882 | | | | — | |
| | | | | | | |
| Netting: | | | | | | | | | | | | | | | | | | | | | | | | | | | | |
AQR Global Equity Fund | | | (248,595) | | | | — | | | | (1,829,949) | | | | — | | | | (248,595) | | | | — | | | | (1,829,949) | |
AQR International Equity Fund | | | (673,260) | | | | — | | | | (2,730,797) | | | | — | | | | (673,260) | | | | — | | | | (2,730,797) | |
AQR Diversified Arbitrage Fund | | | — | | | | — | | | | (429,119) | | | | — | | | | — | | | | — | | | | (429,119) | |
AQR Managed Futures Strategy Fund | | | (12,380,112) | | | | (2,844,689) | | | | (18,933,280) | | | | — | | | | (12,380,112) | | | | (2,844,689) | | | | (18,933,280) | |
AQR Risk Parity Fund | | | (2,187,234) | | | | (8,735,692) | | | | (380,629) | | | | — | | | | (2,187,234) | | | | (8,735,692) | | | | (380,629) | |
AQR Multi-Strategy Alternative Fund | | | (1,372,080) | | | | (544,433) | | | | (1,583,501) | | | | — | | | | (1,372,080) | | | | (544,433) | | | | (1,583,501) | |
AQR Momentum Fund | | | — | | | | — | | | | — | | | | — | | | | — | | | | — | | | | — | |
AQR Small Cap Momentum Fund | | | — | | | | — | | | | — | | | | — | | | | — | | | | — | | | | — | |
| AQR International Momentum Fund | | | — | | | | — | | | | — | | | | — | | | | — | | | | — | | | | — | |
| | | | | | | |
| Net Fair Value of Derivative Contracts: | | | | | | | | | | | | | | | | | | | | | | | | | | | | |
AQR Global Equity Fund | | | 2,307,497 | | | | — | | | | — | | | | — | | | | — | | | | 104,972 | | | | 175,797 | |
AQR International Equity Fund | | | 4,046,142 | | | | — | | | | — | | | | — | | | | — | | | | 819,294 | | | | 502,648 | |
AQR Diversified Arbitrage Fund | | | — | | | | 10,348,073 | | | | 939,967 | | | | 10,991 | | | | 1,187,460 | | | | — | | | | — | |
AQR Managed Futures Strategy Fund | | | 19,746,483 | | | | — | | | | 8,536,738 | | | | — | | | | — | | | | 827,155 | | | | — | |
AQR Risk Parity Fund | | | — | | | | — | | | | 1,193,754 | | | | — | | | | 977,618 | | | | 779,583 | | | | — | |
AQR Multi-Strategy Alternative Fund | | | 909,964 | | | | 445,411 | | | | — | | | | — | | | | — | | | | — | | | | 622,538 | |
AQR Momentum Fund | | | 38,748 | | | | — | | | | — | | | | — | | | | — | | | | — | | | | — | |
AQR Small Cap Momentum Fund | | | 16,188 | | | | — | | | | — | | | | — | | | | — | | | | — | | | | — | |
| AQR International Momentum Fund | | | — | | | | — | | | | — | | | | — | | | | — | | | | — | | | | — | |
The following is the effect of Derivative Instruments on the Statements of Operations for the period ended December 31, 2011:
| | | | | | | | | | | | | | | | | | | | | | | | | | | | | | | | |
| | | REALIZED GAIN (LOSS) ON DERIVATIVES RECOGNIZED
AS A RESULT FROM OPERATIONS | | | NET CHANGE IN UNREALIZED APPRECIATION
(DEPRECIATION) ON DERIVATIVES RECOGNIZED AS A
RESULT FROM OPERATIONS | |
| FUND | | FUTURES
CONTRACTS | | | SWAPS
AND SWAPS
ON
FUTURES
CONTRACTS* | | | FORWARD
CURRENCY
EXCHANGE
CONTRACTS | | | WRITTEN
OPTIONS | | | FUTURES
CONTRACTS | | | SWAPS
AND SWAPS
ON
FUTURES
CONTRACTS* | | | FORWARD
CURRENCY
EXCHANGE
CONTRACTS | | | WRITTEN
OPTIONS | |
| Equity Risk Exposure: | | | | | | | | | | | | | | | | | | | | | | | | | | | | | | | | |
AQR Global Equity Fund | | | $(9,506,900) | | | | $6,655,849 | | | | $— | | | | $— | | | | $2,875,365 | | | | $(598,500) | | | | $— | | | | $— | |
AQR International Equity Fund | | | (16,835,104) | | | | 4,549,756 | | | | — | | | | — | | | | 5,304,818 | | | | (1,259,017) | | | | — | | | | — | |
AQR Diversified Arbitrage Fund | | | (4,553,964) | | | | — | | | | — | | | | 3,905,864 | | | | 1,351,686 | | | | — | | | | — | | | | 272,061 | |
AQR Managed Futures Strategy Fund | | | (85,984,073) | | | | (5,225,489) | | | | — | | | | — | | | | (270,332) | | | | (968,712) | | | | — | | | | — | |
AQR Risk Parity Fund | | | (4,702,570) | | | | (943,426) | | | | — | | | | — | | | | 499,656 | | | | 143,905 | | | | — | | | | — | |
AQR Multi-Strategy Alternative Fund | | | (46,840) | | | | (1,094,381) | | | | — | | | | — | | | | 441,290 | | | | 533,889 | | | | — | | | | — | |
AQR Momentum Fund | | | (644,981) | | | | — | | | | — | | | | — | | | | 40,182 | | | | — | | | | — | | | | — | |
AQR Small Cap Momentum Fund | | | (522,699) | | | | — | | | | — | | | | — | | | | 27,497 | | | | — | | | | — | | | | — | |
AQR International Momentum Fund | | | — | | | | 7,848 | | | | — | | | | — | | | | — | | | | (72,399) | | | | — | | | | — | |
| | | | | | | | | | | | | | | | |
| | AQR Funds | | | | | | Annual Report | | | | | | December 2011 | | 183 |
| | | | | | | | | | |
| | | | |
| Notes to Financial Statements | | | December 31, 2011 | |
| | | | | | | | | | | | | | | | | | | | | | | | | | | | | | | | |
| | | REALIZED GAIN (LOSS) ON DERIVATIVES
RECOGNIZED
AS A RESULT FROM OPERATIONS | | | NET CHANGE IN UNREALIZED APPRECIATION
(DEPRECIATION) ON DERIVATIVES RECOGNIZED AS
A RESULT FROM OPERATIONS | |
| FUND | | FUTURES
CONTRACTS | | | SWAPS
AND SWAPS
ON
FUTURES
CONTRACTS* | | | FORWARD
CURRENCY
EXCHANGE
CONTRACTS | | | WRITTEN
OPTIONS | | | FUTURES
CONTRACTS | | | SWAPS
AND SWAPS
ON
FUTURES
CONTRACTS* | | | FORWARD
CURRENCY
EXCHANGE
CONTRACTS | | | WRITTEN
OPTIONS | |
| | | | | | | | |
| Foreign Exchange Rate Risk Exposure: | | | | | | | | | | | | | | | | | | | | | | | | | | | | | | | | |
AQR Global Equity Fund | | | $— | | | | $— | | | | $(7,081,866) | | | | $— | | | | $— | | | | $— | | | | $(2,466,542) | | | | $— | |
AQR International Equity Fund | | | — | | | | — | | | | (10,271,626) | | | | — | | | | — | | | | — | | | | (5,071,763) | | | | — | |
AQR Diversified Arbitrage Fund | | | — | | | | — | | | | (1,018,934) | | | | — | | | | — | | | | — | | | | 1,226,432 | | | | — | |
AQR Managed Futures Strategy Fund | | | — | | | | — | | | | (54,819,534) | | | | — | | | | (166,314) | | | | — | | | | 2,289,329 | | | | — | |
AQR Risk Parity Fund | | | — | | | | — | | | | 728,764 | | | | — | | | | — | | | | — | | | | 1,148,132 | | | | — | |
AQR Multi-Strategy Alternative Fund | | | — | | | | — | | | | (3,663,069) | | | | — | | | | — | | | | — | | | | (622,538) | | | | — | |
AQR International Momentum Fund | | | — | | | | — | | | | (260,164) | | | | — | | | | — | | | | — | | | | (10,442) | | | | — | |
| | | | | | | | | | | | | | | | | | | | | | | | | | | | | | | | |
| | | | | | | | |
| Interest Rate Risk Exposure: | | | | | | | | | | | | | | | | | | | | | | | | | | | | | | | | |
AQR Diversified Arbitrage Fund | | | (6,516,651) | | | | — | | | | — | | | | — | | | | (1,993,199) | | | | — | | | | — | | | | — | |
AQR Managed Futures Strategy Fund | | | 88,732,302 | | | | 9,360,378 | | | | — | | | | — | | | | 8,653,428 | | | | 1,339,924 | | | | — | | | | — | |
AQR Risk Parity Fund | | | 501,359 | | | | 10,197,689 | | | | — | | | | — | | | | 14,084 | | | | 5,614,131 | | | | — | | | | — | |
AQR Multi-Strategy Alternative Fund | | | 1,342,690 | | | | 19,951 | | | | — | | | | — | | | | 243,719 | | | | 188,631 | | | | — | | | | — | |
| | | | | | | | |
| Credit Risk Exposure: | | | | | | | | | | | | | | | | | | | | | | | | | | | | | | | | |
AQR Diversified Arbitrage Fund | | | — | | | | 4,520,901 | | | | — | | | | — | | | | — | | | | (1,540,741) | | | | — | | | | — | |
AQR Risk Parity Fund | | | — | | | | (3,795,375) | | | | — | | | | — | | | | — | | | | 2,260,474 | | | | — | | | | — | |
AQR Multi-Strategy Alternative Fund | | | — | | | | (94,195) | | | | — | | | | — | | | | — | | | | 55,043 | | | | — | | | | — | |
| | | | | | | | |
| Commodity Exposure: | | | | | | | | | | | | | | | | | | | | | | | | | | | | | | | | |
AQR Managed Futures Strategy Fund | | | (33,054,440) | | | | 4,669,543 | | | | — | | | | — | | | | 742,544 | | | | (4,475,693) | | | | — | | | | — | |
AQR Risk Parity Fund | | | (2,640,972) | | | | (33,790) | | | | — | | | | — | | | | (1,851,536) | | | | (3,575) | | | | — | | | | — | |
AQR Multi-Strategy Alternative Fund | | | 104,460 | | | | 54,526 | | | | — | | | | — | | | | 224,955 | | | | (78,695) | | | | — | | | | — | |
| | * | Swaps and swaps on futures are consolidated for financial reporting purposes. |
For swaps, futures and forward foreign currency contracts, the Funds may be required to post collateral if a Fund is in a net liability position with the counterparty exceeding certain amounts. Additionally, counterparties may immediately terminate the position if a Fund fails to maintain sufficient asset coverage for its contracts or its net assets decline by stated percentages.
As of December 31, 2011, the following Funds had net liability positions:
| | | | | | | | |
| FUND | | DERIVATIVES IN NET
LIABILITY POSITION | | | COLLATERAL
POSTED | |
AQR Risk Parity Fund | | | $(563,447) | | | | $27,879,156 | |
For the period ended December 31, 2011, the quarterly average values of the derivatives held by the Funds were as follows:
| | | | | | | | | | | | | | | | |
| FUND | | SWAP
CONTRACTS
(NOTIONAL VALUE) | | | FUTURES
CONTRACTS | | | WRITTEN
OPTION
CONTRACTS | | | FOREIGN
FORWARD
CURRENCY
CONTRACTS | |
AQR Global Equity Fund | | $ | 23,184,431 | | | $ | 153,391,696 | | | $ | — | | | $ | 352,254,451 | |
AQR International Equity Fund | | | 27,901,287 | | | | 210,452,029 | | | | — | | | | 537,383,739 | |
| | | | | | | | | | | | | | | | |
| 184 | | AQR Funds | | | | | | Annual Report | | | | | | December 2011 | | |
| | | | | | | | | | |
| | | | |
| Notes to Financial Statements | | | December 31, 2011 | |
| | | | | | | | | | | | | | | | |
| FUND | | SWAP CONTRACTS
(NOTIONAL VALUE)* | | | FUTURES
CONTRACTS* | | | WRITTEN
OPTION
CONTRACTS* | | | FOREIGN
FORWARD
CURRENCY
CONTRACTS* | |
AQR Diversified Arbitrage Fund | | $ | 137,575,000 | | | $ | 365,382,983 | | | $ | 274,416 | | | $ | 110,915,121 | |
AQR Managed Futures Strategy Fund | | | 690,962,454 | | | | 5,398,659,991 | | | | — | | | | 4,024,009,764 | |
AQR Risk Parity Fund | | | 526,979,635 | | | | 103,812,192 | | | | — | | | | 128,175,908 | |
AQR Multi-Strategy Alternative Fund** | | | 23,920,228 | | | | 187,825,289 | | | | | | | | 132,151,064 | |
AQR Momentum Fund | | | — | | | | 2,519,156 | | | | — | | | | — | |
AQR Small Cap Momentum Fund | | | — | | | | 993,378 | | | | — | | | | — | |
AQR International Momentum Fund | | | 110,997 | | | | — | | | | — | | | | 777,453 | |
| | * | Values as of each quarter end are used to calculate the average represented. |
| | ** | For the period July 8, 2011 (commencement of operations) to December 31, 2011. |
The Funds’ derivative contracts held at December 31, 2011, are not accounted for as hedging instruments under GAAP.
8. Investment Advisory and Other Agreements
The Adviser serves as the investment adviser to each of the Funds pursuant to an Investment Advisory Agreement, dated December 4, 2008, as amended from time to time, or an Investment Management Agreement, dated June 10, 2010, as amended from time to time, entered into by the Trust, on behalf of the Funds (together, the “Advisory Agreement”). Under the Advisory Agreement, the Adviser furnishes a continuous investment program for each Fund’s portfolio, makes day-to-day investment decisions for the Funds, and manages the Funds’ investments in accordance with the stated policies of each Fund. The Adviser is also responsible for selecting brokers and dealers to execute purchase and sale orders for the portfolio transactions of each Fund, subject to its obligation to seek best execution. The Adviser provides persons satisfactory to the Trustees to serve as officers of the Funds. Pursuant to the Advisory Agreement, the Funds pay the Adviser a management fee calculated on the average daily net assets for each Fund, in the annual ratios below:
| | | | |
| FUND | | RATIO | |
AQR Global Equity Fund | | | 0.40 | % |
AQR International Equity Fund | | | 0.45 | |
AQR Diversified Arbitrage Fund | | | 1.00 | |
AQR Managed Futures Strategy Fund | | | 1.05 | |
AQR Risk Parity Fund | | | 0.75 | * |
AQR Multi-Strategy Alternative Fund | | | 1.85 | ** |
AQR Momentum Fund | | | 0.25 | |
AQR Small Cap Momentum Fund | | | 0.35 | |
AQR International Momentum Fund | | | 0.35 | |
| | * | The AQR Risk Parity Fund Advisory Fee is based on the following two tier structure. The first tier charges 0.75% on the first $1 billion dollars of net assets and the second tier charges 0.70% on net assets in excess of $1 billion dollars. |
| | ** | The AQR Multi-Strategy Alternative Fund Advisory Fee is based on the following two tier structure. The first tier charges 1.85% on the first $1 billion dollars of net assets and the second tier charges 1.80% on net assets in excess of $1 billion dollars |
The Trust and the Adviser have entered into a Fee Waiver and Expense Reimbursement Agreement whereby the Adviser has agreed to waive its fee and/or reimburse each Fund at least through May 1, 2012 (May 1, 2013 for AQR Multi-Strategy Alternative Fund). The Adviser has agreed to waive and/or reimburse each Fund to the extent that the total annual fund operating expense ratios (including the consolidated expenses of the Subsidiaries), exclusive of interest, taxes, borrowing costs, acquired fund fees and expenses, dividend and interest expense related to short sales, and extraordinary expenses exceed the following ratios:
| | | | |
| FUND CLASS | | RATIO | |
AQR Global Equity Fund — Class I | | | 0.90 | % |
AQR Global Equity Fund — Class N | | | 1.20 | |
AQR International Equity Fund — Class I | | | 0.95 | |
| | | | | | | | | | | | | | | | |
| | AQR Funds | | | | | | Annual Report | | | | | | December 2011 | | 185 |
| | | | | | | | | | |
| | | | |
| Notes to Financial Statements | | | December 31, 2011 | |
| | | | |
| FUND CLASS | | RATIO | |
AQR International Equity Fund — Class N | | | 1.25 | % |
AQR Diversified Arbitrage Fund — Class I | | | 1.20 | |
AQR Diversified Arbitrage Fund — Class N | | | 1.50 | |
AQR Managed Futures Strategy Fund — Class I | | | 1.25 | |
AQR Managed Futures Strategy Fund — Class N | | | 1.50 | |
AQR Risk Parity Fund — Class I | | | 0.95 | |
AQR Risk Parity Fund — Class N | | | 1.20 | |
AQR Multi-Strategy Alternative Fund — Class I | | | 1.98 | |
AQR Multi-Strategy Alternative Fund — Class N | | | 2.23 | |
AQR Momentum Fund — Class L | | | 0.49 | |
AQR Small Cap Momentum Fund — Class L | | | 0.65 | |
AQR International Momentum Fund — Class L | | | 0.65 | |
The Trust and the Adviser had previously entered into a Fee Waiver and Expense Reimbursement Agreement whereby the Adviser had agreed to waive its fee and/or reimburse each Fund from January 1, 2011 through May 1, 2011 for AQR Global Equity Fund and AQR International Equity Fund. The Adviser had agreed to waive and/or reimburse the Funds to the extent that the total annual fund operating expense ratios exclusive of interest, taxes, borrowing costs, acquired fund fees and expenses, dividend expense related to short sales, and extraordinary expenses exceed the following ratios:
| | | | |
| FUND CLASS | | RATIO | |
AQR Global Equity Fund — Class I | | | 1.05 | % |
AQR Global Equity Fund — Class N | | | 1.35 | |
AQR International Equity Fund — Class I | | | 1.15 | |
AQR International Equity Fund — Class N | | | 1.45 | |
The Trust, in turn, agreed that the Funds will repay the fee waiver/expense reimbursement to the Adviser. Such repayment shall be made only out of the class of the Fund for which the applicable fee waiver and expense reimbursement was made. Repayments with respect to a Fund must be limited to amounts that do not cause the aggregate operating expenses of the Fund attributable to a share class during a year in which such repayment is made to exceed the applicable ratios when the waiver was generated. A repayment shall be payable only to the extent it can be made during the thirty six months following the applicable period during which the Adviser waived fees or reimbursed the applicable Fund for its operating expenses under the Agreement.
For the period ended December 31, 2011, the amounts waived and reimbursed by the Adviser, as well as the amounts available for potential future recoupment by the Adviser and the expiration schedule at December 31, 2011 are as follows:
| | | | | | | | | | | | | | | | | | | | |
| | | FEES WAIVED/
REIMBURSED
FOR THE
PERIOD
ENDED
DECEMBER 31,
2011 | | | TOTAL
POTENTIAL
RECOUPMENT
AMOUNT | | | POTENTIAL
RECOUPMENT
AMOUNTS EXPIRING
DECEMBER 31 | |
| | | | 2012 | | | 2013 | | | 2014 | |
| | | | | |
AQR GLOBAL EQUITY FUND | | | | | | | | | | | | | | | | | | | | |
Class I | | $ | 30,212 | | | $ | 30,212 | | | $ | — | | | $ | — | | | $ | 30,212 | |
Class N | | | 31,920 | | | | 31,920 | | | | — | | | | — | | | | 31,920 | |
| Class Y | | | — | | | | 287,811 | | | | — | | | | 287,811 | ** | | | — | |
| | | | | |
Totals | | $ | 62,132 | | | $ | 349,943 | | | $ | — | | | $ | 287,811 | | | $ | 62,132 | |
| | | | | | | | | | | | | | | | |
| 186 | | AQR Funds | | | | | | Annual Report | | | | | | December 2011 | | |
| | | | | | | | | | |
| | | | |
| Notes to Financial Statements | | | December 31, 2011 | |
| | | | | | | | | | | | | | | | | | | | |
| | | FEES WAIVED/
REIMBURSED
FOR THE
PERIOD
ENDED
DECEMBER 31,
2011 | | | TOTAL
POTENTIAL
RECOUPMENT
AMOUNT | | | POTENTIAL RECOUPMENT
AMOUNTS EXPIRING
DECEMBER 31 | |
| | | | 2012 | | | 2013 | | | 2014 | |
| | | | |
AQR INTERNATIONAL EQUITY FUND | | | | | | | | | | | | | | | | | |
Class I | | $ | — | | | $ | 68,908 | | | $ | 8,330 | | | $ | 60,578 | | | $ | — | |
Class N | | | 11,477 | | | | 32,597 | | | | 1,375 | | | | 19,745 | | | | 11,477 | |
| Class Y | | | — | | | | 488,290 | | | | 242,140 | * | | | 246,150 | ** | | | — | |
| | | | | |
Totals | | $ | 11,477 | | | $ | 589,795 | | | $ | 251,845 | | | $ | 326,473 | | | $ | 11,477 | |
| | | | |
AQR DIVERSIFIED ARBITRAGE FUND | | | | | | | | | | | | | | | | | |
Class I | | $ | 1,027,719 | | | $ | 1,459,622 | | | $ | 302,711 | * | | $ | 129,192 | | | $ | 1,027,719 | |
| Class N | | | 143,153 | | | | 452,274 | | | | 202,927 | | | | 106,194 | | | | 143,153 | |
| | | | | |
Totals | | $ | 1,170,872 | | | $ | 1,911,896 | | | $ | 505,638 | | | $ | 235,386 | | | $ | 1,170,872 | |
| | | | |
AQR MANAGED FUTURES STRATEGY FUND | | | | | | | | | | | | | | | | | |
Class I | | $ | 430,511 | | | $ | 474,078 | | | $ | — | | | $ | 43,567 | | | $ | 430,511 | |
| Class N | | | 307,475 | | | | 360,458 | | | | — | | | | 52,983 | | | | 307,475 | |
| | | | | |
Totals | | $ | 737,986 | | | $ | 834,536 | | | $ | — | | | $ | 96,550 | | | $ | 737,986 | |
| | | | |
AQR RISK PARITY FUND | | | | | | | | | | | | | | | | | |
Class I | | $ | 145,154 | | | $ | 214,135 | | | $ | — | | | $ | 68,981 | | | $ | 145,154 | |
| Class N | | | 96,564 | | | | 161,166 | | | | — | | | | 64,602 | | | | 96,564 | |
| | | | | |
Totals | | $ | 241,718 | | | $ | 375,301 | | | $ | — | | | $ | 133,583 | | | $ | 241,718 | |
| | | | |
AQR MULTI-STRATEGY ALTERNATIVE FUND | | | | | | | | | | | | | | | | | |
Class I | | $ | 322,982 | | | $ | 322,982 | | | $ | — | | | $ | — | | | $ | 322,982 | |
| Class N | | | 59,491 | | | | 59,491 | | | | — | | | | — | | | | 59,491 | |
| | | | | |
Totals | | $ | 382,473 | | | $ | 382,473 | | | $ | — | | | $ | — | | | $ | 382,473 | |
| | | | |
AQR MOMENTUM FUND | | | | | | | | | | | | | | | | | |
| Class L | | $ | 418,356 | | | $ | 708,674 | | | $ | 125,259 | | | $ | 165,059 | | | $ | 418,356 | |
| | | | |
AQR SMALL CAP MOMENTUM FUND | | | | | | | | | | | | | | | | | |
| Class L | | $ | 171,630 | | | $ | 464,795 | | | $ | 124,592 | | | $ | 168,573 | | | $ | 171,630 | |
| | | | |
AQR INTERNATIONAL MOMENTUM FUND | | | | | | | | | | | | | | | | | |
| Class L | | $ | 230,607 | | | $ | 618,333 | | | $ | 121,539 | | | $ | 266,187 | | | $ | 230,607 | |
| | * | The Adviser has agreed to forgo future recoupments pertaining to Shareholder Servicing Fee Waivers expiring on December 31, 2012 of $281,012 and $20,131 for the AQR International Equity Fund and AQR Diversified Arbitrage Fund, respectively. |
| | ** | The Adviser has agreed to forgo future recoupments incurred in the current period pertaining to Shareholder Servicing Fee Waivers expiring on December 31, 2013 of $447,840 and $429,010 for the AQR Global Equity Fund and AQR International Equity Fund, respectively. |
| | | | | | | | | | | | | | | | |
| | AQR Funds | | | | | | Annual Report | | | | | | December 2011 | | 187 |
| | | | | | | | | | |
| | | | |
| Notes to Financial Statements | | | December 31, 2011 | |
Pursuant to the Sub-Advisory Agreement between the Sub-Adviser, the Adviser and the Trust, the Adviser will pay the Sub-Adviser an annual fee, payable monthly, at the annual rate of 1.00% and 0.35% of the average daily net assets for AQR Diversified Arbitrage Fund and AQR Multi-Strategy Alternative Fund, respectively.
A service provider contributed capital in the amount of $354,026 into the AQR Risk Parity Fund to compensate the Fund for a loss incurred due to a valuation error. The impact of this contribution increased the Fund’s total return by 0.21%.
The Adviser contributed capital in the amount of $208,438 into the AQR Multi-Strategy Alternative Fund to compensate the Fund for a loss incurred due to a trade processing error. The impact of the Adviser’s contribution increased the Fund’s total return by 0.14%.
J.P. Morgan Investor Services Co., serves as the Funds’ Administrator and Accounting Agent and JPMorgan Chase Bank, N.A., serves as Custodian.
ALPS Fund Services, Inc. serves as the Funds’ Transfer Agent, and ALPS Distributors, Inc. serves as the Funds’ Distributor. Fees incurred by the Funds for sub-transfer agency services for the period ended December 31, 2011, were as follows:
| | | | |
| FUND CLASS | | AMOUNT | |
AQR Global Equity Fund — Class I | | $ | 472 | |
AQR Global Equity Fund — Class N | | | 504 | |
AQR International Equity Fund — Class I | | | 60,809 | |
AQR International Equity Fund — Class N | | | 100 | |
AQR Diversified Arbitrage Fund — Class I | | | 1,430,848 | |
AQR Diversified Arbitrage Fund — Class N | | | 499,366 | |
AQR Managed Futures Strategy Fund — Class I | | | 780,857 | |
AQR Managed Futures Strategy Fund — Class N | | | 434,918 | |
AQR Risk Parity Fund — Class I | | | 55,159 | |
AQR Risk Parity Fund — Class N | | | 35,442 | |
AQR Multi-Strategy Alternative Fund — Class I | | | 34,426 | |
AQR Multi-Strategy Alternative Fund — Class N | | | 7,781 | |
AQR Momentum Fund — Class L | | | 262,995 | |
AQR Small Cap Momentum Fund — Class L | | | 79,012 | |
AQR International Momentum Fund — Class L | | | 72,147 | |
9. Distribution and Service Plans
The Trust has adopted a Plan of Distribution (the “Plan”) pursuant to Rule 12b-1 under the 1940 Act with respect to the Class N shares of the Funds, as applicable. The Plan allows for the payment of services related to the distribution and servicing of these shares at a rate of up to 0.25% per annum of the average daily net asset value of the Class N shares of the Funds, as applicable.
Pursuant to the Shareholder Services Agreement, between the Trust (excluding the AQR Diversified Arbitrage Fund, AQR Managed Futures Strategy Fund, AQR Risk Parity Fund and AQR Multi-Strategy Alternative Fund) and the Adviser, the Adviser receives an annual fee (the “Shareholder Services Fee”), payable monthly, at the annual rate of 0.30%, 0.35%, and 0.15% of the average daily net assets of the Class I, Class N and Class L shares, respectively. The Adviser also provides a wide range of services to the Funds and their shareholders under a separate Shareholder Services Agreement. These services include, among others, access to performance information reporting, analysis and explanations of Fund reports as well as electronic access to Fund information. In addition, the Adviser may, from time to time, compensate third parties (including financial intermediaries) from the fees the Adviser receives under the Shareholder Services Agreement for non-distribution shareholder services such third parties provide to clients or
| | | | | | | | | | | | | | | | |
| 188 | | AQR Funds | | | | | | Annual Report | | | | | | December 2011 | | |
| | | | | | | | | | |
| | | | |
| Notes to Financial Statements | | | December 31, 2011 | |
customers that are shareholders of the Funds. Fees incurred by the Funds under the Plan and/or the shareholder services agreement for the period ended December 31, 2011, were as follows:
| | | | |
| FUND CLASS | | AMOUNT | |
AQR Global Equity Fund — Class I | | $ | 8,479 | |
AQR Global Equity Fund — Class N | | | 5,721 | |
AQR International Equity Fund — Class I | | | 389,888 | |
AQR International Equity Fund — Class N | | | 4,809 | |
AQR Momentum Fund — Class L | | | 353,125 | |
AQR Small Cap Momentum Fund — Class L | | | 132,225 | |
AQR International Momentum Fund — Class L | | | 112,356 | |
10. Purchases and Redemption of Shares
Investors may purchase shares of a Fund at their net asset value (“NAV”), based on the next calculation of the NAV after the order is placed. Neither the Fund nor the distributor charges a sales charge or other transaction fee to purchase shares, although other institutions may impose transaction fees on shares purchased through them. The AQR Global Equity and AQR International Equity Funds’ Class Y shares charge subscription and redemption fees of 0.10% each, regardless of the period such shares may have been held. Prior to May 1, 2011, the Funds (excluding AQR Diversified Arbitrage Fund) reserved the right to charge a redemption fee on redemption proceeds for shares that were held for less than 60 days. Effective May 1, 2011, this fee was eliminated for Classes I, N and L.
11. In-Kind Transactions
Effective January 1, 2010, the AQR Global Equity Fund acquired substantially all of the assets and liabilities of three privately offered funds (“Private Funds”) managed by the Adviser in exchange for Class Y shares of the Fund. This transaction was structured to qualify as a tax-free reorganization under the Code. The investment portfolios of the Private Funds, with a fair value of $369,372,153 and identified cost of $335,420,940 as of the date of the reorganization, was the principal asset acquired by the Fund. For financial statement purposes, assets received and shares issued by the Fund were recorded at fair value, and the Fund recorded the cost of such investments at their historical cost as recorded by the Private Funds. The cost basis of the investments received from the Private Funds was carried forward to align ongoing reporting of the Fund’s realized and unrealized gains and losses with amounts distributable for tax purposes. The net assets of the Private Funds at the date of acquisition were $370,340,997, including unrealized appreciation of $33,351,345. The net assets of the AQR Global Equity Fund immediately after the reorganization was $370,340,997. The Fund had no net assets or liabilities prior to the reorganization.
12. Risks and Concentrations
By using derivative instruments, the Funds are exposed to the counterparty’s credit risk, the risk that derivative counterparties may not perform in accordance with the contractual provisions offset by the value of any collateral received. The Funds’ exposure to credit risk associated with counterparty non-performance is limited to the unrealized gains inherent in such transactions that are recognized in the Statements of Assets and Liabilities. The Funds minimize counterparty credit risk through credit limits and approvals, credit monitoring procedures, executing master netting arrangements and managing margin and collateral requirements, as appropriate.
The Funds may have elements of risk not typically associated with investments in the United States of America due to concentrated investments in a limited number of countries or regions, which may vary throughout the year. Such concentrations may subject the Funds to additional risks resulting from political or economic conditions in such countries or regions and the possible imposition of adverse governmental laws or currency exchange restrictions could cause the securities and their markets to be less liquid and their prices to be more volatile than those of comparable U.S. companies.
Swap agreements involve, to varying degrees, elements of market risk (generally equity price risk related to equity index swap agreements, interest rate risk related to bond swap agreements and commodity risk related to synthetic swap agreements utilizing futures) and exposure to loss in excess of the amount reflected on the Statements of Assets and
| | | | | | | | | | | | | | | | |
| | AQR Funds | | | | | | Annual Report | | | | | | December 2011 | | 189 |
| | | | | | | | | | |
| | | | |
| Notes to Financial Statements | | | December 31, 2011 | |
Liabilities. The notional amounts, which are disclosed as of period end in the swap tables included in the Schedules of Investments, reflect the current investment exposure each Fund has under the swap agreement which may exceed the net asset value of the Fund.
The Funds are not limited in the percentage of its assets that may be invested in convertible securities. Convertible securities generally offer lower interest or dividend yields than non-convertible securities of similar quality. The market values of convertible securities tend to decline as interest rates increase and, conversely, to increase as interest rates decline. However, the convertible security’s market value tends to reflect the market price of the common stock of the issuing company when that stock price is greater than the convertible’s “conversion price,” which is the predetermined price at which the convertible security could be exchanged for the associated stock.
Convertible securities and non-convertible income producing securities are subject to certain risks, including (i) if interest rates go up, the value of convertible securities and non-convertible income-producing securities in the Funds’ portfolio generally will decline; (ii) during periods of declining interest rates, the issuer of a security may exercise its option to prepay principal earlier than scheduled, forcing the Funds to reinvest in lower yielding securities (call or prepayment risk); and (iii) during periods of rising interest rates, the average life of certain types of securities may be extended because of slower than expected principal payments (extension risk).
Credit risk is the risk that one or more securities in the Funds’ portfolio will decline in price, or fail to pay interest or principal when due, because the issuer of the security experiences a decline in its financial status. The Funds’ investments in convertible and nonconvertible debt securities involve credit risk. However, in general, lower rated securities carry a greater degree of risk that the issuer will lose its ability to make interest and principal payments, which could have a negative impact on the Funds’ net asset value or dividends.
As of December 31, 2011, a substantial portion of the AQR Global Equity, AQR International Equity and AQR International Momentum Funds’ net assets consisted of issuers that are denominated in foreign currencies. Changes in currency exchange rates will affect the value of and investment income from such securities.
As of December 31, 2011, the AQR Diversified Arbitrage Fund and AQR Multi-Strategy Alternative Fund pledged a substantial portion of their assets for securities sold short to JP Morgan Chase Bank N.A.
13. Line of Credit
The Trust (excluding the AQR Managed Futures Strategy Fund and AQR Risk Parity Fund) has secured a committed, $150,000,000 line of credit with JPMorgan Chase Bank, N.A. Borrowings, if any, under this arrangement bear interest at the Federal Funds Rate plus the sum of (a) 1.5% per annum plus (b) if the LIBOR Reference Rate exceeds the Federal Funds Rate, the amount of such excess, which shall be paid quarterly. The maximum loan amount outstanding per Fund will be the lesser of an amount which does not exceed the borrowing limits set forth in the Fund’s Prospectus and/or Registration Statement and does not cause the Asset Coverage Ratio for all borrowings to drop below 500%. The agreement is subject to an annual commitment fee which is payable in arrears on a quarterly basis. This line of credit expires on March 16, 2012. It is Management’s intention to enter into an agreement with similar terms through 2012. As of and for the period ended December 31, 2011, the Funds did not have any outstanding borrowings under this agreement.
14. Principal Ownership
As of December 31, 2011, the Funds had individual shareholder accounts, owning more than 5% of the total shares outstanding of the Fund as follows:
| | | | | | | | |
| FUND | | NUMBER OF
SHAREHOLDERS | | | TOTAL PERCENTAGE
INTEREST HELD | |
AQR Global Equity Fund | | | 3 | | | | 92.54% | |
AQR International Equity Fund | | | 4 | | | | 68.93% | |
AQR Risk Parity Fund | | | 3 | | | | 30.26% | |
| | | | | | | | | | | | | | | | |
| 190 | | AQR Funds | | | | | | Annual Report | | | | | | December 2011 | | |
| | | | | | | | | | |
| | | | |
| Notes to Financial Statements | | | December 31, 2011 | |
| | | | | | | | |
| FUND | | NUMBER OF
SHAREHOLDERS | | | TOTAL PERCENTAGE
INTEREST HELD | |
AQR Multi-Strategy Alternative Fund | | | 1 | | | | 5.38% | |
AQR Momentum Fund | | | 1 | | | | 27.22% | |
15. Subsequent Events
The Funds have evaluated subsequent events through the date of issuance of this report and have determined that there are no material events that would require accrual or disclosure.
| | | | | | | | | | | | | | | | |
| | AQR Funds | | | | | | Annual Report | | | | | | December 2011 | | 191 |
| | | | | | | | | | |
| | |
| Report of Independent Registered Public Accounting Firm |
To the Board of Trustees and Shareholders of AQR Funds:
In our opinion, the accompanying statements of assets and liabilities, including the schedules of investments, and the related statements of operations, of cash flows and of changes in net assets and the financial highlights present fairly, in all material respects, the financial position of AQR Global Equity Fund, AQR International Equity Fund, AQR Diversified Arbitrage Fund, AQR Managed Futures Strategy Fund, AQR Risk Parity Fund, AQR Multi-Strategy Alternative Fund, AQR Momentum Fund, AQR Small Cap Momentum Fund and AQR International Momentum Fund (nine of the portfolios constituting AQR Funds, hereinafter referred to as the “Funds”) at December 31, 2011, and the results of each of their operations, the changes in each of their net assets, the cash flows of AQR Diversified Arbitrage Fund and the financial highlights for each of the periods presented, in conformity with accounting principles generally accepted in the United States of America. These financial statements and financial highlights (hereafter referred to as “financial statements”) are the responsibility of the Funds’ management. Our responsibility is to express an opinion on these financial statements based on our audits. We conducted our audits of these financial statements in accordance with the standards of the Public Company Accounting Oversight Board (United States). Those standards require that we plan and perform the audit to obtain reasonable assurance about whether the financial statements are free of material misstatement. An audit includes examining, on a test basis, evidence supporting the amounts and disclosures in the financial statements, assessing the accounting principles used and significant estimates made by management, and evaluating the overall financial statement presentation. We believe that our audits, which included confirmation of securities at December 31, 2011 by correspondence with the custodian and brokers, and the application of alternative procedures where securities purchased had not been received, provide a reasonable basis for our opinion.
PricewaterhouseCoopers LLP
New York, New York
February 27, 2012
| | | | | | | | | | | | | | | | |
| 192 | | AQR Funds | | | | | | Annual Report | | | | | | December 2011 | | |
| | | | | | | | | | |
|
| Other Federal Tax Information (Unaudited) |
For the year ended December 31, 2011, certain dividends paid by the Funds may be subject to a maximum tax of 15% as provided for by the Jobs and Growth Tax Relief Reconciliation Act of 2003. The Funds intend to designate the maximum allowable as taxed at the 15% rate. The following represents the percentage of ordinary income distributions treated as qualifying dividends:
| | | | |
| FUND | | PERCENTAGE | |
AQR Global Equity Fund | | | 86.67% | |
AQR International Equity Fund | | | 63.59% | |
AQR Diversified Arbitrage Fund | | | 17.46% | |
AQR Multi-Strategy Alternative Fund | | | 2.66% | |
AQR Momentum Fund | | | 100.00% | |
AQR Small Cap Momentum Fund | | | 87.10% | |
AQR International Momentum Fund | | | 65.20% | |
For the taxable year ended December 31, 2011, the following percentages of income dividends paid by the Fund qualify for the 70% dividends received deductions available to corporations:
| | | | |
| FUND | | PERCENTAGE | |
AQR Global Equity Fund | | | 31.98% | |
AQR Diversified Arbitrage Fund | | | 13.45% | |
AQR Momentum Fund | | | 91.29% | |
AQR Small Cap Momentum Fund | | | 34.52% | |
The Funds designate the following amounts, or the maximum allowable under the Internal Revenue Code, as long term capital gain distributions qualifying for the maximum 15% income tax rate for individuals:
| | | | |
| FUND | | TOTAL | |
AQR Global Equity Fund | | $ | 1,505,593 | |
AQR International Equity Fund | | $ | 2,328,515 | |
AQR Managed Futures Strategy Fund | | $ | 342,818 | |
AQR Risk Parity Fund | | $ | 87,996 | |
AQR Momentum Fund | | $ | 231,091 | |
AQR Small Cap Momentum Fund | | $ | 266,614 | |
Certain Funds have derived net income from sources within foreign countries. As of December 31, 2011, the foreign source income for each Fund was as follows:
| | | | | | | | |
| FUND | | TOTAL | | | PER SHARE | |
AQR International Equity Fund | | $ | 16,065,241 | | | $ | 0.2919 | |
AQR International Momentum Fund | | $ | 2,211,074 | | | $ | 0.9426 | |
Certain Funds intend to elect to pass through to shareholders the income tax credit for taxes paid to foreign countries. As of December 31, 2011, the foreign tax credit for each Fund was as follows:
| | | | | | | | |
| FUND | | TOTAL | | | PER SHARE | |
AQR International Equity Fund | | $ | 303,303 | | | $ | 0.0055 | |
AQR International Momentum Fund | | $ | 90,731 | | | $ | 0.0130 | |
| | | | | | | | | | | | | | | | |
| | AQR Funds | | | | | | Annual Report | | | | | | December 2011 | | 193 |
| | | | | | | | | | |
| | |
| Fund Expense Examples (Unaudited) |
As a shareholder of the Trust, you incur two types of costs: (1) transaction costs and (2) ongoing costs, including management fees; and other Fund expenses. This example is intended to help you understand your ongoing costs (in dollars) of investing in the Fund and to compare these costs with the ongoing costs of investing in other mutual funds The Example is based on an investment of $1,000 invested at the beginning of the period and held for the entire period as indicated below.
Actual Expenses
The table below provides information about actual account values and actual expenses. You may use the information together with the amount you invested, to estimate the expenses that you paid over the period. Simply divide your account value by $1,000 (for example, an $8,600 account value divided by $1,000 = 8.6), then multiply the result by the number under the heading entitled “Expenses Paid for the Period Ended 12/31/11” to estimate the expenses you paid on your account during this period. Each Fund will indirectly bear its pro rata share of the expenses incurred by the underlying investments in which the Fund invests. These expenses are not included in the table.
Hypothetical Example for Comparison Purposes
The table below also provides information about hypothetical account values and hypothetical expenses based on each Fund’s actual expense ratio and an assumed annual rate of return of 5% before expenses, which is not the Fund’s actual return. The hypothetical account values and expenses may not be used to estimate the actual ending account balance or expenses you paid for the period. You may use this information to compare the ongoing costs of investing in a Fund and other funds by comparing this 5% hypothetical example with the 5% hypothetical examples that appear in the shareholder reports of other funds. The Fund will indirectly bear its pro rata share of the expenses incurred by the underlying investments in which the Fund invests. These expenses are not included in the table.
Please note that the expenses shown in the table are meant to highlight your ongoing costs only and do not reflect any transactional costs. Therefore, the hypothetical example is useful in comparing ongoing costs only, and will not help you determine the relative total costs of owning different funds. In addition, if these transactional costs were included, your costs would have been higher.
| | | | | | | | | | | | | | | | |
| | | BEGINNING
ACCOUNT
DATE
VALUE | | | ENDING
ACCOUNT
VALUE
12/31/11 | | | ANNUALIZED
EXPENSE
RATIO FOR
THE PERIOD | | | EXPENSES
PAID FOR THE
PERIOD
ENDING
12/31/11 | |
| | | | |
AQR Global Equity Fund | | | | | | | | | | | | | | | | |
| | | | |
Class I | | | | | | | | | | | | | | | | |
Actual Return | | | $1,000.00 | | | | $ 874.20 | | | | 0.95% | | | | $4.49 | |
Hypothetical Return | | | $1,000.00 | | | | $1,020.42 | | | | 0.95% | | | | $4.84 | |
| | | | |
Class N | | | | | | | | | | | | | | | | |
Actual Return | | | $1,000.00 | | | | $ 871.70 | | | | 1.26% | | | | $5.94 | |
Hypothetical Return | | | $1,000.00 | | | | $1,018.85 | | | | 1.26% | | | | $6.41 | |
| | | | |
Class Y | | | | | | | | | | | | | | | | |
Actual Return | | | $1,000.00 | | | | $ 875.70 | | | | 0.52% | | | | $2.46 | |
Hypothetical Return | | | $1,000.00 | | | | $1,022.58 | | | | 0.52% | | | | $2.65 | |
| | | | |
AQR International Equity Fund | | | | | | | | | | | | | | | | |
| | | | |
Class I | | | | | | | | | | | | | | | | |
Actual Return | | | $1,000.00 | | | | $ 795.20 | | | | 0.93% | | | | $4.21 | |
Hypothetical Return | | | $1,000.00 | | | | $1,020.52 | | | | 0.93% | | | | $4.74 | |
| | | | |
Class N | | | | | | | | | | | | | | | | |
Actual Return | | | $1,000.00 | | | | $ 794.20 | | | | 1.33% | | | | $6.01 | |
Hypothetical Return | | | $1,000.00 | | | | $1,018.50 | | | | 1.33% | | | | $6.77 | |
| | | | |
Class Y | | | | | | | | | | | | | | | | |
Actual Return | | | $1,000.00 | | | | $ 797.70 | | | | 0.57% | | | | $2.58 | |
Hypothetical Return | | | $1,000.00 | | | | $1,022.33 | | | | 0.57% | | | | $2.91 | |
| | | | | | | | | | | | | | | | |
| 194 | | AQR Funds | | | | | | Annual Report | | | | | | December 2011 | | |
| | | | | | | | | | |
| | |
| Fund Expense Examples (Unaudited) |
| | | | | | | | | | | | | | | | |
| | | BEGINNING
ACCOUNT
DATE
VALUE | | | ENDING
ACCOUNT
VALUE
12/31/11 | | | ANNUALIZED
EXPENSE
RATIO FOR
THE PERIOD | | | EXPENSES
PAID FOR THE
PERIOD
ENDING
12/31/11 | |
| | | | |
AQR Diversified Arbitrage Fund | | | | | | | | | | | | | | | | |
| | | | |
Class I | | | | | | | | | | | | | | | | |
Actual Return | | | $1,000.00 | | | | $1,002.70 | | | | 1.21% | | | | $6.11 | |
Hypothetical Return | | | $1,000.00 | | | | $1,019.11 | | | | 1.21% | | | | $6.16 | |
| | | | |
Class N | | | | | | | | | | | | | | | | |
Actual Return | | | $1,000.00 | | | | $1,001.40 | | | | 1.51% | | | | $7.62 | |
Hypothetical Return | | | $1,000.00 | | | | $1,017.59 | | | | 1.51% | | | | $7.68 | |
| | | | |
AQR Managed Futures Strategy Fund | | | | | | | | | | | | | | | | |
| | | | |
Class I | | | | | | | | | | | | | | | | |
Actual Return | | | $1,000.00 | | | | $ 973.10 | | | | 1.25% | | | | $6.22 | |
Hypothetical Return | | | $1,000.00 | | | | $1,018.90 | | | | 1.25% | | | | $6.36 | |
| | | | |
Class N | | | | | | | | | | | | | | | | |
Actual Return | | | $1,000.00 | | | | $ 972.00 | | | | 1.50% | | | | $7.46 | |
Hypothetical Return | | | $1,000.00 | | �� | | $1,017.64 | | | | 1.50% | | | | $7.63 | |
AQR Risk Parity Fund | | | | | | | | | | | | | | | | |
| | | | |
Class I | | | | | | | | | | | | | | | | |
Actual Return | | | $1,000.00 | | | | $ 993.60 | | | | 0.95% | | | | $4.77 | |
Hypothetical Return | | | $1,000.00 | | | | $1,020.42 | | | | 0.95% | | | | $4.84 | |
| | | | |
Class N | | | | | | | | | | | | | | | | |
Actual Return | | | $1,000.00 | | | | $ 992.30 | | | | 1.20% | | | | $6.03 | |
Hypothetical Return | | | $1,000.00 | | | | $1,019.16 | | | | 1.20% | | | | $6.11 | |
| | | | |
AQR Multi-Strategy Alternative Fund | | | | | | | | | | | | | | | | |
| | | | |
Class I (1) | | | 07/18/11 | | | | | | | | | | | | | |
Actual Return | | | $1,000.00 | | | | $ 974.30 | | | | 1.98% | | | | $9.85 | (a) |
Hypothetical Return | | | $1,000.00 | | | | $1,015.22 | | | | 1.98% | | | | $10.06 | |
| | | | |
Class N (1) | | | 07/18/11 | | | | | | | | | | | | | |
Actual Return | | | $1,000.00 | | | | $ 972.70 | | | | 2.23% | | | | $11.09 | (a) |
Hypothetical Return | | | $1,000.00 | | | | $1,013.96 | | | | 2.23% | | | | $11.32 | |
| | | | |
AQR Momentum Fund | | | | | | | | | | | | | | | | |
| | | | |
Class L | | | | | | | | | | | | | | | | |
Actual Return | | | $1,000.00 | | | | $ 917.10 | | | | 0.49% | | | | $2.37 | |
Hypothetical Return | | | $1,000.00 | | | | $1,022.74 | | | | 0.49% | | | | $2.50 | |
| | | | |
AQR Small Cap Momentum Fund | | | | | | | | | | | | | | | | |
| | | | |
Class L | | | | | | | | | | | | | | | | |
Actual Return | | | $1,000.00 | | | | $ 898.20 | | | | 0.65% | | | | $3.11 | |
Hypothetical Return | | | $1,000.00 | | | | $1,021.93 | | | | 0.65% | | | | $3.31 | |
| | | | |
AQR International Momentum Fund | | | | | | | | | | | | | | | | |
| | | | |
Class L | | | | | | | | | | | | | | | | |
Actual Return | | | $1,000.00 | | | | $ 814.00 | | | | 0.65% | | | | $2.97 | |
Hypothetical Return | | | $1,000.00 | | | | $1,021.93 | | | | 0.65% | | | | $3.31 | |
| (1) | Commencement of operations was July 18, 2011, |
| (a) | Expenses are calculated using each Class’ annualized expense ratio, multiplied by the average account value for the period, multiplied by 167/365 (to reflect the period since commencement of operations) |
| | | | | | | | | | | | | | | | |
| | AQR Funds | | | | | | Annual Report | | | | | | December 2011 | | 195 |
| | | | | | | | | | |
|
| Fund Expense Examples (Unaudited) |
Expenses are calculated using each Class’ annualized expense ratio, multiplied by the average account value for the period, multiplied by 184/365 (to reflect the one-half year period unless stated otherwise).
| | | | | | | | | | | | | | | | |
| 196 | | AQR Funds | | | | | | Annual Report | | | | | | December 2011 | | |
| | | | | | | | | | |
| | | | |
| Trustees and Officers (Unaudited) | | | December 31, 2011 | |
Listed in the chart below is basic information regarding the Trustees and Officers of the Trust. The address of each Officer and Trustee is Two Greenwich Plaza, 3rd Floor, Greenwich CT 06830.
| | | | | | | | |
| NAME AND YEAR OF BIRTH | | CURRENT
POSITION WITH
THE TRUST,
TERM OF
OFFICE1 AND
LENGTH OF
TIME SERVED | | PRINCIPAL OCCUPATION(S)
DURING PAST 5 YEARS | | NUMBER
OF FUNDS
IN FUND
COMPLEX
OVERSEEN
BY TRUSTEE | | OTHER
PRESENT OR
PAST
DIRECTORSHIPS
HELD BY
TRUSTEE (DURING
THE PAST 5 YEARS) |
Disinterested Trustees2 | | | | | | | | |
| Timothy K. Armour, 1948 | | Chairman of the
Board since
2010 and Trustee,since 2008 | | Interim Chief Executive Officer of
Janus Capital Group (2009 to
2010); Managing Director,
Morningstar Inc. (2000 to 2008). | | 14 | | Janus Capital
Group (since
2008); ETF
Securities
(since 2010);
AARP
Services, Inc.
(since 2008) |
| | | | |
| L. Joe Moravy, 1950 | | Trustee,
since 2008 | | Managing Director, Finance
Scholars Group (since 2010)
(consulting firm); Managing
Director, LJM Advisory (2008-2010)
(consulting firm); Partner, Ernst &
Young LLP (2002 to 2008). | | 14 | | N/A |
| | | | |
| William L. Atwell, 1950 | | Trustee,
since 2011 | | President (International), CIGNA
(since 2008) (financial services);
Managing Director, Atwell
Associates LLC (2006 to 2008)
(financial services) | | 14 | | USI Holdings
Corporation
(2006 to
2007) |
| | | | |
| Gregg D. Behrens, 1952 | | Trustee,
since 2011 | | Governor, Iowa State University
Foundation (since 2004); Executive
Vice President, Northern Trust
Company (1980 to 2009) (financial
services) | | 14 | | None |
| | | | |
| Brian Posner, 1961 | | Trustee,
since 2011 | | President, Point Rider Group LLC
(since 2008) (consulting and
advisory services); President and
Chief Executive Officer,
ClearBridge Advisors LLC (2005 to
2008) (financial services) | | 14 | | Biogen Idec
(since 2008);
Arch Capital
Group (since
2010);
RiverPark
Funds (since
2010) |
Interested Trustee3 | | | | | | | | |
| David Kabiller, 1963 | | Trustee,
since 2010 | | Founding Principal, AQR Capital
Management, LLC (since 1998) | | 14 | | N/A |
Officers | | | | | | | | |
| Marco Hanig, 1958 | | Chief Executive
Officer, since
2009; President,
since 2008 | | Vice President, AQR Capital
Management, LLC (since 2008);
prior thereto, Principal, William Blair
& Company, L.L.C. (1999 to 2007). | | N/A | | N/A |
| | | | | | | | | | | | | | | | |
| | AQR Funds | | | | | | Annual Report | | | | | | December 2011 | | 197 |
| | | | | | | | | | |
| | | | |
| Trustees and Officers (Unaudited) | | | December 31, 2011 | |
| | | | | | | | |
| NAME AND YEAR OF BIRTH | | CURRENT
POSITION WITH
THE TRUST,
TERM OF
OFFICE1 AND
LENGTH OF
TIME SERVED | | PRINCIPAL OCCUPATION(S)
DURING PAST 5 YEARS | | NUMBER
OF FUNDS
IN FUND
COMPLEX
OVERSEEN
BY TRUSTEE | | OTHER
PRESENT OR
PAST
DIRECTORSHIPS
HELD BY
TRUSTEE (DURING
THE PAST 5 YEARS) |
| | | | |
| Abdon Bolivar, 1965 | | Chief Compliance
Officer, since
2008 | | Chief Compliance Officer,
AQR Capital Management,
LLC (since 2002). | | N/A | | N/A |
| | | | |
| Nir Messafi, 1975 | | Chief Financial
Officer,
since 2010;
Vice President,
since 2009;
Treasurer from
2009 to 2010 | | Vice President, AQR
Capital Management, LLC
(since 2003). | | N/A | | N/A |
| | | | |
| Aaron Masek, 1974 | | Vice President
and Treasurer,
since 2010 | | Vice President, AQR
Capital Management, LLC
(since 2010); prior thereto
Audit Manager, Cohen
Fund Audit Services, Ltd.
(2008 to 2009); prior
thereto Senior Vice
President, Citi Fund
Services Ohio, Inc. (1996
to 2008) | | N/A | | N/A |
| | | | |
| Bradley Asness, 1969 | | Vice President
and Chief
Legal Officer,
since 2009 | | Principal and Chief Legal
Officer, AQR Capital
Management, LLC (since
1998). | | N/A | | N/A |
| | | | |
| Brendan R. Kalb, 1975 | | Executive
Vice President,
since 2009;
Secretary,
since 2008 | | General Counsel, AQR
Capital Management, LLC
(since 2004). | | N/A | | N/A |
| | | | |
| Nicole DonVito, 1979 | | Vice President,
since 2009 | | Vice President, AQR
Capital Management, LLC
(since 2007), prior thereto,
Associate, Schulte Roth &
Zabel LLP (2006 to 2007);
prior thereto, Associate
Dewey & LeBoeuf LLP
(2004 to 2006). | | N/A | | N/A |
| (1) | Each Trustee serves until the election and qualification of a successor, or until death, resignation or removal as provided in the Trust’s Declaration of Trust. |
| (2) | A Disinterested Trustee is any Trustee that is not an “interested person” of the Trust within the meaning of Section 2(a)(19) of the 1940 Act. |
| (3) | An Interested Trustee is a Trustee that is an “interested person” of the Trust within the meaning of Section 2(a)(19) of the 1940 Act. Mr. Kabiller is an interested person of the Trust because of his position with the Adviser. |
| | | | | | | | | | | | | | | | |
| 198 | | AQR Funds | | | | | | Annual Report | | | | | | December 2011 | | |
| | | | | | | | | | |
| | |
| Board Approval of Investment Management Agreement (Unaudited) |
The Board of Trustees (the “Board,” and the members of which are referred to as “Board Members”) of the AQR Funds (the “Trust”) met in person on May 18, 2011, to consider the approval of the investment management agreement (the “Investment Management Agreement”) between the Trust, on behalf of the AQR Multi-Strategy Alternative Fund (the “Fund”), and AQR Capital Management, LLC (“AQR”) and the approval of the investment sub-advisory agreement (the “Sub-Advisory Agreement”) by and among the Trust, on behalf of the Fund, AQR and CNH Partners, LLC (“CNH” or the “Sub-Adviser”). In accordance with Section 15(c) of the Investment Company Act of 1940, as amended (the “1940 Act”), the Board requested, reviewed, and considered materials furnished by AQR and CNH relevant to the Board’s consideration of whether to approve the Investment Management Agreement and Sub-Advisory Agreement. These materials included (a) memoranda and materials prepared by AQR, describing personnel and services to be provided to the Fund; (b) performance information for strategies and model portfolios relevant to the consideration of the Investment Management Agreement and Sub-Advisory Agreement; (c) information independently compiled and prepared by Lipper, Inc. (“Lipper”) relating to the proposed Fund’s fees and expenses; (d) a discussion of the financial statements of AQR and CNH; and (e) a discussion of the compliance programs of AQR and CNH and regulatory exam histories of each. AQR and the Sub-Advisor are referred to herein as the “Adviser,” as applicable. The Investment Management Agreement and the Sub-Advisory Agreement are referred to herein as the “Management Agreement,” as applicable.
At the in person meeting held on May 18, 2011, the Board, including the Board Members who are not “interested persons” as defined in the 1940 Act (the “Independent Board Members”), unanimously approved the Investment Management Agreement and Sub-Advisory Agreement for an initial two-year period. The Board considered all factors it believed relevant with respect to the Fund, including, among other factors: (a) the nature, extent and quality of the services to be provided by the Adviser; (b) the investment performance of the Adviser’s portfolio management; (c) the management fee and the cost of the services and profits to be realized by the Adviser from the relationship with the Fund; (d) economies of scale; and (e) other factors.
The Board also considered other matters it deemed important to the approval process, such as services related to the valuation and pricing of Fund portfolio holdings, direct and indirect benefits to the Adviser and its affiliates from their relationship with the Fund and advice from independent legal counsel with respect to the review process and materials submitted for the Board’s review. The Board did not identify any particular information as controlling, and each Board Member may have attributed different weights to the various items considered.
The following is a summary of the Board’s discussion and views regarding the factors it considered in evaluating the Management Agreement:
The nature, extent and quality of the services to be provided by the Adviser. The Board Members reviewed the services that the Adviser would provide to the Fund under the Management Agreement. The Board considered the size and experience of the Adviser’s staff, its use of technology, and the Fund’s investment objective, strategy and process. The Board reviewed the overall qualifications of the Adviser as an investment adviser. In connection with the investment advisory services to be provided to the Fund, the Board Members took into account detailed discussions they had with officers of the Adviser regarding the management of the Fund’s investments in accordance with the Fund’s stated investment objective and policies and the types of transactions that would be entered into on behalf of the Fund. During these discussions, the Board Members asked detailed questions of, and received answers from, the officers of the Adviser regarding the formulation and proposed implementation of the Fund’s investment strategy its efficacy and potential risks. The Board considered information about how portfolio managers are compensated by the Adviser.
In addition to the investment advisory services to be provided to the Fund, the Board Members considered that AQR also will provide shareholder and administrative services, has responsibility for overseeing CNH with respect to the Fund, oversight of Fund accounting, marketing services, and provides assistance in meeting legal and regulatory requirements and other services necessary for the operation of the Fund. In particular, the Board reviewed the compliance and administrative services to be provided to the Fund by AQR. The Board also reviewed a wide range of services to be provided to certain of the Fund’s shareholders under a shareholder services agreement between the Trust, on behalf of the Fund, and AQR. These services include providing information and services to Fund shareholders, including professional and informative reporting, access to analysis and explanations of Fund reports, and electronic access to Fund information.
Finally, the Independent Board Members had an opportunity to meet outside the presence of management in executive session separately with counsel to discuss and consider the Management Agreement. Based on the presentations at the May 18, 2011, Board meeting, the Board concluded that the services to be provided to the Fund by AQR pursuant to the Management Agreement were likely to be of a high quality and would benefit the Fund.
| | | | | | | | | | | | | | | | |
| | AQR Funds | | | | | | Annual Report | | | | | | December 2011 | | 199 |
| | | | | | | | | | |
| | |
| Board Approval of Investment Management Agreement (Unaudited) |
Investment Performance of the Adviser’s Portfolio Management. Because the Fund is newly formed, the Board did not consider the investment performance of the Fund. The Board based its review of the Adviser’s performance primarily on the experience of the Adviser in managing other registered investment companies and private funds, noting that other funds the Adviser manages might have investment objectives, policies or restrictions different from those of the Fund. The Board reviewed performance information for strategies and model portfolios similar to that of the Fund. The Board also considered the experience, resources and strengths of the Adviser and its affiliates with respect to the investment strategies proposed for the Fund. Based on these factors, the Board Members determined that AQR would be an appropriate investment adviser for the Fund and that CNH would be an appropriate sub-adviser for the Fund.
The Management Fee and the Cost of the Services and Profits to be Realized by the Adviser from the Relationship with the Fund. The Board, including the Independent Board Members, received and reviewed information regarding the management fees to be paid by the Fund to the Adviser pursuant to the Management Agreement. The Board examined this information in order to determine the reasonableness of the fees in light of the nature and quality of services to be provided to the Fund.
To assist in this analysis, the Board received a report independently prepared by Lipper. The report showed comparative fee information for the Fund’s expense group and expense universe, including expense comparisons of contractual management fees and actual total operating expenses. The Board noted that breakpoints are part of the Fund’s proposed management fee rate and that the proposed management fee rate would decrease as the Fund increases in size.
The Board also received and reviewed information regarding the profitability of the Adviser with respect to Fund-related activities. The Board took into consideration the Adviser’s profits from the management of other private accounts. The Board also reviewed the Adviser’s methodology of determining profitability. The Board recognized that profitability may be affected by numerous factors including, among other things, fee waivers and expense reimbursements by the Adviser, the types of funds managed, expense allocations and business mix, and therefore comparability of profitability is somewhat limited.
The Board reviewed the Adviser’s unaudited financial statements. The purpose of the review was to help the Independent Board Members determine whether the firm has the necessary resources to continue to provide high quality services to the Funds and attract and retain high quality employees.
The Board concluded that the management fee is reasonable. The Board concluded that the sub-advisory fee for the Fund is reasonable.
Economies of Scale. Because the Fund is newly formed and had not commenced operations as of May 18, 2011, and the eventual aggregate amount of Fund assets was uncertain, the Adviser was not able to provide the Board members with specific information concerning the extent to which economies of scale would be realized as the Fund grows and whether fee levels would reflect such economies of scale, if any. The Board noted that the Fund does have breakpoints in its management fee that would allow investors to benefit directly in the form of lower fees as Fund assets grow. However, the Adviser presented information to show that the fees were set at a level that is competitive relative to funds of a larger scale. The Board considered that the funds in the AQR fund complex share some common resources and, as a result, an increase in the overall size of the complex could permit each fund to incur lower expenses than it would otherwise as a stand-alone entity. The Board also considered the Adviser’s overall operations and its efforts to expand the scale of, and improve the quality of, its operations.
Other Factors. The Board also took into account other ancillary or “fall-out” benefits that the Adviser or its affiliates may derive from its relationship with the Fund, both tangible and intangible. The Board also received information regarding the Adviser’s brokerage and soft dollar practices. The Board considered that the Adviser is responsible for decisions to buy and sell securities for the Funds, selection of broker-dealers and best execution, and aggregation and allocation of trade orders among the firms’ various advisory clients. The Board noted that the Adviser does not presently intend to make use of soft dollars to acquire third-party research.
Conclusion. Counsel advised the Board concerning the statutory and regulatory requirements for approval and disclosure of investment management agreements. No single factor was determinative to the decision of the Board. Based on the foregoing and such other matters as were deemed relevant, all of the Board Members, including all of the Independent Board Members, concluded that the proposed management fee rates and projected total expense ratios are reasonable in relation to the services to be provided by the Adviser to the Fund, as well as the costs incurred and
| | | | | | | | | | | | | | | | |
| 200 | | AQR Funds | | | | | | Annual Report | | | | | | December 2011 | | |
| | | | | | | | | | |
|
| Board Approval of Investment Management Agreement (Unaudited) |
benefits to be gained by the Adviser in providing such services, including the investment advisory and administrative components. The Board also found the proposed investment management fees to be reasonable in comparison to the fees charged by advisers to other comparable funds of similar, actual or anticipated size. As a result, all of the Board Members, including the Independent Board Members, approved the Investment Management Agreement and the Sub-Advisory Agreement with respect to the Fund. The Independent Board Members were represented by counsel who assisted them in their deliberations.
| | | | | | | | | | | | | | | | |
| | AQR Funds | | | | | | Annual Report | | | | | | December 2011 | | 201 |
| | | | | | | | | | |
Investment Adviser
AQR Capital Management, LLC
Two Greenwich Plaza, 3rd Floor
Greenwich, CT 06830
Sub-Adviser
CNH Partners, LLC
Two Greenwich Plaza, 1st Floor,
Greenwich, CT 06830
Transfer Agent
ALPS Fund Services, Inc.
1290 Broadway, Suite 1100
Denver, CO 80203
Custodian
JPMorgan Chase Bank, N.A.
4 Metro Tech Center
Brooklyn, NY 11245
Distributor
ALPS Distributors, Inc.
1290 Broadway, Suite 1100
Denver, CO 80203
Administrator
J.P. Morgan Investor Services Co.
70 Fargo Street
Boston, MA 02210
Independent Registered Public Accounting Firm
PricewaterhouseCoopers, LLP
300 Madison Avenue
New York, NY 10017
You may obtain a description of the AQR Funds proxy voting, policies, procedures and information regarding how each Fund voted proxies relating to portfolio securities during the 12-month period ending June 30th of each year (available by August 31st of that year) without charge, upon request, by calling 1-866-290-2688 or visiting the funds website www.aqrfunds.com, or by accessing the SEC’s website at www.SEC.Gov. Such reports may be reviewed and copied at the SEC’s Public Reference Room in Washington, DC. Information on the operation of the Public Reference Room may be obtained by calling 202-942-8090.
The Fund files complete schedules of the portfolio holdings with the SEC for the first and third quarters on Form N-Q. The Form N-Q is available without charge, upon request, by calling 1-800-SEC-0330, or by accessing the SEC’s website, at www.SEC.Gov. It may also be reviewed and copied at the SEC’s Public Reference Room in Washington, DC.
This report has been prepared for shareholders and may be distributed to others only if preceded or accompanied by an effective prospectus, which includes information regarding the Funds’ objectives and polices, experienced of its management, marketability of shares and other information.
AQR FUNDS P.O. Box 2248 Denver, CO 80201-2248 1-866-290-2688 www.aqrfunds.com
Item 2. Code of Ethics.
| a). | As of the end of the period, December 31, 2011, the Registrant has adopted a code of ethics, as defined in Item 2 of Form N-CSR, that applies to its principal executive officer, principal financial officer, principal accounting officer or controller, or persons performing similar functions. This code of ethics is included as Exhibit 12 (a)(1). |
| c). | There has been no amendment to the Registrant’s Code of Ethics during the fiscal year ending December 31, 2011 (“Reporting Period”). |
| d). | Registrant granted no waivers from the provisions of its Code of Ethics during the Reporting Period. |
Item 3. Audit Committee Financial Expert.
| a). | The Registrant’s Board of Trustees has determined that its Audit Committee has one “audit committee financial expert”, as that term is defined under Items 3(b) and 3(c), serving on its Audit Committee. Mr. L. Joe Moravy, the Registrant’s audit committee financial expert, is “independent”, as that term is defined under Item 3(a)(2). |
Item 4. Principal Accountant Fees and Services.
Aggregate fees for professional services rendered for the AQR Funds by PricewaterhouseCoopers LLP for the years ended December 31, 2010 and December 31, 2011 were:
| | | | | | | | |
| | | 2010 | | | 2011 | |
Audit Fees (a) | | $ | 311,000 | | | $ | 655,000 | |
Audit Related Fees (b) | | $ | 55,000 | | | $ | 65,000 | |
Tax Fees (c) | | $ | 73,000 | | | $ | 86,450 | |
All Other Fees (d) | | | 0 | | | $ | 0 | |
Total: | | $ | 439,000 | | | $ | 741,450 | |
| (a) | Audit Fees: These fees relate to professional services rendered by PricewaterhouseCoopers LLP for the audits of the Registrant’s annual financial statements or services normally provided by the independent registered public accounting firm in connection with statutory and regulatory filings or engagements. These services include the audits of the financial statements of the Registrant, issuance of consents and assistance with review of documents filed with the SEC. |
| (b) | Audit Related Fees: These fees relate to assurance and related services by PricewaterhouseCoopers LLP that are reasonably related to the performance of audit services in connection with December 31, 2010 and December 31, 2011 annual financial statements. The audit related services provided by PricewaterhouseCoopers LLP in connection with the December 31, 2010 annual financial statements, include the procedures related to the service provider conversion for 7 funds and procedures related to the AQR Global Equity Fund conversion from a privately held fund to a registered investment company. The audit related services provided by PricewaterhouseCoopers LLP for the year-ended December 31, 2011 related to services provided in connection with the review of the June 30, 2011 semi-annual financial statements. |
| (c) | Tax Fees: These fees relate to professional services rendered by PricewaterhouseCoopers LLP for tax compliance, tax advice and tax planning. The tax services provided by PricewaterhouseCoopers LLP related to the review of the Registrant’s federal and state income tax returns and excise tax calculations. |
| (d) | All Other Fees: These fees relate to products and services provided by PricewaterhouseCoopers LLP other than those reported under “Audit Fees,” “Audit-Related Fees,” and “Tax Fees” above. |
| (e) | Audit Committee Pre-approval Policies and Procedures: |
| | (i) | Per Rule 2-01(c)(7)(A) and the charter of the Registrant’s Audit Committee, the Audit Committee approves and recommends the principal accountant for the Registrant, pre-approves (i) the principal accountant’s provision of all audit and permissible non-audit services to the Registrant (including the fees and other compensation to be paid to the principal accountant), and (ii) the principal accountant’s provision of any permissible non-audit services to the Registrant’s investment adviser (the “Adviser”), sub-adviser or any entity controlling, controlled by, or under common control with any investment adviser or sub-adviser, if the engagement relates directly to the operations of the financial reporting of the Trust. |
| | (ii) | 100% of services described in each of Items 4(b) through (d) were approved by the Audit Committee pursuant to paragraph (c)(7)(A) of Rule 2-01 of Regulation S-X. |
| | (f) | Less than 50% of the hours expended on the principal accountant’s engagement to audit Registrant’s financial statements were attributed to work performed by persons other than the accountant’s full-time, permanent employees. |
| | (g) | Disclose the aggregate non-audit fees billed by the Registrant’s accountant for services rendered to the Registrant, and rendered to the Registrant’s investment adviser (not including any sub-adviser whose role is primarily portfolio management and is subcontracted with or overseen by another investment adviser), and any entity controlling, controlled by, or under common control with the adviser that provides ongoing services to the Registrant for the fiscal years ended December 31, 2010 and December 31, 2011: $692,420 and $1,072,168. |
Item 5. Audit Committee of Listed Registrants.
| (a) | The Registrant is an issuer as defined in Section 10A-3 of the Securities Exchange Act of 1934 and has a separately-designated standing Audit Committee in accordance with Section 3(a)(58)(A) of such Act. All of the Board’s independent Trustees, Timothy K. Armour, William L. Atwell, Gregg D. Behrens, L. Joe Moravy and Brian S. Posner, are members of Audit Committee. |
Item 6. Investments
| (a) | Schedule is included as part of the report to shareholders filed under Item 1 of this Form. |
| (b) | The Registrant made no divestments of securities in accordance with Section 13(c) of the Investment Company Act of 1940. |
Item 7. Disclosure of Proxy Voting Policies and Procedures for Closed-End Management Investment Companies.
Not applicable.
Item 8. Portfolio Managers of Closed-End Management Investment Companies.
Not applicable.
Item 9. Purchases of Equity Securities by Closed-End Management Investment Company & Affiliated Purchasers.
Not applicable.
Item 10. Submission of Matters to a Vote of Security Holders.
Not applicable.
Item 11. Controls and Procedures.
| (a) | The Registrant’s principal executive officer and principal financial officer have concluded, based on their evaluation of the Registrant’s disclosure controls and procedures as conducted within 90 days of the filing date of this report, that those disclosure controls and procedures provide reasonable assurance that the material information required to be disclosed by the Registrant on this report is recorded, processed, summarized and reported within the time periods specified in the Securities and Exchange Commission’s rules and forms. |
| (b) | There have not been any changes in registrant’s control over financial reporting (as defined in Rule 30a-3(d) under the Investment Company Act of 1940) that occurred during the second fiscal quarter of the period covered by this report that has materially affected, or is reasonably likely to materially affect, the registrant’s control over financial reporting. |
Item 12. Exhibits.
| (a)(1) | The code of ethics that is the subject of the disclosure required by Item 2 is attached hereto. |
| (a)(2) | Certifications pursuant to Rule 30a-2(a) under the 1940 Act and Section 302 of the Sarbanes-Oxley Act of 2002 are attached hereto. |
| (a)(3) | Any written solicitation to purchase securities under Rule 23c-1 under the 1940 Act – Not Applicable. |
| (b) | Certification required by Rule 30a-2(b) under the 1940 Act and Section 906 of the Sarbanes-Oxley Act of 2002 is attached hereto. |
SIGNATURES
Pursuant to the requirements of the Securities Exchange Act of 1934 and the Investment Company Act of 1940, the Registrant has duly caused this report to be signed on its behalf by the undersigned, thereunto duly authorized.
| | |
| AQR Funds |
| |
| By: | | /s/ Marco Hanig |
| | Marco Hanig, |
| | Principal Executive Officer |
| | March 7, 2012 |
Pursuant to the requirements of the Securities Exchange Act of 1934 and the Investment Company Act of 1940, this report has been signed below by the following persons on behalf of the Registrant and in the capacities and on the dates indicated.
| | |
| By: | | /s/ Marco Hanig |
| | Marco Hanig, |
| | Principal Executive Officer |
| Date: March 7, 2012 |
| | |
| By: | | /s/ Nir Messafi |
| | Nir Messafi, |
| | Principal Financial Officer |
| Date: March 7, 2012 |