UNITED STATES
SECURITIES AND EXCHANGE COMMISSION
Washington, D.C. 20549
FORM N-CSR
CERTIFIED SHAREHOLDER REPORT OF REGISTERED MANAGEMENT
INVESTMENT COMPANIES
Investment Company Act file number: 811-22235
AQR Funds
(Exact name of registrant as specified in charter)
Two Greenwich Plaza, 3rd Floor
Greenwich, CT 06830
(Address of principal executive offices) (Zip code)
Bradley D. Asness, Esq.
Principal & General Counsel
Two Greenwich Plaza
3rd Floor
Greenwich, CT 06830
(Name and address of agent for service)
Registrant’s telephone number, including area code: 203-742-3600
Date of fiscal year end: December 31
Date of reporting period: January 15, 2009 – December 31, 2009
Form N-CSR is to be used by management investment companies to file reports with the Commission not later than 10 days after the transmission to stockholders of any report that is required to be transmitted to stockholders under Rule 30e-1 under the Investment Company Act of 1940 (17 CFR 270.30e-1). The Commission may use the information provided on Form N-CSR in its regulatory, disclosure review, inspection, and policymaking roles.
A registrant is required to disclose the information specified by Form N-CSR, and the Commission will make this information public. A registrant is not required to respond to the collection of information contained in Form N-CSR unless the Form displays a currently valid Office of Management and Budget (“OMB”) control number. Please direct comments concerning the accuracy of the information collection burden estimate and any suggestions for reducing the burden to Secretary, Securities and Exchange Commission, 450 Fifth Street, NW, Washington, DC 20549-0609. The OMB has reviewed this collection of information under the clearance requirements of 44 U.S.C. § 3507.
Item 1. Reports to Stockholders.
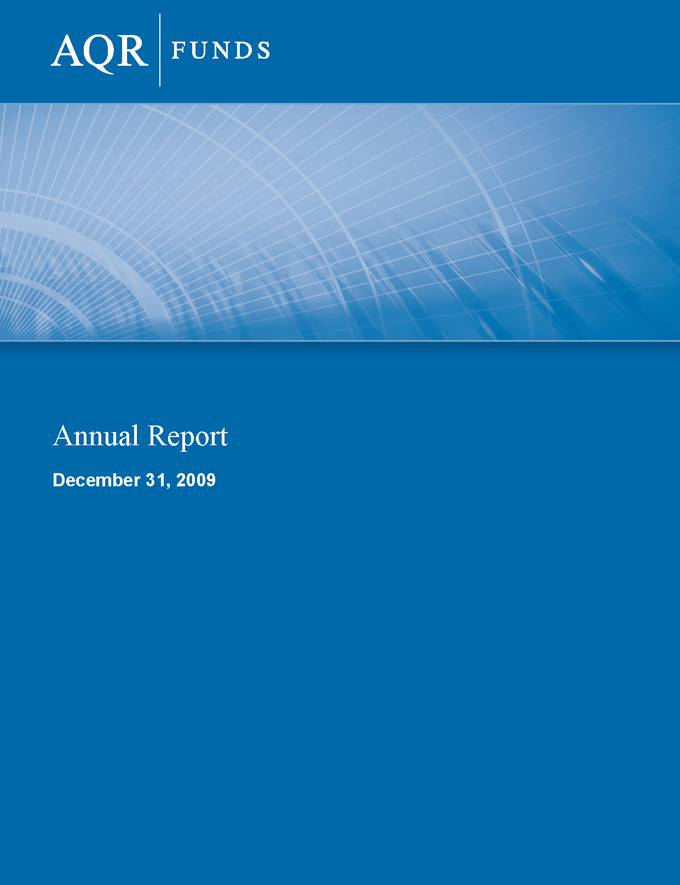
Table of Contents
Shareholder Letter
|
| AQR INTERNATIONAL EQUITY FUND |

Cliff Asness
Managing & Founding Principal

Ronen Israel
Principal

Oktay Kurbanov
Principal

John Liew
Founding Principal

Lars Nielsen
Principal
Dear Shareholder:
International equity markets had a tumultuous year in 2009. After declining by more than 25% during the first quarter in the aftermath of the financial crisis of 2008, the MSCI EAFE Index (the “Index”) rallied strongly in the remainder of the year, posting a return of 31.78% for the full year.
The AQR International Equity Fund Class N shares (the “Fund”) outperformed its benchmark index by a substantial margin, posting a return of 36.38%.1
The Fund is actively managed, and it seeks to outperform its benchmark in three ways: by selecting stocks within each country, and by using futures and forwards contracts to over and under-weight the portfolio’s exposures to each country and to each currency. Each of these decisions is made independently. For the year, all three active strategies contributed to outperformance in a balanced fashion. Stock selection was the strongest contributor driven by positive results in the first eight months of the year. Currency and country selection both had strong years, but their positive results dominated the second half. We believe the year serves as an illustration of the diversification benefits of our multi-strategy approach to international equity management: while stock selection strategies had flat excess returns over the second half of the year, asset allocation strategies produced strong results. More detail on each strategy is provided below.
Stock selection was strongly positive led by outperformance in Europe and Japan, while the U.K. was slightly down. In Japan, value factors – both industry relative and across industries – drove results, particularly earlier in the year. In Europe, value and earnings quality factors, along with relatively less negative momentum contribution led to strong excess performance in 2009. In the UK, weak performance by earnings quality factors depressed the strategy’s performance for the year.
Our stock selection strategy remains broadly diversified across over four hundred names, with any individual position representing a small active weight against the benchmark. The portfolio as a whole is overweight cheaper stocks2 with better momentum and earnings quality.
The country selection strategy was another positive contributor to outperformance. Our underweight position in Japan was the top contributor for 2009. Japan was our least favorite market throughout the year, as it severely lagged other developed markets – with only Greece’s post-downgrade results in contention for worst performer in the second half. In addition, our underweight of Germany and overweights of the Netherlands and Spain were top contributors. Positions that detracted the most value were our overweights of Italy, UK and France, as these markets suffered relative underperformance earlier in the year along with an underweight position in Hong Kong in Q2.
Our country views remained relatively stable over the course of the year. We continued to primarily favor European markets, with our top five countries remaining consistent
| 1 | Full year performance of the Fund includes the performance of a predecessor fund. See p. 6 for further discussion. |
| 2 | Stocks with lower valuation ratios such as Price to Book |
| | | | | | | | | | |
| AQR Funds | | | | Annual Report | | | | December 2009 | | 2 |
| | | | | | | |
Shareholder Letter
|
| AQR INTERNATIONAL EQUITY FUND |
through most of the year, although their relative weightings shifted. For instance during the fourth quarter, Italy and the Netherlands became our favorite markets, and while we remain positive on Spain, France and the UK, our overweights of these countries decreased. In addition, we remain bearish on Japan, Australia, and Germany, which were our largest underweights throughout the year.
Our positive view on Italy, the Netherlands and France is primarily motivated by valuation themes, as these are the three cheapest markets in our universe. This view on valuations has been consistent throughout 2009. Spain and the UK are our other favorite markets, driven by momentum and catalyst based themes. Spain continues to benefit from strong price momentum along with neutral valuation scores, which have improved slightly through the year. Our UK position is motivated by positive fundamental momentum scores such as the depreciation of the Pound, and improvements in analyst sentiment, which overcame more expensive valuations that grew relatively richer during the year.
Our negative view on Japan is driven by weak momentum scores and richer than average valuation measures. While fundamental momentum indicators improved through the year – particularly the health of export partners – this improvement was overcome by worsening momentum themes and more expensive relative valuations. Australia remains the most expensive market on our valuation measures and also features negative fundamental momentum scores such as an appreciating currency and rising interest rates. Both sets of indicators have grown more negative through the year. Our underweight position in Germany is motivated by a collection of small negatives in both price and fundamental momentum measures combined with neutral valuations.
Overall for 2009 the country selection strategy ran at above average attractiveness – meaning the portfolio targeted more tracking error from the strategy than average. This was motivated by above average valuation spreads across the universe of equity markets that we cover. These valuation spreads peaked in early March, retracted throughout 2009 but remained wide at year’s end. Combined with attractive value spreads, we are seeing positive agreement across our factors – especially among our suite of valuation measures, which also increases the strategy’s attractiveness.
The currency selection strategy was a strong positive contributor in 2009. Looking back on the year, the pattern we saw in stocks and country selection also appeared for currencies: i.e., a tale of two periods. During the first half of the year, value themes dominated, while both carry and momentum struggled. During the second half, carry themes drove performance – particularly in Q3 – while value and momentum signals were flat. For the year, value was the strongest theme, followed by carry. 2009 was a negative year for momentum.
We made several significant changes in our currency positioning as the effects of the dramatic currency movements from last Fall’s carry unwind and flight to safety faded. While signals focusing on nominal interest rate differentials started to recover earlier in the year, other interest rate signals, such as those focused on real rate differences, showed positive results later in the summer. While Aussie and Euro positions remain our strongest views, our positioning on the Yen turned bearish from being one our favorite currencies for most of the year.
In the fourth quarter, the Norwegian Krone became our second largest overweight. We believe the Krone, like the Aussie, is particularly attractive on carry indicators and also features positive fundamental and price momentum signals, which overcome slightly rich valuations. Improvements in carry and momentum signals during Q4 also drove our improving opinion. These two positive views reflect Norway and Australia having higher nominal interest rates than the G4 markets, which employed extremely lax monetary policies in 2009 as a response to the financial crisis. In addition, Australia and Norway’s were the first central banks to hike short-term interest rates and market indicators point to further tightening action in the first half of 2010. At
| | | | | | | | | | |
| AQR Funds | | | | Annual Report | | | | December 2009 | | 3 |
| | | | | | | |
Shareholder Letter
|
| AQR INTERNATIONAL EQUITY FUND |
the same time, little tightening is currently expected in G4 markets. Both Australia and Norway’s economies appear to be in better shape than other developed markets and have been able to start contracting monetary policy to prevent a potential rise in inflation, while other central banks remain focused on stimulating economic activity.
At year end, the portfolio’s top underweights continued to be in Euro followed by Yen. The Euro scored particularly poorly on valuation and momentum – both price and fundamental – measures. In addition, the Euro has unattractive carry and interest rate signals. The Yen has expensive valuations and poor momentum which deteriorated over the quarter as the positive impact of last year’s carry unwind faded and relative analyst sentiment has decayed.
| | | | | | | | |
SINCE INCEPTION TOTAL RETURNS AS OF 12/31/2009 AQR INTERNATIONAL EQUITY FUND PERFORMANCE SINCE COMMENCEMENT OF OPERATIONS AS A MUTUAL FUND |
| | | 1 Year | | 3 Year | | 5 Year | | Since
Inception
(8/28/2009) |
| Fund - Class N: AQINX | | – | | – | | – | | 5.84% |
| Fund - Class I: AQIIX | | – | | – | | – | | 5.95% |
| Fund - Class Y: AQIYX | | – | | – | | – | | 6.08% |
| MSCI EAFE Index | | – | | – | | – | | 5.52% |
Past performance does not guarantee future results. Investment results and principal value of an investment will fluctuate so that an investor’s shares, when redeemed, may be worth more or less than their original cost. Class N and Class I shares of the Fund are subject to a 2% redemption fee for redemptions within 60 days of purchase. Class Y shares are subject to a 0.10% redemption fee. If reflected, the redemption fee would reduce the performance quoted. Current performance may be lower or higher than the performance data quoted. As of the latest prospectus, the gross expense ratio for the for the Fund’s Class N/I/YI shares are 1.36%/0.97%/0.91% respectively. Call 1-866-290-2688 or visit www.aqrfunds.com for current month-end performance.
| | | | | | | | | | |
| AQR Funds | | | | Annual Report | | | | December 2009 | | 4 |
| | | | | | | |
Shareholder Letter
|
| AQR INTERNATIONAL EQUITY FUND |
|
AQR INTERNATIONAL EQUITY FUND VS. MSCI EAFE INDEX VALUE OF $10,000 INVESTED ON 8/28/09 |
The chart above represents historical performance of a hypothetical investment of $10,000 in the Fund over the past ten years (or since inception if shorter). Performance calculations are as of the end of December each year. Past performance does not guarantee future results. Returns shown are total returns, which assume the reinvestment of dividends and capital gains. The table and graph presented above do not reflect the deduction of taxes a shareholder would pay on fund distributions or the redemption of fund shares.
| | | | | | | | |
AVERAGE ANNUAL TOTAL RETURNS AS OF 12/31/2009 AQR INTERNATIONAL EQUITY FUND PERFORMANCE SINCE INCEPTION OF PREDECESSOR LIMITED PARTNERSHIP |
| | | 1 Year | | 3 Year | | 5 Year | | Since
Inception
(8/1/2004) |
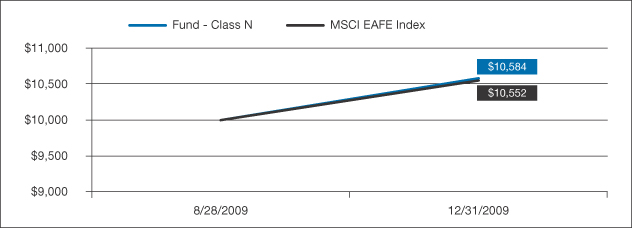
| Fund - Class N: AQINX | | 36.38% | | -7.41% | | 2.64% | | 5.79% |
| Fund - Class I: AQIIX | | 36.94% | | -7.06% | | 3.01% | | 6.18% |
| Fund - Class Y: AQIYX | | 37.30% | | -6.76% | | 3.36% | | 6.53% |
| MSCI EAFE Index | | 31.78% | | -6.04% | | 3.54% | | 6.60% |
Past performance does not guarantee future results. Investment results and principal value of an investment will fluctuate so that an investor’s shares, when redeemed, may be worth more or less than their original cost. Class N and Class I shares of the Fund are subject to a 2% redemption fee for redemptions within 60 days of purchase. Class Y shares are subject to a 0.10% redemption fee. If reflected, the redemption fee would reduce the performance quoted. Current performance may be lower or higher than the performance data quoted. As of the latest prospectus, the gross expense ratio for the for the Fund’s Class N/I/YI shares are 1.36%/0.97%/0.91% respectively. Call 1-866-290-2688 or visit www.aqrfunds.com for current month-end performance.
| | | | | | | | | | |
| AQR Funds | | | | Annual Report | | | | December 2009 | | 5 |
| | | | | | | |
Shareholder Letter
|
| AQR INTERNATIONAL EQUITY FUND |
|
AQR INTERNATIONAL EQUITY FUND VS. MSCI EAFE INDEX VALUE OF $10,000 INVESTED ON 7/31/04 |
The chart above represents historical performance of a hypothetical investment of $10,000 in the Fund over the past ten years (or since inception if shorter). Performance calculations are as of the end of December each year. Past performance does not guarantee future results. Returns shown are total returns, which assume the reinvestment of dividends and capital gains. The table and graph presented above do not reflect the deduction of taxes a shareholder would pay on fund distributions or the redemption of fund shares.
A privately offered fund managed by the Adviser was reorganized into the Class Y shares of the Fund on August 28, 2009, the date the Fund commenced operations. The Class N and Class I shares of the Fund commenced operations on September 30, 2009. The performance of Class N and Class I shares for the period from August 28, 2009 to September 30, 2009 is based on the performance of the Class Y shares of the Fund, and, for all share classes, for periods prior to August 28, 2009 is based on that of the privately offered fund. The total annual fund operating expenses of the privately offered fund were lower than the Fund’s estimated total annual fund operating expenses for Class N, I and Y shares. Also, the Fund’s total annual fund operating expenses for Class Y shares were lower than the Fund’s estimated total annual fund operating expenses for Class N and Class I shares. The Fund has restated the performance of the privately offered fund and of the Class Y shares to reflect the Fund’s expenses of Class N, I and Y shares.
The recent growth rate in the stock market has helped to produce short-term returns for some asset classes that are not typical and may not continue in the future. Because of ongoing market volatility, fund performance may be subject to substantial short-term changes.
Principal Risks: The Fund uses derivatives to manage its country and currency exposures. The use of derivatives exposes the Fund to additional risks including increased volatility, lack of liquidity, and possible losses greater than the Fund’s initial investment as well as increased transaction costs. Foreign investing involves special risks such as currency fluctuations and political uncertainty. The Fund is not suitable for all investors.
An investment in any of the AQR Funds involves risk, including loss of principal. Diversification does not eliminate this risk. The value of the Funds’ portfolio holdings may fluctuate in response to events specific to
| | | | | | | | | | |
| AQR Funds | | | | Annual Report | | | | December 2009 | | 6 |
| | | | | | | |
Shareholder Letter
|
| AQR INTERNATIONAL EQUITY FUND |
the companies in which the Fund invests, as well as economic, political or social events in the United States or abroad. Please refer to the prospectus for complete information regarding all risks associated with the Funds.
An investor considering the Funds should be able to tolerate potentially wide price fluctuations. The funds are subject to high portfolio turnover risk as a result of frequent trading, and thus will incur a higher level of brokerage fees and commissions and cause a higher level of tax liability to shareholders in the funds. The Funds may attempt to increase their income or total return through the use of securities lending, and they may be subject to the possibility of additional loss as a result of this investment technique.
Cliff Asness is a registered representative of ALPS Distributors, Inc.
DEFINITIONS:
The Morgan Stanley Capital International EAFE Index is a market capitalization weighted index composed of companies representative of the market structure of 21 developed market countries in Europe, Australasia and the Far East. You can not invest directly in an index.
Carry: The return obtained from holding an asset (if positive), or the cost of holding it (if negative).
Futures and Forwards contracts: A financial contract obligating the buyer to purchase an asset (or the seller to sell an asset) at a pre-determined future date and price.
G4 Markets: The currencies of the U.S., U.K., Japan, and the Euro.
Momentum: An investment style wherein an asset is deemed to have positive momentum if it has performed well in the past relative to other assets in the same universe.
Price to Book: A valuation ratio of a company’s current share price compared to its book value.
Tracking Error: A measure of how closely a portfolio follows the index to which it is benchmarked. It measures the standard deviation of the difference between the portfolio and index returns.
Valuation: A process of determining the current worth of an asset or company.
| | | | | | | | | | |
| AQR Funds | | | | Annual Report | | | | December 2009 | | 7 |
| | | | | | | |
Ronen Israel
Principal

Mark Mitchell, Ph.D.
Founding Principal, CNH Partners
Lars Nielsen
Principal

Todd Pulvino, Ph.D.
Founding Principal, CNH Partners
Shareholder Letter
| | |
| AQR DIVERSIFIED ARBITRAGE FUND | | |
Dear Shareholder:
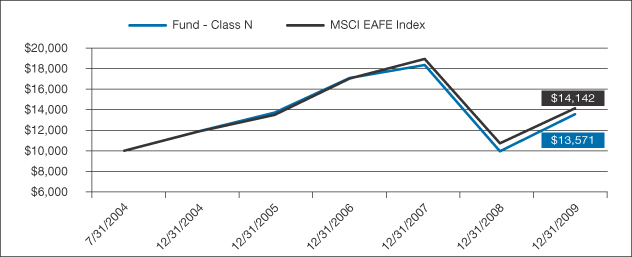
The Diversified Arbitrage Fund completed a positive first year, returning 8.88% (inception date of January 15, 2009 through December 31, 2009) for the Fund’s Class N Shares. During this same time period, the Merrill Lynch 3-Month Treasury Bill Index (the Fund’s benchmark) returned 0.21%. Based on weekly data, the Fund’s equity market beta relative to the S&P 500 during this period was 0.04.
Financial markets were in disarray at the time of the Fund’s launch in January 2009. Arbitrage strategies were impacted causing securities to trade at significant discounts to fundamental values, and causing substantially similar assets to trade at significantly different prices. Thus, at the beginning of the year, low-risk arbitrage strategies offered expected returns in excess of what is typical, a consequence of the high level of risk aversion following the financial crisis of 2008. Arbitrage markets stabilized steadily throughout 2009, commensurate with stabilization of the entire financial markets. As the arbitrage markets stabilized, spreads and cheapness levels reverted to more normal levels, generating a realized return which was greater than would be achieved in a more normal environment.
By design, the Fund invests in multiple arbitrage strategies, and tactically allocates to various strategies based on relative attractiveness. As displayed in the table below, the Fund substantially altered its weights among arbitrage strategies throughout the year.
| | | | | | |
LONG POSITIONS BY STRATEGY (AS % OF INVESTMENT IN SECURITIES) | | | | | | |
| | | 1/31/09 | | 6/30/09 | | 12/31/09 |
| Convertible Arbitrage | | 28% | | 49% | | 44% |
| Merger Arbitrage | | 10% | | 19% | | 34% |
| Dual-Class Arbitrage | | 14% | | 10% | | 12% |
| Price Pressure | | 0% | | 5% | | 4% |
| SPACs | | 37% | | 10% | | 1% |
| Closed-End Fund Arbitrage | | 11% | | 5% | | 2% |
| Other Arbitrage and Alternative Investment Strategies | | 0% | | 2% | | 3% |
Convertible arbitrage has accounted for the largest average strategy weight during the year at 40%, ranging from 28% to 49%. The convertible bond market unraveled during the fall of 2008 when prime brokers reduced the amount of leverage they were willing to provide to convertible arbitrage hedge funds. The prime brokers’ unwillingness to lend was driven by their inability to post convertible bonds as collateral to raise outside capital, a problem that became particularly acute following Lehman’s bankruptcy. As a result, prime brokers increased margin requirements which effectively forced many convertible funds to reduce leverage by selling bonds. This forced selling resulted in a cheapening of bonds relative to fundamental values on a scale that had not been observed historically.1 Given their high level of attractiveness, the Fund immediately allocated a substantial portion of the investment portfolio to convertible bonds. The Fund’s peak allocation to convertibles reached nearly 50% of the total investment portfolio. This tactical allocation paid off. Throughout 2009, prime brokerage financing
| | | | | | | | | | |
| AQR Funds | | | | Annual Report | | | | December 2009 | | 8 |
| | | | | | | |
Shareholder Letter
|
| AQR DIVERSIFIED ARBITRAGE FUND |
stabilized, allowing convertible funds to become active purchasers. In addition, corporate issuers recognized the opportunity to retire debt at less than par by buying bonds in the secondary market. As a result, convertible prices rebounded–convertible arbitrage was the Fund’s strongest contributor accounting for roughly 65% of the Fund’s 2009 return. It is important to note that the Fund’s investment in a convertible bond is based on the cheapness of the bond relative to its fundamental value rather than on a view about the underlying stock price. To capture the bond’s cheapness, equity risk can be hedged by shorting the stock of the underlying issuer. In addition, portfolio hedges are used to reduce systematic credit and interest rate risks.
Merger arbitrage, a well-known arbitrage strategy like convertible arbitrage, involves the purchase of shares of firms that are targets in announced mergers or reorganizations. For a merger where the consideration is the acquirer’s stock, the Fund seeks to hedge market exposure by shorting the stock of the acquiring company in an amount based on the merger agreement between the two firms. Merger arbitrage is especially attractive when deal spreads (the percentage difference between the consideration offered by the acquiring firm and the stock price of the target firm) are wide and when merger activity is high. While deal spreads were relatively wide at the beginning of 2009 due to the tremendous uncertainty in the economy, deal flow was anemic as potential acquirers were hesitant to pursue acquisitions in an unstable market. Consequently the Fund allocated a small amount of capital to merger arbitrage at the beginning of the year. As deal flow increased through 2009, the Fund increased its allocation and by year-end, 34% of the investment portfolio was allocated to merger arbitrage. Roughly 25% of the Fund’s return came from its investment in merger arbitrage benefiting from the fact that mergers closed on time during the year, failures did not cause large losses, and some target holdings received higher bids.
Special Purpose Acquisition Companies (SPACs) also contributed positively to the Fund, accounting for nearly 13% of the 2009 return. SPACs are corporations that raise cash through an initial public offering and place the cash in a trust, typically invested in Treasury bills that can be used to acquire an operating company. If the SPAC fails to complete an acquisition by a pre-determined date, proceeds from the IPO that are held in trust are returned to stock holders. Moreover, even if a sufficient number of stock holders approve the proposed acquisition, opposing stock holders can elect to exchange their shares for a pro-rata portion of the trust. Thus, downside risk is extremely low for the investor who holds the SPAC to maturity. Despite their low risk, SPACs, similar to convertible bonds, were hit hard by hedge fund delevering during the financial crisis of 2008. By simply buying SPAC shares in the secondary market and redeeming those shares for a pro-rata portion of the trust account, investors could earn returns that, in some cases, reached double digits. Given the high risk-adjusted yields, the SPAC strategy received the largest allocation of capital at the beginning of 2009. As financial markets stabilized in 2009 and SPAC yields declined to more normal levels, the Fund steadily reduced its exposure to this asset class. By year end, the allocated weight dropped to only 1% due to low yields and a dormant new-issue market.
The three strategies described above accounted for roughly 80% of the capital allocated in the Fund and all of the return to the Fund in 2009. None of the other strategies such as dual-class arbitrage or closed-end-fund arbitrage contributed materially, either positive or negative, to the Fund’s annual return. However, one strategy that did not perform well in the fourth quarter was Price Pressure. The Price Pressure strategy is designed to profit by providing liquidity to groups of investors that simultaneously initiate trades in a particular direction (i.e. either buy or sell) and where there are no natural investors willing to take the other side. These situations often result from corporate actions that induce trading on pre-specified days resulting in temporary price movements. Through the end of September, the Price Pressure strategy had contributed +0.9% to the Fund’s return. However, in October, Price Pressure contributed -1.4%. This was followed by a -0.5% contribution in November, generating the worst two-month return that we have experienced in the strategy (although well-within the distribution of expected returns based on large-sample historical analysis). The Price Pressure strategy rebounded in December and ended the year with an annual contribution of -0.6% to the Fund, a reasonably small loss given the magnitude of the October and November returns.
| | | | | | | | | | |
| AQR Funds | | | | Annual Report | | | | December 2009 | | 9 |
| | | | | | | |
Shareholder Letter
|
| AQR DIVERSIFIED ARBITRAGE FUND |
Looking forward for 2010, we are optimistic on several fronts. While convertible bonds richened substantially during 2009, they remain systematically cheap. Furthermore, there currently exists a high level of dispersion in cheapness which will allow the Fund to profit from bond selection. Note, however, that we expect to reduce the weight in convertible arbitrage during the year as convertibles continue richening to fair value. With respect to merger arbitrage, the conventional wisdom is that deal flow will improve considerably in 2010 as a result of higher business confidence amidst a rebounding economy. We expect that most new deals will be strategic in nature as firms and industries are forced to restructure in response to the recent upheaval in the economy. An appealing attribute of strategic mergers is that, unlike financing-contingent deals, strategic mergers are less susceptible to termination caused by broad market downturns. We also expect to see several short-term credit investment opportunities as well as opportunities to invest in securities issued by firms raising capital in the convertible and equity markets.
Overall, we believe the Fund had a strong first year. Arbitrage opportunities were plentiful and the Fund successfully allocated capital from one strategy to the next throughout the year. The Fund tries to generate returns that are typically uncorrelated with traditional asset classes, thereby enhancing the typical investor’s portfolio. Investor confidence in our approach was high as the Fund ended its first year with net assets of $239 million. For 2010, there are several arbitrage and alternative investment opportunities for the Fund to deploy capital with the intention of generating a 2010 return substantially greater than the Treasury Bill Index benchmark return.
| | | | | | | | |
SINCE INCEPTION TOTAL RETURNS AS OF 12/31/2009 AQR DIVERSIFIED ARBITRAGE FUND |
| | | | | | | | |
| | | 1 Year | | 3 Year | | 5 Year | | Since
Inception
(1/15/2009) |
| Fund - Class N: ADANX | | – | | – | | – | | 8.88% |
| Fund - Class I: ADAIX | | – | | – | | – | | 9.24% |
| Merrill Lynch 3-Month T-Bill Index | | – | | – | | – | | 0.21% |
Past performance does not guarantee future results. Investment returns and principal value of an investment will fluctuate so that an investor’s shares, when redeemed, may be worth more or less than their original cost. The Fund generally charges 1% of redemption proceeds on shares held for 60 days or less. If reflected, the redemption fee would reduce the performance quoted. Current performance may be lower or higher than the performance data quoted. As of the latest Prospectus, the gross expense ratios for the Class N/I shares are expected to be 2.23%/1.93%, respectively. Call 1-866-290-2688 or visit www.aqrfunds.com for current month-end performance.
| | | | | | | | | | |
| AQR Funds | | | | Annual Report | | | | December 2009 | | 10 |
| | | | | | | |
Shareholder Letter
|
| AQR DIVERSIFIED ARBITRAGE FUND |
|
AQR DIVERSIFIED ARBITRAGE FUND VS. MERRILL LYNCH 3-MONTH T-BILL INDEX VALUE OF $10,000 INVESTED ON 1/15/09 |
The chart above represents historical performance of a hypothetical investment of $10,000 in the Fund over the past ten years (or since inception if shorter). Performance calculations are as of the end of December each year. Past performance does not guarantee future results. Returns shown are total returns, which assume the reinvestment of dividends and capital gains. The table and graph presented above do not reflect the deduction of taxes a shareholder would pay on fund distributions or the redemption of fund shares.
Principal Risks: This Fund has the risk that the anticipated arbitrage opportunities do not play out as planned, resulting in potentially reduced returns or losses to the Fund as it unwinds its trades. This Fund enters into a short sale by selling a security it has borrowed. If the market price of a security increases after the Fund borrows the security, the Fund will suffer a potentially unlimited loss when it replaces the borrowed security at the higher price. Short sales also involve transaction and other costs that will reduce potential Fund gains and increase potential Fund losses. This Fund is not suitable for all Investors.
An investment in any of the AQR Funds involves risk, including loss of principal. The value of the Funds’ portfolio holdings may fluctuate in response to events specific to the companies in which the Fund invests, as well as economic, political or social events in the United States or abroad. The use of derivatives exposes the Funds to additional risks including increased volatility, lack of liquidity, and possible losses greater than the Fund’s initial investment as well as increased transaction costs. Please refer to the prospectus for complete information regarding all risks associated with the Funds.
DEFINITIONS:
Arbitrage: The simultaneous purchase and sale of an asset or two related assets in order to profit from a difference in price.
Beta is a measure of the volatility of a security or portfolio in comparison to an index or the market as a whole, where a security with a beta of 1.0 has equivalent volatility to the index or market it is compared to.
Cheapness: A measure of the discount of a security’s price relative to the fundamental value of the security.
Convertible Bonds: Fixed-income securities that are convertible into common stock.
| | | | | | | | | | |
| AQR Funds | | | | Annual Report | | | | December 2009 | | 11 |
| | | | | | | |
Shareholder Letter
|
| AQR DIVERSIFIED ARBITRAGE FUND |
De-Levering: A process by which a portfolio decreases its notional exposure to the market due to a decrease in available debt capital.
Dual-Class Arbitrage: An investment strategy wherein one simultaneously purchases and sells different share classes of the same company, seeking to profit from a price convergence.
Richness: A measure of the premium of a security’s price relative to the fundamental value of the security.
Spread: The percentage difference in price between two related securities.
S&P 500 Index: An Index of 500 stocks chosen for market size, liquidity and industry grouping, among other factors.
The Merrill Lynch 3 Month Treasury Bill Index is designed to measure the performance of high-quality short-term cash-equivalent investments. Indexes are unmanaged and one cannot invest directly in an index.
| | | | | | | | | | |
| AQR Funds | | | | Annual Report | | | | December 2009 | | 12 |
| | | | | | | |
Shareholder Letter
Cliff Asness
Managing & Founding Principal

Jacques Friedman
Principal
Ronen Israel
Principal
Lars Nielsen
Principal
Dear Shareholder:
The AQR Momentum Fund invests in stocks of large and mid-cap U.S. companies with positive momentum. A stock is considered to have positive momentum if it has performed well in the prior twelve months (excluding the most recent month) relative to other stocks in the Fund’s investment universe, which is comprised of the 1000 largest U.S. companies by market capitalization. The Fund is not actively managed to outperform a growth, value or core benchmark. Rather, it seeks to provide systematic exposure to stocks that share the common characteristic of positive momentum.
From the Fund’s inception on July 9, 2009 to December 31, 2009, the Fund returned 25.58%. The major driver of the Fund’s performance was the overall performance of large and mid-cap US equity markets, as measured by the Russell 1000® Index of large and mid-cap stocks, which rose by 28.26%. Compared to this broad universe, the Fund under-performed by 2.69%. Most of the underperformance was driven by stock momentum, meaning that within a given sector, stocks with poor momentum outperformed those with strong momentum. Sector momentum (i.e. the sector over and under-weights implied by the momentum style) also detracted from performance, but to a lesser extent.
While the momentum style underperformed during the period in question, the benefits of investing in the momentum style need to be judged over the course of one or more business cycles, based both on the Fund’s return and its ability to provide diversification relative to the more traditional value and growth investment styles.
| | | | | | | | |
SINCE INCEPTION TOTAL RETURNS AS OF 12/31/2009 AQR MOMENTUM FUND | | | | | | |
| | | 1 Year | | 3 Year | | 5 Year | | Since
Inception
(7/9/2009) |
| Fund - Class L: AMOMX | | – | | – | | – | | 25.58% |
| Russell 1000® Index | | – | | – | | – | | 28.26% |
Past performance does not guarantee future results. Investment returns and principal value of an investment will fluctuate so that an investor’s shares, when redeemed, may be worth more or less than their original cost. The Fund generally charges 1% of redemption proceeds on shares held for 60 days or less. If reflected, the redemption fee would reduce the performance quoted. Current performance may be lower or higher than the performance data quoted. As of the latest Prospectus, the gross expense ratios for the is expected to be 0.73%. Call 1-866-290-2688 or visit www.aqrfunds.com for current month-end performance.
| | | | | | | | | | |
| AQR Funds | | | | Annual Report | | | | December 2009 | | 13 |
| | | | | | | |
Shareholder Letter
|
AQR MOMENTUM FUND VS. RUSSELL 1000® INDEX VALUE OF $10,000 INVESTED ON 7/9/09 |
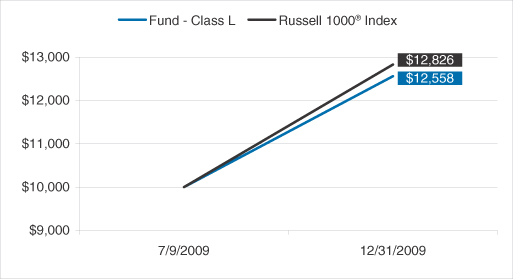
The chart above represents historical performance of a hypothetical investment of $10,000 in the Fund over the past ten years (or since inception if shorter). Performance calculations are as of the end of December each year. Past performance does not guarantee future results. Returns shown are total returns, which assume the reinvestment of dividends and capital gains. The table and graph presented above do not reflect the deduction of taxes a shareholder would pay on fund distributions or the redemption of fund shares.
The recent growth rate in the stock market has helped to produce short-term returns for some asset classes that are not typical and may not continue in the future. Because of ongoing market volatility, fund performance may be subject to substantial short-term changes.
Principal Risks: Securities with positive momentum generally will be more volatile than a broad cross-section of securities. In addition, there may be periods when the momentum style is out of favor, and during which the investment performance of a Fund using a momentum strategy generally will suffer. This Fund is not suitable for all investors.
An investment in any of the AQR Funds involves risk, including loss of principal. The value of the Funds’ portfolio holdings may fluctuate in response to events specific to the companies in which the Funds invest, as well as economic, political or social events in the United States or abroad. An investor considering the Funds should be able to tolerate potentially wide price fluctuations. The Funds are subject to high portfolio turnover risk as a result of frequent trading, and thus, will incur a higher level of brokerage fees and commissions, and cause a higher level of tax liability to shareholders in the Funds. The Funds may attempt to increase their income or total return through the use of securities lending, and they may be subject to the possibility of additional loss as a result of this investment technique. Please refer to the prospectus for complete information regarding all risks associated with the Funds.
Cliff Asness is a registered representative of ALPS Distributors, Inc.
Definitions: The Russell 1000® Index measures the performance of the large and mid-cap segment of the U.S. equity universe. It is a subset of the Russell 3000® Index and includes approximately 1,000 of the largest securities based on a combination of their market cap and current index membership. The Russell 1000 represents approximately 90% of the U.S. market. Indexes are unmanaged and one cannot invest directly in an index.
| | | | | | | | | | |
| AQR Funds | | | | Annual Report | | | | December 2009 | | 14 |
| | | | | | | |
Shareholder Letter
|
| AQR SMALL CAP MOMENTUM FUND |
Cliff Asness
Managing & Founding Principal
Jacques Friedman
Principal
Ronen Israel
Principal
Lars Nielsen
Principal
Dear Shareholder:
The AQR Small Cap Momentum Fund invests in stocks of small-cap U.S. companies with positive momentum. A stock is considered to have positive momentum if it has performed well in the prior twelve months (excluding the most recent month) relative to other stocks in the investment universe, which is comprised of U.S. companies smaller than the 1000th largest and larger than the 3000th smallest company by market capitalization. The Fund is not actively managed to outperform a growth, value or core benchmark. Rather, it seeks to provide systematic exposure to stocks that share the common characteristic of positive momentum.
From the Fund’s inception on July 9, 2009 to December 31, 2009, the Fund returned 21.24%. The major driver of the Fund’s performance was the overall performance of small-cap U.S equity markets, as measured by the Russell 2000® Index of small-cap stocks, which rose by 31.37%. Compared to this broad universe, the Fund under-performed by 10.12%. Most of the underperformance was driven by stock momentum, meaning that within a given sector, stocks with poor momentum outperformed those with strong momentum. Sector momentum (i.e. the sector over and under-weights implied by the momentum style) also detracted from performance, but to a lesser extent.
While the momentum style underperformed during the period in question, the benefits of investing in the momentum style need to be judged over the course of one or more business cycles, based both on the Fund’s return and its ability to provide diversification relative to the more traditional value and growth investment styles.
| | | | | | | | |
SINCE INCEPTION TOTAL RETURNS AS OF 12/31/2009 AQR SMALL CAP MOMENTUM FUND |
| | | 1 Year | | 3 Year | | 5 Year | | Since
Inception
(7/9/2009) |
| Fund—Class L: ASMOX | | – | | – | | – | | 21.24% |
| Russell 2000® Index | | – | | – | | – | | 31.37% |
Past performance does not guarantee future results. Investment returns and principal value of an investment will fluctuate so that an investor’s shares, when redeemed, may be worth more or less than their original cost. The Fund generally charges 1% of redemption proceeds on shares held for 60 days or less. If reflected, the redemption fee would reduce the performance quoted. Current performance may be lower or higher than the performance data quoted. As of the latest Prospectus, the gross expense ratios for the is expected to be 0.85%. Call 1-866-290-2688 or visit www.aqrfunds.com for current month-end performance.
| | | | | | | | | | |
| AQR Funds | | | | Annual Report | | | | December 2009 | | 15 |
| | | | | | | |
Shareholder Letter
|
| AQR SMALL CAP MOMENTUM FUND |
|
AQR SMALL CAP MOMENTUM FUND VS. RUSSELL 2000® INDEX VALUE OF $10,000 INVESTED ON 7/9/09 |
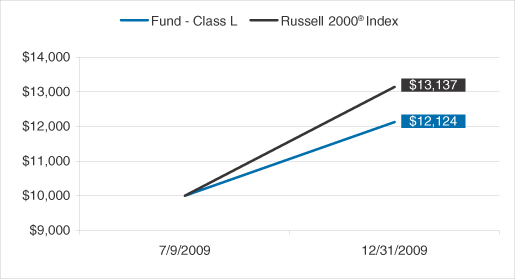
The chart above represents historical performance of a hypothetical investment of $10,000 in the Fund over the past ten years (or since inception if shorter). Performance calculations are as of the end of December each year. Past performance does not guarantee future results. Returns shown are total returns, which assume the reinvestment of dividends and capital gains. The table and graph presented above do not reflect the deduction of taxes a shareholder would pay on fund distributions or the redemption of fund shares.
The recent growth rate in the stock market has helped to produce short-term returns for some asset classes that are not typical and may not continue in the future. Because of ongoing market volatility, fund performance may be subject to substantial short-term changes.
Principal Risks: Securities with positive momentum generally will be more volatile than a broad cross-section of securities. In addition, there may be periods when the momentum style is out of favor, and during which the investment performance of a Fund using a momentum strategy generally will suffer. Funds that emphasize investments in smaller companies generally will experience greater price volatility. This Fund is not suitable for all investors.
An investment in any of the AQR Funds involves risk, including loss of principal. The value of the Funds’ portfolio holdings may fluctuate in response to events specific to the companies in which the Fund invests, as well as economic, political or social events in the United States or abroad. An investor considering the Funds should be able to tolerate potentially wide price fluctuations. The Funds are subject to high portfolio turnover risk as a result of frequent trading, and thus, will incur a higher level of brokerage fees and commissions, and cause a higher level of tax liability to shareholders in the Funds. The Funds may attempt to increase their income or total return through the use of securities lending, and they may be subject to the possibility of additional loss as a result of this investment technique. Please refer to the prospectus for complete information regarding all risks associated with the Funds.
Cliff Asness is a registered representative of ALPS Distributors, Inc.
| | | | | | | | | | |
| AQR Funds | | | | Annual Report | | | | December 2009 | | 16 |
| | | | | | | |
Shareholder Letter
|
| AQR SMALL CAP MOMENTUM FUND |
Definitions: The Russell 2000® Index measures the performance of the small-cap segment of the U.S. equity universe. The Russell 2000® Index is a subset of the Russell 3000® Index representing approximately 8% of the total market capitalization of that index. It includes approximately 2,000 of the smallest securities based on a combination of their market cap and current index membership. Indexes are unmanaged and one cannot invest directly in an index.
| | | | | | | | | | |
| AQR Funds | | | | Annual Report | | | | December 2009 | | 17 |
| | | | | | | |
Cliff Asness
Managing & Founding Principal
Jacques Friedman
Principal
Ronen Israel
Principal
Lars Nielsen
Principal
Shareholder Letter
|
| AQR INTERNATIONAL MOMENTUM FUND |
Dear Shareholder:
The AQR International Momentum Fund invests in stocks of large and mid-cap non-U.S. companies with positive momentum. A stock is considered to have positive momentum if it has performed well in the prior twelve months (excluding the most recent month) relative to other stocks in the investment universe, which is comprised of the top 85% of stocks by market capitalization of each of the 19 major developed markets outside the U.S. The Fund is not actively managed to outperform a growth, value or core benchmark. Rather, it seeks to provide systematic exposure to stocks that share the common characteristic of positive momentum.
From the Fund’s inception on July 9, 2009 to December 31, 2009, the Fund returned 23.08%. The major driver of the Fund’s performance was the overall performance of international developed country equity markets, as measured by the MSCI World ex-USA Index, which rose by 26.97%. Compared to this broad universe, the Fund under-performed by 3.89%. Most of the underperformance was driven by stock momentum, meaning that within a given sector, stocks with poor momentum outperformed those with strong momentum. Sector and country momentum (i.e. the sector and country over and under-weights implied by the momentum style) also detracted from performance, but to a lesser extent.
While the momentum style underperformed during the period in question, the benefits of investing in the momentum style need to be judged over the course of one or more business cycles, based both on the Fund’s return and its ability to provide diversification relative to the more traditional value and growth investment styles.
| | | | | | | | |
SINCE INCEPTION TOTAL RETURNS AS OF 12/31/2009 AQR INTERNATIONAL MOMENTUM FUND | | | | | | |
| | | 1 Year | | 3 Year | | 5 Year | | Since
Inception
(7/9/2009) |
| Fund - Class L: AIMOX | | – | | – | | – | | 23.08% |
| MSCI World ex-USA Index | | – | | – | | – | | 26.97% |
Past performance does not guarantee future results. Investment returns and principal value of an investment will fluctuate so that an investor’s shares, when redeemed, may be worth more or less than their original cost. The Fund generally charges 2% of redemption proceeds on shares held for 60 days or less. If reflected, the redemption fee would reduce the performance quoted. Current performance may be lower or higher than the performance data quoted. As of the latest prospectus, the gross expense ratios for the is expected to be 0.92%. Call 1-866-290-2688 or visit www.aqrfunds.com for current month-end performance.
| | | | | | | | | | |
| AQR Funds | | | | Annual Report | | | | December 2009 | | 18 |
| | | | | | | |
Shareholder Letter
|
| AQR INTERNATIONAL MOMENTUM FUND |
|
AQR INTERNATIONAL MOMENTUM FUND VS. MSCI WORLD EX-USA INDEX VALUE OF $10,000 INVESTED ON 7/9/09 |
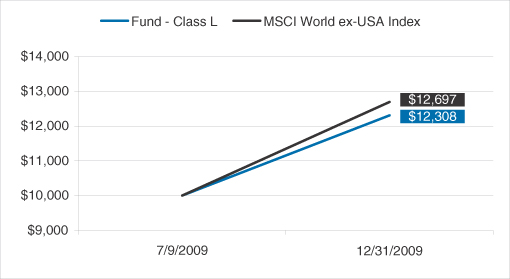
The chart above represents historical performance of a hypothetical investment of $10,000 in the Fund over the past ten years (or since inception if shorter). Performance calculations are as of the end of December each year. Past performance does not guarantee future results. Returns shown are total returns, which assume the reinvestment of dividends and capital gains. The table and graph presented above do not reflect the deduction of taxes a shareholder would pay on fund distributions or the redemption of fund shares.
The recent growth rate in the stock market has helped to produce short-term returns for some asset classes that are not typical and may not continue in the future. Because of ongoing market volatility, fund performance may be subject to substantial short-term changes.
Principal Risks: Securities with positive momentum generally will be more volatile than a broad cross-section of securities. In addition, there may be periods when the momentum style is out of favor, and during which the investment performance of a Fund using a momentum strategy generally will suffer. Foreign investing involves special risks such as currency fluctuations and political uncertainty. This Fund is not suitable for all investors.
An investment in any of the AQR Funds involves risk, including loss of principal. The value of the Funds’ portfolio holdings may fluctuate in response to events specific to the companies in which the Fund invests, as well as economic, political or social events in the United States or abroad. An investor considering the Funds should be able to tolerate potentially wide price fluctuations. The Funds are subject to high portfolio turnover risk as a result of frequent trading, and thus, will incur a higher level of brokerage fees and commissions, and cause a higher level of tax liability to shareholders in the Funds. The Funds may attempt to increase their income or total return through the use of securities lending, and they may be subject to the possibility of additional loss as a result of this investment technique. Please refer to the prospectus for complete information regarding all risks associated with the Funds.
Cliff Asness is a registered representative of ALPS Distributors, Inc.
| | | | | | | | | | |
| AQR Funds | | | | Annual Report | | | | December 2009 | | 19 |
| | | | | | | |
Shareholder Letter
|
| AQR INTERNATIONAL MOMENTUM FUND |
Definitions: The MSCI World ex-USA Index is a market capitalization weighted index composed of companies representative of the market structure of 22 developed market countries in North America, Europe and the Asia/Pacific Region, excluding the U.S.A. Indexes are unmanaged and one cannot invest directly in an index.
| | | | | | | | | | |
| AQR Funds | | | | Annual Report | | | | December 2009 | | 20 |
| | | | | | | |
| | |
| Schedule of Investments | | December 31, 2009 |
| | |
| AQR INTERNATIONAL EQUITY FUND | | |
| | | | | |
| COMMON STOCKS - 79.1% | | SHARES | | VALUE
(Note 2) |
| Australia - 6.7% | | | | | |
| AGL Energy Ltd. | | 2,943 | | $ | 36,991 |
| Amcor Ltd. | | 135,964 | | | 756,957 |
| AMP Ltd. | | 107,632 | | | 650,132 |
| Ansell Ltd. | | 20,714 | | | 202,176 |
| Asciano Group † | | 233,226 | | | 377,573 |
| ASX Ltd. | | 3,473 | | | 108,276 |
| Australia & New Zealand Banking Group Ltd. | | 58,165 | | | 1,185,310 |
| AWB Ltd. | | 183,073 | | | 184,688 |
| BHP Billiton Ltd. | | 115,822 | | | 4,432,116 |
| Billabong International Ltd. | | 10,448 | | | 102,225 |
| Bluescope Steel Ltd. | | 229,219 | | | 631,583 |
| Boral Ltd. | | 53,520 | | | 284,075 |
| Caltex Australia Ltd. † | | 36,251 | | | 301,551 |
| CFS Retail Property Trust REIT | | 69,740 | | | 118,751 |
| Challenger Financial Services Group Ltd. | | 52,749 | | | 198,544 |
| Commonwealth Bank of Australia | | 63,327 | | | 3,091,737 |
| Computershare Ltd. | | 7,774 | | | 79,540 |
| David Jones Ltd. | | 41,608 | | | 200,188 |
| Dexus Property Group REIT | | 136,404 | | | 103,486 |
| Downer EDI Ltd. | | 6,619 | | | 55,123 |
| Energy Resources of Australia Ltd. | | 5,935 | | | 126,656 |
| Felix Resources Ltd. †*(a)(e) | | 592 | | | 43 |
| Flight Centre Ltd. | | 10,987 | | | 180,684 |
| Goodman Group REIT | | 193,631 | | | 109,546 |
| GPT Group REIT † | | 143,427 | | | 77,072 |
| MAp Group | | 174,269 | | | 471,686 |
| Macquarie Group Ltd. | | 6,383 | | | 273,487 |
| Macquarie Infrastructure Group | | 25,619 | | | 30,513 |
| Metcash Ltd. | | 63,748 | | | 255,614 |
| Mirvac Group REIT | | 88,938 | | | 124,091 |
| National Australia Bank Ltd. | | 99,256 | | | 2,422,246 |
| Newcrest Mining Ltd. | | 16,024 | | | 507,555 |
| Orica Ltd. | | 6,777 | | | 157,565 |
| Origin Energy Ltd. | | 33,140 | | | 498,600 |
| Ramsay Health Care Ltd. | | 4,025 | | | 39,198 |
| Rio Tinto Ltd. | | 10,793 | | | 720,483 |
| Santos Ltd. | | 36,866 | | | 464,310 |
| Sigma Pharmaceuticals Ltd. | | 173,386 | | | 153,759 |
| Sims Metal Management Ltd. | | 1,860 | | | 36,444 |
| SP Ausnet | | 81,737 | | | 67,078 |
| Stockland REIT | | 58,884 | | | 207,460 |
| Suncorp-Metway Ltd. | | 54,810 | | | 424,335 |
| TABCORP Holdings Ltd. | | 55,304 | | | 343,124 |
| Tatts Group Ltd. | | 267,448 | | | 583,459 |
| Telstra Corp Ltd. | | 325,979 | | | 1,002,180 |
| Toll Holdings Ltd. | | 27,252 | | | 212,810 |
| Transurban Group | | 37,755 | | | 186,852 |
| Wesfarmers Ltd. | | 38,906 | | | 1,087,609 |
| Wesfarmers Ltd. Price Protected Shares | | 1,765 | | | 49,282 |
| West Australian Newspapers Holdings Ltd. | | 9,379 | | | 67,776 |
| Westfield Group REIT | | 68,093 | | | 762,087 |
| Westpac Banking Corp. | | 76,995 | | | 1,739,217 |
| Woodside Petroleum Ltd. | | 2,736 | | | 115,383 |
| Woolworths Ltd. | | 14,209 | | | 356,373 |
| | | | | |
| | | | | 26,955,599 |
| | | | | |
| Belgium - 0.6% | | | | | |
| Anheuser-Busch InBev NV | | 24,874 | | | 1,287,655 |
| Bekaert NV | | 1,129 | | | 174,240 |
| | | | | |
| | | SHARES | | VALUE
(Note 2) |
| Belgium - 0.6% (continued) | | | | | |
| Delhaize Group | | 4,715 | | $ | 360,694 |
| Groupe Bruxelles Lambert SA | | 2,641 | | | 249,378 |
| Solvay SA Class A | | 3,613 | | | 389,103 |
| | | | | |
| | | | | 2,461,070 |
| | | | | |
| China - 0.0% (b) | | | | | |
| Foxconn International Holdings Ltd. † | | 69,406 | | | 79,901 |
| | | | | |
| | |
| Denmark - 1.1% | | | | | |
| Carlsberg A/S Class B | | 16,514 | | | 1,215,672 |
| Danisco A/S | | 2,919 | | | 194,754 |
| Danske Bank A/S † | | 58,094 | | | 1,304,176 |
| H. Lundbeck A/S | | 17,986 | | | 324,956 |
| Novo Nordisk A/S Class B | | 20,876 | | | 1,332,760 |
| | | | | |
| | | | | 4,372,318 |
| | | | | |
| Finland - 0.8% | | | | | |
| Elisa Oyj Class A | | 9,069 | | | 206,994 |
| Fortum Oyj | | 2,410 | | | 65,382 |
| Metso Oyj | | 29,568 | | | 1,040,065 |
| Sampo Oyj - A Shares | | 24,205 | | | 589,633 |
| Stora Enso Oyj - R Shares † | | 44,418 | | | 311,539 |
| Tieto Oyj | | 14,130 | | | 293,589 |
| UPM-Kymmene Oyj | | 74,955 | | | 891,125 |
| | | | | |
| | | | | 3,398,327 |
| | | | | |
| France - 7.8% | | | | | |
| Atos Origin SA † | | 5,536 | | | 253,624 |
| BNP Paribas | | 12,976 | | | 1,029,230 |
| Bourbon SA | | 5,276 | | | 198,156 |
| Bouygues SA | | 29,915 | | | 1,549,544 |
| Christian Dior SA | | 8,324 | | | 853,041 |
| CNP Assurances | | 9,393 | | | 909,574 |
| Compagnie de Saint-Gobain | | 15,104 | | | 819,336 |
| Compagnie Generale des Etablissements Michelin Class B | | 20,766 | | | 1,590,442 |
| Credit Agricole SA | | 36,854 | | | 646,782 |
| France Telecom SA | | 11,393 | | | 284,691 |
| GDF Suez | | 11,715 | | | 507,505 |
| Klepierre | | 3,675 | | | 148,893 |
| Lagardere SCA | | 10,910 | | | 441,697 |
| Legrand SA | | 6,433 | | | 179,041 |
| LVMH Moet Hennessy Louis Vuitton SA | | 9,659 | | | 1,083,041 |
| M6 Metropole Television | | 11,236 | | | 287,577 |
| PSA Peugot Citroen † | | 16,176 | | | 543,796 |
| PPR | | 10,988 | | | 1,318,944 |
| Publicis Groupe | | 24,422 | | | 993,001 |
| Sanofi-Aventis | | 45,637 | | | 3,589,020 |
| Schneider Electric SA | | 16,492 | | | 1,917,566 |
| SCOR SE | | 36,520 | | | 917,456 |
| Societe BIC SA | | 6,242 | | | 431,229 |
| Societe Generale | | 24,185 | | | 1,680,371 |
| Technip SA | | 3,909 | | | 275,024 |
| Teleperformance | | 3,651 | | | 118,463 |
| Total SA | | 60,684 | | | 3,897,726 |
| Unibail-Rodamco SE | | 3,619 | | | 795,021 |
| Valeo SA † | | 4,783 | | | 167,405 |
| Vallourec SA | | 6,797 | | | 1,229,703 |
| Vinci SA | | 11,314 | | | 636,650 |
| Vivendi | | 73,040 | | | 2,167,806 |
| | | | | |
| | | | | 31,461,355 |
| | | | | |
The accompanying notes are an integral part of these financial statements.
| | | | | | | | | | |
| AQR Funds | | | | Annual Report | | | | December 2009 | | 21 |
| | | | | | | |
| | |
| Schedule of Investments | | December 31, 2009 |
| | |
| AQR INTERNATIONAL EQUITY FUND | | |
| | | | | |
| | | SHARES | | VALUE
(Note 2) |
| Germany - 7.4% | | | | | |
| Allianz SE | | 21,131 | | $ | 2,619,397 |
| BASF SE | | 38,133 | | | 2,360,076 |
| Bayer AG | | 21,664 | | | 1,733,629 |
| Daimler AG | | 30,620 | | | 1,630,931 |
| Deutsche Bank AG | | 20,985 | | | 1,483,848 |
| Deutsche Boerse AG | | 5,256 | | | 435,247 |
| Deutsche Lufthansa AG | | 57,556 | | | 971,874 |
| Deutsche Post AG | | 100,719 | | | 1,946,574 |
| Deutsche Telekom AG | | 33,425 | | | 490,338 |
| E.ON AG | | 40,607 | | | 1,704,439 |
| Hannover Rueckversicherung AG † | | 42,846 | | | 2,001,779 |
| Hochtief AG | | 8,039 | | | 613,109 |
| Infineon Technologies AG † | | 123,802 | | | 688,757 |
| MTU Aero Engines Holding AG | | 22,559 | | | 1,227,762 |
| Muenchener Rueckversicherungs-Gesellschaft AG | | 12,005 | | | 1,869,894 |
| RWE AG | | 19,773 | | | 1,918,817 |
| Salzgitter AG | | 8,551 | | | 837,900 |
| Siemens AG | | 27,612 | | | 2,533,976 |
| Software AG | | 3,266 | | | 355,922 |
| Suedzucker AG | | 13,831 | | | 288,175 |
| ThyssenKrupp AG | | 31,492 | | | 1,183,855 |
| Tognum AG | | 423 | | | 7,002 |
| Volkswagen AG | | 2,843 | | | 268,172 |
| Volkswagen AG Preferred Shares | | 2,126 | | | 235,556 |
| Wincor Nixdorf AG | | 4,291 | | | 293,886 |
| | | | | |
| | | | | 29,700,915 |
| | | | | |
| Hong Kong - 1.8% | | | | | |
| ASM Pacific Technology Ltd. | | 6,404 | | | 60,548 |
| BOC Hong Kong Holdings Ltd. | | 216,553 | | | 486,524 |
| Cheung Kong Holdings Ltd. | | 54,278 | | | 697,482 |
| Cheung Kong Infrastructure Holdings Ltd. | | 14,827 | | | 56,382 |
| Chinese Estates Holdings Ltd. | | 63,869 | | | 108,822 |
| CLP Holdings Ltd. | | 76,509 | | | 517,780 |
| Esprit Holdings Ltd. | | 1,528 | | | 10,138 |
| Hang Lung Group Ltd. | | 21,276 | | | 105,221 |
| Hang Seng Bank Ltd. | | 21,988 | | | 323,487 |
| Henderson Land Development Co., Ltd. | | 40,333 | | | 301,398 |
| Hong Kong and China Gas Co., Ltd. | | 168,813 | | | 423,409 |
| Hong Kong Exchanges & Clearing Ltd. | | 28,854 | | | 513,382 |
| Hopewell Holdings Ltd. | | 73,762 | | | 237,825 |
| Hutchison Whampoa Ltd. | | 45,832 | | | 313,576 |
| Hysan Development Co., Ltd. | | 25,616 | | | 72,495 |
| Industrial and Commercial Bank of China Ltd. | | 55,918 | | | 121,118 |
| Li & Fung Ltd. | | 55,668 | | | 230,156 |
| Link REIT | | 60,382 | | | 154,078 |
| Mongolia Energy Co., Ltd. † | | 95,406 | | | 48,545 |
| Neo-China Land Group Holdings Ltd. †(a)(e) | | 6,136 | | | 633 |
| New World Development Co., Ltd. | | 68,896 | | | 140,369 |
| Orient Overseas International Ltd. | | 16,752 | | | 77,682 |
| Sun Hung Kai Properties Ltd. | | 38,046 | | | 565,710 |
| Swire Pacific Ltd. Class A | | 20,530 | | | 248,277 |
| Television Broadcasts Ltd. | | 54,403 | | | 261,374 |
| Wharf Holdings Ltd. | | 128,243 | | | 735,988 |
| Wheelock and Co., Ltd. | | 77,621 | | | 236,766 |
| Yue Yuen Industrial Holdings Ltd. | | 117,109 | | | 339,059 |
| | | | | |
| | | | | 7,388,224 |
| | | | | |
| | | | | |
| | | SHARES | | VALUE
(Note 2) |
| Italy - 3.2% | | | | | |
| Banca Popolare di Milano Scarl | | 7,766 | | $ | 55,176 |
| Enel SpA | | 278,641 | | | 1,613,160 |
| Eni SpA | | 154,863 | | | 3,943,706 |
| Intesa Sanpaolo † | | 162,062 | | | 729,282 |
| Mediaset SpA | | 140,579 | | | 1,155,831 |
| Prysmian SpA | | 61,779 | | | 1,078,365 |
| Telecom Italia SpA | | 1,312,735 | | | 2,047,795 |
| UniCredit SpA † | | 647,258 | | | 2,164,272 |
| | | | | |
| | | | | 12,787,587 |
| | | | | |
| Japan - 15.3% | | | | | |
| Alfresa Holdings Corp. | | 4,267 | | | 169,654 |
| ALPS Electric Co., Ltd. † | | 21,859 | | | 128,245 |
| AMADA Co., Ltd. | | 40,314 | | | 252,511 |
| Asahi Glass Co., Ltd. | | 104,413 | | | 993,185 |
| Asics Corp. | | 40,319 | | | 361,858 |
| Astellas Pharma, Inc. | | 24,897 | | | 928,879 |
| Bank of Yokohama Ltd. | | 39,142 | | | 178,467 |
| Canon, Inc. | | 49,715 | | | 2,114,800 |
| Canon Marketing Japan, Inc. | | 26,406 | | | 389,124 |
| Central Glass Co., Ltd. | | 63,690 | | | 243,769 |
| Central Japan Railway Co. | | 36 | | | 240,958 |
| Chubu Electric Power Co., Inc. | | 15,197 | | | 362,533 |
| Circle K Sunkus Co., Ltd. | | 19,641 | | | 242,286 |
| COMSYS Holdings Corp. | | 68,886 | | | 724,657 |
| Cosmo Oil Co., Ltd. | | 26,030 | | | 54,695 |
| Credit Saison Co., Ltd. | | 36,512 | | | 408,910 |
| Dai Nippon Printing Co., Ltd. | | 53,861 | | | 686,735 |
| Daiei, Inc. † | | 14,331 | | | 49,336 |
| Daifuku Co., Ltd. | | 24,255 | | | 155,072 |
| Daito Trust Construction Co., Ltd. | | 4,687 | | | 221,922 |
| Daiwa House Industry Co., Ltd. | | 295 | | | 3,172 |
| Daiwa Securities Group, Inc. | | 117,723 | | | 592,458 |
| Doutor Nichires Holdings Co., Ltd. | | 12,483 | | | 160,787 |
| Dowa Holdings Co., Ltd. | | 86,818 | | | 480,370 |
| East Japan Railway Co. | | 5,413 | | | 342,539 |
| Ebara Corp. † | | 67,983 | | | 293,597 |
| FamilyMart Co., Ltd. | | 7,557 | | | 223,095 |
| Fuji Heavy Industries Ltd. † | | 24,721 | | | 120,795 |
| Fuji Oil Co., Ltd. | | 7,454 | | | 109,209 |
| Fujifilm Holdings Corp. | | 18,543 | | | 560,011 |
| Fujikura Ltd. | | 114,188 | | | 594,765 |
| Fujitsu Ltd. | | 39,635 | | | 257,168 |
| Fukuoka Financial Group, Inc. | | 75,046 | | | 261,535 |
| Funai Electric Co., Ltd. | | 14,167 | | | 711,493 |
| Glory Ltd. | | 13,003 | | | 289,186 |
| Hanwa Co., Ltd. | | 26,030 | | | 94,629 |
| Hitachi Capital Corp. | | 36,810 | | | 447,547 |
| Hitachi Chemical Co., Ltd. | | 10,589 | | | 215,810 |
| Hitachi High-Technologies Corp. | | 10,806 | | | 214,395 |
| Hokuhoku Financial Group, Inc. | | 76,812 | | | 157,052 |
| Honda Motor Co., Ltd. | | 32,097 | | | 1,089,009 |
| HOYA Corp. | | 21,563 | | | 575,355 |
| IBIDEN Co., Ltd. | | 7,575 | | | 271,673 |
| ITOCHU Corp. | | 121,444 | | | 897,079 |
| JFE Holdings, Inc. | | 7,247 | | | 286,466 |
| JGC Corp. | | 32,936 | | | 606,933 |
| JTEKT Corp. | | 15,270 | | | 196,399 |
| Kaken Pharmaceutical Co., Ltd. | | 47,918 | | | 407,134 |
The accompanying notes are an integral part of these financial statements.
| | | | | | | | | | |
| AQR Funds | | | | Annual Report | | | | December 2009 | | 22 |
| | | | | | | |
| | |
| Schedule of Investments | | December 31, 2009 |
| | |
| AQR INTERNATIONAL EQUITY FUND | | |
| | | | | |
| | | SHARES | | VALUE
(Note 2) |
| Japan - 15.3% (continued) | | | | | |
| Kandenko Co., Ltd. | | 55,894 | | $ | 353,072 |
| Kaneka Corp. | | 82,625 | | | 526,437 |
| Kansai Electric Power Co., Inc. | | 9,932 | | | 224,131 |
| Kansai Paint Co., Ltd. | | 91,291 | | | 765,058 |
| Kao Corp. | | 15,185 | | | 355,887 |
| Kawasaki Kisen Kaisha Ltd. † | | 60,933 | | | 174,104 |
| KDDI Corp. | | 160 | | | 847,475 |
| Kinden Corp. | | 10,564 | | | 89,516 |
| Kissei Pharmaceutical Co., Ltd. | | 2,663 | | | 52,462 |
| Kobayashi Pharmaceutical Co., Ltd. | | 4,149 | | | 166,248 |
| Komatsu Ltd. | | 6,685 | | | 139,945 |
| KOSE Corp. | | 11,714 | | | 236,842 |
| K’s Holdings Corp. | | 13,432 | | | 403,220 |
| Kyowa Exeo Corp. | | 20,469 | | | 174,165 |
| Lintec Corp. | | 16,021 | | | 322,361 |
| Makita Corp. | | 7,000 | | | 240,436 |
| Marubeni Corp. | | 52,974 | | | 292,627 |
| Matsumotokiyoshi Holdings Co., Ltd. | | 6,270 | | | 138,028 |
| Megmilk Snow Brand Co., Ltd. (f)† | | 3,433 | | | 50,499 |
| Miraca Holdings, Inc. | | 29,206 | | | 803,781 |
| Mitsubishi Corp. | | 24,402 | | | 607,819 |
| Mitsubishi Estate Co., Ltd. | | 41,020 | | | 654,921 |
| Mitsubishi Gas Chemical Co., Inc. | | 38,324 | | | 193,122 |
| Mitsubishi UFJ Financial Group, Inc. | | 223,991 | | | 1,103,331 |
| Mitsui & Co., Ltd. | | 119,143 | | | 1,690,177 |
| Mitsui Chemicals, Inc. | | 56,211 | | | 145,547 |
| Mitsui Engineering & Shipbuilding Co., Ltd. | | 61,509 | | | 148,141 |
| Mitsui Fudosan Co., Ltd. | | 28,205 | | | 476,896 |
| Mitsui O.S.K. Lines Ltd. | | 42,634 | | | 225,221 |
| Mitsumi Electric Co., Ltd. | | 28,889 | | | 510,258 |
| Mizuho Financial Group, Inc. | | 131,957 | | | 237,299 |
| Mizuho Securities Co., Ltd. | | 43,185 | | | 130,676 |
| Mochida Pharmaceutical Co., Ltd. | | 10,649 | | | 95,254 |
| Murata Manufacturing Co., Ltd. | | 2,946 | | | 147,027 |
| Musashino Bank Ltd. | | 4,258 | | | 100,991 |
| NEC Electronics Corp. † | | 29,585 | | | 245,733 |
| NHK Spring Co., Ltd. | | 53,196 | | | 495,299 |
| Nichirei Corp. | | 33,467 | | | 116,187 |
| Nidec Corp. | | 1,804 | | | 166,731 |
| Nintendo Co., Ltd. | | 1,530 | | | 365,421 |
| Nippon Electric Glass Co., Ltd. | | 77,614 | | | 1,068,270 |
| Nippon Mining Holdings, Inc. | | 116,895 | | | 501,690 |
| Nippon Oil Corp. | | 38,353 | | | 177,809 |
| Nippon Telegraph and Telephone Corp. | | 19,019 | | | 751,309 |
| Nipro Corp. | | 7,505 | | | 155,242 |
| Nishi-Nippon City Bank Ltd. | | 49,737 | | | 121,790 |
| Nissan Motor Co., Ltd. † | | 135,755 | | | 1,193,004 |
| Nissan Shatai Co., Ltd. | | 57,403 | | | 512,949 |
| Nisshin Seifun Group, Inc. | | 12,584 | | | 170,060 |
| Nitto Denko Corp. | | 5,383 | | | 193,378 |
| Nomura Holdings, Inc. | | 57,313 | | | 426,218 |
| NTT DoCoMo, Inc. | | 474 | | | 661,461 |
| Okinawa Electric Power Co., Inc. | | 6,253 | | | 333,938 |
| OKUMA Corp. | | 44,072 | | | 230,705 |
| OMRON Corp. | | 14,937 | | | 268,639 |
| ORIX Corp. | | 3,669 | | | 249,801 |
| Osaka Gas Co., Ltd. | | 99,802 | | | 336,361 |
| Point, Inc. | | 9,541 | | | 533,103 |
| | | | | |
| | | SHARES | | VALUE
(Note 2) |
| Japan - 15.3% (continued) | | | | | |
| Promise Co., Ltd. | | 16,933 | | $ | 129,965 |
| Rengo Co., Ltd. | | 84,299 | | | 501,049 |
| Resona Holdings, Inc. | | 8,770 | | | 89,101 |
| Sankyo Co., Ltd. | | 3,024 | | | 151,422 |
| SBI Holdings, Inc. | | 600 | | | 107,420 |
| Secom Co., Ltd. | | 2,273 | | | 107,962 |
| Seino Holdings Co., Ltd. | | 81,837 | | | 519,459 |
| Seven & I Holdings Co., Ltd. | | 11,539 | | | 235,608 |
| Shimachu Co., Ltd. | | 3,933 | | | 77,513 |
| Shin-Etsu Chemical Co., Ltd. | | 16,652 | | | 940,144 |
| Shinko Electric Industries Co., Ltd. | | 43,688 | | | 635,951 |
| SKY Perfect JSAT Holdings, Inc. | | 263 | | | 104,744 |
| Softbank Corp. | | 24,284 | | | 569,283 |
| Sojitz Corp. | | 89,062 | | | 168,514 |
| Sompo Japan Insurance, Inc. | | 80,933 | | | 521,812 |
| Sony Corp. | | 27,971 | | | 813,167 |
| Stanley Electric Co., Ltd. | | 40,694 | | | 825,411 |
| Sumco Corp. | | 7,113 | | | 125,690 |
| Sumitomo Bakelite Co., Ltd. | | 110,263 | | | 544,568 |
| Sumitomo Electric Industries Ltd. | | 24,454 | | | 304,596 |
| Sumitomo Forestry Co., Ltd. | | 10,837 | | | 81,761 |
| Sumitomo Metal Mining Co., Ltd. | | 32,758 | | | 483,428 |
| Sumitomo Mitsui Financial Group, Inc. | | 22,036 | | | 632,331 |
| Sumitomo Realty & Development Co., Ltd. | | 17,261 | | | 325,844 |
| Sumitomo Trust and Banking Co., Ltd. | | 27,075 | | | 132,939 |
| Taiyo Yuden Co., Ltd. | | 44,651 | | | 578,062 |
| Takara Holdings, Inc. | | 26,475 | | | 152,369 |
| Takeda Pharmaceutical Co., Ltd. | | 12,281 | | | 505,993 |
| TDK Corp. | | 3,904 | | | 238,583 |
| THK Co., Ltd. | | 13,205 | | | 234,823 |
| Toho Gas Co., Ltd. | | 31,627 | | | 168,047 |
| Tokai Rika Co., Ltd. | | 28,299 | | | 641,862 |
| Tokai Rubber Industries, Inc. | | 5,608 | | | 58,086 |
| Tokuyama Corp. | | 60,920 | | | 340,634 |
| Tokyo Electron Ltd. | | 9,495 | | | 609,465 |
| Tokyo Gas Co., Ltd. | | 54,071 | | | 215,832 |
| Tokyo Steel Manufacturing Co., Ltd. | | 44,345 | | | 499,221 |
| Tokyu Land Corp. | | 26,483 | | | 98,375 |
| Toppan Forms Co., Ltd. | | 7,253 | | | 75,640 |
| Toshiba Corp. † | | 60,341 | | | 334,826 |
| Toshiba Tec Corp. † | | 5,479 | | | 20,767 |
| Toyo Seikan Kaisha Ltd. | | 19,761 | | | 301,041 |
| Toyo Suisan Kaisha Ltd. | | 28,370 | | | 654,230 |
| Toyota Auto Body Co., Ltd. | | 1,857 | | | 35,142 |
| Toyota Motor Corp. | | 77,953 | | | 3,286,575 |
| Toyota Tsusho Corp. | | 17,510 | | | 259,105 |
| USS Co., Ltd. | | 8,644 | | | 527,683 |
| West Japan Railway Co., | | 82 | | | 274,917 |
| Yamaguchi Financial Group, Inc. | | 7,652 | | | 71,031 |
| Yamatake Corp. | | 4,437 | | | 98,628 |
| Yamato Holdings Co., Ltd. | | 43,160 | | | 600,789 |
| Yamato Kogyo Co., Ltd. | | 5,137 | | | 167,956 |
| Yokogawa Electric Corp. | | 33,711 | | | 297,721 |
| Yokohama Rubber Co., Ltd. | | 12,719 | | | 56,228 |
| | | | | |
| | | | | 61,998,642 |
| | | | | |
| Luxembourg - 0.3% | | | | | |
| ArcelorMittal | | 28,352 | | | 1,295,863 |
| | | | | |
The accompanying notes are an integral part of these financial statements.
| | | | | | | | | | |
| AQR Funds | | | | Annual Report | | | | December 2009 | | 23 |
| | | | | | | |
| | |
| Schedule of Investments | | December 31, 2009 |
| | |
| AQR INTERNATIONAL EQUITY FUND | | |
| | | | | |
| | | SHARES | | VALUE
(Note 2) |
| Netherlands - 3.1% | | | | | |
| Akzo Nobel NV | | 6,944 | | $ | 460,491 |
| Corio NV | | 2,174 | | | 148,114 |
| CSM | | 10,279 | | | 269,995 |
| ING Groep NV † | | 67,777 | | | 652,718 |
| James Hardie Industries NV | | 8,198 | | | 62,356 |
| Koninklijke Ahold NV | | 60,088 | | | 796,086 |
| Koninklijke DSM NV | | 9,593 | | | 471,337 |
| Koninklijke (Royal) Philips Electronics NV | | 25,505 | | | 753,910 |
| Randstad Holding NV † | | 9,403 | | | 467,868 |
| Royal Dutch Shell PLC Class A | | 117,869 | | | 3,566,737 |
| Royal Dutch Shell PLC Class B | | 98,748 | | | 2,875,854 |
| Unilever NV | | 59,667 | | | 1,941,968 |
| | | | | |
| | | | | 12,467,434 |
| | | | | |
| New Zealand - 0.0% (b) | | | | | |
| Telecom Corp. of New Zealand Ltd. | | 78,357 | | | 141,316 |
| | | | | |
| | |
| Singapore - 1.1% | | | | | |
| Ascendas REIT | | 49,637 | | | 77,920 |
| CapitaMall Trust REIT | | 71,994 | | | 91,891 |
| ComfortDelGro Corp., Ltd. | | 129,356 | | | 150,466 |
| Creative Technology Ltd. | | 6 | | | 28 |
| DBS Group Holdings Ltd. | | 56,128 | | | 610,166 |
| Haw Par Corp., Ltd. | | 7,960 | | | 32,790 |
| Jardine Cycle & Carriage Ltd. | | 20,066 | | | 383,118 |
| Keppel Corp., Ltd. | | 77,571 | | | 451,862 |
| Oversea-Chinese Banking Corp., Ltd. | | 90,479 | | | 582,607 |
| Pacific Century Regional Developments Ltd. | | 45,410 | | | 5,820 |
| SembCorp Industries Ltd. | | 32,017 | | | 83,661 |
| SembCorp Marine Ltd. | | 51,142 | | | 133,438 |
| Singapore Exchange Ltd. | | 21,472 | | | 126,431 |
| Singapore Technologies Engineering Ltd. | | 44,265 | | | 101,879 |
| Singapore Telecommunications Ltd. | | 231,524 | | | 509,959 |
| StarHub Ltd. | | 1,988 | | | 3,036 |
| United Overseas Bank Ltd. | | 48,097 | | | 669,499 |
| Yangzijiang Shipbuilding Holdings Ltd. | | 525,319 | | | 448,687 |
| | | | | |
| | | | | 4,463,258 |
| | | | | |
| Spain - 4.7% | | | | | |
| Almirall SA | | 11,258 | | | 147,366 |
| Banco Bilbao Vizcaya Argentaria SA | | 173,991 | | | 3,170,987 |
| Banco Espanol de Credito SA | | 32,402 | | | 396,928 |
| Banco Santander SA | | 6,735 | | | 111,039 |
| Banco Santander SA | | 380,220 | | | 6,283,004 |
| Endesa SA | | 74,446 | | | 2,567,355 |
| Repsol YPF SA | | 34,941 | | | 937,627 |
| Tecnicas Reunidas SA | | 20,264 | | | 1,165,382 |
| Telefonica SA | | 152,986 | | | 4,281,928 |
| | | | | |
| | | | | 19,061,616 |
| | | | | |
| Sweden - 3.2% | | | | | |
| Atlas Copco AB A Shares | | 25,813 | | | 379,448 |
| Boliden AB | | 3,468 | | | 44,440 |
| Electrolux AB Class B † | | 104,600 | | | 2,458,013 |
| Hennes & Mauritz AB B Shares | | 12,776 | | | 708,260 |
| Investor AB B Shares | | 19,364 | | | 358,666 |
| Nordea Bank AB | | 221,074 | | | 2,239,923 |
| Skanska AB B Shares | | 59,389 | | | 1,007,716 |
| Svenska Cellulosa AB B Shares | | 93,410 | | | 1,245,409 |
| Svenska Handelsbanken AB A Shares | | 40,770 | | | 1,161,530 |
| | | | | |
| | | SHARES | | VALUE
(Note 2) |
| Sweden - 3.2% (continued) | | | | | |
| Tele2 AB B Shares | | 65,958 | | $ | 1,013,200 |
| Telefonaktiebolaget LM Ericsson B Shares | | 240,296 | | | 2,212,177 |
| | | | | |
| | | | | 12,828,782 |
| | | | | |
| Switzerland - 6.6% | | | | | |
| ABB Ltd. † | | 105,764 | | | 2,038,001 |
| Adecco SA | | 9,399 | | | 518,496 |
| Baloise Holding AG | | 4,507 | | | 374,203 |
| Compagnie Financiere Richemont SA Class A | | 29,763 | | | 1,000,836 |
| Credit Suisse Group AG | | 42,274 | | | 2,094,312 |
| Helvetia Holding AG | | 113 | | | 34,996 |
| Nestle SA | | 133,451 | | | 6,476,862 |
| Novartis AG | | 111,208 | | | 6,072,986 |
| Roche Holding AG - Genusschein | | 28,267 | | | 4,834,021 |
| Schindler Holding AG | | 11,162 | | | 854,676 |
| Sulzer AG | | 5,717 | | | 448,498 |
| Swiss Life Holding AG † | | 5,123 | | | 651,832 |
| Swisscom AG | | 1,003 | | | 383,058 |
| UBS AG † | | 30,705 | | | 478,145 |
| Zurich Financial Services AG | | 2,191 | | | 479,005 |
| | | | | |
| | | | | 26,739,927 |
| | | | | |
| United Kingdom - 15.4% | | | | | |
| AMEC PLC | | 53,664 | | | 683,704 |
| Anglo American PLC † | | 13,549 | | | 586,773 |
| AstraZeneca PLC | | 56,368 | | | 2,649,135 |
| Aviva PLC | | 299,570 | | | 1,905,606 |
| BAE Systems PLC | | 174,702 | | | 1,011,117 |
| Barclays PLC | | 487,635 | | | 2,148,740 |
| BBA Aviation PLC | | 108,596 | | | 286,392 |
| BG Group PLC | | 34,020 | | | 614,274 |
| BHP Billiton PLC | | 61,575 | | | 1,963,007 |
| BP PLC | | 723,905 | | | 6,990,141 |
| Brit Insurance Holdings NV | | 245,744 | | | 776,100 |
| British American Tobacco PLC | | 45,784 | | | 1,486,298 |
| British Land Co. PLC REIT | | 25,597 | | | 197,106 |
| Cadbury PLC | | 27,670 | | | 355,769 |
| Charter International PLC | | 26,871 | | | 311,282 |
| Daily Mail and General Trust PLC | | 90,114 | | | 605,662 |
| Electrocomponents PLC | | 131,896 | | | 343,167 |
| Eurasian Natural Resources Corp. | | 74,018 | | | 1,084,179 |
| GlaxoSmithKline PLC | | 134,876 | | | 2,860,160 |
| Hays PLC | | 236,406 | | | 395,323 |
| Hiscox Ltd. | | 97,912 | | | 498,941 |
| HMV Group PLC | | 17,621 | | | 26,371 |
| Home Retail Group PLC | | 182,171 | | | 826,230 |
| HSBC Holdings PLC | | 481,886 | | | 5,497,510 |
| IMI PLC | | 66,352 | | | 553,462 |
| Imperial Tobacco Group PLC | | 47,025 | | | 1,483,512 |
| International Personal Finance PLC | | 181,723 | | | 608,345 |
| International Power PLC | | 118,214 | | | 589,047 |
| Invensys PLC | | 44,061 | | | 211,969 |
| Investec PLC | | 94,916 | | | 648,533 |
| J Sainsbury PLC | | 223,129 | | | 1,163,433 |
| Johnson Matthey PLC | | 12,856 | | | 317,137 |
| Kazakhmys PLC † | | 30,049 | | | 636,242 |
| Kesa Electricals PLC | | 216,361 | | | 519,761 |
| Kingfisher PLC | | 361,934 | | | 1,332,352 |
The accompanying notes are an integral part of these financial statements.
| | | | | | | | | | |
| AQR Funds | | | | Annual Report | | | | December 2009 | | 24 |
| | | | | | | |
| | |
| Schedule of Investments | | December 31, 2009 |
| | |
| AQR INTERNATIONAL EQUITY FUND | | |
| | | | | | |
| | | SHARES | | VALUE
(Note 2) |
| United Kingdom - 15.4% (continued) | | | | | | |
| Land Securities Group PLC REIT | | | 21,145 | | $ | 232,734 |
| Lloyds Banking Group PLC † | | | 199,736 | | | 160,703 |
| Logica PLC | | | 140,461 | | | 256,988 |
| Mondi PLC | | | 165,619 | | | 888,549 |
| Old Mutual PLC † | | | 309,400 | | | 541,819 |
| Pearson PLC | | | 85,224 | | | 1,221,937 |
| Persimmon PLC † | | | 74,600 | | | 564,103 |
| Petrofac Ltd. | | | 62,674 | | | 1,049,157 |
| Prudential PLC | | | 50,509 | | | 517,022 |
| Rio Tinto PLC | | | 38,504 | | | 2,079,088 |
| Rolls-Royce Group PLC † | | | 83,181 | | | 647,765 |
| Rolls-Royce Group-C Shares †(a) | | | 4,990,860 | | | 8,061 |
| Royal Bank of Scotland Group PLC † | | | 292,392 | | | 135,731 |
| SEGRO PLC REIT | | | 43,322 | | | 240,297 |
| Smiths News PLC | | | 4,237 | | | 7,371 |
| Sports Direct International PLC | | | 4,364 | | | 6,873 |
| Standard Chartered PLC | | | 53,055 | | | 1,339,419 |
| Tesco PLC | | | 162,045 | | | 1,117,912 |
| Unilever PLC | | | 71,598 | | | 2,295,096 |
| Vodafone Group PLC | | | 1,870,535 | | | 4,331,612 |
| WH Smith PLC | | | 60,503 | | | 481,322 |
| William Morrison Supermarkets PLC | | | 195,304 | | | 871,374 |
| Wolseley PLC † | | | 28,280 | | | 566,076 |
| WS Atkins PLC | | | 48,341 | | | 476,141 |
| | | | | | |
| | | | | | 62,203,930 |
| | | | | | |
TOTAL COMMON STOCKS
(cost $285,668,925) | | | | | | 319,806,064 |
| | | | | | |
| | |
| RIGHTS - 0.0% (b) | | | | |
| Australia - 0.0% (b) | | | | | | |
| Woodside Petroleum †(a) | | | 228 | | | — |
| | | | | | |
| Netherlands - 0.0% (b) | | | | | | |
| Fortis †(a) | | | 142,993 | | | — |
| | | | | | |
TOTAL RIGHTS
(cost $0) | | | | | | — |
| | | | | | |
| |
| MONEY MARKET FUND - 16.6% | | | |
Dreyfus Institutional Cash Advance 99 - Institutional Class, 0.28% (c)(g)
(cost $67,189,097) | | | 67,189,097 | | | 67,189,097 |
| | | | | | |
| | |
| OTHER INVESTMENTS - 0.0% | | | | |
| Commercial Paper - 0.0% (b) | | | PAR VALUE | | | |
| Lehman Commercial Paper, Inc., 0.0% † (a)(e)(cost $453,006) | | $ | 453,006 | | | 88,336 |
| | | | | | |
TOTAL INVESTMENTS - 95.7%
(cost $353,311,028) | | | | | | 387,083,497 |
| | | | | | |
OTHER ASSETS IN EXCESS OF LIABILITIES - 4.3% (d) | | | | | | 17,429,433 |
| | | | | | |
| NET ASSETS - 100.0% | | | | | $ | 404,512,930 |
| | | | | | |
| | | | | |
| INDUSTRY | | VALUE | | % OF NET
ASSETS | |
| Automobile & Components | | $12,750,662 | | 3.1 | % |
| Banks | | 44,572,582 | | 11.0 | |
| Capital Goods | | 33,399,221 | | 8.3 | |
| Commercial & Professional Services | | 3,332,981 | | 0.8 | |
| Consumer Durables & Apparel | | 8,760,456 | | 2.2 | |
| Consumer Services | | 1,268,054 | | 0.3 | |
| Diversified Financials | | 10,728,127 | | 2.7 | |
| Energy | | 28,486,771 | | 7.0 | |
| Food & Staples Retailing | | 7,082,081 | | 1.7 | |
| Food, Beverage & Tobacco | | 18,548,311 | | 4.6 | |
| Health Care Equipment & Services | | 1,523,810 | | 0.4 | |
| Household & Personal Products | | 758,977 | | 0.2 | |
| Insurance | | 16,283,537 | | 4.0 | |
| Materials | | 31,541,834 | | 7.8 | |
| Media | | 7,307,404 | | 1.8 | |
| Pharmaceuticals, Biotechnology & Life Sciences | | 25,533,753 | | 6.3 | |
| Real Estate | | 8,820,664 | | 2.2 | |
| Retailing | | 8,031,061 | | 2.0 | |
| Semiconductors & Semiconductor Equipment | | 2,366,144 | | 0.6 | |
| Software & Services | | 1,605,083 | | 0.4 | |
| Technology Hardware & Equipment | | 10,780,317 | | 2.7 | |
| Telecommunication Services | | 17,525,636 | | 4.3 | |
| Transportation | | 7,090,410 | | 1.8 | |
| Utilities | | 11,708,188 | | 2.9 | |
| Short Term Securities | | 67,189,097 | | 16.6 | |
| Other investments | | 88,336 | | — | |
| | | | | |
| Total Investments | | 387,083,497 | | 95.7 | |
| Other Assets in Excess of Liabilities | | 17,429,433 | | 4.3 | |
| | | | | |
| Net Assets | | $404,512,930 | | 100.0 | % |
| | | | | |
| † | Non-income producing security. |
| (a) | Security fair valued at December 31, 2009. |
| (b) | Represents less than 0.05 percent of net assets. |
| (c) | Represents annualized seven–day yield as of December 31, 2009. |
| (d) | Includes appreciation (depreciation) on futures contracts and forward foreign currency exchange contracts. |
| (e) | Level 3 security (See Note 4). |
| (f) | Level 1 security (See Note 4). |
| (g) | A portion of the security is pledged as collateral at December 31, 2009. |
All securities are Level 2, unless noted otherwise in parentheses.
The following abbreviations are used in portfolio descriptions:
REIT - Real Estate Investment Trust.
The accompanying notes are an integral part of these financial statements.
| | | | | | | | | | |
| AQR Funds | | | | Annual Report | | | | December 2009 | | 25 |
| | | | | | | |
| | |
| Schedule of Investments | | December 31, 2009 |
| | |
| AQR INTERNATIONAL EQUITY FUND | | |
Open futures contracts outstanding at December 31, 2009:
| | | | | | | | | | |
NUMBER OF
CONTRACTS | | TYPE | | EXPIRATION
DATE | | VALUE AT
TRADE DATE | | VALUE AT
DECEMBER 31,
2009 | | NET UNREALIZED
APPRECIATION/
(DEPRECIATION) |
| Long Positions: | | | | | | | | | | |
| 395 | | Amsterdam Index | | January 2010 | | $36,894,197 | | $37,995,470 | | $1,101,273 |
| 291 | | CAC40 10 EURO | | January 2010 | | 16,104,113 | | 16,442,457 | | 338,344 |
| 371 | | FTSE 100 Index | | March 2010 | | 31,565,081 | | 32,128,125 | | 563,044 |
| 248 | | FTSE/MIB Index | | March 2010 | | 40,414,255 | | 41,387,846 | | 973,591 |
| 104 | | IBEX 35 Index | | January 2010 | | 17,451,781 | | 17,777,370 | | 325,589 |
| 23 | | MSCI SING Index | | January 2010 | | 1,112,826 | | 1,144,393 | | 31,567 |
| | | | | | | | | | 3,333,408 |
| Short Positions: | | | | | | | | | | |
| 75 | | DAX INDEX | | March 2010 | | (15,606,092) | | (16,018,554) | | (412,462) |
| 47 | | HANG SENG Index | | January 2010 | | (6,440,400) | | (6,645,310) | | (204,910) |
| 319 | | OMXS30 Index | | January 2010 | | (4,241,792) | | (4,246,853) | | (5,061) |
| 237 | | SPI 200 | | March 2010 | | (24,751,655) | | (25,966,581) | | (1,214,926) |
| 188 | | TOPIX INDEX | | March 2010 | | (18,082,295) | | (18,258,013) | | (175,718) |
| | | | | | | | | | (2,013,077) |
| | | | | | | | | | $1,320,331 |
| | | | | | | | | | |
Cash held as collateral with broker for futures contracts was $14,159,067 at December 31, 2009.
Forward foreign currency exchange contracts outstanding as of December 31, 2009:
| | | | | | | | | | | | |
PURCHASE
CONTRACTS | | COUNTERPARTY | | CURRENCY | | CURRENCY
AMOUNT
PURCHASED | | VALUE AT
SETTLEMENT
DATE | | VALUE AT
DECEMBER 31,
2009 | | NET UNREALIZED
APPRECIATION
(DEPRECIATION) |
Australian Dollar,
Expiring 03/17/10 | | The Royal Bank of
Scotland | | AUD | | 62,284,100 | | $56,589,087 | | $55,506,107 | | $(1,082,980) |
British Pound,
Expiring 03/17/10 | | The Royal Bank of
Scotland | | GBP | | 11,882,300 | | 19,243,601 | | 19,183,276 | | (60,325) |
Danish Krone,
Expiring 03/17/10 | | The Royal Bank of
Scotland | | DKK | | 3,933,000 | | 775,927 | | 756,975 | | (18,952) |
Euro,
Expiring 03/17/10 | | The Royal Bank of
Scotland | | EUR | | 6,743,000 | | 9,919,577 | | 9,665,286 | | (254,291) |
| Hong Kong Dollar, Expiring 03/17/10 | | The Royal Bank of
Scotland | | HKD | | 20,433,000 | | 2,638,344 | | 2,636,729 | | (1,615) |
Japanese Yen,
Expiring 03/17/10 | | The Royal Bank of
Scotland | | JPY | | 1,405,385,800 | | 16,031,634 | | 15,095,658 | | (935,976) |
Norwegian Krone,
Expiring 03/17/10 | | The Royal Bank of
Scotland | | NOK | | 242,641,000 | | 42,606,181 | | 41,761,564 | | (844,617) |
Singapore Dollar,
Expiring 03/17/10 | | The Royal Bank of
Scotland | | SGD | | 2,112,300 | | 1,515,958 | | 1,502,325 | | (13,633) |
Swedish Krona,
Expiring 03/17/10 | | The Royal Bank of
Scotland | | SEK | | 41,793,000 | | 5,917,652 | | 5,843,773 | | (73,879) |
Swiss Franc,
Expiring 03/17/10 | | The Royal Bank of
Scotland | | CHF | | 9,734,200 | | 9,630,542 | | 9,414,509 | | (216,033) |
| | | | | | | | $164,868,503 | | $161,366,202 | | $(3,502,301) |
The accompanying notes are an integral part of these financial statements.
| | | | | | | | | | |
| AQR Funds | | | | Annual Report | | | | December 2009 | | 26 |
| | | | | | | |
| | |
| Schedule of Investments | | December 31, 2009 |
| | |
| AQR INTERNATIONAL EQUITY FUND | | |
| | | | | | | | | | | | |
| SALES CONTRACTS | | COUNTERPARTY | | CURRENCY | | CURRENCY
AMOUNT SOLD | | VALUE AT
SETTLEMENT
DATE | | VALUE AT
DECEMBER 31,
2009 | | NET UNREALIZED
APPRECIATION
(DEPRECIATION) |
Australian Dollar,
Expiring 03/17/10 | | The Royal Bank of
Scotland | | AUD | | (6,062,000) | | $(5,495,082) | | $(5,402,310) | | $92,772 |
British Pound,
Expiring 03/17/10 | | The Royal Bank of
Scotland | | GBP | | (3,879,000) | | (6,317,622) | | (6,262,418) | | 55,204 |
Danish Krone,
Expiring 03/17/10 | | The Royal Bank of
Scotland | | DKK | | (8,631,000) | | (1,744,239) | | (1,661,189) | | 83,050 |
Euro,
Expiring 03/17/10 | | The Royal Bank of
Scotland | | EUR | | (33,670,600) | | (49,897,920) | | (48,262,790) | | 1,635,130 |
Hong Kong Dollar,
Expiring 03/17/10 | | The Royal Bank of
Scotland | | HKD | | (5,362,000) | | (692,613) | | (691,927) | | 686 |
Japanese Yen,
Expiring 03/17/10 | | The Royal Bank of
Scotland | | JPY | | (1,006,989,000) | | (11,233,052) | | (10,816,362) | | 416,690 |
Norwegian Krone,
Expiring 03/17/10 | | The Royal Bank of
Scotland | | NOK | | (12,725,000) | | (2,251,835) | | (2,190,132) | | 61,703 |
Swedish Krona,
Expiring 03/17/10 | | The Royal Bank of
Scotland | | SEK | | (60,783,000) | | (8,780,183) | | (8,499,080) | | 281,103 |
Swiss Franc,
Expiring 03/17/10 | | The Royal Bank of
Scotland | | CHF | | (5,207,000) | | (5,137,479) | | (5,035,991) | | 101,488 |
| | | | | | | | (91,550,025) | | (88,822,199) | | 2,727,826 |
| | | | | | | | $73,318,478 | | $72,544,003 | | $(774,475) |
| | | | | | | | |
AUD - Australian Dollar
GBP - British Pound
DKK - Danish Krone
EUR - Euro
HKD - Hong Kong Dollar
JPY - Japanese Yen
SGD - Singapore Dollar
SEK - Swedish Krona
NOK - Norwegain Krone
CHF - Swiss Franc
Money market fund investment is pledged at the broker for forward foreign currency exchange contracts of $1,670,000 at December 31, 2009.
The accompanying notes are an integral part of these financial statements.
| | | | | | | | | | |
| AQR Funds | | | | Annual Report | | | | December 2009 | | 27 |
| | | | | | | |
| | |
| Schedule of Investments | | December 31, 2009 |
| | |
| AQR DIVERSIFIED ARBITRAGE FUND | | |
| | | | | |
| LONG INVESTMENTS - 123.0% | | SHARES | | VALUE
(Note 2) |
| COMMON STOCKS - 56.0% | | | | |
| | |
| Automobiles & Components - 0.2% | | | | | |
| Westport Innovations, Inc. †(Canada) | | 32,025 | | $ | 370,850 |
| | | | | |
| | |
| Banks - 2.1% | | | | | |
| Bar Harbor Bankshares † | | 612 | | | 16,799 |
| Eagle Bancorp, Inc. † | | 8,553 | | | 89,550 |
| First Chester County Corp. | | 65,556 | | | 599,837 |
| First Keystone Financial, Inc. † | | 17,055 | | | 198,350 |
| Harleysville National Corp. | | 387,385 | | | 2,494,760 |
| Metro Bancorp, Inc. † | | 63,358 | | | 796,410 |
| Zions Bancorporation | | 65,541 | | | 840,891 |
| | | | | |
| | | | | 5,036,597 |
| | | | | |
| Capital Goods - 1.4% | | | | | |
| GenCorp, Inc. † | | 153,793 | | | 1,076,551 |
| Genesis Lease Ltd. ADS (Ireland) | | 188,373 | | | 1,682,171 |
| Hubbell, Inc. Class A | | 2,194 | | | 99,388 |
| Quanta Services, Inc. † | | 1 | | | 21 |
| Roper Industries Inc. | | 3,600 | | | 188,532 |
| Rush Enterprises Inc Class B † | | 1,000 | | | 10,500 |
| Sterling Construction Co. † | | 3,132 | | | 60,072 |
| SunPower Corp. Class B † | | 5,700 | | | 119,415 |
| | | | | |
| | | | | 3,236,650 |
| | | | | |
| Commercial & Professional Services - 3.0% | | | |
| ICF International, Inc. † | | 7,848 | | | 210,326 |
| ICT Group, Inc. † | | 160,711 | | | 2,624,411 |
| MPS Group, Inc. † | | 158,084 | | | 2,172,074 |
| Waste Services, Inc. † | | 249,645 | | | 2,274,266 |
| | | | | |
| | | | | 7,281,077 |
| | | | | |
| Consumer Durables - 2.2% | | | | | |
| Black & Decker Corp. | | 45,723 | | | 2,964,222 |
| FGX International Holdings Ltd. † | | 11,837 | | | 231,887 |
| G-III Apparel Group Ltd. † | | 1,080 | | | 23,404 |
| Lennar Corp. Class B | | 204,766 | | | 2,014,897 |
| | | | | |
| | | | | 5,234,410 |
| | | | | |
| Consumer Services - 2.7% | | | | | |
| Carnival Corp. † (United Kingdom) | | 116,142 | | | 3,680,540 |
| Interstate Hotels & Resorts, Inc. † | | 280,900 | | | 617,980 |
| Landry’s Seafood Restaurants, Inc. † | | 15,609 | | | 332,316 |
| Lincoln Educational Services Corp. † | | 720 | | | 15,602 |
| Rubio’s Restaurants, Inc. † | | 44,838 | | | 323,282 |
| VCG Holding Corp. † | | 34,604 | | | 71,976 |
| Youbet.com. Inc. † | | 480,762 | | | 1,379,787 |
| | | | | |
| | | | | 6,421,483 |
| | | | | |
| Diversified Financials - 2.1% | | | | | |
| Allied Capital Corp. † | | 697,150 | | | 2,516,711 |
| Cowen Group, Inc. Class A† | | 38,556 | | | 228,252 |
| Financial Federal Corp. | | 69,458 | | | 1,910,095 |
| Janus Capital Group, Inc. | | 2,500 | | | 33,625 |
| NASDAQ OMX Group, Inc. † | | 25 | | | 496 |
| Sapphire Industrials Corp. † | | 25,025 | | | 251,251 |
| SWS Group, Inc. | | 11,900 | | | 143,990 |
| | | | | |
| | | | | 5,084,420 |
| | | | | |
| | | | | |
| | | SHARES | | VALUE
(Note 2) |
| Energy - 5.1% | | | | |
| American Oil & Gas, Inc. † | | 133,006 | | $ | 558,625 |
| BJ Services Co. | | 141,800 | | | 2,637,480 |
| Crimson Exploration Inc. † | | 2,376 | | | 10,407 |
| Encore Acquisition Co. † | | 63,317 | | | 3,040,482 |
| Geokinetics, Inc. † | | 12,384 | | | 119,134 |
| Royal Dutch Shell PLC ADR (Netherlands) | | 74,100 | | | 4,307,434 |
| SinoEnergy Corp. † | | 186,385 | | | 342,948 |
| XTO Energy, Inc. | | 25,076 | | | 1,166,786 |
| | | | | |
| | | | | 12,183,296 |
| | | | | |
| Food & Staples Retailing - 1.2% | | | | | |
| Diedrich Coffee, Inc. † | | 83,900 | | | 2,923,915 |
| | | | | |
| Food, Beverage & Tobacco - 4.0% | | | | | |
| Companhia de Bebidas das Americas Class A ADR (a) (Brazil) | | 30,000 | | | 2,590,500 |
| Embotelladora Andina SA ADR Preferred Shares (Chile) | | 10,000 | | | 169,500 |
| Pepsi Bottling Group, Inc. | | 90,132 | | | 3,379,950 |
| PepsiAmericas, Inc. | | 119,976 | | | 3,510,498 |
| | | | | |
| | | | | 9,650,448 |
| | | | | |
| Health Care Equipment & Services - 4.3% | | | |
| Allion Healthcare, Inc. †(a) | | 431,164 | | | 2,828,436 |
| Candela Corp. † | | 417,855 | | | 1,266,100 |
| IMS Health, Inc. | | 141,081 | | | 2,971,166 |
| Medidata Solutions, Inc. † | | 8,820 | | | 137,592 |
| QuadraMed Corp. † | | 113,887 | | | 955,512 |
| Sirona Dental Systems, Inc. † | | 23,616 | | | 749,572 |
| Starlimes Technologies Ltd. (Israel) | | 91,297 | | | 1,268,115 |
| | | | | |
| | | | | 10,176,493 |
| | | | | |
| Household & Personal Products - 0.4% | | | | | |
| Central Garden & Pet Co. Class A † | | 67,115 | | | 667,123 |
| International Absorbents, Inc. † (Canada) | | 67,056 | | | 307,787 |
| | | | | |
| | | | | 974,910 |
| | | | | |
| Insurance - 0.4% | | | | | |
| Conseco, Inc. † | | 134,856 | | | 674,280 |
| Loews Corp. | | 7,700 | | | 279,895 |
| | | | | |
| | | | | 954,175 |
| | | | | |
| Materials - 3.8% | | | | | |
| BHP Billiton PLC ADR (United Kingdom) | | 57,088 | | | 3,645,069 |
| Canplats Resources Corp. † (Canada) | | 481,317 | | | 2,360,909 |
| CF Industries Holdings, Inc. | | 17,815 | | | 1,617,246 |
| China Gerui Advanced Materials Group Ltd. † (China) | | 21,200 | | | 118,720 |
| Freewest Resources Canada Inc. † (Canada) | | 445,980 | | | 413,635 |
| ICO, Inc. | | 106,953 | | | 781,826 |
| U.S. Energy Corp. † | | 21,852 | | | 129,582 |
| | | | | |
| | | | | 9,066,987 |
| | | | | |
| Media - 5.9% | | | | | |
| CBS Corp. Class A | | 8,500 | | | 119,425 |
| Comcast Corp. Class A | | 61,600 | | | 986,216 |
| Discovery Communications, Inc. † | | 158,314 | | | 4,198,488 |
| Liberty Media, Inc. † | | 29,474 | | | 645,775 |
The accompanying notes are an integral part of these financial statements.
| | | | | | | | | | |
| AQR Funds | | | | Annual Report | | | | December 2009 | | 28 |
| | | | | | | |
| | |
| Schedule of Investments | | December 31, 2009 |
| | |
| AQR DIVERSIFIED ARBITRAGE FUND | | |
| | | | | |
| | | SHARES | | VALUE
(Note 2) |
| Media - 5.9% (continued) | | | | | |
| Marvel Entertainment, Inc. † | | 39,478 | | $ | 2,134,970 |
| News Corp. Class A | | 293,232 | | | 4,014,346 |
| Viacom, Inc. Class B †(a) | | 71,249 | | | 2,118,233 |
| | | | | |
| | | | | 14,217,453 |
| | | | | |
| Pharmaceuticals, Biotechnology & Life Sciences - 1.8% | | | | | |
| Eurand NV † (Netherlands) | | 33,264 | | | 429,106 |
| Facet Biotech Corp. † | | 7,174 | | | 126,119 |
| Indevus Pharmaceuticals Escrow †(d)(f)(h) | | 6,006 | | | 7,508 |
| Javelin Pharmaceuticals, Inc. † | | 444,871 | | | 578,332 |
| Trimeris, Inc. † | | 207,965 | | | 544,868 |
| Varian, Inc. † | | 50,130 | | | 2,583,700 |
| | | | | |
| | | | | 4,269,633 |
| | | | | |
| Real Estate - 0.1% | | | | | |
| RAIT Investment Trust REIT | | 181,956 | | | 238,362 |
| | | | | |
| Retailing - 0.0% (c) | | | | | |
| Blockbuster, Inc. Class B † | | 120,300 | | | 70,977 |
| | | | | |
| Semiconductors & Semiconductor Equipment - 0.7% | | | | | |
| California Micro Devices Corp. † | | 21,582 | | | 101,651 |
| Ezchip Semiconductor Ltd. † (Israel) | | 35,460 | | | 428,712 |
| LDK Solar Co,. Ltd. ADR † (China) | | 75,600 | | | 529,956 |
| Nanometrics, Inc. † | | 10,800 | | | 122,364 |
| ZiLOG, Inc. † | | 171,915 | | | 608,579 |
| | | | | |
| | | | | 1,791,262 |
| | | | | |
| Software & Services - 4.2% | | | | | |
| Affiliated Computer Services, Inc. Class A † | | 44,900 | | | 2,680,081 |
| Ectel Ltd. † (Israel) | | 39,242 | | | 48,660 |
| Gartner Group Class A † | | 315 | | | 5,683 |
| Global Med Technologies † | | 35,924 | | | 28,021 |
| I2 Technologies, Inc. † | | 154,014 | | | 2,944,748 |
| On2 Technologies, Inc. † | | 687,117 | | | 419,141 |
| Switch and Data, Inc. † | | 193,648 | | | 3,913,626 |
| | | | | |
| | | | | 10,039,960 |
| | | | | |
| Specified Purpose Acquisition Company - 1.0% | | | |
| BPW Acquisition Corp. † | | 50,689 | | | 533,754 |
| GSME Acquisition Partners I † (China) | | 56,004 | | | 557,800 |
| Liberty Acquisition Holdings Corp. † | | 45,182 | | | 436,910 |
| Overture Acquisition Corp. † | | 25,000 | | | 250,000 |
| Sports Properties Acquisition Corp. † | | 35,850 | | | 352,047 |
| Trian Acquisition I Corp. † | | 15,200 | | | 149,568 |
| | | | | |
| | | | | 2,280,079 |
| | | | | |
| Technology Hardware & Equipment - 5.2% | | | |
| 3Com Corp. † | | 380,349 | | | 2,852,618 |
| Airvana, Inc. † | | 210,151 | | | 1,597,148 |
| Merrimac Industries † | | 11,545 | | | 183,681 |
| Molex, Inc. | | 234,364 | | | 4,483,382 |
| Sun Microsystems, Inc. † | | 360,000 | | | 3,373,200 |
| | | | | |
| | | | | 12,490,029 |
| | | | | |
| | | | | |
| | | SHARES | | VALUE
(Note 2) |
| Telecommunication Services - 1.6% | | | | | |
| Iowa Telecommunications Services, Inc. | | 181,812 | | $ | 3,047,169 |
| SkyTerra Communications, Inc. † | | 137,462 | | | 670,815 |
| | | | | |
| | | | | 3,717,984 |
| | | | | |
| Transportation - 2.6% | | | | | |
| Burlington Northern Santa Fe Corp. | | 60,235 | | | 5,940,376 |
| Quixote Corp. | | 31,639 | | | 201,540 |
| | | | | |
| | | | | 6,141,916 |
| | | | | |
TOTAL COMMON STOCKS
(cost $125,290,585) | | | | | 133,853,366 |
| | | | | |
The accompanying notes are an integral part of these financial statements.
| | | | | | | | | | |
| AQR Funds | | | | Annual Report | | | | December 2009 | | 29 |
| | | | | | | |
| | |
| Schedule of Investments | | December 31, 2009 |
| | |
| AQR DIVERSIFIED ARBITRAGE FUND | | |
| | | | | | | | | | | | | |
| CONVERTIBLE PREFERRED STOCKS - 6.3% | | MOODY’S
RATING
(UNAUDITED)* | | | | | | | SHARES | | VALUE
(Note 2) |
| Banks - 0.4% | | | | | | | | | | | | | |
| Boston Private Capital Trust I, $50 par, 4.875% (a) | | NR | | | | | | | | 3,750 | | $ | 105,703 |
| Regions Financial Corp., $1,000 par, 10% | | BB | ** | | | | | | | 750 | | | 955,058 |
| | | | | | | | | | | | | |
| | | | | | | | | | | | | 1,060,761 |
| | | | | | | | | | | | | |
| Consumer Services - 0.0% (c) | | | | | | | | | | | | | |
| Sealy Corp., $25 par, 8% (a) | | NR | | | | | | | | 528 | | | 45,144 |
| | | | | | | | | | | | | |
| Diversified Financials - 3.6% | | | | | | | | | | | | | |
| Bank of America Corp., $15 par, 10% (b) | | NR | | | | | | | | 491,116 | | | 7,327,451 |
| Citigroup, Inc., $100 par 7.5% † | | NR | | | | | | | | 7,800 | | | 813,852 |
| Dole Food Automatic Exchange 144A, $12.50 par, 7% (a)(d) | | NR | | | | | | | | 3,750 | | | 43,418 |
| MF Global Ltd., $100 par, 9.75% (a)(i) | | NR | | | | | | | | 4,550 | | | 443,056 |
| | | | | | | | | | | | | |
| | | | | | | | | | | | | 8,627,777 |
| | | | | | | | | | | | | |
| Energy - 0.1% | | | | | | | | | | | | | |
| Energy XXI Bermuda Co., $100 par, 7.25% | | NR | | | | | | | | 1,075 | | | 129,892 |
| Whiting Petroleum Corp., $100 par, 6.25% (a) | | B | ** | | | | | | | 100 | | | 17,966 |
| | | | | | | | | | | | | |
| | | | | | | | | | | | | 147,858 |
| | | | | | | | | | | | | |
| Food, Beverage & Tobacco - 1.0% | | | | | | | | | | | | | |
| Bunge Ltd., $1,000 par, 5.125% | | BB | | | | | | | | 1,500 | | | 975,000 |
| Bunge Ltd., $100 par, 4.875% | | Ba1 | | | | | | | | 15,000 | | | 1,368,750 |
| | | | | | | | | | | | | |
| | | | | | | | | | | | | 2,343,750 |
| | | | | | | | | | | | | |
| Pharmaceuticals, Biotechnology & Life Sciences - 1.2% | | | | | | | | | | | | | |
| Mylan Laboratories, $1,000 par, 6.5% (a) | | B | ** | | | | | | | 2,500 | | | 2,860,900 |
| | | | | | | | | | | | | |
TOTAL CONVERTIBLE PREFERRED STOCKS
(cost $15,126,365) | | | | | | | | | | | | | 15,086,190 |
| | | | | | | | | | | | | |
| | | | | |
| CORPORATE BONDS - 0.6% | | | | | INTEREST
RATE | | MATURITY
DATE | | PRINCIPAL
AMOUNT
(000’s) | | |
| Consumer Durables & Apparel - 0.0% (c) | | | | | | | | | | | | | |
| Beazer Homes USA, Inc. (a) | | Caa2 | | | 8.375% | | 04/15/12 | | $ | 50 | | | 47,000 |
| | | | | | | | | | | | | |
| Consumer Services - 0.4% | | | | | | | | | | | | | |
| United Airlines | | B3 | | | 7.371% | | 09/29/49 | | | 500 | | | 762,500 |
| | | | | | | | | | | | | |
| Energy - 0.2% | | | | | | | | | | | | | |
Vantage Drilling Co. 144A | | NR | | | 13.500% | | 12/15/13 | | | 500 | | | 497,500 |
| | | | | | | | | | | | | |
TOTAL CORPORATE BONDS
(cost $1,287,648) | | | | | | | | | | | | | 1,307,000 |
| | | | | | | | | | | | | |
| | | | | | | | | | | | | |
| CONVERTIBLE BONDS - 54.0% | | | | | RATE | | | | | | |
| Automobiles & Components - 2.3% | | | | | | | | | | | | | |
| Exide Technologies (b) | | NR | | | 0.000% | | 09/18/13 | | | 650 | | | 446,875 |
| Ford Motor Co. (a) | | Caa1 | | | 4.250% | | 11/15/16 | | | 2,500 | | | 3,134,375 |
| Ford Motor Co. (a) | | Caa1 | | | 4.250% | | 12/15/36 | | | 1,500 | | | 1,893,750 |
| | | | | | | | | | | | | |
| | | | | | | | | | | | | 5,475,000 |
| | | | | | | | | | | | | |
| Capital Goods - 7.1% | | | | | | | | | | | | | |
| Actuant Corp. (a) | | NR | | | 2.000% | | 11/15/23 | | | 250 | | | 270,000 |
| American Real Estate, LP (a)(b) | | NR | | | 4.000% | | 08/15/13 | | | 650 | | | 539,500 |
| Barnes Group, Inc. (a) | | NR | | | 3.750% | | 08/01/25 | | | 150 | | | 153,750 |
| EnPro Industries, Inc. (a) | | NR | | | 3.938% | | 10/15/15 | | | 300 | | | 297,000 |
| GenCorp, Inc. (a) | | Caa2 | | | 4.000% | | 01/16/24 | | | 150 | | | 149,813 |
| GenCorp Inc. Ser 144A (d) | | NR | | | 4.063% | | 12/31/39 | | | 325 | | | 331,906 |
| General Cable Corp. (a) | | Ba3 | | | 0.880% | | 11/15/13 | | | 3,000 | | | 2,617,500 |
The accompanying notes are an integral part of these financial statements.
| | | | | | | | | | |
| AQR Funds | | | | Annual Report | | | | December 2009 | | 30 |
| | | | | | | |
| | |
| Schedule of Investments | | December 31, 2009 |
| | |
| AQR DIVERSIFIED ARBITRAGE FUND | | |
| | | | | | | | | | | | |
| | | MOODY’S
RATING
(UNAUDITED)* | | RATE | | MATURITY
DATE | | PRINCIPAL
AMOUNT
(000’s) | | VALUE
(Note 2) |
| Capital Goods - 7.1% (continued) | | | | | | | | | | | | |
| MasTec, Inc.Ser 144A (a)(d) | | NR | | 4.250% | | 12/15/14 | | $ | 1,825 | | $ | 1,941,344 |
| Orbital Sciences Corp. (a) | | NR | | 2.438% | | 01/15/27 | | | 800 | | | 757,000 |
| Terex Corp. (a) | | Caa1 | | 4.000% | | 06/01/15 | | | 3,000 | | | 4,327,500 |
| Textron, Inc. (a) | | NR | | 4.500% | | 05/01/13 | | | 2,000 | | | 3,222,500 |
| Titan International, Inc. 144A (d) | | NR | | 5.625% | | 01/15/17 | | | 1,275 | | | 1,351,500 |
| United Rentals, Inc. | | NR | | 4.000% | | 11/15/15 | | | 1,000 | | | 1,105,000 |
| | | | | | | | | | | | |
| | | | | | | | | | | | 17,064,313 |
| | | | | | | | | | | | |
| Commercial & Professional Services - 0.1% | | | | | | | | | | | | |
| Covanta Holding Corp. (a) | | Ba3 | | 1.000% | | 02/01/27 | | | 150 | | | 140,063 |
| | | | | | | | | | | | |
| Consumer Durables - 3.6% | | | | | | | | | | | | |
| D.R. Horton, Inc. (a) | | Ba3 | | 2.000% | | 05/15/14 | | | 2,500 | | | 2,768,750 |
| Eastman Kodak Co. 144A (a)(d) | | Caa1 | | 7.000% | | 04/01/17 | | | 2,500 | | | 2,281,250 |
| Jakks Pacific Inc. 144A (a)(d) | | NR | | 4.500% | | 11/01/14 | | | 1,675 | | | 1,723,156 |
| Newell Rubbermaid, Inc. (a) | | NR | | 5.500% | | 03/15/14 | | | 1,000 | | | 1,888,750 |
| Palm Harbor Homes, Inc. (a) | | NR | | 3.250% | | 05/15/24 | | | 70 | | | 39,200 |
| | | | | | | | | | | | |
| | | | | | | | | | | | 8,701,106 |
| | | | | | | | | | | | |
| Consumer Services - 4.1% | | | | | | | | | | | | |
| Coinstar, Inc. (a) | | NR | | 4.000% | | 09/01/14 | | | 2,150 | | | 2,139,250 |
| Gaylord Entertainment Co. 144A (a)(d) | | NR | | 3.750% | | 10/01/14 | | | 3,375 | | | 3,438,281 |
| Regis Corp. (a) | | NR | | 5.000% | | 07/15/14 | | | 1,200 | | | 1,479,000 |
| Stewart Enterprises, Inc. (a) | | Ba3 | | 3.125% | | 07/15/14 | | | 25 | | | 20,719 |
| Stewart Enterprises, Inc. (a) | | Ba3 | | 3.375% | | 07/15/16 | | | 125 | | | 104,219 |
| Wyndham Worldwide Corp. (a) | | Ba2 | | 3.500% | | 05/01/12 | | | 1,535 | | | 2,580,719 |
| | | | | | | | | | | | |
| | | | | | | | | | | | 9,762,188 |
| | | | | | | | | | | | |
| Diversified Financials - 1.9% | | | | | | | | | | | | |
| Americredit Corp. (a) | | NR | | 0.750% | | 09/15/11 | | | 2,000 | | | 1,847,500 |
| Dollar Financial Corp. (a) | | NA | | 2.875% | | 06/30/27 | | | 150 | | | 139,688 |
| Janus Capital Group, Inc. (a) | | Baa3 | | 3.250% | | 07/15/14 | | | 250 | | | 301,250 |
| Jefferies Group, Inc. (a) | | Baa2 | | 3.875% | | 11/01/29 | | | 100 | | | 98,750 |
| KKR Financial Holdings | | NR | | 7.000% | | 07/15/12 | | | 125 | | | 115,469 |
| MF Global Ltd. (a) | | Baa2 | | 9.000% | | 06/20/38 | | | 1,500 | | | 1,674,375 |
| Penson Worldwide, Inc. 144A (a)(d) | | NR | | 8.000% | | 06/01/14 | | | 250 | | | 302,812 |
| World Acceptance Corp. (a) | | NR | | 3.000% | | 10/01/11 | | | 150 | | | 140,438 |
| | | | | | | | | | | | |
| | | | | | | | | | | | 4,620,282 |
| | | | | | | | | | | | |
| Energy - 3.6% | | | | | | | | | | | | |
| Bristow Group, Inc. (a) | | NR | | 3.000% | | 06/15/38 | | | 1,000 | | | 896,250 |
| Exterran Holdings, Inc. (a) | | NR | | 4.250% | | 06/15/14 | | | 800 | | | 936,000 |
| GMX Resources, Inc. (a) | | NR | | 4.500% | | 05/01/15 | | | 950 | | | 955,937 |
| Goodrich Petroleum Corp. (a) | | NR | | 5.000% | | 10/01/29 | | | 1,000 | | | 1,028,750 |
| Hanover Compressor Co. (a) | | B1 | | 4.750% | | 01/15/14 | | | 1,150 | | | 1,032,125 |
| International Coal Group, Inc. (a) | | NR | | 9.000% | | 08/01/12 | | | 500 | | | 547,500 |
| James River Coal (a)(d) | | NR | | 4.500% | | 12/01/15 | | | 500 | | | 485,625 |
| Petrobank Energy & Resources (Canada) | | NR | | 5.125% | | 07/10/15 | | | 600 | | | 874,875 |
| Western Refining, Inc. | | B3 | | 5.750% | | 06/15/14 | | | 2,000 | | | 1,582,500 |
| Willbros Group, Inc. (a) | | NR | | 2.750% | | 03/15/24 | | | 125 | | | 136,094 |
| | | | | | | | | | | | |
| | | | | | | | | | | | 8,475,656 |
| | | | | | | | | | | | |
| Food & Staples Retailing - 1.4% | | | | | | | | | | | | |
| Great Atlantic & Pacific Tea Co. (a) | | Caa1 | | 6.750% | | 12/15/12 | | | 65 | | | 59,069 |
| Nash Finch Co. (a)(e) | | Caa1 | | 1.631% | | 03/15/35 | | | 3,300 | | | 1,505,624 |
| Rite Aid Corp. (a) | | Ca | | 8.500% | | 05/15/15 | | | 1,500 | | | 1,501,875 |
| Spartan Stores, Inc. (a) | | NR | | 3.375% | | 05/15/27 | | | 475 | | | 374,063 |
| | | | | | | | | | | | |
| | | | | | | | | | | | 3,440,631 |
| | | | | | | | | | | | |
The accompanying notes are an integral part of these financial statements.
| | | | | | | | | | |
| AQR Funds | | | | Annual Report | | | | December 2009 | | 31 |
| | | | | | | |
| | |
| Schedule of Investments | | December 31, 2009 |
| | |
| AQR DIVERSIFIED ARBITRAGE FUND | | |
| | | | | | | | | | | | |
| | | MOODY’S
RATING
(UNAUDITED)* | | RATE | | MATURITY
DATE | | PRINCIPAL
AMOUNT
(000’s) | | VALUE
(Note 2) |
| Food, Beverage & Tobacco - 1.5% | | | | | | | | | | | | |
| Alliance One International, Inc. 144A (a)(d) | | Caa1 | | 5.500% | | 07/15/14 | | $ | 1,000 | | $ | 1,182,500 |
| Vector Group Ltd. (a)(b) | | NR | | 3.750% | | 11/15/14 | | | 1,767 | | | 1,892,899 |
| Vector Group Ltd (a)(b) | | NR | | 3.875% | | 06/15/26 | | | 425 | | | 431,375 |
| | | | | | | | | | | | |
| | | | | | | | | | | | 3,506,774 |
| | | | | | | | | | | | |
| Health Care Equipment & Services - 2.1% | | | | | | | | | | | | |
| China Medical Technologies, Inc. (a) (China) | | NR | | 4.000% | | 08/15/13 | | | 250 | | | 158,438 |
| China Medical Technologies, Inc. (China) | | NR | | 3.500% | | 11/15/11 | | | 750 | | | 624,375 |
| Kinetic Concepts, Inc. 144A (a)(d) | | NR | | 3.250% | | 04/15/15 | | | 750 | | | 740,625 |
| Novamed, Inc. (a) | | NR | | 1.000% | | 06/15/12 | | | 450 | | | 354,937 |
| Sonosite, Inc. (a) | | NR | | 3.750% | | 07/15/14 | | | 1,000 | | | 950,000 |
| Thoratec Corp. (a)(e) | | NR | | 1.380% | | 05/16/34 | | | 150 | | | 122,438 |
| Wilson Greatbatch, Inc. | | NR | | 2.250% | | 06/15/13 | | | 2,000 | | | 1,707,500 |
| Wright Medical Group, Inc. (a) | | NR | | 2.625% | | 12/01/14 | | | 450 | | | 393,750 |
| | | | | | | | | | | | |
| | | | | | | | | | | | 5,052,063 |
| | | | | | | | | | | | |
| Household & Personal Products - 2.4% | | | | | | | | | | | | |
| American Oriental Bioengineering, Inc. 144A (a)(d) | | NR | | 5.000% | | 07/15/15 | | | 1,000 | | | 868,750 |
| Chattem, Inc. (a) | | NR | | 2.000% | | 11/15/13 | | | 3,000 | | | 4,942,500 |
| | | | | | | | | | | | |
| | | | | | | | | | | | 5,811,250 |
| | | | | | | | | | | | |
| Insurance - 1.1% | | | | | | | | | | | | |
| Old Republic International Corp. (a) | | A3 | | 8.000% | | 05/15/12 | | | 1,350 | | | 1,520,437 |
| Stewart Information Services 144A (a)(d) | | NR | | 6.000% | | 10/15/14 | | | 900 | | | 982,980 |
| | | | | | | | | | | | |
| | | | | | | | | | | | 2,503,417 |
| | | | | | | | | | | | |
| Materials - 5.3% | | | | | | | | | | | | |
| Alcoa, Inc. (a) | | Baa3 | | 5.250% | | 03/15/14 | | | 400 | | | 1,037,500 |
| Arcelormittal (a) (Luxembourg) | | Baa3 | | 5.000% | | 05/15/14 | | | 2,500 | | | 4,140,625 |
| Kinross Gold Corp. (a) | | NR | | 1.750% | | 03/15/28 | | | 250 | | | 260,313 |
| Leucadia National Corp. (a) | | B3 | | 3.750% | | 04/15/14 | | | 250 | | | 300,625 |
| Quixote Corp. | | NR | | 7.000% | | 02/15/25 | | | 2,000 | | | 1,980,000 |
| Shengdatech, Inc. (a)(d) | | NR | | 6.000% | | 06/01/18 | | | 200 | | | 189,750 |
| SINO-FOREST Corp. 144A (d) (Canada) | | NR | | 4.250% | | 12/15/16 | | | 450 | | | 491,625 |
| Steel Dynamics, Inc. (a) | | NR | | 5.125% | | 06/15/14 | | | 400 | | | 506,500 |
| Sterlite Industries India Ltd. 4% (a) | | NR | | 4.000% | | 10/30/14 | | | 1,850 | | | 1,942,500 |
| United States Steel Corp. (a) | | Ba3 | | 4.000% | | 05/15/14 | | | 1,000 | | | 1,873,750 |
| | | | | | | | | | | | |
| | | | | | | | | | | | 12,723,188 |
| | | | | | | | | | | | |
| Media - 0.8% | | | | | | | | | | | | |
| Virgin Media, Inc. 144A (a)(d) | | NR | | 6.500% | | 11/15/16 | | | 1,500 | | | 1,777,500 |
| | | | | | | | | | | | |
| Pharmaceuticals, Biotechnology & Life Sciences - 0.9% | | | | | | | | | | | | |
| Cubist Pharmaceuticals, Inc. (a) | | NR | | 2.250% | | 06/15/13 | | | 150 | | | 140,063 |
| Incyte Corp. Ltd. (a)(d) | | NR | | 4.750% | | 10/01/15 | | | 1,000 | | | 1,305,000 |
| King Pharmaceuticals, Inc. (a) | | NR | | 1.250% | | 04/01/26 | | | 100 | | | 92,625 |
| Mannkind Corp. (a) | | NR | | 3.750% | | 12/15/13 | | | 500 | | | 344,375 |
| Onyx Pharmaceuticals, Inc. (a) | | NR | | 4.000% | | 08/15/16 | | | 275 | | | 291,156 |
| | | | | | | | | | | | |
| | | | | | | | | | | | 2,173,219 |
| | | | | | | | | | | | |
| Real Estate - 3.7% | | | | | | | | | | | | |
| Boston Properties (a) | | NR | | 3.750% | | 05/15/36 | | | 3,000 | | | 3,067,500 |
| Digital Realty Trust, LP 144A (d) | | BBB | | 5.500% | | 04/15/29 | | | 1,250 | | | 1,632,812 |
| Forest City Enterprises (a) | | NR | | 3.625% | | 10/15/14 | | | 200 | | | 198,500 |
| Forest City Enterprises (a) | | B3 | | 3.625% | | 10/15/14 | | | 1,050 | | | 1,046,062 |
| Host Hotels & Resorts LP 144A (d) | | NR | | 2.500% | | 10/15/29 | | | 1,650 | | | 1,763,437 |
| KilRoy Realty, LP Series 144A (d) | | NR | | 4.250% | | 11/15/14 | | | 775 | | | 776,939 |
| Vornado Realty, LP (a) | | Baa2 | | 3.875% | | 04/15/25 | | | 400 | | | 438,000 |
| | | | | | | | | | | | |
| | | | | | | | | | | | 8,923,250 |
| | | | | | | | | | | | |
The accompanying notes are an integral part of these financial statements.
| | | | | | | | | | |
| AQR Funds | | | | Annual Report | | | | December 2009 | | 32 |
| | | | | | | |
| | |
| Schedule of Investments | | December 31, 2009 |
| | |
| AQR DIVERSIFIED ARBITRAGE FUND | | |
| | | | | | | | | | | | |
| | | MOODY’S
RATING
(UNAUDITED)* | | RATE | | MATURITY
DATE | | PRINCIPAL
AMOUNT
(000’s) | | VALUE
(Note 2) |
| Retailing - 1.8% | | | | | | | | | | | | |
| RadioShack Corp. 144A (a)(d) | | NR | | 2.500% | | 08/01/13 | | $ | 1,500 | | $ | 1,678,125 |
| Sonic Automotive, Inc. (a) | | NR | | 5.000% | | 10/01/29 | | | 2,500 | | | 2,700,000 |
| | | | | | | | | | | | |
| | | | | | | | | | | | 4,378,125 |
| | | | | | | | | | | | |
| Semiconductors & Semiconductor Equipment - 3.5% | | | | | | | | | | | | |
| Micron Technology, Inc. (a) | | NR | | 1.875% | | 06/01/14 | | | 2,500 | | | 2,406,250 |
| ON Semiconductor Corp. (a) | | NR | | 1.875% | | 12/15/25 | | | 250 | | | 345,313 |
| Photronics, Inc. | | NR | | 5.500% | | 10/01/14 | | | 875 | | | 1,006,250 |
| Rambus, Inc. (a) | | NR | | 5.000% | | 06/15/14 | | | 1,950 | | | 2,920,125 |
| Verigy Ltd. 144A (d) (Singapore) | | NR | | 5.250% | | 07/15/14 | | | 1,325 | | | 1,609,875 |
| | | | | | | | | | | | |
| | | | | | | | | | | | 8,287,813 |
| | | | | | | | | | | | |
| Software & Services - 2.5% | | | | | | | | | | | | |
| Akamai Technologies, Inc. (a) | | NR | | 1.000% | | 12/15/33 | | | 150 | | | 250,125 |
| DST Systems, Inc. (a)(b) | | NR | | 3.625% | | 08/15/23 | | | 1,500 | | | 1,556,249 |
| DST Systems, Inc. (a) | | NR | | 4.125% | | 08/15/23 | | | 475 | | | 513,000 |
| Equinix, Inc. (a) | | NR | | 4.750% | | 06/15/16 | | | 500 | | | 735,000 |
| GSI Commerce, Inc. (a) | | NR | | 2.500% | | 06/01/27 | | | 25 | | | 26,656 |
| Mentor Graphics Corp. (a) | | NR | | 6.250% | | 03/01/26 | | | 150 | | | 146,812 |
| Take-Two Interactive Software, Inc. (a) | | NR | | 4.375% | | 06/01/14 | | | 825 | | | 969,375 |
| THQ, Inc. 144A (a)(d) | | NR | | 5.000% | | 08/15/14 | | | 1,000 | | | 937,500 |
| Verisign, Inc. (a) | | NR | | 3.250% | | 08/15/37 | | | 870 | | | 773,212 |
| WebMD Corp. (a) | | NR | | 1.750% | | 06/15/23 | | | 100 | | | 112,500 |
| | | | | | | | | | | | |
| | | | | | | | | | | | 6,020,429 |
| | | | | | | | | | | | |
| Technology Hardware & Equipment - 1.8% | | | | | | | | | | | | |
| Arris Group, Inc. (a) | | NR | | 2.000% | | 11/15/26 | | | 650 | | | 642,720 |
| Commscope, Inc. (a) | | NR | | 3.250% | | 07/01/15 | | | 2,500 | | | 2,959,376 |
| Finisar Corp 144A (a)(d) | | NR | | 5.000% | | 10/15/29 | | | 450 | | | 493,875 |
| Hutchinson Technology, Inc. (a) | | NR | | 3.250% | | 01/15/26 | | | 250 | | | 200,937 |
| | | | | | | | | | | | |
| | | | | | | | | | | | 4,296,908 |
| | | | | | | | | | | | |
| Telecommunication Services - 0.2% | | | | | | | | | | | | |
| Level 3 Communications, Inc. (a) | | NR | | 7.000% | | 03/15/15 | | | 225 | | | 254,813 |
| Qwest Communications International, Inc. (a) | | B1 | | 3.500% | | 11/15/25 | | | 200 | | | 207,500 |
| | | | | | | | | | | | |
| | | | | | | | | | | | 462,313 |
| | | | | | | | | | | | |
| Transportation - 2.3% | | | | | | | | | | | | |
| AMR Corp. (a) | | NR | | 6.250% | | 10/15/14 | | | 500 | | | 518,125 |
| Avis Budget Group, Inc. 144A (a)(d) | | NR | | 3.500% | | 10/01/14 | | | 2,375 | | | 2,582,811 |
| Hertz Global Holdings, Inc. (a) | | NR | | 5.250% | | 06/01/14 | | | 1,500 | | | 2,445,000 |
| | | | | | | | | | | | |
| | | | | | | | | | | | 5,545,936 |
| | | | | | | | | | | | |
TOTAL CONVERTIBLE BONDS
(cost $119,954,515) | | | | | | | | | | | | 129,141,424 |
| | | | | | | | | | | | |
The accompanying notes are an integral part of these financial statements.
| | | | | | | | | | |
| AQR Funds | | | | Annual Report | | | | December 2009 | | 33 |
| | | | | | | |
| | |
| Schedule of Investments | | December 31, 2009 |
| | |
| AQR DIVERSIFIED ARBITRAGE FUND | | |
| | | | | |
| | |
| CLOSED END FUNDS - 2.3% | | SHARES | | VALUE
(Note 2) |
| Adams Express Co. | | 3,259 | | $ | 32,916 |
| Advent Claymore Enhanced Growth & Income Fund | | 2,500 | | | 28,000 |
| Alpine Global Premier Properties Fund | | 9,374 | | | 58,400 |
| Blackrock Muniholdings California Insured Fund, Inc. | | 2,181 | | | 27,459 |
| BlackRock Muniyield California Fund, Inc. | | 4,185 | | | 53,819 |
| BlackRock Muniyield Michigan Insured Fund II, Inc. | | 1,269 | | | 15,076 |
| BlackRock Muniyield New York Insured Fund, Inc. | | 4,551 | | | 53,702 |
| Boulder Total Return Fund, Inc. † | | 7,540 | | | 95,909 |
| Central Securities Corp. | | 4,207 | | | 75,642 |
| Claymore Dividend & Income Fund | | 1,392 | | | 21,799 |
| Clough Global Allocation Fund | | 3,867 | | | 58,662 |
| Clough Global Equity Fund | | 5,015 | | | 71,113 |
| Clough Global Opportunities Fund | | 5,192 | | | 66,977 |
| Cohen & Steers Dividend Majors Fund, Inc. | | 41,521 | | | 433,894 |
| Cohen & Steers Quality Income Realty Fund, Inc. | | 97,315 | | | 590,702 |
| Cohen & Steers REIT and Preferred Fund | | 42,748 | | | 442,442 |
| Cohen & Steers REIT and Utility Income Fund, Inc. | | 5,401 | | | 57,359 |
| Delaware Enhanced Global Dividend and Income Fund | | 2,651 | | | 31,255 |
| DWS Dreman Value Income Edge Fund, Inc. | | 3,550 | | | 42,848 |
| DWS RREEF World Real Estate & Tactical Strategies Fund, Inc. | | 2,450 | | | 34,716 |
| Evergreen International Balanced Income Fund | | 700 | | | 9,891 |
| First Opportunity Fund, Inc. | | 14,688 | | | 88,569 |
| Gabelli Dividend & Income Trust | | 32,542 | | | 426,626 |
| Gabelli Global Multimedia Trust, Inc. | | 703 | | | 4,661 |
| General American Investors Co, Inc. | | 3,396 | | | 79,670 |
| H&Q Healthcare Investors | | 39,899 | | | 473,601 |
| H&Q Life Sciences Investors | | 22,255 | | | 210,087 |
| John Hancock Bank and Thrift Opportunity Fund | | 61,574 | | | 868,193 |
| Kayne Anderson Energy Development Co. | | 5,167 | | | 75,180 |
| Liberty All Star Equity Fund | | 9,100 | | | 39,403 |
| LMP Capital and Income Fund, Inc. | | 8,323 | | | 86,143 |
| Macquarie Global Infrastructure Total Return Fund, Inc. | | 6,230 | | | 98,745 |
| Morgan Stanley California Insured Municipal Income Trust | | 1,828 | | | 23,069 |
| Morgan Stanley Emerging Markets Debt Fund, Inc. | | 5,688 | | | 57,335 |
| NFJ Dividend Interest & Premium Strategy Fund | | 6,217 | | | 91,701 |
| Nuveen California Dividend Advantage Municipal Fund | | 2,578 | | | 32,019 |
| Nuveen California Performance Plus Municipal Fund, Inc. | | 944 | | | 11,724 |
| Nuveen Insured California Dividend Advantage Municipal Fund | | 642 | | | 8,635 |
| Nuveen Michigan Quality Income | | 546 | | | 6,962 |
| | | | | |
| | |
CLOSED END FUNDS - 2.3%
(continued) | | SHARES | | VALUE
(Note 2) |
| Nuveen New York Dividend Advantage Municipal Fund | | 130 | | $ | 1,682 |
| Nuveen Tax-Advantaged Dividend Growth Fund | | 4,704 | | | 54,378 |
| Nuveen Tax-Advantaged Total Return Strategy Fund | | 651 | | | 6,959 |
| RiverSource Lasalle International Real Estate Fund, Inc. | | 3,300 | | | 24,387 |
| Royce Micro-Cap Trust, Inc. | | 18,331 | | | 135,466 |
| Royce Value Trust, Inc. | | 1,050 | | | 11,340 |
| Source Capital, Inc. | | 200 | | | 8,608 |
| Strategic Global Income Fund, Inc. | | 400 | | | 4,396 |
| Thai Fund, Inc. Com | | 1,334 | | | 11,913 |
| Tri-Continental Corp. | | 21,159 | | | 243,752 |
| Western Asset Emerging Markets Income Fund, Inc. | | 800 | | | 9,856 |
| Western Asset Worldwide Income Fund, Inc. | | 1,444 | | | 18,411 |
| Zweig Fund, Inc. | | 3,000 | | | 9,930 |
| | | | | |
TOTAL CLOSED END FUNDS
(cost $4,874,598) | | | | | 5,525,982 |
| | | | | |
| WARRANTS - 0.0% (c) | | | | | |
BPW Acquisition Corp.
(cost $43,947) | | 45,555 | | | 40,544 |
| | | | | |
| MONEY MARKET FUND - 3.8% | | | |
Dreyfus Institutional Cash Advance 99 - Institutional Class 0.28% (g)
(cost $8,979,867) | | 8,979,867 | | | 8,979,867 |
| | | | | |
TOTAL INVESTMENTS, BEFORE SECURITIES SOLD SHORT
(cost $275,557,525) | | | | | 293,934,373 |
| | | | | |
| SECURITIES SOLD SHORT - (65.8)% | | | | |
| COMMON STOCKS - (65.5)% | | | | | |
| Automobiles & Components - (1.7)% | | | | | |
| Exide Technologies † | | (25,338) | | | (180,153) |
| Ford Motor Co. † | | (377,138) | | | (3,771,380) |
| | | | | |
| | | | | (3,951,533) |
| | | | | |
| Banks - (2.6)% | | | | | |
| Bryn Mawr Bank Corp. | | (12,287) | | | (185,411) |
| First Niagara Financial Group, Inc. | | (183,959) | | | (2,558,870) |
| People’s United Financial, Inc. | | (69,166) | | | (1,155,072) |
| Regions Financial Corp. | | (150,071) | | | (793,876) |
| Tower Bancorp, Inc. | | (29,697) | | | (678,576) |
| Zions Bancorporation | | (65,541) | | | (840,891) |
| | | | | |
| | | | | (6,212,696) |
| | | | | |
| Capital Goods - (5.9)% | | | | | |
| Actuant Corp. Class A | | (7,046) | | | (130,562) |
| Aercap Holdings NV † | | (190,040) | | | (1,721,762) |
| Barnes Group, Inc. | | (3,089) | | | (52,204) |
| Enpro Industries, Inc. † | | (6,699) | | | (176,921) |
| General Cable Corp. † | | (34,591) | | | (1,017,667) |
| Hubbell, Inc. Class B | | (2,194) | | | (103,776) |
| Icahn Enterprises, LP | | (2,181) | | | (87,131) |
| Mastec, Inc. † | | (87,342) | | | (1,091,775) |
The accompanying notes are an integral part of these financial statements.
| | | | | | | | | | |
| AQR Funds | | | | Annual Report | | | | December 2009 | | 34 |
| | | | | | | |
| | |
| Schedule of Investments | | December 31, 2009 |
| | |
| AQR DIVERSIFIED ARBITRAGE FUND | | |
| | | | | |
| | |
| | | SHARES | | VALUE
(Note 2) |
| Capital Goods - (5.9)% (continued) | | | | | |
| Orbital Sciences Corp. † | | (16,452) | | $ | (251,058) |
| Rush Enterprises, Inc. Class A † | | (1,000) | | | (11,890) |
| Stanley Works | | (57,954) | | | (2,985,210) |
| SunPower Corp. Class A † | | (5,700) | | | (134,976) |
| Terex Corp. † | | (166,059) | | | (3,289,629) |
| Textron, Inc. | | (126,500) | | | (2,379,465) |
| United Rental, Inc. † | | (69,296) | | | (679,794) |
| | | | | |
| | | | | (14,113,820) |
| | | | | |
| Commercial & Professional Services - (1.5)% | | | |
| Covanta Holding Corp. † | | (1,584) | | | (28,655) |
| IESI-BFC Ltd. (Canada) | | (145,534) | | | (2,331,455) |
| Sykes Enterprises, Inc. † | | (43,338) | | | (1,103,818) |
| | | | | |
| | | | | (3,463,928) |
| | | | | |
| Consumer Durables - (3.2)% | | | | | |
| DR Horton, Inc. | | (134,018) | | | (1,456,776) |
| Eastman Kodak Co. | | (283,398) | | | (1,195,940) |
| JAKKS Pacific, Inc. † | | (72,701) | | | (881,136) |
| Lennar Corp. Class A | | (204,766) | | | (2,614,861) |
| Newell Rubbermaid, Inc. | | (104,507) | | | (1,568,650) |
| Sealy Corp. † | | (12,799) | | | (40,445) |
| | | | | |
| | | | | (7,757,808) |
| | | | | |
| Consumer Services - (4.5)% | | | | | |
| Carnival PLC ADR † (United Kingdom) | | (116,142) | | | (3,909,340) |
| Churchill Downs, Inc. | | (28,430) | | | (1,061,860) |
| Coinstar, Inc. † | | (33,964) | | | (943,520) |
| Gaylord Entertainment Co. † | | (95,450) | | | (1,885,137) |
| Regis Corp. | | (59,065) | | | (919,642) |
| Stewart Enterprises, Inc. Class A | | (7,110) | | | (36,617) |
| Wyndham Worldwide Corp. | | (102,577) | | | (2,068,978) |
| | | | | |
| | | | | (10,825,094) |
| | | | | |
| Diversified Financials - (5.3)% | | | | | |
| Americredit Corp. † | | (32,768) | | | (623,903) |
| Ares Capital Corp. | | (227,967) | | | (2,838,189) |
| Bank of America Corp. | | (491,116) | | | (7,396,207) |
| Citigroup, Inc. | | (183,314) | | | (606,770) |
| Dollar Financial Corp. † | | (2,295) | | | (54,300) |
| Jefferies Group, Inc. † | | (1,543) | | | (36,615) |
| KKR Financial Holdings Ltd. | | (800) | | | (4,640) |
| MF Global Ltd. | | (142,514) | | | (990,472) |
| Nasdaq OMX Group, Inc. † | | (25) | | | (496) |
| Penson Worldwide, Inc. † | | (20,684) | | | (187,397) |
| World Acceptance Corp. † | | (985) | | | (35,293) |
| | | | | |
| | | | | (12,774,282) |
| | | | | |
| Energy - (5.9)% | | | | | |
| Baker Hughes, Inc. | | (56,800) | | | (2,299,264) |
| Boardwalk Pipeline Partners, LP | | (2,300) | | | (69,069) |
| Bristow Group, Inc. † | | (11,448) | | | (440,176) |
| Denbury Resources, Inc. † | | (111,267) | | | (1,646,751) |
| Diamond Offshore Drilling, Inc. | | (1,240) | | | (122,041) |
| Energy XXI Bermuda Ltd. | | (45,607) | | | (105,352) |
| Exterran Holdings, Inc. † | | (36,580) | | | (784,641) |
| Exxon Mobil Corp. | | (17,861) | | | (1,217,942) |
| GMX Resources, Inc. † | | (39,500) | | | (542,730) |
| | | | | |
| | |
| | | SHARES | | VALUE
(Note 2) |
| Energy - (5.9)% (continued) | | | | |
| Goodrich Petroleum Corp. † | | (22,117) | | $ | (538,549) |
| International Coal Group, Inc. † | | (52,434) | | | (202,395) |
| James River Coal Co. † | | (15,942) | | | (295,405) |
| Petrobank Energy & Resources LP | | (13,392) | | | (655,739) |
| Royal Dutch Shell PLC ADR (Netherlands) | | (74,100) | | | (4,454,151) |
| Western Refining, Inc. † | | (125,929) | | | (593,126) |
| Whiting Petroleum Corp. † | | (214) | | | (15,290) |
| Willbros Group, Inc. † | | (4,324) | | | (72,946) |
| | | | | |
| | | | | (14,055,567) |
| | | | | |
| Food & Staples Retailing - (0.6)% | | | | | |
| Nash Finch Co. | | (16,922) | | | (627,637) |
| Rite Aid Corp. † | | (475,251) | | | (717,629) |
| Spartan Stores, Inc. | | (2,594) | | | (37,068) |
| | | | | |
| | | | | (1,382,334) |
| | | | | |
| Food, Beverage & Tobacco - (4.0)% | | | | | |
| Alliance One International, Inc. † | | (164,993) | | | (805,166) |
| Bunge Ltd. | | (24,626) | | | (1,571,877) |
| Companhia de Bebidas das Americas ADR (Brazil) | | (30,000) | | | (3,032,700) |
| Embotelladora Andina S.A. ADR Class B (Chile) | | (10,000) | | | (204,000) |
| Pepsico, Inc. | | (60,620) | | | (3,685,696) |
| Vector Group Ltd. | | (23,213) | | | (324,982) |
| | | | | |
| | | | | (9,624,421) |
| | | | | |
| Health Care Equipment & Services - (1.3)% |
| China Medical Technologies, Inc. ADR | | (10,494) | | | (147,441) |
| Greatbatch, Inc. † | | (21,799) | | | (419,195) |
| Kinetic Concepts, Inc. † | | (9,864) | | | (371,379) |
| NovaMed, Inc. † | | (43,052) | | | (167,042) |
| Sonosite, Inc. † | | (14,467) | | | (341,855) |
| Syneron Medical Ltd. † | | (123,063) | | | (1,286,008) |
| Thoratec Corp. † | | (3,753) | | | (101,031) |
| Wright Medical Group, Inc. † | | (6,936) | | | (131,437) |
| | | | | |
| | | | | (2,965,388) |
| | | | | |
| Household & Personal Products - (0.5)% |
| American Oriental Bioengineering, Inc. † | | (86,587) | | | (402,630) |
| Central Garden and Pet Co. † | | (67,115) | | | (718,131) |
| Mead Johnson Nutrition Com. Class A † | | (1) | | | (44) |
| | | | | |
| | | | | (1,120,805) |
| | | | | |
| Insurance - (0.5)% |
| CNA Financial Corp. † | | (4,275) | | | (102,600) |
| Old Republic International Corp. | | (51,065) | | | (512,693) |
| Stewart Information Services Corp | | (50,364) | | | (568,106) |
| | | | | |
| | | | | (1,183,399) |
| | | | | |
| Materials - (5.4)% |
| A. Schulman, Inc. Class A | | (19,730) | | | (398,151) |
| Agrium, Inc. † (Canada) | | (17,760) | | | (1,092,240) |
| Alcoa, Inc. | | (56,555) | | | (911,666) |
| Arcelormittal | | (67,155) | | | (3,072,341) |
| BHP Billiton Ltd. ADR (Australia) | | (57,088) | | | (4,371,799) |
| Kinross Gold Corp. (Canada) | | (5,047) | | | (92,865) |
The accompanying notes are an integral part of these financial statements.
| | | | | | | | | | |
| AQR Funds | | | | Annual Report | | | | December 2009 | | 35 |
| | | | | | | |
| | |
| Schedule of Investments | | December 31, 2009 |
| | |
| AQR DIVERSIFIED ARBITRAGE FUND | | |
| | | | | |
| | | SHARES | | VALUE
(Note 2) |
| Materials - (5.4)% (continued) | | | | |
| Leucadia National Corp. † | | (8,835) | | $ | (210,185) |
| ShengdaTech, Inc. † | | (10,706) | | | (65,628) |
| Steel Dynamics, Inc. | | (16,740) | | | (296,633) |
| Sterlite Industries, Inc. ADS (India) | | (55,550) | | | (1,012,121) |
| United States Steel Corp. | | (27,680) | | | (1,525,722) |
| | | | | |
| | | | | (13,049,351) |
| | | | | |
| Media - (6.5)% |
| CBS Corp. | | (8,500) | | | (119,425) |
| Comcast Corp. Class A | | (61,600) | | | (1,038,576) |
| Discovery Communications, Inc. Class A † | | (158,314) | | | (4,855,490) |
| Liberty Global, Inc. Class C † | | (29,474) | | | (644,007) |
| News Corp. Class B | | (293,232) | | | (4,668,253) |
| Viacom, Inc. Class A † | | (71,249) | | | (2,244,344) |
| Virgin Media, Inc. | | (62,077) | | | (1,044,756) |
| Walt Disney Co. | | (31,449) | | | (1,014,230) |
| | | | | |
| | | | | (15,629,081) |
| | | | | |
| Pharmaceuticals, Biotechnology & Life Sciences - (1.8)% | | | | | |
| Bristol-Myers Squibb Co. † | | (1) | | | (25) |
| Cubist Pharmaceuticals, Inc. † | | (1,912) | | | (36,271) |
| Incyte Genomics, Inc. † | | (102,465 | | | (933,456) |
| King Pharmaceuticals, Inc. † | | (2,067) | | | (25,362) |
| MannKind Corp. | | (16,017) | | | (140,309) |
| Mylan, Inc. † | | (126,800) | | | (2,336,924) |
| Myriad Pharmaceuticals | | (126,622) | | | (636,908) |
| Onyx Pharmaceuticals, Inc. † | | (5,249) | | | (154,006) |
| | | | | |
| | | | | (4,263,261) |
| | | | | |
| Real Estate - (1.3)% |
| Boston Properties, Inc. | | (12,200) | | | (818,254) |
| Digital Realty Trust, Inc. | | (20,850) | | | (1,048,338) |
| Forest City Enterprises, Inc. Class A † | | (46,059) | | | (542,575) |
| Host Hotels & Resorts, Inc. REIT | | (3,931) | | | (45,875) |
| KilRoy Realty Corp. | | (13,106) | | | (401,961) |
| Vornado Realty Trust REIT | | (2,308) | | | (161,421) |
| | | | | |
| | | | | (3,018,424) |
| | | | | |
| Retailing - (1.1)% |
| Blockbuster, Inc. Class A | | (120,300) | | | (80,601) |
| RadioShack Corp. | | (36,519) | | | (712,121) |
| Sonic Automotive, Inc. Class A | | (156,874) | | | (1,629,921) |
| Talbots, Inc. | | (29,531) | | | (263,121) |
| | | | | |
| | | | | (2,685,764) |
| | | | | |
| Semiconductors & Semiconductor Equipment - (2.2)% | | | | | |
| Micron Technology, Inc. † | | (121,150) | | | (1,279,344) |
| ON Semiconductor Corp. † | | (29,255) | | | (257,737) |
| Photronics, Inc. † | | (146,276) | | | (650,928) |
| Rambus, Inc. † | | (86,856) | | | (2,119,286) |
| Verify Ltd. | | (81,798) | | | (1,052,740) |
| | | | | |
| | | | | (5,360,035) |
| | | | | |
| Software & Services - (3.3)% |
| Akamai Technologies, Inc. † | | (8,230) | | | (208,466) |
| DST Systems, Inc. † | | (14,551) | | | (633,696) |
| Equinix, Inc. † | | (36,950) | | | (3,922,243) |
| Google, Inc. Class A † | | (687) | | | (425,926) |
| GSI Commerce, Inc. † | | (537) | | | (13,634) |
| JDA Software Group, Inc. † | | (39,204) | | | (998,526) |
| Mentor Graphics Corp. † | | (1,701) | | | (15,020) |
| Take-Two Interactive Software, Inc. † | | (61,469) | | | (617,763) |
| | | | | |
| | | SHARES | | VALUE
(Note 2) |
| Software & Services - (3.3)% (continued) | | |
| THQ, Inc. † | | (85,134) | | $ | (429,075) |
| VeriSign, Inc. † | | (22,861) | | | (554,151) |
| WebMD Health Corp. † | | (1,414) | | | (54,425) |
| | | | | |
| | | | | (7,872,925) |
| | | | | |
| Technology Hardware & Equipment - (4.0)% |
| Arris Group, Inc. † | | (25,399) | | | (290,311) |
| Commscope, Inc. † | | (75,382) | | | (1,999,884) |
| Finisar Corp. † | | (35,908) | | | (320,299) |
| Molex, Inc. | | (234,364) | | | (5,050,544) |
| Xerox Corp. | | (222,000) | | | (1,878,120) |
| | | | | |
| | | | | (9,539,158) |
| | | | | |
| Telecommunication Services - (0.8)% | | | | | |
| Level 3 Communications, Inc. † | | (109,351) | | | (167,307) |
| Qwest Communications International, Inc. | | (18,016) | | | (75,847) |
| Windstream Corp. | | (147,524) | | | (1,621,289) |
| | | | | |
| | | | | (1,864,443) |
| | | | | |
| Transportation - (1.6)% | | | | | |
| AMR Corp. † | | (44,020) | | | (340,275) |
| Avis Budget Group, Inc. † | | (120,607) | | | (1,582,364) |
| Hertz Global Holdings, Inc. † | | (164,763) | | | (1,963,975) |
| | | | | |
| | | | | (3,886,614) |
| | | | | |
TOTAL COMMON STOCKS SOLD SHORT
(proceeds $143,036,379) | | | | | (156,600,131) |
| | | | | |
CLOSED END FUNDS SOLD SHORT - (0.3)% | | | | | |
| Financial Select Sector SPDR Fund | | (28,020) | | | (403,208) |
| Vanguard REIT ETF | | (5,216) | | | (233,364) |
| | | | | |
TOTAL CLOSED END FUNDS SOLD SHORT
(proceeds $641,222) | | | | | (636,572) |
| | | | | |
TOTAL SECURITIES SOLD SHORT
(proceeds $143,677,601) | | | | | (157,236,703) |
| | | | | |
TOTAL INVESTMENTS, NET OF SECURITIES SOLD SHORT - 57.2%
(cost $131,879,924) | | | | | 136,697,670 |
| | | | | |
| OTHER ASSETS IN EXCESS OF LIABILITIES - 42.8% | | | | | 102,384,034 |
| | | | | |
| NET ASSETS - 100.0% | | | | $ | 239,081,704 |
| | | | | |
All securities are United States companies, unless noted otherwise in parentheses.
| † | Non income-producing security. |
| (a) | All or a portion of this security has been segregated as collateral for securities sold short and can be sold or repledged subject to the broker’s right to rehypothecate. At December 31, 2009, the value of these securities was $138,353,795. |
| (b) | Indicates a variable rate security. The interest rate shown represents the discount rate at December 31, 2009. |
| (c) | Represents less than 0.05 percent of net assets. |
| (d) | Private placement security. |
| (e) | Represents a step bond. The rate shown reflects the effective yield at December 31, 2009. |
| (f) | Security is fair valued. |
| (g) | Represents annualized seven-day yield as of December 31, 2009. |
| (h) | Level 3 Security (See Note 4). |
| (i) | Level 2 Security (See Note 4). |
| * | The rating reflected is as of December 31, 2009. Rating of certain bonds may have changed subsequent to that date. |
All securities are Level 1, unless noted otherwise in parentheses.
The accompanying notes are an integral part of these financial statements.
| | | | | | | | | | |
| AQR Funds | | | | Annual Report | | | | December 2009 | | 36 |
| | | | | | | |
| | |
| Schedule of Investments | | December 31, 2009 |
| | |
| AQR DIVERSIFIED ARBITRAGE FUND | | |
The following abbreviations are used in portfolio descriptions:
NR - Not Rated by Moody’s.
ADR - American Depositary Receipt.
ADS - American Depositary Shares.
REIT - Real Estate Investment Trust.
144A - Restricted Security.
| | | | | | | | | | | | |
| Open Written Options contracts outstanding at December 31, 2009: |
| SHARES | | TYPE | | COUNTERPARTY | | EXPIRATION DATE | | VALUE AT
TRADE DATE | | VALUE AT
DECEMBER 31,
2009 | | NET UNREALIZED
APPRECIATION
(DEPRECIATION) |
| 500 | | 3COM Corp. (exercise price $7.50) | | Goldman Sachs | | April 17, 2010 | | $(12,130) | | $(15,000) | | $(2,870) |
| 250 | | 3COM Corp. (exercise price $7.50) | | Goldman Sachs | | January 16, 2010 | | (3,625) | | (2,500) | | 1,125 |
| 134 | | Landry’s Restaurants, Inc.
(exercise price $20.00) | | Goldman Sachs | | January 16, 2010 | | (25,186) | | (28,810) | | (3,624) |
| | | | | | | | $(40,941) | | $(46,310) | | $(5,369) |
| | | | | | | | |
| | | | | | | | | | | | |
| Credit default swap contract-buy protection outstanding as of December 31, 2009: | | |
| COUNTERPARTY | | REFERENCE ENTITY | | FIXED
ANNUAL
RATE
PAID BY
FUND | | NOTIONAL
AMOUNT | | UPFRONT
PREMIUM
PAID | | TERMINATION
DATE | | NET UNREALIZED
DEPRECIATION |
| The Royal Bank of Scotland | | Markit CDX North America High Yield Index - Series 13 | | 5% | | $4,702,500 | | $252,052 | | 12/20/2014 | | $(225,919) |
| | | | | | | | |
| | | | | | | | | | |
| Open futures contracts outstanding at December 31, 2009: |
NUMBER OF
CONTRACTS | | TYPE | | EXPIRATION
DATE | | VALUE AT
TRADE DATE | | VALUE AT
DECEMBER 31,
2009 | | NET UNREALIZED
APPRECIATION
(DEPRECIATION) |
| Short Contracts: | | | | | | | | |
| 344 | | CME E-Muni S&P 500 Index | | March 1, 2010 | | $(18,964,210) | | $(19,104,040) | | $(139,830) |
| 1 | | CBT US 10YR Note | | March 1, 2010 | | (117,998) | | (115,453) | | 2,545 |
| 64 | | CBT US 2YR Note | | March 1, 2010 | | (13,931,719) | | (13,841,000) | | 90,719 |
| 240 | | CBT US 5YR Note | | March 1, 2010 | | (27,915,579) | | (27,451,875) | | 463,704 |
| | | | | | $(60,929,506) | | $(60,512,368) | | $417,138 |
| | | | | | |
Cash held as collateral with broker for futures contracts was $2,137,794 at December 31, 2009.
| | | | | | | | | | | | |
| |
| Forward foreign currency exchange contracts outstanding as of December 31, 2009: | | |
SALE CONTRACT | | COUNTERPARTY | | CURRENCY | | CURRENCY
AMOUNT
SOLD | | VALUE AT
SETTLEMENT
DATE | | VALUE AT
DECEMBER 31,
2009 | | NET UNREALIZED
APPRECIATION
(DEPRECIATION) |
| Canadian Dollar expiring 01/29/10 | | The Royal Bank of
Scotland | | CAD | | (445,980) | | $(422,893) | | $(426,440) | | $(3,547) |
| | | | | | |
| CAD - Canadian Dollar | | | | | | | | | | |
| | | | | | | | | | |
| AQR Funds | | | | Annual Report | | | | December 2009 | | 37 |
| | | | | | | |
The accompanying notes are an integral part of these financial statements
| | |
| Schedule of Investments | | December 31, 2009 |
| | | | | |
| COMMON STOCKS - 99.3% | | SHARES | | VALUE (Note 2) |
| Automobile & Components - 2.1% | | | | | |
| Ford Motor Co. † | | 6,443 | | $ | 64,430 |
| Gentex Corp. | | 300 | | | 5,355 |
| Goodyear Tire & Rubber Co. † | | 700 | | | 9,870 |
| Harley-Davidson, Inc. | | 700 | | | 17,640 |
| Johnson Controls, Inc. | | 1,500 | | | 40,860 |
| TRW Automotive Holdings Corp. † | | 400 | | | 9,552 |
| | | | | |
| | | | | 147,707 |
| | | | | |
| Banks - 0.1% | | | | | |
| First Horizon National Corp. † | | 276 | | | 3,698 |
| | | | | |
| | |
| Capital Goods - 3.4% | | | | | |
| Aecom Technology Corp. † | | 159 | | | 4,373 |
| Armstrong World Industries, Inc. | | 100 | | | 3,893 |
| BE Aerospace, Inc. † | | 400 | | | 9,400 |
| Bucyrus International, Inc. | | 200 | | | 11,274 |
| Carlisle Cos., Inc. | | 300 | | | 10,278 |
| Cooper Industries PLC | | 400 | | | 17,056 |
| Cummins, Inc. | | 500 | | | 22,930 |
| Flowserve Corp. | | 200 | | | 18,906 |
| Goodrich Corp. | | 191 | | | 12,272 |
| Hubbell, Inc. Class B | | 100 | | | 4,730 |
| Ingersoll-Rand PLC | | 600 | | | 21,444 |
| Joy Global, Inc. | | 300 | | | 15,477 |
| KBR, Inc. | | 200 | | | 3,800 |
| McDermott International, Inc. † | | 500 | | | 12,005 |
| Oshkosh Corp. | | 300 | | | 11,109 |
| Precision Castparts Corp. | | 300 | | | 33,104 |
| Rockwell Automation, Inc. | | 200 | | | 9,396 |
| United Technologies Corp. | | 50 | | | 3,471 |
| W.W. Grainger, Inc. | | 99 | | | 9,586 |
| | | | | |
| | | | | 234,504 |
| | | | | |
Commercial & Professional
Services - 0.3% | | | | | |
| Iron Mountain, Inc. † | | 308 | | | 7,010 |
| Manpower, Inc. | | 100 | | | 5,458 |
| R.R. Donnelley & Sons Co. | | 500 | | | 11,135 |
| | | | | |
| | | | | 23,603 |
| | | | | |
| Consumer Durables & Apparel - 1.5% | | | |
| Carter’s, Inc. † | | 200 | | | 5,250 |
| Coach, Inc. | | 507 | | | 18,521 |
| Garmin Ltd. | | 400 | | | 12,280 |
| Hanesbrands, Inc. † | | 300 | | | 7,233 |
| Lennar Corp. Class A | | 400 | | | 5,108 |
| Mattel, Inc. | | 352 | | | 7,033 |
| Newell Rubbermaid, Inc. | | 700 | | | 10,507 |
| Polo Ralph Lauren Corp. | | 200 | | | 16,196 |
| Tupperware Brands Corp. | | 100 | | | 4,657 |
| Whirlpool Corp. | | 200 | | | 16,132 |
| | | | | |
| | | | | 102,917 |
| | | | | |
| Consumer Services - 1.9% | | | | | |
| International Game Technology | | 800 | | | 15,016 |
| Las Vegas Sands Corp. † | | 1,600 | | | 23,904 |
| Royal Caribbean Cruises Ltd. † | | 500 | | | 12,640 |
| Starbucks Corp. † | | 1,434 | | | 33,068 |
| Starwood Hotels & Resorts Worldwide, Inc. | | 500 | | | 18,285 |
| Wyndham Worldwide Corp. | | 400 | | | 8,068 |
| Wynn Resorts Ltd. † | | 300 | | | 17,469 |
| | | | | |
| | | | | 128,450 |
| | | | | |
| Diversified Financials - 9.1% | | | | | |
| American Express Co. | | 2,700 | | | 109,404 |
| AmeriCredit Corp. † | | 200 | | | 3,808 |
| | | | | |
| | | SHARES | | VALUE (Note 2) |
| Diversified Financials - 9.1% (continued) | | | | | |
| Ameriprise Financial, Inc. | | 600 | | $ | 23,292 |
| BlackRock, Inc. | | 135 | | | 31,347 |
| CME Group, Inc. | | 100 | | | 33,595 |
| Discover Financial Services | | 1,400 | | | 20,594 |
| Franklin Resources, Inc. | | 500 | | | 52,675 |
| Goldman Sachs Group, Inc. | | 1,200 | | | 202,607 |
| IntercontinentalExchange, Inc. † | | 53 | | | 5,952 |
| Invesco Ltd. | | 1,000 | | | 23,490 |
| Jefferies Group, Inc. † | | 220 | | | 5,221 |
| Knight Capital Group, Inc. Class A † | | 297 | | | 4,574 |
| Morgan Stanley | | 3,300 | | | 97,680 |
| MSCI, Inc. Class A † | | 200 | | | 6,360 |
| Waddell & Reed Financial, Inc. Class A | | 400 | | | 12,216 |
| | | | | |
| | | | | 632,815 |
| | | | | |
| Energy - 8.4% | | | | | |
| Alpha Natural Resources, Inc. † | | 300 | | | 13,014 |
| Anadarko Petroleum Corp. | | 1,000 | | | 62,420 |
| Cameron International Corp. † | | 500 | | | 20,900 |
| Chesapeake Energy Corp. | | 1,300 | | | 33,644 |
| CNX Gas Corp. † | | 200 | | | 5,904 |
| Concho Resources, Inc. † | | 400 | | | 17,960 |
| CONSOL Energy, Inc. | | 400 | | | 19,920 |
| Continental Resources, Inc. † | | 400 | | | 17,156 |
| Diamond Offshore Drilling, Inc. | | 300 | | | 29,526 |
| Ensco International PLC ADR (United Kingdom) | | 400 | | | 15,976 |
| EXCO Resources, Inc. | | 500 | | | 10,615 |
| FMC Technologies, Inc. † | | 300 | | | 17,352 |
| Halliburton Co. | | 2,000 | | | 60,180 |
| Helmerich & Payne, Inc | | 300 | | | 11,964 |
| Massey Energy Corp. | | 200 | | | 8,402 |
| Nabors Industries Ltd. † | | 700 | | | 15,323 |
| National-Oilwell Varco, Inc. | | 1,000 | | | 44,090 |
| Newfield Exploration Co. † | | 200 | | | 9,646 |
| Noble Corp. | | 600 | | | 24,420 |
| Occidental Petroleum Corp. | | 100 | | | 8,135 |
| Peabody Energy Corp. | | 600 | | | 27,126 |
| Pioneer Natural Resources Co. | | 300 | | | 14,451 |
| Pride International, Inc. † | | 500 | | | 15,955 |
| Quicksilver Resources, Inc. † | | 500 | | | 7,505 |
| Range Resources Corp. | | 200 | | | 9,970 |
| Southwestern Energy Co. † | | 547 | | | 26,365 |
| Weatherford International Ltd. † | | 1,600 | | | 28,656 |
| World Fuel Services Corp. | | 200 | | | 5,358 |
| | | | | |
| | | | | 581,933 |
| | | | | |
| Food & Staples Retailing - 1.3% |
| Rite Aid Corp. † | | 3,400 | | | 5,134 |
| Walgreen Co. | | 2,196 | | | 80,637 |
| Whole Foods Market, Inc. † | | 200 | | | 5,490 |
| | | | | |
| | | | | 91,261 |
| | | | | |
| Food, Beverage & Tobacco - 0.8% |
| Coca-Cola Enterprises, Inc. | | 1,023 | | | 21,688 |
| Cosan Ltd. Class A † (Brazil) | | 400 | | | 3,480 |
| Del Monte Foods Co. | | 878 | | | 9,957 |
| Dr Pepper Snapple Group, Inc. † | | 500 | | | 14,150 |
| Green Mountain Coffee Roasters, Inc. † | | 32 | | | 2,607 |
| Tyson Foods, Inc. Class A | | 468 | | | 5,742 |
| | | | | |
| | | | | 57,624 |
| | | | | |
The accompanying notes are an integral part of these financial statements.
| | | | | | | | | | |
| AQR Funds | | | | Annual Report | | | | December 2009 | | 38 |
| | | | | | | |
| | |
| Schedule of Investments | | December 31, 2009 |
| | | | | |
| | | SHARES | | VALUE (Note 2) |
| Health Care Equipment & Services - 4.5% |
| Brookdale Senior Living, Inc. † | | 300 | | $ | 5,457 |
| Cerner Corp. † | | 254 | | | 20,940 |
| CIGNA Corp. | | 600 | | | 21,162 |
| Community Health Systems, Inc. † | | 200 | | | 7,120 |
| Coventry Health Care, Inc. † | | 400 | | | 9,716 |
| Edwards Lifesciences Corp. † | | 138 | | | 11,985 |
| Express Scripts, Inc. † | | 600 | | | 51,870 |
| Health Management Associates, Inc. Class A † | | 768 | | | 5,583 |
| Hospira, Inc. † | | 191 | | | 9,741 |
| Intuitive Surgical, Inc. † | | 100 | | | 30,332 |
| Kinetic Concepts, Inc. † | | 300 | | | 11,295 |
| McKesson Corp. | | 500 | | | 31,250 |
| Medco Health Solutions, Inc. † | | 941 | | | 60,139 |
| ResMed, Inc. † | | 148 | | | 7,736 |
| Tenet Healthcare Corp. † | | 1,300 | | | 7,007 |
| Universal Health Services, Inc. Class B | | 400 | | | 12,200 |
| Wellpoint, Inc. † | | 88 | | | 5,130 |
| | | | | |
| | | | | 308,663 |
| | | | | |
| Household & Personal Products - 0.4% |
| Estee Lauder Cos., Inc. Class A | | 500 | | | 24,180 |
| NBTY, Inc. † | | 100 | | | 4,354 |
| | | | | |
| | | | | 28,534 |
| | | | | |
| Insurance - 1.8% |
| American National Insurance Co. | | 100 | | | 11,944 |
| Assured Guaranty Ltd. | | 300 | | | 6,528 |
| First American Corp. | | 171 | | | 5,662 |
| Genworth Financial, Inc. Class A † | | 900 | | | 10,215 |
| Hartford Financial Services Group, Inc. | | 1,000 | | | 23,260 |
| Prudential Financial, Inc. | | 1,000 | | | 49,760 |
| XL Capital Ltd. Class A | | 800 | | | 14,664 |
| | | | | |
| | | | | 122,033 |
| | | | | |
| Materials - 6.0% |
| Air Products and Chemicals, Inc. | | 600 | | | 48,636 |
| AK Steel Holding Corp. | | 300 | | | 6,405 |
| Albemarle Corp. | | 300 | | | 10,911 |
| Allegheny Technologies, Inc. | | 100 | | | 4,477 |
| Ashland, Inc. | | 100 | | | 3,962 |
| Celanese Corp. Series A | | 400 | | | 12,840 |
| Cliffs Natural Resources, Inc. | | 300 | | | 13,827 |
| Dow Chemical Co. | | 2,600 | | | 71,838 |
| Freeport-McMoRan Copper & Gold, Inc. † | | 1,000 | | | 80,290 |
| Hecla Mining Co. † | | 800 | | | 4,944 |
| Huntsman Corp. | | 600 | | | 6,774 |
| International Paper Co. | | 900 | | | 24,102 |
| Lubrizol Corp. | | 156 | | | 11,380 |
| MeadWestvaco Corp. | | 400 | | | 11,452 |
| Mosaic Co. | | 900 | | | 53,757 |
| Owens-Illinois, Inc. † | | 100 | | | 3,287 |
| Praxair, Inc. | | 100 | | | 8,031 |
| Rock-Tenn Co. Class A | | 100 | | | 5,041 |
| Royal Gold, Inc. | | 100 | | | 4,710 |
| Steel Dynamics, Inc. | | 500 | | | 8,860 |
| Valspar Corp. | | 500 | | | 13,570 |
| Walter Energy, Inc. | | 100 | | | 7,531 |
| | | | | |
| | | | | 416,625 |
| | | | | |
| Media - 3.4% |
| Cablevision Systems Corp. Class A | | 700 | | | 18,074 |
| CBS Corp. Class B | | 1,500 | | | 21,075 |
| Clear Channel Outdoor Holdings, Inc. Class A † | | 700 | | | 7,273 |
| | | | | |
| | | SHARES | | VALUE (Note 2) |
| Media - 3.4% (continued) |
| Discovery Communications, Inc. Class A † | | 666 | | $ | 20,426 |
| DISH Network Corp. Class A | | 1,100 | | | 22,847 |
| Lamar Advertising Co. Class A † | | 200 | | | 6,218 |
| Liberty Media Corp. Series A † | | 899 | | | 41,489 |
| Scripps Networks Interactive, Inc. Class A | | 300 | | | 12,450 |
| Thomson Reuters Corp. | | 100 | | | 3,225 |
| Time Warner Cable, Inc. | | 700 | | | 28,973 |
| Viacom, Inc. Class B † | | 1,300 | | | 38,649 |
| Virgin Media, Inc. | | 700 | | | 11,781 |
| | | | | |
| | | | | 232,480 |
| | | | | |
| Pharmaceuticals, Biotechnology & Life Sciences - 1.4% |
| Dendreon Corp. † | | 367 | | | 9,645 |
| Endo Pharmaceuticals Holdings, Inc. † | | 200 | | | 4,102 |
| Human Genome Sciences, Inc. † | | 400 | | | 12,240 |
| Life Technologies Corp. † | | 420 | | | 21,937 |
| Mylan, Inc. † | | 526 | | | 9,694 |
| Valeant Pharmaceuticals International † | | 200 | | | 6,358 |
| Warner Chilcott PLC Class A † | | 400 | | | 11,388 |
| Waters Corp. † | | 200 | | | 12,392 |
| Watson Pharmaceuticals, Inc. † | | 174 | | | 6,892 |
| | | | | |
| | | | | 94,648 |
| | | | | |
| Real Estate - 0.6% |
| CB Richard Ellis Group, Inc. Class A REIT † | | 700 | | | 9,499 |
| Digital Realty Trust, Inc. REIT | | 100 | | | 5,028 |
| Jones Lang Lasalle, Inc. | | 100 | | | 6,040 |
| Macerich Co. REIT | | 200 | | | 7,190 |
| Realty Income Corp. REIT | | 234 | | | 6,063 |
| SL Green Realty Corp. REIT | | 200 | | | 10,048 |
| | | | | |
| | | | | 43,868 |
| | | | | |
| Retailing - 6.9% | | | | | |
| Abercrombie & Fitch Co. Class A | | 300 | | | 10,455 |
| Aeropostale, Inc. † | | 62 | | | 2,111 |
| Amazon.com, Inc. † | | 904 | | | 121,605 |
| American Eagle Outfitters, Inc. | | 500 | | | 8,490 |
| AutoNation, Inc. † | | 314 | | | 6,013 |
| Best Buy Co, Inc. | | 1,000 | | | 39,460 |
| CarMax, Inc. † | | 426 | | | 10,331 |
| Chico’s FAS, Inc. † | | 564 | | | 7,924 |
| Dick’s Sporting Goods, Inc. † | | 186 | | | 4,626 |
| Expedia, Inc. † | | 592 | | | 15,220 |
| Gap, Inc. | | 1,586 | | | 33,227 |
| Guess?, Inc. | | 200 | | | 8,460 |
| J. Crew Group, Inc. † | | 200 | | | 8,948 |
| J.C. Penney Co., Inc. | | 500 | | | 13,305 |
| LKQ Corp. † | | 200 | | | 3,918 |
| Limited Brands, Inc. | | 700 | | | 13,468 |
| Macy’s, Inc. | | 900 | | | 15,084 |
| Netflix, Inc. † | | 147 | | | 8,106 |
| Nordstrom, Inc. | | 500 | | | 18,790 |
| Office Depot, Inc. † | | 800 | | | 5,160 |
| O’Reilly Automotive, Inc. † | | 199 | | | 7,586 |
| priceline.com, Inc. † | | 126 | | | 27,531 |
| Ross Stores, Inc. | | 200 | | | 8,542 |
| Sears Holdings Corp. † | | 200 | | | 16,690 |
| Tiffany & Co. | | 200 | | | 8,600 |
| TJX Cos., Inc. | | 901 | | | 32,932 |
| Urban Outfitters, Inc. † | | 400 | | | 13,996 |
| Williams-Sonoma, Inc. | | 500 | | | 10,390 |
| | | | | |
| | | | | 480,968 |
| | | | | |
The accompanying notes are an integral part of these financial statements.
| | | | | | | | | | |
| AQR Funds | | | | Annual Report | | | | December 2009 | | 39 |
| | | | | | | |
| | |
| Schedule of Investments | | December 31, 2009 |
| | | | | |
| | | SHARES | | VALUE (Note 2) |
| Semiconductors & Semiconductor Equipment - 3.8% |
| Advanced Micro Devices, Inc. † | | 1,300 | | $ | 12,584 |
| Analog Devices, Inc. | | 500 | | | 15,790 |
| Atheros Communications, Inc. † | | 300 | | | 10,272 |
| Atmel Corp. † | | 2,900 | | | 13,369 |
| Broadcom Corp. Class A † | | 825 | | | 25,946 |
| Cree, Inc. † | | 185 | | | 10,428 |
| Cypress Semiconductor Corp. † | | 1,100 | | | 11,616 |
| Marvell Technology Group Ltd. † | | 900 | | | 18,675 |
| Maxim Integrated Products, Inc. | | 1,000 | | | 20,300 |
| Micron Technology, Inc. † | | 2,100 | | | 22,176 |
| NVIDIA Corp. † | | 900 | | | 16,812 |
| ON Semiconductor Corp. † | | 800 | | | 7,048 |
| Teradyne, Inc. † | | 1,000 | | | 10,730 |
| Texas Instruments, Inc. | | 2,600 | | | 67,757 |
| | | | | |
| | | | | 263,503 |
| | | | | |
| Software & Services - 22.4% | | | | | |
| Adobe Systems, Inc. † | | 1,200 | | | 44,136 |
| Akamai Technologies, Inc. † | | 400 | | | 10,132 |
| BMC Software, Inc. † | | 238 | | | 9,544 |
| Broadridge Financial Solutions, Inc. | | 400 | | | 9,024 |
| Citrix Systems, Inc. † | | 252 | | | 10,486 |
| Cognizant Technology Solutions Corp. Class A † | | 500 | | | 22,650 |
| Computer Sciences Corp. † | | 195 | | | 11,218 |
| eBay, Inc. † | | 2,900 | | | 68,266 |
| Equinix, Inc. † | | 100 | | | 10,615 |
| Fiserv, Inc. † | | 212 | | | 10,278 |
| Genpact Ltd. † | | 800 | | | 11,920 |
| Google, Inc. Class A † | | 700 | | | 433,986 |
| Informatica Corp. † | | 400 | | | 10,344 |
| Lender Processing Services, Inc. | | 156 | | | 6,343 |
| MasterCard, Inc. Class A | | 300 | | | 76,794 |
| McAfee, Inc. † | | 207 | | | 8,398 |
| Microsoft Corp. | | 18,800 | | | 573,211 |
| Oracle Corp. | | 307 | | | 7,534 |
| Red Hat, Inc. † | | 229 | | | 7,076 |
| Salesforce.com, Inc. † | | 200 | | | 14,754 |
| Sybase, Inc. † | | 277 | | | 12,022 |
| Synopsys, Inc. † | | 300 | | | 6,684 |
| Syntel, Inc. | | 100 | | | 3,803 |
| Visa, Inc. Class A | | 1,500 | | | 131,190 |
| VistaPrint NV, Inc. † | | 134 | | | 7,592 |
| VMware, Inc. Class A † | | 900 | | | 38,142 |
| | | | | |
| | | | | 1,556,142 |
| | | | | |
| Technology Hardware & Equipment - 16.6% |
| ADTRAN, Inc. | | 400 | | | 9,020 |
| Agilent Technologies, Inc. † | | 800 | | | 24,856 |
| Amphenol Corp. Class A | | 400 | | | 18,472 |
| Apple, Inc. † | | 1,957 | | | 412,652 |
| Arris Group, Inc. † | | 400 | | | 4,572 |
| Arrow Electronics, Inc. † | | 200 | | | 5,922 |
| Avnet, Inc. † | | 400 | | | 12,064 |
| Brocade Communications Systems, Inc. † | | 697 | | | 5,318 |
| Corning, Inc. | | 3,100 | | | 59,861 |
| Dolby Laboratories, Inc. Class A † | | 156 | | | 7,446 |
| EMC Corp. † | | 3,900 | | | 68,133 |
| F5 Networks, Inc. † | | 66 | | | 3,497 |
| Ingram Micro, Inc. Class A † | | 230 | | | 4,014 |
| International Business Machines Corp. | | 2,641 | | | 345,707 |
| | | | | |
| | | SHARES | | VALUE (Note 2) |
| Technology Hardware & Equipment - 16.6% (continued) |
| Jabil Circuit, Inc. | | 400 | | $ | 6,948 |
| Juniper Networks, Inc. † | | 873 | | | 23,283 |
| Motorola, Inc. | | 5,300 | | | 41,128 |
| NetApp, Inc. † | | 700 | | | 24,073 |
| Palm, Inc. † | | 499 | | | 5,010 |
| Polycom, Inc. † | | 300 | | | 7,491 |
| SanDisk Corp. † | | 400 | | | 11,596 |
| Seagate Technology | | 1,100 | | | 20,009 |
| Tellabs, Inc. † | | 900 | | | 5,112 |
| Teradata Corp. † | | 188 | | | 5,909 |
| Western Digital Corp. † | | 500 | | | 22,075 |
| | | | | |
| | | | | 1,154,168 |
| | | | | |
| Telecommunication Services - 1.1% | | | | | |
| Crown Castle International Corp. † | | 600 | | | 23,424 |
| NII Holdings, Inc. † | | 400 | | | 13,432 |
| SBA Communications Corp. Class A † | | 200 | | | 6,832 |
| Sprint Nextel Corp. † | | 6,600 | | | 24,156 |
| tw Telecom, Inc. † | | 600 | | | 10,284 |
| | | | | |
| | | | | 78,128 |
| | | | | |
| Transportation - 0.8% | | | | | |
| CSX Corp. | | 800 | | | 38,792 |
| Hertz Global Holdings, Inc. † | | 500 | | | 5,960 |
| JetBlue Airways Corp. † | | 811 | | | 4,420 |
| Kansas City Southern Industries, Inc. † | | 200 | | | 6,658 |
| | | | | |
| | | | | 55,830 |
| | | | | |
| Utilities - 0.7% | | | | | |
| AES Corp. † | | 900 | | | 11,979 |
| Atmos Energy Corp. | | 200 | | | 5,880 |
| Calpine Corp. † | | 1,200 | | | 13,200 |
| National Fuel Gas Company Co. | | 200 | | | 10,000 |
| ONEOK, Inc. | | 100 | | | 4,457 |
| | | | | |
| | | | | 45,516 |
| | | | | |
TOTAL COMMON STOCKS
(cost $6,522,739) | | | | | 6,885,618 |
| | | | | |
| | | | | |
| MONEY MARKET FUND - 2.0% | | | | | |
| Dreyfus Institutional Cash Advance Fund - Institutional Class, 0.28% (a)(b) | | | | | |
(cost $141,027) | | 141,027 | | | 141,027 |
| | | | | |
TOTAL INVESTMENTS - 101.3%
(cost $6,663,766) | | | | | 7,026,645 |
| | | | | |
| LIABILITIES IN EXCESS OF OTHER ASSETS - (1.3)% | | | | | (94,070) |
| | | | | |
| NET ASSETS - 100.0% | | | | $ | 6,932,575 |
| | | | | |
All securities are United States companies, unless noted otherwise in parentheses.
| † | Non income-producing security. |
| (a) | Represents annualized seven-day yield as of December 31, 2009. |
| (b) | Level 2 security (See Note 4). |
All securities are Level 1, unless noted otherwise in parentheses.
The following abbreviations are used in portfolio descriptions:
ADR - American Depository Receipt.
REIT - Real Estate Investment Trust.
The accompanying notes are an integral part of these financial statements.
| | | | | | | | | | |
| AQR Funds | | | | Annual Report | | | | December 2009 | | 40 |
| | | | | | | |
| | |
| Schedule of Investments | | December 31, 2009 |
Open futures contracts outstanding at December 31, 2009:
| | | | | | | | | | |
| NUMBER OF CONTRACTS | | TYPE | | EXPIRATION
DATE | | VALUE AT
TRADE DATE | | VALUE AT
DECEMBER 31,
2009 | | NET UNREALIZED
DEPRECIATION |
| Long Position: | | | | | | | | |
| 1 | | S&P 500 E-MINI | | March 2010 | | $55,676 | | $55,535 | | $(141) |
| | | | | | |
Cash held as collateral for futures contract was $12,484 at December 31, 2009.
The accompanying notes are an integral part of these financial statements.
| | | | | | | | | | |
| AQR Funds | | | | Annual Report | | | | December 2009 | | 41 |
| | | | | | | |
| | |
| Schedule of Investments | | December 31, 2009 |
| | |
| AQR SMALL CAP MOMENTUM FUND | | |
| | | | | |
| COMMON STOCKS - 99.8% | | SHARES | | VALUE (Note 2) |
| Automobile & Components - 2.6% | | | | | |
| American Axle & Manufacturing Holdings, Inc. † | | 600 | | $ | 4,812 |
| ArvinMeritor, Inc. † | | 700 | | | 7,826 |
| Cooper Tire & Rubber Co. | | 565 | | | 11,328 |
| Dana Holding Corp. † | | 1,200 | | | 13,008 |
| Dorman Products, Inc. † | | 132 | | | 2,067 |
| Drew Industries, Inc. † | | 216 | | | 4,460 |
| Federal-Mogul Corp. † | | 1,000 | | | 17,301 |
| Modine Manufacturing Co. † | | 500 | | | 5,920 |
| Spartan Motors, Inc. | | 261 | | | 1,469 |
| Standard Motor Products, Inc. † | | 200 | | | 1,704 |
| Stoneridge, Inc. † | | 300 | | | 2,703 |
| Tenneco, Inc. † | | 500 | | | 8,865 |
| Winnebago Industries, Inc. † | | 300 | | | 3,660 |
| | | | | |
| | | | | 85,123 |
| | | | | |
| Banks - 0.4% | | | | | |
| American National Bankshares, Inc. | | 200 | | | 4,380 |
| Bank of Marin Bancorp | | 85 | | | 2,768 |
| First Bancorp | | 124 | | | 1,732 |
| First Defiance Financial Corp. | | 142 | | | 1,603 |
| Great Southern Bancorp, Inc. | | 135 | | | 2,884 |
| | | | | |
| | | | | 13,367 |
| | | | | |
| Capital Goods - 4.3% | | | | | |
| AAON, Inc. | | 209 | | | 4,073 |
| Advanced Battery Technologies, Inc. † | | 600 | | | 2,400 |
| Aircastle Ltd. | | 680 | | | 6,698 |
| BlueLinx Holdings, Inc. † | | 400 | | | 1,108 |
| Broadwind Energy, Inc. † | | 1,000 | | | 8,090 |
| Builders FirstSource, Inc. † | | 713 | | | 2,745 |
| Capstone Turbine Corp. † | | 2,600 | | | 3,354 |
| Chart Industries, Inc. † | | 400 | | | 6,620 |
| Commercial Vehicle Group, Inc. † | | 400 | | | 2,396 |
| EnerSys † | | 500 | | | 10,935 |
| GenCorp, Inc. † | | 900 | | | 6,300 |
| GeoEye, Inc. † | | 245 | | | 6,831 |
| GT Solar International, Inc. † | | 1,600 | | | 8,896 |
| Interline Brands, Inc. † | | 400 | | | 6,908 |
| John Bean Technologies Corp. | | 300 | | | 5,103 |
| Microvision, Inc. † | | 800 | | | 2,536 |
| Middleby Corp. † | | 200 | | | 9,804 |
| Orion Marine Group, Inc. † | | 218 | | | 4,591 |
| PMFG Inc. † | | 300 | | | 4,863 |
| Polypore International, Inc. † | | 600 | | | 7,140 |
| Power-One, Inc. † | | 1,000 | | | 4,350 |
| Quanex Building Products Corp. | | 400 | | | 6,788 |
| Tennant Co. | | 200 | | | 5,238 |
| Textainer Group Holdings Ltd. | | 500 | | | 8,450 |
| UQM Technologies, Inc. † | | 400 | | | 2,740 |
| | | | | |
| | | | | 138,957 |
| | | | | |
| Commercial & Professional Services - 2.8% | | | |
| Acacia Research Corp. † | | 526 | | | 4,792 |
| Acco Brands Corp. † | | 700 | | | 5,096 |
| APAC Customer Services, Inc. † | | 578 | | | 3,445 |
| Cenveo, Inc. † | | 700 | | | 6,125 |
| Diamond Management & Technology Consultants, Inc. | | 500 | | | 3,685 |
| EnergySolutions, Inc. | | 1,000 | | | 8,490 |
| EnerNOC, Inc. † | | 297 | | | 9,026 |
| HNI Corp. | | 500 | | | 13,814 |
| | | | | |
| | | SHARES | | VALUE (Note 2) |
| Commercial & Professional Services - 2.8% (continued) |
| Interface, Inc. | | 800 | | $ | 6,648 |
| Kforce, Inc. † | | 327 | | | 4,088 |
| M&F Worldwide Corp. † | | 200 | | | 7,900 |
| Metalico, Inc. † | | 700 | | | 3,444 |
| Spherion Corp. † | | 436 | | | 2,450 |
| United Stationers, Inc. † | | 200 | | | 11,370 |
| Volt Information Sciences, Inc. † | | 200 | | | 2,000 |
| | | | | |
| | | | | 92,373 |
| | | | | |
| Consumer Durables & Apparel - 2.6% | | | | | |
| American Greetings Corp. Class A | | 400 | | | 8,716 |
| Beazer Homes USA, Inc. † | | 500 | | | 2,420 |
| Brunswick Corp. | | 900 | | | 11,439 |
| Cherokee, Inc. | | 214 | | | 3,813 |
| Crocs, Inc. † | | 1,000 | | | 5,750 |
| Furniture Brands International, Inc. † | | 600 | | | 3,276 |
| G-III Apparel Group Ltd. † | | 200 | | | 4,334 |
| Hovnanian Enterprises, Inc. † | | 1,000 | | | 3,840 |
| La-Z-Boy, Inc. † | | 600 | | | 5,718 |
| Liz Claiborne, Inc. † | | 1,000 | | | 5,630 |
| Oxford Industries, Inc. | | 200 | | | 4,136 |
| Sealy Corp. † | | 1,100 | | | 3,476 |
| Skechers U.S.A., Inc. Class A † | | 400 | | | 11,764 |
| Smith & Wesson Holding Corp. † | | 786 | | | 3,215 |
| Steven Madden Ltd. † | | 161 | | | 6,640 |
| | | | | |
| | | | | 84,167 |
| | | | | |
| Consumer Services - 5.3% | | | | | |
| AFC Enterprises, Inc. † | | 500 | | | 4,080 |
| Ambassadors Group, Inc. | | 200 | | | 2,658 |
| Ameristar Casinos, Inc. | | 614 | | | 9,351 |
| BJ’s Restaurants, Inc. † | | 282 | | | 5,307 |
| Boyd Gaming Corp. † | | 1,000 | | | 8,370 |
| Buffalo Wild Wings, Inc. † | | 258 | | | 10,390 |
| Caribou Coffee Co., Inc. † | | 400 | | | 3,088 |
| Carrols Restaurant Group, Inc. † | | 215 | | | 1,520 |
| Cheesecake Factory, Inc. † | | 584 | | | 12,609 |
| CPI Corp. | | 300 | | | 3,684 |
| Cracker Barrel Old Country Store, Inc. | | 302 | | | 11,473 |
| DineEquity, Inc. † | | 200 | | | 4,858 |
| Domino’s Pizza, Inc. † | | 700 | | | 5,866 |
| Einstein Noah Restaurant Group, Inc. † | | 300 | | | 2,949 |
| Full House Resorts, Inc. † | | 900 | | | 3,132 |
| Gaylord Entertainment Co. † | | 500 | | | 9,875 |
| Isle of Capri Casinos, Inc. † | | 580 | | | 4,338 |
| Landry’s Restaurants, Inc. † | | 200 | | | 4,258 |
| Life Time Fitness, Inc. † | | 400 | | | 9,972 |
| Lincoln Educational Services Corp. † | | 301 | | | 6,523 |
| Mac-Gray Corp. † | | 300 | | | 3,090 |
| Multimedia Games, Inc. † | | 600 | | | 3,606 |
| P.F. Chang’s China Bistro, Inc. † | | 244 | | | 9,250 |
| Ruby Tuesday, Inc. † | | 462 | | | 3,326 |
| Shuffle Master, Inc. † | | 616 | | | 5,076 |
| Sotheby’s | | 600 | | | 13,488 |
| Steak n Shake Co. † | | 11 | | | 3,565 |
| Stewart Enterprises, Inc. Class A | | 1,200 | | | 6,180 |
| | | | | |
| | | | | 171,882 |
| | | | | |
| Diversified Financials - 4.4% | | | | | |
| Advance America Cash Advance Centers, Inc. | | 873 | | | 4,854 |
| Ares Capital Corp. | | 1,059 | | | 13,185 |
The accompanying notes are an integral part of these financial statements.
| | | | | | | | | | |
| AQR Funds | | | | Annual Report | | | | December 2009 | | 42 |
| | | | | | | |
| | |
| Schedule of Investments | | December 31, 2009 |
| | |
| AQR SMALL CAP MOMENTUM FUND | | |
| | | | | |
| | | SHARES | | VALUE (Note 2) |
| Diversified Financials - 4.4% (continued) |
| ASTA Funding, Inc. | | 200 | | $ | 1,418 |
| BGC Partners, Inc. Class A | | 1,100 | | | 5,082 |
| Broadpoint Gleacher Securities, Inc. † | | 1,758 | | | 7,841 |
| Cardtronics, Inc. † | | 500 | | | 5,535 |
| Cohen & Steers, Inc. | | 400 | | | 9,136 |
| Credit Acceptance Corp. † | | 248 | | | 10,441 |
| Dollar Financial Corp. † | | 300 | | | 7,098 |
| Encore Capital Group, Inc. † | | 274 | | | 4,768 |
| Evercore Partners, Inc. Class A | | 166 | | | 5,046 |
| First Marblehead Corp. † | | 1,400 | | | 2,982 |
| GAMCO Investors, Inc. | | 300 | | | 14,486 |
| Hercules Technology Growth Capital, Inc. | | 202 | | | 2,099 |
| JMP Group, Inc. | | 300 | | | 2,916 |
| MarketAxess Holdings, Inc. | | 482 | | | 6,700 |
| MCG Capital Corp. † | | 800 | | | 3,456 |
| MF Global Ltd. † | | 1,313 | | | 9,125 |
| Oppenheimer Holdings, Inc. Class A | | 200 | | | 6,644 |
| PennantPark Investment Corp. | | 374 | | | 3,336 |
| Primus Guaranty Ltd. † | | 600 | | | 1,830 |
| Pzena Investment Management, Inc. Class A † | | 900 | | | 7,326 |
| Rodman & Renshaw Capital Group, Inc. † | | 400 | | | 1,640 |
| Safeguard Scientifics, Inc. † | | 300 | | | 3,093 |
| U.S. Global Investors, Inc. Class A | | 200 | | | 2,462 |
| | | | | |
| | | | | 142,499 |
| | | | | |
| Energy - 7.7% | | | | | |
| American Oil & Gas, Inc. † | | 700 | | | 2,940 |
| ATP Oil & Gas Corp. † | | 500 | | | 9,140 |
| Berry Petroleum Co. Class A | | 500 | | | 14,575 |
| Brigham Exploration Co. † | | 700 | | | 9,485 |
| Cheniere Energy, Inc. † | | 707 | | | 1,711 |
| China North East Petroleum Holdings Ltd. † | | 300 | | | 2,775 |
| Clean Energy Fuels Corp. † | | 500 | | | 7,705 |
| CVR Energy, Inc. † | | 1,100 | | | 7,546 |
| Enbridge Energy Management LLC † | | 104 | | | 5,524 |
| Energy XXI Ltd. | | 2,000 | | | 4,620 |
| Geokinetics, Inc. † | | 300 | | | 2,886 |
| Global Industries Ltd. † | | 1,200 | | | 8,556 |
| Gulf Island Fabrication, Inc. | | 200 | | | 4,206 |
| Gulfport Energy Corp. † | | 500 | | | 5,725 |
| Helix Energy Solutions Group, Inc. † | | 1,200 | | | 14,100 |
| International Coal Group, Inc. † | | 2,000 | | | 7,720 |
| ION Geophysical Corp. | | 1,300 | | | 7,696 |
| Key Energy Services, Inc. † | | 1,300 | | | 11,427 |
| Kodiak Oil & Gas Corp. † | | 1,700 | | | 3,774 |
| Lufkin Industries, Inc. | | 100 | | | 7,320 |
| Northern Oil and Gas, Inc. † | | 400 | | | 4,736 |
| OYO Geospace Corp. † | | 100 | | | 4,289 |
| Pacific Asia Petroleum, Inc. † | | 900 | | | 4,167 |
| Parker Drilling Co. † | | 1,500 | | | 7,425 |
| Patriot Coal Corp. † | | 900 | | | 13,915 |
| Rex Energy Corp. † | | 400 | | | 4,800 |
| Rosetta Resources, Inc. † | | 500 | | | 9,965 |
| Stone Energy Corp. † | | 600 | | | 10,830 |
| Syntroleum Corp. † | | 619 | | | 1,647 |
| T-3 Energy Services, Inc. † | | 200 | | | 5,100 |
| Tesco Corp. † | | 400 | | | 5,164 |
| TETRA Technologies, Inc. † | | 1,000 | | | 11,080 |
| Toreador Resources Corp. † | | 300 | | | 2,970 |
| | | | | |
| | | SHARES | | VALUE (Note 2) |
| Energy - 7.7% (continued) | | | | | |
| Uranium Energy Corp. † | | 700 | | $ | 2,646 |
| Vanguard Natural Resources LLC | | 244 | | | 5,385 |
| Venoco, Inc. † | | 600 | | | 7,824 |
| Willbros Group, Inc. † | | 400 | | | 6,748 |
| | | | | |
| | | | | 248,122 |
| | | | | |
| Food & Staples Retailing - 0.8% | | | | | |
| Andersons, Inc. | | 200 | | | 5,164 |
| Great Atlantic & Pacific Tea Co., Inc. † | | 600 | | | 7,074 |
| Rite Aid Corp. † | | 9,700 | | | 14,647 |
| | | | | |
| | | | | 26,885 |
| | | | | |
| Food, Beverage & Tobacco - 0.8% | | | | | |
| Alliance One International, Inc. † | | 937 | | | 4,573 |
| B&G Foods, Inc. Class A | | 268 | | | 2,460 |
| Calavo Growers, Inc. | | 229 | | | 3,893 |
| Diamond Foods, Inc. | | 145 | | | 5,153 |
| Imperial Sugar Co. | | 100 | | | 1,744 |
| Universal Corp. | | 200 | | | 9,122 |
| | | | | |
| | | | | 26,945 |
| | | | | |
| Health Care Equipment & Services - 5.1% | | | |
| Air Methods Corp. † | | 101 | | | 3,396 |
| Align Technology, Inc. † | | 786 | | | 14,007 |
| Allied Healthcare International, Inc. † | | 1,400 | | | 4,074 |
| Alphatec Holdings, Inc. † | | 700 | | | 3,738 |
| American Medical Systems Holdings, Inc. † | | 800 | | | 15,431 |
| BioScrip, Inc. † | | 308 | | | 2,575 |
| Bovie Medical Corp. † | | 500 | | | 3,905 |
| Chindex International, Inc. † | | 200 | | | 2,826 |
| Clarient, Inc. † | | 568 | | | 1,505 |
| Computer Programs & Systems, Inc. | | 138 | | | 6,355 |
| Dexcom, Inc. † | | 600 | | | 4,848 |
| Electro-Optical Sciences, Inc. † | | 207 | | | 2,145 |
| Emeritus Corp. † | | 400 | | | 7,500 |
| Endologix, Inc. † | | 500 | | | 2,640 |
| Healthways, Inc. † | | 400 | | | 7,336 |
| Insulet Corp. † | | 400 | | | 5,712 |
| Invacare Corp. | | 300 | | | 7,482 |
| IPC The Hospitalist Co. Inc. † | | 141 | | | 4,688 |
| LCA-Vision, Inc. † | | 365 | | | 1,869 |
| MAKO Surgical Corp. † | | 195 | | | 2,165 |
| MedAssets, Inc. † | | 626 | | | 13,277 |
| Merge Healthcare, Inc. † | | 600 | | | 2,016 |
| NxStage Medical, Inc. † | | 600 | | | 5,010 |
| Odyssey HealthCare, Inc. † | | 266 | | | 4,144 |
| Orthofix International NV † (Netherlands) | | 138 | | | 4,274 |
| Orthovita, Inc. † | | 360 | | | 1,264 |
| Palomar Medical Technologies, Inc. † | | 141 | | | 1,421 |
| Providence Service Corp. † | | 200 | | | 3,160 |
| RehabCare Group, Inc. † | | 131 | | | 3,986 |
| Rockwell Medical Technologies, Inc. † | | 300 | | | 2,307 |
| Sunrise Senior Living, Inc. † | | 700 | | | 2,254 |
| Transcend Services, Inc. † | | 200 | | | 4,272 |
| Utah Medical Products, Inc. | | 200 | | | 5,864 |
| Vascular Solutions, Inc. † | | 400 | | | 3,356 |
| Virtual Radiologic Corp. † | | 300 | | | 3,828 |
| | | | | |
| | | | | 164,630 |
| | | | | |
| Household & Personal Products - 1.2% | | | |
| Bare Escentuals, Inc. † | | 1,100 | | | 13,453 |
| Inter Parfums, Inc. | | 400 | | | 4,868 |
The accompanying notes are an integral part of these financial statements.
| | | | | | | | | | |
| AQR Funds | | | | Annual Report | | | | December 2009 | | 43 |
| | | | | | | |
| | |
| Schedule of Investments | | December 31, 2009 |
| | |
| AQR SMALL CAP MOMENTUM FUND | | |
| | | | | |
| | | SHARES | | VALUE (Note 2) |
| Household & Personal Products - 1.2% (continued) |
| Medifast, Inc. † | | 132 | | $ | 4,037 |
| Orchids Paper Products Co. † | | 200 | | | 4,004 |
| Revlon, Inc. Class A † | | 700 | | | 11,907 |
| | | | | |
| | | | | 38,269 |
| | | | | |
| Insurance - 1.0% | | | | | |
| American Equity Investment Life Holding Co. | | 300 | | | 2,232 |
| American Physicians Service Group, Inc. | | 110 | | | 2,538 |
| American Safety Insurance Holdings Ltd. † | | 231 | | | 3,338 |
| Greenlight Capital Re Ltd. † | | 400 | | | 9,428 |
| Maiden Holdings Ltd. | | 900 | | | 6,588 |
| National Financial Partners Corp. † | | 700 | | | 5,663 |
| Universal Insurance Holdings, Inc. | | 466 | | | 2,735 |
| | | | | |
| | | | | 32,522 |
| | | | | |
| Materials - 4.8% | | | | | |
| AEP Industries, Inc. † | | 62 | | | 2,373 |
| Allied Nevada Gold Corp. † | | 817 | | | 12,320 |
| Boise, Inc. † | | 900 | | | 4,779 |
| Buckeye Technologies, Inc. † | | 500 | | | 4,880 |
| Bway Holding Co. † | | 139 | | | 2,672 |
| General Moly Inc. † | | 1,600 | | | 3,328 |
| Golden Star Resources Ltd. † | | 2,600 | | | 8,112 |
| Graphic Packaging Holding Co. † | | 3,400 | | | 11,798 |
| Hawkins, Inc. | | 114 | | | 2,489 |
| Horsehead Holding Corp. † | | 400 | | | 5,100 |
| Innospec, Inc. | | 300 | | | 3,027 |
| Kaiser Aluminum Corp. | | 200 | | | 8,324 |
| KapStone Paper and Packaging Corp. † | | 400 | | | 3,940 |
| KMG Chemicals, Inc. | | 300 | | | 4,485 |
| Louisiana-Pacific Corp. † | | 1,300 | | | 9,074 |
| LSB Industries, Inc. † | | 100 | | | 1,410 |
| Omnova Solutions, Inc. † | | 689 | | | 4,224 |
| PolyOne Corp. † | | 1,100 | | | 8,217 |
| Schweitzer-Mauduit International, Inc. | | 214 | | | 15,055 |
| Solutia, Inc. † | | 1,200 | | | 15,239 |
| Spartech Corp. | | 400 | | | 4,104 |
| Stillwater Mining Co. † | | 1,300 | | | 12,324 |
| U.S. Gold Corp. † | | 2,073 | | | 5,141 |
| Verso Paper Corp. † | | 700 | | | 1,827 |
| | | | | |
| | | | | 154,242 |
| | | | | |
| Media - 4.0% | | | | | |
| Arbitron, Inc. | | 300 | | | 7,026 |
| Belo Corp. | | 1,100 | | | 5,984 |
| Carmike Cinemas, Inc. † | | 150 | | | 1,134 |
| Dolan Media Co. † | | 400 | | | 4,084 |
| Entercom Communications Corp. Class A † | | 500 | | | 3,535 |
| Entravision Communications Corp. Class A † | | 1,000 | | | 3,400 |
| E.W. Scripps Co. Class A † | | 700 | | | 4,872 |
| Harte-Hanks, Inc. | | 700 | | | 7,546 |
| Knology, Inc. † | | 400 | | | 4,380 |
| Lee Enterprises, Inc. † | | 800 | | | 2,776 |
| LIN TV Corp. Class A † | | 700 | | | 3,122 |
| LodgeNet Interactive Corp. † | | 368 | | | 2,035 |
| Martha Stewart Living Omnimedia, Inc. Class A † | | 800 | | | 3,952 |
| McClatchy Co. Class A | | 1,000 | | | 3,540 |
| Media General, Inc. Class A † | | 400 | | | 3,136 |
| Meredith Corp. | | 500 | | | 15,425 |
| National CineMedia, Inc. | | 489 | | | 8,103 |
| Radio One, Inc. Class D † | | 900 | | | 2,610 |
| | | | | |
| | | SHARES | | VALUE (Note 2) |
| Media - 4.0% (continued) | | | | | |
| Rentrak Corp. † | | 100 | | $ | 1,767 |
| Salem Communications Corp. Class A † | | 400 | | | 2,396 |
| Scholastic Corp. † | | 300 | | | 8,949 |
| Valassis Communications, Inc. † | | 500 | | | 9,130 |
| Warner Music Group Corp. † | | 1,600 | | | 9,056 |
| World Wrestling Entertainment, Inc. Class A | | 734 | | | 11,252 |
| | | | | |
| | | | | 129,210 |
| | | | | |
| Pharmaceuticals, Biotechnology & Life Sciences - 8.1% |
| Acadia Pharmaceuticals, Inc. † | | 1,000 | | | 1,320 |
| Accelrys, Inc. † | | 503 | | | 2,882 |
| Affymax, Inc. † | | 167 | | | 4,132 |
| Ardea Biosciences, Inc. † | | 144 | | | 2,016 |
| ARIAD Pharmaceuticals, Inc. † | | 1,700 | | | 3,876 |
| AVANIR Pharmaceuticals, Inc. Class A † | | 684 | | | 1,300 |
| AVI BioPharma, Inc. † | | 1,700 | | | 2,482 |
| BioCryst Pharmaceuticals, Inc. † | | 702 | | | 4,535 |
| BioSpecifics Technologies Corp. † | | 100 | | | 2,935 |
| Cell Therapeutics, Inc. † | | 6,600 | | | 7,524 |
| CEL-SCI Corp. † | | 3,100 | | | 2,790 |
| Chelsea Therapeutics International Ltd. † | | 800 | | | 2,160 |
| Clinical Data, Inc. † | | 300 | | | 5,478 |
| Curis, Inc. † | | 1,000 | | | 3,250 |
| Cytori Therapeutics, Inc. † | | 600 | | | 3,660 |
| Dionex Corp. † | | 200 | | | 14,773 |
| Enzon Pharmaceuticals, Inc. † | | 500 | | | 5,265 |
| Helicos BioSciences Corp. † | | 900 | | | 927 |
| Hi-Tech Pharmacal Co. Inc. † | | 100 | | | 2,805 |
| ImmunoGen, Inc. † | | 478 | | | 3,757 |
| Immunomedics, Inc. † | | 724 | | | 2,324 |
| Incyte Corp. † | | 1,300 | | | 11,843 |
| Inovio Biomedical, Corp. † | | 1,700 | | | 1,938 |
| Inspire Pharmaceuticals, Inc. † | | 933 | | | 5,150 |
| Ista Pharmaceuticals, Inc. † | | 600 | | | 2,736 |
| Jazz Pharmaceuticals, Inc. † | | 300 | | | 2,364 |
| Keryx Biopharmaceuticals, Inc. † | | 1,000 | | | 2,500 |
| Lannett Co. Inc. † | | 300 | | | 1,773 |
| MannKind Corp. † | | 1,126 | | | 9,864 |
| Maxygen, Inc. † | | 350 | | | 2,132 |
| Medicis Pharmaceutical Corp. Class A | | 600 | | | 16,229 |
| Medivation, Inc. † | | 300 | | | 11,295 |
| Micromet, Inc. † | | 880 | | | 5,861 |
| Nektar Therapeutics † | | 810 | | | 7,549 |
| NeurogesX, Inc. † | | 300 | | | 2,313 |
| Novavax, Inc. † | | 1,400 | | | 3,724 |
| Oncothyreon, Inc. † | | 500 | | | 2,695 |
| Par Pharmaceutical Cos., Inc. † | | 400 | | | 10,824 |
| PDL BioPharma, Inc. | | 1,166 | | | 7,999 |
| Pharmasset, Inc. † | | 300 | | | 6,210 |
| Repligen, Corp. † | | 700 | | | 2,877 |
| Salix Pharmaceuticals Ltd. † | | 554 | | | 14,072 |
| Santarus, Inc. † | | 900 | | | 4,158 |
| Savient Pharmaceuticals, Inc. † | | 700 | | | 9,527 |
| SciClone Pharmaceuticals, Inc. † | | 900 | | | 2,097 |
| SIGA Technologies, Inc. † | | 870 | | | 5,046 |
| Spectrum Pharmaceuticals, Inc. † | | 633 | | | 2,811 |
| StemCells, Inc. † | | 1,347 | | | 1,697 |
| SuperGen, Inc. † | | 585 | | | 1,533 |
| Targacept, Inc. † | | 300 | | | 6,276 |
The accompanying notes are an integral part of these financial statements.
| | | | | | | | | | |
| AQR Funds | | | | Annual Report | | | | December 2009 | | 44 |
| | | | | | | |
| | |
| Schedule of Investments | | December 31, 2009 |
| | |
| AQR SMALL CAP MOMENTUM FUND | | |
| | | | | |
| | | SHARES | | VALUE (Note 2) |
| Pharmaceuticals, Biotechnology & Life Sciences - 8.1% (continued) |
| Vanda Pharmaceuticals, Inc. † | | 326 | | $ | 3,664 |
| Vical, Inc. † | | 800 | | | 2,632 |
| VIVUS, Inc. † | | 800 | | | 7,352 |
| ZymoGenetics, Inc. † | | 800 | | | 5,112 |
| | | | | |
| | | | | 264,044 |
| | | | | |
| Real Estate - 2.8% |
| Ashford Hospitality Trust, Inc. REIT † | | 900 | | | 4,176 |
| CBL & Associates Properties, Inc. REIT | | 1,500 | | | 14,505 |
| DiamondRock Hospitality Co. REIT † | | 1,200 | | | 10,164 |
| DuPont Fabros Technology, Inc. REIT | | 500 | | | 8,995 |
| FelCor Lodging Trust, Inc. REIT † | | 900 | | | 3,240 |
| Forestar Group, Inc. REIT † | | 400 | | | 8,792 |
| Gladstone Commercial Corp. REIT | | 200 | | | 2,682 |
| Gramercy Capital Corp. REIT † | | 1,000 | | | 2,590 |
| LaSalle Hotel Properties REIT | | 600 | | | 12,738 |
| Medical Properties Trust, Inc. REIT | | 800 | | | 8,000 |
| Ramco-Gershenson Properties Trust REIT | | 400 | | | 3,816 |
| Sun Communities, Inc. REIT | | 209 | | | 4,128 |
| U-Store-It Trust REIT | | 1,000 | | | 7,320 |
| | | | | |
| | | | | 91,146 |
| | | | | |
| Retailing - 10.6% | | | | | |
| America’s Car-Mart, Inc. † | | 97 | | | 2,554 |
| AnnTaylor Stores Corp. † | | 700 | | | 9,548 |
| Asbury Automotive Group, Inc. † | | 400 | | | 4,612 |
| Barnes & Noble, Inc. | | 800 | | | 15,256 |
| Big 5 Sporting Goods Corp. | | 225 | | | 3,866 |
| Blue Nile, Inc. † | | 128 | | | 8,106 |
| Bon-Ton Stores, Inc. | | 300 | | | 2,943 |
| Books-A-Million, Inc. | | 300 | | | 2,016 |
| Cabela’s, Inc. † | | 797 | | | 11,365 |
| Casual Male Retail Group, Inc. † | | 1,100 | | | 2,563 |
| Charming Shoppes, Inc. † | | 1,200 | | | 7,764 |
| Citi Trends, Inc. † | | 133 | | | 3,673 |
| Collective Brands, Inc. † | | 600 | | | 13,662 |
| Core-Mark Holding Co, Inc. † | | 105 | | | 3,461 |
| Dillard’s, Inc. Class A | | 700 | | | 12,915 |
| Dress Barn, Inc. † | | 723 | | | 16,700 |
| drugstore.com, Inc. † | | 1,600 | | | 4,944 |
| DSW, Inc. Class A † | | 511 | | | 13,225 |
| Finish Line, Inc. Class A | | 500 | | | 6,275 |
| Gander Mountain Co. † | | 600 | | | 3,060 |
| Genesco, Inc. † | | 300 | | | 8,238 |
| Group 1 Automotive, Inc. † | | 250 | | | 7,088 |
| Gymboree Corp. † | | 300 | | | 13,047 |
| Haverty Furniture Cos. Inc. † | | 225 | | | 3,089 |
| hhgregg, Inc. † | | 391 | | | 8,614 |
| Hot Topic, Inc. † | | 291 | | | 1,851 |
| Jo-Ann Stores, Inc. † | | 302 | | | 10,944 |
| Jos. A. Bank Clothiers, Inc. † | | 176 | | | 7,425 |
| Kirkland’s, Inc. † | | 161 | | | 2,797 |
| Lithia Motors, Inc. Class A † | | 200 | | | 1,644 |
| Lumber Liquidators, Inc. † | | 232 | | | 6,218 |
| MarineMax, Inc. † | | 300 | | | 2,757 |
| Men’s Wearhouse, Inc. | | 600 | | | 12,636 |
| NutriSystem, Inc. | | 300 | | | 9,351 |
| Orbitz Worldwide, Inc. † | | 1,000 | | | 7,340 |
| Penske Automotive Group, Inc. † | | 1,000 | | | 15,180 |
| Pep Boys - Manny, Moe & Jack | | 602 | | | 5,093 |
| Pier 1 Imports, Inc. † | | 900 | | | 4,581 |
| | | | | |
| | | SHARES | | VALUE (Note 2) |
| Retailing - 10.6% (continued) | | | | | |
| Retail Ventures, Inc. † | | 600 | | $ | 5,334 |
| Shoe Carnival, Inc. † | | 200 | | | 4,094 |
| Shutterfly, Inc. † | | 223 | | | 3,972 |
| Sonic Automotive, Inc. Class A † | | 600 | | | 6,234 |
| Stein Mart, Inc. † | | 565 | | | 6,023 |
| Systemax, Inc. † | | 400 | | | 6,284 |
| Talbots, Inc. † | | 600 | | | 5,346 |
| Taleo Corp. | | 400 | | | 9,408 |
| Ulta Salon Cosmetics & Fragrance, Inc. † | | 600 | | | 10,896 |
| U.S. Auto Parts Network, Inc. † | | 600 | | | 3,120 |
| ValueVision Media, Inc. Class A † | | 500 | | | 2,400 |
| West Marine, Inc. † | | 400 | | | 3,224 |
| | | | | |
| | | | | 342,736 |
| | | | | |
| Semiconductors & Semiconductor Equipment - 6.6% |
| Amkor Technology, Inc. † | | 1,800 | | | 12,888 |
| ANADIGICS, Inc. † | | 900 | | | 3,798 |
| Applied Micro Circuits Corp. † | | 508 | | | 3,795 |
| Cavium Networks, Inc. † | | 500 | | | 11,915 |
| Cymer, Inc. † | | 381 | | | 14,623 |
| Diodes, Inc. † | | 600 | | | 12,270 |
| Entegris, Inc. † | | 1,400 | | | 7,392 |
| Entropic Communications, Inc. † | | 1,100 | | | 3,377 |
| Fairchild Semiconductor International, Inc. † | | 1,400 | | | 13,986 |
| Kopin Corp. † | | 530 | | | 2,215 |
| Kulicke & Soffa Industries, Inc. † | | 800 | | | 4,312 |
| Lattice Semiconductor Corp. † | | 1,200 | | | 3,240 |
| LTX-Credence Corp. † | | 1,700 | | | 3,026 |
| MIPS Technologies, Inc. † | | 1,022 | | | 4,466 |
| Monolithic Power Systems, Inc. † | | 291 | | | 6,975 |
| Nanometrics, Inc. † | | 300 | | | 3,399 |
| Netlogic Microsystems, Inc. † | | 291 | | | 13,462 |
| NVE Corp. † | | 42 | | | 1,735 |
| OmniVision Technologies, Inc. † | | 593 | | | 8,616 |
| Photronics, Inc. † | | 500 | | | 2,225 |
| Power Integrations, Inc. | | 300 | | | 10,908 |
| RF Micro Devices, Inc. † | | 2,683 | | | 12,798 |
| Rubicon Technology, Inc. † | | 200 | | | 4,062 |
| Tessera Technologies, Inc. † | | 563 | | | 13,101 |
| Trident Microsystems, Inc. † | | 800 | | | 1,488 |
| TriQuint Semiconductor Corp. † | | 1,700 | | | 10,200 |
| Ultra Clean Holdings † | | 400 | | | 2,796 |
| Veeco Instruments, Inc. † | | 400 | | | 13,216 |
| Volterra Semiconductor Corp. † | | 300 | | | 5,736 |
| Zoran Corp. † | | 202 | | | 2,232 |
| | | | | |
| | | | | 214,252 |
| | | | | |
| Software & Services - 12.1% | | | | | |
| Actuate Corp. † | | 715 | | | 3,060 |
| Advent Software, Inc. † | | 300 | | | 12,219 |
| American Software, Inc. Class A | | 400 | | | 2,400 |
| ArcSight, Inc. † | | 340 | | | 8,697 |
| Ariba, Inc. † | | 900 | | | 11,268 |
| Art Technology Group, Inc. † | | 1,706 | | | 7,694 |
| Blackbaud, Inc. | | 500 | | | 11,815 |
| Blackboard, Inc. † | | 300 | | | 13,617 |
| Bottomline Technologies, Inc. † | | 215 | | | 3,778 |
| CommVault Systems, Inc. † | | 500 | | | 11,845 |
| Deltek, Inc. † | | 800 | | | 6,224 |
| Ebix, Inc. † | | 179 | | | 8,741 |
The accompanying notes are an integral part of these financial statements.
| | | | | | | | | | |
| AQR Funds | | | | Annual Report | | | | December 2009 | | 45 |
| | | | | | | |
| | |
| Schedule of Investments | | December 31, 2009 |
| | |
| AQR SMALL CAP MOMENTUM FUND | | |
| | | | | |
| | | SHARES | | VALUE (Note 2) |
| Software & Services - 12.1% (continued) | | | |
| Euronet Worldwide, Inc. † | | 611 | | $ | 13,411 |
| Exlservice Holdings, Inc. † | | 300 | | | 5,448 |
| Global Cash Access Holdings, Inc. † | | 913 | | | 6,838 |
| GSI Commerce, Inc. † | | 498 | | | 12,644 |
| iGATE Corp. | | 700 | | | 7,000 |
| InfoGROUP, Inc. | | 800 | | | 6,416 |
| Innodata Isogen, Inc. † | | 288 | | | 1,596 |
| Interactive Intelligence, Inc. † | | 151 | | | 2,784 |
| JDA Software Group, Inc. † | | 400 | | | 10,188 |
| Knot, Inc. † | | 200 | | | 2,014 |
| Lionbridge Technologies, Inc. † | | 900 | | | 2,070 |
| LivePerson, Inc. † | | 651 | | | 4,537 |
| MicroStrategy, Inc. Class A † | | 100 | | | 9,402 |
| ModusLink Global Solutions, Inc. † | | 500 | | | 4,705 |
| MoneyGram International, Inc. † | | 789 | | | 2,272 |
| Netezza Corp. † | | 800 | | | 7,760 |
| NetSuite, Inc. † | | 600 | | | 9,588 |
| NIC, Inc. † | | 420 | | | 3,839 |
| Openwave Systems, Inc. † | | 642 | | | 1,464 |
| Pegasystems, Inc. | | 402 | | | 13,668 |
| Perficient, Inc. † | | 500 | | | 4,215 |
| Radiant Systems, Inc. † | | 500 | | | 5,200 |
| RightNow Technologies, Inc. † | | 400 | | | 6,948 |
| Sapient Corp. † | | 1,400 | | | 11,578 |
| SAVVIS, Inc. † | | 651 | | | 9,147 |
| Smith Micro Software, Inc. † | | 166 | | | 1,517 |
| Sonic Solutions † | | 300 | | | 3,549 |
| SonicWALL, Inc. † | | 600 | | | 4,566 |
| Sourcefire, Inc. † | | 214 | | | 5,725 |
| SuccessFactors, Inc. † | | 600 | | | 9,948 |
| TeleTech Holdings, Inc. † | | 700 | | | 14,021 |
| Terremark Worldwide, Inc. † | | 800 | | | 5,472 |
| TNS, Inc. † | | 300 | | | 7,707 |
| Travelzoo, Inc. † | | 162 | | | 1,991 |
| Tyler Technologies, Inc. † | | 496 | | | 9,875 |
| Ultimate Software Group, Inc. | | 300 | | | 8,811 |
| Unisys Corp. † | | 400 | | | 15,425 |
| VeriFone Holdings, Inc. † | | 800 | | | 13,104 |
| Virnetx Holding Corp. † | | 700 | | | 2,065 |
| Virtusa Corp. † | | 400 | | | 3,624 |
| Web.com Group, Inc. † | | 500 | | | 3,265 |
| Wright Express Corp. † | | 446 | | | 14,210 |
| | | | | |
| | | | | 390,965 |
| | | | | |
| Technology Hardware & Equipment - 8.9% | | | |
| Acme Packet, Inc. † | | 635 | | | 6,985 |
| Affymetrix, Inc. † | | 700 | | | 4,088 |
| Agilysys, Inc. | | 300 | | | 2,730 |
| Anaren, Inc. † | | 211 | | | 3,176 |
| Aruba Networks, Inc. † | | 1,017 | | | 10,841 |
| BigBand Networks, Inc. † | | 519 | | | 1,785 |
| Blue Coat Systems, Inc. † | | 469 | | | 13,385 |
| Brightpoint, Inc. † | | 900 | | | 6,615 |
| Ciena Corp. † | | 1,200 | | | 13,008 |
| Compellent Technologies, Inc. † | | 284 | | | 6,441 |
| Comverge, Inc. † | | 300 | | | 3,372 |
| Cray, Inc. † | | 381 | | | 2,446 |
| CTS Corp. | | 500 | | | 4,810 |
| DG Fastchannel, Inc. † | | 300 | | | 8,379 |
| | | | | |
| | | SHARES | | VALUE (Note 2) |
| Technology Hardware & Equipment - 8.9% (continued) |
| DTS, Inc. † | | 200 | | $ | 6,842 |
| Finisar Corp. † | | 800 | | | 7,136 |
| Hughes Communications, Inc. † | | 300 | | | 7,809 |
| Hutchinson Technology, Inc. † | | 300 | | | 3,078 |
| Intevac, Inc. † | | 300 | | | 3,441 |
| Isilon Systems, Inc. † | | 800 | | | 5,488 |
| Littelfuse, Inc. † | | 200 | | | 6,430 |
| Loral Space & Communications, Inc. † | | 304 | | | 9,609 |
| Maxwell Technologies, Inc. † | | 272 | | | 4,852 |
| Mercury Computer Systems, Inc. † | | 380 | | | 4,184 |
| Multi-Fineline Electronix, Inc. † | | 300 | | | 8,511 |
| NETGEAR, Inc. † | | 267 | | | 5,791 |
| Network Equipment Technologies, Inc. † | | 500 | | | 2,025 |
| Novatel Wireless, Inc. † | | 309 | | | 2,463 |
| Oclaro, Inc. † | | 2,400 | | | 3,528 |
| Oplink Communications, Inc. † | | 206 | | | 3,376 |
| Plantronics, Inc. | | 500 | | | 12,990 |
| Plexus Corp. † | | 500 | | | 14,251 |
| Powerwave Technologies, Inc. † | | 2,500 | | | 3,150 |
| Quantum Corp. † | | 2,400 | | | 7,032 |
| Sanmina-SCI Corp. † | | 700 | | | 7,721 |
| ShoreTel, Inc. † | | 280 | | | 1,618 |
| Smart Modular Technologies (WWH), Inc. † | | 700 | | | 4,403 |
| Spectrum Control, Inc. † | | 400 | | | 3,788 |
| STEC, Inc. † | | 500 | | | 8,170 |
| Super Micro Computer, Inc. † | | 500 | | | 5,560 |
| Symmetricom, Inc. † | | 468 | | | 2,434 |
| Synaptics, Inc. † | | 400 | | | 12,260 |
| SYNNEX Corp. † | | 361 | | | 11,068 |
| TTM Technologies, Inc. † | | 500 | | | 5,765 |
| Vishay Intertechnology, Inc. | | 1,900 | | | 15,866 |
| | | | | |
| | | | | 288,700 |
| | | | | |
| Telecommunication Services - 1.4% | | | | | |
| AboveNet, Inc. † | | 200 | | | 13,007 |
| Atlantic Tele-Network, Inc. | | 182 | | | 10,012 |
| Cincinnati Bell, Inc. † | | 2,400 | | | 8,280 |
| inContact, Inc. † | | 906 | | | 2,655 |
| PAETEC Holding Corp. † | | 1,300 | | | 5,395 |
| TerreStar Corp. † | | 2,700 | | | 2,538 |
| Vonage Holdings Corp. † | | 2,100 | | | 2,940 |
| | | | | |
| | | | | 44,827 |
| | | | | |
| Transportation - 1.5% |
| Air Transport Services Group, Inc. † | | 700 | | | 1,848 |
| Atlas Air Worldwide Holdings, Inc. † | | 200 | | | 7,450 |
| Avis Budget Group, Inc. † | | 900 | | | 11,808 |
| Dollar Thrifty Automotive Group, Inc. † | | 200 | | | 5,122 |
| Genco Shipping & Trading Ltd. | | 400 | | | 8,952 |
| International Shipholding Corp. | | 100 | | | 3,107 |
| Macquarie Infrastructure Co. LLC † | | 400 | | | 4,912 |
| Pinnacle Airlines Corp. † | | 400 | | | 2,752 |
| Saia, Inc. † | | 114 | | | 1,689 |
| | | | | |
| | | | | 47,640 |
| | | | | |
TOTAL COMMON STOCKS
(cost $3,038,011) | | | | | 3,233,503 |
| | | | | |
| EXCHANGE-TRADED FUND - 0.2% | | | | | |
iShares Russell 2000 Index Fund
(cost $5,986) | | 100 | | | 6,226 |
| | | | | |
The accompanying notes are an integral part of these financial statements.
| | | | | | | | | | |
| AQR Funds | | | | Annual Report | | | | December 2009 | | 46 |
| | | | | | | |
| | |
| Schedule of Investments | | December 31, 2009 |
| | |
| AQR SMALL CAP MOMENTUM FUND | | |
| | | | | |
| | | SHARES | | VALUE (Note 2) |
| MONEY MARKET FUND - 2.1% | | | | | |
| Dreyfus Institutional Cash Advance 99 - Institutional Class, 0.28% (a)(b) | | | | | |
(cost $66,634) | | 66,634 | | $ | 66,634 |
| | | | | |
TOTAL INVESTMENTS - 102.1% | | | | | |
(cost $3,110,631) | | | | | 3,306,363 |
| | | | | |
LIABILITIES IN EXCESS OF OTHER
ASSETS - (2.1) % | | | | | (66,758) |
| | | | | |
| NET ASSETS - 100.0% | | | | $ | 3,239,605 |
| | | | | |
All securities are United States companies, unless noted otherwise in parentheses.
| (†) | Non-income producing security. |
| (a) | Represents annualized seven-day yield as of December 31, 2009. |
| (b) | Level 2 security (See Note 4). |
All securities are Level 1, unless noted otherwise in parentheses.
The following abbreviations are used in portfolio descriptions:
REIT - Real Estate Investment Trust.
The accompanying notes are an integral part of these financial statements.
| | | | | | | | | | |
| AQR Funds | | | | Annual Report | | | | December 2009 | | 47 |
| | | | | | | |
| | |
| Schedule of Investments | | December 31, 2009 |
| | |
| AQR INTERNATIONAL MOMENTUM FUND | | |
| | | | | |
| COMMON STOCKS - 86.3% | | SHARES | | VALUE (Note 2) |
| Australia - 12.2% | | | | | |
| Amcor Ltd. | | 4,657 | | $ | 25,927 |
| ASX Ltd. | | 442 | | | 13,780 |
| Australia & New Zealand Banking Group Ltd. † | | 17,368 | | | 353,932 |
| BHP Billiton Ltd. | | 36,450 | | | 1,394,818 |
| Coca-Cola Amatil Ltd. | | 3,488 | | | 35,963 |
| Commonwealth Bank of Australia | | 10,457 | | | 510,529 |
| Computershare Ltd. | | 3,550 | | | 36,322 |
| Energy Resources of Australia Ltd. | | 323 | | | 6,893 |
| Equinox Minerals Ltd (b)† | | 6,100 | | | 23,855 |
| Fortescue Metals Group Ltd. † | | 22,627 | | | 89,500 |
| Harvey Norman Holdings Ltd. | | 4,948 | | | 18,654 |
| Macquarie Group Ltd. | | 2,391 | | | 102,445 |
| National Australia Bank Ltd. | | 10,904 | | | 266,102 |
| New Hope Corp Ltd. | | 4,832 | | | 20,306 |
| Orica Ltd. | | 2,058 | | | 47,848 |
| Oxiana Resources NL † | | 31,220 | | | 33,277 |
| Sonic Healthcare Ltd. | | 1,630 | | | 22,449 |
| Toll Holdings Ltd. | | 1,130 | | | 8,824 |
| Wesfarmers Ltd. | | 6,924 | | | 193,559 |
| Westpac Banking Corp. | | 17,653 | | | 398,758 |
| WorleyParsons Ltd. | | 1,373 | | | 35,651 |
| | | | | |
| | | | | 3,639,392 |
| | | | | |
| Austria - 1.3% | | | | | |
| Erste Bank AG | | 2,815 | | | 104,602 |
| Immoeast AG † | | 9,115 | | | 50,043 |
| OMV AG | | 2,026 | | | 88,894 |
| Raiffeisen International Bank-Holding | | 1,503 | | | 83,967 |
| Voestalpine AG | | 1,187 | | | 43,365 |
| | | | | |
| | | | | 370,871 |
| | | | | |
| Belgium - 2.6% | | | | | |
| Anheuser-Busch InBev NV | | 10,685 | | | 553,132 |
| Delhaize Group | | 197 | | | 15,070 |
| Dexia SA † | | 14,154 | | | 89,096 |
| Fortis † | | 20,650 | | | 76,439 |
| UCB SA | | 648 | | | 27,047 |
| | | | | |
| | | | | 760,784 |
| | | | | |
| Canada - 10.3% (b) | | | | | |
| Agrium, Inc. | | 600 | | | 37,531 |
| Bank of Montreal | | 3,300 | | | 176,225 |
| Bank of Nova Scotia | | 5,400 | | | 254,136 |
| Bell Aliant Regional Communication Income Fund | | 1,900 | | | 50,922 |
| Cameco Corp. | | 1,900 | | | 61,640 |
| Canadian Imperial Bank of Commerce | | 1,900 | | | 123,808 |
| Canadian Natural Resources Ltd. | | 3,100 | | | 225,271 |
| Canadian Oil Sands Trust | | 2,700 | | | 77,217 |
| Canadian Tire Corp. Class A | | 600 | | | 32,988 |
| CGI Group. Inc. Class A † | | 2,200 | | | 29,955 |
| CI Financial Corp. | | 1,900 | | | 39,967 |
| Crescent Point Energy Corp. | | 1,100 | | | 41,534 |
| Eldorado Gold Corp. † | | 2,300 | | | 32,812 |
| First Quantum Minerals Ltd. | | 400 | | | 30,697 |
| Franco-Nevada Corp. | | 800 | | | 21,494 |
| George Weston Ltd. | | 300 | | | 19,196 |
| Goldcorp, Inc. | | 1,000 | | | 39,537 |
| IAMGOLD Corp. | | 2,200 | | | 34,730 |
| IGM Financial, Inc. | | 1,300 | | | 52,716 |
| Ivanhoe Mines Ltd. † | | 1,500 | | | 22,245 |
| | | | | |
| | | SHARES | | VALUE (Note 2) |
| Canada - 10.3% (continued) | | | | | |
| Kinross Gold Corp | | 1,000 | | $ | 18,521 |
| Loblaw Cos. Ltd. | | 500 | | | 16,197 |
| Lundin Mining Corp. † | | 5,600 | | | 23,024 |
| Metro, Inc. Class A | | 300 | | | 11,250 |
| National Bank of Canada | | 800 | | | 46,079 |
| Niko Resources Ltd. | | 100 | | | 9,409 |
| Pacific Rubiales Energy Corp. | | 1,200 | | | 17,727 |
| Petrobank Energy and Resources Ltd. † | | 800 | | | 39,172 |
| Royal Bank of Canada | | 7,700 | | | 415,241 |
| Saputo, Inc. | | 900 | | | 26,462 |
| Silver Wheaton Corp. † | | 2,900 | | | 44,033 |
| SNC-Lavalin Group, Inc. | | 800 | | | 41,298 |
| Suncor Energy, Inc. | | 9,500 | | | 337,998 |
| Talisman Energy, Inc. | | 6,500 | | | 122,374 |
| Teck Resources Ltd. Class B † | | 3,900 | | | 137,303 |
| Toronto-Dominion Bank | | 5,100 | | | 321,649 |
| Yamana Gold, Inc. | | 3,100 | | | 35,569 |
| | | | | |
| | | | | 3,067,927 |
| | | | | |
| China - 0.2% | | | | | |
| Foxconn International Holdings Ltd. † | | 40,000 | | | 46,048 |
| | | | | |
| Denmark - 0.6% | | | | | |
| Carlsberg A/S Class B | | 960 | | | 70,670 |
| Danske Bank A/S † | | 3,374 | | | 75,744 |
| Novo Nordisk A/S Class B | | 585 | | | 37,347 |
| | | | | |
| | | | | 183,761 |
| | | | | |
| Finland - 0.4% | | | | | |
| Kone Oyi Class B | | 1,297 | | | 55,582 |
| Sampo Oyj Class A | | 2,722 | | | 66,308 |
| | | | | |
| | | | | 121,890 |
| | | | | |
| France - 9.6% | | | | | |
| Alcatel-Lucent † | | 11,746 | | | 39,551 |
| BNP Paribas | | 7,096 | | | 562,840 |
| Bouygues SA | | 827 | | | 42,837 |
| Christian Dior SA | | 1,122 | | | 114,982 |
| CNP Assurances | | 840 | | | 81,342 |
| Compagnie Generale des Etablissements Michelin Class B | | 698 | | | 53,459 |
| Credit Agricole SA | | 17,563 | | | 308,228 |
| Eiffage SA | | 525 | | | 29,590 |
| Eramet | | 180 | | | 56,371 |
| Essilor International SA | | 668 | | | 39,954 |
| Fonciere des Regions | | 224 | | | 22,905 |
| Iliad SA | | 306 | | | 36,568 |
| Klepierre | | 1,272 | | | 51,535 |
| Lafarge SA | | 1,442 | | | 118,755 |
| Legrand SA | | 1,385 | | | 38,547 |
| LVMH Moet Hennessy Louis Vuitton SA | | 3,401 | | | 381,346 |
| Natixis | | 22,157 | | | 110,637 |
| PSA Peugeot Citroen SA † | | 1,413 | | | 47,501 |
| PPR | | 812 | | | 97,468 |
| Publicis Groupe | | 916 | | | 37,245 |
| Renault SA † | | 1,705 | | | 87,466 |
| Schneider Electric SA | | 1,421 | | | 165,224 |
| Technip SA | | 579 | | | 40,736 |
| Unibail-Rodamco | | 535 | | | 117,529 |
| Vallourec SA | | 431 | | | 77,976 |
| Vinci SA | | 1,765 | | | 99,318 |
| | | | | |
| | | | | 2,859,910 |
| | | | | |
The accompanying notes are an integral part of these financial statements.
| | | | | | | | | | |
| AQR Funds | | | | Annual Report | | | | December 2009 | | 48 |
| | | | | | | |
| | |
| Schedule of Investments | | December 31, 2009 |
| | |
| AQR INTERNATIONAL MOMENTUM FUND | | |
| | | | | |
| | | SHARES | | VALUE (Note 2) |
| Germany - 5.7% | | | | | |
| Adidas AG | | 1,335 | | $ | 72,311 |
| BASF SE | | 6,719 | | | 415,843 |
| Bayerische Motoren Werke AG | | 3,856 | | | 175,533 |
| Deutsche Bank AG | | 4,240 | | | 299,810 |
| Deutsche Postbank AG † | | 1,760 | | | 57,496 |
| Hannover Rueckversicherung AG † | | 181 | | | 8,456 |
| Heidelbergcement AG | | 1,146 | | | 79,282 |
| Henkel AG & Co. KGaA | | 2,539 | | | 133,331 |
| Hochtief AG | | 330 | | | 25,168 |
| Linde AG | | 1,020 | | | 122,892 |
| MAN SE | | 1,033 | | | 80,153 |
| Metro AG | | 1,805 | | | 110,236 |
| ThyssenKrupp AG | | 1,828 | | | 68,719 |
| Wacker Chemie AG | | 346 | | | 60,185 |
| | | | | |
| | | | | 1,709,415 |
| | | | | |
| Hong Kong - 8.2% | | | | | |
| Bank of East Asia Ltd. | | 16,400 | | | 64,428 |
| BOC Hong Kong Holdings Ltd. | | 75,500 | | | 169,624 |
| Cathay Pacific Airways Ltd. | | 27,000 | | | 50,141 |
| Dairy Farm International Holdings Ltd. | | 5,400 | | | 32,251 |
| Esprit Holdings Ltd. | | 6,353 | | | 42,150 |
| Guoco Group Ltd. | | 4,000 | | | 42,723 |
| Hang Lung Group Ltd. | | 8,000 | | | 39,564 |
| Hang Lung Properties Ltd. | | 22,000 | | | 86,248 |
| Henderson Land Development Co. Ltd. | | 12,000 | | | 89,673 |
| Hong Kong and China Gas Co. Ltd. | | 37,000 | | | 92,802 |
| Hong Kong Exchanges & Clearing Ltd. | | 7,000 | | | 124,547 |
| Hong Kong Land Holdings Ltd. | | 13,000 | | | 64,026 |
| Hutchison Whampoa Ltd. | | 31,000 | | | 212,098 |
| Jardine Matheson Holdings Ltd. | | 4,400 | | | 132,188 |
| Jardine Strategic Holdings Ltd. | | 5,500 | | | 96,436 |
| Kerry Properties Ltd. | | 8,500 | | | 42,993 |
| Li & Fung Ltd. | | 24,000 | | | 99,227 |
| Link REIT | | 13,000 | | | 33,172 |
| MTR Corp. Ltd. | | 34,500 | | | 118,855 |
| New World Development Co. Ltd. | | 19,000 | | | 38,711 |
| Noble Group Ltd. | | 30,000 | | | 68,813 |
| NWS Holdings Ltd. | | 4,000 | | | 7,341 |
| Orient Overseas International Ltd. | | 7,000 | | | 32,460 |
| SHANGRI-LA Asia Ltd. | | 20,000 | | | 37,472 |
| Sino Land Co. Ltd. | | 24,000 | | | 46,205 |
| Sino-Forest Corp. †(b) | | 1,400 | | | 25,943 |
| Skyworth Digital Holdings Ltd. | | 22,000 | | | 22,564 |
| Sun Hung Kai Properties Ltd. | | 16,000 | | | 237,906 |
| Swire Pacific Ltd. Class A | | 8,000 | | | 96,747 |
| Wharf Holdings Ltd. | | 19,000 | | | 109,041 |
| Wheelock and Co. Ltd. | | 19,000 | | | 57,955 |
| Yue Yuen Industrial Holdings Ltd. | | 13,500 | | | 39,086 |
| | | | | |
| | | | | 2,453,390 |
| | | | | |
| Italy - 2.2% | | | | | |
| Atlantia SpA | | 2,720 | | | 71,134 |
| Fiat SpA † | | 8,493 | | | 124,286 |
| Mediaset SpA | | 5,843 | | | 48,041 |
| Saipem SpA | | 2,045 | | | 70,574 |
| UniCredit SpA † | | 98,081 | | | 327,959 |
| | | | | |
| | | | | 641,994 |
| | | | | |
| Japan - 9.5% | | | | | |
| Aisin Seiki Co Ltd. | | 1,500 | | | 43,337 |
| AMADA Co. Ltd. | | 4,000 | | | 25,055 |
| | | | | |
| | | SHARES | | VALUE (Note 2) |
| Japan - 9.5% (continued) | | | | | |
| Chiba Bank Ltd. | | 4,000 | | $ | 23,925 |
| COMSYS Holdings Corp. | | 1,500 | | | 15,779 |
| Daicel Chemical Industries Ltd. | | 3,000 | | | 17,622 |
| Dainippon Sumitomo Pharma Co. Ltd. | | 1,100 | | | 11,545 |
| Denso Corp. | | 5,000 | | | 151,085 |
| Fuji Media Holdings, Inc. | | 10 | | | 13,856 |
| GS Yuasa Corp. | | 4,000 | | | 29,571 |
| Hirose Electric Co. Ltd. | | 300 | | | 31,455 |
| Hitachi Chemical Co. Ltd. | | 1,700 | | | 34,647 |
| Hitachi Construction Machinery Co. Ltd. | | 1,400 | | | 36,698 |
| Hitachi Maxell Ltd. | | 1,000 | | | 18,191 |
| Hitachi Software Engineering Co. Ltd. | | 700 | | | 19,813 |
| Honda Motor Co. Ltd. | | 10,800 | | | 366,430 |
| Hoya Corp. | | 1,800 | | | 48,029 |
| IBIDEN Co. Ltd. | | 900 | | | 32,278 |
| IHI Corp. † | | 12,000 | | | 19,137 |
| JSR Corp. | | 1,600 | | | 32,562 |
| Kaneka Corp. | | 3,000 | | | 19,114 |
| Kansai Paint Co. Ltd. | | 4,000 | | | 33,522 |
| Kawasaki Heavy Industries Ltd. | | 11,000 | | | 27,920 |
| Keihin Electric Express Railway Co. Ltd. | | 1,000 | | | 7,362 |
| Keio Corp. | | 1,000 | | | 6,034 |
| Keisei Electric Railway Co. Ltd. | | 1,000 | | | 5,471 |
| Komatsu Ltd. | | 5,100 | | | 106,764 |
| Kubota Corp. | | 4,000 | | | 36,703 |
| Kurita Water Industries Ltd. | | 600 | | | 18,851 |
| Makita Corp. | | 900 | | | 30,913 |
| Matsui Matsushita Electric Works Co. Ltd. | | 1,000 | | | 12,116 |
| McDonald’s Holdings Co. Japan Ltd | | 500 | | | 9,563 |
| Mitsubishi Corp. | | 8,500 | | | 211,723 |
| Mizuho Investors Securities Co. Ltd. † | | 10,000 | | | 9,747 |
| Mizuho Securities Co. Ltd | | 10,000 | | | 30,260 |
| NGK Insulators Ltd. | | 2,000 | | | 43,739 |
| NGK Spark Plug Co. Ltd. | | 1,000 | | | 11,344 |
| Nidec Corp. | | 800 | | | 73,939 |
| Nikon Corp. | | 1,800 | | | 35,544 |
| Nippon Electric Glass Co. Ltd. | | 2,000 | | | 27,528 |
| Nippon Kayaku Co. Ltd. | | 1,000 | | | 9,026 |
| Nippon Mining Holdings, Inc. | | 5,500 | | | 23,605 |
| Nippon Television Network Corp. | | 140 | | | 18,198 |
| Nissan Chemical Industries Ltd. | | 2,000 | | | 28,508 |
| Nissan Motor Co. Ltd. † | | 24,300 | | | 213,546 |
| Nitori Co. Ltd. | | 100 | | | 7,443 |
| Olympus Corp. | | 1,100 | | | 35,465 |
| Park24 Co. Ltd. | | 2,000 | | | 21,272 |
| Rohm Co. Ltd. | | 600 | | | 39,158 |
| Santen Pharmaceutical Co. Ltd. | | 700 | | | 22,486 |
| Sega Sammy Holdings, Inc. | | 1,100 | | | 13,163 |
| Seino Holdings Co. Ltd. | | 3,000 | | | 19,042 |
| Sharp Corp. | | 6,000 | | | 75,770 |
| Shikoku Shimamura Co., Ltd. | | 100 | | | 9,555 |
| Shimano, Inc. | | 800 | | | 32,298 |
| Shin-Etsu Chemical Co. Ltd. | | 600 | | | 33,875 |
| Shinko Electric Industries Co., Ltd. | | 1,200 | | | 17,468 |
| Softbank Corp. | | 400 | | | 9,377 |
| Stanley Electric Co. Ltd. | | 1,300 | | | 26,368 |
| SUMCO Corp. | | 1,300 | | | 22,972 |
| Sumitomo Metal Mining Co. Ltd. | | 5,000 | | | 73,788 |
| Suzuki Motor Corp. | | 3,100 | | | 76,344 |
The accompanying notes are an integral part of these financial statements.
| | | | | | | | | | |
| AQR Funds | | | | Annual Report | | | | December 2009 | | 49 |
| | | | | | | |
| | |
| Schedule of Investments | | December 31, 2009 |
| | |
| AQR INTERNATIONAL MOMENTUM FUND | | |
| | | | | |
| | | SHARES | | VALUE (Note 2) |
| Japan - 9.5% (continued) | | | | | |
| Taiyo Nippon Sanso Corp. | | 2,000 | | $ | 21,285 |
| TDK Corp. | | 600 | | | 36,667 |
| Tokyo Electron Ltd. | | 900 | | | 57,769 |
| Tokyu Land Corp. | | 3,000 | | | 11,144 |
| Toppan Printing Co. Ltd. | | 2,000 | | | 16,284 |
| Toyo Seikan Kaisha Ltd. | | 1,400 | | | 21,328 |
| Toyoda Gosei Co. Ltd. | | 900 | | | 27,265 |
| Toyota Boshoku Corp. | | 1,100 | | | 24,560 |
| Toyota Tsusho Corp. | | 2,600 | | | 38,474 |
| Yokogawa Electric Corp. | | 1,900 | | | 16,780 |
| | | | | |
| | | | | 2,829,455 |
| | | | | |
| Luxembourg - 1.8% | | | | | |
| ArcelorMittal | | 8,665 | | | 377,600 |
| Tenaris SA | | 7,216 | | | 155,511 |
| | | | | |
| | | | | 533,111 |
| | | | | |
| Netherlands - 2.1% | | | | | |
| Akzo Nobel NV | | 1,382 | | | 91,647 |
| ASML Holding NV | | 2,850 | | | 97,304 |
| European Aeronautic Defence and Space Co. NV | | 1,098 | | | 22,071 |
| Hal Trust | | 326 | | | 33,256 |
| Heineken NV | | 2,468 | | | 117,165 |
| Koninklijke (Royal) KPN NV | | 1,108 | | | 54,440 |
| Koninklijke (Royal) Philips Electronics NV | | 4,755 | | | 140,555 |
| Koninklijke KPN NV | | 2,245 | | | 38,159 |
| Randstad Holding NV † | | 877 | | | 43,637 |
| | | | | |
| | | | | 638,234 |
| | | | | |
| Norway - 1.7% | | | | | |
| DnB NOR ASA † | | 12,400 | | | 133,867 |
| Norsk Hydro ASA | | 6,600 | | | 55,443 |
| Seadrill Ltd. | | 3,250 | | | 82,689 |
| Telenor ASA | | 10,400 | | | 145,285 |
| Yara International ASA | | 2,050 | | | 92,855 |
| | | | | |
| | | | | 510,139 |
| | | | | |
| Papua New Guinea - 0.1% | | | | | |
| Oil Search Ltd. | | 6,982 | | | 38,281 |
| | | | | |
| Portugal - 0.5% | | | | | |
| Galp Energia, SGPS, SA Class B | | 6,192 | | | 106,953 |
| Portugal Telecom, SGPS, SA | | 3,443 | | | 42,012 |
| | | | | |
| | | | | 148,965 |
| | | | | |
| Singapore - 3.8% | | | | | |
| Capitaland Ltd. | | 34,000 | | | 100,863 |
| City Developments Ltd. | | 6,000 | | | 49,059 |
| DBS Group Holdings Ltd. | | 17,000 | | | 184,807 |
| Jardine Cycle & Carriage Ltd. | | 2,000 | | | 38,186 |
| Keppel Corp. Ltd. | | 15,000 | | | 87,377 |
| Keppel Land Ltd. | | 22,000 | | | 54,365 |
| Oversea-Chinese Banking Corp. Ltd. | | 19,000 | | | 122,344 |
| SembCorp Marine Ltd. | | 12,000 | | | 31,310 |
| Singapore Airlines Ltd. | | 2,000 | | | 21,182 |
| Singapore Exchange Ltd. | | 12,000 | | | 70,658 |
| United Overseas Bank Ltd. | | 11,000 | | | 153,117 |
| Wilmar International Ltd. | | 46,000 | | | 209,162 |
| | | | | |
| | | | | 1,122,430 |
| | | | | |
| | | | | |
| | | SHARES | | VALUE (Note 2) |
| Spain - 6.1% | | | | | |
| Abertis Infraestructuras SA | | 3,487 | | $ | 78,838 |
| ACS Actividades de Construccion y Servicios SA | | 761 | | | 38,041 |
| Banco Bilbao Vizcaya Argentaria SA | | 22,209 | | | 404,759 |
| Banco Santander SA | | 56,041 | | | 926,058 |
| Bankinter SA | | 2,391 | | | 24,633 |
| Criteria Caixacorp SA | | 14,184 | | | 67,183 |
| EDP Renovaveis SA | | 4,195 | | | 39,774 |
| Endesa SA | | 789 | | | 27,210 |
| Industria de Diseno Textil SA | | 3,206 | | | 200,223 |
| | | | | |
| | | | | 1,806,719 |
| | | | | |
| Sweden - 5.2% | | | | | |
| Alfa Laval AB | | 2,829 | | | 39,121 |
| Assa Abloy AB Class B | | 2,512 | | | 48,394 |
| Atlas Copco AB Class A | | 8,576 | | | 126,066 |
| Electrolux AB Series B † | | 2,737 | | | 64,317 |
| Hennes & Mauritz AB (H&M) Class B | | 4,941 | | | 273,913 |
| Nordea Bank AB | | 25,636 | | | 259,744 |
| Sandvik AB | | 8,709 | | | 104,873 |
| Skandinaviska Enskilda Banken AB Class A † | | 15,933 | | | 98,496 |
| Skanska AB Class B | | 2,602 | | | 44,151 |
| SKF AB Class B | | 2,746 | | | 47,351 |
| Svenska Cellulosa AB Class B | | 3,796 | | | 50,611 |
| Svenska Handelsbanken AB Class A | | 3,128 | | | 89,116 |
| Swedbank AB Class A † | | 5,387 | | | 53,038 |
| Tele2 AB Class B | | 2,106 | | | 32,351 |
| Telia Sonera AB | | 10,673 | | | 77,140 |
| Volvo AB Class B | | 15,290 | | | 131,143 |
| | | | | |
| | | | | 1,539,825 |
| | | | | |
| Switzerland - 2.2% | | | | | |
| Compagnie Financiere Richemont SA Class A | | 2,796 | | | 94,021 |
| Credit Suisse Group AG | | 8,242 | | | 408,320 |
| Geberit AG | | 236 | | | 41,837 |
| Kuehne + Nagel International AG | | 592 | | | 57,560 |
| Sonova Holding AG | | 244 | | | 29,561 |
| Swisscom AG | | 74 | | | 28,262 |
| | | | | |
| | | | | 659,561 |
| | | | | |
TOTAL COMMON STOCKS
(cost $25,019,250) | | | | | 25,682,102 |
| | | | | |
| MONEY MARKET FUND - 10.7% | | | |
| Dreyfus Institutional Cash Advance 99 - Institutional Class, 0.28% (a) | | | | | |
(cost $3,180,612) | | 3,180,612 | | | 3,180,612 |
| | | | | |
TOTAL INVESTMENTS - 97.0%
(cost $28,199,862) | | | | | 28,862,714 |
| | | | | |
OTHER ASSETS IN EXCESS OF
LIABILITIES - 3.0% | | | | | 899,339 |
| | | | | |
| NET ASSETS - 100.0% | | | | $ | 29,762,053 |
| | | | | |
| (†) | Non-income producing security. |
| (a) | Represents annualized seven-day yield as of December 31, 2009. |
| (b) | Level 1 securities (See Note 4). |
The accompanying notes are an integral part of these financial statements.
| | | | | | | | | | |
| AQR Funds | | | | Annual Report | | | | December 2009 | | 50 |
| | | | | | | |
| | |
| Schedule of Investments | | December 31, 2009 |
| | |
| AQR INTERNATIONAL MOMENTUM FUND | | |
| | | | | |
| INDUSTRY | | VALUE | | % OF NET
ASSETS | |
| Automobile & Components | | $1,428,526 | | 4.8 | % |
| Banks | | 7,294,985 | | 24.5 | |
| Capital Goods | | 2,697,388 | | 9.1 | |
| Commercial & Professional Services | | 81,194 | | 0.3 | |
| Consumer Durables & Apparel | | 976,315 | | 3.3 | |
| Diversified Financials | | 1,342,445 | | 4.5 | |
| Energy | | 1,602,435 | | 5.4 | |
| Food & Staples Retailing | | 397,761 | | 1.3 | |
| Food, Beverage & Tobacco | | 1,012,553 | | 3.4 | |
| Health Care Equipment & Services | | 127,429 | | 0.4 | |
| Household & Personal Products | | 133,331 | | 0.5 | |
| Insurance | | 232,545 | | 0.8 | |
| Materials | | 4,131,950 | | 13.9 | |
| Media | | 117,339 | | 0.4 | |
| Pharmaceuticals, Biotechnology & Life Sciences | | 98,426 | | 0.3 | |
| | | | | |
| INDUSTRY (continued) | | VALUE | | % OF NET
ASSETS | |
| Real Estate | | $1,399,684 | | 4.7 | % |
| Retailing | | 819,805 | | 2.8 | |
| Semiconductors & Semiconductor Equipment | | 234,671 | | 0.8 | |
| Software & Services | | 86,089 | | 0.3 | |
| Technology Hardware & Equipment | | 370,466 | | 1.2 | |
| Telecommunication Services | | 460,076 | | 1.5 | |
| Transportation | | 476,903 | | 1.6 | |
| Utilities | | 159,786 | | 0.5 | |
| Money Market Mutual Fund | | 3,180,612 | | 10.7 | |
| Total Investments | | 28,862,714 | | 97.0 | |
| | | | | |
| Other Assets in Excess of Liabilities | | 899,339 | | 3.0 | |
| Total Net Assets | | $29,762,053 | | 100.0 | % |
| | | | | |
| † | Non-income producing security. |
| (a) | Represents annualized seven-day yield at December 31, 2009. |
Equity swap contracts outstanding as of December 31, 2009:
| | | | | | | | | | |
REFERENCE
ENTITY | | COUNTERPARTY | | SHARES
LONG | | VALUE AT
CONTRACT
DATE | | RESET
DATE | | NET UNREALIZED
APPRECIATION
(DEPRECIATION) |
| AAL | | Deutsche Bank | | 8,470 | | $372,709 | | 1/18/2010 | | $(5,895) |
| AMEC PLC | | Deutsche Bank | | 2,404 | | 29,879 | | 1/18/2010 | | 749 |
| Antofagasta PLC | | Deutsche Bank | | 5,783 | | 84,843 | | 1/18/2010 | | 7,150 |
| AU/LN Equity Swap | | Deutsche Bank | | 823 | | 19,993 | | 1/18/2010 | | (7) |
| Barclays PLC | | Deutsche Bank | | 71,729 | | 317,418 | | 1/18/2010 | | (1,347) |
| BP PLC | | Deutsche Bank | | 3,991 | | 37,021 | | 1/18/2010 | | 1,517 |
| British Sky Broadcasting Group PL | | Deutsche Bank | | 1,814 | | 16,554 | | 1/18/2010 | | (169) |
| Cairn Energy PLC | | Deutsche Bank | | 6,740 | | 33,040 | | 1/18/2010 | | 3,041 |
| Carnival Plc | | Deutsche Bank | | 398 | | 13,905 | | 1/18/2010 | | (346) |
| Cobham PLC | | Deutsche Bank | | 5,725 | | 22,368 | | 1/18/2010 | | 756 |
| Compass Group Plc | | Deutsche Bank | | 915 | | 6,591 | | 1/18/2010 | | (43) |
| Eurasian Natural Resources Corporation | | Deutsche Bank | | 8,772 | | 123,833 | | 1/18/2010 | | 4,655 |
| Experian PLC | | Deutsche Bank | | 3,337 | | 33,552 | | 1/18/2010 | | (590) |
| Fresnillo PLC | | Deutsche Bank | | 7,780 | | 100,419 | | 1/18/2010 | | (1,598) |
| G4S PLC | | Deutsche Bank | | 5,274 | | 22,114 | | 1/18/2010 | | (8) |
| Hammerson PLC | | Deutsche Bank | | 929 | | 5,778 | | 1/18/2010 | | 545 |
| Home Retail Group PLC | | Deutsche Bank | | 10,384 | | 47,583 | | 1/18/2010 | | (486) |
| ICAP plc | | Deutsche Bank | | 4,490 | | 30,155 | | 1/18/2010 | | 813 |
| Inmarsat PLC | | Deutsche Bank | | 3,831 | | 40,283 | | 1/18/2010 | | 2,407 |
| Investec PLC | | Deutsche Bank | | 4,485 | | 31,063 | | 1/18/2010 | | (418) |
| Kazakhmys PLC | | Deutsche Bank | | 3,344 | | 67,245 | | 1/18/2010 | | 3,559 |
| KINGFISHER PLC | | Deutsche Bank | | 18,777 | | 68,694 | | 1/18/2010 | | 428 |
| Land Securities Group PLC | | Deutsche Bank | | 503 | | 5,257 | | 1/18/2010 | | 280 |
| Lonmin Plc | | Deutsche Bank | | 1,127 | | 34,924 | | 1/18/2010 | | 494 |
| Man Group PLC | | Deutsche Bank | | 9,663 | | 48,195 | | 1/18/2010 | | (504) |
| Marks & Spencer Group | | Deutsche Bank | | 7,305 | | 47,090 | | 1/18/2010 | | 107 |
| Next PLC | | Deutsche Bank | | 1,143 | | 37,108 | | 1/18/2010 | | 1,109 |
| Old Mutual PLC | | Deutsche Bank | | 45,944 | | 78,929 | | 1/18/2010 | | 1,527 |
| Pearson PLC | | Deutsche Bank | | 1,663 | | 23,194 | | 1/18/2010 | | 650 |
| Petrofac Limited | | Deutsche Bank | | 2,254 | | 35,249 | | 1/18/2010 | | 2,483 |
| Prudential PLC | | Deutsche Bank | | 14,121 | | 139,358 | | 1/18/2010 | | 5,188 |
| Randgold Resources Ltd | | Deutsche Bank | | 285 | | 22,602 | | 1/18/2010 | | 92 |
| Rio Tinto PLC | | Deutsche Bank | | 13,616 | | 750,213 | | 1/18/2010 | | (14,994) |
| Rolls-Royce Group | | Deutsche Bank | | 574,620 | | 928 | | 1/18/2010 | | — |
| Rolls-Royce Group PLC | | Deutsche Bank | | 9,577 | | 74,466 | | 1/18/2010 | | 114 |
The accompanying notes are an integral part of these financial statements.
| | | | | | | | | | |
| AQR Funds | | | | Annual Report | | | | December 2009 | | 51 |
| | | | | | | |
| | |
| Schedule of Investments | | December 31, 2009 |
| | |
| AQR INTERNATIONAL MOMENTUM FUND | | |
| | | | | | | | | | |
REFERENCE
ENTITY | | COUNTERPARTY | | SHARES
LONG | | VALUE AT
CONTRACT
DATE | | RESET
DATE | | NET UNREALIZED
APPRECIATION
(DEPRECIATION) |
| Royal Bank of Scotland Group PLC | | Deutsche Bank | | 15,497 | | $7,694 | | 1/18/2010 | | $(501) |
| SABMILLER PLC | | Deutsche Bank | | 9,588 | | 277,828 | | 1/18/2010 | | 4,002 |
| Sage Group PLC | | Deutsche Bank | | 5,413 | | 19,698 | | 1/18/2010 | | (529) |
| Schroders PLC | | Deutsche Bank | | 2,557 | | 51,419 | | 1/18/2010 | | 3,228 |
| Standard Chartered PLC | | Deutsche Bank | | 12,556 | | 313,104 | | 1/18/2010 | | 3,883 |
| Tui Travel PLC | | Deutsche Bank | | 3,467 | | 14,336 | | 1/18/2010 | | (127) |
| Tullow Oil PLC | | Deutsche Bank | | 4,670 | | 93,306 | | 1/18/2010 | | 4,672 |
| Vedanta Resources Plc | | Deutsche Bank | | 2,339 | | 93,345 | | 1/18/2010 | | 4,485 |
| Vodafone Group Plc | | Deutsche Bank | | 10,851 | | 24,520 | | 1/18/2010 | | 608 |
| WM Morrison Supermarkets PLC | | Deutsche Bank | | 5,145 | | 22,895 | | 1/18/2010 | | 61 |
| WPP PLC | | Deutsche Bank | | 8,401 | | 82,772 | | 1/18/2010 | | (608) |
| Xstrata PLC | | Deutsche Bank | | 19,683 | | 352,928 | | 1/18/2010 | | (1,861) |
| | | | | | | | | | |
| | | | | | | | | | $28,572 |
| | | | | | | | | | |
The swap contracts listed above reset monthly. The final termination date is July 15, 2010.
Cash held as collateral for swap equity contracts was $1,500,034 at December 31, 2009.
Forward foreign currency exchange contracts outstanding as of December 31, 2009:
Long Contracts:
| | | | | | | | | | | | |
| PURCHASE CONTRACTS | | COUNTERPARTY | | CURRENCY | | CURRENCY
AMOUNT
PURCHASED | | VALUE AT
SETTLEMENT
DATE | | VALUE AT
DECEMBER 31,
2009 | | NET UNREALIZED
APPRECIATION
(DEPRECIATION) |
Australian Dollar,
expiring 01/04/10 | | The Royal Bank of Scotland | | AUD | | 901,000 | | $805,818 | | $808,984 | | $3,166 |
Swiss Franc,
expiring 01/04/10 | | The Royal Bank of Scotland | | CHF | | 350,000 | | 337,350 | | 338,352 | | 1,002 |
Euro,
expiring 01/04/10 | | The Royal Bank of Scotland | | EUR | | 1,665,000 | | 2,389,730 | | 2,386,848 | | (2,882) |
| Great British Pound, expiring 03/17/10 | | The Royal Bank of Scotland | | GBP | | 3,225,000 | | 5,360,048 | | 5,206,574 | | (153,474) |
Hong Kong Dollar,
expiring 01/04/10 | | The Royal Bank of Scotland | | HKD | | 5,593,000 | | 721,476 | | 721,382 | | (94) |
Japanese Yen,
expiring 01/05/10 | | The Royal Bank of Scotland | | JPY | | 36,539,000 | | 397,384 | | 392,334 | | (5,050) |
Norwegian Krone,
expiring 01/05/10 | | The Royal Bank of Scotland | | NOK | | 2,653,000 | | 456,859 | | 458,117 | | 1,258 |
Swedish Krona,
expiring 01/05/10 | | The Royal Bank of Scotland | | SEK | | 2,330,000 | | 323,097 | | 325,672 | | 2,575 |
Singapore Dollar,
expiring 01/04/10 | | The Royal Bank of Scotland | | SGD | | 940,000 | | 669,056 | | 669,079 | | 23 |
| | | | | | | | |
| | | | | | | | 11,460,818 | | 11,307,342 | | (153,476) |
| | | | | | | | |
The accompanying notes are an integral part of these financial statements.
| | | | | | | | | | |
| AQR Funds | | | | Annual Report | | | | December 2009 | | 52 |
| | | | | | | |
| | |
| Schedule of Investments | | December 31, 2009 |
| | |
| AQR INTERNATIONAL MOMENTUM FUND | | |
Short Contracts:
| | | | | | | | | | | | |
SALES CONTRACTS | | COUNTERPARTY | | CURRENCY | | CURRENCY
AMOUNT
SOLD | | VALUE AT
SETTLEMENT
DATE | | VALUE AT
DECEMBER 31,
2009 | | NET UNREALIZED
APPRECIATION
(DEPRECIATION) |
| Danish Krone, expiring 01/05/10 | | The Royal Bank of Scotland | | DKK | | (544,000) | | $(104,871) | | $(104,792) | | $79 |
| Euro, expiring 01/05/10 | | The Royal Bank of Scotland | | EUR | | (171,000) | | (245,379) | | (245,136) | | 243 |
Great British Pound,
expiring 03/17/10 | | The Royal Bank of Scotland | | GBP | | (625,000) | | (993,469) | | (1,009,026) | | (15,557) |
| | | | | | | | |
| | | | | | | | (1,343,719) | | (1,358,954) | | (15,235) |
| | | | | | | | |
| | | | | | | | $10,117,099 | | $9,948,388 | | $(168,711) |
| | | | | | | | |
AUD - Australian Dollar
CHF - Swiss Franc
DKK - Danish Krone
EUR - European Euro
GBP - British Pound
HKD - Hong Kong Dollar
JPY - Japanese Yen
NOK - Norwegian Krone
SEK - Swedish Krona
SGD - Singapore Dollar
| | | | | | | | | | |
| AQR Funds | | | | Annual Report | | | | December 2009 | | 53 |
| | | | | | | |
The accompanying notes are an integral part of these financial statements.
| | |
| Statements of Assets and Liabilities | | December 31, 2009 |
| | | | | | | | | | | | |
| | | AQR
INTERNATIONAL
EQUITY
FUND | | | AQR
DIVERSIFIED
ARBITRAGE
FUND | | | AQR
MOMENTUM
FUND | | AQR
SMALL CAP
MOMENTUM
FUND | | AQR
INTERNATIONAL
MOMENTUM
FUND |
| ASSETS: | | | | | | | | | | | | |
| Investments in securities, at value (cost $353,311,028, $275,557,525, $6,663,766, $3,110,631, and $28,199,862, respectively) | | $387,083,497 | | | $293,934,373 | | | $7,026,645 | | $3,306,363 | | $28,862,714 |
| Cash (including foreign cash of $909,907, $939,389, $0, $0, and $0, respectively) | | 1,300,999 | | | 8,131,565 | | | — | | — | | 107 |
| Due from counterparty | | — | | | — | | | — | | — | | 113,076 |
| Swaps, at value | | — | | | 26,133 | | | — | | — | | 28,572 |
| Cash collateral held at brokers | | 14,159,067 | | | 94,646,738 | | | 12,484 | | — | | 1,500,034 |
| Variation margin receivable | | 1,320,331 | | | 417,138 | | | — | | — | | — |
| Receivables: | | | | | | | | | | | | |
Securities sold | | 1,182,745 | | | 8,764,057 | | | 3,184,295 | | 1,480,533 | | 9,946,634 |
Foreign tax reclaim | | 746,350 | | | — | | | — | | — | | 561 |
Dividends and Interest | | 317,093 | | | 1,251,312 | | | 5,121 | | 1,533 | | 8,450 |
Capital Shares sold. | | 17,713 | | | 375,976 | | | — | | — | | 31,888 |
| | | | | |
| Total Assets | | 406,127,795 | | | 407,547,292 | | | 10,228,545 | | 4,788,429 | | 40,492,036 |
| | | | | |
| LIABILITIES: | | | | | | | | | | | | |
| Securities sold short, at value (proceeds $0, $143,677,601, $0, $0, and $0, respectively) | | — | | | 157,236,703 | | | — | | — | | — |
| Call options written, at value (proceeds $0, $40,941, $0, $0, and $0, respectively) | | — | | | 46,310 | | | — | | — | | — |
| Due to custodian | | — | | | — | | | — | | 24,182 | | 18,217 |
| Unrealized depreciation on forward foreign currency contracts | | 774,475 | | | 3,547 | | | — | | — | | 168,711 |
| Variation margin payable | | — | | | — | | | 141 | | — | | — |
| Payables: | | | | | | | | | | | | |
Securities purchased | | 453,006 | | | 10,435,178 | | | 3,234,022 | | 1,463,931 | | 10,468,298 |
Accrued Investment advisory fees | | 84,614 | | | 124,748 | | | 1,432 | | 942 | | 7,408 |
Accrued Shareholder servicing fees | | 10,524 | | | 57,670 | | | 859 | | 404 | | 3,175 |
Accrued Trustees fees | | — | | | 2,627 | | | — | | — | | — |
Capital shares reacquired | | — | | | 106,612 | | | — | | — | | — |
Dividends payable on securities sold short | | — | | | 302,051 | | | — | | — | | — |
Other accrued expenses | | 292,246 | | | 150,142 | | | 59,516 | | 59,365 | | 64,174 |
| | | | | |
| Total Liabilities | | 1,614,865 | | | 168,465,588 | | | 3,295,970 | | 1,548,824 | | 10,729,983 |
| | | | | |
| Net Assets | | $404,512,930 | | | $239,081,704 | | | $6,932,575 | | $3,239,605 | | $29,762,053 |
| | | | | |
| NET ASSETS CONSIST OF: | | | | | | | | | | | | |
| Paid-in capital ($0.001 par value common stock, unlimited authorized shares) | | $380,234,366 | | | $236,508,956 | | | $6,259,865 | | $2,949,944 | | $29,035,063 |
| Undistributed net investment income | | 472,899 | | | 165,585 | | | 631 | | — | | 151,015 |
| Undistributed (accumulated) net realized gain (loss) | | (10,551,741 | ) | | (2,592,782 | ) | | 309,341 | | 93,929 | | 52,354 |
| Net unrealized appreciation | | 34,357,406 | | | 4,999,945 | | | 362,738 | | 195,732 | | 523,621 |
| | | | | |
| Net Assets | | $404,512,930 | | | $239,081,704 | | | $6,932,575 | | $3,239,605 | | $29,762,053 |
(continued on p. 55)
The accompanying notes are an integral part of these financial statements.
| | | | | | | | | | |
| AQR Funds | | | | Annual Report | | | | December 2009 | | 54 |
| | | | | | | |
| | |
| Statements of Assets and Liabilities | | December 31, 2009 |
| | | | | | | | | | |
| | | AQR
INTERNATIONAL
EQUITY
FUND | | AQR
DIVERSIFIED
ARBITRAGE
FUND | | AQR
MOMENTUM
FUND | | AQR
SMALL CAP
MOMENTUM
FUND | | AQR
INTERNATIONAL
MOMENTUM
FUND |
| | | | | |
| NET ASSETS: | | | | | | | | | | |
| Class I | | $44,016,038 | | $160,026,814 | | n/a | | n/a | | n/a |
| Class L | | n/a | | n/a | | $6,932,575 | | $3,239,605 | | $29,762,053 |
| Class N | | 5,785 | | 79,054,890 | | n/a | | n/a | | n/a |
| Class Y | | 360,491,107 | | n/a | | n/a | | n/a | | n/a |
| | | | | |
| SHARES OUTSTANDING: | | | | | | | | | | |
| Class I | | 4,502,376 | | 14,819,735 | | n/a | | n/a | | n/a |
| Class L | | n/a | | n/a | | 568,597 | | 284,134 | | 2,485,331 |
| Class N | | 584 | | 7,332,864 | | n/a | | n/a | | n/a |
| Class Y | | 35,486,692 | | n/a | | n/a | | n/a | | n/a |
| | | | | |
| NET ASSET VALUE PER SHARE: | | | | | | | | | | |
| Class I | | $9.78 | | $10.80 | | n/a | | n/a | | n/a |
| Class L | | n/a | | n/a | | $12.19 | | $11.40 | | $11.98 |
| Class N | | $9.91 | | $10.78 | | n/a | | n/a | | n/a |
| Class Y | | $10.16 | | n/a | | n/a | | n/a | | n/a |
The accompanying notes are an integral part of these financial statements.
| | | | | | | | | | |
| AQR Funds | | | | Annual Report | | | | December 2009 | | 55 |
| | | | | | | |
| | |
| Statements of Operations | | December 31, 2009 |
| | | | | | | | | | |
| | | AQR
INTERNATIONAL
EQUITY FUND | | AQR
DIVERSIFIED
ARBITRAGE FUND | | AQR
MOMENTUM FUND | | AQR
SMALL CAP
MOMENTUM FUND | | AQR
INTERNATIONAL
MOMENTUM FUND |
| | | FOR THE PERIOD
8/28/09*-12/31/09 | | FOR THE PERIOD
1/15/09*-12/31/09 | | FOR THE PERIOD
7/9/09*-12/31/09 | | FOR THE PERIOD
7/9/09*-12/31/09 | | FOR THE PERIOD
7/9/09*-12/31/09 |
| INVESTMENT INCOME: |
| Dividend income† | | $1,691,875 | | $1,031,193 | | $36,358 | | $18,175 | | $77,030 |
| Interest income | | 56,441 | | 1,528,706 | | 261 | | 171 | | 1,650 |
| | | | | |
| Total Income | | 1,748,316 | | 2,559,899 | | 36,619 | | 18,346 | | 78,680 |
| | | | | |
| EXPENSES: | | | | | | | | | | |
| Investment advisory fees | | 525,840 | | 476,426 | | 5,345 | | 4,942 | | 21,492 |
| Shareholder servicing fees | | 293,634 | | 218,205 | | 3,207 | | 2,118 | | 9,211 |
| Custody, administration & accounting fees | | 98,192 | | 93,409 | | 32,916 | | 32,862 | | 36,902 |
| Legal fees | | 65,692 | | 144,197 | | 21,310 | | 21,624 | | 19,879 |
| Audit and tax fees | | 45,000 | | 45,000 | | 45,000 | | 45,000 | | 45,000 |
| Shareholder reporting fees | | 34,379 | | 40,817 | | 313 | | 232 | | 805 |
| Insurance fees | | 32,120 | | 75,956 | | 965 | | 883 | | 999 |
| Transfer agent fees | | 19,750 | | 75,098 | | 12,714 | | 12,587 | | 12,894 |
| Trustee fees | | 19,384 | | 94,400 | | 314 | | 179 | | 1,117 |
| Corporate governance fees | | 14,921 | | 15,000 | | 7,462 | | 7,462 | | 7,466 |
| Registration fees | | 3,197 | | 50,424 | | 3,000 | | 3,000 | | 2,454 |
| Dividends on securities sold short | | — | | 862,214 | | — | | — | | — |
| Distribution fees—Class N | | — | | 70,114 | | — | | — | | — |
| Other fees | | 38,168 | | 26,999 | | 3,190 | | 2,881 | | 3,234 |
| | | | | |
| Total Expenses | | 1,190,277 | | 2,288,259 | | 135,736 | | 133,770 | | 161,453 |
| | | | | |
| Less waivers and reimbursements: | | | | | | | | | | |
Investment advisory fees waived | | (525,840) | | (476,426) | | (5,345) | | (4,942) | | (21,492) |
Shareholder servicing fees waived | | (7,017) | | (49,343) | | (3,207) | | (2,118) | | (9,211) |
Expense reimbursements | | — | | — | | (116,707) | | (117,532) | | (90,836) |
| | | | | |
| Net Expenses | | 657,420 | | 1,762,490 | | 10,477 | | 9,178 | | 39,914 |
| | | | | |
| Net Investment Income | | $1,090,896 | | $797,409 | | $26,142 | | $9,168 | | $38,766 |
(continued on p. 57)
The accompanying notes are an integral part of these financial statements.
| | | | | | | | | | |
| AQR Funds | | | | Annual Report | | | | December 2009 | | 56 |
| | | | | | | |
| | |
| Statements of Operations | | December 31, 2009 |
| | | | | | | | | | | | | | |
| | | AQR
INTERNATIONAL
EQUITY FUND | | | AQR
DIVERSIFIED
ARBITRAGE FUND | | | AQR
MOMENTUM FUND | | | AQR
SMALL CAP
MOMENTUM FUND | | AQR
INTERNATIONAL
MOMENTUM FUND | |
| | | FOR THE PERIOD
8/28/09*-12/31/09 | | | FOR THE PERIOD
1/15/09*-12/31/09 | | | FOR THE PERIOD
7/9/09*-12/31/09 | | | FOR THE PERIOD
7/9/09*-12/31/09 | | FOR THE PERIOD
7/9/09*-12/31/09 | |
| REALIZED AND UNREALIZED GAIN (LOSS): | | | | | | | | | | | | | | |
| Net realized gain (loss) from: | | | | | | | | | | | | | | |
Investments in securities | | $11,302,304 | | | $9,287,805 | | | $467,847 | | | $274,977 | | $267,179 | |
Forward foreign currency contracts | | 6,394,400 | | | (10,822 | ) | | — | | | — | | 140,686 | |
Futures contracts | | 4,225,279 | | | (2,796,869 | ) | | 13,790 | | | — | | — | |
Securities sold short | | — | | | (7,109,857 | ) | | — | | | — | | — | |
Swap contracts | | — | | | (291,132 | ) | | — | | | — | | 371,391 | |
Written options | | — | | | 14,947 | | | — | | | — | | — | |
Net realized gain (loss) | | 21,921,983 | | | (905,928 | ) | | 481,637 | | | 274,977 | | 779,256 | |
| | | | | |
| Net change in unrealized appreciation (depreciation) on: | | | | | | | | | | | | | | |
Investments in securities | | (1,849,087 | ) | | 18,376,848 | | | 362,879 | | | 195,732 | | 662,852 | |
Futures contracts | | 806,953 | | | 417,138 | | | (141 | ) | | — | | — | |
Forward foreign currency contracts | | (2,290,710 | ) | | (3,547 | ) | | — | | | — | | (168,711 | ) |
Foreign currency and foreign currency translations | | 248,152 | | | (104 | ) | | — | | | — | | 908 | |
Securities sold short | | — | | | (13,559,102 | ) | | — | | | — | | — | |
Swap contracts | | — | | | (225,919 | ) | | — | | | — | | 28,572 | |
Written options | | — | | | (5,369 | ) | | — | | | — | | — | |
Net change in unrealized appreciation (depreciation) | | (3,084,692 | ) | | 4,999,945 | | | 362,738 | | | 195,732 | | 523,621 | |
Net gain and change in unrealized appreciation | | 18,837,291 | | | 4,094,017 | | | 844,375 | | | 470,709 | | 1,302,877 | |
Net increase in net assets resulting from operations | | $19,928,187 | | | $4,891,426 | | | $870,517 | | | $479,877 | | $1,341,643 | |
| | | | | | | | | | | | |
† Net of foreign taxes withheld of | | $242,446 | | | $5,274 | | | $59 | | | $— | | $8,743 | |
* Commencement of operations.
The accompanying notes are an integral part of these financial statements.
| | | | | | | | | | |
| AQR Funds | | | | Annual Report | | | | December 2009 | | 57 |
| | | | | | | |
Statements of Changes in Net Assets
| | | | | | | | | | |
| | | AQR
INTERNATIONAL
EQUITY
FUND | | AQR
DIVERSIFIED
ARBITRAGE
FUND | | AQR
MOMENTUM
FUND | | AQR
SMALL CAP
MOMENTUM
FUND | | AQR
INTERNATIONAL
MOMENTUM
FUND |
| | | FOR THE PERIOD
8/28/09*-12/31/09 | | FOR THE PERIOD
1/15/09*-12/31/09 | | FOR THE PERIOD
7/9/09*-12/31/09 | | FOR THE PERIOD
7/9/09*-12/31/09 | | FOR THE PERIOD
7/9/09*-12/31/09 |
| OPERATIONS: |
| Net investment income | | $1,090,896 | | $797,409 | | $26,142 | | $ 9,168 | | $38,766 |
| Net realized gain (loss) | | 21,921,983 | | (905,928) | | 481,637 | | 274,977 | | 779,256 |
| Net change in unrealized appreciation (depreciation) | | (3,084,692) | | 4,999,945 | | 362,738 | | 195,732 | | 523,621 |
Net increase in net assets resulting from operations | | 19,928,187 | | 4,891,426 | | 870,517 | | 479,877 | | 1,341,643 |
| | | | | | | | | | |
| DISTRIBUTIONS TO SHAREHOLDERS: |
| Net investment income: | | | | | | | | | | |
Class I | | (610,914) | | (424,290) | | — | | — | | — |
Class L | | — | | — | | (25,511) | | (9,247) | | (177,254) |
Class N | | — | | (135,050) | | — | | — | | — |
Class Y | | (4,816,996) | | — | | — | | — | | — |
Total | | (5,427,910) | | (559,340) | | (25,511) | | (9,247) | | (177,254) |
| Net realized gain: | | | | | | | | | | |
Class I | | (1,232,295) | | (1,105,118) | | — | | — | | — |
Class L | | — | | — | | (172,296) | | (180,969) | | (437,399) |
Class N | | (20) | | (655,481) | | — | | — | | — |
Class Y | | (9,229,217) | | — | | — | | — | | — |
Total | | (10,461,532) | | (1,760,599) | | (172,296) | | (180,969) | | (437,399) |
Total distributions | | (15,889,442) | | (2,319,939) | | (197,807) | | (190,216) | | (614,653) |
| | | | | | | | | | |
| CAPITAL SHARE TRANSACTIONS: |
| CLASS I | | | | | | | | | | |
| Proceeds from shares sold | | 43,887,953 | | 167,891,859 | | — | | — | | — |
| Reinvestment of distributions | | 1,798,893 | | 1,492,419 | | — | | — | | — |
| Cost of shares reacquired | | (92,897) | | (11,064,860) | | — | | — | | — |
| Redemption fees | | 1,147 | | 527 | | — | | — | | — |
| Net increase from capital share transactions | | 45,595,096 | | 158,319,945 | | — | | — | | — |
| | | | | |
| CLASS L | | | | | | | | | | |
| Proceeds from shares sold | | — | | — | | 6,150,686 | | 3,072,017 | | 29,481,521 |
| Reinvestment of distributions | | — | | — | | 197,602 | | 189,528 | | 614,344 |
| Cost of shares reacquired | | — | | — | | (88,950) | | (312,595) | | (1,064,593) |
| Redemption fees | | — | | — | | 527 | | 994 | | 3,791 |
| Net increase from capital share transactions | | — | | — | | 6,259,865 | | 2,949,944 | | 29,035,063 |
| | | | | |
| CLASS N | | | | | | | | | | |
| Proceeds from shares sold | | 5,697 | | 95,158,643 | | — | | — | | — |
| Reinvestment of distributions | | 20 | | 788,750 | | — | | — | | — |
| Cost of shares reacquired | | — | | (17,858,676) | | — | | — | | — |
| Redemption fees | | — | | 1,555 | | — | | — | | — |
| Net increase from capital share transactions | | 5,717 | | 78,090,272 | | — | | — | | — |
(continued on p. 59)
The accompanying notes are an integral part of these financial statements.
| | | | | | | | | | |
| AQR Funds | | | | Annual Report | | | | December 2009 | | 58 |
| | | | | | | |
Statements of Changes in Net Assets
| | | | | | | | | | |
| | | AQR
INTERNATIONAL
EQUITY
FUND | | AQR
DIVERSIFIED
ARBITRAGE FUND | | AQR
MOMENTUM
FUND | | AQR
SMALL CAP
MOMENTUM
FUND | | AQR
INTERNATIONAL
MOMENTUM
FUND |
| | | FOR THE PERIOD
8/28/09*-12/31/09 | | FOR THE PERIOD
1/15/09*-12/31/099 | | FOR THE PERIOD
7/9/09*-12/31/09 | | FOR THE PERIOD
7/9/09*-12/31/09 | | FOR THE PERIOD
7/9/09*-12/31/09 |
| CAPITAL SHARE TRANSACTIONS: |
| CLASS Y | | | | | | | | | | |
| Proceeds from shares sold | | 38,215,777 | | — | | — | | — | | — |
| In-kind subscription (see Note 10) | | 316,649,562 | | — | | — | | — | | — |
| Capital contribution (see Note 7) | | 15,777 | | — | | — | | — | | — |
| Reinvestment of distributions | | 14,046,213 | | — | | — | | — | | — |
| Cost of shares reacquired | | (14,085,511) | | — | | — | | — | | — |
| Redemption fees | | 31,554 | | — | | — | | — | | — |
| Net increase from capital share transactions | | 354,873,372 | | — | | — | | — | | — |
| Net increase in net assets resulting from share transactions | | 400,474,185 | | 236,410,217 | | 6,259,865 | | 2,949,944 | | 29,035,063 |
| Total increase in net assets | | 404,512,930 | | 238,981,704 | | 6,932,575 | | 3,239,605 | | 29,762,053 |
| | | | | | | | | | |
| NET ASSETS: |
| Beginning of period | | — | | 100,000 | | — | | — | | — |
| End of period | | $404,512,930 | | $239,081,704 | | $6,932,575 | | $3,239,605 | | $29,762,053 |
| Undistributed net investment income at end of period | | $472,899 | | $165,585 | | $631 | | $— | | $151,015 |
| | | | | | | | | | |
| CHANGES IN SHARES OUTSTANDING: |
| CLASS I | | | | | | | | | | |
| Shares outstanding, beginning of period | | — | | — | | — | | — | | — |
| Shares sold | | 4,324,237 | | 15,719,603 | | — | | — | | — |
| Shares issued in reinvestment of distributions | | 187,580 | | 139,609 | | — | | — | | — |
| Shares reacquired | | (9,441) | | (1,039,477) | | — | | — | | — |
| Shares outstanding, end of period | | 4,502,376 | | 14,819,735 | | — | | — | | — |
| | | | | |
| CLASS L | | | | | | | | | | |
| Shares outstanding, beginning of period | | — | | — | | — | | — | | — |
| Shares sold | | — | | — | | 559,779 | | 294,508 | | 2,523,592 |
| Shares issued in reinvestment of distributions | | — | | — | | 16,494 | | 17,013 | | 52,508 |
| Shares reacquired | | — | | — | | (7,676) | | (27,387) | | (90,769) |
| Shares outstanding, end of period | | — | | — | | 568,597 | | 284,134 | | 2,485,331 |
| | | | | |
| CLASS N | | | | | | | | | | |
| Shares outstanding, beginning of period | | — | | 10,000 | | — | | — | | — |
| Shares sold | | 582 | | 8,908,187 | | — | | — | | — |
| Shares issued in reinvestment of distributions | | 2 | | 73,922 | | — | | — | | — |
| Shares reacquired | | — | | (1,659,245) | | — | | — | | — |
| Shares outstanding, end of period | | 584 | | 7,332,864 | | — | | — | | — |
(continued on p. 60)
The accompanying notes are an integral part of these financial statements.
| | | | | | | | | | |
| AQR Funds | | | | Annual Report | | | | December 2009 | | 59 |
| | | | | | | |
Statements of Changes in Net Assets
| | | | | | | | | | |
| | | AQR
INTERNATIONAL
EQUITY
FUND | | AQR
DIVERSIFIED
ARBITRAGE FUND | | AQR
MOMENTUM
FUND | | AQR
SMALL CAP
MOMENTUM
FUND | | AQR
INTERNATIONAL
MOMENTUM
FUND |
| | | FOR THE PERIOD
8/28/09*-12/31/09 | | FOR THE PERIOD
1/15/09*-12/31/099 | | FOR THE PERIOD
7/9/09*-12/31/09 | | FOR THE PERIOD
7/9/09*-12/31/09 | | FOR THE PERIOD
7/9/09*-12/31/09 |
| CHANGES IN SHARES OUTSTANDING: |
| CLASS Y | | | | | | | | | | |
| Shares outstanding, beginning of period | | — | | — | | — | | — | | — |
| Shares sold | | 3,779,363 | | — | | — | | — | | — |
| Shares issued in connection with in-kind subscription (see Note 10) | | 31,664,956 | | | | | | | | |
| Shares issued in reinvestment of distributions | | 1,410,263 | | — | | — | | — | | — |
| Shares reacquired | | (1,367,890) | | — | | — | | — | | — |
| Shares outstanding, end of period | | 35,486,692 | | — | | — | | — | | — |
| * | Commencement of operations. |
The accompanying notes are an integral part of these financial statements.
| | | | | | | | | | |
| AQR Funds | | | | Annual Report | | | | December 2009 | | 60 |
| | | | | | | |
| | |
| Statement of Cash Flows | | December 31, 2009 |
| | | |
| | AQR
DIVERSIFIED
ARBITRAGE FUND |
|
| CASH FLOWS FROM OPERATING ACTIVITIES: | | | |
| Net increase in net assets resulting from operations | | $4,891,426 | |
| Adjustments to reconcile net increase in net assets resulting from operations to net cash used in operating activities: | | | |
Payments to purchase securities | | (551,118,526 | ) |
Payments to cover short securities | | (93,810,589 | ) |
Proceeds from securities sold short | | 230,378,332 | |
Proceeds from sale of securities | | 286,569,785 | |
Realized gain on investment in securities | | (9,287,805 | ) |
Realized loss on securities sold short | | 7,109,857 | |
Unrealized appreciation on investment in securities | | (18,376,848 | ) |
Unrealized depreciation on securities sold short | | 13,559,102 | |
| Increases in operating assets: | | | |
Swaps, at value | | (26,133 | ) |
Variation margin receivable | | (417,138 | ) |
Dividends and interest | | (1,251,312 | ) |
Cash collateral held at brokers | | (94,646,738 | ) |
| Increases in operating liabilities: | | | |
Dividends on securities sold short | | 302,051 | |
Accrued Investment advisory fees | | 124,748 | |
Accrued Shareholder servicing fees | | 57,670 | |
Accrued Trustees fees | | 2,627 | |
Other accrued expenses | | 150,142 | |
Net cash used in operating activities | | $(225,789,349 | ) |
| |
| CASH FLOWS FROM FINANCING ACTIVITIES: | | | |
Proceeds from shares sold | | 262,674,526 | |
Payments on shares redeemed | | (28,814,842 | ) |
Cash distributions paid | | (38,770 | ) |
Net cash provided by financing activities | | $233,820,914 | |
| Net change in cash | | 8,031,565 | |
Cash, beginning of period | | 100,000 | |
Cash, end of period | | $8,131,565 | |
Non-cash financing activities not included herein consists of reinvestment of dividends and distributions of $2,281,169.
The accompanying notes are an integral part of these financial statements.
| | | | | | | | | | |
| AQR Funds | | | | Annual Report | | | | December 2009 | | 61 |
| | | | | | | |
| | | | | | | | | | | | |
| | AQR INTERNATIONAL EQUITY FUND† | | AQR DIVERSIFIED ARBITRAGE FUND† |
| | | | |
| | | CLASS I
9/30/091
TO
12/31/09 |
| | CLASS N
9/30/091
TO
12/31/09 |
| | CLASS Y
8/28/092
TO
12/31/09 | | CLASS I
1/15/092
TO
12/31/09 | | CLASS N
1/15/092
TO
12/31/09 |
| PER SHARE OPERATING PERFORMANCE: |
| Net asset value, beginning of period | | $10.00 | | | $10.00 | | | $10.00 | | $10.00 | | $10.00 |
| Net investment income (loss)3 | | (0.01 | ) | | — | | | 0.03 | | 0.13 | | 0.10 |
| Net realized and unrealized gain | | 0.22 | | | 0.20 | | | 0.57 | | 0.79 | | 0.79 |
| | | | | |
| Net increase in net asset value from operations | | 0.21 | | | 0.20 | | | 0.60 | | 0.92 | | 0.89 |
| Less Distributions: | | | | | | | | | | | | |
Distributions from net investment income | | (0.14 | ) | | — | | | (0.15) | | (0.03) | | (0.02) |
Distributions from net realized gains | | (0.29 | ) | | (0.29) | | | (0.29) | | (0.09) | | (0.09) |
| | | | | |
| Total Distributions | | (0.43 | ) | | (0.29) | | | (0.44) | | (0.12) | | (0.11) |
| | | | | |
| Net asset value, end of period | | $9.78 | | | $9.91 | | | $10.16 | | $10.80 | | $10.78 |
| | | | | |
| TOTAL RETURN4 | | 2.20% | | | 2.04% | | | 6.08% | | 9.24% | | 8.88% |
| | | | | |
| RATIOS/SUPPLEMENTAL DATA: | | | | | | | | | | | | |
| Net assets, end of period | | $44,016,038 | | | $5,785 | | | $360,491,107 | | $160,026,814 | | $79,054,890 |
| | | | | |
| Ratios to average net assets of:5 | | | | | | | | | | | | |
Expenses, net of reimbursements and/or waivers | | 0.90 | % | | 1.25% | | | 0.55% | | 2.46% | | 2.69% |
Expenses, net of reimbursements and/or waivers (excluding dividend short expense) | | 0.90 | % | | 1.25% | | | 0.55% | | 1.20% | | 1.50% |
Expenses, before reimbursements and/or waivers | | 1.01 | % | | 472.86% | 7 | | 0.98% | | 3.25% | | 3.42% |
Net investment income (loss) | | (0.47 | )% | | (0.07)% | | | 0.99% | | 1.30% | | 0.98% |
| Portfolio turnover rate6 | | 29 | % | | 29% | | | 29% | | 482% | | 482% |
| † | Redemption fees of less than $0.005 per share were incurred by each share class. |
| 1 | Commencement of offering of shares. |
| 2 | Commencement of operations. |
| 3 | Based on average shares outstanding. |
| 4 | Total investment return is calculated assuming an initial investment made at the net asset value at the beginning of the period, reinvestment of all dividends and distributions at net asset value during the period and redemption on the last day of the period and is not annualized. |
| 6 | Portfolio turnover is not annualized. |
| 7 | The ratio is annualized for a short period of time and is not representative of what the ratio would be if the Fund class had operated for a longer period of time. |
The accompanying notes are an integral part of these financial statements.
| | | | | | | | | | |
| AQR Funds | | | | Annual Report | | | | December 2009 | | 62 |
| | | | | | | |
| | | | | | |
| | AQR
MOMENTUM
FUND
CLASS L† | | AQR
SMALL CAP
MOMENTUM
FUND
CLASS L† | | AQR
INTERNATIONAL
MOMENTUM FUND
CLASS L† |
| | | | | | |
| | | 7/9/091
TO
12/31/09 | | 7/9/091
TO
12/31/09 | | 7/9/091
TO
12/31/09 |
PER SHARE OPERATING PERFORMANCE: |
| Net asset value, beginning of period | | $10.00 | | $10.00 | | $10.00 |
| Net investment income2 | | 0.07 | | 0.04 | | 0.04 |
| Net realized and unrealized gain | | 2.48 | | 2.06 | | 2.26 |
| | | |
| Net increase in net asset value from operations | | 2.55 | | 2.10 | | 2.30 |
| Less Distributions: | | | | | | |
Distributions from net investment income | | (0.05) | | (0.03) | | (0.09) |
Distributions from net realized gains | | (0.31) | | (0.67) | | (0.23) |
| | | |
| Total Distributions | | (0.36) | | (0.70) | | (0.32) |
| | | |
| Net asset value, end of period | | $12.19 | | $11.40 | | $11.98 |
| | | |
TOTAL RETURN3 | | 25.58% | | 21.24% | | 23.08% |
| | | |
RATIOS/SUPPLEMENTAL DATA: | | | | | | |
| Net assets, end of period | | $6,932,575 | | $3,239,605 | | $29,762,053 |
| Ratios to average net assets of:4 | | | | | | |
Expenses, net of reimbursements and/or waivers | | 0.49% | | 0.65% | | 0.65% |
Expenses, before reimbursements and/or waivers | | 5.08% | | 7.53% | | 2.22% |
Net investment income | | 1.23% | | 0.65% | | 0.63% |
Portfolio turnover rate5 | | 163% | | 136% | | 160% |
| † | Redemption fees of less than $0.005 per share were incurred by each share class. |
| 1 | Commencement of operations. |
| 2 | Based on average shares outstanding. |
| 3 | Total investment return is calculated assuming an initial investment made at the net asset value at the beginning of the period, reinvestment of all dividends and distributions at net asset value during the year and redemption on the last day of the period and is not annualized. |
| 5 | Portfolio turnover is not annualized. |
The accompanying notes are an integral part of these financial statements.
| | | | | | | | | | |
| AQR Funds | | | | Annual Report | | | | December 2009 | | 63 |
| | | | | | | |
| | |
| Notes to Financial Statements | | December 31, 2009 |
1. Organization
AQR Funds (the “Trust”), organized as a Delaware statutory trust on September 4, 2008, is a diversified, open-end management investment company, under the Investment Company Act of 1940, as amended (the “1940 Act”). As of December 31, 2009, the Trust consists of five active series (collectively, the “Funds” and each individually a “Fund”): AQR International Equity Fund, AQR Diversified Arbitrage Fund, AQR Momentum Fund, AQR Small Cap Momentum Fund, and AQR International Momentum Fund. The following funds were registered, but had not commenced operations, as of December 31, 2009: AQR Global Equity Fund, AQR International Small Cap Fund, AQR Emerging Markets Fund, AQR Equity Plus Fund, AQR Small Cap Core Fund, AQR Small Cap Growth Fund and AQR Managed Futures Strategy Fund. The accompanying financial statements relate only to the active series of the Trust. AQR Capital Management, LLC (“the Adviser”) serves as the investment adviser of each Fund.
The investment objective of the AQR International Equity Fund is long-term capital appreciation. The principal investment strategies of the AQR International Equity Fund include seeking to outperform the MSCI EAFE Total Return Index with Net Dividends Unhedged in U.S. Dollars (the “International Equity Benchmark”) while seeking to control its tracking error relative to this benchmark. The International Equity Benchmark is a free float-adjusted market capitalization index that is designed to measure the performance of equities in developed markets, excluding the United States and Canada. Class Y shares commenced operations on August 28, 2009. Class I shares and Class N shares commenced operations on September 30, 2009.
The investment objective of the AQR Diversified Arbitrage Fund is long-term absolute (positive) returns. The principal investment strategies of the AQR Diversified Arbitrage Fund include seeking to outperform the Merrill Lynch 3-Month Treasury Bill Index (the “Absolute Return Benchmark”) using alternative investment strategies such as merger arbitrage, convertible arbitrage, other forms of arbitrage (including, but not limited to, when-issued trading arbitrage, stub-trading arbitrage and dual-class arbitrage) and other types of non-arbitrage alternative investment strategies. The AQR Diversified Arbitrage Fund commenced operations on January 15, 2009. The AQR Diversified Arbitrage Fund offers Class N and Class I shares.
The investment objective of the AQR Momentum Fund is to seek long-term capital appreciation. The Fund invests primarily in equity or equity-related securities (including, but not limited to, exchange-traded funds and equity index futures) of large and mid-sized companies traded on a principal U.S. exchange or over-the-counter market that the Adviser determines to have positive momentum. The Fund’s investment universe consists of large and mid-cap U.S. stocks, which are defined as those in the top 90% of market capitalization or that are larger than the 1000th largest company, whichever is larger, and which meet certain liquidity and other criteria. The Adviser considers a security to have positive momentum primarily if it has a return over the prior twelve months that ranks in the top third of its relevant universe at the time of purchase. The AQR Momentum Fund commenced operations on July 9, 2009. The Fund offers Class L shares.
The investment objective of the AQR Small Cap Momentum Fund is to seek long-term capital appreciation. The Fund invests primarily in equity or equity-related securities (including, but not limited to, exchange-traded funds and equity index futures) of small cap companies traded on a principal U.S. exchange or over-the-counter market that the Adviser determines to have positive momentum. The Fund’s investment universe consists of small capitalization U.S. stocks, which are defined as those in the bottom 10% of market capitalization or that are smaller than the 1000th largest company, whichever is larger. The companies must also be among the top 3000 companies by market capitalization, and meet certain liquidity and other criteria. The AQR Small Cap Momentum Fund commenced operations on July 9, 2009. The Fund offers Class L shares.
The investment objective of the AQR International Momentum Fund is to seek long-term capital appreciation. The Fund invests primarily in equity or equity-related securities (including, but not limited to, exchange-traded funds, equity index futures and depositary receipts) of non-U.S. companies that the Adviser determines to have positive momentum. The Fund’s investment universe consists of stocks in the top 85% of market capitalization in each of the 19 major developed markets outside the U.S., and which meet certain liquidity and other criteria. The AQR International Momentum Fund commenced operations on July 9, 2009. The Fund offers Class L shares.
| | | | | | | | | | |
| AQR Funds | | | | Annual Report | | | | December 2009 | | 64 |
| | | | | | | |
| | |
| Notes to Financial Statements | | December 31, 2009 |
2. Significant Accounting Policies
The following summarizes the significant accounting policies of the Funds:
Use of Estimates: The preparation of the financial statements in conformity with U.S. generally accepted accounting principles (“GAAP”) requires management to make estimates and assumptions that affect the reported amounts of assets and liabilities and disclosure of contingent assets and liabilities at the date of the financial statements and the reported amounts of increases and decreases in net assets from operations during the reported period. Actual results could differ from those estimates.
Securities Valuation: Each Fund’s portfolio securities are valued as of the close of business of the regular session of trading on the NYSE (normally 4:00 p.m. Eastern time). Equity securities, including securities sold short, are valued at the latest quoted sales prices or official closing prices taken from the primary market in which each security trades. In accordance with procedures adopted by the Board of Trustees, the Funds apply fair value pricing to international securities on a daily basis utilizing the quotations of an independent pricing service, unless the Adviser determines that use of another valuation methodology is appropriate. The pricing service uses statistical analysis and quantitative models to adjust local market prices using factors such as subsequent movement and changes in the prices of indices, securities and exchange rates in other markets, in determining fair value as of the time the Fund calculates its net asset value. Securities traded in the over-the-counter market, and which are not quoted by NASDAQ, are valued at the last sale price, if available, otherwise at the last quoted bid price (in the case of short sales, at the ask price). Bonds are valued using the latest bid prices or using valuations based on a matrix system (which considers such factors as security prices, yields, maturities, and ratings), both as furnished by independent pricing services. The Funds value debt securities maturing less than 61 days from the date of purchase at amortized cost, which approximates market value. The value of futures contracts purchased and sold by the Funds is accounted for using the unrealized gain or loss on the contracts that is determined by marking the contracts to their current settlement prices. Futures and options contracts are valued at the last quoted sales price on the valuation date. In the event that the exchange for a specific futures contract closes earlier than 4:00 p.m., the futures contract is valued at the Official Settlement Price of the exchange. Prices of futures contracts are monitored until 4:00 p.m. to determine if fair valuation would provide a more accurate valuation. Investments in open-end investment companies are valued at such investment company’s current day closing net asset value per share. Equity swap contracts are valued at fair value, based on the price of the underlying security. Credit default swaps are valued daily primarily using independent pricing services or market makers.
The Funds may use pricing services to obtain readily available market quotations. Where market quotations are not readily available, or if an available market quotation is determined not to be reliable, a security will be valued based on its fair value as determined in accordance with the valuation procedures approved by the Funds’ Board of Trustees. Using fair value to price securities may result in a value that is different from a security’s most recent closing price and from the price used by other mutual funds to calculate their net assets.
Equity Swaps: The Funds invest in equity swaps to obtain exposure to the underlying referenced security, obtain leverage or enjoy the returns from ownership without actually owning equity. Equity swaps are two-party contracts that generally obligate one party to pay the positive return and the other party to pay the negative return on a specified reference security, basket of securities, security index or index component during the period of the swap. Equity swap contracts are marked to market daily based on the value of the underlying security and the change, if any, is recorded as an unrealized gain or loss. Equity swaps normally do not involve the delivery of securities or other underlying assets. Accordingly, the risk of loss with respect to equity swaps is normally limited to the net amount of payments that a Fund is contractually obligated to make. If the other party to an equity swap defaults, a Fund’s risk of loss consists of the net amount of payments that such Fund is contractually entitled to receive, if any. Equity swaps are derivatives and their value can be very volatile. To the extent that the Adviser or Sub-Adviser, as applicable, do not accurately analyze and predict future market trends, the values of assets or economic factors, a Fund may suffer a loss, which may be substantial. The swap markets in which many types of swap transactions are traded have grown substantially in recent years, with a large number of banks and investment banking firms acting both as principals and as agents. As a result, the markets for certain types of swaps have become relatively liquid. Periodic payments received or paid by the Funds are recorded as realized gains or losses.
Convertible Securities: The Funds invest in preferred stocks and fixed-income securities which are convertible into common stock. Convertible securities may be converted either at a stated price or rate within a specified period of time
| | | | | | | | | | |
| AQR Funds | | | | Annual Report | | | | December 2009 | | 65 |
| | | | | | | |
| | |
| Notes to Financial Statements | | December 31, 2009 |
into a specified number of shares of common stock. Traditionally, convertible securities have paid dividends or interest greater than on the related common stocks, but less than fixed income non-convertible securities. By investing in a convertible security, the Funds may participate in any capital appreciation or depreciation of a company’s stock, but to a lesser degree than if it had invested in that company’s common stock. Convertible securities rank senior to common stock in a corporation’s capital structure and, therefore, entail less risk than the corporation’s common stock. The Funds may attempt to hedge certain of its investments in convertible debt securities by selling short the issuer’s common stock.
Short Sales: The AQR Diversified Arbitrage Fund sells securities it does not own as a hedge against some of its long positions and/or in anticipation of a decline in the market value of that security (short sale). When the Fund makes a short sale, it must borrow the security sold short and deliver it to the broker-dealer through which it made the short sale. The Fund may have to pay a fee to borrow the particular security and may be obligated to remit any interest or dividends received on such borrowed securities. Dividends declared on short positions open are recorded on the ex-date as an expense. A gain, limited to the price at which the Fund sold the security short, or a loss, unlimited in magnitude, will be recognized upon the termination of a short sale if the market price at termination is less than or greater than, respectively, the proceeds originally received. The Fund is also subject to the risk that it may be unable to reacquire a security to terminate a short position except at a price substantially in excess of the last quoted price.
The Fund is required to pledge cash or securities to the broker as collateral for the securities sold short. Collateral requirements are calculated daily based on the current market value of the short positions. Cash deposited with broker for collateral for securities sold short is recorded as an asset on the Statement of Assets and Liabilities and securities segregated as collateral are denoted in the Schedule of Investments. The Fund may receive or pay the net of the following amounts: (i) a portion of the income from the investment of cash collateral; (ii) the broker’s fee on the borrowed securities; and (iii) a financing charge for the difference in the market value of the short position and cash collateral deposited with the broker. This income or fee is calculated daily based upon the market value of each borrowed security and a variable rate that is dependent on the availability of the security. The net amounts of income or fees of $240,130 are included as interest income in the Statement of Operations.
Deposits with brokers and segregated cash for securities sold short represent cash balances on deposit with the Fund’s prime brokers and custodian. The Fund is subject to credit risk should the prime brokers be unable to meet its obligations to the Fund.
Futures Contracts: Each Fund may invest in futures contracts (“futures”) in order to hedge its investments against fluctuations in value caused by changes in prevailing interest rates or market conditions. Investments in futures may increase or leverage exposure to a particular market risk, thereby increasing price volatility of derivative instruments a Fund holds. No monies are paid or received by a Fund upon the purchase or sale of a futures contract. Initially, a Fund will be required to deposit with the broker an amount of cash or cash equivalents, known as initial margin, based on the value of the contract. Subsequent payments, called variation margin, to and from the broker, will be made on a daily basis as the price of the underlying instruments fluctuates, making the long and short positions in the futures contract more or less valuable, a process known as ‘marking-to-the-market.’ Once a final determination of variation margin is made, additional cash is required to be paid by or released to a Fund, and a Fund will realize a loss or gain. The Funds may be subject to the risk that the change in the value of the futures contract may not correlate perfectly with the underlying index. Use of long futures contracts subjects the Funds to risk of loss in excess of the amounts shown on the Statements of Assets and Liabilities, up to the notional value of the futures contracts. Use of short futures contracts subjects the Funds to unlimited risk of loss. The Funds may enter into futures contracts only on exchanges or boards of trade. The exchange or board of trade acts as the counterparty to each futures contract; therefore, the Funds' credit risk is limited to failure of the exchange or board of trade. Under some circumstances, futures exchanges may establish daily limits on the amount that the price of a futures contract can vary from the previous day's settlement price, which could effectively prevent liquidation of unfavorable positions.
Forward Currency Contracts: The Funds may buy and sell forward currency contracts, which are agreements between two parties to buy and sell currencies at a set price on a future date. These contracts are used to protect against a decline in value relative to the U.S. dollar of the currencies in which its portfolio securities are denominated or quoted (or an increase in the value of a currency in which securities a fund intends to buy are denominated, when a fund holds cash
| | | | | | | | | | |
| AQR Funds | | | | Annual Report | | | | December 2009 | | 66 |
| | | | | | | |
| | |
| Notes to Financial Statements | | December 31, 2009 |
reserves and short term investments), or for other investment purposes. The U.S. dollar value of forward currency contracts is determined using current forward currency exchange rates supplied by a quotation service. The market value of the contract will fluctuate with changes in currency exchange rates. The contract is marked to market daily and the change in market value is recorded as an unrealized gain or loss. When the contract is closed, the Fund records a realized gain or loss equal to the difference between the value of the contract at the time it was opened and the value at the time it was closed. The Fund could be exposed to risk if the value of the currency changes unfavorably, if the counterparties to the contracts are unable to meet the terms of their contracts or if the Fund is unable to enter into a closing position. Risks may exceed amounts recognized on the Statements of Assets and Liabilities. Forward currency contracts outstanding at period end, if any, are listed after the Fund’s schedule of investments.
Credit Default Contracts: The Funds may enter into credit default contracts to provide a measure of protection against risk of loss following a default, or other credit event in respect of issuers within an underlying index or a single issuer, or to gain credit exposure to an underlying index or issuer. In a credit default contract, the protection buyer typically makes an up front payment and a periodic stream of payments to a counterparty, the protection seller, in exchange for the right to receive a contingent payment upon the occurrence of a credit event on the reference obligation or all other equally ranked obligations of the reference entity. Credit events are contract specific but may include bankruptcy, failure to pay, restructuring and obligation acceleration. An upfront payment received by a Fund, as the protection seller, is recorded as a liability on the Fund’s books. An upfront payment made by a Fund, as the protection buyer, is recorded as an asset on the Fund’s books. Periodic payments received or paid by a Fund are recorded as realized gains or losses. The credit default contracts are marked to market daily based upon quotations from an independent pricing service or market makers and the change, if any, is recorded as an unrealized gain or loss. Upon the occurrence of a credit event, the difference between the par value and market value of the reference obligation, net of any proportional amount of the upfront payment, is recorded as a realized gain or loss.
In addition to bearing the risk that the credit event will occur, a Fund could be exposed to market risk due to unfavorable changes in interest rates or in the price of the underlying security or index or the possibility that the Fund may be unable to close out its position at the same time or at the same price as if it had purchased the underlying reference obligations. In certain circumstances, a Fund may enter into offsetting credit default contracts which would mitigate its risk of loss. Risks of loss may exceed amounts recognized on the statement of assets and liabilities. The Fund’s maximum risk of loss from counterparty risk, either as the protection seller or as the protection buyer, is the fair value of the contract. This risk may be mitigated by having a master netting arrangement between the Fund and the counterparty. Where a Fund is a seller of protection, the maximum potential amount of future payments the fund may be required to make is equal to the notional amount of the relevant credit default contract. Credit default contracts outstanding, including their respective notional amounts at period end, if any, are listed after the Funds’ schedule of investments.
Master Agreements: The Funds are a party to ISDA (International Swap and Derivatives Association, Inc.) Master Agreements (“Master Agreements”) with certain counterparties that govern over the counter derivative and foreign exchange contracts entered into from time to time. The Master Agreements may contain provisions regarding, among other things, the parties’ general obligations, representations, agreements, collateral requirements, events of default and early termination. With respect to certain counterparties, in accordance with the terms of the Master Agreements, collateral posted to the Fund is held in a segregated account by the Fund’s custodian and with respect to those amounts which can be sold or repledged, are presented in the Fund’s schedule of investments. Collateral pledged by the Fund is segregated by the fund’s custodian and identified in the Fund’s schedule of investments. Collateral can be in the form of cash or debt securities issued by the U.S. Government or related agencies or other securities as agreed to by the Fund and the applicable counterparty. Collateral requirements are determined based on the fund’s net position with each counterparty. Termination events applicable to the Fund may occur upon a decline in the Fund’s net assets below a specified threshold over a certain period of time. Termination events applicable to counterparties may occur upon a decline in the counterparty’s long-term and short-term credit ratings below a specified level. In each case, upon occurrence, the other party may elect to terminate early and cause settlement of all derivative and foreign exchange contracts outstanding, including the payment of any losses and costs resulting from such early termination, as reasonably determined by the terminating party. Any decision by one or more of the Fund’s counterparties to elect early termination could impact the fund’s future derivative activity. The Funds net derivative assets and liabilities on the Statements of Assets and Liabilities when a legally enforceable master netting agreement exists between the Funds and a derivative counterparty.
| | | | | | | | | | |
| AQR Funds | | | | Annual Report | | | | December 2009 | | 67 |
| | | | | | | |
| | |
| Notes to Financial Statements | | December 31, 2009 |
Options: The Funds are authorized to write and purchase put and call options. When a Fund writes an option, an amount equal to the premium received by the Fund is reflected as an asset and an equivalent liability. The amount of the liability is subsequently marked to market to reflect the current market value of the option written. When a security is purchased or sold through an exercise of an option, the related premium paid (or received) is added to (or deducted from) the basis of the security acquired or deducted from (or added to) the proceeds of the security sold. When an option expires (or the Fund enters into a closing transaction), the Fund realizes a gain or loss on the option to the extent of the premiums received or paid (or gain or loss to the extent the cost of the closing transaction exceeds the premium paid or received). The Fund, as writer of an option, bears the market risk of an unfavorable change in the price of the security underlying the written option. Written and purchased options are non-income producing investments.
Transactions in call options written during the period ended December 31, 2009 for the AQR Diversified Arbitrage Fund, were as follows:
| | | | | | | |
| | | SHARES
SUBJECT TO
CALL | | | PREMIUM | |
| | |
| Options outstanding, January 15, 2009* | | — | | | $ | — | |
| Options written | | (6,686 | ) | | | (89,243 | ) |
| Options terminated in closing purchase transactions | | 1,905 | | | | 10,624 | |
| Options expired | | 3,740 | | | | 15,855 | |
| Options exercised | | 157 | | | | 21,823 | |
| Options outstanding, December 31, 2009 | | (884 | ) | | $ | (40,941 | ) |
| * | Commencement of operations |
Federal Income Taxes: Each Fund is treated as a separate taxable entity for federal income tax purposes. Each Fund intends to qualify as a “regulated investment company” under Subchapter M of the Internal Revenue Code, of 1986, as amended. If so qualified, each Fund will not be subject to federal income tax to the extent it distributes substantially all of its net investment income and capital gains to shareholders.
Management evaluates tax positions taken or expected to be taken in the course of preparing the Funds’ tax returns to determine whether the tax positions are “more-likely-than-not” of being sustained by the applicable tax authority. Tax positions not deemed to meet the more-likely-than-not threshold would be recorded as a tax benefit or expense in the current year. The Funds are required to analyze all open tax years. Open tax years are those years that are open for examination by the relevant income taxing authority. The returns of the Funds for the period from commencement of operations through December 31, 2009 are open for examination. As of December 31, 2009, the Funds have no examinations in progress.
The Funds have concluded that there is no tax liability resulting from uncertain income tax positions taken or expected to be taken. The Funds are also not aware of any tax positions for which it is reasonably possible that the total amounts of unrecognized tax expense will significantly change in twelve months.
Securities Transactions and Investment Income: Investment transactions are accounted for on trade date (the date the order to buy or sell is executed). Securities gains and losses are calculated on a specifically identified cost basis. Interest income is determined on the basis of coupon interest accrued using effective interest method adjusted for amortization of premiums and accretion of discounts using the effective yield method. Dividend income is recorded on the ex-dividend date.
Allocation of Income and Expenses: In calculating the net asset value per share of each class, investment income, realized and unrealized gains and losses and expenses other than class specific expenses are allocated daily to each class of shares based upon the proportion of net assets of each class at the beginning of each day. Each Fund is charged for those expenses that are directly attributable to each series, such as advisory fees and registration costs.
The Funds record distributions received in excess of income from underlying investments as a reduction of cost of investments and/or realized gain. Such amounts are based on estimates if actual amounts are not available and actual
| | | | | | | | | | |
| AQR Funds | | | | Annual Report | | | | December 2009 | | 68 |
| | | | | | | |
| | |
| Notes to Financial Statements | | December 31, 2009 |
amounts of income, realized gain and return of capital may differ from the estimated amounts. The Funds adjust the estimated amounts of components of distributions (and consequently its net investment income) as necessary once the issuers provide information about the actual composition of the distributions.
The Funds may be subject to foreign taxes on income, gains on investments or currency repatriation, a portion of which may be recoverable. The Funds will accrue such taxes and recoveries as applicable, based upon their current interpretation of tax rules and regulations that exist in the markets in which they invest.
Foreign Currency Translation: The books and records of the Funds are maintained in U.S. dollars. Foreign currency amounts are translated into U.S. dollars at the prevailing exchange rates of such currencies against the U.S. dollar. The market value of investment securities and the other assets and liabilities are translated at the exchange rate as of the valuation date. Purchases and sales of investment securities, income and expenses are translated at the exchange rate prevailing on the respective dates of such transactions.
Although the net assets of the Funds are presented at the foreign exchange rates and market values at the close of the period, the Funds do not isolate that portion of the results of operations arising as a result of changes in the foreign exchange rates from the fluctuations arising from changes in the market prices of securities held or sold during the period. Accordingly, such foreign currency gains (losses) are included in the reported net realized and unrealized gains (losses) on investment transactions.
Reported realized foreign currency gains or losses arise from the disposition of foreign currency, currency gains or losses realized between the trade and settlement dates on securities transactions, and the difference between the amounts of dividends, interest and foreign withholding taxes recorded on each Fund's books on the transaction date and the U.S. dollar equivalent of the amounts actually received or paid. Unrealized foreign exchange gains and losses arise from changes (due to the changes in the exchange rate) in the value of foreign currency and assets and liabilities (other than investments) denominated in foreign currencies, which are held at period end.
Cash and Cash Equivalents: Cash and cash equivalents includes US dollar and foreign currency at bank accounts at amounts which may exceed insured limits. The Funds are subject to risk to the extent that the institutions may be unable to fulfill their obligations.
Dividend Distributions to Shareholders: The Funds intend to distribute dividends representing substantially all of their net investment income and distribute substantially all of their net realized capital gains, if any, at least annually. Income and capital gain distributions will be determined in accordance with Federal income tax regulations which may differ from GAAP. Distributions to shareholders are recorded on the ex-dividend date.
Indemnification: In the normal course of business, the Funds may enter into various agreements that provide for general indemnifications. The Funds’ maximum exposure under these arrangements is unknown as any potential exposure involves future claims that may be made against the Funds. However, based on experience, the Funds expect the risk of loss to be remote.
3. Federal Income Tax Matters
At December 31, 2009, the cost of long positions and aggregate gross unrealized appreciation (depreciation) of investments for federal income tax purposes were as follows:
| | | | | | | | | | | | |
| FUND | | COST OF
INVESTMENTS | | GROSS
UNREALIZED
APPRECIATION | | GROSS
UNREALIZED
DEPRECIATION | | NET
UNREALIZED
APPRECIATION |
AQR International Equity Fund | | $ | 365,324,248 | | $ | 31,108,430 | | $ | 9,349,181 | | $ | 21,759,249 |
AQR Diversified Arbitrage Fund | | | 275,756,857 | | | 35,188,165 | | | 17,010,649 | | | 18,177,516 |
AQR Momentum Fund | | | 6,664,222 | | | 445,733 | | | 83,310 | | | 362,423 |
AQR Small Cap Momentum Fund | | | 3,111,120 | | | 296,437 | | | 101,194 | | | 195,243 |
AQR International Momentum Fund | | | 28,226,220 | | | 937,263 | | | 300,769 | | | 636,494 |
The differences between book and tax basis appreciation (depreciation) on investments is primarily attributable to wash sale loss deferrals and passive foreign investment companies (AQR International Equity Fund and AQR International Momentum Fund).
| | | | | | | | | | |
| AQR Funds | | | | Annual Report | | | | December 2009 | | 69 |
| | | | | | | |
| | |
| Notes to Financial Statements | | December 31, 2009 |
At December 31, 2009, the components of accumulated earnings/loss on a tax-basis were as follows:
| | | | | | | | | | | | | | | |
| FUND | | CURRENT
DISTRIBUTABLE
ORDINARY
INCOME | | CURRENT
DISTRIBUTABLE LONG TERM CAPITAL GAIN OR
TAX BASIS
CAPITAL LOSS
CARRYFORWARDS | | NET UNREALIZED
APPRECIATION | | OTHER
TEMPORARY
DIFFERENCES | | TOTAL
ACCUMULATED
EARNINGS |
AQR International Equity Fund | | $ | 2,852,084 | | $ | — | | $ | 23,168,198 | | $ | (1,741,718) | | $ | 24,278,564 |
AQR Diversified Arbitrage Fund | | | — | | | — | | | 3,083,492 | | | (510,744) | | | 2,572,748 |
AQR Momentum Fund | | | 297,489 | | | 12,798 | | | 362,423 | | | — | | | 672,710 |
AQR Small Cap Momentum Fund | | | 94,418 | | | — | | | 195,243 | | | — | | | 289,661 |
AQR International Momentum Fund | | | 61,009 | | | — | | | 665,981 | | | — | | | 726,990 |
The differences between book basis and tax basis components of net assets are primarily attributable to tax deferral of losses on wash sales and other book and tax differences including passive foreign investment companies (“PFIC”), foreign currency contracts, swap contracts and post-October losses.
At December 31, 2009, the effect of permanent book/tax reclassifications resulted in increases (decreases) to the components of net assets as follows:
| | | | | | | | | |
| FUND | | UNDISTRIBUTED
NET INVESTMENT
INCOME | | ACCUMULATED
NET REALIZED
GAIN (LOSS) ON
INVESTMENTS | | PAID-IN CAPITAL |
AQR International Equity Fund | | $ | 4,809,913 | | $ | (22,012,192) | | $ | 17,202,279 |
AQR Diversified Arbitrage Fund | | | (72,484) | | | 73,745 | | | (1,261) |
AQR Momentum Fund | | | — | | | — | | | — |
AQR Small Cap Momentum Fund | | | 79 | | | (79) | | | — |
AQR International Momentum Fund | | | 289,503 | | | (289,503) | | | — |
For financial reporting purposes, capital accounts are adjusted to reflect the tax character of permanent book/tax differences. Reclassifications are primarily due to the tax treatment of net operating losses, distribution reclassifications, foreign currency reclassifications, sale of Real Estate Investment Trusts and passive foreign investment companies. Results of operations and net assets were not affected by these reclassifications.
The tax character of the distributions paid during the period ended December 31, 2009, is as follows:
| | | |
| FUND | | ORDINARY INCOME |
AQR International Equity Fund | | $ | 15,889,442 |
AQR Diversified Arbitrage Fund | | | 2,319,939 |
AQR Momentum Fund | | | 197,807 |
AQR Small Cap Momentum Fund | | | 190,216 |
AQR International Momentum Fund | | | 614,653 |
Certain net losses incurred after October 31 and within the taxable year are deemed to arise on the first business day of the Funds’ next taxable year. For the period ended December 31, 2009, the Funds deferred to January 1, 2010 post October losses of:
| | | |
| FUND | | POST OCTOBER LOSSES |
AQR International Equity Fund | | $ | 1,741,718 |
AQR Diversified Arbitrage Fund | | | 510,744 |
| | | | | | | | | | |
| AQR Funds | | | | Annual Report | | | | December 2009 | | 70 |
| | | | | | | |
| | |
| Notes to Financial Statements | | December 31, 2009 |
4. Fair Value Measurements
The Funds utilize various inputs in determining the value of each Fund’s investments. GAAP establishes a hierarchy for inputs used in measuring fair value that maximizes the use of observable inputs and minimizes the use of unobservable inputs by requiring the most observable inputs be used when available. These inputs are summarized in the three broad levels as follows:
Level 1 — quoted prices in active markets for identical securities
Level 2 — other significant observable inputs (including quoted prices for similar securities, interest rates, pre-payment speeds, credit risk, etc.)
Level 3 — significant unobservable inputs (including the Fund’s own assumptions in determining the fair value of investments)
The inputs or methodology used for valuing securities are not necessarily an indication of the risk associated with investing in those securities. The following summarizes inputs used as of December 31, 2009 in valuing the Funds’ assets carried at fair value:
| | | | | | | | | | | | |
| AQR INTERNATIONAL EQUITY FUND | | QUOTED PRICES
IN ACTIVE
MARKET
(LEVEL 1) | | OTHER SIGNIFICANT
OBSERVABLE
INPUTS
(LEVEL 2) | | SIGNIFICANT
UNOBSERVABLE
INPUTS
(LEVEL 3) | | TOTALS |
ASSETS | | | | | | | | | | | | |
Common Stocks† | | $ | 50,499 | | $ | 319,754,889 | | $ | 676 | | $ | 319,806,064 |
Commercial Paper† | | | — | | | — | | | 88,336 | | | 88,336 |
Money Market Funds | | | — | | | 67,189,097 | | | — | | | 67,189,097 |
Futures Contracts* | | | 1,320,331 | | | — | | | — | | | 1,320,331 |
| | | | |
Total Assets | | $ | 1,370,830 | | $ | 386,943,986 | | $ | 89,012 | | $ | 388,403,828 |
| † | Please refer to the Schedule of Investments to view securities segregated by country. |
| | | | | | | | | | | | | | |
LIABILITIES | | | | | | | | | | | | | | |
| Foreign currency contracts* | | $ | — | | $ | (774,475 | ) | | $ | — | | $ | (774,475 | ) |
| | | | |
Total Liabilities | | $ | — | | $ | (774,475 | ) | | $ | — | | $ | (774,475 | ) |
The following is a reconciliation of assets in which significant unobservable inputs (Level 3) were used in determining fair value:
| | | | | | | |
| | | COMMON
STOCKS | | | COMMERCIAL
PAPER |
Balance as of August 28, 2009** | | $ | — | | | $ | — |
| Securities contributed in kind (See Note 10) | | | 259,784 | | | | 79,842 |
| Transferred into Level 3 | | | 84,165 | | | | — |
| Realized gain from sale of security | | | 121,306 | | | | — |
| Change in unrealized appreciation (depreciation) | | | (464,579 | ) | | | 8,494 |
| | |
Balance as of December 31, 2009 | | $ | 676 | | | $ | 88,336 |
The total change in unrealized appreciation (depreciation) included in the Statement of Operations attributable to Level 3 investments still held at December 31, 2009 is $(57,049) and $8,494 for common stocks and commercial paper, respectively.
| * | Derivative instruments, including futures contracts and foreign currency, are valued at the net unrealized appreciation (depreciation) on the instrument. |
| ** | Commencement of operations. |
| | | | | | | | | | |
| AQR Funds | | | | Annual Report | | | | December 2009 | | 71 |
| | | | | | | |
| | |
| Notes to Financial Statements | | December 31, 2009 |
| | | | | | | | | | | | |
| AQR DIVERSIFIED ARBITRAGE FUND | | QUOTED PRICES
IN ACTIVE
MARKET
(LEVEL 1) | | OTHER SIGNIFICANT
OBSERVABLE
INPUTS
(LEVEL 2) | | SIGNIFICANT
UNOBSERVABLE
INPUTS
(LEVEL 3) | | TOTALS |
ASSETS | | | | | | | | | | | | |
Common Stocks† | | $ | 133,845,858 | | $ | — | | $ | 7,508 | | $ | 133,853,366 |
Convertible Preferred Stocks† | | | 14,643,134 | | | 443,056 | | | — | | | 15,086,190 |
Convertible Bonds† | | | — | | | 129,141,424 | | | — | | | 129,141,424 |
Corporate Bonds† | | | — | | | 1,307,000 | | | — | | | 1,307,000 |
Closed End Funds | | | 5,525,982 | | | — | | | — | | | 5,525,982 |
Warrants | | | 40,544 | | | — | | | — | | | 40,544 |
Money Market Funds | | | — | | | 8,979,867 | | | — | | | 8,979,867 |
Futures Contracts* | | | 417,138 | | | — | | | — | | | 417,138 |
| | | | |
Total Assets | | $ | 154,472,656 | | $ | 139,871,347 | | $ | 7,508 | | $ | 294,351,511 |
| † | Please refer to the Schedule of Investments to view securities segregated by industry type. |
| | | | | | | | | | | | | | | |
| AQR DIVERSIFIED ARBITRAGE FUND | | QUOTED PRICES
IN ACTIVE
MARKET
(LEVEL 1) | | | OTHER
SIGNIFICANT
OBSERVABLE
INPUTS
(LEVEL 2) | | | SIGNIFICANT
UNOBSERVABLE
INPUTS
(LEVEL 3) | | TOTALS | |
LIABILITIES | | | | | | | | | | | | | | | |
Common Stocks (Sold Short)† | | $ | (156,600,131 | ) | | $ | — | | | $ | — | | $ | (156,600,131 | ) |
Closed End Funds (Sold Short) | | | (636,572 | ) | | | | | | | | | | (636,572 | ) |
Foreign currency contracts* | | | — | | | | (3,547 | ) | | | — | | | (3,547 | ) |
Swap contracts* | | | — | | | | (225,919 | ) | | | — | | | (225,919 | ) |
Written option contracts* | | | (5,369 | ) | | | — | | | | — | | | (5,369 | ) |
| | | | |
Total Liabilities | | $ | (157,242,072 | ) | | $ | (229,466 | ) | | $ | — | | $ | (157,471,538 | ) |
| † | Please refer to the Schedule of Investments to view securities segregated by industry type. |
The following is a reconciliation of assets in which significant unobservable inputs (Level 3) were used in determining fair value:
| | | |
| | | COMMON STOCKS |
Balance as of January 15, 2009** | | $ | — |
| Transferred into Level 3 | | | 6,606 |
| Change in unrealized appreciation (depreciation) | | | 902 |
| |
Balance as of December 31, 2009 | | $ | 7,508 |
The total change in unrealized appreciation (depreciation) included in the Statement of Operations attributable to Level 3 investments still held at December 31, 2009 is $902.
| * | Derivative instruments, including futures, foreign currency, swaps and options contracts, are valued at the unrealized appreciation (depreciation) on the instrument. |
| ** | Commencement of operations. |
| | | | | | | | | | |
| AQR Funds | | | | Annual Report | | | | December 2009 | | 72 |
| | | | | | | |
| | |
| Notes to Financial Statements | | December 31, 2009 |
| | | | | | | | | | | | |
| AQR MOMENTUM FUND | | QUOTED PRICES
IN ACTIVE
MARKET
(LEVEL 1) | | OTHER SIGNIFICANT
OBSERVABLE
INPUTS
(LEVEL 2) | | SIGNIFICANT
UNOBSERVABLE
INPUTS (LEVEL 3) | | TOTALS |
| ASSETS | | | | | | | | | | | | |
Common Stocks† | | $ | 6,885,618 | | $ | — | | $ | — | | $ | 6,885,618 |
| Money Market Funds | | | — | | | 141,027 | | | — | | | 141,027 |
| | | | |
Total Assets | | $ | 6,885,618 | | $ | 141,027 | | $ | — | | $ | 7,026,645 |
|
| | | | |
| LIABILITIES | | | | | | | | | | | | |
| Futures Contracts* | | $ | (141) | | $ | — | | $ | — | | $ | (141) |
| | | | |
Total Liabilities | | $ | (141) | | $ | — | | $ | — | | $ | (141) |
| * | Derivative instruments, including futures contracts, are valued at the unrealized appreciation/(depreciation) on the instrument. |
| † | Please refer to the Schedule of Investments to view securities segregated by industry type. |
| | | | | | | | | | | | |
| AQR SMALL CAP MOMENTUM FUND | | QUOTED PRICES
IN ACTIVE
MARKET
(LEVEL 1) | | OTHER SIGNIFICANT
OBSERVABLE
INPUTS
(LEVEL 2) | | SIGNIFICANT
UNOBSERVABLE
INPUTS (LEVEL 3) | | TOTALS |
| ASSETS | | | | | | | | | | | | |
Common Stocks† | | $ | 3,233,503 | | $ | — | | $ | — | | $ | 3,233,503 |
Exchange Traded Funds | | | 6,226 | | | — | | | — | | | 6,226 |
| Money Market Funds | | | — | | | 66,634 | | | — | | | 66,634 |
| | | | |
Total Assets | | $ | 3,239,729 | | $ | 66,634 | | $ | — | | $ | 3,306,363 |
|
†Please refer to the Schedule of Investments to view securities segregated by industry type. |
| | | | | | | | | | | | |
| AQR INTERNATIONAL MOMENTUM FUND | | QUOTED PRICES
IN ACTIVE
MARKET
(LEVEL 1) | | OTHER SIGNIFICANT
OBSERVABLE
INPUTS
(LEVEL 2) | | SIGNIFICANT
UNOBSERVABLE
INPUTS (LEVEL 3) | | TOTALS |
| ASSETS | | | | | | | | | | | | |
Common Stocks† | | $ | 3,117,725 | | $ | 22,564,377 | | $ | — | | $ | 25,682,102 |
Money Market Funds | | | — | | | 3,180,612 | | | — | | | 3,180,612 |
| Swap Contracts* | | | — | | | 28,572 | | | — | | | 28,572 |
| | | | |
Total Assets | | $ | 3,117,725 | | $ | 25,773,561 | | $ | — | | $ | 28,891,286 |
LIABILITIES | | | | | | | | | | | | |
| Foreign currency contracts* | | $ | — | | $ | (168,711) | | $ | — | | $ | (168,711) |
| | | | |
Total Liabilities | | $ | — | | $ | (168,711) | | $ | — | | $ | (168,711) |
| * | Derivative instruments, including foreign currency and foreign currency contracts, are valued at the unrealized appreciation/(depreciation) on the instrument. |
| † | Please refer to the Schedule of Investments to view securities segregated by country. |
| | | | | | | | | | |
| AQR Funds | | | | Annual Report | | | | December 2009 | | 73 |
| | | | | | | |
| | |
| Notes to Financial Statements | | December 31, 2009 |
5. Investment Transactions
During the period ended December 31, 2009, the cost of purchases and the proceeds from sales of investments (excluding swap contracts, foreign currency contracts, futures contracts and short-term investments) were as follows:
| | | | | | | | | | | | |
| FUND | | | PURCHASES | | | SALES | |
| SECURITIES
SOLD SHORT | |
| COVERS ON
SECURITIES SOLD
SHORT |
AQR International Equity Fund | | $ | 119,858,424 | | $ | (83,102,138) | | $ | — | | $ | — |
AQR Diversified Arbitrage Fund | | | 478,522,872 | | | (221,658,419) | | | (230,378,332) | | | 93,810,589 |
AQR Momentum Fund | | | 13,542,940 | | | (7,488,048) | | | — | | | — |
AQR Small Cap Momentum Fund | | | 6,806,912 | | | (4,037,892) | | | — | | | — |
AQR International Momentum Fund | | | 42,644,602 | | | (17,892,531) | | | — | | | — |
6. Derivative Instruments and Hedging Activities
Certain Funds use derivative instruments as part of their principal investment strategy to achieve their investment objectives. The effect of such derivative instruments on the Funds’ financial position and financial performance as reflected in the Statement of Assets and Liabilities and Statement of Operations for the period ended December 31, 2009 are as follows:
AQR International Equity Fund
Fair values of derivative instruments as of December 31, 2009 as presented in the Statement of Assets and Liabilities:
| | | | | | | | | | | | |
DERIVATIVES NOT
DESIGNATED AS
HEDGING
INSTRUMENTS,
CARRIED AT FAIR
VALUE | | ASSET DERIVATIVES | | LIABILITY DERIVATIVES | | CARRYING VALUE OF
DERIVATIVES ON THE
STATEMENT OF
ASSETS AND
LIABILITIES |
Equity contracts | | Variation Margin Receivable | | $3,333,408 | | Variation Margin
Payable | | $ | 2,013,077 | | $ | 1,320,331 |
Foreign exchange contracts | | Forward foreign currency contracts | | 2,727,826 | | Forward foreign
currency contracts | | | 3,502,301 | | | (774,475) |
| | | | | | | | | | | | | |
| | Total | | $6,061,234 | | Total | | $ | 5,515,378 | | $ | 545,856 |
| | | | | | | | | | | | | |
The effects of derivative instruments on the Statement of Operations for the period ended December 31, 2009 are as follows:
| | | | | | | | | | |
| | | REALIZED GAIN | | CHANGE IN UNREALIZED
APPRECIATION/DEPRECIATION |
Equity contracts | | Futures contracts | | $ | 4,225,279 | | Futures contracts | | $ | 806,953 |
Foreign exchange contracts | | Forward foreign currency contracts | | | 6,394,400 | | Forward foreign currency
contracts | | | (2,290,710) |
| | | | | | | | | | | |
| | Total | | $ | 10,619,679 | | Total | | $ | (1,483,757) |
| | | | | | | | | | | |
| | | | | | | | | | |
| AQR Funds | | | | Annual Report | | | | December 2009 | | 74 |
| | | | | | | |
| | |
| Notes to Financial Statements | | December 31, 2009 |
AQR Diversified Arbitrage Fund
Fair values of derivative instruments as of December 31, 2009 as presented in the Statement of Assets and Liabilities:
| | | | | | | | | | | | |
DERIVATIVES
NOT
DESIGNATED AS
HEDGING
INSTRUMENTS,
CARRIED AT FAIR
VALUE | | ASSET DERIVATIVES | | LIABILITY DERIVATIVES | | CARRYING VALUE OF
DERIVATIVES ON THE
STATEMENT OF
ASSETS AND
LIABILITIES |
Equity contracts | | Swaps, at value | | $26,133 | | | | $ | — | | $ | 26,133 |
Equity contracts | | | | — | | Call options written, at
value | | | 46,310 | | | (46,310) |
Equity contracts | | Variation Margin Receivable | | 556,968 | | Variation Margin Payable | | | 139,830 | | | 417,138 |
Foreign exchange contracts | | | | — | | Unrealized depreciation on
Forward foreign currency
contracts | | | 3,547 | | | (3,547) |
| | | | | | | | | | | | | |
| | Total | | $583,101 | | Total | | $ | 189,687 | | $ | 393,414 |
| | | | | | | | | | | | | |
The effects of derivative instruments on the Statement of Operations for the period ended December 31, 2009 are as follows:
| | | | | | | | | |
| | | REALIZED GAIN | | CHANGE IN UNREALIZED
APPRECIATION/DEPRECIATION |
Credit contracts | | Swap contracts | | $(291,132) | | Swap contracts | | $ | (225,919) |
Equity contracts | | Futures contracts | | (2,796,869) | | Futures contracts | | | 417,138 |
Equity contracts | | Written options | | 14,947 | | Written options | | | (5,369) |
Foreign exchange contracts | | Forward foreign currency contracts | | (10,822) | | Forward foreign currency
contracts | | | (3,547) |
| | | | | | | | | | |
| | Total | | $(3,083,876) | | Total | | $ | 182,303 |
| | | | | | | | | | |
AQR Momentum Fund
Fair values of derivative instruments as of December 31, 2009 as presented in the Statement of Assets and Liabilities:
| | | | | | | | |
DERIVATIVES NOT DESIGNATED AS
HEDGING INSTRUMENTS, CARRIED AT FAIR
VALUE | | LIABILITY DERIVATIVES | | | | CARRYING VALUE OF
DERIVATIVES ON THE
STATEMENT OF
ASSETS AND
LIABILITIES |
Equity contracts | | Variation Margin Payable | | $ | 141 | | $ | (141) |
| | | | | | | | | |
| | Total | | $ | 141 | | $ | (141) |
| | | | | | | | | |
The effects of derivative instruments on the Statement of Operations for the period ended December 31, 2009 are as follows:
| | | | | | | | | |
| | | REALIZED GAIN | | CHANGE IN UNREALIZED
APPRECIATION/DEPRECIATION |
Equity contracts | | Futures contracts | | $13,790 | | Futures contracts | | $ | (141) |
| | | | | | | | | | |
| | | | | | | | | | |
| AQR Funds | | | | Annual Report | | | | December 2009 | | 75 |
| | | | | | | |
| | |
| Notes to Financial Statements | | December 31, 2009 |
AQR International Momentum Fund
Fair values of derivative instruments as of December 31, 2009 as presented in the Statement of Assets and Liabilities:
| | | | | | | | | | | | | |
DERIVATIVES NOT
DESIGNATED AS
HEDGING
INSTRUMENTS,
CARRIED AT FAIR
VALUE | | ASSET DERIVATIVES | | LIABILITY DERIVATIVES | | CARRYING VALUE OF
DERIVATIVES ON THE
STATEMENT OF
ASSETS AND
LIABILITIES |
Equity contracts | | Swaps, at value | | $ | 58,603 | | Swaps, at value | | $ | 30,031 | | $ | 28,572 |
Foreign exchange contracts | | Forward foreign currency contracts | | | 8,346 | | Forward foreign
currency contracts | | | 177,057 | | | (168,711) |
| | | | | | | | | | | | | | |
| | Total | | $ | 66,949 | | Total | | $ | 207,088 | | $ | (140,139) |
| | | | | | | | | | | | | | |
The effects of derivative instruments on the Statement of Operations for the period ended December 31, 2009 are as follows:
| | | | | | | | | |
| | | REALIZED GAIN | | CHANGE IN UNREALIZED
APPRECIATION/DEPRECIATION |
Equity contracts | | Swap contracts | | $371,391 | | Swap contracts | | $ | 28,572 |
Foreign exchange contracts | | Forward foreign currency contracts | | 140,686 | | Forward foreign currency contracts | | | (168,711) |
| | | | | | | | | | |
| | Total | | $512,077 | | Total | | $ | (140,139) |
| | | | | | | | | | |
For nonexchange traded derivatives (swaps and forward foreign currency contracts), under standard derivative agreements, the Funds may be required to post collateral on derivatives if a Fund is in a net liability position with the counterparty exceeding certain amounts. Additionally, counterparties may immediately terminate derivatives contracts if a Fund fails to maintain sufficient asset coverage for its contracts or its net assets decline by stated percentages.
As of December 31, 2009, the following Funds had net liability positions:
| | | | | | | |
| FUND | | DERIVATIVES IN NET
LIABILITY POSITION | | | COLLATERAL
POSTED |
AQR International Equity Fund | | $ | (774,775 | ) | | $ | 1,670,000 |
AQR Diversified Arbitrage Fund | | | (49,857 | ) | | | — |
AQR Momentum Fund | | | (141 | ) | | | 12,484 |
AQR International Momentum Fund | | | (168,711 | ) | | | 1,500,034 |
For the period ended December 31, 2009, the quarterly average values of the derivatives held by the Funds were as follows:
| | | | | | | | | | | | | | | |
| FUND | | SWAP
CONTRACTS | | FUTURES
CONTRACTS* | | | OPTION
CONTRACTS* | | | FOREIGN
FORWARD
CURRENCY
CONTRACTS* | |
AQR International Equity Fund | | $ | — | | $ | 52,882,824 | | | $ | — | | | $ | 51,689,915 | |
AQR Diversified Arbitrage Fund | | | 63,013 | | | (31,101,125 | ) | | | (11,578 | ) | | | (106,610 | ) |
AQR Momentum Fund | | | — | | | 27,768 | | | | — | | | | — | |
AQR Small Cap Momentum Fund | | | — | | | — | | | | — | | | | — | |
AQR International Momentum Fund | | | 2,619,761 | | | — | | | | — | | | | 5,689,103 | |
| * | Values as of each quarter end are used to calculate the average represented. |
The Funds’ derivative contracts held at December 31, 2009, are not accounted for as hedging instruments under GAAP.
| | | | | | | | | | |
| AQR Funds | | | | Annual Report | | | | December 2009 | | 76 |
| | | | | | | |
| | |
| Notes to Financial Statements | | December 31, 2009 |
7. Investment Advisory and Other Agreements
The Adviser serves as the investment adviser to the Funds pursuant to an Investment Advisory Agreement entered into by the Trust, on behalf of the Funds, dated December 4, 2008, as amended from time to time (the “Advisory Agreement”). Under the Advisory Agreement, the Adviser furnishes a continuous investment program for each Fund’s portfolio, makes day-to-day investment decisions for the Funds, and manages the Funds’ investments in accordance with the stated policies of each Fund. The Adviser is also responsible for selecting brokers and dealers to execute purchase and sale orders for the portfolio transactions of each Fund, subject to its obligation to seek best execution. The Adviser provides persons satisfactory to the Trustees to serve as officers of the Funds. Pursuant to the Advisory Agreement, the Funds pay the Adviser a management fee at an annual rate of 0.45% of the average daily net assets for AQR International Equity Fund. 0.70% of the average daily net assets for AQR Diversified Arbitrage Fund, 0.25% of the average daily net assets for AQR Momentum Fund, 0.35% of the average daily net assets for each of the AQR Small Cap Momentum Fund and AQR International Momentum Fund.
The Trust and the Adviser have entered into a Fee Waiver and Expense Reimbursement Agreement whereby the Adviser has agreed to waive its fee and/or reimburse each Fund at least through December 31, 2010 for AQR International Equity Fund, April 30, 2010 for AQR Diversified Arbitrage Fund and April 30, 2011 for each of AQR Momentum Fund, AQR Small Cap Momentum Fund and AQR International Momentum Fund. The Adviser has agreed to waive and/or reimburse each Fund to the extent that the total annual fund operating expense ratios, exclusive of interest, taxes, borrowing costs, acquired fund fees and expenses, dividend expense related to short sales, and extraordinary expenses exceed the following amounts:
| | | |
| FUND CLASS | | RATIO | |
AQR International Equity Fund — Class I | | 0.90 | % |
AQR International Equity Fund — Class N | | 1.25 | |
AQR International Equity Fund — Class Y | | 0.55 | |
AQR Diversified Arbitrage Fund — Class I | | 1.20 | |
AQR Diversified Arbitrage Fund — Class N | | 1.50 | |
AQR Momentum Fund — Class L | | 0.49 | |
AQR Small Cap Momentum Fund — Class L | | 0.65 | |
AQR International Momentum Fund — Class L | | 0.65 | |
The Trust, in turn, agreed that the Funds will repay the fee waiver/expense reimbursement to the Adviser. Such repayment shall be made only out of the assets of the Fund for which the applicable fee waiver and expense reimbursement was made. Repayments with respect to a Fund must be limited to amounts that do not cause the aggregate operating expenses of the Fund attributable to a share class during a year in which such repayment is made to exceed the applicable ratios reflected in the table above. A repayment shall be payable only to the extent it can be made during the thirty six months following the applicable period during which the Adviser waived fees or reimbursed the applicable Fund for its operating expenses under the Agreement.
For the period ended December 31, 2009, the Adviser waived and reimbursed the following fees, which are all available for recoupment until December 31, 2012:
| | | | | | |
| | | FEES
WAIVED | | FEES
REIMBURSED | | TOTAL |
| AQR INTERNATIONAL EQUITY FUND | | | | | | |
Class I | | $ 8,330 | | $ — | | $ 8,330 |
Class N | | 1,375 | | — | | 1,375 |
| Class Y | | 523,152 | | — | | 523,152 |
| | | |
Totals | | $532,857 | | $ — | | $532,857 |
| | | | | | | | | | |
| AQR Funds | | | | Annual Report | | | | December 2009 | | 77 |
| | | | | | | |
| | |
| Notes to Financial Statements | | December 31, 2009 |
| | | | | | |
| | | FEES
WAIVED | | FEES
REIMBURSED | | TOTAL |
| AQR DIVERSIFIED ARBITRAGE FUND | | | | | | |
Class I | | $322,842 | | $ — | | $322,842 |
| Class N | | 202,927 | | — | | 202,927 |
| | | |
Totals | | $525,769 | | $ — | | $525,769 |
| | | |
| AQR MOMENTUM FUND | | | | | | |
Class L | | $ 8,552 | | $116,707 | | $125,259 |
| | | |
| AQR SMALL CAP MOMENTUM FUND | | | | | | |
Class L | | $ 7,060 | | $117,532 | | $124,592 |
| | | |
| AQR INTERNATIONAL MOMENTUM FUND | | | | | | |
Class L | | $ 30,703 | | $ 90,836 | | $121,539 |
The Adviser has retained CNH Partners, LLC (“CNH”), an affiliate of the Adviser, to serve as an investment sub-adviser to the AQR Diversified Arbitrage Fund. Pursuant to the Sub-Advisory Agreement between CNH, the Adviser and the Trust, the Adviser will pay CNH an annual fee, payable quarterly, at the annual rate of 0.70% of the Fund’s average daily net assets.
Bank of New York Mellon serves as the Funds’ Administrator, Custodian and Accounting Agent.
The Adviser contributed capital in the amount of $15,777 into the AQR International Equity Fund Class Y shares during the period ended December 31, 2009.
ALPS Fund Services, Inc. serves as the Funds’ Transfer Agent, and ALPS Distributors, Inc. serves as the Funds’ Distributor. Fees incurred by the Funds to the Transfer Agent for sub-transfer agency services for the period ended December 31, 2009, were as follows:
| | | |
| FUND CLASS | | AMOUNT |
AQR International Equity Fund — Class I | | $ | 504 |
AQR International Equity Fund — Class N | | | 504 |
AQR International Equity Fund — Class Y | | | — |
AQR Diversified Arbitrage Fund — Class I | | | 4,000 |
AQR Diversified Arbitrage Fund — Class N | | | 22,820 |
AQR Momentum Fund — Class L | | | 498 |
AQR Small Cap Momentum Fund — Class L | | | 413 |
AQR International Momentum Fund — Class L | | | 554 |
8. Distribution and Service Plans
The Trust has adopted a Plan of Distribution (the “Plan”) pursuant to Rule 12b-1 under the 1940 Act with respect to the Class N shares of the Funds, as applicable. The Plan allows for the payment of services related to the distribution and servicing of these shares at a rate of up to 0.25% per annum of the average daily net asset value of the Class N shares of the Funds, as applicable.
Pursuant to the Shareholder Services Agreement, between the Trust, on behalf of the Funds and the Adviser, the Adviser receives an annual fee, payable monthly, at the annual rate of 0.30%, 0.35%, 0.25% and 0.15% of the average daily net assets of the Class I, Class N, Class Y and Class L shares, respectively. The Adviser also provides a wide range of services to the Funds and their shareholders under a separate Shareholder Services Agreement. These services include, among others, access to performance information reporting, analysis and explanations of Fund reports as well as
| | | | | | | | | | |
| AQR Funds | | | | Annual Report | | | | December 2009 | | 78 |
| | | | | | | |
| | |
| Notes to Financial Statements | | December 31, 2009 |
electronic access to Fund information. In addition, the Adviser may, from time to time, compensate third parties (including financial intermediaries) from the fees the Adviser receives under the Shareholder Services Agreement for non-distribution shareholder services such third parties provide to clients or customers that are shareholders of the funds. Fees incurred by the Funds under the Plan and/or the shareholder services agreement for the period ended December 31, 2009, were as follows:
| | | |
| FUND CLASS | | AMOUNT |
AQR International Equity Fund — Class I | | $ | 12,621 |
AQR International Equity Fund — Class N | | | 1 |
AQR International Equity Fund — Class Y | | | 281,012 |
AQR Diversified Arbitrage Fund — Class I | | | 120,046 |
AQR Diversified Arbitrage Fund — Class N | | | 98,159 |
AQR Momentum Fund — Class L | | | 3,207 |
AQR Small Cap Momentum Fund — Class L | | | 2,118 |
AQR International Momentum Fund — Class L | | | 9,211 |
9. Purchases and Redemption of Shares
Investors may purchase shares of a Fund at their net asset value (“NAV”), based on the next calculation of the NAV after the order is placed. Neither the Fund nor the distributor charges a sales charge or other transaction fee to purchase shares, although other institutions may impose transaction fees on shares purchased through them.
Redemption requests will be processed at the next NAV calculated after a redemption request is accepted. The Fund reserves the right to charge a redemption fee of 1% (2% in the case of AQR International Equity Fund and AQR International Momentum Fund), of redemption proceeds on Class I, Class N and Class L shares held for 60 days or less. The Funds charge this fee in order to discourage short-term investors. The Funds retain this fee for the benefit of the remaining shareholders. The AQR International Equity Fund’s Class Y shares charges subscription and redemption fees of 0.10% each regardless of the period such shares may have been held.
10. In-Kind Transaction
On August 28, 2009, the AQR International Equity Fund acquired all of the assets and liabilities of a privately offered fund managed by the Adviser in exchange for Class Y shares of the Fund. This transaction was structured to qualify as a tax-free reorganization under the Code. The investment portfolio of the privately offered fund, with a fair value of $273,684,897 and identified cost of $238,063,341 as of the date of the reorganization, was the principal asset acquired by the Fund. For financial statement purposes, assets received and shares issued by the Fund were recorded at fair value, and the Fund recorded the cost of such investments at their historical cost as recorded by the privately offered fund. The cost basis of the investments received from the privately offered fund was carried forward to align ongoing reporting of the Fund’s realized and unrealized gains and losses with amounts distributable for tax purposes. The net assets of the private fund at the date of acquisition were $316,649,562, including unrealized appreciation of $37,442,098. The net assets of the Fund immediately after the reorganization were $316,649,562. The Fund had no net assets or liabilities prior to the reorganization.
11. Risks and Concentrations
By using derivative instruments, the Funds are exposed to the counterparty’s credit risk-the risk that derivative counterparties may not perform in accordance with the contractual provisions offset by the value of any collateral received. The Funds’ exposure to credit risk associated with counterparty non-performance is limited to the unrealized gains inherent in such transactions that are recognized in the Statement of Assets and Liabilities. The Funds minimize counterparty credit risk through credit limits and approvals, credit monitoring procedures, executing master netting arrangements and managing margin and collateral requirements, as appropriate.
The Funds may have elements of risk not typically associated with investments in the United States of America due to concentrated investments in a limited number of countries or regions, which may vary throughout the year. Such concentrations may subject the Funds to additional risks resulting from political or economic conditions in such countries or regions and the possible imposition of adverse governmental laws or currency exchange restrictions could
| | | | | | | | | | |
| AQR Funds | | | | Annual Report | | | | December 2009 | | 79 |
| | | | | | | |
| | |
| Notes to Financial Statements | | December 31, 2009 |
cause the securities and their markets to be less liquid and their prices to be more volatile than those of comparable US companies.
As of December 31, 2009, substantially all of the AQR International Equity Fund and AQR International Momentum Fund's net assets consisted of issuers that are denominated in foreign currencies. Changes in currency exchange rates will affect the value of and investment income from such securities.
As of December 31, 2009, the AQR Diversified Arbitrage Fund pledged a substantial portion of its assets for securities sold short to Goldman Sachs.
A significant portion of the net assets of the AQR Momentum Fund and the AQR Small Cap Momentum Fund are held by the Adviser and its affiliates. Significant shareholder transactions, if any, may impact the Funds’ performance.
12. Subsequent Events
Effective January 20, 2010, the Board of Trustees of the AQR Funds approved the elimination of the 1.00% redemption fee on the proceeds from redemptions of Class N and I shares of the AQR Diversified Arbitrage Fund held for 60 days or less.
Management has evaluated events occurring subsequent to December 31, 2009 through March 1, 2010, the date the financial statements were issued. Management has determined that there were no material events that would require disclosure or adjustment to the Funds’ financial statement through this date.
| | | | | | | | | | |
| AQR Funds | | | | Annual Report | | | | December 2009 | | 80 |
| | | | | | | |
| | |
Report of Independent Registered Public Accounting Firm |
To the Board of Trustees and Shareholders of AQR Funds:
In our opinion, the accompanying statements of assets and liabilities, including the schedules of investments, and the related statements of operations, of cash flows (AQR Diversified Arbitrage Fund only) and of changes in net assets and the financial highlights present fairly, in all material respects, the financial position of AQR International Equity Fund, AQR Diversified Arbitrage Fund, AQR Momentum Fund, AQR Small Cap Momentum Fund and AQR International Momentum Fund (five of the portfolios constituting AQR Funds, hereafter referred to as the “Funds”) at December 31, 2009, and the results of each of their operations, the cash flows of AQR Diversified Arbitrage Fund, the changes in each of their net assets and the financial highlights for each of the periods presented, in conformity with accounting principles generally accepted in the United States of America. These financial statements and financial highlights (hereafter referred to as “financial statements”) are the responsibility of the Funds’ management. Our responsibility is to express an opinion on these financial statements based on our audits. We conducted our audits of these financial statements in accordance with the standards of the Public Company Accounting Oversight Board (United States). Those standards require that we plan and perform the audit to obtain reasonable assurance about whether the financial statements are free of material misstatement. An audit includes examining, on a test basis, evidence supporting the amounts and disclosures in the financial statements, assessing the accounting principles used and significant estimates made by management, and evaluating the overall financial statement presentation. We believe that our audit, which included confirmation of securities at December 31, 2009 by correspondence with the custodian and brokers, provides a reasonable basis for our opinion.
PricewaterhouseCoopers LLP
New York, New York
March 1, 2010
| | | | | | | | | | |
| AQR Funds | | | | Annual Report | | | | December 2009 | | 81 |
| | | | | | | |
Fund Expense Examples (Unaudited)
December 31, 2009
As a shareholder of the Trust, you incur two types of costs: (1) transaction costs and (2) ongoing costs, including management fees; and other Fund expenses. This example is intended to help you understand your ongoing costs (in dollars) of investing in the Fund and to compare these costs with the ongoing costs of investing in other mutual funds. The Example is based on an investment of $1,000 invested at the beginning of the period and held for the entire period as indicated below.
Actual Expenses
The table below provides information about actual account values and actual expenses. You may use the information together with the amount you invested, to estimate the expenses that you paid over the period. Simply divide your account value by $1,000 (for example, an $8,600 account value divided by $1,000 = 8.6), then multiply the result by the number under the heading entitled “Expenses Paid for the Period Ended 12/31/09” to estimate the expenses you paid on your account during this period. Each Fund will indirectly bear its pro rata share of the expenses incurred by the underlying investments in which the Fund invests. These expenses are not included in the table.
Hypothetical Example for Comparison Purposes
The table below also provides information about hypothetical account values and hypothetical expenses based on each Fund’s actual expense ratio and an assumed annual rate of return of 5% before expenses, which is not the Fund’s actual return. The hypothetical account values and expenses may not be used to estimate the actual ending account balance or expenses you paid for the period. You may use this information to compare the ongoing costs of investing in a Fund and other funds by comparing this 5% hypothetical example with the 5% hypothetical examples that appear in the shareholder reports of other funds. The Fund will indirectly bear its pro rata share of the expenses incurred by the underlying investments in which the Fund invests. These expenses are not included in the table.
Please note that the expenses shown in the table are meant to highlight your ongoing costs only and do not reflect any transactional costs. Therefore, the hypothetical example is useful in comparing ongoing costs only, and will not help you determine the relative total costs of owning different funds. In addition, if these transactional costs were included, your costs would have been higher.
| | | | | | | | |
| | | BEGINNING
ACCOUNT
DATE
VALUE | | ENDING
ACCOUNT
VALUE
12/31/09 | | ANNUALIZED
EXPENSE
RATIO FOR
THE PERIOD | | EXPENSES
PAID FOR THE
PERIOD
ENDING
12/31/09 |
| AQR International Equity Fund | | | | | | | | |
| Class Y (1) | | 8/28/09 | | | | | | |
Actual Return | | $1,000.00 | | $1,060.80 | | 0.55% | | $1.96(a) |
Hypothetical 5% return | | $1,000.00 | | $1,022.43 | | 0.55% | | $2.80(b) |
| Class I (2) | | 9/30/09 | | | | | | |
Actual Return | | $1,000.00 | | $1,022.00 | | 0.90% | | $2.32(c) |
Hypothetical 5% return | | $1,000.00 | | $1,020.67 | | 0.90% | | $4.58(b) |
| Class N (2) | | 9/30/09 | | | | | | |
Actual Return | | $1,000.00 | | $1,020.40 | | 1.25% | | $3.22(c) |
Hypothetical 5% return | | $1,000.00 | | $1,018.90 | | 1.25% | | $6.36(b) |
| AQR Diversified Arbitrage Fund | | | | | | | | |
| Class I | | 6/30/09 | | | | | | |
Actual Return | | $1,000.00 | | $1,092.40 | | 1.20% | | $6.33(b) |
Hypothetical 5% return | | $1,000.00 | | $1,019.16 | | 1.20% | | $6.11(b) |
| Class N | | 6/30/09 | | | | | | |
Actual Return | | $1,000.00 | | $1,088.80 | | 1.50% | | $7.90(b) |
Hypothetical 5% return | | $1,000.00 | | $1,017.64 | | 1.50% | | $7.63(b) |
| | | | | | | | | | |
| AQR Funds | | | | Annual Report | | | | December 2009 | | 82 |
| | | | | | | |
| | | | | | | | |
| | | BEGINNING
ACCOUNT
DATE
VALUE | | ENDING
ACCOUNT
VALUE
12/31/09 | | ANNUALIZED
EXPENSE
RATIO FOR
THE PERIOD | | EXPENSES
PAID FOR THE
PERIOD
ENDING
12/31/09 |
| | | | |
| AQR Momentum Fund | | | | | | | | |
| Class L (3) | | 7/9/09 | | | | | | |
Actual Return | | $1,000.00 | | $1,255.80 | | 0.49% | | $2.65(d) |
Hypothetical 5% return | | $1,000.00 | | $1,022.74 | | 0.49% | | $2.50(b) |
| | | | |
| AQR Small Cap Momentum Fund | | | | | | | | |
| Class L (3) | | 7/9/09 | | | | | | |
Actual Return | | $1,000.00 | | $1,212.40 | | 0.65% | | $3.45(d) |
Hypothetical 5% return | | $1,000.00 | | $1,021.93 | | 0.65% | | $3.31(b) |
| | | | |
| AQR International Momentum Fund | | | | | | | | |
| Class L (3) | | 7/9/09 | | | | | | |
Actual Return | | $1,000.00 | | $1,230.80 | | 0.65% | | $3.48(d) |
Hypothetical 5% return | | $1,000.00 | | $1,021.93 | | 0.65% | | $3.31(b) |
| (1) | Commencement of operations was August 28, 2009. |
| (2) | Commencement of offering of shares was September 30, 2009. |
| (3) | Commencement of operations was July 9, 2009. |
| (a) | Expenses are calculated using each Class’ annualized expense ratio, multipled by the average account value for the period, multipled by 126/365 (to reflect the period since commencement of operations). |
| (b) | Expenses are calculated using each Class’ annualized expense ratio, multipled by the average account value for the period, multipled by 184/365 (to reflect the one-half year period). |
| (c) | Expenses are calculated using each Class’ annualized expense ratio, multipled by the average account value for the period, multipled by 93/365 (to reflect the period since commencement of operations). |
| (d) | Expenses are calculated using each Class’ annualized expense ratio, multipled by the average account value for the period, multipled by 176/365 (to reflect the period since commencement of operations). |
| | | | | | | | | | |
| AQR Funds | | | | Annual Report | | | | December 2009 | | 83 |
| | | | | | | |
| | |
| Trustees and Officers | | December 31, 2009 |
The overall management of the business and affairs of the Funds is vested with the Board of Trustees. The Board of Trustees approves all significant agreements between the Trust and persons or companies furnishing services to it, including the Trust’s agreements with its investment advisers, administrator, custodian and transfer agent. The management of each Fund’s day-to-day operations is delegated to its officers, the Adviser, the Sub-Adviser and the Fund’s administrator, subject always to the investment objectives and policies of the Funds and to general supervision of the Board of Trustees.
Listed in the chart below is basic information regarding the Trustees and officers of the Trust. The address of each officer and Trustee is 2 Greenwich Plaza, Third Floor, Greenwich CT 06830.
| | | | | | | | |
| NAME AND YEAR OF BIRTH | | CURRENT POSITION WITH THE TRUST, TERM OF OFFICE1 AND LENGTH OF TIME SERVED | | PRINCIPAL OCCUPATION(S) DURING PAST 5 YEARS | | NUMBER
OF FUNDS IN FUND COMPLEX OVERSEEN BY TRUSTEE | | OTHER
DIRECTORSHIPS HELD BY TRUSTEE |
Disinterested Trustees2 | | | | | | | | |
| Timothy K. Armour, 1948 | | Trustee, since 2008 | | Interim Chief Executive Officer of Janus Capital Group (since 2009); Managing Director, Morningstar Inc. | | 12 | | Janus Capital
Group; AARP
Services |
| | | | |
| Steven Grenadier, 1964 | | Trustee, since 2008 | | Professor of Finance, Stanford University | | 12 | | E*TRADE Funds;
Nicholas
Applegate Funds |
| | | | |
| L. Joe Moravy, 1950 | | Trustee, since 2008 | | Retired (since 2008); prior thereto, Partner, Ernst & Young LLP | | 12 | | N/A |
| | | | |
Interested Trustee3 | | | | | | | | |
| John M. Liew, Ph.D., 1967 | | Chairman of the Board, since 2008 | | Founding Principal, AQR Capital Management LLC | | 12 | | N/A |
| (1) | Each Trustee serves until the election and qualification of a successor, or until death, resignation or removal as provided in the Trust’s declaration of Trust. |
| (2) | A Disinterested Trustee is any Trustee that is not an “interested person” of the Trust within the meaning of Section 2(a)(19) of the 1940 Act. |
| (3) | An Interested Trustee is a Trustee that is an “interested person” of the Trust within the meaning of Section 2(a)(19) of the 1940 Act. Mr. Liew is an interested person of the Trust because of his position with the Adviser. |
| | | | | | | | | | |
| AQR Funds | | | | Annual Report | | | | December 2009 | | 84 |
| | | | | | | |
| | |
| Trustees and Officers | | December 31, 2009 |
| | | | |
| OFFICERS | | CURRENT POSITION WITH THE TRUST, TERM OF OFFICE2 AND LENGTH OF TIME SERVED | | PRINCIPAL OCCUPATION(S) DURING PART 5 YEARS |
| Marco Hanig, 1958 | | Chief Executive Officer, since 2009;
President,
since 2008 | | Vice President, AQR Capital Management LLC (since 2008); prior thereto, Principal, William Blair & Company, L.L.C. |
| | |
| John B. Howard, 1969 | | Vice President and Chief Financial Officer, since 2009;
Treasurer,
from 2008 to 2009 | | Principal, AQR Capital Management LLC (since 2007); prior thereto, Chief Financial Officer, Knight Capital Group |
| | |
| Brendan R. Kalb, 1975 | | Executive Vice President, since 2009;
Secretary,
since 2008 | | Vice President, AQR Capital Management LLC (since 2004) |
| | |
| Nir Messafi, 1975 | | Vice President and Treasurer, since 2009 | | Vice President, AQR Capital Management, LLC (since 2003) |
| | |
| Nicole DonVito, 1979 | | Vice President, since 2009 | | Vice President, AQR Capital Management, LLC (since 2007), prior thereto, Associate, Schulte Roth & Zabel LLP |
| | |
| Bradley Asness, 1969 | | Vice President and Chief Legal Officer, since 2009 | | Principal, AQR Capital Management, LLC (since 1998) |
| | | | | | | | | | |
| AQR Funds | | | | Annual Report | | | | December 2009 | | 85 |
| | | | | | | |
| | |
| Board Approval of Investment Advisory Agreements |
| | |
| AQR International Equity Fund | | |
The Board of Trustees (the “Board,” and the members of which are referred to as “Board Members”) of the AQR Funds (the “Trust”) met in person on November 25, 2008 to consider the approval of the investment advisory agreement (the “Advisory Agreement”) between the Trust, on behalf of the AQR International Equity Fund (the “Fund”), and AQR Capital Management, LLC (“AQR” or the “Adviser”). In accordance with Section 15(c) of the Investment Company Act of 1940, as amended (the “1940 Act”), the Board requested, reviewed, and considered materials furnished by AQR relevant to the Board’s consideration of whether to approve the Advisory Agreement. These materials included (a) memoranda and materials prepared by AQR, describing personnel and services to be provided to the Fund; (b) private fund and composite performance summaries for strategies relevant to consideration of the Advisory Agreement; (c) information independently compiled and prepared by Lipper, Inc. (“Lipper”) relating to the proposed Fund fees and expenses; (d) a discussion of AQR’s financial statements and financial condition; and (e) a discussion of the AQR compliance program and its regulatory exam history.
At the in-person meeting held on November 25, 2008, the Board, including the Board Members who are not “interested persons” as defined in the 1940 Act (the “Independent Board Members”), unanimously approved the Advisory Agreement for an initial two-year term. The Board considered all factors it believed relevant with respect to the Fund, including, among other factors: (a) the nature, extent and quality of the services to be provided by AQR; (b) the investment performance of AQR portfolio management; (c) the advisory fee and the cost of the services and profits to be realized by AQR from the relationship with the Fund; (d) economies of scale; and (e) other factors.
The Board also considered other matters it deemed important to the approval process, such as services related to the valuation and pricing of Fund portfolio holdings, direct and indirect benefits to AQR and its affiliates from their relationship with the Fund and advice from independent legal counsel with respect to the review process and materials submitted for the Board’s review. The Board did not identify any particular information as controlling, and each Board Member may have attributed different weights to the various items considered.
The following is a summary of the Board’s discussion and views regarding the factors it considered in evaluating the Advisory Agreement:
The nature, extent and quality of the services to be provided by AQR. The Board Members reviewed the services that AQR would provide to the Fund under the Advisory Agreement. The Board considered the size and experience of AQR’s staff, its use of technology, and the Fund’s investment objective, strategy and process. The Board reviewed the overall qualifications of AQR as an investment adviser. In connection with the investment advisory services to be provided to the Fund, the Board Members took into account detailed discussions they had with officers of AQR regarding the management of the Fund’s investments in accordance with the Fund’s stated investment objective and policies and the types of transactions that would be entered into on behalf of the Fund. During these discussions, the Board Members asked detailed questions of, and received answers from, the officers of AQR regarding the formulation and proposed implementation of the Fund’s investment strategy, its efficacy and potential risks. The Board considered AQR’s experience managing private funds with objectives and strategies, similar to the Fund and AQR’s experience managing private funds generally. The Board also considered AQR’s ownership structure and senior management.
In addition to the investment advisory services to be provided to the Fund, the Board Members considered that AQR also will provide administrative services, oversight of Fund accounting, marketing services, assistance in meeting legal and regulatory requirements and other services necessary for the operation of the Fund. In particular, the Board reviewed the compliance and administrative services to be provided to the Fund by AQR. The Board also reviewed a wide range of services provided to the Fund’s shareholders under a Shareholder Services Agreement with AQR. These services include access to performance information reporting, analysis and explanations of Fund reports, and electronic access to Fund information.
The Board also met with senior principals of AQR, including Clifford Asness, Managing and Founding Principal of AQR, and John Liew, Founding Principal of AQR and one of the Funds’ Trustees. The Board also met with the Fund’s portfolio management team. The Board considered information about how portfolio managers are compensated by AQR. The Board was advised that the firm employs a team-based approach in which all employees are compensated based on the firm’s overall performance.
Finally, the Independent Board Members had an opportunity to meet outside the presence of management in executive session separately with counsel to discuss and consider the Advisory Agreement. Based on the presentations at the
| | | | | | | | | | |
| AQR Funds | | | | Annual Report | | | | December 2009 | | 86 |
| | | | | | | |
| | |
| Board Approval of Investment Advisory Agreements |
November 25, 2008 Board meeting, the Board of Trustees concluded that the services to be provided to the Fund by AQR pursuant to the Advisory Agreement were likely to be of a high quality and would benefit the Fund.
Investment Performance of AQR Portfolio Management. Because the Fund is newly formed, the Board did not consider the investment performance of the Fund. The Board based its review of AQR’s performance primarily on the experience of AQR in managing private funds, noting that other funds AQR manages might have investment objectives, policies or restrictions different from those of the Fund. The Board did discuss the prior performance of the AQR International Equity Fund, L.P., a private fund managed by AQR, which was reorganized with and into the Fund. The Board also considered the experience, resources and strengths of AQR and its affiliates with respect to the investment strategies proposed for the Fund. Based on these factors, the Board Members determined that AQR would be an appropriate investment adviser for the Fund.
The Advisory Fee and the Cost of the Services and Profits to be Realized by AQR from the Relationship with the Fund. The Board, including the Independent Board Members, received and reviewed information regarding the advisory fee to be paid by the Fund to AQR pursuant to the Advisory Agreement. The Board examined this information in order to determine the reasonableness of the fees in light of the nature and quality of services to be provided to the Fund.
To assist in this analysis, the Board received a report independently prepared by Lipper. The report showed comparative fee information for the Fund’s expense group and expense universe, including expense comparisons of contractual management fees and actual total operating expenses. The Board was advised that the advisory fees will be at or below the median of comparable funds. Management provided data about the investment management fees for AQR-managed private funds, including the AQR International Equity Fund, L.P. and the investment advisory fees for AQR’s separately managed accounts.
The Board did not receive any information regarding the profitability of AQR with respect to the Fund’s activities, as the Fund had not yet commenced operations. In the future, AQR will provide to the Board an annual estimate of its profitability with respect to Fund-related activities. The Board recognized that since AQR manages other accounts in addition to the Fund, estimates will invariably involve cost allocations based on judgment.
The Board also reviewed AQR’s unaudited financial statements. The purpose of the review was to help the Independent Board Members determine whether the firm has the necessary resources to provide high quality services to the Fund and attract and retain high quality employees.
The Board concluded that the advisory fee is reasonable.
Economies of Scale. Because the Fund is newly formed and had not commenced operations as of November 25, 2008, and the eventual aggregate amount of Fund assets was uncertain, AQR was not able to provide the Board Members with specific information concerning the extent to which economies of scale would be realized as the Fund grows and whether fee levels would reflect such economies of scale, if any. The Board noted that the Fund does not have breakpoints in its advisory fee that would allow investors to benefit directly in the form of lower fees as fund assets grow. However, AQR presented information to show that the fees were already set at a level that is competitive relative to funds of a larger scale. The Board Members also discussed the renewal requirements for investment advisory agreements, and determined that they would revisit this issue of breakpoints in the future.
Other Factors. The Board also received information regarding AQR’s brokerage and soft dollar practices. The Board considered that AQR will be responsible for decisions to buy and sell securities for the Fund, selection of broker-dealers and best execution, and aggregation and allocation of trade orders among the firms’ various advisory clients. The Board noted that AQR does not presently intend to make use of soft dollars to acquire third-party research.
Conclusion. Counsel advised the Board concerning the statutory and regulatory requirements for approval and disclosure of investment advisory agreements. No single factor was determinative to the decision of the Board. Based on the foregoing and such other matters as were deemed relevant, all of the Board Members, including all of the Independent Board Members, concluded that the proposed advisory fee rate and projected total expense ratio are reasonable in relation to the services to be provided by AQR to the Fund, as well as the costs to be incurred and benefits to be gained by AQR in providing such services, including the investment advisory and administrative components. The Board also found the proposed investment advisory fee to be reasonable in comparison to the fees charged by advisers to other comparable funds of similar, actual or anticipated size. As a result, all of the Board Members, including the Independent Board Members, approved the Advisory Agreement. The Independent Board Members were represented by counsel who assisted them in their deliberations.
| | | | | | | | | | |
| AQR Funds | | | | Annual Report | | | | December 2009 | | 87 |
| | | | | | | |
| | |
| Board Approval of Investment Advisory Agreements |
| | |
| AQR Momentum Fund, AQR Small Cap Momentum Fund and AQR International Momentum Fund | | |
The Board met in person on March 10, 2009 to consider the approval of the Advisory Agreement between the Trust, on behalf of each the AQR Momentum Fund, the AQR Small Cap Momentum Fund and the AQR International Momentum Fund (each, a “Fund” and collectively, the “Funds”), and AQR. In accordance with Section 15(c) of the 1940 Act, the Board requested, reviewed, and considered materials furnished by AQR relevant to the Board’s consideration of whether to approve the Advisory Agreement for each Fund. These materials included (a) memoranda and materials prepared by AQR, describing personnel and services to be provided to each Fund; (b) information independently compiled and prepared by Lipper relating to the proposed Fund fees and expenses; (c) a discussion of AQR’s financial statements and financial condition; and (d) a discussion of the AQR compliance program and its regulatory exam history.
At the in-person meeting held on March 10, 2009, the Board, including the Independent Board Members, unanimously approved the Advisory Agreement for an initial two-year term for each Fund. The Board considered all factors it believed relevant with respect to each Fund, including, among other factors: (a) the nature, extent and quality of the services to be provided by AQR; (b) the investment performance of AQR portfolio management; (c) the advisory fee and the cost of the services and profits to be realized by AQR from the relationship with each Fund; (d) economies of scale; and (e) other factors.
The Board also considered other matters it deemed important to the approval process, such as services related to the valuation and pricing of Fund portfolio holdings, direct and indirect benefits to AQR and its affiliates from their relationship with the Funds and advice from independent legal counsel with respect to the review process and materials submitted for the Board’s review. The Board did not identify any particular information as controlling, and each Board Member may have attributed different weights to the various items considered.
The following is a summary of the Board’s discussion and views regarding the factors it considered in evaluating the Advisory Agreement for each Fund:
The nature, extent and quality of the services to be provided by AQR. The Board Members reviewed the services that AQR would provide to each Fund under the Advisory Agreement. The Board considered the size and experience of AQR’s staff, its use of technology, and each Fund’s investment objective, strategy and process. The Board reviewed the overall qualifications of AQR as an investment adviser. In connection with the investment advisory services to be provided to each Fund, the Board Members took into account detailed discussions they had with officers of AQR regarding the management of each Fund’s investments in accordance with the Fund’s stated investment objective and policies and the types of transactions that would be entered into on behalf of the Fund. During these discussions, the Board Members asked detailed questions of, and received answers from, the officers of AQR regarding the formulation and proposed implementation of each Fund’s investment strategy, its efficacy and potential risks. The Board considered AQR’s experience managing private funds generally.
In addition to the investment advisory services to be provided to each Fund, the Board Members considered that AQR also will provide administrative services, oversight of Fund accounting, marketing services, assistance in meeting legal and regulatory requirements and other services necessary for the operation of each Fund. In particular, the Board reviewed the compliance and administrative services to be provided to each Fund by AQR. The Board also reviewed a wide range of services provided to each Fund’s shareholders under a Shareholder Services Agreement with AQR. These services include access to performance information reporting, analysis and explanations of Fund reports, and electronic access to Fund information.
The Board met with senior principals of AQR. The Board also met with each Fund’s portfolio management team. The Board considered information about how portfolio managers are compensated by AQR. The Board was advised that the firm employs a team-based approach in which all employees are compensated based on the firm’s overall performance.
Finally, the Independent Board Members had an opportunity to meet outside the presence of management in executive session separately with counsel to discuss and consider the Advisory Agreement. Based on the presentations at the March 10, 2009 Board meeting, the Board of Trustees concluded that the services to be provided to each Fund by AQR pursuant to the Advisory Agreement were likely to be of a high quality and would benefit the Fund.
Investment Performance of AQR Portfolio Management. Because the Funds are newly formed, the Board did not consider the investment performance of the Funds. The Board based its review of AQR’s performance primarily on the experience of AQR in managing private funds, noting that other funds AQR manages might have investment objectives,
| | | | | | | | | | |
| AQR Funds | | | | Annual Report | | | | December 2009 | | 88 |
| | | | | | | |
| | |
| Board Approval of Investment Advisory Agreements |
policies or restrictions different from those of the Funds. The Board did consider that while the Funds comprised a new product offering of the Adviser, the Adviser has used “momentum” as one of the investment criteria for a number of the Adviser’s other products, but always in combination with other investment criteria. The Board also considered the experience, resources and strengths of AQR and its affiliates with respect to the investment strategies proposed for each Fund. Based on these factors, the Board Members determined that AQR would be an appropriate investment adviser for each Fund.
The Advisory Fee and the Cost of the Services and Profits to be Realized by AQR from the Relationship with each Fund. The Board, including the Independent Board Members, received and reviewed information regarding the advisory fee to be paid by each Fund to AQR pursuant to the Advisory Agreement. The Board examined this information in order to determine the reasonableness of the fees in light of the nature and quality of services to be provided to each Fund.
To assist in this analysis, the Board received a report independently prepared by Lipper. The report showed comparative fee information for each Fund’s expense group and expense universe, including expense comparisons of contractual management fees and actual total operating expenses. The Board was advised that the advisory fees will be at or below the median of comparable funds.
The Board did not receive any information regarding the profitability of AQR with respect to the Funds’ activities, as the Funds had not yet commenced operations. In the future, AQR will provide to the Board an annual estimate of its profitability with respect to Fund-related activities. The Board recognized that since AQR manages other accounts in addition to each Fund, estimates will invariably involve cost allocations based on judgment.
The Board also reviewed AQR’s unaudited financial statements. The purpose of the review was to help the Independent Board Members determine whether the firm has the necessary resources to provide high quality services to each Fund and attract and retain high quality employees.
The Board concluded that the advisory fee is reasonable.
Economies of Scale. Because the Funds are newly formed and had not commenced operations as of March 10, 2009, and the eventual aggregate amount of Fund assets was uncertain, AQR was not able to provide the Board Members with specific information concerning the extent to which economies of scale would be realized as the Funds grow and whether fee levels would reflect such economies of scale, if any. However, AQR presented information to show that the fees were already set at a level that is competitive relative to funds of a larger scale.
Other Factors. The Board also received information regarding AQR’s brokerage and soft dollar practices. The Board considered that AQR will be responsible for decisions to buy and sell securities for the Funds, selection of broker-dealers and best execution, and aggregation and allocation of trade orders among the firms’ various advisory clients. The Board noted that AQR does not presently intend to make use of soft dollars to acquire third-party research.
Conclusion. Counsel advised the Board concerning the statutory and regulatory requirements for approval and disclosure of investment advisory agreements. No single factor was determinative to the decision of the Board. Based on the foregoing and such other matters as were deemed relevant, all of the Board Members, including all of the Independent Board Members, concluded that the proposed advisory fee rate and projected total expense ratio are reasonable in relation to the services to be provided by AQR to each Fund, as well as the costs to be incurred and benefits to be gained by AQR in providing such services, including the investment advisory and administrative components. The Board also found the proposed investment advisory fee to be reasonable in comparison to the fees charged by advisers to other comparable funds of similar, actual or anticipated size. As a result, all of the Board Members, including the Independent Board Members, approved the Advisory Agreement. The Independent Board Members were represented by counsel who assisted them in their deliberations.
| | | | | | | | | | |
| AQR Funds | | | | Annual Report | | | | December 2009 | | 89 |
| | | | | | | |
Investment Advisor
AQR Capital Management, LLC
Two Greenwich Plaza, 3rd Floor
Greenwich, CT 06830
Sub-Adviser
CNH Partners, LLC
Two Greenwich Plaza, 1st Floor,
Greenwich, CT 06830
Transfer Agent
ALPS Fund Services, Inc.
1290 Broadway, Suite 1100
Denver, CO 80203
Distributor
ALPS Distributors, Inc.
1290 Broadway, Suite 1100
Denver, CO 80203
Administrator & Custodian
The Bank of New York Mellon
101 Barclay Street
New York, NY 10286
Independent Registered Public Accounting Firm
PricewaterhouseCoopers, LLP
300 Madison Avenue
New York, NY 10017
You may obtain a description of the AQR Funds proxy voting, policies, procedures and information regarding how each Fund voted proxies relating to portfolio securities during the 12-month period ending June 30th of each year (available by August 31st of that year) without charge, upon request, by calling 1-866-290-2688 or visiting the funds website www.aqrfunds.com, or by accessing the SEC’s website at www.SEC.Gov. Such reports may be reviewed and copied at the SEC’s Public Reference Room in Washington, DC. Information on the operation of the Public Reference Room may be obtained by calling 202-942-8090.
The Fund files complete schedules of the portfolio holdings with the SEC for the first and third quarters on Form N-Q. The Form N-Q is available without charge, upon request, by calling 1-800-SEC-0330, or by accessing the SEC’s website, at www.SEC.Gov. It may also be reviewed and copied at the SEC’s Public Reference Room in Washington, DC.
This report has been prepared for shareholders and may be distributed to others only if preceded or accompanied by an effective prospectus, which includes information regarding the Funds’ objectives and polices, experienced of its management, marketability of shares and other information.
Item 2. Code of Ethics.
a). As of the end of the period covered by this report, the Registrant has adopted a code of ethics that applies to the Registrant’s principal executive officer, principal financial officer or persons performing similar functions (“Code of Ethics”).
b). Not Applicable
c). There has been no amendment to the Registrant’s Code of Ethics during the fiscal year ending December 31, 2009 (“Reporting Period”).
d). Registrant granted no waivers from the provisions of its Code of Ethics during the Reporting Period.
e). Not Applicable
f). Attached
Item 3. Audit Committee Financial Expert.
a). The Registrant’s Board of Trustees has determined that its Audit Committee has one “audit committee financial expert”, as that term is defined under Items 3(b) and 3(c), serving on its Audit Committee. Mr. L. Joe Moravy, the Registrant’s audit committee financial expert, is “independent”, as that term is defined under Item 3(a)(2).
Item 4. Principal Accountant Fees and Services.
The principal accountant fees disclosed in Items 4(a)-(d) are for the five funds of the Registrant that had a fiscal year ending December 31, 2009 and whose financial statements are reported in Item 1.
a). Audit Fees: the aggregate fees billed in each of the last two fiscal years for professional services rendered by the principal accountant for the audit are as follows:
2009: $175,000
2008: $10,000
b). Audit-Related Fees: the aggregate fees billed in each of the last two fiscal years for assurance and related services by the principal accountant that are reasonably related to the performance of the audit of the Registrant’s financial statements and are not reported under paragraph (a) of this item are as follows:
2009: $ 0
2008: N/A
c). Tax Fees: the aggregate fees billed in each of the previous last two fiscal years for professional services rendered by the principal accountant for tax compliance, tax advice, and tax planning are as follows:
2009: $42,500
2008: N/A
The Tax Fees represent services provided in connection with the preparation of tax returns, year-end distribution review, qualifying dividend income analysis and computation of foreign tax credit pass-through.
d). All Other Fees: the aggregate fees billed in each of the last two fiscal years for products and services provided by the principal accountant, other than the services reported in paragraphs (a) and (c) of this Item are as follows:
2009: $0
2008: N/A
| e) | Audit Committee Pre-Approval Policies and Procedures. |
| | (i) | Per Rule 2-01(c)(7)(A) and the charter of the Registrant’s Audit Committee, the Audit Committee approves and recommends the principal accountant for the Registrant, pre-approves (i) the principal accountant’s provision of all audit and permissible non-audit services to the Registrant (including the fees and other compensation to be paid to the principal accountant), and (ii) the principal accountant’s provision of any permissible non-audit services to the Registrant’s investment adviser (the “Adviser”), sub-adviser or any entity controlling, controlled by, or under common control with any investment adviser or sub-adviser, if the engagement relates directly to the operations of the financial reporting of the Trust. |
| | (ii) | 100% of services described in each of Items 4(b) through (d) were approved by the Audit Committee pursuant to paragraph (c)(7)(A) of Rule 2-01 of Regulation S-X. |
(f) Less than 50% of the hours expended on the principal accountant’s engagement to audit Registrant’s financial statements were attributed to work performed by persons other than the accountant’s full-time, permanent employees.
(g) The aggregate non-audit fees billed by the accountant for services rendered to the Registrant, the Adviser and any entity controlling, controlled by, or under common control with the Adviser that provides ongoing services to the Registrant (except for any sub-advisor whose role is primarily portfolio management and is subcontracted with or overseen by another investment advisor) for the last two fiscal years is as follows:
2009: $414,000
2008: N/A
Item 5. Audit Committee of Listed Registrants.
(a) The Registrant is an issuer as defined in Section 10A-3 of the Securities Exchange Act of 1934 and has a separately-designated standing Audit Committee in accordance with Section 3(a)(58)(A) of such Act. All of the Board’s independent Trustees, Timothy K. Armour, Steven Grenadier and L. Joe Moravy, are members of Audit Committee.
(b) Not Applicable.
Item 6. Schedule of Investments.
(a) Schedule is included as part of the report to shareholders filed under Item 1 of this Form.
(b) Not applicable.
Item 7. Disclosure of Proxy Voting Policies and Procedures for Closed-End Management Investment Companies.
Not applicable.
Item 8. Portfolio Managers of Closed-End Management Investment Companies.
Not applicable.
Item 9. Purchases of Equity Securities by Closed-End Management Investment Company & Affiliated Purchasers.
Not applicable.
Item 10. Submission of Matters to a Vote of Security Holders.
Not applicable.
Item 11. Controls and Procedures.
| (a) | The Principal Executive Officer and Principal Financial Officer have evaluated the Registrant’s disclosure controls and procedures within 90 days of the filing date of this report and have concluded that these controls and procedures are effective. |
| (b) | There were no significant changes in the Registrant’s internal controls over financial reporting or in other factors that could significantly affect these controls subsequent to the date of their evaluation. |
Item 12. Exhibits.
(a)(1) Any code of ethics, or amendment thereto, that is the subject of the disclosure required by Item 2 is attached hereto.
(a)(2) Separate certifications for each Principal Executive Officer and Principal Financial Officer of the Registrant as required by Rule 30a-2(a) under the 1940 Act (17CFR 270.30a-(a)) are attached hereto.
SIGNATURES
Pursuant to the requirements of the Securities Exchange Act of 1934 and the Investment Company Act of 1940, the Registrant has duly caused this report to be signed on its behalf by the undersigned, thereunto duly authorized.
Registrant: AQR Funds
| | |
| |
| By: | | /s/ Marco Hanig |
|
| Marco Hanig, Principal Executive Officer |
|
| Date: March 1, 2010 |
Pursuant to the requirements of the Securities Exchange Act of 1934 and the Investment Company Act of 1940, this report has been signed below by the following persons on behalf of the Registrant and in the capacities and on the dates indicated.
Registrant: AQR Funds
| | |
| |
| By: | | /s/ Marco Hanig |
|
| Marco Hanig, Principal Executive Officer |
|
| Date: March 1, 2010 |
| | |
| |
| By: | | /s/ John B. Howard |
|
| John B. Howard, Principal Financial Officer |
|
| Date: March 1, 2010 |