UNITED STATES
SECURITIES AND EXCHANGE COMMISSION
Washington, D.C. 20549
FORM N-CSR
CERTIFIED SHAREHOLDER REPORT OF REGISTERED
MANAGEMENT INVESTMENT COMPANIES
Investment Company Act file number: 811-22235
AQR Funds
(Exact name of registrant as specified in charter)
Two Greenwich Plaza, 3rd Floor
Greenwich, CT 06830
(Address of principal executive offices) (Zip code)
Bradley D. Asness, Esq.
Principal and Chief Legal Officer
Two Greenwich Plaza
3rd Floor
Greenwich, CT 06830
(Name and Address of Agent for Service)
Registrant’s telephone number, including area code: 203-742-3600
Date of fiscal year end: December 31
Date of reporting period: January 1, 2010 to December 31, 2010
Item 1. Reports to Shareholders.
The following is a copy of the report transmitted to shareholders pursuant to Rule 30e-1 under the Investment Company Act of 1940 (17 CFR 270.30e-1.)
AQR FUNDS
Annual Report
December 31, 2010
Table of Contents
Shareholder Letter (Unaudited)

Cliff Asness
Managing & Founding Principal

Ronen Israel
Principal

Oktay Kurbanov
Principal

John Liew
Founding Principal

Lars Nielsen
Principal
Dear Shareholder:
Global equity markets had uneven performance in 2010. During the first half of the year, the MSCI World Index (the “Benchmark”) posted a negative return of -9.84%, followed by a rally of +23.96% in the second half of the year. For the year, the Benchmark finished up +11.76%. The year consisted of two major macro-economic themes: continuation of European debt concerns and quantitative easing policies in the US. These themes had opposite effects on the market, leading to its bumpy performance during the year. During this turbulent period, the AQR Global Equity Fund Class N shares (the “Fund”) fared well, outperforming the Benchmark by +2.07%, with a positive return of +13.83% for the year.
The Fund is actively managed, and it seeks to outperform its benchmark in three ways: by selecting stocks within each country and by using futures and forwards contracts to over and under-weight the portfolio’s exposures to each country and to each currency. In the first half of the year, the stock and currency selection strategies contributed to positive performance while the country selection strategy detracted, with the net result of modest underperformance. In the second half of the year all three strategies were positive contributors. Each of these decisions is made independently. Details on each of the strategies are provided below.
Our stock selection strategies performed well in 2010 led by strong performance in the continental European portfolio. Performance in the US and the UK was also positive, while stock selection in Japan detracted slightly for the year. 2010 was a good year for stock selection in Europe as we observed positive performance across nearly all investment themes, especially momentum. Positive performance in momentum also helped offset negative performance in valuation in the US and UK. The Japan strategy struggled early in the year hurt by poor performance of momentum factors, but contributed positively in Q4 with strong performance of the valuation signals.
Approaching the end of 2010, the portfolio was positioned overweight the industrial sector driven by attractive momentum and underweight the information technology sector due to its high valuation level.
Our stock selection strategy remains broadly diversified across over seven hundred names, with any individual position representing a small active weight against the Benchmark. The portfolio as a whole is overweight cheaper stocks with better momentum and earnings quality.
The country selection strategy detracted from performance in 2010, stemming from underperformance of the value-driven positions. Fears of European defaults made this a difficult year for value. We were overweight in the European region vs. underweight in the Asia/Pacific region. The biggest detractors for the year were our value-driven overweights in Italy and Spain, as these countries sold off during the Greek sovereign debt crisis. An underweight in Canada also detracted from performance. Supported by the rally in commodities, the Canadian equity market showed better than average performance. Momentum themes worked well in 2010, helping to offset losses from
| | | | | | | | | | |
| AQR Funds | | | | Annual Report | | | | December 2010 | | 2 |
| | | | | | | |
Shareholder Letter (Unaudited)
value signals. Positive contributors supported by momentum were our overweight in Germany in the second half of the year, an overweight in the Netherlands and an underweight of Australia.
Our country views continue to favor European markets versus markets in the Asia/Pacific and North American regions. This reflects the value-oriented allocation in the country selection model as European markets are generally fair to cheaply valued versus other regions based on our measures. As European markets showed dispersion of returns and fundamental signals, the model adjusted accordingly. We reduced our position in Spain to a relatively small underweight. On the other hand, the model moved from a flat to an overweight position in Germany and increased its overweight in France. Price momentum drove these changes as Spain was among the worst performers in 2010, trailed only by Greece and Ireland. Germany outpaced other markets by more than 10%, while France’s performance was in line with an average global market. Strong relative momentum combined with improving macro indicators propelled these two countries to our top overweight positions by the end of the year. Additionally, the Netherlands remained one of our top three countries displaying an opportune combination of positive valuation and momentum signals. We increased our underweight in Switzerland over the past year as Swiss banks did not cheapen as much as other financials in Europe, making Switzerland more expensive on a relative basis.
The portfolio maintained underweight positions in the Asia/Pacific region. Australia’s underweight is driven by all major factor themes. This underweight benefited the model throughout the year as Australia’s equity market has showed weak relative performance. The model has maintained its value-driven underweight of Hong Kong, while Japan’s underweight has been reduced due to improvement in its price momentum signals.
In the North American region, the model has maintained a moderate underweight of Canada due to poor valuation indicators.
The currency selection strategy was a positive contributor in 2010. Notably, in a year fraught with sovereign credit concerns, carry and interest rate related themes worked well and were the top contributors to outperformance. This is partially explained by additional measures of the quantitative easing policy in the US originally announced in Q3. The accommodating policy of the Federal Reserve (“Fed”) encouraged risk taking, which provided support for carry related themes. As the model favored the high yielding Australian Dollar, the currency strategy benefited from this increase in risk appetite. The currency strategy also benefited from our significant underweight in the Euro, the worst performing currency in 2010. On a thematic level, momentum added to the outperformance, as the Australian Dollar and the Euro continued their appreciation / depreciation trends respectively. Value signals detracted from the performance for these currencies.
In the European region, we continue to dislike the Euro, which has remained our top underweight position throughout the period. The Euro position combines negative views stemming from carry, price and fundamental momentum. While the deterioration in the Euro’s price momentum was offset by improved valuations, its fundamentals worsened when Eurozone earnings were revised downwards. Interest rate predictors provided additional negative signals, as the continuing sovereign debt crisis made it less likely that Eurozone interest rates would increase in the near term. In Q1, the model moved from flat to an overweight position in the Swedish Krona, driven by a combination of fundamental momentum and value. As the year progressed, the Krona became strong on all factor themes, moving to the largest overweight position in the currency model. The Norwegian Krone overweight has remained relatively stable throughout the year, driven by a combination of fundamental momentum and interest rate related indicators. However, the weak price momentum of the Krone continues to moderate our positive view.
In the Asia/Pacific region, we remain overweight the Australian Dollar and underweight the Japanese Yen. The Aussie/Yen yield differential, as well as fundamental and valuation signals, motivates this positioning.
| | | | | | | | | | |
| AQR Funds | | | | Annual Report | | | | December 2010 | | 3 |
| | | | | | | |
Shareholder Letter (Unaudited)
Over the second half of the year, we have assumed a meaningful underweight in the New Zealand Dollar as weak macro-economic conditions in New Zealand reduced the likelihood of future interest rate increases, making the New Zealand Dollar less attractive relative to other currencies.
In the North American region, we significantly reduced our underweight of the Canadian Dollar to a quarter of its size earlier in the year driven by significant improvement from interest rate predictors.
| | | | |
AVERAGE ANNUAL TOTAL RETURNS AS OF 12/31/2010 AQR GLOBAL EQUITY FUND PERFORMANCE SINCE COMMENCEMENT OF OPERATIONS AS A MUTUAL FUND | |
| | | Since
Inception
(12/31/09) | |
| Fund - Class N: AQGNX | | | 13.83% | |
| Fund - Class I: AQGIX | | | 14.12% | |
| Fund - Class Y: AQGYX | | | 14.54% | |
| MSCI World Total Return (net of dividends) Index | | | 11.76% | |
Past performance does not guarantee future results. Investment results and principal value of an investment will fluctuate so that an investor’s shares, when redeemed, may be worth more or less than their original cost. Class N and Class I shares of the Fund are subject to a 2% redemption fee for redemptions within 60 days of purchase. Class Y shares are subject to a 0.10% redemption fee. If reflected, the redemption fee would reduce the performance quoted. Current performance may be lower or higher than the performance data quoted. As of the latest prospectus, the gross expense ratio for the Fund’s Class N/I/Y shares are 1.34%, 1.04% and 0.89%, respectively. Call 1-866-290-2688 or visit www.aqrfunds.com for current month-end performance.
|
AQR GLOBAL EQUITY FUND VS. MSCI WORLD TOTAL RETURN VALUE OF $10,000 INVESTED ON 12/31/09 |
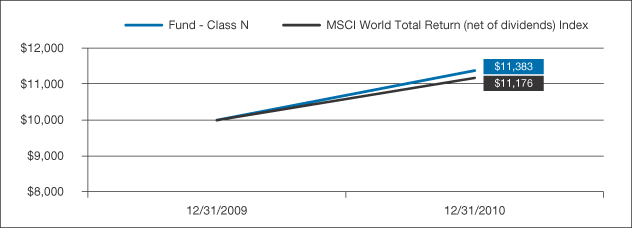
The chart above represents historical performance of a hypothetical investment of $10,000 in the Fund over the past ten years (or since inception if shorter). Performance calculations are as of the end of December each year. Past performance does not guarantee future results. Returns shown are total returns, which assume the reinvestment of dividends and capital gains. The table and graph presented above do not reflect the deduction of taxes a shareholder would pay on fund distributions or the redemption of fund shares.
| | | | | | | | | | |
| AQR Funds | | | | Annual Report | | | | December 2010 | | 4 |
| | | | | | | |
Shareholder Letter (Unaudited)
| | | | | | | | | | | | | | | | |
AVERAGE ANNUAL TOTAL RETURN AS OF 12/31/2010 AQR GLOBAL EQUITY FUND PERFORMANCE SINCE INCEPTION OF PREDECESSOR LIMITED PARTNERSHIP | |
| | | | | | Annualized Total Return | |
| | | YTD | | | 1 Year | | | 3 Year | | | Since
Inception
(06/30/2006) | |
| Fund - Class N: AQGNX | | | 13.83% | | | | 13.83% | | | | -4.86% | | | | 0.25% | |
| Fund - Class I: AQGIX | | | 14.12% | | | | 14.12% | | | | -4.55% | | | | 0.58% | |
| Fund - Class Y: AQGYX | | | 14.54% | | | | 14.54% | | | | -4.21% | | | | 0.94% | |
| MSCI WORLD (net of dividends) Index | | | 11.76% | | | | 11.76% | | | | -4.85% | | | | 1.37% | |
Past performance does not guarantee future results. Investment results and principal value of an investment will fluctuate so that an investor’s shares, when redeemed, may be worth more or less than their original cost. Class N and Class I shares of the Fund are subject to a 2% redemption fee for redemptions within 60 days of purchase. Class Y shares are subject to a 0.10% redemption fee. If reflected, the redemption fee would reduce the performance quoted. Current performance may be lower or higher than the performance data quoted. As of the latest prospectus, the gross expense ratio for the Fund’s Class N/I/Y shares are 1.34%, 1.04% and 0.89%, respectively. Call 1-866-290-2688 or visit www.aqrfunds.com for current month-end performance.
|
AQR GLOBAL EQUITY FUND VS. MSCI WORLD TOTAL RETURN INDEX VALUE OF $10,000 INVESTED ON 6/30/2006 |
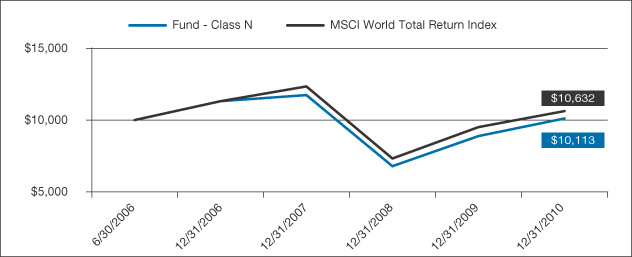
The chart above represents historical performance of a hypothetical investment of $10,000 in the Fund over the past ten years (or since inception if shorter). Performance calculations are as of the end of December each year. Past performance does not guarantee future results. Returns shown are total returns, which assume the reinvestment of dividends and capital gains. The table and graph presented above do not reflect the deduction of taxes a shareholder would pay on fund distributions or the redemption of fund shares.
| | | | | | | | | | |
| AQR Funds | | | | Annual Report | | | | December 2010 | | 5 |
| | | | | | | |
Shareholder Letter (Unaudited)
A privately offered fund managed by the Adviser was reorganized into Class Y shares of the Fund on December 31, 2009, the date the Fund commenced operations. This privately offered fund was organized in March 2006 and commenced operations in June 2006 and had an investment objective, investment policies and restrictions that were, in all material respects, the same as those of the Fund. However, the privately offered fund was not registered as an investment company under the 1940 Act. In addition, this privately offered fund was not subject to certain investment limitations, diversification requirements, liquidity requirements, and other restrictions imposed by the 1940 Act and the Internal Revenue Code which, if applicable, might have adversely affected its performance. The Fund’s performance for periods prior to the commencement of operations on or about December 31, 2009 is that of the privately offered fund. The total annual fund operating expenses of the privately offered fund were lower than the Fund’s estimated total annual fund operating expense for Class N, Class I and Class Y shares during the periods presented. The Fund has restated the performance of the privately offered fund to reflect the Fund’s expenses of the Class N, I and Y shares.
| | | | | | | | | | |
| AQR Funds | | | | Annual Report | | | | December 2010 | | 6 |
| | | | | | | |
Shareholder Letter (Unaudited)
| | | | |
| AQR INTERNATIONAL EQUITY FUND | | | | |
Cliff Asness
Managing & Founding Principal
Ronen Israel
Principal
Oktay Kurbanov
Principal
John Liew
Founding Principal
Lars Nielsen
Principal
Dear Shareholder:
International equity markets had uneven performance in 2010. During the first half of the year, the MSCI EAFE Index (the “Index”) posted a negative return of -13.23%, followed by a rally of +24.18% in the second half of the year. For the year, the index finished up 7.75%. The year was highlighted by two major macro-economic themes: European sovereign debt concerns and quantitative easing in the US. These themes had opposite effects on the market, leading to its bumpy performance during the year. During this period, the AQR International Equity Fund Class N shares (the “Fund”) faired well, outperforming its benchmark index by 2.65%, with a positive return of 10.40% for the year.
The Fund is actively managed, and it seeks to outperform its benchmark in three ways: by selecting stocks within each country and by using futures and forwards contracts to over-and under-weight the portfolio’s exposures to countries and currencies. In the first half of the year, the stock and currency selection strategies contributed to the performance while the country selection strategy detracted, with the net result of modest underperformance. In the second half of the year all three strategies were positive contributors. Details on each of the strategies are provided below.
Our stock selection strategies performed well in 2010 on a benchmark relative basis. The main contributor to the positive performance was the continental European portfolio. Performance in the UK portfolio was also positive, while the Japan strategy was down slightly for the year. This was a good year in Europe as we observed positive performance across nearly all investment themes, especially momentum. In the UK, positive performance in momentum (both within and across industries) offset negative performance in value. The Japan strategy struggled early in the year hurt by poor performance of momentum factors, but contributed positively in Q4 with strong performance of valuation signals.
Approaching the end of 2010, the portfolio was positioned to overweight industrials from attractive momentum, while underweight financials from unfavorable momentum.
Our stock selection strategy remains broadly diversified across over four hundred names, with any individual position representing a small active weight against the benchmark. The portfolio as a whole is overweight cheaper stocks with better momentum and earnings quality.
The country selection strategy was a negative contributor to the performance, stemming from underperformance of value-driven positions. Fears of European defaults made this a difficult year for value, which was overweight the European region vs. underweight the Asia/Pacific region. The biggest detractors for the year were our overweights in Italy and Spain, as these countries sold off during the Greek sovereign debt crisis and amid growing concerns about contagion. An underweight in Sweden was also a detractor as the country significantly outperformed as its macro-economic conditions improved. Momentum themes worked well in 2010, helping offset losses
| | | | | | | | | | |
| AQR Funds | | | | Annual Report | | | | December 2010 | | 7 |
| | | | | | | |
Shareholder Letter (Unaudited)
| | | | |
| AQR INTERNATIONAL EQUITY FUND | | | | |
from value signals. Positive contributors supported by momentum were our overweight in Germany in the second half of the year, an overweight in the Netherlands, and an underweight of Australia.
Our country selection portfolio entered 2010 with an increased weighting towards European markets versus markets in the Asia/Pacific region. This reflects the value-oriented bias in the country selection model as European markets generally were priced fair to cheaply valued relative to markets in the Asia/Pacific region. We maintained this view throughout the year but the positioning within Europe changed materially as the sovereign debt crisis impacted markets differently. Dispersion in performance is reflected in the momentum components of our process. Going into the year we were substantially overweight Spain and Italy based on valuation. Both these positions were reduced over the year on the back of the relative poor performance of these markets. On the other hand, the relative outperformance and better macro economic indicators of Germany and France led us to initiate overweight positions in those countries. The Netherlands remained one of our top positions over the year based on cheap valuation combined with positive momentum signals. Offsetting the overweight positions in Europe is an underweight of Switzerland, which looks unattractive on multiple indicators, as well as a value-driven underweight of Sweden.
The portfolio was underweight equity markets in the Asia-Pacific region throughout the year. Australia’s underweight is driven by all major investment themes in our process. This underweight benefited the model throughout the year as Australia’s equity market has showed weak relative performance. The model has maintained its value-driven underweight of Hong Kong, while Japan’s underweight has been reduced due to improvement in its price momentum signals.
The currency selection strategy was a positive contributor in 2010. Remarkably, in a year fraught with sovereign credit concerns, carry and interest rate related themes performed well and were the top contributors to outperformance. This is partially explained by the additional measures of the quantitative easing policy in the US, which was originally announced in Q3. The accommodating policy of the Fed encouraged risk taking, which provided support for higher yielding currencies. As the model favored the high yielding Australian Dollar, the currency strategy benefited from this increase in risk appetite. The currency strategy also benefited from its significant underweight in the Euro, the worst performing currency in 2010. On a thematic level, momentum added to the outperformance, as the Australian Dollar and the Euro continued their appreciation / depreciation trends respectively. Value detracted from the performance. The Swiss franc was a value-driven underweight that did not perform well, as the franc showed strong performance during the year helped by its safe haven status.
In the European region, our currency views continue to dislike the euro which has remained our top underweight position throughout the period. The strong negative view on the Euro is due to a combination of relatively poor carry, price momentum and fundamental momentum. An additional important consideration is that the continuing sovereign debt crisis makes it less likely that Eurozone interest rates would increase in the near term. The year witnessed meaningful changes in the positioning of the Swiss Franc and the Swedish Krona. The flight to quality caused by the volatile European debt situation led to strong appreciation of the Franc and in the second half of the year, the currency model assumed a significant underweight in the Swiss franc based on valuation. In the first quarter of the year, the model moved from flat to an overweight position in the Swedish Krona, driven by a combination of fundamental momentum and value. As the year progressed, the Krona improved on all factor themes, moving to the largest overweight position in the currency model. The Norwegian Krone overweight has remained relatively stable throughout the year, driven by a combination of fundamental momentum and interest rate related indicators. However, the weak price momentum of the Krone is moderating the positive view.
In the Asia/Pacific region, the model continues to maintain its overweight of the Australian Dollar versus an underweight of the Japanese Yen. The Aussie/Yen yield differential, as well as fundamental and valuation signals, motivates this positioning.
| | | | | | | | | | |
| AQR Funds | | | | Annual Report | | | | December 2010 | | 8 |
| | | | | | | |
Shareholder Letter (Unaudited)
| | | | |
| AQR INTERNATIONAL EQUITY FUND | | | | |
Our optimistic view is driven primarily by the opportunity for the country and currency selection strategies, while the opportunity in the stock selection strategy is about average. In country selection we see relatively extended spreads in valuation between cheap and expensive countries. For currency selection we see an unusually strong level of agreement between the valuation and carry indicators in the model – essentially indicating that we can get exposure to relatively high yielding currencies at unusually reasonable valuations. As always, we seek to maintain a highly diversified portfolio both in terms of individual positions but also in terms of the risk allocation to the three strategies.
| | | | | | | | | | | | |
AVERAGE ANNUAL TOTAL RETURNS AS OF 12/31/2010 AQR INTERNATIONAL EQUITY FUND PERFORMANCE SINCE COMMENCEMENT OF OPERATIONS AS A
MUTUAL FUND | | | | | | | | | |
| | | 1 Year | | | Since
9/29/2009 | | | Since Inception (8/28/2009) | |
| Fund - Class N: AQINX | | | 10.40% | | | | 9.96% | | | | na | |
| Fund - Class I: AQIIX | | | 10.40% | | | | 10.10% | | | | na | |
| Fund - Class Y: AQIYX | | | 10.84% | | | | 10.52% | | | | 12.82% | |
| MSCI EAFE Index | | | 7.75% | | | | 8.38% | | | | 10.03% | |
Past performance does not guarantee future results. Investment results and principal value of an investment will fluctuate so that an investor’s shares, when redeemed, may be worth more or less than their original cost. Class N and Class I shares of the Fund are subject to a 2% redemption fee for redemptions within 60 days of purchase. Class Y shares are subject to a 0.10% redemption fee. If reflected, the redemption fee would reduce the performance quoted. Current performance may be lower or higher than the performance data quoted. As of the latest prospectus, the gross expense ratio for the Fund’s Class N/I/Y shares are 1.43%, 1.13% and 0.98%, respectively. Call 1-866-290-2688 or visit www.aqrfunds.com for current month-end performance.
| * | Class Y shares commenced operations on 8/28/2009 |
| | | | | | | | | | |
| AQR Funds | | | | Annual Report | | | | December 2010 | | 9 |
| | | | | | | |
Shareholder Letter (Unaudited)
|
| AQR INTERNATIONAL EQUITY FUND |
|
AQR INTERNATIONAL EQUITY FUND VS. MSCI EAFE INDEX VALUE OF $10,000 INVESTED ON 9/29/09 |
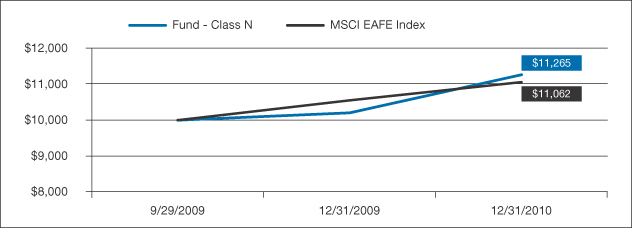
The chart above represents historical performance of a hypothetical investment of $10,000 in the Fund over the past ten years (or since inception if shorter). Performance calculations are as of the end of December each year. Past performance does not guarantee future results. Returns shown are total returns, which assume the reinvestment of dividends and capital gains. The table and graph presented above do not reflect the deduction of taxes a shareholder would pay on fund distributions or the redemption of fund shares.
| | | | | | | | | | | | | | | | |
AVERAGE ANNUAL TOTAL RETURNS AS OF 12/31/2010 AQR INTERNATIONAL EQUITY FUND PERFORMANCE SINCE INCEPTION OF PREDECESSOR LIMITED PARTNERSHIP | |
| | | 1 Year | | | 3 Year | | | 5 Year | | | Since
Inception
(8/1/2004) | |
| Fund - Class N: AQINX | | | 10.40% | | | | -6.56% | | | | 1.79% | | | | 6.50% | |
| Fund - Class I: AQIIX | | | 10.40% | | | | -6.32% | | | | 2.09% | | | | 6.82% | |
| Fund - Class Y: AQIYX | | | 10.84% | | | | -6.00% | | | | 2.44% | | | | 7.19% | |
| MSCI EAFE Index | | | 7.75% | | | | -7.02% | | | | 2.46% | | | | 6.78% | |
Past performance does not guarantee future results. Investment results and principal value of an investment will fluctuate so that an investor’s shares, when redeemed, may be worth more or less than their original cost. Class N and Class I shares of the Fund are subject to a 2% redemption fee for redemptions within 60 days of purchase. Class Y shares are subject to a 0.10% redemption fee. If reflected, the redemption fee would reduce the performance quoted. Current performance may be lower or higher than the performance data quoted. As of the latest prospectus, the gross expense ratio for the Fund’s Class N/I/Y shares are 1.43%, 1.13% and 0.98%, respectively. Call 1-866-290-2688 or visit www.aqrfunds.com for current month-end performance.
| | | | | | | | | | |
| AQR Funds | | | | Annual Report | | | | December 2010 | | 10 |
| | | | | | | |
Shareholder Letter (Unaudited)
|
| AQR INTERNATIONAL EQUITY FUND |
|
AQR INTERNATIONAL EQUITY FUND VS. MSCI EAFE INDEX VALUE OF $10,000 INVESTED ON 8/1/2004 |
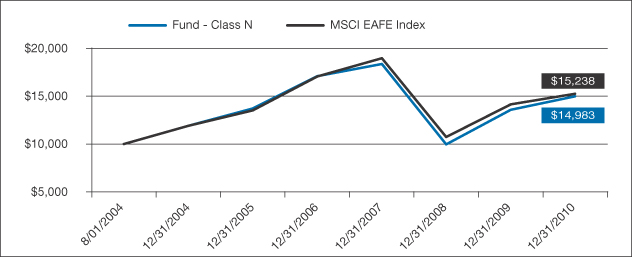
The chart above represents historical performance of a hypothetical investment of $10,000 in the Fund over the past ten years (or since inception if shorter). Performance calculations are as of the end of December each year. Past performance does not guarantee future results. Returns shown are total returns, which assume the reinvestment of dividends and capital gains. The table and graph presented above do not reflect the deduction of taxes a shareholder would pay on fund distributions or the redemption of fund shares.
A privately offered fund managed by the Adviser was reorganized into the Class Y shares of the Fund on August 28, 2009, the date the Fund commenced operations. The Class N and Class I shares of the Fund commenced operations on September 30, 2009. This privately offered fund was organized in June 2004 and commenced operations in August 2004 and had an investment objective, investment policies and restrictions that were, in all material respects, the same as those of the Fund. However, the privately offered fund was not registered as an investment company under the 1940 Act. In addition, this privately offered fund was not subject to certain investment limitations, diversification requirements, liquidity requirements, and other restrictions imposed by the 1940 Act and the Internal Revenue Code which, if applicable, might have adversely affected its performance. The performance of Class N and Class I shares for the period from August 28, 2009 to September 30, 2009 is based on the performance of the Class Y shares of the Fund, and, for all share classes, for periods prior to August 28, 2009 is based on that of the privately offered fund. The total annual fund operating expenses of the privately offered fund were lower than the Fund’s estimated total annual fund operating expenses for Class N, I and Y shares during the periods presented. Also, the Fund’s total annual fund operating expenses for Class Y shares were lower than the Fund’s estimated total annual fund operating expenses for Class N and Class I shares during the periods presented. The Fund has restated the performance of the privately offered fund and of the Class Y shares to reflect the Fund’s expenses of Class N, I and Y shares.
| | | | | | | | | | |
| AQR Funds | | | | Annual Report | | | | December 2010 | | 11 |
| | | | | | | |
Shareholder Letter (Unaudited)
| | | | |
| AQR DIVERSIFIED ARBITRAGE FUND | | | | |
Ronen Israel
Principal

Mark Mitchell, Ph.D.
Founding Principal, CNH Partners
Lars Nielsen
Principal

Todd Pulvino, Ph.D.
Founding Principal, CNH Partners
Dear Shareholder:
The Diversified Arbitrage Fund returned 4.43% for the Fund’s Class N Shares during the 2010 calendar year. During the corresponding period, the Merrill Lynch 3-Month Treasury-Bill Index (the Fund’s benchmark) returned 0.13% and the S&P 500 returned 15.06%. Based on monthly return data, the Fund’s equity market beta (relative to the S&P 500) since inception (January 15, 2009) through December 31, 2010 is 0.06 and its annualized volatility is 3.3%.
Arbitrage markets were largely stable throughout the year, aside from disruptions in May when economic uncertainty increased commensurate with an increase in European sovereign risk and a worsening outlook for the global economy. Indeed, May was the only month during 2010 in which the Fund had a negative return (-1.37%) as arbitrage spreads temporarily widened.
The Fund invests in multiple arbitrage and alternative-investment strategies, and tactically allocates to various strategies based on relative attractiveness. As displayed in the Table below, strategy weights have varied throughout the past 12 months, though considerably less so than in 2009. The Fund reduced its exposure to convertible arbitrage during the year, bringing the weight in convertible arbitrage close to what we expect to be the long-term average. The Table indicates a substantial drop-off in the allocation to merger arbitrage at year-end, but this decline is largely an artifact of the consummation of mergers prior to year-end. This seasonal effect is not uncommon and is driven by firms’ desires to avoid the administrative burden (e.g. tax filings) of carrying two entities into a new fiscal year. The Fund’s allocation to merger arbitrage is expected to rebound in early 2011 as new mergers are announced. The weight in credit-related trades increased from 1% at the end of 2009 to 15% at the end of the 2010 due to numerous opportunities in short-term corporate credit. Both dual-class arbitrage and closed-end-fund arbitrage saw reductions in strategy weights, a result of declining spreads and discounts. The Table also indicates the addition of PIPEs (Private Investments in Public Entities) in the second half of 2010. PIPEs have many structures, but typically are comprised of an equity-linked security (convertible debenture, convertible preferred, or common stock) and long-lived warrants (up to five years). These deals are usually priced such that the unit (for example, common stock plus warrant) is priced at a discount to the market price of the common stock. A common trade is to purchase the unit, and over time sell the common stock. We generally continue to hold the warrant as it tends to have a substantially higher value than what can be obtained by selling in the open market.
| | | | | | | | | | |
| AQR Funds | | | | Annual Report | | | | December 2010 | | 12 |
| | | | | | | |
Shareholder Letter (Unaudited)
|
| AQR DIVERSIFIED ARBITRAGE FUND |
Table of Arbitrage Strategy Weights
| | | | | | | | | | | | |
Long Positions By Strategy as % of Investment in Securities | | | | | | | | | |
| | | 12/31/09 | | | 6/30/10 | | | 12/31/10 | |
| Convertible Arbitrage | | | 44% | | | | 35% | | | | 38% | |
| Merger Arbitrage | | | 34% | | | | 34% | | | | 23% | |
| Credit | | | 1% | | | | 13% | | | | 15% | |
| Dual-Class Arbitrage | | | 12% | | | | 8% | | | | 8% | |
| Price Pressure | | | 4% | | | | 5% | | | | 6% | |
| SPACs (Special Purpose Acquisition Company) | | | 1% | | | | 1% | | | | 3% | |
| PIPEs | | | 0% | | | | 0% | | | | 3% | |
| Closed-End Fund Arbitrage | | | 5% | | | | 2% | | | | 0% | |
| Other Arbitrage and Alternative Investment Strategies | | | 2% | | | | 2% | | | | 4% | |
Notwithstanding the reduction in the allocation to the convertible arbitrage strategy, it continues to have the largest strategy weight. As discussed in detail in the 2009 year-end letter, the convertible bond market unraveled during the 2008 financial crisis causing convertible bonds to trade at significant discounts to fundamental values. As financial markets stabilized in 2009, convertible cheapness began to revert to historical levels. By the end of 2010, convertible cheapness was close to its long-term historical average. Because of the convergence of convertible bonds toward fundamental value in 2010, the convertible arbitrage strategy contributed significantly to the Fund’s positive return for the year, accounting for 34% of the total return. In the meantime, we have positioned the convertible portfolio defensively with 95% of the convertible portfolio invested in equity-sensitive convertibles, where the equity short provides a direct hedge to the long convertible bond position. Although we are still exposed to convertible bonds cheapening relative to fundamental values, these losses are generally temporary, and would be at least partially offset by an increase in realized volatility (realized volatility that is higher than expected results in increased profits) that tends to accompany cheapening episodes.1
Merger arbitrage, a well-known arbitrage strategy like convertible arbitrage, involves the purchase of shares of firms that are targets in announced mergers or reorganizations. For a merger where the consideration is the acquirer’s stock, the Fund seeks to hedge market exposure by shorting the stock of the acquiring company in an amount based on the exchange ratio specified in the merger agreement. Conditions for investing in merger arbitrage are especially attractive when deal spreads (the percentage difference between the consideration offered by the acquiring firm and the stock price of the target firm) are wide and when merger activity is robust. As deal flow began to increase during the latter part of 2009, the Fund increased its allocation to merger arbitrage to 34%. The Fund maintained a higher allocation to merger arbitrage in 2010 than in 2009, although as previously discussed, the allocation fell at year-end as a result of numerous deal closings. Merger arbitrage generated 28% of the Fund’s return during 2010 as the strategy benefited from a combination of deal spread tightening, reasonably strong deal flow, a low frequency of deal failures, and frequent increased offers. We anticipate robust deal flow in 2011 in light of increased business confidence and thus expect to maintain substantial exposure to the merger arbitrage strategy.
| 1 | It is important to note that the Fund’s investment in a convertible bond is based on the cheapness of the bond relative to its fundamental value rather than on a view about the underlying stock price. Specifically, we hedge our long position and attempt to capture the cheapness of the convertible by shorting the stock of the underlying issuer, and by hedging systematic credit and interest rate risk. |
| | | | | | | | | | |
| AQR Funds | | | | Annual Report | | | | December 2010 | | 13 |
| | | | | | | |
Shareholder Letter (Unaudited)
|
| AQR DIVERSIFIED ARBITRAGE FUND |
As mentioned above, the Fund increased its exposure to specific short-term (average duration of 12-15 months) corporate debentures during the first half of the year, particularly in May amid heightened economic uncertainty and European sovereign risk. Historically, as we have documented using our proprietary credit database, short-dated corporate debentures, particularly in the high-yield arena, produce excess returns after accounting for systematic credit and interest rate risk. We postulate that the reason for the excess returns is that fixed-income investors often choose to exchange short-term debentures for longer-term debentures in order to generate higher-expected returns associated with bearing greater systematic credit risk. We focus on short-dated debentures issued by companies that have stable near-term cash flow and sufficient assets to retire the debenture at maturity. We view this trade as similar to a long-dated cash merger trade, but one in which the downside is contractually protected by the underlying indenture. This is not to say that the trade is absent risk. However, the systematic component of risk can be minimized due to the short-dated nature of the security. Our analysis using our proprietary database shows that the modest systematic credit and interest rate risk may be hedged at the portfolio level using credit default swaps and Treasury futures. The Fund took advantage of attractive risk-adjusted yields by selectively purchasing several short-dated corporate debentures and contemporaneously hedging credit risk and interest rate risk at the portfolio level. This strategy contributed 14% to the Fund’s return for the year.
The three strategies described above accounted for roughly 76% of the capital allocated to the Fund (based on 2010 year-end allocations), and likewise 76% of the Fund’s return in 2010. Allocations to the other strategies (dual-class arbitrage, price pressure, PIPEs, SPACs, closed-end-fund arbitrage, etc.) were relatively small on an individual basis as they offered fewer investment opportunities. These strategies contributed positively to the Fund’s return, with only one exception as dual-class arbitrage realized a reasonably small loss to the Fund.
Overall, the Fund had a successful second year. It realized a return in line with our long-term expectations, investing opportunities were good, though not great, and given our multi-strategy approach, we were able to reposition the portfolio as opportunities arose. Looking forward to 2011, we anticipate there will be several opportunities to successfully deploy capital. In particular, merger deal flow is strengthening, in light of the increased business confidence, and we are seeing good opportunities to invest in target firms with attractive deal spreads. Likewise, with the economy growing, we anticipate a pick-up in new capital issues which will lead to an increase in opportunities involving price pressure, PIPEs and SPACs. Importantly, irrespective of where the Fund deploys capital in 2011, we will continue to attempt to hedge out systematic equity, credit and interest rate risk, with the intention of out-performing the Treasury Bill benchmark return.
| | | | | | | | |
AVERAGE ANNUAL TOTAL RETURNS AS OF 12/31/2010 AQR DIVERSIFIED ARBITRAGE FUND | |
| | | 1 Year | | | Since
Inception
(1/15/2009) | |
| Fund - Class N: ADANX | | | 4.43% | | | | 6.78% | |
| Fund - Class I: ADAIX | | | 4.71% | | | | 7.11% | |
| Merrill Lynch 3-Month T-Bill Index | | | 0.13% | | | | 0.17% | |
Past performance does not guarantee future results. Investment returns and principal value of an investment will fluctuate so that an investor’s shares, when redeemed, may be worth more or less than their original cost. If reflected, the redemption fee would reduce the performance quoted.
| | | | | | | | | | |
| AQR Funds | | | | Annual Report | | | | December 2010 | | 14 |
| | | | | | | |
Shareholder Letter (Unaudited)
|
| AQR DIVERSIFIED ARBITRAGE FUND |
Current performance may be lower or higher than the performance data quoted. As of the latest Prospectus, the gross expense ratios for the Class N/I shares are expected to be 2.69% and 2.46%, respectively. Call 1-866-290-2688 or visit www.aqrfunds.com for current month-end performance.
|
AQR DIVERSIFIED ARBITRAGE FUND VS. MERRILL LYNCH 3-MONTH T-BILL INDEX VALUE OF $10,000 INVESTED ON 1/15/09 |
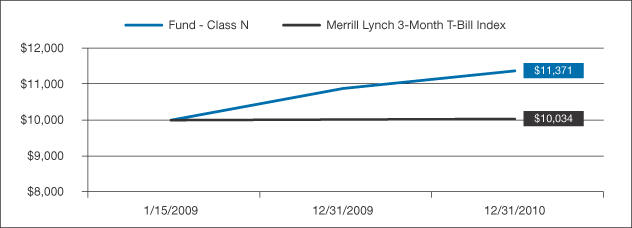
The chart above represents historical performance of a hypothetical investment of $10,000 in the Fund over the past ten years (or since inception if shorter). Performance calculations are as of the end of December each year. Past performance does not guarantee future results. Returns shown are total returns, which assume the reinvestment of dividends and capital gains. The table and graph presented above do not reflect the deduction of taxes a shareholder would pay on fund distributions or the redemption of fund shares.
| | | | | | | | | | |
| AQR Funds | | | | Annual Report | | | | December 2010 | | 15 |
| | | | | | | |
Shareholder Letter (Unaudited)
| | | | |
| AQR MANAGED FUTURES STRATEGY FUND | | | | |
Cliff Asness
Managing & Founding Principal
John Liew
Founding Principal

Brian Hurst
Principal

Lasse Pedersen
Principal

Yao Hua Ooi
Vice President
Dear Shareholder:
On January 6, 2011, the Managed Futures Strategy Fund celebrated its one year anniversary. From its inception date of January 6, 2010 through December 31, 2010, the Fund’s Class N shares returned +5.12% and realized an annualized volatility of 8.6%. During this same period, the Merrill Lynch 3-Month Treasury-Bill Index (the Fund’s benchmark) returned 0.13%. The S&P 500 returned 12.89% over this same period. The Fund’s assets grew to $928 MM by the end of December, reflecting strong investor demand for an actively run managed futures fund in the mutual fund space.
The Fund invests both long and short across a portfolio of futures contracts and futures-related instruments, utilizing more than 100 contracts across four major asset classes: commodities, currencies, fixed income, and equity markets. The Fund pursues a trend-following strategy, and as such, it tends to perform well when there are persistent trends in markets and suffers when there is a lack of trends or when trends reverse sharply. In 2010, the Fund realized gains in currency and fixed income markets, benefiting from a number of persistent trends, such as the weakening of the Euro and declines in government bond yields globally. Those gains were partially offset by losses in equity and commodity markets, where a number of positive trends that formed throughout the latter half of 2009 reversed during the first half of 2010.
By design, the Fund tactically changes the amount of risk it takes in pursing trends across the four major asset classes depending on the relative attractiveness of the trend-following opportunities within each asset class. The Fund will invest more in an asset class when there are perceived strong trends across many assets within that particular asset class. The Fund began the year having its largest risk allocation in equities and currencies, and ended the year with its largest risk allocation in equities and commodities.
In addition, the Fund also tactically changes the level of risk it targets depending on the strength and correlation of trends across the four asset classes. The Adviser started 2010 targeting close to 13% annualized volatility (the maximum ex-ante risk the Fund will target), as there were strong and correlated trends in equity and commodity markets following the strong performance of those markets in 2009, but reduced its overall risk target gradually over the first half of 2010 as those trends weakened. As trends picked up again in the second half of 2010 the risk target was increased, ending the year back at its maximum target. Below is a summary of the asset class risk exposures throughout 2010:
| | | | | | | | | | | | | | | | | | | | |
| Asset Class Exposure (% of Risk Allocation) | | | | | | | |
| | | 1/31/2010 | | | 3/31/2010 | | | 6/30/2010 | | | 9/30/2010 | | | 12/31/2010 | |
| Fixed Income | | | 19.8% | | | | 12.5% | | | | 33.9% | | | | 21.2% | | | | 7.3% | |
| Commodities | | | 15.1% | | | | 17.1% | | | | 27.5% | | | | 19.0% | | | | 32.0% | |
| Currencies | | | 22.6% | | | | 22.6% | | | | 22.0% | | | | 26.8% | | | | 28.7% | |
| Equities | | | 42.5% | | | | 47.8% | | | | 16.6% | | | | 33.0% | | | | 32.0% | |
| | | | | | | | | | |
| AQR Funds | | | | Annual Report | | | | December 2010 | | 16 |
| | | | | | | |
Shareholder Letter (Unaudited)
| | | | |
| AQR MANAGED FUTURES STRATEGY FUND | | | | |
Within each of the asset classes, the fund pursues short-term trend strategies, long-term trend strategies and over-extended trend strategies. Overall, short-term trend strategies performed well in 2010, particularly in fixed income and currency markets, where short-term trends continued in the first part of the year. Long-term trend strategies performed even better than short-term trend strategies, contributing positively in every asset class. The over-extended trend strategies detracted from performance over this period, especially in commodities, where the Fund’s long exposures were reduced on long-term overextended trend indicators. This detracted from performance in the second half of the year, as commodities experienced an extended rally.
The Fund gained 4.9% in the fixed income markets in 2010. The majority of the gains were driven by the Fund’s long positions in European and US government bonds and short-term interest rate futures for most of the year, based on both positive short-term trends and long-term trends. Yields on government bonds of most maturities declined over this period as investors turned to safe-haven assets following fears of a European sovereign debt crisis, benefiting the Fund. While this trend reversed toward the end of the year as growth expectations rose, losses were mitigated by overextended trend signals and short term trend signals which quickly reduced positions, leaving the Fund with reduced fixed income exposure at the end of the year.
The Fund lost 0.7% in equities in 2010. The majority of the losses occurred in the second quarter, as strong short and long term trends in both developed and emerging equity markets reversed sharply following fears of a European sovereign debt crisis, as well as a slowdown in global economic growth. However, the longer term trend reasserted itself in the second half of the year as increased growth expectations and the second round of quantitative easing (“QE2”) drove equities higher, offsetting most of the losses from the first half of the year.
The Fund lost 0.6% in commodities over the course of the year. While the Fund benefited from being long copper and agricultural commodities in the 4th quarter when many commodities rose on increased growth prospects, the gains were not sufficient to overcome losses suffered in energies, base metals and agricultural commodities during the 2nd quarter. During the 2nd quarter, positive short and long term trends reversed in the majority of commodity markets following fears of slower global economic growth in both developed and emerging markets.
In currencies, the Fund gained 1.5% in 2010. Much of the gains came as a result of the Fund’s short position in the Euro in the first part of the year, which profited as the Euro fell on Euro-zone worries. The fund also gained from being long the Australian Dollar, which profited as commodity linked currencies strengthened in the 4th quarter.
The Fund’s performance in 2010 highlighted the potential benefits of the Fund’s approach in diversifying across various trend indicators and asset classes. While fixed income and currencies contributed in the first half of the year, commodities and equities contributed in the second half. While overextended trend signals suffered moderate losses, trend signals performed well. We continue to pursue a risk-balanced approach in investing across the major asset classes, and trust that doing so will benefit the Fund in the long-run.
| | | | | | | | | | |
| AQR Funds | | | | Annual Report | | | | December 2010 | | 17 |
| | | | | | | |
Shareholder Letter (Unaudited)
|
| AQR MANAGED FUTURES STRATEGY FUND |
| | | | |
SINCE INCEPTION TOTAL RETURNS AS OF 12/31/2010 AQR MANAGED FUTURES STRATEGY FUND | |
| | | Since
Inception
(1/6/2010) | |
Fund - Class N: AQMNX | | | 5.12% | |
Fund - Class I: AQMIX | | | 5.41% | |
Merrill Lynch 3-Month T-Bill Index | | | 0.13% | |
Past performance does not guarantee future results. Investment returns and principal value of an investment will fluctuate so that an investor’s shares, when redeemed, may be worth more or less than their original cost. The Fund generally charges 1% of redemption proceeds on shares held for 60 days or less. If reflected, the redemption fee would reduce the performance quoted. Current performance may be lower or higher than the performance data quoted. As of the latest Prospectus, the gross expense ratios for the Class N/I shares are expected to be 1.50% and 1.25%, respectively. Call 1-866-290-2688 or visit www.aqrfunds.com for current month-end performance.
|
AQR MANAGED FUTURES STRATEGY FUND VS. MERRILL LYNCH 3-MONTH T-BILL INDEX VALUE OF $10,000 INVESTED ON 1/6/10 |
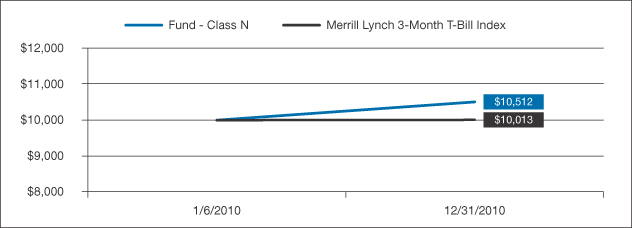
The chart above represents historical performance of a hypothetical investment of $10,000 in the Fund over the past ten years (or since inception if shorter). Performance calculations are as of the end of December each year. Past performance does not guarantee future results. Returns shown are total returns, which assume the reinvestment of dividends and capital gains. The table and graph presented above do not reflect the deduction of taxes a shareholder would pay on fund distributions or the redemption of fund shares.
| | | | | | | | | | |
| AQR Funds | | | | Annual Report | | | | December 2010 | | 18 |
| | | | | | | |
Shareholder Letter (Unaudited)
John Liew
Founding Principal
Brian Hurst
Principal

Michael Mendelson
Principal
Yao Hua Ooi
Vice President
Dear Shareholder:
On December 31, 2010, the AQR Risk Parity Fund completed its first quarter. From its inception date of September 30, 2010 through December 31, 2010, the Fund’s Class N shares returned +3.78% and realized an annualized volatility of 11.75%. During this same period, a 60/40 reference portfolio consisting of 60% S&P 500 Index/40% Barclays US Aggregate Index returned 5.67%. The Fund’s assets grew to $24 MM by the end of December.
The Fund invests across a wide variety of global markets, including: developed and emerging market equities, fixed income and currencies, global credit (corporate, government, and mortgage), and commodities. The Fund’s strategic allocation across these markets is determined by a risk parity approach to allocating investments – which spreads capital across the various asset classes to roughly equally balance the risk allocated to them. The balancing of risk allocation across different asset classes can create a portfolio that can potentially perform more consistently across a wider array of economic environments than portfolios which may have risk more concentrated into a specific asset class.
Starting from this strategic risk parity allocation, we then use AQR’s proprietary macroeconomic views to determine actual capital allocations across a broad array of global markets. The actual allocations represent over- and under-weights of the strategy vs. the strategic risk parity allocation. This strategy centers around building a truly diversified and risk targeted portfolio whose allocations reflect AQR’s forecasts of changes in market environments, all in an attempt to deliver higher returns at a risk level similar to that of traditional portfolios.
The Fund will remain long all of the markets in which we invest while maintaining a moderate (under 0.5 on average) beta to the stock market. Our risk parity framework centers around a core risk allocation balanced across the various types of asset classes (equity, fixed income, credit, commodities). From this core starting point, we rely on the proprietary models we use in our hedge funds, which include signals based on carry, momentum, valuation, and other important economic variables, to determine views across the various markets and apply controlled allocations away from risk parity in an attempt to take advantage of opportunities in the various markets.
The targeted annualized volatility for the fund is 10%, on average, which varies modestly over time based on our perceptions of tactical opportunities within the different asset classes we trade. Over the fourth quarter, our signals indicated an attractive environment for equities, credit and commodities, and as a result the strategy was targeting a higher level of volatility (took a more aggressive stance) than normal.
The Fund experienced gains in three out of its four major asset class buckets. Equities contributed +2.1%, the inflation-sensitive assets contributed 2.7%, the credit assets contributed 2.8%, while the nominal interest exposures lost 3.8% over the quarter.
| | | | | | | | | | |
| AQR Funds | | | | Annual Report | | | | December 2010 | | 19 |
| | | | | | | |
Shareholder Letter (Unaudited)
In the equity bucket, the fund was tactically overweight equities in the fourth quarter on both short-term and long-term market trend signals and profited from a strong rally across both developed and emerging equity markets.
In the inflation bucket, the Fund was tactically overweight commodities in the fourth quarter based on strong macroeconomic growth indicators as well as positive market momentum, and profited from a strong rally across all commodity sectors on hopes of stronger economic growth. The Fund’s inflation-linked bond positions ended the quarter relatively flat, as losses in European linkers and Treasury Inflation-Protected Securities (“TIPS”) were offset by gains in UK linkers.
In the credit bucket, the Fund was tactically overweight high yield credit because of a strong fundamental environment for credit spreads and positive credit market momentum. In addition, the fund was overweight emerging currencies, which appreciated versus developed currencies over the quarter.
In the nominal interest rate bucket, the Fund entered the quarter being overweight bonds on strong momentum coming into the quarter, but reduced its overweight position over the quarter as yields rose and the positive momentum in the market deteriorated following the Fed’s QE2 announcement. In addition, our risk forecasts for bonds increased substantially over the quarter. Part of our risk parity approach to investing involves targeting risk levels. So, when our forecast for risk of a market increases, we generally will lower capital allocation to that market. The combination of a weaker view on fixed income and an increase in forecasted fixed income market risk led us to cut our holdings in bonds by 25% over the quarter.
This has been a good first quarter for the Fund, and we hope to continue to add value to your portfolios going forward.
| | | | | | | | | | |
| AQR Funds | | | | Annual Report | | | | December 2010 | | 20 |
| | | | | | | |
Shareholder Letter (Unaudited)
| | | | |
SINCE INCEPTION TOTAL RETURNS AS OF 12/31/2010 AQR RISK PARITY FUND | |
| | | Since
Inception
(9/30/2010) | |
Fund - Class N: AQRNX | | | 3.78% | |
Fund - Class I: AQRIX | | | 3.88% | |
Merrill Lynch 3-Month T-Bill Index | | | 0.05% | |
Past performance does not guarantee future results. Investment returns and principal value of an investment will fluctuate so that an investor’s shares, when redeemed, may be worth more or less than their original cost. The Fund generally charges 1% of redemption proceeds on shares held for 60 days or less. If reflected, the redemption fee would reduce the performance quoted. Current performance may be lower or higher than the performance data quoted. As of the latest Prospectus, the gross expense ratios for the Class N/I shares are expected to be 1.20% and 0.95%, respectively. Call 1-866-290-2688 or visit www.aqrfunds.com for current month-end performance.
|
AQR RISK PARITY FUND VS. MERRILL LYNCH 3-MONTH T-BILL INDEX VALUE OF $10,000 INVESTED ON 9/30/2010 |
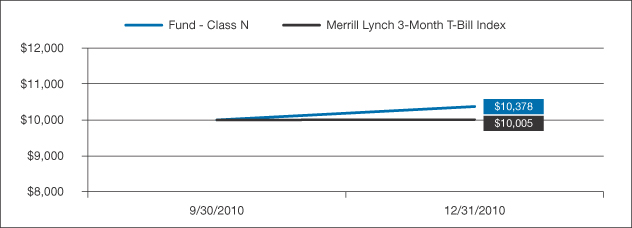
The chart above represents historical performance of a hypothetical investment of $10,000 in the Fund over the past ten years (or since inception if shorter). Performance calculations are as of the end of December each year. Past performance does not guarantee future results. Returns shown are total returns, which assume the reinvestment of dividends and capital gains. The table and graph presented above do not reflect the deduction of taxes a shareholder would pay on fund distributions or the redemption of fund shares.
| | | | | | | | | | |
| AQR Funds | | | | Annual Report | | | | December 2010 | | 21 |
| | | | | | | |
Shareholder Letter (Unaudited)
Cliff Asness
Managing & Founding Principal

Jacques Friedman
Principal
Ronen Israel
Principal
Lars Nielsen
Principal
Dear Shareholder:
Despite a rocky first half of 2010, the equity markets rallied in the second half, as investors put aside European debt troubles and governments around the world continued to bolster the economy. The AQR Momentum Fund finished its first full year beating the equity markets, gaining 18.60%, while the Russell 1000 Index returned 16.10%. The Fund outperformed the Russell 1000 Growth Index, which returned 16.72%.
Most of the outperformance to the Russell 1000 Index was driven by the implied sector over/underweights that result from individual stock positions in the Fund; in other words, the Fund profited by being overweight the sectors that had previously done well and underweight those that had suffered. The Fund was overweight Consumer Discretionary throughout the year, and in the third quarter the overweight swelled to 13%, with 24% of the Fund in Consumer Discretionary names versus 11% in the Russell 1000 Index. Particularly adding to performance were internet retailers that the Fund held such as Amazon.com and Priceline.com, which both saw tremendous gains in the third quarter. In the fourth quarter, the Fund benefitted from underweights in the Healthcare sector and especially in pharmaceutical companies such as Johnson & Johnson and Abbott Labs.
Relative over/underweights within sectors played a smaller role in outperformance. Good stock selection within certain sectors such as Consumer Discretionary and Information Technology were offset by less successful exposures within Financials, particularly in the first quarter, when the Fund failed to capture the upswing of certain beaten-down financials. The Fund’s biggest single contributor to outperformance was Apple, which we were overweight throughout the year. The stock rose 53% in 2010.
The AQR Momentum Fund invests in stocks of large and mid-cap U.S. companies with positive momentum. A stock is considered to have positive momentum if it has performed well in the prior twelve months (excluding the most recent month) relative to other stocks in the Fund’s investment universe, which is comprised of the 1000 largest U.S. companies by market capitalization. The Fund is not actively managed to outperform a growth, value or core benchmark. Rather, it seeks to provide systematic exposure to stocks that share the common characteristic of positive momentum.
Note that the Fund sometimes uses derivatives, such as S&P500 E-Mini futures, to gain market exposure and equitize daily flows. The Fund’s derivatives positions in 2010 detracted about -0.90% over the year, because a larger portion of the Fund was in these positions in mid-May and late June, when markets were falling.
In summary, the AQR Momentum Fund finished its first full year delivering a strong +18.60% return.
| | | | | | | | | | |
| AQR Funds | | | | Annual Report | | | | December 2010 | | 22 |
| | | | | | | |
Shareholder Letter (Unaudited)
| | | | | | | | |
AVERAGE ANNUAL TOTAL RETURNS AS OF 12/31/2010 AQR MOMENTUM FUND | |
| | | 1 Year | | | Since
Inception
(7/9/2009) | |
| Fund—Class L: AMOMX | | | 18.60% | | | | 30.90% | |
| Russell 1000® Index | | | 16.10% | | | | 30.88% | |
Past performance does not guarantee future results. Investment returns and principal value of an investment will fluctuate so that an investor’s shares, when redeemed, may be worth more or less than their original cost. The Fund generally charges 1% of redemption proceeds on shares held for 60 days or less. If reflected, the redemption fee would reduce the performance quoted. Current performance may be lower or higher than the performance data quoted. As of the latest Prospectus, the gross expense ratios for the Class L shares is expected to be 0.49%. Call 1-866-290-2688 or visit www.aqrfunds.com for current month-end performance.
|
AQR MOMENTUM FUND VS. RUSSELL 1000® INDEX VALUE OF $10,000 INVESTED ON 7/9/09 |
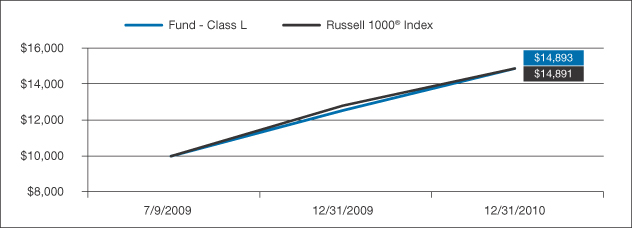
The chart above represents historical performance of a hypothetical investment of $10,000 in the Fund over the past ten years (or since inception if shorter). Performance calculations are as of the end of December each year. Past performance does not guarantee future results. Returns shown are total returns, which assume the reinvestment of dividends and capital gains. The table and graph presented above do not reflect the deduction of taxes a shareholder would pay on fund distributions or the redemption of fund shares.
| | | | | | | | | | |
| AQR Funds | | | | Annual Report | | | | December 2010 | | 23 |
| | | | | | | |
Shareholder Letter (Unaudited)
|
| AQR SMALL CAP MOMENTUM FUND |
Cliff Asness
Managing & Founding Principal
Jacques Friedman
Principal
Ronen Israel
Principal
Lars Nielsen
Principal
Dear Shareholder:
For US small cap stocks, while the first half of 2010 was as rocky as their large and mid-cap peers, the market rally in the second half of the year was even more pronounced. The Russell 2000 Index gained 26.85% for the year, and the AQR Small Cap Momentum Fund (the “Fund”) finished its first full year beating the market, gaining 27.69%. The Fund underperformed the Russell 2000 Growth Index, which returned 29.09%.
Outperformance relative to the Russell 2000 Index was driven both by implied sector over/underweights as well as relative over/underweights within sectors. The Fund’s overweight of Consumer Discretionary stocks during the first quarter and overweight of Energy stocks during the fourth quarter were especially profitable. In the fourth quarter, oil and gas exploration companies like Rosetta Resource and Clayton Williams were both up more than 60%, and the Fund benefitted from being overweight these names.
Relative over/underweights within sectors were also a positive contributor to outperformance. Stock selection within the Industrials sector was noteworthy, as the Fund was overweight big winners like Polypore International and underweight losing stocks like American Semiconductor.
The AQR Small Cap Momentum Fund invests in stocks of small-cap U.S. companies with positive momentum. A stock is considered to have positive momentum if it has performed well in the prior twelve months (excluding the most recent month) relative to other stocks in the investment universe, which is comprised of U.S. companies smaller than the 1000th largest and larger than the 3000th smallest company by market capitalization. The Fund is not actively managed to outperform a growth, value or core benchmark. Rather, it seeks to provide systematic exposure to stocks that share the common characteristic of positive momentum.
Note that the Fund sometimes uses derivatives, such as Russell 2000 E-Mini futures, to gain market exposure and equitize daily flows. The Fund’s derivatives positions in 2010 contributed about +0.88% to performance over the year, because it had larger positions on when the markets were rising in early December.
In summary, the AQR Small Cap Momentum Fund finished its first full year delivering a strong +27.69% return.
| | | | | | | | | | |
| AQR Funds | | | | Annual Report | | | | December 2010 | | 24 |
| | | | | | | |
Shareholder Letter (Unaudited)
|
| AQR SMALL CAP MOMENTUM FUND |
| | | | | | | | |
AVERAGE ANNUAL TOTAL RETURNS AS OF 12/31/2010 AQR SMALL CAP MOMENTUM FUND | |
| | | 1 Year | | | Since
Inception
(7/9/2009) | |
| Fund—Class L: ASMOX | | | 27.69% | | | | 34.37% | |
| Russell 2000® Index | | | 26.85% | | | | 41.22% | |
Past performance does not guarantee future results. Investment returns and principal value of an investment will fluctuate so that an investor’s shares, when redeemed, may be worth more or less than their original cost. The Fund generally charges 1% of redemption proceeds on shares held for 60 days or less. If reflected, the redemption fee would reduce the performance quoted. Current performance may be lower or higher than the performance data quoted. As of the latest Prospectus, the gross expense ratios for the Class L shares is expected to be 0.65%. Call 1-866-290-2688 or visit www.aqrfunds.com for current month-end performance.
|
AQR SMALL CAP MOMENTUM FUND VS. RUSSELL 2000® INDEX VALUE OF $10,000 INVESTED ON 7/9/09 |
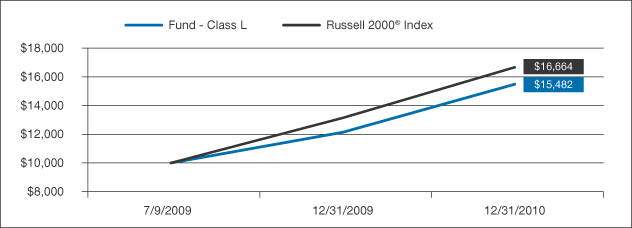
The chart above represents historical performance of a hypothetical investment of $10,000 in the Fund over the past ten years (or since inception if shorter). Performance calculations are as of the end of December each year. Past performance does not guarantee future results. Returns shown are total returns, which assume the reinvestment of dividends and capital gains. The table and graph presented above do not reflect the deduction of taxes a shareholder would pay on fund distributions or the redemption of fund shares.
| | | | | | | | | | |
| AQR Funds | | | | Annual Report | | | | December 2010 | | 25 |
| | | | | | | |
Shareholder Letter (Unaudited)
|
| AQR INTERNATIONAL MOMENTUM FUND |
Cliff Asness
Managing & Founding Principal
Jacques Friedman
Principal
Ronen Israel
Principal
Lars Nielsen
Principal
Dear Shareholder:
While global markets were up overall in 2010, performance was less stellar than the US market, having fared worse in the first half of the year. European countries most affected by the debt crisis suffered more than others. The AQR International Momentum Fund (the “Fund”) finished its first full year beating the global equity markets, returning 14.11% while the MSCI World ex-USA Index gained a modest 8.95%. The Fund outperformed the MSCI World ex-USA Growth Index, which returned 13.06%.
The Fund outperformed the broader MSCI World ex-USA Index, driven in large part by stock selection in the Energy Sector, meaning that within this sector, stocks with good momentum tended to outperform their peers. The largest contributors to outperformance were Royal Dutch Shell, in which the Fund had roughly a 2% overweight during the second half of the year, and BP, in which the Fund had about a -1.3% underweight throughout the year. BP finished down almost -23% on the year in the wake of its oil spill, while Royal Dutch was up 24%, mostly after surprisingly good earnings announcements in the fourth quarter.
To a lesser extent, the Fund also benefitted from good sector and country selection. A sector overweight in Materials contributed positively as the fund was heavily invested in global mining companies such as Rio Tinto and Xstrata, both having outperformed the rest of the market in 2010. The Fund was actually quite well-positioned for the European debt problems during the year, maintaining an overweight in safer countries such as Sweden while underweighting Spain and Greece. Its country over/underweights within Europe contributed positively to outperformance versus the MSCI World ex-USA Index in 2010.
The AQR International Momentum Fund invests in stocks of large and mid-cap non-U.S. companies with positive momentum. A stock is considered to have positive momentum if it has performed well in the prior twelve months (excluding the most recent month) relative to other stocks in the investment universe, which is comprised of approximately the top 85% of stocks by market capitalization of each of the 20 major developed markets outside the U.S. The Fund is not actively managed to outperform a growth, value or core benchmark. Rather, it seeks to provide systematic exposure to stocks that share the common characteristic of positive momentum.
Note that the Fund sometimes uses derivatives to implement its strategy. In particular, the Fund will sometimes trade swaps in UK securities to minimize certain trading costs. Its derivatives positions in 2010 contributed about +2.00% to performance over the year, consistent with UK equity markets in general being up for the year.
In summary, the AQR International Momentum Fund finished its first full year delivering a strong +14.11% return.
| | | | | | | | | | |
| AQR Funds | | | | Annual Report | | | | December 2010 | | 26 |
| | | | | | | |
Shareholder Letter (Unaudited)
|
| AQR INTERNATIONAL MOMENTUM FUND |
| | | | | | | | |
AVERAGE ANNUAL TOTAL RETURNS AS OF 12/31/2010 AQR INTERNATIONAL MOMENTUM FUND | | | | |
| | | 1 Year | | | Since
Inception
(7/9/2009) | |
| Fund—Class L: AIMOX | | | 14.11% | | | | 25.81% | |
| MSCI World ex-USA Index | | | 8.95% | | | | 24.52% | |
Past performance does not guarantee future results. Investment returns and principal value of an investment will fluctuate so that an investor’s shares, when redeemed, may be worth more or less than their original cost. The Fund generally charges 2% of redemption proceeds on shares held for 60 days or less. If reflected, the redemption fee would reduce the performance quoted. Current performance may be lower or higher than the performance data quoted. As of the latest prospectus, the gross expense ratios for the Class L shares is expected to be 0.65%. Call 1-866-290-2688 or visit www.aqrfunds.com for current month-end performance.
|
AQR INTERNATIONAL MOMENTUM FUND VS. MSCI WORLD EX-USA INDEX VALUE OF $10,000 INVESTED ON 7/9/09 |
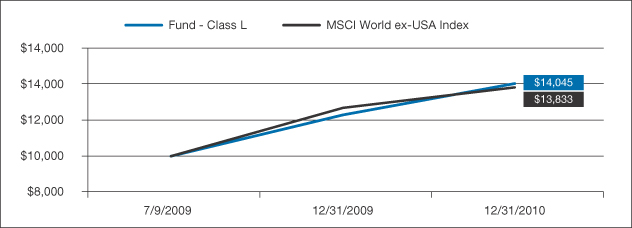
The chart above represents historical performance of a hypothetical investment of $10,000 in the Fund over the past ten years (or since inception if shorter). Performance calculations are as of the end of December each year. Past performance does not guarantee future results. Returns shown are total returns, which assume the reinvestment of dividends and capital gains. The table and graph presented above do not reflect the deduction of taxes a shareholder would pay on fund distributions or the redemption of fund shares.
The recent growth rate in the stock market has helped to produce short-term returns for some asset classes that are not typical and may not continue in the future. Because of ongoing market volatility, fund performance may be subject to substantial short-term changes.
| | | | | | | | | | |
| AQR Funds | | | | Annual Report | | | | December 2010 | | 27 |
| | | | | | | |
Shareholder Letter (Unaudited)
PRINCIPAL RISKS:
AQR Global Equity Fund and AQR International Equity Fund: The AQR Global Equity Fund and the AQR International Equity Fund use derivatives to manage their country and currency exposures. The use of derivatives exposes the Fund to additional risks including increased volatility, lack of liquidity, and possible losses greater than the Fund’s initial investment as well as increased transaction costs. Foreign investing involves special risks such as currency fluctuations and political uncertainty. The Funds are not suitable for all investors.
AQR Diversified Arbitrage Fund: As the AQR Diversified Arbitrage Fund (the “Fund”) employs arbitrage and alternative strategies, the Fund has the risk that the anticipated opportunities do not play out as planned, resulting in potentially reduced returns or losses to the Fund as it unwinds its trades. This Fund enters into a short sale by selling a security it has borrowed. If the market price of a security increases after the Fund borrows the security, the Fund will suffer a potentially unlimited loss when it replaces the borrowed security at the higher price. Short sales also involve transaction and other costs that will reduce potential Fund gains and increase potential Fund losses. The Fund uses derivatives to hedge certain economic exposures. The use of derivatives exposes the Fund to additional risks including increased volatility, lack of liquidity, and possible losses greater than the Fund’s initial investment as well as increased transaction costs. This Fund is not suitable for all investors.
AQR Managed Futures Strategy Fund: The use of derivatives, forward and futures contracts, and commodities exposes the Fund to additional risks including increased volatility, lack of liquidity, and possible losses greater than the Fund’s initial investment as well as increased transaction costs. Concentration generally will lead to greater price volatility. The Fund enters into a short sale by selling a security it has borrowed. If the market price of a security increases after the Fund borrows the security, the Fund will suffer a potentially unlimited loss when it replaces the borrowed security at the higher price. Short sales also involve transaction and other costs that will reduce potential Fund gains and increase potential Fund losses. This Fund is not suitable for all investors.
AQR Risk Parity Fund: Foreign investing involves special risks such as currency fluctuations and political uncertainty. The use of derivatives, forward and futures contracts, and commodities exposes the Fund to additional risks including increased volatility, lack of liquidity, and possible losses greater than the Fund’s initial investment as well as increased transaction costs. This Fund enters into a short sale by selling a security it has borrowed. If the market price of a security increases after the Fund borrows the security, the Fund will suffer a potentially unlimited loss when it replaces the borrowed security at the higher price. Short sales also involve transaction and other costs that will reduce potential Fund gains and increase potential Fund losses. When investing in bonds, yield and share price will vary with changes in interest rates and market conditions. Investors should note that if interest rates rise significantly from current levels, bond total returns will decline and may even turn negative in the short term. There is also a chance that some of the Fund’s holdings may have their credit rating downgraded or may default. Actual or realized volatility can and will differ from the forecasted or target volatility. This Fund is not suitable for all investors.
AQR Momentum Fund: Securities with positive momentum generally will be more volatile than a broad crosssection of securities. In addition, there may be periods when the momentum style is out of favor, and during which the investment performance of a Fund, which uses a momentum strategy, generally will suffer. This Fund is not suitable for all investors.
AQR Small Cap Momentum Fund: Securities with positive momentum generally will be more volatile than a broad crosssection of securities. In addition, there may be periods when the momentum style is out of favor, and during which the investment performance of a Fund, which uses a momentum strategy, generally will suffer. Derivatives are generally more sensitive to changes in economic or market conditions than other types of investments, which could result in losses that significantly exceed the Fund’s original investment. The use of derivatives exposes the Fund to additional risks including increased volatility, lack of liquidity, and possible losses greater than the Fund’s initial investment as well as increased transaction costs. Funds that emphasize investments in smaller companies generally will experience greater price volatility. This Fund is not suitable for all investors.
| | | | | | | | | | |
| AQR Funds | | | | Annual Report | | | | December 2010 | | 28 |
| | | | | | | |
Shareholder Letter (Unaudited)
AQR International Momentum Fund: Securities with positive momentum generally will be more volatile than a broad crosssection of securities. In addition, there may be periods when the momentum style is out of favor, and during which the investment performance of a Fund, which uses a momentum strategy, generally will suffer. Derivatives are generally more sensitive to changes in economic or market conditions than other types of investments, which could result in losses that significantly exceed the Fund’s original investment. The use of derivatives exposes the Fund to additional risks including increased volatility, lack of liquidity, and possible losses greater than the Fund’s initial investment as well as increased transaction costs. Foreign investing involves special risks such as currency fluctuations and political uncertainty. This Fund is not suitable for all investors.
An investment in any of the AQR Funds (the “Funds”) involves risk, including loss of principal. Diversification does not eliminate this risk. The value of the Funds’ portfolio holdings may fluctuate in response to events specific to the companies in which the Fund invests, as well as economic, political or social events in the United States or abroad. Please refer to the prospectus for complete information regarding all risks associated with the Funds.
An investor considering the Funds should be able to tolerate potentially wide price fluctuations. The funds are subject to high portfolio turnover risk as a result of frequent trading, and thus will incur a higher level of brokerage fees and commissions and cause a higher level of tax liability to shareholders in the funds. The Funds may attempt to increase their income or total return through the use of securities lending, and they may be subject to the possibility of additional loss as a result of this investment technique.
Cliff Asness, David Kabiller, Brian Hurst, Yao Hua Ooi and Marco Hanig are registered representatives of ALPS Distributors, Inc.
DEFINITIONS:
Arbitrage: The simultaneous purchase and sale of an asset or two related assets in order to profit from a difference in price.
Bearish: A belief that a particular security, sector or the overall market will fall.
Beta is a measure of the volatility of a security or portfolio in comparison to an index or the market as a whole, where a security with a beta of 1.0 has equivalent volatility to the index or market it is compared to.
Carry: The return obtained from holding an asset (if positive), or the cost of holding it (if negative).
Cheapness: A measure of the discount a security price relative to its fundamental value.
Closed-end fund arbitrage is the practice of buying (selling) closed-end funds that trade at abnormally wide discounts (or premiums) to their underlying net asset values. Positions are unwound when the discount or premium converges to expected levels.
Convertible Bonds: Fixed-income securities that are convertible into common stock.
Correlation: A measurement to identify the relationship and impact on return of two or more assets.
Credit: This strategy purchases attractively priced securities on a hedged basis, typically around event-induced capital flows.
Dual-Class Arbitrage: An investment strategy that takes advantage of inefficiencies in the prices at which different classes of a publicly traded company’s stock are trading.
Futures and Forwards contracts: A financial contract obligating the buyer to purchase an asset (or the seller to sell an asset) at a pre-determined future date and price.
Momentum: An investment style wherein an asset is deemed to have positive momentum if it has performed well in the past relative to other assets in the same universe.
| | | | | | | | | | |
| AQR Funds | | | | Annual Report | | | | December 2010 | | 29 |
| | | | | | | |
Shareholder Letter (Unaudited)
Price to Book: A valuation ratio of a company’s current share price compared to its book value.
Price Pressure: This strategy captures a risk premium by providing liquidity around different types of securities issues and restructuring events. The Fund may employ additional arbitrage and alternative strategies as they arise.
Quantitative Easing: The term quantitative easing describes an extreme form of monetary policy use to stimulate an economy when the interbank interest rate, (which in the US is called the federal funds rate) is either at, or close to zero.
Richness: A measure of the premium a security price relative to its fundamental value.
Sovereign Risk: The probability that the government of a country will refuse to comply with the terms of a loan agreement during economically difficult or politically volatile times.
Special Purpose Acquisition Companies (SPACs): SPACs, often called “blank check” companies, are publicly traded companies whose primary asset is a trust invested in short-term high-grade securities. The Fund seeks to capture a liquidity premium when these securities, which are typically thinly traded, are selling at a discount.
Spread: The percentage difference between two related securities.
S&P 500 Index: An Index of 500 stocks chosen for market size, liquidity and industry grouping, among other factors.
The Merrill Lynch 3 Month Treasury Bill Index is designed to measure the performance of high-quality short-term cash-equivalent investments. Indexes are unmanaged and one cannot invest directly in an index.
The Morgan Stanley Capital International EAFE Index is a free float-adjusted market capitalization index that is designed to measure the performance of equities in developed markets, excluding the United States and Canada.
The Morgan Stanley Capital International World Index is a free float-adjusted market capitalization index that is designed to measure the performance of equities in developed markets, including the United States and Canada.
The MSCI World ex-USA Index is a free float-adjusted market capitalization index that is designed to measure the performance of equities in developed markets, excluding the United States.
The Russell 1000® Index measures the performance of the large and mid-cap segment of the U.S. equity universe. It is a subset of the Russell 3000® Index and includes approximately 1,000 of the largest securities based on a combination of their market cap and current index membership. The Russell 1000 represents approximately 90% of the U.S. market. Indexes are unmanaged and one cannot invest directly in an index.
The Russell 2000® Index measures the performance of the small-cap segment of the U.S. equity universe. The Russell 2000® Index is a subset of the Russell 3000® Index representing approximately 8% of the total market capitalization of that index. It includes approximately 2,000 of the smallest securities based on a combination of their market cap and current index membership. Indexes are unmanaged and one cannot invest directly in an index.
Tracking Error: A measure of how closely a portfolio follows the index to which it is benchmarked. It measures the standard deviation of the difference between the portfolio and index returns.
Valuation: A process of determining the current worth of an asset or company.
Volatility is a statistical measurement of up and down asset price fluctuations over time. If an asset has rapid dramatic price swings, its “volatility” will likely be relatively high. If prices are consistent and rarely change, “volatility” of that asset will likely be relatively low. “Volatility” can be measured as the standard deviation of an asset with a specific time horizon. It is often used to quantify the risk of such asset over a time period, typically expressed in annualized terms.
| | | | | | | | | | |
| AQR Funds | | | | Annual Report | | | | December 2010 | | 30 |
| | | | | | | |
| | | | |
| Schedule of Investments | | | December 31, 2010 | |
| | | | | | | | |
| COMMON STOCKS - 89.4% | | SHARES | | | VALUE
(Note 3) | |
| Australia - 3.6% | | | | | | | | |
| Alumina Ltd. | | | 37,995 | | | $ | 96,799 | |
| Ansell Ltd. | | | 20,994 | | | | 273,281 | |
| ASX Ltd. (a) | | | 2,722 | | | | 105,155 | |
| Australia & New Zealand Banking Group Ltd. | | | 53,416 | | | | 1,278,654 | |
| AXA Asia Pacific Holdings Ltd. | | | 16,242 | | | | 105,118 | |
| Bank of Queensland Ltd. | | | 3,416 | | | | 36,457 | |
| Beach Energy Ltd. | | | 43,365 | | | | 38,453 | |
| BHP Billiton Ltd. | | | 52,374 | | | | 2,440,807 | |
| Brambles Ltd. | | | 6,647 | | | | 48,524 | |
| Caltex Australia Ltd. (a) | | | 15,033 | | | | 221,397 | |
| CFS Retail Property Trust REIT | | | 36,456 | | | | 65,746 | |
| Challenger Ltd. | | | 61,272 | | | | 295,626 | |
| Commonwealth Bank of Australia | | | 24,222 | | | | 1,261,357 | |
| Computershare Ltd. | | | 7,001 | | | | 77,335 | |
| CSL Ltd. | | | 9,106 | | | | 338,779 | |
| Dexus Property Group REIT | | | 74,910 | | | | 61,029 | |
| DUET Group | | | 51,943 | | | | 89,716 | |
| Fairfax Media Ltd. (a) | | | 116,736 | | | | 167,760 | |
| Flight Centre Ltd. | | | 2,293 | | | | 58,313 | |
| Fortescue Metals Group Ltd. † | | | 19,404 | | | | 130,358 | |
| Foster’s Group Ltd. | | | 96,615 | | | | 562,887 | |
| Goodman Group REIT | | | 93,620 | | | | 62,355 | |
| GPT Group REIT | | | 29,672 | | | | 89,542 | |
| GPT Group - In Specie (3)†(b) | | | 96,388 | | | | — | |
| Incitec Pivot Ltd. | | | 63,407 | | | | 257,617 | |
| Lend Lease Group | | | 8,523 | | | | 75,420 | |
| Mirvac Group REIT | | | 51,825 | | | | 65,167 | |
| National Australia Bank Ltd. | | | 48,458 | | | | 1,178,253 | |
| Newcrest Mining Ltd. | | | 12,358 | | | | 513,720 | |
| OneSteel Ltd. | | | 66,192 | | | | 175,739 | |
| Origin Energy Ltd. (a) | | | 15,399 | | | | 263,137 | |
| OZ Minerals Ltd. | | | 52,223 | | | | 92,437 | |
| Paladin Energy Ltd. †(a) | | | 10,415 | | | | 52,609 | |
| Rio Tinto Ltd. (a) | | | 10,632 | | | | 933,061 | |
| Sigma Pharmaceuticals Ltd. † | | | 11,450 | | | | 4,689 | |
| Stockland REIT | | | 33,079 | | | | 122,115 | |
| Suncorp Group Ltd. | | | 41,179 | | | | 363,433 | |
| TABCORP Holdings Ltd. | | | 71,837 | | | | 523,501 | |
| Tatts Group Ltd. | | | 128,292 | | | | 339,509 | |
| Telecom Corp of New Zealand Ltd. (a) | | | 66,719 | | | | 112,082 | |
| Telstra Corp. Ltd. | | | 69,795 | | | | 199,558 | |
| Transurban Group | | | 19,970 | | | | 105,070 | |
| Wesfarmers Ltd. | | | 23,287 | | | | 765,311 | |
| West Australian Newspapers Holdings Ltd. | | | 3,103 | | | | 20,484 | |
| Westfield Group REIT | | | 32,674 | | | | 320,756 | |
| Westfield Retail Trust REIT † | | | 32,674 | | | | 86,076 | |
| Westpac Banking Corp. | | | 34,732 | | | | 790,775 | |
| | | | | | | | |
| | | | | | | 15,265,967 | |
| | | | | | | | |
| Belgium - 0.1% | | | | | | | | |
| KBC Groep NV † | | | 17,206 | | | | 588,558 | |
| | | | | | | | |
| Bermuda - 0.1% | | | | | | | | |
| Everest Re Group Ltd. (1) | | | 5,635 | | | | 477,961 | |
| | | | | | | | |
| Canada - 4.9% (1) | | | | | | | | |
| AGF Management Ltd., Class B | | | 15,018 | | | | 294,571 | |
| | | | | | | | |
| | | SHARES | | | VALUE
(Note 3) | |
| Canada - 4.9% (continued) (1) | | | | | | | | |
| ARC Energy Trust | | | 2,100 | | | $ | 53,702 | |
| Atco Ltd., Class I | | | 3,349 | | | | 199,359 | |
| Bank of Montreal (a) | | | 12,580 | | | | 727,719 | |
| Bank of Nova Scotia | | | 15,799 | | | | 907,888 | |
| Barrick Gold Corp. | | | 26,005 | | | | 1,390,213 | |
| BCE, Inc. | | | 27,609 | | | | 981,937 | |
| Bombardier, Inc., Class B | | | 108,591 | | | | 547,518 | |
| Brookfield Asset Management, Inc., Class A | | | 8,102 | | | | 270,705 | |
| Canadian Imperial Bank of Commerce (a)(c) | | | 5,300 | | | | 417,802 | |
| Canadian National Railway Co. | | | 8,400 | | | | 560,902 | |
| Canadian Natural Resources Ltd. | | | 29,104 | | | | 1,299,011 | |
| Canadian Oil Sands Trust | | | 4,234 | | | | 112,705 | |
| Canadian Pacific Railway Ltd. | | | 6,800 | | | | 442,224 | |
| Celestica, Inc. † | | | 33,711 | | | | 327,390 | |
| Cenovus Energy, Inc. | | | 6,100 | | | | 204,305 | |
| Encana Corp. | | | 27,691 | | | | 810,679 | |
| Enerplus Resources Fund | | | 2,951 | | | | 91,086 | |
| Fairfax Financial Holdings Ltd. | | | 600 | | | | 246,962 | |
| Finning International, Inc. | | | 13,300 | | | | 362,600 | |
| Gildan Activewear, Inc. † | | | 11,100 | | | | 316,696 | |
| Goldcorp, Inc. | | | 3,688 | | | | 170,287 | |
| Great-West Lifeco, Inc. | | | 3,145 | | | | 83,559 | |
| HudBay Minerals, Inc. | | | 10,700 | | | | 193,508 | |
| Imperial Oil Ltd. | | | 7,000 | | | | 285,875 | |
| Inmet Mining Corp. | | | 5,780 | | | | 449,417 | |
| Ivanhoe Mines Ltd. † | | | 4,885 | | | | 113,073 | |
| Laurentian Bank of Canada | | | 4,237 | | | | 204,932 | |
| Magna International, Inc. | | | 19,634 | | | | 1,025,714 | |
| Manulife Financial Corp. | | | 40,900 | | | | 705,918 | |
| National Bank of Canada | | | 2,914 | | | | 200,943 | |
| Nexen, Inc. | | | 15,100 | | | | 346,480 | |
| Niko Resources Ltd. | | | 700 | | | | 72,688 | |
| Pacific Rubiales Energy Corp. | | | 4,000 | | | | 135,863 | |
| Penn West Energy Trust | | | 7,308 | | | | 175,336 | |
| Petrobank Energy & Resources Ltd. †(c) | | | 1,600 | | | | 40,658 | |
| Petrominerales Ltd. | | | 982 | | | | 32,785 | |
| Potash Corp of Saskatchewan, Inc. | | | 6,000 | | | | 932,622 | |
| Power Corp. of Canada | | | 4,746 | | | | 132,161 | |
| Research In Motion Ltd. † | | | 12,640 | | | | 738,696 | |
| Royal Bank of Canada (a) | | | 12,824 | | | | 675,239 | |
| Russel Metals, Inc. | | | 18,100 | | | | 417,139 | |
| Silver Wheaton Corp. † | | | 5,300 | | | | 207,914 | |
| Suncor Energy, Inc. | | | 10,582 | | | | 407,668 | |
| Talisman Energy, Inc. | | | 23,766 | | | | 529,064 | |
| Teck Resources Ltd., Class B (a) | | | 16,493 | | | | 1,025,615 | |
| TELUS Corp. (a) | | | 2,307 | | | | 100,415 | |
| Toronto-Dominion Bank/The | | | 10,112 | | | | 755,614 | |
| Valeant Pharmaceuticals International, Inc. | | | 2,874 | | | | 81,796 | |
| Yellow Media, Inc. | | | 8,100 | | | | 50,541 | |
| | | | | | | | |
| | | | | | | 20,857,494 | |
| | | | | | | | |
| Cayman Islands - 0.0% (d) | | | | | | | | |
| Sands China Ltd. † | | | 31,600 | | | | 69,459 | |
| | | | | | | | |
| | | | |
| | The accompanying notes are an integral part of these financial statements. | | (Continued) |
| | | | | | | | | | |
| AQR Funds | | | | Annual Report | | | | December 2010 | | 31 |
| | | | | | | |
| | | | |
| Schedule of Investments | | | December 31, 2010 | |
| | | | | | | | |
| | | SHARES | | | VALUE
(Note 3) | |
| China - 0.0% (d) | | | | | | | | |
| Foxconn International Holdings Ltd. †(a) | | | 32,101 | | | $ | 22,405 | |
| Yangzijiang Shipbuilding Holdings Ltd. | | | 24,404 | | | | 36,407 | |
| | | | | | | | |
| | | | | | | 58,812 | |
| | | | | | | | |
| Denmark - 0.8% | | | | | | | | |
| AP Moller - Maersk A/S, Class B | | | 56 | | | | 509,122 | |
| Carlsberg A/S, Class B | | | 4,235 | | | | 426,866 | |
| Coloplast A/S, Class B | | | 2,448 | | | | 334,055 | |
| Novo Nordisk A/S, Class B | | | 17,631 | | | | 1,994,684 | |
| | | | | | | | |
| | | | | | | 3,264,727 | |
| | | | | | | | |
| Finland - 0.7% | | | | | | | | |
| Kesko OYJ B Shares | | | 7,485 | | | | 351,149 | |
| Kone OYJ, Class B | | | 2,727 | | | | 152,058 | |
| Nokia OYJ | | | 2,990 | | | | 31,095 | |
| Stora Enso OYJ R Shares | | | 117,053 | | | | 1,209,331 | |
| UPM-Kymmene OYJ | | | 44,257 | | | | 787,660 | |
| Wartsila OYJ | | | 8,435 | | | | 645,303 | |
| | | | | | | | |
| | | | | | | 3,176,596 | |
| | | | | | | | |
| France - 3.6% | | | | | | | | |
| Arkema SA | | | 4,651 | | | | 336,713 | |
| BNP Paribas | | | 24,591 | | | | 1,572,260 | |
| Bouygues SA | | | 14,577 | | | | 631,590 | |
| Christian Dior SA | | | 5,026 | | | | 721,709 | |
| CNP Assurances | | | 1,429 | | | | 25,893 | |
| Compagnie de Saint-Gobain | | | 16,031 | | | | 828,924 | |
| Klepierre REIT | | | 1,740 | | | | 63,091 | |
| Legrand SA | | | 20,362 | | | | 833,824 | |
| L’Oreal SA | | | 8,463 | | | | 944,707 | |
| LVMH Moet Hennessy Louis Vuitton SA | | | 3,924 | | | | 648,836 | |
| Metropole Television SA | | | 17,674 | | | | 429,833 | |
| Natixis † | | | 167,812 | | | | 788,064 | |
| PPR | | | 985 | | | | 157,439 | |
| Rhodia SA | | | 17,559 | | | | 583,673 | |
| Safran SA | | | 6,184 | | | | 220,073 | |
| Sanofi-Aventis SA | | | 6,600 | | | | 424,791 | |
| Schneider Electric SA | | | 2,936 | | | | 441,939 | |
| Societe BIC SA | | | 9,971 | | | | 860,562 | |
| Societe Generale | | | 3,237 | | | | 174,856 | |
| Thales SA | | | 5,276 | | | | 185,528 | |
| Total SA | | | 52,926 | | | | 2,830,029 | |
| Unibail-Rodamco SE REIT | | | 1,690 | | | | 335,929 | |
| Valeo SA † | | | 9,881 | | | | 563,007 | |
| Vivendi SA | | | 35,582 | | | | 965,256 | |
| | | | | | | | |
| | | | | | | 15,568,526 | |
| | | | | | | | |
| Germany - 3.4% | | | | | | | | |
| Adidas AG | | | 10,735 | | | | 701,042 | |
| Allianz SE | | | 8,256 | | | | 984,790 | |
| Aurubis AG | | | 4,144 | | | | 243,968 | |
| BASF SE | | | 11,828 | | | | 947,612 | |
| Bayer AG | | | 15,620 | | | | 1,162,411 | |
| Daimler AG † | | | 12,534 | | | | 851,438 | |
| Deutsche Bank AG | | | 17,142 | | | | 899,974 | |
| Deutsche Boerse AG | | | 2,471 | | | | 171,394 | |
| Deutsche Lufthansa AG † | | | 15,663 | | | | 342,049 | |
| Deutsche Post AG | | | 34,448 | | | | 586,709 | |
| Deutsche Telekom AG | | | 63,382 | | | | 820,275 | |
| | | | | | | | |
| | | SHARES | | | VALUE
(Note 3) | |
| Germany - 3.4% (continued) | | | | | | | | |
| E.ON AG | | | 10,147 | | | $ | 311,093 | |
| Hannover Rueckversicherung AG | | | 11,946 | | | | 643,354 | |
| Infineon Technologies AG † | | | 69,455 | | | | 649,950 | |
| K+S AG | | | 3,818 | | | | 288,900 | |
| MAN SE | | | 6,101 | | | | 729,515 | |
| Muenchener Rueckversicherungs AG | | | 6,256 | | | | 951,217 | |
| RWE AG | | | 8,361 | | | | 560,620 | |
| Siemens AG | | | 17,907 | | | | 2,226,923 | |
| Suedzucker AG | | | 21,344 | | | | 572,259 | |
| | | | | | | | |
| | | | | | | 14,645,493 | |
| | | | | | | | |
| Hong Kong - 1.2% | | | | | | | | |
| AIA Group Ltd. † | | | 125,600 | | | | 353,034 | |
| ASM Pacific Technology Ltd. | | | 2,982 | | | | 37,657 | |
| Cheung Kong Holdings Ltd. | | | 24,201 | | | | 372,932 | |
| Cheung Kong Infrastructure Holdings Ltd. | | | 5,749 | | | | 26,318 | |
| Chinese Estates Holdings Ltd. | | | 46,000 | | | | 75,924 | |
| CLP Holdings Ltd. | | | 30,511 | | | | 247,714 | |
| Esprit Holdings Ltd. | | | 35,944 | | | | 170,963 | |
| Hang Lung Group Ltd. | | | 11,791 | | | | 77,460 | |
| Hang Lung Properties Ltd. | | | 44,000 | | | | 205,635 | |
| Hang Seng Bank Ltd. | | | 11,657 | | | | 191,508 | |
| Hong Kong Exchanges and Clearing Ltd. | | | 16,169 | | | | 366,554 | |
| Hongkong Electric Holdings Ltd. | | | 28,500 | | | | 179,634 | |
| Hopewell Holdings Ltd. | | | 31,195 | | | | 97,882 | |
| Hutchison Whampoa Ltd. | | | 42,489 | | | | 437,049 | |
| Hysan Development Co. Ltd. | | | 34,823 | | | | 163,839 | |
| Li & Fung Ltd. | | | 8,734 | | | | 50,669 | |
| Lifestyle International Holdings Ltd. | | | 9,000 | | | | 22,144 | |
| Link REIT/The REIT | | | 34,329 | | | | 106,578 | |
| Mongolia Energy Corp. Ltd. † | | | 48,885 | | | | 14,580 | |
| New World Development Ltd. | | | 40,173 | | | | 75,364 | |
| NWS Holdings Ltd. | | | 19,500 | | | | 29,592 | |
| Orient Overseas International Ltd. | | | 22,500 | | | | 218,081 | |
| PCCW Ltd. | | | 20,406 | | | | 9,025 | |
| Sun Hung Kai Properties Ltd. | | | 21,022 | | | | 348,751 | |
| Swire Pacific Ltd., Class A | | | 12,818 | | | | 210,577 | |
| Television Broadcasts Ltd. | | | 31,442 | | | | 169,743 | |
| Wharf Holdings Ltd. | | | 41,604 | | | | 319,835 | |
| Wheelock & Co. Ltd. | | | 59,844 | | | | 241,960 | |
| Yue Yuen Industrial Holdings Ltd. | | | 45,623 | | | | 164,098 | |
| | | | | | | | |
| | | | | | | 4,985,100 | |
| | | | | | | | |
| Ireland - 0.6% | | | | | | | | |
| Accenture PLC, Class A (1) | | | 15,874 | | | | 769,730 | |
| Covidien PLC (1) | | | 16,200 | | | | 739,692 | |
| Experian PLC | | | 36,238 | | | | 453,250 | |
| Seagate Technology PLC (1)† | | | 35,300 | | | | 530,559 | |
| | | | | | | | |
| | | | | | | 2,493,231 | |
| | | | | | | | |
| Italy - 1.2% | | | | | | | | |
| Banco Popolare SC (a) | | | 28,700 | | | | 130,783 | |
| Enel SpA | | | 94,899 | | | | 477,409 | |
| ENI SpA | | | 109,223 | | | | 2,403,275 | |
| Fiat SpA | | | 22,378 | | | | 464,618 | |
| Mediaset SpA | | | 72,330 | | | | 439,763 | |
| Pirelli & C SpA | | | 64,444 | | | | 523,545 | |
| | | | |
| | The accompanying notes are an integral part of these financial statements. | | (Continued) |
| | | | | | | | | | |
| AQR Funds | | | | Annual Report | | | | December 2010 | | 32 |
| | | | | | | |
| | | | |
| Schedule of Investments | | | December 31, 2010 | |
| | | | | | | | |
| | | SHARES | | | VALUE
(Note 3) | |
| Italy - 1.2% (continued) | | | | | | | | |
| Telecom Italia SpA | | | 489,169 | | | $ | 637,164 | |
| UniCredit SpA | | | 8,846 | | | | 18,411 | |
| | | | | | | | |
| | | | | | | 5,094,968 | |
| | | | | | | | |
| Japan - 9.0% | | | | | | | | |
| Aeon Co. Ltd. | | | 51,100 | | | | 638,309 | |
| Aisin Seiki Co. Ltd. | | | 16,700 | | | | 589,066 | |
| Ajinomoto Co., Inc. | | | 9,000 | | | | 93,591 | |
| Asahi Glass Co. Ltd. | | | 55,236 | | | | 643,059 | |
| Asahi Kasei Corp. | | | 41,000 | | | | 266,970 | |
| Bridgestone Corp. | | | 12,000 | | | | 231,230 | |
| Brother Industries Ltd. | | | 3,300 | | | | 48,755 | |
| Canon, Inc. | | | 12,745 | | | | 655,337 | |
| Central Japan Railway Co. | | | 42 | | | | 351,464 | |
| Chubu Electric Power Co., Inc. | | | 9,354 | | | | 229,865 | |
| Cosmo Oil Co. Ltd. | | | 13,000 | | | | 42,499 | |
| Credit Saison Co. Ltd. | | | 14,675 | | | | 239,742 | |
| Daicel Chemical Industries Ltd. | | | 64,000 | | | | 466,212 | |
| Daido Steel Co. Ltd. | | | 79,000 | | | | 463,021 | |
| Daiichi Sankyo Co. Ltd. | | | 13,600 | | | | 297,349 | |
| Daito Trust Construction Co. Ltd. | | | 2,486 | | | | 170,077 | |
| Daiwa House Industry Co. Ltd. | | | 151 | | | | 1,852 | |
| Denso Corp. | | | 15,100 | | | | 519,665 | |
| DIC Corp. | | | 31,000 | | | | 69,168 | |
| East Japan Railway Co. | | | 8,512 | | | | 552,916 | |
| Elpida Memory, Inc. † | | | 15,900 | | | | 184,091 | |
| FANUC Corp. | | | 2,600 | | | | 397,843 | |
| Fuji Electric Holdings Co. Ltd. | | | 35,000 | | | | 108,577 | |
| Fuji Heavy Industries Ltd. | | | 57,000 | | | | 440,033 | |
| FUJIFILM Holdings Corp. | | | 15,544 | | | | 560,461 | |
| Fujitsu Ltd. | | | 71,283 | | | | 494,391 | |
| Fukuoka Financial Group, Inc. | | | 10,096 | | | | 43,747 | |
| Hino Motors Ltd. | | | 51,000 | | | | 275,230 | |
| Hitachi High-Technologies Corp. | | | 2,658 | | | | 61,998 | |
| Hitachi Ltd. | | | 101,000 | | | | 536,788 | |
| Honda Motor Co. Ltd. | | | 26,897 | | | | 1,062,705 | |
| Hoya Corp. | | | 9,806 | | | | 237,350 | |
| Idemitsu Kosan Co. Ltd. | | | 800 | | | | 84,862 | |
| IHI Corp. | | | 193,000 | | | | 428,941 | |
| Isuzu Motors Ltd. | | | 107,000 | | | | 484,009 | |
| ITOCHU Corp. | | | 73,888 | | | | 745,257 | |
| Itochu Techno-Solutions Corp. | | | 6,100 | | | | 228,446 | |
| Japan Petroleum Exploration Co. | | | 1,600 | | | | 60,739 | |
| Japan Real Estate Investment Corp. REIT | | | 7 | | | | 72,593 | |
| JFE Holdings, Inc. | | | 2,700 | | | | 93,713 | |
| JTEKT Corp. | | | 12,100 | | | | 142,125 | |
| JX Holdings, Inc. | | | 35,614 | | | | 241,254 | |
| Kaneka Corp. | | | 21,354 | | | | 147,692 | |
| Kansai Electric Power Co., Inc./The | | | 13,500 | | | | 333,243 | |
| KDDI Corp. | | | 77 | | | | 444,504 | |
| Keisei Electric Railway Co. Ltd. | | | 1,461 | | | | 9,735 | |
| Kinden Corp. | | | 44,284 | | | | 408,507 | |
| Kobe Steel Ltd. | | | 208,000 | | | | 526,112 | |
| Komatsu Ltd. | | | 13,300 | | | | 400,708 | |
| Konica Minolta Holdings, Inc. | | | 34,500 | | | | 356,944 | |
| Kuraray Co. Ltd. | | | 39,700 | | | | 567,308 | |
| Kyocera Corp. | | | 2,100 | | | | 213,578 | |
| Makita Corp. | | | 10,246 | | | | 417,366 | |
| | | | | | | | |
| | | SHARES | | | VALUE
(Note 3) | |
| Japan - 9.0% (continued) | | | | | | | | |
| Marubeni Corp. | | | 11,000 | | | $ | 77,089 | |
| Maruichi Steel Tube Ltd. | | | 13,800 | | | | 292,926 | |
| Miraca Holdings, Inc. | | | 6,128 | | | | 246,251 | |
| Mitsubishi Chemical Holdings Corp. | | | 37,000 | | | | 250,192 | |
| Mitsubishi Corp. | | | 2,936 | | | | 79,213 | |
| Mitsubishi Electric Corp. | | | 62,000 | | | | 648,534 | |
| Mitsubishi Estate Co. Ltd. | | | 18,764 | | | | 347,145 | |
| Mitsubishi UFJ Financial Group, Inc. | | | 139,449 | | | | 752,714 | |
| Mitsubishi UFJ Lease & Finance Co. Ltd. | | | 4,658 | | | | 184,047 | |
| Mitsui & Co. Ltd. | | | 34,889 | | | | 574,662 | |
| Mitsui Engineering & Shipbuilding Co. Ltd. | | | 17,000 | | | | 44,871 | |
| Mitsui Fudosan Co. Ltd. | | | 17,598 | | | | 350,102 | |
| Mitsui OSK Lines Ltd. | | | 69,000 | | | | 468,043 | |
| Mitsumi Electric Co. Ltd. | | | 10,040 | | | | 183,673 | |
| Mizuho Financial Group, Inc. | | | 167,128 | | | | 313,840 | |
| Mizuho Securities Co. Ltd. | | | 12,000 | | | | 34,254 | |
| Nippon Building Fund, Inc. REIT | | | 8 | | | | 82,072 | |
| Nippon Electric Glass Co. Ltd. | | | 28,000 | | | | 402,331 | |
| Nippon Kayaku Co. Ltd. | | | 20,546 | | | | 216,831 | |
| Nippon Meat Packers, Inc. | | | 30,097 | | | | 392,577 | |
| Nippon Shokubai Co. Ltd. | | | 13,000 | | | | 134,188 | |
| Nippon Telegraph & Telephone Corp. | | | 7,948 | | | | 362,314 | |
| Nissan Motor Co. Ltd. | | | 10,100 | | | | 95,645 | |
| Nisshin Seifun Group, Inc. | | | 6,500 | | | | 82,369 | |
| Nisshin Steel Co. Ltd. | | | 38,000 | | | | 84,430 | |
| Nisshinbo Holdings, Inc. | | | 9,000 | | | | 98,341 | |
| Nitto Denko Corp. | | | 10,294 | | | | 483,303 | |
| Nomura Holdings, Inc. | | | 15,100 | | | | 95,911 | |
| NTN Corp. | | | 19,000 | | | | 100,376 | |
| NTT Data Corp. | | | 93 | | | | 321,056 | |
| NTT DoCoMo, Inc. | | | 542 | | | | 944,940 | |
| OJI Paper Co. Ltd. | | | 68,682 | | | | 331,808 | |
| Omron Corp. | | | 7,931 | | | | 209,230 | |
| ORIX Corp. | | | 1,599 | | | | 156,826 | |
| Osaka Gas Co. Ltd. | | | 129,446 | | | | 502,315 | |
| Pacific Metals Co. Ltd. | | | 13,000 | | | | 110,117 | |
| Rengo Co. Ltd. | | | 884 | | | | 5,990 | |
| Resona Holdings, Inc. (a) | | | 11,200 | | | | 66,830 | |
| Sapporo Hokuyo Holdings, Inc. | | | 7,191 | | | | 33,637 | |
| SBI Holdings, Inc. | | | 261 | | | | 39,401 | |
| Secom Co. Ltd. | | | 2,900 | | | | 137,171 | |
| Sega Sammy Holdings, Inc. | | | 26,900 | | | | 510,711 | |
| Seino Holdings Corp. | | | 31,100 | | | | 213,324 | |
| Sekisui Chemical Co. Ltd. | | | 38,000 | | | | 272,149 | |
| Sekisui House Ltd. | | | 9,000 | | | | 90,784 | |
| Seven & I Holdings Co. Ltd. | | | 19,530 | | | | 520,123 | |
| Shimizu Corp. | | | 10,000 | | | | 42,643 | |
| Showa Shell Sekiyu KK (a) | | | 25,400 | | | | 232,314 | |
| Softbank Corp. | | | 4,900 | | | | 169,131 | |
| Sojitz Corp. | | | 134,216 | | | | 293,786 | |
| Sony Corp. | | | 22,872 | | | | 818,866 | |
| Sumitomo Corp. | | | 53,700 | | | | 756,742 | |
| Sumitomo Heavy Industries Ltd. | | | 59,000 | | | | 377,779 | |
| Sumitomo Mitsui Financial Group, Inc. | | | 21,249 | | | | 753,155 | |
| Sumitomo Realty & Development Co. Ltd. | | | 5,624 | | | | 133,933 | |
| Sumitomo Trust & Banking Co. Ltd./The | | | 22,000 | | | | 137,967 | |
| | | | |
| | The accompanying notes are an integral part of these financial statements. | | (Continued) |
| | | | | | | | | | |
| AQR Funds | | | | Annual Report | | | | December 2010 | | 33 |
| | | | | | | |
| | | | |
| Schedule of Investments | | | December 31, 2010 | |
| | | | | | | | |
| | | SHARES | | | VALUE
(Note 3) | |
| Japan - 9.0% (continued) | | | | | | | | |
| Taisei Corp. | | | 82,000 | | | $ | 191,401 | |
| Takeda Pharmaceutical Co. Ltd. | | | 19,769 | | | | 972,186 | |
| TDK Corp. | | | 75 | | | | 5,198 | |
| Teijin Ltd. | | | 26,000 | | | | 110,811 | |
| Tokai Rika Co. Ltd. | | | 3,165 | | | | 59,701 | |
| Tokio Marine Holdings, Inc. | | | 17,400 | | | | 517,451 | |
| Tokyo Electric Power Co., Inc./The | | | 3,670 | | | | 89,578 | |
| Tokyo Gas Co. Ltd. | | | 65,000 | | | | 288,139 | |
| Tosoh Corp. | | | 60,000 | | | | 194,505 | |
| Toyota Auto Body Co. Ltd. | | | 10,365 | | | | 193,198 | |
| Toyota Motor Corp. | | | 32,678 | | | | 1,287,830 | |
| USS Co. Ltd. | | | 5,795 | | | | 473,395 | |
| West Japan Railway Co. | | | 44 | | | | 164,402 | |
| Yamada Denki Co. Ltd. | | | 3,370 | | | | 229,505 | |
| Yamaha Corp. | | | 11,300 | | | | 139,654 | |
| Yamaha Motor Co. Ltd. † | | | 18,300 | | | | 297,279 | |
| Yamatake Corp. | | | 3,700 | | | | 87,430 | |
| Yamato Holdings Co. Ltd. | | | 13,500 | | | | 191,707 | |
| | | | | | | | |
| | | | | | | 38,535,339 | |
| | | | | | | | |
| Jersey, Channel Islands - 0.3% | | | | | | | | |
| Wolseley PLC † | | | 36,527 | | | | 1,174,226 | |
| | | | | | | | |
| | |
| Netherlands - 2.1% | | | | | | | | |
| Corio NV REIT | | | 1,027 | | | | 66,201 | |
| ING Groep NV CVA † | | | 61,101 | | | | 598,424 | |
| Koninklijke Ahold NV | | | 68,517 | | | | 908,676 | |
| Koninklijke DSM NV | | | 23,173 | | | | 1,326,112 | |
| Koninklijke Philips Electronics NV | | | 28,583 | | | | 879,716 | |
| Royal Dutch Shell PLC A Shares | | | 56,073 | | | | 1,880,065 | |
| Royal Dutch Shell PLC B Shares | | | 72,935 | | | | 2,425,371 | |
| Unilever NV CVA | | | 24,960 | | | | 781,746 | |
| | | | | | | | |
| | | | | | | 8,866,311 | |
| | | | | | | | |
| New Zealand - 0.0% (d) | | | | | | | | |
| Telecom Corp of New Zealand Ltd. | | | 25,878 | | | | 43,614 | |
| | | | | | | | |
| Singapore - 0.7% | | | | | | | | |
| Ascendas Real Estate Investment Trust REIT | | | 22,478 | | | | 36,337 | |
| CapitaMall Trust REIT | | | 34,494 | | | | 52,557 | |
| ComfortDelGro Corp. Ltd. | | | 47,000 | | | | 56,861 | |
| DBS Group Holdings Ltd. | | | 20,054 | | | | 224,236 | |
| Fraser and Neave Ltd. | | | 66,000 | | | | 330,069 | |
| Genting Singapore PLC † | | | 108,000 | | | | 185,088 | |
| Golden Agri-Resources Ltd. | | | 244,000 | | | | 152,619 | |
| Jardine Cycle & Carriage Ltd. | | | 7,291 | | | | 208,265 | |
| Neptune Orient Lines Ltd. † | | | 112,891 | | | | 192,239 | |
| Oversea-Chinese Banking Corp. Ltd. | | | 70,422 | | | | 543,149 | |
| SembCorp Industries Ltd. | | | 11,777 | | | | 47,228 | |
| SembCorp Marine Ltd. | | | 55,000 | | | | 230,500 | |
| Singapore Exchange Ltd. (a) | | | 10,967 | | | | 72,054 | |
| Singapore Technologies Engineering Ltd. | | | 25,103 | | | | 67,011 | |
| Singapore Telecommunications Ltd. | | | 118,635 | | | | 282,424 | |
| StarHub Ltd. | | | 7,476 | | | | 15,380 | |
| | | | | | | | |
| | | SHARES | | | VALUE
(Note 3) | |
| Singapore - 0.7% (continued) | | | | | | | | |
| United Overseas Bank Ltd. | | | 17,201 | | | $ | 244,537 | |
| UOL Group Ltd. | | | 10,340 | | | | 38,381 | |
| | | | | | | | |
| | | | | | | 2,978,935 | |
| | | | | | | | |
| Spain - 1.5% | | | | | | | | |
| Banco Bilbao Vizcaya Argentaria SA | | | 46,481 | | | | 475,559 | |
| Banco Santander SA | | | 176,313 | | | | 1,886,129 | |
| Endesa SA (a) | | | 30,206 | | | | 785,756 | |
| Inditex SA | | | 22,756 | | | | 1,710,048 | |
| Repsol YPF SA | | | 28,033 | | | | 788,104 | |
| Telefonica SA | | | 40,244 | | | | 922,376 | |
| | | | | | | | |
| | | | | | | 6,567,972 | |
| | | | | | | | |
| Sweden - 1.4% | | | | | | | | |
| Boliden AB | | | 26,673 | | | | 543,659 | |
| Investor AB B Shares | | | 9,034 | | | | 193,392 | |
| NCC AB, Class B | | | 5,150 | | | | 113,498 | |
| Sandvik AB | | | 9,240 | | | | 180,366 | |
| Scania AB B Shares | | | 46,605 | | | | 1,073,251 | |
| Swedbank AB † | | | 13,021 | | | | 182,153 | |
| Tele2 AB B Shares | | | 102,781 | | | | 2,133,346 | |
| Telefonaktiebolaget LM Ericsson B Shares | | | 24,522 | | | | 284,299 | |
| Volvo AB B Shares † | | | 63,582 | | | | 1,120,514 | |
| | | | | | | | |
| | | | | | | 5,824,478 | |
| | | | | | | | |
| Switzerland - 4.7% | | | | | | | | |
| ABB Ltd. † | | | 78,183 | | | | 1,751,094 | |
| ACE Ltd. (1) | | | 16,496 | | | | 1,026,876 | |
| Clariant AG † | | | 15,951 | | | | 324,211 | |
| Compagnie Financiere Richemont SA, Class A | | | 21,055 | | | | 1,241,967 | |
| Nestle SA | | | 80,594 | | | | 4,736,182 | |
| Noble Corp. (1)† | | | 3,835 | | | | 137,178 | |
| Novartis AG | | | 59,248 | | | | 3,498,521 | |
| Roche Holding AG | | | 13,947 | | | | 2,050,891 | |
| Sulzer AG | | | 2,560 | | | | 391,772 | |
| Transocean Ltd. (1)† | | | 3,814 | | | | 265,111 | |
| Tyco Electronics Ltd. (1) | | | 37,660 | | | | 1,333,164 | |
| Tyco International Ltd. (1) | | | 18,600 | | | | 770,784 | |
| UBS AG † | | | 52,129 | | | | 858,551 | |
| Xstrata PLC | | | 68,804 | | | | 1,637,250 | |
| | | | | | | | |
| | | | | | | 20,023,552 | |
| | | | | | | | |
| United Kingdom - 7.4% | | | | | | | | |
| Anglo American PLC | | | 8,784 | | | | 461,447 | |
| Associated British Foods PLC | | | 28,204 | | | | 522,877 | |
| AstraZeneca PLC | | | 36,194 | | | | 1,656,460 | |
| Aviva PLC | | | 134,560 | | | | 830,600 | |
| Barclays PLC | | | 147,562 | | | | 612,422 | |
| BBA Aviation PLC | | | 4,405 | | | | 15,284 | |
| BHP Billiton PLC | | | 33,310 | | | | 1,345,756 | |
| BP PLC | | | 349,186 | | | | 2,584,657 | |
| British American Tobacco PLC | | | 36,951 | | | | 1,427,337 | |
| British Land Co. PLC REIT | | | 13,261 | | | | 109,311 | |
| British Sky Broadcasting Group PLC | | | 17,771 | | | | 205,121 | |
| | | | |
| | The accompanying notes are an integral part of these financial statements. | | (Continued) |
| | | | | | | | | | |
| AQR Funds | | | | Annual Report | | | | December 2010 | | 34 |
| | | | | | | |
| | | | |
| Schedule of Investments | | | December 31, 2010 | |
| | | | | | | | |
| | | SHARES | | | VALUE
(Note 3) | |
| United Kingdom - 7.4% (continued) | | | | | | | | |
| BT Group PLC | | | 362,993 | | | $ | 1,035,312 | |
| Burberry Group PLC | | | 34,987 | | | | 617,481 | |
| Capital Shopping Centres Group PLC REIT | | | 6,502 | | | | 42,588 | |
| Centrica PLC | | | 379,991 | | | | 1,977,130 | |
| Ensco PLC ADR (1) | | | 17,171 | | | | 916,588 | |
| GlaxoSmithKline PLC | | | 84,074 | | | | 1,637,292 | |
| Hammerson PLC REIT | | | 10,329 | | | | 67,596 | |
| HSBC Holdings PLC | | | 192,206 | | | | 1,972,633 | |
| IMI PLC | | | 26,393 | | | | 391,227 | |
| Intermediate Capital Group PLC | | | 18,423 | | | | 96,381 | |
| International Personal Finance PLC | | | 28,464 | | | | 171,649 | |
| Investec PLC | | | 54,548 | | | | 451,272 | |
| ITV PLC † | | | 398,307 | | | | 438,577 | |
| J Sainsbury PLC | | | 38,290 | | | | 225,895 | |
| Kingfisher PLC | | | 118,250 | | | | 489,206 | |
| Land Securities Group PLC REIT | | | 4,504 | | | | 47,710 | |
| Legal & General Group PLC | | | 241,482 | | | | 367,273 | |
| Lloyds Banking Group PLC † | | | 1,203,116 | | | | 1,247,202 | |
| Marks & Spencer Group PLC | | | 10,273 | | | | 59,488 | |
| Mondi PLC | | | 104,822 | | | | 846,719 | |
| Old Mutual PLC | | | 101,402 | | | | 196,092 | |
| Petrofac Ltd. | | | 15,081 | | | | 376,294 | |
| Rio Tinto PLC | | | 23,550 | | | | 1,685,739 | |
| Royal Bank of Scotland Group PLC † | | | 960,732 | | | | 592,484 | |
| Segro PLC REIT | | | 13,080 | | | | 58,815 | |
| Standard Chartered PLC | | | 3,372 | | | | 91,412 | |
| Tate & Lyle PLC | | | 30,201 | | | | 245,758 | |
| Tesco PLC | | | 278,188 | | | | 1,852,431 | |
| Vodafone Group PLC | | | 1,314,008 | | | | 3,463,968 | |
| WH Smith PLC | | | 18,586 | | | | 142,313 | |
| | | | | | | | |
| | | | | | | 31,575,797 | |
| | | | | | | | |
| United States - 42.1% (1) | | | | | | | | |
| 3M Co. | | | 2,100 | | | | 181,230 | |
| Abbott Laboratories | | | 17,584 | | | | 842,449 | |
| Aflac, Inc. | | | 7,600 | | | | 428,868 | |
| Altria Group, Inc. | | | 66,296 | | | | 1,632,208 | |
| American Express Co. | | | 8,889 | | | | 381,516 | |
| American Financial Group, Inc./OH | | | 33,825 | | | | 1,092,209 | |
| Ameriprise Financial, Inc. | | | 9,300 | | | | 535,215 | |
| AmerisourceBergen Corp. | | | 12,000 | | | | 409,440 | |
| Amgen, Inc. † | | | 38,249 | | | | 2,099,870 | |
| Annaly Capital Management, Inc. REIT | | | 8,318 | | | | 149,059 | |
| Apache Corp. | | | 3,280 | | | | 391,074 | |
| Apollo Group, Inc., Class A † | | | 8,000 | | | | 315,920 | |
| Apple, Inc. † | | | 10,128 | | | | 3,266,888 | |
| Archer-Daniels-Midland Co. | | | 1,433 | | | | 43,105 | |
| Ashland, Inc. | | | 14,000 | | | | 712,040 | |
| Assurant, Inc. | | | 23,400 | | | | 901,368 | |
| AT&T, Inc. | | | 129,597 | | | | 3,807,560 | |
| AutoZone, Inc. † | | | 1,000 | | | | 272,590 | |
| AvalonBay Communities, Inc. REIT | | | 1,311 | | | | 147,553 | |
| Bank of America Corp. | | | 187,038 | | | | 2,495,087 | |
| Becton Dickinson and Co. | | | 7,186 | | | | 607,361 | |
| Bed Bath & Beyond, Inc. † | | | 4,300 | | | | 211,345 | |
| Berkshire Hathaway, Inc., Class B † | | | 13,150 | | | | 1,053,446 | |
| | | | | | | | |
| | | SHARES | | | VALUE
(Note 3) | |
| United States - 42.1% (continued) (1) | | | | | | | | |
| Boeing Co./The | | | 7,065 | | | $ | 461,062 | |
| Boston Properties, Inc. REIT | | | 1,463 | | | | 125,964 | |
| Bristol-Myers Squibb Co. | | | 40,432 | | | | 1,070,639 | |
| Broadridge Financial Solutions, Inc. | | | 17,593 | | | | 385,814 | |
| Brookfield Properties Corp. | | | 2,845 | | | | 50,277 | |
| Cablevision Systems Corp., Class A | | | 23,800 | | | | 805,392 | |
| Cardinal Health, Inc. | | | 29,100 | | | | 1,114,821 | |
| Career Education Corp. † | | | 22,359 | | | | 463,502 | |
| Carnival Corp. | | | 5,700 | | | | 262,827 | |
| CF Industries Holdings, Inc. | | | 959 | | | | 129,609 | |
| Chemed Corp. | | | 9,980 | | | | 633,830 | |
| Chevron Corp. | | | 47,800 | | | | 4,361,750 | |
| Chubb Corp. | | | 6,649 | | | | 396,546 | |
| Cimarex Energy Co. | | | 10,800 | | | | 956,124 | |
| Cisco Systems, Inc. † | | | 54,289 | | | | 1,098,266 | |
| Citigroup, Inc. † | | | 463,491 | | | | 2,192,312 | |
| Coach, Inc. | | | 1,800 | | | | 99,558 | |
| Coca-Cola Co./The | | | 32,880 | | | | 2,162,518 | |
| Colgate-Palmolive Co. | | | 15,528 | | | | 1,247,985 | |
| Comcast Corp., Class A | | | 68,480 | | | | 1,504,506 | |
| Comerica, Inc. | | | 7,200 | | | | 304,128 | |
| Computer Sciences Corp. | | | 13,831 | | | | 686,018 | |
| ConAgra Foods, Inc. | | | 25,874 | | | | 584,235 | |
| ConocoPhillips | | | 44,375 | | | | 3,021,937 | |
| Crown Holdings, Inc. † | | | 16,651 | | | | 555,810 | |
| CSX Corp. | | | 20,498 | | | | 1,324,376 | |
| Deere & Co. | | | 3,900 | | | | 323,895 | |
| Delta Air Lines, Inc. † | | | 28,900 | | | | 364,140 | |
| Devon Energy Corp. | | | 10,690 | | | | 839,272 | |
| DIRECTV, Class A † | | | 13,869 | | | | 553,789 | |
| DISH Network Corp., Class A † | | | 8,674 | | | | 170,531 | |
| DR Horton, Inc. | | | 17,000 | | | | 202,810 | |
| Dr Pepper Snapple Group, Inc. | | | 26,432 | | | | 929,349 | |
| DTE Energy Co. | | | 17,400 | | | | 788,568 | |
| Edison International | | | 31,556 | | | | 1,218,062 | |
| Eli Lilly & Co. | | | 13,000 | | | | 455,520 | |
| Emerson Electric Co. | | | 8,741 | | | | 499,723 | |
| Energen Corp. | | | 2,800 | | | | 135,128 | |
| Equity Residential REIT | | | 4,548 | | | | 236,269 | |
| Estee Lauder Cos., Inc./The, Class A | | | 300 | | | | 24,210 | |
| Esterline Technologies Corp. † | | | 2,500 | | | | 171,475 | |
| Exelon Corp. | | | 9,800 | | | | 408,072 | |
| Exxon Mobil Corp. | | | 93,989 | | | | 6,872,476 | |
| FedEx Corp. | | | 8,800 | | | | 818,488 | |
| Ford Motor Co. † | | | 47,100 | | | | 790,809 | |
| Forest Laboratories, Inc. † | | | 15,186 | | | | 485,648 | |
| Franklin Resources, Inc. | | | 3,200 | | | | 355,872 | |
| Freeport-McMoRan Copper & Gold, Inc. | | | 6,500 | | | | 780,585 | |
| Gap, Inc./The | | | 40,219 | | | | 890,449 | |
| General Dynamics Corp. | | | 6,838 | | | | 485,224 | |
| General Electric Co. | | | 198,402 | | | | 3,628,773 | |
| General Mills, Inc. | | | 17,588 | | | | 625,957 | |
| GenOn Energy, Inc. † | | | 6,772 | | | | 25,801 | |
| Goldman Sachs Group, Inc./The | | | 10,405 | | | | 1,749,705 | |
| Goodyear Tire & Rubber Co./The † | | | 16,800 | | | | 199,080 | |
| Google, Inc., Class A † | | | 3,202 | | | | 1,901,892 | |
| Hasbro, Inc. | | | 10,650 | | | | 502,467 | |
| | | | |
| | The accompanying notes are an integral part of these financial statements. | | (Continued) |
| | | | | | | | | | |
| AQR Funds | | | | Annual Report | | | | December 2010 | | 35 |
| | | | | | | |
| | | | |
| Schedule of Investments | | | December 31, 2010 | |
| | | | | | | | |
| | | SHARES | | | VALUE
(Note 3) | |
| United States - 42.1% (continued) (1) | | | | | | | | |
| HCP, Inc. REIT | | | 2,572 | | | $ | 94,624 | |
| Health Care REIT, Inc. REIT | | | 2,485 | | | | 118,385 | |
| Health Net, Inc. † | | | 20,100 | | | | 548,529 | |
| Hewlett-Packard Co. | | | 29,652 | | | | 1,248,349 | |
| HJ Heinz Co. | | | 4,541 | | | | 224,598 | |
| Home Depot, Inc. | | | 30,206 | | | | 1,059,022 | |
| Honeywell International, Inc. | | | 14,402 | | | | 765,610 | |
| Host Hotels & Resorts, Inc. REIT | | | 9,300 | | | | 166,191 | |
| Hudson City Bancorp, Inc. | | | 18,917 | | | | 241,003 | |
| Humana, Inc. † | | | 17,000 | | | | 930,580 | |
| Intel Corp. | | | 96,067 | | | | 2,020,289 | |
| International Business Machines Corp. | | | 25,423 | | | | 3,731,079 | |
| International Paper Co. | | | 34,900 | | | | 950,676 | |
| ITT Corp. | | | 1,082 | | | | 56,383 | |
| ITT Educational Services, Inc. † | | | 2,700 | | | | 171,963 | |
| Johnson & Johnson | | | 68,896 | | | | 4,261,218 | |
| Joy Global, Inc. | | | 3,952 | | | | 342,836 | |
| JPMorgan Chase & Co. | | | 83,773 | | | | 3,553,651 | |
| KBR, Inc. | | | 9,100 | | | | 277,277 | |
| KeyCorp | | | 64,300 | | | | 569,055 | |
| Kimberly-Clark Corp. | | | 25,563 | | | | 1,611,492 | |
| Kimco Realty Corp. REIT | | | 6,500 | | | | 117,260 | |
| King Pharmaceuticals, Inc. † | | | 21,800 | | | | 306,290 | |
| Kohl’s Corp. † | | | 15,400 | | | | 836,836 | |
| Kraft Foods, Inc., Class A | | | 5,321 | | | | 167,665 | |
| L-3 Communications Holdings, Inc. | | | 6,753 | | | | 476,019 | |
| Laboratory Corp of America Holdings † | | | 2,300 | | | | 202,216 | |
| Lexmark International, Inc., Class A † | | | 13,000 | | | | 452,660 | |
| Liberty Media Corp. - Interactive, Series A † | | | 22,700 | | | | 357,979 | |
| Lockheed Martin Corp. | | | 15,743 | | | | 1,100,593 | |
| Loews Corp. | | | 14,300 | | | | 556,413 | |
| Lorillard, Inc. | | | 7,600 | | | | 623,656 | |
| Lowe’s Cos., Inc. | | | 34,200 | | | | 857,736 | |
| Ltd. Brands, Inc. | | | 4,161 | | | | 127,868 | |
| Lubrizol Corp. | | | 7,800 | | | | 833,664 | |
| Macerich Co./The REIT | | | 2,100 | | | | 99,477 | |
| Macy’s, Inc. | | | 19,700 | | | | 498,410 | |
| Marathon Oil Corp. | | | 28,529 | | | | 1,056,429 | |
| Masco Corp. | | | 47,200 | | | | 597,552 | |
| Mattel, Inc. | | | 40,859 | | | | 1,039,044 | |
| McDonald’s Corp. | | | 12,425 | | | | 953,743 | |
| McKesson Corp. | | | 2,700 | | | | 190,026 | |
| MeadWestvaco Corp. | | | 15,400 | | | | 402,864 | |
| Medco Health Solutions, Inc. † | | | 11,921 | | | | 730,400 | |
| Medtronic, Inc. | | | 6,082 | | | | 225,581 | |
| Merck & Co., Inc. | | | 25,719 | | | | 926,913 | |
| MetLife, Inc. | | | 9,700 | | | | 431,068 | |
| Microsoft Corp. | | | 163,550 | | | | 4,566,316 | |
| Morgan Stanley | | | 8,400 | | | | 228,564 | |
| Murphy Oil Corp. | | | 2,494 | | | | 185,928 | |
| Newmont Mining Corp. | | | 5,161 | | | | 317,040 | |
| News Corp., Class A | | | 64,900 | | | | 944,944 | |
| Norfolk Southern Corp. | | | 14,923 | | | | 937,463 | |
| Northrop Grumman Corp. | | | 26,379 | | | | 1,708,832 | |
| Occidental Petroleum Corp. | | | 15,090 | | | | 1,480,329 | |
| Omnicare, Inc. | | | 20,600 | | | | 523,034 | |
| | | | | | | | |
| | | SHARES | | | VALUE
(Note 3) | |
| United States - 42.1% (continued) (1) | | | | | | | | |
| Omnicom Group, Inc. | | | 4,200 | | | $ | 192,360 | |
| Oracle Corp. | | | 36,786 | | | | 1,151,402 | |
| Oshkosh Corp. † | | | 1,300 | | | | 45,812 | |
| Owens Corning † | | | 36,148 | | | | 1,126,010 | |
| Owens-Illinois, Inc. † | | | 11,000 | | | | 337,700 | |
| PDL BioPharma, Inc. | | | 103,643 | | | | 645,696 | |
| Peabody Energy Corp. | | | 10,600 | | | | 678,188 | |
| Penn National Gaming, Inc. † | | | 11,683 | | | | 410,657 | |
| PepsiCo, Inc. | | | 20,772 | | | | 1,357,035 | |
| PetSmart, Inc. | | | 24,354 | | | | 969,776 | |
| Pfizer, Inc. | | | 132,943 | | | | 2,327,832 | |
| Philip Morris International, Inc. | | | 17,493 | | | | 1,023,865 | |
| Plum Creek Timber Co., Inc. REIT | | | 2,131 | | | | 79,806 | |
| PNC Financial Services Group, Inc. | | | 12,800 | | | | 777,216 | |
| Procter & Gamble Co./The | | | 56,808 | | | | 3,654,459 | |
| ProLogis REIT | | | 6,900 | | | | 99,636 | |
| Protective Life Corp. | | | 39,898 | | | | 1,062,883 | |
| Prudential Financial, Inc. | | | 8,139 | | | | 477,841 | |
| Public Storage REIT | | | 1,669 | | | | 169,270 | |
| Qwest Communications International, Inc. | | | 50,658 | | | | 385,507 | |
| Rayonier, Inc. REIT | | | 2,581 | | | | 135,554 | |
| Raytheon Co. | | | 45,167 | | | | 2,093,039 | |
| Reinsurance Group of America, Inc. | | | 10,100 | | | | 542,471 | |
| Reynolds American, Inc. | | | 48,074 | | | | 1,568,174 | |
| Rockwell Automation, Inc. | | | 2,800 | | | | 200,788 | |
| Ross Stores, Inc. | | | 6,713 | | | | 424,597 | |
| RR Donnelley & Sons Co. | | | 12,666 | | | | 221,275 | |
| SanDisk Corp. † | | | 7,000 | | | | 349,020 | |
| Sara Lee Corp. | | | 47,536 | | | | 832,355 | |
| Sealed Air Corp. | | | 9,599 | | | | 244,295 | |
| Simon Property Group, Inc. REIT | | | 4,342 | | | | 431,986 | |
| Southwest Airlines Co. | | | 19,200 | | | | 249,216 | |
| Starbucks Corp. | | | 9,100 | | | | 292,383 | |
| STERIS Corp. | | | 13,030 | | | | 475,074 | |
| Target Corp. | | | 19,800 | | | | 1,190,574 | |
| Texas Instruments, Inc. | | | 9,184 | | | | 298,480 | |
| Thomas & Betts Corp. † | | | 4,614 | | | | 222,856 | |
| Time Warner, Inc. | | | 43,366 | | | | 1,395,084 | |
| Timken Co. | | | 39,333 | | | | 1,877,364 | |
| TJX Cos., Inc. | | | 16,664 | | | | 739,715 | |
| Travelers Cos., Inc./The | | | 43,101 | | | | 2,401,157 | |
| Tupperware Brands Corp. | | | 409 | | | | 19,497 | |
| Tyson Foods, Inc., Class A | | | 36,400 | | | | 626,808 | |
| United Parcel Service, Inc., Class B | | | 11,100 | | | | 805,638 | |
| United Technologies Corp. | | | 17,449 | | | | 1,373,585 | |
| UnitedHealth Group, Inc. | | | 46,700 | | | | 1,686,337 | |
| Unum Group | | | 43,109 | | | | 1,044,100 | |
| URS Corp. † | | | 12,000 | | | | 499,320 | |
| Valero Energy Corp. | | | 28,700 | | | | 663,544 | |
| Ventas, Inc. REIT | | | 2,400 | | | | 125,952 | |
| Verizon Communications, Inc. | | | 73,412 | | | | 2,626,681 | |
| Viacom, Inc., Class B | | | 11,437 | | | | 453,020 | |
| Vishay Intertechnology, Inc. † | | | 29,200 | | | | 428,656 | |
| Vornado Realty Trust REIT | | | 1,648 | | | | 137,328 | |
| W&T Offshore, Inc. | | | 16,600 | | | | 296,642 | |
| Walgreen Co. | | | 18,840 | | | | 734,006 | |
| Wal-Mart Stores, Inc. | | | 65,405 | | | | 3,527,292 | |
| | | | |
| | The accompanying notes are an integral part of these financial statements. | | (Continued) |
| | | | | | | | | | |
| AQR Funds | | | | Annual Report | | | | December 2010 | | 36 |
| | | | | | | |
| | | | |
| Schedule of Investments | | | December 31, 2010 | |
| | | | | | | | |
| | | SHARES | | | VALUE
(Note 3) | |
| United States - 42.1% (continued) (1) | | | | | | | | |
| Walter Energy, Inc. | | | 9,600 | | | $ | 1,227,264 | |
| Waste Management, Inc. | | | 35,273 | | | | 1,300,516 | |
| WellPoint, Inc. † | | | 26,191 | | | | 1,489,220 | |
| Wells Fargo & Co. | | | 32,570 | | | | 1,009,344 | |
| Western Digital Corp. † | | | 19,000 | | | | 644,100 | |
| Western Union Co./The | | | 57,600 | | | | 1,069,632 | |
| Weyerhaeuser Co. REIT | | | 8,600 | | | | 162,798 | |
| Whirlpool Corp. | | | 3,500 | | | | 310,905 | |
| Williams Cos., Inc./The | | | 5,456 | | | | 134,872 | |
| Williams-Sonoma, Inc. | | | 7,790 | | | | 278,025 | |
| Wyndham Worldwide Corp. | | | 24,444 | | | | 732,342 | |
| Wynn Resorts Ltd. | | | 2,000 | | | | 207,680 | |
| | | | | | | | |
| | | | | | | 180,188,380 | |
| | | | | | | | |
TOTAL COMMON STOCKS
(cost $324,170,566) | | | | | | | 382,325,496 | |
| | | | | | | | |
| | |
| PREFERRED STOCKS - 0.1% | | | | | | | | |
| | |
| Germany - 0.1% | | | | | | | | |
| Volkswagen AG | | | 2,748 | | | | 448,546 | |
| | | | | | | | |
| | |
| Switzerland - 0.0% | | | | | | | | |
| Schindler Holding AG | | | 1,025 | | | | 121,630 | |
| | | | | | | | |
TOTAL PREFERRED STOCKS
(cost $323,173) | | | | | | | 570,176 | |
| | | | | | | | |
| | |
| RIGHTS - 0.0% (d) | | | | | | | | |
| | |
| Canada - 0.0% (d)(1) | | | | | | | | |
| Ivanhoe Mines Ltd., expires 1/26/11 † | | | | | | | | |
(cost $—) | | | 4,885 | | | | 6,588 | |
| | | | | | | | |
| | |
| WARRANTS - 0.0% (d) | | | | | | | | |
| | |
| Hong Kong - 0.0% (d) | | | | | | | | |
| Henderson Land Development Co. Ltd., expires 6/1/11 † | | | | | | | | |
(cost $— ) | | | 3 | | | | 1 | |
| | | | | | | | |
| | |
| MONEY MARKET FUNDS - 7.4% | | | | | | | | |
| Dreyfus Institutional Cash Advantage Fund, Class I, 0.180% (e) | | | 385 | | | | 385 | |
| J.P. Morgan Prime Money Market Fund - Capital Shares, 0.130% (e)(f)(h) | | | 31,574,680 | | | | 31,574,680 | |
| | | | | | | | |
TOTAL MONEY MARKET FUNDS
(cost $31,575,065; includes $4,199,946 of cash collateral received for securities on loan) | | | | | | | 31,575,065 | |
| | | | | | | | |
TOTAL INVESTMENTS - 96.9%
(cost $356,068,804) | | | | | | | 414,477,326 | |
| | | | | | | | |
| | |
| OTHER ASSETS IN EXCESS OF LIABILITIES - 3.1% (g) | | | | | | | 13,208,392 | |
| | | | | | | | |
NET ASSETS - 100.0% | | | | | | $ | 427,685,718 | |
| | | | | | | | |
| | | | | | | | |
| SECTOR | | VALUE | | | % OF NET
ASSETS | |
| Consumer Discretionary | | $ | 44,965,680 | | | | 10.5 | % |
| Consumer Staples | | | 39,404,640 | | | | 9.2 | |
| Energy | | | 41,394,986 | | | | 9.7 | |
| Financials | | | 68,431,114 | | | | 16.0 | |
| Health Care | | | 38,901,652 | | | | 9.1 | |
| Industrials | | | 55,539,586 | | | | 13.0 | |
| Information Technology | | | 32,888,198 | | | | 7.7 | |
| Materials | | | 33,005,370 | | | | 7.7 | |
| Telecommunication Services | | | 19,497,515 | | | | 4.5 | |
| Utilities | | | 8,873,520 | | | | 2.1 | |
| Money Market Funds | | | 31,575,065 | | | | 7.4 | |
| | | | | | | | |
Total Investments | | | 414,477,326 | | | | 96.9 | |
| Other Assets in Excess of Liabilities (g) | | | 13,208,392 | | | | 3.1 | |
| | | | | | | | |
Net Assets | | $ | 427,685,718 | | | | 100.0 | % |
| | | | | | | | |
| † | Non income-producing security. |
| (a) | All or a portion of the security on loan. The aggregate market value of such securities is $4,038,816; cash collateral of $4,199,946 was received with which the Fund purchased a money market fund. |
| (b) | Security fair valued at December 31, 2010. |
| (c) | Rule 144A, Section 4(2) or other security which is restricted as to resale to institutional investors. The Fund Advisor has deemed this security to be liquid based upon procedures approved by the Board of Trustees. |
| (d) | Represents less than 0.05 percent of net assets. |
| (e) | Represents annualized seven-day yield as of December 31, 2010. |
| (f) | Represents security, or portion thereof, purchased with the cash collateral received for securities on loan. |
| (g) | Includes appreciation(depreciation) on futures contracts, forward foreign currency exchange contracts and swaps. |
| (h) | A portion of the security is pledged as collateral to the broker for forward foreign exchange contracts. |
All securities are Level 2, unless otherwise noted in parentheses.
| (1) | Level 1 security (See Note 5). |
| (3) | Level 3 security (See Note 5). |
The following abbreviations are used in portfolio descriptions:
ADR - American Depositary Receipt
CVA - Dutch Certificate of Shares
REIT - Real Estate Investment Trust
| | | | |
| | The accompanying notes are an integral part of these financial statements. | | (Continued) |
| | | | | | | | | | |
| AQR Funds | | | | Annual Report | | | | December 2010 | | 37 |
| | | | | | | |
| | | | |
| Schedule of Investments | | | December 31, 2010 | |
Total return swap contracts outstanding as of December 31, 2010
| | | | | | | | | | | | |
| COUNTERPARTY | | UNDERLYING REFERENCE INSTRUMENT | | TERMINATION
DATE | | NOTIONAL
VALUE | | | UNREALIZED
APPRECIATION
(DEPRECIATION) | |
The Royal Bank
of Scotland | | Swiss Market Index | | 03/18/2011 | | | $(34,190,041) | | | | $493,528 | |
| | | | | | | | | | | | |
Collateral is included for forward foreign currency exchange contracts, in the collateral listed below.
Open futures contracts outstanding at December 31, 2010:
| | | | | | | | | | | | | | | | |
NUMBER OF
CONTRACTS | | TYPE | | EXPIRATION
DATE | | VALUE AT
TRADE DATE | | | VALUE AT
DECEMBER 31,
2010 | | | UNREALIZED
APPRECIATION
(DEPRECIATION) | |
| Long Contracts: | | | | | | | | | | | | | | |
| 316 | | Amsterdam Index | | January 21, 2011 | | | $29,760,193 | | | | $30,082,059 | | | | $321,866 | |
| 461 | | CAC40 10 Euro | | January 21, 2011 | | | 24,031,622 | | | | 23,560,026 | | | | (471,596) | |
| 109 | | DAX Index | | March 18, 2011 | | | 25,709,357 | | | | 25,323,199 | | | | (386,158) | |
| 344 | | E-Mini S&P 500 Futures | | March 18, 2011 | | | 21,194,773 | | | | 21,551,600 | | | | 356,827 | |
| 173 | | FTSE 100 Index Futures | | March 18, 2011 | | | 15,798,776 | | | | 15,961,630 | | | | 162,854 | |
| 132 | | FTSE/MIB Index | | March 18, 2011 | | | 18,215,165 | | | | 17,889,971 | | | | (325,194) | |
| 55 | | IBEX 35 Index | | January 21, 2011 | | | 7,420,420 | | | | 7,224,314 | | | | (196,106) | |
| 6 | | SGX MSCI Singapore Index Futures | | January 28, 2011 | | | 350,110 | | | | 354,459 | | | | 4,349 | |
| | | | | | | | | | | | | | | | |
| | | | | | | | | | | | | | | (533,158) | |
| | | | | | | | | | | | | | | | |
| Short Contracts: | | | | | | | | | | | | | | |
| 70 | | Hang Seng Index | | January 28, 2011 | | | (10,192,034) | | | | (10,364,500) | | | | (172,466) | |
| 217 | | OMXS30 Index | | January 21, 2011 | | | (3,715,445) | | | | (3,734,562) | | | | (19,117) | |
| 68 | | S&P/Toronto Stock Exchange 60 Index | | March 17, 2011 | | | (10,354,809) | | | | (10,499,230) | | | | (144,421) | |
| 356 | | SPI 200 | | March 17, 2011 | | | (43,540,859) | | | | (43,151,530) | | | | 389,329 | |
| 48 | | TOPIX Index | | March 10, 2011 | | | (5,214,721) | | | | (5,302,756) | | | | (88,035) | |
| | | | | | | | | | | | | | | | |
| | | | | | | | | | | | | | | (34,710) | |
| | | | | | | | | | | | | | | | |
| | | | | | | | | | | | | | | $(567,868) | |
| | | | | | | | | | | | | | | | |
Cash held as collateral with broker for futures contracts was $14,655,129 at December 31, 2010.
Forward foreign currency exchange contracts outstanding as of December 31, 2010:
| | | | | | | | | | | | | | | | | | | | |
PURCHASE
CONTRACTS | | COUNTERPARTY | | CURRENCY | | CURRENCY
AMOUNT
PURCHASED | | | VALUE AT
SETTLEMENT
DATE | | | VALUE AT
DECEMBER 31,
2010 | | | UNREALIZED APPRECIATION (DEPRECIATION) | |
Australian Dollar,
Expiring 03/16/11 | | The Royal Bank of Scotland | | AUD | | | 45,563,000 | | | | $43,411,004 | | | | $46,290,034 | | | | $2,879,030 | |
Canadian Dollar,
Expiring 03/16/11 | | The Royal Bank of Scotland | | CAD | | | 7,474,000 | | | | 7,319,414 | | | | 7,510,477 | | | | 191,063 | |
Swiss Franc,
Expiring 03/16/11 | | The Royal Bank of Scotland | | CHF | | | 4,411,000 | | | | 4,575,337 | | | | 4,736,119 | | | | 160,782 | |
Danish Krone,
Expiring 03/16/11 | | The Royal Bank of Scotland | | DKK | | | 1,384,000 | | | | 246,983 | | | | 249,098 | | | | 2,115 | |
Euro,
Expiring 03/16/11 | | The Royal Bank of Scotland | | EUR | | | 451,000 | | | | 599,956 | | | | 604,944 | | | | 4,988 | |
British Pound,
Expiring 03/16/11 | | The Royal Bank of Scotland | | GBP | | | 7,553,000 | | | | 11,830,947 | | | | 11,818,959 | | | | (11,988) | |
Hong Kong Dollar,
Expiring 03/16/11 | | The Royal Bank of Scotland | | HKD | | | 9,084,000 | | | | 1,170,459 | | | | 1,169,249 | | | | (1,210) | |
| | | | |
| | The accompanying notes are an integral part of these financial statements. | | (Continued) |
| | | | | | | | | | |
| AQR Funds | | | | Annual Report | | | | December 2010 | | 38 |
| | | | | | | |
| | | | |
| Schedule of Investments | | | December 31, 2010 | |
| | | | | | | | | | | | | | | | | | | | |
PURCHASE
CONTRACTS | | COUNTERPARTY | | CURRENCY | | CURRENCY
AMOUNT
PURCHASED | | | VALUE AT
SETTLEMENT
DATE | | | VALUE AT
DECEMBER 31,
2010 | | | UNREALIZED APPRECIATION (DEPRECIATION) | |
| (continued) | | | | | | | | | | | | | | | | | | | | |
Israeli Shekel,
Expiring 03/16/11 | | The Royal Bank of Scotland | | ILS | | | 5,706,000 | | | | $1,553,182 | | | | $1,609,721 | | | | $56,539 | |
Japanese Yen,
Expiring 03/16/11 | | The Royal Bank of Scotland | | JPY | | | 1,148,164,000 | | | | 13,913,596 | | | | 14,167,307 | | | | 253,711 | |
Norwegian Krone,
Expiring 03/16/11 | | The Royal Bank of Scotland | | NOK | | | 236,843,000 | | | | 38,770,824 | | | | 40,603,676 | | | | 1,832,852 | |
Swedish Krona,
Expiring 03/16/11 | | The Royal Bank of Scotland | | SEK | | | 360,437,000 | | | | 51,711,770 | | | | 53,477,294 | | | | 1,765,524 | |
Singapore Dollar,
Expiring 03/16/11 | | The Royal Bank of Scotland | | SGD | | | 463,000 | | | | 353,879 | | | | 361,421 | | | | 7,542 | |
| | | | | | | | | | | | | | | | | | | | |
| | | | | | | | | | | 175,457,351 | | | | 182,598,299 | | | | 7,140,948 | |
| | | | | | | | | | | | | | | | | | | | |
| | | | | | | | | | | | | | | | | | | | |
SALES
CONTRACTS | | COUNTERPARTY | | CURRENCY | | CURRENCY
AMOUNT
SOLD | | | VALUE AT
SETTLEMENT
DATE | | | VALUE AT
DECEMBER
31, 2010 | | | UNREALIZED
APPRECIATION
(DEPRECIATION) | |
Australian Dollar,
Expiring 03/16/11 | | The Royal Bank of Scotland | | AUD | | | (2,643,000) | | | | $(2,630,517) | | | | $(2,685,173) | | | | $(54,656) | |
Canadian Dollar,
Expiring 03/16/11 | | The Royal Bank of Scotland | | CAD | | | (14,035,000) | | | | (13,733,358) | | | | (14,103,498) | | | | (370,140) | |
Swiss Franc,
Expiring 03/16/11 | | The Royal Bank of Scotland | | CHF | | | (22,348,000) | | | | (22,729,885) | | | | (23,995,192) | | | | (1,265,307) | |
Danish Krone,
Expiring 03/16/11 | | The Royal Bank of Scotland | | DKK | | | (8,811,000) | | | | (1,558,251) | | | | (1,585,841) | | | | (27,590) | |
Euro,
Expiring 03/16/11 | | The Royal Bank of Scotland | | EUR | | | (41,447,000) | | | | (54,543,392) | | | | (55,594,517) | | | | (1,051,125) | |
British Pound,
Expiring 03/16/11 | | The Royal Bank of Scotland | | GBP | | | (2,743,000) | | | | (4,252,999) | | | | (4,292,255) | | | | (39,256) | |
Hong Kong Dollar,
Expiring 03/16/11 | | The Royal Bank of Scotland | | HKD | | | (5,114,000) | | | | (658,039) | | | | (658,251) | | | | (212) | |
Israeli Shekel,
Expiring 03/16/11 | | The Royal Bank of Scotland | | ILS | | | (227,000) | | | | (62,678) | | | | (64,039) | | | | (1,361) | |
Japanese Yen,
Expiring 03/16/11 | | The Royal Bank of Scotland | | JPY | | | (1,711,039,000) | | | | (20,456,432) | | | | (21,112,676) | | | | (656,244) | |
Norwegian Krone,
Expiring 03/16/11 | | The Royal Bank of Scotland | | NOK | | | (22,255,000) | | | | (3,570,829) | | | | (3,815,333) | | | | (244,504) | |
New Zealand Dollar,
Expiring 03/16/11 | | The Royal Bank of Scotland | | NZD | | | (31,364,000) | | | | (23,225,124) | | | | (24,363,659) | | | | (1,138,535) | |
Swedish Krona,
Expiring 03/16/11 | | The Royal Bank of Scotland | | SEK | | | (532,000) | | | | (77,973) | | | | (78,932) | | | | (959) | |
Singapore Dollar,
Expiring 03/16/11 | | The Royal Bank of Scotland | | SGD | | | (14,000) | | | | (10,614) | | | | (10,928) | | | | (314) | |
| | | | | | | | | | | | | | | | | | | | |
| | | | | | | | | | | (147,510,091) | | | | (152,360,294) | | | | (4,850,203) | |
| | | | | | | | | | | | | | | | | | | | |
| | | | | | | | | | | $27,947,260 | | | | $30,238,005 | | | | $2,290,745 | |
| | | | | | | | | | | | | | | | | | | | |
| | | | |
| | The accompanying notes are an integral part of these financial statements. | | (Continued) |
| | | | | | | | | | |
| AQR Funds | | | | Annual Report | | | | December 2010 | | 39 |
| | | | | | | |
| | | | |
| Schedule of Investments | | | December 31, 2010 | |
Money Market fund investment is pledged as collateral to the broker for forward foreign exchange contracts in the amount of $59,700.
AUD - Australian Dollar
CAD - Canadian Dollar
CHF - Swiss Franc
DKK - Danish Krone
EUR - Euro
GBP - British Pound
HKD - Hong Kong Dollar
ILS - Israeli Shekel
JPY - Japanese Yen
NOK - Norwegian Krone
NZD - New Zealand Dollar
SEK - Swedish Krona
SGD - Singapore Dollar
| | | | |
| | The accompanying notes are an integral part of these financial statements. | | |
| | | | | | | | | | |
| AQR Funds | | | | Annual Report | | | | December 2010 | | 40 |
| | | | | | | |
| | | | |
| Schedule of Investments | | | December 31, 2010 | |
| | | | |
| AQR INTERNATIONAL EQUITY FUND | | | | |
| | | | | | | | |
| COMMON STOCKS - 86.9% | | SHARES | | | VALUE
(Note 3) | |
| Australia - 7.7% | | | | | | | | |
| AGL Energy Ltd. | | | 25,094 | | | $ | 392,053 | |
| Alumina Ltd. | | | 85,028 | | | | 216,624 | |
| AMP Ltd. | | | 10,692 | | | | 57,983 | |
| Ansell Ltd. | | | 107,298 | | | | 1,396,711 | |
| ASX Ltd. (a) | | | 5,817 | | | | 224,720 | |
| Australia & New Zealand Banking Group Ltd. | | | 122,242 | | | | 2,926,188 | |
| AXA Asia Pacific Holdings Ltd. | | | 35,273 | | | | 228,286 | |
| Bank of Queensland Ltd. | | | 19,807 | | | | 211,387 | |
| Bendigo and Adelaide Bank Ltd. | | | 4,075 | | | | 41,591 | |
| BHP Billiton Ltd. | | | 118,782 | | | | 5,535,647 | |
| Boral Ltd. | | | 70,433 | | | | 349,189 | |
| Caltex Australia Ltd. | | | 56,047 | | | | 825,426 | |
| CFS Retail Property Trust REIT | | | 69,740 | | | | 125,772 | |
| Challenger Ltd. | | | 156,509 | | | | 755,127 | |
| Commonwealth Bank of Australia | | | 35,177 | | | | 1,831,837 | |
| Computershare Ltd. | | | 15,439 | | | | 170,543 | |
| CSL Ltd. | | | 19,994 | | | | 743,854 | |
| CSR Ltd. | | | 59,287 | | | | 102,068 | |
| Dexus Property Group REIT | | | 186,006 | | | | 151,539 | |
| DUET Group | | | 191,223 | | | | 330,281 | |
| Fairfax Media Ltd. (a) | | | 315,385 | | | | 453,237 | |
| Fortescue Metals Group Ltd. † | | | 45,904 | | | | 308,388 | |
| Foster’s Group Ltd. | | | 275,777 | | | | 1,606,699 | |
| Goodman Group REIT | | | 193,631 | | | | 128,967 | |
| GPT Group REIT | | | 58,413 | | | | 176,274 | |
| GPT Group - In Specie (3)†(b) | | | 143,427 | | | | — | |
| Leighton Holdings Ltd. | | | 6,235 | | | | 196,952 | |
| Lend Lease Group | | | 21,131 | | | | 186,989 | |
| Mirvac Group REIT | | | 88,938 | | | | 111,835 | |
| National Australia Bank Ltd. | | | 105,612 | | | | 2,567,949 | |
| Newcrest Mining Ltd. | | | 28,545 | | | | 1,186,611 | |
| OneSteel Ltd. | | | 184,445 | | | | 489,699 | |
| Origin Energy Ltd. (a) | | | 33,140 | | | | 566,295 | |
| OZ Minerals Ltd. | | | 117,352 | | | | 207,719 | |
| Pacific Brands Ltd. † | | | 251,820 | | | | 253,107 | |
| Paladin Energy Ltd. †(a) | | | 24,740 | | | | 124,968 | |
| Qantas Airways Ltd. † | | | 99,772 | | | | 259,775 | |
| Rio Tinto Ltd. (a) | | | 23,105 | | | | 2,027,687 | |
| Santos Ltd. | | | 9,784 | | | | 132,018 | |
| Stockland REIT | | | 89,584 | | | | 330,710 | |
| Suncorp Group Ltd. | | | 142,126 | | | | 1,254,359 | |
| TABCORP Holdings Ltd. | | | 208,363 | | | | 1,518,412 | |
| Tatts Group Ltd. | | | 142,376 | | | | 376,781 | |
| Telstra Corp. Ltd. | | | 160,562 | | | | 459,078 | |
| Transurban Group | | | 37,755 | | | | 198,645 | |
| UGL Ltd. | | | 6,100 | | | | 90,268 | |
| Wesfarmers Ltd. | | | 27,381 | | | | 900,833 | |
| Westfield Group REIT | | | 84,935 | | | | 833,794 | |
| Westfield Retail Trust REIT † | | | 84,935 | | | | 223,751 | |
| Westpac Banking Corp. | | | 73,229 | | | | 1,667,270 | |
| | | | | | | | |
| | | | | | | 35,455,896 | |
| | | | | | | | |
| Belgium - 0.2% | | | | | | | | |
| Anheuser-Busch InBev NV | | | 7,392 | | | | 424,029 | |
| | | | | | | | |
| | | SHARES | | | VALUE
(Note 3) | |
| Belgium - 0.2% (continued) | | | | | | | | |
| Groupe Bruxelles Lambert SA | | | 2,641 | | | $ | 223,081 | |
| KBC Groep NV † | | | 3,393 | | | | 116,063 | |
| | | | | | | | |
| | | | | | | 763,173 | |
| | | | | | | | |
| Bermuda - 0.0% (c) | | | | | | | | |
| Catlin Group Ltd. | | | 43,157 | | | | 250,511 | |
| | | | | | | | |
| | |
| Cayman Islands - 0.0% (c) | | | | | | | | |
| Sands China Ltd. † | | | 72,000 | | | | 158,262 | |
| | | | | | | | |
| | |
| China - 0.0% (c) | | | | | | | | |
| Foxconn International Holdings Ltd. †(a) | | | 69,406 | | | | 48,443 | |
| Yangzijiang Shipbuilding Holdings Ltd. | | | 63,319 | | | | 94,462 | |
| | | | | | | | |
| | | | | | | 142,905 | |
| | | | | | | | |
| Denmark - 1.6% | | | | | | | | |
| AP Moller - Maersk A/S, Class B | | | 3 | | | | 27,274 | |
| Coloplast A/S, Class B | | | 7,590 | | | | 1,035,735 | |
| Danske Bank A/S † | | | 54,696 | | | | 1,408,558 | |
| Novo Nordisk A/S, Class B | | | 44,694 | | | | 5,056,459 | |
| | | | | | | | |
| | | | | | | 7,528,026 | |
| | | | | | | | |
| Finland - 1.6% | | | | | | | | |
| Kesko OYJ B Shares, Class B | | | 12,311 | | | | 577,555 | |
| Kone OYJ, Class B | | | 5,570 | | | | 310,585 | |
| Nokia OYJ | | | 73,103 | | | | 760,231 | |
| Stora Enso OYJ R Shares (a) | | | 273,203 | | | | 2,822,591 | |
| UPM-Kymmene OYJ | | | 105,655 | | | | 1,880,385 | |
| Wartsila OYJ | | | 12,860 | | | | 983,829 | |
| | | | | | | | |
| | | | | | | 7,335,176 | |
| | | | | | | | |
| France - 8.1% | | | | | | | | |
| Accor SA | | | 26,393 | | | | 1,180,884 | |
| Arkema SA | | | 15,891 | | | | 1,150,444 | |
| BNP Paribas | | | 64,714 | | | | 4,137,580 | |
| Bouygues SA | | | 19,596 | | | | 849,053 | |
| Christian Dior SA | | | 13,165 | | | | 1,890,429 | |
| Compagnie de Saint-Gobain | | | 26,563 | | | | 1,373,508 | |
| Klepierre REIT | | | 3,675 | | | | 133,253 | |
| Legrand SA | | | 40,178 | | | | 1,645,289 | |
| L’Oreal SA | | | 10,722 | | | | 1,196,874 | |
| LVMH Moet Hennessy Louis Vuitton SA | | | 6,597 | | | | 1,090,818 | |
| Metropole Television SA | | | 34,221 | | | | 832,256 | |
| Natixis † | | | 506,383 | | | | 2,378,031 | |
| PPR | | | 1,669 | | | | 266,767 | |
| Rhodia SA | | | 45,610 | | | | 1,516,108 | |
| Safran SA | | | 4,358 | | | | 155,090 | |
| Sanofi-Aventis SA | | | 15,188 | | | | 977,534 | |
| Schneider Electric SA | | | 3,120 | | | | 469,635 | |
| SEB SA | | | 3,699 | | | | 386,194 | |
| Societe BIC SA | | | 14,724 | | | | 1,270,777 | |
| Thales SA | | | 19,344 | | | | 680,223 | |
| Total SA | | | 120,598 | | | | 6,448,548 | |
| Unibail-Rodamco SE REIT | | | 3,619 | | | | 719,366 | |
| Valeo SA † | | | 55,452 | | | | 3,159,586 | |
| Vivendi SA | | | 73,040 | | | | 1,981,403 | |
| Zodiac Aerospace | | | 15,462 | | | | 1,167,207 | |
| | | | | | | | |
| | | | | | | 37,056,857 | |
| | | | | | | | |
| | | | |
| | The accompanying notes are an integral part of these financial statements. | | (Continued) |
| | | | | | | | | | |
| AQR Funds | | | | Annual Report | | | | December 2010 | | 41 |
| | | | | | | |
| | | | |
| Schedule of Investments | | | December 31, 2010 | |
| | | | |
| AQR INTERNATIONAL EQUITY FUND | | | | |
| | | | | | | | |
| | | SHARES | | | VALUE
(Note 3) | |
| Germany - 7.8% | | | | | | | | |
| Adidas AG | | | 21,660 | | | $ | 1,414,491 | |
| Allianz SE | | | 17,348 | | | | 2,069,299 | |
| Aurubis AG | | | 7,693 | | | | 452,907 | |
| BASF SE | | | 44,493 | | | | 3,564,600 | |
| Bayer AG | | | 47,425 | | | | 3,529,278 | |
| Daimler AG † | | | 30,620 | | | | 2,080,026 | |
| Deutsche Bank AG | | | 20,349 | | | | 1,068,345 | |
| Deutsche Boerse AG | | | 5,256 | | | | 364,567 | |
| Deutsche Lufthansa AG † | | | 30,430 | | | | 664,532 | |
| Deutsche Post AG | | | 32,873 | | | | 559,884 | |
| Deutsche Telekom AG | | | 188,151 | | | | 2,435,007 | |
| E.ON AG | | | 40,607 | | | | 1,244,955 | |
| Hannover Rueckversicherung AG (a) | | | 23,501 | | | | 1,265,650 | |
| Infineon Technologies AG † | | | 112,051 | | | | 1,048,556 | |
| K+S AG | | | 9,989 | | | | 755,846 | |
| MAN SE | | | 16,292 | | | | 1,948,084 | |
| Muenchener Rueckversicherungs AG | | | 12,154 | | | | 1,848,000 | |
| RWE AG | | | 22,140 | | | | 1,484,527 | |
| Siemens AG | | | 42,638 | | | | 5,302,483 | |
| SMA Solar Technology AG (a) | | | 4,982 | | | | 462,395 | |
| Software AG | | | 4,595 | | | | 676,170 | |
| Suedzucker AG | | | 33,604 | | | | 900,965 | |
| Tognum AG | | | 18,031 | | | | 476,513 | |
| United Internet AG | | | 26,666 | | | | 435,582 | |
| | | | | | | | |
| | | | | | | 36,052,662 | |
| | | | | | | | |
| Hong Kong - 2.4% | | | | | | | | |
| AIA Group Ltd. † | | | 285,400 | | | | 802,196 | |
| ASM Pacific Technology Ltd. | | | 6,404 | | | | 80,870 | |
| BOC Hong Kong Holdings Ltd. | | | 201,053 | | | | 683,611 | |
| Cheung Kong Holdings Ltd. | | | 66,278 | | | | 1,021,330 | |
| Cheung Kong Infrastructure Holdings Ltd. | | | 14,827 | | | | 67,875 | |
| CLP Holdings Ltd. | | | 39,509 | | | | 320,768 | |
| Hang Lung Group Ltd. | | | 30,276 | | | | 198,897 | |
| Hang Lung Properties Ltd. | | | 128,000 | | | | 598,209 | |
| Hang Seng Bank Ltd. | | | 36,235 | | | | 595,288 | |
| Hong Kong Exchanges and Clearing Ltd. | | | 38,454 | | | | 871,760 | |
| Hongkong Electric Holdings Ltd. | | | 92,500 | | | | 583,022 | |
| Hutchison Whampoa Ltd. | | | 72,832 | | | | 749,163 | |
| Hysan Development Co. Ltd. | | | 86,000 | | | | 404,623 | |
| Li & Fung Ltd. | | | 41,668 | | | | 241,732 | |
| Lifestyle International Holdings Ltd. | | | 20,500 | | | | 50,438 | |
| Link REIT/The REIT | | | 81,382 | | | | 252,659 | |
| Mongolia Energy Corp. Ltd. † | | | 95,406 | | | | 28,455 | |
| New World Development Ltd. | | | 88,896 | | | | 166,768 | |
| NWS Holdings Ltd. | | | 39,000 | | | | 59,183 | |
| PCCW Ltd. | | | 131,000 | | | | 57,935 | |
| Shanghai Industrial Urban Development Group Ltd. † | | | 8 | | | | 3 | |
| Sun Hung Kai Properties Ltd. | | | 43,046 | | | | 714,124 | |
| Swire Pacific Ltd., Class A | | | 27,030 | | | | 444,055 | |
| Television Broadcasts Ltd. | | | 35,403 | | | | 191,127 | |
| Wharf Holdings Ltd. | | | 105,243 | | | | 809,066 | |
| Wheelock & Co. Ltd. | | | 124,621 | | | | 503,866 | |
| Yue Yuen Industrial Holdings Ltd. | | | 122,609 | | | | 441,003 | |
| | | | | | | | |
| | | | | | | 10,938,026 | |
| | | | | | | | |
| | | | | | | | |
| | | SHARES | | | VALUE
(Note 3) | |
| Ireland - 0.3% | | | | | | | | |
| Experian PLC | | | 106,291 | | | $ | 1,329,444 | |
| | | | | | | | |
| | |
| Italy - 2.2% | | | | | | | | |
| Enel SpA | | | 168,489 | | | | 847,618 | |
| ENI SpA | | | 255,085 | | | | 5,612,731 | |
| Fiat SpA | | | 53,479 | | | | 1,110,344 | |
| Intesa Sanpaolo SpA | | | 19,725 | | | | 53,835 | |
| Mediaset SpA | | | 111,019 | | | | 674,991 | |
| Parmalat Finanziaria SpA (3)†(b) | | | 45,800 | | | | — | |
| Pirelli & C SpA | | | 58,775 | | | | 477,490 | |
| Saipem SpA | | | 9,242 | | | | 458,097 | |
| Telecom Italia SpA | | | 793,791 | | | | 1,033,948 | |
| | | | | | | | |
| | | | | | | 10,269,054 | |
| | | | | | | | |
| Japan - 19.2% | | | | | | | | |
| Aeon Co. Ltd. (a) | | | 57,300 | | | | 715,756 | |
| Aeon Mall Co. Ltd. | | | 2,900 | | | | 77,658 | |
| Aisin Seiki Co. Ltd. | | | 30,400 | | | | 1,072,312 | |
| Asahi Glass Co. Ltd. | | | 149,413 | | | | 1,739,470 | |
| Asahi Kasei Corp. | | | 87,000 | | | | 566,498 | |
| Astellas Pharma, Inc. | | | 13,797 | | | | 524,910 | |
| Bridgestone Corp. | | | 43,900 | | | | 845,916 | |
| Brother Industries Ltd. | | | 19,300 | | | | 285,145 | |
| Canon, Inc. (a) | | | 21,715 | | | | 1,116,566 | |
| Central Japan Railway Co. | | | 120 | | | | 1,004,183 | |
| Chubu Electric Power Co., Inc. | | | 38,797 | | | | 953,399 | |
| Cosmo Oil Co. Ltd. | | | 187,000 | | | | 611,338 | |
| Credit Saison Co. Ltd. | | | 39,812 | | | | 650,400 | |
| Daicel Chemical Industries Ltd. | | | 193,000 | | | | 1,405,920 | |
| Daido Steel Co. Ltd. | | | 89,000 | | | | 521,631 | |
| Daiichi Sankyo Co. Ltd. | | | 32,600 | | | | 712,762 | |
| Daito Trust Construction Co. Ltd. | | | 2,787 | | | | 190,670 | |
| Daiwa House Industry Co. Ltd. | | | 17,295 | | | | 212,080 | |
| Dentsu, Inc. | | | 7,700 | | | | 238,158 | |
| East Japan Railway Co. | | | 23,613 | | | | 1,533,835 | |
| FANUC Corp. | | | 4,300 | | | | 657,971 | |
| Fuji Heavy Industries Ltd. | | | 173,721 | | | | 1,341,104 | |
| FUJIFILM Holdings Corp. | | | 39,843 | | | | 1,436,596 | |
| Fujitsu Ltd. | | | 183,635 | | | | 1,273,621 | |
| Fukuoka Financial Group, Inc. | | | 82,046 | | | | 355,511 | |
| Hino Motors Ltd. | | | 121,000 | | | | 652,997 | |
| Hitachi High-Technologies Corp. | | | 3,206 | | | | 74,780 | |
| Hitachi Ltd. | | | 242,000 | | | | 1,286,166 | |
| Honda Motor Co. Ltd. | | | 53,697 | | | | 2,121,577 | |
| Hoya Corp. | | | 30,263 | | | | 732,502 | |
| IHI Corp. | | | 514,000 | | | | 1,142,362 | |
| Isuzu Motors Ltd. | | | 304,000 | | | | 1,375,129 | |
| ITOCHU Corp. | | | 184,044 | | | | 1,856,323 | |
| Itochu Techno-Solutions Corp. | | | 15,200 | | | | 569,242 | |
| Japan Real Estate Investment Corp. REIT | | | 17 | | | | 176,298 | |
| Japan Retail Fund Investment Corp. REIT | | | 48 | | | | 91,889 | |
| Japan Tobacco, Inc. | | | 32 | | | | 118,286 | |
| JFE Holdings, Inc. | | | 17,247 | | | | 598,621 | |
| JTEKT Corp. | | | 32,970 | | | | 387,261 | |
| JX Holdings, Inc. | | | 84,695 | | | | 573,734 | |
| Kaneka Corp. | | | 82,625 | | | | 571,466 | |
| | | | |
| | The accompanying notes are an integral part of these financial statements. | | (Continued) |
| | | | | | | | | | |
| AQR Funds | | | | Annual Report | | | | December 2010 | | 42 |
| | | | | | | |
| | | | |
| Schedule of Investments | | | December 31, 2010 | |
| | | | |
| AQR INTERNATIONAL EQUITY FUND | | | | |
| | | | | | | | |
| | | SHARES | | | VALUE
(Note 3) | |
| Japan - 19.2% (continued) | | | | | | | | |
| Kansai Electric Power Co., Inc./The | | | 19,132 | | | $ | 472,267 | |
| Kao Corp. | | | 7,085 | | | | 190,609 | |
| KDDI Corp. | | | 255 | | | | 1,472,060 | |
| Kinden Corp. | | | 84,564 | | | | 780,079 | |
| Kobe Steel Ltd. | | | 639,000 | | | | 1,616,275 | |
| Komatsu Ltd. | | | 21,138 | | | | 636,854 | |
| Konica Minolta Holdings, Inc. | | | 87,000 | | | | 900,119 | |
| Kuraray Co. Ltd. | | | 65,000 | | | | 928,842 | |
| Kyocera Corp. | | | 2,200 | | | | 223,749 | |
| Makita Corp. | | | 24,600 | | | | 1,002,070 | |
| Marubeni Corp. | | | 34,974 | | | | 245,102 | |
| Maruichi Steel Tube Ltd. | | | 23,400 | | | | 496,700 | |
| Miraca Holdings, Inc. | | | 19,106 | | | | 767,767 | |
| Mitsubishi Chemical Holdings Corp. | | | 85,000 | | | | 574,765 | |
| Mitsubishi Electric Corp. | | | 110,000 | | | | 1,150,624 | |
| Mitsubishi Estate Co. Ltd. | | | 46,020 | | | | 851,397 | |
| Mitsubishi UFJ Financial Group, Inc. | | | 323,091 | | | | 1,743,972 | |
| Mitsui & Co. Ltd. | | | 134,343 | | | | 2,212,785 | |
| Mitsui Fudosan Co. Ltd. | | | 28,205 | | | | 561,122 | |
| Mitsui OSK Lines Ltd. | | | 52,000 | | | | 352,728 | |
| Mitsumi Electric Co. Ltd. | | | 23,189 | | | | 424,223 | |
| Mizuho Financial Group, Inc. | | | 286,710 | | | | 538,396 | |
| Mizuho Securities Co. Ltd. | | | 66,185 | | | | 188,926 | |
| Nippon Building Fund, Inc. REIT | | | 19 | | | | 194,922 | |
| Nippon Electric Glass Co. Ltd. | | | 81,000 | | | | 1,163,885 | |
| Nippon Kayaku Co. Ltd. | | | 31,000 | | | | 327,156 | |
| Nippon Meat Packers, Inc. | | | 82,000 | | | | 1,069,587 | |
| Nippon Shokubai Co. Ltd. | | | 52,000 | | | | 536,754 | |
| Nippon Telegraph & Telephone Corp. | | | 19,019 | | | | 866,991 | |
| Nishi-Nippon City Bank Ltd./The | | | 31,737 | | | | 96,093 | |
| Nisshin Seifun Group, Inc. | | | 30,584 | | | | 387,565 | |
| Nisshin Steel Co. Ltd. | | | 93,000 | | | | 206,631 | |
| Nitto Denko Corp. | | | 19,683 | | | | 924,115 | |
| Nomura Real Estate Holdings, Inc. | | | 3,300 | | | | 59,942 | |
| Nomura Real Estate Office Fund, Inc. REIT | | | 10 | | | | 72,221 | |
| NTT Data Corp. | | | 281 | | | | 970,072 | |
| NTT DoCoMo, Inc. | | | 971 | | | | 1,692,872 | |
| OJI Paper Co. Ltd. | | | 96,000 | | | | 463,783 | |
| Omron Corp. | | | 14,937 | | | | 394,057 | |
| ORIX Corp. | | | 3,669 | | | | 359,848 | |
| Osaka Gas Co. Ltd. | | | 237,802 | | | | 922,790 | |
| Rengo Co. Ltd. | | | 24,299 | | | | 164,639 | |
| Sapporo Hokuyo Holdings, Inc. | | | 55,600 | | | | 260,076 | |
| SBI Holdings, Inc. | | | 600 | | | | 90,576 | |
| Secom Co. Ltd. | | | 2,273 | | | | 107,514 | |
| Sega Sammy Holdings, Inc. | | | 67,900 | | | | 1,289,118 | |
| Seino Holdings Corp. | | | 88,837 | | | | 609,358 | |
| Sekisui Chemical Co. Ltd. | | | 39,000 | | | | 279,310 | |
| Sekisui House Ltd. | | | 19,000 | | | | 191,654 | |
| Seven & I Holdings Co. Ltd. | | | 22,639 | | | | 602,922 | |
| Shimizu Corp. | | | 35,000 | | | | 149,252 | |
| Showa Shell Sekiyu KK (a) | | | 43,100 | | | | 394,203 | |
| Softbank Corp. | | | 25,300 | | | | 873,270 | |
| Sojitz Corp. | | | 339,162 | | | | 742,392 | |
| Sony Corp. | | | 71,471 | | | | 2,558,815 | |
| Sumitomo Corp. | | | 136,300 | | | | 1,920,743 | |
| | | | | | | | |
| | | SHARES | | | VALUE
(Note 3) | |
| Japan - 19.2% (continued) | | | | | | | | |
| Sumitomo Heavy Industries Ltd. | | | 189,000 | | | $ | 1,210,173 | |
| Sumitomo Mitsui Financial Group, Inc. | | | 44,536 | | | | 1,578,545 | |
| Sumitomo Realty & Development Co. Ltd. | | | 13,261 | | | | 315,805 | |
| Sumitomo Trust & Banking Co. Ltd./The | | | 27,075 | | | | 169,793 | |
| Taisei Corp. | | | 30,000 | | | | 70,025 | |
| Takeda Pharmaceutical Co. Ltd. | | | 54,981 | | | | 2,703,818 | |
| Teijin Ltd. | | | 78,000 | | | | 332,433 | |
| Toho Co. Ltd. | | | 4,000 | | | | 64,203 | |
| Toho Gas Co. Ltd. | | | 5,627 | | | | 28,119 | |
| Tokai Rika Co. Ltd. | | | 7,799 | | | | 147,112 | |
| Tokio Marine Holdings, Inc. | | | 38,500 | | | | 1,144,936 | |
| Tokyo Gas Co. Ltd. | | | 241,071 | | | | 1,068,644 | |
| Tokyo Tatemono Co. Ltd. | | | 14,000 | | | | 64,595 | |
| Tokyu Land Corp. | | | 26,483 | | | | 132,664 | |
| Tosoh Corp. | | | 236,000 | | | | 765,054 | |
| Toyota Auto Body Co. Ltd. | | | 19,457 | | | | 362,668 | |
| Toyota Motor Corp. | | | 66,953 | | | | 2,638,598 | |
| USS Co. Ltd. | | | 16,584 | | | | 1,354,750 | |
| West Japan Railway Co. | | | 82 | | | | 306,386 | |
| Yamada Denki Co. Ltd. | | | 8,630 | | | | 587,725 | |
| Yamaha Corp. | | | 19,700 | | | | 243,467 | |
| Yamaha Motor Co. Ltd. † | | | 40,000 | | | | 649,790 | |
| Yamatake Corp. | | | 4,437 | | | | 104,846 | |
| Yamato Holdings Co. Ltd. | | | 24,460 | | | | 347,344 | |
| | | | | | | | |
| | | | | | | 88,038,093 | |
| | | | | | | | |
| Jersey, Channel Islands - 0.6% | | | | | | | | |
| Wolseley PLC † | | | 79,442 | | | | 2,553,807 | |
| | | | | | | | |
| | |
| Netherlands - 4.7% | | | | | | | | |
| Corio NV REIT | | | 2,174 | | | | 140,138 | |
| European Aeronautic Defence and Space Co. NV † | | | 28,971 | | | | 678,691 | |
| ING Groep NV CVA † | | | 168,182 | | | | 1,647,176 | |
| Koninklijke Ahold NV | | | 129,789 | | | | 1,721,269 | |
| Koninklijke DSM NV | | | 50,073 | | | | 2,865,507 | |
| Koninklijke Philips Electronics NV | | | 78,133 | | | | 2,404,744 | |
| Royal Dutch Shell PLC A Shares, Class A | | | 134,779 | | | | 4,518,989 | |
| Royal Dutch Shell PLC B Shares, Class B | | | 169,535 | | | | 5,637,696 | |
| Unilever NV CVA | | | 59,667 | | | | 1,868,768 | |
| | | | | | | | |
| | | | | | | 21,482,978 | |
| | | | | | | | |
| New Zealand - 0.0% (c) | | | | | | | | |
| Telecom Corp of New Zealand Ltd. (a) | | | 18,537 | | | | 31,141 | |
| | | | | | | | |
| | |
| Singapore - 1.6% | | | | | | | | |
| Ascendas Real Estate Investment Trust REIT | | | 49,637 | | | | 80,242 | |
| CapitaMall Trust REIT | | | 71,994 | | | | 109,695 | |
| Cosco Corp. Singapore Ltd. | | | 138,000 | | | | 230,743 | |
| DBS Group Holdings Ltd. | | | 16,128 | | | | 180,337 | |
| Fraser and Neave Ltd. | | | 135,000 | | | | 675,142 | |
| Jardine Cycle & Carriage Ltd. | | | 11,066 | | | | 316,096 | |
| Keppel Corp. Ltd. | | | 62,571 | | | | 553,091 | |
| Neptune Orient Lines Ltd. †(a) | | | 305,000 | | | | 519,376 | |
| Oversea-Chinese Banking Corp. Ltd. | | | 156,479 | | | | 1,206,888 | |
| SembCorp Industries Ltd. | | | 32,017 | | | | 128,395 | |
| | | | |
| | The accompanying notes are an integral part of these financial statements. | | (Continued) |
| | | | | | | | | | |
| AQR Funds | | | | Annual Report | | | | December 2010 | | 43 |
| | | | | | | |
| | | | |
| Schedule of Investments | | | December 31, 2010 | |
| | | | |
| AQR INTERNATIONAL EQUITY FUND | | | | |
| | | | | | | | |
| | | SHARES | | | VALUE
(Note 3) | |
| Singapore - 1.6% (continued) | | | | | | | | |
| SembCorp Marine Ltd. | | | 121,000 | | | $ | 507,099 | |
| Singapore Airlines Ltd. | | | 21,000 | | | | 251,032 | |
| Singapore Exchange Ltd. (a) | | | 29,472 | | | | 193,633 | |
| Singapore Press Holdings Ltd. | | | 131,000 | | | | 407,428 | |
| Singapore Technologies Engineering Ltd. | | | 63,265 | | | | 168,881 | |
| Singapore Telecommunications Ltd. | | | 304,524 | | | | 724,952 | |
| StarHub Ltd. | | | 1,988 | | | | 4,090 | |
| United Overseas Bank Ltd. | | | 59,097 | | | | 840,149 | |
| UOL Group Ltd. | | | 18,000 | | | | 66,814 | |
| | | | | | | | |
| | | | | | | 7,164,083 | |
| | | | | | | | |
| Spain - 3.5% | | | | | | | | |
| Banco Bilbao Vizcaya Argentaria SA | | | 152,295 | | | | 1,558,168 | |
| Banco Santander SA | | | 491,960 | | | | 5,262,801 | |
| Endesa SA (a) | | | 56,918 | | | | 1,480,622 | |
| Inditex SA | | | 46,833 | | | | 3,519,365 | |
| Repsol YPF SA | | | 64,158 | | | | 1,803,703 | |
| Telefonica SA | | | 103,688 | | | | 2,376,486 | |
| | | | | | | | |
| | | | | | | 16,001,145 | |
| | | | | | | | |
| Sweden - 2.8% | | | | | | | | |
| Boliden AB | | | 89,218 | | | | 1,818,475 | |
| Investor AB B Shares, Class B | | | 19,364 | | | | 414,528 | |
| NCC AB, Class B | | | 25,911 | | | | 571,036 | |
| Scania AB B Shares, Class B | | | 143,187 | | | | 3,297,406 | |
| Tele2 AB B Shares, Class B | | | 220,860 | | | | 4,584,222 | |
| Volvo AB B Shares, Class B † | | | 136,146 | | | | 2,399,319 | |
| | | | | | | | |
| | | | | | | 13,084,986 | |
| | | | | | | | |
| Switzerland - 7.6% | | | | | | | | |
| ABB Ltd. † | | | 198,004 | | | | 4,434,770 | |
| Clariant AG † | | | 26,447 | | | | 537,547 | |
| Compagnie Financiere Richemont SA, Class A | | | 48,078 | | | | 2,835,966 | |
| Nestle SA | | | 142,933 | | | | 8,399,592 | |
| Novartis AG | | | 112,428 | | | | 6,638,733 | |
| Roche Holding AG | | | 31,146 | | | | 4,579,986 | |
| Sulzer AG | | | 12,242 | | | | 1,873,464 | |
| UBS AG † | | | 105,229 | | | | 1,733,095 | |
| Xstrata PLC | | | 153,966 | | | | 3,663,754 | |
| | | | | | | | |
| | | | | | | 34,696,907 | |
| | | | | | | | |
| United Kingdom - 15.0% | | | | | | | | |
| Anglo American PLC | | | 22,708 | | | | 1,192,912 | |
| Associated British Foods PLC | | | 35,727 | | | | 662,347 | |
| AstraZeneca PLC | | | 79,641 | | | | 3,644,861 | |
| Aviva PLC | | | 255,557 | | | | 1,577,480 | |
| Barclays PLC | | | 325,648 | | | | 1,351,528 | |
| BHP Billiton PLC | | | 85,688 | | | | 3,461,878 | |
| BP PLC | | | 816,873 | | | | 6,046,452 | |
| British American Tobacco PLC | | | 104,266 | | | | 4,027,569 | |
| British Land Co. PLC REIT | | | 29,205 | | | | 240,737 | |
| British Sky Broadcasting Group PLC | | | 44,987 | | | | 519,261 | |
| BT Group PLC | | | 975,377 | | | | 2,781,925 | |
| Burberry Group PLC | | | 53,720 | | | | 948,097 | |
| Centrica PLC | | | 911,245 | | | | 4,741,297 | |
| Daily Mail & General Trust PLC, Class A | | | 41,282 | | | | 371,573 | |
| Dixons Retail PLC † | | | 43,714 | | | | 15,752 | |
| | | | | | | | |
| | | SHARES | | | VALUE
(Note 3) | |
| United Kingdom - 15.0% (continued) | | | | | | | | |
| GlaxoSmithKline PLC | | | 177,478 | | | $ | 3,456,280 | |
| HSBC Holdings PLC | | | 442,253 | | | | 4,538,895 | |
| IMI PLC | | | 58,065 | | | | 860,706 | |
| Imperial Tobacco Group PLC | | | 17,525 | | | | 540,978 | |
| Investec PLC | | | 163,166 | | | | 1,349,861 | |
| ITV PLC † | | | 1,040,724 | | | | 1,145,944 | |
| J Sainsbury PLC | | | 36,239 | | | | 213,795 | |
| Kingfisher PLC | | | 408,288 | | | | 1,689,107 | |
| Land Securities Group PLC REIT | | | 24,126 | | | | 255,564 | |
| Legal & General Group PLC | | | 478,485 | | | | 727,733 | |
| Lloyds Banking Group PLC † | | | 2,714,734 | | | | 2,814,211 | |
| Mondi PLC | | | 280,485 | | | | 2,265,669 | |
| Next PLC | | | 3,144 | | | | 97,510 | |
| Old Mutual PLC | | | 138,247 | | | | 267,343 | |
| Rio Tinto PLC | | | 53,849 | | | | 3,854,581 | |
| Rolls-Royce Group PLC † | | | 62,372 | | | | 610,262 | |
| Rolls-Royce Group PLC, Class C (3)†(b) | | | 5,323,584 | | | | 8,335 | |
| Royal Bank of Scotland Group PLC † | | | 1,471,653 | | | | 907,569 | |
| Segro PLC REIT | | | 49,428 | | | | 222,255 | |
| Stagecoach Group PLC | | | 49,172 | | | | 163,524 | |
| Tate & Lyle PLC | | | 127,083 | | | | 1,034,125 | |
| Tesco PLC | | | 238,989 | | | | 1,591,408 | |
| Unilever PLC | | | 20,202 | | | | 623,138 | |
| Vodafone Group PLC | | | 2,882,258 | | | | 7,598,166 | |
| WH Smith PLC | | | 55,209 | | | | 422,736 | |
| | | | | | | | |
| | | | | | | 68,843,364 | |
| | | | | | | | |
TOTAL COMMON STOCKS
(cost $342,587,756) | | | | | | | 399,176,496 | |
| | | | | | | | |
| | |
| PREFERRED STOCKS - 0.4% | | | | | | | | |
| | |
| Germany - 0.2% | | | | | | | | |
| Volkswagen AG | | | 6,683 | | | | 1,090,842 | |
| | | | | | | | |
| | |
| Switzerland - 0.2% | | | | | | | | |
| Schindler Holding AG | | | 7,196 | | | | 853,903 | |
| | | | | | | | |
TOTAL PREFERRED STOCKS
(cost $991,222) | | | | | | | 1,944,745 | |
| | | | | | | | |
| | |
| MONEY MARKET FUNDS - 10.0% | | | | | | | | |
| Dreyfus Institutional Cash Advantage Fund, Class I, 0.180% (d) | | | 860 | | | | 860 | |
J.P. Morgan Prime Money Market Fund - Capital Shares, 0.130% (d)(e) | | | 45,794,801 | | | | 45,794,801 | |
| | | | | | | | |
TOTAL MONEY MARKET FUNDS | | | | | | | | |
(cost $45,795,661; includes $7,149,866 of cash collateral received for securities on loan) | | | | | | | 45,795,661 | |
| | | | | | | | |
TOTAL INVESTMENTS - 97.3%
(cost $389,374,639) | | | | | | | 446,916,902 | |
| | | | | | | | |
| OTHER ASSETS IN EXCESS OF LIABILITIES - 2.7% (f) | | | | | | | 12,323,298 | |
| | | | | | | | |
NET ASSETS - 100.0% | | | | | | $ | 459,240,200 | |
| | | | | | | | |
| | | | |
| | The accompanying notes are an integral part of these financial statements. | | (Continued) |
| | | | | | | | | | |
| AQR Funds | | | | Annual Report | | | | December 2010 | | 44 |
| | | | | | | |
| | | | |
| Schedule of Investments | | | December 31, 2010 | |
| | | | |
| AQR INTERNATIONAL EQUITY FUND | | | | |
| | | | | | | | |
| SECTOR | | VALUE | | | % OF NET
ASSETS | |
| Consumer Discretionary | | $ | 50,970,862 | | | | 11.1 | % |
| Consumer Staples | | | 29,374,671 | | | | 6.4 | |
| Energy | | | 33,782,652 | | | | 7.3 | |
| Financials | | | 76,004,092 | | | | 16.5 | |
| Health Care | | | 35,768,689 | | | | 7.8 | |
| Industrials | | | 65,525,483 | | | | 14.3 | |
| Information Technology | | | 14,638,359 | | | | 3.2 | |
| Materials | | | 53,126,054 | | | | 11.5 | |
| Telecommunication Services | | | 26,992,143 | | | | 5.9 | |
| Utilities | | | 14,938,236 | | | | 3.3 | |
| Money Market Funds | | | 45,795,661 | | | | 10.0 | |
| | | | | | | | |
Total Investments | | | 446,916,902 | | | | 97.3 | |
| Other Assets in Excess of Liabilities (f) | | | 12,323,298 | | | | 2.7 | |
| | | | | | | | |
Net Assets | | $ | 459,240,200 | | | | 100.0 | % |
| | | | | | | | |
| † | Non income-producing security. |
| (a) | All or a portion of the security on loan. The aggregate market value of such securities is $6,868,811; cash collateral of $7,149,866 was received with which the Fund purchased a money market fund. |
| (b) | Security fair valued at December 31, 2010. |
| (c) | Represents less than 0.05 percent of net assets. |
| (d) | Represents annualized seven-day yield as of December 31, 2010. |
| (e) | Represents security, or portion thereof, purchased with the cash collateral received for securities on loan. |
| (f) | Includes appreciation(depreciation) on futures contracts, forward foreign currency exchange contracts and swaps. |
All securities are Level 2, unless otherwise noted in parentheses.
| (3) | Level 3 security (See Note 5). |
The following abbreviations are used in portfolio descriptions:
CVA - Dutch Certificate of Shares
REIT - Real Estate Investment Trust
Total return swap contracts outstanding as of December 31, 2010
| | | | | | | | | | | | |
| COUNTERPARTY | | UNDERLYING REFERENCE INSTRUMENT | | TERMINATION
DATE | | NOTIONAL
VALUE | | | UNREALIZED
APPRECIATION
(DEPRECIATION) | |
The Royal Bank
of Scotland | | Swiss Market Index | | 3/18/2011 | | | $(30,248,177) | | | | $439,723 | |
| | | | | | | | | | | | |
Collateral is included in the collateral for forward foreign currency exchange contracts.
Open futures contracts outstanding at December 31, 2010:
| | | | | | | | | | | | | | | | |
NUMBER OF
CONTRACTS | | TYPE | | EXPIRATION
DATE | | VALUE AT
TRADE DATE | | | VALUE AT
DECEMBER 31,
2010 | | | UNREALIZED
APPRECIATION
(DEPRECIATION) | |
| Long Contracts: | | | | | | | | | | | | | | | | |
| 443 | | Amsterdam Index | | January 21, 2011 | | | $41,721,467 | | | | $42,172,000 | | | | $450,533 | |
| 700 | | CAC40 10 Euro | | January 21, 2011 | | | 36,486,606 | | | | 35,774,443 | | | | (712,163) | |
| 118 | | DAX Index | | March 18, 2011 | | | 27,828,982 | | | | 27,414,105 | | | | (414,877) | |
| 185 | | FTSE 100 Index Futures | | March 18, 2011 | | | 16,897,605 | | | | 17,068,795 | | | | 171,190 | |
| 215 | | FTSE/MIB Index | | March 18, 2011 | | | 29,661,574 | | | | 29,138,969 | | | | (522,605) | |
| 2 | | IBEX 35 Index | | January 21, 2011 | | | 269,833 | | | | 262,702 | | | | (7,131) | |
| 11 | | SGX MSCI Singapore Index Futures | | January 28, 2011 | | | 641,715 | | | | 649,842 | | | | 8,127 | |
| | | | | | | | | | | | | | | | |
| | | | | | | | | | | | | | | (1,026,926) | |
| | | | | | | | | | | | | | | | |
| Short Contracts: | | | | | | | | | | | | | | | | |
| 68 | | Hang Seng Index | | January 28, 2011 | | | (9,901,211) | | | | (10,068,372) | | | | (167,161) | |
| 710 | | OMXS30 Index | | January 21, 2011 | | | (12,156,747) | | | | (12,219,074) | | | | (62,327) | |
| 275 | | SPI 200 | | March 17, 2011 | | | (33,635,602) | | | | (33,333,345) | | | | 302,257 | |
| 174 | | TOPIX Index | | March 10, 2011 | | | (18,917,970) | | | | (19,222,489) | | | | (304,519) | |
| | | | | | | | | | | | | | | | |
| | | | | | | | | | | | | | | (231,750) | |
| | | | | | | | | | | | | | | | |
| | | | | | | | | | | | | | | $(1,258,676) | |
| | | | | | | | | | | | | | | | |
Cash held as collateral with broker for futures contracts was $15,310,150 at December 31, 2010.
| | | | |
| | The accompanying notes are an integral part of these financial statements. | | (Continued) |
| | | | | | | | | | |
| AQR Funds | | | | Annual Report | | | | December 2010 | | 45 |
| | | | | | | |
| | | | |
| Schedule of Investments | | | December 31, 2010 | |
| | | | |
| AQR INTERNATIONAL EQUITY FUND | | | | |
Forward foreign currency exchange contracts outstanding as of December 31, 2010:
| | | | | | | | | | | | | | | | | | | | |
PURCHASE
CONTRACTS | | COUNTERPARTY | | CURRENCY | | CURRENCY
AMOUNT
PURCHASED | | | VALUE AT
SETTLEMENT
DATE | | | VALUE AT
DECEMBER 31,
2010 | | | UNREALIZED
APPRECIATION
(DEPRECIATION) | |
Australian Dollar,
Expiring 03/16/11 | | The Royal Bank of Scotland | | AUD | | | 68,926,100 | | | | $65,736,659 | | | | $70,025,930 | | | | $4,289,271 | |
Swiss Franc,
Expiring 03/16/11 | | The Royal Bank of Scotland | | CHF | | | 3,630,000 | | | | 3,746,929 | | | | 3,897,555 | | | | 150,626 | |
Danish Krone,
Expiring 03/16/11 | | The Royal Bank of Scotland | | DKK | | | 31,000 | | | | 5,431 | | | | 5,579 | | | | 148 | |
Euro, Expiring
03/16/11 | | The Royal Bank of Scotland | | EUR | | | 986,000 | | | | 1,316,375 | | | | 1,322,561 | | | | 6,186 | |
British Pound,
Expiring 03/16/11 | | The Royal Bank of Scotland | | GBP | | | 6,308,300 | | | | 9,819,784 | | | | 9,871,250 | | | | 51,466 | |
Hong Kong Dollar,
Expiring 03/16/11 | | The Royal Bank of Scotland | | HKD | | | 22,769,000 | | | | 2,933,772 | | | | 2,930,716 | | | | (3,056) | |
Israeli Shekel,
Expiring 03/16/11 | | The Royal Bank of Scotland | | ILS | | | 13,534,000 | | | | 3,684,060 | | | | 3,818,080 | | | | 134,020 | |
Japanese Yen,
Expiring 03/16/11 | | The Royal Bank of Scotland | | JPY | | | 1,186,035,000 | | | | 14,298,662 | | | | 14,634,601 | | | | 335,939 | |
Norwegian Krone,
Expiring 03/16/11 | | The Royal Bank of Scotland | | NOK | | | 332,142,000 | | | | 54,328,522 | | | | 56,941,462 | | | | 2,612,940 | |
Swedish Krona,
Expiring 03/16/11 | | The Royal Bank of Scotland | | SEK | | | 527,540,000 | | | | 75,559,551 | | | | 78,270,021 | | | | 2,710,470 | |
Singapore Dollar,
Expiring 03/16/11 | | The Royal Bank of Scotland | | SGD | | | 928,000 | | | | 708,367 | | | | 724,638 | | | | 16,271 | |
| | | | | | | | | | | | | | | | | | | | |
| | | | | | | | | | | 232,138,112 | | | | 242,442,393 | | | | 10,304,281 | |
| | | | | | | | | | | | | | | | | | | | |
| | | | | | | | | | | | | | | | | | | | |
SALES
CONTRACTS | | COUNTERPARTY | | CURRENCY | | CURRENCY
AMOUNT
SOLD | | | VALUE AT
SETTLEMENT
DATE | | | VALUE AT
DECEMBER 31,
2010 | | | UNREALIZED
APPRECIATION
(DEPRECIATION) | |
Australian Dollar,
Expiring 03/16/11 | | The Royal Bank of Scotland | | AUD | | | (9,121,000) | | | | $(9,047,817) | | | | $(9,266,541) | | | | $(218,724) | |
Swiss Franc,
Expiring 03/16/11 | | The Royal Bank of Scotland | | CHF | | | (32,105,800) | | | | (32,115,306) | | | | (34,472,203) | | | | (2,356,897) | |
Danish Krone,
Expiring 03/16/11 | | The Royal Bank of Scotland | | DKK | | | (16,587,000) | | | | (2,934,626) | | | | (2,985,397) | | | | (50,771) | |
Euro, Expiring
03/16/11 | | The Royal Bank of Scotland | | EUR | | | (55,567,600) | | | | (73,018,371) | | | | (74,535,045) | | | | (1,516,674) | |
British Pound,
Expiring 03/16/11 | | The Royal Bank of Scotland | | GBP | | | (9,774,000) | | | | (15,252,507) | | | | (15,294,387) | | | | (41,880) | |
Hong Kong Dollar,
Expiring 03/16/11 | | The Royal Bank of Scotland | | HKD | | | (7,259,000) | | | | (934,029) | | | | (934,345) | | | | (316) | |
Israeli Shekel,
Expiring 03/16/11 | | The Royal Bank of Scotland | | ILS | | | (658,000) | | | | (181,492) | | | | (185,628) | | | | (4,136) | |
Japanese Yen,
Expiring 03/16/11 | | The Royal Bank of Scotland | | JPY | | | (3,825,174,200) | | | | (45,747,513) | | | | (47,199,195) | | | | (1,451,682) | |
Norwegian Krone,
Expiring 03/16/11 | | The Royal Bank of Scotland | | NOK | | | (7,433,000) | | | | (1,192,630) | | | | (1,274,292) | | | | (81,662) | |
Swedish Krona,
Expiring 03/16/11 | | The Royal Bank of Scotland | | SEK | | | (7,455,000) | | | | (1,095,777) | | | | (1,106,083) | | | | (10,306) | |
Singapore Dollar,
Expiring 03/16/11 | | The Royal Bank of Scotland | | SGD | | | (96,000) | | | | (72,821) | | | | (74,939) | | | | (2,118) | |
| | | | | | | | | | | | | | | | | | | | |
| | | | | | | | | | | (181,592,889) | | | | (187,328,055) | | | | (5,735,166) | |
| | | | | | | | | | | | | | | | | | | | |
| | | | | | | | | | | $50,545,223 | | | | $55,114,338 | | | | $4,569,115 | |
| | | | | | | | | | | | | | | | | | | | |
| | | | |
| | The accompanying notes are an integral part of these financial statements. | | (Continued) |
| | | | | | | | | | |
| AQR Funds | | | | Annual Report | | | | December 2010 | | 46 |
| | | | | | | |
| | | | |
| Schedule of Investments | | | December 31, 2010 | |
| | | | |
| AQR INTERNATIONAL EQUITY FUND | | | | |
Cash pledged as collateral by the broker for forward foreign exchange contracts in the amount of $2,720,000.
AUD - Australian Dollar
CHF - Swiss Franc
DKK - Danish Krone
EUR - Euro
GBP - British Pound
HKD - Hong Kong Dollar
ILS - Israeli Shekel
JPY - Japanese Yen
NOK - Norwegian Krone
SEK - Swedish Krona
SGD - Singapore Dollar
| | | | |
| | The accompanying notes are an integral part of these financial statements. | | |
| | | | | | | | | | |
| AQR Funds | | | | Annual Report | | | | December 2010 | | 47 |
| | | | | | | |
| | | | |
| Schedule of Investments | | | December 31, 2010 | |
| | | | |
| AQR DIVERSIFIED ARBITRAGE FUND | | | | |
| | | | | | | | |
| LONG INVESTMENTS - 126.2% | | SHARES | | | VALUE
(Note 3) | |
| COMMON STOCKS - 49.8% | | | | | | | | |
| | |
| Consumer Discretionary - 9.4% | | | | | | | | |
| AutoChina International Ltd. (China) † | | | 59,429 | | | $ | 1,542,777 | |
| Cablevision Systems Corp., Class A | | | 69,766 | | | | 2,360,881 | |
| Caribou Coffee Co., Inc. † | | | 73,839 | | | | 744,297 | |
| CBS Corp., Class A | | | 9,650 | | | | 183,639 | |
| China Networks International Holdings Ltd. (3)†(a) | | | 432,416 | | | | 52,971 | |
| China XD Plastics Co. Ltd. (China) † | | | 366,664 | | | | 1,972,652 | |
| Comcast Corp., Class A | | | 1,201,128 | | | | 24,995,474 | |
| Discovery Communications, Inc., Class C † | | | 480,733 | | | | 17,638,094 | |
| Dollar General Corp. † | | | 74,178 | | | | 2,275,039 | |
| Emmis Communications Corp., Class A † | | | 578,313 | | | | 439,518 | |
| Express, Inc. | | | 56,156 | | | | 1,055,733 | |
| Fuel Systems Solutions, Inc. † | | | 23,089 | | | | 678,355 | |
| Jo-Ann Stores, Inc. † | | | 92,600 | | | | 5,576,372 | |
| Kandi Technologies Corp. (China) (2)† | | | 392,493 | | | | 2,068,438 | |
| Lennar Corp. B Shares, Class B | | | 204,766 | | | | 3,188,207 | |
| Liberty Global, Inc. † | | | 697,519 | | | | 23,638,919 | |
| Lincoln Educational Services Corp. | | | 35,000 | | | | 542,850 | |
| Madison Square Garden, Inc., Class A † | | | 95,148 | | | | 2,452,915 | |
| Mediacom Communications Corp., Class A † | | | 599,684 | | | | 5,073,327 | |
| News Corp., Class A | | | 720,732 | | | | 10,493,858 | |
| Playboy Enterprises, Inc., Class B † | | | 364,462 | | | | 1,902,492 | |
| Valuevision Media, Inc., Class A † | | | 74,977 | | | | 458,109 | |
| VCG Holding Corp. † | | | 34,604 | | | | 75,437 | |
| Viacom, Inc., Class B | | | 71,249 | | | | 2,822,173 | |
| Vitamin Shoppe, Inc. † | | | 24,077 | | | | 809,950 | |
| | | | | | | | |
| | | | | | | 113,042,477 | |
| | | | | | | | |
| Consumer Staples - 2.0% | | | | | | | | |
| Alberto-Culver Co. (c) | | | 241,249 | | | | 8,935,863 | |
| Celsius Holdings, Inc. † | | | 184,456 | | | | 77,471 | |
| Central Garden and Pet Co. † | | | 583,483 | | | | 5,741,473 | |
| Del Monte Foods Co. | | | 362,871 | | | | 6,821,975 | |
| Embotelladora Andina SA, Class A ADR (Chile) | | | 10,000 | | | | 238,000 | |
| Green Mountain Coffee Roasters, Inc. † | | | 31,981 | | | | 1,050,896 | |
| Molson Coors Brewing Co., Class B | | | 4,626 | | | | 232,179 | |
| SkyPeople Fruit Juice, Inc. (China) † | | | 152,332 | | | | 705,297 | |
| | | | | | | | |
| | | | | | | 23,803,154 | |
| | | | | | | | |
| Energy - 3.0% | | | | | | | | |
| Baker Hughes, Inc. | | | 400 | | | | 22,868 | |
| C&J Energy Services, Inc. 144A (3)†(a) | | | 77,733 | | | | 777,330 | |
| CIC Energy Corp./Bahamas (Bahamas) † | | | 103,593 | | | | 717,275 | |
| Cloud Peak Energy, Inc. † | | | 152,119 | | | | 3,533,724 | |
| Concho Resources, Inc./Midland TX † | | | 11,246 | | | | 985,937 | |
| EXCO Resources, Inc. | | | 217,200 | | | | 4,218,024 | |
| Gastar Exploration Ltd. † | | | 26,289 | | | | 113,043 | |
| International Coal Group, Inc. † | | | 337,845 | | | | 2,614,920 | |
| Kodiak Oil & Gas Corp. † | | | 5,633 | | | | 37,178 | |
| McDermott International, Inc. † | | | 138,907 | | | | 2,873,986 | |
| Omega Navigation Enterprises, Inc., Class A (Greece) † | | | 276,761 | | | | 354,254 | |
| Petrobank Energy & Resources Ltd. (Canada) †(b) | | | 15,530 | | | | 394,638 | |
| | | | | | | | |
| | | SHARES | | | VALUE
(Note 3) | |
| Energy - 3.0% (continued) | | | | | | | | |
| Petrominerales Ltd. (Canada) | | | 9,535 | | | $ | 318,215 | |
| QEP Resources, Inc. | | | 68,934 | | | | 2,502,994 | |
| Scorpio Tankers, Inc. (Monaco) † | | | 54,000 | | | | 545,940 | |
| Seadrill Ltd. (Bermuda) | | | 143,305 | | | | 4,860,906 | |
| SilverBirch Energy Corp. (Canada) †(b) | | | 5,359 | | | | 38,400 | |
| Storm Resources Ltd. (Canada) † | | | 3,914 | | | | 15,756 | |
| T-3 Energy Services, Inc. † | | | 256,823 | | | | 10,229,260 | |
| Uranium Energy Corp. † | | | 233,188 | | | | 1,408,455 | |
| | | | | | | | |
| | | | | | | 36,563,103 | |
| | | | | | | | |
| Financials - 9.1% | | | | | | | | |
| 57th Street General Acquisition Corp. † | | | 292,050 | | | | 2,818,282 | |
| American Capital Agency Corp. REIT | | | 80,000 | | | | 2,299,200 | |
| Ashford Hospitality Trust, Inc. REIT † | | | 131,385 | | | | 1,267,865 | |
| Australia Acquisition Corp. (Australia) †(c) | | | 612,000 | | | | 5,722,200 | |
| Cazador Acquisition Corp. Ltd. (Cayman Islands) † | | | 319,668 | | | | 3,167,910 | |
| CBOE Holdings, Inc. | | | 11,600 | | | | 265,176 | |
| Center Financial Corp. † | | | 96,473 | | | | 731,265 | |
| Chatham Lodging Trust REIT | | | 1,425 | | | | 24,581 | |
| Compass Diversified Holdings | | | 2,493 | | | | 44,101 | |
| Cypress Sharpridge Investments, Inc. REIT | | | 145,010 | | | | 1,872,079 | |
| Dynex Capital, Inc. REIT | | | 149,334 | | | | 1,630,727 | |
| Equity One, Inc. REIT | | | 74,976 | | | | 1,363,064 | |
| European CleanTech SE, Class A (Luxembourg) (2)† | | | 621,000 | | | | 7,914,474 | |
| First American Financial Corp. | | | 47,677 | | | | 712,294 | |
| First Horizon National Corp. † | | | 56,308 | | | | 663,308 | |
| First Mercury Financial Corp. | | | 331,762 | | | | 5,440,897 | |
| FlatWorld Acquisition Corp. (Virgin Islands, British) † | | | 219,450 | | | | 2,209,862 | |
| Golub Capital BDC, Inc. | | | 19,950 | | | | 341,544 | |
| Green Dot Corp., Class A † | | | 33,797 | | | | 1,917,642 | |
| HCP, Inc. REIT | | | 45,750 | | | | 1,683,142 | |
| Helikos SE (Luxembourg) (2)† | | | 72,000 | | | | 932,634 | |
| Hicks Acquisition Co. II, Inc. † | | | 810,000 | | | | 8,262,000 | |
| Huntington Bancshares, Inc./OH | | | 375,384 | | | | 2,578,888 | |
| IFM Investments Ltd. ADR (China) † | | | 21,000 | | | | 105,000 | |
| Invesco Mortgage Capital, Inc. REIT | | | 105,107 | | | | 2,295,537 | |
| Janus Capital Group, Inc. | | | 2,500 | | | | 32,425 | |
| JWC Acquisition Corp. † | | | 1,032,750 | | | | 10,482,412 | |
| KKR Financial Holdings LLC | | | 269,846 | | | | 2,509,568 | |
| L&L Acquisition Corp. † | | | 306,000 | | | | 3,053,880 | |
| Lexington Realty Trust REIT | | | 300,306 | | | | 2,387,433 | |
| Loews Corp. | | | 7,700 | | | | 299,607 | |
| Marshall & Ilsley Corp. | | | 813,973 | | | | 5,632,693 | |
| Mercer Insurance Group, Inc. | | | 98,872 | | | | 2,767,427 | |
| NewAlliance Bancshares, Inc. | | | 904,621 | | | | 13,551,223 | |
| Patriot National Bank (3)†(a)(b) | | | 2,000,000 | | | | 2,167,200 | |
| Rome Bancorp, Inc. | | | 23,194 | | | | 278,792 | |
| Santa Monica Media Corp. (3)†(a) | | | 15,377 | | | | — | |
| Senior Housing Properties Trust REIT | | | 111,513 | | | | 2,446,595 | |
| SLM Corp. † | | | 57,250 | | | | 720,778 | |
| SP Acquisition Holdings, Inc. (3)†(a) | | | 27,000 | | | | — | |
| Sports Properties Acquisition Corp. (3)†(a) | | | 35,850 | | | | — | |
| Starwood Property Trust, Inc. REIT | | | 74,258 | | | | 1,595,062 | |
| Student Loan Corp./The | | | 11,558 | | | | 374,942 | |
| | | | |
| | The accompanying notes are an integral part of these financial statements. | | (Continued) |
| | | | | | | | | | |
| AQR Funds | | | | Annual Report | | | | December 2010 | | 48 |
| | | | | | | |
| | | | |
| Schedule of Investments | | | December 31, 2010 | |
| | | | |
| AQR DIVERSIFIED ARBITRAGE FUND | | | | |
| | | | | | | | |
| | | SHARES | | | VALUE
(Note 3) | |
| Financials - 9.1% (continued) | | | | | | | | |
| Tower Bancorp, Inc. | | | 10,441 | | | $ | 230,120 | |
| Trian Acquisition I Corp. (3)†(a) | | | 15,200 | | | | — | |
| Two Harbors Investment Corp. REIT | | | 17,500 | | | | 171,325 | |
| Webster Financial Corp. | | | 131,248 | | | | 2,585,586 | |
| Whitney Holding Corp./LA | | | 85,740 | | | | 1,213,221 | |
| Wilber Corp. | | | 110,948 | | | | 1,120,575 | |
| Wilmington Trust Corp. | | | 4,364 | | | | 18,940 | |
| | | | | | | | |
| | | | | | | 109,903,476 | |
| | | | | | | | |
| Health Care - 4.3% | | | | | | | | |
| Access Pharmaceuticals, Inc. †(c) | | | 228,024 | | | | 565,500 | |
| ADAM, Inc. †(c) | | | 131,600 | | | | 946,204 | |
| Adcare Health Systems, Inc. †(c) | | | 42,948 | | | | 168,356 | |
| Alcon, Inc. (Switzerland) (c) | | | 30,000 | | | | 4,902,000 | |
| American Surgical Holdings, Inc. (2) | | | 15,747 | | | | 44,407 | |
| BMP Sunstone Corp. † | | | 568,803 | | | | 5,636,838 | |
| Caraco Pharmaceutical Laboratories Ltd. † | | | 11,906 | | | | 54,053 | |
| China Cord Blood Corp. (Hong Kong) † | | | 26,127 | | | | 104,769 | |
| Cormedix, Inc. † | | | 150,800 | | | | 274,456 | |
| Crucell NV ADR (Netherlands) † | | | 95,289 | | | | 2,981,593 | |
| CryoPort, Inc. † | | | 571,428 | | | | 342,857 | |
| Cypress Bioscience, Inc. † | | | 764,323 | | | | 4,952,813 | |
| Dionex Corp. † | | | 40,878 | | | | 4,824,013 | |
| DynaVox, Inc., Class A † | | | 34,800 | | | | 178,524 | |
| Eurand NV (Netherlands) † | | | 527,035 | | | | 6,234,824 | |
| Genzyme Corp. † | | | 38,400 | | | | 2,734,080 | |
| Indevus Pharmaceuticals, Inc. (3)†(a) | | | 6,006 | | | | 4,625 | |
| Insulet Corp. † | | | 89,949 | | | | 1,394,209 | |
| King Pharmaceuticals, Inc. † | | | 312,729 | | | | 4,393,842 | |
| Lannett Co., Inc. † | | | 73,808 | | | | 412,587 | |
| Martek Biosciences Corp. † | | | 915 | | | | 28,639 | |
| Momenta Pharmaceuticals, Inc. † | | | 168,654 | | | | 2,524,750 | |
| ReGeneRx Biopharmaceuticals, Inc. † | | | 217,790 | | | | 47,914 | |
| Rosetta Genomics Ltd. (Israel) † | | | 382,500 | | | | 361,960 | |
| St Jude Medical, Inc. † | | | 46,460 | | | | 1,986,165 | |
| Tenet Healthcare Corp. † | | | 327,600 | | | | 2,191,644 | |
| Tengion, Inc. † | | | 26,320 | | | | 66,853 | |
| WuXi PharmaTech Cayman, Inc. ADR (China) † | | | 148,246 | | | | 2,392,690 | |
| YM Biosciences, Inc. (Canada) † | | | 375,384 | | | | 874,645 | |
| | | | | | | | |
| | | | | | | 51,625,810 | |
| | | | | | | | |
| Industrials - 6.2% | | | | | | | | |
| Advanced Battery Technologies, Inc. † | | | 965,000 | | | | 3,715,250 | |
| AirTran Holdings, Inc. † | | | 586,876 | | | | 4,337,014 | |
| Allied Defense Group, Inc. †(c) | | | 190,011 | | | | 636,537 | |
| Applied Signal Technology, Inc. | | | 63,880 | | | | 2,420,413 | |
| Babcock & Wilcox Co. † | | | 81,251 | | | | 2,079,213 | |
| Baldor Electric Co. | | | 156,445 | | | | 9,862,293 | |
| Baltic Trading Ltd. | | | 40,500 | | | | 413,505 | |
| Bucyrus International, Inc. | | | 88,570 | | | | 7,918,158 | |
| CAI International, Inc. † | | | 38,204 | | | | 748,798 | |
| China Dredging Group Co. Ltd. (Switzerland) (2)† | | | 1,000,000 | | | | 5,000,000 | |
| China Electric Motor, Inc. (China) † | | | 2,400 | | | | 10,848 | |
| Dollar Thrifty Automotive Group, Inc. † | | | 196,324 | | | | 9,278,272 | |
| Douglas Dynamics, Inc. | | | 15,722 | | | | 238,188 | |
| | | | | | | | |
| | | SHARES | | | VALUE
(Note 3) | |
| Industrials - 6.2% (continued) | | | | | | | | |
| Dynamex, Inc. † | | | 147,458 | | | $ | 3,651,060 | |
| Fushi Copperweld, Inc. (China) † | | | 199,075 | | | | 1,767,786 | |
| Greenbrier Cos., Inc. † | | | 13,291 | | | | 278,978 | |
| Harbin Electric, Inc. (China) † | | | 172,921 | | | | 3,000,179 | |
| Hardinge, Inc. | | | 74,385 | | | | 724,510 | |
| HEICO Corp., Class A | | | 177,853 | | | | 6,637,474 | |
| Hubbell, Inc., Class A | | | 2,194 | | | | 124,290 | |
| Ladish Co., Inc. † | | | 189,029 | | | | 9,188,700 | |
| RCM Technologies, Inc. † | | | 265,735 | | | | 1,233,010 | |
| Regulus Resources, Inc. (Canada) † | | | 85,723 | | | | 98,349 | |
| Rush Enterprises, Inc., Class B † | | | 1,000 | | | | 17,980 | |
| Sapphire Industry Corp. (3)†(a) | | | 25,025 | | | | — | |
| X-TAL Minerals Corp. (Canada) † | | | 775,282 | | | | 1,365,414 | |
| | | | | | | | |
| | | | | | | 74,746,219 | |
| | | | | | | | |
| Information Technology - 8.6% | | | | | | | | |
| Art Technology Group, Inc. † | | | 1,236,533 | | | | 7,394,467 | |
| Authentidate Holding Corp. † | | | 1,274,704 | | | | 567,243 | |
| Authentidate Holding Corp. ADR (3)†(a) | | | 218,000 | | | | 321,648 | |
| AutoNavi Holdings Ltd. ADR (China) † | | | 6,960 | | | | 111,569 | |
| Avago Technologies Ltd. (Singapore) (c) | | | 43,879 | | | | 1,249,235 | |
| BroadSoft, Inc. † | | | 36,536 | | | | 872,480 | |
| Camelot Information Systems, Inc. ADR (China) † | | | 47,756 | | | | 1,142,324 | |
| Changyou.com Ltd. ADR (China) † | | | 29,325 | | | | 836,056 | |
| CommScope, Inc. † | | | 189,450 | | | | 5,914,629 | |
| CoreLogic, Inc. | | | 47,677 | | | | 882,978 | |
| CPI International, Inc. † | | | 252,140 | | | | 4,878,909 | |
| Dice Holdings, Inc. † | | | 203,772 | | | | 2,924,128 | |
| Equinix, Inc. † | | | 7,162 | | | | 581,984 | |
| Funtalk China Holdings Ltd. (China) † | | | 9,832 | | | | 55,747 | |
| GigOptix, Inc. † | | | 200,477 | | | | 551,312 | |
| hiSoft Technology International Ltd. ADR (China) † | | | 700 | | | | 21,140 | |
| Hypercom Corp. † | | | 862,503 | | | | 7,219,150 | |
| Intel Corp. | | | 9,520 | | | | 200,206 | |
| IntraLinks Holdings, Inc. † | | | 89,126 | | | | 1,667,547 | |
| Kemet Corp. † | | | 213,461 | | | | 3,112,261 | |
| L-1 Identity Solutions, Inc. † | | | 382,847 | | | | 4,559,708 | |
| LTX-Credence Corp. † | | | 457,062 | | | | 3,382,259 | |
| Magic Software Enterprises Ltd. (Israel) | | | 239,007 | | | | 1,477,063 | |
| McAfee, Inc. † | | | 191,089 | | | | 8,849,332 | |
| Micron Technology, Inc. † | | | 31,163 | | | | 249,927 | |
| Molex, Inc., Class A | | | 578,121 | | | | 10,909,143 | |
| Motorola Solutions, Inc. † | | | 977,392 | | | | 8,864,945 | |
| NaviSite, Inc. † | | | 407,977 | | | | 1,505,435 | |
| Novell, Inc. † | | | 1,625,362 | | | | 9,622,143 | |
| NU Horizons Electronics Corp. † | | | 220,422 | | | | 1,536,341 | |
| Occam Networks, Inc. † | | | 498,974 | | | | 4,326,105 | |
| Orckit Communications Ltd. (Israel) † | | | 15,174 | | | | 44,308 | |
| RAE Systems, Inc. † | | | 477,177 | | | | 768,255 | |
| RealPage, Inc. † | | | 84,516 | | | | 2,614,080 | |
| Sonic Solutions, Inc. † | | | 85,847 | | | | 1,287,705 | |
| SS&C Technologies Holdings, Inc. † | | | 32,400 | | | | 664,524 | |
| Telestone Technologies Corp. (China) † | | | 115,818 | | | | 1,229,987 | |
| Tessco Technologies, Inc. | | | 56,321 | | | | 898,320 | |
| Voltaire Ltd. (Israel) † | | | 107,907 | | | | 933,396 | |
| | | | | | | | |
| | | | | | | 104,227,989 | |
| | | | | | | | |
| | | | |
| | The accompanying notes are an integral part of these financial statements. | | (Continued) |
| | | | | | | | | | |
| AQR Funds | | | | Annual Report | | | | December 2010 | | 49 |
| | | | | | | |
| | | | |
| Schedule of Investments | | | December 31, 2010 | |
| | | | |
| AQR DIVERSIFIED ARBITRAGE FUND | | | | |
| | | | | | | | |
| | | SHARES | | | VALUE
(Note 3) | |
| Materials - 3.8% | | | | | | | | |
| Airgas, Inc. | | | 57,200 | | | $ | 3,572,712 | |
| Aurcana Corp. (Canada) † | | | 1,246,774 | | | | 978,699 | |
| BHP Billiton plc ADR (United Kingdom) | | | 155,985 | | | | 12,556,793 | |
| CF Industries Holdings, Inc. | | | 1 | | | | 135 | |
| Edgewater Exploration Ltd. (Canada) †(b) | | | 500,000 | | | | 649,122 | |
| Goldcorp, Inc. (Canada) | | | 215,145 | | | | 9,933,946 | |
| Graham Packaging Co., Inc. † | | | 10,750 | | | | 140,180 | |
| Metals USA Holdings Corp. † | | | 61,600 | | | | 938,784 | |
| Monsanto Co. | | | 3,820 | | | | 266,025 | |
| Noranda Aluminum Holding Corp. † | | | 122,380 | | | | 1,786,748 | |
| Puda Coal, Inc. (China) † | | | 200,959 | | | | 2,863,666 | |
| Rock of Ages Corp. † | | | 2,597 | | | | 13,582 | |
| Rockwood Holdings, Inc. † | | | 63,749 | | | | 2,493,861 | |
| TriStar Gold, Inc. (Canada) † | | | 183,521 | | | | 107,122 | |
| Uni-Pixel, Inc. † | | | 38,764 | | | | 282,977 | |
| Western Coal Corp. (Canada) † | | | 779,693 | | | | 9,651,511 | |
| | | | | | | | |
| | | | | | | 46,235,863 | |
| | | | | | | | |
| Telecommunication Services - 1.9% | | | | | | | | |
| IDT Corp. | | | 37,707 | | | | 965,676 | |
| Qwest Communications International, Inc. | | | 1,734,901 | | | | 13,202,597 | |
| Syniverse Holdings, Inc. † | | | 197,796 | | | | 6,102,006 | |
| Telephone & Data Systems, Inc. Special Shares | | | 101,584 | | | | 3,201,928 | |
| | | | | | | | |
| | | | | | | 23,472,207 | |
| | | | | | | | |
| Utilities - 1.5% | | | | | | | | |
| Allegheny Energy, Inc. | | | 421,534 | | | | 10,217,984 | |
| China Hydroelectric Corp. ADR (China) † | | | 24,500 | | | | 181,055 | |
| Nicor, Inc. | | | 99,899 | | | | 4,986,958 | |
| Pennichuck Corp. | | | 32,806 | | | | 897,572 | |
| Questar Corp. | | | 68,934 | | | | 1,200,141 | |
| | | | | | | | |
| | | | | | | 17,483,710 | |
| | | | | | | | |
TOTAL COMMON STOCKS
(cost $568,430,375) | | | | | | | 601,104,008 | |
| | | | | | | | |
| | | | |
| | The accompanying notes are an integral part of these financial statements. | | (Continued) |
| | | | | | | | | | |
| AQR Funds | | | | Annual Report | | | | December 2010 | | 50 |
| | | | | | | |
| | | | |
| Schedule of Investments | | | December 31, 2010 | |
| | | | |
| AQR DIVERSIFIED ARBITRAGE FUND | | | | |
| | | | | | | | | | | | | | | | | | | | |
| CONVERTIBLE PREFERRED STOCKS - 2.7% | | MOODY’S
RATING* (UNAUDITED) | | | | | | | | | SHARES | | | VALUE
(Note 3) | |
| Consumer Discretionary - 0.1% | | | | | | | | | | | | | | | | | | | | |
| Beazer Homes USA, Inc., $25.00 par, 7.250% | | | NR | | | | | | | | | | | | 52,875 | | | $ | 1,246,264 | |
| | | | | | | | | | | | | | | | | | | | |
| | | | | |
| Consumer Staples - 0.8% | | | | | | | | | | | | | | | | | | | | |
| Bunge Ltd., Perpetual (Bermuda), $100.00 par, 4.875% | | | Ba1 | | | | | | | | | | | | 15,000 | | | | 1,410,000 | |
| Universal Corp., Perpetual, $1,000.00 par, 6.750% | | | BB | ** | | | | | | | | | | | 8,350 | | | | 8,425,150 | |
| | | | | | | | | | | | | | | | | | | | |
| | | | | | | | | | | | | | | | | | | 9,835,150 | |
| | | | | | | | | | | | | | | | | | | | |
| Energy - 0.2% | | | | | | | | | | | | | | | | | | | | |
| Energy XXI Bermuda Ltd., Perpetual (Bermuda), $250.00 par, 5.625% (2)† | | | NR | | | | | | | | | | | | 1,200 | | | | 376,875 | |
| Superior Well Services, Inc., Perpetual, Series A, $1,000.00 par, 4.000% (2) | | | NR | | | | | | | | | | | | 1,169 | | | | 1,083,523 | |
| Whiting Petroleum Corp., Perpetual, $100.00 par, 6.250% | | | B | ** | | | | | | | | | | | 1,144 | | | | 316,670 | |
| | | | | | | | | | | | | | | | | | | | |
| | | | | | | | | | | | | | | | | | | 1,777,068 | |
| | | | | | | | | | | | | | | | | | | | |
| Financials - 1.3% | | | | | | | | | | | | | | | | | | | | |
| Boston Private Capital Trust I, $50.00 par, 4.875% | | | NR | | | | | | | | | | | | 3,750 | | | | 103,359 | |
| Dole Food Automatic Common Exchange 144A, $12.50 par, 7.000% †(b) | | | NR | | | | | | | | | | | | 3,750 | | | | 47,930 | |
| MF Global Holdings Ltd., Perpetual, $100.00 par, 9.750% | | | NR | | | | | | | | | | | | 19,550 | | | | 2,370,437 | |
| SLM Corp., Perpetual, Series A, $50.00 par, 6.970% | | | Ba3 | | | | | | | | | | | | 12,500 | | | | 535,000 | |
| Sovereign Capital Trust IV, $50.00 par, 4.375% | | | Baa3 | | | | | | | | | | | | 243,634 | | | | 9,988,994 | |
| UBS AG (Switzerland), $25.00 par, 9.375% (2)† | | | NR | | | | | | | | | | | | 26,000 | | | | 706,940 | |
| UBS AG (Switzerland), $100.00 par, 6.750% † | | | NR | | | | | | | | | | | | 21,500 | | | | 644,355 | |
| Wells Fargo & Co., Perpetual, Series L, $1,000.00 par, 7.500% | | | Baa | | | | | | | | | | | | 3 500 | | | | 500,275 | |
| Wintrust Financial Corp., $50.00 par, 7.500% (2)† | | | NR | | | | | | | | | | | | 24,300 | | | | 1,343,839 | |
| | | | | | | | | | | | | | | | | | | | |
| | | | | | | | | | | | | | | | | | | 16,241,129 | |
| | | | | | | | | | | | | | | | | | | | |
| Industrials - 0.2% | | | | | | | | | | | | | | | | | | | | |
| Kansas City Southern, Perpetual, $1,000.00 par, 5.125% | | | B- | ** | | | | | | | | | | | 1,275 | | | | 1,989,000 | |
| Timberjack Corp. (3)†(a) $188,000 par, 8.000% | | | NR | | | | | | | | | | | | 188,000 | | | | 580,905 | |
| | | | | | | | | | | | | | | | | | | | |
| | | | | | | | | | | | | | | | | | | 2,569,905 | |
| | | | | | | | | | | | | | | | | | | | |
| | | | | |
| Utilities - 0.1% | | | | | | | | | | | | | | | | | | | | |
| PPL Corp., $50.00 par, 9.500% | | | NR | | | | | | | | | | | | 22,650 | | | | 1,245,070 | |
| | | | | | | | | | | | | | | | | | | | |
TOTAL CONVERTIBLE PREFERRED STOCKS
(cost $30,303,979) | | | | | | | | | | | | | | | | | | | 32,914,586 | |
| | | | | | | | | | | | | | | | | | | | |
| | | | | |
| CORPORATE BONDS - 19.2% | | | | | INTEREST
RATE | | | MATURITY
DATE | | | PRINCIPAL
AMOUNT
(000’S) | | | | |
| Communications - 1.8% | | | | | | | | | | | | | | | | | | | | |
| Clear Channel Communications, Inc. (2)(c) | | | Ca | | | | 6.250% | | | | 03/15/11 | | | $ | 425 | | | $ | 423,938 | |
| Global Crossing UK Finance plc (United Kingdom) (2) | | | B3 | | | | 10.750% | | | | 12/15/14 | | | | 1,835 | | | | 1,899,225 | |
| Interactive Network, Inc./FriendFinder Networks Inc 144A (2)(b)(c) | | | B | ** | | | 14.000% | | | | 09/30/13 | | | | 1,110 | | | | 1,148,850 | |
| Primus Telecommunications Holding, Inc./Primus Telecommunications Canada Inc 144A (2)(b) | | | Caa1 | | | | 13.000% | | | | 12/15/16 | | | | 3,425 | | | | 3,716,125 | |
| Securus Technologies, Inc. (2) | | | NR | | | | 17.000% | | | | 05/30/15 | | | | 1,850 | | | | 1,831,500 | |
| Securus Technologies, Inc. (2) | | | NR | | | | 17.000% | | | | 07/30/15 | | | | 1,800 | | | | 1,782,000 | |
| Sprint Capital Corp. (2) | | | Ba3 | | | | 7.625% | | | | 01/30/11 | | | | 4,850 | | | | 4,862,125 | |
| WCP Wireless Site Funding LLC/WCP Wireless Site RE Funding LLC 144A (2)(b) | | | NR | | | | 6.829% | | | | 11/15/15 | | | | 3,325 | | | | 3,187,028 | |
| WCP Wireless Site Funding LLC/WCP Wireless Site RE Funding LLC 144A (2)(b) | | | NR | | | | 9.247% | | | | 11/15/15 | | | | 3,000 | | | | 2,856,262 | |
| | | | | | | | | | | | | | | | | | | | |
| | | | | | | | | | | | | | | | | | | 21,707,053 | |
| | | | | | | | | | | | | | | | | | | | |
| | | | |
| | The accompanying notes are an integral part of these financial statements. | | (Continued) |
| | | | | | | | | | |
| AQR Funds | | | | Annual Report | | | | December 2010 | | 51 |
| | | | | | | |
| | | | |
| Schedule of Investments | | | December 31, 2010 | |
| | | | |
| AQR DIVERSIFIED ARBITRAGE FUND | | | | |
| | | | | | | | | | | | | | | | | | | | |
| | | | | |
| | | MOODY’S
RATING* (UNAUDITED) | | | INTEREST
RATE | | | MATURITY
DATE | | | PRINCIPAL
AMOUNT
(000’S) | | | VALUE
(Note 3) | |
| Consumer Discretionary - 3.2% | | | | | | | | | | | | | | | | | | | | |
| American Airlines Equipment Trust 1990, Series B (2) | | | Caa1 | | | | 10.500% | | | | 09/15/11 | | | $ | 2,575 | | | $ | 2,597,531 | |
| American Airlines Pass Through Trust 2001-01, Series 2001-1, Class A-2 (2) | | | B2 | | | | 6.817% | | | | 05/23/11 | | | | 1,530 | | | | 1,544,535 | |
| American Airlines Pass Through Trust 2001-02, Series 2001-2, Class A-2 (2) | | | Ba1 | | | | 7.858% | | | | 10/01/11 | | | | 925 | | | | 962,000 | |
| AmeriQual Group LLC and AmeriQual Finance Corp. 144A (2)(b)(c) | | | Caa2 | | | | 9.000% | | | | 04/01/12 | | | | 2,765 | | | | 2,709,700 | |
| AMR Corp., Series B MTN (2) | | | CCC+ | ** | | | 10.400% | | | | 03/10/11 | | | | 1,960 | | | | 1,977,150 | |
| Baker & Taylor, Inc. 144A (2)(b)(c) | | | B3 | | | | 11.500% | | | | 07/01/13 | | | | 3,250 | | | | 2,656,875 | |
| Brookstone Co., Inc. 144A (2)(b)(c) | | | CCC+ | ** | | | 13.000% | | | | 10/15/14 | | | | 516 | | | | 476,010 | |
| China Networks International Holdings Ltd. (BRITISH VIRGIN) (2) | | | NR | | | | 10.000% | | | | 04/30/16 | | | | 750 | | | | 750,000 | |
| Delta Air Lines 2001-1 Class B Pass Through Trust, Series 2001-1, Class B (2) | | | NR | | | | 7.711% | | | | 09/18/11 | | | | 1,890 | | | | 1,937,250 | |
| Dollar General Corp. (2) | | | B1 | | | | 10.625% | | | | 07/15/15 | | | | 3,650 | | | | 3,969,375 | |
| GameStop Corp./GameStop, Inc. (2) | | | Ba1 | | | | 8.000% | | | | 10/01/12 | | | | 1,083 | | | | 1,107,367 | |
| Mandalay Resort Group (2)(c) | | | Caa1 | | | | 6.375% | | | | 12/15/11 | | | | 3,575 | | | | 3,597,344 | |
| Pegasus Solutions, Inc. 144A (2)(b)(d) | | | NR | | | | 13.000% | | | | 04/15/14 | | | | 2,941 | | | | 2,529,346 | |
| Sally Holdings LLC/Sally Capital, Inc. (2)(c) | | | B3 | | | | 9.250% | | | | 11/15/14 | | | | 5,500 | | | | 5,775,000 | |
| SouthPeak Interactive Corp. (3)(a) | | | NR | | | | 10.000% | | | | 07/19/13 | | | | 2,500 | | | | 1,341,795 | |
| Unifi, Inc. (2) | | | Caa1 | | | | 11.500% | | | | 05/15/14 | | | | 3,600 | | | | 3,816,000 | |
| Valassis Communications, Inc. (2)(c) | | | Ba3 | | | | 8.250% | | | | 03/01/15 | | | | 824 | | | | 862,110 | |
| | | | | | | | | | | | | | | | | | | | |
| | | | | | | | | | | | | | | | | | | 38,609,388 | |
| | | | | | | | | | | | | | | | | | | | |
| Consumer Staples - 0.5% | | | | | | | | | | | | | | | | | | | | |
| Great Atlantic & Pacific Tea Co. 144A (2)(b)(e) | | | NR | | | | 11.375% | | | | 08/01/15 | | | | 3,555 | | | | 3,199,500 | |
| North Atlantic Trading Co. 144A (2)(b)(c) | | | NR | | | | 10.000% | | | | 03/01/12 | | | | 1,940 | | | | 1,823,600 | |
| Vector Group Ltd. 144A (2)(b) | | | B1 | | | | 11.000% | | | | 08/15/15 | | | | 1,700 | | | | 1,746,750 | |
| | | | | | | | | | | | | | | | | | | | |
| | | | | | | | | | | | | | | | | | | 6,769,850 | |
| | | | | | | | | | | | | | | | | | | | |
| Energy - 2.3% | | | | | | | | | | | | | | | | | | | | |
| Black Elk Energy Offshore Operations LLC and Black Elk Finance Corp., Series AI 144A (2)(b) | | | Caa2 | | | | 13.750% | | | | 12/01/15 | | | | 5,800 | | | | 5,771,000 | |
| Compton Petroleum Finance Corp. (Canada) (2) | | | NR | | | | 10.000% | | | | 09/15/11 | | | | 3,650 | | | | 3,321,500 | |
| Energy XXI Gulf Coast, Inc. (2)(d) | | | B3 | | | | 16.000% | | | | 06/15/14 | | | | 1,502 | | | | 1,704,709 | |
| Golden Close Maritime Corp. MTN (Bermuda) (2) | | | NR | | | | 11.000% | | | | 12/09/15 | | | | 2,500 | | | | 2,587,500 | |
| Harvest Operations Corp. (Canada) (2) | | | NR | | | | 7.500% | | | | 05/31/15 | | | | 275 | | | | 290,595 | |
| InterOil ASA (Canada) (2) | | | NR | | | | 15.000% | | | | 03/14/14 | | | | 6,500 | | | | 1,151,828 | |
| LDK Solar Co. Ltd., Series EXCH (Cayman Islands) (2) | | | NR | | | | 4.750% | | | | 04/15/13 | | | | 2,900 | | | | 2,845,625 | |
| Panoro Energy ASA 144A (Norway) (2)(b) | | | NR | | | | 12.000% | | | | 11/15/18 | | | | 2,300 | | | | 2,300,000 | |
| Polarcus Alima AS (Norway) (2) | | | NR | | | | 12.500% | | | | 10/29/15 | | | | 3,800 | | | | 3,876,000 | |
| RDS Ultra-Deepwater Ltd. 144A (Cayman Islands) (2)(b) | | | B3 | | | | 11.875% | | | | 03/15/17 | | | | 845 | | | | 880,913 | |
| Sevan Marine ASA (Norway) (2) | | | NR | | | | 14.000% | | | | 12/22/14 | | | | 12,000 | | | | 2,064,516 | |
| Sevan Marine ASA 144A (Norway) (2)(b) | | | NR | | | | 12.000% | | | | 08/10/15 | | | | 1,000 | | | | 1,055,000 | |
| | | | | | | | | | | | | | | | | | | | |
| | | | | | | | | | | | | | | | | | | 27,849,186 | |
| | | | | | | | | | | | | | | | | | | | |
| Financials - 4.0% | | | | | | | | | | | | | | | | | | | | |
| Allied Capital Corp. (2) | | | Ba1 | | | | 6.000% | | | | 04/01/12 | | | | 1,650 | | | | 1,692,621 | |
| Ally Financial, Inc. (2) | | | B3 | | | | 7.250% | | | | 03/02/11 | | | | 775 | | | | 779,908 | |
| Ally Financial, Inc. (2) | | | B3 | | | | 6.000% | | | | 12/15/11 | | | | 810 | | | | 830,250 | |
| American General Finance Corp., Series A (2) | | | B3 | | | | 4.625% | | | | 06/22/11 | | | | 7,775 | | | | 10,286,119 | |
| Bankrate, Inc. 144A (2)(b)(c) | | | B2 | | | | 11.750% | | | | 07/15/15 | | | | 1,655 | | | | 1,837,050 | |
| Centro NP LLC (2) | | | Caa2 | | | | 4.500% | | | | 02/01/11 | | | | 3,475 | | | | 3,414,188 | |
| CNO Financial Group, Inc. (2) | | | B2 | | | | 7.000% | | | | 12/30/16 | | | | 3,635 | | | | 5,307,100 | |
| Ford Motor Credit Co. LLC (2) | | | Ba2 | | | | 7.375% | | | | 02/01/11 | | | | 1,505 | | | | 1,509,499 | |
| Icahn Enterprises LP/Icahn Enterprises Finance Corp. 144A (2)(b) | | | Ba3 | | | | 8.000% | | | | 01/15/18 | | | | 2,055 | | | | 2,044,725 | |
| Jack Cooper Holdings Corp. 144A (2)(b) | | | NR | | | | 12.750% | | | | 12/15/15 | | | | 1,775 | | | | 1,757,250 | |
| Landry’s Holdings, Inc. 144A (2)(b) | | | Caa1 | | | | 11.500% | | | | 06/01/14 | | | | 1,545 | | | | 1,514,100 | |
| | | | |
| | The accompanying notes are an integral part of these financial statements. | | (Continued) |
| | | | | | | | | | |
| AQR Funds | | | | Annual Report | | | | December 2010 | | 52 |
| | | | | | | |
| | | | |
| Schedule of Investments | | | December 31, 2010 | |
| | | | |
| AQR DIVERSIFIED ARBITRAGE FUND | | | | |
| | | | | | | | | | | | | | | | | | | | |
| | | MOODY’S
RATING* (UNAUDITED) | | | INTEREST
RATE | | | MATURITY
DATE | | | PRINCIPAL
AMOUNT
(000’S) | | | VALUE
(Note 3) | |
| Financials - 4.0% (continued) | | | | | | | | | | | | | | | | | | | | |
| Offshore Group Investments Ltd. 144A (Cayman Islands) (2)(b)(c) | | | B3 | | | | 11.500% | | | | 08/01/15 | | | $ | 1,950 | | | $ | 2,115,750 | |
| Rare Restaurant Group LLC/RRG Finance Corp. 144A (2)(b) | | | NR | | | | 9.250% | | | | 05/15/14 | | | | 1,300 | | | | 1,131,000 | |
| Regions Financial Corp. (2) | | | B1 | | | | 7.000% | | | | 03/01/11 | | | | 1,705 | | | | 1,708,410 | |
| Rouse Co. LP (The) (2) | | | NR | | | | 6.750% | | | | 11/09/15 | | | | 4,045 | | | | 4,186,575 | |
| Royal Bank of Scotland Group plc (United Kingdom) (2) | | | Ba2 | | | | 6.375% | | | | 02/01/11 | | | | 1,705 | | | | 1,710,507 | |
| Synovus Financial Corp. (2)(c) | | | B3 | | | | 5.125% | | | | 06/15/17 | | | | 1,375 | | | | 1,143,319 | |
| TMX Finance LLC/TitleMax Finance Corp. 144A (2)(b)(c) | | | B2 | | | | 13.250% | | | | 07/15/15 | | | | 380 | | | | 418,000 | |
| UCI Holdco, Inc./Old (2)(d)(c) | | | Caa1 | | | | 9.250% | | | | 12/15/13 | | | | 4,630 | | | | 4,618,067 | |
| | | | | | | | | | | | | | | | | | | | |
| | | | | | | | | | | | | | | | | | | 48,004,438 | |
| | | | | | | | | | | | | | | | | | | | |
| Healthcare - 2.5% | | | | | | | | | | | | | | | | | | | | |
| Adcare Health Systems, Inc. (3)(a) | | | NR | | | | 10.000% | | | | 10/26/13 | | | | 1,850 | | | | 1,898,283 | |
| Incyte Corp. Ltd. (2)(c) | | | NR | | | | 4.750% | | | | 10/01/15 | | | | 1,000 | | | | 2,076,250 | |
| King Pharmaceuticals, Inc. (2)(c) | | | BB | ** | | | 1.250% | | | | 04/01/26 | | | | 10,323 | | | | 10,258,481 | |
| Merge Healthcare, Inc. (2) | | | B2 | | | | 11.750% | | | | 05/01/15 | | | | 1,930 | | | | 2,055,450 | |
| Omnicare, Inc. (2) | | | Ba3 | | | | 3.750% | | | | 12/15/25 | | | | 1,200 | | | | 1,338,000 | |
| Omnicare, Inc. (2) | | | Ba3 | | | | 6.125% | | | | 06/01/13 | | | | 3,260 | | | | 3,276,300 | |
| PDL BioPharma, Inc. 144A (2)(b) | | | NR | | | | 2.875% | | | | 02/15/15 | | | | 1,400 | | | | 1,472,800 | |
| Tenet Healthcare Corp. (2)(c) | | | Caa1 | | | | 6.375% | | | | 12/01/11 | | | | 500 | | | | 504,688 | |
| US Oncology Holdings, Inc. (2)(d) | | | Caa1 | | | | 6.737% | | | | 03/15/12 | | | | 7,058 | | | | 7,110,935 | |
| | | | | | | | | | | | | | | | | | | | |
| | | | | | | | | | | | | | | | | | | 29,991,187 | |
| | | | | | | | | | | | | | | | | | | | |
| Industrials - 2.5% | | | | | | | | | | | | | | | | | | | | |
| Continental Airlines, Inc., Series 2001-1, Class C (2)(c) | | | NR | | | | 7.033% | | | | 06/15/11 | | | | 2,061 | | | | 2,076,413 | |
| Eastman Kodak Co. (2)(c) | | | NR | | | | 7.000% | | | | 04/01/17 | | | | 7,000 | | | | 7,306,250 | |
| Floatel Superior Ltd. (Bahamas) (2) | | | NR | | | | 13.000% | | | | 09/02/15 | | | | 1,100 | | | | 1,177,000 | |
| GenCorp, Inc. (2) | | | CCC | ** | | | 4.063% | | | | 12/31/39 | | | | 325 | | | | 304,687 | |
| Nalco Co. (2) | | | B1 | | | | 8.875% | | | | 11/15/13 | | | | 4,525 | | | | 4,595,703 | |
| Ship Finance International Ltd. (Bermuda) (2) | | | B1 | | | | 8.500% | | | | 12/15/13 | | | | 3,250 | | | | 3,306,875 | |
| Thermadyne Holdings Corp. (2) | | | NR | | | | 9.250% | | | | 02/01/14 | | | | 2,721 | | | | 2,775,420 | |
| United Continental Holdings, Inc. (2) | | | NR | | | | 6.860% | | | | 04/22/14 | | | | 6,874 | | | | 6,873,943 | |
| Western Express, Inc. 144A (2)(b) | | | Caa1 | | | | 12.500% | | | | 04/15/15 | | | | 2,300 | | | | 2,035,500 | |
| | | | | | | | | | | | | | | | | | | | |
| | | | | | | | | | | | | | | | | | | 30,451,791 | |
| | | | | | | | | | | | | | | | | | | | |
| Information Technology - 0.3% | | | | | | | | | | | | | | | | | | | | |
| Amkor Technology, Inc. (2)(c) | | | Ba3 | | | | 9.250% | | | | 06/01/16 | | | | 2,325 | | | | 2,464,500 | |
| Micron Technology, Inc. (2)(c) | | | NR | | | | 1.875% | | | | 06/01/27 | | | | 1,081 | | | | 1,043,165 | |
| | | | | | | | | | | | | | | | | | | | |
| | | | | | | | | | | | | | | | | | | 3,507,665 | |
| | | | | | | | | | | | | | | | | | | | |
| Materials - 0.8% | | | | | | | | | | | | | | | | | | | | |
| AEP Industries, Inc. (2) | | | NR | | | | 7.875% | | | | 03/15/13 | | | | 2,030 | | | | 2,022,388 | |
| Appleton Papers, Inc. 144A (2)(b) | | | B1 | | | | 10.500% | | | | 06/15/15 | | | | 600 | | | | 594,000 | |
| Appleton Papers, Inc. 144A (2)(b) | | | B3 | | | | 11.250% | | | | 12/15/15 | | | | 1,810 | | | | 1,448,000 | |
| Kangaroo Resources Ltd. (Australia) (2) | | | NR | | | | 10.000% | | | | 06/30/12 | | | | 2,800 | | | | 2,800,000 | |
| Sterling Chemicals, Inc. (2) | | | B3 | | | | 10.250% | | | | 04/01/15 | | | | 2,700 | | | | 2,781,000 | |
| | | | | | | | | | | | | | | | | | | | |
| | | | | | | | | | | | | | | | | | | 9,645,388 | |
| | | | | | | | | | | | | | | | | | | | |
| Telecommunication Services - 0.6% | | | | | | | | | | | | | | | | | | | | |
| CW Media Holdings, Inc. 144A (Canada) (2)(b)(d) | | | Ba2 | | | | 13.500% | | | | 08/15/15 | | | | 813 | | | | 923,022 | |
| FiberTower Corp. (2) | | | NR | | | | 9.000% | | | | 01/01/16 | | | | 3,949 | | | | 3,514,176 | |
| MediMedia USA, Inc. 144A (2)(b)(c) | | | Caa2 | | | | 11.375% | | | | 11/15/14 | | | | 2,350 | | | | 2,021,000 | |
| Morris Publishing Group LLC (2) | | | NR | | | | 10.000% | | | | 09/01/14 | | | | 960 | | | | 933,761 | |
| | | | | | | | | | | | | | | | | | | | |
| | | | | | | | | | | | | | | | | | | 7,391,959 | |
| | | | | | | | | | | | | | | | | | | | |
| Utilities - 0.7% | | | | | | | | | | | | | | | | | | | | |
| Dynegy Holdings, Inc. (2) | | | Caa2 | | | | 6.875% | | | | 04/01/11 | | | | 234 | | | | 234,000 | |
| | | | |
| | The accompanying notes are an integral part of these financial statements. | | (Continued) |
| | | | | | | | | | |
| AQR Funds | | | | Annual Report | | | | December 2010 | | 53 |
| | | | | | | |
| | | | |
| Schedule of Investments | | | December 31, 2010 | |
| | | | |
| AQR DIVERSIFIED ARBITRAGE FUND | | | | |
| | | | | | | | | | | | | | | | | | | | |
| | | MOODY’S
RATING* (UNAUDITED) | | | INTEREST
RATE | | | MATURITY
DATE | | | PRINCIPAL
AMOUNT
(000’S) | | | VALUE
(Note 3) | |
| Utilities - 0.7% (continued) | | | | | | | | | | | | | | | | | | | | |
| Mirant Americas Generation LLC (2) | | | B3 | | | | 8.300% | | | | 05/01/11 | | | $ | 1,925 | | | $ | 1,953,875 | |
| Mirant North America LLC (2)(c) | | | WR | | | | 7.375% | | | | 12/31/13 | | | | 5,847 | | | | 5,957,157 | |
| | | | | | | | | | | | | | | | | | | | |
| | | | | | | | | | | | | | | | | | | 8,145,032 | |
| | | | | | | | | | | | | | | | | | | | |
TOTAL CORPORATE BONDS
(cost $229,891,272) | | | | | | | | | | | | | | | | | | | 232,072,937 | |
| | | | | | | | | | | | | | | | | | | | |
| | | | | |
| CONVERTIBLE BONDS - 45.4% | | | | | | | | | | | | | | | |
| Communications - 3.3% | | | | | | | | | | | | | | | | | | | | |
| Ciena Corp. 144A (2)(b)(c) | | | NR | | | | 4.000% | | | | 03/15/15 | | | | 8,000 | | | | 10,020,000 | |
| Clearwire Communications LLC/Clearwire Finance, Inc. 144A (2)(b) | | | CCC- | ** | | | 8.250% | | | | 12/01/40 | | | | 700 | | | | 710,500 | |
| Digital River, Inc. 144A (2)(b)(c) | | | NR | | | | 2.000% | | | | 11/01/30 | | | | 2,600 | | | | 2,541,500 | |
| Equinix, Inc. (2) | | | B- | ** | | | 4.750% | | | | 06/15/16 | | | | 500 | | | | 614,375 | |
| Finisar Corp. 144A (2)(b)(c) | | | NR | | | | 5.000% | | | | 10/15/29 | | | | 700 | | | | 2,020,375 | |
| Playboy Enterprises, Inc. (2)(c) | | | NR | | | | 3.000% | | | | 03/15/25 | | | | 1,410 | | | | 1,367,700 | |
| priceline.com, Inc. 144A (2)(b)(c) | | | BBB- | ** | | | 1.250% | | | | 03/15/15 | | | | 7,675 | | | | 11,263,062 | |
| Virgin Media, Inc. (2)(c) | | | B | ** | | | 6.500% | | | | 11/15/16 | | | | 7,000 | | | | 11,585,000 | |
| | | | | | | | | | | | | | | | | | | | |
| | | | | | | | | | | | | | | | | | | 40,122,512 | |
| | | | | | | | | | | | | | | | | | | | |
| Consumer Discretionary - 12.8% | | | | | | | | | | | | | | | | | | | | |
| AirTran Holdings, Inc. (2) | | | NR | | | | 5.500% | | | | 04/15/15 | | | | 3,659 | | | | 7,478,081 | |
| Alliance Data Systems Corp. (2) | | | NR | | | | 1.750% | | | | 08/01/13 | | | | 3,000 | | | | 3,217,500 | |
| Alliance Data Systems Corp. (2)(c) | | | NR | | | | 4.750% | | | | 05/15/14 | | | | 6,500 | | | | 10,676,250 | |
| AMR Corp. (2)(c) | | | CCC+ | ** | | | 6.250% | | | | 10/15/14 | | | | 7,500 | | | | 8,493,750 | |
| ArvinMeritor, Inc. (2)(f) | | | CCC | ** | | | 4.625% | | | | 03/01/26 | | | | 2,000 | | | | 2,527,500 | |
| Coinstar, Inc. (2)(c) | | | BB+ | ** | | | 4.000% | | | | 09/01/14 | | | | 2,150 | | | | 3,415,812 | |
| Convergys Corp. (2)(c) | | | BB- | ** | | | 5.750% | | | | 09/15/29 | | | | 1,500 | | | | 2,079,375 | |
| DR Horton, Inc., Series DHI (2)(c) | | | Ba3 | | | | 2.000% | | | | 05/15/14 | | | | 7,781 | | | | 8,792,530 | |
| Exide Technologies (2)(c) | | | CCC+ | ** | | | 0.000% | | | | 09/18/13 | | | | 650 | | | | 547,170 | |
| FTI Consulting, Inc. (2)(c) | | | B1 | | | | 3.750% | | | | 07/15/12 | | | | 1,325 | | | | 1,696,000 | |
| Gaylord Entertainment Co. 144A (2)(b)(c) | | | NR | | | | 3.750% | | | | 10/01/14 | | | | 9,875 | | | | 14,392,812 | |
| Hertz Global Holdings, Inc. (2)(c) | | | B- | ** | | | 5.250% | | | | 06/01/14 | | | | 11,500 | | | | 22,051,250 | |
| Jakks Pacific, Inc. 144A (2)(b)(c) | | | NR | | | | 4.500% | | | | 11/01/14 | | | | 3,925 | | | | 5,288,938 | |
| Lennar Corp. 144A (2)(b) | | | B3 | | | | 2.750% | | | | 12/15/20 | | | | 400 | | | | 437,000 | |
| Lennar Corp. 144A (2)(b) | | | B3 | | | | 2.000% | | | | 12/01/20 | | | | 600 | | | | 594,750 | |
| MGM Resorts International 144A (2)(b)(c) | | | Caa1 | | | | 4.250% | | | | 04/15/15 | | | | 5,000 | | | | 5,475,000 | |
| Navistar International Corp. (2)(c) | | | B | ** | | | 3.000% | | | | 10/15/14 | | | | 1,875 | | | | 2,503,125 | |
| Palm Harbor Homes, Inc. (2)(e)(c) | | | NR | | | | 3.250% | | | | 05/15/24 | | | | 70 | | | | 12,600 | |
| Regis Corp. (2)(c) | | | NR | | | | 5.000% | | | | 07/15/14 | | | | 5,000 | | | | 6,387,500 | |
| Saks, Inc. 144A (2)(b)(c) | | | NR | ** | | | 7.500% | | | | 12/01/13 | | | | 800 | | | | 1,684,000 | |
| Sonic Automotive, Inc. (2)(c) | | | B- | ** | | | 5.000% | | | | 10/01/29 | | | | 7,500 | | | | 9,318,750 | |
| Titan International, Inc. 144A (2)(b)(c) | | | B+ | ** | | | 5.625% | | | | 01/15/17 | | | | 5,475 | | | | 11,497,500 | |
| TRW Automotive, Inc. 144A (2)(b)(c) | | | Ba2 | | | | 3.500% | | | | 12/01/15 | | | | 5,850 | | | | 11,246,625 | |
| United Rentals, Inc. (2)(c) | | | NR | | | | 4.000% | | | | 11/15/15 | | | | 5,850 | | | | 12,848,063 | |
| | | | | | | | | | | | | | | | | | | | |
| | | | | | | | | | | | | | | | | | | 152,661,881 | |
| | | | | | | | | | | | | | | | | | | | |
| Consumer Staples - 2.4% | | | | | | | | | | | | | | | | | | | | |
| Alliance One International, Inc. (2)(c) | | | Caa1 | | | | 5.500% | | | | 07/15/14 | | | | 3,400 | | | | 3,829,250 | |
| Central European Distribution Corp. (2)(c) | | | B- | ** | | | 3.000% | | | | 03/15/13 | | | | 2,000 | | | | 1,855,000 | |
| Chiquita Brands International, Inc. (2)(c) | | | B | ** | | | 4.250% | | | | 08/15/16 | | | | 5,000 | | | | 4,843,750 | |
| Nash Finch Co. (2)(f)(c) | | | B3 | | | | 1.631% | | | | 03/15/35 | | | | 4,800 | | | | 2,430,000 | |
| Rite Aid Corp. (2)(c) | | | Ca | | | | 8.500% | | | | 05/15/15 | | | | 1,050 | | | | 977,813 | |
| Spartan Stores, Inc. (2) | | | NR | | | | 3.375% | | | | 05/15/27 | | | | 475 | | | | 450,063 | |
| Tyson Foods, Inc. (2)(c) | | | BB+ | ** | | | 3.250% | | | | 10/15/13 | | | | 4,425 | | | | 5,426,156 | |
| Vector Group Ltd. (2)(c) | | | NR | | | | 3.750% | | | | 11/15/14 | | | | 6,504 | | | | 8,455,200 | |
| Vector Group Ltd. (2)(c) | | | NR | | | | 3.875% | | | | 06/15/26 | | | | 425 | | | | 491,937 | |
| | | | | | | | | | | | | | | | | | | | |
| | | | | | | | | | | | | | | | | | | 28,759,169 | |
| | | | | | | | | | | | | | | | | | | | |
| | | | |
| | The accompanying notes are an integral part of these financial statements. | | (Continued) |
| | | | | | | | | | |
| AQR Funds | | | | Annual Report | | | | December 2010 | | 54 |
| | | | | | | |
| | | | |
| Schedule of Investments | | | December 31, 2010 | |
| | | | |
| AQR DIVERSIFIED ARBITRAGE FUND | | | | |
| | | | | | | | | | | | | | | | | | | | |
| | | MOODY’S
RATING* (UNAUDITED) | | | INTEREST
RATE | | | MATURITY
DATE | | | PRINCIPAL
AMOUNT
(000’S) | | | VALUE
(Note 3) | |
| Energy - 2.3% | | | | | | | | | | | | | | | | | | | | |
| Exterran Energy Corp. (2) | | | B1 | | | | 4.750% | | | | 01/15/14 | | | $ | 1,150 | | | $ | 1,135,625 | |
| Exterran Holdings, Inc. (2)(c) | | | B+ | ** | | | 4.250% | | | | 06/15/14 | | | | 3,675 | | | | 4,566,188 | |
| GMX Resources, Inc. (2) | | | NR | | | | 4.500% | | | | 05/01/15 | | | | 1,875 | | | | 1,399,219 | |
| Goodrich Petroleum Corp. (2)(c) | | | NR | | | | 5.000% | | | | 10/01/29 | | | | 1,000 | | | | 973,750 | |
| Goodrich Petroleum Corp. (2) | | | NR | | | | 3.250% | | | | 12/01/26 | | | | 200 | | | | 198,500 | |
| Green Plains Renewable Energy, Inc. 144A (2)(b)(c) | | | NR | | | | 5.750% | | | | 11/01/15 | | | | 4,100 | | | | 4,258,875 | |
| Harvest Natural Resources, Inc. (2) | | | NR | | | | 8.250% | | | | 03/01/13 | | | | 475 | | | | 1,047,375 | |
| International Coal Group, Inc. (2)(c) | | | B- | ** | | | 4.000% | | | | 04/01/17 | | | | 3,500 | | | | 5,337,500 | |
| James River Coal Co. 144A (2)(b)(c) | | | CCC+ | ** | | | 4.500% | | | | 12/01/15 | | | | 500 | | | | 605,000 | |
| PetroBakken Energy Ltd., Reg S (Canada) (2) | | | NR | | | | 3.125% | | | | 02/08/16 | | | | 700 | | | | 661,500 | |
| Petrominerales Ltd., Series PMG (Canada) (2)(b) | | | NR | | | | 2.625% | | | | 08/25/16 | | | | 1,900 | | | | 2,138,944 | |
| Pioneer Natural Resources Co. (2) | | | BB+ | ** | | | 2.875% | | | | 01/15/38 | | | | 750 | | | | 1,135,312 | |
| Seadrill Ltd. (Bermuda) (2) | | | NR | | | | 3.625% | | | | 11/08/12 | | | | 1,500 | | | | 1,860,000 | |
| Western Refining, Inc. (2) | | | CCC+ | ** | | | 5.750% | | | | 06/15/14 | | | | 1,775 | | | | 2,127,781 | |
| Willbros Group, Inc./Panama (Panama) (2)(c) | | | NR | | | | 2.750% | | | | 03/15/24 | | | | 125 | | | | 127,969 | |
| | | | | | | | | | | | | | | | | | | | |
| | | | | | | | | | | | | | | | | | | 27,573,538 | |
| | | | | | | | | | | | | | | | | | | | |
| Financials - 8.1% | | | | | | | | | | | | | | | | | | | | |
| American Equity Investment Life Holding Co. 144A (2)(b) | | | NR | | | | 5.250% | | | | 12/06/29 | | | | 1,025 | | | | 1,525,969 | |
| American Equity Investment Life Holding Co. 144A (2)(b)(c) | | | NR | | | | 3.500% | | | | 09/15/15 | | | | 200 | | | | 235,750 | |
| Annaly Capital Management, Inc. (2)(c) | | | NR | | | | 4.000% | | | | 02/15/15 | | | | 6,775 | | | | 7,867,469 | |
| BioMed Realty LP 144A (2)(b)(c) | | | NR | | | | 3.750% | | | | 01/15/30 | | | | 3,375 | | | | 3,898,125 | |
| Boston Properties LP (2)(c) | | | A- | ** | | | 3.750% | | | | 05/15/36 | | | | 3,000 | | | | 3,307,500 | |
| CapitalSource, Inc. (2)(f) | | | NR | | | | 4.000% | | | | 07/15/34 | | | | 625 | | | | 621,094 | |
| CBIZ, Inc. 144A (2)(b) | | | NR | | | | 4.875% | | | | 10/01/15 | | | | 1,400 | | | | 1,529,500 | |
| CNO Financial Group, Inc. 144A (2)(b) | | | NR | | | | 7.000% | | | | 12/30/16 | | | | 2,795 | | | | 4,080,700 | |
| CNO Financial Group, Inc. 144A (2)(b) | | | NR | | | | 7.000% | | | | 12/30/16 | | | | 1,410 | | | | 2,058,600 | |
| Developers Diversified Realty Corp. (2)(c) | | | NR | | | | 1.750% | | | | 11/15/40 | | | | 2,850 | | | | 3,017,437 | |
| Digital Realty Trust LP 144A (2)(b)(c) | | | NR | | | | 5.500% | | | | 04/15/29 | | | | 8,450 | | | | 11,344,125 | |
| Dollar Financial Corp. (2) | | | NR | | | | 2.875% | | | | 06/30/27 | | | | 150 | | | | 150,562 | |
| Hilltop Holdings, Inc. (2)(c) | | | NR | | | | 7.500% | | | | 08/15/25 | | | | 998 | | | | 1,076,593 | |
| Host Hotels & Resorts LP 144A (2)(b) | | | BB+ | ** | | | 2.500% | | | | 10/15/29 | | | | 3,425 | | | | 4,824,969 | |
| Icahn Enterprises LP 144A (2)(b) | | | NR | | | | 4.000% | | | | 08/15/13 | | | | 550 | | | | 520,438 | |
| Janus Capital Group, Inc. (2) | | | Baa3 | | | | 3.250% | | | | 07/15/14 | | | | 250 | | | | 296,250 | |
| Jefferies Group, Inc. (2)(c) | | | Baa2 | | | | 3.875% | | | | 11/01/29 | | | | 100 | | | | 104,875 | |
| Kilroy Realty LP 144A (2)(b)(c) | | | NR | | | | 4.250% | | | | 11/15/14 | | | | 5,425 | | | | 6,238,750 | |
| KKR Financial Holdings LLC (2) | | | NR | | | | 7.000% | | | | 07/15/12 | | | | 125 | | | | 130,000 | |
| Leucadia National Corp. (2)(c) | | | B3 | | | | 3.750% | | | | 04/15/14 | | | | 250 | | | | 350,313 | |
| Lexington Realty Trust 144A (2)(b)(c) | | | NR | | | | 6.000% | | | | 01/15/30 | | | | 550 | | | | 671,000 | |
| MF Global Holdings Ltd. (2)(c) | | | Baa2 | | | | 9.000% | | | | 06/20/38 | | | | 5,500 | | | | 6,586,250 | |
| MGIC Investment Corp. (2) | | | CCC+ | ** | | | 5.000% | | | | 05/01/17 | | | | 10,850 | | | | 12,463,937 | |
| National Financial Partners Corp. 144A (2)(b)(c) | | | CCC+ | ** | | | 4.000% | | | | 06/15/17 | | | | 4,025 | | | | 4,975,906 | |
| Penson Worldwide, Inc. 144A (2)(b)(c) | | | NR | | | | 8.000% | | | | 06/01/14 | | | | 4,275 | | | | 3,884,906 | |
| PMI Group, Inc. (2)(c) | | | CCC+ | ** | | | 4.500% | | | | 04/15/20 | | | | 2,850 | | | | 2,351,250 | |
| ProLogis (2) | | | BBB- | ** | | | 3.250% | | | | 03/15/15 | | | | 100 | | | | 110,750 | |
| Radian Group, Inc. (2)(c) | | | CCC+ | ** | | | 3.000% | | | | 11/15/17 | | | | 5,175 | | | | 5,065,031 | |
| SL Green Operating Partnership LP 144A (2)(b)(c) | | | NR | | | | 3.000% | | | | 10/15/17 | | | | 4,125 | | | | 4,212,656 | |
| Stewart Information Services Corp. 144A (2)(b)(c) | | | NR | | | | 6.000% | | | | 10/15/14 | | | | 4,125 | | | | 4,594,219 | |
| World Acceptance Corp. (2)(c) | | | NR | | | | 3.000% | | | | 10/01/11 | | | | 150 | | | | 152,437 | |
| | | | | | | | | | | | | | | | | | | | |
| | | | | | | | | | | | | | | | | | | 98,247,361 | |
| | | | | | | | | | | | | | | | | | | | |
| Healthcare - 2.2% | | | | | | | | | | | | | | | | | | | | |
| American Oriental Bioengineering, Inc. 144A (2)(b) | | | NR | | | | 5.000% | | | | 07/15/15 | | | | 1,000 | | | | 823,750 | |
| China Medical Technologies, Inc. 144A (Cayman Islands) (2)(b) | | | B+ | ** | | | 6.250% | | | | 12/15/16 | | | | 2,625 | | | | 2,647,969 | |
| China Medical Technologies, Inc., Series CMT (Cayman Islands) (2) | | | NR | | | | 4.000% | | | | 08/15/13 | | | | 250 | | | | 212,500 | |
| Enzon Pharmaceuticals, Inc. (2)(c) | | | NR | | | | 4.000% | | | | 06/01/13 | | | | 3,150 | | | | 4,185,563 | |
| Greatbatch, Inc. (2)(c) | | | NR | | | | 2.250% | | | | 06/15/13 | | | | 2,000 | | | | 1,950,000 | |
| | | | |
| | The accompanying notes are an integral part of these financial statements. | | (Continued) |
| | | | | | | | | | |
| AQR Funds | | | | Annual Report | | | | December 2010 | | 55 |
| | | | | | | |
| | | | |
| Schedule of Investments | | | December 31, 2010 | |
| | | | |
| AQR DIVERSIFIED ARBITRAGE FUND | | | | |
| | | | | | | | | | | | | | | | | | | | |
| | | MOODY’S
RATING* (UNAUDITED) | | | INTEREST
RATE | | | MATURITY
DATE | | | PRINCIPAL
AMOUNT
(000’S) | | | VALUE
(Note 3) | |
| Healthcare - 2.2% (continued) | | | | | | | | | | | | | | | | | | | | |
| Hologic, Inc., Series 2010 (2)(f) | | | BB+ | ** | | | 2.000% | | | | 12/15/37 | | | $ | 1,550 | | | $ | 1,619,750 | |
| MannKind Corp. (2) | | | NR | | | | 3.750% | | | | 12/15/13 | | | | 500 | | | | 325,000 | |
| MannKind Corp. 144A (2)(b)(c) | | | NR | | | | 5.750% | | | | 08/15/15 | | | | 1,540 | | | | 2,079,000 | |
| Molina Healthcare, Inc., Series MOH (2)(c) | | | NR | | | | 3.750% | | | | 10/01/14 | | | | 3,375 | | | | 3,370,781 | |
| NovaMed, Inc. (2) | | | NR | | | | 1.000% | | | | 06/15/12 | | | | 700 | | | | 635,250 | |
| SonoSite, Inc. (2)(c) | | | NR | | | | 3.750% | | | | 07/15/14 | | | | 1,000 | | | | 1,097,500 | |
| Stewart Enterprises, Inc. (2) | | | Ba3 | | | | 3.125% | | | | 07/15/14 | | | | 25 | | | | 24,125 | |
| Valeant Pharmaceuticals International, Inc. 144A (Canada) (2)(b)(c) | | | NR | | | | 5.375% | | | | 08/01/14 | | | | 3,000 | | | | 6,240,000 | |
| West Pharmaceutical Services, Inc. (2)(c) | | | NR | | | | 4.000% | | | | 03/15/47 | | | | 2,000 | | | | 1,832,500 | |
| | | | | | | | | | | | | | | | | | | | |
| | | | | | | | | | | | | | | | | | | 27,043,688 | |
| | | | | | | | | | | | | | | | | | | | |
| Industrials - 4.5% | | | | | | | | | | | | | | | | | | | | |
| Bristow Group, Inc. (2) | | | BB | ** | | | 3.000% | | | | 06/15/38 | | | | 1,000 | | | | 1,002,500 | |
| China Linen Textile Industry, Ltd. (Cayman Islands) (3)(a) | | | NR | | | | 7.500% | | | | 11/12/12 | | | | 1,850 | | | | 1,864,435 | |
| EnPro Industries, Inc. (2)(c) | | | NR | | | | 3.938% | | | | 10/15/15 | | | | 3,575 | | | | 4,978,187 | |
| Genco Shipping & Trading Ltd. (Marshall Islands) (2)(c) | | | NR | | | | 5.000% | | | | 08/15/15 | | | | 500 | | | | 510,625 | |
| General Cable Corp. (2)(c) | | | Ba3 | | | | 0.875% | | | | 11/15/13 | | | | 3,000 | | | | 2,966,250 | |
| Kaman Corp. 144A (2)(b)(c) | | | NR | | | | 3.250% | | | | 11/15/17 | | | | 3,800 | | | | 3,966,250 | |
| Kemet Corp. (2) | | | NR | | | | 2.250% | | | | 11/15/26 | | | | 443 | | | | 439,124 | |
| L-1 Identity Solutions, Inc. (2) | | | B+ | ** | | | 3.750% | | | | 05/15/27 | | | | 3,537 | | | | 3,528,158 | |
| MasTec, Inc. (2) | | | NR | | | | 4.250% | | | | 12/15/14 | | | | 2,400 | | | | 2,877,000 | |
| MasTec, Inc. (2) | | | B+ | ** | | | 4.000% | | | | 06/15/14 | | | | 2,125 | | | | 2,560,625 | |
| Orbital Sciences Corp. (2)(c) | | | BB- | ** | | | 2.438% | | | | 01/15/27 | | | | 800 | | | | 830,000 | |
| RTI International Metals, Inc. (2) | | | NR | | | | 3.000% | | | | 12/01/15 | | | | 3,475 | | | | 3,600,969 | |
| Terex Corp. (2)(c) | | | Caa1 | | | | 4.000% | | | | 06/01/15 | | | | 4,500 | | | | 9,185,625 | |
| Textron, Inc., Series TXT (2)(c) | | | BBB- | ** | | | 4.500% | | | | 05/01/13 | | | | 3,500 | | | | 6,650,000 | |
| Trex Co., Inc. (2)(c) | | | NR | | | | 6.000% | | | | 07/01/12 | | | | 3,970 | | | | 4,982,350 | |
| TTM Technologies, Inc. (2)(c) | | | BB- | ** | | | 3.250% | | | | 05/15/15 | | | | 2,450 | | | | 2,930,812 | |
| Ultrapetrol Bahamas Ltd. 144A (Bahamas) (2)(b) | | | NR | | | | 7.250% | | | | 01/15/17 | | | | 900 | | | | 948,375 | |
| | | | | | | | | | | | | | | | | | | | |
| | | | | | | | | | | | | | | | | | | 53,821,285 | |
| | | | | | | | | | | | | | | | | | | | |
| Information Technology - 5.1% | | | | | | | | | | | | | | | | | | | | |
| ADC Telecommunications, Inc. (2) | | | NR | | | | 3.500% | | | | 07/15/17 | | | | 2,924 | | | | 2,924,000 | |
| ADC Telecommunications, Inc. (2) | | | NR | | | | 3.500% | | | | 07/15/15 | | | | 1,837 | | | | 1,837,000 | |
| Arris Group, Inc. (2)(c) | | | NR | | | | 2.000% | | | | 11/15/26 | | | | 650 | | | | 665,438 | |
| Bell Microproducts, Inc., Series B (2)(c) | | | NR | | | | 3.750% | | | | 03/05/24 | | | | 6,900 | | | | 6,917,250 | |
| Cadence Design Systems, Inc. 144A (2)(b)(c) | | | NR | | | | 2.625% | | | | 06/01/15 | | | | 3,325 | | | | 4,201,969 | |
| CommScope, Inc. (2)(c) | | | B | ** | | | 3.250% | | | | 07/01/15 | | | | 3,500 | | | | 4,550,000 | |
| Concur Technologies, Inc. 144A (2)(b)(c) | | | NR | | | | 2.500% | | | | 04/15/15 | | | | 200 | | | | 236,250 | |
| DST Systems, Inc., Series C (2)(f)(c) | | | NR | | | | 4.125% | | | | 08/15/23 | | | | 3,225 | | | | 3,587,812 | |
| EMC Corp./Massachusetts, Series A (2)(c) | | | A- | ** | | | 1.750% | | | | 12/01/11 | | | | 1,725 | | | | 2,494,781 | |
| EMC Corp./Massachusetts, Series B (2)(c) | | | A- | ** | | | 1.750% | | | | 12/01/13 | | | | 3,000 | | | | 4,518,750 | |
| GSI Commerce, Inc. (2) | | | NR | | | | 2.500% | | | | 06/01/27 | | | | 25 | | | | 27,156 | |
| Hutchinson Technology, Inc. (2)(c) | | | NR | ** | | | 3.250% | | | | 01/15/26 | | | | 250 | | | | 179,063 | |
| Mentor Graphics Corp. (2)(c) | | | NR | | | | 6.250% | | | | 03/01/26 | | | | 150 | | | | 159,750 | |
| Micron Technology, Inc. (2) | | | B+ | ** | | | 4.250% | | | | 10/15/13 | | | | 250 | | | | 440,000 | |
| ON Semiconductor Corp. (2)(c) | | | Ba2 | | | | 1.875% | | | | 12/15/25 | | | | 250 | | | | 368,437 | |
| Photronics, Inc. (2)(c) | | | NR | | | | 5.500% | | | | 10/01/14 | | | | 2,200 | | | | 3,049,750 | |
| Quantum Corp. MTN 144A (2)(b) | | | NR | | | | 3.500% | | | | 11/15/15 | | | | 700 | | | | 771,750 | |
| Rambus, Inc. (2)(c) | | | NR | | | | 5.000% | | | | 06/15/14 | | | | 6,450 | | | | 8,393,063 | |
| SanDisk Corp. (2) | | | BB- | ** | | | 1.500% | | | | 08/15/17 | | | | 775 | | | | 874,781 | |
| Take-Two Interactive Software, Inc. (2)(c) | | | NR | | | | 4.375% | | | | 06/01/14 | | | | 3,825 | | | | 5,154,187 | |
| Telvent GIT SA 144A (Spain) (2)(b) | | | NR | | | | 5.500% | | | | 04/15/15 | | | | 1,400 | | | | 1,520,750 | |
| THQ, Inc. (2)(c) | | | NR | | | | 5.000% | | | | 08/15/14 | | | | 2,500 | | | | 2,603,125 | |
| Verigy Ltd. (Singapore) (2)(c) | | | NR | | | | 5.250% | | | | 07/15/14 | | | | 1,325 | | | | 1,571,781 | |
| VeriSign, Inc. (2)(c) | | | NR | | | | 3.250% | | | | 08/15/37 | | | | 3,870 | | | | 4,339,238 | |
| | | | | | | | | | | | | | | | | | | | |
| | | | | | | | | | | | | | | | | | | 61,386,081 | |
| | | | | | | | | | | | | | | | | | | | |
| | | | |
| | The accompanying notes are an integral part of these financial statements. | | (Continued) |
| | | | | | | | | | |
| AQR Funds | | | | Annual Report | | | | December 2010 | | 56 |
| | | | | | | |
| | | | |
| Schedule of Investments | | | December 31, 2010 | |
| | | | |
| AQR DIVERSIFIED ARBITRAGE FUND | | | | |
| | | | | | | | | | | | | | | | | | | | |
| | | MOODY’S
RATING* (UNAUDITED) | | | INTEREST
RATE | | | MATURITY
DATE | | | PRINCIPAL
AMOUNT
(000’S) | | | VALUE
(Note 3) | |
| Materials - 3.1% | | | | | | | | | | | | | | | | | | | | |
| Alcoa, Inc. (2)(c) | | | Baa3 | | | | 5.250% | | | | 03/15/14 | | | $ | 400 | | | $ | 989,500 | |
| ArcelorMittal (Luxembourg) (2)(c) | | | Baa3 | | | | 5.000% | | | | 05/15/14 | | | | 6,375 | | | | 9,211,875 | |
| Cemex SAB de CV 144A (Mexico) (2)(b) | | | NR | | | | 4.875% | | | | 03/15/15 | | | | 3,200 | | | | 3,496,000 | |
| Kaiser Aluminum Corp. 144A (2)(b) | | | NR | | | | 4.500% | | | | 04/01/15 | | | | 300 | | | | 367,800 | |
| Northgate Minerals Corp. (Canada) (2)(c) | | | NR | | | | 3.500% | | | | 10/01/16 | | | | 1,925 | | | | 2,071,781 | |
| Owens-Brockway Glass Container, Inc. 144A (2)(b)(c) | | | Ba3 | | | | 3.000% | | | | 06/01/15 | | | | 4,400 | | | | 4,427,500 | |
| ShengdaTech, Inc. 144A (2)(b) | | | NR | | | | 6.500% | | | | 12/15/15 | | | | 1,200 | | | | 1,204,500 | |
| ShengdaTech, Inc. 144A (2)(b) | | | NR | | | | 6.000% | | | | 06/01/18 | | | | 200 | | | | 193,000 | |
| Sino-Forest Corp. 144A (Canada) (2)(b)(c) | | | BB | ** | | | 4.250% | | | | 12/15/16 | | | | 450 | | | | 586,125 | |
| Steel Dynamics, Inc. (2) | | | BB+ | ** | | | 5.125% | | | | 06/15/14 | | | | 400 | | | | 507,000 | |
| Sterlite Industries India Ltd. (India) (2)(c) | | | NR | | | | 4.000% | | | | 10/30/14 | | | | 5,350 | | | | 5,564,000 | |
| Stillwater Mining Co. (2) | | | B+ | ** | | | 1.875% | | | | 03/15/28 | | | | 1,000 | | | | 1,142,500 | |
| United States Steel Corp. (2)(c) | | | Ba2 | | | | 4.000% | | | | 05/15/14 | | | | 4,000 | | | | 7,760,000 | |
| | | | | | | | | | | | | | | | | | | | |
| | | | | | | | | | | | | | | | | | | 37,521,581 | |
| | | | | | | | | | | | | | | | | | | | |
| Telecommunication Services - 1.6% | | | | | | | | | | | | | | | | | | | | |
| Alaska Communications Systems Group, Inc. (2)(c) | | | NR | | | | 5.750% | | | | 03/01/13 | | | | 650 | | | | 684,938 | |
| Cleveland Unlimited, Inc. † 144A (2)(b)(e) | | | Caa2 | | | | 5.000% | | | | 12/15/10 | | | | 1,830 | | | | 1,830,000 | |
| Level 3 Communications, Inc. (2)(c) | | | Caa3 | | | | 6.500% | | | | 10/01/16 | | | | 2,675 | | | | 2,885,656 | |
| Level 3 Communications, Inc. (2) | | | Caa3 | | | | 3.500% | | | | 06/15/12 | | | | 500 | | | | 475,000 | |
| Level 3 Communications, Inc., Series B (2) | | | Caa3 | | | | 7.000% | | | | 03/15/15 | | | | 1,280 | | | | 1,206,400 | |
| NII Holdings, Inc. (2) | | | B- | ** | | | 3.125% | | | | 06/15/12 | | | | 1,980 | | | | 1,942,875 | |
| tw telecom inc (2)(c) | | | B3 | | | | 2.375% | | | | 04/01/26 | | | | 1,075 | | | | 1,183,844 | |
| XM Satellite Radio, Inc. 144A (2)(b)(c) | | | BB- | ** | | | 7.000% | | | | 12/01/14 | | | | 8,100 | | | | 9,942,750 | |
| | | | | | | | | | | | | | | | | | | | |
| | | | | | | | | | | | | | | | | | | 20,151,463 | |
| | | | | | | | | | | | | | | | | | | | |
TOTAL CONVERTIBLE BONDS
(cost $483,487,318) | | | | | | | | | | | | | | | | | | | 547,288,559 | |
| | | | | | | | | | | | | | | | | | | | |
| | | | |
| | The accompanying notes are an integral part of these financial statements. | | (Continued) |
| | | | | | | | | | |
| AQR Funds | | | | Annual Report | | | | December 2010 | | 57 |
| | | | | | | |
| | | | |
| Schedule of Investments | | | December 31, 2010 | |
| | | | |
| AQR DIVERSIFIED ARBITRAGE FUND | | | | |
| | | | | | | | |
| CLOSED END FUNDS - 0.9% | | SHARES | | | VALUE
(Note 3) | |
| BlackRock Apex Municipal Fund, Inc. | | | 858 | | | $ | 7,336 | |
| Blackrock Core Bond Trust (c) | | | 21,262 | | | | 266,200 | |
| BlackRock Corporate High Yield Fund III, Inc. | | | 17,906 | | | | 121,224 | |
| BlackRock Corporate High Yield Fund V, Inc. | | | 24,223 | | | | 279,533 | |
| BlackRock Corporate High Yield Fund VI, Inc. (c) | | | 6,139 | | | | 71,397 | |
| BlackRock Corporate High Yield Fund, Inc. | | | 6,485 | | | | 44,033 | |
| BlackRock Credit Allocation Income Trust II, Inc. | | | 46,685 | | | | 458,913 | |
| Blackrock Credit Allocation Income Trust III, Inc. (c) | | | 33,890 | | | | 356,523 | |
| Blackrock Credit Allocation Income Trust IV | | | 50,655 | | | | 612,925 | |
| BlackRock Debt Strategies Fund, Inc. | | | 15,366 | | | | 58,544 | |
| BlackRock Income Opportunity Trust, Inc. | | | 29,727 | | | | 288,055 | |
| BlackRock Limited Duration Income Trust | | | 4,207 | | | | 68,574 | |
| BlackRock MuniAssets Fund, Inc. | | | 520 | | | | 6,079 | |
| Credit Suisse Asset Management Income Fund, Inc. | | | 2,821 | | | | 10,043 | |
| Eaton Vance Tax-Advantaged Bond and Options Strategies Fund | | | 2,387 | | | | 39,934 | |
| Invesco Municipal Income Opportunities Trust | | | 3,227 | | | | 19,943 | |
| Invesco Municipal Income Opportunities Trust II | | | 2,196 | | | | 14,977 | |
| Invesco Van Kampen Bond Fund | | | 3,681 | | | | 68,614 | |
| Montgomery Street Income Securities, Inc. | | | 661 | | | | 10,431 | |
| Morgan Stanley Income Securities, Inc. | | | 2,908 | | | | 48,942 | |
| Nuveen California Municipal Value Fund | | | 2,219 | | | | 19,150 | |
| Nuveen Quality Preferred Income Fund | | | 69,458 | | | | 513,989 | |
| Nuveen Quality Preferred Income Fund II | | | 112,713 | | | | 890,433 | |
| Nuveen Quality Preferred Income Fund III | | | 19,772 | | | | 152,442 | |
| Petroleum & Resources Corp. | | | 43,122 | | | | 1,164,725 | |
| Royce Focus Trust, Inc. † | | | 68,244 | | | | 516,607 | |
| Royce Micro-Cap Trust, Inc. | | | 20,022 | | | | 196,216 | |
| Royce Value Trust, Inc. | | | 1,261 | | | | 18,335 | |
| Sprott Physical Gold Trust (Canada) † | | | 303,963 | | | | 3,752,423 | |
| Transamerica Income Shares, Inc. | | | 348 | | | | 7,204 | |
| Western Asset Global Corporate Defined Opportunity Fund, Inc. | | | 28,801 | | | | 516,402 | |
| Western Asset Income Fund | | | 5,860 | | | | 75,535 | |
| Western Asset Investment Grade Defined Opportunity Trust, Inc. | | | 2,246 | | | | 44,942 | |
| | | | | | | | |
TOTAL CLOSED END FUNDS
(cost $10,051,725) | | | | | | | 10,720,623 | |
| | | | | | | | |
| RIGHTS - 0% (g) | | | | | | | | |
Celgene Corp. †
(cost $308,407) | | | 58,190 | | | | 285,131 | |
| | | | | | | | |
| | | | | | | | |
| | | SHARES | | | VALUE
(Note 3) | |
| WARRANTS - 2.7% | | | | | | | | |
| Consumer Discretionary - 0.1% | | | | | | | | |
| China XD Plastics Co. Ltd. (3)†(a) | | | 183,332 | | | $ | 48,638 | |
| Jack Cooper Holdings Corp. † | | | 1,775 | | | | 7,100 | |
| Kandi Technologies Corp. (3)†(a) | | | 169,478 | | | | 199,077 | |
| SouthPeak Interactive Corp. (3)†(a) | | | 5,800,464 | | | | 140,661 | |
| Talbots, Inc. † | | | 195,798 | | | | 256,496 | |
| | | | | | | | |
| | | | | | | 651,972 | |
| | | | | | | | |
| Consumer Staples - 0.0% (g) | | | | | | | | |
| Celsius Holdings, Inc. † | | | 52,500 | | | | 5,250 | |
| HQ Sustainable Maritime Industries, Inc. (3)† | | | 62,284 | | | | 89,951 | |
| | | | | | | | |
| | | | | | | 95,201 | |
| | | | | | | | |
| Energy - 0.0% (g) | | | | | | | | |
| Camac Energy, Inc. (3)† | | | 88,191 | | | | 49,784 | |
| Uranium Energy Corp. (3)†(a) | | | 318,906 | | | | 387,853 | |
| | | | | | | | |
| | | | | | | 437,637 | |
| | | | | | | | |
| Financials - 2.4% | | | | | | | | |
| 57th Street General Acquisition Corp. † | | | 292,050 | | | | 102,217 | |
| Comerica, Inc. † | | | 444,071 | | | | 7,327,172 | |
| Edgewater Exploration Ltd. (Canada) (3)†(a) | | | 250,000 | | | | 73,869 | |
| European CleanTech SE (Germany) (2)† | | | 621,000 | | | | 219,106 | |
| Gerova Financial Group Ltd. † | | | 138,792 | | | | 81,887 | |
| GSME Acquisition Partners I † | | | 56,004 | | | | 13,441 | |
| Helikos SE (Germany) (2)† | | | 72,000 | | | | 62,785 | |
| Lincoln National Corp. † | | | 607,525 | | | | 11,962,167 | |
| PNC Financial Services Group, Inc. † | | | 258,400 | | | | 3,728,712 | |
| Signature Bank † | | | 107,610 | | | | 2,772,034 | |
| Sterling Bancshares, Inc. † | | | 9,708 | | | | 23,493 | |
| Texas Capital Bancshares, Inc. † | | | 16,077 | | | | 184,885 | |
| Valley National Bancorp † | | | 49,509 | | | | 126,248 | |
| Wells Fargo & Co. † | | | 151,514 | | | | 1,683,321 | |
| | | | | | | | |
| | | | | | | 28,361,337 | |
| | | | | | | | |
| Health Care - 0.0% (g) | | | | | | | | |
| Access Pharmaceuticals, Inc. (3)†(a) | | | 68,407 | | | | 7,809 | |
| Cormedix, Inc. † | | | 75,400 | | | | 22,620 | |
| CryoPort, Inc. (3)†(a) | | | 571,428 | | | | 63,943 | |
| ReGeneRx Biopharmaceuticals, Inc. † | | | 240,000 | | | | 12,000 | |
| Rosetta Genomics Ltd. (Israel) (3)†(a) | | | 191,250 | | | | 49,868 | |
| Rosetta Genomics Ltd., Series B (Israel) (3)†(a) | | | 95,625 | | | | — | |
| | | | | | | | |
| | | | | | | 156,240 | |
| | | | | | | | |
| Industrials - 0.0% (g) | | | | | | | | |
| Advanced Battery Technologies, Inc. (3)†(a) | | | 482,500 | | | | 111,289 | |
| China Wood, Inc. (3)†(a) | | | 94,000 | | | | 70,942 | |
| | | | | | | | |
| | | | | | | 182,231 | |
| | | | | | | | |
| Information Technology - 0.0% (g) | | | | | | | | |
| Authentidate Holding Corp. (3)†(a) | | | 1,090,000 | | | | 130,309 | |
| Magic Software Enterprises Ltd. (Israel) (3)† | | | 132,782 | | | | 171,355 | |
| | | | |
| | The accompanying notes are an integral part of these financial statements. | | (Continued) |
| | | | | | | | | | |
| AQR Funds | | | | Annual Report | | | | December 2010 | | 58 |
| | | | | | | |
| | | | |
| Schedule of Investments | | | December 31, 2010 | |
| | | | |
| AQR DIVERSIFIED ARBITRAGE FUND | | | | |
| | | | | | | | |
| | | SHARES | | | VALUE
(Note 3) | |
| Information Technology - 0.0% (continued) (g) | | | | | |
| Orckit Communications Ltd. (Israel) (3)†(a) | | | 84,282 | | | $ | 54,906 | |
| | | | | | | | |
| | | | | | | 356,570 | |
| | | | | | | | |
| Materials - 0.2% | | | | | | | | |
| Aurcana Corp. (Canada) (3)† | | | 623,387 | | | | 157,810 | |
| Kangaroo Resources Ltd. (Australia) (3)†(a) | | | 24,137,931 | | | | 1,735,517 | |
| Kinross Gold Corp. (Canada) †(a) | | | 37,797 | | | | 178,401 | |
| | | | | | | | |
| | | | | | | 2,071,728 | |
| | | | | | | | |
| Utilities - 0.0% (g) | | | | | | | | |
| China Hydroelectric Corp. † | | | 24,500 | | | | 7,350 | |
| | | | | | | | |
TOTAL WARRANTS
(cost $27,822,069) | | | | | | | 32,320,266 | |
| | | | | | | | |
| MONEY MARKET FUNDS - 5.5% | | | | | | | | |
| Dreyfus Institutional Cash Advantage Fund, Class I, 0.180% (2)(h) | | | 89,497 | | | | 89,497 | |
| J.P. Morgan Prime Money Market Fund Capital Shares, 0.130% (2)(h) | | | 66,343,045 | | | | 66,343,045 | |
| | | | | | | | |
TOTAL MONEY MARKET FUNDS
(cost $66,432,542) | | | | | | | 66,432,542 | |
| | | | | | | | |
TOTAL INVESTMENTS, BEFORE SECURITIES SOLD SHORT
(cost $1,416,727,687) | | | | | | | 1,523,138,652 | |
| | | | | | | | |
| |
| SECURITIES SOLD SHORT- (54.3)% | | | | | |
| |
| COMMON STOCKS - (52.6)% | | | | | |
| |
| Consumer Discretionary - (13.6)% | | | | | |
| Beazer Homes USA, Inc. † | | | (182,112) | | | | (981,584) | |
| CBS Corp., Class B | | | (9,650) | | | | (183,833) | |
| Coinstar, Inc. † | | | (46,336) | | | | (2,615,204) | |
| Comcast Corp., Class A | | | (1,201,128) | | | | (26,388,782) | |
| Discovery Communications, Inc., Class A † | | | (480,733) | | | | (20,046,566) | |
| DR Horton, Inc. | | | (363,431) | | | | (4,335,732) | |
| Eastman Kodak Co. † | | | (746,349) | | | | (4,000,431) | |
| Exide Technologies † | | | (22,479) | | | | (211,527) | |
| Gaylord Entertainment Co. † | | | (308,068) | | | | (11,071,964) | |
| Icahn Enterprises LP | | | (675) | | | | (23,666) | |
| Jakks Pacific, Inc. † | | | (205,942) | | | | (3,752,263) | |
| Lennar Corp., Class A | | | (227,838) | | | | (4,271,963) | |
| Liberty Global, Inc., Class A † | | | (697,519) | | | | (24,678,222) | |
| MGM Resorts International † | | | (204,547) | | | | (3,037,523) | |
| News Corp., Class B | | | (720,732) | | | | (11,834,419) | |
| priceline.com, Inc. † | | | (21,086) | | | | (8,424,911) | |
| Regis Corp. | | | (242,479) | | | | (4,025,151) | |
| Saks, Inc. † | | | (135,826) | | | | (1,453,338) | |
| Sirius XM Radio, Inc. † | | | (3,181,842) | | | | (5,218,221) | |
| Sonic Automotive, Inc., Class A | | | (433,828) | | | | (5,743,883) | |
| Stewart Enterprises, Inc., Class A | | | (790) | | | | (5,285) | |
| Talbots, Inc. † | | | (54,773) | | | | (466,666) | |
| TRW Automotive Holdings Corp. † | | | (174,160) | | | | (9,178,232) | |
| Viacom, Inc., Class A | | | (71,249) | | | | (3,267,479) | |
| Virgin Media, Inc. | | | (320,485) | | | | (8,730,011) | |
| | | | | | | | |
| | | | | | | (163,946,856) | |
| | | | | | | | |
| | | | | | | | |
| | | SHARES | | | VALUE
(Note 3) | |
| Consumer Staples - (2.0)% | | | | | | | | |
| Alliance One International, Inc. † | | | (477,918) | | | $ | (2,026,372) | |
| American Oriental Bioengineering, Inc. (China) † | | | (42,401) | | | | (101,763) | |
| Bunge Ltd. (Bermuda) | | | (10,326) | | | | (676,560) | |
| Central European Distribution Corp. † | | | (4,200) | | | | (96,180) | |
| Central Garden and Pet Co., Class A † | | | (583,483) | | | | (5,764,812) | |
| Chiquita Brands International, Inc. † | | | (142,564) | | | | (1,998,747) | |
| Dole Food Co., Inc. † | | | (3,020) | | | | (40,800) | |
| Embotelladora Andina SA, Class B ADR (Chile) | | | (10,000) | | | | (302,700) | |
| Green Mountain Coffee Roasters, Inc. † | | | (31,981) | | | | (1,050,896) | |
| Nash Finch Co. | | | (24,573) | | | | (1,044,598) | |
| Rite Aid Corp. † | | | (241,388) | | | | (213,194) | |
| Spartan Stores, Inc. | | | (1,913) | | | | (32,425) | |
| Tyson Foods, Inc., Class A | | | (172,842) | | | | (2,976,339) | |
| Universal Corp. | | | (117,001) | | | | (4,761,941) | |
| Vector Group Ltd. | | | (183,643) | | | | (3,180,697) | |
| | | | | | | | |
| | | | | | | (24,268,024) | |
| | | | | | | | |
| Energy - (1.9)% | | | | | | | | |
| Boardwalk Pipeline Partners LP | | | (2,300) | | | | (71,599) | |
| Bristow Group, Inc. † | | | (10,4480 | | | | (494,713) | |
| Diamond Offshore Drilling, Inc. | | | (1,240) | | | | (82,919) | |
| Energy XXI Bermuda Ltd. (Bermuda) † | | | (10,800) | | | | (298,836) | |
| Exterran Holdings, Inc. † | | | (128,797) | | | | (3,084,688) | |
| GMX Resources, Inc. † | | | (42,025) | | | | (231,978) | |
| Goodrich Petroleum Corp. † | | | (16,131) | | | | (284,551) | |
| Green Plains Renewable Energy, Inc. † | | | (220,277) | | | | (2,480,319) | |
| Harvest Natural Resources, Inc. † | | | (77,332) | | | | (941,130) | |
| International Coal Group, Inc. † | | | (554,054) | | | | (4,288,378) | |
| James River Coal Co. † | | | (16,255) | | | | (411,739) | |
| PetroBakken Energy Ltd., Class A (Canada) | | | (7,035) | | | | (153,706) | |
| Petrobank Energy & Resources Ltd. (Canada) †(b) | | | (15,531) | | | | (394,664) | |
| Petrominerales Ltd. (Canada) | | | (48,159) | | | | (1,607,159) | |
| Pioneer Natural Resources Co. | | | (12,675) | | | | (1,100,443) | |
| Seadrill Ltd. (Bermuda) | | | (169,127) | | | | (5,736,788) | |
| Western Refining, Inc. † | | | (131,434) | | | | (1,390,572) | |
| Whiting Petroleum Corp. † | | | (2,525) | | | | (295,905) | |
| Willbros Group, Inc. † | | | (647) | | | | (6,353) | |
| | | | | | | | |
| | | | | | | (23,356,440) | |
| | | | | | | | |
| Financials - (10.8)% | | | | | | | | |
| American Equity Investment Life Holding Co. | | | (99,527) | | | | (1,249,064) | |
| Annaly Capital Management, Inc. REIT | | | (261,717) | | | | (4,689,969) | |
| Banco Santander SA ADR (Spain) | | | (20,034) | | | | (213,362) | |
| Bank of Montreal (Canada) | | | (102,514) | | | | (5,901,731) | |
| Berkshire Hills Bancorp, Inc. | | | (9,135) | | | | (201,884) | |
| BioMed Realty Trust, Inc. REIT | | | (118,871) | | | | (2,216,944) | |
| Boston Properties, Inc. REIT | | | (13,000) | | | | (1,119,300) | |
| CNA Financial Corp. † | | | (4,275) | | | | (115,639) | |
| CNO Financial Group, Inc. † | | | (1,287,232) | | | | (8,727,433) | |
| Comerica, Inc. | | | (349,955) | | | | (14,782,099) | |
| Community Bank System, Inc. | | | (20,287) | | | | (563,370) | |
| Developers Diversified Realty Corp. REIT | | | (116,457) | | | | (1,640,879) | |
| Digital Realty Trust, Inc. REIT | | | (139,150) | | | | (7,171,791) | |
| Dollar Financial Corp. † | | | (2,106) | | | | (60,295) | |
| | | | |
| | The accompanying notes are an integral part of these financial statements. | | (Continued) |
| | | | | | | | | | |
| AQR Funds | | | | Annual Report | | | | December 2010 | | 59 |
| | | | | | | |
| | | | |
| Schedule of Investments | | | December 31, 2010 | |
| | | | |
| AQR DIVERSIFIED ARBITRAGE FUND | | | | |
| | | | | | | | |
| | | SHARES | | | VALUE
(Note 3) | |
| Financials - (10.8)% (continued) | | | | | | | | |
| First Niagara Financial Group, Inc. | | | (865,322) | | | $ | (12,097,202) | |
| Hancock Holding Co. | | | (36,016) | | | | (1,255,518) | |
| Hilltop Holdings, Inc. † | | | (37,500) | | | | (372,000) | |
| Host Hotels & Resorts, Inc. REIT | | | (196,067) | | | | (3,503,717) | |
| Jefferies Group, Inc. | | | (1,335) | | | | (35,551) | |
| Kilroy Realty Corp. REIT | | | (92,022) | | | | (3,356,042) | |
| KKR Financial Holdings LLC | | | (700) | | | | (6,510) | |
| Leucadia National Corp. | | | (9,080) | | | | (264,954) | |
| Lexington Realty Trust REIT | | | (55,872) | | | | (444,182) | |
| Lincoln National Corp. | | | (555,588) | | | | (15,450,902) | |
| M&T Bank Corp. | | | (260) | | | | (22,633) | |
| MF Global Holdings Ltd. † | | | (481,976) | | | | (4,029,319) | |
| MGIC Investment Corp. † | | | (629,805) | | | | (6,417,713) | |
| Nara Bancorp, Inc. † | | | (76,112) | | | | (747,420) | |
| National Financial Partners Corp. † | | | (275,083) | | | | (3,686,112) | |
| Penson Worldwide, Inc. † | | | (211,200) | | | | (1,032,768) | |
| PMI Group, Inc. † | | | (307,167) | | | | (1,013,651) | |
| PNC Financial Services Group, Inc. | | | (167,355) | | | | (10,161,796) | |
| ProLogis REIT | | | (3,500) | | | | (50,540) | |
| Radian Group, Inc. | | | (358,644) | | | | (2,894,257) | |
| Signature Bank † | | | (99,627) | | | | (4,981,350) | |
| SL Green Realty Corp. REIT | | | (33,600) | | | | (2,268,336) | |
| SLM Corp. † | | | (57,250) | | | | (720,778) | |
| Sterling Bancshares, Inc. | | | (6,264) | | | | (43,973) | |
| Stewart Information Services Corp. | | | (205,889) | | | | (2,373,900) | |
| Texas Capital Bancshares, Inc. † | | | (13,343) | | | | (283,806) | |
| Valley National Bancorp | | | (25,779) | | | | (368,640) | |
| Wells Fargo & Co. | | | (90,164) | | | | (2,794,182) | |
| Wintrust Financial Corp. | | | (24,567) | | | | (811,448) | |
| World Acceptance Corp. † | | | (1,001) | | | | (52,853) | |
| | | | | | | | |
| | | | | | | (130,195,813) | |
| | | | | | | | |
| Health Care - (1.5)% | | | | | | | | |
| China Medical Technologies, Inc. ADR (China) † | | | (337) | | | | (3,788) | |
| Enzon Pharmaceuticals, Inc. † | | | (194,598) | | | | (2,368,258) | |
| Greatbatch, Inc. † | | | (20,095) | | | | (485,294) | |
| Hologic, Inc. † | | | (49,100) | | | | (924,062) | |
| Incyte Corp. Ltd. † | | | (105,900) | | | | (1,753,704) | |
| MannKind Corp. † | | | (144,979) | | | | (1,168,531) | |
| Molina Healthcare, Inc. † | | | (34,498) | | | | (960,769) | |
| Mylan, Inc./PA † | | | (1) | | | | (21) | |
| NovaMed, Inc. † | | | (10,993) | | | | (126,749) | |
| Novartis AG ADR (Switzerland) | | | (10,373) | | | | (611,488) | |
| PDL BioPharma, Inc. | | | (133,923) | | | | (834,340) | |
| SonoSite, Inc. † | | | (16,814) | | | | (531,323) | |
| St Jude Medical, Inc. † | | | (46,460) | | | | (1,986,165) | |
| Valeant Pharmaceuticals International, Inc. (Canada) | | | (195,579) | | | | (5,532,930) | |
| West Pharmaceutical Services, Inc. | | | (28,208) | | | | (1,162,170) | |
| | | | | | | | |
| | | | | | | (18,449,592) | |
| | | | | | | | |
| Industrials - (8.1)% | | | | | | | | |
| AMR Corp. † | | | (549,277) | | | | (4,278,868) | |
| ArvinMeritor, Inc. † | | | (71,500) | | | | (1,467,180) | |
| Avis Budget Group, Inc. † | | | (128,625) | | | | (2,001,405) | |
| CBIZ, Inc. † | | | (136,992) | | | | (854,830) | |
| EnPro Industries, Inc. † | | | (90,478) | | | | (3,760,266) | |
| | | | | | | | |
| | | SHARES | | | VALUE
(Note 3) | |
| Industrials - (8.1)% (continued) | | | | | | | | |
| FTI Consulting, Inc. † | | | (33,022) | | | $ | (1,231,060) | |
| Genco Shipping & Trading Ltd. † | | | (19,411) | | | | (279,518) | |
| GenCorp, Inc. † | | | (22,277) | | | | (115,172) | |
| General Cable Corp. † | | | (30,877) | | | | (1,083,474) | |
| HEICO Corp. | | | (177,853) | | | | (9,075,839) | |
| Hertz Global Holdings, Inc. † | | | (1,255,749) | | | | (18,195,803) | |
| Hubbell, Inc., Class B | | | (2,194) | | | | (131,925) | |
| Kaman Corp. | | | (22,563) | | | | (655,906) | |
| Kansas City Southern † | | | (40,307) | | | | (1,929,093) | |
| MasTec, Inc. † | | | (213,245) | | | | (3,111,245) | |
| Navistar International Corp. † | | | (30,150) | | | | (1,745,987) | |
| Orbital Sciences Corp. † | | | (15,437) | | | | (264,436) | |
| Robbins & Myers, Inc. | | | (229,716) | | | | (8,219,238) | |
| Rush Enterprises, Inc., Class A † | | | (1,000) | | | | (20,440) | |
| Southwest Airlines Co. | | | (119,113) | | | | (1,546,087) | |
| Terex Corp. † | | | (257,483) | | | | (7,992,272) | |
| Textron, Inc. | | | (242,662) | | | | (5,736,530) | |
| Titan International, Inc. | | | (514,273) | | | | (10,048,894) | |
| Trex Co., Inc. † | | | (138,054) | | | | (3,307,774) | |
| United Rentals, Inc. † | | | (489,648) | | | | (11,139,492) | |
| | | | | | | | |
| | | | | | | (98,192,734) | |
| | | | | | | | |
| Information Technology - (7.2)% | | | | | | | | |
| Alliance Data Systems Corp. † | | | (145,078) | | | | (10,304,890) | |
| Arris Group, Inc. † | | | (18,477) | | | | (207,312) | |
| Cadence Design Systems, Inc. † | | | (356,971) | | | | (2,948,580) | |
| Calix, Inc. † | | | (146,725) | | | | (2,479,653) | |
| Ciena Corp. † | | | (308,000) | | | | (6,483,400) | |
| CommScope, Inc. † | | | (101,873) | | | | (3,180,475) | |
| Concur Technologies, Inc. † | | | (2,900) | | | | (150,597) | |
| Convergys Corp. † | | | (115,546) | | | | (1,521,741) | |
| Digital River, Inc. † | | | (32,713) | | | | (1,125,982) | |
| DST Systems, Inc. | | | (35,364) | | | | (1,568,393) | |
| Ebix, Inc. † | | | (41,413) | | | | (980,246) | |
| EMC Corp./Massachusetts † | | | (260,142) | | | | (5,957,252) | |
| Equinix, Inc. † | | | (11,954) | | | | (971,382) | |
| Finisar Corp. † | | | (62,568) | | | | (1,857,644) | |
| GSI Commerce, Inc. † | | | (537) | | | | (12,458) | |
| GT Solar International, Inc. † | | | (60,360) | | | | (550,483) | |
| Kemet Corp. † | | | (4,088) | | | | (59,603) | |
| Mentor Graphics Corp. † | | | (201) | | | | (2,412) | |
| Micron Technology, Inc. † | | | (134,101) | | | | (1,075,490) | |
| Molex, Inc. | | | (578,121) | | | | (13,134,909) | |
| Motorola Mobility Holdings, Inc. † | | | (36,217) | | | | (1,053,915) | |
| Motorola Solutions, Inc. † | | | (42,758) | | | | (1,626,942) | |
| ON Semiconductor Corp. † | | | (29,965) | | | | (296,054) | |
| Photronics, Inc. † | | | (367,819) | | | | (2,173,810) | |
| Quantum Corp. † | | | (128,457) | | | | (477,860) | |
| Rambus, Inc. † | | | (237,137) | | | | (4,856,566) | |
| Rovi Corp. † | | | (9,345) | | | | (579,483) | |
| SanDisk Corp. † | | | (12,200) | | | | (608,292) | |
| Sohu.com, Inc. (China) † | | | (31,532) | | | | (2,001,967) | |
| Take-Two Interactive Software, Inc. † | | | (286,655) | | | | (3,508,657) | |
| Telvent GIT SA (Spain) † | | | (28,773) | | | | (760,183) | |
| THQ, Inc. † | | | (187,984) | | | | (1,139,183) | |
| TTM Technologies, Inc. † | | | (118,266) | | | | (1,763,346) | |
| VeriFone Systems, Inc. † | | | (198,678) | | | | (7,661,024) | |
| Verigy Ltd. (Singapore) † | | | (63,612) | | | | (828,228) | |
| | | | |
| | The accompanying notes are an integral part of these financial statements. | | (Continued) |
| | | | | | | | | | |
| AQR Funds | | | | Annual Report | | | | December 2010 | | 60 |
| | | | | | | |
| | | | |
| Schedule of Investments | | | December 31, 2010 | |
| | | | |
| AQR DIVERSIFIED ARBITRAGE FUND | | | | |
| | | | | | | | |
| | | SHARES | | | VALUE
(Note 3) | |
| Information Technology - (7.2)% (continued) | | | | | |
| VeriSign, Inc. | | | (100,869) | | | $ | (3,295,390) | |
| WebMD Health Corp. † | | | (1) | | | | (51) | |
| | | | | | | | |
| | | | | | | (87,203,853) | |
| | | | | | | | |
| Materials - (4.6)% | | | | | | | | |
| Alcoa, Inc. | | | (57,855) | | | | (890,388) | |
| Allegheny Technologies, Inc. | | | (86,428) | | | | (4,769,097) | |
| ArcelorMittal NYRS (Luxembourg) | | | (154,343) | | | | (5,885,099) | |
| BHP Billiton Ltd. ADR (Australia) | | | (155,985) | | | | (14,494,126) | |
| Cemex SAB de CV ADR (Mexico) † | | | (188,374) | | | | (2,017,486) | |
| Goldcorp, Inc. (Canada) | | | (215,146) | | | | (9,933,979) | |
| Kaiser Aluminum Corp. | | | (4,543) | | | | (227,559) | |
| Kinross Gold Corp. (Canada) | | | (22,328) | | | | (423,339) | |
| Monsanto Co. | | | (3,820) | | | | (266,025) | |
| Northgate Minerals Corp. (Canada) | | | (358,342) | | | | (1,146,694) | |
| Owens-Illinois, Inc. † | | | (50,040) | | | | (1,536,228) | |
| ShengdaTech, Inc. (China) † | | | (5,646) | | | | (27,665) | |
| Sino-Forest Corp. (Hong Kong) † | | | (17,440) | | | | (408,773) | |
| Steel Dynamics, Inc. | | | (14,830) | | | | (271,389) | |
| Sterlite Industries India Ltd. ADR (India) | | | (119,220) | | | | (1,971,899) | |
| Stillwater Mining Co. † | | | (28,467) | | | | (607,771) | |
| United States Steel Corp. | | | (112,905) | | | | (6,595,910) | |
| Walter Energy, Inc. | | | (25,683) | | | | (3,283,315) | |
| | | | | | | | |
| | | | | | | (54,756,742) | |
| | | | | | | | |
| | | | | | | | |
| | | SHARES | | | VALUE
(Note 3) | |
| Telecommunication Services - (1.7)% | | | | | |
| Alaska Communications Systems Group, Inc. | | | (19,855) | | | $ | (220,390) | |
| CenturyLink, Inc. | | | (281,563) | | | | (12,999,764) | |
| IDT Corp., Class B | | | (37,707) | | | | (967,185) | |
| Level 3 Communications, Inc. † | | | (2,255,790) | | | | (2,210,674) | |
| Telephone & Data Systems, Inc. | | | (101,584) | | | | (3,712,895) | |
| tw telecom inc † | | | (36,428) | | | | (621,097) | |
| | | | | | | | |
| | | | | | | (20,732,005) | |
| | | | | | | | |
| Utilities - (1.2)% | | | | | | | | |
| AGL Resources, Inc. | | | (84,221) | | | | (3,019,323) | |
| FirstEnergy Corp. | | | (280,314) | | | | (10,377,224) | |
| PPL Corp. | | | (30,590) | | | | (805,129) | |
| | | | | | | | |
| | | | | | | (14,201,676) | |
| | | | | | | | |
TOTAL COMMON STOCKS SOLD SHORT
(proceeds $563,755,882) | | | | | | | (635,303,735) | |
| | | | | | | | |
| | | | | | | | | | | | | | | | | | | | |
| CONVERTIBLE BONDS - (0.1)% | | MOODY’S
RATING* (UNAUDITED) | | | INTEREST
RATE | | | MATURITY
DATE | | | PRINCIPAL
AMOUNT
(000’S) | | | VALUE
(Note 3) | |
| Consumer Staples - (0.1)% | | | | | | | | | | | | | | | | | | | | |
| Molson Coors Brewing Co. (2) | | | BBB- | ** | | | 2.500% | | | | 7/30/13 | | | $ | (550) | | | $ | (636,625) | |
| | | | | | | | | | | | | | | | | | | | |
| | | | | |
| Information Technology - 0.0% (g) | | | | | | | | | | | | | | | | | | | | |
| Intel Corp. (2) | | | A- | ** | | | 2.950% | | | | 12/15/35 | | | | (500) | | | | (498,125) | |
| | | | | | | | | | | | | | | | | | | | |
TOTAL CONVERTIBLE BONDS SOLD SHORT
(proceeds $1,099,998) | | | | | | | | | | | | | | | | | | | (1,134,750) | |
| | | | | | | | | | | | | | | | | | | | |
| | | | |
| | The accompanying notes are an integral part of these financial statements. | | (Continued) |
| | | | | | | | | | |
| AQR Funds | | | | Annual Report | | | | December 2010 | | 61 |
| | | | | | | |
| | | | |
| Schedule of Investments | | | December 31, 2010 | |
| | | | |
| AQR DIVERSIFIED ARBITRAGE FUND | | | | |
| | | | | | | | |
| CLOSED END FUNDS - (1.6)% | | SHARES | | | VALUE
(Note 3) | |
| iShares Silver Trust † | | | (21,824) | | | $ | (658,648) | |
| SPDR Barclays Capital High Yield Bond ETF | | | (357,386) | | | | (14,191,798) | |
| SPDR Gold Shares † | | | (30,396) | | | | (4,216,533) | |
| | | | | | | | |
TOTAL CLOSED END FUNDS SOLD SHORT
(proceeds $18,740,200) | | | | | | | (19,066,979) | |
| | | | | | | | |
TOTAL SECURITIES SOLD SHORT
(proceeds $583,596,080) | | | | | | | (655,505,464) | |
| | | | | | | | |
TOTAL INVESTMENTS, NET OF SECURITIES SOLD SHORT - 71.9%
(cost $833,131,607) | | | | | | | 867,633,188 | |
| | | | | | | | |
| OTHER ASSETS IN EXCESS OF LIABILITIES - 28.1%(i) | | | | | | | 339,362,602 | |
| | | | | | | | |
NET ASSETS - 100.0% | | | | | | $ | 1,206,995,790 | |
| | | | | | | | |
All securities are United States companies, unless noted otherwise in parentheses.
All securities are Level 1, unless noted otherwise in parentheses.
| (2) | Level 2 security (See Note 5). |
| (3) | Level 3 security (See Note 5). |
| † | Non income-producing security. |
| (a) | Security fair valued at December 31, 2010. |
| (b) | Rule 144A, Section 4(2) or other security which is restricted as to resale to institutional investors. The Fund Adviser has deemed this security to be liquid based upon procedures approved by the Board of Trustees. |
| (c) | All or portion of this security has been segregated as collateral for securities sold short and can be sold or replaced subject to the broker’s right to re-hypothecate. At December 31, 2010, the value of these securities was $508,661,630. |
| (d) | Represents a Pay-In-Kind Bond. |
| (f) | Represents a step bond. The rate shown reflects the yield at December 31, 2010. |
| (g) | Represents less than 0.05 percent of net assets. |
| (h) | Represents annualized seven-day yield as of December 31, 2010. |
| (i) | Includes appreciation (depreciation) on futures contracts, forward foreign currency exchange contracts, swaps and written options. |
| * | The rating reflected is as December 31, 2010. Rating of certain bonds may have changed subsequent to the date. |
The following abbreviations are used in portfolio descriptions:
144A - Restricted Security
ADR - American Depositary Receipt
MTN - Medium Term Note
NR - Not Rated by Moody’s
NYRS - New York Registry Shares
REIT - Real Estate Investment Trust
Open Written Call Options contracts outstanding at December 31, 2010:
| | | | | | | | | | | | | | | | | | |
| SHARES | | ISSUER | | COUNTERPARTY | | EXPIRATION DATE | | PROCEEDS | | | VALUE AT
DECEMBER 31,
2010 | | | UNREALIZED
APPRECIATION
(DEPRECIATION) | |
| 242 | | Airgas, Inc.
(exercise price $72.50) | | J.P. Morgan | | January 22, 2011 | | | $(3,690) | | | | $(1,210) | | | | $2,480 | |
| 330 | | Airgas, Inc.
(exercise price $57.50) | | J.P. Morgan | | January 22, 2011 | | | (204,270) | | | | (168,300) | | | | 35,970 | |
| 309 | | Baldor Electric Co.
(exercise price $65) | | J.P. Morgan | | February 19, 2011 | | | (5,871) | | | | (3,090) | | | | 2,781 | |
| 374 | | Comerica, Inc.
(exercise price $45) | | J.P. Morgan | | January 21, 2012 | | | (261,422) | | | | (143,990) | | | | 117,432 | |
| 71 | | CommScope, Inc.
(exercise price $32) | | J.P. Morgan | | January 22, 2011 | | | (781) | | | | (355) | | | | 426 | |
| 145 | | Genzyme Corp.
(exercise price $60) | | J.P. Morgan | | January 22, 2011 | | | (145,580) | | | | (168,200) | | | | (22,620) | |
| 145 | | Genzyme Corp.
(exercise price $62.50) | | J.P. Morgan | | January 22, 2011 | | | (111,505) | | | | (131,950) | | | | (20,445) | |
| 152 | | Talbots, Inc.
(exercise price $15) | | J.P. Morgan | | January 22, 2011 | | | (12,502) | | | | (456) | | | | 12,046 | |
| 306 | | Talbots, Inc.
(exercise price $16) | | J.P. Morgan | | January 22, 2011 | | | (17,090) | | | | (306) | | | | 16,784 | |
| 458 | | Talbots, Inc.
(exercise price $18) | | J.P. Morgan | | January 22, 2011 | | | (14,313) | | | | (916) | | | | 13,397 | |
| 3276 | | Tenet Healthcare Corp.
(exercise price $6) | | J.P. Morgan | | January 22, 2011 | | | (217,854) | | | | (278,460) | | | | (60,606) | |
| 322 | | Wells Fargo & Co.
(exercise price $35) | | J.P. Morgan | | January 21, 2012 | | | (118,816) | | | | (80,500) | | | | 38,316 | |
| | | | | | | | | | | | | | | | | | |
| | | | | | | | | $(1,113,694) | | | | $(977,733) | | | | $135,961 | |
| | | | | | | | | | | | | | | | | | |
| | | | |
| | The accompanying notes are an integral part of these financial statements. | | (Continued) |
| | | | | | | | | | |
| AQR Funds | | | | Annual Report | | | | December 2010 | | 62 |
| | | | | | | |
| | | | |
| Schedule of Investments | | | December 31, 2010 | |
| | | | |
| AQR DIVERSIFIED ARBITRAGE FUND | | | | |
Credit default swap contracts buy protection as of December 31, 2010
| | | | | | | | | | | | | | | | | | | | |
| COUNTERPARTY | | REFERENCE ENTITY | | FIXED
ANNUAL
RATE
PAID BY
FUND | | NOTIONAL
AMOUNT | | | UPFRONT
PREMIUM
PAID
(RECEIVED) | | | TERMINATION
DATE | | | UNREALIZED
APPRECIATION
(DEPRECIATION) | |
| Deutsche Bank | | Banco Santander SA | | 1.00% | | | $3,380,000 | | | | $204,285 | | | | 6/20/2015 | | | | $226,853 | |
| Deutsche Bank | | Banco Santander SA | | 3.00% | | | 3,420,000 | | | | 126,733 | | | | 12/20/2015 | | | | 61,984 | |
| Bank of America | | Host Hotels & Resorts LP | | 1.00% | | | 3,450,000 | | | | 195,025 | | | | 12/20/2015 | | | | (5,717) | |
| Bank of America | | Markit CDX North America High Yield Index - Series 15 | | 5.00% | | | 11,250,000 | | | | (143,081) | | | | 12/20/2015 | | | | (206,889) | |
| Deutsche Bank | | Markit CDX North America High Yield Index - Series 15 | | 5.00% | | | 61,450,000 | | | | 587,319 | | | | 12/20/2015 | | | | (2,498,934) | |
| | | | | | | | | | | | | | | | | | | | |
| | | | | | | | | | | | | | | | | | | $(2,422,703) | |
| | | | | | | | | | | | | | | | | | | | |
Cash pledged as collateral to brokers for credit default swap contracts was $3,696,086 at December 31, 2010.
Open futures contracts outstanding at December 31, 2010:
| | | | | | | | | | | | | | | | |
NUMBER OF
CONTRACTS | | TYPE | | EXPIRATION
DATE | | VALUE AT
TRADE DATE | | | VALUE AT
DECEMBER 31,
2010 | | | UNREALIZED
APPRECIATION
(DEPRECIATION) | |
| Short Contracts: | | | | | | | | | | | | | | | | |
| 480 | | 2-Year U.S. Treasury Note | | March 31, 2011 | | | $(105,144,174) | | | | $(105,075,000) | | | | $69,174 | |
| 857 | | 5-Year U.S. Treasury Note | | March 31, 2011 | | | (102,375,821) | | | | (100,884,969) | | | | 1,490,852 | |
| 2,371 | | E-Mini S&P 500 Futures | | March 18, 2011 | | | (146,437,177) | | | | (148,543,150) | | | | (2,105,973) | |
| | | | | | | | | | | | | | | | |
| | | | | | | | | | | | | | | $(545,947) | |
| | | | | | | | | | | | | | | | |
Cash held as collateral with broker for futures contracts was $13,104,344 at December 31, 2010.
Forward foreign currency exchange contracts outstanding as of December 31, 2010:
| | | | | | | | | | | | | | | | | | | | |
PURCHASE
CONTRACTS | | COUNTERPARTY | | CURRENCY | | CURRENCY
AMOUNT
PURCHASED | | | VALUE AT
SETTLEMENT
DATE | | | VALUE AT
DECEMBER 31,
2010 | | | UNREALIZED
APPRECIATION (DEPRECIATION) | |
Australian
Dollar,
Expiring
03/01/11 | | The Royal Bank of Scotland | | AUD | | | 1,526,000 | | | | $1,284,968 | | | | $1,553,209 | | | | $268,241 | |
| | | | | | | | | | | | | | | | | | | | |
| | | | |
| | The accompanying notes are an integral part of these financial statements. | | (Continued) |
| | | | | | | | | | |
| AQR Funds | | | | Annual Report | | | | December 2010 | | 63 |
| | | | | | | |
| | | | |
| Schedule of Investments | | | December 31, 2010 | |
| | | | |
| AQR DIVERSIFIED ARBITRAGE FUND | | | | |
| | | | | | | | | | | | | | | | | | | | |
SALES
CONTRACTS | | COUNTERPARTY | | CURRENCY | | CURRENCY
AMOUNT
SOLD | | | VALUE AT
SETTLEMENT
DATE | | | VALUE AT
DECEMBER 31,
2010 | | | UNREALIZED
APPRECIATION
(DEPRECIATION) | |
Australian Dollar,
Expiring 03/01/11 | | The Royal Bank of Scotland | | AUD | | | (1,526,000) | | | | $(1,294,811) | | | | $(1,553,209) | | | | $(258,398) | |
Canadian Dollar,
Expiring 02/22/11 | | The Royal Bank of Scotland | | CAD | | | (619,221) | | | | (610,623) | | | | (622,564) | | | | (11,941) | |
Canadian Dollar,
Expiring 04/29/11 | | The Royal Bank of Scotland | | CAD | | | (1,547,648) | | | | (1,535,426) | | | | (1,553,285) | | | | (17,859) | |
Euro,
Expiring 02/28/11 | | The Royal Bank of Scotland | | EUR | | | (2,358,403) | | | | (3,092,456) | | | | (3,163,719) | | | | (71,263) | |
Euro,
Expiring 06/22/11 | | The Royal Bank of Scotland | | EUR | | | (8,093,000) | | | | (10,614,128) | | | | (10,849,665) | | | | (235,537) | |
Euro,
Expiring 10/22/12 | | The Royal Bank of Scotland | | EUR | | | (6,210,000) | | | | (8,471,372) | | | | (8,317,363) | | | | 154,009 | |
Norwegian Krone,
Expiring 03/14/11 | | The Royal Bank of Scotland | | NOK | | | (243,750) | | | | (39,207) | | | | (41,792) | | | | (2,585) | |
Norwegian Krone,
Expiring 06/14/11 | | The Royal Bank of Scotland | | NOK | | | (243,750) | | | | (39,016) | | | | (41,589) | | | | (2,573) | |
Norwegian Krone,
Expiring 06/22/11 | | The Royal Bank of Scotland | | NOK | | | (840,000) | | | | (141,010) | | | | (143,262) | | | | (2,252) | |
Norwegian Krone,
Expiring 09/14/11 | | The Royal Bank of Scotland | | NOK | | | (243,750) | | | | (38,829) | | | | (41,385) | | | | (2,556) | |
Norwegian Krone,
Expiring 12/22/11 | | The Royal Bank of Scotland | | NOK | | | (840,000) | | | | (139,681) | | | | (141,853) | | | | (2,172) | |
Norwegian Krone,
Expiring 06/22/12 | | The Royal Bank of Scotland | | NOK | | | (840,000) | | | | (138,326) | | | | (140,537) | | | | (2,211) | |
Norwegian Krone,
Expiring 09/14/12 | | The Royal Bank of Scotland | | NOK | | | (6,500,000) | | | | (1,016,022) | | | | (1,082,831) | | | | (66,809) | |
Norwegian Krone,
Expiring 12/21/12 | | The Royal Bank of Scotland | | NOK | | | (12,840,000) | | | | (2,095,711) | | | | (2,128,270) | | | | (32,559) | |
| | | | | | | | | | | | | | | | | | | | |
| | | | | | | | | | | (29,266,618) | | | | (29,821,324) | | | | (554,706) | |
| | | | | | | | | | | | | | | | | | | | |
| | | | | | | | | | | $(27,981,650) | | | | $(28,268,115) | | | | $(286,465) | |
| | | | | | | | | | | | | | | | | | | | |
Cash pledged as collateral to brokers for forward foreign exchange contracts as of December 31, 2010 was $1,101,237.
AUD - Australian Dollar
CAD - Canadian Dollar
EUR - Euro
NOK - Norwegian Krone
| | | | |
| | The accompanying notes are an integral part of these financial statements. | | |
| | | | | | | | | | |
| AQR Funds | | | | Annual Report | | | | December 2010 | | 64 |
| | | | | | | |
| | | | |
| Consolidated Schedule of Investments | | | December 31, 2010 | |
| | | | |
| AQR MANAGED FUTURES STRATEGY FUND | | | | |
| | | | | | | | |
| MONEY MARKET FUNDS - 93.7% | | SHARES | | | VALUE
(Note 3) | |
| BlackRock Liquidity Funds TempFund Portfolio, Class I, 0.180% (a) | | | 19,616,703 | | | $ | 19,616,703 | |
| Dreyfus Institutional Cash Advantage Fund, Class I, 0.180% (a) | | | 29,425,056 | | | | 29,425,056 | |
| Dreyfus Treasury & Agency Cash Management, Class I, 0.010% (a) | | | 49,041,758 | | | | 49,041,758 | |
| J.P. Morgan Prime Money Market Fund - Capital Shares, 0.130% (a)(c) | | | 673,778,529 | | | | 673,778,529 | |
| UBS Money Series - UBS Select Prime Preferred Fund, Class I, 0.190% (a) | | | 49,041,758 | | | | 49,041,758 | |
| UBS Money Series - UBS Select Treasury Preferred Fund, Class I, 0.020% (a) | | | 49,041,758 | | | | 49,041,758 | |
| | | | | | | | |
TOTAL INVESTMENTS - 93.7%
(cost $869,945,562) | | | | | | | 869,945,562 | |
| | | | | | | | |
| OTHER ASSETS IN EXCESS OF LIABILITIES - 6.3% (b) | | | | | | | 58,334,825 | |
| | | | | | | | |
NET ASSETS - 100.0% | | | | | | $ | 928,280,387 | |
| | | | | | | | |
| (a) | Represents annualized seven-day yield as of December 31, 2010. |
| (b) | Includes appreciation (depreciation) on futures contracts, forward foreign currency exchange contracts and swaps. |
| (c) | A portion of the security is pledged as collateral to the broker for forward foreign currency exchange contracts. |
All securities are Level 2 (See Note 5).
Total return swap contracts outstanding as of December 31, 2010
| | | | | | | | | | | | |
| COUNTERPARTY | | UNDERLYING REFERENCE INSTRUMENT | | TERMINATION
DATE | | NOTIONAL
VALUE | | | UNREALIZED
APPRECIATION
(DEPRECIATION) | |
| Merrill Lynch | | 10-Year Japanese Government Bond | | 03/10/2011 | | | $12,107,611 | | | | $28,139 | |
| Merrill Lynch | | Euro-SCHATZ Futures | | 03/08/2011 | | | 27,649,544 | | | | (11,986) | |
| Merrill Lynch | | KOSPI 200 Future | | 03/10/2011 | | | 22,740,209 | | | | 1,282,171 | |
| Merrill Lynch | | 5-Year U.S. Treasury Note | | 03/31/2011 | | | 2,516,113 | | | | (44,019) | |
| Merrill Lynch | | 2-Year U.S. Treasury Note | | 03/31/2011 | | | 25,218,925 | | | | (44,706) | |
| Merrill Lynch | | Gold 100 OZ Futures | | 02/24/2011 | | | 960,540 | | | | 34,440 | |
| Merrill Lynch | | LME Copper Futures | | 03/14/2011 | | | 7,923,550 | | | | 970,325 | |
| Merrill Lynch | | LME Nickel Futures | | 03/14/2011 | | | 703,740 | | | | 38,700 | |
| Merrill Lynch | | LME Primary Aluminum | | 03/14/2011 | | | 9,125,025 | | | | 510,900 | |
| Barclays Capital | | Coffee “C” Futures | | 03/21/2011 | | | 2,872,125 | | | | 464,812 | |
| Barclays Capital | | Soybean Futures | | 03/14/2011 | | | 2,090,800 | | | | 154,000 | |
| Barclays Capital | | Cocoa Future | | 03/16/2011 | | | (1,017,500) | | | | (105,450) | |
| | | | | | | | | | | | |
| | | | | | | | | | | $3,277,326 | |
| | | | | | | | | | | | |
Cash held as collateral with broker for total return swap contracts was $2,070,000 as of December 31, 2010.
Open futures contracts outstanding at December 31, 2010:
| | | | | | | | | | | | | | | | |
NUMBER OF
CONTRACTS | | TYPE | | EXPIRATION
DATE | | VALUE AT
TRADE DATE | | | VALUE AT
DECEMBER 31,
2010 | | | UNREALIZED
APPRECIATION
(DEPRECIATION) | |
| Long Contracts: | | | | | | | | | | | | | | | | |
| 3 | | 5-Year U.S. Treasury Note | | March 31, 2011 | | | $354,757 | | | | $353,156 | | | | $(1,601) | |
| 43 | | 10-Year U.S. Treasury Note | | March 22, 2011 | | | 5,225,232 | | | | 5,178,813 | | | | (46,419) | |
| 11 | | 3-Month Euro Euribor | | September 17, 2012 | | | 3,625,260 | | | | 3,621,749 | | | | (3,511) | |
| 60 | | 3-Month Euro Euribor | | June 18, 2012 | | | 19,774,809 | | | | 19,791,216 | | | | 16,407 | |
| 157 | | 3-Month Euro Euribor | | March 19, 2012 | | | 51,841,237 | | | | 51,881,797 | | | | 40,560 | |
| 254 | | 3-Month Euro Euribor | | December 19, 2011 | | | 83,987,575 | | | | 84,055,419 | | | | 67,844 | |
| 351 | | 3-Month Euro Euribor | | September 19, 2011 | | | 116,221,469 | | | | 116,308,360 | | | | 86,891 | |
| | | | |
| | The accompanying notes are an integral part of these financial statements. | | (Continued) |
| | | | | | | | | | |
| AQR Funds | | | | Annual Report | | | | December 2010 | | 65 |
| | | | | | | |
| | | | |
| Consolidated Schedule of Investments | | | December 31, 2010 | |
| | | | |
| AQR MANAGED FUTURES STRATEGY FUND | | | | |
| | | | | | | | | | | | | | | | |
NUMBER OF
CONTRACTS | | TYPE | | EXPIRATION
DATE | | VALUE AT
TRADE DATE | | | VALUE AT
DECEMBER 31,
2010 | | | UNREALIZED
APPRECIATION
(DEPRECIATION) | |
| Long Contracts: (continued) | | | | | | | | | | | | | | |
| 426 | | 3-Month Euro Euribor | | June 13, 2011 | | | $141,165,329 | | | | $141,289,162 | | | | $123,833 | |
| 14 | | 90-Day Euro $ Futures | | December 17, 2012 | | | 3,436,045 | | | | 3,437,525 | | | | 1,480 | |
| 21 | | 90-Day Euro $ Futures | | September 17, 2012 | | | 5,194,667 | | | | 5,171,513 | | | | (23,154) | |
| 74 | | 90-Day Euro $ Futures | | June 18, 2012 | | | 18,332,107 | | | | 18,274,300 | | | | (57,807) | |
| 133 | | 90-Day Euro $ Futures | | March 19, 2012 | | | 32,994,026 | | | | 32,934,125 | | | | (59,901) | |
| 216 | | 90-Day Euro $ Futures | | December 19, 2011 | | | 53,621,807 | | | | 53,605,800 | | | | (16,007) | |
| 350 | | 90-Day Euro $ Futures | | September 19, 2011 | | | 86,972,191 | | | | 87,014,375 | | | | 42,184 | |
| 456 | | 90-Day Euro $ Futures | | June 13, 2011 | | | 113,434,230 | | | | 113,498,400 | | | | 64,170 | |
| 20 | | 90-Day Sterling Futures | | September 19, 2012 | | | 3,849,411 | | | | 3,834,277 | | | | (15,134) | |
| 28 | | 90-Day Sterling Futures | | June 20, 2012 | | | 5,376,187 | | | | 5,383,331 | | | | 7,144 | |
| 99 | | 90-Day Sterling Futures | | March 21, 2012 | | | 19,082,234 | | | | 19,086,232 | | | | 3,998 | |
| 217 | | 90-Day Sterling Futures | | December 21, 2011 | | | 41,947,757 | | | | 41,937,403 | | | | (10,354) | |
| 315 | | 90-Day Sterling Futures | | March 16, 2011 | | | 61,144,220 | | | | 61,154,289 | | | | 10,069 | |
| 335 | | 90-Day Sterling Futures | | September 21, 2011 | | | 64,879,343 | | | | 64,873,197 | | | | (6,146) | |
| 441 | | 90-Day Sterling Futures | | June 15, 2011 | | | 85,529,073 | | | | 85,529,698 | | | | 625 | |
| 154 | | Amsterdam Index | | January 21, 2011 | | | 14,504,696 | | | | 14,660,244 | | | | 155,548 | |
| 11 | | Bank Acceptance Futures | | June 13, 2011 | | | 2,724,540 | | | | 2,723,293 | | | | (1,247) | |
| 32 | | Bank Acceptance Futures | | September 19, 2011 | | | 7,911,646 | | | | 7,910,230 | | | | (1,416) | |
| 356 | | CAC40 10 Euro | | January 21, 2011 | | | 18,590,574 | | | | 18,193,860 | | | | (396,714) | |
| 4 | | Canadian 10yr Bond Future | | March 22, 2011 | | | 489,322 | | | | 493,373 | | | | 4,051 | |
| 67 | | Coffee ‘C’ Futures | | March 21, 2011 | | | 5,221,865 | | | | 6,042,563 | | | | 820,698 | |
| 310 | | Corn Futures | | March 14, 2011 | | | 9,046,703 | | | | 9,749,500 | | | | 702,797 | |
| 79 | | DAX Index | | March 18, 2011 | | | 18,634,940 | | | | 18,353,511 | | | | (281,429) | |
| 525 | | DJIA Mini E-CBOT | | March 18, 2011 | | | 29,790,883 | | | | 30,221,625 | | | | 430,742 | |
| 311 | | E-Mini Russell 2000 Futures | | March 18, 2011 | | | 24,004,704 | | | | 24,329,530 | | | | 324,826 | |
| 439 | | E-Mini S&P 500 Futures | | March 18, 2011 | | | 27,079,658 | | | | 27,503,350 | | | | 423,692 | |
| 17 | | Euro - Bobl Futures | | March 8, 2011 | | | 2,692,710 | | | | 2,708,938 | | | | 16,228 | |
| 69 | | Euro - Bund Futures | | March 8, 2011 | | | 11,588,678 | | | | 11,599,565 | | | | 10,887 | |
| 304 | | Euro CHF 3-Month LIFFE | | June 13, 2011 | | | 81,298,693 | | | | 81,381,397 | | | | 82,704 | |
| 305 | | Euro CHF 3-Month LIFFE | | March 14, 2011 | | | 81,621,428 | | | | 81,673,640 | | | | 52,212 | |
| 112 | | Euro SFR 3-Month LIFFE | | September 19, 2011 | | | 29,927,190 | | | | 29,958,588 | | | | 31,398 | |
| 36 | | Euro-Buxl 30-Year Bond | | March 8, 2011 | | | 5,204,369 | | | | 5,211,117 | | | | 6,748 | |
| 983 | | Euro-SCHATZ Futures | | March 8, 2011 | | | 143,536,518 | | | | 143,749,652 | | | | 213,134 | |
| 193 | | FTSE 100 Index Futures | | March 18, 2011 | | | 17,652,643 | | | | 17,806,905 | | | | 154,262 | |
| 614 | | FTSE/JSE Top 40 Index | | March 17, 2011 | | | 26,387,927 | | | | 26,736,367 | | | | 348,440 | |
| 2 | | Gasoil Bullet | | January 11, 2011 | | | 1,547,000 | | | | 1,525,000 | | | | (22,000) | |
| 209 | | Globex Brent Futures | | January 13, 2011 | | | 19,139,050 | | | | 19,802,750 | | | | 663,700 | |
| 124 | | Globex Crude Oil Futures | | January 19, 2011 | | | 11,075,630 | | | | 11,331,120 | | | | 255,490 | |
| 14 | | Globex Heat Oil Futures | | January 28, 2011 | | | 1,457,165 | | | | 1,494,931 | | | | 37,766 | |
| 22 | | Globex RBOB Gasoline | | January 28, 2011 | | | 2,143,596 | | | | 2,245,597 | | | | 102,001 | |
| 119 | | Gold 100 OZ Futures | | February 24, 2011 | | | 16,202,160 | | | | 16,914,660 | | | | 712,500 | |
| 23 | | Hang Seng Index | | January 28, 2011 | | | 3,358,246 | | | | 3,405,479 | | | | 47,233 | |
| 73 | | LME Copper Futures | | March 14, 2011 | | | 16,090,932 | | | | 17,547,375 | | | | 1,456,443 | |
| 15 | | LME Nickel Futures | | March 14, 2011 | | | 2,128,189 | | | | 2,227,320 | | | | 99,131 | |
| 179 | | LME Primary Aluminum | | March 14, 2011 | | | 10,806,758 | | | | 11,056,607 | | | | 249,849 | |
| 633 | | MSCI Taiwan Stock Index Futures | | January 28, 2011 | | | 19,924,490 | | | | 20,211,690 | | | | 287,200 | |
| 404 | | NASDAQ 100 E-Mini Future | | March 18, 2011 | | | 17,887,504 | | | | 17,905,280 | | | | 17,776 | |
| 323 | | S&P MID 400 E-Mini Future | | March 18, 2011 | | | 28,863,689 | | | | 29,241,190 | | | | 377,501 | |
| 192 | | S&P/Toronto Stock Exchange 60 Index | | March 17, 2011 | | | 29,226,305 | | | | 29,644,885 | | | | 418,580 | |
| 242 | | SGX MSCI Singapore Index Futures | | January 28, 2011 | | | 14,219,265 | | | | 14,296,522 | | | | 77,257 | |
| 622 | | SGX S&P CNX Nifty Index Futures | | January 27, 2011 | | | 7,551,388 | | | | 7,668,016 | | | | 116,628 | |
| 272 | | Soybean Futures | | March 14, 2011 | | | 17,688,479 | | | | 19,080,800 | | | | 1,392,321 | |
| 231 | | Soybean Meal Futures | | March 14, 2011 | | | 8,014,717 | | | | 8,637,090 | | | | 622,373 | |
| 231 | | Soybean Oil Futures | | March 14, 2011 | | | 7,516,035 | | | | 8,090,082 | | | | 574,047 | |
| 147 | | SPI 200 | | March 17, 2011 | | | 17,992,884 | | | | 17,818,188 | | | | (174,696) | |
| 239 | | Sugar #11 (World Markets) | | February 28, 2011 | | | 7,845,546 | | | | 8,597,881 | | | | 752,335 | |
| 175 | | TOPIX Index | | March 10, 2011 | | | 19,054,638 | | | | 19,332,963 | | | | 278,325 | |
| | | | |
| | The accompanying notes are an integral part of these financial statements. | | (Continued) |
| | | | | | | | | | |
| AQR Funds | | | | Annual Report | | | | December 2010 | | 66 |
| | | | | | | |
| | | | |
| Consolidated Schedule of Investments | | | December 31, 2010 | |
| | | | |
| AQR MANAGED FUTURES STRATEGY FUND | | | | |
| | | | | | | | | | | | | | | | |
NUMBER OF
CONTRACTS | | TYPE | | EXPIRATION
DATE | | VALUE AT
TRADE DATE | | | VALUE AT
DECEMBER 31,
2010 | | | UNREALIZED
APPRECIATION
(DEPRECIATION) | |
| Long Contracts: (continued) | | | | | | | | | | | | | | |
| 76 | | U.S. Treasury Bond | | March 22, 2011 | | | 9,180,554 | | | | 9,281,500 | | | | 100,946 | |
| 165 | | Wheat Futures | | March 14, 2011 | | | 6,491,889 | | | | 6,552,562 | | | | 60,673 | |
| | | | | | | | | | | | | | | | |
| | | | | | | | | | | | | | | 11,826,111 | |
| | | | | | | | | | | | | | | | |
| Short Contracts: | | | | | | | | | | | | | | | | |
| 379 | | Australian 3-year Bond Future | | March 15, 2011 | | | $(103,929,191) | | | | $(103,948,905) | | | | $(19,714) | |
| 995 | | Australian 10-year Bond Future | | March 15, 2011 | | | (39,858,334) | | | | (40,132,159) | | | | (273,825) | |
| 62 | | Cocoa Futures | | March 16, 2011 | | | (1,736,708) | | | | (1,881,700) | | | | (144,992) | |
| 15 | | Cotton No. 2 Futures | | March 9, 2011 | | | (1,137,346) | | | | (1,086,075) | | | | 51,271 | |
| 45 | | H-SHARES Index Futures | | January 28, 2011 | | | (3,573,725) | | | | (3,664,881) | | | | (91,156) | |
| 67 | | IBEX 35 Index | | January 21, 2011 | | | (9,032,387) | | | | (8,800,528) | | | | 231,859 | |
| 299 | | Lean Hogs Futures | | February 14, 2011 | | | (8,978,390) | | | | (9,538,100) | | | | (559,710) | |
| 39 | | LME Primary Aluminum Futures | | March 14, 2011 | | | (2,257,045) | | | | (2,408,981) | | | | (151,936) | |
| 11 | | LME Zinc Futures | | March 14, 2011 | | | (612,123) | | | | (674,712) | | | | (62,589) | |
| 4 | | Long Gilt | | March 29, 2011 | | | (741,409) | | | | (748,318) | | | | (6,909) | |
| 340 | | Natural Gas Futures | | January 27, 2011 | | | (3,734,050) | | | | (3,744,250) | | | | (10,200) | |
| 1 | | Silver Futures | | March 29, 2011 | | | (153,632) | | | | (154,685) | | | | (1,053) | |
| | | | | | | | | | | | | | | | |
| | | | | | | | | | | | | | | (1,038,954) | |
| | | | | | | | | | | | | | | | |
| | | | | | | | | | | | | | | $10,787,157 | |
| | | | | | | | | | | | | | | | |
Cash held as collateral with broker for futures contracts was $36,685,459 at December 31, 2010.
Forward foreign currency exchange contracts outstanding as of December 31, 2010:
| | | | | | | | | | | | | | | | | | | | |
PURCHASE
CONTRACTS | | COUNTERPARTY | | CURRENCY | | CURRENCY
AMOUNT
PURCHASED | | | VALUE AT
SETTLEMENT
DATE | | | VALUE AT
DECEMBER 31,
2010 | | | UNREALIZED
APPRECIATION
(DEPRECIATION) | |
Australian Dollar,
Expiring 03/16/11 | | The Royal Bank of Scotland | | AUD | | | 192,009,000 | | | | $185,533,265 | | | | $195,072,823 | | | | $9,539,558 | |
Brazilian Real,
Expiring 03/16/11 | | The Royal Bank of Scotland | | BRL | | | 14,240,000 | | | | 8,185,791 | | | | 8,448,724 | | | | 262,933 | |
Canadian Dollar,
Expiring 03/16/11 | | The Royal Bank of Scotland | | CAD | | | 79,708,000 | | | | 78,178,865 | | | | 80,097,016 | | | | 1,918,151 | |
Swiss Franc,
Expiring 03/16/11 | | The Royal Bank of Scotland | | CHF | | | 69,192,000 | | | | 70,997,653 | | | | 74,291,894 | | | | 3,294,241 | |
Chilean Peso,
Expiring 03/16/11 | | The Royal Bank of Scotland | | CLP | | | 992,000,000 | | | | 2,032,306 | | | | 2,107,588 | | | | 75,282 | |
Columbian Peso,
Expiring 03/16/11 | | The Royal Bank of Scotland | | COP | | | 370,000,000 | | | | 192,447 | | | | 194,682 | | | | 2,235 | |
Czech Republic Koruna,
Expiring 03/16/11 | | The Royal Bank of Scotland | | CZK | | | 270,400,000 | | | | 14,340,643 | | | | 14,452,772 | | | | 112,129 | |
Euro,
Expiring 03/16/11 | | The Royal Bank of Scotland | | EUR | | | 22,330,000 | | | | 29,989,158 | | | | 29,952,122 | | | | (37,036) | |
British Pound,
Expiring 03/16/11 | | The Royal Bank of Scotland | | GBP | | | 101,682,999 | | | | 159,020,188 | | | | 159,113,896 | | | | 93,708 | |
Hungarian Forint,
Expiring 03/16/11 | | The Royal Bank of Scotland | | HUF | | | 2,916,000,000 | | | | 13,523,657 | | | | 13,946,890 | | | | 423,233 | |
Indonesian Rupiah,
Expiring 03/16/11 | | The Royal Bank of Scotland | | IDR | | | 24,900,000,000 | | | | 2,736,264 | | | | 2,733,697 | | | | (2,567) | |
Israeli Shekel,
Expiring 03/16/11 | | The Royal Bank of Scotland | | ILS | | | 28,710,000 | | | | 7,877,058 | | | | 8,099,386 | | | | 222,328 | |
Indian Rupee,
Expiring 03/16/11 | | The Royal Bank of Scotland | | INR | | | 1,226,400,000 | | | | 26,645,820 | | | | 27,069,456 | | | | 423,636 | |
| | | | |
| | The accompanying notes are an integral part of these financial statements. | | (Continued) |
| | | | | | | | | | |
| AQR Funds | | | | Annual Report | | | | December 2010 | | 67 |
| | | | | | | |
| | | | |
| Consolidated Schedule of Investments | | | December 31, 2010 | |
| | | | |
| AQR MANAGED FUTURES STRATEGY FUND | | | | |
| | | | | | | | | | | | | | | | | | | | |
PURCHASE
CONTRACTS | | COUNTERPARTY | | CURRENCY | | CURRENCY
AMOUNT
PURCHASED | | | VALUE AT
SETTLEMENT
DATE | | | VALUE AT
DECEMBER 31,
2010 | | | UNREALIZED
APPRECIATION
(DEPRECIATION) | |
| (continued) | | | | | | | | | | | | | | | | | | | | |
Japanese Yen,
Expiring 03/16/11 | | The Royal Bank of Scotland | | JPY | | | 10,567,697,000 | | | | $127,761,517 | | | | $130,395,838 | | | | $2,634,321 | |
Korean Won,
Expiring 03/16/11 | | The Royal Bank of Scotland | | KRW | | | 17,736,910,000 | | | | 15,289,451 | | | | 15,571,038 | | | | 281,587 | |
Mexican Peso,
Expiring 03/16/11 | | The Royal Bank of Scotland | | MXN | | | 427,000,000 | | | | 34,048,715 | | | | 34,435,669 | | | | 386,954 | |
Malaysian Ringgit,
Expiring 03/16/11 | | The Royal Bank of Scotland | | MYR | | | 27,890,000 | | | | 8,910,810 | | | | 9,003,752 | | | | 92,942 | |
Norwegian Krone,
Expiring 03/16/11 | | The Royal Bank of Scotland | | NOK | | | 572,827,000 | | | | 94,846,077 | | | | 98,203,800 | | | | 3,357,723 | |
Philippine Peso,
Expiring 03/16/11 | | The Royal Bank of Scotland | | PHP | | | 270,500,000 | | | | 6,196,646 | | | | 6,173,873 | | | | (22,773) | |
Poland Zloty,
Expiring 03/16/11 | | The Royal Bank of Scotland | | PLN | | | 54,510,000 | | | | 17,702,817 | | | | 18,367,241 | | | | 664,424 | |
Russian Ruble,
Expiring 03/16/11 | | The Royal Bank of Scotland | | RUB | | | 720,000,000 | | | | 23,327,265 | | | | 23,438,758 | | | | 111,493 | |
Swedish Krona,
Expiring 03/16/11 | | The Royal Bank of Scotland | | SEK | | | 320,942,000 | | | | 45,725,189 | | | | 47,617,501 | | | | 1,892,312 | |
Singapore Dollar,
Expiring 03/16/11 | | The Royal Bank of Scotland | | SGD | | | 28,890,000 | | | | 22,112,070 | | | | 22,551,813 | | | | 439,743 | |
Turkish Lira,
Expiring 03/16/11 | | The Royal Bank of Scotland | | TRY | | | 19,610,000 | | | | 12,822,022 | | | | 12,632,021 | | | | (190,001) | |
Taiwanese Dollar,
Expiring 03/16/11 | | The Royal Bank of Scotland | | TWD | | | 584,300,000 | | | | 19,462,094 | | | | 20,075,917 | | | | 613,823 | |
South African Rand,
Expiring 03/16/11 | | The Royal Bank of Scotland | | ZAR | | | 111,400,000 | | | | 15,768,177 | | | | 16,668,254 | | | | 900,077 | |
| | | | | | | | | | | | | | | | | | | | |
| | | | | | | | | | | 1,043,225,965 | | | | 1,070,716,421 | | | | 27,490,456 | |
| | | | | | | | | | | | | | | | | | | | |
| | | | | | | | | | | | | | | | | | | | |
| SALES CONTRACTS | | COUNTERPARTY | | CURRENCY | | CURRENCY
AMOUNT
SOLD | | | VALUE AT
SETTLEMENT
DATE | | | VALUE AT
DECEMBER 31,
2010 | | | UNREALIZED APPRECIATION (DEPRECIATION) | |
Swiss Franc,
Expiring 03/16/11 | | The Royal Bank of Scotland | | CHF | | | (93,840,000) | | | | $(95,806,979) | | | | $(100,756,609) | | | | $(4,949,630) | |
Czech Republic Koruna,
Expiring 03/16/11 | | The Royal Bank of Scotland | | CZK | | | (115,000,000) | | | | (6,112,317) | | | | (6,146,704) | | | | (34,387) | |
Euro,
Expiring 03/16/11 | | The Royal Bank of Scotland | | EUR | | | (363,044,000) | | | | (478,132,289) | | | | (486,965,439) | | | | (8,833,150) | |
British Pound,
Expiring 03/16/11 | | The Royal Bank of Scotland | | GBP | | | (92,483,000) | | | | (143,815,825) | | | | (144,717,707) | | | | (901,882) | |
Hungarian Forint,
Expiring 03/16/11 | | The Royal Bank of Scotland | | HUF | | | (740,000,000) | | | | (3,362,858) | | | | (3,539,334) | | | | (176,476) | |
Japanese Yen,
Expiring 03/16/11 | | The Royal Bank of Scotland | | JPY | | | (4,785,497,000) | | | | (56,997,748) | | | | (59,048,712) | | | | (2,050,964) | |
Korean Won,
Expiring 03/16/11 | | The Royal Bank of Scotland | | KRW | | | (21,100,000,000) | | | | (18,282,912) | | | | (18,523,458) | | | | (240,546) | |
Mexican Peso,
Expiring 03/16/11 | | The Royal Bank of Scotland | | MXN | | | (14,000,000) | | | | (1,105,959) | | | | (1,129,038) | | | | (23,079) | |
Malaysian Ringgit,
Expiring 03/16/11 | | The Royal Bank of Scotland | | MYR | | | (16,500,000) | | | | (5,213,137) | | | | (5,326,709) | | | | (113,572) | |
New Zealand Dollar,
Expiring 03/16/11 | | The Royal Bank of Scotland | | NZD | | | (71,967,000) | | | | (53,325,901) | | | | (55,904,205) | | | | (2,578,304) | |
Philippine Peso,
Expiring 03/16/11 | | The Royal Bank of Scotland | | PHP | | | (182,000,000) | | | | (4,100,396) | | | | (4,153,955) | | | | (53,559) | |
| | | | |
| | The accompanying notes are an integral part of these financial statements. | | (Continued) |
| | | | | | | | | | |
| AQR Funds | | | | Annual Report | | | | December 2010 | | 68 |
| | | | | | | |
| | | | |
| Consolidated Schedule of Investments | | | December 31, 2010 | |
| | | | |
| AQR MANAGED FUTURES STRATEGY FUND | | | | |
| | | | | | | | | | | | | | | | | | | | |
| SALES CONTRACTS | | COUNTERPARTY | | CURRENCY | | CURRENCY
AMOUNT
SOLD | | | VALUE AT
SETTLEMENT
DATE | | | VALUE AT
DECEMBER 31,
2010 | | | UNREALIZED APPRECIATION (DEPRECIATION) | |
| (continued) | | | | | | | | | | | | | | | | | | | | |
Poland Zloty,
Expiring 03/16/11 | | The Royal Bank of Scotland | | PLN | | | (30,900,000) | | | | $(9,962,937) | | | | $(10,411,810) | | | | $(448,873) | |
Russian Ruble,
Expiring 03/16/11 | | The Royal Bank of Scotland | | RUB | | | (181,800,000) | | | | (5,733,549) | | | | (5,918,286) | | | | (184,737) | |
Swedish Krona,
Expiring 03/16/11 | | The Royal Bank of Scotland | | SEK | | | (93,532,000) | | | | (13,662,395) | | | | (13,877,150) | | | | (214,755) | |
Singapore Dollar,
Expiring 03/16/11 | | The Royal Bank of Scotland | | SGD | | | (18,100,000) | | | | (13,773,674) | | | | (14,129,035) | | | | (355,361) | |
Turkish Lira,
Expiring 03/16/11 | | The Royal Bank of Scotland | | TRY | | | (12,600,000) | | | | (8,103,288) | | | | (8,116,443) | | | | (13,155) | |
Taiwanese Dollar,
Expiring 03/16/11 | | The Royal Bank of Scotland | | TWD | | | (138,000,000) | | | | (4,670,914) | | | | (4,741,531) | | | | (70,617) | |
| | | | | | | | | | | | | | | | | | | | |
| | | | | | | | | | | (922,163,078) | | | | (943,406,125) | | | | (21,243,047) | |
| | | | | | | | | | | | | | | | | | | | |
| | | | | | | | | | | $121,062,887 | | | | $127,310,296 | | | | $6,247,409 | |
| | | | | | | | | | | | | | | | | | | | |
Money Market fund investment is pledged as collateral for forward foreign exchange contracts in the amount of $7,532,150.
AUD - Australian Dollar
BRL - Brazilian Real
CAD - Canadian Dollar
CHF - Swiss Franc
CLP - Chilean Peso
COP - Columbian Peso
CZK - Czech Republic Koruna
EUR - Euro
GBP - British Pound
HUF - Hungarian Forint
IDR - Indonesian Rupiah
ILS - Israeli Shekel
INR - Indian Rupee
JPY - Japanese Yen
KRW - Korean Won
MXN - Mexican Peso
MYR - Malaysian Ringgit
NOK - Norwegian Krone
NZD - New Zealand Dollar
PHP - Philippine Peso
PLN - Poland Zloty
RUB - Russian Ruble
SEK - Swedish Krona
SGD - Singapore Dollar
TRY - Turkish Lira
TWD - Taiwan Dollar
ZAR - South African Rand
| | | | |
| | The accompanying notes are an integral part of these financial statements. | | |
| | | | | | | | | | |
| AQR Funds | | | | Annual Report | | | | December 2010 | | 69 |
| | | | | | | |
| | | | |
| Consolidated Schedule of Investments | | | December 31, 2010 | |
| | | | | | | | | | | | | | | | | | | | | | | | |
| GOVERNMENT RELATED OBLIGATIONS - 27.1% | | MOODY’S
RATING* (UNAUDITED) | | | INTEREST
RATE | | | MATURITY
DATE | | | CURRENCY | | | PRINCIPAL
AMOUNT
(000’S) | | | VALUE
(Note 3) | |
| Sovereign Debt - 27.1% | | | | | | | | | | | | | | | | | | | | | | | | |
| France Government Bond OAT (France) | | | NR | | | | 1.600% | | | | 7/25/2015 | | | | EUR | | | | 1,685 | | | $ | 2,380,265 | |
| France Government Bond OAT (France) | | | NR | | | | 2.250% | | | | 7/25/2020 | | | | EUR | | | | 802 | | | | 1,163,761 | |
| United Kingdom Gilt Inflation Linked, Series 3MO (United Kingdom) | | | NR | | | | 1.250% | | | | 11/22/2017 | | | | GBP | | | | 1,748 | | | | 2,965,466 | |
| | | | | | | | | | | | | | | | | | | | | | | | |
TOTAL GOVERNMENT RELATED OBLIGATIONS
(cost $6,622,632) | | | | | | | | | | | | | | | | | | | | | | | 6,509,492 | |
| | | | | | | | | | | | | | | | | | | | | | | | |
| U.S. TREASURY OBLIGATIONS - 16.0% (1) | | | | | | | | | | | | | | | | | | |
| U.S. Treasury Inflation Protected Securities Bonds - 16.0% | | | | | | | | | | | | | | | | | | | | | | | | |
| U.S. Treasury Bond | | | NR | | | | 0.500% | | | | 4/15/2015 | | | | USD | | | | 2,300 | | | | 2,372,709 | |
| U.S. Treasury Bond | | | NR | | | | 2.125% | | | | 1/15/2019 | | | | USD | | | | 1,300 | | | | 1,465,402 | |
| | | | | | | | | | | | | | | | | | | | | | | | |
TOTAL U.S. TREASURY OBLIGATIONS
(cost $3,878,722) | | | | | | | | | | | | | | | | | | | | | | | 3,838,111 | |
| | | | | | | | | | | | | | | | | | | | | | | | |
| | | | | | | | | | | | | | | SHARES | | | | |
| MONEY MARKET FUNDS - 51.0% | | | | | | | | | | | | | | | | | | |
| BlackRock Liquidity Funds TempFund Portfolio, Class I, 0.180% (a) | | | | | | | | | | | | | | | | | | | 900,002 | | | | 900,002 | |
| Dreyfus Institutional Cash Advantage Fund, Class I, 0.180% (a) | | | | | | | | | | | | | | | | | | | 1,350,003 | | | | 1,350,003 | |
| Dreyfus Treasury Cash Management, Class I, 0.010% (a) | | | | | | | | | | | | | | | | | | | 2,250,005 | | | | 2,250,005 | |
| J.P. Morgan Prime Money Market Fund - Capital Shares, 0.130% (a)(c) | | | | | | | | | | | | | | | | | | | 3,214,433 | | | | 3,214,433 | |
| UBS Money Series - UBS Select Prime Preferred Fund, Class I, 0.190% (a) | | | | | | | | | | | | | | | | | | | 2,250,005 | | | | 2,250,005 | |
| UBS Money Series - UBS Select Treasury Preferred Fund, Class I, 0.020% (a) | | | | | | | | | | | | | | | | | | | 2,250,005 | | | | 2,250,005 | |
| | | | | | | | | | | | | | | | | | | | | | | | |
TOTAL MONEY MARKET FUNDS
(cost $12,214,453) | | | | | | | | | | | | | | | | | | | | | | | 12,214,453 | |
| | | | | | | | | | | | | | | | | | | | | | | | |
TOTAL INVESTMENTS - 94.1%
(cost $22,715,807) | | | | | | | | | | | | | | | | | | | | | | | 22,562,056 | |
| | | | | | | | | | | | | | | | | | | | | | | | |
| OTHER ASSETS IN EXCESS OF LIABILITIES - 5.9% (b) | | | | | | | | | | | | | | | | | | | | | | | 1,420,489 | |
| | | | | | | | | | | | | | | | | | | | | | | | |
NET ASSETS - 100.0% | | | | | | | | | | | | | | | | | | | | | | $ | 23,982,545 | |
| | | | | | | | | | | | | | | | | | | | | | | | |
All securities are Level 2, unless noted otherwise in parenthesis.
| (1) | Level 1 security (See Note 5). |
All securities are United States companies, unless noted otherwise in parentheses.
| (a) | Represents annualized seven-day yield as of December 31, 2010. |
| (b) | Includes appreciation(depreciation) on futures contracts and forward foreign currency exchange contracts and swaps. |
| (c) | A portion of the security is pledged as collateral for forward foreign currency exchange contracts. |
| * | The rating reflected is as December 31, 2010. Rating of certain bonds may have changed subsequent to the date. |
| | | | |
| | The accompanying notes are an integral part of these financial statements. | | (Continued) |
| | | | | | | | | | |
| AQR Funds | | | | Annual Report | | | | December 2010 | | 70 |
| | | | | | | |
| | | | |
| Consolidated Schedule of Investments | | | December 31, 2010 | |
Credit default swap contracts sell protection as of December 31, 2010:
| | | | | | | | | | | | | | | | | | | | | | | | |
| COUNTERPARTY | | REFERENCE ENTITY | | FIXED
ANNUAL
RATE
RECEIVED
BY FUND | | CURRENCY | | | NOTIONAL
AMOUNT | | | UPFRONT
PREMIUM
(RECEIVED)
PAID | | | TERMINATION
DATE | | | UNREALIZED
APPRECIATION
(DEPRECIATION) | |
| Deutsche Bank | | Markit CDX North America Investment Grade Index Series 15 | | 1.000% | | | USD | | | | 2,400,000 | | | | $9,379 | | | | 12/20/2015 | | | | $8,125 | |
| Deutsche Bank | | iTraxx Europe Series 14.V1 | | 1.000% | | | EUR | | | | 250,000 | | | | 787 | | | | 12/20/2015 | | | | (1,401) | |
| Deutsche Bank | | Markit CDX North America High Yield Index Series 15 | | 5.000% | | | USD | | | | 1,850,000 | | | | 47,773 | | | | 12/20/2015 | | | | 9,777 | |
| Deutsche Bank | | Markit CDX Emerging Market Index Series 14 | | 5.000% | | | USD | | | | 300,000 | | | | 40,872 | | | | 12/20/2015 | | | | 560 | |
| The Royal Bank of Scotland | | Markit CDX North America High Yield Index Series 15 | | 5.000% | | | USD | | | | 225,000 | | | | (912) | | | | 12/20/2015 | | | | 7,912 | |
| The Royal Bank of Scotland | | Markit CDX Emerging Market Index Series 14 | | 5.000% | | | USD | | | | 300,000 | | | | 42,357 | | | | 12/20/2015 | | | | (925) | |
| The Royal Bank of Scotland | | iTraxx Europe Crossover Series 14.V1 | | 5.000% | | | EUR | | | | 100,000 | | | | 1,845 | | | | 12/20/2015 | | | | 1,805 | |
| The Royal Bank of Scotland | | Markit CDX North America Investment Grade Index Series 15 | | 1.000% | | | USD | | | | 525,000 | | | | 853 | | | | 12/20/2015 | | | | 2,976 | |
| The Royal Bank of Scotland | | iTraxx Europe Series 14.V1 | | 1.000% | | | EUR | | | | 25,000 | | | | 4 | | | | 12/20/2015 | | | | (65) | |
| The Royal Bank of Scotland | | Markit CMBX North America AJ 4 | | 0.960% | | | USD | | | | 25,000 | | | | (7,043) | | | | 2/17/2051 | | | | 317 | |
| Bank of America | | Markit CDX Emerging Market Index Series 14 | | 5.000% | | | USD | | | | 850,000 | | | | 111,319 | | | | 12/20/2015 | | | | 6,072 | |
| Bank of America | | Markit CDX North America High Yield Index Series 15 | | 5.000% | | | USD | | | | 3,150,000 | | | | (21,762) | | | | 12/20/2015 | | | | 119,754 | |
| Bank of America | | Markit CDX North America Investment Grade Index Series 15 | | 1.000% | | | USD | | | | 2,775,000 | | | | 5,038 | | | | 12/20/2015 | | | | 15,200 | |
| Bank of America | | Markit CMBX North America AJ 3 | | 0.755% | | | USD | | | | 50,000 | | | | (12,191) | | | | 12/13/2049 | | | | 2,576 | |
| Bank of America | | Markit CMBX North America AJ 4 | | 0.697% | | | USD | | | | 50,000 | | | | (15,056) | | | | 2/17/2051 | | | | 1,605 | |
| Bank of America | | Markit CMBX North America AJ 5 | | 0.750% | | | USD | | | | 50,000 | | | | (12,443) | | | | 2/15/2051 | | | | 2,088 | |
| Bank of America | | iTraxx Europe Crossover Series 14.V1 | | 5.000% | | | EUR | | | | 1,300,000 | | | | 7,804 | | | | 12/20/2015 | | | | 31,853 | |
| Bank of America | | iTraxx Europe Series 14.V1 | | 1.000% | | | EUR | | | | 2,075,000 | | | | (724) | | | | 12/20/2015 | | | | 3,420 | |
| | | | | | | | | | | | | | | | | | | | | | | | |
| | | | | | | | | | | | | | | | | | | | | | | $211,649 | |
| | | | | | | | | | | | | | | | | | | | | | | | |
Money market fund investment pledged as collateral for credit default swap contracts was $320,000 at December 31, 2010. Additional collateral for positions held at the Royal Bank of Scotland is included in the collateral for forward foreign currency exchange contracts.
| | | | |
| | The accompanying notes are an integral part of these financial statements. | | (Continued) |
| | | | | | | | | | |
| AQR Funds | | | | Annual Report | | | | December 2010 | | 71 |
| | | | | | | |
| | | | |
| Consolidated Schedule of Investments | | | December 31, 2010 | |
Interest rate swap contracts outstanding as of December 31, 2010
| | | | | | | | | | | | | | | | | | | | |
| COUNTERPARTY | | PAYMENTS MADE BY THE FUND | | PAYMENTS
RECEIVED BY
THE FUND | | CURRENCY | | | NOTIONAL
AMOUNT | | | TERMINATION
DATE | | | UNREALIZED
APPRECIATION
(DEPRECIATION) | |
| The Royal Bank of Scotland | | 3 month Hong Kong Interbank Offer Rate | | 2.145% | | | HKD | | | | 1,550,000 | | | | 3/16/2016 | | | | $(1,107) | |
| The Royal Bank of Scotland | | 3 month Hong Kong Interbank Offer Rate | | 1.748% | | | HKD | | | | 2,760,959 | | | | 3/16/2016 | | | | (8,760) | |
| The Royal Bank of Scotland | | 3 month Johannesburg Interbank Agreed Rate | | 7.080% | | | ZAR | | | | 1,320,000 | | | | 3/16/2016 | | | | (1,364) | |
| The Royal Bank of Scotland | | 3 month Johannesburg Interbank Agreed Rate | | 7.390% | | | ZAR | | | | 2,390,000 | | | | 3/16/2016 | | | | 2,203 | |
| The Royal Bank of Scotland | | 3 month Johannesburg Interbank Agreed Rate | | 7.155% | | | ZAR | | | | 3,282,843 | | | | 3/16/2016 | | | | (1,826) | |
| The Royal Bank of Scotland | | 3 month South Korea Interbank Offered Rate | | 3.680% | | | KRW | | | | 200,000,000 | | | | 3/16/2016 | | | | (2,826) | |
| The Royal Bank of Scotland | | 3.950% | | (1) | | | KRW | | | | 220,000,000 | | | | 3/16/2016 | | | | 748 | |
| The Royal Bank of Scotland | | 3 month South Korea Interbank Offered Rate | | 3.690% | | | KRW | | | | 710,000,000 | | | | 3/16/2016 | | | | (9,750) | |
| The Royal Bank of Scotland | | 3 month South Korea Interbank Offered Rate | | 3.930% | | | KRW | | | | 860,000,000 | | | | 3/16/2016 | | | | (3,611) | |
| The Royal Bank of Scotland | | 3 month South Korea Interbank Offered Rate | | 3.750% | | | KRW | | | | 1,455,153,531 | | | | 3/16/2016 | | | | (16,515) | |
| The Royal Bank of Scotland | | 6 month Budapest Interbank Offered Rate | | 5.970% | | | HUF | | | | 38,000,000 | | | | 3/16/2016 | | | | (8,328) | |
| The Royal Bank of Scotland | | 6 month Budapest Interbank Offered Rate | | 6.300% | | | HUF | | | | 43,955,931 | | | | 3/16/2016 | | | | (6,638) | |
| The Royal Bank of Scotland | | 6 month Budapest Interbank Offered Rate | | 7.150% | | | HUF | | | | 49,000,000 | | | | 3/16/2016 | | | | 1,189 | |
| The Royal Bank of Scotland | | 6 month Singapore Interbank Offered Rate | | 1.750% | | | SGD | | | | 220,000 | | | | 3/16/2016 | | | | (3,131) | |
| The Royal Bank of Scotland | | 6 month Singapore Interbank Offered Rate | | 1.816% | | | SGD | | | | 365,898 | | | | 3/16/2016 | | | | (4,306) | |
| The Royal Bank of Scotland | | 6 month Warsaw Interbank Offered Rate | | 4.986% | | | PLN | | | | 990,000 | | | | 3/16/2016 | | | | (8,334) | |
| The Royal Bank of Scotland | | 6 month Warsaw Interbank Offered Rate | | 4.940% | | | PLN | | | | 2,060,979 | | | | 3/16/2016 | | | | (18,569) | |
| The Royal Bank of Scotland | | 6 month Warsaw Interbank Offered Rate | | 5.270% | | | PLN | | | | 590,000 | | | | 3/16/2016 | | | | (2,427) | |
| The Royal Bank of Scotland | | 3 month Johannesburg Interbank Agreed Rate | | 7.040% | | | ZAR | | | | 1,320,000 | | | | 3/16/2016 | | | | (1,697) | |
| The Royal Bank of Scotland | | 3 month Johannesburg Interbank Agreed Rate | | 7.350% | | | ZAR | | | | 1,370,000 | | | | 3/16/2016 | | | | 918 | |
| The Royal Bank of Scotland | | 6.955% | | (2) | | | ZAR | | | | 1,560,000 | | | | 3/16/2016 | | | | 2,842 | |
| The Royal Bank of Scotland | | 3 month Hong Kong Interbank Offered Rate | | 1.630% | | | HKD | | | | 1,590,000 | | | | 3/16/2016 | | | | (6,213) | |
| The Royal Bank of Scotland | | 6 month Prague Interbank Offered Rate | | 2.330% | | | CZK | | | | 3,000,000 | | | | 3/16/2016 | | | | (2,728) | |
| The Royal Bank of Scotland | | 6 month Prague Interbank Offered Rate | | 2.680% | | | CZK | | | | 4,000,000 | | | | 3/16/2016 | | | | (115) | |
| The Royal Bank of Scotland | | 6 month Prague Interbank Offered Rate | | 2.210% | | | CZK | | | | 5,438,792 | | | | 3/16/2016 | | | | (6,585) | |
| The Royal Bank of Scotland | | 3.730% | | (1) | | | KRW | | | | 200,000,000 | | | | 3/16/2016 | | | | (2,667) | |
| | | | | | | | | | | | | | | | | | | | |
| | | | | | | | | | | | | | | | | | | $(109,597) | |
| | | | | | | | | | | | | | | | | | | | |
| (1) | 3 Month South Korea Interbank Offered Rate |
| (2) | 3 Month Johannesburg Interbank Agreed Rate |
Cash collateral held by the broker is included in the forward foreign currency exchange contracts cash collateral.
Total return swap contracts outstanding as of December 31, 2010
| | | | | | | | | | | | |
| COUNTERPARTY | | UNDERLYING REFERENCE INSTRUMENT | | TERMINATION
DATE | | NOTIONAL
VALUE | | | UNREALIZED
APPRECIATION
(DEPRECIATION) | |
| Merrill Lynch | | Australia 10-Year Bond Future | | 03/15/2011 | | | $105,105 | | | | $785 | |
| Merrill Lynch | | 10-Year Japanese Government Bond | | 03/10/2011 | | | 5,188,976 | | | | 12,060 | |
| Merrill Lynch | | 10-Year U.S. Treasury Note | | 03/22/2011 | | | 6,634,935 | | | | (131,310) | |
| Merrill Lynch | | Euro - Bund Futures | | 03/08/2011 | | | 3,709,109 | | | | (10,697) | |
| Merrill Lynch | | Long Gilt | | 03/29/2011 | | | 749,972 | | | | (1,654) | |
| Merrill Lynch | | Swiss Market Index | | 03/18/2011 | | | 69,292 | | | | (1,081) | |
| Royal Bank of Scotland | | Kospi 200 Futures | | 03/10/2011 | | | 339,642 | | | | 22,504 | |
| | | | | | | | | | | | |
| | | | | | | | | | | $(109,393) | |
| | | | | | | | | | | | |
| | | | |
| | The accompanying notes are an integral part of these financial statements. | | (Continued) |
| | | | | | | | | | |
| AQR Funds | | | | Annual Report | | | | December 2010 | | 72 |
| | | | | | | |
| | | | |
| Consolidated Schedule of Investments | | | December 31, 2010 | |
Open futures contracts outstanding at December 31, 2010:
| | | | | | | | | | | | | | | | |
NUMBER OF
CONTRACTS | | TYPE | | EXPIRATION
DATE | | VALUE AT
TRADE DATE | | | VALUE AT
DECEMBER 31,
2010 | | | UNREALIZED
APPRECIATION
(DEPRECIATION) | |
| Long Contracts: | | | | | | | | | | | | | | | | |
| 5 | | 10-Year Mini Japanese Government Bond Futures | | March 9, 2011 | | | $860,721 | | | | $866,839 | | | | $6,118 | |
| 3 | | Amsterdam Index | | January 21, 2011 | | | 282,540 | | | | 285,589 | | | | 3,049 | |
| 9 | | CAC40 10 Euro | | January 21, 2011 | | | 469,372 | | | | 459,957 | | | | (9,415) | |
| 3 | | Coffee ‘C’ Futures | | May 18, 2011 | | | 244,951 | | | | 272,025 | | | | 27,074 | |
| 9 | | Corn Futures | | May 13, 2011 | | | 262,117 | | | | 286,425 | | | | 24,308 | |
| 2 | | Cotton No.2 Futures | | March 9, 2011 | | | 135,201 | | | | 144,810 | | | | 9,609 | |
| 1 | | Cotton No.2 Futures | | May 6, 2011 | | | 68,347 | | | | 68,805 | | | | 458 | |
| 2 | | DAX Index | | March 18, 2011 | | | 472,193 | | | | 464,646 | | | | (7,547) | |
| 4 | | E-Mini Russell 2000 Futures | | March 18, 2011 | | | 309,057 | | | | 312,920 | | | | 3,863 | |
| 49 | | E-Mini S&P 500 Futures | | March 18, 2011 | | | 3,022,025 | | | | 3,069,850 | | | | 47,825 | |
| 8 | | FTSE 100 Index Futures | | March 18, 2011 | | | 731,503 | | | | 738,110 | | | | 6,607 | |
| 4 | | FTSE/JSE Top 40 Index | | March 17, 2011 | | | 171,664 | | | | 174,178 | | | | 2,514 | |
| 1 | | FTSE/MIB Index | | March 18, 2011 | | | 138,761 | | | | 135,530 | | | | (3,231) | |
| 1 | | Globes RBOB Gas Futures | | February 25, 2011 | | | 98,158 | | | | 102,194 | | | | 4,036 | |
| 3 | | Globex Brent FCL Futures | | February 10, 2011 | | | 276,090 | | | | 284,010 | | | | 7,920 | |
| 1 | | Globex Brent Futures | | January 13, 2011 | | | 94,110 | | | | 94,750 | | | | 640 | |
| 12 | | Globex Crude Oil Futures | | February 18, 2011 | | | 1,078,800 | | | | 1,106,640 | | | | 27,840 | |
| 1 | | Globex Crude Oil Futures | | January 19, 2011 | | | 91,490 | | | | 91,380 | | | | (110) | |
| 1 | | Globex Heat Oil Futures | | February 25, 2011 | | | 104,719 | | | | 107,037 | | | | 2,318 | |
| 6 | | Gold 100 OZ Futures | | February 24, 2011 | | | 823,511 | | | | 852,840 | | | | 29,329 | |
| 4 | | H-SHARES Index Futures | | January 28, 2011 | | | 317,212 | | | | 325,767 | | | | 8,555 | |
| 1 | | IBEX 35 Index | | January 21, 2011 | | | 135,967 | | | | 131,351 | | | | (4,616) | |
| 1 | | Lean Hogs Futures | | April 14, 2011 | | | 32,343 | | | | 33,550 | | | | 1,207 | |
| 1 | | Live Cattle Futures | | April 29, 2011 | | | 43,023 | | | | 44,880 | | | | 1,857 | |
| 2 | | LME Aluminum Futures | | July 1, 2011 | | | 116,886 | | | | 123,062 | | | | 6,176 | |
| 2 | | LME Aluminum Futures | | November 2, 2011 | | | 113,253 | | | | 123,201 | | | | 9,948 | |
| 2 | | LME Copper Futures | | March 14, 2011 | | | 418,253 | | | | 480,750 | | | | 62,497 | |
| 2 | | LME Copper Futures | | June 13, 2011 | | | 449,252 | | | | 477,975 | | | | 28,723 | |
| 7 | | LME HG Aluminum Futures | | June 13, 2011 | | | 411,153 | | | | 435,138 | | | | 23,985 | |
| 8 | | LME PRI Aluminum Futures | | March 14, 2011 | | | 470,338 | | | | 494,150 | | | | 23,812 | |
| 10 | | MSCI Taiwan Stock Index Futures | | January 28, 2011 | | | 314,657 | | | | 319,300 | | | | 4,643 | |
| 1 | | Natural Gas Futures | | February 27, 2011 | | | 10,363 | | | | 11,013 | | | | 650 | |
| 22 | | Natural Gas Futures | | February 24, 2011 | | | 227,480 | | | | 243,210 | | | | 15,730 | |
| 3 | | S&P MID 400 E-Mini Future | | March 18, 2011 | | | 266,980 | | | | 271,590 | | | | 4,610 | |
| 2 | | SGX MSCI Singapore Index Futures | | January 28, 2011 | | | 116,549 | | | | 118,153 | | | | 1,604 | |
| 10 | | SGX S&P CNX Nifty Index Futures | | January 27, 2011 | | | 120,969 | | | | 123,280 | | | | 2,311 | |
| 5 | | Soybean Futures | | March 14, 2011 | | | 302,573 | | | | 350,749 | | | | 48,176 | |
| 7 | | Sugar #11 (World Markets) | | April 29, 2011 | | | 200,271 | | | | 229,869 | | | | 29,598 | |
| 6 | | TOPIX Index | | March 10, 2011 | | | 655,938 | | | | 662,844 | | | | 6,906 | |
| 6 | | Wheat Futures | | May 13, 2011 | | | 239,892 | | | | 246,225 | | | | 6,333 | |
| | | | | | | | | | | | | | | | |
| | | | | | | | | | | | | | | 465,910 | |
| | | | | | | | | | | | | | | | |
| Short Contracts: | | | | | | | | | | | | | | | | |
| 2 | | LME Aluminum Futures | | July 1, 2011 | | | (116,997) | | | | (123,062) | | | | (6,065) | |
| 2 | | LME Aluminum Futures | | November 2, 2011 | | | (112,621) | | | | (123,200) | | | | (10,579) | |
| 2 | | LME Copper Futures | | March 14, 2011 | | | (425,623) | | | | (480,751) | | | | (55,128) | |
| 8 | | LME PRI Aluminum Futures | | March 14, 2011 | | | (460,190) | | | | (494,150) | | | | (33,960) | |
| | | | | | | | | | | | | | | | |
| | | | | | | | | | | | | | | (105,732) | |
| | | | | | | | | | | | | | | | |
| | | | | | | | | | | | | | | $360,178 | |
| | | | | | | | | | | | | | | | |
| | | | |
| | The accompanying notes are an integral part of these financial statements. | | (Continued) |
| | | | | | | | | | |
| AQR Funds | | | | Annual Report | | | | December 2010 | | 73 |
| | | | | | | |
| | | | |
| Consolidated Schedule of Investments | | | December 31, 2010 | |
Cash held as collateral with brokers for futures contracts was $650,572 at December 31, 2010.
Forward foreign currency exchange contracts outstanding as of December 31, 2010:
| | | | | | | | | | | | | | | | | | | | |
PURCHASE
CONTRACTS | | COUNTERPARTY | | CURRENCY | | CURRENCY
AMOUNT
PURCHASED | | | VALUE AT
SETTLEMENT
DATE | | | VALUE AT
DECEMBER 31,
2010 | | | UNREALIZED
APPRECIATION
(DEPRECIATION) | |
Brazilian Real,
Expiring 03/16/11 | | The Royal Bank of Scotland | | BRL | | | 1,695,000 | | | | $970,477 | | | | $1,005,659 | | | | $35,182 | |
Euro,
Expiring 03/16/11 | | The Royal Bank of Scotland | | EUR | | | 50,000 | | | | 65,995 | | | | 67,067 | | | | 1,072 | |
Euro,
Expiring 01/03/11 | | The Royal Bank of Scotland | | EUR | | | 363,000 | | | | 476,692 | | | | 486,983 | | | | 10,291 | |
British Pound,
Expiring 03/16/11 | | The Royal Bank of Scotland | | GBP | | | 40,000 | | | | 62,986 | | | | 62,592 | | | | (394) | |
Israeli Shekel,
Expiring 03/16/11 | | The Royal Bank of Scotland | | ILS | | | 3,583,000 | | | | 979,418 | | | | 1,010,801 | | | | 31,383 | |
Japanese Yen,
Expiring 03/16/11 | | The Royal Bank of Scotland | | JPY | | | 7,577,000 | | | | 91,119 | | | | 93,493 | | | | 2,374 | |
Korean Won,
Expiring 03/16/11 | | The Royal Bank of Scotland | | KRW | | | 816,164,000 | | | | 704,845 | | | | 716,502 | | | | 11,657 | |
Mexican Peso,
Expiring 03/16/11 | | The Royal Bank of Scotland | | MXN | | | 16,438,000 | | | | 1,309,204 | | | | 1,325,652 | | | | 16,448 | |
Singapore Dollar,
Expiring 03/16/11 | | The Royal Bank of Scotland | | SGD | | | 929,000 | | | | 708,696 | | | | 725,186 | | | | 16,490 | |
Turkish Lira,
Expiring 03/16/11 | | The Royal Bank of Scotland | | TRY | | | 953,000 | | | | 624,256 | | | | 613,887 | | | | (10,369) | |
Taiwanese Dollar,
Expiring 03/16/11 | | The Royal Bank of Scotland | | TWD | | | 30,818,000 | | | | 1,025,763 | | | | 1,058,873 | | | | 33,110 | |
South African Rand,
Expiring 03/16/11 | | The Royal Bank of Scotland | | ZAR | | | 4,944,000 | | | | 691,104 | | | | 739,747 | | | | 48,643 | |
| | | | | | | | | | | | | | | | | | | | |
| | | | | | | | | | | 7,710,555 | | | | 7,906,442 | | | | 195,887 | |
| | | | | | | | | | | | | | | | | | | | |
| | | | | | | | | | | | | | | | | | | | |
| SALES CONTRACTS | | COUNTERPARTY | | CURRENCY | | CURRENCY
AMOUNT
SOLD | | | VALUE AT
SETTLEMENT
DATE | | | VALUE AT
DECEMBER 31,
2010 | | | UNREALIZED
APPRECIATION
(DEPRECIATION) | |
Brazilian Real,
Expiring 03/16/11 | | The Royal Bank of Scotland | | BRL | | | (38,000) | | | | $(21,936) | | | | $(22,546) | | | | $(610) | |
Euro,
Expiring 03/16/11 | | The Royal Bank of Scotland | | EUR | | | (4,664,000) | | | | (6,132,364) | | | | (6,256,010) | | | | (123,646) | |
Euro,
Expiring 03/16/11 | | The Royal Bank of Scotland | | EUR | | | (363,000) | | | | (476,619) | | | | (486,906) | | | | (10,287) | |
British Pound,
Expiring 03/16/11 | | The Royal Bank of Scotland | | GBP | | | (1,779,000) | | | | (2,776,434) | | | | (2,783,785) | | | | (7,351) | |
British Pound,
Expiring 03/16/11 | | The Royal Bank of Scotland | | GBP | | | (126,000) | | | | (193,851) | | | | (197,165) | | | | (3,314) | |
Japanese Yen,
Expiring 03/16/11 | | The Royal Bank of Scotland | | JPY | | | (3,927,000) | | | | (46,814) | | | | (48,456) | | | | (1,642) | |
Korean Won,
Expiring 03/16/11 | | The Royal Bank of Scotland | | KRW | | | (23,027,000) | | | | (20,010) | | | | (20,215) | | | | (205) | |
Singapore Dollar,
Expiring 03/16/11 | | The Royal Bank of Scotland | | SGD | | | (103,000) | | | | (78,521) | | | | (80,403) | | | | (1,882) | |
Turkish Lira,
Expiring 03/16/11 | | The Royal Bank of Scotland | | TRY | | | (74,000) | | | | (47,663) | | | | (47,668) | | | | (5) | |
Taiwanese Dollar,
Expiring 03/16/11 | | The Royal Bank of Scotland | | TWD | | | (1,405,000) | | | | (46,951) | | | | (48,274) | | | | (1,323) | |
| | | | | | | | | | | | | | | | | | | | |
| | | | | | | | | | | (9,841,163) | | | | (9,991,428) | | | | (150,265) | |
| | | | | | | | | | | | | | | | | | | | |
| | | | | | | | | | | $(2,130,608) | | | | $(2,084,986) | | | | $45,622 | |
| | | | | | | | | | | | | | | | | | | | |
| | | | |
| | The accompanying notes are an integral part of these financial statements. | | (Continued) |
| | | | | | | | | | |
| AQR Funds | | | | Annual Report | | | | December 2010 | | 74 |
| | | | | | | |
| | | | |
| Consolidated Schedule of Investments | | | December 31, 2010 | |
Money Market fund investment is pledged as collateral for forward foreign exchange contracts in the amount of $537,300.
BRL - Brazilian Real
CZK - Czech Republic Koruna
EUR - Euro
GBP - British Pound
HKD - Hong Kong Dollar
HUF - Hungarian Forint
ILS - Israeli Shekel
JPY - Japanese Yen
KRW - Korean Won
MXN - Mexican Peso
PLN - Polish Zlotych
SGD - Singapore Dollar
TRY - Turkish Lira
TWD - Taiwan Dollar
ZAR - South African Rand
| | | | |
| | The accompanying notes are an integral part of these financial statements. | | |
| | | | | | | | | | |
| AQR Funds | | | | Annual Report | | | | December 2010 | | 75 |
| | | | | | | |
| | | | |
| Schedule of Investments | | | December 31, 2010 | |
| | | | | | | | |
| COMMON STOCKS - 97.3% | | SHARES | | | VALUE
(Note 3) | |
| Consumer Discretionary - 29.2% | | | | | | | | |
| Abercrombie & Fitch Co., Class A | | | 3,300 | | | $ | 190,179 | |
| Advance Auto Parts, Inc. | | | 3,200 | | | | 211,680 | |
| Amazon.com, Inc. † | | | 15,800 | | | | 2,844,000 | |
| AutoNation, Inc. †(a) | | | 1,100 | | | | 31,020 | |
| AutoZone, Inc. † | | | 1,800 | | | | 490,662 | |
| BorgWarner, Inc. †(a) | | | 4,100 | | | | 296,676 | |
| Brinker International, Inc. | | | 5,700 | | | | 119,016 | |
| Cablevision Systems Corp., Class A (a) | | | 10,000 | | | | 338,400 | |
| CarMax, Inc. † | | | 10,200 | | | | 325,176 | |
| CBS Corp., Class B | | | 9,600 | | | | 182,880 | |
| Cheesecake Factory, Inc./The † | | | 3,900 | | | | 119,574 | |
| Chipotle Mexican Grill, Inc. † | | | 2,000 | | | | 425,320 | |
| Clear Channel Outdoor Holdings, Inc., Class A † | | | 9,300 | | | | 130,572 | |
| Coach, Inc. | | | 13,507 | | | | 747,072 | |
| Coinstar, Inc. † | | | 2,100 | | | | 118,524 | |
| Dana Holding Corp. †(a) | | | 8,800 | | | | 151,448 | |
| Darden Restaurants, Inc. | | | 5,800 | | | | 269,352 | |
| Deckers Outdoor Corp. †(a) | | | 2,300 | | | | 183,402 | |
| Dick’s Sporting Goods, Inc. †(a) | | | 4,600 | | | | 172,500 | |
| Dillard’s, Inc., Class A (a) | | | 3,700 | | | | 140,378 | |
| DIRECTV, Class A † | | | 8,000 | | | | 319,440 | |
| Discovery Communications, Inc., Class A †(a) | | | 16,666 | | | | 694,972 | |
| Dollar General Corp. † | | | 4,000 | | | | 122,680 | |
| Dollar Tree, Inc. † | | | 6,200 | | | | 347,696 | |
| Family Dollar Stores, Inc. (a) | | | 8,000 | | | | 397,680 | |
| Foot Locker, Inc. | | | 7,900 | | | | 154,998 | |
| Ford Motor Co. †(a) | | | 155,943 | | | | 2,618,283 | |
| Fortune Brands, Inc. | | | 4,600 | | | | 277,150 | |
| Fossil, Inc. † | | | 3,300 | | | | 232,584 | |
| Gentex Corp. (a) | | | 2,900 | | | | 85,724 | |
| Genuine Parts Co. | | | 2,800 | | | | 143,752 | |
| Guess?, Inc. (a) | | | 700 | | | | 33,124 | |
| Harley-Davidson, Inc. | | | 1,600 | | | | 55,472 | |
| Hasbro, Inc. | | | 3,700 | | | | 174,566 | |
| HSN, Inc. †(a) | | | 1,300 | | | | 39,832 | |
| Hyatt Hotels Corp., Class A † | | | 6,400 | | | | 292,864 | |
| Interpublic Group of Cos., Inc./The † | | | 20,600 | | | | 218,772 | |
| Jarden Corp. | | | 4,300 | | | | 132,741 | |
| JC Penney Co., Inc. | | | 7,500 | | | | 242,325 | |
| Johnson Controls, Inc. | | | 27,300 | | | | 1,042,860 | |
| Las Vegas Sands Corp. †(a) | | | 18,600 | | | | 854,670 | |
| Lear Corp. † | | | 1,400 | | | | 138,194 | |
| Leggett & Platt, Inc. | | | 1,500 | | | | 34,140 | |
| Liberty Global, Inc., Class A †(a) | | | 7,200 | | | | 254,736 | |
| Liberty Media Corp. - Capital, Series A † | | | 3,500 | | | | 218,960 | |
| Liberty Media Corp. - Interactive, Series A † | | | 26,000 | | | | 410,020 | |
| Liberty Media Corp. - Starz, Series A † | | | 1,900 | | | | 126,312 | |
| Ltd. Brands, Inc. | | | 14,600 | | | | 448,658 | |
| Macy’s, Inc. | | | 18,000 | | | | 455,400 | |
| Marriott International, Inc., Class A (a) | | | 11,500 | | | | 477,710 | |
| Mattel, Inc. | | | 18,600 | | | | 472,998 | |
| McDonald’s Corp. | | | 47,800 | | | | 3,669,128 | |
| MGM Resorts International † | | | 12,700 | | | | 188,595 | |
| NetFlix, Inc. † | | | 3,100 | | | | 544,670 | |
| Newell Rubbermaid, Inc. | | | 2,900 | | | | 52,722 | |
| | | | | | | | |
| | | SHARES | | | VALUE
(Note 3) | |
| Consumer Discretionary - 29.2% (continued) | | | | | | | | |
| NIKE, Inc., Class B | | | 18,900 | | | $ | 1,614,438 | |
| O’Reilly Automotive, Inc. † | | | 5,800 | | | | 350,436 | |
| Panera Bread Co., Class A †(a) | | | 2,400 | | | | 242,904 | |
| Penn National Gaming, Inc. † | | | 3,500 | | | | 123,025 | |
| PetSmart, Inc. (a) | | | 3,400 | | | | 135,388 | |
| Phillips-Van Heusen Corp. | | | 3,200 | | | | 201,632 | |
| Polo Ralph Lauren Corp. | | | 4,100 | | | | 454,772 | |
| priceline.com, Inc. † | | | 2,226 | | | | 889,398 | |
| Ross Stores, Inc. | | | 5,800 | | | | 366,850 | |
| Royal Caribbean Cruises Ltd. † | | | 5,300 | | | | 249,100 | |
| Saks, Inc. † | | | 11,300 | | | | 120,910 | |
| Sally Beauty Holdings, Inc. † | | | 8,500 | | | | 123,505 | |
| Scripps Networks Interactive, Inc., Class A | | | 500 | | | | 25,875 | |
| Signet Jewelers Ltd. (Bermuda) † | | | 3,900 | | | | 169,260 | |
| Sirius XM Radio, Inc. †(a) | | | 136,000 | | | | 223,040 | |
| Sotheby’s (a) | | | 4,100 | | | | 184,500 | |
| Stanley Black & Decker, Inc. | | | 5,400 | | | | 361,098 | |
| Starbucks Corp. | | | 30,134 | | | | 968,206 | |
| Starwood Hotels & Resorts Worldwide, Inc. | | | 7,500 | | | | 455,850 | |
| Tempur-Pedic International, Inc. †(a) | | | 3,900 | | | | 156,234 | |
| Tenneco, Inc. † | | | 3,100 | | | | 127,596 | |
| Tiffany & Co. | | | 4,800 | | | | 298,896 | |
| Time Warner Cable, Inc. | | | 14,900 | | | | 983,847 | |
| Tractor Supply Co. (a) | | | 3,500 | | | | 169,715 | |
| TRW Automotive Holdings Corp. † | | | 4,800 | | | | 252,960 | |
| Tupperware Brands Corp. | | | 800 | | | | 38,136 | |
| Ulta Salon Cosmetics & Fragrance, Inc. † | | | 3,600 | | | | 122,400 | |
| Under Armour, Inc., Class A † | | | 2,800 | | | | 153,552 | |
| Urban Outfitters, Inc. † | | | 700 | | | | 25,067 | |
| Viacom, Inc., Class B | | | 22,600 | | | | 895,186 | |
| Virgin Media, Inc. (a) | | | 10,700 | | | | 291,468 | |
| Walt Disney Co./The | | | 9,600 | | | | 360,096 | |
| Whirlpool Corp. (a) | | | 900 | | | | 79,947 | |
| Williams-Sonoma, Inc. | | | 1,500 | | | | 53,535 | |
| Wyndham Worldwide Corp. | | | 6,700 | | | | 200,732 | |
| Wynn Resorts Ltd. | | | 3,900 | | | | 404,976 | |
| Yum! Brands, Inc. | | | 20,600 | | | | 1,010,430 | |
| | | | | | | | |
| | | | | | | 36,347,219 | |
| | | | | | | | |
| Consumer Staples - 4.8% | | | | | | | | |
| Altria Group, Inc. | | | 87,800 | | | | 2,161,636 | |
| Brown-Forman Corp., Class B | | | 3,000 | | | | 208,860 | |
| Coca-Cola Enterprises, Inc. | | | 12,323 | | | | 308,445 | |
| Corn Products International, Inc. | | | 900 | | | | 41,400 | |
| Dr Pepper Snapple Group, Inc. | | | 7,700 | | | | 270,732 | |
| Estee Lauder Cos., Inc./The, Class A | | | 7,400 | | | | 597,180 | |
| Green Mountain Coffee Roasters, Inc. †(a) | | | 5,400 | | | | 177,444 | |
| Hansen Natural Corp. † | | | 2,900 | | | | 151,612 | |
| Herbalife Ltd. (Cayman Islands) | | | 1,200 | | | | 82,044 | |
| Hershey Co./The | | | 6,400 | | | | 301,760 | |
| HJ Heinz Co. | | | 1,900 | | | | 93,974 | |
| Hormel Foods Corp. (a) | | | 2,300 | | | | 117,898 | |
| Kraft Foods, Inc., Class A | | | 1,800 | | | | 56,718 | |
| McCormick & Co., Inc. | | | 3,300 | | | | 153,549 | |
| Mead Johnson Nutrition Co. | | | 6,700 | | | | 417,075 | |
| Nu Skin Enterprises, Inc., Class A (a) | | | 4,600 | | | | 139,196 | |
| | | | |
| | The accompanying notes are an integral part of these financial statements. | | (Continued) |
| | | | | | | | | | |
| AQR Funds | | | | Annual Report | | | | December 2010 | | 76 |
| | | | | | | |
| | | | |
| Schedule of Investments | | | December 31, 2010 | |
| | | | | | | | |
| | | SHARES | | | VALUE
(Note 3) | |
| Consumer Staples - 4.8% (continued) | | | | | | | | |
| Sara Lee Corp. | | | 11,100 | | | $ | 194,361 | |
| Smithfield Foods, Inc. † | | | 1,600 | | | | 33,008 | |
| Tyson Foods, Inc., Class A | | | 10,300 | | | | 177,366 | |
| United Natural Foods, Inc. †(a) | | | 800 | | | | 29,344 | |
| Whole Foods Market, Inc. †(a) | | | 6,100 | | | | 308,599 | |
| | | | | | | | |
| | | | | | | 6,022,201 | |
| | | | | | | | |
| Energy - 6.6% | | | | | | | | |
| Arch Coal, Inc. | | | 5,600 | | | | 196,336 | |
| Baker Hughes, Inc. | | | 17,700 | | | | 1,011,909 | |
| Brigham Exploration Co. †(a) | | | 7,100 | | | | 193,404 | |
| CARBO Ceramics, Inc. (a) | | | 1,600 | | | | 165,664 | |
| Cimarex Energy Co. | | | 3,300 | | | | 292,149 | |
| Complete Production Services, Inc. † | | | 4,400 | | | | 130,020 | |
| Concho Resources, Inc./Midland TX †(a) | | | 5,100 | | | | 447,117 | |
| ConocoPhillips | | | 10,900 | | | | 742,290 | |
| Dril-Quip, Inc. † | | | 1,800 | | | | 139,896 | |
| El Paso Corp. | | | 19,900 | | | | 273,824 | |
| Energy XXI Bermuda Ltd. (Bermuda) † | | | 4,500 | | | | 124,515 | |
| FMC Technologies, Inc. † | | | 5,400 | | | | 480,114 | |
| Forest Oil Corp. † | | | 2,600 | | | | 98,722 | |
| McDermott International, Inc. † | | | 9,800 | | | | 202,762 | |
| National Oilwell Varco, Inc. | | | 17,700 | | | | 1,190,325 | |
| Newfield Exploration Co. † | | | 4,600 | | | | 331,706 | |
| Oil States International, Inc. † | | | 2,600 | | | | 166,634 | |
| Patterson-UTI Energy, Inc. | | | 5,600 | | | | 120,680 | |
| Peabody Energy Corp. | | | 10,900 | | | | 697,382 | |
| Pioneer Natural Resources Co. | | | 3,600 | | | | 312,552 | |
| Rosetta Resources, Inc. † | | | 3,300 | | | | 124,212 | |
| Rowan Cos., Inc. † | | | 4,200 | | | | 146,622 | |
| RPC, Inc. (a) | | | 2,100 | | | | 38,052 | |
| SM Energy Co. (a) | | | 1,600 | | | | 94,288 | |
| Sunoco, Inc. | | | 2,700 | | | | 108,837 | |
| Superior Energy Services, Inc. † | | | 3,800 | | | | 132,962 | |
| Whiting Petroleum Corp. † | | | 2,600 | | | | 304,694 | |
| | | | | | | | |
| | | | | | | 8,267,668 | |
| | | | | | | | |
| Financials - 6.8% | | | | | | | | |
| Alexandria Real Estate Equities, Inc. REIT (a) | | | 600 | | | | 43,956 | |
| Alleghany Corp. † | | | 100 | | | | 30,637 | |
| American Campus Communities, Inc. REIT | | | 900 | | | | 28,584 | |
| American Capital Ltd. †(a) | | | 17,800 | | | | 134,568 | |
| American Express Co. | | | 2,600 | | | | 111,592 | |
| American International Group, Inc. † | | | 3,400 | | | | 195,908 | |
| Ameriprise Financial, Inc. | | | 9,200 | | | | 529,460 | |
| Apartment Investment & Management Co., Class A REIT | | | 1,000 | | | | 25,840 | |
| Arch Capital Group Ltd. (Bermuda) † | | | 1,400 | | | | 123,270 | |
| Ares Capital Corp. | | | 3,600 | | | | 59,328 | |
| AvalonBay Communities, Inc. REIT (a) | | | 3,500 | | | | 393,925 | |
| BGC Partners, Inc., Class A | | | 14,300 | | | | 118,833 | |
| Boston Properties, Inc. REIT | | | 1,800 | | | | 154,980 | |
| Brookfield Properties Corp. | | | 18,200 | | | | 319,046 | |
| Camden Property Trust REIT (a) | | | 700 | | | | 37,786 | |
| CB Richard Ellis Group, Inc., Class A † | | | 12,300 | | | | 251,904 | |
| CIT Group, Inc. † | | | 6,100 | | | | 287,310 | |
| City National Corp./CA (a) | | | 500 | | | | 30,680 | |
| | | | | | | | |
| | | SHARES | | | VALUE
(Note 3) | |
| Financials - 6.8% (continued) | | | | | | | | |
| Comerica, Inc. (a) | | | 3,400 | | | $ | 143,616 | |
| Credit Acceptance Corp. † | | | 500 | | | | 31,385 | |
| Douglas Emmett, Inc. REIT (a) | | | 8,500 | | | | 141,100 | |
| East West Bancorp, Inc. | | | 1,700 | | | | 33,235 | |
| Entertainment Properties Trust REIT (a) | | | 1,000 | | | | 46,250 | |
| Equity Residential REIT | | | 10,700 | | | | 555,865 | |
| Erie Indemnity Co., Class A | | | 1,200 | | | | 78,564 | |
| Essex Property Trust, Inc. REIT (a) | | | 300 | | | | 34,266 | |
| Fifth Third Bancorp | | | 8,500 | | | | 124,780 | |
| Forest City Enterprises, Inc., Class A † | | | 7,500 | | | | 125,175 | |
| General Growth Properties, Inc. REIT | | | 25,400 | | | | 393,192 | |
| Hartford Financial Services Group, Inc. | | | 2,700 | | | | 71,523 | |
| HCP, Inc. REIT | | | 4,700 | | | | 172,913 | |
| Home Properties, Inc. REIT (a) | | | 1,100 | | | | 61,039 | |
| Host Hotels & Resorts, Inc. REIT | | | 19,500 | | | | 348,465 | |
| Huntington Bancshares, Inc./OH (a) | | | 9,400 | | | | 64,578 | |
| Jones Lang LaSalle, Inc. | | | 2,100 | | | | 176,232 | |
| KeyCorp | | | 23,200 | | | | 205,320 | |
| Kimco Realty Corp. REIT | | | 2,100 | | | | 37,884 | |
| M&T Bank Corp. | | | 800 | | | | 69,640 | |
| Macerich Co./The REIT | | | 3,002 | | | | 142,205 | |
| Mid-America Apartment Communities, Inc. REIT (a) | | | 1,800 | | | | 114,282 | |
| New York Community Bancorp, Inc. (a) | | | 18,300 | | | | 344,955 | |
| Plum Creek Timber Co., Inc. REIT | | | 600 | | | | 22,470 | |
| ProLogis REIT | | | 4,100 | | | | 59,204 | |
| Prudential Financial, Inc. | | | 3,100 | | | | 182,001 | |
| Public Storage REIT | | | 900 | | | | 91,278 | |
| Rayonier, Inc. REIT | | | 1,500 | | | | 78,780 | |
| Realty Income Corp. REIT | | | 1,000 | | | | 34,200 | |
| SEI Investments Co. | | | 5,100 | | | | 121,329 | |
| Simon Property Group, Inc. REIT | | | 3,100 | | | | 308,419 | |
| SL Green Realty Corp. REIT (a) | | | 2,500 | | | | 168,775 | |
| SLM Corp. † | | | 4,600 | | | | 57,914 | |
| Tanger Factory Outlet Centers REIT | | | 1,000 | | | | 51,190 | |
| Taubman Centers, Inc. REIT | | | 1,700 | | | | 85,816 | |
| UDR, Inc. REIT (a) | | | 7,900 | | | | 185,808 | |
| Unum Group | | | 5,400 | | | | 130,788 | |
| Ventas, Inc. REIT | | | 2,100 | | | | 110,208 | |
| Vornado Realty Trust REIT | | | 1,500 | | | | 124,995 | |
| Weingarten Realty Investors REIT (a) | | | 5,400 | | | | 128,304 | |
| Zions Bancorp. | | | 5,000 | | | | 121,150 | |
| | | | | | | | |
| | | | | | | 8,456,700 | |
| | | | | | | | |
| Health Care - 2.9% | | | | | | | | |
| Agilent Technologies, Inc. † | | | 2,200 | | | | 91,146 | |
| Alexion Pharmaceuticals, Inc. †(a) | | | 3,400 | | | | 273,870 | |
| AMERIGROUP Corp. †(a) | | | 600 | | | | 26,352 | |
| AmerisourceBergen Corp. | | | 3,700 | | | | 126,244 | |
| BioMarin Pharmaceutical, Inc. † | | | 4,400 | | | | 118,492 | |
| Brookdale Senior Living, Inc. † | | | 6,500 | | | | 139,165 | |
| Cardinal Health, Inc. | | | 5,300 | | | | 203,043 | |
| Catalyst Health Solutions, Inc. †(a) | | | 800 | | | | 37,192 | |
| Cooper Cos., Inc./The (a) | | | 1,500 | | | | 84,510 | |
| Dendreon Corp. †(a) | | | 6,867 | | | | 239,795 | |
| Edwards Lifesciences Corp. † | | | 2,900 | | | | 234,436 | |
| Endo Pharmaceuticals Holdings, Inc. † | | | 3,500 | | | | 124,985 | |
| | | | |
| | The accompanying notes are an integral part of these financial statements. | | (Continued) |
| | | | | | | | | | |
| AQR Funds | | | | Annual Report | | | | December 2010 | | 77 |
| | | | | | | |
| | | | |
| Schedule of Investments | | | December 31, 2010 | |
| | | | | | | | |
| | | SHARES | | | VALUE
(Note 3) | |
| Health Care - 2.9% (continued) | | | | | | | | |
| Health Net, Inc. † | | | 1,900 | | | $ | 51,851 | |
| Hill-Rom Holdings, Inc. | | | 3,500 | | | | 137,795 | |
| HMS Holdings Corp. † | | | 1,900 | | | | 123,063 | |
| Humana, Inc. † | | | 1,300 | | | | 71,162 | |
| Illumina, Inc. † | | | 5,200 | | | | 329,368 | |
| Incyte Corp. Ltd. †(a) | | | 8,500 | | | | 140,760 | |
| McKesson Corp. | | | 1,800 | | | | 126,684 | |
| Mylan, Inc./PA † | | | 5,800 | | | | 122,554 | |
| Perrigo Co. (a) | | | 3,100 | | | | 196,323 | |
| Salix Pharmaceuticals Ltd. †(a) | | | 1,500 | | | | 70,440 | |
| SXC Health Solutions Corp. † | | | 1,500 | | | | 64,290 | |
| Varian Medical Systems, Inc. † | | | 3,800 | | | | 263,264 | |
| Watson Pharmaceuticals, Inc. † | | | 2,900 | | | | 149,785 | �� |
| | | | | | | | |
| | | | | | | 3,546,569 | |
| | | | | | | | |
| Industrials - 17.9% | | | | | | | | |
| Acuity Brands, Inc. (a) | | | 2,600 | | | | 149,942 | |
| AGCO Corp. †(a) | | | 2,900 | | | | 146,914 | |
| Amerco, Inc. †(a) | | | 300 | | | | 28,812 | |
| AMETEK, Inc. | | | 6,400 | | | | 251,200 | |
| BE Aerospace, Inc. †(a) | | | 4,200 | | | | 155,526 | |
| Boeing Co./The | | | 900 | | | | 58,734 | |
| Bucyrus International, Inc. | | | 1,900 | | | | 169,860 | |
| Caterpillar, Inc. | | | 25,900 | | | | 2,425,794 | |
| CNH Global NV (Netherlands) † | | | 2,500 | | | | 119,350 | |
| Cooper Industries PLC | | | 6,600 | | | | 384,714 | |
| Crane Co. | | | 700 | | | | 28,749 | |
| CSX Corp. | | | 15,500 | | | | 1,001,455 | |
| Cummins, Inc. | | | 8,400 | | | | 924,084 | |
| Deere & Co. | | | 17,200 | | | | 1,428,460 | |
| Delta Air Lines, Inc. †(a) | | | 5,700 | | | | 71,820 | |
| Donaldson Co., Inc. | | | 2,700 | | | | 157,356 | |
| Dover Corp. | | | 9,600 | | | | 561,120 | |
| Eaton Corp. | | | 6,300 | | | | 639,513 | |
| Emerson Electric Co. | | | 31,800 | | | | 1,818,006 | |
| Expeditors International of Washington, Inc. | | | 7,400 | | | | 404,040 | |
| Fastenal Co. (a) | | | 5,300 | | | | 317,523 | |
| FedEx Corp. | | | 2,000 | | | | 186,020 | |
| Fluor Corp. | | | 5,700 | | | | 377,682 | |
| Gardner Denver, Inc. | | | 2,100 | | | | 144,522 | |
| Genesee & Wyoming, Inc., Class A † | | | 2,300 | | | | 121,785 | |
| Goodrich Corp. | | | 6,800 | | | | 598,876 | |
| Honeywell International, Inc. | | | 29,100 | | | | 1,546,956 | |
| IHS, Inc., Class A †(a) | | | 900 | | | | 72,351 | |
| Joy Global, Inc. | | | 3,400 | | | | 294,950 | |
| Kansas City Southern †(a) | | | 3,600 | | | | 172,296 | |
| KBR, Inc. | | | 3,900 | | | | 118,833 | |
| MSC Industrial Direct Co., Class A | | | 2,200 | | | | 142,318 | |
| Navistar International Corp. † | | | 2,500 | | | | 144,775 | |
| Nordson Corp. (a) | | | 1,600 | | | | 147,008 | |
| Norfolk Southern Corp. | | | 6,000 | | | | 376,920 | |
| Owens Corning † | | | 1,400 | | | | 43,610 | |
| PACCAR, Inc. | | | 12,700 | | | | 729,234 | |
| Parker Hannifin Corp. | | | 6,700 | | | | 578,210 | |
| Precision Castparts Corp. | | | 1,600 | | | | 222,736 | |
| Regal-Beloit Corp. (a) | | | 400 | | | | 26,704 | |
| Rockwell Automation, Inc. | | | 5,300 | | | | 380,063 | |
| | | | | | | | |
| | | SHARES | | | VALUE
(Note 3) | |
| Industrials - 17.9% (continued) | | | | | | | | |
| Roper Industries, Inc. | | | 2,700 | | | $ | 206,361 | |
| Ryder System, Inc. | | | 500 | | | | 26,320 | |
| Seaboard Corp. | | | 21 | | | | 41,811 | |
| Snap-On, Inc. | | | 600 | | | | 33,948 | |
| Southwest Airlines Co. | | | 8,000 | | | | 103,840 | |
| Stericycle, Inc. †(a) | | | 2,900 | | | | 234,668 | |
| Terex Corp. †(a) | | | 1,200 | | | | 37,248 | |
| Textron, Inc. (a) | | | 1,400 | | | | 33,096 | |
| Timken Co. | | | 3,700 | | | | 176,601 | |
| TransDigm Group, Inc. † | | | 2,000 | | | | 144,020 | |
| Union Pacific Corp. | | | 19,500 | | | | 1,806,870 | |
| United Continental Holdings, Inc. † | | | 16,400 | | | | 390,648 | |
| United Parcel Service, Inc., Class B | | | 5,000 | | | | 362,900 | |
| US Airways Group, Inc. †(a) | | | 2,800 | | | | 28,028 | |
| WABCO Holdings, Inc. † | | | 2,900 | | | | 176,697 | |
| WESCO International, Inc. †(a) | | | 2,800 | | | | 147,840 | |
| Woodward Governor Co. | | | 3,200 | | | | 120,192 | |
| WW Grainger, Inc. (a) | | | 3,800 | | | | 524,818 | |
| | | | | | | | |
| | | | | | | 22,264,727 | |
| | | | | | | | |
| Information Technology - 22.9% | | | | | | | | |
| Acme Packet, Inc. † | | | 3,400 | | | | 180,744 | |
| Advanced Micro Devices, Inc. †(a) | | | 7,100 | | | | 58,078 | |
| Akamai Technologies, Inc. † | | | 9,400 | | | | 442,270 | |
| Alliance Data Systems Corp. †(a) | | | 1,800 | | | | 127,854 | |
| Altera Corp. (a) | | | 15,800 | | | | 562,164 | |
| Apple, Inc. † | | | 40,457 | | | | 13,049,810 | |
| Ariba, Inc. † | | | 5,100 | | | | 119,799 | |
| Aruba Networks, Inc. †(a) | | | 6,900 | | | | 144,072 | |
| Atheros Communications, Inc. †(a) | | | 900 | | | | 32,328 | |
| Atmel Corp. † | | | 19,900 | | | | 245,168 | |
| Autodesk, Inc. † | | | 7,900 | | | | 301,780 | |
| Broadcom Corp., Class A | | | 22,200 | | | | 966,810 | |
| Citrix Systems, Inc. † | | | 8,000 | | | | 547,280 | |
| Cognizant Technology Solutions Corp., Class A † | | | 12,200 | | | | 894,138 | |
| Compuware Corp. † | | | 10,300 | | | | 120,201 | |
| Concur Technologies, Inc. †(a) | | | 700 | | | | 36,351 | |
| Cree, Inc. †(a) | | | 1,985 | | | | 130,792 | |
| Cypress Semiconductor Corp. † | | | 6,900 | | | | 128,202 | |
| Dolby Laboratories, Inc., Class A †(a) | | | 4,600 | | | | 306,820 | |
| F5 Networks, Inc. † | | | 4,266 | | | | 555,262 | |
| Factset Research Systems, Inc. | | | 1,300 | | | | 121,888 | |
| Fairchild Semiconductor International, Inc. † | | | 7,700 | | | | 120,197 | |
| Fortinet, Inc. † | | | 3,800 | | | | 122,930 | |
| Gartner, Inc. †(a) | | | 1,600 | | | | 53,120 | |
| Harris Corp. | | | 600 | | | | 27,180 | |
| IAC/InterActiveCorp †(a) | | | 6,700 | | | | 192,290 | |
| Informatica Corp. †(a) | | | 4,500 | | | | 198,135 | |
| Intuit, Inc. † | | | 14,200 | | | | 700,060 | |
| JDS Uniphase Corp. †(a) | | | 10,100 | | | | 146,248 | |
| Lexmark International, Inc., Class A † | | | 2,000 | | | | 69,640 | |
| Loral Space & Communications, Inc. † | | | 500 | | | | 38,250 | |
| MICROS Systems, Inc. † | | | 3,700 | | | | 162,282 | |
| Monster Worldwide, Inc. † | | | 5,100 | | | | 120,513 | |
| NCR Corp. † | | | 7,900 | | | | 121,423 | |
| | | | |
| | The accompanying notes are an integral part of these financial statements. | | (Continued) |
| | | | | | | | | | |
| AQR Funds | | | | Annual Report | | | | December 2010 | | 78 |
| | | | | | | |
| | | | |
| Schedule of Investments | | | December 31, 2010 | |
| | | | | | | | |
| | | SHARES | | | VALUE
(Note 3) | |
| Information Technology - 22.9% (continued) | | | | | | | | |
| NetApp, Inc. † | | | 15,100 | | | $ | 829,896 | |
| Netlogic Microsystems, Inc. † | | | 3,900 | | | | 122,499 | |
| Novellus Systems, Inc. † | | | 3,700 | | | | 119,584 | |
| Parametric Technology Corp. † | | | 5,300 | | | | 119,409 | |
| Polycom, Inc. † | | | 3,600 | | | | 140,328 | |
| Quest Software, Inc. † | | | 1,100 | | | | 30,514 | |
| Rackspace Hosting, Inc. † | | | 4,700 | | | | 147,627 | |
| Red Hat, Inc. † | | | 7,000 | | | | 319,550 | |
| RF Micro Devices, Inc. † | | | 16,200 | | | | 119,070 | |
| Riverbed Technology, Inc. † | | | 6,900 | | | | 242,673 | |
| Rovi Corp. † | | | 5,000 | | | | 310,050 | |
| Salesforce.com, Inc. † | | | 5,800 | | | | 765,600 | |
| SanDisk Corp. † | | | 10,300 | | | | 513,558 | |
| Skyworks Solutions, Inc. †(a) | | | 8,100 | | | | 231,903 | |
| Solera Holdings, Inc. (a) | | | 1,300 | | | | 66,716 | |
| SuccessFactors, Inc. †(a) | | | 4,900 | | | | 141,904 | |
| Tellabs, Inc. | | | 4,300 | | | | 29,154 | |
| Teradata Corp. † | | | 6,300 | | | | 259,308 | |
| TIBCO Software, Inc. † | | | 9,500 | | | | 187,245 | |
| Trimble Navigation Ltd. † | | | 4,900 | | | | 195,657 | |
| TriQuint Semiconductor, Inc. † | | | 10,400 | | | | 121,576 | |
| Veeco Instruments, Inc. †(a) | | | 3,000 | | | | 128,880 | |
| VeriFone Systems, Inc. †(a) | | | 4,500 | | | | 173,520 | |
| VeriSign, Inc. | | | 3,500 | | | | 114,345 | |
| Vishay Intertechnology, Inc. † | | | 8,200 | | | | 120,376 | |
| VMware, Inc., Class A † | | | 11,900 | | | | 1,058,029 | |
| WebMD Health Corp. †(a) | | | 1,000 | | | | 51,060 | |
| Xerox Corp. | | | 55,000 | | | | 633,600 | |
| Zebra Technologies Corp., Class A † | | | 3,200 | | | | 121,568 | |
| | | | | | | | |
| | | | | | | 28,559,278 | |
| | | | | | | | |
| Materials - 5.3% | | | | | | | | |
| Albemarle Corp. | | | 4,000 | | | | 223,120 | |
| Allegheny Technologies, Inc. (a) | | | 1,500 | | | | 82,770 | |
| Allied Nevada Gold Corp. †(a) | | | 6,500 | | | | 171,015 | |
| Ashland, Inc. | | | 3,000 | | | | 152,580 | |
| Ball Corp. | | | 2,700 | | | | 183,735 | |
| Cliffs Natural Resources, Inc. | | | 5,800 | | | | 452,458 | |
| Compass Minerals International, Inc. (a) | | | 500 | | | | 44,635 | |
| Cytec Industries, Inc. | | | 2,600 | | | | 137,956 | |
| Dow Chemical Co./The | | | 6,000 | | | | 204,840 | |
| Eastman Chemical Co. | | | 2,800 | | | | 235,424 | |
| EI du Pont de Nemours & Co. | | | 38,500 | | | | 1,920,380 | |
| FMC Corp. | | | 2,500 | | | | 199,725 | |
| Hecla Mining Co. †(a) | | | 6,100 | | | | 68,686 | |
| Huntsman Corp. | | | 8,300 | | | | 129,563 | |
| International Flavors & Fragrances, Inc. | | | 1,800 | | | | 100,062 | |
| Kronos Worldwide, Inc. | | | 600 | | | | 25,494 | |
| Lubrizol Corp. | | | 1,856 | | | | 198,369 | |
| MeadWestvaco Corp. | | | 5,200 | | | | 136,032 | |
| Mosaic Co./The | | | 2,200 | | | | 167,992 | |
| Newmont Mining Corp. | | | 900 | | | | 55,287 | |
| PPG Industries, Inc. | | | 8,700 | | | | 731,409 | |
| Rockwood Holdings, Inc. †(a) | | | 1,200 | | | | 46,944 | |
| Sherwin-Williams Co./The | | | 2,000 | | | | 167,500 | |
| Solutia, Inc. † | | | 6,500 | | | | 150,020 | |
| | | | | | | | |
| | | SHARES | | | VALUE
(Note 3) | |
| Materials - 5.3% (continued) | | | | | | | | |
| Stillwater Mining Co. † | | | 5,700 | | | $ | 121,695 | |
| Titanium Metals Corp. † | | | 2,900 | | | | 49,822 | |
| Walter Energy, Inc. | | | 2,100 | | | | 268,464 | |
| WR Grace & Co. † | | | 3,700 | | | | 129,981 | |
| | | | | | | | |
| | | | | | | 6,555,958 | |
| | | | | | | | |
| Telecommunication Services - 0.5% | | | | | | | | |
| Crown Castle International Corp. † | | | 3,000 | | | | 131,490 | |
| MetroPCS Communications, Inc. † | | | 9,600 | | | | 121,248 | |
| NII Holdings, Inc. † | | | 3,600 | | | | 160,776 | |
| Windstream Corp. (a) | | | 14,000 | | | | 195,160 | |
| | | | | | | | |
| | | | | | | 608,674 | |
| | | | | | | | |
| Utilities - 0.4% | | | | | | | | |
| American Water Works Co., Inc. | | | 2,800 | | | | 70,812 | |
| Aqua America, Inc. (a) | | | 1,600 | | | | 35,968 | |
| CMS Energy Corp. (a) | | | 2,100 | | | | 39,060 | |
| Nicor, Inc. | | | 800 | | | | 39,936 | |
| Northeast Utilities | | | 1,300 | | | | 41,444 | |
| NSTAR | | | 2,700 | | | | 113,913 | |
| OGE Energy Corp. | | | 1,900 | | | | 86,526 | |
| Oneok, Inc. | | | 2,000 | | | | 110,940 | |
| | | | | | | | |
| | | | | | | 538,599 | |
| | | | | | | | |
TOTAL COMMON STOCKS
(cost $110,979,690) | | | | | | | 121,167,593 | |
| | | | | | | | |
| MONEY MARKET FUND - 15.8% | | | | | | | | |
| J.P. Morgan Prime Money Market Fund - Capital Shares, 0.130% (2)(b)(c) | | | 19,675,828 | | | | 19,675,828 | |
| | | | | | | | |
TOTAL MONEY MARKET FUND
(cost $19,675,828; includes $6,988,139 of cash collateral received for securities on loan) | | | | | | | 19,675,828 | |
| | | | | | | | |
TOTAL INVESTMENTS - 113.1%
(cost $130,655,518) | | | | | | | 140,843,421 | |
| | | | | | | | |
| LIABILITIES IN EXCESS OF OTHER ASSETS - (13.1%) (d) | | | | | | | (16,352,068) | |
| | | | | | | | |
NET ASSETS - 100.0% | | | | | | $ | 124,491,353 | |
| | | | | | | | |
All securities are United States companies, unless noted otherwise in parentheses.
| † | Non income-producing security. |
| (a) | All or a portion of the security on loan. The aggregate market value of such securities is $6,787,555; cash collateral of $6,988,139 was received with which the Fund purchased a money market fund. |
| (b) | Represents annualized seven-day yield as of December 31, 2010. |
| (c) | Represents security, or portion thereof, purchased with the cash collateral received for securities on loan. |
| (d) | Includes (depreciation) on futures contracts. |
All securities are Level 1, unless noted otherwise in parentheses.
| (2) | Level 2 security (See Note 5). |
The following abbreviations are used in portfolio descriptions:
REIT - Real Estate Investment Trust
| | | | |
| | The accompanying notes are an integral part of these financial statements. | | (Continued) |
| | | | | | | | | | |
| AQR Funds | | | | Annual Report | | | | December 2010 | | 79 |
| | | | | | | |
| | | | |
| Schedule of Investments | | | December 31, 2010 | |
Open futures contracts outstanding at December 31, 2010:
| | | | | | | | | | | | | | | | |
NUMBER OF
CONTRACTS | | TYPE | | EXPIRATION
DATE | | VALUE AT
TRADE DATE | | | VALUE AT
DECEMBER 31,
2010 | | | UNREALIZED
APPRECIATION
(DEPRECIATION) | |
| Long Contracts: | |
| 52 | | E-Mini S&P 500 Futures | | March 18, 2011 | | | $3,259,234 | | | | $3,257,800 | | | | $(1,434) | |
| | | | | | | | | | | | | | | | |
Cash held as collateral with broker for futures contracts was $298,540 at December 31, 2010.
| | | | |
| | The accompanying notes are an integral part of these financial statements. | | |
| | | | | | | | | | |
| AQR Funds | | | | Annual Report | | | | December 2010 | | 80 |
| | | | | | | |
| | | | |
| Schedule of Investments | | | December 31, 2010 | |
| | | | |
| AQR SMALL CAP MOMENTUM FUND | | | | |
| | | | | | | | |
| COMMON STOCKS - 97.5% | | SHARES | | | VALUE
(Note 3) | |
| Consumer Discretionary - 17.6% | | | | | | | | |
| 99 Cents Only Stores † | | | 1,000 | | | $ | 15,940 | |
| A. H. Belo Corp., Class A †(a) | | | 3,400 | | | | 29,580 | |
| AFC Enterprises, Inc. † | | | 2,600 | | | | 36,140 | |
| American Axle & Manufacturing Holdings, Inc. † | | | 12,400 | | | | 159,464 | |
| Amerigon, Inc. †(a) | | | 2,700 | | | | 29,376 | |
| AnnTaylor Stores Corp. † | | | 9,000 | | | | 246,510 | |
| Arbitron, Inc. | | | 2,200 | | | | 91,344 | |
| Arctic Cat, Inc. † | | | 3,000 | | | | 43,920 | |
| Asbury Automotive Group, Inc. † | | | 3,700 | | | | 68,376 | |
| Ballantyne Strong, Inc. † | | | 2,500 | | | | 19,425 | |
| Biglari Holdings, Inc. † | | | 121 | | | | 49,635 | |
| BJ’s Restaurants, Inc. † | | | 3,800 | | | | 134,634 | |
| Blyth, Inc. | | | 700 | | | | 24,136 | |
| Bon-Ton Stores, Inc./The † | | | 2,900 | | | | 36,714 | |
| Brown Shoe Co., Inc. | | | 5,900 | | | | 82,187 | |
| Buckle, Inc./The | | | 3,600 | | | | 135,972 | |
| Cabela’s, Inc. † | | | 6,700 | | | | 145,725 | |
| Caribou Coffee Co., Inc. † | | | 1,600 | | | | 16,128 | |
| Casual Male Retail Group, Inc. † | | | 4,600 | | | | 21,804 | |
| Cato Corp./The, Class A | | | 3,800 | | | | 104,158 | |
| CEC Entertainment, Inc. † | | | 1,100 | | | | 42,713 | |
| Cheesecake Factory, Inc./The † | | | 3,100 | | | | 95,046 | |
| Children’s Place Retail Stores, Inc./The † | | | 4,000 | | | | 198,560 | |
| Coinstar, Inc. † | | | 2,000 | | | | 112,880 | |
| Collectors Universe | | | 1,100 | | | | 15,301 | |
| Cost Plus, Inc. † | | | 3,600 | | | | 34,920 | |
| CPI Corp. | | | 2,200 | | | | 49,610 | |
| Cracker Barrel Old Country Store, Inc. | | | 3,300 | | | | 180,741 | |
| CROCS, Inc. † | | | 13,900 | | | | 237,968 | |
| Cumulus Media, Inc., Class A † | | | 3,500 | | | | 15,085 | |
| Dana Holding Corp. † | | | 6,900 | | | | 118,749 | |
| Denny’s Corp. † | | | 12,400 | | | | 44,392 | |
| Destination Maternity Corp. † | | | 500 | | | | 18,965 | |
| DineEquity, Inc. † | | | 2,400 | | | | 118,512 | |
| Domino’s Pizza, Inc. †(a) | | | 7,100 | | | | 113,245 | |
| Dorman Products, Inc. † | | | 1,932 | | | | 70,016 | |
| DSW, Inc., Class A †(a) | | | 6,611 | | | | 258,490 | |
| Einstein Noah Restaurant Group, Inc. † | | | 1,200 | | | | 16,860 | |
| EW Scripps Co., Class A † | | | 5,600 | | | | 56,840 | |
| Finish Line, Inc./The, Class A | | | 10,200 | | | | 175,338 | |
| Gaylord Entertainment Co. † | | | 8,100 | | | | 291,114 | |
| Geeknet, Inc. † | | | 600 | | | | 14,994 | |
| Genesco, Inc. † | | | 3,700 | | | | 138,713 | |
| G-III Apparel Group Ltd. † | | | 1,500 | | | | 52,725 | |
| Global Sources Ltd. (Bermuda) † | | | 2,000 | | | | 19,040 | |
| Global Traffic Network, Inc. † | | | 1,700 | | | | 15,725 | |
| Gray Television, Inc. † | | | 4,800 | | | | 8,976 | |
| Group 1 Automotive, Inc. | | | 2,700 | | | | 112,752 | |
| Helen of Troy Ltd. (Bermuda) † | | | 4,400 | | | | 130,856 | |
| hhgregg, Inc. †(a) | | | 700 | | | | 14,665 | |
| Hibbett Sports, Inc. †(a) | | | 4,500 | | | | 166,050 | |
| HSN, Inc. † | | | 5,500 | | | | 168,520 | |
| Iconix Brand Group, Inc. † | | | 10,500 | | | | 202,755 | |
| Interval Leisure Group, Inc. † | | | 3,500 | | | | 56,490 | |
| iRobot Corp. † | | | 1,400 | | | | 34,832 | |
| Jakks Pacific, Inc. † | | | 3,500 | | | | 63,770 | |
| | | | | | | | |
| | | SHARES | | | VALUE
(Note 3) | |
| Consumer Discretionary - 17.6% (continued) | | | | | |
| Jo-Ann Stores, Inc. † | | | 4,302 | | | $ | 259,066 | |
| JoS. A. Bank Clothiers, Inc. † | | | 4,900 | | | | 197,568 | |
| K12, Inc. † | | | 600 | | | | 17,196 | |
| Kenneth Cole Productions, Inc., Class A † | | | 2,700 | | | | 33,723 | |
| Kid Brands, Inc. † | | | 4,400 | | | | 37,620 | |
| Kingold Jewelry, Inc. (China) † | | | 1,500 | | | | 6,120 | |
| Knology, Inc. † | | | 2,600 | | | | 40,638 | |
| Krispy Kreme Doughnuts, Inc. † | | | 8,000 | | | | 55,840 | |
| K-Swiss, Inc., Class A †(a) | | | 1,300 | | | | 16,211 | |
| Leapfrog Enterprises, Inc. † | | | 10,000 | | | | 55,500 | |
| Libbey, Inc. † | | | 2,200 | | | | 34,034 | |
| Life Time Fitness, Inc. †(a) | | | 6,100 | | | | 250,039 | |
| Lifetime Brands, Inc. † | | | 1,400 | | | | 19,656 | |
| Lithia Motors, Inc., Class A | | | 2,800 | | | | 40,012 | |
| Liz Claiborne, Inc. † | | | 14,700 | | | | 105,252 | |
| Mac-Gray Corp. | | | 1,100 | | | | 16,445 | |
| Maidenform Brands, Inc. † | | | 3,500 | | | | 83,195 | |
| Men’s Wearhouse, Inc./The | | | 7,900 | | | | 197,342 | |
| Monarch Casino & Resort, Inc. † | | | 1,200 | | | | 15,000 | |
| Monro Muffler Brake, Inc. | | | 600 | | | | 20,754 | |
| Morgans Hotel Group Co. † | | | 5,100 | | | | 46,257 | |
| Morton’s Resturant Group, Inc. † | | | 2,500 | | | | 16,200 | |
| Motorcar Parts of America, Inc. † | | | 2,000 | | | | 26,080 | |
| NutriSystem, Inc. (a) | | | 1,100 | | | | 23,133 | |
| OfficeMax, Inc. † | | | 12,900 | | | | 228,330 | |
| Peet’s Coffee & Tea, Inc. †(a) | | | 1,800 | | | | 75,132 | |
| Pep Boys - Manny, Moe & Jack/The | | | 5,600 | | | | 75,208 | |
| Perry Ellis International, Inc. † | | | 1,900 | | | | 52,193 | |
| PF Chang’s China Bistro, Inc. | | | 2,800 | | | | 135,688 | |
| Pier 1 Imports, Inc. † | | | 15,300 | | | | 160,650 | |
| Pinnacle Entertainment, Inc. † | | | 7,700 | | | | 107,954 | |
| Pre-Paid Legal Services, Inc. † | | | 600 | | | | 36,150 | |
| PRIMEDIA, Inc. | | | 3,600 | | | | 15,120 | |
| Quiksilver, Inc. † | | | 16,500 | | | | 83,655 | |
| RC2 Corp. † | | | 3,400 | | | | 74,018 | |
| Red Lion Hotels Corp. † | | | 2,000 | | | | 15,960 | |
| Rentrak Corp. †(a) | | | 700 | | | | 21,112 | |
| Retail Ventures, Inc. † | | | 3,400 | | | | 55,420 | |
| RG Barry Corp. (a) | | | 1,400 | | | | 15,568 | |
| Ruby Tuesday, Inc. † | | | 8,400 | | | | 109,704 | |
| Saks, Inc. † | | | 7,000 | | | | 74,900 | |
| Shoe Carnival, Inc. † | | | 1,800 | | | | 48,600 | |
| Shuffle Master, Inc. † | | | 6,200 | | | | 70,990 | |
| Shutterfly, Inc. † | | | 3,723 | | | | 130,417 | |
| Sinclair Broadcast Group, Inc., Class A | | | 11,700 | | | | 95,706 | |
| Skechers U.S.A., Inc., Class A † | | | 800 | | | | 16,000 | |
| Standard Motor Products, Inc. | | | 1,900 | | | | 26,030 | |
| Steinway Musical Instruments, Inc. † | | | 800 | | | | 15,880 | |
| Steven Madden Ltd. †(a) | | | 3,791 | | | | 158,161 | |
| Stoneridge, Inc. † | | | 3,600 | | | | 56,844 | |
| Sturm, Ruger & Co., Inc. | | | 2,300 | | | | 35,167 | |
| Summer Infant, Inc. † | | | 2,200 | | | | 16,676 | |
| Texas Roadhouse, Inc. † | | | 11,600 | | | | 199,172 | |
| Timberland Co./The, Class A † | | | 7,400 | | | | 181,966 | |
| Tuesday Morning Corp. † | | | 8,600 | | | | 45,408 | |
| U.S. Auto Parts Network, Inc. † | | | 2,500 | | | | 21,000 | |
| Ulta Salon Cosmetics & Fragrance, Inc. † | | | 3,100 | | | | 105,400 | |
| | | | |
| | The accompanying notes are an integral part of these financial statements. | | (Continued) |
| | | | | | | | | | |
| AQR Funds | | | | Annual Report | | | | December 2010 | | 81 |
| | | | | | | |
| | | | |
| Schedule of Investments | | | December 31, 2010 | |
| | | | |
| AQR SMALL CAP MOMENTUM FUND | | | | |
| | | | | | | | |
| | | SHARES | | | VALUE
(Note 3) | |
| Consumer Discretionary - 17.6% (continued) | | | | | |
| Unifi, Inc. † | | | 1,200 | | | $ | 20,316 | |
| Valassis Communications, Inc. † | | | 8,300 | | | | 268,505 | |
| Vitamin Shoppe, Inc. † | | | 1,300 | | | | 43,732 | |
| Zumiez, Inc. † | | | 4,000 | | | | 107,480 | |
| | | | | | | | |
| | | | | | | 9,570,469 | |
| | | | | | | | |
| Consumer Staples - 2.8% | | | | | | | | |
| B&G Foods, Inc. | | | 7,200 | | | | 98,856 | |
| Boston Beer Co., Inc., Class A †(a) | | | 1,100 | | | | 104,599 | |
| Cal-Maine Foods, Inc. | | | 2,500 | | | | 78,950 | |
| Craft Brewers Alliance, Inc. † | | | 2,200 | | | | 16,280 | |
| Darling International, Inc. † | | | 8,700 | | | | 115,536 | |
| Diamond Foods, Inc. (a) | | | 3,000 | | | | 159,540 | |
| Elizabeth Arden, Inc. † | | | 2,700 | | | | 62,127 | |
| Hain Celestial Group, Inc./The † | | | 6,900 | | | | 186,714 | |
| Ingles Markets, Inc., Class A | | | 900 | | | | 17,280 | |
| Inter Parfums, Inc. | | | 1,700 | | | | 32,045 | |
| John B. Sanfilippo & Son, Inc. † | | | 1,300 | | | | 16,172 | |
| Limoneira Co. | | | 600 | | | | 17,220 | |
| Medifast, Inc. † | | | 1,232 | | | | 35,580 | |
| MGP Ingredients, Inc. | | | 1,400 | | | | 15,456 | |
| Nash Finch Co. | | | 400 | | | | 17,004 | |
| Omega Protein Corp. † | | | 2,800 | | | | 22,680 | |
| Pantry, Inc./The †(a) | | | 2,700 | | | | 53,622 | |
| Prestige Brands Holdings, Inc. † | | | 6,200 | | | | 74,090 | |
| Pricesmart, Inc. | | | 2,300 | | | | 87,469 | |
| Schiff Nutrition International, Inc. | | | 4,300 | | | | 39,044 | |
| Star Scientific, Inc. †(a) | | | 15,800 | | | | 30,810 | |
| Vector Group Ltd. | | | 8,500 | | | | 147,220 | |
| WD-40 Co. (a) | | | 1,400 | | | | 56,392 | |
| Weis Markets, Inc. (a) | | | 400 | | | | 16,132 | |
| | | | | | | | |
| | | | | | | 1,500,818 | |
| | | | | | | | |
| Energy - 7.4% | | | | | | | | |
| Abraxas Petroleum Corp. † | | | 7,600 | | | | 34,732 | |
| Apco Oil and Gas International, Inc. | | | 300 | | | | 17,250 | |
| Approach Resources, Inc. † | | | 900 | | | | 20,790 | |
| Basic Energy Services, Inc. † | | | 2,700 | | | | 44,496 | |
| Bristow Group, Inc. † | | | 2,500 | | | | 118,375 | |
| Callon Petroleum Co. †(a) | | | 4,600 | | | | 27,232 | |
| CAMAC Energy, Inc. † | | | 4,900 | | | | 9,751 | |
| Cheniere Energy, Inc. † | | | 6,900 | | | | 38,088 | |
| Clayton Williams Energy, Inc. † | | | 1,100 | | | | 92,367 | |
| Cloud Peak Energy, Inc. † | | | 3,100 | | | | 72,013 | |
| Complete Production Services, Inc. † | | | 3,200 | | | | 94,560 | |
| Crosstex Energy, Inc. | | | 6,100 | | | | 54,046 | |
| CVR Energy, Inc. † | | | 7,000 | | | | 106,260 | |
| Enbridge Energy Management LLC † | | | 1,017 | | | | 64,935 | |
| Endeavour International Corp. † | | | 1,200 | | | | 16,560 | |
| Energy XXI Bermuda Ltd. (Bermuda) † | | | 2,300 | | | | 63,641 | |
| Evolution Petroleum Corp. † | | | 2,400 | | | | 15,648 | |
| Frontier Oil Corp. † | | | 10,600 | | | | 190,906 | |
| FX Energy, Inc. † | | | 2,700 | | | | 16,605 | |
| Georesources, Inc. † | | | 1,300 | | | | 28,873 | |
| Green Plains Renewable Energy, Inc. † | | | 2,300 | | | | 25,898 | |
| Gulfport Energy Corp. †(a) | | | 4,500 | | | | 97,425 | |
| Harvest Natural Resources, Inc. †(a) | | | 4,300 | | | | 52,331 | |
| Houston American Energy Corp. | | | 2,400 | | | | 43,416 | |
| | | | | | | | |
| | | SHARES | | | VALUE
(Note 3) | |
| Energy - 7.4% (continued) | | | | | | | | |
| Hyperdynamics Corp. † | | | 6,900 | | | $ | 34,224 | |
| International Coal Group, Inc. † | | | 33,800 | | | | 261,612 | |
| Knightsbridge Tankers Ltd. (Bermuda) | | | 3,100 | | | | 69,037 | |
| Kodiak Oil & Gas Corp. † | | | 14,900 | | | | 98,340 | |
| Lufkin Industries, Inc. | | | 4,900 | | | | 305,711 | |
| Magellan Petroleum Corp. † | | | 5,500 | | | | 15,840 | |
| Magnum Hunter Resources Corp. † | | | 6,500 | | | | 46,800 | |
| McMoRan Exploration Co. † | | | 13,100 | | | | 224,534 | |
| Miller Petroleum, Inc. † | | | 5,300 | | | | 27,560 | |
| Mitcham Industries, Inc. † | | | 1,500 | | | | 17,325 | |
| Newpark Resources, Inc. † | | | 2,700 | | | | 16,632 | |
| Northern Oil and Gas, Inc. † | | | 6,300 | | | | 171,423 | |
| OYO Geospace Corp. † | | | 500 | | | | 49,555 | |
| Petroleum Development Corp. † | | | 3,800 | | | | 160,398 | |
| Rex Energy Corp. †(a) | | | 2,100 | | | | 28,665 | |
| Rosetta Resources, Inc. † | | | 4,800 | | | | 180,672 | |
| Ship Finance International Ltd. (Bermuda) | | | 7,600 | | | | 163,552 | |
| Swift Energy Co. † | | | 4,500 | | | | 176,175 | |
| T-3 Energy Services, Inc. † | | | 1,100 | | | | 43,813 | |
| Teekay Tankers Ltd., Class A (Bermuda)(a) | | | 7,800 | | | | 96,252 | |
| Tesco Corp. (Canada) † | | | 1,900 | | | | 30,172 | |
| Uranerz Energy Corp. † | | | 11,900 | | | | 47,481 | |
| Uranium Energy Corp. † | | | 10,100 | | | | 61,004 | |
| Uranium Resources, Inc. † | | | 19,100 | | | | 64,940 | |
| USEC, Inc. † | | | 13,400 | | | | 80,668 | |
| VAALCO Energy, Inc. † | | | 3,700 | | | | 26,492 | |
| Venoco, Inc. †(a) | | | 2,100 | | | | 38,745 | |
| W&T Offshore, Inc. | | | 3,100 | | | | 55,397 | |
| Warren Resources, Inc. † | | | 5,100 | | | | 23,052 | |
| Western Refining, Inc. † | | | 6,000 | | | | 63,480 | |
| | | | | | | | |
| | | | | | | 4,025,749 | |
| | | | | | | | |
| Financials - 16.0% | | | | | | | | |
| Abington Bancorp, Inc. | | | 1,300 | | | | 15,509 | |
| Agree Realty Corp. REIT | | | 1,000 | | | | 26,190 | |
| American Equity Investment Life Holding Co. | | | 15,400 | | | | 193,270 | |
| American Safety Insurance Holdings Ltd. † | | | 700 | | | | 14,966 | |
| Ameris Bancorp † | | | 2,701 | | | | 28,469 | |
| Amtrust Financial Services, Inc. | | | 4,600 | | | | 80,500 | |
| Argo Group International Holdings Ltd. (Bermuda) | | | 2,000 | | | | 74,900 | |
| Arlington Asset Investment Corp., Class A | | | 1,600 | | | | 38,384 | |
| Ashford Hospitality Trust, Inc. REIT † | | | 7,700 | | | | 74,305 | |
| Associated Estates Realty Corp. REIT | | | 8,100 | | | | 123,849 | |
| Astoria Financial Corp. (a) | | | 3,900 | | | | 54,249 | |
| Bancorp Rhode Island, Inc. | | | 600 | | | | 17,454 | |
| Bancorp, Inc./DE † | | | 1,600 | | | | 16,272 | |
| Bank of the Ozarks, Inc. (a) | | | 3,100 | | | | 134,385 | |
| BGC Partners, Inc., Class A (a) | | | 12,300 | | | | 102,213 | |
| BlackRock Kelso Capital Corp. | | | 12,600 | | | | 139,356 | |
| BofI Holding, Inc. †(a) | | | 1,000 | | | | 15,510 | |
| Capital Southwest Corp. (a) | | | 300 | | | | 31,140 | |
| CapLease, Inc. REIT | | | 3,900 | | | | 22,698 | |
| Cardinal Financial Corp. | | | 3,800 | | | | 44,194 | |
| Cathay General Bancorp | | | 12,200 | | | | 203,740 | |
| Center Financial Corp. † | | | 7,200 | | | | 54,576 | |
| Citizens & Northern Corp. | | | 1,100 | | | | 16,346 | |
| | | | |
| | The accompanying notes are an integral part of these financial statements. | | (Continued) |
| | | | | | | | | | |
| AQR Funds | | | | Annual Report | | | | December 2010 | | 82 |
| | | | | | | |
| | | | |
| Schedule of Investments | | | December 31, 2010 | |
| | | | |
| AQR SMALL CAP MOMENTUM FUND | | | | |
| | | | | | | | |
| | | SHARES | | | VALUE
(Note 3) | |
| Financials - 16.0% (continued) | | | | | | | | |
| CNA Surety Corp. † | | | 1,800 | | | $ | 42,624 | |
| Colonial Properties Trust REIT (a) | | | 11,100 | | | | 200,355 | |
| Community Bank System, Inc. | | | 5,900 | | | | 163,843 | |
| CompuCredit Holdings Corp. † | | | 2,300 | | | | 16,054 | |
| Credit Acceptance Corp. † | | | 500 | | | | 31,385 | |
| Danvers Bancorp, Inc. | | | 1,300 | | | | 22,971 | |
| DiamondRock Hospitality Co. REIT † | | | 10,800 | | | | 129,600 | |
| Dime Community Bancshares, Inc. | | | 2,000 | | | | 29,180 | |
| Dollar Financial Corp. † | | | 2,000 | | | | 57,260 | |
| Eagle Bancorp, Inc. † | | | 1,300 | | | | 18,759 | |
| Education Realty Trust, Inc. REIT | | | 4,200 | | | | 32,634 | |
| Encore Capital Group, Inc. † | | | 1,874 | | | | 43,945 | |
| Enstar Group Ltd. (Bermuda) † | | | 500 | | | | 42,290 | |
| Enterprise Financial Services Corp. | | | 1,500 | | | | 15,690 | |
| Epoch Holding Corp. | | | 1,100 | | | | 17,083 | |
| Extra Space Storage, Inc. REIT | | | 9,800 | | | | 170,520 | |
| Ezcorp, Inc., Class A † | | | 6,800 | | | | 184,484 | |
| FBL Financial Group, Inc., Class A | | | 3,100 | | | | 88,877 | |
| Federal Agricultural Mortgage Corp., Class C | | | 2,000 | | | | 32,640 | |
| FelCor Lodging Trust, Inc. REIT † | | | 10,000 | | | | 70,400 | |
| Financial Institutions, Inc. | | | 1,300 | | | | 24,661 | |
| First Cash Financial Services, Inc. † | | | 2,700 | | | | 83,673 | |
| First Commonwealth Financial Corp. | | | 8,600 | | | | 60,888 | |
| First Financial Bancorp (a) | | | 4,200 | | | | 77,616 | |
| First Industrial Realty Trust, Inc. REIT † | | | 7,600 | | | | 66,576 | |
| First Merchants Corp. | | | 3,700 | | | | 32,782 | |
| First Potomac Realty Trust REIT | | | 10,700 | | | | 179,974 | |
| FNB Corp./PA (a) | | | 18,100 | | | | 177,742 | |
| FPIC Insurance Group, Inc. † | | | 700 | | | | 25,872 | |
| Gladstone Capital Corp. (a) | | | 4,800 | | | | 55,296 | |
| Gladstone Commercial Corp. REIT | | | 1,400 | | | | 26,362 | |
| Gladstone Investment Corp. | | | 2,700 | | | | 20,655 | |
| Glimcher Realty Trust REIT | | | 11,600 | | | | 97,440 | |
| Global Indemnity PLC (Ireland) † | | | 1,500 | | | | 30,675 | |
| Greenlight Capital Re Ltd., Class A (Cayman Islands) † | | | 1,500 | | | | 40,215 | |
| Hersha Hospitality Trust REIT | | | 22,400 | | | | 147,840 | |
| HFF, Inc., Class A † | | | 4,500 | | | | 43,470 | |
| Horace Mann Educators Corp. | | | 6,500 | | | | 117,260 | |
| Infinity Property & Casualty Corp. | | | 2,400 | | | | 148,320 | |
| Internet Capital Group, Inc. † | | | 4,200 | | | | 59,724 | |
| Ladenburg Thalmann Financial Services, Inc. †(a) | | | 13,100 | | | | 15,327 | |
| Lakeland Bancorp, Inc. | | | 1,400 | | | | 15,358 | |
| Lexington Realty Trust REIT | | | 13,300 | | | | 105,735 | |
| Main Street Capital Corp. | | | 2,100 | | | | 38,199 | |
| MainSource Financial Group, Inc. | | | 1,300 | | | | 13,533 | |
| MarketAxess Holdings, Inc. | | | 5,882 | | | | 122,404 | |
| Marlin Business Services Corp. † | | | 700 | | | | 8,855 | |
| MCG Capital Corp. | | | 9,100 | | | | 63,427 | |
| Meadowbrook Insurance Group, Inc. | | | 10,600 | | | | 108,650 | |
| Medical Properties Trust, Inc. REIT | | | 1,500 | | | | 16,245 | |
| Meridian Interstate Bancorp, Inc. †(a) | | | 400 | | | | 4,716 | |
| MGIC Investment Corp. † | | | 25,900 | | | | 263,921 | |
| MidWestOne Financial Group, Inc. | | | 100 | | | | 1,511 | |
| Monmouth Real Estate Investment Corp., Class A REIT | | | 3,200 | | | | 27,200 | |
| | | | | | | | |
| | | SHARES | | | VALUE
(Note 3) | |
| Financials - 16.0% (continued) | | | | | | | | |
| MPG Office Trust, Inc. REIT † | | | 5,600 | | | $ | 15,400 | |
| MVC Capital, Inc. | | | 4,300 | | | | 62,780 | |
| National Financial Partners Corp. † | | | 5,400 | | | | 72,360 | |
| National Health Investors, Inc. REIT | | | 500 | | | | 22,510 | |
| Nelnet, Inc., Class A | | | 4,100 | | | | 97,129 | |
| NewStar Financial, Inc. †(a) | | | 4,800 | | | | 50,736 | |
| NGP Capital Resources Co. (a) | | | 1,800 | | | | 16,560 | |
| One Liberty Properties, Inc. REIT | | | 1,000 | | | | 16,700 | |
| OneBeacon Insurance Group Ltd., Class A | | | 7,300 | | | | 110,668 | |
| PennantPark Investment Corp. (a) | | | 9,574 | | | | 117,186 | |
| Pennsylvania Real Estate Investment Trust REIT (a) | | | 9,100 | | | | 132,223 | |
| Peoples Bancorp, Inc./OH | | | 1,000 | | | | 15,650 | |
| PHH Corp. † | | | 7,000 | | | | 162,050 | |
| Portfolio Recovery Associates, Inc. † | | | 1,700 | | | | 127,840 | |
| Post Properties, Inc. REIT | | | 6,900 | | | | 250,470 | |
| PrivateBancorp, Inc. | | | 5,800 | | | | 83,404 | |
| Provident Financial Services, Inc. | | | 7,400 | | | | 111,962 | |
| PS Business Parks, Inc. REIT | | | 500 | | | | 27,860 | |
| Ramco-Gershenson Properties Trust REIT | | | 3,300 | | | | 41,085 | |
| Renasant Corp. | | | 1,400 | | | | 23,674 | |
| S&T Bancorp, Inc. (a) | | | 2,400 | | | | 54,216 | |
| Safeguard Scientifics, Inc. † | | | 1,200 | | | | 20,496 | |
| Safety Insurance Group, Inc. | | | 2,700 | | | | 128,439 | |
| Sandy Spring Bancorp, Inc. | | | 1,500 | | | | 27,645 | |
| Saul Centers, Inc. REIT | | | 1,400 | | | | 66,290 | |
| Southwest Bancorp, Inc./OK † | | | 2,100 | | | | 26,040 | |
| StellarOne Corp. | | | 1,200 | | | | 17,448 | |
| Sterling Bancorp/NY | | | 2,100 | | | | 21,987 | |
| Strategic Hotels & Resorts, Inc. REIT † | | | 19,800 | | | | 104,742 | |
| Sun Communities, Inc. REIT (a) | | | 1,709 | | | | 56,927 | |
| Sunstone Hotel Investors, Inc. REIT †(a) | | | 3,400 | | | | 35,122 | |
| Susquehanna Bancshares, Inc. | | | 19,900 | | | | 192,632 | |
| Taylor Capital Group, Inc. †(a) | | | 1,300 | | | | 17,095 | |
| Texas Capital Bancshares, Inc. † | | | 2,600 | | | | 55,302 | |
| Thomas Properties Group, Inc. † | | | 1,900 | | | | 8,018 | |
| TICC Capital Corp. (a) | | | 7,600 | | | | 85,196 | |
| TowneBank/VA (a) | | | 1,800 | | | | 28,602 | |
| Triangle Capital Corp. | | | 4,500 | | | | 85,500 | |
| United Bankshares, Inc. (a) | | | 3,500 | | | | 102,200 | |
| United Financial Bancorp, Inc. | | | 1,900 | | | | 29,013 | |
| United Fire & Casualty Co. | | | 2,400 | | | | 53,568 | |
| Urstadt Biddle Properties, Inc., Class A REIT | | | 3,900 | | | | 75,855 | |
| U-Store-It Trust REIT | | | 4,900 | | | | 46,697 | |
| Virginia Commerce Bancorp, Inc. †(a) | | | 4,500 | | | | 27,810 | |
| Virtus Investment Partners, Inc. † | | | 800 | | | | 36,296 | |
| Washington Banking Co. | | | 1,200 | | | | 16,452 | |
| Webster Financial Corp. | | | 11,000 | | | | 216,700 | |
| WesBanco, Inc. | | | 1,300 | | | | 24,648 | |
| West Coast Bancorp/OR † | | | 9,000 | | | | 25,380 | |
| Western Alliance Bancorp † | | | 7,200 | | | | 52,992 | |
| Winthrop Realty Trust REIT | | | 1,200 | | | | 15,348 | |
| World Acceptance Corp. † | | | 2,000 | | | | 105,600 | |
| WSFS Financial Corp. | | | 1,400 | | | | 66,416 | |
| | | | | | | | |
| | | | | | | 8,740,110 | |
| | | | | | | | |
| | | | |
| | The accompanying notes are an integral part of these financial statements. | | (Continued) |
| | | | | | | | | | |
| AQR Funds | | | | Annual Report | | | | December 2010 | | 83 |
| | | | | | | |
| | | | |
| Schedule of Investments | | | December 31, 2010 | |
| | | | |
| AQR SMALL CAP MOMENTUM FUND | | | | |
| | | | | | | | |
| | | SHARES | | | VALUE
(Note 3) | |
| Health Care - 10.7% | | | | | | | | |
| ABIOMED, Inc. † | | | 2,500 | | | $ | 24,025 | |
| Accelrys, Inc. † | | | 3,900 | | | | 32,370 | |
| Acorda Therapeutics, Inc. † | | | 600 | | | | 16,356 | |
| Air Methods Corp. † | | | 1,300 | | | | 73,151 | |
| Akorn, Inc. †(a) | | | 8,400 | | | | 50,988 | |
| Align Technology, Inc. †(a) | | | 2,600 | | | | 50,804 | |
| Alkermes, Inc. †(a) | | | 3,000 | | | | 36,840 | |
| Analogic Corp. (a) | | | 1,200 | | | | 59,412 | |
| AngioDynamics, Inc. † | | | 1,100 | | | | 16,907 | |
| Ardea Biosciences, Inc. † | | | 1,700 | | | | 44,200 | |
| Arena Pharmaceuticals, Inc. †(a) | | | 13,500 | | | | 23,220 | |
| Ariad Pharmaceuticals, Inc. † | | | 13,100 | | | | 66,810 | |
| Arqule, Inc. † | | | 4,500 | | | | 26,415 | |
| Array Biopharma, Inc. † | | | 5,300 | | | | 15,847 | |
| ArthroCare Corp. † | | | 3,000 | | | | 93,180 | |
| Assisted Living Concepts, Inc., Class A † | | | 500 | | | | 16,265 | |
| AtriCure, Inc. † | | | 1,600 | | | | 16,384 | |
| AVANIR Pharmaceuticals, Inc., Class A †(a) | | | 13,300 | | | | 54,264 | |
| AVI BioPharma, Inc. † | | | 7,700 | | | | 16,324 | |
| Bio-Reference Labs, Inc. †(a) | | | 1,800 | | | | 39,924 | |
| Biotime, Inc. † | | | 3,900 | | | | 32,487 | |
| BMP Sunstone Corp. † | | | 3,100 | | | | 30,721 | |
| BSD Medical Corp. † | | | 3,400 | | | | 15,708 | |
| Caliper Life Sciences, Inc. † | | | 5,600 | | | | 35,504 | |
| Cepheid, Inc. † | | | 9,200 | | | | 209,300 | |
| Chelsea Therapeutics International Ltd. † | | | 5,100 | | | | 38,250 | |
| Chemed Corp. | | | 3,100 | | | | 196,881 | |
| Cleveland BioLabs, Inc. † | | | 2,400 | | | | 17,328 | |
| Corcept Therapeutics, Inc. † | | | 4,200 | | | | 16,212 | |
| Corvel Corp. † | | | 700 | | | | 33,845 | |
| Cyberonics, Inc. † | | | 4,300 | | | | 133,386 | |
| Cyclacel Pharmaceuticals, Inc. † | | | 10,600 | | | | 15,582 | |
| Cytori Therapeutics, Inc. †(a) | | | 3,000 | | | | 15,570 | |
| Delcath Systems, Inc. †(a) | | | 6,300 | | | | 61,740 | |
| Depomed, Inc. † | | | 5,300 | | | | 33,708 | |
| DexCom, Inc. † | | | 7,000 | | | | 95,550 | |
| Dionex Corp. † | | | 2,100 | | | | 247,821 | |
| Dynavax Technologies Corp. † | | | 10,300 | | | | 32,960 | |
| Ensign Group, Inc./The | | | 3,200 | | | | 79,584 | |
| Enzon Pharmaceuticals, Inc. † | | | 5,400 | | | | 65,718 | |
| Exact Sciences Corp. †(a) | | | 4,900 | | | | 29,302 | |
| Five Star Quality Care, Inc. † | | | 4,300 | | | | 30,401 | |
| Hanger Orthopedic Group, Inc. † | | | 2,400 | | | | 50,856 | |
| Healthspring, Inc. † | | | 7,600 | | | | 201,628 | |
| HealthStream, Inc. † | | | 2,300 | | | | 18,492 | |
| HMS Holdings Corp. † | | | 1,300 | | | | 84,201 | |
| Idenix Pharmaceuticals, Inc. †(a) | | | 7,300 | | | | 36,792 | |
| Impax Laboratories, Inc. † | | | 9,000 | | | | 180,990 | |
| Inhibitex, Inc. †(a) | | | 9,600 | | | | 24,960 | |
| Insulet Corp. † | | | 1,600 | | | | 24,800 | |
| Jazz Pharmaceuticals, Inc. †(a) | | | 3,200 | | | | 62,976 | |
| Keryx Biopharmaceuticals, Inc. ��� | | | 11,000 | | | | 50,380 | |
| MAKO Surgical Corp. † | | | 3,900 | | | | 59,358 | |
| MAP Pharmaceuticals, Inc. † | | | 3,000 | | | | 50,220 | |
| MedCath Corp. † | | | 2,300 | | | | 32,085 | |
| Medicines Co./The † | | | 6,100 | | | | 86,193 | |
| Medidata Solutions, Inc. † | | | 1,300 | | | | 31,044 | |
| | | | | | | | |
| | | SHARES | | | VALUE
(Note 3) | |
| Health Care - 10.7% (continued) | | | | | | | | |
| Metabolix, Inc. † | | | 1,400 | | | $ | 17,038 | |
| Metropolitan Health Networks, Inc. † | | | 6,300 | | | | 28,161 | |
| Momenta Pharmaceuticals, Inc. †(a) | | | 1,100 | | | | 16,467 | |
| MWI Veterinary Supply, Inc. † | | | 2,000 | | | | 126,300 | |
| Nabi Biopharmaceuticals † | | | 6,200 | | | | 35,898 | |
| Nektar Therapeutics †(a) | | | 13,710 | | | | 176,174 | |
| Neogen Corp. † | | | 2,300 | | | | 94,369 | |
| Neurocrine Biosciences, Inc. † | | | 8,100 | | | | 61,884 | |
| NPS Pharmaceuticals, Inc. † | | | 6,800 | | | | 53,720 | |
| NxStage Medical, Inc. † | | | 7,000 | | | | 174,160 | |
| OPKO Health, Inc. † | | | 9,300 | | | | 34,131 | |
| OraSure Technologies, Inc. † | | | 2,700 | | | | 15,525 | |
| Pain Therapeutics, Inc. † | | | 2,500 | | | | 16,875 | |
| Par Pharmaceutical Cos., Inc. † | | | 4,900 | | | | 188,699 | |
| Parexel International Corp. † | | | 1,300 | | | | 27,599 | |
| PDI, Inc. † | | | 1,500 | | | | 15,810 | |
| Pharmacyclics, Inc. † | | | 6,900 | | | | 41,952 | |
| Pharmasset, Inc. † | | | 4,400 | | | | 191,004 | |
| pSivida Corp. † | | | 3,100 | | | | 15,841 | |
| Pure Bioscience †(a) | | | 7,100 | | | | 15,762 | |
| Questcor Pharmaceuticals, Inc. † | | | 9,700 | | | | 142,881 | |
| Raptor Pharmaceutical Corp. † | | | 4,500 | | | | 16,425 | |
| Rural/Metro Corp. † | | | 2,000 | | | | 29,160 | |
| SciClone Pharmaceuticals, Inc. † | | | 4,900 | | | | 20,482 | |
| Seattle Genetics, Inc. † | | | 13,100 | | | | 195,845 | |
| Sequenom, Inc. †(a) | | | 6,400 | | | | 51,328 | |
| SIGA Technologies, Inc. † | | | 4,700 | | | | 65,800 | |
| Somaxon Pharmaceuticals, Inc. † | | | 5,500 | | | | 17,325 | |
| SonoSite, Inc. † | | | 1,600 | | | | 50,560 | |
| Staar Surgical Co. †(a) | | | 2,600 | | | | 15,860 | |
| Universal American Corp. | | | 4,600 | | | | 94,070 | |
| Uroplasty, Inc. † | | | 4,200 | | | | 16,884 | |
| Vascular Solutions, Inc. † | | | 1,300 | | | | 15,236 | |
| ViroPharma, Inc. † | | | 12,500 | | | | 216,500 | |
| Volcano Corp. † | | | 7,100 | | | | 193,901 | |
| Zalicus, Inc. † | | | 10,300 | | | | 16,274 | |
| ZIOPHARM Oncology, Inc. † | | | 4,200 | | | | 19,572 | |
| Zoll Medical Corp. †(a) | | | 1,900 | | | | 70,737 | |
| | | | | | | | |
| | | | | | | 5,832,428 | |
| | | | | | | | |
| Industrials - 15.3% | | | | | | | | |
| 3D Systems Corp. † | | | 2,600 | | | | 81,874 | |
| A. O. Smith Corp. | | | 4,600 | | | | 175,168 | |
| AAON, Inc. (a) | | | 1,800 | | | | 50,778 | |
| Acacia Research - Acacia Technologies † | | | 5,626 | | | | 145,938 | |
| Aceto Corp. | | | 2,700 | | | | 24,300 | |
| Active Power, Inc. † | | | 11,800 | | | | 29,028 | |
| Actuant Corp., Class A (a) | | | 6,300 | | | | 167,706 | |
| Advisory Board Co./The † | | | 1,800 | | | | 85,734 | |
| Air Transport Services Group, Inc. † | | | 10,800 | | | | 85,320 | |
| Alamo Group, Inc. | | | 1,000 | | | | 27,820 | |
| Altra Holdings, Inc. †(a) | | | 4,700 | | | | 93,342 | |
| American Railcar Industries, Inc. † | | | 1,800 | | | | 39,834 | |
| Applied Industrial Technologies, Inc. | | | 6,300 | | | | 204,624 | |
| Applied Signal Technology, Inc. | | | 1,000 | | | | 37,890 | |
| ArvinMeritor, Inc. † | | | 13,600 | | | | 279,072 | |
| Astronics Corp. † | | | 1,500 | | | | 31,500 | |
| | | | |
| | The accompanying notes are an integral part of these financial statements. | | (Continued) |
| | | | | | | | | | |
| AQR Funds | | | | Annual Report | | | | December 2010 | | 84 |
| | | | | | | |
| | | | |
| Schedule of Investments | | | December 31, 2010 | |
| | | | |
| AQR SMALL CAP MOMENTUM FUND | | | | |
| | | | | | | | |
| | | SHARES | | | VALUE
(Note 3) | |
| Industrials - 15.3% (continued) | | | | | | | | |
| Atlas Air Worldwide Holdings, Inc. † | | | 4,000 | | | $ | 223,320 | |
| Barrett Business Services, Inc. | | | 1,000 | | | | 15,550 | |
| Belden, Inc. | | | 5,800 | | | | 213,556 | |
| Blount International, Inc. † | | | 7,000 | | | | 110,320 | |
| CAI International, Inc. † | | | 1,700 | | | | 33,320 | |
| Cascade Corp. | | | 1,100 | | | | 52,008 | |
| Casella Waste Systems, Inc., Class A † | | | 2,300 | | | | 16,307 | |
| CDI Corp. | | | 1,700 | | | | 31,603 | |
| Ceradyne, Inc. † | | | 2,300 | | | | 72,519 | |
| Chart Industries, Inc. † | | | 4,400 | | | | 148,632 | |
| CIRCOR International, Inc. | | | 1,700 | | | | 71,876 | |
| Coleman Cable, Inc. † | | | 2,500 | | | | 15,700 | |
| Colfax Corp. † | | | 2,700 | | | | 49,707 | |
| Commercial Vehicle Group, Inc. † | | | 3,500 | | | | 56,875 | |
| Consolidated Graphics, Inc. † | | | 1,600 | | | | 77,488 | |
| Corporate Executive Board Co./The | | | 3,300 | | | | 123,915 | |
| Covenant Transportation Group, Inc., Class A † | | | 1,800 | | | | 17,496 | |
| CPI Aerostructures, Inc. † | | | 1,100 | | | | 15,477 | |
| Deluxe Corp. | | | 7,300 | | | | 168,046 | |
| Dolan Co./The † | | | 4,300 | | | | 59,856 | |
| DXP Enterprises, Inc. † | | | 1,500 | | | | 36,000 | |
| Dycom Industries, Inc. † | | | 3,500 | | | | 51,625 | |
| EnerSys † | | | 5,700 | | | | 183,084 | |
| EnPro Industries, Inc. † | | | 2,600 | | | | 108,056 | |
| Esterline Technologies Corp. † | | | 1,300 | | | | 89,167 | |
| Franklin Electric Co., Inc. | | | 1,900 | | | | 73,948 | |
| Furmanite Corp. † | | | 2,400 | | | | 16,584 | |
| GeoEye, Inc. † | | | 3,300 | | | | 139,887 | |
| Greenbrier Cos., Inc. † | | | 2,600 | | | | 54,574 | |
| HEICO Corp. (a) | | | 3,500 | | | | 178,605 | |
| Herley Industries, Inc. † | | | 1,300 | | | | 22,516 | |
| Herman Miller, Inc. | | | 5,500 | | | | 139,150 | |
| Hexcel Corp. † | | | 10,600 | | | | 191,754 | |
| HUB Group, Inc., Class A † | | | 2,900 | | | | 101,906 | |
| Hurco Cos., Inc. † | | | 700 | | | | 16,555 | |
| II-VI, Inc. † | | | 3,400 | | | | 157,624 | |
| Interface, Inc., Class A (a) | | | 7,900 | | | | 123,635 | |
| Kadant, Inc. †(a) | | | 1,100 | | | | 25,927 | |
| Kelly Services, Inc., Class A † | | | 4,200 | | | | 78,960 | |
| Knoll, Inc. | | | 4,500 | | | | 75,285 | |
| Kratos Defense & Security Solutions, Inc. † | | | 3,000 | | | | 39,510 | |
| Ladish Co., Inc. † | | | 1,100 | | | | 53,471 | |
| Lindsay Corp. | | | 1,600 | | | | 95,088 | |
| LMI Aerospace, Inc. † | | | 1,000 | | | | 15,990 | |
| Lydall, Inc. † | | | 2,000 | | | | 16,100 | |
| Macquarie Infrastructure Co. LLC † | | | 5,600 | | | | 118,552 | |
| McGrath RentCorp. | | | 2,400 | | | | 62,928 | |
| Middleby Corp. † | | | 2,000 | | | | 168,840 | |
| Miller Industries, Inc. | | | 1,400 | | | | 19,922 | |
| Mobile Mini, Inc. † | | | 3,100 | | | | 61,039 | |
| Multi-Color Corp. | | | 800 | | | | 15,568 | |
| NACCO Industries, Inc., Class A (a) | | | 700 | | | | 75,859 | |
| National Presto Industries, Inc. (a) | | | 400 | | | | 52,004 | |
| NN, Inc. † | | | 3,900 | | | | 48,204 | |
| Odyssey Marine Exploration, Inc. † | | | 6,200 | | | | 17,236 | |
| Old Dominion Freight Line, Inc. † | | | 7,900 | | | | 252,721 | |
| | | | | | | | |
| | | SHARES | | | VALUE
(Note 3) | |
| Industrials - 15.3% (continued) | | | | | | | | |
| Pacer International, Inc. †(a) | | | 6,800 | | | $ | 46,512 | |
| Park-Ohio Holdings Corp. † | | | 1,500 | | | | 31,365 | |
| PMFG, Inc. † | | | 1,000 | | | | 16,400 | |
| Polypore International, Inc. † | | | 5,200 | | | | 211,796 | |
| Quality Distribution, Inc. † | | | 3,200 | | | | 29,088 | |
| Quanex Building Products Corp. | | | 2,300 | | | | 43,631 | |
| Raven Industries, Inc. | | | 1,700 | | | | 81,073 | |
| RBC Bearings, Inc. † | | | 2,700 | | | | 105,516 | |
| Robbins & Myers, Inc. | | | 2,200 | | | | 78,716 | |
| Rush Enterprises, Inc., Class A † | | | 3,300 | | | | 67,452 | |
| Satcon Technology Corp. † | | | 12,700 | | | | 57,150 | |
| Sauer-Danfoss, Inc. † | | | 2,400 | | | | 67,800 | |
| Schawk, Inc. | | | 2,300 | | | | 47,334 | |
| Seaspan Corp. (Hong Kong) | | | 3,000 | | | | 37,260 | |
| SFN Group, Inc. † | | | 7,500 | | | | 73,200 | |
| Standex International Corp. (a) | | | 1,500 | | | | 44,865 | |
| Steelcase, Inc., Class A | | | 16,300 | | | | 172,291 | |
| TAL International Group, Inc. | | | 4,700 | | | | 145,089 | |
| Tennant Co. | | | 1,700 | | | | 65,297 | |
| Textainer Group Holdings Ltd. | | | 3,600 | | | | 102,564 | |
| Titan International, Inc. | | | 4,100 | | | | 80,114 | |
| Titan Machinery, Inc. † | | | 2,300 | | | | 44,390 | |
| Tredegar Corp. | | | 800 | | | | 15,504 | |
| Trex Co., Inc. †(a) | | | 1,000 | | | | 23,960 | |
| TriMas Corp. † | | | 3,900 | | | | 79,794 | |
| Twin Disc, Inc. | | | 1,600 | | | | 47,776 | |
| Ultralife Corp. † | | | 2,500 | | | | 16,525 | |
| United Rentals, Inc. † | | | 7,800 | | | | 177,450 | |
| UniTek Global Services, Inc. † | | | 1,700 | | | | 16,694 | |
| Valence Technology, Inc. † | | | 9,700 | | | | 16,296 | |
| Vicor Corp. | | | 3,400 | | | | 55,760 | |
| Wabash National Corp. † | | | 10,700 | | | | 126,795 | |
| Xerium Technologies, Inc. † | | | 1,200 | | | | 19,140 | |
| | | | | | | | |
| | | | | | | 8,355,970 | |
| | | | | | | | |
| Information Technology - 20.1% | | | | | | | | |
| ACI Worldwide, Inc. † | | | 2,500 | | | | 67,175 | |
| Actuate Corp. † | | | 3,600 | | | | 20,520 | |
| Acxiom Corp. †(a) | | | 4,900 | | | | 84,035 | |
| Advent Software, Inc. † | | | 1,000 | | | | 57,920 | |
| Alliance Fiber Optic Products, Inc. † | | | 1,300 | | | | 20,384 | |
| Amtech Systems, Inc. † | | | 1,400 | | | | 35,210 | |
| ANADIGICS, Inc. † | | | 8,800 | | | | 60,984 | |
| Ancestry.com, Inc. † | | | 3,000 | | | | 84,960 | |
| Ariba, Inc. † | | | 6,600 | | | | 155,034 | |
| AXT, Inc. † | | | 4,900 | | | | 51,156 | |
| Black Box Corp. | | | 1,900 | | | | 72,751 | |
| BSQUARE Corp. † | | | 2,700 | | | | 23,625 | |
| Callidus Software, Inc. † | | | 6,700 | | | | 33,768 | |
| Cardtronics, Inc. † | | | 6,900 | | | | 122,130 | |
| Cass Information Systems, Inc. | | | 400 | | | | 15,176 | |
| Cavium Networks, Inc. †(a) | | | 5,200 | | | | 195,936 | |
| CEVA, Inc. † | | | 4,900 | | | | 100,450 | |
| Checkpoint Systems, Inc. † | | | 800 | | | | 16,440 | |
| Ciena Corp. † | | | 8,700 | | | | 183,135 | |
| Cirrus Logic, Inc. †(a) | | | 9,600 | | | | 153,408 | |
| Cognex Corp. | | | 4,500 | | | | 132,390 | |
| Coherent, Inc. † | | | 3,700 | | | | 167,018 | |
| | | | |
| | The accompanying notes are an integral part of these financial statements. | | (Continued) |
| | | | | | | | | | |
| AQR Funds | | | | Annual Report | | | | December 2010 | | 85 |
| | | | | | | |
| | | | |
| Schedule of Investments | | | December 31, 2010 | |
| | | | |
| AQR SMALL CAP MOMENTUM FUND | | | | |
| | | | | | | | |
| | | SHARES | | | VALUE
(Note 3) | |
| Information Technology - 20.1% (continued) | | | | | |
| CommVault Systems, Inc. † | | | 1,100 | | | $ | 31,482 | |
| Constant Contact, Inc. † | | | 2,500 | | | | 77,475 | |
| CSG Systems International, Inc. † | | | 800 | | | | 15,152 | |
| Daktronic, Inc. | | | 3,400 | | | | 54,128 | |
| DDi Corp. | | | 4,900 | | | | 57,624 | |
| Dice Holdings, Inc. † | | | 6,000 | | | | 86,100 | |
| Digital River, Inc. † | | | 5,900 | | | | 203,078 | |
| DSP Group, Inc. † | | | 1,900 | | | | 15,466 | |
| DTS, Inc. † | | | 2,900 | | | | 142,245 | |
| EasyLink Services International Corp., Class A † | | | 2,700 | | | | 11,340 | |
| Electro Rent Corp. | | | 1,000 | | | | 16,160 | |
| Electro Scientific Industries, Inc. † | | | 2,300 | | | | 36,869 | |
| eMagin Corp. † | | | 2,800 | | | | 16,800 | |
| EMS Technologies, Inc. † | | | 800 | | | | 15,824 | |
| Entropic Communications, Inc. †(a) | | | 12,000 | | | | 144,960 | |
| ePlus, Inc. † | | | 700 | | | | 16,548 | |
| ExlService Holdings, Inc. † | | | 1,400 | | | | 30,072 | |
| Finisar Corp. † | | | 9,500 | | | | 282,055 | |
| Forrester Research, Inc. | | | 3,300 | | | | 116,457 | |
| Fundtech Ltd. (Israel) † | | | 1,000 | | | | 16,170 | |
| Gerber Scientific, Inc. † | | | 2,000 | | | | 15,740 | |
| Glu Mobile, Inc. † | | | 7,600 | | | | 15,732 | |
| GSI Technology, Inc. † | | | 2,000 | | | | 16,200 | |
| GT Solar International, Inc. †(a) | | | 1,900 | | | | 17,328 | |
| Hittite Microwave Corp. † | | | 2,900 | | | | 177,016 | |
| iGate Corp. (a) | | | 4,500 | | | | 88,695 | |
| iGO, Inc. † | | | 4,800 | | | | 18,432 | |
| Integrated Silicon Solution, Inc. † | | | 4,400 | | | | 35,332 | |
| Interactive Intelligence, Inc. † | | | 1,300 | | | | 34,008 | |
| Internap Network Services Corp. † | | | 2,700 | | | | 16,416 | |
| IPG Photonics Corp. † | | | 5,000 | | | | 158,100 | |
| Ixia †(a) | | | 5,500 | | | | 92,290 | |
| IXYS Corp. † | | | 2,100 | | | | 24,402 | |
| j2 Global Communications, Inc. † | | | 4,400 | | | | 127,380 | |
| Kemet Corp. † | | | 4,600 | | | | 67,068 | |
| Kenexa Corp. † | | | 2,100 | | | | 45,759 | |
| L-1 Identity Solutions, Inc. † | | | 1,300 | | | | 15,483 | |
| Lattice Semiconductor Corp. †(a) | | | 23,400 | | | | 141,804 | |
| Lawson Software, Inc. † | | | 22,700 | | | | 209,975 | |
| LeCroy Corp. † | | | 2,300 | | | | 22,632 | |
| Limelight Networks, Inc. † | | | 15,100 | | | | 87,731 | |
| Lionbridge Technologies, Inc. †(a) | | | 8,600 | | | | 31,734 | |
| Liquidity Services, Inc. † | | | 1,100 | | | | 15,455 | |
| Littelfuse, Inc. | | | 2,700 | | | | 127,062 | |
| LivePerson, Inc. † | | | 6,051 | | | | 68,376 | |
| LogMeIn, Inc. †(a) | | | 4,300 | | | | 190,662 | |
| LoopNet, Inc. † | | | 1,500 | | | | 16,665 | |
| LTX-Credence Corp. † | | | 2,767 | | | | 20,476 | |
| Magma Design Automation, Inc. † | | | 7,500 | | | | 37,575 | |
| Manhattan Associates, Inc. † | | | 4,000 | | | | 122,160 | |
| Marchex, Inc., Class B | | | 1,800 | | | | 17,172 | |
| MAXIMUS, Inc. | | | 1,100 | | | | 72,138 | |
| Measurement Specialties, Inc. † | | | 2,300 | | | | 67,505 | |
| Mercury Computer Systems, Inc. † | | | 2,900 | | | | 53,302 | |
| Micrel, Inc. | | | 1,600 | | | | 20,784 | |
| Mindspeed Technologies, Inc. † | | | 5,400 | | | | 32,940 | |
| | | | | | | | |
| | | SHARES | | | VALUE
(Note 3) | |
| Information Technology - 20.1% (continued) | | | | | |
| MIPS Technologies, Inc. †(a) | | | 8,000 | | | $ | 121,280 | |
| MoSys, Inc. † | | | 2,800 | | | | 15,932 | |
| Move, Inc. † | | | 17,500 | | | | 44,975 | |
| MTS Systems Corp. | | | 800 | | | | 29,968 | |
| Nanometrics, Inc. † | | | 1,200 | | | | 15,396 | |
| Netgear, Inc. † | | | 4,967 | | | | 167,289 | |
| Netscout Systems, Inc. † | | | 5,300 | | | | 121,953 | |
| NetSuite, Inc. † | | | 3,000 | | | | 75,000 | |
| Network Engines, Inc. †(a) | | | 10,900 | | | | 16,568 | |
| Newport Corp. † | | | 4,100 | | | | 71,217 | |
| Oclaro, Inc. † | | | 8,200 | | | | 107,830 | |
| Omnivision Technologies, Inc. † | | | 7,993 | | | | 236,673 | |
| OpenTable, Inc. † | | | 3,200 | | | | 225,536 | |
| Opnet Technologies, Inc. | | | 1,800 | | | | 48,186 | |
| OSI Systems, Inc. † | | | 2,100 | | | | 76,356 | |
| PC Connection, Inc. † | | | 1,900 | | | | 16,834 | |
| Perficient, Inc. † | | | 3,300 | | | | 41,250 | |
| PFSweb, Inc. † | | | 4,200 | | | | 16,632 | |
| Photronics, Inc. † | | | 8,000 | | | | 47,280 | |
| Plantronics, Inc. | | | 5,100 | | | | 189,822 | |
| Power-One, Inc. †(a) | | | 13,700 | | | | 139,740 | |
| Powerwave Technologies, Inc. † | | | 15,200 | | | | 38,608 | |
| Progress Software Corp. † | | | 6,000 | | | | 253,920 | |
| Quantum Corp. † | | | 14,800 | | | | 55,056 | |
| QuickLogic Corp. †(a) | | | 6,900 | | | | 43,953 | |
| Radiant Systems, Inc. † | | | 4,700 | | | | 91,979 | |
| Richardson Electronics Ltd. (a) | | | 3,200 | | | | 37,408 | |
| RightNow Technologies, Inc. † | | | 1,800 | | | | 42,606 | |
| Rubicon Technology, Inc. †(a) | | | 800 | | | | 16,864 | |
| Saba Software, Inc. † | | | 3,800 | | | | 23,256 | |
| Sapient Corp. | | | 16,400 | | | | 198,440 | |
| SAVVIS, Inc. † | | | 6,551 | | | | 167,181 | |
| Semtech Corp. † | | | 5,400 | | | | 122,256 | |
| Silicon Image, Inc. †(a) | | | 12,900 | | | | 94,815 | |
| Smith Micro Software, Inc. † | | | 4,400 | | | | 69,256 | |
| Sonic Solutions, Inc. † | | | 3,400 | | | | 51,000 | |
| Sourcefire, Inc. †(a) | | | 714 | | | | 18,514 | |
| Spectrum Control, Inc. † | | | 1,600 | | | | 23,984 | |
| Stamps.com, Inc. | | | 2,000 | | | | 26,500 | |
| Standard Microsystems Corp. † | | | 1,700 | | | | 49,011 | |
| Stratasys, Inc. † | | | 3,700 | | | | 120,768 | |
| support.com, Inc. † | | | 9,600 | | | | 62,208 | |
| Sycamore Networks, Inc. | | | 2,300 | | | | 47,357 | |
| Symmetricom, Inc. † | | | 2,700 | | | | 19,143 | |
| Synchronoss Technologies, Inc. † | | | 4,100 | | | | 109,511 | |
| Taleo Corp., Class A † | | | 5,500 | | | | 152,075 | |
| Terremark Worldwide, Inc. †(a) | | | 7,800 | | | | 101,010 | |
| Travelzoo, Inc. † | | | 1,200 | | | | 49,464 | |
| Ultimate Software Group, Inc. † | | | 2,500 | | | | 121,575 | |
| Ultra Clean Holdings † | | | 1,700 | | | | 15,827 | |
| Ultratech, Inc. † | | | 2,000 | | | | 39,760 | |
| Universal Display Corp. †(a) | | | 5,100 | | | | 156,315 | |
| ValueClick, Inc. † | | | 11,700 | | | | 187,551 | |
| VASCO Data Security International, Inc. † | | | 2,000 | | | | 16,260 | |
| Veeco Instruments, Inc. †(a) | | | 1,700 | | | | 73,032 | |
| Verint Systems, Inc. † | | | 1,800 | | | | 57,060 | |
| Viasat, Inc. † | | | 5,100 | | | | 226,491 | |
| | | | |
| | The accompanying notes are an integral part of these financial statements. | | (Continued) |
| | | | | | | | | | |
| AQR Funds | | | | Annual Report | | | | December 2010 | | 86 |
| | | | | | | |
| | | | |
| Schedule of Investments | | | December 31, 2010 | |
| | | | |
| AQR SMALL CAP MOMENTUM FUND | | | | |
| | | | | | | | |
| | | SHARES | | | VALUE
(Note 3) | |
| Information Technology - 20.1% (continued) | | | | | |
| VirnetX Holding Corp. | | | 6,100 | | | $ | 90,585 | |
| Virtusa Corp. † | | | 1,300 | | | | 21,268 | |
| Vocus, Inc. † | | | 1,800 | | | | 49,788 | |
| Wave Systems Corp., Class A † | | | 10,200 | | | | 40,188 | |
| Websense, Inc. † | | | 2,800 | | | | 56,700 | |
| Westell Technologies, Inc., Class A † | | | 10,100 | | | | 33,027 | |
| Wright Express Corp. † | | | 4,400 | | | | 202,400 | |
| X-Rite, Inc. † | | | 3,400 | | | | 15,538 | |
| Zix Corp. †(a) | | | 8,800 | | | | 37,576 | |
| Zygo Corp. † | | | 1,700 | | | | 20,791 | |
| | | | | | | | |
| | | | | | | 10,934,731 | |
| | | | | | | | |
| Materials - 5.4% | | | | | | | | |
| A.M. Castle & Co. † | | | 1,200 | | | | 22,092 | |
| AMCOL International Corp. | | | 1,600 | | | | 49,600 | |
| Balchem Corp. (a) | | | 2,800 | | | | 94,668 | |
| Boise, Inc. (a) | | | 15,000 | | | | 118,950 | |
| Brush Engineered Materials, Inc. † | | | 2,300 | | | | 88,872 | |
| Buckeye Technologies, Inc. | | | 5,100 | | | | 107,151 | |
| Capital Gold Corp. † | | | 3,200 | | | | 16,224 | |
| Carpenter Technology Corp. | | | 6,000 | | | | 241,440 | |
| Clearwater Paper Corp. †(a) | | | 1,300 | | | | 101,790 | |
| Ferro Corp. † | | | 12,800 | | | | 187,392 | |
| Flotek Industries, Inc. † | | | 3,800 | | | | 20,710 | |
| General Moly, Inc. † | | | 7,500 | | | | 48,600 | |
| Globe Specialty Metals, Inc. | | | 10,100 | | | | 172,609 | |
| Gold Resource Corp. | | | 3,300 | | | | 97,020 | |
| Golden Minerals Co. † | | | 1,900 | | | | 50,730 | |
| Golden Star Resources Ltd. † | | | 36,000 | | | | 165,240 | |
| Graphic Packaging Holding Co. †(a) | | | 15,000 | | | | 58,350 | |
| Great Northern Iron Ore Properties (a) | | | 100 | | | | 14,049 | |
| Hawkins, Inc. | | | 1,000 | | | | 44,400 | |
| Innophos Holdings, Inc. | | | 3,600 | | | | 129,888 | |
| KapStone Paper and Packaging Corp. †(a) | | | 4,300 | | | | 65,790 | |
| Kraton Performance Polymers, Inc. † | | | 2,700 | | | | 83,565 | |
| LSB Industries, Inc. † | | | 2,000 | | | | 48,520 | |
| Material Sciences Corp. † | | | 2,500 | | | | 15,975 | |
| Metalline Mining Co. † | | | 13,400 | | | | 16,750 | |
| Minerals Technologies, Inc. | | | 1,500 | | | | 98,115 | |
| Neenah Paper, Inc. | | | 1,600 | | | | 31,488 | |
| NL Industries, Inc. | | | 1,400 | | | | 15,624 | |
| Omnova Solutions, Inc. † | | | 5,500 | | | | 45,980 | |
| PolyOne Corp. † | | | 13,400 | | | | 167,366 | |
| Quaker Chemical Corp. | | | 1,400 | | | | 58,338 | |
| Senomyx, Inc. † | | | 3,400 | | | | 24,242 | |
| Sensient Technologies Corp. | | | 3,800 | | | | 139,574 | |
| Stillwater Mining Co. † | | | 5,200 | | | | 111,020 | |
| UFP Technologies, Inc. † | | | 1,300 | | | | 15,847 | |
| Universal Stainless & Alloy † | | | 800 | | | | 25,024 | |
| US Gold Corp. †(a) | | | 13,700 | | | | 110,559 | |
| WHX Corp. † | | | 1,600 | | | | 20,768 | |
| ZAGG, Inc. † | | | 3,100 | | | | 23,622 | |
| | | | | | | | |
| | | | | | | 2,947,942 | |
| | | | | | | | |
| Telecommunication Services - 1.2% | | | | | | | | |
| 8x8, Inc. †(a) | | | 14,800 | | | | 35,224 | |
| Alaska Communications Systems Group, Inc. (a) | | | 12,900 | | | | 143,190 | |
| Consolidated Communications Holdings, Inc. | | | 2,000 | | | | 38,600 | |
| | | | | | | | |
| | | SHARES | | | VALUE
(Note 3) | |
| Telecommunication Services - 1.2% (continued) | | | | | |
| General Communication, Inc., Class A † | | | 3,000 | | | $ | 37,980 | |
| Globalstar, Inc. †(a) | | | 18,800 | | | | 27,260 | |
| Hughes Communications, Inc. † | | | 1,500 | | | | 60,660 | |
| ICO Global Communications Holdings Ltd. † | | | 10,400 | | | | 15,600 | |
| IDT Corp., Class B | | | 3,200 | | | | 82,080 | |
| Syniverse Holdings, Inc. † | | | 4,700 | | | | 144,995 | |
| Towerstream Corp. † | | | 4,600 | | | | 18,676 | |
| USA Mobility, Inc. | | | 1,500 | | | | 26,655 | |
| Vonage Holdings Corp. †(a) | | | 15,600 | | | | 34,944 | |
| | | | | | | | |
| | | | | | | 665,864 | |
| | | | | | | | |
| Utilities - 1.0% | | | | | | | | |
| Allete, Inc. | | | 2,600 | | | | 96,876 | |
| Artesian Resources Corp., Class A | | | 800 | | | | 15,160 | |
| Chesapeake Utilities Corp. (a) | | | 1,900 | | | | 78,888 | |
| El Paso Electric Co. † | | | 4,000 | | | | 110,120 | |
| Empire District Electric Co./The (a) | | | 1,400 | | | | 31,080 | |
| Middlesex Water Co. | | | 1,700 | | | | 31,195 | |
| South Jersey Industries, Inc. | | | 2,700 | | | | 142,614 | |
| Southwest Gas Corp. | | | 1,100 | | | | 40,337 | |
| York Water Co. | | | 1,100 | | | | 19,019 | |
| | | | | | | | |
| | | | | | | 565,289 | |
| | | | | | | | |
TOTAL COMMON STOCKS
(cost $47,439,167) | | | | | | | 53,139,370 | |
| | | | | | | | |
| | |
| MONEY MARKET FUND - 11.7% | | | | | | | | |
J.P. Morgan Prime Money Market Fund - Capital Shares, 0.130% (2)(b)(c) | | | 6,400,850 | | | | 6,400,850 | |
| | | | | | | | |
TOTAL MONEY MARKET FUND
(cost $6,400,850; includes $2,021,905 of cash collateral received for securities on loan) | | | | | | | 6,400,850 | |
| | | | | | | | |
TOTAL INVESTMENTS - 109.2%
(cost $53,840,017) | | | | | | | 59,540,220 | |
| | | | | | | | |
LIABILITIES IN EXCESS OF OTHER
ASSETS - (9.2%) (d) | | | | (5,035,638) | |
| | | | | | | | |
NET ASSETS - 100.0% | | | $ | 54,504,582 | |
| | | | | | | | |
All securities are United States companies, unless noted otherwise in parentheses.
| † | Non income-producing security. |
| (a) | All or a portion of the security on loan. The aggregate market value of such securities is $1,892,746; cash collateral of $2,021,905 was received with which the Fund purchased a money market fund. |
| (b) | Represents security, or portion thereof, purchased with the cash collateral received for securities on loan. |
| (c) | Represents annualized seven-day yield as of December 31, 2010. |
| (d) | Includes (depreciation) on futures contracts. |
All Securities are Level 1, unless noted otherwise in parentheses.
| (2) | Level 2 security (See Note 5). |
The following abbreviations are used in portfolio descriptions:
REIT - Real Estate Investment Trust
| | | | |
| | The accompanying notes are an integral part of these financial statements. | | (Continued) |
| | | | | | | | | | |
| AQR Funds | | | | Annual Report | | | | December 2010 | | 87 |
| | | | | | | |
| | | | |
| Schedule of Investments | | | December 31, 2010 | |
| | | | |
| AQR SMALL CAP MOMENTUM FUND | | | | |
Open futures contracts outstanding at December 31, 2010:
| | | | | | | | | | | | | | | | |
NUMBER OF
CONTRACTS | | TYPE | | EXPIRATION
DATE | | VALUE AT
TRADE DATE | | | VALUE AT
DECEMBER 31,
2010 | | | UNREALIZED
APPRECIATION (DEPRECIATION) | |
| Long Contracts: | | | | | | | | | | | | | | | | |
| 15 | | E-Mini Russell 2000 Futures | | March 18, 2011 | | | $1,184,759 | | | | $1,173,450 | | | | $(11,309) | |
| | | | | | | | | | | | | | | | |
Cash held as collateral with broker for futures contracts was $189,960 at December 31, 2010.
| | | | |
| | The accompanying notes are an integral part of these financial statements. | | |
| | | | | | | | | | |
| AQR Funds | | | | Annual Report | | | | December 2010 | | 88 |
| | | | | | | |
| | | | |
| Schedule of Investments | | | December 31, 2010 | |
| | | | |
| AQR INTERNATIONAL MOMENTUM FUND | | | | |
| | | | | | | | |
| | | SHARES | | | VALUE
(Note 3) | |
| COMMON STOCKS - 92.2% | | | | | | | | |
| Australia - 1.3% | | | | | | | | |
| Amcor Ltd. | | | 7,128 | | | $ | 49,327 | |
| Australia & New Zealand Banking Group Ltd. | | | 4,197 | | | | 100,466 | |
| Coal & Allied Industries Ltd. | | | 318 | | | | 39,073 | |
| Cochlear Ltd. | | | 365 | | | | 30,113 | |
| Commonwealth Bank of Australia | | | 1,545 | | | | 80,456 | |
| Equinox Minerals Ltd. (1)† | | | 2,100 | | | | 12,913 | |
| Fortescue Metals Group Ltd. † | | | 27,957 | | | | 187,818 | |
| Incitec Pivot Ltd. | | | 11,205 | | | | 45,525 | |
| OZ Minerals Ltd. | | | 42,894 | | | | 75,925 | |
| Paladin Energy Ltd. † | | | 12,165 | | | | 61,448 | |
| Wesfarmers Ltd. | | | 3,047 | | | | 100,037 | |
| | | | | | | | |
| | | | | | | 783,101 | |
| | | | | | | | |
| Austria - 0.6% | | | | | | | | |
| Erste Group Bank AG | | | 4,657 | | | | 220,658 | |
| Vienna Insurance Group AG Wiener Versicherung Gruppe | | | 311 | | | | 16,273 | |
| Voestalpine AG | | | 2,788 | | | | 133,876 | |
| | | | | | | | |
| | | | | | | 370,807 | |
| | | | | | | | |
| Belgium - 0.4% | | | | | | | | |
| Anheuser-Busch InBev NV | | | 1,171 | | | | 67,172 | |
| Bekaert SA | | | 849 | | | | 97,808 | |
| Umicore SA | | | 1,609 | | | | 84,100 | |
| | | | | | | | |
| | | | | | | 249,080 | |
| | | | | | | | |
| Bermuda - 0.2% | | | | | | | | |
| Seadrill Ltd. | | | 3,031 | | | | 103,798 | |
| | | | | | | | |
| Canada - 16.3% (1) | | | | | | | | |
| Agnico-Eagle Mines Ltd. (c) | | | 2,900 | | | | 223,560 | |
| Agrium, Inc. | | | 2,600 | | | | 239,420 | |
| Alamos Gold, Inc. | | | 3,200 | | | | 60,931 | |
| Alimentation Couche Tard, Inc., Class B | | | 3,800 | | | | 103,485 | |
| ARC Energy Trust | | | 3,800 | | | | 97,175 | |
| Bank of Montreal (a) | | | 2,000 | | | | 115,695 | |
| Barrick Gold Corp. | | | 16,400 | | | | 876,735 | |
| Baytex Energy Trust | | | 2,300 | | | | 107,888 | |
| BCE, Inc. | | | 13,300 | | | | 473,026 | |
| Bonavista Energy Trust | | | 1,300 | | | | 37,679 | |
| Brookfield Asset Management, Inc., Class A | | | 4,300 | | | | 143,672 | |
| Canadian Imperial Bank of Commerce (c) | | | 7,100 | | | | 559,697 | |
| Canadian National Railway Co. | | | 1,300 | | | | 86,806 | |
| Canadian Pacific Railway Ltd. | | | 1,600 | | | | 104,053 | |
| Canadian Utilities Ltd., Class A | | | 900 | | | | 49,273 | |
| Centerra Gold, Inc. | | | 1,500 | | | | 29,950 | |
| CGI Group, Inc., Class A † | | | 1,800 | | | | 31,158 | |
| Consolidated Thompson Iron Mines Ltd. †(c) | | | 4,600 | | | | 65,228 | |
| Detour Gold Corp. †(c) | | | 1,600 | | | | 47,002 | |
| Domtar Corp. | | | 300 | | | | 22,776 | |
| Eldorado Gold Corp. | | | 11,200 | | | | 208,524 | |
| Emera, Inc. | | | 2,100 | | | | 66,256 | |
| Enbridge, Inc. | | | 7,300 | | | | 413,396 | |
| Enerplus Resources Fund | | | 1,900 | | | | 58,645 | |
| European Goldfields Ltd. † | | | 4,600 | | | | 64,487 | |
| | | | | | | | |
| | | SHARES | | | VALUE
(Note 3) | |
| Canada - 16.3% (1) (continued) | | | | | | | | |
| Fairfax Financial Holdings Ltd. | | | 100 | | | $ | 41,160 | |
| Finning International, Inc. | | | 2,200 | | | | 59,979 | |
| Franco-Nevada Corp. | | | 1,300 | | | | 43,514 | |
| Gabriel Resources Ltd. † | | | 8,100 | | | | 64,807 | |
| Genworth MI Canada, Inc. | | | 1,100 | | | | 30,543 | |
| George Weston Ltd. | | | 1,200 | | | | 101,686 | |
| Gildan Activewear, Inc. † | | | 3,000 | | | | 85,594 | |
| H&R Real Estate Investment Trust REIT | | | 2,100 | | | | 41,064 | |
| HudBay Minerals, Inc. | | | 3,500 | | | | 63,297 | |
| Industrial Alliance Insurance & Financial Services, Inc. | | | 700 | | | | 25,932 | |
| Intact Financial Corp. (c) | | | 1,200 | | | | 61,422 | |
| Ivanhoe Mines Ltd. † | | | 4,300 | | | | 99,532 | |
| Keyera Facilities Income Fund | | | 1,700 | | | | 60,137 | |
| Kinross Gold Corp. | | | 1,734 | | | | 32,999 | |
| Loblaw Cos. Ltd. | | | 2,100 | | | | 85,319 | |
| Lululemon Athletica, Inc. † | | | 800 | | | | 54,901 | |
| Lundin Mining Corp. † | | | 8,700 | | | | 63,566 | |
| Magna International, Inc. | | | 6,900 | | | | 360,468 | |
| Methanex Corp. | | | 2,000 | | | | 60,887 | |
| Metro, Inc., Class A | | | 2,300 | | | | 104,624 | |
| New Gold, Inc. † | | | 3,600 | | | | 35,071 | |
| Novagold Resources, Inc. † | | | 4,200 | | | | 60,063 | |
| Onex Corp. | | | 2,400 | | | | 73,016 | |
| Osisko Mining Corp. † | | | 7,500 | | | | 109,596 | |
| Pacific Rubiales Energy Corp. | | | 3,100 | | | | 105,294 | |
| Pan American Silver Corp. | | | 1,500 | | | | 61,787 | |
| Pembina Pipeline Corp. | | | 2,000 | | | | 43,476 | |
| Pengrowth Energy Trust | | | 5,300 | | | | 68,167 | |
| Penn West Energy Trust | | | 6,300 | | | | 151,152 | |
| Petrobank Energy & Resources Ltd. †(c) | | | 300 | | | | 7,623 | |
| Petrominerales Ltd. | | | 684 | | | | 22,833 | |
| Potash Corp of Saskatchewan, Inc. | | | 5,200 | | | | 808,273 | |
| RioCan Real Estate Investment Trust REIT | | | 2,200 | | | | 48,709 | |
| Rogers Communications, Inc., Class B | | | 2,500 | | | | 87,053 | |
| Saputo, Inc. (a) | | | 2,000 | | | | 79,666 | |
| SEMAFO, Inc. † | | | 6,600 | | | | 71,403 | |
| Silver Wheaton Corp. † | | | 6,300 | | | | 247,143 | |
| Teck Resources Ltd., Class B | | | 7,400 | | | | 460,168 | |
| TELUS Corp. | | | 6,000 | | | | 274,624 | |
| Tim Hortons, Inc. | | | 1,600 | | | | 66,180 | |
| Toronto-Dominion Bank/The | | | 13,100 | | | | 978,891 | |
| TransCanada Corp. | | | 2,400 | | | | 91,759 | |
| Uranium One, Inc. | | | 12,900 | | | | 61,796 | |
Valeant Pharmaceuticals International,
Inc. | | | 4,529 | | | | 128,899 | |
| Vermilion Energy, Inc. | | | 1,300 | | | | 60,470 | |
| Yellow Media, Inc. | | | 9,600 | | | | 59,900 | |
| | | | | | | | |
| | | | | | | 10,090,960 | |
| | | | | | | | |
| Cayman Islands - 0.2% | | | | | | | | |
| Sands China Ltd. † | | | 45,200 | | | | 99,353 | |
| | | | | | | | |
| China - 0.3% | | | | | | | | |
| AAC Acoustic Technologies Holdings, Inc. | | | 10,000 | | | | 26,675 | |
| Daphne International Holdings Ltd. | | | 16,000 | | | | 14,980 | |
| Great Wall Motor Co. Ltd., H Shares | | | 6,500 | | | | 20,055 | |
| | | | |
| | The accompanying notes are an integral part of these financial statements. | | (Continued) |
| | | | | | | | | | |
| AQR Funds | | | | Annual Report | | | | December 2010 | | 89 |
| | | | | | | |
| | | | |
| Schedule of Investments | | | December 31, 2010 | |
| | | | |
| AQR INTERNATIONAL MOMENTUM FUND | | | | |
| | | | | | | | |
| | | SHARES | | | VALUE
(Note 3) | |
| China - 0.3% (continued) | | | | | | | | |
Guangzhou Pharmaceutical Co. Ltd.,
H Shares | | | 42,000 | | | $ | 69,458 | |
Harbin Power Equipment Co. Ltd.,
H Shares | | | 40,000 | | | | 63,079 | |
| | | | | | | | |
| | | | | | | 194,247 | |
| | | | | | | | |
| Denmark - 4.1% | | | | | | | | |
| AP Moller - Maersk A/S, Class B | | | 67 | | | | 609,128 | |
| Carlsberg A/S, Class B | | | 2,166 | | | | 218,321 | |
| Coloplast A/S, Class B | | | 818 | | | | 111,625 | |
| Danske Bank A/S † | | | 10,797 | | | | 278,049 | |
| FLSmidth & Co. A/S | | | 1,140 | | | | 109,531 | |
| Novo Nordisk A/S, Class B | | | 9,091 | | | | 1,028,511 | |
| Novozymes A/S, Class B | | | 1,039 | | | | 145,580 | |
| William Demant Holding A/S † | | | 450 | | | | 33,405 | |
| | | | | | | | |
| | | | | | | 2,534,150 | |
| | | | | | | | |
| Finland - 1.4% | | | | | | | | |
| Kesko OYJ B Shares, Class B | | | 1,282 | | | | 60,143 | |
| Kone OYJ, Class B | | | 4,181 | | | | 233,134 | |
| Metso OYJ | | | 2,840 | | | | 159,494 | |
| Stora Enso OYJ R Shares | | | 10,977 | | | | 113,409 | |
| UPM-Kymmene OYJ | | | 6,832 | | | | 121,592 | |
| Wartsila OYJ | | | 2,000 | | | | 153,006 | |
| | | | | | | | |
| | | | | | | 840,778 | |
| | | | | | | | |
| France - 6.5% | | | | | | | | |
| Accor SA | | | 3,630 | | | | 162,415 | |
| Air France-KLM † | | | 3,368 | | | | 61,723 | |
| Air Liquide SA | | | 3,604 | | | | 458,108 | |
| Bureau Veritas SA | | | 591 | | | | 45,026 | |
| Cap Gemini SA | | | 805 | | | | 37,781 | |
| Christian Dior SA | | | 1,115 | | | | 160,108 | |
Cie Generale d’Optique Essilor International SA | | | 1,995 | | | | 129,044 | |
| Dassault Systemes SA | | | 716 | | | | 54,264 | |
| Edenred † | | | 3,620 | | | | 86,083 | |
| Eutelsat Communications | | | 1,154 | | | | 42,429 | |
| Fonciere Des Regions REIT | | | 210 | | | | 20,404 | |
| Hermes International | | | 496 | | | | 104,411 | |
| JCDecaux SA † | | | 1,456 | | | | 45,007 | |
| Legrand SA | | | 1,719 | | | | 70,393 | |
| LVMH Moet Hennessy Louis Vuitton SA | | | 4,036 | | | | 667,355 | |
| Pernod-Ricard SA | | | 1,176 | | | | 111,130 | |
| Peugeot SA † | | | 2,907 | | | | 110,890 | |
| PPR | | | 921 | | | | 147,209 | |
| Publicis Groupe SA | | | 2,536 | | | | 132,851 | |
| Rexel SA † | | | 4,367 | | | | 95,341 | |
| Safran SA | | | 4,927 | | | | 175,340 | |
| Schneider Electric SA | | | 4,083 | | | | 614,590 | |
| SEB SA | | | 592 | | | | 61,808 | |
| Sodexo | | | 908 | | | | 62,902 | |
| Technip SA | | | 1,542 | | | | 143,091 | |
| Unibail-Rodamco SE REIT | | | 432 | | | | 85,871 | |
| Vallourec SA | | | 1,688 | | | | 178,171 | |
| | | | | | | | |
| | | | | | | 4,063,745 | |
| | | | | | | | |
| Germany - 10.4% | | | | | | | | |
| Adidas AG | | | 4,232 | | | | 276,368 | |
| BASF SE | | | 14,543 | | | | 1,165,127 | |
| | | | | | | | |
| | | SHARES | | | VALUE
(Note 3) | |
| Germany - 10.4% (continued) | | | | | | | | |
| Bayerische Motoren Werke AG | | | 6,742 | | | $ | 533,265 | |
| Continental AG † | | | 1,773 | | | | 141,391 | |
| Daimler AG † | | | 14,990 | | | | 1,018,275 | |
| Deutsche Lufthansa AG † | | | 7,497 | | | | 163,720 | |
| Fresenius Medical Care AG & Co. KGaA | | | 2,599 | | | | 150,010 | |
| GEA Group AG | | | 2,796 | | | | 81,117 | |
| Generali Deutschland Holding AG | | | 159 | | | | 19,509 | |
| Infineon Technologies AG † | | | 20,153 | | | | 188,589 | |
| K+S AG | | | 2,667 | | | | 201,806 | |
| Lanxess AG | | | 1,642 | | | | 129,613 | |
| Linde AG | | | 3,031 | | | | 460,326 | |
| MAN SE | | | 1,933 | | | | 231,135 | |
| Metro AG | | | 1,483 | | | | 107,458 | |
| Puma AG Rudolf Dassler Sport | | | 56 | | | | 18,555 | |
| Siemens AG | | | 12,098 | | | | 1,504,513 | |
| ThyssenKrupp AG | | | 498 | | | | 20,770 | |
| Wacker Chemie AG | | | 216 | | | | 37,806 | |
| | | | | | | | |
| | | | | | | 6,449,353 | |
| | | | | | | | |
| Hong Kong - 7.0% | | | | | | | | |
| ASM Pacific Technology Ltd. | | | 3,000 | | | | 37,884 | |
| BOC Hong Kong Holdings Ltd. | | | 74,500 | | | | 253,311 | |
| Cathay Pacific Airways Ltd. | | | 33,000 | | | | 91,021 | |
| Cheung Kong Holdings Ltd. | | | 22,000 | | | | 339,015 | |
| Cheung Kong Infrastructure Holdings Ltd. | | | 16,000 | | | | 73,245 | |
| CLP Holdings Ltd. | | | 32,000 | | | | 259,803 | |
| Dairy Farm International Holdings Ltd. | | | 6,300 | | | | 58,506 | |
| Digital China Holdings Ltd. | | | 8,000 | | | | 14,955 | |
| Galaxy Entertainment Group Ltd. † | | | 55,000 | | | | 62,206 | |
| Hang Lung Group Ltd. | | | 19,000 | | | | 124,820 | |
| Hang Lung Properties Ltd. | | | 40,000 | | | | 186,940 | |
| Hong Kong Exchanges and Clearing Ltd. | | | 18,600 | | | | 421,666 | |
| Hongkong & Shanghai Hotels/The | | | 11,000 | | | | 18,844 | |
| Hongkong Electric Holdings Ltd. | | | 18,500 | | | | 116,604 | |
| Hongkong Land Holdings Ltd. (a) | | | 17,000 | | | | 122,712 | |
| Hutchison Whampoa Ltd. | | | 36,000 | | | | 370,302 | |
| Hysan Development Co. Ltd. | | | 8,000 | | | | 37,639 | |
| Jardine Matheson Holdings Ltd. | | | 3,200 | | | | 140,741 | |
| Jardine Strategic Holdings Ltd. | | | 7,000 | | | | 193,642 | |
| Li & Fung Ltd. | | | 48,000 | | | | 278,467 | |
| Lifestyle International Holdings Ltd. | | | 13,500 | | | | 33,216 | |
| Link REIT/The REIT | | | 37,500 | | | | 116,423 | |
| Noble Group Ltd. | | | 19,363 | | | | 32,787 | |
| NWS Holdings Ltd. | | | 33,000 | | | | 50,078 | |
| Orient Overseas International Ltd. | | | 7,000 | | | | 67,847 | |
| Shangri-La Asia Ltd. | | | 24,000 | | | | 65,100 | |
| SJM Holdings Ltd. | | | 38,000 | | | | 60,275 | |
| Stella International Holdings Ltd. | | | 7,500 | | | | 14,949 | |
| Swire Pacific Ltd., Class A | | | 19,500 | | | | 320,351 | |
| United Laboratories International Holdings Ltd./The | | | 12,000 | | | | 24,621 | |
| VTech Holdings Ltd. (a) | | | 2,000 | | | | 23,509 | |
| Wharf Holdings Ltd. | | | 23,000 | | | | 176,815 | |
| Wheelock & Co. Ltd. | | | 16,000 | | | | 64,691 | |
| Wing Hang Bank Ltd. | | | 4,500 | | | | 62,196 | |
| Yue Yuen Industrial Holdings Ltd. | | | 13,500 | | | | 48,557 | |
| | | | | | | | |
| | | | | | | 4,363,738 | |
| | | | | | | | |
| | | | |
| | The accompanying notes are an integral part of these financial statements. | | (Continued) |
| | | | | | | | | | |
| AQR Funds | | | | Annual Report | | | | December 2010 | | 90 |
| | | | | | | |
| | | | |
| Schedule of Investments | | | December 31, 2010 | |
| | | | |
| AQR INTERNATIONAL MOMENTUM FUND | | | | |
| | | | | | | | |
| | | SHARES | | | VALUE
(Note 3) | |
| Ireland - 1.1% | | | | | | | | |
| Experian PLC | | | 14,182 | | | $ | 177,383 | |
| Ryanair Holdings PLC | | | 26,513 | | | | 133,438 | |
| Shire PLC | | | 8,346 | | | | 202,086 | |
| WPP PLC | | | 13,211 | | | | 164,009 | |
| | | | | | | | |
| | | | | | | 676,916 | |
| | | | | | | | |
| Israel - 0.8% | | | | | | | | |
| Bank Hapoalim BM † | | | 12,592 | | | | 65,687 | |
| Bank Leumi Le-Israel BM | | | 26,279 | | | | 134,969 | |
| Bezeq The Israeli Telecommunication Corp. Ltd. | | | 22,496 | | | | 68,623 | |
| Clal Industries and Investments Ltd. | | | 3,102 | | | | 25,142 | |
| Israel Chemicals Ltd. | | | 6,729 | | | | 115,474 | |
| Israel Corp. Ltd./The † | | | 62 | | | | 75,372 | |
| | | | | | | | |
| | | | | | | 485,267 | |
| | | | | | | | |
| Italy - 0.8% | | | | | | | | |
| Fiat SpA | | | 9,441 | | | | 196,016 | |
| Saipem SpA | | | 4,327 | | | | 214,476 | |
| Terna Rete Elettrica Nazionale SpA | | | 16,361 | | | | 69,420 | |
| | | | | | | | |
| | | | | | | 479,912 | |
| | | | | | | | |
| Japan - 8.7% | | | | | | | | |
| ABC-Mart, Inc. | | | 700 | | | | 24,959 | |
| Aeon Co. Ltd. | | | 9,300 | | | | 116,170 | |
| All Nippon Airways Co. Ltd. † | | | 55,000 | | | | 204,895 | |
| Asahi Glass Co. Ltd. | | | 7,000 | | | | 81,494 | |
| Central Japan Railway Co. | | | 2 | | | | 16,736 | |
| Credit Saison Co. Ltd. | | | 3,800 | | | | 62,080 | |
| Daito Trust Construction Co. Ltd. | | | 2,800 | | | | 191,560 | |
| Dena Co. Ltd. | | | 2,900 | | | | 104,007 | |
| Fanuc Ltd. | | | 3,200 | | | | 489,653 | |
| Fuji Electric Holdings Co. Ltd. | | | 17,000 | | | | 52,738 | |
| Fuji Heavy Industries Ltd. | | | 15,000 | | | | 115,798 | |
| Hino Motors Ltd. | | | 4,000 | | | | 21,587 | |
| Hitachi Ltd. | | | 67,660 | | | | 359,595 | |
| IHI Corp. | | | 27,000 | | | | 60,007 | |
| Isuzu Motors Ltd. | | | 24,000 | | | | 108,563 | |
| ITOCHU Corp. | | | 13,300 | | | | 134,148 | |
| Japan Real Estate Investment Corp. REIT | | | 6 | | | | 62,223 | |
| Japan Retail Fund Investment Corp. REIT | | | 33 | | | | 63,173 | |
| JX Holdings, Inc. | | | 36,700 | | | | 248,610 | |
| Kawasaki Kisen Kaisha Ltd. | | | 14,000 | | | | 61,016 | |
| Keihin Corp. | | | 1,700 | | | | 38,166 | |
| Kobe Steel Ltd. | | | 8,000 | | | | 20,235 | |
| Koito Manufacturing Co. Ltd. | | | 1,000 | | | | 15,563 | |
| Komatsu Ltd. | | | 14,700 | | | | 442,888 | |
| McDonald’s Holdings Co. Japan Ltd. | | | 1,000 | | | | 25,083 | |
| Mitsubishi Chemical Holdings Corp. | | | 17,500 | | | | 118,334 | |
| Mitsubishi Electric Corp. | | | 31,000 | | | | 324,267 | |
| Mitsui OSK Lines Ltd. | | | 16,000 | | | | 108,532 | |
| NGK Spark Plug Co. Ltd. | | | 2,000 | | | | 30,595 | |
| NHK Spring Co. Ltd. | | | 4,000 | | | | 43,399 | |
| Nidec Corp. | | | 700 | | | | 70,658 | |
| Nippon Building Fund, Inc. REIT | | | 6 | | | | 61,554 | |
| Nippon Yusen KK | | | 24,000 | | | | 105,772 | |
| NOK Corp. | | | 1,200 | | | | 24,900 | |
| Omron Corp. | | | 1,500 | | | | 39,572 | |
| | | | | | | | |
| | | SHARES | | | VALUE
(Note 3) | |
| Japan - 8.7% (continued) | | | | | | | | |
| Oracle Corp. Japan | | | 1,000 | | | $ | 49,071 | |
| Oriental Land Co. Ltd. | | | 600 | | | | 55,554 | |
| ORIX Corp. | | | 450 | | | | 44,135 | |
| Sanrio Co. Ltd. † | | | 2,600 | | | | 60,818 | |
| Sega Sammy Holdings, Inc. | | | 3,200 | | | | 60,754 | |
| Shiseido Co. Ltd. | | | 900 | | | | 19,619 | |
| SMC Corp. | | | 800 | | | | 136,660 | |
| Softbank Corp. | | | 15,100 | | | | 521,200 | |
| Sumitomo Corp. | | | 15,400 | | | | 217,017 | |
| Sysmex Corp. | | | 400 | | | | 27,694 | |
| Takata Corp. | | | 600 | | | | 17,687 | |
| THK Co. Ltd. | | | 1,800 | | | | 41,214 | |
| Toshiba Corp. | | | 6,000 | | | | 32,598 | |
| Universal Entertainment Corp. † | | | 1,300 | | | | 37,836 | |
| USS Co. Ltd. | | | 400 | | | | 32,676 | |
| | | | | | | | |
| | | | | | | 5,403,063 | |
| | | | | | | | |
| Jersey, Channel Islands - 0.4% | | | | | | | | |
| Randgold Resources Ltd. | | | 716 | | | | 59,291 | |
| Wolseley PLC † | | | 3,655 | | | | 117,497 | |
| Wynn Macau Ltd. | | | 26,800 | | | | 59,975 | |
| | | | | | | | |
| | | | | | | 236,763 | |
| | | | | | | | |
| Luxembourg - 0.3% | | | | | | | | |
| RTL Group SA | | | 547 | | | | 56,867 | |
| Tenaris SA | | | 4,968 | | | | 122,316 | |
| | | | | | | | |
| | | | | | | 179,183 | |
| | | | | | | | |
| Mexico - 0.0% (b) | | | | | | | | |
| Fresnillo PLC | | | 249 | | | | 6,543 | |
| | | | | | | | |
| | |
| Netherlands - 1.2% | | | | | | | | |
| Akzo Nobel NV | | | 425 | | | | 26,546 | |
| ASML Holding NV | | | 323 | | | | 12,436 | |
| European Aeronautic Defence and Space Co. NV † | | | 5,606 | | | | 131,329 | |
| HAL Trust | | | 326 | | | | 41,129 | |
| Koninklijke DSM NV | | | 2,023 | | | | 115,770 | |
| Koninklijke Vopak NV | | | 762 | | | | 36,167 | |
| QIAGEN NV † | | | 1,612 | | | | 31,763 | |
| Royal Dutch Shell PLC, Class A | | | 11,143 | | | | 370,682 | |
| | | | | | | | |
| | | | | | | 765,822 | |
| | | | | | | | |
| Norway - 0.6% | | | | | | | | |
| DnB NOR ASA | | | 15,556 | | | | 219,692 | |
| Telenor ASA | | | 4,187 | | | | 68,493 | |
| Yara International ASA | | | 1,579 | | | | 92,268 | |
| | | | | | | | |
| | | | | | | 380,453 | |
| | | | | | | | |
| Portugal - 0.3% | | | | | | | | |
| Jeronimo Martins SGPS SA | | | 6,068 | | | | 92,884 | |
| Portugal Telecom SGPS SA | | | 7,413 | | | | 84,952 | |
| | | | | | | | |
| | | | | | | 177,836 | |
| | | | | | | | |
| Singapore - 1.5% | | | | | | | | |
| Fraser and Neave Ltd. | | | 11,000 | | | | 55,012 | |
| Genting Singapore PLC † | | | 94,000 | | | | 161,095 | |
| Indofood Agri Resources Ltd. † | | | 35,000 | | | | 76,583 | |
| Jardine Cycle & Carriage Ltd. | | | 2,000 | | | | 57,129 | |
| | | | |
| | The accompanying notes are an integral part of these financial statements. | | (Continued) |
| | | | | | | | | | |
| AQR Funds | | | | Annual Report | | | | December 2010 | | 91 |
| | | | | | | |
| | | | |
| Schedule of Investments | | | December 31, 2010 | |
| | | | |
| AQR INTERNATIONAL MOMENTUM FUND | | | | |
| | | | | | | | |
| | | SHARES | | | VALUE
(Note 3) | |
| Singapore - 1.5% (continued) | | | | | | | | |
| Keppel Corp. Ltd. | | | 20,000 | | | $ | 176,788 | |
| Keppel Land Ltd. | | | 18,000 | | | | 67,519 | |
| Oversea-Chinese Banking Corp. Ltd. | | | 15,000 | | | | 115,692 | |
| SembCorp Industries Ltd. | | | 13,000 | | | | 52,133 | |
| SembCorp Marine Ltd. | | | 17,000 | | | | 71,245 | |
| SIA Engineering Co. Ltd. | | | 10,000 | | | | 33,002 | |
| Singapore Technologies Engineering Ltd. | | | 16,000 | | | | 42,711 | |
| | | | | | | | |
| | | | | | | 908,909 | |
| | | | | | | | |
| Spain - 0.5% | | | | | | | | |
| Inditex SA | | | 4,347 | | | | 326,665 | |
| | | | | | | | |
| Sweden - 7.0% | | | | | | | | |
| Alfa Laval AB | | | 6,815 | | | | 143,945 | |
| Assa Abloy AB, Class B | | | 5,783 | | | | 163,199 | |
| Atlas Copco AB A Shares | | | 19,453 | | | | 491,266 | |
| Boliden AB | | | 4,561 | | | | 92,964 | |
| Electrolux AB (a) | | | 806 | | | | 22,882 | |
| Hennes & Mauritz AB, Class B | | | 26,741 | | | | 890,982 | |
| Hexagon AB, Class B | | | 5,153 | | | | 110,718 | |
| Industrivarden AB, Class C | | | 4,099 | | | | 71,945 | |
| Kinnevik Investment AB, Class B | | | 5,351 | | | | 109,019 | |
| Ratos AB, Class B | | | 1,515 | | | | 56,036 | |
| Sandvik AB | | | 19,693 | | | | 384,409 | |
| Scania AB B Shares | | | 13,034 | | | | 300,156 | |
| Skandinaviska Enskilda Banken AB, Class A | | | 22,491 | | | | 187,860 | |
| Skanska AB, Class B | | | 2,602 | | | | 51,605 | |
| SKF AB, Class B | | | 8,759 | | | | 250,057 | |
| Svenska Handelsbanken AB, Class A | | | 3,079 | | | | 98,463 | |
| Swedbank AB † | | | 15,009 | | | | 209,963 | |
| Swedish Match AB | | | 2,095 | | | | 60,735 | |
| Tele2 AB B Shares | | | 3,216 | | | | 66,752 | |
| Volvo AB B Shares † | | | 33,614 | | | | 592,384 | |
| | | | | | | | |
| | | | | | | 4,355,340 | |
| | | | | | | | |
| Switzerland - 3.2% | | | | | | | | |
| Adecco SA | | | 324 | | | | 21,314 | |
| Compagnie Financiere Richemont SA, Class A | | | 8,093 | | | | 477,380 | |
| Geberit AG | | | 236 | | | | 54,738 | |
| Givaudan SA | | | 44 | | | | 47,646 | |
| Holcim Ltd. | | | 749 | | | | 56,855 | |
| Kuehne & Nagel International AG | | | 682 | | | | 95,181 | |
| Lindt & Spruengli AG | | | 20 | | | | 60,563 | |
| Nestle SA | | | 7,532 | | | | 442,625 | |
| Sonova Holding AG | | | 440 | | | | 56,895 | |
| Sulzer AG | | | 416 | | | | 63,663 | |
| Swatch Group AG/The | | | 767 | | | | 343,047 | |
| Swisscom AG | | | 178 | | | | 78,490 | |
| Xstrata PLC | | | 8,406 | | | | 200,028 | |
| | | | | | | | |
| | | | | | | 1,998,425 | |
| | | | | | | | |
| United Kingdom - 17.1% | | | | | | | | |
| Admiral Group PLC | | | 4,753 | | | | 112,893 | |
| Aggreko PLC | | | 5,019 | | | | 116,626 | |
| Anglo American PLC | | | 4,806 | | | | 252,472 | |
| Antofagasta PLC | | | 5,256 | | | | 133,552 | |
| ARM Holdings PLC | | | 23,893 | | | | 163,761 | |
| | | | | | | | |
| | | SHARES | | | VALUE
(Note 3) | |
| United Kingdom - 17.1% (continued) | | | | | | | | |
| Associated British Foods PLC | | | 6,654 | | | $ | 123,359 | |
| British Airways PLC † | | | 15,783 | | | | 67,558 | |
| British American Tobacco PLC | | | 31,350 | | | | 1,210,982 | |
| British Land Co. PLC REIT | | | 3,082 | | | | 25,405 | |
| BT Group PLC | | | 105,524 | | | | 300,971 | |
| Burberry Group PLC | | | 6,668 | | | | 117,683 | |
| Carnival PLC | | | 12,038 | | | | 562,272 | |
| Centrica PLC | | | 24,337 | | | | 126,628 | |
| Compass Group PLC | | | 30,872 | | | | 281,370 | |
| Diageo PLC | | | 9,350 | | | | 173,966 | |
| GKN PLC | | | 20,726 | | | | 72,243 | |
| HSBC Holdings PLC | | | 5,975 | | | | 61,322 | |
| IMI PLC | | | 4,267 | | | | 63,250 | |
| Inmarsat PLC | | | 1,932 | | | | 20,404 | |
| Intercontinental Hotels Group PLC | | | 5,082 | | | | 99,689 | |
| International Power PLC | | | 11,111 | | | | 76,413 | |
| Intertek Group PLC | | | 2,171 | | | | 60,280 | |
| Investec PLC | | | 9,710 | | | | 80,330 | |
| Johnson Matthey PLC | | | 1,514 | | | | 48,439 | |
| Kingfisher PLC | | | 6,023 | | | | 24,917 | |
| Legal & General Group PLC | | | 47,374 | | | | 72,052 | |
| Lloyds Banking Group PLC † | | | 641,091 | | | | 664,583 | |
| Old Mutual PLC | | | 29,077 | | | | 56,229 | |
| Pearson PLC | | | 3,639 | | | | 57,589 | |
| Petrofac Ltd. | | | 7,969 | | | | 198,839 | |
| Rio Tinto PLC | | | 18,207 | | | | 1,303,281 | |
| Rolls-Royce Group PLC † | | | 10,014 | | | | 97,979 | |
| SABMiller PLC | | | 5,301 | | | | 187,535 | |
| Sage Group PLC/The | | | 14,253 | | | | 61,137 | |
| Severn Trent PLC | | | 3,568 | | | | 82,838 | |
| Smith & Nephew PLC | | | 3,096 | | | | 32,828 | |
| Smiths Group PLC | | | 2,405 | | | | 46,949 | |
| Standard Chartered PLC | | | 31,681 | | | | 858,846 | |
| United Utilities Group PLC | | | 5,125 | | | | 47,614 | |
| Vedanta Resources PLC | | | 86 | | | | 3,407 | |
| Vodafone Group PLC | | | 859,013 | | | | 2,264,517 | |
| Weir Group PLC/The | | | 4,443 | | | | 123,958 | |
| Whitbread PLC | | | 3,097 | | | | 87,025 | |
| | | | | | | | |
| | | | | | | 10,623,991 | |
| | | | | | | | |
| United States - 0.0% (b) | | | | | | | | |
| Brookfield Properties Corp. (1) | | | 1,900 | | | | 33,577 | |
| | | | | | | | |
TOTAL COMMON STOCKS
(cost $51,482,350) | | | | | | | 57,181,775 | |
| | | | | | | | |
| | |
| PREFERRED STOCKS - 3.9% | | | | | | | | |
| | |
| Germany - 3.6% | | | | | | | | |
| Fresenius SE | | | 1,863 | | | | 160,239 | |
| ProSiebenSat.1 Media AG | | | 3,399 | | | | 102,422 | |
| Henkel AG & Co. KGaA | | | 6,682 | | | | 415,920 | |
| Volkswagen AG | | | 8,034 | | | | 1,311,361 | |
| Porsche Automobil Holding SE | | | 3,215 | | | | 258,771 | |
| | | | | | | | |
| | | | | | | 2,248,713 | |
| | | | | | | | |
| Switzerland - 0.3% | | | | | | | | |
| Schindler Holding AG | | | 1,560 | | | | 185,115 | |
| | | | | | | | |
TOTAL PREFERRED STOCKS
(cost $2,351,770) | | | | | | | 2,433,828 | |
| | | | | | | | |
| | | | |
| | The accompanying notes are an integral part of these financial statements. | | (Continued) |
| | | | | | | | | | |
| AQR Funds | | | | Annual Report | | | | December 2010 | | 92 |
| | | | | | | |
| | | | |
| Schedule of Investments | | | December 31, 2010 | |
| | | | |
| AQR INTERNATIONAL MOMENTUM FUND | | | | |
| | | | | | | | |
| | | SHARES | | | VALUE
(Note 3) | |
| | |
| EXCHANGE-TRADED FUND - 1.9% | | | | | | | | |
| | |
| United States - 1.9% | | | | | | | | |
iShares MSCI EAFE Index Fund (1)
(cost $1,153,681) | | | 20,471 | | | $ | 1,192,026 | |
| | | | | | | | |
| | |
| RIGHTS - 0.0% (b) | | | | | | | | |
| | |
| Canada - 0.0% (b) | | | | | | | | |
Ivanhoe Mines Ltd., expires 1/26/11 †(1)
(cost $-) | | | 4,300 | | | | 5,799 | |
| | | | | | | | |
| | |
| WARRANTS - 0.0% (b) | | | | | | | | |
| | |
| Hong Kong - 0.0% (b) | | | | | | | | |
Henderson Land Development Co. Ltd., expires 6/1/11 †
(cost $-) | | | 2 | | | | 1 | |
| | | | | | | | |
| | |
| MONEY MARKET FUND - 2.0% | | | | | | | | |
| J.P. Morgan Prime Money Market Fund - Capital Shares, 0.130% (d)(e)(g) | | | 1,275,687 | | | $ | 1,275,687 | |
| | | | | | | | |
TOTAL MONEY MARKET FUND
(cost $1,275,687; includes $234,166 of cash collateral received for securities on loan) | | | | | | | 1,275,687 | |
| | | | | | | | |
TOTAL INVESTMENTS - 100.0%
(cost $56,263,488) | | | | | | | 62,089,116 | |
| | | | | | | | |
| ASSETS IN EXCESS OF OTHER LIABILITIES - (0.0%) (b)(f) | | | | | | | 2,263 | |
| | | | | | | | |
NET ASSETS - 100.0% | | | | | | $ | 62,091,379 | |
| | | | | | | | |
| | | | | | | | |
| SECTOR | | VALUE | | | % OF NET
ASSETS | |
| Consumer Discretionary | | $ | 11,555,070 | | | | 18.6 | % |
| Consumer Staples | | | 4,178,490 | | | | 6.7 | |
| Energy | | | 2,889,825 | | | | 4.7 | |
| Financials | | | 8,996,003 | | | | 14.5 | |
| Health Care | | | 2,217,191 | | | | 3.6 | |
| Industrials | | | 13,036,024 | | | | 21.0 | |
| Information Technology | | | 1,132,984 | | | | 1.8 | |
| Materials | | | 10,338,617 | | | | 16.7 | |
| Mutual Fund | | | 1,192,026 | | | | 1.9 | |
| Telecommunication Services | | | 4,309,105 | | | | 6.9 | |
| Utilities | | | 968,094 | | | | 1.6 | |
| Money Market Funds | | | 1,275,687 | | | | 2.0 | |
| | | | | | | | |
Total Investments | | | 62,089,116 | | | | 100.0 | |
| Assets in Excess of Other Liabilities (f) | | | 2,263 | | | | (0.0) | |
| | | | | | | | |
Net Assets | | $ | 62,091,379 | | | | 100.0 | % |
| | | | | | | | |
| † | Non income-producing security. |
| (a) | All or a portion of the security on loan. The aggregate market value of such securities is $224,019; cash collateral of $234,166 was received with which the Fund purchased a money market fund. |
| (b) | Represents less than 0.05 percent of net assets. |
| (c) | Private Placement security. |
| (d) | Represents annualized seven-day yield as of December 31, 2010. |
| (e) | Represents security, or portion thereof, purchased with the cash collateral received for securities on loan. |
| (f) | Includes appreciation(depreciation) on forward foreign currency exchange contracts and swaps. |
| (g) | A portion of the security is pledged as collateral for a equity swap contract. |
All securities are Level 2, unless noted otherwise in parentheses.
| (1) | Level 1 security (See Note 5). |
| (3) | Level 3 security (See Note 5). |
The following abbreviations are used in portfolio descriptions:
REIT - Real Estate Investment Trust
Forward foreign currency exchange contracts outstanding as of December 31, 2010:
| | | | | | | | | | | | | | | | | | | | |
PURCHASE
CONTRACTS | | COUNTERPARTY | | CURRENCY | | CURRENCY
AMOUNT
PURCHASED | | | VALUE AT
SETTLEMENT
DATE | | | VALUE AT
DECEMBER 31,
2010 | | | UNREALIZED
APPRECIATION (DEPRECIATION) | |
British Pound,
Expiring 03/16/11 | | The Royal Bank of Scotland | | GBP | | | 1,327,687 | | | | $2,063,521 | | | | $2,077,569 | | | | $14,048 | |
| | | | | | | | | | | | | | | | | | | | |
| | | | | | | | | | | | | | | | | | | | |
| SALES CONTRACTS | | COUNTERPARTY | | CURRENCY | | CURRENCY
AMOUNT
SOLD | | | VALUE AT
SETTLEMENT
DATE | | | VALUE AT
DECEMBER 31,
2010 | | | UNREALIZED APPRECIATION (DEPRECIATION) | |
British Pound,
Expiring 03/16/11 | | The Royal Bank of Scotland | | GBP | | | (540,000) | | | | $(841,388) | | | | $(844,994) | | | | $(3,606) | |
| | | | | | | | | | | | | | | | | | | | |
| | | | | | | | | | | $1,222,133 | | | | $1,232,575 | | | | $10,442 | |
| | | | | | | | | | | | | | | | | | | | |
Cash pledged as collateral for forward foreign exchange contracts in the amount of $40,000.
GBP - British Pound
| | | | |
| | The accompanying notes are an integral part of these financial statements. | | (Continued) |
| | | | | | | | | | |
| AQR Funds | | | | Annual Report | | | | December 2010 | | 93 |
| | | | | | | |
| | | | |
| Schedule of Investments | | | December 31, 2010 | |
| | | | |
| AQR INTERNATIONAL MOMENTUM FUND | | | | |
Equity basket swap contract with Deutsche Bank as of December 31, 2010:
| | | | | | | | | | | | |
REFERENCE
ENTITY | | SHARES
LONG | | VALUE AT
CONTRACT
DATE | | RESET
DATE | | | UNREALIZED
APPRECIATION
(DEPRECIATION) | |
| Antofagasta PLC | | 1,945 | | $46,154 | | | 1/17/2011 | | | | $2,830 | |
| Fresnillo PLC | | 3,595 | | 85,754 | | | 1/17/2011 | | | | 7,901 | |
| Inmarsat PLC | | 2,654 | | 28,196 | | | 1/17/2011 | | | | (434) | |
| Old Mutual PLC | | 7,263 | | 13,517 | | | 1/17/2011 | | | | 400 | |
| Petrofac Ltd. | | 25 | | 587 | | | 1/17/2011 | | | | 32 | |
| Rio Tinto PLC | | 9,358 | | 641,219 | | | 1/17/2011 | | | | 22,561 | |
| Rolls-Royce Group PLC | | 9,577 | | 93,577 | | | 1/17/2011 | | | | 1,422 | |
| Standard Chartered PLC | | 8,875 | | 238,680 | | | 1/17/2011 | | | | (348) | |
| Vedanta Resources PLC | | 838 | | 31,479 | | | 1/17/2011 | | | | (760) | |
| | | | | | | | | | | | |
| | | | | | | | | | | 33,604 | |
| | | | | | | | | | | | |
| Segregated cash balance for swap agreements | | | | | | | | | | | 38,795 | |
| | | | | | | | | | | | |
| | | | | | | | | | | $72,399 | |
| | | | | | | | | | | | |
The Swap contract listed above resets monthly. The final termination date is July 15, 2011.
Money Market Fund investment is pledged as collateral for swap contract was $1,041,113 at December 31, 2010.
| | | | |
| | The accompanying notes are an integral part of these financial statements. | | |
| | | | | | | | | | |
| AQR Funds | | | | Annual Report | | | | December 2010 | | 94 |
| | | | | | | |
| | | | |
| Statements of Assets and Liabilities | | | December 31, 2010 | |
| | | | | | | | | | | | | | | | |
| | | AQR
GLOBAL
EQUITY
FUND | | | AQR
INTERNATIONAL
EQUITY
FUND | | | AQR
DIVERSIFIED
ARBITRAGE
FUND | | | AQR
MANAGED
FUTURES
STRATEGY
FUND* | |
| ASSETS: | | | | | | | | | | | | | | | | |
| Investments in securities, at cost | | | $356,068,804 | | | | $389,374,639 | | | | $1,416,727,687 | | | | $869,945,562 | |
| | | | | | | | | | | | | | | | | |
| Investments in securities, at value** | | | $414,477,326 | | | | $446,916,902 | | | | $1,523,138,652 | | | | $869,945,562 | |
Cash (including foreign currency of $—; $1,192,762; $—;
$—, (respectively) | | | — | | | | 1,192,762 | | | | — | | | | — | |
| Restricted cash | | | — | | | | — | | | | 4,797,323 | | | | — | |
| Swaps, at value | | | 493,528 | | | | 439,723 | | | | — | | | | 3,277,326 | |
| Unrealized appreciation on forward foreign currency contracts | | | 2,290,745 | | | | 4,569,115 | | | | — | | | | 6,247,409 | |
| Due from brokers | | | 14,655,129 | | | | 15,310,150 | | | | 336,629,291 | | | | 36,685,459 | |
Unrealized appreciation on futures contracts | | | — | | | | — | | | | — | | | | 10,787,157 | |
| Receivables: | | | | | | | | | | | | | | | | |
Securities sold | | | 4,001,296 | | | | 1,106,842 | | | | 9,846,344 | | | | — | |
Foreign tax reclaim | | | 372,267 | | | | 890,495 | | | | — | | | | — | |
Dividends and interest | | | 434,866 | | | | 447,812 | | | | 7,412,639 | | | | 75,443 | |
Capital shares sold | | | 200 | | | | 6,079 | | | | 3,029,624 | | | | 2,694,975 | |
Prepaid expenses | | | — | | | | — | | | | 110,126 | | | | 37,257 | |
| Total Assets | | | 436,725,357 | | | | 470,879,880 | | | | 1,884,963,999 | | | | 929,750,588 | |
| LIABILITIES: | | | | | | | | | | | | | | | | |
Securities sold short, at value (proceeds $—; $—; $583,596,080;
$—, respectively) | | | — | | | | — | | | | 655,505,464 | | | | — | |
| Call options written, at value (proceeds $—; $—; $1,113,694; $—, respectively) | | | — | | | | — | | | | 977,733 | | | | — | |
| Due to broker | | | — | | | | — | | | | — | | | | 67,835 | |
| Due to custodian | | | 179,058 | | | | — | | | | 2,480,977 | | | | 280,263 | |
| Swaps, at value | | | — | | | | — | | | | 1,452,422 | | | | — | |
Unrealized depreciation on futures contracts | | | 567,868 | | | | 1,258,676 | | | | 545,947 | | | | — | |
| Unrealized depreciation on forward foreign currency contracts | | | — | | | | — | | | | 286,465 | | | | — | |
| Payables: | | | | | | | | | | | | | | | | |
Securities purchased | | | 3,802,366 | | | | — | | | | 14,457,094 | | | | — | |
Collateral received on securities loaned | | | 4,199,946 | | | | 7,149,866 | | | | — | | | | — | |
Collateral received for forward foreign currency contracts | | | — | | | | 2,720,000 | | | | — | | | | — | |
Accrued Investment advisory fees | | | 106,448 | | | | 191,672 | | | | 753,977 | | | | 607,884 | |
Accrued Custody, administration & accounting fees | | | 101,816 | | | | 126,741 | | | | 142,536 | | | | 104,959 | |
Accrued Transfer agency fees | | | 5,427 | | | | 7,325 | | | | 77,117 | | | | — | |
Accrued Shareholder servicing fees | | | 896 | | | | 21,731 | | | | — | | | | — | |
Accrued Distribution fees—Class N | | | 314 | | | | 306 | | | | 78,623 | | | | 35,798 | |
Capital shares redeemed | | | 5,000 | | | | 11,886 | | | | 590,638 | | | | 373,171 | |
Dividends payable on securities sold short | | | — | | | | — | | | | 619,216 | | | | — | |
Other accrued expenses and liabilities | | | 70,500 | | | | 151,477 | | | | — | | | | 291 | |
| Total Liabilities | | | 9,039,639 | | | | 11,639,680 | | | | 677,968,209 | | | | 1,470,201 | |
| Net Assets | | | $427,685,718 | | | | $459,240,200 | | | | $1,206,995,790 | | | | $928,280,387 | |
| | | | | | | | | | | | | | | | | |
| NET ASSETS CONSIST OF: | | | | | | | | | | | | | | | | |
| Paid-in capital ($0.001 par value common stock, unlimited authorized shares) | | | $370,124,331 | | | | $396,956,097 | | | | $1,181,357,433 | | | | $909,692,316 | |
| Undistributed (accumulated) net investment income (loss) | | | 1,172,016 | | | | 5,785,081 | | | | 2,523,534 | | | | 2,742,185 | |
| Undistributed (accumulated) net realized gain (loss) | | | (5,408,293) | | | | (4,892,647) | | | | (8,247,142) | | | | (4,465,220) | |
| Net unrealized appreciation (depreciation) | | | 61,797,664 | | | | 61,391,669 | | | | 31,361,965 | | | | 20,311,106 | |
| Net Assets | | | $427,685,718 | | | | $459,240,200 | | | | $1,206,995,790 | | | | $928,280,387 | |
| | | | | | | | | | | | | | | | | |
| NET ASSETS: | | | | | | | | | | | | | | | | |
| Class I | | | $1,841,838 | | | | $85,968,655 | | | | $824,237,659 | | | | $657,237,349 | |
| Class N | | | 1,497,723 | | | | 1,472,368 | | | | 382,758,131 | | | | 271,043,038 | |
| Class Y | | | 424,346,157 | | | | 371,799,177 | | | | n/a | | | | n/a | |
| SHARES OUTSTANDING: | | | | | | | | | | | | | | | | |
| Class I | | | 167,896 | | | | 8,227,394 | | | | 73,942,810 | | | | 63,824,670 | |
| Class N | | | 136,540 | | | | 138,711 | | | | 34,430,118 | | | | 26,365,662 | |
| Class Y | | | 38,596,429 | | | | 34,152,071 | | | | n/a | | | | n/a | |
| NET ASSET VALUE PER SHARE: | | | | | | | | | | | | | | | | |
| Class I | | | $10.97 | | | | $10.45 | | | | $11.15 | | | | $10.30 | |
| Class N | | | $10.97 | | | | $10.61 | | | | $11.12 | | | | $10.28 | |
| Class Y | | | $10.99 | | | | $10.89 | | | | n/a | | | | n/a | |
| | * | Consolidated financial statement, see Note 2 in the Notes to Financial Statements for additional information. |
| | ** | Investments in securities includes the market value of securities out on loan of $4,038,816; $6,868,811; $—; and $—, respectively. |
| | | Foreign currency at cost of $—; $1,177,366; $— and $—. |
| | | | |
| | The accompanying notes are an integral part of these financial statements. | | (continued on p. 96) |
| | | | | | | | | | |
| AQR Funds | | | | Annual Report | | | | December 2010 | | 95 |
| | | | | | | |
| | | | |
| Statements of Assets and Liabilities | | | December 31, 2010 | |
| | | | | | | | | | | | | | | | |
| | | AQR
RISK
PARITY
FUND* | | | AQR
MOMENTUM
FUND | | | AQR
SMALL CAP
MOMENTUM
FUND | | | AQR
INTERNATIONAL
MOMENTUM
FUND | |
| ASSETS: | | | | | | | | | | | | | | | | |
| Investments in securities, at cost | | | $22,715,807 | | | | $130,655,518 | | | | $53,840,017 | | | | $56,263,488 | |
| | | | | | | | | | | | | | | | | |
| Investments in securities, at value | | | $22,562,056 | | | | $140,843,421 | | | | $59,540,220 | | | | $62,089,116 | |
| Cash (including foreign currency of $—; $—; $—; ($1,887,356) respectively) | | | — | | | | — | | | | 37,744 | | | | 277,498 | |
| Swaps, at value | | | 360,425 | | | | — | | | | — | | | | 72,399 | |
| Unrealized appreciation on forward foreign currency contracts | | | 45,622 | | | | — | | | | — | | | | 10,442 | |
| Due from brokers | | | 650,572 | | | | 298,540 | | | | 189,960 | | | | — | |
Unrealized appreciation on futures contracts | | | 360,178 | | | | — | | | | — | | | | — | |
| Receivables: | | | | | | | | | | | | | | | | |
Securities sold | | | — | | | | 32,524,623 | | | | 13,225,466 | | | | 21,114,394 | |
Foreign tax reclaim | | | — | | | | — | | | | — | | | | 7,432 | |
Dividends and interest | | | 43,331 | | | | 152,801 | | | | 44,360 | | | | 56,035 | |
Capital shares sold | | | 659,287 | | | | 96,352 | | | | 42,158 | | | | 73,737 | |
Prepaid expenses | | | 131,707 | | | | — | | | | — | | | | — | |
| Total Assets | | | 24,813,178 | | | | 173,915,737 | | | | 73,079,908 | | | | 83,701,053 | |
| LIABILITIES: | | | | | | | | | | | | | | | | |
| Due to broker | | | 44,558 | | | | — | | | | — | | | | — | |
| Collateral received for forward foreign currency contracts | | | — | | | | — | | | | — | | | | 40,000 | |
| Due to custodian | | | 43,959 | | | | 54 | | | | — | | | | — | |
| Swaps at value | | | 169,866 | | | | — | | | | — | | | | — | |
Unrealized depreciation on futures contracts | | | — | | | | 1,434 | | | | 11,309 | | | | — | |
| Payables: | | | | | | | | | | | | | | | | |
Securities purchased | | | 487,518 | | | | 42,341,679 | | | | 16,471,595 | | | | 21,217,882 | |
Collateral received on securities loaned | | | — | | | | 6,988,139 | | | | 2,021,905 | | | | 234,166 | |
Accrued Investment advisory fees | | | 3,872 | | | | 19,888 | | | | 4,759 | | | | 33,247 | |
Accrued Custody, administration & accounting fees | | | 4,636 | | | | 13,613 | | | | 14,115 | | | | 34,517 | |
Accrued Transfer agency fees | | | 2,148 | | | | 1,776 | | | | 1,951 | | | | 2,560 | |
Accrued Shareholder servicing fees | | | — | | | | 14,292 | | | | 6,352 | | | | 7,371 | |
Accrued Distribution fees Class N | | | 2,244 | | | | — | | | | — | | | | — | |
Accrued Trustees fees | | | 190 | | | | 104 | | | | 85 | | | | — | |
Other accrued expenses and liabilities | | | 71,642 | | | | 43,405 | | | | 43,255 | | | | 39,931 | |
| Total Liabilities | | | 830,633 | | | | 49,424,384 | | | | 18,575,326 | | | | 21,609,674 | |
| Net Assets | | | $23,982,545 | | | | $124,491,353 | | | | $54,504,582 | | | | $62,091,379 | |
| | | | | | | | | | | | | | | | | |
| NET ASSETS CONSIST OF: | | | | | | | | | | | | | | | | |
| Paid-in capital ($0.001 par value common stock, unlimited authorized shares) | | | $23,846,124 | | | | $113,665,510 | | | | $48,185,417 | | | | $56,234,793 | |
| Undistributed (accumulated) net investment income (loss) | | | 47,308 | | | | 322,578 | | | | — | | | | 72,009 | |
| Undistributed (accumulated) net realized gain (loss) | | | (123,552) | | | | 316,796 | | | | 630,271 | | | | (160,138) | |
| Net unrealized appreciation (depreciation) | | | 212,665 | | | | 10,186,469 | | | | 5,688,894 | | | | 5,944,715 | |
| Net Assets | | | $23,982,545 | | | | $124,491,353 | | | | $54,504,582 | | | | $62,091,379 | |
| | | | | | | | | | | | | | | | | |
| NET ASSETS: | | | | | | | | | | | | | | | | |
| Class I | | | $12,747,565 | | | | n/a | | | | n/a | | | | n/a | |
| Class L | | | n/a | | | | $124,491,353 | | | | $54,504,582 | | | | $62,091,379 | |
| Class N | | | 11,234,980 | | | | n/a | | | | n/a | | | | n/a | |
| SHARES OUTSTANDING: | | | | | | | | | | | | | | | | |
| Class I | | | 1,240,567 | | | | n/a | | | | n/a | | | | n/a | |
| Class L | | | n/a | | | | 8,646,886 | | | | 3,788,903 | | | | 4,559,775 | |
| Class N | | | 1,094,489 | | | | n/a | | | | n/a | | | | n/a | |
| NET ASSET VALUE PER SHARE: | | | | | | | | | | | | | | | | |
| Class I | | | $10.28 | | | | n/a | | | | n/a | | | | n/a | |
| Class L | | | n/a | | | | $14.40 | | | | $14.39 | | | | $13.62 | |
| Class N | | | $10.27 | | | | n/a | | | | n/a | | | | n/a | |
| | * | Consolidated financial statement, see Note 2 in the Notes to Financial Statements for additional information. |
| | ** | Investments in securities includes the market value of securities out on loan of $—; $6,787,555; $1,892,746 and $224,019, respectively. |
| | | Foreign currency at cost of $—; $—; $—; (1,893,392). |
| | | | |
| | The accompanying notes are an integral part of these financial statements. | | |
| | | | | | | | | | |
| AQR Funds | | | | Annual Report | | | | December 2010 | | 96 |
| | | | | | | |
| | | | |
| Statements of Operations | | | December 31, 2010 | |
| | | | | | | | | | | | | | | | |
| | | AQR GLOBAL EQUITY FUND | | | AQR INTERNATIONAL
EQUITY FUND | | | AQR DIVERSIFIED
ARBITRAGE FUND | | | AQR MANAGED FUTURES
STRATEGY FUND** | |
| �� | | FOR THE YEAR
ENDED
DECEMBER 31,
2010 | | | FOR THE
YEAR ENDED
DECEMBER 31,
2010 | | | FOR THE
YEAR ENDED
DECEMBER 31,
2010 | | | FOR THE PERIOD
1/6/10*-12/31/10 | |
| INVESTMENT INCOME: | | | | | | | | | | | | | | | | |
| Dividend income† | | | $8,603,462 | | | | $10,810,134 | | | | $5,925,076 | | | | $5,513 | |
| Interest income | | | — | | | | — | | | | 18,925,626 | | | | 30,154 | |
| Securities lending income, net | | | 87,533 | | | | 152,895 | | | | — | | | | — | |
| Total Income | | | 8,690,995 | | | | 10,963,029 | | | | 24,850,702 | | | | 35,667 | |
| | | | |
| EXPENSES: | | | | | | | | | | | | | | | | |
| Investment advisory fees | | | 1,502,446 | | | | 1,894,392 | | | | 5,480,605 | | | | 2,980,585 | |
| Custody, administration & accounting fees | | | 260,541 | | | | 363,459 | | | | 377,363 | | | | 181,188 | |
| Legal fees | | | 72,827 | | | | 66,544 | | | | 164,416 | | | | 105,504 | |
| Audit and tax fees | | | 110,840 | | | | 93,497 | | | | 107,048 | | | | 58,885 | |
| Shareholder reporting fees | | | 37,242 | | | | 15,859 | | | | 277,741 | | | | 80,580 | |
| Transfer agent fees | | | 31,509 | | | | 50,523 | | | | 457,843 | | | | 88,945 | |
| Trustees fees | | | 33,622 | | | | 27,128 | | | | 51,882 | | | | 16,459 | |
| Organization and offering costs | | | 24,804 | | | | — | | | | — | | | | 80,500 | |
| Shareholder servicing fees | | | 455,454 | | | | 644,980 | | | | 1,182,906 | | | | — | |
| Distribution fees—Class N | | | 2,780 | | | | 2,260 | | | | 580,768 | | | | 160,102 | |
| Dividends on securities sold short | | | — | | | | — | | | | 9,188,509 | | | | — | |
| Other fees | | | 135,631 | | | | 212,366 | | | | 295,588 | | | | 69,362 | |
| Total Expenses | | | 2,667,696 | | | | 3,371,008 | | | | 18,164,669 | | | | 3,822,110 | |
| | | | |
| Less waivers and reimbursements: | | | | | | | | | | | | | | | | |
Investment advisory fees waived | | | — | | | | (110,503) | | | | — | | | | (96,550) | |
Shareholder servicing fees waived | | | (447,840) | | | | (644,980) | | | | (235,386) | | | | — | |
Expense reimbursements | | | (287,811) | | | | — | | | | — | | | | — | |
| Net Expenses | | | 1,932,045 | | | | 2,615,525 | | | | 17,929,283 | | | | 3,725,560 | |
| Net Investment Income (Loss) | | | 6,758,950 | | | | 8,347,504 | | | | 6,921,419 | | | | (3,689,893) | |
| REALIZED AND UNREALIZED GAIN (LOSS): | | | | | | | | | | | | | | | | |
| Net realized gain (loss) from: | | | | | | | | | | | | | | | | |
Investments in securities | | | 13,868,729 | | | | 7,906,460 | | | | 53,331,878 | | | | — | |
Forward foreign currency contracts | | | 5,990,830 | | | | 3,097,471 | | | | (209,109) | | | | (572,573) | |
Foreign currency and foreign currency translations | | | (646,192) | | | | (626,082) | | | | 429,825 | | | | (18,362) | |
Futures and swaps on futures contracts | | | (38,711) | | | | (314,296) | | | | (12,098,978) | | | | 26,716,217 | |
Net increase from payments by affiliates | | | — | | | | — | | | | 544,199 | | | | — | |
Securities sold short | | | — | | | | — | | | | (37,061,283) | | | | — | |
Swap contracts | | | — | | | | — | | | | (5,831,063) | | | | — | |
Written options | | | — | | | | — | | | | 7,361,398 | | | | — | |
| | | | |
| Net realized gain (loss) | | | 19,174,656 | | | | 10,063,553 | | | | 6,466,867 | | | | 26,125,282 | |
| | | | |
| Net change in unrealized appreciation (depreciation) on: | | | | | | | | | | | | | | | | |
Investments in securities | | | 24,457,310 | | | | 23,769,794 | | | | 88,034,117 | | | | — | |
Futures and swaps on futures contracts | | | 220,340 | | | | (2,139,284) | | | | (963,085) | | | | 14,064,483 | |
Forward foreign currency contracts | | | 2,908,082 | | | | 5,343,590 | | | | (282,918) | | | | 6,247,409 | |
Foreign currency and foreign currency translations | | | 860,587 | | | | 60,163 | | | | (20,358) | | | | (786) | |
Securities sold short | | | — | | | | — | | | | (58,350,282) | | | | — | |
Swap contracts | | | — | | | | — | | | | (2,196,784) | | | | — | |
Written options | | | — | | | | — | | | | 141,330 | | | | — | |
| | | | |
| Net change in unrealized appreciation (depreciation) | | | 28,446,319 | | | | 27,034,263 | | | | 26,362,020 | | | | 20,311,106 | |
| | | | |
| Net gain (loss) and change in unrealized appreciation (depreciation) | | | 47,620,975 | | | | 37,097,816 | | | | 32,828,887 | | | | 46,436,388 | |
| | | | |
Net increase (decrease) in net assets resulting
from operations | | | $54,379,925 | | | | $45,445,320 | | | | $39,750,306 | | | | $42,746,495 | |
| | | | | | | | | | | | | | | | | |
† Net of foreign taxes withheld of | | | $433,484 | | | | $956,948 | | | | $65,404 | | | | $— | |
| | * | Commencement of operations. |
| | ** | Consolidated financial statement, see Note 2 in the Notes to Financial Statements for additional information. |
| | | | |
| | The accompanying notes are an integral part of these financial statements. | | (continued on p. 98) |
| | | | | | | | | | |
| AQR Funds | | | | Annual Report | | | | December 2010 | | 97 |
| | | | | | | |
| | | | |
| Statements of Operations | | | December 31, 2010 | |
| | | | | | | | | | | | | | | | |
| | | AQR RISK PARITY
FUND** | | | AQR MOMENTUM FUND | | | AQR SMALL CAP
MOMENTUM FUND | | | AQR INTERNATIONAL
MOMENTUM
FUND | |
| | | FOR THE PERIOD
9/30/10*-12/31/10 | | | FOR THE
YEAR ENDED
DECEMBER 31,
2010 | | | FOR THE
YEAR ENDED
DECEMBER 31,
2010 | | | FOR THE
YEAR ENDED
DECEMBER 31,
2010 | |
| INVESTMENT INCOME: | | | | | | | | | | | | | | | | |
| Dividend income† | | | — | | | | $644,526 | | | | $174,431 | | | | $697,437 | |
| Interest income | | | $67,735 | | | | 5,182 | | | | 262 | | | | — | |
| Securities lending income, net | | | — | | | | 2,009 | | | | 11,387 | | | | 10,729 | |
| Total Income | | | 67,735 | | | | 651,717 | | | | 186,080 | | | | 708,166 | |
| | | | |
| EXPENSES: | | | | | | | | | | | | | | | | |
| Investment advisory fees | | | 36,242 | | | | 87,137 | | | | 49,659 | | | | 117,405 | |
| Custody, administration & accounting fees | | | 6,169 | | | | 32,790 | | | | 41,797 | | | | 107,413 | |
| Legal fees | | | 42,189 | | | | 46,675 | | | | 47,996 | | | | 48,942 | |
| Audit and tax fees | | | 54,734 | | | | 39,744 | | | | 39,746 | | | | 51,813 | |
| Shareholder reporting fees | | | 242 | | | | 7,041 | | | | 5,352 | | | | 7,791 | |
| Transfer agent fees | | | 6,418 | | | | 25,029 | | | | 22,430 | | | | 34,001 | |
| Trustees fees | | | 199 | | | | 1,829 | | | | 702 | | | | 2,684 | |
| Organization and Offering costs | | | 21,302 | | | | — | | | | — | | | | — | |
| Shareholder servicing fees | | | — | | | | 52,283 | | | | 21,282 | | | | 50,316 | |
| Distribution fees—Class N | | | 5,890 | | | | — | | | | — | | | | — | |
| Other fees | | | 12,001 | | | | 47,584 | | | | 32,555 | | | | 68,511 | |
| Total Expenses | | | 185,386 | | | | 340,112 | | | | 261,519 | | | | 488,876 | |
| | | | |
| Less waivers and reimbursements: | | | | | | | | | | | | | | | | |
Investment advisory fees waived | | | (36,242) | | | | (87,135) | | | | (49,659) | | | | (117,405) | |
Shareholder servicing fees waived | | | — | | | | (52,283) | | | | (21,282) | | | | (50,316) | |
Expense reimbursements | | | (97,341) | | | | (25,641) | | | | (97,632) | | | | (98,466) | |
| Net Expenses | | | 51,803 | | | | 175,053 | | | | 92,946 | | | | 222,689 | |
| Net Investment Income (Loss) | | | 15,932 | | | | 476,664 | | | | 93,134 | | | | 485,477 | |
| | | | |
| REALIZED AND UNREALIZED GAIN (LOSS): | | | | | | | | | | | | | | | | |
| Net realized gain (loss) from: | | | | | | | | | | | | | | | | |
Investments in securities | | | (46,065) | | | | (40,999) | | | | 609,413 | | | | (686,185) | |
Forward foreign currency contracts | | | 231,097 | | | | — | | | | — | | | | (331,704) | |
Foreign currency and foreign currency translations | | | (20,419) | | | | — | | | | — | | | | (137,994) | |
Futures and swaps on futures contracts | | | 98,263 | | | | 337,965 | | | | 410,041 | | | | — | |
Swap contracts | | | 141,580 | | | | — | | | | — | | | | 638,038 | |
| | | | |
| Net realized gain (loss) | | | 404,456 | | | | 296,966 | | | | 1,019,454 | | | | (517,845) | |
| | | | |
| Net change in unrealized appreciation (depreciation) on: | | | | | | | | | | | | | | | | |
Investments in securities | | | (153,751) | | | | 9,825,024 | | | | 5,504,471 | | | | 5,162,776 | |
Futures and swaps on futures contracts | | | 250,785 | | | | (1,293) | | | | (11,309) | | | | — | |
Forward foreign currency contracts | | | 45,622 | | | | — | | | | — | | | | 179,153 | |
Foreign currency and foreign currency translations | | | (32,043) | | | | — | | | | — | | | | 35,338 | |
Swap contracts | | | 102,052 | | | | — | | | | — | | | | 43,827 | |
| | | | |
| Net change in unrealized appreciation (depreciation) | | | 212,665 | | | | 9,823,731 | | | | 5,493,162 | | | | 5,421,094 | |
| | | | |
| Net gain (loss) and change in unrealized appreciation (depreciation) | | | 617,121 | | | | 10,120,697 | | | | 6,512,616 | | | | 4,903,249 | |
| | | | |
Net increase (decrease) in net assets resulting
from operations | | | $633,053 | | | | $10,597,361 | | | | $6,605,750 | | | | $5,388,726 | |
| | | | | | | | | | | | | | | | | |
| | | | | | | | | |
† Net of foreign taxes withheld of | | | $— | | | | $— | | | | $— | | | | $64,195 | |
| | * | Commencement of operations. |
| | ** | Consolidated financial statement, see Note 2 in the Notes to Financial Statements for additional information. |
| | | | |
| | The accompanying notes are an integral part of these financial statements. | | |
| | | | | | | | | | |
| AQR Funds | | | | Annual Report | | | | December 2010 | | 98 |
| | | | | | | |
| | | | |
| Statements of Changes in Net Assets | | | December 31, 2010 | |
| | | | | | | | | | | | |
| | | AQR GLOBAL
EQUITY FUND | | | AQR INTERNATIONAL
EQUITY FUND | |
| | | FOR THE
YEAR ENDED
DECEMBER 31,
2010 | | | FOR THE
YEAR ENDED
DECEMBER 31,
2010 | | | FOR THE PERIOD
8/28/09*-12/31/09 | |
| OPERATIONS: | | | | | | | | | | | | |
| Net investment income (loss) | | | $6,758,950 | | | | $8,347,504 | | | | $1,090,896 | |
| Net realized gain (loss) | | | 19,174,656 | | | | 10,063,553 | | | | 21,921,983 | |
| Net change in unrealized appreciation (depreciation) | | | 28,446,319 | | | | 27,034,263 | | | | (3,084,692) | |
Net increase (decrease) in net assets resulting from operations | | | 54,379,925 | | | | 45,445,320 | | | | 19,928,187 | |
| | |
| DISTRIBUTIONS TO SHAREHOLDERS: | | | | | | | | | |
| Net investment income: | | | | | | | | | | | | |
Class I | | | (57,496) | | | | (1,939,218) | | | | (610,914) | |
Class L | | | — | | | | — | | | | — | |
Class N | | | (43,413) | | | | (30,891) | | | | — | |
Class Y | | | (14,066,551) | | | | (8,858,115) | | | | (4,816,996) | |
Total | | | (14,167,460) | | | | (10,828,224) | | | | (5,427,910) | |
| Net realized gain: | | | | | | | | | | | | |
Class I | | | (12,252) | | | | (751,420) | | | | (1,232,295) | |
Class L | | | — | | | | — | | | | — | |
Class N | | | (10,061) | | | | (12,796) | | | | (20) | |
Class Y | | | (2,827,146) | | | | (3,126,673) | | | | (9,229,217) | |
Total | | | (2,849,459) | | | | (3,890,889) | | | | (10,461,532) | |
Total distributions | | | (17,016,919) | | | | (14,719,113) | | | | (15,889,442) | |
| CAPITAL TRANSACTIONS: | | | | | | | | | |
| CLASS I | | | | | | | | | | | | |
| Proceeds from shares sold | | | 1,656,523 | | | | 44,905,053 | | | | 43,887,953 | |
| Reinvestment of distributions | | | 69,748 | | | | 2,584,353 | | | | 1,798,893 | |
| Cost of shares redeemed | | | — | | | | (12,356,169) | | | | (92,897) | |
| Redemption fees | | | — | | | | 92 | | | | 1,147 | |
| | | |
| Net increase from capital transactions | | | 1,726,271 | | | | 35,133,329 | | | | 45,595,096 | |
| CLASS N | | | | | | | | | | | | |
| Proceeds from shares sold | | | 2,068,625 | | | | 1,454,807 | | | | 5,697 | |
| Reinvestment of distributions | | | 52,615 | | | | 42,682 | | | | 20 | |
| Cost of shares redeemed | | | (754,495) | | | | (97,610) | | | | — | |
| Redemption fees | | | 2 | | | | — | | | | — | |
| | | |
| Net increase (decrease) from capital transactions | | | 1,366,747 | | | | 1,399,879 | | | | 5,717 | |
| | | | | | | | | | | | |
| CLASS Y | | | | | | | | | | | | |
| Proceeds from shares sold | | | — | | | | 3,598,979 | | | | 38,215,777 | |
| In-kind subscription (see Note 11) | | | 370,340,997 | | | | — | | | | 316,649,562 | |
| Capital contribution (see Note 7) | | | — | | | | — | | | | 15,777 | |
| Reinvestment of distributions | | | 16,893,697 | | | | 11,984,789 | | | | 14,046,213 | |
| Cost of shares redeemed | | | (5,000) | | | | (28,131,786) | | | | (14,085,511) | |
| Redemption fees | | | — | | | | 15,873 | | | | 31,554 | |
| | | |
| Net increase (decrease) from capital transactions | | | 387,229,694 | | | | (12,532,145) | | | | 354,873,372 | |
| | | |
| Net increase (decrease) in net assets resulting from capital transactions | | | 390,322,712 | | | | 24,001,063 | | | | 400,474,185 | |
| Total increase (decrease) in net assets | | | 427,685,718 | | | | 54,727,270 | | | | 404,512,930 | |
| | | | | | | | | | | | |
| NET ASSETS: | | | | | | | | | | | | |
| Beginning of period | | | — | | | | 404,512,930 | | | | — | |
| End of period | | | $427,685,718 | | | | $459,240,200 | | | | $404,512,930 | |
| | | | | | | | | | | | | |
| Undistributed accumulated net investment income (loss) at end of period | | | $1,172,016 | | | | $5,785,081 | | | | $472,899 | |
(continued on p. 100)
| | | | |
| | The accompanying notes are an integral part of these financial statements. | | |
| | | | | | | | | | |
| AQR Funds | | | | Annual Report | | | | December 2010 | | 99 |
| | | | | | | |
| | | | |
| Statements of Changes in Net Assets | | | December 31, 2010 | |
| | | | | | | | | | | | |
| | | AQR GLOBAL
EQUITY FUND | | | AQR INTERNATIONAL
EQUITY FUND | |
| | | FOR THE
YEAR ENDED
DECEMBER 31,
2010 | | | FOR THE
YEAR ENDED
DECEMBER 31,
2010 | | | FOR THE PERIOD
8/28/09*-12/31/09 | |
| CHANGES IN SHARES OUTSTANDING: | | | | | | | | | |
| CLASS I | | | | | | | | | | | | |
| Shares outstanding, beginning of period | | | — | | | | 4,502,376 | | | | — | |
| Shares sold | | | 161,426 | | | | 4,730,717 | | | | 4,324,237 | |
| Shares issued in reinvestment of distributions | | | 6,470 | | | | 253,120 | | | | 187,580 | |
| Shares redeemed | | | — | | | | (1,258,819) | | | | (9,441) | |
| | | |
| Shares outstanding, end of period | | | 167,896 | | | | 8,227,394 | | | | 4,502,376 | |
| | | |
| CLASS N | | | | | | | | | | | | |
| Shares outstanding, beginning of period | | | — | | | | 584 | | | | — | |
| Shares sold | | | 203,862 | | | | 144,573 | | | | 582 | |
| Shares issued in reinvestment of distributions | | | 4,880 | | | | 4,116 | | | | 2 | |
| Shares redeemed | | | (72,202) | | | | (10,562) | | | | — | |
| | | |
| Shares outstanding, end of period | | | 136,540 | | | | 138,711 | | | | 584 | |
| CLASS Y | | | | | | | | | | | | |
| Shares outstanding, beginning of period | | | — | | | | 35,486,692 | | | | — | |
| Shares sold | | | — | | | | 343,970 | | | | 3,779,363 | |
| Shares issued in connection with in-kind subscription (see Note 11) | | | 37,034,100 | | | | — | | | | 31,664,956 | |
| Shares issued in reinvestment of distributions | | | 1,562,784 | | | | 1,126,390 | | | | 1,410,263 | |
| Shares redeemed | | | (455) | | | | (2,804,981) | | | | (1,367,890) | |
| | | |
| Shares outstanding, end of period | | | 38,596,429 | | | | 34,152,071 | | | | 35,486,692 | |
| | * | Commencement of operations. |
| | ** | Consolidated financial statement, see Note 2 in the Notes to Financial Statements for additional information. |
The accompanying notes are an integral part of these financial statements.
| | | | | | | | | | |
| AQR Funds | | | | Annual Report | | | | December 2010 | | 100 |
| | | | | | | |
| | | | |
| Statements of Changes in Net Assets | | | December 31, 2010 | |
| | | | | | | | | | | | |
| | | AQR DIVERSIFIED
ARBITRAGE FUND | | | AQR
MANAGED FUTURES
STRATEGY FUND** | |
| | | FOR THE
YEAR ENDED
DECEMBER 31,
2010 | | | FOR THE PERIOD
1/15/09*-12/31/09 | | | FOR THE PERIOD
1/6/10*-12/31/10 | |
| OPERATIONS: | | | | | | | | | | | | |
| Net investment income (loss) | | | $6,921,419 | | | | $797,409 | | | | $(3,689,893) | |
| Net realized gain (loss) | | | 6,466,867 | | | | (905,928) | | | | 26,125,282 | |
| Net change in unrealized appreciation (depreciation) | | | 26,362,020 | | | | 4,999,945 | | | | 20,311,106 | |
Net increase (decrease) in net assets resulting from operations | | | 39,750,306 | | | | 4,891,426 | | | | 42,746,495 | |
| | | | | | | | | | | | |
| DISTRIBUTIONS TO SHAREHOLDERS: | | | | | | | | | | | | |
| Net investment income: | | | | | | | | | | | | |
Class I | | | (2,529,523) | | | | (424,290) | | | | (4,988,075) | |
Class L | | | — | | | | — | | | | — | |
Class N | | | (496,243) | | | | (135,050) | | | | (1,283,887) | |
Total | | | (3,025,766) | | | | (559,340) | | | | (6,271,962) | |
| Net realized gain: | | | | | | | | | | | | |
Class I | | | (9,148,432) | | | | (1,105,118) | | | | (8,519,610) | |
Class N | | | (4,389,758) | | | | (655,481) | | | | (2,443,893) | |
Total | | | (13,538,190) | | | | (1,760,599) | | | | (10,963,503) | |
Total distributions | | | (16,563,956) | | | | (2,319,939) | | | | (17,235,465) | |
| | | | | | | | | | | | |
| CAPITAL TRANSACTIONS: | | | | | | | | | | | | |
| CLASS I | | | | | | | | | | | | |
| Proceeds from shares sold | | | 744,622,281 | | | | 167,891,859 | | | | 658,743,237 | |
| Reinvestment of distributions | | | 10,961,113 | | | | 1,492,419 | | | | 13,031,535 | |
| Cost of shares redeemed | | | (105,043,527) | | | | (11,064,860) | | | | (33,812,899) | |
| Redemption fees | | | 29 | | | | 527 | | | | 12,633 | |
| | | |
| Net increase from capital transactions | | | 650,539,896 | | | | 158,319,945 | | | | 637,974,506 | |
| CLASS N | | | | | | | | | | | | |
| Proceeds from shares sold | | | 366,744,101 | | | | 95,158,643 | | | | 289,880,071 | |
| Reinvestment of distributions | | | 4,779,404 | | | | 788,750 | | | | 3,704,252 | |
| Cost of shares redeemed | | | (77,340,720) | | | | (17,858,676) | | | | (28,806,659) | |
| Redemption fees | | | 5,055 | | | | 1,555 | | | | 17,187 | |
| | | |
| Net increase (decrease) from capital transactions | | | 294,187,840 | | | | 78,090,272 | | | | 264,794,851 | |
| | | |
| Net increase (decrease) in net assets resulting from capital transactions | | | 944,727,736 | | | | 236,410,217 | | | | 902,769,357 | |
| | | |
| Total increase (decrease) in net assets | | | 967,914,086 | | | | 238,981,704 | | | | 928,280,387 | |
| | | | | | | | | | | | |
| NET ASSETS: | | | | | | | | | | | | |
| Beginning of period | | | 239,081,704 | | | | 100,000 | | | | — | |
| End of period | | | $1,206,995,790 | | | | $239,081,704 | | | | $928,280,387 | |
| | | | | | | | | | | | | |
| Undistributed accumulated net investment income (loss) at end of period | | | $2,523,534 | | | | $165,585 | | | | $2,742,185 | |
(continued on p. 102)
| | | | |
| | The accompanying notes are an integral part of these financial statements. | | |
| | | | | | | | | | |
| AQR Funds | | | | Annual Report | | | | December 2010 | | 101 |
| | | | | | | |
| | | | |
| Statements of Changes in Net Assets | | | December 31, 2010 | |
| | | | | | | | | | | | |
| | | AQR DIVERSIFIED
ARBITRAGE FUND | | | AQR
MANAGED FUTURES
STRATEGY FUND** | |
| | | FOR THE
YEAR ENDED
DECEMBER 31,
2010 | | | FOR THE PERIOD
1/15/09*-12/31/09 | | | FOR THE PERIOD
1/6/10*-12/31/10 | |
| CHANGES IN SHARES OUTSTANDING: | | | | | | | | | |
| CLASS I | | | | | | | | | | | | |
| Shares outstanding, beginning of period | | | 14,819,735 | | | | — | | | | — | |
| Shares sold | | | 67,644,901 | | | | 15,719,603 | | | | 65,937,073 | |
| Shares issued in reinvestment of distributions | | | 990,163 | | | | 139,609 | | | | 1,286,430 | |
| Shares redeemed | | | (9,511,989) | | | | (1,039,477) | | | | (3,398,833) | |
| | | |
| Shares outstanding, end of period | | | 73,942,810 | | | | 14,819,735 | | | | 63,824,670 | |
| | | |
| CLASS N | | | | | | | | | | | | |
| Shares outstanding, beginning of period | | | 7,332,864 | | | | 10,000 | | | | — | |
| Shares sold | | | 33,746,669 | | | | 8,908,187 | | | | 28,893,378 | |
| Shares issued in reinvestment of distributions | | | 432,917 | | | | 73,922 | | | | 366,394 | |
| Shares redeemed | | | (7,082,332) | | | | (1,659,245) | | | | (2,894,110) | |
| | | |
| Shares outstanding, end of period | | | 34,430,118 | | | | 7,332,864 | | | | 26,365,662 | |
| | * | Commencement of operations. |
| | ** | Consolidated financial statement, see Note 2 in the Notes to Financial Statements for additional information. |
| | | | |
| | The accompanying notes are an integral part of these financial statements. | | (Continued) |
| | | | | | | | | | |
| AQR Funds | | | | Annual Report | | | | December 2010 | | 102 |
| | | | | | | |
| | | | |
| Statements of Changes in Net Assets | | | December 31, 2010 | |
| | | | | | | | | | | | |
| | | AQR RISK PARITY
FUND** | | | AQR MOMENTUM FUND | |
| | | FOR THE PERIOD
9/30/10*-12/31/10 | | | FOR THE
YEAR ENDED
DECEMBER 31,
2010 | | | FOR THE PERIOD
7/9/09*-12/31/09 | |
| OPERATIONS: | | | | | | | | | | | | |
| Net investment income (loss) | | | $15,932 | | | | $476,664 | | | | $26,142 | |
| Net realized gain (loss) | | | 404,456 | | | | 296,966 | | | | 481,637 | |
| Net change in unrealized appreciation (depreciation) | | | 212,665 | | | | 9,823,731 | | | | 362,738 | |
Net increase (decrease) in net assets resulting from operations | | | 633,053 | | | | 10,597,361 | | | | 870,517 | |
| | | | | | | | | | | | |
| DISTRIBUTIONS TO SHAREHOLDERS: | | | | | | | | | | | | |
| Net investment income: | | | | | | | | | | | | |
Class I | | | (127,380) | | | | — | | | | — | |
Class L | | | — | | | | (134,564) | | | | (25,511) | |
Class N | | | (121,230) | | | | — | | | | — | |
Total | | | (248,610) | | | | (134,564) | | | | (25,511) | |
| Net realized gain: | | | | | | | | | | | | |
Class I | | | — | | | | — | | | | — | |
Class L | | | — | | | | (309,664) | | | | (172,296) | |
Class N | | | — | | | | — | | | | — | |
Total | | | — | | | | (309,664) | | | | (172,296) | |
Total distributions | | | (248,610) | | | | (444,228) | | | | (197,807) | |
| | | | | | | | | | | | |
| CAPITAL TRANSACTIONS: | | | | | | | | | | | | |
| CLASS I | | | | | | | | | | | | |
| Proceeds from shares sold | | | 12,413,848 | | | | — | | | | — | |
| Reinvestment of distributions | | | 127,380 | | | | — | | | | — | |
| Cost of shares redeemed | | | (12,269) | | | | — | | | | — | |
| Redemption fees | | | — | | | | — | | | | — | |
| | | |
| Net increase from capital transactions | | | 12,528,959 | | | | — | | | | — | |
| CLASS L | | | | | | | | | | | | |
| Proceeds from shares sold | | | — | | | | 113,707,968 | | | | 6,150,686 | |
| Reinvestment of distributions | | | — | | | | 443,920 | | | | 197,602 | |
| Cost of shares redeemed | | | — | | | | (6,747,740) | | | | (88,950) | |
| Redemption fees | | | — | | | | 1,497 | | | | 527 | |
| | | |
| Net increase from capital transactions | | | — | | | | 107,405,645 | | | | 6,259,865 | |
| CLASS N | | | | | | | | | | | | |
| Proceeds from shares sold | | | 11,092,756 | | | | — | | | | — | |
| Reinvestment of distributions | | | 120,969 | | | | — | | | | — | |
| Cost of shares redeemed | | | (145,014) | | | | — | | | | — | |
| Redemption fees | | | 432 | | | | — | | | | — | |
| | | |
| Net increase (decrease) from capital transactions | | | 11,069,143 | | | | — | | | | — | |
| | | |
| Net increase (decrease) in net assets resulting from capital transactions | | | 23,598,102 | | | | 107,405,645 | | | | 6,259,865 | |
| Total increase (decrease) in net assets | | | 23,982,545 | | | | 117,558,778 | | | | 6,932,575 | |
| | | | | | | | | | | | |
| NET ASSETS: | | | | | | | | | | | | |
| Beginning of period | | | — | | | | 6,932,575 | | | | — | |
| End of period | | | $23,982,545 | | | | $124,491,353 | | | | $6,932,575 | |
| | | | | | | | | | | | | |
| Undistributed accumulated net investment income (loss) at end of period | | | $47,308 | | | | $322,578 | | | | $631 | |
(continued on p. 104)
| | | | |
| | The accompanying notes are an integral part of these financial statements. | | |
| | | | | | | | | | |
| AQR Funds | | | | Annual Report | | | | December 2010 | | 103 |
| | | | | | | |
| | | | |
| Statements of Changes in Net Assets | | | December 31, 2010 | |
| | | | | | | | | | | | |
| | | AQR RISK PARITY
FUND** | | | AQR MOMENTUM FUND | |
| | | FOR THE PERIOD
9/30/10*-12/31/10 | | | FOR THE
YEAR ENDED
DECEMBER 31,
2010 | | | FOR THE PERIOD
7/9/09*-12/31/09 | |
| CHANGES IN SHARES OUTSTANDING: | | | | | | | | | | | | |
| | | |
| CLASS I | | | | | | | | | | | | |
| | | |
| Shares outstanding, beginning of period | | | — | | | | — | | | | — | |
| Shares sold | | | 1,229,100 | | | | — | | | | — | |
| Shares issued in reinvestment of distributions | | | 12,687 | | | | — | | | | — | |
| Shares redeemed | | | (1,220) | | | | — | | | | — | |
| | | |
| Shares outstanding, end of period | | | 1,240,567 | | | | — | | | | — | |
| | | |
| CLASS L | | | | | | | | | | | | |
| | | |
| Shares outstanding, beginning of period | | | — | | | | 568,597 | | | | — | |
| Shares sold | | | — | | | | 8,561,328 | | | | 559,779 | |
| Shares issued in reinvestment of distributions | | | — | | | | 31,043 | | | | 16,494 | |
| Shares redeemed | | | — | | | | (514,082) | | | | (7,676) | |
| | | |
| Shares outstanding, end of period | | | — | | | | 8,646,886 | | | | 568,597 | |
| | | |
| CLASS N | | | | | | | | | | | | |
| | | |
| Shares outstanding, beginning of period | | | — | | | | — | | | | — | |
| Shares sold | | | 1,096,773 | | | | — | | | | — | |
| Shares issued in reinvestment of distributions | | | 12,061 | | | | — | | | | — | |
| Shares redeemed | | | (14,345) | | | | — | | | | — | |
| | | |
| Shares outstanding, end of period | | | 1,094,489 | | | | — | | | | — | |
| | * | Commencement of operations. |
| | ** | Consolidated financial statement, see Note 2 in the Notes to Financial Statements for additional information. |
The accompanying notes are an integral part of these financial statements.
| | | | | | | | | | |
| AQR Funds | | | | Annual Report | | | | December 2010 | | 104 |
| | | | | | | |
| | | | |
| Statements of Changes in Net Assets | | | December 31, 2010 | |
| | | | | | | | | | | | | | | | |
| | | AQR SMALL CAP
MOMENTUM FUND | | | AQR INTERNATIONAL
MOMENTUM FUND | |
| | | FOR THE YEAR
ENDED
1/1/10-12/31/10 | | | FOR THE PERIOD
7/9/09*-12/31/09 | | | FOR THE YEAR
ENDED
1/1/10-12/31/10 | | | FOR THE PERIOD
7/9/09*-12/31/09 | |
| OPERATIONS: | | | | | | | | | | | | | | | | |
| Net investment income (loss) | | | $93,134 | | | | $9,168 | | | | $485,477 | | | | $38,766 | |
| Net realized gain (loss) | | | 1,019,454 | | | | 274,977 | | | | (517,845) | | | | 779,256 | |
| Net change in unrealized appreciation (depreciation) | | | 5,493,162 | | | | 195,732 | | | | 5,421,094 | | | | 523,621 | |
Net increase (decrease) in net assets
resulting from operations | | | 6,605,750 | | | | 479,877 | | | | 5,388,726 | | | | 1,341,643 | |
| | | | |
| DISTRIBUTIONS TO SHAREHOLDERS: | | | | | | | | | | | | | | | | |
| Net investment income: | | | | | | | | | | | | | | | | |
Class L | | | (88,580) | | | | (9,247) | | | | (198,118) | | | | (177,254) | |
Total | | | (88,580) | | | | (9,247) | | | | (198,118) | | | | (177,254) | |
| Net realized gain: | | | | | | | | | | | | | | | | |
Class L | | | (487,666) | | | | (180,969) | | | | (61,012) | | | | (437,399) | |
Total | | | (487,666) | | | | (180,969) | | | | (61,012) | | | | (437,399) | |
Total distributions | | | (576,246) | | | | (190,216) | | | | (259,130) | | | | (614,653) | |
| | | | | | | | | | | | | | | | |
| CAPITAL TRANSACTIONS: | | | | | | | | | | | | | | | | |
| CLASS L | | | | | | | | | | | | | | | | |
| Proceeds from shares sold | | | 47,944,290 | | | | 3,072,017 | | | | 45,816,669 | | | | 29,481,521 | |
| Reinvestment of distributions | | | 576,046 | | | | 189,528 | | | | 259,022 | | | | 614,344 | |
| Cost of shares redeemed | | | (3,285,924) | | | | (312,595) | | | | (18,877,307) | | | | (1,064,593) | |
| Redemption fees | | | 1,061 | | | | 994 | | | | 1,346 | | | | 3,791 | |
| | | | |
| Net increase (decrease) in net assets resulting from capital transactions | | | 45,235,473 | | | | 2,949,944 | | | | 27,199,730 | | | | 29,035,063 | |
| Total increase (decrease) in net assets | | | 51,264,977 | | | | 3,239,605 | | | | 32,329,326 | | | | 29,762,053 | |
| | | | | | | | | | | | | | | | |
| NET ASSETS: | | | | | | | | | | | | | | | | |
| Beginning of period | | | 3,239,605 | | | | — | | | | 29,762,053 | | | | — | |
| End of period | | | $54,504,582 | | | | $3,239,605 | | | | 62,091,379 | | | | $29,762,053 | |
| | | | | | | | | | | | | | | | | |
| Undistributed accumulated net investment income (loss) at end of period | | | $— | | | | $— | | | | $72,009 | | | | $151,015 | |
| | | | | | | | | | | | | | | | |
| CHANGES IN SHARES OUTSTANDING: | | | | | | | | | | | | | | | | |
| | | | |
| CLASS L | | | | | | | | | | | | | | | | |
| | | | |
| Shares outstanding, beginning of period | | | 284,134 | | | | — | | | | 2,485,331 | | | | — | |
| Shares sold | | | 3,707,891 | | | | 294,508 | | | | 3,653,199 | | | | 2,523,592 | |
| Shares issued in reinvestment of distributions | | | 40,199 | | | | 17,013 | | | | 19,417 | | | | 52,508 | |
| Shares redeemed | | | (243,321) | | | | (27,387) | | | | (1,598,172) | | | | (90,769) | |
| | | | |
| Shares outstanding, end of period | | | 3,788,903 | | | | 284,134 | | | | 4,559,775 | | | | 2,485,331 | |
| | * | Commencement of operations. |
| | ** | Consolidated financial statement, see Note 2 in the Notes to Financial Statements for additional information. |
| | | | |
| | The accompanying notes are an integral part of these financial statements. | | |
| | | | | | | | | | |
| AQR Funds | | | | Annual Report | | | | December 2010 | | 105 |
| | | | | | | |
| | | | |
| Statement of Cash Flows | | | December 31, 2010 | |
| | | | |
| | | AQR
DIVERSIFIED
ARBITRAGE FUND | |
| CASH FLOWS FROM OPERATING ACTIVITIES: | | | | |
| Net increase in net assets resulting from operations | | | $39,750,306 | |
| Adjustments to reconcile net increase in net assets resulting from operations to net cash used in operating activities: | | | | |
Payments to purchase securities | | | (3,352,887,172) | |
Payments to cover short securities | | | (672,441,774) | |
Proceeds from securities sold short | | | 1,083,733,121 | |
Proceeds from sale of securities | | | 2,263,077,192 | |
Realized gain on investments in securities and foreign currency | | | (53,761,703) | |
Realized loss on securities sold short and written options | | | 29,699,885 | |
Unrealized appreciation on investment in securities and foreign currency | | | (88,013,759) | |
Unrealized depreciation on securities sold short and written options | | | 58,208,952 | |
Amortization of bond premium | | | 2,381,163 | |
| (Increases)/decreases in operating assets: | | | | |
Swaps, at value | | | 26,133 | |
Unrealized appreciation on futures contracts | | | 417,138 | |
Dividends and interest | | | (6,161,327) | |
Restricted Cash | | | (4,797,323) | |
Due from brokers | | | (241,982,553) | |
Prepaid expenses | | | (110,126) | |
Receivable from securities sold | | | (1,082,287) | |
| Increases/(decreases) in operating liabilities | | | | |
Due to custodian | | | 2,480,977 | |
Unrealized depreciation on forward foreign currency contracts | | | 282,918 | |
Unrealized depreciation on futures contracts | | | 545,947 | |
Swaps, at value | | | 1,452,422 | |
Dividends on securities sold short | | | 317,165 | |
Accrued Investment advisory fees | | | 629,229 | |
Accrued Custody, admin and accounting fees | | | 142,536 | |
Accrued Shareholder servicing fees | | | (57,670) | |
Accrued Distribution fees | | | 78,623 | |
Accrued Trustees fees | | | (2,627) | |
Accrued Transfer agency fees | | | 77,117 | |
Payable for securities purchased | | | 4,021,916 | |
Other accrued expenses | | | (150,142) | |
Net cash used in operating activities | | | $(934,125,723) | |
| |
| CASH FLOWS FROM FINANCING ACTIVITIES | | | | |
Proceeds from shares sold | | | 1,108,712,734 | |
Payments on shares redeemed | | | (181,895,137) | |
Distributions to shareholders | | | (823,439) | |
Net cash provided by financing activities | | | $925,994,158 | |
| Net change in cash | | | (8,131,565) | |
Cash, beginning of year | | | 8,131,565 | |
Cash, end of year | | | $— | |
Non-cash financing activities not included herein consists of reinvestment of dividends and distribution of $15,740,517.
| | | | |
| | The accompanying notes are an integral part of these financial statements. | | |
| | | | | | | | | | |
| AQR Funds | | | | Annual Report | | | | December 2010 | | 106 |
| | | | | | | |
| | | | |
| Financial Highlights | | | December 31, 2010 | |
| | | | | | | | | | | | | | | | | | | | | | | | | | | | |
| | | PER SHARE OPERATING PERFORMANCE: | |
| | | | | | Change in Net Assets Resulting
from Operations | | | Less Dividends and Distributions | |
| | | | | | | |
| | | Net Asset
Value,
Beginning
of Period | | | Net
Investment
Income
(Loss) | | | Net
Realized
and
Unrealized
Gain
(Loss) | | | Net
Increase
(Decrease)
in Net
Asset
Value from
Operations | | | Distributions
from Net
Investment
Income | | | Distributions
from Net
Realized
Gains | | | Total
Distributions | |
| AQR GLOBAL EQUITY FUND CLASS I1 | | | | | | | | | | | | | | | | | | | | | | | | | | | | |
FOR THE YEAR ENDED DECEMBER 31, 2010 | | | $10.00 | | | | 0.16 | | | | 1.25 | | | | 1.41 | | | | (0.36) | | | | (0.08) | | | | (0.44) | |
| AQR GLOBAL EQUITY FUND CLASS N†1 | | | | | | | | | | | | | | | | | | | | | | | | | | | | |
FOR THE YEAR ENDED DECEMBER 31, 2010 | | | $10.00 | | | | 0.13 | | | | 1.25 | | | | 1.38 | | | | (0.33) | | | | (0.08) | | | | (0.41) | |
| AQR GLOBAL EQUITY FUND CLASS Y1 | | | | | | | | | | | | | | | | | | | | | | | | | | | | |
FOR THE YEAR ENDED DECEMBER 31, 2010 | | | $10.00 | | | | 0.18 | | | | 1.27 | | | | 1.45 | | | | (0.38) | | | | (0.08) | | | | (0.46) | |
| AQR INTERNATIONAL EQUITY FUND CLASS I† | | | | | | | | | | | | | | | | | | | | | | | | | | | | |
FOR THE YEAR ENDED DECEMBER 31, 20101 | | | $9.78 | | | | 0.16 | | | | 0.84 | | | | 1.00 | | | | (0.24) | | | | (0.09) | | | | (0.33) | |
| FOR THE PERIOD 9/30/093 TO 12/31/091 | | | $10.00 | | | | (0.01) | | | | 0.22 | | | | 0.21 | | | | (0.14) | | | | (0.29) | | | | (0.43) | |
| AQR INTERNATIONAL EQUITY FUND CLASS N† | | | | | | | | | | | | | | | | | | | | | | | | | | | | |
FOR THE YEAR ENDED DECEMBER 31, 20101 | | | $9.91 | | | | 0.14 | | | | 0.88 | | | | 1.02 | | | | (0.23) | | | | (0.09) | | | | (0.32) | |
| FOR THE PERIOD 9/30/093 TO 12/31/091 | | | $10.00 | | | | — | | | | 0.20 | | | | 0.20 | | | | — | | | | (0.29) | | | | (0.29) | |
| AQR INTERNATIONAL EQUITY FUND CLASS Y† | | | | | | | | | | | | | | | | | | | | | | | | | | | | |
FOR THE YEAR ENDED DECEMBER 31, 20101 | | | $10.16 | | | | 0.20 | | | | 0.89 | | | | 1.09 | | | | (0.27) | | | | (0.09) | | | | (0.36) | |
| FOR THE PERIOD 8/28/092 TO 12/31/091 | | | $10.00 | | | | 0.03 | | | | 0.57 | | | | 0.60 | | | | (0.15) | | | | (0.29) | | | | (0.44) | |
| AQR DIVERSIFIED ARBITRAGE FUND CLASS I† | | | | | | | | | | | | | | | | | | | | | | | | | | | | |
FOR THE YEAR ENDED DECEMBER 31, 2010 | | | $10.80 | | | | 0.06 | | | | 0.46 | | | | 0.52 | | | | (0.04) | | | | (0.13) | | | | (0.17) | |
| FOR THE PERIOD 1/15/092 TO 12/31/091 | | | $10.00 | | | | 0.13 | | | | 0.79 | | | | 0.92 | | | | (0.03) | | | | (0.09) | | | | (0.12) | |
| AQR DIVERSIFIED ARBITRAGE FUND CLASS N† | | | | | | | | | | | | | | | | | | | | | | | | | | | | |
FOR THE YEAR ENDED DECEMBER 31, 2010 | | | $10.78 | | | | 0.05 | | | | 0.43 | | | | 0.48 | | | | (0.01) | | | | (0.13) | | | | (0.14) | |
| FOR THE PERIOD 1/15/092 TO 12/31/091 | | | $10.00 | | | | 0.10 | | | | 0.79 | | | | 0.89 | | | | (0.02) | | | | (0.09) | | | | (0.11) | |
| AQR MANAGED FUTURES STRATEGY FUND CLASS I† | | | | | | | | | | | | | | | | | | | | | | | | | | | | |
| FOR THE PERIOD 1/6/102 TO 12/31/101 | | | $10.00 | | | | (0.12) | | | | 0.66 | | | | 0.54 | | | | (0.09) | | | | (0.15) | | | | (0.24) | |
| AQR MANAGED FUTURES STRATEGY FUND CLASS N† | | | | | | | | | | | | | | | | | | | | | | | | | | | | |
| FOR THE PERIOD 1/6/102 TO 12/31/101 | | | $10.00 | | | | (0.15) | | | | 0.66 | | | | 0.51 | | | | (0.08) | | | | (0.15) | | | | (0.23) | |
| AQR RISK PARITY FUND CLASS I | | | | | | | | | | | | | | | | | | | | | | | | | | | | |
| FOR THE PERIOD 9/30/102 TO 12/31/10 | | | $10.00 | | | | 0.02 | | | | 0.38 | | | | 0.40 | | | | (0.12) | | | | — | | | | (0.12) | |
| AQR RISK PARITY FUND CLASS N | | | | | | | | | | | | | | | | | | | | | | | | | | | | |
| FOR THE PERIOD 9/30/102 TO 12/31/10 | | | $10.00 | | | | 0.01 | | | | 0.38 | | | | 0.39 | | | | (0.12) | | | | — | | | | (0.12) | |
| AQR MOMENTUM FUND CLASS L† | | | | | | | | | | | | | | | | | | | | | | | | | | | | |
FOR THE YEAR ENDED DECEMBER 31, 2010 | | | $12.19 | | | | 0.06 | | | | 2.21 | | | | 2.27 | | | | (0.02) | | | | (0.04) | | | | (0.06) | |
| FOR THE PERIOD 7/9/092 TO 12/31/091 | | | $10.00 | | | | 0.07 | 1 | | | 2.48 | | | | 2.55 | | | | (0.05) | | | | (0.31) | | | | (0.36) | |
| AQR SMALL CAP MOMENTUM FUND CLASS L† | | | | | | | | | | | | | | | | | | | | | | | | | | | | |
FOR THE YEAR ENDED DECEMBER 31, 2010 | | | $11.40 | | | | 0.03 | | | | 3.13 | | | | 3.16 | | | | (0.03) | | | | (0.14) | | | | (0.17) | |
| FOR THE PERIOD 7/9/092 TO 12/31/091 | | | $10.00 | | | | 0.04 | 1 | | | 2.06 | | | | 2.10 | | | | (0.03) | | | | (0.67) | | | | (0.70) | |
| AQR INTERNATIONAL MOMENTUM FUND CLASS L† | | | | | | | | | | | | | | | | | | | | | | | | | | | | |
FOR THE YEAR ENDED DECEMBER 31, 2010 | | | $11.98 | | | | 0.08 | | | | 1.62 | | | | 1.70 | | | | (0.05) | | | | (0.01) | | | | (0.06) | |
| FOR THE PERIOD 7/9/092 TO 12/31/091 | | | $10.00 | | | | 0.04 | 1 | | | 2.26 | | | | 2.30 | | | | (0.09) | | | | (0.23) | | | | (0.32) | |
| † | Redemption fees of less than $0.005 per share were incurred by the share class. |
| 1 | Based on average shares outstanding. |
| 2 | Commencement of operations. |
| 3 | Commencement of offering of shares. |
| 4 | Total investment return is calculated assuming an initial investment made at the net asset value at the beginning of the period, reinvestment of all dividends and distributions at net asset value during the period and redemption on the last day of the period and is not annualized. |
| 5 | Annualized for periods less than one year. |
| 6 | Portfolio turnover is not annualized. |
| 7 | The ratio is annualized for a short period of time and is not representative of what the ratio would be if the Fund class has operated for a longer period of time. |
| 8 | Total return unadjusted for year end financial reporting purposes for the AQR Diversified Arbitrage Fund was 4.71% and 4.43% for Class I and Class N, respectively. |
| 9 | Total return unadjusted for year end financial reporting purposes for the AQR Risk Parity Fund was 3.88% and 3.78% for Class I and Class N, respectively. |
| 10 | Total return unadjusted for year end financial reporting purposes for the AQR International Momentum Fund was 14.11%. |
| 11 | Ratios do not include the impact of the expenses of the underlying funds in which the Funds invest in. |
| 12 | For the year ended December 31, 2010, the Adviser contributed $544,199 into the AQR Diversified Arbitrage Fund. The impact of the Advisor’s contribution increased the total return by 0.08%. |
| | | | |
| | The accompanying notes are an integral part of these financial statements. | | (Continued) |
| | | | | | | | | | |
| AQR Funds | | | | Annual Report | | | | December 2010 | | 107 |
| | | | | | | |
| | | | |
| Financial Highlights | | | December 31, 2010 | |
| | | | | | | | | | | | | | | | | | | | |
| | | | | | | RATIOS/SUPPLEMENTAL DATA: |
| | | | | |
| | | | | | | | | Ratios to Average Net Assets of:5 | | | | |
| | | | | | | | |
Net
Asset
Value,
End of
Period | | | Total
Return4 | | | Net Assets,
End of Period | | Expenses, Net of
Reimbursements
and/or Waivers11 | | Expenses, Net of
Reimbursements
and/or Waivers
(Excluding Dividend
Short Expense &
Interest Expense)11 | | Expenses, Before
Reimbursements
and/or Waivers11 | | Net Investment
Income (Loss) | | Portfolio
Turnover
Rate6 | | |
| | | | | | | | | | | | | | | | | | | | |
| | $10.97 | | | | 14.12% | | | $1,841,838 | | 0.79% | | 0.79% | | 0.79% | | 1.41% | | 72% | | |
| | | | | | | | | | | | | | | | | | | | |
| | $10.97 | | | | 13.83% | | | $1,497,723 | | 1.10% | | 1.10% | | 1.10% | | 1.28% | | 72% | | |
| | | | | | | | | | | | | | | | | | | | |
| | $10.99 | | | | 14.54% | | | $424,346,157 | | 0.50% | | 0.50% | | 0.71% | | 1.81% | | 72% | | |
| | | | | | | | | | | | | | | | | | | | |
| | $10.45 | | | | 10.40% | | | $85,968,655 | | 0.90% | | 0.90% | | 1.03% | | 1.72% | | 93% | | |
| | $9.78 | | | | 2.20% | | | $44,016,038 | | 0.90% | | 0.90% | | 1.01% | | (0.47)% | | 29% | | |
| | | | | | | | | | | | | | | | | | | | |
| | $10.61 | | | | 10.40% | | | $1,472,368 | | 1.25% | | 1.25% | | 3.50% | | 1.51% | | 93% | | |
| | $9.91 | | | | 2.04% | | | $5,785 | | 1.25% | | 1.25% | | 472.86%7 | | (0.07)% | | 29% | | |
| | | | | | | | | | | | | | | | | | | | |
| | $10.89 | | | | 10.84% | | | $371,799,177 | | 0.55% | | 0.55% | | 0.77% | | 2.02% | | 93% | | |
| | $10.16 | | | | 6.08% | | | $360,491,107 | | 0.55% | | 0.55% | | 0.98% | | 0.99% | | 29% | | |
| | | | | | | | | | | | | | | | | | | | |
| | $11.15 | | | | 4.81%8,12 | | | $824,237,659 | | 2.59% | | 1.20% | | 2.62% | | 1.13% | | 361% | | |
| | $10.80 | | | | 9.24% | | | $160,026,814 | | 2.46% | | 1.20% | | 3.25% | | 1.30% | | 482% | | |
| | | | | | | | | | | | | | | | | | | | |
| | $11.12 | | | | 4.52%8,12 | | | $382,758,131 | | 2.89% | | 1.50% | | 2.92% | | 0.85% | | 361% | | |
| | $10.78 | | | | 8.88% | | | $79,054,890 | | 2.69% | | 1.50% | | 3.42% | | 0.98% | | 482% | | |
| | | | | | | | | | | | | | | | | | | | |
| | $10.30 | | | | 5.41% | | | $657,237,349 | | 1.25% | | 1.25% | | 1.28% | | (1.27)% | | 0% | | |
| | | | | | | | | | | | | | | | | | | | |
| | $10.28 | | | | 5.12% | | | $271,043,038 | | 1.50% | | 1.50% | | 1.56% | | (1.54)% | | 0% | | |
| | | | | | | | | | | | | | | | | | | | |
| | $10.28 | | | | 3.98%9 | | | $12,747,565 | | 0.95% | | 0.95% | | 3.80% | | 0.44% | | 19% | | |
| | | | | | | | | | | | | | | | | | | | |
| | $10.27 | | | | 3.88%9 | | | $11,234,980 | | 1.20% | | 1.20% | | 3.96% | | 0.22% | | 19% | | |
| | | | | | | | | | | | | | | | | | | | |
| | $14.40 | | | | 18.60% | | | $124,491,353 | | 0.49% | | 0.49% | | 0.98% | | 1.37% | | 180% | | |
| | $12.19 | | | | 25.58% | | | $6,932,575 | | 0.49% | | 0.49% | | 5.08% | | 1.23% | | 163% | | |
| | | | | | | | | | | | | | | | | | | | |
| | $14.39 | | | | 27.69% | | | $54,504,582 | | 0.65% | | 0.65% | | 1.85% | | 0.66% | | 380% | | |
| | $11.40 | | | | 21.24% | | | $3,239,605 | | 0.65% | | 0.65% | | 7.53% | | 0.65% | | 136% | | |
| | | | | | | | | | | | | | | | | | | | |
| | $13.62 | | | | 14.20%10 | | | $62,091,379 | | 0.65% | | 0.65% | | 1.46% | | 1.44% | | 269% | | |
| | $11.98 | | | | 23.08% | | | $29,762,053 | | 0.65% | | 0.65% | | 2.22% | | 0.63% | | 160% | | |
| | | | |
| | The accompanying notes are an integral part of these financial statements. | | (Continued) |
| | | | | | | | | | |
| AQR Funds | | | | Annual Report | | | | December 2010 | | 108 |
| | | | | | | |
| | | | |
| Notes to Financial Statements | | | December 31, 2010 | |
1. Organization
AQR Funds (the “Trust”), organized as a Delaware statutory trust on September 4, 2008, is an open-end management investment company, under the Investment Company Act of 1940, as amended (the “1940 Act”). As of December 31, 2010, the Trust consists of eight active series (collectively, the “Funds” and each individually a “Fund”): AQR Global Equity Fund, AQR International Equity Fund, AQR Diversified Arbitrage Fund, AQR Managed Futures Strategy Fund, AQR Risk Parity Fund, AQR Momentum Fund, AQR Small Cap Momentum Fund, and AQR International Momentum Fund. AQR Capital Management, LLC (“the Adviser”) serves as the investment adviser of each Fund. The Adviser has retained CNH Partners, LLC (“the Sub-Adviser”) an affiliate of the Adviser, to serve as an investment sub-adviser to the AQR Diversified Arbitrage Fund.
The investment objective of the AQR Global Equity Fund is long-term capital appreciation. The principal investment strategies of the AQR Global Equity Fund include seeking to outperform the MSCI World Total Return Index (the “Global Equity Benchmark”) while seeking to control its tracking error relative to this benchmark. The Global Equity Benchmark is a free float-adjusted market capitalization index that is designed to measure the performance of equities in developed markets, including the United States and Canada. The AQR Global Equity Fund commenced operations on December 31, 2009. The Fund offers Class I, Class N and Class Y shares.
The investment objective of the AQR International Equity Fund is long-term capital appreciation. The principal investment strategies of the AQR International Equity Fund include seeking to outperform the MSCI EAFE Total Return Index (the “International Equity Benchmark”) while seeking to control its tracking error relative to this benchmark. The International Equity Benchmark is a free float-adjusted market capitalization index that is designed to measure the performance of equities in developed markets, excluding the United States and Canada. The AQR International Equity Fund Class Y shares commenced operations on August 28, 2009. Class I and Class N shares commenced operations on September 30, 2009.
The investment objective of the AQR Diversified Arbitrage Fund is long-term absolute (positive) returns. The principal investment strategies of the AQR Diversified Arbitrage Fund include seeking to outperform the Merrill Lynch 3-Month Treasury Bill Index (the “Absolute Return Benchmark”) using arbitrage and alternative investment strategies such as merger arbitrage, convertible arbitrage, other forms of arbitrage (including, but not limited to, when-issued trading arbitrage, stub-trading arbitrage and dual-class arbitrage) and other types of non-arbitrage alternative investment strategies. The AQR Diversified Arbitrage Fund commenced operations on January 15, 2009. The Fund offers Class I and Class N shares.
The investment objective of the AQR Managed Futures Strategy Fund is to seek positive absolute returns. The Fund invests primarily in a portfolio of futures contracts and futures-related instruments. The Fund’s universe of investments includes more than 100 global developed and emerging market exchange-traded futures, futures related instruments and forward contracts across four major asset classes (commodities, currencies, fixed income and equities); however this universe of investments is subject to change under varying market conditions as these instruments evolve over time. The AQR Managed Futures Strategy Fund commenced operations on January 6, 2010. The Fund offers Class I and Class N shares.
The investment objective of the AQR Risk Parity Fund is to seek total return. Total return consists of capital appreciation and income. The Fund pursues its investment objective by allocating assets among major liquid asset classes (including global developed and emerging market equities, global nominal and inflation-linked government bonds, emerging market bonds, mortgage-backed securities, corporate and sovereign debt, the credit spreads of mortgage-backed securities and corporate and sovereign debt, developed and emerging market currencies, and commodities). The AQR Risk Parity Fund commenced operations on September 30, 2010. The Fund offers Class I and Class N shares.
The investment objective of the AQR Momentum Fund is to seek long-term capital appreciation. The Fund invests primarily in equity or equity-related securities (including, but not limited to, exchange-traded funds, equity index futures, and depository receipts) of large and mid-sized companies traded on a principal U.S. exchange or over-the-counter market that the Adviser determines to have positive momentum. The Adviser considers a security to have positive momentum primarily if it has a return over the prior twelve months, excluding the most recent one month, that ranks in the top third of its relevant universe at the time of purchase. The AQR Momentum Fund commenced operations on July 9, 2009. The Fund offers Class L shares.
| | | | | | | | | | |
| AQR Funds | | | | Annual Report | | | | December 2010 | | 109 |
| | | | | | | |
| | | | |
| Notes to Financial Statements | | | December 31, 2010 | |
The investment objective of the AQR Small Cap Momentum Fund is to seek long-term capital appreciation. The Fund invests primarily in equity or equity-related securities (including, but not limited to, exchange-traded funds, equity index futures and depository receipts) of small cap companies traded on a principal U.S. exchange or over-the-counter market that the Adviser determines to have positive momentum. The Adviser considers a security to have positive momentum primarily if it has a return over the prior twelve months, excluding the most recent one month, that ranks in the top third of its relevant universe at the time of purchase. The AQR Small Cap Momentum Fund commenced operations on July 9, 2009. The Fund offers Class L shares.
The investment objective of the AQR International Momentum Fund is to seek long-term capital appreciation. The Fund invests primarily in equity or equity-related securities (including, but not limited to, exchange-traded funds, equity index futures and depositary receipts) of non-U.S. companies that the Adviser determines to have positive momentum. The Adviser considers a security to have positive momentum primarily if it has a return over the prior twelve months, excluding the most recent one month, that ranks in the top third of its relevant universe at the time of purchase. The AQR International Momentum Fund commenced operations on July 9, 2009. The Fund offers Class L shares.
2. Consolidation of Subsidiary — AQR Managed Futures Strategy Offshore Fund Ltd. and AQR Risk Parity Offshore Fund Ltd.
The consolidated Schedules of Investments, Statements of Assets and Liabilities, of Operations, of Changes in Net Assets and the Financial Highlights of the AQR Managed Futures Strategy Fund and AQR Risk Parity Fund includes the accounts of AQR Managed Futures Strategy Offshore Fund Ltd. and AQR Risk Parity Offshore Fund Ltd., respectively, wholly-owned and controlled subsidiaries (the “Subsidiaries”). All inter-company accounts and transactions have been eliminated in consolidation for the Funds. Each of the Subsidiaries has a fiscal year end of December 31st for financial statement consolidation purposes and a nonconforming tax year end of November 30th.
AQR Managed Futures Strategy Fund and AQR Risk Parity Fund may invest up to 25% of its total assets in its Subsidiary each of which acts as an investment vehicle in order to effect certain investments consistent with the Funds’ investment objectives and policies.
A summary of the Funds’ investment in the Subsidiaries are as follows:
| | | | | | | | | | |
| | | INCEPTION DATE OF SUBSIDIARY | | SUBSIDIARY NET
ASSETS AT
DECEMBER 31, 2010 | | | % OF TOTAL NET
ASSETS AT
DECEMBER 31, 2010 | |
| | | |
AQR Managed Futures Strategy Offshore Fund Ltd. | | January 6, 2010 | | $ | 213,901,854 | | | | 23.0 | % |
AQR Risk Parity Offshore Fund Ltd. | | September 30, 2010 | | | 4,725,747 | | | | 19.7 | |
3. Significant Accounting Policies
The following summarizes the significant accounting policies of the Funds:
Use of Estimates: The preparation of the financial statements in conformity with accounting principles generally accepted in the United States of America (“GAAP”) requires management to make estimates and assumptions that affect the reported amounts of assets and liabilities and disclosure of contingent assets and liabilities at the date of the financial statements and the reported amounts of increases and decreases in net assets from operations during the reported period. Actual results could differ from those estimates.
Securities Valuation: Each Fund’s portfolio securities are valued as of the close of business of the regular session of trading on the NYSE (normally 4:00 p.m. Eastern time). Equity securities, including securities sold short, are valued at the latest quoted sales prices or official closing prices taken from the primary market in which each security trades. In accordance with procedures adopted by the Board of Trustees, the Funds apply fair value pricing to international securities on a daily basis utilizing the quotations of an independent pricing service, unless the Adviser determines that use of another valuation methodology is appropriate. The pricing service uses statistical analysis and quantitative models to adjust local market prices using factors such as subsequent movement and changes in the prices of indices, securities and exchange rates in other markets, in determining fair value as of the time the Funds calculate their net asset value. Securities traded in the over-the-counter market, and which are not quoted by NASDAQ, are valued at the
| | | | | | | | | | |
| AQR Funds | | | | Annual Report | | | | December 2010 | | 110 |
| | | | | | | |
| | | | |
| Notes to Financial Statements | | | December 31, 2010 | |
last sale price, if available, otherwise at the last quoted bid price (in the case of short sales, at the ask price). Bonds are valued using the latest bid prices or using valuations based on a matrix system (which considers such factors as security prices, yields, maturities, and ratings), both as furnished by independent pricing services. The Funds value debt securities maturing less than 61 days from the date of purchase at amortized cost, which approximates market value. The value of futures contracts purchased and sold by the Funds is accounted for using the unrealized gain or loss on the contracts that is determined by marking the contracts to their current settlement prices. Futures and options contracts are valued at the last quoted sales price on the valuation date. In the event that the exchange for a specific futures contract closes earlier than 4:00 p.m., the futures contract is valued at the Official Settlement Price of the exchange. Prices of futures contracts are monitored until 4:00 p.m. to determine if fair valuation would provide a more accurate valuation. Investments in open-end investment companies are valued at such investment company’s current day closing net asset value per share. Exchange-Traded Funds (“ETFs”) and closed-end investment companies are valued at the last quoted sales price. Equity, total return and commodity swap contracts are valued at fair value, based on the price of the underlying referenced instrument. Credit default swaps are valued daily primarily using independent pricing services or market makers. Interest rate swap contracts are valued at fair value as determined by an independent pricing service based on various valuation models which consider the terms of underlying contracts and market data inputs received from third parties.
The Funds may use pricing services to obtain readily available market quotations. Where market quotations are not readily available, or if an available market quotation is determined not to be reliable, a security will be valued based on its fair value as determined in accordance with the valuation procedures approved by the Funds’ Board of Trustees. Using fair value to price securities may result in a value that is different from a security’s most recent closing price and from the prices used by other mutual funds to calculate their net assets.
Convertible Securities: The Funds invest in preferred stocks and fixed-income securities which are convertible into common stock. Convertible securities may be converted either at a stated price or rate within a specified period of time into a specified number of shares of common stock. Traditionally, convertible securities have paid dividends or interest greater than on the related common stocks, but less than fixed income non-convertible securities. By investing in a convertible security, the Funds may participate in any capital appreciation or depreciation of a company’s stock, but to a lesser degree than if it had invested in that company’s common stock. Convertible securities rank senior to common stock in a corporation’s capital structure and, therefore, entail less risk than the corporation’s common stock. The Funds may attempt to hedge certain of their investments in convertible debt securities by selling short the issuer’s common stock.
Short Sales: The AQR Diversified Arbitrage Fund sells securities it does not own as a hedge against some of its long positions and/or in anticipation of a decline in the market value of that security (short sale). When the Fund makes a short sale, it must borrow the security sold short and deliver it to the broker-dealer through which it made the short sale. The Fund may have to pay a fee to borrow the particular security and may be obligated to remit any interest or dividends received on such borrowed securities. Dividends declared on short positions open are recorded on the ex-date as an expense. A gain, limited to the price at which the Fund sold the security short, or a loss, unlimited in magnitude, will be recognized upon the termination of a short sale if the market price at termination is less than or greater than, respectively, the proceeds originally received. The Fund is also subject to the risk that it may be unable to reacquire a security to terminate a short position except at a price substantially in excess of the last quoted price.
The Fund is required to pledge cash or securities to the broker as collateral for the securities sold short. Collateral requirements are calculated daily based on the current market value of the short positions. Cash deposited with broker for collateral for securities sold short is recorded as an asset on the Statement of Assets and Liabilities and securities segregated as collateral are denoted in the Schedule of Investments. The Fund may receive or pay the net of the following amounts: (i) a portion of the income from the investment of cash collateral; (ii) the broker’s fee on the borrowed securities; and (iii) a financing charge for the difference in the market value of the short position and cash collateral deposited with the broker. This income or fee is calculated daily based upon the market value of each borrowed security and a variable rate that is dependent on the availability of the security. The net amount of fees of $4,056,594 are included in interest income in the Statements of Operations.
Futures Contracts: Each Fund may invest in futures contracts (“futures”). Each Fund, excluding AQR Managed Futures Strategy Fund and AQR Risk Parity Fund, may invest in futures in order to hedge its investments or equitize its cash
| | | | | | | | | | |
| AQR Funds | | | | Annual Report | | | | December 2010 | | 111 |
| | | | | | | |
| | | | |
| Notes to Financial Statements | | | December 31, 2010 | |
flows against fluctuations in value caused by changes in prevailing interest rates or market conditions. The AQR Managed Futures Strategy Fund and AQR Risk Parity Fund may invest in futures as part of its primary investment strategy. Investments in futures may increase exposure to a particular market. No monies are paid or received by a Fund upon the purchase or sale of a futures contract. Initially, a Fund will be required to deposit with the broker an amount of cash or cash equivalents, known as initial margin, based on the value of the contract. Subsequent payments, called variation margin, to and from the broker, will be made on a daily basis as the price of the underlying instruments fluctuates, making the long and short positions in the futures contract more or less valuable, a process known as ‘marking-to-the-market.’ Once a final determination of variation margin is made, additional cash is required to be paid by or released to a Fund, and a Fund will realize a loss or gain. The use of long futures contracts subject the Funds to risk of loss in excess of the amounts shown on the Statements of Assets and Liabilities, up to the notional amount of the futures contracts. The use of short futures contracts subjects the Funds to unlimited risk of loss. Futures contracts outstanding at period end, if any, are listed after each Fund’s Schedule of Investments.
Forward Currency Contracts: The Funds may buy and sell forward currency contracts, which are agreements between two parties to buy and sell currencies at a set price on a future date. These contracts are used to protect against a decline in value relative to the U.S. dollar of the currencies in which its portfolio securities are denominated or quoted (or an increase in the value of a currency in which securities a fund intends to buy are denominated, when a fund holds cash reserves and short term investments), or for other investment purposes. The U.S. dollar value of forward currency contracts is determined using current forward currency exchange rates supplied by a quotation service. The market value of the contract will fluctuate with changes in currency exchange rates. The contract is marked to market daily and the change in market value is recorded as an unrealized gain or loss. When the contract is closed, the Fund’s record a realized gain or loss equal to the difference between the value of the contract at the time it was opened and the value at the time it was closed. The Fund’s could be exposed to risk if the value of the currency changes unfavorably, if the counterparties to the contracts are unable to meet the terms of their contracts or if the Fund is unable to enter into a closing position. Risks may exceed amounts recognized on the Statements of Assets and Liabilities. Forward currency contracts outstanding at period end, if any, are listed after each Fund’s Schedule of Investments.
Equity (including total return and commodity) Swap Contracts: The Funds invest in equity swaps to obtain exposure to the underlying referenced instrument, obtain leverage or enjoy the returns from ownership without actually owning the underlying position. Equity swaps are two-party contracts that generally obligate one party to pay the positive return and the other party to pay the negative return on a specified reference security, basket of securities, security index or index component during the period of the swap. Equity swap contracts are marked to market daily based on the value of the underlying security and the change, if any, is recorded as an unrealized gain or loss. Equity swaps normally do not involve the delivery of securities or other underlying assets. If the other party to an equity swap defaults, a Fund’s risk of loss consists of the net amount of payments that such Fund is contractually entitled to receive, if any. Equity swaps are derivatives and their value can be very volatile. To the extent that the Adviser or Sub-Adviser, as applicable, do not accurately analyze and predict future market trends, the values of assets or economic factors, a Fund may suffer a loss, which may exceed the related amounts shown in the Statement of Assets and Liabilities. Periodic payments received or paid by the Funds are recorded as realized gains or losses. Equity swap contracts outstanding at period end, if any, are listed after each Fund’s Schedule of Investments.
Credit Default Swap Contracts: The Funds may enter into credit default swap contracts to provide a measure of protection against risk of loss following a default, or other credit event in respect of issuers within an underlying index or a single issuer, or to gain credit exposure to an underlying index or issuer. In a credit default contract, the protection buyer typically makes an up front payment and a periodic stream of payments to a counterparty, the protection seller, in exchange for the right to receive a contingent payment upon the occurrence of a credit event on the reference obligation or all other equally ranked obligations of the reference entity. Credit events are contract specific but may include bankruptcy, failure to pay, restructuring and obligation acceleration. An upfront payment received by a Fund, as the protection seller, is recorded as a liability on the Fund’s books. An upfront payment made by a Fund, as the protection buyer, is recorded as an asset on the Fund’s books. Periodic payments received or paid by a Fund are recorded as realized gains or losses. The credit default contracts are marked to market daily based upon quotations from an independent pricing service or market makers and the change, if any, is recorded as an unrealized gain or loss. Upon the occurrence of a credit event, the difference between the par value and market value of the reference obligation, net of any proportional amount of the upfront payment, is recorded as a realized gain or loss.
| | | | | | | | | | |
| AQR Funds | | | | Annual Report | | | | December 2010 | | 112 |
| | | | | | | |
| | | | |
| Notes to Financial Statements | | | December 31, 2010 | |
In addition to bearing the risk that the credit event will occur, a Fund could be exposed to market risk due to unfavorable changes in interest rates or in the price of the underlying security or index or the possibility that the Fund may be unable to close out its position at the same time or at the same price as if it had purchased the underlying reference obligations. In certain circumstances, a Fund may enter into offsetting credit default contracts which would mitigate its risk of loss. Risks of loss may exceed amounts recognized on the statements of assets and liabilities. The Fund’s maximum risk of loss from counterparty risk, either as the protection seller or as the protection buyer, is the fair value of the contract. This risk may be mitigated by having a master netting arrangement between the Fund and the counterparty. Where a Fund is a seller of protection, the maximum potential amount of future payments the Fund may be required to make is equal to the notional amount of the relevant credit default contract. The Funds’ risk of loss associated with these instruments may exceed their value, as recorded in the Statements of Assets and Liabilities. Credit default contracts outstanding, including their respective notional amounts at period end, if any, are listed after each Funds’ Schedule of Investments.
The credit default swaps in which the AQR Risk Parity Fund is providing protection at December 31, 2010 are summarized as follows:
| | | | | | | | | | | | | | | | |
| | | MAXIMUM PAYOUT/NOTIONAL
AMOUNT BY PERIOD OF
EXPIRATION
($ IN THOUSANDS) | | | | |
CREDIT SPREAD
ON UNDERLYING (BASIS POINTS) | | 0-5
YEARS
USD | | | 0-5
YEARS
EUR | | | 35-40
YEARS
USD | | | WRITTEN CREDIT
DERIVATIVES AT
FAIR VALUE | |
| 0-250 | | | 7,150 | | | | 2,350 | | | | 175 | | | $ | 243,847 | |
| 251-500 | | | 5,225 | | | | 1,400 | | | | — | | | | 165,702 | |
| | | | | | | | | | | | | | | | |
| Total | | | 12,375 | | | | 3,750 | | | | 175 | | | $ | 409,549 | |
| | | | | | | | | | | | | | | | |
Implied credit spreads are an indication of the seller’s performance risk, related to the likelihood of a credit event occurring that would require a seller to make payment to a buyer. Implied credit spreads are used to determine the value of swap contracts and reflect the cost of buying/selling protection, which may include upfront payments made to enter into the contract. Therefore, higher spreads would indicate a greater likelihood that a seller will be obligated to perform (i.e., make payment) under the swap contract. Increasing values, in absolute terms and relative to notional amounts, are also indicative of greater performance risk. Implied credit spreads for credit default swaps on credit indexes are linked to the weighted average spread across the underlying reference obligations included in a particular index.
Interest Rate Swaps: The AQR Risk Parity Fund may enter into interest rate swaps as part of its investment strategy. Interest rate swaps generally involve agreements to exchange fixed and floating payment obligations, without the exchange of the underlying notional amounts. Periodic payments received or paid by the Fund are recorded as realized gains and losses. Interest rate swaps are marked to market daily based on quotations as provided by an independent pricing service and the change is recorded as unrealized gain or loss. The Fund’s risk of loss associated with these instruments may exceed their value, as recorded in the Statements of Assets and Liabilities. Interest rate contracts outstanding, including their respective notional amounts at period end, if any, are listed after each Fund’s Schedule of Investments.
High Yield Securities: Certain Funds may invest in lower-quality debt securities. Investments in lower-rated securities or unrated securities of comparable quality tend to be more sensitive to economic conditions than higher rated securities. These instruments involve a greater risk of default by the issuer because such securities are generally unsecured and are often subordinated to other creditors’ claims.
Master Agreements: The Funds are a party to ISDA (International Swap and Derivatives Association, Inc.) Master Agreements (“Master Agreements”) with certain counterparties that govern over-the-counter derivative and foreign exchange contracts entered into from time to time. The Master Agreements may contain provisions regarding, among other things, the parties’ general obligations, representations, agreements, collateral requirements, events of default and early termination. With respect to certain counterparties, in accordance with the terms of the Master Agreements, collateral posted to a Fund is held in a segregated account by the Fund’s custodian and with respect to those amounts
| | | | | | | | | | |
| AQR Funds | | | | Annual Report | | | | December 2010 | | 113 |
| | | | | | | |
| | | | |
| Notes to Financial Statements | | | December 31, 2010 | |
which can be sold or repledged, are presented in the Fund’s Schedule of Investments. Collateral pledged by the Fund is segregated by the Fund’s custodian and identified in the Fund’s Schedule of Investments. Collateral can be in the form of cash or debt securities issued by the U.S. Government or related agencies or other securities as agreed to by the Fund and the applicable counterparty. Collateral requirements are determined based on the Fund’s net position with each counterparty. Termination events applicable to the Fund may occur upon a decline in the Fund’s net assets below a specified threshold over a certain period of time. Termination events applicable to counterparties may occur upon a decline in the counterparty’s long-term and short-term credit ratings below a specified level. In each case, upon occurrence, the other party may elect to terminate early and cause settlement of all derivative and foreign exchange contracts outstanding, including the payment of any losses and costs resulting from such early termination, as reasonably determined by the terminating party. Any decision by one or more of the Fund’s counterparties to elect early termination could impact a Fund’s future derivative activity. The Funds’ derivative assets and liabilities on the Statements of Assets and Liabilities are presented net when a legally enforceable master netting agreement exists between the Funds and a derivative counterparty.
Options: The Funds are authorized to write and purchase put and call options. When a Fund writes an option, an amount equal to the premium received by the Fund is reflected as an asset and an equivalent liability. The amount of the liability is subsequently marked to market to reflect the current market value of the option written. When a security is purchased or sold through an exercise of an option, the related premium paid (or received) is added to (or deducted from) the basis of the security acquired or deducted from (or added to) the proceeds of the security sold. When an option expires (or a Fund enters into a closing transaction), the Fund realizes a gain or loss on the option to the extent of the premiums received or paid (or gain or loss to the extent the cost of the closing transaction exceeds the premium paid or received). Written uncovered call options subject the Funds to unlimited risk of loss. Written covered call options limit the upside potential of a security above the strike price. Put options written subject the Funds to risk of loss if the value of the security declines below the exercise price minus the put premium.
The Fund, as writer of an option, bears the market risk of an unfavorable change in the price of the security underlying the written option. Written and purchased options are non-income producing investments.
Transactions in call options written during the period ended December 31, 2010 for the AQR Diversified Arbitrage Fund, were as follows:
| | | | | | | | |
| | | SHARES
SUBJECT TO
CALL | | | PREMIUM | |
| | |
Options outstanding, December 31, 2009 | | | (884 | ) | | $ | (40,941 | ) |
Options written | | | (165,576 | ) | | | (12,878,088 | ) |
Options terminated in closing purchase transactions | | | 7,270 | | | | 1,685,740 | |
Options expired | | | 139,613 | | | | 7,388,877 | |
| Options exercised | | | 13,447 | | | | 2,730,718 | |
| Options outstanding, December 31, 2010 | | | (6,130 | ) | | $ | (1,113,694 | ) |
Securities Lending: The Trust (excluding the AQR Diversified Arbitrage Fund, AQR Managed Futures Strategy Fund, and AQR Risk Parity Fund) may lend securities to brokers approved by the Adviser in order to generate additional income. Securities loaned are collateralized by cash, which is invested in Capital Shares of the JPMorgan Prime Money Market Fund. Upon termination of a loan, the Funds are required to return to the borrower the posted cash collateral. Loans are subject to termination by the Funds or the borrower at any time. Securities lending income is comprised of income earned on cash collateral investments (“Collateral Investments”), net of a rebate received from or paid to borrowers for use of cash collateral and lending agent fees. This amount is recorded as Income from securities lending (net) on the Statements of Operations. The Funds also receive payments from the borrower during the period of the loan, equivalent to dividends and interest earned on the securities loaned, which are recorded as Dividend or Interest income, respectively, on the Statements of Operations.
The Funds bear the risk of loss associated with the Collateral Investments and are not entitled to additional collateral from the borrower to cover any such losses. To the extent that the value of the Collateral Investments decline below the
| | | | | | | | | | |
| AQR Funds | | | | Annual Report | | | | December 2010 | | 114 |
| | | | | | | |
| | | | |
| Notes to Financial Statements | | | December 31, 2010 | |
amount owed to a borrower, a Fund may incur losses that exceed the amount it earned on lending the security. Upon termination of a loan, a Fund may use leverage (borrow money) to repay the borrower for cash collateral posted if the Advisor does not believe that it is prudent to sell the Collateral Investments to fund the payment of this liability.
Securities lending also involves counterparty risks, including the risk that the loaned securities may not be returned in a timely manner or at all.
Federal Income Taxes: Each Fund is treated as a separate taxable entity for federal income tax purposes. Each Fund intends to qualify as a “regulated investment company” under Subchapter M of the Internal Revenue Code of 1986 (“the Code”), as amended. If so qualified, each Fund will not be subject to federal income tax to the extent it distributes substantially all of its net investment income and capital gains to shareholders.
Management evaluates tax positions taken or expected to be taken in the course of preparing the Funds’ tax returns to determine whether the tax positions are “more-likely-than-not” of being sustained by the applicable tax authority. Tax positions not deemed to meet the more-likely-than-not threshold would be recorded as a tax benefit or expense in the current year. The Funds are required to analyze all open tax years. Open tax years are those years that are open for examination by the relevant income taxing authority. The returns of the Funds for the period from commencement of operations through December 31, 2010 are open for examination. As of December 31, 2010, the Funds had no examinations in progress.
The Funds have concluded that there is no tax liability/benefit resulting from uncertain income tax positions taken or expected to be taken. The Funds are also not aware of any tax positions for which it is reasonably possible that the total amounts of unrecognized tax expense will significantly change in twelve months.
Securities Transactions and Investment Income: Investment transactions are accounted for on trade date (the date the order to buy or sell is executed). Securities gains and losses are calculated on a specifically identified cost basis. Interest income is determined on the basis of coupon interest accrued using effective interest method adjusted for amortization of premiums and accretion of discounts using the effective yield method. Dividend income/expense is recorded on the ex-dividend date.
Allocation of Income and Expenses: In calculating the net asset value per share of each class, investment income, realized and unrealized gains and losses and expenses other than class specific expenses are allocated daily to each class of shares based upon the proportion of net assets of each class at the beginning of each day. Each Fund is charged for those expenses that are directly attributable to each series, such as advisory fees and registration costs.
The Funds record distributions received in excess of income from underlying investments as a reduction of cost of investments and/or realized gain. Such amounts are based on estimates (if actual amounts are not available) and actual amounts of income, realized gain and return of capital may differ from the estimated amounts. The Funds adjust the estimated amounts of components of distributions (and consequently its net investment income) as necessary once the issuers provide information about the actual composition of the distributions.
The Funds may be subject to foreign taxes on income, gains on investments or currency repatriation, a portion of which may be recoverable. The Funds will accrue such taxes and recoveries as applicable, based upon their current interpretation of tax rules and regulations that exist in the markets in which they invest.
Organization and Offering Costs: Costs incurred by the AQR Global Equity Fund, AQR Managed Futures Strategy Fund, and AQR Risk Parity Fund in connection with the organization of the Funds, professional fees, printing fees and the offering of the initial registration were $24,804, $80,500 and $21,302, respectively. All costs were expensed as incurred.
Foreign Currency Translation: The books and records of the Funds are maintained in U.S. dollars. Foreign currency amounts are translated into U.S. dollars at the prevailing exchange rates of such currencies against the U.S. dollar. The market value of investment securities and the other assets and liabilities are translated at the exchange rate as of the valuation date. Purchases and sales of investment securities, income and expenses are translated at the exchange rate prevailing on the respective dates of such transactions.
| | | | | | | | | | |
| AQR Funds | | | | Annual Report | | | | December 2010 | | 115 |
| | | | | | | |
| | | | |
| Notes to Financial Statements | | | December 31, 2010 | |
Although the net assets of the Funds are presented at the foreign exchange rates and market values at the close of the period, the Funds do not isolate that portion of the results of operations arising as a result of changes in the foreign exchange rates from the fluctuations arising from changes in the market prices of securities held or sold during the period. Accordingly, such foreign currency gains (losses) are included in the reported net realized and unrealized gains (losses) on investment transactions.
Reported realized foreign currency gains or losses arise from the disposition of foreign currency, currency gains or losses realized between the trade and settlement dates on securities transactions, and the difference between the amounts of dividends, interest and foreign withholding taxes recorded on each Fund’s books on the transaction date and the U.S. dollar equivalent of the amounts actually received or paid. Unrealized foreign exchange gains and losses arise from changes (due to the changes in the exchange rate) in the value of foreign currency and assets and liabilities (other than investments) denominated in foreign currencies, which are held at period end.
Cash and Cash Equivalents: Cash and cash equivalents includes US dollar and foreign currency at bank accounts at amounts which may exceed insured limits. The Funds are subject to risk to the extent that the institutions may be unable to fulfill their obligations.
Due to/from Broker: Due to/from Broker represents cash balances on deposit with the Funds’ primer brokers and counterparties. The Funds are subject to credit risk should the primer brokers and counterparties be unable to meet their obligations to the Funds.
Distributions to Shareholders: The Funds intend to declare and distribute substantially all of their net investment income and net realized capital gains, if any, at least annually. Income and capital gain distributions will be determined in accordance with Federal income tax regulations which may differ from GAAP. Distributions to shareholders are recorded on the ex-dividend date.
Indemnification: In the normal course of business, the Funds may enter into various agreements that provide for general indemnifications. The Funds’ maximum exposure under these arrangements is unknown as any potential exposure involves future claims that may be made against the Funds. However, based on experience, the Funds expect the risk of loss to be remote.
4. Federal Income Tax Matters
At December 31, 2010, the cost of long security positions and aggregate gross unrealized appreciation (depreciation) of investments for federal income tax purposes were as follows:
| | | | | | | | | | | | | | | | |
| FUND | | COST OF INVESTMENTS | | | GROSS UNREALIZED APPRECIATION | | | GROSS UNREALIZED
DEPRECIATION | | | NET UNREALIZED APPRECIATION (DEPRECIATION) | |
AQR Global Equity Fund | | $ | 364,013,812 | | | $ | 61,961,529 | | | $ | (11,498,015 | ) | | $ | 50,463,514 | |
AQR International Equity Fund | | | 393,787,354 | | | | 64,625,679 | | | | (11,496,131 | ) | | | 53,129,548 | |
AQR Diversified Arbitrage Fund | | | 1,429,724,045 | | | | 119,492,546 | | | | (26,077,939 | ) | | | 93,414,607 | |
AQR Managed Futures Strategy Fund | | | 869,945,562 | | | | — | | | | — | | | | — | |
AQR Risk Parity Fund | | | 22,715,807 | | | | 20,150 | | | | (173,901 | ) | | | (153,751 | ) |
AQR Momentum Fund | | | 130,894,706 | | | | 10,395,450 | | | | (446,735 | ) | | | 9,948,715 | |
AQR Small Cap Momentum Fund | | | 53,896,672 | | | | 6,015,578 | | | | (372,030 | ) | | | 5,643,548 | |
AQR International Momentum Fund | | | 56,385,575 | | | | 8,130,158 | | | | (2,426,617 | ) | | | 5,703,541 | |
The differences between book basis and tax basis appreciation (depreciation) on investments is primarily attributable to wash sale loss deferrals and passive foreign investment companies (AQR Global Equity Fund, AQR International Equity Fund and AQR International Momentum Fund).
| | | | | | | | | | |
| AQR Funds | | | | Annual Report | | | | December 2010 | | 116 |
| | | | | | | |
| | | | |
| Notes to Financial Statements | | | December 31, 2010 | |
At December 31, 2010, the components of accumulated earnings/loss on a tax-basis were as follows:
| | | | | | | | | | | | | | | | | | | | |
| FUND | | CURRENT
DISTRIBUTABLE ORDINARY INCOME | | | CURRENT DISTRIBUTABLE LONG TERM CAPITAL GAIN OR TAX BASIS CAPITAL LOSS CARRYFORWARDS | | | NET UNREALIZED APPRECIATION (DEPRECIATION) | | | OTHER TEMPORARY DIFFERENCES | | | TOTAL ACCUMULATED EARNINGS | |
AQR Global Equity Fund | | $ | 5,197,406 | | | $ | 1,346,648 | | | $ | 51,017,333 | | | $ | — | | | $ | 57,561,387 | |
AQR International Equity Fund | | | 7,812,047 | | | | 2,273,246 | | | | 52,198,810 | | | | — | | | | 62,284,103 | |
AQR Diversified Arbitrage Fund | | | 4,148,727 | | | | — | | | | 21,489,630 | | | | — | | | | 25,638,357 | |
AQR Managed Futures Strategy Fund | | | 8,271,751 | | | | 342,818 | | | | 12,472,525 | | | | (2,499,023 | ) | | | 18,588,071 | |
AQR Risk Parity Fund | | | 241,720 | | | | 87,967 | | | | (50,834 | ) | | | (142,432 | ) | | | 136,421 | |
AQR Momentum Fund | | | 647,448 | | | | 229,680 | | | | 9,948,715 | | | | — | | | | 10,825,843 | |
AQR Small Cap Momentum Fund | | | 412,458 | | | | 263,159 | | | | 5,643,548 | | | | — | | | | 6,319,165 | |
AQR International Momentum Fund | | | 123,457 | | | | (135,168 | ) | | | 5,868,297 | | | | — | | | | 5,856,586 | |
The differences between book basis and tax basis components of net assets are primarily attributable to tax deferral losses on wash sales and other book and tax differences including passive foreign investment companies (“PFIC”), forward foreign currency contracts, swap contracts, and foreign income from wholly owned controlled foreign corporations.
At December 31, 2010, the effect of permanent book/tax reclassifications resulted in increase (decrease) to the components of net assets as follows:
| | | | | | | | | | | | |
| FUND | | UNDISTRIBUTED NET INVESTMENT INCOME | | | ACCUMULATED NET REALIZED GAIN (LOSS) ON INVESTMENTS | | | PAID-IN CAPITAL | |
AQR Global Equity Fund | | $ | 8,580,526 | | | $ | (21,733,490 | ) | | $ | 13,152,964 | |
AQR International Equity Fund | | | 7,792,902 | | | | (513,570 | ) | | | (7,279,332 | ) |
AQR Diversified Arbitrage Fund | | | (1,537,704 | ) | | | 1,416,963 | | | | 120,741 | |
AQR Managed Futures Strategy Fund | | | 12,704,040 | | | | (19,626,999 | ) | | | 6,922,959 | |
AQR Risk Parity Fund | | | 279,986 | | | | (528,008 | ) | | | 248,022 | |
AQR Momentum Fund | | | (20,153 | ) | | | 20,153 | | | | — | |
AQR Small Cap Momentum Fund | | | (4,554 | ) | | | 4,554 | | | | — | |
AQR International Momentum Fund | | | (366,365 | ) | | | 366,365 | | | | — | |
For financial reporting purposes, capital accounts are adjusted to reflect the tax character of permanent book/tax differences. Reclassifications are primarily due to the tax treatment of net operating losses, swap contracts, distribution reclassifications, foreign currency reclassifications, sale of Real Estate Investment Trusts and PFIC’s. Results of operations and net assets were not affected by these reclassifications.
| | | | | | | | | | |
| AQR Funds | | | | Annual Report | | | | December 2010 | | 117 |
| | | | | | | |
| | | | |
| Notes to Financial Statements | | | December 31, 2010 | |
The tax character of the distributions paid during the periods ended December 31, 2010 and December 31, 2009, were as follows:
| | | | | | | | | | | | |
| | | DECEMBER 31, 2010 | | | | | | DECEMBER 31, 2009 | |
| FUND | | ORDINARY INCOME | | | CAPITAL GAINS | | | ORDINARY INCOME | |
AQR Global Equity Fund* | | $ | 14,994,426 | | | $ | 2,022,493 | | | | N/A | |
AQR International Equity Fund | | | 14,719,113 | | | | — | | | $ | 15,889,442 | |
AQR Diversified Arbitrage Fund | | | 16,563,956 | | | | — | | | | 2,319,939 | |
AQR Managed Futures Strategy Fund* | | | 9,578,985 | | | | 7,656,480 | | | | N/A | |
AQR Risk Parity Fund* | | | 248,610 | | | | — | | | | N/A | |
AQR Momentum Fund | | | 431,429 | | | | 12,799 | | | | 197,807 | |
AQR Small Cap Momentum Fund | | | 546,289 | | | | 29,957 | | | | 190,216 | |
AQR International Momentum Fund | | | 259,130 | | | | — | | | | 614,653 | |
| | * | The AQR Global Equity Fund, AQR Managed Futures Strategy Fund and AQR Risk Parity Fund commenced operations on December 31, 2009, January 6, 2010 and September 30, 2010, respectively. |
As of December 31, 2010, for Federal Income Tax purposes, the AQR International Momentum Fund has capital loss carryforwards available to offset capital gains, if any, to the extent provided by the Treasury regulations.
| | | | | | | | |
| FUND | | AMOUNT | | | YEAR OF EXPIRATION | |
AQR International Momentum Fund | | $ | 135,168 | | | | 2018 | |
5. Fair Value Measurements
The Funds utilize various inputs in determining the value of each Fund’s investments. GAAP establishes a hierarchy for inputs used in measuring fair value that maximizes the use of observable inputs and minimizes the use of unobservable inputs by requiring the most observable inputs be used when available. These inputs are summarized in the three broad levels as follows:
Level 1 — quoted prices in active markets for identical securities
Level 2 — other significant observable inputs (including quoted prices for similar securities, interest rates, pre-payment speeds, credit risk, etc.)
Level 3 — significant unobservable inputs (including the Fund’s own assumptions in determining the fair value of investments)
Valuation methodology and inputs
An investment asset’s or liability’s level within the fair value hierarchy is based on the lowest level input, individually or in aggregate, that is significant to fair value measurement. The objective of fair value measurement remains the same even when there is a significant decrease in the volume and level of activity for an asset or liability and regardless of the valuation technique used.
The valuation techniques used by the Fund to measure fair value during the year ended December 31, 2010 maximized the use of observable inputs and minimized the use of unobservable inputs.
The inputs or methodology used for valuing securities is not necessarily an indication of the risk associated with investing in those securities. The following are certain inputs and techniques that the Fund uses to evaluate how to classify each major category of assets and liabilities for Level 2 and Level 3, in accordance with GAAP.
Investments that trade in markets that are not considered to be active, but are valued based on quoted market prices, dealer quotations or alternative pricing sources supported by observable inputs are classified within Level 2. These include certain U.S. government and sovereign obligations, most government agency securities, investment-grade corporate bonds, money market funds and less liquid listed equities. Corporate and sovereign bonds and other fixed income instruments are valued at estimated fair value based on quotations from counterparties and other market participants, as well as pricing models using quoted inputs as provided by an independent pricing service. As Level 2 investments include positions that are not traded in active markets and/or are subject to transfer restrictions, valuations
| | | | | | | | | | |
| AQR Funds | | | | Annual Report | | | | December 2010 | | 118 |
| | | | | | | |
| | | | |
| Notes to Financial Statements | | | December 31, 2010 | |
may be adjusted to reflect illiquidity and/or non-transferability, which are generally based on available market information. Investments classified within Level 3 have significant unobservable inputs, as they trade infrequently or not at all. Level 3 instruments include less liquid corporate debt securities, illiquid warrants and illiquid securities. When observable prices are not available for these securities, the Funds use one or more valuation techniques (e.g., the market approach, the income approach or, the cost approach) for which sufficient and reliable data is available. Within Level 3, the use of the market approach generally consists of using comparable market transactions, while the use of the income approach generally consists of the net present value of estimated future cash flows, adjusted as appropriate for liquidity, credit, market and/or other risk factors. The inputs used by the Funds in estimating the value of Level 3 investments include the original transaction price, recent transactions in the same or similar instruments, completed or pending third-party transactions in the underlying investment or comparable issuers, subsequent rounds of financing, recapitalizations and other transactions across the capital structure, offerings in the equity or debt capital markets, and changes in financial ratios or cash flows. Level 3 investments may also be adjusted to reflect illiquidity and/or non-transferability, with the amount of such discount estimated by the Funds in the absence of market information. Assumptions used by the Funds due to the lack of observable inputs may significantly impact the resulting fair value and therefore the Funds’ results of operations.
The Funds invest in derivative instruments. Derivative instruments can be exchange traded or privately negotiated over-the-counter (“OTC”). Exchange-traded derivatives, such as futures contracts and exchange traded option contracts, are typically classified within Level 1 or Level 2 of the fair value hierarchy depending on whether or not they are deemed to be actively traded. Futures and option contracts that are listed on national exchanges and are freely transferable are valued at fair value based on their last sales price on the date of determination on the exchange that constitutes the principal market. OTC derivatives, including forwards, credit default swaps, total return swaps, and interest rate swaps, are valued by the Fund using observable inputs, such as quotations received from the counterparty, dealers or brokers, whenever available and considered reliable. Generally, a valuation model is used consistently for similar derivative types and model inputs, including, but not limited to, market prices, yield curves, credit spreads, volatilities and implied correlations which are obtained from outside brokers and/or pricing services when available. In instances where models are used, the value of an OTC derivative depends upon the contractual terms of, and specific risks inherent in, the instrument as well as the availability and reliability of observable inputs. Such inputs include market prices for reference securities, yield curves, credit curves, measures of volatility, prepayment rates and correlations of such inputs. Certain OTC derivatives, such as generic forwards, swaps and options, have inputs which can generally be corroborated by market data and are therefore classified within Level 2. Equity total return swap transactions are valued at fair value, based on the price of the underlying security. Interest rate swap contracts are valued at estimated fair value as determined by the Fund based on various valuation models which consider the terms of underlying contracts and market data inputs received from third parties.
Credit default swaps are carried at their estimated fair value, as determined in good faith by pricing services approved by the Board of Trustees. In addition to credit quality, the Funds monitor a variety of factors including cash flow assumptions, market activity, market sentiment and valuation as part of its ongoing process of assessing payment and performance risk. As payment and performance risk increases, the value of a credit default swap increases, resulting in recognition of unrealized gains for long positions and unrealized losses for short positions. Conversely, as payment and performance risk decreases, unrealized gains are recognized for short positions and unrealized losses are recognized for long positions. The change in value is recorded within unrealized appreciation/(depreciation) until the occurrence of a credit event or the termination of the swap, at which time a realized gain/(loss) is recorded. Those OTC derivatives that have less liquidity or for which inputs are unobservable are classified within Level 3. While the valuations of these less liquid OTC derivatives may utilize some Level 1 and/or Level 2 inputs, they also include other unobservable inputs which are considered significant to the fair value determination. At each measurement date, the Funds’ update the Level 1 and Level 2 inputs to reflect observable inputs, though the resulting gains and losses are reflected within Level 3 due to the significance of the unobservable inputs.
Transfers
Transfers into, and out of, Level 3 are valued utilizing values as of the begining of the period. Transfers from Level 2 to Level 3 or from Level 3 to Level 2 are due to a decline or an increase in market activity (e.g. frequency of trades), which resulted in a lack of or increase in available market inputs to determine price.
| | | | | | | | | | |
| AQR Funds | | | | Annual Report | | | | December 2010 | | 119 |
| | | | | | | |
| | | | |
| Notes to Financial Statements | | | December 31, 2010 | |
The following summarizes inputs used as of December 31, 2010 in valuing the Funds’ assets carried at fair value:
| | | | | | | | | | | | | | | | |
| AQR GLOBAL EQUITY FUND | | QUOTED PRICES
IN ACTIVE
MARKET
(LEVEL 1) | | | OTHER SIGNIFICANT
OBSERVABLE
INPUTS
(LEVEL 2) | | | SIGNIFICANT
UNOBSERVABLE
INPUTS
(LEVEL 3) | | | TOTALS | |
ASSETS | | | | | | | | | | | | | | | | |
Common Stocks† | | $ | 208,013,517 | | | $ | 174,311,979 | | | $ | — | | | $ | 382,325,496 | |
Preferred Stocks† | | | — | | | | 570,176 | | | | — | | | | 570,176 | |
Rights† | | | 6,588 | | | | — | | | | — | | | | 6,588 | |
Warrants† | | | — | | | | 1 | | | | — | | | | 1 | |
Foreign Currency Contracts* | | | — | | | | 2,290,745 | | | | — | | | | 2,290,745 | |
Money Market Funds | | | — | | | | 31,575,065 | | | | — | | | | 31,575,065 | |
| Total Return Swap Contracts | | | — | | | | 493,528 | | | | — | | | | 493,528 | |
| | | | |
Total Assets | | $ | 208,020,105 | | | $ | 209,241,494 | | | $ | — | | | $ | 417,261,599 | |
|
LIABILITIES | |
| Futures Contracts* | | $ | (567,868 | ) | | $ | — | | | $ | — | | | $ | (567,868 | ) |
| | | | |
Total Liabilities | | $ | (567,868 | ) | | $ | — | | | $ | — | | | $ | (567,868 | ) |
| * | Derivative instruments, including futures, foreign currency, and total return swap contracts are valued at the net unrealized appreciation (depreciation) on the instrument. |
| † | Please refer to the Schedule of Investments to view securities segregated by country. |
There were no material transfers between Levels 1 and 2 during the period.
| | | | | | | | | | | | | | | | |
| AQR INTERNATIONAL EQUITY FUND | | QUOTED PRICES
IN ACTIVE
MARKET
(LEVEL 1) | | | OTHER SIGNIFICANT
OBSERVABLE
INPUTS
(LEVEL 2) | | | SIGNIFICANT
UNOBSERVABLE
INPUTS
(LEVEL 3) | | | TOTALS | |
ASSETS | | | | | | | | | | | | | | | | |
Common Stocks† | | $ | — | | | $ | 399,168,161 | | | $ | 8,335 | | | $ | 399,176,496 | |
Preferred Stock† | | | — | | | | 1,944,745 | | | | — | | | | 1,944,745 | |
Money Market Funds | | | — | | | | 45,795,661 | | | | — | | | | 45,795,661 | |
Foreign Currency Contracts* | | | — | | | | 4,569,115 | | | | — | | | | 4,569,115 | |
| Total Return Swap Contracts* | | | — | | | | 439,723 | | | | — | | | | 439,723 | |
| | | | |
Total Assets | | $ | — | | | $ | 451,917,405 | | | $ | 8,335 | | | $ | 451,925,740 | |
|
LIABILITIES | |
| Futures Contracts* | | $ | (1,258,676 | ) | | $ | — | | | $ | — | | | $ | (1,258,676 | ) |
| | | | |
Total Liabilities | | $ | (1,258,676 | ) | | $ | — | | | $ | — | | | $ | (1,258,676 | ) |
|
†Please refer to the Schedule of Investments to view securities segregated by country. | |
| | | | | | | | | | |
| AQR Funds | | | | Annual Report | | | | December 2010 | | 120 |
| | | | | | | |
| | | | |
| Notes to Financial Statements | | | December 31, 2010 | |
The following is a reconciliation of assets in which significant unobservable inputs (Level 3) were used in determining fair value:
| | | | | | | | |
| | | COMMON
STOCKS | | | COMMERCIAL
PAPER | |
| Balance as of December 31, 2009 | | $ | 676 | | | $ | 88,336 | |
Securities transferred in (out) | | | 8,335 | | | | — | |
Securities purchased/(sold) | | | (11,089 | ) | | | (88,336 | ) |
Change in unrealized appreciation (depreciation) | | | 11,869 | | | | 364,670 | |
| Realized gain (loss) | | | (1,456 | ) | | | (364,670 | ) |
| | |
| Balance as of December 31, 2010 | | $ | 8,335 | | | $ | — | |
The total change in unrealized appreciation (depreciation) included in the Statements of Operations attributable to Level 3 investments still held at December 31, 2010 is $0 for common stocks and there was no change for commercial paper.
| * | Derivative instruments, including futures, foreign currency, and total return swap contracts are valued at the net unrealized appreciation (depreciation) on the instrument. |
There were no material transfers between Levels 1 and 2 during the period.
| | | | | | | | | | | | | | | | |
| AQR DIVERSIFIED ARBITRAGE FUND | | QUOTED PRICES
IN ACTIVE
MARKET
(LEVEL 1) | | | OTHER SIGNIFICANT
OBSERVABLE
INPUTS
(LEVEL 2) | | | SIGNIFICANT
UNOBSERVABLE
INPUTS
(LEVEL 3) | | | TOTALS | |
ASSETS | | | | | | | | | | | | | | | | |
Common Stocks† | | $ | 581,820,281 | | | $ | 15,959,953 | | | $ | 3,323,774 | | | $ | 601,104,008 | |
Convertible Preferred Stocks† | | | 28,822,504 | | | | 3,511,177 | | | | 580,905 | | | | 32,914,586 | |
Corporate Bonds† | | | — | | | | 228,832,859 | | | | 3,240,078 | | | | 232,072,937 | |
Convertible Bonds† | | | — | | | | 545,424,124 | | | | 1,864,435 | | | | 547,288,559 | |
Closed End Funds | | | 10,720,623 | | | | — | | | | — | | | | 10,720,623 | |
Rights† | | | 285,131 | | | | — | | | | — | | | | 285,131 | |
Warrants† | | | 28,494,794 | | | | 281,891 | | | | 3,543,581 | | | | 32,320,266 | |
| Money Market Funds | | | — | | | | 66,432,542 | | | | — | | | | 66,432,542 | |
| | | | |
Total Assets | | $ | 650,143,333 | | | $ | 860,442,546 | | | $ | 12,552,773 | | | $ | 1,523,138,652 | |
| | | | |
LIABILITIES | | | | | | | | | | | | | | | | |
Common Stocks (Sold Short)† | | $ | (635,303,735 | ) | | $ | — | | | $ | — | | | $ | (635,303,735 | ) |
Convertible Bonds (Sold Short)† | | | — | | | | (1,134,750 | ) | | | — | | | | (1,134,750 | ) |
Closed End Funds (Sold Short) | | | (19,066,979 | ) | | | — | | | | — | | | | (19,066,979 | ) |
Foreign currency contracts* | | | — | | | | (286,465 | ) | | | — | | | | (286,465 | ) |
Futures Contracts* | | | (545,947 | ) | | | — | | | | — | | | | (545,947 | ) |
Credit Default Swap Contracts* | | | — | | | | (1,452,422 | ) | | | — | | | | (1,452,422 | ) |
| Written Option Contracts* | | | (977,733 | ) | | | — | | | | — | | | | (977,733 | ) |
| | | | |
Total Liabilities | | $ | (655,894,394 | ) | | $ | (2,873,637 | ) | | $ | — | | | $ | (658,768,031 | ) |
|
† Please refer to the Schedule of Investments to view securities segregated by industry type. | |
| | | | | | | | | | |
| AQR Funds | | | | Annual Report | | | | December 2010 | | 121 |
| | | | | | | |
| | | | |
| Notes to Financial Statements | | | December 31, 2010 | |
The following is a reconciliation of assets in which significant unobservable inputs (Level 3) were used in determining fair value:
| | | | | | | | | | | | | | | | | | | | |
| | | COMMON STOCKS | | | CONVERTIBLE PREFERRED
STOCK | | | CORPORATE
BONDS | | | CONVERTIBLE
BONDS | | | WARRANTS | |
| Balance as of December 31, 2009 | | $ | 7,508 | | | $ | — | | | $ | — | | | $ | — | | | $ | — | |
Securities purchased | | | 3,009,864 | | | | 750,120 | | | | 3,492,980 | | | | 1,850,000 | | | | 974,398 | |
Accrued Discounts/(Premiums) | | | — | | | | — | | | | 87,215 | | | | — | | | | — | |
Change in unrealized appreciation (depreciation) | | | 306,402 | | | | (169,215 | ) | | | (340,117 | ) | | | 14,435 | | | | 2,569,183 | |
Transfers into Level Three | | | — | | | | — | | | | — | | | | — | | | | — | |
| | | | | |
| Balance as of December 31, 2010 | | $ | 3,323,774 | | | $ | 580,905 | | | $ | 3,240,078 | | | $ | 1,864,435 | | | $ | 3,543,581 | |
The total change in unrealized appreciation (depreciation) included in the Statements of Operations attributable to Level 3 investments still held at December 31, 2010 is $306,402, $(169,215), $(340,117), $14,435, and $2,569,183 for common stocks, convertible preferred stock, corporate bonds, convertible bonds and warrants, respectively.
| * | Derivative instruments, including futures, and foreign currency are valued at the unrealized appreciation (depreciation) on the instrument. Written options and credit default swap contracts are reported at market value. |
There were no material transfers between Levels 1 and 2 during the period.
| | | | | | | | | | | | | | | | |
AQR MANAGED FUTURES STRATEGY
FUND | | QUOTED PRICES
IN ACTIVE
MARKET
(LEVEL 1) | | | OTHER SIGNIFICANT
OBSERVABLE
INPUTS
(LEVEL 2) | | | SIGNIFICANT
UNOBSERVABLE
INPUTS
(LEVEL 3) | | | TOTALS | |
ASSETS | | | | | | | | | | | | | | | | |
Money Market Funds | | $ | — | | | $ | 869,945,562 | | | $ | — | | | $ | 869,945,562 | |
Total Return Swap Contracts* | | | — | | | | 3,277,326 | | | | — | | | | 3,277,326 | |
Futures Contracts* | | | 10,787,157 | | | | — | | | | — | | | | 10,787,157 | |
| Foreign Currency Contracts* | | | — | | | | 6,247,409 | | | | — | | | | 6,247,409 | |
| | | | |
Total Assets | | $ | 10,787,157 | | | $ | 879,470,297 | | | $ | — | | | $ | 890,257,454 | |
There were no material transfers between Levels 1 and 2 during the period.
There were no Level 3 securities held during the period.
| * | Derivative instruments, including futures, foreign currency and total return swap contracts, are valued at the unrealized appreciation (depreciation) on the instrument. |
| | | | | | | | | | | | | | | | |
| AQR RISK PARITY FUND | | QUOTED PRICES
IN ACTIVE
MARKET
(LEVEL 1) | | | OTHER SIGNIFICANT
OBSERVABLE
INPUTS
(LEVEL 2) | | | SIGNIFICANT
UNOBSERVABLE INPUTS
(LEVEL 3) | | | TOTALS | |
ASSETS | | | | | | | | | | | | | | | | |
Government Related Obligations | | $ | — | | | $ | 6,509,492 | | | $ | — | | | $ | 6,509,492 | |
U.S. Treasury Obligations | | | 3,838,111 | | | | — | | | | — | | | | 3,838,111 | |
Money Market Funds | | | — | | | | 12,214,453 | | | | — | | | | 12,214,453 | |
Futures Contracts* | | | 360,178 | | | | — | | | | — | | | | 360,178 | |
Forward Currency Contracts | | | — | | | | 45,622 | | | | — | | | | 45,622 | |
Credit Default Swaps* | | | — | | | | 409,549 | | | | — | | | | 409,549 | |
| Total Return Swap Contracts | | | — | | | | 22,504 | | | | — | | | | 22,504 | |
| | | | |
Total Assets | | $ | 4,198,289 | | | $ | 19,201,620 | | | $ | — | | | $ | 23,399,909 | |
| | | | | | | | | | |
| AQR Funds | | | | Annual Report | | | | December 2010 | | 122 |
| | | | | | | |
| | | | |
| Notes to Financial Statements | | | December 31, 2010 | |
| | | | | | | | | | | | | | | | |
| AQR RISK PARITY FUND | | QUOTED PRICES
IN ACTIVE
MARKET
(LEVEL 1) | | | OTHER SIGNIFICANT
OBSERVABLE
INPUTS
(LEVEL 2) | | | SIGNIFICANT
UNOBSERVABLE INPUTS
(LEVEL 3) | | | TOTALS | |
LIABILITIES | |
Interest Rate Swap Contracts* | | | — | | | | (109,597 | ) | | | — | | | | (109,597 | ) |
| Total Return Swap Contracts* | | | — | | | | (131,897 | ) | | | — | | | | (131,897 | ) |
| | | | |
Total Liabilities | | $ | — | | | $ | (241,494 | ) | | $ | — | | | $ | (241,494 | ) |
| * | Derivative instruments, including futures, foreign currency, interest rate and total return swap contracts, are valued at the unrealized appreciation (depreciation) on the instrument. Credit default swap contracts are reported at market value. |
There were no material transfers between Levels 1 and 2 during the period.
There were no Level 3 securities held during the period.
| | | | | | | | | | | | | | | | |
| AQR MOMENTUM FUND | | QUOTED PRICES
IN ACTIVE
MARKET
(LEVEL 1) | | | OTHER SIGNIFICANT
OBSERVABLE
INPUTS
(LEVEL 2) | | | SIGNIFICANT
UNOBSERVABLE
INPUTS (LEVEL 3) | | | TOTALS | |
ASSETS | | | | | | | | | | | | | | | | |
Common Stocks† | | $ | 121,167,593 | | | $ | — | | | $ | — | | | $ | 121,167,593 | |
| Money Market Funds | | | — | | | | 19,675,828 | | | | — | | | | 19,675,828 | |
| | | | |
Total Assets | | $ | 121,167,593 | | | $ | 19,675,828 | | | $ | — | | | $ | 140,843,421 | |
|
LIABILITIES | |
| Futures Contracts* | | $ | (1,434 | ) | | $ | — | | | $ | — | | | $ | (1,434 | ) |
| | | | |
Total Liabilities | | $ | (1,434 | ) | | $ | — | | | $ | — | | | $ | (1,434 | ) |
| * | Derivative instruments, including futures contracts, are valued at the unrealized appreciation (depreciation) on the instrument. |
| † | Please refer to the Schedule of Investments to view securities segregated by industry type. |
There were no material transfers between Levels 1 and 2 during the period.
| | | | | | | | | | | | | | | | |
| AQR SMALL CAP MOMENTUM FUND | | QUOTED PRICES
IN ACTIVE
MARKET
(LEVEL 1) | | | OTHER SIGNIFICANT
OBSERVABLE
INPUTS
(LEVEL 2) | | | SIGNIFICANT
UNOBSERVABLE
INPUTS
(LEVEL 3) | | | TOTALS | |
ASSETS | | | | | | | | | | | | | | | | |
Common Stocks† | | $ | 53,139,370 | | | $ | — | | | $ | — | | | $ | 53,139,370 | |
| Money Market Funds | | | — | | | | 6,400,850 | | | | — | | | | 6,400,850 | |
| | | | |
Total Assets | | $ | 53,139,370 | | | $ | 6,400,850 | | | $ | — | | | $ | 59,540,220 | |
|
LIABILITIES | |
| Futures Contracts* | | $ | (11,309 | ) | | $ | — | | | $ | — | | | $ | (11,309 | ) |
| | | | |
Total Liabilities | | $ | (11,309 | ) | | $ | — | | | $ | — | | | $ | (11,309 | ) |
| * | Derivative instruments, including futures contracts, are valued at the unrealized appreciation (depreciation) on the instrument. |
| † | Please refer to the Schedule of Investments to view securities segregated by industry type. |
| | | | | | | | | | |
| AQR Funds | | | | Annual Report | | | | December 2010 | | 123 |
| | | | | | | |
| | | | |
| Notes to Financial Statements | | | December 31, 2010 | |
There were no material transfers between Levels 1 and 2 during the period.
| | | | | | | | | | | | | | | | |
| AQR INTERNATIONAL MOMENTUM FUND | | QUOTED PRICES
IN ACTIVE
MARKET
(LEVEL 1) | | | OTHER SIGNIFICANT
OBSERVABLE
INPUTS
(LEVEL 2) | | | SIGNIFICANT
UNOBSERVABLE
INPUTS
(LEVEL 3) | | | TOTALS | |
ASSETS | | | | | | | | | | | | | | | | |
Common Stocks† | | $ | 10,137,450 | | | $ | 47,044,325 | | | $ | — | | | $ | 57,181,775 | |
Preferred Stocks† | | | — | | | | 2,433,828 | | | | — | | | | 2,433,828 | |
Exchange Traded Funds | | | 1,192,026 | | | | — | | | | — | | | | 1,192,026 | |
Rights† | | | 5,799 | | | | — | | | | — | | | | 5,799 | |
Warrants† | | | — | | | | 1 | | | | — | | | | 1 | |
Money Market Funds | | | — | | | | 1,275,687 | | | | — | | | | 1,275,687 | |
Foreign Currency Contracts* | | | — | | | | 10,442 | | | | — | | | | 10,442 | |
| Equity Basket Swap Contract* | | | — | | | | 72,399 | | |
| —
|
| | | 72,399 | |
| | | | |
Total Assets | | $ | 11,335,275 | | | $ | 50,836,682 | | | $ | — | | | $ | 62,171,957 | |
| * | Derivative instruments, including foreign currency and swap contracts, are valued at the unrealized appreciation (depreciation) on the instrument. |
| † | Please refer to the Schedule of Investments to view securities segregated by country. |
There were no material transfers between Levels 1 and 2 during the period.
6. Investment Transactions
During the period ended December 31, 2010, the cost of purchases and the proceeds from sales of investments (excluding swap contracts, foreign currency contracts, futures contracts and short-term investments) were as follows:
| | | | | | | | | | | | | | | | |
| FUND | | PURCHASES | | | SALES | | | SECURITIES SOLD SHORT | | | COVERS ON SECURITIES SOLD SHORT | |
AQR Global Equity Fund | | $ | 243,374,567 | | | $ | (267,951,797 | ) | | $ | — | | | $ | — | |
AQR International Equity | | | 384,122,770 | | | | (334,119,034 | ) | | | — | | | | — | |
AQR Diversified Arbitrage Fund | | | 2,745,983,753 | | | | (1,733,464,236 | ) | | | 1,082,414,196 | | | | (672,441,774 | ) |
AQR Managed Futures Strategy Fund | | | — | | | | — | | | | — | | | | — | |
AQR Risk Parity Fund | | | 12,705,644 | | | | 2,142,754 | | | | — | | | | — | |
AQR Momentum Fund | | | 168,059,666 | | | | (63,561,560 | ) | | | — | | | | — | |
AQR Small Cap Momentum Fund | | | 99,753,544 | | | | (55,963,166 | ) | | | — | | | | — | |
AQR International Momentum Fund | | | 115,279,358 | | | | (84,619,528 | ) | | | — | | | | — | |
During the period ended December 31, 2010, the cost of in-kind purchases for the AQR Global Equity Fund was $335,420,940 (see Note 11).
The AQR Risk Parity Fund had long-term purchases and sales of U.S. Government obligations of $4,772,002 and $882,902, respectively.
| | | | | | | | | | |
| AQR Funds | | | | Annual Report | | | | December 2010 | | 124 |
| | | | | | | |
| | | | |
| Notes to Financial Statements | | | December 31, 2010 | |
7. Derivative Instruments and Hedging Activities
Certain Funds use derivative instruments as part of their principal investment strategy to achieve their investment objectives. The effect of such derivative instruments on the Funds’ financial position and financial performance as reflected in the Statements of Assets and Liabilities and Statements of Operations for the period ended December 31, 2010 are as follows:
| | | | | | | | | | | | | | | | | | | | | | | | | | | | |
| | | ASSETS | | | LIABILITIES | |
| FUND | | UNREALIZED
APPRECIATION
ON FUTURES
CONTRACTS | | | SWAPS AT VALUE | | | UNREALIZED
APPRECIATION
ON FORWARD
CURRENCY
CONTRACTS | | | WRITTEN
OPTIONS
AT
MARKET
VALUE | | | UNREALIZED
DEPRECIATION
ON FUTURES
CONTRACTS | | | SWAPS AT VALUE | | | UNREALIZED
DEPRECIATION
ON FORWARD
CURRENCY
CONTRACTS | |
| Equity Risk Exposure: | | | | | | | | | | | | | | | | | | | | | | | | | | | | |
| AQR Global Equity Fund | | | $1,235,225 | | | | $493,528 | | | | $— | | | | $— | | | | $1,803,093 | | | | $— | | | | $— | |
| AQR International Equity Fund | | | 932,107 | | | | 439,723 | | | | — | | | | — | | | | 2,190,783 | | | | — | | | | — | |
| AQR Diversified Arbitrage Fund | | | — | | | | — | | | | — | | | | 977,733 | | | | 2,105,973 | | | | — | | | | — | |
| AQR Managed Futures Strategy Fund | | | 3,689,869 | | | | 1,282,171 | | | | — | | | | — | | | | 943,995 | | | | 11,986 | | | | — | |
| AQR Risk Parity Fund | | | 92,487 | | | | 35,349 | | | | — | | | | — | | | | 24,809 | | | | 144,742 | | | | — | |
| AQR Momentum Fund | | | — | | | | — | | | | — | | | | — | | | | 1,434 | | | | — | | | | — | |
| AQR Small Cap Momentum Fund | | | — | | | | — | | | | — | | | | — | | | | 11,309 | | | | — | | | | — | |
| AQR International Momentum Fund | | | — | | | | 72,399 | | | | — | | | | — | | | | — | | | | — | | | | — | |
| | | | | |
| Foreign Exchange Rate Risk Exposure: | | | | | | | | | | | | | | | | | | | | | |
| AQR Global Equity Fund | | | — | | | | — | | | | 7,154,146 | | | | — | | | | — | | | | — | | | | 4,863,401 | |
| AQR International Equity Fund | | | — | | | | — | | | | 10,307,337 | | | | — | | | | — | | | | — | | | | 5,738,222 | |
| AQR Diversified Arbitrage Fund | | | — | | | | — | | | | 422,250 | | | | — | | | | — | | | | — | | | | 708,715 | |
| AQR Managed Futures Strategy Fund | | | 166,314 | | | | — | | | | 27,742,833 | | | | — | | | | — | | | | — | | | | 21,495,424 | |
| AQR Risk Parity Fund | | | — | | | | — | | | | 206,650 | | | | — | | | | — | | | | — | | | | 161,028 | |
| AQR International Momentum Fund | | | — | | | | — | | | | 14,048 | | | | — | | | | — | | | | — | | | | 3,606 | |
| | | | | | | |
| Interest Rate Risk Exposure: | | | | | | | | | | | | | | | | | | | | | | | | | | | | |
| AQR Diversified Arbitrage Fund | | | 1,560,026 | | | | — | | | | — | | | | — | | | | — | | | | — | | | | — | |
| AQR Managed Futures Strategy Fund | | | 817,199 | | | | 28,139 | | | | — | | | | — | | | | 543,145 | | | | 88,725 | | | | — | |
| AQR Risk Parity Fund | | | 6,118 | | | | 7,900 | | | | — | | | | — | | | | — | | | | 117,497 | | | | — | |
| | | | | | | |
| Credit Risk Exposure: | | | | | | | | | | | | | | | | | | | | | | | | | | | | |
| AQR Diversified Arbitrage Fund | | | — | | | | — | | | | — | | | | — | | | | — | | | | 1,452,422 | | | | — | |
| AQR Risk Parity Fund | | | — | | | | 409,549 | | | | — | | | | — | | | | — | | | | — | | | | — | |
| | | | | | | |
| Commodity Exposure: | | | | | | | | | | | | | | | | | | | | | | | | | | | | |
| AQR Managed Futures Strategy Fund | | | 8,553,395 | | | | 2,173,177 | | | | — | | | | — | | | | 952,480 | | | | 105,450 | | | | — | |
| AQR Risk Parity Fund | | | 392,224 | | | | — | | | | — | | | | — | | | | 105,842 | | | | — | | | | — | |
| | | | | | | |
| Netting | | | | | | | | | | | | | | | | | | | | | | | | | | | | |
| AQR Global Equity Fund | | | (1,235,225) | | | | — | | | | (4,863,401) | | | | — | | | | (1,235,225) | | | | — | | | | (4,863,401) | |
| AQR International Equity Fund | | | (932,107) | | | | — | | | | (5,738,222) | | | | — | | | | (932,107) | | | | — | | | | (5,738,222) | |
| AQR Diversified Arbitrage Fund | | | (1,560,026) | | | | — | | | | (422,250) | | | | — | | | | (1,560,026) | | | | — | | | | (422,250) | |
| AQR Managed Futures Strategy Fund | | | (2,439,620) | | | | (206,161) | | | | (21,495,424) | | | | — | | | | (2,439,620) | | | | (206,161) | | | | (21,495,424) | |
| AQR Risk Parity Fund | | | (130,651) | | | | (262,239) | | | | (161,028) | | | | — | | | | (130,651) | | | | (262,239) | | | | (161,028) | |
| AQR Momentum Fund | | | — | | | | — | | | | — | | | | — | | | | — | | | | — | | | | — | |
| AQR Small Cap Momentum Fund | | | — | | | | — | | | | — | | | | — | | | | — | | | | — | | | | — | |
| AQR International Momentum Fund | | | — | | | | — | | | | (3,606) | | | | — | | | | — | | | | — | | | | (3,606) | |
| | | | | | |
| Net Fair Value of Derivative Contracts | | | | | | | | | | | | | | | | | | | | | | | | | |
| AQR Global Equity Fund | | | — | | | | 493,528 | | | | 2,290,745 | | | | — | | | | 567,868 | | | | — | | | | — | |
| AQR International Equity Fund | | | — | | | | 439,723 | | | | 4,569,115 | | | | — | | | | 1,258,676 | | | | — | | | | — | |
| AQR Diversified Arbitrage Fund | | | — | | | | — | | | | — | | | | 977,733 | | | | 545,947 | | | | 1,452,422 | | | | 286,465 | |
| AQR Managed Futures Strategy Fund | | | 10,787,157 | | | | 3,277,326 | | | | 6,247,409 | | | | — | | | | — | | | | — | | | | — | |
| AQR Risk Parity Fund | | | 360,178 | | | | 190,559 | | | | 45,622 | | | | — | | | | — | | | | — | | | | — | |
| AQR Momentum Fund | | | — | | | | — | | | | — | | | | — | | | | 1,434 | | | | — | | | | — | |
| AQR Small Cap Momentum Fund | | | — | | | | — | | | | — | | | | — | | | | 11,309 | | | | — | | | | — | |
| AQR International Momentum Fund | | | — | | | | 72,399 | | | | 10,442 | | | | — | | | | — | | | | — | | | | — | |
| | | | | | | | | | |
| AQR Funds | | | | Annual Report | | | | December 2010 | | 125 |
| | | | | | | |
| | | | |
| Notes to Financial Statements | | | December 31, 2010 | |
The following is the effect of Derivative Instruments on the Statements of Operations for the period ended December 31, 2010:
| | | | | | | | | | | | | | | | | | | | | | | | | | | | | | | | |
| | | REALIZED GAIN (LOSS) ON DERIVATIVES
RECOGNIZED AS A RESULT FROM OPERATIONS: | | | NET CHANGE IN UNREALIZED APPRECIATION
(DEPRECIATION) ON DERIVATIVES RECOGNIZED AS
A RESULT FROM OPERATIONS: | |
| FUND | | FUTURES
AND SWAPS
ON
FUTURES
CONTRACTS* | | | SWAPS
CONTRACTS | | | FORWARD
CURRENCY
CONTRACTS | | | WRITTEN
OPTIONS | | | FUTURES
AND SWAPS
ON
FUTURES
CONTRACTS* | | | SWAPS
CONTRACTS | | | FORWARD
CURRENCY
CONTRACTS | | | WRITTEN
OPTIONS | |
| Equity Risk Exposure: | | | | | | | | | | | | | | | | | | | | | | | | | | | | | | | | |
AQR Global Equity Fund | | | $(38,711) | | | | $— | | | | $— | | | | $— | | | | $220,340 | | | | $— | | | | $— | | | | $— | |
AQR International Equity Fund | | | (314,296) | | | | — | | | | — | | | | — | | | | (2,139,284) | | | | — | | | | — | | | | — | |
AQR Diversified Arbitrage Fund | | | (8,817,593) | | | | — | | | | — | | | | 7,361,398 | | | | (1,966,143) | | | | — | | | | — | | | | 141,330 | |
AQR Managed Futures Strategy Fund | | | 15,903,220 | | | | — | | | | — | | | | — | | | | 4,028,045 | | | | — | | | | — | | | | — | |
AQR Risk Parity Fund | | | 326,160 | | | | — | | | | — | | | | — | | | | (41,715) | | | | — | | | | — | | | | — | |
AQR Momentum Fund | | | 337,965 | | | | — | | | | — | | | | — | | | | (1,293) | | | | — | | | | — | | | | — | |
AQR Small Cap Momentum Fund | | | 410,041 | | | | — | | | | — | | | | — | | | | (11,309) | | | | — | | | | — | | | | — | |
AQR International Momentum Fund | | | — | | | | 638,038 | | | | — | | | | — | | | | — | | | | 43,827 | | | | — | | | | — | |
| | | | | | | | |
| Foreign Exchange Rate Risk Exposure: | | | | | | | | | | | | | | | | | | | | | | | | | | | | | | | | |
AQR Global Equity Fund | | | — | | | | — | | | | 5,990,830 | | | | — | | | | — | | | | — | | | | 2,908,082 | | | | — | |
AQR International Equity Fund | | | — | | | | — | | | | 3,097,471 | | | | — | | | | — | | | | — | | | | 5,343,590 | | | | — | |
AQR Diversified Arbitrage Fund | | | — | | | | — | | | | (209,109) | | | | — | | | | — | | | | — | | | | (282,918) | | | | — | |
AQR Managed Futures Strategy Fund | | | 28,689 | | | | — | | | | (572,573) | | | | — | | | | 166,314 | | | | — | | | | 6,247,409 | | | | — | |
AQR Risk Parity Fund | | | — | | | | — | | | | 231,097 | | | | — | | | | — | | | | — | | | | 45,622 | | | | — | |
AQR International Momentum Fund | | | — | | | | — | | | | (331,704) | | | | — | | | | — | | | | — | | | | 179,153 | | | | — | |
| | | | | | | | |
| Interest Rate Risk Exposure: | | | | | | | | | | | | | | | | | | | | | | | | | | | | | | | | |
AQR Diversified Arbitrage Fund | | | (3,281,385) | | | | — | | | | — | | | | — | | | | 1,003,058 | | | | — | | | | — | | | | — | |
AQR Managed Futures Strategy Fund | | | 3,939,811 | | | | — | | | | — | | | | — | | | | 201,482 | | | | — | | | | — | | | | — | |
AQR Risk Parity Fund | | | (486,453) | | | | — | | | | — | | | | — | | | | 6,118 | | | | (109,597) | | | | — | | | | — | |
| | | | | | | | |
| Credit Risk Exposure: | | | | | | | | | | | | | | | | | | | | | | | | | | | | | | | | |
AQR Diversified Arbitrage Fund | | | — | | | | (5,831,063) | | | | — | | | | — | | | | — | | | | (2,196,784) | | | | — | | | | — | |
AQR Risk Parity Fund | | | — | | | | 141,580 | | | | — | | | | — | | | | — | | | | 211,649 | | | | — | | | | — | |
| | | | | | | | |
| Commodity Risk Exposure: | | | | | | | | | | | | | | | | | | | | | | | | | | | | | | | | |
AQR Managed Futures Strategy Fund | | | 6,844,497 | | | | — | | | | — | | | | — | | | | 9,668,642 | | | | — | | | | — | | | | — | |
AQR Risk Parity Fund | | | 258,556 | | | | — | | | | — | | | | — | | | | 286,382 | | | | — | | | | — | | | | — | |
| * | Futures and swaps on futures are consolidated for financial reporting purposes. |
For swaps, futures and forward foreign currency contracts, the Funds may be required to post collateral if a Fund is in a net liability position with the counterparty exceeding certain amounts. Additionally, counterparties may immediately terminate the position if a Fund fails to maintain sufficient asset coverage for its contracts or its net assets decline by stated percentages.
As of December 31, 2010, the following Funds had net liability positions:
| | | | | | | | |
| FUND | | DERIVATIVES IN NET
LIABILITY POSITION | | | COLLATERAL
POSTED | |
AQR Diversified Arbitrage Fund | | $ | (3,262,567 | ) | | $ | 17,890,872 | |
AQR Momentum Fund | | | (1,434 | ) | | | 298,540 | |
AQR Small Cap Momentum Fund | | | (11,309 | ) | | | 189,960 | |
| | | | | | | | | | |
| AQR Funds | | | | Annual Report | | | | December 2010 | | 126 |
| | | | | | | |
| | | | |
| Notes to Financial Statements | | | December 31, 2010 | |
For the period ended December 31, 2010, the quarterly average values of the derivatives held by the Funds were as follows:
| | | | | | | | | | | | | | | | |
| FUND | | SWAP
CONTRACTS (NOTIONAL VALUE) | | | FUTURES
CONTRACTS* | | | WRITTEN
OPTION
CONTRACTS* | | | FOREIGN
FORWARD
CURRENCY
CONTRACTS* | |
AQR Global Equity Fund | | $ | (8,547,510 | ) | | $ | 41,879,161 | | | | $— | | | $ | 27,459,023 | |
AQR International Equity Fund | | | (7,562,044 | ) | | | 53,855,334 | | | | — | | | | 52,941,168 | |
AQR Diversified Arbitrage Fund | | | 15,052,288 | | | | (209,666,104 | ) | | | (755,462 | ) | | | (14,925,660 | ) |
AQR Managed Futures Strategy Fund | | | 107,215,016 | | | | 1,076,775,011 | | | | — | | | | 78,652,326 | |
AQR Risk Parity Fund | | | 2,685,598,939 | | | | 9,886,162 | | | | — | | | | (442,124 | ) |
AQR Momentum Fund | | | — | | | | 1,522,491 | | | | — | | | | — | |
AQR Small Cap Momentum Fund | | | — | | | | 293,363 | | | | — | | | | — | |
AQR International Momentum Fund | | | 2,055,828 | | | | — | | | | — | | | | 2,700,732 | |
| | * | Values as of each quarter end are used to calculate the average represented. |
The Funds’ derivative contracts held at December 31, 2010, are not accounted for as hedging instruments under GAAP.
8. Investment Advisory and Other Agreements
The Adviser serves as the investment adviser to each of the Funds pursuant to an Investment Advisory Agreement, dated December 4, 2008, as amended from time to time, or an Investment Management Agreement, dated June 10, 2010, as amended from time to time, entered into by the Trust, on behalf of the Funds (together, the “Advisory Agreement”). Under the Advisory Agreement, the Adviser furnishes a continuous investment program for each Fund’s portfolio, makes day-to-day investment decisions for the Funds, and manages the Funds’ investments in accordance with the stated policies of each Fund. The Adviser is also responsible for selecting brokers and dealers to execute purchase and sale orders for the portfolio transactions of each Fund, subject to its obligation to seek best execution. The Adviser provides persons satisfactory to the Trustees to serve as officers of the Funds. Pursuant to the Advisory Agreement, the Funds pay the Adviser a management fee calculated on the average daily net assets for each Fund, in the annual ratios below:
| | | | |
| FUND | | RATIO | |
AQR Global Equity Fund | | | 0.40 | % |
AQR International Equity Fund | | | 0.45 | |
AQR Diversified Arbitrage Fund | | | 1.00 | |
AQR Managed Futures Strategy Fund | | | 1.05 | |
AQR Risk Parity Fund | | | 0.75 | |
AQR Momentum Fund | | | 0.25 | |
AQR Small Cap Momentum Fund | | | 0.35 | |
AQR International Momentum Fund | | | 0.35 | |
Effective October 1, 2010, the shareholders of the AQR Diversified Arbitrage Fund agreed to increase the Fund’s investment advisory fee from 0.70% to 1.00%.
The Trust and the Adviser have entered into a Fee Waiver and Expense Reimbursement Agreement whereby the Adviser has agreed to waive its fee and/or reimburse each Fund at least through December 31, 2010 for AQR Global Equity Fund and AQR International Equity Fund, May 1, 2011 for AQR Diversified Arbitrage Fund, AQR Managed Futures Strategy Fund, AQR Momentum Fund, AQR Small Cap Momentum Fund and AQR International Momentum Fund, and May 1, 2012 for AQR Risk Parity Fund. The Adviser has agreed to waive and/or reimburse each Fund to the extent that the total annual fund operating expense ratios (including consolidation), exclusive of interest, taxes, borrowing costs, acquired fund fees and expenses, dividend expense related to short sales, and extraordinary expenses exceed the following ratios:
| | | | |
| FUND CLASS | | RATIO | |
AQR Global Equity Fund — Class I | | | 0.85 | % |
AQR Global Equity Fund — Class N | | | 1.20 | |
| | | | | | | | | | |
| AQR Funds | | | | Annual Report | | | | December 2010 | | 127 |
| | | | | | | |
| | | | |
| Notes to Financial Statements | | | December 31, 2010 | |
| | | | |
| FUND CLASS | | RATIO | |
AQR Global Equity Fund — Class Y | | | 0.50 | % |
AQR International Equity Fund — Class I | | | 0.90 | |
AQR International Equity Fund — Class N | | | 1.25 | |
AQR International Equity Fund — Class Y | | | 0.55 | |
AQR Diversified Arbitrage Fund — Class I | | | 1.20 | |
AQR Diversified Arbitrage Fund — Class N | | | 1.50 | |
AQR Managed Futures Strategy Fund — Class I | | | 1.25 | |
AQR Managed Futures Strategy Fund — Class N | | | 1.50 | |
AQR Risk Parity Fund – Class I | | | 0.95 | |
AQR Risk Parity Fund – Class N | | | 1.20 | |
AQR Momentum Fund — Class L | | | 0.49 | |
AQR Small Cap Momentum Fund — Class L | | | 0.65 | |
AQR International Momentum Fund — Class L | | | 0.65 | |
The Trust, in turn, agreed that the Funds will repay the fee waiver/expense reimbursement to the Adviser. Such repayment shall be made only out of the class of the Fund for which the applicable fee waiver and expense reimbursement was made. Repayments with respect to a Fund must be limited to amounts that do not cause the aggregate operating expenses of the Fund attributable to a share class during a year in which such repayment is made to exceed the applicable ratios reflected in the table above. A repayment shall be payable only to the extent it can be made during the thirty six months following the applicable period during which the Adviser waived fees or reimbursed the applicable Fund for its operating expenses under the Agreement.
For the period ended December 31, 2010, the amounts waived and reimbursed by the Adviser, as well as the amounts available for potential future recoupment by the Adviser and the expiration schedule at December 31, 2010 are as follows:
| | | | | | | | | | | | | | | | |
| | | FEES WAIVED/
REIMBURSED
FOR THE
PERIOD
DECEMBER 31,
2010 | | | TOTAL
POTENTIAL
RECOUPMENT
AMOUNT | | | POTENTIAL RECOUPMENT
AMOUNTS EXPIRING | |
| | | | DECEMBER 31,
2012 | | | DECEMBER 31,
2013 | |
| | | | |
| AQR GLOBAL EQUITY FUND | | | | | | | | | | | | | | | | |
Class I | | $ | — | | | $ | — | | | $ | — | | | $ | — | |
Class N | | | — | | | | — | | | | — | | | | — | |
| Class Y | | | 735,651 | | | | 287,811 | | | | — | | | | 287,811 | ** |
| | | | |
| Totals | | $ | 735,651 | | | $ | 287,811 | | | $ | — | | | $ | 287,811 | |
| | | | |
| AQR INTERNATIONAL EQUITY FUND | | | | | | | | | | | | | | | | |
Class I | | $ | 60,578 | | | $ | 68,908 | | | $ | 8,330 | | | $ | 60,578 | |
Class N | | | 19,745 | | | | 21,120 | | | | 1,375 | | | | 19,745 | |
| Class Y | | | 675,160 | | | | 488,290 | | | | 242,140 | * | | | 246,150 | ** |
| | | | |
| Totals | | $ | 755,483 | | | $ | 578,318 | | | $ | 251,845 | | | $ | 326,473 | |
| | | | |
| AQR DIVERSIFIED ARBITRAGE FUND | | | | | | | | | | | | | | | | |
Class I | | $ | 129,192 | | | $ | 431,903 | | | $ | 302,711 | * | | $ | 129,192 | |
| Class N | | | 106,194 | | | | 309,121 | | | | 202,927 | | | | 106,194 | |
| | | | |
| Totals | | $ | 235,386 | | | $ | 741,024 | | | $ | 505,638 | | | $ | 235,386 | |
| | | | | | | | | | |
| AQR Funds | | | | Annual Report | | | | December 2010 | | 128 |
| | | | | | | |
| | | | |
| Notes to Financial Statements | | | December 31, 2010 | |
| | | | | | | | | | | | | | | | |
| | | FEES WAIVED/
REIMBURSED
FOR THE
PERIOD
DECEMBER 31,
2010 | | | TOTAL
POTENTIAL
RECOUPMENT
AMOUNT | | | POTENTIAL RECOUPMENT
AMOUNTS EXPIRING | |
| | | | DECEMBER 31,
2012 | | | DECEMBER 31,
2013 | |
| | | | |
| AQR MANAGED FUTURES STRATEGY FUND | | | | | | | | | | | | | | | | |
Class I | | $ | 43,567 | | | $ | 43,567 | | | $ | — | | | $ | 43,567 | |
| Class N | | | 52,983 | | | | 52,983 | | | | — | | | | 52,983 | |
| | | | |
| Totals | | $ | 96,550 | | | $ | 96,550 | | | $ | — | | | $ | 96,550 | |
| | | | |
| AQR RISK PARITY FUND | | | | | | | | | | | | | | | | |
Class I | | $ | 68,981 | | | $ | 68,981 | | | $ | — | | | $ | 68,981 | |
| Class N | | | 64,602 | | | | 64,602 | | | | — | | | | 64,602 | |
| | | | |
| Totals | | $ | 133,583 | | | $ | 133,583 | | | $ | — | | | $ | 133,583 | |
| | | | |
| AQR MOMENTUM FUND | | | | | | | | | | | | | | | | |
| Class L | | $ | 165,059 | | | $ | 290,318 | | | $ | 125,259 | | | $ | 165,059 | |
| | | | |
| AQR SMALL CAP MOMENTUM FUND | | | | | | | | | | | | | | | | |
Class L | | $ | 168,573 | | | $ | 293,165 | | | $ | 124,592 | | | $ | 168,573 | |
| | | | |
| AQR INTERNATIONAL MOMENTUM FUND | | | | | | | | | | | | | | | | |
Class L | | $ | 266,187 | | | $ | 387,726 | | | $ | 121,539 | | | $ | 266,187 | |
| | * | The Adviser has agreed to forgo future recoupments pertaining to Shareholder Servicing Fee Waivers expiring on December 31, 2012 of $281,012 and $20,131 for the AQR International Equity Fund and AQR Diversified Arbitrage Fund, respectively. |
| | ** | The Adviser has agreed to forgo future recoupments incurred in the current period pertaining to Shareholder Servicing Fee Waivers expiring on December 31, 2013 of $447,840 and $429,010 for the AQR Global Equity Fund and AQR International Equity Fund, respectively. |
Pursuant to the Sub-Advisory Agreement between the Sub-Adviser, the Adviser and the Trust, the Adviser will pay the Sub-Adviser an annual fee, payable monthly, at the annual rate of 0.70% of the Fund’s average daily net assets. Effective October 1, 2010, the shareholders of the AQR Diversified Arbitrage Fund approved the Amended and Restated Investment Sub-Advisory Agreement (the “A&R Sub-Advisory Agreement”), between the Sub-Adviser, the Adviser and the Trust. Under the A&R Sub-Advisory Agreement, the Adviser will pay the Sub-Adviser an annual fee, payable monthly, at an annual rate of 1.00% of the Fund’s average daily net assets.
The Advisor contributed capital in the amount of $15,777 in the AQR International Equity Fund Class Y shares during the period ended December 31, 2009.
For the year ended December 31, 2010 the Advisor contributed $544,199 into the AQR Diversified Arbitrage Fund. The impact of the Adviser’s contribution increased the Fund’s total return by 0.08%.
Effective September 12, 2010 for the AQR Managed Futures Strategy Fund and September 19, 2010 for the remaining active Funds in the Trust, J.P. Morgan Investor Services Co., serves as the Funds’ Administrator and Accounting Agent and JPMorgan Chase Bank, N.A., serves as Custodian. Prior to the aforementioned dates, The Bank of New York Mellon served as the Funds’ Administrator, Custodian and Accounting Agent.
| | | | | | | | | | |
| AQR Funds | | | | Annual Report | | | | December 2010 | | 129 |
| | | | | | | |
| | | | |
| Notes to Financial Statements | | | December 31, 2010 | |
ALPS Fund Services, Inc. serves as the Funds’ Transfer Agent, and ALPS Distributors, Inc. serves as the Funds’ Distributor. Fees incurred by the Funds for sub-transfer agency services for the period ended December 31, 2010, were as follows:
| | | | |
| FUND CLASS | | AMOUNT | |
AQR Global Equity Fund — Class I | | $ | 16 | |
AQR Global Equity Fund — Class N | | | 66 | |
AQR International Equity Fund — Class I | | | 14,035 | |
AQR International Equity Fund — Class N | | | 378 | |
AQR Diversified Arbitrage Fund — Class I | | | 167,438 | |
AQR Diversified Arbitrage Fund — Class N | | | 153,565 | |
AQR Managed Futures Strategy Fund — Class I | | | 41,738 | |
AQR Managed Futures Strategy Fund — Class N | | | 20,624 | |
AQR Risk Parity Fund – Class I | | | 1,529 | |
AQR Risk Parity Funds – Class N | | | 1,529 | |
AQR Momentum Fund — Class L | | | 2,201 | |
AQR Small Cap Momentum Fund — Class L | | | 178 | |
AQR International Momentum Fund — Class L | | | 10,872 | |
9. Distribution and Service Plans
The Trust has adopted a Plan of Distribution (the “Plan”) pursuant to Rule 12b-1 under the 1940 Act with respect to the Class N shares of the Funds, as applicable. The Plan allows for the payment of services related to the distribution and servicing of these shares at a rate of up to 0.25% per annum of the average daily net asset value of the Class N shares of the Funds, as applicable.
Pursuant to the Shareholder Services Agreement, between the Trust (excluding the AQR Diversified Arbitrage Fund, AQR Managed Futures Strategy Fund and AQR Risk Parity Fund) and the Adviser, the Adviser receives an annual fee (the “Shareholder Services Fee”), payable monthly, at the annual rate of 0.30%, 0.35%, and 0.15% of the average daily net assets of the Class I, Class N and Class L shares, respectively. The Adviser also provides a wide range of services to the Funds and their shareholders under a separate Shareholder Services Agreement. These services include, among others, access to performance information reporting, analysis and explanations of Fund reports as well as electronic access to Fund information. In addition, the Adviser may, from time to time, compensate third parties (including financial intermediaries) from the fees the Adviser receives under the Shareholder Services Agreement for non- distribution shareholder services such third parties provide to clients or customers that are shareholders of the Funds. Fees incurred by the Funds under the Plan and/or the shareholder services agreement for the period ended December 31, 2010, were as follows:
For the period January 1, 2010 through June 30, 2010, the Class Y shares of the Funds charged a 0.25% Shareholder Service Fee. Effective July 1, 2010, the Board of Trustees approved the elimination of this fee.
For the period January 1, 2010 through June 30, 2010, the Class I shares of the AQR Diversified Arbitrage Fund charged a 0.30% Shareholder Services Fee. For the period July 1, 2010 through September 30, 2010, the Board of Trustees approved the rate change to 0.25%. Effective October 1, 2010, the shareholders of the Fund in conjunction with the approval of the new investment advisory fee approved the elimination of the Shareholders Services fees for Class I shares.
For the period January 1, 2010 through September 30, 2010, the Class N shares of the AQR Diversified Arbitrage Fund charged a 0.35% Shareholder Services Fee. Effective October 1, 2010, the shareholders of the Fund in conjunction with the approval of the new investment advisory fee approved the elimination of the Shareholder Services fees for Class N shares.
| | | | |
| FUND CLASS | | AMOUNT | |
AQR Global Equity Fund — Class I | | $ | 3,722 | |
AQR Global Equity Fund — Class N | | | 3,892 | |
AQR Global Equity Fund — Class Y | | | 447,840 | |
AQR International Equity Fund — Class I | | | 212,805 | |
| | | | | | | | | | |
| AQR Funds | | | | Annual Report | | | | December 2010 | | 130 |
| | | | | | | |
| | | | |
| Notes to Financial Statements | | | December 31, 2010 | |
| | | | |
| FUND CLASS | | AMOUNT | |
AQR International Equity Fund — Class N | | $ | 3,165 | |
AQR International Equity Fund — Class Y | | | 429,010 | |
AQR Diversified Arbitrage Fund — Class I | | | 681,706 | |
AQR Diversified Arbitrage Fund — Class N | | | 501,200 | |
AQR Momentum Fund — Class L | | | 52,283 | |
AQR Small Cap Momentum Fund — Class L | | | 21,282 | |
AQR International Momentum Fund — Class L | | | 50,316 | |
10. Purchases and Redemption of Shares
Investors may purchase shares of a Fund at their net asset value (“NAV”), based on the next calculation of the NAV after the order is placed. Neither the Fund nor the distributor charges a sales charge or other transaction fee to purchase shares, although other institutions may impose transaction fees on shares purchased through them.
Redemption requests will be processed at the next NAV calculated after a redemption request is accepted. The Funds (excluding AQR Diversified Arbitrage Fund) reserve the right to charge a redemption fee of 1% (2% in the case of AQR Global Equity Fund, AQR International Equity Fund and AQR International Momentum Fund), of redemption proceeds on Class I, Class N and Class L shares held for 60 days or less. The Funds charge this fee in order to discourage short-term investors. The Funds retain this fee for the benefit of the remaining shareholders. The AQR Global Equity and AQR International Equity Funds’ Class Y shares charge subscription and redemption fees of 0.10% each, regardless of the period such shares may have been held.
11. In-Kind Transactions
On December 31, 2009, the AQR Global Equity Fund acquired substantially all of the assets and liabilities of three privately offered funds (“Private Funds”) managed by the Adviser in exchange for Class Y shares of the Fund. This transaction was structured to qualify as a tax-free reorganization under the Code. The investment portfolios of the Private Funds, with a fair value of $369,372,153 and identified cost of $335,420,940 as of the date of the reorganization, was the principal asset acquired by the Fund. For financial statement purposes, assets received and shares issued by the Fund were recorded at fair value, and the Fund recorded the cost of such investments at their historical cost as recorded by the Private Funds. The cost basis of the investments received from the Private Funds was carried forward to align ongoing reporting of the Fund’s realized and unrealized gains and losses with amounts distributable for tax purposes. The net assets of the Private Funds at the date of acquisition were $370,340,997, including unrealized appreciation of $33,351,345. The net assets of the AQR Global Equity Fund immediately after the reorganization was $370,340,997. The Fund had no net assets or liabilities prior to the reorganization.
On August 28, 2009, the AQR International Equity Fund acquired all of the assets and liabilities of a privately offered fund managed by the Adviser in exchange for Class Y shares of the Fund. This transaction was structured to qualify as a tax-free reorganization under the Code. The investment portfolio of the privately offered fund, with a fair value of $273,684,897 and identified cost of $238,063,341 as of the date of the reorganization, was the principal asset acquired by the Fund. For financial statement purposes, assets received and shares issued by the Fund were recorded at fair value, and the Fund recorded the cost of such investments at their historical cost as recorded by the privately offered fund. The cost basis of the investments received from the privately offered fund was carried forward to align ongoing reporting of the Fund’s realized and unrealized gains and losses with amounts distributable for tax purposes. The net assets of the private fund at the date of acquisition were $316,649,562, including unrealized appreciation of $37,442,098. The net assets of the Fund immediately after the reorganization were $316,649,562. The Fund had no net assets or liabilities prior to the reorganization.
12. Risks and Concentrations
By using derivative instruments, the Funds are exposed to the counterparty’s credit risk, the risk that derivative counterparties may not perform in accordance with the contractual provisions offset by the value of any collateral received. The Funds’ exposure to credit risk associated with counterparty non-performance is limited to the unrealized gains inherent in such transactions that are recognized in the Statements of Assets and Liabilities. The Funds minimize counterparty credit risk through credit limits and approvals, credit monitoring procedures, executing master netting arrangements and managing margin and collateral requirements, as appropriate.
| | | | | | | | | | |
| AQR Funds | | | | Annual Report | | | | December 2010 | | 131 |
| | | | | | | |
| | | | |
| Notes to Financial Statements | | | December 31, 2010 | |
The Funds may have elements of risk not typically associated with investments in the United States of America due to concentrated investments in a limited number of countries or regions, which may vary throughout the year. Such concentrations may subject the Funds to additional risks resulting from political or economic conditions in such countries or regions and the possible imposition of adverse governmental laws or currency exchange restrictions could cause the securities and their markets to be less liquid and their prices to be more volatile than those of comparable US companies.
Swap agreements involve, to varying degrees, elements of market risk (generally equity price risk related to equity index swap agreements, interest rate risk related to bond swap agreements and commodity risk related to synthetic swap agreements utilizing futures) and exposure to loss in excess of the amount reflected on the Statements of Assets and Liabilities. The notional amounts, which are disclosed as of period end in the swap tables included in the Schedules of Portfolio Investments, reflect the current investment exposure each Fund has under the swap agreement which may exceed the net asset value of the Fund.
As of December 31, 2010, a substantial portion of the AQR Global Equity, AQR International Equity and AQR International Momentum Funds’ net assets consisted of issuers that are denominated in foreign currencies. Changes in currency exchange rates will affect the value of and investment income from such securities.
As of December 31, 2010, the AQR Diversified Arbitrage Fund pledged a substantial portion of its assets for securities sold short to JP Morgan Chase Bank N.A.
13. Line of Credit
The Trust (excluding the AQR Managed Futures Strategy and AQR Risk Parity Funds) has secured an uncommitted, $150,000,000 line of credit with JPMorgan Chase Bank, N.A. Borrowings, if any, under this arrangement bear interest at the Fed Funds Rate plus the sum of (a) 1.5% per annum plus (b) if the LIBOR Reference Rate exceeds the Federal Funds Rate, the amount of such excess, which shall be paid quarterly. The maximum loan amount outstanding per Fund, will be the lesser of an amount which does not exceed the borrowing limits set forth in the Fund’s Prospectus and/or Registration Statement and does not cause the Asset Coverage Ratio for all borrowings to drop below 500%. The agreement is subject to an annual commitment fee which is payable in arrears on a quarterly basis. This line of credit expires on September 16, 2011. As of and for the year ended December 31, 2010, the Funds did not have any outstanding borrowings under this agreement.
14. Principal Ownership
As of December 31, 2010, the Funds had individual shareholder accounts, owning more than 5% of the total shares outstanding of the Fund. The AQR Global Equity Fund has 2 shareholders that have a combined interest of the Fund of 73%. The AQR International Equity Fund has 4 shareholders that have a combined interest of the Fund of 69%. The AQR Risk Parity Fund is 35% owned by the Adviser and its affiliates.
15. New Accounting Pronouncement
In January 2010, the Financial Accounting Standards Board issued an update to improve disclosure about fair value measurements. This update requires entities to disclose a) the amounts of significant transfers between Level 1 and Level 2 of the fair value hierarchy and the reasons for these transfers, b) the reasons for any transfers in or out of Level 3 and c) information in the reconciliation of recurring Level 3 measurements about purchases, sales, issuances and settlements on a gross basis. In addition, this update clarifies the requirements for entities to disclose information about both the valuation techniques and inputs used in estimating Level 2 and Level 3 fair value measurements. The requirement to disclose information about purchases, sales, issuances and settlements in the reconciliation of recurring Level 3 measurements is effective for financial statements issued for interim and annual reporting periods beginning after December 15, 2010.
16. Subsequent Events
The Funds have evaluated subsequent events through the date of issuance of this report and have determined that there are no material events that would require disclosure.
| | | | | | | | | | |
| AQR Funds | | | | Annual Report | | | | December 2010 | | 132 |
| | | | | | | |
| | |
Report of Independent Registered Public Accounting Firm |
To the Board of Trustees and Shareholders of AQR Funds:
In our opinion, the accompanying statements of assets and liabilities, including the schedules of investments, and the related statements of operations, of cash flows and of changes in net assets and the financial highlights present fairly, in all material respects, the financial position of AQR Global Equity Fund, AQR International Equity Fund, AQR Diversified Arbitrage Fund, AQR Managed Futures Strategy Fund, AQR Risk Parity Fund, AQR Momentum Fund, AQR Small Cap Momentum Fund, and AQR International Momentum Fund (eight of the portfolios constituting AQR Funds, hereinafter referred to as the “Funds”) at December 31, 2010, and the results of each of their operations, the changes in each of their net assets, the cash flows of AQR Diversified Arbitrage Fund and the financial highlights for each of the periods presented, in conformity with accounting principles generally accepted in the United States of America. These financial statements and financial highlights (hereafter referred to as “financial statements”) are the responsibility of the Funds’ management. Our responsibility is to express an opinion on these financial statements based on our audits. We conducted our audits of these financial statements in accordance with the standards of the Public Company Accounting Oversight Board (United States). Those standards require that we plan and perform the audit to obtain reasonable assurance about whether the financial statements are free of material misstatement. An audit includes examining, on a test basis, evidence supporting the amounts and disclosures in the financial statements, assessing the accounting principles used and significant estimates made by management, and evaluating the overall financial statement presentation. We believe that our audits, which included confirmation of securities at December 31, 2010 by correspondence with the custodian and brokers, provide a reasonable basis for our opinion.
PricewaterhouseCoopers LLP
March 7, 2011
| | | | | | | | | | |
| AQR Funds | | | | Annual Report | | | | December 2010 | | 133 |
| | | | | | | |
| | |
| Other Federal Tax Information (Unaudited) |
For the year ended December 31, 2010, certain dividends paid by the Funds may be subject to a maximum tax of 15% as provided for by the Jobs and Growth Tax Relief Reconciliation Act of 2003. The Funds intend to designate the maximum allowable as taxed at the 15% rate. The following represents the percentage of ordinary income distributions treated as qualifying dividends:
| | | | |
| FUND | | PERCENTAGE | |
AQR Global Equity Fund | | | 50.38 | % |
AQR International Equity Fund | | | 57.08 | % |
AQR Diversified Arbitrage Fund | | | 22.42 | % |
AQR Momentum Fund | | | 94.74 | % |
AQR Small Cap Momentum Fund | | | 15.89 | % |
AQR International Momentum Fund | | | 100.00 | % |
For the taxable year ended December 31, 2010, the following percentages of income dividends paid by the Fund qualify for the 70% dividends received deductions available to corporations:
| | | | |
| FUND | | PERCENTAGE | |
AQR Diversified Arbitrage Fund | | | 13.97 | % |
AQR Global Equity Fund | | | 14.24 | % |
AQR Momentum Fund | | | 25.87 | % |
AQR Small Cap Momentum Fund | | | 11.41 | % |
The Funds designate the following amounts, or the maximum allowable under the Internal Revenue Code, as long term capital gain distributions qualifying for the maximum 15% income tax rate for individuals:
| | | | |
| FUND | | TOTAL | |
AQR Global Equity Fund | | $ | 2,022,493 | |
AQR Managed Futures Strategy Fund | | $ | 7,656,480 | |
AQR Momentum Fund | | $ | 12,799 | |
AQR Small Cap Momentum Fund | | $ | 29,957 | |
Certain Funds have derived net income from sources within foreign countries. As of December 31, 2010, the foreign source income for each Fund was as follows:
| | | | | | | | |
| FUND | | TOTAL | | | PER SHARE | |
AQR International Equity Fund | | $ | 11,701,142 | | | $ | 0.2847 | |
AQR International Momentum Fund | | $ | 727,083 | | | $ | 0.1677 | |
Certain Funds intend to elect to pass through to shareholders the income tax credit for taxes paid to foreign countries. As of December 31, 2010, the foreign tax credit for each Fund was as follows:
| | | | | | | | |
| FUND | | TOTAL | | | PER SHARE | |
AQR International Equity Fund | | $ | 855,622 | | | $ | 0.0208 | |
AQR International Momentum Fund | | $ | 57,020 | | | $ | 0.0131 | |
| | | | | | | | | | |
| AQR Funds | | | | Annual Report | | | | December 2010 | | 134 |
| | | | | | | |
Fund Expense Examples (Unaudited)
December 31, 2010
As a shareholder of the Trust, you incur two types of costs: (1) transaction costs and (2) ongoing costs, including management fees; and other Fund expenses. This example is intended to help you understand your ongoing costs (in dollars) of investing in the Fund and to compare these costs with the ongoing costs of investing in other mutual funds. The Example is based on an investment of $1,000 invested at the beginning of the period and held for the entire period as indicated below.
Actual Expenses
The table below provides information about actual account values and actual expenses. You may use the information together with the amount you invested, to estimate the expenses that you paid over the period. Simply divide your account value by $1,000 (for example, an $8,600 account value divided by $1,000 = 8.6), then multiply the result by the number under the heading entitled “Expenses Paid for the Period Ended 12/31/10” to estimate the expenses you paid on your account during this period. Each Fund will indirectly bear its pro rata share of the expenses incurred by the underlying investments in which the Fund invests. These expenses are not included in the table.
Hypothetical Example for Comparison Purposes
The table below also provides information about hypothetical account values and hypothetical expenses based on each Fund’s actual expense ratio and an assumed annual rate of return of 5% before expenses, which is not the Fund’s actual return. The hypothetical account values and expenses may not be used to estimate the actual ending account balance or expenses you paid for the period. You may use this information to compare the ongoing costs of investing in a Fund and other funds by comparing this 5% hypothetical example with the 5% hypothetical examples that appear in the shareholder reports of other funds. The Fund will indirectly bear its pro rata share of the expenses incurred by the underlying investments in which the Fund invests. These expenses are not included in the table.
Please note that the expenses shown in the table are meant to highlight your ongoing costs only and do not reflect any transactional costs. Therefore, the hypothetical example is useful in comparing ongoing costs only, and will not help you determine the relative total costs of owning different funds. In addition, if these transactional costs were included, your costs would have been higher.
| | | | | | | | | | |
| | | BEGINNING
ACCOUNT
DATE
VALUE | | | ENDING
ACCOUNT
VALUE
12/31/10 | | ANNUALIZED
EXPENSE
RATIO FOR
THE PERIOD | | EXPENSES
PAID FOR THE
PERIOD
ENDING
12/31/10 |
| AQR Global Equity Fund | | | | | | | | | | |
| Class I (1) | | | | | | | | | | |
Actual Return | | | $1,000.00 | | | $1,137.22 | | 0.79% | | $4.26 |
Hypothetical Return | | | $1,000.00 | | | $1,046.02 | | 0.79% | | $4.07 |
| Class N (1) | | | | | | | | | | |
Actual Return | | | $1,000.00 | | | $1,133.21 | | 1.10% | | $5.43 |
Hypothetical Return | | | $1,000.00 | | | $1,044.91 | | 1.10% | | $5.21 |
| Class Y (1) | | | | | | | | | | |
Actual Return | | | $1,000.00 | | | $1,142.88 | | 0.50% | | $2.70 |
Hypothetical Return | | | $1,000.00 | | | $1,047.48 | | 0.50% | | $2.58 |
| AQR International Equity Fund | | | | | | | | | | |
| Class I | | | | | | | | | | |
Actual Return | | | $1,000.00 | | | $1,099.46 | | 0.90% | | $4.76 |
Hypothetical Return | | | $1,000.00 | | | $1,045.46 | | 0.90% | | $4.64 |
| Class N | | | | | | | | | | |
Actual Return | | | $1,000.00 | | | $1,097.70 | | 1.25% | | $6.61 |
Hypothetical Return | | | $1,000.00 | | | $1,043.70 | | 1.25% | | $6.44 |
| Class Y | | | | | | | | | | |
Actual Return | | | $1,000.00 | | | $1,105.63 | | 0.55% | | $2.92 |
Hypothetical Return | | | $1,000.00 | | | $1,047.23 | | 0.55% | | $2.84 |
| | | | | | | | | | |
| AQR Funds | | | | Annual Report | | | | December 2010 | | 135 |
| | | | | | | |
| | | | | | | | | | |
| | | BEGINNING
ACCOUNT
DATE
VALUE | | | ENDING
ACCOUNT
VALUE
12/31/10 | | ANNUALIZED
EXPENSE
RATIO FOR
THE PERIOD | | EXPENSES
PAID FOR THE
PERIOD
ENDING
12/31/10 |
| AQR Diversified Arbitrage Fund | | | | | | | | | | |
| Class I | | | | | | | | | | |
Actual Return | | | $1,000.00 | | | $1,041.05 | | 1.20% | | $6.17 |
Hypothetical Return | | | $1,000.00 | | | $1,043.95 | | 1.20% | | $6.18 |
| Class N | | | | | | | | | | |
Actual Return | | | $1,000.00 | | | $1,036.74 | | 1.50% | | $7.70 |
Hypothetical Return | | | $1,000.00 | | | $1,042.44 | | 1.50% | | $7.72 |
| AQR Managed Futures Strategy Fund | | | | | | | | | | |
| Class I (2) | | | 1/6/10 | | | | | | | |
Actual Return | | | $1,000.00 | | | $1,047.80 | | 1.25% | | $6.45 |
Hypothetical Return | | | $1,000.00 | | | $1,043.70 | | 1.25% | | $6.44 |
| Class N (2) | | | 1/6/10 | | | | | | | |
Actual Return | | | $1,000.00 | | | $1,043.64 | | 1.50% | | $7.73 |
Hypothetical Return | | | $1,000.00 | | | $1,042.44 | | 1.50% | | $7.72 |
| AQR Risk Parity Fund | | | | | | | | | | |
| Class I (3) | | | 9/30/10 | | | | | | | |
Actual Return | | | $1,000.00 | | | $1,036.38 | | 0.95% | | $2.46(a) |
Hypothetical Return | | | $1,000.00 | | | $1,047.58 | | 0.95% | | $2.48 |
| Class N (3) | | | 9/30/10 | | | | | | | |
Actual Return | | | $1,000.00 | | | $1,034.74 | | 1.20% | | $3.11(a) |
Hypothetical Return | | | $1,000.00 | | | $1,046.94 | | 1.20% | | $3.13 |
| AQR Momentum Fund | | | | | | | | | | |
| Class L | | | | | | | | | | |
Actual Return | | | $1,000.00 | | | $1,183.53 | | 0.49% | | $2.70 |
Hypothetical Return | | | $1,000.00 | | | $1,047.53 | | 0.49% | | $2.53 |
| AQR Small Cap Momentum Fund | | | | | | | | | | |
| Class I | | | | | | | | | | |
Actual Return | | | $1,000.00 | | | $1,273.62 | | 0.65% | | $3.73 |
Hypothetical Return | | | $1,000.00 | | | $1,046.72 | | 0.65% | | $3.35 |
| AQR International Momentum Fund | | | | | | | | | | |
| Class I | | | | | | | | | | |
Actual Return | | | $1,000.00 | | | $1,137.82 | | 0.65% | | $3.50 |
Hypothetical Return | | | $1,000.00 | | | $1,046.72 | | 0.65% | | $3.35 |
| (1) | Commencement of operations was December 31, 2009. |
| (2) | Commencement of operations was January 6, 2010. |
| (3) | Commencement of operations was September 30, 2010. |
| (a) | Expenses are calculated using each Class’ annualized expense ratio, multipled by the average account value for the period, multipled by 93/365 (to reflect the period since commencement of operations). |
Expenses are calculated using each Class’ annualized expense ratio, multipled by the average account value for the period, multipled by 184/365 (to reflect the one-half year period unless stated otherwise).
| | | | | | | | | | |
| AQR Funds | | | | Annual Report | | | | December 2010 | | 136 |
| | | | | | | |
| | | | |
| Trustees and Officers (Unaudited) | | | December 31, 2010 | |
The overall management of the business and affairs of the Funds is vested with the Board of Trustees. The Board of Trustees consists of four individuals (each, a “Trustee”), three of whom are not “interested persons” of the Trust as defined in the Investment Company Act (the “Disinterested Trustees”). The Trustees are responsible for the oversight of the operations of the Trust and perform the various duties imposed on the directors of investment companies by the 1940 Act. The Board of Trustees approves all significant agreements between the Trust and persons or companies furnishing services to it, including the Trust’s agreements with its investment advisers, investment sub-advisers, administrator, custodian and transfer agent. The management of each Fund’s day-to-day operations is delegated to its officers, the Adviser, the Sub-Adviser (in the case of AQR Diversified Arbitrage Fund) and the Funds’ administrator, subject always to the investment objectives and policies of each of the Funds and to general supervision of the Board of Trustees. The Disinterested Trustees have retained independent legal counsel to assist them in connection with their duties.
Listed in the chart below is basic information regarding the Trustees and officers of the Trust. The address of each officer and Trustee is 2 Greenwich Plaza, Third Floor, Greenwich CT 06830.
| | | | | | | | | | | | | | | | |
| NAME AND YEAR OF BIRTH | | CURRENT
POSITION WITH
THE TRUST,
TERM OF
OFFICE1 AND
LENGTH OF
TIME SERVED | | | PRINCIPAL OCCUPATION(S)
DURING PAST 5 YEARS | | | NUMBER
OF FUNDS
IN FUND
COMPLEX
OVERSEEN
BY TRUSTEE | | | OTHER
PRESENT OR
PAST
DIRECTORSHIPS
HELD BY
TRUSTEE (DURING
THE PAST 5 YEARS) | |
Disinterested Trustees2 | | | | | | | | | | | | | |
| Timothy K. Armour, 1948 | |
| Chairman of the
Board since
2010 and Trustee,
since 2008 |
| |
| Interim Chief Executive Officer of
Janus Capital Group (2009 to
2010); Managing Director,
Morningstar Inc. (2000 to 2008). |
| | | 13 | | |
| Janus Capital
Group; AARP
Services, Inc.
ETF Securities |
|
| | | | |
| Steven Grenadier, 1964 | |
| Trustee,
since 2008 |
| |
| Professor of Finance, Stanford
University (since 1992). |
| | | 13 | | |
| Nicholas
Applegate
Institutional
Funds |
|
| | | | |
| L. Joe Moravy, 1950 | |
| Trustee,
since 2008 |
| |
| Managing Director, Financial
Scholars Group (since 2010)
(consulting firm); Managing
Director, LJM Advisory (2008-
2010) (consulting firm); Partner,
Ernst & Young LLP (2002 to
2008). |
| | | 13 | | | | N/A | |
| | | | |
Interested Trustee3 | | | | | | | | | | | | | | | | |
| David Kabiller, 1963 | |
| Trustee,
since 2010 |
| |
| Founding Principal, AQR Capital
Management, LLC (since 1998) |
| | | 13 | | | | N/A | |
| | | | |
Officers | | | | | | | | | | | | | | | | |
| Marco Hanig, 1958 | |
| Chief Executive
Officer, since
2009; President,
since 2008 |
| |
| Vice President, AQR Capital
Management, LLC (since 2008);
prior thereto, Principal, William
Blair & Company, L.L.C. (1999 to
2007). |
| | | | | | | | |
| | | | |
| Abdon Bolivar, 1965 | |
| Chief Compliance
Officer, since
2008 |
| |
| Chief Compliance Officer, AQR
Capital Management, LLC (since
2002) |
| | | | | | | | |
| | | | | | | | | | |
| AQR Funds | | | | Annual Report | | | | December 2010 | | 137 |
| | | | | | | |
| | | | |
| Trustees and Officers (Unaudited) | | | December 31, 2010 | |
| | | | | | | | |
| NAME AND YEAR OF BIRTH | | CURRENT
POSITION WITH
THE TRUST,
TERM OF
OFFICE1 AND
LENGTH OF
TIME SERVED | | PRINCIPAL OCCUPATION(S)
DURING PAST 5 YEARS | | NUMBER
OF FUNDS
IN FUND
COMPLEX
OVERSEEN
BY TRUSTEE | | OTHER
PRESENT OR
PAST
DIRECTORSHIPS
HELD BY
TRUSTEE (DURING
THE PAST 5 YEARS) |
| | | | |
| Nir Messafi, 1975 | | Chief Financial
Officer, since
2010; Vice
President,
since 2009;
Treasurer
2009 to 2010 | | Vice President, AQR Capital
Management, LLC (since 2003). | | | | |
| | | | |
| Aaron Masek, 1974 | | Vice President
and Treasurer,
since 2010 | | Vice President, AQR Capital
Management, LLC (since 2010);
prior thereto Audit Manager,
Cohen Fund Audit Services, Ltd.
(2008 to 2009); prior thereto Senior
Vice President, Citi Fund Services
Ohio, Inc. (1996 - 2008). | | | | |
| | | | |
| Bradley Asness, 1969 | | Vice President
and Chief
Legal Officer,
since 2009 | | Principal and Chief Legal Officer,
AQR Capital Management, LLC
(since 1998). | | | | |
| | | | |
| Brendan R. Kalb, 1975 | | Executive Vice
President,
since 2009;
Secretary,
since 2008 | | Vice President and
General Counsel, AQR Capital
Management, LLC (since 2004). | | | | |
| | | | |
| Nicole DonVito, 1979 | | Vice President,
since 2009 | | Vice President, AQR Capital
Management, LLC (since 2007),
prior thereto, Associate, Schulte
Roth & Zabel LLP (2006 to 2007);
prior thereto, Associate Dewey &
LeBoeuf LLP (2004 to 2006). | | | | |
| | | | |
| Michael Kalansky, 1979 | | Assistant
Treasurer | | Associate, AQR Capital
Management, LLC (since 2010);
prior thereto Senior Accountant,
KBC Financial Products (2008 to
2009); prior thereto Manager of
Accounting, Citi Property Investors
(2005 to 2008). | | | | |
| (1) | Each Trustee serves until the election and qualification of a successor, or until death, resignation or removal as provided in the Trust’s Declaration of Trust. |
| (2) | A Disinterested Trustee is any Trustee that is not an “interested person” of the Trust within the meaning of Section 2(a)(19) of the 1940 Act. |
| (3) | An Interested Trustee is a Trustee that is an “interested person” of the Trust within the meaning of Section 2(a)(19) of the 1940 Act. Mr. Kabiller is an interested person of the Trust because of his position with the Adviser. |
| | | | | | | | | | |
| AQR Funds | | | | Annual Report | | | | December 2010 | | 138 |
| | | | | | | |
| | |
| Board Approval of Investment Management Agreement (Unaudited) |
The Board of Trustees (the “Board,” and the members of which are referred to as “Board Members”) of the AQR Funds (the “Trust”) met in person on June 9-10, 2010 to consider the approval of the investment management agreement (the “Management Agreement”) between the Trust, on behalf of the AQR Risk Parity Fund (the “Fund”), and AQR Capital Management, LLC (“AQR” of the “Adviser”). In accordance with Section 15(c) of the Investment Company Act of 1940. as amended (the “1940 Act”), the Board requested, reviewed, and considered materials furnished by AQR relevant to the Board’s consideration of whether to approve the Management Agreement. These materials included (a) memoranda and materials prepared by AQR, describing personnel and services to be provided to the Fund; (b) performance information for strategies and model portfolios relevant to consideration of the Management Agreement; (c) information independently compiled and prepared by Lipper, Inc. (“Lipper”) relating to the proposed Fund fees and expenses; (d) a discussion of AQR’s financial statements; and (e) a discussion of the AQR compliance program and its regulatory exam histories.
At the in-person meeting held on June 9-10, 2010, the Board, including the Board Members who are not “interested persons” as defined in the 1940 Act (the “Independent Board Members”), unanimously approved the Management Agreement for an initial two-year term. The Board considered all factors it believed relevant with respect to the Fund, including, among other factors: (a) the nature, extent and quality of the services to be provided by AQR; (b) the investment performance of AQR portfolio management; (c) the advisory fee and the cost of the services and profits to be realized by AQR from the relationship with the Fund; (d) economies of scale; and (e) other factors.
The Board also considered other matters it deemed important to the approval process, such as services related to the valuation and pricing of Fund portfolio holdings, direct and indirect benefits to AQR and its affiliates from their relationship with the Fund and advice from independent legal counsel with respect to the review process and materials submitted for the Board’s review. The Board did not identify any particular information as controlling, and each Board Member may have attributed different weights to the various items considered.
The following is a summary of the Board’s discussion and views regarding the factors it considered in evaluating the Management Agreement:
The nature, extent and quality of the services to be provided by AQR. The Board Members reviewed the services that AQR would provide to the Fund under the Management Agreement. The Board considered the size and experience of AQR’s staff. Its use of technology, and the Fund’s investment objective, strategy and process. The Board reviewed the overall qualifications of AQR as an investment adviser. In connection with the investment advisory services to be provided to the Fund, the Board Members took into account detailed discussions they had with officers of AQR regarding the management of the Fund’s investments in accordance with the Fund’s stated investment objective and policies and the types of transactions that would be entered into on behalf of the Fund. During these discussions, the Board Members asked detailed questions of, and received answers from, the officers of AQR regarding the formulation and proposed implementation of the Fund’s investment strategy its efficacy and potential risks. The Board considered information about how portfolio managers are compensated by AQR.
In addition to the investment advisory services to be provided to the Fund, the Board Members considered that AQR also will provide shareholder and administrative services, oversight of Fund accounting, marketing services, assistance in meeting legal and regulatory requirements and other services necessary for the operation of the Fund. In particular, the Board of Trustees reviewed the compliance and administrative services to be provided to the Fund by AQR.
Finally, the Independent Board Members had an opportunity to meet outside the presence of management in executive session separately with counsel to discuss and consider the Management Agreement. Based on the presentations at the June 9-10, 2010 Board meeting, the Board of Trustees concluded that the services to be provided to the Fund by AQR pursuant to the Management Agreement were likely to be of a high quality and would benefit the Fund.
Investment Performance of AQR Portfolio Management. Because the Fund is newly formed, the Board did not consider the investment performance of the Fund. The Board based its review of AQR’s performance primarily on the experience of AQR in managing other registered investment companies and private funds, noting that other funds AQR manages might have investment objectives, policies or restrictions different from those of the Fund. The Board reviewed performance information for strategies and model portfolios similar to that of the Fund. The Board also considered the experience, resources and strengths of AQR and its affiliates with respect to the investment strategies proposed for the Fund. Based on these factors, the Board Members determined that AQR would be an appropriate investment adviser for the Fund.
| | | | | | | | | | |
| AQR Funds | | | | Annual Report | | | | December 2010 | | 139 |
| | | | | | | |
| | |
| Board Approval of Investment Advisory Agreements (Unaudited) |
The Management Fee and the Cost of the Services and Profits to be Realized by AQR from the Relationship with the Fund. The Board, including the Independent Board Members, received and reviewed information regarding the management fee to be paid by the Fund to AQR pursuant to the Management Agreement. The Board examined this information in order to determine the reasonableness of the fees in light of the nature and quality of services to be provided to the Fund.
To assist in this analysis, the Board received a report independently prepared by Lipper. The report showed comparative fee information for the Fund’s expense group and expense universe, including expense comparisons of contractual management fees and actual total operating expenses. The Board was advised that the advisory fees will be below the median of comparable funds. The Board noted that breakpoints are part of the Fund’s proposed advisory fee rate and that the proposed advisory fee rate would decrease as the Fund increases in size.
The Board also received and reviewed information regarding the profitability of the Adviser with respect to Fund-related activities. The Board also took into consideration the Adviser’s profits from the management of other private accounts. The Board reviewed the Adviser’s methodology of determining profitability. The Board recognized that profitability may be affected by numerous factors including, among other things, fee waivers and expense reimbursements by the Adviser, the types of funds managed, expense allocations and business mix, and therefore comparability of profitability is somewhat limited.
The Board reviewed the Adviser’s unaudited financial statements. The purpose of the review was to help the Independent Board Members determine whether the firm has the necessary resources to continue to provide high quality services to the Funds and attract and retain high quality employees.
The Board concluded that the management fee is reasonable.
Economies of Scale. Because the Fund is newly formed and had not commenced operations as of June 9-10, 2010, and the eventual aggregate amount of Fund assets was uncertain, AQR was not able to provide the Board members with specific information concerning the extent to which economies of scale would be realized as the Fund grows and whether fee levels would reflect such economies of scale, if any. The Board noted that the Fund does have breakpoints in its management fee that would allow investors to benefit directly in the form of lower fees as fund assets grow. The Board also considered that the funds in the AQR fund complex share some common resources and, as a result, an increase in the overall size of the complex could permit each fund to incur lower expenses than it would otherwise as a stand-alone entity. The Board also considered the Adviser’s overall operations and its efforts to expand the scale of, and improve the quality of, its operations.
Other Factors. The Board also took into account other ancillary or “fall-out” benefits that the Adviser or its affiliates may derive from its relationship with the Fund, both tangible and intangible. The Board also received information regarding the Adviser’s brokerage and soft dollar practices. The Board considered that the Adviser is responsible for decisions to buy and sell securities for the Funds, selection of broker-dealers and best execution, and aggregation and allocation of trade orders among the firms various advisory clients. The Board noted that the Adviser does not presently intend to make use of soft dollars to acquire third-party research.
Conclusion. Counsel advised the Board concerning the statutory and regulatory requirements for approval and disclosure of investment advisory agreements. No single factor was determinative to the decision of the Board. Based on the foregoing and such other matters as were deemed relevant, all of the Board Members, including all of the Independent Board Members, concluded that the proposed advisory fee rate and projected total expense ratio are reasonable in relation to the services to be provided by AQR to the Fund, as well as the costs to be incurred and benefits to be gained by AQR in providing such services, including the investment advisory and administrative components. The Board also found the proposed investment advisory fee to be reasonable in comparison to the fees charged by advisers to other comparable funds of similar, actual or anticipated size. As a result, all of the Board Members, including the Independent Board Members, approved the Management Agreement. The Independent Board Members were represented by counsel who assisted them in their deliberations.
| | | | | | | | | | |
| AQR Funds | | | | Annual Report | | | | December 2010 | | 140 |
| | | | | | | |
Investment Advisor
AQR Capital Management, LLC
Two Greenwich Plaza, 3rd Floor
Greenwich, CT 06830
Sub-Adviser
CNH Partners, LLC
Two Greenwich Plaza, 1st Floor,
Greenwich, CT 06830
Transfer Agent
ALPS Fund Services, Inc.
1290 Broadway, Suite 1100
Denver, CO 80203
Custodian
JPMorgan Chase Bank, N.A.
4 Metro Tech Center
Brooklyn, NY 11245
Distributor
ALPS Distributors, Inc.
1290 Broadway, Suite 1100
Denver, CO 80203
Administrator
J.P. Morgan Investor Services Co.
70 Fargo Street
Boston, MA 02210
Independent Registered Public Accounting Firm
PricewaterhouseCoopers, LLP
300 Madison Avenue
New York, NY 10017
You may obtain a description of the AQR Funds proxy voting, policies, procedures and information regarding how each Fund voted proxies relating to portfolio securities during the 12-month period ending June 30th of each year (available by August 31st of that year) without charge, upon request, by calling 1-866-290-2688 or visiting the funds website www.aqrfunds.com, or by accessing the SEC’s website at www.SEC.Gov. Such reports may be reviewed and copied at the SEC’s Public Reference Room in Washington, DC. Information on the operation of the Public Reference Room may be obtained by calling 202-942-8090.
The Fund files complete schedules of the portfolio holdings with the SEC for the first and third quarters on Form N-Q. The Form N-Q is available without charge, upon request, by calling 1-800-SEC-0330, or by accessing the SEC’s website, at www.SEC.Gov. It may also be reviewed and copied at the SEC’s Public Reference Room in Washington, DC.
This report has been prepared for shareholders and may be distributed to others only if preceded or accompanied by an effective prospectus, which includes information regarding the Funds’ objectives and polices, experienced of its management, marketability of shares and other information.
AQR FUNDS
P.O. Box 2248
Denver, CO 80201-2248
1-866-290-2688
www.aqrfunds.com
Item 2. Code of Ethics.
| a). | As of the end of the period, December 31, 2010, the Registrant has adopted a code of ethics, as defined in Item 2 of Form N-CSR, that applies to its principal executive officer, principal financial officer, principal accounting officer or controller, or persons performing similar functions. This code of ethics is included as Exhibit 12 (a)(1). |
| c). | There has been no amendment to the Registrant’s Code of Ethics during the fiscal year ending December 31, 2010 (“Reporting Period”). |
| d). | Registrant granted no waivers from the provisions of its Code of Ethics during the Reporting Period. |
Item 3. Audit Committee Financial Expert.
| a). | The Registrant’s Board of Trustees has determined that its Audit Committee has one “audit committee financial expert”, as that term is defined under Items 3(b) and 3(c), serving on its Audit Committee. Mr. L. Joe Moravy, the Registrant’s audit committee financial expert, is “independent”, as that term is defined under Item 3(a)(2). |
Item 4. Principal Accountant Fees and Services.
Aggregate fees for professional services rendered for the AQR Funds by PricewaterhouseCoopers LLP for the years ended December 31, 2009 and December 31, 2010 were:
| | | | | | | | |
| | | 2009 | | | 2010 | |
Audit Fees (a) | | $ | 175,000 | | | $ | 311,000 | |
Audit Related Fees (b) | | | 0 | | | $ | 55,000 | |
Tax Fees (c) | | $ | 42,500 | | | $ | 73,000 | |
All Other Fees (d) | | | 0 | | | | 0 | |
Total: | | $ | 217,500 | | | $ | 439,000 | |
| (a) | Audit Fees: These fees relate to professional services rendered by PricewaterhouseCoopers LLP for the audits of the Registrant’s annual financial statements or services normally provided by the independent registered public accounting firm in connection with statutory and regulatory filings or engagements. These services include the audits of the financial statements of the Registrant, issuance of consents and assistance with review of documents filed with the SEC. |
| (b) | Audit Related Fees: These fees relate to assurance and related services by PricewaterhouseCoopers LLP that are reasonably related to the performance of audit services in connection with December 31, 2009 and December 31, 2010 annual financial statements. The audit related services provided by PricewaterhouseCoopers LLP include the procedures related to the service provider conversion for 7 funds and procedures related to the AQR Global Equity Fund conversion from a privately held fund to a registered investment company. |
| (c) | Tax Fees: These fees relate to professional services rendered by PricewaterhouseCoopers LLP for tax compliance, tax advice and tax planning. The tax services provided by PricewaterhouseCoopers LLP related to the review of the Registrant’s federal and state income tax returns and excise tax calculations. |
| (d) | All Other Fees: These fees relate to products and services provided by PricewaterhouseCoopers LLP other than those reported under “Audit Fees,” “Audit-Related Fees,” and “Tax Fees” above. |
| (e) | Audit Committee Pre-approval Policies and Procedures: |
| | (i) | Per Rule 2-01(c)(7)(A) and the charter of the Registrant’s Audit Committee, the Audit Committee approves and recommends the principal accountant for the Registrant, pre-approves (i) the principal accountant’s provision of all audit and permissible non-audit services to the Registrant (including the fees and other compensation to be paid to the principal accountant), and (ii) the principal accountant’s provision of any permissible non-audit services to the Registrant’s investment adviser (the “Adviser”), sub-adviser or any entity controlling, controlled by, or under common control with any investment adviser or sub-adviser, if the engagement relates directly to the operations of the financial reporting of the Trust. |
| | (ii) | 100% of services described in each of Items 4(b) through (d) were approved by the Audit Committee pursuant to paragraph (c)(7)(A) of Rule 2-01 of Regulation S-X. |
| (f) | Less than 50% of the hours expended on the principal accountant’s engagement to audit Registrant’s financial statements were attributed to work performed by persons other than the accountant’s full-time, permanent employees. |
| (g) | Disclose the aggregate non-audit fees billed by the Registrant’s accountant for services rendered to the Registrant, and rendered to the Registrant’s investment adviser (not including any sub-adviser whose role is primarily portfolio management and is subcontracted with or overseen by another investment adviser), and any entity controlling, controlled by, or under common control with the adviser that provides ongoing services to the Registrant for the fiscal years ended December 31, 2009 and December 31, 2010: $665,500 and $691,773. |
Item 5. Audit Committee of Listed Registrants.
| (a) | The Registrant is an issuer as defined in Section 10A-3 of the Securities Exchange Act of 1934 and has a separately-designated standing Audit Committee in accordance with Section 3(a)(58)(A) of such Act. All of the Board’s independent Trustees, Timothy K. Armour, Steven Grenadier and L. Joe Moravy, are members of Audit Committee. |
Item 6. Investments
| (a) | Schedule is included as part of the report to shareholders filed under Item 1 of this Form. |
| (b) | The Registrant made no divestments of securities in accordance with Section 13(c) of the Investment Company Act of 1940. |
Item 7. Disclosure of Proxy Voting Policies and Procedures for Closed-End Management Investment Companies.
Not applicable.
Item 8. Portfolio Managers of Closed-End Management Investment Companies.
Not applicable.
Item 9. Purchases of Equity Securities by Closed-End Management Investment Company & Affiliated Purchasers.
Not applicable.
Item 10. Submission of Matters to a Vote of Security Holders.
Not applicable.
Item 11. Controls and Procedures.
| (a) | The Registrant’s principal executive officer and principal financial officer have concluded, based on their evaluation of the Registrant’s disclosure controls and procedures as conducted within 90 days of the filing date of this report, that those disclosure controls and procedures provide reasonable assurance that the material information required to be disclosed by the Registrant on this report is recorded, processed, summarized and reported within the time periods specified in the Securities and Exchange Commission’s rules and forms. |
| (b) | There have not been any changes in registrant’s control over financial reporting (as defined in Rule 30a-3(d) under the Investment Company Act of 1940) that occurred during the second fiscal quarter of the period covered |
| | by this report that has materially affected, or is reasonably likely to materially affect, the registrant’s control over financial reporting. Certain enhancements to controls and procedures are being made to ensure timely financial statement preparation and review. |
Item 12. Exhibits.
| (a)(1) | The code of ethics that is the subject of the disclosure required by Item 2 is attached hereto. |
| (a)(2) | Certifications pursuant to Rule 30a-2(a) under the 1940 Act and Section 302 of the Sarbanes-Oxley Act of 2002 are attached hereto. |
| (a)(3) | Any written solicitation to purchase securities under Rule 23c-1 under the 1940 Act – Not Applicable. |
| (b) | Certification required by Rule 30a-2(b) under the 1940 Act and Section 906 of the Sarbanes-Oxley Act of 2002 is attached hereto. |
SIGNATURES
Pursuant to the requirements of the Securities Exchange Act of 1934 and the Investment Company Act of 1940, the Registrant has duly caused this report to be signed on its behalf by the undersigned, thereunto duly authorized.
AQR Funds
|
By: /S/ Marco Hanig |
| Marco Hanig, |
| Principal Executive Officer |
| March 7, 2011 |
Pursuant to the requirements of the Securities Exchange Act of 1934 and the Investment Company Act of 1940, this report has been signed below by the following persons on behalf of the Registrant and in the capacities and on the dates indicated.
|
By: /S/ Marco Hanig |
| Marco Hanig, |
| Principal Executive Officer |
| Date: March 7, 2011 |
|
By: /S/ Nir Messafi |
| Nir Messafi, |
| Principal Financial Officer |
| Date: March 7, 2011 |