Table of Contents
UNITED STATES
SECURITIES AND EXCHANGE COMMISSION
Washington, D.C. 20549
FORM N-CSR
CERTIFIED SHAREHOLDER REPORT OF REGISTERED
MANAGEMENT INVESTMENT COMPANIES
Investment Company Act file number: 811-22235
AQR Funds
(Exact name of registrant as specified in charter)
Two Greenwich Plaza, 3rd Floor
Greenwich, CT 06830
(Address of principal executive offices) (Zip code)
Bradley D. Asness, Esq.
Principal and Chief Legal Officer
Two Greenwich Plaza
3rd Floor
Greenwich, CT 06830
(Name and Address of Agent for Service)
Registrant’s telephone number, including area code: 203-742-3600
Date of fiscal year end: December 31
Date of reporting period: January 1, 2012 to December 31, 2012
Table of Contents
Item 1. Reports to Shareholders.
The following is a copy of the report transmitted to shareholders pursuant to Rule 30e-1 under the Investment Company Act of 1940 (17 CFR 270.30e-1.)
Table of Contents
Table of Contents
| Shareholder Letters (unaudited) | ||||
| 2 | ||||
| 6 | ||||
| 10 | ||||
| 12 | ||||
| 14 | ||||
| 16 | ||||
| 21 | ||||
| 23 | ||||
| 25 | ||||
| 27 | ||||
| 29 | ||||
| 31 | ||||
| Schedule of Investments | ||||
| 37 | ||||
| 46 | ||||
| 53 | ||||
| 56 | ||||
| 59 | ||||
| 62 | ||||
| 85 | ||||
| 90 | ||||
| 99 | ||||
| 104 | ||||
| 108 | ||||
| 115 | ||||
| Financial Statements and Notes | 120 | |||
| Report of Independent Registered Public Accounting Firm | 171 | |||
| Other Federal Tax Information (unaudited) | 172 | |||
| Fund Expense Examples (unaudited) | 173 | |||
| Trustees and Officers (unaudited) | 176 | |||
| Board Approval of Investment Advisory Agreement (unaudited) | 178 | |||
Table of Contents
Shareholder Letter (Unaudited)

Cliff Asness
Managing & Founding Principal

Ronen Israel
Principal

Oktay Kurbanov
Principal

John Liew
Founding Principal

Lars Nielsen
Principal
Dear Shareholder:
Global equity markets had a strong year in 2012, with the MSCI World Index returning 15.83%. Market sentiment generally improved over the year, as global central banks continued to lend support via the implementation of extraordinary easing programs. Notably, the Federal Reserve Bank announced a third round of quantitative easing, the European Central Bank (ECB) announced a program of open ended outright monetary transactions, and the Bank of Japan implemented an explicit inflation target. The main exception to the general trend of positive performance during the year was in May, when elevating sovereign risk concerns in Europe drove equity market losses. However, the downturn proved short lived as swift and decisive action by the ECB helped to alleviate these concerns, allowing markets to resume their upward trend. Towards the end of the year, political events played an important role in determining relative market moves. A comprehensive victory for the dovish Liberal Democratic Party in the Japanese general elections in early December resulted in significant weakening of the yen, and outperformance of Japanese equity markets. At the other end of the spectrum, North American markets were the worst performing going into the year-end due to concerns about the impact of the impending U.S. fiscal cliff on the economy. The AQR Global Equity Fund Class I shares (the “Fund”) returned 18.95% for the year, outperforming its benchmark index by 3.12%.
The Fund is actively managed, and it seeks to outperform its benchmark in three ways: by selecting stocks within each country and by using futures and forwards contracts to over-and under-weight countries and currencies relative to the benchmark. Details on each of the strategies are provided below.
The stock selection strategies outperformed in 2012, led mainly by strong returns in the Europe strategy and positive returns in Canada. The U.S. strategy detracted slightly from performance.
Momentum signals within and across industries drove most of the outperformance in Europe, notably in the second quarter. In the U.S., industry valuation signals performed well, while industry momentum signals detracted from performance.
Sector positioning for the overall strategy contributed positively to the fund performance this year. Gains from an average net underweight position in utilities offset losses from an average net overweight position in materials. Our industry-neutral bets for the overall strategy also outperformed this year, notably within the materials and information technology sectors.
Tactically, we are underweight value in Japan, Canada and Europe, due to a tightening of value spreads in these regions. We remain overweight value in the U.S. due to a wide value spread.
The country selection strategy detracted from fund performance in 2012 after losses in the first three quarters outweighed a gain in the fourth quarter. Overall, both valuation and momentum signals detracted, though value was the more significant detractor. Fundamental momentum signals based on exchange rate moves, trade relationships and analyst sentiment contributed during the year.
| 2 | AQR Funds | Annual Report | December 2012 | |||||||||||||
Table of Contents
Shareholder Letter (Unaudited)
| AQR GLOBAL EQUITY FUND |
The biggest detractor was our underweight of Japan during the second quarter. At the time, we were overweight Japan after a strong start of the year had resulted in positive price momentum. Over the course of the quarter, heightened global risk aversion led to significant appreciation of the Japanese yen, resulting in underperformance of the Japanese equity market as exporters became less competitive. A second major detractor was our overweight position in U.K. equities, which was motivated by cheap valuation. The U.K. underperformed during the first quarter in particular after worsening sentiment resulted in Fitch downgrading the country’s fiscal rating outlook from stable to negative. Our underweight position in Canada, driven by expensive valuation, was the most significant contributor during the year. The Canadian equity market underperformed throughout the year, but in the fourth quarter in particular due to concerns about falling commodity prices.
Our largest overweight positions as of the end of 2012 were in France and Hong Kong, where we see a combination of attractive valuation levels and strong price momentum. We also favor Germany due to positive price momentum and improving analyst sentiment. Meanwhile, Australia continues to be our largest underweight due to expensive valuation coupled with deteriorating prices and economic fundamentals. We also continue to underweight both Canada and the U.S. due to expensive valuation, as well as negative price momentum in the case of Canada.
The currency selection strategy contributed significantly to fund performance in 2012, driven in particular by strong performance of our valuation theme. We also saw good performance of factors based on investor sentiment and equities, while interest rate related factors had relatively flat performance. Though the relatively low volatility environment proved favorable for carry trades, factors aimed at predicting future changes in interest rates struggled due to a lack of clear trends in global monetary policy. Gains to the strategy were concentrated in the first and fourth quarters.
The biggest contributor to strategy gains was our underweight position in the Japanese yen, driven mainly by valuation factors. Following a multi-year appreciation trend, the yen entered 2012 at an extremely over-valued level. The expensive currency drove worsening economic fundamentals, including a historically weak current account. While the announcement of an explicit 1% inflation target in the first quarter caused a temporary sell-off in the yen, the second and third quarters saw further richening of the currency as markets grew skeptical of the ability of the Bank of Japan to achieve its target. Towards the end of the year, there was a reversal in this trend. The announcement of a general election in December and the dovish policies of the eventual winner Shinzo Abe fuelled expectations of further easing and inflation, leading to a pronounced depreciation of the yen.
Our positioning in Europe, where we were overweight the Norwegian krone and the Swedish krona and underweight the euro and the Swiss franc, also contributed during the year. An improving economic outlook, in addition to a high interest rate differential, led to outperformance of the Scandinavian currencies. One detractor from strategy performance was our underweight position in the Australian dollar during the second half of the year. The currency rallied during this period as continued easing by G3 central banks encouraged investment in high yielding assets.
Going forward, as of the end of 2012, we favor the Norwegian krone where we see a high and improving level of carry, in addition to strong price momentum. We also continue to hold overweight positions in the Swedish krona and the U.S. dollar due to attractive levels of valuation, as well as improving economic fundamentals. The Japanese yen continues to be our most significant underweight position as the currency remains expensive, in spite of its recent weak price trend. We also dislike the Australian dollar due to a combination of expensive valuation and worsening economic and equity market fundamentals.
| AQR Funds | Annual Report | December 2012 | 3 | |||||||||||||
Table of Contents
Shareholder Letter (Unaudited)
| AQR GLOBAL EQUITY FUND |
| AVERAGE ANNUAL TOTAL RETURNS AS OF 12/31/2012 AQR GLOBAL EQUITY FUND PERFORMANCE SINCE COMMENCEMENT OF OPERATIONS AS A MUTUAL FUND | ||||||||||||
| 1 Year | 3 Year | Since Inception (12/31/2009) | ||||||||||
| Fund - Class I: AQGIX | 18.95% | 8.20% | 8.20% | |||||||||
| Fund - Class N: AQGNX | 18.67% | 7.89% | 7.89% | |||||||||
| Fund - Class Y: AQGYX | 19.45% | 8.66% | 8.66% | |||||||||
MSCI World Total Return (net of dividends) Index | 15.83% | 6.93% | 6.93% | |||||||||
Past performance does not guarantee future results. Investment results and principal value of an investment will fluctuate so that an investor’s shares, when redeemed, may be worth more or less than their original cost. Class Y shares are subject to a 0.10% redemption fee. If reflected, the redemption fee would reduce the performance quoted. Current performance may be lower or higher than the performance data quoted. As of the latest prospectus, the gross expense ratio for the Fund’s Class I/N/Y shares are 2.04%, 3.23% and 0.53%, respectively. Call 1-866-290-2688 or visit www.aqrfunds.com for current month-end performance.
AQR GLOBAL EQUITY FUND VS. MSCI WORLD TOTAL RETURN INDEX VALUE OF $10,000 INVESTED ON 12/31/09 |
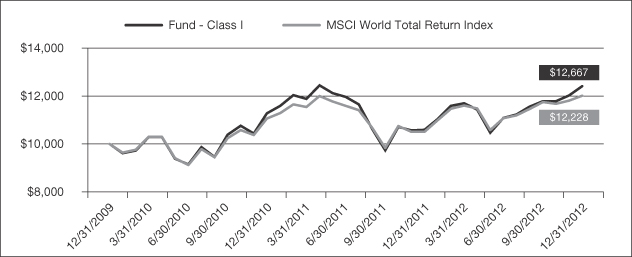
The chart above represents historical performance of a hypothetical investment of $10,000 in the Fund over the past ten years (or since inception if shorter). Performance data quoted represents past performance and does not guarantee future results. Returns shown are total returns, which assume the reinvestment of dividends and capital gains. The table and graph presented above do not reflect the deduction of taxes a shareholder would pay on fund distributions or the redemption of fund shares.
| 4 | AQR Funds | Annual Report | December 2012 | |||||||||||||
Table of Contents
Shareholder Letter (Unaudited)
| AQR GLOBAL EQUITY FUND |
| AVERAGE ANNUAL TOTAL RETURNS AS OF 12/31/2012 AQR GLOBAL EQUITY FUND PERFORMANCE SINCE INCEPTION OF PREDECESSOR LIMITED PARTNERSHIP | ||||||||||||||||
| 1 Year | 3 Year | 5 Year | Since Inception (6/30/2006) | |||||||||||||
| Fund - Class I: AQGIX | 18.95% | 8.20% | -0.70% | 2.02% | ||||||||||||
| Fund - Class N: AQGNX | 18.67% | 7.89% | -1.02% | 1.69% | ||||||||||||
| Fund - Class Y: AQGYX | 19.45% | 8.66% | -0.31% | 2.42% | ||||||||||||
MSCI World Total Return (net of dividends) Index | 15.83% | 6.93% | -1.18% | 2.35% | ||||||||||||
Past performance does not guarantee future results. Investment results and principal value of an investment will fluctuate so that an investor’s shares, when redeemed, may be worth more or less than their original cost. Class Y shares are subject to a 0.10% redemption fee. If reflected, the redemption fee would reduce the performance quoted. Current performance may be lower or higher than the performance data quoted. As of the latest prospectus, the gross expense ratio for the Fund’s Class I/N/Y shares are 2.04%, 3.23% and 0.53%, respectively. Call 1-866-290-2688 or visit www.aqrfunds.com for current month-end performance.
AQR GLOBAL EQUITY FUND VS. MSCI WORLD TOTAL RETURN INDEX VALUE OF $10,000 INVESTED ON 6/30/06 |
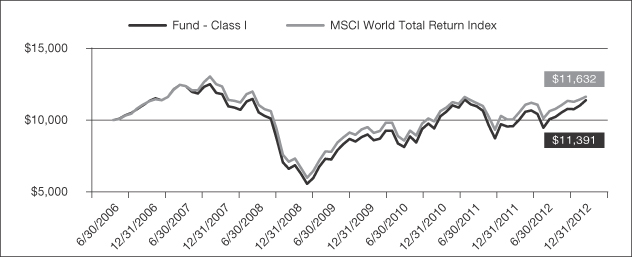
The chart above represents historical performance of a hypothetical investment of $10,000 in the Fund over the past ten years (or since inception if shorter). Performance data quoted represents past performance and does not guarantee future results. Returns shown are total returns, which assume the reinvestment of dividends and capital gains. The table and graph presented above do not reflect the deduction of taxes a shareholder would pay on fund distributions or the redemption of fund shares.
| AQR Funds | Annual Report | December 2012 | 5 | |||||||||||||
Table of Contents
Shareholder Letter (Unaudited)
Cliff Asness
Managing & Founding Principal
Ronen Israel
Principal
Oktay Kurbanov
Principal
John Liew
Founding Principal
Lars Nielsen
Principal
Dear Shareholder:
International equity markets had a strong year in 2012, with the MSCI EAFE Index returning 17.32%. Market sentiment generally improved over the year, as global central banks continued to lend support via the implementation of extraordinary easing programs. Notably, the Federal Reserve Bank announced a third round of quantitative easing, the European Central Bank (ECB) announced a program of open ended outright monetary transactions, and the Bank of Japan implemented an explicit inflation target. The main exception to the general trend of positive performance during the year was in May, when elevating sovereign risk concerns in Europe drove equity market losses. However, the downturn proved short lived as swift and decisive action by the ECB helped to alleviate these concerns, allowing markets to resume their upward trend. Towards the end of the year, Japanese equity markets had particularly strong performance after a comprehensive victory for the dovish Liberal Democratic Party in the Japanese general elections in early December resulted in significant weakening of the yen. The AQR International Equity Fund Class I shares (the “Fund”) returned 22.87% for the year, outperforming its benchmark index by 5.55%.
The Fund is actively managed, and it seeks to outperform its benchmark in three ways: by selecting stocks within each country and by using futures and forwards contracts to over-and under-weight countries and currencies relative to the benchmark. Details on each of the strategies are provided below.
The stock selection strategies outperformed in 2012, driven by strong returns from the Europe strategy. Our Japan strategy detracted slightly from performance, while returns in other regions were either flat or slightly negative.
Industry-relative momentum and valuation signals drove most of the outperformance in Europe, notably earlier in the year. In Japan, valuation signals underperformed, offsetting gains from momentum signals. These two investment themes tend to be negatively correlated.
Sector positioning for the overall strategy contributed positively to the fund’s performance this year. Gains from an average net underweight position in utilities and an average net underweight position in telecommunications offset losses from an average net underweight in financials. Our industry-neutral bets for the overall strategy also outperformed this year, notably within the consumer discretionary and financials sectors.
Tactically, we are underweight value in Japan and Europe, due to a tightening of value spreads.
The country selection strategy detracted from fund performance in 2012 after losses in the first half of the year. Overall, both valuation and momentum signals detracted, though value was the more significant detractor. Fundamental momentum signals based on exchange rate moves, trade relationships and analyst sentiment contributed during the year.
| 6 | AQR Funds | Annual Report | December 2012 | |||||||||||||
Table of Contents
Shareholder Letter (Unaudited)
| AQR INTERNATIONAL EQUITY FUND |
The biggest detractors during the year were our positions in Switzerland and Japan, with the negative contribution happening mostly during the second quarter. At the time, we were underweight Switzerland due to expensive valuation, and overweight Japan due to strong price momentum. Over the second quarter, worsening sentiment on Europe and generally heightened global risk aversion led to significant depreciation of the franc, while the Japanese yen appreciated. Given the reliance of both economies on exports, the result was outperformance of Switzerland and underperformance of Japan, leading to losses to both positions. These losses were partially offset by gains from our underweight position in Spain during the same period, which was motivated by weak price momentum and worsening economic fundamentals.
Our largest overweight positions as of the end of 2012 are in France and Hong Kong, where we see a combination of attractive valuation levels and strong price momentum. We also favor Germany due to positive price momentum and improving analyst sentiment. Meanwhile, Australia continues to be our largest underweight due to expensive valuation coupled with deteriorating prices and economic fundamentals. Sweden is also a major underweight position due to expensive valuation, a strengthening currency and worsening analyst sentiment.
The currency selection strategy contributed significantly to fund performance in 2012, driven in particular by strong performance of our valuation theme. We also saw good performance of factors based on investor sentiment and equities, while interest rate related factors had relatively flat performance. Though the relatively low volatility environment proved favorable for carry trades, factors aimed at predicting future changes in interest rates struggled due to a lack of clear trends in global monetary policy. Gains to the strategy were concentrated in the first and fourth quarters.
The biggest contributor to strategy gains was our underweight position in the Japanese yen, driven mainly by valuation factors. Following a multi-year appreciation trend, the yen entered 2012 at an extremely over-valued level. The expensive currency drove worsening economic fundamentals, including a historically weak current account. While the announcement of an explicit 1% inflation target in the first quarter caused a temporary sell-off in the yen, the second and third quarters saw further richening of the currency as markets grew skeptical of the ability of the Bank of Japan to achieve its target. Towards the end of the year, there was a reversal in this trend. The announcement of a general election in December and the dovish policies of the eventual winner Shinzo Abe fuelled expectations of further easing and inflation, leading to a pronounced depreciation of the yen.
Our positioning in Europe, where we were overweight the Norwegian krone and the Swedish krona and underweight the euro and the Swiss franc, also contributed during the year. An improving economic outlook, in addition to a high interest rate differential, led to outperformance of the Scandinavian currencies. One detractor from strategy performance was our overweight position in the U.S. dollar, which was motivated by cheap valuation. The U.S. dollar underperformed during the year as the improving risk environment reduced the demand for safe havens.
Going forward, as of the end of 2012, we favor the Norwegian krone where we see a high and improving level of carry, in addition to strong price momentum. We also continue to hold overweight positions in the Swedish krona and the U.S. dollar due to attractive levels of valuation, as well as improving economic fundamentals. The Japanese yen continues to be our most significant underweight position as the currency remains expensive in spite of its recent weak price trend. We also dislike the Australian dollar due to a combination of expensive valuation and worsening economic and equity market fundamentals.
| AQR Funds | Annual Report | December 2012 | 7 | |||||||||||||
Table of Contents
Shareholder Letter (Unaudited)
| AQR INTERNATIONAL EQUITY FUND |
| AVERAGE ANNUAL TOTAL RETURNS AS OF 12/31/2012 AQR INTERNATIONAL EQUITY FUND PERFORMANCE SINCE COMMENCEMENT OF OPERATIONS AS A MUTUAL FUND | ||||||||||||||||
| 1 Year | 3 Year | Since Inception 9/29/2009 | Since Inception 8/28/2009 | |||||||||||||
| Fund - Class I: AQIIX | 22.87% | 4.86% | 5.17% | na | ||||||||||||
| Fund - Class N: AQINX | 22.41% | 4.62% | 4.90% | na | ||||||||||||
| Fund - Class Y: AQIYX | 23.26% | 5.25% | na | 6.57% | ||||||||||||
MSCI EAFE Index | 17.32% | 3.56% | 4.11% | 4.86% | ||||||||||||
Past performance does not guarantee future results. Investment results and principal value of an investment will fluctuate so that an investor’s shares, when redeemed, may be worth more or less than their original cost. Class Y shares are subject to a 0.10% redemption fee. If reflected, the redemption fee would reduce the performance quoted. Current performance may be lower or higher than the performance data quoted. As of the latest prospectus, the gross expense ratio for the Fund’s Class I/N/Y shares are 0.96%, 2.20% and 0.60%, respectively. Call 1-866-290-2688 or visit www.aqrfunds.com for current month-end performance.
AQR INTERNATIONAL EQUITY FUND VS. MSCI EAFE INDEX VALUE OF $10,000 INVESTED ON 9/29/09 |
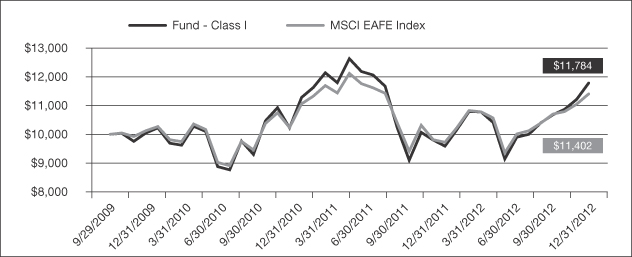
The chart above represents historical performance of a hypothetical investment of $10,000 in the Fund over the past ten years (or since inception if shorter). Performance data quoted represents past performance and does not guarantee future results. Returns shown are total returns, which assume the reinvestment of dividends and capital gains. The table and graph presented above do not reflect the deduction of taxes a shareholder would pay on fund distributions or the redemption of fund shares.
| 8 | AQR Funds | Annual Report | December 2012 | |||||||||||||
Table of Contents
Shareholder Letter (Unaudited)
| AQR INTERNATIONAL EQUITY FUND |
| AVERAGE ANNUAL TOTAL RETURNS AS OF 12/31/2012 AQR INTERNATIONAL EQUITY FUND PERFORMANCE SINCE INCEPTION OF PREDECESSOR LIMITED PARTERSHIP | ||||||||||||||||
| 1 Year | 3 Year | 5 Year | Since Inception (7/31/2004) | |||||||||||||
| Fund - Class I: AQIIX | 22.87% | 4.86% | -3.00% | 5.72% | ||||||||||||
| Fund - Class N: AQINX | 22.41% | 4.62% | -3.29% | 5.37% | ||||||||||||
| Fund - Class Y: AQIYX | 23.26% | 5.25% | -2.66% | 6.07% | ||||||||||||
MSCI EAFE Index | 17.32% | 3.56% | -3.69% | 1.91% | ||||||||||||
Past performance does not guarantee future results. Investment results and principal value of an investment will fluctuate so that an investor’s shares, when redeemed, may be worth more or less than their original cost. Class Y shares are subject to a 0.10% redemption fee. If reflected, the redemption fee would reduce the performance quoted. Current performance may be lower or higher than the performance data quoted. As of the latest prospectus, the gross expense ratio for the Fund’s Class I/N/Y shares are 0.96%, 2.20% and 0.60%, respectively. Call 1-866-290-2688 or visit www.aqrfunds.com for current month-end performance.
AQR INTERNATIONAL EQUITY FUND VS. MSCI EAFE INDEX VALUE OF $10,000 INVESTED ON 7/31/04 |
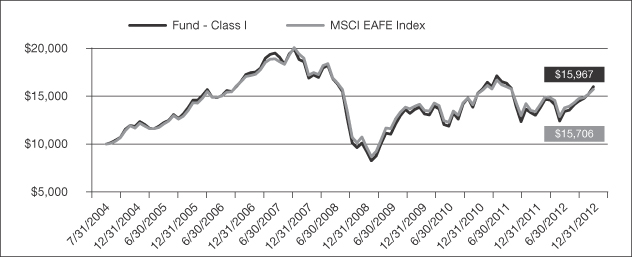
The chart above represents historical performance of a hypothetical investment of $10,000 in the Fund over the past ten years (or since inception if shorter). Performance data quoted represents past performance and does not guarantee future results. Returns shown are total returns, which assume the reinvestment of dividends and capital gains. The table and graph presented above do not reflect the deduction of taxes a shareholder would pay on fund distributions or the redemption of fund shares.
| AQR Funds | Annual Report | December 2012 | 9 | |||||||||||||
Table of Contents
Shareholder Letter (Unaudited)

Jacques Friedman
Principal
Lars Nielsen
Principal

Andrea Frazzini
Vice President

Hoon Kim
Vice President
Dear Shareholder:
After a volatile and disappointing year in 2011, the Emerging equity market rebounded in 2012 and ended the year on a positive note as reduced concerns over the European financial crisis improved the perceived growth prospects in emerging countries. The MSCI Emerging Index returned 13.78% since the inception of the AQR Emerging Defensive Equity Fund (the “Fund”) on July 9th 2012, and returned 18.2% for the full year. Since the inception of the Fund, strong performance in the market was accompanied by a realized volatility of 12.1%, a low figure by historical standards. The Fund underperformed the market, returning 10.39% with a realized volatility of 9.8%. The Fund seeks to provide exposure to Emerging stock markets with lower volatility than its stock market benchmark. We expect the strategy to underperform the index when the markets are rising, but outperform the index during market declines.
To achieve this objective, the Fund overweights low-risk sectors, countries and stocks while underweighting high-risk sectors, countries and stocks, relative to the market. The Fund had an overweight position in low-risk sectors like utilities and telecommunication services since the Fund’s inception, which negatively affected performance as these sectors trailed the market. An underweighting of high-risk sectors like energy and financials also negatively contributed to the Fund’s performance, as high-risk sectors generally led the recent market rally.
Selecting low-risk countries during this period contributed positively to the performance of the Fund, while selecting low-risk stocks detracted from the Fund’s performance relative to the market. A meaningful portion of underperformance was attributed to low-risk stock selection in Brazil.
The Fund pursues a defensive strategy in emerging markets, meaning it seeks to participate in rising equity markets while mitigating downside risk in declining markets. To achieve this objective, the Fund invests in a broadly diversified set of large/mid-cap companies that we believe to be profitable, stable, low-risk businesses. Profitable and stable companies are identified through measures including profit margins, asset efficiency, leverage, and earnings variability. These companies tend to be lower beta stocks, which are less sensitive to fluctuations in the overall economy and the stock market. We expect lower beta stocks to produce higher risk-adjusted returns over the long term than higher beta stocks.
| 10 | AQR Funds | Annual Report | December 2012 | |||||||||||||
Table of Contents
Shareholder Letter (Unaudited)
| AQR EMERGING DEFENSIVE EQUITY FUND |
| AVERAGE ANNUAL TOTAL RETURNS AS OF 12/31/2012 AQR EMERGING DEFENSIVE EQUITY FUND | ||||
| Since Inception (7/9/2012) | ||||
| Fund - Class I: AZEIX | 10.39% | |||
| Fund - Class N: AZENX | 10.32% | |||
MSCI Emerging Markets Index | 13.78% | |||
Past performance does not guarantee future results. Investment results and principal value of an investment will fluctuate so that an investor’s shares, when redeemed, may be worth more or less than their original cost. Current performance may be lower or higher than the performance data quoted. As of the latest prospectus, the gross expense ratio for the Fund’s Class I/N shares are 1.92% and 2.17%, respectively. Call 1-866-290-2688 or visit www.aqrfunds.com for current month-end performance.
AQR EMERGING DEFENSIVE EQUITY FUND VS. MSCI EMERGING MARKETS INDEX VALUE OF $10,000 INVESTED ON 7/9/12 |
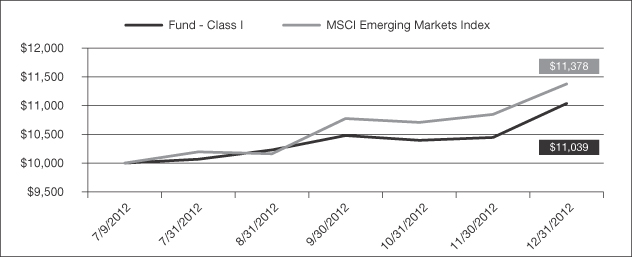
The chart above represents historical performance of a hypothetical investment of $10,000 in the Fund over the past ten years (or since inception if shorter). Performance data quoted represents past performance and does not guarantee future results. Returns shown are total returns, which assume the reinvestment of dividends and capital gains. The table and graph presented above do not reflect the deduction of taxes a shareholder would pay on fund distributions or the redemption of fund shares.
| AQR Funds | Annual Report | December 2012 | 11 | |||||||||||||
Table of Contents
Shareholder Letter (Unaudited)
Jacques Friedman
Principal
Lars Nielsen
Principal
Andrea Frazzini
Vice President
Hoon Kim
Vice President
Dear Shareholder:
After a volatile year in 2011, the International equity markets rebounded in 2012 and ended the year on a positive note, due to reduced concerns related to the European financial crisis and well-received announcements of proactive fiscal and monetary policy proposals in Japan, following the country’s recent elections. The MSCI World ex-USA Index returned 15.08% since the inception of the AQR International Defensive Equity Fund (the “Fund”) on July 9th 2012, and returned 18.1% for the full year. Since inception of the Fund, strong performance in the market was accompanied by realized volatility of 13.7%, a low figure by historical standards. The Fund underperformed the market, returning 7.69% with a realized volatility of 9.4%. The Fund seeks to provide exposure to International stock markets with lower volatility than its stock market benchmark. We expect the strategy to underperform its index when markets are rising, but outperform the index during market declines.
To achieve this objective, the Fund overweights low-risk sectors, countries and stocks, and underweights high-risk sectors, countries and stocks relative to the market. Propelled by reduced concerns over the European financial crisis and the pro-growth policies proposed by the newly elected Japanese Liberal Democratic Party’s Prime Minister Abe, the fourth quarter of 2012 could be characterized as a “risk-on” rally. Higher-risk sectors like consumer discretionary and financials outperformed the market, while lower-risk sectors like consumer staples and utilities underperformed the market. As a result, the Fund’s sector selection relative to the MSCI World ex-USA Index underperformed for the year. Underweighting financials and overweighting telecommunications services and health care sectors contributed negatively to the Fund’s performance, while underweighting the materials sector helped to offset some of these losses.
Due to prolonged concerns over the European financial crisis, most European countries have experienced higher volatility, leading the Fund to reduce its exposure to the region. Since the inception of the Fund in July 2012, underweighting countries like France, Germany and Spain has negatively contributed to the Fund’s performance, as equity markets in this region have rallied from the improved perception of Europe’s economic situation.
The Fund pursues a defensive strategy in developed markets outside of the U.S., meaning it seeks to participate in rising equity markets while mitigating downside risk in declining markets. To achieve this objective, the Fund invests in a broadly diversified set of large/mid-cap companies that we believe to be profitable, stable, low-risk businesses. Profitable and stable companies are identified through measures including profit margins, asset efficiency, leverage, and earnings variability. These companies tend to be lower beta stocks, which are less sensitive to fluctuations in the overall economy and the stock market. We expect lower beta stocks to produce higher risk-adjusted returns over the long term than higher beta stocks.
| 12 | AQR Funds | Annual Report | December 2012 | |||||||||||||
Table of Contents
Shareholder Letter (Unaudited)
| AQR INTERNATIONAL DEFENSIVE EQUITY FUND |
| AVERAGE ANNUAL TOTAL RETURNS AS OF 12/31/2012 AQR INTERNATIONAL DEFENSIVE EQUITY FUND | ||||
| Since Inception (7/9/2012) | ||||
| Fund - Class I: ANDIX | 7.69% | |||
| Fund - Class N: ANDNX | 7.62% | |||
MSCI World ex USA Index (Net) | 15.08% | |||
Past performance does not guarantee future results. Investment results and principal value of an investment will fluctuate so that an investor’s shares, when redeemed, may be worth more or less than their original cost. Current performance may be lower or higher than the performance data quoted. As of the latest prospectus, the gross expense ratio for the Fund’s Class I/N shares are 1.67% and 1.92%, respectively. Call 1-866-290-2688 or visit www.aqrfunds.com for current month-end performance.
AQR INTERNATIONAL DEFENSIVE EQUITY FUND VS. MSCI WORLD ex-USA INDEX (NET) VALUE OF $10,000 INVESTED ON 7/9/12 |
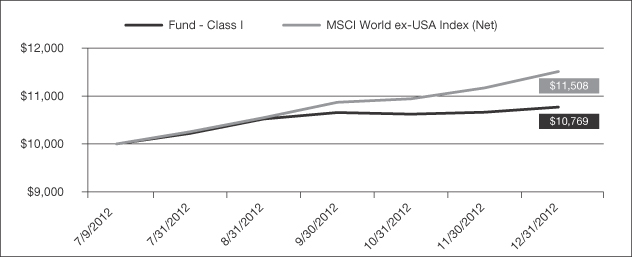
The chart above represents historical performance of a hypothetical investment of $10,000 in the Fund over the past ten years (or since inception if shorter). Performance data quoted represents past performance and does not guarantee future results. Returns shown are total returns, which assume the reinvestment of dividends and capital gains. The table and graph presented above do not reflect the deduction of taxes a shareholder would pay on fund distributions or the redemption of fund shares.
| AQR Funds | Annual Report | December 2012 | 13 | |||||||||||||
Table of Contents
Shareholder Letter (Unaudited)
Jacques Friedman
Principal
Lars Nielsen
Principal
Andrea Frazzini
Vice President
Hoon Kim
Vice President
Dear Shareholder:
After a volatile year in 2011, the U.S. equity market rebounded in 2012 and ended the year on a positive note. Despite looming uncertainty regarding the U.S. “fiscal cliff” in the fourth quarter, eased concerns related to the European financial crisis led to a strong finish in equity markets for the year. The Russell 1000 Index returned 7.04% since the inception of the AQR U.S. Defensive Equity Fund (the “Fund”) on July 9th 2012, and returned 16.4% for the full year. Since inception of the Fund, strong performance in the market was accompanied by a realized volatility of 11.9%, a low figure by historical standards. The Fund underperformed the index, returning 2.34% with realized volatility of 9.7%. The Fund seeks to provide exposure to U.S. stock markets with lower volatility than its stock market benchmark. We expect the strategy to underperform its index when markets are rising, but outperform the index during market declines.
To achieve this objective, the Fund overweights low-risk sectors and low-risk stocks, while underweighting high-risk sectors and high-risk stocks relative to the market. In 2012, high-risk sectors, like consumer discretionary and financials, outperformed the market while low-risk sectors like consumer staples and utilities underperformed the market. As a result, the Fund’s sector selection relative to the Russell 1000 Index underperformed for the year. Underweighting the information technology sector led to positive contributions as this sector underperformed, led mainly by the decline in Apple, Inc. in the fourth quarter of 2012. However, this gain was largely offset by losses in the utilities and consumer staples sectors, where the Fund had overweight positions due to the lower-risk nature of these sectors. High-risk stocks within sectors also outperformed low-risk stocks, contributing negatively to the Fund’s performance relative to the index for the year.
The Fund pursues a defensive strategy in the U.S., meaning it seeks to participate in rising equity markets while mitigating downside risk in declining markets. To achieve this objective, the Fund invests in a broadly diversified set of large/mid-cap companies that we believe to be profitable, stable, low-risk businesses. Profitable and stable companies are identified through measures including profit margins, asset efficiency, leverage, and earnings variability. These companies tend to be lower beta stocks, which are less sensitive to fluctuations in the overall economy and the stock market. We expect lower beta stocks to produce higher risk-adjusted returns over the long term than higher beta stocks.
| 14 | AQR Funds | Annual Report | December 2012 | |||||||||||||
Table of Contents
Shareholder Letter (Unaudited)
| AQR U.S. DEFENSIVE EQUITY FUND |
| AVERAGE ANNUAL TOTAL RETURNS AS OF 12/31/2012 AQR U.S. DEFENSIVE EQUITY FUND | ||||
| Since Inception (7/9/2012) | ||||
| Fund - Class I: AUEIX | 2.34% | |||
| Fund - Class N: AUENX | 2.19% | |||
Russell 1000 Index | 7.04% | |||
Past performance does not guarantee future results. Investment results and principal value of an investment will fluctuate so that an investor’s shares, when redeemed, may be worth more or less than their original cost. Current performance may be lower or higher than the performance data quoted. As of the latest prospectus, the gross expense ratio for the Fund’s Class I/N shares are 1.03% and 1.28%, respectively. Call 1-866-290-2688 or visit www.aqrfunds.com for current month-end performance.
AQR U.S. DEFENSIVE EQUITY FUND VS. RUSSELL 1000 INDEX VALUE OF $10,000 INVESTED ON 7/9/12 |
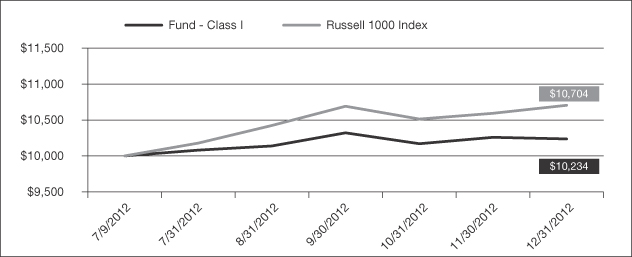
The chart above represents historical performance of a hypothetical investment of $10,000 in the Fund over the past ten years (or since inception if shorter). Performance data quoted represents past performance and does not guarantee future results. Returns shown are total returns, which assume the reinvestment of dividends and capital gains. The table and graph presented above do not reflect the deduction of taxes a shareholder would pay on fund distributions or the redemption of fund shares.
| AQR Funds | Annual Report | December 2012 | 15 | |||||||||||||
Table of Contents
Shareholder Letter (Unaudited)
Ronen Israel
Principal

Mark Mitchell, Ph.D.
Founding Principal, CNH Partners
Lars Nielsen
Principal

Todd Pulvino, Ph.D.
Founding Principal, CNH Partners
Dear Shareholder:
The Diversified Arbitrage Fund Class I returned 3.04% during the 2012 calendar year. During the corresponding period, the Merrill Lynch 3 Month Treasury Bill Index (the Fund’s benchmark) returned 0.11% and the S&P 500 returned 16.00%. Based on monthly return data since inception (January 15, 2009) through December 31, 2012, the Fund’s equity market beta (relative to the S&P 500) is 0.06, the annualized volatility is 2.5%, and the Sharpe ratio is 1.78.
Despite the European sovereign debt crisis and uncertainty stemming from the U.S. fiscal cliff, both of which paralyzed market participants and corporate decision makers, arbitrage strategies involving corporate securities were notably stable throughout 2012. In the prior year, particularly in early August of 2011, the European sovereign debt crisis caused an increase in risk aversion and a commensurate widening of arbitrage spreads. However, by the end of 2011, arbitrage markets had stabilized. The one exception was convertible arbitrage which was subject to substantial selling during the second half of 2011 when long-only convertible funds and Wall Street trading desks reduced their convertible exposures. As 2012 unfolded, the convertible market cheapening of 2011 reversed course. We attribute this to two factors. First, from a demand perspective, selling pressure abated early in 2012 and appetites from both yield investors and equity investors looking for downside protection increased. Second, the convertible new-issue calendar was largely dormant, a result of issuers’ abilities to pay historically low coupon rates on non-convertible debt thereby avoiding the issuance of dilutive call options that are imbedded in convertible securities. As of year-end 2012, convertible securities were trading at prices comparable to long-run historical averages. Although there was a welcomed increase in merger activity during the fourth quarter, merger activity throughout 2012 was quite low. Investment opportunities in the event-driven strategy were also below average, primarily due to a lack of major corporate events which tend to generate event-driven investment opportunities.
Strategy Allocations
The Fund tactically allocates to arbitrage strategies based on relative attractiveness. Long-run strategic allocations to merger arbitrage, convertible arbitrage, and event arbitrage (consisting of event-driven credit, dual-class arbitrage, closed-end-fund discount arbitrage, and so forth) are 33% each. However, as displayed in the table below, strategy weights have varied significantly since the Fund’s inception. For example, the allocation to merger arbitrage decreased from 34% to 23% during 2010, subsequently rebounded to 35% by year-end 2011, and then declined to 27% as of year-end 2012. Variations in merger arbitrage weights are driven by changing characteristics of the merger universe, and in particular, the level of aggregate merger activity.
| 16 | AQR Funds | Annual Report | December 2012 | |||||||||||||
Table of Contents
Shareholder Letter (Unaudited)
| AQR DIVERSIFIED ARBITRAGE FUND |
| ARBITRAGE STRATEGY WEIGHTS AS PERCENTAGE OF TOTAL LONG MARKET VALUE | ||||||||||||||||
| Strategy | 12/31/09 | 12/31/10 | 12/31/11 | 12/31/12 | ||||||||||||
| Convertible Arbitrage | 44% | 38% | 36% | 48% | ||||||||||||
| Merger Arbitrage | 34% | 23% | 35% | 27% | ||||||||||||
| Event - Driven Credit | 1% | 15% | 10% | 11% | ||||||||||||
| Dual-Class Arbitrage | 12% | 8% | 5% | 3% | ||||||||||||
| Price Pressure | 4% | 6% | 1% | 1% | ||||||||||||
| Special Purpose Acquisition Corporations (“SPACs”) | 1% | 3% | 6% | 5% | ||||||||||||
| Private Investment in Public Equity (“PIPEs”) | 0% | 3% | 2% | 1% | ||||||||||||
| Closed-End Fund Arbitrage | 2% | 0% | 2% | 2% | ||||||||||||
Other Arbitrage and Alternative Investment Strategies | 2% | 4% | 3% | 2% | ||||||||||||
Convertible Arbitrage
As measured by the percentage of long market value, convertible arbitrage continues to have the largest strategy weight with 48% as of year-end 2012. Convertible arbitrage involves the purchase of a convertible security at a price below its fundamental or intrinsic value, and the contemporaneous hedging of the convertible’s risk via shorting the underlying stock. In addition to hedging equity risk, convertible arbitrage investments often require hedging of credit and interest rate risk. With a fully hedged position, the arbitrageur profits when the difference between the convertible security’s fundamental value and its traded value converges. Note that while the convertible arbitrage strategy accounts for nearly half of the Fund’s portfolio at year-end 2012, its effective risk weighting is much lower (roughly 30%) as the convertible portfolio consists of equity-sensitive (and thus high-delta) bonds. Because there is a direct relationship between an equity-sensitive convertible bond and the underlying common stock, arbitrage trades using equity-sensitive bonds (long the bond and short the common stock) have relatively low risk. As mentioned above, convertible securities cheapened considerably during the second half of 2011 as the European sovereign risk crisis unfolded. We noted in last year’s annual letter that we anticipated increasing the exposure to convertible arbitrage in 2012 and this resulted in the weight of 48% as of the end of the year. As 2012 unfolded and buyers returned to the convertible market, convertible prices converged toward theoretical values. As a result, the convertible arbitrage strategy contributed 1.20% to the Fund’s overall return.1
Merger Arbitrage
Merger arbitrage involves the assumption of deal failure risk following publicly-announced mergers and acquisitions. The most common merger arbitrage trade involves the purchase of the target company’s equity. Depending on the structure of the transaction, additional trades are used to hedge market and industry risk. For example, in a merger where the consideration is the acquirer’s stock, the Fund seeks to hedge market and industry exposure by shorting the stock of the acquiring company in an amount based on the exchange ratio specified in the merger agreement. Conditions for investing in merger arbitrage are especially attractive when deal spreads (the percentage difference between the consideration offered by the acquiring firm and the stock price of the target firm) are wide and when merger activity is robust. In
| 1 | It is important to note that the Fund’s investment in a convertible bond is based on the cheapness of the bond relative to its fundamental value rather than on a view about the underlying stock price. Specifically, we hedge the long position and attempt to capture the cheapness of the convertible by shorting the stock of the underlying issuer, and by hedging systematic credit and interest rate risk. Thus, the Fund benefitted from the convergence between convertible prices and their theoretical values rather than from increasing convertible prices. |
| AQR Funds | Annual Report | December 2012 | 17 | |||||||||||||
Table of Contents
Shareholder Letter (Unaudited)
| AQR DIVERSIFIED ARBITRAGE FUND |
2012, corporate executives remained on the sidelines and retained large cash balances in light of heightened geopolitical risk. Although deal flow was sluggish, albeit with a small pick-up in merger activity during the 4th quarter, the quality of the deal flow was high (e.g., few financing contingent deals) and thus deal spreads were appropriately tight throughout the year. The only exception was the temporary widening of deal spreads during the 3rd quarter caused by concerns that Canadian regulators would block a spate of deals over national security issues. In spite of tight spreads, the relatively low deal termination rate in 2012 resulted in a contribution of 1.00% to the Fund’s return from merger arbitrage.
Event-Driven Investments
The Fund’s third primary strategy is event-driven arbitrage and alternative investments which consists of several sub-strategies such as event-driven credit, dual-class arbitrage, closed-end-fund discount arbitrage and so forth. As shown in the Table above, the event-driven credit category has the largest sub-strategy weight at 11% of total long market value. The credit sub-strategy consists primarily of short-term (average expected duration of 12 months) corporate debentures and of high-quality distressed securities. Historically, as we have documented using our proprietary corporate debenture database, short-dated corporate debentures, particularly in the high-yield arena, produce excess returns after accounting for systematic credit and interest rate risk. We postulate that the reason for the excess returns is that fixed-income investors often choose to exchange short-term debentures for longer-term debentures in order to generate higher-expected returns associated with bearing greater systematic credit risk. We focus on short-dated debentures issued by companies that have stable near-term cash flow and sufficient assets to retire the debenture at maturity. We view this trade as similar to a long-dated cash merger trade, but one in which the downside is contractually protected by the underlying bond indenture. This is not to say that the trade is absent risk as a sharply negative event (e.g. financial fraud) can result in non-payment. Rather, the systematic component of risk is minimal, a direct result of the short-dated nature of the investments. Our analysis using our proprietary database shows that the modest systematic credit and interest rate risk that remains can be hedged at the portfolio level using credit default swaps and Treasury futures. In addition to short-dated debentures, the Fund also holds securities issued by distressed companies. Distressed situations, which are triggered by covenant violations, missed coupon payments, and bankruptcy filings, often cause widespread selling of the distressed issuer’s debt. Not all distressed scenarios are resolved profitably for buyers of distressed debt, but the moderate probability of a substantial loss is the reason why the strategy has, overall, positive risk-adjusted returns. In our implementation of the strategy, we tend to focus on those distressed situations and on the securities within the capital structure with lower downside risk. In addition, since distressed returns co-vary with credit market returns, we attempt to hedge the systematic credit risk associated with the strategy. For the year 2012, the event-driven credit sub-strategy yielded roughly flat results, primarily because of losses associated with the credit market hedge that resulted from investors’ appetites for high-yield bonds.
The second largest sub-strategy within the event-driven/alternative investment category is SPACs with a weight of 5%. SPACs are corporations that raise cash through an initial public offering, and place the cash in a trust to be used to acquire an operating company. Because SPAC assets are held in trust accounts invested in Treasury securities while the SPAC sponsors search for assets to acquire, these investments have very little risk. On the low side, SPACs will generate Treasury bill returns. However, if the SPAC sponsor finds a good acquisition at a great price, the embedded call option on the acquisition target provides significant upside to SPAC investors.
Dual-class arbitrage represents the third largest sub-strategy within the event-driven/alternative investment category. Dual-class arbitrage involves trading two classes of stocks issued by the same firm where each class has identical rights to the underlying cash flows of the firm. When the prices of the two classes of
| 18 | AQR Funds | Annual Report | December 2012 | |||||||||||||
Table of Contents
Shareholder Letter (Unaudited)
| AQR DIVERSIFIED ARBITRAGE FUND |
stock diverge, buying the low-price share class and shorting the high-price share class generates excess returns on average. In addition, because the dual-class arbitrage strategy has a negative beta, it helps to reduce the systematic equity market risk in the portfolio. As dual-class spreads tightened during the year, the Fund reduced its exposure to dual-class arbitrage from 5% to 3%.
Other sub-strategies (price pressure, PIPEs, closed-end-funds, and other arbitrage and alternative investments) collectively account for 6% of the Fund’s portfolio. Overall, the event-driven arbitrage strategy contributed 0.84% to the Fund’s overall return. Roughly half of this sub-strategy’s return came from a special situation that the Fund was actively involved in over the year. The situation centered on legal proceedings related to the treatment of a convertible bond following the acquisition of the issuer. When the acquiring company refused to increase the debenture’s coupon rate as required by the indenture, legal action was initiated and the case was settled in the Fund’s favor.
Summary
Overall, the Fund realized a return of 3.04% in 2012, a year with one of the lowest levels of deal flow in our investing experience. A welcome respite from the low deal flow was a moderate increase in merger activity during the fourth quarter, plausibly consistent with corporations deploying their large cash balances as political and tax uncertainties are resolved. We expect this trend to continue in 2013 as the U.S. fiscal plan evolves. We expect the convertible market to be quiet in 2013, at least in the early months. This will be particularly true if market volatility remains low and the high-yield new-issue market remains open. Opportunities in event-driven/alternative investments will depend on the level of corporate activity related to new capital issues and restructuring events. With respect to portfolio composition, we anticipate selling richly-price convertible securities and increasing the weights in merger arbitrage and event-driven investments. Of course, if a macroeconomic event occurs that induces market volatility and dampens high-yield issuance, we will likely reverse course and increase the weight in convertible arbitrage. In the meantime, we intend to maintain conservative leverage and preserve our ability to deploy capital when opportunities arise. Importantly, irrespective of where the Fund deploys capital in 2013, we will continue to hedge systematic equity, credit, and interest rate risk, with the intention of delivering uncorrelated positive returns.2
| 2 | Note that the Fund utilizes various derivatives instruments (e.g., futures, options, forwards, and swaps), primarily to hedge systematic risks including credit risk and interest rate risk. While the purpose of employing derivatives instruments is to decrease the Fund’s overall risk, hedging instruments are imperfect tools and their effectiveness depends on the degree of price correlation between the derivative instruments and the assets being hedged. Imperfect correlation may be caused by several factors, including temporary price disparities between derivative markets and markets for the underlying assets. |
| AQR Funds | Annual Report | December 2012 | 19 | |||||||||||||
Table of Contents
Shareholder Letter (Unaudited)
| AQR DIVERSIFIED ARBITRAGE FUND |
| AVERAGE ANNUAL TOTAL RETURNS AS OF 12/31/2012 AQR DIVERSIFIED ARBITRAGE FUND | ||||||||||||
| 1 Year | 3 Year | Since Inception (1/15/2009) | ||||||||||
| Fund - Class I: ADAIX | 3.04% | 2.94% | 4.52% | |||||||||
| Fund - Class N: ADANX | 2.83% | 2.67% | 4.23% | |||||||||
Merrill Lynch 3-Month T-Bill Index | 0.11% | 0.11% | 0.14% | |||||||||
Past performance does not guarantee future results. Investment results and principal value of an investment will fluctuate so that an investor’s shares, when redeemed, may be worth more or less than their original cost. Current performance may be lower or higher than the performance data quoted. As of the latest prospectus, the gross expense ratio for the Fund’s Class I/N shares are 2.86% and 3.10%, respectively. Call 1-866-290-2688 or visit www.aqrfunds.com for current month-end performance.
AQR DIVERSIFIED ARBITRAGE FUND VS. MERRILL LYNCH 3-MONTH T-BILL INDEX VALUE OF $10,000 INVESTED ON 1/15/09 |
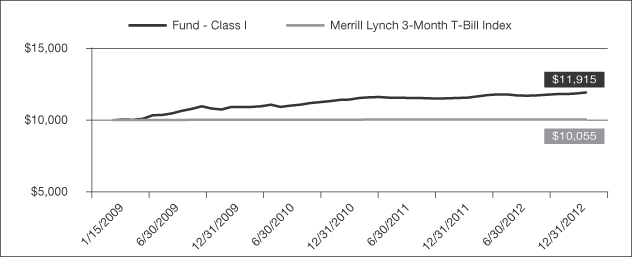
The chart above represents historical performance of a hypothetical investment of $10,000 in the Fund over the past ten years (or since inception if shorter). Performance data quoted represents past performance and does not guarantee future results. Returns shown are total returns, which assume the reinvestment of dividends and capital gains. The table and graph presented above do not reflect the deduction of taxes a shareholder would pay on fund distributions or the redemption of fund shares.
| 20 | AQR Funds | Annual Report | December 2012 | |||||||||||||
Table of Contents
Shareholder Letter (Unaudited)
Cliff Asness
Managing & Founding Principal
Jacques Friedman
Principal
Ronen Israel
Principal
Lars Nielsen
Principal
Andrea Frazzini
Vice President
U.S. markets ended 2012 on a mixed note, amid uncertainty about the November elections and fiscal cliff concerns. Despite relatively flat fourth quarter performance, the Russell 1000 Index returned 16.42% and the Russell 1000 Growth Index returned 15.26% for the full year, buoyed by strong gains in the first and third quarters. The AQR Momentum Fund (the “Fund”) outperformed the market, gaining 17.49% (Class L Shares) for the year.
The outperformance to the Russell 1000 Index was driven roughly equally by the Fund’s stock-level underweights of past losers and overweights of past winners within sectors and its relative exposures across sectors. In Information Technology, a large contributor was an underweight in Google, particularly in the second quarter, when the company underperformed on concerns of slow growth in Europe, a region that accounts for a relatively large share of the company’s revenue, and higher than expected hiring costs that put a drag on earnings. In Consumer Staples, the Fund benefited from the overweight in Colgate whose price trended up over the year due to sustained sales growth and gross margin increases, particularly from emerging markets.
In addition, the Fund’s underweight in Energy, a sector that underperformed the market due to weak energy prices and sluggish growth that put a dent on demand, as well as the overweight in Consumer Discretionary, a sector that outperformed the market, also added to performance.
The AQR Momentum Fund invests in stocks of large and mid-cap U.S. companies with positive momentum. A stock is considered to have positive momentum if it has performed well in the prior twelve months (excluding the most recent month) relative to other stocks in the Fund’s investment universe, which is comprised of the 1000 largest U.S. companies by market capitalization. The Fund is not actively managed to outperform a growth, value or core benchmark. Rather, it seeks to provide systematic exposure to stocks that share the common characteristic of positive momentum.
Note that the Fund sometimes uses derivatives, such as S&P 500 E-Mini futures, to gain market exposure and equitize daily flows. The Fund’s derivatives positions in 2012 contributed about 0.16% over the year.
| AQR Funds | Annual Report | December 2012 | 21 | |||||||||||||
Table of Contents
Shareholder Letter (Unaudited)
| AQR MOMENTUM FUND |
| AVERAGE ANNUAL TOTAL RETURNS AS OF 12/31/2012 AQR MOMENTUM FUND | ||||||||||||||||
| 1 Year | 3 Year | Since Inception (12/17/12) | Since Inception (7/9/2009) | |||||||||||||
| Fund - Class L: AMOMX | 17.49% | 10.68% | na | 16.53% | ||||||||||||
| Fund - Class N: AMONX | na | na | 0.19% | na | ||||||||||||
Russell 1000® Index | 16.42% | 11.12% | -0.09% | 17.62% | ||||||||||||
Past performance does not guarantee future results. Investment results and principal value of an investment will fluctuate so that an investor’s shares, when redeemed, may be worth more or less than their original cost. Current performance may be lower or higher than the performance data quoted. As of the latest prospectus, the gross expense ratio for the Fund’s Class L/N shares are 0.67% and 0.92%, respectively. Call 1-866-290-2688 or visit www.aqrfunds.com for current month-end performance.
AQR MOMENTUM FUND VS. RUSSELL 1000® INDEX VALUE OF $10,000 INVESTED ON 7/9/09 |
The chart above represents historical performance of a hypothetical investment of $10,000 in the Fund over the past ten years (or since inception if shorter). Performance data quoted represents past performance and does not guarantee future results. Returns shown are total returns, which assume the reinvestment of dividends and capital gains. The table and graph presented above do not reflect the deduction of taxes a shareholder would pay on fund distributions or the redemption of fund shares.
| 22 | AQR Funds | Annual Report | December 2012 | |||||||||||||
Table of Contents
Shareholder Letter (Unaudited)
Cliff Asness
Managing & Founding Principal
Jacques Friedman
Principal
Ronen Israel
Principal
Lars Nielsen
Principal
Andrea Frazzini
Vice President
U.S. Small Cap stocks fared similarly well to their large- and mid-cap peers. The Russell 2000 Index finished up 16.35% for the year and the Russell 2000 Growth Index returned 14.59% for the year. The AQR Small Cap Momentum Fund (the “Fund”) strongly outperformed both Russell indices, up 19.62% (Class L Shares) in 2012.
Outperformance relative to the Russell 2000 Index was largely driven by relative exposures within the Health Care, Consumer Discretionary and Information Technology sectors. In Health Care, the Fund benefitted from its overweight in clinical-stage biotech company, Pharmacyclics, whose price soared in the first half of the year on positive clinical trials, including a late stage one for ibrutinib, a drug used in treating chronic lymphocytic leukemia. In addition, the overweights in pharmaceutical companies, Vivus and Arena Pharma, who both gained on FDA approval of their obesity drugs, contributed positively to performance. In Consumer Discretionary, large contributors to outperformance included the Fund’s overweight in specialty retailer for home furniture Conn’s, whose prices jumped in July on record second quarter net income driven by an improved product selection in the furniture and mattress category, and Select Comfort, the manufacturer of the Sleep Number mattress, whose price jumped in July on better than expected financial performance in the previous quarter.
Relative exposures across sectors also added positively, but more modestly to performance, particularly from the underweight in Energy, a sector that underperformed the market over the year due to weak demand stemming from economic growth concerns.
The AQR Small Cap Momentum Fund invests in stocks of small-cap U.S. companies with positive momentum. A stock is considered to have positive momentum if it has performed well in the prior twelve months (excluding the most recent month) relative to other stocks in the investment universe, which is comprised of U.S. companies smaller than the 1000th largest and larger than the 3000th smallest company by market capitalization. The Fund is not actively managed to outperform a growth, value or core benchmark. Rather, it seeks to provide systematic exposure to stocks that share the common characteristic of positive momentum.
Note that the Fund sometimes uses derivatives, such as Russell 2000 E-Mini futures, to gain market exposure and equitize daily flows. The Fund’s derivatives positions in 2011 contributed about 0.05% to performance over the year.
| AQR Funds | Annual Report | December 2012 | 23 | |||||||||||||
Table of Contents
Shareholder Letter (Unaudited)
| AQR SMALL CAP MOMENTUM FUND |
| AVERAGE ANNUAL TOTAL RETURNS AS OF 12/31/2012 AQR SMALL CAP MOMENTUM FUND | ||||||||||||||||
| 1 Year | 3 Year | Since Inception (12/17/12) | Since Inception (7/9/2009) | |||||||||||||
| Fund - Class L: ASMOX | 19.62% | 14.15% | na | 18.47% | ||||||||||||
| Fund - Class N: ASMNX | na | na | 2.11% | na | ||||||||||||
Russell 2000® Index | 16.35% | 12.25% | 1.84% | 19.47% | ||||||||||||
Past performance does not guarantee future results. Investment results and principal value of an investment will fluctuate so that an investor’s shares, when redeemed, may be worth more or less than their original cost. Current performance may be lower or higher than the performance data quoted. As of the latest prospectus, the gross expense ratio for the Fund’s Class L/N shares are 0.85% and 1.10%, respectively. Call 1-866-290-2688 or visit www.aqrfunds.com for current month-end performance.
AQR SMALL CAP MOMENTUM FUND VS. RUSSELL 2000® INDEX VALUE OF $10,000 INVESTED ON 7/9/09 |
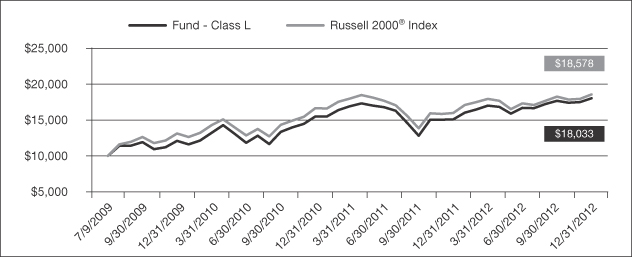
The chart above represents historical performance of a hypothetical investment of $10,000 in the Fund over the past ten years (or since inception if shorter). Performance data quoted represents past performance and does not guarantee future results. Returns shown are total returns, which assume the reinvestment of dividends and capital gains. The table and graph presented above do not reflect the deduction of taxes a shareholder would pay on fund distributions or the redemption of fund shares.
| 24 | AQR Funds | Annual Report | December 2012 | |||||||||||||
Table of Contents
Shareholder Letter (Unaudited)
Cliff Asness
Managing & Founding Principal
Jacques Friedman
Principal
Ronen Israel
Principal
Lars Nielsen
Principal
Andrea Frazzini
Vice President
Non-U.S. equity markets ended the year on significant gains with the MSCI World ex-U.S. returning 5.93% in the fourth quarter. Equity markets in Asia produced solid results due to encouraging economic growth in China and favorable political outcomes in Japan. European stocks also rallied on continued upbeat investor sentiment about the European Central Bank’s bond-buying program, which has reduced borrowing costs for the distressed Eurozone countries. For the year, The MSCI World ex-USA Index returned 16.41%, while the MSCI World ex-USA Growth Index gained 15.48%. The AQR International Momentum Fund (the “Fund”) outperformed both benchmarks, returning 17.92% (Class L Shares).
The Fund’s outperformance relative to the broader MSCI World ex-USA Index, was primarily driven by over and underweights within sectors, particularly in Consumer Staples and Telecommunication Services. In Consumer Staples, the Fund benefited from overweights in beer companies AB Inbev and SAB Miller, particularly in the first quarter when prices jumped on profits that beat expectations and forecasts of further income growth. In Telecommunication Services, the Fund gained from overweights in Telestra, a company that outperformed over the year due to improved productivity, and TELUS, which rallied in the third quarter due to increased revenue derived from wider smart phone adoption as well as strong TV and high-speed Internet customer base growth.
Relative exposures across sectors contributed only a small amount to performance. The biggest contributions came from the overweight in Consumer Staples, a sector that outperformed the market for the year. The largest detractor was from Financials, a sector that the fund underweighted on average, but that strongly outperformed the market, especially in the first and fourth quarters. Relative exposures across countries contributed only a small amount to performance, primarily from the overweight in Belgium, and underweight in Canada.
The AQR International Momentum Fund invests in stocks of large and mid-cap non-U.S. companies with positive momentum. A stock is considered to have positive momentum if it has performed well in the prior twelve months (excluding the most recent month) relative to other stocks in the investment universe, which is comprised of approximately the top 85% of stocks by market capitalization of each of the 20 major developed markets outside the U.S. The Fund is not actively managed to outperform a growth, value or core benchmark. Rather, it seeks to provide systematic exposure to stocks that share the common characteristic of positive momentum. The Fund does not currently use derivatives.
| AQR Funds | Annual Report | December 2012 | 25 | |||||||||||||
Table of Contents
Shareholder Letter (Unaudited)
| AQR INTERNATIONAL MOMENTUM FUND |
| AVERAGE ANNUAL TOTAL RETURNS AS OF 12/31/2012 AQR INTERNATIONAL MOMENTUM FUND | ||||||||||||||||
| 1 Year | 3 Year | Since Inception (12/17/12) | Since Inception (7/9/2009) | |||||||||||||
| Fund - Class L: AIMOX | 17.92% | 4.84% | na | 10.57% | ||||||||||||
| Fund - Class N: AIONX | na | na | 1.00% | na | ||||||||||||
MSCI World ex-USA Index | 16.41% | 3.65% | 0.84% | 10.45% | ||||||||||||
Past performance does not guarantee future results. Investment results and principal value of an investment will fluctuate so that an investor’s shares, when redeemed, may be worth more or less than their original cost. Current performance may be lower or higher than the performance data quoted. As of the latest prospectus, the gross expense ratio for the Fund’s Class L/N shares are 0.99% and 1.24%, respectively. Call 1-866-290-2688 or visit www.aqrfunds.com for current month-end performance.
AQR INTERNATIONAL MOMENTUM FUND VS. MSCI WORLD ex-USA INDEX VALUE OF $10,000 INVESTED ON 7/9/09 |
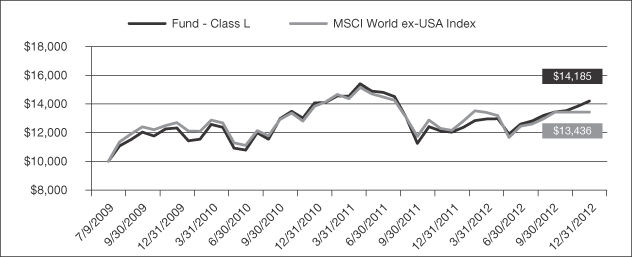
The chart above represents historical performance of a hypothetical investment of $10,000 in the Fund over the past ten years (or since inception if shorter). Performance data quoted represents past performance and does not guarantee future results. Returns shown are total returns, which assume the reinvestment of dividends and capital gains. The table and graph presented above do not reflect the deduction of taxes a shareholder would pay on fund distributions or the redemption of fund shares.
| 26 | AQR Funds | Annual Report | December 2012 | |||||||||||||
Table of Contents
Shareholder Letter (Unaudited)
Cliff Asness
Managing & Founding Principal
Jacques Friedman
Principal
Ronen Israel
Principal
Lars Nielsen
Principal
Andrea Frazzini
Vice President
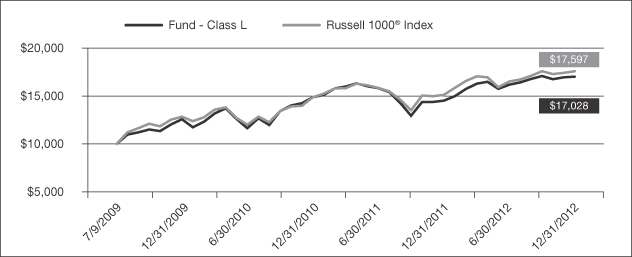
The AQR Tax-Managed Momentum Fund (the “Fund”) outperformed the market, gaining 13.67% (Class L Shares) for the year since its inception on January 27, 2012. Over the same period, the Russell 1000 Index returned 10.65% and the Russell 1000 Growth Index returned 8.62%.
The outperformance to the Russell 1000 Index was driven roughly equally by the Fund’s relative exposures across sectors, as well as by stock-level underweights of past losers and overweights of past winners within sectors, particularly in Information Technology and Health Care. In Information Technology, a large contributor was an underweight in Google, particularly in the second quarter, when the company underperformed on concerns of slow growth in Europe, a region that accounts for a relatively large share of the company’s revenue, and higher than expected hiring costs that put a drag on earnings. In Health Care, the Fund benefited from overweights in Pfizer, which, despite losing the patent for Lipitor, recorded strong performance benefiting from several successful pipeline products and restructuring actions, as well as in Cerner, a company that reported stronger than expected bookings and earnings, particularly in the first and third quarters.
In addition, the Fund’s overweights in Consumer Staples and Consumer Discretionary, sectors that outperformed the market in 2012 over the live period of the Fund, and underweights in Industrials and Energy, sectors that underperformed during the period, also contributed positively to performance.
The AQR Tax-Managed Momentum Fund invests in stocks of large and mid-cap U.S. companies with positive momentum. A stock is considered to have positive momentum if it has performed well in the prior twelve months (excluding the most recent month) relative to other stocks in the Fund’s investment universe, which is comprised of the 1000 largest U.S. companies by market capitalization. The Fund employs a tax management strategy which considers the potential impact of taxes on investment return. The Fund does not currently use derivatives.
| AQR Funds | Annual Report | December 2012 | 27 | |||||||||||||
Table of Contents
Shareholder Letter (Unaudited)
| AQR TAX-MANAGED MOMENTUM FUND |
| AVERAGE ANNUAL TOTAL RETURNS AS OF 12/31/2012 AQR TAX-MANAGED MOMENTUM FUND | ||||||||
| Since Inception (12/17/12) | Since Inception (1/27/2012) | |||||||
| Fund - Class L: ATMOX | na | 13.67% | ||||||
| Fund - Class N: ATMNX | 0.09% | na | ||||||
Russell 1000® Index | -0.09% | 10.65% | ||||||
Past performance does not guarantee future results. Investment results and principal value of an investment will fluctuate so that an investor’s shares, when redeemed, may be worth more or less than their original cost. Current performance may be lower or higher than the performance data quoted. As of the latest prospectus, the gross expense ratio for the Fund’s Class L/N shares are 1.00% and 1.25%, respectively. Call 1-866-290-2688 or visit www.aqrfunds.com for current month-end performance.
AQR TAX-MANAGED MOMENTUM FUND VS. RUSSELL 1000® RETURN INDEX VALUE OF $10,000 INVESTED ON 1/27/12 |
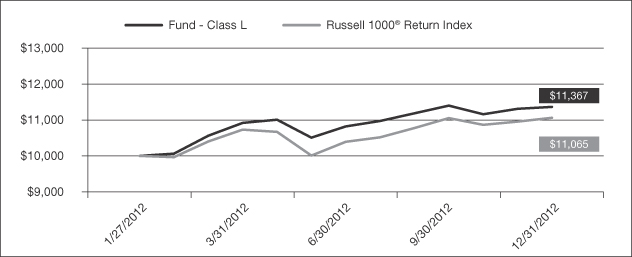
The chart above represents historical performance of a hypothetical investment of $10,000 in the Fund over the past ten years (or since inception if shorter). Performance data quoted represents past performance and does not guarantee future results. Returns shown are total returns, which assume the reinvestment of dividends and capital gains. The table and graph presented above do not reflect the deduction of taxes a shareholder would pay on fund distributions or the redemption of fund shares.
| 28 | AQR Funds | Annual Report | December 2012 | |||||||||||||
Table of Contents
Shareholder Letter (Unaudited)
Cliff Asness
Managing & Founding Principal
Jacques Friedman
Principal
Ronen Israel
Principal
Lars Nielsen
Principal
Andrea Frazzini
Vice President
The AQR Tax-Managed Small Cap Momentum Fund (the “Fund”) strongly outperformed the market, gaining 13.01% (Class L Shares) for the year since its inception on January 27, 2012. Over the same period, the Russell 2000 Index returned 7.86% and the Russell 2000 Growth Index returned 5.74%.
Outperformance relative to the Russell 2000 Index was largely driven by relative exposures within the Information Technology, Industrials and Health Care sectors. In Information Technology, the Fund benefited from an overweight in the provider of on-demand automation solutions for the residential mortgage industry, Ellie Mae, that delivered better than anticipated results, particularly in the third quarter as it benefited from higher than expected mortgage origination volume. In Industrials, the Fund gained from the overweight in Generac Holdings, a manufacturer of standby and prime power generator sets, whose stock price soared in the fourth quarter on a demand surge for home and portable generators as a result of major power outages in the Northeast. In Health Care, the Fund benefitted from overweights in clinical-stage companies, Pharmacyclics, Vivus and Arena Pharma, which saw their share prices soar during the year on FDA approvals for various clinical trials of their signature drugs.
Relative exposures across sectors, particularly the underweights in Energy and Utilities, sectors that underperformed the market over the live period of the Fund, contributed modestly to performance.
The AQR Tax-Managed Small Cap Momentum Fund invests in stocks of small-cap U.S. companies with positive momentum. A stock is considered to have positive momentum if it has performed well in the prior twelve months (excluding the most recent month) relative to other stocks in the investment universe, which is comprised of U.S. companies smaller than the 1000th largest and larger than the 3000th smallest company by market capitalization. The Fund employs a tax management strategy which considers the potential impact of taxes on investment return. The Fund does not currently use derivatives.
| AQR Funds | Annual Report | December 2012 | 29 | |||||||||||||
Table of Contents
Shareholder Letter (Unaudited)
| AQR TAX-MANAGED SMALL CAP MOMENTUM FUND |
| AVERAGE ANNUAL TOTAL RETURNS AS OF 12/31/2012 AQR TAX-MANAGED SMALL CAP MOMENTUM FUND | ||||||||
| Since Inception (12/17/12) | Since Inception (1/27/2012) | |||||||
| Fund - Class L: ATSMX | na | 13.01% | ||||||
| Fund - Class N: ATSNX | 2.20% | na | ||||||
Russell 2000® Index | 1.84% | 7.86% | ||||||
Past performance does not guarantee future results. Investment results and principal value of an investment will fluctuate so that an investor’s shares, when redeemed, may be worth more or less than their original cost. Current performance may be lower or higher than the performance data quoted. As of the latest prospectus, the gross expense ratio for the Fund’s Class L/N shares are 2.08% and 2.33%, respectively. Call 1-866-290-2688 or visit www.aqrfunds.com for current month-end performance.
AQR TAX-MANAGED SMALL CAP MOMENTUM FUND VS. RUSSELL 2000® RETURN INDEX VALUE OF $10,000 INVESTED ON 1/27/12 |
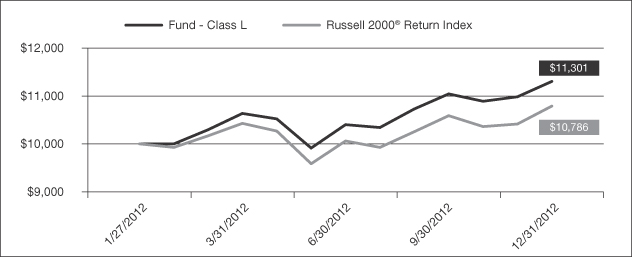
The chart above represents historical performance of a hypothetical investment of $10,000 in the Fund over the past ten years (or since inception if shorter). Performance data quoted represents past performance and does not guarantee future results. Returns shown are total returns, which assume the reinvestment of dividends and capital gains. The table and graph presented above do not reflect the deduction of taxes a shareholder would pay on fund distributions or the redemption of fund shares.
| 30 | AQR Funds | Annual Report | December 2012 | |||||||||||||
Table of Contents
Shareholder Letter (Unaudited)
Cliff Asness
Managing & Founding Principal
Jacques Friedman
Principal
Ronen Israel
Principal
Lars Nielsen
Principal
Andrea Frazzini
Vice President
The AQR Tax-Managed International Momentum Fund (the “Fund”) outperformed the market in 2012 since its inception on January 27, 2012, gaining 14.46% (Class L Shares). Over the same period, the MSCI World ex-USA Index returned 9.83% and the MSCI World ex-USA Growth Index returned 8.83%.
The Fund’s outperformance relative to the broader MSCI World ex-USA Index was primarily driven by over and underweights within sectors, particularly in Consumer Staples, Telecommunication Services and Information Technology. In Consumer Staples, the Fund benefited from overweights in beer companies, AB Inbev and SAB Miller, particularly in the first quarter when prices jumped on profits that beat expectations and forecasts of further income growth over the year. In Telecommunication Services, the Fund gained from overweights in Telestra, a company that outperformed over the year due to improved productivity, and TELUS, which rallied in the third quarter due to increased revenue derived from wider smart phone adoption as well as strong TV and high-speed Internet customer base growth.
Relative exposures across sectors contributed only a small amount to performance. The largest contributions came from the overweight in Consumer Staples, a sector that outperformed the market in 2012 since the inception of the Fund, and from the underweight in Materials, a sector that underperformed during this period. Relative exposures across countries contributed only a small amount to performance, primarily from the overweight in Belgium.
The AQR Tax-Managed International Momentum Fund invests in stocks of large and mid-cap non-U.S. companies with positive momentum. A stock is considered to have positive momentum if it has performed well in the prior twelve months (excluding the most recent month) relative to other stocks in the investment universe, which is comprised of approximately the top 85% of stocks by market capitalization of each of the 20 major developed markets outside the U.S. The Fund is not actively managed to outperform a growth, value or core benchmark. Rather, it seeks to provide systematic exposure to stocks that share the common characteristic of positive momentum. The Fund employs a tax management strategy which considers the potential impact of taxes on investment return. The Fund does not currently use derivatives.
| AQR Funds | Annual Report | December 2012 | 31 | |||||||||||||
Table of Contents
Shareholder Letter (Unaudited)
| AQR TAX-MANAGED INTERNATIONAL MOMENTUM FUND |
| AVERAGE ANNUAL TOTAL RETURNS AS OF 12/31/2012 AQR TAX-MANAGED INTERNATIONAL MOMENTUM FUND | ||||||||
| Since Inception (12/17/12) | Since Inception (1/27/2012) | |||||||
| Fund - Class L: ATIMX | na | 14.46% | ||||||
| Fund - Class N: ATNNX | 0.90% | na | ||||||
MSCI World ex USA (Net) Index | 0.83% | 9.83% | ||||||
Past performance does not guarantee future results. Investment results and principal value of an investment will fluctuate so that an investor’s shares, when redeemed, may be worth more or less than their original cost. Current performance may be lower or higher than the performance data quoted. As of the latest prospectus, the gross expense ratio for the Fund’s Class L/N shares are 1.72% and 1.97%, respectively. Call 1-866-290-2688 or visit www.aqrfunds.com for current month-end performance.
AQR TAX-MANAGED INTERNATIONAL MOMENTUM FUND VS. MSCI WORLD ex-USA (NET) INDEX VALUE OF $10,000 INVESTED ON 1/27/12 |
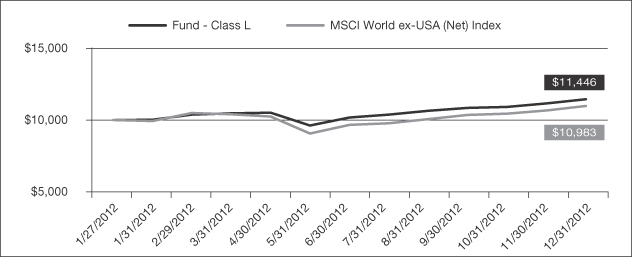
The chart above represents historical performance of a hypothetical investment of $10,000 in the Fund over the past ten years (or since inception if shorter). Performance data quoted represents past performance and does not guarantee future results. Returns shown are total returns, which assume the reinvestment of dividends and capital gains. The table and graph presented above do not reflect the deduction of taxes a shareholder would pay on fund distributions or the redemption of fund shares.
| 32 | AQR Funds | Annual Report | December 2012 | |||||||||||||
Table of Contents
Shareholder Letter (Unaudited)
PRINCIPAL RISKS:
AQR Global Equity Fund, AQR International Equity Fund: Common stocks are subject to greater fluctuations in market value than certain other asset classes as a result of such factors as a company’s business performance, investor perceptions, stock market trends and general economic conditions. Funds that emphasize investments in small and mid-cap companies generally will experience greater price volatility. The AQR Global Equity Fund and the AQR International Equity Fund use derivatives to manage their country and currency exposures. The use of derivatives exposes the Funds to additional risks including increased volatility, lack of liquidity, and possible losses greater than a Fund’s initial investment as well as increased transaction costs. Foreign investing involves special risks such as currency fluctuations, political uncertainty, differences in generally accepted accounting principles, increased volatility and lower trading volume. These Funds are not suitable for all investors.
AQR Emerging Defensive Equity Fund, AQR International Defensive Equity Fund and AQR U.S. Defensive Equity Fund: Common stocks are subject to greater fluctuations in market value than certain other asset classes as a result of such factors as a company’s business performance, investor perceptions, stock market trends and general economic conditions. Funds that emphasize investments in small and mid-cap companies generally will experience greater price volatility. The use of derivatives exposes the Funds to additional risks, including increased volatility, lack of liquidity, and possible losses greater than a Fund’s initial investment as well as increased transaction costs. Emerging market and foreign investing by the AQR Emerging Defensive Equity Fund and AQR International Defensive Equity Fund involves special risks such as currency fluctuations, political uncertainty, differences in generally accepted accounting principles, increased volatility and lower trading volume. These Funds are not suitable for all investors.
AQR Diversified Arbitrage Fund: As the AQR Diversified Arbitrage Fund (the “Fund”) employs arbitrage and alternative strategies, the Fund has the risk that the anticipated opportunities do not play out as planned, resulting in potentially reduced returns or losses to the Fund as it unwinds its trades. This Fund enters into a short sale by selling a security it has borrowed. If the market price of a security increases after the Fund borrows the security, the Fund will suffer a potentially unlimited loss when it replaces the borrowed security at the higher price. Short sales also involve transaction and other costs that will reduce potential Fund gains and increase potential Fund losses. The use of derivatives exposes the Fund to additional risks including increased volatility, lack of liquidity, and possible losses greater than the Fund’s initial investment as well as increased transaction costs. This Fund is not suitable for all investors.
AQR Momentum Fund, AQR Small Cap Momentum Fund, AQR International Momentum Fund, AQR Tax-Managed Momentum Fund, AQR Tax-Managed Small Cap Momentum Fund and AQR Tax-Managed International Momentum Fund: Securities with positive momentum generally will be more volatile than a broad cross-section of securities. In addition, there may be periods when the momentum style is out of favor, and during which the investment performance of a Fund, which uses a momentum strategy, generally will suffer. Common stocks are subject to greater fluctuations in market value than certain other asset classes as a result of such factors as a company’s business performance, investor perceptions, stock market trends and general economic conditions. The use of derivatives exposes the Funds to additional risks including increased volatility, lack of liquidity, and possible losses greater than a Fund’s initial investment as well as increased transaction costs. Investments in small cap companies by the AQR Small Cap Momentum Fund and AQR Tax-Managed Small Cap Momentum Funds involve higher risks in some respects than do investments in stocks of larger companies and generally will experience greater price volatility. The performance of the AQR Tax-Managed Momentum Fund, AQR Tax-Managed Small Cap Momentum Fund and AQR Tax-Managed International Momentum Fund (each, a “Tax-Managed Fund”) may deviate from that of non-tax-managed funds and may not provide as high a return before consideration of federal income tax consequences. Each Tax-Managed Fund will balance investment considerations with tax consequences and can realize capital gains. Foreign investing by the AQR
| AQR Funds | Annual Report | December 2012 | 33 | |||||||||||||
Table of Contents
Shareholder Letter (Unaudited)
International Momentum Fund and AQR Tax-Managed International Momentum Fund involves special risks such as currency fluctuations, political uncertainty, differences in generally accepted accounting principles, increased volatility and lower trading volume. The Funds are not suitable for all investors.
An investment in any of the AQR Funds listed above (the “Funds”) involves risk, including loss of principal. Diversification does not eliminate this risk. The value of the Funds’ portfolio holdings may fluctuate in response to events specific to the companies in which the Fund invests, as well as economic, political or social events in the United States or abroad. The Funds from time to time employ various hedging techniques, it is not possible to hedge fully or perfectly against any risk, and hedging entails its own costs.
An investor considering the Funds should be able to tolerate potentially wide price fluctuations. The Funds may be subject to high portfolio turnover risk as a result of frequent trading, and thus will incur a higher level of brokerage fees and commissions and cause a higher level of tax liability to shareholders in the funds. The Funds may attempt to increase their income or total return through the use of securities lending, and they may be subject to the possibility of additional loss as a result of this investment technique.
Please refer to each Fund’s prospectus for complete information regarding all risks associated with the Funds.
Cliff Asness, David Kabiller, Brian Hurst, Yao Hua Ooi and Marco Hanig are registered representatives of ALPS Distributors, Inc.
DEFINITIONS:
Arbitrage: The simultaneous purchase and sale of an asset or two related assets in order to profit from a difference in price.
Bearish: A belief that a particular security, sector or the overall market will fall.
Beta is a measure of the volatility of a security or portfolio in comparison to an index or the market as a whole, where a security with a beta of 1.0 has equivalent volatility to the index or market it is compared to.
Bullish: A belief that a particular security, sector or the overall market will rise.
Carry: The return obtained from holding an asset (if positive), or the cost of holding it (if negative).
Cheapness: A measure of the discount a security price relative to its fundamental value.
Closed-end fund arbitrage is the practice of buying (selling) closed-end funds that trade at abnormally wide discounts (or premiums) to their underlying net asset values. Positions are unwound when the discount or premium converges to expected levels.
Convertible Bonds: Fixed-income securities that are convertible into common stock.
Credit: This strategy purchases attractively priced securities on a hedged basis, typically around event induced capital flows.
Delta: The ratio comparing the change in the price of the underlying asset to the corresponding change in the price of a derivative.
| 34 | AQR Funds | Annual Report | December 2012 | |||||||||||||
Table of Contents
Shareholder Letter (Unaudited)
Dovish: A monetary policy that involves the maintenance of low interest rates in the belief that inflation and its negative effects will have a minimal impact on society.
Dual-Class Arbitrage: An investment strategy that takes advantage of inefficiencies in the prices at which different classes of a publicly traded company’s stock are trading.
E-Mini: An electronically traded futures contract on the Chicago Mercantile Exchange that represents a portion of the normal futures contracts.
Futures and Forwards contracts: A financial contract obligating the buyer to purchase an asset (or the seller to sell an asset) at a pre-determined future date and price.
Momentum: An investment style wherein an asset is deemed to have positive momentum if it has performed well in the past relative to other assets in the same universe.
PIPEs: Private investments in public companies whose stocks are quoted on stock exchanges or which trade in the over-the-counter securities market, a type of investment commonly referred to as a “PIPE” transaction. PIPE transactions generally result in the Fund acquiring either restricted stock or an instrument convertible into restricted stock. As with investments in other types of restricted securities, such an investment may be illiquid.
Price to Book: A valuation ratio of a company’s current share price compared to its book value.
Price Pressure: This strategy captures a risk premium by providing liquidity around different types of securities issues and restructuring events. The Fund may employ additional arbitrage and alternative strategies as they arise.
Quantitative Easing: The term quantitative easing describes an extreme form of monetary policy used to stimulate an economy when the interbank interest rate (which in the US is called the federal funds rate) is either at, or close to zero.
Richness: A measure of the premium of a security price relative to its fundamental value.
Sharpe Ratio: a ratio which measures risk-adjusted performance
Sovereign Risk: The probability that the government of a country will refuse to comply with the terms of a loan agreement during economically difficult or politically volatile times.
Special Purpose Acquisition Companies (SPACs): SPACs, often called “blank check” companies, are publicly traded companies whose primary asset is a trust invested in short-term high-grade securities. The Fund seeks to capture a liquidity premium when these securities, which are typically thinly traded, are selling at a discount.
Spread: The percentage difference between two related securities.
The Merrill Lynch 3 Month Treasury Bill Index is designed to measure the performance of high-quality short-term cash-equivalent investments. Indexes are unmanaged and one cannot invest directly in an index.
| AQR Funds | Annual Report | December 2012 | 35 | |||||||||||||
Table of Contents
Shareholder Letter (Unaudited)
The Morgan Stanley Capital International EAFE Index is a free float-adjusted market capitalization index that is designed to measure the performance of equities in developed markets, excluding the United States and Canada. Indexes are unmanaged and one cannot invest directly in an index.
The Morgan Stanley Capital International World Index is a free float-adjusted market capitalization index that is designed to measure the performance of equities in developed markets, including the United States and Canada. Indexes are unmanaged and one cannot invest directly in an index.
The MSCI World ex-USA Index is a free float-adjusted market capitalization index that is designed to measure the performance of equities in developed markets, excluding the United States. Indexes are unmanaged and one cannot invest directly in an index.
The Russell 1000® Index measures the performance of the large and mid-cap segment of the U.S. equity universe. It is a subset of the Russell 3000® Index and includes approximately 1,000 of the largest securities based on a combination of their market cap and current index membership. The Russell 1000 represents approximately 90% of the U.S. market. Indexes are unmanaged and one cannot invest directly in an index.
The Russell 2000® Index measures the performance of the small-cap segment of the U.S. equity universe. The Russell 2000® Index is a subset of the Russell 3000® Index representing approximately 8% of the total market capitalization of that index. It includes approximately 2,000 of the smallest securities based on a combination of their market cap and current index membership. Indexes are unmanaged and one cannot invest directly in an index.
The S&P 500 Index is a capitalization weighted index designed to measure performance of the broad domestic economy through changes in the aggregate market value of 500 stocks representing all major industries. Indexes are unmanaged and one cannot invest directly in an index.
Valuation: A process of determining the current worth of an asset or company.
Volatility is a statistical measurement of up and down asset price fluctuations over time. If an asset has rapid dramatic price swings, its “volatility” will likely be relatively high. If prices are consistent and rarely change, “volatility” of that asset will likely be relatively low. “Volatility” can be measured as the standard deviation of an asset with a specific time horizon. It is often used to quantify the risk of such asset over a time period, typically expressed in annualized terms.
| 36 | AQR Funds | Annual Report | December 2012 | |||||||||||||
Table of Contents
| Schedule of Investments | December 31, 2012 |
| COMMON STOCKS - 88.4% | SHARES | VALUE (Note 2) | ||||||
| Australia - 3.5% | ||||||||
| Alumina Ltd. | 37,995 | $ | 36,465 | |||||
| AMP Ltd. | 8,025 | 40,706 | ||||||
| Arrium Ltd. | 102,428 | 99,829 | ||||||
| ASX Ltd. | 2,722 | 88,830 | ||||||
| Australia & New Zealand Banking Group Ltd. | 58,438 | 1,539,053 | ||||||
| BHP Billiton Ltd. | 46,981 | 1,834,159 | ||||||
| BlueScope Steel Ltd. † | 71,372 | 261,064 | ||||||
| Boart Longyear Ltd. | 154,716 | 309,140 | ||||||
| Caltex Australia Ltd. | 4,245 | 85,620 | ||||||
| CFS Retail Property Trust Group REIT | 36,456 | 72,929 | ||||||
| Commonwealth Bank of Australia | 25,481 | 1,659,486 | ||||||
| Computershare Ltd. | 7,001 | 66,045 | ||||||
| CSL Ltd. | 12,744 | 719,492 | ||||||
| Dexus Property Group REIT | 74,910 | 79,562 | ||||||
| Downer EDI Ltd. † | 78,613 | 337,007 | ||||||
| Flight Centre Ltd. (a) | 122 | 3,452 | ||||||
| Fortescue Metals Group Ltd. | 19,404 | 96,699 | ||||||
| Goodman Group REIT | 30,110 | 137,198 | ||||||
| GPT Group - In Specie REIT (3)†(b) | 96,388 | — | ||||||
| GPT Group REIT | 29,672 | 114,213 | ||||||
| Incitec Pivot Ltd. | 49,412 | 168,464 | ||||||
| JB Hi-Fi Ltd. | 10,620 | 114,943 | ||||||
| Lend Lease Group | 8,523 | 83,234 | ||||||
| Macquarie Group Ltd. | 4,411 | 165,241 | ||||||
| Mirvac Group REIT | 51,825 | 80,652 | ||||||
| Mount Gibson Iron Ltd. | 67,214 | 59,510 | ||||||
| National Australia Bank Ltd. | 49,795 | 1,309,762 | ||||||
| Newcrest Mining Ltd. | 12,358 | 289,087 | ||||||
| OZ Minerals Ltd. | 5,222 | 37,084 | ||||||
| Pacific Brands Ltd. | 178,673 | 116,187 | ||||||
| Primary Health Care Ltd. | 34,724 | 144,865 | ||||||
| Qantas Airways Ltd. † | 166,131 | 260,147 | ||||||
| QBE Insurance Group Ltd. | 34,512 | 395,436 | ||||||
| Rio Tinto Ltd. | 4,452 | 313,016 | ||||||
| Sims Metal Management Ltd. | 653 | 6,453 | ||||||
| Sonic Healthcare Ltd. | 22,861 | 319,108 | ||||||
| SP AusNet | 17,716 | 20,588 | ||||||
| Stockland REIT | 43,746 | 161,752 | ||||||
| Suncorp Group Ltd. | 36,258 | 387,193 | ||||||
| Tabcorp Holdings Ltd. | 60,707 | 193,899 | ||||||
| Telecom Corp of New Zealand Ltd. | 283,914 | 531,882 | ||||||
| Telstra Corp. Ltd. | 224,774 | 1,024,234 | ||||||
| Transfield Services Ltd. | 22,519 | 46,087 | ||||||
| Wesfarmers Ltd. | 8,077 | 311,620 | ||||||
| Westfield Group REIT | 35,184 | 388,567 | ||||||
| Westfield Retail Trust REIT | 46,500 | 146,706 | ||||||
| Westpac Banking Corp. | 46,017 | 1,260,856 | ||||||
| Woodside Petroleum Ltd. | 1,089 | 38,807 | ||||||
| Woolworths Ltd. | 21,562 | 661,487 | ||||||
| WorleyParsons Ltd. | 1,627 | 40,078 | ||||||
|
| |||||||
| 16,657,894 | ||||||||
|
| |||||||
| Belgium - 0.6% | ||||||||
| Anheuser-Busch InBev NV | 24,188 | 2,106,401 | ||||||
| Solvay SA | 4,570 | 664,990 | ||||||
| SHARES | VALUE (Note 2) | |||||||
| Belgium - 0.6% (continued) | ||||||||
| Umicore SA | 1,866 | $ | 103,326 | |||||
|
| |||||||
| 2,874,717 | ||||||||
|
| |||||||
| Canada - 4.4% | ||||||||
| Agrium, Inc. (1) | 9,000 | 897,014 | ||||||
| Alimentation Couche Tard, Inc., Class B (1) | 5,600 | 275,468 | ||||||
| ARC Resources Ltd. (1) | 4,700 | 115,480 | ||||||
| Athabasca Oil Corp. (1)† | 4,800 | 50,427 | ||||||
| Bank of Montreal (1) | 18,380 | 1,124,567 | ||||||
| Bank of Nova Scotia (1) | 5,799 | 334,986 | ||||||
| Baytex Energy Corp. (1) | 1,900 | 81,887 | ||||||
| BCE, Inc. (1) | 1,709 | 73,243 | ||||||
| Bonavista Energy Corp. (1) | 1,300 | 19,369 | ||||||
| Brookfield Asset Management, Inc., Class A (1) | 8,102 | 296,810 | ||||||
| Brookfield Office Properties, Inc. (1) | 2,845 | 48,508 | ||||||
| Canadian Imperial Bank of Commerce (1)(a) | 3,700 | 297,466 | ||||||
| Canadian National Railway Co. (1) | 10,800 | 980,762 | ||||||
| Canadian Tire Corp. Ltd., Class A (1) | 2,400 | 167,399 | ||||||
| Cenovus Energy, Inc. (1) | 9,000 | 301,206 | ||||||
| Centerra Gold, Inc. (1) | 16,700 | 156,306 | ||||||
| CGI Group, Inc., Class A (1)† | 3,700 | 85,330 | ||||||
| CI Financial Corp. (1) | 2,600 | 65,163 | ||||||
| Crescent Point Energy Corp. (1)(a) | 4,600 | 173,974 | ||||||
| Eldorado Gold Corp. (1) | 10,600 | 136,403 | ||||||
| Empire Co., Ltd., Class A (1) | 4,500 | 266,689 | ||||||
| Enbridge, Inc. (1) | 900 | 38,924 | ||||||
| Encana Corp. (1) | 17,500 | 345,883 | ||||||
| Enerplus Corp. (1) | 2,951 | 38,271 | ||||||
| Fairfax Financial Holdings Ltd. (1) | 900 | 324,414 | ||||||
| Finning International, Inc. (1) | 15,700 | 387,804 | ||||||
| Franco-Nevada Corp. (1) | 2,100 | 119,873 | ||||||
| Goldcorp, Inc. (1) | 12,788 | 470,149 | ||||||
| Great-West Lifeco, Inc. (1) | 3,145 | 76,989 | ||||||
| Husky Energy, Inc. (1) | 28,200 | 833,498 | ||||||
| IGM Financial, Inc. (1) | 1,700 | 71,097 | ||||||
| Imperial Oil Ltd. (1) | 19,400 | 833,379 | ||||||
| Inmet Mining Corp. (1) | 880 | 65,476 | ||||||
| Kinross Gold Corp. (1) | 53,600 | 520,535 | ||||||
| Magna International, Inc. (1) | 13,034 | 650,979 | ||||||
| Manulife Financial Corp. (1) | 63,100 | 857,023 | ||||||
| MEG Energy Corp. (1)† | 2,000 | 61,204 | ||||||
| National Bank of Canada (1) | 514 | 39,913 | ||||||
| New Gold, Inc. (1)† | 7,000 | 77,481 | ||||||
| Nexen, Inc. (1) | 8,700 | 232,391 | ||||||
| Onex Corp. (1) | 14,400 | 606,141 | ||||||
| Open Text Corp. (1)† | 900 | 50,334 | ||||||
| Osisko Mining Corp. (1)† | 5,500 | 44,235 | ||||||
| Penn West Petroleum Ltd. (1)(a) | 7,500 | 81,432 | ||||||
| Power Corp. of Canada (1) | 4,746 | 121,095 | ||||||
| Research In Motion Ltd. (1)†(a) | 7,500 | 88,972 | ||||||
| RioCan Real Estate Investment Trust REIT (1)(a) | 2,100 | 58,184 | ||||||
| Rogers Communications, Inc., Class B (1) | 17,700 | 803,591 | ||||||
| The accompanying notes are an integral part of these financial statements. | (Continued) |
| AQR Funds | Annual Report | December 2012 | 37 | |||||||||||||
Table of Contents
| Schedule of Investments | December 31, 2012 |
| AQR GLOBAL EQUITY FUND |
| SHARES | VALUE (Note 2) | |||||||
| Canada - 4.4% (continued) | ||||||||
| Royal Bank of Canada (1) | 30,324 | $ | 1,825,476 | |||||
| Shoppers Drug Mart Corp. (1) | 1,400 | 60,239 | ||||||
| Silver Wheaton Corp. (1) | 5,300 | 191,071 | ||||||
| Sun Life Financial, Inc. (1) | 24,900 | 660,112 | ||||||
| Suncor Energy, Inc. (1) | 45,782 | 1,505,508 | ||||||
| Talisman Energy, Inc. (1) | 37,400 | 422,992 | ||||||
| Teck Resources Ltd., Class B (1) | 10,993 | 399,514 | ||||||
| Toronto-Dominion Bank/The (1) | 8,012 | 674,580 | ||||||
| Tourmaline Oil Corp. (1)† | 1,900 | 59,653 | ||||||
| TransCanada Corp. (1)(a) | 11,100 | 524,703 | ||||||
| Turquoise Hill Resources Ltd. (1)† | 4,885 | 37,324 | ||||||
| Valeant Pharmaceuticals International, Inc. (1)† | 4,574 | 272,867 | ||||||
| Vermilion Energy, Inc. (1) | 1,500 | 78,370 | ||||||
| Yamana Gold, Inc. (1) | 12,000 | 206,414 | ||||||
|
| |||||||
| 20,766,547 | ||||||||
|
| |||||||
| China - 0.0% (c) | ||||||||
| Foxconn International Holdings Ltd. † | 32,101 | 15,746 | ||||||
|
| |||||||
| Denmark - 0.9% | ||||||||
| Coloplast A/S, Class B | 22,865 | 1,121,303 | ||||||
| Danske Bank A/S † | 10,597 | 179,981 | ||||||
| DSV A/S | 14,561 | 376,729 | ||||||
| Novo Nordisk A/S, Class B | 16,721 | 2,722,792 | ||||||
|
| |||||||
| 4,400,805 | ||||||||
|
| |||||||
| Finland - 0.6% | ||||||||
| Kone OYJ, Class B | 5,983 | 442,501 | ||||||
| Metso OYJ | 51,726 | 2,208,274 | ||||||
|
| |||||||
| 2,650,775 | ||||||||
|
| |||||||
| France - 3.1% | ||||||||
| Arkema SA | 14,463 | 1,518,594 | ||||||
| AtoS | 7,645 | 536,884 | ||||||
| AXA SA | 30,119 | 540,810 | ||||||
| BNP Paribas SA | 16,706 | 951,073 | ||||||
| Christian Dior SA | 1,281 | 218,352 | ||||||
| Cie Generale des Etablissements Michelin | 20,130 | 1,928,835 | ||||||
| Danone SA | 10,243 | 676,952 | ||||||
| Dassault Systemes SA | 2,905 | 324,800 | ||||||
| Klepierre REIT | 1,740 | 69,546 | ||||||
| Publicis Groupe SA | 2,961 | 178,143 | ||||||
| Remy Cointreau SA | 3,059 | 334,604 | ||||||
| Sanofi | 26,147 | 2,479,516 | ||||||
| SES SA FDR | 1,045 | 30,097 | ||||||
| Societe BIC SA | 10,276 | 1,231,759 | ||||||
| Societe Generale SA † | 10,937 | 415,851 | ||||||
| Total SA | 38,405 | 1,998,323 | ||||||
| Unibail-Rodamco SE REIT | 1,690 | 409,830 | ||||||
| Vivendi SA | 40,112 | 907,170 | ||||||
|
| |||||||
| 14,751,139 | ||||||||
|
| |||||||
| Germany - 2.8% | ||||||||
| Adidas AG | 13,780 | 1,229,854 | ||||||
| BASF SE | 12,470 | 1,179,162 | ||||||
| Bayer AG | 6,991 | 666,674 | ||||||
| Brenntag AG | 204 | 26,876 | ||||||
| SHARES | VALUE (Note 2) | |||||||
| Germany - 2.8% (continued) | ||||||||
| Celesio AG | 28,381 | $ | 491,585 | |||||
| Continental AG | 8,322 | 969,956 | ||||||
| Deutsche Bank AG | 44,577 | 1,961,155 | ||||||
| Deutsche Post AG | 83,272 | 1,834,107 | ||||||
| E.ON SE | 18,220 | 341,735 | ||||||
| Fresenius SE & Co. KGaA | 1,761 | 202,635 | ||||||
| GEA Group AG | 7,024 | 228,390 | ||||||
| Hannover Rueckversicherung AG | 11,338 | 888,034 | ||||||
| Kabel Deutschland Holding AG | 2,604 | 195,992 | ||||||
| Merck KGaA | 13,949 | 1,838,405 | ||||||
| Salzgitter AG | 4,820 | 252,609 | ||||||
| SAP AG | 11,051 | 888,640 | ||||||
|
| |||||||
| 13,195,809 | ||||||||
|
| |||||||
| Hong Kong - 1.2% | ||||||||
| AIA Group Ltd. | 166,400 | 659,998 | ||||||
| ASM Pacific Technology Ltd. (a) | 2,982 | 36,610 | ||||||
| BOC Hong Kong Holdings Ltd. | 107,500 | 338,172 | ||||||
| Cheung Kong Holdings Ltd. | 16,201 | 252,078 | ||||||
| Cheung Kong Infrastructure Holdings Ltd. | 5,749 | 35,512 | ||||||
| Chinese Estates Holdings Ltd. | 9,500 | 16,146 | ||||||
| CLP Holdings Ltd. | 40,511 | 340,367 | ||||||
| First Pacific Co., Ltd. | 34,000 | 37,547 | ||||||
| Galaxy Entertainment Group Ltd. † | 54,000 | 216,528 | ||||||
| Hang Lung Group Ltd. | 791 | 4,551 | ||||||
| Hang Seng Bank Ltd. | 15,157 | 233,978 | ||||||
| HKT Trust/HKT Ltd. | 842 | 827 | ||||||
| Hong Kong & China Gas Co., Ltd. | 89,200 | 245,078 | ||||||
| Hong Kong Exchanges and Clearing Ltd. | 16,169 | 279,823 | ||||||
| Hopewell Holdings Ltd. | 9,195 | 39,868 | ||||||
| Hutchison Whampoa Ltd. | 36,489 | 386,672 | ||||||
| Hysan Development Co., Ltd. | 34,823 | 169,338 | ||||||
| Kerry Properties Ltd. | 32,500 | 170,739 | ||||||
| Li & Fung Ltd. | 77,468 | 139,790 | ||||||
| Link REIT/The REIT | 34,329 | 171,923 | ||||||
| Mongolia Energy Corp. Ltd. † | 885 | 43 | ||||||
| New World Development Co., Ltd. | 58,173 | 92,098 | ||||||
| NWS Holdings Ltd. | 19,500 | 33,143 | ||||||
| PCCW Ltd. | 65,406 | 28,909 | ||||||
| Sino Land Co., Ltd. | 88,000 | 161,141 | ||||||
| SJM Holdings Ltd. | 135,000 | 318,608 | ||||||
| Sun Hung Kai Properties Ltd. | 22,022 | 333,969 | ||||||
| Swire Pacific Ltd., Class A | 11,818 | 147,831 | ||||||
| Swire Properties Ltd. | 72 | 243 | ||||||
| Television Broadcasts Ltd. | 442 | 3,323 | ||||||
| Wharf Holdings Ltd. | 42,604 | 339,542 | ||||||
| Wheelock & Co., Ltd. | 60,844 | 310,371 | ||||||
| Wing Hang Bank Ltd. | 3,000 | 31,600 | ||||||
| Yue Yuen Industrial Holdings Ltd. | 49,123 | 166,144 | ||||||
|
| |||||||
| 5,742,510 | ||||||||
|
| |||||||
| Ireland - 0.0% (c) | ||||||||
| James Hardie Industries PLC CDI | 4,289 | 41,525 | ||||||
|
| |||||||
| Italy - 1.2% | ||||||||
| Assicurazioni Generali SpA | 18,525 | 338,539 | ||||||
| Enel SpA | 155,110 | 645,177 | ||||||
| Eni SpA | 68,444 | 1,676,707 | ||||||
| The accompanying notes are an integral part of these financial statements. | (Continued) |
| 38 | AQR Funds | Annual Report | December 2012 | |||||||||||||
Table of Contents
| Schedule of Investments | December 31, 2012 |
| AQR GLOBAL EQUITY FUND |
| SHARES | VALUE (Note 2) | |||||||
| Italy - 1.2% (continued) | ||||||||
| Fiat Industrial SpA | 25,628 | $ | 280,769 | |||||
| Fiat SpA † | 64,198 | 323,392 | ||||||
| Intesa Sanpaolo SpA | 181,257 | 313,450 | ||||||
| Prysmian SpA | 52,124 | 1,040,446 | ||||||
| Telecom Italia SpA | 247,367 | 224,378 | ||||||
| Tenaris SA | 13,412 | 279,645 | ||||||
| UniCredit SpA † | 67,592 | 332,854 | ||||||
|
| |||||||
| 5,455,357 | ||||||||
|
| |||||||
| Japan - 7.6% | ||||||||
| Ajinomoto Co., Inc. | 36,000 | 476,369 | ||||||
| Alfresa Holdings Corp. | 5,700 | 222,798 | ||||||
| Asahi Glass Co., Ltd. | 236 | 1,723 | ||||||
| Asahi Kasei Corp. | 27,000 | 159,654 | ||||||
| Astellas Pharma, Inc. | 15,900 | 714,889 | ||||||
| Brother Industries Ltd. (a) | 40,000 | 430,618 | ||||||
| Canon, Inc. (a) | 12,145 | 470,737 | ||||||
| Central Japan Railway Co. | 6,300 | 511,305 | ||||||
| Chiyoda Corp. | 32,000 | 458,405 | ||||||
| Chubu Electric Power Co., Inc. | 6,354 | 84,793 | ||||||
| Chugai Pharmaceutical Co., Ltd. | 16,600 | 318,058 | ||||||
| Credit Saison Co., Ltd. | 75 | 1,876 | ||||||
| Daicel Corp. | 40,000 | 264,654 | ||||||
| Daido Steel Co., Ltd. | 17,000 | 86,203 | ||||||
| Daihatsu Motor Co., Ltd. | 11,000 | 219,151 | ||||||
| Daito Trust Construction Co., Ltd. | 1,586 | 149,893 | ||||||
| Daiwa House Industry Co., Ltd. | 8,151 | 140,138 | ||||||
| Daiwa Securities Group, Inc. | 27,000 | 150,634 | ||||||
| Denki Kagaku Kogyo KK | 26,000 | 89,018 | ||||||
| DIC Corp. | 495 | 919 | ||||||
| East Japan Railway Co. | 12,812 | 828,477 | ||||||
| FANUC Corp. | 1,200 | 223,260 | ||||||
| Fuji Electric Co., Ltd. | 41,000 | 100,877 | ||||||
| Fuji Heavy Industries Ltd. | 50,733 | 639,759 | ||||||
| FUJIFILM Holdings Corp. | 44 | 885 | ||||||
| Fujitsu Ltd. | 93,115 | 390,522 | ||||||
| Fukuoka Financial Group, Inc. | 104,000 | 416,496 | ||||||
| Hino Motors Ltd. | 975 | 8,813 | ||||||
| Hitachi High-Technologies Corp. | 10,758 | 222,622 | ||||||
| Hokuriku Electric Power Co. | 12,500 | 148,345 | ||||||
| Honda Motor Co., Ltd. | 13,597 | 503,560 | ||||||
| Hoya Corp. | 6 | 118 | ||||||
| IHI Corp. | 198,000 | 513,435 | ||||||
| Inpex Corp. | 67 | 358,340 | ||||||
| Isetan Mitsukoshi Holdings Ltd. | 12,300 | 120,372 | ||||||
| Isuzu Motors Ltd. | 52,000 | 310,306 | ||||||
| ITOCHU Corp. | 61,388 | 648,816 | ||||||
| Japan Petroleum Exploration Co. | 500 | 17,659 | ||||||
| Japan Real Estate Investment Corp. REIT | 7 | 68,965 | ||||||
| Japan Retail Fund Investment Corp. REIT | 18 | 33,089 | ||||||
| Japan Tobacco, Inc. | 28,800 | 813,582 | ||||||
| JGC Corp. | 15,000 | 467,422 | ||||||
| JTEKT Corp. | 47,188 | 449,863 | ||||||
| JX Holdings, Inc. | 14 | 79 | ||||||
| Kajima Corp. | 8,000 | 26,470 | ||||||
| Kaneka Corp. | 354 | 1,791 | ||||||
| Kao Corp. | 9,600 | 250,152 | ||||||
| SHARES | VALUE (Note 2) | |||||||
| Japan - 7.6% (continued) | ||||||||
| Keisei Electric Railway Co., Ltd. | 31,461 | $ | 265,493 | |||||
| Kinden Corp. | 284 | 1,851 | ||||||
| Kirin Holdings Co., Ltd. | 14,000 | 164,724 | ||||||
| Kobe Steel Ltd. | 759 | 970 | ||||||
| Koito Manufacturing Co., Ltd. | 34,000 | 495,859 | ||||||
| Konica Minolta Holdings, Inc. | 72,500 | 521,734 | ||||||
| Kubota Corp. | 343 | 3,944 | ||||||
| Kurita Water Industries Ltd. | 3,700 | 81,256 | ||||||
| Makita Corp. | 46 | 2,137 | ||||||
| Marubeni Corp. | 15,000 | 107,629 | ||||||
| Medipal Holdings Corp. | 20,000 | 221,748 | ||||||
| Miraca Holdings, Inc. | 28 | 1,129 | ||||||
| Mitsubishi Corp. | 36 | 693 | ||||||
| Mitsubishi Estate Co., Ltd. | 22,764 | 544,986 | ||||||
| Mitsubishi UFJ Financial Group, Inc. | 286,249 | 1,548,926 | ||||||
| Mitsubishi UFJ Lease & Finance Co., Ltd. | 4,038 | 173,699 | ||||||
| Mitsui & Co., Ltd. | 41,189 | 617,376 | ||||||
| Mitsui Fudosan Co., Ltd. | 17,598 | 430,501 | ||||||
| Mitsumi Electric Co., Ltd. † | 40 | 234 | ||||||
| Mizuho Financial Group, Inc. | 409,441 | 750,704 | ||||||
| MS&AD Insurance Group Holdings | 11,900 | 237,488 | ||||||
| Namco Bandai Holdings, Inc. | 29,400 | 381,089 | ||||||
| NGK Spark Plug Co., Ltd. | 8,000 | 106,571 | ||||||
| NHK Spring Co., Ltd. | 25,500 | 210,120 | ||||||
| Nippon Building Fund, Inc. REIT | 8 | 82,758 | ||||||
| Nippon Electric Glass Co., Ltd. | 31,000 | 176,514 | ||||||
| Nippon Express Co., Ltd. | 25,000 | 103,306 | ||||||
| Nippon Kayaku Co., Ltd. | 546 | 6,019 | ||||||
| Nippon Meat Packers, Inc. | 97 | 1,345 | ||||||
| Nippon Steel & Sumitomo Metal | 822 | 2,024 | ||||||
| Nippon Telegraph & Telephone Corp. | 7,948 | 334,634 | ||||||
| Nishi-Nippon City Bank Ltd./The | 363 | 901 | ||||||
| Nisshin Steel Holdings Co. Ltd. † | 21,200 | 193,317 | ||||||
| Nitto Denko Corp. | 5,594 | 275,497 | ||||||
| Nomura Holdings, Inc. | 58,800 | 348,054 | ||||||
| Nomura Real Estate Holdings, Inc. | 1,700 | 32,508 | ||||||
| North Pacific Bank Ltd. † | 68 | 191 | ||||||
| NSK Ltd. | 55,000 | 391,361 | ||||||
| NTT DOCOMO, Inc. | 153 | 220,553 | ||||||
| Obayashi Corp. | 49,000 | 276,268 | ||||||
| Oji Holdings Corp. | 682 | 2,352 | ||||||
| Omron Corp. | 31 | 744 | ||||||
| ORIX Corp. | 1,599 | 180,621 | ||||||
| Osaka Gas Co., Ltd. | 129,446 | 470,190 | ||||||
| Otsuka Corp. | 1,100 | 83,227 | ||||||
| Otsuka Holdings Co., Ltd. | 2,200 | 61,977 | ||||||
| Pacific Metals Co., Ltd. | 720 | 3,412 | ||||||
| Rengo Co., Ltd. | 884 | 4,465 | ||||||
| Resona Holdings, Inc. | 125,600 | 574,290 | ||||||
| Rohm Co., Ltd. | 5,900 | 192,870 | ||||||
| Secom Co., Ltd. | 3,500 | 176,338 | ||||||
| Sega Sammy Holdings, Inc. | 10,100 | 170,481 | ||||||
| Seiko Epson Corp. (a) | 14,900 | 121,535 | ||||||
| Seino Holdings Co., Ltd. | 100 | 634 | ||||||
| Sekisui Chemical Co., Ltd. | 52,000 | 453,633 | ||||||
| Sekisui House Ltd. | 9,000 | 98,547 | ||||||
| Seven & I Holdings Co., Ltd. | 28,130 | 793,006 | ||||||
| The accompanying notes are an integral part of these financial statements. | (Continued) |
| AQR Funds | Annual Report | December 2012 | 39 | |||||||||||||
Table of Contents
| Schedule of Investments | December 31, 2012 |
| AQR GLOBAL EQUITY FUND |
| SHARES | VALUE (Note 2) | |||||||
| Japan - 7.6% (continued) | ||||||||
| Shimamura Co., Ltd. | 1,800 | $ | 174,916 | |||||
| Shinsei Bank Ltd. | 156,000 | 312,240 | ||||||
| Shionogi & Co., Ltd. | 32,200 | 536,575 | ||||||
| Softbank Corp. | 11,200 | 410,382 | ||||||
| Sojitz Corp. | 168,216 | 248,714 | ||||||
| Sony Corp. | 17 | 191 | ||||||
| Sumitomo Corp. | 10,000 | 128,298 | ||||||
| Sumitomo Electric Industries Ltd. | 15,800 | 182,629 | ||||||
| Sumitomo Heavy Industries Ltd. | 118,000 | 565,519 | ||||||
| Sumitomo Metal Mining Co., Ltd. | 41,000 | 578,751 | ||||||
| Sumitomo Mitsui Financial Group, Inc. | 33,849 | 1,230,134 | ||||||
| Sumitomo Realty & Development Co., Ltd. | 5,624 | 187,357 | ||||||
| Suzuken Co., Ltd. | 11,900 | 335,259 | ||||||
| Suzuki Motor Corp. | 22,900 | 599,254 | ||||||
| T&D Holdings, Inc. | 47,400 | 577,108 | ||||||
| Taisei Corp. | 169,000 | 561,971 | ||||||
| Takashimaya Co., Ltd. | 11,000 | 78,277 | ||||||
| Takeda Pharmaceutical Co., Ltd. | 3,769 | 168,455 | ||||||
| THK Co., Ltd. | 4,000 | 71,943 | ||||||
| Tohoku Electric Power Co., Inc. † | 6,900 | 64,339 | ||||||
| Tokai Rika Co., Ltd. | 65 | 905 | ||||||
| Tokyo Electric Power Co., Inc † | 26,870 | 64,758 | ||||||
| Tokyo Gas Co., Ltd. | 105,000 | 479,751 | ||||||
| Tokyu Land Corp. | 5,000 | 36,636 | ||||||
| Tosoh Corp. | 169,000 | 406,616 | ||||||
| Toyota Boshoku Corp. | 23,300 | 270,150 | ||||||
| Toyota Motor Corp. | 36,041 | 1,682,976 | ||||||
| Toyota Tsusho Corp. | 9,900 | 244,360 | ||||||
| USS Co., Ltd. | 3,205 | 333,735 | ||||||
| West Japan Railway Co. | 12,000 | 472,760 | ||||||
| Yamaha Corp. | 10,700 | 113,483 | ||||||
|
| |||||||
| 36,338,785 | ||||||||
|
| |||||||
| Netherlands - 1.5% | ||||||||
| ASML Holding NV | 8,429 | 540,582 | ||||||
| Corio NV REIT | 1,041 | 47,736 | ||||||
| Gemalto NV | 22,800 | 2,058,037 | ||||||
| ING Groep NV CVA † | 60,387 | 573,555 | ||||||
| Koninklijke Ahold NV | 108,713 | 1,457,733 | ||||||
| Koninklijke Philips Electronics NV | 100,997 | 2,674,419 | ||||||
|
| |||||||
| 7,352,062 | ||||||||
|
| |||||||
| Singapore - 0.7% | ||||||||
| Ascendas Real Estate Investment Trust REIT | 22,478 | 43,988 | ||||||
| CapitaCommercial Trust REIT | 33,000 | 45,795 | ||||||
| CapitaMall Trust REIT | 34,494 | 60,615 | ||||||
| DBS Group Holdings Ltd. (a) | 46,054 | 565,383 | ||||||
| Fraser and Neave Ltd. | 15,000 | 119,858 | ||||||
| Global Logistic Properties Ltd. | 29,000 | 67,069 | ||||||
| Hutchison Port Holdings Trust, Class U | 83,000 | 66,431 | ||||||
| Jardine Cycle & Carriage Ltd. | 291 | 11,590 | ||||||
| Keppel Corp. Ltd. | 27,000 | 246,552 | ||||||
| Keppel Land Ltd. | 78,000 | 261,242 | ||||||
| Oversea-Chinese Banking Corp. Ltd. | 54,422 | 438,532 | ||||||
| SembCorp Industries Ltd. | 11,777 | 51,351 | ||||||
| Singapore Exchange Ltd. | 10,967 | 63,730 | ||||||
| SHARES | VALUE (Note 2) | |||||||
| Singapore - 0.7% (continued) | ||||||||
| Singapore Technologies Engineering Ltd. | 25,103 | $ | 79,230 | |||||
| Singapore Telecommunications Ltd. | 129,635 | 352,741 | ||||||
| StarHub Ltd. | 7,476 | 23,416 | ||||||
| United Overseas Bank Ltd. | 33,201 | 544,631 | ||||||
| UOL Group Ltd. | 10,340 | 50,996 | ||||||
| Wilmar International Ltd. | 71,000 | 196,016 | ||||||
| Yangzijiang Shipbuilding Holdings Ltd. (a) | 190,404 | 152,548 | ||||||
|
| |||||||
| 3,441,714 | ||||||||
|
| |||||||
| Spain - 0.8% | ||||||||
| Banco Bilbao Vizcaya Argentaria SA | 68,218 | 633,802 | ||||||
| Banco Santander SA | 143,502 | 1,166,242 | ||||||
| Enagas SA | 49,657 | 1,063,853 | ||||||
| Iberdrola SA | 83,107 | 464,128 | ||||||
| Inditex SA | 2,557 | 359,275 | ||||||
|
| |||||||
| 3,687,300 | ||||||||
|
| |||||||
| Sweden - 1.5% | ||||||||
| Boliden AB | 51,733 | 982,979 | ||||||
| Electrolux AB, Series B | 89,346 | 2,360,026 | ||||||
| Husqvarna AB, B Shares | 66,358 | 402,728 | ||||||
| Investor AB, B Shares | 9,034 | 237,325 | ||||||
| Nordea Bank AB | 59,245 | 569,873 | ||||||
| Scania AB, B Shares | 15,138 | 314,740 | ||||||
| Svenska Cellulosa AB, B Shares | 73,651 | 1,601,365 | ||||||
| Swedish Match AB | 8,980 | 301,458 | ||||||
| TeliaSonera AB | 34,247 | 232,503 | ||||||
|
| |||||||
| 7,002,997 | ||||||||
|
| |||||||
| Switzerland - 3.4% | ||||||||
| Adecco SA † | 4,888 | 258,860 | ||||||
| Compagnie Financiere Richemont SA, Class A | 18,369 | 1,441,885 | ||||||
| Nestle SA | 28,490 | 1,858,786 | ||||||
| Novartis AG | 45,910 | 2,900,286 | ||||||
| Roche Holding AG | 22,012 | 4,450,412 | ||||||
| STMicroelectronics NV | 141,383 | 1,023,142 | ||||||
| Sulzer AG | 1,989 | 314,797 | ||||||
| Syngenta AG | 5,441 | 2,198,090 | ||||||
| Transocean Ltd. | 6,407 | 287,249 | ||||||
| Wolseley PLC | 33,520 | 1,602,884 | ||||||
|
| |||||||
| 16,336,391 | ||||||||
|
| |||||||
| United Kingdom - 7.9% | ||||||||
| 3i Group plc | 84,967 | 303,242 | ||||||
| AMEC PLC | 37,129 | 613,778 | ||||||
| Anglo American PLC | 14,024 | 442,080 | ||||||
| Associated British Foods PLC | 52,703 | 1,346,474 | ||||||
| AstraZeneca PLC | 33,542 | 1,589,546 | ||||||
| Aviva PLC | 127,850 | 791,129 | ||||||
| Babcock International Group PLC | 36,444 | 575,269 | ||||||
| BAE Systems PLC | 204,941 | 1,139,101 | ||||||
| Barclays PLC | 651,419 | 2,829,752 | ||||||
| BHP Billiton PLC | 35,178 | 1,240,851 | ||||||
| BP PLC | 80,748 | 561,434 | ||||||
| British American Tobacco PLC | 49,512 | 2,516,941 | ||||||
| British Land Co. PLC REIT | 13,261 | 122,513 | ||||||
| BT Group PLC | 424,653 | 1,620,137 | ||||||
| The accompanying notes are an integral part of these financial statements. | (Continued) |
| 40 | AQR Funds | Annual Report | December 2012 | |||||||||||||
Table of Contents
| Schedule of Investments | December 31, 2012 |
| AQR GLOBAL EQUITY FUND |
| SHARES | VALUE (Note 2) | |||||||
| United Kingdom - 7.9% (continued) | ||||||||
| Capital Shopping Centres Group PLC REIT | 6,502 | $ | 37,406 | |||||
| Experian PLC | 45,119 | 727,180 | ||||||
| GlaxoSmithKline PLC | 84,201 | 1,833,250 | ||||||
| Glencore International PLC | 14,355 | 82,926 | ||||||
| Hammerson PLC REIT | 10,329 | 82,825 | ||||||
| HSBC Holdings PLC | 252,987 | 2,680,846 | ||||||
| Imperial Tobacco Group PLC | 21,940 | 850,648 | ||||||
| ITV PLC | 240,490 | 417,194 | ||||||
| Johnson Matthey PLC | 29,274 | 1,149,974 | ||||||
| Kazakhmys PLC | 30,207 | 390,416 | ||||||
| Kingfisher PLC | 76,070 | 355,443 | ||||||
| Land Securities Group PLC REIT | 12,541 | 167,310 | ||||||
| Legal & General Group PLC | 136,840 | 328,124 | ||||||
| Lloyds Banking Group PLC † | 394,683 | 314,521 | ||||||
| National Grid PLC | 57,009 | 653,860 | ||||||
| Next PLC | 13,849 | 840,669 | ||||||
| Randgold Resources Ltd. | 1,514 | 149,776 | ||||||
| Reed Elsevier PLC | 20,306 | 214,384 | ||||||
| Rio Tinto PLC | 21,503 | 1,254,177 | ||||||
| Royal Dutch Shell PLC, A Shares | 59,129 | 2,052,379 | ||||||
| Royal Dutch Shell PLC, B Shares | 53,762 | 1,918,031 | ||||||
| RSA Insurance Group PLC | 524,927 | 1,084,063 | ||||||
| Sage Group PLC/The | 21,831 | 104,974 | ||||||
| Segro PLC REIT | 13,080 | 53,092 | ||||||
| Smith & Nephew PLC | 104,364 | 1,153,629 | ||||||
| TUI Travel PLC | 194,118 | 900,757 | ||||||
| Tullow Oil PLC | 14,217 | 296,388 | ||||||
| Unilever PLC | 21,107 | 820,449 | ||||||
| Vodafone Group PLC | 250,556 | 630,716 | ||||||
| Xstrata PLC | 28,345 | 494,785 | ||||||
|
| |||||||
| 37,732,439 | ||||||||
|
| |||||||
| United States - 46.7% | ||||||||
| 3M Co. (1) | 17,300 | 1,606,305 | ||||||
| Abbott Laboratories (1) | 35,484 | 2,324,202 | ||||||
| Accenture PLC, Class A (1) | 23,974 | 1,594,271 | ||||||
| ACE Ltd. (1)(a) | 2,800 | 223,440 | ||||||
| ACE Ltd. (1) | 1,296 | 103,421 | ||||||
| Advance Auto Parts, Inc. (1) | 9,500 | 687,325 | ||||||
| Allstate Corp./The (1) | 23,300 | 935,961 | ||||||
| Alpha Natural Resources, Inc. (1)†(a) | 248,400 | 2,419,416 | ||||||
| Altria Group, Inc. (1) | 51,996 | 1,633,714 | ||||||
| Ameren Corp. (1) | 13,100 | 402,432 | ||||||
| American Electric Power Co., Inc. (1) | 19,300 | 823,724 | ||||||
| American International Group, Inc. (1)† | 18,200 | 642,460 | ||||||
| American Tower Corp. REIT (1) | 8,200 | 633,614 | ||||||
| Ameriprise Financial, Inc. (1) | 20,500 | 1,283,915 | ||||||
| Amgen, Inc. (1) | 35,149 | 3,034,062 | ||||||
| Annaly Capital Management, Inc. REIT (1)(a) | 14,918 | 209,449 | ||||||
| Apple, Inc. (1) | 13,528 | 7,210,830 | ||||||
| Archer-Daniels-Midland Co. (1) | 30,633 | 839,038 | ||||||
| Arrow Electronics, Inc. (1)†(a) | 2,900 | 110,432 | ||||||
| Assurant, Inc. (1) | 18,100 | 628,070 | ||||||
| AT&T, Inc. (1) | 144,997 | 4,887,849 | ||||||
| Avago Technologies Ltd. (1) | 8,400 | 265,944 | ||||||
| AvalonBay Communities, Inc. REIT (1) | 1,311 | 177,758 | ||||||
| SHARES | VALUE (Note 2) | |||||||
| United States - 46.7% (continued) | ||||||||
| Avery Dennison Corp. (1)(a) | 23,900 | $ | 834,588 | |||||
| Avnet, Inc. (1)† | 22,100 | 676,481 | ||||||
| Axis Capital Holdings Ltd. (1) | 49,800 | 1,725,072 | ||||||
| Bank of America Corp. (1) | 159,938 | 1,855,281 | ||||||
| Becton Dickinson and Co. (1)(a) | 1,086 | 84,914 | ||||||
| Berkshire Hathaway, Inc., Class B (1)† | 13,150 | 1,179,555 | ||||||
| Best Buy Co., Inc. (1)(a) | 90,700 | 1,074,795 | ||||||
| Biogen Idec, Inc. (1)† | 2,300 | 337,341 | ||||||
| BlackRock, Inc. (1)(a) | 500 | 103,355 | ||||||
| Boston Properties, Inc. REIT (1) | 2,763 | 292,353 | ||||||
| Boston Scientific Corp. (1)† | 128,200 | 734,586 | ||||||
| Bunge Ltd. (1)(a) | 17,100 | 1,242,999 | ||||||
| CA, Inc. (1) | 63,300 | 1,391,334 | ||||||
| Cabot Oil & Gas Corp. (1) | 20,500 | 1,019,670 | ||||||
| Campbell Soup Co. (1)(a) | 6,500 | 226,785 | ||||||
| Capital One Financial Corp. (1) | 27,900 | 1,616,247 | ||||||
| CF Industries Holdings, Inc. (1) | 10,100 | 2,051,916 | ||||||
| Chevron Corp. (1) | 45,700 | 4,941,998 | ||||||
| Cisco Systems, Inc. (1) | 115,689 | 2,273,289 | ||||||
| Citigroup, Inc. (1) | 30,419 | 1,203,376 | ||||||
| Coca-Cola Co./The (1) | 65,760 | 2,383,800 | ||||||
| Colgate-Palmolive Co. (1) | 1,828 | 191,099 | ||||||
| Comcast Corp., Class A (1) | 50,600 | 1,891,428 | ||||||
| Comerica, Inc. (1)(a) | 28,200 | 855,588 | ||||||
| ConAgra Foods, Inc. (1) | 59,374 | 1,751,533 | ||||||
| ConocoPhillips (1) | 3,375 | 195,716 | ||||||
| Costco Wholesale Corp. (1) | 2,200 | 217,294 | ||||||
| CVS Caremark Corp. (1) | 54,000 | 2,610,900 | ||||||
| Deere & Co. (1)(a) | 6,600 | 570,372 | ||||||
| DeVry, Inc. (1)(a) | 16,400 | 389,172 | ||||||
| DIRECTV (1)† | 13,869 | 695,669 | ||||||
| Discover Financial Services (1) | 33,600 | 1,295,280 | ||||||
| DISH Network Corp., Class A (1) | 41,374 | 1,506,014 | ||||||
| DTE Energy Co. (1) | 17,600 | 1,056,880 | ||||||
| Duke Energy Corp. (1) | 11,600 | 740,080 | ||||||
| Edison International (1) | 4,656 | 210,405 | ||||||
| Eli Lilly & Co. (1) | 63,900 | 3,151,548 | ||||||
| Entergy Corp. (1) | 13,700 | 873,375 | ||||||
| Equifax, Inc. (1) | 9,000 | 487,080 | ||||||
| Equity Residential REIT (1) | 348 | 19,721 | ||||||
| Everest Re Group Ltd. (1)(a) | 22,800 | 2,506,860 | ||||||
| Expedia, Inc. (1) | 5,000 | 307,250 | ||||||
| Exxon Mobil Corp. (1) | 80,789 | 6,992,288 | ||||||
| Fidelity National Information Services, Inc. (1) | 27,000 | 939,870 | ||||||
| Fifth Third Bancorp (1)(a) | 36,600 | 555,954 | ||||||
| Flextronics International Ltd. (1)† | 64,400 | 399,924 | ||||||
| Flowserve Corp. (1) | 3,300 | 484,440 | ||||||
| Ford Motor Co. (1)(a) | 47,100 | 609,945 | ||||||
| Forest Laboratories, Inc. (1)† | 37,686 | 1,331,069 | ||||||
| GameStop Corp., Class A (1)(a) | 76,000 | 1,906,840 | ||||||
| Gap, Inc./The (1) | 34,919 | 1,083,886 | ||||||
| General Electric Co. (1) | 87,202 | 1,830,370 | ||||||
| General Growth Properties, Inc. REIT (1) | 8,100 | 160,785 | ||||||
| Goldman Sachs Group, Inc./The (1) | 8,400 | 1,071,504 | ||||||
| Google, Inc., Class A (1)†(a) | 3,402 | 2,413,277 | ||||||
| HCP, Inc. REIT (1)(a) | 8,272 | 373,729 | ||||||
| The accompanying notes are an integral part of these financial statements. | (Continued) |
| AQR Funds | Annual Report | December 2012 | 41 | |||||||||||||
Table of Contents
| Schedule of Investments | December 31, 2012 |
| AQR GLOBAL EQUITY FUND |
| SHARES | VALUE (Note 2) | |||||||
| United States - 46.7% (continued) | ||||||||
| Health Care REIT, Inc. REIT (1) | 5,300 | $ | 324,837 | |||||
| Home Depot, Inc./The (1) | 1,506 | 93,146 | ||||||
| Host Hotels & Resorts, Inc. REIT (1)(a) | 9,300 | 145,731 | ||||||
| Humana, Inc. (1) | 18,400 | 1,262,792 | ||||||
| Ingersoll-Rand PLC (1) | 41,200 | 1,975,952 | ||||||
| Intel Corp. (1) | 35,067 | 723,432 | ||||||
| International Business Machines Corp. (1) | 14,723 | 2,820,191 | ||||||
| International Paper Co. (1) | 13,200 | 525,888 | ||||||
| Invesco Ltd. (1) | 9,300 | 242,637 | ||||||
| JM Smucker Co./The (1) | 7,600 | 655,424 | ||||||
| Johnson & Johnson (1) | 57,216 | 4,010,842 | ||||||
| JPMorgan Chase & Co. (1) | 109,573 | 4,817,925 | ||||||
| KBR, Inc. (1) | 23,200 | 694,144 | ||||||
| KeyCorp (1) | 231,200 | 1,946,704 | ||||||
| Kimberly-Clark Corp. (1)(a) | 25,563 | 2,158,284 | ||||||
| Kimco Realty Corp. REIT (1)(a) | 6,500 | 125,580 | ||||||
| L-3 Communications Holdings, Inc. (1) | 12,753 | 977,135 | ||||||
| Lincoln National Corp. (1)(a) | 43,200 | 1,118,880 | ||||||
| Loews Corp. (1) | 25,600 | 1,043,200 | ||||||
| Lowe’s Cos., Inc. (1) | 26,000 | 923,520 | ||||||
| LSI Corp. (1)† | 183,600 | 1,299,888 | ||||||
| LyondellBasell Industries NV, Class A (1) | 54,800 | 3,128,532 | ||||||
| Macerich Co./The REIT (1) | 2,100 | 122,430 | ||||||
| Macy’s, Inc. (1)(a) | 24,400 | 952,088 | ||||||
| Marathon Oil Corp. (1) | 46,729 | 1,432,711 | ||||||
| Marriott International, Inc., Class A (1)(a) | 2,400 | 89,448 | ||||||
| Marvell Technology Group Ltd. (1) | 195,600 | 1,420,056 | ||||||
| Mastercard, Inc., Class A (1) | 3,300 | 1,621,224 | ||||||
| Maxim Integrated Products, Inc. (1) | 8,500 | 249,900 | ||||||
| McDonald’s Corp. (1) | 10,925 | 963,694 | ||||||
| McKesson Corp. (1) | 24,400 | 2,365,824 | ||||||
| Medtronic, Inc. (1) | 21,882 | 897,600 | ||||||
| Merck & Co., Inc. (1) | 84,919 | 3,476,584 | ||||||
| MetroPCS Communications, Inc. (1)†(a) | 36,100 | 358,834 | ||||||
| Microsoft Corp. (1) | 76,550 | 2,046,181 | ||||||
| Mondelez International, Inc., Class A (1) | 64,221 | 1,635,709 | ||||||
| Monsanto Co. (1) | 10,000 | 946,500 | ||||||
| Murphy Oil Corp. (1) | 22,194 | 1,321,653 | ||||||
| Nabors Industries Ltd. (1)† | 86,500 | 1,249,925 | ||||||
| Newell Rubbermaid, Inc. (1) | 12,700 | 282,829 | ||||||
| Newfield Exploration Co. (1)† | 20,300 | 543,634 | ||||||
| Newmont Mining Corp. (1) | 5,161 | 239,677 | ||||||
| News Corp., Class A (1)(a) | 63,100 | 1,611,574 | ||||||
| Northrop Grumman Corp. (1)(a) | 35,479 | 2,397,671 | ||||||
| Occidental Petroleum Corp. (1) | 7,990 | 612,114 | ||||||
| Owens-Illinois, Inc. (1)† | 16,800 | 357,336 | ||||||
| PepsiCo, Inc. (1) | 20,772 | 1,421,428 | ||||||
| PetSmart, Inc. (1)(a) | 23,500 | 1,605,990 | ||||||
| Pfizer, Inc. (1) | 172,443 | 4,324,870 | ||||||
| Philip Morris International, Inc. (1) | 39,293 | 3,286,466 | ||||||
| Pinnacle West Capital Corp. (1) | 9,800 | 499,604 | ||||||
| Plains Exploration & Production Co. (1)† | 7,100 | 333,274 | ||||||
| PPG Industries, Inc. (1) | 12,700 | 1,718,945 | ||||||
| Procter & Gamble Co./The (1) | 68,108 | 4,623,852 | ||||||
| Prologis, Inc. REIT (1) | 5,980 | 218,210 | ||||||
| Prudential Financial, Inc. (1) | 17,900 | 954,607 | ||||||
| Public Service Enterprise Group, Inc. (1) | 10,500 | 321,300 | ||||||
| SHARES | VALUE (Note 2) | |||||||
| United States - 46.7% (continued) | ||||||||
| Public Storage REIT (1) | 3,069 | $ | 444,882 | |||||
| Quest Diagnostics, Inc. (1) | 18,600 | 1,083,822 | ||||||
| Raytheon Co. (1) | 21,467 | 1,235,640 | ||||||
| RenaissanceRe Holdings Ltd. (1)(a) | 3,600 | 292,536 | ||||||
| Reynolds American, Inc. (1) | 13,974 | 578,943 | ||||||
| Seagate Technology PLC (1)(a) | 53,700 | 1,636,776 | ||||||
| Simon Property Group, Inc. REIT (1) | 6,242 | 986,798 | ||||||
| SLM Corp. (1) | 98,000 | 1,678,740 | ||||||
| Southwest Airlines Co. (1)(a) | 19,200 | 196,608 | ||||||
| Sprint Nextel Corp. (1)† | 95,700 | 542,619 | ||||||
| St Jude Medical, Inc. (1) | 32,400 | 1,170,936 | ||||||
| Stryker Corp. (1) | 21,900 | 1,200,558 | ||||||
| Symantec Corp. (1)† | 69,600 | 1,309,176 | ||||||
| Target Corp. (1) | 8,200 | 485,194 | ||||||
| Thermo Fisher Scientific, Inc. (1) | 14,100 | 899,298 | ||||||
| Time Warner Cable, Inc. (1) | 6,200 | 602,578 | ||||||
| TJX Cos., Inc. (1) | 12,800 | 543,360 | ||||||
| Total System Services, Inc. (1) | 25,400 | 544,068 | ||||||
| Travelers Cos., Inc./The (1) | 27,201 | 1,953,576 | ||||||
| Tyco International Ltd. (1) | 15,500 | 453,375 | ||||||
| Tyson Foods, Inc., Class A (1) | 131,000 | 2,541,400 | ||||||
| Union Pacific Corp. (1) | 1,700 | 213,724 | ||||||
| United States Steel Corp. (1)(a) | 4,300 | 102,641 | ||||||
| UnitedHealth Group, Inc. (1) | 7,700 | 417,648 | ||||||
| Unum Group (1) | 65,509 | 1,363,897 | ||||||
| URS Corp. (1)(a) | 3,800 | 149,188 | ||||||
| US Bancorp (1) | 18,100 | 578,114 | ||||||
| Valero Energy Corp. (1)(a) | 6,800 | 232,016 | ||||||
| Ventas, Inc. REIT (1) | 4,800 | 310,656 | ||||||
| Verizon Communications, Inc. (1)(a) | 80,412 | 3,479,427 | ||||||
| Viacom, Inc., Class B (1) | 20,737 | 1,093,669 | ||||||
| Vornado Realty Trust REIT (1)(a) | 2,748 | 220,060 | ||||||
| Wal-Mart Stores, Inc. (1) | 51,705 | 3,527,832 | ||||||
| Walt Disney Co./The (1) | 7,500 | 373,425 | ||||||
| Waste Management, Inc. (1)(a) | 2,373 | 80,065 | ||||||
| Watson Pharmaceuticals, Inc. (1)† | 9,000 | 774,000 | ||||||
| Wells Fargo & Co. (1) | 104,770 | 3,581,039 | ||||||
| Western Digital Corp. (1) | 49,000 | 2,082,010 | ||||||
| Weyerhaeuser Co. REIT (1) | 8,600 | 239,252 | ||||||
| Whiting Petroleum Corp. (1)† | 17,500 | 758,975 | ||||||
| Williams Cos., Inc./The (1) | 24,100 | 789,034 | ||||||
| Yahoo!, Inc. (1)† | 38,500 | 766,150 | ||||||
| Zimmer Holdings, Inc. (1)(a) | 21,500 | 1,433,190 | ||||||
|
| |||||||
| 222,069,813 | ||||||||
|
| |||||||
TOTAL COMMON STOCKS | 420,514,325 | |||||||
|
| |||||||
| PREFERRED STOCKS - 1.0% | ||||||||
| Germany - 1.0% | ||||||||
| Henkel AG & Co. KGaA | 25,082 | 2,063,522 | ||||||
| ProSiebenSat.1 Media AG | 53,410 | 1,521,321 | ||||||
| Volkswagen AG | 4,235 | 971,716 | ||||||
|
| |||||||
TOTAL PREFERRED STOCKS | 4,556,559 | |||||||
|
| |||||||
| The accompanying notes are an integral part of these financial statements. | (Continued) |
| 42 | AQR Funds | Annual Report | December 2012 | |||||||||||||
Table of Contents
| Schedule of Investments | December 31, 2012 |
| AQR GLOBAL EQUITY FUND |
| MONEY MARKET FUNDS - 7.4% | SHARES | VALUE (Note 2) | ||||||
| J.P. Morgan U.S. Treasury Plus Money | ||||||||
Market Fund - Institutional Shares, 0.000% (d)(e) | 35,254,366 | $ | 35,254,366 | |||||
|
| |||||||
| INVESTMENTS OF CASH COLLATERAL FOR SECURITIES ON LOAN - 3.3% | ||||||||
| J.P. Morgan Prime Money Market Fund - | ||||||||
Capital Shares, 0.120% (d)(f) | 15,571,488 | 15,571,488 | ||||||
|
| |||||||
TOTAL INVESTMENTS - 100.1% | 475,896,738 | |||||||
|
| |||||||
| LIABILITIES IN EXCESS OF OTHER ASSETS - (0.1%) (g) | (340,212) | |||||||
|
| |||||||
NET ASSETS - 100.0% |
| $ | 475,556,526 | |||||
|
| |||||||
| † | Non income-producing security. |
| (a) | All or a portion of the security on loan. The aggregate market value of such securities is $15,413,989; cash collateral of $15,571,488 was received with which the Fund purchased a money market fund. |
| (b) | Security fair valued at $0 as of December 31, 2012 using procedures approved by the Board of Trustees. |
| (c) | Represents less than 0.05 percent of net assets. |
| (d) | Represents annualized seven-day yield as of December 31, 2012. |
| (e) | A portion of the security is pledged as collateral to the brokers for forward foreign currency exchange and swap contracts. |
| (f) | Represents security, or portion thereof, purchased with the cash collateral received for securities on loan. |
| (g) | Includes appreciation (depreciation) on forward foreign currency exchange, futures and swap contracts. |
All securities are Level 2 with respect to ASC 820, unless otherwise noted in parentheses.
| (1) | Level 1 security (See Note 4). |
| (3) | Level 3 security (See Note 4). |
The following abbreviations are used in portfolio descriptions:
CDI - CHESS Depository Interest
CVA - Dutch Certificate of Shares
FDR - Fiduciary Depositary Receipt
REIT - Real Estate Investment Trust
| SECTOR | VALUE | % OF NET ASSETS | ||||||
| Consumer Discretionary | $ | 43,699,035 | 9.2 | % | ||||
| Consumer Staples | 51,732,530 | 10.9 | ||||||
| Energy | 38,865,536 | 8.2 | ||||||
| Financials | 90,484,680 | 19.0 | ||||||
| Health Care | 59,802,940 | 12.6 | ||||||
| Industrials | 41,703,705 | 8.7 | ||||||
| Information Technology | 42,227,161 | 8.9 | ||||||
| Materials | 29,816,979 | 6.3 | ||||||
| Telecommunication Services | 16,688,046 | 3.5 | ||||||
| Utilities | 10,050,272 | 2.1 | ||||||
| Money Market Funds | 50,825,854 | 10.7 | ||||||
|
|
|
| |||||
Total Investments | 475,896,738 | 100.1 | ||||||
| Liabilities in Excess of Other Assets (g) | (340,212) | (0.1) | ||||||
|
|
|
| |||||
Net Assets | $ | 475,556,526 | 100.0 | % | ||||
|
|
|
| |||||
Total return swap contract outstanding as of December 31, 2012:
| COUNTERPARTY | UNDERLYING REFERENCE INSTRUMENT | TERMINATION DATE | CURRENCY | NOTIONAL VALUE | UNREALIZED APPRECIATION (DEPRECIATION) | |||||||||
| The Royal Bank of Scotland | Swiss Market Index Futures | 3/15/2013 | CHF | 7,911,068 | $(88,758) | |||||||||
|
| |||||||||||||
Money Market Fund investment and cash pledged as collateral for total return swap contract is included in the collateral for forward foreign currency exchange contracts.
Open futures contracts outstanding at December 31, 2012:
| NUMBER OF CONTRACTS | DESCRIPTION | EXPIRATION DATE | VALUE AT TRADE DATE | VALUE AT DECEMBER 31, 2012 | UNREALIZED APPRECIATION (DEPRECIATION) | |||||||||||
| Long Contracts: | ||||||||||||||||
| 73 | Amsterdam Index Futures | January 18, 2013 | $6,624,194 | $6,611,973 | $(12,221) | |||||||||||
| 632 | CAC40 10 Euro Futures | January 18, 2013 | 30,447,538 | 30,381,870 | (65,668) | |||||||||||
| 55 | DAX Index Futures | March 15, 2013 | 13,846,225 | 13,827,054 | (19,171) | |||||||||||
| 166 | FTSE 100 Index Futures | March 15, 2013 | 15,932,578 | 15,769,641 | (162,937) | |||||||||||
| 12 | FTSE/MIB Index Futures | March 15, 2013 | 1,279,439 | 1,291,227 | 11,788 | |||||||||||
| The accompanying notes are an integral part of these financial statements. | (Continued) |
| AQR Funds | Annual Report | December 2012 | 43 | |||||||||||||
Table of Contents
| Schedule of Investments | December 31, 2012 |
| AQR GLOBAL EQUITY FUND |
| NUMBER OF CONTRACTS | DESCRIPTION | EXPIRATION DATE | VALUE AT TRADE DATE | VALUE AT DECEMBER 31, 2012 | UNREALIZED APPRECIATION (DEPRECIATION) | |||||||||||
| Long Contracts: (continued) | ||||||||||||||||
| 128 | Hang Seng Index Futures | January 30, 2013 | $18,660,574 | $18,722,282 | $61,708 | |||||||||||
| 93 | IBEX 35 Index Futures | January 18, 2013 | 9,813,514 | 9,907,584 | 94,070 | |||||||||||
| 7 | MSCI Singapore Index Futures | January 30, 2013 | 413,098 | 412,705 | (393) | |||||||||||
| 190 | S&P 500 E-Mini Futures | March 15, 2013 | 13,584,699 | 13,490,950 | (93,749) | |||||||||||
| 137 | TOPIX Index Futures | March 7, 2013 | 12,436,748 | 13,623,305 | 1,186,557 | |||||||||||
|
|
|
|
|
| |||||||||||
| 123,038,607 | 124,038,591 | 999,984 | ||||||||||||||
|
|
|
|
|
| |||||||||||
| Short Contracts: | ||||||||||||||||
| 642 | OMXS30 Index Futures | January 18, 2013 | (10,837,597) | (10,935,861) | (98,264) | |||||||||||
| 160 | S&P/Toronto Stock Exchange 60 Index Futures | March 14, 2013 | (22,592,474) | (22,886,097) | (293,623) | |||||||||||
| 493 | SPI 200 Index Futures | March 21, 2013 | (58,644,590) | (59,079,705) | (435,115) | |||||||||||
|
|
|
|
|
| |||||||||||
| (92,074,661) | (92,901,663) | (827,002) | ||||||||||||||
|
|
|
|
|
| |||||||||||
| $30,963,946 | $31,136,928 | $172,982 | ||||||||||||||
|
|
|
|
|
| |||||||||||
Cash held as collateral with broker for futures contracts was $12,288,138 at December 31, 2012.
Forward foreign currency exchange contracts outstanding as of December 31, 2012:
| PURCHASE CONTRACTS | COUNTERPARTY | CURRENCY | CURRENCY AMOUNT PURCHASED | VALUE AT SETTLEMENT DATE | VALUE AT DECEMBER 31, 2012 | UNREALIZED APPRECIATION (DEPRECIATION) | ||||||||||||||
| Canadian Dollar, Expiring 03/20/13 | The Royal Bank of Scotland | CAD | 10,494,000 | $10,548,820 | $10,532,896 | $(15,924) | ||||||||||||||
| Swiss Franc, Expiring 03/20/13 | The Royal Bank of Scotland | CHF | 12,689,000 | 13,911,581 | 13,892,925 | (18,656) | ||||||||||||||
| Danish Krone, Expiring 03/20/13 | The Royal Bank of Scotland | DKK | 279,000 | 49,316 | 49,423 | 107 | ||||||||||||||
| Euro, Expiring 03/20/13 | The Royal Bank of Scotland | EUR | 16,632,000 | 21,786,226 | 21,968,344 | 182,118 | ||||||||||||||
| British Pound, Expiring 03/20/13 | The Royal Bank of Scotland | GBP | 13,612,000 | 21,896,749 | 22,106,687 | 209,938 | ||||||||||||||
| Hong Kong Dollar, Expiring 03/20/13 | The Royal Bank of Scotland | HKD | 5,768,000 | 744,381 | 744,366 | (15) | ||||||||||||||
| Israeli Shekel, Expiring 03/20/13 | The Royal Bank of Scotland | ILS | 4,616,000 | 1,208,214 | 1,232,909 | 24,695 | ||||||||||||||
| Japanese Yen, Expiring 03/21/13 | The Royal Bank of Scotland | JPY | 1,311,946,000 | 15,645,290 | 15,152,823 | (492,467) | ||||||||||||||
| Norwegian Krone, Expiring 03/20/13 | The Royal Bank of Scotland | NOK | 377,936,000 | 66,717,990 | 67,811,933 | 1,093,943 | ||||||||||||||
| New Zealand Dollar, Expiring 03/20/13 | The Royal Bank of Scotland | NZD | 17,752,000 | 14,729,904 | 14,598,736 | (131,168) | ||||||||||||||
| Swedish Krona, Expiring 03/20/13 | The Royal Bank of Scotland | SEK | 210,652,000 | 31,794,729 | 32,336,190 | 541,461 | ||||||||||||||
| Singapore Dollar, Expiring 03/20/13 | The Royal Bank of Scotland | SGD | 685,000 | 561,426 | 560,722 | (704) | ||||||||||||||
|
|
|
|
|
| |||||||||||||||
| $199,594,626 | $200,987,954 | $1,393,328 | ||||||||||||||||||
|
|
|
|
|
| |||||||||||||||
| The accompanying notes are an integral part of these financial statements. | (Continued) |
| 44 | AQR Funds | Annual Report | December 2012 | |||||||||||||
Table of Contents
| Schedule of Investments | December 31, 2012 |
| AQR GLOBAL EQUITY FUND |
| SALES CONTRACTS | COUNTERPARTY | CURRENCY | CURRENCY AMOUNT SOLD | VALUE AT SETTLEMENT DATE | VALUE AT DECEMBER 31, 2012 | UNREALIZED APPRECIATION (DEPRECIATION) | ||||||||||||||
| Australian Dollar, Expiring 03/20/13 | The Royal Bank of Scotland | AUD | (10,302,000) | $(10,691,135) | $(10,638,470) | $52,665 | ||||||||||||||
| Canadian Dollar, Expiring 03/20/13 | The Royal Bank of Scotland | CAD | (1,646,000) | (1,662,584) | (1,652,101) | 10,483 | ||||||||||||||
| Swiss Franc, Expiring 03/20/13 | The Royal Bank of Scotland | CHF | (16,541,000) | (17,868,098) | (18,110,400) | (242,302) | ||||||||||||||
| Danish Krone, Expiring 03/20/13 | The Royal Bank of Scotland | DKK | (11,728,000) | (2,057,930) | (2,077,535) | (19,605) | ||||||||||||||
| Euro, Expiring 03/20/13 | The Royal Bank of Scotland | EUR | (17,253,000) | (22,549,880) | (22,788,591) | (238,711) | ||||||||||||||
| British Pound, Expiring 03/20/13 | The Royal Bank of Scotland | GBP | (8,381,000) | (13,604,680) | (13,611,236) | (6,556) | ||||||||||||||
| Hong Kong Dollar, Expiring 03/20/13 | The Royal Bank of Scotland | HKD | (690,000) | (89,050) | (89,045) | 5 | ||||||||||||||
| Israeli Shekel, Expiring 03/20/13 | The Royal Bank of Scotland | ILS | (353,000) | (93,102) | (94,284) | (1,182) | ||||||||||||||
| Japanese Yen, Expiring 03/21/13 | The Royal Bank of Scotland | JPY | (8,021,931,000) | (97,569,363) | (92,652,365) | 4,916,998 | ||||||||||||||
| Norwegian Krone, Expiring 03/20/13 | The Royal Bank of Scotland | NOK | (151,476,000) | (26,911,059) | (27,178,889) | (267,830) | ||||||||||||||
| New Zealand Dollar, Expiring 03/20/13 | The Royal Bank of Scotland | NZD | (22,980,000) | (19,006,762) | (18,898,093) | 108,669 | ||||||||||||||
| Swedish Krona, Expiring 03/20/13 | The Royal Bank of Scotland | SEK | (41,719,000) | (6,244,222) | (6,404,086) | (159,864) | ||||||||||||||
| Singapore Dollar, Expiring 03/20/13 | The Royal Bank of Scotland | SGD | (253,000) | (207,268) | (207,099) | 169 | ||||||||||||||
|
|
|
|
|
| |||||||||||||||
| (218,555,133) | (214,402,194) | 4,152,939 | ||||||||||||||||||
|
|
|
|
|
| |||||||||||||||
| $(18,960,507) | $(13,414,240) | $5,546,267 | ||||||||||||||||||
|
|
|
|
|
| |||||||||||||||
Money Market Fund is pledged as collateral for total return swap and forward foreign currency exchange contracts in the amount of $92. Additional cash held as collateral for the Royal Bank of Scotland for total return swaps and forward foreign currency exchange contracts was $4,680,000 at December 31, 2012.
AUD - Australian Dollar
CAD - Canadian Dollar
CHF - Swiss Franc
DKK - Danish Krone
EUR - Euro
GBP - British Pound
HKD - Hong Kong Dollar
ILS - Israeli Shekel
JPY - Japanese Yen
NOK - Norwegian Krone
NZD - New Zealand Dollar
SEK - Swedish Krona
SGD - Singapore Dollar
| The accompanying notes are an integral part of these financial statements. |
| AQR Funds | Annual Report | December 2012 | 45 | |||||||||||||
Table of Contents
| Schedule of Investments | December 31, 2012 |
| COMMON STOCKS - 85.2% | SHARES | VALUE (Note 2) | ||||||
| Australia - 7.9% | ||||||||
| AGL Energy Ltd. | 37,161 | $ | 597,403 | |||||
| Alumina Ltd. | 85,028 | 81,605 | ||||||
| Amcor Ltd. | 28,354 | 239,641 | ||||||
| AMP Ltd. | 285,205 | 1,446,666 | ||||||
| ASX Ltd. | 5,817 | 189,833 | ||||||
| Australia & New Zealand Banking Group Ltd. | 201,309 | 5,301,775 | ||||||
| BHP Billiton Ltd. | 162,655 | 6,350,123 | ||||||
| BlueScope Steel Ltd. † | 188,185 | 688,341 | ||||||
| Boart Longyear Ltd. | 633,841 | 1,266,484 | ||||||
| Caltex Australia Ltd. | 17,951 | 362,065 | ||||||
| CFS Retail Property Trust Group REIT | 103,020 | 206,088 | ||||||
| Commonwealth Bank of Australia | 72,863 | 4,745,307 | ||||||
| Computershare Ltd. | 15,439 | 145,645 | ||||||
| CSL Ltd. | 26,162 | 1,477,036 | ||||||
| Dexus Property Group REIT | 226,661 | 240,738 | ||||||
| Downer EDI Ltd. † | 271,927 | 1,165,728 | ||||||
| Fortescue Metals Group Ltd. (a) | 71,153 | 354,587 | ||||||
| Goodman Group REIT | 96,905 | 441,552 | ||||||
| GPT Group - In Specie REIT (3)†(b) | 143,427 | — | ||||||
| GPT Group REIT | 79,625 | 306,491 | ||||||
| Incitec Pivot Ltd. | 178,519 | 608,639 | ||||||
| JB Hi-Fi Ltd. | 40,770 | 441,265 | ||||||
| Lend Lease Group | 21,131 | 206,361 | ||||||
| Mirvac Group REIT | 167,786 | 261,116 | ||||||
| Mount Gibson Iron Ltd. | 421,389 | 373,091 | ||||||
| National Australia Bank Ltd. | 182,289 | 4,794,764 | ||||||
| Newcrest Mining Ltd. | 41,734 | 976,271 | ||||||
| OZ Minerals Ltd. | 11,735 | 83,337 | ||||||
| Pacific Brands Ltd. (a) | 636,610 | 413,972 | ||||||
| Primary Health Care Ltd. | 143,122 | 597,089 | ||||||
| Qantas Airways Ltd. † | 533,320 | 835,134 | ||||||
| Rio Tinto Ltd. | 5,795 | 407,441 | ||||||
| Shopping Centres Australasia Property Group REIT † | 14,194 | 22,110 | ||||||
| Sims Metal Management Ltd. | 24,291 | 240,028 | ||||||
| Sonic Healthcare Ltd. | 70,400 | 982,688 | ||||||
| SP AusNet | 151,567 | 176,137 | ||||||
| Stockland REIT | 127,919 | 472,983 | ||||||
| Suncorp Group Ltd. | 125,128 | 1,336,222 | ||||||
| Tabcorp Holdings Ltd. | 154,941 | 494,884 | ||||||
| Telecom Corp of New Zealand Ltd. | 669,261 | 1,253,789 | ||||||
| Telstra Corp. Ltd. | 739,231 | 3,368,475 | ||||||
| Wesfarmers Ltd. | 38,833 | 1,498,222 | ||||||
| Westfield Group REIT | 117,916 | 1,302,248 | ||||||
| Westfield Retail Trust REIT | 166,603 | 525,626 | ||||||
| Westpac Banking Corp. | 168,693 | 4,622,154 | ||||||
| Woolworths Ltd. | 76,027 | 2,332,383 | ||||||
| WorleyParsons Ltd. | 8,681 | 213,839 | ||||||
|
| |||||||
| 54,447,376 | ||||||||
|
| |||||||
| Belgium - 1.8% | ||||||||
| Anheuser-Busch InBev NV | 88,424 | 7,700,365 | ||||||
| Groupe Bruxelles Lambert SA | 2,641 | 210,636 | ||||||
| UCB SA | 19,228 | 1,101,541 | ||||||
| Umicore SA | 58,208 | 3,223,151 | ||||||
|
| |||||||
| 12,235,693 | ||||||||
|
| |||||||
| SHARES | VALUE (Note 2) | |||||||
| China - 0.0% (c) | ||||||||
| Foxconn International Holdings Ltd. † | 69,406 | $ | 34,045 | |||||
|
| |||||||
| Denmark - 2.2% | ||||||||
| Coloplast A/S, Class B | 72,130 | 3,537,267 | ||||||
| Danske Bank A/S † | 31,768 | 539,553 | ||||||
| DSV A/S | 27,819 | 719,745 | ||||||
| Novo Nordisk A/S, Class B | 61,763 | 10,057,281 | ||||||
|
| |||||||
| 14,853,846 | ||||||||
|
| |||||||
| Finland - 1.2% | ||||||||
| Kone OYJ, Class B | 22,443 | 1,659,878 | ||||||
| Metso OYJ | 152,331 | 6,503,278 | ||||||
|
| |||||||
| 8,163,156 | ||||||||
|
| |||||||
| France - 6.7% | ||||||||
| Arkema SA | 39,038 | 4,098,934 | ||||||
| AtoS | 22,659 | 1,591,269 | ||||||
| AXA SA | 78,177 | 1,403,729 | ||||||
| BNP Paribas SA | 44,081 | 2,509,532 | ||||||
| Casino Guichard Perrachon SA | 5,328 | 510,329 | ||||||
| Christian Dior SA | 13,165 | 2,244,027 | ||||||
| Cie Generale des Etablissements Michelin | 55,213 | 5,290,449 | ||||||
| Credit Agricole SA † | 59,088 | 481,217 | ||||||
| Dassault Systemes SA | 8,002 | 894,682 | ||||||
| Edenred | 7,763 | 240,097 | ||||||
| France Telecom SA | 22,735 | 252,218 | ||||||
| Klepierre REIT | 3,675 | 146,887 | ||||||
| Lagardere SCA | 4,912 | 165,219 | ||||||
| PPR | 707 | 132,782 | ||||||
| Publicis Groupe SA | 39,203 | 2,358,575 | ||||||
| Remy Cointreau SA | 5,653 | 618,344 | ||||||
| Renault SA | 10,127 | 549,977 | ||||||
| Safran SA | 2,056 | 89,039 | ||||||
| Sanofi | 50,669 | 4,804,933 | ||||||
| SES SA FDR | 22,845 | 657,953 | ||||||
| Societe BIC SA | 16,433 | 1,969,784 | ||||||
| Societe Generale SA † | 45,655 | 1,735,915 | ||||||
| Sodexo | 19,090 | 1,613,079 | ||||||
| Total SA | 139,740 | 7,271,075 | ||||||
| Unibail-Rodamco SE REIT | 3,619 | 877,618 | ||||||
| Vivendi SA | 151,119 | 3,417,697 | ||||||
|
| |||||||
| 45,925,360 | ||||||||
|
| |||||||
| Germany - 7.2% | ||||||||
| Adidas AG | 51,445 | 4,591,424 | ||||||
| BASF SE | 54,079 | 5,113,704 | ||||||
| Bayer AG | 56,770 | 5,413,688 | ||||||
| Beiersdorf AG | 18,763 | 1,536,326 | ||||||
| Celesio AG | 16,109 | 279,023 | ||||||
| Continental AG | 29,504 | 3,438,788 | ||||||
| Deutsche Bank AG | 146,433 | 6,442,287 | ||||||
| Deutsche Post AG | 186,112 | 4,099,209 | ||||||
| E.ON SE | 133,519 | 2,504,285 | ||||||
| GEA Group AG | 81,968 | 2,665,248 | ||||||
| Hannover Rueckversicherung AG | 23,595 | 1,848,047 | ||||||
| HeidelbergCement AG | 23,024 | 1,408,878 | ||||||
| Merck KGaA | 47,577 | 6,270,397 | ||||||
| Muenchener Rueckversicherungs AG | 3,247 | 586,173 | ||||||
| The accompanying notes are an integral part of these financial statements. | (Continued) |
| 46 | AQR Funds | Annual Report | December 2012 | |||||||||||||
Table of Contents
| Schedule of Investments | December 31, 2012 |
| AQR INTERNATIONAL EQUITY FUND |
| SHARES | VALUE (Note 2) | |||||||
| Germany - 7.2% (continued) | ||||||||
| Salzgitter AG | 7,753 | $ | 406,324 | |||||
| SAP AG | 24,525 | 1,972,120 | ||||||
| Suedzucker AG | 19,032 | 781,208 | ||||||
|
| |||||||
| 49,357,129 | ||||||||
|
| |||||||
| Hong Kong - 2.7% | ||||||||
| AIA Group Ltd. | 459,200 | 1,821,341 | ||||||
| ASM Pacific Technology Ltd. (a) | 6,404 | 78,622 | ||||||
| BOC Hong Kong Holdings Ltd. | 268,053 | 843,236 | ||||||
| Cheung Kong Holdings Ltd. | 18,278 | 284,395 | ||||||
| Cheung Kong Infrastructure Holdings Ltd. | 25,827 | 159,533 | ||||||
| CLP Holdings Ltd. | 122,509 | 1,029,300 | ||||||
| First Pacific Co., Ltd. | 104,000 | 114,849 | ||||||
| Galaxy Entertainment Group Ltd. † | 119,000 | 477,164 | ||||||
| Hang Lung Group Ltd. | 42,276 | 243,215 | ||||||
| Hang Seng Bank Ltd. | 28,835 | 445,125 | ||||||
| Henderson Land Development Co. Ltd. | 16,000 | 114,547 | ||||||
| HKT Trust/HKT Ltd. | 694 | 682 | ||||||
| Hong Kong & China Gas Co., Ltd. | 242,600 | 666,546 | ||||||
| Hong Kong Exchanges and Clearing Ltd. | 54,954 | 951,043 | ||||||
| Hopewell Holdings Ltd. | 29,500 | 127,907 | ||||||
| Hutchison Whampoa Ltd. | 89,832 | 951,945 | ||||||
| Hysan Development Co., Ltd. | 117,000 | 568,952 | ||||||
| Kerry Properties Ltd. | 75,000 | 394,013 | ||||||
| Li & Fung Ltd. | 221,336 | 399,398 | ||||||
| Lifestyle International Holdings Ltd. | 170,000 | 420,525 | ||||||
| Link REIT/The REIT | 119,882 | 600,382 | ||||||
| Mongolia Energy Corp. Ltd. † | 406 | 20 | ||||||
| MTR Corp. Ltd. | 119,500 | 473,524 | ||||||
| New World Development Co., Ltd. | 154,896 | 245,228 | ||||||
| NWS Holdings Ltd. | 39,000 | 66,286 | ||||||
| PCCW Ltd. | 131,000 | 57,902 | ||||||
| Shanghai Industrial Urban Development Group Ltd. † | 8 | 2 | ||||||
| Sino Land Co., Ltd. | 406,000 | 743,445 | ||||||
| SJM Holdings Ltd. | 473,000 | 1,116,309 | ||||||
| Sun Hung Kai Properties Ltd. | 77,046 | 1,168,421 | ||||||
| Swire Pacific Ltd., Class A | 31,530 | 394,407 | ||||||
| Swire Properties Ltd. | 71 | 239 | ||||||
| Television Broadcasts Ltd. | 403 | 3,030 | ||||||
| Wharf Holdings Ltd. | 145,243 | 1,157,547 | ||||||
| Wheelock & Co., Ltd. | 221,621 | 1,130,509 | ||||||
| Wing Hang Bank Ltd. | 7,000 | 73,733 | ||||||
| Wynn Macau Ltd. † | 168,000 | 462,618 | ||||||
| Yue Yuen Industrial Holdings Ltd. | 259,609 | 878,050 | ||||||
|
| |||||||
| 18,663,990 | ||||||||
|
| |||||||
| Italy - 2.0% | ||||||||
| Assicurazioni Generali SpA | 52,361 | 956,882 | ||||||
| Enel SpA | 334,175 | 1,389,994 | ||||||
| Eni SpA | 219,563 | 5,378,746 | ||||||
| Fiat Industrial SpA | 123,907 | 1,357,471 | ||||||
| Intesa Sanpaolo SpA | 450,059 | 778,292 | ||||||
| Prysmian SpA | 100,175 | 1,999,591 | ||||||
| Telecom Italia SpA | 1,385,934 | 1,257,133 | ||||||
| UniCredit SpA † | 181,238 | 892,498 | ||||||
|
| |||||||
| 14,010,607 | ||||||||
|
| |||||||
| SHARES | VALUE (Note 2) | |||||||
| Japan - 17.1% | ||||||||
| Ajinomoto Co., Inc. | 160,000 | $ | 2,117,194 | |||||
| Alfresa Holdings Corp. | 14,500 | 566,766 | ||||||
| Asahi Glass Co., Ltd. | 413 | 3,016 | ||||||
| Astellas Pharma, Inc. | 55,400 | 2,490,872 | ||||||
| Azbil Corp. | 37 | 748 | ||||||
| Brother Industries Ltd. (a) | 146,800 | 1,580,368 | ||||||
| Canon, Inc. (a) | 76,115 | 2,950,199 | ||||||
| Casio Computer Co., Ltd. (a) | 52,400 | 459,927 | ||||||
| Central Japan Railway Co. | 28,100 | 2,280,582 | ||||||
| Chiyoda Corp. | 118,000 | 1,690,370 | ||||||
| Chubu Electric Power Co., Inc. | 82,997 | 1,107,575 | ||||||
| Chugai Pharmaceutical Co., Ltd. | 13,400 | 256,745 | ||||||
| Credit Saison Co., Ltd. | 12 | 300 | ||||||
| Daicel Corp. | 193,000 | 1,276,954 | ||||||
| Daido Steel Co., Ltd. | 78,000 | 395,518 | ||||||
| Daihatsu Motor Co., Ltd. | 60,000 | 1,195,371 | ||||||
| Daito Trust Construction Co., Ltd. | 3,987 | 376,812 | ||||||
| Daiwa House Industry Co., Ltd. | 17,295 | 297,349 | ||||||
| Daiwa Securities Group, Inc. | 87,000 | 485,377 | ||||||
| East Japan Railway Co. | 45,513 | 2,943,059 | ||||||
| FamilyMart Co., Ltd. | 7,200 | 296,626 | ||||||
| Fuji Electric Co., Ltd. | 162,000 | 398,587 | ||||||
| Fuji Heavy Industries Ltd. | 206,721 | 2,606,818 | ||||||
| FUJIFILM Holdings Corp. | 43 | 865 | ||||||
| Fujitsu Ltd. | 38,000 | 159,371 | ||||||
| Fukuoka Financial Group, Inc. | 266,046 | 1,065,453 | ||||||
| Hitachi High-Technologies Corp. | 13,800 | 285,572 | ||||||
| Hitachi Ltd. | 109,000 | 641,411 | ||||||
| Honda Motor Co., Ltd. | 33,697 | 1,247,956 | ||||||
| IHI Corp. | 722,000 | 1,872,222 | ||||||
| Isetan Mitsukoshi Holdings Ltd. | 51,600 | 504,976 | ||||||
| Isuzu Motors Ltd. | 126,000 | 751,895 | ||||||
| ITOCHU Corp. | 38,144 | 403,148 | ||||||
| J Front Retailing Co., Ltd. | 26,000 | 144,101 | ||||||
| Japan Petroleum Exploration Co. | 12,000 | 423,810 | ||||||
| Japan Real Estate Investment Corp. REIT | 29 | 285,712 | ||||||
| Japan Retail Fund Investment Corp. REIT | 93 | 170,959 | ||||||
| Japan Tobacco, Inc. | 115,600 | 3,265,628 | ||||||
| JGC Corp. | 63,000 | 1,963,172 | ||||||
| JTEKT Corp. | 89,370 | 852,003 | ||||||
| JX Holdings, Inc. | 95 | 536 | ||||||
| Kajima Corp. | 145,000 | 479,760 | ||||||
| Kaneka Corp. | 625 | 3,162 | ||||||
| Kansai Electric Power Co., Inc./The | 32 | 336 | ||||||
| Kao Corp. | 7,085 | 184,618 | ||||||
| Keisei Electric Railway Co., Ltd. | 100,000 | 843,881 | ||||||
| Kinden Corp. | 564 | 3,675 | ||||||
| Koito Manufacturing Co., Ltd. | 133,000 | 1,939,685 | ||||||
| Komatsu Ltd. | 38 | 975 | ||||||
| Konica Minolta Holdings, Inc. | 303,000 | 2,180,489 | ||||||
| Marubeni Corp. | 974 | 6,989 | ||||||
| Medipal Holdings Corp. | 79,700 | 883,666 | ||||||
| Miraca Holdings, Inc. | 6 | 242 | ||||||
| Mitsubishi Electric Corp. | 53,000 | 451,261 | ||||||
| Mitsubishi Estate Co., Ltd. | 74,020 | 1,772,091 | ||||||
| Mitsubishi UFJ Financial Group, Inc. | 1,027,091 | 5,557,706 | ||||||
| Mitsubishi UFJ Lease & Finance Co., Ltd. | 18,600 | 800,101 | ||||||
| The accompanying notes are an integral part of these financial statements. | (Continued) |
| AQR Funds | Annual Report | December 2012 | 47 | |||||||||||||
Table of Contents
| Schedule of Investments | December 31, 2012 |
| AQR INTERNATIONAL EQUITY FUND |
| SHARES | VALUE (Note 2) | |||||||
| Japan - 17.1% (continued) | ||||||||
| Mitsui & Co., Ltd. | 211,143 | $ | 3,164,794 | |||||
| Mitsui Fudosan Co., Ltd. | 44,205 | 1,081,391 | ||||||
| Mitsumi Electric Co., Ltd. † | 89 | 521 | ||||||
| Mizuho Financial Group, Inc. | 826,310 | 1,515,028 | ||||||
| MS&AD Insurance Group Holdings | 83,000 | 1,656,429 | ||||||
| Namco Bandai Holdings, Inc. | 116,600 | 1,511,393 | ||||||
| NHK Spring Co., Ltd. | 51,700 | 426,009 | ||||||
| Nippon Building Fund, Inc. REIT | 31 | 320,688 | ||||||
| Nippon Electric Glass Co., Ltd. | 234,000 | 1,332,394 | ||||||
| Nippon Steel & Sumitomo Metal | 405 | 997 | ||||||
| Nippon Telegraph & Telephone Corp. | 19,019 | 800,756 | ||||||
| Nishi-Nippon City Bank Ltd./The | 737 | 1,829 | ||||||
| Nisshin Seifun Group, Inc. | 20,084 | 251,334 | ||||||
| Nisshin Steel Holdings Co. Ltd. † | 39,900 | 363,837 | ||||||
| Nitto Denko Corp. | 15,383 | 757,592 | ||||||
| Nomura Holdings, Inc. | 191,200 | 1,131,768 | ||||||
| Nomura Real Estate Holdings, Inc. | 3,300 | 63,104 | ||||||
| NSK Ltd. | 172,000 | 1,223,892 | ||||||
| NTT DOCOMO, Inc. | 361 | 520,389 | ||||||
| Obayashi Corp. | 165,000 | 930,289 | ||||||
| ORIX Corp. | 5,939 | 670,861 | ||||||
| Osaka Gas Co., Ltd. | 389,802 | 1,415,887 | ||||||
| Otsuka Holdings Co., Ltd. | 23,600 | 664,842 | ||||||
| Rengo Co., Ltd. | 299 | 1,510 | ||||||
| Resona Holdings, Inc. | 488,500 | 2,233,603 | ||||||
| Seino Holdings Co., Ltd. | 837 | 5,310 | ||||||
| Sekisui Chemical Co., Ltd. | 109,000 | 950,884 | ||||||
| Sekisui House Ltd. | 32,000 | 350,390 | ||||||
| Seven & I Holdings Co., Ltd. | 95,039 | 2,679,223 | ||||||
| Sharp Corp. | 245 | 863 | ||||||
| Shimamura Co., Ltd. | 6,400 | 621,925 | ||||||
| Shinsei Bank Ltd. | 555,000 | 1,110,853 | ||||||
| Shionogi & Co., Ltd. | 103,900 | 1,731,372 | ||||||
| Softbank Corp. | 25,900 | 949,008 | ||||||
| Sojitz Corp. | 609,162 | 900,671 | ||||||
| Sony Corp. | 71 | 796 | ||||||
| Sumitomo Corp. | 109,500 | 1,404,863 | ||||||
| Sumitomo Heavy Industries Ltd. | 426,000 | 2,041,618 | ||||||
| Sumitomo Metal Mining Co., Ltd. | 119,000 | 1,679,790 | ||||||
| Sumitomo Mitsui Financial Group, Inc. | 90,036 | 3,272,072 | ||||||
| Sumitomo Mitsui Trust Holdings, Inc. | 206,341 | 727,003 | ||||||
| Sumitomo Realty & Development Co., Ltd. | 20,261 | 674,972 | ||||||
| Suzuken Co., Ltd. | 28,700 | 808,565 | ||||||
| Suzuki Motor Corp. | 97,200 | 2,543,561 | ||||||
| T&D Holdings, Inc. | 112,300 | 1,367,283 | ||||||
| Taisei Corp. | 568,000 | 1,888,756 | ||||||
| Takeda Pharmaceutical Co., Ltd. | 5,981 | 267,321 | ||||||
| THK Co., Ltd. | 26,100 | 469,427 | ||||||
| Toho Co., Ltd. | 4,000 | 70,402 | ||||||
| Tohoku Electric Power Co., Inc. † | 15,700 | 146,395 | ||||||
| Tokai Rika Co., Ltd. | 99 | 1,378 | ||||||
| Tokio Marine Holdings, Inc. | 31,500 | 877,567 | ||||||
| Tokyo Electric Power Co., Inc † | 62,373 | 150,322 | ||||||
| Tokyo Gas Co., Ltd. | 178,071 | 813,616 | ||||||
| Tokyu Land Corp. | 26,483 | 194,044 | ||||||
| Tosoh Corp. | 665,000 | 1,599,997 | ||||||
| Toyo Suisan Kaisha Ltd. | 11,000 | 293,081 | ||||||
| SHARES | VALUE (Note 2) | |||||||
| Japan - 17.1% (continued) | ||||||||
| Toyota Boshoku Corp. | 64,500 | $ | 747,841 | |||||
| Toyota Motor Corp. | 105,878 | 4,944,095 | ||||||
| Toyota Tsusho Corp. | 38,500 | 950,287 | ||||||
| USS Co., Ltd. | 16,584 | 1,726,885 | ||||||
| West Japan Railway Co. | 48,900 | 1,926,497 | ||||||
| Yamaha Corp. | 4,900 | 51,969 | ||||||
|
| |||||||
| 117,906,599 | ||||||||
|
| |||||||
| Luxembourg - 0.3% | ||||||||
| ArcelorMittal | 68,789 | 1,199,366 | ||||||
| Millicom International Cellular SA SDR | 8,418 | 730,691 | ||||||
|
| |||||||
| 1,930,057 | ||||||||
|
| |||||||
| Netherlands - 3.7% | ||||||||
| ASML Holding NV | 37,614 | 2,412,322 | ||||||
| Corio NV REIT | 2,205 | 101,113 | ||||||
| Gemalto NV | 55,350 | 4,996,156 | ||||||
| ING Groep NV CVA † | 159,010 | 1,510,274 | ||||||
| Koninklijke Ahold NV | 339,927 | 4,558,081 | ||||||
| Koninklijke DSM NV | 25,048 | 1,526,567 | ||||||
| Koninklijke Philips Electronics NV | 285,445 | 7,558,637 | ||||||
| Unilever NV CVA | 75,159 | 2,875,853 | ||||||
|
| |||||||
| 25,539,003 | ||||||||
|
| |||||||
| Singapore - 1.6% | ||||||||
| Ascendas Real Estate Investment Trust REIT | 80,637 | 157,800 | ||||||
| CapitaLand Ltd. | 7,000 | 21,547 | ||||||
| CapitaMall Trust REIT | 116,994 | 205,590 | ||||||
| ComfortDelGro Corp. Ltd. | 278,000 | 408,973 | ||||||
| DBS Group Holdings Ltd. | 112,128 | 1,376,542 | ||||||
| Fraser and Neave Ltd. | 50,000 | 399,529 | ||||||
| Global Logistic Properties Ltd. | 89,000 | 205,832 | ||||||
| Golden Agri-Resources Ltd. | 1,004,000 | 540,303 | ||||||
| Hutchison Port Holdings Trust, Class U | 253,000 | 202,493 | ||||||
| Jardine Cycle & Carriage Ltd. | 66 | 2,629 | ||||||
| Keppel Corp. Ltd. | 79,728 | 728,041 | ||||||
| Keppel Land Ltd. | 222,000 | 743,536 | ||||||
| Neptune Orient Lines Ltd. †(a) | 150,000 | 142,842 | ||||||
| Noble Group Ltd. | 408,000 | 394,178 | ||||||
| Oversea-Chinese Banking Corp. Ltd. | 173,479 | 1,397,891 | ||||||
| SembCorp Industries Ltd. | 48,017 | 209,370 | ||||||
| Singapore Airlines Ltd. | 21,000 | 186,261 | ||||||
| Singapore Exchange Ltd. | 40,472 | 235,187 | ||||||
| Singapore Technologies Engineering Ltd. | 63,265 | 199,677 | ||||||
| Singapore Telecommunications Ltd. | 422,524 | 1,149,700 | ||||||
| StarHub Ltd. | 23,988 | 75,135 | ||||||
| United Overseas Bank Ltd. | 96,097 | 1,576,379 | ||||||
| UOL Group Ltd. | 18,000 | 88,774 | ||||||
| Yangzijiang Shipbuilding Holdings Ltd. (a) | 558,319 | 447,314 | ||||||
|
| |||||||
| 11,095,523 | ||||||||
|
| |||||||
| Spain - 1.7% | ||||||||
| ACS Actividades de Construccion y Servicios SA | 8,859 | 224,519 | ||||||
| Amadeus IT Holding SA, A Shares | 35,353 | 893,420 | ||||||
| Banco Bilbao Vizcaya Argentaria SA | 196,454 | 1,825,221 | ||||||
| Banco Santander SA | 454,190 | 3,691,206 | ||||||
| The accompanying notes are an integral part of these financial statements. | (Continued) |
| 48 | AQR Funds | Annual Report | December 2012 | |||||||||||||
Table of Contents
| Schedule of Investments | December 31, 2012 |
| AQR INTERNATIONAL EQUITY FUND |
| SHARES | VALUE (Note 2) | |||||||
| Spain - 1.7% (continued) | ||||||||
| Distribuidora Internacional de Alimentacion SA | 367,312 | $ | 2,346,810 | |||||
| Enagas SA | 53,884 | 1,154,413 | ||||||
| Iberdrola SA | 244,898 | 1,367,682 | ||||||
|
| |||||||
| 11,503,271 | ||||||||
|
| |||||||
| Sweden - 3.4% | ||||||||
| Boliden AB | 174,343 | 3,312,692 | ||||||
| Electrolux AB, Series B | 260,148 | 6,871,669 | ||||||
| Investor AB, B Shares | 19,364 | 508,695 | ||||||
| Sandvik AB | 77,198 | 1,240,708 | ||||||
| Scania AB, B Shares | 60,520 | 1,258,295 | ||||||
| SKF AB, B Shares | 40,839 | 1,034,354 | ||||||
| Svenska Cellulosa AB, B Shares | 164,814 | 3,583,487 | ||||||
| Swedish Match AB | 140,006 | 4,699,990 | ||||||
| TeliaSonera AB | 90,089 | 611,614 | ||||||
|
| |||||||
| 23,121,504 | ||||||||
|
| |||||||
| Switzerland - 7.5% | ||||||||
| Adecco SA † | 1,893 | 100,250 | ||||||
| Aryzta AG † | 7,955 | 409,328 | ||||||
| Compagnie Financiere Richemont SA, Class A | 69,122 | 5,425,770 | ||||||
| Nestle SA | 176,041 | 11,485,526 | ||||||
| Novartis AG | 112,540 | 7,109,522 | ||||||
| Roche Holding AG | 57,127 | 11,550,005 | ||||||
| STMicroelectronics NV | 302,856 | 2,198,593 | ||||||
| Sulzer AG | 11,721 | 1,855,073 | ||||||
| Syngenta AG | 15,534 | 6,275,524 | ||||||
| Transocean Ltd. | 11,824 | 530,113 | ||||||
| Wolseley PLC | 84,180 | 4,025,380 | ||||||
| Zurich Insurance Group AG † | 2,038 | 546,098 | ||||||
|
| |||||||
| 51,511,182 | ||||||||
|
| |||||||
| United Kingdom - 18.2% | ||||||||
| AMEC PLC | 39,348 | 650,460 | ||||||
| Anglo American PLC | 19,344 | 609,783 | ||||||
| AstraZeneca PLC | 171,603 | 8,132,219 | ||||||
| Aviva PLC | 280,251 | 1,734,178 | ||||||
| Babcock International Group PLC | 48,590 | 766,994 | ||||||
| BAE Systems PLC | 442,521 | 2,459,615 | ||||||
| Barclays PLC | 2,236,606 | 9,715,773 | ||||||
| BHP Billiton PLC | 107,199 | 3,781,283 | ||||||
| BP PLC | 867,638 | 6,032,613 | ||||||
| British American Tobacco PLC | 148,481 | 7,548,028 | ||||||
| British Land Co. PLC REIT | 29,205 | 269,814 | ||||||
| BT Group PLC | 613,066 | 2,338,971 | ||||||
| Experian PLC | 97,933 | 1,578,379 | ||||||
| GKN PLC | 159,668 | 602,393 | ||||||
| GlaxoSmithKline PLC | 341,170 | 7,428,058 | ||||||
| Glencore International PLC | 202,161 | 1,167,850 | ||||||
| Hammerson PLC REIT | 28,872 | 231,517 | ||||||
| HSBC Holdings PLC | 1,273,881 | 13,499,028 | ||||||
| Imperial Tobacco Group PLC | 107,121 | 4,153,250 | ||||||
| Investec PLC | 16,924 | 117,819 | ||||||
| ITV PLC | 1,842,919 | 3,197,034 | ||||||
| J Sainsbury PLC | 140,391 | 794,282 | ||||||
| Johnson Matthey PLC | 75,510 | 2,966,269 | ||||||
| SHARES | VALUE (Note 2) | |||||||
| United Kingdom - 18.2% (continued) | ||||||||
| Kazakhmys PLC | 116,972 | $ | 1,511,826 | |||||
| Kingfisher PLC | 422,221 | 1,972,859 | ||||||
| Land Securities Group PLC REIT | 24,126 | 321,866 | ||||||
| Legal & General Group PLC | 1,238,241 | 2,969,139 | ||||||
| Lloyds Banking Group PLC † | 2,090,666 | 1,666,041 | ||||||
| National Grid PLC | 42,987 | 493,036 | ||||||
| Next PLC | 35,023 | 2,125,983 | ||||||
| Randgold Resources Ltd. | 3,761 | 372,065 | ||||||
| Reed Elsevier PLC | 49,673 | 524,430 | ||||||
| Rio Tinto PLC | 65,621 | 3,827,388 | ||||||
| Royal Bank of Scotland Group PLC † | 333,629 | 1,783,225 | ||||||
| Royal Dutch Shell PLC, A Shares | 181,544 | 6,301,428 | ||||||
| Royal Dutch Shell PLC, B Shares | 114,217 | 4,074,843 | ||||||
| RSA Insurance Group PLC | 1,325,063 | 2,736,480 | ||||||
| Sage Group PLC/The | 58,964 | 283,529 | ||||||
| Segro PLC REIT | 49,428 | 200,630 | ||||||
| Smith & Nephew PLC | 125,497 | 1,387,231 | ||||||
| Tate & Lyle PLC | 124,842 | 1,544,571 | ||||||
| TUI Travel PLC | 469,786 | 2,179,927 | ||||||
| Tullow Oil PLC | 33,537 | 699,160 | ||||||
| Unilever PLC | 67,483 | 2,623,126 | ||||||
| Vodafone Group PLC | 1,171,928 | 2,950,054 | ||||||
| WPP PLC | 62,942 | 919,531 | ||||||
| Xstrata PLC | 106,095 | 1,851,974 | ||||||
|
| |||||||
| 125,095,952 | ||||||||
|
| |||||||
TOTAL COMMON STOCKS | 585,394,293 | |||||||
|
| |||||||
| PREFERRED STOCKS - 1.3% | ||||||||
| Germany - 1.3% | ||||||||
| Henkel AG & Co. KGaA | 50,844 | 4,182,988 | ||||||
| ProSiebenSat.1 Media AG | 60,023 | 1,709,684 | ||||||
| Volkswagen AG | 13,560 | 3,111,328 | ||||||
|
| |||||||
TOTAL PREFERRED STOCKS | 9,004,000 | |||||||
|
| |||||||
| MONEY MARKET FUNDS - 10.8% | ||||||||
J.P. Morgan U.S. Treasury Plus Money Market Fund - Institutional Shares, 0.000% (d)(e) | 74,381,692 | 74,381,692 | ||||||
|
| |||||||
| INVESTMENTS OF CASH COLLATERAL FOR SECURITIES ON LOAN - 0.8% | ||||||||
J.P. Morgan Prime Money Market Fund - Capital Shares, 0.120% (d)(f) | 5,135,864 | 5,135,864 | ||||||
|
| |||||||
TOTAL INVESTMENTS - 98.1% | 673,915,849 | |||||||
|
| |||||||
| OTHER ASSETS IN EXCESS OF LIABILITIES - 1.9% (g) | 13,181,109 | |||||||
|
| |||||||
NET ASSETS - 100.0% |
| $ | 687,096,958 | |||||
|
| |||||||
| † | Non income-producing security. |
| (a) | All or a portion of the security on loan. The aggregate market value of such securities is $4,849,090; cash collateral of $5,135,864 was received with which the Fund purchased a money market fund. |
| The accompanying notes are an integral part of these financial statements. | (Continued) |
| AQR Funds | Annual Report | December 2012 | 49 | |||||||||||||
Table of Contents
| Schedule of Investments | December 31, 2012 |
| AQR INTERNATIONAL EQUITY FUND |
| (b) | Security fair valued at $0 as of December 31, 2012 using procedures approved by the Board of Trustees. |
| (c) | Represents less than 0.05 percent of net assets. |
| (d) | Represents annualized seven-day yield as of December 31, 2012. |
| (e) | A portion of the security is pledged as collateral to the brokers for forward foreign currency exchange and swap contracts. |
| (f) | Represents security, or portion thereof, purchased with the cash collateral received for securities on loan. |
| (g) | Includes appreciation on forward foreign currency exchange, futures and swap contracts. |
All securities are Level 2 with respect to ASC 820, unless otherwise noted in parentheses.
| (3) | Level 3 security (See Note 4). |
The following abbreviations are used in portfolio descriptions:
CVA - Dutch Certificate of Shares
FDR - Fiduciary Depositary Receipt
REIT - Real Estate Investment Trust
SDR - Swedish Depository Receipt
| SECTOR | VALUE | % OF NET ASSETS | ||||||
| Consumer Discretionary | $ | 77,591,843 | 11.3 | % | ||||
| Consumer Staples | 75,410,504 | 11.0 | ||||||
| Energy | 31,938,709 | 4.7 | ||||||
| Financials | 134,273,478 | 19.5 | ||||||
| Health Care | 77,798,369 | 11.3 | ||||||
| Industrials | 80,710,333 | 11.7 | ||||||
| Information Technology | 24,632,342 | 3.6 | ||||||
| Materials | 59,136,038 | 8.6 | ||||||
| Telecommunication Services | 19,734,214 | 2.9 | ||||||
| Utilities | 13,172,463 | 1.9 | ||||||
| Money Market Funds | 79,517,556 | 11.6 | ||||||
|
|
|
| |||||
Total Investments | 673,915,849 | 98.1 | ||||||
| Other Assets in Excess of Liabilities (g) | 13,181,109 | 1.9 | ||||||
|
|
|
| |||||
Net Assets | $ | 687,096,958 | 100.0 | % | ||||
|
|
|
| |||||
Total return swap contract outstanding as of December 31, 2012:
| COUNTERPARTY | UNDERLYING REFERENCE INSTRUMENT | TERMINATION DATE | CURRENCY | NOTIONAL VALUE | UNREALIZED APPRECIATION (DEPRECIATION) | |||||||||||
| The Royal Bank of Scotland | Swiss Market Index Futures | 3/15/2013 | CHF | (4,497,526) | $46,560 | |||||||||||
|
| |||||||||||||||
Money Market Fund investment pledged as collateral for total return swap contract is included in the collateral for forward foreign currency exchange contracts.
Open futures contracts outstanding at December 31, 2012:
| NUMBER OF CONTRACTS | DESCRIPTION | EXPIRATION DATE | VALUE AT TRADE DATE | VALUE AT DECEMBER 31, 2012 | UNREALIZED APPRECIATION (DEPRECIATION) | |||||||||||
| Long Contracts: | ||||||||||||||||
| 1,273 | CAC40 10 Euro Futures | January 18, 2013 | $61,329,255 | $61,196,393 | $(132,862) | |||||||||||
| 70 | DAX Index Futures | March 15, 2013 | 17,622,274 | 17,598,068 | (24,206) | |||||||||||
| 113 | FTSE 100 Index Futures | March 15, 2013 | 10,853,439 | 10,734,756 | (118,683) | |||||||||||
| 171 | Hang Seng Index Futures | January 30, 2013 | 24,929,220 | 25,011,799 | 82,579 | |||||||||||
| 186 | IBEX 35 Index Futures | January 18, 2013 | 19,626,086 | 19,815,169 | 189,083 | |||||||||||
| 29 | MSCI Singapore Index Futures | January 30, 2013 | 1,710,462 | 1,709,778 | (684) | |||||||||||
| 209 | TOPIX Index Futures | March 7, 2013 | 18,979,477 | 20,782,998 | 1,803,521 | |||||||||||
|
|
|
|
|
| |||||||||||
| 155,050,213 | 156,848,961 | 1,798,748 | ||||||||||||||
|
|
|
|
|
| |||||||||||
| Short Contracts: | ||||||||||||||||
| 5 | Amsterdam Index Futures | January 18, 2013 | (452,717) | (452,875) | (158) | |||||||||||
| 7 | FTSE/MIB Index Futures | March 15, 2013 | (738,637) | (753,216) | (14,579) | |||||||||||
| 1,325 | OMXS30 Index Futures | January 18, 2013 | (22,367,315) | (22,570,120) | (202,805) | |||||||||||
| 418 | SPI 200 Index Futures | March 21, 2013 | (49,723,073) | (50,091,920) | (368,847) | |||||||||||
|
|
|
|
|
| |||||||||||
| (73,281,742) | (73,868,131) | (586,389) | ||||||||||||||
|
|
|
|
|
| |||||||||||
| $81,768,471 | $82,980,830 | $1,212,359 | ||||||||||||||
|
|
|
|
|
| |||||||||||
| The accompanying notes are an integral part of these financial statements. | (Continued) |
| 50 | AQR Funds | Annual Report | December 2012 | |||||||||||||
Table of Contents
| Schedule of Investments | December 31, 2012 |
| AQR INTERNATIONAL EQUITY FUND |
Cash held as collateral with broker for futures contracts was $13,546,834 at December 31, 2012.
Forward foreign currency exchange contracts outstanding as of December 31, 2012:
| PURCHASE CONTRACTS | COUNTERPARTY | CURRENCY | CURRENCY AMOUNT PURCHASED | VALUE AT SETTLEMENT DATE | VALUE AT DECEMBER 31, 2012 | UNREALIZED APPRECIATION (DEPRECIATION) | ||||||||||||||
| Swiss Franc, Expiring 03/20/13 | The Royal Bank of Scotland | CHF | 23,818,000 | $26,135,440 | $26,077,838 | $(57,602) | ||||||||||||||
| Danish Krone, Expiring 03/20/13 | The Royal Bank of Scotland | DKK | 794,000 | 140,377 | 140,652 | 275 | ||||||||||||||
| Euro, Expiring 03/20/13 | The Royal Bank of Scotland | EUR | 39,587,000 | 51,920,382 | 52,288,410 | 368,028 | ||||||||||||||
| British Pound, Expiring 03/20/13 | The Royal Bank of Scotland | GBP | 38,528,300 | 61,995,604 | 62,572,220 | 576,616 | ||||||||||||||
| Hong Kong Dollar, Expiring 03/20/13 | The Royal Bank of Scotland | HKD | 23,132,000 | 2,985,263 | 2,985,207 | (56) | ||||||||||||||
| Israeli Shekel, Expiring 03/20/13 | The Royal Bank of Scotland | ILS | 15,621,000 | 4,089,350 | 4,172,287 | 82,937 | ||||||||||||||
| Norwegian Krone, Expiring 03/20/13 | The Royal Bank of Scotland | NOK | 683,082,000 | 120,586,179 | 122,563,373 | 1,977,194 | ||||||||||||||
| New Zealand Dollar, Expiring 03/20/13 | The Royal Bank of Scotland | NZD | 17,435,000 | 14,290,367 | 14,338,044 | 47,677 | ||||||||||||||
| Swedish Krona, Expiring 03/20/13 | The Royal Bank of Scotland | SEK | 370,867,000 | 55,977,827 | 56,930,036 | 952,209 | ||||||||||||||
| Singapore Dollar, Expiring 03/20/13 | The Royal Bank of Scotland | SGD | 2,862,300 | 2,346,070 | 2,342,998 | (3,072) | ||||||||||||||
|
|
|
|
|
| |||||||||||||||
| 340,466,859 | 344,411,065 | 3,944,206 | ||||||||||||||||||
|
|
|
|
|
| |||||||||||||||
| SALES CONTRACTS | COUNTERPARTY | CURRENCY | CURRENCY AMOUNT SOLD | VALUE AT SETTLEMENT DATE | VALUE AT DECEMBER 31, 2012 | UNREALIZED APPRECIATION (DEPRECIATION) | ||||||||||||||
| Australian Dollar, Expiring 03/20/13 | The Royal Bank of Scotland | AUD | (34,284,900) | $(35,555,196) | $(35,404,668) | $150,528 | ||||||||||||||
| Swiss Franc, Expiring 03/20/13 | The Royal Bank of Scotland | CHF | (39,220,800) | (42,397,470) | (42,942,047) | (544,577) | ||||||||||||||
| Danish Krone, Expiring 03/20/13 | The Royal Bank of Scotland | DKK | (39,506,000) | (6,931,369) | (6,998,218) | (66,849) | ||||||||||||||
| Euro, Expiring 03/20/13 | The Royal Bank of Scotland | EUR | (19,983,600) | (26,078,557) | (26,395,298) | (316,741) | ||||||||||||||
| British Pound, Expiring 03/20/13 | The Royal Bank of Scotland | GBP | (5,622,000) | (9,118,722) | (9,130,458) | (11,736) | ||||||||||||||
| Hong Kong Dollar, Expiring 03/20/13 | The Royal Bank of Scotland | HKD | (503,000) | (64,921) | (64,913) | 8 | ||||||||||||||
| Israeli Shekel, Expiring 03/20/13 | The Royal Bank of Scotland | ILS | (1,165,000) | (307,681) | (311,165) | (3,484) | ||||||||||||||
| Japanese Yen, Expiring 03/21/13 | The Royal Bank of Scotland | JPY | (9,264,894,200) | (112,513,622) | (107,008,444) | 5,505,178 | ||||||||||||||
| Norwegian Krone, Expiring 03/20/13 | The Royal Bank of Scotland | NOK | (284,333,000) | (50,318,343) | (51,017,025) | (698,682) | ||||||||||||||
| New Zealand Dollar, Expiring 03/20/13 | The Royal Bank of Scotland | NZD | (15,143,000) | (12,401,655) | (12,453,169) | (51,514) | ||||||||||||||
| Swedish Krona, Expiring 03/20/13 | The Royal Bank of Scotland | SEK | (96,390,000) | (14,425,344) | (14,796,372) | (371,028) | ||||||||||||||
| The accompanying notes are an integral part of these financial statements. | (Continued) |
| AQR Funds | Annual Report | December 2012 | 51 | |||||||||||||
Table of Contents
| Schedule of Investments | December 31, 2012 |
| AQR INTERNATIONAL EQUITY FUND |
| SALES CONTRACTS | COUNTERPARTY | CURRENCY | CURRENCY AMOUNT SOLD | VALUE AT SETTLEMENT DATE | VALUE AT DECEMBER 31, 2012 | UNREALIZED APPRECIATION (DEPRECIATION) | ||||||||||||||
| Singapore Dollar, Expiring 03/20/13 | The Royal Bank of Scotland | SGD | (790,000) | $(648,321) | $(646,672) | $1,649 | ||||||||||||||
|
|
|
|
|
| |||||||||||||||
| (310,761,201) | (307,168,449) | 3,592,752 | ||||||||||||||||||
|
|
|
|
|
| |||||||||||||||
| $29,705,658 | $37,242,616 | $7,536,958 | ||||||||||||||||||
|
|
|
|
|
| |||||||||||||||
Money Market Fund is pledged as collateral for total return swap and forward foreign currency exchange contracts in the amount of $63. Additional cash held as collateral for the broker for forward currency exchange contracts was $6,010,000 at December 31, 2012.
AUD - Australian Dollar
CHF - Swiss Franc
DKK - Danish Krone
EUR - Euro
GBP - British Pound
HKD - Hong Kong Dollar
ILS - Israeli Shekel
JPY - Japanese Yen
NOK - Norwegian Krone
NZD - New Zealand Dollar
SEK - Swedish Krona
SGD - Singapore Dollar
| The accompanying notes are an integral part of these financial statements. |
| 52 | AQR Funds | Annual Report | December 2012 | |||||||||||||
Table of Contents
| Schedule of Investments | December 31, 2012 |
| COMMON STOCKS - 96.0% | SHARES | VALUE (Note 2) | ||||||
| Brazil - 14.0% | ||||||||
| All America Latina Logistica SA (1) | 1,300 | $ | 5,276 | |||||
| CCR SA (1) | 10,800 | 102,593 | ||||||
| Centrais Eletricas Brasileiras SA ADR (1)(a) | 440 | 1,373 | ||||||
| Cia de Bebidas das Americas ADR (1)(a) | 2,230 | 93,638 | ||||||
| Cia de Saneamento Basico do Estado de Sao Paulo ADR (1) | 207 | 17,299 | ||||||
| Cia Energetica de Minas Gerais ADR (1) | 3,853 | 41,844 | ||||||
| Cia Hering (1) | 1,800 | 36,914 | ||||||
| Cia Paranaense de Energia ADR (1) | 1,118 | 17,161 | ||||||
| Cielo SA (1) | 200 | 5,567 | ||||||
| CPFL Energia SA ADR (1) | 3,984 | 83,505 | ||||||
| Diagnosticos da America SA (1) | 4,600 | 29,633 | ||||||
| EDP - Energias do Brasil SA (1) | 16,600 | 101,262 | ||||||
| Light SA (1) | 5,300 | 57,776 | ||||||
| Natura Cosmeticos SA (1) | 3,800 | 108,831 | ||||||
| Souza Cruz SA (1) | 6,900 | 103,829 | ||||||
| Telefonica Brasil SA ADR (1)(a) | 2,735 | 65,804 | ||||||
| Tim Participacoes SA ADR (1)(a) | 1,544 | 30,602 | ||||||
| Tractebel Energia SA (1) | 5,900 | 96,100 | ||||||
| Vale SA (1) | 300 | 6,195 | ||||||
|
| |||||||
| 1,005,202 | ||||||||
|
| |||||||
| Chile - 4.5% | ||||||||
| Banco Santander Chile ADR (1)(a) | 2,493 | 71,026 | ||||||
| Cencosud SA (1) | 12,916 | 70,023 | ||||||
| Enersis SA ADR (1) | 3,843 | 70,019 | ||||||
| SACI Falabella (1) | 7,112 | 73,258 | ||||||
| Sociedad Quimica y Minera de Chile SA ADR (1) | 728 | 41,962 | ||||||
|
| |||||||
| 326,288 | ||||||||
|
| |||||||
| China - 2.4% | ||||||||
| China Petroleum & Chemical Corp. ADR (1) | 135 | 15,514 | ||||||
| China Yurun Food Group Ltd. † | 25,000 | 18,496 | ||||||
| Dongfeng Motor Group Co., Ltd., H Shares | 8,000 | 12,595 | ||||||
| PetroChina Co., Ltd. ADR (1) | 165 | 23,724 | ||||||
| Sun Art Retail Group Ltd. | 32,500 | 50,246 | ||||||
| Tsingtao Brewery Co. Ltd., H Shares | 6,000 | 35,762 | ||||||
| Want Want China Holdings Ltd. | 5,000 | 7,007 | ||||||
| ZHuzhou CSR Times Electric Co., Ltd., H Shares | 2,000 | 7,591 | ||||||
|
| |||||||
| 170,935 | ||||||||
|
| |||||||
| Hong Kong - 1.4% | ||||||||
| China Merchants Holdings International Co. Ltd. | 4,000 | 13,063 | ||||||
| China Unicom Hong Kong Ltd. ADR (1) | 2,264 | 36,880 | ||||||
| GOME Electrical Appliances Holding Ltd. † | 425,000 | 51,425 | ||||||
|
| |||||||
| 101,368 | ||||||||
|
| |||||||
| India - 0.3% | ||||||||
| Dr Reddy’s Laboratories Ltd. ADR (1) | 693 | 23,070 | ||||||
|
| |||||||
| Indonesia - 5.1% | ||||||||
| Bank Central Asia Tbk PT | 75,500 | 71,535 | ||||||
| Bank Mandiri Persero Tbk PT | 19,000 | 16,050 | ||||||
| Bank Negara Indonesia Persero Tbk PT | 17,000 | 6,552 | ||||||
| Indo Tambangraya Megah Tbk PT | 7,000 | 30,303 | ||||||
| SHARES | VALUE (Note 2) | |||||||
| Indonesia - 5.1% (continued) | ||||||||
| Perusahaan Gas Negara Persero Tbk PT | 132,500 | $ | 63,447 | |||||
| Semen Gresik Persero Tbk PT | 49,500 | 81,765 | ||||||
| Telekomunikasi Indonesia Persero Tbk PT ADR (1)(a) | 2,285 | 84,431 | ||||||
| United Tractors Tbk PT | 5,500 | 11,345 | ||||||
|
| |||||||
| 365,428 | ||||||||
|
| |||||||
| Korea, Republic of - 12.5% | ||||||||
| Amorepacific Corp. † | 42 | 47,612 | ||||||
| Cheil Industries, Inc. † | 322 | 28,464 | ||||||
| Daewoo International Corp. † | 190 | 7,077 | ||||||
| E-Mart Co., Ltd. † | 61 | 13,561 | ||||||
| Honam Petrochemical Corp. † | 77 | 17,939 | ||||||
| Hyundai Department Store Co., Ltd. † | 195 | 29,011 | ||||||
| Hyundai Glovis Co. Ltd. † | 302 | 62,858 | ||||||
| Hyundai Mobis † | 106 | 28,759 | ||||||
| Hyundai Wia Corp. † | 34 | 5,538 | ||||||
| Kangwon Land, Inc. † | 2,470 | 67,507 | ||||||
| Kia Motors Corp. † | 303 | 16,112 | ||||||
| Korea Zinc Co. Ltd. † | 20 | 7,645 | ||||||
| KT Corp. ADR (1) | 5,621 | 94,096 | ||||||
| KT&G Corp. † | 1,118 | 84,626 | ||||||
| LG Chem Ltd. † | 97 | 30,317 | ||||||
| LG Display Co. Ltd. † | 200 | 5,899 | ||||||
| LG Household & Health Care Ltd. † | 92 | 56,360 | ||||||
| LG Uplus Corp. † | 5,900 | 43,176 | ||||||
| Lotte Shopping Co., Ltd. † | 232 | 81,932 | ||||||
| Samsung Electronics Co. Ltd. GDR | 63 | 44,782 | ||||||
| Samsung Engineering Co., Ltd. † | 118 | 18,384 | ||||||
| Samsung Fire & Marine Insurance Co. Ltd. | 25 | 5,079 | ||||||
| Samsung Life Insurance Co., Ltd. | 329 | 29,017 | ||||||
| Samsung Techwin Co. Ltd. † | 122 | 6,848 | ||||||
| SK Telecom Co., Ltd. ADR (1)(a) | 4,489 | 71,061 | ||||||
|
| |||||||
| 903,660 | ||||||||
|
| |||||||
| Malaysia - 14.6% | ||||||||
| AMMB Holdings Bhd | 29,800 | 66,417 | ||||||
| Axiata Group Bhd | 30,600 | 66,186 | ||||||
| CIMB Group Holdings Bhd | 30,300 | 75,845 | ||||||
| DiGi.Com Bhd | 60,500 | 105,149 | ||||||
| Kuala Lumpur Kepong Bhd | 6,700 | 52,795 | ||||||
| Malayan Banking Bhd | 34,900 | 105,259 | ||||||
| Maxis Bhd | 42,500 | 92,525 | ||||||
| Petronas Chemicals Group Bhd | 24,800 | 52,041 | ||||||
| Public Bank Bhd | 11,600 | 61,897 | ||||||
| Sime Darby Bhd | 33,700 | 105,250 | ||||||
| Telekom Malaysia Bhd | 53,300 | 105,444 | ||||||
| Tenaga Nasional Bhd | 43,900 | 99,800 | ||||||
| UMW Holdings Bhd | 16,800 | 65,840 | ||||||
|
| |||||||
| 1,054,448 | ||||||||
|
| |||||||
| Mexico - 4.1% | ||||||||
| America Movil SAB de CV, Series L ADR (1)(a) | 1,726 | 39,940 | ||||||
| Coca-Cola Femsa SAB de CV ADR (1)(a) | 650 | 96,876 | ||||||
| Grupo Televisa SAB ADR (1)(a) | 2,109 | 56,057 | ||||||
| Wal-Mart de Mexico SAB de CV, Series V (1) | 31,300 | 102,135 | ||||||
|
| |||||||
| 295,008 | ||||||||
|
| |||||||
| The accompanying notes are an integral part of these financial statements. | (Continued) |
| AQR Funds | Annual Report | December 2012 | 53 | |||||||||||||
Table of Contents
| Schedule of Investments | December 31, 2012 |
| AQR EMERGING DEFENSIVE EQUITY FUND |
| SHARES | VALUE (Note 2) | |||||||
| Poland - 3.7% | ||||||||
| Bank Pekao SA | 350 | $ | 18,992 | |||||
| PGE SA | 12,572 | 74,170 | ||||||
| Powszechna Kasa Oszczednosci Bank Polski SA | 2,012 | 24,096 | ||||||
| Powszechny Zaklad Ubezpieczen SA | 555 | 78,572 | ||||||
| Telekomunikacja Polska SA | 18,152 | 71,608 | ||||||
|
| |||||||
| 267,438 | ||||||||
|
| |||||||
| Russia - 2.6% | ||||||||
| Lukoil OAO ADR (1) | 949 | 64,057 | ||||||
| Magnit OJSC GDR | 1,242 | 50,494 | ||||||
| MMC Norilsk Nickel OJSC ADR (1) | 1,841 | 34,869 | ||||||
| Rosneft OAO GDR | 770 | 6,806 | ||||||
| Tatneft OAO ADR | 751 | 33,437 | ||||||
|
| |||||||
| 189,663 | ||||||||
|
| |||||||
| South Africa - 14.6% | ||||||||
| ABSA Group Ltd. | 2,086 | 40,611 | ||||||
| Aspen Pharmacare Holdings Ltd. † | 4,372 | 87,533 | ||||||
| Bidvest Group Ltd. | 3,210 | 82,124 | ||||||
| FirstRand Ltd. | 3,618 | 13,313 | ||||||
| Gold Fields Ltd. ADR (1)(a) | 7,891 | 98,559 | ||||||
| Kumba Iron Ore Ltd. | 835 | 56,499 | ||||||
| Life Healthcare Group Holdings Ltd. | 18,417 | 74,014 | ||||||
| Mr Price Group Ltd. | 1,581 | 26,202 | ||||||
| MTN Group Ltd. | 1,534 | 32,289 | ||||||
| Nedbank Group Ltd. | 1,971 | 44,048 | ||||||
| Remgro Ltd. | 5,512 | 104,029 | ||||||
| Sanlam Ltd. | 11,228 | 59,788 | ||||||
| Shoprite Holdings Ltd. | 3,556 | 86,265 | ||||||
| Standard Bank Group Ltd. | 6,482 | 91,428 | ||||||
| Tiger Brands Ltd. | 597 | 23,021 | ||||||
| Vodacom Group Ltd. | 2,962 | 43,590 | ||||||
| Woolworths Holdings Ltd. | 10,660 | 89,733 | ||||||
|
| |||||||
| 1,053,046 | ||||||||
|
| |||||||
| Taiwan - 8.9% | ||||||||
| Acer, Inc. † | 43,000 | 37,500 | ||||||
| Cheng UEI Precision Industry Co., Ltd. | 6,059 | 13,140 | ||||||
| China Petrochemical Development Corp. | 1,400 | 874 | ||||||
| China Steel Corp. | 32,480 | 30,671 | ||||||
| Chunghwa Telecom Co., Ltd. ADR (1) | 1,303 | 42,139 | ||||||
| Evergreen Marine Corp. Taiwan Ltd. † | 39,000 | 23,433 | ||||||
| Far EasTone Telecommunications Co. Ltd. | 32,000 | 81,708 | ||||||
| Foxconn Technology Co., Ltd. | 7,350 | 23,220 | ||||||
| Hon Hai Precision Industry Co., Ltd. | 7,000 | 21,667 | ||||||
| HTC Corp. | 2,000 | 20,891 | ||||||
| Kinsus Interconnect Technology Corp. | 2,000 | 6,319 | ||||||
| Powertech Technology, Inc. | 10,000 | 16,239 | ||||||
| Realtek Semiconductor Corp. | 20,200 | 43,015 | ||||||
| Richtek Technology Corp. | 4,000 | 23,592 | ||||||
| Synnex Technology International Corp. | 18,000 | 33,327 | ||||||
| Taiwan Mobile Co. Ltd. | 21,000 | 77,607 | ||||||
| Taiwan Semiconductor Manufacturing Co., Ltd. ADR (1) | 2,756 | 47,293 | ||||||
| Uni-President Enterprises Corp. | 44,890 | 82,696 | ||||||
| Wistron Corp. | 13,650 | 14,290 | ||||||
|
| |||||||
| 639,621 | ||||||||
|
| |||||||
| SHARES | VALUE (Note 2) | |||||||
| Thailand - 4.1% | ||||||||
| Advanced Info Service PCL NVDR | 15,600 | $ | 107,294 | |||||
| CP ALL PCL NVDR | 57,700 | 86,762 | ||||||
| PTT Global Chemical PCL NVDR | 27,200 | 62,929 | ||||||
| PTT PCL NVDR | 3,700 | 40,450 | ||||||
|
| |||||||
| 297,435 | ||||||||
|
| |||||||
| Turkey - 3.2% | ||||||||
| Akbank TAS | 1,415 | 7,021 | ||||||
| KOC Holding AS | 12,784 | 66,796 | ||||||
| Turk Hava Yollari † | 5,020 | 17,706 | ||||||
| Turk Telekomunikasyon AS | 27,179 | 105,671 | ||||||
| Turkcell Iletisim Hizmetleri AS † | 3,600 | 23,393 | ||||||
| Turkiye Garanti Bankasi AS | 1,356 | 7,078 | ||||||
|
| |||||||
| 227,665 | ||||||||
|
| |||||||
TOTAL COMMON STOCKS | 6,920,275 | |||||||
|
| |||||||
| PREFERRED STOCKS - 0.5% | ||||||||
| Brazil - 0.5% | ||||||||
| Eletropaulo Metropolitana Eletricidade de Sao Paulo SA (1) | 3,800 | 31,180 | ||||||
| Lojas Americanas SA (1) | 801 | 7,168 | ||||||
|
| |||||||
TOTAL PREFERRED STOCKS | 38,348 | |||||||
|
| |||||||
| EXCHANGE-TRADED FUNDS - 2.0% | ||||||||
| iShares MSCI Emerging Markets Index | ||||||||
Fund (1) | 3,220 | 142,807 | ||||||
|
| |||||||
| MONEY MARKET FUNDS - 6.7% | ||||||||
| J.P. Morgan U.S. Treasury Plus Money | ||||||||
Market Fund - Institutional Shares, 0.000% (b) (cost $480,043) | 480,043 | 480,043 | ||||||
|
| |||||||
| INVESTMENTS OF CASH COLLATERAL FOR SECURITIES ON LOAN - 2.5% | ||||||||
| J.P. Morgan Prime Money Market Fund - | ||||||||
Capital Shares, 0.120% (b)(c) | 179,141 | 179,141 | ||||||
|
| |||||||
TOTAL INVESTMENTS - 107.7% | 7,760,614 | |||||||
|
| |||||||
| LIABILITIES IN EXCESS OF OTHER ASSETS - (7.7%) | (554,094) | |||||||
|
| |||||||
NET ASSETS - 100.0% | $ | 7,206,520 | ||||||
|
| |||||||
| † | Non income-producing security. |
| (a) | All or a portion of the security on loan. The aggregate market value of such securities is $174,682; cash collateral of $179,141 was received with which the Fund purchased a money market fund. |
| (b) | Represents annualized seven-day yield as of December 31, 2012. |
| (c) | Represents security, or portion thereof, purchased with the cash collateral received for securities on loan. |
| The accompanying notes are an integral part of these financial statements. | (Continued) |
| 54 | AQR Funds | Annual Report | December 2012 | |||||||||||||
Table of Contents
| Schedule of Investments | December 31, 2012 |
| AQR EMERGING DEFENSIVE EQUITY FUND |
All securities are Level 2 with respect to ASC 820, unless otherwise noted in parentheses.
| (1) | Level 1 security (See Note 4). |
The following abbreviations are used in portfolio descriptions:
ADR - American Depositary Receipt
GDR - Global Depositary Receipt
NVDR - Non-Voting Depositary Receipt
| SECTOR | VALUE | % OF NET ASSETS | ||||||
| Consumer Discretionary | $ | 648,052 | 9.0 | % | ||||
| Consumer Staples | 1,271,036 | 17.6 | ||||||
| Energy | 214,291 | 3.0 | ||||||
| Financials | 997,652 | 13.8 | ||||||
| Health Care | 214,250 | 3.0 | ||||||
| Industrials | 530,345 | 7.4 | ||||||
| Information Technology | 356,741 | 4.9 | ||||||
| Materials | 550,729 | 7.6 | ||||||
| Mutual Fund | 142,807 | 2.0 | ||||||
| Telecommunication Services | 1,420,592 | 19.7 | ||||||
| Utilities | 754,935 | 10.5 | ||||||
| Money Market Funds | 659,184 | 9.2 | ||||||
|
|
|
| |||||
Total Investments | 7,760,614 | 107.7 | ||||||
| Liabilities in Excess of Other Assets | (554,094) | (7.7) | ||||||
|
|
|
| |||||
Net Assets | $ | 7,206,520 | 100.0 | % | ||||
|
|
|
| |||||
| The accompanying notes are an integral part of these financial statements. |
| AQR Funds | Annual Report | December 2012 | 55 | |||||||||||||
Table of Contents
| Schedule of Investments | December 31, 2012 |
| COMMON STOCKS - 91.3% | SHARES | VALUE (Note 2) | ||||||
| Australia - 15.4% | ||||||||
| AGL Energy Ltd. | 2,108 | $ | 33,888 | |||||
| Amcor Ltd. | 9,198 | 77,739 | ||||||
| APA Group | 1,621 | 9,358 | ||||||
| ASX Ltd. | 1,108 | 36,159 | ||||||
| Aurizon Holdings Ltd. | 6,529 | 25,675 | ||||||
| Brambles Ltd. | 1,955 | 15,502 | ||||||
| Coca-Cola Amatil Ltd. | 6,085 | 85,515 | ||||||
| Cochlear Ltd. | 805 | 66,734 | ||||||
| Commonwealth Bank of Australia | 226 | 14,719 | ||||||
| Computershare Ltd. | 222 | 2,094 | ||||||
| Crown Ltd. | 1,432 | 16,004 | ||||||
| CSL Ltd. | 563 | 31,785 | ||||||
| Insurance Australia Group Ltd. | 1,888 | 9,299 | ||||||
| Metcash Ltd. | 16,471 | 57,101 | ||||||
| Orica Ltd. | 208 | 5,472 | ||||||
| Sonic Healthcare Ltd. | 3,275 | 45,714 | ||||||
| Sydney Airport | 4,034 | 14,210 | ||||||
| Tabcorp Holdings Ltd. | 13,620 | 43,502 | ||||||
| Tatts Group Ltd. | 8,784 | 27,668 | ||||||
| Telstra Corp. Ltd. | 19,041 | 86,765 | ||||||
| Transurban Group | 7,180 | 45,640 | ||||||
| Wesfarmers Ltd. | 2,082 | 80,326 | ||||||
| Woodside Petroleum Ltd. | 806 | 28,722 | ||||||
| Woolworths Ltd. | 2,747 | 84,273 | ||||||
| WorleyParsons Ltd. | 623 | 15,346 | ||||||
|
| |||||||
| 959,210 | ||||||||
|
| |||||||
| Belgium - 1.1% | ||||||||
| Belgacom SA | 973 | 28,617 | ||||||
| Delhaize Group SA | 382 | 15,387 | ||||||
| Umicore SA | 393 | 21,762 | ||||||
|
| |||||||
| 65,766 | ||||||||
|
| |||||||
| Canada - 15.3% | ||||||||
| Agnico-Eagle Mines Ltd. (1) | 53 | 2,778 | ||||||
| Agrium, Inc. (1) | 22 | 2,193 | ||||||
| Bank of Montreal (1) | 908 | 55,555 | ||||||
| Bank of Nova Scotia (1) | 789 | 45,577 | ||||||
| Barrick Gold Corp. (1) | 203 | 7,106 | ||||||
| BCE, Inc. (1) | 1,975 | 84,643 | ||||||
| Canadian Imperial Bank of Commerce (1) | 546 | 43,896 | ||||||
| Canadian National Railway Co. (1) | 344 | 31,239 | ||||||
| Enbridge, Inc. (1) | 659 | 28,501 | ||||||
| Franco-Nevada Corp. (1) | 472 | 26,943 | ||||||
| Goldcorp, Inc. (1) | 242 | 8,897 | ||||||
| IAMGOLD Corp. (1) | 2,745 | 31,432 | ||||||
| Imperial Oil Ltd. (1) | 1,040 | 44,676 | ||||||
| Intact Financial Corp. (1) | 812 | 52,873 | ||||||
| Loblaw Cos., Ltd. (1)(a) | 280 | 11,803 | ||||||
| Metro, Inc. (1) | 663 | 42,212 | ||||||
| National Bank of Canada (1) | 599 | 46,513 | ||||||
| Pembina Pipeline Corp. (1) | 742 | 21,230 | ||||||
| Potash Corp of Saskatchewan, Inc. (1) | 155 | 6,308 | ||||||
| Rogers Communications, Inc., Class B (1) | 536 | 24,335 | ||||||
| Royal Bank of Canada (1) | 303 | 18,240 | ||||||
| Shaw Communications, Inc., Class B (1) | 1,402 | 32,192 | ||||||
| Shoppers Drug Mart Corp. (1) | 1,536 | 66,091 | ||||||
| Silver Wheaton Corp. (1) | 759 | 27,363 | ||||||
| SHARES | VALUE (Note 2) | |||||||
| Canada - 15.3% (continued) | ||||||||
| Tim Hortons, Inc. (1) | 1,736 | $ | 85,221 | |||||
| Toronto-Dominion Bank/The (1) | 362 | 30,479 | ||||||
| TransCanada Corp. (1)(a) | 734 | 34,697 | ||||||
| Yamana Gold, Inc. (1) | 2,227 | 38,307 | ||||||
|
| |||||||
| 951,300 | ||||||||
|
| |||||||
| Denmark - 1.2% | ||||||||
| Coloplast A/S, Class B | 605 | 29,669 | ||||||
| Novo Nordisk A/S, Class B | 270 | 43,966 | ||||||
|
| |||||||
| 73,635 | ||||||||
|
| |||||||
| France - 2.4% | ||||||||
| Cie Generale d’Optique Essilor International SA | 367 | 37,015 | ||||||
| Danone SA | 686 | 45,337 | ||||||
| Dassault Systemes SA | 157 | 17,554 | ||||||
| L’Oreal SA | 145 | 20,176 | ||||||
| Pernod-Ricard SA | 63 | 7,309 | ||||||
| SES SA FDR | 361 | 10,397 | ||||||
| Sodexo | 77 | 6,506 | ||||||
| Total SA | 53 | 2,758 | ||||||
|
| |||||||
| 147,052 | ||||||||
|
| |||||||
| Germany - 2.8% | ||||||||
| Adidas AG | 285 | 25,436 | ||||||
| Bayer AG | 323 | 30,802 | ||||||
| Beiersdorf AG | 853 | 69,844 | ||||||
| Fresenius Medical Care AG & Co. KGaA | 135 | 9,317 | ||||||
| Fresenius SE & Co. KGaA | 27 | 3,107 | ||||||
| Metro AG | 653 | 18,141 | ||||||
| SAP AG | 235 | 18,897 | ||||||
|
| |||||||
| 175,544 | ||||||||
|
| |||||||
| Hong Kong - 2.6% | ||||||||
| CLP Holdings Ltd. | 3,500 | 29,407 | ||||||
| Hang Seng Bank Ltd. | 1,600 | 24,699 | ||||||
| Hong Kong & China Gas Co., Ltd. | 16,000 | 43,960 | ||||||
| Power Assets Holdings Ltd. | 3,500 | 30,029 | ||||||
| SJM Holdings Ltd. | 4,000 | 9,440 | ||||||
| Wynn Macau Ltd. † | 8,800 | 24,232 | ||||||
|
| |||||||
| 161,767 | ||||||||
|
| |||||||
| Ireland - 0.1% | ||||||||
| James Hardie Industries PLC CDI | 362 | 3,505 | ||||||
|
| |||||||
| Italy - 0.3% | ||||||||
| Luxottica Group SpA | 507 | 20,926 | ||||||
|
| |||||||
| Japan - 23.7% | ||||||||
| Aeon Co., Ltd. | 200 | 2,286 | ||||||
| Ajinomoto Co., Inc. | 2,000 | 26,465 | ||||||
| All Nippon Airways Co., Ltd. | 3,000 | 6,303 | ||||||
| Asahi Group Holdings Ltd. | 1,400 | 29,810 | ||||||
| Asahi Kasei Corp. | 1,000 | 5,913 | ||||||
| Astellas Pharma, Inc. | 900 | 40,465 | ||||||
| Bank of Yokohama Ltd./The | 2,000 | 9,299 | ||||||
| Brother Industries Ltd. | 1,600 | 17,225 | ||||||
| Canon, Inc. | 600 | 23,256 | ||||||
| Central Japan Railway Co. | 500 | 40,580 | ||||||
| The accompanying notes are an integral part of these financial statements. | (Continued) |
| 56 | AQR Funds | Annual Report | December 2012 | |||||||||||||
Table of Contents
| Schedule of Investments | December 31, 2012 |
| AQR INTERNATIONAL DEFENSIVE EQUITY FUND |
| SHARES | VALUE (Note 2) | |||||||
| Japan - 23.7% (continued) | ||||||||
| Chiba Bank Ltd./The | 3,000 | $ | 17,574 | |||||
| Chugai Pharmaceutical Co., Ltd. | 3,500 | 67,060 | ||||||
| Dai Nippon Printing Co., Ltd. | 1,000 | 7,841 | ||||||
| Daiichi Sankyo Co., Ltd. | 1,400 | 21,493 | ||||||
| Dentsu, Inc. | 300 | 8,036 | ||||||
| East Japan Railway Co. | 300 | 19,399 | ||||||
| Eisai Co., Ltd. | 700 | 29,220 | ||||||
| FamilyMart Co., Ltd. | 600 | 24,719 | ||||||
| Fast Retailing Co., Ltd. | 100 | 25,521 | ||||||
| Fujitsu Ltd. | 1,000 | 4,194 | ||||||
| Hoya Corp. | 1,000 | 19,704 | ||||||
| Kao Corp. | 2,200 | 57,327 | ||||||
| Kawasaki Kisen Kaisha Ltd. † | 9,000 | 13,820 | ||||||
| KDDI Corp. | 300 | 21,209 | ||||||
| Lawson, Inc. | 400 | 27,134 | ||||||
| Namco Bandai Holdings, Inc. | 1,700 | 22,036 | ||||||
| Nippon Express Co., Ltd. | 12,000 | 49,587 | ||||||
| Nippon Yusen KK | 1,000 | 2,354 | ||||||
| Nitori Holdings Co., Ltd. | 250 | 18,317 | ||||||
| NTT DOCOMO, Inc. | 56 | 80,725 | ||||||
| Odakyu Electric Railway Co., Ltd. | 2,000 | 20,808 | ||||||
| Omron Corp. | 300 | 7,201 | ||||||
| Oriental Land Co., Ltd. | 200 | 24,221 | ||||||
| Osaka Gas Co., Ltd. | 21,000 | 76,279 | ||||||
| Otsuka Holdings Co., Ltd. | 2,500 | 70,428 | ||||||
| Secom Co., Ltd. | 1,000 | 50,382 | ||||||
| Seven & I Holdings Co., Ltd. | 1,400 | 39,467 | ||||||
| Shimamura Co., Ltd. | 300 | 29,153 | ||||||
| Shionogi & Co., Ltd. | 1,200 | 19,997 | ||||||
| Shiseido Co., Ltd. | 100 | 1,412 | ||||||
| Shizuoka Bank Ltd./The | 4,000 | 39,072 | ||||||
| Softbank Corp. | 200 | 7,328 | ||||||
| Suzuki Motor Corp. | 200 | 5,234 | ||||||
| Sysmex Corp. | 200 | 9,210 | ||||||
| Takeda Pharmaceutical Co., Ltd. | 900 | 40,225 | ||||||
| Tokyo Gas Co., Ltd. | 14,000 | 63,967 | ||||||
| Toyo Suisan Kaisha Ltd. | 2,000 | 53,288 | ||||||
| Trend Micro, Inc. | 400 | 12,086 | ||||||
| Unicharm Corp. | 900 | 46,768 | ||||||
| West Japan Railway Co. | 800 | 31,517 | ||||||
| Yamato Holdings Co., Ltd. | 5,700 | 86,623 | ||||||
|
| |||||||
| 1,473,538 | ||||||||
|
| |||||||
| Netherlands - 1.4% | ||||||||
| Koninklijke Ahold NV | 3,917 | 52,523 | ||||||
| Koninklijke KPN NV | 1,138 | 5,628 | ||||||
| Unilever NV CVA | 708 | 27,091 | ||||||
|
| |||||||
| 85,242 | ||||||||
|
| |||||||
| Norway - 0.7% | ||||||||
| Statoil ASA | 864 | 21,777 | ||||||
| Telenor ASA | 1,226 | 24,963 | ||||||
|
| |||||||
| 46,740 | ||||||||
|
| |||||||
| Singapore - 0.8% | ||||||||
| Singapore Telecommunications Ltd. | 17,000 | 46,257 | ||||||
| Wilmar International Ltd. | 2,000 | 5,522 | ||||||
|
| |||||||
| 51,779 | ||||||||
|
| |||||||
| SHARES | VALUE (Note 2) | |||||||
| Spain - 0.7% | ||||||||
| Inditex SA | 301 | $ | 42,292 | |||||
|
| |||||||
| Sweden - 2.3% | ||||||||
| Hennes & Mauritz AB, B Shares | 1,200 | 41,588 | ||||||
| Swedish Match AB | 714 | 23,969 | ||||||
| Tele2 AB, B Shares | 4,406 | 79,638 | ||||||
|
| |||||||
| 145,195 | ||||||||
|
| |||||||
| Switzerland - 4.9% | ||||||||
| Kuehne + Nagel International AG | 272 | 32,792 | ||||||
| Nestle SA | 1,305 | 85,143 | ||||||
| Novartis AG | 821 | 51,865 | ||||||
| Roche Holding AG | 117 | 23,655 | ||||||
| SGS SA | 20 | 44,421 | ||||||
| Sonova Holding AG † | 159 | 17,669 | ||||||
| Swisscom AG | 82 | 35,532 | ||||||
| Syngenta AG | 36 | 14,544 | ||||||
|
| |||||||
| 305,621 | ||||||||
|
| |||||||
| United Kingdom - 15.3% | ||||||||
| Associated British Foods PLC | 3,499 | 89,394 | ||||||
| AstraZeneca PLC | 1,652 | 78,288 | ||||||
| British American Tobacco PLC | 843 | 42,854 | ||||||
| British Sky Broadcasting Group PLC | 1,069 | 13,483 | ||||||
| Burberry Group PLC | 617 | 12,403 | ||||||
| Centrica PLC | 14,240 | 77,717 | ||||||
| Compass Group PLC | 3,711 | 44,052 | ||||||
| Experian PLC | 561 | 9,041 | ||||||
| GlaxoSmithKline PLC | 1,473 | 32,071 | ||||||
| Imperial Tobacco Group PLC | 381 | 14,772 | ||||||
| J Sainsbury PLC | 3,512 | 19,870 | ||||||
| Marks & Spencer Group PLC | 4,636 | 29,122 | ||||||
| National Grid PLC | 7,276 | 83,451 | ||||||
| Next PLC | 258 | 15,661 | ||||||
| Pearson PLC | 795 | 15,496 | ||||||
| Randgold Resources Ltd. | 79 | 7,815 | ||||||
| Reckitt Benckiser Group PLC | 878 | 55,735 | ||||||
| Rexam PLC | 1,352 | 9,674 | ||||||
| Royal Dutch Shell PLC, B Shares | 459 | 16,375 | ||||||
| Sage Group PLC/The | 1,205 | 5,794 | ||||||
| Shire PLC | 80 | 2,461 | ||||||
| Smith & Nephew PLC | 3,441 | 38,036 | ||||||
| SSE PLC | 2,916 | 67,838 | ||||||
| Tesco PLC | 1,004 | 5,531 | ||||||
| Unilever PLC | 1,341 | 52,126 | ||||||
| Vodafone Group PLC | 15,558 | 39,164 | ||||||
| Whitbread PLC | 485 | 19,489 | ||||||
| WM Morrison Supermarkets PLC | 12,932 | 55,526 | ||||||
|
| |||||||
| 953,239 | ||||||||
|
| |||||||
| United States - 0.3% | ||||||||
| Thomson Reuters Corp. (1) | 569 | 16,463 | ||||||
|
| |||||||
TOTAL COMMON STOCKS | 5,678,814 | |||||||
|
| |||||||
| The accompanying notes are an integral part of these financial statements. | (Continued) |
| AQR Funds | Annual Report | December 2012 | 57 | |||||||||||||
Table of Contents
| Schedule of Investments | December 31, 2012 |
| AQR INTERNATIONAL DEFENSIVE EQUITY FUND |
| PREFERRED STOCKS - 0.5% | SHARES | VALUE (Note 2) | ||||||
| Germany - 0.5% | ||||||||
Henkel AG & Co. KGaA | 366 | $ | 30,111 | |||||
|
| |||||||
| EXCHANGE-TRADED FUNDS - 7.3% | ||||||||
iShares MSCI EAFE Index Fund (1) | 7,952 | 451,833 | ||||||
|
| |||||||
| MONEY MARKET FUNDS - 1.3% | ||||||||
| J.P. Morgan U.S. Treasury Plus Money Market Fund - Institutional Shares, | ||||||||
0.000% (b) | 80,464 | 80,464 | ||||||
|
| |||||||
| INVESTMENTS OF CASH COLLATERAL FOR SECURITIES ON LOAN - 0.7% | ||||||||
| J.P. Morgan Prime Money Market Fund - | ||||||||
Capital Shares, 0.120% (b)(c) | 40,474 | 40,474 | ||||||
|
| |||||||
TOTAL INVESTMENTS - 101.1% | 6,281,696 | |||||||
|
| |||||||
| LIABILITIES IN EXCESS OF OTHER ASSETS - (1.1%) | (65,395) | |||||||
|
| |||||||
NET ASSETS - 100.0% | $ | 6,216,301 | ||||||
|
| |||||||
| † | Non income-producing security. |
| (a) | All or a portion of the security on loan. The aggregate market value of such securities is $38,540; cash collateral of $40,474 was received with which the Fund purchased a money market fund. |
| (b) | Represents annualized seven-day yield as of December 31, 2012. |
| (c) | Represents security, or portion thereof, purchased with the cash collateral received for securities on loan. |
All securities are Level 2 with respect to ASC 820, unless otherwise noted in parentheses.
| (1) | Level 1 security (See Note 4). |
The following abbreviations are used in portfolio descriptions:
CDI - CHESS Depository Interest
CVA - Dutch Certificate of Shares
FDR - Fiduciary Depositary Receipt
| SECTOR | VALUE | % OF NET ASSETS | ||||||
| Consumer Discretionary | $ | 684,092 | 11.0 | % | ||||
| Consumer Staples | 1,472,353 | 23.7 | ||||||
| Energy | 214,082 | 3.4 | ||||||
| Financials | 443,957 | 7.1 | ||||||
| Health Care | 840,253 | 13.5 | ||||||
| Industrials | 547,736 | 8.8 | ||||||
| Information Technology | 128,005 | 2.1 | ||||||
| Materials | 297,749 | 4.8 | ||||||
| Mutual Fund | 451,833 | 7.3 | ||||||
| Telecommunication Services | 564,804 | 9.1 | ||||||
| Utilities | 515,894 | 8.3 | ||||||
| Money Market Funds | 120,938 | 2.0 | ||||||
|
|
|
| |||||
Total Investments | 6,281,696 | 101.1 | ||||||
| Liabilities in Excess of Other Assets | (65,395) | (1.1) | ||||||
|
|
|
| |||||
Net Assets | $ | 6,216,301 | 100.0 | % | ||||
|
|
|
| |||||
| The accompanying notes are an integral part of these financial statements. |
| 58 | AQR Funds | Annual Report | December 2012 | |||||||||||||
Table of Contents
| Schedule of Investments | December 31, 2012 |
| COMMON STOCKS - 93.3% | SHARES | VALUE (Note 2) | ||||||
| Consumer Discretionary - 8.7% | ||||||||
| Advance Auto Parts, Inc. | 235 | $ | 17,002 | |||||
| Amazon.com, Inc. † | 308 | 77,351 | ||||||
| Apollo Group, Inc., Class A † | 655 | 13,703 | ||||||
| AutoZone, Inc. † | 181 | 64,152 | ||||||
| Big Lots, Inc. †(a) | 677 | 19,267 | ||||||
| Chipotle Mexican Grill, Inc. †(a) | 49 | 14,576 | ||||||
| Dollar Tree, Inc. † | 1,060 | 42,994 | ||||||
| Family Dollar Stores, Inc. | 418 | 26,505 | ||||||
| Home Depot, Inc./The | 349 | 21,586 | ||||||
| ITT Educational Services, Inc. †(a) | 336 | 5,816 | ||||||
| McDonald’s Corp. | 1,300 | 114,673 | ||||||
| McGraw-Hill Cos., Inc./The | 432 | 23,617 | ||||||
| NIKE, Inc., Class B | 98 | 5,057 | ||||||
| O’Reilly Automotive, Inc. † | 115 | 10,283 | ||||||
| Panera Bread Co., Class A † | 332 | 52,732 | ||||||
| PetSmart, Inc. | 924 | 63,146 | ||||||
| priceline.com, Inc. † | 9 | 5,591 | ||||||
| Scripps Networks Interactive, Inc., Class A | 55 | 3,186 | ||||||
| Target Corp. | 582 | 34,437 | ||||||
| Time Warner, Inc. | 369 | 17,649 | ||||||
| TJX Cos., Inc. | 756 | 32,092 | ||||||
| Tupperware Brands Corp. | 314 | 20,127 | ||||||
| Viacom, Inc., Class B | 336 | 17,721 | ||||||
| Washington Post Co./The, Class B | 6 | 2,191 | ||||||
| Yum! Brands, Inc. | 216 | 14,342 | ||||||
|
| |||||||
| 719,796 | ||||||||
|
| |||||||
| Consumer Staples - 23.4% | ||||||||
| Altria Group, Inc. | 3,673 | 115,406 | ||||||
| Brown-Forman Corp., Class B | 1,140 | 72,105 | ||||||
| Campbell Soup Co. (a) | 874 | 30,494 | ||||||
| Church & Dwight Co., Inc. (a) | 1,197 | 64,123 | ||||||
| Clorox Co./The (a) | 585 | 42,834 | ||||||
| Coca-Cola Co./The | 644 | 23,345 | ||||||
| Colgate-Palmolive Co. | 1,096 | 114,576 | ||||||
| Costco Wholesale Corp. | 1,178 | 116,351 | ||||||
| CVS Caremark Corp. | 703 | 33,990 | ||||||
| Estee Lauder Cos., Inc./The, Class A | 639 | 38,251 | ||||||
| General Mills, Inc. | 1,796 | 72,576 | ||||||
| Hershey Co./The | 942 | 68,031 | ||||||
| HJ Heinz Co. | 1,570 | 90,558 | ||||||
| Hormel Foods Corp. (a) | 504 | 15,730 | ||||||
| Kellogg Co. | 234 | 13,069 | ||||||
| Kimberly-Clark Corp. | 1,374 | 116,007 | ||||||
| Kroger Co./The | 2,025 | 52,691 | ||||||
| Lorillard, Inc. | 577 | 67,319 | ||||||
| McCormick & Co., Inc. (a) | 1,314 | 83,478 | ||||||
| Monster Beverage Corp. † | 30 | 1,586 | ||||||
| PepsiCo, Inc. | 1,679 | 114,894 | ||||||
| Philip Morris International, Inc. | 1,377 | 115,172 | ||||||
| Procter & Gamble Co./The | 1,697 | 115,209 | ||||||
| Reynolds American, Inc. | 2,798 | 115,921 | ||||||
| Safeway, Inc. (a) | 565 | 10,221 | ||||||
| Sysco Corp. (a) | 643 | 20,357 | ||||||
| Walgreen Co. | 1,595 | 59,031 | ||||||
| Wal-Mart Stores, Inc. | 1,691 | 115,377 | ||||||
| Whole Foods Market, Inc. | 421 | 38,450 | ||||||
|
| |||||||
| 1,937,152 | ||||||||
|
| |||||||
| SHARES | VALUE (Note 2) | |||||||
| Energy - 1.4% | ||||||||
| CARBO Ceramics, Inc. (a) | 86 | $ | 6,737 | |||||
| Chevron Corp. | 84 | 9,084 | ||||||
| Exxon Mobil Corp. | 622 | 53,834 | ||||||
| Spectra Energy Corp. | 1,557 | 42,631 | ||||||
|
| |||||||
| 112,286 | ||||||||
|
| |||||||
| Financials - 10.7% | ||||||||
| ACE Ltd. (Switzerland) | 800 | 63,840 | ||||||
| Aon PLC (United Kingdom) | 654 | 36,362 | ||||||
| Bank of Hawaii Corp. (a) | 1,768 | 77,880 | ||||||
| Chubb Corp./The | 1,478 | 111,323 | ||||||
| City National Corp. (a) | 302 | 14,955 | ||||||
| Cullen/Frost Bankers, Inc. (a) | 1,781 | 96,655 | ||||||
| Everest Re Group Ltd. | 723 | 79,494 | ||||||
| M&T Bank Corp. (a) | 259 | 25,504 | ||||||
| Marsh & McLennan Cos., Inc. | 1,297 | 44,708 | ||||||
| New York Community Bancorp, Inc. (a) | 1,418 | 18,576 | ||||||
| Northern Trust Corp. | 1,100 | 55,176 | ||||||
| People’s United Financial, Inc. (a) | 8,138 | 98,388 | ||||||
| Progressive Corp./The | 659 | 13,905 | ||||||
| Travelers Cos., Inc./The | 916 | 65,787 | ||||||
| US Bancorp | 669 | 21,368 | ||||||
| WR Berkley Corp. (a) | 1,635 | 61,705 | ||||||
|
| |||||||
| 885,626 | ||||||||
|
| |||||||
| Health Care - 15.5% | ||||||||
| Abbott Laboratories | 1,232 | 80,696 | ||||||
| Aetna, Inc. | 422 | 19,539 | ||||||
| Allergan, Inc. | 968 | 88,795 | ||||||
| AmerisourceBergen Corp. | 1,063 | 45,900 | ||||||
| Amgen, Inc. | 441 | 38,067 | ||||||
| Baxter International, Inc. | 306 | 20,398 | ||||||
| Becton Dickinson and Co. (a) | 936 | 73,186 | ||||||
| Biogen Idec, Inc. † | 335 | 49,135 | ||||||
| Bristol-Myers Squibb Co. | 2,101 | 68,472 | ||||||
| Cardinal Health, Inc. | 184 | 7,577 | ||||||
| Celgene Corp. † | 314 | 24,718 | ||||||
| Cerner Corp. † | 55 | 4,270 | ||||||
| Covance, Inc. †(a) | 47 | 2,715 | ||||||
| CR Bard, Inc. | 411 | 40,171 | ||||||
| Edwards Lifesciences Corp. † | 202 | 18,214 | ||||||
| Eli Lilly & Co. | 1,575 | 77,679 | ||||||
| Forest Laboratories, Inc. † | 1,268 | 44,786 | ||||||
| Gilead Sciences, Inc. † | 173 | 12,707 | ||||||
| Henry Schein, Inc. †(a) | 195 | 15,690 | ||||||
| Humana, Inc. | 291 | 19,971 | ||||||
| IDEXX Laboratories, Inc. † | 490 | 45,472 | ||||||
| Johnson & Johnson | 1,645 | 115,315 | ||||||
| Laboratory Corp of America Holdings † | 313 | 27,112 | ||||||
| McKesson Corp. | 325 | 31,512 | ||||||
| Merck & Co., Inc. | 788 | 32,261 | ||||||
| Mettler-Toledo International, Inc. †(a) | 122 | 23,583 | ||||||
| Myriad Genetics, Inc. † | 485 | 13,216 | ||||||
| Patterson Cos., Inc. | 914 | 31,286 | ||||||
| Pfizer, Inc. | 1,066 | 26,735 | ||||||
| Quest Diagnostics, Inc. | 430 | 25,056 | ||||||
| St Jude Medical, Inc. | 112 | 4,048 | ||||||
| Stryker Corp. | 1,299 | 71,211 | ||||||
| The accompanying notes are an integral part of these financial statements. | (Continued) |
| AQR Funds | Annual Report | December 2012 | 59 | |||||||||||||
Table of Contents
| Schedule of Investments | December 31, 2012 |
| AQR U.S. DEFENSIVE EQUITY FUND |
| SHARES | VALUE (Note 2) | |||||||
| Health Care - 15.5% (continued) | ||||||||
| UnitedHealth Group, Inc. | 610 | $ | 33,086 | |||||
| Vertex Pharmaceuticals, Inc. † | 405 | 16,986 | ||||||
| Waters Corp. †(a) | 25 | 2,178 | ||||||
| WellPoint, Inc. | 61 | 3,716 | ||||||
| Zimmer Holdings, Inc. | 452 | 30,130 | ||||||
|
| |||||||
| 1,285,589 | ||||||||
|
| |||||||
| Industrials - 6.6% | ||||||||
| 3M Co. | 686 | 63,695 | ||||||
| Boeing Co./The | 27 | 2,035 | ||||||
| CH Robinson Worldwide, Inc. (a) | 163 | 10,305 | ||||||
| Cintas Corp. | 132 | 5,399 | ||||||
| Clean Harbors, Inc. †(a) | 51 | 2,806 | ||||||
| Danaher Corp. | 542 | 30,298 | ||||||
| Dun & Bradstreet Corp./The (a) | 71 | 5,584 | ||||||
| Equifax, Inc. | 315 | 17,048 | ||||||
| Fastenal Co. (a) | 392 | 18,302 | ||||||
| FedEx Corp. | 46 | 4,219 | ||||||
| General Dynamics Corp. | 157 | 10,875 | ||||||
| Honeywell International, Inc. | 156 | 9,901 | ||||||
| Knight Transportation, Inc. (a) | 732 | 10,709 | ||||||
| Landstar System, Inc. | 584 | 30,637 | ||||||
| Lockheed Martin Corp. | 315 | 29,071 | ||||||
| MSC Industrial Direct Co., Inc., Class A (a) | 79 | 5,955 | ||||||
| Northrop Grumman Corp. | 245 | 16,557 | ||||||
| Raytheon Co. | 640 | 36,838 | ||||||
| Republic Services, Inc. | 110 | 3,226 | ||||||
| Robert Half International, Inc. | 379 | 12,060 | ||||||
| Southwest Airlines Co. | 401 | 4,106 | ||||||
| Stericycle, Inc.† | 848 | 79,093 | ||||||
| United Parcel Service, Inc., Class B | 460 | 33,916 | ||||||
| United Technologies Corp. | 126 | 10,333 | ||||||
| Waste Management, Inc. (a) | 2,162 | 72,946 | ||||||
| Werner Enterprises, Inc. (a) | 622 | 13,479 | ||||||
| WW Grainger, Inc. | 45 | 9,107 | ||||||
|
| |||||||
| 548,500 | ||||||||
|
| |||||||
| Information Technology - 13.6% | ||||||||
| Accenture PLC, Class A (Ireland) | 875 | 58,187 | ||||||
| ADTRAN, Inc. (a) | 729 | 14,245 | ||||||
| Analog Devices, Inc. | 1,629 | 68,516 | ||||||
| Applied Materials, Inc. | 303 | 3,466 | ||||||
| Arris Group, Inc. † | 98 | 1,464 | ||||||
| Autodesk, Inc. † | 539 | 19,054 | ||||||
| Automatic Data Processing, Inc. | 1,869 | 106,552 | ||||||
| Broadcom Corp., Class A † | 862 | 28,627 | ||||||
| Broadridge Financial Solutions, Inc. | 138 | 3,157 | ||||||
| Citrix Systems, Inc. † | 20 | 1,315 | ||||||
| F5 Networks, Inc. † | 163 | 15,835 | ||||||
| FactSet Research Systems, Inc. (a) | 608 | 53,540 | ||||||
| FLIR Systems, Inc. | 106 | 2,365 | ||||||
| Google, Inc., Class A † | 91 | 64,553 | ||||||
| IAC/InterActiveCorp | 404 | 19,109 | ||||||
| Intel Corp. | 1,335 | 27,541 | ||||||
| International Business Machines Corp. | 565 | 108,226 | ||||||
| Intuit, Inc. | 1,309 | 77,886 | ||||||
| Linear Technology Corp. | 1,783 | 61,157 | ||||||
| Marvell Technology Group Ltd. | 995 | 7,224 | ||||||
| SHARES | VALUE (Note 2) | |||||||
| Information Technology - 13.6% (continued) | ||||||||
| Mastercard, Inc., Class A | 83 | $ | 40,776 | |||||
| Maxim Integrated Products, Inc. | 467 | 13,730 | ||||||
| Microchip Technology, Inc. (a) | 119 | 3,878 | ||||||
| Microsoft Corp. | 1,791 | 47,873 | ||||||
| Paychex, Inc. (a) | 2,077 | 64,678 | ||||||
| QUALCOMM, Inc. | 129 | 8,001 | ||||||
| Riverbed Technology, Inc. † | 976 | 19,247 | ||||||
| Silicon Laboratories, Inc. † | 127 | 5,310 | ||||||
| Sohu.com, Inc. (China) † | 232 | 10,983 | ||||||
| Synopsys, Inc. † | 667 | 21,237 | ||||||
| Teradata Corp. † | 79 | 4,889 | ||||||
| Texas Instruments, Inc. (a) | 52 | 1,609 | ||||||
| Total System Services, Inc. | 2,220 | 47,552 | ||||||
| Visa, Inc., Class A | 317 | 48,051 | ||||||
| VMware, Inc., Class A † | 149 | 14,027 | ||||||
| Xilinx, Inc. | 807 | 28,971 | ||||||
|
| |||||||
| 1,122,831 | ||||||||
|
| |||||||
| Materials - 0.3% | ||||||||
| AK Steel Holding Corp. (a) | 1,036 | 4,766 | ||||||
| Monsanto Co. | 15 | 1,420 | ||||||
| Newmont Mining Corp. | 135 | 6,269 | ||||||
| Sherwin-Williams Co./The | 53 | 8,152 | ||||||
| Sigma-Aldrich Corp. (a) | 33 | 2,428 | ||||||
|
| |||||||
| 23,035 | ||||||||
|
| |||||||
| Telecommunication Services - 2.9% | ||||||||
| AT&T, Inc. | 2,940 | 99,107 | ||||||
| CenturyLink, Inc. | 1,011 | 39,550 | ||||||
| tw telecom, Inc. †(a) | 116 | 2,955 | ||||||
| Verizon Communications, Inc. | 2,219 | 96,016 | ||||||
|
| |||||||
| 237,628 | ||||||||
|
| |||||||
| Utilities - 10.2% | ||||||||
| American Electric Power Co., Inc. | 731 | 31,199 | ||||||
| American Water Works Co., Inc. | 1,559 | 57,886 | ||||||
| CenterPoint Energy, Inc. | 163 | 3,138 | ||||||
| Consolidated Edison, Inc. | 840 | 46,654 | ||||||
| Dominion Resources, Inc. | 2,234 | 115,721 | ||||||
| DTE Energy Co. | 1,063 | 63,833 | ||||||
| Duke Energy Corp. | 748 | 47,722 | ||||||
| Entergy Corp. | 143 | 9,116 | ||||||
| NextEra Energy, Inc. | 355 | 24,562 | ||||||
| NiSource, Inc. | 694 | 17,274 | ||||||
| Northeast Utilities | 257 | 10,044 | ||||||
| OGE Energy Corp. | 418 | 23,538 | ||||||
| ONEOK, Inc. | 367 | 15,689 | ||||||
| PG&E Corp. | 2,105 | 84,579 | ||||||
| Pinnacle West Capital Corp. | 461 | 23,502 | ||||||
| Public Service Enterprise Group, Inc. | 1,654 | 50,612 | ||||||
| Questar Corp. (a) | 869 | 17,171 | ||||||
| Sempra Energy | 1,101 | 78,105 | ||||||
| Southern Co. | 1,855 | 79,412 | ||||||
| UGI Corp. | 832 | 27,215 | ||||||
| Wisconsin Energy Corp. | 53 | 1,953 | ||||||
| Xcel Energy, Inc. | 442 | 11,806 | ||||||
|
| |||||||
| 840,731 | ||||||||
|
| |||||||
TOTAL COMMON STOCKS | 7,713,174 | |||||||
|
| |||||||
| The accompanying notes are an integral part of these financial statements. | (Continued) |
| 60 | AQR Funds | Annual Report | December 2012 | |||||||||||||
Table of Contents
| Schedule of Investments | December 31, 2012 |
| AQR U.S. DEFENSIVE EQUITY FUND |
| EXCHANGE-TRADED FUNDS - 5.7% | SHARES | VALUE (Note 2) | ||||||
SPDR S&P 500 ETF Trust | 3,320 | $ | 473,166 | |||||
|
| |||||||
| MONEY MARKET FUNDS - 12.0% | ||||||||
| J.P. Morgan U.S. Treasury Plus Money Market Fund - Institutional Shares, | ||||||||
0.000% (2)(b) | 989,475 | 989,475 | ||||||
|
| |||||||
| INVESTMENTS OF CASH COLLATERAL FOR SECURITIES ON LOAN - 10.3% | ||||||||
| J.P. Morgan Prime Money Market Fund - | ||||||||
Capital Shares, 0.120% (2)(b)(c) | 850,057 | 850,057 | ||||||
|
| |||||||
TOTAL INVESTMENTS - 121.3% | 10,025,872 | |||||||
|
| |||||||
| LIABILITIES IN EXCESS OF OTHER ASSETS - (21.3%) | (1,763,142) | |||||||
|
| |||||||
NET ASSETS - 100.0% | $ | 8,262,730 | ||||||
|
| |||||||
All securities are United States companies, unless noted otherwise in parentheses.
| † | Non income-producing security. |
| (a) | All or a portion of the security on loan. The aggregate market value of such securities is $838,381; cash collateral of $850,057 was received with which the Fund purchased a money market fund. |
| (b) | Represents annualized seven-day yield as of December 31, 2012. |
| (c) | Represents security, or portion thereof, purchased with the cash collateral received for securities on loan. |
All securities are Level 1 with respect to ASC 820, unless otherwise noted in parentheses.
| (2) | Level 2 security (See Note 4). |
| The accompanying notes are an integral part of these financial statements. |
| AQR Funds | Annual Report | December 2012 | 61 | |||||||||||||
Table of Contents
| Schedule of Investments | December 31, 2012 |
| LONG INVESTMENTS - 100.9% | SHARES | VALUE (Note 2) | ||||||
| COMMON STOCKS - 42.2% | ||||||||
| Consumer Discretionary - 6.5% | ||||||||
| American Greetings Corp., Class A | 516,253 | $ | 8,719,513 | |||||
| Ameristar Casinos, Inc. | 3,808 | 99,922 | ||||||
| Arbitron, Inc. | 183,039 | 8,544,261 | ||||||
| Astral Media, Inc., Class A (Canada) | 370,186 | 17,204,885 | ||||||
| Bluegreen Corp. † | 281,143 | 2,637,121 | ||||||
| Brick Ltd./The (Canada) | 681,706 | 3,673,413 | ||||||
| Brookfield Residential Properties, Inc. (Canada) †(a) | 31,800 | 570,492 | ||||||
| China Century Dragon Media, Inc. (3)†(b) | 150,272 | 20 | ||||||
| China Networks International Holdings Ltd. (3)†(b) | 2,287,278 | 5,718 | ||||||
| Conn’s, Inc. †(a) | 44,871 | 1,376,642 | ||||||
| Heelys, Inc. † | 23,103 | 51,520 | ||||||
| JAKKS Pacific, Inc. | 152,019 | 1,903,278 | ||||||
| Kayak Software Corp. † | 413,909 | 16,440,466 | ||||||
| Learning Tree International, Inc. † | 172,918 | 942,403 | ||||||
| Lennar Corp. B Shares, Class B | 40,782 | 1,245,482 | ||||||
| Liberty Global, Inc. † | 740,523 | 43,505,726 | ||||||
| Orient-Express Hotels Ltd., Class A (Bermuda) † | 870,570 | 10,176,963 | ||||||
| RONA, Inc. (Canada) | 224,995 | 2,413,488 | ||||||
| Sealy Corp. † | 162,275 | 352,137 | ||||||
| Teavana Holdings, Inc. † | 707,742 | 10,970,001 | ||||||
| Warnaco Group, Inc./The † | 471,458 | 33,742,249 | ||||||
|
| |||||||
| 164,575,700 | ||||||||
|
| |||||||
| Consumer Staples - 1.8% | ||||||||
| Celsius Holdings, Inc. †(a) | 37,315 | 7,523 | ||||||
| Central Garden and Pet Co. †(a) | 524,204 | 5,252,524 | ||||||
| Dole Food Co., Inc. † | 60,479 | 693,694 | ||||||
| Grupo Modelo SAB de CV, Series C (Mexico) | 2,088,835 | 18,737,026 | ||||||
| Hillshire Brands Co. | 245,313 | 6,903,108 | ||||||
| Neptune Technologies & Bioressources, Inc. (Canada) (3)†(b) | 6,407 | 7 | ||||||
| Ralcorp Holdings, Inc. † | 145,797 | 13,070,701 | ||||||
| Westway Group, Inc. † | 62,020 | 413,673 | ||||||
|
| |||||||
| 45,078,256 | ||||||||
|
| |||||||
| Energy - 3.8% | ||||||||
| C&C Energia Ltd. (Canada) † | 399,048 | 3,811,155 | ||||||
| Celtic Exploration Ltd. (Canada) † | 723,653 | 19,126,206 | ||||||
| CVR Energy, Inc. † | — | 227,654 | ||||||
| Gulf United Energy, Inc. (3)†(b) | 1,959,798 | 15,287 | ||||||
| Gulfport Energy Corp. † | 52,000 | 1,987,440 | ||||||
| McMoRan Exploration Co. † | 322,532 | 5,176,639 | ||||||
| Mission NewEnergy Ltd. (Australia) † | 20,132 | 1,208 | ||||||
| Nexen, Inc. (Canada) | 799,066 | 21,526,838 | ||||||
| Petrobank Energy & Resources Ltd. (Canada) † | 790,642 | 9,856,199 | ||||||
| Plains Exploration & Production Co. † | 355,429 | 16,683,837 | ||||||
| Royal Dutch Shell PLC, Class A ADR (Netherlands) | 229,015 | 15,790,584 | ||||||
|
| |||||||
| 94,203,047 | ||||||||
|
| |||||||
| SHARES | VALUE (Note 2) | |||||||
| Financials - 11.9% | ||||||||
| Alterra Capital Holdings Ltd. (Bermuda) | 428,172 | $ | 12,070,169 | |||||
| Andina Acquisition Corp. †(a) | 415,800 | 4,124,736 | ||||||
| Aquasition Corp. (United Kingdom) †(a) | 850,000 | 8,483,000 | ||||||
| Azteca Acquisition Corp. (3)†(a)(b) | 800,000 | 7,936,000 | ||||||
| BancTrust Financial Group, Inc. † | 637,279 | 1,771,636 | ||||||
| BGS Acquisition Corp. (Argentina) †(a) | 671,160 | 6,456,559 | ||||||
| Blue Wolf Mongolia Holdings Corp. †(a) | 526,500 | 5,186,025 | ||||||
| Chart Acquisition Corp. †(a) | 1,268,625 | 12,686,250 | ||||||
| China Growth Equity Investment Ltd. (China) † | 395,000 | 3,961,850 | ||||||
| China VantagePoint Acquisition Co. (3)†(b) | 199,098 | 1,184,633 | ||||||
| Cis Acquisition Ltd. (Russian Federation) † | 850,000 | 8,576,500 | ||||||
| Citizens Republic Bancorp, Inc. † | 497,794 | 9,443,152 | ||||||
| Collabrium Japan Acquisition Corp. (United Kingdom) †(a) | 595,000 | 6,063,050 | ||||||
| Colony Financial, Inc. REIT | 13,053 | 254,533 | ||||||
| CreXus Investment Corp. REIT | 131,496 | 1,610,826 | ||||||
| Empeiria Acquisition Corp. † | 81,633 | 835,922 | ||||||
| Epoch Holding Corp. | 548,234 | 15,295,729 | ||||||
| First California Financial Group, Inc. † | 1,262,163 | 9,743,898 | ||||||
| FlatWorld Acquisition Corp. (Virgin Islands, British) (3)(b) | 219,450 | — | ||||||
| General American Investors Co., Inc. | 10,966 | 305,074 | ||||||
| General Growth Properties, Inc. REIT | 353,993 | 7,026,761 | ||||||
| Global Cornerstone Holdings Ltd. † | 632,000 | 5,814,400 | ||||||
| Global Eagle Acquisition Corp. † | 1,382,500 | 13,755,875 | ||||||
| Home Loan Servicing Solutions Ltd. (Cayman Islands) | 106,600 | 2,014,740 | ||||||
| Hudson City Bancorp, Inc. | 5,649,997 | 45,934,476 | ||||||
| Hyde Park Acquisition Corp. II †(a) | 1,195,400 | 12,228,942 | ||||||
| Infinity Cross Border Acquisition Corp. (Israel) † | 287,100 | 2,187,702 | ||||||
| Janus Capital Group, Inc. | 2,500 | 21,300 | ||||||
| Jefferies Group, Inc. | 358,644 | 6,660,019 | ||||||
| KBW, Inc. | 693,747 | 10,614,329 | ||||||
| Knight Capital Group, Inc., Class A † | 152,400 | 534,924 | ||||||
| L&L Acquisition Corp. (3)†(b) | 306,000 | — | ||||||
| LaSalle Hotel Properties REIT | 75,447 | 1,915,599 | ||||||
| Lone Oak Acquisition Corp. (Hong Kong) (3)†(b) | 328,820 | 2,627,272 | ||||||
| Main Street Capital Corp. | 55,956 | 1,707,218 | ||||||
| Nautilus Marine Acquisition Corp. (Greece) † | 777,600 | 7,776,000 | ||||||
| Neptune Tech, Inc. (Canada) (3)†(b) | 3,203 | 6 | ||||||
| NorthStar Realty Finance Corp. REIT | 241,202 | 1,698,062 | ||||||
| NYSE Euronext | 234,774 | 7,404,772 | ||||||
| Parkway Properties, Inc./Md REIT | 9,914 | 138,697 | ||||||
| Patriot National Bank ADR (3)†(b) | 2,000,000 | 1,277,200 | ||||||
| PMI Group, Inc./The † | 263 | 4 | ||||||
| Prime Acquisition Corp. (China) † | 423,935 | 4,205,435 | ||||||
| RAIT Financial Trust REIT | 121,500 | 686,475 | ||||||
| ROI Acquisition Corp. (3)†(b) | 756,000 | 7,333,200 | ||||||
| Roma Financial Corp. | 898 | 13,578 | ||||||
| Rouse Properties, Inc. REIT | 13,278 | 224,664 | ||||||
| Santa Monica Media Corp. (3)†(b) | 15,377 | — | ||||||
| SCG Financial Acquistion Corp. † | 631,210 | 6,217,418 | ||||||
| SeaBright Holdings, Inc. | 864,610 | 9,571,233 | ||||||
| Select Income REIT REIT | 25,363 | 628,241 | ||||||
| The accompanying notes are an integral part of these financial statements. | (Continued) |
| 62 | AQR Funds | Annual Report | December 2012 | |||||||||||||
Table of Contents
| Schedule of Investments | December 31, 2012 |
| AQR DIVERSIFIED ARBITRAGE FUND |
| SHARES | VALUE (Note 2) | |||||||
| Financials - 11.9% (continued) | ||||||||
| Selway Capital Acquisition Corp., Class A † | 414,792 | $ | 4,064,962 | |||||
| SP Acquisition Holdings, Inc. (3)†(b) | 27,000 | — | ||||||
| Trian Acquisition I Corp. (3)†(b) | 15,200 | — | ||||||
| Trio Merger Corp. † | 456,000 | 4,514,400 | ||||||
| Universal Business Payment Solutions Acquisition Corp. † | 649,525 | 2,955,339 | ||||||
| West Coast Bancorp | 494,970 | 10,963,585 | ||||||
|
| |||||||
| 298,706,370 | ||||||||
|
| |||||||
| Health Care - 5.9% | ||||||||
| Abbott Laboratories (a) | 479,051 | 31,377,841 | ||||||
| Acadia Healthcare Co., Inc. †(a) | 35,374 | 825,275 | ||||||
| Access Pharmaceuticals, Inc. †(a) | 228,024 | 54,726 | ||||||
| AcelRx Pharmaceuticals, Inc. †(a) | 17,156 | 73,428 | ||||||
| American Surgical Holdings, Inc. (3)†(b) | 15,747 | — | ||||||
| Amgen, Inc. | 593 | 51,188 | ||||||
| Amil Participacoes SA (Brazil) | 25,630 | 386,171 | ||||||
| BioMimetic Therapeutics, Inc. † | 1,027,623 | 7,439,991 | ||||||
| China Medical Technologies, Inc. ADR (China) (3)†(a)(b) | 4,931 | 12,623 | ||||||
| Complete Genomics, Inc. † | 1,351,096 | 4,255,952 | ||||||
| Cormedix, Inc. †(a) | 112,436 | 80,954 | ||||||
| Coventry Health Care, Inc. | 932,428 | 41,800,747 | ||||||
| Cytori Therapeutics, Inc. † | 107,811 | 304,027 | ||||||
| Derma Sciences, Inc. † | 14,755 | 163,928 | ||||||
| Forest Laboratories, Inc. (3)†(b) | 335,833 | 319,041 | ||||||
| Galena Biopharma, Inc. † | 510,000 | 780,300 | ||||||
| Indevus Pharmaceuticals, Inc. (3)†(b) | 6,006 | — | ||||||
| Infinity Pharmaceuticals, Inc. † | 64,802 | 2,268,070 | ||||||
| MannKind Corp. † | 7 | 16 | ||||||
| Mediq NV (Netherlands) (2) | 392,923 | 6,666,524 | ||||||
| Neostem, Inc. † | 324,000 | 192,942 | ||||||
| Progenics Pharmaceuticals, Inc. † | 53,407 | 159,153 | ||||||
| Provectus Pharmaceuticals, Inc. † | 694,393 | 388,860 | ||||||
| PSS World Medical, Inc. † | 720,617 | 20,811,419 | ||||||
| Puma Biotechnology, Inc. † | 31,047 | 582,131 | ||||||
| Repros Therapeutics, Inc. † | 28,278 | 445,379 | ||||||
| Rexahn Pharmaceuticals, Inc. † | 2,550,000 | 790,500 | ||||||
| RXi Pharmaceuticals Corp. † | 94,852 | 7,114 | ||||||
| Sarepta Therapeutics, Inc. † | 3,324 | 85,759 | ||||||
| Sunrise Senior Living, Inc. † | 1,139,919 | 16,392,035 | ||||||
| YM Biosciences, Inc. (Canada) † | 4,084,900 | 11,723,663 | ||||||
|
| |||||||
| 148,439,757 | ||||||||
|
| |||||||
| Industrials - 4.0% | ||||||||
| Allied Defense Group, Inc./The (3)†(b) | 190,011 | 598,535 | ||||||
| Cascade Corp. | 193,388 | 12,434,848 | ||||||
| China Electric Motor, Inc. (China) †(a) | 2,400 | 192 | ||||||
| GeoEye, Inc. † | 659,422 | 20,264,038 | ||||||
| Kratos Defense & Security Solutions, Inc. † | 67,232 | 338,177 | ||||||
| Oshkosh Corp. † | 112,303 | 3,329,784 | ||||||
| Premier Alliance Group, Inc. † | 315,572 | 239,835 | ||||||
| Regal-Beloit Corp. | 22,163 | 1,561,826 | ||||||
| Robbins & Myers, Inc. | 337,055 | 20,037,920 | ||||||
| Sapphire Industry Corp. (3)†(b) | 25,025 | — | ||||||
| SHARES | VALUE (Note 2) | |||||||
| Industrials - 4.0% (continued) | ||||||||
| Sensata Technologies Holding NV (Netherlands) † | 39,538 | $ | 1,284,194 | |||||
| Shaw Group, Inc./The † | 438,398 | 20,433,731 | ||||||
| TNT Express NV (Netherlands) (2) | 1,578,472 | 17,633,149 | ||||||
| Trex Co., Inc. † | 81,055 | 3,017,678 | ||||||
|
| |||||||
| 101,173,907 | ||||||||
|
| |||||||
| Information Technology - 4.2% | ||||||||
| Compuware Corp. † | 730,702 | 7,942,731 | ||||||
| Comverse Technology, Inc. † | 1,878,132 | 7,212,027 | ||||||
| Comverse, Inc. †(a) | 225,648 | 6,437,737 | ||||||
| Cymer, Inc. † | 251,114 | 22,708,239 | ||||||
| Intermec, Inc. † | 1,192,774 | 11,760,752 | ||||||
| LML Payment Systems, Inc. (Canada) † | 1,065,100 | 3,663,944 | ||||||
| Magic Software Enterprises Ltd. (Israel) | 16,153 | 75,919 | ||||||
| MEMSIC, Inc. † | 79,248 | 264,688 | ||||||
| MIPS Technologies, Inc. † | 1,623,678 | 12,697,162 | ||||||
| Molex, Inc., Class A | 96,944 | 2,163,790 | ||||||
| Orckit Communications Ltd. (Israel) † | 15,174 | 2,261 | ||||||
| Peer 1 Network Enterprises, Inc. (Canada) † | 159,214 | 613,039 | ||||||
| Pervasive Software, Inc. † | 274,996 | 2,450,214 | ||||||
| PLX Technology, Inc. † | 1,898,961 | 6,893,228 | ||||||
| Retalix Ltd. (Israel) | 249,464 | 7,424,049 | ||||||
| SinoHub, Inc. (China) † | 190,038 | 1,900 | ||||||
| SouthPeak Interactive Corp. (3)†(b) | 1,500,000 | 1,200 | ||||||
| Telestone Technologies Corp. (China) †(c) | 115,818 | 151,722 | ||||||
| TNS, Inc. † | 516,235 | 10,701,552 | ||||||
| Vantiv, Inc., Class A † | 77,376 | 1,580,018 | ||||||
|
| |||||||
| 104,746,172 | ||||||||
|
| |||||||
| Materials - 2.7% | ||||||||
| Andina Minerals, Inc. (Canada) † | 1,175,148 | 933,313 | ||||||
| Aurcana Corp. (Canada) (3)†(b) | 1,246,774 | 1,165,678 | ||||||
| Cereplast, Inc. † | 258,156 | 5,809 | ||||||
| CGA Mining Ltd. (Australia) † | 3,652,710 | 9,657,814 | ||||||
| China GengSheng Minerals, Inc. (China) †(c) | 33,531 | 9,774 | ||||||
| Edgewater Exploration Ltd. (Canada) † | 417,850 | 193,235 | ||||||
| Energy Fuels, Inc. (Canada) † | 720,000 | 126,671 | ||||||
| Graphic Packaging Holding Co. † | 137,788 | 890,110 | ||||||
| Headwaters, Inc. † | 263,250 | 2,253,420 | ||||||
| Inmet Mining Corp. (Canada) | 229,611 | 17,084,056 | ||||||
| Lion One Metals Ltd. (Canada) (3)†(b) | 775,282 | 607,942 | ||||||
| Mines Management, Inc. † | 16,120 | 16,604 | ||||||
| Orko Silver Corp. (Canada) † | 2,256,848 | 5,331,852 | ||||||
| Queenston Mining, Inc. (Canada) † | 208,587 | 1,023,328 | ||||||
| Southern Arc Minerals, Inc. (Canada) (3)†(b) | 248,481 | 63,700 | ||||||
| Spartech Corp. † | 1,159,677 | 10,518,270 | ||||||
| Talison Lithium Ltd. (Australia) † | 2,146,588 | 15,775,167 | ||||||
| Titanium Metals Corp. | 44,231 | 730,254 | ||||||
| Vista Gold Corp. † | 116,790 | 315,333 | ||||||
|
| |||||||
| 66,702,330 | ||||||||
|
| |||||||
| The accompanying notes are an integral part of these financial statements. | (Continued) |
| AQR Funds | Annual Report | December 2012 | 63 | |||||||||||||
Table of Contents
| Schedule of Investments | December 31, 2012 |
| AQR DIVERSIFIED ARBITRAGE FUND |
| SHARES | VALUE (Note 2) | |||||||
| Telecommunication Services - 0.9% | ||||||||
| Clearwire Corp., Class A † | 2,223,401 | $ | 6,425,629 | |||||
| Cleveland Unlimited (3)†(b) | 1 | 1,185,204 | ||||||
| MetroPCS Communications, Inc. † | 399,700 | 3,973,018 | ||||||
| Sprint Nextel Corp. † | 413,100 | 2,342,277 | ||||||
| TELUS Corp., Class A (Canada) | 151,829 | 9,872,625 | ||||||
| XO holdings, Inc. O Shares (3)†(b) | 1,366,340 | — | ||||||
|
| |||||||
| 23,798,753 | ||||||||
|
| |||||||
| SHARES | VALUE (Note 2) | |||||||
| Utilities - 0.5% | ||||||||
| CH Energy Group, Inc. | 202,114 | $ | 13,181,875 | |||||
| Connecticut Water Service, Inc. | 7,935 | 236,304 | ||||||
|
| |||||||
| 13,418,179 | ||||||||
|
| |||||||
TOTAL COMMON STOCKS | 1,060,842,471 | |||||||
|
| |||||||
| CONVERTIBLE PREFERRED STOCKS - 1.6% | SHARES | VALUE (Note 2) | ||||||||||
| Consumer Discretionary - 0.4% | ||||||||||||
| Sealy Corp., $25.00 par, 8.000% †(d) | 148,011 | $ | 10,915,811 | |||||||||
|
| |||||||||||
| Consumer Staples - 0.0% (e) | ||||||||||||
| Universal Corp., Perpetual, $1,000.00 par, 6.750% † | 700 | 777,000 | ||||||||||
|
| |||||||||||
| Energy - 0.1% | ||||||||||||
| Superior Well Services, Inc., Perpetual, Series A, $1,000.00 par, 4.000% (2) | 1,169 | 1,075,480 | ||||||||||
|
| |||||||||||
| Financials - 0.5% | ||||||||||||
| Alpine Banks of Colorado, $1,000.00 par, 0.000% (3)(b) | 326,700 | 2,686,955 | ||||||||||
| Jack Cooper Holdings Corp. 144A, $99.08 par, 13.750% (2)(a)(f) | 6,950,000 | 7,401,750 | ||||||||||
| Jack Cooper Holdings Corp., Perpetual 144A, $100.00 par, 0.000% (2)†(f)(g) | 2,000 | 220,000 | ||||||||||
| MF Global Holdings Ltd., Perpetual, $100.00 par, 9.750% (2)† | 19,550 | 182,059 | ||||||||||
| SLM Corp., Perpetual, Series A, $50.00 par, 6.970% | 12,500 | 602,750 | ||||||||||
|
| |||||||||||
| 11,093,514 | ||||||||||||
|
| |||||||||||
| Industrials - 0.3% | ||||||||||||
| China Dredging Group Co., Ltd. ADR (China), $5.00 par, 0.000% (3)†(b) | 1,000,000 | 5,000,000 | ||||||||||
| Genesee & Wyoming, Inc., $100.00 par, 5.000% † | 13,325 | 1,484,538 | ||||||||||
| Timberjack Corp., $188,000.00 par, 0.000% (3)†(b) | 188,000 | 454,847 | ||||||||||
|
| |||||||||||
| 6,939,385 | ||||||||||||
|
| |||||||||||
| Information Technology - 0.0%(e) | ||||||||||||
| Authentidate Holding Corp., Series C ADR, $1.60 par, 0.000% (3)†(b) | 218,000 | 327,872 | ||||||||||
|
| |||||||||||
| Materials - 0.3% | ||||||||||||
| North Atlantic Trading Co. 144A, $97.00 par, 19.000% (2)(d)(f) | 2,080,000 | 2,225,600 | ||||||||||
| North Atlantic Trading Co. 144A, $98.00 par, 11.500% (2)(f) | 5,625,000 | 5,842,969 | ||||||||||
|
| |||||||||||
| 8,068,569 | ||||||||||||
|
| |||||||||||
TOTAL CONVERTIBLE PREFERRED STOCKS | 39,197,631 | |||||||||||
|
| |||||||||||
| The accompanying notes are an integral part of these financial statements. | (Continued) |
| 64 | AQR Funds | Annual Report | December 2012 | |||||||||||||
Table of Contents
| Schedule of Investments | December 31, 2012 |
| AQR DIVERSIFIED ARBITRAGE FUND |
| CORPORATE BONDS - 13.1% | INTEREST RATE | MATURITY DATE | PRINCIPAL AMOUNT (000’S) | VALUE (Note 2) | ||||||||||||
| Communications - 0.9% | ||||||||||||||||
| Baker & Taylor Acquisitions Corp. (3)(a)(b)(f) | 15.000% | 04/01/17 | $ | 3,250 | 2,242,500 | |||||||||||
| Clear Channel Communications, Inc. (2) | 5.750% | 01/15/13 | 2,700 | 2,700,000 | ||||||||||||
| Intelsat Investments SA (Luxembourg) (2)(a) | 6.500% | 11/01/13 | 7,200 | 7,470,000 | ||||||||||||
| Interactive Network, Inc./FriendFinder Networks, Inc. (2) | 14.000% | 09/30/13 | 775 | 676,307 | ||||||||||||
| Interactive Network, Inc./FriendFinder Networks, Inc. 144A (2)(d)(f) | 11.500% | 04/30/14 | 2,690 | 356,482 | ||||||||||||
| Primus Telecommunications Holding, Inc./Primus Telecommunications Canada, Inc. (3)(b)(f) | 13.000% | 12/15/16 | 1,150 | 1,134,153 | ||||||||||||
| WCP Wireless Site Funding / WCP Wireless Site RE Funding / WCP Wireless Site Non 144A (2)(f) | 9.247% | 11/15/15 | 3,000 | 3,180,549 | ||||||||||||
| WCP Wireless Site Funding / WCP Wireless Site RE Funding / WCP Wireless Site Non 144A (2)(f) | 6.829% | 11/15/15 | 3,325 | 3,599,499 | ||||||||||||
|
| |||||||||||||||
| 21,359,490 | ||||||||||||||||
|
| |||||||||||||||
| Consumer Discretionary - 2.6% | ||||||||||||||||
| Broder Bros Co. (3)(b)(d)(f) | 12.000% | 10/15/13 | 6,475 | 6,394,062 | ||||||||||||
| Brookstone Co., Inc. 144A (2)(f) | 13.000% | 10/15/14 | 516 | 490,200 | ||||||||||||
| Caesars Entertainment Operating Co., Inc. (2)(a) | 5.375% | 12/15/13 | 4,975 | 4,850,625 | ||||||||||||
| Cenveo Corp. (2) | 7.875% | 12/01/13 | 8,025 | 8,046,667 | ||||||||||||
| Empire Today LLC/Empire Today Finance Corp. (3)(a)(b)(f) | 11.375% | 02/01/17 | 3,250 | 3,453,125 | ||||||||||||
| HOA Restaurant Group LLC/HOA Finance Corp. 144A (2)(f) | 11.250% | 04/01/17 | 8,975 | 8,122,375 | ||||||||||||
| IDQ Holdings, Inc. 144A (2)(f) | 11.500% | 04/01/17 | 4,325 | 4,660,188 | ||||||||||||
| Mandalay Resort Group (2) | 7.625% | 07/15/13 | 13,375 | 13,642,500 | ||||||||||||
| Mastro’s Restaurants LLC/RRG Finance Corp. 144A (2)(f) | 12.000% | 06/01/17 | 6,625 | 6,890,000 | ||||||||||||
| MGM Resorts International (2)(a) | 6.750% | 04/01/13 | 5,900 | 5,966,375 | ||||||||||||
| Pegasus Solutions, Inc. 144A (2)(d)(f) | 13.000% | 04/15/14 | 3,784 | 3,405,262 | ||||||||||||
|
| |||||||||||||||
| 65,921,379 | ||||||||||||||||
|
| |||||||||||||||
| Consumer Staples - 0.1% | ||||||||||||||||
| Vector Group Ltd. (2) | 11.000% | 08/15/15 | 1,700 | 1,770,125 | ||||||||||||
|
| |||||||||||||||
| Energy - 2.2% | ||||||||||||||||
| Black Elk Energy Offshore Operations LLC / Black Elk Finance Corp. (3)(b) | 13.750% | 12/01/15 | 5,800 | 5,539,000 | ||||||||||||
| CCS, Inc. 144A (Canada) (2)(a)(f) | 11.000% | 11/15/15 | 4,800 | 4,788,000 | ||||||||||||
| Chesapeake Energy Corp. (2) | 7.625% | 07/15/13 | 7,250 | 7,467,500 | ||||||||||||
| EOAL Cyprus Holdings Ltd. (Cyprus) (2) | 20.000% | 06/22/13 | 350 | 420,000 | ||||||||||||
| EOAL Cyprus Holdings Ltd. (Cyprus) (2) | 20.000% | 06/22/13 | 230 | 276,210 | ||||||||||||
| EOAL Cyprus Holdings Ltd. (Cyprus) (3)(b)(h) | 15.000% | 07/15/15 | 4,100 | 205,000 | ||||||||||||
| Floatel International Ltd. (Bermuda) (3)(b) | 8.000% | 10/11/17 | 1,100 | 1,111,000 | ||||||||||||
| Global Rig Co. ASA (Norway) (3)(b) | 13.000% | 06/15/15 | 3,230 | 3,359,199 | ||||||||||||
| Golden Close Maritime Corp. Ltd. MTN (Bermuda) (3)(b) | 11.000% | 12/09/15 | 2,500 | 2,687,500 | ||||||||||||
| Green Field Energy Services, Inc. (3)(a)(b)(f) | 13.250% | 11/15/16 | 48 | 48,000 | ||||||||||||
| Green Field Energy Services, Inc. 144A (3)(b)(f) | 13.250% | 11/15/16 | 2,025 | 2,025,000 | ||||||||||||
| Harvest Natural Resources, Inc. (3)(b) | 11.000% | 10/11/14 | 5,975 | 5,795,750 | ||||||||||||
| Harvest Operations Corp. (Canada) (2) | 7.500% | 05/31/15 | CAD 275 | 287,524 | ||||||||||||
| InterOil Exploration and Production ASA (Norway) (2) | 15.000% | 03/14/14 | NOK 6,500 | 1,111,061 | ||||||||||||
| Offshore Group Investment Ltd. (Cayman Islands) (3)(b)(f) | 7.500% | 11/01/19 | $ | 399 | 402,990 | |||||||||||
| Offshore Group Investment Ltd. (Cayman Islands) (2) | 11.500% | 08/01/15 | 2,162 | 2,356,580 | ||||||||||||
| Panoro Energy ASA (Norway) (3)(b)(f) | 12.000% | 11/15/18 | NOK 2,100 | 2,220,750 | ||||||||||||
| Petrominerales Ltd. (Canada) (2) | 3.250% | 06/12/17 | $ | 3,200 | 2,662,080 | |||||||||||
| Polarcus Alima AS (Norway) (2) | 12.500% | 10/29/15 | 3,800 | 4,037,500 | ||||||||||||
| RDS Ultra-Deepwater Ltd. (Cayman Islands) (3)(b)(f) | 11.875% | 03/15/17 | 845 | 950,625 | ||||||||||||
| Regency Energy Partners LP/Regency Energy Finance Corp. (2) | 9.375% | 06/01/16 | 3,760 | 4,032,600 | ||||||||||||
| Sidewinder Drilling, Inc. (3)(a)(b)(f) | 9.750% | 11/15/19 | 3,750 | 3,768,750 | ||||||||||||
|
| |||||||||||||||
| 55,552,619 | ||||||||||||||||
|
| |||||||||||||||
| The accompanying notes are an integral part of these financial statements. | (Continued) |
| AQR Funds | Annual Report | December 2012 | 65 | |||||||||||||
Table of Contents
| Schedule of Investments | December 31, 2012 |
| AQR DIVERSIFIED ARBITRAGE FUND |
| INTEREST RATE | MATURITY DATE | PRINCIPAL AMOUNT (000’S) | VALUE (Note 2) | |||||||||||||
| Financials - 4.5% | ||||||||||||||||
| ABN Amro North American Holding Preferred Capital Repackage Trust I, Perpetual Bond (3)(a)(b)(f)(g) | 3.407% | 12/31/49 | $ | 6,175 | $ | 6,175,000 | ||||||||||
| AV Homes, Inc. (2) | 7.500% | 02/15/16 | 5,900 | 6,032,750 | ||||||||||||
| BPA Laboratories, Inc. 144A (2)(f) | 12.250% | 04/01/17 | 5,875 | 5,302,187 | ||||||||||||
| CFG Holdings Ltd. / CFG Finance LLC 144A (Cayman Islands) (2)(a)(f) | 11.500% | 11/15/19 | 6,412 | 6,412,000 | ||||||||||||
| CNO Financial Group, Inc. (2)(a) | 7.000% | 12/30/16 | 3,635 | 6,456,669 | ||||||||||||
| CNO Financial Group, Inc., Series UNRE (2) | 7.000% | 12/30/16 | 2,367 | 4,204,384 | ||||||||||||
| Global Investments Ltd. (Bermuda) (3)(b) | 11.000% | 09/24/17 | 2,200 | 2,145,000 | ||||||||||||
| Icahn Enterprises LP/Icahn Enterprises Finance Corp. (2) | 8.000% | 01/15/18 | 4,530 | 4,864,088 | ||||||||||||
| ING Capital Funding Trust III, Perpetual Bond, Series 9 (2)(g) | 3.911% | 12/29/49 | 3,875 | 3,678,816 | ||||||||||||
| iStar Financial, Inc. (2) | 8.625% | 06/01/13 | 5,175 | 5,310,844 | ||||||||||||
| iStar Financial, Inc., Series B (2) | 5.950% | 10/15/13 | 15,050 | 15,369,812 | ||||||||||||
| Jasper Explorer Ltd. (Cyprus) (2) | 13.500% | 05/27/16 | 6,000 | 4,740,000 | ||||||||||||
| KCAP Financial, Inc. (2) | 8.750% | 03/15/16 | 4,000 | 4,622,500 | ||||||||||||
| MF Global Holdings Ltd. (2)(h) | 3.375% | 08/01/18 | 2,750 | 1,751,406 | ||||||||||||
| Rouse Co./The (3)(a)(b) | 6.750% | 11/09/15 | 4,045 | 4,242,194 | ||||||||||||
| Speedy Cash Intermediate Holdings Corp. 144A (2)(f) | 10.750% | 05/15/18 | 10,950 | 11,661,750 | ||||||||||||
| Synovus Financial Corp. (2) | 5.125% | 06/15/17 | 1,375 | 1,361,250 | ||||||||||||
| TMX Finance LLC / TitleMax Finance Corp. (3)(b) | 13.250% | 07/15/15 | 6,115 | 6,787,650 | ||||||||||||
| TMX Finance LLC/ TitleMax Finance Corp. (3)(b) | 13.250% | 07/15/15 | 11,378 | 12,629,580 | ||||||||||||
|
| |||||||||||||||
| 113,747,880 | ||||||||||||||||
|
| |||||||||||||||
| Health Care - 0.4% | ||||||||||||||||
| KV Pharmaceutical Co. (2)(h) | 12.000% | 03/15/15 | 8,175 | 6,540,000 | ||||||||||||
| MannKind Corp. (2) | 5.750% | 08/15/15 | 1,540 | 918,225 | ||||||||||||
| Merge Healthcare, Inc. (2)(a) | 11.750% | 05/01/15 | 1,930 | 2,072,337 | ||||||||||||
| Select Medical Corp. (2) | 7.625% | 02/01/15 | 1,638 | 1,640,048 | ||||||||||||
| US Oncology, Inc. (3)(b)(h) | 9.125% | 08/15/17 | 5,786 | — | ||||||||||||
|
| |||||||||||||||
| 11,170,610 | ||||||||||||||||
|
| |||||||||||||||
| Industrials - 1.7% | ||||||||||||||||
| AAR Corp. (2)(a) | 1.750% | 02/01/26 | 2,200 | 2,194,500 | ||||||||||||
| American Piping Products, Inc. (3)(b)(f) | 12.875% | 11/15/17 | 1,975 | 1,935,500 | ||||||||||||
| Boa Deep C AS (Norway) (3)(b)(g) | 7.380% | 04/27/16 | NOK | 17,219 | 3,144,623 | |||||||||||
| Chloe Marine Corp. Ltd. (Bermuda) (3)(b) | 12.000% | 12/28/16 | $ | 1,400 | 1,533,000 | |||||||||||
| MasTec, Inc. (2) | 4.250% | 12/15/14 | 2,400 | 4,065,000 | ||||||||||||
| Ship Finance International Ltd. (Bermuda) (2) | 8.500% | 12/15/13 | 5,625 | 5,632,031 | ||||||||||||
| Ship Finance International Ltd. 144A (Bermuda) (2)(f)(g) | 5.820% | 04/07/14 | NOK | 51,000 | 9,220,064 | |||||||||||
| Songa Offshore SE (Cyprus) (2)(g) | 12.100% | 11/17/16 | 15,000 | 2,570,735 | ||||||||||||
| Songa Offshore SE (Cyprus) (2) | 9.810% | 06/11/15 | 25,500 | 4,152,310 | ||||||||||||
| Tempel Steel Co. 144A (2)(a)(f) | 12.000% | 08/15/16 | $ | 5,625 | 5,076,563 | |||||||||||
| United Continental Holdings, Inc. (2) | 6.860% | 04/22/14 | 1,147 | 1,152,835 | ||||||||||||
| Western Express, Inc. 144A (2)(f) | 12.500% | 04/15/15 | 2,300 | 1,403,000 | ||||||||||||
|
| |||||||||||||||
| 42,080,161 | ||||||||||||||||
|
| |||||||||||||||
| Information Technology - 0.2% | ||||||||||||||||
| Bankrate, Inc. (2) | 11.750% | 07/15/15 | 1,077 | 1,188,739 | ||||||||||||
| Freescale Semiconductor, Inc. (2) | 8.875% | 12/15/14 | 2,030 | 2,047,762 | ||||||||||||
| GT Advanced Technologies, Inc. (2)(a) | 3.000% | 10/01/17 | 3,325 | 2,418,938 | ||||||||||||
| SouthPeak Interactive Corp. (3)(b)(h) | 29.000% | 12/31/13 | 1,091 | 141,862 | ||||||||||||
|
| |||||||||||||||
| 5,797,301 | ||||||||||||||||
|
| |||||||||||||||
| The accompanying notes are an integral part of these financial statements. | (Continued) |
| 66 | AQR Funds | Annual Report | December 2012 | |||||||||||||
Table of Contents
| Schedule of Investments | December 31, 2012 |
| AQR DIVERSIFIED ARBITRAGE FUND |
| INTEREST RATE | MATURITY DATE | PRINCIPAL AMOUNT (000’S) | VALUE (Note 2) | |||||||||||||
| Materials - 0.3% | ||||||||||||||||
| Appleton Papers, Inc. 144A (2)(f) | 10.500% | 06/15/15 | $ | 600 | $ | 636,000 | ||||||||||
| Cereplast, Inc. (3)(b) | 15.000% | 03/21/13 | 178 | 177,983 | ||||||||||||
| Jaguar Mining, Inc. (2) | 5.500% | 03/31/16 | 500 | 217,500 | ||||||||||||
| Standard Steel LLC / Standard Steel Finance Corp. (3)(b)(f) | 12.000% | 05/01/15 | 5,631 | 6,123,713 | ||||||||||||
|
| |||||||||||||||
| 7,155,196 | ||||||||||||||||
|
| |||||||||||||||
| Telecommunication Services - 0.1% | ||||||||||||||||
| FiberTower Corp. (3)(b)(h) | 9.000% | 01/01/16 | 4,444 | 866,596 | ||||||||||||
| MediMedia USA, Inc. (3)(a)(b)(f) | 11.375% | 11/15/14 | 2,350 | 2,279,500 | ||||||||||||
|
| |||||||||||||||
| 3,146,096 | ||||||||||||||||
|
| |||||||||||||||
| Utilities - 0.1% | ||||||||||||||||
| Atlantic Offshore (Norway) (2) | 11.830% | 06/27/15 | NOK | 12,000 | 2,159,147 | |||||||||||
|
| |||||||||||||||
TOTAL CORPORATE BONDS | 329,860,004 | |||||||||||||||
|
| |||||||||||||||
| CONVERTIBLE BONDS - 6.6% | ||||||||||||||||
| Consumer Discretionary - 1.1% | ||||||||||||||||
| M/I Homes, Inc. (2) | 3.250% | 09/15/17 | $ | 2,300 | 2,932,500 | |||||||||||
| Meritage Homes Corp. (2) | 1.875% | 09/15/32 | 2,475 | 2,464,172 | ||||||||||||
| Palm Harbor Homes, Inc. (3)(b)(h) | 3.250% | 05/15/24 | 70 | 2,800 | ||||||||||||
| Standard Pacific Corp. (2)(a) | 1.250% | 08/01/32 | 975 | 1,143,187 | ||||||||||||
| Toll Brothers Finance Corp. 144A (2)(a)(f) | 0.500% | 09/15/32 | 875 | 881,563 | ||||||||||||
| Volkswagen International Finance NV 144A (Netherlands) (2)(f) | 5.500% | 11/09/15 | EUR | 13,500 | 19,663,625 | |||||||||||
|
| |||||||||||||||
| 27,087,847 | ||||||||||||||||
|
| |||||||||||||||
| Consumer Staples - 0.6% | ||||||||||||||||
| Central European Distribution Corp. (2) | 3.000% | 03/15/13 | $ | 3,875 | 1,976,250 | |||||||||||
| Vector Group Ltd. (2)(g) | 2.500% | 01/15/19 | 5,950 | 6,483,287 | ||||||||||||
| Vector Group Ltd. (2)(g) | 3.750% | 11/15/14 | 6,504 | 7,703,175 | ||||||||||||
| Vector Group Ltd. (2) | 3.875% | 06/15/26 | 58 | 59,160 | ||||||||||||
|
| |||||||||||||||
| 16,221,872 | ||||||||||||||||
|
| |||||||||||||||
| Energy - 1.1% | ||||||||||||||||
| Cal Dive International, Inc. 144A (2)(f) | 5.000% | 07/15/17 | 2,275 | 2,262,203 | ||||||||||||
| Cobalt International Energy, Inc. (2) | 2.625% | 12/01/19 | 6,400 | 6,460,000 | ||||||||||||
| Heckmann Corp. (2)(a) | 9.875% | 04/15/18 | 3,950 | 4,078,375 | ||||||||||||
| PetroBakken Energy Ltd., Reg S (Canada) (2) | 3.125% | 02/08/16 | 2,900 | 2,869,550 | ||||||||||||
| Petrominerales Ltd., Series PMG (Canada) (2) | 2.625% | 08/25/16 | 1,900 | 1,844,900 | ||||||||||||
| Polarcus Ltd., Series PLCS (Norway) (2) | 2.875% | 04/27/16 | 400 | 409,680 | ||||||||||||
| Vantage Drilling Co. (Cayman Islands) (2)(a) | 7.875% | 09/01/42 | 4,625 | 5,142,422 | ||||||||||||
| ZaZa Energy Corp. 144A (2)(f) | 9.000% | 08/01/17 | 3,550 | 3,674,250 | ||||||||||||
|
| |||||||||||||||
| 26,741,380 | ||||||||||||||||
|
| |||||||||||||||
| Financials - 0.7% | ||||||||||||||||
| AV Homes, Inc. (2) | 7.500% | 02/15/16 | 200 | 202,000 | ||||||||||||
| CNO Financial Group, Inc., Series 1 (2)(a) | 7.000% | 12/30/16 | 3,963 | 7,039,279 | ||||||||||||
| iStar Financial, Inc. (2) | 3.000% | 11/15/16 | 2,800 | 2,852,500 | ||||||||||||
| Janus Capital Group, Inc. (2) | 3.250% | 07/15/14 | 250 | 259,687 | ||||||||||||
| Jefferies Group, Inc. (2) | 3.875% | 11/01/29 | 3,175 | 3,145,234 | ||||||||||||
| Knight Capital Group, Inc. (2) | 3.500% | 03/15/15 | 800 | 794,500 | ||||||||||||
| TICC Capital Corp. 144A (2)(a)(f) | 7.500% | 11/01/17 | 3,550 | 3,474,563 | ||||||||||||
|
| |||||||||||||||
| 17,767,763 | ||||||||||||||||
|
| |||||||||||||||
| The accompanying notes are an integral part of these financial statements. | (Continued) |
| AQR Funds | Annual Report | December 2012 | 67 | |||||||||||||
Table of Contents
| Schedule of Investments | December 31, 2012 |
| AQR DIVERSIFIED ARBITRAGE FUND |
| INTEREST RATE | MATURITY DATE | PRINCIPAL AMOUNT (000’S) | VALUE (Note 2) | |||||||||||||
| Health Care - 1.2% | ||||||||||||||||
| Adcare Health Systems, Inc. (3)(b) | 10.000% | 10/26/13 | $ | 1,850 | $ | 2,138,776 | ||||||||||
| Enzon Pharmaceuticals, Inc. (3)(b) | 4.000% | 06/01/13 | 1,850 | 1,856,937 | ||||||||||||
| Exelixis, Inc. (2)(a) | 4.250% | 08/15/19 | 3,350 | 3,259,969 | ||||||||||||
| MannKind Corp. (2)(a) | 3.750% | 12/15/13 | 500 | 352,500 | ||||||||||||
| Medicis Pharmaceutical Corp. (3)(b) | 1.375% | 06/01/17 | 17,575 | 19,215,099 | ||||||||||||
| Sequenom, Inc. 144A (2)(a)(f) | 5.000% | 10/01/17 | 2,825 | 3,370,578 | ||||||||||||
|
| |||||||||||||||
| 30,193,859 | ||||||||||||||||
|
| |||||||||||||||
| Industrials - 0.4% | ||||||||||||||||
| China Linen Textile Industry Ltd. (Cayman Islands) (3)(b)(h) | 7.500% | 12/31/13 | 1,850 | 878,545 | ||||||||||||
| Lufthansa Malta Blues LP, Series JBLU 144A (Malta) (2)(f) | 0.750% | 04/05/17 | EUR | 2,800 | 4,066,185 | |||||||||||
| MasTec, Inc. (2)(a) | 4.000% | 06/15/14 | $ | 2,125 | 3,490,312 | |||||||||||
| Ultrapetrol Bahamas Ltd. 144A (Bahamas) (2)(f) | 7.250% | 01/15/17 | 900 | 896,625 | ||||||||||||
|
| |||||||||||||||
| 9,331,667 | ||||||||||||||||
|
| |||||||||||||||
| Information Technology - 0.1% | ||||||||||||||||
| Hutchinson Technology, Inc. (2) | 8.500% | 01/15/26 | 95 | 55,813 | ||||||||||||
| Quantum Corp. 144A (2)(a)(f) | 4.500% | 11/15/17 | �� | 1,650 | 1,633,500 | |||||||||||
| SouthPeak Interactive Corp. (3)(b)(h) | 10.000% | 07/19/13 | 2,500 | 275,000 | ||||||||||||
|
| |||||||||||||||
| 1,964,313 | ||||||||||||||||
|
| |||||||||||||||
| Materials - 0.1% | ||||||||||||||||
| Cereplast, Inc. (3)(b)(h) | 7.000% | 06/01/16 | 4,450 | 1,910,754 | ||||||||||||
| ShengdaTech, Inc. (3)(b)(f)(h) | 6.500% | 12/15/15 | 1,200 | 12,000 | ||||||||||||
| ShengdaTech, Inc. (3)(b)(f)(h) | 6.000% | 06/01/18 | 300 | 3,000 | ||||||||||||
| Stillwater Mining Co., Series SWC (2) | 1.750% | 10/15/32 | 1,225 | 1,427,891 | ||||||||||||
|
| |||||||||||||||
| 3,353,645 | ||||||||||||||||
|
| |||||||||||||||
| Telecommunication Services - 1.3% | ||||||||||||||||
| Level 3 Communications, Inc. (2) | 6.500% | 10/01/16 | 13,525 | 19,129,422 | ||||||||||||
| Level 3 Communications, Inc. (2) | 15.000% | 01/15/13 | 10,975 | 11,853,000 | ||||||||||||
| Level 3 Communications, Inc., Series B (2) | 7.000% | 03/15/15 | 1,280 | 1,522,400 | ||||||||||||
|
| |||||||||||||||
| 32,504,822 | ||||||||||||||||
|
| |||||||||||||||
TOTAL CONVERTIBLE BONDS | 165,167,168 | |||||||||||||||
|
| |||||||||||||||
| BANK LOANS - 1.1% | ||||||||||||||||
| Consumer Discretionary - 0.3% | ||||||||||||||||
| Eastman Kodak Co. (2) | 8.500% | 07/20/13 | 7,863 | 7,865,136 | ||||||||||||
|
| |||||||||||||||
| Energy - 0.8% | ||||||||||||||||
| Overseas Shipholding Group, Inc. (2) | 2.958% | 02/08/13 | 80 | 68,375 | ||||||||||||
| Overseas Shipholding Group, Inc. (2) | 2.959% | 02/08/13 | 1,717 | 1,474,621 | ||||||||||||
| Overseas Shipholding Group, Inc. (2) | 2.961% | 02/08/13 | 1,114 | 957,250 | ||||||||||||
| Overseas Shipholding Group, Inc. (2) | 2.961% | 02/08/13 | 27 | 22,792 | ||||||||||||
| Overseas Shipholding Group, Inc. (2) | 0.750% | 02/08/13 | 24 | 20,845 | ||||||||||||
| Overseas Shipholding Group, Inc. (2) | 2.961% | 02/08/13 | 119 | 102,563 | ||||||||||||
| Overseas Shipholding Group, Inc. (2) | 2.960% | 02/08/13 | 398 | 341,875 | ||||||||||||
| Overseas Shipholding Group, Inc. (2) | 2.959% | 02/08/13 | 496 | 426,204 | ||||||||||||
| Patriot Coal Corp. (2) | 9.250% | 12/31/49 | 5,167 | 5,182,838 | ||||||||||||
| Patriot Coal Corp. (2) | 9.250% | 12/31/49 | 10,333 | 10,365,677 | ||||||||||||
|
| |||||||||||||||
| 18,963,040 | ||||||||||||||||
|
| |||||||||||||||
TOTAL BANK LOANS | 26,828,176 | |||||||||||||||
|
| |||||||||||||||
| The accompanying notes are an integral part of these financial statements. | (Continued) |
| 68 | AQR Funds | Annual Report | December 2012 | |||||||||||||
Table of Contents
| Schedule of Investments | December 31, 2012 |
| AQR DIVERSIFIED ARBITRAGE FUND |
| CLOSED END FUNDS - 2.8% | SHARES | VALUE (Note 2) | ||||||
| Adams Express Co. | 6,691 | $ | 70,858 | |||||
| Advent Claymore Convertible Securities and Income Fund (a) | 6,434 | 103,716 | ||||||
| Advent Claymore Convertible Securities and Income Fund II | 103,668 | 671,769 | ||||||
| Advent Claymore Enhanced Growth & Income Fund (a) | 25,046 | 227,919 | ||||||
| ASA Gold and Precious Metals Ltd. (Bermuda) (a) | 29,928 | 644,350 | ||||||
| BlackRock Core Bond Trust | 116,352 | 1,733,645 | ||||||
| BlackRock Credit Allocation Income Trust IV | 416,046 | 5,712,315 | ||||||
| BlackRock Energy and Resources Trust | 468 | 11,021 | ||||||
| BlackRock Enhanced Capital and Income Fund, Inc. | 49,000 | 608,580 | ||||||
| BlackRock Enhanced Equity Dividend Trust | 491,166 | 3,526,572 | ||||||
| BlackRock Global Opportunities Equity Trust (a) | 135,096 | 1,783,267 | ||||||
| BlackRock Income Opportunity Trust, Inc. | 157,562 | 1,786,753 | ||||||
| BlackRock International Growth and Income Trust | 236,094 | 1,735,291 | ||||||
| BlackRock Real Asset Equity Trust | 1,672 | 17,155 | ||||||
| BlackRock Resources & Commodities Strategy Trust | 76,137 | 974,554 | ||||||
| Calamos Convertible and High Income Fund | 7,445 | 90,457 | ||||||
| CBRE Clarion Global Real Estate Income Fund (a) | 22,636 | 200,555 | ||||||
| Central Securities Corp. | 8,781 | 175,444 | ||||||
| Clough Global Equity Fund (a) | 42,417 | 551,421 | ||||||
| Cohen & Steers Global Income Builder, Inc. | 16,633 | 171,653 | ||||||
| Cutwater Select Income Fund (a) | 67 | 1,317 | ||||||
| Eaton Vance Enhanced Equity Income Fund | 181,099 | 1,930,515 | ||||||
| Eaton Vance Enhanced Equity Income Fund II | 199,776 | 2,085,661 | ||||||
| Eaton Vance Risk-Managed Diversified Equity Income Fund | 547,623 | 5,711,708 | ||||||
| Eaton Vance Tax Managed Global Buy Write Opportunities Fund | 487,874 | 5,215,373 | ||||||
| Eaton Vance Tax-Advantaged Dividend Income Fund | 82,079 | 1,354,303 | ||||||
| Eaton Vance Tax-Advantaged Global Dividend Opportunities Fund | 55,512 | 1,115,236 | ||||||
| Eaton Vance Tax-Managed Buy-Write Income Fund | 66,184 | 928,562 | ||||||
| Eaton Vance Tax-Managed Buy-Write Opportunities Fund | 163,140 | 2,039,250 | ||||||
| Eaton Vance Tax-Managed Diversified Equity Income Fund | 641,571 | 6,011,520 | ||||||
| Eaton Vance Tax-Managed Global Diversified Equity Income Fund | 1,127,139 | 9,930,095 | ||||||
| First Opportunity Fund, Inc. † | 26,788 | 206,000 | ||||||
| CLOSED END FUNDS - 2.8% (continued) | SHARES | VALUE (Note 2) | ||||||
| First Trust Aberdeen Emerging Opportunity Fund | 3,150 | $ | 69,457 | |||||
| First Trust Enhanced Equity Income Fund | 30,306 | 358,823 | ||||||
| Gabelli Dividend & Income Trust | 10,158 | 164,356 | ||||||
| ING Global Advantage and Premium Opportunity Fund | 5,945 | 67,476 | ||||||
| ING Global Equity Dividend & Premium Opportunity Fund | 46,706 | 404,941 | ||||||
| ING Infrastructure Industrials and Materials Fund | 360 | 5,900 | ||||||
| ING Risk Managed Natural Resources Fund | 4,327 | 44,741 | ||||||
| Invesco Bond Fund | 42,334 | 903,408 | ||||||
| Invesco Dynamic Credit Opportunities Fund | 51,267 | 639,812 | ||||||
| John Hancock Hedged Equity & Income Fund | 32,427 | 494,836 | ||||||
| John Hancock Tax-Advantaged Dividend Income Fund | 727 | 13,115 | ||||||
| Lazard Global Total Return and Income Fund, Inc. | 13,536 | 204,258 | ||||||
| Madison Covered Call & Equity Strategy Fund | 58,184 | 443,362 | ||||||
| Montgomery Street Income Securities, Inc. | 6,483 | 109,563 | ||||||
| Morgan Stanley Emerging Markets Fund, Inc. | 14,406 | 223,293 | ||||||
| Morgan Stanley Income Securities, Inc. | 22,748 | 419,473 | ||||||
| NFJ Dividend Interest & Premium Strategy Fund | 13,135 | 204,906 | ||||||
| Nuveen Core Equity Alpha Fund | 2,239 | 29,891 | ||||||
| Nuveen Equity Premium Advantage Fund | 69,690 | 829,311 | ||||||
| Nuveen Equity Premium and Growth Fund | 33,266 | 430,129 | ||||||
| Nuveen Equity Premium Income Fund | 73,723 | 872,143 | ||||||
| Nuveen Equity Premium Opportunity Fund | 67,405 | 813,578 | ||||||
| Nuveen Global Value Opportunities Fund | 815 | 12,152 | ||||||
| Nuveen Quality Preferred Income Fund | 10,824 | 93,844 | ||||||
| Nuveen Quality Preferred Income Fund II | 118,168 | 1,117,869 | ||||||
| Nuveen Quality Preferred Income Fund III | 4,186 | 37,214 | ||||||
| Nuveen Tax-Advantaged Total Return Strategy Fund | 16,300 | 171,313 | ||||||
| Petroleum & Resources Corp. | 43,260 | 1,034,779 | ||||||
| Royce Focus Trust, Inc. | 85,665 | 565,389 | ||||||
| Royce Value Trust, Inc. | 925 | 12,413 | ||||||
| Source Capital, Inc. | 2,664 | 139,114 | ||||||
| Templeton Emerging Markets Fund | 1,082 | 21,640 | ||||||
| Tri-Continental Corp. | 6,492 | 103,872 | ||||||
| Wells Fargo Advantage Global Dividend Opportunity Fund | 833 | 6,306 | ||||||
| The accompanying notes are an integral part of these financial statements. | (Continued) |
| AQR Funds | Annual Report | December 2012 | 69 | |||||||||||||
Table of Contents
| Schedule of Investments | December 31, 2012 |
| AQR DIVERSIFIED ARBITRAGE FUND |
| CLOSED END FUNDS - 2.8% (continued) | SHARES | VALUE (Note 2) | ||||||
| Western Asset Global Corporate Defined Opportunity Fund, Inc. | 63,106 | $ | 1,309,450 | |||||
| Western Asset Income Fund | 6,209 | 92,017 | ||||||
| Zweig Fund, Inc. | 3,946 | 48,102 | ||||||
|
| |||||||
TOTAL CLOSED END FUNDS | 69,839,081 | |||||||
|
| |||||||
| EXCHANGE TRADED FUNDS - 0.1% | ||||||||
SPDR Barclays High Yield Bond ETF | 56,184 | 2,286,689 | ||||||
|
| |||||||
| PREFERRED STOCKS - 0.1% | ||||||||
| Financials - 0.1% | ||||||||
| Ally Financial, Inc., Perpetual Preferred Stock, | ||||||||
144A, 7.00%, 03/07/13 (2)(a)(f)(m) | 2,175 | 2,136,190 | ||||||
|
| |||||||
| Utilities - 0.0% (e) | ||||||||
Genie Energy Ltd., Perpetual Preferred Stock, Series 12-A†, 7.50%, 11/15/16 (g)(m) | 219,216 | 1,545,473 | ||||||
|
| |||||||
TOTAL PREFERRED STOCKS | 3,681,663 | |||||||
|
| |||||||
| RIGHTS - 0.0% (e) | ||||||||
| Health Care - 0.0% (e) | ||||||||
American Medical Alert Corp. (3)†(b) | 283,523 | 2,835 | ||||||
|
| |||||||
| Information Technology - 0.0% (e) | ||||||||
Gerber Scientific, Inc. (3)†(b) | 879,944 | — | ||||||
|
| |||||||
TOTAL RIGHTS | 2,835 | |||||||
|
| |||||||
| SHORT-TERM INVESTMENTS -4.8% | PRINCIPAL AMOUNT (000’S) | |||||||
U.S. Treasury Bill, 0.000% 6/20/2013(i) | $ | 120,700 | 120,640,495 | |||||
|
| |||||||
| WARRANTS - 0.8% | SHARES | |||||||
| Consumer Discretionary - 0.1% | ||||||||
| Kandi Technologies Corp. (3)†(b) | 169,478 | 29,981 | ||||||
| RLJ Entertainment, Inc. † | 799,518 | 175,894 | ||||||
| Tile Shop Holdings, Inc. † | 319,611 | 1,748,272 | ||||||
|
| |||||||
| 1,954,147 | ||||||||
|
| |||||||
| Consumer Staples - 0.0% (e) | ||||||||
| Celsius Holdings, Inc. (3)†(b) | 52,500 | 89 | ||||||
| HQ Sustainable Maritime Industries, Inc. (3)†(b) | 62,284 | 6 | ||||||
|
| |||||||
| 95 | ||||||||
|
| |||||||
| Energy - 0.0% (e) | ||||||||
| Camac Energy, Inc. (3)†(b) | 88,191 | 3,907 | ||||||
| Green Field Energy Services, Inc. (3)†(b) | 2,025 | 60,750 | ||||||
| Harvest Natural Resources, Inc. (3)†(b) | 51,454 | 108,542 | ||||||
| Pacific Ethanol, Inc. (3)†(b) | 318,750 | 31,259 | ||||||
| SHARES | VALUE (Note 2) | |||||||
| Energy - 0.0% (e) (continued) | ||||||||
| Plug Power, Inc. (3)†(b) | 88,875 | $ | 3,990 | |||||
| Syntroleum Corp. (3)†(b) | 253,165 | 5,418 | ||||||
|
| |||||||
| 213,866 | ||||||||
|
| |||||||
| Financials - 0.7% | ||||||||
| Andina Acquisition Corp. †(a) | 415,800 | 62,370 | ||||||
| Associated Banc-Corp †(a) | 20,065 | 21,269 | ||||||
| Australia Acquisition Corp. (Australia) (3)†(b) | 612,000 | — | ||||||
| Azteca Acquisition Corp. (3)†(a)(b) | 800,000 | 160,000 | ||||||
| BGS Acquisition Corp. (Argentina) †(a) | 671,160 | 87,251 | ||||||
| Blue Wolf Mongolia Holdings Corp. †(a) | 526,500 | 52,650 | ||||||
| Boston Private Financial Holdings, Inc. †(a) | 97,674 | 290,092 | ||||||
| China Growth Equity Investment Ltd. (China) † | 395,000 | 51,350 | ||||||
| Comerica, Inc. † | 45,508 | 307,291 | ||||||
| Empeiria Acquisition Corp. † | 680,000 | 272,000 | ||||||
| European CleanTech SE (Germany) (3)†(b) | 621,000 | 122,953 | ||||||
| exceet Group SE (Germany) (2)† | 72,000 | 18,057 | ||||||
| Gerova Financial Group Ltd. (Bermuda) (3)†(b) | 138,792 | 1,388 | ||||||
| Global Cornerstone Holdings Ltd. † | 632,000 | 126,400 | ||||||
| Global Eagle Acquisition Corp. † | 1,382,500 | 967,750 | ||||||
| Infinity Cross Border Acquisition Corp. (Israel) † | 287,100 | 169,389 | ||||||
| IVS Group (Luxembourg) (3)†(b) | 590,301 | 280,500 | ||||||
| Jack Cooper Holdings Corp. (2)†(a) | 2,223 | 271,206 | ||||||
| Lincoln National Corp. † | 49,759 | 856,850 | ||||||
| Lone Oak Acquisition Corp. (Hong Kong) (3)†(b) | 328,820 | 49,323 | ||||||
| Nautilus Marine Acquisition Corp. (Greece) † | 777,600 | 194,400 | ||||||
| Neostem (3)†(b) | 243,000 | 23,328 | ||||||
| Prime Acquisition Corp. (China) † | 423,935 | 67,830 | ||||||
| ROI Acquisition Corp. (3)†(b) | 756,000 | 254,016 | ||||||
| SCG Financial Acquistion Corp. † | 631,210 | 157,802 | ||||||
| Selway Capital Acquisition Corp. † | 414,792 | 207,396 | ||||||
| Signature Bank † | 107,610 | 4,557,283 | ||||||
| Texas Capital Bancshares, Inc. † | 16,077 | 480,542 | ||||||
| Trio Merger Corp. † | 456,000 | 182,400 | ||||||
| Universal Business Payment Solutions Acquisition Corp. (2)† | 947,052 | 246,233 | ||||||
| Valley National Bancorp † | 49,509 | 19,804 | ||||||
| Wintrust Financial Corp. † | 415,782 | 6,943,559 | ||||||
|
| |||||||
| 17,502,682 | ||||||||
|
| |||||||
| Health Care - 0.0% (e) | ||||||||
| Access Pharmaceuticals, Inc. (3)†(b) | 68,407 | 27 | ||||||
| ADVENTRX Pharmaceuticals, Inc. (3)†(b) | 103,750 | 20,449 | ||||||
| Bionovo, Inc. (3)†(b) | 39,373 | 4 | ||||||
| Cormedix, Inc. †(a) | 75,400 | 8,392 | ||||||
| CryoPort, Inc. (3)†(b) | 1,704,825 | 94,819 | ||||||
| The accompanying notes are an integral part of these financial statements. | (Continued) |
| 70 | AQR Funds | Annual Report | December 2012 | |||||||||||||
Table of Contents
| Schedule of Investments | December 31, 2012 |
| AQR DIVERSIFIED ARBITRAGE FUND |
| SHARES | VALUE (Note 2) | |||||||
| Health Care - 0.0% (e) (continued) | ||||||||
| CytRx Corp. (3)†(b) | 2,268,000 | $ | 41,051 | |||||
| Galena Biopharma, Inc. (3)†(b) | 510,000 | 148,002 | ||||||
| InspireMD, Inc. (United Kingdom) (3)†(b) | 67,911 | 18,553 | ||||||
| IntelliPharmaCeutics International, Inc., Series A (3)†(b) | 220,000 | 96,272 | ||||||
| IntelliPharmaCeutics International, Inc., Series B (3)†(b) | 220,000 | 30,536 | ||||||
| MannKind Corp. † | 425,000 | 140,250 | ||||||
| Opexa Therapeutics, Inc. (3)†(b) | 47,362 | 455 | ||||||
| Pluristem Therapeutics, Inc. (Israel) (3)†(b) | 173,242 | 98,679 | ||||||
| Pluristem Therapeutics, Inc. (Israel) † | 63,750 | 19,125 | ||||||
| Provectus Pharmaceuticals, Inc., Series A (3)†(b) | 881,558 | 20,540 | ||||||
| Provectus Pharmaceuticals, Inc., Series C (3)†(b) | 617,090 | 14,378 | ||||||
| ReGeneRx Biopharmaceuticals, Inc. (3)†(b) | 240,000 | 2,400 | ||||||
| Rexahn Pharmaceuticals, Inc. (3)†(b) | 1,402,500 | 138,146 | ||||||
| Rosetta Genomics Ltd. (Israel) (3)†(b) | 688,211 | 5,536 | ||||||
| RXi Pharmaceuticals Corp. (3)†(b) | 144,175 | 133,362 | ||||||
| Synergy Pharmaceuticals, Inc. (3)†(b) | 82,000 | 112,701 | ||||||
| Zogenix, Inc. (3)†(b) | 38,250 | 11,265 | ||||||
|
| |||||||
| 1,154,942 | ||||||||
|
| |||||||
| Industrials - 0.0% (e) | ||||||||
| China Wood, Inc. (3)†(b) | 94,000 | 56,851 | ||||||
| Plastec Technologies Ltd. (Hong Kong) (3)†(b) | 56,004 | 5,601 | ||||||
| Spherix, Inc. (3)†(b) | 196,441 | 923 | ||||||
|
| |||||||
| 63,375 | ||||||||
|
| |||||||
| Information Technology - 0.0% (e) | ||||||||
| Authentidate Holding Corp. (3)†(b) | 1,377,760 | 112,166 | ||||||
| Magic Software Enterprises Ltd. (Israel) (3)†(b) | 132,782 | 22,785 | ||||||
| Microvision, Inc. (3)†(b) | 42,000 | 27,888 | ||||||
| Net Element International, Inc. (Bulgaria) (3)†(b) | 319,668 | 47,950 | ||||||
| Orckit Communications Ltd. (Israel) (3)†(b) | 84,282 | 9 | ||||||
| SinoHub, Inc. (China) (3)†(b) | 267,392 | 27 | ||||||
|
| |||||||
| 210,825 | ||||||||
|
| |||||||
| Materials - 0.0% (e) | ||||||||
| AUMN (3)†(b) | 73,912 | 53,823 | ||||||
| Aurcana Corp. (Canada) (3)†(b) | 623,387 | 305,335 | ||||||
| Calvista Gold Corp. (Canada) (3)†(b) | 100,000 | — | ||||||
| Cereplast, Inc. (3)†(b) | 64,539 | 6 | ||||||
| China Shen Zhou Mining & Resources, Inc. (China) (3)†(b) | 66,762 | 921 | ||||||
| Edgewater Exploration Ltd. (Canada) (3)†(b) | 250,000 | 930 | ||||||
| Energy Fuels, Inc. (Canada) (3)†(b) | 360,000 | 3,800 | ||||||
| SHARES | VALUE (Note 2) | |||||||
| Materials - 0.0% (e) (continued) | ||||||||
| Kangaroo Resources Ltd. (Australia) (3)†(b) | 24,137,931 | $ | 62,759 | |||||
|
| |||||||
| 427,574 | ||||||||
|
| |||||||
| Utilities - 0.0%(e) | ||||||||
| China Hydroelectric Corp. (China) † | 24,500 | 135 | ||||||
|
| |||||||
TOTAL WARRANTS | 21,527,641 | |||||||
|
| |||||||
| MONEY MARKET FUNDS - 27.7% | ||||||||
| Dreyfus Treasury Cash Management, Class I, 0.010% (2)(j) | 101,526,932 | 101,526,932 | ||||||
| J.P. Morgan Prime Money Market Fund - Capital Shares, 0.120% (2)(j)(k) | 319,451,802 | 319,451,802 | ||||||
| J.P. Morgan U.S. Treasury Plus Money Market Fund - Institutional Shares, 0.000% (2)(j) | 173,377,291 | 173,377,291 | ||||||
| UBS Money Series - UBS Select Treasury Preferred Fund, Class I, 0.010% (2)(j) | 101,526,932 | 101,526,932 | ||||||
|
| |||||||
TOTAL MONEY MARKET FUNDS | 695,882,957 | |||||||
|
| |||||||
| INVESTMENTS OF CASH COLLATERAL FOR SECURITIES ON LOAN - 0.0% (e) | ||||||||
| J.P. Morgan Prime Money Market | ||||||||
Fund - Capital Shares, 0.120% (2)(j) | 161,950 | 161,950 | ||||||
|
| |||||||
| PURCHASED OPTIONS - 0.0%(e) | CONTRACTS/ NOTIONAL | |||||||
| Put - Knight Capital Group, Inc., Expires 07/20/13, Strike $4.00 | 372 | 26,040 | ||||||
| Put - Knight Capital Group, Inc, Expires 07/20/13, Strike $5.00 | 136 | 22,440 | ||||||
| Put - Sprint Nextel Corp., Expires 01/18/14, Strike $10.00 | 1,859 | 1,143,285 | ||||||
|
| |||||||
TOTAL PURCHASED OPTIONS | 1,191,765 | |||||||
|
| |||||||
TOTAL INVESTMENTS, BEFORE SECURITIES SOLD SHORT |
| 2,537,110,526 | ||||||
|
| |||||||
| SECURITIES SOLD SHORT - (19.4)% | ||||||||
COMMON STOCKS - (17.3)% | ||||||||
| Consumer Discretionary - (2.6)% | ||||||||
| Lennar Corp., Class A | (40,782) | (1,577,040) | ||||||
| Liberty Global, Inc., Class A † | (740,523) | (46,645,544) | ||||||
| M/I Homes, Inc. † | (56,477) | (1,496,640) | ||||||
| Meritage Homes Corp. † | (24,688) | (922,097) | ||||||
| priceline.com, Inc. † | (6,419) | (3,987,483) | ||||||
| PVH Corp. | (86,383) | (9,589,377) | ||||||
| Standard Pacific Corp. † | (89,297) | (656,333) | ||||||
| Toll Brothers, Inc. † | (9,092) | (293,944) | ||||||
|
| |||||||
| (65,168,458) | ||||||||
|
| |||||||
| The accompanying notes are an integral part of these financial statements. | (Continued) |
| AQR Funds | Annual Report | December 2012 | 71 | |||||||||||||
Table of Contents
| Schedule of Investments | December 31, 2012 |
| AQR DIVERSIFIED ARBITRAGE FUND |
| SHARES | VALUE (Note 2) | |||||||
| Consumer Staples - (0.4)% | ||||||||
| American Oriental Bioengineering, Inc. (China) † | (4,761) | $ | (1,619) | |||||
| Central Garden and Pet Co., Class A † | (524,330) | (5,479,248) | ||||||
| Dole Food Co., Inc. † | (28,946) | (332,011) | ||||||
| Universal Corp. | (12,936) | (645,636) | ||||||
| Vector Group Ltd. | (213,050) | (3,168,053) | ||||||
|
| |||||||
| (9,626,567) | ||||||||
|
| |||||||
| Energy - (1.6)% | ||||||||
| Baytex Energy Corp. (Canada) | (60,584) | (2,611,075) | ||||||
| Cal Dive International, Inc. † | (531,354) | (919,242) | ||||||
| Chesapeake Energy Corp. | (21,532) | (357,862) | ||||||
| Crescent Point Energy Corp. (Canada) | (66,001) | (2,496,187) | ||||||
| Enerplus Corp. (Canada) | (171,802) | (2,228,055) | ||||||
| Pacific Rubiales Energy Corp. (Colombia) | (141,195) | (3,280,403) | ||||||
| Pengrowth Energy Corp. (Canada) | (465,836) | (2,318,175) | ||||||
| Penn West Petroleum Ltd. (Canada) | (209,215) | (2,271,561) | ||||||
| Petrominerales Ltd. (Canada) | (103,939) | (896,426) | ||||||
| Polarcus Ltd. (Norway) (2)† | (155,079) | (189,456) | ||||||
| Royal Dutch Shell PLC, Class B ADR (Netherlands) | (228,796) | (16,219,348) | ||||||
| Talisman Energy, Inc. (Canada) | (253,729) | (2,869,660) | ||||||
| Vantage Drilling Co. † | (1,356,219) | (2,481,881) | ||||||
|
| |||||||
| (39,139,331) | ||||||||
|
| |||||||
| Financials - (5.1)% | ||||||||
| Associated Banc-Corp | (6,884) | (90,318) | ||||||
| AV Homes, Inc. † | (52,200) | (742,284) | ||||||
| Boston Private Financial Holdings, Inc. | (70,169) | (632,223) | ||||||
| CNO Financial Group, Inc. | (1,537,118) | (14,341,311) | ||||||
| Columbia Banking System, Inc. | (268,108) | (4,809,857) | ||||||
| Comerica, Inc. | (23,950) | (726,643) | ||||||
| FirstMerit Corp. | (680,863) | (9,661,446) | ||||||
| IntercontinentalExchange, Inc. † | (39,082) | (4,838,742) | ||||||
| Investors Bancorp, Inc. | (946) | (16,820) | ||||||
| KCAP Financial, Inc. | (48,088) | (441,929) | ||||||
| Leucadia National Corp. | (290,663) | (6,914,873) | ||||||
| Lincoln National Corp. | (47,292) | (1,224,863) | ||||||
| M&T Bank Corp. | (475,019) | (46,775,121) | ||||||
| Markel Corp. † | (18,407) | (7,977,962) | ||||||
| PacWest Bancorp | (149,975) | (3,716,380) | ||||||
| PMI Group, Inc./The † | (263) | (4) | ||||||
| Signature Bank † | (100,992) | (7,204,769) | ||||||
| Stifel Financial Corp. † | (70,008) | (2,238,156) | ||||||
| Texas Capital Bancshares, Inc. † | (15,342) | (687,628) | ||||||
| TICC Capital Corp. | (71,362) | (722,183) | ||||||
| Trustmark Corp. | (81,086) | (1,821,192) | ||||||
| Valley National Bancorp | (10,159) | (94,479) | ||||||
| Wintrust Financial Corp. | (350,463) | (12,861,992) | ||||||
|
| |||||||
| (128,541,175) | ||||||||
|
| |||||||
| Health Care - (2.3)% | ||||||||
| Abbott Laboratories † | (479,051) | (15,042,201) | ||||||
| AbbVie, Inc. † | (479,051) | (16,364,382) | ||||||
| Adcare Health Systems, Inc. † | (16,341) | (77,620) | ||||||
| Aetna, Inc. | (361,711) | (16,747,219) | ||||||
| Affymetrix, Inc. † | (89,948) | (285,135) | ||||||
| SHARES | VALUE (Note 2) | |||||||
| Health Care - (2.3)% (continued) | ||||||||
| Enzon Pharmaceuticals, Inc. | (37,092) | $ | (164,317) | |||||
| Exelixis, Inc. † | (420,980) | (1,923,879) | ||||||
| Sequenom, Inc. † | (454,955) | (2,147,388) | ||||||
| Wright Medical Group, Inc. † | (255,529) | (5,363,554) | ||||||
|
| |||||||
| (58,115,695) | ||||||||
|
| |||||||
| Industrials - (1.3)% | ||||||||
| Chicago Bridge & Iron Co. NV (Netherlands) | (56,086) | (2,599,586) | ||||||
| DigitalGlobe, Inc. † | (787,803) | (19,253,905) | ||||||
| Genesee & Wyoming, Inc., Class A † | (14,200) | (1,080,336) | ||||||
| JetBlue Airways Corp. † | (379,283) | (2,165,706) | ||||||
| MasTec, Inc. † | (224,970) | (5,608,502) | ||||||
| Trex Co., Inc. † | (80,961) | (3,014,178) | ||||||
| Ultrapetrol Bahamas Ltd. (Bahamas) † | (58,046) | (95,776) | ||||||
|
| |||||||
| (33,817,989) | ||||||||
|
| |||||||
| Information Technology - (1.4)% | ||||||||
| ASML Holding NV NYRS (Netherlands) | (288,352) | (18,572,752) | ||||||
| Digital River, Inc. † | (1,323) | (19,038) | ||||||
| GT Advanced Technologies, Inc. † | (314,859) | (950,874) | ||||||
| Integrated Device Technology, Inc. † | (994,713) | (7,261,405) | ||||||
| Molex, Inc. | (96,795) | (2,645,407) | ||||||
| ON Semiconductor Corp. † | (35,714) | (251,784) | ||||||
| Verint Systems, Inc. † | (235,330) | (6,909,289) | ||||||
|
| |||||||
| (36,610,549) | ||||||||
|
| |||||||
| Materials - (1.6)% | ||||||||
| B2Gold Corp. (Canada) † | (2,698,577) | (9,658,122) | ||||||
| First Majestic Silver Corp. (Canada) † | (272,041) | (5,486,220) | ||||||
| First Quantum Minerals Ltd. (Canada) | (340,192) | (7,493,322) | ||||||
| Freeport-McMoRan Copper & Gold, Inc. | (231,990) | (7,934,058) | ||||||
| Kaiser Aluminum Corp. | (70) | (4,318) | ||||||
| Osisko Mining Corp. (Canada) † | (128,438) | (1,032,979) | ||||||
| PolyOne Corp. | (367,046) | (7,495,079) | ||||||
| Sino-Forest Corp. (Canada) (3)†(b) | (46,847) | (32,207) | ||||||
| Stillwater Mining Co. † | (71,650) | (915,687) | ||||||
|
| |||||||
| (40,051,992) | ||||||||
|
| |||||||
| Telecommunication Services - (1.0)% | ||||||||
| Level 3 Communications, Inc. † | (610,879) | (14,117,414) | ||||||
| TELUS Corp. (Canada) | (151,829) | (9,936,732) | ||||||
|
| |||||||
| (24,054,146) | ||||||||
|
| |||||||
TOTAL COMMON STOCKS SOLD SHORT |
| (435,125,902) | ||||||
|
| |||||||
| EXCHANGE TRADED FUNDS - (1.5)% | ||||||||
| SPDR Barclays High Yield Bond ETF | (713,164) | (29,025,775) | ||||||
| SPDR Gold Shares † | (3,205) | (519,242) | ||||||
| SPDR S&P 500 ETF Trust | (61,184) | (8,719,944) | ||||||
|
| |||||||
TOTAL EXCHANGE TRADED FUNDS SOLD SHORT | (38,264,961) | |||||||
|
| |||||||
| The accompanying notes are an integral part of these financial statements. | (Continued) |
| 72 | AQR Funds | Annual Report | December 2012 | |||||||||||||
Table of Contents
| Schedule of Investments | December 31, 2012 |
| AQR DIVERSIFIED ARBITRAGE FUND |
| SHARES | VALUE (Note 2) | |||||||
| PREFERRED STOCKS - (0.6)% | ||||||||
| Consumer Discretionary - (0.6)% | ||||||||
| Volkswagen AG (Germany) (2) | ||||||||
(proceeds $13,734,005) | (67,195) | $ | (15,417,822) | |||||
|
| |||||||
TOTAL SECURITIES SOLD SHORT | (488,808,685) | |||||||
|
| |||||||
TOTAL INVESTMENTS, NET OF SECURITIES SOLD SHORT - 81.5% |
| 2,048,301,841 | ||||||
|
| |||||||
| OTHER ASSETS IN EXCESS OF LIABILITIES - 18.5% (l) | 465,793,483 | |||||||
|
| |||||||
NET ASSETS - 100.0% | $ | 2,514,095,324 | ||||||
|
| |||||||
| † | Non income-producing security. |
| (a) | All or a portion of this security has been segregated as collateral for securities sold short and can be sold or replaced subject to the broker’s right to re-hypothecate. At December 31, 2012, the value of these securities was $225,264,625. In addition, $415,842,487 of cash collateral was pledged. |
| (b) | Security fair valued at as of December 31, 2012 using procedures approved by the Board of Trustees. The total value of positions fair valued was $151,410,483 or 5.9% of total net assets. |
| (c) | All or a portion of the security on loan. The aggregate market value of such securities is $151,539; cash collateral of $161,950 was received with which the Fund purchased a money market fund. |
| (d) | Represents a Pay-in-Kind Bond. |
| (e) | Represents less than 0.05 percent of net assets. |
| (f) | Rule 144A, Section 4(2) or other security which is restricted as to resale to institutional investors. The Fund Advisor has deemed this security to be liquid based upon procedures approved by the Board of Trustees. |
| (g) | Indicates a variable rate security. The interest rate shown represents the discount rate at December 31, 2012. |
| (h) | Defaulted security. |
| (i) | The rate shown is the effective yield at the date of purchase. |
| (j) | Represents annualized seven-day yield as of December 31, 2012. |
| (k) | A portion of the security is pledged as collateral to the brokers for forward foreign currency exchange, futures and swap contracts. |
| (l) | Includes appreciation (depreciation) on forward foreign currency exchange, futures and swap contracts. |
| (m) | Security is perpetual and, thus, does not have a predetermined maturity date. The coupon rate for this security is fixed for a period of time and may be structured to adjust thereafter. The date shown, if applicable, reflects the next call date. The coupon rate shown is the rate in effect as of December 31, 2012. |
All bonds are denominated in US dollars, unless noted otherwise.
All securities are United States companies, unless noted otherwise in parentheses.
All securities are Level 1 with respect to ASC 820, unless otherwise noted in parentheses.
| (2) | Level 2 security (See Note 4). |
| (3) | Level 3 security (See Note 4). |
The following abbreviations are used in portfolio descriptions:
144A - Restricted Security
ADR - American Depositary Receipt
CAD - Canadian Dollar
EUR - Euro
MTN - Medium Term Note
NOK - Norwegian Krone
NR - Not Rated by Moody’s
NYRS - New York Registry Shares
REIT - Real Estate Investment Trust
WR - Withheld Ratings
Credit default swap contracts sell protection as of December 31, 2012:
| COUNTERPARTY | REFERENCE ENTITY | FIXED ANNUAL RATE RECEIVED BY FUND | CURRENCY | CREDIT SPREAD | NOTIONAL AMOUNT | UPFRONT PREMIUM (RECEIVED) PAID | TERMINATION DATE | UNREALIZED APPRECIATION (DEPRECIATION) | ||||||||||||||||||
| The Royal Bank of Scotland | Markit CDX North America High Yield Index Series 18 | 5.000% | USD | 4.581% | 193,990,500 | $(1,346,309) | 6/20/2017 | $4,882,501 | ||||||||||||||||||
| The Royal Bank of Scotland | Markit CDX North America High Yield Index Series 19 | 5.000% | USD | 4.909% | 2,750,000 | 9,929 | 12/20/2017 | (1,533) | ||||||||||||||||||
|
|
|
| |||||||||||||||||||||||
| $(1,336,380) | $4,880,968 | |||||||||||||||||||||||||
|
|
|
| |||||||||||||||||||||||
| The accompanying notes are an integral part of these financial statements. | (Continued) |
| AQR Funds | Annual Report | December 2012 | 73 | |||||||||||||
Table of Contents
| Schedule of Investments | December 31, 2012 |
| AQR DIVERSIFIED ARBITRAGE FUND |
Credit default swap contracts buy protection as of December 31, 2012:
| COUNTERPARTY | REFERENCE ENTITY | FIXED ANNUAL RATE RECEIVED BY FUND | CURRENCY | CREDIT SPREAD | NOTIONAL AMOUNT | UPFRONT PREMIUM (RECEIVED) PAID | TERMINATION DATE | UNREALIZED APPRECIATION (DEPRECIATION) | ||||||||||||||||||
| Bank of America | Host Hotels & Resorts LP | 1.000% | USD | 0.936% | 3,450,000 | $116,435 | 12/20/2015 | $(124,116) | ||||||||||||||||||
| The Royal Bank of Scotland | Markit CDX North America High Yield Index Series 18 | 5.000% | USD | 4.581% | 193,990,500 | (5,070,006) | 6/20/2017 | 1,533,814 | ||||||||||||||||||
| The Royal Bank of Scotland | Markit CDX North America High Yield Index Series 19 | 5.000% | USD | 4.909% | 190,050,000 | 600,107 | 12/20/2017 | (1,475,330) | ||||||||||||||||||
| The Royal Bank of Scotland | Markit CDX North America High Yield Index Series 19 | 5.000% | USD | 4.909% | 4,000,000 | (16,859) | 12/20/2017 | (19,187) | ||||||||||||||||||
| The Royal Bank of Scotland | Markit CDX North America High Yield Index Series 19 | 5.000% | USD | 4.909% | 600,000 | (16,823) | 12/20/2017 | 13,991 | ||||||||||||||||||
|
|
|
| |||||||||||||||||||||||
| $(4,387,146) | $(70,828) | |||||||||||||||||||||||||
|
|
|
| |||||||||||||||||||||||
Money Market Fund is pledged as collateral to brokers for credit default swap contracts in the amount of $622. Additional collateral for positions held at the Royal Bank of Scotland is included in the collateral for forward foreign currency exchange contracts.
Open Written Options contracts outstanding at December 31, 2012:
Call Options Written
| SHARES | ISSUER | COUNTERPARTY | EXPIRATION DATE | PROCEEDS | VALUE AT DECEMBER 31, 2012 | UNREALIZED APPRECIATION (DEPRECIATION) | ||||||||||||||||
| 177 | Clearwire Corp. (Exercise price $3) | J.P. Morgan | March 16, 2013 | $(1,593) | $(885) | $708 | ||||||||||||||||
| 372 | Knight Capital Group, Inc. (Exercise price $4) | J.P. Morgan | July 20, 2013 | (510) | (1,860) | (1,350) | ||||||||||||||||
| 136 | Knight Capital Group, Inc. (Exercise price $5) | J.P. Morgan | July 20, 2013 | — | (136) | (136) | ||||||||||||||||
| 86 | McMoRan Exploration Co. (Exercise price $14) | J.P. Morgan | January 19, 2013 | (11,330) | (17,028) | (5,698) | ||||||||||||||||
| 104 | McMoRan Exploration Co. (Exercise price $15) | J.P. Morgan | January 19, 2013 | (5,371) | (11,128) | (5,757) | ||||||||||||||||
| 1,252 | MetroPCS Communications, Inc. (Exercise price $9) | J.P. Morgan | January 19, 2013 | (148,988) | (106,420) | 42,568 | ||||||||||||||||
| 1,859 | Sprint Nextel Corp. (Exercise price $10) | J.P. Morgan | January 18, 2014 | (15,801) | (9,295) | 6,506 | ||||||||||||||||
|
|
|
|
|
| |||||||||||||||||
| $(183,593) | $(146,752) | $36,841 | ||||||||||||||||||||
|
|
|
|
|
| |||||||||||||||||
| The accompanying notes are an integral part of these financial statements. | (Continued) |
| 74 | AQR Funds | Annual Report | December 2012 | |||||||||||||
Table of Contents
| Schedule of Investments | December 31, 2012 |
| AQR DIVERSIFIED ARBITRAGE FUND |
Open futures contracts outstanding at December 31, 2012:
| NUMBER OF CONTRACTS | DESCRIPTION | EXPIRATION DATE | VALUE AT TRADE DATE | VALUE AT DECEMBER��31, 2012 | UNREALIZED APPRECIATION (DEPRECIATION) | |||||||||||
| Short Contracts: | ||||||||||||||||
| 1,446 | S&P 500 E-Mini Futures | March 15, 2013 | $(103,565,926) | $(102,673,230) | $892,696 | |||||||||||
| 1,656 | U.S. Treasury 2-Year Note Futures | March 28, 2013 | (364,980,795) | (365,096,250) | (115,455) | |||||||||||
| 468 | U.S. Treasury 5-Year Note Futures | March 28, 2013 | (58,270,074) | (58,225,781) | 44,293 | |||||||||||
|
|
|
|
|
| |||||||||||
| $(526,816,795) | $(525,995,261) | $821,534 | ||||||||||||||
|
|
|
|
|
| |||||||||||
Cash held as collateral with broker for futures contracts was $2,309,930 at December 31, 2012.
Forward foreign currency exchange contracts outstanding as of December 31, 2012:
| PURCHASE CONTRACTS | COUNTERPARTY | CURRENCY | CURRENCY AMOUNT PURCHASED | VALUE AT SETTLEMENT DATE | VALUE AT DECEMBER 31, 2012 | UNREALIZED APPRECIATION (DEPRECIATION) | ||||||||||||||
| Canadian Dollar, Expiring 01/22/13 | The Royal Bank of Scotland | CAD | 645,460 | $654,691 | $648,634 | $(6,057) | ||||||||||||||
| Canadian Dollar, Expiring 02/07/13 | The Royal Bank of Scotland | CAD | 14,839,415 | 14,977,189 | 14,907,012 | (70,177) | ||||||||||||||
| Canadian Dollar, Expiring 06/04/13 | The Royal Bank of Scotland | CAD | 329,592 | 332,287 | 330,213 | (2,074) | ||||||||||||||
| Euro, Expiring 01/28/13 | The Royal Bank of Scotland | EUR | 5,590,151 | 7,131,356 | 7,380,392 | 249,036 | ||||||||||||||
| Euro, Expiring 02/07/13 | The Royal Bank of Scotland | EUR | 993,586 | 1,308,732 | 1,311,896 | 3,164 | ||||||||||||||
| Norwegian Krone, Expiring 01/07/13 | The Royal Bank of Scotland | NOK | 401,625 | 69,457 | 72,253 | 2,796 | ||||||||||||||
| Norwegian Krone, Expiring 04/09/13 | The Royal Bank of Scotland | NOK | 410,550 | 70,759 | 73,610 | 2,851 | ||||||||||||||
| Norwegian Krone, Expiring 07/09/13 | The Royal Bank of Scotland | NOK | 406,088 | 69,760 | 72,559 | 2,799 | ||||||||||||||
| Norwegian Krone, Expiring 10/09/13 | The Royal Bank of Scotland | NOK | 410,550 | 70,292 | 73,055 | 2,763 | ||||||||||||||
|
|
|
|
|
| |||||||||||||||
| 24,684,523 | 24,869,624 | 185,101 | ||||||||||||||||||
|
|
|
|
|
| |||||||||||||||
| SALES CONTRACTS | COUNTERPARTY | CURRENCY | CURRENCY AMOUNT SOLD | VALUE AT SETTLEMENT DATE | VALUE AT DECEMBER 31, 2012 | UNREALIZED APPRECIATION (DEPRECIATION) | ||||||||||||||
| Australian Dollar, Expiring 12/31/13 | The Royal Bank of Scotland | AUD | (275,541) | $(278,298) | $(279,006) | $(708) | ||||||||||||||
| Brazilian Real, Expiring 04/05/13* | The Royal Bank of Scotland | BRL | (791,700) | (382,187) | (382,099) | 88 | ||||||||||||||
| Canadian Dollar, Expiring 01/07/13 | The Royal Bank of Scotland | CAD | (940,119) | (944,789) | (945,052) | (263) | ||||||||||||||
| Canadian Dollar, Expiring 01/22/13 | The Royal Bank of Scotland | CAD | (645,460) | (648,064) | (648,634) | (570) | ||||||||||||||
| Canadian Dollar, Expiring 02/07/13 | The Royal Bank of Scotland | CAD | (37,774,781) | (37,908,196) | (37,947,444) | (39,248) | ||||||||||||||
| Canadian Dollar, Expiring 02/15/13 | The Royal Bank of Scotland | CAD | (612,973) | (615,283) | (615,676) | (393) | ||||||||||||||
| Canadian Dollar, Expiring 02/22/13 | The Royal Bank of Scotland | CAD | (3,681,212) | (3,682,437) | (3,696,924) | (14,487) | ||||||||||||||
| The accompanying notes are an integral part of these financial statements. | (Continued) |
| AQR Funds | Annual Report | December 2012 | 75 | |||||||||||||
Table of Contents
| Schedule of Investments | December 31, 2012 |
| AQR DIVERSIFIED ARBITRAGE FUND |
| SALES CONTRACTS | COUNTERPARTY | CURRENCY | CURRENCY AMOUNT SOLD | VALUE AT SETTLEMENT DATE | VALUE AT DECEMBER 31, 2012 | UNREALIZED APPRECIATION (DEPRECIATION) | ||||||||||||||
| Canadian Dollar, Expiring 02/28/13 | The Royal Bank of Scotland | CAD | (1,615,200) | $(1,621,296) | $(1,621,899) | $(603) | ||||||||||||||
| Canadian Dollar, Expiring 03/07/13 | The Royal Bank of Scotland | CAD | (16,099,413) | (16,251,164) | (16,163,794) | 87,370 | ||||||||||||||
| Canadian Dollar, Expiring 06/04/13 | The Royal Bank of Scotland | CAD | (9,192,964) | (9,245,971) | (9,210,272) | 35,699 | ||||||||||||||
| Canadian Dollar, Expiring 06/28/13 | The Royal Bank of Scotland | CAD | (13,648,756) | (13,696,228) | (13,666,483) | 29,745 | ||||||||||||||
| Euro, Expiring 01/28/13 | The Royal Bank of Scotland | EUR | (5,855,786) | (7,902,383) | (7,731,096) | 171,287 | ||||||||||||||
| Euro, Expiring 01/31/13 | The Royal Bank of Scotland | EUR | (217,350) | (284,994) | (286,964) | (1,970) | ||||||||||||||
| Euro, Expiring 02/07/13 | The Royal Bank of Scotland | EUR | (993,586) | (1,283,003) | (1,311,896) | (28,893) | ||||||||||||||
| Euro, Expiring 02/22/13 | The Royal Bank of Scotland | EUR | (5,206,236) | (6,708,322) | (6,874,991) | (166,669) | ||||||||||||||
| Euro, Expiring 02/28/13 | The Royal Bank of Scotland | EUR | (14,995,484) | (19,773,045) | (19,802,976) | (29,931) | ||||||||||||||
| Euro, Expiring 03/20/13 | The Royal Bank of Scotland | EUR | (4,793,643) | (6,245,538) | (6,331,674) | (86,136) | ||||||||||||||
| Euro, Expiring 04/05/13 | The Royal Bank of Scotland | EUR | (21,000) | (27,672) | (27,742) | (70) | ||||||||||||||
| Euro, Expiring 06/10/13 | The Royal Bank of Scotland | EUR | (437,363) | (559,680) | (578,146) | (18,466) | ||||||||||||||
| Euro, Expiring 12/31/13 | The Royal Bank of Scotland | EUR | (18,000) | (23,720) | (23,850) | (130) | ||||||||||||||
| Euro, Expiring 04/07/14 | The Royal Bank of Scotland | EUR | (21,000) | (27,733) | (27,864) | (131) | ||||||||||||||
| Euro, Expiring 06/09/14 | The Royal Bank of Scotland | EUR | (742,500) | (954,016) | (986,056) | (32,040) | ||||||||||||||
| Euro, Expiring 04/07/15 | The Royal Bank of Scotland | EUR | (21,000) | (27,804) | (27,967) | (163) | ||||||||||||||
| Euro, Expiring 06/09/15 | The Royal Bank of Scotland | EUR | (742,500) | (956,986) | (988,817) | (31,831) | ||||||||||||||
| Euro, Expiring 11/09/15 | The Royal Bank of Scotland | EUR | (311,240) | (401,618) | (414,491) | (12,873) | ||||||||||||||
| Euro, Expiring 04/05/16 | The Royal Bank of Scotland | EUR | (21,000) | (27,886) | (27,967) | (81) | ||||||||||||||
| Euro, Expiring 04/05/17 | The Royal Bank of Scotland | EUR | (21,000) | (28,010) | (27,967) | 43 | ||||||||||||||
| Norwegian Krone, Expiring 01/07/13 | The Royal Bank of Scotland | NOK | (1,160,250) | (201,524) | (208,732) | (7,208) | ||||||||||||||
| Norwegian Krone, Expiring 03/27/13 | The Royal Bank of Scotland | NOK | (360,000) | (58,752) | (64,577) | (5,825) | ||||||||||||||
| Norwegian Krone, Expiring 04/09/13 | The Royal Bank of Scotland | NOK | (1,186,033) | (205,326) | (212,650) | (7,324) | ||||||||||||||
| Norwegian Krone, Expiring 05/21/13 | The Royal Bank of Scotland | NOK | (978,750) | (168,040) | (175,212) | (7,172) | ||||||||||||||
| Norwegian Krone, Expiring 06/11/13 | The Royal Bank of Scotland | NOK | (1,365,872) | (222,061) | (244,321) | (22,260) | ||||||||||||||
| Norwegian Krone, Expiring 06/27/13 | The Royal Bank of Scotland | NOK | (368,000) | (59,876) | (65,787) | (5,911) | ||||||||||||||
| Norwegian Krone, Expiring 07/09/13 | The Royal Bank of Scotland | NOK | (1,173,142) | (202,413) | (209,616) | (7,203) | ||||||||||||||
| Norwegian Krone, Expiring 09/16/13 | The Royal Bank of Scotland | NOK | (6,745,753) | (1,166,288) | (1,201,539) | (35,251) | ||||||||||||||
| The accompanying notes are an integral part of these financial statements. | (Continued) |
| 76 | AQR Funds | Annual Report | December 2012 | |||||||||||||
Table of Contents
| Schedule of Investments | December 31, 2012 |
| AQR DIVERSIFIED ARBITRAGE FUND |
| SALES CONTRACTS | COUNTERPARTY | CURRENCY | CURRENCY AMOUNT SOLD | VALUE AT SETTLEMENT DATE | VALUE AT DECEMBER 31, 2012 | UNREALIZED APPRECIATION (DEPRECIATION) | ||||||||||||||
| Norwegian Krone, Expiring 09/27/13 | The Royal Bank of Scotland | NOK | (368,000) | $(59,686) | $(65,514) | $(5,828) | ||||||||||||||
| Norwegian Krone, Expiring 10/09/13 | The Royal Bank of Scotland | NOK | (1,186,033) | (203,939) | (211,047) | (7,108) | ||||||||||||||
| Norwegian Krone, Expiring 11/18/13 | The Royal Bank of Scotland | NOK | (978,750) | (166,612) | (173,899) | (7,287) | ||||||||||||||
| Norwegian Krone, Expiring 12/11/13 | The Royal Bank of Scotland | NOK | (1,397,358) | (225,770) | (248,059) | (22,289) | ||||||||||||||
| Norwegian Krone, Expiring 12/18/13 | The Royal Bank of Scotland | NOK | (51,000,000) | (8,733,470) | (9,051,107) | (317,637) | ||||||||||||||
| Norwegian Krone, Expiring 12/27/13 | The Royal Bank of Scotland | NOK | (364,000) | $(58,852) | (64,578) | (5,726) | ||||||||||||||
| Norwegian Krone, Expiring 03/27/14 | The Royal Bank of Scotland | NOK | (360,000) | (58,013) | (63,657) | (5,644) | ||||||||||||||
| Norwegian Krone, Expiring 05/19/14 | The Royal Bank of Scotland | NOK | (978,750) | (164,808) | (172,727) | (7,919) | ||||||||||||||
| Norwegian Krone, Expiring 06/11/14 | The Royal Bank of Scotland | NOK | (1,389,722) | (222,926) | (245,046) | (22,120) | ||||||||||||||
| Norwegian Krone, Expiring 06/27/14 | The Royal Bank of Scotland | NOK | (368,000) | (59,102) | (64,850) | (5,748) | ||||||||||||||
| Norwegian Krone, Expiring 09/29/14 | The Royal Bank of Scotland | NOK | (368,000) | (58,875) | (64,624) | (5,749) | ||||||||||||||
| Norwegian Krone, Expiring 11/18/14 | The Royal Bank of Scotland | NOK | (17,178,750) | (2,863,290) | (3,011,129) | (147,839) | ||||||||||||||
| Norwegian Krone, Expiring 12/11/14 | The Royal Bank of Scotland | NOK | (1,397,358) | (222,594) | (244,722) | (22,128) | ||||||||||||||
| Norwegian Krone, Expiring 12/29/14 | The Royal Bank of Scotland | NOK | (364,000) | (58,017) | (63,705) | (5,688) | ||||||||||||||
| Norwegian Krone, Expiring 03/27/15 | The Royal Bank of Scotland | NOK | (360,000) | (57,174) | (62,798) | (5,624) | ||||||||||||||
| Norwegian Krone, Expiring 06/11/15 | The Royal Bank of Scotland | NOK | (26,889,722) | (4,251,474) | (4,677,278) | (425,804) | ||||||||||||||
| Norwegian Krone, Expiring 06/29/15 | The Royal Bank of Scotland | NOK | (12,368,000) | (1,956,653) | (2,149,872) | (193,219) | ||||||||||||||
| Norwegian Krone, Expiring 04/27/16 | The Royal Bank of Scotland | NOK | (19,387,600) | (3,266,931) | (3,331,678) | (64,747) | ||||||||||||||
|
|
|
|
|
| |||||||||||||||
| (155,478,789) | (156,996,471) | (1,517,682) | ||||||||||||||||||
|
|
|
|
|
| |||||||||||||||
| $(130,794,266) | $(132,126,847) | $(1,332,581) | ||||||||||||||||||
|
|
|
|
|
| |||||||||||||||
Money Market Fund is pledged as collateral for forward foreign currency exchange contracts in the amount of $17,876,514.
| * | Non deliverable forward. See Note 3 in the Notes to Financial Statements. |
AUD - Australian Dollar
BRL - Brazilian Real
CAD - Canadian Dollar
EUR - Euro
NOK - Norwegian Krone
| The accompanying notes are an integral part of these financial statements. | (Continued) |
| AQR Funds | Annual Report | December 2012 | 77 | |||||||||||||
Table of Contents
| Schedule of Investments | December 31, 2012 |
| AQR DIVERSIFIED ARBITRAGE FUND |
Total Return Basket Swaps* Outstanding at December 31, 2012
| COUNTERPARTY | DESCRIPTION | TERMINATION DATE | VALUE (NOTE 2) | |||||
| Deutsche Bank | The Fund receives or pays the total return on a portfolio of long and short positions and pays or receives a specified LIBOR or Federal Funds floating rate, which is denominated in various foreign currencies based on the local currencies of the positions within the swap. | 06/13/2013 | $278,224 | |||||
|
| |||||||
| * | See the accompanying “Additional Information — Total Return Basket Swaps” for further details. |
Additional Information — Total Return Basket Swaps
The following table represents the individual long and short positions and related values within the total return basket swaps as of December 31, 2012.
| REFERENCE ENTITY | SHARES | NOTIONAL (a) | NET UNREALIZED APPRECIATION (DEPRECIATION) | |||||||||
| Long Positions | ||||||||||||
| United Kingdom | ||||||||||||
| Aegis Group PLC | 5,110,556 | $ | 19,533,688 | $ | 116,251 | |||||||
| Xstrata PLC | 271,244 | 4,364,408 | 370,375 | |||||||||
|
| |||||||||||
| 486,626 | ||||||||||||
|
| |||||||||||
| Total of Long Equity Positions | 486,626 | |||||||||||
|
| |||||||||||
| Short Positions | ||||||||||||
| Glencore International PLC | (847,909) | (4,809,203) | (89,024) | |||||||||
|
| |||||||||||
Total of Long and Short Equity Positions | 397,602 | |||||||||||
|
| |||||||||||
Net Cash and Other Receivables/ (Payables)(b) | (119,378) | |||||||||||
|
| |||||||||||
Swaps, at Value | $ | 278,224 | ||||||||||
|
| |||||||||||
| (a) | Notional value represents the market value (including any fees or commissions) of the long and short positions when they are established. |
| (b) | Cash and other receivables includes the gains (or losses) realized within the swap when the swap resets. Gains (or losses) will be realized on the swap, and reflected on the Statement of Operations, when cash is settled with the counterparty. |
Money Market Fund held as collateral was $10,601,572 at December 31, 2012.
Total Return Basket Swaps* Outstanding at December 31, 2012
| COUNTERPARTY | DESCRIPTION | TERMINATION DATES | VALUE (NOTE 2) | |||||
| JPMorgan | The Fund receives or pays the total return on a portfolio of long and short positions and pays or receives a specified LIBOR or Federal Funds floating rate, which is denominated in various foreign currencies based on the local currencies of the positions within the swap. | 08/30/2013 - 02/28/2014 | $(4,539,748) | |||||
|
| |||||||
| * | See the accompanying “Additional Information — Total Return Basket Swaps” for further details. |
Additional Information — Total Return Basket Swaps
The following table represents the individual long and short positions and related values within the total return basket swaps as of December 31, 2012.
| The accompanying notes are an integral part of these financial statements. | (Continued) |
| 78 | AQR Funds | Annual Report | December 2012 | |||||||||||||
Table of Contents
| Schedule of Investments | December 31, 2012 |
| AQR DIVERSIFIED ARBITRAGE FUND |
| REFERENCE ENTITY | SHARES | NOTIONAL (a) | NET UNREALIZED APPRECIATION (DEPRECIATION) | |||||||||
| Long Positions | ||||||||||||
| United States | ||||||||||||
| Beazer Homes USA, Inc. | 40,300 | $ | 952,289 | $ | 196,261 | |||||||
| Boston Private Capital | 1,225 | 42,262 | 9,723 | |||||||||
| Chesapeake Energy Corp. | 19,713 | 373,706 | (46,076) | |||||||||
| Energy XXI, Inc. | 9,535 | 3,414,722 | (104,289) | |||||||||
| Enzon Pharmaceuticals, Inc. | 23,419 | 104,780 | (1,034) | |||||||||
| General Motors Co. | 121,646 | 2,554,775 | 952,279 | |||||||||
| Genesee & Wyoming, Inc. | 206 | 15,090 | 583 | |||||||||
| GT Advanced Technologies, Inc. | 60,384 | 189,548 | (7,188) | |||||||||
| Interpublic Group of Cos, Inc./The | 3,000 | 3,094,500 | 122,070 | |||||||||
| JetBlue Airways Corp. | 5,578 | 31,270 | 581 | |||||||||
| Level 3 Communications, Inc. | 68,687 | 1,457,388 | 129,969 | |||||||||
| Meritage Homes Corp. | 1,915 | 71,161 | 364 | |||||||||
| MetLife, Inc. | 55,475 | 2,500,996 | (34,023) | |||||||||
| NextEra Energy, Inc. | 61,525 | 3,168,537 | (101,516) | |||||||||
| Nielsen Holdings NV | 6,800 | 376,550 | 5,312 | |||||||||
| ON Semiconductor Corp. | 8,928 | 61,206 | 1,736 | |||||||||
| PPL Corp. | 166,325 | 9,264,302 | (563,842) | |||||||||
| PPL Corp. | 64,425 | 3,582,030 | (120,475) | |||||||||
| Thompson Creek Metals Co., Inc. | 226,250 | 3,738,781 | 1,107,494 | |||||||||
| Universal Corp. | 8,350 | 9,103,587 | 436,288 | |||||||||
| Wells Fargo & Co. | 500 | 591,375 | 21,125 | |||||||||
| Whiting Petroleum Corp. | 1,144 | 241,241 | (11,225) | |||||||||
| Wintrust Financial Corp. | 58,975 | 3,275,968 | (61,830) | |||||||||
|
| |||||||||||
| 1,932,287 | ||||||||||||
|
| |||||||||||
| Total of Long Equity Positions | 1,932,287 | |||||||||||
|
| |||||||||||
| Short Positions | ||||||||||||
| United States | ||||||||||||
| 3D Systems Corp. | (518,942) | (20,999,018) | (6,686,538) | |||||||||
| A.M. Castle & Co. | (82,300) | (764,214) | (451,357) | |||||||||
| Accuray, Inc. | (47,561) | (315,008) | 9,191 | |||||||||
| Affymetrix, Inc. | (212,730) | (843,164) | 168,810 | |||||||||
| Alcoa, Inc. | (875,102) | (7,837,480) | 241,595 | |||||||||
| Allegheny Technologies, Inc. | (678) | (18,937) | (1,647) | |||||||||
| Alliance Data Systems Corp. | (220,747) | (28,979,666) | (2,975,670) | |||||||||
| Alliance One International, Inc. | (413,745) | (1,254,604) | (251,427) | |||||||||
| American Equity Investment Life Holding Co. | (1,288,054) | (14,497,547) | (1,229,593) | |||||||||
| REFERENCE ENTITY | SHARES | NOTIONAL (a) | NET UNREALIZED APPRECIATION (DEPRECIATION) | |||||||||
| United States (continued) | ||||||||||||
| Amkor Technology, Inc. | (1,652,505) | $ | (8,831,797) | $ | 1,808,651 | |||||||
| Annaly Capital Management, Inc. | (3,326) | (48,675) | 1,978 | |||||||||
| ArcelorMittal | (51,091) | (831,488) | (61,071) | |||||||||
| Archer-Daniels-Midland Co. | (1,748) | (48,673) | 796 | |||||||||
| ARES Captial Corp. | (90,912) | (1,581,330) | (9,630) | |||||||||
| AuRico Gold, Inc. | (162,929) | (1,170,997) | (161,762) | |||||||||
| AV Homes, Inc. | (89,727) | (1,136,615) | (139,303) | |||||||||
| Avis Budget Group, Inc. | (346,093) | (5,604,737) | (1,254,826) | |||||||||
| Beazer Homes USA, Inc. | (56,975) | (778,365) | (183,943) | |||||||||
| BioMed Realty Trust, Inc. | (318,122) | (5,941,919) | (207,379) | |||||||||
| Boston Private Financial Holdings, Inc. | (848) | (8,334) | 694 | |||||||||
| Boston Properties, Inc. | (47,034) | (5,103,358) | 126,691 | |||||||||
| Bristow Group, Inc. | (7,534) | (370,344) | (33,931) | |||||||||
| Cadence Design Systems, Inc. | (858,054) | (10,803,564) | (788,746) | |||||||||
| CBIZ, Inc. | (103,982) | (591,898) | (22,636) | |||||||||
| Cemex SAB de CV | (281,431) | (2,212,224) | (565,500) | |||||||||
| Cenveo, Inc. | (332,568) | (659,879) | (238,054) | |||||||||
| Chart Industries, Inc. | (98,439) | (6,860,711) | 297,783 | |||||||||
| China Medical Technologies, Inc. | (45,264) | (129,002) | 13,127 | |||||||||
| Chiquita Brands International, Inc. | (63,487) | (415,664) | (108,104) | |||||||||
| Ciena Corp. | (483,346) | (7,944,149) | 355,616 | |||||||||
| CNO Financial Group, Inc. | (32,960) | (311,548) | 4,031 | |||||||||
| Coinstar, Inc. | (42,420) | (2,083,247) | (123,017) | |||||||||
| Concur Technologies, Inc. | (3,133) | (212,739) | 1,198 | |||||||||
| Convergys Corp. | (596,235) | (9,189,053) | (595,164) | |||||||||
| DDR Corp. | (854,117) | (12,929,725) | (445,747) | |||||||||
| DFC Global Corp. | (28,089) | (554,095) | 34,168 | |||||||||
| Digital Realty Trust, Inc. | (198,379) | (15,019,640) | 1,551,690 | |||||||||
| Dole Food Co., Inc. | (32,320) | (393,647) | 22,937 | |||||||||
| DR Horton, Inc. | (1,615,365) | (30,561,594) | (1,390,325) | |||||||||
| DST Systems, Inc. | (16,680) | (897,683) | (113,125) | |||||||||
| Energy XXI, Inc. | (77,233) | (2,604,515) | 118,384 | |||||||||
| EnPro Industries, Inc. | (85,706) | (3,013,829) | (491,546) | |||||||||
| Equinix, Inc. | (149,641) | (27,362,545) | (3,493,430) | |||||||||
| Espeed, Inc. | (9,248) | (34,271) | 2,273 | |||||||||
| Exelixis, Inc. | (69,585) | (323,595) | 5,592 | |||||||||
| Exterran Holdings, Inc. | (92,070) | (1,753,299) | (264,876) | |||||||||
| Fifth & Pacific Cos., Inc. | (1,721,547) | (20,645,101) | (788,159) | |||||||||
| Finisar Corp. | (30,913) | (450,698) | (53,183) | |||||||||
| GenCorp, Inc. | (252,194) | (2,113,724) | (193,851) | |||||||||
| General Cable Corp. | (242,214) | (6,913,416) | (452,312) | |||||||||
| General Motors Co. | (101,625) | (3,563,227) | (921,485) | |||||||||
| The accompanying notes are an integral part of these financial statements. | (Continued) |
| AQR Funds | Annual Report | December 2012 | 79 | |||||||||||||
Table of Contents
| Schedule of Investments | December 31, 2012 |
| AQR DIVERSIFIED ARBITRAGE FUND |
| REFERENCE ENTITY | SHARES | NOTIONAL (a) | NET UNREALIZED APPRECIATION (DEPRECIATION) | |||||||||
| United States (continued) | ||||||||||||
| Goodrich Petroleum Corp. | (3,895) | $ | (43,200) | $ | 6,899 | |||||||
| Green Plains Renewable Energy, Inc. | (147,338) | (850,446) | (314,998) | |||||||||
| Group 1 Automotive, Inc. | (54,273) | (2,988,658) | (375,725) | |||||||||
| Hawaiian Holdings, Inc. | (26,643) | (162,743) | (12,302) | |||||||||
| Health Care REIT, Inc. | (18,279) | (1,089,481) | (30,839) | |||||||||
| Hertz Global Holdings, Inc. | (2,324,134) | (29,199,991) | (8,613,669) | |||||||||
| Hilltop Holdings, Inc. | (13,653) | (178,389) | (6,473) | |||||||||
| Host Hotels & Resorts, Inc. | (1,433,291) | (22,175,340) | (284,330) | |||||||||
| Interpublic Group of Cos., Inc./The | (98,323) | (1,046,217) | (37,302) | |||||||||
| iStar Financial, Inc. | (117,682) | (952,954) | (6,155) | |||||||||
| JAKKS Pacific, Inc. | (164,036) | (2,631,137) | 577,407 | |||||||||
| Kaman Corp. | (78,450) | (2,585,644) | (301,316) | |||||||||
| Kilroy Realty Corp. | (167,620) | (7,864,893) | (75,266) | |||||||||
| L-3 Communications Holdings, Inc. | (15,262) | (1,079,014) | (90,361) | |||||||||
| Lennar Corp. | (1,120,500) | (37,258,045) | (6,071,690) | |||||||||
| Leucadia National Corp. | (7,735) | (174,052) | (9,963) | |||||||||
| Lexington Realty Trust | (893,113) | (8,116,043) | (1,216,987) | |||||||||
| M/I Homes, Inc. | (22,765) | (528,505) | (74,768) | |||||||||
| MasTec, Inc. | (36,708) | (840,521) | (74,610) | |||||||||
| Medicines Co./The | (19,495) | (488,851) | 21,556 | |||||||||
| Meritor, Inc. | (20,020) | (93,963) | (732) | |||||||||
| MetLife, Inc. | (51,684) | (1,749,916) | 47,445 | |||||||||
| MGIC Investment Corp. | (403,721) | (669,961) | (403,937) | |||||||||
| MGM Resorts International | (118,741) | (1,196,073) | (186,073) | |||||||||
| Microchip Technology | (364,422) | (12,734,687) | 858,174 | |||||||||
| Micron Technology, Inc. | (228,700) | (1,519,350) | 67,105 | |||||||||
| Molina Healthcare, Inc. | (36,554) | (948,466) | (40,685) | |||||||||
| National Financial Partners Corp. | (273,549) | (4,250,476) | (438,154) | |||||||||
| Navistar International Corp. | (12,308) | (275,087) | 7,142 | |||||||||
| NetApp, Inc. | (109,023) | (3,408,155) | (249,566) | |||||||||
| NextEra Energy, Inc. | (29,639) | (2,065,571) | 14,849 | |||||||||
| Nielsen Holdings NV | (10,643) | (312,789) | (12,780) | |||||||||
| NorthStar Realty Finance Corp. | (374,689) | (2,248,302) | (389,508) | |||||||||
| Nuance Communications, Inc. | (10,496) | (245,690) | 11,419 | |||||||||
| Omnicare, Inc. | (74,777) | (2,410,766) | (288,684) | |||||||||
| Pdl Biopharma, Inc. | (211,228) | (1,528,896) | 39,739 | |||||||||
| Penson Worldwide, Inc. | (217,523) | (25,668) | 18,707 | |||||||||
| PHH Corp. | (309,365) | (6,200,210) | (837,844) | |||||||||
| REFERENCE ENTITY | SHARES | NOTIONAL (a) | NET UNREALIZED APPRECIATION (DEPRECIATION) | |||||||||
| United States (continued) | ||||||||||||
| Photronics, Inc. | (328,891) | $ | (1,932,319) | $ | (27,872) | |||||||
| Pioneer Natural Resources Co. | (4,547) | (453,093) | (31,572) | |||||||||
| PPL Corp. | (200,072) | (5,959,867) | 231,806 | |||||||||
| priceline.com, Inc. | (38,461) | (21,862,734) | (2,029,240) | |||||||||
| Prologis, Inc. | (147,571) | (5,069,868) | (314,998) | |||||||||
| Quantum Corp. | (732,835) | (904,328) | (4,387) | |||||||||
| Radian Group, Inc. | (318,829) | (1,120,610) | (827,435) | |||||||||
| Rambus, Inc. | (16,705) | (83,043) | 1,523 | |||||||||
| Regeneron Pharmaceuticals, Inc. | (131,997) | (18,393,717) | (4,187,010) | |||||||||
| Regis Corp. | (450,495) | (7,822,492) | 200,117 | |||||||||
| Rite Aid Corp. | (49,261) | (59,525) | (7,470) | |||||||||
| RTI International Metals, Inc. | (82,602) | (2,035,184) | (241,327) | |||||||||
| Ryman Hospitality Properties | (637,779) | (22,360,834) | (2,168,146) | |||||||||
| Saks, Inc. | (138,691) | (1,524,471) | 66,828 | |||||||||
| Salesforce.com, Inc. | (260,154) | (36,886,932) | (6,844,955) | |||||||||
| SanDisk Corp. | (206) | (8,838) | (135) | |||||||||
| Sequenom, Inc. | (858,663) | (3,161,778) | (891,112) | |||||||||
| Sirius XM Radio | (9,471,585) | (24,178,775) | (3,194,106) | |||||||||
| SL Green Realty Corp. | (106,785) | (8,568,822) | 383,751 | |||||||||
| Smithfield Foods, Inc. | (214,040) | (4,649,465) | 32,623 | |||||||||
| Sotheby’s | (73,898) | (2,394,911) | (89,540) | |||||||||
| Standard Pacific Corp. | (100,065) | (748,983) | 13,506 | |||||||||
| Sterlite Industries India Ltd. | (16,054) | (131,016) | (7,209) | |||||||||
| Stewart Enterprises, Inc. | (572) | (4,489) | 118 | |||||||||
| Stewart Information Services Corp. | (442,256) | (8,251,812) | (3,246,844) | |||||||||
| Stillwater Mining Co. | (13,896) | (160,960) | (16,631) | |||||||||
| SYNNEX Corp. | (77,592) | (2,624,077) | (43,536) | |||||||||
| Take-Two Interactive Software, Inc. | (270,169) | (2,757,646) | (216,915) | |||||||||
| Terex Corp. | (613,293) | (13,619,335) | (3,620,332) | |||||||||
| Textron, Inc. | (331,886) | (8,900,371) | 672,917 | |||||||||
| Thompson Creek M | (1,023,970) | (2,645,761) | (1,593,475) | |||||||||
| TICC Capital Corp. | (33,942) | (340,194) | (3,300) | |||||||||
| Time Warner, Inc. | (56,517) | (1,367,861) | (71,627) | |||||||||
| Titan International, Inc. | (732,667) | (15,900,742) | (12,785) | |||||||||
| Titan Machinery, Inc. | (95,499) | (2,565,871) | 207,046 | |||||||||
| Toll Brothers, Inc. | (52,491) | (1,771,663) | 74,629 | |||||||||
| TRW Automotive Holdings Corp. | (200,279) | (8,718,282) | (2,018,675) | |||||||||
| TTM Technologies, Inc. | (112,150) | (1,073,895) | 42,115 | |||||||||
| Tyson Foods, Inc. | (288,809) | (4,930,767) | (672,128) | |||||||||
| Ultrapetrol Bahamas Ltd. | (27,843) | (42,810) | (3,131) | |||||||||
| United Rentals, Inc. | (749,607) | (24,640,632) | (9,481,479) | |||||||||
| The accompanying notes are an integral part of these financial statements. | (Continued) |
| 80 | AQR Funds | Annual Report | December 2012 | |||||||||||||
Table of Contents
| Schedule of Investments | December 31, 2012 |
| AQR DIVERSIFIED ARBITRAGE FUND |
| REFERENCE ENTITY | SHARES | NOTIONAL (a) | NET UNREALIZED APPRECIATION (DEPRECIATION) | |||||||||
| United States (continued) | ||||||||||||
| United States Steel Corp. | (187,861) | $ | (4,128,871) | $ | (355,371) | |||||||
| Universal Corp. | (110,011) | (5,178,098) | (312,551) | |||||||||
| Vantage Drilling Co. | (9,257) | (16,713) | (228) | |||||||||
| Vector Group Ltd. | (83,511) | (1,335,708) | 93,899 | |||||||||
| VeriSign, Inc. | (682,954) | (29,757,185) | 3,244,911 | |||||||||
| Virgin Media, Inc. | (343,522) | (9,457,040) | (3,167,394) | |||||||||
| Viropharma, Inc. | (448,146) | (10,943,113) | 743,310 | |||||||||
| Vishay Intertechnology, Inc. | (428,417) | (4,374,260) | (179,812) | |||||||||
| Wells Fargo & Co. | (1,340) | (45,421) | (380) | |||||||||
| Western Refining, Inc. | (2,153,410) | (56,632,135) | (4,072,492) | |||||||||
| Whiting Petroleum Corp. | (5,165) | (235,094) | 11,088 | |||||||||
| Wintrust Financial Corp. | (57,990) | (2,144,279) | 16,046 | |||||||||
| Xilinx, Inc. | (356,616) | (12,047,739) | (754,775) | |||||||||
|
| |||||||||||
| (83,380,549) | ||||||||||||
|
| |||||||||||
Total of Short Equity Positions | (83,380,549) | |||||||||||
|
| |||||||||||
Total of Long and Short Equity Positions | (81,448,262) | |||||||||||
|
| |||||||||||
| PRINCIPAL | ||||||||||||
| Fixed Income | ||||||||||||
| Long Positions | ||||||||||||
| United States | ||||||||||||
| 3D Systems Corp., 5.50%, 12/15/16 | $ | 11,725,000 | 21,958,158 | 7,214,446 | ||||||||
| A.M. Castle & Co., 7.00%, 12/15/17 | 925,000 | 1,023,487 | 472,248 | |||||||||
| Accuray, Inc., 3.75%, 08/01/16 | 700,000 | 699,898 | 11,457 | |||||||||
| Afford Resid Com, 7.50%, 08/15/25 | 998,000 | 1,149,987 | 47,816 | |||||||||
| Affymetrix, Inc., 4.00%, 07/01/19 | 2,525,000 | 2,305,184 | (190,391) | |||||||||
| Alcoa, Inc., 5.25%, 03/15/14 | 6,700,000 | 10,413,334 | (714,705) | |||||||||
| Alliance Data Systems Corp., 4.75%, 05/15/14 | 10,500,000 | 29,510,176 | 2,717,391 | |||||||||
| Alliance One International, Inc., 5.50%, 07/15/14 | 4,500,000 | 4,188,065 | 324,998 | |||||||||
| American Equity Investment Life Holding Co., 5.25%, 12/06/29 | 10,275,000 | 13,562,147 | 456,806 | |||||||||
| American Equity Investment Life Holding Co., 3.50%, 09/15/15 | 8,925,000 | 10,225,694 | 170,298 | |||||||||
| REFERENCE ENTITY | PRINCIPAL | NOTIONAL (a) | NET UNREALIZED APPRECIATION (DEPRECIATION) | |||||||||
| United States (continued) | ||||||||||||
| Amkor Technology, Inc., 6.00%, 04/15/14 | $ | 5,950,000 | $ | 11,393,256 | $ | (2,462,413) | ||||||
| Annaly Capital Management, Inc., 5.00%, 05/15/15 | 3,150,000 | 3,228,750 | (24,832) | |||||||||
| ArcelorMittal, 5.00%, 05/15/14 | 6,875,000 | 7,114,669 | 75,664 | |||||||||
| Archer-Daniels-Midland Co., 0.88%, 02/15/14 | 1,500,000 | 1,512,152 | (6,256) | |||||||||
| Ares Capital Corp., 5.75%, 02/01/16 | 4,425,000 | 4,699,686 | 157,479 | |||||||||
| Ares Capital Corp., 5.13%, 06/01/16 | 3,025,000 | 3,147,186 | 74,408 | |||||||||
| AV Homes, Inc., 7.50%, 02/15/16 | 3,920,000 | 4,080,885 | (10,622) | |||||||||
| AV Homes, Inc., 7.50%, 02/15/16 | 980,000 | 991,025 | 42,857 | |||||||||
| Avis Budget Group, Inc., 3.50%, 10/01/14 | 7,400,000 | 9,280,939 | 917,897 | |||||||||
| BGC Partners, Inc., 4.50%, 07/15/16 | 1,400,000 | 1,270,325 | 43,276 | |||||||||
| BioMed Realty LP, 3.75%, 01/15/30 | 8,975,000 | 10,494,207 | 161,990 | |||||||||
| Boston Properties LP, 3.63%, 02/15/14 | 3,750,000 | 4,178,527 | (175,619) | |||||||||
| Boston Properties LP, 3.75%, 05/15/36 | 5,750,000 | 6,773,621 | (481,719) | |||||||||
| Bristow Group, Inc., 3.00%, 06/15/38 | 1,000,000 | 1,016,167 | 47,734 | |||||||||
| Cadence Design Systems, Inc., 2.63%, 06/01/15 | 6,925,000 | 12,112,331 | 619,182 | |||||||||
| CBIZ, Inc., 4.88%, 10/01/15 | 1,400,000 | 1,423,464 | 43,661 | |||||||||
| Cemex SAB de CV, 4.88%, 03/15/15 | 3,200,000 | 3,040,566 | 493,975 | |||||||||
| Cemex SAB de CV, 3.75%, 03/15/18 | 500,000 | 467,761 | 105,958 | |||||||||
| Cemex SAB de CV, 7.00%, 05/15/17 | 1,800,000 | 1,498,849 | 201,026 | |||||||||
| Cemex SAB de CV, 3.25%, 03/15/16 | 900,000 | 838,981 | 190,121 | |||||||||
| Chart Industries, Inc., 2.00%, 08/01/18 | 8,825,000 | 11,114,840 | (170,137) | |||||||||
| China Medical Technologies, Inc., 4.00%, 08/15/13 | 250,000 | 43,750 | (35,625) | |||||||||
| China Medical Technologies, Inc., 6.25%, 12/15/16 | 2,625,000 | 459,375 | (374,063) | |||||||||
| Chiquita Brands International, Inc., 4.25%, 08/15/16 | 5,000,000 | 3,911,910 | 518,355 | |||||||||
| Ciena Corp., 4.00%, 12/15/20 | 13,175,000 | 14,705,935 | 377,052 | |||||||||
| The accompanying notes are an integral part of these financial statements. | (Continued) |
| AQR Funds | Annual Report | December 2012 | 81 | |||||||||||||
Table of Contents
| Schedule of Investments | December 31, 2012 |
| AQR DIVERSIFIED ARBITRAGE FUND |
| REFERENCE ENTITY | PRINCIPAL | NOTIONAL (a) | NET UNREALIZED APPRECIATION (DEPRECIATION) | |||||||||
| United States (continued) | ||||||||||||
| Ciena Corp., 4.00%, 03/15/15 | $ | 2,900,000 | $ | 3,455,512 | $ | (128,814) | ||||||
| Coinstar, Inc., 4.00%, 09/01/14 | 2,150,000 | 3,035,501 | 37,076 | |||||||||
| Concur Technologies, Inc., 2.50%, 04/15/15 | 200,000 | 289,653 | (8,956) | |||||||||
| Convergys Corp., 5.75%, 09/15/29 | 7,825,000 | 12,481,258 | 397,946 | |||||||||
| DDR Corp., 1.75%, 11/15/40 | 22,575,000 | 25,117,827 | 118,700 | |||||||||
| DFC Global Corp., 3.25%, 04/15/17 | 800,000 | 939,522 | (62,451) | |||||||||
| DFC Global Corp., 2.88%, 06/30/27 | 150,000 | 159,152 | (9,140) | |||||||||
| Digital Realty Trust LP, 5.50%, 04/15/29 | 8,450,000 | 15,949,848 | (1,522,228) | |||||||||
| DR Horton, Inc., 2.00%, 05/15/14 | 24,531,000 | 36,365,834 | 2,533,504 | |||||||||
| DST Systems, Inc., 1000.00%, 08/15/23 | 975,000 | 1,156,594 | 117,609 | |||||||||
| EnPro Industries, Inc., 3.94%, 10/15/15 | 3,575,000 | 4,332,063 | 437,210 | |||||||||
| Equinix, Inc., 4.75%, 06/15/16 | 13,075,000 | 29,961,820 | 3,138,764 | |||||||||
| Exide Technologies, 4.25%, 06/15/14 | 3,675,000 | 4,054,315 | 160,854 | |||||||||
| Exide Technologies, 1000.00%, 09/18/13 | 650,000 | 554,125 | 50,375 | |||||||||
| Fifth & Pacific Cos., Inc., 6.00%, 06/15/14 | 6,250,000 | 21,389,581 | 713,870 | |||||||||
| Finisar Corp., 5.00%, 10/15/29 | 400,000 | 687,111 | 50,425 | |||||||||
| Gaylord Entertainment Co., 3.75%, 10/01/14 | 14,350,000 | 22,548,930 | 2,574,017 | |||||||||
| Genco Shipping & Trading Ltd., 5.00%, 08/15/15 | 500,000 | 239,931 | (50,800) | |||||||||
| GenCorp, Inc., 4.06%, 12/31/39 | 3,575,000 | 4,146,875 | 241,839 | |||||||||
| General Cable Corp., 0.88%, 11/15/13 | 6,075,000 | 5,974,234 | 50,714 | |||||||||
| General Cable Corp., 4.50%, 11/15/29 | 9,620,000 | 10,171,948 | 261,833 | |||||||||
| GMX Resources, Inc., 4.50%, 05/01/15 | 1,875,000 | 830,391 | 27,577 | |||||||||
| Goodrich Petroleum Corp., 5.00%, 10/01/29 | 1,000,000 | 958,472 | (7,085) | |||||||||
| Green Plains Renewable Energy, Inc., 5.75%, 11/01/15 | 4,100,000 | 2,988,699 | 702,589 | |||||||||
| REFERENCE ENTITY | PRINCIPAL | NOTIONAL (a) | NET UNREALIZED APPRECIATION (DEPRECIATION) | |||||||||
| United States (continued) | ||||||||||||
| Group 1 Automotive, Inc., 3.00%, 03/15/20 | $ | 2,350,000 | $ | 3,783,305 | $ | 394,291 | ||||||
| Hawaiian Holdings, Inc., 5.00%, 03/15/16 | 300,000 | 327,583 | 8,767 | |||||||||
| Health Care REIT, Inc., 3.00%, 12/01/29 | 1,275,000 | 1,563,256 | 4,267 | |||||||||
| Hertz Global Holdings, Inc., 5.25%, 06/01/14 | 20,275,000 | 32,909,285 | 8,314,274 | |||||||||
| Host Hotels & Resorts LP, 2.50%, 10/15/29 | 27,225,000 | 35,072,987 | 582,885 | |||||||||
| Host Hotels & Resorts, Inc., 3.00%, 08/01/35 | 5,800,000 | 5,770,031 | 174,836 | |||||||||
| JAKKS Pacific, Inc., 4.50%, 11/01/14 | 3,925,000 | 4,799,784 | (597,256) | |||||||||
| James River Coal Co., 4.50%, 12/01/15 | 500,000 | 180,813 | 30,791 | |||||||||
| Kaman Corp., 3.25%, 11/15/17 | 3,800,000 | 4,500,283 | 289,502 | |||||||||
| Kilroy Realty LP, 4.25%, 11/15/14 | 7,390,000 | 10,091,097 | (59,963) | |||||||||
| LDK Solar Co. Ltd., 4.75%, 04/15/13 | 625,000 | 387,938 | 87,173 | |||||||||
| Lennar Corp., 2.75%, 12/15/20 | 15,175,000 | 23,741,394 | 4,200,096 | |||||||||
| Lennar Corp., 2.00%, 12/01/20 | 350,000 | 445,045 | 63,270 | |||||||||
| Lennar Corp., 3.25%, 11/15/21 | 14,100,000 | 23,013,239 | 2,338,147 | |||||||||
| Leucadia National Corp., 3.75%, 04/15/14 | 250,000 | 285,287 | 8,129 | |||||||||
| Lexington Realty Trust, 6.00%, 01/15/30 | 7,550,000 | 10,379,989 | 1,437,362 | |||||||||
| Medicines Co./The, 1.38%, 06/01/17 | 825,000 | 923,922 | (19,581) | |||||||||
| Meritor, Inc., 4.63%, 03/01/26 | 2,000,000 | 1,801,882 | 95,542 | |||||||||
| MGIC Investment Corp., 5.00%, 05/01/17 | 10,850,000 | 6,610,970 | 1,638,289 | |||||||||
| MGM Resorts International, 4.25%, 04/15/15 | 6,375,000 | 6,544,250 | 259,355 | |||||||||
| Microchip Technology, Inc., 2.13%, 12/15/37 | 10,650,000 | 14,135,031 | (678,837) | |||||||||
| The accompanying notes are an integral part of these financial statements. | (Continued) |
| 82 | AQR Funds | Annual Report | December 2012 | |||||||||||||
Table of Contents
| Schedule of Investments | December 31, 2012 |
| AQR DIVERSIFIED ARBITRAGE FUND |
| REFERENCE ENTITY | PRINCIPAL | NOTIONAL (a) | NET UNREALIZED APPRECIATION (DEPRECIATION) | |||||||||
| United States (continued) | ||||||||||||
| Micron Technology, Inc., 1.50%, 08/01/31 | $ | 400,000 | $ | 379,217 | $ | (6,971) | ||||||
| Micron Technology, Inc., 2.38%, 05/01/32 | 3,050,000 | 3,077,154 | (125,510) | |||||||||
| Molina Healthcare, Inc., 3.75%, 10/01/14 | 1,875,000 | 2,135,351 | 45,743 | |||||||||
| Nash Finch Co., 1.63%, 03/15/35 | 4,275,000 | 2,048,802 | (45,464) | |||||||||
| National Financial Partners Corp., 4.00%, 06/15/17 | 4,025,000 | 5,535,607 | 433,944 | |||||||||
| Navistar International Corp., 3.00%, 10/15/14 | 2,475,000 | 2,261,326 | 14,645 | |||||||||
| NetApp, Inc., 1.75%, 06/01/13 | 5,600,000 | 6,086,332 | 215,014 | |||||||||
| Northgate Minerals Corp., 3.50%, 10/01/16 | 2,825,000 | 2,918,030 | 170,320 | |||||||||
| NorthStar Realty Finance Corp., 7.50%, 03/15/31 | 3,400,000 | 3,671,293 | 472,035 | |||||||||
| Nuance Communications, Inc., 2.75%, 11/01/31 | 600,000 | 677,471 | (23,315) | |||||||||
| Omnicare, Inc., 3.75%, 12/15/25 | 2,400,000 | 3,263,750 | 277,453 | |||||||||
| Penson Worldwide, Inc., 8.00%, 06/01/14 | 8,515,000 | 755,468 | (442,004) | |||||||||
| PHH Corp., 6.00%, 06/15/17 | 4,300,000 | 7,660,023 | 871,402 | |||||||||
| Photronics, Inc., 5.50%, 10/01/14 | 2,200,000 | 3,231,952 | (121,369) | |||||||||
| Pioneer Natural Resources Co., 2.88%, 01/15/38 | 200,000 | 330,463 | 29,693 | |||||||||
| Powerwave Technologies, Inc., 2.75%, 07/15/41 | 3,900,000 | 1,173,764 | (341,791) | |||||||||
| priceline.com, Inc., 1.25%, 03/15/15 | 12,400,000 | 23,810,158 | 2,051,335 | |||||||||
| Prologis, Inc., 3.25%, 03/15/15 | 11,905,000 | 13,419,328 | 185,958 | |||||||||
| Protein Design Labs, Inc., 2.88%, 02/15/15 | 1,400,000 | 1,736,763 | 51,190 | |||||||||
| Radian Group, Inc., 3.00%, 11/15/17 | 5,175,000 | 3,292,164 | 1,304,633 | |||||||||
| Rambus, Inc., 5.00%, 06/15/14 | 6,450,000 | 6,502,851 | (45,852) | |||||||||
| REFERENCE ENTITY | PRINCIPAL | NOTIONAL (a) | NET UNREALIZED APPRECIATION (DEPRECIATION) | |||||||||
| United States (continued) | ||||||||||||
| Regeneron Pharmaceuticals, Inc., 1.88%, 10/01/16 | $ | 11,925,000 | $ | 20,994,211 | $ | 4,000,542 | ||||||
| Regis Corp., 5.00%, 07/15/14 | 10,000,000 | 12,727,780 | (201,732) | |||||||||
| Rite Aid Corp., 8.50%, 05/15/15 | 300,000 | 322,054 | 6,944 | |||||||||
| RTI International Metals, Inc., 3.00%, 12/01/15 | 5,250,000 | 5,537,873 | 175,071 | |||||||||
| Saks, Inc., 7.50%, 12/01/13 | 800,000 | 1,651,166 | (133,557) | |||||||||
| Salesforce.com, Inc., 0.75%, 01/15/15 | 23,625,000 | 41,328,488 | 6,032,880 | |||||||||
| SanDisk Corp., 1.00%, 05/15/13 | 10,300,000 | 10,376,962 | (153,714) | |||||||||
| Sequenom, Inc., 5.00%, 10/01/17 | 4,500,000 | 4,586,187 | 848,457 | |||||||||
| SL Green Operating Partnership LP, 3.00%, 10/15/17 | 15,150,000 | 17,762,118 | (687,256) | |||||||||
| Smithfield Foods, Inc., 4.00%, 06/30/13 | 11,700,000 | 12,576,201 | (178,942) | |||||||||
| Sotheby’s, 3.13%, 06/15/13 | 5,025,000 | 5,716,551 | (279,076) | |||||||||
| Standard Pacific Corp., 1.25%, 08/01/32 | 1,150,000 | 1,355,088 | (928) | |||||||||
| Sterlite Industries India Ltd., 4.00%, 10/30/14 | 5,350,000 | 5,077,450 | 105,620 | |||||||||
| Stewart Enterprises, Inc., 3.13%, 07/15/14 | 25,000 | 25,219 | 439 | |||||||||
| Stewart Information Services Corp., 6.00%, 10/15/14 | 6,125,000 | 9,446,790 | 3,341,335 | |||||||||
| Stillwater Mining Co., 1.88%, 03/15/28 | 1,000,000 | 1,002,760 | 2,834 | |||||||||
| SYNNEX Corp., 4.00%, 05/15/18 | 2,750,000 | 3,409,695 | (126,350) | |||||||||
| Take-Two Interactive Software, Inc., 1.75%, 12/01/16 | 2,200,000 | 1,949,307 | 146,722 | |||||||||
| Take-Two Interactive Software, Inc., 4.38%, 06/01/14 | 3,825,000 | 4,490,060 | 169,176 | |||||||||
| Terex Corp., 4.00%, 06/01/15 | 11,325,000 | 17,656,882 | 3,488,667 | |||||||||
| Textron, Inc., 4.50%, 05/01/13 | 4,400,000 | 9,115,150 | (752,035) | |||||||||
| Time Warner, Inc., 2.38%, 04/01/26 | 1,075,000 | 1,435,151 | 42,037 | |||||||||
| The accompanying notes are an integral part of these financial statements. | (Continued) |
| AQR Funds | Annual Report | December 2012 | 83 | |||||||||||||
Table of Contents
| Schedule of Investments | December 31, 2012 |
| AQR DIVERSIFIED ARBITRAGE FUND |
| REFERENCE ENTITY | PRINCIPAL | NOTIONAL (a) | NET UNREALIZED APPRECIATION (DEPRECIATION) | |||||||||
| United States (continued) | ||||||||||||
| Titan International, Inc., 5.63%, 01/15/17 | $ | 7,575,000 | $ | 18,214,322 | $ | 15,711 | ||||||
| Titan Machinery, Inc., 3.75%, 05/01/19 | 6,650,000 | 6,609,821 | (312,643) | |||||||||
| Toll Brothers, Inc., 0.50%, 09/15/32 | 5,625,000 | 5,760,624 | (84,732) | |||||||||
| TRW Automotive, Inc., 3.50%, 12/01/15 | 6,650,000 | 10,712,133 | 2,013,346 | |||||||||
| TTM Technologies, Inc., 3.25%, 05/15/15 | 5,775,000 | 5,857,496 | (7,596) | |||||||||
| Tyson Foods, Inc., 3.25%, 10/15/13 | 6,600,000 | 7,462,904 | 564,935 | |||||||||
| United Rentals, Inc., 4.00%, 11/15/15 | 8,500,000 | 25,552,181 | 9,511,962 | |||||||||
| United States Steel Corp., 4.00%, 05/15/14 | 16,184,000 | 17,355,544 | 176,881 | |||||||||
| VeriSign, Inc., 3.25%, 08/15/37 | 27,135,000 | 38,791,739 | (4,234,509) | |||||||||
| Virgin Media, Inc., 6.50%, 11/15/16 | 6,950,000 | 11,370,680 | 2,991,926 | |||||||||
| ViroPharma, Inc., 2.00%, 03/15/17 | 10,375,000 | 15,298,228 | (789,134) | |||||||||
| Vishay Intertechnology, Inc., 2.25%, 11/15/40 | 6,500,000 | 5,869,903 | 125,023 | |||||||||
| Western Refining, Inc., 5.75%, 06/15/14 | 21,247,000 | 53,370,849 | 8,886,801 | |||||||||
| Xilinx, Inc., 3.13%, 03/15/37 | 13,400,000 | 16,487,816 | 613,240 | |||||||||
| XM Satellite Radio, Inc., 7.00%, 12/01/14 | 19,594,000 | 30,501,862 | 3,243,151 | |||||||||
|
| |||||||||||
Total of Long Fixed Income Positions | 82,769,065 | |||||||||||
|
| |||||||||||
Net Cash and Other Receivables/(Payables) (b) | (5,860,551) | |||||||||||
|
| |||||||||||
Swaps, at Value | $ | (4,539,748) | ||||||||||
|
| |||||||||||
| (a) | Notional value represents the market value (including any fees or commissions) of the long and short positions when they are established. |
| (b) | Cash and other receivables includes the gains (or losses) realized within the swap when the swap resets. Gains (or losses) will be realized on the swap, and reflected on the Statement of Operations, when cash is settled with the counterparty. |
Money Market Fund pledged as collateral to the broker in the amount of $286,480,000.
| The accompanying notes are an integral part of these financial statements. |
| 84 | AQR Funds | Annual Report | December 2012 | |||||||||||||
Table of Contents
| Schedule of Investments | December 31, 2012 |
| COMMON STOCKS - 99.1% | SHARES | VALUE (Note 2) | ||||||
| Consumer Discretionary - 21.5% | ||||||||
| Advance Auto Parts, Inc. | 2,300 | $ | 166,405 | |||||
| Amazon.com, Inc. † | 12,300 | 3,089,022 | ||||||
| American Eagle Outfitters, Inc. (a) | 22,900 | 469,679 | ||||||
| Apollo Group, Inc., Class A †(a) | 8,300 | 173,636 | ||||||
| AutoNation, Inc. † | 14,700 | 583,590 | ||||||
| AutoZone, Inc. † | 1,400 | 496,202 | ||||||
| Bed Bath & Beyond, Inc. † | 2,300 | 128,593 | ||||||
| Big Lots, Inc. †(a) | 7,800 | 221,988 | ||||||
| BorgWarner, Inc. † | 1,700 | 121,754 | ||||||
| Brinker International, Inc. (a) | 12,400 | 384,276 | ||||||
| Brunswick Corp. (a) | 20,700 | 602,163 | ||||||
| Buckle, Inc./The (a) | 7,400 | 330,336 | ||||||
| Cabela’s, Inc. †(a) | 11,000 | 459,250 | ||||||
| Carter’s, Inc. † | 7,700 | 428,505 | ||||||
| CBS Corp., Class B | 73,900 | 2,811,895 | ||||||
| Chico’s FAS, Inc. | 25,500 | 470,730 | ||||||
| Chipotle Mexican Grill, Inc. † | 800 | 237,968 | ||||||
| Cinemark Holdings, Inc. (a) | 15,800 | 410,484 | ||||||
| Clear Channel Outdoor Holdings, Inc., Class A †(a) | 9,300 | 65,286 | ||||||
| Comcast Corp., Class A | 228,800 | 8,552,544 | ||||||
| Dick’s Sporting Goods, Inc. (a) | 4,600 | 209,254 | ||||||
| Dillard’s, Inc., Class A (a) | 10,500 | 879,585 | ||||||
| Discovery Communications, Inc., Class A † | 37,066 | 2,352,950 | ||||||
| DISH Network Corp., Class A | 43,800 | 1,594,320 | ||||||
| Dollar General Corp. † | 19,200 | 846,528 | ||||||
| Dollar Tree, Inc. † | 17,900 | 726,024 | ||||||
| Domino’s Pizza, Inc. (a) | 10,800 | 470,340 | ||||||
| DR Horton, Inc. (a) | 73,900 | 1,461,742 | ||||||
| DSW, Inc., Class A (a) | 6,600 | 433,554 | ||||||
| Expedia, Inc. | 26,200 | 1,609,990 | ||||||
| Family Dollar Stores, Inc. | 4,900 | 310,709 | ||||||
| Foot Locker, Inc. | 24,400 | 783,728 | ||||||
| Fossil, Inc. †(a) | 6,900 | 642,390 | ||||||
| Gannett Co., Inc. (a) | 26,700 | 480,867 | ||||||
| Gap, Inc./The | 66,600 | 2,067,264 | ||||||
| General Motors Co. † | 21,600 | 622,728 | ||||||
| Gentex Corp. (a) | 13,000 | 244,660 | ||||||
| Genuine Parts Co. (a) | 16,500 | 1,049,070 | ||||||
| GNC Holdings, Inc., Class A | 12,900 | 429,312 | ||||||
| H&R Block, Inc. | 25,400 | 471,678 | ||||||
| Harley - Davidson, Inc. | 13,200 | 644,688 | ||||||
| Hasbro, Inc. (a) | 3,200 | 114,880 | ||||||
| Home Depot, Inc./The | 130,100 | 8,046,685 | ||||||
| HSN, Inc. (a) | 8,000 | 440,640 | ||||||
| Hyatt Hotels Corp., Class A †(a) | 10,100 | 389,557 | ||||||
| Jarden Corp. †(a) | 9,200 | 475,640 | ||||||
| Lamar Advertising Co., Class A † | 12,300 | 476,625 | ||||||
| Las Vegas Sands Corp. | 7,200 | 332,352 | ||||||
| Lennar Corp., Class A(a) | 60,600 | 2,343,402 | ||||||
| Liberty Global, Inc., Class A † | 29,200 | 1,839,308 | ||||||
| Liberty Interactive Corp., Series A † | 25,100 | 493,968 | ||||||
| Liberty Media Corp. - Liberty Capital, Class A † | 20,900 | 2,424,609 | ||||||
| LKQ Corp. †(a) | 47,000 | 991,700 | ||||||
| Lowe’s Cos., Inc. | 93,100 | 3,306,912 | ||||||
| SHARES | VALUE (Note 2) | |||||||
| Consumer Discretionary - 21.5% (continued) | ||||||||
| Ltd. Brands, Inc. (a) | 29,600 | $ | 1,392,976 | |||||
| Macy’s, Inc. | 32,800 | 1,279,856 | ||||||
| Marriott International, Inc., Class A (a) | 24,800 | 924,296 | ||||||
| Mattel, Inc. (a) | 33,000 | 1,208,460 | ||||||
| McGraw-Hill Cos., Inc./The | 24,400 | 1,333,948 | ||||||
| Mohawk Industries, Inc. †(a) | 11,600 | 1,049,452 | ||||||
| News Corp., Class A (a) | 213,700 | 5,457,898 | ||||||
| Nordstrom, Inc. | 11,100 | 593,850 | ||||||
| O’Reilly Automotive, Inc. † | 7,200 | 643,824 | ||||||
| Panera Bread Co., Class A † | 2,400 | 381,192 | ||||||
| PetSmart, Inc. | 9,200 | 628,728 | ||||||
| Pier 1 Imports, Inc. (a) | 24,000 | 480,000 | ||||||
| Polaris Industries, Inc. (a) | 10,200 | 858,330 | ||||||
| priceline.com, Inc. † | 2,026 | 1,258,551 | ||||||
| PulteGroup, Inc. †(a) | 88,400 | 1,605,344 | ||||||
| PVH Corp. (a) | 9,800 | 1,087,898 | ||||||
| Ralph Lauren Corp. | 1,900 | 284,848 | ||||||
| Rent-A-Center, Inc. (a) | 8,000 | 274,880 | ||||||
| Ross Stores, Inc. | 24,800 | 1,342,920 | ||||||
| Sally Beauty Holdings, Inc. †(a) | 22,600 | 532,682 | ||||||
| Signet Jewelers Ltd. (Bermuda) (a) | 3,900 | 208,260 | ||||||
| Sirius XM Radio, Inc. (a) | 528,500 | 1,527,365 | ||||||
| Six Flags Entertainment Corp. | 16,300 | 997,560 | ||||||
| Standard Pacific Corp. †(a) | 136,800 | 1,005,480 | ||||||
| Starbucks Corp. | 3,834 | 205,579 | ||||||
| Target Corp. | 9,100 | 538,447 | ||||||
| Tempur-Pedic International, Inc. †(a) | 16,100 | 506,989 | ||||||
| Tenneco, Inc. †(a) | 3,100 | 108,841 | ||||||
| Time Warner Cable, Inc. (a) | 37,400 | 3,634,906 | ||||||
| Time Warner, Inc. | 79,300 | 3,792,919 | ||||||
| TJX Cos., Inc. | 75,900 | 3,221,955 | ||||||
| Toll Brothers, Inc. †(a) | 43,000 | 1,390,190 | ||||||
| Tractor Supply Co. | 8,000 | 706,880 | ||||||
| TRW Automotive Holdings Corp. † | 11,400 | 611,154 | ||||||
| Tupperware Brands Corp. | 4,600 | 294,860 | ||||||
| Ulta Salon Cosmetics & Fragrance, Inc. (a) | 8,300 | 815,558 | ||||||
| Under Armour, Inc., Class A †(a) | 13,800 | 669,714 | ||||||
| Urban Outfitters, Inc. † | 12,700 | 499,872 | ||||||
| VF Corp. | 4,600 | 694,462 | ||||||
| Viacom, Inc., Class B | 13,100 | 690,894 | ||||||
| Virgin Media, Inc. (a) | 17,600 | 646,800 | ||||||
| Walt Disney Co./The | 142,500 | 7,095,075 | ||||||
| Weight Watchers International, Inc. (a) | 8,600 | 450,296 | ||||||
| Whirlpool Corp. | 16,500 | 1,678,875 | ||||||
| Wolverine World Wide, Inc. (a) | 8,400 | 344,232 | ||||||
| Wyndham Worldwide Corp. | 26,300 | 1,399,423 | ||||||
| Wynn Resorts Ltd. | 3,900 | 438,711 | ||||||
| Yum! Brands, Inc. | 19,200 | 1,274,880 | ||||||
|
| |||||||
| 118,282,075 | ||||||||
|
| |||||||
| Consumer Staples - 6.6% | ||||||||
| Altria Group, Inc. | 36,000 | 1,131,120 | ||||||
| Beam, Inc. | 5,400 | 329,886 | ||||||
| Brown-Forman Corp., Class B | 5,700 | 360,525 | ||||||
| Casey’s General Stores, Inc. (a) | 5,900 | 313,290 | ||||||
| Church & Dwight Co., Inc. (a) | 12,500 | 669,625 | ||||||
| Coca-Cola Enterprises, Inc. | 6,823 | 216,494 | ||||||
| Colgate-Palmolive Co. | 3,300 | 344,982 | ||||||
| The accompanying notes are an integral part of these financial statements. | (Continued) |
| AQR Funds | Annual Report | December 2012 | 85 | |||||||||||||
Table of Contents
| Schedule of Investments | December 31, 2012 |
| AQR MOMENTUM FUND |
| SHARES | VALUE (Note 2) | |||||||
| Consumer Staples - 6.6% (continued) | ||||||||
| Constellation Brands, Inc., Class A † | 17,800 | $ | 629,942 | |||||
| Costco Wholesale Corp. | 7,000 | 691,390 | ||||||
| CVS Caremark Corp. | 43,800 | 2,117,730 | ||||||
| Darling International, Inc. † | 15,500 | 248,620 | ||||||
| Dean Foods Co. †(a) | 31,800 | 525,018 | ||||||
| Estee Lauder Cos., Inc./The, Class A | 24,500 | 1,466,570 | ||||||
| Hain Celestial Group, Inc./The †(a) | 7,600 | 412,072 | ||||||
| Herbalife Ltd. (Cayman Islands) (a) | 12,700 | 418,338 | ||||||
| Hershey Co./The | 14,900 | 1,076,078 | ||||||
| Hillshire Brands Co. | 8,960 | 252,134 | ||||||
| Hormel Foods Corp. (a) | 19,500 | 608,595 | ||||||
| Ingredion, Inc. | 4,600 | 296,378 | ||||||
| JM Smucker Co./The | 6,800 | 586,432 | ||||||
| Kimberly-Clark Corp. (a) | 9,600 | 810,528 | ||||||
| McCormick & Co., Inc. | 3,300 | 209,649 | ||||||
| Monster Beverage Corp. †(a) | 11,200 | 592,256 | ||||||
| Nu Skin Enterprises, Inc., Class A (a) | 5,900 | 218,595 | ||||||
| Philip Morris International, Inc. | 57,700 | 4,826,028 | ||||||
| Pricesmart, Inc. (a) | 7,900 | 608,695 | ||||||
| Reynolds American, Inc. (a) | 8,400 | 348,012 | ||||||
| Smithfield Foods, Inc. † | 14,000 | 301,980 | ||||||
| TreeHouse Foods, Inc. †(a) | 4,700 | 245,011 | ||||||
| Tyson Foods, Inc., Class A | 22,700 | 440,380 | ||||||
| Wal-Mart Stores, Inc. | 200,800 | 13,700,584 | ||||||
| Whole Foods Market, Inc. | 15,000 | 1,369,950 | ||||||
|
| |||||||
| 36,366,887 | ||||||||
|
| |||||||
| Energy - 3.5% | ||||||||
| Atwood Oceanics, Inc. †(a) | 7,100 | 325,109 | ||||||
| Berry Petroleum Co., Class A (a) | 3,600 | 120,780 | ||||||
| Cabot Oil & Gas Corp. | 9,500 | 472,530 | ||||||
| CARBO Ceramics, Inc. (a) | 3,900 | 305,526 | ||||||
| Cheniere Energy, Inc. †(a) | 24,100 | 452,598 | ||||||
| Cobalt International Energy, Inc. † | 51,400 | 1,262,384 | ||||||
| Concho Resources, Inc. † | 1,100 | 88,616 | ||||||
| Continental Resources, Inc. †(a) | 9,100 | 668,759 | ||||||
| Dresser-Rand Group, Inc. †(a) | 3,600 | 202,104 | ||||||
| Energen Corp. | 2,800 | 126,252 | ||||||
| Energy XXI Bermuda Ltd. (Bermuda) (a) | 4,500 | 144,855 | ||||||
| EOG Resources, Inc. | 5,500 | 664,345 | ||||||
| Golar LNG Ltd. (Bermuda) (a) | 10,300 | 378,834 | ||||||
| HollyFrontier Corp. | 16,200 | 754,110 | ||||||
| Kinder Morgan, Inc. | 53,300 | 1,883,089 | ||||||
| Kodiak Oil & Gas Corp. †(a) | 51,900 | 459,315 | ||||||
| Lufkin Industries, Inc. (a) | 1,900 | 110,447 | ||||||
| Marathon Petroleum Corp. | 24,700 | 1,556,100 | ||||||
| National Oilwell Varco, Inc. | 8,200 | 560,470 | ||||||
| Oceaneering International, Inc. | 7,300 | 392,667 | ||||||
| Pioneer Natural Resources Co. | 4,700 | 500,973 | ||||||
| Rosetta Resources, Inc. †(a) | 10,000 | 453,600 | ||||||
| Seadrill Ltd. (Norway) | 36,600 | 1,346,880 | ||||||
| SM Energy Co. (a) | 8,300 | 433,343 | ||||||
| Spectra Energy Corp. | 10,700 | 292,966 | ||||||
| Tesoro Corp. | 20,700 | 911,835 | ||||||
| Tidewater, Inc. | 2,900 | 129,572 | ||||||
| Valero Energy Corp. | 33,300 | 1,136,196 | ||||||
| Western Refining, Inc. (a) | 16,900 | 476,411 | ||||||
| Williams Cos., Inc./The | 58,900 | 1,928,386 | ||||||
| SHARES | VALUE (Note 2) | |||||||
| Energy - 3.5% (continued) | ||||||||
| World Fuel Services Corp. (a) | 7,000 | $ | 288,190 | |||||
| WPX Energy, Inc. † | 10,366 | 154,246 | ||||||
|
| |||||||
| 18,981,488 | ||||||||
|
| |||||||
| Financials - 17.7% | ||||||||
| Aflac, Inc. | 10,000 | 531,200 | ||||||
| Allstate Corp./The | 52,100 | 2,092,857 | ||||||
| American Campus Communities, Inc. REIT (a) | 7,300 | 336,749 | ||||||
| American Capital Ltd. † | 99,700 | 1,196,400 | ||||||
| American Express Co. | 8,500 | 488,580 | ||||||
| American Financial Group, Inc. | 8,200 | 324,064 | ||||||
| American International Group, Inc. † | 124,300 | 4,387,790 | ||||||
| American Tower Corp. REIT | 25,100 | 1,939,477 | ||||||
| Ameriprise Financial, Inc. | 26,300 | 1,647,169 | ||||||
| Aon PLC (United Kingdom) | 11,400 | 633,840 | ||||||
| Arch Capital Group Ltd. (Bermuda) †(a) | 13,000 | 572,260 | ||||||
| AvalonBay Communities, Inc. REIT | 3,800 | 515,242 | ||||||
| Bank of America Corp. | 783,800 | 9,092,080 | ||||||
| Bank of New York Mellon Corp/The | 20,000 | 514,000 | ||||||
| BB&T Corp. | 73,900 | 2,151,229 | ||||||
| BGC Partners, Inc., Class A | 14,300 | 49,478 | ||||||
| Boston Properties, Inc. REIT | 6,400 | 677,184 | ||||||
| Camden Property Trust REIT (a) | 3,800 | 259,198 | ||||||
| Capital One Financial Corp. | 43,300 | 2,508,369 | ||||||
| Capitol Federal Financial, Inc. (a) | 26,600 | 310,954 | ||||||
| CBL & Associates Properties, Inc. REIT | 22,000 | 466,620 | ||||||
| Cincinnati Financial Corp. | 26,000 | 1,018,160 | ||||||
| Citigroup, Inc. | 130,700 | 5,170,492 | ||||||
| Digital Realty Trust, Inc. REIT (a) | 10,100 | 685,689 | ||||||
| Discover Financial Services | 66,500 | 2,563,575 | ||||||
| Douglas Emmett, Inc. REIT (a) | 8,500 | 198,050 | ||||||
| Equity Residential REIT | 13,200 | 748,044 | ||||||
| Erie Indemnity Co., Class A (a) | 2,000 | 138,440 | ||||||
| Essex Property Trust, Inc. REIT a) | 1,800 | 263,970 | ||||||
| Extra Space Storage, Inc. REIT | 11,900 | 433,041 | ||||||
| Fidelity National Financial, Inc., Class A (a) | 21,800 | 513,390 | ||||||
| Fifth Third Bancorp | 103,800 | 1,576,722 | ||||||
| Franklin Resources, Inc. | 11,700 | 1,470,690 | ||||||
| General Growth Properties, Inc. REIT | 109,100 | 2,165,635 | ||||||
| Goldman Sachs Group, Inc./The | 27,800 | 3,546,168 | ||||||
| Hartford Financial Services Group, Inc. (a) | 23,000 | 516,120 | ||||||
| Health Care REIT, Inc. REIT (a) | 7,100 | 435,159 | ||||||
| Host Hotels & Resorts, Inc. REIT (a) | 29,600 | 463,832 | ||||||
| Huntington Bancshares, Inc. | 70,400 | 449,856 | ||||||
| Invesco Ltd. | 39,300 | 1,025,337 | ||||||
| JPMorgan Chase & Co. | 185,500 | 8,156,435 | ||||||
| KeyCorp | 59,300 | 499,306 | ||||||
| Lincoln National Corp. (a) | 39,600 | 1,025,640 | ||||||
| M&T Bank Corp. | 4,900 | 482,503 | ||||||
| Macerich Co./The REIT (a) | 7,100 | 413,930 | ||||||
| Mid-America Apartment Communities, Inc. REIT (a) | 1,800 | 116,550 | ||||||
| Moody’s Corp. (a) | 18,400 | 925,888 | ||||||
| NASDAQ OMX Group, Inc./The | 5,000 | 125,050 | ||||||
| Ocwen Financial Corp. † | 31,400 | 1,086,126 | ||||||
| Post Properties, Inc. REIT (a) | 5,900 | 294,705 | ||||||
| Prologis, Inc. REIT(a) | 8,130 | 296,664 | ||||||
| The accompanying notes are an integral part of these financial statements. | (Continued) |
| 86 | AQR Funds | Annual Report | December 2012 | |||||||||||||
Table of Contents
| Schedule of Investments | December 31, 2012 |
| AQR MOMENTUM FUND |
| SHARES | VALUE (Note 2) | |||||||
| Financials - 17.7% (continued) | ||||||||
| Rayonier, Inc. REIT (a) | 13,850 | $ | 717,845 | |||||
| Regions Financial Corp. | 174,400 | 1,241,728 | ||||||
| RenaissanceRe Holdings Ltd. (Bermuda) (a) | 4,100 | 333,166 | ||||||
| Rouse Properties, Inc. REIT (a) | 303 | 5,127 | ||||||
| Signature Bank†(a) | 5,800 | 413,772 | ||||||
| Simon Property Group, Inc. REIT | 20,400 | 3,225,036 | ||||||
| SL Green Realty Corp. REIT (a) | 1,200 | 91,980 | ||||||
| SunTrust Banks, Inc. | 52,800 | 1,496,880 | ||||||
| Taubman Centers, Inc. REIT | 6,500 | 511,680 | ||||||
| Torchmark Corp. (a) | 9,400 | 485,698 | ||||||
| Travelers Cos., Inc./The | 22,900 | 1,644,678 | ||||||
| UDR, Inc. REIT (a) | 7,900 | 187,862 | ||||||
| US Bancorp | 154,500 | 4,934,730 | ||||||
| Ventas, Inc. REIT | 14,000 | 906,080 | ||||||
| Weingarten Realty Investors REIT (a) | 5,400 | 144,558 | ||||||
| Wells Fargo & Co. | 326,600 | 11,163,188 | ||||||
| Weyerhaeuser Co. REIT | 63,800 | 1,774,916 | ||||||
| WR Berkley Corp. | 13,700 | 517,038 | ||||||
|
| |||||||
| 97,295,869 | ||||||||
|
| |||||||
| Health Care - 14.0% | ||||||||
| Abbott Laboratories | 72,400 | 4,742,200 | ||||||
| Alexion Pharmaceuticals, Inc. † | 20,300 | 1,904,343 | ||||||
| Align Technology, Inc. †(a) | 13,100 | 363,525 | ||||||
| Allergan, Inc. | 600 | 55,038 | ||||||
| Amgen, Inc. | 65,700 | 5,671,224 | ||||||
| Arena Pharmaceuticals, Inc. †(a) | 120,400 | 1,086,008 | ||||||
| Ariad Pharmaceuticals, Inc. †(a) | 47,800 | 916,804 | ||||||
| athenahealth, Inc. †(a) | 6,800 | 499,460 | ||||||
| Baxter International, Inc. | 15,700 | 1,046,562 | ||||||
| Biogen Idec, Inc. † | 15,900 | 2,332,053 | ||||||
| BioMarin Pharmaceutical, Inc. † | 13,400 | 659,950 | ||||||
| Bristol-Myers Squibb Co. | 1,500 | 48,885 | ||||||
| Brookdale Senior Living, Inc. † | 19,500 | 493,740 | ||||||
| Catamaran Corp. †(a) | 32,500 | 1,531,075 | ||||||
| Cepheid, Inc. †(a) | 11,200 | 378,672 | ||||||
| Cerner Corp. †(a) | 15,500 | 1,203,420 | ||||||
| Community Health Systems, Inc. | 16,800 | 516,432 | ||||||
| Cooper Cos., Inc./The | 7,400 | 684,352 | ||||||
| Cubist Pharmaceuticals, Inc. †(a) | 8,600 | 361,716 | ||||||
| DaVita HealthCare Partners, Inc. † | 8,800 | 972,664 | ||||||
| Edwards Lifesciences Corp. †(a) | 10,500 | 946,785 | ||||||
| Eli Lilly & Co. | 65,400 | 3,225,528 | ||||||
| Express Scripts Holding Co. † | 64,500 | 3,483,000 | ||||||
| Gilead Sciences, Inc. † | 66,300 | 4,869,735 | ||||||
| HCA Holdings, Inc. | 49,600 | 1,496,432 | ||||||
| Henry Schein, Inc. †(a) | 4,600 | 370,116 | ||||||
| Hill-Rom Holdings, Inc. (a) | 3,500 | 99,750 | ||||||
| HMS Holdings Corp. †(a) | 5,700 | 147,744 | ||||||
| IDEXX Laboratories, Inc. †(a) | 4,000 | 371,200 | ||||||
| Illumina, Inc. †(a) | 19,300 | 1,072,887 | ||||||
| Intuitive Surgical, Inc. †(a) | 2,600 | 1,274,962 | ||||||
| Jazz Pharmaceuticals PLC (Ireland) †(a) | 8,000 | 425,600 | ||||||
| McKesson Corp. | 2,900 | 281,184 | ||||||
| Medivation, Inc. †(a) | 39,600 | 2,025,936 | ||||||
| Medtronic, Inc. | 25,400 | 1,041,908 | ||||||
| Merck & Co., Inc. | 140,700 | 5,760,258 | ||||||
| SHARES | VALUE (Note 2) | |||||||
| Health Care - 14.0% (continued) | ||||||||
| Mylan, Inc. † | 37,500 | $ | 1,030,500 | |||||
| Omnicare, Inc. (a) | 8,700 | 314,070 | ||||||
| Onyx Pharmaceuticals, Inc. †(a) | 13,000 | 981,890 | ||||||
| Perrigo Co. (a) | 9,300 | 967,479 | ||||||
| Pfizer, Inc. | 436,100 | 10,937,388 | ||||||
| Pharmacyclics, Inc. † | 23,900 | 1,383,810 | ||||||
| Questcor Pharmaceuticals, Inc. (a) | 23,500 | 627,920 | ||||||
| Regeneron Pharmaceuticals, Inc. † | 15,300 | 2,617,371 | ||||||
| ResMed, Inc. (a) | 13,000 | 540,410 | ||||||
| Tenet Healthcare Corp. †(a) | 17,100 | 555,237 | ||||||
| Thermo Fisher Scientific, Inc. | 13,100 | 835,518 | ||||||
| UnitedHealth Group, Inc. | 12,300 | 667,152 | ||||||
| Vertex Pharmaceuticals, Inc. † | 13,300 | 557,802 | ||||||
| ViroPharma, Inc. †(a) | 10,700 | 243,532 | ||||||
| Vivus, Inc. †(a) | 37,700 | 505,934 | ||||||
| Watson Pharmaceuticals, Inc. † | 5,900 | 507,400 | ||||||
| WellCare Health Plans, Inc. †(a) | 10,500 | 511,245 | ||||||
| Zimmer Holdings, Inc. | 8,000 | 533,280 | ||||||
|
| |||||||
| 76,679,086 | ||||||||
|
| |||||||
| Industrials - 8.7% | ||||||||
| A. O. Smith Corp. (a) | 8,100 | 510,867 | ||||||
| Acacia Research Corp. †(a) | 8,700 | 223,155 | ||||||
| ACCO Brands Corp. †(a) | 1,715 | 12,588 | ||||||
| Acuity Brands, Inc. (a) | 2,600 | 176,098 | ||||||
| Alaska Air Group, Inc. †(a) | 7,800 | 336,102 | ||||||
| Amerco, Inc. (a) | 1,900 | 240,939 | ||||||
| AMETEK, Inc. (a) | 6,900 | 259,233 | ||||||
| Chart Industries, Inc. †(a) | 5,200 | 346,684 | ||||||
| Clean Harbors, Inc. †(a) | 4,800 | 264,048 | ||||||
| Copa Holdings SA (Panama), Class A | 5,000 | 497,250 | ||||||
| Copart, Inc. † | 14,400 | 424,800 | ||||||
| Donaldson Co., Inc. (a) | 8,800 | 288,992 | ||||||
| Fastenal Co. (a) | 21,700 | 1,013,173 | ||||||
| Flowserve Corp. | 7,200 | 1,056,960 | ||||||
| Fluor Corp. | 2,700 | 158,598 | ||||||
| Fortune Brands Home & Security, Inc. †(a) | 31,300 | 914,586 | ||||||
| Gardner Denver, Inc. | 2,100 | 143,850 | ||||||
| General Electric Co. | 653,600 | 13,719,064 | ||||||
| Genesee & Wyoming, Inc., Class A †(a) | 2,300 | 174,984 | ||||||
| Hertz Global Holdings, Inc. † | 32,900 | 535,283 | ||||||
| Hexcel Corp. †(a) | 15,700 | 423,272 | ||||||
| Honeywell International, Inc. | 8,200 | 520,454 | ||||||
| Hubbell, Inc., Class B | 3,700 | 313,131 | ||||||
| IHS, Inc., Class A †(a) | 4,100 | 393,600 | ||||||
| Illinois Tool Works, Inc. | 38,100 | 2,316,861 | ||||||
| Iron Mountain, Inc. (a) | 18,945 | 588,242 | ||||||
| JB Hunt Transport Services, Inc. (a) | 14,400 | 859,824 | ||||||
| Kansas City Southern (a) | 7,900 | 659,492 | ||||||
| KBR, Inc. | 3,900 | 116,688 | ||||||
| Kennametal, Inc. (a) | 7,500 | 300,000 | ||||||
| Kirby Corp. †(a) | 4,600 | 284,694 | ||||||
| Lockheed Martin Corp. | 15,100 | 1,393,579 | ||||||
| Masco Corp. (a) | 61,500 | 1,024,590 | ||||||
| Mueller Industries, Inc. | 6,500 | 325,195 | ||||||
| Nordson Corp. (a) | 3,200 | 201,984 | ||||||
| Old Dominion Freight Line, Inc. †(a) | 11,100 | 380,508 | ||||||
| Pall Corp. (a) | 7,000 | 421,820 | ||||||
| The accompanying notes are an integral part of these financial statements. | (Continued) |
| AQR Funds | Annual Report | December 2012 | 87 | |||||||||||||
Table of Contents
| Schedule of Investments | December 31, 2012 |
| AQR MOMENTUM FUND |
| SHARES | VALUE (Note 2) | |||||||
| Industrials - 8.7% (continued) | ||||||||
| Polypore International, Inc. †(a) | 10,200 | $ | 474,300 | |||||
| Precision Castparts Corp. | 4,500 | 852,390 | ||||||
| Raytheon Co. | 8,400 | 483,504 | ||||||
| Roper Industries, Inc. | 9,300 | 1,036,764 | ||||||
| SPX Corp. | 4,900 | 343,735 | ||||||
| Stericycle, Inc. † | 7,700 | 718,179 | ||||||
| Terex Corp. †(a) | 21,000 | 590,310 | ||||||
| Textron, Inc. | 18,300 | 453,657 | ||||||
| Timken Co. | 3,700 | 176,971 | ||||||
| Towers Watson & Co., Class A (a) | 5,000 | 281,050 | ||||||
| TransDigm Group, Inc. | 9,000 | 1,227,240 | ||||||
| Triumph Group, Inc. (a) | 6,300 | 411,390 | ||||||
| Union Pacific Corp. | 11,600 | 1,458,352 | ||||||
| United Rentals, Inc. †(a) | 24,700 | 1,124,344 | ||||||
| US Airways Group, Inc. †(a) | 82,700 | 1,116,450 | ||||||
| USG Corp. †(a) | 39,400 | 1,105,958 | ||||||
| Verisk Analytics, Inc., Class A † | 8,300 | 423,300 | ||||||
| WABCO Holdings, Inc. † | 2,900 | 189,051 | ||||||
| Wabtec Corp. | 4,400 | 385,176 | ||||||
| Waste Connections, Inc. (a) | 8,300 | 280,457 | ||||||
| Werner Enterprises, Inc. (a) | 10,900 | 236,203 | ||||||
| WESCO International, Inc. †(a) | 7,500 | 505,725 | ||||||
| Woodward, Inc. (a) | 3,200 | 122,016 | ||||||
| WW Grainger, Inc. (a) | 9,500 | 1,922,515 | ||||||
|
| |||||||
| 47,740,225 | ||||||||
|
| |||||||
| Information Technology - 18.2% | ||||||||
| 3D Systems Corp. †(a) | 23,800 | 1,269,730 | ||||||
| Acme Packet, Inc. †(a) | 6,600 | 145,992 | ||||||
| Activision Blizzard, Inc. (a) | 34,500 | 366,390 | ||||||
| Adobe Systems, Inc. † | 14,700 | 553,896 | ||||||
| Akamai Technologies, Inc. † | 12,800 | 523,648 | ||||||
| Alliance Data Systems Corp. †(a) | 4,600 | 665,896 | ||||||
| ANSYS, Inc. † | 5,600 | 377,104 | ||||||
| AOL, Inc. †(a) | 32,400 | 959,364 | ||||||
| Apple, Inc. | 78,800 | 42,002,764 | ||||||
| Arrow Electronics, Inc. † | 8,600 | 327,488 | ||||||
| Automatic Data Processing, Inc. | 19,700 | 1,123,097 | ||||||
| CA, Inc. | 16,500 | 362,670 | ||||||
| Cadence Design Systems, Inc. †(a) | 23,600 | 318,836 | ||||||
| Cirrus Logic, Inc. †(a) | 28,800 | 834,336 | ||||||
| Cisco Systems, Inc. | 22,100 | 434,265 | ||||||
| Citrix Systems, Inc. † | 7,700 | 506,275 | ||||||
| Concur Technologies, Inc. †(a) | 6,600 | 445,632 | ||||||
| CoreLogic, Inc. † | 18,100 | 487,252 | ||||||
| Cypress Semiconductor Corp. †(a) | 6,900 | 74,796 | ||||||
| eBay, Inc. † | 113,300 | 5,780,566 | ||||||
| Equinix, Inc. †(a) | 8,300 | 1,711,460 | ||||||
| F5 Networks, Inc. † | 6,500 | 631,475 | ||||||
| FactSet Research Systems, Inc. (a) | 1,300 | 114,478 | ||||||
| Fairchild Semiconductor International, Inc. † | 7,700 | 110,880 | ||||||
| Fidelity National Information Services, Inc. | 18,200 | 633,542 | ||||||
| Fiserv, Inc. † | 7,400 | 584,822 | ||||||
| Fortinet, Inc. † | 19,300 | 406,651 | ||||||
| Gartner, Inc. †(a) | 6,200 | 285,324 | ||||||
| Google, Inc., Class A † | 7,200 | 5,107,464 | ||||||
| IAC/InterActiveCorp (a) | 16,100 | 761,530 | ||||||
| SHARES | VALUE (Note 2) | |||||||
| Information Technology - 18.2% (continued) | ||||||||
| Informatica Corp. † | 2,300 | $ | 69,736 | |||||
| InterDigital, Inc. (a) | 6,200 | 254,820 | ||||||
| Intuit, Inc. | 8,200 | 487,900 | ||||||
| IPG Photonics Corp. (a) | 3,700 | 246,605 | ||||||
| Jabil Circuit, Inc. | 15,000 | 289,350 | ||||||
| Jack Henry & Associates, Inc. (a) | 8,800 | 345,488 | ||||||
| KLA-Tencor Corp. | 11,300 | 539,688 | ||||||
| LinkedIn Corp., Class A † | 10,200 | 1,171,164 | ||||||
| Mastercard, Inc., Class A | 8,500 | 4,175,880 | ||||||
| Maxim Integrated Products, Inc. | 21,200 | 623,280 | ||||||
| Molex, Inc. (a) | 9,000 | 245,970 | ||||||
| Motorola Solutions, Inc. | 10,300 | 573,504 | ||||||
| NCR Corp. † | 8,300 | 211,484 | ||||||
| NetSuite, Inc. †(a) | 8,500 | 572,050 | ||||||
| NeuStar, Inc., Class A † | 8,700 | 364,791 | ||||||
| Nuance Communications, Inc. †(a) | 23,600 | 526,752 | ||||||
| Oracle Corp. | 110,800 | 3,691,856 | ||||||
| QUALCOMM, Inc. | 800 | 49,616 | ||||||
| Rackspace Hosting, Inc. †(a) | 18,800 | 1,396,276 | ||||||
| Red Hat, Inc. † | 7,400 | 391,904 | ||||||
| Salesforce.com, Inc. †(a) | 6,600 | 1,109,460 | ||||||
| Skyworks Solutions, Inc. † | 20,400 | 414,120 | ||||||
| SolarWinds, Inc. †(a) | 12,600 | 660,870 | ||||||
| Solera Holdings, Inc. (a) | 5,700 | 304,779 | ||||||
| Teradata Corp. † | 14,100 | 872,649 | ||||||
| TIBCO Software, Inc. † | 20,000 | 440,200 | ||||||
| Total System Services, Inc. | 15,100 | 323,442 | ||||||
| Trimble Navigation Ltd. †(a) | 3,400 | 203,252 | ||||||
| Universal Display Corp. †(a) | 8,600 | 220,332 | ||||||
| VeriFone Systems, Inc. † | 8,300 | 246,344 | ||||||
| VeriSign, Inc. † | 22,700 | 881,214 | ||||||
| Visa, Inc., Class A | 52,700 | 7,988,266 | ||||||
| Vishay Intertechnology, Inc. †(a) | 8,200 | 87,166 | ||||||
| VMware, Inc., Class A † | 3,100 | 291,834 | ||||||
| Western Digital Corp. (a) | 33,000 | 1,402,170 | ||||||
| Xilinx, Inc. | 9,300 | 333,870 | ||||||
| Zebra Technologies Corp., Class A † | 3,200 | 125,696 | ||||||
|
| |||||||
| 100,041,401 | ||||||||
|
| |||||||
| Materials - 4.1% | ||||||||
| Airgas, Inc. | 4,900 | 447,321 | ||||||
| Albemarle Corp. (a) | 4,000 | 248,480 | ||||||
| Allied Nevada Gold Corp. †(a) | 15,600 | 470,028 | ||||||
| Ashland, Inc. (a) | 6,600 | 530,706 | ||||||
| Ball Corp. | 5,200 | 232,700 | ||||||
| Carpenter Technology Corp. (a) | 5,700 | 294,291 | ||||||
| Celanese Corp., Series A | 7,000 | 311,710 | ||||||
| CF Industries Holdings, Inc. | 6,800 | 1,381,488 | ||||||
| Eagle Materials, Inc. (a) | 9,400 | 549,900 | ||||||
| Eastman Chemical Co. | 18,900 | 1,286,145 | ||||||
| Ecolab, Inc. | 18,600 | 1,337,340 | ||||||
| FMC Corp. | 8,000 | 468,160 | ||||||
| Huntsman Corp. (a) | 30,500 | 484,950 | ||||||
| International Flavors & Fragrances, Inc. | 6,500 | 432,510 | ||||||
| International Paper Co. | 36,100 | 1,438,224 | ||||||
| Louisiana-Pacific Corp. †(a) | 35,300 | 681,996 | ||||||
| MeadWestvaco Corp. | 5,200 | 165,724 | ||||||
| Monsanto Co. | 29,900 | 2,830,035 | ||||||
| The accompanying notes are an integral part of these financial statements. | (Continued) |
| 88 | AQR Funds | Annual Report | December 2012 | |||||||||||||
Table of Contents
| Schedule of Investments | December 31, 2012 |
| AQR MOMENTUM FUND |
| SHARES | VALUE (Note 2) | |||||||
| Materials - 4.1% (continued) | ||||||||
| NewMarket Corp. (a) | 1,600 | $ | 419,520 | |||||
| PPG Industries, Inc. | 16,700 | 2,260,345 | ||||||
| Praxair, Inc. | 6,900 | 755,205 | ||||||
| Rockwood Holdings, Inc. | 5,700 | 281,922 | ||||||
| Royal Gold, Inc. | 4,300 | 349,633 | ||||||
| Sherwin-Williams Co./The | 16,400 | 2,522,648 | ||||||
| SunCoke Energy, Inc. † | 2,334 | 36,387 | ||||||
| Valspar Corp. | 8,500 | 530,400 | ||||||
| Vulcan Materials Co. | 9,800 | 510,090 | ||||||
| Westlake Chemical Corp. (a) | 12,800 | 1,015,040 | ||||||
| WR Grace & Co. † | 3,700 | 248,751 | ||||||
|
| |||||||
| 22,521,649 | ||||||||
|
| |||||||
| Telecommunication Services - 3.5% | ||||||||
| AT&T, Inc. | 264,000 | 8,899,440 | ||||||
| CenturyLink, Inc. (a) | 11,200 | 438,144 | ||||||
| Crown Castle International Corp. † | 30,200 | 2,179,232 | ||||||
| Level 3 Communications, Inc. †(a) | 21,386 | 494,231 | ||||||
| SBA Communications Corp., Class A †(a) | 23,400 | 1,661,868 | ||||||
| Verizon Communications, Inc. | 131,100 | 5,672,697 | ||||||
|
| |||||||
| 19,345,612 | ||||||||
|
| |||||||
| Utilities - 1.3% | ||||||||
| AGL Resources, Inc. | 7,100 | 283,787 | ||||||
| American Water Works Co., Inc. | 20,500 | 761,165 | ||||||
| Atmos Energy Corp. (a) | 9,100 | 319,592 | ||||||
| Calpine Corp. † | 27,100 | 491,323 | ||||||
| Cleco Corp. (a) | 8,100 | 324,081 | ||||||
| DTE Energy Co. | 8,500 | 510,425 | ||||||
| Hawaiian Electric Industries, Inc. (a) | 11,500 | 289,110 | ||||||
| ITC Holdings Corp. (a) | 7,500 | 576,825 | ||||||
| National Fuel Gas Co. (a) | 5,400 | 273,726 | ||||||
| NiSource, Inc. | 5,300 | 131,917 | ||||||
| OGE Energy Corp. | 7,300 | 411,063 | ||||||
| ONEOK, Inc. | 22,400 | 957,600 | ||||||
| Portland General Electric Co. | 12,000 | 328,320 | ||||||
| Questar Corp. (a) | 15,300 | 302,328 | ||||||
| Sempra Energy (a) | 6,900 | 489,486 | ||||||
| SHARES | VALUE (Note 2) | |||||||
| Utilities - 1.3% (continued) | ||||||||
| UIL Holdings Corp. (a) | 7,700 | $ | 275,737 | |||||
| WGL Holdings, Inc. (a) | 6,900 | 270,411 | ||||||
|
| |||||||
| 6,996,896 | ||||||||
|
| |||||||
TOTAL COMMON STOCKS | 544,251,188 | |||||||
|
| |||||||
| MONEY MARKET FUNDS - 1.0% | ||||||||
| J.P. Morgan U.S. Treasury Plus Money Market Fund - Institutional Shares, 0.000% (2)(b) (cost $5,219,179) | 5,219,179 | 5,219,179 | ||||||
|
| |||||||
| INVESTMENTS OF CASH COLLATERAL FOR SECURITIES ON LOAN - 16.1% | ||||||||
| J.P. Morgan Prime Money Market Fund - | ||||||||
Capital Shares, 0.120% (2)(b)(c) | 88,331,686 | 88,331,686 | ||||||
|
| |||||||
TOTAL INVESTMENTS - 116.2% | 637,802,053 | |||||||
|
| |||||||
| LIABILITIES IN EXCESS OF OTHER ASSETS - (16.2%) (d) | (88,938,740) | |||||||
|
| |||||||
NET ASSETS - 100.0% | $ | 548,863,313 | ||||||
|
| |||||||
All securities are United States companies, unless noted otherwise in parentheses.
| † | Non income-producing security. |
| (a) | All or a portion of the security on loan. The aggregate market value of such securities is $88,153,912; cash collateral of $88,331,686 was received with which the Fund purchased a money market fund. |
| (b) | Represents annualized seven-day yield as of December 31, 2012. |
| (c) | Represents security, or portion thereof, purchased with the cash collateral received for securities on loan. |
| (d) | Includes appreciation on futures contracts. |
All securities are Level 1 with respect to ASC 820, unless otherwise noted in parentheses.
| (2) | Level 2 security (See Note 4). |
The following abbreviations are used in portfolio descriptions:
REIT - Real Estate Investment Trust
Open futures contracts outstanding at December 31, 2012:
| NUMBER OF CONTRACTS | DESCRIPTION | EXPIRATION DATE | VALUE AT TRADE DATE | VALUE AT DECEMBER 31, 2012 | UNREALIZED APPRECIATION | |||||||||||
| Long Contracts: | ||||||||||||||||
| 83 | S&P 500 E-Mini Futures | March 15, 2013 | $5,878,393 | $5,893,415 | $15,022 | |||||||||||
|
|
|
|
|
| |||||||||||
Cash held as collateral with broker for futures contracts was $332,353 at December 31, 2012.
| The accompanying notes are an integral part of these financial statements. |
| AQR Funds | Annual Report | December 2012 | 89 | |||||||||||||
Table of Contents
| Schedule of Investments | December 31, 2012 |
| COMMON STOCKS - 98.1% | SHARES | VALUE (Note 2) | ||||||
| Consumer Discretionary - 17.8% | ||||||||
| A. H. Belo Corp., Class A | 3,400 | $ | 15,810 | |||||
| AFC Enterprises, Inc. † | 5,000 | 130,650 | ||||||
| America’s Car-Mart, Inc. †(a) | 3,100 | 125,612 | ||||||
| ANN, Inc. † | 17,300 | 585,432 | ||||||
| Arctic Cat, Inc. †(a) | 13,800 | 460,782 | ||||||
| Asbury Automotive Group, Inc. †(a) | 17,000 | 544,510 | ||||||
| Ascent Capital Group, Inc., Class A † | 4,800 | 297,312 | ||||||
| Beazer Homes USA, Inc. †(a) | 15,680 | 264,835 | ||||||
| Belo Corp., Class A (a) | 35,800 | 274,586 | ||||||
| Black Diamond, Inc. † | 2,900 | 23,780 | ||||||
| Bob Evans Farms, Inc. (a) | 5,300 | 213,060 | ||||||
| Bon-Ton Stores, Inc./The (a) | 7,900 | 95,748 | ||||||
| Brown Shoe Co., Inc. | 25,100 | 461,087 | ||||||
| Buffalo Wild Wings, Inc. †(a) | 2,600 | 189,332 | ||||||
| Build-A-Bear Workshop, Inc. †(a) | 3,600 | 13,752 | ||||||
| Cabela’s, Inc. †(a) | 2,400 | 100,200 | ||||||
| Caribou Coffee Co., Inc. † | 18,300 | 296,277 | ||||||
| Carmike Cinemas, Inc. † | 4,900 | 73,500 | ||||||
| Carrols Restaurant Group, Inc. † | 5,800 | 34,684 | ||||||
| Cavco Industries, Inc. †(a) | 1,300 | 64,974 | ||||||
| Churchill Downs, Inc. | 3,600 | 239,220 | ||||||
| Collectors Universe (a) | 5,900 | 59,177 | ||||||
| Conn’s, Inc. †(a) | 19,600 | 601,328 | ||||||
| Cooper Tire & Rubber Co. | 16,500 | 418,440 | ||||||
| Core-Mark Holding Co., Inc. | 2,900 | 137,315 | ||||||
| Cracker Barrel Old Country Store, Inc. | 8,300 | 533,358 | ||||||
| CSS Industries, Inc. (a) | 2,600 | 56,914 | ||||||
| Delta Apparel, Inc. †(a) | 2,300 | 32,154 | ||||||
| Denny’s Corp. †(a) | 18,100 | 88,328 | ||||||
| DineEquity, Inc. †(a) | 4,500 | 301,500 | ||||||
| Domino’s Pizza, Inc. | 6,600 | 287,430 | ||||||
| Dorman Products, Inc. | 10,964 | 387,468 | ||||||
| Drew Industries, Inc. | 2,600 | 83,850 | ||||||
| Einstein Noah Restaurant Group, Inc. | 3,600 | 43,956 | ||||||
| Ethan Allen Interiors, Inc. (a) | 4,400 | 113,124 | ||||||
| Fiesta Restaurant Group, Inc. † | 5,800 | 88,856 | ||||||
| Fifth & Pacific Cos., Inc. † | 57,000 | 709,650 | ||||||
| Finish Line, Inc./The, Class A | 5,500 | 104,115 | ||||||
| Fisher Communications, Inc. | 2,300 | 62,077 | ||||||
| Francesca’s Holdings Corp. †(a) | 7,700 | 199,892 | ||||||
| Fred’s, Inc., Class A (a) | 7,400 | 98,494 | ||||||
| Geeknet, Inc. † | 1,800 | 28,980 | ||||||
| Gentherm, Inc. †(a) | 8,800 | 117,040 | ||||||
| G-III Apparel Group Ltd. † | 10,800 | 369,684 | ||||||
| Global Sources Ltd. (Bermuda) † | 2,900 | 18,792 | ||||||
| Grand Canyon Education, Inc. †(a) | 13,600 | 319,192 | ||||||
| Group 1 Automotive, Inc. (a) | 5,400 | 334,746 | ||||||
| Helen of Troy Ltd. (Bermuda) †(a) | 2,700 | 90,153 | ||||||
| Hibbett Sports, Inc. †(a) | 5,600 | 295,120 | ||||||
| Hot Topic, Inc. (a) | 24,900 | 240,285 | ||||||
| Hovnanian Enterprises, Inc., Class A †(a) | 84,700 | 592,900 | ||||||
| Interval Leisure Group, Inc. | 6,500 | 126,035 | ||||||
| Jack in the Box, Inc. † | 5,300 | 151,580 | ||||||
| KB Home (a) | 34,000 | 537,200 | ||||||
| Kingold Jewelry, Inc. (China) † | 9,300 | 10,695 | ||||||
| Kona Grill, Inc. † | 3,200 | 27,744 | ||||||
| Krispy Kreme Doughnuts, Inc. †(a) | 14,300 | 134,134 | ||||||
| SHARES | VALUE (Note 2) | |||||||
| Consumer Discretionary - 17.8% (continued) | ||||||||
| La-Z-Boy, Inc. | 30,700 | $ | 434,405 | |||||
| LeapFrog Enterprises, Inc. †(a) | 45,800 | 395,254 | ||||||
| Libbey, Inc. †(a) | 4,300 | 83,205 | ||||||
| Lions Gate Entertainment Corp. † | 5,400 | 88,560 | ||||||
| Lithia Motors, Inc., Class A (a) | 11,300 | 422,846 | ||||||
| Lumber Liquidators Holdings, Inc. †(a) | 15,100 | 797,733 | ||||||
| M/I Homes, Inc. † | 16,300 | 431,950 | ||||||
| Marriott Vacations Worldwide Corp. † | 6,500 | 270,855 | ||||||
| Martha Stewart Living Omnimedia, Class A† | 6,100 | 14,945 | ||||||
| MDC Holdings, Inc. (a) | 15,000 | 551,400 | ||||||
| Meredith Corp. (a) | 3,800 | 130,910 | ||||||
| Meritage Homes Corp. †(a) | 16,600 | 620,010 | ||||||
| Motorcar Parts of America, Inc. †(a) | 4,400 | 28,908 | ||||||
| Movado Group, Inc. | 10,800 | 331,344 | ||||||
| Multimedia Games Holding Co., Inc. † | 17,500 | 257,425 | ||||||
| NACCO Industries, Inc., Class A | 1,700 | 103,173 | ||||||
| New York Times Co./The, Class A †(a) | 27,800 | 237,134 | ||||||
| Nexstar Broadcasting Group, Inc., Class A † | 2,900 | 30,711 | ||||||
| OfficeMax, Inc. | 32,600 | 318,176 | ||||||
| Orient-Express Hotels Ltd., Class A (Bermuda) † | 18,800 | 219,772 | ||||||
| Oxford Industries, Inc. (a) | 4,300 | 199,348 | ||||||
| Papa John’s International, Inc. † | 7,200 | 395,568 | ||||||
| Pier 1 Imports, Inc. (a) | 9,700 | 194,000 | ||||||
| Pool Corp. | 2,900 | 122,728 | ||||||
| Red Robin Gourmet Burgers, Inc. †(a) | 1,100 | 38,819 | ||||||
| Regis Corp. (a) | 5,500 | 93,060 | ||||||
| RG Barry Corp. | 2,800 | 39,676 | ||||||
| Ruth’s Hospitality Group, Inc. †(a) | 11,400 | 82,878 | ||||||
| Ryland Group, Inc./The(a) | 21,300 | 777,450 | ||||||
| Saga Communications, Inc., Class A | 300 | 13,950 | ||||||
| Scholastic Corp. (a) | 3,800 | 112,328 | ||||||
| Select Comfort Corp. †(a) | 28,400 | 743,228 | ||||||
| SHFL Entertainment, Inc. † | 18,300 | 265,350 | ||||||
| Shoe Carnival, Inc. (a) | 4,200 | 86,058 | ||||||
| Sinclair Broadcast Group, Inc., Class A | 24,100 | 304,142 | ||||||
| Skechers U.S.A., Inc., Class A †(a) | 13,500 | 249,750 | ||||||
| Smith & Wesson Holding Corp. †(a) | 46,500 | 392,460 | ||||||
| Sonic Automotive, Inc., Class A | 13,200 | 275,748 | ||||||
| Sonic Corp. † | 13,700 | 142,617 | ||||||
| Stage Stores, Inc. | 17,300 | 428,694 | ||||||
| Standard Motor Products, Inc. | 7,000 | 155,540 | ||||||
| Standard Pacific Corp. †(a) | 30,900 | 227,115 | ||||||
| Steiner Leisure Ltd. †(a) | 1,700 | 81,923 | ||||||
| Steinway Musical Instruments, Inc. † | 3,500 | 74,025 | ||||||
| Stewart Enterprises, Inc., Class A (a) | 15,600 | 119,184 | ||||||
| Sturm, Ruger & Co., Inc. (a) | 12,400 | 562,960 | ||||||
| Systemax, Inc. | 3,200 | 30,880 | ||||||
| Texas Roadhouse, Inc. (a) | 3,100 | 52,080 | ||||||
| Thor Industries, Inc. (a) | 7,900 | 295,697 | ||||||
| Town Sports International Holdings, Inc. | 13,300 | 141,645 | ||||||
| Unifi, Inc. †(a) | 3,700 | 48,137 | ||||||
| Valassis Communications, Inc. | 10,000 | 257,800 | ||||||
| Vitamin Shoppe, Inc. †(a) | 9,300 | 533,448 | ||||||
| VOXX International Corp. †(a) | 6,800 | 45,764 | ||||||
| The accompanying notes are an integral part of these financial statements. | (Continued) |
| 90 | AQR Funds | Annual Report | December 2012 | |||||||||||||
Table of Contents
| Schedule of Investments | December 31, 2012 |
| AQR SMALL CAP MOMENTUM FUND |
| SHARES | VALUE (Note 2) | |||||||
| Consumer Discretionary - 17.8% (continued) | ||||||||
| Winmark Corp. (a) | 600 | $ | 34,200 | |||||
| Winnebago Industries, Inc. † | 4,900 | 83,937 | ||||||
| Zale Corp. † | 28,400 | 116,724 | ||||||
| Zumiez, Inc. †(a) | 1,600 | 31,056 | ||||||
|
| |||||||
| 25,925,532 | ||||||||
|
| |||||||
| Consumer Staples - 3.2% | ||||||||
| B&G Foods, Inc. (a) | 19,100 | 540,721 | ||||||
| Boston Beer Co., Inc./The, Class A †(a) | 2,400 | 322,680 | ||||||
| Calavo Growers, Inc. (a) | 4,000 | 100,840 | ||||||
| Cal-Maine Foods, Inc. | 5,200 | 209,144 | ||||||
| Coca-Cola Bottling Co. Consolidated (a) | 1,200 | 79,800 | ||||||
| Craft Brew Alliance, Inc. †(a) | 4,500 | 29,160 | ||||||
| Cyanotech Corp. † | 1,300 | 6,019 | ||||||
| Elizabeth Arden, Inc. †(a) | 9,300 | 418,593 | ||||||
| Hain Celestial Group, Inc./The †(a) | 1,300 | 70,486 | ||||||
| Ingles Markets, Inc., Class A (a) | 2,200 | 37,972 | ||||||
| J&J Snack Foods Corp. | 3,500 | 223,790 | ||||||
| Limoneira Co. | 1,600 | 31,024 | ||||||
| Medifast, Inc. † | 3,300 | 87,087 | ||||||
| National Beverage Corp. (a) | 3,200 | 46,688 | ||||||
| Omega Protein Corp. † | 13,000 | 79,560 | ||||||
| Pizza Inn Holdings, Inc. †(a) | 12,000 | 41,040 | ||||||
| Prestige Brands Holdings, Inc. † | 16,400 | 328,492 | ||||||
| Revlon, Inc., Class A † | 3,200 | 46,400 | ||||||
| Smart Balance, Inc. †(a) | 31,600 | 407,640 | ||||||
| Snyders-Lance, Inc. | 8,500 | 204,935 | ||||||
| Spartan Stores, Inc. (a) | 6,500 | 99,840 | ||||||
| Spectrum Brands Holdings, Inc. | 4,300 | 193,199 | ||||||
| Star Scientific, Inc. †(a) | 64,200 | 172,056 | ||||||
| Susser Holdings Corp. † | 12,400 | 427,676 | ||||||
| USANA Health Sciences, Inc. †(a) | 3,300 | 108,669 | ||||||
| WD-40 Co. (a) | 5,800 | 273,238 | ||||||
| Weis Markets, Inc. (a) | 2,000 | 78,340 | ||||||
|
| |||||||
| 4,665,089 | ||||||||
|
| |||||||
| Energy - 3.4% | ||||||||
| Adams Resources & Energy, Inc. | 700 | 24,549 | ||||||
| Alon USA Energy, Inc. | 19,400 | 350,946 | ||||||
| Approach Resources, Inc. †(a) | 500 | 12,505 | ||||||
| Cheniere Energy, Inc. †(a) | 3,800 | 71,364 | ||||||
| Crosstex Energy, Inc. | 12,400 | 177,816 | ||||||
| Dawson Geophysical Co. † | 3,100 | 81,778 | ||||||
| Delek US Holdings, Inc. | 22,500 | 569,700 | ||||||
| Double Eagle Petroleum Co. † | 9,500 | 37,430 | ||||||
| Enbridge Energy Management LLC † | 2,568 | 74,190 | ||||||
| EPL Oil & Gas, Inc. † | 6,900 | 155,595 | ||||||
| Evolution Petroleum Corp. †(a) | 10,800 | 87,804 | ||||||
| Exterran Holdings, Inc. †(a) | 19,800 | 434,016 | ||||||
| Geospace Technologies Corp. †(a) | 4,300 | 382,141 | ||||||
| Gulf Island Fabrication, Inc. | 3,100 | 74,493 | ||||||
| Halcon Resources Corp. † | 80,100 | 554,292 | ||||||
| Hercules Offshore, Inc. † | 28,500 | 176,130 | ||||||
| Hornbeck Offshore Services, Inc. †(a) | 2,600 | 89,284 | ||||||
| Miller Energy Resources, Inc. †(a) | 5,300 | 20,988 | ||||||
| Mitcham Industries, Inc. †(a) | 5,800 | 79,054 | ||||||
| Panhandle Oil and Gas, Inc., Class A (a) | 1,300 | 36,699 | ||||||
| Parker Drilling Co. † | 29,100 | 133,860 | ||||||
| SHARES | VALUE (Note 2) | |||||||
| Energy - 3.4% (continued) | ||||||||
| PHI, Inc. † | 1,900 | $ | 63,631 | |||||
| Rentech, Inc. | 52,300 | 137,549 | ||||||
| REX American Resources Corp. † | 4,500 | 86,805 | ||||||
| Royale Energy, Inc. †(a) | 18,600 | 47,988 | ||||||
| SemGroup Corp., Class A † | 9,900 | 386,892 | ||||||
| Ship Finance International Ltd. (Bermuda) (a) | 16,400 | 272,732 | ||||||
| TGC Industries, Inc. | 5,250 | 42,997 | ||||||
| Uranerz Energy Corp. †(a) | 14,800 | 20,572 | ||||||
| VAALCO Energy, Inc. † | 13,800 | 119,370 | ||||||
| Western Refining, Inc. (a) | 4,600 | 129,674 | ||||||
|
| |||||||
| 4,932,844 | ||||||||
|
| |||||||
| Financials - 23.6% | ||||||||
| 1st Source Corp. | 4,400 | 97,196 | ||||||
| Acadia Realty Trust REIT (a) | 3,200 | 80,256 | ||||||
| Agree Realty Corp. REIT | 2,100 | 56,259 | ||||||
| Alexander & Baldwin, Inc. † | 3,900 | 114,543 | ||||||
| American Assets Trust, Inc. REIT | 3,900 | 108,927 | ||||||
| American Safety Insurance Holdings Ltd. (Bermuda) † | 1,900 | 35,948 | ||||||
| Ameris Bancorp †(a) | 5,701 | 71,206 | ||||||
| AMERISAFE, Inc. † | 4,000 | 109,000 | ||||||
| Apollo Investment Corp. | 16,900 | 141,284 | ||||||
| Arlington Asset Investment Corp., Class A (a) | 2,800 | 58,156 | ||||||
| Associated Estates Realty Corp. REIT (a) | 4,000 | 64,480 | ||||||
| Banco Latinoamericano de Comercio Exterior SA, Class E (Panama) | 16,700 | 360,052 | ||||||
| Bancorp, Inc. †(a) | 2,800 | 30,716 | ||||||
| BancorpSouth, Inc. (a) | 8,700 | 126,498 | ||||||
| Bank of Marin Bancorp (a) | 1,200 | 44,952 | ||||||
| Bank of the Ozarks, Inc. | 17,000 | 568,990 | ||||||
| Banner Corp. (a) | 6,300 | 193,599 | ||||||
| BBCN Bancorp, Inc. (a) | 22,400 | 259,168 | ||||||
| Beneficial Mutual Bancorp, Inc. †(a) | 2,600 | 24,700 | ||||||
| Berkshire Hills Bancorp, Inc. (a) | 5,000 | 119,300 | ||||||
| BlackRock Kelso Capital Corp. (a) | 21,100 | 212,266 | ||||||
| BofI Holding, Inc. † | 3,800 | 105,906 | ||||||
| Boston Private Financial Holdings, Inc. (a) | 32,500 | 292,825 | ||||||
| Brandywine Realty Trust REIT (a) | 51,200 | 624,128 | ||||||
| Bryn Mawr Bank Corp. | 2,400 | 53,448 | ||||||
| Cardinal Financial Corp. | 6,300 | 102,501 | ||||||
| Chemical Financial Corp. (a) | 1,500 | 35,640 | ||||||
| Citizens & Northern Corp. (a) | 4,300 | 81,270 | ||||||
| Citizens, Inc. †(a) | 7,900 | 87,295 | ||||||
| City Holding Co. (a) | 1,300 | 45,305 | ||||||
| CNB Financial Corp. | 1,800 | 29,484 | ||||||
| CNO Financial Group, Inc. (a) | 27,700 | 258,441 | ||||||
| Cohen & Steers, Inc. (a) | 3,000 | 91,410 | ||||||
| Colonial Properties Trust REIT (a) | 9,700 | 207,289 | ||||||
| Columbia Banking System, Inc. | 11,600 | 208,104 | ||||||
| Community Bank System, Inc. | 10,500 | 287,280 | ||||||
| Community Trust Bancorp, Inc. (a) | 3,300 | 108,174 | ||||||
| Coresite Realty Corp. REIT | 9,200 | 254,472 | ||||||
| Cousins Properties, Inc. REIT | 25,400 | 212,090 | ||||||
| Crawford & Co., Class B | 6,200 | 49,476 | ||||||
| Credit Acceptance Corp. † | 318 | 32,334 | ||||||
| The accompanying notes are an integral part of these financial statements. | (Continued) |
| AQR Funds | Annual Report | December 2012 | 91 | |||||||||||||
Table of Contents
| Schedule of Investments | December 31, 2012 |
| AQR SMALL CAP MOMENTUM FUND |
| SHARES | VALUE (Note 2) | |||||||
| Financials - 23.6% (continued) | ||||||||
| CubeSmart REIT (a) | 48,300 | $ | 703,731 | |||||
| CVB Financial Corp. (a) | 25,100 | 261,040 | ||||||
| DCT Industrial Trust, Inc. REIT (a) | 93,300 | 605,517 | ||||||
| Diamond Hill Investment Group, Inc. (a) | 500 | 33,930 | ||||||
| DuPont Fabros Technology, Inc. REIT (a) | 6,400 | 154,624 | ||||||
| Eagle Bancorp, Inc. †(a) | 5,400 | 107,838 | ||||||
| EastGroup Properties, Inc. REIT | 11,000 | 591,910 | ||||||
| Education Realty Trust, Inc. REIT (a) | 20,000 | 212,800 | ||||||
| eHealth, Inc. †(a) | 4,600 | 126,408 | ||||||
| Employers Holdings, Inc. | 3,300 | 67,914 | ||||||
| Encore Capital Group, Inc. † | 7,674 | 234,978 | ||||||
| Enstar Group Ltd. (Bermuda) † | 2,500 | 279,950 | ||||||
| Enterprise Financial Services Corp. | 4,200 | 54,894 | ||||||
| ESB Financial Corp. | 1,600 | 22,192 | ||||||
| FBL Financial Group, Inc., Class A (a) | 7,100 | 242,891 | ||||||
| Federal Agricultural Mortgage Corp., Class C | 7,100 | 230,750 | ||||||
| FelCor Lodging Trust, Inc. REIT † | 22,700 | 106,009 | ||||||
| First Busey Corp. (a) | 11,700 | 54,405 | ||||||
| First Commonwealth Financial Corp. (a) | 18,100 | 123,442 | ||||||
| First Defiance Financial Corp. | 1,400 | 26,866 | ||||||
| First Financial Bancorp (a) | 14,400 | 210,528 | ||||||
| First Financial Bankshares, Inc. (a) | 4,400 | 171,644 | ||||||
| First Financial Corp. | 2,700 | 81,648 | ||||||
| First Industrial Realty Trust, Inc. REIT † | 41,100 | 578,688 | ||||||
| First Interstate Bancsystem, Inc. | 1,400 | 21,602 | ||||||
| First Merchants Corp. | 9,200 | 136,528 | ||||||
| First Midwest Bancorp, Inc. (a) | 10,800 | 135,216 | ||||||
| Flagstar Bancorp, Inc. †(a) | 14,800 | 287,120 | ||||||
| FNB Corp. (a) | 1,300 | 13,806 | ||||||
| Fox Chase Bancorp, Inc. | 3,300 | 54,945 | ||||||
| German American Bancorp, Inc. (a) | 1,900 | 41,268 | ||||||
| Glacier Bancorp, Inc. (a) | 16,000 | 235,360 | ||||||
| Gladstone Capital Corp. | 7,300 | 59,568 | ||||||
| Gladstone Commercial Corp. REIT (a) | 5,400 | 96,930 | ||||||
| Gladstone Investment Corp. | 9,900 | 68,904 | ||||||
| Glimcher Realty Trust REIT | 29,900 | 331,591 | ||||||
| Global Indemnity PLC (Ireland) † | 1,500 | 33,195 | ||||||
| Gramercy Capital Corp. REIT† | 20,400 | 59,976 | ||||||
| Greenhill & Co., Inc. (a) | 7,600 | 395,124 | ||||||
| Gyrodyne Co. of America, Inc. REIT (a) | 700 | 50,442 | ||||||
| Hersha Hospitality Trust REIT | 56,300 | 281,500 | ||||||
| HFF, Inc., Class A (a) | 9,100 | 135,590 | ||||||
| Hilltop Holdings, Inc. †(a) | 4,800 | 64,992 | ||||||
| Home BancShares, Inc. (a) | 10,600 | 350,012 | ||||||
| Homeowners Choice, Inc. (a) | 14,300 | 297,297 | ||||||
| Horizon Technology Finance Corp. | 900 | 13,401 | ||||||
| Hudson Pacific Properties, Inc. REIT (a) | 3,600 | 75,816 | ||||||
| Hudson Valley Holding Corp. (a) | 2,100 | 32,697 | ||||||
| Independent Bank Corp. (a) | 1,500 | 43,425 | ||||||
| Infinity Property & Casualty Corp. | 3,300 | 192,192 | ||||||
| International Bancshares Corp. (a) | 14,900 | 268,945 | ||||||
| INTL FCStone, Inc. †(a) | 3,000 | 52,230 | ||||||
| Investors Bancorp, Inc. | 13,700 | 243,586 | ||||||
| Kansas City Life Insurance Co. | 1,100 | 41,976 | ||||||
| KCAP Financial, Inc. (a) | 7,900 | 72,601 | ||||||
| Kemper Corp. (a) | 7,000 | 206,500 | ||||||
| SHARES | VALUE (Note 2) | |||||||
| Financials - 23.6% (continued) | ||||||||
| Ladenburg Thalmann Financial Services, Inc. †(a) | 46,300 | $ | 64,820 | |||||
| Lakeland Financial Corp. | 7,600 | 196,384 | ||||||
| Lexington Realty Trust REIT (a) | 49,600 | 518,320 | ||||||
| LTC Properties, Inc. REIT | 10,700 | 376,533 | ||||||
| Maiden Holdings Ltd. (Bermuda) | 15,800 | 145,202 | ||||||
| Main Street Capital Corp. | 20,700 | 631,557 | ||||||
| MainSource Financial Group, Inc. | 3,300 | 41,811 | ||||||
| MarketAxess Holdings, Inc. | 6,282 | 221,755 | ||||||
| MB Financial, Inc. | 7,700 | 152,075 | ||||||
| Medallion Financial Corp. | 7,700 | 90,398 | ||||||
| Medical Properties Trust, Inc. REIT | 12,100 | 144,716 | ||||||
| Medley Capital Corp. | 17,300 | 251,888 | ||||||
| Monmouth Real Estate Investment Corp., Class A REIT (a) | 8,600 | 89,096 | ||||||
| Montpelier Re Holdings Ltd. (Bermuda) | 7,500 | 171,450 | ||||||
| MVC Capital, Inc. | 4,300 | 52,245 | ||||||
| National Financial Partners Corp. †(a) | 5,800 | 99,412 | ||||||
| National Health Investors, Inc. REIT (a) | 10,400 | 587,912 | ||||||
| National Penn Bancshares, Inc. (a) | 8,800 | 82,016 | ||||||
| Nelnet, Inc., Class A (a) | 2,900 | 86,391 | ||||||
| Netspend Holdings, Inc. †(a) | 18,300 | 216,306 | ||||||
| New Mountain Finance Corp. | 4,600 | 68,540 | ||||||
| NewStar Financial, Inc. †(a) | 11,100 | 155,511 | ||||||
| Northfield Bancorp, Inc. | 2,000 | 30,500 | ||||||
| OceanFirst Financial Corp. | 1,500 | 20,625 | ||||||
| Ocwen Financial Corp. † | 5,300 | 183,327 | ||||||
| OmniAmerican Bancorp, Inc. † | 2,200 | 50,886 | ||||||
| One Liberty Properties, Inc. REIT (a) | 3,500 | 71,015 | ||||||
| OneBeacon Insurance Group Ltd., Class A | 14,400 | 200,160 | ||||||
| Oritani Financial Corp. | 22,500 | 344,700 | ||||||
| PacWest Bancorp(a) | 6,400 | 158,592 | ||||||
| Park National Corp. (a) | 1,000 | 64,630 | ||||||
| Pebblebrook Hotel Trust REIT | 11,100 | 256,410 | ||||||
| Penns Woods Bancorp, Inc. | 700 | 26,187 | ||||||
| Pennsylvania Real Estate Investment Trust REIT (a) | 34,900 | 615,636 | ||||||
| PHH Corp. †(a) | 10,700 | 243,425 | ||||||
| Pinnacle Financial Partners, Inc. † | 11,500 | 216,660 | ||||||
| Platinum Underwriters Holdings Ltd. (Bermuda) | 3,100 | 142,600 | ||||||
| Portfolio Recovery Associates, Inc. †(a) | 4,400 | 470,184 | ||||||
| Primerica, Inc. | 10,100 | 303,101 | ||||||
| PrivateBancorp, Inc. | 25,700 | 393,724 | ||||||
| Prospect Capital Corp. (a) | 7,000 | 76,090 | ||||||
| PS Business Parks, Inc. REIT | 6,400 | 415,872 | ||||||
| Radian Group, Inc. (a) | 69,700 | 425,867 | ||||||
| Ramco-Gershenson Properties Trust REIT | 5,800 | 77,198 | ||||||
| Republic Bancorp, Inc., Class A (a) | 1,300 | 27,469 | ||||||
| Retail Opportunity Investments Corp. REIT (a) | 18,200 | 234,052 | ||||||
| RLI Corp. (a) | 2,700 | 174,582 | ||||||
| Rockville Financial, Inc. | 6,200 | 79,980 | ||||||
| Ryman Hospitality Properties REIT (a) | 5,200 | 199,992 | ||||||
| Sabra Health Care REIT, Inc. REIT | 24,100 | 523,452 | ||||||
| The accompanying notes are an integral part of these financial statements. | (Continued) |
| 92 | AQR Funds | Annual Report | December 2012 | |||||||||||||
Table of Contents
| Schedule of Investments | December 31, 2012 |
| AQR SMALL CAP MOMENTUM FUND |
| SHARES | VALUE (Note 2) | |||||||
| Financials - 23.6% (continued) | ||||||||
| Safeguard Scientifics, Inc. †(a) | 4,700 | $ | 69,325 | |||||
| Safety Insurance Group, Inc. | 1,900 | 87,723 | ||||||
| Seacoast Banking Corp of Florida † | 8,500 | 13,685 | ||||||
| Solar Capital Ltd. (a) | 6,500 | 155,415 | ||||||
| Southside Bancshares, Inc. (a) | 7,035 | 148,157 | ||||||
| Sovran Self Storage, Inc. REIT | 8,600 | 534,060 | ||||||
| St Joe Co./The† (a) | 9,500 | 219,260 | ||||||
| STAG Industrial, Inc. REIT | 25,300 | 454,641 | ||||||
| Sterling Financial Corp. (a) | 2,900 | 60,552 | ||||||
| Stewart Information Services Corp. (a) | 16,100 | 418,600 | ||||||
| Strategic Hotels & Resorts, Inc. REIT † | 25,000 | 160,000 | ||||||
| Sun Communities, Inc. REIT (a) | 11,509 | 459,094 | ||||||
| Sunstone Hotel Investors, Inc. REIT † | 85,100 | 911,421 | ||||||
| Susquehanna Bancshares, Inc. | 6,900 | 72,312 | ||||||
| SWS Group, Inc. † | 6,300 | 33,327 | ||||||
| Symetra Financial Corp. | 5,800 | 75,284 | ||||||
| Synovus Financial Corp. (a) | 188,000 | 460,600 | ||||||
| Territorial Bancorp, Inc. | 3,600 | 82,260 | ||||||
| Texas Capital Bancshares, Inc. †(a) | 8,500 | 380,970 | ||||||
| TICC Capital Corp. (a) | 6,600 | 66,792 | ||||||
| Tompkins Financial Corp. | 1,500 | 59,460 | ||||||
| Triangle Capital Corp. | 18,300 | 466,467 | ||||||
| Umpqua Holdings Corp. | 10,000 | 117,900 | ||||||
| United Financial Bancorp, Inc. (a) | 5,100 | 80,172 | ||||||
| Universal Health Realty Income Trust REIT (a) | 4,100 | 207,501 | ||||||
| ViewPoint Financial Group, Inc. (a) | 12,300 | 257,562 | ||||||
| Virginia Commerce Bancorp, Inc. † | 13,700 | 122,615 | ||||||
| Virtus Investment Partners, Inc. † | 3,700 | 447,478 | ||||||
| Walter Investment Management Corp. †(a) | 4,120 | 177,242 | ||||||
| Washington Trust Bancorp, Inc. | 4,200 | 110,502 | ||||||
| WesBanco, Inc. (a) | 9,200 | 204,424 | ||||||
| West Bancorporation, Inc. | 2,200 | 23,716 | ||||||
| West Coast Bancorp | 2,720 | 60,248 | ||||||
| Western Alliance Bancorp †(a) | 13,300 | 140,049 | ||||||
| Wintrust Financial Corp. (a) | 7,500 | 275,250 | ||||||
| WisdomTree Investments, Inc. † | 23,000 | 140,760 | ||||||
| World Acceptance Corp. †(a) | 400 | 29,824 | ||||||
| WSFS Financial Corp. | 2,000 | 84,500 | ||||||
| Zillow, Inc., Class A †(a) | 9,100 | 252,525 | ||||||
|
| |||||||
| 34,316,227 | ||||||||
|
| |||||||
| Health Care - 16.8% | ||||||||
| Aastrom Biosciences, Inc. †(a) | 16,500 | 20,790 | ||||||
| Abaxis, Inc. (a) | 5,400 | 200,340 | ||||||
| ABIOMED, Inc. †(a) | 11,000 | 148,060 | ||||||
| Acadia Healthcare Co., Inc. †(a) | 8,300 | 193,639 | ||||||
| ACADIA Pharmaceuticals, Inc. †(a) | 72,600 | 337,590 | ||||||
| Accuray, Inc. †(a) | 10,900 | 70,087 | ||||||
| Achillion Pharmaceuticals, Inc. †(a) | 24,900 | 199,698 | ||||||
| Aegerion Pharmaceuticals, Inc. †(a) | 8,400 | 213,276 | ||||||
| Affymax, Inc. † | 31,500 | 598,500 | ||||||
| Air Methods Corp. (a) | 18,300 | 675,087 | ||||||
| Akorn, Inc. †(a) | 18,800 | 251,168 | ||||||
| Alnylam Pharmaceuticals, Inc. †(a) | 18,900 | 344,925 | ||||||
| AMN Healthcare Services, Inc. † | 6,700 | 77,385 | ||||||
| Amsurg Corp. † | 8,000 | 240,080 | ||||||
| Analogic Corp. | 5,400 | 401,220 | ||||||
| SHARES | VALUE (Note 2) | |||||||
| Health Care - 16.8% (continued) | ||||||||
| AngioDynamics, Inc. †(a) | 3,100 | $ | 34,069 | |||||
| Antares Pharma, Inc. †(a) | 62,000 | 236,220 | ||||||
| Apricus Biosciences, Inc. †(a) | 7,900 | 15,721 | ||||||
| Arena Pharmaceuticals, Inc. †(a) | 25,600 | 230,912 | ||||||
| Ariad Pharmaceuticals, Inc. †(a) | 4,900 | 93,982 | ||||||
| Arqule, Inc. †(a) | 6,200 | 17,298 | ||||||
| Array BioPharma, Inc. †(a) | 83,000 | 308,760 | ||||||
| AtriCure, Inc. †(a) | 6,300 | 43,470 | ||||||
| Atrion Corp. (a) | 300 | 58,800 | ||||||
| Auxilium Pharmaceuticals, Inc. † | 13,100 | 242,743 | ||||||
| Biolase, Inc. †(a) | 21,207 | 39,232 | ||||||
| Bio-Reference Labs, Inc. †(a) | 17,700 | 507,813 | ||||||
| BioScrip, Inc. †(a) | 15,900 | 171,243 | ||||||
| BSD Medical Corp. †(a) | 8,200 | 12,382 | ||||||
| Cambrex Corp. †(a) | 8,300 | 94,454 | ||||||
| Cantel Medical Corp. | 4,649 | 138,215 | ||||||
| Capital Senior Living Corp. † | 16,300 | 304,647 | ||||||
| Cardiovascular Systems, Inc. † | 5,600 | 70,280 | ||||||
| Celldex Therapeutics, Inc. † | 45,300 | 303,963 | ||||||
| Celsion Corp. †(a) | 42,500 | 348,075 | ||||||
| Cerus Corp. †(a) | 13,000 | 41,080 | ||||||
| Chemed Corp. (a) | 2,100 | 144,039 | ||||||
| Conceptus, Inc. † | 9,600 | 201,696 | ||||||
| CONMED Corp. (a) | 3,700 | 103,415 | ||||||
| Corcept Therapeutics, Inc. †(a) | 9,500 | 13,585 | ||||||
| Corvel Corp. † | 1,600 | 71,728 | ||||||
| Curis, Inc. †(a) | 40,700 | 139,601 | ||||||
| Cyberonics, Inc. † | 13,800 | 724,914 | ||||||
| Cynosure, Inc., Class A †(a) | 8,300 | 200,113 | ||||||
| DexCom, Inc. † | 22,900 | 311,669 | ||||||
| Dynavax Technologies Corp. † | 71,100 | 203,346 | ||||||
| Echo Therapeutics, Inc. †(a) | 8,800 | 9,152 | ||||||
| Endologix, Inc. † (a) | 18,700 | 266,288 | ||||||
| Ensign Group, Inc./The | 3,500 | 95,165 | ||||||
| Exact Sciences Corp. † | 41,700 | 441,603 | ||||||
| Furiex Pharmaceuticals, Inc. † | 3,000 | 57,780 | ||||||
| Genomic Health, Inc. † | 7,700 | 209,902 | ||||||
| Gentiva Health Services, Inc. †(a) | 18,200 | 182,910 | ||||||
| GTx, Inc. †(a) | 12,200 | 51,240 | ||||||
| Hanger, Inc. † | 3,400 | 93,024 | ||||||
| Hansen Medical, Inc. †(a) | 19,600 | 40,768 | ||||||
| HealthStream, Inc. †(a) | 17,400 | 422,994 | ||||||
| HeartWare International, Inc. †(a) | 4,300 | 360,985 | ||||||
| Hi-Tech Pharmacal Co., Inc. (a) | 4,700 | 164,406 | ||||||
| ICU Medical, Inc. †(a) | 1,600 | 97,488 | ||||||
| Idenix Pharmaceuticals, Inc. †(a) | 5,900 | 28,615 | ||||||
| Immunogen, Inc. †(a) | 11,900 | 151,725 | ||||||
| Immunomedics, Inc. †(a) | 19,800 | 57,816 | ||||||
| Impax Laboratories, Inc. † | 6,700 | 137,283 | ||||||
| Infinity Pharmaceuticals, Inc. † | 17,100 | 598,500 | ||||||
| Insulet Corp. †(a) | 2,900 | 61,538 | ||||||
| Isis Pharmaceuticals, Inc. †(a) | 39,700 | 415,262 | ||||||
| Jazz Pharmaceuticals PLC (Ireland) †(a) | 2,300 | 122,360 | ||||||
| Ligand Pharmaceuticals, Inc., Class B †(a) | 8,400 | 174,216 | ||||||
| MAP Pharmaceuticals, Inc. †(a) | 9,200 | 144,532 | ||||||
| Maxygen, Inc. | 11,000 | 27,060 | ||||||
| MedAssets, Inc. †(a) | 14,300 | 239,811 | ||||||
| The accompanying notes are an integral part of these financial statements. | (Continued) |
| AQR Funds | Annual Report | December 2012 | 93 | |||||||||||||
Table of Contents
| Schedule of Investments | December 31, 2012 |
| AQR SMALL CAP MOMENTUM FUND |
| SHARES | VALUE (Note 2) | |||||||
| Health Care - 16.8% (continued) | ||||||||
| MedCath Corp. (3)†(a)(d) | 10,300 | $ | 14,729 | |||||
| Medicines Co./The† | 12,700 | 304,419 | ||||||
| Medidata Solutions, Inc. † | 10,300 | 403,657 | ||||||
| Medivation, Inc. †(a) | 6,400 | 327,424 | ||||||
| MELA Sciences, Inc. †(a) | 19,800 | 35,442 | ||||||
| Merge Healthcare, Inc. †(a) | 30,200 | 74,594 | ||||||
| Merit Medical Systems, Inc. † | 7,600 | 105,640 | ||||||
| Molina Healthcare, Inc. † | 11,300 | 305,778 | ||||||
| MWI Veterinary Supply, Inc. †(a) | 3,400 | 374,000 | ||||||
| Navidea Biopharmaceuticals, Inc. †(a) | 46,100 | 130,463 | ||||||
| Nektar Therapeutics† (a) | 52,400 | 388,284 | ||||||
| Neogen Corp. † | 2,300 | 104,236 | ||||||
| Neurocrine Biosciences, Inc. † | 7,100 | 53,108 | ||||||
| NPS Pharmaceuticals, Inc. †(a) | 49,200 | 447,720 | ||||||
| NuVasive, Inc. †(a) | 9,700 | 149,962 | ||||||
| Obagi Medical Products, Inc. † | 8,200 | 111,438 | ||||||
| Oncothyreon, Inc. †(a) | 19,600 | 37,632 | ||||||
| Optimer Pharmaceuticals, Inc. † | 3,900 | 35,295 | ||||||
| OraSure Technologies, Inc. † | 19,300 | 138,574 | ||||||
| Orexigen Therapeutics, Inc. †(a) | 77,600 | 408,952 | ||||||
| Pacira Pharmaceuticals, Inc. †(a) | 23,100 | 403,557 | ||||||
| Pain Therapeutics, Inc. †(a) | 10,200 | 27,642 | ||||||
| PAREXEL International Corp. †(a) | 15,200 | 449,768 | ||||||
| PDL BioPharma, Inc. (a) | 34,300 | 241,815 | ||||||
| Pharmacyclics, Inc. † | 5,500 | 318,450 | ||||||
| Progenics Pharmaceuticals, Inc. † | 14,200 | 42,316 | ||||||
| Quidel Corp. † | 9,600 | 179,232 | ||||||
| Repros Therapeutics, Inc. †(a) | 7,200 | 113,400 | ||||||
| Rigel Pharmaceuticals, Inc. †(a) | 14,500 | 94,250 | ||||||
| Rockwell Medical Technologies, Inc. †(a) | 5,100 | 41,055 | ||||||
| RTI Biologics, Inc. † | 21,000 | 89,670 | ||||||
| Sangamo Biosciences, Inc. †(a) | 7,900 | 47,479 | ||||||
| Santarus, Inc. † | 52,400 | 575,352 | ||||||
| Sarepta Therapeutics, Inc. †(a) | 18,800 | 485,040 | ||||||
| SciClone Pharmaceuticals, Inc. †(a) | 20,600 | 88,786 | ||||||
| Select Medical Holdings Corp. | 33,300 | 314,019 | ||||||
| Solta Medical, Inc. †(a) | 10,900 | 29,103 | ||||||
| Spectranetics Corp. †(a) | 8,200 | 121,114 | ||||||
| Spectrum Pharmaceuticals, Inc. (a) | 8,200 | 91,758 | ||||||
| Staar Surgical Co. †(a) | 14,800 | 90,280 | ||||||
| Sunesis Pharmaceuticals, Inc. † | 19,400 | 81,480 | ||||||
| Synageva BioPharma Corp. † | 3,300 | 152,757 | ||||||
| Synergetics USA, Inc. † | 9,900 | 47,520 | ||||||
| Synta Pharmaceuticals Corp. †(a) | 13,000 | 117,260 | ||||||
| Team Health Holdings, Inc. † | 3,000 | 86,310 | ||||||
| Theravance, Inc. †(a) | 6,800 | 151,436 | ||||||
| Threshold Pharmaceuticals, Inc. †(a) | 82,800 | 348,588 | ||||||
| Transcept Pharmaceuticals, Inc. † | 6,100 | 27,145 | ||||||
| Trius Therapeutics, Inc. † | 10,600 | 50,668 | ||||||
| Universal American Corp. (a) | 19,100 | 164,069 | ||||||
| Uroplasty, Inc. † | 11,800 | 38,114 | ||||||
| US Physical Therapy, Inc. | 3,000 | 82,620 | ||||||
| Vascular Solutions, Inc. † | 2,200 | 34,760 | ||||||
| Vical, Inc. †(a) | 32,800 | 95,448 | ||||||
| ViroPharma, Inc. †(a) | 14,500 | 330,020 | ||||||
| West Pharmaceutical Services, Inc. | 6,800 | 372,300 | ||||||
| Wright Medical Group, Inc. †(a) | 15,000 | 314,850 | ||||||
| SHARES | VALUE (Note 2) | |||||||
| Health Care - 16.8% (continued) | ||||||||
| XenoPort, Inc. † | 17,600 | $ | 136,752 | |||||
| ZIOPHARM Oncology, Inc. †(a) | 15,300 | 63,648 | ||||||
|
| |||||||
| 24,542,911 | ||||||||
|
| |||||||
| Industrials - 13.6% | ||||||||
| AAON, Inc. (a) | 4,700 | 98,089 | ||||||
| Aceto Corp. | 7,400 | 74,296 | ||||||
| Acorn Energy, Inc. (a) | 2,700 | 21,087 | ||||||
| Advisory Board Co./The † | 7,800 | 364,962 | ||||||
| Aircastle Ltd. | 15,800 | 198,132 | ||||||
| Alamo Group, Inc. (a) | 2,500 | 81,600 | ||||||
| Allegiant Travel Co. (a) | 5,400 | 396,414 | ||||||
| Amerco, Inc. (a) | 1,100 | 139,491 | ||||||
| American Railcar Industries, Inc. (a) | 6,000 | 190,380 | ||||||
| Apogee Enterprises, Inc. | 3,000 | 71,910 | ||||||
| Applied Industrial Technologies, Inc. (a) | 1,600 | 67,216 | ||||||
| Argan, Inc. | 2,300 | 41,400 | ||||||
| Astec Industries, Inc. (a) | 4,900 | 163,317 | ||||||
| Astronics Corp. †(a) | 5,400 | 123,552 | ||||||
| Astronics Corp., Class B †(a) | 1,052 | 22,818 | ||||||
| AT Cross Co., Class A † | 2,100 | 22,638 | ||||||
| Atlas Air Worldwide Holdings, Inc. † | 6,700 | 296,877 | ||||||
| Avis Budget Group, Inc. †(a) | 20,900 | 414,238 | ||||||
| AZZ, Inc. | 8,900 | 342,027 | ||||||
| Barrett Business Services, Inc. (a) | 3,600 | 137,124 | ||||||
| Beacon Roofing Supply, Inc. †(a) | 16,300 | 542,464 | ||||||
| Builders FirstSource, Inc. † | 10,600 | 59,148 | ||||||
| Casella Waste Systems, Inc., Class A †(a) | 10,100 | 44,238 | ||||||
| CBIZ, Inc. †(a) | 10,400 | 61,464 | ||||||
| Celadon Group, Inc. (a) | 3,900 | 70,473 | ||||||
| Coleman Cable, Inc. (a) | 6,900 | 63,963 | ||||||
| Corporate Executive Board Co./The | 2,700 | 128,142 | ||||||
| Covenant Transportation Group, Inc., Class A † | 2,600 | 14,378 | ||||||
| CPI Aerostructures, Inc. †(a) | 1,800 | 18,018 | ||||||
| CRA International, Inc. †(a) | 2,200 | 43,494 | ||||||
| Deluxe Corp. (a) | 14,800 | 477,152 | ||||||
| DigitalGlobe, Inc. † | 7,200 | 175,968 | ||||||
| Douglas Dynamics, Inc. (a) | 6,500 | 93,535 | ||||||
| DXP Enterprises, Inc. †(a) | 6,600 | 323,862 | ||||||
| Dynamic Materials Corp. (a) | 5,600 | 77,840 | ||||||
| Echo Global Logistics, Inc. †(a) | 4,100 | 73,677 | ||||||
| Encore Wire Corp. (a) | 2,900 | 87,899 | ||||||
| EnerSys, Inc. †(a) | 13,900 | 523,057 | ||||||
| Exponent, Inc. † | 4,900 | 273,567 | ||||||
| Flow International Corp. † | 11,400 | 39,900 | ||||||
| Forward Air Corp. (a) | 2,500 | 87,525 | ||||||
| Franklin Electric Co., Inc. | 5,300 | 329,501 | ||||||
| Furmanite Corp. †(a) | 7,300 | 39,201 | ||||||
| G&K Services, Inc., Class A | 4,000 | 136,600 | ||||||
| GenCorp, Inc. †(a) | 21,600 | 197,640 | ||||||
| Generac Holdings, Inc. (a) | 18,200 | 624,442 | ||||||
| Geo Group, Inc./The | 19,326 | 544,993 | ||||||
| Gibraltar Industries, Inc. † | 3,100 | 49,352 | ||||||
| Global Power Equipment Group, Inc. | 5,200 | 89,180 | ||||||
| Gorman-Rupp Co./The(a) | 3,500 | 104,405 | ||||||
| GP Strategies Corp. † | 5,000 | 103,250 | ||||||
| Graham Corp. (a) | 1,900 | 37,050 | ||||||
| The accompanying notes are an integral part of these financial statements. | (Continued) |
| 94 | AQR Funds | Annual Report | December 2012 | |||||||||||||
Table of Contents
| Schedule of Investments | December 31, 2012 |
| AQR SMALL CAP MOMENTUM FUND |
| SHARES | VALUE (Note 2) | |||||||
| Industrials - 13.6% (continued) | ||||||||
| Granite Construction, Inc. | 5,000 | $ | 168,100 | |||||
| Great Lakes Dredge & Dock Corp. | 8,000 | 71,440 | ||||||
| H&E Equipment Services, Inc. (a) | 15,800 | 238,106 | ||||||
| Hardinge, Inc. | 4,300 | 42,742 | ||||||
| Healthcare Services Group, Inc. (a) | 14,800 | 343,804 | ||||||
| Heritage-Crystal Clean, Inc. †(a) | 1,400 | 21,014 | ||||||
| HNI Corp. | 5,300 | 159,318 | ||||||
| Houston Wire & Cable Co. | 4,500 | 55,215 | ||||||
| Hudson Global, Inc. †(a) | 5,400 | 24,192 | ||||||
| Hurco Cos., Inc. † | 4,400 | 101,200 | ||||||
| InnerWorkings, Inc. †(a) | 12,900 | 177,762 | ||||||
| Insteel Industries, Inc. (a) | 3,700 | 46,176 | ||||||
| Intersections, Inc. (a) | 2,300 | 21,804 | ||||||
| JetBlue Airways Corp. † | 27,000 | 154,170 | ||||||
| Kadant, Inc. † | 3,300 | 87,483 | ||||||
| Kaman Corp. (a) | 5,100 | 187,680 | ||||||
| Lydall, Inc. † | 8,800 | 126,192 | ||||||
| Macquarie Infrastructure Co. LLC | 6,100 | 277,916 | ||||||
| Manitowoc Co., Inc./The (a) | 15,500 | 243,040 | ||||||
| MasTec, Inc. † | 9,000 | 224,370 | ||||||
| McGrath RentCorp. (a) | 4,400 | 127,688 | ||||||
| Metalico, Inc. †(a) | 10,700 | 20,972 | ||||||
| Middleby Corp. †(a) | 1,100 | 141,031 | ||||||
| Miller Industries, Inc. (a) | 7,800 | 118,950 | ||||||
| Mine Safety Appliances Co. | 4,200 | 179,382 | ||||||
| Mistras Group, Inc. †(a) | 8,900 | 219,741 | ||||||
| Mueller Industries, Inc. | 2,700 | 135,081 | ||||||
| Mueller Water Products, Inc., Class A | 76,900 | 431,409 | ||||||
| Multi-Color Corp. | 6,200 | 148,738 | ||||||
| Navigant Consulting, Inc. † | 7,300 | 81,468 | ||||||
| Northwest Pipe Co. † | 2,800 | 66,808 | ||||||
| Odyssey Marine Exploration, Inc. †(a) | 26,100 | 77,517 | ||||||
| On Assignment, Inc. † | 27,700 | 561,756 | ||||||
| Park-Ohio Holdings Corp. † | 2,600 | 55,406 | ||||||
| Patrick Industries, Inc. †(a) | 7,200 | 112,032 | ||||||
| PMFG, Inc. †(a) | 3,900 | 35,451 | ||||||
| Powell Industries, Inc. † | 1,200 | 49,836 | ||||||
| Primoris Services Corp. | 13,000 | 195,520 | ||||||
| Quality Distribution, Inc. †(a) | 12,000 | 72,000 | ||||||
| Quanex Building Products Corp. | 9,800 | 200,018 | ||||||
| Raven Industries, Inc. (a) | 6,400 | 168,704 | ||||||
| RBC Bearings, Inc. †(a) | 2,800 | 140,196 | ||||||
| Roadrunner Transportation Systems, Inc. † | 3,000 | 54,420 | ||||||
| Rush Enterprises, Inc., Class A †(a) | 5,900 | 121,953 | ||||||
| SeaCube Container Leasing Ltd. | 7,600 | 143,260 | ||||||
| Seaspan Corp. (Hong Kong) | 3,700 | 59,311 | ||||||
| Spirit Airlines, Inc. † | 3,900 | 69,108 | ||||||
| Standex International Corp. | 3,500 | 179,515 | ||||||
| Steelcase, Inc., Class A | 33,300 | 424,242 | ||||||
| Sun Hydraulics Corp. (a) | 6,700 | 174,736 | ||||||
| TAL International Group, Inc. (a) | 8,300 | 301,954 | ||||||
| Taser International, Inc. †(a) | 20,400 | 182,376 | ||||||
| Team, Inc. † | 6,600 | 251,064 | ||||||
| Tennant Co. (a) | 5,000 | 219,750 | ||||||
| Textainer Group Holdings Ltd. (a) | 9,500 | 298,870 | ||||||
| Thermon Group Holdings, Inc. †(a) | 4,000 | 90,120 | ||||||
| Titan Machinery, Inc. †(a) | 3,900 | 96,330 | ||||||
| TRC Cos., Inc. †(a) | 2,900 | 16,878 | ||||||
| SHARES | VALUE (Note 2) | |||||||
| Industrials - 13.6% (continued) | ||||||||
| Trex Co., Inc. † | 9,700 | $ | 361,131 | |||||
| Twin Disc, Inc. | 4,800 | 83,664 | ||||||
| UniFirst Corp. | 4,100 | 300,612 | ||||||
| United Rentals, Inc. † | 1,086 | 49,435 | ||||||
| Universal Forest Products, Inc. (a) | 7,000 | 266,280 | ||||||
| US Airways Group, Inc. †(a) | 45,700 | 616,950 | ||||||
| US Ecology, Inc. (a) | 5,300 | 124,762 | ||||||
| USG Corp. †(a) | 7,000 | 196,490 | ||||||
| Valence Technology, Inc. † | 9,700 | 60 | ||||||
| Wabash National Corp. †(a) | 3,600 | 32,292 | ||||||
| XPO Logistics, Inc. †(a) | 11,600 | 201,608 | ||||||
|
| |||||||
| 19,831,545 | ||||||||
|
| |||||||
| Information Technology - 12.5% | ||||||||
| 3D Systems Corp. †(a) | 4,200 | 224,070 | ||||||
| Accelrys, Inc. † | 7,200 | 65,160 | ||||||
| ACI Worldwide, Inc. †(a) | 11,300 | 493,697 | ||||||
| Actuate Corp. † | 14,700 | 82,320 | ||||||
| Acxiom Corp. † | 13,100 | 228,726 | ||||||
| Agilysys, Inc. † | 10,000 | 83,700 | ||||||
| Alliance Fiber Optic Products, Inc. | 3,000 | 36,060 | ||||||
| American Software, Inc., Class A | 8,600 | 66,736 | ||||||
| Anaren, Inc. †(a) | 4,700 | 91,415 | ||||||
| AOL, Inc. †(a) | 4,100 | 121,401 | ||||||
| Arris Group, Inc. † | 19,300 | 288,342 | ||||||
| Aspen Technology, Inc. † | 4,000 | 110,560 | ||||||
| ATMI, Inc. † | 11,000 | 229,680 | ||||||
| Blucora, Inc. † | 19,000 | 298,490 | ||||||
| BroadSoft, Inc. †(a) | 1,100 | 39,963 | ||||||
| BroadVision, Inc. †(a) | 4,900 | 43,708 | ||||||
| Brooks Automation, Inc. (a) | 11,100 | 89,355 | ||||||
| BSQUARE Corp. † | 6,000 | 17,700 | ||||||
| CalAmp Corp. †(a) | 6,400 | 53,248 | ||||||
| Callidus Software, Inc. †(a) | 16,900 | 76,726 | ||||||
| Cardtronics, Inc. † | 5,400 | 128,196 | ||||||
| CIBER, Inc. †(a) | 10,100 | 33,734 | ||||||
| Cirrus Logic, Inc. †(a) | 3,400 | 98,498 | ||||||
| Computer Task Group, Inc. †(a) | 4,100 | 74,743 | ||||||
| Comtech Telecommunications Corp. (a) | 4,000 | 101,520 | ||||||
| Convergys Corp. (a) | 20,100 | 329,841 | ||||||
| Cornerstone OnDemand, Inc. † | 24,100 | 711,673 | ||||||
| Cray, Inc. † | 7,600 | 121,220 | ||||||
| CSG Systems International, Inc. † | 7,000 | 127,260 | ||||||
| CVD Equipment Corp. †(a) | 11,300 | 108,480 | ||||||
| Datalink Corp. †(a) | 11,900 | 101,745 | ||||||
| Dealertrack Technologies, Inc. †(a) | 6,700 | 192,424 | ||||||
| Digi International, Inc. † | 7,200 | 68,184 | ||||||
| Digimarc Corp. (a) | 2,200 | 45,540 | ||||||
| Dot Hill Systems Corp. † | 19,100 | 17,906 | ||||||
| eGain Communications Corp. †(a) | 4,300 | 19,307 | ||||||
| Electro Rent Corp. | 4,400 | 67,672 | ||||||
| Electronics for Imaging, Inc. †(a) | 5,600 | 106,344 | ||||||
| Ellie Mae, Inc. †(a) | 24,800 | 688,200 | ||||||
| eMagin Corp. (a) | 6,100 | 21,777 | ||||||
| Emcore Corp. †(a) | 7,250 | 31,175 | ||||||
| Entegris, Inc. † | 9,600 | 88,128 | ||||||
| EPIQ Systems, Inc. | 4,100 | 52,398 | ||||||
| ePlus, Inc. | 2,800 | 115,752 | ||||||
| The accompanying notes are an integral part of these financial statements. | (Continued) |
| AQR Funds | Annual Report | December 2012 | 95 | |||||||||||||
Table of Contents
| Schedule of Investments | December 31, 2012 |
| AQR SMALL CAP MOMENTUM FUND |
| SHARES | VALUE (Note 2) | |||||||
| Information Technology - 12.5% (continued) | ||||||||
| Euronet Worldwide, Inc. † | 3,800 | $ | 89,680 | |||||
| ExlService Holdings, Inc. †(a) | 4,000 | 106,000 | ||||||
| Fair Isaac Corp. | 10,600 | 445,518 | ||||||
| FalconStor Software, Inc. †(a) | 9,600 | 22,368 | ||||||
| FARO Technologies, Inc. †(a) | 3,400 | 121,312 | ||||||
| FEI Co. (a) | 4,900 | 271,754 | ||||||
| Forrester Research, Inc. | 3,800 | 101,840 | ||||||
| Global Cash Access Holdings, Inc. † | 38,500 | 301,840 | ||||||
| Globecomm Systems, Inc. † | 5,100 | 57,630 | ||||||
| Glu Mobile, Inc. †(a) | 38,000 | 87,020 | ||||||
| GSI Group, Inc. † | 6,900 | 59,754 | ||||||
| GSI Technology, Inc. † | 5,000 | 31,350 | ||||||
| Hackett Group, Inc./The | 5,800 | 24,824 | ||||||
| Heartland Payment Systems, Inc. (a) | 9,500 | 280,250 | ||||||
| iGO, Inc. †(a) | 12,500 | 3,269 | ||||||
| Immersion Corp. †(a) | 13,500 | 92,745 | ||||||
| Insight Enterprises, Inc. †(a) | 11,200 | 194,544 | ||||||
| Integrated Silicon Solution, Inc. † | 7,500 | 67,500 | ||||||
| Internap Network Services Corp. †(a) | 7,800 | 54,132 | ||||||
| Ixia† (a) | 25,800 | 438,084 | ||||||
| IXYS Corp. | 8,400 | 76,776 | ||||||
| Keynote Systems, Inc. | 7,200 | 101,448 | ||||||
| Kulicke & Soffa Industries, Inc. † | 17,100 | 205,029 | ||||||
| Liquidity Services, Inc. †(a) | 7,000 | 286,020 | ||||||
| LivePerson, Inc. †(a) | 20,251 | 266,098 | ||||||
| Majesco Entertainment Co. † | 42,600 | 44,730 | ||||||
| Manhattan Associates, Inc. † | 5,800 | 349,972 | ||||||
| Marchex, Inc., Class B | 13,700 | 56,307 | ||||||
| MAXIMUS, Inc. | 4,200 | 265,524 | ||||||
| Measurement Specialties, Inc. † | 3,900 | 134,004 | ||||||
| Mentor Graphics Corp. †(a) | 17,900 | 304,658 | ||||||
| Mercury Systems, Inc. †(a) | 4,500 | 41,400 | ||||||
| Mitek Systems, Inc. †(a) | 15,900 | 51,039 | ||||||
| Monolithic Power Systems, Inc. (a) | 12,700 | 282,956 | ||||||
| Monotype Imaging Holdings, Inc. (a) | 10,400 | 166,192 | ||||||
| MoSys, Inc. †(a) | 5,300 | 18,444 | ||||||
| MTS Systems Corp. | 2,200 | 112,046 | ||||||
| Nanometrics, Inc. † | 8,800 | 126,896 | ||||||
| Netlist, Inc. †(a) | 13,900 | 10,286 | ||||||
| Netscout Systems, Inc. † | 14,200 | 369,058 | ||||||
| NIC, Inc. | 16,100 | 263,074 | ||||||
| NVE Corp. † | 2,400 | 133,176 | ||||||
| OSI Systems, Inc. † | 7,600 | 486,704 | ||||||
| PC Connection, Inc. | 6,800 | 78,200 | ||||||
| PDF Solutions, Inc. † | 12,000 | 165,360 | ||||||
| PFSweb, Inc. †(a) | 9,900 | 28,116 | ||||||
| Procera Networks, Inc. † | 9,600 | 178,080 | ||||||
| PROS Holdings, Inc. † | 8,200 | 149,978 | ||||||
| QuickLogic Corp. †(a) | 5,700 | 12,369 | ||||||
| RealNetworks, Inc. † | 4,000 | 30,240 | ||||||
| Richardson Electronics Ltd. | 9,500 | 107,540 | ||||||
| Rogers Corp. † | 3,100 | 153,946 | ||||||
| Saba Software, Inc. †(a) | 13,200 | 115,368 | ||||||
| SciQuest, Inc. †(a) | 2,000 | 31,720 | ||||||
| Seachange International, Inc. †(a) | 4,300 | 41,581 | ||||||
| Sourcefire, Inc. †(a) | 10,000 | 472,200 | ||||||
| SPS Commerce, Inc. †(a) | 4,000 | 149,080 | ||||||
| SHARES | VALUE (Note 2) | |||||||
| Information Technology - 12.5% (continued) | ||||||||
| SS&C Technologies Holdings, Inc. †(a) | 8,500 | $ | 196,520 | |||||
| Stamps.com, Inc. †(a) | 5,600 | 141,120 | ||||||
| Stratasys Ltd. † | 9,400 | 753,410 | ||||||
| Super Micro Computer, Inc. †(a) | 9,400 | 95,880 | ||||||
| support.com, Inc. †(a) | 12,700 | 53,086 | ||||||
| SYNNEX Corp. †(a) | 2,600 | 89,388 | ||||||
| Telenav, Inc. † | 9,300 | 74,214 | ||||||
| Tessco Technologies, Inc. | 1,400 | 30,996 | ||||||
| TiVo, Inc. † | 11,300 | 139,216 | ||||||
| Tyler Technologies, Inc. † | 8,700 | 421,428 | ||||||
| Ultimate Software Group, Inc. † | 2,400 | 226,584 | ||||||
| Ultratech, Inc. † | 9,500 | 354,350 | ||||||
| VirnetX Holding Corp. †(a) | 2,700 | 79,056 | ||||||
| Virtusa Corp. †(a) | 4,600 | 75,578 | ||||||
| Web.com Group, Inc. †(a) | 24,800 | 367,040 | ||||||
| Westell Technologies, Inc., Class A †(a) | 19,600 | 36,260 | ||||||
| WEX, Inc. † | 800 | 60,296 | ||||||
| Zix Corp. †(a) | 14,200 | 39,760 | ||||||
| Zygo Corp. † | 7,800 | 122,460 | ||||||
|
| |||||||
| 18,266,445 | ||||||||
|
| |||||||
| Materials - 5.4% | ||||||||
| A Schulman, Inc. | 9,100 | 263,263 | ||||||
| ADA-ES, Inc. †(a) | 4,300 | 72,584 | ||||||
| American Vanguard Corp. (a) | 13,800 | 428,766 | ||||||
| Balchem Corp. | 4,800 | 174,720 | ||||||
| Boise, Inc. | 31,500 | 250,425 | ||||||
| Chemtura Corp. † | 17,700 | 376,302 | ||||||
| Deltic Timber Corp. (a) | 1,900 | 134,178 | ||||||
| Eagle Materials, Inc. | 4,000 | 234,000 | ||||||
| Flotek Industries, Inc. †(a) | 18,100 | 220,820 | ||||||
| Georgia Gulf Corp. | 15,000 | 619,200 | ||||||
| Graphic Packaging Holding Co. † | 19,900 | 128,554 | ||||||
| H.B. Fuller Co. (a) | 14,100 | 490,962 | ||||||
| Handy & Harman Ltd. † | 2,400 | 36,168 | ||||||
| Hawkins, Inc. (a) | 1,700 | 65,688 | ||||||
| Haynes International, Inc. | 1,400 | 72,618 | ||||||
| Headwaters, Inc. † | 48,100 | 411,736 | ||||||
| Innophos Holdings, Inc. (a) | 3,500 | 162,750 | ||||||
| Innospec, Inc. | 6,700 | 231,083 | ||||||
| Kaiser Aluminum Corp. | 3,100 | 191,239 | ||||||
| KapStone Paper and Packaging Corp. | 3,800 | 84,322 | ||||||
| Koppers Holdings, Inc. | 3,700 | 141,155 | ||||||
| Kraton Performance Polymers, Inc. † | 6,200 | 148,986 | ||||||
| Louisiana-Pacific Corp. † | 6,700 | 129,444 | ||||||
| Material Sciences Corp. † | 8,000 | 72,240 | ||||||
| Metals USA Holdings Corp. | 4,400 | 76,956 | ||||||
| Midway Gold Corp. †(a) | 30,700 | 42,673 | ||||||
| Myers Industries, Inc. | 10,900 | 165,135 | ||||||
| Neenah Paper, Inc. (a) | 4,000 | 113,880 | ||||||
| PolyOne Corp. (a) | 30,900 | 630,978 | ||||||
| Quaker Chemical Corp. (a) | 2,400 | 129,264 | ||||||
| Schweitzer-Mauduit International, Inc. | 400 | 15,612 | ||||||
| Senomyx, Inc. † | 8,600 | 14,448 | ||||||
| Stepan Co. (a) | 4,800 | 266,592 | ||||||
| SunCoke Energy, Inc. † | 6,800 | 106,012 | ||||||
| Texas Industries, Inc. †(a) | 7,200 | 367,272 | ||||||
| The accompanying notes are an integral part of these financial statements. | (Continued) |
| 96 | AQR Funds | Annual Report | December 2012 | |||||||||||||
Table of Contents
| Schedule of Investments | December 31, 2012 |
| AQR SMALL CAP MOMENTUM FUND |
| SHARES | VALUE (Note 2) | |||||||
| Materials - 5.4% (continued) | ||||||||
| Tredegar Corp. | 5,000 | $ | 102,100 | |||||
| UFP Technologies, Inc. †(a) | 3,400 | 60,928 | ||||||
| Universal Stainless & Alloy †(a) | 2,600 | 95,602 | ||||||
| Vista Gold Corp. † | 33,900 | 91,530 | ||||||
| Worthington Industries, Inc. | 17,300 | 449,627 | ||||||
|
| |||||||
| 7,869,812 | ||||||||
|
| |||||||
| Telecommunication Services - 1.0% | ||||||||
| 8x8, Inc. † | 33,400 | 246,826 | ||||||
| Atlantic Tele-Network, Inc. | 2,200 | 80,762 | ||||||
| Cincinnati Bell, Inc. †(a) | 82,000 | 449,360 | ||||||
| Cogent Communications Group, Inc. (a) | 12,400 | 280,736 | ||||||
| Elephant Talk Communications Corp. † | 14,600 | 14,600 | ||||||
| General Communication, Inc., Class A † | 4,600 | 44,114 | ||||||
| HickoryTech Corp. (a) | 1,700 | 16,541 | ||||||
| IDT Corp., Class B (a) | 7,300 | 69,642 | ||||||
| inContact, Inc. †(a) | 14,500 | 75,110 | ||||||
| NTELOS Holdings Corp. | 6,450 | 84,559 | ||||||
| ORBCOMM, Inc. †(a) | 4,000 | 15,680 | ||||||
| Premiere Global Services, Inc. † | 10,600 | 103,668 | ||||||
|
| |||||||
| 1,481,598 | ||||||||
|
| |||||||
| Utilities - 0.8% | ||||||||
| Artesian Resources Corp., Class A | 2,300 | 51,589 | ||||||
| Chesapeake Utilities Corp. | 7,400 | 335,960 | ||||||
| Connecticut Water Service, Inc. (a) | 2,900 | 86,362 | ||||||
| Laclede Group, Inc./The (a) | 5,000 | 193,050 | ||||||
| MGE Energy, Inc. (a) | 3,600 | 183,420 | ||||||
| Middlesex Water Co. | 4,300 | 84,108 | ||||||
| Unitil Corp. (a) | 4,200 | 108,864 | ||||||
| York Water Co. (a) | 4,100 | 72,037 | ||||||
|
| |||||||
| 1,115,390 | ||||||||
|
| |||||||
TOTAL COMMON STOCKS | 142,947,393 | |||||||
|
| |||||||
| PREFERRED STOCKS - 0.0% (b) | ||||||||
| Utilities - 0.0% (b) | ||||||||
Genie Energy Ltd., Perpetual Bond, Series 12-A †, 7.50%, 11/15/2016 (a)(c) | 5,900 | 41,595 | ||||||
|
| |||||||
| RIGHTS - 0.0% (b) | ||||||||
| Information Technology - 0.0% (b) | ||||||||
Gerber Scientific, Inc. (3)†(d) | 4,000 | — | ||||||
|
| |||||||
| WARRANTS - 0.0% (b) | ||||||||
| Energy - 0.0% (b) | ||||||||
Magnum Hunter Resources Corp. † | 2,980 | 59 | ||||||
|
| |||||||
| MONEY MARKET FUNDS - 1.4% | SHARES | VALUE (Note 2) | ||||||
| J.P. Morgan U.S. Treasury Plus Money Market Fund - Institutional Shares, 0.000% (2)(e) (cost $2,039,258) | 2,039,258 | $ | 2,039,258 | |||||
|
| |||||||
| INVESTMENTS OF CASH COLLATERAL FOR SECURITIES ON LOAN - 28.6% | ||||||||
| J.P. Morgan Prime Money Market Fund - | ||||||||
Capital Shares, 0.120% (2)(e)(f) | 41,729,314 | 41,729,314 | ||||||
|
| |||||||
TOTAL INVESTMENTS - 128.1% | 186,757,619 | |||||||
|
| |||||||
| LIABILITIES IN EXCESS OF OTHER ASSETS - (28.1%) (g) | (40,977,654) | |||||||
|
| |||||||
NET ASSETS - 100.0% | $ | 145,779,965 | ||||||
|
| |||||||
All securities are United States companies, unless noted otherwise in parentheses.
| † | Non income-producing security. |
| (a) | All or a portion of the security on loan. The aggregate market value of such securities is $41,226,770; cash collateral of $41,729,314 was received with which the Fund purchased a money market fund. |
| (b) | Represents less than 0.05 percent of net assets. |
| (c) | Security is perpetual and, thus, does not have a predetermined maturity date. The coupon rate for this security is fixed for a period of time and may be structured to adjust thereafter. The date shown, if applicable, reflects the next call date. The coupon rate shown is the rate in effect as of December 31, 2012. |
| (d) | Security fair valued as of December 31, 2012 using procedures approved by the Board of Trustees. The total value of positions fair valued was $14,729 or 0.0% of total net assets. |
| (e) | Represents annualized seven-day yield as of December 31, 2012. |
| (f) | Represents security, or portion thereof, purchased with the cash collateral received for securities on loan. |
| (g) | Includes appreciation on futures contracts. |
All securities are Level 1 with respect to ASC 820, unless otherwise noted in parentheses.
| (2) | Level 2 security (See Note 4). |
| (3) | Level 3 security (See Note 4). |
The following abbreviations are used in portfolio descriptions:
REIT - Real Estate Investment Trust
| The accompanying notes are an integral part of these financial statements. | (Continued) |
| AQR Funds | Annual Report | December 2012 | 97 | |||||||||||||
Table of Contents
| Schedule of Investments | December 31, 2012 |
| AQR SMALL CAP MOMENTUM FUND |
Open futures contracts outstanding at December 31, 2012:
| NUMBER OF CONTRACTS | DESCRIPTION | EXPIRATION DATE | VALUE AT TRADE DATE | VALUE AT DECEMBER 31, 2012 | UNREALIZED APPRECIATION | |||||||||||
| Long Contracts: | ||||||||||||||||
| 26 | E-Mini Russell 2000 Futures | March 15, 2013 | $2,173,887 | $2,201,160 | $27,273 | |||||||||||
|
|
|
|
|
| |||||||||||
Cash held as collateral with broker for futures contracts was $78,182 at December 31, 2012.
| The accompanying notes are an integral part of these financial statements. |
| 98 | AQR Funds | Annual Report | December 2012 | |||||||||||||
Table of Contents
| Schedule of Investments | December 31, 2012 |
| COMMON STOCKS – 98.0% | SHARES | VALUE (Note 2) | ||||||
| Australia – 8.3% | ||||||||
| ALS Ltd. | 11,725 | $ | 133,751 | |||||
| Amcor Ltd. | 30,438 | 257,254 | ||||||
| Atlas Iron Ltd. | 18,245 | 34,914 | ||||||
| Aurizon Holdings Ltd. | 27,946 | 109,894 | ||||||
| Australia & New Zealand Banking Group Ltd. | 49,898 | 1,314,139 | ||||||
| Caltex Australia Ltd. | 4,085 | 82,393 | ||||||
| CFS Retail Property Trust Group REIT | 41,469 | 82,957 | ||||||
| Coca-Cola Amatil Ltd. | 10,216 | 143,569 | ||||||
| Cochlear Ltd. | 3,817 | 316,428 | ||||||
| Commonwealth Bank of Australia | 27,136 | 1,767,271 | ||||||
| Commonwealth Property Office Fund REIT | 75,980 | 80,944 | ||||||
| CSL Ltd. | 8,759 | 494,510 | ||||||
| Dexus Property Group REIT | 90,954 | 96,603 | ||||||
| Goodman Group REIT | 24,585 | 112,023 | ||||||
| GPT Group REIT | 38,389 | 147,766 | ||||||
| Insurance Australia Group Ltd. | 62,946 | 310,031 | ||||||
| Macquarie Group Ltd. | 5,790 | 216,899 | ||||||
| Mesoblast Ltd. †(a) | 10,394 | 58,113 | ||||||
| Mirvac Group REIT | 60,599 | 94,307 | ||||||
| National Australia Bank Ltd. | 5,541 | 145,745 | ||||||
| New Hope Corp. Ltd. | 14,557 | 63,984 | ||||||
| OZ Minerals Ltd. | 4,289 | 30,459 | ||||||
| Paladin Energy Ltd. † | 12,165 | 13,431 | ||||||
| Ramsay Health Care Ltd. | 3,907 | 111,436 | ||||||
| Shopping Centres Australasia Property Group REIT † | 3,776 | 5,882 | ||||||
| Sonic Healthcare Ltd. | 6,491 | 90,605 | ||||||
| Telecom Corp of New Zealand Ltd. | 36,210 | 67,836 | ||||||
| Telstra Corp. Ltd. | 255,311 | 1,163,383 | ||||||
| Wesfarmers Ltd. | 3,799 | 146,570 | ||||||
| Westfield Group REIT | 56,684 | 626,010 | ||||||
| Westfield Retail Trust REIT | 88,920 | 280,539 | ||||||
| Westpac Banking Corp. | 49,967 | 1,369,086 | ||||||
| Woolworths Ltd. | 18,883 | 579,299 | ||||||
| WorleyParsons Ltd. | 2,954 | 72,766 | ||||||
|
| |||||||
| 10,620,797 | ||||||||
|
| |||||||
| Austria – 0.3% | ||||||||
| Andritz AG | 1,830 | 117,593 | ||||||
| Erste Group Bank AG † | 4,525 | 143,870 | ||||||
| Immofinanz AG NPV † | 30,467 | 128,260 | ||||||
| Lenzing AG | 606 | 54,484 | ||||||
|
| |||||||
| 444,207 | ||||||||
|
| |||||||
| Belgium – 3.2% | ||||||||
| Ageas | 11,340 | 335,066 | ||||||
| Anheuser-Busch InBev NV | 28,891 | 2,515,960 | ||||||
| Belgacom SA | 2,566 | 75,470 | ||||||
| KBC Groep NV | 4,440 | 154,744 | ||||||
| RTL Group SA | 766 | 76,064 | ||||||
| Solvay SA | 2,403 | 349,665 | ||||||
| UCB SA | 3,497 | 200,337 | ||||||
| Umicore SA | 5,663 | 313,577 | ||||||
|
| |||||||
| 4,020,883 | ||||||||
|
| |||||||
| SHARES | VALUE (Note 2) | |||||||
| Canada – 4.9% | ||||||||
| Agnico-Eagle Mines Ltd. (1) | 6,100 | $ | 319,687 | |||||
| Agrium, Inc. (1) | 2,900 | 289,038 | ||||||
| Alimentation Couche Tard, Inc., Class B (1) | 3,800 | 186,925 | ||||||
| Atco Ltd., Class I (1) | 1,000 | 81,150 | ||||||
| Boardwalk Real Estate Investment Trust REIT (1) | 1,500 | 97,311 | ||||||
| Brookfield Office Properties, Inc. (1) | 7,200 | 122,763 | ||||||
| Calloway Real Estate Investment Trust REIT (1) | 3,200 | 93,134 | ||||||
| Canadian National Railway Co. (1) | 1,200 | 108,973 | ||||||
| Canadian Pacific Railway Ltd. (1) | 4,600 | 466,613 | ||||||
| Canadian Utilities Ltd., Class A (1) | 1,700 | 122,950 | ||||||
| CGI Group, Inc., Class A (1)† | 10,200 | 235,235 | ||||||
| CI Financial Corp. (1) | 3,300 | 82,707 | ||||||
| Dollarama, Inc. (1) | 4,000 | 237,137 | ||||||
| Domtar Corp. (1) | 900 | 75,007 | ||||||
| Emera, Inc. (1) | 2,100 | 73,343 | ||||||
| Empire Co., Ltd., Class A (1) | 1,100 | 65,190 | ||||||
| First Capital Realty, Inc. (1) | 3,800 | 71,897 | ||||||
| First Majestic Silver Corp. (1)† | 4,300 | 86,718 | ||||||
| Franco-Nevada Corp. (1) | 3,600 | 205,497 | ||||||
| Gildan Activewear, Inc. (1) | 3,000 | 109,571 | ||||||
| H&R Real Estate Investment Trust REIT (1) | 5,400 | 130,833 | ||||||
| Intact Financial Corp. (1) | 2,700 | 175,811 | ||||||
| Keyera Corp. (1) | 1,700 | 84,137 | ||||||
| Lululemon Athletica, Inc. (1)† | 3,000 | 227,737 | ||||||
| Methanex Corp. (1) | 2,000 | 63,697 | ||||||
| Metro, Inc. (1) | 4,200 | 267,403 | ||||||
| Onex Corp. (1) | 2,400 | 101,023 | ||||||
| Paramount Resources Ltd., Class A (1)† | 2,400 | 77,209 | ||||||
| RioCan Real Estate Investment Trust REIT (1)(a) | 8,000 | 221,655 | ||||||
| Royal Bank of Canada (1) | 14,800 | 890,946 | ||||||
| Shoppers Drug Mart Corp. (1) | 200 | 8,606 | ||||||
| Sun Life Financial, Inc. (1) | 11,800 | 312,824 | ||||||
| Toronto-Dominion Bank/The (1) | 500 | 42,098 | ||||||
| Valeant Pharmaceuticals International, Inc. (1)† | 3,529 | 210,527 | ||||||
| Yamana Gold, Inc. (1) | 15,100 | 259,738 | ||||||
|
| |||||||
| 6,205,090 | ||||||||
|
| |||||||
| Denmark – 2.3% | ||||||||
| Carlsberg A/S, Class B | 3,117 | 307,076 | ||||||
| Coloplast A/S, Class B | 4,470 | 219,209 | ||||||
| Danske Bank A/S † | 20,820 | 353,610 | ||||||
| DSV A/S | 2,710 | 70,114 | ||||||
| H Lundbeck A/S | 3,734 | 54,724 | ||||||
| Novo Nordisk A/S, Class B | 10,771 | 1,753,914 | ||||||
| William Demant Holding A/S † | 1,394 | 119,761 | ||||||
|
| |||||||
| 2,878,408 | ||||||||
|
| |||||||
| Finland – 1.4% | ||||||||
| Elisa OYJ | 3,629 | 80,454 | ||||||
| Kesko OYJ, B Shares | 1,282 | 42,088 | ||||||
| Kone OYJ, Class B | 7,497 | 554,476 | ||||||
| Konecranes OYJ | 3,800 | 129,678 | ||||||
| Nokian Renkaat OYJ | 4,727 | 189,350 | ||||||
| The accompanying notes are an integral part of these financial statements. | (Continued) |
| AQR Funds | Annual Report | December 2012 | 99 | |||||||||||||
Table of Contents
| Schedule of Investments | December 31, 2012 |
| AQR INTERNATIONAL MOMENTUM FUND |
| SHARES | VALUE (Note 2) | |||||||
| Finland – 1.4% (continued) | ||||||||
| Sampo OYJ, A Shares | 14,032 | $ | 454,436 | |||||
| Wartsila OYJ | 8,465 | 368,531 | ||||||
|
| |||||||
| 1,819,013 | ||||||||
|
| |||||||
| France – 9.1% | ||||||||
| Air Liquide SA | 3,601 | 454,942 | ||||||
| AXA SA | 25,427 | 456,561 | ||||||
| BNP Paribas SA | 23,724 | 1,350,608 | ||||||
| Bureau Veritas SA | 591 | 66,269 | ||||||
| Christian Dior SA | 1,623 | 276,647 | ||||||
| Cie Generale des Etablissements Michelin | 1,933 | 185,218 | ||||||
| Cie Generale d’Optique Essilor International SA | 3,545 | 357,539 | ||||||
| Credit Agricole SA † | 21,317 | 173,607 | ||||||
| Dassault Systemes SA | 1,844 | 206,172 | ||||||
| Edenred | 3,620 | 111,960 | ||||||
| European Aeronautic Defence and Space Co. NV | 6,208 | 244,727 | ||||||
| Eutelsat Communications SA | 3,108 | 103,373 | ||||||
| Hermes International | 1,274 | 380,889 | ||||||
| Iliad SA | 1,834 | 315,132 | ||||||
| Lafarge SA | 5,316 | 343,266 | ||||||
| L’Oreal SA | 7,307 | 1,016,714 | ||||||
| LVMH Moet Hennessy Louis Vuitton SA | 971 | 179,205 | ||||||
| Pernod-Ricard SA (a) | 4,394 | 509,796 | ||||||
| PPR | 1,784 | 335,054 | ||||||
| Publicis Groupe SA | 5,534 | 332,943 | ||||||
| Renault SA | 5,669 | 307,872 | ||||||
| Rexel SA | 4,367 | 89,317 | ||||||
| Safran SA | 2,192 | 94,929 | ||||||
| Sanofi | 19,537 | 1,852,691 | ||||||
| Schneider Electric SA | 4,553 | 333,465 | ||||||
| SCOR SE | 2,421 | 65,436 | ||||||
| SEB SA | 592 | 43,799 | ||||||
| Societe Generale SA † | 13,974 | 531,326 | ||||||
| Sodexo | 1,964 | 165,955 | ||||||
| Technip SA | 1,542 | 178,311 | ||||||
| Total SA | 6,227 | 324,009 | ||||||
| Unibail-Rodamco SE REIT | 1,172 | 284,213 | ||||||
|
| |||||||
| 11,671,945 | ||||||||
|
| |||||||
| Germany – 10.3% | ||||||||
| Adidas AG | 5,909 | 527,373 | ||||||
| Allianz SE | 9,248 | 1,289,142 | ||||||
| BASF SE | 14,012 | 1,324,973 | ||||||
| Bayer AG | 18,737 | 1,786,793 | ||||||
| Beiersdorf AG | 7,760 | 635,394 | ||||||
| Continental AG | 5,548 | 646,638 | ||||||
| Daimler AG | 230 | 12,663 | ||||||
| Deutsche Bank AG | 7,732 | 340,168 | ||||||
| Deutsche Boerse AG | 410 | 25,142 | ||||||
| Deutsche Lufthansa AG | 16,412 | 310,257 | ||||||
| Deutsche Post AG | 32,986 | 726,533 | ||||||
| Fresenius SE & Co. KGaA | 2,724 | 313,446 | ||||||
| GEA Group AG | 2,796 | 90,914 | ||||||
| Hannover Rueckversicherung AG | 4,457 | 349,089 | ||||||
| HeidelbergCement AG | 5,185 | 317,279 | ||||||
| Kabel Deutschland Holding AG | 2,893 | 217,743 | ||||||
| SHARES | VALUE (Note 2) | |||||||
| Germany – 10.3% (continued) | ||||||||
| Lanxess AG | 3,371 | $ | 297,253 | |||||
| Linde AG | 1,228 | 214,836 | ||||||
| MAN SE | 1,150 | 123,534 | ||||||
| Merck KGaA | 3,635 | 479,074 | ||||||
| Muenchener Rueckversicherungs AG | 4,909 | 886,210 | ||||||
| RWE AG | 5,360 | 222,319 | ||||||
| SAP AG | 23,270 | 1,871,202 | ||||||
| Suedzucker AG | 2,234 | 91,699 | ||||||
|
| |||||||
| 13,099,674 | ||||||||
|
| |||||||
| Hong Kong – 6.8% | ||||||||
| AAC Technologies Holdings, Inc. | 35,500 | 125,877 | ||||||
| AIA Group Ltd. | 206,200 | 817,858 | ||||||
| ASM Pacific Technology Ltd. (a) | 9,700 | 119,088 | ||||||
| BOC Hong Kong Holdings Ltd. | 228,500 | 718,811 | ||||||
| Cheung Kong Holdings Ltd. | 48,000 | 746,852 | ||||||
| Cheung Kong Infrastructure Holdings Ltd. | 31,000 | 191,487 | ||||||
| CLP Holdings Ltd. | 1,500 | 12,603 | ||||||
| Dah Chong Hong Holdings Ltd. | 63,000 | 67,259 | ||||||
| First Pacific Co., Ltd. | 72,000 | 79,511 | ||||||
| Galaxy Entertainment Group Ltd. † | 92,000 | 368,900 | ||||||
| Giordano International Ltd. | 64,000 | 62,048 | ||||||
| Global Bio-Chem Technology Group Co., Ltd. | 198,000 | 22,815 | ||||||
| Great Wall Motor Co., Ltd. | 250 | 804 | ||||||
| Hang Seng Bank Ltd. (a) | 31,100 | 480,089 | ||||||
| Henderson Land Development Co. Ltd. | 59,000 | 422,393 | ||||||
| Hong Kong & China Gas Co., Ltd. | 176,000 | 483,562 | ||||||
| Hysan Development Co., Ltd. | 25,000 | 121,571 | ||||||
| Lifestyle International Holdings Ltd. | 33,500 | 82,868 | ||||||
| Link REIT/The REIT | 59,500 | 297,982 | ||||||
| Melco International Development Ltd. | 103,000 | 122,286 | ||||||
| MTR Corp. Ltd. | 60,500 | 239,734 | ||||||
| New World Development Co., Ltd. | 196,000 | 310,303 | ||||||
| NWS Holdings Ltd. | 61,000 | 103,678 | ||||||
| Orient Overseas International Ltd. | 19,000 | 125,432 | ||||||
| Sands China Ltd. | 137,200 | 613,375 | ||||||
| Shangri-La Asia Ltd. | 24,000 | 48,346 | ||||||
| Sino Land Co., Ltd. | 168,000 | 307,632 | ||||||
| SJM Holdings Ltd. | 79,000 | 186,445 | ||||||
| SmarTone Telecommunications Holdings Ltd. | 31,500 | 57,751 | ||||||
| Stella International Holdings Ltd. | 32,500 | 88,537 | ||||||
| Swire Pacific Ltd., Class A (a) | 26,000 | 325,232 | ||||||
| Swire Properties Ltd. | 50 | 168 | ||||||
| Television Broadcasts Ltd. | 10,000 | 75,188 | ||||||
| Towngas China Co., Ltd. | 39,000 | 32,333 | ||||||
| Vinda International Holdings Ltd. (a) | 44,000 | 60,960 | ||||||
| Wharf Holdings Ltd. | 58,000 | 462,244 | ||||||
| Wheelock & Co., Ltd. | 41,000 | 209,145 | ||||||
| Yingde Gases | 63,500 | 65,087 | ||||||
|
| |||||||
| 8,656,254 | ||||||||
|
| |||||||
| Israel – 0.6% | ||||||||
| Bezeq The Israeli Telecommunication Corp. Ltd. | 22,496 | 26,057 | ||||||
| Israel Chemicals Ltd. | 25,004 | 301,127 | ||||||
| Israel Corp. Ltd./The | 62 | 40,783 | ||||||
| The accompanying notes are an integral part of these financial statements. | (Continued) |
| 100 | AQR Funds | Annual Report | December 2012 | |||||||||||||
Table of Contents
| Schedule of Investments | December 31, 2012 |
| AQR INTERNATIONAL MOMENTUM FUND |
| SHARES | VALUE (Note 2) | |||||||
| Israel – 0.6% (continued) | ||||||||
| Mellanox Technologies Ltd. † | 1,786 | $ | 110,628 | |||||
| Teva Pharmaceutical Industries Ltd. | 8,831 | 328,155 | ||||||
|
| |||||||
| 806,750 | ||||||||
|
| |||||||
| Italy – 2.3% | ||||||||
| Davide Campari-Milano SpA | 11,007 | 84,587 | ||||||
| Exor SpA | 4,986 | 125,657 | ||||||
| Fiat Industrial SpA | 27,185 | 297,827 | ||||||
| Lottomatica Group SpA | 13,558 | 309,782 | ||||||
| Luxottica Group SpA | 15,970 | 659,159 | ||||||
| Pirelli & C. SpA (a) | 20,366 | 234,651 | ||||||
| Prada SpA | 57,900 | 562,601 | ||||||
| Prysmian SpA | 14,955 | 298,516 | ||||||
| Salvatore Ferragamo Italia SpA | 5,363 | 118,725 | ||||||
| Tenaris SA | 9,423 | 196,473 | ||||||
| Terna Rete Elettrica Nazionale SpA | 16,361 | 65,473 | ||||||
|
| |||||||
| 2,953,451 | ||||||||
|
| |||||||
| Japan – 17.7% | ||||||||
| ABC-Mart, Inc. | 2,700 | 117,546 | ||||||
| Acom Co., Ltd. †(a) | 4,470 | 128,751 | ||||||
| Aeon Credit Service Co., Ltd. | 5,400 | 109,266 | ||||||
| Ajinomoto Co., Inc. | 24,000 | 317,579 | ||||||
| Aozora Bank Ltd. | 58,000 | 178,334 | ||||||
| Asics Corp. | 5,100 | 77,910 | ||||||
| Astellas Pharma, Inc. | 14,200 | 638,455 | ||||||
| Autobacs Seven Co., Ltd. (a) | 1,100 | 46,116 | ||||||
| Calbee, Inc. | 3,600 | 253,666 | ||||||
| Calsonic Kansei Corp. | 14,000 | 57,657 | ||||||
| Century Tokyo Leasing Corp. | 4,800 | 99,679 | ||||||
| Chiyoda Corp. | 7,000 | 100,276 | ||||||
| Chugai Pharmaceutical Co., Ltd. | 13,800 | 264,409 | ||||||
| Chugoku Bank Ltd./The | 5,000 | 69,789 | ||||||
| Cosmos Pharmaceutical Corp. | 1,200 | 119,255 | ||||||
| Credit Saison Co., Ltd. | 3,800 | 95,048 | ||||||
| Daido Steel Co., Ltd. | 12,000 | 60,849 | ||||||
| Dainippon Screen Manufacturing Co., Ltd. †(a) | 7,000 | 43,025 | ||||||
| Dainippon Sumitomo Pharma Co., Ltd. | 6,800 | 81,693 | ||||||
| Daito Trust Construction Co., Ltd. | 1,100 | 103,961 | ||||||
| Daiwa House Industry Co., Ltd. | 9,000 | 154,735 | ||||||
| Eisai Co., Ltd. | 2,900 | 121,054 | ||||||
| FamilyMart Co., Ltd. | 6,000 | 247,189 | ||||||
| Fast Retailing Co., Ltd. | 2,700 | 689,069 | ||||||
| Fuji Heavy Industries Ltd. | 42,000 | 529,634 | ||||||
| Hankyu Hanshin Holdings, Inc. | 52,000 | 268,857 | ||||||
| Heiwa Corp. | 3,300 | 53,778 | ||||||
| Hikari Tsushin, Inc. | 2,600 | 100,325 | ||||||
| Hino Motors Ltd. | 32,000 | 289,242 | ||||||
| Hitachi Ltd. | 660 | 3,884 | ||||||
| Hitachi Transport System Ltd. | 3,200 | 46,752 | ||||||
| Hoshizaki Electric Co., Ltd. | 3,200 | 85,086 | ||||||
| House Foods Corp. | 3,600 | 54,245 | ||||||
| IHI Corp. | 27,000 | 70,014 | ||||||
| Isuzu Motors Ltd. | 52,000 | 310,306 | ||||||
| Itochu Techno-Solutions Corp. | 6,900 | 284,131 | ||||||
| Japan Real Estate Investment Corp. REIT | 32 | 315,268 | ||||||
| Japan Retail Fund Investment Corp. REIT | 33 | 60,663 | ||||||
| SHARES | VALUE (Note 2) | |||||||
| Japan – 17.7% (continued) | ||||||||
| Japan Tobacco, Inc. | 35,300 | $ | 997,203 | |||||
| JGC Corp. | 8,000 | 249,292 | ||||||
| Joyo Bank Ltd./The | 19,000 | 90,274 | ||||||
| Kakaku.com, Inc. | 2,100 | 69,328 | ||||||
| KDDI Corp. | 4,500 | 318,138 | ||||||
| Kewpie Corp. | 4,700 | 64,856 | ||||||
| Keyence Corp. | 40 | 11,093 | ||||||
| Kintetsu Corp. (a) | 71,000 | 290,938 | ||||||
| Kubota Corp. | 28,000 | 321,927 | ||||||
| Kyowa Hakko Kirin Co., Ltd. | 6,000 | 59,191 | ||||||
| Lawson, Inc. | 4,500 | 305,258 | ||||||
| M3, Inc. | 69 | 110,129 | ||||||
| Matsui Securities Co. Ltd. | 38,500 | 351,711 | ||||||
| McDonald’s Holdings Co., Japan Ltd. (a) | 3,700 | 97,636 | ||||||
| Miraca Holdings, Inc. | 1,700 | 68,545 | ||||||
| Mitsubishi Estate Co., Ltd. | 23,000 | 550,636 | ||||||
| Mitsubishi UFJ Financial Group, Inc. | 83,400 | 451,287 | ||||||
| Mitsui Fudosan Co., Ltd. | 17,000 | 415,872 | ||||||
| Mizuho Financial Group, Inc. | 403,000 | 738,895 | ||||||
| Namco Bandai Holdings, Inc. | 12,300 | 159,435 | ||||||
| NHK Spring Co., Ltd. | 12,500 | 103,000 | ||||||
| Nikon Corp. | 8,900 | 262,767 | ||||||
| Nippon Shokubai Co., Ltd. | 7,000 | 71,702 | ||||||
| Nippon Television Network Corp. | 5,100 | 68,176 | ||||||
| Nishi-Nippon City Bank Ltd./The | 21,000 | 52,108 | ||||||
| Nomura Real Estate Holdings, Inc. | 16,900 | 323,170 | ||||||
| Nomura Research Institute Ltd. | 3,500 | 72,908 | ||||||
| Odakyu Electric Railway Co., Ltd. | 11,000 | 114,446 | ||||||
| Ono Pharmaceutical Co., Ltd. | 2,500 | 127,710 | ||||||
| Oriental Land Co., Ltd. | 2,300 | 278,540 | ||||||
| ORIX Corp. | 2,830 | 319,673 | ||||||
| Otsuka Holdings Co., Ltd. | 12,200 | 343,690 | ||||||
| Park24 Co., Ltd. | 5,400 | 85,282 | ||||||
| Santen Pharmaceutical Co., Ltd. | 2,100 | 80,667 | ||||||
| Sawai Pharmaceutical Co., Ltd. | 700 | 70,267 | ||||||
| Sekisui Chemical Co., Ltd. | 10,000 | 87,237 | ||||||
| Seven & I Holdings Co., Ltd. | 10,300 | 290,365 | ||||||
| Shimamura Co., Ltd. | 2,300 | 223,504 | ||||||
| Shimano, Inc. | 1,600 | 102,453 | ||||||
| Shionogi & Co., Ltd. | 18,000 | 299,949 | ||||||
| SKY Perfect JSAT Holdings, Inc. | 133 | 55,544 | ||||||
| Softbank Corp. | 19,800 | 725,496 | ||||||
| Sugi Holdings Co., Ltd. | 2,600 | 91,726 | ||||||
| Sumitomo Corp. | 18,100 | 232,219 | ||||||
| Sumitomo Forestry Co., Ltd. | 9,300 | 87,935 | ||||||
| Sumitomo Mitsui Financial Group, Inc. | 11,300 | 410,663 | ||||||
| Sumitomo Realty & Development Co., Ltd. | 12,000 | 399,766 | ||||||
| Suruga Bank Ltd. | 8,000 | 98,393 | ||||||
| Sysmex Corp. | 3,100 | 142,751 | ||||||
| Taiheiyo Cement Corp. | 49,000 | 134,716 | ||||||
| Taisei Corp. | 28,000 | 93,108 | ||||||
| Tobu Railway Co., Ltd. | 73,000 | 387,130 | ||||||
| Toho Gas Co., Ltd. | 17,000 | 91,162 | ||||||
| Tokyo Gas Co., Ltd. | 52,000 | 237,591 | ||||||
| Tokyu Land Corp. | 21,000 | 153,869 | ||||||
| Toyota Motor Corp. | 36,600 | 1,709,079 | ||||||
| Toyota Tsusho Corp. | 18,400 | 454,163 | ||||||
| The accompanying notes are an integral part of these financial statements. | (Continued) |
| AQR Funds | Annual Report | December 2012 | 101 | |||||||||||||
Table of Contents
| Schedule of Investments | December 31, 2012 |
| AQR INTERNATIONAL MOMENTUM FUND |
| SHARES | VALUE (Note 2) | |||||||
| Japan – 17.7% (continued) | ||||||||
| Trend Micro, Inc. | 3,500 | $ | 105,753 | |||||
| Unicharm Corp. | 7,800 | 405,324 | ||||||
| USS Co., Ltd. | 1,250 | 130,162 | ||||||
| Yahoo Japan Corp. | 858 | 277,817 | ||||||
| Yakult Honsha Co., Ltd. | 5,200 | 227,771 | ||||||
| Yokogawa Electric Corp. | 8,300 | 91,012 | ||||||
| Yokohama Rubber Co., Ltd./The | 14,000 | 101,486 | ||||||
| Zensho Holdings Co., Ltd. | 4,900 | 56,534 | ||||||
|
| |||||||
| 22,647,924 | ||||||||
|
| |||||||
| Netherlands – 2.4% | ||||||||
| Akzo Nobel NV | 4,998 | 330,851 | ||||||
| ASML Holding NV | 8,980 | 575,920 | ||||||
| Gemalto NV | 3,241 | 292,548 | ||||||
| Heineken NV | 12,204 | 818,199 | ||||||
| Koninklijke DSM NV | 1,137 | 69,295 | ||||||
| Koninklijke Philips Electronics NV | 24,188 | 640,503 | ||||||
| Koninklijke Vopak NV | 762 | 53,864 | ||||||
| Unilever NV CVA | 6,623 | 253,420 | ||||||
|
| |||||||
| 3,034,600 | ||||||||
|
| |||||||
| Norway – 1.3% | ||||||||
| Aker Solutions ASA | 15,020 | 311,044 | ||||||
| DNB ASA | 10,033 | 128,238 | ||||||
| Golar LNG Ltd. | 2,009 | 75,630 | ||||||
| Marine Harvest ASA † | 140,424 | 130,814 | ||||||
| Petroleum Geo-Services ASA | 17,644 | 307,312 | ||||||
| Seadrill Ltd. | 4,710 | 173,525 | ||||||
| Telenor ASA | 7,480 | 152,307 | ||||||
| TGS Nopec Geophysical Co. ASA | 12,494 | 412,623 | ||||||
|
| |||||||
| 1,691,493 | ||||||||
|
| |||||||
| Portugal – 0.1% | ||||||||
| Jeronimo Martins SGPS SA | 6,068 | 117,333 | ||||||
| Portugal Telecom SGPS SA | 7,413 | 36,916 | ||||||
|
| |||||||
| 154,249 | ||||||||
|
| |||||||
| Singapore – 4.1% | ||||||||
| Ascendas Real Estate Investment Trust REIT | 206,000 | 403,126 | ||||||
| CapitaCommercial Trust REIT | 117,000 | 162,363 | ||||||
| CapitaLand Ltd. | 125,000 | 384,764 | ||||||
| CapitaMalls Asia Ltd. | 92,000 | 148,171 | ||||||
| Dairy Farm International Holdings, Ltd. | 6,300 | 68,749 | ||||||
| DBS Group Holdings Ltd. | 27,000 | 331,466 | ||||||
| Global Logistic Properties Ltd. | 210,000 | 485,670 | ||||||
| Jardine Cycle & Carriage Ltd. | 6,000 | 238,979 | ||||||
| Jardine Matheson Holdings Ltd. (a) | 11,600 | 723,803 | ||||||
| Jardine Strategic Holdings Ltd. | 7,000 | 250,449 | ||||||
| Keppel Corp. Ltd. | 34,000 | 310,473 | ||||||
| Noble Group Ltd. | 19,363 | 18,707 | ||||||
| SembCorp Industries Ltd. | 13,000 | 56,684 | ||||||
| SembCorp Marine Ltd. | 94,000 | 359,098 | ||||||
| Singapore Telecommunications Ltd. | 90,000 | 244,893 | ||||||
| StarHub Ltd. | 33,000 | 103,363 | ||||||
| Suntec Real Estate Investment Trust REIT | 92,000 | 126,752 | ||||||
| United Overseas Bank Ltd. | 50,000 | 820,202 | ||||||
|
| |||||||
| 5,237,712 | ||||||||
|
| |||||||
| SHARES | VALUE (Note 2) | |||||||
| Spain – 1.7% | ||||||||
| Amadeus IT Holding SA, A Shares | 12,030 | $ | 304,015 | |||||
| Grifols SA † | 9,811 | 343,072 | ||||||
| Inditex SA | 10,745 | 1,509,740 | ||||||
|
| |||||||
| 2,156,827 | ||||||||
|
| |||||||
| Sweden – 3.3% | ||||||||
| Alfa Laval AB | 6,671 | 139,489 | ||||||
| Assa Abloy AB, Class B | 5,856 | 220,436 | ||||||
| Electrolux AB, Series B | 11,360 | 300,068 | ||||||
| Elekta AB, B Shares | 6,724 | 105,174 | ||||||
| Getinge AB, B Shares | 4,444 | 151,064 | ||||||
| Hennes & Mauritz AB, B Shares | 367 | 12,719 | ||||||
| Hexagon AB, B Shares | 12,321 | 311,576 | ||||||
| Industrivarden AB, Class C | 4,099 | 68,292 | ||||||
| Investor AB, B Shares | 16,029 | 421,084 | ||||||
| Meda AB, A Shares | 7,554 | 77,872 | ||||||
| Skandinaviska Enskilda Banken AB, Class A | 69,929 | 598,290 | ||||||
| Svenska Cellulosa AB, B Shares | 5,358 | 116,497 | ||||||
| Svenska Handelsbanken AB, A Shares | 15,565 | 559,591 | ||||||
| Swedbank AB, A Shares | 37,745 | 741,515 | ||||||
| Volvo AB, B Shares | 23,782 | 327,933 | ||||||
|
| |||||||
| 4,151,600 | ||||||||
|
| |||||||
| Switzerland – 5.6% | ||||||||
| Actelion Ltd. | 6,152 | 294,379 | ||||||
| Compagnie Financiere Richemont SA, Class A | 9,054 | 710,699 | ||||||
| Geberit AG † | 236 | 52,315 | ||||||
| Holcim Ltd. † | 4,469 | 329,165 | ||||||
| Nestle SA | 16,197 | 1,056,748 | ||||||
| Novartis AG | 17,077 | 1,078,810 | ||||||
| Roche Holding AG | 807 | 163,160 | ||||||
| Schindler Holding AG | 1,395 | 201,795 | ||||||
| SGS SA | 237 | 526,392 | ||||||
| Swatch Group AG/The | 716 | 363,087 | ||||||
| Syngenta AG | 1,918 | 774,846 | ||||||
| UBS AG † | 43,757 | 684,748 | ||||||
| Wolseley PLC | 4,864 | 232,590 | ||||||
| Zurich Insurance Group AG † | 2,580 | 691,332 | ||||||
|
| |||||||
| 7,160,066 | ||||||||
|
| |||||||
| United Kingdom – 12.3% | ||||||||
| Aberdeen Asset Management PLC | 54,480 | 327,829 | ||||||
| Aggreko PLC | 7,624 | 217,578 | ||||||
| ARM Holdings PLC | 2,198 | 27,758 | ||||||
| Associated British Foods PLC | 9,388 | 239,848 | ||||||
| AstraZeneca PLC | 240 | 11,373 | ||||||
| Barclays PLC | 216,815 | 941,840 | ||||||
| BG Group PLC | 2,230 | 37,196 | ||||||
| British American Tobacco PLC | 482 | 24,502 | ||||||
| BT Group PLC | 130,732 | 498,769 | ||||||
| Bunzl PLC | 7,883 | 130,477 | ||||||
| Compass Group PLC | 41,470 | 492,280 | ||||||
| Croda International PLC | 3,164 | 123,665 | ||||||
| Diageo PLC | 46,529 | 1,355,233 | ||||||
| Experian PLC | 34,548 | 556,808 | ||||||
| Fresnillo PLC | 1,715 | 52,602 | ||||||
| The accompanying notes are an integral part of these financial statements. | (Continued) |
| 102 | AQR Funds | Annual Report | December 2012 | |||||||||||||
Table of Contents
| Schedule of Investments | December 31, 2012 |
| AQR INTERNATIONAL MOMENTUM FUND |
| SHARES | VALUE (Note 2) | |||||||
| United Kingdom – 12.3% (continued) | ||||||||
| G4S PLC | 22,026 | $ | 92,289 | |||||
| GlaxoSmithKline PLC | 913 | 19,878 | ||||||
| HSBC Holdings PLC | 212,050 | 2,247,046 | ||||||
| IMI PLC | 4,267 | 77,230 | ||||||
| Imperial Tobacco Group PLC | 8,078 | 313,197 | ||||||
| InterContinental Hotels Group PLC | 11,899 | 333,652 | ||||||
| Intertek Group PLC | 2,171 | 110,280 | ||||||
| Johnson Matthey PLC | 2,582 | 101,429 | ||||||
| Kingfisher PLC | 42,770 | 199,846 | ||||||
| Legal & General Group PLC | 62,913 | 150,857 | ||||||
| Meggitt PLC | 17,966 | 112,499 | ||||||
| Mondi PLC | 7,018 | 77,464 | ||||||
| National Grid PLC | 13,628 | 156,305 | ||||||
| Next PLC | 6,383 | 387,464 | ||||||
| Old Mutual PLC | 139,415 | 409,467 | ||||||
| Pearson PLC | 15,946 | 310,812 | ||||||
| Petrofac Ltd. | 14,632 | 391,054 | ||||||
| Prudential PLC | 39,000 | 556,427 | ||||||
| Randgold Resources Ltd. | 303 | 29,975 | ||||||
| Reed Elsevier PLC | 9,377 | 98,999 | ||||||
| Rexam PLC | 12,637 | 90,420 | ||||||
| Rolls-Royce Holdings PLC † | 35,118 | 503,711 | ||||||
| Royal Bank of Scotland Group PLC † | 149,501 | 799,073 | ||||||
| SABMiller PLC | 32,301 | 1,499,126 | ||||||
| Sage Group PLC/The | 14,253 | 68,536 | ||||||
| Severn Trent PLC | 3,568 | 91,811 | ||||||
| Shire PLC | 2,048 | 62,999 | ||||||
| Smith & Nephew PLC | 5,401 | 59,702 | ||||||
| SSE PLC | 8,866 | 206,260 | ||||||
| Standard Life PLC | 35,622 | 194,726 | ||||||
| Tate & Lyle PLC | 14,485 | 179,211 | ||||||
| Tullow Oil PLC | 11,125 | 231,927 | ||||||
| United Utilities Group PLC | 13,217 | 145,502 | ||||||
| Vodafone Group PLC | 112,887 | 284,167 | ||||||
| WPP PLC | 7,612 | 111,205 | ||||||
|
| |||||||
| 15,742,304 | ||||||||
|
| |||||||
TOTAL COMMON STOCKS | 125,153,247 | |||||||
|
| |||||||
| PREFERRED STOCKS – 0.0%(b) | ||||||||
| United Kingdom – 0.0%(b) | ||||||||
| Rolls-Royce Holdings PLC (3)†(c) | ||||||||
(cost $—) | 2,668,968 | 4,336 | ||||||
|
| |||||||
| EXCHANGE-TRADED FUNDS – 1.3% | ||||||||
| iShares MSCI EAFE Index Fund (1) | ||||||||
(cost $1,595,542) | 29,970 | 1,702,895 | ||||||
|
| |||||||
| MONEY MARKET FUNDS – 0.6% | ||||||||
| J.P. Morgan U.S. Treasury Plus Money Market Fund - Institutional Shares, 0.000% (d) | ||||||||
(cost $733,982) | 733,982 | 733,982 | ||||||
|
| |||||||
| INVESTMENTS OF CASH COLLATERAL FOR SECURITIES ON LOAN – 1.2% | SHARES | VALUE (Note 2) | ||||||
| J.P. Morgan Prime Money Market Fund - Capital Shares, 0.120% (d)(e) | ||||||||
(cost $1,550,145) | 1,550,145 | $ | 1,550,145 | |||||
|
| |||||||
TOTAL INVESTMENTS – 101.1% | 129,144,605 | |||||||
|
| |||||||
| LIABILITIES IN EXCESS OF OTHER ASSETS – (1.1%) | (1,460,091) | |||||||
|
| |||||||
NET ASSETS – 100.0% | $ | 127,684,514 | ||||||
|
| |||||||
| † | Non income-producing security. |
| (a) | All or a portion of the security on loan. The aggregate market value of such securities is $1,474,484; cash collateral of $1,550,145 was received with which the Fund purchased a money market fund. |
| (b) | Represents less than 0.05 percent of net assets. |
| (c) | Security fair valued as of December 31, 2012 using procedures approved by the Board of Trustees. The total value of positions fair valued was $4,336 or 0.0% of total net assets. |
| (d) | Represents annualized seven-day yield as of December 31, 2012. |
| (e) | Represents security, or portion thereof, purchased with the cash collateral received for securities on loan. |
All securities are Level 2 with respect to ASC 820, unless otherwise noted in parentheses.
| (1) | Level 1 security (See Note 4). |
| (3) | Level 3 security (See Note 4). |
The following abbreviations are used in portfolio descriptions:
CVA - Dutch Certificate of Shares
REIT - Real Estate Investment Trust
| SECTOR | VALUE | % OF NET ASSETS | ||||||
| Consumer Discretionary | $ | 18,731,585 | 14.7 | % | ||||
| Consumer Staples | 16,231,964 | 12.7 | ||||||
| Energy | 3,033,024 | 2.4 | ||||||
| Financials | 39,794,821 | 31.2 | ||||||
| Health Care | 13,523,258 | 10.6 | ||||||
| Industrials | 14,325,187 | 11.2 | ||||||
| Information Technology | 5,207,503 | 4.1 | ||||||
| Materials | 7,946,260 | 6.2 | ||||||
| Mutual Fund | 1,702,896 | 1.3 | ||||||
| Telecommunication Services | 4,150,130 | 3.2 | ||||||
| Utilities | 2,213,850 | 1.7 | ||||||
| Money Market Funds | 2,284,127 | 1.8 | ||||||
|
|
|
| |||||
Total Investments | 129,144,605 | 101.1 | ||||||
| Liabilities in Excess of Other Assets | (1,460,091) | (1.1) | ||||||
|
|
|
| |||||
| Net Assets | $ | 127,684,514 | 100.0 | % | ||||
|
|
|
| |||||
| The accompanying notes are an integral part of these financial statements. |
| AQR Funds | Annual Report | December 2012 | 103 | |||||||||||||
Table of Contents
| Schedule of Investments | December 31, 2012 |
| COMMON STOCKS - 77.8% | SHARES | VALUE (Note 2) | ||||||
| Consumer Discretionary - 17.6% | ||||||||
| Aaron’s, Inc. | 93 | $ | 2,630 | |||||
| Amazon.com, Inc. † | 143 | 35,913 | ||||||
| Apollo Group, Inc., Class A † | 71 | 1,485 | ||||||
| AutoNation, Inc. † | 90 | 3,573 | ||||||
| AutoZone, Inc. † | 16 | 5,671 | ||||||
| Bed Bath & Beyond, Inc. † | 101 | 5,647 | ||||||
| BorgWarner, Inc. † | 22 | 1,576 | ||||||
| Carter’s, Inc. † | 59 | 3,283 | ||||||
| CBS Corp., Class B | 788 | 29,983 | ||||||
| Chipotle Mexican Grill, Inc. †(a) | 49 | 14,576 | ||||||
| Cinemark Holdings, Inc. | 92 | 2,390 | ||||||
| Coach, Inc. | 66 | 3,664 | ||||||
| Comcast Corp., Class A | 2,226 | 83,208 | ||||||
| Deckers Outdoor Corp. †(a) | 28 | 1,128 | ||||||
| Dillard’s, Inc., Class A | 49 | 4,105 | ||||||
| DIRECTV † | 86 | 4,314 | ||||||
| DISH Network Corp., Class A | 437 | 15,907 | ||||||
| Dollar General Corp. † | 490 | 21,604 | ||||||
| Dollar Tree, Inc. † | 295 | 11,965 | ||||||
| Domino’s Pizza, Inc. | 82 | 3,571 | ||||||
| DR Horton, Inc. (a) | 795 | 15,725 | ||||||
| DSW, Inc., Class A (a) | 51 | 3,350 | ||||||
| Expedia, Inc. | 167 | 10,262 | ||||||
| Express, Inc. † | 194 | 2,927 | ||||||
| Family Dollar Stores, Inc. | 63 | 3,995 | ||||||
| Foot Locker, Inc. | 105 | 3,373 | ||||||
| Fossil, Inc. † | 37 | 3,445 | ||||||
| GameStop Corp., Class A (a) | 66 | 1,656 | ||||||
| Gap, Inc./The | 502 | 15,582 | ||||||
| General Motors Co. † | 604 | 17,413 | ||||||
| Genuine Parts Co. (a) | 74 | 4,705 | ||||||
| GNC Holdings, Inc., Class A | 104 | 3,461 | ||||||
| Goodyear Tire & Rubber Co./The † | 186 | 2,569 | ||||||
| H&R Block, Inc. | 197 | 3,658 | ||||||
| Home Depot, Inc./The | 1,306 | 80,776 | ||||||
| HSN, Inc. | 57 | 3,140 | ||||||
| Las Vegas Sands Corp. | 457 | 21,095 | ||||||
| Lennar Corp., Class A (a) | 624 | 24,130 | ||||||
| Liberty Media Corp. - Liberty Capital, Class A †(a) | 103 | 11,949 | ||||||
| LKQ Corp. † | 202 | 4,262 | ||||||
| Lowe’s Cos., Inc. | 949 | 33,709 | ||||||
| Ltd. Brands, Inc. (a) | 139 | 6,541 | ||||||
| Macy’s, Inc. | 524 | 20,446 | ||||||
| Madison Square Garden Co./The, Class A † | 56 | 2,484 | ||||||
| Mattel, Inc. | 402 | 14,721 | ||||||
| McGraw-Hill Cos., Inc./The | 120 | 6,560 | ||||||
| News Corp., Class A | 2,041 | 52,127 | ||||||
| NIKE, Inc., Class B | 248 | 12,797 | ||||||
| Nordstrom, Inc. | 59 | 3,157 | ||||||
| O’Reilly Automotive, Inc. † | 60 | 5,365 | ||||||
| Panera Bread Co., Class A † | 24 | 3,812 | ||||||
| PetSmart, Inc. | 64 | 4,374 | ||||||
| Polaris Industries, Inc. (a) | 56 | 4,712 | ||||||
| priceline.com, Inc. † | 31 | 19,257 | ||||||
| PulteGroup, Inc. † | 1,557 | 28,275 | ||||||
| Ralph Lauren Corp. | 40 | 5,997 | ||||||
| SHARES | VALUE (Note 2) | |||||||
| Consumer Discretionary - 17.6% (continued) | ||||||||
| Rent-A-Center, Inc. | 182 | $ | 6,254 | |||||
| Ross Stores, Inc. | 256 | 13,862 | ||||||
| Sally Beauty Holdings, Inc. †(a) | 147 | 3,465 | ||||||
| Sears Canada, Inc. (Canada) | 14 | 141 | ||||||
| Service Corp. International | 218 | 3,011 | ||||||
| Sirius XM Radio, Inc. | 7,022 | 20,294 | ||||||
| Six Flags Entertainment Corp. | 133 | 8,140 | ||||||
| Standard Pacific Corp. †(a) | 2,031 | 14,928 | ||||||
| Starbucks Corp. | 252 | 13,512 | ||||||
| Tesla Motors, Inc. †(a) | 56 | 1,897 | ||||||
| Tiffany & Co. (a) | 39 | 2,236 | ||||||
| Time Warner Cable, Inc. | 305 | 29,643 | ||||||
| Time Warner, Inc. | 682 | 32,620 | ||||||
| TJX Cos., Inc. | 768 | 32,602 | ||||||
| Tractor Supply Co. | 49 | 4,330 | ||||||
| Tupperware Brands Corp. | 43 | 2,756 | ||||||
| Ulta Salon Cosmetics & Fragrance, Inc. (a) | 50 | 4,913 | ||||||
| Under Armour, Inc., Class A †(a) | 82 | 3,979 | ||||||
| VF Corp. | 51 | 7,699 | ||||||
| Viacom, Inc., Class B | 118 | 6,223 | ||||||
| Walt Disney Co./The | 1,400 | 69,706 | ||||||
| Weight Watchers International, Inc. (a) | 51 | 2,670 | ||||||
| Whirlpool Corp. | 212 | 21,571 | ||||||
| Wolverine World Wide, Inc. (a) | 151 | 6,188 | ||||||
| Wyndham Worldwide Corp. | 277 | 14,739 | ||||||
| Wynn Resorts Ltd. | 37 | 4,162 | ||||||
| Yum! Brands, Inc. | 243 | 16,135 | ||||||
|
| |||||||
| 1,065,676 | ||||||||
|
| |||||||
| Consumer Staples - 5.9% | ||||||||
| Altria Group, Inc. | 155 | 4,870 | ||||||
| Brown-Forman Corp., Class B | 66 | 4,174 | ||||||
| Casey’s General Stores, Inc. (a) | 44 | 2,336 | ||||||
| Church & Dwight Co., Inc. (a) | 85 | 4,553 | ||||||
| Coca-Cola Co./The | 102 | 3,698 | ||||||
| Colgate-Palmolive Co. | 155 | 16,204 | ||||||
| ConAgra Foods, Inc. | 182 | 5,369 | ||||||
| Costco Wholesale Corp. | 147 | 14,519 | ||||||
| CVS Caremark Corp. | 518 | 25,045 | ||||||
| Estee Lauder Cos., Inc./The, Class A | 151 | 9,039 | ||||||
| Flowers Foods, Inc. (a) | 102 | 2,374 | ||||||
| General Mills, Inc. | 150 | 6,062 | ||||||
| Green Mountain Coffee Roasters, Inc. †(a) | 84 | 3,474 | ||||||
| Herbalife Ltd. (Cayman Islands)(a) | 71 | 2,339 | ||||||
| Hershey Co./The | 95 | 6,861 | ||||||
| HJ Heinz Co. | 50 | 2,884 | ||||||
| Hormel Foods Corp. (a) | 136 | 4,245 | ||||||
| JM Smucker Co./The | 55 | 4,743 | ||||||
| Kimberly-Clark Corp. | 194 | 16,379 | ||||||
| Kroger Co./The | 86 | 2,238 | ||||||
| Lorillard, Inc. | 61 | 7,117 | ||||||
| Mead Johnson Nutrition Co. | 82 | 5,403 | ||||||
| Mondelez International, Inc., Class A | 535 | 13,626 | ||||||
| Monster Beverage Corp. † | 364 | 19,248 | ||||||
| Nu Skin Enterprises, Inc., Class A (a) | 58 | 2,149 | ||||||
| Philip Morris International, Inc. | 381 | 31,867 | ||||||
| Pricesmart, Inc. (a) | 39 | 3,005 | ||||||
| Reynolds American, Inc. | 232 | 9,612 | ||||||
| The accompanying notes are an integral part of these financial statements. | (Continued) |
| 104 | AQR Funds | Annual Report | December 2012 | |||||||||||||
Table of Contents
| Schedule of Investments | December 31, 2012 |
| AQR TAX-MANAGED MOMENTUM FUND |
| SHARES | VALUE (Note 2) | |||||||
| Consumer Staples - 5.9% (continued) | ||||||||
| Smithfield Foods, Inc. † | 116 | $ | 2,502 | |||||
| TreeHouse Foods, Inc. † | 39 | 2,033 | ||||||
| Tyson Foods, Inc., Class A | 192 | 3,725 | ||||||
| Wal-Mart Stores, Inc. | 1,467 | 100,093 | ||||||
| Whole Foods Market, Inc. | 135 | 12,330 | ||||||
|
| |||||||
| 354,116 | ||||||||
|
| |||||||
| Energy - 3.7% | ||||||||
| Anadarko Petroleum Corp. | 60 | 4,459 | ||||||
| Apco Oil and Gas International, Inc. | 32 | 394 | ||||||
| Cabot Oil & Gas Corp. | 130 | 6,466 | ||||||
| CARBO Ceramics, Inc. | 17 | 1,332 | ||||||
| Chesapeake Energy Corp. | 102 | 1,695 | ||||||
| Chevron Corp. | 66 | 7,137 | ||||||
| Cobalt International Energy, Inc. †(a) | 967 | 23,750 | ||||||
| ConocoPhillips | 135 | 7,829 | ||||||
| Dresser-Rand Group, Inc. †(a) | 42 | 2,358 | ||||||
| EOG Resources, Inc. | 141 | 17,031 | ||||||
| EQT Corp. | 82 | 4,836 | ||||||
| FMC Technologies, Inc. † | 64 | 2,741 | ||||||
| Golar LNG Ltd. (Bermuda) (a) | 71 | 2,611 | ||||||
| Helix Energy Solutions Group, Inc. † | 146 | 3,013 | ||||||
| HollyFrontier Corp. | 81 | 3,771 | ||||||
| Key Energy Services, Inc. † | 134 | 931 | ||||||
| Kinder Morgan, Inc. | 785 | 27,734 | ||||||
| Kodiak Oil & Gas Corp. †(a) | 1,503 | 13,302 | ||||||
| Marathon Oil Corp. | 178 | 5,458 | ||||||
| Marathon Petroleum Corp. | 398 | 25,074 | ||||||
| Noble Energy, Inc. | 23 | 2,340 | ||||||
| Oasis Petroleum, Inc. † | 30 | 954 | ||||||
| Oceaneering International, Inc. | 67 | 3,604 | ||||||
| Range Resources Corp. (a) | 84 | 5,278 | ||||||
| Rosetta Resources, Inc. † | 40 | 1,814 | ||||||
| Seadrill Ltd. (Norway) | 368 | 13,542 | ||||||
| SM Energy Co. | 42 | 2,193 | ||||||
| Spectra Energy Corp. | 227 | 6,215 | ||||||
| Tesoro Corp. | 112 | 4,934 | ||||||
| Valero Energy Corp. | 295 | 10,065 | ||||||
| Williams Cos., Inc./The | 269 | 8,807 | ||||||
| World Fuel Services Corp. (a) | 52 | 2,141 | ||||||
|
| |||||||
| 223,809 | ||||||||
|
| |||||||
| Financials - 14.0% | ||||||||
| American Campus Communities, Inc. REIT | 63 | 2,906 | ||||||
| American Express Co. | 240 | 13,795 | ||||||
| American Financial Group, Inc. | 68 | 2,687 | ||||||
| American International Group, Inc. † | 1,511 | 53,338 | ||||||
| American Tower Corp. REIT | 358 | 27,663 | ||||||
| Arch Capital Group Ltd. (Bermuda) †(a) | 86 | 3,786 | ||||||
| AvalonBay Communities, Inc. REIT | 37 | 5,017 | ||||||
| Bank of America Corp. | 8,568 | 99,389 | ||||||
| BB&T Corp. | 375 | 10,916 | ||||||
| Boston Properties, Inc. REIT | 39 | 4,127 | ||||||
| BRE Properties, Inc. REIT (a) | 50 | 2,542 | ||||||
| Capital One Financial Corp. | 522 | 30,239 | ||||||
| Chubb Corp./The | 190 | 14,311 | ||||||
| Citigroup, Inc. | 1,449 | 57,322 | ||||||
| Digital Realty Trust, Inc. REIT (a) | 55 | 3,734 | ||||||
| SHARES | VALUE (Note 2) | |||||||
| Financials - 14.0% (continued) | ||||||||
| Discover Financial Services | 505 | $ | 19,468 | |||||
| Equity Lifestyle Properties, Inc. REIT | 31 | 2,086 | ||||||
| Erie Indemnity Co., Class A (a) | 32 | 2,215 | ||||||
| Essex Property Trust, Inc. REIT (a) | 22 | 3,226 | ||||||
| Extra Space Storage, Inc. REIT | 110 | 4,003 | ||||||
| Federal Realty Investment Trust REIT (a) | 34 | 3,537 | ||||||
| Fidelity National Financial, Inc., Class A | 146 | 3,438 | ||||||
| General Growth Properties, Inc. REIT | 1,377 | 27,333 | ||||||
| Goldman Sachs Group, Inc./The | 413 | 52,682 | ||||||
| HCP, Inc. REIT | 443 | 20,015 | ||||||
| Health Care REIT, Inc. REIT | 462 | 28,316 | ||||||
| JPMorgan Chase & Co. | 1,985 | 87,280 | ||||||
| Marsh & McLennan Cos., Inc. | 196 | 6,756 | ||||||
| Moody’s Corp. (a) | 113 | 5,686 | ||||||
| Ocwen Financial Corp. † | 242 | 8,371 | ||||||
| ProAssurance Corp. | 66 | 2,785 | ||||||
| Prologis, Inc. REIT | 69 | 2,518 | ||||||
| Public Storage REIT | 117 | 16,960 | ||||||
| Rayonier, Inc. REIT | 72 | 3,732 | ||||||
| Regions Financial Corp. | 1,356 | 9,655 | ||||||
| Signature Bank†(a) | 40 | 2,854 | ||||||
| Simon Property Group, Inc. REIT | 219 | 34,622 | ||||||
| Tanger Factory Outlet Centers REIT(a) | 72 | 2,462 | ||||||
| Taubman Centers, Inc. REIT | 42 | 3,306 | ||||||
| US Bancorp | 1,669 | 53,308 | ||||||
| Ventas, Inc. REIT | 229 | 14,821 | ||||||
| Wells Fargo & Co. | 2,702 | 92,354 | ||||||
| WR Berkley Corp. (a) | 97 | 3,661 | ||||||
|
| |||||||
| 849,222 | ||||||||
|
| |||||||
| Health Care - 9.9% | ||||||||
| Abbott Laboratories | 447 | 29,278 | ||||||
| Accretive Health, Inc. †(a) | 106 | 1,225 | ||||||
| Aetna, Inc. | 150 | 6,945 | ||||||
| Alexion Pharmaceuticals, Inc. † | 280 | 26,267 | ||||||
| Allergan, Inc. | 105 | 9,632 | ||||||
| AmerisourceBergen Corp. | 46 | 1,986 | ||||||
| Amgen, Inc. | 558 | 48,167 | ||||||
| Arena Pharmaceuticals, Inc. † | 1,025 | 9,245 | ||||||
| athenahealth, Inc. †(a) | 42 | 3,085 | ||||||
| Biogen Idec, Inc. † | 167 | 24,494 | ||||||
| BioMarin Pharmaceutical, Inc. † | 82 | 4,038 | ||||||
| Bristol-Myers Squibb Co. | 165 | 5,377 | ||||||
| Cardinal Health, Inc. | 99 | 4,077 | ||||||
| Catamaran Corp. †(a) | 175 | 8,244 | ||||||
| Celgene Corp. † | 205 | 16,138 | ||||||
| Cepheid, Inc. †(a) | 65 | 2,198 | ||||||
| Cerner Corp. † | 78 | 6,056 | ||||||
| Cigna Corp. | 80 | 4,277 | ||||||
| Cubist Pharmaceuticals, Inc. †(a) | 74 | 3,112 | ||||||
| Eli Lilly & Co. | 601 | 29,641 | ||||||
| Express Scripts Holding Co. † | 474 | 25,596 | ||||||
| Gilead Sciences, Inc. † | 668 | 49,065 | ||||||
| HCA Holdings, Inc. | 382 | 11,525 | ||||||
| Humana, Inc. | 72 | 4,941 | ||||||
| Intuitive Surgical, Inc. † | 26 | 12,750 | ||||||
| Jazz Pharmaceuticals PLC (Ireland) †(a) | 22 | 1,170 | ||||||
| Johnson & Johnson | 76 | 5,328 | ||||||
| The accompanying notes are an integral part of these financial statements. | (Continued) |
| AQR Funds | Annual Report | December 2012 | 105 | |||||||||||||
Table of Contents
| Schedule of Investments | December 31, 2012 |
| AQR TAX-MANAGED MOMENTUM FUND |
| SHARES | VALUE (Note 2) | |||||||
| Health Care - 9.9% (continued) | ||||||||
| McKesson Corp. | 63 | $ | 6,108 | |||||
| Medivation, Inc. †(a) | 360 | 18,418 | ||||||
| Merck & Co., Inc. | 951 | 38,934 | ||||||
| Omnicare, Inc. (a) | 90 | 3,249 | ||||||
| Onyx Pharmaceuticals, Inc. †(a) | 115 | 8,686 | ||||||
| Perrigo Co. (a) | 47 | 4,889 | ||||||
| Pfizer, Inc. | 3,371 | 84,545 | ||||||
| Pharmacyclics, Inc. † | 404 | 23,392 | ||||||
| Regeneron Pharmaceuticals, Inc. †(a) | 147 | 25,147 | ||||||
| Thoratec Corp. † | 57 | 2,139 | ||||||
| UnitedHealth Group, Inc. | 330 | 17,899 | ||||||
| Watson Pharmaceuticals, Inc. † | 45 | 3,870 | ||||||
| WellCare Health Plans, Inc. †(a) | 53 | 2,581 | ||||||
| WellPoint, Inc. | 89 | 5,422 | ||||||
|
| |||||||
| 599,136 | ||||||||
|
| |||||||
| Industrials - 7.1% | ||||||||
| A. O. Smith Corp. (a) | 349 | 22,011 | ||||||
| Chart Industries, Inc. †(a) | 99 | 6,600 | ||||||
| CLARCOR, Inc. (a) | 41 | 1,959 | ||||||
| Clean Harbors, Inc. †(a) | 45 | 2,475 | ||||||
| Copart, Inc. † | 106 | 3,127 | ||||||
| Delta Air Lines, Inc. † | 1,583 | 18,790 | ||||||
| Donaldson Co., Inc. | 84 | 2,759 | ||||||
| Fastenal Co. (a) | 131 | 6,116 | ||||||
| Fortune Brands Home & Security, Inc. † | 539 | 15,750 | ||||||
| Gardner Denver, Inc. | 25 | 1,712 | ||||||
| Generac Holdings, Inc. | 139 | 4,769 | ||||||
| General Electric Co. | 5,273 | 110,680 | ||||||
| Genesee & Wyoming, Inc., Class A †(a) | 34 | 2,587 | ||||||
| Hexcel Corp. †(a) | 109 | 2,939 | ||||||
| Iron Mountain, Inc. | 125 | 3,881 | ||||||
| Kansas City Southern (a) | 58 | 4,842 | ||||||
| Kirby Corp. †(a) | 47 | 2,909 | ||||||
| Lincoln Electric Holdings, Inc. | 63 | 3,067 | ||||||
| Lockheed Martin Corp. | 39 | 3,599 | ||||||
| Norfolk Southern Corp. | 121 | 7,483 | ||||||
| Old Dominion Freight Line, Inc. †(a) | 84 | 2,880 | ||||||
| Polypore International, Inc. †(a) | 35 | 1,627 | ||||||
| Precision Castparts Corp. | 33 | 6,251 | ||||||
| Rollins, Inc. | 105 | 2,314 | ||||||
| Ryder System, Inc. (a) | 25 | 1,248 | ||||||
| Teledyne Technologies, Inc. †(a) | 41 | 2,668 | ||||||
| Towers Watson & Co., Class A | 39 | 2,192 | ||||||
| TransDigm Group, Inc. | 32 | 4,364 | ||||||
| Triumph Group, Inc. (a) | 44 | 2,873 | ||||||
| Union Pacific Corp. | 285 | 35,830 | ||||||
| United Parcel Service, Inc., Class B | 166 | 12,239 | ||||||
| United Rentals, Inc. †(a) | 336 | 15,295 | ||||||
| US Airways Group, Inc. †(a) | 359 | 4,847 | ||||||
| USG Corp. †(a) | 586 | 16,449 | ||||||
| Verisk Analytics, Inc., Class A† | 332 | 16,932 | ||||||
| Wabtec Corp. | 40 | 3,502 | ||||||
| Waste Connections, Inc. (a) | 76 | 2,568 | ||||||
| WESCO International, Inc. †(a) | 423 | 28,523 | ||||||
| WW Grainger, Inc. (a) | 195 | 39,462 | ||||||
|
| |||||||
| 430,119 | ||||||||
|
| |||||||
| SHARES | VALUE (Note 2) | |||||||
| Information Technology - 13.9% | ||||||||
| 3D Systems Corp. †(a) | 257 | $ | 13,711 | |||||
| Alliance Data Systems Corp. †(a) | 33 | 4,777 | ||||||
| AOL, Inc. †(a) | 358 | 10,600 | ||||||
| Apple, Inc. | 681 | 362,993 | ||||||
| Automatic Data Processing, Inc. | 159 | 9,065 | ||||||
| Cadence Design Systems, Inc. † | 264 | 3,567 | ||||||
| Cisco Systems, Inc. | 802 | 15,759 | ||||||
| CommVault Systems, Inc. †(a) | 40 | 2,788 | ||||||
| Dell, Inc. | 606 | 6,139 | ||||||
| eBay, Inc. † | 1,230 | 62,755 | ||||||
| Electronic Arts, Inc. † | 216 | 3,138 | ||||||
| Equinix, Inc. † | 74 | 15,259 | ||||||
| Fortinet, Inc. † | 124 | 2,613 | ||||||
| Fusion-io, Inc. †(a) | 135 | 3,096 | ||||||
| Google, Inc., Class A† | 57 | 40,434 | ||||||
| IAC/InterActiveCorp | 82 | 3,879 | ||||||
| Intel Corp. | 648 | 13,368 | ||||||
| International Business Machines Corp. | 24 | 4,597 | ||||||
| Intuit, Inc. | 74 | 4,403 | ||||||
| IPG Photonics Corp. (a) | 43 | 2,866 | ||||||
| Jack Henry & Associates, Inc. | 62 | 2,434 | ||||||
| KLA-Tencor Corp. | 80 | 3,821 | ||||||
| LinkedIn Corp., Class A † | 114 | 13,089 | ||||||
| Mastercard, Inc., Class A | 58 | 28,494 | ||||||
| Microsoft Corp. | 300 | 8,019 | ||||||
| Molex, Inc. | 79 | 2,159 | ||||||
| Motorola Solutions, Inc. | 138 | 7,684 | ||||||
| NCR Corp. † | 290 | 7,389 | ||||||
| NetSuite, Inc. †(a) | 72 | 4,846 | ||||||
| NeuStar, Inc., Class A† | 69 | 2,893 | ||||||
| Nuance Communications, Inc. †(a) | 155 | 3,460 | ||||||
| Oracle Corp. | 1,453 | 48,414 | ||||||
| QUALCOMM, Inc. | 171 | 10,605 | ||||||
| Rackspace Hosting, Inc. †(a) | 82 | 6,090 | ||||||
| SolarWinds, Inc. †(a) | 98 | 5,140 | ||||||
| Teradata Corp. † | 80 | 4,951 | ||||||
| TIBCO Software, Inc. † | 93 | 2,047 | ||||||
| Total System Services, Inc. | 143 | 3,063 | ||||||
| Ultimate Software Group, Inc. †(a) | 25 | 2,360 | ||||||
| Universal Display Corp. † | 41 | 1,050 | ||||||
| VeriFone Systems, Inc. † | 48 | 1,425 | ||||||
| Visa, Inc., Class A | 446 | 67,605 | ||||||
| VMware, Inc., Class A†(a) | 140 | 13,180 | ||||||
| Xilinx, Inc. | 97 | 3,482 | ||||||
|
| |||||||
| 839,507 | ||||||||
|
| |||||||
| Materials - 1.6% | ||||||||
| Airgas, Inc. | 30 | 2,739 | ||||||
| Allied Nevada Gold Corp. †(a) | 73 | 2,200 | ||||||
| Carpenter Technology Corp. (a) | 51 | 2,633 | ||||||
| Celanese Corp., Series A(a) | 24 | 1,069 | ||||||
| CF Industries Holdings, Inc. | 82 | 16,659 | ||||||
| Ecolab, Inc. | 65 | 4,674 | ||||||
| Molycorp, Inc. †(a) | 35 | 330 | ||||||
| Monsanto Co. | 313 | 29,625 | ||||||
| NewMarket Corp. (a) | 14 | 3,671 | ||||||
| Newmont Mining Corp. | 60 | 2,786 | ||||||
| Praxair, Inc. | 34 | 3,721 | ||||||
| The accompanying notes are an integral part of these financial statements. | (Continued) |
| 106 | AQR Funds | Annual Report | December 2012 | |||||||||||||
Table of Contents
| Schedule of Investments | December 31, 2012 |
| AQR TAX-MANAGED MOMENTUM FUND |
| SHARES | VALUE (Note 2) | |||||||
| Materials - 1.6% (continued) | ||||||||
| Royal Gold, Inc. | 48 | $ | 3,903 | |||||
| Sherwin-Williams Co./The | 116 | 17,843 | ||||||
| WR Grace & Co. † | 48 | 3,227 | ||||||
|
| |||||||
| 95,080 | ||||||||
|
| |||||||
| Telecommunication Services - 2.3% | ||||||||
| AT&T, Inc. | 2,011 | 67,791 | ||||||
| Crown Castle International Corp. † | 254 | 18,329 | ||||||
| Level 3 Communications, Inc. †(a) | 128 | 2,958 | ||||||
| Verizon Communications, Inc. | 1,160 | 50,193 | ||||||
|
| |||||||
| 139,271 | ||||||||
|
| |||||||
| Utilities - 1.8% | ||||||||
| AGL Resources, Inc. | 62 | 2,478 | ||||||
| Ameren Corp. | 110 | 3,379 | ||||||
| American Electric Power Co., Inc. | 130 | 5,548 | ||||||
| American Water Works Co., Inc. | 122 | 4,530 | ||||||
| Calpine Corp. † | 225 | 4,079 | ||||||
| CenterPoint Energy, Inc. | 247 | 4,755 | ||||||
| Cleco Corp. (a) | 70 | 2,801 | ||||||
| CMS Energy Corp. | 150 | 3,657 | ||||||
| Consolidated Edison, Inc. | 120 | 6,665 | ||||||
| Dominion Resources, Inc. | 205 | 10,619 | ||||||
| DTE Energy Co. | 87 | 5,224 | ||||||
| FirstEnergy Corp. | 177 | 7,391 | ||||||
| ITC Holdings Corp. | 37 | 2,846 | ||||||
| NextEra Energy, Inc. | 56 | 3,875 | ||||||
| NiSource, Inc. | 195 | 4,854 | ||||||
| OGE Energy Corp. | 61 | 3,435 | ||||||
| ONEOK, Inc. | 108 | 4,617 | ||||||
| Pinnacle West Capital Corp. | 73 | 3,722 | ||||||
| Portland General Electric Co. | 98 | 2,681 | ||||||
| PPL Corp. | 242 | 6,928 | ||||||
| Questar Corp. (a) | 122 | 2,411 | ||||||
| UIL Holdings Corp. (a) | 72 | 2,578 | ||||||
| WGL Holdings, Inc. (a) | 68 | 2,665 | ||||||
| Wisconsin Energy Corp. | 89 | 3,280 | ||||||
| Xcel Energy, Inc. | 158 | 4,220 | ||||||
|
| |||||||
| 109,238 | ||||||||
|
| |||||||
TOTAL COMMON STOCKS | 4,705,174 | |||||||
|
| |||||||
| EXCHANGE-TRADED FUNDS - 1.5% | SHARES | VALUE (Note 2) | ||||||
SPDR S&P 500 ETF Trust | 643 | $ | 91,641 | |||||
|
| |||||||
| MONEY MARKET FUNDS - 1.3% | ||||||||
J.P. Morgan U.S. Treasury Plus Money Market Fund - Institutional Shares, 0.000% (2)(b) | 80,570 | 80,570 | ||||||
|
| |||||||
| INVESTMENTS OF CASH COLLATERAL FOR SECURITIES ON LOAN - 8.4% | ||||||||
| J.P. Morgan Prime Money Market Fund - | ||||||||
Capital Shares, 0.120% (2)(b)(c) | 506,866 | 506,866 | ||||||
|
| |||||||
TOTAL INVESTMENTS - 89.0% | 5,384,251 | |||||||
|
| |||||||
| OTHER ASSETS IN EXCESS OF LIABILITIES - 11.0% | 666,578 | |||||||
|
| |||||||
NET ASSETS - 100.0% | $ | 6,050,829 | ||||||
|
| |||||||
All securities are United States companies, unless noted otherwise in parentheses.
| † | Non income-producing security. |
| (a) | All or a portion of the security on loan. The aggregate market value of such securities is $506,928; cash collateral of $506,866 was received with which the Fund purchased a money market fund. |
| (b) | Represents annualized seven-day yield as of December 31, 2012. |
| (c) | Represents security, or portion thereof, purchased with the cash collateral received for securities on loan. |
All securities are Level 1 with respect to ASC 820, unless otherwise noted in parentheses.
(2) Level 2 security (See Note 4).
The following abbreviations are used in portfolio descriptions:
REIT - Real Estate Investment Trust
| The accompanying notes are an integral part of these financial statements. |
| AQR Funds | Annual Report | December 2012 | 107 | |||||||||||||
Table of Contents
| Schedule of Investments | December 31, 2012 |
| COMMON STOCKS - 97.9% | SHARES | VALUE (Note 2) | ||||||
| Consumer Discretionary - 16.9% | ||||||||
| AFC Enterprises, Inc. † | 273 | $ | 7,133 | |||||
| American Public Education, Inc. †(a) | 58 | 2,094 | ||||||
| America’s Car-Mart, Inc. †(a) | 61 | 2,472 | ||||||
| Ameristar Casinos, Inc. (a) | 118 | 3,096 | ||||||
| ANN, Inc. † | 284 | 9,611 | ||||||
| Arctic Cat, Inc. †(a) | 166 | 5,543 | ||||||
| Asbury Automotive Group, Inc. † | 376 | 12,043 | ||||||
| Ascent Capital Group, Inc., Class A† | 63 | 3,902 | ||||||
| Barnes & Noble, Inc. †(a) | 101 | 1,524 | ||||||
| Beazer Homes USA, Inc. † | 314 | 5,303 | ||||||
| bebe stores, inc. (a) | 410 | 1,636 | ||||||
| Belo Corp., Class A | 816 | 6,259 | ||||||
| BJ’s Restaurants, Inc. †(a) | 57 | 1,875 | ||||||
| Black Diamond, Inc. † | 382 | 3,132 | ||||||
| Bob Evans Farms, Inc. | 192 | 7,718 | ||||||
| Bon-Ton Stores, Inc./The (a) | 262 | 3,175 | ||||||
| Brown Shoe Co., Inc. | 531 | 9,754 | ||||||
| Brunswick Corp. (a) | 116 | 3,374 | ||||||
| Buffalo Wild Wings, Inc. †(a) | 66 | 4,806 | ||||||
| Cabela’s, Inc. †(a) | 102 | 4,259 | ||||||
| Caribou Coffee Co., Inc. † | 143 | 2,315 | ||||||
| Children’s Place Retail Stores, Inc./The † | 73 | 3,233 | ||||||
| Churchill Downs, Inc. (a) | 75 | 4,984 | ||||||
| Coinstar, Inc. †(a) | 52 | 2,705 | ||||||
| Conn’s, Inc. †(a) | 363 | 11,137 | ||||||
| Cooper Tire & Rubber Co. | 371 | 9,409 | ||||||
| Core-Mark Holding Co., Inc. | 49 | 2,320 | ||||||
| Cracker Barrel Old Country Store, Inc. | 222 | 14,266 | ||||||
| CSS Industries, Inc. (a) | 91 | 1,992 | ||||||
| Delta Apparel, Inc. †(a) | 110 | 1,538 | ||||||
| DineEquity, Inc. †(a) | 99 | 6,633 | ||||||
| Domino’s Pizza, Inc. | 176 | 7,665 | ||||||
| Dorman Products, Inc. | 216 | 7,633 | ||||||
| Drew Industries, Inc. | 70 | 2,258 | ||||||
| Einstein Noah Restaurant Group, Inc. (a) | 90 | 1,099 | ||||||
| Ethan Allen Interiors, Inc. (a) | 121 | 3,111 | ||||||
| Fiesta Restaurant Group, Inc. † | 173 | 2,650 | ||||||
| Fifth & Pacific Cos., Inc. † | 902 | 11,230 | ||||||
| Finish Line, Inc./The, Class A (a) | 238 | 4,505 | ||||||
| Fisher Communications, Inc. | 68 | 1,835 | ||||||
| Francesca’s Holdings Corp. †(a) | 220 | 5,711 | ||||||
| Genesco, Inc. †(a) | 38 | 2,090 | ||||||
| Gentherm, Inc. †(a) | 157 | 2,088 | ||||||
| G-III Apparel Group Ltd. † | 239 | 8,181 | ||||||
| Grand Canyon Education, Inc. † | 268 | 6,290 | ||||||
| Group 1 Automotive, Inc. (a) | 93 | 5,765 | ||||||
| Helen of Troy Ltd. (Bermuda) †(a) | 96 | 3,205 | ||||||
| Hibbett Sports, Inc. †(a) | 172 | 9,064 | ||||||
| Hillenbrand, Inc. | 64 | 1,447 | ||||||
| Hot Topic, Inc. (a) | 342 | 3,300 | ||||||
| Hovnanian Enterprises, Inc., Class A †(a) | 1,709 | 11,963 | ||||||
| iRobot Corp. †(a) | 130 | 2,436 | ||||||
| Johnson Outdoors, Inc., Class A †(a) | 84 | 1,673 | ||||||
| Jos. A. Bank Clothiers, Inc. †(a) | 118 | 5,024 | ||||||
| K12, Inc. † | 78 | 1,594 | ||||||
| KB Home | 685 | 10,823 | ||||||
| Kona Grill, Inc. † | 165 | 1,431 | ||||||
| SHARES | VALUE (Note 2) | |||||||
| Consumer Discretionary - 16.9% (continued) | ||||||||
| Krispy Kreme Doughnuts, Inc. †(a) | 235 | $ | 2,204 | |||||
| La-Z-Boy, Inc. | 430 | 6,085 | ||||||
| LeapFrog Enterprises, Inc. †(a) | 701 | 6,050 | ||||||
| LIN TV Corp., Class A †(a) | 714 | 5,376 | ||||||
| Lions Gate Entertainment Corp. †(a) | 298 | 4,887 | ||||||
| Lithia Motors, Inc., Class A (a) | 269 | 10,066 | ||||||
| Lumber Liquidators Holdings, Inc. †(a) | 305 | 16,113 | ||||||
| M/I Homes, Inc. † | 386 | 10,229 | ||||||
| Marriott Vacations Worldwide Corp. † | 294 | 12,251 | ||||||
| Martha Stewart Living Omnimedia, Class A † | 226 | 554 | ||||||
| McClatchy Co./The, Class A †(a) | 1,026 | 3,355 | ||||||
| MDC Holdings, Inc. | 331 | 12,168 | ||||||
| Men’s Wearhouse, Inc./The (a) | 77 | 2,399 | ||||||
| Meritage Homes Corp. †(a) | 248 | 9,263 | ||||||
| Monro Muffler Brake, Inc. (a) | 114 | 3,987 | ||||||
| Movado Group, Inc. | 246 | 7,547 | ||||||
| Multimedia Games Holding Co., Inc. † | 490 | 7,208 | ||||||
| NACCO Industries, Inc., Class A | 143 | 8,679 | ||||||
| New York Times Co./The, Class A † | 552 | 4,709 | ||||||
| Nexstar Broadcasting Group, Inc., Class A † | 220 | 2,330 | ||||||
| OfficeMax, Inc. | 853 | 8,325 | ||||||
| Oxford Industries, Inc. (a) | 75 | 3,477 | ||||||
| Papa John’s International, Inc. † | 112 | 6,153 | ||||||
| Penske Automotive Group, Inc. (a) | 131 | 3,942 | ||||||
| Pier 1 Imports, Inc. (a) | 221 | 4,420 | ||||||
| Pool Corp. | 199 | 8,422 | ||||||
| Red Robin Gourmet Burgers, Inc. †(a) | 87 | 3,070 | ||||||
| Ryland Group, Inc./The (a) | 377 | 13,761 | ||||||
| Saga Communications, Inc., Class A | 37 | 1,721 | ||||||
| Select Comfort Corp. †(a) | 608 | 15,911 | ||||||
| Sinclair Broadcast Group, Inc., Class A | 335 | 4,228 | ||||||
| Skechers U.S.A., Inc., Class A †(a) | 234 | 4,329 | ||||||
| Smith & Wesson Holding Corp. †(a) | 1,136 | 9,588 | ||||||
| Sonic Automotive, Inc., Class A | 237 | 4,951 | ||||||
| Stage Stores, Inc. | 411 | 10,185 | ||||||
| Standard Motor Products, Inc. (a) | 126 | 2,800 | ||||||
| Standard Pacific Corp. † | 722 | 5,307 | ||||||
| Steinway Musical Instruments, Inc. † | 94 | 1,988 | ||||||
| Steven Madden Ltd. †(a) | 109 | 4,607 | ||||||
| Sturm, Ruger & Co., Inc. (a) | 220 | 9,988 | ||||||
| Systemax, Inc. | 145 | 1,399 | ||||||
| Thor Industries, Inc. | 327 | 12,240 | ||||||
| Town Sports International Holdings, Inc. | 240 | 2,556 | ||||||
| True Religion Apparel, Inc. | 123 | 3,127 | ||||||
| Vitamin Shoppe, Inc. † | 232 | 13,308 | ||||||
| Winmark Corp. (a) | 35 | 1,995 | ||||||
| Zale Corp. † | 736 | 3,025 | ||||||
|
| |||||||
| 583,595 | ||||||||
|
| |||||||
| Consumer Staples - 4.1% | ||||||||
| Andersons, Inc./The (a) | 86 | 3,689 | ||||||
| B&G Foods, Inc. (a) | 336 | 9,512 | ||||||
| Boston Beer Co., Inc./The, Class A †(a) | 72 | 9,680 | ||||||
| Calavo Growers, Inc. | 67 | 1,689 | ||||||
| Cal-Maine Foods, Inc. | 101 | 4,062 | ||||||
| Coca-Cola Bottling Co. Consolidated | 37 | 2,460 | ||||||
| Dean Foods Co. † | 222 | 3,665 | ||||||
| The accompanying notes are an integral part of these financial statements. | (Continued) |
| 108 | AQR Funds | Annual Report | December 2012 | |||||||||||||
Table of Contents
| Schedule of Investments | December 31, 2012 |
| AQR TAX-MANAGED SMALL CAP MOMENTUM FUND |
| SHARES | VALUE (Note 2) | |||||||
| Consumer Staples - 4.1% (continued) | ||||||||
| Elizabeth Arden, Inc. †(a) | 131 | $ | 5,896 | |||||
| Fresh Del Monte Produce, Inc. (a) | 157 | 4,137 | ||||||
| Hain Celestial Group, Inc./The †(a) | 80 | 4,338 | ||||||
| Harbinger Group, Inc. † | 1,228 | 9,443 | ||||||
| J&J Snack Foods Corp. | 84 | 5,371 | ||||||
| Lancaster Colony Corp. (a) | 40 | 2,768 | ||||||
| Lifevantage Corp. †(a) | 1,587 | 3,476 | ||||||
| Medifast, Inc. † | 203 | 5,357 | ||||||
| National Beverage Corp. (a) | 207 | 3,020 | ||||||
| Omega Protein Corp. †(a) | 138 | 845 | ||||||
| Pizza Inn Holdings, Inc. †(a) | 228 | 780 | ||||||
| Prestige Brands Holdings, Inc. † | 333 | 6,670 | ||||||
| Reed’s, Inc. † | 1,017 | 5,807 | ||||||
| Revlon, Inc., Class A† | 233 | 3,378 | ||||||
| Rite Aid Corp. †(a) | 2,521 | 3,429 | ||||||
| Sanderson Farms, Inc. | 65 | 3,091 | ||||||
| Smart Balance, Inc. †(a) | 415 | 5,353 | ||||||
| Snyders-Lance, Inc. | 152 | 3,665 | ||||||
| Spartan Stores, Inc. | 107 | 1,643 | ||||||
| Spectrum Brands Holdings, Inc. | 123 | 5,526 | ||||||
| Star Scientific, Inc. †(a) | 1,901 | 5,095 | ||||||
| Susser Holdings Corp. † | 195 | 6,726 | ||||||
| Universal Corp. (a) | 72 | 3,594 | ||||||
| WD-40 Co. | 78 | 3,675 | ||||||
| Weis Markets, Inc. | 80 | 3,134 | ||||||
|
| |||||||
| 140,974 | ||||||||
|
| |||||||
| Energy - 3.4% | ||||||||
| Alon USA Energy, Inc. | 292 | 5,282 | ||||||
| Bristow Group, Inc. | 51 | 2,737 | ||||||
| Cheniere Energy, Inc. †(a) | 188 | 3,531 | ||||||
| Crosstex Energy, Inc. | 243 | 3,485 | ||||||
| Dawson Geophysical Co. † | 42 | 1,108 | ||||||
| Delek US Holdings, Inc. | 505 | 12,787 | ||||||
| Enbridge Energy Management LLC† | 106 | 3,062 | ||||||
| EPL Oil & Gas, Inc. †(a) | 282 | 6,359 | ||||||
| Evolution Petroleum Corp. † | 187 | 1,520 | ||||||
| Exterran Holdings, Inc. † | 289 | 6,335 | ||||||
| Geospace Technologies Corp. † | 69 | 6,132 | ||||||
| Goodrich Petroleum Corp. † | 71 | 662 | ||||||
| Gulf Island Fabrication, Inc. | 61 | 1,466 | ||||||
| Halcon Resources Corp. † | 1,666 | 11,529 | ||||||
| Hercules Offshore, Inc. †(a) | 631 | 3,899 | ||||||
| Hornbeck Offshore Services, Inc. † | 60 | 2,060 | ||||||
| Kodiak Oil & Gas Corp. † | 259 | 2,292 | ||||||
| Panhandle Oil and Gas, Inc., Class A | 65 | 1,835 | ||||||
| PHI, Inc. † | 89 | 2,981 | ||||||
| Rentech, Inc. | 1,324 | 3,482 | ||||||
| REX American Resources Corp. † | 79 | 1,524 | ||||||
| Rex Energy Corp. †(a) | 251 | 3,268 | ||||||
| RigNet, Inc. † | 88 | 1,798 | ||||||
| SemGroup Corp., Class A † | 244 | 9,535 | ||||||
| Ship Finance International Ltd. (Bermuda) | 459 | 7,633 | ||||||
| TGC Industries, Inc. | 573 | 4,693 | ||||||
| Western Refining, Inc. (a) | 170 | 4,792 | ||||||
|
| |||||||
| 115,787 | ||||||||
|
| |||||||
| SHARES | VALUE (Note 2) | |||||||
| Financials - 23.6% | ||||||||
| 1st Source Corp. | 130 | $ | 2,872 | |||||
| Acadia Realty Trust REIT (a) | 188 | 4,715 | ||||||
| Alexander & Baldwin, Inc. † | 121 | 3,554 | ||||||
| American Assets Trust, Inc. REIT | 329 | 9,189 | ||||||
| AMERISAFE, Inc. † | 115 | 3,134 | ||||||
| Amtrust Financial Services, Inc. (a) | 180 | 5,164 | ||||||
| Associated Estates Realty Corp. REIT | 200 | 3,224 | ||||||
| Bank of Kentucky Financial Corp. (a) | 70 | 1,731 | ||||||
| Bank of Marin Bancorp | 56 | 2,098 | ||||||
| Bank of the Ozarks, Inc. | 413 | 13,823 | ||||||
| Banner Corp. (a) | 212 | 6,515 | ||||||
| BBCN Bancorp, Inc. (a) | 497 | 5,750 | ||||||
| BofI Holding, Inc. † | 111 | 3,094 | ||||||
| Boston Private Financial Holdings, Inc. (a) | 425 | 3,829 | ||||||
| Brandywine Realty Trust REIT | 912 | 11,117 | ||||||
| Bridge Capital Holdings †(a) | 96 | 1,494 | ||||||
| Bryn Mawr Bank Corp. (a) | 114 | 2,539 | ||||||
| Cash America International, Inc. (a) | 26 | 1,031 | ||||||
| Cedar Realty Trust, Inc. REIT (a) | 989 | 5,222 | ||||||
| Center Bancorp, Inc. | 140 | 1,621 | ||||||
| Chesapeake Lodging Trust REIT | 157 | 3,278 | ||||||
| Citizens & Northern Corp. | 103 | 1,947 | ||||||
| Citizens, Inc. † | 264 | 2,917 | ||||||
| CNO Financial Group, Inc. (a) | 725 | 6,764 | ||||||
| Cohen & Steers, Inc. (a) | 106 | 3,230 | ||||||
| Colonial Properties Trust REIT (a) | 532 | 11,369 | ||||||
| Community Bank System, Inc. (a) | 218 | 5,965 | ||||||
| Community Trust Bancorp, Inc. (a) | 85 | 2,786 | ||||||
| Coresite Realty Corp. REIT (a) | 334 | 9,238 | ||||||
| Crawford & Co., Class B | 345 | 2,753 | ||||||
| CubeSmart REIT (a) | 892 | 12,996 | ||||||
| CVB Financial Corp. (a) | 482 | 5,013 | ||||||
| DCT Industrial Trust, Inc. REIT (a) | 1,582 | 10,267 | ||||||
| DFC Global Corp. †(a) | 70 | 1,296 | ||||||
| DuPont Fabros Technology, Inc. REIT (a) | 276 | 6,668 | ||||||
| Eagle Bancorp, Inc. †(a) | 112 | 2,237 | ||||||
| EastGroup Properties, Inc. REIT | 204 | 10,977 | ||||||
| Education Realty Trust, Inc. REIT | 966 | 10,278 | ||||||
| eHealth, Inc. †(a) | 111 | 3,050 | ||||||
| Employers Holdings, Inc. | 119 | 2,449 | ||||||
| Enstar Group Ltd. (Bermuda) † | 55 | 6,159 | ||||||
| Enterprise Financial Services Corp. | 163 | 2,130 | ||||||
| ESB Financial Corp. | 126 | 1,748 | ||||||
| Excel Trust, Inc. REIT (a) | 195 | 2,471 | ||||||
| Ezcorp, Inc., Class A † | 144 | 2,860 | ||||||
| FBL Financial Group, Inc., Class A | 141 | 4,824 | ||||||
| Federal Agricultural Mortgage Corp., Class C | 183 | 5,948 | ||||||
| FelCor Lodging Trust, Inc. REIT † | 1,903 | 8,887 | ||||||
| Fidus Investment Corp. | 392 | 6,448 | ||||||
| First Busey Corp. (a) | 512 | 2,381 | ||||||
| First Cash Financial Services, Inc. †(a) | 128 | 6,351 | ||||||
| First Defiance Financial Corp. | 120 | 2,303 | ||||||
| First Financial Corp. | 67 | 2,026 | ||||||
| First Industrial Realty Trust, Inc. REIT † | 954 | 13,432 | ||||||
| First Interstate Bancsystem, Inc. | 302 | 4,660 | ||||||
| FirstMerit Corp. (a) | 330 | 4,683 | ||||||
| Flagstar Bancorp, Inc. †(a) | 387 | 7,508 | ||||||
| The accompanying notes are an integral part of these financial statements. | (Continued) |
| AQR Funds | Annual Report | December 2012 | 109 | |||||||||||||
Table of Contents
| Schedule of Investments | December 31, 2012 |
| AQR TAX-MANAGED SMALL CAP MOMENTUM FUND |
| SHARES | VALUE (Note 2) | |||||||
| Financials - 23.6% (continued) | ||||||||
| FNB Corp. | 528 | $ | 5,607 | |||||
| Fox Chase Bancorp, Inc. | 146 | 2,431 | ||||||
| FXCM, Inc., Class A | 276 | 2,779 | ||||||
| Gladstone Investment Corp. | 220 | 1,531 | ||||||
| Glimcher Realty Trust REIT | 692 | 7,674 | ||||||
| Golub Capital BDC, Inc. | 236 | 3,771 | ||||||
| Gyrodyne Co. of America, Inc. REIT (a) | 84 | 6,053 | ||||||
| Heritage Commerce Corp. † | 261 | 1,822 | ||||||
| HFF, Inc., Class A (a) | 152 | 2,265 | ||||||
| Home BancShares, Inc. (a) | 287 | 9,477 | ||||||
| Homeowners Choice, Inc. (a) | 337 | 7,006 | ||||||
| Hudson Pacific Properties, Inc. REIT (a) | 472 | 9,940 | ||||||
| Hudson Valley Holding Corp. | 85 | 1,323 | ||||||
| International Bancshares Corp. (a) | 362 | 6,534 | ||||||
| Investors Bancorp, Inc. | 291 | 5,174 | ||||||
| Kearny Financial Corp. | 178 | 1,736 | ||||||
| Kemper Corp. | 236 | 6,962 | ||||||
| Ladenburg Thalmann Financial Services, Inc. † | 1,019 | 1,427 | ||||||
| Lakeland Financial Corp. | 116 | 2,997 | ||||||
| LTC Properties, Inc. REIT | 138 | 4,856 | ||||||
| Maiden Holdings Ltd. (Bermuda) | 347 | 3,189 | ||||||
| Main Street Capital Corp. | 317 | 9,672 | ||||||
| MarketAxess Holdings, Inc. | 166 | 5,860 | ||||||
| MB Financial, Inc. | 97 | 1,916 | ||||||
| MBIA, Inc. †(a) | 175 | 1,374 | ||||||
| Meadowbrook Insurance Group, Inc. (a) | 279 | 1,613 | ||||||
| Medallion Financial Corp. | 191 | 2,242 | ||||||
| Medley Capital Corp. (a) | 502 | 7,309 | ||||||
| Mercantile Bank Corp. (a) | 192 | 3,168 | ||||||
| National Financial Partners Corp. †(a) | 188 | 3,222 | ||||||
| National Interstate Corp. (a) | 96 | 2,767 | ||||||
| National Penn Bancshares, Inc. | 862 | 8,034 | ||||||
| Nelnet, Inc., Class A | 74 | 2,204 | ||||||
| Netspend Holdings, Inc. †(a) | 582 | 6,879 | ||||||
| New Mountain Finance Corp. | 636 | 9,476 | ||||||
| NewStar Financial, Inc. † | 175 | 2,452 | ||||||
| Nicholas Financial, Inc. | 81 | 1,004 | ||||||
| Old National Bancorp (a) | 280 | 3,324 | ||||||
| OmniAmerican Bancorp, Inc. † | 247 | 5,713 | ||||||
| One Liberty Properties, Inc. REIT | 127 | 2,577 | ||||||
| OneBeacon Insurance Group Ltd., Class A | 661 | 9,188 | ||||||
| Oritani Financial Corp. | 260 | 3,983 | ||||||
| PacWest Bancorp (a) | 303 | 7,508 | ||||||
| Pebblebrook Hotel Trust REIT | 276 | 6,376 | ||||||
| Pennsylvania Real Estate Investment Trust REIT (a) | 803 | 14,165 | ||||||
| Pinnacle Financial Partners, Inc. † | 181 | 3,410 | ||||||
| Platinum Underwriters Holdings Ltd. (Bermuda) | 224 | 10,304 | ||||||
| Portfolio Recovery Associates, Inc. †(a) | 112 | 11,968 | ||||||
| Primerica, Inc. | 324 | 9,723 | ||||||
| PrivateBancorp, Inc. | 381 | 5,837 | ||||||
| Prospect Capital Corp. | 806 | 8,761 | ||||||
| PS Business Parks, Inc. REIT | 143 | 9,292 | ||||||
| Radian Group, Inc. | 1,791 | 10,943 | ||||||
| RAIT Financial Trust REIT | 853 | 4,819 | ||||||
| SHARES | VALUE (Note 2) | |||||||
| Financials - 23.6% (continued) | ||||||||
| Ramco-Gershenson Properties Trust REIT | 567 | $ | 7,547 | |||||
| Retail Opportunity Investments Corp. REIT (a) | 228 | 2,932 | ||||||
| Rockville Financial, Inc. | 241 | 3,109 | ||||||
| Sabra Health Care REIT, Inc. REIT | 393 | 8,536 | ||||||
| Seacoast Banking Corp of Florida † | 696 | 1,121 | ||||||
| Security National Financial Corp., Class A † | 321 | 2,818 | ||||||
| Selective Insurance Group, Inc. | 103 | 1,985 | ||||||
| Sovran Self Storage, Inc. REIT | 310 | 19,251 | ||||||
| STAG Industrial, Inc. REIT | 942 | 16,928 | ||||||
| Stewart Information Services Corp. (a) | 227 | 5,902 | ||||||
| Strategic Hotels & Resorts, Inc. REIT † | 1,142 | 7,309 | ||||||
| Sun Communities, Inc. REIT (a) | 184 | 7,340 | ||||||
| Sunstone Hotel Investors, Inc. REIT † | 1,678 | 17,971 | ||||||
| Susquehanna Bancshares, Inc. | 548 | 5,743 | ||||||
| SWS Group, Inc. † | 203 | 1,074 | ||||||
| Symetra Financial Corp. | 262 | 3,401 | ||||||
| Synovus Financial Corp. (a) | 4,766 | 11,677 | ||||||
| Taylor Capital Group, Inc. † | 206 | 3,718 | ||||||
| Territorial Bancorp, Inc. | 211 | 4,821 | ||||||
| Texas Capital Bancshares, Inc. †(a) | 258 | 11,564 | ||||||
| THL Credit, Inc. | 294 | 4,348 | ||||||
| Triangle Capital Corp. | 324 | 8,259 | ||||||
| Trustmark Corp. (a) | 208 | 4,672 | ||||||
| UMB Financial Corp. (a) | 34 | 1,491 | ||||||
| Umpqua Holdings Corp. | 478 | 5,636 | ||||||
| United Bankshares, Inc. (a) | 73 | 1,775 | ||||||
| United Financial Bancorp, Inc. (a) | 122 | 1,918 | ||||||
| Universal Health Realty Income Trust REIT | 73 | 3,695 | ||||||
| ViewPoint Financial Group, Inc. | 201 | 4,209 | ||||||
| Virginia Commerce Bancorp, Inc. † | 236 | 2,112 | ||||||
| Virtus Investment Partners, Inc. †(a) | 95 | 11,489 | ||||||
| Walker & Dunlop, Inc. †(a) | 107 | 1,783 | ||||||
| Walter Investment Management Corp. † | 74 | 3,183 | ||||||
| Washington Trust Bancorp, Inc. | 110 | 2,894 | ||||||
| Webster Financial Corp. (a) | 223 | 4,583 | ||||||
| WesBanco, Inc. (a) | 152 | 3,377 | ||||||
| West Bancorporation, Inc. | 175 | 1,887 | ||||||
| Western Alliance Bancorp †(a) | 525 | 5,528 | ||||||
| WisdomTree Investments, Inc. † | 468 | 2,864 | ||||||
| World Acceptance Corp. †(a) | 66 | 4,921 | ||||||
| Zillow, Inc., Class A †(a) | 200 | 5,550 | ||||||
|
| |||||||
| 814,571 | ||||||||
|
| |||||||
| Health Care - 16.6% | ||||||||
| Abaxis, Inc. | 78 | 2,894 | ||||||
| ABIOMED, Inc. †(a) | 235 | 3,163 | ||||||
| Acadia Healthcare Co., Inc. †(a) | 338 | 7,886 | ||||||
| ACADIA Pharmaceuticals, Inc. † | 1,474 | 6,854 | ||||||
| Achillion Pharmaceuticals, Inc. †(a) | 345 | 2,767 | ||||||
| Acorda Therapeutics, Inc. †(a) | 61 | 1,516 | ||||||
| Acura Pharmaceuticals, Inc. †(a) | 437 | 970 | ||||||
| Aegerion Pharmaceuticals, Inc. † | 138 | 3,504 | ||||||
| Affymax, Inc. † | 662 | 12,578 | ||||||
| Air Methods Corp. (a) | 312 | 11,510 | ||||||
| Akorn, Inc. †(a) | 663 | 8,858 | ||||||
| Align Technology, Inc. †(a) | 105 | 2,914 | ||||||
| Alkermes PLC (Ireland)†(a) | 155 | 2,871 | ||||||
| The accompanying notes are an integral part of these financial statements. | (Continued) |
| 110 | AQR Funds | Annual Report | December 2012 | |||||||||||||
Table of Contents
| Schedule of Investments | December 31, 2012 |
| AQR TAX-MANAGED SMALL CAP MOMENTUM FUND |
| SHARES | VALUE (Note 2) | |||||||
| Health Care - 16.6% (continued) | ||||||||
| Alnylam Pharmaceuticals, Inc. † | 394 | $ | 7,190 | |||||
| AMN Healthcare Services, Inc. † | 443 | 5,117 | ||||||
| Amsurg Corp. †(a) | 151 | 4,531 | ||||||
| Analogic Corp. | 62 | 4,607 | ||||||
| Anika Therapeutics, Inc. † | 394 | 3,916 | ||||||
| Antares Pharma, Inc. †(a) | 931 | 3,547 | ||||||
| Apricus Biosciences, Inc. †(a) | 249 | 495 | ||||||
| Arena Pharmaceuticals, Inc. † | 540 | 4,871 | ||||||
| Ariad Pharmaceuticals, Inc. †(a) | 298 | 5,716 | ||||||
| Array BioPharma, Inc. † | 1,518 | 5,647 | ||||||
| Atrion Corp. | 11 | 2,156 | ||||||
| BioDelivery Sciences International, Inc. † | 978 | 4,215 | ||||||
| Biolase, Inc. †(a) | 388 | 718 | ||||||
| Bio-Reference Labs, Inc. †(a) | 414 | 11,878 | ||||||
| BioScrip, Inc. †(a) | 379 | 4,082 | ||||||
| Cambrex Corp. † | 263 | 2,993 | ||||||
| Cantel Medical Corp. | 280 | 8,324 | ||||||
| Capital Senior Living Corp. † | 432 | 8,074 | ||||||
| Celldex Therapeutics, Inc. † | 715 | 4,798 | ||||||
| Celsion Corp. †(a) | 1,235 | 10,115 | ||||||
| Centene Corp. †(a) | 61 | 2,501 | ||||||
| Cerus Corp. † | 1,221 | 3,858 | ||||||
| Conceptus, Inc. † | 306 | 6,429 | ||||||
| Curis, Inc. † | 447 | 1,533 | ||||||
| Cyberonics, Inc. † | 240 | 12,607 | ||||||
| Cynosure, Inc., Class A † | 245 | 5,907 | ||||||
| DexCom, Inc. † | 511 | 6,955 | ||||||
| Dynavax Technologies Corp. † | 1,432 | 4,095 | ||||||
| Echo Therapeutics, Inc. † | 488 | 508 | ||||||
| Endologix, Inc. †(a) | 490 | 6,978 | ||||||
| Exact Sciences Corp. † | 307 | 3,251 | ||||||
| ExamWorks Group, Inc. †(a) | 253 | 3,539 | ||||||
| Exelixis, Inc. †(a) | 177 | 809 | ||||||
| Furiex Pharmaceuticals, Inc. † | 216 | 4,160 | ||||||
| GenMark Diagnostics, Inc. † | 694 | 6,246 | ||||||
| Genomic Health, Inc. † | 224 | 6,106 | ||||||
| Gentiva Health Services, Inc. †(a) | 402 | 4,040 | ||||||
| GTx, Inc. †(a) | 394 | 1,655 | ||||||
| Halozyme Therapeutics, Inc. †(a) | 449 | 3,013 | ||||||
| Hanger, Inc. †(a) | 261 | 7,141 | ||||||
| HealthStream, Inc. †(a) | 255 | 6,199 | ||||||
| HeartWare International, Inc. † | 87 | 7,304 | ||||||
| Hi-Tech Pharmacal Co., Inc. (a) | 77 | 2,693 | ||||||
| ICU Medical, Inc. †(a) | 136 | 8,286 | ||||||
| Idenix Pharmaceuticals, Inc. †(a) | 334 | 1,620 | ||||||
| Immunogen, Inc. †(a) | 127 | 1,619 | ||||||
| Infinity Pharmaceuticals, Inc. † | 341 | 11,935 | ||||||
| Insulet Corp. †(a) | 205 | 4,350 | ||||||
| InterMune, Inc. † | 139 | 1,347 | ||||||
| IPC The Hospitalist Co., Inc. † | 27 | 1,072 | ||||||
| Isis Pharmaceuticals, Inc. †(a) | 610 | 6,381 | ||||||
| Jazz Pharmaceuticals PLC (Ireland) †(a) | 72 | 3,830 | ||||||
| Lexicon Pharmaceuticals, Inc. †(a) | 4,198 | 9,320 | ||||||
| Ligand Pharmaceuticals, Inc., Class B † | 179 | 3,712 | ||||||
| Luminex Corp. † | 195 | 3,268 | ||||||
| Magellan Health Services, Inc. † | 46 | 2,254 | ||||||
| MedAssets, Inc. † | 339 | 5,685 | ||||||
| SHARES | VALUE (Note 2) | |||||||
| Health Care - 16.6% (continued) | ||||||||
| Medicines Co./The † | 371 | $ | 8,893 | |||||
| Medidata Solutions, Inc. † | 149 | 5,839 | ||||||
| Medivation, Inc. † | 144 | 7,367 | ||||||
| Merge Healthcare, Inc. †(a) | 546 | 1,349 | ||||||
| Merit Medical Systems, Inc. † | 161 | 2,238 | ||||||
| Momenta Pharmaceuticals, Inc. †(a) | 100 | 1,178 | ||||||
| MWI Veterinary Supply, Inc. †(a) | 55 | 6,050 | ||||||
| Nanosphere, Inc. † | 1,470 | 4,234 | ||||||
| Navidea Biopharmaceuticals, Inc. †(a) | 438 | 1,240 | ||||||
| Nektar Therapeutics †(a) | 1,048 | 7,766 | ||||||
| NPS Pharmaceuticals, Inc. †(a) | 1,089 | 9,910 | ||||||
| Omeros Corp. †(a) | 747 | 3,877 | ||||||
| Omnicell, Inc. † | 188 | 2,796 | ||||||
| Oncothyreon, Inc. †(a) | 759 | 1,457 | ||||||
| OPKO Health, Inc. †(a) | 445 | 2,140 | ||||||
| Optimer Pharmaceuticals, Inc. † | 216 | 1,955 | ||||||
| OraSure Technologies, Inc. † | 284 | 2,039 | ||||||
| Orexigen Therapeutics, Inc. †(a) | 1,467 | 7,731 | ||||||
| Pacira Pharmaceuticals, Inc. † | 552 | 9,643 | ||||||
| PAREXEL International Corp. † | 228 | 6,747 | ||||||
| PDL BioPharma, Inc. (a) | 712 | 5,020 | ||||||
| Pernix Therapeutics Holdings †(a) | 112 | 868 | ||||||
| Pharmacyclics, Inc. † | 104 | 6,022 | ||||||
| Progenics Pharmaceuticals, Inc. † | 866 | 2,581 | ||||||
| Quidel Corp. † | 203 | 3,790 | ||||||
| Repros Therapeutics, Inc. †(a) | 329 | 5,182 | ||||||
| RTI Biologics, Inc. †(a) | 511 | 2,182 | ||||||
| Santarus, Inc. † | 731 | 8,026 | ||||||
| Sarepta Therapeutics, Inc. †(a) | 330 | 8,514 | ||||||
| Select Medical Holdings Corp. | 1,022 | 9,637 | ||||||
| Skilled Healthcare Group, Inc., Class A † | 623 | 3,968 | ||||||
| Solta Medical, Inc. †(a) | 977 | 2,609 | ||||||
| Spectranetics Corp. †(a) | 286 | 4,224 | ||||||
| Spectrum Pharmaceuticals, Inc. (a) | 460 | 5,147 | ||||||
| Staar Surgical Co. †(a) | 228 | 1,391 | ||||||
| Sunesis Pharmaceuticals, Inc. † | 1,476 | 6,199 | ||||||
| Synta Pharmaceuticals Corp. † | 981 | 8,849 | ||||||
| Theravance, Inc. †(a) | 222 | 4,944 | ||||||
| Threshold Pharmaceuticals, Inc. †(a) | 1,495 | 6,294 | ||||||
| Universal American Corp. | 417 | 3,582 | ||||||
| Vical, Inc. † | 620 | 1,804 | ||||||
| ViroPharma, Inc. † | 338 | 7,693 | ||||||
| Vivus, Inc. †(a) | 199 | 2,671 | ||||||
| West Pharmaceutical Services, Inc. | 178 | 9,745 | ||||||
| Wright Medical Group, Inc. †(a) | 352 | 7,388 | ||||||
| XenoPort, Inc. † | 408 | 3,170 | ||||||
| ZIOPHARM Oncology, Inc. †(a) | 300 | 1,248 | ||||||
|
| |||||||
| 570,678 | ||||||||
|
| |||||||
| Industrials - 14.1% | ||||||||
| AAON, Inc. | 131 | 2,734 | ||||||
| Acacia Research Corp. †(a) | 72 | 1,847 | ||||||
| Advisory Board Co./The†(a) | 101 | 4,726 | ||||||
| Aerovironment, Inc. † | 107 | 2,326 | ||||||
| Aircastle Ltd. | 313 | 3,925 | ||||||
| Albany International Corp., Class A(a) | 105 | 2,381 | ||||||
| Allegiant Travel Co. | 158 | 11,599 | ||||||
| The accompanying notes are an integral part of these financial statements. | (Continued) |
| AQR Funds | Annual Report | December 2012 | 111 | |||||||||||||
Table of Contents
| Schedule of Investments | December 31, 2012 |
| AQR TAX-MANAGED SMALL CAP MOMENTUM FUND |
| SHARES | VALUE (Note 2) | |||||||
| Industrials - 14.1% (continued) | ||||||||
| Amerco, Inc. (a) | 85 | $ | 10,779 | |||||
| American Railcar Industries, Inc. (a) | 113 | 3,585 | ||||||
| Apogee Enterprises, Inc. | 271 | 6,496 | ||||||
| Applied Industrial Technologies, Inc. | 164 | 6,890 | ||||||
| Argan, Inc. | 130 | 2,340 | ||||||
| Astec Industries, Inc. (a) | 103 | 3,433 | ||||||
| Astronics Corp. † | 75 | 1,716 | ||||||
| Astronics Corp., Class B † | 11 | 244 | ||||||
| AT Cross Co., Class A † | 141 | 1,520 | ||||||
| Avis Budget Group, Inc. †(a) | 469 | 9,296 | ||||||
| AZZ, Inc. | 116 | 4,458 | ||||||
| Barnes Group, Inc. | 224 | 5,031 | ||||||
| Barrett Business Services, Inc. (a) | 87 | 3,314 | ||||||
| Beacon Roofing Supply, Inc. †(a) | 267 | 8,886 | ||||||
| Brink’s Co./The | 68 | 1,940 | ||||||
| Builders FirstSource, Inc. †(a) | 1,259 | 7,025 | ||||||
| Capstone Turbine Corp. †(a) | 1,193 | 1,062 | ||||||
| Chart Industries, Inc. †(a) | 43 | 2,867 | ||||||
| Coleman Cable, Inc. (a) | 177 | 1,641 | ||||||
| Colfax Corp. †(a) | 113 | 4,560 | ||||||
| Corporate Executive Board Co./The | 53 | 2,515 | ||||||
| Curtiss-Wright Corp. (a) | 66 | 2,167 | ||||||
| Deluxe Corp. (a) | 367 | 11,832 | ||||||
| Douglas Dynamics, Inc. (a) | 179 | 2,576 | ||||||
| DXP Enterprises, Inc. †(a) | 77 | 3,778 | ||||||
| Dycom Industries, Inc. † | 159 | 3,148 | ||||||
| Echo Global Logistics, Inc. † | 134 | 2,408 | ||||||
| EDAC Technologies Corp. † | 106 | 1,308 | ||||||
| Encore Wire Corp. (a) | 111 | 3,364 | ||||||
| EnerSys, Inc. † | 213 | 8,015 | ||||||
| Exponent, Inc. †(a) | 69 | 3,852 | ||||||
| Forward Air Corp. | 130 | 4,551 | ||||||
| Franklin Covey Co. † | 154 | 1,987 | ||||||
| Franklin Electric Co., Inc. | 101 | 6,279 | ||||||
| FTI Consulting, Inc. †(a) | 53 | 1,749 | ||||||
| GATX Corp. | 58 | 2,511 | ||||||
| GenCorp, Inc. †(a) | 259 | 2,370 | ||||||
| Generac Holdings, Inc. (a) | 415 | 14,239 | ||||||
| Geo Group, Inc./The | 559 | 15,764 | ||||||
| Gorman-Rupp Co./The (a) | 102 | 3,043 | ||||||
| GP Strategies Corp. † | 152 | 3,139 | ||||||
| H&E Equipment Services, Inc. (a) | 289 | 4,355 | ||||||
| Healthcare Services Group, Inc. (a) | 518 | 12,033 | ||||||
| Heritage-Crystal Clean, Inc. †(a) | 100 | 1,501 | ||||||
| Houston Wire & Cable Co. | 95 | 1,166 | ||||||
| Huron Consulting Group, Inc. †(a) | 102 | 3,436 | ||||||
| Hyster-Yale Materials Handling, Inc. | 124 | 6,051 | ||||||
| ICF International, Inc. †(a) | 68 | 1,594 | ||||||
| InnerWorkings, Inc. †(a) | 264 | 3,638 | ||||||
| Intersections, Inc. | 103 | 976 | ||||||
| Kadant, Inc. † | 59 | 1,564 | ||||||
| Kaman Corp. (a) | 93 | 3,422 | ||||||
| Kimball International, Inc., Class B | 371 | 4,307 | ||||||
| Lydall, Inc. †(a) | 165 | 2,366 | ||||||
| Macquarie Infrastructure Co. LLC | 173 | 7,882 | ||||||
| Manitowoc Co., Inc./The (a) | 444 | 6,962 | ||||||
| MasTec, Inc. †(a) | 231 | 5,759 | ||||||
| SHARES | VALUE (Note 2) | |||||||
| Industrials - 14.1% (continued) | ||||||||
| Matson, Inc. | 121 | $ | 2,991 | |||||
| McGrath RentCorp. | 83 | 2,409 | ||||||
| Middleby Corp. † | 56 | 7,180 | ||||||
| Miller Industries, Inc. | 112 | 1,708 | ||||||
| Mine Safety Appliances Co. | 161 | 6,876 | ||||||
| Mistras Group, Inc. † | 236 | 5,827 | ||||||
| Mueller Industries, Inc. | 166 | 8,305 | ||||||
| Mueller Water Products, Inc., Class A | 1,356 | 7,607 | ||||||
| Multi-Color Corp. | 103 | 2,471 | ||||||
| Navigant Consulting, Inc. † | 256 | 2,857 | ||||||
| NL Industries, Inc. | 120 | 1,374 | ||||||
| Nortek, Inc. †(a) | 210 | 13,913 | ||||||
| On Assignment, Inc. † | 426 | 8,639 | ||||||
| Patrick Industries, Inc. † | 633 | 9,849 | ||||||
| PMFG, Inc. † | 111 | 1,009 | ||||||
| Primoris Services Corp. | 239 | 3,595 | ||||||
| Quality Distribution, Inc. † | 153 | 918 | ||||||
| RBC Bearings, Inc. †(a) | 66 | 3,305 | ||||||
| Roadrunner Transportation Systems, Inc. † | 126 | 2,286 | ||||||
| Saia, Inc. † | 229 | 5,294 | ||||||
| SeaCube Container Leasing Ltd. | 255 | 4,807 | ||||||
| Simpson Manufacturing Co., Inc. (a) | 89 | 2,918 | ||||||
| Standex International Corp. | 60 | 3,077 | ||||||
| Steelcase, Inc., Class A | 547 | 6,969 | ||||||
| Sun Hydraulics Corp. (a) | 83 | 2,165 | ||||||
| Taser International, Inc. † | 464 | 4,148 | ||||||
| Team, Inc. † | 99 | 3,766 | ||||||
| Tennant Co. | 62 | 2,725 | ||||||
| Textainer Group Holdings Ltd. | 231 | 7,267 | ||||||
| Thermon Group Holdings, Inc. †(a) | 117 | 2,636 | ||||||
| Titan International, Inc. (a) | 137 | 2,976 | ||||||
| TRC Cos., Inc. † | 244 | 1,420 | ||||||
| Trex Co., Inc. † | 201 | 7,483 | ||||||
| Twin Disc, Inc. | 79 | 1,377 | ||||||
| United Rentals, Inc. †(a) | 89 | 4,051 | ||||||
| United Stationers, Inc. (a) | 120 | 3,719 | ||||||
| Universal Truckload Services, Inc. | 73 | 1,332 | ||||||
| US Airways Group, Inc. †(a) | 1,336 | 18,036 | ||||||
| US Ecology, Inc. | 115 | 2,707 | ||||||
| USG Corp. †(a) | 223 | 6,260 | ||||||
| Watts Water Technologies, Inc., Class A (a) | 58 | 2,493 | ||||||
| Werner Enterprises, Inc. (a) | 267 | 5,786 | ||||||
| XPO Logistics, Inc. †(a) | 226 | 3,928 | ||||||
|
| |||||||
| 484,687 | ||||||||
|
| |||||||
| Information Technology - 12.3% | ||||||||
| 3D Systems Corp. †(a) | 89 | 4,748 | ||||||
| ACI Worldwide, Inc. †(a) | 147 | 6,422 | ||||||
| Actuate Corp. †(a) | 330 | 1,848 | ||||||
| Agilysys, Inc. † | 234 | 1,959 | ||||||
| American Software, Inc., Class A (a) | 231 | 1,793 | ||||||
| AOL, Inc. †(a) | 173 | 5,123 | ||||||
| Arris Group, Inc. † | 469 | 7,007 | ||||||
| Aspen Technology, Inc. † | 281 | 7,767 | ||||||
| ATMI, Inc. † | 113 | 2,359 | ||||||
| Blackbaud, Inc. | 186 | 4,246 | ||||||
| Blucora, Inc. † | 397 | 6,237 | ||||||
| Bottomline Technologies, Inc. †(a) | 106 | 2,797 | ||||||
| The accompanying notes are an integral part of these financial statements. | (Continued) |
| 112 | AQR Funds | Annual Report | December 2012 | |||||||||||||
Table of Contents
| Schedule of Investments | December 31, 2012 |
| AQR TAX-MANAGED SMALL CAP MOMENTUM FUND |
| SHARES | VALUE (Note 2) | |||||||
| Information Technology - 12.3% (continued) | ||||||||
| Brooks Automation, Inc. (a) | 216 | $ | 1,739 | |||||
| CACI International, Inc., Class A †(a) | 39 | 2,146 | ||||||
| CalAmp Corp. † | 349 | 2,904 | ||||||
| Cardtronics, Inc. † | 192 | 4,558 | ||||||
| Cass Information Systems, Inc. (a) | 63 | 2,642 | ||||||
| CEVA, Inc. †(a) | 113 | 1,780 | ||||||
| Cirrus Logic, Inc. † | 157 | 4,548 | ||||||
| Clearfield, Inc. † | 208 | 934 | ||||||
| Cognex Corp. | 109 | 4,013 | ||||||
| Coherent, Inc. | 68 | 3,442 | ||||||
| CommVault Systems, Inc. †(a) | 72 | 5,019 | ||||||
| Computer Task Group, Inc. † | 144 | 2,625 | ||||||
| Comtech Telecommunications Corp. | 107 | 2,716 | ||||||
| Cornerstone OnDemand, Inc. †(a) | 438 | 12,934 | ||||||
| CoStar Group, Inc. †(a) | 108 | 9,652 | ||||||
| Cray, Inc. † | 352 | 5,614 | ||||||
| CVD Equipment Corp. † | 115 | 1,104 | ||||||
| Datalink Corp. †(a) | 194 | 1,659 | ||||||
| Dealertrack Technologies, Inc. †(a) | 171 | 4,911 | ||||||
| Digi International, Inc. † | 137 | 1,297 | ||||||
| eGain Communications Corp. † | 191 | 858 | ||||||
| Electro Rent Corp. | 141 | 2,169 | ||||||
| Electronics for Imaging, Inc. †(a) | 183 | 3,475 | ||||||
| Ellie Mae, Inc. †(a) | 487 | 13,514 | ||||||
| Entegris, Inc. † | 550 | 5,049 | ||||||
| ePlus, Inc. | 69 | 2,852 | ||||||
| Euronet Worldwide, Inc. †(a) | 143 | 3,375 | ||||||
| ExlService Holdings, Inc. † | 162 | 4,293 | ||||||
| Fair Isaac Corp. | 165 | 6,935 | ||||||
| FARO Technologies, Inc. †(a) | 79 | 2,819 | ||||||
| FEI Co. (a) | 87 | 4,825 | ||||||
| Global Cash Access Holdings, Inc. † | 470 | 3,685 | ||||||
| Globecomm Systems, Inc. † | 166 | 1,876 | ||||||
| Glu Mobile, Inc. †(a) | 1,754 | 4,017 | ||||||
| GT Advanced Technologies, Inc. †(a) | 207 | 625 | ||||||
| Hackett Group, Inc./The | 376 | 1,609 | ||||||
| Heartland Payment Systems, Inc. (a) | 174 | 5,133 | ||||||
| Insight Enterprises, Inc. † | 194 | 3,370 | ||||||
| Integrated Silicon Solution, Inc. † | 174 | 1,566 | ||||||
| Ixia †(a) | 344 | 5,841 | ||||||
| j2 Global, Inc. | 128 | 3,914 | ||||||
| Key Tronic Corp. † | 295 | 3,021 | ||||||
| Keynote Systems, Inc. | 110 | 1,550 | ||||||
| Kulicke & Soffa Industries, Inc. † | 235 | 2,818 | ||||||
| Lattice Semiconductor Corp. †(a) | 450 | 1,795 | ||||||
| Liquidity Services, Inc. †(a) | 81 | 3,310 | ||||||
| LiveDeal, Inc. †(a) | 278 | 1,012 | ||||||
| LivePerson, Inc. †(a) | 246 | 3,232 | ||||||
| Majesco Entertainment Co. † | 597 | 627 | ||||||
| Manhattan Associates, Inc. †(a) | 104 | 6,275 | ||||||
| Market Leader, Inc. † | 546 | 3,576 | ||||||
| MAXIMUS, Inc. | 137 | 8,661 | ||||||
| Measurement Specialties, Inc. † | 59 | 2,027 | ||||||
| Mentor Graphics Corp. †(a) | 559 | 9,514 | ||||||
| MicroStrategy, Inc., Class A† | 10 | 934 | ||||||
| MKS Instruments, Inc. | 143 | 3,687 | ||||||
| SHARES | VALUE (Note 2) | |||||||
| Information Technology - 12.3% (continued) | ||||||||
| Monotype Imaging Holdings, Inc. (a) | 188 | $ | 3,004 | |||||
| MTS Systems Corp. | 53 | 2,699 | ||||||
| Nanometrics, Inc. †(a) | 125 | 1,803 | ||||||
| Netscout Systems, Inc. † | 276 | 7,173 | ||||||
| NIC, Inc. | 297 | 4,853 | ||||||
| OSI Systems, Inc. † | 155 | 9,926 | ||||||
| PC Connection, Inc. | 132 | 1,518 | ||||||
| PDF Solutions, Inc. † | 254 | 3,500 | ||||||
| Pegasystems, Inc. | 54 | 1,225 | ||||||
| Procera Networks, Inc. † | 307 | 5,695 | ||||||
| PROS Holdings, Inc. † | 171 | 3,128 | ||||||
| QAD, Inc., Class A | 107 | 1,541 | ||||||
| Richardson Electronics Ltd. | 132 | 1,494 | ||||||
| Rogers Corp. † | 60 | 2,980 | ||||||
| Saba Software, Inc. †(a) | 585 | 5,113 | ||||||
| Sapient Corp. † | 247 | 2,608 | ||||||
| ScanSource, Inc. † | 78 | 2,478 | ||||||
| SciQuest, Inc. † | 176 | 2,791 | ||||||
| Semtech Corp. † | 117 | 3,387 | ||||||
| Silicon Graphics International Corp. † | 221 | 2,261 | ||||||
| Sourcefire, Inc. †(a) | 253 | 11,947 | ||||||
| SPS Commerce, Inc. †(a) | 179 | 6,671 | ||||||
| SS&C Technologies Holdings, Inc. †(a) | 374 | 8,647 | ||||||
| Stamps.com, Inc. †(a) | 180 | 4,536 | ||||||
| Stratasys Ltd. † | 210 | 16,831 | ||||||
| Super Micro Computer, Inc. †(a) | 181 | 1,846 | ||||||
| TiVo, Inc. † | 368 | 4,534 | ||||||
| Tyler Technologies, Inc. † | 137 | 6,636 | ||||||
| Ultimate Software Group, Inc. † | 83 | 7,836 | ||||||
| Ultratech, Inc. †(a) | 112 | 4,178 | ||||||
| Unisys Corp. †(a) | 76 | 1,315 | ||||||
| USA Technologies, Inc. † | 881 | 1,533 | ||||||
| ValueClick, Inc. †(a) | 209 | 4,057 | ||||||
| VirnetX Holding Corp. †(a) | 80 | 2,342 | ||||||
| Volterra Semiconductor Corp. †(a) | 75 | 1,288 | ||||||
| Web.com Group, Inc. †(a) | 429 | 6,349 | ||||||
| Zygo Corp. † | 126 | 1,978 | ||||||
|
| |||||||
| 424,083 | ||||||||
|
| |||||||
| Materials - 5.4% | ||||||||
| ADA-ES, Inc. †(a) | 175 | 2,954 | ||||||
| AEP Industries, Inc. † | 90 | 5,331 | ||||||
| AMCOL International Corp. | 59 | 1,810 | ||||||
| American Vanguard Corp. (a) | 323 | 10,036 | ||||||
| Balchem Corp. | 58 | 2,111 | ||||||
| Boise, Inc. | 591 | 4,698 | ||||||
| Buckeye Technologies, Inc. | 156 | 4,479 | ||||||
| Calgon Carbon Corp. †(a) | 158 | 2,240 | ||||||
| Chemtura Corp. † | 522 | 11,098 | ||||||
| Core Molding Technologies, Inc. † | 248 | 1,637 | ||||||
| Deltic Timber Corp. (a) | 41 | 2,895 | ||||||
| Eagle Materials, Inc. | 154 | 9,009 | ||||||
| Flotek Industries, Inc. †(a) | 274 | 3,343 | ||||||
| Friedman Industries, Inc. | 127 | 1,285 | ||||||
| Georgia Gulf Corp. | 242 | 9,990 | ||||||
| Graphic Packaging Holding Co. † | 551 | 3,560 | ||||||
| H.B. Fuller Co. | 215 | 7,486 | ||||||
| The accompanying notes are an integral part of these financial statements. | (Continued) |
| AQR Funds | Annual Report | December 2012 | 113 | |||||||||||||
Table of Contents
| Schedule of Investments | December 31, 2012 |
| AQR TAX-MANAGED SMALL CAP MOMENTUM FUND |
| SHARES | VALUE (Note 2) | |||||||
| Materials - 5.4% (continued) | ||||||||
| Haynes International, Inc. | 62 | 3,216 | ||||||
| Headwaters, Inc. † | 1,216 | 10,409 | ||||||
| Innophos Holdings, Inc. (a) | 147 | 6,836 | ||||||
| Innospec, Inc. | 119 | 4,104 | ||||||
| KapStone Paper and Packaging Corp. | 146 | 3,240 | ||||||
| Kraton Performance Polymers, Inc. † | 138 | 3,316 | ||||||
| Louisiana-Pacific Corp. † | 209 | 4,038 | ||||||
| LSB Industries, Inc. † | 79 | 2,798 | ||||||
| Material Sciences Corp. † | 165 | 1,490 | ||||||
| Metals USA Holdings Corp. | 207 | 3,620 | ||||||
| Myers Industries, Inc. (a) | 203 | 3,075 | ||||||
| Olin Corp. (a) | 256 | 5,527 | ||||||
| Paramount Gold and Silver Corp. †(a) | 449 | 1,042 | ||||||
| PH Glatfelter Co. (a) | 228 | 3,985 | ||||||
| PolyOne Corp. (a) | 556 | 11,354 | ||||||
| RTI International Metals, Inc. †(a) | 55 | 1,516 | ||||||
| Stepan Co. | 84 | 4,665 | ||||||
| SunCoke Energy, Inc. †(a) | 187 | 2,915 | ||||||
| Texas Industries, Inc. †(a) | 211 | 10,763 | ||||||
| Tredegar Corp. | 103 | 2,103 | ||||||
| United States Lime & Minerals, Inc. † | 32 | 1,508 | ||||||
| Universal Stainless & Alloy †(a) | 48 | 1,765 | ||||||
| Worthington Industries, Inc. | 316 | 8,213 | ||||||
|
| |||||||
| 185,460 | ||||||||
|
| |||||||
| Telecommunication Services - 0.8% | ||||||||
| 8x8, Inc. † | 552 | 4,079 | ||||||
| Atlantic Tele-Network, Inc. | 74 | 2,717 | ||||||
| Cincinnati Bell, Inc. †(a) | 883 | 4,839 | ||||||
| Cogent Communications Group, Inc. (a) | 214 | 4,845 | ||||||
| Consolidated Communications Holdings, Inc. | 147 | 2,340 | ||||||
| HickoryTech Corp. (a) | 139 | 1,353 | ||||||
| inContact, Inc. †(a) | 395 | 2,046 | ||||||
| Premiere Global Services, Inc. † | 278 | 2,719 | ||||||
| Primus Telecommunications Group, Inc. | 259 | 2,815 | ||||||
| Vonage Holdings Corp. † | 714 | 1,692 | ||||||
|
| |||||||
| 29,445 | ||||||||
|
| |||||||
| Utilities - 0.7% | ||||||||
| ALLETE, Inc. | 35 | 1,434 | ||||||
| Artesian Resources Corp., Class A | 114 | 2,557 | ||||||
| Black Hills Corp. | 75 | 2,726 | ||||||
| Chesapeake Utilities Corp. | 72 | 3,269 | ||||||
| El Paso Electric Co. | 44 | 1,404 | ||||||
| MGE Energy, Inc. | 78 | 3,974 | ||||||
| Middlesex Water Co. | 156 | 3,051 | ||||||
| South Jersey Industries, Inc. | 37 | 1,862 | ||||||
| SHARES | VALUE (Note 2) | |||||||
| Utilities - 0.7% (continued) | ||||||||
| Unitil Corp. | 94 | $ | 2,437 | |||||
| York Water Co. | 145 | 2,548 | ||||||
|
| |||||||
| 25,262 | ||||||||
|
| |||||||
TOTAL COMMON STOCKS | 3,374,542 | |||||||
|
| |||||||
| EXCHANGE-TRADED FUNDS - 1.7% | ||||||||
iShares Russell 2000 Index Fund | 686 | 57,823 | ||||||
|
| |||||||
| MONEY MARKET FUNDS - 2.3% | ||||||||
J.P. Morgan U.S. Treasury Plus Money Market Fund - Institutional Shares, 0.000% (2)(b) | 78,638 | 78,638 | ||||||
|
| |||||||
| INVESTMENTS OF CASH COLLATERAL FOR SECURITIES ON LOAN - 28.8% | ||||||||
| J.P. Morgan Prime Money Market Fund - | ||||||||
Capital Shares, 0.120% (2)(b)(c) | 992,291 | 992,291 | ||||||
|
| |||||||
TOTAL INVESTMENTS - 130.7% | 4,503,294 | |||||||
|
| |||||||
| LIABILITIES IN EXCESS OF OTHER ASSETS - (30.7%) | (1,058,084) | |||||||
|
| |||||||
NET ASSETS - 100.0% | $ | 3,445,210 | ||||||
|
| |||||||
All securities are United States companies, unless noted otherwise in parentheses.
| † | Non income-producing security. |
| (a) | All or a portion of the security on loan. The aggregate market value of such securities is $982,928; cash collateral of $992,291 was received with which the Fund purchased a money market fund. |
| (b) | Represents annualized seven-day yield as of December 31, 2012. |
| (c) | Represents security, or portion thereof, purchased with the cash collateral received for securities on loan. |
All securities are Level 1 with respect to ASC 820, unless otherwise noted in parentheses.
(2) Level 2 security (See Note 4).
The following abbreviations are used in portfolio descriptions:
REIT - Real Estate Investment Trust
| The accompanying notes are an integral part of these financial statements. |
| 114 | AQR Funds | Annual Report | December 2012 | |||||||||||||
Table of Contents
| Schedule of Investments | December 31, 2012 |
| COMMON STOCKS - 96.4% | SHARES | VALUE (Note 2) | ||||||
| Australia - 8.8% | ||||||||
| ALS Ltd. | 295 | $ | 3,365 | |||||
| Amcor Ltd. | 586 | 4,953 | ||||||
| Aurizon Holdings Ltd. | 3,392 | 13,339 | ||||||
| Australia & New Zealand Banking Group Ltd. | 2,283 | 60,126 | ||||||
| Brambles Ltd. | 322 | 2,553 | ||||||
| Coca-Cola Amatil Ltd. | 386 | 5,425 | ||||||
| Commonwealth Bank of Australia | 1,530 | 99,643 | ||||||
| CSL Ltd. | 472 | 26,648 | ||||||
| Dexus Property Group REIT | 4,204 | 4,465 | ||||||
| GPT Group REIT | 1,253 | 4,823 | ||||||
| Mesoblast Ltd. † | 152 | 850 | ||||||
| Mirvac Group REIT | 2,298 | 3,576 | ||||||
| National Australia Bank Ltd. | 1,442 | 37,929 | ||||||
| New Hope Corp. Ltd. | 547 | 2,404 | ||||||
| Orica Ltd. | 113 | 2,973 | ||||||
| Ramsay Health Care Ltd. | 161 | 4,592 | ||||||
| Santos Ltd. | 278 | 3,257 | ||||||
| Telecom Corp of New Zealand Ltd. | 1,966 | 3,683 | ||||||
| Telstra Corp. Ltd. | 16,142 | 73,555 | ||||||
| Washington H Soul Pattinson & Co., Ltd. | 170 | 2,421 | ||||||
| Wesfarmers Ltd. | 803 | 30,981 | ||||||
| Westfield Retail Trust REIT | 16,763 | 52,887 | ||||||
| Westpac Banking Corp. | 2,294 | 62,855 | ||||||
|
| |||||||
| 507,303 | ||||||||
|
| |||||||
| Austria - 0.9% | ||||||||
| Andritz AG | 416 | 26,732 | ||||||
| Lenzing AG | 12 | 1,079 | ||||||
| Raiffeisen Bank International AG | 448 | 18,636 | ||||||
| Strabag SE | 102 | 2,755 | ||||||
|
| |||||||
| 49,202 | ||||||||
|
| |||||||
| Belgium - 3.1% | ||||||||
| Ageas | 619 | 18,290 | ||||||
| Anheuser-Busch InBev NV | 1,465 | 127,579 | ||||||
| Belgacom SA | 94 | 2,765 | ||||||
| KBC Groep NV | 457 | 15,927 | ||||||
| RTL Group SA | 62 | 6,157 | ||||||
| UCB SA | 98 | 5,614 | ||||||
|
| |||||||
| 176,332 | ||||||||
|
| |||||||
| Bermuda - 0.1% | ||||||||
| Gulf Keystone Petroleum Ltd. † | 2,240 | 6,583 | ||||||
|
| |||||||
| Canada - 5.6% | ||||||||
| Agrium, Inc. (1) | 184 | 18,339 | ||||||
| Alimentation Couche Tard, Inc., Class B (1) | 100 | 4,919 | ||||||
| AltaGas Ltd. (1) | 100 | 3,375 | ||||||
| AuRico Gold, Inc. (1)† | 200 | 1,647 | ||||||
| Bank of Montreal (1) | 100 | 6,118 | ||||||
| BCE, Inc. (1) | 136 | 5,829 | ||||||
| Boardwalk Real Estate Investment Trust REIT (1) | 100 | 6,487 | ||||||
| Brookfield Asset Management, Inc., Class A (1) | 509 | 18,647 | ||||||
| Brookfield Office Properties, Inc. (1) | 100 | 1,705 | ||||||
| SHARES | VALUE (Note 2) | |||||||
| Canada - 5.6% (continued) | ||||||||
| Calloway Real Estate Investment Trust REIT (1) | 100 | $ | 2,910 | |||||
| Canadian Pacific Railway Ltd. (1) | 327 | 33,170 | ||||||
| Canadian Utilities Ltd., Class A (1) | 100 | 7,232 | ||||||
| CGI Group, Inc., Class A (1)† | 676 | 15,590 | ||||||
| Crescent Point Energy Corp. (1) | 100 | 3,782 | ||||||
| Dollarama, Inc. (1) | 343 | 20,335 | ||||||
| Eldorado Gold Corp. (1) | 200 | 2,574 | ||||||
| Empire Co., Ltd., Class A (1) | 100 | 5,926 | ||||||
| Ensign Energy Services, Inc. (1) | 100 | 1,545 | ||||||
| First Majestic Silver Corp. (1)† | 100 | 2,017 | ||||||
| Fortis, Inc. (1) | 100 | 3,440 | ||||||
| Franco-Nevada Corp. (1) | 100 | 5,708 | ||||||
| IGM Financial, Inc. (1) | 100 | 4,182 | ||||||
| Intact Financial Corp. (1) | 100 | 6,512 | ||||||
| Jean Coutu Group PJC, Inc./The, Class A (1) | 200 | 2,921 | ||||||
| Loblaw Cos., Ltd. (1) | 100 | 4,215 | ||||||
| Lululemon Athletica, Inc. (1)† | 100 | 7,591 | ||||||
| Metro, Inc. (1) | 100 | 6,367 | ||||||
| National Bank of Canada (1) | 100 | 7,765 | ||||||
| New Gold, Inc. (1)† | 300 | 3,321 | ||||||
| Onex Corp. (1) | 100 | 4,209 | ||||||
| Open Text Corp. (1)† | 100 | 5,593 | ||||||
| Paramount Resources Ltd., Class A (1)† | 100 | 3,217 | ||||||
| Pembina Pipeline Corp. (1) | 100 | 2,861 | ||||||
| Precision Drilling Corp. (1) | 200 | 1,653 | ||||||
| RioCan Real Estate Investment Trust REIT (1)(a) | 242 | 6,705 | ||||||
| Rogers Communications, Inc., Class B (1) | 209 | 9,489 | ||||||
| Royal Bank of Canada (1) | 592 | 35,638 | ||||||
| Shaw Communications, Inc., Class B (1) | 100 | 2,296 | ||||||
| Tim Hortons, Inc. (1) | 100 | 4,909 | ||||||
| Toronto-Dominion Bank/The (1) | 132 | 11,114 | ||||||
| TransAlta Corp. (1) | 100 | 1,520 | ||||||
| Trilogy Energy Corp. (1) | 100 | 2,927 | ||||||
| Valeant Pharmaceuticals International, Inc. (1)† | 100 | 5,966 | ||||||
| Vermilion Energy, Inc. (1) | 100 | 5,225 | ||||||
| Yamana Gold, Inc. (1) | 300 | 5,160 | ||||||
|
| |||||||
| 322,651 | ||||||||
|
| |||||||
| Denmark - 2.1% | ||||||||
| Chr Hansen Holding A/S | 299 | 9,737 | ||||||
| Coloplast A/S, Class B | 90 | 4,414 | ||||||
| Danske Bank A/S † | 918 | 15,591 | ||||||
| Novo Nordisk A/S, Class B | 520 | 84,675 | ||||||
| Novozymes A/S, B Shares | 153 | 4,343 | ||||||
| William Demant Holding A/S † | 39 | 3,351 | ||||||
|
| |||||||
| 122,111 | ||||||||
|
| |||||||
| Finland - 1.3% | ||||||||
| Elisa OYJ | 766 | 16,982 | ||||||
| Kone OYJ, Class B | 305 | 22,558 | ||||||
| Metso OYJ | 434 | 18,528 | ||||||
| Sampo OYJ, A Shares | 595 | 19,269 | ||||||
|
| |||||||
| 77,337 | ||||||||
|
| |||||||
| The accompanying notes are an integral part of these financial statements. | (Continued) |
| AQR Funds | Annual Report | December 2012 | 115 | |||||||||||||
Table of Contents
| Schedule of Investments | December 31, 2012 |
| AQR TAX-MANAGED INTERNATIONAL MOMENTUM FUND |
| SHARES | VALUE (Note 2) | |||||||
| France - 6.8% | ||||||||
| Air Liquide SA | 161 | $ | 20,340 | |||||
| AXA SA | 1,176 | 21,116 | ||||||
| BNP Paribas SA | 957 | 54,482 | ||||||
| Cie Generale d’Optique Essilor International SA | 243 | 24,508 | ||||||
| Danone SA | 363 | 23,990 | ||||||
| Dassault Systemes SA | 53 | 5,926 | ||||||
| Edenred | 323 | 9,990 | ||||||
| European Aeronautic Defence and Space Co. NV | 496 | 19,553 | ||||||
| Eutelsat Communications SA | 106 | 3,526 | ||||||
| Hermes International | 35 | 10,464 | ||||||
| Iliad SA | 21 | 3,608 | ||||||
| L’Oreal SA | 257 | 35,760 | ||||||
| LVMH Moet Hennessy Louis Vuitton SA | 196 | 36,173 | ||||||
| Pernod-Ricard SA | 92 | 10,674 | ||||||
| Sanofi | 811 | 76,907 | ||||||
| Societe Generale SA † | 493 | 18,745 | ||||||
| Sodexo | 65 | 5,493 | ||||||
| Technip SA | 46 | 5,319 | ||||||
| Unibail-Rodamco SE REIT | 24 | 5,820 | ||||||
|
| |||||||
| 392,394 | ||||||||
|
| |||||||
| Germany - 12.9% | ||||||||
| Adidas AG | 418 | 37,306 | ||||||
| Allianz SE | 505 | 70,395 | ||||||
| BASF SE | 688 | 65,057 | ||||||
| Bayer AG | 857 | 81,725 | ||||||
| Bayerische Motoren Werke AG | 248 | 24,133 | ||||||
| Beiersdorf AG | 64 | 5,240 | ||||||
| Brenntag AG | 188 | 24,768 | ||||||
| Continental AG | 321 | 37,414 | ||||||
| Daimler AG | 372 | 20,481 | ||||||
| Deutsche Bank AG | 632 | 27,805 | ||||||
| Deutsche Lufthansa AG | 730 | 13,800 | ||||||
| Deutsche Post AG | 1,412 | 31,100 | ||||||
| Deutsche Postbank AG † | 67 | 2,812 | ||||||
| Fresenius Medical Care AG & Co. KGaA | 109 | 7,522 | ||||||
| Fresenius SE & Co. KGaA | 61 | 7,019 | ||||||
| GEA Group AG | 93 | 3,024 | ||||||
| Hannover Rueckversicherung AG | 53 | 4,151 | ||||||
| Kabel Deutschland Holding AG | 81 | 6,097 | ||||||
| Lanxess AG | 284 | 25,043 | ||||||
| Linde AG | 191 | 33,415 | ||||||
| Merck KGaA | 201 | 26,491 | ||||||
| Muenchener Rueckversicherungs AG | 363 | 65,532 | ||||||
| RWE AG | 513 | 21,278 | ||||||
| SAP AG | 1,156 | 92,957 | ||||||
| Suedzucker AG | 113 | 4,638 | ||||||
|
| |||||||
| 739,203 | ||||||||
|
| |||||||
| Hong Kong - 5.8% | ||||||||
| AIA Group Ltd. | 10,600 | 42,043 | ||||||
| BOC Hong Kong Holdings Ltd. | 10,500 | 33,031 | ||||||
| Cheung Kong Holdings Ltd. | 2,000 | 31,119 | ||||||
| Cheung Kong Infrastructure Holdings Ltd. | 1,000 | 6,177 | ||||||
| China Overseas Grand Oceans Group Ltd. | 500 | 611 | ||||||
| CLP Holdings Ltd. | 1,000 | 8,402 | ||||||
| SHARES | VALUE (Note 2) | |||||||
| Hong Kong - 5.8% (continued) | ||||||||
| Dah Chong Hong Holdings Ltd. | 2,000 | $ | 2,135 | |||||
| First Pacific Co., Ltd. | 12,000 | 13,252 | ||||||
| Galaxy Entertainment Group Ltd. † | 6,000 | 24,059 | ||||||
| Giordano International Ltd. | 2,000 | 1,939 | ||||||
| Hang Seng Bank Ltd. | 1,200 | 18,524 | ||||||
| Henderson Land Development Co. Ltd. | 3,000 | 21,478 | ||||||
| Hong Kong & China Gas Co., Ltd. | 2,200 | 6,045 | ||||||
| Link REIT/The REIT | 3,500 | 17,528 | ||||||
| Luk Fook Holdings International Ltd. | 1,000 | 3,210 | ||||||
| Melco International Development Ltd. | 2,000 | 2,374 | ||||||
| New World Development Co., Ltd. | 9,000 | 14,249 | ||||||
| Power Assets Holdings Ltd. | 1,000 | 8,580 | ||||||
| Sands China Ltd. | 6,000 | 26,824 | ||||||
| SJM Holdings Ltd. | 6,000 | 14,160 | ||||||
| SmarTone Telecommunications Holdings Ltd. | 1,500 | 2,750 | ||||||
| Stella International Holdings Ltd. | 1,000 | 2,724 | ||||||
| Vinda International Holdings Ltd. (a) | 1,000 | 1,385 | ||||||
| Wharf Holdings Ltd. | 2,000 | 15,939 | ||||||
| Wheelock & Co., Ltd. | 3,000 | 15,303 | ||||||
| Yingde Gases | 1,000 | 1,025 | ||||||
|
| |||||||
| 334,866 | ||||||||
|
| |||||||
| Israel - 0.3% | ||||||||
| EZchip Semiconductor Ltd. † | 308 | 10,223 | ||||||
| Mellanox Technologies Ltd. † | 77 | 4,769 | ||||||
|
| |||||||
| 14,992 | ||||||||
|
| |||||||
| Italy - 2.2% | ||||||||
| Davide Campari-Milano SpA | 430 | 3,304 | ||||||
| Fiat Industrial SpA | 2,270 | 24,869 | ||||||
| Lottomatica Group SpA | 157 | 3,587 | ||||||
| Luxottica Group SpA | 512 | 21,133 | ||||||
| Pirelli & C. SpA | 343 | 3,952 | ||||||
| Prada SpA | 3,200 | 31,094 | ||||||
| Saipem SpA | 71 | 2,766 | ||||||
| Salvatore Ferragamo Italia SpA | 534 | 11,822 | ||||||
| Tenaris SA | 1,141 | 23,790 | ||||||
|
| |||||||
| 126,317 | ||||||||
|
| |||||||
| Japan - 16.6% | ||||||||
| Acom Co., Ltd. †(a) | 620 | 17,858 | ||||||
| Aeon Co., Ltd. | 200 | 2,286 | ||||||
| Aozora Bank Ltd. | 1,000 | 3,075 | ||||||
| Astellas Pharma, Inc. | 800 | 35,969 | ||||||
| Autobacs Seven Co., Ltd. | 100 | 4,192 | ||||||
| Bridgestone Corp. | 400 | 10,413 | ||||||
| Calbee, Inc. | 500 | 35,231 | ||||||
| Capcom Co., Ltd. | 700 | 10,702 | ||||||
| Chugai Pharmaceutical Co., Ltd. | 800 | 15,328 | ||||||
| CyberAgent, Inc. | 1 | 2,055 | ||||||
| Dainippon Sumitomo Pharma Co., Ltd. | 300 | 3,604 | ||||||
| Don Quijote Co., Ltd. | 100 | 3,679 | ||||||
| East Japan Railway Co. | 100 | 6,466 | ||||||
| Eisai Co., Ltd. | 100 | 4,174 | ||||||
| FamilyMart Co., Ltd. | 100 | 4,120 | ||||||
| FANUC Corp. | 100 | 18,605 | ||||||
| Fast Retailing Co., Ltd. | 100 | 25,521 | ||||||
| The accompanying notes are an integral part of these financial statements. | (Continued) |
| 116 | AQR Funds | Annual Report | December 2012 | |||||||||||||
Table of Contents
| Schedule of Investments | December 31, 2012 |
| AQR TAX-MANAGED INTERNATIONAL MOMENTUM FUND |
| SHARES | VALUE (Note 2) | |||||||
| Japan - 16.6% (continued) | ||||||||
| Fuji Heavy Industries Ltd. | 1,000 | $ | 12,610 | |||||
| Gree, Inc. | 500 | 7,760 | ||||||
| Hiroshima Bank Ltd./The | 1,000 | 4,193 | ||||||
| Hitachi Ltd. | 2,000 | 11,769 | ||||||
| Hitachi Transport System Ltd. | 200 | 2,922 | ||||||
| House Foods Corp. | 100 | 1,507 | ||||||
| Inpex Corp. | 1 | 5,348 | ||||||
| ITOCHU Corp. | 1,800 | 19,024 | ||||||
| Itochu Techno-Solutions Corp. | 100 | 4,118 | ||||||
| Japan Tobacco, Inc. | 1,500 | 42,374 | ||||||
| Kajima Corp. | 1,000 | 3,309 | ||||||
| Kakaku.com, Inc. | 100 | 3,301 | ||||||
| Keihan Electric Railway Co., Ltd. | 1,000 | 4,526 | ||||||
| Kintetsu Corp. | 3,000 | 12,293 | ||||||
| Kobayashi Pharmaceutical Co., Ltd. | 100 | 4,747 | ||||||
| Komeri Co., Ltd. | 100 | 2,526 | ||||||
| K’s Holdings Corp. | 100 | 2,546 | ||||||
| Lawson, Inc. | 300 | 20,351 | ||||||
| LIXIL Group Corp. | 700 | 15,614 | ||||||
| M3, Inc. | 3 | 4,788 | ||||||
| Matsui Securities Co. Ltd. | 1,700 | 15,530 | ||||||
| Mitsubishi Estate Co., Ltd. | 1,000 | 23,941 | ||||||
| Mitsubishi Heavy Industries, Ltd. | 1,000 | 4,837 | ||||||
| Mitsubishi UFJ Financial Group, Inc. | 3,600 | 19,480 | ||||||
| Mitsui Fudosan Co., Ltd. | 1,000 | 24,463 | ||||||
| Mizuho Financial Group, Inc. | 13,800 | 25,302 | ||||||
| Nabtesco Corp. | 100 | 2,234 | ||||||
| Namco Bandai Holdings, Inc. | 200 | 2,592 | ||||||
| Nikon Corp. | 600 | 17,715 | ||||||
| Nippon Telegraph & Telephone Corp. | 100 | 4,210 | ||||||
| Nissan Motor Co., Ltd. | 1,200 | 11,387 | ||||||
| Nissin Foods Holdings Co., Ltd. | 100 | 3,794 | ||||||
| Nitori Holdings Co., Ltd. | 50 | 3,663 | ||||||
| Nomura Research Institute Ltd. | 700 | 14,581 | ||||||
| Oji Holdings Corp. | 1,000 | 3,449 | ||||||
| Ono Pharmaceutical Co., Ltd. | 100 | 5,108 | ||||||
| Otsuka Holdings Co., Ltd. | 400 | 11,269 | ||||||
| Park24 Co., Ltd. | 200 | 3,159 | ||||||
| Pola Orbis Holdings, Inc. | 400 | 11,485 | ||||||
| Rakuten, Inc. | 600 | 4,679 | ||||||
| Sanrio Co., Ltd. (a) | 100 | 3,190 | ||||||
| Santen Pharmaceutical Co., Ltd. | 100 | 3,841 | ||||||
| Sega Sammy Holdings, Inc. | 700 | 11,816 | ||||||
| Seven & I Holdings Co., Ltd. | 800 | 22,553 | ||||||
| SKY Perfect JSAT Holdings, Inc. | 6 | 2,506 | ||||||
| Softbank Corp. | 800 | 29,313 | ||||||
| Square Enix Holdings Co., Ltd. | 600 | 7,633 | ||||||
| Sugi Holdings Co., Ltd. | 100 | 3,528 | ||||||
| Sumitomo Corp. | 200 | 2,566 | ||||||
| Sumitomo Mitsui Financial Group, Inc. | 1,000 | 36,342 | ||||||
| Sumitomo Realty & Development Co., Ltd. | 1,000 | 33,314 | ||||||
| Taiheiyo Cement Corp. | 4,000 | 10,997 | ||||||
| Taisei Corp. | 1,000 | 3,325 | ||||||
| Toho Co., Ltd. | 200 | 3,520 | ||||||
| Toho Gas Co., Ltd. | 1,000 | 5,362 | ||||||
| Tokyo Gas Co., Ltd. | 3,000 | 13,707 | ||||||
| Tokyu Corp. | 1,000 | 5,634 | ||||||
| SHARES | VALUE (Note 2) | |||||||
| Japan - 16.6% (continued) | ||||||||
| Tokyu Land Corp. | 3,000 | $ | 21,981 | |||||
| Toray Industries, Inc. | 1,000 | 6,143 | ||||||
| Toyota Motor Corp. | 1,800 | 84,053 | ||||||
| Unicharm Corp. | 400 | 20,786 | ||||||
| USS Co., Ltd. | 30 | 3,124 | ||||||
| West Japan Railway Co. | 100 | 3,940 | ||||||
| Yakult Honsha Co., Ltd. | 100 | 4,380 | ||||||
| Yamada Denki Co., Ltd. | 40 | 1,546 | ||||||
| Yamato Holdings Co., Ltd. | 200 | 3,039 | ||||||
| Yokogawa Electric Corp. | 300 | 3,290 | ||||||
| Zensho Holdings Co., Ltd. | 200 | 2,308 | ||||||
|
| |||||||
| 955,519 | ||||||||
|
| |||||||
| Netherlands - 2.4% | ||||||||
| Akzo Nobel NV | 301 | 19,925 | ||||||
| ASML Holding NV | 404 | 25,910 | ||||||
| Heineken NV | 422 | 28,292 | ||||||
| Koninklijke Ahold NV | 658 | 8,823 | ||||||
| Koninklijke Philips Electronics NV | 1,024 | 27,116 | ||||||
| Unilever NV CVA | 768 | 29,387 | ||||||
|
| |||||||
| 139,453 | ||||||||
|
| |||||||
| Norway - 1.5% | ||||||||
| Aker Solutions ASA | 867 | 17,954 | ||||||
| Gjensidige Forsikring ASA | 1,119 | 16,081 | ||||||
| Golar LNG Ltd. | 70 | 2,635 | ||||||
| Seadrill Ltd. | 556 | 20,484 | ||||||
| Telenor ASA | 565 | 11,505 | ||||||
| TGS Nopec Geophysical Co. ASA | 507 | 16,744 | ||||||
|
| |||||||
| 85,403 | ||||||||
|
| |||||||
| Portugal - 0.1% | ||||||||
| Galp Energia SGPS SA | 140 | 2,181 | ||||||
| Jeronimo Martins SGPS SA | 313 | 6,052 | ||||||
|
| |||||||
| 8,233 | ||||||||
|
| |||||||
| Singapore - 3.8% | ||||||||
| CapitaLand Ltd. | 9,000 | 27,703 | ||||||
| CapitaMalls Asia Ltd. | 18,000 | 28,990 | ||||||
| DBS Group Holdings Ltd. (a) | 2,000 | 24,553 | ||||||
| First Resources Ltd. | 7,000 | 11,672 | ||||||
| Global Logistic Properties Ltd. | 12,000 | 27,753 | ||||||
| Jardine Matheson Holdings Ltd. | 400 | 24,959 | ||||||
| Jardine Strategic Holdings Ltd. | 500 | 17,889 | ||||||
| Keppel Corp. Ltd. | 3,000 | 27,395 | ||||||
| Singapore Telecommunications Ltd. | 10,000 | 27,210 | ||||||
| StarHub Ltd. | 1,000 | 3,132 | ||||||
|
| |||||||
| 221,256 | ||||||||
|
| |||||||
| Spain - 2.3% | ||||||||
| Abertis Infraestructuras SA | 340 | 5,615 | ||||||
| Amadeus IT Holding SA, A Shares | 895 | 22,618 | ||||||
| CaixaBank | 381 | 1,335 | ||||||
| Endesa SA | 148 | 3,300 | ||||||
| Ferrovial SA | 390 | 5,805 | ||||||
| Gas Natural SDG SA | 438 | 7,896 | ||||||
| Inditex SA | 505 | 70,956 | ||||||
| The accompanying notes are an integral part of these financial statements. | (Continued) |
| AQR Funds | Annual Report | December 2012 | 117 | |||||||||||||
Table of Contents
| Schedule of Investments | December 31, 2012 |
| AQR TAX-MANAGED INTERNATIONAL MOMENTUM FUND |
| SHARES | VALUE (Note 2) | |||||||
| Spain - 2.3% (continued) | ||||||||
| Mapfre SA | 1,513 | $ | 4,662 | |||||
| Repsol SA | 400 | 8,165 | ||||||
|
| |||||||
| 130,352 | ||||||||
|
| |||||||
| Sweden - 3.1% | ||||||||
| Boliden AB | 854 | 16,227 | ||||||
| Elekta AB, B Shares | 244 | 3,817 | ||||||
| Getinge AB, B Shares | 138 | 4,691 | ||||||
| Hennes & Mauritz AB, B Shares | 383 | 13,274 | ||||||
| Investor AB, B Shares | 2,125 | 55,824 | ||||||
| Skandinaviska Enskilda Banken AB, Class A | 3,931 | 33,632 | ||||||
| Svenska Handelsbanken AB, A Shares | 392 | 14,093 | ||||||
| Swedbank AB, A Shares | 1,359 | 26,698 | ||||||
| Swedish Match AB | 114 | 3,827 | ||||||
| Tele2 AB, B Shares | 227 | 4,103 | ||||||
| Volvo AB, B Shares | 203 | 2,799 | ||||||
|
| |||||||
| 178,985 | ||||||||
|
| |||||||
| Switzerland - 5.7% | ||||||||
| Compagnie Financiere Richemont SA, Class A | 744 | 58,401 | ||||||
| Lindt & Spruengli AG † | 1 | 3,261 | ||||||
| Nestle SA | 1,134 | 73,986 | ||||||
| Novartis AG | 832 | 52,560 | ||||||
| Roche Holding AG | 156 | 31,540 | ||||||
| Schindler Holding AG | 32 | 4,629 | ||||||
| SGS SA | 12 | 26,653 | ||||||
| Syngenta AG | 94 | 37,975 | ||||||
| UBS AG † | 2,068 | 32,362 | ||||||
| Wolseley PLC | 78 | 3,730 | ||||||
|
| |||||||
| 325,097 | ||||||||
|
| |||||||
| United Kingdom - 11.0% | ||||||||
| Aggreko PLC | 133 | 3,796 | ||||||
| ARM Holdings PLC | 591 | 7,464 | ||||||
| Associated British Foods PLC | 210 | 5,365 | ||||||
| AstraZeneca PLC | 50 | 2,369 | ||||||
| Babcock International Group PLC | 190 | 2,999 | ||||||
| Barclays PLC | 9,263 | 40,238 | ||||||
| BG Group PLC | 687 | 11,459 | ||||||
| BP PLC | 740 | 5,145 | ||||||
| British American Tobacco PLC | 941 | 47,836 | ||||||
| British Land Co. PLC REIT | 245 | 2,263 | ||||||
| British Sky Broadcasting Group PLC | 451 | 5,688 | ||||||
| BT Group PLC | 5,048 | 19,259 | ||||||
| Bunzl PLC | 221 | 3,658 | ||||||
| Burberry Group PLC | 203 | 4,081 | ||||||
| Compass Group PLC | 1,417 | 16,821 | ||||||
| Croda International PLC | 111 | 4,338 | ||||||
| Diageo PLC | 1,887 | 54,962 | ||||||
| Experian PLC | 1,092 | 17,600 | ||||||
| Fresnillo PLC | 272 | 8,343 | ||||||
| G4S PLC | 681 | 2,853 | ||||||
| GlaxoSmithKline PLC | 126 | 2,743 | ||||||
| HSBC Holdings PLC | 6,883 | 72,938 | ||||||
| Imperial Tobacco Group PLC | 538 | 20,859 | ||||||
| Intertek Group PLC | 94 | 4,775 | ||||||
| SHARES | VALUE (Note 2) | |||||||
| United Kingdom - 11.0% (continued) | ||||||||
| Kingfisher PLC | 1,009 | $ | 4,715 | |||||
| Land Securities Group PLC REIT | 307 | 4,096 | ||||||
| Legal & General Group PLC | 1,967 | 4,717 | ||||||
| Meggitt PLC | 501 | 3,137 | ||||||
| National Grid PLC | 2,270 | 26,036 | ||||||
| Next PLC | 241 | 14,629 | ||||||
| Pearson PLC | 343 | 6,686 | ||||||
| Prudential PLC | 327 | 4,665 | ||||||
| Randgold Resources Ltd. | 40 | 3,957 | ||||||
| Reckitt Benckiser Group PLC | 500 | 31,740 | ||||||
| Rexam PLC | 527 | 3,771 | ||||||
| Rolls-Royce Holdings PLC † | 1,309 | 18,775 | ||||||
| Royal Bank of Scotland Group PLC † | 6,019 | 32,171 | ||||||
| SABMiller PLC | 977 | 45,344 | ||||||
| Sage Group PLC/The | 697 | 3,351 | ||||||
| Severn Trent PLC | 173 | 4,452 | ||||||
| Shire PLC | 214 | 6,583 | ||||||
| SSE PLC | 372 | 8,654 | ||||||
| Standard Life PLC | 762 | 4,165 | ||||||
| Tate & Lyle PLC | 322 | 3,984 | ||||||
| Tesco PLC | 1,089 | 5,999 | ||||||
| Tullow Oil PLC | 321 | 6,692 | ||||||
| United Utilities Group PLC | 372 | 4,095 | ||||||
| Vodafone Group PLC | 1,092 | 2,749 | ||||||
| Weir Group PLC/The | 123 | 3,803 | ||||||
| WM Morrison Supermarkets PLC | 1,127 | 4,839 | ||||||
|
| |||||||
| 631,657 | ||||||||
|
| |||||||
TOTAL COMMON STOCKS | 5,545,246 | |||||||
|
| |||||||
| PREFERRED STOCKS - 0.0% (b) | ||||||||
| United Kingdom - 0.0% (b) | ||||||||
Rolls-Royce Holdings PLC (3)†(c) | 99,484 | 162 | ||||||
|
| |||||||
| EXCHANGE-TRADED FUNDS - 3.3% | ||||||||
iShares MSCI EAFE Index Fund (1) | 3,414 | 193,983 | ||||||
|
| |||||||
| RIGHTS - 0.0% (b) | ||||||||
| Spain - 0.0% (b) | ||||||||
Repsol SA, expires 1/10/13 † | 400 | 244 | ||||||
|
| |||||||
| MONEY MARKET FUNDS - 3.0% | ||||||||
J.P. Morgan U.S. Treasury Plus Money Market Fund - |
| |||||||
Institutional Shares, 0.000% (d) | 169,898 | 169,898 | ||||||
|
| |||||||
| The accompanying notes are an integral part of these financial statements. | (Continued) |
| 118 | AQR Funds | Annual Report | December 2012 | |||||||||||||
Table of Contents
| Schedule of Investments | December 31, 2012 |
| AQR TAX-MANAGED INTERNATIONAL MOMENTUM FUND |
| INVESTMENTS OF CASH COLLATERAL FOR SECURITIES ON LOAN - 0.7% | SHARES | VALUE (Note 2) | ||||||
| J.P. Morgan Prime Money Market Fund - | ||||||||
Capital Shares, 0.120% (d)(e) | 39,305 | $ | 39,305 | |||||
|
| |||||||
TOTAL INVESTMENTS - 103.4% | 5,948,838 | |||||||
|
| |||||||
| LIABILITIES IN EXCESS OF OTHER ASSETS - (3.4%) | (200,006) | |||||||
|
| |||||||
NET ASSETS - 100.0% | $ | 5,748,832 | ||||||
|
| |||||||
| † | Non income-producing security. |
| (a) | All or a portion of the security on loan. The aggregate market value of such securities is $37,276; cash collateral of $39,305 was received with which the Fund purchased a money market fund. |
| (b) | Represents less than 0.05 percent of net assets. |
| (c) | Security fair valued as of December 31, 2012 using procedures approved by the Board of Trustees. The total value of positions fair valued was $162 or 0.0% of total net assets. |
| (d) | Represents annualized seven-day yield as of December 31, 2012. |
| (e) | Represents security, or portion thereof, purchased with the cash collateral received for securities on loan. |
All securities are Level 2 with respect to ASC 820, unless otherwise noted in parentheses.
(1) Level 1 security (See Note 4).
(3) Level 3 security (See Note 4).
The following abbreviations are used in portfolio descriptions:
CVA - Dutch Certificate of Shares
REIT - Real Estate Investment Trust
| SECTOR | VALUE | % OF NET ASSETS | ||||||
| Consumer Discretionary | $ | 782,275 | 13.6 | % | ||||
| Consumer Staples | 836,694 | 14.5 | ||||||
| Energy | 168,177 | 2.9 | ||||||
| Financials | 1,704,366 | 29.6 | ||||||
| Health Care | 548,667 | 9.6 | ||||||
| Industrials | 569,746 | 9.9 | ||||||
| Information Technology | 257,554 | 4.5 | ||||||
| Materials | 321,856 | 5.6 | ||||||
| Mutual Fund | 193,983 | 3.3 | ||||||
| Telecommunication Services | 220,141 | 3.8 | ||||||
| Utilities | 136,176 | 2.4 | ||||||
| Money Market Funds | 209,203 | 3.7 | ||||||
|
|
|
| |||||
Total Investments | 5,948,838 | 103.4 | ||||||
| Liabilities in Excess of Other Assets | (200,006) | (3.4) | ||||||
|
|
|
| |||||
Net Assets | $ | 5,748,832 | 100.0 | % | ||||
|
|
|
| |||||
| The accompanying notes are an integral part of these financial statements. |
| AQR Funds | Annual Report | December 2012 | 119 | |||||||||||||
Table of Contents
| AQR GLOBAL EQUITY FUND | AQR INTERNATIONAL EQUITY FUND | AQR EMERGING DEFENSIVE EQUITY FUND | ||||||||||
| ASSETS: | ||||||||||||
| Investments in securities, at cost | $409,520,506 | $593,263,843 | $7,250,274 | |||||||||
| Investments in securities, at value* | $475,896,738 | $673,915,849 | $7,760,614 | |||||||||
| Cash (including foreign currency of $1,332,151, $1,363,627 and $14,370, respectively) | 1,334,377 | 1,363,627 | 14,370 | |||||||||
| Due from brokers | 12,288,138 | 13,546,834 | — | |||||||||
| Unrealized appreciation on forward foreign currency exchange contracts | 5,546,267 | 7,536,958 | — | |||||||||
| Swaps, at value | — | 46,560 | — | |||||||||
| Unrealized appreciation on futures contracts | 172,982 | 1,212,359 | — | |||||||||
| Receivables: | ||||||||||||
Securities sold | 10,641 | 92 | 2,868 | |||||||||
Foreign tax reclaim | 518,148 | 810,530 | — | |||||||||
Dividends and interest | 503,589 | 447,521 | 11,581 | |||||||||
Capital shares sold | — | 52,722 | — | |||||||||
Due from Investment Advisor | — | — | 5,132 | |||||||||
Prepaid expenses | 31,176 | 43,364 | 13,623 | |||||||||
| Total Assets | 496,302,056 | 698,976,416 | 7,808,188 | |||||||||
| LIABILITIES: | ||||||||||||
| Due to brokers | 4,680,000 | 6,010,000 | — | |||||||||
| Swaps, at value | 88,758 | — | — | |||||||||
| Payables: | ||||||||||||
Securities purchased | 10,615 | — | 375,459 | |||||||||
Collateral received on securities loaned | 15,571,488 | 5,135,864 | 179,141 | |||||||||
Accrued Investment advisory fees | 249,127 | 394,783 | — | |||||||||
Accrued Shareholder servicing fees | 814 | 53,927 | 1,353 | |||||||||
Accrued Distribution fees—Class N | 297 | 3,348 | 376 | |||||||||
Capital shares redeemed | — | 29,527 | — | |||||||||
Other accrued expenses and liabilities | 144,431 | 252,009 | 45,339 | |||||||||
| Total Liabilities | 20,745,530 | 11,879,458 | 601,668 | |||||||||
| Net Assets | $475,556,526 | $687,096,958 | $7,206,520 | |||||||||
| NET ASSETS CONSIST OF: | ||||||||||||
| Paid-in capital ($0.001 par value common stock, unlimited authorized shares) | $416,907,660 | $622,704,028 | $6,697,038 | |||||||||
| Undistributed (accumulated) net investment income (loss) | (575,224) | (1,607,306) | 4,259 | |||||||||
| Undistributed (accumulated) net realized gain (loss) | (13,129,650) | (23,462,854) | (6,501) | |||||||||
| Net unrealized appreciation (depreciation) | 72,353,740 | 89,463,090 | 511,724 | |||||||||
| Net Assets | $475,556,526 | $687,096,958 | $7,206,520 | |||||||||
| NET ASSETS: | ||||||||||||
| Class I | $626,448 | $196,971,397 | $5,402,251 | |||||||||
| Class N | 517,504 | 15,561,822 | 1,804,269 | |||||||||
| Class Y | 474,412,574 | 474,563,739 | — | |||||||||
| SHARES OUTSTANDING: | ||||||||||||
| Class I | 55,196 | 19,233,566 | 494,839 | |||||||||
| Class N | 45,729 | 1,492,563 | 165,019 | |||||||||
| Class Y | 41,798,875 | 44,308,341 | — | |||||||||
| NET ASSET VALUE AND PUBLIC OFFERING PRICE PER SHARE: | ||||||||||||
| Class I | $11.35 | $10.24 | $10.92 | |||||||||
| Class N | $11.32 | $10.43 | $10.93 | |||||||||
| Class Y | $11.35 | $10.71 | — | |||||||||
| Foreign currency at cost of $1,331,794, $1,345,976 and $14,311, respectively. |
| * | Investments in securities includes the market value of securities out on loan of $15,413,989, $4,849,090 and $174,682, respectively. |
| The accompanying notes are an integral part of these financial statements. |
| 120 | AQR Funds | Annual Report | December 2012 | |||||||||||||
Table of Contents
| Statements of Assets and Liabilities | December 31, 2012 |
| AQR INTERNATIONAL DEFENSIVE EQUITY FUND | AQR U.S. DEFENSIVE EQUITY FUND | AQR DIVERSIFIED ARBITRAGE FUND | ||||||||||
| ASSETS: | ||||||||||||
| Investments in securities, at cost | $6,037,371 | $9,992,429 | $2,523,306,080 | |||||||||
| Investments in securities, at value* | $6,281,696 | $10,025,872 | $2,537,110,526 | |||||||||
| Cash (including foreign currency of $16,208, $— and $4,910,708, respectively) | 16,208 | — | 34,722,274 | |||||||||
| Due from brokers | — | — | 415,842,487 | |||||||||
| Swaps, at value | — | — | 278,224 | |||||||||
| Unrealized appreciation on futures contracts | — | — | 821,534 | |||||||||
| Receivables: | ||||||||||||
Securities sold | — | 914,476 | 52,468,003 | |||||||||
Foreign tax reclaim | 160 | — | 27,944 | |||||||||
Dividends and interest | 14,798 | 10,536 | 10,058,645 | |||||||||
Capital shares sold | — | 113 | 5,125,706 | |||||||||
Due from Investment Advisor | 6,907 | 9,234 | — | |||||||||
Prepaid expenses | 13,590 | 13,604 | 206,945 | |||||||||
| Total Assets | 6,333,359 | 10,973,835 | 3,056,662,288 | |||||||||
| LIABILITIES: | ||||||||||||
| Securities sold short, at value (proceeds $—, $— and $468,262,960, respectively) | — | — | 488,808,685 | |||||||||
| Options written, at value (proceeds $—, $— and $183,593, respectively) | — | — | 146,752 | |||||||||
| Due to custodian | — | 488 | — | |||||||||
| Unrealized depreciation on forward foreign currency exchange contracts | — | — | 1,332,581 | |||||||||
| Swaps, at value | — | — | 5,453,134 | |||||||||
| Payables: | ||||||||||||
Securities purchased | 31,742 | 1,823,305 | 37,434,977 | |||||||||
Collateral received on securities loaned | 40,474 | 850,057 | 161,950 | |||||||||
Accrued Investment advisory fees | — | — | 2,128,308 | |||||||||
Accrued Shareholder servicing fees | 1,223 | 1,396 | — | |||||||||
Accrued Distribution fees—Class N | 257 | 91 | 161,121 | |||||||||
Capital shares redeemed | — | — | 5,501,541 | |||||||||
Dividends and interest payable on securities sold short | — | — | 501,181 | |||||||||
Other accrued expenses and liabilities | 43,362 | 35,768 | 936,734 | |||||||||
| Total Liabilities | 117,058 | 2,711,105 | 542,566,964 | |||||||||
| Net Assets | $6,216,301 | $8,262,730 | $2,514,095,324 | |||||||||
| NET ASSETS CONSIST OF: | ||||||||||||
| Paid-in capital ($0.001 par value common stock, unlimited authorized shares) | $5,969,913 | $8,230,750 | $2,514,592,247 | |||||||||
| Undistributed (accumulated) net investment income (loss) | (143) | 5,727 | 417,982 | |||||||||
| Undistributed (accumulated) net realized gain (loss) | 2,149 | (7,190) | 200,558 | |||||||||
| Net unrealized appreciation (depreciation) | 244,382 | 33,443 | (1,115,463) | |||||||||
| Net Assets | $6,216,301 | $8,262,730 | $2,514,095,324 | |||||||||
| NET ASSETS: | ||||||||||||
| Class I | $5,366,031 | $7,841,840 | $1,752,723,858 | |||||||||
| Class N | 850,270 | 420,890 | 761,371,466 | |||||||||
| SHARES OUTSTANDING: | ||||||||||||
| Class I | 502,748 | 771,572 | 158,688,997 | |||||||||
| Class N | 79,543 | 41,347 | 69,181,212 | |||||||||
| NET ASSET VALUE AND PUBLIC OFFERING PRICE PER SHARE: | ||||||||||||
| Class I | $10.67 | $10.16 | $11.05 | |||||||||
| Class N | $10.69 | $10.18 | $11.01 | |||||||||
| Foreign currency at cost of $16,160, $— and $4,799,844, respectively. |
| * | Investments in securities includes the market value of securities out on loan of $38,540, $838,381 and $151,539, respectively. |
| The accompanying notes are an integral part of these financial statements. |
| AQR Funds | Annual Report | December 2012 | 121 | |||||||||||||
Table of Contents
| Statements of Assets and Liabilities | December 31, 2012 |
| AQR MOMENTUM FUND | AQR SMALL CAP MOMENTUM FUND | AQR INTERNATIONAL MOMENTUM FUND | ||||||||||
| ASSETS: | ||||||||||||
| Investments in securities, at cost | $581,077,900 | $167,530,671 | $112,655,193 | |||||||||
| Investments in securities, at value* | $637,802,053 | $186,757,619 | $129,144,605 | |||||||||
| Cash (including foreign currency of $463, $— and $222,474, respectively) | 463 | 462,660 | 223,331 | |||||||||
| Due from brokers | 332,353 | 78,182 | — | |||||||||
| Unrealized appreciation on futures contracts | 15,022 | 27,273 | — | |||||||||
| Receivables: | ||||||||||||
Securities sold | 759 | — | — | |||||||||
Foreign tax reclaim | — | — | 83,876 | |||||||||
Dividends and interest | 559,223 | 143,595 | 107,870 | |||||||||
Capital shares sold | 1,170,570 | 345,219 | 390,416 | |||||||||
Prepaid expenses | 32,922 | 13,168 | 11,314 | |||||||||
| Total Assets | 639,913,365 | 187,827,716 | 129,961,412 | |||||||||
| LIABILITIES: | ||||||||||||
| Due to custodian | 2,518 | — | — | |||||||||
| Payables: | ||||||||||||
Securities purchased | — | — | 486,797 | |||||||||
Collateral received on securities loaned | 88,331,686 | 41,729,314 | 1,550,145 | |||||||||
Accrued Investment advisory fees | 100,576 | 69,761 | 40,311 | |||||||||
Accrued Shareholder servicing fees | 64,567 | 17,821 | 15,844 | |||||||||
Accrued Distribution fees��Class N | 4,721 | 1 | 1 | |||||||||
Capital shares redeemed | 2,350,940 | 153,320 | 88,364 | |||||||||
Other accrued expenses and liabilities | 195,044 | 77,534 | 95,436 | |||||||||
| Total Liabilities | 91,050,052 | 42,047,751 | 2,276,898 | |||||||||
| Net Assets | $548,863,313 | $145,779,965 | $127,684,514 | |||||||||
| NET ASSETS CONSIST OF: | ||||||||||||
| Paid-in capital ($0.001 par value common stock, unlimited authorized shares) | $500,198,848 | $124,905,247 | $123,011,755 | |||||||||
| Undistributed (accumulated) net investment income (loss) | 227,113 | 146,099 | (313,735) | |||||||||
| Undistributed (accumulated) net realized gain (loss) | (8,301,860) | 1,474,398 | (11,504,982) | |||||||||
| Net unrealized appreciation (depreciation) | 56,739,212 | 19,254,221 | 16,491,476 | |||||||||
| Net Assets | $548,863,313 | $145,779,965 | $127,684,514 | |||||||||
| NET ASSETS: | ||||||||||||
| Class L | $490,441,577 | $145,769,751 | $127,673,412 | |||||||||
| Class N | 58,421,736 | 10,214 | 11,102 | |||||||||
| SHARES OUTSTANDING: | ||||||||||||
| Class L | 30,541,508 | 8,871,777 | 9,757,051 | |||||||||
| Class N | 3,638,858 | 622 | 849 | |||||||||
| NET ASSET VALUE AND PUBLIC OFFERING PRICE PER SHARE: | ||||||||||||
| Class L | $16.06 | $16.43 | $13.09 | |||||||||
| Class N | $16.05 | $16.43 | † | $13.08 | ||||||||
| Foreign currency at cost of $426, $— and $222,056, respectively. |
| * | Investments in securities includes the market value of securities out on loan of $88,153,912, $41,226,770 and $1,474,484, respectively. |
| † | Per share amounts do not recalculate due to rounding of net assets and/or shares outstanding. |
| The accompanying notes are an integral part of these financial statements. |
| 122 | AQR Funds | Annual Report | December 2012 | |||||||||||||
Table of Contents
| Statements of Assets and Liabilities | December 31, 2012 |
| AQR TAX-MANAGED MOMENTUM FUND | AQR TAX-MANAGED SMALL CAP MOMENTUM FUND | AQR TAX-MANAGED INTERNATIONAL MOMENTUM FUND | ||||||||||
| ASSETS: | ||||||||||||
| Investments in securities, at cost | $5,093,283 | $4,231,205 | $5,436,535 | |||||||||
| Investments in securities, at value* | $5,384,251 | $4,503,294 | $5,948,838 | |||||||||
| Cash (including foreign currency of $—, $— and $22,059, respectively) | — | 11,031 | 22,071 | |||||||||
| Receivables: | ||||||||||||
Foreign tax reclaim | — | — | 1,881 | |||||||||
Dividends and interest | 6,892 | 2,680 | 5,855 | |||||||||
Capital shares sold | 1,241,230 | — | — | |||||||||
Prepaid expenses | 13,100 | 13,057 | 13,069 | |||||||||
| Total Assets | 6,645,473 | 4,530,062 | 5,991,714 | |||||||||
| LIABILITIES: | ||||||||||||
| Payables: | ||||||||||||
Securities purchased | 42,073 | 41,327 | 140,585 | |||||||||
Collateral received on securities loaned | 506,866 | 992,291 | 39,305 | |||||||||
Due to Investment Advisor | 12,468 | 16,306 | 12,933 | |||||||||
Accrued Distribution fees—Class N | 1 | 1 | 1 | |||||||||
Other accrued expenses and liabilities | 33,236 | 34,927 | 50,058 | |||||||||
| Total Liabilities | 594,644 | 1,084,852 | 242,882 | |||||||||
| Net Assets | $6,050,829 | $3,445,210 | $5,748,832 | |||||||||
| NET ASSETS CONSIST OF: | ||||||||||||
| Paid-in capital ($0.001 par value common stock, unlimited authorized shares) | $5,770,596 | $3,153,059 | $5,224,221 | |||||||||
| Undistributed (accumulated) net investment income (loss) | 3,454 | 3,863 | (14,184) | |||||||||
| Undistributed (accumulated) net realized gain (loss) | (14,189) | 16,199 | 26,343 | |||||||||
| Net unrealized appreciation (depreciation) | 290,968 | 272,089 | 512,452 | |||||||||
| Net Assets | $6,050,829 | $3,445,210 | $5,748,832 | |||||||||
| NET ASSETS: | ||||||||||||
| Class L | $6,040,821 | $3,434,992 | $5,738,743 | |||||||||
| Class N | 10,008 | 10,218 | 10,089 | |||||||||
| SHARES OUTSTANDING: | ||||||||||||
| Class L | 542,643 | 307,953 | 510,465 | |||||||||
| Class N | 899 | 917 | 898 | |||||||||
| NET ASSET VALUE AND PUBLIC OFFERING PRICE PER SHARE: | ||||||||||||
| Class L | $11.13 | $11.15 | $11.24 | |||||||||
| Class N | $11.13 | $11.15 | † | $11.24 | † | |||||||
| Foreign currency at cost of $—, $— and $21,983, respectively. |
| * | Investments in securities includes the market value of securities out on loan of $506,928, $982,928 and $37,276, respectively. |
| † | Per share amounts do not recalculate due to rounding of net assets and/or shares outstanding. |
| The accompanying notes are an integral part of these financial statements. |
| AQR Funds | Annual Report | December 2012 | 123 | |||||||||||||
Table of Contents
| Statements of Operations | December 31, 2012 |
| AQR GLOBAL EQUITY FUND | AQR INTERNATIONAL EQUITY FUND | AQR EMERGING DEFENSIVE EQUITY FUND | ||||||||||
| FOR THE YEAR ENDED DECEMBER 31, 2012 | FOR THE YEAR ENDED DECEMBER 31, 2012 | FOR THE PERIOD 07/09/12*-12/31/12 | ||||||||||
| INVESTMENT INCOME: | ||||||||||||
| Dividend income† | $11,820,928 | $17,661,016 | $81,249 | |||||||||
| Securities lending income, net | 203,348 | 494,124 | 91 | |||||||||
| Total Income | 12,024,276 | 18,155,140 | 81,340 | |||||||||
| EXPENSES: | ||||||||||||
| Investment advisory fees | 1,747,589 | 2,642,211 | 15,889 | |||||||||
| Shareholder servicing fees | 11,838 | 558,878 | 6,621 | |||||||||
| Custody, administration & accounting fees | 162,837 | 215,223 | 8,725 | |||||||||
| Legal fees | 25,187 | 25,799 | 2,629 | |||||||||
| Audit & tax fees | 70,550 | 69,537 | 55,050 | |||||||||
| Shareholder reporting fees | 9,195 | 19,902 | 3,192 | |||||||||
| Transfer agent fees | 10,585 | 89,588 | 6,144 | |||||||||
| Trustee fees | 26,157 | 34,468 | 92 | |||||||||
| Organization and offering costs | — | — | 20,029 | |||||||||
| Distribution fees—Class N | 3,967 | 33,404 | 1,507 | |||||||||
| Recoupment of waiver | 91,006 | 139,423 | — | |||||||||
| Registration fees | 26,562 | 38,173 | 21,988 | |||||||||
| Pricing fee | 17,678 | 16,611 | 10,044 | |||||||||
| Other fees | 79,511 | 114,426 | 4,615 | |||||||||
| Total Expenses | 2,282,662 | 3,997,643 | 156,525 | |||||||||
| Less waivers: | ||||||||||||
Investment advisory fees waived | (7,873) | — | (15,889) | |||||||||
Shareholder servicing fees waived | (11,838) | — | (6,621) | |||||||||
Expense reimbursements | — | — | (101,965) | |||||||||
| Net Expenses | 2,262,951 | 3,997,643 | 32,050 | |||||||||
| Net Investment Income (Loss) | 9,761,325 | 14,157,497 | 49,290 | |||||||||
| REALIZED AND UNREALIZED GAIN (LOSS): | ||||||||||||
| Net realized gain (loss) from: | ||||||||||||
Investments in securities | 12,448,971 | (9,070,105) | 9,489 | |||||||||
Foreign currency and foreign currency translations | (226,127) | (477,185) | (5,725) | |||||||||
Forward foreign currency exchange contracts | 7,969,959 | 15,010,931 | — | |||||||||
Futures contracts | 2,427,378 | 7,075,466 | — | |||||||||
Swap and swaps on futures contracts | 3,330,894 | 1,841,341 | — | |||||||||
| Net realized gain (loss) | 25,951,075 | 14,380,448 | 3,764 | |||||||||
| Net change in unrealized appreciation (depreciation) on: | ||||||||||||
Investments in securities | 38,743,797 | 90,469,316 | 510,340 | |||||||||
Foreign currency and foreign currency translations | (20,795) | (39,053) | 1,384 | |||||||||
Forward foreign currency exchange contracts | 5,722,064 | 8,039,606 | — | |||||||||
Futures contracts | (2,134,515) | (2,833,783) | — | |||||||||
Swap and swaps on futures contracts | 16,214 | 865,854 | — | |||||||||
| Net change in unrealized appreciation (depreciation) | 42,326,765 | 96,501,940 | 511,724 | |||||||||
| Net gain (loss) and change in unrealized appreciation (depreciation) | 68,277,840 | 110,882,388 | 515,488 | |||||||||
| Net increase (decrease) in net assets resulting from operations | $78,039,165 | $125,039,885 | $564,778 | |||||||||
† Net of foreign taxes withheld of | $517,974 | $1,088,541 | $5,667 | |||||||||
| * | Commencement of operations. |
| The accompanying notes are an integral part of these financial statements. |
| 124 | AQR Funds | Annual Report | December 2012 | |||||||||||||
Table of Contents
| Statements of Operations | December 31, 2012 |
| AQR INTERNATIONAL DEFENSIVE EQUITY FUND | AQR U.S. DEFENSIVE EQUITY FUND | AQR DIVERSIFIED ARBITRAGE FUND | ||||||||||
| FOR THE PERIOD 07/09/12*-12/31/12 | FOR THE PERIOD 07/09/12*-12/31/12 | FOR THE YEAR ENDED DECEMBER 31, 2012 | ||||||||||
| INVESTMENT INCOME: | ||||||||||||
| Dividend income† | $50,968 | $58,084 | $21,268,415 | |||||||||
| Interest income | — | — | 54,951,525 | |||||||||
| Securities lending income, net | 109 | 377 | 219,269 | |||||||||
| Total Income | 51,077 | 58,461 | 76,439,209 | |||||||||
| EXPENSES: | ||||||||||||
| Investment advisory fees | 7,291 | 5,085 | 23,956,575 | |||||||||
| Shareholder servicing fees | 4,556 | 4,238 | — | |||||||||
| Custody, administration & accounting fees | 3,948 | 6,253 | 772,005 | |||||||||
| Legal fees | 2,727 | 3,302 | 244,911 | |||||||||
| Audit & tax fees | 55,050 | 40,950 | 230,557 | |||||||||
| Shareholder reporting fees | 3,173 | 2,613 | 316,492 | |||||||||
| Transfer agent fees | 6,092 | 6,798 | 2,750,614 | |||||||||
| Trustee fees | 57 | 47 | 143,809 | |||||||||
| Organization and offering costs | 20,816 | 20,474 | — | |||||||||
| Distribution fees—Class N | 1,344 | 903 | 1,784,883 | |||||||||
| Dividends and interest on securities sold short | — | — | 25,900,160 | |||||||||
| Recoupment of waiver | — | — | 392,888 | |||||||||
| Registration fees | 21,985 | 21,985 | 342,094 | |||||||||
| Pricing fee | 9,784 | 607 | 20,869 | |||||||||
| Other fees | 4,418 | 4,578 | 843,236 | |||||||||
| Total Expenses | 141,241 | 117,833 | 57,699,093 | |||||||||
| Less waivers: | ||||||||||||
Investment advisory fees waived | (7,291) | (5,085) | (227,590) | |||||||||
Shareholder servicing fees waived | (4,556) | (4,238) | — | |||||||||
Expense reimbursements | (111,569) | (94,844) | — | |||||||||
| Net Expenses | 17,825 | 13,666 | 57,471,503 | |||||||||
| Net Investment Income (Loss) | 33,252 | 44,795 | 18,967,706 | |||||||||
| REALIZED AND UNREALIZED GAIN (LOSS): | ||||||||||||
| Net realized gain (loss) from: | ||||||||||||
Investments in securities | 19,375 | (2,179) | 227,266,846 | |||||||||
Foreign currency and foreign currency translations | (3,096) | — | 15,112,282 | |||||||||
Forward foreign currency exchange contracts | — | — | (2,549,327) | |||||||||
Futures contracts | — | — | (18,355,820) | |||||||||
Securities sold short | — | — | (119,739,781) | |||||||||
Swap and swaps on futures contracts | — | — | (43,824,276) | |||||||||
Written options | — | — | 3,360,916 | |||||||||
| Net realized gain (loss) | 16,279 | (2,179) | 61,270,840 | |||||||||
| Net change in unrealized appreciation (depreciation) on: | ||||||||||||
Investments in securities | 244,325 | 33,443 | 32,163,707 | |||||||||
Foreign currency and foreign currency translations | 57 | — | 5,422,422 | |||||||||
Forward foreign currency exchange contracts | — | — | (2,272,548) | |||||||||
Futures contracts | — | — | 2,008,994 | |||||||||
Securities sold short | — | — | (52,516,542) | |||||||||
Swap and swaps on futures contracts | — | — | 4,512,060 | |||||||||
Written options | — | — | (371,181) | |||||||||
| Net change in unrealized appreciation (depreciation) | 244,382 | 33,443 | (11,053,088) | |||||||||
| Net gain (loss) and change in unrealized appreciation (depreciation) | 260,661 | 31,264 | 50,217,752 | |||||||||
| Net increase (decrease) in net assets resulting from operations | $293,913 | $76,059 | $69,185,458 | |||||||||
† Net of foreign taxes withheld of | $3,452 | $— | $333,001 | |||||||||
| * | Commencement of operations. |
| The accompanying notes are an integral part of these financial statements. |
| AQR Funds | Annual Report | December 2012 | 125 | |||||||||||||
Table of Contents
| Statements of Operations | December 31, 2012 |
| AQR MOMENTUM FUND | AQR SMALL CAP | AQR INTERNATIONAL MOMENTUM FUND | ||||||||||
| FOR THE YEAR ENDED DECEMBER 31, 2012 | FOR THE YEAR ENDED DECEMBER 31, 2012 | FOR THE YEAR ENDED | ||||||||||
| INVESTMENT INCOME: | ||||||||||||
| Dividend income† | $9,380,171 | $2,458,375 | $3,139,071 | |||||||||
| Interest income | 162 | 80 | — | |||||||||
| Securities lending income, net | 143,633 | 167,197 | 79,644 | |||||||||
| Total Income | 9,523,966 | 2,625,652 | 3,218,715 | |||||||||
| EXPENSES: | ||||||||||||
| Investment advisory fees | 1,087,067 | 436,076 | 366,874 | |||||||||
| Shareholder servicing fees | 652,246 | 186,893 | 157,234 | |||||||||
| Custody, administration & accounting fees | 125,963 | 42,668 | 66,602 | |||||||||
| Legal fees | 18,769 | 3,844 | 4,414 | |||||||||
| Audit & tax fees | 39,960 | 38,660 | 51,367 | |||||||||
| Shareholder reporting fees | 34,422 | 21,613 | 16,951 | |||||||||
| Transfer agent fees | 406,891 | 105,256 | 104,023 | |||||||||
| Trustee fees | 24,840 | 7,132 | 5,804 | |||||||||
| Distribution fees—Class N | 4,721 | 1 | 1 | |||||||||
| Other fees | 124,836 | 57,671 | 61,504 | |||||||||
| Total Expenses | 2,519,715 | 899,814 | 834,774 | |||||||||
| Less waivers: | ||||||||||||
Shareholder servicing fees waived | (335,876) | (74,662) | (140,733) | |||||||||
| Net Expenses | 2,183,839 | 825,152 | 694,041 | |||||||||
| Net Investment Income (Loss) | 7,340,127 | 1,800,500 | 2,524,674 | |||||||||
| REALIZED AND UNREALIZED GAIN (LOSS): | ||||||||||||
| Net realized gain (loss) from: | ||||||||||||
Investments in securities | 12,934,616 | 7,023,315 | 1,203,670 | |||||||||
Foreign currency and foreign currency translations | 122 | — | (48,603) | |||||||||
Futures contracts | 531,791 | 14,542 | — | |||||||||
| Net realized gain (loss) | 13,466,529 | 7,037,857 | 1,155,067 | |||||||||
| Net change in unrealized appreciation (depreciation) on: | ||||||||||||
Investments in securities | 39,554,467 | 12,320,689 | 13,704,406 | |||||||||
Foreign currency and foreign currency translations | 37 | — | 4,476 | |||||||||
Futures contracts | (23,726) | 11,085 | — | |||||||||
| Net change in unrealized appreciation (depreciation) | 39,530,778 | 12,331,774 | 13,708,882 | |||||||||
| Net gain (loss) and change in unrealized appreciation (depreciation) | 52,997,307 | 19,369,631 | 14,863,949 | |||||||||
| Net increase (decrease) in net assets resulting from operations | $60,337,434 | $21,170,131 | $17,388,623 | |||||||||
† Net of foreign taxes withheld of | $— | $729 | $260,289 | |||||||||
| The accompanying notes are an integral part of these financial statements. |
| 126 | AQR Funds | Annual Report | December 2012 | |||||||||||||
Table of Contents
| Statements of Operations | December 31, 2012 |
| AQR TAX-MANAGED MOMENTUM FUND | AQR TAX-MANAGED SMALL CAP MOMENTUM FUND | AQR TAX-MANAGED INTERNATIONAL MOMENTUM FUND | ||||||||||
| FOR THE PERIOD 01/27/12*-12/31/12 | FOR THE PERIOD 01/27/12*-12/31/12 | FOR THE PERIOD 01/27/12*-12/31/12 | ||||||||||
| INVESTMENT INCOME: | ||||||||||||
| Dividend income† | $70,117 | $58,219 | $103,334 | |||||||||
| Securities lending income, net | 1,041 | 5,210 | 883 | |||||||||
| Total Income | 71,158 | 63,429 | 104,217 | |||||||||
| EXPENSES: | ||||||||||||
| Investment advisory fees | 8,753 | 9,669 | 13,508 | |||||||||
| Shareholder servicing fees | 4,377 | 3,626 | 5,066 | |||||||||
| Custody, administration & accounting fees | 5,953 | 10,519 | 19,721 | |||||||||
| Legal fees | 783 | 768 | 908 | |||||||||
| Audit & tax fees | 45,212 | 45,391 | 58,756 | |||||||||
| Shareholder reporting fees | 7,348 | 6,894 | 6,917 | |||||||||
| Transfer agent fees | 12,770 | 12,710 | 12,797 | |||||||||
| Trustee fees | 158 | 142 | 175 | |||||||||
| Organization and offering costs | 28,994 | 24,651 | 24,978 | |||||||||
| Distribution fees—Class N | 1 | 1 | 1 | |||||||||
| Registration fees | 19,382 | 19,381 | 19,382 | |||||||||
| Pricing fee | 2,895 | 9,103 | 20,123 | |||||||||
| Other fees | 2,611 | 2,281 | 2,634 | |||||||||
| Total Expenses | 139,237 | 145,136 | 184,966 | |||||||||
| Less waivers: | ||||||||||||
Investment advisory fees waived | (8,753) | (9,669) | (13,508) | |||||||||
Shareholder servicing fees waived | (4,377) | (3,626) | (5,066) | |||||||||
Expense reimbursements | (110,047) | (114,632) | (142,423) | |||||||||
| Net Expenses | 16,060 | 17,209 | 23,969 | |||||||||
| Net Investment Income (Loss) | 55,098 | 46,220 | 80,248 | |||||||||
| REALIZED AND UNREALIZED GAIN (LOSS): | ||||||||||||
| Net realized gain (loss) from: | ||||||||||||
Investments in securities | 17,580 | 18,525 | 26,491 | |||||||||
Foreign currency and foreign currency translations | 44 | — | (1,790) | |||||||||
Futures contracts | 2,745 | (3,953) | — | |||||||||
| Net realized gain (loss) | 20,369 | 14,572 | 24,701 | |||||||||
| Net change in unrealized appreciation (depreciation) on: | ||||||||||||
Investments in securities | 290,968 | 272,089 | 512,303 | |||||||||
Foreign currency and foreign currency translations | — | — | 149 | |||||||||
| Net change in unrealized appreciation (depreciation) | 290,968 | 272,089 | 512,452 | |||||||||
| Net gain (loss) and change in unrealized appreciation (depreciation) | 311,337 | 286,661 | 537,153 | |||||||||
| Net increase (decrease) in net assets resulting from operations | $366,435 | $332,881 | $617,401 | |||||||||
† Net of foreign taxes withheld of | $2 | $48 | $7,680 | |||||||||
| * | Commencement of operations. |
| The accompanying notes are an integral part of these financial statements. |
| AQR Funds | Annual Report | December 2012 | 127 | |||||||||||||
Table of Contents
| Statements of Changes in Net Assets | December 31, 2012 |
| AQR GLOBAL EQUITY FUND | AQR INTERNATIONAL EQUITY FUND | |||||||||||||||
| FOR THE YEAR ENDED DECEMBER 31, 2012 | FOR THE YEAR ENDED DECEMBER 31, 2011 | FOR THE YEAR ENDED DECEMBER 31, 2012 | FOR THE YEAR ENDED DECEMBER 31, 2011 | |||||||||||||
| OPERATIONS: | ||||||||||||||||
| Net investment income (loss) | $9,761,325 | $9,396,671 | $14,157,497 | $12,140,951 | ||||||||||||
| Net realized gain (loss) | 25,951,075 | (5,012,673) | 14,380,448 | (21,266,844) | ||||||||||||
| Net change in unrealized appreciation (depreciation) | 42,326,765 | (31,770,689) | 96,501,940 | (68,430,519) | ||||||||||||
Net increase (decrease) in net assets resulting from operations | 78,039,165 | (27,386,691) | 125,039,885 | (77,556,412) | ||||||||||||
| DISTRIBUTIONS TO SHAREHOLDERS: | ||||||||||||||||
| Net investment income: | ||||||||||||||||
Class I | (44,921) | (22,319) | (6,044,927) | (3,204,118) | ||||||||||||
Class N | (39,465) | (14,377) | (442,708) | (20,121) | ||||||||||||
Class Y | (13,830,600) | (6,318,978) | (14,968,277) | (8,730,438) | ||||||||||||
Total | (13,914,986) | (6,355,674) | (21,455,912) | (11,954,677) | ||||||||||||
| Net realized gain: | ||||||||||||||||
Class I | (36,801) | (27,548) | — | (1,042,406) | ||||||||||||
Class N | (34,857) | (21,102) | — | (8,687) | ||||||||||||
Class Y | (9,350,410) | (5,068,282) | — | (2,482,902) | ||||||||||||
Total | (9,422,068) | (5,116,932) | — | (3,533,995) | ||||||||||||
Total distributions | (23,337,054) | (11,472,606) | (21,455,912) | (15,488,672) | ||||||||||||
| CAPITAL TRANSACTIONS: | ||||||||||||||||
| CLASS I | ||||||||||||||||
| Proceeds from shares sold | 289,737 | 2,662,793 | 56,017,676 | 100,254,223 | ||||||||||||
| Reinvestment of distributions | 81,722 | 49,867 | 5,225,139 | 4,080,915 | ||||||||||||
| Cost of shares redeemed | (2,120,396) | (1,826,180) | (33,350,378) | (19,241,187) | ||||||||||||
| Redemption fees | — | — | — | 2,037 | ||||||||||||
| Net increase (decrease) from capital transactions | (1,748,937) | 886,480 | 27,892,437 | 85,095,988 | ||||||||||||
| CLASS N | ||||||||||||||||
| Proceeds from shares sold | 73,666 | 1,035,527 | 15,872,803 | 92,400 | ||||||||||||
| Reinvestment of distributions | 74,323 | 35,479 | 442,505 | 28,595 | ||||||||||||
| Cost of shares redeemed | (1,850,280) | (392,823) | (3,715,733) | (178,203) | ||||||||||||
| Net increase (decrease) from capital transactions | (1,702,291) | 678,183 | 12,599,575 | (57,208) | ||||||||||||
| CLASS Y | ||||||||||||||||
| Proceeds from shares sold | — | 6,057 | 45,779,910 | 49,085,024 | ||||||||||||
| Reinvestment of distributions | 23,181,009 | 11,387,260 | 14,968,276 | 11,213,340 | ||||||||||||
| Cost of shares redeemed | (659,771) | — | (5,836,872) | (23,486,766) | ||||||||||||
| Redemption fees | 4 | — | 32,284 | 31,881 | ||||||||||||
| Net increase (decrease) from capital transactions | 22,521,242 | 11,393,317 | 54,943,598 | 36,843,479 | ||||||||||||
| Net increase (decrease) in net assets resulting from capital transactions | 19,070,014 | 12,957,980 | 95,435,610 | 121,882,259 | ||||||||||||
| Total increase (decrease) in net assets | 73,772,125 | (25,901,317) | 199,019,583 | 28,837,175 | ||||||||||||
| NET ASSETS: | ||||||||||||||||
| Beginning of period | 401,784,401 | 427,685,718 | 488,077,375 | 459,240,200 | ||||||||||||
| End of period | $475,556,526 | $401,784,401 | $687,096,958 | $488,077,375 | ||||||||||||
| Undistributed accumulated net investment income (loss) at end of year | $(575,224) | $3,812,624 | $(1,607,306) | $5,593,024 | ||||||||||||
| The accompanying notes are an integral part of these financial statements. | (continued on p. 123) |
| 128 | AQR Funds | Annual Report | December 2012 | |||||||||||||
Table of Contents
| Statements of Changes in Net Assets | December 31, 2012 |
| AQR GLOBAL EQUITY FUND | AQR INTERNATIONAL EQUITY FUND | |||||||||||||||
| FOR THE YEAR ENDED DECEMBER 31, 2012 | FOR THE YEAR ENDED DECEMBER 31, 2011 | FOR THE YEAR ENDED DECEMBER 31, 2012 | FOR THE YEAR ENDED DECEMBER 31, 2011 | |||||||||||||
| CHANGES IN SHARES OUTSTANDING: | ||||||||||||||||
| CLASS I | ||||||||||||||||
| Shares outstanding, beginning of period | 210,532 | 167,896 | 16,066,790 | 8,227,394 | ||||||||||||
| Shares sold | 25,557 | 226,766 | 6,218,133 | 9,343,360 | ||||||||||||
| Shares issued on reinvestment of distributions | 7,336 | 5,184 | 524,610 | 492,270 | ||||||||||||
| Shares redeemed | (188,229) | (189,314) | (3,575,967) | (1,996,234) | ||||||||||||
| Shares outstanding, end of period | 55,196 | 210,532 | 19,233,566 | 16,066,790 | ||||||||||||
| CLASS N | ||||||||||||||||
| Shares outstanding, beginning of period | 202,461 | 136,540 | 133,174 | 138,711 | ||||||||||||
| Shares sold | 6,817 | 100,038 | 1,698,841 | 9,129 | ||||||||||||
| Shares issued on reinvestment of distributions | 6,690 | 3,692 | 43,639 | 3,388 | ||||||||||||
| Shares redeemed | (170,239) | (37,809) | (383,091) | (18,054) | ||||||||||||
| Shares outstanding, end of period | 45,729 | 202,461 | 1,492,563 | 133,174 | ||||||||||||
| CLASS Y | ||||||||||||||||
| Shares outstanding, beginning of period | 39,780,661 | 38,596,429 | 38,834,729 | 34,152,071 | ||||||||||||
| Shares sold | — | 525 | 4,631,152 | 5,482,006 | ||||||||||||
| Shares issued on reinvestment of distributions | 2,080,881 | 1,183,707 | 1,436,495 | 1,296,340 | ||||||||||||
| Shares redeemed | (62,667) | — | (594,035) | (2,095,688) | ||||||||||||
| Shares outstanding, end of period | 41,798,875 | 39,780,661 | 44,308,341 | 38,834,729 | ||||||||||||
| The accompanying notes are an integral part of these financial statements. |
| AQR Funds | Annual Report | December 2012 | 129 | |||||||||||||
Table of Contents
| Statements of Changes in Net Assets | December 31, 2012 |
| AQR EMERGING DEFENSIVE EQUITY FUND | AQR INTERNATIONAL DEFENSIVE EQUITY FUND | |||||||
FOR THE PERIOD 7/09/12*-12/31/12 | FOR THE PERIOD 7/09/12*-12/31/12 | |||||||
| OPERATIONS: | ||||||||
| Net investment income (loss) | $49,290 | $33,252 | ||||||
| Net realized gain (loss) | 3,764 | 16,279 | ||||||
| Net change in unrealized appreciation (depreciation) | 511,724 | 244,382 | ||||||
Net increase (decrease) in net assets resulting from operations | 564,778 | 293,913 | ||||||
| DISTRIBUTIONS TO SHAREHOLDERS: | ||||||||
| Net investment income: | ||||||||
Class I | (34,222) | (26,339) | ||||||
Class N | (9,990) | (3,918) | ||||||
Total | (44,212) | (30,257) | ||||||
| Net realized gain: | ||||||||
Class I | (11,427) | (16,369) | ||||||
Class N | (4,811) | (4,353) | ||||||
Total | (16,238) | (20,722) | ||||||
Total distributions | (60,450) | (50,979) | ||||||
| CAPITAL TRANSACTIONS: | ||||||||
| CLASS I | ||||||||
| Proceeds from shares sold | 5,666,656 | 7,216,220 | ||||||
| Reinvestment of distributions | 45,649 | 42,708 | ||||||
| Cost of shares redeemed | (689,457) | (2,065,477) | ||||||
| Net increase (decrease) from capital transactions | 5,022,848 | 5,193,451 | ||||||
| CLASS N | ||||||||
| Proceeds from shares sold | 1,857,059 | 1,791,100 | ||||||
| Reinvestment of distributions | 14,801 | 8,271 | ||||||
| Cost of shares redeemed | (192,516) | (1,019,455) | ||||||
| Net increase (decrease) from capital transactions | 1,679,344 | 779,916 | ||||||
| Net increase (decrease) in net assets resulting from capital transactions | 6,702,192 | 5,973,367 | ||||||
| Total increase (decrease) in net assets | 7,206,520 | 6,216,301 | ||||||
| NET ASSETS: | ||||||||
| Beginning of period | — | — | ||||||
| End of period | $7,206,520 | $6,216,301 | ||||||
| Undistributed accumulated net investment income (loss) at end of year | $4,259 | $(143) | ||||||
| CHANGES IN SHARES OUTSTANDING: | ||||||||
| CLASS I | ||||||||
| Shares outstanding, beginning of period | — | — | ||||||
| Shares sold | 556,121 | 693,168 | ||||||
| Shares issued on reinvestment of distributions | 4,278 | 4,014 | ||||||
| Shares redeemed | (65,560) | (194,434) | ||||||
| Shares outstanding, end of period | 494,839 | 502,748 | ||||||
| CLASS N | ||||||||
| Shares outstanding, beginning of period | — | — | ||||||
| Shares sold | 181,889 | 174,715 | ||||||
| Shares issued on reinvestment of distributions | 1,386 | 776 | ||||||
| Shares redeemed | (18,256) | (95,948) | ||||||
| Shares outstanding, end of period | 165,019 | 79,543 | ||||||
| * | Commencement of operations. |
| The accompanying notes are an integral part of these financial statements. |
| 130 | AQR Funds | Annual Report | December 2012 | |||||||||||||
Table of Contents
| Statements of Changes in Net Assets | December 31, 2012 |
| AQR U.S. DEFENSIVE EQUITY FUND | AQR DIVERSIFIED ARBITRAGE FUND | |||||||||||
FOR THE PERIOD 7/09/12*-12/31/12 | FOR THE YEAR ENDED DECEMBER 31, 2012 | FOR THE YEAR ENDED DECEMBER 31, 2011 | ||||||||||
| OPERATIONS: | ||||||||||||
| Net investment income (loss) | $44,795 | $18,967,706 | $18,776,535 | |||||||||
| Net realized gain (loss) | (2,179) | 61,270,840 | 13,987,344 | |||||||||
| Net change in unrealized appreciation (depreciation) | 33,443 | (11,053,088) | (21,424,340) | |||||||||
Net increase (decrease) in net assets resulting from operations | 76,059 | 69,185,458 | 11,339,539 | |||||||||
| DISTRIBUTIONS TO SHAREHOLDERS: | ||||||||||||
| Net investment income: | ||||||||||||
Class I | (40,855) | (20,054,461) | (11,719,651) | |||||||||
Class N | (1,691) | (6,424,707) | (3,932,191) | |||||||||
Total | (42,546) | (26,479,168) | (15,651,842) | |||||||||
| Net realized gain: | ||||||||||||
Class I | (4,695) | (8,252,742) | (35,178,186) | |||||||||
Class N | (316) | (3,609,101) | (16,128,531) | |||||||||
Total | (5,011) | (11,861,843) | (51,306,717) | |||||||||
Total distributions | (47,557) | (38,341,011) | (66,958,559) | |||||||||
| CAPITAL TRANSACTIONS: | ||||||||||||
| CLASS I | ||||||||||||
| Proceeds from shares sold | 8,863,968 | 1,015,619,538 | 1,014,567,810 | |||||||||
| Reinvestment of distributions | 45,549 | 24,177,205 | 41,800,931 | |||||||||
| Cost of shares redeemed | (1,076,018) | (765,520,230) | (385,285,948) | |||||||||
| Net increase (decrease) from capital transactions | 7,833,499 | 274,276,513 | 671,082,793 | |||||||||
| CLASS N | ||||||||||||
| Proceeds from shares sold | 1,421,979 | 313,184,408 | 452,133,887 | |||||||||
| Reinvestment of distributions | 2,007 | 9,826,792 | 19,853,899 | |||||||||
| Cost of shares redeemed | (1,023,257) | (222,575,477) | (185,908,766) | |||||||||
| Redemption fees | — | — | 58 | |||||||||
| Net increase (decrease) from capital transactions | 400,729 | 100,435,723 | 286,079,078 | |||||||||
| Net increase (decrease) in net assets resulting from capital transactions | 8,234,228 | 374,712,236 | 957,161,871 | |||||||||
| Total increase (decrease) in net assets | 8,262,730 | 405,556,683 | 901,542,851 | |||||||||
| NET ASSETS: | ||||||||||||
| Beginning of period | — | 2,108,538,641 | 1,206,995,790 | |||||||||
| End of period | $8,262,730 | $2,514,095,324 | $2,108,538,641 | |||||||||
| Undistributed accumulated net investment income (loss) at end of year | $5,727 | $417,982 | $(1,386,575) | |||||||||
| CHANGES IN SHARES OUTSTANDING: | ||||||||||||
| CLASS I | ||||||||||||
| Shares outstanding, beginning of period | — | 133,778,788 | 73,942,810 | |||||||||
| Shares sold | 872,439 | 91,852,169 | 90,365,152 | |||||||||
| Shares issued on reinvestment of distributions | 4,479 | 2,195,928 | 3,838,469 | |||||||||
| Shares redeemed | (105,346) | (69,137,888) | (34,367,643) | |||||||||
| Shares outstanding, end of period | 771,572 | 158,688,997 | 133,778,788 | |||||||||
| CLASS N | ||||||||||||
| Shares outstanding, beginning of period | — | 60,071,714 | 34,430,118 | |||||||||
| Shares sold | 141,350 | 28,441,266 | 40,438,007 | |||||||||
| Shares issued on reinvestment of distributions | 197 | 894,936 | 1,829,852 | |||||||||
| Shares redeemed | (100,200) | (20,226,704) | (16,626,263) | |||||||||
| Shares outstanding, end of period | 41,347 | 69,181,212 | 60,071,714 | |||||||||
| * | Commencement of operations. |
| The accompanying notes are an integral part of these financial statements. |
| AQR Funds | Annual Report | December 2012 | 131 | |||||||||||||
Table of Contents
| Statements of Changes in Net Assets | December 31, 2012 |
| AQR MOMENTUM FUND | AQR SMALL CAP MOMENTUM FUND | |||||||||||||||
| FOR THE YEAR ENDED DECEMBER 31, 2012 | FOR THE YEAR ENDED DECEMBER 31, 2011 | FOR THE YEAR ENDED DECEMBER 31, 2012 | FOR THE YEAR ENDED DECEMBER 31, 2011 | |||||||||||||
| OPERATIONS: | ||||||||||||||||
| Net investment income (loss) | $7,340,127 | $2,522,585 | $1,800,500 | $227,233 | ||||||||||||
| Net realized gain (loss) | 13,466,529 | (21,841,538) | 7,037,857 | (5,687,386) | ||||||||||||
| Net change in unrealized appreciation (depreciation) | 39,530,778 | 7,021,965 | 12,331,774 | 1,233,553 | ||||||||||||
Net increase (decrease) in net assets resulting from operations | 60,337,434 | (12,296,988) | 21,170,131 | (4,226,600) | ||||||||||||
| DISTRIBUTIONS TO SHAREHOLDERS: | ||||||||||||||||
| Net investment income: | ||||||||||||||||
Class L | (7,610,158) | (2,025,248) | (1,541,164) | (150,004) | ||||||||||||
Total | (7,610,158) | (2,025,248) | (1,541,164) | (150,004) | ||||||||||||
| Net realized gain: | ||||||||||||||||
Class L | — | (566,418) | — | (713,111) | ||||||||||||
Total | — | (566,418) | — | (713,111) | ||||||||||||
Total distributions | (7,610,158) | (2,591,666) | (1,541,164) | (863,115) | ||||||||||||
| CAPITAL TRANSACTIONS: | ||||||||||||||||
| CLASS L | ||||||||||||||||
| Proceeds from shares sold | 231,326,342 | 234,799,847 | 50,077,757 | 69,908,520 | ||||||||||||
| Reinvestment of distributions | 7,604,346 | 2,589,299 | 1,537,931 | 860,975 | ||||||||||||
| Cost of shares redeemed | (104,299,857) | (44,238,993) | (26,009,044) | (19,650,773) | ||||||||||||
| Redemption fees | — | 2,432 | — | 765 | ||||||||||||
| Net increase (decrease) from capital transactions | 134,630,831 | 193,152,585 | 25,606,644 | 51,119,487 | ||||||||||||
| CLASS N | ||||||||||||||||
| Proceeds from shares sold | 58,966,793 | (a) | — | 10,000 | (a) | — | ||||||||||
| Cost of shares redeemed | (216,871) | (a) | — | — | — | |||||||||||
| Net increase (decrease) from capital transactions | 58,749,922 | — | 10,000 | — | ||||||||||||
| Net increase (decrease) in net assets resulting from capital transactions | 193,380,753 | 193,152,585 | 25,616,644 | 51,119,487 | ||||||||||||
| Total increase (decrease) in net assets | 246,108,029 | 178,263,931 | 45,245,611 | 46,029,772 | ||||||||||||
| NET ASSETS: | ||||||||||||||||
| Beginning of period | 302,755,284 | 124,491,353 | 100,534,354 | 54,504,582 | ||||||||||||
| End of period | $548,863,313 | $302,755,284 | $145,779,965 | $100,534,354 | ||||||||||||
| Undistributed accumulated net investment income (loss) at end of year | $227,113 | $716,277 | $146,099 | $30,383 | ||||||||||||
| CHANGES IN SHARES OUTSTANDING: | ||||||||||||||||
| CLASS L | ||||||||||||||||
| Shares outstanding, beginning of period | 21,793,766 | 8,646,886 | 7,238,497 | 3,788,903 | ||||||||||||
| Shares sold | 14,895,037 | 16,107,289 | 3,211,497 | 4,790,883 | ||||||||||||
| Shares issued on reinvestment of distributions | 481,898 | 192,513 | 97,153 | 63,354 | ||||||||||||
| Shares redeemed | (6,629,193) | (3,152,922) | (1,675,370) | (1,404,643) | ||||||||||||
| Shares outstanding, end of period | 30,541,508 | 21,793,766 | 8,871,777 | 7,238,497 | ||||||||||||
| CLASS N | ||||||||||||||||
| Shares outstanding, beginning of period | — | (a) | — | — | (a) | — | ||||||||||
| Shares sold | 3,652,468 | — | 622 | — | ||||||||||||
| Shares redeemed | (13,610) | — | — | — | ||||||||||||
| Shares outstanding, end of period | 3,638,858 | — | 622 | — | ||||||||||||
| (a) | Commencement of offering class of shares effective December 17, 2012. |
| The accompanying notes are an integral part of these financial statements. |
| 132 | AQR Funds | Annual Report | December 2012 | |||||||||||||
Table of Contents
| Statements of Changes in Net Assets | December 31, 2012 |
| AQR INTERNATIONAL MOMENTUM FUND | AQR TAX-MANAGED MOMENTUM FUND | |||||||||||
| FOR THE YEAR ENDED DECEMBER 31, 2012 | FOR THE YEAR ENDED DECEMBER 31, 2011 | FOR THE PERIOD 1/27/12*-12/31/12 | ||||||||||
| OPERATIONS: | ||||||||||||
| Net investment income (loss) | $2,524,674 | $1,671,768 | $55,098 | |||||||||
| Net realized gain (loss) | 1,155,067 | (12,171,592) | 20,369 | |||||||||
| Net change in unrealized appreciation (depreciation) | 13,708,882 | (3,162,121) | 290,968 | |||||||||
Net increase (decrease) in net assets resulting from operations | 17,388,623 | (13,661,945) | 366,435 | |||||||||
| DISTRIBUTIONS TO SHAREHOLDERS: | ||||||||||||
| Net investment income: | ||||||||||||
Class L | (2,965,770) | (1,944,737) | (58,114) | |||||||||
Total | (2,965,770) | (1,944,737) | (58,114) | |||||||||
| Net realized gain: | ||||||||||||
Class L | — | — | (35,669) | |||||||||
Total | — | — | (35,669) | |||||||||
Total distributions | (2,965,770) | (1,944,737) | (93,783) | |||||||||
| CAPITAL TRANSACTIONS: | ||||||||||||
| CLASS L | ||||||||||||
| Proceeds from shares sold | 54,777,235 | 57,657,994 | 5,727,135 | |||||||||
| Reinvestment of distributions | 2,965,195 | 1,943,164 | 93,783 | |||||||||
| Cost of shares redeemed | (21,716,680) | (28,862,650) | (52,741) | |||||||||
| Redemption fees | — | 1,706 | — | |||||||||
| Net increase (decrease) from capital transactions | 36,025,750 | 30,740,214 | 5,768,177 | |||||||||
| CLASS N | ||||||||||||
| Proceeds from shares sold | 11,000(a) | — | 10,000(a) | |||||||||
| Net increase (decrease) from capital transactions | 11,000 | — | 10,000 | |||||||||
| Net increase (decrease) in net assets resulting from capital transactions | 36,036,750 | 30,740,214 | 5,778,177 | |||||||||
| Total increase (decrease) in net assets | 50,459,603 | 15,133,532 | 6,050,829 | |||||||||
| NET ASSETS: | ||||||||||||
| Beginning of period | 77,224,911 | 62,091,379 | — | |||||||||
| End of period | $127,684,514 | $77,224,911 | $6,050,829 | |||||||||
| Undistributed accumulated net investment income (loss) at end of year | $(313,735) | $92,674 | $3,454 | |||||||||
| CHANGES IN SHARES OUTSTANDING: | ||||||||||||
| CLASS L | ||||||||||||
| Shares outstanding, beginning of period | 6,789,578 | 4,559,775 | — | |||||||||
| Shares sold | 4,490,971 | 4,299,973 | 538,821 | |||||||||
| Shares issued on reinvestment of distributions | 229,327 | 176,171 | 8,557 | |||||||||
| Shares redeemed | (1,752,825) | (2,246,341) | (4,735) | |||||||||
| Shares outstanding, end of period | 9,757,051 | 6,789,578 | 542,643 | |||||||||
| CLASS N | ||||||||||||
| Shares outstanding, beginning of period | — | (a) | — | — | (a) | |||||||
| Shares sold | 849 | — | 899 | |||||||||
| Shares outstanding, end of period | 849 | — | 899 | |||||||||
| * | Commencement of operations. |
| (a) | Commencement of offering class of shares effective December 17, 2012. |
| The accompanying notes are an integral part of these financial statements. |
| AQR Funds | Annual Report | December 2012 | 133 | |||||||||||||
Table of Contents
| Statements of Changes in Net Assets | December 31, 2012 |
| AQR TAX-MANAGED SMALL CAP MOMENTUM FUND | AQR TAX-MANAGED INTERNATIONAL MOMENTUM FUND | |||||||
FOR THE PERIOD 1/27/12*-12/31/12 | FOR THE PERIOD 1/27/12*-12/31/12 | |||||||
| OPERATIONS: | ||||||||
| Net investment income (loss) | $46,220 | $80,248 | ||||||
| Net realized gain (loss) | 14,572 | 24,701 | ||||||
| Net change in unrealized appreciation (depreciation) | 272,089 | 512,452 | ||||||
Net increase (decrease) in net assets resulting from operations | 332,881 | 617,401 | ||||||
| DISTRIBUTIONS TO SHAREHOLDERS: | ||||||||
| Net investment income: | ||||||||
Class L | (43,740) | (91,118) | ||||||
Total | (43,740) | (91,118) | ||||||
| Net realized gain: | ||||||||
Class L | — | (8,768) | ||||||
Total | — | (8,768) | ||||||
Total distributions | (43,740) | (99,886) | ||||||
| CAPITAL TRANSACTIONS: | ||||||||
| CLASS L | ||||||||
| Proceeds from shares sold | 3,103,895 | 5,127,939 | ||||||
| Reinvestment of distributions | 43,740 | 99,886 | ||||||
| Cost of shares redeemed | (1,566) | (6,508) | ||||||
| Net increase (decrease) from capital transactions | 3,146,069 | 5,221,317 | ||||||
| CLASS N | ||||||||
| Proceeds from shares sold | 10,000 | (a) | 10,000 | (a) | ||||
| Net increase (decrease) from capital transactions | 10,000 | 10,000 | ||||||
| Net increase (decrease) in net assets resulting from capital transactions | 3,156,069 | 5,231,317 | ||||||
| Total increase (decrease) in net assets | 3,445,210 | 5,748,832 | ||||||
| NET ASSETS: | ||||||||
| Beginning of period | — | — | ||||||
| End of period | $3,445,210 | $5,748,832 | ||||||
| Undistributed accumulated net investment income (loss) at end of year | $3,863 | $(14,184) | ||||||
| CHANGES IN SHARES OUTSTANDING: | ||||||||
| CLASS L | ||||||||
| Shares outstanding, beginning of period | — | — | ||||||
| Shares sold | 304,030 | 502,067 | ||||||
| Shares issued on reinvestment of distributions | 4,069 | 8,983 | ||||||
| Shares redeemed | (146) | (585) | ||||||
| Shares outstanding, end of period | 307,953 | 510,465 | ||||||
| CLASS N | ||||||||
| Shares outstanding, beginning of period | — | (a) | — | (a) | ||||
| Shares sold | 917 | 898 | ||||||
| Shares outstanding, end of period | 917 | 898 | ||||||
| * | Commencement of operations. |
| (a) | Commencement of offering class of shares effective December 17, 2012. |
| The accompanying notes are an integral part of these financial statements. |
| 134 | AQR Funds | Annual Report | December 2012 | |||||||||||||
Table of Contents
| Statement of Cash Flows | December 31, 2012 |
| AQR DIVERSIFIED ARBITRAGE FUND | ||||
| CASH FLOWS FROM OPERATING ACTIVITIES: | ||||
| Net increase in net assets resulting from operations | $69,185,458 | |||
| Adjustments to reconcile net increase in net assets resulting from operations to net cash provided (used) in operating activities: | ||||
Payments to purchase securities | (4,889,645,085) | |||
Payments to cover short securities | (2,195,436,494) | |||
Proceeds from securities sold short | 1,605,375,462 | |||
Proceeds from sale of securities | 5,106,583,472 | |||
Realized gain on investments in securities | (227,266,846) | |||
Realized loss on securities sold short and written options | 116,378,865 | |||
Change in unrealized appreciation on investments in securities | (32,163,707) | |||
Change in unrealized depreciation on securities sold short and written options | 52,887,723 | |||
Accretion of bond discount | (755,866) | |||
| Increases in operating assets: | ||||
Due from brokers | 60,184,678 | |||
Unrealized appreciation on forward foreign currency exchange contracts | 939,967 | |||
Swaps, at value | 10,069,849 | |||
Unrealized appreciation on futures contracts | (821,534) | |||
Receivable for securities sold | 41,430,379 | |||
Foreign tax reclaim | (27,944) | |||
Dividends and interest | 3,724,748 | |||
Prepaid expenses | (8,627) | |||
| Decreases in operating liabilities | ||||
Due to broker | (1,640,000) | |||
Unrealized depreciation on forward foreign currency exchange contracts | 1,332,581 | |||
Swaps, at value | 5,453,134 | |||
Unrealized depreciation on futures contracts | (1,187,460) | |||
Payable for securities purchased | (29,718,028) | |||
Collateral received on securities loaned | (524,149) | |||
Accrued Investment advisory fees | 800,120 | |||
Accrued Distribution fees — Class N | 23,484 | |||
Dividends on securities sold short | (337,372) | |||
Other accrued expenses | (138,628) | |||
Net cash used in operating activities | $(305,301,820) | |||
| CASH FLOWS FROM FINANCING ACTIVITIES | ||||
Proceeds from shares sold | 1,327,927,310 | |||
Payments on shares redeemed | (984,683,968) | |||
Cash distributions paid | (4,337,014) | |||
Net cash provided by financing activities | $338,906,328 | |||
| Net change in cash | 33,604,508 | |||
Cash, beginning of year | 1,117,766 | |||
Cash, end of year | $34,722,274 | |||
Supplemental disclosure of cash flow information:
Cash paid during the year for interest in the amount of $7,086,808.
| The accompanying notes are an integral part of these financial statements. |
| AQR Funds | Annual Report | December 2012 | 135 | |||||||||||||
Table of Contents
| Financial Highlights | December 31, 2012 |
| PER SHARE OPERATING PERFORMANCE | ||||||||||||||||||||||||||||
| Change in Net Assets Resulting from Operations | Less Dividends and Distributions | |||||||||||||||||||||||||||
| Net Asset Value, Beginning of Period | Net Investment Income (Loss) | Net Realized and Unrealized Gain (Loss) | Net Increase (Decrease) in Net Asset Value from Operations | Distributions from Net Investment Income | Distributions from Net Realized Gains | Total Distributions | ||||||||||||||||||||||
| AQR GLOBAL EQUITY FUND CLASS I | ||||||||||||||||||||||||||||
| FOR THE YEAR ENDED DECEMBER 31, 20125 | $9.99 | 0.20 | 1.69 | 1.89 | (0.29) | (0.24) | (0.53) | |||||||||||||||||||||
| FOR THE YEAR ENDED DECEMBER 31, 20115 | $10.97 | 0.21 | (0.95) | (0.74) | (0.11) | (0.13) | (0.24) | |||||||||||||||||||||
| FOR THE YEAR ENDED DECEMBER 31, 20105 | $10.00 | 0.16 | 1.25 | 1.41 | (0.36) | (0.08) | (0.44) | |||||||||||||||||||||
| AQR GLOBAL EQUITY FUND CLASS N | ||||||||||||||||||||||||||||
| FOR THE YEAR ENDED DECEMBER 31, 20125 | $9.97 | 0.16 | 1.70 | 1.86 | (0.27) | (0.24) | (0.51) | |||||||||||||||||||||
| FOR THE YEAR ENDED DECEMBER 31, 20115 | $10.97 | 0.16 | (0.94) | (0.78) | (0.09) | (0.13) | (0.22) | |||||||||||||||||||||
| FOR THE YEAR ENDED DECEMBER 31, 2010†,5 | $10.00 | 0.13 | 1.25 | 1.38 | (0.33) | (0.08) | (0.41) | |||||||||||||||||||||
| AQR GLOBAL EQUITY FUND CLASS Y | ||||||||||||||||||||||||||||
| FOR THE YEAR ENDED DECEMBER 31, 2012†,5 | $10.00 | 0.24 | 1.70 | 1.94 | (0.35) | (0.24) | (0.59) | |||||||||||||||||||||
| FOR THE YEAR ENDED DECEMBER 31, 20115 | $10.99 | 0.24 | (0.94) | (0.70) | (0.16) | (0.13) | (0.29) | |||||||||||||||||||||
| FOR THE YEAR ENDED DECEMBER 31, 20105 | $10.00 | 0.18 | 1.27 | 1.45 | (0.38) | (0.08) | (0.46) | |||||||||||||||||||||
| AQR INTERNATIONAL EQUITY FUND CLASS I | ||||||||||||||||||||||||||||
| FOR THE YEAR ENDED DECEMBER 31, 20125 | $8.60 | 0.20 | 1.76 | 1.96 | (0.32) | — | (0.32) | |||||||||||||||||||||
| FOR THE YEAR ENDED DECEMBER 31, 2011†,5 | $10.45 | 0.21 | (1.78) | (1.57) | (0.21) | (0.07) | (0.28) | |||||||||||||||||||||
| FOR THE YEAR ENDED DECEMBER 31, 2010†,5 | $9.78 | 0.16 | 0.84 | 1.00 | (0.24) | (0.09) | (0.33) | |||||||||||||||||||||
| FOR THE PERIOD ENDED 9/30/096—12/31/09†,5 | $10.00 | (0.01) | 0.22 | 0.21 | (0.14) | (0.29) | (0.43) | |||||||||||||||||||||
| AQR INTERNATIONAL EQUITY FUND CLASS N | ||||||||||||||||||||||||||||
| FOR THE YEAR ENDED DECEMBER 31, 20125 | $8.76 | 0.19 | 1.76 | 1.95 | (0.28) | — | (0.28) | |||||||||||||||||||||
| FOR THE YEAR ENDED DECEMBER 31, 20115 | $10.61 | 0.20 | (1.83) | (1.63) | (0.15) | (0.07) | (0.22) | |||||||||||||||||||||
| FOR THE YEAR ENDED DECEMBER 31, 20105 | $9.91 | 0.14 | 0.88 | 1.02 | (0.23) | (0.09) | (0.32) | |||||||||||||||||||||
| FOR THE PERIOD ENDED 9/30/096—12/31/095 | $10.00 | — | 0.20 | 0.20 | — | (0.29) | (0.29) | |||||||||||||||||||||
| AQR INTERNATIONAL EQUITY FUND CLASS Y | ||||||||||||||||||||||||||||
| FOR THE YEAR ENDED DECEMBER 31, 2012†,5 | $8.98 | 0.25 | 1.83 | 2.08 | (0.35) | — | (0.35) | |||||||||||||||||||||
| FOR THE YEAR ENDED DECEMBER 31, 2011†,5 | $10.89 | 0.28 | (1.88) | (1.60) | (0.24) | (0.07) | (0.31) | |||||||||||||||||||||
| FOR THE YEAR ENDED DECEMBER 31, 2010†,5 | $10.16 | 0.20 | 0.89 | 1.09 | (0.27) | (0.09) | (0.36) | |||||||||||||||||||||
| FOR THE PERIOD ENDED 8/28/098—12/31/09†,5 | $10.00 | 0.03 | 0.57 | 0.60 | (0.15) | (0.29) | (0.44) | |||||||||||||||||||||
| AQR EMERGING DEFENSIVE EQUITY FUND CLASS I | ||||||||||||||||||||||||||||
| FOR THE PERIOD ENDED 7/09/128—12/31/125 | $10.00 | 0.10 | 0.94 | 1.04 | (0.09) | (0.03) | (0.12) | |||||||||||||||||||||
| AQR EMERGING DEFENSIVE EQUITY FUND CLASS N | ||||||||||||||||||||||||||||
| FOR THE PERIOD ENDED 7/09/128—12/31/125 | $10.00 | 0.08 | 0.94 | 1.02 | (0.06) | (0.03) | (0.09) | |||||||||||||||||||||
| AQR INTERNATIONAL DEFENSIVE EQUITY FUND CLASS I | ||||||||||||||||||||||||||||
| FOR THE PERIOD ENDED 7/09/128—12/31/125 | $10.00 | 0.10 | 0.67 | 0.77 | (0.06) | (0.04) | (0.10) | |||||||||||||||||||||
| AQR INTERNATIONAL DEFENSIVE EQUITY FUND CLASS N | ||||||||||||||||||||||||||||
| FOR THE PERIOD ENDED 7/09/128—12/31/125 | $10.00 | 0.08 | 0.68 | 0.76 | (0.03) | (0.04) | (0.07) | |||||||||||||||||||||
| * | Annualized for periods less than one year. |
| † | Redemption fees of less than $0.005 per share were incurred by the share class. |
| 1 | Total investment return is calculated assuming an initial investment made at the net asset value at the beginning of the period, reinvestment of all dividends and distributions at net asset value during the period and redemption on the last day of the period and is not annualized. |
| 2 | Includes adjustments in accordance with accounting principles generally accepted in the United States of America and as such, the net asset value for financial reporting purposes and the returns based upon those net asset values may differ from the net asset value and returns for shareholder transactions. |
| 3 | Ratios do not include the impact of the expenses of the underlying funds in which the Fund invests. |
| 4 | Portfolio turnover is not annualized. |
| 5 | Per share net investment income (loss) and net realized and unrealized gain (loss) are based on average shares outstanding. |
| 6 | Commencement of offering of shares. |
| 7 | The ratio is not representative of what the ratio would be if the Fund class had operated for a longer period of time. Certain non-recurring expenses incurred by the Fund were not annualized for the period ended December 31, 2012. |
| 8 | Commencement of operations. |
| The accompanying notes are an integral part of these financial statements. |
| 136 | AQR Funds | Annual Report | December 2012 | |||||||||||||
Table of Contents
| Financial Highlights | December 31, 2012 |
| RATIOS/SUPPLEMENTAL DATA | ||||||||||||||||||||||||||||||||
| Ratios to Average Net Assets of:* | ||||||||||||||||||||||||||||||||
| Net Asset Value, End of Period | Total Return1,2 | Net Assets, End of Period | Expenses, Net of Reimbursements and/or Waivers3 | Expenses, Net of Reimbursements and/or Waivers (Excluding Dividend Short Expense & Interest Expense)3 | Expenses, Before Reimbursements and/or Waivers3 | Net Investment Income (Loss) | Portfolio Turnover Rate4 | |||||||||||||||||||||||||
| $11.35 | 18.95 | % | $626,448 | 0.95 | % | 0.94 | % | 1.41 | % | 1.83 | % | 87 | % | |||||||||||||||||||
| $9.99 | (6.68 | )% | $2,102,815 | 0.96 | % | 0.95 | % | 2.03 | % | 1.90 | % | 59 | % | |||||||||||||||||||
| $10.97 | 14.12 | % | $1,841,838 | 0.79 | % | 0.79 | % | 0.79 | % | 1.41 | % | 72 | % | |||||||||||||||||||
| $11.32 | 18.67 | % | $517,504 | 1.25 | % | 1.24 | % | 1.87 | % | 1.51 | % | 87 | % | |||||||||||||||||||
| $9.97 | (7.03 | )% | $2,019,253 | 1.27 | % | 1.26 | % | 3.22 | % | 1.46 | % | 59 | % | |||||||||||||||||||
| $10.97 | 13.83 | % | $1,497,723 | 1.10 | % | 1.10 | % | 1.10 | % | 1.28 | % | 72 | % | |||||||||||||||||||
| $11.35 | 19.45 | % | $474,412,574 | 0.51 | % | 0.50 | % | 0.51 | % | 2.24 | % | 87 | % | |||||||||||||||||||
| $10.00 | (6.22 | )% | $397,662,333 | 0.52 | % | 0.51 | % | 0.52 | % | 2.21 | % | 59 | % | |||||||||||||||||||
| $10.99 | 14.54 | % | $424,346,157 | 0.50 | % | 0.50 | % | 0.71 | % | 1.81 | % | 72 | % | |||||||||||||||||||
| $10.24 | 22.87 | % | $196,971,397 | 0.91 | % | 0.90 | % | 0.91 | % | 2.17 | % | 74 | % | |||||||||||||||||||
| $8.60 | (15.00 | )% | $138,229,387 | 0.94 | % | 0.93 | % | 0.94 | % | 2.13 | % | 60 | % | |||||||||||||||||||
| $10.45 | 10.40 | % | $85,968,655 | 0.90 | % | 0.90 | % | 1.03 | % | 1.72 | % | 93 | % | |||||||||||||||||||
| $9.78 | 2.20 | % | $44,016,038 | 0.90 | % | 0.90 | % | 1.01 | % | (0.47 | )% | 29 | % | |||||||||||||||||||
| $10.43 | 22.41 | % | $15,561,822 | 1.28 | % | 1.27 | % | 1.28 | % | 2.00 | % | 74 | % | |||||||||||||||||||
| $8.76 | (15.27 | )% | $1,166,515 | 1.35 | % | 1.34 | % | 2.18 | % | 1.96 | % | 60 | % | |||||||||||||||||||
| $10.61 | 10.40 | % | $1,472,368 | 1.25 | % | 1.25 | % | 3.50 | % | 1.51 | % | 93 | % | |||||||||||||||||||
| $9.91 | 2.04 | % | $5,785 | 1.25 | % | 1.25 | % | 472.86 | %7 | (0.07 | )% | 29 | % | |||||||||||||||||||
| $10.71 | 23.26 | % | $474,563,739 | 0.56 | % | 0.55 | % | 0.56 | % | 2.52 | % | 74 | % | |||||||||||||||||||
| $8.98 | (14.66 | )% | $348,681,473 | 0.58 | % | 0.57 | % | 0.58 | % | 2.63 | % | 60 | % | |||||||||||||||||||
| $10.89 | 10.84 | % | $371,799,177 | 0.55 | % | 0.55 | % | 0.77 | % | 2.02 | % | 93 | % | |||||||||||||||||||
| $10.16 | 6.08 | % | $360,491,107 | 0.55 | % | 0.55 | % | 0.98 | % | 0.99 | % | 29 | % | |||||||||||||||||||
| $10.92 | 10.39 | % | $5,402,251 | 1.15 | % | 1.15 | % | 4.14 | % | 1.92 | % | 38 | % | |||||||||||||||||||
| $10.93 | 10.22 | % | $1,804,269 | 1.40 | % | 1.40 | % | 5.41 | % | 1.67 | % | 38 | % | |||||||||||||||||||
| $10.67 | 7.69 | % | $5,366,031 | 0.90 | % | 0.90 | % | 5.00 | % | 1.91 | % | 81 | % | |||||||||||||||||||
| $10.69 | 7.62 | % | $850,270 | 1.15 | % | 1.15 | % | 6.96 | % | 1.61 | % | 81 | % | |||||||||||||||||||
| The accompanying notes are an integral part of these financial statements. |
| AQR Funds | Annual Report | December 2012 | 137 | |||||||||||||
Table of Contents
| Financial Highlights | December 31, 2012 |
| PER SHARE OPERATING PERFORMANCE | ||||||||||||||||||||||||||||
| Change in Net Assets Resulting from Operations | Less Dividends and Distributions | |||||||||||||||||||||||||||
| Net Asset Value, Beginning of Period | Net Investment Income (Loss) | Net Realized and Unrealized Gain (Loss) | Net Increase (Decrease) in Net Asset Value from Operations | Distributions from Net Investment Income | Distributions from Net Realized Gains | Total Distributions | ||||||||||||||||||||||
| AQR U.S. DEFENSIVE EQUITY FUND CLASS I | ||||||||||||||||||||||||||||
| FOR THE PERIOD ENDED 7/09/128—12/31/125 | $10.00 | 0.14 | 10 | 0.10 | 0.24 | (0.07) | (0.01) | (0.08) | ||||||||||||||||||||
| AQR U.S. DEFENSIVE EQUITY FUND CLASS N | ||||||||||||||||||||||||||||
| FOR THE PERIOD ENDED 7/09/128—12/31/125 | $10.00 | 0.08 | 10 | 0.15 | 0.23 | (0.04) | (0.01) | (0.05) | ||||||||||||||||||||
| AQR DIVERSIFIED ARBITRAGE FUND CLASS I | ||||||||||||||||||||||||||||
| FOR THE YEAR ENDED DECEMBER 31, 20125 | $10.89 | 0.10 | 10 | 0.24 | 0.34 | (0.13) | (0.05) | (0.18) | ||||||||||||||||||||
| FOR THE YEAR ENDED DECEMBER 31, 20115 | $11.15 | 0.13 | (0.02) | 0.11 | (0.09) | (0.28) | (0.37) | |||||||||||||||||||||
| FOR THE YEAR ENDED DECEMBER 31, 2010† | $10.80 | 0.06 | 0.46 | 0.52 | (0.04) | (0.13) | (0.17) | |||||||||||||||||||||
| FOR THE PERIOD ENDED 1/15/098—12/31/09†,5 | $10.00 | 0.13 | 0.79 | 0.92 | (0.03) | (0.09) | (0.12) | |||||||||||||||||||||
| AQR DIVERSIFIED ARBITRAGE FUND CLASS N | ||||||||||||||||||||||||||||
| FOR THE YEAR ENDED DECEMBER 31, 20125 | $10.85 | 0.06 | 10 | 0.24 | 0.30 | (0.09) | (0.05) | (0.14) | ||||||||||||||||||||
| FOR THE YEAR ENDED DECEMBER 31, 2011†,5 | $11.12 | 0.10 | (0.02) | 0.08 | (0.07) | (0.28) | (0.35) | |||||||||||||||||||||
| FOR THE YEAR ENDED DECEMBER 31, 2010† | $10.78 | 0.05 | 0.43 | 0.48 | (0.01) | (0.13) | (0.14) | |||||||||||||||||||||
| FOR THE PERIOD ENDED 1/15/098—12/31/09†,5 | $10.00 | 0.10 | 0.79 | 0.89 | (0.02) | (0.09) | (0.11) | |||||||||||||||||||||
| AQR MOMENTUM FUND CLASS L | ||||||||||||||||||||||||||||
| FOR THE YEAR ENDED DECEMBER 31, 20125 | $13.89 | 0.26 | 10 | 2.16 | 2.42 | (0.25) | — | (0.25) | ||||||||||||||||||||
| FOR THE YEAR ENDED DECEMBER 31, 2011†,5 | $14.40 | 0.15 | (0.54) | (0.39) | (0.09) | (0.03) | (0.12) | |||||||||||||||||||||
| FOR THE YEAR ENDED DECEMBER 31, 2010† | $12.19 | 0.06 | 2.21 | 2.27 | (0.02) | (0.04) | (0.06) | |||||||||||||||||||||
| FOR THE PERIOD ENDED 7/09/098—12/31/09†,5 | $10.00 | 0.07 | 2.48 | 2.55 | (0.05) | (0.31) | (0.36) | |||||||||||||||||||||
| AQR MOMENTUM FUND CLASS N | ||||||||||||||||||||||||||||
| FOR THE PERIOD ENDED 12/17/126—12/31/125 | $16.02 | 0.01 | 10 | 0.02 | 0.03 | — | — | — | ||||||||||||||||||||
| AQR SMALL CAP MOMENTUM FUND CLASS L | ||||||||||||||||||||||||||||
| FOR THE YEAR ENDED DECEMBER 31, 20125 | $13.89 | 0.22 | 10 | 2.50 | 2.72 | (0.18) | — | (0.18) | ||||||||||||||||||||
| FOR THE YEAR ENDED DECEMBER 31, 2011†,5 | $14.39 | 0.04 | (0.42) | (0.38) | (0.02) | (0.10) | (0.12) | |||||||||||||||||||||
| FOR THE YEAR ENDED DECEMBER 31, 2010† | $11.40 | 0.03 | 3.13 | 3.16 | (0.03) | (0.14) | (0.17) | |||||||||||||||||||||
| FOR THE PERIOD ENDED 7/09/098—12/31/09†,5 | $10.00 | 0.04 | 2.06 | 2.10 | (0.03) | (0.67) | (0.70) | |||||||||||||||||||||
| AQR SMALL CAP MOMENTUM FUND CLASS N | ||||||||||||||||||||||||||||
| FOR THE PERIOD ENDED 12/17/126—12/31/125 | $16.09 | 0.02 | 10 | 0.32 | 0.34 | — | — | — | ||||||||||||||||||||
| * | Annualized for periods less than one year. |
| † | Redemption fees of less than $0.005 per share were incurred by the share class. |
| 1 | Total investment return is calculated assuming an initial investment made at the net asset value at the beginning of the period, reinvestment of all dividends and distributions at net asset value during the period and redemption on the last day of the period and is not annualized. |
| 2 | Includes adjustments in accordance with accounting principles generally accepted in the United States of America and as such, the net asset value for financial reporting purposes and the returns based upon those net asset values may differ from the net asset value and returns for shareholder transactions. |
| 3 | Ratios do not include the impact of the expenses of the underlying funds in which the Fund invests. |
| 4 | Portfolio turnover is not annualized. |
| 5 | Per share net investment income (loss) and net realized and unrealized gain (loss) are based on average shares outstanding. |
| 6 | Commencement of offering of shares. |
| 7 | The ratio is not representative of what the ratio would be if the Fund class had operated for a longer period of time. Certain non-recurring expenses incurred by the Fund were not annualized for the period ended December 31, 2012. |
| 8 | Commencement of operations. |
| 9 | For the year ended December 31, 2010, the Advisor contributed $544,199 into the Fund to compensate the Fund for a loss incurred due to trade processing errors. The impact of the Advisor’s contribution increased the total return by 0.08%. |
| The accompanying notes are an integral part of these financial statements. |
| 138 | AQR Funds | Annual Report | December 2012 | |||||||||||||
Table of Contents
| Financial Highlights | December 31, 2012 |
| RATIOS/SUPPLEMENTAL DATA | ||||||||||||||||||||||||||||||||
| Ratios to Average Net Assets of:* | ||||||||||||||||||||||||||||||||
| Net Asset Value, End of Period | Total Return1,2 | Net Assets, End of Period | Expenses, Net of Reimbursements and/or Waivers3 | Expenses, Net of Reimbursements and/or Waivers (Excluding Dividend Short Expense & Interest Expense)3 | Expenses, Before Reimbursements and/or Waivers3 | Net Investment Income (Loss) | Portfolio Turnover Rate4 | |||||||||||||||||||||||||
| $10.16 | 2.34 | % | $7,841,840 | 0.75 | % | 0.75 | % | 3.90 | % | 2.90 | %10 | 141 | % | |||||||||||||||||||
| $10.18 | 2.29 | % | $420,890 | 1.00 | % | 1.00 | % | 9.36 | % | 1.70 | %10 | 141 | % | |||||||||||||||||||
| $11.05 | 3.13 | % | $1,752,723,858 | 2.30 | % | 1.21 | % | 2.32 | % | 0.88 | %10 | 312 | % | |||||||||||||||||||
| $10.89 | 0.99 | % | $1,456,748,122 | 2.75 | % | 1.20 | % | 2.84 | % | 1.18 | % | 298 | % | |||||||||||||||||||
| $11.15 | 4.81 | %9 | $824,237,659 | 2.59 | % | 1.20 | % | 2.62 | % | 1.13 | % | 361 | % | |||||||||||||||||||
| $10.80 | 9.24 | % | $160,026,814 | 2.46 | % | 1.20 | % | 3.25 | % | 1.30 | % | 482 | % | |||||||||||||||||||
| $11.01 | 2.83 | % | $761,371,466 | 2.62 | % | 1.52 | % | 2.62 | % | 0.57 | %10 | 312 | % | |||||||||||||||||||
| $10.85 | 0.68 | % | $651,790,519 | 3.05 | % | 1.50 | % | 3.08 | % | 0.89 | % | 298 | % | |||||||||||||||||||
| $11.12 | 4.52 | %9 | $382,758,131 | 2.89 | % | 1.50 | % | 2.92 | % | 0.85 | % | 361 | % | |||||||||||||||||||
| $10.78 | 8.88 | % | $79,054,890 | 2.69 | % | 1.50 | % | 3.42 | % | 0.98 | % | 482 | % | |||||||||||||||||||
| $16.06 | 17.49 | % | $490,441,577 | 0.50 | % | 0.49 | % | 0.58 | % | 1.69 | %10 | 68 | % | |||||||||||||||||||
| $13.89 | (2.68 | )% | $302,755,284 | 0.50 | % | 0.49 | % | 0.67 | % | 1.07 | % | 162 | % | |||||||||||||||||||
| $14.40 | 18.60 | % | $124,491,353 | 0.49 | % | 0.49 | % | 0.98 | % | 1.37 | % | 180 | % | |||||||||||||||||||
| $12.19 | 25.58 | % | $6,932,575 | 0.49 | % | 0.49 | % | 5.08 | % | 1.23 | % | 163 | % | |||||||||||||||||||
| $16.05 | 0.19 | % | $58,421,736 | 0.75 | % | 0.74 | % | 0.82 | % | 1.19 | %10 | 68 | % | |||||||||||||||||||
| $16.43 | 19.62 | % | $145,769,751 | 0.66 | % | 0.65 | % | 0.72 | % | 1.44 | %10 | 73 | % | |||||||||||||||||||
| $13.89 | (2.62 | )% | $100,534,354 | 0.66 | % | 0.65 | % | 0.85 | % | 0.26 | % | 121 | % | |||||||||||||||||||
| $14.39 | 27.69 | % | $54,504,582 | 0.65 | % | 0.65 | % | 1.85 | % | 0.66 | % | 380 | % | |||||||||||||||||||
| $11.40 | 21.24 | % | $3,239,605 | 0.65 | % | 0.65 | % | 7.53 | % | 0.65 | % | 136 | % | |||||||||||||||||||
| $16.43 | 2.11 | % | $10,214 | 0.90 | % | 0.90 | % | 135.33 | %7 | 3.36 | %10 | 73 | % | |||||||||||||||||||
| 10 | For the year ended December 31, 2012 certain Funds received special dividends which materially impacted the Net Investment Income Per Share and Net Investment Income Ratio. These dividends are not expected to continue in the future. Had these special dividends not been received the Net Investment Income Per Share and Net Investment Income Ratio would have been as follows: |
| FUND | NET INVESTMENT INCOME PER SHARE | NET INVESTMENT INCOME RATIO | ||||||
AQR U.S. Defensive Equity Fund—Class I | $ | 0.11 | 2.58% | |||||
AQR U.S. Defensive Equity Fund—Class N | 0.05 | 1.38 | ||||||
AQR Diversified Arbitrage Fund—Class I | 0.08 | 0.73 | ||||||
AQR Diversified Arbitrage Fund—Class N | 0.04 | 0.42 | ||||||
AQR Momentum Fund—Class L | 0.24 | 1.57 | ||||||
AQR Momentum Fund—Class N | 0.01 | 1.07 | ||||||
AQR Small Cap Momentum Fund—Class L | 0.15 | 1.01 | ||||||
AQR Small Cap Momentum Fund—Class N | 0.02 | 2.93 | ||||||
| The accompanying notes are an integral part of these financial statements. |
| AQR Funds | Annual Report | December 2012 | 139 | |||||||||||||
Table of Contents
| Financial Highlights | December 31, 2012 |
| PER SHARE OPERATING PERFORMANCE | ||||||||||||||||||||||||||||
| Change in Net Assets Resulting from Operations | Less Dividends and Distributions | |||||||||||||||||||||||||||
| Net Asset Value, Beginning of Period | Net Investment Income (Loss) | Net Realized and Unrealized Gain (Loss) | Net Increase (Decrease) in Net Asset Value from Operations | Distributions from Net Investment Income | Distributions from Net Realized Gains | Total Distributions | ||||||||||||||||||||||
| AQR INTERNATIONAL MOMENTUM FUND CLASS L | ||||||||||||||||||||||||||||
| FOR THE YEAR ENDED DECEMBER 31, 20125 | $11.37 | 0.29 | 1.74 | 2.03 | (0.31) | — | (0.31) | |||||||||||||||||||||
| FOR THE YEAR ENDED DECEMBER 31, 2011†,5 | $13.62 | 0.29 | (2.26) | (1.97) | (0.28) | — | (0.28) | |||||||||||||||||||||
| FOR THE YEAR ENDED DECEMBER 31, 2010† | $11.98 | 0.08 | 1.62 | 1.70 | (0.05) | (0.01) | (0.06) | |||||||||||||||||||||
| FOR THE PERIOD ENDED 7/09/098—12/31/09†,5 | $10.00 | 0.04 | 2.26 | 2.30 | (0.09) | (0.23) | (0.32) | |||||||||||||||||||||
| AQR INTERNATIONAL MOMENTUM FUND CLASS N | ||||||||||||||||||||||||||||
| FOR THE PERIOD ENDED 12/17/126—12/31/125 | $12.95 | — | 0.13 | 0.13 | — | — | — | |||||||||||||||||||||
| AQR TAX-MANAGED MOMENTUM FUND CLASS L | ||||||||||||||||||||||||||||
| FOR THE PERIOD ENDED 1/27/128—12/31/125 | $10.00 | 0.19 | 9 | 1.17 | 1.36 | (0.14) | (0.09) | (0.23) | ||||||||||||||||||||
| AQR TAX-MANAGED MOMENTUM FUND CLASS N | ||||||||||||||||||||||||||||
| FOR THE PERIOD ENDED 12/17/126—12/31/125 | $11.12 | 0.01 | 9 | — | 0.01 | — | — | — | ||||||||||||||||||||
| AQR TAX-MANAGED SMALL CAP MOMENTUM FUND CLASS L | ||||||||||||||||||||||||||||
| FOR THE PERIOD ENDED 1/27/128—12/31/125 | $10.00 | 0.19 | 9 | 1.11 | 1.30 | (0.15) | — | (0.15) | ||||||||||||||||||||
| AQR TAX-MANAGED SMALL CAP MOMENTUM FUND CLASS N | ||||||||||||||||||||||||||||
| FOR THE PERIOD ENDED 12/17/126—12/31/125 | $10.91 | 0.02 | 9 | 0.22 | 0.24 | — | — | — | ||||||||||||||||||||
| AQR TAX-MANAGED INTERNATIONAL MOMENTUM FUND CLASS L | ||||||||||||||||||||||||||||
| FOR THE PERIOD ENDED 1/27/128—12/31/125 | $10.00 | 0.23 | 1.22 | 1.45 | (0.19) | (0.02) | (0.21) | |||||||||||||||||||||
| AQR TAX-MANAGED INTERNATIONAL MOMENTUM FUND CLASS N | ||||||||||||||||||||||||||||
| FOR THE PERIOD ENDED 12/17/126—12/31/125 | $11.14 | — | 0.10 | 0.10 | — | — | — | |||||||||||||||||||||
| * | Annualized for periods less than one year. |
| 1 | Total investment return is calculated assuming an initial investment made at the net asset value at the beginning of the period, reinvestment of all dividends and distributions at net asset value during the period and redemption on the last day of the period and is not annualized. |
| 2 | Includes adjustments in accordance with accounting principles generally accepted in the United States of America and as such, the net asset value for financial reporting purposes and the returns based upon those net asset values may differ from the net asset value and returns for shareholder transactions. |
| 3 | Ratios do not include the impact of the expenses of the underlying funds in which the Fund invests. |
| 4 | Portfolio turnover is not annualized. |
| 5 | Per share net investment income (loss) and net realized and unrealized gain (loss) are based on average shares outstanding. |
| 6 | Commencement of offering of shares. |
| 7 | The ratio is not representative of what the ratio would be if the Fund class had operated for a longer period of time. Certain non-recurring expenses incurred by the Fund were not annualized for the period ended December 31, 2012. |
| 8 | Commencement of operations. |
| The accompanying notes are an integral part of these financial statements. |
| 140 | AQR Funds | Annual Report | December 2012 | |||||||||||||
Table of Contents
| Financial Highlights | December 31, 2012 |
| RATIOS/SUPPLEMENTAL DATA | ||||||||||||||||||||||||||||||||
| Ratios to Average Net Assets of:* | ||||||||||||||||||||||||||||||||
| Net Asset Value, End of Period | Total Return1,2 | Net Assets, End of Period | Expenses, Net of Reimbursements and/or Waivers3 | Expenses, Net of Reimbursements and/or Waivers (Excluding Dividend Short Expense & Interest Expense)3 | Expenses, Before Reimbursements and/or Waivers3 | Net Investment Income (Loss) | Portfolio Turnover Rate4 | |||||||||||||||||||||||||
| $13.09 | 17.92 | % | $127,673,412 | 0.66 | % | 0.65 | % | 0.80 | % | 2.41 | % | 116 | % | |||||||||||||||||||
| $11.37 | (14.42 | )% | $77,224,911 | 0.66 | % | 0.65 | % | 0.97 | % | 2.23 | % | 203 | % | |||||||||||||||||||
| $13.62 | 14.20 | % | $62,091,379 | 0.65 | % | 0.65 | % | 1.46 | % | 1.44 | % | 269 | % | |||||||||||||||||||
| $11.98 | 23.08 | % | $29,762,053 | 0.65 | % | 0.65 | % | 2.22 | % | 0.63 | % | 160 | % | |||||||||||||||||||
| $13.08 | 1.00 | % | $11,102 | 0.90 | % | 0.90 | % | 132.42 | %7 | 0.25 | % | 116 | % | |||||||||||||||||||
| $11.13 | 13.67 | % | $6,040,821 | 0.55 | % | 0.54 | % | 4.57 | % | 1.89 | %9 | 93 | % | |||||||||||||||||||
| $11.13 | 0.09 | % | $10,008 | 0.79 | % | 0.79 | % | 15.32 | %7 | 2.41 | %9 | 93 | % | |||||||||||||||||||
| $11.15 | 13.01 | % | $3,434,992 | 0.71 | % | 0.70 | % | 5.77 | % | 1.91 | %9 | 93 | % | |||||||||||||||||||
| $11.15 | 2.20 | % | $10,218 | 0.95 | % | 0.95 | % | 12.32 | %7 | 4.19 | %9 | 93 | % | |||||||||||||||||||
| $11.24 | 14.46 | % | $5,738,743 | 0.71 | % | 0.70 | % | 5.28 | % | 2.38 | % | 131 | % | |||||||||||||||||||
| $11.24 | 0.90 | % | $10,089 | 0.95 | % | 0.95 | % | 15.82 | %7 | 0.15 | % | 131 | % | |||||||||||||||||||
| 9 | For the year ended December 31, 2012 certain Funds received special dividends which materially impacted the Net Investment Income Per Share and Net Investment Income Ratio. These dividends are not expected to continue in the future. Had these special dividends not been received the Net Investment Income Per Share and Net Investment Income Ratio would have been as follows: |
| FUND | NET INVESTMENT INCOME PER SHARE | NET INVESTMENT INCOME RATIO | ||||||
AQR Tax-Managed Momentum Fund—Class L | $0.17 | 1.76% | ||||||
AQR Tax-Managed Momentum Fund—Class N | 0.01 | 2.28 | ||||||
AQR Tax-Managed Small Cap Momentum Fund—Class L | 0.12 | 1.26 | ||||||
AQR Tax-Managed Small Cap Momentum Fund—Class N | 0.02 | 3.54 | ||||||
| The accompanying notes are an integral part of these financial statements. |
| AQR Funds | Annual Report | December 2012 | 141 | |||||||||||||
Table of Contents
| Notes to Financial Statements | December 31, 2012 |
1. Organization
AQR Funds (the “Trust”), organized as a Delaware statutory trust on September 4, 2008, is an open-end management investment company, under the Investment Company Act of 1940, as amended (the “1940 Act”). As of December 31, 2012, the Trust consists of eighteen active series, of which twelve of the active series are presented in this book and the remaining six active series are reported in a separate book, (collectively, the “Funds” and each individually a “Fund”): AQR Global Equity Fund, AQR International Equity Fund, AQR Emerging Defensive Equity Fund, AQR International Defensive Equity Fund, AQR U.S. Defensive Equity Fund, AQR Diversified Arbitrage Fund, , AQR Momentum Fund, AQR Small Cap Momentum Fund, AQR International Momentum Fund, AQR Tax-Managed Momentum Fund, AQR Tax-Managed Small Cap Momentum Fund and AQR Tax-Managed International Momentum Fund. AQR Capital Management, LLC (“the Advisor”) serves as the investment advisor of each Fund. The Advisor has retained CNH Partners, LLC (“the Sub-Advisor”), an affiliate of the Advisor, to serve as an investment sub-advisor to the AQR Diversified Arbitrage Fund.
The investment objective of the AQR Global Equity Fund is to seek long-term capital appreciation. The principal investment strategies of the AQR Global Equity Fund include seeking to outperform, after expenses, the MSCI World Index (the “Global Equity Benchmark”) while seeking to control its tracking error relative to this benchmark. The Global Equity Benchmark is a free float-adjusted market capitalization index that is designed to measure the performance of equities in developed markets, including the United States and Canada. The Fund offers Class I, Class N and Class Y shares.
The investment objective of the AQR International Equity Fund is to seek long-term capital appreciation. The principal investment strategies of the AQR International Equity Fund include seeking to outperform, after expenses, the MSCI EAFE Index (the “International Equity Benchmark”) while seeking to control its tracking error relative to this benchmark. The International Equity Benchmark is a free float-adjusted market capitalization index that is designed to measure the performance of equities in developed markets, excluding the United States and Canada. The Fund offers Class I, Class N and Class Y shares.
The investment objective of the AQR Emerging Defensive Equity Fund is to seek total return. The Fund pursues a “defensive” strategy that provides exposure to emerging stock markets. The Fund seeks to invest in lower beta stocks of companies with stable businesses, high profitability, low operating and financial leverage, lower earnings-per-share variability and other measures of quality. These stocks generally are less volatile than the market average, and are expected to produce higher risk adjusted returns over a full market cycle than market indexes. The Fund offers Class I and Class N shares.
The investment objective of the AQR International Defensive Equity Fund is to seek total return. The Fund pursues a “defensive” strategy that provides exposure to international stock markets. The Fund seeks to invest in lower beta stocks of companies with stable businesses, high profitability, low operating and financial leverage, lower earnings-per-share variability and other measures of quality. These stocks generally are less volatile than the market average, and are expected to produce higher risk adjusted returns over a full market cycle than market indexes. The Fund offers Class I and Class N shares.
The investment objective of the AQR U.S. Defensive Equity Fund is to seek total return. The Fund pursues a “defensive” strategy that provides exposure the U.S. stock market. The Fund seeks to invest in lower beta stocks of companies with stable businesses, high profitability, low operating and financial leverage, lower earnings-per-share variability and other measures of quality. These stocks generally are less volatile than the market average, and are expected to produce higher risk adjusted returns over a full market cycle than market indexes. The Fund offers Class I and Class N shares.
The investment objective of the AQR Diversified Arbitrage Fund is to seek positive absolute returns. The principal investment strategies of the AQR Diversified Arbitrage Fund include seeking to outperform, after expenses, the BofA Merrill Lynch 3-Month Treasury Bill Index (the “Absolute Return Benchmark”) using arbitrage and alternative investment strategies such as merger arbitrage, convertible arbitrage, other forms of arbitrage (including, but not limited to, when-issued trading arbitrage, stub-trading arbitrage and dual-class arbitrage) and other types of non-arbitrage alternative investment strategies. The Fund offers Class I and Class N shares.
| 142 | AQR Funds | Annual Report | December 2012 | |||||||||||||
Table of Contents
| Notes to Financial Statements | December 31, 2012 |
The investment objective of the AQR Momentum Fund is to seek long-term capital appreciation. The Fund invests primarily in equity or equity-related securities (including, but not limited to, exchange-traded funds, equity index futures, and depositary receipts) of large and mid-sized companies traded on a principal U.S. exchange or over-the-counter market that the Advisor determines to have positive momentum. The Advisor considers a security to have positive momentum primarily if it has a return over the prior twelve months that ranks in the top third of its relevant universe at the time of purchase. The Fund offers Class L and Class N shares.
The investment objective of the AQR Small Cap Momentum Fund is to seek long-term capital appreciation. The Fund invests primarily in equity or equity-related securities (including, but not limited to, exchange-traded funds, equity index futures and depositary receipts) of small cap companies traded on a principal U.S. exchange or over-the-counter market that the Advisor determines to have positive momentum. The Fund offers Class L and Class N shares.
The investment objective of the AQR International Momentum Fund is to seek long-term capital appreciation. The Fund invests primarily in equity or equity-related securities (including, but not limited to, exchange-traded funds, equity index futures and depositary receipts) of non-U.S. companies that the Advisor determines to have positive momentum. The Fund offers Class L and Class N shares.
The investment objective of the AQR Tax-Managed Momentum Fund is to seek long-term after-tax capital appreciation. The Fund invests primarily in equity or equity-related securities (including, but not limited to, exchange traded funds, equity index futures, and depositary receipts) of large and mid-sized companies traded on a principal U.S. exchange or over-the-counter market that the Advisor determines to have positive momentum. The Fund is designed to have lower distributions of realized capital gains, in particular, emphasizing smaller short-term capital gains as opposed to funds that do not focus on tax efficiency. Some of the strategies the Fund may utilize to do this include: deferring the realizations of capital gains thereby moving potential short-term capital gains into long-term capital gains, harvesting losses to offset realized gains, attempting to generate short-term losses, and limiting portfolio turnover that may result in taxable gains. The Fund offers Class L and Class N shares.
The investment objective of the AQR Tax-Managed Small Cap Momentum Fund is to seek long-term after-tax capital appreciation. The Fund invests primarily in equity or equity-related securities (including, but not limited to, exchange traded funds, equity index futures, and depositary receipts) of small cap companies traded on a principal U.S. exchange or over-the-counter market that the Advisor determines to have positive momentum. The Fund is designed to have lower distributions of realized capital gains, in particular, emphasizing smaller short-term capital gains as opposed to funds that do not focus on tax efficiency. Some of the strategies the Fund may utilize to do this include: deferring the realizations of capital gains thereby moving potential short-term capital gains into long-term capital gains, harvesting losses to offset realized gains, attempting to generate short-term losses, and limiting portfolio turnover that may result in taxable gains. The Fund offers Class L and Class N shares.
The investment objective of the AQR Tax-Managed International Momentum Fund is to seek long-term after-tax capital appreciation. The Fund invests primarily in equity or equity-related securities (including, but not limited to, exchange traded funds, equity index futures, and depositary receipts) of non-U.S. companies that the Advisor determines to have positive momentum. The Fund is designed to have lower distributions of realized capital gains, in particular, emphasizing smaller short-term capital gains as opposed to funds that do not focus on tax efficiency. Some of the strategies the Fund may utilize to do this include: deferring the realizations of capital gains thereby moving potential short-term capital gains into long-term capital gains, harvesting losses to offset realized gains, attempting to generate short-term losses, and limiting portfolio turnover that may result in taxable gains. The Fund offers Class L and Class N shares.
2. Significant Accounting Policies
The following summarizes the significant accounting policies of the Funds:
Use of Estimates: The preparation of the financial statements in conformity with accounting principles generally accepted in the United States of America (“GAAP”) requires management to make estimates and assumptions that affect the reported amounts of assets and liabilities and disclosure of contingent assets and liabilities, if any, at the date of the financial statements and the reported amounts of increases and decreases in net assets from operations during the reported period. Actual results could differ from those estimates and such differences could be material.
| AQR Funds | Annual Report | December 2012 | 143 | |||||||||||||
Table of Contents
| Notes to Financial Statements | December 31, 2012 |
Valuation of Investments: Each Fund’s portfolio securities are valued as of the close of business of the regular session of trading on the NYSE (normally 4:00 p.m. Eastern time). Equity securities, including securities sold short and warrants, are valued at the latest quoted sales prices or official closing prices taken from the primary market in which each security trades. The value of securities listed on the NASDAQ shall generally be the NASDAQ Official Closing Price. In accordance with procedures adopted by the Board of Trustees, the Funds apply fair value pricing to international securities traded outside of North America on a daily basis utilizing the quotations of an independent pricing service, unless the Advisor determines that use of another valuation methodology is appropriate. The pricing service uses statistical analysis and quantitative models to adjust local market prices using factors such as subsequent movement and changes in the prices of indices, securities and exchange rates in other markets, in determining fair value as of the time the Funds calculate their net asset value. Securities traded in the over-the-counter market, and which are not quoted by NASDAQ, are valued at the last sale price, if available, otherwise at the last quoted bid price (in the case of short sales, at the ask price). Bonds are valued using the latest bid prices or evaluated quotes furnished by independent pricing services. Evaluated quotes are based on a matrix system, which may consider such factors as quoted prices, yields, maturities and ratings and are not necessarily reliant on quoted prices. The Funds value debt securities maturing less than 61 days from the date of purchase at amortized cost, which approximates market value. The value of futures contracts purchased and sold by the Funds is accounted for using the unrealized gain or loss on the contracts that is determined by marking the contracts to their current settlement prices. Futures and options contracts are valued at the last quoted sales price on the valuation date. In the event that the exchange for a specific futures contract closes earlier than 4:00 p.m., the futures contract is valued at the Official Settlement Price of the exchange. Prices of futures contracts are monitored until 4:00 p.m. to determine if fair valuation would provide a more accurate valuation. Investments in open-end investment companies are valued at such investment company’s current day closing net asset value per share. Exchange-Traded Funds (“ETFs”) and closed-end investment companies are valued at the last quoted sales price. Total return swap contracts are valued at fair value, based on the price of the underlying referenced instrument. Credit default swaps are valued daily primarily using independent pricing services or market makers.
The Funds may use pricing services to obtain readily available market quotations. Where market quotations are not readily available, or if an available market quotation is determined not to reflect fair value, a security will be valued based on its fair value as determined in accordance with the valuation procedures approved by the Funds’ Board of Trustees, which may include the use of proprietary valuation models which may consider market transactions in comparable securities and the various relationships between securities in determining value and/or market characteristics such as benchmark yield curves, credit spreads, estimated default rates, underlying collateral, and other unique security features. Using fair value to price securities may result in a value that is different from a security’s most recent closing price and from the prices used by other mutual funds to calculate their net assets. It is possible the estimated values may differ significantly from the values which would have been used had a ready market for the investments existed, these differences could be material.
Loan Participations and Assignments: The Diversified Arbitrage Fund invests in loan participations and assignments. When the Fund purchases a loan participation, the Fund typically enters into a contractual relationship with the lender or a third party selling such participations (“Selling Participant”), but not the borrower. In this case, the Fund assumes the credit risk of the borrower and the Selling Participant and any other persons inter-positioned between the Fund and the borrower (“Intermediate Participants”). In contrast, when the Fund purchases an assignment, the contractual relationship is with the borrower and the credit risk assumed by the Fund is only with the borrower. Although certain loan participations or assignments are secured by collateral, the Fund could experience delays or limitations in realizing on such collateral or have its interest subordinated to other indebtedness of the obligor. The Fund may also enter into unfunded loan commitments, which are contractual obligations for future funding. These unfunded commitments represent a future obligation in full, even though a percentage of the loan may not be utilized by the borrower. These types of investments may include standby financing commitments, such as revolving credit facilities, which obligate the Fund to supply additional cash to the borrower on demand. The value of the unfunded portion of the investment is determined using a pro-rata allocation, based on its par value relative to the par value of the entire investment. The unrealized appreciation (depreciation) from unfunded commitments is reported in the Statements of Assets and Liabilities. In addition, loan participations and assignments are vulnerable to market conditions such that economic conditions or other events may reduce the demand for loan participations and assignments and certain loan participations and assignments which were liquid, when purchased, may become illiquid.
| 144 | AQR Funds | Annual Report | December 2012 | |||||||||||||
Table of Contents
| Notes to Financial Statements | December 31, 2012 |
Convertible Securities: The Funds invest in preferred stocks and fixed-income securities which are convertible into common stock. Convertible securities may be converted either at a stated price or rate within a specified period of time into a specified number of shares of common stock. By investing in a convertible security, the Funds may participate in any capital appreciation or depreciation of a company’s stock, but to a lesser degree than if it had invested in that company’s common stock. Convertible securities rank senior to common stock in a corporation’s capital structure and, therefore, entail less risk than the corporation’s common stock. The Funds may attempt to hedge some of their investments in convertible debt securities by selling short the issuer’s common stock.
Short Sales: The AQR Diversified Arbitrage Fund sells securities it does not own as a hedge against some of its long positions and/or in anticipation of a decline in the market value of that security (short sale). When the Fund makes a short sale, it must borrow the security sold short and deliver it to the broker-dealer through which it made the short sale. The Fund may have to pay a fee to borrow the particular security and may be obligated to remit any interest or dividends received on such borrowed securities. Dividends declared on short positions open are recorded on the ex-date as an expense. A gain, limited to the price at which the Fund sold the security short, or a loss, unlimited in magnitude, will be recognized upon the termination of a short sale if the market price at termination is less than or greater than, respectively, the proceeds originally received. The Fund is also subject to the risk that they may be unable to reacquire a security to terminate a short position except at a price substantially in excess of the last quoted price. The Fund is also subject to risk of loss if the broker were to fail to perform its obligations under the contractual terms. Liabilities for securities sold short are reported at market value on the Statements of Assets and Liabilities and the change in market value is recorded as unrealized gain or loss on the Statements of Operations.
The Fund is required to pledge cash or securities to the broker as collateral for the securities sold short. Collateral requirements are calculated daily based on the current market value of the short positions. Cash deposited with broker for collateral for securities sold short is recorded as an asset on the Statements of Assets and Liabilities and securities segregated as collateral are denoted in the Schedules of Investments. The Fund may receive or pay the net of the following amounts: (i) a portion of the income from the investment of cash collateral; (ii) the broker’s fee on the borrowed securities; and (iii) a financing charge for the difference in the market value of the short position and cash collateral deposited with the broker. This income or fee is calculated daily based upon the market value of each borrowed security and a variable rate that is dependent on the availability of the security. The net amount of fees of $4,429,088, incurred by the Diversified Arbitrage Fund is included in dividend and interest on securities sold short in the Statements of Operations.
Futures Contracts: The Funds invest in futures contracts. The Funds invest in futures in order to hedge their investments or equitize their cash flows against fluctuations in value caused by changes in prevailing interest rates or market conditions. Investments in futures may increase or decrease exposure to a particular market. In the event of a bankruptcy or insolvency of a futures commission merchant that holds margin on behalf of the Funds, the Funds may not be entitled to the return of all of the margin owed to the Funds, potentially resulting in a loss. No monies are paid to or received by a Fund upon the purchase or sale of a futures contract. Initially, a Fund will be required to deposit with the broker an amount of cash or cash equivalents, known as initial margin, based on the value of the contract. Subsequent payments to and from the broker, will be made on a periodic basis as the price of the underlying instruments fluctuates. Changes in market value of open futures contracts are recorded as unrealized appreciation or depreciation in the Statements of Operations. Realized gains or losses, represent the difference between the value of the contract at the time it was opened and the value at the time it was closed, and are reported in the Statements of Operations at the closing or expiration of futures contracts. Securities deposited as initial margin are designated in the Schedules of Investments and cash deposited is presented as Due from Broker on the Statements of Assets and Liabilities. The use of long futures contracts subjects the Funds to risk of loss in excess of the amounts shown on the Statements of Assets and Liabilities, up to the contract amount of the futures contracts. The use of short futures contracts subjects the Funds to unlimited risk of loss. Futures contracts outstanding at period end, if any, are listed after each Fund’s Schedule of Investments.
Forward Currency Contracts: The Funds buy and sell forward currency contracts, which are agreements between two parties to buy and sell currencies at a set price on a future date. These contracts are used to protect against a decline in value relative to the U.S. dollar of the currencies in which portfolio securities are denominated or quoted (or an increase in the value of a currency in which securities a Fund intends to buy are denominated, when a Fund holds cash reserves
| AQR Funds | Annual Report | December 2012 | 145 | |||||||||||||
Table of Contents
| Notes to Financial Statements | December 31, 2012 |
and short term investments), or for other investment purposes. The U.S. dollar value of forward currency contracts is determined using current forward currency exchange rates supplied by a quotation service. The market value of the contract will fluctuate with changes in currency exchange rates. The contract is marked to market daily and the change in market value is recorded as an unrealized gain or loss. When the contract is closed, the Funds record a realized gain or loss equal to the difference between the value of the contract at the time it was opened and the value at the time it was closed. The Funds could be exposed to risk if the value of the currency changes unfavorably, if the counterparties to the contracts are unable to meet the terms of their contracts or if the Fund is unable to enter into a closing position. Risks may exceed amounts recognized on the Statements of Assets and Liabilities. Non-deliverable forward foreign currency exchange contracts are settled with the counterparty in cash without the delivery of foreign currency. Forward currency contracts outstanding at period end, if any, are listed after each Fund’s Schedule of Investments.
Total Return Swap Contracts: Certain Funds invest in total return swaps to obtain exposure to the underlying referenced instrument, obtain leverage or attain the returns from ownership without actually owning the underlying position. Total return swaps are two-party contracts that generally obligate one party to pay the positive return and the other party to pay the negative return on a specified reference security, basket of securities, security index or index component during the period of the swap. Total return swap contracts are marked to market daily based on the value of the underlying reference entity and the change, if any, is recorded as an unrealized gain or loss. Total return swaps normally do not involve the delivery of securities or other underlying assets. If the other party to an total return swap defaults, a Fund’s risk of loss consists of the net amount of payments that such Fund is contractually entitled to receive, if any. Total return swaps are derivatives and their value can be very volatile. To the extent that the Advisor or Sub-Advisor, as applicable, do not accurately analyze and predict future market trends, the values of assets or economic factors, a Fund may suffer a loss, which may exceed the related amounts shown in the Statements of Assets and Liabilities. Periodic payments received or paid by the Funds are recorded as realized gains or losses. Total return swap contracts outstanding at period end, if any, are listed after each Fund’s Schedule of Investments.
Credit Default Swap Contracts: The AQR Diversified Arbitrage Fund enters into credit default swap contracts to provide a measure of protection against risk of loss following a default, or other credit event in respect of issuers within an underlying index or a single issuer, or to gain credit exposure to an underlying index or issuer. In a credit default contract, the protection buyer typically makes an up-front payment and a periodic stream of payments to a counterparty, the protection seller, in exchange for the right to receive a contingent payment upon the occurrence of a credit event on the reference obligation or all other equally ranked obligations of the reference entity. Credit events are contract specific but may include bankruptcy, failure to pay, restructuring and obligation acceleration. An up-front payment received by a Fund, as the protection seller, is recorded as a liability on the Fund’s Statement of Assets and Liabilities. An up-front payment made by a Fund, as the protection buyer, is recorded as an asset on the Fund’s Statement of Assets and Liabilities. Up-front payments are amortized over the term of the contract. Periodic payments received or paid by a Fund are recorded as realized gains or losses. The credit default contracts are marked to market daily based upon quotations from an independent pricing service or market makers and the change, if any, is recorded as an unrealized gain or loss. Upon the occurrence of a credit event, the difference between the par value and market value of the reference obligation, net of any proportional amount of the up-front payment, is recorded as a realized gain or loss.
In addition to bearing the risk that the credit event will occur, a Fund could be exposed to market risk due to unfavorable changes in interest rates or in the price of the underlying security or index or the possibility that the Fund may be unable to close out its position at the same time or at the same price as if it had purchased the underlying reference obligations. In certain circumstances, a Fund may enter into offsetting credit default contracts which would mitigate its risk of loss. Risks of loss may exceed amounts recognized on the Statements of Assets and Liabilities. The Fund’s maximum risk of loss from counterparty risk, either as the protection seller or as the protection buyer, is the fair value of the contract. This risk may be mitigated by having a master netting arrangement between the Fund and the counterparty. Where a Fund is a seller of protection, the maximum potential amount of future payments the Fund may be required to make is equal to the notional amount of the relevant credit default contract. The Fund’s risk of loss associated with these instruments may exceed their value as recorded in the Statements of Assets and Liabilities. Credit default contracts outstanding, including their respective notional amounts at period end, if any, are listed after the Fund’s Schedule of Investments.
Implied credit spreads are an indication of the seller’s performance risk, related to the likelihood of a credit event occurring that would require a seller to make payment to a buyer. Implied credit spreads are used to determine the value
| 146 | AQR Funds | Annual Report | December 2012 | |||||||||||||
Table of Contents
| Notes to Financial Statements | December 31, 2012 |
of swap contracts and reflect the cost of buying/selling protection, which may include up-front payments made to enter into the contract. Therefore, higher spreads would indicate a greater likelihood that a seller will be obligated to perform (i.e., make payment) under the swap contract. Increasing values, in absolute terms and relative to notional amounts, are also indicative of greater performance risk. Implied credit spreads for credit default swaps on credit indexes are linked to the weighted average spread across the underlying reference obligations included in a particular index.
High Yield Securities: The AQR Diversified Arbitrage Fund invests in lower-quality debt securities. Investments in lower-rated securities or unrated securities of comparable quality tend to be more sensitive to economic conditions than higher rated securities causing greater price volatility. These instruments involve a greater risk of loss due to default by the issuer because such securities are generally unsecured and are often subordinated to other creditors’ claims.
Master Agreements: The Funds are a party to ISDA (International Swap and Derivatives Association, Inc.) Master Agreements (“Master Agreements”) with certain counterparties that govern over-the-counter derivative and foreign exchange contracts entered into from time to time. The Master Agreements may contain provisions regarding, among other things, the parties’ general obligations, representations, agreements, collateral requirements, events of default and early termination. With respect to certain counterparties, in accordance with the terms of the Master Agreements, collateral posted for the benefit of a Fund is held in a segregated account by a custodian of the Fund’s custodian and with respect to those amounts which can be sold or repledged, are presented in the Fund’s Schedule of Investments. Collateral pledged by the Fund is segregated by the Fund’s custodian and identified in the Fund’s Schedule of Investments. Collateral can be in the form of cash or debt securities issued by the U.S. Government or related agencies or other securities and money market funds as agreed to by the Fund and the applicable counterparty. Collateral requirements are generally determined based on the Fund’s net position with each counterparty. Termination events applicable to the Fund may occur upon a decline in the Fund’s net assets below a specified threshold over a certain period of time. Termination events applicable to counterparties may occur upon a decline in the counterparty’s long-term and short-term credit ratings below a specified level. In each case, upon occurrence, the other party may elect to terminate early and cause settlement of all derivative and foreign exchange contracts outstanding, including the payment of any losses and costs resulting from such early termination, as reasonably determined by the terminating party. Any decision by one or more of the Fund’s counterparties to elect early termination could impact a Fund’s future derivative activity. The Funds’ derivative assets and liabilities on the Statements of Assets and Liabilities are presented net when a legally enforceable master netting agreement exists between the Funds and a derivative counterparty.
Options: The AQR Diversified Arbitrage Fund may write and purchase put and call options from time to time. When a Fund writes an option, an amount equal to the premium received by the Fund is reflected as an asset and an equivalent liability. The amount of the liability is subsequently marked to market to reflect the current market value of the option written. When a security is purchased or sold through an exercise of an option, the related premium paid (or received) is added to (or deducted from) the basis of the security acquired or deducted from (or added to) the proceeds of the security sold. When an option expires, the Fund realizes a gain or loss on the option to the extent of the premiums received or paid. When a Fund enters into a closing transaction, the Fund realizes a gain or loss to the extent the cost of the closing transaction exceeds the premiums paid or received. Written uncovered call options subject the Funds to unlimited risk of loss. Written covered call options limit the upside potential of a security above the strike price. Put options written subject the Funds to risk of loss if the value of the security declines below the exercise price minus the put premium. The Fund, as writer of an option, bears the market risk of an unfavorable change in the price of the security underlying the written option. Written and purchased options are non-income producing investments.
| AQR Funds | Annual Report | December 2012 | 147 | |||||||||||||
Table of Contents
| Notes to Financial Statements | December 31, 2012 |
Transactions in call and put options written during the period ended December 31, 2012 for the AQR Diversified Arbitrage Fund were as follows:
| CALL OPTIONS | PUT OPTIONS | |||||||||||||||
| SHARES SUBJECT TO CALL | PREMIUM | SHARES SUBJECT TO PUT | PREMIUM | |||||||||||||
Options outstanding, December 31, 2011 | (2,541 | ) | $ | (419,013 | ) | — | $ | — | ||||||||
Options written | (20,609 | ) | (3,099,692 | ) | (3,700 | ) | (25,900 | ) | ||||||||
Options expired | 18,700 | 3,094,312 | 3,700 | 25,900 | ||||||||||||
| Options exercised | 464 | 240,800 | — | — | ||||||||||||
| Options outstanding, December 31, 2012 | (3,986 | ) | $ | (183,593 | ) | — | $ | — | ||||||||
Securities Lending: The Funds may lend securities to brokers approved by the Advisor in order to generate additional income. Securities loaned are collateralized by cash, which is invested in various JPMorgan Money Market Funds. Upon termination of a loan, the Funds are required to return to the borrower the posted cash collateral. Loans are subject to termination by the Funds or the borrower at any time. Securities lending income is comprised of income earned on cash collateral investments, net of a rebate received from or paid to borrowers for use of cash collateral and lending agent fees. This amount is recorded as Securities lending income, net on the Statements of Operations. The Funds also receive payments from the borrower during the period of the loan, equivalent to dividends and interest earned on the securities loaned, which are recorded as Dividend or Interest income, respectively, on the Statements of Operations.
The Funds bear the risk of loss associated with the collateral investments and are not entitled to additional collateral from the borrower to cover any such losses. To the extent that the value of the collateral investments declines below the amount owed to a borrower, a Fund may incur losses that exceed the amount it earned on lending the security. Upon termination of a loan, a Fund may use leverage (borrow money) to repay the borrower for cash collateral posted if the Advisor does not believe that it is prudent to sell the collateral investments to fund the payment of this liability.
Securities lending also involves counterparty risks, including the risk that the loaned securities may not be returned in a timely manner or at all.
Federal Income Taxes: Each Fund is treated as a separate taxable entity for federal income tax purposes. Each Fund intends to qualify as a “regulated investment company” under Subchapter M of the Code, as amended. If so qualified, each Fund will not be subject to federal income tax to the extent it distributes substantially all of its net investment income and capital gains to shareholders.
Management evaluates tax positions taken or expected to be taken in the course of preparing the Funds’ tax returns to determine whether the tax positions are “more-likely-than-not” of being sustained by the applicable tax authority. Tax positions deemed to meet the more-likely-than-not threshold would be recorded as a tax benefit or expense in the current year. The Funds are required to analyze all open tax years. Open tax years are those years that are open for examination by the relevant income taxing authority. The returns of the Funds for the prior three fiscal years, or since inception if shorter, are open for examination. As of December 31, 2012, the Funds had no examinations in progress.
The Funds have concluded that there is no tax liability/benefit resulting from uncertain income tax positions taken or expected to be taken. The Funds are also not aware of any tax positions for which it is reasonably possible that the total amounts of unrecognized tax expense will significantly change in twelve months.
Securities Transactions and Investment Income: Investment transactions are accounted for on trade date (the date the order to buy or sell is executed). Securities gains and losses are calculated on a specifically identified cost basis. Interest income is determined on the basis of coupon interest accrued using the effective interest method adjusted for amortization of premiums and accretion of discounts using the effective yield method. Dividend income/expense is recorded on the ex-dividend date.
Allocation of Income and Expenses: In calculating the net asset value per share of each class, investment income, realized and unrealized gains and losses and expenses other than class specific expenses are allocated daily to each
| 148 | AQR Funds | Annual Report | December 2012 | |||||||||||||
Table of Contents
| Notes to Financial Statements | December 31, 2012 |
class of shares based upon the proportion of net assets of each class at the beginning of each day. Each Fund is charged for those expenses that are directly attributable to each Fund, such as advisory fees and registration costs. Trust level expenses are allocated among the Funds based on the ratio of average net assets or some other reasonable methodology.
The Funds record distributions received in excess of income from underlying investments as a reduction of cost of investments and/or realized gain. Such amounts are based on estimates (if actual amounts are not available) and actual amounts of income, realized gain and return of capital may differ from the estimated amounts. The Funds adjust the estimated amounts of components of distributions (and consequently net investment income) as necessary once the issuers provide information about the actual composition of the distributions.
The Funds may be subject to foreign taxes on income, capital gains on investments or currency repatriation, a portion of which may be recoverable. The Funds will accrue such taxes and recoveries as applicable, based upon their current interpretation of tax rules and regulations that exist in the markets in which they invest.
Organization and Offering Costs: Costs incurred by the AQR Emerging Defensive Equity Fund, AQR International Defensive Equity Fund, AQR U.S. Defensive Equity Fund, AQR Tax-Managed Momentum Fund, AQR Tax-Managed Small Cap Momentum Fund and AQR Tax-Managed International Momentum Fund in connection with the organization of those Funds, including professional and incorporation fees, are fully expensed by the end of the fiscal year. Offering costs, including professional fees, printing fees and the offering of the initial registration, are amortized over a period not longer than twelve months from the date the Funds commenced operations.
Foreign Currency Translation: The books and records of the Funds are maintained in U.S. dollars. Foreign currency amounts are translated into U.S. dollars at the prevailing exchange rates of such currencies against the U.S. dollar. The market value of investment securities and the other assets and liabilities are translated at the exchange rate as of the valuation date. Purchases and sales of investment securities, income and expenses are translated at the exchange rate prevailing on the respective dates of such transactions.
Although the net assets of the Funds are presented at the foreign exchange rates and market values at the close of the period, the Funds do not isolate that portion of the results of operations arising as a result of changes in the foreign exchange rates from the fluctuations arising from changes in the market prices of securities held or sold during the period. Accordingly, such foreign currency gains (losses) are included in the reported net realized and unrealized gains (losses) on investment transactions.
Reported realized foreign currency gains or losses arise from the disposition of foreign currency and forward foreign currency contracts, currency gains or losses realized between the trade and settlement dates on securities transactions, and the difference between the amounts of dividends, interest and foreign withholding taxes recorded on each Fund’s books on the transaction date and the U.S. dollar equivalent of the amounts actually received or paid. Unrealized foreign exchange gains and losses arise from changes (due to the changes in the exchange rate) in the value of foreign currency and assets and liabilities (other than investments) denominated in foreign currencies, which are held at period end.
Cash and Cash Equivalents: Cash and cash equivalents include U.S. dollar and foreign currency at bank accounts at amounts which may exceed insured limits. The Funds are subject to risk to the extent that the institutions may be unable to fulfill their obligations.
Due to/from Broker: Due to/from Broker represents cash balances on deposit with the Funds’ prime brokers and counterparties. The Funds are subject to credit risk should the prime brokers and counterparties be unable to meet their obligations to the Funds.
Distributions to Shareholders: The Funds intend to declare and distribute substantially all of their net investment income and net realized capital gains, if any, at least annually. Income and capital gain distributions will be determined in accordance with federal income tax regulations which may differ from GAAP. Distributions to shareholders are recorded on the ex-dividend date. To the extent these “book/tax” differences are permanent in nature (i.e., that they result from other than timing of recognition — “temporary differences”), such amounts are reclassified within the capital accounts based on their Federal tax-basis treatment.
| AQR Funds | Annual Report | December 2012 | 149 | |||||||||||||
Table of Contents
| Notes to Financial Statements | December 31, 2012 |
Indemnification: In the normal course of business, the Funds may enter into various agreements that provide for general indemnifications. The Funds’ maximum exposure under these arrangements is unknown as any potential exposure involves future claims that may be made against the Funds. However, based on experience, the Funds expect the risk of loss to be remote.
3. Federal Income Tax Matters
At December 31, 2012, the cost of long security positions and aggregate gross unrealized appreciation (depreciation) of investments for federal income tax purposes were as follows:
| FUND | COST OF INVESTMENTS | GROSS UNREALIZED APPRECIATION | GROSS UNREALIZED DEPRECIATION | NET UNREALIZED APPRECIATION (DEPRECIATION) | ||||||||||||
AQR Global Equity Fund | $ | 428,908,095 | $ | 57,058,965 | $ | (10,070,322 | ) | $ | 46,988,643 | |||||||
AQR International Equity Fund | 605,908,821 | 86,823,805 | (18,816,777 | ) | 68,007,028 | |||||||||||
AQR Emerging Defensive Equity Fund | 7,250,657 | 630,637 | (120,680 | ) | 509,957 | |||||||||||
AQR International Defensive Equity Fund | 6,038,978 | 335,711 | (92,993 | ) | 242,718 | |||||||||||
AQR U.S. Defensive Equity Fund | 10,000,295 | 160,810 | (135,233 | ) | 25,577 | |||||||||||
AQR Diversified Arbitrage Fund | 2,525,090,879 | 85,242,063 | (73,222,416 | ) | 12,019,647 | |||||||||||
AQR Momentum Fund | 581,463,342 | 66,620,463 | (10,281,752 | ) | 56,338,711 | |||||||||||
AQR Small Cap Momentum Fund | 167,527,265 | 24,593,920 | (5,363,566 | ) | 19,230,354 | |||||||||||
AQR International Momentum Fund | 113,364,714 | 17,033,771 | (1,253,880 | ) | 15,779,891 | |||||||||||
AQR Tax-Managed Momentum Fund | 5,099,248 | 398,469 | (113,466 | ) | 285,003 | |||||||||||
AQR Tax-Managed Small Cap Momentum Fund | 4,232,405 | 416,560 | (145,671 | ) | 270,889 | |||||||||||
AQR Tax-Managed International Momentum Fund | 5,465,416 | 560,640 | (77,218 | ) | 483,422 | |||||||||||
The differences between book basis and tax basis appreciation (depreciation) on investments is primarily attributable to wash sale loss deferrals.
| FUND | CURRENT DISTRIBUTABLE ORDINARY INCOME | CURRENT DISTRIBUTABLE LONG TERM CAPITAL GAIN OR TAX BASIS CAPITAL LOSS CARRYFORWARDS | NET UNREALIZED APPRECIATION (DEPRECIATION) | POST OCTOBER CAPITAL OR LATE YEAR ORDINARY LOSS DEFERRALS | TOTAL ACCUMULATED EARNINGS | |||||||||||||||
AQR Global Equity Fund | $ | 3,463,894 | $ | 7,536,432 | $ | 47,648,540 | $ | — | $ | 58,648,866 | ||||||||||
AQR International Equity Fund | — | (4,938,860 | ) | 69,331,790 | — | 64,392,930 | ||||||||||||||
AQR Emerging Defensive Equity Fund | 4,259 | 295 | 510,738 | (5,810 | ) | 509,482 | ||||||||||||||
AQR International Defensive Equity Fund | 4,984 | — | 242,775 | (1,371 | ) | 246,388 | ||||||||||||||
AQR U.S. Defensive Equity Fund | 6,403 | — | 25,577 | — | 31,980 | |||||||||||||||
AQR Diversified Arbitrage Fund | 7,706,850 | 12,362,641 | (20,566,414 | ) | — | (496,923 | ) | |||||||||||||
AQR Momentum Fund | 227,113 | (7,901,396 | ) | 56,338,748 | — | 48,664,465 | ||||||||||||||
AQR Small Cap Momentum Fund | 176,355 | 1,468,009 | 19,230,354 | — | 20,874,718 | |||||||||||||||
| 150 | AQR Funds | Annual Report | December 2012 | |||||||||||||
Table of Contents
| Notes to Financial Statements | December 31, 2012 |
| FUND | CURRENT DISTRIBUTABLE ORDINARY INCOME | CURRENT DISTRIBUTABLE LONG TERM CAPITAL GAIN OR TAX BASIS CAPITAL LOSS CARRYFORWARDS | NET UNREALIZED APPRECIATION (DEPRECIATION) | POST OCTOBER CAPITAL OR LATE YEAR ORDINARY LOSS DEFERRALS | TOTAL ACCUMULATED EARNINGS | |||||||||||||||
AQR International Momentum Fund | $ | 164,408 | $ | (11,273,604 | ) | $ | 15,781,955 | $ | — | $ | 4,672,759 | |||||||||
AQR Tax-Managed Momentum Fund | 3,454 | 316 | 285,003 | (8,540 | ) | 280,233 | ||||||||||||||
AQR Tax-Managed Small Cap Momentum Fund | 21,262 | — | 270,889 | — | 292,151 | |||||||||||||||
AQR Tax-Managed International Momentum Fund | 42,354 | — | 483,571 | (1,314 | ) | 524,611 | ||||||||||||||
The differences between book basis and tax basis components of net assets are primarily attributable to tax deferral losses on wash sales and other book and tax differences including capital loss carryforwards, passive foreign investment companies (“PFIC”), forward foreign currency exchange contracts and swap contracts.
At December 31, 2012, the effect of permanent book/tax reclassifications resulted in increase (decrease) to the components of net assets as follows:
| FUND | UNDISTRIBUTED NET INVESTMENT INCOME | ACCUMULATED NET REALIZED GAIN(LOSS) ON INVESTMENTS | PAID-IN CAPITAL | |||||||||
AQR Global Equity Fund | $ | (234,187 | ) | $ | (13,484,432 | ) | $ | 13,718,619 | ||||
AQR International Equity Fund | 98,085 | (8,084,859 | ) | 7,986,774 | ||||||||
AQR Emerging Defensive Equity Fund | (819 | ) | 5,973 | (5,154 | ) | |||||||
AQR International Defensive Equity Fund | (3,138 | ) | 6,592 | (3,454 | ) | |||||||
AQR U.S. Defensive Equity Fund | 3,478 | — | (3,478 | ) | ||||||||
AQR Diversified Arbitrage Fund | 9,316,019 | (9,832,510 | ) | 516,491 | ||||||||
AQR Momentum Fund | (219,133 | ) | 219,133 | — | ||||||||
AQR Small Cap Momentum Fund | (143,620 | ) | 158,612 | (14,992 | ) | |||||||
AQR International Momentum Fund | 34,687 | (34,687 | ) | — | ||||||||
AQR Tax-Managed Momentum Fund | 6,470 | 1,111 | (7,581 | ) | ||||||||
AQR Tax-Managed Small Cap Momentum Fund | 1,383 | 1,627 | (3,010 | ) | ||||||||
AQR Tax-Managed International Momentum Fund | (3,314 | ) | 10,410 | (7,096 | ) | |||||||
For financial reporting purposes, capital accounts are adjusted to reflect the tax character of permanent book/tax differences. Reclassifications are primarily due to the tax treatment of swap contracts, distribution reclassifications, foreign currency reclassifications, sale of Real Estate Investment Trusts and PFIC’s. Results of operations and net assets were not affected by these reclassifications.
| AQR Funds | Annual Report | December 2012 | 151 | |||||||||||||
Table of Contents
| Notes to Financial Statements | December 31, 2012 |
The tax character of the distributions paid during the periods ended December 31, 2012 and December 31, 2011, were as follows:
| FUND | DECEMBER 31, 2012 ORDINARY INCOME | CAPITAL GAINS | DECEMBER 31, 2011 ORDINARY INCOME | CAPITAL GAINS | ||||||||||||
AQR Global Equity Fund | $ | 13,914,986 | $ | 9,422,068 | $ | 9,967,013 | $ | 1,505,593 | ||||||||
AQR International Equity Fund | 21,455,912 | — | 13,160,157 | 2,328,515 | ||||||||||||
AQR Emerging Defensive Equity Fund | 60,238 | 212 | — | — | ||||||||||||
AQR International Defensive Equity Fund | 47,043 | 3,936 | — | — | ||||||||||||
AQR U.S. Defensive Equity Fund | 47,557 | — | — | — | ||||||||||||
AQR Diversified Arbitrage Fund | 38,341,011 | — | 66,958,559 | — | ||||||||||||
AQR Momentum Fund | 7,610,158 | — | 2,360,576 | 231,090 | ||||||||||||
AQR Small Cap Momentum Fund | 1,541,164 | — | 596,501 | 266,614 | ||||||||||||
AQR International Momentum Fund | 2,965,770 | — | 1,944,737 | — | ||||||||||||
AQR Tax-Managed Momentum Fund | 91,814 | 1,969 | — | — | ||||||||||||
AQR Tax-Managed Small Cap Momentum Fund | 43,740 | — | — | — | ||||||||||||
AQR Tax-Managed International Momentum Fund | 92,966 | 6,920 | — | — | ||||||||||||
The AQR Tax-Managed Momentum Fund, AQR Tax-Managed Small Cap Momentum Fund and AQR Tax-Managed International Momentum Fund commenced operations on January 27, 2012.
The AQR Emerging Defensive Equity Fund, AQR International Defensive Equity Fund and AQR U.S. Defensive Equity Fund commenced operations on July 9, 2012.
As of December 31, 2012, for federal income tax purposes, the following Funds have capital loss carryforwards available to offset capital gains, if any, to the extent provided by the Treasury regulations.
| FUND | SHORT-TERM | LONG TERM | YEAR OF EXPIRATION | |||||||||
AQR International Equity Fund | $ | 4,938,860 | $ | — | N/A | |||||||
AQR Momentum Fund | 7,901,396 | — | N/A | |||||||||
AQR International Momentum Fund | 107,993 | — | 2018 | |||||||||
AQR International Momentum Fund | 10,946,594 | 219,017 | N/A | |||||||||
During the year ended December 31, 2012, the Funds utilized capital loss carryforwards in the amounts listed below:
| FUND | SHORT-TERM | LONG TERM | ||||||
AQR Global Equity Fund | $ | 2,949,955 | 2,262,240 | |||||
AQR International Equity Fund | 8,121,463 | 3,983,295 | ||||||
AQR International Momentum Fund | — | 1,446,020 | ||||||
AQR Momentum Fund | 7,831,124 | — | ||||||
AQR Small Cap Momentum Fund | 2,514,982 | — | ||||||
| POST OCTOBER CAPITAL LOSSES | ||||
AQR Emerging Defensive Equity Fund | $ | 5,810 | ||
AQR International Defensive Equity Fund | 1,371 | |||
AQR Tax-Managed Momentum Fund | 8,540 | |||
AQR Tax-Managed International Momentum Fund | 1,314 | |||
Under the Regulated Investment Company Modernization Act of 2010, the Funds will be permitted to carry forward capital losses incurred in taxable years beginning after December 22, 2010 for an unlimited period. Post-enactment capital loss carryforwards will retain their character as either short-term or long-term capital losses rather than being considered short-term as under previous law. Any post-enactment capital losses generated will be required to be utilized prior to the losses incurred in pre-enactment tax years.
| 152 | AQR Funds | Annual Report | December 2012 | |||||||||||||
Table of Contents
| Notes to Financial Statements | December 31, 2012 |
4. Fair Value Measurements
The Funds utilize various inputs in determining the value of each Fund’s investments. GAAP establishes a hierarchy for inputs used in measuring fair value that maximizes the use of observable inputs and minimizes the use of unobservable inputs by requiring the most observable inputs be used when available. These inputs are summarized in the three broad levels as follows:
Level 1 — quoted prices in active markets for identical securities
Level 2 — other significant observable inputs (including quoted prices for similar securities, interest rates, pre-payment speeds, credit risk, etc.)
Level 3 — significant unobservable inputs (including the Fund’s own assumptions in determining the fair value of investments)
Valuation methodology and inputs
An investment asset’s or liability’s level within the fair value hierarchy is based on the lowest level input, individually or in aggregate, that is significant to fair value measurement. The objective of fair value measurement remains the same even when there is a significant decrease in the volume and level of activity for an asset or liability and regardless of the valuation technique used. The valuation techniques used by the Funds to measure fair value maximize the use of observable inputs and minimize the use of unobservable inputs.
The inputs or methodology used for valuing securities are not necessarily an indication of the risk associated with investing in those securities. The following are certain inputs and techniques that the Funds use to evaluate how to classify each major category of assets and liabilities for Level 2 and Level 3, in accordance with GAAP.
Equities traded outside North America are fair valued daily based on the application of a fair value factor and therefore are considered Level 2 (Note 3). Investments that trade in markets that are not considered to be active, but are valued based on quoted market prices, dealer quotations or alternative pricing sources supported by observable inputs are also classified within Level 2. These include certain U.S. government and sovereign obligations, most government agency securities, investment-grade corporate bonds, money market funds and less liquid listed equities. Corporate and sovereign bonds and other fixed-income instruments are valued at estimated fair value based on quotations (including evaluated quotes) from an independent pricing service, as well as quotations from counterparties and other market participants. As Level 2 investments include positions that are not traded in active markets and/or are subject to transfer restrictions, valuations may be adjusted to reflect illiquidity and/or non-transferability, which are generally based on available market information. Investments classified within Level 3 have significant unobservable inputs, as they trade infrequently or not at all. Level 3 instruments include illiquid securities. When observable prices are not available for these securities, the Funds use one or more valuation techniques (e.g., the market approach, the income approach, or the cost approach) for which sufficient and reliable data is available. Within Level 3, the use of the market approach generally consists of using comparable market transactions, while the use of the income approach generally consists of the net present value of estimated future cash flows, adjusted as appropriate for liquidity, credit, market and/or other risk factors. The inputs used by the Funds in estimating the value of Level 3 investments include the original transaction price, recent transactions in the same or similar instruments, completed or pending third-party transactions in the underlying investment or comparable issuers, subsequent rounds of financing, recapitalizations and other transactions across the capital structure, offerings in the equity or debt capital markets, and changes in financial ratios or cash flows. Level 3 investments may also be adjusted to reflect illiquidity and/or non-transferability, with the amount of such discount estimated by the Funds in the absence of market information. Assumptions used by the Funds due to the lack of observable inputs may significantly impact the resulting fair value and therefore the Funds’ results of operations.
The Funds invest in derivative instruments. Derivative instruments can be exchange traded or privately negotiated over-the-counter (“OTC”). Exchange-traded derivatives, such as futures contracts and exchange traded option contracts, are typically classified within Level 1 or Level 2 of the fair value hierarchy depending on whether or not they are deemed to be actively traded. Futures and option contracts that are listed on national exchanges and are freely transferable are valued at fair value based on their last sales price on the date of determination on the exchange that constitutes the principal market. OTC derivatives, including forwards, total return and credit default swaps, are valued by the Funds
| AQR Funds | Annual Report | December 2012 | 153 | |||||||||||||
Table of Contents
| Notes to Financial Statements | December 31, 2012 |
using observable inputs, such as quotations received from the counterparty, or dealers and brokers, whenever available and considered reliable. Generally, a valuation model is used consistently for similar derivative types and model inputs, including, but not limited to, market prices, yield curves, credit spreads, volatilities and implied correlations which are obtained from outside brokers and/or pricing services when available. In instances where models are used, the value of an OTC derivative depends upon the contractual terms of, and specific risks inherent in, the instrument as well as the availability and reliability of observable inputs. Such inputs include market prices for reference securities, yield curves, credit curves, measures of volatility, prepayment rates and correlations of such inputs. Certain OTC derivatives, such as generic forwards, swaps and options, have inputs which can generally be corroborated by market data and are therefore classified within Level 2. Equity total return swap transactions are valued at fair value, based on the price of the underlying security.
Credit default swaps are carried at their estimated fair value, as determined in good faith by pricing services approved by the Board of Trustees. In addition to credit quality, the Funds monitor a variety of factors including cash flow assumptions, market activity, market sentiment and valuation as part of their ongoing process of assessing payment and performance risk. As payment and performance risk increases, the value of a credit default swap contract increases, resulting in recognition of unrealized gains for long positions and unrealized losses for short positions. Conversely, as payment and performance risk decreases, unrealized gains are recognized for short positions and unrealized losses are recognized for long positions. The change in value is recorded within unrealized appreciation/(depreciation) until the occurrence of a credit event or the termination of the swap, at which time a realized gain/(loss) is recorded. Those OTC derivatives that have less liquidity or for which inputs are unobservable are classified within Level 3. While the valuations of these less liquid OTC derivatives may utilize some Level 1 and/or Level 2 inputs, they also include other unobservable inputs which are considered significant to the fair value determination. At each measurement date, the Funds update the Level 1 and Level 2 inputs to reflect observable inputs, though the resulting gains and losses are reflected within Level 3 due to the significance of the unobservable inputs.
Securities for which market quotations or independent pricing service quotations are not readily available, are not readily marketable, or model priced and all other assets of the Funds are valued at fair value using valuation procedures for the Funds, which have been approved by the Board of Trustees. The Advisor has established a Valuation Committee (the “VC”) which is responsible for overseeing the pricing and valuation of all securities held in the Funds. The VC operates under the valuation procedures approved by the Funds Board of Trustees. The VC meets quarterly and on an as-needed basis. The VC is responsible for valuing any securities or other assets for which prices or valuations are not readily determinable by the Funds’ pricing services. The VC considers time-sensitive valuation issues, including those relating to market closures, changes in illiquid security values, model prices and other events that may have a potentially material impact on security values. On a quarterly basis the VC meets to review the results of back test reports generated by the Advisors internal risk department. The VC prepares for the Funds’ Board of Trustees an analysis relating to Level 3 positions. On a daily basis, the Trust’s fund accounting agent compares trade executions prices to the prior night’s valuation price for all positions which were traded and held the previous day. On a monthly basis, model prices are reviewed against available third party model prices.
Quantitative Information
These tables include a description of unobservable and quantitative inputs and the relationship of such inputs, as used in determining the value of Level 3 financial instruments, except for Level 3 instruments for which prior transaction or third party pricing information was used without adjustment.
Transfers
Transfers into, and out of, Level 3 are valued utilizing values as of the beginning of the period. Transfers from Level 2 to Level 3 or from Level 3 to Level 2 are due to a decline or an increase in market activity (e.g. frequency of trades), which resulted in a lack of or increase in available market inputs to determine price.
| 154 | AQR Funds | Annual Report | December 2012 | |||||||||||||
Table of Contents
| Notes to Financial Statements | December 31, 2012 |
The following summarizes inputs used as of December 31, 2012 in valuing the Funds’ assets carried at fair value:
| AQR GLOBAL EQUITY FUND | QUOTED PRICES IN ACTIVE MARKET (LEVEL 1) | OTHER SIGNIFICANT OBSERVABLE INPUTS (LEVEL 2) | SIGNIFICANT UNOBSERVABLE INPUTS (LEVEL 3) | TOTALS | ||||||||||||
ASSETS | ||||||||||||||||
Common Stocks† | $ | 242,836,360 | $ | 177,677,965 | $ | — | $ | 420,514,325 | ||||||||
Preferred Stocks† | — | 4,556,559 | — | 4,556,559 | ||||||||||||
Money Market Funds | — | 50,825,854 | — | 50,825,854 | ||||||||||||
Forward Foreign Currency Exchange Contracts* | — | 5,546,267 | — | 5,546,267 | ||||||||||||
| Futures Contracts* | 172,982 | — | — | 172,982 | ||||||||||||
Total Assets | $ | 243,009,342 | $ | 238,606,645 | $ | — | $ | 481,615,987 | ||||||||
| AQR GLOBAL EQUITY FUND | QUOTED PRICES IN ACTIVE MARKET (LEVEL 1) | OTHER SIGNIFICANT OBSERVABLE INPUTS (LEVEL 2) | SIGNIFICANT UNOBSERVABLE INPUTS (LEVEL 3) | TOTALS | ||||||||||||
Liabilities | ||||||||||||||||
| Total Return Swap Contracts* | $ | — | $ | (88,758 | ) | $ | — | $ | (88,758 | ) | ||||||
Total Liabilities | $ | — | $ | (88,758 | ) | $ | — | $ | (88,758 | ) | ||||||
* Derivative instruments, including futures, forward foreign currency exchange and total return swap contracts, are valued at the unrealized appreciation (depreciation) of the instrument. † Please refer to the Schedule of Investments to view securities segregated by country. |
| |||||||||||||||
There were no transfers between Levels 1 and 2 during the period. All securities listed in the Schedule of Investments with a market value of zero are classified as Level 3 and considered quantitatively insignificant to the portfolio.
| AQR INTERNATIONAL EQUITY FUND | QUOTED PRICES IN ACTIVE MARKET (LEVEL 1) | OTHER SIGNIFICANT OBSERVABLE INPUTS (LEVEL 2) | SIGNIFICANT UNOBSERVABLE INPUTS (LEVEL 3) | TOTALS | ||||||||||||
ASSETS | ||||||||||||||||
Common Stocks† | $ | �� | $ | 585,394,293 | $ | — | $ | 585,394,293 | ||||||||
Preferred Stocks† | — | 9,004,000 | — | 9,004,000 | ||||||||||||
Money Market Funds | — | 79,517,556 | — | 79,517,556 | ||||||||||||
Forward Foreign Currency Exchange Contracts* | — | 7,536,958 | — | 7,536,958 | ||||||||||||
Futures Contracts* | 1,212,359 | — | — | 1,212,359 | ||||||||||||
| Total Return Swap Contracts* | — | 46,560 | — | 46,560 | ||||||||||||
Total Assets | $ | 1,212,359 | $ | 681,499,367 | $ | — | $ | 682,711,726 | ||||||||
* Derivative instruments, including futures, forward foreign currency exchange and total return swap contracts, are valued at the unrealized appreciation (depreciation) of the instrument. † Please refer to the Schedule of Investments to view securities segregated by country. |
| |||||||||||||||
There were no transfers between Levels 1 and 2 during the period. All securities listed in the Schedule of Investments with a market value of zero are classified as Level 3 and considered quantitatively insignificant to the portfolio.
| AQR Funds | Annual Report | December 2012 | 155 | |||||||||||||
Table of Contents
| Notes to Financial Statements | December 31, 2012 |
| AQR EMERGING DEFENSIVE EQUITY FUND | QUOTED PRICES IN ACTIVE MARKET (LEVEL 1) | OTHER SIGNIFICANT OBSERVABLE INPUTS (LEVEL 2) | SIGNIFICANT UNOBSERVABLE INPUTS (LEVEL 3) | TOTALS | ||||||||||||
ASSETS | ||||||||||||||||
Common Stocks† | $ | 2,262,191 | $ | 4,658,084 | $ | — | $ | 6,920,275 | ||||||||
Exchange-Traded Funds | 142,807 | — | — | 142,807 | ||||||||||||
Preferred Stocks† | 38,348 | — | — | 38,348 | ||||||||||||
| Money Market Funds | — | 659,184 | — | 659,184 | ||||||||||||
Total Assets | $ | 2,443,346 | $ | 5,317,268 | $ | — | $ | 7,760,614 | ||||||||
† Please refer to the Schedule of Investments to view securities segregated by country. |
| |||||||||||||||
There were no transfers between Levels 1 and 2 during the period. There were no Level 3 securities held during the period.
| AQR INTERNATIONAL DEFENSIVE EQUITY FUND | QUOTED PRICES IN ACTIVE MARKET (LEVEL 1) | OTHER SIGNIFICANT OBSERVABLE INPUTS (LEVEL 2) | SIGNIFICANT UNOBSERVABLE INPUTS (LEVEL 3) | TOTALS | ||||||||||||
ASSETS | ||||||||||||||||
Common Stocks† | $ | 967,763 | $ | 4,711,051 | $ | — | $ | 5,678,814 | ||||||||
Exchange-Traded Funds | 451,833 | — | — | 451,833 | ||||||||||||
Preferred Stocks† | — | 30,111 | — | 30,111 | ||||||||||||
| Money Market Funds | — | 120,938 | — | 120,938 | ||||||||||||
Total Assets | $ | 1,419,596 | $ | 4,862,100 | $ | — | $ | 6,281,696 | ||||||||
| † | Please refer to the Schedule of Investments to view securities segregated by country. |
There were no transfers between Levels 1 and 2 during the period. There were no Level 3 securities held during the period.
| AQR U.S. DEFENSIVE EQUITY FUND | QUOTED PRICES IN ACTIVE MARKET (LEVEL 1) | OTHER SIGNIFICANT OBSERVABLE INPUTS (LEVEL 2) | SIGNIFICANT UNOBSERVABLE INPUTS (LEVEL 3) | TOTALS | ||||||||||||
ASSETS | ||||||||||||||||
Common Stocks† | $ | 7,713,174 | $ | — | $ | — | $ | 7,713,174 | ||||||||
Exchange-Traded Funds | 473,166 | — | — | 473,166 | ||||||||||||
| Money Market Funds | — | 1,839,532 | — | 1,839,532 | ||||||||||||
Total Assets | $ | 8,186,340 | $ | 1,839,532 | $ | — | $ | 10,025,872 | ||||||||
| † | Please refer to the Schedule of Investments to view securities segregated by industry type. |
There were no transfers between Levels 1 and 2 during the period. There were no Level 3 securities held during the period.
| 156 | AQR Funds | Annual Report | December 2012 | |||||||||||||
Table of Contents
| Notes to Financial Statements | December 31, 2012 |
| AQR DIVERSIFIED ARBITRAGE FUND | QUOTED PRICES IN ACTIVE MARKET (LEVEL 1) | OTHER SIGNIFICANT OBSERVABLE INPUTS (LEVEL 2) | SIGNIFICANT UNOBSERVABLE INPUTS (LEVEL 3) | TOTALS | ||||||||||||
ASSETS | ||||||||||||||||
Common Stocks† | $ | 1,012,209,532 | $ | 24,299,673 | $ | 24,333,266 | $ | 1,060,842,471 | ||||||||
Convertible Preferred Stocks† | 13,780,099 | 16,947,858 | 8,469,674 | 39,197,631 | ||||||||||||
Corporate Bonds† | — | 240,340,399 | 89,519,605 | 329,860,004 | ||||||||||||
Convertible Bonds† | — | 138,874,257 | 26,292,911 | 165,167,168 | ||||||||||||
Bank Loans† | — | 26,828,176 | — | 26,828,176 | ||||||||||||
Closed End Funds | 69,839,081 | — | — | 69,839,081 | ||||||||||||
Exchange-Traded Funds | 2,286,689 | — | — | 2,286,689 | ||||||||||||
Preferred Stocks† | 1,545,473 | 2,136,190 | — | 3,681,663 | ||||||||||||
Rights† | — | — | 2,835 | 2,835 | ||||||||||||
Short-Term Investments | — | 120,640,495 | — | 120,640,495 | ||||||||||||
Warrants† | 18,167,746 | 535,496 | 2,824,399 | 21,527,641 | ||||||||||||
Money Market Funds | — | 696,044,907 | — | 696,044,907 | ||||||||||||
Purchased Options | 1,191,765 | — | — | 1,191,765 | ||||||||||||
Futures Contracts* | 821,534 | — | — | 821,534 | ||||||||||||
| Total Return Basket Swaps Contracts* | — | 278,224 | — | 278,224 | ||||||||||||
Total Assets | $ | 1,119,841,919 | $ | 1,266,925,675 | $ | 151,442,690 | $ | 2,538,210,284 | ||||||||
| AQR DIVERSIFIED ARBITRAGE FUND | QUOTED PRICES IN ACTIVE MARKET (LEVEL 1) | OTHER SIGNIFICANT OBSERVABLE INPUTS (LEVEL 2) | SIGNIFICANT UNOBSERVABLE INPUTS (LEVEL 3) | TOTALS | ||||||||||||
Liabilities | ||||||||||||||||
Common Stocks (Sold Short)† | $ | (434,904,239 | ) | $ | (189,456 | ) | $ | (32,207 | ) | $ | (435,125,902 | ) | ||||
Exchange-Traded Funds (Sold Short) | (38,264,961 | ) | — | — | (38,264,961 | ) | ||||||||||
Preferred Stocks (Sold Short)† | — | (15,417,822 | ) | — | (15,417,822 | ) | ||||||||||
Written Options (Sold Short) | (144,756 | ) | (1,996 | ) | — | (146,752 | ) | |||||||||
Forward Foreign Currency Exchange Contracts* | — | (1,332,581 | ) | — | (1,332,581 | ) | ||||||||||
Credit Default Swap Contracts* | — | (913,386 | ) | — | (913,386 | ) | ||||||||||
| Total Return Basket Swaps Contracts* | — | (4,539,748 | ) | — | (4,539,748 | ) | ||||||||||
Total Liabilities | $ | (473,313,956 | ) | $ | (22,394,989 | ) | $ | (32,207 | ) | $ | (495,741,152 | ) | ||||
| * | Derivative instruments, including futures, total return basket swaps and forward foreign currency exchange contracts, are valued at the unrealized appreciation (depreciation) of the instrument. Credit default swap, total return basket swap and option contracts are reported at market value. |
| † | Please refer to the Schedule of Investments to view securities segregated by industry type. |
| AQR Funds | Annual Report | December 2012 | 157 | |||||||||||||
Table of Contents
| Notes to Financial Statements | December 31, 2012 |
Quantitative Information about Level 3 Fair Value Measurements**
| FAIR VALUE AT 12/31/2012 | VALUATION TECHNIQUE(S) | UNOBSERVABLE INPUT(S) | RANGE | |||||||
| Common Stocks | $3,136,725 | Liquidity Discount | Underlying Price Liquidity Discount | $0.0008 – $1.1 41.95% – 50.00% | ||||||
| Common Stocks (Shorts) | $(32,207) | Theoretical Price Estimate | Liquidity Discount | 50.0% | ||||||
| Convertible Preferred Stocks | $1,134,153 | Comparable Security | Liquidity Discount | 10.0% | ||||||
| $3,469,674 | Jump-Diffusion Model* | Underlying Price Volatility Credit Spread Liquidity Discount | $0.94 – $4.00 42.0% – 150.0% 800 – 3000 bps 14.93% – 98.72% | |||||||
| Corporate Bonds*** | $319,845 | Discounted Cash Flow Model | Discount Rate | 15.1% – 25.0% | ||||||
| Convertible Bonds*** | $5,203,075 | Jump-Diffusion Model* | Underlying Price Volatility Credit Spread Liquidity Discount | $0.0008 – $4.75 75.0% – 150.0% 1200 – 4000 bps 1.5% – 50.0% | ||||||
| Warrants | $1,839,429 | Black Scholes Model | Underlying Price Volatility Liquidity Discount | $0.009 – $9.07 40.0% – 150.0% 10.0% – 77.5% | ||||||
| * | The Jump Diffusion Model extends the classical Black-Scholes Model by taking bankruptcy into consideration, and derives a partial differential equation for pricing a convertible bond or stock. The essential inputs to the model are stock volatility and default probability, which is typically approximated with credit spread. |
| ** | The table above does not include Level 3 securities that are valued by pricing vendors or brokers. At December 31, 2012, the value of these securities was $136,339,789. The inputs for these securities are not readily available or cannot be reasonably estimated and are generally those inputs described in Note 4. The appropriateness of fair values for these securities is monitored on an ongoing basis which may include results of back testing, results of pricing vendor and/or broker due diligence, unchanged price review and consideration of macro or security specific events. |
| *** | Certain positions in convertible and corporate bonds whose fair valuation is based on management’s estimates of potential recoveries on litigation proceedings, have not been included in the table above. |
Level 3 values are based on significant unobservable inputs that reflect the Advisor’s determination of assumptions that market participants might reasonably use in valuing the securities. Changes in significant unobservable inputs could cause significant changes in valuation to individual securities and in aggregate. Fair value determinations and valuation of investments that are not actively trading involve judgment and may differ materially from valuations that would have been used had greater market activity occurred.
The significant unobservable inputs used in the fair value measurement of the Fund’s investments in common stocks, corporate bonds, convertible bonds, convertible preferred stocks and warrants potentially include credit spread, liquidity discount and volatility. Significant increases in the credit spread or liquidity discount inputs in isolation would potentially result in a significantly lower fair value measurement, whereas an increase in volatility generally results in a higher fair value measurement. Generally, a change in the assumption used for the credit spread would be accompanied by a directionally-similar change in the assumptions used for the volatility and liquidity discount. Investments in common stocks potentially include liquidity discount, theoretical value, book to value analysis and/or broker quotes. Significant changes in any of these inputs would significantly change the fair value measurement of the position.
| 158 | AQR Funds | Annual Report | December 2012 | |||||||||||||
Table of Contents
| Notes to Financial Statements | December 31, 2012 |
The following is a reconciliation of assets and liabilities in which significant unobservable inputs (Level 3) were used in determining fair value:
| AQR DIVERSIFIED ARBITRAGE FUND | COMMON STOCKS | CONVERTIBLE PREFERRED STOCK | CORPORATE BONDS | CONVERTIBLE BONDS | WARRANTS | RIGHTS | SHORT COMMON STOCK | |||||||||||||||||||||
| Balance as of December 31, 2011 | $ | 13,402,480 | $ | 1,181,492 | $ | 4,152,274 | $ | 4,372,176 | $ | 2,984,201 | $ | — | $ | (64,415 | ) | |||||||||||||
Accrued discounts/ (premiums) | — | — | (457,029 | ) | 3,480 | — | — | — | ||||||||||||||||||||
Realized gain/(loss) | 570,411 | — | (13,535 | ) | 13,149 | (1,126 | ) | — | — | |||||||||||||||||||
Change in unrealized appreciation/(depreciation) | (4,092,398 | ) | (372,104 | ) | (5,336,764 | ) | (2,080,079 | ) | (1,057,262 | ) | — | 32,208 | ||||||||||||||||
Purchases 1 | 7,579,943 | 2,660,286 | 47,863,818 | 22,713,435 | 142,493 | — | — | |||||||||||||||||||||
Sales2 | (8,909,987 | ) | — | (9,303,071 | ) | (713,125 | ) | — | — | — | ||||||||||||||||||
Transfers in to Level 3 | 15,782,817 | 5,000,000 | 52,613,912 | 1,983,875 | 756,093 | 2,835 | — | |||||||||||||||||||||
| Transfers out of Level 3 | — | — | — | — | — | — | — | |||||||||||||||||||||
| Balance as of December 31, 2012 | $ | 24,333,266 | $ | 8,469,674 | $ | 89,519,605 | $ | 26,292,911 | $ | 2,824,399 | $ | 2,835 | $ | (32,207 | ) | |||||||||||||
| Change in unrealized appreciation/ (depreciation) for securities still held at December 31, 2012 | $ | (3,430,024 | ) | $ | (329,748 | ) | $ | (5,336,764 | ) | $ | (3,587,930 | ) | $ | (900,408 | ) | $ | — | $ | 32,208 | |||||||||
| 1 | Purchases include all purchases of securities and securities received in corporate actions. |
| 2 | Sales include all sales of securities, maturities, paydowns and securities tendered in a corporate action. |
| AQR MOMENTUM FUND | QUOTED PRICES IN ACTIVE MARKET (LEVEL 1) | OTHER SIGNIFICANT OBSERVABLE INPUTS (LEVEL 2) | SIGNIFICANT UNOBSERVABLE INPUTS (LEVEL 3) | TOTALS | ||||||||||||
ASSETS | ||||||||||||||||
Common Stocks† | $ | 544,251,188 | $ | — | $ | — | $ | 544,251,188 | ||||||||
Money Market Funds | — | 93,550,865 | — | 93,550,865 | ||||||||||||
| Futures Contracts* | 15,022 | — | — | 15,022 | ||||||||||||
Total Assets | $ | 544,266,210 | $ | 93,550,865 | $ | — | $ | 637,817,075 | ||||||||
| * | Derivative instruments, including futures contracts, are valued at the unrealized appreciation (depreciation) of the instrument. |
| † | Please refer to the Schedule of Investments to view securities segregated by industry type. |
There were no transfers between Levels 1 and 2 during the period. There were no Level 3 securities held during the period.
| AQR Funds | Annual Report | December 2012 | 159 | |||||||||||||
Table of Contents
| Notes to Financial Statements | December 31, 2012 |
| AQR SMALL CAP MOMENTUM FUND | QUOTED PRICES IN ACTIVE MARKET (LEVEL 1) | OTHER SIGNIFICANT OBSERVABLE INPUTS (LEVEL 2) | SIGNIFICANT UNOBSERVABLE INPUTS (LEVEL 3) | TOTALS | ||||||||||||
ASSETS | ||||||||||||||||
Common Stocks† | $ | 142,932,664 | $ | — | $ | 14,729 | $ | 142,947,393 | ||||||||
Preferred Stocks† | 41,595 | — | — | 41,595 | ||||||||||||
Rights† | — | — | — | — | ||||||||||||
Warrants† | 59 | — | — | 59 | ||||||||||||
Money Market Funds | — | 43,768,572 | — | 43,768,572 | ||||||||||||
| Futures Contracts* | 27,273 | — | — | 27,273 | ||||||||||||
Total Assets | $ | 143,001,591 | $ | 43,768,572 | $ | 14,729 | $ | 186,784,892 | ||||||||
| * | Derivative instruments, including futures contracts, are valued at the unrealized appreciation (depreciation) of the instrument. |
| † | Please refer to the Schedule of Investments to view securities segregated by industry type. |
There were no transfers between Levels 1 and 2 during the period. Securities listed in the Schedule of Investments with a total market value of $14,729 are classified as Level 3 and considered quantitatively insignificant to the portfolio. The total change in unrealized appreciation (depreciation) included in the Statements of Operations attributable to Level 3 investments still held at December 31, 2012 is $63,269.
| AQR INTERNATIONAL MOMENTUM FUND | QUOTED PRICES IN ACTIVE MARKET (LEVEL 1) | OTHER SIGNIFICANT OBSERVABLE INPUTS (LEVEL 2) | SIGNIFICANT UNOBSERVABLE INPUTS (LEVEL 3) | TOTALS | ||||||||||||
ASSETS | ||||||||||||||||
Common Stocks† | $ | 6,205,090 | $ | 118,948,157 | $ | — | $ | 125,153,247 | ||||||||
Exchange-Traded Funds | 1,702,895 | — | — | 1,702,895 | ||||||||||||
Preferred Stocks† | — | — | 4,336 | 4,336 | ||||||||||||
| Money Market Funds | — | 2,284,127 | — | 2,284,127 | ||||||||||||
Total Assets | $ | 7,907,985 | $ | 121,232,284 | $ | 4,336 | $ | 129,144,605 | ||||||||
| † | Please refer to the Schedule of Investments to view securities segregated by country. |
There were no transfers between Levels 1 and 2 during the period. Securities listed in the Schedule of Investments with a total market value of $4,336 are classified as Level 3 and considered quantitatively insignificant to the portfolio. The total change in unrealized appreciation (depreciation) included in the Statements of Operations attributable to Level 3 investments still held at December 31, 2012 is $4,336.
| AQR TAX-MANAGED MOMENTUM FUND | QUOTED PRICES IN ACTIVE MARKET (LEVEL 1) | OTHER SIGNIFICANT OBSERVABLE INPUTS (LEVEL 2) | SIGNIFICANT UNOBSERVABLE INPUTS (LEVEL 3) | TOTALS | ||||||||||||
ASSETS | ||||||||||||||||
Common Stocks† | $ | 4,705,174 | $ | — | $ | — | $ | 4,705,174 | ||||||||
Exchange-Traded Funds | 91,641 | — | — | 91,641 | ||||||||||||
| Money Market Funds | — | 587,436 | — | 587,436 | ||||||||||||
Total Assets | $ | 4,796,815 | $ | 587,436 | $ | — | $ | 5,384,251 | ||||||||
| † | Please refer to the Schedule of Investments to view securities segregated by industry type. |
There were no transfers between Levels 1 and 2 during the period. There were no Level 3 securities held during the period.
| 160 | AQR Funds | Annual Report | December 2012 | |||||||||||||
Table of Contents
| Notes to Financial Statements | December 31, 2012 |
| AQR TAX-MANAGED SMALL CAP MOMENTUM FUND | QUOTED PRICES IN ACTIVE MARKET (LEVEL 1) | OTHER SIGNIFICANT OBSERVABLE INPUTS (LEVEL 2) | SIGNIFICANT UNOBSERVABLE INPUTS (LEVEL 3) | TOTALS | ||||||||||||
ASSETS | ||||||||||||||||
Common Stocks† | $ | 3,374,542 | $ | — | $ | — | $ | 3,374,542 | ||||||||
Exchange-Traded Funds | 57,823 | — | — | 57,823 | ||||||||||||
| Money Market Funds | — | 1,070,929 | — | 1,070,929 | ||||||||||||
Total Assets | $ | 3,432,365 | $ | 1,070,929 | $ | — | $ | 4,503,294 | ||||||||
| † | Please refer to the Schedule of Investments to view securities segregated by industry type. |
There were no transfers between Levels 1 and 2 during the period. There were no Level 3 securities held during the period.
| AQR TAX-MANAGED INTERNATIONAL MOMENTUM FUND | QUOTED PRICES IN ACTIVE MARKET (LEVEL 1) | OTHER SIGNIFICANT OBSERVABLE INPUTS (LEVEL 2) | SIGNIFICANT UNOBSERVABLE INPUTS (LEVEL 3) | TOTALS | ||||||||||||
ASSETS | ||||||||||||||||
Common Stocks† | $ | 322,651 | $ | 5,222,595 | $ | — | $ | 5,545,246 | ||||||||
Exchange-Traded Funds | 193,983 | — | — | 193,983 | ||||||||||||
Preferred Stocks† | — | — | 162 | 162 | ||||||||||||
Rights† | — | 244 | — | 244 | ||||||||||||
| Money Market Funds | — | 209,203 | — | 209,203 | ||||||||||||
Total Assets | $ | 516,634 | $ | 5,432,042 | $ | 162 | $ | 5,948,838 | ||||||||
| † | Please refer to the Schedule of Investments to view securities segregated by country. |
There were no transfers between Levels 1 and 2 during the period. Securities listed in the Schedule of Investments with a total market value of $162 are classified as Level 3 and considered quantitatively insignificant to the portfolio. The total change in unrealized appreciation (depreciation) included in the Statements of Operations attributable to Level 3 investments still held at December 31, 2012 is zero.
5. Investment Transactions
During the period ended December 31, 2012, the cost of purchases and the proceeds from sales of investments (excluding swap contracts, forward foreign currency exchange contracts, futures contracts and short-term investments) were as follows:
| FUND | PURCHASES | SALES | SECURITIES SOLD SHORT | COVERS ON SECURITIES SOLD SHORT | ||||||||||||
AQR Global Equity Fund | $ | 355,386,235 | $ | 341,860,666 | $ | — | $ | — | ||||||||
AQR International Equity Fund | 460,097,805 | 372,301,539 | — | — | ||||||||||||
AQR Emerging Defensive Equity Fund | 8,751,053 | 2,169,466 | — | — | ||||||||||||
AQR International Defensive Equity Fund | 8,985,398 | 3,088,342 | — | — | ||||||||||||
AQR U.S. Defensive Equity Fund | 13,303,860 | 5,148,783 | — | — | ||||||||||||
AQR Diversified Arbitrage Fund | 4,170,420,938 | 5,105,787,786 | 1,602,249,870 | 2,195,436,494 | ||||||||||||
AQR Momentum Fund | 482,332,899 | 291,760,146 | — | — | ||||||||||||
AQR Small Cap Momentum Fund | 112,688,676 | 89,412,647 | — | — | ||||||||||||
AQR International Momentum Fund | 156,052,615 | 120,808,118 | — | — | ||||||||||||
AQR Tax-Managed Momentum Fund | 7,358,587 | 2,870,311 | — | — | ||||||||||||
AQR Tax-Managed Small Cap Momentum Fund | 5,385,166 | 2,243,402 | — | — | ||||||||||||
AQR Tax-Managed International Momentum Fund | 9,859,187 | 4,658,269 | — | — | ||||||||||||
| AQR Funds | Annual Report | December 2012 | 161 | |||||||||||||
Table of Contents
| Notes to Financial Statements | December 31, 2012 |
6. Derivative Instruments and Hedging Activities
Certain Funds use derivative instruments as part of their principal investment strategy to achieve their investment objectives. The values of such derivative instruments reflected in the Statements of Assets and Liabilities at December 31, 2012 are as follows:
| ASSETS | LIABILITIES | |||||||||||||||||||||||||||||||
| FUND | | UNREALIZED APPRECIATION ON FUTURES CONTRACTS | | | SWAPS AT VALUE | | | UNREALIZED APPRECIATION ON FORWARD CURRENCY EXCHANGE CONTRACTS | | | WRITTEN OPTIONS AT MARKET VALUE | | | UNREALIZED DEPRECIATION ON FUTURES CONTRACTS | | | SWAPS AT VALUE | | | UNREALIZED DEPRECIATION ON FORWARD CURRENCY EXCHANGE CONTRACTS | | | WRITTEN OPTIONS AT MARKET VALUE | | ||||||||
| Equity Risk Exposure: | ||||||||||||||||||||||||||||||||
AQR Global Equity Fund | $1,354,123 | $— | $— | $— | $1,181,141 | $88,758 | $— | $— | ||||||||||||||||||||||||
AQR International Equity Fund | 2,075,183 | 46,560 | — | — | 862,824 | — | — | — | ||||||||||||||||||||||||
AQR Diversified Arbitrage Fund | 892,696 | 278,224 | — | — | — | 4,539,748 | — | 146,752 | ||||||||||||||||||||||||
AQR Momentum Fund | 15,022 | — | — | — | — | — | — | — | ||||||||||||||||||||||||
AQR Small Cap Momentum Fund | 27,273 | — | — | — | — | — | — | — | ||||||||||||||||||||||||
| Foreign Exchange Rate Risk Exposure: | ||||||||||||||||||||||||||||||||
AQR Global Equity Fund | — | — | 7,141,251 | — | — | — | 1,594,984 | — | ||||||||||||||||||||||||
AQR International Equity Fund | — | — | 9,662,299 | — | — | — | 2,125,341 | — | ||||||||||||||||||||||||
AQR Diversified Arbitrage Fund | — | — | 587,641 | — | — | — | 1,920,222 | — | ||||||||||||||||||||||||
| Interest Rate Risk Exposure: | ||||||||||||||||||||||||||||||||
AQR Diversified Arbitrage Fund | 44,293 | — | — | — | 115,455 | — | — | — | ||||||||||||||||||||||||
| Credit Risk Exposure: | ||||||||||||||||||||||||||||||||
| AQR Diversified Arbitrage Fund | — | — | — | — | — | 913,386 | — | — | ||||||||||||||||||||||||
| Netting: | ||||||||||||||||||||||||||||||||
AQR Global Equity Fund | (1,181,141) | — | (1,594,984) | — | (1,181,141) | — | (1,594,984) | — | ||||||||||||||||||||||||
AQR International Equity Fund | (862,824) | — | (2,125,341) | — | (862,824) | — | (2,125,341) | — | ||||||||||||||||||||||||
| AQR Diversified Arbitrage Fund | (115,455) | (278,224) | (587,641) | — | (115,455) | (278,224) | (587,641) | — | ||||||||||||||||||||||||
| Net Fair Value of Derivative Contracts: | ||||||||||||||||||||||||||||||||
AQR Global Equity Fund | 172,982 | — | 5,546,267 | — | — | 88,758 | — | — | ||||||||||||||||||||||||
AQR International Equity Fund | 1,212,359 | 46,560 | 7,536,958 | — | — | — | — | — | ||||||||||||||||||||||||
AQR Diversified Arbitrage Fund | 821,534 | — | — | — | — | 5,174,910 | 1,332,581 | 146,752 | ||||||||||||||||||||||||
AQR Momentum Fund | 15,022 | — | — | — | — | — | — | — | ||||||||||||||||||||||||
AQR Small Cap Momentum Fund | 27,273 | — | — | — | — | — | — | — | ||||||||||||||||||||||||
| 162 | AQR Funds | Annual Report | December 2012 | |||||||||||||
Table of Contents
| Notes to Financial Statements | December 31, 2012 |
The following is the effect of Derivative Instruments on the Statements of Operations for the period ended December 31, 2012:
| | REALIZED GAIN (LOSS) ON DERIVATIVES RECOGNIZED AS A RESULT FROM OPERATIONS | | | NET CHANGE IN UNREALIZED APPRECIATION (DEPRECIATION) ON DERIVATIVES RECOGNIZED AS A RESULT FROM OPERATIONS | | |||||||||||||||||||||||||||
| FUND | | FUTURES CONTRACTS | | | SWAPS AND SWAPS ON FUTURES CONTRACTS | * | | FORWARD CURRENCY EXCHANGE CONTRACTS | | | WRITTEN OPTIONS | | | FUTURES CONTRACTS | | | SWAPS AND SWAPS ON FUTURES CONTRACTS | * | | FORWARD CURRENCY EXCHANGE CONTRACTS | | | WRITTEN OPTIONS | | ||||||||
| Equity Risk Exposure: | ||||||||||||||||||||||||||||||||
AQR Global Equity Fund | $2,427,378 | $3,330,894 | $— | $— | $(2,134,515) | $16,214 | $— | $— | ||||||||||||||||||||||||
AQR International Equity Fund | 7,075,466 | 1,841,341 | — | — | (2,833,783) | 865,854 | — | — | ||||||||||||||||||||||||
AQR Diversified Arbitrage Fund | (16,526,023) | (13,160,417) | — | 3,360,916 | 1,646,983 | (4,261,524) | — | (371,181) | ||||||||||||||||||||||||
AQR Momentum Fund | 531,791 | — | — | — | (23,726) | — | — | — | ||||||||||||||||||||||||
AQR Small Cap Momentum Fund | 14,542 | — | — | — | 11,085 | — | — | — | ||||||||||||||||||||||||
AQR Tax-Managed Momentum Fund | 2,745 | — | — | — | — | — | — | — | ||||||||||||||||||||||||
AQR Tax-Managed Small Cap Momentum Fund | (3,953) | — | — | — | — | — | — | — | ||||||||||||||||||||||||
| Foreign Exchange Rate Risk Exposure: | ||||||||||||||||||||||||||||||||
AQR Global Equity Fund | — | — | 7,969,959 | — | — | — | 5,722,064 | — | ||||||||||||||||||||||||
AQR International Equity Fund | — | — | 15,010,931 | — | — | — | 8,039,606 | — | ||||||||||||||||||||||||
AQR Diversified Arbitrage Fund | — | — | (2,549,327) | — | — | — | (2,272,548) | — | ||||||||||||||||||||||||
| Interest Rate Risk Exposure: | ||||||||||||||||||||||||||||||||
AQR Diversified Arbitrage Fund | (1,829,797) | — | — | — | 362,011 | — | — | — | ||||||||||||||||||||||||
| Credit Risk Exposure: | ||||||||||||||||||||||||||||||||
AQR Diversified Arbitrage Fund | — | (30,663,859) | — | — | — | 8,773,584 | — | — | ||||||||||||||||||||||||
| * | Swaps and swaps on futures are combined for financial reporting purposes. |
For swaps, futures and forward foreign currency contracts, the Funds may be required to post collateral if a Fund is in a net liability position with the counterparty exceeding certain amounts. Additionally, counterparties may immediately terminate the position if a Fund fails to maintain sufficient asset coverage for its contracts or its net assets decline by stated percentages.
As of December 31, 2012, the following Funds had net liability positions:
| FUND | DERIVATIVES IN NET LIABILITY POSITION | COLLATERAL POSTED | ||||||
AQR Diversified Arbitrage Fund | (5,832,709) | 317,268,638 | ||||||
| AQR Funds | Annual Report | December 2012 | 163 | |||||||||||||
Table of Contents
| Notes to Financial Statements | December 31, 2012 |
For the period ended December 31, 2012, the quarterly average values of the derivatives held by the Funds were as follows:
| AQR GLOBAL EQUITY FUND | AQR INTERNATIONAL EQUITY FUND | AQR DIVERSIFIED ARBITRAGE FUND | AQR MOMENTUM FUND | AQR SMALL CAP MOMENTUM FUND | ||||||||||||||||
Futures Contracts* | ||||||||||||||||||||
Average Notional Balance Long | $96,033,561 | $148,652,806 | $— | $3,022,517 | $987,172 | |||||||||||||||
Average Notional Balance Short | 66,326,908 | 73,022,040 | 465,655,158 | — | — | |||||||||||||||
Forward Foreign Currency Exchange Contracts* |
| |||||||||||||||||||
Average Value Purchased | 202,261,709 | 347,215,859 | 13,474,277 | — | — | |||||||||||||||
Average Value Sold | 214,144,333 | 320,517,860 | 116,923,190 | — | — | |||||||||||||||
Exchange-Traded Options* | ||||||||||||||||||||
Average Value of Contracts Written | — | — | (239,358) | — | — | |||||||||||||||
Credit Default Swaps* | ||||||||||||||||||||
Average Notional Balance — Buy Protection | — | — | 293,728,350 | — | — | |||||||||||||||
Average Notional Balance — Sell Protection | — | — | 121,621,450 | — | — | |||||||||||||||
Total Return Swaps* | ||||||||||||||||||||
Average Notional Balance — Long | 11,028,976 | 8,555,400 | — | — | — | |||||||||||||||
Average Notional Balance — Short | 4,214,030 | 13,268,610 | — | — | — | |||||||||||||||
Total Return Basket Swaps* | ||||||||||||||||||||
Average Value of Underlying | — | — | 21,925,828 | — | — | |||||||||||||||
Average Value of Underlying | — | — | (21,680,093) | — | — | |||||||||||||||
| * | Values as of each quarter end are used to calculate the average represented. |
The Funds’ derivative contracts held at December 31, 2012, are not accounted for as hedging instruments under GAAP.
7. Investment Advisory and Other Agreements
The Advisor serves as the investment advisor to each of the Funds pursuant to an Investment Advisory Agreement, dated December 4, 2008, as amended, or an Investment Management Agreement, dated June 10, 2010, as amended, entered into by the Trust, on behalf of the Funds (together, the “Advisory Agreement”). Under the Advisory Agreement, the Advisor furnishes a continuous investment program for each Fund’s portfolio, makes day-to-day investment decisions for the Funds, and manages the Funds’ investments in accordance with the stated policies of each Fund. The Advisor is also responsible for selecting brokers and dealers to execute purchase and sale orders for the portfolio transactions of each Fund, subject to its obligation to seek best execution. The Advisor provides persons satisfactory to the Funds’ Board of Trustees to serve as officers of the Funds. Pursuant to the Advisory Agreement, the Funds pay the Advisor a management fee calculated on the average daily net assets for each Fund, in the annual ratios below:
| FUND | RATIO | |||
AQR Global Equity Fund | 0.40 | % | ||
AQR International Equity Fund | 0.45 | |||
AQR Emerging Defensive Equity Fund | 0.60 | * | ||
AQR International Defensive Equity Fund | 0.40 | ** | ||
AQR U.S. Defensive Equity Fund | 0.30 | *** | ||
AQR Diversified Arbitrage Fund | 1.00 | |||
AQR Momentum Fund | 0.25 | |||
AQR Small Cap Momentum Fund | 0.35 | |||
AQR International Momentum Fund | 0.35 | |||
AQR Tax-Managed Momentum Fund | 0.30 | |||
AQR Tax-Managed Small Cap Momentum Fund | 0.40 | |||
AQR Tax-Managed International Momentum Fund | 0.40 | |||
| * | The AQR Emerging Defensive Equity Fund Advisory Fee is based on the following three tier structure. The first tier charges 0.60% on the first $1 billion of net assets; the second tier charges 0.575% on net assets in excess of $1 billion, up to $3 billion; and the third tier charges 0.55% on net assets in excess of $3 billion. |
| 164 | AQR Funds | Annual Report | December 2012 | |||||||||||||
Table of Contents
| Notes to Financial Statements | December 31, 2012 |
| ** | The AQR International Defensive Equity Fund Advisory Fee is based on the following three tier structure. The first tier charges 0.40% on the first $1 billion of net assets; the second tier charges 0.375% on net assets in excess of $1 billion, up to $3 billion; and the third tier charges 0.35% on net assets in excess of $3 billion. |
| *** | The AQR U.S. Defensive Equity Fund Advisory Fee is based on the following three tier structure. The first tier charges 0.30% on the first $1 billion of net assets; the second tier charges 0.275% on net assets in excess of $1 billion, up to $3 billion; and the third tier charges 0.25% on net assets in excess of $3 billion. |
The Trust and the Advisor have entered into a Fee Waiver and Expense Reimbursement Agreement whereby the Advisor has agreed to waive its fee and/or reimburse each Fund at least through April 30, 2013, unless otherwise noted. The Advisor has agreed to waive and/or reimburse each Fund to the extent that the total annual fund operating expense ratios (including the consolidated expenses of the Subsidiaries), exclusive of interest, taxes, borrowing costs, acquired fund fees and expenses, dividend and interest expense related to short sales, and extraordinary expenses exceed the following ratios:
| FUND | CLASS I | CLASS L | CLASS N | |||||||||
AQR Global Equity Fund | 0.95 | % | — | % | 1.25 | % | ||||||
AQR International Equity Fund | 1.00 | — | 1.30 | |||||||||
AQR Emerging Defensive Equity Fund * | 1.15 | — | 1.40 | |||||||||
AQR International Defensive Equity Fund * | 0.90 | — | 1.15 | |||||||||
AQR U.S. Defensive Equity Fund * | 0.75 | — | 1.00 | |||||||||
AQR Diversified Arbitrage Fund | 1.20 | — | 1.50 | |||||||||
AQR Momentum Fund ** | — | 0.49 | 0.74 | |||||||||
AQR Small Cap Momentum Fund ** | — | 0.65 | 0.90 | |||||||||
AQR International Momentum Fund ** | — | 0.65 | 0.90 | |||||||||
AQR Tax-Managed Momentum Fund ** | — | 0.54 | 0.79 | |||||||||
AQR Tax-Managed Small Cap Momentum Fund ** | — | 0.70 | 0.95 | |||||||||
AQR Tax-Managed International Momentum Fund ** | — | 0.70 | 0.95 | |||||||||
| * | This arrangement will continue at least through April 30, 2014 for Class I and N. |
| ** | This arrangement will continue at least through April 30, 2014 for Class N. |
The Trust and the Advisor had previously entered into a Fee Waiver and Expense Reimbursement Agreement whereby the Advisor had agreed to waive its fee and/or reimburse each Fund from January 1, 2012 through April 30, 2012 for AQR Global Equity Fund and AQR International Equity Fund. The Advisor had agreed to waive and/or reimburse the Funds to the extent that the total annual fund operating expense ratios exclusive of interest, taxes, borrowing costs, acquired fund fees and expenses, dividend expense related to short sales, and extraordinary expenses exceed the following ratios:
| FUND CLASS | RATIO | |||
AQR Global Equity Fund — Class I | 0.90 | % | ||
AQR Global Equity Fund — Class N | 1.20 | |||
AQR International Equity Fund — Class I | 0.95 | |||
AQR International Equity Fund — Class N | 1.25 | |||
The Trust, in turn, agreed that the Funds will repay the fee waiver/expense reimbursement to the Advisor. Such repayment shall be made only out of the class of the Fund for which the applicable fee waiver and expense reimbursement was made. Repayments with respect to a Fund must be limited to amounts that do not cause the aggregate operating expenses of the Fund attributable to a share class during a year in which such repayment is made to exceed the applicable ratios when the waiver was generated. A repayment shall be payable only to the extent it can be made during the thirty six months following the applicable period during which the Advisor waived fees or reimbursed the applicable Fund for its operating expenses under the Agreement.
| AQR Funds | Annual Report | December 2012 | 165 | |||||||||||||
Table of Contents
| Notes to Financial Statements | December 31, 2012 |
For the period ended December 31, 2012, the amounts waived and reimbursed by the Advisor, as well as the amounts available for potential future recoupment by the Advisor and the expiration schedule at December 31, 2012 are as follows:
| FEES WAIVED/ REIMBURSED FOR THE PERIOD ENDED DECEMBER 31, 2012 | TOTAL POTENTIAL AT | POTENTIAL RECOUPMENT AMOUNTS EXPIRING DECEMBER 31 | ||||||||||||||||||
| 2013 | 2014 | 2015 | ||||||||||||||||||
AQR GLOBAL EQUITY FUND |
| |||||||||||||||||||
Class I | $ | 9,775 | $ | 39,987 | $ | — | $ | 30,212 | $ | 9,775 | ||||||||||
Class N | 9,936 | 41,856 | — | 31,920 | 9,936 | |||||||||||||||
| Class Y | — | 196,805 | 196,805 | — | — | |||||||||||||||
Totals | $ | 19,711 | $ | 278,648 | $ | 196,805 | $ | 62,132 | $ | 19,711 | ||||||||||
AQR INTERNATIONAL EQUITY FUND | ||||||||||||||||||||
Class I | $ | — | $ | 26,420 | $ | 26,420 | $ | — | $ | — | ||||||||||
Class N | — | 31,222 | 19,745 | 11,477 | — | |||||||||||||||
| Class Y | — | 246,150 | 246,150 | — | — | |||||||||||||||
Totals | $ | — | $ | 303,792 | $ | 292,315 | $ | 11,477 | $ | — | ||||||||||
AQR EMERGING DEFENSIVE EQUITY FUND | ||||||||||||||||||||
Class I | $ | 91,760 | $ | 91,760 | $ | — | $ | — | $ | 91,760 | ||||||||||
| Class N | 32,715 | 32,715 | — | — | 32,715 | |||||||||||||||
Totals | $ | 124,475 | $ | 124,475 | $ | — | $ | — | $ | 124,475 | ||||||||||
AQR INTERNATIONAL DEFENSIVE EQUITY FUND |
| |||||||||||||||||||
Class I | $ | 79,941 | $ | 79,941 | $ | — | $ | — | $ | 79,941 | ||||||||||
| Class N | 43,475 | 43,475 | — | — | 43,475 | |||||||||||||||
Totals | $ | 123,416 | $ | 123,416 | $ | — | $ | — | $ | 123,416 | ||||||||||
AQR U.S. DEFENSIVE EQUITY FUND | ||||||||||||||||||||
Class I | $ | 65,338 | $ | 65,338 | $ | — | $ | — | $ | 65,338 | ||||||||||
| Class N | 38,829 | 38,829 | — | — | 38,829 | |||||||||||||||
Totals | $ | 104,167 | $ | 104,167 | $ | — | $ | — | $ | 104,167 | ||||||||||
AQR DIVERSIFIED ARBITRAGE FUND | ||||||||||||||||||||
Class I | $ | 227,590 | $ | 1,384,501 | $ | 129,192 | $ | 1,027,719 | $ | 227,590 | ||||||||||
| Class N | — | 53,957 | 8,388 | 45,569 | — | |||||||||||||||
Totals | $ | 227,590 | $ | 1,438,458 | $ | 137,580 | $ | 1,073,288 | $ | 227,590 | ||||||||||
AQR MOMENTUM FUND | ||||||||||||||||||||
Class L | $ | 334,720 | $ | 918,135 | $ | 165,059 | $ | 418,356 | $ | 334,720 | ||||||||||
| Class N | 1,156 | 1,156 | — | — | 1,156 | |||||||||||||||
Totals | $ | 335,876 | $ | 919,291 | $ | 165,059 | $ | 418,356 | $ | 335,876 | ||||||||||
AQR SMALL CAP MOMENTUM FUND | ||||||||||||||||||||
Class L | $ | 74,142 | $ | 414,345 | $ | 168,573 | $ | 171,630 | $ | 74,142 | ||||||||||
| Class N | 520 | 520 | — | — | 520 | |||||||||||||||
Totals | $ | 74,662 | $ | 414,865 | $ | 168,573 | $ | 171,630 | $ | 74,662 | ||||||||||
| 166 | AQR Funds | Annual Report | December 2012 | |||||||||||||
Table of Contents
| Notes to Financial Statements | December 31, 2012 |
| FEES WAIVED/ REIMBURSED FOR THE PERIOD ENDED DECEMBER 31, 2012 | TOTAL POTENTIAL AT | POTENTIAL RECOUPMENT AMOUNTS EXPIRING DECEMBER 31 | ||||||||||||||||||
| 2013 | 2014 | 2015 | ||||||||||||||||||
AQR INTERNATIONAL MOMENTUM FUND | ||||||||||||||||||||
Class L | $ | 140,213 | $ | 637,007 | $ | 266,187 | $ | 230,607 | $ | 140,213 | ||||||||||
| Class N | 520 | 520 | — | — | 520 | |||||||||||||||
Totals | $ | 140,733 | $ | 637,527 | $ | 266,187 | $ | 230,607 | $ | 140,733 | ||||||||||
AQR TAX-MANAGED MOMENTUM FUND | ||||||||||||||||||||
Class L | $ | 123,116 | $ | 123,116 | $ | — | $ | — | $ | 123,116 | ||||||||||
| Class N | 61 | 61 | — | — | 61 | |||||||||||||||
Totals | $ | 123,177 | $ | 123,177 | $ | — | $ | — | $ | 123,177 | ||||||||||
AQR TAX-MANAGED SMALL CAP MOMENTUM FUND |
| |||||||||||||||||||
Class L | $ | 127,875 | $ | 127,875 | $ | — | $ | — | $ | 127,875 | ||||||||||
| Class N | 52 | 52 | — | — | 52 | |||||||||||||||
Totals | $ | 127,927 | $ | 127,927 | $ | — | $ | — | $ | 127,927 | ||||||||||
AQR TAX-MANAGED INTERNATIONAL MOMENTUM FUND |
| |||||||||||||||||||
Class L | $ | 160,934 | $ | 160,934 | $ | — | $ | — | $ | 160,934 | ||||||||||
| Class N | 63 | 63 | — | — | 63 | |||||||||||||||
Totals | $ | 160,997 | $ | 160,997 | $ | — | $ | — | $ | 160,997 | ||||||||||
The Advisor has agreed to forgo future recoupments incurred in the current period pertaining to Shareholder Servicing Fee Waivers expiring on December 31, 2013 of $447,840 and $429,010 for the AQR Global Equity Fund and AQR International Equity Fund, respectively.
During the period ended December 31, 2012, the Funds recouped amounts as follows:
| FUND | CLASS I | CLASS N | CLASS Y | |||||||||
AQR Global Equity Fund | $ | — | $ | — | $ | 91,006 | ||||||
AQR International Equity Fund | 42,252 | 383 | 96,788 | |||||||||
AQR Diversified Arbitrage Fund | — | 392,888 | — | |||||||||
Pursuant to the Sub-Advisory Agreement between the Sub-Advisor, the Advisor and the Trust, the Advisor will pay the Sub-Advisor an annual fee, payable monthly, at the annual rate of 1.00% of the average daily net assets for AQR Diversified Arbitrage Fund.
J.P. Morgan Investor Services Co., serves as the Funds’ Administrator and Accounting Agent and JPMorgan Chase Bank, N.A., serves as Custodian.
ALPS Fund Services, Inc. serves as the Funds’ Transfer Agent, and ALPS Distributors, Inc. serves as the Funds’ Distributor.
8. Distribution Plan
The Trust has adopted a Plan of Distribution (the “Plan”) pursuant to Rule 12b-1 under the 1940 Act with respect to the Class N shares of the Funds, as applicable. The Plan allows for the payment of services related to the distribution and servicing of these shares at a rate of up to 0.25% per annum of the average daily net asset value of the Class N shares of the Funds, as applicable.
| AQR Funds | Annual Report | December 2012 | 167 | |||||||||||||
Table of Contents
| Notes to Financial Statements | December 31, 2012 |
9. Shareholder Service Plan
Pursuant to a Shareholder Services Agreement, between the Trust (excluding the AQR Diversified Arbitrage Fund) and the Advisor, the Advisor provides a wide range of services to the Funds and their shareholders. These services include, among others, access to performance information reporting, analysis and explanations of Fund reports as well as electronic access to Fund information. Under this agreement the Advisor receives an annual fee, payable monthly, calculated on the average daily net assets of each Class at the following rates:
| FUND | CLASS I | CLASS L | CLASS N | |||||||||
AQR Global Equity Fund | 0.30 | % | — | % | 0.35 | % | ||||||
AQR International Equity Fund | 0.30 | — | 0.35 | |||||||||
AQR Emerging Defensive Equity Fund | 0.25 | — | 0.25 | |||||||||
AQR International Defensive Equity Fund | 0.25 | — | 0.25 | |||||||||
AQR U.S. Defensive Equity Fund | 0.25 | — | 0.25 | |||||||||
AQR Momentum Fund | — | 0.15 | 0.15 | |||||||||
AQR Small Cap Momentum Fund | — | 0.15 | 0.15 | |||||||||
AQR International Momentum Fund | — | 0.15 | 0.15 | |||||||||
AQR Tax-Managed Momentum Fund | — | 0.15 | 0.15 | |||||||||
AQR Tax-Managed Small Cap Momentum Fund | — | 0.15 | 0.15 | |||||||||
AQR Tax-Managed International Momentum Fund | — | 0.15 | 0.15 | |||||||||
In addition, the Advisor may, from time to time, compensate third parties (including financial intermediaries) from the fees the Advisor receives under the Shareholder Services Agreement for non-distribution shareholder services such third parties provide to clients or customers that are shareholders of the Funds. Fees incurred by the Funds under the Plan and/or the shareholder services agreement for the year ended December 31, 2012, were as follows:
| FUND | CLASS I | CLASS L | CLASS N | |||||||||
AQR Global Equity Fund | $ | 6,285 | $ | — | $ | 5,553 | ||||||
AQR International Equity Fund | 512,113 | — | 46,765 | |||||||||
AQR Emerging Defensive Equity Fund | 5,114 | — | 1,507 | |||||||||
AQR International Defensive Equity Fund | 3,212 | — | 1,344 | |||||||||
AQR U.S. Defensive Equity Fund | 3,335 | — | 903 | |||||||||
AQR Momentum Fund | — | 649,413 | 2,833 | |||||||||
AQR Small Cap Momentum Fund | — | 186,892 | 1 | |||||||||
AQR International Momentum Fund | — | 157,233 | 1 | |||||||||
AQR Tax-Managed Momentum Fund | — | 4,376 | 1 | |||||||||
AQR Tax-Managed Small Cap Momentum Fund | — | 3,625 | 1 | |||||||||
AQR Tax-Managed International Momentum Fund | — | 5,065 | 1 | |||||||||
10. Purchases and Redemption of Shares
Investors may purchase shares of a Fund at their net asset value (“NAV”), based on the next calculation of the NAV after the order is placed. Neither the Fund nor the distributor charges a sales charge or other transaction fee to purchase shares, although other institutions may impose transaction fees on shares purchased through them. The AQR Global Equity and AQR International Equity Funds’ Class Y shares charge subscription and redemption fees of 0.10% each, regardless of the period such shares may have been held. Prior to May 1, 2011, the Funds reserved the right to charge a redemption fee on redemption proceeds for shares that were held for less than 60 days. Effective May 1, 2011, this fee was eliminated for Class I, Class N and Class L Shares.
11. Risks and Concentrations
The counterparties to the Funds’ currency forward, futures, option and swap contracts and repurchase and reverse repurchase agreements include affiliates of the Funds clearing brokers and other major financial institutions. While the Funds utilize multiple clearing brokers and counterparties, a concentration of credit risk exists because of balances held and transactions with a limited number of clearing brokers and counterparties.
| 168 | AQR Funds | Annual Report | December 2012 | |||||||||||||
Table of Contents
| Notes to Financial Statements | December 31, 2012 |
By using derivative instruments, the Funds are exposed to the counterparty’s credit risk, the risk that derivative counterparties may not perform in accordance with the contractual provisions offset by the value of any collateral received. The Funds’ exposure to credit risk associated with counterparty non-performance is limited to the unrealized gains inherent in such transactions that are recognized in the Statements of Assets and Liabilities. The Funds minimize counterparty credit risk through credit limits and approvals, credit monitoring procedures, executing master netting arrangements and managing margin and collateral requirements, as appropriate.
The Funds may have elements of risk not typically associated with investments in the United States of America due to concentrated investments in a limited number of countries or regions, which may vary throughout the year. Such concentrations may subject the Funds to additional risks resulting from political or economic conditions in such countries or regions and the possible imposition of adverse governmental laws or currency exchange restrictions could cause the securities and their markets to be less liquid and their prices to be more volatile than those of comparable U.S. companies.
Swap agreements involve, to varying degrees, elements of market risk (generally equity price risk related to equity index swap agreements, interest rate risk related to bond swap agreements and commodity risk related to synthetic swap agreements utilizing futures) and exposure to loss in excess of the amount reflected on the Statements of Assets and Liabilities. The notional amounts, which are disclosed as of period end in the swap tables included in the Schedules of Investments, reflect the current investment exposure each Fund has under the swap agreement which may exceed the net asset value of the Fund.
The Funds are not limited in the percentage of its assets that may be invested in convertible securities. Convertible securities generally offer lower interest or dividend yields than non-convertible securities of similar quality. The market values of convertible securities tend to decline as interest rates increase and, conversely, to increase as interest rates decline. However, the convertible security’s market value tends to reflect the market price of the common stock of the issuing company when that stock price is greater than the convertible’s “conversion price,” which is the predetermined price at which the convertible security could be exchanged for the associated stock.
Convertible securities and non-convertible income producing securities are subject to certain risks, including (i) if interest rates go up, the value of convertible securities and non-convertible income-producing securities in the Funds’ portfolio generally will decline; (ii) during periods of declining interest rates, the issuer of a security may exercise its option to prepay principal earlier than scheduled, forcing the Funds to reinvest in lower yielding securities (call or prepayment risk); and (iii) during periods of rising interest rates, the average life of certain types of securities may be extended because of slower than expected principal payments (extension risk).
Credit risk is the risk that one or more securities in the Funds’ portfolio will decline in price, or fail to pay interest or principal when due, because the issuer of the security experiences a decline in its financial status. The Funds’ investments in convertible and nonconvertible debt securities involve credit risk. However, in general, lower rated securities carry a greater degree of risk that the issuer will lose its ability to make interest and principal payments, which could have a negative impact on the Funds’ net asset value or dividends.
As of December 31, 2012, a substantial portion of the AQR Global Equity, AQR International Equity, AQR Emerging Defensive Equity, AQR International Defensive Equity, AQR International Momentum and AQR Tax-Managed International Momentum Funds’ net assets consisted of issuers that are denominated in foreign currencies. Changes in currency exchange rates will affect the value of and investment income from such securities.
As of December 31, 2012, the AQR Diversified Arbitrage Fund had pledged a substantial portion of its assets for securities sold short to JPMorgan Chase Bank, N.A.
12. Line of Credit
For the period of January 1, 2012 to March 1, 2012, it was contractually extended through March 16, 2012, the Trust had secured a committed, $150,000,000 line of credit with JPMorgan Chase Bank, N.A. Borrowings, if any, under this arrangement bore interest at the Federal Funds Rate plus the sum of (a) 1.5% per annum plus (b) if the LIBOR Reference Rate exceeded the Federal Funds Rate, the amount of such excess, which was paid quarterly. The maximum loan
| AQR Funds | Annual Report | December 2012 | 169 | |||||||||||||
Table of Contents
| Notes to Financial Statements | December 31, 2012 |
amount outstanding per Fund was the lesser of an amount which did not exceed the borrowing limits set forth in the Fund’s Prospectus and/or Registration Statement and did not cause the Asset Coverage Ratio for all borrowings to drop below 500%. The agreement was subject to an annual commitment fee which was payable in arrears on a quarterly basis. This line of credit expired on March 16, 2012. For the period ended March 16, 2012, the Funds did not have any outstanding borrowings under this agreement.
Effective March 2, 2012 and terminating on March 1, 2013, the Trust had secured a committed, $150,000,000 line of credit with Bank of America, N.A. Borrowings, if any, under this arrangement bore interest at the sum of (a) 1.0% per annum plus (b) the higher of (i) the Federal Funds Rate and (ii) the Eurodollar Rate, the amount of such excess, which was paid quarterly. The maximum loan amount outstanding per Fund was the lesser of an amount which did not exceed the borrowing limits set forth in the Fund’s Prospectus and/or Registration Statement and did not cause the Asset Coverage Ratio for all borrowings to drop below 500%. The agreement is subject to an annual commitment fee which is payable in arrears on a quarterly basis. In the event of a draw upon the line of credit, investments of the responsible Fund may be designated as collateral until its loan is repaid in full. For the period ended December 31, 2012, the Funds did not have any outstanding borrowings under this agreement.
13. Principal Ownership
As of December 31, 2012, the Funds had individual shareholder accounts owning more than 5% of the total shares outstanding of the Fund as follows:
| FUND | NUMBER OF SHAREHOLDERS | TOTAL PERCENTAGE INTEREST HELD | ||||||
AQR Global Equity Fund | 3 | 93.43% | ||||||
AQR International Equity Fund | 4 | 63.37% | ||||||
AQR Emerging Defensive Equity Fund* | 4 | 58.82% | ||||||
AQR Momentum Fund | 1 | 27.90% | ||||||
AQR Tax-Managed Momentum Fund* | 3 | 37.58% | ||||||
AQR Tax-Managed Small Cap Momentum Fund* | 3 | 65.63% | ||||||
AQR Tax-Managed International Momentum Fund* | 3 | 39.83% | ||||||
Significant shareholder transactions by these shareholders, if any, may impact the Fund’s performance.
| * | The percentage shown is owned by the Advisor and its affiliates. |
14. New Accounting Pronouncements
In December 2011, the FASB issued ASU No. 2011-11, Balance Sheet (Topic) 210: Disclosures about Offsetting Assets and Liabilities (“ASU 2011-11”) which provides guidance to enhance disclosures about financial instruments and derivative instruments that are either (a) offset or (b) subject to an enforceable master netting arrangement or similar agreement even if the Funds do not elect to net the transactions on the balance sheet. Under this new guidance, Funds are required to disclose quantitative information relating to recognized assets and liabilities that are offset or subject to an enforceable master netting arrangement or similar agreement. On January 9, 2013, the FASB clarified the scope of ASU 2011-11, which limits the offsetting disclosures to derivatives, repurchase agreements, and securities lending transactions. The Funds are required to apply ASU 2011-11, and the related amendment, for annual reporting periods beginning on or after January 1, 2013, and interim periods within those annual periods. Implementation of ASU 2011-11 may require legal interpretation of relevant agreements and an analysis of the contracts associated with such agreements to determine whether they fall within the scope of the standard. Management is currently assessing the impact of ASU 2011-11 but does not believe the adoption will have a material impact on their financial statements.
15. Subsequent Events
The Funds have evaluated subsequent events through the date of issuance of this report and have determined that there are no material events that would require accrual or disclosure.
| 170 | AQR Funds | Annual Report | December 2012 | |||||||||||||
Table of Contents
To the Board of Trustees and Shareholders of AQR Funds:
In our opinion, the accompanying statements of assets and liabilities, including the schedules of investments, and the related statements of operations, of changes in net assets and of cash flows and the financial highlights present fairly, in all material respects, the financial position of AQR Global Equity Fund, AQR International Equity Fund, AQR Emerging Defensive Equity Fund, AQR International Defensive Equity Fund, AQR U.S. Defensive Equity Fund, AQR Diversified Arbitrage Fund, AQR Momentum Fund, AQR Small Cap Momentum Fund, AQR International Momentum Fund, AQR Tax-Managed Momentum Fund, AQR Tax-Managed Small Cap Momentum Fund and AQR Tax-Managed International Momentum Fund (twelve of the portfolios constituting AQR Funds, hereinafter referred to as the “Funds”) at December 31, 2012, and the results of each of their operations, the changes in each of their net assets, the cash flows of AQR Diversified Arbitrage Fund and the financial highlights for each of the periods presented, in conformity with accounting principles generally accepted in the United States of America. These financial statements and financial highlights (hereafter referred to as “financial statements”) are the responsibility of the Funds’ management; our responsibility is to express an opinion on these financial statements based on our audits. We conducted our audits of these financial statements in accordance with the standards of the Public Company Accounting Oversight Board (United States). Those standards require that we plan and perform the audit to obtain reasonable assurance about whether the financial statements are free of material misstatement. An audit includes examining, on a test basis, evidence supporting the amounts and disclosures in the financial statements, assessing the accounting principles used and significant estimates made by management, and evaluating the overall financial statement presentation. We believe that our audits, which included confirmation of securities at December 31, 2012 by correspondence with the custodian, brokers, agent banks, transfer agents, and portfolio companies and the application of alternative auditing procedures where confirmation of securities purchased had not been received, provide a reasonable basis for our opinion.
PricewaterhouseCoopers LLP
New York, New York
February 28, 2013
| AQR Funds | Annual Report | December 2012 | 171 | |||||||||||||
Table of Contents
For the year ended December 31, 2012, certain dividends paid by the Funds may be subject to a maximum tax of 15% as provided for by the Jobs and Growth Tax Relief Reconciliation Act of 2003. The Funds intend to designate the maximum allowable as taxed at the 15% rate. The following represents the percentage of ordinary income distributions treated as qualifying dividends:
| FUND | PERCENTAGE | |||
AQR Global Equity Fund | 66.03% | |||
AQR International Equity Fund | 53.30% | |||
AQR Emerging Defensive Equity Fund | 60.32% | |||
AQR International Defensive Equity Fund | 85.84% | |||
AQR U.S. Defensive Equity Fund | 69.70% | |||
AQR Diversified Arbitrage Fund | 24.01% | |||
AQR Momentum Fund | 93.57% | |||
AQR Small Cap Momentum Fund | 100.00% | |||
AQR International Momentum Fund | 73.44% | |||
AQR Tax-Managed Momentum Fund | 59.21% | |||
AQR Tax-Managed Small Cap Momentum Fund | 75.56% | |||
AQR Tax-Managed International Momentum Fund | 88.77% | |||
For the taxable year ended December 31, 2012, the following percentages of income dividends paid by the Fund qualify for the 70% dividends received deductions available to corporations:
| FUND | PERCENTAGE | |||
AQR Global Equity Fund | 39.16% | |||
AQR U.S. Defensive Equity Fund | 64.18% | |||
AQR Diversified Arbitrage Fund | 17.14% | |||
AQR Momentum Fund | 97.37% | |||
AQR Small Cap Momentum Fund | 91.58% | |||
AQR Tax-Managed Momentum Fund | 58.38% | |||
AQR Tax-Managed Small Cap Momentum Fund | 50.98% | |||
The Funds designate the following amounts, or the maximum allowable under the Internal Revenue Code, as long term capital gain distributions qualifying for the maximum 15% income tax rate for individuals:
| FUND | TOTAL | |||
AQR Global Equity Fund | $ | 9,422,068 | ||
AQR Emerging Defensive Equity Fund | 212 | |||
AQR Tax-Managed Momentum Fund | 1,969 | |||
AQR Tax-Managed International Momentum Fund | 6,920 | |||
AQR International Defensive Equity Fund | 3,936 | |||
Certain Funds have derived net income from sources within foreign countries. As of December 31, 2012, the foreign source income for each Fund was as follows:
| FUND | TOTAL | PER SHARE | ||||||
AQR International Equity Fund | $ | 17,661,015 | $ | 0.2716 | ||||
AQR Emerging Defensive Equity Fund | $ | 86,926 | $ | 0.1317 | ||||
AQR International Defensive Equity Fund | $ | 49,683 | $ | 0.0853 | ||||
AQR International Momentum Fund | $ | 3,401,110 | $ | 0.3486 | ||||
AQR Tax-Managed International Momentum Fund | $ | 97,883 | $ | 0.1914 | ||||
Certain Funds intend to elect to pass through to shareholders the income tax credit for taxes paid to foreign countries. As of December 31, 2012, the foreign tax credit for each Fund was as follows:
| FUND | TOTAL | PER SHARE | ||||||
AQR International Equity Fund | $ | 387,257 | $ | 0.0060 | ||||
AQR Emerging Defensive Equity Fund | $ | 7,030 | $ | 0.0107 | ||||
AQR International Defensive Equity Fund | $ | 3,302 | $ | 0.0057 | ||||
AQR International Momentum Fund | $ | 155,017 | $ | 0.0159 | ||||
AQR Tax-Managed International Momentum Fund | $ | 6,205 | $ | 0.0121 | ||||
| 172 | AQR Funds | Annual Report | December 2012 | |||||||||||||
Table of Contents
| BEGINNING ACCOUNT DATE VALUE | ENDING ACCOUNT VALUE 12/31/12 | ANNUALIZED EXPENSE RATIO FOR THE PERIOD | EXPENSES PAID FOR THE PERIOD ENDING 12/31/12 | |||||||||||||
AQR Global Equity Fund | ||||||||||||||||
Class I | ||||||||||||||||
Actual Return | $1,000.00 | $1,131.70 | 0.96% | $5.14 | ||||||||||||
Hypothetical Return | $1,000.00 | $1,020.31 | 0.96% | $4.88 | ||||||||||||
Class N | ||||||||||||||||
Actual Return | $1,000.00 | $1,130.00 | 1.26% | $6.75 | ||||||||||||
Hypothetical Return | $1,000.00 | $1,018.80 | 1.26% | $6.39 | ||||||||||||
Class Y | ||||||||||||||||
Actual Return | $1,000.00 | $1,134.30 | 0.51% | $2.74 | ||||||||||||
Hypothetical Return | $1,000.00 | $1,022.57 | 0.51% | $2.59 | ||||||||||||
AQR International Equity Fund | ||||||||||||||||
Class I | ||||||||||||||||
Actual Return | $1,000.00 | $1,189.90 | 0.92% | $5.06 | ||||||||||||
Hypothetical Return | $1,000.00 | $1,020.51 | 0.92% | $4.67 | ||||||||||||
Class N | ||||||||||||||||
Actual Return | $1,000.00 | $1,188.80 | 1.28% | $7.04 | ||||||||||||
Hypothetical Return | $1,000.00 | $1,018.70 | 1.28% | $6.50 | ||||||||||||
Class Y | ||||||||||||||||
Actual Return | $1,000.00 | $1,192.80 | 0.57% | $3.14 | ||||||||||||
Hypothetical Return | $1,000.00 | $1,022.27 | 0.57% | $2.90 | ||||||||||||
AQR Emerging Defensive Equity Fund | ||||||||||||||||
Class I (1) | ||||||||||||||||
Actual Return | $1,000.00 | $1,103.90 | 1.15% | $5.82(a) | ||||||||||||
Hypothetical Return | $1,000.00 | $1,019.36 | 1.15% | $5.84 | ||||||||||||
Class N (1) | ||||||||||||||||
Actual Return | $1,000.00 | $1,103.20 | 1.40% | $7.08(a) | ||||||||||||
Hypothetical Return | $1,000.00 | $1,018.10 | 1.40% | $7.10 | ||||||||||||
AQR International Defensive Equity Fund | ||||||||||||||||
Class I (1) | ||||||||||||||||
Actual Return | $1,000.00 | $1,076.90 | 0.90% | $4.49(a) | ||||||||||||
Hypothetical Return | $1,000.00 | $1,020.61 | 0.90% | $4.57 | ||||||||||||
Class N (1) | ||||||||||||||||
Actual Return | $1,000.00 | $1,076.20 | 1.15% | $5.74(a) | ||||||||||||
Hypothetical Return | $1,000.00 | $1,019.36 | 1.15% | $5.84 | ||||||||||||
AQR U.S. Defensive Equity Fund | ||||||||||||||||
Class I (1) | ||||||||||||||||
Actual Return | $1,000.00 | $1,023.40 | 0.75% | $3.65(a) | ||||||||||||
Hypothetical Return | $1,000.00 | $1,021.37 | 0.75% | $3.81 | �� | |||||||||||
Class N (1) | ||||||||||||||||
Actual Return | $1,000.00 | $1,021.90 | 1.00% | $4.86(a) | ||||||||||||
Hypothetical Return | $1,000.00 | $1,020.11 | 1.00% | $5.08 | ||||||||||||
| AQR Funds | Annual Report | December 2012 | 173 | |||||||||||||
Table of Contents
| Fund Expense Examples (Unaudited) |
| BEGINNING ACCOUNT DATE VALUE | ENDING ACCOUNT VALUE 12/31/12 | ANNUALIZED EXPENSE RATIO FOR THE PERIOD | EXPENSES PAID FOR THE PERIOD ENDING 12/31/12 | |||||||||||||
AQR Diversified Arbitrage Fund | ||||||||||||||||
Class I | ||||||||||||||||
Actual Return | $1,000.00 | $1,019.20 | 2.14% | $10.86 | ||||||||||||
Hypothetical Return | $1,000.00 | $1,014.38 | 2.14% | $10.84 | ||||||||||||
Class N | ||||||||||||||||
Actual Return | $1,000.00 | $1,018.90 | 2.47% | $12.53 | ||||||||||||
Hypothetical Return | $1,000.00 | $1,012.72 | 2.47% | $12.50 | ||||||||||||
AQR Momentum Fund | ||||||||||||||||
Class L | ||||||||||||||||
Actual Return | $1,000.00 | $1,051.50 | 0.50% | $2.58 | ||||||||||||
Hypothetical Return | $1,000.00 | $1,022.62 | 0.50% | $2.54 | ||||||||||||
Class N (2) | ||||||||||||||||
Actual Return | $1,000.00 | $1,001.90 | 0.75% | $0.31(b) | ||||||||||||
Hypothetical Return | $1,000.00 | $1,021.37 | 0.75% | $3.81 | ||||||||||||
AQR Small Cap Momentum Fund | ||||||||||||||||
Class L | ||||||||||||||||
Actual Return | $1,000.00 | $1,078.90 | 0.66% | $3.45 | ||||||||||||
Hypothetical Return | $1,000.00 | $1,021.82 | 0.66% | $3.35 | ||||||||||||
Class N (2) | ||||||||||||||||
Actual Return | $1,000.00 | $1,021.10 | 0.90% | $0.37(b) | ||||||||||||
Hypothetical Return | $1,000.00 | $1,020.61 | 0.90% | $4.57 | ||||||||||||
AQR International Momentum Fund | ||||||||||||||||
Class L | ||||||||||||||||
Actual Return | $1,000.00 | $1,128.60 | 0.67% | $3.58 | ||||||||||||
Hypothetical Return | $1,000.00 | $1,021.77 | 0.67% | $3.40 | ||||||||||||
Class N (2) | ||||||||||||||||
Actual Return | $1,000.00 | $1,010.00 | 0.90% | $0.37(b) | ||||||||||||
Hypothetical Return | $1,000.00 | $1,020.61 | 0.90% | $4.57 | ||||||||||||
AQR Tax-Managed Momentum Fund | ||||||||||||||||
Class L (3) | ||||||||||||||||
Actual Return | $1,000.00 | $1,050.60 | 0.54% | $2.78 | ||||||||||||
Hypothetical Return | $1,000.00 | $1,022.42 | 0.54% | $2.75 | ||||||||||||
Class N (2) | ||||||||||||||||
Actual Return | $1,000.00 | $1,000.90 | 0.79% | $0.32(b) | ||||||||||||
Hypothetical Return | $1,000.00 | $1,021.17 | 0.79% | $4.01 | ||||||||||||
AQR Tax-Managed Small Cap Momentum Fund | ||||||||||||||||
Class L (3) | ||||||||||||||||
Actual Return | $1,000.00 | $1,086.60 | 0.71% | $3.72 | ||||||||||||
Hypothetical Return | $1,000.00 | $1,021.57 | 0.71% | $3.61 | ||||||||||||
Class N (2) | ||||||||||||||||
Actual Return | $1,000.00 | $1,022.00 | 0.95% | $0.39(b) | ||||||||||||
Hypothetical Return | $1,000.00 | $1,020.36 | 0.95% | $4.82 | ||||||||||||
| 174 | AQR Funds | Annual Report | December 2012 | |||||||||||||
Table of Contents
| Fund Expense Examples (Unaudited) |
| BEGINNING ACCOUNT DATE VALUE | ENDING ACCOUNT VALUE 12/31/12 | ANNUALIZED EXPENSE RATIO FOR THE PERIOD | EXPENSES PAID FOR THE PERIOD ENDING 12/31/12 | |||||||||||||
AQR Tax-Managed International Momentum Fund | ||||||||||||||||
Class L (3) | ||||||||||||||||
Actual Return | $1,000.00 | $1,124.40 | 0.70% | $3.74 | ||||||||||||
Hypothetical Return | $1,000.00 | $1,021.62 | 0.70% | $3.56 | ||||||||||||
Class N (2) | ||||||||||||||||
Actual Return | $1,000.00 | $1,009.00 | 0.95% | $0.39(b) | ||||||||||||
Hypothetical Return | $1,000.00 | $1,020.36 | 0.95% | $4.82 | ||||||||||||
| Expenses are calculated using each Class’ annualized expense ratio, multiplied by the average account value for the period, multiplied by 184/366 (to reflect the one-half year period unless stated otherwise). |
| (1) | Commencement of operations was July 9, 2012. |
| (a) | Expenses are calculated using each Class’ annualized expense ratio, multiplied by the average account value for the period, multiplied by 176/366 (to reflect the period since commencement of operations). |
| (2) | Commencement of operations was December 17, 2012. |
| (b) | Expenses are calculated using each Class’ annualized expense ratio, multiplied by the average account value for the period, multiplied by 15/366 (to reflect the period since commencement of operations). |
| (3) | Commencement of operations was January 27, 2012. |
| AQR Funds | Annual Report | December 2012 | 175 | |||||||||||||
Table of Contents
Listed in the chart below is basic information regarding the Trustees and Officers of the Trust. The address of each Officer and Trustee is Two Greenwich Plaza, 3rd Floor, Greenwich CT 06830.
| NAME AND YEAR OF BIRTH | CURRENT POSITION WITH THE TRUST, TERM OF OFFICE1 AND LENGTH OF TIME SERVED | PRINCIPAL OCCUPATION(S) DURING PAST 5 YEARS | NUMBER OF FUNDS IN FUND COMPLEX OVERSEEN BY TRUSTEE | OTHER PRESENT OR PAST DIRECTORSHIPS HELD BY TRUSTEE (DURING THE PAST 5 YEARS) | ||||
Disinterested Trustees2 | ||||||||
| Timothy K. Armour, 1948 | Chairman of the Board since 2010 and Trustee, since 2008 | Interim Chief Executive Officer of Janus Capital Group (2009 to 2010); Managing Director, Chief Operating Officer and President, Morningstar Inc. (1998 to 2008). | 31 | Janus Capital Group (since 2008); ETF Securities (since 2009); AARP Services, Inc. (since 2008) | ||||
| L. Joe Moravy, 1950 | Trustee, since 2008 | Managing Director, Finance Scholars Group (since 2010) (consulting firm); Managing Director, LJM Advisory (2008- 2010) (consulting firm); Partner, Ernst & Young LLP (2002 to 2008). | 31 | Nuveen Exchange Traded Commodities Funds (since 2012) | ||||
| William L. Atwell, 1950 | Trustee, since 2011 | Managing Director, Atwell Partners LLC (since 2012) (consulting services); President (CIGNA International), CIGNA (2008 to 2012) (Insurance). | 31 | None | ||||
| Gregg D. Behrens, 1952 | Trustee, since 2011 | Governor, Iowa State University Foundation (volunteer, since 2004); Executive Vice President and Chief Executive Officer (Asia-Pacific Region), Northern Trust Company (1974 to 2009) (financial services). | 31 | None | ||||
| Brian Posner, 1961 | Trustee, since 2011 | President, Point Rider Group LLC (since 2008) (consulting and advisory services); President and Chief Executive Officer, ClearBridge Advisors LLC (2005 to 2008) (financial services). | 31 | Biogen Idec (since 2008); Arch Capital Group (since 2010); Anadys Pharmaceuticals, Inc. (2011); BG Medicine (since 2012); RiverPark Funds (2010 to 2012) | ||||
Interested Trustee3 | ||||||||
| David Kabiller, 1963 | Trustee, since 2010 | Founding Principal, AQR Capital Management, LLC (since 1998) | 31 | None | ||||
Officers | ||||||||
| Marco Hanig, 1958 | Chief Executive Officer, since 2009; President, since 2008 | Principal, AQR Capital Management, LLC (since 2008). | N/A | N/A | ||||
| 176 | AQR Funds | Annual Report | December 2012 | |||||||||||||
Table of Contents
| Trustees and Officers (Unaudited) | December 31, 2012 |
| NAME AND YEAR OF BIRTH | CURRENT POSITION WITH THE TRUST, TERM OF OFFICE1 AND LENGTH OF TIME SERVED | PRINCIPAL OCCUPATION(S) DURING PAST 5 YEARS | NUMBER OF FUNDS IN FUND COMPLEX OVERSEEN BY TRUSTEE | OTHER PRESENT OR PAST DIRECTORSHIPS HELD BY TRUSTEE (DURING THE PAST 5 YEARS) | ||||
| Abdon Bolivar, 1965 | Chief Compliance Officer, since 2008 | Chief Compliance Officer, AQR Capital Management, LLC (since 2002). | N/A | N/A | ||||
| Nir Messafi, 1975 | Chief Financial Officer, since 2010; Vice President, since 2009; Treasurer from 2009 to 2010 | Vice President, AQR Capital Management, LLC (since 2003). | N/A | N/A | ||||
| Aaron Masek, 1974 | Vice President and Treasurer, since 2010 | Vice President, AQR Capital Management, LLC (since 2010); prior thereto Audit Manager, Cohen Fund Audit Services, Ltd. (2008 to 2009); prior thereto Senior Vice President, Citi Fund Services Ohio, Inc. (1996 to 2008). | N/A | N/A | ||||
| Bradley Asness, 1969 | Vice President and Chief Legal Officer, since 2009 | Principal and Chief Legal Officer, AQR Capital Management, LLC (since 1998). | N/A | N/A | ||||
| Brendan R. Kalb, 1975 | Executive Vice President, since 2009; Secretary, since 2008 | General Counsel, AQR Capital Management, LLC (since 2004). | N/A | N/A | ||||
| Nicole DonVito, 1979 | Vice President, since 2009 | Vice President, AQR Capital Management, LLC (since 2007). | N/A | N/A | ||||
| (1) | Each Trustee serves until the election and qualification of a successor, or until death, resignation or removal as provided in the Trust’s Declaration of Trust. |
| (2) | A Disinterested Trustee is any Trustee that is not an “interested person” of the Trust within the meaning of Section 2(a)(19) of the 1940 Act. |
| (3) | An Interested Trustee is a Trustee that is an “interested person” of the Trust within the meaning of Section 2(a)(19) of the 1940 Act. Mr. Kabiller is an interested person of the Trust because of his position with the Advisor. |
| AQR Funds | Annual Report | December 2012 | 177 | |||||||||||||
Table of Contents
| AQR U.S. Defensive Equity Fund, AQR International Defensive Equity Fund, and AQR Emerging Defensive Equity Fund |
The Board of Trustees (the “Board,” and the members of which are referred to as “Board Members”) of the AQR Funds (the “Trust”) met in person on May 22-23, 2012, to consider the approval of the investment advisory agreement between the Trust, on behalf of the AQR U.S. Defensive Equity Fund, AQR International Defensive Equity Fund, and AQR Emerging Defensive Equity Fund (together, the “Funds”), and AQR Capital Management, LLC (“AQR”) (the “Investment Advisory Agreement”). In accordance with Section 15(c) of the Investment Company Act of 1940, as amended (the “1940 Act”), the Board requested, reviewed and considered materials furnished by AQR relevant to the Board’s consideration of whether to approve the Investment Advisory Agreement. These materials included: (1) memoranda and materials provided by AQR, describing the personnel and services to be provided to the Funds; (2) performance information for strategies and model portfolios relevant to the consideration of the Investment Advisory Agreement; (3) information independently compiled and prepared by FUSE Research relating to the Funds’ proposed fees and expenses; (4) a discussion of the financial statements of AQR and the regulatory exam history; and (5) a discussion of the compliance program and the regulatory exam history of AQR. AQR is referred to herein as the “Advisor,” as applicable.
At an in person meeting held on May 22-23, 2012, the Board, including the Board Members who are not “interested persons” as defined in the 1940 Act (the “Independent Board Members”), unanimously approved the Investment Advisory Agreement for an initial two-year period. The Board considered all factors it believed to be relevant with respect to the Funds, including, among other factors: (a) the nature, extent and quality of the services to be provided by the Advisor; (b) the investment performance of the Advisor and the Advisor’s portfolio management; (c) the advisory fee and the cost of the services and profits to be realized by the Advisor from the relationship with the Funds; (d) economies of scale; and (e) other factors.
The Board also considered other matters it deemed important to the approval process, such as the services related to the valuation and pricing of the Funds’ portfolio holdings, direct and indirect benefits to the Advisor and its affiliates from their relationship with the Funds and advice from independent legal counsel with respect to the review process and materials submitted for the Board’s review. The Board did not identify any particular information as controlling, and each Board Member may have attributed different weightings to the various items considered.
The following is a summary of the Board’s discussion and views regarding the factors it considered in evaluating the Investment Advisory Agreement:
The nature, extent and quality of the services to be provided by the Advisor. The Board Members reviewed the services that the Advisor would provide to the Funds under the Investment Advisory Agreement. The Board considered the size and experience of the Advisor’s staff, its use of technology, and the Funds’ stated investment objectives, strategies and processes. The Board reviewed the overall qualifications of the Advisor as an investment advisor. In connection with the investment advisory services to be provided to the Funds, the Board Members took into account detailed conversations they had with officers of the Advisor regarding the management of the Funds’ investments in accordance with the Funds’ stated investment objectives and policies and the types of transactions that would be entered into on behalf of the Funds. During these discussions, the Board Members asked detailed questions of, and received answers from, the officers of the Advisor regarding the formulation and proposed implementation of the Funds’ investment strategies, their efficacy and potential risks.
In addition to the investment advisory services to be provided to the Funds, the Board Members considered that AQR also will provide shareholder and administrative services, oversight of Fund accounting, marketing services, and assistance in meeting legal and regulatory requirements and other services necessary for the operation of the Funds. In particular, the Board Members reviewed the compliance and administrative services to be provided to the Funds by AQR. The Board also reviewed a wide range of services to be provided to certain of the Funds’ shareholders under a shareholder services agreement between the Trust, on behalf of the Funds, and AQR. These services include providing information and services to Fund shareholders, including professional and informative reporting, access to analysis and explanations of Fund reports, and electronic access to Fund information.
Finally, the Independent Board Members had an opportunity to meet outside the presence of management in executive session separately with counsel to discuss and consider the Investment Advisory Agreement. Based on the presentations at the May 22-23, 2012 Board meeting, the Board concluded that the services to be provided to the Funds by AQR pursuant to the Investment Advisory Agreement were likely to be of a high quality and would benefit the Funds.
| 178 | AQR Funds | Annual Report | December 2012 | |||||||||||||
Table of Contents
| Board Approval of Investment Advisory Agreement (Unaudited) | ||
Investment Performance and the Advisor’s Portfolio Management. Because the Funds are newly formed, the Board did not consider the investment performance of the Funds. The Board based its review of the Advisor’s performance primarily on the experience of the Advisor in managing other registered investment companies and private funds, noting that other funds the Advisor manages might have investment objectives, policies or restrictions different from those of the Funds. The Board reviewed performance information for strategies and model portfolios similar to that of the Funds. The Board also considered the experience, resources and strengths of the Advisor and its affiliates with respect to the investment strategies proposed for the Funds. Based on these factors, the Board Members determined that the AQR would be an appropriate investment advisor for the Funds.
The Advisory Fee and the Cost of the Services and Profits to be Realized by the Advisor from the Relationship with the Funds. The Board, including the Independent Board Members, received and reviewed information regarding the management fees to be paid by the Funds to the Advisor pursuant to the Investment Advisory Agreement. The Board examined this information in order to determine the reasonableness of the fees in light of the nature and quality of services to be provided to the Funds.
To assist in this analysis, the Board received a report independently prepared by FUSE Research using Morningstar data. The report showed comparative fee information for each Fund’s expense group and expense universe, including expense comparisons of contractual investment advisory fees and actual total operating expenses. The Board noted that breakpoints are part of the Funds’ proposed investment advisory fee rate and that the proposed management fee rate would decrease as a Fund increases in size.
The Board also received and reviewed information regarding the profitability of the Advisor with respect to Fund-related activities. The Board took into consideration the Advisor’s profits from the management of other private accounts. The Board also reviewed the Advisor’s methodology of determining profitability. The Board recognized that profitability may be affected by numerous factors including, among other things, fee waivers and expense reimbursements by the Advisor, the types of funds managed, expense allocations and business mix, and therefore comparability of profitability is somewhat limited.
The Board reviewed an estimate of the Advisor’s costs and profitability for fiscal year ended December 31, 2011. The purpose of the review was to help the Independent Board Members determine whether the firm has the necessary resources to continue to provide high quality services to the Funds and attract and retain high quality employees.
The Board concluded that the management fee is reasonable.
Economies of Scale. Because the Funds are newly formed and had not commenced operations as of May 23, 2012, and the eventual aggregate amount of Fund assets was uncertain, the Advisor was not able to provide the Board Members with specific information concerning the extent to which economies of scale would be realized as the Funds grow and whether fee levels would reflect such economies of scale, if any. The Board noted that the Funds would have breakpoints in their advisory fees which allow investors to benefit directly in the form of lower fees as fund assets grow. The Advisor presented information to show that the fees were set as a level that is competitive relative to funds of similar, actual or anticipated size. The Board considered that the funds in the AQR fund complex share some common resources and, as a result, an increase in the overall size of the complex could permit each fund to incur lower expenses than it would otherwise as a stand-alone entity. The Board also considered the Advisor’s overall operations and its efforts to expand the scale of, and improve the quality of, its operations.
Other Factors. The Board also took into account other ancillary or “fall out” benefits that the Advisor or its affiliates may derive from its relationship with the Funds, both tangible and intangible. The Board also received information regarding the Advisor’s brokerage and soft dollar practices. The Board considered that the Advisor is responsible for decisions to buy and sell securities for the Funds, selection of broker-dealers and best execution, and aggregation and allocation of trade orders among the firm’s various advisory clients. The Board noted that the Advisor does not presently intend to make use of soft dollars to acquire third-party research.
Conclusion. Counsel advised the Board concerning the statutory and regulatory requirements for approval and disclosure of investment advisory agreements. No single factor was determinative to the decision of the Board. Based on the foregoing and such other matters as were deemed relevant, all of the Board Members, including all of the Independent Board Members, concluded that the proposed advisory fee rates and projected total expense ratios are reasonable in relation to the services to be provided by the Advisor to the Funds, as well as the costs incurred and benefits to be gained by the Advisor in providing such services, including the investment advisory and administrative
| AQR Funds | Annual Report | December 2012 | 179 | |||||||||||||
Table of Contents
| Board Approval of Investment Advisory Agreement (Unaudited) |
components. The Board also found the proposed investment advisory fees to be reasonable in comparison to the fees charged by advisors to other comparable funds of similar, actual or anticipated size. As a result, all of the Board Members, including the Independent Board Members, approved the Investment Advisory Agreement with respect to the Funds. The Independent Board Members were represented by counsel who assisted them in their deliberations.
| 180 | AQR Funds | Annual Report | December 2012 | |||||||||||||
Table of Contents
Investment Advisor
AQR Capital Management, LLC
Two Greenwich Plaza, 3rd Floor
Greenwich, CT 06830
Sub-Advisor
CNH Partners, LLC
Two Greenwich Plaza, 1st Floor,
Greenwich, CT 06830
Transfer Agent
ALPS Fund Services, Inc.
1290 Broadway, Suite 1100
Denver, CO 80203
Custodian
JPMorgan Chase Bank, N.A.
4 Metro Tech Center
Brooklyn, NY 11245
Distributor
ALPS Distributors, Inc.
1290 Broadway, Suite 1100
Denver, CO 80203
Administrator
J.P. Morgan Investor Services Co.
70 Fargo Street
Boston, MA 02210
Independent Registered Public Accounting Firm
PricewaterhouseCoopers, LLP
300 Madison Avenue
New York, NY 10017
You may obtain a description of the AQR Funds proxy voting, policies, procedures and information regarding how each Fund voted proxies relating to portfolio securities during the 12-month period ending June 30th of each year (available by August 31st of that year) without charge, upon request, by calling 1-866-290-2688 or visiting the funds website www.aqrfunds.com, or by accessing the SEC’s website at www.SEC.Gov. Such reports may be reviewed and copied at the SEC’s Public Reference Room in Washington, DC. Information on the operation of the Public Reference Room may be obtained by calling 202-942-8090.
The Fund files complete schedules of the portfolio holdings with the SEC for the first and third quarters on Form N-Q. The Form N-Q is available without charge, upon request, by calling 1-800-SEC-0330, or by accessing the SEC’s website, at www.SEC.Gov. It may also be reviewed and copied at the SEC’s Public Reference Room in Washington, DC.
This report has been prepared for shareholders and may be distributed to others only if preceded or accompanied by an effective prospectus, which includes information regarding the Funds’ objectives and polices, experienced of its management, marketability of shares and other information.
Table of Contents

P.O. Box 2248
Denver, CO 80201-2248
1-866-290-2688
www.aqrfunds.com
Table of Contents
Table of Contents
Table of Contents
Shareholder Letter (Unaudited)

Cliff Asness
Managing & Founding Principal

John Liew
Founding Principal

Brian Hurst
Principal

Yao Hua Ooi
Principal
Dear Shareholder:
The AQR Managed Futures Strategy Fund pursues an active managed futures strategy. We invest in futures and forward contracts both long and short across the global equity, fixed income, commodity, and currency markets.
We utilize both short and long-term trend following signals to attempt to profit from different types of trends that occur in all of these markets.
Trend following can be simply described as going long markets that are rising in price, and going short markets that are falling in price.
In addition to trend following signals, we also incorporate signals that seek to identify over-extended trends, and reduce risk when the chance of a reversal is perceived as higher than normal, since market reversals generally cause losses for trend following strategies.
We expect that the correlation of this strategy to the equity markets will average close to zero over a full economic cycle. That said, it is the nature of the strategy to exhibit a positive beta when the markets have been rising and a negative beta when the markets have been falling.
The strategy had strong relative and reasonable absolute performance for the full year 2012, with returns of +2.99% comparing favorably to returns of +0.11% for the Merrill Lynch 3 Month Treasury Bill index and returns of -3.45% for the Newedge CTA Trend Sub-Index, a peer index of trend-following managed futures hedge funds. By asset class, equities contributed +1.62%, fixed income detracted -0.19%, commodities detracted -2.17%, and currencies added +3.73%.
A strong first quarter rally in global equities and economically-sensitive commodities was followed by markets stalling on mixed economic news including slowing U.S. employment growth in April. This led to relatively neutral portfolio positioning at the end of April, which quickly shifted to bearish positioning in May as equities, energies, and industrial metals declined on resurgent concerns about Eurozone stability following the first Greek elections and Spanish bank downgrades. Market trends remained bearish through much of June, but turned bullish in July and August as policy makers attempted to solve the Eurozone crisis and global central banks announced yet more rate cuts and monetary easing. Trends across most markets aside from fixed income stayed bullish for the rest of the year, and the fund finished December with an expected portfolio beta of +0.5 to the S&P 500 equity index.
The strategy’s average annualized volatility target is 10%, which we allow to vary based on the conditional attractiveness of trends in the markets we trade. The fund entered the year targeting near 6% volatility, as short-term and long-term signals conflicted across most markets aside from fixed income. Volatility remained low
| 2 | AQR Funds | Annual Report | December 2012 | |||||||||||||
Table of Contents
Shareholder Letter (Unaudited)
| AQR MANAGED FUTURES STRATEGY FUND |
through April even as positioning in equities and commodities grew more bullish during the early-year rally, since fixed income signals moved closer to neutral following the March 2012 bonds sell-off. The downturn of growth-sensitive assets in May and June pushed short-term signals into bearish agreement with long-term signals, resulting in higher-than-average target for the fund through the second half of Q2. With a bounce-back of risky assets through July and August, the Fund settled into normal levels of targeted volatility at 10%. The Fund was at above average volatility through September and October, but reduced volatility for much of November as fiscal cliff worries weakened bullish trends across most markets. The fund ended the year with an expected volatility of 10%.
Long term trend following signals performed well, contributing profitably in every asset class other than commodities, where choppy markets throughout the year led to losses. Shorter term signals were much weaker due to multiple large and short-lived reversals throughout the year, especially in bond futures and commodities. This does not prove that long term trend following is superior to short term trend following – they just work in different environments. Given that it’s difficult to predict which environment will prevail, the strategy is diversified across many horizons of trend following in order to perform well across a greater variety of market environments. Overextended trend signals contributed strongly for the year in every asset class other than fixed income, as they successfully restrained Fund positioning in trends that had gone too far over the past few years.
In equities, the Fund began the year close to neutral, with the largest long positions in the outperforming US markets. Long positions in the US helped equities contribute in the first quarter, but the fund moved into short positioning swiftly enough to benefit from May’s global equity market declines, particularly losses in China and the European periphery. However, the fund was positioned very bearishly in June as markets rebounded following rate cuts by the Chinese central bank and an agreement by European leaders to spread losses on any bailout funds more broadly. The Fund turned bullish in equities again during July as equity markets rallied, and benefitted in August from the positive US Payrolls and the European Central Bank (“ECB”) announcement regarding its commitment to maintaining the Euro. The fund maintained long positions across all or nearly all developed and emerging equity markets from mid-August through year-end, with only a brief drop in mid-November as US markets dipped following the collapse of US fiscal cliff negotiations. The fund ended the year long all equity markets except for a neutral position in the Apple-heavy NASDAQ.
In fixed income, the Fund entered the year strongly long most bond futures and short term interest rate futures, with the only short positions in a few short rate contracts in the US. This positioning detracted early in the year as global benchmark yields rose in February and March due to improving economic news and a general equity market rally. Bond markets reversed in the second quarter as European debt concerns re-emerged and central banks announced new rate cuts, with Australian, U.K., and US long bonds leading the rebound. However, August saw another bond sell-off on positive economic data and political support for the Eurozone. Fixed income continued to detract through the end of the year as long-term yields stagnated and eventually ticked up slightly near year-end. These reversals caused fixed income exposures to provide a minor drag on Fund performance for the year, with the largest losses from positions in Australian and UK bonds. We ended the year still generally long due to positive long-term trends for most securities, though positions were smaller than at the start of 2012. The largest positions at year-end were long Japanese and German bonds, but the fund held small shorts in Australian bonds as well as Canadian and Swiss short term interest rate futures.
In commodities, the Fund entered the year long most energies and short nearly all other commodities. This positioning detracted initially as commodities rallied in January, but the portfolio benefited as softs and metals sold off strongly in March. This left the portfolio in a more bearish position to benefit as
| AQR Funds | Annual Report | December 2012 | 3 | |||||||||||||
Table of Contents
Shareholder Letter (Unaudited)
| AQR MANAGED FUTURES STRATEGY FUND |
commodities dropped sharply in May on the market sell-off. From that point on, multiple reversals across most commodity sectors caused the asset class to detract from fund performance. Agriculturals rallied from June through August on the drought in the mid-west but gave up much of those gains in the last four months. Base metals reversed a multi-month decline in September as risky assets rallied, but see-sawed through the end of the year, detracting from trend-following performance. Energies also declined slightly through the last few months, shifting from nearly universal longs to smaller long and short positions. Overall the losses outweighed gains in commodities, with the bright spots being gains from short positions in coffee and natural gas and a long position in soymeal versus losses in wheat, corn, and all metals. The fund finished the year slightly short in most commodities, with the largest longs in gasoline and zinc and the largest shorts in gold, sugar, and soy oil.
In the currency markets, the Fund’s largest positions entering the year were short the Euro with sizable long positions in the Australian Dollar and British Pound. The Euro short remained the largest position through the much of the year, as the currency fell on concerns ranging from the failure of initial Greek elections to produce a government to the downgrades and necessary bailouts of Spanish banks. However, the euro short turned into a detractor starting in August as the currency rallied following the head of the European Central Bank announcing that the ECB would do “whatever it takes” to preserve the currency. Positioning in the Japanese Yen also shifted throughout the year, as the currency often moved opposite to global equities. Declines in the first quarter gave way to a large rally in May as Eurozone troubles caused investors to bid up the yen as a safe haven currency. The Yen resumed its decline in the second half of the year, generating considerable gains for the portfolio in the fourth quarter. Despite losses on the euro short and a vacillating New Zealand Dollar, the fund benefited strongly as the carry trade reasserted itself through much of the year, generating sizable gains for short positions against the Japanese Yen and benefiting long positions in the Norwegian Krone, Australian Dollar, and most emerging market currencies. The fund ended the year strongly short the Japanese Yen and U.S. Dollar, with the largest long positions in the New Zealand Dollar, Norwegian Krone, and British Pound, plus long positions across most emerging market currencies.
Overall, we believe this year continued to illustrate the importance of our fund construction, which emphasizes diversification across asset classes as well as diversification across signals. Strong gains in currencies and equities counterbalanced losses in commodities; long term momentum and overextended signals provided positive returns as shorter term signals detracted. Most importantly, the fund’s strongly positive returns in May provided a hedge against short-term losses on global equities, yet the fund still managed to capture gains in the fourth quarter rally. We believe this ability of trend-following strategies to do well in months and quarters with poor traditional asset returns provides one of the strongest arguments for a managed futures strategy in most investors’ portfolios.
| 4 | AQR Funds | Annual Report | December 2012 | |||||||||||||
Table of Contents
Shareholder Letter (Unaudited)
| AQR MANAGED FUTURES STRATEGY FUND |
AVERAGE ANNUAL TOTAL RETURNS AS OF 12/31/2012 AQR MANAGED FUTURES STRATEGY FUND | ||||||||
| 1 Year | Since Inception (1/6/2010) | |||||||
| Fund - Class I: AQMIX | 2.99% | 0.55% | ||||||
| Fund - Class N: AQMNX | 2.68% | 0.28% | ||||||
Merrill Lynch 3-Month T-Bill Index | 0.11% | 0.11% | ||||||
Past performance does not guarantee future results. Investment results and principal value of an investment will fluctuate so that an investor’s shares, when redeemed, may be worth more or less than their original cost. Current performance may be lower or higher than the performance data quoted. As of the latest prospectus, the gross expense ratio for the Fund’s Class I/N shares are 1.40% and 1.67%, respectively. Call 1-866-290-2688 or visit www.aqrfunds.com for current month-end performance.
AQR MANAGED FUTURES STRATEGY FUND VS. MERRILL LYNCH 3-MONTH T-BILL INDEX VALUE OF $10,000 INVESTED ON 1/6/2010 | ||||
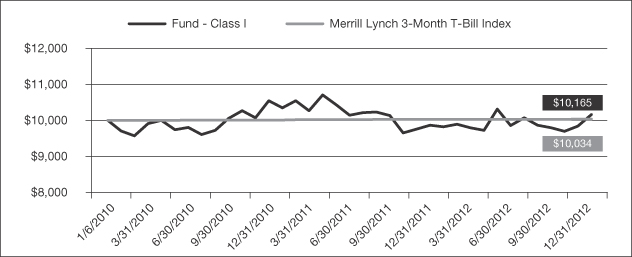
The chart above represents historical performance of a hypothetical investment of $10,000 in the Fund over the past ten years (or since inception if shorter). Performance data quoted represents past performance and does not guarantee future results. Returns shown are total returns, which assume the reinvestment of dividends and capital gains. The table and graph presented above do not reflect the deduction of taxes a shareholder would pay on fund distributions or the redemption of fund shares.
| AQR Funds | Annual Report | December 2012 | 5 | |||||||||||||
Table of Contents
Shareholder Letter (Unaudited)
Brian Hurst
Principal
Yao Hua Ooi
Principal

Ari Levine
Vice President
Dear Shareholders:
The AQR Risk-Balanced Commodities Strategy Fund Class I shares returned -1.30% from their July 9 inception through the end of the year, versus a decline of -0.36% for the Dow Jones-UBS Commodity Index. Tactical returns accounted for all of the underperformance. Our strategic portfolio benefited from better contract positioning relative to the index and better allocations across commodities within each sector. Although we expect volatility targeting to add value in the long run by diversifying through time, it detracted somewhat for the year by driving a portfolio-wide overweight during commodities’ broad fourth quarter decline. These periods of underperformance will tend to occur with some frequency, as we expect the Fund to average a sizable tracking error of 8-10% annualized versus the Dow Jones-UBS Commodity Index. The portfolio structure and our risk management were built to be benchmark-agnostic and outperform over full market cycles rather than the short-term.
The Fund pursues an active approach to commodities investment, aiming to outperform standard commodity future indices through greater risk diversification, risk controls, and active commodity selection. The Fund invests in twenty-four commodity futures across six sectors: energies, base and precious metals, agricultural products, softs, and livestock.
We pursue a risk-balanced approach to build a truly diversified portfolio where all assets matter, but no one commodity matters too much. Risk-balancing involves allocating investments by risk, which means that we attempt to avoid significantly overweighting any particular sector, such as energies. In addition, commodity sectors which have lower risk will generally be allocated more capital than sectors which are deemed riskier.
In addition to balancing risk across sectors, the portfolio is dynamically adjusted through time as market conditions change in an attempt to keep the overall portfolio volatility steady through time. The Fund incorporates a systematic drawdown control that will reduce the portfolio’s target risk level and total exposures in adverse market environments. We believe that greater diversification and portfolio-wide risk controls lead to more consistent volatility, reduce tail risk associated with this volatile asset class, and help the investor to remain invested through more difficult market environments.
We utilize AQR’s proprietary macroeconomic, fundamental, and technical views in a systematic way to overlay the portfolio with over- and under-weights based on those views. The ultimate goal is to build a commodities portfolio that in the long run will deliver higher returns at a risk level similar to traditional indices by combining a better strategic allocation overlaid with tactical tilts.
The Fund is allowed to go both long and short in any given commodity, but will maintain a net long position across the portfolio. The investment process leads to an average beta to the Dow-Jones UBS Commodity Index around 1.0, although the portfolio will typically have lower beta in high volatility environments and a higher beta
| 6 | AQR Funds | Annual Report | December 2012 | |||||||||||||
Table of Contents
Shareholder Letter (Unaudited)
| AQR RISK-BALANCED COMMODITIES STRATEGY FUND |
in low volatility environments. Our tactical over- and under-weights around the risk-balanced framework use the same forecasting models used in our global macro hedge funds and include signals based on price trends, the shape of each commodity’s futures curve, inventory, macroeconomic variables, and many other indicators. The annualized target volatility for the portfolio averages 18%. This target varies modestly over time, increasing a bit when we are generally bullish on commodities and decreasing when we are less optimistic.
The portfolio’s exposures are reviewed daily and adjusted as necessary to keep overall portfolio risk level and risk balance across sectors fairly steady. The Fund shifted from an initial net exposure of 90% of NAV to a net exposure of 140% over the second half of the year as expected commodity volatility steadily declined. Tactical views gradually shifted bearish to bullish through the third quarter on positive price trends and economic news, then ended the year neutral as most commodities stagnated or declined through the fourth quarter. On a sector basis, the largest shifts in position sizes were in energies and base metals, both of which saw larger notional allocations mostly due to declining volatility expectations along with improving tactical views.
Moving to return attribution, the strategic portion of the portfolio returned +0.6% while tactical tilts detracted -1.9%. The strategic return in this attribution is the return to a long-only portfolio with risk-balanced sector weights and a volatility target of 18% annualized. The tactical returns are the active returns to commodity over- and underweights relative to this strategic portfolio. Breaking out total returns by sector, energies contributed +1.3%, base metals contributed +0.7%, precious metals contributed +0.6%, agriculturals detracted -1.9%, softs detracted -1.9%, and livestock detracted -0.1%.
The largest sector contributors to Fund performance since inception were energies and base metals, with return contributions of +1.3% and +0.7%, respectively. Both sectors were boosted in the summer by positive economic developments including positive payrolls data in the U.S., and had strong returns through September on news of monetary easing by the U.S. Federal Reserve (Fed) and continuing efforts of the European Central Bank (ECB) to stabilize the Euro Zone. Oil and distillate prices declined only slightly over the fourth quarter, and our tactical models benefitted from an underweight on natural gas as mild fall weather in the northern U.S. drove a 10% decline.
The two biggest detracting sectors were agriculturals and softs, each with return contributions of -1.9%. The Fund started too late to catch much of the summer rally in grain prices driven by drought in the US mid-west, but it suffered when grain prices fell sharply through the fourth quarter as global crop conditions outside the U.S. were favorable. This price reversal also caused some slight tactical losses to our trend-following models. Softs fell throughout the second half, with sugar futures declining 15% on a global glut and coffee futures falling 24% following a very strong harvest in Brazil and elsewhere.
Tactical positioning detracted -1.9% from performance since inception, with the two largest detractors being trend-following strategies across most sectors and relative-value trades within metals. Trend-following suffered most in agriculturals and base metals as those two sectors experienced the largest reversals from a bullish trend in the third quarter to broad declines in the fourth. The Fund also suffered due to a tactical long position in silver versus other metals motivated by seasonal effects and greater exposure to improving economic indicators. On the contributor side, our tactical models benefited from shifting positioning in wheat driven by seasonal effects and curve shape signals. Tactical positioning in gold also contributed throughout the year, moving from a third quarter overweight driven by seasonal effects and positive price trends to a well-timed short position as negative value signals began to dominate.
At year end, the Fund had a roughly neutral tactical view on commodities, with modestly negative return trends offset by modestly positive economic fundamental signals. Our largest overweight was a sizable
| AQR Funds | Annual Report | December 2012 | 7 | |||||||||||||
Table of Contents
Shareholder Letter (Unaudited)
| AQR RISK-BALANCED COMMODITIES STRATEGY FUND |
long in copper versus an underweight in aluminum on the basis of inventory signals, and relative price trends and economic demand signals for both metals. We also maintain an overweight on Brent and WTI crude oil futures versus underweights in refined oil products due to unusually wide price spreads. The Fund’s largest underweight at year end was gold due to negative price trends aligning with long-term value signals.
The Fund finished 2012 with slightly negative returns. The strategic allocation managed to add some value relative to the benchmark, but active tactical positioning detracted enough that the Fund underperformed. However, while short term results can be noisy, in the long term we believe the Fund’s broader diversification, strong risk management, and active commodity selection will ultimately deliver more steady volatility and superior returns across market environments. We appreciate your investment.
AVERAGE ANNUAL TOTAL RETURNS AS OF 12/31/2012 AQR RISK-BALANCED COMMODITIES STRATEGY FUND | ||||
| Since Inception (7/9/2012) | ||||
| Fund - Class I: ARCIX | -1.30% | |||
| Fund - Class N: ARCNX | -1.40% | |||
Dow Jones-UBS Commodity Index Total Return | -0.36% | |||
Past performance does not guarantee future results. Investment results and principal value of an investment will fluctuate so that an investor’s shares, when redeemed, may be worth more or less than their original cost. Current performance may be lower or higher than the performance data quoted. As of the latest prospectus, the gross expense ratio for the Fund’s Class I/N shares are 1.36% and 1.61%, respectively. Call 1-866-290-2688 or visit www.aqrfunds.com for current month-end performance.
AQR RISK-BALANCED COMMODITIES STRATEGY FUND VS. DOW JONES-UBS COMMODITY INDEX VALUE OF $10,000 INVESTED ON 7/9/2012 | ||
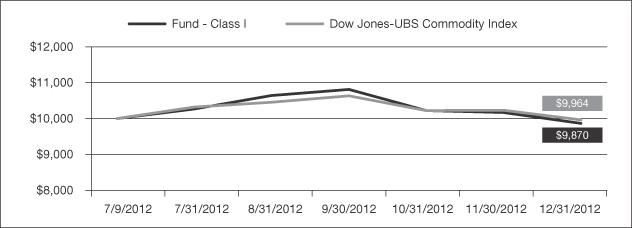
The chart above represents historical performance of a hypothetical investment of $10,000 in the Fund over the past ten years (or since inception if shorter). Performance data quoted represents past performance and does not guarantee future results. Returns shown are total returns, which assume the reinvestment of dividends and capital gains. The table and graph presented above do not reflect the deduction of taxes a shareholder would pay on fund distributions or the redemption of fund shares.
| 8 | AQR Funds | Annual Report | December 2012 | |||||||||||||
Table of Contents
Shareholder Letter (Unaudited)
John Liew
Founding Principal
Brian Hurst
Principal

Michael
Mendelson
Principal
Yao Hua Ooi
Principal
Dear Shareholder:
On December 31, 2012, the AQR Risk Parity Fund completed its second full fiscal year. From December 31, 2011 through December 31, 2012, the Fund’s Class I shares returned +14.26% and realized an annualized volatility of 6.09%. During this same period, the Fund’s old benchmark the Merrill Lynch 3 Month Treasury Bill Index returned +0.11%, while the new benchmark a 60/40 benchmark consisting of 60% S&P 500 Index/40% Barclays U.S. Aggregate Bond Index returned 11.31% at an average realized volatility of 7.02%. The new benchmark is more representative of the Funds investment strategy and holdings than the previous benchmark the Merrill Lynch 3 Month Treasury Bill Index. The Fund’s net assets across all share classes grew to over $1.0 billion by the end of 2012.
Through the use of derivatives such as futures and swaps, the Fund invests across a wide variety of global markets, including: developed and emerging market equities, fixed income and currencies, global credit (corporate, government, and mortgage), and commodities in an attempt to build a truly diversified portfolio where all asset classes matter, but no one asset class matters too much. Risk Parity investing involves allocating investments by risk which means that instruments which have lower risk will generally be allocated larger capital than instruments which are deemed more risky. As markets move through different risk regimes, the portfolio is dynamically adjusted to help keep the overall portfolio risk and balance of risks across asset classes fairly steady through time. We believe this leads to more consistent results, reduces tail risk associated with investments in the capital markets, and enables the investor to remain invested through more difficult market environments.
In addition to varying position sizes to control for increasing or decreasing risk expectations, we also overlay modest portfolio tilts based on AQR’s proprietary expected return models, which include signals based on carry, momentum, valuation, and other important economic variables. These views determine over- and underweights across a broad array of global markets. The ultimate goal is to build a portfolio that in the long run will deliver higher returns at a risk level similar to that of traditional portfolios by combining a better asset allocation with return-boosting tactical tilts. The Fund will generally remain long all of the markets in which we invest while striving to average a moderate (under 0.5 on average) beta to the stock market over a full market cycle.
The targeted annualized volatility for the Fund is 10%, on average, which varies modestly over time based on our perceptions of tactical opportunities within the different asset classes we trade. We started and ended the year close to the 10% long term average, but overall bearish views led us to target less volatility in the second quarter. This was reversed in the third quarter, as our tactical signals indicated an attractive environment overall on the back of positive trends.
In 2012, asset prices were driven by a tug of war between improving economic fundamentals and continued concerns about tail risks, mostly from Europe. However, overall it was a positive year for risk assets, with volatility of all assets except bonds coming down substantially from elevated 2011 levels, leading to significantly higher exposures in all but the nominal bond bucket. Fund exposures as a whole ended 2012 about 30% higher than they had been a year earlier, with equity, inflation, and credit exposures all up, while bond exposure was down, led by a bearish tilt in bonds. In
| AQR Funds | Annual Report | December 2012 | 9 | |||||||||||||
Table of Contents
Shareholder Letter (Unaudited)
| AQR RISK PARITY FUND |
order to maintain portfolio risk at a steady target, the Fund moved from a 0.20 beta versus the S&P 500 Index at the end of 2011 to a 0.41 beta at the end of 2012.
The Fund experienced gains in all of the four major asset class buckets for the full year. To a net return of +14.26% for 2012, equities contributed +3.02%, fixed income contributed +4.14%, inflation-linked assets contributed +1.67%, and credit assets added +5.43%. Like risk, returns for the year were shaped by generally improving economic fundamentals outweighing tail risk concerns. The tactical tilts we made in the Fund added to returns in credit and equities, but detracted in fixed income and inflation, on net detracting -0.3% from the Fund’s return.
The equity bucket contributed positively to the Fund in all but the second quarter as equity markets rallied. The Fund was tactically overweight equities through most of the year on positive momentum. The second quarter was an exception, as falling markets in the second quarter hurt trend signals and caused us to switch to a bearish position. Markets subsequently turned around, and with the resulting improving trend signals we returned to our overweight in equities. Equity notional exposures increased over the year, increasing as volatility dropped with improving markets. This move was tempered in the second quarter in conjunction with the market uncertainty and bearish tactical move, but this was a small move in the context of the equity volatility decrease over the year. Our tactical tilts in equities added modestly to the Fund for the year, with a +0.1% contribution. Positive returns from asset class timing and trend-following signals were partially offset by losses in relative value positions.
The nominal bond bucket was a strong contributor to the Fund, driven by second quarter returns, although returns in the second half were also positive. Bonds rallied in the second quarter on weakening macroeconomic conditions and heightened risk aversion from Euro-area concerns. Accommodative monetary policy also helped bonds in the second quarter, as well as the rest of the year. The Fund moved from bullish to bearish bonds over the year, driven by negative asset class timing signals. While long term trends remained strong at the end of the year, short-term trend signals had worsened, strengthening our bearish tilt. Tactical tilts to bonds detracted -0.8% from performance, mostly from our negative asset class timing signal, as bonds performed well. Trend-following signals also detracted for the year, while relative value trades in fixed-income were relatively flat. While we ended the year overall underweight bonds, we had a modest overweight on German bunds on a relative-value basis based on momentum, versus U.K. gilts, which we disliked based on poor valuation and price momentum factors.
The inflation bucket was positive for the year, driven by strong performance from inflation-linked bonds, offsetting losses from commodities. Inflation-linked bonds preformed well as aggressive easing measures implemented by global central banks put downward pressure on real yields. Commodities detracted -1.2% over the year, of which -0.4% was due to tactical tilts, mostly from poor trend-following performance. Commodities dropped sharply in May due to weakening economic conditions and the European debt crisis, with energies hit particularly hard. The fourth quarter was also difficult for commodities, as grains dropped from their post-drought highs due to news of better-than-expected global harvests. The Fund ended the year as we started, with a tactical underweight in commodities, although we moved to an overweight in the third quarter. On a relative-value basis, we ended the year long copper versus aluminum on price momentum and supply factors and long crude versus unleaded/heating oil on crack-spread timing.
Credit was the best performing asset class bucket in 2012. High yield credit spreads drove the strong returns, as global easing measures led the spread on high yield credit default swaps to its tightest level since May 2011 in the third quarter. The primary markets remained active, leading 2012 to set a new record for annual issuance of $370 billion. Tactically, we were overweight, for much of the year sizably so, high yield credit throughout the year on several factors, especially positive price momentum. This tactical position added +0.8% over the year. We ended the year with less of an overweight, as we steadily reduced our position over the fourth quarter based on negative corporate fundamental momentum. Corporate and emerging credit spread, emerging currencies, and commercial mortgage backed spreads also all contributed positively to the Fund.
| 10 | AQR Funds | Annual Report | December 2012 | |||||||||||||
Table of Contents
Shareholder Letter (Unaudited)
| AQR RISK PARITY FUND |
This has been a good second year for the Fund, as it beat the benchmark’s return at a lower level of volatility. We believe the benefits of broad risk-based diversification and volatility targeting were well evidenced over this period as all four risk categories contributed meaningfully, outperforming the equity risk dominated benchmark during a period of strong equity returns. We remain confident that the diversification of a risk parity approach provides a sound allocation for the wide variety of potential market environments we may face in the coming years.
AVERAGE ANNUAL TOTAL RETURNS AS OF 12/31/2012 AQR RISK PARITY FUND | ||||||||
| 1 Year | Since Inception (9/30/2010) | |||||||
| Fund - Class I: AQRIX | 14.26% | 10.44% | ||||||
| Fund - Class N: AQRNX | 14.00% | 10.17% | ||||||
Merrill Lynch 3-Month T-Bill Index | 0.11% | 0.11% | ||||||
60% S&P 500 Index/40% Barclays U.S. Aggregate Bond Index | 11.31% | 9.66% | ||||||
Past performance does not guarantee future results. Investment results and principal value of an investment will fluctuate so that an investor’s shares, when redeemed, may be worth more or less than their original cost. Current performance may be lower or higher than the performance data quoted. As of the latest prospectus, the gross expense ratio for the Fund’s Class I/N shares are 1.12% and 1.48%, respectively. Call 1-866-290-2688 or visit www.aqrfunds.com for current month-end performance.
| AQR RISK PARITY FUND VS. MERRILL LYNCH 3-MONTH T-BILL INDEX AND 60% S&P 500 INDEX/40% BARCLAYS U.S. AGGREGATE BOND INDEX VALUE OF $10,000 INVESTED ON 9/30/2010 |
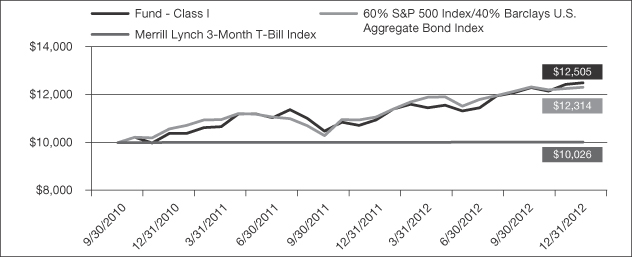
The chart above represents historical performance of a hypothetical investment of $10,000 in the Fund over the past ten years (or since inception if shorter). Performance data quoted represents past performance and does not guarantee future results. Returns shown are total returns, which assume the reinvestment of dividends and capital gains. The table and graph presented above do not reflect the deduction of taxes a shareholder would pay on fund distributions or the redemption of fund shares.
| AQR Funds | Annual Report | December 2012 | 11 | |||||||||||||
Table of Contents
Shareholder Letter (Unaudited)
John Liew
Founding Principal
Brian Hurst
Principal
Michael
Mendelson
Principal
Yao Hua Ooi
Principal
Dear Shareholder:
On December 31, 2012, the AQR Risk Parity II MV Fund completed its first two months. From its inception date of November 6, 2012 through December 31, 2012, the Fund’s Class I shares returned +1.77% and realized an annualized volatility of 5.27%. During this same period, the Fund’s benchmark a 60/40 benchmark consisting of 60% S&P 500 Index/40% Barclays U.S. Aggregate Bond Index returned +0.68% at an average realized volatility of 7.47%. The Fund’s net assets across all share classes grew to over $32 million by the end of December.
Through the use of derivatives such as futures and swaps, the Fund invests across a wide variety of global markets, including: developed and emerging market equities, fixed income, and commodities in an attempt to build a truly diversified portfolio where all asset classes matter, but no one asset class matters too much. Risk Parity investing involves allocating investments by risk which means that instruments which have lower risk will generally be allocated larger capital than instruments which are deemed more risky. As markets move through different risk regimes, the portfolio is dynamically adjusted to help keep the overall portfolio risk and balance of risks across asset classes fairly steady through time. We believe this leads to more consistent results, reduces tail risk associated with investments in the capital markets, and enables the investor to remain invested through more difficult market environments.
In addition to varying position sizes to control for increasing or decreasing risk expectations, we also overlay modest portfolio tilts based on AQR’s proprietary expected return models, which include signals based on carry, momentum, valuation, and other important economic variables. These views determine over- and underweights across a broad array of global markets. The ultimate goal is to build a portfolio that in the long run will deliver higher returns at a risk level similar to that of traditional portfolios by combining a better asset allocation with return-boosting tactical tilts. The Fund will remain long all of the markets in which we invest while averaging a moderate (under 0.3 on average) beta to the stock market over a full market cycle. Total Fund exposures finished the year close to their inception levels. Commodity exposures increased over the period as volatility estimates came down since inception.
The targeted annualized volatility for the Fund is 10%, on average, which varies modestly over time based on our perceptions of tactical opportunities within the different asset classes we trade. The Fund has remained close to the 10% average target annualized volatility since inception.
The Fund experienced gains in all of the three major asset class buckets for the two months since inception. To a net return of +1.77%, equities contributed +1.24%, fixed income contributed +0.23%, and inflation-linked assets contributed +0.30%.
| 12 | AQR Funds | Annual Report | December 2012 | |||||||||||||
Table of Contents
Shareholder Letter (Unaudited)
| AQR RISK PARITY II MV FUND |
The equity bucket was the main contributor to the Fund since inception as equity markets rallied after underperforming at the beginning of November. Both developed and emerging market equities rose on positive economic news globally. The Fund was tactically overweight equities with the exceptions of Canada and Australia. Our position was driven by positive trend-following signals amid generally rising global markets and a bullish assets-class timing position. On a relative value basis we were overweight EuroStoxx based on strong valuation versus Canadian and Australian equities. Our tactical tilts in equities added +0.1% to the Fund.
The nominal bond bucket contributed positively to returns, as positive performance from German bunds buoyed the portfolio. German bunds rose during the quarter as the market priced in expectations of further monetary policy accommodation given the Eurozone’s continued economic malaise. Tactically we were significantly underweight bonds based on negative asset-class timing signals. Short term trend signals also worsened over the period. On a relative value basis we were modestly overweight Germany based on momentum. Out tactical tilts in nominal bonds detracted -0.1% from the Fund.
The inflation bucket added to returns since inception based on positive returns in inflation-linked bonds, which did well as extraordinary easing efforts from global central banks put downward pressure on real yields. Commodities were mixed during the period. Grains dropped from their post-drought highs due to news of better-than-expected harvests. In energies, natural gas dropped as mild weather reduced demand, while crude oil performed well. Overall commodities detracted from the Fund, as bearish tactical tilts, based on underweight to flat trend-following and asset-class timing views, performed poorly. On a relative-value basis, we ended the year long copper versus aluminum on price momentum and supply factors and long crude versus unleaded/heating oil on crack-spread timing.
This has been a good start for the Fund, and we hope to continue to add value to your portfolios going forward. We are confident that the diversification of a risk parity approach provides a sound allocation for the wide variety of potential market environments we may face in the coming years.
AVERAGE ANNUAL TOTAL RETURNS AS OF 12/31/2012 AQR RISK PARITY II MV FUND | ||||
| Since Inception (11/5/2012) | ||||
| Fund - Class I: QRMIX | 1.77% | |||
| Fund - Class N: QRMNX | 1.70% | |||
60% S&P 500 Index/40% Barclays U.S. Aggregate Bond Index | 0.68% | |||
Past performance does not guarantee future results. Investment results and principal value of an investment will fluctuate so that an investor’s shares, when redeemed, may be worth more or less than their original cost. Current performance may be lower or higher than the performance data quoted. As of the latest prospectus, the gross expense ratio for the Fund’s Class I/N shares are 1.34% and 1.59%, respectively. Call 1-866-290-2688 or visit www.aqrfunds.com for current month-end performance.
| AQR Funds | Annual Report | December 2012 | 13 | |||||||||||||
Table of Contents
Shareholder Letter (Unaudited)
| AQR RISK PARITY II MV FUND |
AQR RISK PARITY II MV FUND VS. 60% S&P 500 INDEX/40% BARCLAYS U.S. AGGREGATE BOND INDEX VALUE OF $10,000 INVESTED ON 11/5/2012 | ||
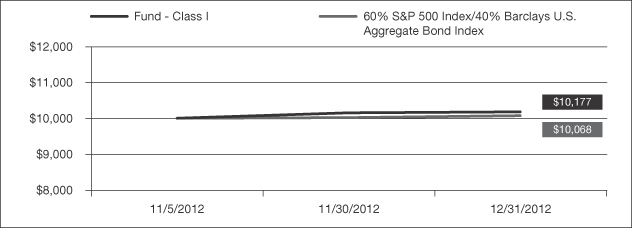
The chart above represents historical performance of a hypothetical investment of $10,000 in the Fund over the past ten years (or since inception if shorter). Performance data quoted represents past performance and does not guarantee future results. Returns shown are total returns, which assume the reinvestment of dividends and capital gains. The table and graph presented above do not reflect the deduction of taxes a shareholder would pay on fund distributions or the redemption of fund shares.
| 14 | AQR Funds | Annual Report | December 2012 | |||||||||||||
Table of Contents
Shareholder Letter (Unaudited)
John Liew
Founding Principal
Brian Hurst
Principal
Michael
Mendelson
Principal
Yao Hua Ooi
Principal
Dear Shareholder:
On December 31, 2012, the AQR Risk Parity II HV Fund completed its first two months. From its inception date of November 6, 2012 through December 31, 2012, the Fund’s Class I shares returned +2.44% and realized an annualized volatility of 7.57%. During this same period, the Fund’s benchmark a 60/40 benchmark consisting of 60% S&P 500 Index/40% Barclays U.S. Aggregate Bond Index returned +0.68% at an average realized volatility of 7.47%. The Fund’s net assets across all share classes grew to over $22 million by the end of December.
Through the use of derivatives such as futures and swaps, the Fund invests across a wide variety of global markets, including: developed and emerging market equities, fixed income, and commodities in an attempt to build a truly diversified portfolio where all asset classes matter, but no one asset class matters too much. Risk Parity investing involves allocating investments by risk which means that instruments which have lower risk will generally be allocated larger capital than instruments which are deemed more risky. As markets move through different risk regimes, the portfolio is dynamically adjusted to help keep the overall portfolio risk and balance of risks across asset classes fairly steady through time. We believe this leads to more consistent results, reduces tail risk associated with investments in the capital markets, and enables the investor to remain invested through more difficult market environments.
In addition to varying position sizes to control for increasing or decreasing risk expectations, we also overlay modest portfolio tilts based on AQR’s proprietary expected return models, which include signals based on carry, momentum, valuation, and other important economic variables. These views determine over- and underweights across a broad array of global markets. The ultimate goal is to build a portfolio that in the long run will deliver higher returns at a risk level similar to that of traditional portfolios by combining a better asset allocation with return-boosting tactical tilts. The Fund will remain long all of the markets in which we invest while averaging a moderate (under 0.5 on average) beta to the stock market over a full market cycle. Total Fund exposures finished the year close to their inception levels. Commodity exposures increased over the period as volatility estimates came down since inception.
The targeted annualized volatility for the Fund is 15%, on average, which varies modestly over time based on our perceptions of tactical opportunities within the different asset classes we trade. The Fund has remained close to the 15% average target annualized volatility since inception.
The Fund experienced gains in all of the three major asset class buckets for the two months since inception. To a net return of +2.44%, equities contributed +1.84%, fixed income contributed +0.36%, and inflation-linked assets contributed +0.24%.
| AQR Funds | Annual Report | December 2012 | 15 | |||||||||||||
Table of Contents
Shareholder Letter (Unaudited)
| AQR RISK PARITY II HV FUND |
The equity bucket was the main contributor to the Fund since inception as equity markets rallied after underperforming at the beginning of November. Both developed and emerging market equities rose on positive economic news globally. The Fund was tactically overweight equities with the exceptions of Canada and Australia. Our position was driven by positive trend-following signals amid generally rising global markets and a bullish assets – class timing position. On a relative value basis we were overweight Eurozone equities based on strong valuation versus Canadian and Australian equities. Our tactical tilts in equities added +0.1% to the Fund.
The nominal bond bucket contributed positively to returns, as positive performance from German bunds buoyed the portfolio. German bunds rose during the quarter as the market priced in expectations of further monetary policy accommodation given the Eurozone’s continued economic malaise. Tactically we were significantly underweight bonds based on negative asset – class timing signals. Short term trend signals also worsened over the period. On a relative value basis we were modestly overweight Germany based on momentum. Out tactical tilts in nominal bonds detracted -0.2% from the Fund.
The inflation bucket added to returns since inception based on positive returns in inflation-linked bonds, which did well as extraordinary easing efforts from global central banks put downward pressure on real yields. Commodities were mixed during the period. Grains dropped from their post-drought highs due to news of better-than-expected harvests. In energies, natural gas dropped as mild weather reduced demand, while crude oil performed well. Overall commodities detracted from the Fund, as bearish tactical tilts, based on underweight to flat trend-following and asset-class timing views, performed poorly. On a relative-value basis, we ended the year long copper versus aluminum on price momentum and supply factors and long crude versus unleaded/heating oil on crack-spread timing.
This has been a good start for the Fund, and we hope to continue to add value to your portfolios going forward. We are confident that the diversification of a risk parity approach provides a sound allocation for the wide variety of potential market environments we may face in the coming years.
AVERAGE ANNUAL TOTAL RETURNS AS OF 12/31/2012 AQR RISK PARITY II HV FUND | ||||
| Since Inception (11/5/2012) | ||||
| Fund - Class I: QRHIX | 2.44% | |||
| Fund - Class N: QRHNX | 2.38% | |||
60% S&P 500 Index/40% Barclays U.S. Aggregate Bond Index | 0.68% | |||
Past performance does not guarantee future results. Investment results and principal value of an investment will fluctuate so that an investor’s shares, when redeemed, may be worth more or less than their original cost. Current performance may be lower or higher than the performance data quoted. As of the latest prospectus, the gross expense ratio for the Fund’s Class I/N shares are 1.54% and 1.79%, respectively. Call 1-866-290-2688 or visit www.aqrfunds.com for current month-end performance.
| 16 | AQR Funds | Annual Report | December 2012 | |||||||||||||
Table of Contents
Shareholder Letter (Unaudited)
| AQR RISK PARITY II HV FUND |
AQR RISK PARITY II HV FUND VS. 60% S&P 500 INDEX/40% BARCLAYS U.S. AGGREGATE BOND INDEX VALUE OF $10,000 INVESTED ON 11/5/2012 | ||
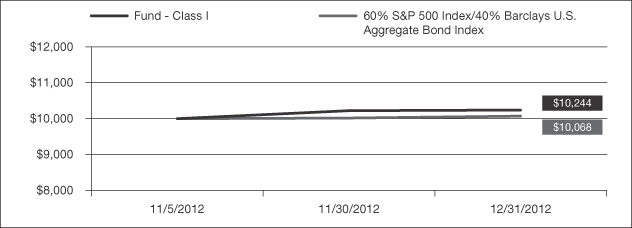
The chart above represents historical performance of a hypothetical investment of $10,000 in the Fund over the past ten years (or since inception if shorter). Performance data quoted represents past performance and does not guarantee future results. Returns shown are total returns, which assume the reinvestment of dividends and capital gains. The table and graph presented above do not reflect the deduction of taxes a shareholder would pay on fund distributions or the redemption of fund shares.
| AQR Funds | Annual Report | December 2012 | 17 | |||||||||||||
Table of Contents
Shareholder Letter (Unaudited)
John Liew
Founding Principal

Jacques Friedman
Principal

Ronen Israel
Principal

Lars Nielsen
Principal

Mark Mitchell, Ph.D.
Founding Principal, CNH Partners

Todd Pulvino, Ph.D.
Founding Principal, CNH Partners
Dear Shareholder:
The AQR Multi-Strategy Alternative Fund’s Class I shares returned +2.36% in 2012. For the year, the Fund had positive contributions from six of the nine main strategies and realized 4.2% annualized weekly volatility and a -0.07 weekly correlation to equities. For the year, the Fund’s benchmark, the Merrill Lynch 3 Month Treasury Bill Index, had a slight positive return of 0.11%. The hedge fund industry, as measured by its major indices, also posted positive returns, with the Dow Jones Credit Suisse (DJCS) Hedge Fund Index gaining 7.7% net of fees for the year. The investable DJCS Core Index gained 5.31% net of fees in 2012. The HFRI Fund Weighted Composite Index gained 6.2% net of fees in 2012. The investable HFRX Global Hedge Fund Index gained 0.92% net of fees in 2012.
The Fund attempts to provide attractive risk-adjusted returns by providing exposure to a broadly-diversified portfolio of classic, relative-value alternative strategies. We include strategies that are liquid and which can be built to be low-to-uncorrelated with traditional markets, something we believe should be a key feature of alternative strategies that are meant to be a source of diversifying returns. We believe in providing a great deal of transparency, which means providing insight into our investment process and the economic themes we seek to capture in addition to positions.
Our focus on providing a broadly-diversified portfolio starts with including nine major categories in our Fund. They are Long/Short Equity, Equity Market Neutral, Dedicated Short Bias, Emerging Markets, Convertible Arbitrage, Event Driven, Global Macro, Managed Futures and Fixed Income Relative Value. We believe that each of these categories offers good long term risk-adjusted returns, but they each go through good times and bad times. The key is that they usually go through ups and downs at different times, thus allowing us to benefit by diversifying across the nine and generating more consistent long-term performance. Underlying the nine major categories are approximately 60+ strategies that make up the economic themes and classic strategies within the Fund. Each strategy is built from the bottom up by internal, experienced teams at AQR.
Our portfolio construction approach is to be as diversified and balanced as possible, starting with equal risk weighting as a baseline and then making small tactical tilts around the strategic risk allocation when we think strategies are conditionally attractive or unattractive. Because we are trading in these markets daily and because all of the strategies are managed in one portfolio, we can stay disciplined about rebalancing to our strategic weights, stay nimble by taking advantage of tactical opportunities and also provide efficient exposure by netting positions and transactions costs.
We target 10% annual volatility in the Fund and an annual return of 7-8% net of fees in excess of cash.
Central banks were quite accommodating in 2012, keeping rates low and, in some cases, purchasing bonds. This had a positive effect on asset prices around the world,
| 18 | AQR Funds | Annual Report | December 2012 | |||||||||||||
Table of Contents
Shareholder Letter (Unaudited)
| AQR MULTI-STRATEGY ALTERNATIVE FUND |
as equities recorded strong gains as measured by the S&P 500 Index (+15.9%), MSCI World Index (+16.4%), and MSCI Emerging Markets Index (+18.2%). Corporate credit returns were also robust as gains were found in Barclays U.S. Corporate Investment Grade Index (+9.4%) and Credit Suisse Leveraged Loan Index (+9.4%).
On a relative basis the Fund’s performance was slightly better than the performance of the major hedge fund indices and global equity markets. The Fund’s realized volatility was below target, realizing 5.5% volatility based on daily returns. The Fund’s realized beta to the MSCI World index was less than 0.1. Of the nine major categories, four had positive returns and five had negative returns. The estimated contributions were as follows:
Long/Short Equity: 1.30%
Equity Market Neutral: -0.79%
Dedicated Short Bias: -0.49%
Emerging Markets: 1.23%
Event Driven: 0.70%
Convertible Arbitrage: 0.64%
Global Macro: -0.59%
Managed Futures: 0.21%
Fixed Income Relative Value: 0.15%
Following is a more detailed review of the performance of the categories with notable contributions.
Long/Short Equity: The Fund’s growth-oriented stock-selection sub-strategy performed well overall in 2012, with non-U.S. portfolios leading and the U.S. portfolio lagging. Growth themes were the dominant drivers of positive contributions across geographies. As for industry selection opportunities, 2012 presented some challenges. S&P 500 Sector performance was contained within a relatively narrow band. In the past 20 years, there were only three years in which the range of best performing and worst performing S&P 500 sectors was lower, and there was only a single year in the past 20 when sector dispersion (average sector performance difference from the index) was lower. The Fund’s U.S. industry selection sub-strategy performed quite admirably given the limited range of sector performance. Global sector compression within the MSCI World Index was less extreme compared with the past, but 2012 sector spreads were certainly less than average. The Fund’s UK Long/Short portfolio was the only geographic portfolio that performed poorly in industry themes.
Emerging Markets: Emerging Markets strategies were a significant driver of performance in 2012. The primary driver of returns was the Emerging Currencies sub-strategy. Improving sentiment related to the European debt crisis benefited the Fund’s long emerging European currencies, which provided the largest concentration of gains by region in the sub-strategy. Meaningful gains came from the Turkish Lira, Polish Zloty, and Hungarian Forint. The Emerging Stock-selection sub-strategy benefited from stock and industry tilts. Several themes contributed, including value, growth and sentiment. The Emerging Equity Directional portfolio avoided any negative quarters this year as it nimbly shifted exposure from long each equity market traded in January and February to short every market from March to July (except China in June) and then flipping long every market (except India) for the remainder of the year. Value themes performed well within the Emerging Equity Directional portfolio, while growth themes detracted from performance.
Event Driven: The merger environment was fairly benign as characterized by declines in deal flow, declines in deal spreads and a low rate of deal failure. The dollar volume of deals declined globally by 14% from 2011 but the decline was more pronounced among deals where the target was in the U.S. (-22% Year over
| AQR Funds | Annual Report | December 2012 | 19 | |||||||||||||
Table of Contents
Shareholder Letter (Unaudited)
| AQR MULTI-STRATEGY ALTERNATIVE FUND |
Year) or where target value exceeded $1 billion (-17% Year over Year). In fact, deals in which the target was in the U.S. and over $1 billion declined by 31%. Among the universe of deals, median spreads have come down from as high as 7% in January to a little more than 2% at year-end. As stated above, a diminished level of deal failures within the portfolio in 2012 has also had a significant positive impact on returns.
Equity Market Neutral: This was the worst performing strategy during the past year. Most of the losses were sustained in the first four months of the year. The rest of the year, experienced gains in one month that were often wiped out in the next. These losses were concentrated within quality measures (e.g., defensive themes such as low leverage and low risk) and contained almost entirely within the U.S. portfolio. In addition, the Fund’s earnings quality themes that focus on accruals, contributed negatively in the second and third-quarters of this year.
Global Macro: The Developed Equity Relative Value sub-strategy was the primary source of the strategy’s struggles in 2012, with losses concentrated in the first and fourth-quarters. In each case the largest loss came from short TOPIX positions and next largest losses were from long FTSE positions. In both quarters, the Japanese market far outperformed other developed markets on the back of yen depreciation and the resulting outlook for stronger export competitiveness. The Commodities Relative Value sub-strategy, which was introduced to Global Macro in June, was a detractor for the year, with losses concentrated in the third-quarter, when the relative value sub-strategy increased positioning in grains after drought-driven prices peaked. In addition to gains from yen positioning, the currency sub-strategy also had positive contribution from short euro positions held throughout the year, although gains were concentrated in the second and third-quarters. The Developed Equity Directional sub-strategy was long all equity indices traded throughout the year and, as markets went up, so did the contribution to performance.
Dedicated Short Bias: The directional short component of the Dedicated Short Bias strategy represented a headwind for much of the year as global equity markets rallied by 16.4%. Fortunately, this directional component is modest in size, though the losses from direction were greater than total losses for the strategy as a result of positive contribution from the Dedicated Short Bias stock-selection sub-strategies. Within these four market-neutral, regional portfolios there was good contribution from the US and Japanese portfolios with little impact from either the U.K. or European portfolios. Sentiment-oriented themes performed well across regions. The fundamentally-oriented themes that were introduced to the strategy at mid-year produced negative results on balance.
Tactical Positioning: As of December 31st, six of the Fund’s nine strategies are tactically underweight relative to strategic allocation, but only three are tactically positioned below 90% of strategic weights. Long/Short Equity is the only strategy that is tactically overweight.
The Fund’s three arbitrage strategies: Event Driven, Convertible Arbitrage and Fixed Income Relative Value, remain significantly underweight. Convertible Arbitrage’s weighting reflects the continued low level of issuance and a universe of securities that appears fully valued. Event Driven’s weighting has increased modestly given a broader opportunity set, but is overall underweight, given that spreads have tightened to just 2.3% and deal flow remains modest and tilted toward small transactions. Significant divergence in view among Fixed Income Relative Value’s trading themes has persisted all quarter and the strategy remains meaningfully underweight.
| 20 | AQR Funds | Annual Report | December 2012 | |||||||||||||
Table of Contents
Shareholder Letter (Unaudited)
| AQR MULTI-STRATEGY ALTERNATIVE FUND |
The Long/Short Equity strategy has remained at 15% overweight over the course of the quarter as upward momentum in markets has kept the variable net exposure component toward upper risk levels. Dedicated Short Bias and Equity Market Neutral both remain at neutral allocations.
AVERAGE ANNUAL TOTAL RETURNS AS OF 12/31/2012 AQR MULTI-STRATEGY ALTERNATIVE FUND | ||||||||
| 1 Year | Since Inception (7/18/2011) | |||||||
| Fund - Class I: ASAIX | 2.36% | -0.19% | ||||||
| Fund - Class N: ASANX | 2.11% | -0.40% | ||||||
Merrill Lynch 3-Month T-Bill Index | 0.11% | 0.09% | ||||||
Past performance does not guarantee future results. Investment results and principal value of an investment will fluctuate so that an investor’s shares, when redeemed, may be worth more or less than their original cost. Current performance may be lower or higher than the performance data quoted. As of the latest prospectus, the gross expense ratio for the Fund’s Class I/N shares are 2.59% and 2.85%, respectively. Call 1-866-290-2688 or visit www.aqrfunds.com for current month-end performance.
AQR MULTI-STRATEGY ALTERNATIVE FUND VS. MERRILL LYNCH 3-MONTH T-BILL INDEX VALUE OF $10,000 INVESTED ON 7/18/2011 |
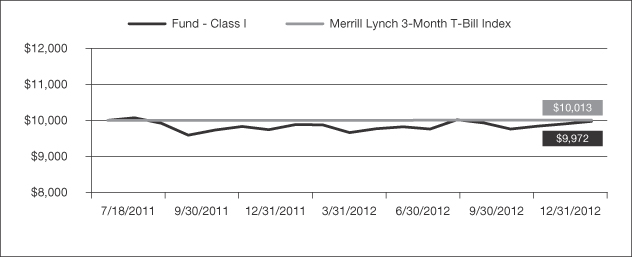
The chart above represents historical performance of a hypothetical investment of $10,000 in the Fund over the past ten years (or since inception if shorter). Performance data quoted represents past performance and does not guarantee future results. Returns shown are total returns, which assume the reinvestment of dividends and capital gains. The table and graph presented above do not reflect the deduction of taxes a shareholder would pay on fund distributions or the redemption of fund shares.
| AQR Funds | Annual Report | December 2012 | 21 | |||||||||||||
Table of Contents
Shareholder Letter (Unaudited)
PRINCIPAL RISKS:
AQR Managed Futures Strategy Fund: The use of derivatives, including forward and futures contracts, swap agreements, and exposure to the commodities markets exposes the Fund to additional risks including increased volatility, lack of liquidity, and possible losses greater than the Fund’s initial investment as well as increased transaction costs. Derivative contracts involve exposure to counterparty credit risk, which refers to the possibility that the counterparty to a derivative instrument will not be able to make principal and interest payments when due. When investing in bonds, yield and share price will vary with changes in interest rates and market conditions. Investors should note that if interest rates rise significantly from current levels, bond total returns will decline and may even turn negative in the short term. There is also a chance that some of the Fund’s holdings may have their credit rating downgraded or may default. Emerging market and foreign investing involves special risks such as currency fluctuations, political uncertainty, differences in generally accepted accounting principles, increased volatility and lower trading volume. This Fund is not suitable for all investors.
AQR Risk-Balanced Commodities Strategy Fund: The use of derivatives, including forward and futures contracts, swap agreements and exposure to the commodities markets exposes the Fund to additional risks including increased volatility, lack of liquidity, and possible losses greater than the Fund’s initial investment as well as increased transaction costs. Derivative contracts involve exposure to counterparty credit risk, which refers to the possibility that the counterparty to a derivative instrument will not be able to make principal and interest payments when due. When investing in bonds, yield and share price will vary with changes in interest rates and market conditions. Investors should note that if interest rates rise significantly from current levels, bond total returns will decline and may even turn negative in the short term. There is also a chance that some of the Fund’s holdings may have their credit rating downgraded or may default. Foreign investing involves special risks such as currency fluctuations, political uncertainty, differences in generally accepted accounting principles, increased volatility and lower trading volume. This Fund is not suitable for all investors.
AQR Risk Parity Fund, AQR Risk Parity II MV Fund and AQR Risk Parity II HV Fund: The use of derivatives, including forward and futures contracts, swap agreements and exposure to the commodities markets exposes the Funds to additional risks including increased volatility, lack of liquidity, and possible losses greater than a Fund’s initial investment as well as increased transaction costs. Derivative contracts involve exposure to counterparty credit risk, which refers to the possibility that the counterparty to a derivative instrument will not be able to make principal and interest payments when due. When investing in bonds, yield and share price will vary with changes in interest rates and market conditions. Investors should note that if interest rates rise significantly from current levels, bond total returns will decline and may even turn negative in the short term. There is also a chance that some of the Fund’s holdings may have their credit rating downgraded or may default. Emerging market and foreign investing involves special risks such as currency fluctuations, political uncertainty, differences in generally accepted accounting principles, increased volatility and lower trading volume. These Funds are not suitable for all investors.
AQR Multi-Strategy Alternative Fund: The use of derivatives, including forward and futures contracts, swap agreements and exposure to the commodities markets exposes the Fund to additional risks including increased volatility, lack of liquidity, and possible losses greater than the Fund’s initial investment as well as increased transaction costs. Derivative contracts involve exposure to counterparty credit risk, which refers to the possibility that the counterparty to a derivative instrument will not be able to make principal and interest payments when due. The Fund employs arbitrage and alternative strategies, which carry the risk that the anticipated opportunities do not play out as planned, resulting in potentially reduced returns or losses to the Fund as it unwinds its trades. This Fund enters into a short sale by selling a security it has borrowed. If the market price of a security increases after the Fund borrows the security, the Fund will
| 22 | AQR Funds | Annual Report | December 2012 | |||||||||||||
Table of Contents
Shareholder Letter (Unaudited)
suffer a potentially unlimited loss when it replaces the borrowed security at the higher price. Short sales also involve transaction and other costs that will reduce potential Fund gains and increase potential Fund losses. When investing in bonds, yield and share price will vary with changes in interest rates and market conditions. Investors should note that if interest rates rise significantly from current levels, bond total returns will decline and may even turn negative in the short term. There is also a chance that some of the Fund’s holdings may have their credit rating downgraded or may default. Emerging market and foreign investing involves special risks such as currency fluctuations, political uncertainty, differences in generally accepted accounting principles, increased volatility and lower trading volume. This Fund is not suitable for all investors.
An investment in any of the AQR Funds listed above (the “Funds”) involves risk, including loss of principal. Diversification does not eliminate this risk. The value of the Funds’ portfolio holdings may fluctuate in response to events specific to the companies in which the Fund invests, as well as economic, political or social events in the United States or abroad.
The Funds are each a non-diversified fund. Because each Fund may invest in securities of a smaller number of issuers, the Fund may be more exposed to the risks associated with and developments affecting an individual issuer than a fund that invests more widely, which may therefore have a greater impact on the Fund’s performance. The Funds also invests in a wholly-owned and controlled subsidiary and is indirectly exposed to the risks associated with the subsidiary’s investments. The Funds from time to time employ various hedging techniques, it is not possible to hedge fully or perfectly against any risk, and hedging entails its own costs.
An investor considering the Funds should be able to tolerate potentially wide price fluctuations. The Funds are subject to high portfolio turnover risk as a result of frequent trading, and thus will incur a higher level of brokerage fees and commissions and cause a higher level of tax liability to shareholders in the funds. The AQR Multi-Strategy Alternative Fund may attempt to increase their income or total return through the use of securities lending, and they may be subject to the possibility of additional loss as a result of this investment technique.
Please refer to each Fund’s prospectus for complete information regarding all risks associated with the Funds.
Cliff Asness, David Kabiller, Brian Hurst, Yao Hua Ooi and Marco Hanig are registered representatives of ALPS Distributors, Inc.
DEFINITIONS:
Barclays U.S. Aggregate Bond Index is a broad-based bond index comprised of government, corporate, mortgage and asset-backed issues, rated investment grade or higher, and having at least one year to maturity.
Barclays U.S. Corporate Investment Grade Index is an unmanaged index consisting of publicly issued US Corporate and specified foreign debentures and secured notes that are rated investment grade (Baa3/BBB- or higher) by at least two ratings agencies, have at least one year to final maturity and have at least $250 million par amount outstanding.
Bearish: A belief that a particular security, sector or the overall market will fall.
| AQR Funds | Annual Report | December 2012 | 23 | |||||||||||||
Table of Contents
Shareholder Letter (Unaudited)
Beta is a measure of the volatility of a security or portfolio in comparison to an index or the market as a whole, where a security with a beta of 1.0 has equivalent volatility to the index or market it is compared to.
Bullish: A belief that a particular security, sector or the overall market will rise.
Correlation: A measurement to identify the relationship and impact on return of two or more assets.
Crack Spread: In commodity markets, the differential between the price of crude oil and the petroleum products extracted from it.
Credit: This strategy purchases attractively priced securities on a hedged basis, typically around event induced capital flows.
Credit Suisse Leveraged Loan Index tracks the investable market of the U.S. dollar denominated leveraged loan market. It consists of issues rated “5B” or lower, meaning that the highest rated issues included in this index are Moody’s/S&P ratings of Baa1/BB+ or Ba1/BBB+. All loans are funded term loans with a tenor of at least one year and are made by issuers domiciled in developed countries.
Dow Jones Credit Suisse Core Hedge Fund Index is an investable, asset-weighted hedge fund index that seeks to provide broad representation of the liquid, investable hedge fund universe with limited platform bias. The index reflects the performance of managed accounts and other regulated fund structures sourced from across a range of platforms.
Dow Jones Credit Suisse Hedge Fund Index is an asset-weighted benchmark that seeks to measure hedge fund performance and provide the most accurate representation of the hedge fund universe.
Dow Jones-UBS Commodity Index is a broad-based index used to represent the most frequently-traded global commodity futures.
Futures and Forwards contracts: A financial contract obligating the buyer to purchase an asset (or the seller to sell an asset) at a pre-determined future date and price.
HFRI Fund Weighted Composite Index is a global, equal-weighted index of over 2,000 single-manager funds.
HFRX Global Hedge Fund Index is designed to be representative of the overall composition of the hedge fund universe. It is comprised of all eligible hedge fund strategies; including but not limited to convertible arbitrage, distressed securities, equity hedge, equity market neutral, event driven, macro, merger arbitrage, and relative value arbitrage. The strategies are asset weighted based on the distribution of assets in the hedge fund industry.
Merrill Lynch 3 Month Treasury Bill Index is designed to measure the performance of high-quality short-term cash-equivalent investments. Indexes are unmanaged and one cannot invest directly in an index.
Momentum: An investment style wherein an asset is deemed to have positive momentum if it has performed well in the past relative to other assets in the same universe.
| 24 | AQR Funds | Annual Report | December 2012 | |||||||||||||
Table of Contents
Shareholder Letter (Unaudited)
MSCI EAFE Index is a free float-adjusted market capitalization index that is designed to measure the performance of equities in developed markets, excluding the United States and Canada. Indexes are unmanaged and one cannot invest directly in an index.
MSCI Emerging Markets Index is a free float-adjusted market capitalization index that is designed to measure equity market performance in the global emerging markets.
MSCI World ex-USA Index is a free float-adjusted market capitalization index that is designed to measure the performance of equities in developed markets, excluding the United States. Indexes are unmanaged and one cannot invest directly in an index.
MSCI World Index is a free float-adjusted market capitalization index that is designed to measure the performance of equities in developed markets, including the United States and Canada. Indexes are unmanaged and one cannot invest directly in an index.
Newedge CTA Trend Sub-Index is a subset of the Newedge CTA Index, and follows traders of trend following methodologies. The Newedge CTA Index is equal weighted, calculates the daily rate of return for a pool of CTAs selected from the larger managers that are open to new investment.
S&P 500 Index is a capitalization weighted index designed to measure performance of the broad domestic economy through changes in the aggregate market value of 500 stocks representing all major industries. Indexes are unmanaged and one cannot invest directly in an index.
Tail Risk: The risk of larger or more frequent losses than would be expected if returns to an asset or portfolio followed a normal distribution.
Tracking Error: A measure of how closely a portfolio follows the index to which it is benchmarked. It measures the standard deviation of the difference between the portfolio and index returns.
Volatility is a statistical measurement of up and down asset price fluctuations over time. If an asset has rapid dramatic price swings, its “volatility” will likely be relatively high. If prices are consistent and rarely change, “volatility” of that asset will likely be relatively low. “Volatility” can be measured as the standard deviation of an asset with a specific time horizon. It is often used to quantify the risk of such asset over a time period, typically expressed in annualized terms.
| AQR Funds | Annual Report | December 2012 | 25 | |||||||||||||
Table of Contents
| MONEY MARKET FUNDS - 81.6% | SHARES | VALUE (Note 3) | ||||||
| BlackRock Liquidity Funds TempFund Portfolio, Class I, 0.140% (a) | 155,658,517 | $ | 155,658,517 | |||||
| Dreyfus Treasury Cash Management, Class I, 0.010% (a) | 622,634,067 | 622,634,066 | ||||||
| J.P. Morgan Prime Money Market Fund - Capital Shares, 0.120% (a)(b) | 10,608 | 10,608 | ||||||
| J.P. Morgan U.S. Treasury Plus Money Market Fund - Institutional Shares, 0.000% (a)(b) | 634,381,938 | 634,381,938 | ||||||
| UBS Money Series - UBS Select Treasury Preferred Fund, Class I, 0.010% (a) | 762,355,858 | 762,355,858 | ||||||
|
| |||||||
TOTAL MONEY MARKET FUNDS | 2,175,040,987 | |||||||
|
| |||||||
| PRINCIPAL AMOUNT (000’S) | VALUE (Note 3) | |||||||
| SHORT-TERM INVESTMENTS - 9.7% | ||||||||
U.S. Treasury Bill, 0.000% 6/20/13 (c) (cost $258,013,347) | $ | 258,130 | $ | 258,002,742 | ||||
|
| |||||||
TOTAL INVESTMENTS - 91.3% | 2,433,043,729 | |||||||
|
| |||||||
| OTHER ASSETS IN EXCESS OF LIABILITIES - 8.7% (d) | 231,233,468 | |||||||
|
| |||||||
NET ASSETS - 100.0% | $ | 2,664,277,197 | ||||||
|
| |||||||
| (a) | Represents annualized seven-day yield as of December 31, 2012. |
| (b) | A portion of the security is pledged as collateral to the brokers for forward foreign currency exchange, futures and swap contracts. |
| (c) | The rate shown is the effective yield at the date of purchase. |
| (d) | Includes appreciation on forward foreign currency exchange, futures and swap contracts. |
All securities are Level 2 with respect to ASC 820 (See Note 5).
Total return swap contracts outstanding as of December 31, 2012:
| COUNTERPARTY | UNDERLYING REFERENCE INSTRUMENT | TERMINATION DATE | CURRENCY | NOTIONAL VALUE | UNREALIZED APPRECIATION (DEPRECIATION) | |||||||||||
| Barclays Capital | Cocoa Futures | 3/13/2013 | USD | (14,564,060) | $1,304,580 | |||||||||||
| Barclays Capital | Coffee ‘C’ Futures | 3/18/2013 | USD | (873,562) | 64,688 | |||||||||||
| Barclays Capital | Corn Futures | 3/14/2013 | USD | 6,343,238 | (163,725) | |||||||||||
| Bank of America | Euro - Bobl Futures | 3/7/2013 | EUR | 201,818,064 | 1,852,483 | |||||||||||
| Bank of America | Euro - SCHATZ Futures | 3/7/2013 | EUR | 466,373,700 | 707,037 | |||||||||||
| Barclays Capital | LME Aluminum Futures | 3/20/2013 | USD | (1,904,975) | 40,400 | |||||||||||
| Barclays Capital | Soybean Futures | 3/14/2013 | USD | 715,125 | (10,375) | |||||||||||
| The Royal Bank of Scotland | Swiss Market Index Futures | 3/15/2013 | CHF | 96,582,653 | (1,097,767) | |||||||||||
| Bank of America | U.S. Treasury 2-Year Note Futures | 3/28/2013 | USD | 121,888,278 | 30,940 | |||||||||||
| Bank of America | U.S. Treasury 5-Year Note Futures | 3/28/2013 | USD | 237,813,336 | (182,477) | |||||||||||
| Barclays Capital | Wheat Futures | 3/14/2013 | USD | 7,035,325 | $(694,624) | |||||||||||
|
| |||||||||||||||
| $1,851,160 | ||||||||||||||||
|
| |||||||||||||||
Money Market Fund is pledged as collateral to brokers for total return swap contracts in the amount of $4,890,999. Additional collateral for positions held at Royal Bank of Scotland is included in the collateral for forward foreign currency exchange contracts. Additional cash held as collateral for the broker for total return swap contracts was $2,400,000 at December 31, 2012.
| The accompanying notes are an integral part of these financial statements. | (Continued) |
| 26 | AQR Funds | Annual Report | December 2012 | |||||||||||||
Table of Contents
| Consolidated Schedule of Investments | December 31, 2012 |
| AQR MANAGED FUTURES STRATEGY FUND |
Open futures contracts outstanding at December 31, 2012:
| NUMBER OF CONTRACTS | DESCRIPTION | EXPIRATION DATE | VALUE AT TRADE DATE | VALUE AT DECEMBER 31, 2012 | UNREALIZED APPRECIATION (DEPRECIATION) | |||||||||||
| Long Contracts: | ||||||||||||||||
| 163 | Corn Futures | March 14, 2013 | $6,130,705 | $5,690,738 | $(439,967) | |||||||||||
| 330 | Globex RBOB Gas Futures | January 30, 2013 | 36,814,932 | 38,277,162 | 1,462,230 | |||||||||||
| 251 | Lean Hogs Futures | February 14, 2013 | 8,754,616 | 8,606,790 | (147,826) | |||||||||||
| 215 | LME Aluminum Futures | January 11, 2013 | 10,750,344 | 10,988,543 | 238,199 | |||||||||||
| 95 | LME Aluminum Futures | January 15, 2013 | 4,697,902 | 4,859,440 | 161,538 | |||||||||||
| 114 | LME Aluminum Futures | January 16, 2013 | 5,577,632 | 5,832,525 | 254,893 | |||||||||||
| 37 | LME Aluminum Futures | January 17, 2013 | 1,813,059 | 1,893,392 | 80,333 | |||||||||||
| 13 | LME Aluminum Futures | January 18, 2013 | 650,346 | 665,382 | 15,036 | |||||||||||
| 137 | LME Aluminum Futures | January 25, 2013 | 6,617,644 | 7,022,038 | 404,394 | |||||||||||
| 154 | LME Aluminum Futures | February 1, 2013 | 7,471,021 | 7,904,550 | 433,529 | |||||||||||
| 103 | LME Aluminum Futures | February 14, 2013 | 5,142,880 | 5,300,664 | 157,784 | |||||||||||
| 8 | LME Aluminum Futures | February 15, 2013 | 393,321 | 411,786 | 18,465 | |||||||||||
| 184 | LME Aluminum Futures | February 27, 2013 | 9,272,253 | 9,492,974 | 220,721 | |||||||||||
| 227 | LME Aluminum Futures | February 28, 2013 | 11,488,958 | 11,713,597 | 224,639 | |||||||||||
| 217 | LME Aluminum Futures | March 4, 2013 | 11,385,789 | 11,205,934 | (179,855) | |||||||||||
| 26 | LME Aluminum Futures | March 5, 2013 | 1,366,066 | 1,342,894 | (23,172) | |||||||||||
| 243 | LME Aluminum Futures | March 20, 2013 | 12,765,845 | 12,585,881 | (179,964) | |||||||||||
| 136 | LME Aluminum Futures | March 21, 2013 | 6,997,418 | 7,044,494 | 47,076 | |||||||||||
| 23 | LME Copper Futures | January 4, 2013 | 4,781,731 | 4,546,766 | (234,965) | |||||||||||
| 3 | LME Copper Futures | January 8, 2013 | 613,899 | 593,184 | (20,715) | |||||||||||
| 4 | LME Copper Futures | January 9, 2013 | 820,599 | 790,954 | (29,645) | |||||||||||
| 3 | LME Copper Futures | January 11, 2013 | 614,808 | 593,279 | (21,529) | |||||||||||
| 13 | LME Copper Futures | February 1, 2013 | 2,537,471 | 2,573,113 | 35,642 | |||||||||||
| 4 | LME Copper Futures | February 5, 2013 | 761,706 | 791,864 | 30,158 | |||||||||||
| 11 | LME Copper Futures | February 6, 2013 | 2,113,943 | 2,177,720 | 63,777 | |||||||||||
| 9 | LME Copper Futures | February 7, 2013 | 1,738,139 | 1,781,847 | 43,708 | |||||||||||
| 23 | LME Copper Futures | February 8, 2013 | 4,381,837 | 4,553,805 | 171,968 | |||||||||||
| 5 | LME Copper Futures | February 12, 2013 | 950,914 | 990,127 | 39,213 | |||||||||||
| 16 | LME Copper Futures | February 13, 2013 | 3,033,226 | 3,168,544 | 135,318 | |||||||||||
| 5 | LME Copper Futures | February 14, 2013 | 961,258 | 990,213 | 28,955 | |||||||||||
| 8 | LME Copper Futures | February 15, 2013 | 1,528,832 | 1,584,410 | 55,578 | |||||||||||
| 6 | LME Copper Futures | February 19, 2013 | 1,154,710 | 1,188,512 | 33,802 | |||||||||||
| 3 | LME Copper Futures | February 20, 2013 | 582,005 | 594,281 | 12,276 | |||||||||||
| 44 | LME Copper Futures | March 4, 2013 | 8,793,641 | 8,718,875 | (74,766) | |||||||||||
| 16 | LME Copper Futures | March 5, 2013 | 3,226,511 | 3,170,600 | (55,911) | |||||||||||
| 19 | LME Copper Futures | March 6, 2013 | 3,820,521 | 3,765,207 | (55,314) | |||||||||||
| 124 | LME Copper Futures | March 20, 2013 | 24,896,436 | 24,583,775 | (312,661) | |||||||||||
| 43 | LME Copper Futures | March 21, 2013 | 8,370,019 | 8,525,116 | 155,097 | |||||||||||
| 44 | LME Nickel Futures | January 4, 2013 | 4,922,216 | 4,487,675 | (434,541) | |||||||||||
| 8 | LME Nickel Futures | January 8, 2013 | 870,726 | 816,089 | (54,637) | |||||||||||
| 14 | LME Nickel Futures | January 9, 2013 | 1,524,818 | 1,428,220 | (96,598) | |||||||||||
| 17 | LME Nickel Futures | January 10, 2013 | 1,820,789 | 1,734,344 | (86,445) | |||||||||||
| 3 | LME Nickel Futures | January 11, 2013 | 317,208 | 306,075 | (11,133) | |||||||||||
| 44 | LME Nickel Futures | January 25, 2013 | 4,274,716 | 4,491,944 | 217,228 | |||||||||||
| 35 | LME Nickel Futures | February 1, 2013 | 3,433,568 | 3,574,271 | 140,703 | |||||||||||
| 6 | LME Nickel Futures | February 5, 2013 | 568,702 | 612,844 | 44,142 | |||||||||||
| 4 | LME Nickel Futures | February 6, 2013 | 385,590 | 408,580 | 22,990 | |||||||||||
| 10 | LME Nickel Futures | February 7, 2013 | 976,816 | 1,021,498 | 44,682 | |||||||||||
| 16 | LME Nickel Futures | February 8, 2013 | 1,539,866 | 1,634,471 | 94,605 | |||||||||||
| 10 | LME Nickel Futures | February 13, 2013 | 957,616 | 1,021,776 | 64,160 | |||||||||||
| 22 | LME Nickel Futures | February 14, 2013 | 2,144,144 | 2,248,009 | 103,865 | |||||||||||
| 32 | LME Nickel Futures | February 15, 2013 | 3,060,327 | 3,269,979 | 209,652 | |||||||||||
| 35 | LME Nickel Futures | February 19, 2013 | 3,389,456 | 3,577,188 | 187,732 | |||||||||||
| The accompanying notes are an integral part of these financial statements. | (Continued) |
| AQR Funds | Annual Report | December 2012 | 27 | |||||||||||||
Table of Contents
| Consolidated Schedule of Investments | December 31, 2012 |
| AQR MANAGED FUTURES STRATEGY FUND |
| NUMBER OF CONTRACTS | DESCRIPTION | EXPIRATION DATE | VALUE AT TRADE DATE | VALUE AT DECEMBER 31, 2012 | UNREALIZED APPRECIATION (DEPRECIATION) | |||||||||||
| Long Contracts: (continued) | ||||||||||||||||
| 15 | LME Nickel Futures | February 28, 2013 | $1,536,901 | $1,533,716 | $(3,185) | |||||||||||
| 60 | LME Nickel Futures | March 4, 2013 | 6,303,583 | 6,135,995 | (167,588) | |||||||||||
| 29 | LME Nickel Futures | March 5, 2013 | 3,055,510 | 2,965,867 | (89,643) | |||||||||||
| 28 | LME Nickel Futures | March 6, 2013 | 2,947,612 | 2,863,728 | (83,884) | |||||||||||
| 117 | LME Nickel Futures | March 20, 2013 | 12,325,347 | 11,974,014 | (351,333) | |||||||||||
| 75 | LME Zinc Futures | January 4, 2013 | 3,896,876 | 3,843,525 | (53,351) | |||||||||||
| 6 | LME Zinc Futures | January 8, 2013 | 307,037 | 307,713 | 676 | |||||||||||
| 30 | LME Zinc Futures | January 9, 2013 | 1,533,317 | 1,538,858 | 5,541 | |||||||||||
| 36 | LME Zinc Futures | January 15, 2013 | 1,728,283 | 1,848,708 | 120,425 | |||||||||||
| 60 | LME Zinc Futures | January 16, 2013 | 2,874,846 | 3,081,750 | 206,904 | |||||||||||
| 85 | LME Zinc Futures | January 17, 2013 | 4,048,261 | 4,366,641 | 318,380 | |||||||||||
| 105 | LME Zinc Futures | January 18, 2013 | 4,999,218 | 5,395,084 | 395,866 | |||||||||||
| 64 | LME Zinc Futures | January 22, 2013 | 3,013,702 | 3,290,896 | 277,194 | |||||||||||
| 57 | LME Zinc Futures | January 23, 2013 | 2,630,285 | 2,931,510 | 301,225 | |||||||||||
| 90 | LME Zinc Futures | January 24, 2013 | 4,167,144 | 4,629,578 | 462,434 | |||||||||||
| 102 | LME Zinc Futures | January 25, 2013 | 4,668,151 | 5,247,824 | 579,673 | |||||||||||
| 32 | LME Zinc Futures | February 1, 2013 | 1,516,001 | 1,648,536 | 132,535 | |||||||||||
| 29 | LME Zinc Futures | February 5, 2013 | 1,336,221 | 1,495,102 | 158,881 | |||||||||||
| 139 | LME Zinc Futures | February 15, 2013 | 6,757,078 | 7,179,593 | 422,515 | |||||||||||
| 52 | LME Zinc Futures | February 19, 2013 | 2,515,746 | 2,687,893 | 172,147 | |||||||||||
| 59 | LME Zinc Futures | February 20, 2013 | 2,867,010 | 3,050,300 | 183,290 | |||||||||||
| 52 | LME Zinc Futures | February 21, 2013 | 2,496,620 | 2,688,907 | 192,287 | |||||||||||
| 81 | LME Zinc Futures | February 27, 2013 | 4,044,559 | 4,193,269 | 148,710 | |||||||||||
| 177 | LME Zinc Futures | February 28, 2013 | 8,876,720 | 9,164,795 | 288,075 | |||||||||||
| 81 | LME Zinc Futures | March 4, 2013 | 4,109,525 | 4,197,237 | 87,712 | |||||||||||
| 470 | LME Zinc Futures | March 18, 2013 | 23,884,502 | 24,428,250 | 543,748 | |||||||||||
| 231 | Soybean Futures | March 14, 2013 | 17,127,080 | 16,279,725 | (847,355) | |||||||||||
| 816 | Amsterdam Index Futures | January 18, 2013 | 74,064,635 | 73,909,176 | (155,459) | |||||||||||
| 1,560 | CAC40 10 Euro Futures | January 18, 2013 | 75,131,184 | 74,993,224 | (137,960) | |||||||||||
| 289 | DAX Index Futures | March 15, 2013 | 72,742,773 | 72,654,883 | (87,890) | |||||||||||
| 745 | DJIA Mini E-CBOT Futures | March 15, 2013 | 49,200,670 | 48,525,575 | (675,095) | |||||||||||
| 527 | E-Mini Russell 2000 Futures | March 15, 2013 | 44,058,956 | 44,615,820 | 556,864 | |||||||||||
| 857 | FTSE 100 Index Futures | March 15, 2013 | 82,115,499 | 81,413,145 | (702,354) | |||||||||||
| 2,110 | FTSE/JSE Top 40 Index Futures | March 20, 2013 | 86,320,875 | 87,344,418 | 1,023,543 | |||||||||||
| 392 | FTSE/MIB Index Futures | March 15, 2013 | 41,847,181 | 42,180,111 | 332,930 | |||||||||||
| 553 | Hang Seng Index Futures | January 30, 2013 | 80,620,217 | 80,886,109 | 265,892 | |||||||||||
| 514 | H-SHARES Index Futures | January 30, 2013 | 37,589,525 | 37,968,829 | 379,304 | |||||||||||
| 307 | IBEX 35 Index Futures | January 18, 2013 | 32,574,408 | 32,705,681 | 131,273 | |||||||||||
| 268 | KOSPI Index 200 Futures | March 14, 2013 | 32,805,891 | 33,306,774 | 500,883 | |||||||||||
| 1,173 | MSCI Singapore Index Futures | January 30, 2013 | 69,181,865 | 69,157,595 | (24,270) | |||||||||||
| 1,837 | MSCI Taiwan Stock Index Futures | January 30, 2013 | 49,899,697 | 50,517,500 | 617,803 | |||||||||||
| 268 | NASDAQ 100 E-Mini Futures | March 15, 2013 | 14,283,773 | 14,232,140 | (51,633) | |||||||||||
| 695 | S&P 500 E-Mini Futures | March 15, 2013 | 49,686,891 | 49,348,475 | (338,416) | |||||||||||
| 634 | S&P MID 400 E-Mini Futures | March 15, 2013 | 64,215,993 | 64,547,540 | 331,547 | |||||||||||
| 329 | S&P/Toronto Stock Exchange 60 Index Futures | March 14, 2013 | 46,457,807 | 47,059,535 | 601,728 | |||||||||||
| 4,723 | SGX S&P CNX Nifty Index Futures | January 31, 2013 | 56,144,476 | 56,232,038 | 87,562 | |||||||||||
| 1,020 | SPI 200 Index Futures | March 21, 2013 | 121,251,882 | 122,233,873 | 981,991 | |||||||||||
| 814 | TOPIX Index Futures | March 7, 2013 | 74,313,132 | 80,944,307 | 6,631,175 | |||||||||||
| 265 | 10-Year Japanese Government Bond Futures | March 11, 2013 | 442,610,994 | 439,398,049 | (3,212,945) | |||||||||||
| 1,982 | 3-Month Euro Euribor Futures | June 17, 2013 | 652,902,734 | 652,923,369 | 20,635 | |||||||||||
| 1,665 | 3-Month Euro Euribor Futures | September 16, 2013 | 548,393,636 | 548,357,804 | (35,832) | |||||||||||
| 1,468 | 3-Month Euro Euribor Futures | December 16, 2013 | 483,355,113 | 483,307,484 | (47,629) | |||||||||||
| 1,463 | 3-Month Euro Euribor Futures | March 17, 2014 | 481,482,018 | 481,516,509 | 34,491 | |||||||||||
| 1,481 | 3-Month Euro Euribor Futures | June 16, 2014 | 487,121,919 | 487,245,356 | 123,437 | |||||||||||
| The accompanying notes are an integral part of these financial statements. | (Continued) |
| 28 | AQR Funds | Annual Report | December 2012 | |||||||||||||
Table of Contents
| Consolidated Schedule of Investments | December 31, 2012 |
| AQR MANAGED FUTURES STRATEGY FUND |
| NUMBER OF CONTRACTS | DESCRIPTION | EXPIRATION DATE | VALUE AT TRADE DATE | VALUE AT DECEMBER 31, 2012 | UNREALIZED APPRECIATION (DEPRECIATION) | |||||||||||
| Long Contracts: (continued) | ||||||||||||||||
| 1,500 | 3-Month Euro Euribor Futures | September 15, 2014 | $493,096,368 | $493,273,567 | $177,199 | |||||||||||
| 1,512 | 3-Month Euro Euribor Futures | December 15, 2014 | 496,641,149 | 496,920,391 | 279,242 | |||||||||||
| 1,814 | 90-Day EURODollar Futures | June 17, 2013 | 452,021,551 | 452,026,125 | 4,574 | |||||||||||
| 1,256 | 90-Day EURODollar Futures | September 16, 2013 | 312,927,205 | 312,916,700 | (10,505) | |||||||||||
| 1,000 | 90-Day EURODollar Futures | December 16, 2013 | 249,073,115 | 249,062,500 | (10,615) | |||||||||||
| 780 | 90-Day EURODollar Futures | March 17, 2014 | 194,226,950 | 194,210,250 | (16,700) | |||||||||||
| 662 | 90-Day EURODollar Futures | June 16, 2014 | 164,782,160 | 164,755,250 | (26,910) | |||||||||||
| 704 | 90-Day EURODollar Futures | September 15, 2014 | 175,162,666 | 175,120,000 | (42,666) | |||||||||||
| 815 | 90-Day EURODollar Futures | December 15, 2014 | 202,714,184 | 202,609,000 | (105,184) | |||||||||||
| 1,304 | 90-Day GBP LIBOR Futures | December 18, 2013 | 263,450,856 | 263,249,595 | (201,261) | |||||||||||
| 1,589 | 90-Day Sterling Futures | June 19, 2013 | 321,071,689 | 320,881,771 | (189,918) | |||||||||||
| 1,262 | 90-Day Sterling Futures | September 18, 2013 | 254,988,207 | 254,821,949 | (166,258) | |||||||||||
| 1,419 | 90-Day Sterling Futures | March 19, 2014 | 286,623,414 | 286,407,998 | (215,416) | |||||||||||
| 1,504 | 90-Day Sterling Futures | June 18, 2014 | 303,674,086 | 303,442,061 | (232,025) | |||||||||||
| 1,512 | 90-Day Sterling Futures | September 17, 2014 | 305,144,401 | 304,902,605 | (241,796) | |||||||||||
| 1,591 | 90-Day Sterling Futures | December 17, 2014 | 320,682,526 | 320,671,831 | (10,695) | |||||||||||
| 850 | Canadian 10-Year Bond Futures | March 19, 2013 | 116,025,242 | 115,822,861 | (202,381) | |||||||||||
| 446 | Euro – Bobl Futures | March 7, 2013 | 74,984,844 | 75,247,340 | 262,496 | |||||||||||
| 929 | Euro – Bund Futures | March 7, 2013 | 177,188,202 | 178,588,655 | 1,400,453 | |||||||||||
| 999 | Euro – SCHATZ Futures | March 7, 2013 | 146,179,270 | 146,176,735 | (2,535) | |||||||||||
| 39 | Euro CHF 3-Month LIFFE Futures | September 16, 2013 | 10,677,335 | 10,667,277 | (10,058) | |||||||||||
| 517 | Euro-Buxl 30-Year Bond Futures | March 7, 2013 | 91,477,456 | 93,449,794 | 1,972,338 | |||||||||||
| 111 | Long Gilt Futures | March 26, 2013 | 21,583,641 | 21,442,934 | (140,707) | |||||||||||
| 392 | U.S. Long Bond Futures | March 19, 2013 | 58,676,933 | 57,820,000 | (856,933) | |||||||||||
| 749 | U.S. Treasury 10-Year Note Futures | March 19, 2013 | 99,994,483 | 99,453,156 | (541,327) | |||||||||||
|
|
|
|
|
| |||||||||||
| 10,332,968,307 | 10,347,588,617 | 14,620,310 | ||||||||||||||
|
|
|
|
|
| |||||||||||
| Short Contracts: | ||||||||||||||||
| 883 | Coffee ‘C’ Futures | March 18, 2013 | (52,160,859) | (47,615,775) | 4,545,084 | |||||||||||
| 1,176 | Cotton No. 2 Futures | March 6, 2013 | (41,946,805) | (44,182,320) | (2,235,515) | |||||||||||
| 602 | Crude Oil Financial Futures | February 18, 2013 | (52,704,650) | (55,275,640) | (2,570,990) | |||||||||||
| 10 | Globex Brent FCL Futures | February 15, 2013 | (1,065,300) | (1,111,100) | (45,800) | |||||||||||
| 200 | Globex Heat Oil Futures | January 30, 2013 | (25,047,460) | (25,467,120) | (419,660) | |||||||||||
| 540 | Gold 100 OZ Futures | February 26, 2013 | (91,474,050) | (90,493,200) | 980,850 | |||||||||||
| 122 | ICE Euro Gasoil Futures | January 9, 2013 | (11,206,525) | (11,309,400) | (102,875) | |||||||||||
| 215 | LME Aluminum Futures | January 11, 2013 | (10,795,559) | (10,988,542) | (192,983) | |||||||||||
| 95 | LME Aluminum Futures | January 15, 2013 | (4,705,251) | (4,859,440) | (154,189) | |||||||||||
| 114 | LME Aluminum Futures | January 16, 2013 | (5,607,146) | (5,832,525) | (225,379) | |||||||||||
| 37 | LME Aluminum Futures | January 17, 2013 | (1,814,679) | (1,893,392) | (78,713) | |||||||||||
| 13 | LME Aluminum Futures | January 18, 2013 | (647,640) | (665,382) | (17,742) | |||||||||||
| 137 | LME Aluminum Futures | January 25, 2013 | (6,634,458) | (7,022,037) | (387,579) | |||||||||||
| 154 | LME Aluminum Futures | February 1, 2013 | (7,438,865) | (7,904,550) | (465,685) | |||||||||||
| 103 | LME Aluminum Futures | February 14, 2013 | (5,152,410) | (5,300,663) | (148,253) | |||||||||||
| 8 | LME Aluminum Futures | February 15, 2013 | (392,837) | (411,786) | (18,949) | |||||||||||
| 184 | LME Aluminum Futures | February 27, 2013 | (9,283,656) | (9,492,974) | (209,318) | |||||||||||
| 227 | LME Aluminum Futures | February 28, 2013 | (11,488,687) | (11,713,597) | (224,910) | |||||||||||
| 217 | LME Aluminum Futures | March 4, 2013 | (11,356,865) | (11,205,934) | 150,931 | |||||||||||
| 26 | LME Aluminum Futures | March 5, 2013 | (1,363,802) | (1,342,893) | 20,909 | |||||||||||
| 433 | LME Aluminum Futures | March 20, 2013 | (22,592,848) | (22,426,694) | 166,154 | |||||||||||
| 136 | LME Aluminum Futures | March 21, 2013 | (7,010,414) | (7,044,494) | (34,080) | |||||||||||
| 23 | LME Copper Futures | January 4, 2013 | (4,787,188) | (4,546,766) | 240,422 | |||||||||||
| 3 | LME Copper Futures | January 8, 2013 | (611,058) | (593,184) | 17,874 | |||||||||||
| 4 | LME Copper Futures | January 9, 2013 | (820,494) | (790,954) | 29,540 | |||||||||||
| 3 | LME Copper Futures | January 11, 2013 | (611,995) | (593,278) | 18,717 | |||||||||||
| 13 | LME Copper Futures | February 1, 2013 | (2,546,362) | (2,573,113) | (26,751) | |||||||||||
| 4 | LME Copper Futures | February 5, 2013 | (761,213) | (791,864) | (30,651) | |||||||||||
| The accompanying notes are an integral part of these financial statements. | (Continued) |
| AQR Funds | Annual Report | December 2012 | 29 | |||||||||||||
Table of Contents
| Consolidated Schedule of Investments | December 31, 2012 |
| AQR MANAGED FUTURES STRATEGY FUND |
| NUMBER OF CONTRACTS | DESCRIPTION | EXPIRATION DATE | VALUE AT TRADE DATE | VALUE AT DECEMBER 31, 2012 | UNREALIZED APPRECIATION (DEPRECIATION) | |||||||||||
| Short Contracts: (continued) | ||||||||||||||||
| 11 | LME Copper Futures | February 6, 2013 | $(2,109,939) | $(2,177,719) | $(67,780) | |||||||||||
| 9 | LME Copper Futures | February 7, 2013 | (1,746,021) | (1,781,847) | (35,826) | |||||||||||
| 23 | LME Copper Futures | February 8, 2013 | (4,367,010) | (4,553,804) | (186,794) | |||||||||||
| 5 | LME Copper Futures | February 12, 2013 | (949,199) | (990,128) | (40,929) | |||||||||||
| 16 | LME Copper Futures | February 13, 2013 | (3,029,154) | (3,168,544) | (139,390) | |||||||||||
| 5 | LME Copper Futures | February 14, 2013 | (960,876) | (990,213) | (29,337) | |||||||||||
| 8 | LME Copper Futures | February 15, 2013 | (1,528,147) | (1,584,410) | (56,263) | |||||||||||
| 6 | LME Copper Futures | February 19, 2013 | (1,152,981) | (1,188,512) | (35,531) | |||||||||||
| 3 | LME Copper Futures | February 20, 2013 | (581,268) | (594,282) | (13,014) | |||||||||||
| 44 | LME Copper Futures | March 4, 2013 | (8,812,852) | (8,718,875) | 93,977 | |||||||||||
| 16 | LME Copper Futures | March 5, 2013 | (3,214,774) | (3,170,600) | 44,174 | |||||||||||
| 19 | LME Copper Futures | March 6, 2013 | (3,824,595) | (3,765,207) | 59,388 | |||||||||||
| 43 | LME Copper Futures | March 20, 2013 | (8,370,419) | (8,525,019) | (154,600) | |||||||||||
| 43 | LME Copper Futures | March 21, 2013 | (8,389,491) | (8,525,115) | (135,624) | |||||||||||
| 44 | LME Nickel Futures | January 4, 2013 | (4,926,038) | (4,487,676) | 438,362 | |||||||||||
| 8 | LME Nickel Futures | January 8, 2013 | (865,907) | (816,089) | 49,818 | |||||||||||
| 14 | LME Nickel Futures | January 9, 2013 | (1,516,178) | (1,428,220) | 87,958 | |||||||||||
| 17 | LME Nickel Futures | January 10, 2013 | (1,810,473) | (1,734,345) | 76,128 | |||||||||||
| 3 | LME Nickel Futures | January 11, 2013 | (313,357) | (306,074) | 7,283 | |||||||||||
| 44 | LME Nickel Futures | January 25, 2013 | (4,237,438) | (4,491,944) | (254,506) | |||||||||||
| 35 | LME Nickel Futures | February 1, 2013 | (3,435,758) | (3,574,272) | (138,514) | |||||||||||
| 6 | LME Nickel Futures | February 5, 2013 | (569,652) | (612,844) | (43,192) | |||||||||||
| 4 | LME Nickel Futures | February 6, 2013 | (383,278) | (408,581) | (25,303) | |||||||||||
| 10 | LME Nickel Futures | February 7, 2013 | (979,819) | (1,021,498) | (41,679) | |||||||||||
| 16 | LME Nickel Futures | February 8, 2013 | (1,527,045) | (1,634,471) | (107,426) | |||||||||||
| 10 | LME Nickel Futures | February 13, 2013 | (952,697) | (1,021,776) | (69,079) | |||||||||||
| 22 | LME Nickel Futures | February 14, 2013 | (2,129,009) | (2,248,009) | (119,000) | |||||||||||
| 32 | LME Nickel Futures | February 15, 2013 | (3,069,533) | (3,269,979) | (200,446) | |||||||||||
| 35 | LME Nickel Futures | February 19, 2013 | (3,379,549) | (3,577,189) | (197,640) | |||||||||||
| 15 | LME Nickel Futures | February 28, 2013 | (1,552,476) | (1,533,716) | 18,760 | |||||||||||
| 60 | LME Nickel Futures | March 4, 2013 | (6,302,829) | (6,135,995) | 166,834 | |||||||||||
| 29 | LME Nickel Futures | March 5, 2013 | (3,053,654) | (2,965,867) | 87,787 | |||||||||||
| 28 | LME Nickel Futures | March 6, 2013 | (2,958,603) | (2,863,728) | 94,875 | |||||||||||
| 113 | LME Nickel Futures | March 20, 2013 | (11,832,029) | (11,564,646) | 267,383 | |||||||||||
| 75 | LME Zinc Futures | January 4, 2013 | (3,901,530) | (3,843,525) | 58,005 | |||||||||||
| 6 | LME Zinc Futures | January 8, 2013 | (305,990) | (307,713) | (1,723) | |||||||||||
| 30 | LME Zinc Futures | January 9, 2013 | (1,526,952) | (1,538,857) | (11,905) | |||||||||||
| 36 | LME Zinc Futures | January 15, 2013 | (1,734,726) | (1,848,708) | (113,982) | |||||||||||
| 60 | LME Zinc Futures | January 16, 2013 | (2,885,505) | (3,081,750) | (196,245) | |||||||||||
| 85 | LME Zinc Futures | January 17, 2013 | (4,050,148) | (4,366,641) | (316,493) | |||||||||||
| 105 | LME Zinc Futures | January 18, 2013 | (4,997,850) | (5,395,084) | (397,234) | |||||||||||
| 64 | LME Zinc Futures | January 22, 2013 | (3,008,700) | (3,290,895) | (282,195) | |||||||||||
| 57 | LME Zinc Futures | January 23, 2013 | (2,632,833) | (2,931,510) | (298,677) | |||||||||||
| 90 | LME Zinc Futures | January 24, 2013 | (4,180,350) | (4,629,577) | (449,227) | |||||||||||
| 102 | LME Zinc Futures | January 25, 2013 | (4,670,528) | (5,247,824) | (577,296) | |||||||||||
| 32 | LME Zinc Futures | February 1, 2013 | (1,510,938) | (1,648,536) | (137,598) | |||||||||||
| 29 | LME Zinc Futures | February 5, 2013 | (1,339,129) | (1,495,102) | (155,973) | |||||||||||
| 139 | LME Zinc Futures | February 15, 2013 | (6,741,865) | (7,179,593) | (437,728) | |||||||||||
| 52 | LME Zinc Futures | February 19, 2013 | (2,512,817) | (2,687,893) | (175,076) | |||||||||||
| 59 | LME Zinc Futures | February 20, 2013 | (2,856,981) | (3,050,300) | (193,319) | |||||||||||
| 52 | LME Zinc Futures | February 21, 2013 | (2,490,392) | (2,688,907) | (198,515) | |||||||||||
| 81 | LME Zinc Futures | February 27, 2013 | (4,046,833) | (4,193,269) | (146,436) | |||||||||||
| 177 | LME Zinc Futures | February 28, 2013 | (8,880,467) | (9,164,795) | (284,328) | |||||||||||
| 81 | LME Zinc Futures | March 4, 2013 | (4,103,304) | (4,197,238) | (93,934) | |||||||||||
| 2,590 | Natural Gas Swap Futures | January 30, 2013 | (21,853,837) | (21,697,724) | 156,113 | |||||||||||
| 204 | Silver Futures | March 26, 2013 | (32,093,499) | (30,831,540) | 1,261,959 | |||||||||||
| The accompanying notes are an integral part of these financial statements. | (Continued) |
| 30 | AQR Funds | Annual Report | December 2012 | |||||||||||||
Table of Contents
| Consolidated Schedule of Investments | December 31, 2012 |
| AQR MANAGED FUTURES STRATEGY FUND |
| NUMBER OF CONTRACTS | DESCRIPTION | EXPIRATION DATE | VALUE AT TRADE DATE | VALUE AT DECEMBER 31, 2012 | UNREALIZED APPRECIATION (DEPRECIATION) | |||||||||||
| Short Contracts: (continued) | ||||||||||||||||
| 355 | Soybean Meal Futures | March 14, 2013 | $(16,086,089) | $(14,888,700) | $1,197,389 | |||||||||||
| 1,864 | Soybean Oil Futures | March 14, 2013 | (55,740,218) | (55,584,480) | 155,738 | |||||||||||
| 3,306 | Sugar #11 (World Markets) Futures | March 28, 2013 | (74,662,273) | (72,240,067) | 2,422,206 | |||||||||||
| 1,317 | Australia 3-Year Bond Futures | March 15, 2013 | (149,328,007) | (149,810,250) | (482,243) | |||||||||||
| 415 | Canadian 3-Month Bank Acceptance Futures | June 17, 2013 | (102,913,060) | (102,905,147) | 7,913 | |||||||||||
| 243 | Canadian 3-Month Bank Acceptance Futures | September 16, 2013 | (60,242,643) | (60,230,874) | 11,769 | |||||||||||
| 39 | Euro CHF 3-Month LIFFE Futures | June 17, 2013 | (10,668,623) | (10,665,145) | 3,478 | |||||||||||
|
|
|
|
|
| |||||||||||
| (1,088,827,211) | (1,090,521,455) | (1,694,244) | ||||||||||||||
|
|
|
|
|
| |||||||||||
| $9,244,141,096 | $9,257,067,162 | $12,926,066 | ||||||||||||||
|
|
|
|
|
| |||||||||||
Cash held as collateral with broker for futures contracts was $163,305,389 at December 31, 2012.
Forward foreign currency exchange contracts outstanding as of December 31, 2012:
| PURCHASE CONTRACTS | COUNTERPARTY | CURRENCY | CURRENCY AMOUNT PURCHASED | VALUE AT SETTLEMENT DATE | VALUE AT DECEMBER 31, 2012 | UNREALIZED APPRECIATION (DEPRECIATION) | ||||||||||||||
| Australian Dollar, Expiring 03/20/13 | The Royal Bank of Scotland | AUD | 109,770,000 | $113,610,912 | $113,355,162 | $(255,750) | ||||||||||||||
| Canadian Dollar, Expiring 03/20/13 | The Royal Bank of Scotland | CAD | 235,681,000 | 237,288,102 | 236,554,544 | (733,558) | ||||||||||||||
| Chilean Peso, Expiring 03/20/13* | The Royal Bank of Scotland | CLP | 5,552,000,000 | 11,394,561 | 11,479,382 | 84,821 | ||||||||||||||
| Columbian Peso, Expiring 03/20/13* | The Royal Bank of Scotland | COP | 9,970,000,000 | 5,442,882 | 5,603,339 | 160,457 | ||||||||||||||
| Czech Republic Koruna, Expiring 03/20/13 | The Royal Bank of Scotland | CZK | 462,000,000 | 23,971,197 | 24,322,319 | 351,122 | ||||||||||||||
| Euro, Expiring 03/20/13 | The Royal Bank of Scotland | EUR | 309,427,000 | 407,148,953 | 408,706,036 | 1,557,083 | ||||||||||||||
| British Pound, Expiring 03/20/13 | The Royal Bank of Scotland | GBP | 190,940,999 | 307,504,191 | 310,099,386 | 2,595,195 | ||||||||||||||
| Hungarian Forint, Expiring 03/20/13 | The Royal Bank of Scotland | HUF | 4,926,000,000 | 22,345,722 | 22,130,360 | (215,362) | ||||||||||||||
| Israeli Shekel, Expiring 03/20/13 | The Royal Bank of Scotland | ILS | 70,000,000 | 18,388,503 | 18,696,632 | 308,129 | ||||||||||||||
| Indian Rupee, Expiring 03/20/13* | The Royal Bank of Scotland | INR | 1,772,400,000 | 32,004,591 | 31,888,815 | (115,776) | ||||||||||||||
| Japanese Yen, Expiring 03/21/13 | The Royal Bank of Scotland | JPY | 2,953,673,000 | 35,896,371 | 34,114,578 | (1,781,793) | ||||||||||||||
| Korean Won, Expiring 03/20/13* | The Royal Bank of Scotland | KRW | 150,533,720,000 | 138,612,453 | 139,981,758 | 1,369,305 | ||||||||||||||
| Mexican Peso, Expiring 03/20/13 | The Royal Bank of Scotland | MXN | 956,000,000 | 73,520,834 | 73,438,720 | (82,114) | ||||||||||||||
| Malaysian Ringgit, Expiring 03/20/13* | The Royal Bank of Scotland | MYR | 114,690,000 | 37,440,007 | 37,306,901 | (133,106) | ||||||||||||||
| Norwegian Krone, Expiring 03/20/13 | The Royal Bank of Scotland | NOK | 2,233,203,000 | 394,564,106 | 400,696,977 | 6,132,871 | ||||||||||||||
| New Zealand Dollar, Expiring 03/20/13 | The Royal Bank of Scotland | NZD | 659,426,000 | 543,238,485 | 542,293,041 | (945,444) | ||||||||||||||
| The accompanying notes are an integral part of these financial statements. | (Continued) |
| AQR Funds | Annual Report | December 2012 | 31 | |||||||||||||
Table of Contents
| Consolidated Schedule of Investments | December 31, 2012 |
| AQR MANAGED FUTURES STRATEGY FUND |
| PURCHASE CONTRACTS | COUNTERPARTY | CURRENCY | CURRENCY AMOUNT PURCHASED | VALUE AT SETTLEMENT DATE | VALUE AT DECEMBER 31, 2012 | UNREALIZED APPRECIATION (DEPRECIATION) | ||||||||||||||
| Philippine Peso, Expiring 03/20/13* | The Royal Bank of Scotland | PHP | 2,074,500,000 | $50,833,129 | $50,536,878 | $(296,251) | ||||||||||||||
| Poland Zloty, Expiring 03/20/13 | The Royal Bank of Scotland | PLN | 232,510,000 | 73,163,701 | 74,552,231 | 1,388,530 | ||||||||||||||
| Russian Ruble, Expiring 03/20/13* | The Royal Bank of Scotland | RUB | 2,948,200,000 | 94,305,977 | 95,289,695 | 983,718 | ||||||||||||||
| Swedish Krona, Expiring 03/20/13 | The Royal Bank of Scotland | SEK | 900,411,000 | 135,946,313 | 138,217,827 | 2,271,514 | ||||||||||||||
| Singapore Dollar, Expiring 03/20/13 | The Royal Bank of Scotland | SGD | 163,090,000 | 133,683,423 | 133,500,868 | (182,555) | ||||||||||||||
| Turkish Lira, Expiring 03/20/13 | The Royal Bank of Scotland | TRY | 134,610,000 | 74,458,275 | 74,706,166 | 247,891 | ||||||||||||||
| Taiwanese Dollar, Expiring 03/20/13* | The Royal Bank of Scotland | TWD | 4,366,300,000 | 151,062,397 | 150,410,102 | (652,295) | ||||||||||||||
| South African Rand, Expiring 03/20/13 | The Royal Bank of Scotland | ZAR | 78,000,000 | 8,922,662 | 9,105,096 | 182,434 | ||||||||||||||
|
|
|
|
|
| |||||||||||||||
| 3,124,747,747 | 3,136,986,813 | 12,239,066 | ||||||||||||||||||
|
|
|
|
|
| |||||||||||||||
| SALES CONTRACTS | COUNTERPARTY | CURRENCY | CURRENCY AMOUNT SOLD | VALUE AT SETTLEMENT DATE | VALUE AT DECEMBER 31, 2012 | UNREALIZED APPRECIATION (DEPRECIATION) | ||||||||||||||
| Australian Dollar, Expiring 03/20/13 | The Royal Bank of Scotland | AUD | (60,082,000) | $(62,684,761) | $(62,044,319) | $640,442 | ||||||||||||||
| Brazilian Real, Expiring 03/20/13* | The Royal Bank of Scotland | BRL | (79,060,000) | (36,980,214) | (38,240,438) | (1,260,224) | ||||||||||||||
| Canadian Dollar, Expiring 03/20/13 | The Royal Bank of Scotland | CAD | (16,602,000) | (16,705,732) | (16,663,535) | 42,197 | ||||||||||||||
| Czech Republic Koruna, Expiring 03/20/13 | The Royal Bank of Scotland | CZK | (321,832,000) | (16,602,176) | (16,943,074) | (340,898) | ||||||||||||||
| Euro, Expiring 03/20/13 | The Royal Bank of Scotland | EUR | (379,516,026) | (493,038,752) | (501,282,986) | (8,244,234) | ||||||||||||||
| British Pound, Expiring 03/20/13 | The Royal Bank of Scotland | GBP | (16,106,000) | (25,852,498) | (26,157,089) | (304,591) | ||||||||||||||
| Indonesian Rupiah, Expiring 03/20/13* | The Royal Bank of Scotland | IDR | (207,100,000,000) | (21,447,805) | (21,294,436) | 153,369 | ||||||||||||||
| Israeli Shekel, Expiring 03/20/13 | The Royal Bank of Scotland | ILS | (20,390,000) | (5,337,137) | (5,446,062) | (108,925) | ||||||||||||||
| Indian Rupee, Expiring 03/20/13* | The Royal Bank of Scotland | INR | (2,430,000,000) | (43,520,540) | (43,720,278) | (199,738) | ||||||||||||||
| Japanese Yen, Expiring 03/21/13 | The Royal Bank of Scotland | JPY | (104,424,495,000) | (1,267,237,013) | (1,206,090,700) | 61,146,313 | ||||||||||||||
| Korean Won, Expiring 03/20/13* | The Royal Bank of Scotland | KRW | (10,400,000,000) | (9,549,519) | (9,670,991) | (121,472) | ||||||||||||||
| Malaysian Ringgit, Expiring 03/20/13* | The Royal Bank of Scotland | MYR | (1,000,000) | (325,941) | (325,285) | 656 | ||||||||||||||
| Norwegian Krone, Expiring 03/20/13 | The Royal Bank of Scotland | NOK | (123,140,000) | (21,684,130) | (22,094,644) | (410,514) | ||||||||||||||
| New Zealand Dollar, Expiring 03/20/13 | The Royal Bank of Scotland | NZD | (76,432,000) | (62,936,262) | (62,855,486) | 80,776 | ||||||||||||||
| Russian Ruble, Expiring 03/20/13* | The Royal Bank of Scotland | RUB | (200,000,000) | (6,410,047) | (6,464,263) | (54,216) | ||||||||||||||
| Singapore Dollar, Expiring 03/20/13 | The Royal Bank of Scotland | SGD | (16,700,000) | (13,674,420) | (13,670,148) | 4,272 | ||||||||||||||
| Turkish Lira, Expiring 03/20/13 | The Royal Bank of Scotland | TRY | (2,500,000) | (1,383,462) | (1,387,456) | (3,994) | ||||||||||||||
| The accompanying notes are an integral part of these financial statements. | (Continued) |
| 32 | AQR Funds | Annual Report | December 2012 | |||||||||||||
Table of Contents
| Consolidated Schedule of Investments | December 31, 2012 |
| AQR MANAGED FUTURES STRATEGY FUND |
| SALES CONTRACTS | COUNTERPARTY | CURRENCY | CURRENCY AMOUNT SOLD | VALUE AT SETTLEMENT DATE | VALUE AT DECEMBER 31, 2012 | UNREALIZED APPRECIATION (DEPRECIATION) | ||||||||||||||
| Taiwanese Dollar, Expiring 03/20/13* | The Royal Bank of Scotland | TWD | (240,000,000) | $(8,302,210) | $(8,267,509) | $34,701 | ||||||||||||||
| South African Rand, Expiring 03/20/13 | The Royal Bank of Scotland | ZAR | (404,600,000) | (45,784,690) | (47,229,768) | (1,445,078) | ||||||||||||||
|
|
|
|
|
| |||||||||||||||
| (2,159,457,309) | (2,109,848,467) | 49,608,842 | ||||||||||||||||||
|
|
|
|
|
| |||||||||||||||
| $965,290,438 | $1,027,138,346 | $61,847,908 | ||||||||||||||||||
|
|
|
|
|
| |||||||||||||||
Money Market Fund is pledged as collateral for total return swap and forward foreign currency exchange contracts in the amount of $9,304. Additional cash held as collateral for the broker for forward currency exchange contracts was $23,450,000 at December 31, 2012.
| * | Non deliverable forward. See Note 3 in the Notes to Financial Statements. |
AUD - Australian Dollar
BRL - Brazilian Real
CAD - Canadian Dollar
CLP - Chilean Peso
COP - Columbian Peso
CZK - Czech Republic Koruna
EUR - Euro
GBP - British Pound
HUF - Hungarian Forint
IDR - Indonesian Rupiah
ILS - Israeli Shekel
INR - Indian Rupee
JPY - Japanese Yen
KRW - Korean Won
MXN - Mexican Peso
MYR - Malaysian Ringgit
NOK - Norwegian Krone
NZD - New Zealand Dollar
PHP - Philippine Peso
PLN - Poland Zloty
RUB - Russian Ruble
SEK - Swedish Krona
SGD - Singapore Dollar
TRY - Turkish Lira
TWD - Taiwan Dollar
ZAR - South African Rand
| The accompanying notes are an integral part of these financial statements. |
| AQR Funds | Annual Report | December 2012 | 33 | |||||||||||||
Table of Contents
| Consolidated Schedule of Investments | December 31, 2012 |
| MONEY MARKET FUNDS - 96.0% | SHARES | VALUE (Note 3) | ||||||
J.P. Morgan U.S. Treasury Plus Money Market Fund – Institutional Shares, 0.000% (a)(b) | 62,932,482 | $ | 62,932,482 | |||||
|
| |||||||
| PRINCIPAL AMOUNT (000’S) | ||||||||
| SHORT-TERM INVESTMENTS - 4.0% | ||||||||
U.S. Treasury Bill, 0.000%, 6/20/2013 (c) | 2,600 | 2,598,718 | ||||||
|
| |||||||
TOTAL INVESTMENTS - 100.0% | 65,531,200 | |||||||
|
| |||||||
| OTHER ASSETS IN EXCESS OF LIABILITIES - 0.0% (d)(e) | 5,915 | |||||||
|
| |||||||
NET ASSETS - 100.0% |
| $ | 65,537,115 | |||||
|
| |||||||
| (a) | Represents annualized seven-day yield as of December 31, 2012. |
| (b) | A portion of the security is pledged as collateral to the brokers for futures and swap contracts. |
| (c) | The rate shown is the effective yield at the date of purchase. |
| (d) | Includes appreciation (depreciation) on futures and swap contracts. |
| (e) | Represents less than 0.05 percent of net assets. |
All securities are Level 2 with respect to ASC 820 (See Note 5).
Total return swap contracts outstanding as of December 31, 2012:
| COUNTERPARTY | UNDERLYING REFERENCE INSTRUMENT | TERMINATION DATE | CURRENCY | NOTIONAL VALUE | UNREALIZED APPRECIATION (DEPRECIATION) | |||||||||||
| Barclays Capital | Cocoa Futures | 3/13/2013 | USD | 389,910 | $(32,150) | |||||||||||
| Barclays Capital | Cocoa Futures | 5/15/2013 | USD | (139,800) | 5,040 | |||||||||||
| Barclays Capital | Coffee ‘C’ Futures | 3/18/2013 | USD | 2,781,075 | (192,675) | |||||||||||
| Barclays Capital | Coffee ‘C’ Futures | 5/20/2013 | USD | 110,775 | (750) | |||||||||||
| Barclays Capital | Corn Futures | 3/14/2013 | USD | 4,940,200 | (296,838) | |||||||||||
| Barclays Capital | Corn Futures | 5/14/2013 | USD | (1,914,400) | 23,725 | |||||||||||
| Deutsche Bank | Corn Futures | 5/14/2013 | USD | 37,700 | (2,687) | |||||||||||
| Barclays Capital | Cotton No. 2 Futures | 3/6/2013 | USD | 874,800 | 26,880 | |||||||||||
| Barclays Capital | Gold 100 OZ Futures | 2/26/2013 | USD | 6,260,355 | (227,475) | |||||||||||
| Barclays Capital | Lean Hogs Futures | 2/14/2013 | USD | 585,956 | (3,026) | |||||||||||
| Deutsche Bank | Lean Hogs Futures | 2/14/2013 | USD | (1,000,920) | 6,510 | |||||||||||
| Barclays Capital | Live Cattle Futures | 2/28/2013 | USD | 5,212,290 | 26,790 | |||||||||||
| Deutsche Bank | Live Cattle Futures | 2/28/2013 | USD | 574,200 | 7,920 | |||||||||||
| Barclays Capital | LME Aluminum Futures | 3/20/2013 | USD | 17,875 | (17,875) | |||||||||||
| Barclays Capital | LME Aluminum Futures | 6/19/2013 | USD | 418,700 | 900 | |||||||||||
| Barclays Capital | LME Copper Futures | 3/20/2013 | USD | (30,088) | 30,088 | |||||||||||
| Barclays Capital | LME Copper Futures | 6/19/2013 | USD | 14,261,025 | (151,994) | |||||||||||
| Barclays Capital | LME Lead Futures | 3/20/2013 | USD | (45,194) | 45,194 | |||||||||||
| Barclays Capital | LME Lead Futures | 6/19/2013 | USD | 1,322,869 | 23,206 | |||||||||||
| Barclays Capital | LME Nickel Futures | 3/20/2013 | USD | (29,496) | 29,496 | |||||||||||
| Barclays Capital | LME Nickel Futures | 6/19/2013 | USD | 1,382,106 | (46,980) | |||||||||||
| Barclays Capital | LME Zinc Futures | 3/20/2013 | USD | (22,288) | 22,287 | |||||||||||
| Barclays Capital | LME Zinc Futures | 6/19/2013 | USD | 1,723,638 | 11,750 | |||||||||||
| Barclays Capital | Silver Futures | 3/26/2013 | USD | 9,359,770 | (745,075) | |||||||||||
| Barclays Capital | Soybean Futures | 3/14/2013 | USD | 9,084,013 | (133,688) | |||||||||||
| Deutsche Bank | Soybean Futures | 3/14/2013 | USD | 221,962 | (10,537) | |||||||||||
| Barclays Capital | Soybean Meal Futures | 3/14/2013 | USD | 3,916,880 | (58,400) | |||||||||||
| Deutsche Bank | Soybean Meal Futures | 3/14/2013 | USD | 88,600 | (4,720) | |||||||||||
| Barclays Capital | Soybean Oil Futures | 3/14/2013 | USD | 4,210,356 | (65,376) | |||||||||||
| Deutsche Bank | Soybean Oil Futures | 3/14/2013 | USD | 215,124 | (6,384) | |||||||||||
| Barclays Capital | Sugar #11 (World Markets) Futures | 2/28/2013 | USD | 2,806,698 | (31,595) | |||||||||||
| Barclays Capital | Wheat Futures | 3/14/2013 | USD | (1,221,500) | 132,300 | |||||||||||
| The accompanying notes are an integral part of these financial statements. | (Continued) |
| 34 | AQR Funds | Annual Report | December 2012 | |||||||||||||
Table of Contents
| Consolidated Schedule of Investments | December 31, 2012 |
| AQR RISK-BALANCED COMMODITIES STRATEGY FUND |
| COUNTERPARTY | UNDERLYING REFERENCE INSTRUMENT | TERMINATION DATE | CURRENCY | NOTIONAL VALUE | UNREALIZED APPRECIATION (DEPRECIATION) | |||||||||||
| Barclays Capital | Wheat Futures | 5/14/2013 | USD | 1,099,750 | $(36,288) | |||||||||||
| Deutsche Bank | Wheat Futures | 5/14/2013 | USD | 217,125 | (20,187) | |||||||||||
|
| |||||||||||||||
| $(1,692,614) | ||||||||||||||||
|
| |||||||||||||||
Money Market Fund is pledged as collateral to brokers for total return swap contracts in the amount of $9,980,824.
Open futures contracts outstanding at December 31, 2012:
| NUMBER OF CONTRACTS | DESCRIPTION | EXPIRATION DATE | VALUE AT TRADE DATE | VALUE AT DECEMBER 31, 2012 | UNREALIZED APPRECIATION (DEPRECIATION) | |||||||||||
| Long Contracts: | ||||||||||||||||
| 9 | Brent Crude Futures | March 13, 2013 | $983,550 | $989,010 | $5,460 | |||||||||||
| 46 | Crude Oil Financial Futures | March 19, 2013 | 4,178,350 | 4,244,420 | 66,070 | |||||||||||
| 73 | Globex Brent FCL Futures | March 12, 2013 | 7,951,160 | 8,021,970 | 70,810 | |||||||||||
| 25 | ICE Euro Gasoil Futures | February 11, 2013 | 2,341,200 | 2,317,500 | (23,700) | |||||||||||
| 9 | ICE Euro Gasoil Futures | February 12, 2013 | 848,935 | 834,300 | (14,635) | |||||||||||
| 63 | Lean Hogs Futures | February 14, 2013 | 2,168,799 | 2,160,270 | (8,529) | |||||||||||
| 2 | LME Copper Futures | January 25, 2013 | 393,193 | 395,744 | 2,551 | |||||||||||
| 2 | LME Copper Futures | February 8, 2013 | 381,103 | 395,983 | 14,880 | |||||||||||
| 4 | LME Copper Futures | February 15, 2013 | 760,282 | 792,205 | 31,923 | |||||||||||
| 3 | LME Copper Futures | February 27, 2013 | 585,199 | 594,375 | 9,176 | |||||||||||
| 14 | LME Copper Futures | March 6, 2013 | 2,820,627 | 2,774,362 | (46,265) | |||||||||||
| 4 | LME Copper Futures | March 13, 2013 | 806,006 | 792,850 | (13,156) | |||||||||||
| 29 | LME Copper Futures | March 20, 2013 | 5,755,566 | 5,749,432 | (6,134) | |||||||||||
| 26 | LME Copper Futures | June 19, 2013 | 5,255,062 | 5,166,688 | (88,374) | |||||||||||
| 5 | LME Lead Futures | March 20, 2013 | 290,277 | 290,875 | 598 | |||||||||||
| 5 | LME Lead Futures | June 19, 2013 | 291,321 | 292,625 | 1,304 | |||||||||||
| 40 | Natural Gas Swap Futures | March 26, 2013 | 346,400 | 336,500 | (9,900) | |||||||||||
| 4 | Soybean Futures | March 14, 2013 | 286,535 | 281,900 | (4,635) | |||||||||||
| 14 | Soybean Oil Futures | March 14, 2013 | 418,795 | 417,480 | (1,315) | |||||||||||
| 65 | WTI Crude Oil Futures | January 30, 2013 | 5,669,670 | 5,968,300 | 298,630 | |||||||||||
|
|
|
|
|
| |||||||||||
| 42,532,030 | 42,816,789 | 284,759 | ||||||||||||||
|
|
|
|
|
| |||||||||||
| Short Contracts: | ||||||||||||||||
| 2 | Globex Heat Oil Futures | March 27, 2013 | (252,840) | (253,411) | (571) | |||||||||||
| 18 | Globex RBOB Gas Futures | January 30, 2013 | (2,008,087) | (2,087,845) | (79,758) | |||||||||||
| 2 | LME Copper Futures | January 25, 2013 | (393,022) | (395,745) | (2,723) | |||||||||||
| 2 | LME Copper Futures | February 8, 2013 | (380,324) | (395,983) | (15,659) | |||||||||||
| 4 | LME Copper Futures | February 15, 2013 | (764,675) | (792,205) | (27,530) | |||||||||||
| 3 | LME Copper Futures | February 27, 2013 | (586,495) | (594,375) | (7,880) | |||||||||||
| 14 | LME Copper Futures | March 6, 2013 | (2,818,352) | (2,774,362) | 43,990 | |||||||||||
| 4 | LME Copper Futures | March 13, 2013 | (805,982) | (792,850) | 13,132 | |||||||||||
| 29 | LME Copper Futures | March 20, 2013 | (5,829,166) | (5,749,432) | 79,734 | |||||||||||
| 7 | LME Copper Futures | June 19, 2013 | (1,391,222) | (1,391,031) | 191 | |||||||||||
| 5 | LME Lead Futures | March 20, 2013 | (289,367) | (290,875) | (1,508) | |||||||||||
| 13 | WTI Crude Oil Futures | March 20, 2013 | (1,174,868) | (1,199,510) | (24,642) | |||||||||||
|
|
|
|
|
| |||||||||||
| (16,694,400) | (16,717,624) | (23,224) | ||||||||||||||
|
|
|
|
|
| |||||||||||
| $25,837,630 | $26,099,165 | $261,535 | ||||||||||||||
|
|
|
|
|
| |||||||||||
Cash held as collateral with broker for futures contracts was $1,856,573 at December 31, 2012.
| The accompanying notes are an integral part of these financial statements. |
| AQR Funds | Annual Report | December 2012 | 35 | |||||||||||||
Table of Contents
| Consolidated Schedule of Investments | December 31, 2012 |
| GOVERNMENT RELATED OBLIGATIONS - 29.6% | INTEREST RATE | MATURITY DATE | CURRENCY | PRINCIPAL AMOUNT (000’S) | VALUE (Note 3) | |||||||||||||
| Sovereign Debt - 29.6% | ||||||||||||||||||
| Deutsche Bundesrepublik Inflation Linked Bond (Germany) | 1.500% | 04/15/16 | EUR | 39,734 | $ | 57,015,722 | ||||||||||||
| Deutsche Bundesrepublik Inflation Linked Bond (Germany) | 1.750% | 04/15/20 | EUR | 34,848 | 54,495,809 | |||||||||||||
| France Government Bond OAT (France) | 1.600% | 07/25/15 | EUR | 50,714 | 72,010,114 | |||||||||||||
| France Government Bond OAT (France) | 1.100% | 07/25/22 | EUR | 28,916 | 41,976,643 | |||||||||||||
| United Kingdom Treasury Gilt (United Kingdom) | 1.875% | 11/22/22 | GBP | 39,529 | 82,569,399 | |||||||||||||
|
| |||||||||||||||||
TOTAL GOVERNMENT RELATED OBLIGATIONS | 308,067,687 | |||||||||||||||||
|
| |||||||||||||||||
| U.S. TREASURY OBLIGATIONS - 28.2% | ||||||||||||||||||
| U.S. Treasury Inflation Protected Securities - 28.2% | ||||||||||||||||||
| U.S. Treasury Bond | 0.125% | 01/15/22 | USD | 110,800 | 122,970,216 | |||||||||||||
| U.S. Treasury Bond | 0.125% | 04/15/17 | USD | 52,600 | 57,365,294 | |||||||||||||
| U.S. Treasury Bond | 1.625% | 01/15/18 | USD | 21,600 | 27,660,252 | |||||||||||||
| U.S. Treasury Bond | 2.375% | 01/15/17 | USD | 39,000 | 51,993,458 | |||||||||||||
| U.S. Treasury Bond | 2.625% | 07/15/17 | USD | 25,100 | 33,568,475 | |||||||||||||
|
| |||||||||||||||||
TOTAL U.S. TREASURY OBLIGATIONS | 293,557,695 | |||||||||||||||||
|
| |||||||||||||||||
| MONEY MARKET FUNDS - 28.2% | SHARES | VALUE (Note 3) | ||||||
| BlackRock Liquidity Funds TempFund Portfolio, Series I, Class I, 0.140% (a) | 14,580,601 | $ | 14,580,601 | |||||
| Dreyfus Treasury Cash Management, Series I, Class I, 0.010% (a) | 58,322,406 | 58,322,406 | ||||||
| J.P. Morgan Prime Money Market Fund -Capital Shares, 0.120% (a) | 78 | 78 | ||||||
| J.P. Morgan U.S. Treasury Plus Money Market Fund - Institutional Shares, 0.000% (a)(b) | 146,896,189 | 146,896,189 | ||||||
| UBS Money Series - UBS Select Treasury Preferred Fund, Series I, Class I, 0.010% (a) | 72,903,853 | 72,903,853 | ||||||
|
| |||||||
TOTAL MONEY MARKET FUNDS | 292,703,127 | |||||||
|
| |||||||
| SHORT-TERM INVESTMENT - 8.4% | PRINCIPAL AMOUNT (000’S) | |||||||
| U.S. Treasury Bill, 0.000%, 6/20/2013 (c) (cost $87,250,553) | $ | 87,251 | 87,246,966 | |||||
|
| |||||||
TOTAL INVESTMENTS - 94.4% | 981,575,475 | |||||||
|
| |||||||
| OTHER ASSETS IN EXCESS OF LIABILITIES - 5.6% (d) | 58,038,640 | |||||||
|
| |||||||
NET ASSETS - 100.0% | $ | 1,039,614,115 | ||||||
|
| |||||||
All securities are United States companies, unless noted otherwise in parentheses.
| (a) | Represents annualized seven-day yield as of December 31, 2012. |
| (b) | A portion of the security is pledged as collateral to the brokers for forward foreign currency exchange and swap contracts. |
| (c) | The rate shown is the effective yield at the date of purchase. |
| (d) | Includes appreciation (depreciation) on forward foreign currency exchange, futures and swap contracts. |
All securities are Level 2 with respect to ASC 820 (See Note 5).
The following abbreviations are used in portfolio descriptions:
EUR - Euro
GBP - British Pound
USD - United States Dollar
| The accompanying notes are an integral part of these financial statements. | (Continued) |
| 36 | AQR Funds | Annual Report | December 2012 | |||||||||||||
Table of Contents
| Consolidated Schedule of Investments | December 31, 2012 |
| AQR RISK PARITY FUND |
Credit default swap contracts sell protection as of December 31, 2012:
| COUNTERPARTY | REFERENCE ENTITY | FIXED ANNUAL RATE RECEIVED BY FUND | CURRENCY | CREDIT SPREAD | NOTIONAL AMOUNT | UPFRONT PREMIUM (RECEIVED) PAID | TERMINATION DATE | UNREALIZED APPRECIATION (DEPRECIATION) | ||||||||||||||||||
| Bank of America | Markit CMBX North America AJ 3 | 1.470% | USD | 1.116% | 425,000 | $(135,245) | 12/13/2049 | $2,582 | ||||||||||||||||||
| Deutsche Bank | Markit CMBX North America AJ 3 | 1.470% | USD | 1.116% | 2,000,000 | (707,455) | 12/13/2049 | 83,162 | ||||||||||||||||||
| Deutsche Bank | Markit CMBX North America AJ 4 | 0.960% | USD | 0.999% | 2,100,000 | (755,721) | 02/17/2051 | 76,619 | ||||||||||||||||||
| Deutsche Bank | Markit CMBX North America AJ 5 | 0.980% | USD | 0.915% | 100,000 | (30,940) | 02/15/2051 | (383) | ||||||||||||||||||
| Morgan Stanley Capital Services, Inc. | Markit CMBX North America AJ 3 | 1.470% | USD | 1.116% | 1,400,000 | (474,439) | 12/13/2049 | 37,433 | ||||||||||||||||||
| Morgan Stanley Capital Services, Inc. | Markit CMBX North America AJ 4 | 0.960% | USD | 0.999% | 1,700,000 | (663,675) | 02/17/2051 | 113,926 | ||||||||||||||||||
| Morgan Stanley Capital Services, Inc. | Markit CMBX North America AJ 5 | 0.980% | USD | 0.915% | 100,000 | (33,981) | 02/15/2051 | 2,658 | ||||||||||||||||||
| The Royal Bank of Scotland | iTraxx Europe Crossover Series 17.V1 | 5.000% | EUR | 4.150% | 51,725,000 | 2,757,330 | 6/20/2017 | (314,800) | ||||||||||||||||||
| The Royal Bank of Scotland | iTraxx Europe Series 17.V1 | 1.000% | EUR | 1.115% | 78,000,000 | 1,302,386 | 6/20/2017 | (1,779,011) | ||||||||||||||||||
| The Royal Bank of Scotland | iTraxx Europe Crossover Series 18.V1 | 5.000% | EUR | 4.829% | 44,725,000 | (965,945) | 12/20/2017 | 1,477,203 | ||||||||||||||||||
| The Royal Bank of Scotland | iTraxx Europe Series 18.V1 | 1.000% | EUR | 1.174% | 78,750,000 | (1,326,879) | 12/20/2017 | 504,115 | ||||||||||||||||||
| The Royal Bank of Scotland | iTraxx Europe Series 18.V1 | 1.000% | EUR | 1.174% | 17,750,000 | (299,074) | 12/20/2017 | 113,626 | ||||||||||||||||||
| The Royal Bank of Scotland | iTraxx Europe Series 18.V1 | 1.000% | EUR | 1.174% | 11,250,000 | (189,554) | 12/20/2017 | 72,016 | ||||||||||||||||||
| The Royal Bank of Scotland | Markit CDX Emerging Market Index Series 16 | 5.000% | USD | 1.977% | 28,450,000 | (1,948,511) | 12/20/2016 | 5,290,938 | ||||||||||||||||||
| The Royal Bank of Scotland | Markit CDX Emerging Market Index Series 17 | 5.000% | USD | 2.043% | 41,450,000 | (4,333,078) | 6/20/2017 | 9,596,603 | ||||||||||||||||||
| The Royal Bank of Scotland | Markit CDX Emerging Market Index Series 18 | 5.000% | USD | 2.088% | 34,625,000 | 4,350,234 | 12/20/2017 | 376,405 | ||||||||||||||||||
| The Royal Bank of Scotland | Markit CDX Emerging Market Index Series 18 | 5.000% | USD | 2.088% | 4,000,000 | 502,554 | 12/20/2017 | 43,484 | ||||||||||||||||||
| The Royal Bank of Scotland | Markit CDX North America High Yield Index Series 18 | 5.000% | USD | 4.581% | 175,279,500 | 4,356,407 | 6/20/2017 | (1,161,293) | ||||||||||||||||||
| The Royal Bank of Scotland | Markit CDX North America High Yield Index Series 19 | 5.000% | USD | 4.927% | 141,050,000 | 306,188 | 12/20/2017 | 359,520 | ||||||||||||||||||
| The Royal Bank of Scotland | Markit CDX North America Investment Grade Index Series 18 | 1.000% | USD | 0.836% | 222,875,000 | (598,437) | 6/20/2017 | 2,242,834 | ||||||||||||||||||
| The Royal Bank of Scotland | Markit CDX North America Investment Grade Index Series 19 | 1.000% | USD | 0.953% | 226,875,000 | (75,464) | 12/20/2017 | 654,366 | ||||||||||||||||||
| The Royal Bank of Scotland | Markit CDX North America Investment Grade Index Series 19 | 1.000% | USD | 0.953% | 22,500,000 | (7,484) | 12/20/2017 | 64,896 | ||||||||||||||||||
| The Royal Bank of Scotland | Markit CMBX North America AJ 3 | 1.470% | USD | 1.116% | 425,000 | (110,475) | 12/13/2049 | (22,186) | ||||||||||||||||||
| The Royal Bank of Scotland | Markit CMBX North America AJ 4 | 0.960% | USD | 0.999% | 1,125,000 | (411,281) | 02/17/2051 | 47,476 | ||||||||||||||||||
| The Royal Bank of Scotland | Markit CMBX North America AJ 5 | 0.980% | USD | 0.915% | 375,000 | (117,852) | 02/15/2051 | 392 | ||||||||||||||||||
|
|
|
| |||||||||||||||||||||||
| $389,609 | $17,882,581 | |||||||||||||||||||||||||
|
|
|
| |||||||||||||||||||||||
| The accompanying notes are an integral part of these financial statements. | (Continued) |
| AQR Funds | Annual Report | December 2012 | 37 | |||||||||||||
Table of Contents
| Consolidated Schedule of Investments | December 31, 2012 |
| AQR RISK PARITY FUND |
Credit default swap contracts buy protection as of December 31, 2012:
| COUNTERPARTY | REFERENCE ENTITY | FIXED ANNUAL RATE RECEIVED BY FUND | CURRENCY | CREDIT SPREAD | NOTIONAL AMOUNT | UPFRONT PREMIUM (RECEIVED) PAID | TERMINATION DATE | UNREALIZED APPRECIATION (DEPRECIATION) | ||||||||||||||||||
| The Royal Bank of Scotland | iTraxx Europe Crossover Series 17.V1 | 5.000% | EUR | 4.150% | 51,725,000 | $49,495 | 6/20/2017 | $(2,492,024) | ||||||||||||||||||
| The Royal Bank of Scotland | iTraxx Europe Series 17.V1 | 1.000% | EUR | 1.115% | 78,000,000 | (1,354,066) | 6/20/2017 | 1,830,689 | ||||||||||||||||||
| The Royal Bank of Scotland | Markit CDX Emerging Market Index Series 16 | 5.000% | USD | 1.977% | 28,450,000 | 2,734,661 | 12/20/2016 | (6,077,088) | ||||||||||||||||||
| The Royal Bank of Scotland | Markit CDX Emerging Market Index Series 17 | 5.000% | USD | 2.043% | 41,450,000 | 4,743,730 | 6/20/2017 | (10,007,255) | ||||||||||||||||||
| The Royal Bank of Scotland | Markit CDX North America High Yield Index Series 18 | 5.000% | USD | 4.581% | 175,279,500 | 205,259 | 6/20/2017 | (3,400,373) | ||||||||||||||||||
| The Royal Bank of Scotland | Markit CDX North America Investment Grade Index Series 18 | 1.000% | USD | 0.836% | 222,875,000 | 555,890 | 6/20/2017 | (2,200,286) | ||||||||||||||||||
|
|
|
| |||||||||||||||||||||||
| $6,934,969 | $(22,346,337) | |||||||||||||||||||||||||
|
|
|
| |||||||||||||||||||||||
Money Market Fund is pledged as collateral to brokers for credit default swap contracts in the amount of $8,838,038. Additional collateral for positions held at the Royal Bank of Scotland is included in the collateral for forward foreign currency exchange contracts. Additional collateral for positions held at Bank of America included in the collateral for total return swap contracts.
Interest rate swap contracts outstanding as of December 31, 2012:
| COUNTERPARTY | PAYMENTS MADE BY THE FUND | PAYMENTS RECEIVED BY THE FUND | CURRENCY | NOTIONAL AMOUNT | TERMINATION DATE | UNREALIZED APPRECIATION (DEPRECIATION) | ||||||||||||||
| The Royal Bank of Scotland | 6 Month Prague Interbank Offered Rate | 1.050% | CZK | 440,000,000 | 03/21/2018 | $262,346 | ||||||||||||||
| The Royal Bank of Scotland | 6 Month Prague Interbank Offered Rate | 1.110% | CZK | 20,000,000 | 03/21/2018 | 15,082 | ||||||||||||||
| The Royal Bank of Scotland | 3 Month Hong Kong Interbank Offered Rate | 0.840% | HKD | 19,000,000 | 03/21/2018 | 11,287 | ||||||||||||||
| The Royal Bank of Scotland | 3 Month Hong Kong Interbank Offered Rate | 0.902% | HKD | 172,000,000 | 03/21/2018 | 170,337 | ||||||||||||||
| The Royal Bank of Scotland | 6 Month Budapest Interbank Offered Rate | 6.130% | HUF | 3,900,000,000 | 03/21/2018 | 856,435 | ||||||||||||||
| The Royal Bank of Scotland | 6 Month Budapest Interbank Offered Rate | 6.160% | HUF | 500,000,000 | 03/21/2018 | 112,907 | ||||||||||||||
| The Royal Bank of Scotland | 3 Month Korean Certificate of Deposit | 2.733% | KRW | 15,000,000,000 | * | 03/21/2018 | (112,156) | |||||||||||||
| The Royal Bank of Scotland | 3 Month Korean Certificate of Deposit | 2.798% | KRW | 42,000,000,000 | * | 03/21/2018 | (196,237) | |||||||||||||
| The Royal Bank of Scotland | 3 Month Korean Certificate of Deposit | 2.800% | KRW | 41,000,000,000 | * | 03/21/2018 | (187,142) | |||||||||||||
| The Royal Bank of Scotland | 3 Month Korean Certificate of Deposit | 2.806% | KRW | 42,000,000,000 | * | 03/21/2018 | (180,288) | |||||||||||||
| The Royal Bank of Scotland | 6 Month Warsaw Interbank Offered Rate | 4.120% | PLN | 23,000,000 | 03/21/2018 | 273,905 | ||||||||||||||
| The accompanying notes are an integral part of these financial statements. | (Continued) |
| 38 | AQR Funds | Annual Report | December 2012 | |||||||||||||
Table of Contents
| Consolidated Schedule of Investments | December 31, 2012 |
| AQR RISK PARITY FUND |
| COUNTERPARTY | PAYMENTS MADE BY THE FUND | PAYMENTS RECEIVED BY THE FUND | CURRENCY | NOTIONAL AMOUNT | TERMINATION DATE | UNREALIZED APPRECIATION (DEPRECIATION) | ||||||||||||||
| The Royal Bank of Scotland | 6 Month Warsaw Interbank Offered Rate | 4.199% | PLN | 194,000,000 | 03/21/2018 | 2,537,331 | ||||||||||||||
| The Royal Bank of Scotland | 6 Month Singapore Interbank Offered Rate | 1.050% | SGD | 30,000,000 | 03/21/2018 | 130,588 | ||||||||||||||
| The Royal Bank of Scotland | 6 Month Singapore Interbank Offered Rate | 1.050% | SGD | 4,000,000 | 03/21/2018 | 17,412 | ||||||||||||||
| The Royal Bank of Scotland | 3 Month Johannesburg Interbank Agreed Rate | 5.960% | ZAR | 65,000,000 | 03/22/2018 | 30,609 | ||||||||||||||
| The Royal Bank of Scotland | 3 Month Johannesburg Interbank Agreed Rate | 6.131% | ZAR | 386,000,000 | 03/22/2018 | 521,277 | ||||||||||||||
|
| |||||||||||||||||||
| $4,263,693 | ||||||||||||||||||||
|
| |||||||||||||||||||
| * | Non-deliverable interest rate swap. See Note 3 in the Notes to Financial Statements. |
Money Market Fund pledged as collateral to broker is included in the forward foreign currency exchange contracts.
Total return swap contracts outstanding as of December 31, 2012:
| COUNTERPARTY | UNDERLYING REFERENCE INSTRUMENT | TERMINATION DATE | CURRENCY | NOTIONAL VALUE | UNREALIZED APPRECIATION (DEPRECIATION) | |||||||||||
| Bank of America | 10-Year Japanese Government Bond Futures | 3/11/2013 | JPY | 16,482,080,600 | $(1,250,794) | |||||||||||
| Bank of America | Australia 10-Year Bond Futures | 3/15/2013 | AUD | 2,229,738 | (10,831) | |||||||||||
| Morgan Stanley and Co., International PLC | Bovespa Index | 2/13/2013 | BRL | 17,129,311 | 309,252 | |||||||||||
| Barclays Capital | Cocoa Futures | 5/15/2013 | USD | 24,100 | (1,640) | |||||||||||
| Bank of America | Euro - Bund Futures | 3/7/2013 | EUR | 56,379,610 | 741,704 | |||||||||||
| Morgan Stanley and Co., International PLC | Russian Depository Index | 6/15/2050 | USD | 584,639 | 7,724 | |||||||||||
| Morgan Stanley and Co., International PLC | Russian Trading System Index Futures | 3/15/2013 | USD | 4,845,971 | $92,223 | |||||||||||
| Barclays Capital | Soybean Futures | 3/14/2013 | USD | 1,215,713 | (17,637) | |||||||||||
| Morgan Stanley and Co., International PLC | Swiss Market Index Futures | 3/15/2013 | CHF | 15,611,762 | (168,897) | |||||||||||
| Bank of America | U.S. Treasury 10-Year Note Futures | 3/19/2013 | USD | 173,483,285 | (602,098) | |||||||||||
| Barclays Capital | Wheat Futures | 3/14/2013 | USD | 258,969 | (25,569) | |||||||||||
|
| |||||||||||||||
| $(926,563) | ||||||||||||||||
|
| |||||||||||||||
Money Market Fund is pledged as collateral to brokers for total return swap contracts in the amount of $182,120.
| The accompanying notes are an integral part of these financial statements. | (Continued) |
| AQR Funds | Annual Report | December 2012 | 39 | |||||||||||||
Table of Contents
| Consolidated Schedule of Investments | December 31, 2012 |
| AQR RISK PARITY FUND |
Open futures contracts outstanding at December 31, 2012:
| NUMBER OF CONTRACTS | DESCRIPTION | EXPIRATION DATE | VALUE AT TRADE DATE | VALUE AT DECEMBER 31, 2012 | UNREALIZED APPRECIATION (DEPRECIATION) | |||||||||||
| Long Contracts: | ||||||||||||||||
| 2 | Cattle Feeder Futures | January 31, 2013 | $149,166 | $151,400 | $2,234 | |||||||||||
| 21 | Cocoa Futures | March 13, 2013 | 506,195 | 469,560 | (36,635) | |||||||||||
| 61 | Coffee ‘C’ Futures | March 18, 2013 | 3,610,942 | 3,289,425 | (321,517) | |||||||||||
| 6 | Coffee ‘C’ Futures | May 20, 2013 | 335,862 | 330,075 | (5,787) | |||||||||||
| 292 | Corn Futures | March 14, 2013 | 10,721,267 | 10,194,450 | (526,817) | |||||||||||
| 48 | Cotton No. 2 Futures | March 6, 2013 | 1,754,491 | 1,803,360 | 48,869 | |||||||||||
| 394 | Crude Oil Financial Futures | March 19, 2013 | 35,782,420 | 36,354,380 | 571,960 | |||||||||||
| 283 | Globex Brent FCL Futures | March 12, 2013 | 30,838,440 | 31,098,870 | 260,430 | |||||||||||
| 39 | Globex Heat Oil Futures | March 27, 2013 | 4,931,472 | 4,941,518 | 10,046 | |||||||||||
| 49 | Globex RBOB Gas Futures | January 30, 2013 | 5,496,435 | 5,683,579 | 187,144 | |||||||||||
| 48 | Gold 100 OZ Futures | February 26, 2013 | 8,352,793 | 8,043,840 | (308,953) | |||||||||||
| 126 | ICE Euro Gasoil Futures | February 11, 2013 | 11,854,300 | 11,680,200 | (174,100) | |||||||||||
| 111 | Lean Hogs Futures | February 14, 2013 | 3,826,327 | 3,806,190 | (20,137) | |||||||||||
| 180 | Live Cattle Futures | February 28, 2013 | 9,448,308 | 9,525,600 | 77,292 | |||||||||||
| 2 | LME Aluminum Futures | January 11, 2013 | 100,953 | 102,219 | 1,266 | |||||||||||
| 19 | LME Aluminum Futures | February 8, 2013 | 912,440 | 976,614 | 64,174 | |||||||||||
| 42 | LME Aluminum Futures | February 15, 2013 | 2,055,563 | 2,161,876 | 106,313 | |||||||||||
| 1 | LME Aluminum Futures | February 20, 2013 | 49,520 | 51,525 | 2,005 | |||||||||||
| 61 | LME Aluminum Futures | February 21, 2013 | 2,976,898 | 3,143,605 | 166,707 | |||||||||||
| 6 | LME Aluminum Futures | February 27, 2013 | 302,356 | 309,553 | 7,197 | |||||||||||
| 6 | LME Aluminum Futures | March 4, 2013 | 313,260 | 309,841 | (3,419) | |||||||||||
| 1 | LME Aluminum Futures | March 13, 2013 | 53,336 | 51,726 | (1,610) | |||||||||||
| 36 | LME Aluminum Futures | March 20, 2013 | 1,873,951 | 1,864,575 | (9,376) | |||||||||||
| 43 | LME Aluminum Futures | June 19, 2013 | 2,307,212 | 2,255,350 | (51,862) | |||||||||||
| 2 | LME Copper Futures | January 4, 2013 | 416,827 | 395,371 | (21,456) | |||||||||||
| 4 | LME Copper Futures | January 11, 2013 | 815,717 | 791,038 | (24,679) | |||||||||||
| 4 | LME Copper Futures | January 18, 2013 | 823,255 | 791,250 | (32,005) | |||||||||||
| 1 | LME Copper Futures | January 24, 2013 | 196,652 | 197,864 | 1,212 | |||||||||||
| 4 | LME Copper Futures | January 25, 2013 | 786,106 | 791,489 | 5,383 | |||||||||||
| 11 | LME Copper Futures | February 8, 2013 | 2,096,068 | 2,177,907 | 81,839 | |||||||||||
| 11 | LME Copper Futures | February 15, 2013 | 2,090,774 | 2,178,564 | 87,790 | |||||||||||
| 1 | LME Copper Futures | February 20, 2013 | 193,785 | 198,094 | 4,309 | |||||||||||
| 19 | LME Copper Futures | February 21, 2013 | 3,664,103 | 3,763,781 | 99,678 | |||||||||||
| 8 | LME Copper Futures | February 27, 2013 | 1,561,330 | 1,585,000 | 23,670 | |||||||||||
| 3 | LME Copper Futures | February 28, 2013 | 586,164 | 594,394 | 8,230 | |||||||||||
| 2 | LME Copper Futures | March 4, 2013 | 400,477 | 396,313 | (4,164) | |||||||||||
| 28 | LME Copper Futures | March 6, 2013 | 5,630,241 | 5,548,725 | (81,516) | |||||||||||
| 6 | LME Copper Futures | March 13, 2013 | 1,209,010 | 1,189,275 | (19,735) | |||||||||||
| 162 | LME Copper Futures | March 20, 2013 | 31,874,285 | 32,117,513 | 243,228 | |||||||||||
| 158 | LME Copper Futures | June 19, 2013 | 31,930,715 | 31,397,563 | (533,152) | |||||||||||
| 4 | LME Lead Futures | January 25, 2013 | 201,706 | 231,450 | 29,744 | |||||||||||
| 2 | LME Lead Futures | February 8, 2013 | 108,723 | 115,756 | 7,033 | |||||||||||
| 9 | LME Lead Futures | February 15, 2013 | 494,562 | 521,543 | 26,981 | |||||||||||
| 1 | LME Lead Futures | February 21, 2013 | 53,658 | 58,006 | 4,348 | |||||||||||
| 1 | LME Lead Futures | February 27, 2013 | 55,002 | 58,044 | 3,042 | |||||||||||
| 1 | LME Lead Futures | March 6, 2013 | 55,797 | 58,088 | 2,291 | |||||||||||
| 2 | LME Lead Futures | March 13, 2013 | 115,749 | 116,262 | 513 | |||||||||||
| 33 | LME Lead Futures | March 20, 2013 | 1,834,028 | 1,919,775 | 85,747 | |||||||||||
| 35 | LME Lead Futures | June 19, 2013 | 2,024,711 | 2,048,375 | 23,664 | |||||||||||
| 4 | LME Nickel Futures | January 4, 2013 | 448,660 | 407,970 | (40,690) | |||||||||||
| 2 | LME Nickel Futures | January 18, 2013 | 207,003 | 204,114 | (2,889) | |||||||||||
| 1 | LME Nickel Futures | January 25, 2013 | 98,666 | 102,090 | 3,424 | |||||||||||
| 2 | LME Nickel Futures | February 8, 2013 | 192,483 | 204,309 | 11,826 | |||||||||||
| The accompanying notes are an integral part of these financial statements. | (Continued) |
| 40 | AQR Funds | Annual Report | December 2012 | |||||||||||||
Table of Contents
| Consolidated Schedule of Investments | December 31, 2012 |
| AQR RISK PARITY FUND |
| NUMBER OF CONTRACTS | DESCRIPTION | EXPIRATION DATE | VALUE AT TRADE DATE | VALUE AT DECEMBER 31, 2012 | UNREALIZED APPRECIATION (DEPRECIATION) | |||||||||||
| Long Contracts (continued) | ||||||||||||||||
| 10 | LME Nickel Futures | February 15, 2013 | $953,776 | $1,021,868 | $68,092 | |||||||||||
| 4 | LME Nickel Futures | February 21, 2013 | 393,774 | 408,859 | 15,085 | |||||||||||
| 2 | LME Nickel Futures | February 27, 2013 | 200,227 | 204,486 | 4,259 | |||||||||||
| 1 | LME Nickel Futures | February 28, 2013 | 102,460 | 102,248 | (212) | |||||||||||
| 2 | LME Nickel Futures | March 6, 2013 | 210,544 | 204,552 | (5,992) | |||||||||||
| 21 | LME Nickel Futures | March 20, 2013 | 2,150,072 | 2,149,182 | (890) | |||||||||||
| 21 | LME Nickel Futures | June 19, 2013 | 2,229,649 | 2,156,742 | (72,907) | |||||||||||
| 14 | LME Zinc Futures | January 4, 2013 | 731,435 | 717,458 | (13,977) | |||||||||||
| 23 | LME Zinc Futures | January 11, 2013 | 1,140,549 | 1,180,233 | 39,684 | |||||||||||
| 6 | LME Zinc Futures | February 15, 2013 | 291,614 | 309,911 | 18,297 | |||||||||||
| 16 | LME Zinc Futures | February 27, 2013 | 798,925 | 828,300 | 29,375 | |||||||||||
| 3 | LME Zinc Futures | February 28, 2013 | 150,634 | 155,336 | 4,702 | |||||||||||
| 4 | LME Zinc Futures | March 6, 2013 | 202,564 | 207,350 | 4,786 | |||||||||||
| 2 | LME Zinc Futures | March 13, 2013 | 103,203 | 103,812 | 609 | |||||||||||
| 71 | LME Zinc Futures | March 20, 2013 | 3,640,831 | 3,690,225 | 49,394 | |||||||||||
| 71 | LME Zinc Futures | June 19, 2013 | 3,692,685 | 3,733,713 | 41,028 | |||||||||||
| 1,073 | Natural Gas Swap Futures | March 26, 2013 | 9,292,180 | 9,026,612 | (265,568) | |||||||||||
| 78 | Silver Futures | March 26, 2013 | 13,268,994 | 11,788,530 | (1,480,464) | |||||||||||
| 236 | Soybean Futures | March 14, 2013 | 17,275,024 | 16,632,100 | (642,924) | |||||||||||
| 113 | Soybean Meal Futures | March 14, 2013 | 5,100,818 | 4,739,220 | (361,598) | |||||||||||
| 202 | Soybean Oil Futures | March 14, 2013 | 6,045,534 | 6,023,640 | (21,894) | |||||||||||
| 184 | Sugar #11 (World Markets) Futures | March 28, 2013 | 4,254,505 | 4,020,621 | (233,884) | |||||||||||
| 71 | Wheat Futures | March 14, 2013 | 3,036,629 | 2,761,900 | (274,729) | |||||||||||
| 12 | Wheat Futures | May 14, 2013 | 519,028 | 472,650 | (46,378) | |||||||||||
| 47 | Amsterdam Index Futures | January 18, 2013 | 4,264,698 | 4,257,024 | (7,674) | |||||||||||
| 181 | CAC40 10 Euro Futures | January 18, 2013 | 8,721,638 | 8,701,137 | (20,501) | |||||||||||
| 24 | DAX Index Futures | March 15, 2013 | 6,041,679 | 6,033,624 | (8,055) | |||||||||||
| 122 | E-Mini Russell 2000 Futures | March 15, 2013 | 10,195,147 | 10,328,520 | 133,373 | |||||||||||
| 765 | Euro Stoxx 50 Index | March 15, 2013 | 26,560,762 | 26,405,270 | (155,492) | |||||||||||
| 265 | FTSE 100 Index Futures | March 15, 2013 | 25,402,108 | 25,174,427 | (227,681) | |||||||||||
| 225 | FTSE/JSE Top 40 Index Futures | March 20, 2013 | 9,200,286 | 9,313,978 | 113,692 | |||||||||||
| 26 | FTSE/MIB Index Futures | March 15, 2013 | 2,772,119 | 2,797,661 | 25,542 | |||||||||||
| 100 | Hang Seng Index Futures | January 30, 2013 | 14,579,137 | 14,626,783 | 47,646 | |||||||||||
| 212 | H-SHARES Index Futures | January 30, 2013 | 15,504,468 | 15,660,296 | 155,828 | |||||||||||
| 27 | IBEX 35 Index Futures | January 18, 2013 | 2,848,933 | 2,876,396 | 27,463 | |||||||||||
| 95 | KOSPI Index 200 Futures | March 14, 2013 | 11,528,383 | 11,806,506 | 278,123 | |||||||||||
| 375 | MSCI Taiwan Stock Index Futures | January 30, 2013 | 10,186,068 | 10,312,500 | 126,432 | |||||||||||
| 1,777 | S&P 500 E-Mini Futures | March 15, 2013 | 127,052,108 | 126,175,885 | (876,223) | |||||||||||
| 110 | S&P MID 400 E-Mini Futures | March 15, 2013 | 11,148,724 | 11,199,100 | 50,376 | |||||||||||
| 24 | S&P/Toronto Stock Exchange 60 Index Futures | March 14, 2013 | 3,389,589 | 3,432,914 | 43,325 | |||||||||||
| 404 | SGX S&P CNX Nifty Index Futures | January 31, 2013 | 4,802,537 | 4,810,024 | 7,487 | |||||||||||
| 16 | SPI 200 Index Futures | March 21, 2013 | 1,903,176 | 1,917,394 | 14,218 | |||||||||||
| 248 | TOPIX Index Futures | March 7, 2013 | 22,540,329 | 24,661,165 | 2,120,836 | |||||||||||
| 158 | 10-Year Japanese Government Bond Futures | March 11, 2013 | 263,964,932 | 261,980,724 | (1,984,208) | |||||||||||
| 36 | Australia 10-Year Bond Futures | March 15, 2013 | 4,583,463 | 4,610,165 | 26,702 | |||||||||||
| 835 | Euro - Bund Futures | March 7, 2013 | 159,095,799 | 160,518,328 | 1,422,529 | |||||||||||
| 837 | U.S. Treasury 10-Year Note Futures | March 19, 2013 | 111,647,442 | 111,137,907 | (509,535) | |||||||||||
|
|
|
|
|
| |||||||||||
| 1,162,439,343 | 1,160,136,530 | (2,302,813) | ||||||||||||||
|
|
|
|
|
| |||||||||||
| Short Contracts: | ||||||||||||||||
| 57 | Corn Futures | May 14, 2013 | (2,018,073) | (1,995,713) | 22,360 | |||||||||||
| 2 | LME Aluminum Futures | January 11, 2013 | (99,895) | (102,219) | (2,324) | |||||||||||
| 19 | LME Aluminum Futures | February 8, 2013 | (912,195) | (976,615) | (64,420) | |||||||||||
| 42 | LME Aluminum Futures | February 15, 2013 | (2,042,183) | (2,161,877) | (119,694) | |||||||||||
| The accompanying notes are an integral part of these financial statements. | (Continued) |
| AQR Funds | Annual Report | December 2012 | 41 | |||||||||||||
Table of Contents
| Consolidated Schedule of Investments | December 31, 2012 |
| AQR RISK PARITY FUND |
| NUMBER OF CONTRACTS | DESCRIPTION | EXPIRATION DATE | VALUE AT TRADE DATE | VALUE AT DECEMBER 31, 2012 | UNREALIZED APPRECIATION (DEPRECIATION) | |||||||||||
| Short Contracts (continued) | ||||||||||||||||
| 1 | LME Aluminum Futures | February 20, 2013 | $(49,436) | $(51,525) | $(2,089) | |||||||||||
| 61 | LME Aluminum Futures | February 21, 2013 | (2,975,862) | (3,143,605) | (167,743) | |||||||||||
| 6 | LME Aluminum Futures | February 27, 2013 | (302,728) | (309,554) | (6,826) | |||||||||||
| 6 | LME Aluminum Futures | March 4, 2013 | (312,600) | (309,842) | 2,758 | |||||||||||
| 1 | LME Aluminum Futures | March 13, 2013 | (53,048) | (51,726) | 1,322 | |||||||||||
| 36 | LME Aluminum Futures | March 20, 2013 | (1,913,406) | (1,864,575) | 48,831 | |||||||||||
| 2 | LME Copper Futures | January 4, 2013 | (416,122) | (395,371) | 20,751 | |||||||||||
| 4 | LME Copper Futures | January 11, 2013 | (822,994) | (791,038) | 31,956 | |||||||||||
| 4 | LME Copper Futures | January 18, 2013 | (821,994) | (791,250) | 30,744 | |||||||||||
| 1 | LME Copper Futures | January 24, 2013 | (197,615) | (197,864) | (249) | |||||||||||
| 4 | LME Copper Futures | January 25, 2013 | (787,385) | (791,489) | (4,104) | |||||||||||
| 11 | LME Copper Futures | February 8, 2013 | (2,087,399) | (2,177,906) | (90,507) | |||||||||||
| 11 | LME Copper Futures | February 15, 2013 | (2,103,010) | (2,178,564) | (75,554) | |||||||||||
| 1 | LME Copper Futures | February 20, 2013 | (193,998) | (198,093) | (4,095) | |||||||||||
| 19 | LME Copper Futures | February 21, 2013 | (3,669,701) | (3,763,781) | (94,080) | |||||||||||
| 8 | LME Copper Futures | February 27, 2013 | (1,563,987) | (1,585,000) | (21,013) | |||||||||||
| 3 | LME Copper Futures | February 28, 2013 | (587,545) | (594,394) | (6,849) | |||||||||||
| 2 | LME Copper Futures | March 4, 2013 | (400,500) | (396,313) | 4,187 | |||||||||||
| 28 | LME Copper Futures | March 6, 2013 | (5,636,705) | (5,548,725) | 87,980 | |||||||||||
| 6 | LME Copper Futures | March 13, 2013 | (1,212,231) | (1,189,275) | 22,956 | |||||||||||
| 162 | LME Copper Futures | March 20, 2013 | (32,637,274) | (32,117,513) | 519,761 | |||||||||||
| 12 | LME Copper Futures | June 19, 2013 | (2,378,493) | (2,384,625) | (6,132) | |||||||||||
| 4 | LME Lead Futures | January 25, 2013 | (201,935) | (231,450) | (29,515) | |||||||||||
| 2 | LME Lead Futures | February 8, 2013 | (109,497) | (115,757) | (6,260) | |||||||||||
| 9 | LME Lead Futures | February 15, 2013 | (488,236) | (521,544) | (33,308) | |||||||||||
| 1 | LME Lead Futures | February 21, 2013 | (53,798) | (58,006) | (4,208) | |||||||||||
| 1 | LME Lead Futures | February 27, 2013 | (54,839) | (58,044) | (3,205) | |||||||||||
| 1 | LME Lead Futures | March 6, 2013 | (55,923) | (58,087) | (2,164) | |||||||||||
| 2 | LME Lead Futures | March 13, 2013 | (114,347) | (116,263) | (1,916) | |||||||||||
| 33 | LME Lead Futures | March 20, 2013 | (1,899,294) | (1,919,775) | (20,481) | |||||||||||
| 4 | LME Nickel Futures | January 4, 2013 | (448,314) | (407,971) | 40,343 | |||||||||||
| 2 | LME Nickel Futures | January 18, 2013 | (206,601) | (204,115) | 2,486 | |||||||||||
| 1 | LME Nickel Futures | January 25, 2013 | (98,824) | (102,090) | (3,266) | |||||||||||
| 2 | LME Nickel Futures | February 8, 2013 | (190,881) | (204,309) | (13,428) | |||||||||||
| 10 | LME Nickel Futures | February 15, 2013 | (956,826) | (1,021,869) | (65,043) | |||||||||||
| 4 | LME Nickel Futures | February 21, 2013 | (395,994) | (408,859) | (12,865) | |||||||||||
| 2 | LME Nickel Futures | February 27, 2013 | (200,865) | (204,486) | (3,621) | |||||||||||
| 1 | LME Nickel Futures | February 28, 2013 | (103,498) | (102,247) | 1,251 | |||||||||||
| 2 | LME Nickel Futures | March 6, 2013 | (211,329) | (204,552) | 6,777 | |||||||||||
| 21 | LME Nickel Futures | March 20, 2013 | (2,221,511) | (2,149,182) | 72,329 | |||||||||||
| 14 | LME Zinc Futures | January 4, 2013 | (732,155) | (717,458) | 14,697 | |||||||||||
| 23 | LME Zinc Futures | January 11, 2013 | (1,140,339) | (1,180,234) | (39,895) | |||||||||||
| 6 | LME Zinc Futures | February 15, 2013 | (290,465) | (309,910) | (19,445) | |||||||||||
| 16 | LME Zinc Futures | February 27, 2013 | (799,374) | (828,300) | (28,926) | |||||||||||
| 3 | LME Zinc Futures | February 28, 2013 | (151,645) | (155,335) | (3,690) | |||||||||||
| 4 | LME Zinc Futures | March 6, 2013 | (202,994) | (207,350) | (4,356) | |||||||||||
| 2 | LME Zinc Futures | March 13, 2013 | (103,959) | (103,812) | 147 | |||||||||||
| 71 | LME Zinc Futures | March 20, 2013 | (3,652,855) | (3,690,225) | (37,370) | |||||||||||
| 2 | LME Zinc Futures | June 19, 2013 | (104,395) | (105,175) | (780) | |||||||||||
|
|
|
|
|
| |||||||||||
| (81,387,072) | (81,454,857) | (67,785) | ||||||||||||||
|
|
|
|
|
| |||||||||||
| $1,081,052,271 | $1,078,681,673 | $(2,370,598) | ||||||||||||||
|
|
|
|
|
| |||||||||||
Cash held as collateral with broker for futures contracts was $47,293,578 at December 31, 2012.
| The accompanying notes are an integral part of these financial statements. | (Continued) |
| 42 | AQR Funds | Annual Report | December 2012 | |||||||||||||
Table of Contents
| Consolidated Schedule of Investments | December 31, 2012 |
| AQR RISK PARITY FUND |
Forward foreign currency exchange contracts outstanding as of December 31, 2012:
| PURCHASE CONTRACTS | COUNTERPARTY | CURRENCY | CURRENCY AMOUNT PURCHASED | VALUE AT SETTLEMENT DATE | VALUE AT DECEMBER 31, 2012 | UNREALIZED APPRECIATION (DEPRECIATION) | ||||||||||||||
| Brazilian Real, Expiring 03/20/13* | The Royal Bank of Scotland | BRL | 50,205,000 | $23,580,015 | $24,283,597 | $703,582 | ||||||||||||||
| Czech Republic Koruna, Expiring 03/20/13 | The Royal Bank of Scotland | CZK | 20,088,000 | 1,035,405 | 1,057,547 | 22,142 | ||||||||||||||
| Hong Kong Dollar, Expiring 03/20/13 | The Royal Bank of Scotland | HKD | 6,556,000 | 846,072 | 846,058 | (14) | ||||||||||||||
| Hungarian Forint, Expiring 03/20/13 | The Royal Bank of Scotland | HUF | 96,500,000 | 436,257 | 433,532 | (2,725) | ||||||||||||||
| Israeli Shekel, Expiring 03/20/13 | The Royal Bank of Scotland | ILS | 175,351,000 | 45,916,835 | 46,835,332 | 918,497 | ||||||||||||||
| Japanese Yen, Expiring 03/21/13 | The Royal Bank of Scotland | JPY | 183,000,000 | 2,126,428 | 2,113,629 | (12,799) | ||||||||||||||
| Korean Won, Expiring 03/20/13* | The Royal Bank of Scotland | KRW | 60,538,954,000 | 55,746,677 | 56,295,354 | 548,677 | ||||||||||||||
| Mexican Peso, Expiring 03/20/13 | The Royal Bank of Scotland | MXN | 950,096,000 | 72,958,684 | 72,985,182 | 26,498 | ||||||||||||||
| Poland Zloty, Expiring 03/20/13 | The Royal Bank of Scotland | PLN | 4,155,000 | 1,278,855 | 1,332,263 | 53,408 | ||||||||||||||
| Singapore Dollar, Expiring 03/20/13 | The Royal Bank of Scotland | SGD | 48,698,000 | 39,919,614 | 39,862,807 | (56,807) | ||||||||||||||
| Turkish Lira, Expiring 03/20/13 | The Royal Bank of Scotland | TRY | 86,851,000 | 48,029,107 | 48,200,767 | 171,660 | ||||||||||||||
| Taiwanese Dollar, Expiring 03/20/13* | The Royal Bank of Scotland | TWD | 1,518,177,000 | 52,520,872 | 52,298,092 | (222,780) | ||||||||||||||
| South African Rand, Expiring 03/20/13 | The Royal Bank of Scotland | ZAR | 166,221,000 | 18,868,180 | 19,403,310 | 535,130 | ||||||||||||||
|
|
|
|
|
| |||||||||||||||
| 363,263,001 | 365,947,470 | 2,684,469 | ||||||||||||||||||
|
|
|
|
|
| |||||||||||||||
| SALES CONTRACTS | COUNTERPARTY | CURRENCY | CURRENCY AMOUNT SOLD | VALUE AT SETTLEMENT DATE | VALUE AT DECEMBER 31, 2012 | UNREALIZED APPRECIATION (DEPRECIATION) | ||||||||||||||
| Brazilian Real, Expiring 03/20/13* | The Royal Bank of Scotland | BRL | (3,923,000) | $(1,833,569) | $(1,897,512) | $(63,943) | ||||||||||||||
| Swiss Franc, Expiring 03/20/13 | The Royal Bank of Scotland | CHF | (117,000) | (126,486) | (128,101) | (1,615) | ||||||||||||||
| Euro, Expiring 03/20/13 | The Royal Bank of Scotland | EUR | (282,985,000) | (368,687,891) | (373,780,172) | (5,092,281) | ||||||||||||||
| British Pound, Expiring 03/20/13 | The Royal Bank of Scotland | GBP | (50,560,000) | (81,358,624) | (82,112,407) | (753,783) | ||||||||||||||
| Hungarian Forint, Expiring 03/20/13 | The Royal Bank of Scotland | HUF | (1,076,000) | (4,869) | (4,834) | 35 | ||||||||||||||
| Japanese Yen, Expiring 03/21/13 | The Royal Bank of Scotland | JPY | (60,000,000) | (729,444) | (692,993) | 36,451 | ||||||||||||||
| Korean Won, Expiring 03/20/13* | The Royal Bank of Scotland | KRW | (416,753,000) | (382,728) | (387,540) | (4,812) | ||||||||||||||
| Mexican Peso, Expiring 03/20/13 | The Royal Bank of Scotland | MXN | (18,108,000) | (1,411,761) | (1,391,034) | 20,727 | ||||||||||||||
| Poland Zloty, Expiring 03/20/13 | The Royal Bank of Scotland | PLN | (12,669,000) | $(4,018,482) | $(4,062,200) | $(43,718) | ||||||||||||||
| The accompanying notes are an integral part of these financial statements. | (Continued) |
| AQR Funds | Annual Report | December 2012 | 43 | |||||||||||||
Table of Contents
| Consolidated Schedule of Investments | December 31, 2012 |
| AQR RISK PARITY FUND |
| SALES CONTRACTS | COUNTERPARTY | CURRENCY | CURRENCY AMOUNT SOLD | VALUE AT SETTLEMENT DATE | VALUE AT DECEMBER 31, 2012 | UNREALIZED APPRECIATION (DEPRECIATION) | ||||||||||||||
| Russian Ruble, Expiring 03/20/13* | The Royal Bank of Scotland | RUB | (146,134,000) | $(4,680,032) | $(4,723,243) | $(43,211) | ||||||||||||||
| Turkish Lira, Expiring 03/20/13 | The Royal Bank of Scotland | TRY | (1,366,000) | (757,206) | (758,106) | (900) | ||||||||||||||
| South African Rand, Expiring 03/20/13 | The Royal Bank of Scotland | ZAR | (16,460,000) | (1,831,442) | (1,921,409) | (89,967) | ||||||||||||||
|
|
|
|
|
| |||||||||||||||
| (465,822,534) | (471,859,551) | (6,037,017) | ||||||||||||||||||
|
|
|
|
|
| |||||||||||||||
| $(102,559,533) | $(105,912,081) | $(3,352,548) | ||||||||||||||||||
|
|
|
|
|
| |||||||||||||||
Money Market Fund is pledged as collateral for forward foreign currency exchange contracts in the amount of $35,023,413.
| * | Non deliverable forward. See Note 3 in the Notes to Financial Statements. |
BRL - Brazilian Real
CHF - Swiss Franc
CZK - Czech Republic Koruna
EUR - Euro
GBP - British Pound
HKD - Hong Kong Dollar
HUF - Hungarian Forint
ILS - Israeli Shekel
JPY - Japanese Yen
KRW - Korean Won
MXN - Mexican Peso
PLN - Poland Zloty
RUB - Russian Ruble
SGD - Singapore Dollar
TRY - Turkish Lira
TWD - Taiwan Dollar
ZAR - South African Rand
| The accompanying notes are an integral part of these financial statements. |
| 44 | AQR Funds | Annual Report | December 2012 | |||||||||||||
Table of Contents
| Consolidated Schedule of Investments | December 31, 2012 |
| GOVERNMENT RELATED OBLIGATIONS - 21.0% | INTEREST RATE | MATURITY DATE | CURRENCY | PRINCIPAL AMOUNT (000’S) | VALUE (Note 3) | |||||||||||||
| Sovereign Debt—21.0% | ||||||||||||||||||
| Deutsche Bundesrepublik Inflation Linked Bond (Germany) | 1.500% | 04/15/16 | EUR | 1,037 | $1,487,367 | |||||||||||||
| Deutsche Bundesrepublik Inflation Linked Bond (Germany) | 1.750% | 04/15/20 | EUR | 868 | 1,358,151 | |||||||||||||
| France Government Bond OAT (France) | 1.600% | 07/25/15 | EUR | 592 | 841,239 | |||||||||||||
| France Government Bond OAT (France) | 1.100% | 07/25/22 | EUR | 752 | 1,092,329 | |||||||||||||
| United Kingdom Treasury Gilt (United Kingdom) | 1.875% | 11/22/22 | GBP | 955 | 1,995,635 | |||||||||||||
|
| |||||||||||||||||
TOTAL GOVERNMENT RELATED OBLIGATIONS | 6,774,721 | |||||||||||||||||
|
| |||||||||||||||||
| U.S. TREASURY OBLIGATIONS - 25.8% | ||||||||||||||||||
| U.S. Treasury Inflation Protected Securities - 25.8% | ||||||||||||||||||
| U.S. Treasury Inflation Protected Securities | 0.125% | 01/15/22 | USD | 3,100 | 3,440,502 | |||||||||||||
| U.S. Treasury Inflation Protected Securities | 0.125% | 04/15/17 | USD | 1,800 | 1,963,071 | |||||||||||||
| U.S. Treasury Inflation Protected Securities | 1.625% | 01/15/18 | USD | 700 | 896,397 | |||||||||||||
| U.S. Treasury Inflation Protected Securities | 2.375% | 01/15/17 | USD | 800 | 1,066,533 | |||||||||||||
| U.S. Treasury Inflation Protected Securities | 2.625% | 07/15/17 | USD | 700 | 936,173 | |||||||||||||
|
| |||||||||||||||||
TOTAL U.S. TREASURY OBLIGATIONS | 8,302,676 | |||||||||||||||||
|
| |||||||||||||||||
| MONEY MARKET FUNDS - 23.5% | SHARES | VALUE (Note 3) | ||||||
J.P. Morgan U.S. Treasury Plus Money Market Fund - Institutional Shares, 0.000% (a)(b) | 7,594,622 | $7,594,622 | ||||||
|
| |||||||
| SHORT-TERM INVESTMENT - 3.9% | PRINCIPAL AMOUNT (000’s) | |||||||
U.S. Treasury Bill, 0.000%, 6/20/2013(c) | $1,259 | 1,259,379 | ||||||
|
| |||||||
TOTAL INVESTMENTS - 74.2% | 23,931,398 | |||||||
|
| |||||||
| OTHER ASSETS IN EXCESS OF LIABILITIES—25.8% (d) | 8,321,167 | |||||||
|
| |||||||
NET ASSETS—100.0% | $32,252,565 | |||||||
|
| |||||||
All securities are United States companies, unless noted otherwise in parentheses.
| (a) | Represents annualized seven-day yield as of December 31, 2012. |
(b) A portion of the security is pledged as collateral to the brokers for forward foreign currency exchange and swap contracts.
| (c) | The rate shown is the effective yield at the date of purchase. |
| (d) | Includes depreciation on forward foreign currency exchange, futures and swap contracts. |
All securities are Level 2 with respect to ASC 820 (See Note 5).
The following abbreviations are used in portfolio descriptions:
EUR - Euro
GBP - British Pound
USD - United States Dollar
| The accompanying notes are an integral part of these financial statements. | (Continued) |
| AQR Funds | Annual Report | December 2012 | 45 | |||||||||||||
Table of Contents
| Consolidated Schedule of Investments | December 31, 2012 |
| AQR RISK PARITY II MV FUND |
Total return swap contracts outstanding as of December 31, 2012:
| COUNTERPARTY | UNDERLYING REFERENCE INSTRUMENT | TERMINATION DATE | CURRENCY | NOTIONAL VALUE | UNREALIZED APPRECIATION (DEPRECIATION) | |||||||||||
| Goldman Sachs | Bovespa Index | 2/13/2013 | BRL | 600,109 | $6,135 | |||||||||||
| Barclays Capital | Coffee ‘C’ Futures | 5/20/2013 | USD | 110,775 | (750) | |||||||||||
| Barclays Capital | Corn Futures | 5/14/2013 | USD | 138,800 | 1,250 | |||||||||||
| Barclays Capital | Cotton No. 2 Futures | 3/6/2013 | USD | 37,400 | 170 | |||||||||||
| Barclays Capital | Gold 100 OZ Futures | 2/26/2013 | USD | 174,905 | (7,325) | |||||||||||
| Barclays Capital | Live Cattle Futures | 2/28/2013 | USD | 53,380 | (460) | |||||||||||
| Barclays Capital | LME Aluminum Futures | 6/19/2013 | USD | 52,475 | (25) | |||||||||||
| Barclays Capital | LME Copper Futures | 6/19/2013 | USD | 198,775 | (56) | |||||||||||
| Barclays Capital | LME Nickel Futures | 6/19/2013 | USD | 105,570 | (2,868) | |||||||||||
| Bank of America | Russian Trading System Index Futures | 3/15/2013 | USD | 156,555 | 2,544 | |||||||||||
| Barclays Capital | Soybean Futures | 3/14/2013 | USD | 70,263 | 212 | |||||||||||
| Goldman Sachs | Swiss Market Index Futures | 3/15/2013 | CHF | 410,342 | (5,849) | |||||||||||
| Bank of America | U.S. Treasury 10-Year Note Futures | 3/19/2013 | USD | 531,445 | (320) | |||||||||||
| Barclays Capital | Wheat Futures | 5/14/2013 | USD | 78,150 | 625 | |||||||||||
|
| |||||||||||||||
| $(6,717) | ||||||||||||||||
|
| |||||||||||||||
Money Market Fund is pledged as collateral to brokers for total return swap contracts in the amount of $110,000.
Open futures contracts outstanding at December 31, 2012:
| NUMBER OF CONTRACTS | DESCRIPTION | EXPIRATION DATE | VALUE AT TRADE DATE | VALUE AT DECEMBER 31, 2012 | UNREALIZED APPRECIATION (DEPRECIATION) | |||||||||||
| Long Contracts: | ||||||||||||||||
| 1 | Coffee ‘C’ Futures | March 18, 2013 | $59,325 | $53,925 | $(5,400) | |||||||||||
| 4 | Corn Futures | March 14, 2013 | 146,100 | 139,650 | (6,450) | |||||||||||
| 1 | Cotton No. 2 Futures | March 6, 2013 | 37,549 | 37,570 | 21 | |||||||||||
| 14 | Crude Oil Financial Futures | March 19, 2013 | 1,264,520 | 1,291,780 | 27,260 | |||||||||||
| 10 | Globex Brent FCL Futures | March 12, 2013 | 1,084,900 | 1,098,900 | 14,000 | |||||||||||
| 1 | Globex Heat Oil Futures | March 27, 2013 | 126,420 | 126,706 | 286 | |||||||||||
| 2 | Globex RBOB Gas Futures | January 30, 2013 | 228,627 | 231,983 | 3,356 | |||||||||||
| 1 | Gold 100 OZ Futures | February 26, 2013 | 166,262 | 167,580 | 1,318 | |||||||||||
| 5 | ICE Euro Gasoil Futures | February 11, 2013 | 464,400 | 463,500 | (900) | |||||||||||
| 5 | Lean Hogs Futures | February 14, 2013 | 172,921 | 171,450 | (1,471) | |||||||||||
| 4 | Live Cattle Futures | February 28, 2013 | 212,654 | 211,680 | (974) | |||||||||||
| 1 | LME Aluminum Futures | February 15, 2013 | 48,942 | 51,473 | 2,531 | |||||||||||
| 2 | LME Aluminum Futures | March 18, 2013 | 104,747 | 103,587 | (1,160) | |||||||||||
| 1 | LME Aluminum Futures | March 19, 2013 | 52,277 | 51,785 | (492) | |||||||||||
| 2 | LME Aluminum Futures | June 19, 2013 | 106,473 | 104,900 | (1,573) | |||||||||||
| 1 | LME Copper Futures | February 6, 2013 | 191,947 | 197,974 | 6,027 | |||||||||||
| 1 | LME Copper Futures | February 28, 2013 | 197,052 | 198,132 | 1,080 | |||||||||||
| 3 | LME Copper Futures | March 18, 2013 | 601,979 | 594,757 | (7,222) | |||||||||||
| 4 | LME Copper Futures | June 19, 2013 | 806,071 | 794,875 | (11,196) | |||||||||||
| 2 | LME Lead Futures | February 28, 2013 | 110,958 | 116,100 | 5,142 | |||||||||||
| 1 | LME Lead Futures | March 6, 2013 | 55,797 | 58,088 | 2,291 | |||||||||||
| 1 | LME Lead Futures | March 20, 2013 | 56,039 | 58,175 | 2,136 | |||||||||||
| 1 | LME Lead Futures | June 19, 2013 | 57,815 | 58,525 | 710 | |||||||||||
| 1 | LME Zinc Futures | February 27, 2013 | 49,933 | 51,769 | 1,836 | |||||||||||
| 2 | LME Zinc Futures | March 18, 2013 | 103,009 | 103,930 | 921 | |||||||||||
| 1 | LME Zinc Futures | March 19, 2013 | 51,914 | 51,965 | 51 | |||||||||||
| The accompanying notes are an integral part of these financial statements. | (Continued) |
| 46 | AQR Funds | Annual Report | December 2012 | |||||||||||||
Table of Contents
| Consolidated Schedule of Investments | December 31, 2012 |
| AQR RISK PARITY II MV FUND |
| NUMBER OF CONTRACTS | DESCRIPTION | EXPIRATION DATE | VALUE AT TRADE DATE | VALUE AT DECEMBER 31, 2012 | UNREALIZED APPRECIATION (DEPRECIATION) | |||||||||||
| Long Contracts: (continued) | ||||||||||||||||
| 3 | LME Zinc Futures | June 19, 2013 | $157,900 | $157,763 | $(137) | |||||||||||
| 40 | Natural Gas Swap Futures | March 26, 2013 | 344,142 | 336,499 | (7,643) | |||||||||||
| 2 | Silver Futures | March 26, 2013 | 332,984 | 302,270 | (30,714) | |||||||||||
| 6 | Soybean Futures | March 14, 2013 | 438,388 | 422,850 | (15,538) | |||||||||||
| 4 | Soybean Meal Futures | March 14, 2013 | 173,904 | 167,760 | (6,144) | |||||||||||
| 6 | Soybean Oil Futures | March 14, 2013 | 179,414 | 178,920 | (494) | |||||||||||
| 7 | Sugar #11 (World Markets) Futures | March 28, 2013 | 152,067 | 152,958 | 891 | |||||||||||
| 1 | Wheat Futures | March 14, 2013 | 42,682 | 38,900 | (3,782) | |||||||||||
| 1 | Wheat Futures | May 14, 2013 | 40,726 | 39,388 | (1,338) | |||||||||||
| 1 | Amsterdam Index Futures | January 18, 2013 | 90,908 | 90,575 | (333) | |||||||||||
| 6 | CAC40 10 Euro Futures | January 18, 2013 | 289,121 | 288,435 | (686) | |||||||||||
| 1 | DAX Index Futures | March 15, 2013 | 252,239 | 251,401 | (838) | |||||||||||
| 5 | E-Mini Russell 2000 Futures | March 15, 2013 | 418,398 | 423,300 | 4,902 | |||||||||||
| 21 | Euro Stoxx 50 Index | March 15, 2013 | 730,097 | 724,851 | (5,246) | |||||||||||
| 8 | FTSE 100 Index Futures | March 15, 2013 | 766,807 | 759,983 | (6,824) | |||||||||||
| 7 | FTSE/JSE Top 40 Index Futures | March 20, 2013 | 286,515 | 289,768 | 3,253 | |||||||||||
| 1 | FTSE/MIB Index Futures | March 15, 2013 | 107,639 | 107,602 | (37) | |||||||||||
| 2 | Hang Seng Index Futures | January 30, 2013 | 291,853 | 292,535 | 682 | |||||||||||
| 7 | H-SHARES Index Futures | January 30, 2013 | 512,009 | 517,085 | 5,076 | |||||||||||
| 1 | IBEX 35 Index Futures | January 18, 2013 | 105,795 | 106,533 | 738 | |||||||||||
| 3 | KOSPI Index 200 Futures | March 14, 2013 | 366,510 | 372,837 | 6,327 | |||||||||||
| 10 | MSCI Taiwan Stock Index Futures | January 30, 2013 | 271,704 | 275,000 | 3,296 | |||||||||||
| 71 | S&P 500 E-Mini Futures | March 15, 2013 | 5,052,591 | 5,041,355 | (11,236) | |||||||||||
| 5 | S&P MID 400 E-Mini Futures | March 15, 2013 | 506,800 | 509,050 | 2,250 | |||||||||||
| 1 | S&P/Toronto Stock Exchange 60 Index Futures | March 14, 2013 | 140,982 | 143,038 | 2,056 | |||||||||||
| 14 | SGX S&P CNX Nifty Index Futures | January 31, 2013 | 166,591 | 166,684 | 93 | |||||||||||
| 1 | SPI 200 Index Futures | March 21, 2013 | 118,939 | 119,837 | 898 | |||||||||||
| 7 | TOPIX Index Futures | March 7, 2013 | 643,686 | 696,081 | 52,395 | |||||||||||
| 2 | Australia 10-Year Bond Futures | March 15, 2013 | 254,634 | 256,120 | 1,486 | |||||||||||
| 34 | Euro – Bund Futures | March 7, 2013 | 6,480,590 | 6,536,075 | 55,485 | |||||||||||
| 74 | Mini Japanese 10-Year Treasury Bond | March 8, 2013 | 12,340,809 | 12,267,420 | (73,389) | |||||||||||
| 78 | U.S. Treasury 10-Year Note Futures | March 19, 2013 | 10,366,628 | 10,356,937 | (9,691) | |||||||||||
|
|
|
|
|
| |||||||||||
| 48,982,683 | 48,980,569 | (2,114) | ||||||||||||||
|
|
|
|
|
| |||||||||||
| Short Contracts: | ||||||||||||||||
| 1 | LME Aluminum Futures | February 15, 2013 | (48,623) | (51,473) | (2,850) | |||||||||||
| 2 | LME Aluminum Futures | March 18, 2013 | (104,825) | (103,587) | 1,238 | |||||||||||
| 1 | LME Aluminum Futures | March 19, 2013 | (52,198) | (51,784) | 414 | |||||||||||
| 2 | LME Aluminum Futures | June 19, 2013 | (104,541) | (104,900) | (359) | |||||||||||
| 1 | LME Copper Futures | February 6, 2013 | (192,248) | (197,974) | (5,726) | |||||||||||
| 1 | LME Copper Futures | February 28, 2013 | (197,498) | (198,131) | (633) | |||||||||||
| 3 | LME Copper Futures | March 18, 2013 | (605,418) | (594,756) | 10,662 | |||||||||||
| 2 | LME Lead Futures | February 28, 2013 | (111,559) | (116,100) | (4,541) | |||||||||||
| 1 | LME Lead Futures | March 6, 2013 | (55,923) | (58,087) | (2,164) | |||||||||||
| 1 | LME Lead Futures | March 20, 2013 | (57,497) | (58,175) | (678) | |||||||||||
| 1 | LME Zinc Futures | February 27, 2013 | (49,961) | (51,769) | (1,808) | |||||||||||
| 2 | LME Zinc Futures | March 18, 2013 | (104,327) | (103,930) | 397 | |||||||||||
| 1 | LME Zinc Futures | March 19, 2013 | (51,848) | (51,965) | (117) | |||||||||||
|
|
|
|
|
| |||||||||||
| (1,736,466) | (1,742,631) | (6,165) | ||||||||||||||
|
|
|
|
|
| |||||||||||
| $47,246,217 | $47,237,938 | $(8,279) | ||||||||||||||
|
|
|
|
|
| |||||||||||
Cash held as collateral with broker for futures contracts was $1,335,729 at December 31, 2012.
| The accompanying notes are an integral part of these financial statements. | (Continued) |
| AQR Funds | Annual Report | December 2012 | 47 | |||||||||||||
Table of Contents
| Consolidated Schedule of Investments | December 31, 2012 |
| AQR RISK PARITY II MV FUND |
Forward foreign currency exchange contracts outstanding as of December 31, 2012:
| PURCHASE CONTRACTS | COUNTERPARTY | CURRENCY | CURRENCY AMOUNT PURCHASED | VALUE AT SETTLEMENT DATE | VALUE AT DECEMBER 31, 2012 | UNREALIZED APPRECIATION (DEPRECIATION) | ||||||||||||||
| Swiss Franc, Expiring 03/20/13 | The Royal Bank of Scotland | CHF | 5,000 | $5,462 | $5,474 | $12 | ||||||||||||||
|
|
|
|
|
| |||||||||||||||
| SALES CONTRACTS | COUNTERPARTY | CURRENCY | CURRENCY AMOUNT SOLD | VALUE AT SETTLEMENT DATE | VALUE AT DECEMBER 31, 2012 | UNREALIZED APPRECIATION (DEPRECIATION) | ||||||||||||||
| Euro, Expiring 03/20/13 | The Royal Bank of Scotland | EUR | (3,624,000) | $(4,753,354) | $(4,786,752) | $(33,398) | ||||||||||||||
| British Pound, Expiring 03/20/13 | The Royal Bank of Scotland | GBP | (1,215,000) | (1,964,116) | (1,973,232) | (9,116) | ||||||||||||||
| Russian Ruble, Expiring 03/20/13* | The Royal Bank of Scotland | RUB | (4,766,000) | (152,148) | (154,044) | (1,896) | ||||||||||||||
|
|
|
|
|
| |||||||||||||||
| (6,869,618) | (6,914,028) | (44,410) | ||||||||||||||||||
|
|
|
|
|
| |||||||||||||||
| $(6,864,156) | $(6,908,554) | $(44,398) | ||||||||||||||||||
|
|
|
|
|
| |||||||||||||||
Cash held as collateral with broker for forward currency exchange contracts was $120,000 at December 31, 2012.
| * | Non deliverable forward. See Note 3 in the Notes to Financial Statements. |
CHF - Swiss Franc
EUR - Euro
GBP - British Pound
RUB - Russian Ruble
| The accompanying notes are an integral part of these financial statements. |
| 48 | AQR Funds | Annual Report | December 2012 | |||||||||||||
Table of Contents
| Consolidated Schedule of Investments | December 31, 2012 |
| GOVERNMENT RELATED OBLIGATIONS - 46.5% | INTEREST RATE | MATURITY DATE | CURRENCY | PRINCIPAL AMOUNT (000’S) | VALUE (Note 3) | |||||||||||||
| Sovereign Debt - 46.5% | ||||||||||||||||||
| Deutsche Bundesrepublik Inflation Linked Bond (Germany) | 1.500% | 04/15/16 | EUR | $ | 1,612 | $ | 2,313,742 | |||||||||||
| Deutsche Bundesrepublik Inflation Linked Bond (Germany) | 1.750% | 04/15/20 | EUR | 1,303 | 2,037,270 | |||||||||||||
| France Government Bond OAT (France) | 1.600% | 07/25/15 | EUR | 948 | 1,345,983 | |||||||||||||
| France Government Bond OAT (France) | 1.100% | 07/25/22 | EUR | 1,075 | 1,560,511 | |||||||||||||
| United Kingdom Treasury Gilt (United Kingdom) | 1.875% | 11/22/22 | GBP | 1,433 | 2,993,453 | |||||||||||||
|
| |||||||||||||||||
TOTAL GOVERNMENT RELATED OBLIGATIONS | 10,250,959 | |||||||||||||||||
|
| |||||||||||||||||
| U.S. TREASURY OBLIGATIONS - 48.2% | ||||||||||||||||||
| U.S. Treasury Inflation Protected Securities - 48.2% | ||||||||||||||||||
| U.S. Treasury Inflation Protected Securities (a) | 0.125% | 01/15/22 | USD | 4,000 | 4,439,358 | |||||||||||||
| U.S. Treasury Inflation Protected Securities (a) | 0.125% | 04/15/17 | USD | 2,300 | 2,508,368 | |||||||||||||
| U.S. Treasury Inflation Protected Securities (a) | 1.625% | 01/15/18 | USD | 900 | 1,152,511 | |||||||||||||
| U.S. Treasury Inflation Protected Securities (a) | 2.375% | 01/15/17 | USD | 1,000 | 1,333,166 | |||||||||||||
| U.S. Treasury Inflation Protected Securities (a) | 2.625% | 07/15/17 | USD | 900 | 1,203,650 | |||||||||||||
|
| |||||||||||||||||
TOTAL U.S. TREASURY OBLIGATIONS | 10,637,053 | |||||||||||||||||
|
| |||||||||||||||||
| MONEY MARKET FUNDS - 39.1% | SHARES | VALUE (Note 3) | ||||||
| J.P. Morgan U.S. Treasury Plus Money Market Fund - Institutional Shares, 0.000% (b)(c) | ||||||||
(cost $8,617,542) | 8,617,542 | $ | 8,617,542 | |||||
|
| |||||||
| SHORT-TERM INVESTMENTS - 9.7% | PRINCIPAL AMOUNT (000’s) | |||||||
| U.S. Treasury Bill, 0.000%, 6/20/2013 (d) | ||||||||
(cost $2,149,027) | $ | 2,149 | 2,148,940 | |||||
|
| |||||||
TOTAL INVESTMENTS - 143.5% | 31,654,494 | |||||||
|
| |||||||
| LIABILITIES IN EXCESS OF OTHER ASSETS - (43.5%) (e) | (9,596,020) | |||||||
|
| |||||||
NET ASSETS - 100.0% | $ | 22,058,474 | ||||||
|
| |||||||
All securities are United States companies, unless noted otherwise in parentheses.
| (a) | On December 31, 2012, securities valued at $10,637,053 were pledged as collateral for reverse repurchase agreements outstanding. |
| (b) | Represents annualized seven-day yield as of December 31, 2012. |
| (c) | A portion of the security is pledged as collateral to the brokers for swap contracts. |
| (d) | The rate shown is the effective yield at the date of purchase. |
| (e) | Includes depreciation on forward foreign currency exchange, futures and swap contracts. |
All securities are Level 2 with respect to ASC 820 (See Note 5).
The following abbreviations are used in portfolio descriptions:
EUR - Euro
GBP - British Pound
USD - United States Dollar
Open reverse repurchase agreements at December 31, 2012:
| Counterparty | Trade Date | Rate | Due Date | Principal Amount of Reverse Repurchase Agreement | ||||||||||
| Credit Suisse First Boston LLC | 12/28/2012 | 0.27% | 1/16/2013 | $3,762,390 | ||||||||||
| Barclays Capital | 12/14/2012 | 0.32% | 1/16/2013 | 2,790,625 | ||||||||||
| Barclays Capital | 12/14/2012 | 0.37% | 1/16/2013 | 4,036,875 | ||||||||||
|
| |||||||||||||
| $10,589,890 | ||||||||||||||
|
| |||||||||||||
| The accompanying notes are an integral part of these financial statements. | (Continued) |
| AQR Funds | Annual Report | December 2012 | 49 | |||||||||||||
Table of Contents
| Consolidated Schedule of Investments | December 31, 2012 |
| AQR RISK PARITY II HV FUND |
Total return swap contracts outstanding as of December 31, 2012:
| COUNTERPARTY | UNDERLYING REFERENCE INSTRUMENT | TERMINATION DATE | CURRENCY | NOTIONAL VALUE | UNREALIZED APPRECIATION (DEPRECIATION) | |||||||||||
| Goldman Sachs | Bovespa Index | 2/13/2013 | BRL | 899,083 | $9,705 | |||||||||||
| Barclays Capital | Coffee ‘C’ Futures | 3/18/2013 | USD | 56,438 | (2,512) | |||||||||||
| Barclays Capital | Coffee ‘C’ Futures | 5/20/2013 | USD | 57,113 | (2,100) | |||||||||||
| Barclays Capital | Cotton No. 2 Futures | 3/6/2013 | USD | 37,335 | 235 | |||||||||||
| Barclays Capital | Gold 100 OZ Futures | 2/26/2013 | USD | 340,545 | (5,385) | |||||||||||
| Barclays Capital | Live Cattle Futures | 2/28/2013 | USD | 210,650 | 1,030 | |||||||||||
| Barclays Capital | LME Copper Futures | 6/19/2013 | USD | 401,525 | (4,088) | |||||||||||
| Bank of America | Russian Trading System Index Futures | 3/15/2013 | USD | 242,032 | 2,736 | |||||||||||
| Barclays Capital | Silver Futures | 3/26/2013 | USD | 170,600 | (19,465) | |||||||||||
| Barclays Capital | Soybean Futures | 3/14/2013 | USD | 287,925 | (6,025) | |||||||||||
| Goldman Sachs | Swiss Market Index Futures | 3/15/2013 | CHF | 612,065 | (4,999) | |||||||||||
| Bank of America | U.S. Treasury 10-Year Note Futures | 3/19/2013 | USD | 8,920,459 | (24,115) | |||||||||||
| Barclays Capital | Wheat Futures | 5/14/2013 | USD | 40,200 | (813) | |||||||||||
|
| |||||||||||||||
| $(55,796) | ||||||||||||||||
|
| |||||||||||||||
Money Market Fund is pledged as collateral to brokers for total return swap contracts in the amount of $280,000.
Open futures contracts outstanding at December 31, 2012:
| NUMBER OF CONTRACTS | DESCRIPTION | EXPIRATION DATE | VALUE AT TRADE DATE | VALUE AT DECEMBER 31, 2012 | UNREALIZED APPRECIATION (DEPRECIATION) | |||||||||||
| Long Contracts: | ||||||||||||||||
| 1 | Cocoa Futures | May 15, 2013 | $23,502 | $22,460 | $(1,042) | |||||||||||
| 1 | Coffee ‘C’ Futures | May 20, 2013 | 56,197 | 55,013 | (1,184) | |||||||||||
| 6 | Corn Futures | March 14, 2013 | 218,978 | 209,475 | (9,503) | |||||||||||
| 4 | Corn Futures | May 14, 2013 | 140,960 | 140,050 | (910) | |||||||||||
| 1 | Cotton No. 2 Futures | March 6, 2013 | 36,635 | 37,570 | 935 | |||||||||||
| 17 | Crude Oil Financial Futures | March 19, 2013 | 1,545,780 | 1,568,590 | 22,810 | |||||||||||
| 12 | Globex Brent FCL Futures | March 12, 2013 | 1,306,810 | 1,318,680 | 11,870 | |||||||||||
| 2 | Globex Heat Oil Futures | March 27, 2013 | 252,630 | 253,411 | 781 | |||||||||||
| 2 | Globex RBOB Gas Futures | January 30, 2013 | 227,417 | 231,982 | 4,565 | |||||||||||
| 1 | Gold 100 OZ Futures | February 26, 2013 | 165,592 | 167,580 | 1,988 | |||||||||||
| 6 | ICE Euro Gasoil Futures | February 11, 2013 | 562,950 | 556,200 | (6,750) | |||||||||||
| 7 | Lean Hogs Futures | February 14, 2013 | 242,397 | 240,030 | (2,367) | |||||||||||
| 2 | Live Cattle Futures | February 28, 2013 | 105,528 | 105,840 | 312 | |||||||||||
| 1 | LME Aluminum Futures | February 6, 2013 | 47,789 | 51,380 | 3,591 | |||||||||||
| 1 | LME Aluminum Futures | February 15, 2013 | 48,942 | 51,473 | 2,531 | |||||||||||
| 1 | LME Aluminum Futures | February 21, 2013 | 48,802 | 51,535 | 2,733 | |||||||||||
| 1 | LME Aluminum Futures | March 13, 2013 | 53,336 | 51,726 | (1,610) | |||||||||||
| 1 | LME Aluminum Futures | March 14, 2013 | 53,102 | 51,737 | (1,365) | |||||||||||
| 1 | LME Aluminum Futures | March 20, 2013 | 53,195 | 51,793 | (1,402) | |||||||||||
| 2 | LME Aluminum Futures | June 19, 2013 | 107,530 | 104,900 | (2,630) | |||||||||||
| 2 | LME Copper Futures | February 6, 2013 | 383,895 | 395,949 | 12,054 | |||||||||||
| 1 | LME Copper Futures | March 4, 2013 | 200,238 | 198,156 | (2,082) | |||||||||||
| 1 | LME Copper Futures | March 14, 2013 | 202,529 | 198,218 | (4,311) | |||||||||||
| 2 | LME Copper Futures | March 20, 2013 | 400,466 | 396,513 | (3,953) | |||||||||||
| 4 | LME Copper Futures | June 19, 2013 | 807,871 | 794,875 | (12,996) | |||||||||||
| 1 | LME Lead Futures | February 20, 2013 | 54,702 | 58,000 | 3,298 | |||||||||||
| 1 | LME Lead Futures | March 20, 2013 | 56,127 | 58,175 | 2,048 | |||||||||||
| 1 | LME Lead Futures | June 19, 2013 | 57,815 | 58,525 | 710 | |||||||||||
| The accompanying notes are an integral part of these financial statements. | (Continued) |
| 50 | AQR Funds | Annual Report | December 2012 | |||||||||||||
Table of Contents
| Consolidated Schedule of Investments | December 31, 2012 |
| AQR RISK PARITY II HV FUND |
| NUMBER OF CONTRACTS | DESCRIPTION | EXPIRATION DATE | VALUE AT TRADE DATE | VALUE AT DECEMBER 31, 2012 | UNREALIZED APPRECIATION (DEPRECIATION) | |||||||||||
| Long Contracts: (continued) | ||||||||||||||||
| 1 | LME Nickel Futures | March 12, 2013 | $107,121 | $102,305 | $(4,816) | |||||||||||
| 1 | LME Nickel Futures | June 19, 2013 | 107,510 | 102,702 | (4,808) | |||||||||||
| 2 | LME Zinc Futures | February 28, 2013 | 100,423 | 103,558 | 3,135 | |||||||||||
| 3 | LME Zinc Futures | March 20, 2013 | 153,327 | 155,925 | 2,598 | |||||||||||
| 4 | LME Zinc Futures | June 19, 2013 | 208,478 | 210,350 | 1,872 | |||||||||||
| 48 | Natural Gas Swap Futures | March 26, 2013 | 416,130 | 403,800 | (12,330) | |||||||||||
| 2 | Silver Futures | March 26, 2013 | 320,791 | 302,270 | (18,521) | |||||||||||
| 6 | Soybean Futures | March 14, 2013 | 430,023 | 422,850 | (7,173) | |||||||||||
| 5 | Soybean Meal Futures | March 14, 2013 | 218,882 | 209,700 | (9,182) | |||||||||||
| 8 | Soybean Oil Futures | March 14, 2013 | 239,926 | 238,560 | (1,366) | |||||||||||
| 9 | Sugar #11 (World Markets) Futures | March 28, 2013 | 196,139 | 196,661 | 522 | |||||||||||
| 2 | Wheat Futures | March 14, 2013 | 85,559 | 77,800 | (7,759) | |||||||||||
| 1 | Wheat Futures | May 14, 2013 | 41,290 | 39,388 | (1,902) | |||||||||||
| 3 | Amsterdam Index Futures | January 18, 2013 | 271,693 | 271,725 | 32 | |||||||||||
| 9 | CAC40 10 Euro Futures | January 18, 2013 | 432,687 | 432,653 | (34) | |||||||||||
| 1 | DAX Index Futures | March 15, 2013 | 252,447 | 251,401 | (1,046) | |||||||||||
| 6 | E-Mini Russell 2000 Futures | March 15, 2013 | 501,531 | 507,960 | 6,429 | |||||||||||
| 35 | Euro Stoxx 50 Index | March 15, 2013 | 1,212,872 | 1,208,084 | (4,788) | |||||||||||
| 13 | FTSE 100 Index Futures | March 15, 2013 | 1,245,965 | 1,234,972 | (10,993) | |||||||||||
| 10 | FTSE/JSE Top 40 Index Futures | March 20, 2013 | 409,945 | 413,954 | 4,009 | |||||||||||
| 1 | FTSE/MIB Index Futures | March 15, 2013 | 106,620 | 107,602 | 982 | |||||||||||
| 3 | Hang Seng Index Futures | January 30, 2013 | 437,216 | 438,803 | 1,587 | |||||||||||
| 8 | H-SHARES Index Futures | January 30, 2013 | 584,860 | 590,954 | 6,094 | |||||||||||
| 2 | IBEX 35 Index Futures | January 18, 2013 | 212,186 | 213,066 | 880 | |||||||||||
| 5 | KOSPI Index 200 Futures | March 14, 2013 | 612,935 | 621,395 | 8,460 | |||||||||||
| 16 | MSCI Taiwan Stock Index Futures | January 30, 2013 | 435,859 | 440,000 | 4,141 | |||||||||||
| 88 | S&P 500 E-Mini Futures | March 15, 2013 | 6,249,810 | 6,248,440 | (1,370) | |||||||||||
| 6 | S&P MID 400 E-Mini Futures | March 15, 2013 | 607,175 | 610,860 | 3,685 | |||||||||||
| 1 | S&P/Toronto Stock Exchange 60 Index Futures | March 14, 2013 | 140,982 | 143,038 | 2,056 | |||||||||||
| 17 | SGX S&P CNX Nifty Index Futures | January 31, 2013 | 202,137 | 202,402 | 265 | |||||||||||
| 1 | SPI 200 Index Futures | March 21, 2013 | 118,890 | 119,838 | 948 | |||||||||||
| 9 | TOPIX Index Futures | March 7, 2013 | 822,176 | 894,962 | 72,786 | |||||||||||
| 2 | Australia 10-Year Bond Futures | March 15, 2013 | 254,938 | 256,120 | 1,182 | |||||||||||
| 56 | Euro - Bund Futures | March 7, 2013 | 10,713,661 | 10,765,301 | 51,640 | |||||||||||
| 83 | Mini Japanese 10-Year Treasury Bond | March 8, 2013 | 13,862,876 | 13,759,404 | (103,472) | |||||||||||
| 37 | U.S. Treasury 10-Year Note Futures | March 19, 2013 | 4,925,379 | 4,912,906 | (12,473) | |||||||||||
|
|
|
|
|
| |||||||||||
| 54,702,154 | 54,691,545 | (10,609) | ||||||||||||||
|
|
|
|
|
| |||||||||||
| The accompanying notes are an integral part of these financial statements. | (Continued) |
| AQR Funds | Annual Report | December 2012 | 51 | |||||||||||||
Table of Contents
| Consolidated Schedule of Investments | December 31, 2012 |
| AQR RISK PARITY II HV FUND |
| NUMBER OF CONTRACTS | DESCRIPTION | EXPIRATION DATE | VALUE AT TRADE DATE | VALUE AT DECEMBER 31, 2012 | UNREALIZED APPRECIATION (DEPRECIATION) | |||||||||||
| Short Contracts: | ||||||||||||||||
| 1 | LME Aluminum Futures | February 6, 2013 | $(47,798) | $(51,380) | $(3,582) | |||||||||||
| 1 | LME Aluminum Futures | February 15, 2013 | (48,623) | (51,473) | (2,850) | |||||||||||
| 1 | LME Aluminum Futures | February 21, 2013 | (48,785) | (51,535) | (2,750) | |||||||||||
| 1 | LME Aluminum Futures | March 13, 2013 | (53,048) | (51,726) | 1,322 | |||||||||||
| 1 | LME Aluminum Futures | March 14, 2013 | (53,258) | (51,736) | 1,522 | |||||||||||
| 1 | LME Aluminum Futures | March 20, 2013 | (53,122) | (51,793) | 1,329 | |||||||||||
| 1 | LME Aluminum Futures | June 19, 2013 | (53,772) | (52,450) | 1,322 | |||||||||||
| 2 | LME Copper Futures | February 6, 2013 | (384,497) | (395,949) | (11,452) | |||||||||||
| 1 | LME Copper Futures | March 4, 2013 | (200,250) | (198,156) | 2,094 | |||||||||||
| 1 | LME Copper Futures | March 14, 2013 | (201,961) | (198,219) | 3,742 | |||||||||||
| 2 | LME Copper Futures | March 20, 2013 | (403,845) | (396,513) | 7,332 | |||||||||||
| 1 | LME Lead Futures | February 20, 2013 | (54,548) | (58,000) | (3,452) | |||||||||||
| 1 | LME Lead Futures | March 20, 2013 | (57,497) | (58,175) | (678) | |||||||||||
| 1 | LME Nickel Futures | March 12, 2013 | (107,068) | (102,304) | 4,764 | |||||||||||
| 2 | LME Zinc Futures | February 28, 2013 | (101,097) | (103,557) | (2,460) | |||||||||||
| 3 | LME Zinc Futures | March 20, 2013 | (154,905) | (155,925) | (1,020) | |||||||||||
|
|
|
|
|
| |||||||||||
| (2,024,074) | (2,028,891) | (4,817) | ||||||||||||||
|
|
|
|
|
| |||||||||||
| $52,678,080 | $52,662,654 | $(15,426) | ||||||||||||||
|
|
|
|
|
| |||||||||||
Cash held as collateral with broker for futures contracts was $1,805,945 at December 31, 2012.
Forward foreign currency exchange contracts outstanding as of December 31, 2012:
| PURCHASE CONTRACTS | COUNTERPARTY | CURRENCY | CURRENCY AMOUNT PURCHASED | VALUE AT SETTLEMENT DATE | VALUE AT DECEMBER 31, 2012 | UNREALIZED APPRECIATION (DEPRECIATION) | ||||||||||||||
| Swiss Franc, Expiring 03/20/13 | The Royal Bank of Scotland | CHF | 7,000 | $7,647 | $7,664 | $17 | ||||||||||||||
| Japanese Yen, Expiring 03/21/13 | The Royal Bank of Scotland | JPY | 14,000 | 170 | 162 | (8) | ||||||||||||||
|
|
|
|
|
| |||||||||||||||
| 7,817 | 7,826 | 9 | ||||||||||||||||||
|
|
|
|
|
| |||||||||||||||
| SALES CONTRACTS | COUNTERPARTY | CURRENCY | CURRENCY AMOUNT SOLD | VALUE AT SETTLEMENT DATE | VALUE AT DECEMBER 31, 2012 | UNREALIZED APPRECIATION (DEPRECIATION) | ||||||||||||||
| Euro, Expiring 03/20/13 | The Royal Bank of Scotland | EUR | (5,554,000) | $(7,263,459) | $(7,335,989) | $(72,530) | ||||||||||||||
| British Pound, Expiring 03/20/13 | The Royal Bank of Scotland | GBP | (1,842,000) | (2,966,920) | (2,991,516) | (24,596) | ||||||||||||||
| Japanese Yen, Expiring 03/21/13 | The Royal Bank of Scotland | JPY | (26,000) | (311) | (300) | 11 | ||||||||||||||
| Russian Ruble, Expiring 03/20/13* | The Royal Bank of Scotland | RUB | (7,297,000) | (234,725) | (235,850) | (1,125) | ||||||||||||||
|
|
|
|
|
| |||||||||||||||
| (10,465,415) | (10,563,655) | (98,240) | ||||||||||||||||||
|
|
|
|
|
| |||||||||||||||
| $(10,457,598) | $(10,555,829) | $(98,231) | ||||||||||||||||||
|
|
|
|
|
| |||||||||||||||
| The accompanying notes are an integral part of these financial statements. | (Continued) |
| 52 | AQR Funds | Annual Report | December 2012 | |||||||||||||
Table of Contents
| Consolidated Schedule of Investments | December 31, 2012 |
| AQR RISK PARITY II HV FUND |
Cash held as collateral with broker for forward currency exchange contracts was $120,000 at December 31, 2012.
| * | Non deliverable forward. See Note 3 in the Notes to Financial Statements. |
BRL - Brazilian Real
CHF - Swiss Franc
EUR - Euro
GBP - British Pound
JPY - Japanese Yen
RUB - Russian Ruble
| The accompanying notes are an integral part of these financial statements. |
| AQR Funds | Annual Report | December 2012 | 53 | |||||||||||||
Table of Contents
| Consolidated Schedule of Investments | December 31, 2012 |
| LONG INVESTMENTS - 112.3% | SHARES | VALUE (Note 3) | ||||||
| COMMON STOCKS - 45.1% | ||||||||
| Belgium - 0.6% | ||||||||
| Anheuser-Busch InBev NV (a) | 11,804 | $ | 1,027,946 | |||||
| Belgacom SA (a) | 13,651 | 401,497 | ||||||
| Mobistar SA (a) | 3,860 | 99,221 | ||||||
| Solvay SA (a) | 7,968 | 1,159,440 | ||||||
| UCB SA (a) | 18,818 | 1,078,053 | ||||||
| Umicore SA (a) | 26,106 | 1,445,567 | ||||||
|
| |||||||
| 5,211,724 | ||||||||
|
| |||||||
| Brazil - 0.9% | ||||||||
| Amil Participacoes SA (1)(a) | 18,635 | 280,776 | ||||||
| Banco Bradesco SA ADR (1)(c) | 14,000 | 243,180 | ||||||
| Banco do Brasil SA (1)(a) | 28,200 | 352,586 | ||||||
| BM&FBovespa SA (1)(a) | 29,600 | 202,393 | ||||||
| BR Malls Participacoes SA (1)(a) | 13,300 | 175,515 | ||||||
| Braskem SA ADR (1)(c) | 7,200 | 96,120 | ||||||
| CCR SA (1)(a) | 28,800 | 273,582 | ||||||
| Cia Brasileira de Distribuicao Grupo Pao de Acucar ADR (1)(c) | 8,400 | 372,876 | ||||||
| Cia de Bebidas das Americas ADR (1)(a)(c) | 17,900 | 751,621 | ||||||
| Cia de Saneamento Basico do Estado de Sao Paulo ADR (1)(c) | 4,600 | 384,422 | ||||||
| Cia Energetica de Minas Gerais ADR (1)(a)(c) | 63,475 | 689,339 | ||||||
| Cielo SA (1)(a) | 80 | 2,227 | ||||||
| Itau Unibanco Holding SA ADR (1)(c) | 14,300 | 235,378 | ||||||
| JBS SA (1)†(a) | 175,993 | 515,730 | ||||||
| Multiplan Empreendimentos Imobiliarios SA (1)(a) | 1,400 | 41,162 | ||||||
| Natura Cosmeticos SA (1)(a) | 23,300 | 667,308 | ||||||
| Petroleo Brasileiro SA ADR (1)(c) | 5,500 | 106,150 | ||||||
| Porto Seguro SA (1)(a) | 34,900 | 400,391 | ||||||
| Tim Participacoes SA ADR (1)(c) | 19,700 | 390,454 | ||||||
| Vale SA ADR (1)(c) | 63,300 | 1,284,990 | ||||||
|
| |||||||
| 7,466,200 | ||||||||
|
| |||||||
| Chile - 0.1% | ||||||||
| Banco Santander Chile ADR (1)(c) | 36 | 1,026 | ||||||
| CAP SA (1)(a) | 2,254 | 75,588 | ||||||
| Enersis SA ADR (1)(c) | 27,300 | 497,406 | ||||||
| ENTEL Chile SA (1)(a) | 18,283 | 378,045 | ||||||
| SACI Falabella (1)(a) | 14,803 | 152,479 | ||||||
|
| |||||||
| 1,104,544 | ||||||||
|
| |||||||
| China - 1.1% | ||||||||
| Agricultural Bank of China Ltd., H Shares (a) | 225,000 | 113,545 | ||||||
| Bank of China Ltd., H Shares (a) | 2,190,000 | 991,813 | ||||||
| Bank of Communications Co., Ltd., H Shares (a) | 126,000 | 96,358 | ||||||
| China BlueChemical Ltd., H Shares (a) | 476,000 | 324,708 | ||||||
| China Citic Bank Corp. Ltd., H Shares (a) | 353,000 | 213,925 | ||||||
| China Communications Services Corp. Ltd., H Shares (a) | 130,000 | 75,969 | ||||||
| China Construction Bank Corp., H Shares (a) | 1,951,000 | 1,594,381 | ||||||
| China Merchants Bank Co. Ltd., H Shares (a) | 35,500 | 79,816 | ||||||
| SHARES | VALUE (Note 3) | |||||||
| China - 1.1% (continued) | ||||||||
| China Oilfield Services Ltd., H Shares (a) | 200,000 | $ | 419,354 | |||||
| China Petroleum & Chemical Corp. ADR (1)(c) | 4,400 | 505,648 | ||||||
| China Railway Construction Corp. Ltd., H Shares (a) | 353,000 | 408,364 | ||||||
| China Railway Group Ltd., H Shares (a) | 1,040,000 | 618,403 | ||||||
| China Shanshui Cement Group Ltd. (a) | 399,000 | 298,586 | ||||||
| China Telecom Corp. Ltd., H Shares (a) | 678,000 | 383,372 | ||||||
| China Zhongwang Holdings Ltd. (a) | 186 | 70 | ||||||
| Chongqing Rural Commercial Bank, H Shares (a) | 598,000 | 333,817 | ||||||
| CNOOC Ltd. ADR (1)(c) | 5,500 | 1,210,000 | ||||||
| Country Garden Holdings Co., Ltd. †(a) | 83,000 | 44,344 | ||||||
| Dongfeng Motor Group Co., Ltd., H Shares (a) | 106,000 | 166,887 | ||||||
| Evergrande Real Estate Group Ltd. (a) | 98,000 | 55,278 | ||||||
| Industrial & Commercial Bank of China Ltd., H Shares (a) | 1,051,000 | 758,587 | ||||||
| Longfor Properties Co., Ltd. (a) | 19,000 | 37,777 | ||||||
| Parkson Retail Group Ltd. (a) | 30,500 | 24,790 | ||||||
| PetroChina Co., Ltd. ADR (1)(c) | 500 | 71,890 | ||||||
| Sino-Ocean Land Holdings Ltd. (a) | 27,000 | 20,534 | ||||||
| Sinopharm Group Co. Ltd., H Shares (a) | 40,000 | 127,021 | ||||||
| SOHO China Ltd. (a) | 39,000 | 31,713 | ||||||
| Tencent Holdings Ltd. (a) | 2,600 | 85,271 | ||||||
| Zhaojin Mining Industry Co. Ltd., H Shares (a) | 263,500 | 421,754 | ||||||
| Zhejiang Expressway Co., Ltd., H Shares (a) | 164,000 | 129,727 | ||||||
|
| |||||||
| 9,643,702 | ||||||||
|
| |||||||
| Denmark - 0.9% | ||||||||
| AP Moeller - Maersk A/S, Class B (a) | 152 | 1,151,044 | ||||||
| Carlsberg A/S, Class B (a) | 7,693 | 757,887 | ||||||
| Chr Hansen Holding A/S (a) | 4,798 | 156,256 | ||||||
| Coloplast A/S, Class B (a) | 6,378 | 312,778 | ||||||
| DSV A/S (a) | 36,875 | 954,046 | ||||||
| GN Store Nord A/S (a) | 48,101 | 699,051 | ||||||
| Novo Nordisk A/S, Class B (a) | 18,809 | 3,062,795 | ||||||
| Vestas Wind Systems A/S† (a) | 112,305 | 635,515 | ||||||
|
| |||||||
| 7,729,372 | ||||||||
|
| |||||||
| Finland - 0.6% | ||||||||
| Fortum OYJ (a) | 9,820 | 183,840 | ||||||
| Kone OYJ, Class B (a) | 11,901 | 880,194 | ||||||
| Metso OYJ (a) | 57,003 | 2,433,558 | ||||||
| Outotec OYJ (a) | 16,159 | 912,919 | ||||||
| Sampo OYJ, A Shares (a) | 695 | 22,508 | ||||||
| Stora Enso OYJ, R Shares (a) | 86,624 | 606,317 | ||||||
|
| |||||||
| 5,039,336 | ||||||||
|
| |||||||
| Germany - 4.2% | ||||||||
| Adidas AG (a) | 4,256 | 379,845 | ||||||
| Aurubis AG (a) | 36,587 | 2,617,380 | ||||||
| Bayer AG (a) | 53,677 | 5,118,734 | ||||||
| Bilfinger SE (a) | 30,770 | 2,983,503 | ||||||
| Brenntag AG (a) | 5,440 | 716,694 | ||||||
| Continental AG (a) | 3,648 | 425,186 | ||||||
| The accompanying notes are an integral part of these financial statements. | (Continued) |
| 54 | AQR Funds | Annual Report | December 2012 | |||||||||||||
Table of Contents
| Consolidated Schedule of Investments | December 31, 2012 |
| AQR MULTI-STRATEGY ALTERNATIVE FUND |
| SHARES | VALUE (Note 3) | |||||||
| Germany - 4.2% (continued) | ||||||||
| Deutsche Lufthansa AG (a) | 62,190 | $ | 1,175,657 | |||||
| Deutsche Post AG (a) | 166,189 | 3,660,396 | ||||||
| E.ON SE (a) | 132,800 | 2,490,800 | ||||||
| Freenet AG (a) | 40,893 | 757,889 | ||||||
| GEA Group AG (a) | 50,273 | 1,634,662 | ||||||
| Hannover Rueckversicherung AG (a) | 5,061 | 396,396 | ||||||
| HeidelbergCement AG (a) | 5,874 | 359,440 | ||||||
| Hochtief AG †(a) | 9,199 | 538,081 | ||||||
| Kabel Deutschland Holding AG (a) | 5,813 | 437,519 | ||||||
| Lanxess AG (a) | 3,174 | 279,881 | ||||||
| Leoni AG (a) | 46,512 | 1,769,493 | ||||||
| Linde AG (a) | 83 | 14,521 | ||||||
| Merck KGaA (a) | 28,985 | 3,820,070 | ||||||
| Metro AG (a) | 20,738 | 576,129 | ||||||
| Muenchener Rueckversicherungs AG (a) | 4,419 | 797,752 | ||||||
| Rheinmetall AG (a) | 19,017 | 923,838 | ||||||
| Rhoen Klinikum AG (a) | 38,413 | 774,210 | ||||||
| Salzgitter AG (a) | 6,501 | 340,708 | ||||||
| SAP AG (a) | 8,238 | 662,439 | ||||||
| Software AG (a) | 4,160 | 177,471 | ||||||
| Suedzucker AG (a) | 24,757 | 1,016,202 | ||||||
| TUI AG †(a) | 85,238 | 891,360 | ||||||
|
| |||||||
| 35,736,256 | ||||||||
|
| |||||||
| Hong Kong - 0.6% | ||||||||
| China Gas Holdings Ltd. (a) | 206,000 | 163,367 | ||||||
| China Mengniu Dairy Co., Ltd. (a) | 282,000 | 806,059 | ||||||
| China Mobile Ltd. ADR (1)(c) | 33,200 | 1,949,504 | ||||||
| China Overseas Land & Investment Ltd. (a) | 132,000 | 401,337 | ||||||
| China Resources Land Ltd. (a) | 66,000 | 182,866 | ||||||
| COSCO Pacific Ltd. (a) | 152,000 | 220,395 | ||||||
| GOME Electrical Appliances Holding Ltd. †(a) | 8,793,000 | 1,063,946 | ||||||
| Huabao International Holdings Ltd. (a) | 135,000 | 67,571 | ||||||
| Shimao Property Holdings Ltd. (a) | 38,000 | 73,355 | ||||||
| Shougang Fushan Resources Group Ltd. (a) | 1,130,000 | 424,114 | ||||||
|
| |||||||
| 5,352,514 | ||||||||
|
| |||||||
| India - 0.4% | ||||||||
| Dr Reddy’s Laboratories Ltd. ADR (1)(a)(c) | 9,600 | 319,584 | ||||||
| HDFC Bank Ltd. ADR (1)(c) | 7,500 | 305,400 | ||||||
| ICICI Bank Ltd. ADR (1)(c) | 6,000 | 261,660 | ||||||
| Infosys Ltd. ADR (1)(a)(c) | 22,400 | 947,520 | ||||||
| Tata Motors Ltd. ADR (1)(c) | 33,300 | 956,376 | ||||||
| Wipro Ltd. ADR (1)(c) | 19,200 | 168,192 | ||||||
|
| |||||||
| 2,958,732 | ||||||||
|
| |||||||
| Indonesia - 0.4% | ||||||||
| Astra Agro Lestari Tbk PT (a) | 11,000 | 22,586 | ||||||
| Bank Rakyat Indonesia Persero Tbk PT (a) | 349,500 | 253,476 | ||||||
| Bumi Resources Tbk PT (a) | 4,587,500 | 282,983 | ||||||
| Indo Tambangraya Megah Tbk PT (a) | 24,500 | 106,062 | ||||||
| Indocement Tunggal Prakarsa Tbk PT (a) | 153,500 | 358,583 | ||||||
| Indofood Sukses Makmur Tbk PT (a) | 1,378,000 | 838,243 | ||||||
| Kalbe Farma Tbk PT (a) | 735,000 | 80,999 | ||||||
| Perusahaan Gas Negara Persero Tbk PT (a) | 851,000 | 407,495 | ||||||
| SHARES | VALUE (Note 3) | |||||||
| Indonesia - 0.4% (continued) | ||||||||
| Telekomunikasi Indonesia Persero Tbk PT ADR (1)(c) | 10,900 | $ | 402,755 | |||||
| Unilever Indonesia Tbk PT (a) | 150,000 | 325,203 | ||||||
|
| |||||||
| 3,078,385 | ||||||||
|
| |||||||
| Italy - 2.0% | ||||||||
| Ansaldo STS SpA (a) | 2,945 | 27,565 | ||||||
| Banca Popolare dell’Emilia Romagna Scrl (a) | 169,001 | 1,174,478 | ||||||
| Enel SpA (a) | 1,157,333 | 4,813,903 | ||||||
| Eni SpA (a) | 109,656 | 2,686,299 | ||||||
| Fiat Industrial SpA (a) | 6,608 | 72,394 | ||||||
| Fiat SpA †(a) | 406,446 | 2,047,436 | ||||||
| Impregilo SpA (a) | 232,772 | 1,091,150 | ||||||
| Lottomatica Group SpA (a) | 10,876 | 248,502 | ||||||
| Prysmian SpA (a) | 98,447 | 1,965,098 | ||||||
| Saipem SpA (a) | 1,060 | 41,290 | ||||||
| Telecom Italia SpA (a) | 2,598,844 | 2,357,322 | ||||||
|
| |||||||
| 16,525,437 | ||||||||
|
| |||||||
| Japan - 21.2% | ||||||||
| Acom Co., Ltd. †(a) | 11,480 | 330,663 | ||||||
| Aeon Co., Ltd. (a) | 3,400 | 38,857 | ||||||
| Air Water, Inc. (a) | 7,000 | 89,592 | ||||||
| Aisin Seiki Co., Ltd. (a) | 5,800 | 181,117 | ||||||
| Ajinomoto Co., Inc. (a) | 160,000 | 2,117,194 | ||||||
| All Nippon Airways Co., Ltd. (a) | 319,000 | 670,187 | ||||||
| Alps Electric Co., Ltd. (a) | 156,900 | 949,835 | ||||||
| Amada Co., Ltd. (a) | 130,000 | 845,917 | ||||||
| Anritsu Corp. (a) | 30,000 | 356,399 | ||||||
| Aozora Bank Ltd. (a) | 27,000 | 83,017 | ||||||
| Asahi Group Holdings Ltd. (a) | 5,100 | 108,593 | ||||||
| Asahi Kasei Corp. (a) | 397,000 | 2,347,505 | ||||||
| Astellas Pharma, Inc. (a) | 87,900 | 3,952,124 | ||||||
| Azbil Corp. (a) | 45,700 | 924,234 | ||||||
| Bank of Yokohama Ltd./The (a) | 54,000 | 251,079 | ||||||
| Bridgestone Corp. (a) | 40,800 | 1,062,088 | ||||||
| Brother Industries Ltd. (a) | 27,000 | 290,667 | ||||||
| Calsonic Kansei Corp. (a) | 227,000 | 934,873 | ||||||
| Casio Computer Co., Ltd. (a) | 151,900 | 1,333,260 | ||||||
| Central Japan Railway Co. (a) | 16,500 | 1,339,132 | ||||||
| Chiba Bank Ltd./The (a) | 112,000 | 656,114 | ||||||
| Chiyoda Corp. (a) | 246,000 | 3,523,992 | ||||||
| Chubu Electric Power Co., Inc. (a) | 196,900 | 2,627,583 | ||||||
| Chugai Pharmaceutical Co., Ltd. (a) | 64,000 | 1,226,246 | ||||||
| Citizen Holdings Co., Ltd. (a) | 90,600 | 478,588 | ||||||
| COMSYS Holdings Corp. (a) | 118,000 | 1,515,545 | ||||||
| Dai Nippon Printing Co., Ltd. (a) | 68,000 | 533,218 | ||||||
| Daicel Corp. (a) | 131,000 | 866,741 | ||||||
| Daido Steel Co., Ltd. (a) | 25,000 | 126,769 | ||||||
| Daihatsu Motor Co., Ltd. (a) | 47,000 | 936,374 | ||||||
| Daiichi Sankyo Co., Ltd. (a) | 58,100 | 891,964 | ||||||
| Dainippon Sumitomo Pharma Co., Ltd. (a) | 27,800 | 333,982 | ||||||
| Denki Kagaku Kogyo KK | 79,852 | 273,396 | ||||||
| Denso Corp. (a) | 40,500 | 1,410,381 | ||||||
| Dentsu, Inc. (a) | 81,200 | 2,175,000 | ||||||
| DIC Corp. (a) | 510,000 | 946,325 | ||||||
| East Japan Railway Co. (a) | 31,300 | 2,023,988 | ||||||
| The accompanying notes are an integral part of these financial statements. | (Continued) |
| AQR Funds | Annual Report | December 2012 | 55 | |||||||||||||
Table of Contents
| Consolidated Schedule of Investments | December 31, 2012 |
| AQR MULTI-STRATEGY ALTERNATIVE FUND |
| SHARES | VALUE (Note 3) | |||||||
| Japan - 21.2% (continued) | ||||||||
| Ebara Corp. (a) | 366,000 | $ | 1,540,259 | |||||
| Exedy Corp. (a) | 7,700 | 170,805 | ||||||
| FamilyMart Co., Ltd. (a) | 7,900 | 325,465 | ||||||
| Fuji Electric Co., Ltd. (a) | 446,000 | 1,097,344 | ||||||
| Fuji Heavy Industries Ltd. (a) | 222,000 | 2,799,491 | ||||||
| Fuji Media Holdings, Inc. (a) | 998 | 1,508,441 | ||||||
| Fujikura Ltd. (a) | 279,000 | 870,872 | ||||||
| Fujitsu Ltd. (a) | 678,000 | 2,843,515 | ||||||
| Fukuoka Financial Group, Inc. (a) | 390,000 | 1,561,861 | ||||||
| Hamamatsu Photonics KK (a) | 1,100 | 39,995 | ||||||
| Hino Motors Ltd. (a) | 114,000 | 1,030,425 | ||||||
| Hitachi High-Technologies Corp. (a) | 88,800 | 1,837,596 | ||||||
| Hitachi Ltd. (a) | 546,000 | 3,212,941 | ||||||
| Hokkaido Electric Power Co., Inc. (a) | 23,700 | 287,712 | ||||||
| Hokuetsu Kishu Paper Co., Ltd. (a) | 153,000 | 887,966 | ||||||
| Hoya Corp. (a) | 14,700 | 289,648 | ||||||
| Idemitsu Kosan Co., Ltd. (a) | 3,600 | 313,698 | ||||||
| IHI Corp. (a) | 800,000 | 2,074,485 | ||||||
| Inpex Corp. (a) | 14 | 74,877 | ||||||
| Isetan Mitsukoshi Holdings Ltd. (a) | 78,800 | 771,165 | ||||||
| Isuzu Motors Ltd. (a) | 221,000 | 1,318,801 | ||||||
| ITOCHU Corp. (a) | 70,100 | 740,894 | ||||||
| Itochu Techno-Solutions Corp. (a) | 1,900 | 78,239 | ||||||
| J Front Retailing Co., Ltd. (a) | 177,000 | 980,997 | ||||||
| Japan Petroleum Exploration Co. (a) | 7,900 | 279,008 | ||||||
| Japan Tobacco, Inc. (a) | 130,400 | 3,683,719 | ||||||
| JGC Corp. (a) | 198,000 | 6,169,971 | ||||||
| JSR Corp. (a) | 8,900 | 169,880 | ||||||
| JTEKT Corp. (a) | 227,000 | 2,164,089 | ||||||
| Kajima Corp. (a) | 610,000 | 2,018,300 | ||||||
| Kaken Pharmaceutical Co., Ltd. (a) | 173 | 2,545 | ||||||
| Kandenko Co., Ltd. (a) | 292 | 1,313 | ||||||
| Kao Corp. (a) | 47,900 | 1,248,157 | ||||||
| KDDI Corp. (a) | 3,200 | 226,231 | ||||||
| Keio Corp. (a) | 65,000 | 484,582 | ||||||
| Keisei Electric Railway Co., Ltd. (a) | 98,000 | 827,003 | ||||||
| Keyence Corp. (a) | 200 | 55,465 | ||||||
| Kobe Steel Ltd. (a) | 935,000 | 1,194,677 | ||||||
| Konami Corp. (a) | 34,600 | 779,168 | ||||||
| Konica Minolta Holdings, Inc. (a) | 333,000 | 2,396,379 | ||||||
| Kuraray Co., Ltd. (a) | 17,700 | 232,032 | ||||||
| Kurita Water Industries Ltd. (a) | 22,000 | 483,143 | ||||||
| KYB Co., Ltd. (a) | 61,000 | 248,542 | ||||||
| Kyocera Corp. (a) | 8,400 | 761,589 | ||||||
| Kyowa Hakko Kirin Co., Ltd. (a) | 65,000 | 641,239 | ||||||
| Lintec Corp. (a) | 23,700 | 443,538 | ||||||
| Marubeni Corp. (a) | 28,000 | 200,907 | ||||||
| Marui Group Co., Ltd. (a) | 12,800 | 102,255 | ||||||
| Miraca Holdings, Inc. (a) | 19,500 | 786,255 | ||||||
| Mitsubishi Chemical Holdings Corp. (a) | 146,000 | 727,311 | ||||||
| Mitsubishi Corp. (a) | 5,800 | 111,667 | ||||||
| Mitsubishi Electric Corp. (a) | 220,000 | 1,873,158 | ||||||
| Mitsubishi Heavy Industries, Ltd. (a) | 175,000 | 846,515 | ||||||
| Mitsubishi Materials Corp. (a) | 447,000 | 1,528,147 | ||||||
| Mitsubishi Motors Corp. †(a) | 578,000 | 597,590 | ||||||
| Mitsubishi UFJ Financial Group, Inc. (a) | 296,600 | 1,604,936 | ||||||
| Mitsubishi UFJ Lease & Finance Co., Ltd. (a) | 14,730 | 633,629 | ||||||
| SHARES | VALUE (Note 3) | |||||||
| Japan - 21.2% (continued) | ||||||||
| Mitsui & Co., Ltd. (a) | 95,700 | $ | 1,434,434 | |||||
| Mitsui Engineering & Shipbuilding Co., Ltd. (a) | 390,000 | 601,684 | ||||||
| Mitsui Mining & Smelting Co., Ltd. (a) | 485,000 | 1,197,325 | ||||||
| Mizuho Financial Group, Inc. (a) | 1,323,300 | 2,426,252 | ||||||
| Nachi-Fujikoshi Corp. (a) | 31,000 | 126,664 | ||||||
| Namco Bandai Holdings, Inc. (a) | 120,500 | 1,561,945 | ||||||
| NET One Systems Co., Ltd. (a) | 196,600 | 1,941,293 | ||||||
| NGK Spark Plug Co., Ltd. (a) | 40,000 | 532,853 | ||||||
| NHK Spring Co., Ltd. (a) | 194,400 | 1,601,858 | ||||||
| Nippon Electric Glass Co., Ltd. (a) | 10,000 | 56,940 | ||||||
| Nippon Express Co., Ltd. (a) | 151,000 | 623,968 | ||||||
| Nippon Kayaku Co., Ltd. (a) | 88,000 | 970,069 | ||||||
| Nippon Meat Packers, Inc. (a) | 40,000 | 554,480 | ||||||
| Nippon Paper Group, Inc. (a) | 10,500 | 145,889 | ||||||
| Nippon Sheet Glass Co., Ltd. (a) | 435,000 | 575,135 | ||||||
| Nippon Shokubai Co., Ltd. (a) | 97,000 | 993,583 | ||||||
| Nippon Television Network Corp. (a) | 54,700 | 731,219 | ||||||
| Nisshin Seifun Group, Inc. (a) | 35,500 | 444,252 | ||||||
| Nisshinbo Holdings, Inc. (a) | 72,000 | 609,433 | ||||||
| Nitto Denko Corp. (a) | 17,100 | 842,152 | ||||||
| North Pacific Bank Ltd. †(a) | 34 | 96 | ||||||
| NSK Ltd. (a) | 79,000 | 562,136 | ||||||
| NTT DOCOMO, Inc. (a) | 518 | 746,707 | ||||||
| Obayashi Corp. (a) | 537,000 | 3,027,666 | ||||||
| Odakyu Electric Railway Co., Ltd. (a) | 22,000 | 228,893 | ||||||
| Okinawa Electric Power Co., Inc./The (a) | 2 | 62 | ||||||
| OKUMA Corp. (a) | 128,000 | 883,356 | ||||||
| Osaka Gas Co., Ltd. (a) | 802,000 | 2,913,124 | ||||||
| Otsuka Holdings Co., Ltd. (a) | 33,500 | 943,738 | ||||||
| Pacific Metals Co., Ltd. (a) | 134,000 | 634,993 | ||||||
| Pioneer Corp. †(a) | 366,500 | 918,233 | ||||||
| Rengo Co., Ltd. (a) | 49,000 | 247,469 | ||||||
| Resona Holdings, Inc. (a) | 687,200 | 3,142,133 | ||||||
| Rohm Co., Ltd. (a) | 3,100 | 101,338 | ||||||
| Ryohin Keikaku Co., Ltd. (a) | 6,600 | 369,124 | ||||||
| Sankyo Co., Ltd. (a) | 11,100 | 440,448 | ||||||
| Santen Pharmaceutical Co., Ltd. (a) | 18,200 | 699,116 | ||||||
| Sapporo Holdings Ltd. (a) | 174,000 | 563,577 | ||||||
| Secom Co., Ltd. (a) | 39,400 | 1,985,060 | ||||||
| Sega Sammy Holdings, Inc. (a) | 51,600 | 870,973 | ||||||
| Sekisui Chemical Co., Ltd. (a) | 187,000 | 1,631,333 | ||||||
| Seven & I Holdings Co., Ltd. (a) | 171,200 | 4,826,260 | ||||||
| Shimadzu Corp. (a) | 27,000 | 184,241 | ||||||
| Shimamura Co., Ltd. (a) | 9,100 | 884,300 | ||||||
| Shimizu Corp. (a) | 308,000 | 1,157,809 | ||||||
| Shinsei Bank Ltd. (a) | 911,000 | 1,823,401 | ||||||
| Shionogi & Co., Ltd. (a) | 25,800 | 429,927 | ||||||
| Showa Denko KK | 163,618 | 250,078 | ||||||
| Sojitz Corp. (a) | 476,300 | 704,229 | ||||||
| Square Enix Holdings Co., Ltd. (a) | 45,200 | 574,988 | ||||||
| Sumitomo Bakelite Co., Ltd. (a) | 68,000 | 284,767 | ||||||
| Sumitomo Corp. (a) | 47,900 | 614,548 | ||||||
| Sumitomo Electric Industries Ltd. (a) | 84,300 | 974,409 | ||||||
| Sumitomo Heavy Industries Ltd. (a) | 716,000 | 3,431,452 | ||||||
| Sumitomo Metal Mining Co., Ltd. (a) | 159,000 | 2,244,425 | ||||||
| Sumitomo Mitsui Trust Holdings, Inc. (a) | 136,000 | 479,170 | ||||||
| The accompanying notes are an integral part of these financial statements. | (Continued) |
| 56 | AQR Funds | Annual Report | December 2012 | |||||||||||||
Table of Contents
| Consolidated Schedule of Investments | December 31, 2012 |
| AQR MULTI-STRATEGY ALTERNATIVE FUND |
| SHARES | VALUE (Note 3) | |||||||
| Japan - 21.2% (continued) | ||||||||
| Sumitomo Osaka Cement Co., Ltd. (a) | 106,000 | $ | 386,036 | |||||
| Suzuki Motor Corp. (a) | 129,100 | 3,378,330 | ||||||
| T&D Holdings, Inc. (a) | 44,700 | 544,235 | ||||||
| Taisei Corp. (a) | 608,000 | 2,021,767 | ||||||
| Takara Holdings, Inc. (a) | 24 | 191 | ||||||
| Takashimaya Co., Ltd. (a) | 206,000 | 1,465,913 | ||||||
| THK Co., Ltd. (a) | 31,000 | 557,557 | ||||||
| Tobu Railway Co., Ltd. (a) | 8,000 | 42,425 | ||||||
| Toho Gas Co., Ltd. (a) | 9,000 | 48,262 | ||||||
| Tokyo Gas Co., Ltd. (a) | 483,000 | 2,206,854 | ||||||
| Tokyo Steel Manufacturing Co., Ltd. (a) | 187,300 | 916,459 | ||||||
| Tokyu Corp. (a) | 17,000 | 95,773 | ||||||
| Toppan Printing Co., Ltd. (a) | 148,000 | 917,471 | ||||||
| Toray Industries, Inc. (a) | 39,000 | 239,578 | ||||||
| Tosoh Corp. (a) | 254,000 | 611,127 | ||||||
| Toyo Seikan Kaisha Ltd. (a) | 26,200 | 353,058 | ||||||
| Toyo Suisan Kaisha Ltd. (a) | 16,000 | 426,300 | ||||||
| Toyota Boshoku Corp. (a) | 20,900 | 242,323 | ||||||
| Toyota Tsusho Corp. (a) | 76,000 | 1,875,891 | ||||||
| Ube Industries Ltd. (a) | 148,000 | 355,530 | ||||||
| UNY Co., Ltd. (a) | 261,300 | 1,936,288 | ||||||
| Ushio, Inc. (a) | 9,200 | 100,885 | ||||||
| USS Co., Ltd. (a) | 10,070 | 1,048,585 | ||||||
| West Japan Railway Co. (a) | 48,800 | 1,922,557 | ||||||
| Yamaguchi Financial Group, Inc. (a) | 56 | 495 | ||||||
| Yamaha Corp. (a) | 77,900 | 826,198 | ||||||
| Yamazaki Baking Co., Ltd. (a) | 38,000 | 423,422 | ||||||
| Yokohama Rubber Co., Ltd./The (a) | 121,000 | 877,126 | ||||||
| Zeon Corp. (a) | 26,000 | 225,450 | ||||||
|
| |||||||
| 180,724,064 | ||||||||
|
| |||||||
| Korea, Republic of - 1.0% | ||||||||
| BS Financial Group, Inc. †(a) | 11,900 | 147,554 | ||||||
| Daelim Industrial Co., Ltd. †(a) | 5,679 | 465,146 | ||||||
| DGB Financial Group, Inc. †(a) | 6,960 | 94,954 | ||||||
| Dongbu Insurance Co., Ltd. (a) | 5,516 | 238,303 | ||||||
| Dongkuk Steel Mill Co., Ltd. †(a) | 11,380 | 146,885 | ||||||
| Hanwha Corp. †(a) | 7,850 | 251,691 | ||||||
| Hanwha Life Insurance Co., Ltd. (a) | 45,280 | 327,102 | ||||||
| Hyundai Motor Co. †(a) | 239 | 49,268 | ||||||
| Hyundai Wia Corp. †(a) | 1,973 | 321,372 | ||||||
| KB Financial Group, Inc. †(a) | 2,900 | 103,585 | ||||||
| KCC Corp. (a) | 1,159 | 323,909 | ||||||
| Kia Motors Corp. †(a) | 5,038 | 267,889 | ||||||
| Korea Exchange Bank† (a) | 10,460 | 74,834 | ||||||
| Korea Gas Corp. †(a) | 3,240 | 227,899 | ||||||
| Korean Air Lines Co., Ltd. †(a) | 2 | 85 | ||||||
| KP Chemical Corp. (3)†(a)(d) | 880 | 10,461 | ||||||
| KT Corp. ADR (1)(a)(c) | 36,100 | 604,314 | ||||||
| LG Chem Ltd. †(a) | 1,460 | 456,326 | ||||||
| LG Corp. †(a) | 7,449 | 456,323 | ||||||
| LG Display Co., Ltd. ADR (1)(c) | 66,200 | 958,576 | ||||||
| LG Electronics, Inc. †(a) | 5,486 | 380,748 | ||||||
| Mirae Asset Securities Co., Ltd. (a) | 4,480 | 150,520 | ||||||
| Samsung Card Co., Ltd. †(a) | 5,357 | 183,606 | ||||||
| Samsung Heavy Industries Co., Ltd. †(a) | 9,240 | 337,613 | ||||||
| Shinsegae Co., Ltd. †(a) | 544 | 110,957 | ||||||
| SK Holdings Co., Ltd. †(a) | 5,566 | 941,316 | ||||||
| SHARES | VALUE (Note 3) | |||||||
| Korea, Republic of - 1.0% (continued) | ||||||||
| SK Networks Co., Ltd. †(a) | 12,660 | $ | 100,343 | |||||
| Woori Finance Holdings Co., Ltd. †(a) | 42,830 | 477,765 | ||||||
|
| |||||||
| 8,209,344 | ||||||||
|
| |||||||
| Luxembourg - 0.2% | ||||||||
| APERAM (a) | 120,201 | 1,834,619 | ||||||
|
| |||||||
| Malaysia - 0.4% | ||||||||
| Alliance Financial Group Bhd (a) | 144,900 | 209,248 | ||||||
| AMMB Holdings Bhd (a) | 142,400 | 317,373 | ||||||
| CIMB Group Holdings Bhd (a) | 145,800 | 364,955 | ||||||
| DiGi.Com Bhd (a) | 132,400 | 230,111 | ||||||
| Hong Leong Bank Bhd (a) | 19,200 | 93,049 | ||||||
| Malayan Banking Bhd (a) | 171,900 | 518,456 | ||||||
| Petronas Chemicals Group Bhd (a) | 52,800 | 110,797 | ||||||
| RHB Capital Bhd (a) | 9,600 | 24,210 | ||||||
| Tenaga Nasional Bhd (a) | 308,900 | 702,237 | ||||||
| UMW Holdings Bhd (a) | 274,700 | 1,076,571 | ||||||
|
| |||||||
| 3,647,007 | ||||||||
|
| |||||||
| Mexico - 1.0% | ||||||||
| Alfa SAB de CV, Class A (1)(a) | 247,000 | 525,097 | ||||||
| America Movil SAB de CV, Series L ADR (1)(c) | 29,400 | 680,316 | ||||||
| Arca Continental SAB de CV (1)(a) | 42,300 | 314,903 | ||||||
| Coca-Cola Femsa SAB de CV ADR (1)(c) | 1,500 | 223,560 | ||||||
| Fomento Economico Mexicano SAB de CV ADR (1)(c) | 2,300 | 231,610 | ||||||
| Grupo Bimbo SAB de CV, Series A (1)(a) | 93,100 | 241,063 | ||||||
| Grupo Financiero Banorte SAB de CV O Shares (1)(a) | 179,900 | 1,161,682 | ||||||
| Grupo Mexico SAB de CV, Series B (1)(a) | 157,000 | 566,358 | ||||||
| Grupo Modelo SAB de CV, Series C (1)(a) | 452,178 | 4,056,075 | ||||||
| Grupo Televisa SAB ADR (1)(c) | 6,000 | 159,480 | ||||||
| Kimberly-Clark de Mexico SAB de CV, Class A (1)(a) | 131,400 | 337,488 | ||||||
|
| |||||||
| 8,497,632 | ||||||||
|
| |||||||
| Netherlands - 1.4% | ||||||||
| Aegon NV (a) | 532,872 | 3,442,254 | ||||||
| Delta Lloyd NV (a) | 27,650 | 455,498 | ||||||
| Koninklijke Ahold NV (a) | 109,684 | 1,470,753 | ||||||
| Koninklijke Boskalis Westminster NV (a) | 20,389 | 922,948 | ||||||
| Koninklijke DSM NV (a) | 27,234 | 1,659,794 | ||||||
| Koninklijke Philips Electronics NV (a) | 40,756 | 1,079,226 | ||||||
| Koninklijke Vopak NV (a) | 3,896 | 275,399 | ||||||
| Nutreco NV (a) | 28,062 | 2,385,627 | ||||||
| SBM Offshore NV † | 1 | 14 | ||||||
|
| |||||||
| 11,691,513 | ||||||||
|
| |||||||
| Norway - 0.8% | ||||||||
| Aker Solutions ASA (a) | 22,433 | 464,557 | ||||||
| DNB ASA (a) | 66,932 | 855,502 | ||||||
| Orkla ASA (a) | 41,807 | 366,377 | ||||||
| Petroleum Geo-Services ASA (a) | 32,791 | 571,133 | ||||||
| Statoil ASA (a) | 58,258 | 1,468,371 | ||||||
| Telenor ASA (a) | 37,818 | 770,044 | ||||||
| Yara International ASA (a) | 52,495 | 2,617,329 | ||||||
|
| |||||||
| 7,113,313 | ||||||||
|
| |||||||
| The accompanying notes are an integral part of these financial statements. | (Continued) |
| AQR Funds | Annual Report | December 2012 | 57 | |||||||||||||
Table of Contents
| Consolidated Schedule of Investments | December 31, 2012 |
| AQR MULTI-STRATEGY ALTERNATIVE FUND |
| SHARES | VALUE (Note 3) | |||||||
| Peru - 0.0%(b) | ||||||||
| Cia de Minas Buenaventura SA ADR (1)(c) | 3,700 | $ | 133,015 | |||||
| Credicorp Ltd. (1)(c) | 1,300 | 190,528 | ||||||
|
| |||||||
| 323,543 | ||||||||
|
| |||||||
| Poland - 0.3% | ||||||||
| Grupa Lotos SA †(a) | 10,370 | 138,645 | ||||||
| KGHM Polska Miedz SA (a) | 4,971 | 307,094 | ||||||
| PGE SA (a) | 109,777 | 647,642 | ||||||
| Powszechny Zaklad Ubezpieczen SA (a) | 5,013 | 709,699 | ||||||
| Tauron Polska Energia SA (a) | 306,329 | 470,531 | ||||||
|
| |||||||
| 2,273,611 | ||||||||
|
| |||||||
| South Africa - 0.7% | ||||||||
| ABSA Group Ltd. (a) | 6,007 | 116,946 | ||||||
| African Bank Investments Ltd. (a) | 36,591 | 139,635 | ||||||
| Barloworld Ltd. (a) | 3,044 | 31,569 | ||||||
| Bidvest Group Ltd. (a) | 7,298 | 186,710 | ||||||
| FirstRand Ltd. (a) | 102,307 | 376,465 | ||||||
| Gold Fields Ltd. ADR (1)(c) | 19,500 | 243,555 | ||||||
| Growthpoint Properties Ltd. (a) | 53,458 | 154,684 | ||||||
| Harmony Gold Mining Co. Ltd. ADR (1)(c) | 54,200 | 485,632 | ||||||
| Imperial Holdings Ltd. (a) | 16,044 | 378,363 | ||||||
| Investec Ltd. (a) | 30,397 | 211,951 | ||||||
| Liberty Holdings Ltd. (a) | 37,144 | 489,320 | ||||||
| MMI Holdings Ltd. (a) | 41,221 | 108,394 | ||||||
| MTN Group Ltd. (a) | 9,212 | 193,901 | ||||||
| Naspers Ltd., N Shares (a) | 7,698 | 497,220 | ||||||
| Nedbank Group Ltd. (a) | 4,640 | 103,694 | ||||||
| Redefine Properties Ltd. (a) | 48,731 | 53,994 | ||||||
| RMB Holdings Ltd. (a) | 41,547 | 200,914 | ||||||
| Sanlam Ltd. (a) | 49,748 | 264,903 | ||||||
| Sasol Ltd. ADR (1)(c) | 4,200 | 181,818 | ||||||
| Truworths International Ltd. (a) | 22,282 | 286,935 | ||||||
| Woolworths Holdings Ltd. (a) | 154,376 | 1,299,494 | ||||||
|
| |||||||
| 6,006,097 | ||||||||
|
| |||||||
| Sweden - 2.1% | ||||||||
| Boliden AB (a) | 213,018 | 4,047,556 | ||||||
| Electrolux AB, Series B (a) | 59,600 | 1,574,302 | ||||||
| Getinge AB, B Shares (a) | 7,685 | 261,235 | ||||||
| Lundin Petroleum AB †(a) | 38,639 | 894,193 | ||||||
| Meda AB, A Shares (a) | 25,527 | 263,149 | ||||||
| NCC AB, B Shares (a) | 27,320 | 574,399 | ||||||
| Nordea Bank AB (a) | 69,055 | 664,235 | ||||||
| Securitas AB, B Shares (a) | 50,842 | 445,716 | ||||||
| Skandinaviska Enskilda Banken AB, Class A (a) | 189,686 | 1,622,892 | ||||||
| Skanska AB, B Shares (a) | 46,671 | 765,913 | ||||||
| SKF AB, B Shares (a) | 17,018 | 431,025 | ||||||
| Svenska Cellulosa AB, B Shares (a) | 26,641 | 579,245 | ||||||
| Swedbank AB, A Shares (a) | 88,868 | 1,745,845 | ||||||
| Swedish Match AB (a) | 37,666 | 1,264,445 | ||||||
| Tele2 AB, B Shares(a) | 44,791 | 809,591 | ||||||
| Telefonaktiebolaget LM Ericsson, B Shares (a) | 94,825 | 957,851 | ||||||
| Trelleborg AB, B Shares (a) | 99,527 | 1,244,717 | ||||||
|
| |||||||
| 18,146,309 | ||||||||
|
| |||||||
| SHARES | VALUE (Note 3) | |||||||
| Switzerland - 2.5% | ||||||||
| ABB Ltd. †(a) | 16,552 | $ | 343,248 | |||||
| Aryzta AG †(a) | 5,524 | 284,240 | ||||||
| Dufry AG †(a) | 3,464 | 458,052 | ||||||
| Galenica AG (a) | 587 | 341,168 | ||||||
| Georg Fischer AG †(a) | 536 | 216,601 | ||||||
| Logitech International SA †(a) | 28,571 | 219,340 | ||||||
| Nestle SA (a) | 14,043 | 916,214 | ||||||
| Novartis AG (a) | 24,142 | 1,525,129 | ||||||
| OC Oerlikon Corp. AG †(a) | 289,136 | 3,292,782 | ||||||
| Roche Holding AG (a) | 24,546 | 4,962,739 | ||||||
| Schindler Holding AG (a) | 1,153 | 166,788 | ||||||
| SGS SA (a) | 179 | 397,570 | ||||||
| Sulzer AG (a) | 20,117 | 3,183,900 | ||||||
| Swiss Life Holding AG †(a) | 8,212 | 1,096,107 | ||||||
| Swiss Re AG †(a) | 13,856 | 1,004,544 | ||||||
| Syngenta AG (a) | 6,016 | 2,430,382 | ||||||
| UBS AG †(a) | 1,481 | 23,176 | ||||||
|
| |||||||
| 20,861,980 | ||||||||
|
| |||||||
| Taiwan - 0.9% | ||||||||
| Asustek Computer, Inc. (a) | 220 | 2,491 | ||||||
| Cheng Shin Rubber Industry Co. Ltd. (a) | 56,000 | 146,658 | ||||||
| Chicony Electronics Co. Ltd. (a) | 44,000 | 102,603 | ||||||
| China Motor Corp. (a) | 211,000 | 199,023 | ||||||
| China Petrochemical Development Corp. (a) | 993,932 | 620,707 | ||||||
| Delta Electronics, Inc. (a) | 113,000 | 416,454 | ||||||
| E.Sun Financial Holding Co., Ltd. (a) | 750 | 422 | ||||||
| Eva Airways Corp. †(a) | 729,500 | 428,998 | ||||||
| Far EasTone Telecommunications Co. Ltd. (a) | 189,000 | 482,589 | ||||||
| Foxconn Technology Co., Ltd. (a) | 550 | 1,738 | ||||||
| Fubon Financial Holding Co., Ltd. (a) | 48,297 | 58,638 | ||||||
| Hon Hai Precision Industry Co., Ltd. (a) | 357,900 | 1,107,815 | ||||||
| Lite-On Technology Corp. (a) | 102,510 | 136,816 | ||||||
| MStar Semiconductor, Inc. (a) | 4,000 | 30,243 | ||||||
| Nan Ya Printed Circuit Board Corp. (a) | 45,000 | 55,985 | ||||||
| President Chain Store Corp. (a) | 28,000 | 150,230 | ||||||
| Realtek Semiconductor Corp. (a) | 220,281 | 469,082 | ||||||
| Shin Kong Financial Holding Co., Ltd. †(a) | 440,000 | 124,833 | ||||||
| Siliconware Precision Industries Co. (a) | 58,000 | 62,480 | ||||||
| SinoPac Financial Holdings Co., Ltd. (a) | 613 | 265 | ||||||
| Taiwan Business Bank †(a) | 480 | 145 | ||||||
| Taiwan Cooperative Financial Holding(a) | 102,250 | 57,816 | ||||||
| Taiwan Semiconductor Manufacturing Co., Ltd. ADR (1)(c) | 40,900 | 701,844 | ||||||
| Tripod Technology Corp. (a) | 330 | 714 | ||||||
| Uni-President Enterprises Corp. (a) | 939,237 | 1,730,262 | ||||||
| Walsin Lihwa Corp. †(a) | 486,000 | 167,350 | ||||||
| Yang Ming Marine Transport Corp. †(a) | 100 | 48 | ||||||
|
| |||||||
| 7,256,249 | ||||||||
|
| |||||||
| Thailand - 0.2% | ||||||||
| Advanced Info Service PCL NVDR (a) | 177,700 | 1,222,186 | ||||||
| Bangkok Bank PCL NVDR (a) | 1,000 | 6,429 | ||||||
| Krung Thai Bank PCL NVDR (a) | 18,500 | 11,946 | ||||||
| Thai Oil PCL NVDR (a) | 95,900 | 214,044 | ||||||
|
| |||||||
| 1,454,605 | ||||||||
|
| |||||||
| The accompanying notes are an integral part of these financial statements. | (Continued) |
| 58 | AQR Funds | Annual Report | December 2012 | |||||||||||||
Table of Contents
| Consolidated Schedule of Investments | December 31, 2012 |
| AQR MULTI-STRATEGY ALTERNATIVE FUND |
| SHARES | VALUE (Note 3) | |||||||
| Turkey - 0.3% | ||||||||
| Arcelik AS (a) | 34,062 | $ | 223,988 | |||||
| Asya Katilim Bankasi AS †(a) | 139,054 | 173,156 | ||||||
| Turk Hava Yollari †(a) | 363,212 | 1,281,093 | ||||||
| Turkcell Iletisim Hizmetleri AS †(a) | 13,780 | 89,544 | ||||||
| Turkiye Halk Bankasi AS (a) | 85,910 | 846,871 | ||||||
| Turkey - 0.3% | ||||||||
| Turkiye Vakiflar Bankasi Tao, Class D (a) | 63,794 | 165,948 | ||||||
|
| |||||||
| 2,780,600 | ||||||||
|
| |||||||
| United States - 0.3% | ||||||||
| Amgen, Inc. (1)(c) | 246 | 21,235 | ||||||
| Citigroup, Inc. (1)(c) | 27,351 | 1,082,005 | ||||||
| Clearwire Corp., Class A (1)†(a) | 3,600 | 10,404 | ||||||
| Knight Capital Group, Inc., Class A (1)†(a) | 31,100 | 109,161 | ||||||
| McMoRan Exploration Co. (1)†(c) | 3,800 | 60,990 | ||||||
| MetroPCS Communications, Inc. (1)†(c) | 79,500 | 790,230 | ||||||
| Riverbed Technology, Inc. (1)†(c) | 3,956 | 78,012 | ||||||
| Southern Copper Corp. (1)(c) | 6,301 | 238,556 | ||||||
| Sprint Nextel Corp. (1)†(c) | 66,200 | 375,354 | ||||||
|
| |||||||
| 2,765,947 | ||||||||
|
| |||||||
TOTAL COMMON STOCKS | 383,432,635 | |||||||
|
| |||||||
| SHARES | VALUE (Note 3) | |||||||
| PREFERRED STOCKS - 0.4% | ||||||||
| Brazil - 0.1% | ||||||||
| AES Tiete SA (1)(a) | 21,800 | $ | 251,166 | |||||
| Banco do Estado do Rio Grande do Sul SA, Series B (1)(a) | 4,900 | 37,118 | ||||||
| Lojas Americanas SA (1)(a) | 49 | 439 | ||||||
| Metalurgica Gerdau SA (1)(a) | 16,800 | 187,897 | ||||||
| Usinas Siderurgicas de Minas Gerais SA, Series A (1)(a) | 108,929 | 680,972 | ||||||
|
| |||||||
| 1,157,592 | ||||||||
|
| |||||||
| Germany - 0.3% | ||||||||
| Henkel AG & Co. KGaA (a) | 654 | 53,805 | ||||||
| Porsche Automobil Holding SE (a) | 6,869 | 565,421 | ||||||
| ProSiebenSat.1 Media AG (a) | 54,696 | 1,557,951 | ||||||
| Volkswagen AG | 973 | 223,254 | ||||||
|
| |||||||
| 2,400,431 | ||||||||
|
| |||||||
TOTAL PREFERRED STOCKS | 3,558,023 | |||||||
|
| |||||||
| CONVERTIBLE PREFERRED STOCKS - 0.3% | SHARES | VALUE (Note 3) | ||||||||||||||
| United States - 0.3% | ||||||||||||||||
| MetLife, Inc., $82.88 par, 5.000%, 09/04/13 (1)(a) | 9,060 | $ | 402,898 | |||||||||||||
| NextEra Energy, Inc., $50.00 par, 5.599%, 06/01/15 † | 842,500 | 419,987 | ||||||||||||||
| PPL Corp., $50.00 par, 9.500%, 07/01/13 (1)(c) | 30,275 | 1,583,685 | ||||||||||||||
| PPL Corp., $50.00 par, 8.750%, 05/01/14 (1)(c) | 4,600 | 247,158 | ||||||||||||||
|
| |||||||||||||||
TOTAL CONVERTIBLE PREFERRED STOCKS | 2,653,728 | |||||||||||||||
|
| |||||||||||||||
| CORPORATE BONDS - 10.9% | INTEREST RATE | MATURITY DATE | PRINCIPAL AMOUNT (000’S) | |||||||||||||
| Canada - 0.0% (b) | ||||||||||||||||
| Petrominerales Ltd. (a) | 3.250% | 06/12/17 | $ | 400 | 332,760 | |||||||||||
|
| |||||||||||||||
| Mexico - 0.1% | ||||||||||||||||
| Cemex SAB de CV (c) | 3.250% | 03/15/16 | 500 | 566,875 | ||||||||||||
|
| |||||||||||||||
| United States - 10.8% | ||||||||||||||||
| Annaly Capital Management, Inc. (c) | 5.000% | 05/15/15 | 425 | 429,516 | ||||||||||||
| Archer-Daniels-Midland Co. (c) | 0.875% | 02/15/14 | 600 | 600,375 | ||||||||||||
| Chart Industries, Inc. (c) | 2.000% | 08/01/18 | 2,900 | 3,572,437 | ||||||||||||
| General Cable Corp. (c)(e) | 4.500% | 11/15/29 | 2,825 | 3,047,469 | ||||||||||||
| Gilead Sciences, Inc., Series D (c) | 1.625% | 05/01/16 | 8,500 | 14,333,125 | ||||||||||||
| Health Care REIT, Inc. (c) | 3.000% | 12/01/29 | 3,325 | 4,079,359 | ||||||||||||
| L-3 Communications Holdings, Inc. (c) | 3.000% | 08/01/35 | 2,850 | 2,885,625 | ||||||||||||
| Medtronic, Inc., Series B (3)(c)(d) | 1.625% | 04/15/13 | 1,250 | 1,253,906 | ||||||||||||
| Microchip Technology, Inc. (c) | 2.125% | 12/15/37 | 4,325 | 5,460,312 | ||||||||||||
| Micron Technology, Inc., Series C 144A (c)(f) | 2.375% | 05/01/32 | 3,475 | 3,349,031 | ||||||||||||
| NetApp, Inc. (c) | 1.750% | 06/01/13 | 6,625 | 7,444,844 | ||||||||||||
| Omnicare, Inc. (c) | 3.750% | 12/15/25 | 725 | 1,068,469 | ||||||||||||
| The accompanying notes are an integral part of these financial statements. | (Continued) |
| AQR Funds | Annual Report | December 2012 | 59 | |||||||||||||
Table of Contents
| Consolidated Schedule of Investments | December 31, 2012 |
| AQR MULTI-STRATEGY ALTERNATIVE FUND |
| INTEREST RATE | MATURITY DATE | PRINCIPAL AMOUNT (000’S) | VALUE (Note 3) | |||||||||||||
| United States - 10.8% (continued) | ||||||||||||||||
| PHH Corp. (a)(c) | 6.000% | 06/15/17 | $ | 7,702 | $ | 15,259,587 | ||||||||||
| Salesforce.com, Inc. (a)(c) | 0.750% | 01/15/15 | 5,450 | 10,906,813 | ||||||||||||
| SanDisk Corp. (c) | 1.000% | 05/15/13 | 1,150 | 1,139,938 | ||||||||||||
| Smithfield Foods, Inc. (c) | 4.000% | 06/30/13 | 3,300 | 3,495,938 | ||||||||||||
| Vishay Intertechnology, Inc. 144A (c)(f) | 2.250% | 11/15/40 | 2,125 | 1,953,672 | ||||||||||||
| Xilinx, Inc. (c) | 3.125% | 03/15/37 | 8,825 | 11,180,172 | ||||||||||||
|
| |||||||||||||||
| 91,460,588 | ||||||||||||||||
|
| |||||||||||||||
TOTAL CORPORATE BONDS | 92,360,223 | |||||||||||||||
|
| |||||||||||||||
| CONVERTIBLE BONDS - 20.6% | ||||||||||||||||
| India - 0.0% (b) | ||||||||||||||||
| Sterlite Industries India Ltd. (c) | 4.000% | 10/30/14 | 225 | 216,422 | ||||||||||||
|
| |||||||||||||||
| Malta - 0.1% | ||||||||||||||||
| Lufthansa Malta Blues LP, Series JBLU 144A (a)(f) | 0.750% | 04/05/17 | EUR | 475 | 689,799 | |||||||||||
|
| |||||||||||||||
| Netherlands - 0.3% | ||||||||||||||||
| Volkswagen International Finance NV 144A (a)(f) | 5.500% | 11/09/15 | 2,000 | 2,913,130 | ||||||||||||
|
| |||||||||||||||
| United States - 20.2% | ||||||||||||||||
| Alcoa, Inc. (c) | 5.250% | 03/15/14 | 3,125 | 4,474,609 | ||||||||||||
| Amkor Technology, Inc. (c) | 6.000% | 04/15/14 | 3,475 | 5,171,234 | ||||||||||||
| Ares Capital Corp. 144A (c)(f) | 5.750% | 02/01/16 | 1,625 | 1,744,844 | ||||||||||||
| Avis Budget Group, Inc. (c) | 3.500% | 10/01/14 | 2,150 | 2,944,156 | ||||||||||||
| Boston Properties LP (c) | 3.750% | 05/15/36 | 750 | 817,031 | ||||||||||||
| Boston Properties LP 144A (c)(f) | 3.625% | 02/15/14 | 1,500 | 1,580,625 | ||||||||||||
| Cadence Design Systems, Inc. (c) | 2.625% | 06/01/15 | 2,900 | 5,325,125 | ||||||||||||
| Ciena Corp. 144A (c)(f) | 4.000% | 03/15/15 | 505 | 573,175 | ||||||||||||
| Ciena Corp., Series WI | 4.000% | 12/15/20 | 2,195 | 2,511,903 | ||||||||||||
| Cobalt International Energy, Inc. (c) | 2.625% | 12/01/19 | 1,175 | 1,186,016 | ||||||||||||
| DDR Corp. (c) | 1.750% | 11/15/40 | 7,470 | 8,333,719 | ||||||||||||
| Digital Realty Trust LP 144A (c)(f) | 5.500% | 04/15/29 | 1,650 | 2,797,781 | ||||||||||||
| DR Horton, Inc., Series DHI (a) | 2.000% | 05/15/14 | 5,450 | 8,628,031 | ||||||||||||
| Equinix, Inc. (a)(c) | 4.750% | 06/15/16 | 4,450 | 11,255,719 | ||||||||||||
| Exelixis, Inc. (c) | 4.250% | 08/15/19 | 650 | 632,531 | ||||||||||||
| Exterran Holdings, Inc. (c) | 4.250% | 06/15/14 | 825 | 944,625 | ||||||||||||
| Gaylord Entertainment Co. 144A (a)(c)(f) | 3.750% | 10/01/14 | 3,350 | 5,833,187 | ||||||||||||
| General Cable Corp. (c) | 0.875% | 11/15/13 | 1,925 | 1,906,953 | ||||||||||||
| Hertz Global Holdings, Inc. (a)(c) | 5.250% | 06/01/14 | 6,625 | 13,440,469 | ||||||||||||
| Host Hotels & Resorts LP 144A (c)(f) | 2.500% | 10/15/29 | 6,050 | 7,891,469 | ||||||||||||
| Jefferies Group, Inc. (c) | 3.875% | 11/01/29 | 482 | 477,481 | ||||||||||||
| Knight Capital Group, Inc. (c) | 3.500% | 03/15/15 | 325 | 322,766 | ||||||||||||
| Lennar Corp. 144A (c)(f) | 3.250% | 11/15/21 | 4,800 | 8,610,000 | ||||||||||||
| Lennar Corp. 144A (c)(f) | 2.750% | 12/15/20 | 1,375 | 2,530,000 | ||||||||||||
| Lennar Corp. 144A (c)(f) | 2.000% | 12/01/20 | 2,875 | 4,170,547 | ||||||||||||
| Level 3 Communications, Inc. (c) | 15.000% | 01/15/13 | 1,550 | 1,674,000 | ||||||||||||
| Medicis Pharmaceutical Corp. (3)(c)(d) | 1.375% | 06/01/17 | 1,825 | 1,995,309 | ||||||||||||
| Micron Technology, Inc., Series D 144A (c)(f) | 3.125% | 05/01/32 | 200 | 194,750 | ||||||||||||
| Navistar International Corp. (c) | 3.000% | 10/15/14 | 350 | 319,594 | ||||||||||||
| PHH Corp. (c) | 4.000% | 09/01/14 | 600 | 670,875 | ||||||||||||
| priceline.com, Inc. 144A (c)(f) | 1.250% | 03/15/15 | 275 | 572,516 | ||||||||||||
| ProLogis LP (c) | 3.250% | 03/15/15 | 3,175 | 3,597,672 | ||||||||||||
| Regeneron Pharmaceuticals, Inc. (c) | 1.875% | 10/01/16 | 6,550 | 13,697,687 | ||||||||||||
| SL Green Operating Partnership LP 144A (c)(f) | 3.000% | 10/15/17 | 5,325 | 5,967,328 | ||||||||||||
| Standard Pacific Corp. (c) | 1.250% | 08/01/32 | 350 | 410,375 | ||||||||||||
| The accompanying notes are an integral part of these financial statements. | (Continued) |
| 60 | AQR Funds | Annual Report | December 2012 | |||||||||||||
Table of Contents
| Consolidated Schedule of Investments | December 31, 2012 |
| AQR MULTI-STRATEGY ALTERNATIVE FUND |
| INTEREST RATE | MATURITY DATE | PRINCIPAL AMOUNT (000’S) | VALUE (Note 3) | |||||||||||||
| United States - 20.2% (continued) | ||||||||||||||||
| Stillwater Mining Co., Series SWC (c) | 1.750% | 10/15/32 | $ | 200 | $ | 233,125 | ||||||||||
| Take-Two Interactive Software, Inc. (c) | 1.750% | 12/01/16 | 200 | 190,250 | ||||||||||||
| Textron, Inc., Series TXT (a)(c) | 4.500% | 05/01/13 | 875 | 1,656,484 | ||||||||||||
| Toll Brothers Finance Corp. 144A (c)(f) | 0.500% | 09/15/32 | 1,225 | 1,234,187 | ||||||||||||
| Tyson Foods, Inc. (c) | 3.250% | 10/15/13 | 2,975 | 3,597,891 | ||||||||||||
| United States Steel Corp. (c) | 4.000% | 05/15/14 | 3,725 | 4,016,016 | ||||||||||||
| VeriSign, Inc. (a)(c) | 3.250% | 08/15/37 | 11,944 | 15,064,370 | ||||||||||||
| Virgin Media, Inc. (c) | 6.500% | 11/15/16 | 725 | 1,492,141 | ||||||||||||
| XM Satellite Radio, Inc. 144A (c)(f) | 7.000% | 12/01/14 | 6,500 | 11,155,625 | ||||||||||||
|
| |||||||||||||||
| 171,844,191 | ||||||||||||||||
|
| |||||||||||||||
TOTAL CONVERTIBLE BONDS | 175,663,542 | |||||||||||||||
|
| |||||||||||||||
| PURCHASED OPTIONS - 0.0% (b) | CONTRACTS | VALUE (Note 3) | ||||||
| Put - Knight Capital Group, Inc., Expires 07/20/2013, Strike $5.00 | 28 | $ | 4,620 | |||||
| Put - Knight Capital Group, Inc., Expires 07/20/2013, Strike $4.00 | 76 | 5,320 | ||||||
|
| |||||||
| Put - Sprint Nextel Corp., Expires 01/18/2014, Strike $10.00 | 298 | 183,270 | ||||||
|
| |||||||
TOTAL PURCHASED OPTIONS | 193,210 | |||||||
|
| |||||||
| SHARES | ||||||||
| MONEY MARKET FUNDS - 33.2% | ||||||||
| BlackRock Liquidity Funds TempFund Portfolio, Class I, 0.140% (g) | 1,000,063 | 1,000,063 | ||||||
| Dreyfus Treasury Cash Management, Class I, 0.010% (g) | 4,000,251 | 4,000,251 | ||||||
| J.P. Morgan U.S. Treasury Plus Money Market Fund - Institutional Shares, 0.000% (a)(g)(h) | 272,404,955 | 272,404,955 | ||||||
| UBS Money Series - UBS Select Treasury Preferred Fund, Class I, 0.010% (g) | 5,000,647 | 5,000,647 | ||||||
|
| |||||||
TOTAL MONEY MARKET FUNDS | 282,405,916 | |||||||
|
| |||||||
| INVESTMENTS OF CASH COLLATERAL FOR SECURITIES ON LOAN - 0.1% | ||||||||
J.P. Morgan U.S. Treasury Plus Money Market Fund - Institutional Shares, 0.000% (g)(i) (Cost $1,238,191) | 1,238,191 | 1,238,191 | ||||||
|
| |||||||
| | PRINCIPAL AMOUNT (000’S) | | ||||||
| SHORT-TERM INVESTMENTS - 1.7% | ||||||||
| U.S. Treasury Bill, 0.000%, 6/20/13 (j) | ||||||||
| (cost $14,573,408) | $ | 14,580 | 14,572,812 | |||||
|
| |||||||
TOTAL INVESTMENTS, BEFORE SECURITIES SOLD SHORT |
| 956,078,280 | ||||||
|
| |||||||
| PRINCIPAL AMOUNT (000’S) | VALUE (Note 3) | |||||||
| SECURITIES SOLD SHORT- (61.1)% | ||||||||
| COMMON STOCKS - (56.2)% | ||||||||
| Belgium - (0.3)% | ||||||||
| Bekaert SA | $ | (8,111) | (236,208) | |||||
| Colruyt SA | (9,899) | (490,843) | ||||||
| Delhaize Group SA | (24,298) | (978,695) | ||||||
| Telenet Group Holding NV | (18,854) | (891,358) | ||||||
|
| |||||||
| (2,597,104) | ||||||||
|
| |||||||
| SHARES | ||||||||
| Canada - 0.0%(b) | ||||||||
| Petrominerales Ltd. (1) (cost $179,081) | (14,896) | (128,445) | ||||||
|
| |||||||
| Denmark - (0.7)% | ||||||||
| FLSmidth & Co. A/S | (49,329) | (2,873,067) | ||||||
| Novozymes A/S, B Shares | (110,170) | (3,127,356) | ||||||
|
| |||||||
| (6,000,423) | ||||||||
|
| |||||||
| Finland - (0.7)% | ||||||||
| Cargotec Oyj, B Shares | (2,401) | (63,908) | ||||||
| Elisa OYJ | (32,203) | (713,931) | ||||||
| Konecranes OYJ | (5,243) | (178,922) | ||||||
| Neste Oil OYJ | (5,966) | (77,344) | ||||||
| Nokia OYJ | (79,328) | (313,481) | ||||||
| Nokian Renkaat OYJ | (83,961) | (3,363,234) | ||||||
| Outokumpu OYJ † | (38,758) | (41,146) | ||||||
| Rautaruukki OYJ | (34,651) | (274,166) | ||||||
| UPM-Kymmene OYJ | (16,221) | (190,836) | ||||||
| Wartsila OYJ | (22,238) | (968,150) | ||||||
|
| |||||||
| (6,185,118) | ||||||||
|
| |||||||
| Germany - (3.9)% | ||||||||
| Aixtron SE NA | (94,254) | (1,123,997) | ||||||
| Allianz SE | (15,234) | (2,123,572) | ||||||
| BASF SE | (23,045) | (2,179,132) | ||||||
| Bayerische Motoren Werke AG | (6,797) | (661,423) | ||||||
| Beiersdorf AG | (4,747) | (388,687) | ||||||
| Commerzbank AG † | (1,238,128) | (2,371,951) | ||||||
| The accompanying notes are an integral part of these financial statements. | (Continued) |
| AQR Funds | Annual Report | December 2012 | 61 | |||||||||||||
Table of Contents
| Consolidated Schedule of Investments | December 31, 2012 |
| AQR MULTI-STRATEGY ALTERNATIVE FUND |
| SHARES | VALUE (Note 3) | |||||||
| Germany - (3.9)% (continued) | ||||||||
| Daimler AG | (13,388) | $ | (737,083) | |||||
| Deutsche Telekom AG | (92,440) | (1,052,236) | ||||||
| Dialog Semiconductor plc † | (26,397) | (467,598) | ||||||
| Fraport AG Frankfurt Airport Services Worldwide | (22,700) | (1,324,231) | ||||||
| Fresenius Medical Care AG & Co. KGaA | (20,147) | (1,390,386) | ||||||
| Hugo Boss AG | (3,077) | (327,009) | ||||||
| Infineon Technologies AG | (644,495) | (5,250,342) | ||||||
| K+S AG | (91,435) | (4,246,582) | ||||||
| Kloeckner & Co. SE † | (49,590) | (592,914) | ||||||
| MAN SE | (9,984) | (1,072,488) | ||||||
| MTU Aero Engines Holding AG | (310) | (28,291) | ||||||
| RWE AG | (2,775) | (115,100) | ||||||
| Siemens AG | (3,241) | (354,405) | ||||||
| Sky Deutschland AG † | (301,528) | (1,672,200) | ||||||
| Stada Arzneimittel AG | (88,186) | (2,853,942) | ||||||
| Symrise AG | (28,681) | (1,030,442) | ||||||
| ThyssenKrupp AG | (78,700) | (1,858,309) | ||||||
|
| |||||||
| (33,222,320) | ||||||||
|
| |||||||
| India - 0.0% (b) | ||||||||
| Sterlite Industries India Ltd. ADR (1) (cost $8,320) | (675) | (5,812) | ||||||
|
| |||||||
| Italy - (2.1)% | ||||||||
| A2A SpA | (1,708,191) | (989,825) | ||||||
| Atlantia SpA | (80,496) | (1,461,693) | ||||||
| Buzzi Unicem SpA | (74,190) | (1,043,279) | ||||||
| Enel Green Power SpA | (417,624) | (777,936) | ||||||
| Finmeccanica SpA † | (569,323) | (3,294,790) | ||||||
| Luxottica Group SpA | (24,761) | (1,022,006) | ||||||
| Mediaset SpA | (1,007,059) | (2,092,215) | ||||||
| Pirelli & C. SpA | (198,672) | (2,289,037) | ||||||
| Salvatore Ferragamo Italia SpA | (17,902) | (396,311) | ||||||
| Snam SpA | (4,706) | (21,966) | ||||||
| Tenaris SA | (119,067) | (2,482,590) | ||||||
| Terna Rete Elettrica Nazionale SpA | (105,550) | (422,385) | ||||||
| Tod’s SpA | (15,366) | (1,951,016) | ||||||
|
| |||||||
| (18,245,049) | ||||||||
|
| |||||||
| Japan - (19.1)% | ||||||||
| ABC-Mart, Inc. | (46,660) | (2,031,365) | ||||||
| Advantest Corp. | (110,120) | (1,739,131) | ||||||
| Aeon Credit Service Co., Ltd. | (23,400) | (473,487) | ||||||
| Asahi Glass Co., Ltd. | (204,000) | (1,489,525) | ||||||
| Asics Corp. | (108,800) | (1,662,090) | ||||||
| Canon, Inc. | (15,700) | (608,528) | ||||||
| Capcom Co., Ltd. | (45,000) | (687,984) | ||||||
| Chugoku Electric Power Co., Inc./The | (15,400) | (242,338) | ||||||
| Credit Saison Co., Ltd. | (34,700) | (867,940) | ||||||
| CyberAgent, Inc. | (221) | (454,104) | ||||||
| Dai-ichi Life Insurance Co., Ltd./The | (308) | (433,374) | ||||||
| Daikin Industries Ltd. | (88,600) | (3,043,333) | ||||||
| Dainippon Screen Manufacturing Co., Ltd. † | (197,000) | (1,210,842) | ||||||
| Daiwa Securities Group, Inc. | (1,000) | (5,579) | ||||||
| Dena Co., Ltd. | (2,300) | (75,874) | ||||||
| Disco Corp. | (29,200) | (1,522,114) | ||||||
| Don Quijote Co., Ltd. | (48,100) | (1,769,399) | ||||||
| Dowa Holdings Co., Ltd. | (12,000) | (77,679) | ||||||
| SHARES | VALUE (Note 3) | |||||||
| Japan - (19.1)% (continued) | ||||||||
| Eisai Co., Ltd. | (14,600) | $ | (609,445) | |||||
| Electric Power Development Co., Ltd. | (48,000) | (1,138,459) | ||||||
| FANUC Corp. | (18,400) | (3,423,313) | ||||||
| Fast Retailing Co., Ltd. | (6,500) | (1,658,871) | ||||||
| FUJIFILM Holdings Corp. | (36,200) | (728,339) | ||||||
| Furukawa Electric Co., Ltd. † | (103,000) | (231,659) | ||||||
| Gree, Inc. | (39,400) | (611,469) | ||||||
| GS Yuasa Corp. | (638,298) | (2,573,489) | ||||||
| Hankyu Hanshin Holdings, Inc. | (141,000) | (729,015) | ||||||
| Hirose Electric Co., Ltd. | (1,800) | (215,531) | ||||||
| Hisamitsu Pharmaceutical Co., Inc. | (12,400) | (617,153) | ||||||
| Hitachi Chemical Co., Ltd. | (4,100) | (61,800) | ||||||
| Hitachi Construction Machinery Co., Ltd. | (68,400) | (1,438,502) | ||||||
| Hitachi Metals Ltd. | (322,000) | (2,745,978) | ||||||
| Hokuriku Electric Power Co. | (40,600) | (481,824) | ||||||
| Honda Motor Co., Ltd. | (32,000) | (1,185,108) | ||||||
| Ibiden Co., Ltd. | (35,800) | (572,874) | ||||||
| JFE Holdings, Inc. | (202,600) | (3,818,331) | ||||||
| Joyo Bank Ltd./The | (16,000) | (76,020) | ||||||
| JX Holdings, Inc. | (11,700) | (66,056) | ||||||
| Kakaku.com, Inc. | (80,900) | (2,670,766) | ||||||
| Kansai Electric Power Co., Inc./The | (213,300) | (2,240,107) | ||||||
| Kansai Paint Co., Ltd. | (88,000) | (948,366) | ||||||
| Kawasaki Heavy Industries Ltd. | (102,868) | (279,753) | ||||||
| Kawasaki Kisen Kaisha Ltd. † | (158,646) | (243,619) | ||||||
| Keikyu Corp. | (48,000) | (426,126) | ||||||
| Kikkoman Corp. | (56,000) | (799,633) | ||||||
| Kirin Holdings Co., Ltd. | (128,000) | (1,506,048) | ||||||
| Komatsu Ltd. | (190,600) | (4,890,872) | ||||||
| K’s Holdings Corp. | (37,500) | (954,589) | ||||||
| Kubota Corp. | (28,000) | (321,927) | ||||||
| Kyushu Electric Power Co., Inc. | (81,800) | (932,620) | ||||||
| Lawson, Inc. | (26,400) | (1,790,848) | ||||||
| LIXIL Group Corp. | (118,800) | (2,649,897) | ||||||
| Mabuchi Motor Co., Ltd. | (1,500) | (63,966) | ||||||
| Makita Corp. | (106,300) | (4,938,099) | ||||||
| Mazda Motor Corp. † | (452,948) | (929,592) | ||||||
| MEIJI Holdings Co., Ltd. | (3,500) | (151,787) | ||||||
| Minebea Co., Ltd. | (483,649) | (1,718,204) | ||||||
| Mitsubishi Gas Chemical Co., Inc. | (109,000) | (668,592) | ||||||
| Mitsubishi Tanabe Pharma Corp. | (21,600) | (281,700) | ||||||
| Mitsui Chemicals, Inc. | (305,000) | (794,848) | ||||||
| Mitsui OSK Lines Ltd. | (550,000) | (1,638,423) | ||||||
| Mori Seiki Co., Ltd. | (170,400) | (1,492,011) | ||||||
| MS&AD Insurance Group Holdings | (5,800) | (115,750) | ||||||
| Murata Manufacturing Co., Ltd. | (44,500) | (2,625,117) | ||||||
| Nabtesco Corp. | (116,679) | (2,606,173) | ||||||
| NGK Insulators Ltd. | (119,000) | (1,411,659) | ||||||
| Nidec Corp. | (68,300) | (3,988,643) | ||||||
| Nikon Corp. | (39,500) | (1,166,214) | ||||||
| Nintendo Co., Ltd. | (3,900) | (416,431) | ||||||
| Nippon Steel & Sumitomo Metal | (1,312,071) | (3,230,546) | ||||||
| Nippon Yusen KK | (150,000) | (353,075) | ||||||
| Nissan Chemical Industries Ltd. | (42,800) | (506,696) | ||||||
| Nissan Motor Co., Ltd. | (210,200) | (1,994,562) | ||||||
| Nissin Foods Holdings Co., Ltd. | (4,200) | (159,340) | ||||||
| Nitori Holdings Co., Ltd. | (26,000) | (1,904,930) | ||||||
| NKSJ Holdings, Inc. | (34,150) | (732,485) | ||||||
| The accompanying notes are an integral part of these financial statements. | (Continued) |
| 62 | AQR Funds | Annual Report | December 2012 | |||||||||||||
Table of Contents
| Consolidated Schedule of Investments | December 31, 2012 |
| AQR MULTI-STRATEGY ALTERNATIVE FUND |
| SHARES | VALUE (Note 3) | |||||||
| Japan - (19.1)% (continued) | ||||||||
| Nomura Research Institute Ltd. | (30,000) | $ | (624,922) | |||||
| NTN Corp. | (832,402) | (2,256,111) | ||||||
| NTT Data Corp. | (338) | (1,058,015) | ||||||
| Oji Holdings Corp. | (5,000) | (17,247) | ||||||
| Omron Corp. | (1,800) | (43,206) | ||||||
| Oriental Land Co., Ltd. | (6,300) | (762,958) | ||||||
| OSAKA Titanium Technologies Co. | (7,800) | (174,497) | ||||||
| Panasonic Corp. | (35,600) | (217,567) | ||||||
| Rakuten, Inc. | (601,268) | (4,688,961) | ||||||
| Ricoh Co., Ltd. | (288,000) | (3,056,959) | ||||||
| Rinnai Corp. | (10,900) | (740,588) | ||||||
| Saizeriya Co., Ltd. | (5) | (69) | ||||||
| Sanrio Co., Ltd. | (10,200) | (325,420) | ||||||
| Sawai Pharmaceutical Co., Ltd. | (13,200) | (1,325,037) | ||||||
| SBI Holdings, Inc. | (342,920) | (3,065,466) | ||||||
| Seven Bank Ltd. | (72) | (190) | ||||||
| Sharp Corp. | (331,000) | (1,166,057) | ||||||
| Shikoku Electric Power Co., Inc. | (122,100) | (1,947,894) | ||||||
| Shimano, Inc. | (9,300) | (595,508) | ||||||
| Shin-Etsu Chemical Co., Ltd. | (6,700) | (408,901) | ||||||
| Shinko Electric Industries Co., Ltd. | (26,000) | (206,998) | ||||||
| Shiseido Co., Ltd. | (6,200) | (87,516) | ||||||
| Shizuoka Bank Ltd./The | (8,000) | (78,145) | ||||||
| Showa Shell Sekiyu KK | (47,000) | (266,221) | ||||||
| SMC Corp. | (15,400) | (2,797,479) | ||||||
| Softbank Corp. | (8,100) | (296,794) | ||||||
| Sony Corp. | (76,200) | (854,618) | ||||||
| Start Today Co., Ltd. | (76,864) | (713,195) | ||||||
| Sumco Corp. † | (32,000) | (314,766) | ||||||
| Sumitomo Chemical Co., Ltd. | (1,561,362) | (4,920,536) | ||||||
| Sumitomo Mitsui Financial Group, Inc. | (10,500) | (381,589) | ||||||
| Sumitomo Rubber Industries Ltd. | (25,300) | (305,935) | ||||||
| Suruga Bank Ltd. | (56,000) | (688,749) | ||||||
| Sysmex Corp. | (30,200) | (1,390,674) | ||||||
| Taiheiyo Cement Corp. | (898,814) | (2,471,110) | ||||||
| Taiyo Nippon Sanso Corp. | (214,615) | (1,234,730) | ||||||
| Takeda Pharmaceutical Co., Ltd. | (22,600) | (1,010,107) | ||||||
| TDK Corp. | (69,100) | (2,516,398) | ||||||
| Teijin Ltd. | (11,561) | (28,791) | ||||||
| Terumo Corp. | (75,400) | (2,994,129) | ||||||
| Toho Titanium Co., Ltd. | (14,600) | (145,339) | ||||||
| Tokai Carbon Co., Ltd. | (147,000) | (618,564) | ||||||
| Tokio Marine Holdings, Inc. | (22,200) | (618,476) | ||||||
| Tokuyama Corp. | (143,000) | (315,344) | ||||||
| Tokyo Electron Ltd. | (9,400) | (433,540) | ||||||
| TonenGeneral Sekiyu KK | (36,000) | (311,319) | ||||||
| Toshiba Corp. | (242,000) | (957,890) | ||||||
| TOTO Ltd. | (43,000) | (323,277) | ||||||
| Toyota Industries Corp. | (9,000) | (287,334) | ||||||
| Toyota Motor Corp. | (60,600) | (2,829,786) | ||||||
| Trend Micro, Inc. | (5,900) | (178,269) | ||||||
| Tsumura & Co. | (46,300) | (1,399,677) | ||||||
| Unicharm Corp. | (23,500) | (1,221,168) | ||||||
| Yahoo Japan Corp. | (9,563) | (3,096,457) | ||||||
| Yakult Honsha Co., Ltd. | (14,900) | (652,652) | ||||||
| Yamada Denki Co., Ltd. | (96,470) | (3,728,662) | ||||||
| Yamaha Motor Co., Ltd. | (63,700) | (705,651) | ||||||
| Yamato Holdings Co., Ltd. | (15,000) | (227,955) | ||||||
| SHARES | VALUE (Note 3) | |||||||
| Japan - (19.1)% (continued) | ||||||||
| Yaskawa Electric Corp. | (228,000) | $ | (2,200,198) | |||||
| Yokogawa Electric Corp. | (2,400) | (26,317) | ||||||
|
| |||||||
| (162,233,864) | ||||||||
|
| |||||||
| Luxembourg - (0.7)% | ||||||||
| ArcelorMittal | (256,251) | (4,467,848) | ||||||
| Oriflame Cosmetics SA SDR | (35,024) | (1,120,186) | ||||||
|
| |||||||
| (5,588,034) | ||||||||
|
| |||||||
| Mexico - (0.1)% | ||||||||
| Cemex SAB de CV ADR †(1) | (37,862) | (373,698) | ||||||
|
| |||||||
| Netherlands - (0.8)% | ||||||||
| Akzo Nobel NV | (93) | (6,156) | ||||||
| ASML Holding NV | (24,061) | (1,543,119) | ||||||
| Fugro NV CVA | (41,910) | (2,486,848) | ||||||
| Heineken NV | (3,643) | (244,240) | ||||||
| Koninklijke KPN NV | (158,287) | (782,780) | ||||||
| Randstad Holding NV | (30,870) | (1,145,805) | ||||||
| Royal Imtech NV | (20,634) | (479,266) | ||||||
| SBM Offshore NV † | (10,030) | (141,450) | ||||||
| Wolters Kluwer NV | (11,899) | (244,426) | ||||||
|
| |||||||
| (7,074,090) | ||||||||
|
| |||||||
| Norway - (0.5)% | ||||||||
| Marine Harvest ASA † | (1,825,302) | (1,700,384) | ||||||
| Norsk Hydro ASA | (229,301) | (1,163,824) | ||||||
| Schibsted ASA | (3,203) | (136,976) | ||||||
| Seadrill Ltd. | (1,243) | (45,794) | ||||||
| Storebrand ASA † | (175,893) | (862,661) | ||||||
| TGS Nopec Geophysical Co. ASA | (13,608) | (449,414) | ||||||
|
| |||||||
| (4,359,053) | ||||||||
|
| |||||||
| Sweden - (2.0)% | ||||||||
| Alfa Laval AB | (25,982) | (543,278) | ||||||
| Assa Abloy AB, Class B | (32,649) | (1,228,997) | ||||||
| Atlas Copco AB, A Shares | (15,387) | (426,686) | ||||||
| Elekta AB, B Shares | (171,894) | (2,688,699) | ||||||
| Hexagon AB, B Shares | (166,308) | (4,205,636) | ||||||
| Husqvarna AB, B Shares | (222,078) | (1,347,796) | ||||||
| Modern Times Group AB, B Shares | (30,742) | (1,077,390) | ||||||
| Sandvik AB | (83,325) | (1,339,180) | ||||||
| Scania AB, B Shares | (37,951) | (789,054) | ||||||
| SSAB AB, A Shares | (257,613) | (2,269,688) | ||||||
| Svenska Handelsbanken AB, A Shares | (16,828) | (604,999) | ||||||
| Volvo AB, B Shares | (14,455) | (199,322) | ||||||
|
| |||||||
| (16,720,725) | ||||||||
|
| |||||||
| Switzerland - (2.4)% | ||||||||
| Adecco SA † | (5,039) | (266,857) | ||||||
| Baloise Holding AG | (1,651) | (142,601) | ||||||
| Clariant AG † | (139,807) | (1,906,929) | ||||||
| Compagnie Financiere Richemont SA, Class A | (12,270) | (963,141) | ||||||
| Credit Suisse Group AG † | (205,882) | (5,024,832) | ||||||
| Geberit AG † | (1,937) | (429,385) | ||||||
| Givaudan SA † | (1,089) | (1,150,844) | ||||||
| Holcim Ltd. † | (15,098) | (1,112,044) | ||||||
| Julius Baer Group Ltd. † | (40,221) | (1,431,981) | ||||||
| Kuehne + Nagel International AG | (14,654) | (1,766,674) | ||||||
| The accompanying notes are an integral part of these financial statements. | (Continued) |
| AQR Funds | Annual Report | December 2012 | 63 | |||||||||||||
Table of Contents
| Consolidated Schedule of Investments | December 31, 2012 |
| AQR MULTI-STRATEGY ALTERNATIVE FUND |
| SHARES | VALUE (Note 3) | |||||||
| Switzerland - (2.4)% (continued) | ||||||||
| Nobel Biocare Holding AG † | (15,866) | $ | (134,911) | |||||
| Sika AG | (41) | (94,831) | ||||||
| Sonova Holding AG † | (37,690) | (4,188,267) | ||||||
| Swatch Group AG/The | (2,814) | (1,426,991) | ||||||
| Swisscom AG | (571) | (247,422) | ||||||
| Temenos Group AG† | (14,091) | (247,610) | ||||||
|
| |||||||
| (20,535,320) | ||||||||
|
| |||||||
| United Kingdom - (0.3)% | ||||||||
| Subsea 7 SA (cost $2,798,807) | (120,610) | (2,898,537) | ||||||
|
| |||||||
| United States - (22.6)% | ||||||||
| Alcoa, Inc. (1) | (408,163) | (3,542,855) | ||||||
| Amkor Technology, Inc. (1)† | (985,153) | (4,186,900) | ||||||
| Annaly Capital Management, Inc. REIT (1) | (449) | (6,304) | ||||||
| Archer-Daniels-Midland Co. (1) | (699) | (19,146) | ||||||
| Ares Capital Corp. (1) | (19,963) | (349,353) | ||||||
| Avis Budget Group, Inc. (1)† | (100,554) | (1,992,980) | ||||||
| Boston Properties, Inc. REIT (1) | (8,499) | (899,279) | ||||||
| Cadence Design Systems, Inc. (1)† | (359,329) | (4,854,535) | ||||||
| Chart Industries, Inc. (1)† | (32,348) | (2,156,641) | ||||||
| Ciena Corp. (1)† | (81,052) | (1,272,516) | ||||||
| Citigroup, Inc. (1) | (27,351) | (1,082,006) | ||||||
| CVR Energy, Inc. (1)† | (1,538) | (75,039) | ||||||
| DDR Corp. REIT (1) | (282,625) | (4,425,908) | ||||||
| Digital Realty Trust, Inc. REIT (1) | (38,737) | (2,629,855) | ||||||
| DR Horton, Inc. (1) | (358,882) | (7,098,686) | ||||||
| Equinix, Inc. (1)† | (50,929) | (10,501,560) | ||||||
| Exelixis, Inc. (1)† | (79,471) | (363,182) | ||||||
| Exterran Holdings, Inc. (1)† | (20,669) | (453,065) | ||||||
| General Cable Corp. (1)† | (71,465) | (2,173,251) | ||||||
| Gilead Sciences, Inc. (1)† | (164,720) | (12,098,684) | ||||||
| Health Care REIT, Inc. REIT (1) | (47,668) | (2,921,572) | ||||||
| Hertz Global Holdings, Inc. (1)† | (759,427) | (12,355,877) | ||||||
| Host Hotels & Resorts, Inc. REIT (1) | (319,626) | (5,008,539) | ||||||
| JetBlue Airways Corp. (1)† | (63,396) | (361,991) | ||||||
| L-3 Communications Holdings, Inc. (1) | (7,499) | (574,573) | ||||||
| Lennar Corp., Class A (1) | (314,843) | (12,174,979) | ||||||
| Level 3 Communications, Inc. (1)† | (3,157) | (72,958) | ||||||
| Medtronic, Inc. (1) | (1,176) | (48,240) | ||||||
| MetLife, Inc. (1) | (8,441) | (278,047) | ||||||
| Microchip Technology, Inc. (1) | (147,993) | (4,823,092) | ||||||
| Micron Technology, Inc. (1)† | (249,189) | (1,582,350) | ||||||
| Navistar International Corp. (1)† | (1,740) | (37,880) | ||||||
| NetApp, Inc. (1)† | (128,978) | (4,327,212) | ||||||
| NextEra Energy, Inc. (1) | (4,059) | (280,842) | ||||||
| Omnicare, Inc. (1) | (22,589) | (815,463) | ||||||
| PHH Corp. (1)† | (566,500) | (12,887,875) | ||||||
| PPL Corp. (1) | (29,234) | (836,969) | ||||||
| priceline.com, Inc. (1)† | (853) | (529,884) | ||||||
| Prologis, Inc. REIT (1) | (39,356) | (1,436,100) | ||||||
| Regeneron Pharmaceuticals, Inc. (1)† | (72,502) | (12,402,917) | ||||||
| Riverbed Technology, Inc. (1)† | (3,956) | (78,012) | ||||||
| Royal Caribbean Cruises Ltd. | (20,093) | (673,084) | ||||||
| Ryman Hospitality Properties REIT (1) | (153,126) | (5,889,226) | ||||||
| SHARES | VALUE (Note 3) | |||||||
| United States - (22.6)% (continued) | ||||||||
| Salesforce.com, Inc. (1)† | (60,014) | $ | (10,088,353) | |||||
| SanDisk Corp. (1)† | (89) | (3,877) | ||||||
| Sirius XM Radio, Inc. (1) | (3,003,716) | (8,680,739) | ||||||
| SL Green Realty Corp. REIT (1) | (37,533) | (2,876,904) | ||||||
| Smithfield Foods, Inc. (1)† | (60,370) | (1,302,181) | ||||||
| Standard Pacific Corp. (1)† | (31,189) | (229,239) | ||||||
| Stillwater Mining Co. (1)† | (13,793) | (176,275) | ||||||
| Take-Two Interactive Software, Inc. (1)† | (5,342) | (58,815) | ||||||
| Textron, Inc. (1) | (66,000) | (1,636,140) | ||||||
| Toll Brothers, Inc. (1)† | (11,606) | (375,222) | ||||||
| Tyson Foods, Inc., Class A (1) | (130,183) | (2,525,550) | ||||||
| United States Steel Corp. (1) | (43,239) | (1,032,115) | ||||||
| VeriSign, Inc. (1)† | (300,615) | (11,669,874) | ||||||
| Virgin Media, Inc. (1) | (35,835) | (1,316,936) | ||||||
| Vishay Intertechnology, Inc. (1)† | (140,059) | (1,488,827) | ||||||
| Xilinx, Inc. (1) | (234,861) | (8,431,510) | ||||||
|
| |||||||
| (192,471,984) | ||||||||
|
| |||||||
TOTAL COMMON STOCKS SOLD SHORT | ||||||||
(proceeds $442,332,551) | (478,639,576) | |||||||
|
| |||||||
| PREFERRED STOCKS - (0.3)% | ||||||||
| Germany - (0.3)% | ||||||||
| Volkswagen AG (cost $2,048,389) | (9,954) | (2,283,935) | ||||||
|
| |||||||
| EXCHANGE TRADED FUNDS - (4.6)% | ||||||||
| iShares MSCI Emerging Markets Index Fund (1) | (860,900) | (38,180,915) | ||||||
| SPDR S&P 500 ETF Trust (1) | (5,995) | (854,407) | ||||||
|
| |||||||
| TOTAL EXCHANGE TRADED FUNDS SOLD SHORT | ||||||||
(proceeds $35,324,577) | (39,035,322) | |||||||
|
| |||||||
| TOTAL SECURITIES SOLD SHORT | ||||||||
(proceeds $479,705,517) | (519,958,833) | |||||||
|
| |||||||
| TOTAL INVESTMENTS, NET OF SECURITIES SOLD SHORT - 51.2% | ||||||||
(Cost $414,708,678) |
| 436,119,447 | ||||||
|
| |||||||
OTHER ASSETS IN EXCESS OF LIABILITIES - 48.8% (k) |
| 415,246,580 | ||||||
|
| |||||||
| NET ASSETS - 100.0% | $ | 851,366,027 | ||||||
|
| |||||||
| The accompanying notes are an integral part of these financial statements. | (Continued) |
| 64 | AQR Funds | Annual Report | December 2012 | |||||||||||||
Table of Contents
| Consolidated Schedule of Investments | December 31, 2012 |
| AQR MULTI-STRATEGY ALTERNATIVE FUND |
| SECTOR | VALUE | % OF NET ASSETS | ||||||
| Consumer Discretionary | $ | 1,943,169 | 0.2 | % | ||||
| Consumer Staples | 31,169,366 | 3.7 | ||||||
| Energy | 2,672,305 | 0.3 | ||||||
| Financials | 38,205,095 | 4.5 | ||||||
| Health Care | 19,324,277 | 2.3 | ||||||
| Industrials | 43,211,286 | 5.1 | ||||||
| Information Technology | 2,301,375 | 0.3 | ||||||
| Materials | 2,881,863 | 0.3 | ||||||
| Mutual Fund | (39,035,322) | (4.6 ) | ||||||
| Telecommunication Services | 23,199,696 | 2.7 | ||||||
| Utilities | 11,836,208 | 1.4 | ||||||
| Money Market Funds | 283,644,107 | 33.3 | ||||||
| Other Investments | 14,766,022 | 1.7 | ||||||
|
|
|
| |||||
Total Investments | 436,119,447 | 51.2 | ||||||
| Other Assets in Excess of Liabilities (k) | 415,246,580 | 48.8 | ||||||
|
|
|
| |||||
Net Assets | $ | 851,366,027 | 100.0 | % | ||||
|
|
|
| |||||
| † | Non income-producing security. |
| (a) | All or a portion of the security on loan. The aggregate market value of such securities is $1,217,790; cash collateral of $1,238,191 was received with which the Fund purchased a money market fund. |
| (b) | Represents less than 0.05 percent of net assets. |
| (c) | All or a portion of this security has been segregated as collateral for securities sold short and can be sold or replaced subject to the broker’s right to re-hypothecate. At December 31, 2012, the value of these securities was $283,477,034. In addition, $356,617,427 of cash collateral was pledged. |
| (d) | Security fair valued at as of December 31, 2012 using procedures approved by the Board of Trustees. The total value of positions fair valued was $3,259,676 or 0.4% of total net assets. |
| (e) | Represents a step bond. The rate shown reflects the yield at December 31, 2012. |
| (f) | Rule 144A, Section 4(2) or other security which is restricted as to resale to institutional investors. The Fund Advisor has deemed this security to be liquid based upon procedures approved by the Board of Trustees. |
| (g) | Represents annualized seven-day yield as of December 31, 2012. |
| (h) | A portion of the security is pledged as collateral to the brokers for forward foreign currency exchange, futures and swap contracts. |
| (i) | Represents security, or portion thereof, purchased with the cash collateral received for securities on loan. |
| (j) | The rate shown is the effective yield at the date of purchase. |
| (k) | Includes appreciation on forward foreign currency exchange, futures and swap contracts. |
| * | The rating reflected is as December 31, 2012 and is unaudited. Rating of certain bonds may have changed subsequent to the date. |
| ** | S & P Rating provided. |
All securities are Level 2 with respect to ASC 820, unless otherwise noted in parentheses.
| (1) | Level 1 security (See Note 5). |
| (3) | Level 3 security (See Note 5). |
The following abbreviations are used in portfolio descriptions:
144A - Restricted Security
ADR - American Depositary Receipt
CVA - Dutch Certification
EUR - Euro
NR - Not Rated by Moody’s
NVDR - Non-Voting Depository Receipt
REIT - Real Estate Investment Trust
SDR - Special Drawing Rights
| The accompanying notes are an integral part of these financial statements. | (Continued) |
| AQR Funds | Annual Report | December 2012 | 65 | |||||||||||||
Table of Contents
| Consolidated Schedule of Investments | December 31, 2012 |
| AQR MULTI-STRATEGY ALTERNATIVE FUND |
Credit default swap contracts sell protection as of December 31, 2012:
| COUNTERPARTY | REFERENCE ENTITY | FIXED ANNUAL RATE RECEIVED BY FUND | CURRENCY | CREDIT SPREAD | NOTIONAL AMOUNT | UPFRONT PREMIUM (RECEIVED) PAID | TERMINATION DATE | UNREALIZED APPRECIATION (DEPRECIATION) | ||||||||||||||||||
| The Royal Bank of Scotland | Markit CDX North America High Yield Index Series 18 | 5.000% | USD | 4.581% | 40,936,500 | $1,107,173 | 6/20/2017 | $(360,955) | ||||||||||||||||||
| The Royal Bank of Scotland | Markit CDX North America High Yield Index Series 19 | 5.000% | USD | 4.909% | 44,750,000 | (44,669) | 12/20/2017 | 255,874 | ||||||||||||||||||
| The Royal Bank of Scotland | Markit CDX North America High Yield Index Series 19 | 5.000% | USD | 4.909% | 200,000 | 2,845 | 12/20/2017 | (1,901) | ||||||||||||||||||
|
|
|
| |||||||||||||||||||||||
| $1,065,349 | $(106,982) | |||||||||||||||||||||||||
|
|
|
| |||||||||||||||||||||||
Credit default swap contracts buy protection as of December 31, 2012:
| COUNTERPARTY | REFERENCE ENTITY | FIXED ANNUAL RATE RECEIVED BY FUND | CURRENCY | CREDIT SPREAD | NOTIONAL AMOUNT | UPFRONT PREMIUM (RECEIVED) PAID | TERMINATION DATE | UNREALIZED APPRECIATION (DEPRECIATION) | ||||||||||||||||||
| The Royal Bank of Scotland | Markit CDX North America High Yield Index Series 18 | 5.000% | USD | 4.581% | 40,936,500 | $309,981 | 6/20/2017 | $(1,056,199) | ||||||||||||||||||
| The Royal Bank of Scotland | Markit CDX North America High Yield Index Series 19 | 5.000% | USD | 4.909% | 5,100,000 | (6,794) | 12/20/2017 | (17,277) | ||||||||||||||||||
| The Royal Bank of Scotland | Markit CDX North America High Yield Index Series 19 | 5.000% | USD | 4.909% | 700,000 | (932) | 12/20/2017 | (2,371) | ||||||||||||||||||
|
|
|
| |||||||||||||||||||||||
| $302,255 | $(1,075,847) | |||||||||||||||||||||||||
|
|
|
| |||||||||||||||||||||||
Collateral for positions held at the Royal Bank of Scotland is included in the collateral for forward foreign currency exchange contracts.
Open Written Options contracts outstanding at December 31, 2012:
Call Options Written
| SHARES | ISSUER | COUNTERPARTY | EXPIRATION DATE | PROCEEDS | VALUE AT DECEMBER 31, 2012 | UNREALIZED APPRECIATION (DEPRECIATION) | ||||||||||||||||
| 36 | Clearwire Corp. (Exercise price $3) | J.P. Morgan | March 16, 2013 | $(324) | $(180) | $144 | ||||||||||||||||
| 76 | Knight Capital Group, Inc. (Exercise price $4) | J.P. Morgan | July 20, 2013 | (104) | (380) | (276) | ||||||||||||||||
| The accompanying notes are an integral part of these financial statements. | (Continued) |
| 66 | AQR Funds | Annual Report | December 2012 | |||||||||||||
Table of Contents
| Consolidated Schedule of Investments | December 31, 2012 |
| AQR MULTI-STRATEGY ALTERNATIVE FUND |
| SHARES | ISSUER | COUNTERPARTY | EXPIRATION DATE | PROCEEDS | VALUE AT DECEMBER 31, 2012 | UNREALIZED APPRECIATION (DEPRECIATION) | ||||||||||||||||
| 28 | Knight Capital Group, Inc. (Exercise price $5) | J.P. Morgan | July 20, 2013 | $– | $(28) | $(28) | ||||||||||||||||
| 17 | McMoRan Exploration Co. (Exercise price $14) | J.P. Morgan | January 19, 2013 | (2,239) | (3,366) | (1,127) | ||||||||||||||||
| 21 | McMoRan Exploration Co. (Exercise price $15) | J.P. Morgan | January 19, 2013 | (1,085) | (2,247) | (1,162) | ||||||||||||||||
| 249 | MetroPCS Communications, Inc. (Exercise price $9) | J.P. Morgan | January 19, 2013 | (29,631) | (21,165) | 8,466 | ||||||||||||||||
| 298 | Sprint Nextel Corp. (Exercise price $10) | J.P. Morgan | January 18, 2014 | (2,533) | (1,490) | 1,043 | ||||||||||||||||
|
|
|
|
|
| |||||||||||||||||
| $(35,916) | $(28,856) | $7,060 | ||||||||||||||||||||
|
|
|
|
|
| |||||||||||||||||
Total return swap contracts outstanding as of December 31, 2012:
| COUNTERPARTY | UNDERLYING REFERENCE INSTRUMENT | TERMINATION DATE | CURRENCY | NOTIONAL VALUE | UNREALIZED APPRECIATION (DEPRECIATION) | |||||||||
| Morgan Stanley and Co., International PLC | Bovespa Index | 2/13/2013 | BRL | (18,831,927) | $(375,151) | |||||||||
| Bank of America | Canadian 10-Year Bond Futures | 3/19/2013 | CAD | 18,753,882 | (51,702) | |||||||||
| Barclays Capital | Cocoa Futures | 3/13/2013 | USD | (540,320) | 48,400 | |||||||||
| Barclays Capital | Corn Futures | 3/14/2013 | USD | (3,227,250) | 85,125 | |||||||||
| Deutsche Bank | Corn Futures | 3/14/2013 | USD | 3,013,000 | (220,000) | |||||||||
| Bank of America | Euro - Bobl Futures | 3/7/2013 | EUR | 16,246,989 | 149,131 | |||||||||
| Bank of America | Euro - Bund Futures | 3/7/2013 | EUR | (10,238,444) | (133,734) | |||||||||
| Bank of America | Euro - Buxl 30-Year Bond Futures | 3/7/2013 | EUR | 3,596,429 | 133,048 | |||||||||
| Bank of America | Euro - SCHATZ Futures | 3/7/2013 | EUR | 37,979,422 | 56,608 | |||||||||
| Bank of America | Long Gilt Futures | 3/26/2013 | GBP | (19,109,127) | (57,520) | |||||||||
| Morgan Stanley and Co., International PLC | Russian Trading System Index Futures | 3/15/2013 | USD | 10,241,393 | 194,903 | |||||||||
| Barclays Capital | Soybean Futures | 3/14/2013 | USD | (3,972,300) | 166,650 | |||||||||
| Deutsche Bank | Soybean Futures | 3/14/2013 | USD | 2,515,575 | (119,425) | |||||||||
| Morgan Stanley and Co., International PLC | Swiss Market Index Futures | 3/15/2013 | CHF | (136,193) | 1,306 | |||||||||
| Bank of America | U.S. Long Bond Futures | 3/19/2013 | USD | 5,983,504 | (83,504) | |||||||||
| Bank of America | U.S. Treasury 10-Year Note Futures | 3/19/2013 | USD | 9,863,222 | (37,410) | |||||||||
| Bank of America | U.S. Treasury 2-Year Note Futures | 3/28/2013 | USD | (22,922,951) | (5,799) | |||||||||
| Bank of America | U.S. Treasury 5-Year Note Futures | 3/28/2013 | USD | 12,576,955 | (11,135) | |||||||||
|
| |||||||||||||
| $(260,209) | ||||||||||||||
|
| |||||||||||||
Money Market is pledged as collateral to brokers for total return swap contracts in the amount of $5,058,260.
Open futures contracts outstanding at December 31, 2012:
| NUMBER OF CONTRACTS | DESCRIPTION | EXPIRATION DATE | VALUE AT TRADE DATE | VALUE AT DECEMBER 31, 2012 | UNREALIZED APPRECIATION (DEPRECIATION) | |||||||||||
| Long Contracts: | ||||||||||||||||
| 3 | Corn Futures | March 14, 2013 | $111,876 | $104,738 | $(7,138) | |||||||||||
| 174 | Globex Brent FCL Futures | February 15, 2013 | 18,909,820 | 19,333,140 | 423,320 | |||||||||||
| 38 | Globex RBOB Gas Futures | January 30, 2013 | 4,239,295 | 4,407,673 | 168,378 | |||||||||||
| 27 | Lean Hogs Futures | February 14, 2013 | 942,101 | 925,830 | (16,271) | |||||||||||
| The accompanying notes are an integral part of these financial statements. | (Continued) |
| AQR Funds | Annual Report | December 2012 | 67 | |||||||||||||
Table of Contents
| Consolidated Schedule of Investments | December 31, 2012 |
| AQR MULTI-STRATEGY ALTERNATIVE FUND |
| NUMBER OF CONTRACTS | DESCRIPTION | EXPIRATION DATE | VALUE AT TRADE DATE | VALUE AT DECEMBER 31, 2012 | UNREALIZED APPRECIATION (DEPRECIATION) | |||||||||||
| Long Contracts: (continued) | ||||||||||||||||
| 2 | LME Aluminum Futures | January 4, 2013 | $105,423 | $102,070 | $(3,353) | |||||||||||
| 26 | LME Aluminum Futures | January 11, 2013 | 1,300,042 | 1,328,847 | 28,805 | |||||||||||
| 11 | LME Aluminum Futures | January 15, 2013 | 543,968 | 562,672 | 18,704 | |||||||||||
| 13 | LME Aluminum Futures | January 16, 2013 | 636,046 | 665,113 | 29,067 | |||||||||||
| 5 | LME Aluminum Futures | January 17, 2013 | 245,008 | 255,864 | 10,856 | |||||||||||
| 19 | LME Aluminum Futures | January 25, 2013 | 918,005 | 973,859 | 55,854 | |||||||||||
| 19 | LME Aluminum Futures | February 1, 2013 | 921,805 | 975,236 | 53,431 | |||||||||||
| 13 | LME Aluminum Futures | February 14, 2013 | 649,101 | 669,015 | 19,914 | |||||||||||
| 1 | LME Aluminum Futures | February 15, 2013 | 49,165 | 51,473 | 2,308 | |||||||||||
| 16 | LME Aluminum Futures | February 27, 2013 | 806,283 | 825,476 | 19,193 | |||||||||||
| 32 | LME Aluminum Futures | February 28, 2013 | 1,628,280 | 1,651,256 | 22,976 | |||||||||||
| 27 | LME Aluminum Futures | March 4, 2013 | 1,416,107 | 1,394,286 | (21,821) | |||||||||||
| 12 | LME Aluminum Futures | March 5, 2013 | 630,492 | 619,797 | (10,695) | |||||||||||
| 39 | LME Aluminum Futures | March 20, 2013 | 2,049,037 | 2,019,956 | (29,081) | |||||||||||
| 14 | LME Aluminum Futures | March 21, 2013 | 720,322 | 725,168 | 4,846 | |||||||||||
| 7 | LME Copper Futures | January 4, 2013 | 1,456,686 | 1,383,798 | (72,888) | |||||||||||
| 1 | LME Copper Futures | January 8, 2013 | 204,633 | 197,728 | (6,905) | |||||||||||
| 1 | LME Copper Futures | January 11, 2013 | 204,936 | 197,760 | (7,176) | |||||||||||
| 2 | LME Copper Futures | January 25, 2013 | 393,053 | 395,744 | 2,691 | |||||||||||
| 1 | LME Copper Futures | February 5, 2013 | 190,427 | 197,966 | 7,539 | |||||||||||
| 1 | LME Copper Futures | February 6, 2013 | 192,177 | 197,975 | 5,798 | |||||||||||
| 1 | LME Copper Futures | February 7, 2013 | 193,127 | 197,983 | 4,856 | |||||||||||
| 3 | LME Copper Futures | February 8, 2013 | 571,655 | 593,975 | 22,320 | |||||||||||
| 1 | LME Copper Futures | February 12, 2013 | 190,183 | 198,026 | 7,843 | |||||||||||
| 2 | LME Copper Futures | February 13, 2013 | 379,153 | 396,068 | 16,915 | |||||||||||
| 3 | LME Copper Futures | February 15, 2013 | 573,755 | 594,154 | 20,399 | |||||||||||
| 1 | LME Copper Futures | February 19, 2013 | 192,452 | 198,086 | 5,634 | |||||||||||
| 3 | LME Copper Futures | February 28, 2013 | 590,483 | 594,394 | 3,911 | |||||||||||
| 6 | LME Copper Futures | March 4, 2013 | 1,199,184 | 1,188,938 | (10,246) | |||||||||||
| 2 | LME Copper Futures | March 5, 2013 | 403,314 | 396,325 | (6,989) | |||||||||||
| 14 | LME Copper Futures | March 6, 2013 | 2,819,840 | 2,774,362 | (45,478) | |||||||||||
| 7 | LME Copper Futures | March 12, 2013 | 1,423,961 | 1,387,444 | (36,517) | |||||||||||
| 1 | LME Copper Futures | March 13, 2013 | 202,195 | 198,212 | (3,983) | |||||||||||
| 4 | LME Copper Futures | March 19, 2013 | 801,006 | 793,000 | (8,006) | |||||||||||
| 55 | LME Copper Futures | March 20, 2013 | 11,064,838 | 10,904,094 | (160,744) | |||||||||||
| 6 | LME Copper Futures | March 21, 2013 | 1,167,910 | 1,189,551 | 21,641 | |||||||||||
| 3 | LME Nickel Futures | January 4, 2013 | 336,199 | 305,978 | (30,221) | |||||||||||
| 1 | LME Nickel Futures | January 8, 2013 | 108,841 | 102,011 | (6,830) | |||||||||||
| 1 | LME Nickel Futures | January 9, 2013 | 108,916 | 102,016 | (6,900) | |||||||||||
| 2 | LME Nickel Futures | January 10, 2013 | 214,210 | 204,040 | (10,170) | |||||||||||
| 2 | LME Nickel Futures | January 11, 2013 | 212,607 | 204,050 | (8,557) | |||||||||||
| 7 | LME Nickel Futures | January 25, 2013 | 681,149 | 714,627 | 33,478 | |||||||||||
| 4 | LME Nickel Futures | February 1, 2013 | 392,952 | 408,488 | 15,536 | |||||||||||
| 2 | LME Nickel Futures | February 5, 2013 | 189,567 | 204,281 | 14,714 | |||||||||||
| 1 | LME Nickel Futures | February 7, 2013 | 97,682 | 102,150 | 4,468 | |||||||||||
| 2 | LME Nickel Futures | February 8, 2013 | 192,483 | 204,309 | 11,826 | |||||||||||
| 1 | LME Nickel Futures | February 13, 2013 | 95,762 | 102,178 | 6,416 | |||||||||||
| 3 | LME Nickel Futures | February 14, 2013 | 292,383 | 306,546 | 14,163 | |||||||||||
| 5 | LME Nickel Futures | February 15, 2013 | 478,262 | 510,934 | 32,672 | |||||||||||
| 3 | LME Nickel Futures | February 19, 2013 | 290,525 | 306,616 | 16,091 | |||||||||||
| 3 | LME Nickel Futures | February 28, 2013 | 308,391 | 306,743 | (1,648) | |||||||||||
| 8 | LME Nickel Futures | March 4, 2013 | 840,874 | 818,133 | (22,741) | |||||||||||
| 4 | LME Nickel Futures | March 5, 2013 | 421,450 | 409,085 | (12,365) | |||||||||||
| 3 | LME Nickel Futures | March 6, 2013 | 315,815 | 306,827 | (8,988) | |||||||||||
| 15 | LME Nickel Futures | March 20, 2013 | 1,580,344 | 1,535,130 | (45,214) | |||||||||||
| 7 | LME Zinc Futures | January 4, 2013 | 364,191 | 358,729 | (5,462) | |||||||||||
| 2 | LME Zinc Futures | January 8, 2013 | 102,346 | 102,571 | 225 | |||||||||||
| The accompanying notes are an integral part of these financial statements. | (Continued) |
| 68 | AQR Funds | Annual Report | December 2012 | |||||||||||||
Table of Contents
| Consolidated Schedule of Investments | December 31, 2012 |
| AQR MULTI-STRATEGY ALTERNATIVE FUND |
| NUMBER OF CONTRACTS | DESCRIPTION | EXPIRATION DATE | VALUE AT TRADE DATE | VALUE AT DECEMBER 31, 2012 | UNREALIZED APPRECIATION (DEPRECIATION) | |||||||||||
| Long Contracts: (continued) | ||||||||||||||||
| 3 | LME Zinc Futures | January 9, 2013 | $153,332 | $153,886 | $554 | |||||||||||
| 3 | LME Zinc Futures | January 15, 2013 | 144,023 | 154,058 | 10,035 | |||||||||||
| 7 | LME Zinc Futures | January 16, 2013 | 335,399 | 359,538 | 24,139 | |||||||||||
| 11 | LME Zinc Futures | January 17, 2013 | 523,893 | 565,095 | 41,202 | |||||||||||
| 11 | LME Zinc Futures | January 18, 2013 | 523,343 | 565,200 | 41,857 | |||||||||||
| 7 | LME Zinc Futures | January 22, 2013 | 329,624 | 359,942 | 30,318 | |||||||||||
| 6 | LME Zinc Futures | January 23, 2013 | 276,872 | 308,580 | 31,708 | |||||||||||
| 11 | LME Zinc Futures | January 24, 2013 | 509,318 | 565,838 | 56,520 | |||||||||||
| 12 | LME Zinc Futures | January 25, 2013 | 549,457 | 617,391 | 67,934 | |||||||||||
| 4 | LME Zinc Futures | February 1, 2013 | 189,456 | 206,067 | 16,611 | |||||||||||
| 5 | LME Zinc Futures | February 5, 2013 | 230,383 | 257,776 | 27,393 | |||||||||||
| 23 | LME Zinc Futures | February 15, 2013 | 1,118,124 | 1,187,990 | 69,866 | |||||||||||
| 5 | LME Zinc Futures | February 19, 2013 | 241,899 | 258,452 | 16,553 | |||||||||||
| 8 | LME Zinc Futures | February 20, 2013 | 388,747 | 413,600 | 24,853 | |||||||||||
| 9 | LME Zinc Futures | February 21, 2013 | 432,107 | 465,387 | 33,280 | |||||||||||
| 12 | LME Zinc Futures | February 27, 2013 | 599,194 | 621,225 | 22,031 | |||||||||||
| 16 | LME Zinc Futures | February 28, 2013 | 796,950 | 828,456 | 31,506 | |||||||||||
| 6 | LME Zinc Futures | March 4, 2013 | 304,152 | 310,906 | 6,754 | |||||||||||
| 56 | LME Zinc Futures | March 20, 2013 | 2,845,558 | 2,910,600 | 65,042 | |||||||||||
| 24 | Soybean Futures | March 14, 2013 | 1,719,212 | 1,691,400 | (27,812) | |||||||||||
| 21 | Wheat Futures | March 14, 2013 | 928,464 | 816,900 | (111,564) | |||||||||||
| 106 | Amsterdam Index Futures | January 18, 2013 | 9,620,210 | 9,600,946 | (19,264) | |||||||||||
| 360 | CAC40 10 Euro Futures | January 18, 2013 | 17,347,373 | 17,306,129 | (41,244) | |||||||||||
| 30 | DAX Index Futures | March 15, 2013 | 7,552,099 | 7,542,030 | (10,069) | |||||||||||
| 56 | DJIA Mini E-CBOT Futures | March 15, 2013 | 3,699,166 | 3,647,560 | (51,606) | |||||||||||
| 788 | E-Mini Russell 2000 Futures | March 15, 2013 | 65,873,041 | 66,712,080 | 839,039 | |||||||||||
| 1,650 | Euro Stoxx 50 Index | March 15, 2013 | 57,310,742 | 56,952,543 | (358,199) | |||||||||||
| 377 | FTSE 100 Index Futures | March 15, 2013 | 36,185,108 | 35,814,184 | (370,924) | |||||||||||
| 452 | FTSE/JSE Top 40 Index Futures | March 20, 2013 | 18,482,290 | 18,710,747 | 228,457 | |||||||||||
| 39 | Hang Seng Index Futures | January 30, 2013 | 5,686,066 | 5,704,445 | 18,379 | |||||||||||
| 246 | H-SHARES Index Futures | January 30, 2013 | 17,990,325 | 18,171,852 | 181,527 | |||||||||||
| 23 | IBEX 35 Index Futures | January 18, 2013 | 2,426,694 | 2,450,263 | 23,569 | |||||||||||
| 16 | KOSPI Index 200 Futures | March 14, 2013 | 1,942,757 | 1,988,464 | 45,707 | |||||||||||
| 94 | MSCI Singapore Index Futures | January 30, 2013 | 5,544,063 | 5,542,041 | (2,022) | |||||||||||
| 3 | MSCI Taiwan Stock Index Futures | January 30, 2013 | 81,528 | 82,500 | 972 | |||||||||||
| 17 | NASDAQ 100 E-Mini Futures | March 15, 2013 | 907,866 | 902,785 | (5,081) | |||||||||||
| 45 | S&P MID 400 E-Mini Futures | March 15, 2013 | 4,563,803 | 4,581,450 | 17,647 | |||||||||||
| 29 | S&P/Toronto Stock Exchange 60 Index Futures | March 14, 2013 | 4,097,209 | 4,148,105 | 50,896 | |||||||||||
| 139 | 3-Month Euro Euribor Futures | December 16, 2013 | 45,764,359 | 45,762,765 | (1,594) | |||||||||||
| 138 | 3-Month Euro Euribor Futures | March 17, 2014 | 45,412,884 | 45,419,876 | 6,992 | |||||||||||
| 139 | 3-Month Euro Euribor Futures | June 16, 2014 | 45,714,645 | 45,730,658 | 16,013 | |||||||||||
| 140 | 3-Month Euro Euribor Futures | September 15, 2014 | 46,017,813 | 46,038,866 | 21,053 | |||||||||||
| 140 | 3-Month Euro Euribor Futures | December 15, 2014 | 45,985,977 | 46,011,148 | 25,171 | |||||||||||
| 384 | 90-Day EURODollar Futures | June 17, 2013 | 95,712,629 | 95,688,000 | (24,629) | |||||||||||
| 105 | 90-Day EURODollar Futures | September 16, 2013 | 26,156,966 | 26,159,438 | 2,472 | |||||||||||
| 98 | 90-Day EURODollar Futures | December 16, 2013 | 24,407,192 | 24,408,125 | 933 | |||||||||||
| 78 | 90-Day EURODollar Futures | March 17, 2014 | 19,420,882 | 19,421,025 | 143 | |||||||||||
| 67 | 90-Day EURODollar Futures | June 16, 2014 | 16,676,108 | 16,674,625 | (1,483) | |||||||||||
| 70 | 90-Day EURODollar Futures | September 15, 2014 | 17,415,758 | 17,412,500 | (3,258) | |||||||||||
| 81 | 90-Day EURODollar Futures | December 15, 2014 | 20,146,252 | 20,136,600 | (9,652) | |||||||||||
| 125 | 90-Day GBP LIBOR Futures | December 18, 2013 | 25,257,631 | 25,234,816 | (22,815) | |||||||||||
| 1,449 | 90-Day Sterling Futures | June 19, 2013 | 292,601,346 | 292,610,250 | 8,904 | |||||||||||
| 958 | 90-Day Sterling Futures | September 18, 2013 | 193,424,049 | 193,438,532 | 14,483 | |||||||||||
| 135 | 90-Day Sterling Futures | March 19, 2014 | 27,272,020 | 27,248,118 | (23,902) | |||||||||||
| 145 | 90-Day Sterling Futures | June 18, 2014 | 29,280,498 | 29,254,720 | (25,778) | |||||||||||
| 147 | 90-Day Sterling Futures | September 17, 2014 | 29,669,499 | 29,643,309 | (26,190) | |||||||||||
| The accompanying notes are an integral part of these financial statements. | (Continued) |
| AQR Funds | Annual Report | December 2012 | 69 | |||||||||||||
Table of Contents
| Consolidated Schedule of Investments | December 31, 2012 |
| AQR MULTI-STRATEGY ALTERNATIVE FUND |
| NUMBER OF CONTRACTS | DESCRIPTION | EXPIRATION DATE | VALUE AT TRADE DATE | VALUE AT DECEMBER 31, 2012 | UNREALIZED APPRECIATION (DEPRECIATION) | |||||||||||
| Long Contracts: (continued) | ||||||||||||||||
| 153 | 90-Day Sterling Futures | December 17, 2014 | $30,836,055 | $30,837,706 | $1,651 | |||||||||||
| 407 | Australia 10-Year Bond Futures | March 15, 2013 | 51,818,628 | 52,120,472 | 301,844 | |||||||||||
| 177 | Canadian 3-Month Bank Acceptance Futures | June 17, 2013 | 43,929,805 | 43,889,665 | (40,140) | |||||||||||
| 3 | Euro CHF 3-Month LIFFE Futures | June 17, 2013 | 820,998 | 820,396 | (602) | |||||||||||
| 9 | Euro CHF 3-Month LIFFE Futures | September 16, 2013 | 2,464,437 | 2,461,680 | (2,757) | |||||||||||
|
|
|
|
|
| |||||||||||
| 1,517,518,371 | 1,519,282,195 | 1,763,824 | ||||||||||||||
|
|
|
|
|
| |||||||||||
| Short Contracts: | ||||||||||||||||
| 11 | Cocoa Futures | March 13, 2013 | (261,470) | (245,959) | 15,511 | |||||||||||
| 98 | Coffee ‘C’ Futures | March 18, 2013 | (5,798,429) | (5,284,650) | 513,779 | |||||||||||
| 118 | Cotton No. 2 Futures | March 6, 2013 | (4,204,227) | (4,433,259) | (229,032) | |||||||||||
| 58 | Crude Oil Financial Futures | February 18, 2013 | (5,077,900) | (5,325,560) | (247,660) | |||||||||||
| 22 | Globex Heat Oil Futures | January 30, 2013 | (2,755,460) | (2,801,383) | (45,923) | |||||||||||
| 167 | Gold 100 OZ Futures | February 26, 2013 | (28,196,771) | (27,985,860) | 210,911 | |||||||||||
| 12 | ICE Euro Gasoil Futures | January 9, 2013 | (1,100,800) | (1,112,400) | (11,600) | |||||||||||
| 2 | LME Aluminum Futures | January 4, 2013 | (105,922) | (102,071) | 3,851 | |||||||||||
| 26 | LME Aluminum Futures | January 11, 2013 | (1,305,509) | (1,328,846) | (23,337) | |||||||||||
| 11 | LME Aluminum Futures | January 15, 2013 | (544,819) | (562,672) | (17,853) | |||||||||||
| 13 | LME Aluminum Futures | January 16, 2013 | (639,411) | (665,112) | (25,701) | |||||||||||
| 5 | LME Aluminum Futures | January 17, 2013 | (245,227) | (255,864) | (10,637) | |||||||||||
| 19 | LME Aluminum Futures | January 25, 2013 | (920,483) | (973,859) | (53,376) | |||||||||||
| 19 | LME Aluminum Futures | February 1, 2013 | (917,782) | (975,237) | (57,455) | |||||||||||
| 13 | LME Aluminum Futures | February 14, 2013 | (650,304) | (669,016) | (18,712) | |||||||||||
| 1 | LME Aluminum Futures | February 15, 2013 | (49,105) | (51,474) | (2,369) | |||||||||||
| 16 | LME Aluminum Futures | February 27, 2013 | (807,274) | (825,476) | (18,202) | |||||||||||
| 32 | LME Aluminum Futures | February 28, 2013 | (1,628,749) | (1,651,256) | (22,507) | |||||||||||
| 27 | LME Aluminum Futures | March 4, 2013 | (1,412,451) | (1,394,287) | 18,164 | |||||||||||
| 12 | LME Aluminum Futures | March 5, 2013 | (629,468) | (619,797) | 9,671 | |||||||||||
| 63 | LME Aluminum Futures | March 20, 2013 | (3,292,725) | (3,263,006) | 29,719 | |||||||||||
| 14 | LME Aluminum Futures | March 21, 2013 | (721,660) | (725,168) | (3,508) | |||||||||||
| 7 | LME Copper Futures | January 4, 2013 | (1,456,564) | (1,383,799) | 72,765 | |||||||||||
| 1 | LME Copper Futures | January 8, 2013 | (203,686) | (197,728) | 5,958 | |||||||||||
| 1 | LME Copper Futures | January 11, 2013 | (203,998) | (197,759) | 6,239 | |||||||||||
| 2 | LME Copper Futures | January 25, 2013 | (393,039) | (395,745) | (2,706) | |||||||||||
| 1 | LME Copper Futures | February 5, 2013 | (190,303) | (197,966) | (7,663) | |||||||||||
| 1 | LME Copper Futures | February 6, 2013 | (191,813) | (197,975) | (6,162) | |||||||||||
| 1 | LME Copper Futures | February 7, 2013 | (194,002) | (197,983) | (3,981) | |||||||||||
| 3 | LME Copper Futures | February 8, 2013 | (569,291) | (593,975) | (24,684) | |||||||||||
| 1 | LME Copper Futures | February 12, 2013 | (189,840) | (198,026) | (8,186) | |||||||||||
| 2 | LME Copper Futures | February 13, 2013 | (378,644) | (396,068) | (17,424) | |||||||||||
| 3 | LME Copper Futures | February 15, 2013 | (573,032) | (594,153) | (21,121) | |||||||||||
| 1 | LME Copper Futures | February 19, 2013 | (192,163) | (198,085) | (5,922) | |||||||||||
| 3 | LME Copper Futures | February 28, 2013 | (587,545) | (594,394) | (6,849) | |||||||||||
| 6 | LME Copper Futures | March 4, 2013 | (1,201,694) | (1,188,938) | 12,756 | |||||||||||
| 2 | LME Copper Futures | March 5, 2013 | (401,847) | (396,325) | 5,522 | |||||||||||
| 14 | LME Copper Futures | March 6, 2013 | (2,818,353) | (2,774,363) | 43,990 | |||||||||||
| 7 | LME Copper Futures | March 12, 2013 | (1,419,239) | (1,387,444) | 31,795 | |||||||||||
| 1 | LME Copper Futures | March 13, 2013 | (201,973) | (198,212) | 3,761 | |||||||||||
| 4 | LME Copper Futures | March 19, 2013 | (801,358) | (793,000) | 8,358 | |||||||||||
| 17 | LME Copper Futures | March 20, 2013 | (3,338,451) | (3,370,356) | (31,905) | |||||||||||
| 6 | LME Copper Futures | March 21, 2013 | (1,170,627) | (1,189,551) | (18,924) | |||||||||||
| 3 | LME Nickel Futures | January 4, 2013 | (336,112) | (305,978) | 30,134 | |||||||||||
| 1 | LME Nickel Futures | January 8, 2013 | (108,238) | (102,011) | 6,227 | |||||||||||
| The accompanying notes are an integral part of these financial statements. | (Continued) |
| 70 | AQR Funds | Annual Report | December 2012 | |||||||||||||
Table of Contents
| Consolidated Schedule of Investments | December 31, 2012 |
| AQR MULTI-STRATEGY ALTERNATIVE FUND |
| NUMBER OF CONTRACTS | DESCRIPTION | EXPIRATION DATE | VALUE AT TRADE DATE | VALUE AT DECEMBER 31, 2012 | UNREALIZED APPRECIATION (DEPRECIATION) | |||||||||||
| Short Contracts (continued) | ||||||||||||||||
| 1 | LME Nickel Futures | January 9, 2013 | $(108,298) | $(102,015) | $6,283 | |||||||||||
| 2 | LME Nickel Futures | January 10, 2013 | (212,997) | (204,041) | 8,956 | |||||||||||
| 2 | LME Nickel Futures | January 11, 2013 | (212,373) | (204,050) | 8,323 | |||||||||||
| 7 | LME Nickel Futures | January 25, 2013 | (675,937) | (714,628) | (38,691) | |||||||||||
| 4 | LME Nickel Futures | February 1, 2013 | (392,803) | (408,488) | (15,685) | |||||||||||
| 2 | LME Nickel Futures | February 5, 2013 | (189,884) | (204,281) | (14,397) | |||||||||||
| 1 | LME Nickel Futures | February 7, 2013 | (97,982) | (102,150) | (4,168) | |||||||||||
| 2 | LME Nickel Futures | February 8, 2013 | (190,881) | (204,309) | (13,428) | |||||||||||
| 1 | LME Nickel Futures | February 13, 2013 | (95,270) | (102,178) | (6,908) | |||||||||||
| 3 | LME Nickel Futures | February 14, 2013 | (290,319) | (306,546) | (16,227) | |||||||||||
| 5 | LME Nickel Futures | February 15, 2013 | (479,695) | (510,934) | (31,239) | |||||||||||
| 3 | LME Nickel Futures | February 19, 2013 | (289,676) | (306,617) | (16,941) | |||||||||||
| 3 | LME Nickel Futures | February 28, 2013 | (310,405) | (306,743) | 3,662 | |||||||||||
| 8 | LME Nickel Futures | March 4, 2013 | (840,834) | (818,133) | 22,701 | |||||||||||
| 4 | LME Nickel Futures | March 5, 2013 | (421,194) | (409,085) | 12,109 | |||||||||||
| 3 | LME Nickel Futures | March 6, 2013 | (316,993) | (306,828) | 10,165 | |||||||||||
| 14 | LME Nickel Futures | March 20, 2013 | (1,465,910) | (1,432,788) | 33,122 | |||||||||||
| 7 | LME Zinc Futures | January 4, 2013 | (364,639) | (358,729) | 5,910 | |||||||||||
| 2 | LME Zinc Futures | January 8, 2013 | (101,997) | (102,571) | (574) | |||||||||||
| 3 | LME Zinc Futures | January 9, 2013 | (152,695) | (153,886) | (1,191) | |||||||||||
| 3 | LME Zinc Futures | January 15, 2013 | (144,560) | (154,058) | (9,498) | |||||||||||
| 7 | LME Zinc Futures | January 16, 2013 | (336,642) | (359,537) | (22,895) | |||||||||||
| 11 | LME Zinc Futures | January 17, 2013 | (524,137) | (565,095) | (40,958) | |||||||||||
| 11 | LME Zinc Futures | January 18, 2013 | (523,305) | (565,200) | (41,895) | |||||||||||
| 7 | LME Zinc Futures | January 22, 2013 | (329,077) | (359,942) | (30,865) | |||||||||||
| 6 | LME Zinc Futures | January 23, 2013 | (277,140) | (308,580) | (31,440) | |||||||||||
| 11 | LME Zinc Futures | January 24, 2013 | (510,932) | (565,837) | (54,905) | |||||||||||
| 12 | LME Zinc Futures | January 25, 2013 | (549,798) | (617,391) | (67,593) | |||||||||||
| 4 | LME Zinc Futures | February 1, 2013 | (188,742) | (206,067) | (17,325) | |||||||||||
| 5 | LME Zinc Futures | February 5, 2013 | (230,884) | (257,776) | (26,892) | |||||||||||
| 23 | LME Zinc Futures | February 15, 2013 | (1,116,001) | (1,187,991) | (71,990) | |||||||||||
| 5 | LME Zinc Futures | February 19, 2013 | (241,617) | (258,451) | (16,834) | |||||||||||
| 8 | LME Zinc Futures | February 20, 2013 | (387,387) | (413,600) | (26,213) | |||||||||||
| 9 | LME Zinc Futures | February 21, 2013 | (431,029) | (465,387) | (34,358) | |||||||||||
| 12 | LME Zinc Futures | February 27, 2013 | (599,531) | (621,225) | (21,694) | |||||||||||
| 16 | LME Zinc Futures | February 28, 2013 | (797,224) | (828,456) | (31,232) | |||||||||||
| 6 | LME Zinc Futures | March 4, 2013 | (303,767) | (310,906) | (7,139) | |||||||||||
| 1,155 | Natural Gas Swap Futures | January 30, 2013 | (9,840,730) | (9,676,012) | 164,718 | |||||||||||
| 1 | Silver Futures | March 26, 2013 | (149,229) | (151,135) | (1,906) | |||||||||||
| 45 | Soybean Meal Futures | March 14, 2013 | (2,039,082) | (1,887,300) | 151,782 | |||||||||||
| 201 | Soybean Oil Futures | March 14, 2013 | (6,015,042) | (5,993,820) | 21,222 | |||||||||||
| 356 | Sugar #11 (World Markets) Futures | March 28, 2013 | (8,031,817) | (7,779,027) | 252,790 | |||||||||||
| 9 | FTSE/MIB Index Futures | March 15, 2013 | (949,676) | (968,421) | (18,745) | |||||||||||
| 6,664 | S&P 500 E-Mini Futures | March 15, 2013 | (476,418,692) | (473,177,320) | 3,241,372 | |||||||||||
| 926 | SGX S&P CNX Nifty Index Futures | January 31, 2013 | (11,024,245) | (11,024,956) | (711) | |||||||||||
| 514 | SPI 200 Index Futures | March 21, 2013 | (61,144,954) | (61,596,285) | (451,331) | |||||||||||
| 149 | TOPIX Index Futures | March 7, 2013 | (14,073,656) | (14,816,587) | (742,931) | |||||||||||
| 1,223 | 3-Month Euro Euribor Futures | June 17, 2013 | (402,905,154) | (402,888,638) | 16,516 | |||||||||||
| 480 | 3-Month Euro Euribor Futures | September 16, 2013 | (158,146,769) | (158,085,133) | 61,636 | |||||||||||
| 94 | Australia 3-Year Bond Futures | March 15, 2013 | (10,659,843) | (10,692,607) | (32,764) | |||||||||||
| 55 | Canadian 3-Month Bank Acceptance Futures | September 16, 2013 | (13,645,578) | (13,632,503) | 13,075 | |||||||||||
| 49 | Mini Japanese 10-Year Treasury Bond | March 8, 2013 | (8,145,797) | (8,123,022) | 22,775 | |||||||||||
| The accompanying notes are an integral part of these financial statements. | (Continued) |
| AQR Funds | Annual Report | December 2012 | 71 | |||||||||||||
Table of Contents
| Consolidated Schedule of Investments | December 31, 2012 |
| AQR MULTI-STRATEGY ALTERNATIVE FUND |
| NUMBER OF CONTRACTS | DESCRIPTION | EXPIRATION DATE | VALUE AT TRADE DATE | VALUE AT DECEMBER 31, 2012 | UNREALIZED APPRECIATION (DEPRECIATION) | |||||||||||
| Short Contracts (continued) | ||||||||||||||||
| 12 | U.S. Treasury 2-Year Note Futures | March 28, 2013 | $(2,644,665) | $(2,645,625) | $(960) | |||||||||||
| 7 | U.S. Treasury 5-Year Note Futures | March 28, 2013 | (871,528) | (870,899) | 629 | |||||||||||
|
|
|
|
|
| |||||||||||
| (1,279,796,770) | (1,277,615,835) | 2,180,935 | ||||||||||||||
|
|
|
|
|
| |||||||||||
| $237,721,601 | $241,666,360 | $3,944,759 | ||||||||||||||
|
|
|
|
|
| |||||||||||
Cash held as collateral with broker for futures contracts was $41,916,112 at December 31, 2012.
Forward foreign currency exchange contracts outstanding as of December 31, 2012:
| PURCHASE CONTRACTS | COUNTERPARTY | CURRENCY | CURRENCY AMOUNT PURCHASED | VALUE AT SETTLEMENT DATE | VALUE AT DECEMBER 31, 2012 | UNREALIZED APPRECIATION (DEPRECIATION) | ||||||||||||||
| Australian Dollar, Expiring 03/20/13 | The Royal Bank of Scotland | AUD | 18,714,000 | $19,565,439 | $19,325,212 | $(240,227) | ||||||||||||||
| Brazilian Real, Expiring 03/20/13* | The Royal Bank of Scotland | BRL | 700,000 | 333,897 | 338,582 | 4,685 | ||||||||||||||
| Canadian Dollar, Expiring 03/20/13 | The Royal Bank of Scotland | CAD | 74,574,000 | 75,041,925 | 74,850,406 | (191,519) | ||||||||||||||
| Chilean Peso, Expiring 03/20/13* | The Royal Bank of Scotland | CLP | 176,380,000 | 363,745 | 364,685 | 940 | ||||||||||||||
| Columbian Peso, Expiring 03/20/13* | The Royal Bank of Scotland | COP | 486,000,000 | 265,320 | 273,142 | 7,822 | ||||||||||||||
| Czech Republic Koruna, Expiring 03/20/13 | The Royal Bank of Scotland | CZK | 61,000,000 | 3,169,180 | 3,211,388 | 42,208 | ||||||||||||||
| Euro, Expiring 03/20/13 | The Royal Bank of Scotland | EUR | 52,046,000 | 68,285,870 | 68,744,855 | 458,985 | ||||||||||||||
| British Pound, Expiring 03/20/13 | The Royal Bank of Scotland | GBP | 10,247,000 | 16,487,777 | 16,641,729 | 153,952 | ||||||||||||||
| Hungarian Forint, Expiring 03/20/13 | The Royal Bank of Scotland | HUF | 5,562,400,000 | 25,229,543 | 24,989,427 | (240,116) | ||||||||||||||
| Israeli Shekel, Expiring 03/20/13 | The Royal Bank of Scotland | ILS | 5,900,000 | 1,544,063 | 1,575,859 | 31,796 | ||||||||||||||
| Indian Rupee, Expiring 03/20/13* | The Royal Bank of Scotland | INR | 139,000,000 | 2,513,971 | 2,500,872 | (13,099) | ||||||||||||||
| Japanese Yen, Expiring 03/21/13 | The Royal Bank of Scotland | JPY | 612,959,000 | 7,372,770 | 7,079,605 | (293,165) | ||||||||||||||
| Korean Won, Expiring 03/20/13* | The Royal Bank of Scotland | KRW | 52,924,959,000 | 48,706,400 | 49,215,078 | 508,678 | ||||||||||||||
| Mexican Peso, Expiring 03/20/13 | The Royal Bank of Scotland | MXN | 606,092,000 | 46,502,473 | 46,559,227 | 56,754 | ||||||||||||||
| Malaysian Ringgit, Expiring 03/20/13* | The Royal Bank of Scotland | MYR | 38,029,000 | 12,419,393 | 12,370,251 | (49,142) | ||||||||||||||
| Norwegian Krone, Expiring 03/20/13 | The Royal Bank of Scotland | NOK | 743,807,000 | 131,318,418 | 133,459,079 | 2,140,661 | ||||||||||||||
| New Zealand Dollar, Expiring 03/20/13 | The Royal Bank of Scotland | NZD | 101,599,000 | 83,624,154 | 83,552,106 | (72,048) | ||||||||||||||
| Peru Nuevo Sol, Expiring 03/20/13* | The Royal Bank of Scotland | PEN | 243,000 | 94,811 | 94,859 | 48 | ||||||||||||||
| Poland Zloty, Expiring 03/20/13 | The Royal Bank of Scotland | PLN | 107,751,000 | 33,882,401 | 34,549,385 | 666,984 | ||||||||||||||
| Russian Ruble, Expiring 03/20/13* | The Royal Bank of Scotland | RUB | 784,288,000 | 25,115,058 | 25,349,218 | 234,160 | ||||||||||||||
| The accompanying notes are an integral part of these financial statements. | (Continued) |
| 72 | AQR Funds | Annual Report | December 2012 | |||||||||||||
Table of Contents
| Consolidated Schedule of Investments | December 31, 2012 |
| AQR MULTI-STRATEGY ALTERNATIVE FUND |
| PURCHASE CONTRACTS | COUNTERPARTY | CURRENCY | CURRENCY AMOUNT PURCHASED | VALUE AT SETTLEMENT DATE | VALUE AT DECEMBER 31, 2012 | UNREALIZED APPRECIATION (DEPRECIATION) | ||||||||||||||
| Swedish Krona, Expiring 03/20/13 | The Royal Bank of Scotland | SEK | 251,667,000 | $37,973,591 | $38,632,209 | $658,618 | ||||||||||||||
| Singapore Dollar, Expiring 03/20/13 | The Royal Bank of Scotland | SGD | 500,000 | 410,054 | 409,287 | (767) | ||||||||||||||
| Turkish Lira, Expiring 03/20/13 | The Royal Bank of Scotland | TRY | 85,789,000 | 47,426,566 | 47,611,376 | 184,810 | ||||||||||||||
| Taiwanese Dollar, Expiring 03/20/13* | The Royal Bank of Scotland | TWD | 574,037,000 | 19,858,291 | 19,774,400 | (83,891) | ||||||||||||||
| South African Rand, Expiring 03/20/13 | The Royal Bank of Scotland | ZAR | 28,000,000 | 3,225,644 | 3,268,496 | 42,852 | ||||||||||||||
|
|
|
|
|
| |||||||||||||||
| 710,730,754 | 714,740,733 | 4,009,979 | ||||||||||||||||||
|
|
|
|
|
| |||||||||||||||
SALES CONTRACTS | COUNTERPARTY | CURRENCY | CURRENCY AMOUNT SOLD | VALUE AT SETTLEMENT DATE | VALUE AT DECEMBER 31, 2012 | UNREALIZED APPRECIATION (DEPRECIATION) | ||||||||||||||
| Australian Dollar, Expiring 03/20/13 | The Royal Bank of Scotland | AUD | (15,890,000) | $(16,508,100) | $(16,408,978) | $99,122 | ||||||||||||||
| Brazilian Real, Expiring 03/20/13* | The Royal Bank of Scotland | BRL | (90,516,000) | (42,367,194) | (43,781,577) | (1,414,383) | ||||||||||||||
| Brazilian Real, Expiring 04/05/13* | The Royal Bank of Scotland | BRL | (127,728) | (60,664) | (61,646) | (982) | ||||||||||||||
| Canadian Dollar, Expiring 03/20/13 | The Royal Bank of Scotland | CAD | (9,367,000) | (9,407,536) | (9,401,718) | 5,818 | ||||||||||||||
| Swiss Franc, Expiring 03/20/13 | The Royal Bank of Scotland | CHF | (45,077,000) | (48,732,311) | (49,353,879) | (621,568) | ||||||||||||||
| Czech Republic Koruna, Expiring 03/20/13 | The Royal Bank of Scotland | CZK | (503,946,000) | (25,996,793) | (26,530,595) | (533,802) | ||||||||||||||
| Danish Krone, Expiring 03/20/13 | The Royal Bank of Scotland | DKK | (6,753,000) | (1,183,402) | (1,196,248) | (12,846) | ||||||||||||||
| Euro, Expiring 03/20/13 | The Royal Bank of Scotland | EUR | (87,376,391) | (113,693,347) | (115,410,932) | (1,717,585) | ||||||||||||||
| Euro, Expiring 04/05/13 | The Royal Bank of Scotland | EUR | (3,562) | (4,694) | (4,706) | (12) | ||||||||||||||
| Euro, Expiring 06/10/13 | The Royal Bank of Scotland | EUR | (64,795) | (82,916) | (85,652) | (2,736) | ||||||||||||||
| Euro, Expiring 04/07/14 | The Royal Bank of Scotland | EUR | (3,562) | (4,704) | (4,726) | (22) | ||||||||||||||
| Euro, Expiring 06/09/14 | The Royal Bank of Scotland | EUR | (110,000) | (141,336) | (146,082) | (4,746) | ||||||||||||||
| Euro, Expiring 04/07/15 | The Royal Bank of Scotland | EUR | (3,562) | (4,716) | (4,744) | (28) | ||||||||||||||
| Euro, Expiring 06/09/15 | The Royal Bank of Scotland | EUR | (110,000) | (141,776) | (146,491) | (4,715) | ||||||||||||||
| Euro, Expiring 11/09/15 | The Royal Bank of Scotland | EUR | (46,110) | (59,499) | (61,407) | (1,908) | ||||||||||||||
| Euro, Expiring 04/05/16 | The Royal Bank of Scotland | EUR | (3,562) | (4,730) | (4,744) | (14) | ||||||||||||||
| Euro, Expiring 04/05/17 | The Royal Bank of Scotland | EUR | (3,562) | (4,751) | (4,744) | 7 | ||||||||||||||
| British Pound, Expiring 03/20/13 | The Royal Bank of Scotland | GBP | (15,854,000) | (25,544,009) | (25,747,826) | (203,817) | ||||||||||||||
| Hong Kong Dollar, Expiring 03/20/13 | The Royal Bank of Scotland | HKD | (57,390,000) | (7,406,639) | (7,406,235) | 404 | ||||||||||||||
| Indonesian Rupiah, Expiring 03/20/13* | The Royal Bank of Scotland | IDR | (36,466,804,000) | (3,770,398) | (3,749,590) | 20,808 | ||||||||||||||
| The accompanying notes are an integral part of these financial statements. | (Continued) |
| AQR Funds | Annual Report | December 2012 | 73 | |||||||||||||
Table of Contents
| Consolidated Schedule of Investments | December 31, 2012 |
| AQR MULTI-STRATEGY ALTERNATIVE FUND |
SALES CONTRACTS | COUNTERPARTY | CURRENCY | CURRENCY AMOUNT SOLD | VALUE AT SETTLEMENT DATE | VALUE AT DECEMBER 31, 2012 | UNREALIZED APPRECIATION (DEPRECIATION) | ||||||||||||||
| Israeli Shekel, Expiring 03/20/13 | The Royal Bank of Scotland | ILS | (174,725,000) | $(45,734,740) | $(46,668,130) | $(933,390) | ||||||||||||||
| Indian Rupee, Expiring 03/20/13* | The Royal Bank of Scotland | INR | (2,248,692,000) | (40,578,719) | (40,458,206) | 120,513 | ||||||||||||||
| Japanese Yen, Expiring 03/21/13 | The Royal Bank of Scotland | JPY | (17,626,563,000) | (214,083,578) | (203,584,740) | 10,498,838 | ||||||||||||||
| Korean Won, Expiring 03/20/13* | The Royal Bank of Scotland | KRW | (1,946,311,000) | (1,793,895) | (1,809,880) | (15,985) | ||||||||||||||
| Mexican Peso, Expiring 03/20/13 | The Royal Bank of Scotland | MXN | (12,954,000) | (993,461) | (995,110) | (1,649) | ||||||||||||||
| Norwegian Krone, Expiring 03/20/13 | The Royal Bank of Scotland | NOK | (10,946,000) | (1,927,352) | (1,964,008) | (36,656) | ||||||||||||||
| New Zealand Dollar, Expiring 03/20/13 | The Royal Bank of Scotland | NZD | (9,994,000) | (8,227,378) | (8,218,779) | 8,599 | ||||||||||||||
| Peru Nuevo Sol, Expiring 03/20/13* | The Royal Bank of Scotland | PEN | (962,000) | (372,219) | (375,533) | (3,314) | ||||||||||||||
| Philippine Peso, Expiring 03/20/13* | The Royal Bank of Scotland | PHP | (145,500,000) | (3,565,303) | (3,544,524) | 20,779 | ||||||||||||||
| Poland Zloty, Expiring 03/20/13 | The Royal Bank of Scotland | PLN | (1,009,000) | (322,547) | (323,527) | (980) | ||||||||||||||
| Russian Ruble, Expiring 03/20/13* | The Royal Bank of Scotland | RUB | (34,280,000) | (1,099,025) | (1,107,975) | (8,950) | ||||||||||||||
| Swedish Krona, Expiring 03/20/13 | The Royal Bank of Scotland | SEK | (56,446,000) | (8,453,085) | (8,664,758) | (211,673) | ||||||||||||||
| Singapore Dollar, Expiring 03/20/13 | The Royal Bank of Scotland | SGD | (23,568,000) | (19,316,820) | (19,292,099) | 24,721 | ||||||||||||||
| Thailand Baht, Expiring 03/20/13 | The Royal Bank of Scotland | THB | (21,895,000) | (710,738) | (712,665) | (1,927) | ||||||||||||||
| Turkish Lira, Expiring 03/20/13 | The Royal Bank of Scotland | TRY | (544,000) | $(299,561) | $(301,910) | $(2,349) | ||||||||||||||
| Taiwanese Dollar, Expiring 03/20/13* | The Royal Bank of Scotland | TWD | (53,000,000) | (1,835,119) | (1,825,742) | 9,377 | ||||||||||||||
| South African Rand, Expiring 03/20/13 | The Royal Bank of Scotland | ZAR | (270,392,000) | (30,615,425) | (31,563,400) | (947,975) | ||||||||||||||
|
|
|
|
|
| |||||||||||||||
| (675,048,480) | (670,923,506) | 4,124,974 | ||||||||||||||||||
|
|
|
|
|
| |||||||||||||||
| $35,682,274 | $43,817,227 | $8,134,953 | ||||||||||||||||||
|
|
|
|
|
| |||||||||||||||
Money Market Fund is pledged as collateral with broker for forward foreign currency exchange contracts was $3,128,206 at December 31, 2012.
| * | Non deliverable forward. See Note 3 in the Notes to Financial Statements. |
AUD - Australian Dollar
BRL - Brazilian Real
CAD - Canadian Dollar
CHF - Swiss Franc
CLP - Chilean Peso
COP - Columbian Peso
CZK - Czech Republic Koruna
DKK - Danish Krone
EUR - Euro
GBP - British Pound
HKD - Hong Kong Dollar
HUF - Hungarian Forint
IDR - Indonesian Rupiah
| The accompanying notes are an integral part of these financial statements. | (Continued) |
| 74 | AQR Funds | Annual Report | December 2012 | |||||||||||||
Table of Contents
| Consolidated Schedule of Investments | December 31, 2012 |
| AQR MULTI-STRATEGY ALTERNATIVE FUND |
ILS - Israeli Shekel
INR - Indian Rupee
JPY - Japanese Yen
KRW - Korean Won
MXN - Mexican Peso
MYR - Malaysian Ringgit
NOK - Norwegian Krone
NZD - New Zealand Dollar
PEN - Peruvian Nuevo Sol
PHP - Philippine Peso
PLN - Poland Zloty
RUB - Russian Ruble
SEK - Swedish Krona
SGD - Singapore Dollar
THB - Thailand Baht
TRY - Turkish Lira
TWD - Taiwan Dollar
ZAR - South African Rand
| The accompanying notes are an integral part of these financial statements. | (Continued) |
| AQR Funds | Annual Report | December 2012 | 75 | |||||||||||||
Table of Contents
| Consolidated Schedule of Investments | December 31, 2012 |
| AQR MULTI-STRATEGY ALTERNATIVE FUND |
Total Return Basket Swaps* Outstanding at December 31, 2012
| COUNTERPARTY | DESCRIPTION | TERMINATION DATES | VALUE (Note 3) | |||||
| Deutsche Bank | The Fund receives or pays the total return on a portfolio of long and short positions and pays or receives a specified LIBOR or Federal Funds floating rate, which is denominated in various foreign currencies based on the local currencies of the positions within the swaps. | 07/23/2013 —12/23/2013 | $4,477,715 | |||||
|
| |||||||
| * | See the accompanying “Additional Information — Total Return Basket Swaps” for further details. |
Additional Information — Total Return Basket Swaps
The following table represents the individual long and short positions and related values within the total return basket swaps as of December 31, 2012.
| REFERENCE ENTITY | SHARES | NOTIONAL (a) | NET UNREALIZED APPRECIATION (DEPRECIATION) | |||||||||
| Long Positions | ||||||||||||
| France | ||||||||||||
| Arkema SA | 51,846 | $ | 4,693,788 | $ | 749,968 | |||||||
| AtoS | 40,589 | 2,557,456 | 292,979 | |||||||||
| Cap Gemini SA | 25,310 | 1,023,166 | 83,577 | |||||||||
| Casino Guichard Perrachon SA | 947 | 88,329 | 2,377 | |||||||||
| Cie Generale de Geophysique – Veritas | 15,600 | 475,988 | (1,962) | |||||||||
| Cie Generale des Etablissements Michelin | 25,957 | 2,094,281 | 392,890 | |||||||||
| Cie Generale d’Optique Essilor International SA | 7,547 | 767,270 | (6,101) | |||||||||
| Danone SA | 182 | 11,966 | 62 | |||||||||
| Dassault Systemes SA | 9,459 | 976,574 | 81,010 | |||||||||
| Edenred | 58 | 1,767 | 27 | |||||||||
| Etablissements Maurel et Prom | 53,473 | 853,689 | 47,610 | |||||||||
| Faurecia | 3,191 | 49,464 | 650 | |||||||||
| France Telecom SA | 3,334 | 39,520 | (2,533) | |||||||||
| GDF Suez | 1,998 | 51,114 | (9,963) | |||||||||
| Iliad SA | 1,016 | 166,347 | 8,230 | |||||||||
| Lagardere SCA | 41,480 | 1,229,771 | 165,445 | |||||||||
| PPR | 3,931 | 715,471 | 22,813 | |||||||||
| Remy Cointreau SA | 2,007 | 243,274 | (23,741) | |||||||||
| Renault SA | 42,257 | 2,042,456 | 252,437 | |||||||||
| Rexel SA | 46,553 | 933,333 | 18,803 | |||||||||
| Safran SA | 1,605 | 59,476 | 10,032 | |||||||||
| Sanofi | 34,622 | 3,063,552 | 219,647 | |||||||||
| Schneider Electric SA | 2,233 | 151,340 | 12,207 | |||||||||
| Societe BIC SA | 10,131 | 1,183,180 | 31,198 | |||||||||
| Suez Environnement Co. | 137,055 | 1,545,410 | 107,858 | |||||||||
| Thales SA | 2,580 | 90,831 | (937) | |||||||||
| Total SA | 30,226 | 1,610,964 | (38,218) | |||||||||
| Valeo SA | 52,922 | 2,699,252 | (40,981) | |||||||||
| Vivendi SA | 175,468 | 3,788,778 | 179,595 | |||||||||
|
| |||||||||||
| 2,554,979 | ||||||||||||
|
| |||||||||||
| REFERENCE ENTITY | SHARES | NOTIONAL (a) | NET UNREALIZED APPRECIATION (DEPRECIATION) | |||||||||
| Netherlands | ||||||||||||
| European Aeronautic Defence and Space Co NV | 42,013 | $ | 1,688,773 | $ | (32,570) | |||||||
|
| |||||||||||
| Spain | ||||||||||||
| Distribuidora International PLC | 22,613 | 121,422 | 23,056 | |||||||||
| Enagas SA | 90,092 | 1,830,554 | 99,580 | |||||||||
| Endesa SA | 408 | 7,267 | 1,830 | |||||||||
| Ferrovial SA | 40 | 449 | 147 | |||||||||
| Fomento de Construcciones | 7,870 | 110,966 | (12,966) | |||||||||
| Gas Natural SDG SA | 23,168 | 304,231 | 113,426 | |||||||||
| Iberdrola SA | 117,431 | 592,071 | 63,746 | |||||||||
| Inditex SA | 7,669 | 870,905 | 206,637 | |||||||||
| Indra Sistemas SA | 3 | 39 | 1 | |||||||||
| International Group PLC | 101,246 | 281,095 | 19,467 | |||||||||
| Obrascon Huarte Lain SA | 15,793 | 344,521 | 116,953 | |||||||||
| Red Electrica Corp SA | 896 | 41,977 | 2,282 | |||||||||
| Tecnicas Reunidas SA | 38,577 | 1,710,656 | 96,249 | |||||||||
|
| |||||||||||
| 730,408 | ||||||||||||
|
| |||||||||||
| Switzerland | ||||||||||||
| Wolseley PLC | 75,996 | 3,113,584 | 520,448 | |||||||||
|
| |||||||||||
| United Kingdom | ||||||||||||
| Aegis Group PLC | 1,033,190 | 3,965,418 | 7,167 | |||||||||
| Alent PLC | 49,076 | 233,031 | 13,149 | |||||||||
| AMEC PLC | 48,639 | 861,727 | (57,678) | |||||||||
| Anglo American PLC | 73,058 | 2,281,915 | 21,102 | |||||||||
| AstraZeneca PLC | 7,960 | 377,563 | (341) | |||||||||
| Aveva Group PLC | 17,147 | 465,620 | 149,707 | |||||||||
| Aviva PLC | 216,960 | 1,167,438 | 175,099 | |||||||||
| Babcock International Group PLC | 264,251 | 3,717,684 | 453,524 | |||||||||
| Barclays PLC | 328,496 | 1,047,649 | 379,331 | |||||||||
| Barratt Developments PLC | 120,652 | 378,053 | 34,029 | |||||||||
| The accompanying notes are an integral part of these financial statements. | (Continued) |
| 76 | AQR Funds | Annual Report | December 2012 | |||||||||||||
Table of Contents
| Consolidated Schedule of Investments | December 31, 2012 |
| AQR MULTI-STRATEGY ALTERNATIVE FUND |
| REFERENCE ENTITY | SHARES | NOTIONAL (a) | NET UNREALIZED APPRECIATION (DEPRECIATION) | |||||||||
| United Kingdom (continued) | ||||||||||||
| BT Group PLC | 658,486 | $ | 2,340,620 | $ | 171,638 | |||||||
| Bundesrepublik Deutschland | 363,317 | 1,900,760 | 100,600 | |||||||||
| Bunzl PLC | 10,829 | 197,372 | (18,133) | |||||||||
| De La Rue PLC | 2,556 | 37,385 | 628 | |||||||||
| Drax Group PLC | 79,306 | 672,074 | 37,914 | |||||||||
| Dresdner Bank AG | 231,950 | 1,019,037 | (23,123) | |||||||||
| Eurasian Natural Resources Corp. PLC | 14,815 | 76,329 | (6,262) | |||||||||
| Experian PLC | 58,814 | 900,269 | 47,632 | |||||||||
| FIH Erhvervsbank A/S | 13,770 | 149,764 | 13,696 | |||||||||
| GAS PLC | 294,448 | 1,227,223 | 6,513 | |||||||||
| GKN PLC | 735,906 | 2,495,756 | 280,660 | |||||||||
| GlaxoSmithKline PLC | 25,122 | 584,072 | (37,108) | |||||||||
| Hays PLC | 130,329 | 192,294 | (15,051) | |||||||||
| HSBC Holdings PLC | 137,578 | 1,273,469 | 184,413 | |||||||||
| Inchcape PLC | 312,518 | 1,885,912 | 335,019 | |||||||||
| Informa PLC | 47,807 | 309,939 | 42,497 | |||||||||
| Intermediate Capital Group PLC | 60,056 | 250,737 | 62,818 | |||||||||
| Investec PLC | 138,659 | 842,250 | 123,043 | |||||||||
| ITV PLC | 418,878 | 623,633 | 103,023 | |||||||||
| J Sainsbury PLC | 152,190 | 865,716 | (4,679) | |||||||||
| John Wood Group PLC | 95,709 | 1,196,342 | (52,186) | |||||||||
| Kesa Electricals PLC | 190,122 | 175,414 | 3,177 | |||||||||
| Kingfisher PLC | 443,211 | 1,998,691 | 72,246 | |||||||||
| Legal & General Group SA | 755,881 | 1,545,213 | 267,290 | |||||||||
| Lloyds Banking Group PLC | 1,914,173 | 1,407,153 | 118,242 | |||||||||
| Michael Page International PLC | 84,193 | 500,999 | 49,328 | |||||||||
| Mondi PLC | 5,168 | 56,519 | 525 | |||||||||
| National Grid PLC | 45,423 | 506,886 | 14,089 | |||||||||
| Next PLC | 32,179 | 1,752,063 | 201,282 | |||||||||
| Northwest Equity Corp. | 286,145 | 1,426,469 | 163,979 | |||||||||
| Pennon Group PLC | 819 | 9,680 | (1,320) | |||||||||
| Reckitt Benckiser Group PLC | 4,896 | 285,228 | 25,569 | |||||||||
| Rexam PLC | 25,822 | 186,954 | (2,193) | |||||||||
| Rolls-Royce Holdings PLC | 28,771 | 395,575 | 17,099 | |||||||||
| Rolls-Royce Holdings PLC | 2,102,160 | 27 | 3,388 | |||||||||
| Rolls-Royce Holdings PLC | 3,831 | 6 | — | |||||||||
| Royal Bank of Scotland Group PLC | 39,715 | 204,623 | 7,651 | |||||||||
| Sanyo Shinpan Finance Co. Ltd. | 1,089,039 | 1,925,905 | 323,146 | |||||||||
| Serco Group PLC | 112,558 | 1,004,634 | (18,654) | |||||||||
| Severn Trent PLC | 7,756 | 216,511 | (16,934) | |||||||||
| Shinsei Bank Ltd. | 6,801 | 277,814 | (14,128) | |||||||||
| Smith & Nephew PLC | 16,885 | 177,920 | 8,725 | |||||||||
| SSE PLC | 7,416 | 164,972 | 7,554 | |||||||||
| REFERENCE ENTITY | SHARES | NOTIONAL (a) | NET UNREALIZED APPRECIATION (DEPRECIATION) | |||||||||
| United Kingdom (continued) | ||||||||||||
| Standard Life PLC | 16,018 | $ | 84,325 | $ | 3,236 | |||||||
| Sumitomo Bakelite Co., Ltd. | 21,634 | 400,387 | 21,293 | |||||||||
| Tate & Lyle PLC | 257,304 | 2,857,094 | 326,323 | |||||||||
| Thomas Cook Group PLC | 61,612 | 23,813 | 25,063 | |||||||||
| Vesusius PLC | 75,685 | 381,136 | 44,259 | |||||||||
| William Hill PLC | 519,550 | 2,389,490 | 570,817 | |||||||||
| WPP PLC | 39,674 | 525,684 | 53,921 | |||||||||
| Xstrata PLC | 45,423 | 711,932 | 80,963 | |||||||||
|
| |||||||||||
| 4,884,577 | ||||||||||||
|
| |||||||||||
| United States | ||||||||||||
| Gazprom OAO | 103,467 | 1,020,881 | (20,826) | |||||||||
| Lukoil OAO | 16,723 | 969,657 | 153,140 | |||||||||
| Reliance Industries Ltd. | 1,464 | 42,090 | 3,184 | |||||||||
| Rosneft Oil Co. | 44,138 | 375,108 | 24,837 | |||||||||
| Samsung Electronics Co., Ltd. | 6,176 | 3,539,940 | 893,220 | |||||||||
| State Bank of India | 5,922 | 486,610 | 53,456 | |||||||||
| Surgutneftegaz ADR | 8,960 | 77,688 | 3,016 | |||||||||
| Tatneft | 14,154 | 451,559 | 178,622 | |||||||||
| TMK OAO Via TMK Capital SA | 6,160 | 92,995 | 2,512 | |||||||||
|
| |||||||||||
| 1,291,161 | ||||||||||||
|
| |||||||||||
Total of Long Equity Positions | 9,949,003 | |||||||||||
|
| |||||||||||
| Short Positions | ||||||||||||
| France | ||||||||||||
| Accor SA | (27,593) | (981,810) | (2,349) | |||||||||
| Air France-KLM | (17,760) | (168,894) | 2,370 | |||||||||
| Alcatel-Lucent | (1,493,447) | (1,645,135) | (368,426) | |||||||||
| Alstom SA | (13,128) | (496,953) | (31,895) | |||||||||
| Bouygues SA | (27,480) | (741,874) | (75,852) | |||||||||
| Bureau Veritas SA | (1,608) | (156,191) | (24,113) | |||||||||
| Carrefour SA | (78,624) | (1,687,229) | (337,129) | |||||||||
| Christian Dior SA | (493) | (76,837) | (7,197) | |||||||||
| Cie de St-Gobain | (15,374) | (563,469) | (96,749) | |||||||||
| Electricite de France SA | (61,257) | (1,308,010) | 172,887 | |||||||||
| Eutelsat Communications SA | (41,334) | (1,393,743) | 18,966 | |||||||||
| Hermes International | (432) | (128,860) | (296) | |||||||||
| Lafarge SA | (53,262) | (2,649,059) | (790,189) | |||||||||
| Legrand SA | (26,567) | (990,325) | (137,074) | |||||||||
| L’Oreal SA | (1,430) | (191,227) | (7,746) | |||||||||
| LVMH Moet Hennessy Louis Vuitton SA | (20,065) | (3,450,477) | (252,661) | |||||||||
| Neopost SA | (14,242) | (807,420) | 52,142 | |||||||||
| Nexans SA | (6,231) | (284,121) | 5,282 | |||||||||
| Pernod-Ricard SA | (1,193) | (136,959) | (1,454) | |||||||||
| Peugeot SA | (70,861) | (582,731) | 65,623 | |||||||||
| Publicis Groupe SA | (4,298) | (235,896) | (22,685) | |||||||||
| The accompanying notes are an integral part of these financial statements. | (Continued) |
| AQR Funds | Annual Report | December 2012 | 77 | |||||||||||||
Table of Contents
| Consolidated Schedule of Investments | December 31, 2012 |
| AQR MULTI-STRATEGY ALTERNATIVE FUND |
| REFERENCE ENTITY | SHARES | NOTIONAL (a) | NET UNREALIZED APPRECIATION (DEPRECIATION) | |||||||||
| France (continued) | ||||||||||||
| SES SA | (1,051) | $ | (29,363) | $ | (906) | |||||||
| Sodexo | (3,853) | (322,470) | (3,103) | |||||||||
| Technip SA | (906) | (104,470) | (296) | |||||||||
| Vallourec SA | (109,557) | (5,519,256) | (231,617) | |||||||||
| Veolia Environnement SA | (238,423) | (2,666,490) | (223,922) | |||||||||
| Zodiac Aerospace | (34) | (3,620) | (144) | |||||||||
|
| |||||||||||
| (2,298,533) | ||||||||||||
|
| |||||||||||
| Netherlands | ||||||||||||
| Gemalto NV | (5,050) | (490,410) | 34,573 | |||||||||
|
| |||||||||||
| Spain | ||||||||||||
| Abertis Infraestructuras SA | (58,384) | (863,731) | (100,561) | |||||||||
| Acciona SA | (12,671) | (766,133) | (180,120) | |||||||||
| Acerinox SA | (944) | (10,484) | (11) | |||||||||
| Amadeus IT Holding SA | (18,104) | (366,146) | (91,367) | |||||||||
| Ebro Foods SA | (8,742) | (148,300) | (25,257) | |||||||||
| Repsol SA | (42,115) | 82 | (25,765) | |||||||||
| Repsol YPF SA | (42,115) | (697,213) | (162,469) | |||||||||
| Telefonica SA | (105,058) | (1,426,804) | 4,418 | |||||||||
|
| |||||||||||
| (581,132) | ||||||||||||
|
| |||||||||||
| United Kingdom | ||||||||||||
| Admiral Group PLC | (127,055) | (2,440,977) | 20,763 | |||||||||
| Aggreko PLC | (99,864) | (3,474,551) | 624,575 | |||||||||
| Banca Popolare di Crema SpA | (46,592) | (529,701) | (57,936) | |||||||||
| Barloworld Ltd. | (81,849) | (1,864,506) | (253,725) | |||||||||
| BG Group PLC | (98,578) | (1,929,064) | 284,801 | |||||||||
| BP PLC | (272,092) | (1,900,168) | 8,336 | |||||||||
| British American Tobacco PLC | (6,654) | (347,085) | 8,829 | |||||||||
| Burberry Group PLC | (161,851) | (3,111,755) | (141,689) | |||||||||
| Capita Group PLC/The | (276,535) | (3,258,021) | (159,096) | |||||||||
| Carnival PLC | (51,214) | (1,697,045) | (291,712) | |||||||||
| Cascade Bancorp | (64,691) | (409,560) | 4,481 | |||||||||
| Centrica PLC | (16,410) | (84,801) | (4,760) | |||||||||
| Cobham PLC | (39,058) | (147,026) | 5,107 | |||||||||
| Depfa Funding III LP | (95,203) | (1,766,226) | (320,144) | |||||||||
| Diageo PLC | (120,131) | (3,302,582) | (196,429) | |||||||||
| Glencore International PLC | (136,252) | (769,909) | (17,196) | |||||||||
| Home Retail Group PLC | (137,501) | (207,319) | (79,588) | |||||||||
| ICAP PLC | (262,495) | (1,376,679) | 49,335 | |||||||||
| IMI PLC | (86,573) | (1,238,445) | (328,462) | |||||||||
| Inmarsat PLC | (333) | (3,215) | 5 | |||||||||
| InterContinental Hotels Group PLC | (15,016) | (412,293) | (8,761) | |||||||||
| Intertek Group PLC | (34,270) | (1,435,438) | (305,365) | |||||||||
| Invensys PLC | (96,938) | (370,705) | (148,063) | |||||||||
| Johnson Matthey PLC | (23,490) | (879,835) | (42,926) | |||||||||
| Kazakhmys PLC | (25,460) | (308,974) | (20,088) | |||||||||
| Kotak Mahindra Prime Ltd. | (186,782) | (5,067,320) | (708,562) | |||||||||
| Lonmin PLC | (35,106) | (166,008) | (137) | |||||||||
| REFERENCE ENTITY | SHARES | NOTIONAL (a) | NET UNREALIZED APPRECIATION (DEPRECIATION) | |||||||||
| United Kingdom (continued) | ||||||||||||
| Man Group PLC | (1,048,629) | $ | (1,379,066) | $ | (59,126) | |||||||
| Marks & Spencer Group PLC | (438,970) | (2,543,816) | (213,629) | |||||||||
| Mitchells & Butlers PLC | (36,683) | (159,121) | (35,855) | |||||||||
| Old Mutual PLC | (92,961) | (266,160) | (6,870) | |||||||||
| Petrofac Ltd | (8,490) | (217,837) | (9,066) | |||||||||
| ProLogis LP | (523) | (19,967) | (474) | |||||||||
| Prudential PLC | (79,111) | (926,447) | (202,257) | |||||||||
| Royal Dutch Shell PLC | (27,749) | (1,014,831) | 24,849 | |||||||||
| SABMiller PLC | (42,630) | (1,846,431) | (132,075) | |||||||||
| Shire PLC | (41,231) | (1,280,527) | 12,215 | |||||||||
| Signature Metals Ltd. | (48,011) | (996,413) | (230,189) | |||||||||
| Smiths Group PLC | (22,444) | (377,265) | (62,359) | |||||||||
| UBS AG | (24,364) | (417,749) | (18,805) | |||||||||
| United Utilities Group PLC | (27,702) | (319,517) | 14,554 | |||||||||
| Vedanta Resources PLC | (51,756) | (850,700) | (148,578) | |||||||||
| Vodafone Group PLC | (52,736) | (152,616) | 19,866 | |||||||||
| Whitbread PLC | (19,075) | (643,658) | (122,861) | |||||||||
|
| |||||||||||
| (3,249,067) | ||||||||||||
|
| |||||||||||
Total of Short Equity Positions |
| (6,094,159) | ||||||||||
|
| |||||||||||
Total of Long and Short Equity Positions |
| 3,854,844 | ||||||||||
|
| |||||||||||
Net Cash and Other Receivables/(Payables) (b) |
| 622,871 | ||||||||||
|
| |||||||||||
Swaps, at Value | $ | 4,477,715 | ||||||||||
|
| |||||||||||
| (a) | Notional value represents the market value (including any fees or commissions) of the long and short positions when they are established. |
| (b) | Cash and other receivables includes the gains (or losses) realized within the swap when the swap resets. Gains (or losses) will be realized on the swap, and reflected on the Statement of Operations, when cash is settled with the counterparty. |
| Money | Market Fund is pledged as collateral to the broker in the |
amount of $12,660,861 at December 31, 2012.
| The accompanying notes are an integral part of these financial statements. | (Continued) |
| 78 | AQR Funds | Annual Report | December 2012 | |||||||||||||
Table of Contents
| Consolidated Schedule of Investments | December 31, 2012 |
| AQR MULTI-STRATEGY ALTERNATIVE FUND |
Total Return Basket Swaps* Outstanding at December 31, 2012
| COUNTERPARTY | DESCRIPTION | TERMINATION DATE | VALUE (Note 3) | |||||
| Morgan Stanley | The Fund receives or pays the total return on a portfolio of long and short positions and pays or receives a specified LIBOR or Federal Funds floating rate, which is denominated in various foreign currencies based on the local currencies of the positions within the swaps. | 07/24/2013 | $(4,492,231) | |||||
|
| |||||||
| * | See the accompanying “Additional Information — Total Return Basket Swaps” for further details. |
Additional Information — Total Return Basket Swaps
The following table represents the individual long and short positions and related values within the total return basket swaps as of December 31, 2012.
REFERENCE ENTITY | SHARES | NOTIONAL (a) | NET UNREALIZED APPRECIATION (DEPRECIATION) | |||||||||
| Long Positions | ||||||||||||
| Canada | ||||||||||||
| Brookfield Assets | 1,500 | $ | 51,671 | $ | 3,304 | |||||||
| Sears Canada, Inc. | 3,983 | 33,974 | 6,135 | |||||||||
|
| |||||||||||
| 9,439 | ||||||||||||
|
| |||||||||||
| United States | ||||||||||||
| 3M Co. | 3,800 | 340,337 | 12,493 | |||||||||
| Abbott Laboratories | 7,500 | 485,263 | 5,987 | |||||||||
| Accenture PLC | 30,600 | 1,966,005 | 68,895 | |||||||||
| ACE Ltd. | 25,900 | 1,926,610 | 140,210 | |||||||||
| Acuity Brands, Inc. | 400 | 24,969 | 2,123 | |||||||||
| Advance Auto Parts, Inc. | 30,200 | 2,203,447 | (18,477) | |||||||||
| AECOM Technology Corp. | 75,300 | 1,501,716 | 290,424 | |||||||||
| Aeropostale, Inc. | 181,600 | 2,983,953 | (621,337) | |||||||||
| AES Corp./The | 100,200 | 1,167,078 | (94,938) | |||||||||
| Aflac, Inc. | 16,800 | 727,482 | 164,934 | |||||||||
| AGCO Corp. | 29,200 | 1,278,797 | 155,507 | |||||||||
| Agilent Technologies, Inc. | 5,700 | 221,889 | 11,469 | |||||||||
| Airgas, Inc. | 1,600 | 143,876 | 2,188 | |||||||||
| AK Steel Holding Corp. | 334,100 | 1,709,603 | (172,743) | |||||||||
| Akamai Technologies, Inc. | 16,300 | 613,489 | 53,344 | |||||||||
| Alaska Air Group, Inc. | 39,500 | 1,478,314 | 223,741 | |||||||||
| Albemarle Corp. | 13,100 | 793,517 | 20,255 | |||||||||
| Alcoa, Inc. | 59,100 | 512,474 | 514 | |||||||||
| Alliant Energy Corp. | 1,500 | 68,128 | (2,263) | |||||||||
| Alliant Techsystems, Inc. | 29,900 | 1,469,948 | 382,656 | |||||||||
| Allied World Assuarance | 16,300 | 1,290,865 | (6,425) | |||||||||
| Allscripts Healthcare | 31,600 | 382,528 | (84,856) | |||||||||
| Allstate Corp. | 17,200 | 615,296 | 75,628 | |||||||||
| Alpha Natural Resources, Inc. | 282,900 | 1,948,318 | 807,128 | |||||||||
| Altria Group, Inc. | 20,900 | 712,752 | (56,074) | |||||||||
| AMDOCS Ltd. | 18,300 | 606,006 | 16,011 | |||||||||
| Ameren Corp. | 32,500 | 1,084,250 | (85,850) | |||||||||
| American Capital Ltd. | 514,200 | 5,264,692 | 905,708 | |||||||||
REFERENCE ENTITY | SHARES | NOTIONAL (a) | NET UNREALIZED APPRECIATION (DEPRECIATION) | |||||||||
| United States (continued) | ||||||||||||
| American Eagle Outfitters, Inc. | 172,600 | $ | 3,595,629 | $ | (55,603) | |||||||
| American Electric Power Co., Inc. | 31,100 | 1,279,451 | 47,897 | |||||||||
| American Financial Group, Inc. | 48,600 | 1,874,769 | 45,903 | |||||||||
| American Water Works Co., Inc. | 7,500 | 271,160 | 7,315 | |||||||||
| Ameriprise Financial, Inc. | 66,900 | 3,467,115 | 722,832 | |||||||||
| AmerisourceBergen Corp. | 15,100 | 577,801 | 74,217 | |||||||||
| Amgen, Inc. | 43,700 | 3,540,849 | 231,335 | |||||||||
| Anadarko Petroleum Corp. | 4,600 | 323,805 | 18,021 | |||||||||
| Analog Devices, Inc. | 12,400 | 458,338 | 63,206 | |||||||||
| Anixter International, Inc. | 6,200 | 382,318 | 14,358 | |||||||||
| AON PLC | 5,900 | 283,731 | 44,309 | |||||||||
| Applied Industrial Technologies, Inc. | 11,900 | 456,320 | 43,599 | |||||||||
| Applied Materials, Inc. | 59,400 | 665,552 | 13,984 | |||||||||
| Archer-Daniels-Midland Co. | 129,700 | 3,683,376 | (130,893) | |||||||||
| ARES Captial Corp. | 43,400 | 703,047 | 56,452 | |||||||||
| Armstrong World Industries, Inc. | 15,200 | 692,134 | 78,962 | |||||||||
| Arris Group, Inc. | 72,800 | 1,020,602 | 67,030 | |||||||||
| Arrow Electronics, Inc. | 46,500 | 1,655,162 | 115,558 | |||||||||
| Arthur J. & Gallager Corp. | 1,200 | 43,447 | (1,867) | |||||||||
| Ascena Retail Group | 72,200 | 1,372,345 | (37,367) | |||||||||
| Associated Banc-Corp. | 66,000 | 852,651 | 13,269 | |||||||||
| Assurant, Inc. | 75,400 | 2,694,505 | (78,125) | |||||||||
| AT&T, Inc. | 57,100 | 2,017,085 | (92,244) | |||||||||
| Atmos Energy Corp. | 2,300 | 79,560 | 1,216 | |||||||||
| Autodesk, Inc. | 17,100 | 549,738 | 54,747 | |||||||||
| Autoliv, Inc. | 14,900 | 838,195 | 165,916 | |||||||||
| Automatic Data Processing, Inc. | 800 | 42,624 | 2,984 | |||||||||
| The accompanying notes are an integral part of these financial statements. | (Continued) |
| AQR Funds | Annual Report | December 2012 | 79 | |||||||||||||
Table of Contents
| Consolidated Schedule of Investments | December 31, 2012 |
| AQR MULTI-STRATEGY ALTERNATIVE FUND |
REFERENCE ENTITY | SHARES | NOTIONAL (a) | NET UNREALIZED APPRECIATION (DEPRECIATION) | |||||||||
| United States (continued) | ||||||||||||
| Autozone, Inc. | 600 | $ | 229,076 | $ | (16,418) | |||||||
| Avago Technologies Ltd. | 65,500 | 2,103,731 | (30,001) | |||||||||
| Avnet, Inc. | 100,200 | 3,152,233 | (85,111) | |||||||||
| Axis Capital Holdings Co. | 30,800 | 1,101,415 | (34,503) | |||||||||
| Ball Corp. | 16,900 | 710,205 | 46,070 | |||||||||
| BE Aerospace, Inc. | 16,600 | 712,203 | 107,837 | |||||||||
| Beam, Inc. | 5,400 | 322,882 | 7,004 | |||||||||
| Becton Dickinson | 1,200 | 90,443 | 3,385 | |||||||||
| Bemis Co., Inc. | 1,700 | 51,118 | 5,764 | |||||||||
| Best Buy Co., Inc. | 170,800 | 2,094,231 | (70,251) | |||||||||
| Big Lots, Inc. | 53,500 | 1,907,394 | (384,784) | |||||||||
| Biogen Idec, Inc. | 23,400 | 3,269,707 | 162,372 | |||||||||
| BMC Software, Inc. | 45,000 | 1,820,876 | (36,176) | |||||||||
| Boeing Co./The | 600 | 44,657 | 559 | |||||||||
| Boston Scientific Corp. | 22,700 | 131,599 | (1,528) | |||||||||
| Brinker International, Inc. | 26,200 | 839,535 | (27,597) | |||||||||
| Bristow Group, Inc. | 16,900 | 786,233 | 120,621 | |||||||||
| Broadridge Financial Solutions, Inc. | 29,200 | 655,634 | 12,462 | |||||||||
| Brocade Communications Systems, Inc. | 929,300 | 4,831,171 | 121,998 | |||||||||
| Brown & Brown, Inc. | 21,600 | 568,492 | (18,556) | |||||||||
| Buckle, Inc./The | 14,200 | 588,403 | 45,485 | |||||||||
| Bunge Ltd. | 8,400 | 559,623 | 50,973 | |||||||||
| CA, Inc. | 113,200 | 2,763,016 | (274,880) | |||||||||
| Cabot Corp. | 21,000 | 859,556 | (23,966) | |||||||||
| Cabot Oil & Gas Corp. | 22,400 | 970,531 | 143,645 | |||||||||
| Cameron International Corp. | 3,400 | 154,114 | 37,850 | |||||||||
| Capital One Financial Corp. | 59,900 | 3,426,064 | 43,943 | |||||||||
| CapitalSource, Inc. | 31,700 | 216,720 | 23,566 | |||||||||
| Cardinal Health, Inc. | 61,300 | 2,580,947 | (56,613) | |||||||||
| Career Education Corp. | 147,795 | 777,482 | (257,243) | |||||||||
| Carefusion Corp. | 22,500 | 580,989 | 62,061 | |||||||||
| Carlisle Cos, Inc. | 17,300 | 954,642 | 61,906 | |||||||||
| Carpenter Technology Corp. | 5,700 | 293,005 | 1,286 | |||||||||
| Carter’s, Inc. | 17,800 | 978,053 | 12,517 | |||||||||
| CBRE Group, Inc. | 5,100 | 87,539 | 13,951 | |||||||||
| CBS Corp. | 30,900 | 1,030,971 | 144,774 | |||||||||
| Celanese Corp. | 24,300 | 982,536 | 99,543 | |||||||||
| CenterPoint Energy, Inc. | 39,200 | 781,410 | (26,810) | |||||||||
| CF Industries Holdings, Inc. | 16,700 | 3,162,572 | 230,200 | |||||||||
| Charles River Laboratories International, Inc. | 23,400 | 839,261 | 37,537 | |||||||||
| Chemed Corp. | 4,500 | 296,921 | 11,733 | |||||||||
| Chevron Corp. | 38,200 | 4,083,849 | 47,099 | |||||||||
| Chicos’s, Inc. | 121,400 | 2,026,274 | 214,770 | |||||||||
| Church & Dwight Co., Inc. | 3,300 | 181,268 | (4,487) | |||||||||
| CIGNA Corp. | 29,800 | 1,360,071 | 233,037 | |||||||||
REFERENCE ENTITY | SHARES | NOTIONAL (a) | NET UNREALIZED APPRECIATION (DEPRECIATION) | |||||||||
| United States (continued) | ||||||||||||
| Cinemark Holdings, Inc. | 14,900 | $ | 357,344 | $ | 29,758 | |||||||
| Cintas Corp. | 20,900 | 859,980 | (5,170) | |||||||||
| Cisco Systems, Inc. | 104,400 | 1,738,329 | 313,131 | |||||||||
| CLARCOR, Inc. | 1,800 | 87,496 | (1,492) | |||||||||
| Cleco Corp. | 3,400 | 147,412 | (11,378) | |||||||||
| Coca-Cola Enterprises, Inc. | 62,000 | 1,845,771 | 121,489 | |||||||||
| Colgate-Palmolive Co. | 900 | 92,230 | 1,856 | |||||||||
| Comcast Corp. | 63,300 | 2,058,128 | 308,026 | |||||||||
| Commerce Bancshares, Inc. | 5,465 | 208,668 | (17,066) | |||||||||
| Commercial Metals Co. | 153,600 | 2,042,594 | 239,902 | |||||||||
| Community Health Systems, Inc. | 57,500 | 1,566,105 | 201,445 | |||||||||
| Commvault Systems, Inc. | 15,100 | 907,737 | 144,884 | |||||||||
| Computer Sciences Corp. | 63,600 | 1,946,643 | 600,537 | |||||||||
| Compuware Corp. | 115,800 | 1,017,910 | 240,836 | |||||||||
| Comtech Telecommunications Corp. | 4,900 | 137,838 | (13,476) | |||||||||
| ConAgra Foods, Inc. | 13,600 | 343,167 | 58,033 | |||||||||
| ConocoPhillips | 58,700 | 3,257,402 | 146,611 | |||||||||
| Consolidated Edison, Inc. | 17,500 | 1,068,984 | (97,034) | |||||||||
| Convergys Corp. | 56,400 | 843,572 | 81,952 | |||||||||
| Con-way, Inc. | 50,600 | 1,635,503 | (227,811) | |||||||||
| Cooper Cos., Inc./The | 18,300 | 1,587,337 | 105,047 | |||||||||
| Copa Holdings SA | 2,600 | 252,465 | 6,105 | |||||||||
| Copart, Inc. | 26,400 | 719,721 | 59,079 | |||||||||
| Corning, Inc. | 66,100 | 792,393 | 41,789 | |||||||||
| Corrections Corp. of America | 25,300 | 741,730 | 155,662 | |||||||||
| Costco Wholesale Corp. | 7,200 | 652,664 | 58,480 | |||||||||
| Covance, Inc. | 16,300 | 767,122 | 174,529 | |||||||||
| Covidien PLC | 27,000 | 1,498,835 | 60,145 | |||||||||
| CR Bard, Inc. | 500 | 50,210 | (1,340) | |||||||||
| Crane Co. | 32,500 | 1,283,256 | 220,844 | |||||||||
| Crocs, Inc. | 112,000 | 1,928,329 | (316,649) | |||||||||
| Crown Holdings, Inc. | 42,300 | 1,539,694 | 17,369 | |||||||||
| CSX Corp. | 16,400 | 358,713 | (35,141) | |||||||||
| Cummins, Inc. | 25,200 | 2,444,090 | 286,330 | |||||||||
| CVS Caremark Corp. | 33,800 | 1,545,834 | 88,396 | |||||||||
| Cypress Semiconductor | 22,600 | 262,996 | (18,012) | |||||||||
| Cytec Industries, Inc. | 28,800 | 1,919,054 | 63,250 | |||||||||
| Darling International | 15,200 | 249,839 | (6,031) | |||||||||
| DaVita, Inc. | 27,500 | 2,545,624 | 493,951 | |||||||||
| Dean Foods Co. | 176,700 | 2,756,625 | 160,692 | |||||||||
| Delta Air Lines, Inc. | 264,200 | 2,660,922 | 475,132 | |||||||||
| Denbury Resources, Inc. | 24,200 | 371,063 | 20,977 | |||||||||
| Devon Energy Corp. | 26,300 | 1,549,476 | (180,824) | |||||||||
| Diebold, Inc. | 36,200 | 1,159,938 | (51,856) | |||||||||
| Dillards, Inc. | 49,400 | 3,580,285 | 557,953 | |||||||||
| Discover Financial Services | 110,300 | 4,014,178 | 237,887 | |||||||||
| The accompanying notes are an integral part of these financial statements. | (Continued) |
| 80 | AQR Funds | Annual Report | December 2012 | |||||||||||||
Table of Contents
| Consolidated Schedule of Investments | December 31, 2012 |
| AQR MULTI-STRATEGY ALTERNATIVE FUND |
REFERENCE ENTITY | SHARES | NOTIONAL (a) | NET UNREALIZED APPRECIATION (DEPRECIATION) | |||||||||
| United States (continued) | ||||||||||||
| DISH Network Corp. | 155,200 | $ | 4,619,463 | $ | 1,029,817 | |||||||
| Dolby Laboratories, Inc. | 30,600 | 1,280,707 | (383,209) | |||||||||
| Dollar General Corp. | 18,000 | 889,309 | (95,689) | |||||||||
| Dollar Tree, Inc. | 25,100 | 1,135,907 | (117,851) | |||||||||
| Dominos Pizza, Inc. | 48,600 | 1,680,079 | 436,451 | |||||||||
| Domtar Corp. | 8,500 | 664,309 | 45,611 | |||||||||
| Donaldson Co., Inc. | 2,200 | 75,526 | (3,278) | |||||||||
| Dover Corp. | 6,800 | 414,228 | 32,600 | |||||||||
| DR Horton, Inc. | 40,100 | 763,859 | 29,319 | |||||||||
| Dr Pepper Snapple Group, Inc. | 14,000 | 619,553 | (1,033) | |||||||||
| Dresser-Rand Group, Inc. | 18,100 | 881,393 | 134,741 | |||||||||
| DST Systems, Inc. | 16,200 | 894,356 | 87,364 | |||||||||
| DTE Energy Co. | 26,700 | 1,582,371 | 20,964 | |||||||||
| Dun & Bradstreet Corp./The | 5,800 | 413,834 | 42,336 | |||||||||
| E*Trade Financial Corp. | 51,600 | 448,981 | 12,839 | |||||||||
| East West BanCorp., Inc. | 32,200 | 701,234 | (9,256) | |||||||||
| Eastman Chemical Co. | 4,600 | 265,055 | 47,975 | |||||||||
| Edison International | 41,400 | 1,866,563 | 4,303 | |||||||||
| Eli Lilly & Co. | 42,200 | 1,826,565 | 254,739 | |||||||||
| EMCOR Group, Inc. | 29,600 | 878,230 | 146,226 | |||||||||
| Endo Pharmaceuticals Holdings, Inc. | 47,200 | 1,432,078 | (192,134) | |||||||||
| Energizer Holdings, Inc. | 9,500 | 688,384 | 71,426 | |||||||||
| Energy XXI, Inc. | 21,200 | 703,872 | (21,444) | |||||||||
| Entergy Corp. | 14,000 | 970,776 | (78,276) | |||||||||
| EOG Resources, Inc. | 6,000 | 681,968 | 42,772 | |||||||||
| Equifax, Inc. | 14,000 | 681,860 | 75,820 | |||||||||
| Esterline Technologies Corp. | 1,000 | 60,456 | 3,154 | |||||||||
| Everest Re Group Ltd. | 18,900 | 1,983,479 | 94,576 | |||||||||
| EXCO Resources, Inc. | 11,000 | 76,250 | (1,780) | |||||||||
| Expedia, Inc. | 59,000 | 3,141,937 | 483,613 | |||||||||
| Express Scripts PLC | 15,600 | 940,047 | (97,647) | |||||||||
| Exxon Mobil Corp. | 10,800 | 946,086 | (11,346) | |||||||||
| EzCorp., Inc. | 25,700 | 616,922 | (106,520) | |||||||||
| Fair Isaac Corp. | 16,000 | 676,902 | (4,422) | |||||||||
| FedEx Corp. | 7,800 | 710,027 | 5,389 | |||||||||
| Fidelity National Information Services, Inc. | 19,300 | 679,455 | (7,622) | |||||||||
| Fifth Third BanCorp. | 165,800 | 2,304,945 | 213,557 | |||||||||
| First Solar, Inc. | 31,300 | 628,319 | 338,225 | |||||||||
| FirstMerit Corp. | 1,500 | 21,148 | 137 | |||||||||
| Fiserv, Inc. | 7,500 | 542,916 | 49,809 | |||||||||
| Flextronics, Inc. | 510,800 | 3,280,605 | (108,537) | |||||||||
| FMC Corp. | 800 | 42,082 | 4,734 | |||||||||
| Foot Locker, Inc. | 132,900 | 4,258,472 | 10,276 | |||||||||
| Forest Laboratories, Inc. | 71,500 | 2,480,028 | 45,352 | |||||||||
| Forest Oil Corp. | 25,800 | 216,508 | (43,906) | |||||||||
| Fortinet, Inc. | 46,200 | 1,125,984 | (152,550) | |||||||||
| Foster Wheeler AG | 22,800 | 455,590 | 98,906 | |||||||||
| Fulton Financial Corp. | 48,400 | 496,036 | (30,912) | |||||||||
| GameStop Corp. | 119,400 | 2,252,073 | 743,673 | |||||||||
REFERENCE ENTITY | SHARES | NOTIONAL (a) | NET UNREALIZED APPRECIATION (DEPRECIATION) | |||||||||
| United States (continued) | ||||||||||||
| Gap, Inc./The | 146,300 | $ | 5,128,536 | $ | (587,384) | |||||||
| Garmin, Ltd. | 2,600 | 103,986 | 2,146 | |||||||||
| Gartner, Inc. | 18,700 | 835,572 | 25,002 | |||||||||
| General Cable Corp. | 42,300 | 1,198,242 | 88,101 | |||||||||
| General Dynamics Corp. | 16,200 | 1,065,954 | 56,220 | |||||||||
| General Electric Co. | 45,000 | 993,138 | (48,588) | |||||||||
| Genuine Parts Co. | 15,000 | 932,986 | 20,714 | |||||||||
| Genworth Financial, Inc. | 444,000 | 2,330,751 | 1,003,689 | |||||||||
| Global Payments, Inc. | 12,400 | 530,829 | 30,891 | |||||||||
| Goldman Sachs Group, Inc./The | 23,400 | 2,749,681 | 235,223 | |||||||||
| Goodyear Tire & Rubber Co./The | 135,600 | 1,653,517 | 219,119 | |||||||||
| Graco, Inc. | 6,700 | 352,039 | (7,056) | |||||||||
| Guess?, Inc. | 89,500 | 2,427,603 | (231,273) | |||||||||
| H.J. Heinz Co. | 6,900 | 402,300 | (4,308) | |||||||||
| Halliburton Co. | 8,700 | 257,803 | 44,000 | |||||||||
| Hanover Insurance Group, Inc./The | 11,200 | 433,103 | 785 | |||||||||
| Harman International Industries, Inc. | 77,500 | 3,242,119 | 217,481 | |||||||||
| Harris Teeter Supe Co. | 6,000 | 239,572 | (8,212) | |||||||||
| Harsco Corp. | 17,200 | 359,251 | 44,949 | |||||||||
| Hasbro, Inc. | 40,500 | 1,424,806 | 29,144 | |||||||||
| HCC Insurance Holdings, Inc. | 23,900 | 763,826 | 125,493 | |||||||||
| Health Net, Inc. | 62,300 | 1,578,937 | (65,047) | |||||||||
| HealthSouth Corp. | 14,400 | 324,384 | (20,400) | |||||||||
| Helix Energy Solutions Group, Inc. | 92,300 | 1,684,701 | 220,371 | |||||||||
| Henry Schein, Inc. | 3,100 | 242,671 | 6,755 | |||||||||
| Hershey Co./The | 900 | 65,150 | (152) | |||||||||
| Hess Corp. | 46,500 | 2,277,544 | 185,096 | |||||||||
| Hill-Rom Holdings, Inc. | 52,500 | 1,610,529 | (114,279) | |||||||||
| Hillshire Brands Co. | 95,000 | 2,785,099 | (111,799) | |||||||||
| Hittite Microwave Corp. | 400 | 20,828 | 4,012 | |||||||||
| HollyFrontier Corp. | 48,600 | 1,800,544 | 461,786 | |||||||||
| Home Depot, Inc. | 31,600 | 1,840,612 | 113,848 | |||||||||
| Honeywell International, Inc. | 4,200 | 237,912 | 28,662 | |||||||||
| Hormel Foods Corp. | 3,200 | 93,728 | 6,144 | |||||||||
| Hubbell, Inc. | 9,600 | 788,873 | 23,575 | |||||||||
| Humana, Inc. | 39,100 | 2,886,894 | (203,461) | |||||||||
| Huntington Bancshares, Inc. | 202,400 | 1,302,025 | (8,689) | |||||||||
| Huntsman Corp. | 5,500 | 89,501 | (2,052) | |||||||||
| IAC/InterActiveCorp. | 76,000 | 3,716,392 | (121,592) | |||||||||
| Ingersoll-Rand PLC | 52,600 | 2,344,138 | 178,558 | |||||||||
| Ingram Micro, Inc. | 166,700 | 2,878,428 | (57,864) | |||||||||
| Ingredion, Inc. | 32,500 | 1,843,619 | 250,356 | |||||||||
| Integrys Energy Group, Inc. | 300 | 16,216 | (550) | |||||||||
| International Game Technology | 2,800 | 38,866 | 810 | |||||||||
| International Paper Co. | 3,000 | 103,855 | 15,665 | |||||||||
| The accompanying notes are an integral part of these financial statements. | (Continued) |
| AQR Funds | Annual Report | December 2012 | 81 | |||||||||||||
Table of Contents
| Consolidated Schedule of Investments | December 31, 2012 |
| AQR MULTI-STRATEGY ALTERNATIVE FUND |
REFERENCE ENTITY | SHARES | NOTIONAL (a) | NET UNREALIZED APPRECIATION (DEPRECIATION) | |||||||||
| United States (continued) | ||||||||||||
| Interpublic Group of Cos., Inc./The | 252,600 | $ | 2,800,706 | $ | (17,054) | |||||||
| Intuit, Inc. | 13,300 | 762,522 | 28,828 | |||||||||
| InvesCo., Ltd. | 66,900 | 1,523,300 | 222,121 | |||||||||
| Itron, Inc. | 30,800 | 1,266,887 | 105,253 | |||||||||
| ITT Corp. | 93,900 | 2,049,223 | 153,671 | |||||||||
| ITT Educational Services, Inc. | 19,400 | 1,176,024 | (840,210) | |||||||||
| Jabil Circuit, Inc. | 192,900 | 3,883,142 | (162,101) | |||||||||
| Jack Henry & Associates, Inc. | 1,400 | 54,373 | 591 | |||||||||
| Jacobs Engineering Group, Inc. | 4,800 | 188,592 | 15,744 | |||||||||
| Jarden Corp. | 5,100 | 261,752 | 1,918 | |||||||||
| JDS Uniphase Corp. | 154,300 | 1,713,990 | 375,232 | |||||||||
| JM Smucker Co./The | 2,100 | 168,486 | 12,618 | |||||||||
| Jones Lang LaSalle, Inc. | 4,700 | 367,563 | 26,955 | |||||||||
| JPMorgan Chase & Co. | 76,800 | 2,671,997 | 704,899 | |||||||||
| Kansas City Southern | 900 | 73,314 | 1,818 | |||||||||
| KBR, Inc. | 150,900 | 4,278,839 | 236,088 | |||||||||
| Key Energy Group | 77,000 | 550,755 | (15,605) | |||||||||
| KeyCorp. | 290,800 | 2,286,319 | 162,217 | |||||||||
| Kimberly-Clark Corp. | 17,500 | 1,471,900 | 5,625 | |||||||||
| KLA-Tencor Corp. | 25,000 | 1,167,414 | 26,586 | |||||||||
| Kroger Co./The | 11,900 | 284,818 | 24,820 | |||||||||
| L-3 Communications Holdings, Inc. | 10,500 | 755,309 | 49,201 | |||||||||
| Landstar System, Inc. | 15,000 | 773,547 | 13,353 | |||||||||
| Lender Processing Services, Inc. | 42,700 | 1,084,569 | (33,295) | |||||||||
| Lennox International, Inc. | 2,300 | 119,720 | 1,076 | |||||||||
| Lincoln National Corp. | 42,700 | 1,096,314 | 9,616 | |||||||||
| LKQ Corp. | 10,400 | 193,192 | 26,248 | |||||||||
| Lockheed Martin Corp. | 11,300 | 1,009,343 | 33,534 | |||||||||
| Loews Corp. | 46,500 | 1,902,740 | (7,865) | |||||||||
| Lowe’s Cos, Inc. | 134,800 | 3,774,983 | 1,013,113 | |||||||||
| LSI Corp. | 400,500 | 2,996,224 | (160,684) | |||||||||
| Lyondellbasell Industries, Inc. | 164,800 | 6,999,439 | 2,408,993 | |||||||||
| Macy’s, Inc. | 73,000 | 2,779,645 | 68,815 | |||||||||
| Magellan Health Services, Inc. | 12,800 | 596,611 | 30,589 | |||||||||
| Manpower, Inc. | 50,300 | 1,870,076 | 264,656 | |||||||||
| Marathon Oil Corp. | 103,900 | 2,683,175 | 502,399 | |||||||||
| Marsh & McLennan Cos, Inc. | 17,800 | 580,861 | 32,705 | |||||||||
| Marvell Technology Group Ltd. | 183,100 | 2,182,673 | (853,367) | |||||||||
| Mattel, Inc. | 30,300 | 1,051,757 | 57,829 | |||||||||
| Maxim Integrated Products, Inc. | 34,900 | 997,764 | 28,296 | |||||||||
| McDermott International, Inc. | 237,200 | 2,470,876 | 143,068 | |||||||||
| McKesson Corp. | 29,800 | 2,659,485 | 229,923 | |||||||||
| MeadWestvaco Corp. | 28,400 | 804,841 | 100,267 | |||||||||
REFERENCE ENTITY | SHARES | NOTIONAL (a) | NET UNREALIZED APPRECIATION (DEPRECIATION) | |||||||||
| United States (continued) | ||||||||||||
| MetroPCS Communications, Inc. | 183,500 | $ | 1,757,289 | $ | 66,701 | |||||||
| MGM Resorts International | 50,300 | 548,162 | 37,330 | |||||||||
| Micron Technology, Inc. | 165,400 | 1,076,690 | (26,400) | |||||||||
| Microsoft Corp. | 4,100 | 122,718 | (13,125) | |||||||||
| MKS Instruments, Inc. | 71,800 | 1,855,791 | (4,787) | |||||||||
| Mohawk Industries, Inc. | 16,200 | 1,264,105 | 201,509 | |||||||||
| Molex, Inc. | 18,700 | 457,949 | 53,122 | |||||||||
| Mondelez International, Inc. | 36,300 | 956,706 | (32,145) | |||||||||
| Monsanto Co. | 21,200 | 1,652,450 | 354,130 | |||||||||
| Monster Beverage Corp. | 6,300 | 446,880 | (113,736) | |||||||||
| Motorola Solutions, Inc. | 31,600 | 1,544,402 | 215,086 | |||||||||
| Murphy Oil Corp. | 39,700 | 1,997,740 | 366,395 | |||||||||
| Nabors Industries Ltd. | 135,300 | 1,970,764 | (15,679) | |||||||||
| National Oilwell Varco, Inc. | 18,100 | 1,218,590 | 18,545 | |||||||||
| NCR Corp. | 168,100 | 3,835,545 | 447,643 | |||||||||
| Neustar, Inc. | 2,500 | 87,275 | 17,550 | |||||||||
| New York Times Co./The | 7,300 | 49,125 | 13,144 | |||||||||
| Newell Rubbermaid, Inc. | 36,600 | 715,700 | 99,382 | |||||||||
| Newfield Exploration Co. | 10,700 | 357,318 | (70,772) | |||||||||
| News Corp. | 233,100 | 5,214,165 | 739,209 | |||||||||
| NiSource, Inc. | 7,200 | 178,607 | 601 | |||||||||
| Northrop Grumman Corp. | 60,600 | 3,998,516 | 96,832 | |||||||||
| NorthWestern Corp. | 1,100 | 39,775 | (1,572) | |||||||||
| NV Energy, Inc. | 24,400 | 423,111 | 19,505 | |||||||||
| NVIDIA Corp. | 132,400 | 1,712,634 | (85,438) | |||||||||
| NVR, Inc. | 100 | 86,737 | 5,263 | |||||||||
| Occidental Petroleum Corp. | 3,800 | 315,100 | (23,982) | |||||||||
| Oceaneering International, Inc. | 35,300 | 1,764,732 | 134,055 | |||||||||
| OGE Energy Corp. | 6,800 | 365,074 | 17,834 | |||||||||
| Oil States International, Inc. | 3,500 | 267,996 | (17,606) | |||||||||
| Old Dominion Freight Line, Inc. | 30,200 | 893,976 | 141,280 | |||||||||
| Olin Corp. | 16,300 | 344,490 | 7,427 | |||||||||
| Omnicare, Inc. | 16,500 | 557,378 | 38,272 | |||||||||
| Omnicom Group, Inc. | 7,200 | 363,689 | (3,977) | |||||||||
| ON Semiconductor Corp. | 244,300 | 1,573,153 | 149,162 | |||||||||
| Orchard Supply Hardware | 99 | 188 | (10) | |||||||||
| O’Reilly Automotive, Inc. | 9,100 | 830,616 | (16,894) | |||||||||
| Oshkosh Corp. | 3,600 | 106,946 | (206) | |||||||||
| Owens & Minor, Inc. | 4,500 | 126,298 | 1,997 | |||||||||
| Owens-Illinois, Inc. | 92,300 | 1,976,950 | (13,729) | |||||||||
| Packaging Corp. of America | 8,700 | 294,482 | 40,207 | |||||||||
| Pall Corp. | 7,400 | 420,033 | 25,891 | |||||||||
| Panera Bread Co. | 5,300 | 801,462 | 40,337 | |||||||||
| Parker Hannifin Corp. | 15,100 | 1,161,852 | 122,554 | |||||||||
| The accompanying notes are an integral part of these financial statements. | (Continued) |
| 82 | AQR Funds | Annual Report | December 2012 | |||||||||||||
Table of Contents
| Consolidated Schedule of Investments | December 31, 2012 |
| AQR MULTI-STRATEGY ALTERNATIVE FUND |
REFERENCE ENTITY | SHARES | NOTIONAL (a) | NET UNREALIZED APPRECIATION (DEPRECIATION) | |||||||||
| United States (continued) | ||||||||||||
| Patterson Cos, Inc. | 18,400 | $ | 640,471 | $ | (10,639) | |||||||
| Patterson-UTI Energy, Inc. | 94,100 | 1,477,455 | 275,628 | |||||||||
| Paychex, Inc. | 9,000 | 290,174 | (9,914) | |||||||||
| Penn National Gaming, Inc. | 1,300 | 63,660 | 183 | |||||||||
| PerkinElmer, Inc. | 16,400 | 436,496 | 84,040 | |||||||||
| PetSmart, Inc. | 24,800 | 1,679,397 | 15,435 | |||||||||
| Pfizer, Inc. | 82,600 | 1,995,223 | 76,385 | |||||||||
| PG&E Corp. | 20,600 | 914,881 | (87,173) | |||||||||
| Pinnacle West Capital Corp. | 11,000 | 577,672 | (16,892) | |||||||||
| Plains Exploration & Production Co. | 36,100 | 1,361,430 | 333,104 | |||||||||
| PMC—Sierra, Inc. | 117,100 | 709,405 | (99,314) | |||||||||
| PNC Financial Services Group, Inc. | 20,700 | 1,283,589 | (76,572) | |||||||||
| PNM Resources, Inc. | 18,700 | 371,126 | 12,411 | |||||||||
| Polaris Industries, Inc. | 13,400 | 1,013,981 | 113,629 | |||||||||
| Polycom, Inc. | 134,700 | 1,525,306 | (116,344) | |||||||||
| Popular, Inc. | 29,926 | 510,860 | 111,302 | |||||||||
| Portland General Electric Co. | 9,000 | 233,977 | 12,263 | |||||||||
| PPG Industries, Inc. | 14,000 | 1,511,684 | 383,216 | |||||||||
| ProAssurance Corp. | 11,800 | 527,353 | (29,511) | |||||||||
| Procter & Gamble Co. | 11,500 | 732,503 | 48,232 | |||||||||
| Protective Life Corp. | 62,900 | 1,751,778 | 45,904 | |||||||||
| Prudential Financial, Inc. | 8,500 | 495,177 | (41,872) | |||||||||
| Public Service Enterprise Group, Inc. | 19,200 | 616,860 | (29,340) | |||||||||
| Pulte Group, Inc. | 135,700 | 1,695,521 | 768,791 | |||||||||
| PVH Corp. | 12,700 | 1,211,404 | 198,423 | |||||||||
| QEP Resources, Inc. | 8,600 | 256,284 | 4,038 | |||||||||
| QLogic Corp. | 122,900 | 1,600,202 | (404,385) | |||||||||
| Quest Diagnostics, Inc. | 600 | 34,676 | 286 | |||||||||
| RadioShack Corp. | 178,100 | 685,175 | (307,603) | |||||||||
| RalCorp. Holdings, Inc. | 4,500 | 399,654 | 3,771 | |||||||||
| Ralph Lauren Corp. | 2,300 | 326,892 | 17,924 | |||||||||
| Raytheon Co. | 64,700 | 3,596,756 | 127,376 | |||||||||
| Regal Entertainment Group | 32,500 | 449,995 | 3,380 | |||||||||
| Regal-Beloit Corp. | 5,300 | 370,184 | 3,307 | |||||||||
| Regions Financial Corp. | 115,800 | 806,002 | 18,494 | |||||||||
| Reinsurance Group of America, Inc. | 35,200 | 1,943,617 | (59,713) | |||||||||
| Reliance Steel & Aluminum Co. | 55,700 | 2,966,273 | 492,697 | |||||||||
| Reynolds American, Inc. | 1,700 | 69,397 | 1,034 | |||||||||
| Riverbed Technology, Inc. | 103,000 | 1,841,706 | 189,454 | |||||||||
| Robert Half International, Inc. | 10,900 | 282,593 | 64,245 | |||||||||
| Rock-Tenn Co. | 100 | 6,460 | 531 | |||||||||
| Rockwell Automation, Inc. | 6,300 | 492,969 | 36,168 | |||||||||
REFERENCE ENTITY | SHARES | NOTIONAL (a) | NET UNREALIZED APPRECIATION (DEPRECIATION) | |||||||||
| United States (continued) | ||||||||||||
| Rockwood Holdings, Inc. | 3,100 | $ | 157,193 | $ | (3,867) | |||||||
| Ross Stores, Inc. | 56,700 | 3,526,839 | (456,534) | |||||||||
| RPC, Inc. | 50,550 | 597,293 | 21,439 | |||||||||
| RPM International, Inc. | 29,100 | 796,083 | 58,293 | |||||||||
| Ryder System, Inc. | 32,700 | 1,393,956 | 238,755 | |||||||||
| Safeway, Inc. | 23,600 | 417,956 | 8,968 | |||||||||
| SAIC, Inc. | 4,900 | 58,218 | (2,750) | |||||||||
| Sally Beauty Holdings, Inc. | 70,900 | 1,911,046 | (239,933) | |||||||||
| Sanderson Farms, Inc. | 6,500 | 313,180 | (4,105) | |||||||||
| SEACOR Holdings, Inc. | 11,900 | 1,054,657 | (57,437) | |||||||||
| Seagate Technology PLC | 118,500 | 3,335,086 | 276,794 | |||||||||
| Sears Holdings Corp. | 10,500 | 489,549 | (55,269) | |||||||||
| SEI Investments Co. | 20,100 | 415,971 | 53,163 | |||||||||
| Sempra Energy | 600 | 40,570 | 1,994 | |||||||||
| Service Corp. International | 107,200 | 1,361,420 | 119,012 | |||||||||
| Shaw Group, Inc./The | 27,800 | 761,631 | 534,127 | |||||||||
| Sherwin-Williams Co./The | 6,700 | 892,208 | 138,386 | |||||||||
| Signet Jewelers Ltd. | 39,500 | 1,942,578 | 166,722 | |||||||||
| SLM Corp. | 130,000 | 2,051,494 | 175,406 | |||||||||
| SM Energy Co. | 8,900 | 528,299 | (63,630) | |||||||||
| Smith Corp. | 20,400 | 1,100,359 | 186,269 | |||||||||
| Snap-on, Inc. | 14,200 | 949,827 | 171,831 | |||||||||
| Sohu.com, Inc. | 21,200 | 885,866 | 117,742 | |||||||||
| Sonoco Products Co. | 1,100 | 32,627 | 76 | |||||||||
| Spirit Aerosystems Holdings, Inc. | 10,900 | 242,874 | (57,901) | |||||||||
| SPX Corp. | 11,200 | 811,387 | (25,707) | |||||||||
| St. Jude Medical, Inc. | 3,800 | 138,393 | (1,061) | |||||||||
| Starbucks Corp. | 1,300 | 67,820 | 1,886 | |||||||||
| Starwood Hotels & Resorts Worldwide, Inc. | 3,600 | 191,096 | 15,400 | |||||||||
| Steel Dynamics, Inc. | 294,100 | 3,599,034 | 438,959 | |||||||||
| STERIS Corp. | 3,000 | 102,654 | 1,536 | |||||||||
| SunTrust Banks, Inc. | 22,900 | 657,828 | (8,613) | |||||||||
| Swift Energy Co. | 35,600 | 643,268 | (95,384) | |||||||||
| Symantec Corp. | 179,900 | 2,927,375 | 456,544 | |||||||||
| Synopsys, Inc. | 44,800 | 1,359,761 | 66,671 | |||||||||
| TE Connectivity Ltd. | 60,200 | 2,015,290 | 219,334 | |||||||||
| Tech Data Corp. | 49,800 | 2,379,131 | (111,737) | |||||||||
| Teleflex, Inc. | 6,100 | 393,839 | 41,152 | |||||||||
| Telephone & Data System | 44,900 | 1,035,848 | (41,762) | |||||||||
| Tellabs, Inc. | 507,900 | 1,909,852 | (751,840) | |||||||||
| Tempur Pedic Co. | 19,000 | 534,126 | 64,184 | |||||||||
| Tesoro Corp. | 28,900 | 1,156,605 | 116,440 | |||||||||
| Thermo Fisher Scientific, Inc. | 14,000 | 897,498 | (4,578) | |||||||||
| Thoratec Corp. | 60,300 | 2,000,971 | 261,485 | |||||||||
| TIBCO Software, Inc. | 15,300 | 464,841 | (128,088) | |||||||||
| Time Warner Cable, Inc. | 26,400 | 2,225,587 | 340,229 | |||||||||
| Timken Co. | 75,400 | 3,569,362 | 37,020 | |||||||||
| TJX Cos, Inc. | 58,200 | 2,516,089 | (45,499) | |||||||||
| The accompanying notes are an integral part of these financial statements. | (Continued) |
| AQR Funds | Annual Report | December 2012 | 83 | |||||||||||||
Table of Contents
| Consolidated Schedule of Investments | December 31, 2012 |
| AQR MULTI-STRATEGY ALTERNATIVE FUND |
REFERENCE ENTITY | SHARES | NOTIONAL (a) | NET UNREALIZED APPRECIATION (DEPRECIATION) | |||||||||
| United States (continued) | ||||||||||||
| Toll Brothers, Inc. | 17,700 | $ | 575,065 | $ | (2,824) | |||||||
| Torchmark Corp. | 16,000 | 820,359 | 6,361 | |||||||||
| Total System Services, Inc. | 57,100 | 1,329,726 | (106,644) | |||||||||
| Towers Watson & Co. | 13,000 | 821,624 | (90,894) | |||||||||
| Tractor Supply Co. | 10,900 | 1,032,283 | (69,159) | |||||||||
| Transdigm, Inc. | 1,600 | 200,120 | 18,056 | |||||||||
| Transocean Ltd. | 35,200 | 1,636,754 | (65,074) | |||||||||
| Travelers Cos, Inc./The | 11,500 | 776,907 | 49,023 | |||||||||
| TRW Automotive Holdings Corp. | 26,500 | 1,247,798 | 172,867 | |||||||||
| Tupperware Brands Corp. | 27,900 | 1,592,776 | 195,614 | |||||||||
| Tyco International Ltd. | 102,300 | 2,832,830 | 159,445 | |||||||||
| Tyson Foods, Inc. | 75,400 | 1,283,494 | 179,266 | |||||||||
| UGI Corp. | 1,600 | 46,848 | 5,488 | |||||||||
| Ultra Salon, Inc. | 7,100 | 643,076 | 54,570 | |||||||||
| Union Pacific Corp. | 7,500 | 914,489 | 28,411 | |||||||||
| Unit Corp. | 27,300 | 1,084,727 | 145,138 | |||||||||
| United Parcel Service, Inc. | 7,300 | 532,334 | 5,895 | |||||||||
| United States Steel Corp. | 121,500 | 2,610,597 | 289,608 | |||||||||
| United Technologies Corp. | 200 | 15,602 | 800 | |||||||||
| Universal Corp. | 100 | 5,164 | (173) | |||||||||
| Universal Health Services, Inc. | 30,400 | 1,243,962 | 225,878 | |||||||||
| Unum Group | 80,800 | 1,572,616 | 109,640 | |||||||||
| URS Corp. | 32,100 | 1,196,969 | 63,277 | |||||||||
| US BanCorp. | 19,600 | 625,750 | 274 | |||||||||
| Valero Energy Corp. | 43,100 | 1,239,939 | 230,633 | |||||||||
| Validus Holding Ltd. | 37,800 | 1,262,579 | 44,545 | |||||||||
| Valmont Industries, Inc. | 2,400 | 312,501 | 15,219 | |||||||||
| Valspar Corp. | 23,200 | 1,218,330 | 229,350 | |||||||||
| Verisk Analytics, Inc. | 5,200 | 251,000 | 14,200 | |||||||||
| Verizon Communications, Inc. | 28,500 | 1,265,898 | (32,703) | |||||||||
| Vertex Pharmaceuticals, Inc. | 80,700 | 3,838,858 | (454,300) | |||||||||
| Viacom, Inc. | 4,400 | 208,808 | 23,248 | |||||||||
| ViroPharma, Inc. | 800 | 18,536 | (328) | |||||||||
| Vishay Intertechnology, Inc. | 37,300 | 363,563 | 32,936 | |||||||||
| WABCO Holdings, Inc. | 42,100 | 2,393,180 | 351,319 | |||||||||
| Wabtec Corp. | 4,800 | 356,047 | 64,145 | |||||||||
| Wal-Mart Stores, Inc. | 12,600 | 908,599 | (48,901) | |||||||||
| Walt Disney Co./The | 12,400 | 607,127 | 10,269 | |||||||||
| Warnaco Group, Inc./The | 8,300 | 433,657 | 160,374 | |||||||||
| Warner Chilcott PLC | 387,300 | 5,693,895 | (1,030,803) | |||||||||
| Washington Post Co./The | 1,800 | 641,142 | 16,236 | |||||||||
| Waste Management, Inc. | 2,200 | 73,512 | 716 | |||||||||
| Waters Corp. | 500 | 41,133 | 2,427 | |||||||||
| Watson Pharmaceuticals, Inc. | 7,800 | 634,268 | 36,533 | |||||||||
| Weatherford International Ltd. | 9,100 | 105,478 | (3,649) | |||||||||
REFERENCE ENTITY | SHARES | NOTIONAL (a) | NET UNREALIZED APPRECIATION (DEPRECIATION) | |||||||||
| United States (continued) | ||||||||||||
| Webster Financial Corp. | 10,500 | $ | 223,915 | $ | (8,140) | |||||||
| WellPoint, Inc. | 2,900 | 183,560 | (6,892) | |||||||||
| Wells Fargo & Co. | 51,200 | 1,695,784 | 54,232 | |||||||||
| Werner Enterprises, Inc. | 6,000 | 142,532 | (12,512) | |||||||||
| Western Digital Corp. | 114,800 | 4,234,559 | 643,293 | |||||||||
| WGL Holdings, Inc. | 900 | 35,298 | (27) | |||||||||
| Whirlpool Corp. | 37,400 | 2,883,105 | 922,345 | |||||||||
| Whiting Petroleum Corp. | 34,100 | 1,610,065 | (131,148) | |||||||||
| Williams-Sonoma, Inc. | 27,400 | 1,022,616 | 176,683 | |||||||||
| Wisconsin Energy Corp. | 18,100 | 726,265 | (59,280) | |||||||||
| Wolverine World Wide, Inc. | 8,700 | 365,395 | (8,869) | |||||||||
| WR Grace & Co. | 36,000 | 2,114,189 | 306,091 | |||||||||
| Wyndham Worldwide Corp. | 46,800 | 2,411,178 | 79,050 | |||||||||
| Xcel Energy, Inc. | 10,900 | 303,802 | (12,663) | |||||||||
| Xerox Corp. | 14,500 | 102,892 | (4,002) | |||||||||
| Yahoo!, Inc. | 298,000 | 5,236,183 | 694,017 | |||||||||
| Zimmer Holdings, Inc. | 11,700 | 744,666 | 35,256 | |||||||||
|
| |||||||||||
| 30,501,898 | ||||||||||||
|
| |||||||||||
| Total of Long Equity Positions | 30,511,337 | |||||||||||
|
| |||||||||||
| Short Positions | ||||||||||||
| Switzerland | ||||||||||||
| Pentair Ltd. | (45,610) | (1,959,131) | (282,601) | |||||||||
|
| |||||||||||
| United States | ||||||||||||
| Abercrombie & Fitch Co. | (44,200) | (1,734,363) | (385,911) | |||||||||
| ACME Packet, Inc. | (101,700) | (1,958,526) | (291,078) | |||||||||
| Activision Blizzard, Inc. | (48,500) | (560,852) | 45,782 | |||||||||
| Actuant Corp. | (40,200) | (1,098,174) | (23,808) | |||||||||
| Adobe Systems, Inc. | (24,500) | (782,306) | (140,854) | |||||||||
| ADTRAN, Inc. | (133,300) | (3,317,906) | 713,224 | |||||||||
| Advanced Micro Device | (694,100) | (2,088,938) | 423,098 | |||||||||
| Aetna, Inc. | (4,000) | (186,704) | 1,504 | |||||||||
| Air Products & Chemicals, Inc. | (5,200) | (425,608) | (11,296) | |||||||||
| Alere, Inc. | (37,700) | (712,279) | 14,829 | |||||||||
| Allegheny Technologies, Inc. | (27,000) | (838,863) | 19,143 | |||||||||
| Allergan, Inc. | (13,100) | (1,150,133) | (51,530) | |||||||||
| Alliance Data Systems Corp. | (15,600) | (2,045,032) | (213,224) | |||||||||
| Altera Corp. | (55,500) | (1,895,241) | (16,179) | |||||||||
| Amazon.com, Inc. | (14,300) | (3,215,962) | (375,340) | |||||||||
| American Express Co. | (37,000) | (2,152,317) | 25,557 | |||||||||
| AMETEK, Inc. | (5,300) | (178,663) | (20,458) | |||||||||
| Amphenol Corp. | (24,000) | (1,335,138) | (217,662) | |||||||||
| ANSYS, Inc. | (10,900) | (753,700) | 19,694 | |||||||||
| Apache Corp. | (7,200) | (605,723) | 40,523 | |||||||||
| Apollo Group, Inc. | (88,200) | (2,405,928) | 560,784 | |||||||||
| Apple, Inc. | (3,900) | (2,296,533) | 217,716 | |||||||||
| ARCH Capital Group, Inc. | (14,100) | (559,028) | (61,654) | |||||||||
| The accompanying notes are an integral part of these financial statements. | (Continued) |
| 84 | AQR Funds | Annual Report | December 2012 | |||||||||||||
Table of Contents
| Consolidated Schedule of Investments | December 31, 2012 |
| AQR MULTI-STRATEGY ALTERNATIVE FUND |
REFERENCE ENTITY | SHARES | NOTIONAL (a) | NET UNREALIZED APPRECIATION (DEPRECIATION) | |||||||||
| United States (continued) | ||||||||||||
| Arch Coal, Inc. | (400,700) | $ | (2,794,851) | $ | (138,273) | |||||||
| Aruba Networks, Inc. | (188,400) | (2,854,845) | (1,054,455) | |||||||||
| Ashland, Inc. | (18,400) | (1,223,653) | (255,891) | |||||||||
| Assured Guaranty Ltd. | (86,800) | (1,077,713) | (157,451) | |||||||||
| athenahealth, Inc. | (11,900) | (899,403) | 25,348 | |||||||||
| Atmel Corp. | (328,300) | (1,939,138) | (211,227) | |||||||||
| Atwood Oceanics, Inc. | (21,300) | (890,024) | (85,303) | |||||||||
| Autonation, Inc. | (10,500) | (402,076) | (14,774) | |||||||||
| Avery Dennison Corp. | (9,200) | (278,606) | (42,658) | |||||||||
| Avon Products, Inc. | (168,500) | (2,618,134) | 198,474 | |||||||||
| Baker Hughes, Inc. | (81,200) | (3,516,060) | 199,852 | |||||||||
| Bally Technologies, Inc. | (31,700) | (1,468,585) | 51,278 | |||||||||
| Bank of America Corp | (26,700) | (209,113) | (100,607) | |||||||||
| Bank of Hawaii | (4,300) | (209,643) | 20,228 | |||||||||
| Bank of New York Mellon Corp./The | (32,600) | (720,157) | (117,663) | |||||||||
| Barnes Group, Inc. | (12,900) | (311,502) | 21,768 | |||||||||
| Baxter International, Inc. | (33,500) | (2,178,937) | (54,173) | |||||||||
| Baytex Energy Corp. | (2,900) | (122,370) | (3,026) | |||||||||
| BB&T Corp. | (900) | (28,158) | 1,959 | |||||||||
| Berry Petroleum Co. | (13,500) | (548,438) | 95,513 | |||||||||
| Bill Barrett Corp. | (44,600) | (1,012,849) | 219,415 | |||||||||
| BioMarin Pharmaceutical, Inc. | (59,300) | (2,269,244) | (651,281) | |||||||||
| Black Hills Corp. | (31,300) | (1,054,794) | (82,648) | |||||||||
| BorgWarner, Inc. | (11,600) | (848,225) | 17,433 | |||||||||
| Bristol-Myers Squibb Co. | (137,200) | (4,561,436) | 90,088 | |||||||||
| Broadcom Corp. | (11,100) | (383,954) | 15,323 | |||||||||
| Brookdale Senior Living | (51,600) | (924,499) | (382,013) | |||||||||
| Cablevision Systems Corp. | (121,400) | (1,766,176) | (47,540) | |||||||||
| CACI International, Inc. | (4,000) | (214,959) | (5,161) | |||||||||
| Cadence Design Systems, Inc. | (5,400) | (61,695) | (11,259) | |||||||||
| Calpine Corp. | (29,200) | (512,081) | (17,315) | |||||||||
| Campbell Soup Co. | (10,300) | (337,575) | (21,792) | |||||||||
| CarMax, Inc. | (158,400) | (4,742,145) | (1,204,191) | |||||||||
| Carnival Corp. | (23,900) | (753,936) | (124,867) | |||||||||
| Casey’s General Stores, Inc. | (1,400) | (80,350) | 6,010 | |||||||||
| Cash America International, Inc. | (29,700) | (1,272,539) | 94,340 | |||||||||
| Caterpillar, Inc. | (51,400) | (4,450,070) | (154,342) | |||||||||
| Cavium, Inc. | (121,300) | (3,222,645) | (563,128) | |||||||||
| Centene Corp. | (31,300) | (1,236,811) | (46,489) | |||||||||
| CenturyLink, Inc. | (19,400) | (760,510) | 1,582 | |||||||||
| Cepheid, Inc. | (74,100) | (2,854,554) | 349,233 | |||||||||
| Cerner Corp. | (6,900) | (523,935) | (11,781) | |||||||||
| CH Robinson Worldwide, Inc. | (31,400) | (1,845,747) | (139,361) | |||||||||
| Charles Schwab Corp./The | (527,600) | (6,867,654) | (708,682) | |||||||||
| Chart Industries, Inc. | (21,600) | (1,383,199) | (56,873) | |||||||||
| Check Point Software | (27,800) | (1,323,021) | (1,371) | |||||||||
| Cheesecake Factory, Inc. | (12,600) | (414,379) | 2,107 | |||||||||
REFERENCE ENTITY | SHARES | NOTIONAL (a) | NET UNREALIZED APPRECIATION (DEPRECIATION) | |||||||||
| United States (continued) | ||||||||||||
| Chesapeake Energy Corp. | (208,200) | $ | (3,660,385) | $ | 200,101 | |||||||
| Childrens Place Retail Stores, Inc./The | (25,300) | (1,159,785) | 39,248 | |||||||||
| Chipotle Mexican Grill, Inc. | (19,500) | (6,407,620) | 607,150 | |||||||||
| Ciena Corp. | (103,300) | (1,350,452) | (271,358) | |||||||||
| Cimarex Energy Co. | (13,700) | (802,434) | 11,533 | |||||||||
| Cinncinnati Financial Corp. | (34,000) | (1,213,889) | (117,551) | |||||||||
| Citigroup, Inc. | (21,100) | (780,647) | (54,069) | |||||||||
| Citrix Systems, Inc. | (4,200) | (268,218) | (7,932) | |||||||||
| City National Corp. | (6,200) | (317,070) | 10,046 | |||||||||
| Clean Harbors, Inc. | (6,600) | (386,925) | 23,859 | |||||||||
| Cliffs Natural Resources, Inc. | (208,600) | (7,773,936) | (269,680) | |||||||||
| Clorox Co. | (2,000) | (149,517) | 3,077 | |||||||||
| CMS Energy Corp. | (5,700) | (128,079) | (10,887) | |||||||||
| Coach, Inc. | (146,800) | (8,355,975) | 207,107 | |||||||||
| Coca-Cola Co./The | (65,500) | (2,472,710) | 98,335 | |||||||||
| Cognizant Technology Solutions Corp. | (38,400) | (2,268,386) | (575,134) | |||||||||
| Comerica, Inc. | (66,100) | (2,044,991) | 39,517 | |||||||||
| Compass Minerals International, Inc. | (6,600) | (499,657) | 6,571 | |||||||||
| Concho Resources, Inc. | (17,000) | (1,460,728) | 91,208 | |||||||||
| Concur Technologies, Inc. | (47,600) | (3,052,560) | (161,392) | |||||||||
| Consol Energy, Inc. | (164,500) | (5,120,133) | (160,317) | |||||||||
| Continental Resources, Inc. | (23,900) | (1,739,642) | (16,769) | |||||||||
| Core Laboratories NV | (20,400) | (2,437,353) | 207,429 | |||||||||
| Cree, Inc. | (87,200) | (2,460,152) | (502,904) | |||||||||
| Crown Castle International Corp. | (19,700) | (1,154,824) | (266,728) | |||||||||
| Cubist Pharmaceutical Co. | (13,300) | (567,777) | 8,379 | |||||||||
| Cullen Frost Bankers | (5,200) | (301,602) | 19,398 | |||||||||
| CVR Energy, Inc. | (6,700) | (263,229) | (63,664) | |||||||||
| Cymer, Inc. | (1,600) | (140,277) | (4,411) | |||||||||
| Dana Holding Corp. | (97,700) | (1,304,973) | (220,124) | |||||||||
| Danaher Corp. | (37,400) | (1,955,881) | (134,779) | |||||||||
| Darden Restaurants, Inc. | (14,300) | (720,728) | 76,227 | |||||||||
| Deckers Outdoor Corp. | (46,200) | (2,284,942) | 424,468 | |||||||||
| Deere & Co. | (2,900) | (228,499) | (22,119) | |||||||||
| Dell, Inc. | (175,600) | (1,764,067) | (14,761) | |||||||||
| DENTSPLY International, Inc. | (25,900) | (988,656) | (37,243) | |||||||||
| DeVry, Inc. | (75,000) | (1,753,705) | (26,045) | |||||||||
| Diamond Offshore Drill | (2,600) | (159,609) | (17,087) | |||||||||
| Dick’s Sporting Goods, Inc. | (16,200) | (802,717) | 65,779 | |||||||||
| Discovery Communications, Inc. | (23,000) | (1,202,607) | (257,433) | |||||||||
| Dominion Resources, Inc. | (42,500) | (2,232,168) | 30,668 | |||||||||
| The accompanying notes are an integral part of these financial statements. | (Continued) |
| AQR Funds | Annual Report | December 2012 | 85 | |||||||||||||
Table of Contents
| Consolidated Schedule of Investments | December 31, 2012 |
| AQR MULTI-STRATEGY ALTERNATIVE FUND |
REFERENCE ENTITY | SHARES | NOTIONAL (a) | NET UNREALIZED APPRECIATION (DEPRECIATION) | |||||||||
| United States (continued) | ||||||||||||
| Dow Chemical Co./The | (88,600) | $ | (2,818,571) | $ | (44,981) | |||||||
| DreamWorks Animation SKG, Inc. | (10,800) | (201,557) | 22,601 | |||||||||
| Dril-Quip, Inc. | (4,600) | (309,554) | (26,476) | |||||||||
| DSW, Inc. | (3,200) | (209,141) | �� | (1,067) | ||||||||
| Eagle Materials, Inc. | (4,300) | (172,172) | (79,378) | |||||||||
| eBay, Inc. | (16,000) | (688,325) | (127,995) | |||||||||
| Ecolab, Inc. | (36,600) | (2,443,626) | (187,914) | |||||||||
| Edwards Lifesciences Corp. | (3,800) | (349,594) | 6,948 | |||||||||
| EI du Pont de Nemours & Co. | (21,000) | (1,044,846) | 100,476 | |||||||||
| Electronic Arts, Inc. | (90,600) | (1,236,430) | (79,988) | |||||||||
| EMC Corp. | (26,400) | (696,342) | 28,422 | |||||||||
| Emerson Electric Co. | (20,600) | (974,459) | (116,517) | |||||||||
| Enerplus Corp. | (21,100) | (315,144) | 41,688 | |||||||||
| EQT Corp. | (14,400) | (818,148) | (31,164) | |||||||||
| Equinix, Inc. | (21,400) | (3,560,056) | (852,624) | |||||||||
| Estee Lauder Cos., Inc./The | (300) | (17,997) | 39 | |||||||||
| Exelon Corp. | (171,700) | (5,648,193) | 541,835 | |||||||||
| Expeditors International of Washington, Inc. | (15,500) | (581,461) | (31,564) | |||||||||
| F5 Networks, Inc. | (10,700) | (1,025,991) | (13,514) | |||||||||
| Factset Research Systems, Inc. | (7,400) | (768,805) | 117,161 | |||||||||
| Fairchild Semiconductor Co. | (26,700) | (369,829) | (14,651) | |||||||||
| Family Dollar Stores, Inc. | (3,200) | (202,551) | (361) | |||||||||
| Fastenal Co. | (100,900) | (4,369,404) | (341,617) | |||||||||
| Federated Investors, Inc. | (4,300) | (89,412) | 2,423 | |||||||||
| Fidelity National Financial, Inc. | (15,200) | (290,536) | (67,424) | |||||||||
| Finisar Corp. | (365,600) | (4,967,818) | (991,462) | |||||||||
| First Horizon National Corp. | (151,600) | (1,337,181) | (165,175) | |||||||||
| FirstEnergy Corp. | (5,500) | (227,975) | (1,705) | |||||||||
| FLIR Systems, Inc. | (82,900) | (1,687,000) | (162,499) | |||||||||
| Flowers Foods, Inc. | (42,600) | (939,494) | (51,808) | |||||||||
| Flowserve Corp. | (3,000) | (360,133) | (80,267) | |||||||||
| Fluor Corp. | (3,500) | (190,834) | (14,756) | |||||||||
| FMC Technologies, Inc. | (66,500) | (2,892,044) | 43,849 | |||||||||
| Forest City Enterprises, Inc. | (176,000) | (2,645,610) | (196,790) | |||||||||
| Fossil, Inc. | (26,100) | (1,854,784) | (575,126) | |||||||||
| Franklin Resources, Inc. | (8,700) | (1,011,509) | (82,081) | |||||||||
| Freeport-McMoRan Copper & Gold, Inc. | (101,900) | (3,745,897) | 260,917 | |||||||||
| FTI Consulting, Inc. | (61,400) | (1,759,661) | (266,539) | |||||||||
| Gannett Co., Inc. | (64,700) | (875,956) | (289,291) | |||||||||
| Gardner Denver, Inc. | (3,900) | (278,942) | 11,792 | |||||||||
| GATX Corp. | (17,900) | (725,528) | (49,542) | |||||||||
| General Mills, Inc. | (9,700) | (378,079) | (13,898) | |||||||||
| Genesee & Wyoming, Inc. | (12,100) | (701,047) | (219,521) | |||||||||
REFERENCE ENTITY | SHARES | NOTIONAL (a) | NET UNREALIZED APPRECIATION (DEPRECIATION) | |||||||||
| United States (continued) | ||||||||||||
| Gentex Corp. | (133,300) | $ | (2,473,089) | �� | $ | (35,617) | ||||||
| Geo Group, Inc./The | (20,200) | (457,934) | (111,706) | |||||||||
| Gilead Sciences, Inc. | (53,300) | (3,375,264) | (539,621) | |||||||||
| Google, Inc. | (700) | (476,905) | (19,654) | |||||||||
| GrafTech International Ltd. | (50,800) | (494,007) | 16,995 | |||||||||
| Great Plains Energy, Inc. | (4,600) | (91,310) | (2,116) | |||||||||
| Green Mountain Coffee Roasters, Inc. | (146,900) | (3,462,291) | (2,613,493) | |||||||||
| Greenhill & Co., Inc. | (51,700) | (1,899,036) | (788,847) | |||||||||
| Gulfport Energy Corp. | (59,100) | (1,545,383) | (713,419) | |||||||||
| H&R Block, Inc. | (100,300) | (1,528,296) | (334,275) | |||||||||
| Hain Celestial Group, Inc./The | (19,800) | (1,121,491) | 47,935 | |||||||||
| Hancock Holding Co. | (13,400) | (408,242) | (17,074) | |||||||||
| Hanesbrands, Inc. | (37,900) | (1,096,691) | (260,887) | |||||||||
| Harley-Davidson, Inc. | (500) | (24,415) | (5) | |||||||||
| Harris Corp. | (44,500) | (1,838,353) | (340,367) | |||||||||
| Hartford Financial Services Group, Inc. | (47,100) | (819,136) | (237,788) | |||||||||
| Hawaiian Electric Industries, Inc. | (3,100) | (77,919) | (15) | |||||||||
| Helmerich & Payne, Inc. | (6,100) | (297,165) | (44,496) | |||||||||
| Hertz Global Holdings, Inc. | (197,400) | (2,929,326) | (282,372) | |||||||||
| Hewlett-Packard Co. | (145,200) | (2,678,455) | 609,355 | |||||||||
| Hexcel Corp. | (61,700) | (1,571,564) | (91,868) | |||||||||
| Hologic, Inc. | (40,100) | (785,119) | (18,084) | |||||||||
| Hospira, Inc. | (50,500) | (1,697,630) | 120,010 | |||||||||
| IDEX Corp. | (8,300) | (335,879) | (50,320) | |||||||||
| IDEXX Laboratories, Inc. | (4,100) | (381,460) | 980 | |||||||||
| IHS, Inc. | (9,200) | (926,991) | 43,791 | |||||||||
| Illinois Tool Works, Inc. | (10,500) | (572,515) | (65,990) | |||||||||
| Informatica Corp. | (77,200) | (2,340,566) | (138) | |||||||||
| Intel Corp. | (74,500) | (1,491,851) | (45,084) | |||||||||
| InterDigital, Inc. | (23,000) | (730,025) | (215,275) | |||||||||
| International Business Machines Corp. | (3,300) | (672,120) | 40,005 | |||||||||
| Interoil Corp. | (3,000) | (174,900) | 8,310 | |||||||||
| Intersil Corp. | (38,000) | (311,354) | (3,666) | |||||||||
| Intrepid Potash, Inc. | (116,200) | (2,524,042) | 50,144 | |||||||||
| Intuitive Surgical, Inc. | (5,500) | (2,790,571) | 93,536 | |||||||||
| IPG Photonics Corp. | (39,000) | (1,915,717) | (683,633) | |||||||||
| Iron Mountain, Inc. | (30,486) | (873,766) | (72,824) | |||||||||
| ITC Holdings Corp. | (12,200) | (873,319) | (64,983) | |||||||||
| Jazz Pharmaceuticals Co. | (53,100) | (2,694,346) | (130,574) | |||||||||
| JB Hunt Transport Services, Inc. | (11,900) | (661,190) | (49,359) | |||||||||
| JC Penney Co., Inc. | (94,900) | (2,406,872) | 536,393 | |||||||||
| Jefferies Group, Inc. | (69,500) | (933,993) | (356,622) | |||||||||
| JetBlue Airways Corp. | (167,300) | (821,533) | (133,750) | |||||||||
| Johnson & Johnson | (6,000) | (424,316) | 3,716 | |||||||||
| Johnson Controls, Inc. | (172,000) | (4,822,706) | (457,694) | |||||||||
| Joy Global, Inc. | (34,900) | (1,895,867) | (330,055) | |||||||||
| The accompanying notes are an integral part of these financial statements. | (Continued) |
| 86 | AQR Funds | Annual Report | December 2012 | |||||||||||||
Table of Contents
| Consolidated Schedule of Investments | December 31, 2012 |
| AQR MULTI-STRATEGY ALTERNATIVE FUND |
REFERENCE ENTITY | SHARES | NOTIONAL (a) | NET UNREALIZED APPRECIATION (DEPRECIATION) | |||||||||
| United States (continued) | ||||||||||||
| Juniper Networks, Inc. | (153,300) | $ | (2,730,658) | $ | (284,753) | |||||||
| Kellogg Co. | (30,600) | (1,568,761) | (140,249) | |||||||||
| Kennametal, Inc. | (3,800) | (144,233) | (7,767) | |||||||||
| Kirby Corp. | (43,100) | (2,287,793) | (379,666) | |||||||||
| Knight Transportation, Inc. | (23,200) | (380,048) | 40,632 | |||||||||
| Kohl’s Corp. | (44,900) | (2,265,557) | 335,755 | |||||||||
| Laboratory Corp. of America Holdings | (9,200) | (801,195) | 4,291 | |||||||||
| Lam Research Corp. | (27,700) | (1,022,529) | 21,728 | |||||||||
| Lamar Advertising Co. | (52,200) | (1,433,441) | (589,309) | |||||||||
| Las Vegas Sands Corp. | (84,400) | (3,634,744) | (261,160) | |||||||||
| Leap Wireless International, Inc. | (250,900) | (1,443,244) | (225,241) | |||||||||
| Legg Mason, Inc. | (52,000) | (1,239,616) | (97,824) | |||||||||
| Leggett & Platt, Inc. | (33,000) | (682,753) | (215,507) | |||||||||
| Lennar Corp. | (59,300) | (1,769,262) | (523,869) | |||||||||
| Leucadia National Corp. | (21,400) | (459,194) | (49,912) | |||||||||
| Level 3 Communications, Inc. | (8,400) | (179,882) | (14,242) | |||||||||
| Lexmark International, Inc. | (14,800) | (347,259) | 4,047 | |||||||||
| Liberty Global, Inc. | (9,300) | (589,373) | 3,566 | |||||||||
| Life Technologies Corp. | (6,500) | (297,343) | (21,677) | |||||||||
| Life Time Fitness, Inc. | (39,100) | (1,734,036) | (190,075) | |||||||||
| LifePoint Hospitals, Inc. | (7,400) | (267,677) | (11,673) | |||||||||
| Linear Technology Corp. | (9,800) | (300,944) | (35,196) | |||||||||
| Lorillard, Inc. | (2,700) | (318,396) | 3,387 | |||||||||
| Ltd. Brands, Inc. | (47,900) | (2,314,424) | 60,250 | |||||||||
| Lufkin Industries, Inc. | (51,100) | (2,899,503) | (70,940) | |||||||||
| Lululemon Athletica, Inc. | (64,900) | (4,346,418) | (600,909) | |||||||||
| M&T Bank Corp. | (3,100) | (262,411) | (42,846) | |||||||||
| Manitowoc Co., Inc./The | (127,400) | (1,464,139) | (533,493) | |||||||||
| Markel Corp. | (2,000) | (869,226) | 2,386 | |||||||||
| Marriott International, Inc. | (31,300) | (1,222,192) | 55,641 | |||||||||
| Martin Marietta Materials, Inc. | (32,200) | (2,519,974) | (515,842) | |||||||||
| Masco Corp. | (52,300) | (732,187) | (139,131) | |||||||||
| Masimo Corp. | (46,800) | (1,023,537) | 40,269 | |||||||||
| McCormick & Co., Inc. | (8,800) | (525,018) | (34,046) | |||||||||
| McDonald’s Corp. | (9,400) | (838,105) | 8,931 | |||||||||
| McGraw-Hill Cos, Inc./The | (3,200) | (179,410) | 4,466 | |||||||||
| McMoRan Exploration Co. | (12,600) | (178,620) | (23,610) | |||||||||
| MDU Resources Group, Inc. | (17,900) | (395,323) | 15,127 | |||||||||
| Mednax, Inc. | (25,900) | (1,791,019) | (268,549) | |||||||||
| Medtronic, Inc. | (10,000) | (380,300) | (29,900) | |||||||||
| MEMC Electronic Materials, Inc. | (25,900) | (50,632) | (32,507) | |||||||||
| Men’s Wearhouse, Inc./The | (41,600) | (1,285,554) | (10,702) | |||||||||
| Merck & Co., Inc. | (14,600) | (607,496) | 9,772 | |||||||||
REFERENCE ENTITY | SHARES | NOTIONAL (a) | NET UNREALIZED APPRECIATION (DEPRECIATION) | |||||||||
| United States (continued) | ||||||||||||
| MetLife, Inc. | (38,000) | $ | (1,286,186) | $ | 34,466 | |||||||
| Mettler-Toledo International, Inc. | (6,900) | (1,086,830) | (246,940) | |||||||||
| Micro Devices, Inc. | (202,400) | (802,263) | (104,489) | |||||||||
| Microchip Technology | (17,600) | (560,486) | (13,098) | |||||||||
| MICROS Systems, Inc. | (6,300) | (280,133) | 12,761 | |||||||||
| Monster Worldwide, Inc. | (179,700) | (1,280,634) | 270,720 | |||||||||
| Monster Worldwide, Inc. | (26,100) | (1,802,579) | 82,850 | |||||||||
| Mosaic Co./The | (29,700) | (1,605,445) | (76,466) | |||||||||
| MSC Industrial Direct Co., Inc. | (15,600) | (1,046,453) | (129,475) | |||||||||
| Mylan, Inc. | (85,100) | (1,803,798) | (534,750) | |||||||||
| National Fuel Gas Co. | (4,200) | (217,047) | 4,149 | |||||||||
| Navistar International Corp. | (32,400) | (664,768) | (40,580) | |||||||||
| NetApp, Inc. | (7,000) | (239,962) | 5,112 | |||||||||
| Netflix, Inc. | (5,200) | (356,002) | (126,454) | |||||||||
| NextEra Energy, Inc. | (3,000) | (192,450) | (15,120) | |||||||||
| NII Holdings, Inc. | (152,500) | (1,308,624) | 221,299 | |||||||||
| NIKE, Inc. | (36,600) | (1,744,271) | (144,289) | |||||||||
| Noble Corp. | (31,100) | (1,054,378) | (28,524) | |||||||||
| Noble Energy, Inc. | (100) | (8,668) | (1,506) | |||||||||
| Nordson Corp. | (6,800) | (404,948) | (24,268) | |||||||||
| Nordstrom, Inc. | (53,000) | (2,880,832) | 45,332 | |||||||||
| Norfolk Southern Corp. | (200) | (12,508) | 140 | |||||||||
| Northeast Utilities | (18,900) | (739,017) | 405 | |||||||||
| Northern Trust Corp. | (9,800) | (445,292) | (46,276) | |||||||||
| NRG Energy, Inc. | (92,608) | (1,658,643) | (470,415) | |||||||||
| Nu Skin Enterprises | (30,500) | (1,409,491) | 279,466 | |||||||||
| Nuance Communications, Inc. | (197,500) | (4,473,815) | 65,615 | |||||||||
| Nucor Corp. | (30,100) | (1,117,916) | (181,802) | |||||||||
| Old Republic International Corp. | (81,700) | (778,601) | (91,504) | |||||||||
| Oneok, Inc. | (16,500) | (718,151) | 12,776 | |||||||||
| Onyx Pharmaceuticals, Inc. | (35,500) | (2,551,674) | (129,641) | |||||||||
| Oracle Corp. | (2,400) | (66,672) | (13,296) | |||||||||
| Owens Corning | (77,800) | (2,569,166) | (308,656) | |||||||||
| PACCAR, Inc. | (1,300) | (52,958) | (5,815) | |||||||||
| Parametric Technology | (17,800) | (371,103) | (29,575) | |||||||||
| Peabody Energy Corp. | (176,200) | (4,403,550) | (285,132) | |||||||||
| Penn West Petroleum Corp. | (57,200) | (752,629) | 131,437 | |||||||||
| Penske Automotive Group, Inc. | (42,900) | (1,090,553) | (200,308) | |||||||||
| Pepco Holdings, Inc. | (9,800) | (187,135) | (5,043) | |||||||||
| PepsiCo, Inc. | (10,400) | (729,210) | 17,538 | |||||||||
| Perrigo Co. | (20,700) | (2,289,360) | 135,939 | |||||||||
| Philip Morris International, Inc. | (8,100) | (685,121) | 7,637 | |||||||||
| Pioneer Natural Resources Co. | (23,800) | (2,329,260) | (207,582) | |||||||||
| Pitney Bowes, Inc. | (51,100) | (626,784) | 83,080 | |||||||||
| Plantronics, Inc. | (5,600) | (177,645) | (28,827) | |||||||||
| The accompanying notes are an integral part of these financial statements. | (Continued) |
| AQR Funds | Annual Report | December 2012 | 87 | |||||||||||||
Table of Contents
| Consolidated Schedule of Investments | December 31, 2012 |
| AQR MULTI-STRATEGY ALTERNATIVE FUND |
REFERENCE ENTITY | SHARES | NOTIONAL (a) | NET UNREALIZED APPRECIATION (DEPRECIATION) | |||||||||
| United States (continued) | ||||||||||||
| PPL Corp. | (42,600) | $ | (1,239,761) | $ | 20,123 | |||||||
| Praxair, Inc. | (7,800) | (870,122) | 16,412 | |||||||||
| Precision Castparts Corp. | (5,900) | (967,233) | (150,345) | |||||||||
| priceline.com, Inc. | (1,300) | (832,629) | 25,069 | |||||||||
| Principal Financial Group, Inc. | (21,600) | (581,387) | (34,645) | |||||||||
| Progressive Corp./The | (154,900) | (3,444,284) | 175,894 | |||||||||
| Prosperity Bancshares, Inc. | (3,200) | (145,071) | 10,671 | |||||||||
| QUALCOMM, Inc. | (70,500) | (4,001,720) | (370,690) | |||||||||
| Quality Systems, Inc. | (31,800) | (741,311) | 189,263 | |||||||||
| Quanta Services, Inc. | (38,700) | (916,295) | (139,828) | |||||||||
| Questar Corp. | (10,800) | (215,664) | 2,256 | |||||||||
| Quicksilver Resources, Inc. | (18,700) | (58,368) | 4,886 | |||||||||
| Rackspace Hosting, Inc. | (60,500) | (3,012,011) | (1,481,324) | |||||||||
| Rambus, Inc. | (78,100) | (368,830) | (12,298) | |||||||||
| Range Resources Corp. | (53,900) | (3,430,292) | 43,755 | |||||||||
| Red Hat, Inc. | (7,800) | (426,073) | 12,985 | |||||||||
| Rent-A-Center, Inc. | (13,400) | (449,629) | (10,795) | |||||||||
| Republic Services, Inc. | (16,600) | (443,923) | (42,955) | |||||||||
| ResMed, Inc. | (13,100) | (474,396) | (70,171) | |||||||||
| Rockwell Collins, Inc. | (25,200) | (1,352,804) | (113,080) | |||||||||
| Roper Industries, Inc. | (7,900) | (794,578) | (86,114) | |||||||||
| Rosetta Resources, Inc. | (28,800) | (1,175,173) | (131,195) | |||||||||
| Rovi Corp. | (59,100) | (1,008,048) | 96,135 | |||||||||
| Rowan Co. | (28,800) | (902,350) | 1,774 | |||||||||
| Saks, Inc. | (16,400) | (168,981) | (3,383) | |||||||||
| Salesforce.com, Inc. | (41,900) | (5,772,750) | (1,270,640) | |||||||||
| Salix Pharmaceutical Corp. | (67,700) | (3,356,385) | 615,889 | |||||||||
| SanDisk Corp. | (106,800) | (3,917,550) | (734,658) | |||||||||
| SandRidge Energy, Inc. | (217,790) | (1,423,034) | 40,067 | |||||||||
| SBA Communications Corp. | (7,300) | (441,041) | (77,405) | |||||||||
| SCANA Corp. | (1,200) | (54,972) | 204 | |||||||||
| Schlumberger Ltd. | (28,500) | (2,004,402) | 29,637 | |||||||||
| Schnitzer Steel Industries, Inc. | (7,600) | (261,605) | 31,097 | |||||||||
| Scotts Miracle-Gro Co. | (12,200) | (522,859) | (14,551) | |||||||||
| Scripps Networks Interactive, Inc. | (11,700) | (646,302) | (31,362) | |||||||||
| Sealed Air Corp. | (110,200) | (1,777,720) | (151,882) | |||||||||
| Sensata Technologies | (51,000) | (1,444,569) | (211,911) | |||||||||
| Sigma-Aldrich Corp. | (10,100) | (723,213) | (19,945) | |||||||||
| Signature Bank Co. | (9,500) | (586,750) | (90,980) | |||||||||
| Silicon Laboratories, Inc. | (6,600) | (226,578) | (49,368) | |||||||||
| Skyworks Solutions, Inc. | (38,600) | (962,713) | 179,133 | |||||||||
| Smithfield Foods, Inc. | (61,200) | (1,233,467) | (86,617) | |||||||||
| Solera Holdings, Inc. | (5,300) | (228,101) | (55,290) | |||||||||
| Sotheby’s | (12,100) | (379,355) | (27,447) | |||||||||
| Southern Co. | (33,400) | (1,487,038) | 57,184 | |||||||||
| Southwest Airlines Co. | (24,100) | (202,617) | (44,167) | |||||||||
| Southwestern Energy Co. | (114,900) | (3,621,947) | (216,862) | |||||||||
REFERENCE ENTITY | SHARES | NOTIONAL (a) | NET UNREALIZED APPRECIATION (DEPRECIATION) | |||||||||
| United States (continued) | ||||||||||||
| Spectra Energy Corp. | (2,700) | $ | (74,511) | $ | 585 | |||||||
| Stanley Black & Decker, Inc. | (20,500) | (1,425,389) | (90,996) | |||||||||
| Staples, Inc. | (96,300) | (1,151,768) | 53,948 | |||||||||
| State Street Corp. | (2,600) | (108,361) | (13,865) | |||||||||
| Stericycle, Inc. | (4,100) | (355,163) | (27,244) | |||||||||
| Stifel Financial Corp. | (25,400) | (833,090) | 21,052 | |||||||||
| Strayer Education, Inc. | (5,400) | (304,477) | 1,159 | |||||||||
| Stryker Corp. | (2,000) | (107,374) | (2,266) | |||||||||
| Superior Energy Services, Inc. | (22,100) | (446,149) | (11,763) | |||||||||
| SVB Financial Group | (14,900) | (879,673) | 45,720 | |||||||||
| Synovus Financial Corp. | (1,332,000) | (2,680,085) | (583,315) | |||||||||
| Sysco Corp. | (18,400) | (509,819) | (72,725) | |||||||||
| T Rowe Price Group, Inc. | (23,600) | (1,409,583) | (127,485) | |||||||||
| Take-Two Interactive Software, Inc. | (81,800) | (933,733) | 33,115 | |||||||||
| Target Corp. | (11,600) | (691,852) | 5,480 | |||||||||
| TCF Financial Corp. | (90,600) | (1,059,958) | (40,832) | |||||||||
| TECO Energy, Inc. | (2,400) | (42,579) | 2,355 | |||||||||
| Tenet Healthcare Corp. | (50,075) | (1,212,959) | (412,976) | |||||||||
| Tenneco, Inc. | (29,700) | (862,414) | (180,353) | |||||||||
| Teradata Corp. | (5,000) | (316,380) | 6,930 | |||||||||
| Teradyne, Inc. | (7,200) | (110,108) | (11,500) | |||||||||
| Terex Corp. | (5,200) | (91,758) | (54,414) | |||||||||
| Texas Instruments, Inc. | (61,400) | (1,748,666) | (151,050) | |||||||||
| Textron, Inc. | (29,500) | (761,253) | 29,948 | |||||||||
| Tidewater, Inc. | (9,500) | (475,190) | 50,730 | |||||||||
| Tiffany & Co. | (78,200) | (4,595,193) | 111,205 | |||||||||
| Time Warner, Inc. | (34,400) | (1,352,238) | (293,114) | |||||||||
| TreeHouse Foods, Inc. | (16,200) | (928,929) | 84,423 | |||||||||
| Trimble Navigation Ltd. | (12,600) | (598,855) | (154,373) | |||||||||
| Trinity Industries, Inc. | (5,200) | (182,126) | (4,138) | |||||||||
| Triumph Group, Inc. | (14,900) | (929,433) | (43,537) | |||||||||
| Ultra Petroleum Corp. | (87,900) | (1,883,898) | 290,271 | |||||||||
| Under Armour, Inc. | (62,700) | (3,094,328) | 51,497 | |||||||||
| United Continental Holdings, Inc. | (39,900) | (911,032) | (21,830) | |||||||||
| United Natural Foods, Inc. | (7,500) | (397,284) | (4,641) | |||||||||
| UnitedHealth Group, Inc. | (22,300) | (1,236,766) | 27,214 | |||||||||
| Urban Outfitters, Inc. | (112,900) | (3,401,188) | (1,042,556) | |||||||||
| Vail Resorts, Inc. | (15,900) | (706,697) | (153,334) | |||||||||
| Valley National Bancorp. | (36,000) | (366,960) | 32,160 | |||||||||
| ValueClick, Inc. | (59,900) | (976,810) | (185,849) | |||||||||
| Varian Medical Systems, Inc. | (26,700) | (1,752,397) | (123,011) | |||||||||
| VCA Antech, Inc. | (69,700) | (1,442,698) | (24,487) | |||||||||
| Vectren Corp. | (400) | (11,600) | (160) | |||||||||
| VeriSign, Inc. | (26,500) | (1,001,588) | (27,142) | |||||||||
| VF Corp. | (2,600) | (401,285) | 8,763 | |||||||||
| The accompanying notes are an integral part of these financial statements. | (Continued) |
| 88 | AQR Funds | Annual Report | December 2012 | |||||||||||||
Table of Contents
| Consolidated Schedule of Investments | December 31, 2012 |
| AQR MULTI-STRATEGY ALTERNATIVE FUND |
REFERENCE ENTITY | SHARES | NOTIONAL (a) | NET UNREALIZED APPRECIATION (DEPRECIATION) | |||||||||
| United States (continued) | ||||||||||||
| Virgin Media, Inc. | (87,600) | $ | (2,189,179) | $ | (1,030,121) | |||||||
| Visa, Inc. | (10,300) | (1,254,329) | (306,945) | |||||||||
| Volcano Corp. | (31,100) | (896,086) | 161,815 | |||||||||
| Waddell & Reed Financial, Inc. | (26,700) | (830,264) | (99,430) | |||||||||
| Walgreen Co. | (2,000) | (74,449) | 429 | |||||||||
| Walter Energy, Inc. | (53,600) | (1,729,214) | (193,954) | |||||||||
| Waste Connections, Inc. | (2,700) | (83,211) | (8,022) | |||||||||
| Watsco, Inc. | (15,000) | (1,117,444) | (6,056) | |||||||||
| Weight Watchers International, Inc. | (10,400) | (551,571) | 7,027 | |||||||||
| Wendy’s Company/The | (22,900) | (107,274) | (356) | |||||||||
| WESCO International, Inc. | (13,000) | (780,862) | (95,728) | |||||||||
| Westar Energy, Inc. | (3,900) | (111,033) | (585) | |||||||||
| Western Union Co./The | (257,100) | (3,861,426) | 362,295 | |||||||||
| Whole Foods Market, Inc. | (200) | (18,536) | 270 | |||||||||
| Williams Cos, Inc./The | (7,900) | (255,625) | (3,021) | |||||||||
| Windstream Corp. | (24,700) | (258,269) | 53,753 | |||||||||
| WMS Industries, Inc. | (10,700) | (175,704) | (11,546) | |||||||||
| Woodward, Inc. | (23,600) | (902,627) | 2,759 | |||||||||
| World Fuel Services | (3,400) | (126,749) | (13,229) | |||||||||
| Worthington Industries, Inc. | (8,800) | (180,381) | (48,331) | |||||||||
REFERENCE ENTITY | SHARES | NOTIONAL (a) | NET UNREALIZED APPRECIATION (DEPRECIATION) | |||||||||
| United States (continued) | ||||||||||||
| WR Berkley Corp. | (6,600) | $ | (253,435) | $ | 4,351 | |||||||
| WW Grainger, Inc. | (3,000) | (575,616) | (31,494) | |||||||||
| Wynn Resorts Ltd. | (5,800) | (605,521) | (46,921) | |||||||||
| Xilinx, Inc. | (11,800) | (394,895) | (28,725) | |||||||||
| Yum! Brands, Inc. | (400) | (26,471) | (89) | |||||||||
| Zions BanCorp. | (170,100) | (3,314,406) | (325,734) | |||||||||
|
| |||||||||||
| (33,022,035) | ||||||||||||
|
| |||||||||||
Total of Short Equity Positions |
| (33,304,636) | ||||||||||
|
| |||||||||||
Total of Long and Short Equity Positions |
| (2,793,299) | ||||||||||
|
| |||||||||||
Net Cash and Other Receivables/(Payables) (b) |
| (1,698,932) | ||||||||||
|
| |||||||||||
Swaps, at Value | $ | (4,492,231) | ||||||||||
|
| |||||||||||
| (a) | Notional value represents the market value (including any fees or commissions) of the long and short positions when they are established. |
| (b) | Cash and other receivables includes the gains (or losses) realized within the swap when the swap resets. Gains (or losses) will be realized on the swap, and reflected on the Statement of Operations, when cash is settled with the counterparty. |
Money Market Fund is pledged as collateral to the broker in the amount of $98,015,710 at December 31, 2012.
| The accompanying notes are an integral part of these financial statements. | (Continued) |
| AQR Funds | Annual Report | December 2012 | 89 | |||||||||||||
Table of Contents
| Consolidated Schedule of Investments | December 31, 2012 |
| AQR MULTI-STRATEGY ALTERNATIVE FUND |
Total Return Basket Swaps* Outstanding at December 31, 2012
| COUNTERPARTY | DESCRIPTION | TERMINATION DATES | VALUE (Note 3) | |||||
| Morgan Stanley | The Fund receives or pays the total return on a portfolio of long and short positions and pays or receives a specified LIBOR or Federal Funds floating rate, which is denominated in various foreign currencies based on the local currencies of the positions within the swap. | 07/24/2013 –09/30/2014 | $2,764,991 | |||||
|
| |||||||
| * | See the accompanying “Additional Information — Total Return Basket Swaps” for further details. |
Additional Information — Total Return Basket Swaps
The following table represents the individual long and short positions and related values within the total return basket swaps as of December 31, 2012.
REFERENCE ENTITY | SHARES | NOTIONAL (a) | NET UNREALIZED APPRECIATION (DEPRECIATION) | |||||||||
| Long Positions | ||||||||||||
| Australia | ||||||||||||
| CGA Mining Ltd. | 548,129 | $ | 1,556,509 | $ | (107,249) | |||||||
| Talison Lithium Ltd. | 455,162 | 3,118,034 | 226,929 | |||||||||
|
| |||||||||||
| 119,680 | ||||||||||||
|
| |||||||||||
| Bermuda | ||||||||||||
| Alterra Capital Holdings Ltd. | 84,350 | 2,384,153 | (6,326) | |||||||||
| Orient-Express Hotels Ltd. | 250,009 | 2,971,662 | (49,057) | |||||||||
|
| |||||||||||
| (55,383) | ||||||||||||
|
| |||||||||||
| Canada | ||||||||||||
| Astral Media, Inc. | 87,152 | 4,148,941 | (98,436) | |||||||||
| Brick Ltd./The | 121,806 | 651,566 | 4,793 | |||||||||
| C&C Energia Ltd. | 96,136 | 859,988 | 58,170 | |||||||||
| Celtic Exploration Ltd. | 143,507 | 3,756,379 | 36,522 | |||||||||
| Inmet Mining Corp. | 45,093 | 3,017,515 | 337,600 | |||||||||
| Nexen, Inc. | 159,319 | 4,022,843 | 269,211 | |||||||||
| Queenston Mining, Inc. | 51,388 | 238,191 | 13,919 | |||||||||
|
| |||||||||||
| 621,779 | ||||||||||||
|
| |||||||||||
| Israel | ||||||||||||
| Retalix Ltd. | 29,102 | 861,608 | 4,468 | |||||||||
|
| |||||||||||
| Netherlands | ||||||||||||
| Mediq NV | 57,306 | 968,647 | 3,635 | |||||||||
| TNT Express | 353,785 | 3,904,395 | 47,745 | |||||||||
|
| |||||||||||
| 51,380 | ||||||||||||
|
| |||||||||||
| United States | ||||||||||||
| American Greetings Corp. | 198,469 | $ | 3,369,933 | (17,792) | ||||||||
| Ameristar Casinos, Inc. | 20,453 | 536,171 | 516 | |||||||||
| Arbitron, Inc. | 52,495 | 2,446,074 | 4,392 | |||||||||
| Cascade Corp. | 33,135 | 2,146,565 | (15,984) | |||||||||
| Citizens Republic Bancorp, Inc. | 235,312 | 4,487,491 | (23,623) | |||||||||
REFERENCE ENTITY | SHARES | NOTIONAL (a) | NET UNREALIZED APPRECIATION (DEPRECIATION) | |||||||||
| United States (continued) | ||||||||||||
| Clearwire Corp. | 423,114 | $ | 1,224,086 | $ | (1,287) | |||||||
| Compuware Corp. | 88,363 | 951,451 | 9,055 | |||||||||
| Comverse Technology, Inc. | 118,712 | 408,304 | 47,550 | |||||||||
| Coventry Health Care, Inc. | 215,864 | 9,054,568 | 622,615 | |||||||||
| CreXus Investment Corp. | 63,043 | 776,154 | (3,877) | |||||||||
| CVR Energy, Inc. | 4,900 | 148,813 | 90,258 | |||||||||
| Cymer, Inc. | 70,785 | 5,458,396 | 942,692 | |||||||||
| Energy Group, Inc. | 67,336 | 4,383,481 | 8,173 | |||||||||
| Epoch Holding Corp. | 111,523 | 3,094,882 | 16,610 | |||||||||
| Hudson City BanCorp., Inc. | 1,189,205 | 9,639,937 | 28,300 | |||||||||
| Intermec, Inc. | 79,016 | 775,904 | 3,194 | |||||||||
| Jefferies Group, Inc. | 73,425 | 1,331,446 | 32,056 | |||||||||
| Kayak Software Corp. | 75,247 | 2,990,504 | (1,694) | |||||||||
| KBW, Inc. | 192,734 | 3,329,249 | (380,419) | |||||||||
| McMoRan Exploration Co. | 104,681 | 1,618,024 | 62,106 | |||||||||
| NYSE Euronext | 50,724 | 1,619,995 | (20,160) | |||||||||
| Oshkosh Corp. | 14,253 | 430,759 | (8,157) | |||||||||
| Plains Exploration & Production Co. | 85,187 | 3,824,201 | 174,477 | |||||||||
| PSS World Medical, Inc. | 252,484 | 7,198,111 | 93,627 | |||||||||
| RalCorp. Holdings, Inc. | 51,829 | 4,616,489 | 29,981 | |||||||||
| Robbins & Myers, Inc. | 141,731 | 8,441,806 | (15,898) | |||||||||
| Shaw Group, Inc./The | 123,889 | 5,192,458 | 582,008 | |||||||||
| Sunrise Senior Living, Inc. | 268,545 | 3,841,835 | 19,842 | |||||||||
| Teavana Holdings, Inc. | 200,159 | 3,025,767 | 76,697 | |||||||||
| TNS, Inc. | 82,236 | 1,707,693 | (2,941) | |||||||||
| Warnaco Group, Inc./The | 118,864 | 8,428,547 | 78,550 | |||||||||
|
| |||||||||||
| 2,430,867 | ||||||||||||
|
| |||||||||||
| Total of Long Equity Positions | 3,172,791 | |||||||||||
|
| |||||||||||
| The accompanying notes are an integral part of these financial statements. | (Continued) |
| 90 | AQR Funds | Annual Report | December 2012 | |||||||||||||
Table of Contents
| Consolidated Schedule of Investments | December 31, 2012 |
| AQR MULTI-STRATEGY ALTERNATIVE FUND |
REFERENCE ENTITY | SHARES | NOTIONAL (a) | NET UNREALIZED APPRECIATION (DEPRECIATION) | |||||||||
| Short Positions | ||||||||||||
| Canada | ||||||||||||
| B2Gold Corp. | (413,766) | $ | (1,619,569) | $ | 138,714 | |||||||
| First Quantum Minerals Ltd. | (66,232) | (1,368,067) | (90,809) | |||||||||
| Osisko Mining Corp. | (27,564) | (209,260) | (12,427) | |||||||||
|
| |||||||||||
| 35,478 | ||||||||||||
|
| |||||||||||
| Colombia | ||||||||||||
| Pacific Rubiales Energy Corp. | (33,309) | (743,482) | (30,391) | |||||||||
|
| |||||||||||
| Netherlands | ||||||||||||
| ASML Holding NV | (81,111) | (5,594,841) | 370,482 | |||||||||
| Chicago Bridge & Iron Co. NV | (15,724) | (579,094) | (149,713) | |||||||||
|
| |||||||||||
| 220,769 | ||||||||||||
|
| |||||||||||
| United States | ||||||||||||
| Aetna, Inc. | (83,188) | (3,299,214) | (552,390) | |||||||||
| FirstMerit Corp. | (320,128) | (4,618,586) | 75,969 | |||||||||
| Freeport-McMoRan Copper & Gold, Inc. | (54,133) | (1,751,939) | (99,410) | |||||||||
| IntercontinentalExchange, Inc. | (8,451) | (1,065,028) | 18,709 | |||||||||
| Leucadia National Corp. | (60,985) | (1,426,170) | (24,663) | |||||||||
| M&T Bank Corp. | (100,229) | (9,845,751) | (23,799) | |||||||||
| Markel Corp. | (3,656) | (1,596,341) | 11,758 | |||||||||
REFERENCE ENTITY | SHARES | NOTIONAL (a) | NET UNREALIZED APPRECIATION (DEPRECIATION) | |||||||||
| United States (continued) | ||||||||||||
| priceline.com, Inc. | (1,152) | $ | (739,297) | $ | 23,674 | |||||||
| PVH Corp. | (21,741) | (2,403,925) | (9,543) | |||||||||
| Stifel Financial Corp. | (23,337) | (718,890) | (27,193) | |||||||||
| Verint Systems, Inc. | (15,207) | (407,568) | (38,909) | |||||||||
|
| |||||||||||
| (645,797) | ||||||||||||
|
| |||||||||||
Total of Short Equity Positions |
| (419,941) | ||||||||||
|
| |||||||||||
Total of Long and Short Equity Positions | 2,752,850 | |||||||||||
|
| |||||||||||
| Net Cash and Other Receivables/(Payables)(b) | 12,141 | |||||||||||
|
| |||||||||||
Swaps, at Value | $ | 2,764,991 | ||||||||||
|
| |||||||||||
| (a) | Notional value represents the market value (including any fees or commissions) of the long and short positions when they are established. |
| (b) | Cash and other receivables includes the gains (or losses) realized within the swap when the swap resets. Gains (or losses) will be realized on the swap, and reflected on the Statement of Operations, when cash is settled with the counterparty. |
Additional collateral for this position held with Morgan Stanley is included in the collateral noted in the other Morgan Stanley total return basket swap.
| The accompanying notes are an integral part of these financial statements. |
| AQR Funds | Annual Report | December 2012 | 91 | |||||||||||||
Table of Contents
AQR MANAGED | AQR RISK-BALANCED COMMODITIES STRATEGY FUND** | AQR FUND** | ||||||||||
| ASSETS: | ||||||||||||
| Investments in securities, at cost | $2,433,054,334 | $65,531,311 | $960,565,376 | |||||||||
| Investments in securities, at value | $2,433,043,729 | $65,531,200 | $981,575,475 | |||||||||
| Cash (including foreign currency of $1,722,984, $– and $2,637,082, respectively) | 3,541,197 | — | 2,818,195 | |||||||||
| Due from brokers | 163,305,389 | 1,856,573 | 47,293,578 | |||||||||
| Unrealized appreciation on forward foreign currency exchange contracts | 61,847,908 | — | — | |||||||||
| Swaps, at value | 2,948,927 | — | 9,609,974 | |||||||||
| Unrealized appreciation on futures contracts | 12,926,066 | 261,535 | — | |||||||||
| Receivables: | ||||||||||||
Dividends and interest | 43,013 | 1,089 | 3,022,444 | |||||||||
Capital shares sold | 20,977,831 | 60,471 | 6,349,789 | |||||||||
Prepaid expenses | 148,238 | 15,706 | 66,201 | |||||||||
| Total Assets | 2,698,782,298 | 67,726,574 | 1,050,735,656 | |||||||||
| LIABILITIES: | ||||||||||||
| Due to brokers | 27,871,488 | 387,299 | — | |||||||||
| Unrealized depreciation on forward foreign currency exchange contracts | — | — | 3,352,548 | |||||||||
| Swaps, at value | 1,097,767 | 1,692,614 | 3,412,022 | |||||||||
| Unrealized depreciation on futures contracts | — | — | 2,370,598 | |||||||||
| Payables: | ||||||||||||
Securities purchased | — | — | 180,000 | |||||||||
Accrued Investment advisory fees | 2,206,093 | 830 | 667,796 | |||||||||
Accrued Distribution fees — Class N | 108,577 | 432 | 35,269 | |||||||||
Capital shares redeemed | 2,369,243 | 13,198 | 734,996 | |||||||||
Other accrued expenses and liabilities | 851,933 | 95,086 | 368,312 | |||||||||
| Total Liabilities | 34,505,101 | 2,189,459 | 11,121,541 | |||||||||
| Net Assets | $2,664,277,197 | $65,537,115 | $1,039,614,115 | |||||||||
| NET ASSETS CONSIST OF: | ||||||||||||
| Paid-in capital ($0.001 par value common stock, unlimited authorized shares) | $2,604,764,420 | $66,968,305 | $990,471,191 | |||||||||
| Undistributed (accumulated) net investment income (loss) | (1,795,380) | — | 12,558,291 | |||||||||
| Undistributed (accumulated) net realized gain (loss) | (15,421,984) | — | 22,311,734 | |||||||||
| Net unrealized appreciation (depreciation) | 76,730,141 | (1,431,190) | 14,272,899 | |||||||||
| Net Assets | $2,664,277,197 | $65,537,115 | $1,039,614,115 | |||||||||
| NET ASSETS: | ||||||||||||
| Class I | $2,136,959,054 | $63,330,812 | $868,660,662 | |||||||||
| Class N | 527,318,143 | 2,206,303 | 170,953,453 | |||||||||
| SHARES OUTSTANDING: | ||||||||||||
| Class I | 218,555,645 | 6,413,854 | 75,596,068 | |||||||||
| Class N | 54,190,271 | 223,691 | 14,906,004 | |||||||||
| NET ASSET VALUE AND PUBLIC OFFERING PRICE PER SHARE: | ||||||||||||
| Class I | $9.78 | $9.87 | $11.49 | |||||||||
| Class N | $9.73 | $9.86 | $11.47 | |||||||||
Foreign currency at cost of $1,638,472, $– and $2,629,598, respectively.
| ** | Consolidated financial statement, see Note 2 in the Notes to Financial Statements for additional information. |
| The accompanying notes are an integral part of these financial statements. |
| 92 | AQR Funds | Annual Report | December 2012 | |||||||||||||
Table of Contents
| Consolidated Statements of Assets and Liabilities | December 31, 2012 |
| AQR RISK PARITY II MV FUND** | AQR RISK PARITY II HV FUND** | AQR MULTI- STRATEGY ALTERNATIVE FUND** | ||||||||||
| ASSETS: | ||||||||||||
| Investments in securities, at cost | $23,808,865 | $31,476,415 | $894,414,195 | |||||||||
| Investments in securities, at value* | $23,931,398 | $31,654,494 | $956,078,280 | |||||||||
| Cash (including foreign currency of $12,026, $(2,182) and $1,828,720, respectively) | 2,624,423 | 1,301,173 | 1,828,720 | |||||||||
| Due from brokers | 1,489,729 | 1,925,945 | 398,533,539 | |||||||||
| Unrealized appreciation on forward foreign currency exchange contracts | — | — | 8,134,953 | |||||||||
| Swaps, at value | 2,510 | 4,706 | 4,623,240 | |||||||||
| Unrealized appreciation on futures contracts | — | — | 3,944,759 | |||||||||
| Receivables: | ||||||||||||
Securities sold | — | — | 569,887 | |||||||||
Foreign tax reclaim | — | — | 163,300 | |||||||||
Dividends and interest | 66,339 | 89,317 | 899,605 | |||||||||
Capital shares sold | 5,419,184 | 79,482 | 9,581,937 | |||||||||
Due from Investment Advisor | 92,340 | 90,647 | — | |||||||||
Prepaid expenses | 29,191 | 29,301 | 45,835 | |||||||||
| Total Assets | 33,655,114 | 35,175,065 | 1,384,404,055 | |||||||||
| LIABILITIES: | ||||||||||||
| Securities sold short, at value (proceeds $–, $– and $479,705,517, respectively) | — | — | 519,958,833 | |||||||||
| Options written, at value (proceeds $–, $– and $35,916, respectively) | — | — | 28,856 | |||||||||
| Reverse repurchase agreements, at value | — | 10,589,890 | — | |||||||||
| Due to custodian | — | — | 2,768,008 | |||||||||
| Unrealized depreciation on forward foreign currency exchange contracts | 44,398 | 98,231 | — | |||||||||
| Swaps, at value | 9,227 | 60,502 | 1,948,199 | |||||||||
| Unrealized depreciation on futures contracts | 8,279 | 15,426 | — | |||||||||
| Payables: | ||||||||||||
Securities purchased | 1,277,596 | 2,300,456 | 4,194,119 | |||||||||
Collateral received on securities loaned | — | — | 1,238,191 | |||||||||
Accrued Investment advisory fees | — | — | 1,288,356 | |||||||||
Accrued Distribution fees — Class N | 557 | 883 | 7,701 | |||||||||
Capital shares redeemed | — | — | 910,895 | |||||||||
Dividends and interest payable on securities sold short | — | — | 274,469 | |||||||||
Interest payable for reverse repurchase agreements | — | 890 | — | |||||||||
Other accrued expenses and liabilities | 62,492 | 50,313 | 420,401 | |||||||||
| Total Liabilities | 1,402,549 | 13,116,591 | 533,038,028 | |||||||||
| Net Assets | $32,252,565 | $22,058,474 | $851,366,027 | |||||||||
| NET ASSETS CONSIST OF: | ||||||||||||
| Paid-in capital ($0.001 par value common stock, unlimited authorized shares) | $32,057,873 | $21,824,849 | $835,456,459 | |||||||||
| Undistributed (accumulated) net investment income (loss) | 64,137 | 73,283 | (5,193,502) | |||||||||
| Undistributed (accumulated) net realized gain (loss) | 66,086 | 149,726 | (14,168,417) | |||||||||
| Net unrealized appreciation (depreciation) | 64,469 | 10,616 | 35,271,487 | |||||||||
| Net Assets | $32,252,565 | $22,058,474 | $851,366,027 | |||||||||
| NET ASSETS: | ||||||||||||
| Class I | $29,993,223 | $16,253,630 | $808,261,775 | |||||||||
| Class N | 2,259,342 | 5,804,844 | 43,104,252 | |||||||||
| SHARES OUTSTANDING: | ||||||||||||
| Class I | 2,950,196 | 1,591,812 | 81,626,174 | |||||||||
| Class N | 221,957 | 567,306 | 4,359,055 | |||||||||
| NET ASSET VALUE AND PUBLIC OFFERING PRICE PER SHARE: | ||||||||||||
| Class I | $10.17 | $10.21 | $9.90 | |||||||||
| Class N | $10.18 | $10.23 | $9.89 | |||||||||
Foreign currency at cost of $11,942, $(2,234) and $1,818,706, respectively.
| * | Investments in securities includes the market value of securities out on loan of $–, $– and $1,217,790, respectively. |
| ** | Consolidated financial statement, see Note 2 in the Notes to Financial Statements for additional information. |
| The accompanying notes are an integral part of these financial statements. |
| AQR Funds | Annual Report | December 2012 | 93 | |||||||||||||
Table of Contents
| Consolidated Statements of Operations | December 31, 2012 |
| AQR MANAGED FUTURES STRATEGY FUND** | AQR RISK-BALANCED COMMODITIES STRATEGY FUND** | AQR RISK PARITY FUND** | ||||||||||
| FOR THE YEAR ENDED DECEMBER 31, 2012 | FOR THE PERIOD 07/09/12*-12/31/12 | FOR THE YEAR ENDED DECEMBER 31, 2012 | ||||||||||
| INVESTMENT INCOME: | ||||||||||||
| Dividend income† | $75,847 | $2,043 | $63,274 | |||||||||
| Interest income | 140,714 | 80 | 6,437,704 | |||||||||
| Total Income | 216,561 | 2,123 | 6,500,978 | |||||||||
| EXPENSES: | ||||||||||||
| Investment advisory fees | 19,150,312 | 97,255 | 5,288,569 | |||||||||
| Shareholder servicing fees | — | 40,523 | — | |||||||||
| Custody, administration & accounting fees | 892,942 | 16,586 | 329,545 | |||||||||
| Legal fees | 105,601 | 8,462 | 67,520 | |||||||||
| Audit & tax fees | 109,275 | 98,840 | 138,431 | |||||||||
| Shareholder reporting fees | 269,816 | 4,171 | 59,504 | |||||||||
| Transfer agent fees | 1,878,660 | 14,005 | 435,020 | |||||||||
| Trustee fees | 104,264 | 422 | 37,847 | |||||||||
| Organization and offering costs | — | 56,092 | — | |||||||||
| Distribution fees — Class N | 1,129,440 | 1,476 | 276,893 | |||||||||
| Recoupment of waiver | 87,813 | — | 198,237 | |||||||||
| Registration fees | 114,301 | 22,002 | 55,083 | |||||||||
| Other fees | 271,221 | 13,134 | 125,553 | |||||||||
| Total Expenses | 24,113,645 | 372,968 | 7,012,202 | |||||||||
| Less waivers: | ||||||||||||
Investment advisory fees waived | (77,598) | (97,255) | (34,933) | |||||||||
Shareholder servicing fees waived | — | (40,523) | — | |||||||||
Expense reimbursements | — | (63,132) | — | |||||||||
| Net Expenses | 24,036,047 | 172,058 | 6,977,269 | |||||||||
| Net Investment Income (Loss) | (23,819,486) | (169,935) | (476,291) | |||||||||
| REALIZED AND UNREALIZED GAIN (LOSS): | ||||||||||||
| Net realized gain (loss) from: | ||||||||||||
Investments in securities | (795) | 87 | (593,456) | |||||||||
Foreign currency and foreign currency translations | 180,819 | — | (267,659) | |||||||||
Forward foreign currency exchange contracts | 39,914,761 | — | 589,108 | |||||||||
Futures contracts | 12,352,467 | 13,670 | 19,995,601 | |||||||||
Securities sold short | 511 | — | — | |||||||||
Swap and swaps on futures contracts | (9,398,634) | (763,125) | 62,150,269 | |||||||||
| Net realized gain (loss) | 43,049,129 | (749,368) | 81,873,863 | |||||||||
| Net change in unrealized appreciation (depreciation) on: | ||||||||||||
Investments in securities | (10,605) | (111) | 22,331,583 | |||||||||
Foreign currency and foreign currency translations | 172,920 | — | 152,792 | |||||||||
Forward foreign currency exchange contracts | 53,311,170 | — | (4,546,302) | |||||||||
Futures contracts | (6,820,417) | 261,535 | (1,392,980) | |||||||||
Swap and swaps on futures contracts | 2,678,315 | (1,692,614) | (9,134,220) | |||||||||
| Net change in unrealized appreciation (depreciation) | 49,331,383 | (1,431,190) | 7,410,873 | |||||||||
| Net gain (loss) and change in unrealized appreciation (depreciation) | 92,380,512 | (2,180,558) | 89,284,736 | |||||||||
| Net increase (decrease) in net assets resulting from operations | $68,561,026 | $(2,350,493) | $88,808,445 | |||||||||
| ||||||||||||
† Net of foreign taxes withheld of | $— | $— | $141 | |||||||||
| * | Commencement of operations. |
| ** | Consolidated financial statement, see Note 2 in the Notes to Financial Statements for additional information. |
| The accompanying notes are an integral part of these financial statements. |
| 94 | AQR Funds | Annual Report | December 2012 | |||||||||||||
Table of Contents
| Consolidated Statements of Operations | December 31, 2012 |
| AQR RISK PARITY II MV FUND** | AQR RISK PARITY II HV FUND** | AQR MULTI- STRATEGY ALTERNATIVE FUND** | ||||||||||
| FOR THE PERIOD 11/05/12*-12/31/12 | FOR THE PERIOD 11/05/12*-12/31/12 | FOR THE YEAR ENDED DECEMBER 31, 2012 | ||||||||||
| INVESTMENT INCOME: | ||||||||||||
| Dividend income† | $17 | $— | $5,011,116 | |||||||||
| Interest income | 24,000 | 32,274 | 4,877,026 | |||||||||
| Securities lending income, net | — | — | 1,052 | |||||||||
| Total Income | 24,017 | 32,274 | 9,889,194 | |||||||||
| EXPENSES: | ||||||||||||
| Investment advisory fees | 10,888 | 14,027 | 10,344,540 | |||||||||
| Shareholder servicing fees | 5,444 | 5,010 | — | |||||||||
| Custody, administration & accounting fees | 2,506 | 2,460 | 347,717 | |||||||||
| Legal fees | 1,134 | 1,134 | 43,095 | |||||||||
| Audit & tax fees | 103,271 | 103,271 | 142,811 | |||||||||
| Shareholder reporting fees | 1,284 | 1,284 | 55,583 | |||||||||
| Transfer agent fees | 2,540 | 2,286 | 434,983 | |||||||||
| Trustee fees | 167 | 167 | 29,293 | |||||||||
| Organization and offering costs | 3,060 | 3,060 | — | |||||||||
| Distribution fees — Class N | 749 | 1,095 | 79,960 | |||||||||
| Dividends and interest on securities sold short and reverse repurchase agreement | — | 2,524 | 8,529,206 | |||||||||
| Other fees | 6,291 | 6,290 | 233,077 | |||||||||
| Total Expenses | 137,334 | 142,608 | 20,240,265 | |||||||||
| Less waivers: | ||||||||||||
Investment advisory fees waived | (10,888) | (14,027) | (505,508) | |||||||||
Shareholder servicing fees waived | (5,444) | (5,010) | — | |||||||||
Expense reimbursements | (99,563) | (96,888) | — | |||||||||
| Net Expenses | 21,439 | 26,683 | 19,734,757 | |||||||||
| Net Investment Income (Loss) | 2,578 | 5,591 | (9,845,563) | |||||||||
| REALIZED AND UNREALIZED GAIN (LOSS): | ||||||||||||
| Net realized gain (loss) from: | ||||||||||||
Investments in securities | (9,840) | 2,308 | (4,327,497) | |||||||||
Foreign currency and foreign currency translations | 4,179 | (2,168) | (357,756) | |||||||||
Forward foreign currency exchange contracts | (47,570) | (63,479) | 9,133,934 | |||||||||
Futures contracts | 206,799 | 333,858 | (11,794,288) | |||||||||
Securities sold short | — | — | (10,756,429) | |||||||||
Swap and swaps on futures contracts | 6,459 | 20,200 | 6,144,568 | |||||||||
Written options | — | — | 290,594 | |||||||||
| Net realized gain (loss) | 160,027 | 290,719 | (11,666,874) | |||||||||
| Net change in unrealized appreciation (depreciation) on: | ||||||||||||
Investments in securities | 122,533 | 178,079 | 62,430,362 | |||||||||
Foreign currency and foreign currency translations | 1,330 | 1,990 | 483,319 | |||||||||
Forward foreign currency exchange contracts | (44,398) | (98,231) | 8,757,491 | |||||||||
Futures contracts | (8,279) | (15,426) | 3,034,795 | |||||||||
Securities sold short | — | — | (40,840,903) | |||||||||
Swap and swaps on futures contracts | (6,717) | (55,796) | 608,569 | |||||||||
Written options | — | — | 7,060 | |||||||||
| Net change in unrealized appreciation (depreciation) | 64,469 | 10,616 | 34,480,693 | |||||||||
| Net gain (loss) and change in unrealized appreciation (depreciation) | 224,496 | 301,335 | 22,813,819 | |||||||||
| Net increase (decrease) in net assets resulting from operations | $227,074 | $306,926 | $12,968,256 | |||||||||
| ||||||||||||
† Net of foreign taxes withheld of | $— | $— | $629,837 | |||||||||
| * | Commencement of operations. |
| ** | Consolidated financial statement, see Note 2 in the Notes to Financial Statements for additional information. |
| The accompanying notes are an integral part of these financial statements. |
| AQR Funds | Annual Report | December 2012 | 95 | |||||||||||||
Table of Contents
| Consolidated Statements of Changes in Net Assets | December 31, 2012 |
| AQR MANAGED FUTURES STRATEGY FUND ** | AQR RISK- BALANCED COMMODITIES STRATEGY FUND ** | |||||||||||
| FOR THE YEAR ENDED DECEMBER 31, 2012 | FOR THE YEAR ENDED DECEMBER 31, 2011 | FOR THE PERIOD 7/09/12*-12/31/12 | ||||||||||
| OPERATIONS: | ||||||||||||
| Net investment income (loss) | $(23,819,486) | $(17,478,823) | $(169,935) | |||||||||
| Net realized gain (loss) | 43,049,129 | (76,560,349) | (749,368) | |||||||||
| Net change in unrealized appreciation (depreciation) | 49,331,383 | 7,087,652 | (1,431,190) | |||||||||
Net increase (decrease) in net assets resulting from operations | 68,561,026 | (86,951,520) | (2,350,493) | |||||||||
| DISTRIBUTIONS TO SHAREHOLDERS: | ||||||||||||
| Net investment income: | ||||||||||||
Class I | (13,405,142) | (4,266,973) | — | |||||||||
Class N | (3,993,493) | (878,801) | — | |||||||||
Total | (17,398,635) | (5,145,774) | — | |||||||||
| Net realized gain: | ||||||||||||
Class I | — | (4,032,084) | — | |||||||||
Class N | — | (1,840,539) | — | |||||||||
Total | — | (5,872,623) | — | |||||||||
Total distributions | (17,398,635) | (11,018,397) | — | |||||||||
| CAPITAL TRANSACTIONS: | ||||||||||||
| CLASS I | ||||||||||||
| Proceeds from shares sold | 1,395,656,377 | 729,947,536 | 77,004,032 | |||||||||
| Reinvestment of distributions | 10,360,005 | 7,389,845 | — | |||||||||
| Cost of shares redeemed | (387,573,411) | (246,691,399) | (11,390,971) | |||||||||
| Redemption fees | — | 20,254 | — | |||||||||
| Net increase (decrease) from capital transactions | 1,018,442,971 | 490,666,236 | 65,613,061 | |||||||||
| CLASS N | ||||||||||||
| Proceeds from shares sold | 330,844,230 | 423,947,640 | 3,507,402 | |||||||||
| Reinvestment of distributions | 3,925,643 | 2,697,407 | — | |||||||||
| Cost of shares redeemed | (295,614,412) | (192,116,250) | (1,232,855) | |||||||||
| Redemption fees | — | 10,871 | — | |||||||||
| Net increase (decrease) from capital transactions | 39,155,461 | 234,539,668 | 2,274,547 | |||||||||
| Net increase (decrease) in net assets resulting from capital transactions | 1,057,598,432 | 725,205,904 | 67,887,608 | |||||||||
| Total increase (decrease) in net assets | 1,108,760,823 | 627,235,987 | 65,537,115 | |||||||||
| NET ASSETS: | ||||||||||||
| Beginning of period | 1,555,516,374 | 928,280,387 | — | |||||||||
| End of period | $2,664,277,197 | $1,555,516,374 | $65,537,115 | |||||||||
| Undistributed accumulated net investment income (loss) at end of year | $(1,795,380) | $17,343,520 | $— | |||||||||
| The accompanying notes are an integral part of these financial statements. | (continued on p. 95) |
| 96 | AQR Funds | Annual Report | December 2012 | |||||||||||||
Table of Contents
| Consolidated Statements of Changes in Net Assets | December 31, 2012 |
| AQR MANAGED FUTURES STRATEGY FUND ** | AQR RISK- BALANCED COMMODITIES STRATEGY FUND ** | |||||||||||
| FOR THE YEAR ENDED DECEMBER 31, 2012 | FOR THE YEAR ENDED DECEMBER 31, 2011 | FOR THE PERIOD 7/09/12*-12/31/12 | ||||||||||
| CHANGES IN SHARES OUTSTANDING: | ||||||||||||
| CLASS I | ||||||||||||
| Shares outstanding, beginning of period | 112,731,031 | 63,824,670 | — | |||||||||
| Shares sold | 145,328,092 | 73,078,580 | 7,499,229 | |||||||||
| Shares issued on reinvestment of distributions | 1,075,795 | 763,414 | — | |||||||||
| Shares redeemed | (40,579,273) | (24,935,633) | (1,085,375) | |||||||||
| Shares outstanding, end of period | 218,555,645 | 112,731,031 | 6,413,854 | |||||||||
| CLASS N | ||||||||||||
| Shares outstanding, beginning of period | 49,946,509 | 26,365,662 | — | |||||||||
| Shares sold | 34,790,824 | 42,737,324 | 340,691 | |||||||||
| Shares issued on reinvestment of distributions | 409,770 | 279,235 | — | |||||||||
| Shares redeemed | (30,956,832) | (19,435,712) | (117,000) | |||||||||
| Shares outstanding, end of period | 54,190,271 | 49,946,509 | 223,691 | |||||||||
| * | Commencement of operations. |
| ** | Consolidated financial statement, see Note 2 in the Notes to Financial Statements for additional information. |
| The accompanying notes are an integral part of these financial statements. |
| AQR Funds | Annual Report | December 2012 | 97 | |||||||||||||
Table of Contents
| Consolidated Statements of Changes in Net Assets | December 31, 2012 |
| AQR RISK PARITY FUND** | AQR RISK PARITY II MV FUND** | AQR RISK PARITY II HV FUND** | ||||||||||||||
| FOR THE YEAR ENDED DECEMBER 31, 2012 | FOR THE YEAR ENDED DECEMBER 31, 2011 | FOR THE PERIOD 11/05/12*-12/31/12 | FOR THE PERIOD 11/05/12*-12/31/12 | |||||||||||||
| OPERATIONS: | ||||||||||||||||
| Net investment income (loss) | $(476,291) | $654,398 | $2,578 | $5,591 | ||||||||||||
| Net realized gain (loss) | 81,873,863 | (838,017) | 160,027 | 290,719 | ||||||||||||
| Net change in unrealized appreciation (depreciation) | 7,410,873 | 6,649,361 | 64,469 | 10,616 | ||||||||||||
Net increase (decrease) in net assets | 88,808,445 | 6,465,742 | 227,074 | 306,926 | ||||||||||||
| DISTRIBUTIONS TO SHAREHOLDERS: | ||||||||||||||||
| Net investment income: | ||||||||||||||||
Class I | (9,796,702) | (5,049,564) | (16,427) | (36,666) | ||||||||||||
Class N | (1,584,812) | (1,569,186) | — | (4,075) | ||||||||||||
Total | (11,381,514) | (6,618,750) | (16,427) | (40,741) | ||||||||||||
| Net realized gain: | ||||||||||||||||
Class I | (32,256,921) | (66,070) | — | — | ||||||||||||
Class N | (6,624,667) | (21,926) | — | — | ||||||||||||
Total | (38,881,588) | (87,996) | — | — | ||||||||||||
Total distributions | (50,263,102) | (6,706,746) | (16,427) | (40,741) | ||||||||||||
| CAPITAL TRANSACTIONS: | ||||||||||||||||
| CLASS I | ||||||||||||||||
| Proceeds from shares sold | 669,000,824 | 353,204,416 | 38,864,832 | 15,978,772 | ||||||||||||
| Contributions from service provider or Advisor | — | 305,701 | — | — | ||||||||||||
| Reinvestment of distributions | 35,264,133 | 4,940,908 | 16,427 | 36,666 | ||||||||||||
| Cost of shares redeemed | (206,439,327) | (34,286,993) | (9,067,579) | (1,270) | ||||||||||||
| Redemption fees | — | 2,899 | — | — | ||||||||||||
| Net increase (decrease) from capital transactions | 497,825,630 | 324,166,931 | 29,813,680 | 16,014,168 | ||||||||||||
| CLASS N | ||||||||||||||||
| Proceeds from shares sold | 132,332,404 | 96,623,560 | 3,242,604 | 6,140,990 | ||||||||||||
| Contributions from service provider or Advisor | — | 48,325 | — | — | ||||||||||||
| Reinvestment of distributions | 8,172,729 | 729,224 | — | 4,075 | ||||||||||||
| Cost of shares redeemed | (26,348,713) | (56,223,377) | (1,014,366) | (366,944) | ||||||||||||
| Redemption fees | — | 518 | — | — | ||||||||||||
| Net increase (decrease) from capital transactions | 114,156,420 | 41,178,250 | 2,228,238 | 5,778,121 | ||||||||||||
| Net increase (decrease) in net assets resulting from capital transactions | 611,982,050 | 365,345,181 | 32,041,918 | 21,792,289 | ||||||||||||
| Total increase (decrease) in net assets | 650,527,393 | 365,104,177 | 32,252,565 | 22,058,474 | ||||||||||||
| NET ASSETS: | ||||||||||||||||
| Beginning of period | 389,086,722 | 23,982,545 | — | — | ||||||||||||
| End of period | $1,039,614,115 | $389,086,722 | $32,252,565 | $22,058,474 | ||||||||||||
| Undistributed accumulated net investment income (loss) at end of year | $12,558,291 | $(3,415,164) | $64,137 | $73,283 | ||||||||||||
| The accompanying notes are an integral part of these financial statements. | (continued on p. 97) |
| 98 | AQR Funds | Annual Report | December 2012 | |||||||||||||
Table of Contents
| Consolidated Statements of Changes in Net Assets | December 31, 2012 |
| AQR RISK PARITY FUND** | AQR RISK PARITY II MV FUND** | AQR RISK PARITY II HV FUND** | ||||||||||||||
| FOR THE YEAR ENDED DECEMBER 31, 2012 | FOR THE YEAR ENDED DECEMBER 31, 2011 | FOR THE PERIOD 11/05/12*-12/31/12 | FOR THE PERIOD 11/05/12*-12/31/12 | |||||||||||||
| CHANGES IN SHARES OUTSTANDING: | ||||||||||||||||
| CLASS I | ||||||||||||||||
| Shares outstanding, beginning of period | 31,791,062 | 1,240,567 | — | — | ||||||||||||
| Shares sold | 58,917,029 | 33,312,865 | 3,844,193 | 1,588,338 | ||||||||||||
| Shares issued on reinvestment of distributions | 3,071,788 | 473,267 | 1,620 | 3,599 | ||||||||||||
| Shares redeemed | (18,183,811) | (3,235,637) | (895,617) | (125) | ||||||||||||
| Shares outstanding, end of period | 75,596,068 | 31,791,062 | 2,950,196 | 1,591,812 | ||||||||||||
| CLASS N | ||||||||||||||||
| Shares outstanding, beginning of period | 4,868,266 | 1,094,489 | — | — | ||||||||||||
| Shares sold | 11,658,773 | 9,042,347 | 321,962 | 602,901 | ||||||||||||
| Shares issued on reinvestment of distributions | 713,153 | 70,051 | — | 399 | ||||||||||||
| Shares redeemed | (2,334,188) | (5,338,621) | (100,005) | (35,994) | ||||||||||||
| Shares outstanding, end of period | 14,906,004 | 4,868,266 | 221,957 | 567,306 | ||||||||||||
| * | Commencement of operations. |
| ** | Consolidated financial statement, see Note 2 in the Notes to Financial Statements for additional information. |
| The accompanying notes are an integral part of these financial statements. |
| AQR Funds | Annual Report | December 2012 | 99 | |||||||||||||
Table of Contents
| Consolidated Statements of Changes in Net Assets | December 31, 2012 |
| AQR MULTI-STRATEGY ALTERNATIVE FUND** | ||||||||
| FOR THE YEAR ENDED DECEMBER 31, 2012 | FOR THE PERIOD 7/18/11*-12/31/11 | |||||||
| OPERATIONS: | ||||||||
| Net investment income (loss) | $(9,845,563) | $(795,745) | ||||||
| Net realized gain (loss) | (11,666,874) | (2,880,941) | ||||||
| Net change in unrealized appreciation (depreciation) | 34,480,693 | 790,794 | ||||||
Net increase (decrease) in net assets resulting from operations | 12,968,256 | (2,885,892) | ||||||
| DISTRIBUTIONS TO SHAREHOLDERS: | ||||||||
| Net investment income: | ||||||||
Class I | (1,085,248) | (937,657) | ||||||
Class N | — | (105,452) | ||||||
Total | (1,085,248) | (1,043,109) | ||||||
| Net realized gain: | ||||||||
Class I | (1,191,421) | — | ||||||
Class N | (54,608) | — | ||||||
Total | (1,246,029) | — | ||||||
Total distributions | (2,331,277) | (1,043,109) | ||||||
| CAPITAL TRANSACTIONS: | ||||||||
| CLASS I | ||||||||
| Proceeds from shares sold | 682,299,842 | 294,713,422 | ||||||
| Reinvestment of distributions | 1,825,572 | 908,123 | ||||||
| Cost of shares redeemed | (142,988,282) | (35,134,145) | ||||||
| Net increase (decrease) from capital transactions | 541,137,132 | 260,487,400 | ||||||
| CLASS N | ||||||||
| Proceeds from shares sold | 39,666,094 | 56,013,187 | ||||||
| Reinvestment of distributions | 54,570 | 105,452 | ||||||
| Cost of shares redeemed | (41,973,512) | (10,832,274) | ||||||
| Net increase (decrease) from capital transactions | (2,252,848) | 45,286,365 | ||||||
| Net increase (decrease) in net assets resulting from capital transactions | 538,884,284 | 305,773,765 | ||||||
| Total increase (decrease) in net assets | 549,521,263 | 301,844,764 | ||||||
| NET ASSETS: | ||||||||
| Beginning of period | 301,844,764 | — | ||||||
| End of period | $851,366,027 | $301,844,764 | ||||||
| Undistributed accumulated net investment income (loss) at end of year | $(5,193,502) | $(1,092,123) | ||||||
| The accompanying notes are an integral part of these financial statements. | (continued on p. 99) |
| 100 | AQR Funds | Annual Report | December 2012 | |||||||||||||
Table of Contents
| Consolidated Statements of Changes in Net Assets | December 31, 2012 |
| AQR MULTI-STRATEGY ALTERNATIVE FUND** | ||||||||
| FOR THE YEAR ENDED DECEMBER 31, 2012 | FOR THE PERIOD 7/18/11*-12/31/11 | |||||||
| CHANGES IN SHARES OUTSTANDING: | ||||||||
| CLASS I | ||||||||
| Shares outstanding, beginning of period | 26,521,933 | — | ||||||
| Shares sold | 69,512,527 | 30,030,309 | ||||||
| Shares issued on reinvestment of distributions | 184,399 | 93,141 | ||||||
| Shares redeemed | (14,592,685) | (3,601,517) | ||||||
| Shares outstanding, end of period | 81,626,174 | 26,521,933 | ||||||
| CLASS N | ||||||||
| Shares outstanding, beginning of period | 4,608,787 | — | ||||||
| Shares sold | 4,042,219 | 5,701,028 | ||||||
| Shares issued on reinvestment of distributions | 5,529 | 10,815 | ||||||
| Shares redeemed | (4,297,480) | (1,103,056) | ||||||
| Shares outstanding, end of period | 4,359,055 | 4,608,787 | ||||||
| * | Commencement of operations. |
| ** | Consolidated financial statement, see Note 2 in the Notes to Financial Statements for additional information. |
| The accompanying notes are an integral part of these financial statements. |
| AQR Funds | Annual Report | December 2012 | 101 | |||||||||||||
Table of Contents
| Statement of Cash flows | December 31, 2012 |
| AQR RISK PARITY II HV FUND | ||||
| CASH FLOWS FROM OPERATING ACTIVITIES: | ||||
| Net increase in net assets resulting from operations | $306,926 | |||
| Adjustments to reconcile net increase in net assets resulting from operations to net cash provided (used) in operating activities: | ||||
Payments to purchase securities | (31,496,543) | |||
Proceeds from sale of securities | 609 | |||
Realized gain on investments in securities | (2,308) | |||
Change in unrealized appreciation on investments in securities | (178,079) | |||
Amortization of bond premium | 21,827 | |||
| Increases in operating assets: | ||||
Due from brokers | (1,925,945) | |||
Swaps, at value | (4,706) | |||
Dividends and interest | (89,317) | |||
Expense reimbursement due from Advisor | (90,647) | |||
Prepaid expenses | (29,301) | |||
| Increases in operating liabilities | ||||
Unrealized depreciation on forward foreign currency exchange contracts | 98,231 | |||
Swaps, at value | 60,502 | |||
Unrealized depreciation on futures contracts | 15,426 | |||
Payable for securities purchased | 2,300,456 | |||
Accrued Distribution fees — Class N | 883 | |||
Interest Payable | 890 | |||
Other accrued expenses | 50,313 | |||
Net cash used in operating activities | $(30,960,783) | |||
| CASH FLOWS FROM FINANCING ACTIVITIES | ||||
Proceeds from shares sold | 22,040,280 | |||
Net change in reverse repurchase agreement | 10,589,890 | |||
Payments on shares redeemed | (368,214) | |||
Net cash provided by financing activities | $32,261,956 | |||
| Net change in cash | 1,301,173 | |||
Cash, beginning of period | — | |||
Cash, end of period | $1,301,173 | |||
Supplemental disclosure of cash flow information:
Cash paid during the period for interest in the amount of $1,634.
| The accompanying notes are an integral part of these financial statements. |
| 102 | AQR Funds | Annual Report | December 2012 | |||||||||||||
Table of Contents
| Statement of Cash flows | December 31, 2012 |
| AQR MULTI-STRATEGY ALTERNATIVE FUND | ||||
| CASH FLOWS FROM OPERATING ACTIVITIES: | ||||
| Net increase in net assets resulting from operations | $12,968,256 | |||
| Adjustments to reconcile net increase in net assets resulting from operations to net cash provided (used) in operating activities: | ||||
Payments to purchase securities | (998,184,370) | |||
Payments to cover short securities | (239,318,059) | |||
Proceeds from securities sold short | 644,340,420 | |||
Proceeds from sale of securities | 213,762,654 | |||
Realized loss on investments in securities | 4,327,497 | |||
Realized loss on securities sold short and written options | 10,465,835 | |||
Change in unrealized appreciation on investments in securities | (62,430,362) | |||
Change in unrealized depreciation on securities sold short and written options | 40,833,843 | |||
Accretion of bond discount | (104,027) | |||
| (Increase)/Decreases in operating assets: | ||||
Due from brokers | (300,985,834) | |||
Unrealized appreciation on forward foreign currency exchange contracts | (8,134,953) | |||
Swaps, at value | (3,792,418) | |||
Unrealized appreciation on futures contracts | (3,034,795) | |||
Receivable for securities sold | 392,868 | |||
Foreign tax reclaim | (163,300) | |||
Dividends and interest | (202,015) | |||
Prepaid expenses | (7,685) | |||
| (Decrease)/Increases in operating liabilities | ||||
Due to broker/custodian | 2,344,637 | |||
Unrealized depreciation on forward foreign currency exchange contracts | (622,538) | |||
Swaps, at value | 1,562,788 | |||
Payable for securities purchased | 3,168,497 | |||
Collateral received on securities loaned | 1,238,191 | |||
Accrued Investment advisory fees | 1,071,592 | |||
Accrued Distribution fees — Class N | 1,221 | |||
Dividends on securities sold short | 231,292 | |||
Other accrued expenses | 212,100 | |||
Net cash used in operating activities | $(680,058,665) | |||
| CASH FLOWS FROM FINANCING ACTIVITIES | ||||
Proceeds from shares sold | 713,290,258 | |||
Payments on shares redeemed | (188,114,553) | |||
Cash distributions paid | (451,135) | |||
Net cash provided by financing activities | $524,724,570 | |||
| Net change in cash | (155,334,095) | |||
Cash, beginning of year | 157,162,815 | |||
Cash, end of year | $1,828,720 | |||
Supplemental disclosure of cash flow information:
Cash paid during the year for interest in the amount of $1,940,366.
| The accompanying notes are an integral part of these financial statements. |
| AQR Funds | Annual Report | December 2012 | 103 | |||||||||||||
Table of Contents
| Financial Highlights | December 31, 2012 |
| PER SHARE OPERATING PERFORMANCE | ||||||||||||||||||||||||||||
| Change in Net Assets Resulting from Operations | Less Dividends and Distributions | |||||||||||||||||||||||||||
| Net Asset Value, Beginning of Period | Net Investment Income (Loss) | Net Realized and Unrealized Gain (Loss) | Net Increase (Decrease) in Net Asset Value from Operations | Distributions from Net Investment Income | Distributions from Net Realized Gains | Total Distributions | ||||||||||||||||||||||
| AQR MANAGED FUTURES STRATEGY FUND CLASS I | ||||||||||||||||||||||||||||
| FOR THE YEAR ENDED DECEMBER 31, 20125 | $9.57 | (0.12) | 0.40 | 0.28 | (0.07) | — | (0.07) | |||||||||||||||||||||
| FOR THE YEAR ENDED DECEMBER 31, 2011†,5 | $10.30 | (0.12) | (0.53) | (0.65) | (0.04) | (0.04) | (0.08) | |||||||||||||||||||||
| FOR THE PERIOD ENDED 1/06/106—12/31/10 †,5 | $10.00 | (0.12) | 0.66 | 0.54 | (0.09) | (0.15) | (0.24) | |||||||||||||||||||||
| AQR MANAGED FUTURES STRATEGY FUND CLASS N | ||||||||||||||||||||||||||||
| FOR THE YEAR ENDED DECEMBER 31, 20125 | $9.55 | (0.14) | 0.39 | 0.25 | (0.07) | — | (0.07) | |||||||||||||||||||||
| FOR THE YEAR ENDED DECEMBER 31, 2011†,5 | $10.28 | (0.15) | (0.52) | (0.67) | (0.02) | (0.04) | (0.06) | |||||||||||||||||||||
| FOR THE PERIOD ENDED 1/06/106—12/31/10 †,5 | $10.00 | (0.15) | 0.66 | 0.51 | (0.08) | (0.15) | (0.23) | |||||||||||||||||||||
| AQR RISK-BALANCED COMMODITIES STRATEGY FUND CLASS I | ||||||||||||||||||||||||||||
| FOR THE PERIOD ENDED 7/09/126—12/31/12 5 | $10.00 | (0.05) | (0.08) | (0.13) | — | — | — | |||||||||||||||||||||
| AQR RISK-BALANCED COMMODITIES STRATEGY FUND CLASS N | ||||||||||||||||||||||||||||
| FOR THE PERIOD ENDED 7/09/126—12/31/12 5 | $10.00 | (0.06) | (0.08) | (0.14) | — | — | — | |||||||||||||||||||||
| AQR RISK PARITY FUND CLASS I | ||||||||||||||||||||||||||||
| FOR THE YEAR ENDED DECEMBER 31, 20125 | $10.62 | — | 1.49 | 1.49 | (0.14) | (0.48) | (0.62) | |||||||||||||||||||||
| FOR THE YEAR ENDED DECEMBER 31, 2011†,5 | $10.28 | 0.04 | 0.51 | 0.55 | (0.21) | (0.00) | 7 | (0.21) | ||||||||||||||||||||
| FOR THE PERIOD ENDED 9/30/106—12/31/10 | $10.00 | 0.02 | 0.38 | 0.40 | (0.12) | — | (0.12) | |||||||||||||||||||||
| AQR RISK PARITY FUND CLASS N | ||||||||||||||||||||||||||||
| FOR THE YEAR ENDED DECEMBER 31, 20125 | $10.59 | (0.03) | 1.50 | 1.47 | (0.11) | (0.48) | (0.59) | |||||||||||||||||||||
| FOR THE YEAR ENDED DECEMBER 31, 2011†,5 | $10.27 | 0.03 | 0.49 | 0.52 | (0.20) | (0.00) | 7 | (0.20) | ||||||||||||||||||||
| FOR THE PERIOD ENDED 9/30/106—12/31/10 † | $10.00 | 0.01 | 0.38 | 0.39 | (0.12) | — | (0.12) | |||||||||||||||||||||
| AQR RISK PARITY II MV FUND CLASS I | ||||||||||||||||||||||||||||
| FOR THE PERIOD ENDED 11/05/126—12/31/12 5 | $10.00 | — | 0.19 | 0.19 | (0.02) | — | (0.02) | |||||||||||||||||||||
| AQR RISK PARITY II MV FUND CLASS N | ||||||||||||||||||||||||||||
| FOR THE PERIOD ENDED 11/05/126—12/31/12 5 | $10.00 | — | 0.18 | 0.18 | — | — | — | |||||||||||||||||||||
| AQR RISK PARITY II HV FUND CLASS I | ||||||||||||||||||||||||||||
| FOR THE PERIOD ENDED 11/05/126—12/31/12 5 | $10.00 | 0.01 | 0.23 | 0.24 | (0.03) | — | (0.03) | |||||||||||||||||||||
| AQR RISK PARITY II HV FUND CLASS N | ||||||||||||||||||||||||||||
| FOR THE PERIOD ENDED 11/05/126—12/31/12 5 | $10.00 | (0.01) | 0.25 | 0.24 | (0.01) | — | (0.01) | |||||||||||||||||||||
| AQR MULTI-STRATEGY ALTERNATIVE FUND CLASS I | ||||||||||||||||||||||||||||
| FOR THE YEAR ENDED DECEMBER 31, 20125 | $9.70 | (0.17) | 0.40 | 0.23 | (0.01) | (0.02) | (0.03) | |||||||||||||||||||||
| FOR THE PERIOD ENDED 7/18/116—12/31/11 5 | $10.00 | (0.05) | (0.21) | (0.26) | (0.04) | — | (0.04) | |||||||||||||||||||||
| AQR MULTI-STRATEGY ALTERNATIVE FUND CLASS N | ||||||||||||||||||||||||||||
| FOR THE YEAR ENDED DECEMBER 31, 20125 | $9.69 | (0.23) | 0.45 | 0.22 | — | (0.02) | (0.02) | |||||||||||||||||||||
| FOR THE PERIOD ENDED 7/18/116—12/31/11 5 | $10.00 | (0.06) | (0.21) | (0.27) | (0.04) | — | (0.04) | |||||||||||||||||||||
| * | Annualized for periods less than one year. |
| † | Redemption fees of less than $0.005 per share were incurred by the share class. |
| 1 | Total investment return is calculated assuming an initial investment made at the net asset value at the beginning of the period, reinvestment of all dividends and distributions at net asset value during the period and redemption on the last day of the period and is not annualized. |
| 2 | Includes adjustments in accordance with accounting principles generally accepted in the United States of America and as such, the net asset value for financial reporting purposes and the returns based upon those net asset values may differ from the net asset value and returns for shareholder transactions. |
| 3 | Ratios do not include the impact of the expenses of the underlying funds in which the Fund invests. |
| 4 | Portfolio turnover is not annualized. |
| 5 | Per share net investment income (loss) and net realized and unrealized gain (loss) are based on average shares outstanding. |
| 6 | Commencement of operations. |
| 7 | Amount is less than $.005 per share. |
| 8 | For the year ended December 31, 2011, a service provider contributed $354,026 into the Fund to compensate the Fund for a loss incurred due to a valuation error. The impact of this contribution increased the Fund’s total return by 0.21%. |
| 9 | For the year ended December 31, 2011, the Advisor contributed $208,438 into the Fund to compensate the Fund for a loss incurred due to a trade processing error. The impact of the Advisor’s contribution increased the Fund’s total return by 0.14%. |
| The accompanying notes are an integral part of these financial statements. |
| 104 | AQR Funds | Annual Report | December 2012 | |||||||||||||
Table of Contents
| Financial Highlights | December 31, 2012 |
| RATIOS/SUPPLEMENTAL DATA | ||||||||||||||||||||||||||||||||
| Ratios to Average Net Assets of:* | ||||||||||||||||||||||||||||||||
| Net Asset Value, End of Period | Total Return1,2 | Net Assets, End of Period | Expenses, Net of Reimbursements and/or Waivers3 | Expenses, Net of Reimbursements and/or Waivers (Excluding Dividend Short Expense & Interest Expense)3 | Expenses, Before Reimbursements and/or Waivers3 | Net Investment Income (Loss) | Portfolio Turnover Rate4 | |||||||||||||||||||||||||
| $ | 9.78 | 2.99 | % | $ | 2,136,959,054 | 1.25 | % | 1.25 | % | 1.25 | % | (1.24 | )% | 0 | % | |||||||||||||||||
| $ | 9.57 | (6.37 | )% | $ | 1,078,662,373 | 1.25 | % | 1.25 | % | 1.30 | % | (1.22 | )% | 0 | % | |||||||||||||||||
| $ | 10.30 | 5.41 | % | $ | 657,237,349 | 1.25 | % | 1.25 | % | 1.28 | % | (1.27 | )% | 0 | % | |||||||||||||||||
| $ | 9.73 | 2.68 | % | $ | 527,318,143 | 1.50 | % | 1.50 | % | 1.52 | % | (1.48 | )% | 0 | % | |||||||||||||||||
| $ | 9.55 | (6.59 | )% | $ | 476,854,001 | 1.50 | % | 1.50 | % | 1.57 | % | (1.47 | )% | 0 | % | |||||||||||||||||
| $ | 10.28 | 5.12 | % | $ | 271,043,038 | 1.50 | % | 1.50 | % | 1.56 | % | (1.54 | )% | 0 | % | |||||||||||||||||
| $ | 9.87 | (1.30 | )% | $ | 63,330,812 | 1.05 | % | 1.05 | % | 1.72 | % | (1.04 | )% | 0 | % | |||||||||||||||||
| $ | 9.86 | (1.40 | )% | $ | 2,206,303 | 1.30 | % | 1.30 | % | 4.00 | % | (1.30 | )% | 0 | % | |||||||||||||||||
| $ | 11.49 | 14.05 | % | $ | 868,660,662 | 0.95 | % | 0.95 | % | 0.95 | % | (0.03 | )% | 72 | % | |||||||||||||||||
| $ | 10.62 | 5.45 | %8 | $ | 337,526,380 | 0.95 | % | 0.95 | % | 1.06 | % | 0.41 | % | 66 | % | |||||||||||||||||
| $ | 10.28 | 3.98 | % | $ | 12,747,565 | 0.95 | % | 0.95 | % | 3.80 | % | 0.44 | % | 19 | % | |||||||||||||||||
| $ | 11.47 | 13.89 | % | $ | 170,953,453 | 1.20 | % | 1.20 | % | 1.23 | % | (0.26 | )% | 72 | % | |||||||||||||||||
| $ | 10.59 | 5.12 | %8 | $ | 51,560,342 | 1.20 | % | 1.20 | % | 1.42 | % | 0.30 | % | 66 | % | |||||||||||||||||
| $ | 10.27 | 3.88 | % | $ | 11,234,980 | 1.20 | % | 1.20 | % | 3.96 | % | 0.22 | % | 19 | % | |||||||||||||||||
| $ | 10.17 | 1.87 | % | $ | 29,993,223 | 0.95 | % | 0.95 | % | 2.07 | % | 0.18 | % | 0 | % | |||||||||||||||||
| $ | 10.18 | 1.80 | % | $ | 2,259,342 | 1.20 | % | 1.20 | % | 2.81 | % | (0.29 | )% | 0 | % | |||||||||||||||||
| $ | 10.21 | 2.44 | % | $ | 16,253,630 | 1.28 | % | 1.15 | % | 2.26 | % | 0.53 | % | 0 | % | |||||||||||||||||
| $ | 10.23 | 2.38 | % | $ | 5,804,844 | 1.53 | % | 1.40 | % | 3.44 | % | (0.62 | )% | 0 | % | |||||||||||||||||
| $ | 9.90 | 2.36 | % | $ | 808,261,775 | 3.52 | % | 1.98 | % | 3.60 | % | (1.73 | )% | 208 | % | |||||||||||||||||
| $ | 9.70 | (2.57 | )%9 | $ | 257,168,435 | 2.23 | % | 1.98 | % | 2.59 | % | (1.09 | )% | 133 | % | |||||||||||||||||
| $ | 9.89 | 2.22 | % | $ | 43,104,252 | 3.76 | % | 2.23 | % | 3.93 | % | (2.32 | )% | 208 | % | |||||||||||||||||
| $ | 9.69 | (2.73 | )%9 | $ | 44,676,329 | 2.48 | % | 2.23 | % | 2.85 | % | (1.37 | )% | 133 | % | |||||||||||||||||
| The accompanying notes are an integral part of these financial statements. |
| AQR Funds | Annual Report | December 2012 | 105 | |||||||||||||
Table of Contents
| Notes to Financial Statements | December 31, 2012 |
1. Organization
AQR Funds (the “Trust”), organized as a Delaware statutory trust on September 4, 2008, is an open-end management investment company, under the Investment Company Act of 1940, as amended (the “1940 Act”). As of December 31, 2012, the Trust consists of eighteen active series, of which six of the active series are presented in this book and the remaining twelve active series are reported in a separate book, (collectively, the “Funds” and each individually a “Fund”): AQR Managed Futures Strategy Fund, AQR Risk-Balanced Commodities Strategy Fund, AQR Risk Parity Fund, AQR Risk Parity II MV Fund, AQR Risk Parity II HV Fund and AQR Multi-Strategy Alternative Fund. AQR Capital Management, LLC (“the Advisor”) serves as the investment advisor of each Fund. The Advisor has retained CNH Partners, LLC (“the Sub-Advisor”), an affiliate of the Advisor, to serve as an investment sub-advisor to the AQR Multi-Strategy Alternative Fund.
The investment objective of the AQR Managed Futures Strategy Fund is to seek positive absolute returns. However, while seeking to generate positive performance over a multi-year period of time, the Fund may have positive or negative returns over shorter time periods. The Fund invests primarily in a portfolio of futures contracts, futures-related instruments and equity swaps. The Fund’s universe of investments currently includes more than 100 global developed and emerging market exchange-traded futures, futures-related instruments, forward contracts, and equity swaps across four major asset classes (commodities, currencies, fixed-income and equities); however this universe of investments is subject to change under varying market conditions as these instruments evolve over time. The Fund offers Class I and Class N shares.
The investment objective of the AQR Risk-Balanced Commodities Strategy Fund is to seek total return. The Fund pursues its investment objective by investing in a portfolio of commodity futures contracts. The Fund seeks to balance risks across commodity sectors, managing risk over time through volatility targeting and drawdown control, and improving returns using information on commodity fundamentals and trends. The fund can go long or short individual commodity contracts, but will always be net long commodities as a whole. The Fund offers Class I and Class N shares.
The investment objective of the AQR Risk Parity Fund is to seek total return. Total return consists of capital appreciation and income. The Fund pursues its investment objective by allocating assets among major liquid asset classes (including global developed and emerging market equities, global nominal and inflation-linked government bonds, emerging market fixed income, sovereign debt, the credit spreads of mortgage-backed securities and corporate and sovereign debt, developed and emerging market currencies, and commodities). The Fund offers Class I and Class N shares.
The investment objective of the AQR Risk Parity II MV Fund is to seek total return. Total return consists of capital appreciation and income. The Fund pursues its investment objective by allocating assets among major liquid asset classes (including global developed and emerging market equities, global nominal and inflation-linked government bonds, developed and emerging market currencies, and commodities). The “MV” in the Fund’s name reflects its “moderate volatility” approach. On average, the Advisor will target an annualized volatility level of 10% and expects the Fund’s targeted annualized volatility will typically range from 7% to 13%. The Fund offers Class I and Class N shares.
The investment objective of the AQR Risk Parity II HV Fund is to seek total return. Total return consists of capital appreciation and income. The Fund pursues its investment objective by allocating assets among major liquid asset classes (including global developed and emerging market equities, global nominal and inflation-linked government bonds, developed and emerging market currencies, and commodities). The “HV” in the Fund’s name reflects its “high volatility” approach. On average, the Advisor, will target an annualized volatility level of 15% and expects that the Fund’s targeted annualized volatility will typically range from 10% to 20%The Fund offers Class I and Class N shares.
The investment objective of the AQR Multi-Strategy Alternative Fund is to seek positive absolute returns. However, while seeking to generate positive performance over a multi-year period of time, the Fund may have positive or negative returns over shorter time periods. The Fund invests globally (including in emerging markets) in a broad range of instruments, including, but not limited to, equities, bonds, currencies, commodities, credit derivatives, convertible securities, futures, forwards, options and swaps. The Fund offers Class I and Class N shares.
| 106 | AQR Funds | Annual Report | December 2012 | |||||||||||||
Table of Contents
| Notes to Financial Statements | December 31, 2012 |
2. Consolidation of Subsidiaries
The consolidated Schedules of Investments, Statements of Assets and Liabilities, of Operations, of Changes in Net Assets, of Cash Flows and the Financial Highlights of the AQR Managed Futures Strategy Fund, AQR Risk-Balanced Commodities Strategy Fund, AQR Risk Parity Fund, AQR Risk Parity II MV Fund, AQR Risk Parity II HV Fund and AQR Multi-Strategy Alternative Fund include the accounts of AQR Managed Futures Strategy Offshore Fund Ltd., AQR Risk-Balanced Commodities Strategy Offshore Fund Ltd., AQR Risk Parity Offshore Fund Ltd., AQR Risk Parity II MV Offshore Fund Ltd., AQR Risk Parity II HV Offshore Fund Ltd., and AQR Multi-Strategy Alternative Offshore Fund Ltd., respectively, wholly-owned and controlled subsidiaries (the “Subsidiaries”). All inter-company accounts and transactions have been eliminated in consolidation for the Funds. Each of the Subsidiaries has a fiscal year end of December 31st for financial statement consolidation purposes and a nonconforming tax year end of November 30th.
The Subsidiaries are classified as controlled foreign corporations under the Internal Revenue Code of 1986 (“the Code”). Each Subsidiary’s taxable income is included in the calculation of the relevant Fund’s taxable income. Net losses of the Subsidiaries are not deductible by the Funds either in the current period or future periods.
AQR Managed Futures Strategy Fund, AQR Risk-Balanced Commodities Strategy Fund, AQR Risk Parity Fund, AQR Risk Parity II MV Fund, AQR Risk Parity II HV Fund, and AQR Multi-Strategy Alternative Fund may each invest up to 25% of their total assets in its respective Subsidiary, each of which acts as an investment vehicle in order to effect certain investments consistent with the Funds’ investment objectives and policies.
| INCEPTION DATE OF SUBSIDIARY | SUBSIDIARY NET ASSETS AT DECEMBER 31, 2012 | % OF TOTAL NET ASSETS AT DECEMBER 31, 2012 | ||||||||||
AQR Managed Futures Strategy Offshore Fund, Ltd. | January 6, 2010 | $ | 604,357,543 | 22.7% | ||||||||
AQR Risk-Balanced Commodities Strategy Offshore Fund, Ltd. | July 9, 2012 | 15,879,452 | 24.2% | |||||||||
AQR Risk Parity Offshore Fund, Ltd. | September 30, 2010 | 205,735,010 | 19.8% | |||||||||
AQR Risk Parity II MV Offshore Fund, Ltd. | November 5, 2012 | 7,745,614 | 24.0% | |||||||||
AQR Risk Parity II HV Offshore Fund, Ltd. | November 5, 2012 | 5,253,922 | 23.8% | |||||||||
AQR Multi-Strategy Alternative Offshore Fund, Ltd. | July 18, 2011 | 125,666,774 | 14.8% | |||||||||
3. Significant Accounting Policies
The following summarizes the significant accounting policies of the Funds:
Use of Estimates: The preparation of the financial statements in conformity with accounting principles generally accepted in the United States of America (“GAAP”) requires management to make estimates and assumptions that affect the reported amounts of assets and liabilities and disclosure of contingent assets and liabilities, if any, at the date of the financial statements and the reported amounts of increases and decreases in net assets from operations during the reported period. Actual results could differ from those estimates and such differences could be material.
Valuation of Investments: Each Fund’s portfolio securities are valued as of the close of business of the regular session of trading on the NYSE (normally 4:00 p.m. Eastern time). Equity securities, including securities sold short and warrants, are valued at the latest quoted sales prices or official closing prices taken from the primary market in which each security trades. The value of securities listed on the NASDAQ shall generally be the NASDAQ Official Closing Price. In accordance with procedures adopted by the Board of Trustees, the Funds apply fair value pricing to international securities traded outside of North America on a daily basis utilizing the quotations of an independent pricing service, unless the Advisor determines that use of another valuation methodology is appropriate. The pricing service uses statistical analysis and quantitative models to adjust local market prices using factors such as subsequent movement and changes in the prices of indices, securities and exchange rates in other markets, in determining fair value as of the time the Funds calculate their net asset value. Securities traded in the over-the-counter market, and which are not quoted by NASDAQ, are valued at the last sale price, if available, otherwise at the last quoted bid price (in the case of short sales, at the ask price). Bonds are valued using the latest bid prices or evaluated quotes furnished by independent pricing services. Evaluated quotes are based on a matrix system, which may consider such factors as quoted prices, yields, maturities and ratings and is not necessarily reliant on quoted prices. The Funds value debt securities maturing
| AQR Funds | Annual Report | December 2012 | 107 | |||||||||||||
Table of Contents
| Notes to Financial Statements | December 31, 2012 |
less than 61 days from the date of purchase at amortized cost, which approximates market value. The value of futures contracts purchased and sold by the Funds is accounted for using the unrealized gain or loss on the contracts that is determined by marking the contracts to their current settlement prices. Futures and options contracts are valued at the last quoted sales price on the valuation date. In the event that the exchange for a specific futures contract closes earlier than 4:00 p.m., the futures contract is valued at the Official Settlement Price of the exchange. Prices of futures contracts are monitored until 4:00 p.m. to determine if fair valuation would provide a more accurate valuation. Investments in open-end investment companies are valued at such investment company’s current day closing net asset value per share. Exchange-Traded Funds (“ETFs”) and closed-end investment companies are valued at the last quoted sales price. Equity, total return and commodity swap contracts are valued at fair value, based on the price of the underlying referenced instrument. Credit default swaps are valued daily primarily using independent pricing services or market makers. Interest rate swap contracts are valued at fair value as determined by an independent pricing service based on various valuation models which consider the terms of underlying contracts and market data inputs received from third parties.
The Funds may use pricing services to obtain readily available market quotations. Where market quotations are not readily available, or if an available market quotation is determined not to reflect fair value, a security will be valued based on its fair value as determined in accordance with the valuation procedures approved by the Funds’ Board of Trustees, which may include the use of proprietary valuation models which may consider market transactions in comparable securities and the various relationships between securities in determining value and/or market characteristics such as benchmark yield curves, credit spreads, estimated default rates, underlying collateral, and other unique security features. Using fair value to price securities may result in a value that is different from a security’s most recent closing price and from the prices used by other mutual funds to calculate their net assets. It is possible the estimated values may differ significantly from the values which would have been used had a ready market for the investments existed, these differences could be material.
Convertible Securities: The Funds invest in preferred stocks and fixed-income securities which are convertible into common stock. Convertible securities may be converted either at a stated price or rate within a specified period of time into a specified number of shares of common stock. By investing in a convertible security, the Funds may participate in any capital appreciation or depreciation of a company’s stock, but to a lesser degree than if it had invested in that company’s common stock. Convertible securities rank senior to common stock in a corporation’s capital structure and, therefore, entail less risk than the corporation’s common stock. The Funds may attempt to hedge some of their investments in convertible debt securities by selling short the issuer’s common stock.
Short Sales: The AQR Multi-Strategy Alternative Fund sells securities it does not own as a hedge against some of its long positions and/or in anticipation of a decline in the market value of that security (short sale). When the Fund makes a short sale, it must borrow the security sold short and deliver it to the broker-dealer through which it made the short sale. The Fund may have to pay a fee to borrow the particular security and may be obligated to remit any interest or dividends received on such borrowed securities. Dividends declared on short positions open are recorded on the ex-date as an expense. A gain, limited to the price at which the Fund sold the security short, or a loss, unlimited in magnitude, will be recognized upon the termination of a short sale if the market price at termination is less than or greater than, respectively, the proceeds originally received. The Fund is also subject to the risk that they may be unable to reacquire a security to terminate a short position except at a price substantially in excess of the last quoted price. The Fund is also subject to risk of loss if the broker were to fail to perform its obligations under the contractual terms. Liabilities for securities sold short are reported at market value on the Statements of Assets and Liabilities and the change in market value is recorded as unrealized gain or loss on the Statements of Operations.
The Fund is required to pledge cash or securities to the broker as collateral for the securities sold short. Collateral requirements are calculated daily based on the current market value of the short positions. Cash deposited with broker for collateral for securities sold short is recorded as an asset on the Statements of Assets and Liabilities and securities segregated as collateral are denoted in the Schedules of Investments. The Fund may receive or pay the net of the following amounts: (i) a portion of the income from the investment of cash collateral; (ii) the broker’s fee on the borrowed securities; and (iii) a financing charge for the difference in the market value of the short position and cash collateral deposited with the broker. This income or fee is calculated daily based upon the market value of each borrowed security and a variable rate that is dependent on the availability of the security. The net amount of fees of $990,761, incurred by
| 108 | AQR Funds | Annual Report | December 2012 | |||||||||||||
Table of Contents
| Notes to Financial Statements | December 31, 2012 |
AQR Multi-Strategy Alternative Fund is included in dividend and interest on securities sold short in the Statements of Operations.
Futures Contracts: The Funds invest in futures contracts as part of their primary investment strategy. Investments in futures may increase or decrease exposure to a particular market. In the event of a bankruptcy or insolvency of a futures commission merchant that holds margin on behalf of the Funds, the Funds may not be entitled to the return of all of the margin owed to the Funds, potentially resulting in a loss. No monies are paid to or received by a Fund upon the purchase or sale of a futures contract. Initially, a Fund will be required to deposit with the broker an amount of cash or cash equivalents, known as initial margin, based on the value of the contract. Subsequent payments to and from the broker, will be made on a periodic basis as the price of the underlying instruments fluctuates. Changes in market value of open futures contracts are recorded as unrealized appreciation or depreciation in the Statements of Operations. Realized gains or losses, represent the difference between the value of the contract at the time it was opened and the value at the time it was closed, and are reported in the Statements of Operations at the closing or expiration of futures contracts. Securities deposited as initial margin are designated in the Schedules of Investments and cash deposited is presented as Due from Broker on the Statements of Assets and Liabilities. The use of long futures contracts subjects the Funds to risk of loss in excess of the amounts shown on the Statements of Assets and Liabilities, up to the contract amount of the futures contracts. The use of short futures contracts subjects the Funds to unlimited risk of loss. Futures contracts outstanding at period end, if any, are listed after each Fund’s Schedule of Investments.
Forward Currency Contracts: The Funds buy and sell forward currency contracts, which are agreements between two parties to buy and sell currencies at a set price on a future date. These contracts are used to protect against a decline in value relative to the U.S. dollar of the currencies in which portfolio securities are denominated or quoted (or an increase in the value of a currency in which securities a Fund intends to buy are denominated, when a Fund holds cash reserves and short term investments), or for other investment purposes. The U.S. dollar value of forward currency contracts is determined using current forward currency exchange rates supplied by a quotation service. The market value of the contract will fluctuate with changes in currency exchange rates. The contract is marked to market daily and the change in market value is recorded as an unrealized gain or loss. When the contract is closed, the Funds record a realized gain or loss equal to the difference between the value of the contract at the time it was opened and the value at the time it was closed. The Funds could be exposed to risk if the value of the currency changes unfavorably, if the counterparties to the contracts are unable to meet the terms of their contracts or if the Fund is unable to enter into a closing position. Risks may exceed amounts recognized on the Statements of Assets and Liabilities. Non-deliverable forward foreign currency exchange contracts are settled with the counterparty in cash without the delivery of foreign currency. Forward currency contracts outstanding at period end, if any, are listed after each Fund’s Schedule of Investments.
Total Return Swap Contracts: Certain Funds invest in total return swaps to obtain exposure to the underlying referenced instrument, obtain leverage or attain the returns from ownership without actually owning the underlying position. Total return swaps are two-party contracts that generally obligate one party to pay the positive return and the other party to pay the negative return on a specified reference security, basket of securities, security index or index component during the period of the swap. Total return swap contracts are marked to market daily based on the value of the underlying reference entity and the change, if any, is recorded as an unrealized gain or loss. Total return swaps normally do not involve the delivery of securities or other underlying assets. If the other party to an total return swap defaults, a Fund’s risk of loss consists of the net amount of payments that such Fund is contractually entitled to receive, if any. Total return swaps are derivatives and their value can be very volatile. To the extent that the Advisor or Sub-Advisor, as applicable, do not accurately analyze and predict future market trends, the values of assets or economic factors, a Fund may suffer a loss, which may exceed the related amounts shown in the Statements of Assets and Liabilities. Periodic payments received or paid by the Funds are recorded as realized gains or losses. Total return swap contracts outstanding at period end, if any, are listed after each Fund’s Schedule of Investments.
Credit Default Swap Contracts: Certain Funds enter into credit default swap contracts to provide a measure of protection against risk of loss following a default, or other credit event in respect of issuers within an underlying index or a single issuer, or to gain credit exposure to an underlying index or issuer. In a credit default contract, the protection buyer typically makes an up-front payment and a periodic stream of payments to a counterparty, the protection seller, in exchange for the right to receive a contingent payment upon the occurrence of a credit event on the reference obligation or all other equally ranked obligations of the reference entity. Credit events are contract specific but may include
| AQR Funds | Annual Report | December 2012 | 109 | |||||||||||||
Table of Contents
| Notes to Financial Statements | December 31, 2012 |
bankruptcy, failure to pay, restructuring and obligation acceleration. An up-front payment received by a Fund, as the protection seller, is recorded as a liability on the Fund’s Statement of Assets and Liabilities. An up-front payment made by a Fund, as the protection buyer, is recorded as an asset on the Fund’s Statement of Assets and Liabilities. Up-front payments are amortized over the term of the contract. Periodic payments received or paid by a Fund are recorded as realized gains or losses. The credit default contracts are marked to market daily based upon quotations from an independent pricing service or market makers and the change, if any, is recorded as an unrealized gain or loss. Upon the occurrence of a credit event, the difference between the par value and market value of the reference obligation, net of any proportional amount of the up-front payment, is recorded as a realized gain or loss.
In addition to bearing the risk that the credit event will occur, a Fund could be exposed to market risk due to unfavorable changes in interest rates or in the price of the underlying security or index or the possibility that the Fund may be unable to close out its position at the same time or at the same price as if it had purchased the underlying reference obligations. In certain circumstances, a Fund may enter into offsetting credit default contracts which would mitigate its risk of loss. Risks of loss may exceed amounts recognized on the Statements of Assets and Liabilities. The Fund’s maximum risk of loss from counterparty risk, either as the protection seller or as the protection buyer, is the fair value of the contract. This risk may be mitigated by having a master netting arrangement between the Fund and the counterparty. Where a Fund is a seller of protection, the maximum potential amount of future payments the Fund may be required to make is equal to the notional amount of the relevant credit default contract. The Fund’s risk of loss associated with these instruments may exceed their value, as recorded in the Statements of Assets and Liabilities. Credit default contracts outstanding, including their respective notional amounts at period end, if any, are listed after the Fund’s Schedule of Investments.
Implied credit spreads are an indication of the seller’s performance risk, related to the likelihood of a credit event occurring that would require a seller to make payment to a buyer. Implied credit spreads are used to determine the value of swap contracts and reflect the cost of buying/selling protection, which may include up-front payments made to enter into the contract. Therefore, higher spreads would indicate a greater likelihood that a seller will be obligated to perform (i.e., make payment) under the swap contract. Increasing values, in absolute terms and relative to notional amounts, are also indicative of greater performance risk. Implied credit spreads for credit default swaps on credit indexes are linked to the weighted average spread across the underlying reference obligations included in a particular index.
Interest Rate Swaps: The AQR Risk Parity Fund enters into interest rate swaps as part of its investment strategy. Interest rate swaps generally involve agreements to exchange fixed and floating payment obligations, without the exchange of the underlying notional amounts. Periodic payments received or paid by the Fund are recorded as realized gains and losses. Interest rate swaps are marked to market daily based on quotations as provided by an independent pricing service and the change is recorded as unrealized gain or loss. The Fund’s risk of loss associated with these instruments may exceed their value, as recorded in the Statements of Assets and Liabilities. Interest rate contracts outstanding, including their respective notional amounts at period end, if any, are listed after the Fund’s Schedule of Investments. Non-deliverable interest rate swaps are settled with the counterparty in cash without the delivery of foreign currency.
High Yield Securities: The AQR Multi-Strategy Alternative Fund invests in lower-quality debt securities. Investments in lower-rated securities or unrated securities of comparable quality tend to be more sensitive to economic conditions than higher rated securities causing greater price volatility. These instruments involve a greater risk of loss due to default by the issuer because such securities are generally unsecured and are often subordinated to other creditors’ claims.
Master Agreements: The Funds are a party to ISDA (International Swap and Derivatives Association, Inc.) Master Agreements (“Master Agreements”) with certain counterparties that govern over-the-counter derivative and foreign exchange contracts entered into from time to time. The Master Agreements may contain provisions regarding, among other things, the parties’ general obligations, representations, agreements, collateral requirements, events of default and early termination. With respect to certain counterparties, in accordance with the terms of the Master Agreements, collateral posted for the benefit of a Fund is held in a segregated account by a custodian of the Fund and with respect to those amounts which can be sold or repledged, are presented in the Fund’s Schedule of Investments. Collateral pledged by the Fund is segregated by the Fund’s custodian and identified in the Fund’s Schedule of Investments. Collateral can be in the form of cash or debt securities issued by the U.S. Government or related agencies or other securities and money market funds as agreed to by the Fund and the applicable counterparty. Collateral requirements are generally determined based on the Fund’s net position with each counterparty. Termination events applicable to the Fund may
| 110 | AQR Funds | Annual Report | December 2012 | |||||||||||||
Table of Contents
| Notes to Financial Statements | December 31, 2012 |
occur upon a decline in the Fund’s net assets below a specified threshold over a certain period of time. Termination events applicable to counterparties may occur upon a decline in the counterparty’s long-term and short-term credit ratings below a specified level. In each case, upon occurrence, the other party may elect to terminate early and cause settlement of all derivative and foreign exchange contracts outstanding, including the payment of any losses and costs resulting from such early termination, as reasonably determined by the terminating party. Any decision by one or more of the Fund’s counterparties to elect early termination could impact a Fund’s future derivative activity. The Funds’ derivative assets and liabilities on the Statements of Assets and Liabilities are presented net when a legally enforceable master netting agreement exists between the Funds and a derivative counterparty.
Reverse Repurchase Agreements: The AQR Risk Parity II HV Fund enters into reverse repurchase agreements. In a reverse repurchase agreement, the Fund sells to a counterparty a security that it holds with a contemporaneous agreement to repurchase the same security at an agreed-upon price and date. Reverse repurchase agreements are valued based on the amount of cash received plus accrued interest, which represents fair value. Reverse repurchase agreements are reflected as a liability on the Statements of Assets and Liabilities. Interest payments made are recorded as a component of interest expense on the Statements of Operations. In periods of increased demand for the security, the Fund may receive a fee for use of the security by the counterparty, which may result in interest income to the Fund. The Fund monitors collateral market value for the reverse repurchase agreement, including accrued interest, throughout the lives of the agreements, and when necessary, delivers or receives cash or securities in order to manage credit exposure and liquidity. If the counterparty defaults or enters insolvency proceeding, realization or return of the collateral to the Fund may be delayed or limited.
Options: The AQR Multi-Strategy Alternative Fund may write and purchase put and call options from time to time. When a Fund writes an option, an amount equal to the premium received by the Fund is reflected as an asset and an equivalent liability. The amount of the liability is subsequently marked to market to reflect the current market value of the option written. When a security is purchased or sold through an exercise of an option, the related premium paid (or received) is added to (or deducted from) the basis of the security acquired or deducted from (or added to) the proceeds of the security sold. When an option expires, the Fund realizes a gain or loss on the option to the extent of the premiums received or paid. When a Fund enters into a closing transaction, the Fund realizes a gain or loss to the extent the cost of the closing transaction exceeds the premiums paid or received. Written uncovered call options subject the Funds to unlimited risk of loss. Written covered call options limit the upside potential of a security above the strike price. Put options written subject the Funds to risk of loss if the value of the security declines below the exercise price minus the put premium. The Fund, as writer of an option, bears the market risk of an unfavorable change in the price of the security underlying the written option. Written and purchased options are non-income producing investments.
Transactions in call and put options written during the year ended December 31, 2012 for the AQR Multi-Strategy Alternative Fund were as follows:
| CALL OPTIONS | PUT OPTIONS | |||||||||||||||
| SHARES SUBJECT TO CALL | PREMIUM | SHARES SUBJECT TO PUT | PREMIUM | |||||||||||||
Options outstanding, December 31, 2011 | — | $ | — | — | $ | — | ||||||||||
Options written | (2,463 | ) | (321,641 | ) | (700 | ) | (4,900 | ) | ||||||||
Options expired | 1,689 | 260,296 | 700 | 4,900 | ||||||||||||
| Options exercised | 49 | 25,429 | — | — | ||||||||||||
| Options outstanding, December 31, 2012 | (725 | ) | $ | (35,916 | ) | — | $ | — | ||||||||
Securities Lending: The AQR Multi-Strategy Alternative Fund may lend securities to brokers approved by the Advisor in order to generate additional income. Securities loaned are collateralized by cash, which is invested in various JPMorgan Money Market Funds. Upon termination of a loan, the Fund is required to return to the borrower the posted cash collateral. Loans are subject to termination by the Fund or the borrower at any time. Securities lending income is comprised of income earned on cash collateral investments, net of a rebate received from or paid to borrowers for use of cash collateral and lending agent fees. This amount is recorded as Securities lending income, net on the Statements of
| AQR Funds | Annual Report | December 2012 | 111 | |||||||||||||
Table of Contents
| Notes to Financial Statements | December 31, 2012 |
Operations. The Fund also receives payments from the borrower during the period of the loan, equivalent to dividends and interest earned on the securities loaned, which are recorded as Dividend or Interest income, respectively, on the Statements of Operations.
The Fund bears the risk of loss associated with the collateral investments and is not entitled to additional collateral from the borrower to cover any such losses. To the extent that the value of the collateral investments declines below the amount owed to a borrower, the Fund may incur losses that exceed the amount it earned on lending the security. Upon termination of a loan, the Fund may use leverage (borrow money) to repay the borrower for cash collateral posted if the Advisor does not believe that it is prudent to sell the collateral investments to fund the payment of this liability.
Securities lending also involves counterparty risks, including the risk that the loaned securities may not be returned in a timely manner or at all.
Federal Income Taxes: Each Fund is treated as a separate taxable entity for federal income tax purposes. Each Fund intends to qualify as a “regulated investment company” under Subchapter M of the Code, as amended. If so qualified, each Fund will not be subject to federal income tax to the extent it distributes substantially all of its net investment income and capital gains to shareholders.
Management evaluates tax positions taken or expected to be taken in the course of preparing the Funds’ tax returns to determine whether the tax positions are “more-likely-than-not” of being sustained by the applicable tax authority. Tax positions deemed to meet the more-likely-than-not threshold would be recorded as a tax benefit or expense in the current year. The Funds are required to analyze all open tax years. Open tax years are those years that are open for examination by the relevant income taxing authority. The returns of the Funds for the prior three fiscal years, or since inception if shorter, are open for examination. As of December 31, 2012, the Funds had no examinations in progress.
The Funds have concluded that there is no tax liability/benefit resulting from uncertain income tax positions taken or expected to be taken. The Funds are also not aware of any tax positions for which it is reasonably possible that the total amounts of unrecognized tax expense will significantly change in twelve months.
Securities Transactions and Investment Income: Investment transactions are accounted for on trade date (the date the order to buy or sell is executed). Securities gains and losses are calculated on a specifically identified cost basis. Interest income is determined on the basis of coupon interest accrued using the effective interest method adjusted for amortization of premiums and accretion of discounts using the effective yield method. Dividend income/expense is recorded on the ex-dividend date.
Allocation of Income and Expenses: In calculating the net asset value per share of each class, investment income, realized and unrealized gains and losses and expenses other than class specific expenses are allocated daily to each class of shares based upon the proportion of net assets of each class at the beginning of each day. Each Fund is charged for those expenses that are directly attributable to each Fund, such as advisory fees and registration costs. Trust level expenses are allocated among the Funds based on the ratio of average net assets or some other reasonable methodology.
The Funds record distributions received in excess of income from underlying investments as a reduction of cost of investments and/or realized gain. Such amounts are based on estimates (if actual amounts are not available) and actual amounts of income, realized gain and return of capital may differ from the estimated amounts. The Funds adjust the estimated amounts of components of distributions (and consequently net investment income) as necessary once the issuers provide information about the actual composition of the distributions.
The Funds may be subject to foreign taxes on income, capital gains on investments or currency repatriation, a portion of which may be recoverable. The Funds will accrue such taxes and recoveries as applicable, based upon their current interpretation of tax rules and regulations that exist in the markets in which they invest.
Organization and Offering Costs: Costs incurred by the AQR Risk-Balanced Commodity Strategy Fund, AQR Risk Parity II MV Fund and AQR Risk Parity II HV Fund in connection with the organization of those Funds, including professional and incorporation fees, are fully expensed by the end of the fiscal year. Offering costs, including
| 112 | AQR Funds | Annual Report | December 2012 | |||||||||||||
Table of Contents
| Notes to Financial Statements | December 31, 2012 |
professional fees, printing fees and the offering of the initial registration are amortized over a period not longer than twelve months from the date the Funds commenced operations.
Foreign Currency Translation: The books and records of the Funds are maintained in U.S. dollars. Foreign currency amounts are translated into U.S. dollars at the prevailing exchange rates of such currencies against the U.S. dollar. The market value of investment securities and the other assets and liabilities are translated at the exchange rate as of the valuation date. Purchases and sales of investment securities, income and expenses are translated at the exchange rate prevailing on the respective dates of such transactions.
Although the net assets of the Funds are presented at the foreign exchange rates and market values at the close of the period, the Funds do not isolate that portion of the results of operations arising as a result of changes in the foreign exchange rates from the fluctuations arising from changes in the market prices of securities held or sold during the period. Accordingly, such foreign currency gains (losses) are included in the reported net realized and unrealized gains (losses) on investment transactions.
Reported realized foreign currency gains or losses arise from the disposition of foreign currency and forward foreign currency contracts, currency gains or losses realized between the trade and settlement dates on securities transactions, and the difference between the amounts of dividends, interest and foreign withholding taxes recorded on each Fund’s books on the transaction date and the U.S. dollar equivalent of the amounts actually received or paid. Unrealized foreign exchange gains and losses arise from changes (due to the changes in the exchange rate) in the value of foreign currency and assets and liabilities (other than investments) denominated in foreign currencies, which are held at period end.
Cash and Cash Equivalents: Cash and cash equivalents include U.S. dollar and foreign currency at bank accounts at amounts which may exceed insured limits. The Funds are subject to risk to the extent that the institutions may be unable to fulfill their obligations.
Due to/from Broker: Due to/from Broker represents cash balances on deposit with the Funds’ prime brokers and counterparties. The Funds are subject to credit risk should the prime brokers and counterparties be unable to meet their obligations to the Funds.
Distributions to Shareholders: The Funds intend to declare and distribute substantially all of their net investment income and net realized capital gains, if any, at least annually. Income and capital gain distributions will be determined in accordance with federal income tax regulations which may differ from GAAP. Distributions to shareholders are recorded on the ex-dividend date. To the extent these “book/tax” differences are permanent in nature (i.e., that they result from other than timing of recognition — “temporary differences”), such amounts are reclassified within the capital accounts based on their Federal tax-basis treatment.
Indemnification: In the normal course of business, the Funds may enter into various agreements that provide for general indemnifications. The Funds’ maximum exposure under these arrangements is unknown as any potential exposure involves future claims that may be made against the Funds. However, based on experience, the Funds expect the risk of loss to be remote.
4. Federal Income Tax Matters
At December 31, 2012, the cost of long security positions and aggregate gross unrealized appreciation (depreciation) of investments for federal income tax purposes were as follows:
| FUND | COST OF INVESTMENTS | GROSS UNREALIZED APPRECIATION | GROSS UNREALIZED DEPRECIATION | NET UNREALIZED APPRECIATION (DEPRECIATION) | ||||||||||||
AQR Managed Futures Strategy Fund | $ | 2,433,054,334 | $ | — | $ | (10,605 | ) | $ | (10,605 | ) | ||||||
AQR Risk-Balanced Commodities Strategy Fund | 65,531,311 | — | (111 | ) | (111 | ) | ||||||||||
AQR Risk Parity Fund | 960,951,019 | 35,272,685 | (14,648,229 | ) | 20,624,456 | |||||||||||
AQR Risk Parity II MV Fund | 23,808,865 | 159,673 | (37,140 | ) | 122,533 | |||||||||||
AQR Risk Parity II HV Fund | 31,476,415 | 305,114 | (127,035 | ) | 178,079 | |||||||||||
AQR Multi-Strategy Alternative Fund | 903,920,089 | 73,440,388 | (21,282,197 | ) | 52,158,191 | |||||||||||
| AQR Funds | Annual Report | December 2012 | 113 | |||||||||||||
Table of Contents
| Notes to Financial Statements | December 31, 2012 |
The differences between book basis and tax basis appreciation (depreciation) on investments is primarily attributable to wash sale loss deferrals.
| FUND | CURRENT DISTRIBUTABLE ORDINARY INCOME | CURRENT DISTRIBUTABLE LONG TERM CAPITAL GAIN OR TAX BASIS CAPITAL LOSS CARRYFORWARDS | NET UNREALIZED APPRECIATION (DEPRECIATION) | POST OCTOBER CAPITAL OR LATE YEAR ORDINARY LOSS DEFERRALS | TOTAL ACCUMULATED EARNINGS | |||||||||||||||
AQR Managed Futures Strategy Fund | $ | — | $ | 45,094,728 | $ | 16,162,509 | $ | (1,744,460 | ) | $ | 59,512,777 | |||||||||
AQR Risk-Balanced Commodities Strategy Fund | — | — | (1,431,190 | ) | — | (1,431,190 | ) | |||||||||||||
AQR Risk Parity Fund | 25,896,308 | — | 23,246,616 | — | 49,142,924 | |||||||||||||||
AQR Risk Parity II MV Fund | 74,882 | — | 119,810 | — | 194,692 | |||||||||||||||
AQR Risk Parity II HV Fund | 134,957 | — | 98,668 | — | 233,625 | |||||||||||||||
AQR Multi-Strategy Alternative Fund | 11,048,197 | 7,305,608 | (2,444,237 | ) | — | 15,909,568 | ||||||||||||||
The differences between book basis and tax basis components of net assets are primarily attributable to tax deferral losses on wash sales and other book and tax differences including capital loss carryforwards, passive foreign investment companies (“PFIC”), forward foreign currency exchange contracts, swap contracts, the use of equalization and the tax treatment of income and gain or loss from the subsidiary.
At December 31, 2012, the effect for permanent book/tax reclassifications resulted in increase (decrease) to the components of net assets as follows:
| FUND | UNDISTRIBUTED NET INVESTMENT INCOME | ACCUMULATED NET REALIZED GAIN(LOSS) ON INVESTMENTS | PAID-IN CAPITAL | |||||||||
AQR Managed Futures Strategy Fund | $ | 22,079,221 | $ | 30,943,032 | $ | (53,022,253 | ) | |||||
AQR Risk-Balanced Commodities Strategy Fund | 169,935 | 749,368 | (919,303 | ) | ||||||||
AQR Risk Parity Fund | 27,831,260 | (20,345,938 | ) | (7,485,322 | ) | |||||||
AQR Risk Parity II MV Fund | 77,986 | (93,941 | ) | 15,955 | ||||||||
AQR Risk Parity II HV Fund | 108,433 | (140,993 | ) | 32,560 | ||||||||
AQR Multi-Strategy Alternative Fund | 6,829,432 | 2,847,378 | (9,676,810 | ) | ||||||||
For financial reporting purposes, capital accounts are adjusted to reflect the tax character of permanent book/tax differences. Reclassifications are primarily due to the tax treatment of swap contracts, distribution reclassifications, foreign currency reclassifications, sale of Real Estate Investment Trusts, PFICs and the tax treatment of income and gain or loss from the subsidiary. Results of operations and net assets were not affected by these reclassifications.
| 114 | AQR Funds | Annual Report | December 2012 | |||||||||||||
Table of Contents
| Notes to Financial Statements | December 31, 2012 |
The tax character of the distributions paid during the periods ended December 31, 2012 and December 31, 2011, were as follows:
| FUND | DECEMBER 31, 2012 ORDINARY INCOME | CAPITAL GAINS | DECEMBER 31, 2011 ORDINARY INCOME | CAPITAL GAINS | ||||||||||||
AQR Managed Futures Strategy Fund | $ | 17,396,750 | $ | 1,885 | $ | 10,675,579 | $ | 342,818 | ||||||||
AQR Risk Parity Fund | 49,637,112 | 625,990 | 6,618,750 | 87,996 | ||||||||||||
AQR Risk Parity II MV Fund | 16,427 | — | — | — | ||||||||||||
AQR Risk Parity II HV Fund | 40,741 | — | — | — | ||||||||||||
AQR Multi-Strategy Alternative Fund | 2,331,277 | — | 1,043,109 | — | ||||||||||||
The AQR Risk Parity II HV Fund and AQR Risk Parity II MV Fund commenced operations on November 5, 2012.
During the year ended December 31, 2012, the Funds utilized capital loss carryforwards in the amounts listed below:
| FUND | SHORT-TERM | LONG TERM | ||||||
AQR Managed Futures Strategy Fund | $ | 49,365,405 | $ | 20,410,226 | ||||
AQR Multi-Strategy Alternative Fund | 561,141 | 1,234,913 | ||||||
| LATE YEAR ORDINARY LOSS DEFFERALS | ||||
AQR Managed Futures Strategy Fund | $ | 1,744,460 | ||
Under the Regulated Investment Company Modernization Act of 2010, the Funds will be permitted to carry forward capital losses incurred in taxable years beginning after December 22, 2010 for an unlimited period. Post-enactment capital loss carryforwards will retain their character as either short-term or long-term capital losses rather than being considered short-term as under previous law. Any post-enactment capital losses generated will be required to be utilized prior to the losses incurred in pre-enactment tax years.
5. Fair Value Measurements
The Funds utilize various inputs in determining the value of each Fund’s investments. GAAP establishes a hierarchy for inputs used in measuring fair value that maximizes the use of observable inputs and minimizes the use of unobservable inputs by requiring the most observable inputs be used when available. These inputs are summarized in the three broad levels as follows:
Level 1 — quoted prices in active markets for identical securities
Level 2 — other significant observable inputs (including quoted prices for similar securities, interest rates, pre-payment speeds, credit risk, etc.)
Level 3 — significant unobservable inputs (including the Fund’s own assumptions in determining the fair value of investments)
Valuation methodology and inputs
An investment asset’s or liability’s level within the fair value hierarchy is based on the lowest level input, individually or in aggregate, that is significant to fair value measurement. The objective of fair value measurement remains the same even when there is a significant decrease in the volume and level of activity for an asset or liability and regardless of the valuation technique used. The valuation techniques used by the Funds to measure fair value maximize the use of observable inputs and minimize the use of unobservable inputs.
The inputs or methodology used for valuing securities are not necessarily an indication of the risk associated with investing in those securities. The following are certain inputs and techniques that the Funds use to evaluate how to classify each major category of assets and liabilities for Level 2 and Level 3, in accordance with GAAP.
| AQR Funds | Annual Report | December 2012 | 115 | |||||||||||||
Table of Contents
| Notes to Financial Statements | December 31, 2012 |
Equities traded outside North America (including those included as underlying reference instruments for total return swaps) are fair valued daily based on the application of a fair value factor and therefore are considered Level 2 (Note 3). Investments that trade in markets that are not considered to be active, but are valued based on quoted market prices, dealer quotations or alternative pricing sources supported by observable inputs are also classified within Level 2. These include certain U.S. government and sovereign obligations, most government agency securities, investment-grade corporate bonds, money market funds and less liquid listed equities. Corporate and sovereign bonds and other fixed-income instruments are valued at estimated fair value based on quotations (including evaluated quotes) from an independent pricing service, counterparties and other market participants. As Level 2 investments include positions that are not traded in active markets and/or are subject to transfer restrictions, valuations may be adjusted to reflect illiquidity and/or non-transferability, which are generally based on available market information. Investments classified within Level 3 have significant unobservable inputs, as they trade infrequently or not at all. Level 3 instruments include illiquid securities. When observable prices are not available for these securities, the Funds use one or more valuation techniques (e.g., the market approach, the income approach, or the cost approach) for which sufficient and reliable data is available. Within Level 3, the use of the market approach generally consists of using comparable market transactions, while the use of the income approach generally consists of the net present value of estimated future cash flows, adjusted as appropriate for liquidity, credit, market and/or other risk factors. The inputs used by the Funds in estimating the value of Level 3 investments include the original transaction price, recent transactions in the same or similar instruments, completed or pending third-party transactions in the underlying investment or comparable issuers, subsequent rounds of financing, recapitalizations and other transactions across the capital structure, offerings in the equity or debt capital markets, and changes in financial ratios or cash flows. Level 3 investments may also be adjusted to reflect illiquidity and/or non-transferability, with the amount of such discount estimated by the Funds in the absence of market information. Assumptions used by the Funds due to the lack of observable inputs may significantly impact the resulting fair value and therefore the Funds’ results of operations.
The Funds invest in derivative instruments. Derivative instruments can be exchange traded or privately negotiated over-the-counter (“OTC”). Exchange-traded derivatives, such as futures contracts and exchange traded option contracts, are typically classified within Level 1 or Level 2 of the fair value hierarchy depending on whether or not they are deemed to be actively traded. Futures and option contracts that are listed on national exchanges and are freely transferable are valued at fair value based on their last sales price on the date of determination on the exchange that constitutes the principal market. OTC derivatives, including forwards, credit default swaps, total return swaps, and interest rate swaps, are valued by the Funds using observable inputs, such as quotations received from the counterparty, or dealers and brokers, whenever available and considered reliable. Generally, a valuation model is used consistently for similar derivative types and model inputs, including, but not limited to, market prices, yield curves, credit spreads, volatilities and implied correlations which are obtained from outside brokers and/or pricing services when available. In instances where models are used, the value of an OTC derivative depends upon the contractual terms of, and specific risks inherent in, the instrument as well as the availability and reliability of observable inputs. Such inputs include market prices for reference securities, yield curves, credit curves, measures of volatility, prepayment rates and correlations of such inputs. Certain OTC derivatives, such as generic forwards, swaps and options, have inputs which can generally be corroborated by market data and are therefore classified within Level 2. Equity total return swap transactions are valued at fair value, based on the price of the underlying security. Interest rate swap contracts are valued at estimated fair value as determined by the Funds based on various valuation models which consider the terms of underlying contracts and market data inputs received from third parties.
Credit default swaps are carried at their estimated fair value, as determined in good faith by pricing services approved by the Board of Trustees. In addition to credit quality, the Funds monitor a variety of factors including cash flow assumptions, market activity, market sentiment and valuation as part of their ongoing process of assessing payment and performance risk. As payment and performance risk increases, the value of a credit default swap contract increases, resulting in recognition of unrealized gains for long positions and unrealized losses for short positions. Conversely, as payment and performance risk decreases, unrealized gains are recognized for short positions and unrealized losses are recognized for long positions. The change in value is recorded within unrealized appreciation/(depreciation) until the occurrence of a credit event or the termination of the swap, at which time a realized gain/(loss) is recorded. Those OTC derivatives that have less liquidity or for which inputs are unobservable are classified within Level 3. While the valuations of these less liquid OTC derivatives may utilize some Level 1 and/or Level 2 inputs, they also include other unobservable inputs which are considered significant to the fair value determination. At each measurement date, the Funds update the Level 1 and Level 2 inputs to reflect observable inputs, though the resulting gains and losses are reflected within Level 3 due to the significance of the unobservable inputs.
| 116 | AQR Funds | Annual Report | December 2012 | |||||||||||||
Table of Contents
| Notes to Financial Statements | December 31, 2012 |
Securities, for which market quotations or independent pricing service quotations are not readily available, are not readily marketable, or model priced and all other assets of the Funds are valued at fair value using valuation procedures for the Funds, which have been approved by the Board of Trustees. The Advisor has established a Valuation Committee (the “VC”) which is responsible for overseeing the pricing and valuation of all securities held in the Funds. The VC operates under the valuation procedures approved by the Funds Board of Trustees. The VC meets quarterly and on an as-needed basis. The VC is responsible for valuing any securities or other assets for which prices or valuations are not readily determinable by the Funds’ pricing services. The VC considers time-sensitive valuation issues, including those relating to market closures, changes in illiquid security values, model prices and other events that may have a potentially material impact on security values. On a quarterly basis the VC meets to review the results of back test reports generated by the Advisors internal risk department. The VC prepares for the Funds’ Board of Trustees an analysis relating to Level 3 positions. On a daily basis, the Trust’s fund accounting agent compares trade executions prices to the prior night’s valuation price for all positions which were traded and held the previous day. On a monthly basis, model prices are reviewed against available third party model prices.
Quantitative Information
These tables include a description of unobservable and quantitative inputs and the interrelationship of such inputs, as used in determining the value of Level 3 financial instruments, except for Level 3 instruments for which prior transaction or third party pricing information was used without adjustment.
Transfers
Transfers into, and out of, Level 3 are valued utilizing values as of the beginning of the period. Transfers from Level 2 to Level 3 or from Level 3 to Level 2 are due to a decline or an increase in market activity (e.g. frequency of trades), which resulted in a lack of or increase in available market inputs to determine price.
The following summarizes inputs used as of December 31, 2012 in valuing the Funds’ assets carried at fair value:
| AQR MANAGED FUTURES STRATEGY FUND | QUOTED PRICES IN ACTIVE MARKET (LEVEL 1) | OTHER SIGNIFICANT OBSERVABLE INPUTS (LEVEL 2) | SIGNIFICANT UNOBSERVABLE INPUTS (LEVEL 3) | TOTALS | ||||||||||||
ASSETS | ||||||||||||||||
Short-Term Investments | $ | — | $ | 258,002,742 | $ | — | $ | 258,002,742 | ||||||||
Money Market Funds | — | 2,175,040,987 | — | 2,175,040,987 | ||||||||||||
Forward Foreign Currency Exchange Contracts* | — | 61,847,908 | — | 61,847,908 | ||||||||||||
Futures Contracts* | 12,926,066 | — | — | 12,926,066 | ||||||||||||
| Total Return Swap Contracts* | — | 2,948,928 | — | 2,948,928 | ||||||||||||
Total Assets | $ | 12,926,066 | $ | 2,497,840,565 | $ | — | $ | 2,510,766,631 | ||||||||
LIABILITIES | ||||||||||||||||
| Total Return Swap Contracts* | $ | — | $ | (1,097,768 | ) | $ | — | $ | (1,097,768 | ) | ||||||
Total Liabilities | $ | — | $ | (1,097,768 | ) | $ | — | $ | (1,097,768 | ) | ||||||
* Derivative instruments, including futures, forward foreign currency exchange and total return swap contracts, are valued at the unrealized appreciation (depreciation) of the instrument. |
| |||||||||||||||
| AQR Funds | Annual Report | December 2012 | 117 | |||||||||||||
Table of Contents
| Notes to Financial Statements | December 31, 2012 |
There were no transfers between Levels 1 and 2 during the period. There were no Level 3 securities held during the period.
| AQR RISK-BALANCED COMMODITIES STRATEGY FUND | QUOTED PRICES IN ACTIVE MARKET (LEVEL 1) | OTHER SIGNIFICANT OBSERVABLE INPUTS (LEVEL 2) | SIGNIFICANT UNOBSERVABLE INPUTS (LEVEL 3) | TOTALS | ||||||||||||
ASSETS | ||||||||||||||||
Short-Term Investments | $ | — | $ | 2,598,718 | $ | — | $ | 2,598,718 | ||||||||
Money Market Funds | — | 62,932,482 | — | 62,932,482 | ||||||||||||
| Futures Contracts* | 261,535 | — | — | 261,535 | ||||||||||||
Total Assets | $ | 261,535 | $ | 65,531,200 | $ | — | $ | 65,792,735 | ||||||||
LIABILITIES | ||||||||||||||||
| Total Return Swap Contracts* | $ | — | $ | (1,692,614 | ) | $ | — | $ | (1,692,614 | ) | ||||||
Total Liabilities | $ | — | $ | (1,692,614 | ) | $ | — | $ | (1,692,614 | ) | ||||||
| * | Derivative instruments, including futures and total return swap contracts, are valued at the unrealized appreciation (depreciation) of the instrument. |
There were no transfers between Levels 1 and 2 during the period. There were no Level 3 securities held during the period.
| AQR RISK PARITY FUND | QUOTED PRICES IN ACTIVE MARKET (LEVEL 1) | OTHER SIGNIFICANT OBSERVABLE INPUTS (LEVEL 2) | SIGNIFICANT UNOBSERVABLE INPUTS (LEVEL 3) | TOTALS | ||||||||||||
ASSETS | ||||||||||||||||
Government Related Obligations | $ | — | $ | 308,067,687 | $ | — | $ | 308,067,687 | ||||||||
Short-Term Investments | — | 87,246,966 | — | 87,246,966 | ||||||||||||
U.S. Treasury Obligations | — | 293,557,695 | — | 293,557,695 | ||||||||||||
Money Market Funds | — | 292,703,127 | — | 292,703,127 | ||||||||||||
Credit Default Swap Contracts* | — | 2,860,822 | — | 2,860,822 | ||||||||||||
Interest Rate Swap Contracts* | — | 4,263,693 | — | 4,263,693 | ||||||||||||
| Total Return Swap Contracts* | — | 240,302 | — | 240,302 | ||||||||||||
Total Assets | $ | — | $ | 988,940,292 | $ | — | $ | 988,940,292 | ||||||||
LIABILITIES | ||||||||||||||||
Forward Foreign Currency Exchange Contracts* | $ | — | $ | (3,352,548 | ) | $ | — | $ | (3,352,548 | ) | ||||||
Futures Contracts* | (2,370,598 | ) | — | — | (2,370,598 | ) | ||||||||||
| Total Return Swap Contracts* | — | (1,166,865 | ) | — | (1,166,865 | ) | ||||||||||
Total Liabilities | $ | (2,370,598 | ) | $ | (4,519,413 | ) | $ | — | $ | (6,890,011 | ) | |||||
| * | Derivative instruments, including futures, forward foreign currency exchange, interest rate swap and total return swap contracts, are valued at the unrealized appreciation (depreciation) of the instrument. Credit default swap contracts are reported at market value. |
| 118 | AQR Funds | Annual Report | December 2012 | |||||||||||||
Table of Contents
| Notes to Financial Statements | December 31, 2012 |
There were no transfers between Levels 1 and 2 during the period. There were no Level 3 securities held during the period.
| AQR RISK PARITY II MV FUND | QUOTED PRICES IN ACTIVE MARKET (LEVEL 1) | OTHER SIGNIFICANT OBSERVABLE INPUTS (LEVEL 2) | SIGNIFICANT UNOBSERVABLE INPUTS (LEVEL 3) | TOTALS | ||||||||||||
ASSETS | ||||||||||||||||
Government Related Obligations | $ | — | $ | 6,774,721 | $ | — | $ | 6,774,721 | ||||||||
Short-Term Investments | — | 1,259,379 | — | 1,259,379 | ||||||||||||
U.S. Treasury Obligations | — | 8,302,676 | — | 8,302,676 | ||||||||||||
Money Market Funds | — | 7,594,622 | — | 7,594,622 | ||||||||||||
| Total Return Swap Contracts* | — | 2,510 | — | 2,510 | ||||||||||||
Total Assets | $ | — | $ | 23,933,908 | $ | — | $ | 23,933,908 | ||||||||
LIABILITIES | ||||||||||||||||
Forward Foreign Currency Exchange Contracts* | $ | — | $ | (44,398 | ) | $ | — | $ | (44,398 | ) | ||||||
Futures Contracts* | (8,279 | ) | — | — | (8,279 | ) | ||||||||||
| Total Return Swap Contracts* | — | (9,227 | ) | — | (9,227 | ) | ||||||||||
Total Liabilities | $ | (8,279 | ) | $ | (53,625 | ) | $ | — | $ | (61,904 | ) | |||||
| * | Derivative instruments, including futures, total return swap and forward foreign currency exchange contracts, are valued at the unrealized appreciation (depreciation) of the instrument. |
There were no transfers between Levels 1 and 2 during the period. There were no Level 3 securities held during the period.
| AQR RISK PARITY II HV FUND | QUOTED PRICES IN ACTIVE MARKET (LEVEL 1) | OTHER SIGNIFICANT OBSERVABLE INPUTS (LEVEL 2) | SIGNIFICANT UNOBSERVABLE INPUTS (LEVEL 3) | TOTALS | ||||||||||||
ASSETS | ||||||||||||||||
Government Related Obligations | $ | — | $ | 10,250,959 | $ | — | $ | 10,250,959 | ||||||||
Short-Term Investments | — | 2,148,940 | — | 2,148,940 | ||||||||||||
U.S. Treasury Obligations | — | 10,637,053 | — | 10,637,053 | ||||||||||||
Money Market Funds | — | 8,617,542 | — | 8,617,542 | ||||||||||||
| Total Return Swap Contracts* | — | 4,706 | — | 4,706 | ||||||||||||
Total Assets | $ | — | $ | 31,659,200 | $ | — | $ | 31,659,200 | ||||||||
LIABILITIES | ||||||||||||||||
Reverse Repurchase Agreements (Sold Short) | $ | — | $ | (10,589,890 | ) | $ | — | $ | (10,589,890 | ) | ||||||
Forward Foreign Currency Exchange Contracts* | — | (98,231 | ) | — | (98,231 | ) | ||||||||||
Futures Contracts* | (15,426 | ) | — | — | (15,426 | ) | ||||||||||
| Total Return Swap Contracts* | — | (60,502 | ) | — | (60,502 | ) | ||||||||||
Total Liabilities | $ | (15,426 | ) | $ | (10,748,623 | ) | $ | — | $ | (10,764,049 | ) | |||||
| * | Derivative instruments, including futures, total return swap and forward foreign currency exchange contracts, are valued at the unrealized appreciation (depreciation) of the instrument. |
| AQR Funds | Annual Report | December 2012 | 119 | |||||||||||||
Table of Contents
| Notes to Financial Statements | December 31, 2012 |
There were no transfers between Levels 1 and 2 during the period.
| AQR MULTI-STRATEGY ALTERNATIVE FUND | QUOTED PRICES IN ACTIVE MARKET (LEVEL 1) | OTHER SIGNIFICANT OBSERVABLE INPUTS (LEVEL 2) | SIGNIFICANT UNOBSERVABLE INPUTS (LEVEL 3) | TOTALS | ||||||||||||
ASSETS | ||||||||||||||||
Common Stocks† | $ | 30,432,134 | $ | 352,990,040 | $ | 10,461 | $ | 383,432,635 | ||||||||
Convertible Preferred Stocks† | 2,233,741 | 419,987 | — | 2,653,728 | ||||||||||||
Corporate Bonds† | — | 91,106,317 | 1,253,906 | 92,360,223 | ||||||||||||
Convertible Bonds† | — | 173,668,233 | 1,995,309 | 175,663,542 | ||||||||||||
Preferred Stocks† | 1,157,592 | 2,400,431 | — | 3,558,023 | ||||||||||||
Short-Term Investments | — | 14,572,812 | — | 14,572,812 | ||||||||||||
Money Market Funds | — | 283,644,107 | — | 283,644,107 | ||||||||||||
Purchased Options | 193,210 | — | — | 193,210 | ||||||||||||
Forward Foreign Currency Exchange Contracts* | — | 8,134,953 | — | 8,134,953 | ||||||||||||
Futures Contracts* | 3,944,759 | — | — | 3,944,759 | ||||||||||||
Credit Default Swap Contracts* | — | 184,775 | — | 184,775 | ||||||||||||
Total Return Swap Contracts* | — | 300,175 | — | 300,175 | ||||||||||||
| Total Return Basket Swaps Contracts* | — | 4,477,715 | — | 4,477,715 | ||||||||||||
Total Assets | $ | 37,961,436 | $ | 931,899,545 | $ | 3,259,676 | $ | 973,120,657 | ||||||||
| AQR MULTI-STRATEGY ALTERNATIVE FUND | QUOTED PRICES IN ACTIVE MARKET (LEVEL 1) | OTHER SIGNIFICANT OBSERVABLE INPUTS (LEVEL 2) | SIGNIFICANT UNOBSERVABLE INPUTS (LEVEL 3) | TOTALS | ||||||||||||
LIABILITIES | ||||||||||||||||
Common Stocks (Sold Short)† | $ | (192,306,855) | $ | (286,332,721) | $ | — | $ | (478,639,576) | ||||||||
Exchange-Traded Funds (Sold Short) | (39,035,322) | — | — | (39,035,322) | ||||||||||||
Preferred Stocks (Sold Short)† | — | (2,283,935) | — | (2,283,935) | ||||||||||||
Written Options (Sold Short)* | (28,448) | (408) | — | (28,856) | ||||||||||||
Total Return Swap Contracts* | — | (560,384) | — | (560,384) | ||||||||||||
| Total Return Basket Swaps Contracts* | — | (1,727,240) | — | (1,727,240) | ||||||||||||
Total Liabilities | $ | (231,370,625) | $ | (290,904,688) | $ | — | $ | (522,275,313) | ||||||||
* Derivative instruments, including futures, total return swap and forward foreign currency exchange contracts, are valued at the unrealized appreciation (depreciation) of the instrument. Credit default swap, written options and total return basket swap contracts are reported at market value. |
| |||||||||||||||
† Please refer to the Schedule of Investments to view securities segregated by country. |
| |||||||||||||||
There were no transfers between Levels 1 and 2 during the period.
| AQR MULTI-STRATEGY ALTERNATIVE FUND | COMMON STOCKS | CORPORATE BONDS | CONVERTIBLE BONDS | |||||||||
| Balance as of December 31, 2011 | $ | — | $ | — | $ | — | ||||||
Accrued discounts/(premiums) | — | — | — | |||||||||
Realized gain/(loss) | (23,185 | ) | — | 1,875 | ||||||||
Change in unrealized appreciation/(depreciation) | (458 | ) | (5,469 | ) | 23,918 | |||||||
Purchases | 211,723 | 1,259,375 | 2,071,391 | |||||||||
Sales | (177,619 | ) | — | (101,875 | ) | |||||||
Transfers in to Level 3 | — | — | — | |||||||||
| Transfers out of Level 3 | — | — | — | |||||||||
| Balance as of December 31, 2012 | $ | 10,461 | $ | 1,253,906 | $ | 1,995,309 | ||||||
| Change in unrealized appreciation/(depreciation) for securities still held at December 31, 2012 | $ | (458 | ) | $ | (5,469 | ) | $ | 23,918 | ||||
| 120 | AQR Funds | Annual Report | December 2012 | |||||||||||||
Table of Contents
| Notes to Financial Statements | December 31, 2012 |
6. Investment Transactions
During the year ended December 31, 2012, the cost of purchases and the proceeds from sales of investments (excluding short-term investments) were as follows:
| FUND | PURCHASES | SALES | SECURITIES SOLD SHORT | COVERS ON SECURITIES SOLD SHORT | ||||||||||||
AQR Managed Futures Strategy Fund | $ | — | $ | — | $ | — | $ | — | ||||||||
AQR Risk-Balanced Commodities Strategy Fund | — | — | — | — | ||||||||||||
AQR Risk Parity Fund | 677,669,619 | 242,159,407 | — | — | ||||||||||||
AQR Risk Parity II MV Fund | 14,972,397 | 581 | — | — | ||||||||||||
AQR Risk Parity II HV Fund | 20,732,322 | 609 | — | — | ||||||||||||
AQR Multi-Strategy Alternative Fund | 696,784,951 | 213,723,545 | 644,013,879 | 239,318,059 | ||||||||||||
The AQR Risk Parity Fund had purchases and sales of long-term U.S. Government obligations of $380,850,199 and $153,899,460, respectively. The AQR Risk Parity II MV Fund had purchases and sales of long-term U.S. Government obligations of $8,310,946 and none, respectively. The AQR Risk Parity II HV Fund had purchases and sales of long-term U.S. Government obligations of $10,663,174 and none, respectively
7. Derivative Instruments and Hedging Activities
Certain Funds use derivative instruments as part of their principal investment strategy to achieve their investment objectives. The values of such derivative instruments reflected in the Statements of Assets and Liabilities at December 31, 2012 are as follows:
| ASSETS | LIABILITIES | |||||||||||||||||||||||||||
| FUND | | UNREALIZED APPRECIATION ON FUTURES CONTRACTS | | | SWAPS AT VALUE | | | UNREALIZED APPRECIATION ON FORWARD CURRENCY EXCHANGE CONTRACTS | | | UNREALIZED DEPRECIATION ON FUTURES CONTRACTS | | | SWAPS AT VALUE | | | UNREALIZED DEPRECIATION ON FORWARD CURRENCY EXCHANGE CONTRACTS | | | WRITTEN OPTIONS AT MARKET VALUE | | |||||||
| Equity Risk Exposure: | ||||||||||||||||||||||||||||
AQR Managed Futures Strategy Fund | $12,442,495 | $— | $— | $2,173,077 | $1,097,767 | $— | $— | |||||||||||||||||||||
AQR Risk Parity Fund | 3,144,341 | 409,199 | — | 1,295,626 | 168,897 | — | — | |||||||||||||||||||||
AQR Risk Parity II MV Fund | 81,966 | 8,679 | — | 25,200 | 5,849 | — | — | |||||||||||||||||||||
AQR Risk Parity II HV Fund | 112,354 | 12,441 | — | 18,231 | 4,999 | — | — | |||||||||||||||||||||
AQR Multi-Strategy Alternative Fund | 4,647,565 | 7,438,915 | — | 2,072,127 | 4,867,382 | — | 28,856 | |||||||||||||||||||||
| Foreign Exchange Rate Risk Exposure: | ||||||||||||||||||||||||||||
Managed Futures Strategy Fund | — | — | 79,735,796 | — | — | 17,887,888 | — | |||||||||||||||||||||
AQR Risk Parity Fund | — | — | 3,036,807 | — | — | 6,389,355 | — | |||||||||||||||||||||
AQR Risk Parity II MV Fund | — | — | 12 | — | — | 44,410 | — | |||||||||||||||||||||
AQR Risk Parity II HV Fund | — | — | 28 | — | — | 98,259 | — | |||||||||||||||||||||
AQR Multi—Strategy Alternative Fund | — | — | 16,002,939 | — | — | 7,867,986 | — | |||||||||||||||||||||
| Interest Rate Risk Exposure: | ||||||||||||||||||||||||||||
AQR Managed Futures Strategy Fund | 4,298,025 | 2,590,460 | — | 7,002,539 | 182,477 | — | — | |||||||||||||||||||||
AQR Risk Parity Fund | 1,449,231 | 5,681,220 | — | 2,493,743 | 2,539,546 | — | — | |||||||||||||||||||||
AQR Risk Parity II MV Fund | 56,971 | — | — | 83,080 | 320 | — | — | |||||||||||||||||||||
AQR Risk Parity II HV Fund | 52,822 | — | — | 115,945 | 24,115 | — | — | |||||||||||||||||||||
AQR Multi-Strategy Alternative Fund | 514,290 | 338,787 | — | 216,524 | 380,804 | — | — | |||||||||||||||||||||
| Credit Risk Exposure: | ||||||||||||||||||||||||||||
AQR Risk Parity Fund | — | 5,346,281 | — | — | 2,485,459 | — | — | |||||||||||||||||||||
AQR Multi-Strategy Alternative Fund | — | 184,775 | — | — | — | — | — | |||||||||||||||||||||
| AQR Funds | Annual Report | December 2012 | 121 | |||||||||||||
Table of Contents
| Notes to Financial Statements | December 31, 2012 |
| ASSETS | LIABILITIES | |||||||||||||||||||||||||||
| FUND | | UNREALIZED APPRECIATION ON FUTURES CONTRACTS | | | SWAPS AT VALUE | | | UNREALIZED APPRECIATION ON FORWARD CURRENCY EXCHANGE CONTRACTS | | | UNREALIZED DEPRECIATION ON FUTURES CONTRACTS | | | SWAPS AT VALUE | | | UNREALIZED DEPRECIATION ON FORWARD CURRENCY EXCHANGE CONTRACTS | | | WRITTEN OPTIONS AT MARKET VALUE | | |||||||
| Commodity Exposure: | ||||||||||||||||||||||||||||
AQR Managed Futures Strategy Fund | 23,566,924 | 1,409,668 | — | 18,205,762 | 868,724 | — | — | |||||||||||||||||||||
AQR Risk Balanced Commodities Strategy Fund | 638,449 | 392,086 | — | 376,914 | 2,084,700 | — | — | |||||||||||||||||||||
AQR Risk Parity Fund | 3,466,536 | — | — | 6,641,337 | 44,846 | — | — | |||||||||||||||||||||
AQR Risk Parity II MV Fund | 82,568 | 2,257 | — | 121,504 | 11,484 | — | — | |||||||||||||||||||||
AQR Risk Parity II HV Fund | 101,780 | 1,265 | — | 148,206 | 40,388 | — | — | |||||||||||||||||||||
| AQR Multi-Strategy Alternative Fund | 3,475,798 | 300,175 | — | 2,404,243 | 339,425 | — | — | |||||||||||||||||||||
| Netting: | ||||||||||||||||||||||||||||
AQR Managed Futures Strategy Fund | (27,381,378) | (2,148,968) | (17,887,888) | (27,381,378) | (2,148,968) | (17,887,888) | — | |||||||||||||||||||||
AQR Risk Balanced Commodities Strategy Fund | (376,914) | (392,086) | — | (376,914) | (392,086) | — | — | |||||||||||||||||||||
AQR Risk Parity Fund | (8,060,108) | (5,238,748) | (3,036,807) | (8,060,108) | (5,238,748) | (3,036,807) | — | |||||||||||||||||||||
AQR Risk Parity II MV Fund | (221,505) | (10,936) | (12) | (221,505) | (10,936) | (12) | — | |||||||||||||||||||||
AQR Risk Parity II HV Fund | (266,956) | (13,706) | (28) | (266,956) | (13,706) | (28) | — | |||||||||||||||||||||
| AQR Multi-Strategy Alternative Fund | (4,692,894) | (5,587,611) | (7,867,986) | (4,692,894) | (5,587,611) | (7,867,986) | — | |||||||||||||||||||||
| Net Fair Value of Derivative Contracts: | ||||||||||||||||||||||||||||
AQR Managed Futures Strategy Fund | 12,926,066 | 1,851,160 | 61,847,908 | — | — | — | — | |||||||||||||||||||||
AQR Risk Balanced Commodities Strategy Fund | 261,535 | — | — | — | 1,692,614 | — | — | |||||||||||||||||||||
AQR Risk Parity Fund | — | 6,197,952 | — | 2,370,598 | — | 3,352,548 | — | |||||||||||||||||||||
AQR Risk Parity II MV Fund | — | — | — | 8,279 | 6,717 | 44,398 | — | |||||||||||||||||||||
AQR Risk Parity II HV Fund | — | — | — | 15,426 | 55,796 | 98,231 | — | |||||||||||||||||||||
AQR Multi-Strategy Alternative Fund | 3,944,759 | 2,675,041 | 8,134,953 | — | — | — | 28,856 | |||||||||||||||||||||
The following is the effect of Derivative Instruments on the Statements of Operations for the year ended December 31, 2012:
| | REALIZED GAIN (LOSS) ON DERIVATIVES RECOGNIZED AS A RESULT FROM OPERATIONS | | | NET CHANGE IN UNREALIZED APPRECIATION (DEPRECIATION) ON DERIVATIVES RECOGNIZED AS A RESULT FROM OPERATIONS | | |||||||||||||||||||||||||||
| FUND | | FUTURES CONTRACTS | | | SWAPS AND SWAPS ON FUTURES CONTRACTS | * | | FORWARD CURRENCY EXCHANGE CONTRACTS | | | WRITTEN OPTIONS | | | FUTURES CONTRACTS | | | SWAPS AND SWAPS ON FUTURES CONTRACTS | * | | FORWARD CURRENCY EXCHANGE CONTRACTS | | | WRITTEN OPTIONS | | ||||||||
| Equity Risk Exposure: | ||||||||||||||||||||||||||||||||
AQR Managed Futures Strategy Fund | 27,382,609 | 8,138,672 | — | — | 7,793,876 | (1,399,240) | — | — | ||||||||||||||||||||||||
AQR Risk Parity Fund | 18,437,143 | 1,854,812 | — | — | 1,281,381 | 205,790 | — | — | ||||||||||||||||||||||||
AQR Risk Parity II MV Fund | 125,478 | 9,361 | — | — | 56,766 | 2,830 | — | — | ||||||||||||||||||||||||
AQR Risk Parity II HV Fund | 223,272 | 14,149 | — | — | 94,123 | 7,442 | — | — | ||||||||||||||||||||||||
AQR Multi-Strategy Alternative Fund | (7,539,666) | 4,084,669 | — | 290,594 | 2,134,148 | 2,037,644 | — | 7,060 | ||||||||||||||||||||||||
| Foreign Exchange Rate Risk Exposure: | ||||||||||||||||||||||||||||||||
AQR Managed Futures Strategy Fund | — | — | 39,914,761 | — | — | — | 53,311,170 | — | ||||||||||||||||||||||||
AQR Risk Parity Fund | — | — | 589,108 | — | — | — | (4,546,302) | — | ||||||||||||||||||||||||
AQR Risk Parity II MV Fund | — | — | (47,570) | — | — | — | (44,398) | — | ||||||||||||||||||||||||
AQR Risk Parity II HV Fund | — | — | (63,479) | — | — | — | (98,231) | — | ||||||||||||||||||||||||
AQR Multi-Strategy Alternative Fund | — | — | 9,133,934 | — | — | — | 8,757,491 | — | ||||||||||||||||||||||||
| 122 | AQR Funds | Annual Report | December 2012 | |||||||||||||
Table of Contents
| Notes to Financial Statements | December 31, 2012 |
| | REALIZED GAIN (LOSS) ON DERIVATIVES RECOGNIZED AS A RESULT FROM OPERATIONS | | | NET CHANGE IN UNREALIZED APPRECIATION (DEPRECIATION) ON DERIVATIVES RECOGNIZED AS A RESULT FROM OPERATIONS | | |||||||||||||||||||||||||||
| FUND | | FUTURES CONTRACTS | | | SWAPS AND SWAPS ON FUTURES CONTRACTS | * | | FORWARD CURRENCY EXCHANGE CONTRACTS | | | WRITTEN OPTIONS | | | FUTURES CONTRACTS | | | SWAPS AND SWAPS ON FUTURES CONTRACTS | * | | FORWARD CURRENCY EXCHANGE CONTRACTS | | | WRITTEN OPTIONS | | ||||||||
| Interest Rate Risk Exposure: | ||||||||||||||||||||||||||||||||
AQR Managed Futures Strategy Fund | 10,127,993 | (1,689,900) | — | — | (11,631,996) | 1,128,645 | — | — | ||||||||||||||||||||||||
AQR Risk Parity Fund | 10,020,404 | 23,252,481 | — | — | (1,064,714) | (2,362,860) | — | — | ||||||||||||||||||||||||
AQR Risk Parity II MV Fund | 58,363 | (1,592) | — | — | (26,109) | (320) | — | — | ||||||||||||||||||||||||
AQR Risk Parity II HV Fund | 69,159 | 7,716 | — | — | (63,123) | (24,115) | — | — | ||||||||||||||||||||||||
AQR Multi-Strategy Alternative Fund | 2,196,303 | (953,359) | — | — | 54,047 | (230,648) | — | — | ||||||||||||||||||||||||
| Credit Risk Exposure: | ||||||||||||||||||||||||||||||||
AQR Risk Parity Fund | — | 36,227,974 | — | — | — | (6,935,879) | — | — | ||||||||||||||||||||||||
AQR Multi-Strategy Alternative Fund | — | 4,054,355 | — | — | — | (1,237,872) | — | — | ||||||||||||||||||||||||
| Commodity Exposure: | ||||||||||||||||||||||||||||||||
AQR Managed Futures Strategy Fund | (25,158,135) | (15,847,406) | — | — | (2,982,297) | 2,948,910 | — | — | ||||||||||||||||||||||||
AQR Risk-Balanced Commodities Strategy Fund | 13,670 | (763,125) | — | — | 261,535 | (1,692,614) | — | — | ||||||||||||||||||||||||
AQR Risk Parity Fund | (8,461,946) | 815,002 | — | — | (1,609,647) | (41,271) | — | — | ||||||||||||||||||||||||
AQR Risk Parity II MV Fund | 22,958 | (1,310) | — | — | (38,936) | (9,227) | — | — | ||||||||||||||||||||||||
AQR Risk Parity II HV Fund | 41,427 | (1,665) | — | — | (46,426) | (39,123) | — | — | ||||||||||||||||||||||||
AQR Multi-Strategy Alternative Fund | (6,450,925) | (1,041,097) | — | — | 846,600 | 39,445 | — | — | ||||||||||||||||||||||||
For swaps, futures and forward foreign currency contracts, the Funds may be required to post collateral if a Fund is in a net liability position with the counterparty exceeding certain amounts. Additionally, counterparties may immediately terminate the position if a Fund fails to maintain sufficient asset coverage for its contracts or its net assets decline by stated percentages.
As of December 31, 2012, the following Funds had net liability positions:
| FUND | DERIVATIVES IN NET LIABILITY POSITION | COLLATERAL POSTED | ||||||
AQR Risk-Balanced Commodities Strategy Fund | (1,431,079) | 11,837,397 | ||||||
AQR Risk Parity II MV Fund | (59,394) | 1,565,729 | ||||||
AQR Risk Parity II HV Fund | (169,453) | 2,205,945 | ||||||
For the year ended December 31, 2012, the quarterly average values of the derivatives held by the Funds were as follows:
| AQR MANAGED FUTURES STRATEGY FUND | AQR RISK BALANCED COMMODITIES STRATEGY FUND | AQR RISK PARITY FUND | AQR RISK PARITY II MV | AQR RISK PARITY II HV | AQR MULTI- STRATEGY ALTERNATIVE FUND | |||||||||||||||||||
Futures Contracts* |
| |||||||||||||||||||||||
Average Notional Balance Long | $7,131,787,909 | $28,838,854 | $630,599,398 | $48,980,569 | $54,691,545 | $948,457,935 | ||||||||||||||||||
Average Notional Balance Short | 940,908,850 | 11,589,204 | 46,202,310 | 1,742,631 | 2,028,891 | 762,526,593 | ||||||||||||||||||
| AQR Funds | Annual Report | December 2012 | 123 | |||||||||||||
Table of Contents
| Notes to Financial Statements | December 31, 2012 |
| AQR MANAGED FUTURES STRATEGY FUND | AQR RISK BALANCED COMMODITIES STRATEGY FUND | AQR RISK PARITY FUND | AQR RISK PARITY II MV | AQR RISK PARITY II HV | AQR MULTI- STRATEGY ALTERNATIVE FUND | |||||||||||||||||||
Forward Foreign Currency |
| |||||||||||||||||||||||
Average Value Purchased | 2,162,995,118 | — | 180,466,998 | 5,474 | 7,826 | 416,091,755 | ||||||||||||||||||
Average Value Sold | 1,981,686,503 | — | 274,262,092 | 6,914,028 | 10,563,655 | 443,025,667 | ||||||||||||||||||
Exchange-Traded Options* |
| |||||||||||||||||||||||
Average Value of Contracts Written | — | — | — | — | — | (20,962) | ||||||||||||||||||
Credit Default Swaps* |
| |||||||||||||||||||||||
Average Notional Balance — Buy Protection | — | — | 326,204,563 | — | — | 16,373,800 | ||||||||||||||||||
Average Notional Balance — Sell Protection | — | — | 737,583,928 | — | — | 37,515,800 | ||||||||||||||||||
Total Return Swaps* |
| |||||||||||||||||||||||
Average Notional Balance — Long | 741,811,284 | 47,965,767 | 390,819,572 | 2,450,326 | 11,873,294 | 82,004,988 | ||||||||||||||||||
Average Notional Balance — Short | 53,557,794 | 2,515,206 | — | — | — | 47,742,522 | ||||||||||||||||||
Interest Rate-Related Swaps* |
| |||||||||||||||||||||||
Average Notional Balance | — | — | 699,979,358 | — | — | — | ||||||||||||||||||
Total Return Basket Swaps* |
| |||||||||||||||||||||||
Average Value of Underlying Positions — Long | — | — | — | — | — | 18,059,880 | ||||||||||||||||||
Average Value of Underlying Positions — Short | — | — | — | — | — | (17,488,917) | ||||||||||||||||||
| * | Values as of each quarter end are used to calculate the average represented. |
The Funds’ derivative contracts held at December 31, 2012, are not accounted for as hedging instruments under GAAP.
8. Investment Advisory and Other Agreements
The Advisor serves as the investment advisor to each of the Funds pursuant to an Investment Advisory Agreement, dated December 4, 2008, as amended, or an Investment Management Agreement, dated June 10, 2010, as amended, entered into by the Trust, on behalf of the Funds (together, the “Advisory Agreement”). Under the Advisory Agreement, the Advisor furnishes a continuous investment program for each Fund’s portfolio, makes day-to-day investment decisions for the Funds, and manages the Funds’ investments in accordance with the stated policies of each Fund. The Advisor is also responsible for selecting brokers and dealers to execute purchase and sale orders for the portfolio transactions of each Fund, subject to its obligation to seek best execution. The Advisor provides persons satisfactory to the Funds’ Board of Trustees to serve as officers of the Funds. Pursuant to the Advisory Agreement, the Funds pay the Advisor a management fee calculated on the average daily net assets for each Fund, in the annual ratios below:
| FUND | RATIO | |||
AQR Managed Futures Strategy Fund | 1.05 | % | ||
AQR Risk-Balanced Commodities Strategy Fund | 0.60 | * | ||
AQR Risk Parity Fund | 0.75 | ** | ||
AQR Risk Parity II MV Fund | 0.50 | *** | ||
AQR Risk Parity II HV Fund | 0.70 | **** | ||
AQR Multi-Strategy Alternative Fund | 1.85 | ***** | ||
| * | The AQR Risk-Balanced Commodities Strategy Fund Advisory Fee is based on the following three tier structure. The first tier charges 0.60% on the first $1 billion of net assets; the second tier charges 0.575% on net assets in excess of $1 billion, up to $3 billion; and the third tier charges 0.55% on net assets in excess of $3 billion. |
| ** | The AQR Risk Parity Fund Advisory Fee is based on the following two tier structure. The first tier charges 0.75% on the first $1 billion of net assets and the second tier charges 0.70% on net assets in excess of $1 billion. |
| 124 | AQR Funds | Annual Report | December 2012 | |||||||||||||
Table of Contents
| Notes to Financial Statements | December 31, 2012 |
| *** | The AQR Risk Parity II MV Fund Advisory Fee is based on the following three tier structure. The first tier charges 0.50% on the first $1 billion of net assets; the second tier charges 0.475% on net assets in excess of $1 billion, up to $3 billion; and the third tier charges 0.45% on net assets in excess of $3 billion. |
| **** | The AQR Risk Parity II HV Fund Advisory Fee is based on the following three tier structure. The first tier charges 0.70% on the first $1 billion of net assets; the second tier charges 0.675% on net assets in excess of $1 billion, up to $3 billion; and the third tier charges 0.65% on net assets in excess of $3 billion. |
| ***** | The AQR Multi-Strategy Alternative Fund Advisory Fee is based on the following two tier structure. The first tier charges 1.85% on the first $1 billion of net assets and the second tier charges 1.80% on net assets in excess of $1 billion. |
The Trust and the Advisor have entered into a Fee Waiver and Expense Reimbursement Agreement whereby the Advisor has agreed to waive its fee and/or reimburse each Fund at least through April 30, 2013 (April 30, 2014 for Risk-Balanced Commodities Strategy Fund, AQR Risk Parity II MV Fund and AQR Risk Parity II HV Fund). The Advisor has agreed to waive and/or reimburse each Fund to the extent that the total annual fund operating expense ratios (including the consolidated expenses of the Subsidiaries), exclusive of interest, taxes, borrowing costs, acquired fund fees and expenses, dividend and interest expense related to short sales, and extraordinary expenses exceed the following ratios:
| FUND | CLASS I | CLASS N | ||||||
AQR Managed Futures Strategy Fund | 1.25 | % | 1.50 | % | ||||
AQR Risk-Balanced Commodities Strategy Fund | 1.05 | 1.30 | ||||||
AQR Risk Parity Fund | 0.95 | 1.20 | ||||||
AQR Risk Parity II MV Fund | 0.95 | 1.20 | ||||||
AQR Risk Parity II HV Fund | 1.15 | 1.40 | ||||||
AQR Multi-Strategy Alternative Fund | 1.98 | 2.23 | ||||||
The Trust, in turn, agreed that the Funds will repay the fee waiver/expense reimbursement to the Advisor. Such repayment shall be made only out of the class of the Fund for which the applicable fee waiver and expense reimbursement was made. Repayments with respect to a Fund must be limited to amounts that do not cause the aggregate operating expenses of the Fund attributable to a share class during a year in which such repayment is made to exceed the applicable ratios when the waiver was generated. A repayment shall be payable only to the extent it can be made during the thirty six months following the applicable period during which the Advisor waived fees or reimbursed the applicable Fund for its operating expenses under the Agreement.
For the year ended December 31, 2012, the amounts waived and reimbursed by the Advisor, as well as the amounts available for potential future recoupment by the Advisor and the expiration schedule at December 31, 2012 are as follows:
| FEES WAIVED/ REIMBURSED FOR THE PERIOD ENDED DECEMBER 31, 2012 | TOTAL POTENTIAL FOR THE | POTENTIAL RECOUPMENT AMOUNTS EXPIRING DECEMBER 31 | ||||||||||||||||||
| 2013 | 2014 | 2015 | ||||||||||||||||||
AQR MANAGED FUTURES STRATEGY FUND | ||||||||||||||||||||
Class I | $ | — | $ | 386,265 | $ | 13,457 | $ | 372,808 | $ | — | ||||||||||
| Class N | 77,598 | 438,056 | 52,983 | 307,475 | 77,598 | |||||||||||||||
Totals | $ | 77,598 | $ | 824,321 | $ | 66,440 | $ | 680,283 | $ | 77,598 | ||||||||||
AQR RISK-BALANCED COMMODITIES STRATEGY FUND | ||||||||||||||||||||
Class I | $ | 181,810 | $ | 181,810 | $ | — | $ | — | $ | 181,810 | ||||||||||
| Class N | 19,100 | 19,100 | — | — | 19,100 | |||||||||||||||
Totals | $ | 200,910 | $ | 200,910 | $ | — | $ | — | $ | 200,910 | ||||||||||
AQR RISK PARITY FUND | ||||||||||||||||||||
Class I | $ | — | $ | 15,898 | $ | 1,760 | $ | 14,138 | $ | — | ||||||||||
| Class N | 34,933 | 196,099 | 64,602 | 96,564 | 34,933 | |||||||||||||||
Totals | $ | 34,933 | $ | 211,997 | $ | 66,362 | $ | 110,702 | $ | 34,933 | ||||||||||
| AQR Funds | Annual Report | December 2012 | 125 | |||||||||||||
Table of Contents
| Notes to Financial Statements | December 31, 2012 |
| FEES WAIVED/ REIMBURSED FOR THE PERIOD ENDED DECEMBER 31, 2012 | TOTAL POTENTIAL FOR THE | POTENTIAL RECOUPMENT AMOUNTS EXPIRING DECEMBER 31 | ||||||||||||||||||
| 2013 | 2014 | 2015 | ||||||||||||||||||
| AQR RISK PARITY II MV FUND | ||||||||||||||||||||
Class I | $ | 102,338 | $ | 102,338 | $ | — | $ | — | $ | 102,338 | ||||||||||
| Class N | 13,557 | 13,557 | — | — | 13,557 | |||||||||||||||
Totals | $ | 115,895 | $ | 115,895 | $ | — | $ | — | $ | 115,895 | ||||||||||
| AQR RISK PARITY II HV FUND | ||||||||||||||||||||
Class I | $ | 79,653 | $ | 79,653 | $ | — | $ | — | $ | 79,653 | ||||||||||
| Class N | 36,272 | 36,272 | — | — | 36,272 | |||||||||||||||
Totals | $ | 115,925 | $ | 115,925 | $ | — | $ | — | $ | 115,925 | ||||||||||
| AQR MULTI-STRATEGY ALTERNATIVE FUND | ||||||||||||||||||||
Class I | $ | 449,951 | $ | 772,933 | $ | — | $ | 322,982 | $ | 449,951 | ||||||||||
| Class N | 55,557 | 115,048 | — | 59,491 | 55,557 | |||||||||||||||
Totals | $ | 505,508 | $ | 887,981 | $ | — | $ | 382,473 | $ | 505,508 | ||||||||||
During the year ended December 31, 2012, AQR Managed Futures Strategy Fund Class I and Risk Parity Fund Class I recouped $87,813 and $198,237, respectively.
Pursuant to the Sub-Advisory Agreement between the Sub-Advisor, the Advisor and the Trust, the Advisor will pay the Sub-Advisor an annual fee, payable monthly, at the annual rate of 0.35% of the average daily net assets for AQR Multi-Strategy Alternative Fund.
J.P. Morgan Investor Services Co., serves as the Funds’ Administrator and Accounting Agent and JPMorgan Chase Bank, N.A., serves as Custodian.
ALPS Fund Services, Inc. serves as the Funds’ Transfer Agent, and ALPS Distributors, Inc. serves as the Funds’ Distributor.
9. Distribution Plan
The Trust has adopted a Plan of Distribution (the “Plan”) pursuant to Rule 12b-1 under the 1940 Act with respect to the Class N shares of the Funds, as applicable. The Plan allows for the payment of services related to the distribution and servicing of these shares at a rate of up to 0.25% per annum of the average daily net asset value of the Class N shares of the Funds, as applicable.
10. Shareholder Service Plan
Pursuant to a Shareholder Services Agreement, between the Trust (excluding the AQR Managed Futures Strategy Fund, AQR Risk Parity Fund and AQR Multi-Strategy Alternative Fund) and the Advisor, the Advisor provides a wide range of services to the Funds and their shareholders. These services include, among others, access to performance information reporting, analysis and explanations of Fund reports as well as electronic access to Fund information. Under this agreement the Advisor receives an annual fee, payable monthly, calculated on the average daily net assets of each Class at the following rates:
| FUND | CLASS I | CLASS N | ||||||
AQR Risk-Balanced Commodities Strategy Fund | 0.25 | % | 0.25 | % | ||||
AQR Risk Parity II MV Fund | 0.25 | 0.25 | ||||||
AQR Risk Parity II HV Fund | 0.25 | 0.25 | ||||||
| 126 | AQR Funds | Annual Report | December 2012 | |||||||||||||
Table of Contents
| Notes to Financial Statements | December 31, 2012 |
In addition, the Advisor may, from time to time, compensate third parties (including financial intermediaries) from the fees the Advisor receives under the Shareholder Services Agreement for non-distribution shareholder services such third parties provide to clients or customers that are shareholders of the Funds. Fees incurred by the Funds under the Plan and/or the shareholder services agreement for the year ended December 31, 2012, were as follows:
| FUND | CLASS I | CLASS N | ||||||
AQR Risk-Balanced Commodities Strategy Fund | $ | 39,047 | $ | 1,476 | ||||
AQR Risk Parity II MV Fund | 4,695 | 749 | ||||||
AQR Risk Parity II HV Fund | 3,915 | 1,095 | ||||||
11. Purchases and Redemption of Shares
Investors may purchase shares of a Fund at their net asset value (“NAV”), based on the next calculation of the NAV after the order is placed. Neither the Fund nor the distributor charges a sales charge or other transaction fee to purchase shares, although other institutions may impose transaction fees on shares purchased through them. Prior to May 1, 2011, the Funds reserved the right to charge a redemption fee on redemption proceeds for shares that were held for less than 60 days. Effective May 1, 2011, this fee was eliminated.
12. Risks and Concentrations
The Funds, at times, utilize substantial leverage in their investment program. Such leverage may take the form of trading on margin, investing in derivative instruments that are inherently leveraged, entering into repurchase transactions and entering into other forms of direct and indirect borrowings.
There is no guarantee that the Funds’ borrowing arrangements or other arrangements for obtaining leverage will continue to be available, or if available, will be available on terms and conditions acceptable to the Funds. Unfavorable economic conditions also could increase funding costs, limits access to the capital markets or result in a decision by lenders not to extend credit to the Funds. In addition, a decline in market value of the Funds assets may have particular adverse consequences in instances where they have borrowed money based on the market value of those assets. A decrease in market value of those assets may result in the lender (including derivative counterparties) requiring the Funds to post additional collateral or otherwise sell assets at a time when it may not be in the Funds best interest to do so.
The counterparties to the Funds securities sold short, currency forward, futures, option and swap contracts and reverse repurchase agreements include affiliates of the Funds clearing brokers and other major financial institutions. While the Funds utilize multiple clearing brokers and counterparties, a concentration of credit risk exists because of balances held and transactions with a limited number of clearing brokers and counterparties.
By using derivative instruments, the Funds are exposed to the counterparty’s credit risk, the risk that derivative counterparties may not perform in accordance with the contractual provisions offset by the value of any collateral received. The Funds’ exposure to credit risk associated with counterparty non-performance is limited to the unrealized gains inherent in such transactions that are recognized in the Statements of Assets and Liabilities. The Funds minimize counterparty credit risk through credit limits and approvals, credit monitoring procedures, executing master netting arrangements and managing margin and collateral requirements, as appropriate.
The Funds may have elements of risk not typically associated with investments in the United States of America due to concentrated investments in a limited number of countries or regions, which may vary throughout the year. Such concentrations may subject the Funds to additional risks resulting from political or economic conditions in such countries or regions and the possible imposition of adverse governmental laws or currency exchange restrictions could cause the securities and their markets to be less liquid and their prices to be more volatile than those of comparable U.S. companies.
Swap agreements involve, to varying degrees, elements of market risk (generally equity price risk related to equity index swap agreements, interest rate risk related to bond swap agreements and commodity risk related to synthetic swap agreements utilizing futures) and exposure to loss in excess of the amount reflected on the Statements of Assets and Liabilities. The notional amounts, which are disclosed as of period end in the swap tables included in the Schedules of
| AQR Funds | Annual Report | December 2012 | 127 | |||||||||||||
Table of Contents
| Notes to Financial Statements | December 31, 2012 |
Investments, reflect the current investment exposure each Fund has under the swap agreement which may exceed the net asset value of the Fund.
The Funds are not limited in the percentage of its assets that may be invested in convertible securities. Convertible securities generally offer lower interest or dividend yields than non-convertible securities of similar quality. The market values of convertible securities tend to decline as interest rates increase and, conversely, to increase as interest rates decline. However, the convertible security’s market value tends to reflect the market price of the common stock of the issuing company when that stock price is greater than the convertible’s “conversion price,” which is the predetermined price at which the convertible security could be exchanged for the associated stock.
Convertible securities and non-convertible income producing securities are subject to certain risks, including (i) if interest rates go up, the value of convertible securities and non-convertible income-producing securities in the Funds’ portfolio generally will decline; (ii) during periods of declining interest rates, the issuer of a security may exercise its option to prepay principal earlier than scheduled, forcing the Funds to reinvest in lower yielding securities (call or prepayment risk); and (iii) during periods of rising interest rates, the average life of certain types of securities may be extended because of slower than expected principal payments (extension risk).
Credit risk is the risk that one or more securities in the Funds’ portfolio will decline in price, or fail to pay interest or principal when due, because the issuer of the security experiences a decline in its financial status. The Funds’ investments in convertible and nonconvertible debt securities involve credit risk. However, in general, lower rated securities carry a greater degree of risk that the issuer will lose its ability to make interest and principal payments, which could have a negative impact on the Funds’ net asset value or dividends.
As of December 31, 2012, the AQR Multi-Strategy Alternative Fund pledged a substantial portion of its assets for securities sold short to JPMorgan Chase Bank, N.A.
13. Line of Credit
For the period of January 1, 2012 to March 1, 2012, and contractually extended through March 16, 2012, the Trust (excluding the AQR Managed Futures Strategy Fund and AQR Risk Parity Fund) had secured a committed, $150,000,000 line of credit with JPMorgan Chase Bank, N.A. Borrowings, if any, under this arrangement bore interest at the Federal Funds Rate plus the sum of (a) 1.5% per annum plus (b) if the LIBOR Reference Rate exceeded the Federal Funds Rate, the amount of such excess, which was paid quarterly. The maximum loan amount outstanding per Fund was the lesser of an amount which did not exceed the borrowing limits set forth in the Fund’s Prospectus and/or Registration Statement and did not cause the Asset Coverage Ratio for all borrowings to drop below 500%. The agreement was subject to an annual commitment fee which was payable in arrears on a quarterly basis. This line of credit expired on March 16, 2012. For the period ended March 16, 2012, the Funds did not have any outstanding borrowings under this agreement.
Effective March 2, 2012 and terminating on March 1, 2013, the Trust (excluding the AQR Managed Futures Strategy Fund, AQR Risk Parity Fund, AQR Risk Parity II MV Fund and Risk Parity II HV Fund) had secured a committed, $150,000,000 line of credit with Bank of America, N.A. Borrowings, if any, under this arrangement bore interest at the sum of (a) 1.0% per annum plus (b) the higher of (i) the Federal Funds Rate and (ii) the Eurodollar Rate, the amount of such excess, which was paid quarterly. The maximum loan amount outstanding per Fund was the lesser of an amount which did not exceed the borrowing limits set forth in the Fund’s Prospectus and/or Registration Statement and did not cause the Asset Coverage Ratio for all borrowings to drop below 500%. The agreement is subject to an annual commitment fee which is payable in arrears on a quarterly basis. In the event of a draw upon the line of credit, investments of the responsible Fund may be designated as collateral until its loan is repaid in full. For the year ended December 31, 2012, the Funds did not have any outstanding borrowings under this agreement.
| 128 | AQR Funds | Annual Report | December 2012 | |||||||||||||
Table of Contents
| Notes to Financial Statements | December 31, 2012 |
14. Principal Ownership
As of December 31, 2012, the Funds had individual shareholder accounts owning more than 5% of the total shares outstanding of the Fund as follows:
| FUND | NUMBER OF SHAREHOLDERS | TOTAL PERCENTAGE INTEREST HELD | ||||||
AQR Risk Parity Fund | 1 | 7.39 | % | |||||
AQR Risk Parity II HV Fund * | 4 | 68.00 | % | |||||
| * | The percentage shown is owned by the Advisor and its affiliates. |
Significant shareholder transactions by these shareholders, if any, may impact the Funds’ performance.
15. New Accounting Pronouncements
In December 2011, the FASB issued ASU No. 2011-11, Balance Sheet (Topic) 210: Disclosures about Offsetting Assets and Liabilities (“ASU 2011-11”) which provides guidance to enhance disclosures about financial instruments and derivative instruments that are either (a) offset or (b) subject to an enforceable master netting arrangement or similar agreement even if the Funds do not elect to net the transactions on the balance sheet. Under this new guidance, Funds are required to disclose quantitative information relating to recognized assets and liabilities that are offset or subject to an enforceable master netting arrangement or similar agreement. On January 9, 2013, the FASB clarified the scope of ASU 2011-11, which limits the offsetting disclosures to derivatives, repurchase agreements, and securities lending transactions. The Funds are required to apply ASU 2011-11, and the related amendment, for annual reporting periods beginning on or after January 1, 2013, and interim periods within those annual periods. Implementation of ASU 2011-11 may require legal interpretation of relevant agreements and an analysis of the contracts associated with such agreements to determine whether they fall within the scope of the standard. Management is currently assessing the impact of ASU 2011-11 but does not believe the adoption will have a material impact on their financial statements.
16. Subsequent Events
The Funds have evaluated subsequent events through the date of issuance of this report and have determined that there are no material events that would require accrual or disclosure.
| AQR Funds | Annual Report | December 2012 | 129 | |||||||||||||
Table of Contents
To the Board of Trustees and Shareholders of AQR Funds:
In our opinion, the accompanying consolidated statements of assets and liabilities, including the consolidated schedules of investments, and the related consolidated statements of operations, of changes in net assets, and of cash flows and the financial highlights present fairly, in all material respects, the financial position of AQR Managed Futures Strategy Fund, AQR Risk-Balanced Commodities Strategy Fund, AQR Risk Parity Fund, AQR Risk Parity II MV Fund, AQR Risk Parity II HV Fund and AQR Multi-Strategy Alternative Fund (six of the portfolios constituting AQR Funds, hereinafter referred to as the “Funds”) and their subsidiaries at December 31, 2012, and the results of each of their operations, the changes in each of their net assets, the cash flows of AQR Multi-Strategy Alternative Fund and AQR Risk Parity II HV Fund and the financial highlights for each of the periods presented, in conformity with accounting principles generally accepted in the United States of America. These financial statements and financial highlights (hereafter referred to as “financial statements”) are the responsibility of the Funds’ management; our responsibility is to express an opinion on these financial statements based on our audits. We conducted our audits of these financial statements in accordance with the standards of the Public Company Accounting Oversight Board (United States). Those standards require that we plan and perform the audit to obtain reasonable assurance about whether the financial statements are free of material misstatement. An audit includes examining, on a test basis, evidence supporting the amounts and disclosures in the financial statements, assessing the accounting principles used and significant estimates made by management, and evaluating the overall financial statement presentation. We believe that our audits, which included confirmation of securities at December 31, 2012 by correspondence with the custodian, brokers and transfer agents and the application of alternative procedures where confirmation of securities purchased had not been received, provide a reasonable basis for our opinion.
PricewaterhouseCoopers LLP
New York, New York
February 28, 2013
| 130 | AQR Funds | Annual Report | December 2012 | |||||||||||||
Table of Contents
For the year ended December 31, 2012, certain dividends paid by the Funds may be subject to a maximum tax of 15% as provided for by the Jobs and Growth Tax Relief Reconciliation Act of 2003. The Funds intend to designate the maximum allowable as taxed at the 15% rate. The following represents the percentage of ordinary income distributions treated as qualifying dividends:
| FUND | PERCENTAGE | |||
AQR Multi-Strategy Alternative Fund | 100.00% | |||
For the taxable year ended December 31, 2012, the following percentages of income dividends paid by the Fund qualify for the 70% dividends received deductions available to corporations:
| FUND | PERCENTAGE | |||
AQR Multi-Strategy Alternative Fund | 1.92% | |||
The Funds designate the following amounts, or the maximum allowable under the Internal Revenue Code, as long term capital gain distributions qualifying the maximum 15% income tax rate for individuals:
| FUND | TOTAL | |||
AQR Managed Futures Strategy Fund | $ | 1,885 | ||
AQR Risk Parity Fund | 625,990 | |||
| AQR Funds | Annual Report | December 2012 | 131 | |||||||||||||
Table of Contents
| BEGINNING ACCOUNT DATE VALUE | ENDING ACCOUNT VALUE 12/31/12 | ANNUALIZED EXPENSE RATIO FOR THE PERIOD | EXPENSES PAID FOR THE PERIOD ENDING 12/31/12 | |||||||||||||
AQR Managed Futures Strategy Fund | ||||||||||||||||
Class I | ||||||||||||||||
Actual Return | $1,000.00 | $1,031.00 | 1.25% | $6.38 | ||||||||||||
Hypothetical Return | $1,000.00 | $1,018.85 | 1.25% | $6.34 | ||||||||||||
Class N | ||||||||||||||||
Actual Return | $1,000.00 | $1,030.00 | 1.50% | $7.65 | ||||||||||||
Hypothetical Return | $1,000.00 | $1,017.60 | 1.50% | $7.61 | ||||||||||||
AQR Risk-Balanced Commodities Strategy Fund | ||||||||||||||||
Class I (1) | ||||||||||||||||
Actual Return | $1,000.00 | $987.00 | 1.05% | $5.02 | (a) | |||||||||||
Hypothetical Return | $1,000.00 | $1,019.86 | 1.05% | $5.33 | ||||||||||||
Class N (1) | ||||||||||||||||
Actual Return | $1,000.00 | $986.00 | 1.30% | $6.21 | (a) | |||||||||||
Hypothetical Return | $1,000.00 | $1,018.60 | 1.30% | $6.60 | ||||||||||||
AQR Risk Parity Fund | ||||||||||||||||
Class I | ||||||||||||||||
Actual Return | $1,000.00 | $1,091.20 | 0.95% | $4.99 | ||||||||||||
Hypothetical Return | $1,000.00 | $1,020.36 | 0.95% | $4.82 | ||||||||||||
Class N | ||||||||||||||||
Actual Return | $1,000.00 | $1,090.50 | 1.20% | $6.31 | ||||||||||||
Hypothetical Return | $1,000.00 | $1,019.10 | 1.20% | $6.09 | ||||||||||||
AQR Risk Parity II MV Fund | ||||||||||||||||
Class I (2) | ||||||||||||||||
Actual Return | $1,000.00 | $1,017.70 | 0.95% | $1.49 | (b) | |||||||||||
Hypothetical Return | $1,000.00 | $1,020.36 | 0.95% | $4.82 | ||||||||||||
Class N (2) | ||||||||||||||||
Actual Return | $1,000.00 | $1,017.00 | 1.20% | $1.88 | (b) | |||||||||||
Hypothetical Return | $1,000.00 | $1,019.10 | 1.20% | $6.09 | ||||||||||||
AQR Risk Parity II HV Fund | ||||||||||||||||
Class I (2) | ||||||||||||||||
Actual Return | $1,000.00 | $1,024.40 | 1.28% | $2.02(b) | ||||||||||||
Hypothetical Return | $1,000.00 | $1,018.70 | 1.28% | $6.50 | ||||||||||||
Class N (2) | ||||||||||||||||
Actual Return | $1,000.00 | $1,023.80 | 1.53% | $2.41(b) | ||||||||||||
Hypothetical Return | $1,000.00 | $1,017.44 | 1.53% | $7.76 | ||||||||||||
| 132 | AQR Funds | Annual Report | December 2012 | |||||||||||||
Table of Contents
| Funds Expense Example (Unaudited) |
| BEGINNING ACCOUNT DATE VALUE | ENDING ACCOUNT VALUE 12/31/12 | ANNUALIZED EXPENSE RATIO FOR THE PERIOD | EXPENSES PAID FOR THE PERIOD ENDING 12/31/12 | |||||||||||||
AQR Multi-Strategy Alternative Fund | ||||||||||||||||
Class I | ||||||||||||||||
Actual Return | $1,000.00 | $1,021.50 | 4.10% | $20.83 | ||||||||||||
Hypothetical Return | $1,000.00 | $1,004.52 | 4.10% | $20.66 | ||||||||||||
Class N | ||||||||||||||||
Actual Return | $1,000.00 | $1,020.10 | 5.01% | $25.44 | ||||||||||||
Hypothetical Return | $1,000.00 | $999.95 | 5.01% | $25.19 | ||||||||||||
| Expenses are calculated using each Class’ annualized expense ratio, multiplied by the average account value for the period, multiplied by 184/366 (to reflect the one-half year period unless stated otherwise). |
| (1) | Commencement of operations was July 9, 2012. |
| (a) | Expenses are calculated using each Class’ annualized expense ratio, multiplied by the average account value for the period, multiplied by 176/366 (to reflect the period since commencement of operations). |
| (2) | Commencement of operations was November 5, 2012. |
| (b) | Expenses are calculated using each Class’ annualized expense ratio, multiplied by the average account value for the period, multiplied by 57/366 (to reflect the period since commencement of operations). |
| AQR Funds | Annual Report | December 2012 | 133 | |||||||||||||
Table of Contents
Listed in the chart below is basic information regarding the Trustees and Officers of the Trust. The address of each Officer and Trustee is Two Greenwich Plaza, 3rd Floor, Greenwich CT 06830.
| NAME AND YEAR OF BIRTH | CURRENT POSITION WITH THE TRUST, TERM OF OFFICE1 AND LENGTH OF TIME SERVED | PRINCIPAL OCCUPATION(S) DURING PAST 5 YEARS | NUMBER OF FUNDS IN FUND COMPLEX OVERSEEN BY TRUSTEE | OTHER PRESENT OR PAST DIRECTORSHIPS HELD BY TRUSTEE (DURING THE PAST 5 YEARS) | ||||
Disinterested Trustees2 | ||||||||
| Timothy K. Armour, 1948 | Chairman of the Board since 2010 and Trustee, since 2008 | Interim Chief Executive Officer of Janus Capital Group (2009 to 2010); Managing Director, Chief Operating Officer and President, Morningstar Inc. (1998 to 2008). | 31 | Janus Capital Group (since 2008); ETF Securities (since 2009); AARP Services, Inc. (since 2008) | ||||
| L. Joe Moravy, 1950 | Trustee, since 2008 | Managing Director, Finance Scholars Group (since 2010) (consulting firm); Managing Director, LJM Advisory (2008- 2010) (consulting firm); Partner, Ernst & Young LLP (2002 to 2008). | 31 | Nuveen Exchange Traded Commodities Funds (since 2012) | ||||
| William L. Atwell, 1950 | Trustee, since 2011 | Managing Director, Atwell Partners LLC (since 2012) (consulting services); President (CIGNA International), CIGNA (2008 to 2012) (Insurance). | 31 | None | ||||
| Gregg D. Behrens, 1952 | Trustee, since 2011 | Governor, Iowa State University Foundation (volunteer, since 2004); Executive Vice President, and Chief Executive Officer (Asia-Pacific Region), Northern Trust Company (1974 to 2009) (financial services). | 31 | None | ||||
| Brian Posner, 1961 | Trustee, since 2011 | President, Point Rider Group LLC (since 2008) (consulting and advisory services); President and Chief Executive Officer, ClearBridge Advisors LLC (2005 to 2008) (financial services). | 31 | Biogen Idec (since 2008); Arch Capital Group (since 2010); Anadys Pharmaceuticals, Inc. (2011); BG Medicine (since 2012); RiverPark Funds (2010 to 2012) | ||||
Interested Trustee3 | ||||||||
| David Kabiller, 1963 | Trustee, since 2010 | Founding Principal, AQR Capital Management, LLC (since 1998). | 31 | None | ||||
| 134 | AQR Funds | Annual Report | December 2012 | |||||||||||||
Table of Contents
| Trustees and Officers (Unaudited) | December 31, 2011 |
| NAME AND YEAR OF BIRTH | CURRENT POSITION WITH THE TRUST, TERM OF OFFICE1 AND LENGTH OF TIME SERVED | PRINCIPAL OCCUPATION(S) DURING PAST 5 YEARS | NUMBER OF FUNDS IN FUND COMPLEX OVERSEEN BY TRUSTEE | OTHER PRESENT OR PAST DIRECTORSHIPS HELD BY TRUSTEE (DURING THE PAST 5 YEARS) | ||||
Officers | ||||||||
| Marco Hanig, 1958 | Chief Executive Officer, since 2009; President, since 2008 | Principal, AQR Capital Management, LLC (since 2008). | N/A | N/A | ||||
| Abdon Bolivar, 1965 | Chief Compliance Officer, since 2008 | Chief Compliance Officer, AQR Capital Management, LLC (since 2002). | N/A | N/A | ||||
| Nir Messafi, 1975 | Chief Financial Officer, since 2010; Vice President, since 2009; Treasurer from 2009 to 2010 | Vice President, AQR Capital Management, LLC (since 2003). | N/A | N/A | ||||
| Aaron Masek, 1974 | Vice President and Treasurer, since 2010 | Vice President, AQR Capital Management, LLC (since 2010); prior thereto Audit Manager, Cohen Fund Audit Services, Ltd. (2008 to 2009); prior thereto Senior Vice President, Citi Fund Services Ohio, Inc. (1996 to 2008). | N/A | N/A | ||||
| Bradley Asness, 1969 | Vice President and Chief Legal Officer, since 2009 | Principal and Chief Legal Officer, AQR Capital Management, LLC (since 1998). | N/A | N/A | ||||
| Brendan R. Kalb, 1975 | Executive Vice President, since 2009; Secretary, since 2008 | General Counsel, AQR Capital Management, LLC (since 2004). | N/A | N/A | ||||
| Nicole DonVito, 1979 | Vice President, since 2009 | Vice President, AQR Capital Management, LLC (since 2007). | N/A | N/A | ||||
| (1) | Each Trustee serves until the election and qualification of a successor, or until death, resignation or removal as provided in the Trust’s Declaration of Trust. |
| (2) | A Disinterested Trustee is any Trustee that is not an “interested person” of the Trust within the meaning of Section 2(a)(19) of the 1940 Act. |
| (3) | An Interested Trustee is a Trustee that is an “interested person” of the Trust within the meaning of Section 2(a)(19) of the 1940 Act. Mr. Kabiller is an interested person of the Trust because of his position with the Advisor. |
| AQR Funds | Annual Report | December 2012 | 135 | |||||||||||||
Table of Contents
| AQR RISK-BALANCED COMMODITIES STRATEGY FUND AND AQR RISK-BALANCED COMMODITIES STRATEGY LV FUND |
The Board of Trustees (the “Board,” and the members of which are referred to as “Board Members”) of the AQR Funds (the “Trust”) met in person on May 22-23, 2012, to consider the approval of the investment advisory agreement between the Trust, on behalf of the AQR Risk-Balanced Commodities Strategy Fund and AQR Risk-Balanced Commodities Strategy LV Fund (together, the “Funds”), and AQR Capital Management, LLC (“AQR”) (the “Investment Advisory Agreement”). In accordance with Section 15(c) of the Investment Company Act of 1940, as amended (the “1940 Act”), the Board requested, reviewed and considered materials furnished by AQR relevant to the Board’s consideration of whether to approve the Investment Advisory Agreement. These materials included: (1) memoranda and materials provided by AQR, describing the personnel and services to be provided to the Funds; (2) performance information for strategies and model portfolios relevant to the consideration of the Investment Advisory Agreement; (3) information independently compiled and prepared by FUSE Research relating to the Funds’ proposed fees and expenses; (4) a discussion of the financial statements of AQR and the regulatory exam history; and (5) a discussion of the compliance program and the regulatory exam history of AQR. AQR is referred to herein as the “Advisor,” as applicable.
At an in person meeting held on May 22-23, 2012, the Board, including the Board Members who are not “interested persons” as defined in the 1940 Act (the “Independent Board Members”), unanimously approved the Investment Advisory Agreement for an initial two-year period. The Board considered all factors it believed to be relevant with respect to the Funds, including, among other factors: (a) the nature, extent and quality of the services to be provided by the Advisor; (b) the investment performance of the Advisor and the Advisor’s portfolio management; (c) the advisory fee and the cost of the services and profits to be realized by the Advisor from the relationship with the Funds; (d) economies of scale; and (e) other factors.
The Board also considered other matters it deemed important to the approval process, such as the services related to the valuation and pricing of the Funds’ portfolio holdings, direct and indirect benefits to the Advisor and its affiliates from their relationship with the Funds and advice from independent legal counsel with respect to the review process and materials submitted for the Board’s review. The Board did not identify any particular information as controlling, and each Board Member may have attributed different weightings to the various items considered.
The following is a summary of the Board’s discussion and views regarding the factors it considered in evaluating the Investment Advisory Agreement:
The nature, extent and quality of the services to be provided by the Advisor. The Board Members reviewed the services that the Advisor would provide to the Funds under the Investment Advisory Agreement. The Board considered the size and experience of the Advisor’s staff, its use of technology, and the Funds’ stated investment objectives, strategies and processes. The Board reviewed the overall qualifications of the Advisor as an investment advisor. In connection with the investment advisory services to be provided to the Funds, the Board Members took into account detailed conversations they had with officers of the Advisor regarding the management of the Funds’ investments in accordance with the Funds’ stated investment objectives and policies and the types of transactions that would be entered into on behalf of the Funds. During these discussions, the Board Members asked detailed questions of, and received answers from, the officers of the Advisor regarding the formulation and proposed implementation of the Funds’ investment strategies, their efficacy and potential risks.
In addition to the investment advisory services to be provided to the Funds, the Board Members considered that AQR also will provide shareholder and administrative services, oversight of Fund accounting, marketing services, and assistance in meeting legal and regulatory requirements and other services necessary for the operation of the Funds. In particular, the Board Members reviewed the compliance and administrative services to be provided to the Funds by AQR. The Board also reviewed a wide range of services to be provided to certain of the Funds’ shareholders under a shareholder services agreement between the Trust, on behalf of the Funds, and AQR. These services include providing information and services to Fund shareholders, including professional and informative reporting, access to analysis and explanations of Fund reports, and electronic access to Fund information.
Finally, the Independent Board Members had an opportunity to meet outside the presence of management in executive session separately with counsel to discuss and consider the Investment Advisory Agreement. Based on the presentations at the May 22-23, 2012 Board meeting, the Board concluded that the services to be provided to the Funds by AQR pursuant to the Investment Advisory Agreement were likely to be of a high quality and would benefit the Funds.
Investment Performance and the Advisor’s Portfolio Management. Because the Funds are newly formed, the Board did not consider the investment performance of the Funds. The Board based its review of the Advisor’s performance
| 136 | AQR Funds | Annual Report | December 2012 | |||||||||||||
Table of Contents
| Board Approval of Investment Advisory Agreements (Unaudited) | ||
primarily on the experience of the Advisor in managing other registered investment companies and private funds, noting that other funds the Advisor manages might have investment objectives, policies or restrictions different from those of the Funds. The Board reviewed performance information for strategies and model portfolios similar to that of the Funds. The Board also considered the experience, resources and strengths of the Advisor and its affiliates with respect to the investment strategies proposed for the Funds. Based on these factors, the Board Members determined that the AQR would be an appropriate investment advisor for the Funds.
The Advisory Fee and the Cost of the Services and Profits to be Realized by the Advisor from the Relationship with the Funds. The Board, including the Independent Board Members, received and reviewed information regarding the management fees to be paid by the Funds to the Advisor pursuant to the Investment Advisory Agreement. The Board examined this information in order to determine the reasonableness of the fees in light of the nature and quality of services to be provided to the Funds.
To assist in this analysis, the Board received a report independently prepared by FUSE Research using Morningstar data. The report showed comparative fee information for each Fund’s expense group and expense universe, including expense comparisons of contractual investment advisory fees and actual total operating expenses. The Board noted that breakpoints are part of the Funds’ proposed investment advisory fee rate and that the proposed management fee rate would decrease as a Fund increases in size.
The Board also received and reviewed information regarding the profitability of the Advisor with respect to Fund-related activities. The Board took into consideration the Advisor’s profits from the management of other private accounts. The Board also reviewed the Advisor’s methodology of determining profitability. The Board recognized that profitability may be affected by numerous factors including, among other things, fee waivers and expense reimbursements by the Advisor, the types of funds managed, expense allocations and business mix, and therefore comparability of profitability is somewhat limited.
The Board reviewed an estimate of the Advisor’s costs and profitability for fiscal year ended December 31, 2011. The purpose of the review was to help the Independent Board Members determine whether the firm has the necessary resources to continue to provide high quality services to the Funds and attract and retain high quality employees.
The Board concluded that the management fee is reasonable.
Economies of Scale. Because the Funds are newly formed and had not commenced operations as of May 23, 2012, and the eventual aggregate amount of Fund assets was uncertain, the Advisor was not able to provide the Board Members with specific information concerning the extent to which economies of scale would be realized as the Funds grow and whether fee levels would reflect such economies of scale, if any. The Board noted that the Funds would have breakpoints in their advisory fees which allow investors to benefit directly in the form of lower fees as fund assets grow. The Advisor presented information to show that the fees were set as a level that is competitive relative to funds of similar, actual or anticipated size. The Board considered that the funds in the AQR fund complex share some common resources and, as a result, an increase in the overall size of the complex could permit each fund to incur lower expenses than it would otherwise as a stand-alone entity. The Board also considered the Advisor’s overall operations and its efforts to expand the scale of, and improve the quality of, its operations.
Other Factors. The Board also took into account other ancillary or “fall out” benefits that the Advisor or its affiliates may derive from its relationship with the Funds, both tangible and intangible. The Board also received information regarding the Advisor’s brokerage and soft dollar practices. The Board considered that the Advisor is responsible for decisions to buy and sell securities for the Funds, selection of broker-dealers and best execution, and aggregation and allocation of trade orders among the firm’s various advisory clients. The Board noted that the Advisor does not presently intend to make use of soft dollars to acquire third-party research.
Conclusion. Counsel advised the Board concerning the statutory and regulatory requirements for approval and disclosure of investment advisory agreements. No single factor was determinative to the decision of the Board. Based on the foregoing and such other matters as were deemed relevant, all of the Board Members, including all of the Independent Board Members, concluded that the proposed advisory fee rates and projected total expense ratios are reasonable in relation to the services to be provided by the Advisor to the Funds, as well as the costs incurred and benefits to be gained by the Advisor in providing such services, including the investment advisory and administrative components. The Board also found the proposed investment advisory fees to be reasonable in comparison to the fees charged by advisors to other comparable funds of similar, actual or anticipated size. As a result, all of the Board Members, including the Independent Board Members, approved the Investment Advisory Agreement with respect to the Funds. The Independent Board Members were represented by counsel who assisted them in their deliberations.
| AQR Funds | Annual Report | December 2012 | 137 | |||||||||||||
Table of Contents
| Board Approval of Investment Advisory Agreements (Unaudited) |
| AQR RISK PARITY II MV FUND AND AQR RISK PARITY II HV FUND |
The Board of Trustees (the “Board,” and the members of which are referred to as “Board Members”) of the AQR Funds (the “Trust”) met in person on August 15-16, 2012, to consider the approval of the investment advisory agreement between the Trust, on behalf of the AQR Risk Parity II MV Fund and the AQR Risk Parity II HV Fund (together, the “Funds”), and AQR Capital Management, LLC (“AQR”) (the “Investment Advisory Agreement”). In accordance with Section 15(c) of the Investment Company Act of 1940, as amended (the “1940 Act”), the Board requested, reviewed and considered materials furnished by AQR relevant to the Board’s consideration of whether to approve the Investment Advisory Agreement. These materials included: (1) memoranda and materials provided by AQR, describing the personnel and services to be provided to the Funds; (2) performance information for strategies and model portfolios relevant to the consideration of the Investment Advisory Agreement; (3) information independently compiled and prepared by FUSE Research relating to the Funds’ proposed fees and expenses; (4) a discussion of the financial statements of AQR and the regulatory exam history; and (5) a discussion of the compliance program and the regulatory exam history of AQR. AQR is referred to herein as the “Advisor,” as applicable.
At an in person meeting held on August 15-16, 2012, the Board, including the Board Members who are not “interested persons” as defined in the 1940 Act (the “Independent Board Members”), unanimously approved the Investment Advisory Agreement for an initial two-year period. The Board considered all factors it believed to be relevant with respect to the Funds, including, among other factors: (a) the nature, extent and quality of the services to be provided by the Advisor; (b) the investment performance of the Advisor and the Advisor’s portfolio management; (c) the advisory fee and the cost of the services and profits to be realized by the Advisor from the relationship with the Funds; (d) economies of scale; and (e) other factors.
The Board also considered other matters it deemed important to the approval process, such as the services related to the valuation and pricing of the Funds’ portfolio holdings, direct and indirect benefits to the Advisor and its affiliates from their relationship with the Funds and advice from independent legal counsel (the “Independent Trustee Counsel”) with respect to the review process and materials submitted for the Board’s review. The Board did not identify any particular information as controlling, and each Board Member may have attributed different weightings to the various items considered.
The following is a summary of the Board’s discussion and views regarding the factors it considered in evaluating the Investment Advisory Agreement:
The nature, extent and quality of the services to be provided by the Advisor. The Board Members reviewed the services that the Advisor would provide to the Funds under the Investment Advisory Agreement. The Board considered the size and experience of the Advisor’s staff, its use of technology, and the Funds’ stated investment objectives, strategies and processes. The Board reviewed the overall qualifications of the Advisor as an investment advisor. In connection with the investment advisory services to be provided to the Funds, the Board Members took into account detailed conversations they had with officers of the Advisor regarding the management of the Funds’ investments in accordance with the Funds’ stated investment objectives and policies and the types of transactions that would be entered into on behalf of the Funds. During these discussions, the Board Members asked detailed questions of, and received answers from, the officers of the Advisor regarding the formulation and proposed implementation of the Funds’ investment strategies, their efficacy and potential risks.
In addition to the investment advisory services to be provided to the Funds, the Board Members considered that AQR also will provide shareholder and administrative services, oversight of Fund accounting, marketing services, and assistance in meeting legal and regulatory requirements and other services necessary for the operation of the Funds. In particular, the Board Members reviewed the compliance and administrative services to be provided to the Funds by AQR. The Board also reviewed a wide range of services to be provided to certain of the Funds’ shareholders under a shareholder services agreement between the Trust, on behalf of the Funds, and AQR. These services include providing information and services to Fund shareholders, including professional and informative reporting, access to analysis and explanations of Fund reports, and electronic access to Fund information.
Finally, the Independent Board Members had an opportunity to meet outside the presence of management in executive session separately with Independent Trustee Counsel to discuss and consider the Investment Advisory Agreement. Based on the presentations at the August 15-16, 2012 Board meeting, the Board concluded that the services to be
| 138 | AQR Funds | Annual Report | December 2012 | |||||||||||||
Table of Contents
| Board Approval of Investment Advisory Agreements (Unaudited) |
provided to the Funds by AQR pursuant to the Investment Advisory Agreement were likely to be of a high quality and would benefit the Funds.
Investment Performance and the Advisor’s Portfolio Management. Because the Funds are newly formed, the Board did not consider the investment performance of the Funds. The Board based its review of the Advisor’s performance primarily on the experience of the Advisor in managing other registered investment companies and private funds, noting that other funds the Advisor manages might have investment objectives, policies or restrictions different from those of the Funds. The Board reviewed performance information for strategies and model portfolios similar to that of the Funds. The Board also considered the experience, resources and strengths of the Advisor and its affiliates with respect to the investment strategies proposed for the Funds. Based on these factors, the Board Members determined that the AQR would be an appropriate investment advisor for the Funds.
The Advisory Fee and the Cost of the Services and Profits to be Realized by the Advisor from the Relationship with the Funds. The Board, including the Independent Board Members, received and reviewed information regarding the management fees to be paid by the Funds to the Advisor pursuant to the Investment Advisory Agreement. The Board examined this information in order to determine the reasonableness of the fees in light of the nature and quality of services to be provided to the Funds.
To assist in this analysis, the Board received a report independently prepared by FUSE Research using Morningstar data. The report showed comparative fee information for each Fund’s expense group and expense universe, including expense comparisons of contractual investment advisory fees and actual total operating expenses. The Board noted that breakpoints are part of the Funds’ proposed investment advisory fee rate and that the proposed management fee rate would decrease as a Fund increases in size.
The Board also received and reviewed information regarding the profitability of the Advisor with respect to Fund-related activities. The Board took into consideration the Advisor’s profits from the management of other private accounts. The Board also reviewed the Advisor’s methodology of determining profitability. The Board recognized that profitability may be affected by numerous factors including, among other things, fee waivers and expense reimbursements by the Advisor, the types of funds managed, expense allocations and business mix, and therefore comparability of profitability is somewhat limited.
The Board reviewed an estimate of the Advisor’s costs and profitability for fiscal year ended December 31, 2011. The purpose of the review was to help the Independent Board Members determine whether the firm has the necessary resources to continue to provide high quality services to the Funds and attract and retain high quality employees.
The Board concluded that the management fee is reasonable.
Economies of Scale. Because the Funds are newly formed and had not commenced operations as of August 16, 2012, and the eventual aggregate amount of Fund assets was uncertain, the Advisor was not able to provide the Board Members with specific information concerning the extent to which economies of scale would be realized as the Funds grow and whether fee levels would reflect such economies of scale, if any. The Board noted that the Funds would have breakpoints in their advisory fees which allow investors to benefit directly in the form of lower fees as fund assets grow. The Advisor presented information to show that the fees were set as a level that is competitive relative to funds of similar, actual or anticipated size. The Board considered that the funds in the AQR fund complex share some common resources and, as a result, an increase in the overall size of the complex could permit each fund to incur lower expenses than it would otherwise as a stand-alone entity. The Board also considered the Advisor’s overall operations and its efforts to expand the scale of, and improve the quality of, its operations.
Other Factors. The Board also took into account other ancillary or “fall out” benefits that the Advisor or its affiliates may derive from its relationship with the Funds, both tangible and intangible. The Board also received information regarding the Advisor’s brokerage and soft dollar practices. The Board considered that the Advisor is responsible for decisions to buy and sell securities for the Funds, selection of broker-dealers and best execution, and aggregation and allocation of trade orders among the firm’s various advisory clients. The Board noted that the Adviser does not presently intend to make use of soft dollars to acquire third-party research.
Conclusion. Counsel advised the Board concerning the statutory and regulatory requirements for approval and disclosure of investment advisory agreements. No single factor was determinative to the decision of the Board. Based on the foregoing and such other matters as were deemed relevant, all of the Board Members, including all of the Independent Board Members, concluded that the proposed advisory fee rates and projected total expense ratios are
| AQR Funds | Annual Report | December 2012 | 139 | |||||||||||||
Table of Contents
| Board Approval of Investment Advisory Agreements (Unaudited) | ||
reasonable in relation to the services to be provided by the Advisor to the Funds, as well as the costs incurred and benefits to be gained by the Advisor in providing such services, including the investment advisory and administrative components. The Board also found the proposed investment advisory fees to be reasonable in comparison to the fees charged by advisors to other comparable funds of similar, actual or anticipated size. As a result, all of the Board Members, including the Independent Board Members, approved the Investment Advisory Agreement with respect to the Funds. The Independent Board Members were represented by Independent Trustee Counsel who assisted them in their deliberations.
| 140 | AQR Funds | Annual Report | December 2012 | |||||||||||||
Table of Contents
Investment Advisor
AQR Capital Management, LLC
Two Greenwich Plaza, 3rd Floor
Greenwich, CT 06830
Sub-Advisor
CNH Partners, LLC
Two Greenwich Plaza, 1st Floor,
Greenwich, CT 06830
Transfer Agent
ALPS Fund Services, Inc.
1290 Broadway, Suite 1100
Denver, CO 80203
Custodian
JPMorgan Chase Bank, N.A.
4 Metro Tech Center
Brooklyn, NY 11245
Distributor
ALPS Distributors, Inc.
1290 Broadway, Suite 1100
Denver, CO 80203
Administrator
J.P. Morgan Investor Services Co.
70 Fargo Street
Boston, MA 02210
Independent Registered Public Accounting Firm
PricewaterhouseCoopers, LLP
300 Madison Avenue
New York, NY 10017
You may obtain a description of the AQR Funds proxy voting, policies, procedures and information regarding how each Fund voted proxies relating to portfolio securities during the 12-month period ending June 30th of each year (available by August 31st of that year) without charge, upon request, by calling 1-866-290-2688 or visiting the funds website www.aqrfunds.com, or by accessing the SEC’s website at www.SEC.Gov. Such reports may be reviewed and copied at the SEC’s Public Reference Room in Washington, DC. Information on the operation of the Public Reference Room may be obtained by calling 202-942-8090.
The Fund files complete schedules of the portfolio holdings with the SEC for the first and third quarters on Form N-Q. The Form N-Q is available without charge, upon request, by calling 1-800-SEC-0330, or by accessing the SEC’s website, at www.SEC.Gov. It may also be reviewed and copied at the SEC’s Public Reference Room in Washington, DC.
This report has been prepared for shareholders and may be distributed to others only if preceded or accompanied by an effective prospectus, which includes information regarding the Funds’ objectives and polices, experienced of its management, marketability of shares and other information.
Table of Contents

P.O. Box 2248
Denver, CO 80201-2248
1-866-290-2688
www.aqrfunds.com
Table of Contents
Item 2. Code of Ethics.
a). | As of the end of the period, December 31, 2012, the Registrant has adopted a code of ethics, as defined in Item 2 of Form N-CSR, that applies to its principal executive officer, principal financial officer, principal accounting officer or controller, or persons performing similar functions. This code of ethics is included as Exhibit 12 (a)(1). |
b). | Not Applicable. |
c). | There has been no substantive amendments to the Registrant’s Code of Ethics during the fiscal year ending December 31, 2012 (“Reporting Period”). |
d). | Registrant granted no waivers from the provisions of its Code of Ethics during the Reporting Period. |
e). | Not Applicable. |
f). | Attached. |
Table of Contents
Item 3. Audit Committee Financial Expert.
a). | The Registrant’s Board of Trustees has determined that its Audit Committee has one “audit committee financial expert”, as that term is defined under Items 3(b) and 3(c), serving on its Audit Committee. Mr. L. Joe Moravy, the Registrant’s audit committee financial expert, is “independent”, as that term is defined under Item 3(a)(2). |
Item 4. Principal Accountant Fees and Services.
Aggregate fees for professional services rendered for the AQR Funds by PricewaterhouseCoopers LLP for the years ended December 31, 2011 and December 31, 2012 were:
| 2011 | 2012 | |||||||
Audit Fees (a) | $ | 655,000 | $ | 1,194,300 | ||||
Audit Related Fees (b) | $ | 65,000 | $ | 74,500 | ||||
Tax Fees (c) | $ | 86,450 | $ | 187,950 | ||||
All Other Fees (d) | $ | 0 | $ | 0 | ||||
Total: | $ | 806,450 | $ | 1,456,750 | ||||
(a) | Audit Fees: These fees relate to professional services rendered by PricewaterhouseCoopers LLP for the audits of the Registrant’s annual financial statements or services normally provided by the independent registered public accounting firm in connection with statutory and regulatory filings or engagements. These services include the audits of the financial statements of the Registrant, issuance of consents and assistance with review of documents filed with the SEC. |
(b) | Audit Related Fees: These fees relate to assurance and related services by PricewaterhouseCoopers LLP that are reasonably related to the performance of the audit of the Registrant’s December 31, 2011 and December 31, 2012 annual financial statements that are not reported under “Audit Fees” above. The audit related services provided by PricewaterhouseCoopers LLP for the year-ended December 31, 2011 and December 31, 2012 related to services provided in connection with the review of the June 30, 2011 and June 30, 2012 semi-annual financial statements, respectively and review of amendments to the Registrant’s Registration Statement. |
(c) | Tax Fees: These fees relate to professional services rendered by PricewaterhouseCoopers LLP for tax compliance, tax advice and tax planning. The tax services provided by PricewaterhouseCoopers LLP related to the review of the Registrant’s federal and state income tax returns, excise tax calculations and the completion of an international taxation review. |
(d) | All Other Fees: These fees relate to products and services provided by PricewaterhouseCoopers LLP other than those reported under “Audit Fees,” “Audit-Related Fees,” and “Tax Fees” above. |
(e) | Audit Committee Pre-approval Policies and Procedures: |
(i) | Per Rule 2-01(c)(7)(A) and the charter of the Registrant’s Audit Committee, the Audit Committee approves and recommends the principal accountant for the Registrant, pre-approves (i) the principal accountant’s provision of all audit and permissible non-audit services to the Registrant (including the fees and other compensation to be paid to the principal accountant), and (ii) the principal accountant’s provision of any permissible non-audit services to the Registrant’s investment adviser (the “Adviser”), sub-adviser or any entity controlling, controlled by, or under common control with any investment adviser or sub-adviser, if the engagement relates directly to the operations of the financial reporting of the Trust. |
(ii) | 100% of services described in each of Items 4(b) through (d) were approved by the Audit Committee pursuant to paragraph (c)(7)(A) of Rule 2-01 of Regulation S-X. |
Table of Contents
(f) | Less than 50% of the hours expended on the principal accountant’s engagement to audit Registrant’s financial statements were attributed to work performed by persons other than the accountant’s full-time, permanent employees. |
(g) | Disclose the aggregate non-audit fees billed by the Registrant’s accountant for services rendered to the Registrant, and rendered to the Registrant’s investment adviser (not including any sub-adviser whose role is primarily portfolio management and is subcontracted with or overseen by another investment adviser), and any entity controlling, controlled by, or under common control with the adviser that provides ongoing services to the Registrant for the fiscal years ended December 31, 2011 and December 31, 2012: $320,000 and $329,724. |
(h) | Not Applicable. |
Item 5. Audit Committee of Listed Registrants.
(a) | The Registrant is an issuer as defined in Section 10A-3 of the Securities Exchange Act of 1934 and has a separately-designated standing Audit Committee in accordance with Section 3(a)(58)(A) of such Act. All of the Board’s independent Trustees, Timothy K. Armour, William L. Atwell, Gregg D. Behrens, L. Joe Moravy and Brian S. Posner, are members of Audit Committee. |
(b) | Not Applicable. |
Item 6. Investments
(a) | Schedule is included as part of the report to shareholders filed under Item 1 of this Form. |
(b) | The Registrant made no divestments of securities in accordance with Section 13(c) of the Investment Company Act of 1940. |
Item 7. Disclosure of Proxy Voting Policies and Procedures for Closed-End Management Investment Companies.
Not applicable.
Item 8. Portfolio Managers of Closed-End Management Investment Companies.
Not applicable.
Item 9. Purchases of Equity Securities by Closed-End Management Investment Company & Affiliated Purchasers.
Not applicable.
Item 10. Submission of Matters to a Vote of Security Holders.
Not applicable.
Item 11. Controls and Procedures.
(a) | The Registrant’s principal executive officer and principal financial officer have concluded, based on their evaluation of the Registrant’s disclosure controls and procedures as conducted within 90 days of the filing date of this report, that those disclosure controls and procedures provide reasonable assurance that the material information required to be disclosed by the Registrant on this report is recorded, processed, summarized and reported within the time periods specified in the Securities and Exchange Commission’s rules and forms. |
(b) | There have not been any changes in registrant’s control over financial reporting (as defined in Rule 30a-3(d) under the Investment Company Act of 1940) that occurred during the second fiscal quarter of the period covered by this report that has materially affected, or is reasonably likely to materially affect, the registrant’s control over financial reporting. |
Table of Contents
Item 12. Exhibits.
(a)(1) | The code of ethics that is the subject of the disclosure required by Item 2 is attached hereto. |
(a)(2) | Certifications pursuant to Rule 30a-2(a) under the 1940 Act and Section 302 of the Sarbanes-Oxley Act of 2002 are attached hereto. |
(a)(3) | Any written solicitation to purchase securities under Rule 23c-1 under the 1940 Act – Not Applicable. |
(b) | Certification required by Rule 30a-2(b) under the 1940 Act and Section 906 of the Sarbanes-Oxley Act of 2002 is attached hereto. |
Table of Contents
SIGNATURES
Pursuant to the requirements of the Securities Exchange Act of 1934 and the Investment Company Act of 1940, the Registrant has duly caused this report to be signed on its behalf by the undersigned, thereunto duly authorized.
AQR Funds
By: /s/ Marco Hanig | ||||
Marco Hanig, | ||||
Principal Executive Officer | ||||
March 11, 2013 |
Pursuant to the requirements of the Securities Exchange Act of 1934 and the Investment Company Act of 1940, this report has been signed below by the following persons on behalf of the Registrant and in the capacities and on the dates indicated.
By: /s/ Marco Hanig | ||
Marco Hanig, | ||
Principal Executive Officer | ||
Date: March 11, 2013 |
By: /s/ Nir Messafi | ||
Nir Messafi, | ||
Principal Financial Officer | ||
Date: March 11, 2013 |