UNITED STATES
SECURITIES AND EXCHANGE COMMISSION
Washington, D.C. 20549
FORM N-CSR
CERTIFIED SHAREHOLDER REPORT OF REGISTERED
MANAGEMENT INVESTMENT COMPANIES
Investment Company Act file number 811-22264
The Motley Fool Funds Trust
(Exact name of registrant as specified in charter)
Motley Fool Asset Management, LLC
2000 Duke Street, Suite 175
Alexandria, VA 22314
(Address of principal executive offices) (Zip code)
Peter E. Jacobstein
Motley Fool Asset Management, LLC
2000 Duke Street, Suite 175
Alexandria, VA 22314
(Name and address of agent for service)
Registrant’s telephone number, including area code: (703) 302-1100
Date of fiscal year end: October 31
Date of reporting period: October 31, 2010
Form N-CSR is to be used by management investment companies to file reports with the Commission not later than 10 days after the transmission to stockholders of any report that is required to be transmitted to stockholders under Rule 30e-1 under the Investment Company Act of 1940 (17 CFR 270.30e-1). The Commission may use the information provided on Form N-CSR in its regulatory, disclosure review, inspection, and policymaking roles.
A registrant is required to disclose the information specified by Form N-CSR, and the Commission will make this information public. A registrant is not required to respond to the collection of information contained in Form N-CSR unless the Form displays a currently valid Office of Management and Budget (“OMB”) control number. Please direct comments concerning the accuracy of the information collection burden estimate and any suggestions for reducing the burden to Secretary, Securities and Exchange Commission, 100 F Street, NE, Washington, DC 20549. The OMB has reviewed this collection of information under the clearance requirements of 44 U.S.C. § 3507.
| Item 1. | Reports to Stockholders. |

TABLE OF CONTENTS
This report has been prepared for shareholders of Motley Fool Independence Fund. It is not authorized for distribution to prospective investors unless accompanied or preceded by a current prospectus, which contains more complete information about the Fund. Investors are reminded to read the prospectus carefully before investing. Past performance is no guarantee of future results. Share prices will fluctuate and there may be a gain or loss when shares are redeemed. Fund shares are distributed by BNY Mellon Distributors Inc., 760 Moore Rd., King of Prussia, PA 19406.
Letter from the President
Dear Shareholder:
Followers of our parent company, The Motley Fool Holdings, Inc., know that we’ve been critical of the mutual fund industry for years. It’s not that we dislike mutual funds. Quite the contrary – we think they can be a fantastic way for individual investors to access professional money management.
But we have been – and remain – critics of many mutual fund industry practices. And so with the launch of Motley Fool Asset Management, we’ve tried hard to get right what we think the industry often gets wrong.
Take, for instance, communications with shareholders. We believe many fund managers do a poor job of explaining what they do with shareholders’ money, and why. We think this is wrong. At Motley Fool Funds, we try to treat our shareholders like partners, and we want to make sure you know how we’re investing your money. We strive to operate transparently. Here are some of the things we do to keep you informed:
| | • | | Every month, your portfolio managers share their perspectives on the economy, the markets, and your funds in an insightful written commentary. |
| | • | | We publish the Fund’s Top 11 Holdings monthly, not just when we’re required to do so. |
| | • | | We actively seek questions from investors, and answer them in a bi-monthly column called “Question Authority.” |
| | • | | We feature twice-yearly conference calls with our portfolio managers, offering shareholders the opportunity to ask questions in a live forum. |
| | • | | Every year we hold a live, in-person meeting for shareholders. |
| | • | | We always strive to communicate in plain English, whether it’s in our prospectus or in this Annual Report. |
So how can you keep in touch with us? The easiest way is to subscribe to our monthly newsletter, Declarations. You’ll get the Portfolio Managers’ commentaries, Top 11 Holdings, Question Authority, and other news about your investment in a single monthly email. And we promise not to fill your inbox with other extraneous emails. You can sign up for Declarations at our website, www.foolfunds.com.
| | | | |
| Motley Fool Independence Fund | | | 3 | |
We appreciate the trust you’ve placed in Motley Fool Funds with your investment, and we promise to work every day to fulfill that trust.
|
| Foolishly, |
|
 |
| Peter Jacobstein |
| President, Motley Fool Asset Management |
PS: The Independence Fund has been joined by a new fund, The Motley Fool Great America Fund. You can find more details at our website, www.foolfunds.com.
| | |
| 4 | | Motley Fool Independence Fund |
Letter to Shareholders
Dear Fellow Independence Fund Shareholder:

Portfolio Manager
Bill Mann
Just as a single game can’t determine whether a team is a lock for the Super Bowl, a fund’s performance over any 12-month period isn’t a true measure of a portfolio manager’s ability. Nonetheless, I am quite proud to report that in its first year of operation the Motley Fool Independence Fund generated returns of 24.18% including reinvested dividends, while our benchmark, the MSCI World Index, returned just 13.32% for the same period (Nov. 1, 2009 through Oct. 31, 2010).
In any normal year, a 13% return for the global markets would be worthy of applause. In context, though, for U.S. investors, returns from 2000 to today are still negative. The market rebound that began in early 2009, while welcome, has not alleviated what have been generally painful market returns for more than a decade. Results for the Independence Fund are flattered, in some measure, by our avoidance of a lousy investing decade.
You should anticipate that our results will continue to diverge from the market. This year we benefitted because the market validated several of our decisions rather quickly. We won’t be so lucky every year. The media freaks out whenever stock markets swoon, but it is these precise bouts of volatility that give us opportunities to deploy money into companies at compelling prices. This mind-set demands patience because we are necessarily investing where the market perceives there to be risk.
We’d Like to Thank ... Europe
When media mouthpieces and armchair economists chatter noisily about economic data signaling “The End Of The World As We Know It” (or TEOTWAWKI, to make it sound like a town in Wisconsin), this very fear, which drives investors out of stocks, creates compelling values. Our job is to find them.
Over the past year, much of that chatter was about Europe. In our view, it came down to two obviously contradictory themes:
| | (1) | The market underestimated the potential for substantial economic pain in Europe. |
| | (2) | The market overestimated the potential for sustained economic pain in many European companies. |
| | | | |
| Motley Fool Independence Fund | | | 5 | |
If you’ve read our monthly Declarations letters (sign up to receive them at www.foolfunds.com), you’ll know that we’ve believed for a while that the inflexibility of Europe’s markets made a long-term decline in their global relevance a near certainty. We just didn’t know when or how this weakness would reveal itself. Then, European markets went into a tailspin caused by the shocking (shocking!) revelation that Greece quite possibly had fibbed on its financial statements for the better part of a decade. Turns out Italy, Spain, and Portugal may have done the same thing.
When the European markets started collapsing, we started investing in what we feel are top-notch companies such as Telefónica (which became one of our largest holdings), Delachaux, and Nestlé. In April, we deployed significant assets into Hellenic Exchanges, owner of the two largest stock exchanges in Greece, controlling 98% of the market. Yes, we bought into one of the world’s most volatile markets (albeit in a substantially profitable company) during its darkest hour, and we did it because we are risk averse.
You see, world-class companies like Telefónica occasionally sell at bargain prices because of the market’s slavish devotion to volatility (beta) as the measure of risk. When stocks swing wildly, investors can fail to assess and discount for actual risks. For example, when Spain’s sovereign debt came under pressure, shares of many Spanish companies dropped precipitously, increasing volatility and making them “riskier.” That is, if you measure risk by volatility. We do not.
True Independence
If you invest a single red cent with Motley Fool Asset Management, it’s your responsibility to know and internalize the fact that we fear neither volatility nor divergence. You also should expect that we will underperform for months, quarters, perhaps even years. This will happen because our weightings will stray from the MSCI World Index, and from time to time sectors or countries to which we have little exposure will catch the fancy of the market, propelling them to extreme heights.
Straying from your index weightings is exceedingly hard to do precisely because it invites returns that could diverge from your benchmark — and most asset management companies have no incentive to do so. Asset managers benefit when the amount of money under their control increases. If they deviate too far from their benchmarks and underperform for even a short period of time, investors rapidly desert the fund. Investing legend Seth Klarman calls this condition “enforced mediocrity,” where the best move a fund manager can make is to invest where everyone else does and settle for average results (less a generous fee).
| | |
| 6 | | Motley Fool Independence Fund |
At Motley Fool Asset Management, we practice conservatism. Our discipline demands that we sell stocks as they approach our assessment of fair value. We are value investors because we are risk averse. Sometimes making decisions on these bases can be costly — we elected to sell our beloved Chipotle as the market began to price the stock based on increasingly fantastical futures. Still, we believe that an investing discipline that starts by asking “what bad might happen” rather than the more typical (and perhaps more fun) “what do we stand to gain?” will, over the long run, increase our probability of avoiding costly mistakes.
The World Is Not Ending
A few weeks ago I received the semiannual report from my 401(k) provider, and it suggested investing defensively due to “these uncertain times.” It’s great advice, except that it is completely backwards. Market disasters have come precisely when average investors were confident in some bullish theses: Oil is running out (2007); China is going to rule the world (2007); housing prices don’t go down (2005); the Internet is changing everything (1999). Market confidence and market opportunity rarely coincide.
Today, there is a dog’s breakfast of reasons for average investors to be horribly pessimistic. There’s potential for massive inflation, an uppity North Korea, 10% unemployment, insider-trading scandals, public-pension shortages, European bank woes, European public debt woes, European government budget woes, additional unassigned woes, bad coffee, and 100% too much Carrot Top. And, of course, there’s the lingering real estate mess.
In early November, the Federal Reserve announced that it would inject another $600 billion into the U.S. economy, and critics accused Fed Chairman Ben Bernanke of trying to lower the value of the U.S. dollar and stimulate the economy through increased exports. I think these critics missed the mark, because I suspect Bernanke is actually desperately trying to prop up U.S. real estate markets.
This past month venerable Wilmington Trust sold itself to M&T Bank for 40% below where it was trading on the market, in no small part because of its exposure to bad construction loans. Bernanke can’t say that he’s propping up the real estate market, because real estate prices might collapse. But exposure to real estate continues to make our banks vulnerable, and I believe this is one big reason why many stocks are still somewhat attractively priced.
Last year, for the first time in decades, China invested more in hard assets than it did in U.S government securities. What are the Chinese buying instead? Well, commodities, for one. Independence Fund holding CNOOC, part of the state-run Chinese oil conglomerate, spent more than $2 billion for shale oil acreage in the US, and is expanding its business interests in oil exploration markets from
| | | | |
| Motley Fool Independence Fund | | | 7 | |
Indonesia to Nigeria to Argentina. You can see some of this effect in commodity prices, which have been strong through 2010. Demand for commodities is picking up just when producers have underinvested in expanding production. We will continue to seek out companies that benefit from this trend to go along with some of our long-term holdings such as Zhongpin and International Assets.
In closing, 2010 was a great year for the Independence Fund and for us as shareholders. The scoreboard shows that we did well, but remember, short-term returns do not always reflect the wisdom (or lack thereof) of the decisions made over that time. My team has been scouring the world for companies that offer compelling bargains, from Botswana to Kuwait to Chicago. We promise to continue to do our best for you, and, as always, my team and I thank you for your faith in us.
|
| Foolish best, |
|
 |
The Letter to Shareholders seeks to describe some of the Adviser’s current opinions and views of the financial markets. Although the Adviser believes it has a reasonable basis for any opinions or views expressed, actual results may differ, sometimes significantly so, from those expected or expressed. The securities held by the Fund that are discussed in the Letter to Shareholders were held during the period covered by the Annual Report. They do not comprise the entire investment portfolio of the Fund, may be sold at any time and may no longer be held by the Fund. The opinions of the Adviser with respect to those securities may change at any time.
| | |
| 8 | | Motley Fool Independence Fund |
Portfolio Characteristics (Unaudited)
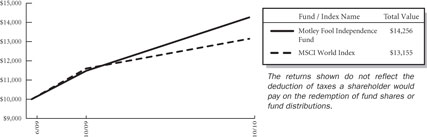
At October 31, 2010, the Motley Fool Independence Fund (the “Fund”) had an audited net asset value of $14.14 per share attributed to 9,081,201 shares outstanding. This compares with an unaudited net asset value as of June 16, 2009 of $10.00 per share attributed to 100,000 shares outstanding. From the Fund’s launch on June 16, 2009 to October 31, 2010 the Fund had a total return of 42.56% versus a return of 31.55% over the same period for its benchmark, MSCI World Index. The graph below shows the performance of $10,000 invested in the Fund at inception. The results shown below do not reflect the deduction of taxes that a shareholder would pay on fund distributions or the redemption of fund shares.
Average Annual Total Retuns as of 10/31/10
| | | | |
| | |
| | | Fund* | | Benchmark** |
One Year | | 24.18% | | 13.32% |
Since Inception | | 42.56% | | 31.55% |
Inception Date | | 06/16/2009 | | |
Total Fund Operating Expenses (February 26, 2010 Prospectus) | | 2.26% | | |
The returns shown do not reflect the deduction of taxes a shareholder would pay on the redemption of fund shares or fund distributions.
The performance data quoted represents past performance and does not guarantee future results. Current performance may be lower or higher. Performance data current to the most recent month-end may be obtained at www.foolfunds.com. The investment return and principal value of an investment will fluctuate so that shares, when redeemed, may be worth more or less than their original cost.
| * | These returns reflect expense waivers by the Fund’s investment adviser. Without these waivers, returns would have been lower. |
| ** | The MSCI World Index is a free float-adjusted market capitalization weighted index that is designed to measure the equity market performance of developed markets. The MSCI World Index consists of the following 23 developed market country indices: Australia, Austria, Belgium, Canada, Denmark, Finland, France, Germany, Greece, Hong Kong, Ireland, Italy, Japan, Netherlands, New Zealand, Norway, Portugal, Singapore, Spain, Sweden, Switzerland, the United Kingdom, and the United States. The MSCI World Index is not available for direct investment. The Fund may invest in countries that are not included within the MSCI World Index (such as emerging market countries) and its investment portfolio is not weighted in terms of countries or issuers the same as the MSCI World Index. For this reason, the Fund’s investment performance should not be expected to track, and may exceed or trail, the MSCI World Index. Since Inception returns for the Benchmark performance reflect the closest month end to the Inception Date of the Fund. |
| | | | |
| Motley Fool Independence Fund | | | 9 | |
The investment objective of the Fund is to achieve long-term capital appreciation. The Fund pursues this objective by investing primarily in common stocks of companies located anywhere in the world. The Fund invests in areas of the market that, in the view of Motley Fool Asset Management, LLC (the “Adviser”), offer the greatest potential for long-term capital appreciation. The Fund may invest in other types of securities and in other asset classes when, in the judgment of the Adviser, such investments offer attractive potential returns. As such, the Fund’s performance will deviate significantly from its benchmark from time to time. It is the view of the Adviser that this deviation is less meaningful over shorter time frames and will become more relevant when the Fund’s age can be measured in years rather than months.
Because the Fund is free to invest in companies of any size around the world, at times, the Fund may be heavily invested in small-cap stocks and foreign securities, each of which presents extra risk. Small-cap stocks tend to be more volatile and less liquid than their large-cap counterparts. Fluctuations in currency exchange rates can cause losses when investing in foreign securities, with emerging markets presenting additional risks of illiquidity, political instability, and lax regulation. You are strongly encouraged to read more about the Fund’s strategies and risks in the prospectus.
The Fund invests in securities of companies the Adviser believes are undervalued. Unlike mutual funds that are constrained by a style-box, the Fund may invest in any company, country, market, industry or sector where the Adviser’s analysis suggests that there is opportunity for gains that outweigh risks. In identifying investments for the Fund, the Adviser looks for companies it believes the market has irrationally undervalued and looks for companies that have high-quality businesses with strong market positions, manageable leverage, and robust streams of free cash flow. The following tables show the top 11 holdings and top 10 industries and countries in which the Fund was invested at fiscal year-end. Portfolio holdings are subject to change without notice.
| | |
| 10 | | Motley Fool Independence Fund |
| | | | |
Top Eleven Holdings* | | Percent
of
Net Assets | |
Telefonica SA | | | 3.90 | % |
POSCO | | | 3.64 | |
WellPoint, Inc. | | | 3.50 | |
Annaly Capital Management, Inc. | | | 3.03 | |
Zhongpin, Inc. | | | 3.02 | |
Yum! Brands, Inc. | | | 2.86 | |
Becton, Dickinson and Co. | | | 2.59 | |
Arrow Electronics, Inc. | | | 2.55 | |
Innophos Holdings, Inc. | | | 2.47 | |
Sung Kwang Bend Co., Ltd. | | | 2.34 | |
Lukoil OAO | | | 2.25 | |
| | | | |
| | | 32.15 | % |
| | | | |
| * | As of the date of the report the fund had a holding of 5.00% in the PNC Bank Money Market Fund. |
| | | | |
| |
Top Ten Sectors | | Percent
of
Net Assets | |
Consumer, Non-cyclical | | | 24.57 | % |
Financial | | | 16.07 | |
Communications | | | 12.02 | |
Basic Materials | | | 9.09 | |
Industrial | | | 8.96 | |
Consumer, Cyclical | | | 8.68 | |
Energy | | | 8.64 | |
Utilities | | | 3.64 | |
Technology | | | 2.93 | |
Diversified | | | 1.42 | |
| | | | |
| | | 96.02 | % |
| | | | |
| | | | |
| Motley Fool Independence Fund | | | 11 | |
| | | | |
Top Eleven Countries | | Percent
of
Net Assets | |
United States* | | | 50.93 | % |
Hong Kong | | | 6.61 | |
South Korea | | | 5.98 | |
Spain | | | 3.90 | |
China | | | 3.02 | |
France | | | 2.93 | |
Bermuda | | | 2.77 | |
Japan | | | 2.32 | |
Canada | | | 2.28 | |
Russia | | | 2.25 | |
Brazil | | | 1.51 | |
| | | | |
| | | 84.50 | % |
| | | | |
| * | As of the date of the report the fund had a holding of 5.00% in the PNC Bank Money Market Fund. |
| | |
| 12 | | Motley Fool Independence Fund |
About Your Expenses (Unaudited)
As a shareholder of the Fund, you incur ongoing costs, including advisory fees and other Fund expenses. This example is intended to help you to understand your ongoing costs (in dollars) of investing in the Fund and to compare these costs with the ongoing costs of investing in other mutual funds. It is based on an investment of $1,000 invested at the beginning of the period and held for the entire period from May 1, 2010 to October 31, 2010.
Actual Expenses
The first section of the table below provides information about actual account values and actual expenses. You may use the information in this section, together with the amount you invested, to estimate the expenses that you incurred over the period. Simply divide your account value by $1,000 (for example, an $8,600 account value divided by $1,000 = 8.6), then multiply the result by the number in the first section under the heading entitled “Expenses Paid During Period” to estimate the expenses attributable to your investment during this period.
Hypothetical Example for Comparison Purposes
The second section of the table below provides information about hypothetical account values and hypothetical expenses based on the Fund’s actual expense ratio and an assumed rate of return of 5% per year before expenses, which is not the Fund’s actual return. Thus, you should not use the hypothetical account values and expenses to estimate the actual ending account balance or your expenses for the period. Rather, these figures are provided to enable you to compare the ongoing costs of investing in the Fund as compared to the costs of investing in other funds. To do so, compare this 5% hypothetical example with the 5% hypothetical examples that appear in the shareholder reports of the other funds. Please note that the expenses shown in the table are meant to highlight your ongoing costs only. Therefore, the second section of the table is useful in comparing ongoing costs only and will not help you determine the relative total costs of owning different funds.
| | | | | | | | | | | | | | | | |
| | | Beginning
Account
Value
05/01/10 | | | Ending
Account
Value
10/31/10 | | | Annualized
Expense
Ratio(1) | | | Expenses
Paid
During
Period(2) | |
Actual | | $ | 1,000 | | | $ | 1,089 | | | | 1.40 | % | | $ | 7.37 | |
Hypothetical | | $ | 1,000 | | | $ | 1,018 | | | | 1.40 | % | | $ | 7.12 | |
| (1) | These ratios reflect expenses waived by the Fund’s investment Adviser. Without these Waivers, the Fund’s expenses would have been higher and the ending account values would have been lower. |
| (2) | Expenses are equal to the Fund’s annualized expense ratio for the period May 1, 2010 to October 31, 2010, multiplied by the average account value over the period, multiplied by the number of days (184) in the most recent fiscal half-year, then divided by 365. |
| | | | |
| Motley Fool Independence Fund | | | 13 | |
Financial Statements
Schedule of Investments at October 31, 2010
| | | | | | | | |
Issues | | Par | | | Value
(Note 2) | |
Corporate Bond — 0.59% | | | | | | | | |
Level 3 Financing, Inc. 8.75%, 02/15/17 | | $ | 825,000 | | | $ | 755,906 | |
| | | | | | | | |
Total Corporate Bond (Cost $724,653) | | | | | | | 755,906 | |
| | | | | | | | |
| | |
Issues | | Shares | | | Value
(Note 2) | |
Equity Securities — 96.02% | | | | | | | | |
Agriculture — 2.47% | | | | | | | | |
Cresud SACIF y A (Argentina)(a) | | | 80,671 | | | | 1,586,799 | |
Philip Morris International, Inc. (United States) | | | 27,072 | | | | 1,583,712 | |
| | | | | | | | |
| | | | | | | 3,170,511 | |
| | | | | | | | |
Apparel — 1.76% | | | | | | | | |
Coach, Inc. (United States) | | | 22,190 | | | | 1,109,500 | |
Under Armour, Inc. (United States)* | | | 24,705 | | | | 1,153,229 | |
| | | | | | | | |
| | | | | | | 2,262,729 | |
| | | | | | | | |
Banks — 1.40% | | | | | | | | |
Qatar Islamic Bank (Qatar) | | | 85,050 | | | | 1,797,296 | |
| | | | | | | | |
Beverages — 1.04% | | | | | | | | |
Diageo PLC (United Kingdom)(a) | | | 17,979 | | | | 1,330,446 | |
| | | | | | | | |
Chemicals — 4.46% | | | | | | | | |
Innophos Holdings, Inc. (United States) | | | 86,164 | | | | 3,163,942 | |
Monsanto Co. (United States) | | | 43,218 | | | | 2,568,014 | |
| | | | | | | | |
| | | | | | | 5,731,956 | |
| | | | | | | | |
Commercial Services — 3.67% | | | | | | | | |
Huron Consulting Group, Inc. (United States)* | | | 113,518 | | | | 2,260,143 | |
Paychex, Inc. (United States) | | | 88,702 | | | | 2,457,046 | |
| | | | | | | | |
| | | | | | | 4,717,189 | |
| | | | | | | | |
Cosmetics/Personal Care — 1.66% | | | | | | | | |
Unicharm Corp. (Japan) | | | 55,800 | | | | 2,131,601 | |
| | | | | | | | |
Electric — 3.64% | | | | | | | | |
Brookfield Infrastructure Partners LP (Bermuda) | | | 109,127 | | | | 2,308,036 | |
Entergy Corp. (United States) | | | 7,664 | | | | 571,198 | |
GDF Suez (France) | | | 24,000 | | | | 958,972 | |
Otter Tail Corp. (United States) | | | 40,725 | | | | 835,677 | |
| | | | | | | | |
| | | | | | | 4,673,883 | |
| | | | | | | | |
The accompanying notes are an integral part of these financial statements.
| | |
| 14 | | Motley Fool Independence Fund |
| | | | | | | | |
| | |
Issues | | Shares | | | Value
(Note 2) | |
Equity Securities (continued) | | | | | | | | |
Electrical Components & Equipment — 0.81% | | | | | | | | |
AMETEK, Inc. (United States) | | | 19,208 | | | $ | 1,038,192 | |
| | | | | | | | |
Electronics — 3.34% | | | | | | | | |
Arrow Electronics, Inc. (United States)* | | | 110,650 | | | | 3,276,347 | |
Waters Corp. (United States)* | | | 13,673 | | | | 1,013,579 | |
| | | | | | | | |
| | | | | | | 4,289,926 | |
| | | | | | | | |
Entertainment — 0.58% | | | | | | | | |
Penn National Gaming, Inc. (United States)* | | | 22,583 | | | | 751,111 | |
| | | | | | | | |
Financial Services - Diversified — 2.13% | | | | | | | | |
Hellenic Exchanges SA Holding (Greece) | | | 201,622 | | | | 1,598,218 | |
International Assets Holding Corp. (United States)* | | | 51,513 | | | | 1,135,861 | |
| | | | | | | | |
| | | | | | | 2,734,079 | |
| | | | | | | | |
Food — 5.87% | | | | | | | | |
BRF - Brasil Foods SA (Brazil)*(a) | | | 132,204 | | | | 1,934,144 | |
Nestle SA (Switzerland) | | | 11,694 | | | | 640,533 | |
Olam International Ltd. (Singapore) | | | 445,219 | | | | 1,082,219 | |
Zhongpin, Inc. (China)* | | | 191,892 | | | | 3,880,056 | |
| | | | | | | | |
| | | | | | | 7,536,952 | |
| | | | | | | | |
Healthcare - Products — 4.97% | | | | | | | | |
Becton, Dickinson and Co. (United States) | | | 43,950 | | | | 3,319,104 | |
Natus Medical, Inc. (United States)* | | | 82,500 | | | | 1,080,750 | |
Nihon Kohden Corp. (Japan) | | | 44,831 | | | | 852,148 | |
Stryker Corp. (United States) | | | 22,805 | | | | 1,128,619 | |
| | | | | | | | |
| | | | | | | 6,380,621 | |
| | | | | | | | |
Healthcare - Services — 3.50% | | | | | | | | |
WellPoint, Inc. (United States)* | | | 82,697 | | | | 4,493,755 | |
| | | | | | | | |
Holding Companies - Diversified — 1.42% | | | | | | | | |
KHD Humboldt Wedag International AG (Germany)* | | | 50,440 | | | | 459,004 | |
Swire Pacific Ltd. (Hong Kong) | | | 96,114 | | | | 1,368,079 | |
| | | | | | | | |
| | | | | | | 1,827,083 | |
| | | | | | | | |
Insurance — 5.15% | | | | | | | | |
Berkshire Hathaway, Inc. (United States)* | | | 11 | | | | 1,312,300 | |
Berkshire Hathaway, Inc., Class B (United States)* | | | 4,600 | | | | 365,976 | |
Enstar Group Ltd. (Bermuda)* | | | 15,510 | | | | 1,243,747 | |
HCC Insurance Holdings, Inc. (United States) | | | 63,200 | | | | 1,673,536 | |
The accompanying notes are an integral part of these financial statements.
| | | | |
| Motley Fool Independence Fund | | | 15 | |
| | | | | | | | |
Issues | | Shares | | | Value
(Note 2) | |
Equity Securities (continued) | | | | | | | | |
Insurance (continued) | | | | | | | | |
Loews Corp. (United States) | | | 51,000 | | | $ | 2,013,480 | |
| | | | | | | | |
| | | | | | | 6,609,039 | |
| | | | | | | | |
Internet — 2.17% | | | | | | | | |
Google, Inc. (United States)* | | | 3,600 | | | | 2,206,764 | |
TheStreet.com, Inc. (United States) | | | 190,423 | | | | 582,694 | |
| | | | | | | | |
| | | | | | | 2,789,458 | |
| | | | | | | | |
Iron/Steel — 4.62% | | | | | | | | |
POSCO (South Korea)(a) | | | 44,991 | | | | 4,676,365 | |
Terra Nova Royalty Corp. (Canada)* | | | 159,514 | | | | 1,256,970 | |
| | | | | | | | |
| | | | | | | 5,933,335 | |
| | | | | | | | |
Lodging — 0.55% | | | | | | | | |
Melco Crown Entertainment Ltd. (Hong Kong)*(a) | | | 112,999 | | | | 708,504 | |
| | | | | | | | |
Machinery - Diversified — 1.77% | | | | | | | | |
Flowserve Corp. (United States) | | | 22,700 | | | | 2,270,000 | |
| | | | | | | | |
Metal Fabricate/Hardware — 3.05% | | | | | | | | |
Delachaux SA (France) | | | 11,098 | | | | 906,342 | |
Sung Kwang Bend Co., Ltd. (South Korea) | | | 130,672 | | | | 3,004,949 | |
| | | | | | | | |
| | | | | | | 3,911,291 | |
| | | | | | | | |
Oil & Gas — 7.17% | | | | | | | | |
CNOOC Ltd. (Hong Kong)(a) | | | 4,438 | | | | 927,187 | |
Denbury Resources, Inc. (United States)* | | | 166,100 | | | | 2,827,022 | |
Lukoil OAO (Russia)(a) | | | 51,750 | | | | 2,890,238 | |
Occidental Petroleum Corp. (United States) | | | 12,645 | | | | 994,276 | |
Sasol Ltd. (South Africa)(a) | | | 34,637 | | | | 1,567,324 | |
| | | | | | | | |
| | | | | | | 9,206,047 | |
| | | | | | | | |
Oil & Gas Services — 1.47% | | | | | | | | |
Cie Generale de Geophysique-Veritas (France)*(a) | | | 81,195 | | | | 1,891,032 | |
| | | | | | | | |
Pharmaceuticals — 1.39% | | | | | | | | |
Dr. Reddy’s Laboratories Ltd. (India)(a) | | | 47,177 | | | | 1,784,706 | |
| | | | | | | | |
Real Estate — 4.36% | | | | | | | | |
Brookfield Asset Management, Inc. (Canada) | | | 56,374 | | | | 1,675,435 | |
Cheung Kong Holdings Ltd. (Hong Kong) | | | 85,337 | | | | 1,303,452 | |
Henderson Land Development Co., Ltd. (Hong Kong) | | | 367,764 | | | | 2,621,205 | |
| | | | | | | | |
| | | | | | | 5,600,092 | |
| | | | | | | | |
The accompanying notes are an integral part of these financial statements.
| | |
| 16 | | Motley Fool Independence Fund |
| | | | | | | | |
Issues | | Shares | | | Value
(Note 2) | |
Equity Securities (continued) | | | | | | | | |
Real Estate Investment Trusts — 3.03% | | | | | | | | |
Annaly Capital Management, Inc. (United States) | | | 219,989 | | | $ | 3,896,005 | |
| | | | | | | | |
Retail — 5.78% | | | | | | | | |
Costco Wholesale Corp. (United States) | | | 27,558 | | | | 1,729,816 | |
McDonald’s Corp. (United States) | | | 12,177 | | | | 947,005 | |
Wal-Mart de Mexico SAB de CV, Series V (Mexico) | | | 390,098 | | | | 1,067,809 | |
Yum! Brands, Inc. (United States) | | | 74,132 | | | | 3,673,982 | |
| | | | | | | | |
| | | | | | | 7,418,612 | |
| | | | | | | | |
Semiconductors — 1.91% | | | | | | | | |
Formfactor, Inc. (United States)* | | | 166,000 | | | | 1,615,180 | |
Linear Technology Corp. (United States) | | | 25,825 | | | | 832,340 | |
| | | | | | | | |
| | | | | | | 2,447,520 | |
| | | | | | | | |
Software — 1.03% | | | | | | | | |
Fundtech Ltd. (Israel)* | | | 94,943 | | | | 1,319,708 | |
| | | | | | | | |
Telecommunications — 9.85% | | | | | | | | |
American Tower Corp. (United States)* | | | 49,686 | | | | 2,564,294 | |
China Mobile Ltd. (Hong Kong)(a) | | | 30,340 | | | | 1,558,566 | |
Infinera Corp. (United States)* | | | 268,100 | | | | 2,195,739 | |
Telefonica SA (Spain)(a) | | | 61,703 | | | | 5,006,581 | |
Telekomunikasi Indonesia Tbk PT (Indonesia)(a) | | | 32,674 | | | | 1,319,703 | |
| | | | | | | | |
| | | | | | | 12,644,883 | |
| | | | | | | | |
Total Equity Securities (Cost $106,621,922) | | | | | | | 123,297,562 | |
| | | | | | | | |
Other Investments — 5.00% | | | | | | | | |
Temporary Cash Investment — 5.00% | | | | | | | | |
PNC Bank Money Market Fund | | | 6,423,418 | | | | 6,423,418 | |
| | | | | | | | |
Total Other Investments (Cost $6,423,418) | | | | | | | 6,423,418 | |
| | | | | | | | |
Total Investment Portfolio (Cost $113,769,993) — 101.61% | | | | | | | 130,476,886 | |
Liabilities in Excess of Other Assets — (1.61)% | | | | | | | (2,070,691 | ) |
| | | | | | | | |
NET ASSETS — 100.00% (Applicable to 9,081,201 shares outstanding) | | | | | | $ | 128,406,195 | |
| | | | | | | | |
| * | Non-income producing security. |
| (a) | ADR — American Depositary Receipts |
LP — Limited Partnership
PLC — Public Limited Company
The accompanying notes are an integral part of these financial statements.
| | |
| Motley Fool Independence Fund | | 17 |
Statement of Assets and Liabilities
| | | | |
| | | As of
October 31, 2010 | |
Assets: | | | | |
Investments in securities of unaffiliated issuers, at value (1) | | $ | 130,476,886 | |
Foreign currency, at value (2) | | | 138,195 | |
Receivables: | | | | |
Dividends | | | 101,656 | |
Interest | | | 15,490 | |
Shares of beneficial interest sold | | | 420,556 | |
Reimbursement due from adviser | | | 102,211 | |
Prepaid expenses and other assets | | | 14,488 | |
| | | | |
Total Assets | | | 131,269,482 | |
| | | | |
Liabilities | | | | |
Payables: | | | | |
Investment securities purchased | | | 2,494,048 | |
Fund Share Redeemed | | | 50,811 | |
Deferred foreign capital gains taxes | | | 1,099 | |
Accrued expenses: | | | | |
Audit fees | | | 35,170 | |
Accounting and administration fees | | | 46,716 | |
Advisory fees | | | 109,421 | |
Custodian fees | | | 6,718 | |
Legal fees | | | 16,766 | |
Transfer agent fees | | | 64,390 | |
Trustee fees | | | 8,061 | |
Other expenses | | | 30,087 | |
| | | | |
Total Liabilities | | | 2,863,287 | |
| | | | |
Net Assets | | $ | 128,406,195 | |
| | | | |
Net Assets Consist of: | | | | |
Paid-in-Capital | | $ | 109,899,492 | |
Undistributed Net Investment Income | | | 867,782 | |
Accumulated Net Realized Gain (Loss) on Investments and Foreign Currency Translation | | | 932,922 | |
Net Unrealized Appreciation (Depreciation) on Investments, Foreign | | | | |
Currencies, and Assets and Liabilities denominated in Foreign Currencies | | | 16,705,999 | |
| | | | |
Net Assets | | $ | 128,406,195 | |
| | | | |
Net Asset Value: | | | | |
$0.001 par value, unlimited shares authorized | | | | |
Net assets applicable to capital shares outstanding | | $ | 128,406,195 | |
Shares outstanding | | | 9,081,201 | |
| | | | |
Net asset value, offering and redemption price per share | | $ | 14.14 | |
| | | | |
(1) Investments in securities of unaffiliated issuers, at cost | | $ | 113,769,993 | |
(2) Foreign currency, at cost | | $ | 135,694 | |
The accompanying notes are an integral part of these financial statements.
| | |
| 18 | | Motley Fool Independence Fund |
Statement of Operations
| | | | |
| | | For the Year Ended
October 31, 2010 | |
Investment Income | | | | |
Dividends | | $ | 2,245,668 | |
Interest | | | 40,248 | |
Less foreign taxes withheld | | | (72,371 | ) |
| | | | |
Total Investment Income | | | 2,213,545 | |
| | | | |
Expenses | | | | |
Accounting and administration fees | | | 171,201 | |
Blue sky fees | | | 29,270 | |
Chief Compliance Officer fees | | | 35,017 | |
Custodian fees | | | 43,902 | |
Investment advisory fees | | | 812,323 | |
Organization fees | | | 5,631 | |
Professional fees | | | 164,810 | |
Shareholder reporting fees | | | 39,124 | |
Transfer agent fees | | | 369,919 | |
Trustee fees | | | 84,163 | |
Other expenses | | | 69,121 | |
| | | | |
Total expenses | | | 1,824,481 | |
| | | | |
Expenses waived/reimbursed net of amount recaptured | | | (680,671 | ) |
| | | | |
Net expenses | | | 1,143,810 | |
| | | | |
Net Investment Income | | | 1,069,735 | |
| | | | |
Realized and Unrealized Gain (Loss) | | | | |
Net realized gain (loss) from: | | | | |
Investment securities | | | 850,146 | |
Foreign currency transactions | | | (44,859 | ) |
| | | | |
Net realized gain on investments and foreign currency transactions | | | 805,287 | |
| | | | |
Change in net unrealized appreciation (depreciation) on: | | | | |
Investment securities (net of capital gains taxes of $3,351) | | | 15,588,855 | |
Foreign currency translations | | | (1,937 | ) |
| | | | |
Change in net unrealized appreciation (depreciation) on investments, foreign currencies, and assets and liabilities denominated in foreign currencies | | | 15,586,918 | |
| | | | |
Net realized and unrealized gain | | | 16,392,205 | |
| | | | |
Net Increase in Net Assets Resulting from Operations | | $ | 17,461,940 | |
| | | | |
The accompanying notes are an integral part of these financial statements.
| | |
| Motley Fool Independence Fund | | 19 |
Statement of Changes in Net Assets
| | | | | | | | |
| | | For the Year Ended
October 31, 2010 | | | Period
June 16, 2009**
to
October 31, 2009 | |
Operations: | | | | | | | | |
Net Investment Income | | $ | 1,069,735 | | | $ | 24,876 | |
Net Realized Gain on Investments and Foreign Currency Transactions | | | 805,287 | | | | 278,905 | |
Change in net unrealized Appreciation (Depreciation) on Investments, Foreign Currencies, and Assets and Liabilities Denominated in Foreign Currencies | | | 15,586,918 | | | | 1,119,081 | |
| | | | | | | | |
Net increase in net assets resulting from operations | | | 17,461,940 | | | | 1,422,862 | |
| | | | | | | | |
Dividends and Distributions to Shareholders: | | | | | | | | |
Dividends from net investment income | | | (95,696 | ) | | | — | |
Distributions from net realized capital gains | | | (295,167 | ) | | | — | |
| | | | | | | | |
Total dividends and distributions | | | (390,863 | ) | | | — | |
| | | | | | | | |
Capital Share Transactions: | | | | | | | | |
Proceeds from shares sold (7,468,879 and 2,671,053*** shares, respectively) | | | 93,888,742 | | | | 29,235,924 | |
Reinvestment of dividends and distributions (31,228 and 0 shares, respectively) | | | 384,097 | | | | — | |
Value of shares redeemed (1,069,514 and 20,445 shares, respectively) | | | (13,409,649 | ) | | | (236,279 | ) |
| | | | | | | | |
Redemption fees | | | 45,165 | | | | 4,256 | |
| | | | | | | | |
Net increase from capital share transactions | | | 80,908,355 | | | | 29,003,901 | |
| | | | | | | | |
Total increase in net assets | | | 97,979,432 | | | | 30,426,763 | |
| | | | | | | | |
Net Assets: | | | | | | | | |
Beginning of Period | | | 30,426,763 | | | | — | |
| | | | | | | | |
End of Period* | | $ | 128,406,195 | | | $ | 30,426,763 | |
| | | | | | | | |
| | | | | | | | |
| * Including undistributed net investment income | | $ | 867,782 | | | $ | 17,033 | |
| | | | | | | | |
| ** | Commencement of Operations. |
| *** | On April 6, 2009, 10,000 shares of the Fund were issued for cash at $10.00 per share to the Adviser. |
The accompanying notes are an integral part of these financial statements.
| | |
| 20 | | Motley Fool Independence Fund |
Financial Highlights
| | | | | | | | |
(for a share outstanding through the period) | | For the Year Ended
October 31, 2010 | | | Period
June 16, 2009
to
October 31, 2009(1)(2) | |
Net Asset Value, Beginning of Period | | $ | 11.48 | | | $ | 10.00 | |
| | | | | | | | |
Income From Investment Operations(3) | | | | | | | | |
Net Investment Income | | | 0.16 | | | | 0.02 | |
Net Gains on Securities (Realized and Unrealized) | | | 2.39 | | | | 1.46 | |
| | | | | | | | |
Total From Investment Operations | | | 2.55 | | | | 1.48 | |
| | | | | | | | |
Less Distributions | | | | | | | | |
Net Investment Income | | | 0.02 | | | | — | |
Net Realized Gains | | | 0.08 | | | | — | |
| | | | | | | | |
Total Distributions | | | 0.10 | | | | — | |
| | | | | | | | |
Redemption Fees | | | 0.01 | | | | — | |
| | | | | | | | |
Net Asset Value, End of Period | | $ | 14.14 | | | $ | 11.48 | |
| | | | | | | | |
Total Return(4)(5) | | | 24.18 | % | | | 14.80 | % |
Net Assets, End of Period (thousands) | | $ | 128,406 | | | $ | 30,427 | |
Ratios/Supplemental Data | | | | | | | | |
Ratio of Expenses to Average Net Assets | | | 1.38 | % | | | 1.35 | % |
Ratio of Expenses to Average Net Assets (Before Waivers and Reimbursement of Expenses and/or Recapture of Previously Waived Fees) | | | 2.20 | % | | | 7.01 | % |
Ratio of Net Investment Income to Average Net Assets | | | 1.29 | % | | | 0.41 | % |
Ratio of Income to Average Net Assets (Before Waivers and Reimbursement of Expenses and/or Recapture of Previously Waived Fees) | | | 0.47 | % | | | (5.25 | )% |
Portfolio Turnover | | | 37 | % | | | 50 | % |
| (1) | Because of commencement of operations and related preliminary transaction costs, these ratios are not necessarily indicative of future ratios. |
| (2) | Inception date of the fund was June 16, 2009. All ratios for the period have been annualized. Total return for the period has not been annualized. |
| (3) | Per share data calculated using average shares outstanding method. |
| (4) | During the year ended October 31, 2010, 0.08% of the Fund’s total return was attributable to redemption fees received as referrenced in Note 4. Excluding this item, the total return would have been 24.10%. For the period ended October 31, 2009, redemption fees received had no effect on the Fund’s total return. |
| (5) | Total return reflects the rate an investor would have earned on an investment in the Fund during each period, assuming reinvestment of all distributions. |
The accompanying notes are an integral part of these financial statements.
| | |
| Motley Fool Independence Fund | | 21 |
Notes to Financial Statements
1. Organization:
Motley Fool Independence Fund (the “Fund”) is a diversified series of The Motley Fool Funds Trust (the “Trust”), an open-end management investment company (or mutual fund) registered under the Investment Company Act of 1940, as amended (“1940 Act”). The Trust is a Delaware statutory trust organized on November 7, 2008. The purpose of the Trust is to conduct, operate and carry on the business of a management investment company registered under the 1940 Act through one or more series (each, a “Series”) investing primarily in securities. The beneficial interest in the Trust is represented by transferable units called “Shares of Beneficial Interest.” Each Series has its own investment goals and strategies. The financial statements are presented for the Fund.
Under the Trust’s organizational documents, its Trustees and officers are indemnified against certain liabilities arising out of the performance of their duties for the Trust by the Trust. In addition, in the normal course of business, the Trust enters into contracts with vendors and others that provide for general indemnifications. The Trust’s maximum exposure under these arrangements is unknown as this would involve future claims that may be made against the Trust. However, the Trust believes the risk of loss to be remote.
2. Significant Accounting Policies:
Basis of Preparation
The policies described below are followed consistently by the Fund in the preparation of its financial statements in conformity with accounting principles generally accepted in the United States of America (“U.S. GAAP”) for U.S. mutual funds.
The preparation of financial statements in accordance with U.S. GAAP requires management to make estimates and assumptions that affect the reported amounts and disclosures. Actual results could differ from those estimates.
Security Valuation
Securities held by the Trust are generally valued at fair value as of the close of regular trading on each business day (generally 4 pm Eastern time) that the New York Stock Exchange (“NYSE”) is open. Securities, other than stock options, listed on the NYSE or other exchanges are valued on the basis of the last quoted sale price on the exchange on which they are primarily traded. However, if the last sale price on the NYSE is different from the last sale price on any other exchange, the NYSE price will be used. If there are no sales on that day, then the securities are valued at the bid price on the NYSE or other primary exchange for that day. Securities traded in the OTC market are valued on the basis of the last sales price as reported by NASDAQ. If there are no sales on that day, then the securities are valued at the mean between the closing bid and asked prices as reported by NASDAQ. Stock options and stock index options traded on national securities exchanges or on NASDAQ are valued at the mean between the latest bid and
| | |
| 22 | | Motley Fool Independence Fund |
Notes to Financial Statements—(Continued)
asked prices for such options. Securities for which market quotations are not readily available or whose values have been affected by events occurring before the Fund’s pricing time but after the close of the securities markets, and other assets are valued at fair value as determined pursuant to procedures adopted in good faith by the Board of Trustees (the “Board”). Debt securities that mature in fewer than 60 days are valued at amortized cost (unless the Board determines that this method does not represent fair value), if their original maturity was 60 days or less or by amortizing the value as of the 61st day before maturity, if their original term to maturity exceeded 60 days.
When fair value pricing is employed, the prices of securities used by a fund to calculate its net asset value (the “NAV”) may differ from quoted or published prices for the same securities.
 You’d think that it would be easy to determine what a share of the Fund is worth – just add up the value of everything it holds, and then divide by the number of shares. It’s not that simple, though. Some foreign markets have different operating hours (when it’s daytime in Chicago, for example, it is night in Shanghai). That means that when we calculate the Fund’s value at the end of the day, the market quotations for some of the securities held by the Fund could be several hours old, and intervening events may have affected what the stocks are worth. In addition, characteristics of the relevant markets and stocks might, in some cases, cast doubt on a particular valuation. For these reasons, we may rely on a pricing service to determine the value of particular securities. It is possible that when the Fund buys or sells the securities, the price on the real market will be different from the value used for the fair-value pricing.
The values of securities held by the Fund and other assets used in computing NAV are generally determined as of the time trading in such securities is completed each day, which, in the case of foreign securities, generally occurs at various times before the close of the NYSE. Trading in securities listed on foreign securities exchanges are valued at the last sale or, if no sales are reported, at the bid price as of the close of the exchange, subject to possible adjustment as described in the Prospectus. Foreign currency exchange rates are also generally determined before the close of the NYSE. On occasion, the values of such securities and exchange rates may be affected by events occurring between the time as of which determinations of such values or exchange rates are made and the close of the NYSE. When such events materially affect the value of securities held by the Fund or their liabilities, such securities and liabilities will be valued at fair value in accordance with procedures adopted in good faith by the Board. In this regard, the Trust has retained a third party fair value pricing service to quantitatively analyze the price movement of the Fund’s holdings on foreign exchanges and to automatically fair value if the variation from the prior day’s closing price exceeds specified parameters. As of October 31, 2010, such price movements for certain securities had exceeded specified parameters and the third party fair value service quantitatively fair valued the affected securities. The Board will review and monitor the methods used by the service to assure itself that securities are valued at their fair values. The values of any assets and liabilities initially expressed in foreign currencies will be converted to U.S. dollars based on exchange rates supplied by a quotation service.
| | |
| Motley Fool Independence Fund | | 23 |
Notes to Financial Statements—(Continued)
Fair Value Measurements
The Financial Accounting Standards Board (“FASB”) “Fair Value Measurements and Disclosures” defines fair value as the price that the Fund would receive upon selling an investment in an orderly transaction to an independent buyer in the principal market, or in the absence of a principal market, the most advantageous market for the investment. Valuation techniques should maximize the use of observable market data and minimize the use of unobservable inputs. Inputs refer broadly to the assumptions that market participants would use in pricing an asset. Inputs may be observable or unobservable. Observable inputs are inputs that reflect the assumptions market participants would use in pricing the asset or liability developed based on market data obtained from sources independent of the reporting entity. Unobservable inputs are inputs that reflect the reporting entity’s own assumptions about the assumptions market participants would use in pricing the asset or liability developed based on the best information available in the circumstances.
Fair value measurements utilize a hierarchy based on the observability of inputs used to establish fair value.
Investment assets reported at fair value are classified based on the lowest level input that is significant to fair value:
Level 1 — quoted prices in active markets for identical securities
Investments whose values are based on quoted market prices in active markets, and whose values are therefore classified as Level 1 prices, include active listed domestic and foreign equity securities.
Level 2 — observable inputs other than Level 1 (including quoted prices for similar securities, interest rates, prepayment speeds, credit risk, etc.)
Investments that trade in markets that are not considered to be active, but whose values are based on quoted market prices, dealer quotations or valuations provided by alternative pricing sources supported by observable inputs are classified as Level 2 prices. These generally include investment grade corporate bonds and less liquid listed domestic and foreign equity securities.
Level 3 — significant unobservable inputs (including the Fund’s own assumptions in determining the fair value of investments)
Investments whose values are classified as Level 3 prices have significant unobservable inputs, as they may trade infrequently or not at all.
The Fund did not have any significant transfers between Level 1 and Level 2 during the year ended October 31, 2010.
| | |
| 24 | | Motley Fool Independence Fund |
Notes to Financial Statements—(Continued)
| | | | |
Valuation Inputs | | Value | |
Level 1 — Quoted Prices | | | | |
U.S. Common Stocks | | $ | 64,640,190 | |
Foreign Common Stocks | | | 40,392,360 | |
Temporary Cash Investment | | | 6,423,418 | |
Level 2 — Other Significant Observable Inputs | | | | |
Corporate Bond | | | 755,906 | |
Foreign Common Stocks | | | 18,265,012 | |
Level 3 — Significant Unobservable Inputs | | | — | |
| | | | |
Total Value of Investments | | $ | 130,476,886 | |
| | | | |
The inputs or methodology used for valuing securities are not necessarily an indication of the risk associated with investing in those securities.
Dividends and Distributions
When the Fund pays a dividend or other distribution, its net asset value (NAV) per share will decline by the per-share amount of the distribution. Investors are no poorer for this “distribution drop,” however. As this section explains, investors may elect to reinvest their dividend and distribution payments. Doing so would allow them to acquire additional shares at the post-distribution NAV per share. They may also choose to receive a check in the amount of their portion of the dividend or distribution.
The Fund pays dividends from its net investment income and distributes any net capital gains that it realizes. Dividends and capital gains distributions are generally paid once a year. All dividends and other distributions will be reinvested in Fund shares unless a shareholder chooses one of the following options: (1) receive dividends in cash, while reinvesting capital gains and other distributions in additional Fund shares; or (2) receive all dividends and other distributions in cash.
Securities Transactions, Investment Income and Expenses
Securities transactions are accounted for as of the trade date. Costs used in determining realized gains and losses on the sales of investment securities are on the basis of identified cost. Dividend income is recorded on the ex-dividend date. Interest income is recorded on an accrual basis. Discount and premium are amortized using the effective interest method. Expenses directly attributable to the Fund are directly charged.
Foreign Currency Translation
The books and records of the Fund are maintained in U.S. dollars as follows: (1) the values of investment securities and other assets and liabilities stated in foreign currencies are translated at the exchange rates prevailing at the end of the period; and (2) purchases, sales and income are translated at the rates of exchange prevailing on the
| | |
| Motley Fool Independence Fund | | 25 |
Notes to Financial Statements—(Continued)
respective dates of such transactions. Transaction gains or losses resulting from changes in exchange rates during the reporting period or upon settlement from foreign currency transactions are reported in the Statements of Operations for the current period. The Fund does not isolate the portion of gains and losses on investments.
3. Investment Policies and Practices:
The sections below describe some of the different types of investments that may be made by the Fund and the investment practices in which the Fund may engage.
When we say that the Fund may invest in other types of securities and in other asset classes, the “may” is well worth emphasizing, as the Fund’s primary focus is the common stock companies that the Adviser believes are both promising and undervalued.
Foreign Securities
The Fund may invest in equity and fixed-income securities of foreign companies, including companies located in both developed and emerging-market countries. Investment in foreign securities may include the purchase of American Depositary Receipts (“ADRs”) and other depositary receipts (European Depositary Receipts (“EDRs”) and Global Depositary Receipts (“GDRs”) that represent indirect interests in securities of foreign issuers. A significant portion of the Fund’s exposure to foreign investments may be composed of such investments. Investments in foreign securities are affected by risk factors generally not associated with investments in the securities of U.S. companies in the U.S. With respect to such securities, there may be more limited information publicly available concerning the issuer than would be the case with respect to domestic securities, foreign issuers may use different accounting standards, and foreign trading markets may not be as liquid as U.S. markets. Foreign securities also involve such risks as currency risks, possible imposition of withholding or confiscatory taxes, possible currency transfer restrictions, expropriation or other adverse political or economic developments, and the difficulty of enforcing obligations in other countries. These risks may be greater in emerging-market countries and in less developed countries.
| | |
| 26 | | Motley Fool Independence Fund |
Notes to Financial Statements—(Continued)
If the Fund holds a foreign stock, and the stock is traded on a foreign exchange, with its price denominated in that foreign currency, the value of the stock will change, for the Fund, whenever the relative value of the U.S. dollar and that foreign currency change. To take an imaginary example, if the Fund holds shares in Ruritania Telecom, traded on the Ruritanian Stock Exchange, those shared will be worth more to the Fund if the value of the Ruritanian ploof increases against the U.S. dollar, and vice versa, all other things being equal.
The purchase of securities denominated in foreign currencies will subject the value of the Fund’s investments in those securities to fluctuations caused by changes in foreign exchange rates. To hedge against the effects of changes in foreign exchange rates, the Fund may enter into forward foreign currency exchange contracts (“forward contracts”). These contracts represent agreements to exchange an amount of currency at an agreed-upon future date and rate. The Fund will generally use forward contracts only to “lock in” the price in U.S. dollars of a foreign security that the Fund plans to purchase or to sell, but in certain limited cases, it may use such contracts to hedge against an anticipated substantial decline in the price of a foreign currency against the U.S. dollar that would adversely affect the U.S. dollar value of foreign securities held by the Fund. Forward contracts will not be used in all cases and, in any event, cannot completely protect the Fund against all changes in the values of foreign securities resulting from fluctuations in foreign exchange rates. The Fund will not enter into a forward contract if, as a result, forward contracts would represent more than 20% of the Fund’s total assets. For hedging purposes, the Fund may also use options on foreign currencies, which expose the Fund to certain risks.
Some foreign securities are traded in the U.S. in the form of ADRs. ADRs are receipts typically issued by a U.S. bank or trust company evidencing ownership of the underlying securities of foreign issuers. EDRs and GDRs are receipts typically issued by foreign banks or trust companies, evidencing ownership of underlying securities issued by either a foreign or U.S. issuer. Generally, depositary receipts in registered form are designed for use in the U.S. and depositary receipts in bearer form are designed for use in securities markets outside the U.S. Depositary receipts may not necessarily be denominated in the same currency as the underlying securities into which they may be converted. Depositary receipts generally involve the same risks as other investments in foreign securities. However, holders of ADRs and other depositary receipts may not have all the legal rights of shareholders and may experience difficulty in receiving shareholder communications.
The Fund invests in the securities of foreign companies, including companies located in both developed and emerging market countries. Investments in foreign securities may be made through the purchase of depository receipts that represent indirect interests in the securities of foreign companies. A significant portion of the Fund’s investments in foreign companies may be composed of such investments. Investing in securities of foreign companies involves risks generally not associated with investments in the
| | |
| Motley Fool Independence Fund | | 27 |
Notes to Financial Statements—(Continued)
securities of U.S. companies. These risks may relate to those associated with fluctuations in foreign currency exchange rates, unreliable and untimely information about issuers, and political and economic instability. Securities of foreign issuers generally trade and thus may be purchased and sold by the Fund in foreign markets.
Types of Fixed-Income Securities
The Fund may invest in bonds and other types of debt obligations of U.S. and foreign issuers. Fixed income securities purchased by the Fund may include, among others, bonds, notes and debentures issued by corporations; debt securities issued or guaranteed by the U.S. government or one of its agencies or instrumentalities (“U.S. Government Securities”); municipal securities; mortgage-backed and asset-backed securities; and debt securities issued or guaranteed by foreign governments, their agencies, instrumentalities, or political subdivisions, or by government-owned, -controlled, or -sponsored entities, including central banks. These investments also include money market instruments and other types of obligations. Investors should recognize that, although securities ratings issued by Standard & Poor’s® Ratings Services (“S&P”), a division of The McGraw-Hill Companies, Inc., and Moody’s Investors Services©, Inc. (“Moody’s”), provide a generally useful guide as to credit risks, they do not offer any criteria to evaluate interest rate risk. Changes in interest rate levels generally cause fluctuations in the prices of fixed-income securities and will, therefore, cause fluctuations in the NAV per share of the Fund. Subsequent to the purchase of a fixed-income security by the Fund, the ratings or credit quality of such security may deteriorate. Any such subsequent adverse changes in the rating or quality of a security held by the Fund would not require the Fund to sell the security.
Real Estate Investment Trusts
Real estate investment trusts (“REITs”) are pooled investment vehicles that manage a portfolio of real estate or real estate-related loans to earn profits for their shareholders. REITs are generally classified as equity REITs, mortgage REITs, or a combination of equity and mortgage REITs. Investing in REITs involves certain unique risks in addition to those risks associated with investing in the real estate industry in general. Equity REITs may be affected by changes in the value of the underlying property owned by the REITs, while mortgage REITs may be affected by the quality of the borrower on any credit extended. REITs are dependent upon management skills, may not be diversified geographically or by property type, and are subject to heavy cash-flow dependency, default by borrowers, and self-liquidation. REITs must also meet certain requirements under the Internal Revenue Code of 1986, as amended (the “Code”), to avoid entity level tax and be eligible to pass through certain tax attributes of their income to shareholders. REITs are consequently subject to the risk of failing to meet these requirements for favorable tax treatment and of failing to maintain their exemptions from registration under the 1940 Act. REITs are also subject to the risks of changes in the Code, affecting their tax status.
| | |
| 28 | | Motley Fool Independence Fund |
Notes to Financial Statements—(Continued)
REITs (especially mortgage REITs) are also subject to interest rate risks. When interest rates decline, the value of a REIT’s investment in fixed-rate obligations can be expected to rise. Conversely, when interest rates rise, the value of a REIT’s investment in fixed-rate obligations can be expected to decline. In contrast, as interest rates on adjustable-rate mortgage loans are reset periodically, yields on a REIT’s investments in such loans will gradually align themselves to reflect changes in market interest rates, causing the value of such investments to fluctuate less dramatically in response to interest rate fluctuations than would investments in fixed-rate obligations.
The management of a REIT may be subject to conflicts of interest with respect to the operation of the business of the REIT and may be involved in real estate activities competitive with the REIT. REITs may own properties through joint ventures or in other circumstances in which a REIT may not have control over its investments. REITs may use significant amounts of leverage.
REITs often do not provide complete tax information until after the end of the calendar year. Consequently, because of the delay, it may be necessary for the Fund, if invested in REITs, to request permission to extend the deadline for issuance of Forms 1099-DIV beyond January 31. Alternatively, amended Forms 1099-DIV may be sent. During the year ended October 31, 2010, the Fund invested in REITs.
Temporary Investments
During periods of adverse market or economic conditions, the Fund may temporarily invest all or a substantial portion of its assets in high-quality, fixed-income securities, money market instruments, and shares of money market mutual funds, or it may hold cash. At such times, the Fund would not be pursuing its stated investment objective with its usual investment strategies. The Fund may also hold these investments for liquidity purposes. Fixed-income securities will be deemed to be of high quality if they are rated “A” or better by S&P or Moody’s or, if unrated, are determined to be of comparable quality by the Adviser. Money market instruments are high-quality, short-term fixed-income obligations (which generally have remaining maturities of one year or less), and may include U.S. Government Securities, commercial paper, certificates of deposit and banker’s acceptances issued by domestic branches of United States banks that are members of the Federal Deposit Insurance Corporation, and repurchase agreements for U.S. Government Securities. In lieu of purchasing money market instruments, the Fund may purchase shares of money market mutual funds that invest primarily in U.S. Government Securities and repurchase agreements involving those securities, subject to certain limitations imposed by the 1940 Act. The Fund, as an investor in a money market fund, will indirectly bear the fees and expenses of that fund, which will be in addition to the fees and expenses of the Fund. Repurchase Agreements involve certain risks not associated with direct investments in debt securities.
| | |
| Motley Fool Independence Fund | | 29 |
Notes to Financial Statements—(Continued)
4. Fees and Transactions with Related Parties:
Fund Expenses
The Fund pays all of its expenses other than those expressly assumed by the Adviser. Expenses of the Fund are deducted from the Fund’s total income before dividends are paid.
Investment Adviser
Subject to the supervision of the Board, Motley Fool Asset Management (the “Adviser”) manages the overall investment operations of the Fund in accordance with the Fund’s investment objective and policies and formulates a continuing investment strategy for the Fund pursuant to the terms of the Investment Advisory Agreement between the Adviser and the Trust on behalf of the Fund. The Adviser is a wholly owned subsidiary of The Motley Fool Holdings Inc. (“TMF Holdings”), a multimedia financial-services holding company that also owns The Motley Fool, LLC, which publishes investment information and analysis across a wide range of media, including investment newsletter services, websites, and books. TMF Holdings is controlled by David Gardner and Tom Gardner, along with other private shareholders.
Under the terms of the Advisory Agreement, the Fund pays the Adviser a fee that is computed and paid monthly at an annual rate of 0.95% of the Fund’s average daily net assets during the month (the “Basic Fee”). Upon the Fund’s completion of 12 full calendar months, the Basic Fee became subject to a monthly adjustment (the “Monthly Performance Adjustment”) based on the investment performance of the Fund relative to the performance of the MSCI World Index measured over a trailing-36-month period ending on the last day of the month for which the fee is to be paid (or if the Fund does not have 36 full calendar months of operations, the number of months since commencement of the Fund’s operations) (the “Performance Measurement Period”) is the Basic Fee plus or minus the Monthly Performance Adjustment.
The Monthly Performance Adjustment is calculated by subtracting from the cumulative percentage performance of the Fund (essentially, the change in the Fund’s net asset value per share) during the Performance Measurement Period (net of all expenses, including advisory fees) the percentage change in the MSCI World Index over the same period (including the value of dividends paid during the measurement period on stocks included in the MSCI World Index). The Monthly Performance Adjustment will be based on an annual percentage rate determined by: (i) subtracting 3 from the positive or negative percentage difference between the investment performance of the Fund and the investment performance of the MSCI World Index during the Performance Measurement Period; and (ii) multiplying the result by 2%, but will be limited to a rate of not more than +0.20% nor less than -0.20% . The dollar amount of the Monthly Performance Adjustment is then determined by dividing the annual percentage rate by 12; and (iii) multiplying the result by the average daily net assets of the Fund during the Performance Measurement Period. There will be no Monthly Performance Adjustment
| | |
| 30 | | Motley Fool Independence Fund |
Notes to Financial Statements—(Continued)
if the difference between the investment performance of the Fund and the investment performance of the index is less than 3 percentage points. Because the operation of the Expense Limitation and Reimbursement Agreement will have a positive effect upon the Fund’s investment performance, the agreement may result in an increase in the Monthly Performance Adjustment and the Total Advisory Fee. The Adviser has agreed to waive the amount of any increase in the Monthly Performance Adjustment that exceeds the amount that would have been payable to it in the absence of the Expense Limitation and Reimbursement Agreement to the extent that such increase exceeds the cumulative amount of expenses deferred, absorbed or reimbursed by the Adviser that it has not previously recovered as a result of higher positive performance-based adjustments in one or more prior months resulting from the Expense Limitation and Reimbursement Agreement.
Under the terms of an Expense Limitation and Reimbursement Agreement entered into by the Adviser and the Fund, the Adviser has contractually agreed to waive its fees or to reimburse a portion of the Fund’s operating expenses until at least February 28, 2011, to the extent necessary to limit the Fund’s operating expenses (excluding the advisory fee, brokerage commissions, taxes, interest expense, acquired fund fees and expenses and any extraordinary expenses) to an amount not exceeding 0.40% annually of the Fund’s average daily net assets. The Adviser may recover from the Fund fees and expenses previously waived or reimbursed for a period of three years after such fees or expenses were incurred, provided that the repayments do not cause the Fund’s ordinary operating expenses (excluding the advisory fee, brokerage commissions, taxes, interest expense, acquired fund fees and expenses and any extraordinary expenses) to exceed 0.40% annually of the Fund’s average daily net assets. As of October 31, 2009, the Adviser waived fees or reimbursed the Fund in the amount of $344,182, which may be recovered by the Adviser through October 31, 2012. As of October 31, 2010, the Adviser waived fees or reimbursed the Fund in the amount of $680,671, which may be recovered by the Adviser through October 31, 2013.
Trustees’ Fees
Each Trustee who is not an “interested person,” as defined by the 1940 Act, of the Trust is paid: (i) an annual retainer of $20,000; (ii) a fee of $1,250 for each quarterly meeting of the Board attended; and (iii) a fee of $500 for each meeting attended of any committee of the Board of which such Trustee is a member (if such meeting is not held on the same day as a meeting of the Board). Officers of the Trust, all of whom are members, officers, or employees of the Adviser, or its affiliates, receive no compensation from the Trust.
Other Service Providers
On July 1, 2010, The PNC Financial Services Group, Inc. sold the outstanding stock of PNC Global Investment Servicing Inc. (“PNC GIS”) to The Bank of New York Mellon Corporation. The Stock Sale included PNC GIS, PFPC Distributors, Inc. and PFPC Trust Company. At the closing of the sale, PNC GIS and PFPC Distributors, Inc.
| | |
| Motley Fool Independence Fund | | 31 |
Notes to Financial Statements—(Continued)
changed their names to BNY Mellon Investment Servicing (US) Inc. (“BNY Mellon”) and BNY Mellon Distributors Inc. (the “Distributor”), respectively. PFPC Trust Company will be renamed BNY Mellon Investment Servicing Trust Company on or about July 1, 2011.
Administration and Accounting Services
The Trust has entered into an Administration and Accounting Services Agreement with BNY Mellon. Pursuant to the Administration and Accounting Services Agreement, BNY Mellon provides various administrative and accounting services necessary for the operations of the Trust and the Fund. Services provided by BNY Mellon include facilitating general Fund management; monitoring the Fund’s compliance with federal and state regulations; supervising the maintenance of the Fund’s general ledger, the preparation of the Fund’s financial statements, the determination of NAV and the payment of dividends and other distributions to shareholders; and preparing specified financial, tax and other reports. The Fund pays the Administrator an annual fee calculated based upon the Fund’s average net assets. The fee is paid monthly. The Fund also reimburses the Administrator for certain out-of-pocket expenses.
Transfer Agent
BNY Mellon serves as the Fund’s transfer agent and dividend disbursing agent. BNY Mellon receives a fee based mainly upon the number of accounts serviced. Certain minimum fees and transaction charges may apply.
For the year ended October 31, 2010, BNY Mellon received $543,527 in aggregate fees and expenses for services rendered under the various agreements described above.
Custodian
PFPC Trust Company serves as custodian for the Fund. In that capacity, it maintains custody of all securities and cash assets of the Fund. The custodian is authorized to hold the Fund’s investments in securities depositories and with sub-custodians approved by the Fund.
Custodian fees for the Fund are calculated based on the average daily gross assets of the Fund. PFPC Trust Co. also receives other transaction based charges and is reimbursed for out-of-pocket expenses.
For the year ended October 31, 2010, PFPC Trust Company received $46,484 in aggregate fees and expenses for services rendered under the custody agreements described above.
Distribution
The Distributor serves as the principal underwriter of the Fund pursuant to an Underwriting Agreement for the limited purpose of acting as statutory underwriter to facilitate the distribution of shares of the Fund. The Fund does not pay any fees to the Distributor in its capacity as Underwriter. The fees are paid by the Adviser.
| | |
| 32 | | Motley Fool Independence Fund |
Notes to Financial Statements—(Continued)
Redemption Fees
The Fund charges a redemption fee of 2.00% on proceeds from Shares redeemed or exchanged within 90 days following their acquisition. The redemption fee is calculated as a percentage of the net asset value of the total redemption proceeds and is retained by the Fund and accounted for as additional paid-in capital. Certain exceptions to the imposition of the redemption fee exist. Please see the Fund’s prospectus for more information.
5. Control Persons and Principal Holders:
Any person beneficially owning, directly or indirectly, more than 25% of the outstanding shares of the Fund is presumed to control the Fund. Through the exercise of voting rights with respect to shares of the Fund, such a person may be able to determine the outcome of shareholders voting on matters as to which the approval of shareholders of the Fund is required. Principal holders are persons who own beneficially 5% or more of the outstanding shares of the Fund. As of October 31, 2010, the Trust was not aware of any shareholders who beneficially owned 5% or more of the Fund’s outstanding shares.
6. Investment Transactions:
For the year ended October 31, 2010, the cost of purchases and proceeds from sales and maturities of investment securities for the Fund were as follows:
Cost of Purchases and Proceeds from Sales and Maturities of Long-Term Securities
(other than Temporary Cash Investments)
| | | | | | |
| Purchases | | | Sales and Maturity Proceeds | |
| $ | 107,413,641 | | | $ | 29,192,022 | |
7. Shares of Beneficial Interest:
The Trust is authorized to issue an unlimited number of Shares of Beneficial Interest with a par value of $0.001. Currently, the Fund is the sole series of shares of the Trust, and all shares of the Fund are of a single class. The Board has the authority to establish additional series of shares (representing interests in separate investment portfolios of the Trust in addition to the Fund) and, subject to applicable rules, may establish two or more classes of shares of any series, with the differences in classes representing differences as to certain expenses and share distribution arrangements. Shares are fully paid, non-assessable and have no pre-emptive or conversion rights.
| | |
| Motley Fool Independence Fund | | 33 |
Notes to Financial Statements—(Continued)
8. Federal Income Taxes:
The Trust intends the Fund to qualify as a regulated investment company (“RIC”) under Subchapter M of the Code. If so qualified, the Trust will not be subject to federal income tax on that part of its net investment income and net capital gains that it distributes to its shareholders. Certain federal income and excise taxes would be imposed on the Fund if it fails to make certain required distributions of its income to shareholders. The Trust intends, however, to make distributions to the Fund’s shareholders in a manner that will avoid the imposition of any such taxes. For this reason, no provision for excise or income taxes is required.
Net investment income (loss) and net realized gains (losses) may differ for financial statements and tax purposes primarily due to differing treatments for amortization of deferred organization costs, foreign currency transactions, foreign capital gains taxes and investments in partnerships and Passive Foreign Investment Companies (“PFIC’s”).
Distributions during the year ended October 31, 2010, were characterized as follows for tax purposes:
| | | | | | | | |
Tax Year End | | Ordinary
Income | | | Long-Term
Capital Gain | |
2010 | | $ | 390,863 | | | $ | — | |
There were no distributions for the period ended October 31, 2009.
At October 31, 2010, the components of distributable earnings on a tax basis were as follows:
| | | | | | | | | | | | | | |
Undistributed
Ordinary
Income | | | Undistributed
Long-Term
Capital Gain | | | Capital
Loss
Carryover | | | Net Unrealized
Appreciation
(Depreciation)
on Investments | |
| $ | 1,632,397 | | | $ | 625,977 | | | $ | — | | | $ | 16,248,329 | |
For federal income tax purposes, there was no capital loss carryover as of October 31, 2010.
At October 31, 2010, the aggregate cost of investment securities for federal income tax purposes (excluding foreign currency, securities sold short and derivative related items) and the net unrealized appreciation from investments for those securities having an excess of value over cost and net unrealized depreciation from investments for those securities having an excess of cost over value (based on cost for federal income tax purposes) were as follows:
| | | | | | | | | | | | | | |
| Federal Tax Cost | | | Net Unrealized
Appreciation
(Depreciation) | | | Appreciated
Securities | | | Depreciated
Securities | |
| $ | 114,227,663 | | | $ | 16,249,223 | | | $ | 17,441,758 | | | $ | (1,192,535 | ) |
| | |
| 34 | | Motley Fool Independence Fund |
Notes to Financial Statements—(Continued)
The differences between book basis and tax basis unrealized appreciation is attributable primarily to the deferral of losses on wash sales and cumulative basis adjustments for partnerships and PFIC’s.
At October 31, 2010, capital contributions, accumulated undistributed net investment income and accumulated net realized gain (loss) from investments have been adjusted for current period permanent book/tax differences which arose principally from differing book/tax treatments of amortization of deferred organization costs, foreign currency transactions, and investments in partnerships and PFICs. The following amounts were reclassified within the capital accounts:
| | | | | | | | | | |
| Paid in Capital | | | Accumulated
Undistributed Income | | | Accumulated
Net Realized
Gain (Loss)
on Investments | |
| $ | (5,631 | ) | | $ | (123,290 | ) | | $ | 128,921 | |
Management has analyzed the Fund’s tax position and has concluded that no provision for income tax is required in the financial statements. The Fund is not aware of any tax positions for which it is reasonably possible that the total amounts of unrecognized tax benefits will significantly change in the next twelve months. However, management’s conclusions may be subject to review and adjustment at a later date based on certain factors including, but not limited to, further implementation guidance from the FASB, new tax laws, regulations and administrative interpretations (including court decisions).
9. Subsequent Events:
Subsequent events have been evaluated through the date that the financial statements were available to be issued. All subsequent events determined to be relevant and material to the financial statements have been appropriately recorded or disclosed.
| | |
| Motley Fool Independence Fund | | 35 |
Report of Independent Registered Public Accounting Firm
To the Shareholders and Board of Trustees
of Motley Fool Independence Fund, a series
of The Motley Fool Funds Trust
We have audited the accompanying statement of assets and liabilities of Motley Fool Independence Fund (the “Fund”), a series of The Motley Fool Funds Trust, including the schedule of investments, as of October 31, 2010, and the related statements of operations for the year then ended and the statements of changes in net assets and financial highlights for the year ended October 31, 2010 and for the period from June 16, 2009 (commencement of operations) through October 31, 2009. These financial statements and financial highlights are the responsibility of the Fund’s management. Our responsibility is to express an opinion on these financial statements and financial highlights based on our audit.
We conducted our audits in accordance with the standards of the Public Company Accounting Oversight Board (United States). Those standards require that we plan and perform the audit to obtain reasonable assurance about whether the financial statements and financial highlights are free of material misstatement. An audit includes examining, on a test basis, evidence supporting the amounts and disclosures in the financial statements. Our procedures included confirmation of securities owned as of October 31, 2010, by correspondence with the custodian and brokers. An audit also includes assessing the accounting principles used and significant estimates made by management, as well as evaluating the overall financial statement presentation. We believe that our audit provides a reasonable basis for our opinion.
In our opinion, the financial statements and financial highlights referred to above present fairly, in all material respects, the financial position of Motley Fool Independence Fund, a series of The Motley Fool Funds Trust, as of October 31, 2010, the results of its operations for the year then ended, and the changes in net assets and financial highlights for the year ended October 31, 2010 and for the period from June 16, 2009 (commencement of operations) through October 31, 2009, in conformity with accounting principles generally accepted in the United States of America.

Boston, Massachusetts
December 22, 2010
| | |
| 36 | | Motley Fool Independence Fund |
Notice to Shareholders (Unaudited)
Tax Information
All designations are based on financial information available as of the date of this annual report and, accordingly, are subject to change. For each item, it is the intention of the Fund to designate the maximum amount permitted under the Internal Revenue Code and the regulations thereunder.
For the period ended October 31, 2010, the Fund designated a portion of its distributions as follows:
| | | | |
Qualified Dividend Income (QDI) | | | 32.76 | % |
Dividends Received Deduction (DRD) | | | 13.30 | % |
| | |
| Motley Fool Independence Fund | | 37 |
Information on Proxy Voting
The Trust’s proxy voting guidelines, used to determine how to vote proxies relating to portfolio securities and information regarding how the Trust voted proxies relating to portfolio securities of the Fund during the most recent 12-month period ended June 30 is available (i) without charge, upon request, by calling (888) 863-8803; (ii) on the U.S. Securities and Exchange Commission’s (“SEC”) website at http://www.sec.gov; and (iii) on the Fund’s website at http://www.foolfunds.com.
Quarterly Schedule of Investments
The Trust provides a complete list of the Fund’s holdings four times in each fiscal year, at the quarter-ends. For the second and fourth quarters, the Portfolio of Investments appears in the semi-annual and annual reports to shareholders. For the first and third quarters, the Trust files the Portfolio of Investments with the SEC on Form N-Q. Shareholders can obtain the Form N-Q (i) without charge, upon request, by calling (888) 863-8803; (ii) on the SEC’s website at http://www.sec.gov; and (iii) on the Fund’s website at http://www.foolfunds.com. The Form N-Q may be reviewed or copied at the SEC Public Reference Room in Washington, D.C. Information on the operation of the Public Reference Room may be obtained by calling (800) SEC-0330.
| | |
| 38 | | Motley Fool Independence Fund |
The Motley Fool Funds Trust Privacy Policy
We collect the following nonpublic personal information about you:
| | • | | Information we receive from you on or in applications or other forms, our website, correspondence, or conversations, including, but not limited to, your name, address, phone number, Social Security number, assets, income, and date of birth. |
| | • | | Information about your transactions with us, our affiliates, or others, including, but not limited to, your account number and balance, payments history, parties to transactions, cost-basis information, and other financial information. |
We do not disclose any nonpublic personal information about our current or former shareholders to nonaffiliated third parties, except as permitted by law. For example, we are permitted by law to disclose all of the information we collect, as described above, to our transfer agent to process your transactions. Furthermore, we restrict access to your nonpublic personal information to those persons who require such information to provide products or services to you. We maintain physical, electronic, and procedural safeguards that comply with federal standards to guard your nonpublic personal information.
In the event that you hold shares of the Fund through a financial intermediary, including, but not limited to, a securities dealer, bank, or trust company, the privacy policy of your financial intermediary would govern how your nonpublic personal information would be shared with nonaffiliated third parties.
| | |
| Motley Fool Independence Fund | | 39 |
Directors and Officers (Unaudited)
| | | | | | | | | | |
NAME, ADDRESS, AND AGE (1) | | POSITION(S)
HELD WITH
THE TRUST | | TERM OF OFFICE
AND
LENGTH OF TIME
SERVED (2) | | PRINCIPAL OCCUPATIONS DURING PAST FIVE YEARS | | NUMBER OF
PORTFOLIOS IN
FUND COMPLEX
OVERSEEN BY
TRUSTEE | | OTHER
DIRECTORSHIPS
HELD BY TRUSTEE |
| | | | | | INDEPENDENT TRUSTEES | | | | |
| | | | | |
| Kathleen A. O’Neil 58 | | Trustee | | Since March, 2009 | | President/CEO, Liberty Street Advisors (consultancy); Director, BMC Software, Guidance Software, MetLife Bank, N.A., John Carroll University (1999 to 2008) | | 2 | | BMC Software, Guidance Software, MetLife Bank N.A. |
| | | | | |
| Gary Langbaum 61 | | Trustee | | Since March, 2009 | | Retired | | 2 | | None |
| | | | | |
| Stephen L. Boyd 70 | | Trustee | | Since March, 2009 | | Advisory Director, Morgan Stanley Investment Management | | 2 | | None |
| | | | | |
| | | | | | INTERESTED TRUSTEES AND OFFICERS | | | | |
| | | | | |
Peter E. Jacobstein(3) 45 | | Trustee President | | Since November, 2008 | | President, Motley Fool Asset Management, LLC; SVP, The Motley Fool, Inc. (financial publishing); VP, Strategy and Development, Discovery Comm., Inc. (media) | | 2 | | None |
| | | | | |
| Ollen C. Douglass 47 | | Treasurer | | Since November, 2008 | | Chief Financial Officer, The Motley Fool Holdings, Inc. (and its predecessor, The Motley Fool, Inc.) (financial publishing); Director, Fool/Lovemoney.com Financial Services, Ltd. (UK mortgage adviser) (2008 to 2009), Lovemoney.com, Ltd. (UK financial information site) (2009 to 2009) and The Motley Fool, Ltd. (UK financial information site) | | N/A | | N/A |
| | | | | |
| Lawrence T. Greenberg 47 | | Vice President Secretary | | Since March, 2009 | | SVP and Chief Legal Officer, The Motley Fool Holdings, Inc. (and its predecessor, The Motley Fool, Inc.) (financial publishing); Adjunct Professor, Washington College of Law, American University, George Mason School of Law (2000 to 2007); Director, Fool/Lovemoney.com Financial Services, Ltd. (UK mortgage adviser) (2008 to 2009), Lovemoney.com, Ltd. (UK financial information site) | | N/A | | N/A |
| (1) | Each Trustee can be contacted by writing to The Motley Fool Funds Trust, 2000 Duke Street, Suite 175, Alexandria, VA 22314. |
| (2) | Each Trustee holds office until the next meeting of shareholders at which Trustees are elected (or otherwise appointed) and serve until his or her successor has been elected or qualified. |
| (3) | Mr. Jacobstein is an “interested person” (as defined by the 1940 Act) of the Trust. Mr. Jacobstein is the President and Chairman of the Adviser. |
For more information regarding the trustees and officers, please refer to the Statement of Additional Information, which is available, without charge, upon request by calling (888) 863-8803 or visiting www.foolfunds.com.
| | |
| 40 | | Motley Fool Independence Fund |
Investment Adviser
Motley Fool Asset Management, LLC
2000 Duke Street
Suite 175
Alexandria, VA 22314
Administrator and Transfer Agent
BNY Mellon Investment Servicing (US) Inc.
P.O. Box 9780
Providence, RI 02940-9780
Custodian
PFPC Trust Company
8800 Tinicum Boulevard
Philadelphia, PA 19153
Independent Registered Public Accounting Firm
Grant Thornton, LLP
226 Causeway Street
Boston, MA 02114
Underwriter
BNY Mellon Distributors Inc.
760 Moore Road
King of Prussia, PA 19406
Legal Counsel
Morgan Lewis & Bockius LLP
1111 Pennsylvania Ave., NW
Washington, DC 20004-2541
| | |
| Motley Fool Independence Fund | | 41 |
Left Blank for Foolish Use
(Not a Part of the Annual Report)
Motley Fool Funds Guiding Principles
At Motley Fool Funds, we aim to get right what we believe much of the fund industry gets wrong. Our approach all begins with a shareholder-centric philosophy that we think is unique.
| | • | | We are — and will remain — significant investors with you in Motley Fool Funds. |
| | • | | We will manage your investment in Motley Fool Funds as if it were our own. |
| | • | | We will keep our financial incentives aligned with those of our shareholders. |
| | • | | We will invest for the long term. We seek to maximize returns while we minimize business, regulatory, financial, and sovereign risks. |
| | • | | We will not impose loads or 12b-1 charges, and we will apply redemption fees only to discourage the short-term trading that can hurt all the Fund’s investors. |
| | • | | We will be advocates on your behalf with company managers and boards, in the interest of enhancing the value of your shares. |
| | • | | We will recognize that one of our most powerful analytical weapons is the phrase “I don’t know.” In that spirit, we will constantly review our successes and mistakes and remain passionate about learning. |
| | • | | We will communicate with our shareholders as clearly and candidly as possible. |

Visit us online at www.foolfunds.com. You’ll find:
| | • | | Monthly shareholder letters from Portfolio Manager Bill Mann |
| | • | | Bill’s answers to shareholder questions |
| | • | | Updated fund performance details |
| | • | | Sign-up form for Declarations, our monthly e-mail newsletter |
| | • | | Access to shareholder account information |
Reach us by phone: 888.863.8803 or contact your securities dealer.
Contact us by mail:
Motley Fool Funds
P.O. Box 9780
Providence, RI 02940-9780
©All Rights Reserved
This report has been prepared for shareholders of Motley Fool Independence Fund. It is not authorized for distribution to prospective investors unless accompanied or preceded by a current prospectus, which contains more complete information about the Fund. Investors are reminded to read the prospectus carefully before investing. Past performance is no guarantee of future results. Share prices will fluctuate and there may be a gain or loss when shares are redeemed. Fund shares are distributed by BNY Mellon Distributors Inc., 760 Moore Rd., King of Prussia, PA 19406.
MFF-ANR-002
| | (a) | The registrant, as of the end of the period covered by this report, has adopted a code of ethics that applies to the registrant’s principal executive officer, principal financial officer, principal accounting officer or controller, or persons performing similar functions, regardless of whether these individuals are employed by the registrant or a third party. |
| | (b) | There have been no amendments, during the period covered by this report, to a provision of the code of ethics that applies to the registrant’s principal executive officer, principal financial officer, principal accounting officer or controller, or persons performing similar functions, regardless of whether these individuals are employed by the registrant or a third party, and that relates to any element of the code of ethics description. |
| | (c) | The registrant has not granted any waivers, including an implicit waiver, from a provision of the code of ethics that applies to the registrant’s principal executive officer, principal financial officer, principal accounting officer or controller, or persons performing similar functions, regardless of whether these individuals are employed by the registrant or a third party, that relates to one or more of the items set forth in paragraph (b) of this item’s instructions. |
| Item 3. | Audit Committee Financial Expert. |
As of the end of the period covered by the report, the Registrant’s board of trustees has determined that Gary Langbaum and Kathleen A. O’Neil are qualified to serve as audit committee financial experts serving on its audit committee and that each of them is “independent,” as defined by Item 3 of Form N-CSR.
| Item 4. | Principal Accountant Fees and Services. |
Audit Fees
| | (a) | The aggregate fees billed from the Registrant’s inception on June 16, 2009 through October 31, 2009 and the fiscal year ended October 31, 2010 for professional services rendered by the principal accountant for the audit of the registrant’s annual financial statements or services that are normally provided by the accountant in connection with statutory and regulatory filings or engagements for those fiscal periods are $26,250 and $10,350, respectively. |
Audit-Related Fees
| | (b) | The aggregate fees billed from the Registrant’s inception on June 16, 2009 through October 31, 2009 and the fiscal year ended October 31, 2010 for assurance and related services by the principal accountant that are reasonably related to the performance of the audit of the registrant’s financial statements and are not reported under paragraph (a) of this Item are $245 and $0, respectively. Services provided were for administrative services related to the audit. |
Tax Fees
| | (c) | The aggregate fees billed from the Registrant’s inception on June 16, 2009 through October 31, 2009 and the fiscal year ended October 31, 2010 for professional services rendered by the principal accountant for tax compliance, tax advice, and tax planning are $3,675 and $0, respectively. Services provided were for review of federal and state tax returns. |
All Other Fees
| | (d) | The aggregate fees billed from the Registrant’s inception on June 16, 2009 through October 31, 2009 and the fiscal year ended October 31, 2010 for products and services provided by the principal accountant, other than the services reported in paragraphs (a) through (c) of this Item are $175 and $1,553, respectively. Services provided were for administrative services related to the audit and for services related to the 485b. |
| | (e)(1) | The audit committee’s pre-approval policies and procedures: |
Pursuant to Registrant’s Audit Committee Charter (the “Charter”), the Audit Committee is responsible for pre-approving any engagement of the auditor to provide audit and non-audit services to the Registrant. The Audit Committee is also responsible for pre-approving non-audit services provided by the auditor to the Adviser or any Motley Fool Affiliate that provides ongoing services to the Trust if the engagement relates directly to the operations and financial reporting of the Trust.
The Audit Committee may form one or more subcommittees (which may consist of one or more Audit Committee members), and may delegate to any such committee or to the Chair of the Audit Committee any portion of its authority, including the authority to pre-approve audit and permitted non-audit services, as it deems appropriate from time to time. Any decision of a subcommittee or of the Chair to pre-approve audit or non-audit services shall be presented to the Audit Committee at its next regularly scheduled meeting.
| | (e)(2) | The percentage of services described in each of paragraphs (b) through (d) of this Item that were approved by the audit committee pursuant to paragraph (c)(7)(i)(C) of Rule 2-01 of Regulation S-X are as follows: |
| | (g) | The aggregate non-audit fees billed by the registrant’s accountant for services rendered to the registrant, and rendered to the registrant’s investment adviser (not including any sub-adviser whose role is primarily portfolio management and is subcontracted with or overseen by another investment adviser), and any entity controlling, controlled by, or under common control with the adviser that provides ongoing services to the registrant from the Registrant’s inception on June 16, 2009 through October 31, 2009 and the fiscal year ended October 31, 2010 were $4,095 and $25,733, respectively. |
| | (h) | The registrant’s audit committee of the board of directors has considered whether the provision of non-audit services that were rendered to the registrant’s investment adviser (not including any sub-adviser whose role is primarily portfolio management and is subcontracted with or overseen by another investment adviser), and any entity controlling, controlled by, or under common control with the investment adviser that provides ongoing services to the registrant that were not pre-approved pursuant to paragraph (c)(7)(ii) of Rule 2-01 of Regulation S-X is compatible with maintaining the principal accountant’s independence. |
| Item 5. | Audit Committee of Listed Registrants. |
Not applicable.
| (a) | Schedule of Investments in securities of unaffiliated issuers as of the close of the reporting period is included as part of the report to shareholders filed under Item 1 of this form. |
| Item 7. | Disclosure of Proxy Voting Policies and Procedures for Closed-End Management Investment Companies. |
Not applicable.
| Item 8. | Portfolio Managers of Closed-End Management Investment Companies. |
Not applicable.
| Item 9. | Purchases of Equity Securities by Closed-End Management Investment Company and Affiliated Purchasers. |
Not applicable.
| Item 10. | Submission of Matters to a Vote of Security Holders. |
Not applicable.
| Item 11. | Controls and Procedures. |
| | (a) | The registrant’s principal executive and principal financial officers, or persons performing similar functions, have concluded that the registrant’s disclosure controls and procedures (as defined in Rule 30a-3(c) under the Investment Company Act of 1940, as amended (the “1940 Act”) (17 CFR 270.30a-3(c))) are effective, as of a date within 90 days of the filing date of the report that includes the disclosure required by this paragraph, based on their evaluation of these controls and procedures required by Rule 30a-3(b) under the 1940 Act (17 CFR 270.30a-3(b)) and Rules 13a-15(b) or 15d-15(b) under the Securities Exchange Act of 1934, as amended (17 CFR 240.13a-15(b) or 240.15d-15(b)). |
| | (b) | There were no changes in the registrant’s internal control over financial reporting (as defined in Rule 30a-3(d) under the 1940 Act (17 CFR 270.30a-3(d)) that occurred during the registrant’s second fiscal quarter of the period covered by this report that has materially affected, or is reasonably likely to materially affect, the registrant’s internal control over financial reporting. |
| | |
(a)(1) | | Code of ethics, or any amendment thereto, that is the subject of disclosure required by Item 2 is attached hereto. |
| |
(a)(2) | | Certifications pursuant to Rule 30a-2(a) under the 1940 Act and Section 302 of the Sarbanes-Oxley Act of 2002 are attached hereto. |
| |
(a)(3) | | Not applicable. |
| |
(b) | | Certifications pursuant to Rule 30a-2(b) under the 1940 Act and Section 906 of the Sarbanes-Oxley Act of 2002 are attached hereto. |
SIGNATURES
Pursuant to the requirements of the Securities Exchange Act of 1934 and the Investment Company Act of 1940, the registrant has duly caused this report to be signed on its behalf by the undersigned, thereunto duly authorized.
| | |
| (registrant) The Motley Fool Funds Trust |
| |
| By (Signature and Title)* | | /s/ PETER E. JACOBSTEIN |
| | Peter E. Jacobstein, President |
| | (principal executive officer) |
Date December 21, 2010
Pursuant to the requirements of the Securities Exchange Act of 1934 and the Investment Company Act of 1940, this report has been signed below by the following persons on behalf of the registrant and in the capacities and on the dates indicated.
| | |
| By (Signature and Title)* | | /s/ PETER E. JACOBSTEIN |
| | Peter E. Jacobstein, President |
| | (principal executive officer) |
Date December 21, 2010
| | |
| By (Signature and Title)* | | /s/ OLLEN C. DOUGLASS |
| | Ollen C. Douglass, Treasurer |
| | (principal financial officer) |
Date December 21, 2010
| * | Print the name and title of each signing officer under his or her signature. |