UNITED STATES
SECURITIES AND EXCHANGE COMMISSION
Washington, D.C. 20549
FORM N-CSR
CERTIFIED SHAREHOLDER REPORT OF REGISTERED MANAGEMENT
INVESTMENT COMPANIES
Investment Company Act file number 811-22264
The Motley Fool Funds Trust
(Exact name of registrant as specified in charter)
Motley Fool Asset Management, LLC
2000 Duke Street, Suite 175
Alexandria, VA 22314
(Address of principal executive offices) (Zip code)
Peter E. Jacobstein
Motley Fool Asset Management, LLC
2000 Duke Street, Suite 175
Alexandria, VA 22314
(Name and address of agent for service)
Registrant’s telephone number, including area code: (703) 302-1100
Date of fiscal year end: October 31
Date of reporting period: October 31, 2011
Form N-CSR is to be used by management investment companies to file reports with the Commission not later than 10 days after the transmission to stockholders of any report that is required to be transmitted to stockholders under Rule 30e-1 under the Investment Company Act of 1940 (17 CFR 270.30e-1). The Commission may use the information provided on Form N-CSR in its regulatory, disclosure review, inspection, and policymaking roles.
A registrant is required to disclose the information specified by Form N-CSR, and the Commission will make this information public. A registrant is not required to respond to the collection of information contained in Form N-CSR unless the Form displays a currently valid Office of Management and Budget (“OMB”) control number. Please direct comments concerning the accuracy of the information collection burden estimate and any suggestions for reducing the burden to Secretary, Securities and Exchange Commission, 100 F Street, NE, Washington, DC 20549. The OMB has reviewed this collection of information under the clearance requirements of 44 U.S.C. § 3507.
Item 1. Reports to Stockholders.
The Report to Shareholders is attached herewith.
A N N U A L R E P O R T
| | |
A series of The Motley Fool Funds Trust | | October 31, 2011 |
| | |
| | | |
Motley Fool Independence Fund & Motley Fool Great America Fund present:
Top 10 Reasons to
Read This Report
| | 10. | A free Motley Fool Funds ball cap and the chance to win lunch with Portfolio Manager Bill Mann. Really! |
| | 9. | A list of the Motley Fool Funds Guiding Principles. Now in an exciting new font! (Kidding – it’s the same font.) |
| | 8. | Unusual use of the word “autodidact.” |
| | 7. | A list of every single holding of both funds as of October 31, 2011, from the $7.38 million in Yum! Brands in the Independence Fund to the $117,440 in Varian Medical Systems in the Great America Fund. |
| | 6. | OK, don’t read it. It’s just that we worked really hard on it. And it’s just about your money. Which is pretty important. |
| | 5. | A whole lot of stimulating boilerplate! |
| | 4. | A section about expenses, which has been carefully and humorlessly reviewed by our auditors.* |
| | 3. | The fascinating story of Frank H. Brown’s monumental influence on your life. |
| | 2. | Interesting graphs of the relative performance of our funds vs. their benchmarks, as required by mutual fund law.** |
| | 1. | A not completely gratuitous reference to J. Martin Troost’s The Sex Lives of Cannibals. |
* Our auditors may have great senses of humor. We don’t really know.
| ** Full | disclosure: We don’t actually find these graphs interesting. |

 Hello, and welcome to the annual report. Throughout, the Funds have included comments to help you understand the annual report, teach you some things to look for in a fund, and to make you chuckle a little. Our investment adviser is an affiliate of The Motley Fool, LLC (“The Motley Fool”), a publisher of investment information and analysis. Like The Motley Fool, our goal is to educate, amuse, and enrich you. Don’t forget to visit www.FoolFunds.com and sign up for our e-newsletter Declarations, featuring Bill Mann’s monthly Letter to Shareholders.
Motley Fool Independence Fund
 During the year ended October 31, 2011, the Motley Fool Independence Fund returned 1.9% versus its benchmark index, which returned 2.3%.
We set up best and worst case scenarios for all companies we analyze. Way to nail the worst case, Hellenic Exchanges!
We continued to find little value in European banks. That’s why we didn’t own any.
Motley Fool Great America Fund
During the year ended October 31, 2011, the Motley Fool Great America Fund returned 10.5% and outperformed its benchmark index by 2.6%.
Remember what we said about European banks for Indy? Yeah, we didn’t hold any American ones in Great America either.
Buying Schweitzer-Mauduit: helpful. Buying Joe’s Jeans: not helpful.
This report has been prepared for shareholders of Motley Fool Independence Fund and Motley Fool Great America Fund. It is not authorized for distribution to prospective investors unless accompanied or preceded by a current prospectus, which contains more complete information about the Funds. Investors are reminded to read the prospectus carefully before investing. Past performance is no guarantee of future results. Share prices will fluctuate and there may be a gain or loss when shares are redeemed. Fund shares are distributed by BNY Mellon Distributors Inc., 760 Moore Rd., King of Prussia, PA 19406.
| | | | |
| 2 | | | | The Motley Fool Funds Trust |
TABLE OF CONTENTS
Letter from the President
| | |

President Peter Jacobstein | | Dear Fellow Shareholder: |
| | What happens when a long-time critic of the mutual fund industry creates a mutual fund? |
| | You get Motley Fool Funds. |
| | For 15 years, The Motley Fool was a harsh detractor of mutual fund industry practices that we believed were harmful to individual shareholders. Yet our criticism of mutual funds only seemed to make more people ask us: “can’t YOU manage my money for me?” |
| | So after years of study and soul-searching, we concluded that the best way we could help these investors was to create a mutual fund ourselves — but one that was true to our principles. |
This isn’t just a marketing slogan for us. We built Motley Fool Funds from the
| | | | |
| The Motley Fool Funds Trust | | | | 3 |
ground up to be a different kind of mutual fund company. Simply put: We want to be the most shareholder-friendly fund company in the business.
To make sure we’re serving you as well as possible, we focus on three critical areas:
1. The way we manage your money: We invest according to Foolish investment principles.
| | • | | We do extensive bottoms-up research on every company we hold. |
| | • | | We strive to buy stocks we can hold for the long-term — to hold down our trading costs and your tax bill. |
| | • | | We invest alongside you: Our Portfolio Managers invest their own money in our funds, and The Motley Fool has put $1 million of the company’s money into each fund as well. |
2. The fees we charge shareholders: We charge simple, fair fees that ensure our interests are always aligned with yours.
| | • | | We don’t charge loads or 12b-1 fees, ever. |
| | • | | We keep our fees for each fund below their category average. |
| | • | | Our management fees are performance-based. That means if our funds perform better, we earn more; if our funds perform worse, we earn less. |
3. The way we communicate with shareholders: We want you to know how we’re investing your money. And we want to make all our shareholders better investors.
| | • | | Our portfolio team writes a monthly email, Declarations, for all shareholders (sign up for free at FoolFunds.com), so you always know what we’re thinking and how we’re managing your money. |
| | • | | We give you multiple ways to interact with the portfolio team, including: |
n “Question Authority” online Q&A with the team
n Semi-annual conference calls
n Annual in-person shareholder meeting
| | • | | We write in plain English, not Wall Street jargon. |
At Motley Fool Funds, we want to change money management for the better. My
| | | | |
| 4 | | | | The Motley Fool Funds Trust |
team and I work hard every day to live our values.
Thank you for your investment in Motley Fool Funds, and for your continued confidence in us.
|
| Sincerely, |
|
 |
Peter Jacobstein
President, Motley Fool Asset Management
PS: If you’re not already receiving our monthly newsletter, Declarations, I urge you to sign up today at FoolFunds.com. Full of investing insights, observations on the economy, travel tips, and witty asides, it’s always entertaining, and you’re guaranteed to learn something new every month.
| | | | |
| The Motley Fool Funds Trust | | | | 5 |
Letter to Shareholders
| | |

Portfolio Manager Bill Mann | | Dear Fellow Motley Fool Funds Shareholder: |
| | For the year ended October 31, 2011, the Motley Fool Independence Fund generated a return of 1.9% versus a return of 2.3% for the MSCI World, its benchmark. The Motley Fool Great America Fund had a return of 10.5% versus a return of 7.9% for the Russell Midcap Index. |
Had you simply tuned out over the past year, you might be excused for thinking that those returns suggest fairly benign market conditions. In actuality, they’ve been anything but. As global economic conditions have grown scarier, markets worldwide have displayed remarkable levels of volatility, with daily national index moves of 3, 4, even 5% becoming commonplace, particularly starting in June. The American stock market suffered a stomach-churning decline of more than 20%, only to rally rapidly through October. Stock movements in the U.S. were nothing compared to those in a multitude of international markets, with countries as diverse as Austria, Argentina, Greece, and Egypt suffering declines approaching 40%.
The Independence Fund ended the fiscal year trailing its benchmark by a fraction of a percent. We closed out our first year in the Great America Fund with a rather strong showing.
In 2010, the Independence Fund bested its benchmark, and I made the same claim then as I do now: We make no effort whatsoever to mimic the weightings of companies, industries, or geographies of our indexes, and as such we view our one-year relative performance to be an exercise in randomness as much as anything else. Whether the story is good or bad, our message is the same: If you find us worrying too much about our benchmarks, you should find someone else to manage your money because that would be a sign that we have lost our focus.
All in all, my own assessment is that we had a good year. There are some decisions that I’d like to have back — for example, selling Chipotle and buying Joe’s Jeans — but my regrets are due more to bad decisions than bad outcomes. If you make good decisions, on the balance the outcomes tend to take care of themselves. Good decisions are the result of having a good process in place. This is not to say that even good processes are lapse-free. Regarding Joe’s Jeans, for example, I undervalued the dynamic that had its chief designer being paid a percentage of gross (instead of net) profits, which put his interests ahead of — and at odds with — those of minority shareholders. This wasn’t just a bad outcome. It was a mistake.
| | | | |
| 6 | | | | The Motley Fool Funds Trust |
By the same measure, I’m proud of our process in investing in WeMade Entertainment, a Korean purveyor of online games, most notably the wildly profitable Legends of Mir II. Korean companies tend to offer analytical challenges, in no small part because they tend to only report results in Korean. Anthony Arsta’s primary research on this company was nothing short of spectacular, and the results for shareholders have been more than satisfactory.
We have made hundreds of investing decisions over the last year, none of which were conducted in consideration of the composition of our benchmarks. Despite this, our end-of-year scorecard shows that our funds tracked their benchmarks quite closely. One thing that volatility tends to cause among asset classes is increased correlation — even for ones that should move in the opposite direction. Through September and October, for example, the Treasury, equity, and precious metal markets all moved in lockstep with one another. In times when investing is generally rational, this should not happen. I feel very safe in declaring the market environment in which we currently operate as being highly irrational.
Two things I want you to do
I hope to convince you to do two things today. The first is fairly simple. We constantly look for ways to make the Fool Funds family extremely shareholder-friendly, and one way we do that is to communicate obsessively with our members and other folks who are interested in what we have to say. We do this through our monthly email, Declarations, which includes our shareholder letters (wholly written by our portfolio team), Question Authority (where we answer questions from our shareholders), dispatches from our travels, and our quarterly conference calls and annual live meeting. If you aren’t getting Declarations, please email contest@FoolFunds.com to sign up, even if you’re not a current shareholder (OK, especially if you’re not a current shareholder). To show our thanks, we’ll send a Motley Fool Funds ball cap to everyone who emails us (make sure you provide your postal address) and you’ll be entered in our contest. Grand prize: Lunch with me and another member of our portfolio team at a restaurant in your town. Sweet, right? (For complete contest rules, visit FoolFunds.com/help/contest.aspx.)
The reason we’re going to such lengths to encourage you to sign up is simple: We believe that mutual funds work best when the largest number of shareholders possible is aligned in philosophy and temperament with those who are managing their money. Even the best performing mutual funds deliver poor results for shareholders who buy and sell at the wrong time. It is important — very important — that you know what we are thinking and why.
That’s the first thing I want you to do today. I’ll tell you about the second in a moment.
The dismal lives of economic prognosticators
I’d like to invite you to a basketball game. It’s just your standard game: two teams,
| | | | |
| The Motley Fool Funds Trust | | | | 7 |
basket at each end, tall people, cheerleaders, all the trappings. Except in this game, the scoring system is quite different.
Rather than counting baskets made, a team of basketball experts determines the score based upon a large set of statistical measures: baskets attempted, turnovers, times shoelaces tied (TST), injuries, scoring balance, fan happiness, concession stand sales, fatigue measurements, etc. At the end of the game, the experts tell you which team won.
There are two other factors you should know about how scoring is measured. First, the measurements are all backward-looking. The experts who score the game have access to almost none of the information in real time, so they can only guess at the score at any point during the game. Second, the statistics they use are all prone to substantial revision. A team that thought it had won might be informed days or weeks later that the result had been reversed due to a revision to the sports drink-to-pretzel ratio.
Is this something that you’d like to watch? Frankly, it sounds like a pretty miserable experience, fraught with error and uncertainty. And yet, the process I describe is similar to that of economic analysis. In 1992, lousy economic data essentially scuppered George H. W. Bush’s re-election efforts. Cold comfort when much of those indicators were later revised higher. Given these two factors (the dependency on statistics that are rear-view and prone to substantial revision), is there any wonder that consensus among economists is so rare, even on events that happened years prior?
All hail Alaska
If economists cannot agree on events that took place years ago, and can’t access important data to determine what is happening right this second, what hope do we have that their forecasts are accurate? Past experience should suggest “very little,” but that doesn’t stop people from either making bold forecasts, or consuming them (I’m sure the former is a condition of the latter). Economic forecasts are little more than guesses made on bad data and historical inferences.
Which, of course, is why the story of Frank H. Brown is so important.
Who is Frank H. Brown, you ask? It’s a name that is associated with an event that has made the lives of millions of people around the world both better and different. Thanks to Frank H. Brown, many items in your daily life cost a fraction of what they would otherwise, if they were available at all.
Frank H. Brown was the world’s first container ship. It plied the Inside Passage route from Seattle and the Pacific Northwest up to Juneau and Skagway, Alaska. For centuries, shipping had been done essentially the same way: each parcel carried individually. This not only wasn’t very efficient, but it also left the packages exposed to the elements, so spoilage was quite common.
| | | | |
| 8 | | | | The Motley Fool Funds Trust |
In the 1950s, employees of the shipping company looked at all of these odd-shaped packages going to various places in Alaska and thought it might be wise to combine them into metal containers that could be offloaded in each port. They immediately noticed two benefits: the cargo hold was substantially more efficient to load and unload, and far fewer items were arriving at their destination damaged. This insight led to one of the most underrated developments of the last century: the standard-sized shipping container.
The advent of the shipping container spawned a massive industry (several of them, actually), and has transformed the very concept of product availability. (Don’t believe this is a big deal? Pick up a copy of Sex Lives of Cannibals by J. Martin Troost to read a modern account of living in Kiribati, a small South Pacific country that is too economically small to warrant regular shipments of products generally available all over the world. And no, that wasn’t a ploy to write the word “sex” into an annual letter.)
Containerized shipping makes goods all over the world cheaper to deliver and has unleashed massive amounts of economic activity, creating millions of jobs and shrinking the distance between producer and consumer. Fresh mangoes in Toledo? Frank H. Brown. Korean televisions in Estonia? Frank H. Brown. Enfamil in Zimbabwe? Frank H. Brown.
You might wonder why I’m bringing this up. Think back again to our miserable basketball game and the even more miserable practice of economic forecasting. Could experts have predicted the origin of something as transformative as the shipping container? Not a chance. Economists can only see what they know to look for, and then guess what this means about the future. Along comes something amazing, like the shipping container or the vacuum cleaner or the heart stent, created by someone for whom “this is how things are done” is merely a challenge, and whole new avenues of economic activity result.
Home of the autodidacts
And where, in all likelihood is the person who is creating the next amazing something? That’s a bit of a trick question, because there are probably thousands of amazing somethings rather than one big one. Nonetheless, a ridiculously large number — way too high to be coincidence — of these creative minds are residents of the United States.
This is the reason, despite an economy so miserable that thousands of Americans chose this fall to engage in long-term occupation protests in cities throughout the country, that great investors like Warren Buffett have invested billions of dollars into American companies over the last year. Buffett has often said that few fortunes will be made betting against the future of America, and I completely agree. The conditions that made the invention of the container ship or the stent or the UPC code have not been revoked.
| | | | |
| The Motley Fool Funds Trust | | | | 9 |
“But wait,” you must certainly be saying, “I constantly hear how the American education system is failing.” There is some truth to this, but unlike the educational systems in many countries, the American system doesn’t favor learning by rote. Education in many other countries is focused on preparing students for the standardized tests that play far larger roles in their college placements than the equivalent SAT or ACT do in the U.S.
Even more important, the center of the bell curve is far less relevant to the potential for future economic growth than the right tail, the high achievers. This is where you find those who go on to create the heart stents, the Netflixes, the Facebooks, and hundreds of other innovations that generate trillions of dollars in economic value.
The great news here is that America’s ability to turn out creative entrepreneurs hasn’t been revoked, sad headlines harkening the end of days be damned. The even better news is that while the United States is statistically very good at producing entrepreneurs, we by no means have a monopoly. I have full confidence in predicting that many of the elements that will help the global economy emerge from its malaise are, at this moment, not being tracked by economists.
The best time to invest
This is where I attempt to convince you to do one more thing. Warren Buffett has famously noted that the best time to buy is when there is “blood in the streets.” Sir John Templeton said to “buy on the cannons, sell on the trumpets.” I, like you, look at the three large pillars of the global economy — the U.S., China, and Europe — with the alarming realization that each one is shakier than the next. Pundits seem to have come to the same gloomy consensus: There’s no way out of this massive balance sheet mess. Certainly there are going to be plenty of reckonings to be had for a generation’s worth of miserable fiscal management.
But history will show that many of the biggest bargains in the stock market come during times of despair. It’s a pretty simple concept: where there are few shoppers, there are likely to be price inefficiencies. This dynamic shows up in the returns of shareholders in mutual funds versus the funds themselves. According to a Wall Street Journal article from December 2009, the CGM Focus Fund rose more than 18% per year through the decade, yet its typical shareholder lost 11% annually over the same period, a result that is entirely a function of shareholders buying when things were great, and selling when they weren’t.
What I want you to do is this: Get out there and invest.
In order to profit from market freak-outs, you need to invest into them. I am not asking you to invest in our funds specifically — I’m simply asking you to invest in something. Do it because few other people are, because everything looks like it will come apart at the seams. Sure, it’s possible that things will remain bad for a while. I wouldn’t argue otherwise, because I can’t. There is both literal and figurate
| | | | |
| 10 | | | | The Motley Fool Funds Trust |
blood running in the streets these days. As citizens we can and should be highly concerned and outraged. But by the same measure, many of the great investors have gifted us with clear instructions on what we should do during times of economic and political duress: Get out there and look for opportunities to buy. There is an inherent logic to making investments in the world’s great companies when the market has cast them aside.
Which is what your investment team here at Fool Funds is doing.
As always, the entire team here at Motley Fool Asset Management joins me in thanking you for entrusting us with your money. We are humbled by your trust.
Foolishly,

William H. Mann, III
The Letter to Shareholders seeks to describe some of the Adviser’s current opinions and views of the financial markets. Although the Adviser believes it has a reasonable basis for any opinions or views expressed, actual results may differ, sometimes significantly so, from those expected or expressed. The securities held by the Fund that are discussed in the Letter to Shareholders were held during the period covered by the Annual Report. They do not comprise the entire investment portfolio of the Fund, may be sold at any time and may no longer be held by the Fund. The opinions of the Adviser with respect to those securities may change at any time.
| | | | |
| The Motley Fool Funds Trust | | | | 11 |
Motley Fool Independence Fund Portfolio Characteristics (Unaudited)
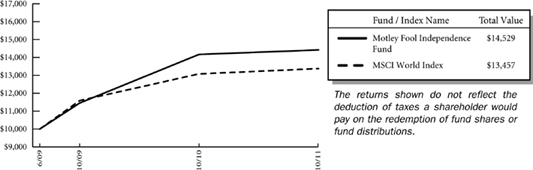
At October 31, 2011, the Motley Fool Independence Fund (the “Fund”) had an audited net asset value of $14.15 per share attributed to 14,010,532 shares outstanding. This compares with an unaudited net asset value as of June 16, 2009 of $10.00 per share attributed to 100,000 shares outstanding. From the Fund’s launch on June 16, 2009 to October 31, 2011 the Fund had a total return of 17.03% versus a return of 13.32% over the same period for its benchmark, MSCI World Index. The graph below shows the performance of $10,000 invested in the Fund at inception. The results shown below do not reflect the deduction of taxes that a shareholder would pay on fund distributions or the redemption of fund shares.
Average Annual Total Returns as of 10/31/2011
| | | | |
| | | Fund* | | Benchmark** |
| | | |
One Year | | 1.91% | | 2.30% |
| | |
Since Inception | | 17.03% | | 13.32% |
| | |
Inception Date | | 06/16/2009 | | |
| | |
Total Annual Fund Operating Expenses Before Expense Limitation (February 28, 2011 Prospectus) | | 2.20% | | |
The performance data quoted represents past performance and does not guarantee future results. Current performance may be lower or higher. Performance data current to the most recent month-end may be obtained at www.FoolFunds.com. The investment return and principal value of an investment will fluctuate so that shares, when redeemed, may be worth more or less than their original cost. *These returns reflect expense waivers by the Fund’s investment adviser. Without these waivers, returns would have been lower.
**The MSCI World Index is a free float-adjusted market capitalization weighted index that is designed to measure the equity market performance of developed markets. The MSCI World Index consists of the following 24 developed market country indices: Australia, Austria, Belgium, Canada, Denmark, Finland, France, Germany, Greece, Hong Kong, Ireland, Israel, Italy, Japan, Netherlands, New Zealand, Norway, Portugal, Singapore, Spain, Sweden, Switzerland, the United Kingdom, and the United States. The MSCI World Index is not available for direct investment. The Fund may invest in countries that are not included within the MSCI World Index (such as emerging market countries) and its investment portfolio is not weighted in terms of countries or issuers the same as the MSCI World Index. For this reason, the Fund’s investment performance should not be expected to track, and may exceed or trail, the MSCI World Index. Since Inception returns for the Benchmark reflect the performance based on the Inception Date of the Fund.
| | | | |
| 12 | | | | Motley Fool Independence Fund |
The investment objective of the Independence Fund is to achieve long-term capital appreciation. The Fund pursues this objective by investing primarily in common stocks of companies located anywhere in the world. The Fund invests in areas of the market that, in the view of Motley Fool Asset Management, LLC (the “Adviser”), offer the greatest potential for long-term capital appreciation. The Fund may invest in other types of securities and in other asset classes when, in the judgment of the Adviser, such investments offer attractive potential returns. As such, the Fund’s performance will deviate significantly from its benchmark from time to time. It is the view of the Adviser that this deviation is less meaningful over shorter time frames and is more relevant over multi-year periods.
Because the Independence Fund is free to invest in companies of any size around the world, at times, the Fund may be heavily invested in small-cap stocks and foreign securities, each of which presents extra risk. Small-cap stocks tend to be more volatile and less liquid than their large-cap counterparts. Fluctuations in currency exchange rates can cause losses when investing in foreign securities, with emerging markets presenting additional risks of illiquidity, political instability, and lax regulation. You are strongly encouraged to read more about the Fund’s strategies and risks in the prospectus.
The Independence Fund invests in securities of companies the Adviser believes are undervalued. Unlike mutual funds that are constrained by a style-box, the Fund may invest in any company, country, market, industry or sector where the Adviser’s analysis suggests that there is opportunity for gains that outweigh risks. In identifying investments for the Fund, the Adviser looks for companies it believes the market has irrationally undervalued and looks for companies that have high-quality businesses with strong market positions, manageable leverage, and robust streams of free cash flow. The following tables show the top 11 holdings and top 10 sectors and countries in which the Fund was invested at fiscal year-end. Portfolio holdings are subject to change without notice.
Certain mutual fund ratings and review services have created style boxes, which look more or less like a tic-tac-toe board; arranging funds by the size of the companies they typically invest in (large-, mid-, and small-cap) along one axis, and along a “value” to “growth” basis on the other axis. This may be a helpful way – at times – to think about certain investment opportunities, but we don’t believe we’ll improve your returns by limiting ourselves to any one portion of that style box.
| | | | |
Top Eleven Holdings* | | % of Net
Assets | |
| |
Telefonica SA | | | 3.72 | % |
Yum! Brands, Inc. | | | 3.49 | |
WellPoint, Inc. | | | 3.26 | |
Denbury Resources, Inc. | | | 2.87 | |
POSCO | | | 2.71 | |
Loews Corp. | | | 2.64 | |
HCC Insurance Holdings, Inc. | | | 2.42 | |
Lukoil OAO | | | 2.31 | |
Brookfield Asset Management, Inc. | �� | | 2.29 | |
Google, Inc. | | | 2.24 | |
Markel Corp. | | | 2.18 | |
| | | | |
| | | 30.13 | % |
| | | | |
| * | As of the date of the report the fund had a holding of 0.68% in the BNY Mellon Cash Reserve. |
| | | | |
| Motley Fool Independence Fund | | | | 13 |
The Motley Fool Independence Fund uses the Global Industry Classification StandardSM (“GICSSM”) as the basis for the classification of securities on the Schedule of Investments (“SOI”).We believe that this makes the SOI classifications more standard with the rest of the industry.
| | | | |
| Top Ten Sectors | | % of Net Assets | |
| | | | | |
| |
Financials | | | 22.19 | % |
Consumer Staples | | | 14.54 | |
Health Care | | | 13.03 | |
Information Technology | | | 10.20 | |
Consumer Discretionary | | | 9.01 | |
Industrials | | | 7.96 | |
Energy | | | 6.98 | |
Materials | | | 5.34 | |
Telecommunications | | | 5.19 | |
Utilities | | | 2.81 | |
| | | | |
| | | 97.25 | % |
| | | | |
| | | | |
| Top Eleven Countries | | % of Net Assets | |
| | | | | |
United States* | | | 50.35 | % |
Japan | | | 5.83 | |
South Korea | | | 4.06 | |
Spain | | | 3.72 | |
Brazil | | | 3.43 | |
Bermuda | | | 3.11 | |
Canada | | | 2.91 | |
Hong Kong | | | 2.71 | |
Russia | | | 2.31 | |
United Kingdom | | | 2.28 | |
Singapore | | | 1.78 | |
| | | | |
| | | 82.49 | % |
| | | | |
| * | As of the date of the report the fund had a holding of 0.68% in the BNY Mellon Cash Reserve. |
| | | | |
| 14 | | | | Motley Fool Independence Fund |
About Your Expenses
As a shareholder of the Independence Fund, you incur ongoing costs, including advisory fees and other Fund expenses. This example is intended to help you to understand your ongoing costs (in dollars) of investing in the Fund and to compare these costs with the ongoing costs of investing in other mutual funds. It is based on an investment of $1,000 invested at the beginning of the period and held for the entire period from May 1, 2011 to October 31, 2011.
Actual Expenses
The first section of the table below provides information about actual account values and actual expenses. You may use the information in this section, together with the amount you invested, to estimate the expenses that you incurred over the period. Simply divide your account value by $1,000 (for example, an $8,600 account value divided by $1,000 = 8.6), then multiply the result by the number in the first section under the heading entitled “Expenses Paid During Period” to estimate the expenses attributable to your investment during this period.
Hypothetical Example for Comparison Purposes
The second section of the table below provides information about hypothetical account values and hypothetical expenses based on the Independence Fund’s actual expense ratio and an assumed rate of return of 5% per year before expenses, which is not the Fund’s actual return. Thus, you should not use the hypothetical account values and expenses to estimate the actual ending account balance or your expenses for the period. Rather, these figures are provided to enable you to compare the ongoing costs of investing in the Fund as compared to the costs of investing in other funds. To do so, compare this 5% hypothetical example with the 5% hypothetical examples that appear in the shareholder reports of the other funds. Please note that the expenses shown in the table are meant to highlight your ongoing costs only. Therefore, the second section of the table is useful in comparing ongoing costs only and will not help you determine the relative total costs of owning different funds.
Do you know how many times a fund, or the market, has returned a smooth 5% over a long period of time? Never. But we have to pick some example. In reality the market’s returns are always far bumpier, with the market returning 20% one year, followed by a loss of 10% the next year, followed by a 3% gain, etc. These variations affect actual expenses as well. Happily, over almost all time periods of 20 years or longer, according to the research of University of Pennsylvania’s Jeremy Siegel and others, the domestic market’s returns have been at least 5% per year on average.
| | | | | | | | | | | | | | | | |
| | | Beginning
Account Value
05/01/11 | | | Ending
Account Value
10/31/11 | | | Annualized
Expense Ratio(1) | | | Expenses Paid
During Period(2) | |
| | |
Actual | | $ | 1,000 | | | $ | 905.88 | | | | 1.43 | % | | $ | 6.87 | |
Hypothetical | | $ | 1,000 | | | $ | 1,018.00 | | | | 1.43 | % | | $ | 7.27 | |
| (1) | These ratios reflect expenses waived by the Fund’s investment Adviser. Without these Waivers, the Fund’s expenses would have been higher and the ending account values would have been lower. |
| (2) | Expenses are equal to the Fund’s annualized expense ratio for the period May 1, 2011 to October 31, 2011, multiplied by the average account value over the period, multiplied by the number of days (184) in the most recent fiscal half-year, then divided by 365. |
| | | | |
| Motley Fool Independence Fund (Unaudited) | | 15 |
The Motley Fool Funds Trust
Motley Fool Independence Fund
Schedule of Investments
at October 31, 2011
| | | | | | | | |
| Issues | | Shares | | | Value (Note 2) | |
| | |
| | |
Equity Securities — 95.51% | | | | | | | | |
Beverages — 0.75% | | | | | | | | |
Coca-Cola Icecek AS (Turkey) | | | 110,000 | | | $ | 1,483,505 | |
| | | | | | | | |
| | |
Capital Markets — 0.75% | | | | | | | | |
INTL FCStone, Inc. (United States)* | | | 61,513 | | | | 1,491,075 | |
| | | | | | | | |
| | |
Chemicals — 1.80% | | | | | | | | |
Innophos Holdings, Inc. (United States) | | | 81,164 | | | | 3,570,404 | |
| | | | | | | | |
| | |
Commercial Banks — 2.44% | | | | | | | | |
Banco Latinoamericano de Comercio Exterior SA (Panama) | | | 98,265 | | | | 1,596,806 | |
Qatar Islamic Bank (Qatar) | | | 146,650 | | | | 3,249,739 | |
| | | | | | | | |
| | |
| | | | | | | 4,846,545 | |
| | | | | | | | |
| | |
Commercial Services & Supplies — 3.05% | | | | | | | | |
De La Rue PLC (United Kingdom) | | | 190,900 | | | | 2,586,118 | |
Multiplus SA (Brazil) | | | 204,600 | | | | 3,455,981 | |
| | | | | | | | |
| | |
| | | | | | | 6,042,099 | |
| | | | | | | | |
| | |
Communications Equipment — 2.70% | | | | | | | | |
Cisco Systems, Inc. (United States) | | | 68,000 | | | | 1,260,040 | |
Infinera Corp. (United States)* | | | 561,100 | | | | 4,101,641 | |
| | | | | | | | |
| | |
| | | | | | | 5,361,681 | |
| | | | | | | | |
| | |
Construction & Engineering — 0.35% | | | | | | | | |
KHD Humboldt Wedag International AG (Germany)* | | | 109,586 | | | | 686,118 | |
| | | | | | | | |
| | |
Containers & Packaging — 0.68% | | | | | | | | |
Crown Holdings, Inc. (United States)* | | | 40,000 | | | | 1,351,600 | |
| | | | | | | | |
| | |
Diversified Consumer Services — 0.04% | | | | | | | | |
MegaStudy Co., Ltd (South Korea) | | | 800 | | | | 88,480 | |
| | | | | | | | |
| | |
Diversified Financial Services — 0.65% | | | | | | | | |
Hellenic Exchanges SA (Greece) | | | 264,077 | | | | 1,289,924 | |
| | | | | | | | |
| | |
Diversified Telecommunication Services — 3.72% | | | | | | | | |
Telefonica SA (Spain)(a) | | | 345,359 | | | | 7,380,322 | |
| | | | | | | | |
| | |
Electric Utilities — 2.81% | | | | | | | | |
Brookfield Infrastructure Partners LP (Bermuda) | | | 163,127 | | | | 4,092,857 | |
See Notes to Financial Statements.
| | | | |
| 16 | | | | Motley Fool Independence Fund |
| | | | | | | | |
| Issues | | Shares | | | Value (Note 2) | |
| | |
| | |
Equity Securities (continued) | | | | | | | | |
Electric Utilities (continued) | | | | | | | | |
Otter Tail Corp. (United States) | | | 75,725 | | | $ | 1,469,822 | |
| | | | | | | | |
| | |
| | | | | | | 5,562,679 | |
| | | | | | | | |
| | |
Electrical Equipment — 0.48% | | | | | | | | |
Legrand SA (France) | | | 27,209 | | | | 961,795 | |
| | | | | | | | |
| | |
Food & Staples Retailing — 4.02% | | | | | | | | |
Costco Wholesale Corp. (United States) | | | 29,558 | | | | 2,460,703 | |
Olam International Ltd. (Singapore) | | | 1,765,139 | | | | 3,535,746 | |
Wal-Mart de Mexico SAB de CV, Series V (Mexico) | | | 768,098 | | | | 1,982,635 | |
| | | | | | | | |
| | |
| | | | | | | 7,979,084 | |
| | | | | | | | |
| | |
Food Products — 5.13% | | | | | | | | |
BRF - Brasil Foods SA (Brazil)(a) | | | 158,704 | | | | 3,340,719 | |
Cresud SACIF y A (Argentina)(a) | | | 238,196 | | | | 2,765,456 | |
Nestle SA (Switzerland) | | | 38,694 | | | | 2,237,972 | |
PT Nippon Indosari Corpindo Tbk (Indonesia) | | | 4,795,000 | | | | 1,834,658 | |
| | | | | | | | |
| | |
| | | | | | | 10,178,805 | |
| | | | | | | | |
| | |
Health Care Equipment & Supplies — 6.25% | | | | | | | | |
Becton, Dickinson and Co. (United States) | | | 50,200 | | | | 3,927,146 | |
Covidien PLC (Ireland) | | | 41,000 | | | | 1,928,640 | |
Natus Medical, Inc. (United States)* | | | 243,900 | | | | 2,097,540 | |
Nihon Kohden Corp. (Japan) | | | 133,481 | | | | 3,116,252 | |
Zimmer Holdings, Inc. (United States)* | | | 25,000 | | | | 1,315,750 | |
| | | | | | | | |
| | |
| | | | | | | 12,385,328 | |
| | | | | | | | |
| | |
Health Care Providers & Services — 3.26% | | | | | | | | |
WellPoint, Inc. (United States) | | | 93,697 | | | | 6,455,723 | |
| | | | | | | | |
| | |
Hotels, Restaurants & Leisure — 5.43% | | | | | | | | |
Arcos Dorados Holdings, Inc. (Argentina) | | | 8,000 | | | | 187,200 | |
McDonald’s Corp. (United States) | | | 19,177 | | | | 1,780,585 | |
Penn National Gaming, Inc. (United States)* | | | 52,083 | | | | 1,874,988 | |
Yum! Brands, Inc. (United States) | | | 129,132 | | | | 6,917,601 | |
| | | | | | | | |
| | |
| | | | | | | 10,760,374 | |
| | | | | | | | |
| | |
Household Products — 1.83% | | | | | | | | |
Unicharm Corp. (Japan) | | | 80,800 | | | | 3,618,540 | |
| | | | | | | | |
| | |
Insurance — 10.41% | | | | | | | | |
Berkshire Hathaway, Inc. (United States)* | | | 33 | | | | 3,859,350 | |
See Notes to Financial Statements.
| | | | |
| Motley Fool Independence Fund | | | | 17 |
| | | | | | | | |
| Issues | | Shares | | | Value (Note 2) | |
| | |
| | |
Equity Securities (continued) | | | | | | | | |
Insurance (continued) | | | | | | | | |
Berkshire Hathaway, Inc., Class B (United States)* | | | 4,600 | | | $ | 358,156 | |
Enstar Group Ltd. (Bermuda)* | | | 22,510 | | | | 2,070,245 | |
HCC Insurance Holdings, Inc. (United States) | | | 180,200 | | | | 4,795,122 | |
Loews Corp. (United States) | | | 131,690 | | | | 5,228,093 | |
Markel Corp. (United States)* | | | 11,200 | | | | 4,328,800 | |
| | | | | | | | |
| | |
| | | | | | | 20,639,766 | |
| | | | | | | | |
| | |
Internet Software & Services — 2.24% | | | | | | | | |
Google, Inc. (United States)* | | | 7,500 | | | | 4,444,800 | |
| | | | | | | | |
| | |
IT Services — 1.55% | | | | | | | | |
Paychex, Inc. (United States) | | | 105,702 | | | | 3,080,156 | |
| | | | | | | | |
| | |
Leisure Equipment & Products — 1.55% | | | | | | | | |
Shimano, Inc. (Japan) | | | 62,000 | | | | 3,064,674 | |
| | | | | | | | |
| | |
Machinery — 1.30% | | | | | | | | |
Flowserve Corp. (United States) | | | 27,700 | | | | 2,567,513 | |
| | | | | | | | |
| | |
Metals & Mining — 2.71% | | | | | | | | |
POSCO (South Korea)(a) | | | 62,491 | | | | 5,369,227 | |
| | | | | | | | |
| | |
Oil, Gas & Consumable Fuels — 6.98% | | | | | | | | |
Denbury Resources, Inc. (United States)* | | | 362,200 | | | | 5,686,540 | |
Lukoil OAO (Russia)(a) | | | 79,350 | | | | 4,578,495 | |
Occidental Petroleum Corp. (United States) | | | 22,645 | | | | 2,104,626 | |
Total Gabon (Gabon) | | | 3,470 | | | | 1,460,398 | |
| | | | | | | | |
| | |
| | | | | | | 13,830,059 | |
| | | | | | | | |
| | |
Pharmaceuticals — 3.53% | | | | | | | | |
Astellas Pharma, Inc. (Japan) | | | 17,000 | | | | 621,748 | |
Astrazeneca PLC (United Kingdom)(a) | | | 40,100 | | | | 1,921,191 | |
Chugai Pharmaceutical Co., Ltd. (Japan) | | | 36,000 | | | | 563,893 | |
Dr. Reddy’s Laboratories Ltd. (India)(a) | | | 100,177 | | | | 3,320,868 | |
Santen Pharmaceutical Co., Ltd. (Japan) | | | 15,250 | | | | 569,032 | |
| | | | | | | | |
| | |
| | | | | | | 6,996,732 | |
| | | | | | | | |
| | |
Professional Services — 2.17% | | | | | | | | |
Bureau Veritas SA (France) | | | 800 | | | | 62,074 | |
Huron Consulting Group, Inc. (United States)* | | | 117,518 | | | | 4,231,823 | |
| | | | | | | | |
| | |
| | | | | | | 4,293,897 | |
| | | | | | | | |
See Notes to Financial Statements.
| | | | |
| 18 | | | | Motley Fool Independence Fund |
| | | | | | | | |
| Issues | | Shares | | | Value (Note 2) | |
| | |
| | |
Equity Securities (continued) | | | | | | | | |
Real Estate Investment Trusts — 2.93% | | | | | | | | |
Annaly Capital Management, Inc. (United States) | | | 219,989 | | | $ | 3,706,815 | |
DuPont Fabros Technology, Inc. (United States) | | | 101,000 | | | | 2,099,790 | |
| | | | | | | | |
| | |
| | | | | | | 5,806,605 | |
| | | | | | | | |
| | |
Real Estate Management & Development — 5.00% | | | | | | | | |
Brookfield Asset Management, Inc. (Canada) | | | 156,374 | | | | 4,534,846 | |
Cheung Kong Holdings Ltd. (Hong Kong) | | | 170,337 | | | | 2,111,486 | |
Henderson Land Development Co., Ltd. (Hong Kong) | | | 596,764 | | | | 3,261,929 | |
| | | | | | | | |
| | |
| | | | | | | 9,908,261 | |
| | | | | | | | |
| | |
Semiconductors & Semiconductor Equipment — 1.32% | | | | | | | | |
Formfactor, Inc. (United States)* | | | 233,100 | | | | 1,393,938 | |
NVIDIA Corp. (United States)* | | | 82,000 | | | | 1,213,600 | |
| | | | | | | | |
| | |
| | | | | | | 2,607,538 | |
| | | | | | | | |
| | |
Software — 2.39% | | | | | | | | |
DuzonBizon Co., Ltd. (South Korea)* | | | 184,180 | | | | 1,164,544 | |
Fundtech Ltd. (Israel) | | | 93,102 | | | | 2,142,277 | |
Wemade Entertainment Co., Ltd. (South Korea) | | | 29,507 | | | | 1,430,569 | |
| | | | | | | | |
| | |
| | | | | | | 4,737,390 | |
| | | | | | | | |
| | |
Specialty Retail — 0.09% | | | | | | | | |
Best Buy Co., Inc. (United States) | | | 7,000 | | | | 183,610 | |
| | | | | | | | |
| | |
Textiles, Apparel & Luxury Goods — 1.90% | | | | | | | | |
Under Armour, Inc. (United States)* | | | 44,705 | | | | 3,773,549 | |
| | | | | | | | |
| | |
Tobacco — 1.06% | | | | | | | | |
Philip Morris International, Inc. (United States) | | | 30,072 | | | | 2,101,131 | |
| | | | | | | | |
| | |
Trading Companies & Distributors — 0.62% | | | | | | | | |
MFC Industrial Ltd. (Canada) | | | 174,514 | | | | 1,226,833 | |
| | | | | | | | |
| | |
Wireless Telecommunication Services — 1.62% | | | | | | | | |
American Tower Corp. (United States)* | | | 16,686 | | | | 919,398 | |
SBA Communications Corp. (United States)* | | | 60,000 | | | | 2,285,400 | |
| | | | | | | | |
| | | | | | | 3,204,798 | |
| | | | | | | | |
| | |
Total Equity Securities (Cost $ 175,674,755) | | | | | | | 189,330,620 | |
| | | | | | | | |
See Notes to Financial Statements.
| | | | |
| Motley Fool Independence Fund | | | | 19 |
| | | | | | | | |
| Issues | | Shares | | | Value (Note 2) | |
| | |
| | |
Exchange Traded Note — 0.70% | | | | | | | | |
American International Group, Inc. (United States) | | | 56,950 | | | $ | 1,379,329 | |
| | | | | | | | |
Total Exchange Traded Note (Cost $ 1,253,490) | | | | | | | 1,379,329 | |
| | | | | | | | |
| | |
Participatory Note — 1.74% | | | | | | | | |
Food Products — 1.74% | | | | | | | | |
Almarai Co. (Saudi Arabia) 144A | | | 145,000 | | | | 3,460,344 | |
| | | | | | | | |
Total Participatory Note (Cost $ 3,576,755) | | | | | | | 3,460,344 | |
| | | | | | | | |
| | |
Other Investments — 0.68% | | | | | | | | |
Temporary Cash Investment — 0.68% | | | | | | | | |
BNY Mellon Cash Reserve | | | 1,347,465 | | | | 1,347,465 | |
| | | | | | | | |
| | |
Total Other Investments (Cost $ 1,347,465) | | | | | | | 1,347,465 | |
| | | | | | | | |
| | |
Total Investment Portfolio (Cost 181,852,465) — 98.63% | | | | | | | 195,517,758 | |
Other Assets in Excess of Liabilities — 1.37% | | | | | | | 2,714,588 | |
| | | | | | | | |
| | |
NET ASSETS — 100.00% | | | | | | | | |
(Applicable to 14,010,532 shares outstanding) | | | | | | $ | 198,232,346 | |
| | | | | | | | |
| * | Non-income producing security. |
| (a) | ADR — American Depositary Receipts |
| 144A | Security exempt from registration under Rule 144A of the Securities Act of 1933. These securities may be resold in transactions exempt from registration, normally to qualified institutional buyers. Total market value of Rule 144A securities is $3,460,344 and represents 1.74% of net assets as of October 31, 2011. |
LP — Limited Partnership
| PLC | — Public Limited Company |
See Notes to Financial Statements.
| | | | |
| 20 | | | | Motley Fool Independence Fund |
Statement of Assets and Liabilities
| | | | | | |
| | | As of October 31, 2011 | | | |
| |
| | |
Assets: | | | | | | |
Investments in securities of unaffiliated issuers,
at value (at cost, $181,852,465) | | $ | 195,517,758 | | | |
Foreign currency, at value
(at cost, $1,803,162) | | | 1,806,929 | | | |
Receivables: | | | | | | |
Dividends and Tax Reclaims | | | 227,461 | | | |
Interest | | | 38 | | | |
Investment securities sold | | | 1,682,397 | | | |
Shares of beneficial interest sold | | | 185,082 | | | |
Prepaid expenses and other assets | | | 23,988 | | | |
| | | | | | |
Total Assets | | | 199,443,653 | | | |
| | | | | | |
| | |
Liabilities | | | | | | |
Payables: | | | | | | |
Cash overdraft | | | 3 | | | |
Investment securities purchased | | | 604,260 | | | |
Shares of beneficial interest redeemed | | | 290,323 | | | |
Accrued expenses: | | | | | | |
Audit fees | | | 16,965 | | | |
Accounting and administration fees | | | 56,429 | | | |
Advisory fees | | | 134,134 | | | |
Custodian fees | | | 12,158 | | | |
Legal fees | | | 18,065 | | | |
Transfer agent fees | | | 28,949 | | | |
Trustee fees | | | 2,787 | | | |
Other expenses | | | 47,234 | | | |
| | | | | | |
Total Liabilities | | | 1,211,307 | | | |
| | | | | | |
Net Assets | | $ | 198,232,346 | | | |
| | | | | | |
The accompanying notes are an integral part of these financial statements.
| | | | |
| Motley Fool Independence Fund | | | | 21 |
Statement of Assets and Liabilities
| | | | | | |
| | | As of October 31, 2011 | | | |
| |
| | |
Net Assets Consist of: | | | | | | |
Paid-in-Capital | | $ | 183,969,169 | | | |
Undistributed Net Investment Income | | | 599,663 | | | |
Accumulated Net Realized Gain (Loss) | | | (4,519 | ) | | |
Net Unrealized Appreciation (Depreciation) on
Investments, Foreign Currencies, and Assets and
Liabilities denominated in Foreign Currencies | | | 13,668,033 | | | |
| | | | | | |
Net Assets | | $ | 198,232,346 | | | |
| | | | | | |
| | |
Net Asset Value: | | | | | | |
$0.001 par value, unlimited shares authorized | | | | | | |
Net assets applicable to capital shares outstanding | | $ | 198,232,346 | | | |
Shares outstanding | | | 14,010,532 | | | |
| | | | | | |
Net asset value, offering and redemption price per
share | | $ | 14.15 | | | |
| | | | | | |
The accompanying notes are an integral part of these financial statements.
| | | | |
| 22 | | | | Motley Fool Independence Fund |
Statement of Operations
| | | | | | |
| | | Year Ended
October 31, 2011 | | | |
| |
| | |
Investment Income | | | | | | |
Dividends | | $ | 4,178,278 | | | |
Interest | | | 29,137 | | | |
Less foreign taxes withheld | | | (263,644 | ) | | |
| | | | | | |
Total Investment Income | | | 3,943,771 | | | |
| | | | | | |
| | |
Expenses | | | | | | |
Accounting and administration fees | | | 189,491 | | | |
Blue sky fees | | | 28,370 | | | |
Shareholder account-related services | | | 126,946 | | | |
Chief Compliance Officer fees | | | 23,532 | | | |
Custodian fees | | | 72,905 | | | |
Investment advisory fees | | | 1,849,271 | | | |
Professional fees | | | 77,057 | | | |
Shareholder reporting fees | | | 21,133 | | | |
Transfer agent fees | | | 372,540 | | | |
Trustee fees | | | 47,236 | | | |
Other expenses | | | 31,593 | | | |
| | | | | | |
Total expenses | | | 2,840,074 | | | |
| | | | | | |
Expenses waived/reimbursed net of amount
recaptured | | | (271,178 | ) | | |
| | | | | | |
Net expenses | | | 2,568,896 | | | |
| | | | | | |
Net Investment Income | | | 1,374,875 | | | |
| | | | | | |
| | |
Realized and Unrealized Gain (Loss) | | | | | | |
| | |
Net realized gain (loss) from: | | | | | | |
Investment securities | | | 137,987 | | | |
Foreign currency transactions | | | (147,572 | ) | | |
| | | | | | |
Net realized loss on investments and foreign
currency transactions | | | (9,585 | ) | | |
| | | | | | |
Change in net unrealized appreciation
(depreciation) on: | | | | | | |
Investment securities | | | (3,041,600 | ) | | |
Foreign currency translations | | | 3,634 | | | |
| | | | | | |
Change in net unrealized appreciation
(depreciation) on investments, foreign
currencies, and assets and liabilities
denominated in foreign currencies | | | (3,037,966 | ) | | |
| | | | | | |
Net realized and unrealized loss | | | (3,047,551 | ) | | |
| | | | | | |
| | |
Net Decrease in Net Assets Resulting from
Operations | | $ | (1,672,676 | ) | | |
| | | | | | |
The accompanying notes are an integral part of these financial statements.
| | | | |
| Motley Fool Independence Fund | | | | 23 |
Statements of Changes in Net Assets
| | | | | | | | | | |
| | | Year Ended October 31, 2011 | | | Year Ended October 31, 2010 | | | |
| |
| | | |
Operations: | | | | | | | | | | |
Net Investment Income | | $ | 1,374,875 | | | $ | 1,069,735 | | | |
Net Realized Gain/(Loss) on Investments and
Foreign Currency Transactions | | | (9,585 | ) | | | 805,287 | | | |
Change in Net Unrealized Appreciation/
(Depreciation) on Investments and Foreign
Currency Translation | | | (3,037,966 | ) | | | 15,586,918 | | | |
| | | | | | | | | | |
Net increase/(decrease) in net assets resulting from
operations | | | (1,672,676 | ) | | | 17,461,940 | | | |
| | | | | | | | | | |
| | | |
Dividends and Distributions to Shareholders: | | | | | | | | | | |
Dividends from net investment income | | | (1,465,155 | ) | | | (95,696 | ) | | |
Distributions from net realized capital gains | | | (1,105,695 | ) | | | (295,167 | ) | | |
| | | | | | | | | | |
Total dividends and distributions | | | (2,570,850 | ) | | | (390,863 | ) | | |
| | | | | | | | | | |
| | | |
Capital Share Transactions: | | | | | | | | | | |
Proceeds from shares sold (7,313,429 and 7,468,879
shares, respectively) | | | 108,513,048 | | | | 93,888,742 | | | |
Reinvestment of dividends and distributions
(175,447 and 31,228 shares, respectively) | | | 2,522,930 | | | | 384,097 | | | |
Value of shares redeemed (2,559,545 and 1,069,514
shares, respectively) | | | (37,047,015 | ) | | | (13,409,649 | ) | | |
| | | | | | | | | | |
Redemption and small-balance account fees | | | 80,714 | | | | 45,165 | | | |
| | | | | | | | | | |
Net increase from capital share transactions | | | 74,069,677 | | | | 80,908,355 | | | |
| | | | | | | | | | |
Total increase in net assets | | | 69,826,151 | | | | 97,979,432 | | | |
| | | | | | | | | | |
| | | |
Net Assets: | | | | | | | | | | |
Beginning of Period | | | 128,406,195 | | | | 30,426,763 | | | |
| | | | | | | | | | |
End of Period* | | $ | 198,232,346 | | | $ | 128,406,195 | | | |
| | | | | | | | | | |
*Including undistributed net investment income | | $ | 599,663 | | | $ | 867,782 | | | |
| | | | | | | | | | |
The accompanying notes are an integral part of these financial statements.
| | | | |
| 24 | | | | Motley Fool Independence Fund |
Financial Highlights
| | | | | | | | | | | | |
| | | Years ended October 31, | |
| | | 2011 | | | 2010(1) | | | 2009(2)(3) | |
Net Asset Value, Beginning of Period | | $ | 14.14 | | | $ | 11.48 | | | $ | 10.00 | |
| | | | | | | | | | | | |
| | | |
Income From Investment Operations (4) | | | | | | | | | | | | |
Net Investment Income | | | 0.11 | | | | 0.16 | | | | 0.02 | |
Net Gains on Securities (Realized and Unrealized) | | | 0.15 | | | | 2.59 | | | | 1.46 | |
| | | | | | | | | | | | |
Total From Investment Operations | | | 0.26 | | | | 2.75 | | | | 1.48 | |
| | | | | | | | | | | | |
| | | |
Less Distributions | | | | | | | | | | | | |
Net Investment Income | | | (0.15 | ) | | | (0.02 | ) | | | — | |
Net Realized Capital Gains | | | (0.11 | ) | | | (0.08 | ) | | | — | |
| | | | | | | | | | | | |
Total Distributions | | | (0.26 | ) | | | (0.10 | ) | | | — | |
| | | | | | | | | | | | |
| | | |
Redemption Fees | | | 0.01 | | | | 0.01 | | | | — | * |
| | | | | | | | | | | | |
| | | |
Net Asset Value, End of Period | | $ | 14.15 | | | $ | 14.14 | | | $ | 11.48 | |
| | | | | | | | | | | | |
Total Return(5)(6) | | | 1.91 | % | | | 24.18 | % | | | 14.80 | % |
Net Assets, End of Period (thousands) | | $ | 198,232 | | | $ | 128,406 | | | $ | 30,427 | |
| | | |
Ratios/Supplemental Data | | | | | | | | | | | | |
| | | |
Ratio of Expenses to Average Net Assets | | | 1.43 | % | | | 1.38 | % | | | 1.35 | % |
Ratio of Expenses to Average Net Assets (Before Waivers and Reimbursement of Expenses and/or Recapture of Previously Waived Fees) | | | 1.58 | % | | | 2.20 | % | | | 7.01 | % |
Ratio of Net Investment Income to Average Net Assets | | | 0.76 | % | | | 1.29 | % | | | 0.41 | % |
Ratio of Income to Average Net Assets (Before Waivers and Reimbursement of Expenses and/or Recapture of Previously Waived Fees) | | | 0.61 | % | | | 0.47 | % | | | (5.25 | )% |
Portfolio Turnover | | | 37 | % | | | 37 | % | | | 50 | % |
| * | Amount represents less than $0.005 per share. |
| (1) | Due to a clerical error, Net Gains on Securities (Realized and Unrealized) and Total From Investment Operations for the year ended October 31, 2010 were reported in the 2010 Annual Report as $2.39 and $2.55, respectively. Such amounts have been revised as shown above. |
| (2) | Because of commencement of operations and related preliminary transaction costs, these ratios are not necessarily indicative of future ratios. |
| (3) | Commenced operations on June 16, 2009. All ratios for the period have been annualized. Total return and portfolio turnover for the period have not been annualized. |
| (4) | Per share data calculated using average shares outstanding method. |
| (5) | During the years ended October 31, 2011 and October 31, 2010, 0.07% and 0.08%, respectively, of the Fund’s total return was attributable to redemption and small-balance account fees received as referenced in Note 4. Excluding this item, the total return would have been 1.84% and 24.10%, respectively. For the period ended October 31, 2009, redemption and small-balance account fees received had no effect on the Fund’s total return. |
| (6) | Total return reflects the rate an investor would have earned on an investment in the Fund during each period, assuming reinvestment of all distributions. |
The accompanying notes are an integral part of these financial statements.
| | | | |
| Motley Fool Independence Fund | | | | 25 |
Motley Fool Great America Fund Portfolio Characteristics (Unaudited)
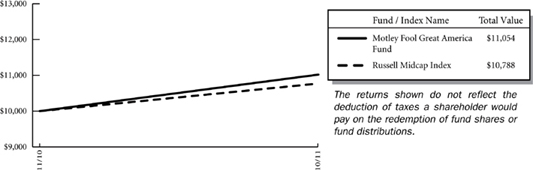
At October 31, 2011, the Motley Fool Great America Fund (the “Fund”) had an audited net asset value of $11.04 per share attributed to 5,043,986 shares outstanding. This compares with an unaudited net asset value as of November 1, 2010 of $10.00 per share attributed to 102,000 shares outstanding. From the Fund’s launch on November 1, 2010 to October 31, 2011 the Fund had a total return of 10.54% versus a return of 7.88% over the same period for its benchmark, Russell Midcap Index. The graph below shows the performance of $10,000 invested in the Fund at inception. The results shown below do not reflect the deduction of taxes that a shareholder would pay on fund distributions or the redemption of fund shares.
Let’s be serious though. A graph of the performance of any investment over one year tells you virtually nothing. In about five years, they’ll actually tell you quite a bit about how well we’re managing your money.
Average Annual Total Returns as of 10/31/2011
| | | | | | |
| | | Fund* | | Benchmark** | |
| | |
Since Inception | | 10.54% | | | 7.88 | % |
Inception Date | | 11/01/2010 | | | | |
Total Annual Fund Operating Expenses Before Expense Limitation (February 28, 2011 Prospectus) | | 2.30% | | | | |
The performance data quoted represents past performance and does not guarantee future results. Current performance may be lower or higher. Performance data current to the most recent month-end may be obtained at www.FoolFunds.com. The investment return and principal value of an investment will fluctuate so that shares, when redeemed, may be worth more or less than their original cost.
*These returns reflect expense waivers by the Fund’s investment adviser. Without these waivers, returns would have been lower.
** The Russell Midcap Index is an unmanaged, free float-adjusted, market capitalization weighted index that is designed to measure the performance of the mid-cap segment of the U.S. equity universe. The Russell Midcap Index is a subset of the Russell 1000® Index. It includes approximately 800 of the smallest securities based on a combination of their market cap and current index membership. The Russell Midcap Index represents approximately 27% of the total market capitalization of the Russell 1000 companies. The Fund may invest in companies that are not included within the Russell Midcap Index and its investment portfolio is not weighted in terms of issuers the same as the Russell Midcap Index. For this reason, the Fund’s investment performance should not be expected to track, and may exceed or trail, the Russell Midcap Index. Since Inception returns for the Benchmark reflect the performance based on the Inception Date of the Fund.
| | | | |
| 26 | | | | Motley Fool Great America Fund |
The investment objective of the Great America Fund is to achieve long-term capital appreciation. The Fund pursues this objective by investing primarily in common stocks of companies organized in the United States. The Fund employs a value-based Investment strategy and seeks long-term growth of capital by acquiring securities of companies at prices the investment adviser, Motley Fool Asset Management, LLC (the “Adviser”), believes to be significantly below their intrinsic value. The Fund may invest in other types of securities and in other asset classes when, in the judgment of the Adviser, such investments offer attractive potential returns. As such, the Fund’s performance will deviate significantly from its benchmark from time to time. It is the view of the Adviser that this deviation is less meaningful over shorter time frames and is more relevant over multi-year periods.
Although the Great America Fund may invest in companies with any market capitalization, the Adviser expects that investments in the securities of companies having smaller- and mid-market capitalizations will be important components of the Fund’s investment program. Investments in securities of these companies may involve greater risk than do investments in larger, more established companies. Small-and mid-cap stocks tend to be more volatile and less liquid than their large-cap counterparts. You are strongly encouraged to read more about the Fund’s strategies and risks in the prospectus.
The Great America Fund invests in securities of companies the Adviser believes are undervalued. Unlike mutual funds that hew to their benchmark, the Fund may invest in any company, industry or sector where the Adviser’s analysis suggests that there is opportunity for gains that outweigh risks. In identifying investments for the Fund, the Adviser looks for companies it believes the market has irrationally undervalued and looks for companies that have high-quality businesses with strong market positions, manageable leverage, and robust streams of free cash flow. The following tables show the top 11 holdings and top 10 sectors in which the Fund was invested at fiscal year-end. Portfolio holdings are subject to change without notice.
Certain mutual fund ratings and review services have created style boxes, which look more or less like a tic-tac-toe board; arranging funds by the size of the companies they typically invest in (large-, mid-, and small-cap) along one axis, and along a “value” to “growth” basis on the other axis. This may be a helpful way - at times - to think about certain investment opportunities, but we don’t believe we’ll improve your returns by limiting ourselves to any one portion of that style box.
| | | | |
| Top Eleven Holdings* | | % of Net
Assets | |
| | |
| |
Big Lots, Inc. | | | 4.60 | % |
HCC Insurance Holdings, Inc. | | | 4.16 | |
Berkshire Hathaway, Inc. | | | 3.57 | |
Schweitzer-Mauduit International, Inc. | | | 3.54 | |
Horsehead Holding Corp. | | | 3.35 | |
Thor Industries, Inc. | | | 3.32 | |
WellPoint, Inc. | | | 3.24 | |
Markel Corp. | | | 3.12 | |
Trimas Corp. | | | 3.04 | |
Under Armour, Inc. | | | 3.03 | |
Denbury Resources, Inc. | | | 2.99 | |
| | | | |
| | | 37.96 | % |
| | | | |
| * | As of the date of the report the fund had a holding of 0.87% in the BNY Mellon Cash Reserve. |
| | | | |
| Motley Fool Great America Fund | | | | 27 |
| | | | |
| Top Ten Sectors | | % of Net
Assets | |
| | |
| |
Financials | | | 22.73 | % |
Consumer Discretionary | | | 21.52 | |
Materials | | | 11.88 | |
Information Technology | | | 10.77 | |
Health Care | | | 9.91 | |
Industrials | | | 9.91 | |
Telecommunication Services | | | 4.85 | |
Energy | | | 4.14 | |
Consumer Staples | | | 2.91 | |
| | | | |
| | | 98.62 | % |
| | | | |
| | | | |
| 28 | | | | Motley Fool Great America Fund |
About Your Expenses
As a shareholder of the Great America Fund, you incur ongoing costs, including advisory fees and other Fund expenses. This example is intended to help you to understand your ongoing costs (in dollars) of investing in the Fund and to compare these costs with the ongoing costs of investing in other mutual funds. It is based on an investment of $1,000 invested at the beginning of the period and held for the entire period from May 1, 2011 to October 31, 2011.
Actual Expenses
The first section of the table below provides information about actual account values and actual expenses. You may use the information in this section, together with the amount you invested, to estimate the expenses that you incurred over the period. Simply divide your account value by $1,000 (for example, an $8,600 account value divided by $1,000 = 8.6), then multiply the result by the number in the first section under the heading entitled “Expenses Paid During Period” to estimate the expenses attributable to your investment during this period.
Hypothetical Example for Comparison Purposes
The second section of the table below provides information about hypothetical account values and hypothetical expenses based on the Fund’s actual expense ratio and an assumed rate of return of 5% per year before expenses, which is not the Fund’s actual return. Thus, you should not use the hypothetical account values and expenses to estimate the actual ending account balance or your expenses for the period. Rather, these figures are provided to enable you to compare the ongoing costs of investing in the Fund as compared to the costs of investing in other funds. To do so, compare this 5% hypothetical example with the 5% hypothetical examples that appear in the shareholder reports of the other funds. Please note that the expenses shown in the table are meant to highlight your ongoing costs only. Therefore, the second section of the table is useful in comparing ongoing costs only and will not help you determine the relative total costs of owning different funds.
Do you know how many times a fund, or the market, has returned a smooth 5% over a long period of time? Never. But we have to pick some example. In reality, the market’s returns are always far bumpier, with the market returning 20% one year, followed by a loss of 10% the next year, followed by a 3% gain, etc. These variations affect actual expenses as well. Happily, over almost all time periods of 20 years or longer, according to the research of University of Pennsylvania’s Jeremy Siegel and others, the domestic market’s returns have been at least 5% per year on average.
| | | | | | | | | | | | | | | | |
| | | Beginning Account Value 05/01/2011 | | | Ending
Account Value
10/31/11 | | | Annualized
Expense Ratio(1) | | | Expenses Paid
During Period(2) | |
| | |
| | | | |
Actual | | $ | 1,000 | | | $ | 920.77 | | | | 1.35 | % | | $ | 6.54 | |
Hypothetical | | $ | 1,000 | | | $ | 1,018.40 | | | | 1.35 | % | | $ | 6.87 | |
| (1) | These ratios reflect expenses waived by the Fund’s investment Adviser. Without these Waivers, the Fund’s expenses would have been higher and the ending account values would have been lower. |
| (2) | Expenses are equal to the Fund’s annualized expense ratio for the period May 1, 2011 to October 31, 2011, multiplied by the average account value over the period, multiplied by the number of days (184) in the most recent fiscal half-year, then divided by 365. |
| | | | |
| Motley Fool Great America Fund (Unaudited) | | 29 |
The Motley Fool Funds Trust
Motley Fool Great America Fund
Schedule of Investments
at October 31, 2011
| | | | | | | | |
| Issues | | Shares | | | Value
(Note 2) | |
| | |
Equity Securities — 98.62% | | | | | | | | |
Auto Components — 1.33% | | | | | | | | |
Drew Industries, Inc. (United States) | | | 30,811 | | | $ | 740,388 | |
| | | | | | | | |
Automobiles — 3.32% | | | | | | | | |
Thor Industries, Inc. (United States) | | | 69,988 | | | | 1,850,483 | |
| | | | | | | | |
Beverages — 1.85% | | | | | | | | |
Heckmann Corp. (United States)* | | | 172,000 | | | | 1,030,280 | |
| | | | | | | | |
Capital Markets — 3.49% | | | | | | | | |
Diamond Hill Investment Group, Inc. (United States) | | | 15,453 | | | | 1,163,302 | |
INTL FCStone, Inc. (United States)* | | | 32,300 | | | | 782,952 | |
| | | | | | | | |
| | | | | | | 1,946,254 | |
| | | | | | | | |
Chemicals — 1.07% | | | | | | | | |
Innophos Holdings, Inc. (United States) | | | 13,500 | | | | 593,865 | |
| | | | | | | | |
Communications Equipment — 5.64% | | | | | | | | |
Cisco Systems, Inc. (United States) | | | 87,000 | | | | 1,612,110 | |
Infinera Corp. (United States)* | | | 209,490 | | | | 1,531,372 | |
| | | | | | | | |
| | | | | | | 3,143,482 | |
| | | | | | | | |
Containers & Packaging — 2.72% | | | | | | | | |
Crown Holdings, Inc. (United States)* | | | 44,800 | | | | 1,513,792 | |
| | | | | | | | |
Diversified Telecommunication Services — 2.65% | | | | | | | | |
Level 3 Communications, Inc. (United States)* | | | 55,250 | | | | 1,474,622 | |
| | | | | | | | |
Energy Equipment & Services — 1.14% | | | | | | | | |
Dresser-Rand Group, Inc. (United States)* | | | 13,180 | | | | 637,912 | |
| | | | | | | | |
Health Care Equipment & Supplies — 2.92% | | | | | | | | |
Natus Medical, Inc. (United States)* | | | 175,700 | | | | 1,511,020 | |
Varian Medical Systems, Inc. (United States)* | | | 2,000 | | | | 117,440 | |
| | | | | | | | |
| | | | | | | 1,628,460 | |
| | | | | | | | |
Health Care Providers & Services — 6.99% | | | | | | | | |
Laboratory Corp. of America Holdings (United States)* | | | 8,920 | | | | 747,942 | |
Quest Diagnostics, Inc. (United States) | | | 24,000 | | | | 1,339,200 | |
WellPoint, Inc. (United States) | | | 26,200 | | | | 1,805,180 | |
| | | | | | | | |
| | | | | | | 3,892,322 | |
| | | | | | | | |
Hotels, Restaurants & Leisure — 5.02% | | | | | | | | |
International Speedway Corp. (United States) | | | 23,760 | | | | 566,914 | |
See Notes to Financial Statements.
| | | | |
| 30 | | | | Motley Fool Great America Fund |
| | | | | | | | |
| Issues | | Shares | | | Value
(Note 2) | |
| | |
Equity Securities (continued) | | | | | | | | |
Hotels, Restaurants & Leisure (continued) | | | | | | | | |
Penn National Gaming, Inc. (United States)* | | | 30,617 | | | $ | 1,102,212 | |
Red Robin Gourmet Burgers, Inc. (United States)* | | | 45,000 | | | | 1,128,150 | |
| | | | | | | | |
| | | | | | | 2,797,276 | |
| | | | | | | | |
Insurance — 13.05% | | | | | | | | |
Berkshire Hathaway, Inc. (United States)* | | | 17 | | | | 1,988,150 | |
Berkshire Hathaway, Inc., Class B (United States)* | | | 3,000 | | | | 233,580 | |
HCC Insurance Holdings, Inc. (United States) | | | 87,000 | | | | 2,315,070 | |
Loews Corp. (United States) | | | 25,000 | | | | 992,500 | |
Markel Corp. (United States)* | | | 4,500 | | | | 1,739,250 | |
| | | | | | | | |
| | | | | | | 7,268,550 | |
| | | | | | | | |
Internet & Catalog Retail — 0.65% | | | | | | | | |
Liberty Interactive Corp. (United States)* | | | 22,000 | | | | 361,460 | |
| | | | | | | | |
Internet Software & Services — 1.86% | | | | | | | | |
Google, Inc. (United States)* | | | 1,750 | | | | 1,037,120 | |
| | | | | | | | |
IT Services — 2.41% | | | | | | | | |
Paychex, Inc. (United States) | | | 46,000 | | | | 1,340,440 | |
| | | | | | | | |
Machinery — 6.30% | | | | | | | | |
Flow International Corp. (United States)* | | | 523,400 | | | | 1,355,606 | |
Flowserve Corp. (United States) | | | 4,950 | | | | 458,816 | |
Trimas Corp. (United States)* | | | 86,800 | | | | 1,691,732 | |
| | | | | | | | |
| | | | | | | 3,506,154 | |
| | | | | | | | |
Metals & Mining — 3.35% | | | | | | | | |
Horsehead Holding Corp. (United States)* | | | 214,700 | | | | 1,863,596 | |
| | | | | | | | |
Multiline Retail — 4.60% | | | | | | | | |
Big Lots, Inc. (United States)* | | | 68,000 | | | | 2,562,920 | |
| | | | | | | | |
Oil, Gas & Consumable Fuels — 2.99% | | | | | | | | |
Denbury Resources, Inc. (United States)* | | | 106,100 | | | | 1,665,770 | |
| | | | | | | | |
Paper & Forest Products — 4.75% | | | | | | | | |
KapStone Paper and Packaging Corp. (United States)* | | | 41,200 | | | | 675,680 | |
Schweitzer-Mauduit International, Inc. (United States) | | | 28,000 | | | | 1,968,960 | |
| | | | | | | | |
| | | | | | | 2,644,640 | |
| | | | | | | | |
Personal Products — 1.06% | | | | | | | | |
Female Health Co. (United States) | | | 129,500 | | | | 589,225 | |
| | | | | | | | |
Professional Services — 3.36% | | | | | | | | |
Barrett Business Services, Inc. (United States) | | | 46,200 | | | | 733,194 | |
See Notes to Financial Statements.
| | | | |
| Motley Fool Great America Fund | | | | 31 |
| | | | | | | | |
| Issues | | Shares | | | Value (Note 2) | |
| | |
| | |
Equity Securities (continued) | | | | | | | | |
Professional Services (continued) | | | | | | | | |
Huron Consulting Group, Inc. (United States)* | | | 31,550 | | | $ | 1,136,116 | |
| | | | | | | | |
| | | | | | | 1,869,310 | |
| | | | | | | | |
| | |
Real Estate Investment Trusts — 6.18% | | | | | | | | |
Annaly Capital Management, Inc. (United States) | | | 39,000 | | | | 657,150 | |
DuPont Fabros Technology, Inc. (United States) | | | 57,550 | | | | 1,196,464 | |
Retail Opportunity Investments Corp. (United States) | | | 139,560 | | | | 1,590,984 | |
| | | | | | | | |
| | | | | | | 3,444,598 | |
| | | | | | | | |
| | |
Road & Rail — 0.26% | | | | | | | | |
Zipcar, Inc. (United States)* | | | 7,000 | | | | 143,150 | |
| | | | | | | | |
| | |
Semiconductors & Semiconductor Equipment — 0.86% | | | | | | | | |
Formfactor, Inc. (United States)* | | | 80,000 | | | | 478,400 | |
| | | | | | | | |
| | |
Specialty Retail — 3.56% | | | | | | | | |
Men’s Wearhouse, Inc. (United States) | | | 34,500 | | | | 1,065,360 | |
Tractor Supply Co. (United States) | | | 12,900 | | | | 915,126 | |
| | | | | | | | |
| | | | | | | 1,980,486 | |
| | | | | | | | |
| | |
Textiles, Apparel & Luxury Goods — 3.03% | | | | | | | | |
Under Armour, Inc. (United States)* | | | 20,000 | | | | 1,688,200 | |
| | | | | | | | |
| | |
Wireless Telecommunication Services — 2.21% | | | | | | | | |
SBA Communications Corp. (United States)* | | | 32,250 | | | | 1,228,402 | |
| | | | | | | | |
Total Equity Securities (Cost $ 55,351,460) | | | | | | | 54,921,557 | |
| | | | | | | | |
| | |
Exchange Traded Note — 0.42% | | | | | | | | |
American International Group, Inc. (United States) | | | 9,650 | | | | 233,723 | |
| | | | | | | | |
| | |
Total Exchange Traded Note (Cost $ 211,726) | | | | | | | 233,723 | |
| | | | | | | | |
| | |
Other Investments — 0.87% | | | | | | | | |
Temporary Cash Investment — 0.87% | | | | | | | | |
BNY Mellon Cash Reserve | | | 484,325 | | | | 484,325 | |
| | | | | | | | |
| | |
Total Other Investments (Cost $ 484,325) | | | | | | | 484,325 | |
| | | | | | | | |
| | |
Total Investment Portfolio (Cost $56,047,511) — 99.91% | | | | | | | 55,639,605 | |
Other Assets in Excess of Liabilities — 0.09% | | | | | | | 51,818 | |
| | | | | | | | |
| | |
NET ASSETS — 100.00% | | | | | | | | |
(Applicable to 5,043,986 shares outstanding) | | | | | | $ | 55,691,423 | |
| | | | | | | | |
| * | Non-income producing security. |
See Notes to Financial Statements.
| | | | |
| 32 | | | | Motley Fool Great America Fund |
Statement of Assets and Liabilities
| | | | | | |
| | | As of
October 31, 2011 | | | |
| |
Assets: | | | | | | |
| | |
Investments in securities of unaffiliated issuers, at value (at cost, $56,047,511) | | $ | 55,639,605 | | | |
Cash | | | 2 | | | |
Receivables: | | | | | | |
Dividends | | | 21,195 | | | |
Interest | | | 26 | | | |
Investment securities sold | | | 462,149 | | | |
Shares of beneficial interest sold | | | 59,021 | | | |
Deferred offering costs | | | 94 | | | |
Prepaid expenses and other assets | | | 28,470 | | | |
| | | | | | |
Total Assets | | | 56,210,562 | | | |
| | | | | | |
| | |
Liabilities | | | | | | |
Payables: | | | | | | |
Investment securities purchased | | | 60,426 | | | |
Shares of beneficial interest redeemed | | | 328,550 | | | |
Accrued expenses: | | | | | | |
Audit fees | | | 16,965 | | | |
Accounting and administration fees | | | 42,207 | | | |
Advisory fees | | | 12,253 | | | |
Custodian fees | | | 2,468 | | | |
Legal fees | | | 15,262 | | | |
Transfer agent fees | | | 11,046 | | | |
Trustee fees | | | 5,287 | | | |
Other expenses | | | 24,675 | | | |
| | | | | | |
Total Liabilities | | | 519,139 | | | |
| | | | | | |
Net Assets | | $ | 55,691,423 | | | |
| | | | | | |
The accompanying notes are an integral part of these financial statements.
| | | | |
| Motley Fool Great America Fund | | | | 33 |
Statement of Assets and Liabilities
| | | | | | |
| | | As of
October 31, 2011 | | | |
| |
| | |
Net Assets Consist of: | | | | | | |
Paid-in-Capital | | $ | 56,774,718 | | | |
Accumulated Net Realized Gain (Loss) on Investments | | | (675,389 | ) | | |
Net Unrealized Appreciation (Depreciation) on Investments | | | (407,906 | ) | | |
| | | | | | |
Net Assets | | $ | 55,691,423 | | | |
| | | | | | |
Net Asset Value: | | | | | | |
$0.001 par value, unlimited shares authorized | | | | | | |
Net assets applicable to capital shares outstanding | | $ | 55,691,423 | | | |
Shares outstanding | | | 5,043,986 | | | |
| | | | | | |
Net asset value, offering and redemption price per share | | $ | 11.04 | | | |
| | | | | | |
The accompanying notes are an integral part of these financial statements.
| | | | |
| 34 | | | | Motley Fool Great America Fund |
Statements of Operations
| | | | |
| | | November 1, 2010** to October 31, 2011 | |
| | |
| |
Investment Income | | | | |
Dividends | | $ | 372,284 | |
| | | | |
| |
Expenses | | | | |
Accounting and administration fees | | | 129,048 | |
Blue sky fees | | | 24,630 | |
Shareholder account-related services | | | 48,037 | |
Chief Compliance Officer fees | | | 23,656 | |
Custodian fees | | | 19,143 | |
Investment advisory fees | | | 406,264 | |
Organization fees | | | 8,502 | |
Professional fees | | | 71,812 | |
Shareholder reporting fees | | | 20,516 | |
Transfer agent fees | | | 102,815 | |
Trustee fees | | | 48,280 | |
Other expenses | | | 21,205 | |
| | | | |
Total expenses | | | 923,908 | |
| | | | |
Expenses waived/reimbursed net of amount recaptured | | | (346,585 | ) |
| | | | |
Net expenses | | | 577,323 | |
| | | | |
Net Investment Loss | | | (205,039 | ) |
| | | | |
| |
Realized and Unrealized Loss | | | | |
| |
Net realized loss from: | | | | |
Investment securities | | | (675,389 | ) |
| | | | |
Net realized loss on investments | | | (675,389 | ) |
| | | | |
| |
Change in net unrealized depreciation on: | | | | |
Investment securities | | | (407,906 | ) |
| | | | |
Change in net unrealized depreciation on
investments | | | (407,906 | ) |
| | | | |
Net realized and unrealized loss | | | (1,083,295 | ) |
| | | | |
Net Decrease in Net Assets Resulting from
Operations | | $ | (1,288,334 | ) |
| | | | |
** Commencement of Operations.
The accompanying notes are an integral part of these financial statements.
| | | | |
Motley Fool Great America Fund | | | | 35 |
Statement of Changes in Net Assets
| | | | |
| | | November 1, 2010** to October 31, 2011 | |
| | |
| |
Operations: | | | | |
Net Investment Loss | | $ | (205,039 | ) |
Net Realized Loss on Investments | | | (675,389 | ) |
Change in Net Unrealized Depreciation on
Investments | | | (407,906 | ) |
| | | | |
Net decrease in net assets resulting from
operations | | | (1,288,334 | ) |
| | | | |
| |
Dividends and Distributions to Shareholders: | | | | |
Dividends from net investment income | | | (14,540 | ) |
| | | | |
| |
Capital Share Transactions: | | | | |
Proceeds from shares sold (6,270,751 shares)*** | | | 70,605,428 | |
Reinvestment of dividends and distributions (1,286
shares) | | | 14,168 | |
Value of shares redeemed (1,228,051 shares) | | | (13,662,823 | ) |
| | | | |
Redemption fees | | | 37,524 | |
| | | | |
Net increase from capital share transactions | | | 56,994,297 | |
| | | | |
Total increase in net assets | | | 55,691,423 | |
| | | | |
| |
Net Assets: | | | | |
Beginning of Period | | | — | |
| | | | |
End of Period* | | $ | 55,691,423 | |
| | | | |
*Including undistributed net investment income | | $ | — | |
| | | | |
** Commencement of Operations.
*** On November 1, 2010, 102,000 shares of the Fund were issued for cash at $10.00 per share to the Adviser.
The accompanying notes are an integral part of these financial statements.
| | | | |
| 36 | | | | Motley Fool Great America Fund |
Financial Highlights
| | | | |
| | | Period ended
October 31, | |
| | | 2011(1)(2) | |
Net Asset Value, Beginning of Period | | $ | 10.00 | |
Income From Investment Operations (3) | | | | |
Net Investment Loss | | | (0.05 | ) |
Net Gains on Securities (Realized and Unrealized) | | | 1.09 | |
| | | | |
Total From Investment Operations | | | 1.04 | |
| | | | |
| |
Less Distributions | | | | |
Net Investment Income | | | (0.01 | ) |
Net Realized Capital Gains | | | — | |
| | | | |
Total Distributions | | | (0.01 | ) |
| | | | |
Redemption Fees | | | 0.01 | |
| | | | |
Net Asset Value, End of Period | | $ | 11.04 | |
| | | | |
| |
Total Return(4)(5) | | | 10.54 | % |
Net Assets, End of Period (thousands) | | $ | 55,691 | |
| |
Ratios/Supplemental Data | | | | |
Ratio of Expenses to Average Net Assets | | | 1.35 | % |
Ratio of Expenses to Average Net Assets (Before Waivers and Reimbursement of
Expenses and/or Recapture of Previously
Waived Fees) | | | 2.16 | % |
Ratio of Net Investment Income to Average Net Assets | | | (0.48 | %) |
Ratio of Income to Average Net Assets (Before Waivers and Reimbursement of
Expenses and/or Recapture of Previously
Waived Fees) | | | (1.29 | %) |
Portfolio Turnover | | | 18 | % |
| (1) | Because of commencement of operations and related preliminary transaction costs, these ratios
are not necessarily indicative of future ratios. |
| (2) | Inception date of the Great America Fund was November 1, 2010. All ratios for the period have
been annualized. Total return and portfolio turnover for the period have not been annualized. |
| (3) | Per share data calculated using average shares outstanding method. |
| (4) | During the period ended October 31, 2011, 0.10% of the Fund’s total return was attributable to
redemption fees received as referenced in Note 4. Excluding this item, the total return would
have been 10.44%. |
| (5) | Total return reflects the rate an investor would have earned on an investment in the Fund dur
ing each period, assuming reinvestment of all distributions. |
The accompanying notes are an integral part of these financial statements.
| | | | |
| Motley Fool Great America Fund | | | | 37 |
Notes to Financial Statements
1. Organization:
Motley Fool Independence Fund (“Independence Fund”) and Motley Fool Great America Fund (“Great America Fund”) (each a “Fund” and together the “Funds”) are diversified series of The Motley Fool Funds Trust (the “Trust”), an open-end management investment company (or mutual fund) organized on November 7, 2008, as a statutory trust under the laws of the State of Delaware. The investment objective of each Fund is to achieve long-term capital appreciation. The Independence Fund pursues its objective by investing primarily in common stocks of U.S. companies and of companies that are organized under the laws of other countries around the world. The Great America Fund pursues its objective by investing primarily in common stocks of companies that are organized in the United States and that are engaged in a broad range of industries.
Under the Trust’s organizational documents, its Trustees and officers are indemnified against certain liabilities arising out of the performance of their duties for the Trust by the Trust. In addition, in the normal course of business, the Trust enters into contracts with vendors and others that provide for general indemnifications. The Trust’s maximum exposure under these arrangements is unknown as this would involve future claims that may be made against the Trust. However, the Trust believes the risk of loss to be remote.
2. Significant Accounting Policies:
Basis of Preparation
The policies described below are followed consistently by the Funds in the preparation of their financial statements in conformity with accounting principles generally accepted in the United States of America (“U.S. GAAP”) for U.S. mutual funds.
The preparation of financial statements in accordance with U.S. GAAP requires management to make estimates and assumptions that affect the reported amounts and disclosures. Actual results could differ from those estimates.
Security Valuation
Securities held by the Trust are generally valued at fair value as of the close of regular trading on each business day (generally 4 pm Eastern time) that the New York Stock Exchange (“NYSE”) is open. Securities, other than stock options, listed on the NYSE or other exchanges are valued on the basis of the last quoted sale price on the exchange on which they are primarily traded. However, if the last sale price on the NYSE is different from the last sale price on any other exchange, the NYSE price will be used. If there are no sales on that day, then the securities are valued at the bid price on the NYSE or other primary exchange for that day. Securities traded in the OTC market are valued on the basis of the last sales price as reported by NASDAQ. If there are no sales on that day, then the securities are valued at the mean between the closing bid and asked prices as
| | | | |
| 38 | | | | The Motley Fool Funds Trust |
reported by NASDAQ. Stock options and stock index options traded on national securities exchanges or on NASDAQ are valued at the mean between the latest bid and asked prices for such options. Securities for which market quotations are not readily available or whose values have been affected by events occurring before the Funds’ pricing time but after the close of the securities markets, and other assets are valued at fair value as determined pursuant to procedures adopted in good faith by the Board of Trustees (the “Board”). Debt securities that mature in fewer than 60 days are valued at amortized cost (unless the Board determines that this method does not represent fair value), if their original maturity was 60 days or less or by amortizing the value as of the 61st day before maturity, if their original term to maturity exceeded 60 days.
When fair value pricing is employed, the prices of securities used by a fund to calculate its net asset value (the “NAV”) may differ from quoted or published prices for the same securities.
You’d think that it would be easy to determine what a share of the Fund is worth –just add up the value of everything it holds, and then divide by the number of shares. It’s not that simple, though. Some foreign markets have different operating hours (when it’s daytime in Chicago, for example, it is night in Shanghai). That means that when we calculate a Fund’s value at the end of the day, the market quotations for some of the securities held by the Fund could be several hours old, and intervening events may have affected what the stocks are worth. In addition, characteristics of the relevant markets and stocks might, in some cases, cast doubt on a particular valuation. For these reasons, we may rely on a pricing service to determine the value of particular securities. It is possible that when a Fund buys or sells the securities, the price on the real market will be different from the value used for the fair-value pricing.
The values of securities held by the Funds and other assets used in computing NAV are generally determined as of the time trading in such securities is completed each day, which, in the case of foreign securities, generally occurs at various times before the close of the NYSE. Trading in securities listed on foreign securities exchanges are valued at the last sale or, if no sales are reported, at the bid price as of the close of the exchange, subject to possible adjustment as described in the Prospectus. Foreign currency exchange rates are also generally determined before the close of the NYSE. On occasion, the values of such securities and exchange rates may be affected by events occurring between the time as of which determinations of such values or exchange rates are made and the close of the NYSE. When such events materially affect the value of securities held by the Funds or their liabilities, such securities and liabilities will be valued at fair value in accordance with procedures adopted in good faith by the Board. In this regard, the Trust has retained a third party fair value pricing service to quantitatively analyze the price movement of the Funds’ holdings on foreign exchanges and to automatically fair value if the variation from the prior day’s closing price exceeds specified parameters. As of October 31, 2011, such price movements for certain securities had exceeded specified parameters and the third party fair value service quantitatively fair
| | | | |
| The Motley Fool Funds Trust | | | | 39 |
valued the affected securities. The Board will review and monitor the methods used by the service to assure itself that securities are valued at their fair values. The values of any assets and liabilities initially expressed in foreign currencies will be converted to U.S. dollars based on exchange rates supplied by a quotation service.
Fair Value Measurements
The Financial Accounting Standards Board (“FASB”) “Fair Value Measurements and Disclosures” defines fair value as the price that a Fund would receive upon selling an investment in an orderly transaction to an independent buyer in the principal market, or in the absence of a principal market, the most advantageous market for the investment. Valuation techniques should maximize the use of observable market data and minimize the use of unobservable inputs. Inputs refer broadly to the assumptions that market participants would use in pricing an asset. Inputs may be observable or unobservable. Observable inputs are inputs that reflect the assumptions market participants would use in pricing the asset or liability developed based on market data obtained from sources independent of the reporting entity. Unobservable inputs are inputs that reflect the reporting entity’s own assumptions about the assumptions market participants would use in pricing the asset or liability developed based on the best information available in the circumstances.
Fair value measurements utilize a hierarchy based on the observability of inputs used to establish fair value.
Investment assets reported at fair value are classified based on the lowest level input that is significant to fair value:
Level 1 — quoted prices in active markets for identical securities
Investments whose values are based on quoted market prices in active markets, and whose values are therefore classified as Level 1 prices, include active listed domestic and foreign equity securities.
Level 2 — observable inputs other than Level 1 (including quoted prices for similar securities, interest rates, prepayment speeds, credit risk, etc.)
Investments that trade in markets that are not considered to be active, but whose values are based on quoted market prices, dealer quotations or valuations provided by alternative pricing sources supported by observable inputs are classified as Level 2 prices. These generally include investment grade corporate bonds and less liquid listed domestic and foreign equity securities.
Level 3 — significant unobservable inputs (including the Fund’s own assumptions in determining the fair value of investments)
Investments whose values are classified as Level 3 prices have significant unobservable inputs, as they may trade infrequently or not at all.
| | | | |
| 40 | | | | The Motley Fool Funds Trust |
The Funds did not have any transfers between Level 1 and Level 2 during the year ended October 31, 2011.
| | | | |
| | | Independence
Fund | |
| | |
| Valuation Inputs | | Value | |
| | |
Level 1 — Quoted Prices | |
U.S. Common Stocks | | | $98,436,830 | |
Foreign Common Stocks | | | 52,517,008 | |
Exchange Traded Note | | | 1,379,329 | |
Participatory Note | | | 3,460,344 | |
Temporary Cash Investment | | | 1,347,465 | |
Level 2 — Other Significant Observable Inputs | | | | |
Foreign Common Stocks | | | 38,376,782 | |
Level 3 — Significant Unobservable Inputs | | | — | |
Total Value of Investments | | | $195,517,758 | |
| | | | |
| | |
| | | Great America
Fund | |
| | |
| Valuation Inputs | | Value | |
| | |
Level 1 — Quoted Prices | |
U.S. Common Stocks | | | $54,921,557 | |
Exchange Traded Note | | | 233,723 | |
Temporary Cash Investment | | | 484,325 | |
Level 2 — Other Significant Observable Inputs | | | — | |
Level 3 — Significant Unobservable Inputs | | | — | |
Total Value of Investments | | | $55,639,605 | |
The inputs or methodology used for valuing securities are not necessarily an indication of the risk associated with investing in those securities.
| | | | |
| The Motley Fool Funds Trust | | | | 41 |
Dividends and Distributions
When a Fund pays a dividend or other distribution, its net asset value (NAV) per share will decline by the per-share amount of the distribution. Investors are no poorer for this “distribution drop,” however. As this section explains, investors may elect to reinvest their dividend and distribution payments. Doing so would allow them to acquire additional shares at the post-distribution NAV per share. They may also choose to receive a check in the amount of their portion of the dividend or distribution.
Each Fund pays dividends from its net investment income and distributes any net capital gains that it realizes. Dividends and capital gains distributions are generally paid once a year. All dividends and other distributions will be reinvested in Fund shares unless a shareholder chooses either to (1) receive dividends in cash, while reinvesting capital gains distributions in additional Fund shares; or (2) receive all distributions in cash. Additionally, each Fund reports details of distribution-related transactions on quarterly account statements. You may not receive a separate confirmation statement for these transactions.
Securities Transactions, Investment Income and Expenses
Securities transactions are accounted for as of the trade date. Costs used in determining realized gains and losses on the sales of investment securities are on the basis of identified cost. Dividend income is recorded on the ex-dividend date. Interest income is recorded on an accrual basis. Discount and premium are amortized using the effective interest method. Expenses directly attributable to a Fund are directly charged to that Fund. Common expenses of the Trust are allocated using methods approved by the Board.
Foreign Currency Translation
The books and records of the Funds are maintained in U.S. dollars as follows: (1) the values of investment securities and other assets and liabilities stated in foreign currencies are translated at the exchange rates prevailing at the end of the period; and (2) purchases, sales and income are translated at the rates of exchange prevailing on the respective dates of such transactions. Transaction gains or losses resulting from changes in exchange rates during the reporting period or upon settlement from foreign currency transactions are reported in the Statements of Operations for the current period. The Funds do not isolate the portion of gains and losses on investments.
3. Investment Policies and Practices:
The sections below describe some of the different types of investments that may be made by the Funds and the investment practices in which the Funds may engage.
| | | | |
| 42 | | | | The Motley Fool Funds Trust |
When we say that the Funds may invest in other types of securities and in other asset classes, the “may” is well worth emphasizing, as the Fund’s primary focus is the common stock companies that the Adviser believes are both promising and undervalued.
Foreign Securities
The Independence Fund invests, and the Great America Fund may invest, in equity and fixed-income securities of foreign companies, including companies located in both developed and emerging-market countries. Investment in foreign securities may include the purchase of American Depositary Receipts (“ADRs”) and other depositary receipts (European Depositary Receipts (“EDRs”) and Global Depositary Receipts (“GDRs”)) that represent indirect interests in securities of foreign issuers. A significant portion of a Fund’s exposure to foreign investments may be composed of such investments. Investments in foreign securities are affected by risk factors generally not associated with investments in the securities of U.S. companies in the U.S. With respect to such securities, there may be more limited information publicly available concerning the issuer than would be the case with respect to domestic securities, foreign issuers may use different accounting standards, and foreign trading markets may not be as liquid as are U.S. markets. Foreign securities also involve such risks as currency risks, possible imposition of withholding or confiscatory taxes, possible currency transfer restrictions, expropriation or other adverse political or economic developments, and the difficulty of enforcing obligations in other countries. These risks may be greater in emerging-market countries and in less-developed countries.
If a Fund holds a foreign stock, and the stock is traded on a foreign exchange, with its price denominated in that foreign currency, the value of the stock will change, for the Fund, whenever the relative value of the U.S. dollar and that foreign currency change. To take an imaginary example, if the Fund holds shares in Ruritania Telecom, traded on the Ruritanian Stock Exchange, those shares will be worth more to the Fund if the value of the Ruritanian ploof increases against the U.S. dollar, and vice versa, all other things being equal.
The purchase of securities denominated in foreign currencies will subject the value of the Funds’ investments in those securities to fluctuations caused by changes in foreign exchange rates. To hedge against the effects of changes in foreign exchange rates, the Funds may enter into forward foreign currency exchange contracts (“forward contracts”). These contracts represent agreements to exchange an amount of currency at an agreed-upon future date and rate. The Funds will generally use forward contracts only to “lock in” the price in U.S. dollars of a foreign security that a Fund plans to purchase or to sell. In certain limited cases, it may use such contracts to hedge against an anticipated substantial decline in the price of a foreign currency against the U.S. dollar that would adversely affect the U.S. dollar value of foreign securities held by the Fund. Forward contracts will not be used in all cases and, in any event, cannot
| | | | |
| The Motley Fool Funds Trust | | | | 43 |
completely protect the Funds against all changes in the values of foreign securities resulting from fluctuations in foreign exchange rates. The Funds will not enter into a forward contract if, as a result, forward contracts would represent more than 20% of a Fund’s total assets. For hedging purposes, the Funds may also use options on foreign currencies, which expose the Funds to certain risks.
Some foreign securities are traded in the U.S. in the form of ADRs. ADRs are receipts typically issued by a U.S. bank or trust company evidencing ownership of the underlying securities of foreign issuers. EDRs and GDRs are receipts typically issued by foreign banks or trust companies, evidencing ownership of underlying securities issued by either a foreign or U.S. issuer. Generally, depositary receipts in registered form are designed for use in the U.S. and depositary receipts in bearer form are designed for use in securities markets outside the U.S. Depositary receipts may not necessarily be denominated in the same currency as the underlying securities into which they may be converted. Depositary receipts generally involve the same risks as other investments in foreign securities. However, holders of ADRs and other depositary receipts may not have all the legal rights of shareholders and may experience difficulty in receiving shareholder communications.
Types of Fixed-Income Securities
A Fund may invest in bonds and other types of debt obligations of U.S. and foreign issuers. Fixed income securities purchased by a Fund may include, among others, bonds, notes and debentures issued by corporations; debt securities issued or guaranteed by the U.S. government or one of its agencies or instrumentalities (“U.S. Government Securities”); municipal securities; mortgage-backed and asset-backed securities; and debt securities issued or guaranteed by foreign governments, their agencies, instrumentalities, or political subdivisions, or by government-owned, -controlled, or -sponsored entities, including central banks. These investments also include money market instruments and other types of obligations. Investors should recognize that, although securities ratings issued by Standard & Poor’s® Ratings Services (“S&P”), a division of The McGraw-Hill Companies, Inc., and Moody’s Investors Services©, Inc. (“Moody’s”), provide a generally useful guide as to credit risks, they do not offer any criteria to evaluate interest rate risk. Changes in interest rate levels generally cause fluctuations in the prices of fixed-income securities and will, therefore, cause fluctuations in the NAV per share of a Fund. Subsequent to the purchase of a fixed-income security by a Fund, the ratings or credit quality of such security may deteriorate. Any such subsequent adverse changes in the rating or quality of a security held by a Fund would not require a Fund to sell the security.
Participatory Notes
A participatory note, as used by a Fund, is an instrument used by investors to obtain exposure to an equity investment, including common stocks and warrants, in a local market where direct ownership is not permitted. In countries where direct ownership by a foreign investor, such as a Fund, is not allowed by local law, such as Saudi Arabia,
| | | | |
| 44 | | | | The Motley Fool Funds Trust |
an investor may gain exposure to the market through a participatory note, which derives its value from a group of underlying equity securities. A participatory note is intended (disregarding the effect of any fees and expenses) to reflect the performance of the underlying equity securities on a one-to-one basis so that investors will not normally gain more in absolute terms than they would have made had they invested in the underlying securities directly, and will not normally lose more than they would have lost had they invested in the underlying securities directly.
In addition to providing access to otherwise closed markets, participatory notes can also provide a less expensive option to direct investment (where ownership by foreign investors is permitted) by reducing registration and transaction costs in acquiring and selling local registered shares. The Funds’ investment manager also believes that participatory notes can offer greater liquidity in markets that restrict the ability of the Funds to dispose of an investment by either restricting transactions by size or requiring registration and/or regulatory approvals.
The purchase of participatory notes involves risks that are in addition to the risks normally associated with a direct investment in the underlying securities. The Fund is subject to the risk that the issuer of the participatory note (i.e., the issuing bank or broker-dealer), which is the only responsible party under the note, is unable or refuses to perform under the terms of the participatory note, also known as counterparty risk.
While the holder of a participatory note is entitled to receive from the bank or broker-dealer any dividends or other distributions paid on the underlying securities, the holder is not entitled to the same rights as an owner of the underlying securities, such as voting rights.
Participatory notes may not be traded on exchanges, are privately issued, and may be illiquid. To the extent a participatory note is determined to be illiquid, it would be subject to the Fund’s limitation on investments in illiquid securities. There can be no assurance that the trading price or value of participatory notes will equal the value of the underlying value of the equity securities they seek to replicate.
Real Estate Investment Trusts
Real estate investment trusts (“REITs”) are pooled investment vehicles that manage a portfolio of real estate or real estate-related loans to earn profits for their shareholders. REITs are generally classified as equity REITs, mortgage REITs, or a combination of equity and mortgage REITs. Investing in REITs involves certain unique risks in addition to those risks associated with investing in the real estate industry in general. Equity REITs may be affected by changes in the value of the underlying property owned by the REITs, while mortgage REITs may be affected by the quality of the borrower on any credit extended. REITs are dependent upon management skills, may not be diversified geographically or by property type, and are subject to heavy cash-flow dependency, default by borrowers, and self-liquidation. REITs must also meet certain requirements under the Internal Revenue Code of 1986, as amended (the “Code”), to avoid entity
| | | | |
| The Motley Fool Funds Trust | | | | 45 |
level tax and be eligible to pass through certain tax attributes of their income to shareholders. REITs are consequently subject to the risk of failing to meet these requirements for favorable tax treatment and of failing to maintain their exemptions from registration under the 1940 Act. REITs are also subject to the risks of changes in the Code, affecting their tax status.
REITs (especially mortgage REITs) are also subject to interest rate risks. When interest rates decline, the value of a REIT’s investment in fixed-rate obligations can be expected to rise. Conversely, when interest rates rise, the value of a REIT’s investment in fixed-rate obligations can be expected to decline. In contrast, as interest rates on adjustable-rate mortgage loans are reset periodically, yields on a REIT’s investments in such loans will gradually align themselves to reflect changes in market interest rates, causing the value of such investments to fluctuate less dramatically in response to interest rate fluctuations than would investments in fixed-rate obligations.
The management of a REIT may be subject to conflicts of interest with respect to the operation of the business of the REIT and may be involved in real estate activities competitive with the REIT. REITs may own properties through joint ventures or in other circumstances in which a REIT may not have control over its investments. REITs may use significant amounts of leverage.
REITs often do not provide complete tax information until after the end of the calendar year. Consequently, because of the delay, it may be necessary for a Fund, if invested in REITs, to request permission to extend the deadline for issuance of Forms 1099-DIV beyond January 31. Alternatively, amended Forms 1099-DIV may be sent. During the year ended October 31, 2011, both Funds invested in REITs.
Temporary Investments
During periods of adverse market or economic conditions, a Fund may temporarily invest all or a substantial portion of its assets in high-quality, fixed-income securities, money market instruments, and shares of money market mutual funds, or it may hold cash. At such times, a Fund would not be pursuing its stated investment objective with its usual investment strategies. A Fund may also hold these investments for liquidity purposes. Fixed-income securities will be deemed to be of high quality if they are rated “A” or better by S&P or Moody’s or, if unrated, are determined to be of comparable quality by the Adviser. Money market instruments are high-quality, short-term fixed income obligations (which generally have remaining maturities of one year or less), and may include U.S. Government Securities, commercial paper, certificates of deposit and banker’s acceptances issued by domestic branches of United States banks that are members of the Federal Deposit Insurance Corporation, and repurchase agreements for US. Government Securities. In lieu of purchasing money market instruments, a Fund may purchase shares of money market mutual funds that invest primarily in U.S. Government Securities and repurchase agreements involving those securities, subject to certain limitations imposed by the 1940 Act. A Fund, as an investor in a money market fund, will indirectly bear the fees and expenses of the money market fund. These
| | | | |
| 46 | | | | The Motley Fool Funds Trust |
indirect fees and expenses will be in addition to the fees and expenses of the Funds. Repurchase Agreements involve certain risks not associated with direct investments in debt securities.
4. Fees and Transactions with Related Parties:
Fund Expenses
Each Fund pays all of its expenses other than those expressly assumed by the Adviser. Expenses of each Fund are deducted from the Funds’ total income before dividends are paid.
Investment Adviser
Subject to the supervision of the Board, Motley Fool Asset Management (the “Adviser”) manages the overall investment operations of the Funds in accordance with the Funds’ investment objective and policies and formulates a continuing investment strategy for the Funds pursuant to the terms of the Investment Advisory Agreement between the Adviser and the Trust on behalf of the Funds. The Adviser is a wholly owned subsidiary of The Motley Fool Holdings Inc. (“TMF Holdings”), a multimedia financial-services holding company that also owns The Motley Fool, LLC, which publishes investment information and analysis across a wide range of media, including investment newsletter services, websites, and books. TMF Holdings is controlled by David Gardner and Tom Gardner, along with other private shareholders.
Under the terms of the Advisory Agreement, each Fund pays the Adviser a fee that is computed and paid monthly at an annual rate of 0.95% of the Funds’ average daily net assets during the month (the “Basic Fee”). Commencing the first month after each Fund has completed 12 full calendar months of operations, the Basic Fee is subject to a monthly adjustment (the “Monthly Performance Adjustment”) based on the investment performance of each Fund relative to the performance of the MSCI World Index for the Independence Fund, and the Russell Midcap Index for the Great America Fund, measured over a trailing-36-month period ending on the last day of the month for which the fee is to be paid (or, if each Fund does not have 36 full calendar months of operations, the number of months since commencement of each Fund’s operations) (the “Performance Measurement Period”). The fee payable for each month (the “Total Advisory Fee”) will be the Basic Fee plus or minus the Monthly Performance Adjustment.
The Monthly Performance Adjustment is calculated by subtracting from the cumulative percentage performance of the Funds (essentially, the change in the Funds’ net asset value per share) during the Performance Measurement Period (net of all expenses, including advisory fees) the percentage change in the MSCI World Index for the Independence Fund and the Russell Midcap Index for the Great America Fund over the same period (including the value of dividends paid during the measurement period on stocks included in the MSCI World Index, or the Russell Midcap Index, respectively).
| | | | |
| The Motley Fool Funds Trust | | | | 47 |
The Monthly Performance Adjustment is based on an annual percentage rate determined by (i) subtracting 3 from the positive or negative percentage difference between the investment performance of the Funds and the investment performance of the MSCI World Index for the Independence Fund and the Russell Midcap Index for the Great America Fund during the Performance Measurement Period, and (ii) multiplying the result by 2%, but the annual percentage rate used in determining the Monthly Performance Adjustment will be limited to a rate of not more than +0.20% nor less than -0.20%. The dollar amount of the Monthly Performance Adjustment is then determined by dividing the annual percentage rate by 12 and (iii) multiplying the result by the average daily net assets of each Fund during the Performance Measurement Period. There is no Monthly Performance Adjustment if the difference between the investment performance of each Fund and the investment performance of its index is three percentage points or less. Because the operation of the Expense Limitation and Reimbursement Agreement will have a positive effect upon each Fund’s Investment performance, the agreement may result in an increase in the Monthly Performance Adjustment and the Total Advisory Fee. The Adviser has agreed to waive the amount of the increase in the Monthly Performance Adjustment that exceeds the amount that would have been payable to it in the absence of the Expense Limitation and Reimbursement Agreement to the extent that such increase exceeds the cumulative amount of expenses deferred, absorbed, or reimbursed by the Adviser that it has not previously recovered as a result of higher positive performance-based adjustments in one or more prior months resulting from the Expense Limitation and Reimbursement Agreement.
Under the terms of an Expense Limitation and Reimbursement Agreement entered into by the Adviser and the Funds, the Adviser has contractually agreed to pay, waive or absorb a portion of the Funds’ operating expenses through at least February 2012, to the extent necessary to limit the Funds’ annual operating expenses (excluding the advisory fee, brokerage commissions, taxes, interest expense, acquired fund fees and expenses, and any extraordinary expenses) to an amount not exceeding 0.40% annually of each Fund’s average daily net assets. The Adviser may recover from the Funds’ fees and expenses previously paid, waived or absorbed for a period of three years after such fees or expenses were incurred, provided that the repayments do not cause the Funds’ operating expenses (excluding the advisory fee, brokerage commissions, taxes, interest expense, acquired fund fees and expenses, and any extraordinary expenses) to exceed 0.40% annually of the Funds’ average daily net assets. Previously waived fees subject to future recovery by the Adviser are as follows:
| | | | |
| 48 | | | | The Motley Fool Funds Trust |
| | | | | | |
| | | Independence Fund | | | | |
| | | |
| | | Year End | | Recovery
Available | | |
| | | |
| 2012 | | | | $344,182 | | |
| 2013 | | | | $680,671 | | |
| 2014 | | | | $271,178 | | |
| | | |
| | | Great America Fund | | | | |
| | | |
| | Year End | | Recovery Available | | |
| | | |
| 2014 | | | | $346,585 | | |
Trustees Fees
Effective April 1, 2011, each Trustee who is not an “interested person,” as defined by the 1940 Act, of the Trust is paid an annual retainer of $30,000. Prior to April 1, 2011, each Independent Trustee was paid (i) an annual retainer of $20,000, (ii) a fee of $1,250 for each quarterly meeting of the Board attended, and (iii) a fee of $500 for each meeting attended of any committee of the Board of which such Trustee is a member (if such meeting is not held on the same day as a meeting of the Board). Officers of the Trust, all of whom are members, officers, or employees of the Adviser, or their affiliates, receive no compensation from the Trust.
Other Service Providers
Administration and Accounting Services
The Trust has entered into an Administration and Accounting Services Agreement with BNY Mellon. Pursuant to the Administration and Accounting Services Agreement, BNY Mellon provides various administrative and accounting services necessary for the operations of the Trust and the Funds. Services provided by BNY Mellon include facilitating general Fund management; monitoring the Funds’ compliance with federal and state regulations; supervising the maintenance of the Funds’ general ledger, the preparation of the Funds’ financial statements, the determination of NAV and the payment of dividends and other distributions to shareholders; and preparing specified financial, tax and other reports. The Funds pays the Administrator an annual fee calculated based upon the Funds’ average net assets. The fee is paid monthly. The Funds also reimburse the Administrator for certain out-of-pocket expenses.
| | | | |
| The Motley Fool Funds Trust | | | | 49 |
Transfer Agent
BNY Mellon serves as the Funds’ transfer agent and dividend disbursing agent. BNY Mellon receives a fee based mainly upon the number of accounts serviced. Certain minimum fees and transaction charges may apply.
For the year ended October 31, 2011, BNY Mellon received $775,875 in aggregate fees and expenses for services rendered under the various agreements described above.
Custodian
Effective April 11, 2011, BNY Mellon replaced PFPC Trust Company as custodian of the Trust’s Assets. BNY Mellon serves as custodian of the Trust’s assets and is responsible for maintaining custody of the Funds’ cash and investments and retaining subcustodians, including in connection with the custody of foreign securities.
Custodian fees for the Funds are calculated based on the average daily gross assets of the Funds. BNY Mellon also receives other transaction based charges and is reimbursed for out-of-pocket expenses.
For the year ended October 31, 2011, BNY Mellon received $84,140 in aggregate fees and expenses for services rendered under the custody agreements described above.
Distribution
The Distributor serves as the principal underwriter of the Funds pursuant to an Underwriting Agreement for the limited purpose of acting as statutory underwriter to facilitate the distribution of shares of the Funds. The Funds do not pay any fees to the Distributor in its capacity as Underwriter. The fees are paid by the Adviser.
Shareholder Account-related Services
The Trust’s board has authorized it to pay fees to financial intermediaries, including securities dealers, that provide shareholder account-related services to their customers who own shares of the Trust’s Funds, or to reimburse the Adviser for such expenses it paid on the Trust’s behalf. These financial intermediaries generally have omnibus accounts with the Trust’s Transfer Agent and provide shareholder services or sub-transfer agent services to the shareholders who are their customers. The fees paid by the Funds for these services will not exceed the fees they would have incurred if customers of the financial intermediaries maintained their accounts directly with the Trust. For the year ended October 31, 2011, Motley Fool Independence Fund paid $116,316 and Motley Fool Great America Fund paid $36,131 for such third party shareholder account-related services.
Redemption Fees
The Funds charge a redemption fee of 2.00% on proceeds from Shares redeemed or exchanged within 90 days following their acquisition. The redemption fee is calculated
| | | | |
| 50 | | | | The Motley Fool Funds Trust |
as a percentage of the net asset value of the total redemption proceeds and is retained by the Funds and accounted for as additional paid-in capital. Certain exceptions to the imposition of the redemption fee exist. Please see the Funds’ prospectus for more information.
Small-Balance Account Fee
The Funds charge a small-balance account fee of $24 annually if the value of any fund position is less than $10,000. The fee is assessed by redeeming shares from that fund position. Certain exceptions to the imposition of the small-balance account fee exist. Please see the Funds’ prospectus for more information.
5. Control Persons and Principal Holders:
Any person beneficially owning, directly or indirectly, more than 25% of the outstanding shares of a Fund is presumed to control the Fund. Through the exercise of voting rights with respect to shares of the Fund, such a person may be able to determine the outcome of shareholders voting on matters as to which the approval of shareholders of the Fund is required. Principal holders are persons who own beneficially 5% or more of the outstanding shares of the Fund. As of October 31, 2011, the Trust was not aware of any shareholders who beneficially owned 5% or more of each Fund’s outstanding shares.
6. Investment Transactions:
For year ended October 31, 2011, the cost of purchases and proceeds from sales and maturities of investment securities for the Funds were as follows:
Cost of Purchases and Proceeds from Sales and Maturities of Long-Term Securities
(other than Temporary Cash Investments)
| | | | | | | | | | |
| |
| Fund | | Purchases | | | Sales and Maturity Proceeds | | | |
| | | | | | | | | | | |
Independence Fund | | | $135,089,637 | | | | $62,186,371 | | | |
Great America Fund | | | 63,665,042 | | | | 7,426,055 | | | |
7. Shares of Beneficial Interest:
The Trust is authorized to issue an unlimited number of shares of beneficial interest, $.001 par value. Currently, the Trust consists of two series of shares, the Independence Fund and the Great America Fund, and all shares of each series represent a single class. However, the Board has the authority to establish additional series of shares (representing interests in separate investment portfolios of the Trust in addition to these two series) and, subject to applicable rules, may establish two or more classes of shares of any series, with the differences in classes representing differences as to certain
| | | | |
| The Motley Fool Funds Trust | | | | 51 |
expenses and share distribution arrangements. Shares are fully paid and non-assessable and have no pre-emptive or conversion rights.
8. Federal Income Taxes:
Each Fund intends to qualify as a regulated investment company (“RIC”) under Subchapter M of the Code. If so qualified, a Fund will not be subject to federal income tax on that part of its net investment income and net capital gains that it distributes to its shareholders. Certain federal income and excise taxes would be imposed on a Fund if it fails to make certain required distributions of its income to shareholders. The Funds intend, however, to make distributions in a manner that will avoid the imposition of any such taxes. For this reason, no provision for excise or income taxes is required.
Net investment income (loss) and net realized gains (losses) may differ for financial statements and tax purposes primarily due to differing treatments for amortization of deferred organization costs, foreign currency transactions, and investments in partnerships and Passive Foreign Investment Companies (“PFICs”).
Distributions during the years ended October 31, 2011 and October 31, 2010, were characterized as follows for tax purposes:
| | | | | | | | |
| | | Independence Fund | | | | | | |
| |
| | Tax Year End | | Ordinary
Income | | Long-Term Capital Gain | | |
| | | | | |
| 2011 | | | | $1,944,873 | | $625,977 | | |
| 2010 | | | | $ 390,863 | | $ — | | |
| | | | |
| | | Great America Fund | | | | | | |
| | | | | |
| | Tax Year End | | Ordinary
Income | | Long-Term Capital Gain | | |
| | | | | |
| 2011 | | | | $14,540 | | — | | |
At October 31, 2011, the components of distributable earnings for the Funds, on a tax basis were as follows:
| | | | |
| 52 | | | | The Motley Fool Funds Trust |
| | | | | | |
| Independence Fund | | | | | | |
| |
Undistributed Ordinary Income | | Undistributed Long-Term Capital Gain | | Capital Loss Carryover | | Net Unrealized Appreciation (Depreciation) on Investments |
| |
$618,786 | | — | | $(77,586) | | $13,721,977 |
| | | |
| Great America Fund | | | | | | |
| |
Undistributed Ordinary Income | | Undistributed Long-Term Capital Gain | | Capital Loss Carryover | | Net Unrealized Appreciation (Depreciation) on Investments |
| |
— | | — | | $(675,389) | | $(407,906) |
For Federal income tax purposes, realized capital losses may be carried forward and applied against future realized capital gains. The capital loss carryovers noted above will expire October 31, 2019.
The “Regulated Investment Company Modernization Act of 2010” (the “Act”) was enacted on December 22, 2010. The Act makes changes to several tax rules impacting the Funds. In general, the provisions of the Act will be effective for the Fund’s fiscal year beginning after October 31, 2011. Although the Act provides several benefits, including the unlimited carryover of future capital loses, there may be a greater likelihood that all or a portion of each Fund’s pre-enactment capital loss carryovers may expire without being utilized due to the fact that post-enactment capital losses get utilized before pre-enactment capital loss carryovers. Relevant information regarding the impact of the Act on the Funds will be contained within this section of the Funds’ fiscal year ending October 31, 2012 financial statements.
At October 31, 2011, the aggregate cost of investment securities for federal income tax purposes (excluding foreign currency, securities sold short and derivative related items) and the net unrealized appreciation from investments for those securities having an excess of value over cost and net unrealized depreciation from investments for those securities having an excess of cost over value (based on cost for federal income tax purposes) were as follows:
| | | | |
| The Motley Fool Funds Trust | | | | 53 |
| | | | | | |
| Independence Fund | | | | | | |
| |
| Federal Tax Cost | | Net Unrealized Appreciation (Depreciation) | | Appreciated Securities | | Depreciated Securities |
| |
$181,798,521 | | $13,719,237 | | $21,674,434 | | $(7,955,197) |
| | | |
| Great America Fund | | | | | | |
| |
| Federal Tax Cost | | Net Unrealized Appreciation (Depreciation) | | Appreciated Securities | | Depreciated Securities |
| |
$56,047,511 | | $(407,906) | | $3,685,307 | | $(4,093,213) |
The differences between book basis and tax basis unrealized appreciation is attributable primarily to the deferral of losses on wash sales and cumulative basis adjustments for partnerships and PFICs.
At October 31, 2011, capital contributions, accumulated undistributed net investment income and accumulated net realized gain (loss) from investments have been adjusted for current period permanent book/tax differences which arose principally from differing book/tax treatments of amortization of deferred organization costs, foreign currency transactions, and investments in partnerships and PFICs. The following amounts were reclassified within the capital accounts for the Independence Fund:
| | | | |
| Independence Fund | | | | |
| |
| Paid in Capital | | Accumulated Undistributed Income | | Accumulated Net Realized Gain (Loss) on Investments |
| |
— | | $(177,839) | | $177,839 |
| | |
| Great America Fund | | | | |
| |
| Paid in Capital | | Accumulated Undistributed Income | | Accumulated Net Realized Gain (Loss) on Investments |
| |
$(219,579) | | $219,579 | | — |
| | | | |
| 54 | | | | The Motley Fool Funds Trust |
Management has analyzed the Funds’ tax positions and has concluded that no provision for income tax is required in the financial statements. The Funds are not aware of any tax positions for which it is reasonably possible that the total amounts of unrecognized tax benefits will significantly change in the next twelve months. However, management’s conclusions may be subject to review and adjustment at a later date based on certain factors including, but not limited to, further implementation guidance from the FASB, new tax laws, regulations and administrative interpretations (including court decisions).
9. Recent Accounting Pronouncements:
In May 2011, the FASB issued “Amendments to Achieve Common Fair Value Measurement and Disclosure Requirements in U.S. GAAP and IFRSs (the “Standard”). The Standard includes common requirements for measurement of and disclosure about fair value between U.S. GAAP and IFRS. The Standard will require reporting entities to disclose quantitative information about the unobservable inputs used in the fair value measurements categorized within Level 3 of the fair value hierarchy. In addition, the Standard will require reporting entities to make disclosures about amounts and reasons for all transfers in and out of Level 1 and Level 2 fair value measurements. The new and revised disclosures are effective for interim and annual reporting periods beginning after December 15, 2011. At this time, management is evaluating the implications of the Standard and its impact on the financial statements has not been determined.
10. Change in Independent Registered Public Accounting Firm:
In September 2011, Tait, Weller & Baker, LLP (“Tait, Weller & Baker”) succeeded Grant Thornton, LLP (“Grant Thornton”) as the Trust’s independent registered public accounting firm. The Trust’s selection of Tait, Weller & Baker as its independent registered public accounting firm was recommended by the Trust’s Audit Committee and was approved by the Trust’s Board of Trustees.
During the Trust’s fiscal years ended October 31, 2010 and October 31, 2009 and through September 14, 2011, (i) there were no disagreements with Grant Thornton on any matter of accounting principles or practices, financial statement disclosure or auditing scope or procedure, which disagreements, if not resolved to the satisfaction of Grant Thornton, would have caused it to make reference to the subject matter of the disagreements in connection with its reports on the Trust’s financial statements for such years, and (ii) there were no “reportable events” of the kind described in Item 304(a)(1)(v) of Regulation S-K under the Securities Exchange Act of 1934, as amended.
| | | | |
| The Motley Fool Funds Trust | | | | 55 |
11. Subsequent Events:
Subsequent events have been evaluated through the date that the financial statements were issued. All subsequent events determined to be relevant and material to the financial statements have been appropriately recorded or disclosed.
| | | | |
| 56 | | | | The Motley Fool Funds Trust |
Report of Independent Registered Public Accounting Firm
To the Shareholders and Board of Trustees
of Motley Fool Funds Trust
We have audited the accompanying statement of assets and liabilities of Motley Fool Independence Fund and Motley Fool Great America Fund, the “Funds,” each a series of The Motley Fool Funds Trust, including the schedules of investments, as of October 31, 2011, and the related statements of operations, the statements of changes in net assets, and the financial highlights for the year then ended. These financial statements and financial highlights are the responsibility of the Funds’ management. Our responsibility is to express an opinion on these financial statements and financial highlights based on our audit. The statements of changes in net assets for the year ended October 31, 2010 and the financial highlights for the periods prior to October 31, 2011 have been audited by other auditors, whose report dated December 22, 2010 expressed an unqualified opinion on such financial statements and financial highlights.
We conducted our audit in accordance with the standards of the Public Company Accounting Oversight Board (United States). Those standards require that we plan and perform the audit to obtain reasonable assurance about whether the financial statements and financial highlights are free of material misstatement. The Funds are not required to have, nor were we engaged to perform, an audit of their internal control over financial reporting. Our audit included consideration of internal control over financial reporting as a basis for designing audit procedures that are appropriate in the circumstances, but not for the purpose of expressing an opinion on the effectiveness of the Funds’ internal control over financial reporting. Accordingly, we express no such opinion. An audit includes examining, on a test basis, evidence supporting the amounts and disclosures in the financial statements. Our procedures included confirmation of securities owned as of October 31, 2011, by correspondence with the custodian and brokers. An audit also includes assessing the accounting principles used and significant estimates made by management, as well as evaluating the overall financial statement presentation. We believe that our audit provides a reasonable basis for our opinion.
In our opinion, the financial statements and financial highlights referred to above present fairly, in all material respects, the financial position of Motley Fool Independence Fund and Motley Fool Great America Fund as of October 31, 2011, the results of their operations, the changes in their net assets and the financial highlights for the year then ended, in conformity with accounting principles generally accepted in the United States of America.
TAIT, WELLER & BAKER LLP
Philadelphia, Pennsylvania
December 16, 2011
| | | | |
| The Motley Fool Funds Trust | | | | 57 |
Notice to Shareholders (Unaudited)
Tax Information
All designations are based on financial information available as of the date of this annual report and, accordingly, are subject to change. For each item, it is the intention of the Fund to designate the maximum amount permitted under the Internal Revenue Code and the regulations thereunder.
For the period ended October 31, 2011, each Fund designated a portion of its distributions as follows:
| | | | | | | | |
Motley Fool Independence Fund |
| |
Total Distributions | | Ordinary Income | | Short-term Capital Gains | | Long-term Capital Gains | | Return of Capital |
| |
100.00% | | 56.99% | | 18.66% | | 24.35% | | — |
| | | | |
| | |
Qualified Dividend Income (QDI) | | | 79.39 | % |
Dividends Received Deduction (DRD) | | | 42.11 | % |
| | | | | | | | |
Motley Fool Great America Fund |
| |
Total Distributions | | Ordinary Income | | Short-term Capital Gains | | Long-term Capital Gains | | Return of Capital |
| |
100.00% | | 100.00% | | — | | — | | — |
| | | | |
| | |
Qualified Dividend Income (QDI) | | | 100.00 | % |
Dividends Received Deduction (DRD) | | | 100.00 | % |
| | | | |
| 58 | | | | The Motley Fool Funds Trust |
Information on Proxy Voting
The Trust’s proxy voting guidelines, used to determine how to vote proxies relating to portfolio securities and information regarding how the Trust voted proxies relating to portfolio securities of the Fund during the most recent 12-month period ended June 30 is available (i) without charge, upon request, by calling (888) 863-8803; (ii) on the U.S. Securities and Exchange Commission’s (“SEC”) website at http://www.sec.gov; and (iii) on the Fund’s website at http://www.FoolFunds.com.
Quarterly Schedule of Investments
The Trust provides a complete list of the Fund’s holdings four times in each fiscal year,at the quarter-ends. For the second and fourth quarters, the Portfolio of Investments appears in the semi-annual and annual reports to shareholders. For the first and third quarters, the Trust files the Portfolio of Investments with the SEC on Form N-Q. Shareholders can obtain the Form N-Q (i) without charge, upon request, by calling(888) 863-8803; (ii) on the SEC’s website at http://www.sec.gov; and (iii) on the Fund’s website at http://www.FoolFunds.com. The Form N-Q may be reviewed or copied at the SEC Public Reference Room in Washington, D.C. Information on the operation of the Public Reference Room may be obtained by calling (800) SEC-0330.
| | | | |
| The Motley Fool Funds Trust | | | | 59 |
The Motley Fool Funds Trust Privacy Policy
What Does Motley Fool Funds Trust Do With Your Personal Information?
Why?: Financial companies choose how they share your personal information. Federal law gives consumers the right to limit some but not all sharing. Federal law also requires us to tell you how we collect, share, and protect your personal information. Please read this notice carefully to understand what we do.
What?: The type of personal information we collect and share depend on the product of service you have with us. This information can include:
| | • | | Social Security number and transaction history |
| | • | | Account balances and checking account information |
| | • | | Account transactions and wire transfer instructions |
When you are no longer a customer, we continue to share your information as described in this notice.
How?: All financial companies need to share customers’ personal information to run their everyday business. In the section below, we list the reasons financial companies can share their customers’ personal information; the reasons The Motley Fool Funds Trust chooses to share; and whether you can limit this sharing.
| | | | |
| Reasons we share your personal information | | Does the Motley Fool Funds Trust share? | | Can you limit this sharing? |
| |
For our everyday business purposes —
such as to process your transaction, maintain your account(s), provide you with necessary information, respond to court orders and legal investigation, or report to credit bureaus | | Yes | | No |
For our marketing purposes —
to offer our products and services to you | | Yes | | Yes |
For joint marketing with other financial companies | | No | | We don’t share |
For our affiliates’ everyday business purposes —
information about your transactions and experiences | | Yes | | No |
For our affiliates’ everyday business purposes —
information about your creditworthiness | | No | | We don’t share |
For our affiliates to market to you | | Yes | | Yes |
For nonaffiliates to market to you | | No | | We don’t share |
To limit our sharing:
| | • | | Visit us online: http://www.FoolFunds.com/marketing/EmailRestriction.aspx |
Please note:
If you are a new customer, we can begin sharing your information 30 days from the
| | | | |
| 60 | | | | The Motley Fool Funds Trust |
days from the date we sent this notice. When you are no longer our customer, we continue to share your information as described in this notice.
However, you can contact us at any time to limit our sharing.
Questions: Call 1-888-863-8803 or go to www.FoolFunds.com
What we do:
How does The Motley Fool Funds Trust protect my personal information?
To protect your personal information from unauthorized access and use, we use security measures that comply with federal law. These measures include physical, electronic, and procedural safeguards, including encryption, authentication and secured buildings and files.
How does The Motley Fool Funds Trust collect my personal information?
We collect your personal information, for example, when you
| | • | | open an account or provide account information |
| | • | | make deposits or withdrawals from your account |
| | • | | make a wire transfer or tell us where to send the money |
We also collect your personal information from other companies.
Why can’t I limit all sharing?
Federal law gives you the right to limit only
| | • | | sharing for affiliates’ everyday business purposes — information about your creditworthiness |
| | • | | make deposits or withdrawals from your account |
| | • | | sharing for nonaffiliates to market to you |
State laws and individual companies may give you additional rights to limit sharing.
What happens when I limit sharing for an account I hold jointly with someone else?
Your choices will apply to everyone on your account.
Definitions:
Affiliates - Companies related by common ownership or control. They can be financial and nonfinancial companies.
Our affiliates include companies with a Motley Fool name; financial companies such as Motley Fool Asset Management, LLC; and nonfinancial companies such as The Motley Fool, LLC and The Motley Fool Holdings, Inc.
Nonaffiliates - Companies not related by common ownership or control. They can be financial and nonfinancial companies.
The Motley Fool Funds Trust does not share with nonaffiliates so they can market to you.
Joint marketing - A formal agreement between nonaffiliated financial companies that together market financial products or services to you.
The Motley Fool Funds Trust doesn’t jointly market.
| | | | |
| The Motley Fool Funds Trust | | | | 61 |
Directors and Officers
| | | | | | | | | | |
NAME, ADDRESS,
AND AGE (1) | | POSITION(S) HELD WITH THE TRUST | | TERM OF OFFICE AND LENGTH OF TIME SERVED (2) | | PRINCIPAL OCCUPATIONS DURING PAST FIVE YEARS | | NUMBER OF
PORTFOLIOS IN
FUND COMPLEX
OVERSEEN BY TRUSTEE | | OTHER
DIRECTORSHIPS
HELD BY TRUSTEE |
| | | |
INDEPENDENT TRUSTEES |
| | | | | |
Kathleen A. O’Neil 59 | | Trustee | | Since March, 2009 | | President/CEO, Liberty Street Advisors (consultancy); Director, BMC Software, Guidance Software, MetLife Bank, N.A., John Carroll University (1999 to 2008) | | 3 | | BMC Software, Guidance Software, MetLife Bank N.A. |
| | | | | |
Gary Langbaum 62. | | Trustee | | Since March, 2009 | | Retired | | 3 | | None |
| | | | | |
Stephen L. Boyd 71 | | Trustee | | Since March, 2009 | | Advisory Director, Morgan Stanley Investment Management | | 3 | | None |
| INTERESTED TRUSTEES AND OFFICERS |
| | | | | |
Peter E. Jacobstein(3) 46 | | Trustee President | | Since
November, 2008 | | President, Motley Fool Asset Management, LLC; SVP, The Motley Fool, Inc. (financial publishing) | | 3 | | None |
| | | | | |
Philip J. Biedronski, Jr. 43 | | Treasurer | | Since September, 2011 | | Controller & Treasurer, The Motley Fool Holdings, Inc. (and its predecessor, The Motley Fool, Inc.) (financial publishing) | | N/A | | N/A |
| | | | | |
Lawrence T. Greenberg 48 | | Vice President Secretary | | Since March, 2009 | | SVP and Chief Legal Officer, The Motley Fool Holdings, Inc. (and its predecessor, The Motley Fool, Inc.) (financial publishing). Adjunct professor, Washington College of Law, American University, 2006-present, George Mason University School of Law (2000 to 2007). Director, Fool/Love Money.com Financial Services, Ltd. (U.K. mortgage adviser) (2008 to 2009), Lovemoney. com, Ltd. (U.K. financial information site) (2009 to 2009). Director, The Motley Fool Australia Pty Ltd. (financial publishing) (2010-present) | | N/A | | N/A |
| | | | | |
Salvatore Faia 48 | | Chief Compliance Officer | | Since March, 2009 | | President, Vigilant Compliance Services since 2004; and Director of EIP Growth and Income Fund since 2005 | | N/A | | N/A |
| (1) | Each Trustee can be contacted by writing to The Motley Fool Funds Trust, 2000 Duke Street, Suite 175, Alexandria, VA 22314. |
| (2) | Each Trustee holds office until the next meeting of shareholders at which Trustees are elected (or otherwise appointed) and serve until his or her successor has been elected or qualified. |
| (3) | Mr. Jacobstein is an “interested person” (as defined by the 1940 Act) of the Trust. Mr. Jacobstein is the President and Chairman of the Adviser. |
For more information regarding the trustees and officers, please refer to the Statement of Additional Information, which is available, without charge, upon request by calling (888) 863-8803 or visiting www.www.FoolFunds.com.
| | | | |
| 62 | | | | The Motley Fool Funds Trust |
Board Approval of Advisory Agreement (Unaudited)
At a meeting held in person on March 16, 2011, the Board, including the Trustees who are not “interested persons,” as defined by the Investment Company Act of 1940, as amended, of the Trust or the Adviser (the “Independent Trustees”), approved the continuation of the Advisory Agreement between the Trust and the Adviser pursuant to which the Adviser provides investment advisory services to the Independence Fund.
In determining whether to approve the continuation of the Advisory Agreement, the Board exercised its business judgment and considered various sources of information regarding the Adviser and the Independence Fund, as well as various factors including those described below that the Board deemed to be relevant. In its deliberations, the Board did not rank the importance of any particular piece of information or factor considered, and it is assumed that each Trustee attributed different weights to the various factors. The following summarizes the materials and principal factors that the Board considered, and the conclusions the Board reached, in approving the Advisory Agreement for the Independence Fund.
In its deliberations, the Board considered many factors, including the nature, extent and quality of services provided by the Adviser; particularly, the qualifications and capabilities of the personnel responsible for providing services to the Independence Fund. It was provided with information regarding the Adviser and its personnel, including information regarding the Adviser’s financial condition. The Board reviewed the financial condition of the Adviser to determine that adequate resources were available to continue to provide the level of service to the Independence Fund. On the basis of this evaluation, the Board concluded that the Adviser and its personnel were well-qualified to continue to provide all required services to the Independence Fund and to continue to provide services that are of a high quality, and that the Adviser had the appropriate resources to provide such services to the Independence Fund.
The Board recognized that a fund’s investment performance is an important factor for a mutual fund board to consider in connection with the approval of an investment advisory agreement. The Board reviewed the performance of the Adviser and the Independence Fund over various periods of time as compared to relevant indices and concluded that the Independence Fund was delivering reasonable performance results consistent with the investment strategies of that Fund.
The Board also considered the costs of services provided by the Adviser and the profits to be realized by the Adviser and its affiliates under the Advisory Agreement, as well as comparative fees and expenses of other mutual funds. In connection with the Board’s review of this factor, the Board evaluated the structure of the advisory fee and noted that the actual fees payable depend partially on the performance of the Fund and that this should continue to provide a strong incentive for the Adviser to use its best efforts and commit resources to management of the Fund and thus the likelihood that the Fund will perform well. The Board also considered information regarding the advisory fees of comparable mutual funds and information regarding fulcrum fees paid by other
| | | | |
| The Motley Fool Funds Trust | | | | 63 |
mutual funds to their investment advisers. It evaluated the proposed advisory fee arrangements of the Independence Fund in light of this information and, in this regard, considered various factors that judicial decisions have specified as pertinent generally and factors that the Securities and Exchange Commission has stated should be considered when implementing fulcrum fee arrangements of the type proposed for the Independence Fund. After its review of this information, the Board concluded that the fees paid under the Advisory Agreement compared favorably to the average management fees paid by peer group funds, and that the overall expense ratio of the Independence Fund is below the average expense ratio of funds in the peer group. Based on the foregoing considerations, the Board determined that it was satisfied that the advisory fee proposed for the Independence Fund was consistent with applicable standards and was reasonable and fair.
The Board recognized the importance of considering economies of scale in costs of providing services to the Independence Fund when evaluating the advisory fee, including the extent to which any such economies of scale would be shared with the Independence Fund for the benefit of shareholders. The Board considered that there were currently no breakpoints in the advisory fee, however, the Fund experiences some economies of scale with growth because certain of the Fund’s expenses are fixed and are spread among a larger shareholder base as the Fund grows.
The Board considered the comparative performance information, noting that the Independence Fund outperformed its benchmark for the one year period and since-inception time periods.
The Board further considered the benefits received by the Adviser due to its relationship with the Independence Fund. It concluded that the benefits were limited to the advisory fees and soft dollar research resulting from the Adviser’s services to the Independence Fund.
Based on its review of the information and factors described above, and other considerations deemed pertinent, the Board, including all of the Independent Trustees, unanimously approved the continuation of the Advisory Agreement for the Independence Fund.
| | | | |
| 64 | | | | The Motley Fool Funds Trust |
Investment Adviser
Motley Fool Asset Management, LLC
2000 Duke Street
Suite 175
Alexandria, VA 22314
Administrator and Transfer Agent
BNY Mellon Investment Servicing (US) Inc.
P.O. Box 9780
Providence, RI 02940-9780
Custodian
The Bank of New York Mellon
1 Wallstreet
New York, NY 10286
Independent Registered Public Accounting Firm
Tait, Weller & Baker, LLP
1818 Market Street, Suite 2400
Philadelphia, PA 19103
Underwriter
BNY Mellon Distributors Inc.
760 Moore Road
King of Prussia, PA 19406
Legal Counsel
Morgan Lewis & Bockius LLP
1111 Pennsylvania Ave., NW
Washington, DC 20004-2541
| | | | |
| The Motley Fool Funds Trust | | | | 65 |
Motley Fool Funds Guiding Principles
At Motley Fool Funds, we aim to get right what we believe much of the fund industry gets wrong. Our approach all begins with a shareholder-centric philosophy that we think is unique.
| | • | | We are — and will remain — significant investors with you in Motley Fool Funds. |
| | • | | We will manage your investment in Motley Fool Funds as if it were our own. |
| | • | | We will keep our financial incentives aligned with those of our shareholders. |
| | • | | We will invest for the long term. We seek to maximize returns while we minimize business, regulatory, financial, and sovereign risks. |
| | • | | We will not impose loads or 12b-1 charges, and we will apply redemption fees only to discourage the short-term trading that can hurt all a Fund’s investors. |
| | • | | We will be advocates on your behalf with company managers and boards, in the interest of enhancing the value of your shares. |
| | • | | We will recognize that one of our most powerful analytical weapons is the phrase “I don’t know.” In that spirit, we will constantly review our successes and mistakes and remain passionate about learning. |
| | • | | We will communicate with our shareholders as clearly and candidly as possible. |
Have you signed up for Declarations yet?
If you don’t subscribe to Declarations, the free monthly newsletter from the Fool Funds portfolio team, here’s just a sampling of what you’ve missed this year...
| | | “Our inclination is not to forecast events or the market’s reaction to them. We try to remain impervious to investing fads, to avoid the popular, and to buy companies that few seem to like. Hell, many times even we don’t like’ em.” |
| | | “In our shop, we make an attempt to qualify each company, ranging from break-the-mold great at the top to how-in-the-world-do-they-stay-in business crappy at the bottom. For lack of a better term, we call this the ‘awesomeness continuum’. (OK ‘for lack of a better term’ is false modesty. ‘Awesomeness continuum’ is pretty sweet.)” 6/2011 |
| | | “I’d like to say something here, though for reasons of a regulatory, legal, or commonsense nature I may be prevented from doing so. (If you’re reading this, you’ll know I succeeded. If you’re not reading this, well, that’s quite an interesting test case of Cartesian physics, now isn’t it?)” 8/2011 |
| | | “It has long been settled in all the right circles that the greatest superpower is the ability to turn into an invisible bear.” 9/2011 |
| | | “The worry is that a Greek default would cascade into a massive debt-driven collapse in markets throughout the globe. During the Cold War, they called this the ‘domino effect.’ In nuclear war it was ‘mutually assured destruction.’ In college sports it’s called ‘realignment.’” 10/2011 |
To subscribe, simply email contest@FoolFunds.com to sign up. To show our thanks, we’ll send a Motley Fool Funds ball cap to everyone who emails us (make sure you provide your postal address) and you’ll be entered in a contest to win lunch with Portfolio Manager Bill Mann and another member of our portfolio team at a restaurant in your town. (For complete contest rules, visit FoolFunds.com/help/ contest.aspx.)
Visit us online at www.FoolFunds.com. You’ll find:
| | • | | Sign-up form for Declarations, our monthly e-mail newsletter |
| | • | | Monthly shareholder letters from Portfolio Manager Bill Mann |
| | • | | Bill’s answers to shareholder questions |
| | • | | Updated fund performance details |
| | • | | Access to shareholder account information |
Reach us by phone: 888.863.8803 or contact your securities dealer.
Contact us by mail:
Motley Fool Funds
P.O. Box 9780
Providence, RI 02940-9780
©All Rights Reserved
This report has been prepared for shareholders of Motley Fool Independence Fund and Motley Fool Great America Fund. It is not authorized for distribution to prospective investors unless accompanied or preceded by a current prospectus, which contains more complete information about the Fund. Investors are reminded to read the prospectus carefully before investing. Past performance is no guarantee of future results. Share prices will fluctuate and there may be a gain or loss when shares are redeemed. Fund shares are distributed by BNY Mellon Distributors Inc., 760 Moore Rd., King of Prussia, PA 19406.
MFF-ANR-003
Item 2. Code of Ethics.
| | (a) | The registrant, as of the end of the period covered by this report, has adopted a code of ethics that applies to the registrant’s principal executive officer, principal financial officer, principal accounting officer or controller, or persons performing similar functions, regardless of whether these individuals are employed by the registrant or a third party. |
| | (c) | There have been no amendments, during the period covered by this report, to a provision of the code of ethics that applies to the registrant’s principal executive officer, principal financial officer, principal accounting officer or controller, or persons performing similar functions, regardless of whether these individuals are employed by the registrant or a third party, and that relates to any element of the code of ethics description. |
| | (d) | The registrant has not granted any waivers, including an implicit waiver, from a provision of the code of ethics that applies to the registrant’s principal executive officer, principal financial officer, principal accounting officer or controller, or persons performing similar functions, regardless of whether these individuals are employed by the registrant or a third party, that relates to one or more of the items set forth in paragraph (b) of this item’s instructions. |
Item 3. Audit Committee Financial Expert.
As of the end of the period covered by the report, the Registrant’s board of trustees has determined that Gary Langbaum and Kathleen A. O’Neil are qualified to serve as audit committee financial experts serving on its audit committee and that each of them is “independent,” as defined by Item 3 of Form N-CSR.
Item 4. Principal Accountant Fees and Services.
Audit Fees
| | (a) | The aggregate fees billed for each of the last two fiscal years for professional services rendered by the principal accountant for the audit of the registrant’s annual financial statements or services that are normally provided by the accountant in connection with statutory and regulatory filings or engagements for those fiscal years are $30,000 for 2011 and $31,500 for 2010. |
Audit-Related Fees
| | (b) | The aggregate fees billed in each of the last two fiscal years for assurance and related services by the principal accountant that are reasonably related to the performance of the audit of the registrant’s financial statements and are not reported under paragraph (a) of this Item are $0 for 2011 and $1,017 for 2010. Services provided were for administrative services related to the audit. |
Tax Fees
| | (c) | The aggregate fees billed in each of the last two fiscal years for professional services rendered by the principal accountant for tax compliance, tax advice, and tax planning are $6,000 for 2011 and $3,675 for 2010. Services provided were for review of federal and state tax returns. |
All Other Fees
| | (d) | The aggregate fees billed in each of the last two fiscal years for products and services provided by the principal accountant, other than the services reported in paragraphs (a) through (c) of this Item are $2,070 for 2011 and $1,553 for 2010. Services provided were for administrative services related to the audit and for services related to the 485b. |
| | (e)(1) | The audit committee’s pre-approval policies and procedures: |
Pursuant to Registrant’s Audit Committee Charter (the “Charter”), the Audit Committee is responsible for pre-approving any engagement of the auditor to provide audit and non-audit services to the Registrant. The Audit Committee is also responsible for pre-approving non-audit services provided by the auditor to the Adviser or any Motley Fool Affiliate that provides ongoing services to the Trust if the engagement relates directly to the operations and financial reporting of the Trust.
The Audit Committee may form one or more subcommittees (which may consist of one or more Audit Committee members), and may delegate to any such committee or to the Chair of the Audit Committee any portion of its authority, including the authority to pre-approve audit and permitted non-audit services, as it deems appropriate from time to time. Any decision of a subcommittee or of the Chair to pre-approve audit or non-audit services shall be presented to the Audit Committee at its next regularly scheduled meeting.
| | (e)(2) | The percentage of services described in each of paragraphs (b) through (d) of this Item that were approved by the audit committee pursuant to paragraph (c)(7)(i)(C) of Rule 2-01 of Regulation S-X are as follows: |
(b) 100%
(c) 100%
(d) 100%
| | (g) | The aggregate non-audit fees billed by the registrant’s accountant for services rendered to the registrant, and rendered to the registrant’s investment adviser (not including any sub-adviser whose role is primarily portfolio management and is subcontracted with or overseen by another investment adviser), and any entity controlling, controlled by, or under common control with the adviser that provides ongoing services to the registrant for each of the last two fiscal years of the registrant was $0 for 2011 and $41,368 for 2010. |
| | (h) | The registrant’s audit committee of the board of directors has considered whether the provision of non-audit services that were rendered to the registrant’s investment adviser (not including any sub-adviser whose role is primarily portfolio management and is subcontracted with or overseen by another investment adviser), and any entity controlling, controlled by, or under common control with the investment adviser that provides ongoing services to the registrant that were not pre-approved pursuant to paragraph (c)(7)(ii) of Rule 2-01 of Regulation S-X is compatible with maintaining the principal accountant’s independence. |
Item 5. Audit Committee of Listed registrants.
Not applicable.
Item 6. Investments.
| (a) | Schedule of Investments in securities of unaffiliated issuers as of the close of the reporting period is included as part of the report to shareholders filed under Item 1 of this form. |
Item 7. Disclosure of Proxy Voting Policies and Procedures for Closed-End Management Investment Companies.
Not applicable.
Item 8. Portfolio Managers of Closed-End Management Investment Companies.
Not applicable.
Item 9. Purchases of Equity Securities by Closed-End Management Investment Company and Affiliated Purchasers.
Not applicable.
Item 10. Submission of Matters to a Vote of Security Holders.
Not applicable.
Item 11. Controls and Procedures.
| | (a) | The registrant’s principal executive and principal financial officers, or persons performing similar functions, have concluded that the registrant’s disclosure controls and procedures (as defined in Rule 30a-3(c) under the Investment Company Act of 1940, as amended (the “1940 Act”) (17 CFR 270.30a-3(c))) are effective, as of a date within 90 days of the filing date of the report that includes the disclosure required by this paragraph, based on their evaluation of these controls and procedures required by Rule 30a-3(b) under the 1940 Act (17 CFR 270.30a-3(b)) and Rules 13a-15(b) or 15d-15(b) under the Securities Exchange Act of 1934, as amended (17 CFR 240.13a-15(b) or 240.15d-15(b)). |
| | (b) | There were no changes in the registrant’s internal control over financial reporting (as defined in Rule 30a-3(d) under the 1940 Act (17 CFR 270.30a-3(d)) that occurred during the registrant’s |
| | second fiscal quarter of the period covered by this report that has materially affected, or is reasonably likely to materially affect, the registrant’s internal control over financial reporting. |
Item 12. Exhibits.
| | (a)(1) | Code of ethics, or any amendment thereto, that is the subject of disclosure required by Item 2 is attached hereto. |
| | (a)(2) | Certifications pursuant to Rule 30a-2(a) under the 1940 Act and Section 302 of the Sarbanes-Oxley Act of 2002 are attached hereto. |
| | (b) | Certifications pursuant to Rule 30a-2(b) under the 1940 Act and Section 906 of the Sarbanes-Oxley Act of 2002 are attached hereto. |
SIGNATURES
Pursuant to the requirements of the Securities Exchange Act of 1934 and the Investment Company Act of 1940, the registrant has duly caused this report to be signed on its behalf by the undersigned, thereunto duly authorized.
| | |
| (registrant) The Motley Fool Funds Trust |
|
| By (Signature and Title)* /s/ Peter E. Jacobstein |
| | Peter E. Jacobstein, President |
| | (principal executive officer) |
|
| Date December 29, 2011 |
Pursuant to the requirements of the Securities Exchange Act of 1934 and the Investment Company Act of 1940, this report has been signed below by the following persons on behalf of the registrant and in the capacities and on the dates indicated.
| | |
| By (Signature and Title)* /s/ Peter E. Jacobstein |
| | Peter E. Jacobstein, President |
| | (principal executive officer) |
|
| Date December 29, 2011 |
|
| By (Signature and Title)* /s/ Philip J. Biedronski |
| | Philip J. Biedronski, Treasurer |
| | (principal financial officer) |
|
| Date December 29, 2011 |
* Print the name and title of each signing officer under his or her signature.