UNITED STATES
SECURITIES AND EXCHANGE COMMISSION
Washington, D.C. 20549
FORM N-CSR
CERTIFIED SHAREHOLDER REPORT OF REGISTERED MANAGEMENT
INVESTMENT COMPANIES
Investment Company Act file number 811-22264
The Motley Fool Funds Trust
(Exact name of registrant as specified in charter)
Motley Fool Asset Management, LLC
2000 Duke Street, Suite 175
Alexandria, VA 22314
(Address of principal executive offices) (Zip code)
Peter E. Jacobstein
Motley Fool Asset Management, LLC
2000 Duke Street, Suite 175
Alexandria, VA 22314
(Name and address of agent for service)
Registrant’s telephone number, including area code: (703) 302-1100
Date of fiscal year end: October 31
Date of reporting period: October 31, 2013
Form N-CSR is to be used by management investment companies to file reports with the Commission not later than 10 days after the transmission to stockholders of any report that is required to be transmitted to stockholders under Rule 30e-1 under the Investment Company Act of 1940 (17 CFR 270.30e-1). The Commission may use the information provided on Form N-CSR in its regulatory, disclosure review, inspection, and policymaking roles.
A registrant is required to disclose the information specified by Form N-CSR, and the Commission will make this information public. A registrant is not required to respond to the collection of information contained in Form N-CSR unless the Form displays a currently valid Office of Management and Budget (“OMB”) control number. Please direct comments concerning the accuracy of the information collection burden estimate and any suggestions for reducing the burden to Secretary, Securities and Exchange Commission, 100 F Street, NE, Washington, DC 20549. The OMB has reviewed this collection of information under the clearance requirements of 44 U.S.C. § 3507.
Item 1. Reports to Stockholders.
The Report to Shareholders is attached herewith.
| | |
| MOTLEY FOOL INDEPENDENCE FUND (FOOLX) | |  |
| | |
 | | During the year ended October 31, 2013, the Motley Fool Independence Fund returned 25.14% versus a return of 26.48% for its benchmark, the MSCI World Index. |
| | Consumer discretionary stocks continued to be the market leaders at home and abroad, the continuation of a four-year trend that started with the bottoming of global markets in 2009. |
| | |
| MOTLEY FOOL GREAT AMERICA FUND (TMFGX) | |  |
| | |
| | During the year ended October 31, 2013, the Motley Fool Great America Fund returned 37.44% versus a return of 33.79% for its benchmark, the Russell Midcap Index. |
| | Little-known or appreciated KapStone Paper returned more than 100%, and too many stocks to name returned greater than 50% over the last year. Smaller caps outperformed large caps by nearly 10% for the year – the type of dichotomy that is unlikely to repeat during the coming year. |
| | |
| MOTLEY FOOL EPIC VOYAGE FUND (TMFEX) | |  |
| | |
| | During the year ended October 31, 2013, the Motley Fool Epic Voyage Fund returned 17.32% versus a return of 21.58% for its benchmark, the Russell Global Ex-US Index. |
| | Developed markets around the world dramatically outperformed emerging markets for the year. |
This report has been prepared for shareholders of Motley Fool Independence Fund, Motley Fool Great America Fund and Motley Fool Epic Voyage Fund. It is not authorized for distribution to prospective investors unless accompanied or preceded by a current prospectus, which contains more complete information about the Funds. Investors are reminded to read the prospectus carefully before investing. Returns quoted represent past performance, which is no guarantee of future results. Current returns may be lower or higher and can be found at foolfunds.com. Share prices will fluctuate and there may be a gain or loss when shares are redeemed. Fund shares are distributed by Foreside Funds Distributors LLC, Berwyn, Pennsylvania.
Letter from the President
| | |

President Peter Jacobstein | | Dear Fellow Shareholder: As I write this letter in early December, pundits are proclaiming 2013 the year of the Great Rotation. They’re referring to individual investors’ massive move back to stocks after years of selling. Data from the Investment Company Institute bears this out: from 2008 through 2012, investors pulled money out of equity mutual funds each year – a total of $535 billion during the period. But beginning in January of 2013, the trend reversed sharply. For the first nine months of the year, investors added $134 billion to equity mutual funds. |
To which I say: aaarrrrghhhh!
Here’s the problem: in 2009, as money was flowing out of equity funds, the Dow Jones Industrial Average bottomed out around 6,600. Individual investors fled the stock market. They continued to do so until January 2013, at which time the Dow stood at about 13,400. Then they piled back in.
Let me repeat: aaarrrrghhhh!
Individual investors were selling their shares when they should have been buying.
OK, so in hindsight that was a bad time to sell. A fair question is: what’s the outlook for stock purchases today?
I have no idea. Nor does anyone. Not the guy on CNBC. Not your friend with the hot tip. No one can consistently predict the short-term direction of the stock market. Period.
So what’s a prudent investor to do? My own solution is to do what Motley Fool Funds’ portfolio team does. Make investments I believe in and can understand.
| | |
| |
| |
| | |
| The Motley Fool Funds Trust | | 3 |
And hold them for as long as I can. When the market goes up, and when the market goes down.
In two words: Stay Invested.
At Motley Fool Funds, we believe there’s a right way to invest. In fact, we built our whole company around it.
We invest according to Foolish principles: We’re bottom-up investors – we research and buy companies we believe we can understand. And we seek to hold them for the long term – to hold down trading costs and tax bills. (Much more on this in Portfolio Manager Bill Mann’s excellent letter, which follows.)
We charge simple, fair fees: We don’t charge sales loads or 12b-1 fees, ever.
We embrace radical transparency: We believe you ought to know how we’re investing your money, so we write in plain English. We publish a fantastic monthly email dispatch – Declarations (you can sign up today at FoolFunds.com). We publish all of our funds’ holdings every month on our website, FoolFunds.com. We hold semiannual conference calls with the portfolio team, and we invite all our shareholders to visit us at our headquarters once a year for a party.
On behalf of all of us at Motley Fool Funds, thank you for your investment.
Sincerely,

Peter Jacobstein
President, Motley Fool Asset Management
| | |
|
| |
| | |
| 4 | | The Motley Fool Funds Trust |
Letter to Shareholders
| | |

Portfolio Manager Bill Mann | | Dear Fellow Fool Funds Shareholder: Last January I broke my shoulder skiing with my daredevil 11-year old daughter. We were in Beaver Creek, Colorado, and it was snowing to beat the band; lots of deep, beautiful powder but rather poor visibility. We had picked some pretty good lines through the trees and were tearing it up. Then I hit a jump that I didn’t see and landed square on my shoulder. BAM! Broken scapula – which is, I’m told, a pretty tough bone to break. All I know is that I’d prefer not to find out again. It is tempting to leave the story above alone, because if you’re injured, you should at least have the benefit of an awesome story to go with it. And tree skiing sounds pretty awesome. Except that I left out one piece of information – we were on a green slope. Those are the easier ones – the near total opposite of this: |
| |
| |
| |
| |
| |
| |
| |
| |
| |
| |

We’d totally been skiing more aggressive stuff earlier, but we were on our last run down before the lifts closed. The key reason I fell was the fact that my guard was completely down, and I wasn’t really paying as close attention as I should have been.
Isn’t that the case with so many things? How many times have you been forced to concentrate to do something skillful, only to follow it up with something boneheaded when less concentration seems required?
To make an almost completely ham-handed comparison, in investing many times
| | |
| |
| |
| | |
| The Motley Fool Funds Trust | | 5 |
the risks are far higher when things feel more secure, but unlike skiing, this isn’t entirely a function of our letting our guards down. In investing, the times that seem the easiest are actually when risks are at their greatest, not only because people become less cautious (though they do), but also because cheery stock markets are very rarely cheap.
In 2009, when we started the Motley Fool Independence Fund, one well known market commentator acidly noted our “perfect timing” in getting into the mutual fund business. He wasn’t paying us a compliment. But our timing was good – we put our stake in the ground at a time when equities were more out of favor than they’d been in a generation. We felt good about doing this because we were willing to wait.
What a difference a year makes.
In last year’s annual report I wrote to you about investing in Korean Girl Bands. Seriously, go back and look. OK, it’s possible that we were talking about other things as well, such as the utter disinterest of investors in buying equities, incredible levels of market correlation, the impending mime apocalypse (that’s in there, too), and our need to be patient.
Why did we need to be patient at the end of 2012? Well, in short, 2012 was a pretty bad investing year, and I was advising folks to take the long view. Buy when others are selling. Face your fears. That sort of thing.
In short, 2012 seems like a million years ago, because 2013 was the polar opposite. It seems, in the short course of 12 months, that we have gone from the fear end of the spectrum to the greed end. The good news is that the advice I gave last year holds true for the current environment, but for precisely the opposite reason: to win in investing, patience is required.
What, you thought I was going to shout at you to jump in with both feet? Many stock markets around the world sit at all-time highs. In direct opposition to the experience of the previous five years, investors are once again pouring money into equity mutual funds. This is a great environment for people who run investment firms. Whether it’s a great environment for investors is an entirely different question.
My message last year was an exhortation for you to get out there and invest. Obviously, given the spectacular performance of the stock market, my advice this year is the opposite, correct?
No, it isn’t. I fully believe that superinvestor Shelby Davis had it exactly right when he said that the best time to invest is when you have the money. Setting money aside to invest is a lifetime habit. While I do not see as many opportunities in stocks today as I did a year ago (or, my heavens, four years ago), it’s not like we are investing in the market. We are investing in companies – we are owners of businesses. Buying into a great business – like Under Armour, or Shimano, or Swatch, or Guinness Nigeria, or Bank of Greenland – at a fair price is the very
| | |
| |
| |
| | |
| 6 | | The Motley Fool Funds Trust |
basis of business-centric investing. We own these firms because they have moats and what we view as a plain capability to generate supernormal returns on capital. Even if we struggle to find places to invest, we still would much rather own great companies than not.
So, everything’s better, right?
The rapid rise in stock markets throughout the world suggests that the financial troubles of the past four years are behind us. While I agree that things are better, if the troubles were truly behind us, central banks around the globe would be ratcheting up interest rates from crisis levels. This isn’t happening, not much anyway.
In fact, the event that destabilized global markets the most in 2013 was a suggestion by Federal Reserve Chairman Benjamin Bernanke that things were in fact improving. Treasury yields soared (and emerging market stocks and currencies skittered) following Bernanke’s suggestion that the central bank would slow its pace of bond purchases. The Federal Reserve is considering a host of bad options when it does decide to slow its bond buying, but the reality is that, with a $4 trillion balance sheet, it cannot keep up the same pace.
The funny thing is that an interest rate increase would be a sign that the U.S. economy has become less fragile. We don’t know when interest rates will rise from their still-historically low levels. But rise they will, because they must. We don’t place any stock in trade on our ability to time the market, and we don’t really think anyone else is that competent at market timing, either. After all, those who have been positioning themselves for an explosion of inflation and/or interest rates have been waiting five years for the “inevitable” to happen.
The thing is, it is inevitable, and as such, at some point those who hold long-dated bonds are almost certainly going to suffer fairly significant loss. That’s more like a physics problem than it is a financial one – if something can’t persist in perpetuity, then at some point it will stop.
| | |
|
| |
| | |
| The Motley Fool Funds Trust | | 7 |
Such considerations don’t really come into bearing when we analyze businesses for investment. I’d say that we don’t really put them on our list, but the truth is we really don’t have such a list. Our goal is to find the best businesses in the world, and buy them at a price that we believe (to use my favorite Bushism) misunderestimates the pricing power and market opportunity these companies have before them. Our usage of macroeconomic trends is, thus, merely responsive. When we believe that the market has overreacted to some trend or event by creating value in a company we consider to be great, we will be at the ready to invest.
That’s the thing that’s so frustrating to me about 2013. There are lots of things that investors should freak out about – and yet by and large the massive flows of easy money have overwhelmed every other signal to which the market might respond. Investor David Einhorn described the liquidity as “jelly doughnuts.” The first one tastes awesome and gives you a shot of energy. The fifth? Not so much. At some point the massive injections of liquidity will manifest in their own problems. The question is when.
This may sound like bad news. For investors with a value bent, it’s quite the opposite. We spend all of our time focusing on finding companies that have pricing power that come at what we believe to be a discount, and have the right people running them. It’s a pretty simple model. In a nutshell: if you can buy companies that are cheap, important and jerk-free, you’re probably going to do OK.
The key – and I stress this – is that in order to benefit from the pricing power of these companies in spite of whatever macroeconomic influences buffer, batter or even bolster their share prices in the shorter term is that you have to stay invested in them. How many times have we as investors looked at companies that we didn’t own and say“man, I knew that was going to be big!”?You might feel a little smarter, but you sure as heck don’t feel any richer. In our practice, we resist selling shares of companies that have the highest rating on our“awesomeness continuum”even if we believe they are slightly overvalued. These kinds of companies are always desirable – and while we might not allocate new capital to them if we believe they’re priced dearly, we firmly believe that the greater mistake is in walking away from a great franchise over a few pennies.
I like to take time in these pages to remind you how we invest. You will note once again that the turnover for our three funds is well below the average of our peers. This is a manifestation of three virtuous philosophies.
First, we are business-centric investors. While we are willing to sell any company in our portfolio at any time, we hate doing so.
Second, we believe in low-cost investing, and among the greatest costs for investors are the frictional ones from trading that come in the form of bid/ask spreads, commissions and taxes. We are terrible clients for brokers, and we don’t mind that one bit.
| | |
|
| |
| | |
| 8 | | The Motley Fool Funds Trust |
And finally, we believe that overtrading is a manifestation of overconfidence, and we like to remain humble about what we know and what we do not know. We know that there are observable traits of great businesses, and we like to concentrate our assets in those businesses and hold on tight. We do not know what the future holds, which is why we would prefer to stay invested, patient and disciplined, in businesses that have proven track records of excellence rather than consistently seeking out the next new thing.
Annual Results
For the year ending October 31, 2013, the Motley Fool Independence Fund turned in gains of 25.1% versus 26.5% for its benchmark, the MSCI World Index. If you bought shares in the Independence Fund on the day it launched in June 2009, you would have doubled your money by the end of October.
For the year ending October 31, 2013, the Motley Fool Great America Fund turned in returns of 37.4% versus 33.8% for the Russell Midcap Index. From its inception in November 2010, Great America has generated returns of 73.1% versus 61.9% for its benchmark.
For the year ending October 31, 2013, the Motley Fool Epic Voyage Fund turned in returns of 17.3% versus 21.6% for the Russell Global ex-US Index. From its inception in November 2011, Epic Voyage has generated returns of 28.5% versus 32.2% for its benchmark.
As I have noted in the past, we do not spend much time thinking about one year returns, which we believe are a function of lots of randomness. Nor do we think much about our benchmarks – we make no effort to match our holdings to the indexes by company, geography or by industry. In 2013 both the Independence Fund and especially the Epic Voyage fund were harmed by our decision to allocate a much higher percentage of our invested assets to emerging markets stocks than our benchmarks (20.3% for Independence Fund versus 7.6% for the MSCI World, and 43.9% versus 13.9% for the Russell Global ex-US).
While much of the investment world makes macroeconomic bets, we focus on companies, and we like to buy them at times when they’re beaten down in price. Emerging market stocks have quickly gone from being in to very much out. A look at the worst performing stock markets for 2013 includes Brazil (-10%), Peru (-22%), and Mexico (-6%).
All three of our funds’ returns versus their benchmarks were negatively impacted by our large cash balances. I lament neither decision. We were able to find some wonderful companies in 2013, including Crown Seal in Thailand, Carter Bank & Trust in Virginia, Crimson Wine Group in California, and Industrias Bachoco in Mexico. But we are only willing to invest at prices we believe to be advantageous. We appreciate your patience with us, and believe that over the long term such an investment policy maximizes our chance of generating a satisfactory return for shareholders.
| | |
|
| |
| | |
| The Motley Fool Funds Trust | | 9 |
One more thing...
I am constantly reminded that the money we manage is not our own. It is yours. OK, some of it is our own – the investment team maintains significant stakes in the three Fool Funds. We are humbled and honored by your faith in us.
Wait, wait, wait. You didn’t think we were done, did you? For the last two years we have run a contest, and we’re doing it again this year. I’m pretty sure no other mutual fund company does anything similar. If you send an email to stayinvested@foolfunds.com, you will be eligible to have me and other members of the FoolFunds investment team come to your town to join you for lunch. Everyone who mails us will receive a Fool Funds ski hat, so please include your name and postal address in your email. We’ll register you for Declarations, our free, monthly email newsletter. (Existing Declarations subscribers, you can win, too!)
In 2012 we went to Saratoga Springs, NewYork, and in 2013 we were in Morristown, New Jersey. Both times we met Motley Fool Funds shareholders who absolutely delighted us with their tales, their hopes and their dreams, and on both cases our hosts showed deep pride in showing us their communities.
This year we’re doing it again. Would love to come and see where you are from and share a meal with some fellow Fools. (People who live in Hawaii encouraged to enter multiple times.)
Foolish Best,

William H. Mann, III
P.S. Thanks for reading all the way to end. Enjoy the rest of the report and send us a quick hello at stayinvested@foolfunds.com to enter the contest.
The Letter to Shareholders seeks to describe some of the Adviser’s current opinions and views of the financial markets. Although the Adviser believes it has a
| | |
|
| |
| | |
| 10 | | The Motley Fool Funds Trust |
reasonable basis for any opinions or views expressed, actual results may differ, sometimes significantly so, from those expected or expressed. The securities held by the Fund that are discussed in the Letter to Shareholders were held during the period covered by the annual report. They do not comprise the entire investment portfolio of the Fund, may be sold at any time, and may no longer be held by the Fund. The opinions of the Adviser with respect to those securities may change at any time.
 New to investing? Reading your first mutual fund annual report?
Welcome! Here are some important things you need to know.
Mutual fund investing offers many potential benefits. But there also are risks. Financial gain is not guaranteed when it comes to investing in equity securities. It’s possible to lose money, including your principal — especially during the short term.
We focus on stocks we have good reason to believe are undervalued by the market. We expect the price of these stocks eventually to rise as the market recognizes the true worth of the companies issuing them. But keep in mind that value stocks can remain undervalued by the market for a long time. And it’s possible that the intrinsic worth of any particular company may not match our valuation.
Our funds may invest in foreign companies and in companies with small market capitalization. There are certain risks associated with these types of investments. The risks are described on pages 13, 28, and 41 of this report. Additional risk information is provided in section 3 of the Notes to Financial Statements, pp. 58-62.
| | |
|
| |
| | |
| The Motley Fool Funds Trust | | 11 |
Motley Fool Independence Fund Portfolio Characteristics
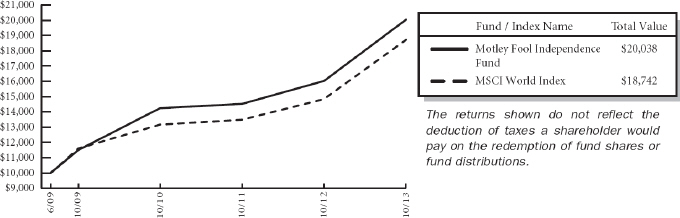
At October 31, 2013, the Motley Fool Independence Fund (the “Fund”) had an audited net asset value of $19.24 per share attributed to 18,398,888 shares outstanding. This compares with an unaudited net asset value as of June 16, 2009 of $10.00 per share attributed to 100,000 shares outstanding. From the Fund’s launch on June 16, 2009 to October 31, 2013, the Fund had an average annual total return of 17.22% versus a return of 15.44% over the same period for its benchmark, MSCI World Index. The graph below shows the performance of $10,000 invested in the Fund at inception. The results shown below do not reflect the deduction of taxes that a shareholder would pay on fund distributions or the redemption of fund shares.
| | | | |
Average Annual Total Returns as of 10/31/2013 |
| | | Fund* | | Benchmark** |
| | | | | |
One Year | | 25.14% | | 26.48% |
Since Inception | | 17.22% | | 15.44% |
Inception Date | | 06/16/2009 | | |
Total Annual Fund Operating Expenses Before Expense Limitation (February 28, 2013 Prospectus) | | 1.54% | | |
The performance data quoted represents past performance and does not guarantee future results. Current performance may be lower or higher. Performance data current to the most recent month-end may be obtained at www.FoolFunds.com. The investment return and principal value of an investment will fluctuate so that shares, when redeemed, may be worth more or less than their original cost.
*These returns reflect expense waivers by the Fund’s investment adviser. Without these waivers, returns would have been lower.
**The MSCI World Index is a free float-adjusted market capitalization weighted index that is designed to measure the equity market performance of developed markets. The MSCI World Index consists of the following 23 developed market country indices: Australia, Austria, Belgium, Canada, Denmark, Finland, France, Germany, Hong Kong, Ireland, Israel, Italy, Japan, Netherlands, New Zealand, Norway, Portugal, Singapore, Spain, Sweden, Switzerland, the United Kingdom, and the United States. The MSCI World Index is not available for direct investment. The Fund may invest in countries that are not included within the MSCI World Index (such as emerging market countries) and its investment portfolio is not weighted in terms of countries or issuers the same as the MSCI World Index. For this reason, the Fund’s investment performance should not be expected to track, and may exceed or trail, the MSCI World Index. Since Inception returns for the Benchmark reflect the performance based on the Inception Date of the Fund.
| | |
|
| |
| | |
| 12 | | Motley Fool Independence Fund |
The investment objective of the Independence Fund is to achieve long-term capital appreciation. The Fund pursues this objective by investing primarily in common stocks of companies located anywhere in the world. The Fund invests in areas of the market that, in the view of Motley Fool Asset Management, LLC (the “Adviser”), offer the greatest potential for long-term capital appreciation. The Fund may invest in other types of securities and in other asset classes when, in the judgment of the Adviser, such investments offer attractive potential returns. As such, the Fund’s performance will deviate significantly from its benchmark from time to time. It is the view of the Adviser that this deviation is less meaningful over shorter time frames and is more relevant over multi-year periods.
Because the Independence Fund is free to invest in companies of any size around the world, at times, the Fund may be heavily invested in small-cap stocks and foreign securities, each of which presents extra risk. Small-cap stocks tend to be more volatile and less liquid than their large-cap counterparts. Fluctuations in currency exchange rates can cause losses when investing in foreign securities, with emerging markets presenting additional risks of illiquidity, political instability, and lax regulation. You are strongly encouraged to read more about the Fund’s strategies and risks in the prospectus.
The Independence Fund invests in securities of companies the Adviser believes are undervalued. Unlike mutual funds that are constrained by a style-box, the Fund may invest in any company, country, market, industry or sector where the Adviser’s analysis suggests that there is opportunity for gains that outweigh risks. In identifying investments for the Fund, the Adviser looks for companies it believes the market has irrationally undervalued and looks for companies that have high-quality businesses with strong market positions, manageable leverage, and robust streams of free cash flow. The following tables show the top 11 holdings, sector allocation and top 11 countries in which the Fund was invested as of October 31, 2013. Portfolio holdings are subject to change without notice.
Certain mutual fund ratings and review services have created style boxes, which look more or less like a tic-tac-toe board; arranging funds by the size of the companies they typically invest in (large-, mid-, and small-cap) along one axis, and along a “value” to “growth” basis on the other axis. This may be a helpful way – at times –to think about certain investment opportunities, but we don’t believe we’ll improve your returns by limiting ourselves to any one portion of that style box.
| | |
| Top Eleven Holdings* | | % of Net
Assets |
| | | |
Baidu, Inc. | | 2.80% |
Google, Inc. | | 2.62 |
HDFC Bank Ltd. | | 2.61 |
Berkshire Hathaway, Inc. | | 2.59 |
Banco Latinoamericano de Comercio Exterior SA | | 2.49 |
Markel Corp. | | 2.42 |
Loews Corp. | | 2.41 |
Compartamos SAB de CV | | 2.39 |
WellPoint, Inc. | | 2.24 |
Chipotle Mexican Grill, Inc. | | 2.14 |
Tod’s S.p.A. | | 1.97 |
| | |
| | 26.68% |
| | |
| * | As of the date of the report, the fund had a holding of 6.56% in the BNY Mellon Cash Reserve. |
| | |
|
| |
| | |
| Motley Fool Independence Fund | | 13 |
The Motley Fool Independence Fund uses the Global Industry Classification StandardSM (“GICS SM”) as the basis for the classification of securities on the Schedule of Investments (“SOI”). We believe that this makes the SOI classifications more standard with the rest of the industry.
| | |
Sector Allocation | | % of Net
Assets |
| |
Financials | | 29.65% |
Consumer Discretionary | | 17.65 |
Information Technology | | 13.37 |
Health Care | | 8.59 |
Consumer Staples | | 7.60 |
Energy | | 6.61 |
Industrials | | 3.51 |
Telecommunication Services | | 2.50 |
Materials | | 2.36 |
Utilities | | 1.02 |
| | |
| | 92.86% |
| | |
| | |
Top Eleven Countries | | % of Net
Assets |
| |
United States* | | 43.38% |
South Korea | | 3.94 |
India | | 3.84 |
Switzerland | | 3.78 |
China | | 3.70 |
Japan | | 3.36 |
Hong Kong | | 3.30 |
Saudi Arabia | | 3.12 |
Bermuda | | 2.84 |
Panama | | 2.49 |
Mexico | | 2.39 |
| | |
| | 76.14% |
| | |
| * | As of the date of the report, the fund had a holding of 6.56% in the BNY Mellon Cash Reserve. |
| | |
|
| |
| | |
| 14 | | Motley Fool Independence Fund |
About Your Expenses
As a shareholder of the Independence Fund, you incur ongoing costs, including advisory fees and other Fund expenses. This example is intended to help you to understand your ongoing costs (in dollars) of investing in the Fund and to compare these costs with the ongoing costs of investing in other mutual funds. It is based on an investment of $1,000 invested at the beginning of the period and held for the entire period from May 1, 2013 to October 31, 2013.
Actual Expenses
The first section of the table below provides information about actual account values and actual expenses. You may use the information in this section, together with the amount you invested, to estimate the expenses that you incurred over the period. Simply divide your account value by $1,000 (for example, an $8,600 account value divided by $1,000 = 8.6), then multiply the result by the number in the first section under the heading entitled “Expenses Paid During Period” to estimate the expenses attributable to your investment during this period.
Hypothetical Example for Comparison Purposes
The second section of the table below provides information about hypothetical account values and hypothetical expenses based on the Independence Fund’s actual expense ratio and an assumed rate of return of 5% per year before expenses, which is not the Fund’s actual return. Thus, you should not use the hypothetical account values and expenses to estimate the actual ending account balance or your expenses for the period. Rather, these figures are provided to enable you to compare the ongoing costs of investing in the Fund as compared to the costs of investing in other funds. To do so, compare this 5% hypothetical example with the 5% hypothetical examples that appear in the shareholder reports of the other funds. Please note that the expenses shown in the table are meant to highlight your ongoing costs only. Therefore, the second section of the table is useful in comparing ongoing costs only and will not help you determine the relative total costs of owning different funds.
Do you know how many times a fund, or the market, has returned a smooth 5% over a long period of time? Never. But we have to pick some example. In reality, the market’s returns are always far bumpier, with the market returning 20% one year, followed by a loss of 10% the next year, followed by a 3% gain, etc. These variations affect actual expenses as well. Happily, over almost all time periods of 20 years or longer, according to the research of University of Pennsylvania’s Jeremy Siegel and others, the domestic market’s returns have been at least 5% per year on average.
| | | | | | | | | | | | | | |
| | | Beginning Account
Value 05/01/13 | | | | Ending Account
Value 10/31/13 | | | | Annualized
Expense Ratio(1) | | | | Expenses Paid
During Period(2) |
| | | | | | | | | | | | | | | |
Actual | | $1,000 | | | | $1,114.07 | | | | 1.35% | | | | $7.19 |
Hypothetical | | $1,000 | | | | $1,018.40 | | | | 1.35% | | | | $6.87 |
| (1) | These ratios reflect expenses waived by the Fund’s investment adviser. Without these Waivers, the Fund’s expenses would have been higher and the ending account values would have been lower. |
| (2) | Expenses are equal to the Fund’s annualized expense ratio for the period May 1, 2013 to October 31,2013, multiplied by the average account value over the period, multiplied by the number of days (184) in the most recent fiscal half-year, then divided by 365. |
| | |
|
| |
| | |
| Motley Fool Independence Fund (Unaudited) | | 15 |
The Motley Fool Funds Trust
Motley Fool Independence Fund
Schedule of Investments
at October 31, 2013
| | | | | | | | |
Issues | | Shares | | | Value (Note 2) | |
| | | | | | | | | |
Equity Securities — 89.74% | | | | | | | | |
Beverages — 1.30% | | | | | | | | |
Coca-Cola HBC AG (Switzerland)* | | | 159,606 | | | $ | 4,590,393 | |
| | | | | | | | |
Capital Markets — 1.76% | | | | | | | | |
INTL FCStone, Inc. (United States)* | | | 85,513 | | | | 1,749,596 | |
TD Ameritrade Holding Corp. (United States) | | | 165,000 | | | | 4,497,900 | |
| | | | | | | | |
| | | | | | | 6,247,496 | |
| | | | | | | | |
Chemicals — 2.06% | | | | | | | | |
China BlueChemical Ltd. (China) | | | 5,000,000 | | | | 3,213,958 | |
Innophos Holdings, Inc. (United States) | | | 81,164 | | | | 4,067,940 | |
| | | | | | | | |
| | | | | | | 7,281,898 | |
| | | | | | | | |
Commercial Banks — 8.56% | | | | | | | | |
Banco Latinoamericano de Comercio Exterior SA (Panama) | | | 336,265 | | | | 8,820,231 | |
Credicorp Ltd. (Bermuda) | | | 47,000 | | | | 6,420,200 | |
HDFC Bank Ltd. (India)(a) | | | 255,000 | | | | 9,243,750 | |
Monarch Financial Holdings, Inc. (United States) | | | 167,309 | | | | 1,985,958 | |
Siam Commercial Bank PCL (Thailand)(b) | | | 725,000 | | | | 3,844,056 | |
| | | | | | | | |
| | | | | | | 30,314,195 | |
| | | | | | | | |
Commercial Services & Supplies — 3.51% | | | | | | | | |
Covanta Holding Corp. (United States) | | | 100,000 | | | | 1,717,000 | |
De La Rue PLC (United Kingdom) | | | 275,900 | | | | 3,781,418 | |
Depa Ltd. (United Arab Emirates)* | | | 5,815,390 | | | | 3,431,080 | |
KAR Auction Services, Inc. (United States) | | | 117,708 | | | | 3,498,282 | |
| | | | | | | | |
| | | | | | | 12,427,780 | |
| | | | | | | | |
Communications Equipment — 2.57% | | | | | | | | |
Cisco Systems, Inc. (United States) | | | 105,000 | | | | 2,362,500 | |
Infinera Corp. (United States)* | | | 661,100 | | | | 6,749,831 | |
| | | | | | | | |
| | | | | | | 9,112,331 | |
| | | | | | | | |
Computers & Peripherals — 1.62% | | | | | | | | |
Apple, Inc. (United States) | | | 11,000 | | | | 5,745,850 | |
| | | | | | | | |
Consumer Finance — 2.39% | | | | | | | | |
Compartamos SAB de CV (Mexico) | | | 4,350,000 | | | | 8,445,113 | |
| | | | | | | | |
| | |
| See Notes to Financial Statements. |
| |
| | |
| 16 | | Motley Fool Independence Fund |
| | | | | | | | |
Issues | | Shares | | | Value (Note 2) | |
| | | | | | | | | |
Equity Securities (continued) | | | | | | | | |
Diversified Financial Services — 2.59% | | | | | | | | |
Berkshire Hathaway, Inc. (United States)* | | | 53 | | | $ | 9,168,724 | |
| | | | | | | | |
Diversified Telecommunication Services — 1.01% | | | | | | | | |
Level 3 Communications, Inc. (United States)* | | | 117,500 | | | | 3,589,625 | |
| | | | | | | | |
Electric Utilities — 1.02% | | | | | | | | |
Brookfield Infrastructure Partners LP (Bermuda) | | | 92,127 | | | | 3,627,040 | |
| | | | | | | | |
Electronic Equipment, Instruments & Components — 1.29% | | | | | | | | |
CrucialTec Co., Ltd. (South Korea)* | | | 252,000 | | | | 3,145,452 | |
Samsung SDI Co., Ltd. (South Korea) | | | 8,500 | | | | 1,416,876 | |
| | | | | | | | |
| | | | | | | 4,562,328 | |
| | | | | | | | |
Energy Equipment & Services — 2.06% | | | | | | | | |
CGG (France)*(a) | | | 99,000 | | | | 2,173,050 | |
Geospace Technologies Corp. (United States)* | | | 52,400 | | | | 5,104,808 | |
| | | | | | | | |
| | | | | | | 7,277,858 | |
| | | | | | | | |
Food & Staples Retailing — 1.32% | | | | | | | | |
Costco Wholesale Corp. (United States) | | | 39,558 | | | | 4,667,844 | |
| | | | | | | | |
Food Products — 3.35% | | | | | | | | |
BRF - Brasil Foods SA (Brazil)(a) | | | 108,704 | | | | 2,546,935 | |
Nestle SA (Switzerland) | | | 68,694 | | | | 4,958,605 | |
PT Nippon Indosari Corpindo Tbk (Indonesia) | | | 7,906,960 | | | | 4,345,847 | |
| | | | | | | | |
| | | | | | | 11,851,387 | |
| | | | | | | | |
Health Care Equipment & Supplies — 5.04% | | | | | | | | |
Covidien PLC (Ireland) | | | 62,000 | | | | 3,974,820 | |
Natus Medical, Inc. (United States)* | | | 268,900 | | | | 5,305,397 | |
Nihon Kohden Corp. (Japan) | | | 133,481 | | | | 5,497,631 | |
Zimmer Holdings, Inc. (United States) | | | 35,000 | | | | 3,061,450 | |
| | | | | | | | |
| | | | | | | 17,839,298 | |
| | | | | | | | |
Health Care Providers & Services — 2.24% | | | | | | | | |
WellPoint, Inc. (United States) | | | 93,697 | | | | 7,945,506 | |
| | | | | | | | |
Hotels, Restaurants & Leisure — 5.98% | | | | | | | | |
Ajisen China Holdings Ltd. (Hong Kong) | | | 3,550,000 | | | | 3,724,971 | |
Chipotle Mexican Grill, Inc. (United States)* | | | 14,400 | | | | 7,588,368 | |
Penn National Gaming, Inc. (United States)* | | | 52,083 | | | | 3,047,376 | |
Wynn Macau Ltd. (Macau) | | | 1,000,000 | | | | 3,838,766 | |
| | |
| See Notes to Financial Statements. |
| |
| | |
| Motley Fool Independence Fund | | 17 |
| | | | | | | | |
Issues | | Shares | | | Value (Note 2) | |
| | | | | | | | | |
Equity Securities (continued) | | | | | | | | |
Hotels, Restaurants & Leisure (continued) | | | | | | | | |
Yum! Brands, Inc. (United States) | | | 44,132 | | | $ | 2,984,206 | |
| | | | | | | | |
| | | | | | | 21,183,687 | |
| | | | | | | | |
Insurance — 6.64% | | | | | | | | |
HCC Insurance Holdings, Inc. (United States) | | | 140,200 | | | | 6,400,130 | |
Loews Corp. (United States) | | | 176,690 | | | | 8,535,894 | |
Markel Corp. (United States)* | | | 16,200 | | | | 8,580,654 | |
| | | | | | | | |
| | | | | | | 23,516,678 | |
| | | | | | | | |
Internet & Catalog Retail — 1.79% | | | | | | | | |
CJ O Shopping Co., Ltd. (South Korea) | | | 18,949 | | | | 6,323,606 | |
| | | | | | | | |
Internet Software & Services — 5.41% | | | | | | | | |
Baidu, Inc. (China)*(a) | | | 61,500 | | | | 9,895,350 | |
Google, Inc. (United States)* | | | 9,000 | | | | 9,275,220 | |
| | | | | | | | |
| | | | | | | 19,170,570 | |
| | | | | | | | |
Leisure Equipment & Products — 1.81% | | | | | | | | |
Shimano, Inc. (Japan) | | | 73,000 | | | | 6,389,260 | |
| | | | | | | | |
Media — 1.45% | | | | | | | | |
DreamWorks Animation SKG, Inc. (United States)* | | | 85,000 | | | | 2,910,400 | |
Multiplus SA (Brazil) | | | 178,600 | | | | 2,212,369 | |
| | | | | | | | |
| | | | | | | 5,122,769 | |
| | | | | | | | |
Metals & Mining — 0.31% | | | | | | | | |
Antofagasta PLC (United Kingdom) | | | 80,000 | | | | 1,093,366 | |
| | | | | | | | |
Multiline Retail — 0.74% | | | | | | | | |
Dollar Tree, Inc. (United States)* | | | 45,000 | | | | 2,628,000 | |
| | | | | | | | |
Oil, Gas & Consumable Fuels — 4.56% | | | | | | | | |
Denbury Resources, Inc. (United States)* | | | 262,200 | | | | 4,979,178 | |
Lukoil OAO (Russia)(a) | | | 62,350 | | | | 4,082,054 | |
Occidental Petroleum Corp. (United States) | | | 49,145 | | | | 4,721,852 | |
Total Gabon SA (Gabon) | | | 3,670 | | | | 2,356,940 | |
| | | | | | | | |
| | | | | | | 16,140,024 | |
| | | | | | | | |
Pharmaceuticals — 1.31% | | | | | | | | |
Dr. Reddy’s Laboratories Ltd. (India)(a) | | | 110,177 | | | | 4,368,518 | |
Mallinckrodt PLC (Ireland)* | | | 6,125 | | | | 257,311 | |
| | | | | | | | |
| | | | | | | 4,625,829 | |
| | | | | | | | |
| | |
| See Notes to Financial Statements. |
| |
| | |
| 18 | | Motley Fool Independence Fund |
| | | | | | | | |
| | |
| Issues | | Shares | | | Value
(Note 2) | |
| | | | | | | | | |
| | |
Equity Securities (continued) | | | | | | | | |
Real Estate Investment Trusts — 2.11% | | | | | | | | |
American Tower Corp. (United States) | | | 55,500 | | | $ | 4,403,925 | |
Lippo Malls Indonesia Retail Trust (Singapore) | | | 8,500,000 | | | | 3,074,924 | |
| | | | | | | | |
| | |
| | | | | | | 7,478,849 | |
| | | | | | | | |
Real Estate Management & Development — 4.11% | | | | | | | | |
Brookfield Asset Management, Inc. (Canada) | | | 166,374 | | | | 6,585,083 | |
Cheung Kong Holdings Ltd. (Hong Kong) | | | 235,337 | | | | 3,675,269 | |
Henderson Land Development Co., Ltd. (Hong Kong) | | | 726,671 | | | | 4,299,919 | |
| | | | | | | | |
| | |
| | | | | | | 14,560,271 | |
| | | | | | | | |
Semiconductors & Semiconductor Equipment — 1.60% | | | | | | | | |
Intel Corp. (United States) | | | 44,000 | | | | 1,074,920 | |
Taiwan Semiconductor Manufacturing Co., Ltd. (Taiwan)(a) | | | 250,000 | | | | 4,602,500 | |
| | | | | | | | |
| | |
| | | | | | | 5,677,420 | |
| | | | | | | | |
Software — 0.87% | | | | | | | | |
DuzonBizon Co., Ltd. (South Korea) | | | 328,180 | | | | 3,078,790 | |
| | | | | | | | |
Specialty Retail — 0.96% | | | | | | | | |
Williams-Sonoma, Inc. (United States) | | | 65,000 | | | | 3,408,600 | |
| | | | | | | | |
Textiles, Apparel & Luxury Goods — 4.92% | | | | | | | | |
Swatch Group SA (Switzerland) | | | 6,000 | | | | 3,832,148 | |
Tod’s S.p.A. (Italy) | | | 42,000 | | | | 6,989,298 | |
Under Armour, Inc. (United States)* | | | 81,410 | | | | 6,606,422 | |
| | | | | | | | |
| | |
| | | | | | | 17,427,868 | |
| | | | | | | | |
Wireless Telecommunication Services — 1.48% | | | | | | | | |
SBA Communications Corp. (United States)* | | | 60,000 | | | | 5,248,200 | |
| | | | | | | | |
| | |
Total Equity Securities (Cost $ 228,973,726) | | | | | | | 317,768,453 | |
| | | | | | | | |
| | |
Participatory Notes — 3.12% | | | | | | | | |
Commercial Banks — 1.48% | | | | | | | | |
Al Rajhi Banking & Investment Co. (Saudi Arabia)(c) | | | 268,000 | | | | 5,243,353 | |
| | | | | | | | |
Food Products — 1.64% | | | | | | | | |
Almarai Co. (Saudi Arabia)(c) | | | 385,759 | | | | 5,789,695 | |
| | | | | | | | |
| | |
Total Participatory Notes (Cost $ 9,675,985) | | | | | | | 11,033,048 | |
| | | | | | | | |
| | |
| See Notes to Financial Statements. |
| |
| | |
| Motley Fool Independence Fund | | 19 |
| | | | | | | | |
| | |
| Issues | | Shares | | | Value
(Note 2) | |
| | | | | | | | | |
| | |
Other Investments — 6.56% | | | | | | | | |
Temporary Cash Investment — 6.56% | | | | | | | | |
BNY Mellon Cash Reserve | | | 23,217,509 | | | | $23,217,509 | |
| | | | | | | | |
| | |
Total Other Investments (Cost $23,217,509) | | | | | | | 23,217,509 | |
| | | | | | | | |
| | |
Total Investment Portfolio (Cost 261,867,220) — 99.42% | | | | | | | 352,019,010 | |
Liabilities in Excess of Other Assets — 0.58% | | | | | | | 2,061,810 | |
| | | | | | | | |
| | |
NET ASSETS — 100.00% | | | | | | | | |
(Applicable to 18,398,888 shares outstanding) | | | | | | | $354,080,820 | |
| | | | | | | | |
| | | | | | | | |
| * | Non-income producing security. |
| (a) | ADR — American Depositary Receipts |
| (b) | NVDR — Non-Voting Depository Receipts |
| (c) | Security exempt from registration under Rule 144A of the Securities Act of 1933. These securities may be resold in transactions exempt from registration, normally to qualified institutional buyers. Total market value of Rule 144A securities is $11,033,048 and represents 3.12% of net assets as of October 31, 2013. |
LP — Limited Partnership
PCL — Public Company Limited
PLC — Public Limited Company
| | |
| See Notes to Financial Statements. |
| |
| | |
| 20 | | Motley Fool Independence Fund |
Statement of Assets and Liabilities
| | | | |
| | | As of October 31, 2013 | |
| | |
Assets: | | | | |
Investments in securities of unaffiliated issuers, at value
(at cost, $261,867,220) | | | $352,019,010 | |
| |
Foreign currency, at value
(at cost, $1,243,770) | | | 1,261,388 | |
Receivables: | | | | |
Dividends and tax reclaims | | | 432,221 | |
Interest | | | 224 | |
Shares of beneficial interest sold | | | 930,908 | |
Prepaid expenses and other assets | | | 27,681 | |
| | | | |
Total Assets | | | 354,671,432 | |
| | | | |
| |
Liabilities | | | | |
Payables: | | | | |
Investment securities purchased | | | 111,054 | |
Shares of beneficial interest redeemed | | | 58,555 | |
Accrued expenses: | | | | |
Audit fees | | | 19,000 | |
Accounting and administration fees | | | 42,371 | |
Advisory fees | | | 272,034 | |
Custodian fees | | | 10,105 | |
Legal fees | | | 3,803 | |
Transfer agent fees | | | 42,162 | |
Trustee fees | | | 475 | |
Other expenses | | | 31,053 | |
| | | | |
Total Liabilities | | | 590,612 | |
| | | | |
Net Assets | | $ | 354,080,820 | |
| | | | |
| | |
| The accompanying notes are an integral part of these financial statements. |
| |
| | |
| Motley Fool Independence Fund | | 21 |
Statement of Assets and Liabilities
| | | | | | | |
| | | As of October 31, 2013 | | |
| |
Net Assets Consist of: | | | | | | | |
Paid-in-Capital | | | $ | 260,041,662 | | | |
Undistributed Net Investment Income | | | | 590,254 | | | |
Accumulated Net Realized Gain on Investments and Foreign Currency Transactions | | | | 3,278,369 | | | |
Net Unrealized Appreciation/(Depreciation) on Investments, Foreign Currencies, and Assets and Liabilities Denominated in Foreign Currencies | | | | 90,170,535 | | | |
| | | | | | | |
Net Assets | | | $ | 354,080,820 | | | |
| | | | | | | |
Net Asset Value: | | | | | | | |
$0.001 par value, unlimited shares authorized | | | | | | | |
Net assets applicable to capital shares outstanding | | | $ | 354,080,820 | | | |
Shares outstanding | | | | 18,398,888 | | | |
| | | | | | | |
Net asset value, offering, and redemption price per share* | | | $ | 19.24 | | | |
| | | | | | | |
| * | A charge of 2% is imposed on the redemption proceeds of shares redeemed or exchanged within 90 days of purchase. |
| | |
| The accompanying notes are an integral part of these financial statements. |
| |
| | |
| 22 | | Motley Fool Independence Fund |
Statement of Operations
| | | | | | | | | | |
| | | Year Ended
October 31, 2013 | | |
| | | | | | | | | |
Investment Income | | | | | | | |
Dividends | | | $ | 5,160,436 | | | |
Interest | | | | 19,141 | | | |
Less foreign taxes withheld | | | | (246,647 | ) | | |
| | | | | | | | |
Total Investment Income | | | | 4,932,930 | | | |
| | | | | | | | |
| | |
Expenses | | | | | | | |
Accounting and administration fees | | | | 249,847 | | | |
Blue sky fees | | | | 35,842 | | | |
Shareholder account-related services | | | | 198,091 | | | |
Chief Compliance Officer fees | | | | 15,621 | | | |
Custodian fees | | | | 118,970 | | | |
Investment advisory fees | | | | 2,641,349 | | | |
Professional fees | | | | 51,228 | | | |
Shareholder reporting fees | | | | 20,457 | | | |
Transfer agent fees | | | | 362,557 | | | |
Trustee fees | | | | 32,702 | | | |
Other expenses | | | | 38,056 | | | |
| | | | | | | | |
Total expenses | | | | 3,764,720 | | | |
| | | | | | | | |
Expenses waived/reimbursed net of amount recaptured | | | | (27,093 | ) | | |
| | | | | | | | |
Net expenses | | | | 3,737,627 | | | |
| | | | | | | | |
Net Investment Income | | | | 1,195,303 | | | |
| | | | | | | | |
| | |
Realized and Unrealized Gain (Loss) | | | | | | | |
| | |
Net realized gain (loss) from: | | | | | | | |
Investment securities | | | | 3,339,773 | | | |
Foreign currency transactions | | | | (78,371 | ) | | |
| | | | | | | | |
| | |
Net realized gain on investments and foreign currency transactions | | | | 3,261,402 | | | |
| | | | | | | | |
| | |
Change in net unrealized appreciation/(depreciation) on: | | | | | | | |
Investment securities | | | | 57,985,581 | | | |
Foreign currency translations | | | | 14,461 | | | |
| | | | | | | | |
| | |
Change in net unrealized appreciation/(depreciation) on investments, foreign currencies, and assets and liabilities denominated in foreign currencies | | | | 58,000,042 | | | |
| | | | | | | | |
| | |
Net realized and unrealized gain | | | | 61,261,444 | | | |
| | | | | | | | |
| | |
Net Increase in Net Assets Resulting from Operations | | | $ | 62,456,747 | | | |
| | | | | | | �� | | | |
| | |
| The accompanying notes are an integral part of these financial statements. |
| |
| | |
| Motley Fool Independence Fund | | 23 |
Statements of Changes in Net Assets
| | | | | | | | | | |
| | | Year
Ended
October 31,
2013 | | | Year
Ended
October 31,
2012 | | | |
| | | | | | | | | | | |
Operations: | | | | | | | | | | |
Net Investment Income | | $ | 1,195,303 | | | $ | 1,936,850 | | | |
Net Realized Gain/(Loss) on Investments and Foreign Currency Transactions | | | 3,261,402 | | | | (122,699 | ) | | |
Change in Net Unrealized Appreciation/(Depreciation) on Investments, Foreign Currencies, and Assets and Liabilities Denominated in Foreign Currencies | | | 58,000,042 | | | | 18,502,460 | | | |
| | | | | | | | | | |
| | | |
Net increase in net assets resulting from operations | | | 62,456,747 | | | | 20,316,611 | | | |
| | | | | | | | | | |
| | | |
Dividends to Shareholders: | | | | | | | | | | |
Dividends from net investment income | | | (1,588,159 | ) | | | (1,409,218 | ) | | |
| | | | | | | | | | |
| | | |
Capital Share Transactions: | | | | | | | | | | |
Proceeds from shares sold (6,299,592 and 3,537,966 shares, respectively) | | | 109,943,562 | | | | 52,796,542 | | | |
Reinvestment of dividends (100,131 and 99,973 shares, respectively) | | | 1,561,039 | | | | 1,385,628 | | | |
Value of shares redeemed (2,718,295 and 2,931,011 shares, respectively) | | | (46,269,770 | ) | | | (43,489,388 | ) | | |
| | | | | | | | | | |
Redemption and small-balance account fees | | | 96,740 | | | | 48,140 | | | |
| | | | | | | | | | |
Net increase from capital share transactions | | | 65,331,571 | | | | 10,740,922 | | | |
| | | | | | | | | | |
Total increase in net assets | | | 126,200,159 | | | | 29,648,315 | | | |
| | | | | | | | | | |
| | | |
Net Assets: | | | | | | | | | | |
Beginning of Period | | | 227,880,661 | | | | 198,232,346 | | | |
| | | | | | | | | | |
End of Period* | | $ | 354,080,820 | | | $ | 227,880,661 | | | |
| | | | | | | | | | |
* Including undistributed net investment income | | $ | 609,266 | | | $ | 1,002,122 | | | |
| | | | | | | | | | |
| | |
| The accompanying notes are an integral part of these financial statements. |
| |
| | |
| 24 | | Motley Fool Independence Fund |
Financial Highlights
(for a share outstanding throughout each period)
| | | | | | | | | | | | | | | | | | | | |
| | | Years Ended October 31, | |
| | | | | | | | | | | | | | | | | | | | | |
| | | 2013 | | | 2012 | | | 2011 | | | 2010(1) | | | 2009(2)(3) | |
| | | | | |
Net Asset Value, Beginning of Period | | $ | 15.48 | | | $ | 14.15 | | | $ | 14.14 | | | $ | 11.48 | | | $ | 10.00 | |
Income From Investment Operations | | | | | | | | | | | | | | | | | | | | |
Net Investment Income(4) | | | 0.07 | | | | 0.14 | | | | 0.11 | | | | 0.16 | | | | 0.02 | |
Net Gains on Securities (Realized and Unrealized) | | | 3.79 | | | | 1.29 | | | | 0.15 | | | | 2.59 | | | | 1.46 | |
Total From Investment Operations | | | 3.86 | | | | 1.43 | | | | 0.26 | | | | 2.75 | | | | 1.48 | |
Less Distributions | | | | | | | | | | | | | | | | | | | | |
Net Investment Income | | | (0.11 | ) | | | (0.10 | ) | | | (0.15 | ) | | | (0.02 | ) | | | — | |
Net Realized Capital Gains | | | — | | | | — | | | | (0.11 | ) | | | (0.08 | ) | | | — | |
Total Distributions | | | (0.11 | ) | | | (0.10 | ) | | | (0.26 | ) | | | (0.10 | ) | | | — | |
Redemption and Small-Balance Account Fees | | | 0.01 | | | | — | * | | | 0.01 | | | | 0.01 | | | | — | * |
Net Asset Value, End of Period | | $ | 19.24 | | | $ | 15.48 | | | $ | 14.15 | | | $ | 14.14 | | | $ | 11.48 | |
| | | | | | | | | | | | | | | | | | | | |
Total Return(5)(6) | | | 25.14 | % | | | 10.21 | % | | | 1.91 | % | | | 24.18 | % | | | 14.80 | % |
Net Assets, End of Period (thousands) | | $ | 354,081 | | | $ | 227,881 | | | $ | 198,232 | | | $ | 128,406 | | | $ | 30,427 | |
| | | | | |
Ratios/Supplemental Data | | | | | | | | | | | | | | | | | | | | |
Ratio of Expenses to Average Net Assets | | | 1.36 | % | | | 1.47 | % | | | 1.43 | % | | | 1.38 | % | | | 1.35 | % |
Ratio of Expenses to Average Net Assets (Before Waivers and Reimbursement of Expenses and/or Recapture of Previously Waived Fees) | | | 1.37 | % | | | 1.54 | % | | | 1.58 | % | | | 2.20 | % | | | 7.01 | % |
Ratio of Net Investment Income to Average Net Assets | | | 0.44 | % | | | 0.93 | % | | | 0.76 | % | | | 1.29 | % | | | 0.41 | % |
Ratio of Net Investment Income to Average Net Assets (Before Waivers and Reimbursement of Expenses and/or Recapture of Previously Waived Fees) | | | 0.43 | % | | | 0.86 | % | | | 0.61 | % | | | 0.47 | % | | | (5.25 | )% |
Portfolio Turnover | | | 22 | % | | | 37 | % | | | 37 | % | | | 37 | % | | | 50 | % |
* Amount represents less than $0.005 per share.
| (1) | Due to a clerical error, Net Gains on Securities (Realized and Unrealized) and Total From Investment Operations for the year ended October 31, 2010 were reported in the 2010 Annual Report as $2.39 and $2.55, respectively. Such amounts have been revised as shown above. |
| (2) | Because of commencement of operations and related preliminary transaction costs, these ratios are not necessarily indicative of future ratios. |
| (3) | Commenced operations on June 16, 2009. All ratios for the period have been annualized. Total return and portfolio turnover for the period have not been annualized. |
| | |
| The accompanying notes are an integral part of these financial statements. |
| |
| | |
| Motley Fool Independence Fund | | 25 |
Financial Highlights
| (4) | Per share data calculated using average shares outstanding method. |
| (5) | During the years ended October 31, 2013, October 31, 2011 and October 31, 2010, 0.06%, 0.07% and 0.08%, respectively, of the Fund’s total return was attributable to redemption and small-balance account fees received as referenced in Note 4. Excluding this item, the total return would have been 25.08%, 1.84% and 24.10%, respectively. For the year ended October 31, 2012 and the period ended October 31, 2009, redemption and small-balance account fees received had no effect on the Fund’s total return. |
| (6) | Total return reflects the rate an investor would have earned on an investment in the Fund during each period, assuming reinvestment of all distributions. |
| | |
| The accompanying notes are an integral part of these financial statements. |
| |
| | |
| 26 | | Motley Fool Independence Fund |
Motley Fool Great America Fund Portfolio Characteristics
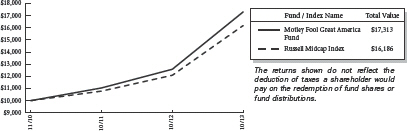
At October 31, 2013, the Motley Fool Great America Fund (the “Fund”) had an audited net asset value of $17.25 per share attributed to 9,412,353 shares outstanding. This compares with an unaudited net asset value as of November 1, 2010 of $10.00 per share attributed to 102,000 shares outstanding. From the Fund’s launch on November 1, 2010 to October 31, 2013, the Fund had an average annual total return of 20.10% versus a return of 17.43% over the same period for its benchmark, Russell Midcap Index. The graph below shows the performance of $10,000 invested in the Fund at inception. The results shown below do not reflect the deduction of taxes that a shareholder would pay on fund distributions or the redemption of fund shares.
|
 Let’s be serious though. A graph of the performance of any investment over less than three years tells you virtually nothing. In about five years, they’ll actually tell you quite a bit about how well we’re managing your money. Let’s be serious though. A graph of the performance of any investment over less than three years tells you virtually nothing. In about five years, they’ll actually tell you quite a bit about how well we’re managing your money.
|
| | | | |
| Average Annual Total Returns as of 10/31/2013 |
| | Fund* | | Benchmark** |
| |
| | |
One Year | | 37.44% | | 33.79% |
| |
Since Inception | | 20.10% | | 17.43% |
| |
Inception Date | | 11/01/2010 | | |
| |
Total Annual Fund Operating Expenses Before Expense Limitation (February 28, 2013 Prospectus) | | 1.74% | | |
| |
The performance data quoted represents past performance and does not guarantee future results. Current performance may be lower or higher. Performance data current to the most recent month-end may be obtained at www.FoolFunds.com. The investment return and principal value of an investment will fluctuate so that shares, when redeemed, may be worth more or less than their original cost.
*These returns reflect expense waivers by the Fund’s investment adviser. Without these waivers, returns would have been lower.
**The Russell Midcap Index is an unmanaged, free float-adjusted, market capitalization weighted index that is designed to measure the performance of the mid-cap segment of the U.S. equity universe. The Russell Midcap Index is a subset of the Russell 1000® Index. It includes approximately 800 of the smallest securities based on a combination of their market cap and current index membership. The Russell Midcap Index represents approximately 31% of the total market capitalization of the Russell 1000 companies. The Fund may invest in companies that are not included within the Russell Midcap Index and its investment portfolio is not weighted in terms of issuers the same as the Russell Midcap Index. For this reason, the Fund’s investment performance should not be expected to track, and may exceed or trail, the Russell Midcap Index. Since Inception returns for the Benchmark reflect the performance based on the Inception Date of the Fund.
| | |
|
| |
| | |
| Motley Fool Great America Fund | | 27 |
The investment objective of the Great America Fund is to achieve long-term capital appreciation. The Fund pursues this objective by investing primarily in common stocks of companies organized in the United States. The Fund employs a value-based investment strategy and seeks long-term growth of capital by acquiring securities of companies at prices the investment adviser, Motley Fool Asset Management, LLC (the “Adviser”), believes to be significantly below their intrinsic value. The Fund may invest in other types of securities and in other asset classes when, in the judgment of the Adviser, such investments offer attractive potential returns. As such, the Fund’s performance will deviate significantly from its benchmark from time to time. It is the view of the Adviser that this deviation is less meaningful over shorter time frames and is more relevant over multi-year periods.
Although the Great America Fund may invest in companies with any market capitalization, the Adviser expects that investments in the securities of companies having smaller- and mid-market capitalizations will be important components of the Fund’s investment program. Investments in securities of these companies may involve greater risk than do investments in larger, more established companies. Small-and mid-cap stocks tend to be more volatile and less liquid than their large-cap counterparts. You are strongly encouraged to read more about the Fund’s strategies and risks in the prospectus.
The Great America Fund invests in securities of companies the Adviser believes are undervalued. Unlike mutual funds that hew to their benchmark, the Fund may invest in any company, industry or sector where the Adviser’s analysis suggests that there is opportunity for gains that outweigh risks. In identifying investments for the Fund, the Adviser looks for companies it believes the market has irrationally undervalued and looks for companies that have high-quality businesses with strong market positions, manageable leverage, and robust streams of free cash flow. The following tables show the top 11 holdings and sectors in which the Fund was invested as of October 31, 2013. Portfolio holdings are subject to change without notice.
Certain mutual fund ratings and review services have created style boxes, which look more or less like a tic-tac-toe board; arranging funds by the size of the companies they typically invest in (large-, mid-, and small-cap) along one axis, and along a “value” to “growth” basis on the other axis. This may be a helpful way – at times –to think about certain investment opportunities, but we don’t believe we’ll improve your returns by limiting ourselves to any one portion of that style box.
| | | | |
Top Eleven Holdings* | | % of Net
Assets | |
| | |
Geospace Technologies Corp. | | | 2.85 | % |
Berkshire Hathaway, Inc. | | | 2.66 | |
Markel Corp. | | | 2.59 | |
Texas Roadhouse, Inc. | | | 2.52 | |
CARBO Ceramics, Inc. | | | 2.41 | |
Trimas Corp. | | | 2.29 | |
American Woodmark Corp. | | | 2.20 | |
Thor Industries, Inc. | | | 2.14 | |
Tractor Supply Co. | | | 2.11 | |
Natus Medical, Inc. | | | 2.04 | |
SBA Communications Corp. | | | 2.01 | |
| | | | |
| | | 25.82 | % |
| | | | |
| * | As of the date of the report, the fund had a holding of 7.94% in the BNY Mellon Cash Reserve. |
| | |
|
| |
| | |
| 28 | | Motley Fool Great America Fund |
The Motley Fool Great America Fund uses the Global Industry Classification StandardSM (“GICS SM”) as the basis for the classification of securities on the Schedule of Investments (“SOI”). We believe that this makes the SOI classifications more standard with the rest of the industry.
| | |
Sector Allocation | | % of Net
Assets |
| |
Consumer Discretionary | | 24.91% |
Financials | | 22.70 |
Industrials | | 12.15 |
Information Technology | | 7.68 |
Energy | | 6.96 |
Health Care | | 6.55 |
Materials | | 6.21 |
Consumer Staples | | 3.38 |
Telecommunication Services | | 2.99 |
| | |
| | 93.53% |
| | |
| | |
|
| |
| | |
| Motley Fool Great America Fund | | 29 |
About Your Expenses
As a shareholder of the Great America Fund, you incur ongoing costs, including advisory fees and other Fund expenses. This example is intended to help you to understand your ongoing costs (in dollars) of investing in the Fund and to compare these costs with the ongoing costs of investing in other mutual funds. It is based on an investment of $1,000 invested at the beginning of the period and held for the entire period from May 1, 2013 to October 31, 2013.
Actual Expenses
The first section of the table below provides information about actual account values and actual expenses. You may use the information in this section, together with the amount you invested, to estimate the expenses that you incurred over the period. Simply divide your account value by $1,000 (for example, an $8,600 account value divided by $1,000 = 8.6), then multiply the result by the number in the first section under the heading entitled “Expenses Paid During Period” to estimate the expenses attributable to your investment during this period.
Hypothetical Example for Comparison Purposes
The second section of the table below provides information about hypothetical account values and hypothetical expenses based on the Fund’s actual expense ratio and an assumed rate of return of 5% per year before expenses, which is not the Fund’s actual return. Thus, you should not use the hypothetical account values and expenses to estimate the actual ending account balance or your expenses for the period. Rather, these figures are provided to enable you to compare the ongoing costs of investing in the Fund as compared to the costs of investing in other funds. To do so, compare this 5% hypothetical example with the 5% hypothetical examples that appear in the shareholder reports of the other funds. Please note that the expenses shown in the table are meant to highlight your ongoing costs only. Therefore, the second section of the table is useful in comparing ongoing costs only and will not help you determine the relative total costs of owning different funds.
Do you know how many times a fund, or the market, has returned a smooth 5% over a long period of time? Never. But we have to pick some example. In reality, the market’s returns are always far bumpier, with the market returning 20% one year, followed by a loss of 10% the next year, followed by a 3% gain, etc. These variations affect actual expenses as well. Happily, over almost all time periods of 20 years or longer, according to the research of University of Pennsylvania’s Jeremy Siegel and others, the domestic market’s returns have been at least 5% per year on average.
| | | | | | | | |
| | Beginning
Account
Value
05/01/13 | | Ending
Account
Value
10/31/13 | | Annualized
Expense
Ratio(1) | | Expenses
Paid
During
Period(2) |
| |
Actual | | $1,000 | | $1,191.60 | | 1.39% | | $7.68 |
Hypothetical | | $1,000 | | $1,018.20 | | 1.39% | | $7.07 |
| (1) | These ratios reflect expenses waived by the Fund’s investment adviser. Without these Waivers, the Fund’s expenses would have been higher and the ending account values would have been lower. |
| (2) | Expenses are equal to the Fund’s annualized expense ratio for the period May 1,2013 to October 31, 2013, multiplied by the average account value over the period, multiplied by the number of days (184) in the most recent fiscal half-year, then divided by 365. |
| | |
|
| |
| | |
| 30 | | Motley Fool Great America Fund (Unaudited) |
The Motley Fool Funds Trust
Motley Fool Great America Fund
Schedule of Investments
at October 31, 2013
| | | | | | | | |
| Issues | | Shares | | | Value (Note 2) | |
| | | | | | | | | |
Equity Securities — 93.53% | | | | | | | | |
Air Freight & Logistics — 3.33% | | | | | | | | |
CH Robinson Worldwide, Inc. (United States) | | | 46,000 | | | $ | 2,748,040 | |
XPO Logistics, Inc. (United States)* | | | 132,000 | | | | 2,663,760 | |
| | | | | | | | |
| | | | | | | 5,411,800 | |
| | | | | | | | |
| | |
Auto Components — 1.71% | | | | | | | | |
Drew Industries, Inc. (United States) | | | 55,311 | | | | 2,779,931 | |
| | | | | | | | |
Automobiles — 2.14% | | | | | | | | |
Thor Industries, Inc. (United States) | | | 59,988 | | | | 3,479,904 | |
| | | | | | | | |
Beverages — 1.45% | | | | | | | | |
Crimson Wine Group Ltd. (United States)* | | | 269,847 | | | | 2,361,161 | |
| | | | | | | | |
Building Products — 2.20% | | | | | | | | |
American Woodmark Corp. (United States)* | | | 105,200 | | | | 3,568,384 | |
| | | | | | | | |
Capital Markets — 4.70% | | | | | | | | |
Diamond Hill Investment Group, Inc. (United States) | | | 29,023 | | | | 3,200,366 | |
INTL FCStone, Inc. (United States)* | | | 79,300 | | | | 1,622,478 | |
TD Ameritrade Holding Corp. (United States) | | | 58,000 | | | | 1,581,080 | |
Virtus Investment Partners, Inc. (United States)* | | | 6,000 | | | | 1,221,120 | |
| | | | | | | | |
| | | | | | | 7,625,044 | |
| | | | | | | | |
| | |
Chemicals — 1.08% | | | | | | | | |
Innophos Holdings, Inc. (United States) | | | 35,000 | | | | 1,754,200 | |
| | | | | | | | |
Commercial Banks — 4.39% | | | | | | | | |
Access National Corp. (United States) | | | 65,529 | | | | 952,137 | |
Carter Bank & Trust (United States) | | | 156,643 | | | | 1,749,702 | |
Monarch Financial Holdings, Inc. (United States) | | | 217,900 | | | | 2,586,473 | |
Suffolk Bancorp. (United States)* | | | 93,646 | | | | 1,830,779 | |
| | | | | | | | |
| | | | | | | 7,119,091 | |
| | | | | | | | |
| | |
Commercial Services & Supplies — 2.08% | | | | | | | | |
Covanta Holding Corp. (United States) | | | 50,000 | | | | 858,500 | |
KAR Auction Services, Inc. (United States) | | | 85,000 | | | | 2,526,200 | |
| | | | | | | | |
| | | | | | | 3,384,700 | |
| | | | | | | | |
| | |
Communications Equipment — 3.75% | | | | | | | | |
Cisco Systems, Inc. (United States) | | | 130,000 | | | | 2,925,000 | |
Infinera Corp. (United States)* | | | 309,500 | | | | 3,159,995 | |
| | | | | | | | |
| | | | | | | 6,084,995 | |
| | | | | | | | |
| | |
| See Notes to Financial Statements. |
| |
| | |
| Motley Fool Great America Fund | | 31 |
| | | | | | | | |
| Issues | | Shares | | | Value (Note 2) | |
| | | | | | | | | |
Equity Securities (continued) | | | | | | | | |
Computers & Peripherals — 1.82% | | | | | | | | |
Apple, Inc. (United States) | | | 5,650 | | | $ | 2,951,277 | |
| | | | | | | | |
Diversified Financial Services — 2.66% | | | | | | | | |
Berkshire Hathaway, Inc. (United States)* | | | 25 | | | | 4,324,870 | |
| | | | | | | | |
Diversified Telecommunication Services — 0.99% | | | | | | | | |
Level 3 Communications, Inc. (United States)* | | | 52,418 | | | | 1,601,370 | |
| | | | | | | | |
Energy Equipment & Services — 5.26% | | | | | | | | |
CARBO Ceramics, Inc. (United States) | | | 31,200 | | | | 3,910,608 | |
Geospace Technologies Corp. (United States)* | | | 47,500 | | | | 4,627,450 | |
| | | | | | | | |
| | | | | | | 8,538,058 | |
| | | | | | | | |
Food & Staples Retailing — 1.93% | | | | | | | | |
Costco Wholesale Corp. (United States) | | | 26,500 | | | | 3,127,000 | |
| | | | | | | | |
Health Care Equipment & Supplies — 3.80% | | | | | | | | |
Natus Medical, Inc. (United States)* | | | 167,700 | | | | 3,308,721 | |
Varian Medical Systems, Inc. (United States)* | | | 39,500 | | | | 2,866,910 | |
| | | | | | | | |
| | | | | | | 6,175,631 | |
| | | | | | | | |
Health Care Providers & Services — 2.75% | | | | | | | | |
Quest Diagnostics, Inc. (United States) | | | 24,000 | | | | 1,437,840 | |
WellPoint, Inc. (United States) | | | 35,700 | | | | 3,027,360 | |
| | | | | | | | |
| | | | | | | 4,465,200 | |
| | | | | | | | |
Hotels, Restaurants & Leisure — 8.83% | | | | | | | | |
Chipotle Mexican Grill, Inc. (United States)* | | | 4,800 | | | | 2,529,456 | |
Panera Bread Co. (United States)* | | | 5,000 | | | | 789,600 | |
Penn National Gaming, Inc. (United States)* | | | 41,117 | | | | 2,405,756 | |
Red Robin Gourmet Burgers, Inc. (United States)* | | | 20,000 | | | | 1,523,600 | |
Texas Roadhouse, Inc. (United States) | | | 149,000 | | | | 4,085,580 | |
Wynn Resorts Ltd. (United States) | | | 18,000 | | | | 2,992,500 | |
| | | | | | | | |
| | | | | | | 14,326,492 | |
| | | | | | | | |
Household Durables — 1.72% | | | | | | | | |
TRI Pointe Homes, Inc. (United States)* | | | 175,000 | | | | 2,786,000 | |
| | | | | | | | |
Insurance — 5.32% | | | | | | | | |
HCC Insurance Holdings, Inc. (United States) | | | 35,000 | | | | 1,597,750 | |
Loews Corp. (United States) | | | 58,500 | | | | 2,826,135 | |
Markel Corp. (United States)* | | | 7,950 | | | | 4,210,876 | |
| | | | | | | | |
| | | | | | | 8,634,761 | |
| | | | | | | | |
Internet & Catalog Retail — 0.97% | | | | | | | | |
Liberty Interactive Corp. (United States)* | | | 58,150 | | | | 1,567,724 | |
| | | | | | | | |
| | |
| See Notes to Financial Statements. |
| |
| | |
| 32 | | Motley Fool Great America Fund |
| | | | | | | | |
| Issues | | Shares | | | Value (Note 2) | |
| | | | | | | | | |
Equity Securities (continued) | | | | | | | | |
Internet Software & Services — 1.33% | | | | | | | | |
Google, Inc. (United States)* | | | 2,100 | | | $ | 2,164,218 | |
| | | | | | | | |
Machinery — 4.53% | | | | | | | | |
Actuant Corp. (United States) | | | 56,500 | | | | 2,122,140 | |
Flow International Corp. (United States)* | | | 378,400 | | | | 1,509,816 | |
Trimas Corp. (United States)* | | | 98,300 | | | | 3,721,638 | |
| | | | | | | | |
| | | | | | | 7,353,594 | |
| | | | | | | | |
Media — 1.89% | | | | | | | | |
DreamWorks Animation SKG, Inc. (United States)* | | | 89,600 | | | | 3,067,904 | |
| | | | | | | | |
Metals & Mining — 1.46% | | | | | | | | |
Horsehead Holding Corp. (United States)* | | | 163,200 | | | | 2,368,032 | |
| | | | | | | | |
Oil, Gas & Consumable Fuels — 1.70% | | | | | | | | |
Denbury Resources, Inc. (United States)* | | | 145,300 | | | | 2,759,247 | |
| | | | | | | | |
Paper & Forest Products — 3.67% | | | | | | | | |
KapStone Paper and Packaging Corp. (United States) | | | 55,200 | | | | 2,868,192 | |
Schweitzer-Mauduit International, Inc. (United States) | | | 50,000 | | | | 3,094,000 | |
| | | | | | | | |
| | | | | | | 5,962,192 | |
| | | | | | | | |
Real Estate Investment Trusts — 5.13% | | | | | | | | |
American Tower Corp. (United States) | | | 30,700 | | | | 2,436,045 | |
Annaly Capital Management, Inc. (United States) | | | 95,000 | | | | 1,120,050 | |
Capstead Mortgage Corp. (United States) | | | 140,000 | | | | 1,656,200 | |
Retail Opportunity Investments Corp. (United States) | | | 171,560 | | | | 2,539,088 | |
Sunstone Hotel Investors, Inc. (United States) | | | 43,000 | | | | 569,750 | |
| | | | | | | | |
| | | | | | | 8,321,133 | |
| | | | | | | | |
Semiconductors & Semiconductor Equipment — 0.33% | | | | | | | | |
Intel Corp. (United States) | | | 22,000 | | | | 537,460 | |
| | | | | | | | |
Software — 0.45% | | | | | | | | |
Ansys, Inc. (United States)* | | | 8,300 | | | | 725,835 | |
| | | | | | | | |
Specialty Retail — 6.03% | | | | | | | | |
Autozone, Inc. (United States)* | | | 6,400 | | | | 2,782,016 | |
Tractor Supply Co. (United States) | | | 48,000 | | | | 3,424,800 | |
Urban Outfitters, Inc. (United States)* | | | 20,000 | | | | 757,600 | |
Williams-Sonoma, Inc. (United States) | | | 53,800 | | | | 2,821,272 | |
| | | | | | | | |
| | | | | | | 9,785,688 | |
| | | | | | | | |
Textiles, Apparel & Luxury Goods — 1.62% | | | | | | | | |
Under Armour, Inc. (United States)* | | | 32,500 | | | | 2,637,375 | |
| | | | | | | | |
| | |
| See Notes to Financial Statements. |
| |
| | |
| Motley Fool Great America Fund | | 33 |
| | | | | | | | |
| Issues | | Shares | | | Value (Note 2) | |
| | | | | | | | | |
Equity Securities (continued) | | | | | | | | |
Thrifts & Mortgage Finance — 0.50% | | | | | | | | |
New Hampshire Thrift Bancshares, Inc. (United States) | | | 57,594 | | | $ | 817,835 | |
| | | | | | | | |
Wireless Telecommunication Services — 2.01% | | | | | | | | |
SBA Communications Corp. (United States)* | | | 37,250 | | | | 3,258,258 | |
| | | | | | | | |
Total Equity Securities (Cost $ 114,220,372) | | | | | | | 151,826,364 | |
| | | | | | | | |
| | | Par | | | | |
| | | | | | | | |
Corporate Bond — 0.66% | | | | | | | | |
Metals & Mining — 0.66% | | | | | | | | |
Horsehead Holding Corp. | | | | | | | | |
10.50%, 06/01/17 (United States)(a) | | $ | 1,000,000 | | | | 1,080,000 | |
| | | | | | | | |
Total Corporate Bond (Cost 1,045,000) | | | | | | | 1,080,000 | |
| | | | | | | | |
| | | Shares | | | | |
| | | | | | | | |
Other Investments — 7.94% | | | | | | | | |
Temporary Cash Investment — 7.94% | | | | | | | | |
BNY Mellon Cash Reserve | | | 12,892,317 | | | | 12,892,317 | |
| | | | | | | | |
Total Other Investments (Cost 12,892,317) | | | | | | | 12,892,317 | |
| | | | | | | | |
| | |
Total Investment Portfolio (Cost $128,157,689) — 102.13% | | | | | | | 165,798,681 | |
Liabilities in Excess of Other Assets — (2.13)% | | | | | | | (3,462,203 | ) |
| | | | | | | | |
NET ASSETS — 100.00% | | | | | | | | |
(Applicable to 9,412,353 shares outstanding) | | | | | | $ | 162,336,478 | |
| | | | | | | | |
| * | Non-income producing security. |
| (a) | Security exempt from registration under Rule 144A of the Securities Act of 1933. These securities may be resold in transactions exempt from registration, normally to qualified institutional buyers. Total market value of Rule 144A securities is $1,080,000 and represents 0.66% of net assets as of October 31, 2013. |
| | |
| See Notes to Financial Statements. |
| |
| | |
| 34 | | Motley Fool Great America Fund |
Statement of Assets and Liabilities
| | | | | | | |
| | | As of
October 31, 2013 | | |
| | | | | | | | |
Assets: | | | | | | | |
| | |
Investments in securities of unaffiliated issuers, at value (at cost, $128,157,689) | | | | $165,798,681 | | | |
Receivables: | | | | | | | |
Dividends | | | | 26,038 | | | |
Interest | | | | 44,007 | | | |
Shares of beneficial interest sold | | | | 641,283 | | | |
Prepaid expenses and other assets | | | | 28,744 | | | |
| | | | | | | |
Total Assets | | | | 166,538,753 | | | |
| | | | | | | |
| | |
Liabilities | | | | | | | |
Payables: | | | | | | | |
Investment securities purchased | | | | 3,956,671 | | | |
Shares of beneficial interest redeemed | | | | 35,962 | | | |
Accrued expenses: | | | | | | | |
Audit fees | | | | 19,000 | | | |
Accounting and administration fees | | | | 31,293 | | | |
Advisory fees | | | | 116,202 | | | |
Custodian fees | | | | 1,081 | | | |
Legal fees | | | | 3,803 | | | |
Transfer agent fees | | | | 17,955 | | | |
Trustee fees | | | | 475 | | | |
Other expenses | | | | 19,833 | | | |
| | | | | | | |
Total Liabilities | | | | 4,202,275 | | | |
| | | | | | | |
Net Assets | | | | $162,336,478 | | | |
| | | | | | | |
| | |
| The accompanying notes are an integral part of these financial statements. |
| |
| | |
| Motley Fool Great America Fund | | 35 |
Statement of Assets and Liabilities
| | | | | | | |
| | | As of
October 31, 2013 | | |
| | | | | | | | |
Net Assets Consist of: | | | | | | | |
Paid-in-Capital | | | $ | 122,476,303 | | | |
Accumulated Net Realized Gain on Investments | | | | 2,219,183 | | | |
Net Unrealized Appreciation/(Depreciation) on Investments | | | | 37,640,992 | | | |
| | | | | | | |
Net Assets | | | $ | 162,336,478 | | | |
| | | | | | | |
Net Asset Value: | | | | | | | |
$0.001 par value, unlimited shares authorized | | | | | | | |
Net assets applicable to capital shares outstanding | | | $ | 162,336,478 | | | |
Shares outstanding | | | | 9,412,353 | | | |
| | | | | | | |
Net asset value, offering, and redemption price per share* | | | $ | 17.25 | | | |
| | | | | | | |
| * | A charge of 2% is imposed on the redemption proceeds of shares redeemed or exchanged within 90 days of purchase. |
| | |
| The accompanying notes are an integral part of these financial statements. |
| |
| | |
| 36 | | Motley Fool Great America Fund |
Statement of Operations
| | | | | | | |
| | | Year Ended
October 31, 2013 | | |
| | | | | | | | |
Investment Income | | | | | | | |
Dividends | | | $ | 1,349,310 | | | |
Interest | | | | 105,015 | | | |
| | | | | | | |
Total Investment Income | | | | 1,454,325 | | | |
| | | | | | | |
| | |
Expenses | | | | | | | |
Accounting and administration fees | | | | 129,481 | | | |
Blue sky fees | | | | 29,988 | | | |
Shareholder account-related services | | | | 93,785 | | | |
Chief Compliance Officer fees | | | | 15,621 | | | |
Custodian fees | | | | 18,818 | | | |
Investment advisory fees | | | | 1,013,331 | | | |
Professional fees | | | | 51,228 | | | |
Shareholder reporting fees | | | | 15,345 | | | |
Transfer agent fees | | | | 159,904 | | | |
Trustee fees | | | | 32,702 | | | |
Other expenses | | | | 29,286 | | | |
| | | | | | | |
Total expenses | | | | 1,589,489 | | | |
| | | | | | | |
Expenses waived/reimbursed net of amount recaptured | | | | (162,758 | ) | | |
| | | | | | | |
Net expenses | | | | 1,426,731 | | | |
| | | | | | | |
Net Investment Income | | | | 27,594 | | | |
| | | | | | | |
| | |
Realized and Unrealized Gain | | | | | | | |
Net realized gain from: | | | | | | | |
Investment securities | | | | 2,768,030 | | | |
| | | | | | | |
Net realized gain on investments | | | | 2,768,030 | | | |
| | | | | | | |
| | |
Change in net unrealized appreciation/ (depreciation) on: | | | | | | | |
Investment securities | | | | 30,799,791 | | | |
| | | | | | | |
Change in net unrealized appreciation/ (depreciation) on investments | | | | 30,799,791 | | | |
| | | | | | | |
Net realized and unrealized gain | | | | 33,567,821 | | | |
| | | | | | | |
| | |
Net Increase in Net Assets Resulting from Operations | | | $ | 33,595,415 | | | |
| | | | | | | |
| | |
| The accompanying notes are an integral part of these financial statements. |
| |
| | |
| Motley Fool Great America Fund | | 37 |
Statements of Changes in Net Assets
| | | | | | | | | | | | |
| | | Year Ended
October 31,
2013 | | Year Ended
October 31,
2012 | | |
| | | | | | | | | | | | | |
Operations: | | | | | | | | | | | | |
Net Investment Income Gain/(Loss) | | | $ | 27,594 | | | | $ | (306,441 | ) | | |
Net Realized Gain on Investments | | | | 2,768,030 | | | | | 571,216 | | | |
Change in Net Unrealized Appreciation/ (Depreciation) on Investments | | | | 30,799,791 | | | | | 7,249,107 | | | |
| | | | | | | | | | | | |
Net increase in net assets resulting from operations | | | | 33,595,415 | | | | | 7,513,882 | | | |
| | | | | | | | | | | | |
| | | |
Dividends to Shareholders: | | | | | | | | | | | | |
Dividends from net investment income | | | | (163,061 | ) | | | | (4,290 | ) | | |
| | | | | | | | | | | | |
| | | |
Capital Share Transactions: | | | | | | | | | | | | |
Proceeds from shares sold (5,160,822 and 1,673,923 shares, respectively) | | | | 77,683,032 | | | | | 20,273,730 | | | |
Reinvestment of dividends (12,546 and 382 shares, respectively) | | | | 161,594 | | | | | 4,238 | | | |
Value of shares redeemed (1,113,746 and 1,365,560 shares, respectively) | | | | (16,332,520 | ) | | | | (16,160,824 | ) | | |
| | | | | | | | | | | | |
Redemption and small-balance account fees | | | | 55,388 | | | | | 18,471 | | | |
| | | | | | | | | | | | |
Net increase from capital share transactions | | | | 61,567,494 | | | | | 4,135,615 | | | |
| | | | | | | | | | | | |
Total increase in net assets | | | | 94,999,848 | | | | | 11,645,207 | | | |
| | | | | | | | | | | | |
| | | |
Net Assets: | | | | | | | | | | | | |
Beginning of Period | | | | 67,336,630 | | | | | 55,691,423 | | | |
| | | | | | | | | | | | |
End of Period* | | | $ | 162,336,478 | | | | $ | 67,336,630 | | | |
| | | | | | | | | | | | |
* Including accumulated net investment loss | | | $ | — | | | | $ | (308,996 | ) | | |
| | | | | | | | | | | | |
| | |
| The accompanying notes are an integral part of these financial statements. |
| |
| | |
| 38 | | Motley Fool Great America Fund |
Financial Highlights
(for a share outstanding throughout each period)
| | | | | | | | | | | | | | | |
| | | Years ended October 31, | | Period Ended
October 31, |
| | | 2013 | | 2012 | | 2011(1)(2) |
Net Asset Value, Beginning of Period | | | $ | 12.58 | | | | $ | 11.04 | | | | $ | 10.00 | |
Income From Investment Operations | | | | | | | | | | | | | | | |
Net Investment Income/(Loss)(3) | | | | — | * | | | | (0.06 | ) | | | | (0.05 | ) |
Net Gains on Securities (Realized and Unrealized) | | | | 4.69 | | | | | 1.60 | | | | | 1.09 | |
Total From Investment Operations | | | | 4.69 | | | | | 1.54 | | | | | 1.04 | |
Less Distributions | | | | | | | | | | | | | | | |
Net Investment Income | | | | (0.03 | ) | | | | — | * | | | | (0.01 | ) |
Total Distributions | | | | (0.03 | ) | | | | — | * | | | | (0.01 | ) |
Redemption and Small-Balance Account Fees | | | | 0.01 | | | | | — | * | | | | 0.01 | |
Net Asset Value, End of Period | | | $ | 17.25 | | | | $ | 12.58 | | | | $ | 11.04 | |
| | | | | | | | | | | | | | | |
Total Return(4) (5) | | | | 37.44 | % | | | | 13.96 | % | | | | 10.54 | % |
Net Assets, End of Period (thousands) | | | $ | 162,336 | | | | $ | 67,337 | | | | $ | 55,691 | |
Ratios/Supplemental Data | | | | | | | | | | | | | | | |
Ratio of Expenses to Average Net Assets | | | | 1.38 | % | | | | 1.37 | % | | | | 1.35 | % |
Ratio of Expenses to Average Net Assets (Before Waivers and Reimbursement of Expenses and/or Recapture of Previously Waived Fees) | | | | 1.54 | % | | | | 1.74 | % | | | | 2.16 | % |
Ratio of Net Investment Income to Average Net Assets | | | | 0.03 | % | | | | (0.51 | %) | | | | (0.48 | %) |
Ratio of Net Investment Income to Average Net Assets (Before Waivers and Reimbursement of Expenses and/or Recapture of Previously Waived Fees) | | | | (0.13 | %) | | | | (0.88 | %) | | | | (1.29 | %) |
Portfolio Turnover | | | | 24 | % | | | | 30 | % | | | | 18 | % |
| * | Amount represents less than $0.005 per share. |
| (1) | Because of commencement of operations and related preliminary transaction costs, these ratios are not necessarily indicative of future ratios. |
| (2) | Inception date of the Great America Fund was November 1, 2010. All ratios for the period have been annualized. Total return and portfolio turnover for the period have not been annualized. |
| (3) | Per share data calculated using average shares outstanding method. |
| (4) | During the year ended October 31, 2013 and the period ended October 31, 2011, 0.08% and 0.10%, respectively, of the Fund’s total return was attributable to redemption fees received as referenced in Note 4. Excluding this item, the total return would have been 37.36% and 10.44%, respectively. For the year ended October 31, 2012, redemption and small-balance account fees received had no effect on the Fund’s total return. |
| (5) | Total return reflects the rate an investor would have earned on an investment in the Fund during each period, assuming reinvestment of all distributions. |
| | |
| The accompanying notes are an integral part of these financial statements. |
| |
| | |
| Motley Fool Great America Fund | | 39 |
Motley Fool Epic Voyage Fund Portfolio Characteristics
At October 31, 2013, the Motley Fool Epic Voyage Fund (the “Fund”) had an audited net asset value of $12.66 per share attributed to 3,168,598 shares outstanding. This compares with an unaudited net asset value as of November 1, 2011 of $10.00 per share attributed to 106,350 shares outstanding. From the Fund’s launch on November 1, 2011 to October 31, 2013, the Fund had an average annual total return of 13.35% versus a return of 14.98% over the same period for its benchmark, the Russell Global ex-U.S. Index. The graph below shows the performance of $10,000 invested in the Fund at inception. The results shown below do not reflect the deduction of taxes that a shareholder would pay on fund distributions or the redemption of fund shares.
|
Let’s be serious though. A graph of the performance of any investment over less than two years tells you virtually nothing. In about five years, they’ll actually tell you quite a bit about how well we’re managing your money. |
| | | | |
Total Returns as of 10/31/2013 |
| | Fund* | | Benchmark** |
| |
| | |
One Year | | 17.32% | | 21.58% |
| |
Since Inception | | 13.35% | | 14.98% |
| |
Inception Date | | 11/01/2011 | | |
| |
Total Annual Fund Operating Expenses Before Expense Limitation (February 28, 2013 Prospectus) | | 4.13% | | |
| |
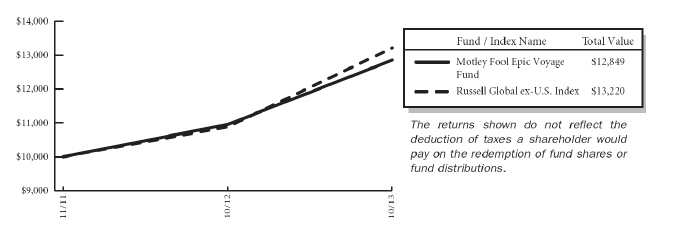
The performance data quoted represents past performance and does not guarantee future results. Current performance may be lower or higher. Performance data current to the most recent month-end may be obtained at www.FoolFunds.com. The investment return and principal value of an investment will fluctuate so that shares, when redeemed, may be worth more or less than their original cost.
* These returns reflect expense waivers by the Fund’s investment adviser. Without these waivers, returns would have been lower.
** The Russell Global ex-U.S. Index measures the performance of the global equity market based on all investable equity securities, excluding companies assigned to the United States. The Russell Global ex-U.S. Index is constructed to provide a comprehensive and unbiased barometer for the global segment and is completely reconstituted annually to accurately reflect the changes in the market over time, and it is widely recognized by investors in international markets as a benchmark for portfolios of foreign securities. However, the Epic Voyage Fund may invest in countries that are not included within the Russell Global ex-U.S. Index, and its investment portfolio is not weighted in terms of countries or issuers in correlation with the Russell Global ex-U.S. Index. For this reason, the Epic Voyage Fund’s investment performance should not be expected to track, and may exceed or trail, the Russell Global ex-U.S. Index. In addition, the performance of the Russell Global ex-U.S. Index may not correlate with the performance of U.S. markets. Under normal circumstances, the Epic Voyage Fund seeks to stay fully invested, primarily in common stocks, and does not attempt to time the market. Although current income in not an objective of the Epic Voyage Fund, the Adviser considers current income in assessing the intrinsic value of securities being considered for purchase by the Epic Voyage Fund.
| | |
|
| |
| | |
| 40 | | Motley Fool Epic Voyage Fund |
The investment objective of the Epic Voyage Fund is to achieve long-term capital appreciation. The Fund pursues this objective by investing primarily in common stocks of foreign companies. The Fund employs a value-based investment strategy and seeks long-term growth of capital by acquiring securities of companies at prices the investment adviser, Motley Fool Asset Management, LLC (the “Adviser”), believes to be significantly below their intrinsic value. The Fund may invest in other types of securities and in other asset classes when, in the judgment of the Adviser, such investments offer attractive potential returns. As such, the Fund’s performance will deviate significantly from its benchmark from time to time. It is the view of the Adviser that this deviation is less meaningful over shorter time frames and is more relevant over multi-year periods.
Because the Epic Voyage Fund is free to invest in companies of any size around the world, investments in the securities of foreign companies, including depositary receipts, companies with smaller market capitalizations (less than $2 billion), and companies in emerging market countries, will be important components of the Epic Voyage Fund’s investment program, although the Epic Voyage Fund may invest in issuers of all capitalization sizes. Small-cap stocks tend to be more volatile and less liquid than their large-cap counterparts. Fluctuations in currency exchange rates can cause losses when investing in foreign securities, with emerging markets presenting additional risks of illiquidity, political instability, and lax regulation. You are strongly encouraged to read more about the Fund’s strategies and risks in the prospectus.
The Epic Voyage Fund invests in securities of companies the Adviser believes are undervalued. Unlike mutual funds that are constrained by a style box, the Fund may invest in any company, industry or sector where the Adviser’s analysis suggests that there is opportunity for gains that outweigh risks. In identifying investments for the Fund, the Adviser looks for companies it believes the market has irrationally undervalued and companies that have high-quality businesses with strong market positions, manageable leverage, and robust streams of free cash flow. The following tables show the top 11 holdings, sector allocation, and top 11 countries in which the Fund was invested as of October 31, 2013. Portfolio holdings are subject to change without notice.
Certain mutual fund ratings and review services have created style boxes, which look more or less like a tic-tac-toe board; arranging funds by the size of the companies they typically invest in (large-, mid-, and small-cap) along one axis, and along a “value” to “growth” basis on the other axis. This may be a helpful way – at times – to think about certain investment opportunities, but we don’t believe we’ll improve your returns by limiting ourselves to any one portion of that style box.
| | |
| Top Eleven Holdings* | | % of Net
Assets |
| | | |
Baidu, Inc. | | 3.53% |
Almarai Co. | | 3.50 |
Banco Latinoamericano de Comercio Exterior SA | | 3.47 |
HDFC Bank Ltd. | | 3.30 |
Compartamos SAB de CV | | 3.25 |
Tod’s S.p.A. | | 2.78 |
Lippo Malls Indonesia Retail Trust | | 2.46 |
Odontoprev SA | | 2.44 |
Credicorp Ltd. | | 2.39 |
PT Nippon Indosari Corpindo Tbk | | 2.36 |
BrainJuicer Group PLC | | 2.11 |
| | |
| | 31.59% |
| | |
| * | As of the date of the report, the fund had a holding of 10.57% in the BNY Mellon Cash Reserve. |
| | |
|
| |
| | |
| Motley Fool Epic Voyage Fund | | 41 |
The Motley Fool Epic Voyage Fund uses the Global Industry Classification StandardSM (“GICSSM”) as the basis for the classification of securities on the Schedule of Investments (“SOI”). We believe that this makes the SOI classifications more standard with the rest of the industry.
| | |
| Sector Allocation | | % of Net
Assets |
| | | |
Financials | | 26.33% |
Consumer Discretionary | | 18.24 |
Consumer Staples | | 15.40 |
Information Technology | | 7.65 |
Energy | | 7.48 |
Health Care | | 7.48 |
Materials | | 3.89 |
Industrials | | 3.06 |
| | |
| | 89.53% |
| | |
| |
| | |
| Top Eleven Countries | | % of Net
Assets |
| | | |
United Kingdom | | 6.65% |
Saudi Arabia | | 5.45 |
Mexico | | 5.23 |
China | | 5.05 |
Brazil | | 4.95 |
India | | 4.76 |
South Korea | | 4.38 |
Switzerland | | 4.23 |
Japan | | 3.89 |
Canada | | 3.62 |
Panama | | 3.47 |
| | |
| | 51.68% |
| | |
| | |
|
| |
| | |
| 42 | | Motley Fool Epic Voyage Fund |
About Your Expenses
As a shareholder of the Epic Voyage Fund, you incur ongoing costs, including advisory fees and other Fund expenses. This example is intended to help you to understand your ongoing costs (in dollars) of investing in the Fund and to compare these costs with the ongoing costs of investing in other mutual funds. It is based on an investment of $1,000 invested at the beginning of the period and held for the entire period from May 1, 2013 to October 31, 2013.
Actual Expenses
The first section of the table below provides information about actual account values and actual expenses. You may use the information in this section, together with the amount you invested, to estimate the expenses that you incurred over the period. Simply divide your account value by $1,000 (for example, an $8,600 account value divided by $1,000 = 8.6), then multiply the result by the number in the first section under the heading entitled “Expenses Paid During Period” to estimate the expenses attributable to your investment during this period.
Hypothetical Example for Comparison Purposes
The second section of the table below provides information about hypothetical account values and hypothetical expenses based on the Fund’s actual expense ratio and an assumed rate of return of 5% per year before expenses, which is not the Fund’s actual return. Thus, you should not use the hypothetical account values and expenses to estimate the actual ending account balance or your expenses for the period. Rather, these figures are provided to enable you to compare the ongoing costs of investing in the Fund as compared to the costs of investing in other funds. To do so, compare this 5% hypothetical example with the 5% hypothetical examples that appear in the shareholder reports of the other funds. Please note that the expenses shown in the table are meant to highlight your ongoing costs only. Therefore, the second section of the table is useful in comparing ongoing costs only and will not help you determine the relative total costs of owning different funds.
Do you know how many times a fund, or the market, has returned a smooth 5% over a long period of time? Never. But we have to pick some example. In reality, the market’s returns are always far bumpier, with the market returning 20% one year, followed by a loss of 10% the next year, followed by a 3% gain, etc. These variations affect actual expenses as well. Happily, over almost all time periods of 20 years or longer, according to the research of University of Pennsylvania’s Jeremy Siegel and others, the domestic market’s returns have been at least 5% per year on average.
| | | | | | | | | | | | | | |
| | | Beginning Account
Value
05/01/13 | | | | Ending
Account
Value
10/31/13 | | | | Annualized
Expense
Ratio(1) | | | | Expenses
Paid
During
Period(2) |
| | | | | | | | | | | | | | | |
Actual | | $1,000 | | | | $1,072.88 | | | | 1.35% | | | | $7.05 |
Hypothetical | | $1,000 | | | | $1,018.40 | | | | 1.35% | | | | $6.87 |
| (1) | These ratios reflect expenses waived by the Fund’s investment adviser. Without these Waivers, the Fund’s expenses would have been higher and the ending account values would have been lower. |
| (2) | Expenses are equal to the Fund’s annualized expense ratio for the period May 1,2013 to October 31, 2013, multiplied by the average account value over the period, multiplied by the number of days (184) in the most recent fiscal half-year, then divided by 365. |
| | |
|
| |
| | |
| Motley Fool Epic Voyage Fund (Unaudited) | | 43 |
The Motley Fool Funds Trust
Motley Fool Epic Voyage Fund
Schedule of Investments
at October 31, 2013
| | | | | | | | |
| Issues | | Shares | | | Value
(Note 2) | |
| | |
Equity Securities — 83.42% | | | | | | | | |
Beverages — 3.84% | | | | | | | | |
Coca-Cola HBC AG (Switzerland)* | | | 12,802 | | | $ | 368,196 | |
Corp Lindley SA (Peru) | | | 648,214 | | | | 689,589 | |
Guinness Nigeria PLC (Nigeria) | | | 305,000 | | | | 484,005 | |
| | | | | | | | |
| | | | | | | 1,541,790 | |
| | | | | | | | |
Capital Markets — 3.13% | | | | | | | | |
City of London Investment Group PLC (United Kingdom) | | | 124,028 | | | | 497,170 | |
Tarpon Investimentos SA (Brazil) | | | 110,000 | | | | 757,164 | |
| | | | | | | | |
| | | | | | | 1,254,334 | |
| | | | | | | | |
Chemicals — 1.52% | | | | | | | | |
China BlueChemical Ltd. (China) | | | 950,000 | | | | 610,652 | |
| | | | | | | | |
Commercial Banks — 11.60% | | | | | | | | |
Banco Latinoamericano de Comercio Exterior SA (Panama) | | | 53,100 | | | | 1,392,813 | |
Credicorp Ltd. (Bermuda) | | | 7,000 | | | | 956,200 | |
Gronlandsbanken AB (Denmark) | | | 2,987 | | | | 370,299 | |
HDFC Bank Ltd. (India)(a) | | | 36,550 | | | | 1,324,937 | |
Siam Commercial Bank PCL (Thailand)(b) | | | 115,000 | | | | 609,747 | |
| | | | | | | | |
| | | | | | | 4,653,996 | |
| | | | | | | | |
Commercial Services & Supplies — 1.94% | | | | | | | | |
De La Rue PLC (United Kingdom) | | | 27,111 | | | | 371,577 | |
Depa Ltd. (United Arab Emirates)* | | | 691,600 | | | | 408,044 | |
| | | | | | | | |
| | | | | | | 779,621 | |
| | | | | | | | |
Consumer Finance — 3.25% | | | | | | | | |
Compartamos SAB de CV (Mexico) | | | 670,853 | | | | 1,302,397 | |
| | | | | | | | |
Containers & Packaging — 1.42% | | | | | | | | |
Crown Seal PCL (Thailand)(b) | | | 289,900 | | | | 570,432 | |
| | | | | | | | |
Electronic Equipment, Instruments & Components — 1.50% | | | | | | | | |
CrucialTec Co., Ltd. (South Korea)* | | | 34,750 | | | | 433,748 | |
Samsung SDI Co., Ltd. (South Korea) | | | 1,000 | | | | 166,691 | |
| | | | | | | | |
| | | | | | | 600,439 | |
| | | | | | | | |
| | |
| See Notes to Financial Statements. |
| |
| | |
| 44 | | Motley Fool Epic Voyage Fund |
| | | | | | | | |
| Issues | | Shares | | | Value
(Note 2) | |
| | | | | | | | | |
Equity Securities (continued) | | | | | | | | |
Energy Equipment & Services — 1.83% | | | | | | | | |
CGG (France)*(a) | | | 33,500 | | | $ | 735,325 | |
| | | | | | | | |
Food Products — 6.18% | | | | | | | | |
Flour Mills of Nigeria PLC (Nigeria) | | | 440,000 | | | | 235,516 | |
Industrias Bachoco SAB de CV (Mexico)(a) | | | 19,455 | | | | 797,460 | |
Nestle SA (Switzerland) | | | 6,885 | | | | 496,987 | |
PT Nippon Indosari Corpindo Tbk (Indonesia) | | | 1,724,540 | | | | 947,847 | |
| | | | | | | | |
| | | | | | | 2,477,810 | |
| | | | | | | | |
Health Care Equipment & Supplies — 2.02% | | | | | | | | |
Covidien PLC (Ireland) | | | 12,628 | | | | 809,581 | |
| | | | | | | | |
Health Care Provider & Services — 2.44% | | | | | | | | |
Odontoprev SA (Brazil) | | | 237,000 | | | | 979,654 | |
| | | | | | | | |
Hotels, Restaurants & Leisure — 1.74% | | | | | | | | |
Ajisen China Holdings Ltd. (Hong Kong) | | | 300,000 | | | | 314,786 | |
Wynn Macau Ltd. (Macau) | | | 100,000 | | | | 383,877 | |
| | | | | | | | |
| | | | | | | 698,663 | |
| | | | | | | | |
Internet & Catalog Retail — 1.67% | | | | | | | | |
CJ O Shopping Co., Ltd. (South Korea) | | | 2,002 | | | | 668,102 | |
| | | | | | | | |
Internet Software & Services — 3.53% | | | | | | | | |
Baidu, Inc. (China)*(a) | | | 8,800 | | | | 1,415,920 | |
| | | | | | | | |
Leisure Equipment & Products — 1.86% | | | | | | | | |
Shimano, Inc. (Japan) | | | 8,550 | | | | 748,331 | |
| | | | | | | | |
Media — 2.73% | | | | | | | | |
BrainJuicer Group PLC (United Kingdom) | | | 166,336 | | | | 846,789 | |
Multiplus SA (Brazil) | | | 20,000 | | | | 247,746 | |
| | | | | | | | |
| | | | | | | 1,094,535 | |
| | | | | | | | |
Metals & Mining — 0.27% | | | | | | | | |
Antofagasta PLC (United Kingdom) | | | 8,000 | | | | 109,337 | |
| | | | | | | | |
Oil, Gas & Consumable Fuels — 5.65% | | | | | | | | |
Lukoil OAO (Russia)(a) | | | 4,687 | | | | 306,858 | |
Sprott Resource Corp. (Canada) | | | 270,000 | | | | 735,434 | |
Statoil ASA (Norway)(a) | | | 31,000 | | | | 732,530 | |
Total Gabon SA (Gabon) | | | 768 | | | | 493,223 | |
| | | | | | | | |
| | | | | | | 2,268,045 | |
| | | | | | | | |
| | |
| See Notes to Financial Statements. |
| |
| | |
| Motley Fool Epic Voyage Fund | | 45 |
| | | | | | | | |
| Issues | | Shares | | | Value
(Note 2) | |
| | |
Equity Securities (continued) | | | | | | | | |
Pharmaceuticals — 3.02% | | | | | | | | |
Dr. Reddy’s Laboratories Ltd. (India)(a) | | | 14,779 | | | $ | 585,988 | |
Roche Holding AG (Switzerland) | | | 230 | | | | 63,603 | |
Teva Pharmaceutical Industries Ltd. (Israel)(a) | | | 15,201 | | | | 563,805 | |
| | | | | | | | |
| | | | | | | 1,213,396 | |
| | | | | | | | |
Real Estate Investment Trusts — 2.46% | | | | | | | | |
Lippo Malls Indonesia Retail Trust (Singapore) | | | 2,725,000 | | | | 985,784 | |
| | | | | | | | |
Real Estate Management & Development — 3.95% | | | | | | | | |
Brookfield Asset Management, Inc. (Canada) | | | 18,100 | | | | 716,398 | |
Cheung Kong Holdings Ltd. (Hong Kong) | | | 27,188 | | | | 424,596 | |
Henderson Land Development Co., Ltd. (Hong Kong) | | | 74,739 | | | | 442,252 | |
| | | | | | | | |
| | | | | | | 1,583,246 | |
| | | | | | | | |
Semiconductors & Semiconductor Equipment — 1.40% | | | | | | | | |
Taiwan Semiconductor Manufacturing Co., Ltd. (Taiwan)(a) | | | 30,500 | | | | 561,505 | |
| | | | | | | | |
Software — 1.23% | | | | | | | | |
DuzonBizon Co., Ltd. (South Korea) | | | 52,400 | | | | 491,586 | |
| | | | | | | | |
Specialty Retail — 4.13% | | | | | | | | |
Asahi Co., Ltd. (Japan) | | | 38,000 | | | | 644,143 | |
Fast Retailing Co., Ltd. (Japan) | | | 500 | | | | 168,306 | |
Halfords Group PLC (United Kingdom) | | | 124,475 | | | | 843,064 | |
| | | | | | | | |
| | | | | | | 1,655,513 | |
| | | | | | | | |
Textiles, Apparel & Luxury Goods — 6.11% | | | | | | | | |
Adidas AG (Germany) | | | 5,015 | | | | 571,439 | |
Swatch Group SA (Switzerland) | | | 1,200 | | | | 766,430 | |
Tod’s S.p.A. (Italy) | | | 6,700 | | | | 1,114,959 | |
| | | | | | | | |
| | | | | | | 2,452,828 | |
| | | | | | | | |
Tobacco — 1.88% | | | | | | | | |
Philip Morris CR AS (Czech Republic) | | | 1,327 | | | | 753,108 | |
| | | | | | | | |
Transportation Infrastructure — 1.12% | | | | | | | | |
International Container Terminal Services, Inc. (Philippines) | | | 50,000 | | | | 120,377 | |
SATS Ltd. (Singapore) | | | 120,000 | | | | 328,306 | |
| | | | | | | | |
| | | | | | | 448,683 | |
| | | | | | | | |
Total Equity Securities (Cost $ 28,329,866) | | | | | | | 33,464,613 | |
| | | | | | | | |
| | |
| See Notes to Financial Statements. |
| |
| | |
| 46 | | Motley Fool Epic Voyage Fund |
| | | | | | | | |
| Issues | | Shares | | | Value (Note 2) | |
| | | | | | | | | |
| | | | | | | | | |
Participatory Notes — 6.12% | | | | | | | | |
Commercial Banks — 1.95% | | | | | | | | |
Al Rajhi Banking & Investment Co. (Saudi Arabia)(c) | | | 40,000 | | | $ | 782,590 | |
| | | | | | | | |
Food Products — 3.50% | | | | | | | | |
Almarai Co. (Saudi Arabia)(c) | | | 93,586 | | | | 1,404,593 | |
| | | | | | | | |
Metals & Mining — 0.67% | | | | | | | | |
Aluminum Bahrain BSC (Bahrain)(c) | | | 196,998 | | | | 269,109 | |
| | | | | | | | |
Total Participatory Notes (Cost $ 2,148,992) | | | | | | | 2,456,292 | |
| | | | | | | | |
| | |
Other Investments — 10.57% | | | | | | | | |
Temporary Cash Investment — 10.57% | | | | | | | | |
BNY Mellon Cash Reserve | | | 4,241,730 | | | | 4,241,730 | |
| | | | | | | | |
Total Other Investments (Cost $ 4,241,730) | | | | | | | 4,241,730 | |
| | | | | | | | |
| | |
Total Investment Portfolio (Cost $ 34,720,588) — 100.11% | | | | | | | 40,162,635 | |
Other Assets in Excess of Liabilities — (0.11)% | | | | | | | (43,837 | ) |
| | | | | | | | |
NET ASSETS — 100.00% | | | | | | | | |
(Applicable to 3,168,598 shares outstanding) | | | | | | $ | 40,118,798 | |
| | | | | | | | |
| * | Non-income producing security. |
| (a) | ADR — American Depositary Receipts |
| (b) | NVDR — Non-Voting Depository Receipts |
| (c) | Security exempt from registration under Rule 144A of the Securities Act of 1933. These securities may be resold in transactions exempt from registration, normally to qualified institutional buyers. Total market value of Rule 144A securities is $2,456,292 and represents 6.12% of net assets as of October 31, 2013. |
PLC — Public Limited Company
| | |
| See Notes to Financial Statements. |
| |
| | |
| Motley Fool Epic Voyage Fund | | 47 |
Statement of Assets and Liabilities
| | | | | | | |
| | | As of
October 31, 2013 | | |
| | | | | | | | |
| | | | | | | | |
Assets: | | | | | | | |
Investments in securities of unaffiliated issuers, at value (at cost, $34,720,588) | | | $ | 40,162,635 | | | |
Foreign currency, at value
(at cost, $404,330) | | | | 413,403 | | | |
Receivables: | | | | | | | |
Dividends and tax reclaims | | | | 62,544 | | | |
Interest | | | | 30 | | | |
Shares of beneficial interest sold | | | | 96,925 | | | |
Reimbursement due from adviser | | | | 2,523 | | | |
Prepaid expenses and other assets | | | | 22,170 | | | |
| | | | | | | |
Total Assets | | | | 40,760,230 | | | |
| | | | | | | |
| | |
Liabilities | | | | | | | |
Payables: | | | | | | | |
Investment securities purchased | | | | 563,044 | | | |
Shares of beneficial interest redeemed | | | | 3,384 | | | |
Accrued expenses: | | | | | | | |
Audit fees | | | | 19,000 | | | |
Accounting and administration fees | | | | 25,783 | | | |
Custodian fees | | | | 5,209 | | | |
Legal fees | | | | 3,803 | | | |
Transfer agent fees | | | | 9,597 | | | |
Trustee fees | | | | 475 | | | |
Other expenses | | | | 11,137 | | | |
| | | | | | | |
Total Liabilities | | | | 641,432 | | | |
| | | | | | | |
Net Assets | | | $ | 40,118,798 | | | |
| | | | | | | |
| | |
| The accompanying notes are an integral part of these financial statements. |
| |
| | |
| 48 | | Motley Fool Epic Voyage Fund |
Statement of Assets and Liabilities
| | | | | | | |
| | | As of
October 31, 2013 | | |
| | | | | | | | |
| | | | | | | | |
Net Assets Consist of: | | | | | | | |
Paid-in-Capital | | | $ | 34,378,979 | | | |
Undistributed Net Investment Income | | | | 214,069 | | | |
Accumulated Net Realized Gain on Investments and Foreign Currency Transactions | | | | 74,370 | | | |
Net Unrealized Appreciation/(Depreciation) on Investments, Foreign Currencies, and Assets and Liabilities Denominated in Foreign Currencies | | | | 5,451,380 | | | |
| | | | | | | |
Net Assets | | | $ | 40,118,798 | | | |
| | | | | | | |
Net Asset Value: | | | | | | | |
$0.001 par value, unlimited shares authorized | | | | | | | |
Net assets applicable to capital shares outstanding | | | $ | 40,118,798 | | | |
Shares outstanding | | | | 3,168,598 | | | |
| | | | | | | |
Net asset value, offering, and redemption price per share* | | | $ | 12.66 | | | |
| | | | | | | |
| * | A charge of 2% is imposed on the redemption proceeds of shares redeemed or exchanged within 90 days of purchase. |
| | |
| The accompanying notes are an integral part of these financial statements. |
| |
| | |
| Motley Fool Epic Voyage Fund | | 49 |
Statement of Operations
| | | | | | | |
| | | Year Ended
October 31, 2013 | | |
| | | | | | | | |
| | | | | | | | |
Investment Income | | | | | | | |
Dividends | | | $ | 708,901 | | | |
Interest | | | | 13 | | | |
Less foreign taxes withheld | | | | (34,034 | ) | | |
| | | | | | | |
Total Investment Income | | | | 674,880 | | | |
| | | | | | | |
| | |
Expenses | | | | | | | |
Accounting and administration fees | | | | 101,170 | | | |
Blue sky fees | | | | 24,488 | | | |
Shareholder account-related services | | | | 27,837 | | | |
Chief Compliance Officer fees | | | | 15,621 | | | |
Custodian fees | | | | 55,870 | | | |
Investment advisory fees | | | | 256,343 | | | |
Organization fees | | | | 71 | | | |
Professional fees | | | | 51,228 | | | |
Shareholder reporting fees | | | | 11,867 | | | |
Transfer agent fees | | | | 94,286 | | | |
Trustee fees | | | | 31,717 | | | |
Other expenses | | | | 33,259 | | | |
| | | | | | | |
Total expenses | | | | 703,757 | | | |
| | | | | | | |
Expenses waived/reimbursed net of amount recaptured | | | | (339,127 | ) | | |
| | | | | | | |
Net expenses | | | | 364,630 | | | |
| | | | | | | |
Net Investment Income | | | | 310,250 | | | |
| | | | | | | |
| | |
Realized and Unrealized Gain (Loss) | | | | | | | |
Net realized gain (loss) from: | | | | | | | |
Investment securities | | | | 79,381 | | | |
Foreign currency transactions | | | | (14,961 | ) | | |
| | | | | | | |
Net realized gain on investments | | | | 64,420 | | | |
| | | | | | | |
| | |
Change in net unrealized appreciation/ (depreciation) on: | | | | | | | |
Investment securities | | | | 3,990,742 | | | |
Foreign currency translations | | | | 9,488 | | | |
| | | | | | | |
Change in net unrealized appreciation/ (depreciation) on investments | | | | 4,000,230 | | | |
| | | | | | | |
Net realized and unrealized gain | | | | 4,064,650 | | | |
| | | | | | | |
| | |
Net Increase in Net Assets Resulting from Operations | | | $ | 4,374,900 | | | |
| | | | | | | |
| | |
| The accompanying notes are an integral part of these financial statements. |
| |
| | |
| 50 | | Motley Fool Epic Voyage Fund |
Statement of Changes in Net Assets
| | | | | | | | | | |
| | | Year Ended
October 31,
2013 | | November 1, 2011**
to October 31, 2012 |
| | | | | | | | | | | |
Operations: | | | | | | | | | | |
Net Investment Income | | | $ | 310,250 | | | | $ | 204,589 | |
Net Realized Gain/(Loss) on Investments and Foreign Currency Transactions | | | | 64,420 | | | | | (11,073 | ) |
Change in Net Unrealized Appreciation/ (Depreciation) on Investments and Foreign Currency Translation | | | | 4,000,230 | | | | | 1,451,150 | |
| | | | | | | | | | |
| | |
Net increase in net assets resulting from operations | | | | 4,374,900 | | | | | 1,644,666 | |
| | | | | | | | | | |
| | |
Dividends to Shareholders: | | | | | | | | | | |
Dividends from net investment income | | | | (285,585 | ) | | | | (7,058 | ) |
| | | | | | | | | | |
| | |
Capital Share Transactions: | | | | | | | | | | |
Proceeds from shares sold (1,852,867 and 1,925,819 shares, respectively)*** | | | | 21,945,292 | | | | | 19,311,733 | |
Reinvestment of dividends (25,851 and 741 shares, respectively) | | | | 282,553 | | | | | 6,939 | |
Value of shares redeemed (471,264 and 165,416 shares, respectively) | | | | (5,481,997 | ) | | | | (1,690,314 | ) |
| | | | | | | | | | |
Redemption fees | | | | 12,015 | | | | | 5,654 | |
| | | | | | | | | | |
Net increase from capital share transactions | | | | 16,757,863 | | | | | 17,634,012 | |
| | | | | | | | | | |
Total increase in net assets | | | | 20,847,178 | | | | | 19,271,620 | |
| | | | | | | | | | |
| | |
Net Assets: | | | | | | | | | | |
Beginning of Period | | | | 19,271,620 | | | | | — | |
| | | | | | | | | | |
End of Period* | | | $ | 40,118,798 | | | | | $19,271,620 | |
| | | | | | | | | | |
| | |
* Including undistributed net investment income | | | $ | 214,069 | | | | $ | 204,294 | |
| | | | | | | | | | |
| ** | Commencement of Operations. |
| *** | On November 1, 2011, 106,350 shares of the Fund were issued for cash at $10.00 per share to the Adviser. |
| | |
| The accompanying notes are an integral part of these financial statements. |
| |
| | |
| Motley Fool Epic Voyage Fund | | 51 |
Financial Highlights
(for a share outstanding throughout each period)
| | | | | | | | | | |
| | | Year Ended
October 31, | | Period Ended
October 31, |
| | | 2013 | | 2012(1)(2) |
Net Asset Value, Beginning of Period | | | $ | 10.94 | | | | $ | 10.00 | |
Income From Investment Operations | | | | | | | | | | |
Net Investment Income(3) | | | | 0.13 | | | | | 0.18 | |
Net Gains on Securities (Realized and Unrealized) | | | | 1.73 | | | | | 0.77 | |
Total From Investment Operations | | | | 1.86 | | | | | 0.95 | |
Less Distributions | | | | | | | | | | |
Net Investment Income | | | | (0.15 | ) | | | | (0.01 | ) |
Net Realized Capital Gains | | | | — | | | | | — | |
Total Distributions | | | | (0.15 | ) | | | | (0.01 | ) |
Redemption Fees | | | | 0.01 | | | | | — | * |
Net Asset Value, End of Period | | | $ | 12.66 | | | | $ | 10.94 | |
| | | | | | | | | | |
Total Return(4) (5) | | | | 17.32 | % | | | | 9.52 | % |
Net Assets, End of Period (thousands) | | | $ | 40,119 | | | | $ | 19,272 | |
| | |
Ratios/Supplemental Data | | | | | | | | | | |
| | |
Ratio of Expenses to Average Net Assets | | | | 1.35 | % | | | | 1.35 | % |
Ratio of Expenses to Average Net Assets (Before Waivers and Reimbursement of Expenses and/or Recapture of Previously Waived Fees) | | | | 2.60 | % | | | | 4.13 | % |
Ratio of Net Investment Income to Average Net Assets | | | | 1.15 | % | | | | 1.75 | % |
Ratio of Net Investment Income to Average Net Assets (Before Waivers and Reimbursement of Expenses and/or Recapture of Previously Waived Fees) | | | | (0.10 | %) | | | | (1.03 | %) |
Portfolio Turnover | | | | 26 | % | | | | 17 | % |
| * | Amount represents less than $0.005 per share. |
| (1) | Inception date of the Epic Voyage Fund was November 1, 2011. All ratios for the period have been annualized. Total return and portfolio turnover for the period have not been annualized. |
| (2) | Because of commencement of operations and related preliminary transaction costs, these ratios are not necessarily indicative of future ratios. |
| (3) | Per share data calculated using average shares outstanding method. |
| (4) | During the year ended October 31, 2013, 0.09% of the Funds total return was attributable to redemption and small-balance account fees received as referenced in Note 4. Excluding this item, the total return would have been 17.23%. For the period ended October 31, 2012, redemption and small-balance account fees received had no effect on the Fund’s total return. |
| (5) | Total return reflects the rate an investor would have earned on an investment in the Fund during each period, assuming reinvestment of all distributions. |
| | |
| The accompanying notes are an integral part of these financial statements. |
| |
| | |
| 52 | | Motley Fool Epic Voyage Fund |
Notes to Financial Statements
1. Organization:
Motley Fool Independence Fund (“Independence Fund”), Motley Fool Great America Fund (“Great America Fund”), and Motley Fool Epic Voyage Fund (“Epic Voyage Fund”) (each a “Fund” and together the “Funds”) are diversified series of The Motley Fool Funds Trust (the “Trust”), an open-end management investment company (or mutual fund) organized on November 7, 2008, as a statutory trust under the laws of the State of Delaware. The investment objective of each Fund is to achieve long-term capital appreciation. The Independence Fund pursues its objective by investing primarily in common stocks of U.S. companies and of companies that are organized under the laws of other countries around the world. The Great America Fund pursues its objective by investing primarily in common stocks of companies that are organized in the United States and that are engaged in a broad range of industries. The Epic Voyage Fund pursues its objective by investing primarily in common stocks of foreign companies.
Under the Trust’s organizational documents, its Trustees and officers are indemnified against certain liabilities arising out of the performance of their duties for the Trust by the Trust. In addition, in the normal course of business, the Trust enters into contracts with vendors and others that provide for general indemnifications. The Trust’s maximum exposure under these arrangements is unknown as this would involve future claims that may be made against the Trust. However, the Trust believes the risk of loss to be remote.
2. Significant Accounting Policies:
Basis of Preparation
The policies described below are followed consistently by the Funds in the preparation of their financial statements in conformity with accounting principles generally accepted in the United States of America (“U.S. GAAP”) for U.S. mutual funds.
The preparation of financial statements in accordance with U.S. GAAP requires management to make estimates and assumptions that affect the reported amounts and disclosures. Actual results could differ from those estimates.
Security Valuation
Securities held by the Trust are generally valued at fair value as of the close of regular trading on each business day (generally 4 pm Eastern time) that the New York Stock Exchange (“NYSE”) is open. Securities, other than stock options, listed on the NYSE or other exchanges are valued on the basis of the last quoted sale price on the exchange on which they are primarily traded. However, if the last sale price on the NYSE is different from the last sale price on any other exchange, the NYSE price will be used. If there are no sales on that day, then the securities are valued at the bid price on the NYSE or other primary exchange for that day. Securities traded in the OTC market are valued on the basis of the last sales price as reported by NASDAQ. If there are no sales on that day,
| | |
|
| |
| | |
| The Motley Fool Funds Trust | | 53 |
then the securities are valued at the mean between the closing bid and asked prices as reported by NASDAQ. Stock options and stock index options traded on national securities exchanges or on NASDAQ are valued at the mean between the latest bid and asked prices for such options. Securities for which market quotations are not readily available or whose values have been affected by events occurring before the Funds’ pricing time but after the close of the securities markets, and other assets are valued at fair value as determined pursuant to procedures adopted in good faith by the Board of Trustees (the “Board”). Debt securities that mature in fewer than 60 days are valued at amortized cost (unless the Board determines that this method does not represent fair value), if their original maturity was 60 days or less or by amortizing the value as of the 61st day before maturity, if their original term to maturity exceeded 60 days.
When fair value pricing is employed, the prices of securities used by a fund to calculate its net asset value (the “NAV”) may differ from quoted or published prices for the same securities.
You’d think that it would be easy to determine what a share of the Fund is worth – just add up the value of everything it holds, and then divide by the number of shares. It’s not that simple, though. Some foreign markets have different operating hours (when it’s daytime in Chicago, for example, it is night in Shanghai). That means that when we calculate a Fund’s value at the end of the day, the market quotations for some of the securities held by the Fund could be several hours old, and intervening events may have affected what the stocks are worth. In addition, characteristics of the relevant markets and stocks might, in some cases, cast doubt on a particular valuation. For these reasons, we may rely on a pricing service to determine the value of particular securities. It is possible that when a Fund buys or sells the securities, the price on the real market will be different from the value used for the fair-value pricing.
The values of securities held by the Funds and other assets used in computing NAV are generally determined as of the time trading in such securities is completed each day, which, in the case of foreign securities, generally occurs at various times before the close of the NYSE. Trading in securities listed on foreign securities exchanges are valued at the last sale or, if no sales are reported, at the bid price as of the close of the exchange, subject to possible adjustment as described in the Prospectus. Foreign currency exchange rates are also generally determined before the close of the NYSE. On occasion, the values of such securities and exchange rates may be affected by events occurring between the time as of which determinations of such values or exchange rates are made and the close of the NYSE. When such events materially affect the value of securities held by the Funds or their liabilities, such securities and liabilities will be valued at fair value in accordance with procedures adopted in good faith by the Board. In this regard, the Trust has retained a third-party fair-value pricing service to quantitatively analyze the price movement of the Funds’ holdings on foreign exchanges and to automatically determine fair value if the variation from the prior day’s closing price exceeds specified parameters. As of October 31, 2013, such price movements for certain securities had
| | |
| |
| | |
| 54 | | The Motley Fool Funds Trust |
exceeded specified parameters and the third-party fair-value service quantitatively fair valued the affected securities. The Board will review and monitor the methods used by the service to assure itself that securities are valued at their fair values. The values of any assets and liabilities initially expressed in foreign currencies will be converted to U.S. dollars based on exchange rates supplied by a quotation service.
Fair Value Measurements
The Financial Accounting Standards Board (“FASB”) “Fair Value Measurements and Disclosures” defines fair value as the price that a Fund would receive upon selling an investment in an orderly transaction to an independent buyer in the principal market, or in the absence of a principal market, the most advantageous market for the investment. Valuation techniques should maximize the use of observable market data and minimize the use of unobservable inputs. Inputs refer broadly to the assumptions that market participants would use in pricing an asset. Inputs may be observable or unobservable. Observable inputs are inputs that reflect the assumptions market participants would use in pricing the asset or liability developed based on market data obtained from sources independent of the reporting entity. Unobservable inputs are inputs that reflect the reporting entity’s own assumptions about the assumptions market participants would use in pricing the asset or liability developed based on the best information available in the circumstances.
Fair value measurements utilize a hierarchy based on the observability of inputs used to establish fair value.
Investment assets reported at fair value are classified based on the lowest level input that is significant to fair value:
Level 1 — quoted prices in active markets for identical securities
Investments whose values are based on quoted market prices in active markets, and whose values are therefore classified as Level 1 prices, include active listed domestic and foreign equity securities.
Level 2 — observable inputs other than Level 1 (including quoted prices for similar securities, interest rates, prepayment speeds, credit risk, etc.)
Investments that trade in markets that are not considered to be active, but whose values are based on quoted market prices, dealer quotations or valuations provided by alternative pricing sources supported by observable inputs are classified as Level 2 prices. These generally include investment grade corporate bonds and less liquid listed domestic and foreign equity securities.
Level 3 — significant unobservable inputs (including the Fund’s own assumptions in determining the fair value of investments)
Investments whose values are classified as Level 3 prices have significant unobservable inputs, as they may trade infrequently or not at all.
| | |
| |
| | |
| The Motley Fool Funds Trust | | 55 |
The Funds did not have any transfers between Level 1 and Level 2 during the year ended October 31, 2013.
| | | | | |
| |
| | | Independence
Fund |
| | | | | | |
Valuation Inputs | | Value |
| | | | | | |
Level 1 — Quoted Prices | | | | | |
| | | | | | |
U.S. Common Stocks | | | $ | 153,611,554 | |
| | | | | | |
Foreign Common Stocks | | | | 83,042,345 | |
| | | | | | |
Temporary Cash Investment | | | | 23,217,509 | |
| | | | | | |
Level 2 — Other Significant Observable Inputs | | | | | |
| | | | | | |
Foreign Common Stocks | | | | 81,114,554 | |
| | | | | | |
Participatory Notes | | | | 11,033,048 | |
| | | | | | |
Level 3 — Significant Unobservable Inputs | | | | — | |
| | | | | | |
Total Value of Investments | | | $ | 352,019,010 | |
| | | | | | |
| | | | | |
| | | | | | |
| |
| | | Great America
Fund |
| | | | | | |
Valuation Inputs | | Value |
| | | | | | |
Level 1 — Quoted Prices | | | | | |
| | | | | | |
U.S. Common Stocks | | | $ | 151,826,364 | |
| | | | | | |
Temporary Cash Investment | | | | 12,892,317 | |
| | | | | | |
Level 2 — Other Significant Observable Inputs | | | | | |
| | | | | | |
Corporate Bond | | | | 1,080,000 | |
| | | | | | |
Level 3 — Significant Unobservable Inputs | | | | — | |
| | | | | | |
Total Value of Investments | | | $ | 165,798,681 | |
| | | | | | |
| | | | | |
| | | | | | |
| | |
|
| |
| | |
| 56 | | The Motley Fool Funds Trust |
| | | | | |
| |
| | | Epic Voyage
Fund |
| | | | | | |
Valuation Inputs | | Value |
| | | | | | |
Level 1 — Quoted Prices | | | | | |
| | | | | | |
Foreign Common Stocks | | | $ | 19,699,459 | |
| | | | | | |
Temporary Cash Investment | | | | 4,241,730 | |
| | | | | | |
Level 2 — Other Significant Observable Inputs | | | | | |
| | | | | | |
Foreign Common Stocks | | | | 13,765,154 | |
| | | | | | |
Participatory Notes | | | | 2,456,292 | |
| | | | | | |
Level 3 — Significant Unobservable Inputs | | | | — | |
| | | | | | |
Total Value of Investments | | | $ | 40,162,635 | |
| | | | | | |
The inputs or methodology used for valuing securities are not necessarily an indication of the risk associated with investing in those securities.
Dividends and Distributions
When a Fund pays a dividend or other distribution, its net asset value (NAV) per share will decline by the per-share amount of the distribution. Investors are no poorer for this “distribution drop,” however. As this section explains, investors may elect to reinvest their dividend and distribution payments. Doing so would allow them to acquire additional shares at the post-distribution NAV per share. They may also choose to receive a check in the amount of their portion of the dividend or distribution.
Each Fund pays dividends from its net investment income and distributes any net capital gains that it realizes. Dividends and capital gains distributions are generally paid once a year. All dividends and other distributions will be reinvested in Fund shares unless a shareholder chooses either to (1) receive dividends in cash, while reinvesting capital gains distributions in additional Fund shares; or (2) receive all distributions in cash. Additionally, each Fund reports details of distribution-related transactions on quarterly account statements. You may not receive a separate confirmation statement for these transactions.
Securities Transactions, Investment Income and Expenses
Securities transactions are accounted for as of the trade date. Costs used in determining realized gains and losses on the sales of investment securities are on the basis of identified cost. Dividend income is recorded on the ex-dividend date. Interest income is recorded on an accrual basis. Discount and premium are amortized using the effective interest method. Expenses directly attributable to a Fund are directly charged to that Fund. Common expenses of the Trust are allocated using methods approved by the Board.
| | |
|
| |
| | |
| The Motley Fool Funds Trust | | 57 |
Foreign Currency Translation
The books and records of the Funds are maintained in U.S. dollars as follows: (1) the values of investment securities and other assets and liabilities stated in foreign currencies are translated at the exchange rates prevailing at the end of the period; and (2) purchases, sales and income are translated at the rates of exchange prevailing on the respective dates of such transactions. Transaction gains or losses resulting from changes in exchange rates during the reporting period or upon settlement from foreign currency transactions are reported in the Statements of Operations for the current period. The Funds do not isolate the portion of gains and losses on investments.
3. Investment Policies and Practices:
The sections below describe some of the different types of investments that may be made by the Funds and the investment practices in which the Funds may engage.
When we say that the Funds may invest in other types of securities and in other asset classes, the “may” is well worth emphasizing, as the Fund’s primary focus is the common stock companies that the Adviser believes are both promising and undervalued.
Foreign Securities
The Independence Fund and Epic Voyage Fund invest, and the Great America Fund may invest, in equity and fixed-income securities of foreign companies, including companies located in both developed and emerging-market countries. Investment in foreign securities may include the purchase of American Depositary Receipts (“ADRs”) and other depositary receipts (European Depositary Receipts (“EDRs”) and Global Depositary Receipts (“GDRs”)) that represent indirect interests in securities of foreign issuers. A significant portion of a Fund’s exposure to foreign investments may be composed of such investments. Investments in foreign securities are affected by risk factors generally not associated with investments in the securities of U.S. companies in the U.S. With respect to such securities, there may be more limited information publicly available concerning the issuer than would be the case with respect to domestic securities, foreign issuers may use different accounting standards, and foreign trading markets may not be as liquid as are U.S. markets. Foreign securities also involve such risks as currency risks, possible imposition of withholding or confiscatory taxes, possible currency transfer restrictions, expropriation or other adverse political or economic developments, and the difficulty of enforcing obligations in other countries. These risks may be greater in emerging-market countries and in less-developed countries.
| | |
|
| |
| | |
| 58 | | The Motley Fool Funds Trust |
If a Fund holds a foreign stock, and the stock is traded on a foreign exchange, with its price denominated in that foreign currency, the value of the stock will change, for the Fund, whenever the relative value of the U.S.dollar and that foreign currency change. To take an imaginary example, if the Fund holds shares in RuritaniaTelecom, traded on the Ruritanian Stock Exchange, those shares will be worth more to the Fund if the value of the Ruritanian ploof increases against the U.S. dollar, and vice versa, all other things being equal.
The purchase of securities denominated in foreign currencies will subject the value of the Funds’ investments in those securities to fluctuations caused by changes in foreign exchange rates. To hedge against the effects of changes in foreign exchange rates, the Funds may enter into forward foreign currency exchange contracts (“forward contracts”). These contracts represent agreements to exchange an amount of currency at an agreed-upon future date and rate. The Funds will generally use forward contracts only to “lock in” the price in U.S. dollars of a foreign security that a Fund plans to purchase or to sell. In certain limited cases, it may use such contracts to hedge against an anticipated substantial decline in the price of a foreign currency against the U.S. dollar that would adversely affect the U.S. dollar value of foreign securities held by the Fund. Forward contracts will not be used in all cases and, in any event, cannot completely protect the Funds against all changes in the values of foreign securities resulting from fluctuations in foreign exchange rates. The Funds will not enter into a forward contract if, as a result, forward contracts would represent more than 20% of a Fund’s total assets. For hedging purposes, the Funds may also use options on foreign currencies, which expose the Funds to certain risks.
Some foreign securities are traded in the U.S. in the form of ADRs. ADRs are receipts typically issued by a U.S. bank or trust company evidencing ownership of the underlying securities of foreign issuers. EDRs and GDRs are receipts typically issued by foreign banks or trust companies, evidencing ownership of underlying securities issued by either a foreign or U.S. issuer. Generally, depositary receipts in registered form are designed for use in the U.S. and depositary receipts in bearer form are designed for use in securities markets outside the U.S. Depositary receipts may not necessarily be denominated in the same currency as the underlying securities into which they may be converted. Depositary receipts generally involve the same risks as other investments in foreign securities. However, holders of ADRs and other depositary receipts may not have all the legal rights of shareholders and may experience difficulty in receiving shareholder communications.
Types of Fixed-Income Securities
A Fund may invest in bonds and other types of debt obligations of U.S. and foreign issuers. Fixed income securities purchased by a Fund may include, among others, bonds, notes, and debentures issued by corporations; debt securities issued or guaranteed by the U.S. government or one of its agencies or instrumentalities (“U.S. Government Securities”); municipal securities; mortgage-backed and asset-backed
| | |
|
| |
| | |
| The Motley Fool Funds Trust | | 59 |
securities; and debt securities issued or guaranteed by foreign governments, their agencies, instrumentalities, or political subdivisions, or by government-owned, -controlled, or -sponsored entities, including central banks. These investments also include money market instruments and other types of obligations. Investors should recognize that, although securities ratings issued by Standard & Poor’s® Ratings Services (“S&P”), a division of The McGraw-Hill Companies, Inc., and Moody’s Investors Services©, Inc. (“Moody’s”), provide a generally useful guide as to credit risks, they do not offer any criteria to evaluate interest rate risk. Changes in interest rate levels generally cause fluctuations in the prices of fixed-income securities and will, therefore, cause fluctuations in the NAV per share of a Fund. Subsequent to the purchase of a fixed-income security by a Fund, the ratings or credit quality of such security may deteriorate. Any such subsequent adverse changes in the rating or quality of a security held by a Fund would not require a Fund to sell the security.
Participatory Notes
A participatory note, as used by a Fund, is an instrument used by investors to obtain exposure to an equity investment, including common stocks and warrants, in a local market where direct ownership is not permitted (or is impractical.) In countries where direct ownership by a foreign investor, such as a Fund, is not allowed by local law, such as Saudi Arabia, an investor may gain exposure to the market through a participatory note, which derives its value from a group of underlying equity securities. A participatory note is intended (disregarding the effect of any fees and expenses) to reflect the performance of the underlying equity securities on a one-to-one basis so that investors will not normally gain more in absolute terms than they would have made had they invested in the underlying securities directly, and will not normally lose more than they would have lost had they invested in the underlying securities directly.
In addition to providing access to otherwise closed markets, participatory notes can also provide a less expensive option to direct investment (where ownership by foreign investors is permitted) by reducing registration and transaction costs in acquiring and selling local registered shares. The Funds’ investment manager also believes that participatory notes can offer greater liquidity in markets that restrict the ability of the Funds to dispose of an investment by either restricting transactions by size or requiring registration and/or regulatory approvals.
The purchase of participatory notes involves risks that are in addition to the risks normally associated with a direct investment in the underlying securities. The Fund is subject to the risk that the issuer of the participatory note (i.e., the issuing bank or broker-dealer), which is the only responsible party under the note, is unable or refuses to perform under the terms of the participatory note, also known as counterparty risk.
While the holder of a participatory note is entitled to receive from the bank or broker-dealer any dividends or other distributions paid on the underlying securities, the holder is not entitled to the same rights as an owner of the underlying securities, such as voting rights.
| | |
|
| |
| | |
| 60 | | The Motley Fool Funds Trust |
Participatory notes may not be traded on exchanges, are privately issued, and may be illiquid. To the extent a participatory note is determined to be illiquid, it would be subject to the Fund’s limitation on investments in illiquid securities. There can be no assurance that the trading price or value of participatory notes will equal the value of the underlying value of the equity securities they seek to replicate.
Real Estate Investment Trusts
Real estate investment trusts (“REITs”) are pooled investment vehicles that manage a portfolio of real estate or real estate-related loans to earn profits for their shareholders. REITs are generally classified as equity REITs, mortgage REITs, or a combination of equity and mortgage REITs. Investing in REITs involves certain unique risks in addition to those risks associated with investing in the real estate industry in general. Equity REITs may be affected by changes in the value of the underlying property owned by the REITs, while mortgage REITs may be affected by the quality of the borrower on any credit extended. REITs are dependent upon management skills, may not be diversified geographically or by property type, and are subject to heavy cash-flow dependency, default by borrowers, and self-liquidation. REITs must also meet certain requirements under the Internal Revenue Code of 1986, as amended (the “Code”), to avoid entity level tax and be eligible to pass through certain tax attributes of their income to shareholders. REITs are consequently subject to the risk of failing to meet these requirements for favorable tax treatment and of failing to maintain their exemptions from registration under the 1940 Act. REITs are also subject to the risks of changes in the Code, affecting their tax status.
REITs (especially mortgage REITs) are also subject to interest rate risks. When interest rates decline, the value of a REIT’s investment in fixed-rate obligations can be expected to rise. Conversely, when interest rates rise, the value of a REIT’s investment in fixed-rate obligations can be expected to decline. In contrast, as interest rates on adjustable-rate mortgage loans are reset periodically, yields on a REIT’s investments in such loans will gradually align themselves to reflect changes in market interest rates, causing the value of such investments to fluctuate less dramatically in response to interest rate fluctuations than would investments in fixed-rate obligations.
The management of a REIT may be subject to conflicts of interest with respect to the operation of the business of the REIT and may be involved in real estate activities competitive with the REIT. REITs may own properties through joint ventures or in other circumstances in which a REIT may not have control over its investments. REITs may use significant amounts of leverage.
REITs often do not provide complete tax information until after the end of the calendar year. Consequently, because of the delay, it may be necessary for a Fund, if invested in REITs, to request permission to extend the deadline for issuance of Forms 1099-DIV beyond January 31. Alternatively, amended Forms 1099-DIV may be sent. During the year ended October 31, 2013, the Independence, Great America, and Epic Voyage Funds invested in REITs.
| | |
|
| |
| | |
| The Motley Fool Funds Trust | | 61 |
Temporary Investments
During periods of adverse market or economic conditions, a Fund may temporarily invest all or a substantial portion of its assets in high-quality, fixed-income securities, money market instruments, and shares of money market mutual funds, or it may hold cash. At such times, a Fund would not be pursuing its stated investment objective with its usual investment strategies. A Fund may also hold these investments for liquidity purposes. Fixed-income securities will be deemed to be of high quality if they are rated “A” or better by S&P or Moody’s or, if unrated, are determined to be of comparable quality by the Adviser. Money market instruments are high-quality, short-term fixed income obligations (which generally have remaining maturities of one year or less), and may include U.S. Government Securities, commercial paper, certificates of deposit and banker’s acceptances issued by domestic branches of United States banks that are members of the Federal Deposit Insurance Corporation, and repurchase agreements for US. Government Securities. In lieu of purchasing money market instruments, a Fund may purchase shares of money market mutual funds that invest primarily in U.S. Government Securities and repurchase agreements involving those securities, subject to certain limitations imposed by the 1940 Act. A Fund, as an investor in a money market fund, will indirectly bear the fees and expenses of the money market fund. These indirect fees and expenses will be in addition to the fees and expenses of the Funds. Repurchase Agreements involve certain risks not associated with direct investments in debt securities.
4. Fees and Transactions with Related Parties:
Fund Expenses
Each Fund pays all of its expenses other than those expressly assumed by Motley Fool Asset Management (“the Adviser”). Expenses of each Fund are deducted from the Funds’ total income before dividends are paid.
Investment Adviser
Subject to the supervision of the Board, the Adviser manages the overall investment operations of the Funds in accordance with the Funds’ investment objective and policies and formulates a continuing investment strategy for the Funds pursuant to the terms of the Investment Advisory Agreement between the Adviser and the Trust on behalf of the Funds. The Adviser is a wholly owned subsidiary of The Motley Fool Holdings Inc. (“TMF Holdings”), a multimedia financial-services holding company that also owns The Motley Fool, LLC, which publishes investment information and analysis across a wide range of media, including investment newsletter services, websites, and books. TMF Holdings is controlled by David Gardner and Tom Gardner, along with other private shareholders.
Under the terms of the Advisory Agreement, each Fund pays the Adviser a fee that is computed and paid monthly at an annual rate of 0.95% of the Funds’ average daily net
| | |
|
| |
| | |
| 62 | | The Motley Fool Funds Trust |
assets during the month (the “Basic Fee”). Commencing the first month after each Fund has completed 12 full calendar months of operations, the Basic Fee is subject to a monthly adjustment (the “Monthly Performance Adjustment”) based on the investment performance of each Fund relative to the performance of the MSCI World Index for the Independence Fund, the Russell Midcap Index for the Great America Fund, and the Russell Global ex-U.S. Index for the Epic Voyage Fund, measured over a trailing-36-month period ending on the last day of the month for which the fee is to be paid (or, if each Fund does not have 36 full calendar months of operations, the number of months since commencement of each Fund’s operations) (the “Performance Measurement Period”). The fee payable for each month (the “Total Advisory Fee”) will be the Basic Fee plus or minus the Monthly Performance Adjustment.
The Monthly Performance Adjustment is calculated by subtracting from the cumulative percentage performance of the Funds (essentially, the change in the Funds’ net asset value per share) during the Performance Measurement Period (net of all expenses, including advisory fees) the percentage change in the MSCI World Index for the Independence Fund, the Russell Midcap Index for the Great America Fund, and the Russell Global ex-U.S. Index for the Epic Voyage Fund over the same period (including the value of dividends paid during the measurement period on stocks included in the MSCI World Index, the Russell Midcap Index, or the Russell Global ex-U.S. Index, respectively). The Monthly Performance Adjustment is based on an annual percentage rate determined by (i) subtracting 3 from the positive or negative percentage difference between the investment performance of the Funds and the investment performance of the MSCI World Index for the Independence Fund, the Russell Midcap Index for the Great America Fund, and the Russell Global ex-U.S. Index for the Epic Voyage Fund during the Performance Measurement Period, and (ii) multiplying the result by 2%, but the annual percentage rate used in determining the Monthly Performance Adjustment will be limited to a rate of not more than +0.20% nor less than -0.20%. The dollar amount of the Monthly Performance Adjustment is then determined by dividing the annual percentage rate by 12, and (iii) multiplying the result by the average daily net assets of each Fund during the Performance Measurement Period. There is no Monthly Performance Adjustment if the difference between the investment performance of each Fund and the investment performance of its index is three percentage points or less. Because the operation of the Expense Limitation and Reimbursement Agreement will have a positive effect upon each Fund’s Investment performance, the agreement may result in an increase in the Monthly Performance Adjustment and the Total Advisory Fee. The Adviser has agreed to waive the amount of the increase in the Monthly Performance Adjustment that exceeds the amount that would have been payable to it in the absence of the Expense Limitation and Reimbursement Agreement to the extent that such increase exceeds the cumulative amount of expenses deferred, absorbed, or reimbursed by the Adviser that it has not previously recovered as a result of higher positive performance-based adjustments in one or more prior months resulting from the Expense Limitation and Reimbursement Agreement.
| | |
|
| |
| | |
| The Motley Fool Funds Trust | | 63 |
Under the terms of an Expense Limitation and Reimbursement Agreement entered into by the Adviser and the Funds, the Adviser has contractually agreed to pay, waive, or absorb a portion of the Funds’ operating expenses through the end of February 2015, to the extent necessary to limit the Funds’ annual operating expenses (excluding the advisory fee, brokerage commissions, taxes, interest expense, acquired fund fees and expenses, and any extraordinary expenses) to an amount not exceeding 0.40% annually of each Fund’s average daily net assets. The Adviser may recover from the Funds’ fees and expenses previously paid, waived, or absorbed for a period of three years after such fees or expenses were incurred, provided that the repayments do not cause the Funds’ operating expenses (excluding the advisory fee, brokerage commissions, taxes, interest expense, acquired fund fees and expenses, and any extraordinary expenses) to exceed 0.40% annually of the Funds’ average daily net assets. Previously waived fees subject to future recovery by the Adviser are as follows:
| | | | | | | | |
| | Independence Fund | | | | | | |
| |
| | Year End | | | | Recovery Available | | |
| |
2014 | | | | | | $271,178 | | |
| |
2015 | | $142,313 | | |
| |
2016 | | | | | | $ 40,400 | | |
| |
| | | | | | | | |
| | Great America Fund | | | | | | |
| |
| | Year End | | | | Recovery Available | | |
| |
2014 | | | | | | $346,585 | | |
| | | | | | | | | |
2015 | | | | | | $227,414 | | |
| | | | | | | | | |
2016 | | | | | | $162,758 | | |
| | | | | | | | | |
| | | | | | | | |
| | Epic Voyage Fund | | | | | | |
| |
| | Year End | | | | Recovery Available | | |
| |
2015 | | | | | | $324,259 | | |
| |
2016 | | | | | | $339,127 | | |
| |
Trustees Fees
Effective November 1, 2013, each Trustee who is not an “interested person,” as defined by the 1940 Act, of the Trust is paid an annual retainer of $35,000. From April 1, 2011 through October 31, 2013, each Trustee was paid an annual retainer of $30,000. Prior to
| | |
|
| |
| | |
| 64 | | The Motley Fool Funds Trust |
April 1, 2011, each Independent Trustee was paid (i) an annual retainer of $20,000, (ii) a fee of $1,250 for each quarterly meeting of the Board attended, and (iii) a fee of $500 for each meeting attended of any committee of the Board of which such Trustee is a member (if such meeting is not held on the same day as a meeting of the Board). Officers of the Trust, all of whom are members, officers, or employees of the Adviser, or their affiliates, receive no compensation from the Trust.
Other Service Providers
Administration and Accounting Services
The Trust has entered into an Administration and Accounting Services Agreement with BNY Mellon. Pursuant to the Administration and Accounting Services Agreement, BNY Mellon provides various administrative and accounting services necessary for the operations of the Trust and the Funds. Services provided by BNY Mellon include facilitating general Fund management; monitoring the Funds’ compliance with federal and state regulations; supervising the maintenance of the Funds’ general ledger, the preparation of the Funds’ financial statements, the determination of NAV, and the payment of dividends and other distributions to shareholders; and preparing specified financial, tax, and other reports. The Funds pays the Administrator an annual fee calculated based upon the Funds’ average net assets. The fee is paid monthly. The Funds also reimburse the Administrator for certain out-of-pocket expenses.
Transfer Agent
BNY Mellon serves as the Funds’ transfer agent and dividend disbursing agent. BNY Mellon receives a fee based mainly upon the number of accounts serviced. Certain minimum fees and transaction charges may apply.
For the year ended October 31, 2013, BNY Mellon received $1,252,626 aggregate fees and expenses for services rendered under the various agreements described above.
Custodian
BNY Mellon serves as custodian of the Trust’s assets and is responsible for maintaining custody of the Funds’ cash and investments and retaining subcustodians, including in connection with the custody of foreign securities.
Custodian fees for the Funds are calculated based on the average daily gross assets of the Funds. BNY Mellon also receives other transaction based charges and is reimbursed for out-of-pocket expenses.
For the year ended October 31, 2013, BNY Mellon received $188,834 in aggregate fees and expenses for services rendered under the custody agreements described above.
| | |
|
| |
| | |
| The Motley Fool Funds Trust | | 65 |
Distribution
The Distributor serves as the principal underwriter of the Funds pursuant to an Underwriting Agreement for the limited purpose of acting as statutory underwriter to facilitate the distribution of shares of the Funds. The Funds do not pay any fees to the Distributor in its capacity as Underwriter. The fees are paid by the Adviser.
Shareholder Account-related Services
The Trust’s board has authorized it to pay fees to financial intermediaries, including securities dealers, that provide shareholder account-related services to their customers who own shares of the Trust’s Funds, or to reimburse the Adviser for such expenses it paid on the Trust’s behalf. These financial intermediaries generally have omnibus accounts with the Trust’s Transfer Agent and provide shareholder services or sub-transfer agent services to the shareholders who are their customers. The fees paid by the Funds for these services will not exceed the fees they would have incurred if customers of the financial intermediaries maintained their accounts directly with the Trust. For the year ended October 31, 2013, Motley Fool Independence Fund paid $224,229, Motley Fool Great America Fund paid $103,441, and Motley Fool Epic Voyage Fund paid $30,296 for such third-party shareholder account-related services.
Redemption Fees
The Funds charge a redemption fee of 2.00% on proceeds from Shares redeemed or exchanged within 90 days following their acquisition. The redemption fee is calculated as a percentage of the net asset value of the total redemption proceeds and is retained by the Funds and accounted for as additional paid-in capital. Certain exceptions to the imposition of the redemption fee exist. Please see the Funds’ prospectus for more information.
Small-Balance Account Fee
The Funds charge a small-balance account fee of $24 annually if the value of an account is less than $10,000. The fee is assessed by redeeming shares from that account. Certain exceptions to the imposition of the small-balance account fee exist. Please see the Funds’ prospectus for more information.
5. Control Persons and Principal Holders:
Any person beneficially owning, directly or indirectly, more than 25% of the outstanding shares of a Fund is presumed to control the Fund. Through the exercise of voting rights with respect to shares of the Fund, such a person may be able to determine the outcome of shareholders voting on matters as to which the approval of shareholders of the Fund is required. Principal holders are persons who own beneficially 5% or more of the outstanding shares of the Fund. As of October 31, 2013, the Trust was not aware of any shareholders who beneficially owned 5% or more of each Fund’s outstanding shares.
| | |
|
| |
| | |
| 66 | | The Motley Fool Funds Trust |
6. Investment Transactions:
For the year ended October 31, 2013, the cost of purchases and proceeds from sales and maturities of investment securities for the Funds were as follows:
| | | | | | | | | | |
Cost of Purchases and Proceeds from Sales and Maturities of Long-Term Securities (other than Temporary Cash Investments) |
| | | | | | | | | | | |
Fund | | Purchases | | Sales and Maturity Proceeds |
| | | | | | | | | | | |
| | |
Independence Fund | | | | $114,120,690 | | | | | $56,675,690 | |
Great America Fund | | | | 78,470,284 | | | | | 23,563,037 | |
Epic Voyage Fund | | | | 20,357,514 | | | | | 6,609,756 | |
7. Shares of Beneficial Interest:
The Trust is authorized to issue an unlimited number of shares of beneficial interest, $.001 par value. Currently, the Trust consists of three series of shares, the Independence Fund, the Great America Fund, and the Epic Voyage Fund, and all shares of each series represent a single class. However, the Board has the authority to establish additional series of shares (representing interests in separate investment portfolios of the Trust in addition to these three series) and, subject to applicable rules, may establish two or more classes of shares of any series, with the differences in classes representing differences as to certain expenses and share distribution arrangements. Shares are fully paid and non-assessable and have no pre-emptive or conversion rights.
8. Federal Income Taxes:
Each Fund intends to qualify as a regulated investment company (“RIC”) under Subchapter M of the Code. If so qualified, a Fund will not be subject to federal income tax on that part of its net investment income and net capital gains that it distributes to its shareholders. Certain federal income and excise taxes would be imposed on a Fund if it fails to make certain required distributions of its income to shareholders. The Funds intend, however, to make distributions in a manner that will avoid the imposition of any such taxes. For this reason, no provision for excise or income taxes is required.
Net investment income (loss) and net realized gains (losses) may differ for financial statements and tax purposes primarily due to differing treatments for amortization of deferred organization costs, foreign currency transactions, and investments in partnerships and Passive Foreign Investment Companies (“PFICs”).
Distributions during the years ended October 31, 2013 and October 31, 2012, were characterized as follows for tax purposes:
| | |
|
| |
| | |
| The Motley Fool Funds Trust | | 67 |
| | | | | | | | | | |
Independence Fund | | | | |
| | | | | | | | | | | |
Tax Year End | | Ordinary
Income | | Long-Term
Capital Gain |
| | | | | | | | | | | |
2013 | | | $ | 1,588,159 | | | | | — | |
2012 | | | | 1,409,218 | | | | | — | |
| | | | | | | | | | |
Great America Fund | | | | |
| | | | | | | | | | | |
Tax Year End | | Ordinary
Income | | Long-Term
Capital Gain |
| | | | | | | | | | | |
2013 | | | $ | 163,061 | | | | | — | |
2012 | | | | 4,290 | | | | | — | |
| | | | | | | | | | |
Epic Voyage Fund | | | | |
| | | | | | | | | | | |
Tax Year End | | Ordinary
Income | | Long-Term
Capital Gain |
| | | | | | | | | | | |
2013 | | | $ | 285,585 | | | | | — | |
2012 | | | | 7,058 | | | | | — | |
At October 31, 2013, the components of distributable earnings for the Funds, on a tax basis were as follows:
| | | | | | |
Independence Fund |
| | | | | | | |
Undistributed Ordinary Income | | Undistributed Long-Term Capital Gain | | Capital Loss Carryover | | Net Unrealized Appreciation (Depreciation) on Investments |
| | | | | | | |
$603,915 | | $3,348,747 | | — | | $90,086,496 |
| | | | | | |
Great America Fund |
| | | | | | | |
Undistributed Ordinary Income | | Undistributed Long-Term Capital Gain | | Capital Loss Carryover | | Net Unrealized Appreciation (Depreciation) on Investments |
| | | | | | | |
$77,157 | | $2,142,026 | | — | | $37,640,992 |
| | |
|
| |
| | |
| 68 | | The Motley Fool Funds Trust |
| | | | | | |
| | | |
Epic Voyage Fund | | | | | | |
| | | | | | | |
Undistributed Ordinary Income | | Undistributed Long-Term Capital Gain | | Capital Loss Carryover | | Net Unrealized Appreciation (Depreciation) on Investments |
| | | | | | | |
$259,444 | | $74,370 | | — | | $5,406,005 |
For Federal income tax purposes, the Funds measure capital loss carryovers annually at October 31, its fiscal year end. Capital loss carryovers may be carried forward and applied against future capital gains. Under the Regulated Investment Company Modernization Act of 2010, capital losses incurred by these funds after October 31, 2012 will not be subject to expiration and will retain their character as either short-term or long-term capital losses. In addition, such losses must be utilized prior to the losses incurred in the years preceding enactment. As of October 31, 2013, the Funds had no capital loss carryovers.
During the year ended October 31, 2013 the Independence Fund, the Great America Fund and the Epic Voyage Fund utilized capital loss carryovers to offset realized capital gains for Federal income tax purposes in the amounts of $243,354, $104,384 and $5,011, respectively.
At October 31, 2013, the aggregate cost of investment securities for federal income tax purposes (excluding foreign currency, securities sold short, and derivative related items) and the net unrealized appreciation from investments for those securities having an excess of value over cost and net unrealized depreciation from investments for those securities having an excess of cost over value (based on cost for federal income tax purposes) were as follows:
| | | | | | |
| | | |
Independence Fund | | | | | | |
| | | | | | | |
| Federal Tax Cost | | Net Unrealized Appreciation (Depreciation) | | Appreciated Securities | | Depreciated Securities |
| | | | | | | |
$261,951,259 | | $90,067,751 | | $91,551,892 | | $(1,484,141) |
| | | | | | |
| | | |
Great America Fund | | | | | | |
| | | | | | | |
| Federal Tax Cost | | Net Unrealized Appreciation (Depreciation) | | Appreciated Securities | | Depreciated Securities |
| | | | | | | |
$128,157,689 | | $37,640,992 | | $38,056,250 | | $(415,258) |
| | |
|
| |
| | |
| The Motley Fool Funds Trust | | 69 |
| | | | | | |
Epic Voyage Fund | | | | | | |
| | | | | | | |
| Federal Tax Cost | | Net Unrealized Appreciation (Depreciation) | | Appreciated Securities | | Depreciated Securities |
| | | | | | | |
$34,765,963 | | $5,396,672 | | $5,929,887 | | $(533,215) |
The differences between book basis and tax basis unrealized appreciation is attributable primarily to the deferral of losses on wash sales and cumulative basis adjustments for partnerships and PFICs.
At October 31, 2013, capital contributions, accumulated undistributed net investment income, and accumulated net realized gain (loss) from investments have been adjusted for current period permanent book/tax differences which arose principally from differing book/tax treatments of amortization of deferred organization costs, foreign currency transactions, and investments in partnerships and PFICs. The following amounts were reclassified within the capital accounts for the Independence Fund:
| | | | |
| | |
Independence Fund | | | | |
| | | | | |
| Paid in Capital | | Accumulated Undistributed Income | | Accumulated Net Realized Gain (Loss) on Investments |
| | | | | |
— | | $(19,012) | | $19,012 |
| | | | |
| | |
Great America Fund | | | | |
| | | | | |
| Paid in Capital | | Accumulated Undistributed Income | | Accumulated Net Realized Gain (Loss) on Investments |
| | | | | |
— | | $444,463 | | $(444,463) |
| | | | |
| | |
Epic Voyage Fund | | | | |
| | | | | |
| Paid in Capital | | Accumulated Undistributed Income | | Accumulated Net Realized Gain (Loss) on Investments |
| | | | | |
$(71) | | $(14,890) | | $14,961 |
| | |
|
| |
| | |
| 70 | | The Motley Fool Funds Trust |
Management has analyzed the Funds’ tax positions and has concluded that no provision for income tax is required in the financial statements. The Funds are not aware of any tax positions for which it is reasonably possible that the total amounts of unrecognized tax benefits will significantly change in the next twelve months. However, management’s conclusions may be subject to review and adjustment at a later date based on certain factors including, but not limited to, further implementation guidance from the FASB, new tax laws, regulations, and administrative interpretations (including court decisions).
9. Subsequent Events:
Subsequent events have been evaluated through the date that the financial statements were issued. All subsequent events determined to be relevant and material to the financial statements have been appropriately recorded or disclosed.
| | |
|
| |
| | |
| The Motley Fool Funds Trust | | 71 |
Report of Independent Registered Public Accounting Firm
To the Shareholders and Board of Trustees
of Motley Fool Funds Trust
We have audited the accompanying statement of assets and liabilities of Motley Fool Independence Fund, Motley Fool Great America Fund and Motley Fool Epic Voyage Fund, the “Funds,” each a series of The Motley Fool Funds Trust, including the schedules of investments, as of October 31, 2013, and the related statements of operations for the year then ended, the statements of changes in net assets for each of the two years in the period then ended and the financial highlights for each of the three years in the period then ended, with respect for Motley Fool Epic Voyage Fund the financial highlights for each of the two years in the period then ended. These financial statements and financial highlights are the responsibility of the Funds’ management. Our responsibility is to express an opinion on these financial statements and financial highlights based on our audits. The financial highlights for the periods prior to October 31, 2011 have been audited by other auditors, whose report dated December 22, 2010 expressed an unqualified opinion on such financial highlights.
We conducted our audits in accordance with the standards of the Public Company Accounting Oversight Board (United States). Those standards require that we plan and perform the audit to obtain reasonable assurance about whether the financial statements and financial highlights are free of material misstatement. The Funds are not required to have, nor were we engaged to perform, an audit of their internal control over financial reporting. Our audit included consideration of internal control over financial reporting as a basis for designing audit procedures that are appropriate in the circumstances, but not for the purpose of expressing an opinion on the effectiveness of the Funds’ internal control over financial reporting. Accordingly, we express no such opinion. An audit includes examining, on a test basis, evidence supporting the amounts and disclosures in the financial statements. Our procedures included confirmation of securities owned as of October 31, 2013, by correspondence with the custodian and brokers or by other appropriate auditing procedures where replies from brokers were not received. An audit also includes assessing the accounting principles used and significant estimates made by management, as well as evaluating the overall financial statement presentation. We believe that our audits provide a reasonable basis for our opinion.
In our opinion, the financial statements and financial highlights referred to above present fairly, in all material respects, the financial position of Motley Fool Independence Fund, Motley Fool Great America Fund and Motley Fool Epic Voyage Fund as of October 31, 2013, the results of their operations for the year then ended, the changes in their net assets and the financial highlights for the periods indicated above, in conformity with accounting principles generally accepted in the United States of America.
TAIT, WELLER & BAKER LLP
| | |
| Philadelphia, Pennsylvania | | |
| December 18, 2013 | | |
| | |
|
| |
| | |
| 72 | | The Motley Fool Funds Trust |
Notice to Shareholders (Unaudited)
Tax Information
All reportings are based on financial information available as of the date of this annual report and, accordingly, are subject to change. For each item, it is the intention of the Fund to report the maximum amount permitted under the Internal Revenue Code and the regulations thereunder.
For the period ended October 31, 2013, each Fund reported a portion of its distributions as follows:
| | | | | | | | | | |
Motley Fool Independence Fund | | | | | | | | |
| | |
Qualified Dividend Income | | Dividends Received Deduction | | Foreign Source Income | | Foreign Tax Credit | | Return of Capital | |
| | |
| | | | |
$1,588,159 | | $1,067,347 | | — | | — | | | — | |
| | | | |
| | | | | | | | |
| | |
Qualified Dividend Income (QDI) | | | | | | | 100.00 | % |
Dividends Received Deduction (DRD) | | | | | | | 67.21 | % |
| |
Motley Fool Great America Fund | | | | | | | | |
| | |
Qualified Dividend Income | | Dividends Received Deduction | | Foreign Source Income | | Foreign Tax Credit | | Return of Capital | |
| | |
| | | | |
$163,061 | | $163,061 | | — | | — | | | — | |
| | | | |
| | | | | | | | |
| | |
Qualified Dividend Income (QDI) | | | | | | | 100.00 | % |
Dividends Received Deduction (DRD) | | | | | | | 100.00 | % |
| |
Motley Fool Epic Voyage Fund | | | | | | | | |
| | |
Qualified Dividend Income | | Dividends Received Deduction | | Foreign Source Income | | Foreign Tax Credit | | Return of Capital | |
| | |
| | | | |
$251,960 | | — | | $619,201 | | $23,138 | | | — | |
| | | | |
| | | | | | | | |
| | |
Qualified Dividend Income (QDI) | | | | | | | 86.93 | % |
Dividends Received Deduction (DRD) | | | | | | | — | |
| | |
|
| |
| | |
| The Motley Fool Funds Trust | | 73 |
Information on Proxy Voting
The Trust’s proxy voting guidelines used to determine how to vote proxies relating to portfolio securities and information regarding how the Trust voted proxies relating to portfolio securities of the Fund during the most recent 12-month period ended June 30 is available (i) without charge, upon request, by calling (888) 863-8803; (ii) on the U.S. Securities and Exchange Commission’s (“SEC”) website at http://www.sec.gov; and (iii) on the Fund’s website at http://www.FoolFunds.com.
Quarterly Schedule of Investments
The Trust provides a complete list of the Fund’s holdings four times in each fiscal year and at the quarter-ends. For the second and fourth quarters, the Portfolio of Investments appears in the semiannual and annual reports to shareholders. For the first and third quarters, the Trust files the Portfolio of Investments with the SEC on Form N-Q. Shareholders can obtain the Form N-Q (i) without charge, upon request, by calling (888) 863-8803; (ii) on the SEC’s website at http://www.sec.gov; and (iii) on the Fund’s website at http://www.FoolFunds.com. The Form N-Q may be reviewed or copied at the SEC Public Reference Room in Washington, D.C. Information on the operation of the Public Reference Room may be obtained by calling (800) SEC-0330.
| | |
|
| |
| | |
| 74 | | The Motley Fool Funds Trust |
The Motley Fool Funds Trust Privacy Notice
What Does Motley Fool Funds Trust Do With Your Personal Information?
Why?: Financial companies choose how they share your personal information. Federal law gives consumers the right to limit some but not all sharing. Federal law also requires us to tell you how we collect, share, and protect your personal information. Please read this notice carefully to understand what we do.
What?: The type of personal information we collect and share depend on the product of service you have with us. This information can include:
| | — | | Social Security number and transaction history |
| | — | | Account balances and checking account information |
| | — | | Account transactions and wire transfer instructions |
When you are no longer a customer, we continue to share your information as described in this notice.
How?: All financial companies need to share customers’ personal information to run their everyday business. In the section below, we list the reasons financial companies can share their customers’ personal information; the reasons The Motley Fool Funds Trust chooses to share; and whether you can limit this sharing.
| | | | |
| | | |
Reasons we share your personal information | | Does the Motley Fool Funds Trust share? | | Can you limit this sharing? |
| | | | | |
For our everyday business purposes —
such as to process your transaction, maintain your account(s), provide you with necessary information, respond to court orders and legal investigation, or report to credit bureaus | | Yes | | No |
For our marketing purposes —
to offer our products and services to you | | Yes | | Yes |
For joint marketing with other financial companies | | No | | We don’t share |
For our affiliates’ everyday business purposes —
information about your transactions and experiences | | Yes | | No |
For our affiliates’ everyday business purposes —
information about your creditworthiness | | No | | We don’t share |
For our affiliates to market to you | | Yes | | Yes |
For nonaffiliates to market to you | | No | | We don’t share |
To limit our sharing:
| | — | | Visit us online: http://signup.foolfunds.com/marketing/ |
SubscriptionManagement.aspx
| | |
|
| |
| | |
| The Motley Fool Funds Trust | | 75 |
Please note:
If you are a new customer, we can begin sharing your information 30 days from the days from the date we sent this notice. When you are no longer our customer, we continue to share your information as described in this notice.
However, you can contact us at any time to limit our sharing.
Questions: Call 1-888-863-8803 or go to www.FoolFunds.com
What we do:
How does The Motley Fool Funds Trust protect my personal information?
To protect your personal information from unauthorized access and use, we use security measures that comply with federal law. These measures include physical, electronic, and procedural safeguards, including encryption, authentication and secured buildings and files.
How does The Motley Fool Funds Trust collect my personal information?
We collect your personal information, for example, when you
| | • | | open an account or provide account information |
| | • | | make deposits or withdrawals from your account |
| | • | | make a wire transfer or tell us where to send the money |
We also collect your personal information from other companies.
Why can’t I limit all sharing?
Federal law gives you the right to limit only
| | • | | sharing for affiliates’ everyday business purposes — information about your creditworthiness |
| | • | | make deposits or withdrawals from your account |
| | • | | sharing for nonaffiliates to market to you |
State laws and individual companies may give you additional rights to limit sharing.
What happens when I limit sharing for an account I hold jointly with someone else?
Your choices will apply to everyone on your account.
Definitions:
Affiliates - Companies related by common ownership or control. They can be financial and nonfinancial companies.
Our affiliates include companies with a Motley Fool name; financial companies such as Motley Fool Asset Management, LLC; and nonfinancial companies such as The Motley Fool, LLC and The Motley Fool Holdings, Inc.
Nonaffiliates - Companies not related by common ownership or control. They can be financial and nonfinancial companies.
The Motley Fool Funds Trust does not share with nonaffiliates so they can market to you.
Joint marketing - A formal agreement between nonaffiliated financial companies that together market financial products or services to you.
The Motley Fool Funds Trust doesn’t jointly market.
| | |
|
| |
| | |
| 76 | | The Motley Fool Funds Trust |
Directors and Officers
| | | | | | | | | | |
NAME, ADDRESS,
AND AGE (1) | | POSITION(S)
HELD WITH
THE TRUST | | TERM OF
OFFICE AND
LENGTH OF TIME
SERVED (2) | | PRINCIPAL OCCUPATIONS DURING PAST FIVE YEARS | | NUMBER OF
PORTFOLIOS IN
FUND COMPLEX OVERSEEN
BY TRUSTEE | | OTHER
DIRECTORSHIPS HELD BY
TRUSTEE |
| |
| | | | | | | INDEPENDENT TRUSTEES | | | | |
Kathleen A. O’Neil
61 | | Trustee | | Since
March, 2009 | | President/CEO, Liberty Street Advisors (consultancy); Director, BMC Software, Guidance Software, MetLife Bank, N.A., John Carroll University (1999 to 2008) | | 3 | | None |
Stephen L. Boyd
72 | | Trustee | | Since
March, 2009 | | None | | 3 | | None |
Carl G. Verboncoeur
60 | | Trustee | | Since
July, 2012 | | Self-employed consultant since 2009; Chief Executive Officer, Rydex Investments (2003-2009) | | 3 | | SPDR Series
Trust(Trustee);
SPDR Index
Shares
Funds(Trustee);
SSgA Active
ETF
Trust(Trustee);
SSgA Master
Trust(Trustee) |
| | | | | | | INTERESTED TRUSTEES AND OFFICERS | | | | |
Peter E. Jacobstein(3)
48 | | Trustee
President | | Since
November, 2008 | | President, Motley Fool Asset Management, LLC; SVP, The Motley Fool, Inc. (financial publishing) | | 3 | | None |
Philip J. Biedronski, Jr.
46 | | Treasurer | | Since
September, 2011 | | Controller & Treasurer, The Motley Fool Holdings, Inc. (and its predecessor, The Motley Fool, Inc.) (financial publishing) | | N/A | | N/A |
Lawrence T. Greenberg
50 | | Vice President
Secretary | | Since
March, 2009 | | SVP and Chief Legal Officer, The Motley Fool Holdings, Inc. (and its predecessor, The Motley Fool, Inc.) (financial publishing). Adjunct professor, Washington College of Law, American University, 2006-present, Director, Fool/Love Money.com Financial Services, Ltd. (U.K. mortgage adviser) (2008 to 2009), Lovemoney. com, Ltd. (U.K. financial information site) (2009 to 2009). Director, The Motley Fool Australia Pty Ltd. (financial publishing) (2010-present). Director, The Motley Fool Canada, ULC (2012-present). Director, The Motley Fool Singapore PTE LTD (2012-present). Manager, Motley Fool Financial Planning (January 2013-present). | | N/A | | N/A |
Salvatore Faia
50 | | Chief
Compliance
Officer | | Since
March, 2009 | | President, Vigilant Compliance LLC since 2004; and Director of EIP Growth and Income Fund since 2005 | | N/A | | N/A |
| (1) | Each Trustee can be contacted by writing to The Motley Fool Funds Trust, 2000 Duke Street, Suite 175, Alexandria, VA 22314. |
| (2) | Each Trustee holds office until the next meeting of shareholders at which Trustees are elected (or otherwise appointed) and serve until his or her successor has been elected or qualified. |
| (3) | Mr. Jacobstein is an “interested person” (as defined by the 1940 Act) of the Trust. Mr. Jacobstein is the President and Chairman of the Adviser. |
For more information regarding the trustees and officers, please refer to the Statement of Additional Information, which is available, without charge, upon request by calling (888) 863-8803 or visiting www.www.FoolFunds.com.
| | |
|
| |
| | |
| The Motley Fool Funds Trust | | 77 |
Investment Adviser
Motley Fool Asset Management, LLC
2000 Duke Street
Suite 175
Alexandria, VA 22314
Administrator and Transfer Agent
BNY Mellon Investment Servicing (US) Inc.
P.O. Box 9780
Providence, RI 02940-9780
Custodian
The Bank of New York Mellon
One Wall Street
New York, NY 10286
Independent Registered Public Accounting Firm
Tait, Weller & Baker, LLP
1818 Market Street, Suite 2400
Philadelphia, PA 19103
Distributor
Foreside Funds Distributors LLC
899 Cassatt Road
400 Berwyn Park, Suite 110
Berwyn, PA 19312
Legal Counsel
Bingham McCutchen LLP
2020 K Street NW
Washington, DC 20006-1806
| | |
|
| |
| | |
| 78 | | The Motley Fool Funds Trust |
Motley Fool Funds
Guiding Principles
At Motley Fool Funds, we aim to get right what we believe much of the fund industry gets wrong. 0ur approach all begins with a shareholder-centric philosophy that we think is unique.
1
We are — and will remain — significant investors with you in Motley Fool Funds.
4
We will invest for the long term. We seek to maximize returns while we minimize business, regulatory, financial, and sovereign risks.
7
We will be advocates on your behalf with company managers and boards, in the interest of enhancing the value of your shares.
2
We will manage your investment in Motley Fool Funds as if it were our own.
5
We will not impose loads or 12b-1 charges, and we will apply redemption fees only to discourage the short-term trading that can hurt all of a Fund’s investors.
8
We will communicate with our shareholders as clearly and candidly as possible.
3
We will keep our financial incentives aligned with those of our shareholders.
6
We will recognize that one of our most powerful analytical weapons is the phrase “I don’t know.” In that spirit, we will constantly review our successes and mistakes and remain passionate about learning.

To stay up-to-date with your Motley Fool Fund, please be sure to join Bill Mann’s Declarations newsletter at:www.FoolFunds.com.

Item 2. Code of Ethics.
| | (a) | The registrant, as of the end of the period covered by this report, has adopted a code of ethics that applies to the registrant’s principal executive officer, principal financial officer, principal accounting officer or controller, or persons performing similar functions, regardless of whether these individuals are employed by the registrant or a third party. |
| | (c) | There have been no amendments, during the period covered by this report, to a provision of the code of ethics that applies to the registrant’s principal executive officer, principal financial officer, principal accounting officer or controller, or persons performing similar functions, regardless of whether these individuals are employed by the registrant or a third party, and that relates to any element of the code of ethics description. |
| | (d) | The registrant has not granted any waivers, including an implicit waiver, from a provision of the code of ethics that applies to the registrant’s principal executive officer, principal financial officer, principal accounting officer or controller, or persons performing similar functions, regardless of whether these individuals are employed by the registrant or a third party, that relates to one or more of the items set forth in paragraph (b) of this item’s instructions. |
Item 3. Audit Committee Financial Expert.
As of the end of the period covered by the report, the Registrant’s board of trustees has determined that Carl G. Verboncoeur and Kathleen A. O’Neil are qualified to serve as audit committee financial experts serving on its audit committee and that each of them is “independent,” as defined by Item 3 of Form N-CSR.
Item 4. Principal Accountant Fees and Services.
Audit Fees
| | (a) | The aggregate fees billed for each of the last two fiscal years for professional services rendered by the principal accountant for the audit of the registrant’s annual financial statements or services that are normally provided by the accountant in connection with statutory and regulatory filings or engagements for those fiscal years are $47,400 for 2013 and $46,200 for 2012. |
Audit-Related Fees
| | (b) | The aggregate fees billed in each of the last two fiscal years for assurance and related services by the principal accountant that are reasonably related to the performance of the audit of the registrant’s financial statements and are not reported under paragraph (a) of this Item are $0 for 2013 and $0 for 2012. |
Tax Fees
| | (c) | The aggregate fees billed in each of the last two fiscal years for professional services rendered by the principal accountant for tax compliance, tax advice, and tax planning are $9,600 for 2013 and $9,300 for 2012. Services provided were for review of federal and state tax returns. |
All Other Fees
| | (d) | The aggregate fees billed in each of the last two fiscal years for products and services provided by the principal accountant, other than the services reported in paragraphs (a) through (c) of this Item are $0 for 2013 and $0 for 2012. |
(e)(1) The audit committee’s pre-approval policies and procedures:
Pursuant to Registrant’s Audit Committee Charter (the “Charter”), the Audit Committee is responsible for pre-approving any engagement of the auditor to provide audit and non-audit services to the Registrant. The Audit Committee is also responsible for pre-approving non-audit services provided by the auditor to the Adviser or any Motley Fool Affiliate that provides ongoing services to the Trust if the engagement relates directly to the operations and financial reporting of the Trust.
The Audit Committee may form one or more subcommittees (which may consist of one or more Audit Committee members), and may delegate to any such committee or to the Chair of the Audit Committee any portion of its authority, including the authority to pre-approve audit and permitted non-audit services, as it deems appropriate from time to time. Any decision of a subcommittee or of the Chair to pre-approve audit or non-audit services shall be presented to the Audit Committee at its next regularly scheduled meeting.
| | (e)(2) | The percentage of services described in each of paragraphs (b) through (d) of this Item that were approved by the audit committee pursuant to paragraph (c)(7)(i)(C) of Rule 2-01 of Regulation S-X are as follows: |
(b) Not Applicable
(c) 100%
(d) Not Applicable
Item 5. Audit Committee of Listed Registrants.
Not applicable.
Item 6. Investments.
| (a) | Schedule of Investments in securities of unaffiliated issuers as of the close of the reporting period is included as part of the report to shareholders filed under Item 1 of this form. |
| Item 7. | Disclosure of Proxy Voting Policies and Procedures for Closed-End Management Investment Companies. |
Not applicable.
Item 8. Portfolio Managers of Closed-End Management Investment Companies.
Not applicable.
| Item 9. | Purchases of Equity Securities by Closed-End Management Investment Company and Affiliated Purchasers. |
Not applicable.
Item 10. Submission of Matters to a Vote of Security Holders.
Not Applicable.
Item 11. Controls and Procedures.
| | (a) | The registrant’s principal executive and principal financial officers, or persons performing similar functions, have concluded that the registrant’s disclosure controls and procedures (as defined in Rule 30a-3(c) under the Investment Company Act of 1940, as amended (the “1940 Act”) (17 CFR 270.30a-3(c))) are effective, as of a date within 90 days of the filing date of the report that includes the disclosure required by this paragraph, based on their evaluation of these controls and procedures required by Rule 30a-3(b) under the 1940 Act (17 CFR 270.30a-3(b)) and Rules 13a-15(b) or 15d-15(b) under the Securities Exchange Act of 1934, as amended (17 CFR 240.13a-15(b) or 240.15d-15(b)). |
| | (b) | There were no changes in the registrant’s internal control over financial reporting (as defined in Rule 30a-3(d) under the 1940 Act (17 CFR 270.30a-3(d)) that occurred during the registrant’s second fiscal quarter of the period covered by this report that has materially affected, or is reasonably likely to materially affect, the registrant’s internal control over financial reporting. |
| | (a)(1) | Code of ethics, or any amendment thereto, that is the subject of disclosure required by Item 2 is attached hereto. |
| | (a)(2) | Certifications pursuant to Rule 30a-2(a) under the 1940 Act and Section 302 of the Sarbanes-Oxley Act of 2002 are attached hereto. |
| | (b) | Certifications pursuant to Rule 30a-2(b) under the 1940 Act and Section 906 of the Sarbanes-Oxley Act of 2002 are attached hereto. |
(12.other) Not applicable.
SIGNATURES
Pursuant to the requirements of the Securities Exchange Act of 1934 and the Investment Company Act of 1940, the registrant has duly caused this report to be signed on its behalf by the undersigned, thereunto duly authorized.
| | |
(Registrant) | | The Motley Fool Funds Trust |
| | |
By (Signature and Title)* | | /s/ Peter E. Jacobstein |
| | Peter E. Jacobstein, President |
| | (principal executive officer) |
Pursuant to the requirements of the Securities Exchange Act of 1934 and the Investment Company Act of 1940, this report has been signed below by the following persons on behalf of the registrant and in the capacities and on the dates indicated.
| | |
By (Signature and Title)* | | /s/ Peter E. Jacobstein |
| | Peter E. Jacobstein, President |
| | (principal executive officer) |
| | |
By (Signature and Title)* | | /s/ Philip J. Biedronski |
| | Philip J. Biedronski, Treasurer |
| | (principal financial officer) |
* Print the name and title of each signing officer under his or her signature.