UNITED STATES
SECURITIES AND EXCHANGE COMMISSION
Washington, D.C. 20549
FORM N-CSR
CERTIFIED SHAREHOLDER REPORT OF REGISTERED
MANAGEMENT INVESTMENT COMPANIES
Investment Company Act file number 811-22264
The Motley Fool Funds Trust
(Exact name of registrant as specified in charter)
Motley Fool Asset Management, LLC
2000 Duke Street, Suite 175
Alexandria, VA 22314
(Address of principal executive offices) (Zip code)
Peter E. Jacobstein
Motley Fool Asset Management, LLC
2000 Duke Street, Suite 175
Alexandria, VA 22314
(Name and address of agent for service)
Registrant’s telephone number, including area code: (703) 302-1100
Date of fiscal year end: October 31
Date of reporting period: April 30, 2011
Form N-CSR is to be used by management investment companies to file reports with the Commission not later than 10 days after the transmission to stockholders of any report that is required to be transmitted to stockholders under Rule 30e-1 under the Investment Company Act of 1940 (17 CFR 270.30e-1). The Commission may use the information provided on Form N-CSR in its regulatory, disclosure review, inspection, and policymaking roles.
A registrant is required to disclose the information specified by Form N-CSR, and the Commission will make this information public. A registrant is not required to respond to the collection of information contained in Form N-CSR unless the Form displays a currently valid Office of Management and Budget (“OMB”) control number. Please direct comments concerning the accuracy of the information collection burden estimate and any suggestions for reducing the burden to Secretary, Securities and Exchange Commission, 100 F Street, NE, Washington, DC 20549. The OMB has reviewed this collection of information under the clearance requirements of 44 U.S.C. § 3507.
Item 1. Reports to Stockholders.
The Report to Shareholders is attached herewith.

 Hello, and welcome to the semiannual report. Throughout, the Funds have included comments to help you understand the semiannual report, teach you some things to look for in a fund, and to make you chuckle, a little. Our investment adviser is an affiliate of The Motley Fool, LLC (The Motley Fool), a publisher of investment information and analysis. Like The Motley Fool, our goal is to educate, amuse, and enrich you. Don’t forget to visit www.foolfunds.com and sign up for our e-newsletter Declarations, featuring Bill Mann’s monthly Letter to Shareholders.
TABLE OF CONTENTS
This report has been prepared for shareholders of Motley Fool Independence Fund and Motley Fool Great America Fund. It is not authorized for distribution to prospective investors unless accompanied or preceded by a current prospectus, which contains more complete information about the Funds. Investors are reminded to read the prospectus carefully before investing. Past performance is no guarantee of future results. Share prices will fluctuate and there may be a gain or loss when shares are redeemed. Fund shares are distributed by BNY Mellon Distributors Inc., 760 Moore Rd., King of Prussia, PA
19406.
Letter to Shareholders
| | |

Portfolio Manager Bill Mann | | Reality is a very effective teacher. – Robert M. Gates |
| | Dear Fellow Fool Funds Shareholder: |
| | This semiannual filing marks the first full six month period of operations for the Motley Fool Great America Fund, and the third full six-month period for our oldest fund, the Motley Fool Independence Fund. For the period from November 1, 2010 to April 30, 2011, the GreatAmerica Fund returned 20.1%, as compared to 20.7% for the Russell Midcap Index against which it is benchmarked. The Independence Fund generated returns of 12.5%, versus 15.0% for its benchmark, the MSCI World Index. |
| |
As of April 30, 2011, the Great America Fund holds assets exceeding $50 million, up from zero on November 1, 2010. As of April 30, 2011 the Independence Fund holds $195.1 million versus $131.7 million in assets under management as of November 1, 2010.
Not to mention the locusts…
Here is a set of facts: In the last 6 months we have witnessed:.
| | • | | Massive drought in China’s primary wheat producing region |
| | • | | Unprecedented flooding in Australia |
| | • | | A 6.3 magnitude earthquake in New Zealand |
| | • | | The 9.0 magnitude earthquake in Japan, which spawned… |
| | • | | A devastating tsunami that swept as much as 6 miles inland and… |
| | • | | Caused the largest nuclear accident in more than a generation |
| | • | | A series of revolutions throughout the Middle East that roiled oil supplies, sending… |
| | • | | Oil over $100 per barrel, and causing gasoline prices to spike |
| | • | | Generationally high prices of many commodities, including wheat, corn and cotton |
| | • | | Bailouts of Ireland and Portugal, as well as… |
| | • | | The renewed worry that the 2010 bailout of Greece wasn’t enough to pre- vent default |
| | • | | Gold and silver prices spiking to all-time highs as investors attempt to hide their assets from economic catastrophe |
| | • | | An averted shutdown of the United States government, plus increased stress at nearly every level of government due to fiscal rot |
| | | | |
| The Motley Fool Funds Trust | | | 3 | |
| | • | | U.S. and international un- and underemployment rates that remain stubbornly high |
| | • | | A corporate governance crisis hitting Berkshire Hathaway |
This murderer’s row of a list isn’t a comprehensive detailing of the calamities and tribulations that the world has faced over the last half year. One would think that any number of these items would be enough to send stock markets into a panic. And yet, with the exception of certain markets in Europe and the Middle East, the last 6 months have been extraordinarily strong for many equity markets around the globe.
For the primary reason, we must look back only a little bit farther, to late August 2010, when Federal Reserve Chairman Ben Bernanke announced a second round of quantitative easing, or QE2. Whether this program has been effective is up for debate, but it has certainly lit a fire under the U.S. stock market, something Bernanke stated was a goal of the program. Well played, sir, and thanks for the bodacious party.
If the price is right...
The end result is an investing environment as bizarre as I’ve ever seen. Looking at the U.S. stock market, a major theme has been the outperformance of “growth” companies, commodity and cyclical stocks, which means that, for the most part, small cap companies have performed very, very well. Left behind have been the large-and mega-cap companies, which seem to have missed the investment community’s collective fancy, despite the fact that many of these firms (including ones that we have been buying) now sell at massive discounts to their historical valuations.
Sometimes love is truly where the growth is, and we fully embrace buying rapid growers when we can get them at a discount. “Value” investing isn’t, to us, about statistical measures, it’s all about buying the right companies at the right price. In fact, our absolute favorite investing situations are ones where we believe that a company has an underappreciated growth trajectory in its future. Companies of this type rarely look cheap on a current basis, and can be extremely susceptible to investor fancy should they disappoint even a tiny bit. The truly great growth company, I’ve observed, is a rare phenomenon. Most momentum stocks ultimately disappoint.
Given our unwillingness to participate in folly, I believe that our portfolios have both performed well over this time period. Both the Independence Fund and the Great America Fund ended April with substantial cash positions, a testament to the difficulty we have had of late finding companies that trade at prices we consider compelling. I’ll be honest, I hate holding lots of cash. It’s a pretty pathetic investment, it doesn’t earn anything and it is guaranteed to lose purchasing power
| | | | |
| | 4 | | | The Motley Fool Funds Trust |
over time. But we will not invest in companies unless we find compelling reason to do so, and “we need to deploy all this cash” does not rise to the level of compelling.
When others get greedy...
Presently market valuation tells me that the greed-fear pendulum has swung to the side of greed, but so too does my inbox. Over the last few months, we’ve received a number of emails in our Ask Bill (askbill@foolfunds.com) folder decrying our willingness to own Cisco since the stock has “gone nowhere.” Perhaps we’d be better off having bought stocks that have “gone somewhere,” but I don’t think so. Chasing frothy companies might be much more fun, and it certainly would be easier for us to explain (“LinkedIn is gonna be HUGE!!!”), but to us there’s not much to be gained from taking great risks for the potential of little gain. Instead, we’re willing to do nothing, even if it makes you mad at us for doing something like owning Cisco.
I am not a market forecaster, and I will not do so here, but I note that the investing population’s appetite for risk is temporal in nature. At the moment investors seem to ignore the various risk factors facing companies throughout the globe. At some point this will switch, and risk is all they will consider. In the meantime, we continue our vigilant search in the market’s less well-traveled segments for misunderstood, obscure companies that trade at levels where we have conviction that we’re being well compensated.
All in all, I believe that we have had a good, but not stellar six month period. I firmly believe that our portfolio has been extremely well positioned to weather a prolonged weakness in the market, the kind that the set of events above may have under different conditions brought to bear.
Independence Fund Results
The six months ending April 30 saw the Independence Fund underperform its benchmark, 12.5% versus 15.0%. Several possible reasons for this have been mentioned in the text above, but it’s important to remember that we don’t sweat the short-term movements. As I said in the semiannual report one year ago — following a period of outperformance — “We ask that you pay those results little attention.” Our focus and attention extends beyond these six month blocks. The Independence Fund ended the period with 75 positions, up from 69 on October 31. Consistent with our actions since inception of the Fund, we are not overly concerned with matching our holdings to the MSCI World Index — we hold more Asia and less Europe than our benchmark, and a full 21% of the assets are invested in a dozen countries excluded from the benchmark.
| | | | |
| The Motley Fool Funds Trust | | | 5 | |
Compared to our filing six months ago, we have 17 new positions and 11 that were eliminated. This may sound like a lot of trading, but the core portfolio has been stable. Ten of our Top 11 holdings from six months ago are still among that list (with Arrow Electronics being the sole dropout), and our turnover through the first half of our fiscal year is below 16%. Our new holdings are an eclectic mix including U.S. tech giant Cisco, Indonesian breadmaker Nippon Indosari, Japanese manufacturer Shimano, and Saudi Arabian dairy Almarai.
The best-performing holdings of the past six months include CGG Veritas, Under Armour, Occidental Petroleum, Huron Consulting, and Brasil Foods. Many of our best performers benefitted from rising materials and commodities costs, while others like Under Armour simply continued to defy expectations. In the not-so-good category, we had dismal performance from “household names” like Telkom Indonesia, Cresud, Zhongpin, and Sung Kwang Bend.
Great America Fund Results
As previously mentioned, the Great America Fund completed its first six months with a return of 20.1% compared to returns of 20.7% for the Russell Midcap Index against which Great America is benchmarked. Returns of better than 20% over any six month period are phenomenal on an absolute basis. We expect to see that type of return quite infrequently in this or any other fund we manage. On a relative basis of course, the results were not remarkable – our benchmark slightly surpassed our fund’s results.
Although we ended up in much the same place as the benchmark in the first six months, that’s more coincidence than anything else. With an average of approximately 40 stocks in the fund (a higher number at the end of the six month period than at the beginning), our results will be somewhat more volatile on a daily, weekly or monthly basis than the more diversified index. Also, with a smattering of large cap stocks in the fund (by prospectus, the fund may hold up to 25% of assets in companies larger than mid-cap size), our results will at times differ significantly from the index.
In our first half-year, the best performing holdings included Level 3 Communications, Intuitive Surgical, Horsehead Holding, WellPoint and Range Resources. Unsurprisingly, these companies included a couple materials companies, and a couple health care companies, both very well performing sectors for the time period we’re measuring here. In the laggards category, we held Joe’s Jeans, Kid Brands, Cisco, MannKind and Orion Marine Group. Each of these companies had very company specific reasons (as the very poorest performers in any group of stocks most often do) for their poor performance.
We finished the half-year with cash being our biggest holding at 15%. We’re not
| | | | |
| | 6 | | | The Motley Fool Funds Trust |
happy holding cash, but as the market has experienced slightly negative returns from the end of January through the beginning of June (when this is being written), holding onto a higher level of cash than will usually be the case hasn’t been a bad choice. It may interest you to know that as prices came down after the end of April, we have been able to find more good uses for our cash than was the case in March and April.
As always, we promise to continue to do our best for you, and my team and I thank you for your faith in us.
Foolish best,

P.S. - Sign up for monthly updates from Bill Mann, plus performance information and top holdings, by visiting www. foolfunds.com and subscribing to our free e-newsletter, Declarations.
The Letter to Shareholders seeks to describe some of the Adviser’s current opinions and views of the financial markets. Although the Adviser believes it has a reasonable basis for any opinions or views expressed, actual results may differ, sometimes significantly so, from those expected or expressed. The securities held by the Fund that are discussed in the Letter to Shareholders were held during the period covered by the Annual Report. They do not comprise the entire investment portfolio of the Fund, may be sold at any time and may no longer be held by the Fund. The opinions of the Adviser with respect to those securities may change at any time.
| | | | |
| The Motley Fool Funds Trust | | | 7 | |
Motley Fool Independence Fund Portfolio Characteristics (Unaudited)
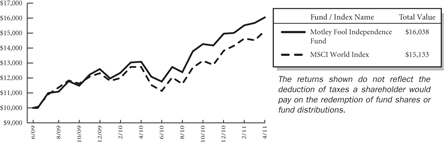
At April 30, 2011, the Motley Fool Independence Fund (the “Fund”) had an unaudited net asset value of $15.62 per share attributed to 12,607,563 shares outstanding. This compares with an unaudited net asset value as of June 16, 2009 of $10.00 per share attributed to 100,000 shares outstanding. From the Fund’s launch on June 16, 2009 to April 30, 2011 the Fund had an annualized total return of 28.72% versus a return of 24.78% over the same period for its benchmark, MSCI World Index. The graph below shows the performance of $10,000 invested in the Fund at inception. The returns shown below do not reflect the deduction of taxes that a shareholder would pay on fund distributions or the redemption of fund shares or fund distributions.
Average Annual Total Retuns as of 04/30/2011
| | | | | | | | |
| | | Fund* | | | Benchmark** | |
One Year | | | 22.56 | % | | | 18.87 | % |
Since Inception | | | 28.72 | % | | | 24.78 | % |
Inception Date | | | 06/16/2009 | | | | | |
Total Annual Fund Operating Expenses Before Expense Limitation (February 28, 2011 Prospectus) | | | 2.20 | % | | | | |
The performance data quoted represents past performance and does not guarantee future results. Current performance may be lower or higher. Performance data current to the most recent month-end may be obtained at www.foolfunds.com. The investment return and principal value of an investment will fluctuate so that shares, when redeemed, may be worth more or less than their original cost.
| * | These returns reflect expense waivers by the Fund’s investment adviser. Without these waivers, returns would have been lower. |
| ** | The MSCI World Index is a free float-adjusted market capitalization weighted index that is designed to measure the equity market performance of developed markets. The MSCI World Index consists of the following 24 developed market country indices: Australia, Austria, Belgium, Canada, Denmark, Finland, France, Germany, Greece, Hong Kong, Ireland, Israel, Italy, Japan, Netherlands, New Zealand, Norway, Portugal, Singapore, Spain, Sweden, Switzerland, the United Kingdom, and the United States. The MSCI World Index is not available for direct investment. The Fund may invest in countries that are not included within the MSCI World Index (such as emerging market countries) and its investment portfolio is not weighted in terms of countries or issuers the same as the MSCI World Index. For this reason, the Fund’s investment performance should not be expected to track, and may exceed or trail, the MSCI World Index. Since Inception returns for the Benchmark reflect the performance based on the Inception Date of the Fund. |
| | | | |
| | 8 | | | Motley Fool Independence Fund |
The investment objective of the Independence Fund is to achieve long-term capital appreciation. The Fund pursues this objective by investing primarily in common stocks of companies located anywhere in the world. The Fund invests in areas of the market that, in the view of Motley Fool Asset Management, LLC (the “Adviser”), offer the greatest potential for long-term capital appreciation. The Fund may invest in other types of securities and in other asset classes when, in the judgment of the Adviser, such investments offer attractive potential returns. As such, the Fund’s performance will deviate significantly from its benchmark from time to time. It is the view of the Adviser that this deviation is less meaningful over shorter time frames and is more relevant over multi-year periods.
Because the Independence Fund is free to invest in companies of any size around the world, at times, the Fund may be heavily invested in small-cap stocks and foreign securities, each of which presents extra risk. Small-cap stocks tend to be more volatile and less liquid than their large-cap counterparts. Fluctuations in currency exchange rates can cause losses when investing in foreign securities, with emerging markets presenting additional risks of illiquidity, political instability, and lax regulation. You are strongly encouraged to read more about the Fund’s strategies and risks in the prospectus.
The Independence Fund invests in securities of companies the Adviser believes are undervalued. Unlike mutual funds that are constrained by a style-box, the Fund may invest in any company, country, market, industry or sector where the Adviser’s analysis suggests that there is opportunity for gains that outweigh risks. In identifying investments for the Fund, the Adviser looks for companies it believes the market has irrationally undervalued and looks for companies that have high-quality businesses with strong market positions, manageable leverage, and robust streams of free cash flow. The following tables show the top 11 holdings and top 10 sectors and countries in which the Fund was invested as of April 30, 2011. Portfolio holdings are subject to change without notice.
Certain mutual fund ratings and review services have created style boxes, which look more or less like a tic-tac-toe board; arranging funds by the size of the companies they typically invest in (large-, mid-, and small-cap) along one axis, and along a “value” to “growth” basis on the other axis. This may be a helpful way – at times – to think about certain investment opportunities, but we don’t believe we’ll improve your returns by limiting ourselves to any one portion of that style box.
| | | | |
Top Eleven Holdings* | | % of Net
Assets | |
POSCO | | | 3.95 | % |
WellPoint, Inc. | | | 3.54 | |
Telefonica SA | | | 3.26 | |
Zhongpin, Inc. | | | 2.38 | |
Lukoil OAO | | | 2.27 | |
Loews Corp. | | | 2.21 | |
Sung Kwang Bend Co., Ltd. | | | 2.18 | |
Yum! Brands, Inc. | | | 2.02 | |
Annaly Capital Management, Inc. | | | 1.99 | |
Becton, Dickinson and Co. | | | 1.92 | |
Innophos Holdings, Inc. | | | 1.91 | |
| | | | |
| | | 27.63 | % |
| | | | |
| * | As of the date of the report the fund had a holding of 7.62% in the BNY Mellon Cash Reserve Fund. |
| | | | |
| Motley Fool Independence Fund | | | 9 | |
The Motley Fool Independence Fund has begun using the Global Industry Classification StandardSM (“GICS SM”) as the basis for the classification of securities on the Schedule of Investments (“SOI”).We believe that this change makes the SOI classifications more standard with the rest of the industry. This change in classification method does not impact the values of the securities, the Net Assets of the Fund, or the value of the shares outstanding.
| | | | |
Top Ten Sectors | | % of Net
Assets | |
Financials | | | 16.53 | % |
Consumer Staples | | | 14.68 | |
Health Care | | | 11.19 | |
Information Technology | | | 10.73 | |
Industrials | | | 8.37 | |
Materials | | | 8.12 | |
Telecommunication Services | | | 6.66 | |
Utilities | | | 5.44 | |
Energy | | | 5.09 | |
Consumer Discretionary | | | 4.75 | |
| | | | |
| | | 91.56 | % |
| | | | |
| | | | |
Top Eleven Countries | | % of Net
Assets | |
United States* | | | 43.66 | % |
South Korea | | | 7.35 | |
Hong Kong | | | 3.47 | |
Japan | | | 3.47 | |
Spain | | | 3.26 | |
Bermuda | | | 2.70 | |
United Kingdom | | | 2.68 | |
France | | | 2.65 | |
China | | | 2.38 | |
Russia | | | 2.28 | |
Indonesia | | | 1.70 | |
| | | | |
| | | 75.60 | % |
| | | | |
| * | As of the date of the report the fund had a holding of 7.62% in the BNY Mellon Cash Reserve Fund. |
| | | | |
| | 10 | | | Motley Fool Independence Fund |
About Your Expenses (Unaudited)
As a shareholder of the Independence Fund, you incur ongoing costs, including advisory fees and other Fund expenses. This example is intended to help you to understand your ongoing costs (in dollars) of investing in the Fund and to compare these costs with the ongoing costs of investing in other mutual funds. It is based on an investment of $1,000 invested at the beginning of the period and held for the entire period from November 1, 2010 to April 30, 2011.
Actual Expenses
The first section of the table below provides information about actual account values and actual expenses. You may use the information in this section, together with the amount you invested, to estimate the expenses that you incurred over the period. Simply divide your account value by $1,000 (for example, an $8,600 account value divided by $1,000 = 8.6), then multiply the result by the number in the first section under the heading entitled “Expenses Paid During Period” to estimate the expenses attributable to your investment during this period.
Hypothetical Example for Comparison Purposes
The second section of the table below provides information about hypothetical account values and hypothetical expenses based on the Independence Fund’s actual expense ratio and an assumed rate of return of 5% per year before expenses, which is not the Fund’s actual return. Thus, you should not use the hypothetical account values and expenses to estimate the actual ending account balance or your expenses for the period. Rather, these figures are provided to enable you to compare the ongoing costs of investing in the Fund as compared to the costs of investing in other funds. To do so, compare this 5% hypothetical example with the 5% hypothetical examples that appear in the shareholder reports of the other funds. Please note that the expenses shown in the table are meant to highlight your ongoing costs only. Therefore, the second section of the table is useful in comparing ongoing costs only and will not help you determine the relative total costs of owning different funds.
Do you know how many times a fund, or the market, has returned a smooth 5% over a long period of time? Never. But we have to pick some example. In reality, the market’s returns are always far bumpier, with the market returning 20% one year, followed by a loss of 10% the next year, followed by a 3% gain, etc. These variations affect actual expenses as well. Happily, over almost all time periods of 20 years or longer, according to the research of University of Pennsylvania’s Jeremy Siegel and others, the domestic market’s returns have been at least 5% per year on average.
| | | | | | | | | | | | | | | | |
| | | Beginning
Account
Value
11/01/10 | | | Ending
Account
Value
04/30/11 | | | Annualized
Expense
Ratio(1) | | | Expenses
Paid
During
Period(2) | |
Actual | | $ | 1,000 | | | $ | 1,125.00 | | | | 1.42 | % | | $ | 7.48 | |
Hypothetical | | $ | 1,000 | | | $ | 1,017.75 | | | | 1.42 | % | | $ | 7.10 | |
| (1) | These ratios reflect expenses waived by the Fund’s investment Adviser. Without these Waivers, the Fund’s expenses would have been higher and the ending account values would have been lower. |
| (2) | Expenses are equal to the Fund’s annualized expense ratio for the period November 1, 2010 to April 30, 2011, multiplied by the average account value over the period, multiplied by the number of days (181) in the most recent fiscal half-year, then divided by 365. |
| | | | |
| Motley Fool Independence Fund | | | 11 | |
The Motley Fool Funds Trust
Motley Fool Independence Fund
Schedule of Investments
at April 30, 2011
(Unaudited)
| | | | | | | | |
Issues | | Shares | | | Value
(Note 2) | |
Equity Securities — 90.55% | | | | | | | | |
Beverages — 0.74% | | | | | | | | |
Diageo PLC (United Kingdom)(a) | | | 17,979 | | | $ | 1,462,951 | |
| | | | | | | | |
Building Products — 2.18% | | | | | | | | |
Sung Kwang Bend Co., Ltd. (South Korea) | | | 260,672 | | | | 4,303,059 | |
| | | | | | | | |
Capital Markets — 0.76% | | | | | | | | |
INTL FCStone, Inc. (United States)* | | | 56,513 | | | | 1,496,464 | |
| | | | | | | | |
Chemicals — 2.81% | | | | | | | | |
Innophos Holdings, Inc. (United States) | | | 81,164 | | | | 3,761,140 | |
Monsanto Co. (United States) | | | 26,218 | | | | 1,783,873 | |
| | | | | | | | |
| | | | | | | 5,545,013 | |
| | | | | | | | |
Commercial Banks — 1.55% | | | | | | | | |
Qatar Islamic Bank (Qatar) | | | 138,050 | | | | 3,057,755 | |
| | | | | | | | |
Commercial Services & Supplies — 0.93% | | | | | | | | |
De La Rue PLC (United Kingdom) | | | 137,400 | | | | 1,826,252 | |
| | | | | | | | |
Communications Equipment — 3.29% | | | | | | | | |
Cisco Systems, Inc. (United States) | | | 195,000 | | | | 3,424,200 | |
Infinera Corp. (United States)* | | | 390,100 | | | | 3,050,582 | |
| | | | | | | | |
| | | | | | | 6,474,782 | |
| | | | | | | | |
Construction & Engineering — 1.34% | | | | | | | | |
KHD Humboldt Wedag International AG (Germany)* | | | 99,586 | | | | 1,030,715 | |
Orion Marine Group, Inc. (United States)* | | | 156,000 | | | | 1,611,480 | |
| | | | | | | | |
| | | | | | | 2,642,195 | |
| | | | | | | | |
Containers & Packaging — 0.65% | | | | | | | | |
Crown Holdings, Inc. (United States)* | | | 34,000 | | | | 1,271,600 | |
| | | | | | | | |
Diversified Financial Services — 1.10% | | | | | | | | |
Hellenic Exchanges SA (Greece) | | | 271,622 | | | | 2,171,735 | |
| | | | | | | | |
Diversified Telecommunication Services — 4.37% | | | | | | | | |
PT Telekomunikasi Indonesia Tbk (Indonesia)(a) | | | 60,174 | | | | 2,174,688 | |
Telefonica SA (Spain)(a) | | | 238,359 | | | | 6,426,159 | |
| | | | | | | | |
| | | | | | | 8,600,847 | |
| | | | | | | | |
See Notes to Financial Statements.
| | | | |
| | 12 | | | Motley Fool Independence Fund |
| | | | | | | | |
Issues | | Shares | | | Value
(Note 2) | |
Equity Securities (continued) | | | | | | | | |
Electric Utilities — 3.20% | | | | | | | | |
Brookfield Infrastructure Partners LP (Bermuda) | | | 119,127 | | | $ | 2,799,484 | |
Entergy Corp. (United States) | | | 17,664 | | | | 1,231,534 | |
Otter Tail Corp. (United States) | | | 58,725 | | | | 1,372,991 | |
Tokyo Electric Power Co., Inc. (Japan) | | | 167,000 | | | | 895,607 | |
| | | | | | | | |
| | | | | | | 6,299,616 | |
| | | | | | | | |
Electronic Equipment & Instruments — 0.55% | | | | | | | | |
Compagnie Industrielle Et Financiere d Ingenierie- Ingenico SA (France) | | | 22,000 | | | | 1,091,728 | |
| | | | | | | | |
Energy Equipment & Services — 0.18% | | | | | | | | |
Cie Generale de Geophysique-Veritas SA (France)*(a) | | | 10,000 | | | | 353,900 | |
| | | | | | | | |
Food & Staples Retailing — 3.30% | | | | | | | | |
Costco Wholesale Corp. (United States) | | | 29,558 | | | | 2,391,833 | |
Olam International Ltd. (Singapore) | | | 1,230,219 | | | | 2,890,135 | |
Wal-Mart de Mexico SAB de CV, Series V (Mexico) | | | 390,098 | | | | 1,219,935 | |
| | | | | | | | |
| | | | | | | 6,501,903 | |
| | | | | | | | |
Food Products — 7.15% | | | | | | | | |
BRF - Brasil Foods SA (Brazil)(a) | | | 132,204 | | | | 2,737,945 | |
Cresud SACIF y A (Argentina)(a) | | | 176,861 | | | | 3,079,150 | |
Nestle SA (Switzerland) | | | 38,694 | | | | 2,401,674 | |
PT Nippon Indosari Corpindo Tbk (Indonesia) | | | 3,528,000 | | | | 1,167,100 | |
Zhongpin, Inc. (China)* | | | 280,892 | | | | 4,690,897 | |
| | | | | | | | |
| | | | | | | 14,076,766 | |
| | | | | | | | |
Health Care Equipment & Supplies — 5.63% | | | | | | | | |
Becton, Dickinson and Co. (United States) | | | 43,950 | | | | 3,777,063 | |
Covidien PLC (Ireland) | | | 36,000 | | | | 2,004,840 | |
Natus Medical, Inc. (United States)* | | | 122,500 | | | | 2,078,825 | |
Nihon Kohden Corp. (Japan) | | | 133,481 | | | | 2,834,782 | |
Zimmer Holdings, Inc. (United States)* | | | 6,000 | | | | 391,500 | |
| | | | | | | | |
| | | | | | | 11,087,010 | |
| | | | | | | | |
Health Care Providers & Services — 3.54% | | | | | | | | |
WellPoint, Inc. (United States) | | | 90,697 | | | | 6,964,623 | |
| | | | | | | | |
Hotels, Restaurants & Leisure — 3.84% | | | | | | | | |
McDonald’s Corp. (United States) | | | 19,177 | | | | 1,501,751 | |
Penn National Gaming, Inc. (United States)* | | | 52,083 | | | | 2,083,841 | |
See Notes to Financial Statements.
| | | | |
| Motley Fool Independence Fund | | | 13 | |
| | | | | | | | |
Issues | | Shares | | | Value
(Note 2) | |
Equity Securities (continued) | | | | | | | | |
Hotels, Restaurants & Leisure (continued) | | | | | | | | |
Yum! Brands, Inc. (United States) | | | 74,132 | | | $ | 3,976,440 | |
| | | | | | | | |
| | | | | | | 7,562,032 | |
| | | | | | | | |
Household Products — 1.52% | | | | | | | | |
Unicharm Corp. (Japan) | | | 75,800 | | | | 3,002,421 | |
| | | | | | | | |
Insurance — 6.15% | | | | | | | | |
Berkshire Hathaway, Inc. (United States)* | | | 18 | | | | 2,245,500 | |
Berkshire Hathaway, Inc., Class B (United States)* | | | 4,600 | | | | 383,180 | |
Enstar Group Ltd. (Bermuda)* | | | 22,510 | | | | 2,524,497 | |
HCC Insurance Holdings, Inc. (United States) | | | 80,200 | | | | 2,609,708 | |
Loews Corp. (United States) | | | 98,190 | | | | 4,345,889 | |
| | | | | | | | |
| | | | | | | 12,108,774 | |
| | | | | | | | |
Internet Software & Services — 1.85% | | | | | | | | |
Google, Inc. (United States)* | | | 6,700 | | | | 3,645,470 | |
| | | | | | | | |
IT Services — 1.76% | | | | | | | | |
Paychex, Inc. (United States) | | | 105,702 | | | | 3,457,512 | |
| | | | | | | | |
Leisure Equipment & Products — 0.05% | | | | | | | | |
Shimano, Inc. (Japan) | | | 2,000 | | | | 107,338 | |
| | | | | | | | |
Machinery — 2.26% | | | | | | | | |
Delachaux SA (France) | | | 11,098 | | | | 1,256,280 | |
Flowserve Corp. (United States) | | | 25,200 | | | | 3,190,824 | |
| | | | | | | | |
| | | | | | | 4,447,104 | |
| | | | | | | | |
Metals & Mining — 4.66% | | | | | | | | |
POSCO (South Korea)(a) | | | 70,491 | | | | 7,775,158 | |
Terra Nova Royalty Corp. (Canada) | | | 174,514 | | | | 1,399,602 | |
| | | | | | | | |
| | | | | | | 9,174,760 | |
| | | | | | | | |
Multi-Utilities — 2.24% | | | | | | | | |
GDF Suez (France) | | | 61,518 | | | | 2,515,430 | |
RWE AG (Germany) | | | 29,000 | | | | 1,891,901 | |
| | | | | | | | |
| | | | | | | 4,407,331 | |
| | | | | | | | |
Oil, Gas & Consumable Fuels — 4.91% | | | | | | | | |
Denbury Resources, Inc. (United States)* | | | 166,100 | | | | 3,748,877 | |
Lukoil OAO (Russia)(a) | | | 64,350 | | | | 4,485,195 | |
See Notes to Financial Statements.
| | | | |
| | 14 | | | Motley Fool Independence Fund |
| | | | | | | | |
Issues | | Shares | | | Value
(Note 2) | |
Equity Securities (continued) | | | | | | | | |
Oil, Gas & Consumable Fuels (continued) | | | | | | | | |
Occidental Petroleum Corp. (United States) | | | 12,645 | | | $ | 1,445,197 | |
| | | | | | | | |
| | | | | | | 9,679,269 | |
| | | | | | | | |
Pharmaceuticals — 2.02% | | | | | | | | |
Astrazeneca PLC (United Kingdom)(a) | | | 40,100 | | | | 1,998,183 | |
Dr. Reddy’s Laboratories Ltd. (India)(a) | | | 47,177 | | | | 1,851,226 | |
Teva Pharmaceutical Industries Ltd. (Israel)(a) | | | 3,000 | | | | 137,190 | |
| | | | | | | | |
| | | | | | | 3,986,599 | |
| | | | | | | | |
Professional Services — 1.66% | | | | | | | | |
Huron Consulting Group, Inc. (United States)* | | | 113,518 | | | | 3,269,318 | |
| | | | | | | | |
Real Estate Investment Trusts — 3.25% | | | | | | | | |
Annaly Capital Management, Inc. (United States) | | | 219,989 | | | | 3,924,604 | |
DuPont Fabros Technology, Inc. (United States) | | | 101,000 | | | | 2,470,460 | |
| | | | | | | | |
| | | | | | | 6,395,064 | |
| | | | | | | | |
Real Estate Management & Development — 3.73% | | | | | | | | |
Brookfield Asset Management, Inc. (Canada) | | | 56,374 | | | | 1,895,294 | |
Cheung Kong Holdings Ltd. (Hong Kong) | | | 65,337 | | | | 1,031,178 | |
Henderson Land Development Co., Ltd. (Hong Kong) | | | 468,764 | | | | 3,217,486 | |
Swire Pacific Ltd. (Hong Kong) | | | 78,114 | | | | 1,195,549 | |
| | | | | | | | |
| | | | | | | 7,339,507 | |
| | | | | | | | |
Semiconductors & Semiconductor Equipment — 1.22% | | | | | | | | |
Formfactor, Inc. (United States)* | | | 231,000 | | | | 2,395,470 | |
| | | | | | | | |
Software — 2.06% | | | | | | | | |
DuzonBizon Co., Ltd. (South Korea)* | | | 115,000 | | | | 1,139,932 | |
Fundtech Ltd. (Israel)* | | | 94,943 | | | | 1,678,592 | |
Wemade Entertainment Co., Ltd. (South Korea) | | | 38,522 | | | | 1,248,899 | |
| | | | | | | | |
| | | | | | | 4,067,423 | |
| | | | | | | | |
Textiles, Apparel & Luxury Goods — 0.86% | | | | | | | | |
Under Armour, Inc. (United States)* | | | 24,705 | | | | 1,691,304 | |
| | | | | | | | |
Tobacco — 0.95% | | | | | | | | |
Philip Morris International, Inc. (United States) | | | 27,072 | | | | 1,879,880 | |
| | | | | | | | |
Wireless Telecommunication Services — 2.29% | | | | | | | | |
American Tower Corp. (United States)* | | | 59,686 | | | | 3,122,175 | |
| | | | | | | | |
See Notes to Financial Statements.
| | | | |
| Motley Fool Independence Fund | | | 15 | |
| | | | | | | | |
Issues | | Shares | | | Value
(Note 2) | |
Equity Securities (continued) | | | | | | | | |
Wireless Telecommunication Services (continued) | | | | | | | | |
China Mobile Ltd. (Hong Kong)(a) | | | 30,340 | | | $ | 1,398,370 | |
| | | | | | | | |
| | | | | | | 4,520,545 | |
| | | | | | | | |
Total Equity Securities (Cost $ 149,626,611) | | | | | | | 178,365,320 | |
| | | | | | | | |
Participatory Note — 1.01% | | | | | | | | |
Food Products — 1.01% | | | | | | | | |
Almarai Co. (Saudi Arabia) | | | 80,000 | | | | 1,999,840 | |
| | | | | | | | |
Total Participatory Note (Cost $ 2,016,656) | | | | | | | 1,999,840 | |
| | | | | | | | |
Other Investments — 7.62% | | | | | | | | |
Temporary Cash Investment — 7.62% | | | | | | | | |
BNY Mellon Cash Reserve | | | 15,013,426 | | | | 15,013,426 | |
| | | | | | | | |
Total Other Investments (Cost $ 15,013,426) | | | | | | | 15,013,426 | |
| | | | | | | | |
Total Investment Portfolio (Cost 166,656,693) — 99.18% | | | | | | | 195,378,586 | |
Other Assets in Excess of Liabilities — 0.82% | | | | | | | 1,607,193 | |
| | | | | | | | |
NET ASSETS — 100.00% (Applicable to 12,607,563 shares outstanding) | | | | | | $ | 196,985,779 | |
| | | | | | | | |
| * | Non-income producing security. |
| (a) | ADR — American Depositary Receipts |
LP — Limited Partnership
PLC — Public Limited Company
See Notes to Financial Statements.
| | | | |
| | 16 | | | Motley Fool Independence Fund |
Statements of Assets and Liabilities
| | | | |
| | | April 30, 2011
(Unaudited) | |
Assets: | | | | |
| |
Investments in securities of unaffiliated issuers, at value (1) | | $ | 195,378,586 | |
Foreign currency, at value (2) | | | 372,663 | |
Receivables: | | | | |
Dividends and Tax Reclaims | | | 231,403 | |
Interest | | | 356 | |
Investment securities sold | | | 44,703 | |
Shares of beneficial interest sold | | | 2,701,534 | |
Reimbursement due from adviser | | | 20,346 | |
Prepaid expenses and other assets | | | 35,974 | |
| | | | |
Total Assets | | | 198,785,565 | |
| | | | |
| |
Liabilities | | | | |
Payables: | | | | |
Investment securities purchased | | | 1,277,594 | |
Fund share redeemed | | | 190,616 | |
Accrued expenses: | | | | |
Audit fees | | | 14,730 | |
Accounting and administration fees | | | 38,942 | |
Advisory fees | | | 152,507 | |
Custodian fees | | | 8,883 | |
Legal fees | | | 14,590 | |
Transfer agent fees | | | 70,823 | |
Trustee fees | | | 2,152 | |
Other expenses | | | 28,949 | |
| | | | |
Total Liabilities | | | 1,799,786 | |
| | | | |
Net Assets | | $ | 196,985,779 | |
| | | | |
| |
Net Assets Consist of: | | | | |
Paid-in-Capital | | $ | 162,265,878 | |
Undistributed Net Investment Income | | | 69,856 | |
Accumulated Net Realized Gain (Loss) on Investments and Foreign Currency Translation | | | 5,928,124 | |
Net Unrealized Appreciation (Depreciation) on Investments, Foreign Currencies, and Assets and Liabilities denominated in Foreign Currencies | | | 28,721,921 | |
| | | | |
Net Assets | | $ | 196,985,779 | |
| | | | |
Net Asset Value: | | | | |
$0.001 par value, unlimited shares authorized | | | | |
Net assets applicable to capital shares outstanding | | $ | 196,985,779 | |
Shares outstanding | | | 12,607,563 | |
| | | | |
Net asset value, offering and redemption price per share | | $ | 15.62 | |
| | | | |
(1) Investments in securities of unaffiliated issuers, at cost | | $ | 166,656,693 | |
(2) Foreign currency, at cost | | $ | 370,190 | |
The accompanying notes are an integral part of these financial statements.
| | | | |
| Motley Fool Independence Fund | | | 17 | |
Statement of Operations
| | | | |
| | | Six Months Ended
April 30, 2011
(Unaudited) | |
Investment Income | | | | |
Dividends | | $ | 1,873,525 | |
Interest | | | 29,206 | |
Less foreign taxes withheld | | | (107,277 | ) |
| | | | |
Total Investment Income | | | 1,795,454 | |
| | | | |
Expenses | | | | |
Accounting and administration fees | | | 89,289 | |
Blue sky fees | | | 8,182 | |
Chief Compliance Officer fees | | | 11,713 | |
Custodian fees | | | 28,089 | |
Investment advisory fees | | | 810,933 | |
Professional fees | | | 45,498 | |
Shareholder reporting fees | | | 15,949 | |
Transfer agent fees | | | 197,475 | |
Trustee fees | | | 21,240 | |
Other expenses | | | 49,345 | |
| | | | |
Total expenses | | | 1,277,713 | |
| | | | |
Expenses waived/reimbursed net of amount recaptured | | | (149,487 | ) |
| | | | |
Net expenses | | | 1,128,226 | |
| | | | |
Net Investment Income | | | 667,228 | |
| | | | |
Realized and Unrealized Gain (Loss) | | | | |
| |
Net realized gain (loss) from: | | | | |
Investment securities | | | 6,120,863 | |
Foreign currency transactions | | | (19,965 | ) |
| | | | |
Net realized gain on investments and foreign currency transactions | | | 6,100,898 | |
| | | | |
Change in net unrealized appreciation (depreciation) on: | | | | |
Investment securities | | | 12,015,000 | |
Foreign currency translations | | | 922 | |
| | | | |
Change in net unrealized appreciation (depreciation) on investments, foreign currencies, and assets and liabilities denominated in foreign currencies | | | 12,015,922 | |
| | | | |
Net realized and unrealized gain | | | 18,116,820 | |
| | | | |
Net Increase in Net Assets Resulting from Operations | | $ | 18,784,048 | |
| | | | |
The accompanying notes are an integral part of these financial statements.
| | | | |
| | 18 | | | Motley Fool Independence Fund |
Statements of Changes in Net Assets
| | | | | | | | |
| | | Six Months
Ended
April 30,
2011
(Unaudited) | | | Year
Ended
October 31,
2010 | |
Operations: | | | | | | | | |
Net Investment Income | | $ | 667,228 | | | $ | 1,069,735 | |
Net Realized Gain on Investments and Foreign Currency Transactions | | | 6,100,898 | | | | 805,287 | |
Change in net unrealized Appreciation (Depreciation) on Investments, Foreign Currencies, and Assets and Liabilities Denominated in Foreign Currencies | | | 12,015,922 | | | | 15,586,918 | |
| | | | | | | | |
Net increase in net assets resulting from operations | | | 18,784,048 | | | | 17,461,940 | |
| | | | | | | | |
Dividends and Distributions to Shareholders: | | | | | | | | |
Dividends from net investment income | | | (1,465,154 | ) | | | (95,696 | ) |
Distributions from net realized capital gains | | | (1,105,696 | ) | | | (295,167 | ) |
| | | | | | | | |
Total dividends and distributions | | | (2,570,850 | ) | | | (390,863 | ) |
| | | | | | | | |
Capital Share Transactions: | | | | | | | | |
Proceeds from shares sold (4,157,037 and 7,468,879 shares, respectively) | | | 61,782,396 | | | | 93,888,742 | |
Reinvestment of dividends and distributions (175,447 and 31,228 shares, respectively) | | | 2,522,930 | | | | 384,097 | |
Value of shares redeemed (806,122 and 1,069,514 shares, respectively) | | | (11,977,461 | ) | | | (13,409,649 | ) |
| | | | | | | | |
Redemption fees | | | 38,521 | | | | 45,165 | |
| | | | | | | | |
Net increase from capital share transactions | | | 52,366,386 | | | | 80,908,355 | |
| | | | | | | | |
Total increase in net assets | | | 68,579,584 | | | | 97,979,432 | |
| | | | | | | | |
Net Assets: | | | | | | | | |
Beginning of Period | | | 128,406,195 | | | | 30,426,763 | |
| | | | | | | | |
End of Period* | | $ | 196,985,779 | | | $ | 128,406,195 | |
| | | | | | | | |
* Including undistributed net investment income | | $ | 69,856 | | | $ | 867,782 | |
| | | | | | | | |
The accompanying notes are an integral part of these financial statements.
| | | | |
| Motley Fool Independence Fund | | | 19 | |
Financial Highlights
| | | | | | | | | | | | |
(for a share outstanding through the period) | | Six Months
Ended
April 30, 2011
(Unaudited)(1) | | | For the
Year
Ended
October 31,
2010(2) | | | Period
June 16, 2009
to
October 31,
2009(3),(4) | |
Net Asset Value, Beginning of Period | | $ | 14.14 | | | $ | 11.48 | | | $ | 10.00 | |
| | | | | | | | | | | | |
Income From Investment Operations (5) | | | | | | | | | | | | |
Net Investment Income | | | 0.06 | | | | 0.16 | | | | 0.02 | |
Net Gains on Securities (Realized and Unrealized) | | | 1.68 | | | | 2.59 | | | | 1.46 | |
| | | | | | | | | | | | |
Total From Investment Operations | | | 1.74 | | | | 2.75 | | | | 1.48 | |
| | | | | | | | | | | | |
Less Distributions | | | | | | | | | | | | |
Net Investment Income | | | (0.15 | ) | | | (0.02 | ) | | | — | |
Net Realized Gains | | | (0.11 | ) | | | (0.08 | ) | | | — | |
| | | | | | | | | | | | |
Total Distributions | | | (0.26 | ) | | | (0.10 | ) | | | — | |
| | | | | | | | | | | | |
Redemption Fees | | | — | * | | | 0.01 | | | | — | * |
| | | | | | | | | | | | |
Net Asset Value, End of Period | | $ | 15.62 | | | $ | 14.14 | | | $ | 11.48 | |
| | | | | | | | | | | | |
Total Return(6),(7) | | | 12.50 | % | | | 24.18 | % | | | 14.80 | % |
Net Assets, End of Period (thousands) | | $ | 196,986 | | | $ | 128,406 | | | $ | 30,427 | |
| | | |
Ratios/Supplemental Data | | | | | | | | | | | | |
| | | |
Ratio of Expenses to Average Net Assets | | | 1.42 | % | | | 1.38 | % | | | 1.35 | % |
Ratio of Expenses to Average Net Assets (Before Waivers and Reimbursement of Expenses and/or Recapture of Previously Waived Fees) | | | 1.61 | % | | | 2.20 | % | | | 7.01 | % |
Ratio of Net Investment Income to Average Net Assets | | | 0.84 | % | | | 1.29 | % | | | 0.41 | % |
Ratio of Income to Average Net Assets (Before Waivers and Reimbursement of Expenses and/or Recapture of Previously Waived Fees) | | | 0.65 | % | | | 0.47 | % | | | (5.25 | )% |
Portfolio Turnover | | | 16 | % | | | 37 | % | | | 50 | % |
| * | Amount represents less than $0.005 per share. |
| (1) | All ratios for the period have been annualized. Total return and portfolio turnover for the period have not been annualized. |
| (2) | Due to a clerical error, Net Gains on Securities (Realized and Unrealized) and Total From Investment Operations for the year ended October 31, 2010 were reported in the 2010 Annual Report as $2.39 and $2.55, respectively. Such amounts have been revised as shown above. |
| (3) | Because of commencement of operations and related preliminary transaction costs, these ratios are not necessarily indicative of future ratios. |
| (4) | Inception date of the Independence Fund was June 16, 2009. All ratios for the period have been annualized. Total return for the period has not been annualized. |
| (5) | Per share data calculated using average shares outstanding method. |
| (6) | During the year ended October 31, 2010, 0.08% of the Fund’s total return was attributable to redemption fees received as referenced in Note 4. Excluding this item, the total return would have been 24.10%. For the period ended October 31, 2009, and the six months ended April 30, 2011, redemption fees received had no effect on the Fund’s total return. |
| (7) | Total return reflects the rate an investor would have earned on an investment in the Fund during each period, assuming reinvestment of all distributions. |
The accompanying notes are an integral part of these financial statements.
| | | | |
| | 20 | | | Motley Fool Independence Fund |
Motley Fool Great America Fund Portfolio Characteristics (Unaudited)
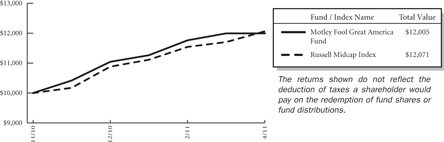
At April 30, 2011, the Motley Fool Great America Fund (the “Fund”) had an unaudited net asset value of $11.99 per share attributed to 4,249,015 shares outstanding. This compares with an unaudited net asset value as of November 1, 2010 of $10.00 per share attributed to 102,000 shares outstanding. From the Fund’s launch on November 1, 2010 to April 30, 2011 the Fund had a total return of 20.05% versus a return of 20.72% over the same period for its benchmark, Russell Midcap Index. The graph below shows the performance of $10,000 invested in the Fund at inception. The results shown below do not reflect the deduction of taxes that a shareholder would pay on fund distributions or the redemption of fund shares.
Let’s be serious though. A graph of the performance of any investment over six months tells you virtually nothing. In about five years, they’ll actually tell you quite a bit about how well we’re managing your money.
Average Annual Total Retuns as of 04/30/2011
| | | | | | | | |
| | | Fund* | | | Benchmark** | |
Since Inception | | | 20.05 | % | | | 20.72 | % |
Inception Date | | | 11/01/2010 | | | | | |
Total Annual Fund Operating Expenses Before Expense Limitation (February 28, 2011 Prospectus) | | | 2.30 | % | | | | |
The performance data quoted represents past performance and does not guarantee future results. Current performance may be lower or higher. Performance data current to the most recent month-end may be obtained at www.foolfunds.com. The investment return and principal value of an investment will fluctuate so that shares, when redeemed, may be worth more or less than their original cost.
| * | These returns reflect expense waivers by the Fund’s investment adviser. Without these waivers, returns would have been lower. |
| ** | The Russell Midcap Index is an unmanaged, free float-adjusted, market capitalization weighted index that is designed to measure the performance of the mid-cap segment of the U.S. equity universe. The Russell Midcap Index is a subset of the Russell 1000® Index. It includes approximately 800 of the smallest securities based on a combination of their market cap and current index membership. The Russell Midcap Index represents approximately 27% of the total market capitalization of the Russell 1000 companies. The Fund may invest in companies that are not included within the Russell Midcap Index and its investment portfolio is not weighted in terms of issuers the same as the Russell Midcap Index. For this reason, the Fund’s investment performance should not be expected to track, and may exceed or trail, the Russell Midcap Index. Since Inception returns for the Benchmark reflect the performance based on the Inception Date of the Fund. |
| | | | |
| Motley Fool Great America Fund | | | 21 | |
The investment objective of the Great America Fund is to achieve long-term capital appreciation. The Fund pursues this objective by investing primarily in common stocks of companies organized in the United States. The Fund employs a value-based Investment strategy and seeks long-term growth of capital by acquiring securities of companies at prices the investment adviser, Motley Fool Asset Management, LLC (the “Adviser”), believes to be significantly below their intrinsic value. The Fund may invest in other types of securities and in other asset classes when, in the judgment of the Adviser, such investments offer attractive potential returns. As such, the Fund’s performance will deviate significantly from its benchmark from time to time. It is the view of the Adviser that this deviation is less meaningful over shorter time frames and will become more relevant when the Fund’s age can be measured in years rather than months.
Although the Great America Fund may invest in companies with any market capitalization, the Adviser expects that investments in the securities of companies having smaller- and mid-market capitalizations will be important components of the Fund’s investment program. Investments in securities of these companies may involve greater risk than do investments in larger, more established companies. Small-and mid-cap stocks tend to be more volatile and less liquid than their large-cap counterparts. You are strongly encouraged to read more about the Fund’s strategies and risks in the prospectus.
The Fund invests in securities of companies the Adviser believes are undervalued. Unlike mutual funds that hew to their benchmark, the Fund may invest in any company, industry or sector where the Adviser’s analysis suggests that there is opportunity for gains that outweigh risks. In identifying investments for the Fund, the Adviser looks for companies it believes the market has irrationally undervalued and looks for companies that have high-quality businesses with strong market positions, manageable leverage, and robust streams of free cash flow. The following tables show the top 11 holdings and top 10 sectors in which the Fund was invested as of April 30, 2011. Portfolio holdings are subject to change without notice.
Certain mutual fund ratings and review services have created style boxes, which look more or less like a tic-tac-toe board; arranging funds by the size of the companies they typically invest in (large-, mid-, and small-cap) along one axis, and along a “value” to “growth” basis on the other axis. This may be a helpful way – at times – to think about certain investment opportunities, but we don’t believe we’ll improve your returns by limiting ourselves to any one portion of that style box.
| | | | |
Top Eleven Holdings* | | % of Net
Assets | |
Horsehead Holding Corp. | | | 3.68 | % |
Crown Holdings, Inc. | | | 3.29 | |
Range Resources Corp. | | | 2.98 | |
Markel Corp. | | | 2.87 | |
WellPoint, Inc. | | | 2.67 | |
Thor Industries, Inc. | | | 2.62 | |
Cisco Systems, Inc. | | | 2.58 | |
Penn National Gaming, Inc. | | | 2.40 | |
Red Robin Gourmet Burgers, Inc. | | | 2.40 | |
Intuitive Surgical, Inc. | | | 2.35 | |
Natus Medical, Inc. | | | 2.32 | |
| | | | |
| | | 30.16 | % |
| | | | |
| * | As of the date of the report the fund had a holding of 16.19% in the BNY Mellon Cash Reserve Fund. |
| | | | |
| | 22 | | | Motley Fool Great America Fund |
| | | | |
Top Ten Sectors | | % of Net
Assets | |
Consumer Discretionary | | | 16.36 | % |
Financials | | | 15.38 | |
Industrials | | | 10.62 | |
Health Care | | | 10.09 | |
Materials | | | 9.71 | |
Information Technology | | | 8.02 | |
Energy | | | 5.65 | |
Telecommunication Services | | | 3.82 | |
Consumer Staples | | | 2.58 | |
| | | | |
| | | 82.23 | % |
| | | | |
| | | | |
| Motley Fool Great America Fund | | | 23 | |
About Your Expenses (Unaudited)
As a shareholder of the Great America Fund, you incur ongoing costs, including advisory fees and other Fund expenses. This example is intended to help you to understand your ongoing costs (in dollars) of investing in the Fund and to compare these costs with the ongoing costs of investing in other mutual funds. It is based on an investment of $1,000 invested at the beginning of the period and held for the entire period from November 1, 2010 to April 30, 2011.
Actual Expenses
The first section of the table below provides information about actual account values and actual expenses. You may use the information in this section, together with the amount you invested, to estimate the expenses that you incurred over the period. Simply divide your account value by $1,000 (for example, an $8,600 account value divided by $1,000 = 8.6), then multiply the result by the number in the first section under the heading entitled “Expenses Paid During Period” to estimate the expenses attributable to your investment during this period.
Hypothetical Example for Comparison Purposes
The second section of the table below provides information about hypothetical account values and hypothetical expenses based on the Fund’s actual expense ratio and an assumed rate of return of 5% per year before expenses, which is not the Fund’s actual return. Thus, you should not use the hypothetical account values and expenses to estimate the actual ending account balance or your expenses for the period. Rather, these figures are provided to enable you to compare the ongoing costs of investing in the Fund as compared to the costs of investing in other funds. To do so, compare this 5% hypothetical example with the 5% hypothetical examples that appear in the shareholder reports of the other funds. Please note that the expenses shown in the table are meant to highlight your ongoing costs only. Therefore, the second section of the table is useful in comparing ongoing costs only and will not help you determine the relative total costs of owning different funds.
Do you know how many times a fund, or the market, has returned a smooth 5% over a long period of time? Never. But we have to pick some example. In reality, the market’s returns are always far bumpier, with the market returning 20% one year, followed by a loss of 10% the next year, followed by a 3% gain, etc. These variations affect actual expenses as well. Happily, over almost all time periods of 20 years or longer, according to the research of University of Pennsylvania’s Jeremy Siegel and others, the domestic market’s returns have been at least 5% per year on average.
| | | | | | | | | | | | | | | | |
| | | Beginning
Account
Value
11/01/10 | | | Ending
Account
Value
04/30/11 | | | Annualized
Expense
Ratio(1) | | | Expenses
Paid
During
Period(2) | |
Actual | | $ | 1,000 | | | $ | 1,200.47 | | | | 1.35 | % | | $ | 7.37 | |
Hypothetical | | $ | 1,000 | | | $ | 1,018.10 | | | | 1.35 | % | | $ | 6.76 | |
| (1) | These ratios reflect expenses waived by the Fund’s investment Adviser. Without these Waivers, the Fund’s expenses would have been higher and the ending account values would have been lower. |
| (2) | Expenses are equal to the Fund’s annualized expense ratio for the period November 1, 2010 to April 30, 2011, multiplied by the average account value over the period, multiplied by the number of days (181) in the most recent fiscal half-year, then divided by 365. |
| | | | |
| | 24 | | | Motley Fool Great America Fund |
The Motley Fool Funds Trust
Motley Fool Great America Fund
Schedule of Investments
at April 30, 2011
(Unaudited)
| | | | | | | | |
Issues | | Shares | | | Value
(Note 2) | |
Equity Securities — 82.23% | | | | | | | | |
Auto Components — 1.36% | | | | | | | | |
Drew Industries, Inc. (United States) | | | 28,811 | | | $ | 693,481 | |
| | | | | | | | |
Automobiles — 2.76% | | | | | | | | |
Harley-Davidson, Inc. (United States) | | | 2,000 | | | | 74,520 | |
Thor Industries, Inc. (United States) | | | 42,988 | | | | 1,333,058 | |
| | | | | | | | |
| | | | | | | 1,407,578 | |
| | | | | | | | |
Beverages — 1.32% | | | | | | | | |
Heckmann Corp. (United States)* | | | 107,000 | | | | 674,100 | |
| | | | | | | | |
Capital Markets — 2.56% | | | | | | | | |
Diamond Hill Investment Group, Inc. (United States) | | | 10,653 | | | | 873,546 | |
INTL FCStone, Inc. (United States)* | | | 16,300 | | | | 431,624 | |
| | | | | | | | |
| | | | | | | 1,305,170 | |
| | | | | | | | |
Chemicals — 1.23% | | | | | | | | |
Innophos Holdings, Inc. (United States) | | | 13,500 | | | | 625,590 | |
| | | | | | | | |
Communications Equipment — 4.73% | | | | | | | | |
Cisco Systems, Inc. (United States) | | | 75,000 | | | | 1,317,000 | |
Infinera Corp. (United States)* | | | 139,490 | | | | 1,090,812 | |
| | | | | | | | |
| | | | | | | 2,407,812 | |
| | | | | | | | |
Construction & Engineering — 2.00% | | | | | | | | |
Orion Marine Group, Inc. (United States)* | | | 98,700 | | | | 1,019,571 | |
| | | | | | | | |
Containers & Packaging — 3.29% | | | | | | | | |
Crown Holdings, Inc. (United States)* | | | 44,800 | | | | 1,675,520 | |
| | | | | | | | |
Diversified Telecommunication Services — 2.15% | | | | | | | | |
Level 3 Communications, Inc. (United States)* | | | 703,760 | | | | 1,097,866 | |
| | | | | | | | |
Energy Equipment & Services — 1.15% | | | | | | | | |
Dresser-Rand Group, Inc. (United States)* | | | 11,180 | | | | 587,397 | |
| | | | | | | | |
Food Products — 0.23% | | | | | | | | |
Smithfield Foods, Inc. (United States)* | | | 5,000 | | | | 117,800 | |
| | | | | | | | |
Health Care Equipment & Supplies — 5.52% | | | | | | | | |
Cooper Cos, Inc. (United States) | | | 5,770 | | | | 432,173 | |
Intuitive Surgical, Inc. (United States)* | | | 3,420 | | | | 1,195,974 | |
See Notes to Financial Statements.
| | | | |
| Motley Fool Great America Fund | | | 25 | |
| | | | | | | | |
Issues | | Shares | | | Value
(Note 2) | |
Equity Securities (continued) | | | | | | | | |
Health Care Equipment & Supplies (continued) | | | | | | | | |
Natus Medical, Inc. (United States)* | | | 69,700 | | | $ | 1,182,809 | |
| | | | | | | | |
| | | | | | | 2,810,956 | |
| | | | | | | | |
Health Care Providers & Services — 4.58% | | | | | | | | |
Laboratory Corp. of America Holdings (United States)* | | | 8,920 | | | | 860,513 | |
Quest Diagnostics, Inc. (United States) | | | 2,000 | | | | 112,760 | |
WellPoint, Inc. (United States) | | | 17,700 | | | | 1,359,183 | |
| | | | | | | | |
| | | | | | | 2,332,456 | |
| | | | | | | | |
Hotels, Restaurants & Leisure — 6.23% | | | | | | | | |
International Speedway Corp. (United States) | | | 23,760 | | | | 727,056 | |
Penn National Gaming, Inc. (United States)* | | | 30,617 | | | | 1,224,986 | |
Red Robin Gourmet Burgers, Inc. (United States)* | | | 45,000 | | | | 1,223,550 | |
| | | | | | | | |
| | | | | | | 3,175,592 | |
| | | | | | | | |
Household Durables — 1.87% | | | | | | | | |
Kid Brands, Inc. (United States)* | | | 130,300 | | | | 952,493 | |
| | | | | | | | |
Insurance — 7.19% | | | | | | | | |
Berkshire Hathaway, Inc. (United States)* | | | 7 | | | | 873,250 | |
Berkshire Hathaway, Inc., Class B (United States)* | | | 3,000 | | | | 249,900 | |
HCC Insurance Holdings, Inc. (United States) | | | 33,200 | | | | 1,080,328 | |
Markel Corp. (United States)* | | | 3,500 | | | | 1,460,480 | |
| | | | | | | | |
| | | | | | | 3,663,958 | |
| | | | | | | | |
Internet Software & Services — 1.87% | | | | | | | | |
Google, Inc. (United States)* | | | 1,750 | | | | 952,175 | |
| | | | | | | | |
Machinery — 5.41% | | | | | | | | |
Flow International Corp. (United States)* | | | 256,900 | | | | 1,107,239 | |
Flowserve Corp. (United States) | | | 4,450 | | | | 563,459 | |
Trimas Corp. (United States)* | | | 46,800 | | | | 1,086,228 | |
| | | | | | | | |
| | | | | | | 2,756,926 | |
| | | | | | | | |
Metals & Mining — 3.68% | | | | | | | | |
Horsehead Holding Corp. (United States)* | | | 119,000 | | | | 1,876,630 | |
| | | | | | | | |
Multiline Retail — 0.16% | | | | | | | | |
Big Lots, Inc. (United States)* | | | 2,000 | | | | 82,220 | |
| | | | | | | | |
Oil, Gas & Consumable Fuels — 4.49% | | | | | | | | |
Denbury Resources, Inc. (United States)* | | | 34,100 | | | | 769,637 | |
Range Resources Corp. (United States) | | | 26,940 | | | | 1,520,763 | |
| | | | | | | | |
| | | | | | | 2,290,400 | |
| | | | | | | | |
See Notes to Financial Statements.
| | | | |
| | 26 | | | Motley Fool Great America Fund |
| | | | | | | | |
Issues | | Shares | | | Value
(Note 2) | |
Equity Securities (continued) | | | | | | | | |
Paper & Forest Products — 1.51% | | | | | | | | |
KapStone Paper and Packaging Corp. (United States)* | | | 41,200 | | | $ | 716,056 | |
Schweitzer-Mauduit International, Inc. (United States) | | | 1,000 | | | | 51,840 | |
| | | | | | | | |
| | | | | | | 767,896 | |
| | | | | | | | |
Personal Products — 1.03% | | | | | | | | |
Female Health Co. (United States) | | | 110,700 | | | | 523,611 | |
| | | | | | | | |
Professional Services — 3.21% | | | | | | | | |
Barrett Business Services, Inc. (United States) | | | 45,200 | | | | 728,624 | |
Huron Consulting Group, Inc. (United States)* | | | 31,550 | | | | 908,640 | |
| | | | | | | | |
| | | | | | | 1,637,264 | |
| | | | | | | | |
Real Estate Investment Trusts — 5.63% | | | | | | | | |
Annaly Capital Management, Inc. (United States) | | | 39,000 | | | | 695,760 | |
DuPont Fabros Technology, Inc. (United States) | | | 47,550 | | | | 1,163,073 | |
Retail Opportunity Investments Corp. (United States) | | | 89,560 | | | | 1,011,132 | |
| | | | | | | | |
| | | | | | | 2,869,965 | |
| | | | | | | | |
Semiconductors & Semiconductor Equipment — 1.42% | | | | | | | | |
Formfactor, Inc. (United States)* | | | 70,000 | | | | 725,900 | |
| | | | | | | | |
Specialty Retail — 3.21% | | | | | | | | |
Men’s Wearhouse, Inc. (United States) | | | 34,500 | | | | 962,205 | |
Tractor Supply Co. (United States) | | | 10,900 | | | | 674,383 | |
| | | | | | | | |
| | | | | | | 1,636,588 | |
| | | | | | | | |
Textiles, Apparel & Luxury Goods — 0.77% | | | | | | | | |
Joe’s Jeans, Inc. (United States)* | | | 398,900 | | | | 390,523 | |
| | | | | | | | |
Wireless Telecommunication Services — 1.67% | | | | | | | | |
SBA Communications Corp. (United States)* | | | 22,000 | | | | 849,860 | |
| | | | | | | | |
Total Equity Securities (Cost $ 38,195,968) | | | | | | | 41,907,298 | |
| | | | | | | | |
Other Investments — 16.19% | | | | | | | | |
Temporary Cash Investment — 16.19% | | | | | | | | |
BNY Mellon Cash Reserve | | | 8,252,749 | | | | 8,252,749 | |
| | | | | | | | |
Total Other Investments (Cost $ 8,252,749) | | | | | | | 8,252,749 | |
| | | | | | | | |
Total Investment Portfolio (Cost 46,448,717) — 98.42% | | | | | | | 50,160,047 | |
Other Assets in Excess of Liabilities — 1.58% | | | | | | | 804,698 | |
| | | | | | | | |
NET ASSETS — 100.00% (Applicable to 4,249,015 shares outstanding) | | | | | | $ | 50,964,745 | |
| | | | | | | | |
| * | Non-income producing security. |
See Notes to Financial Statements.
| | | | |
Motley Fool Great America Fund | | | 27 | |
Statement of Assets and Liabilities
| | | | |
| | | As of
April 30, 2011
(Unaudited) | |
Assets: | | | | |
| |
Investments in securities of unaffiliated issuers, at value (1) | | $ | 50,160,047 | |
Receivables: | | | | |
Dividends | | | 5,535 | |
Interest | | | 236 | |
Shares of beneficial interest sold | | | 886,413 | |
Deferred offering costs | | | 4,403 | |
Reimbursement due from adviser | | | 25,574 | |
Prepaid expenses and other assets | | | 37,606 | |
| | | | |
Total Assets | | | 51,119,814 | |
| | | | |
Liabilities | | | | |
Payables: | | | | |
Fund share redeemed | | | 9,011 | |
Accrued expenses: | | | | |
Audit fees | | | 12,294 | |
Accounting and administration fees | | | 31,979 | |
Advisory fees | | | 37,148 | |
Custodian fees | | | 5,640 | |
Legal fees | | | 7,754 | |
Transfer agent fees | | | 26,886 | |
Trustee fees | | | 3,638 | |
Other expenses | | | 20,719 | |
| | | | |
Total Liabilities | | | 155,069 | |
| | | | |
Net Assets | | $ | 50,964,745 | |
| | | | |
Net Assets Consist of: | | | | |
Paid-in-Capital | | $ | 47,399,446 | |
Distributions in Excess of Net Investment Income | | | (91,245 | ) |
Accumulated Net Realized Gain (Loss) on Investments | | | (54,786 | ) |
Net Unrealized Appreciation (Depreciation) on Investments | | | 3,711,330 | |
| | | | |
Net Assets | | $ | 50,964,745 | |
| | | | |
Net Asset Value: | | | | |
$0.001 par value, unlimited shares authorized | | | | |
Net assets applicable to capital shares outstanding | | $ | 50,964,745 | |
Shares outstanding | | | 4,249,015 | |
| | | | |
Net asset value, offering and redemption price per share | | $ | 11.99 | |
| | | | |
(1) Investments in securities of unaffiliated issuers, at cost | | $ | 46,448,717 | |
The accompanying notes are an integral part of these financial statements.
| | | | |
| | 28 | | | Motley Fool Great America Fund |
Statements of Operations
| | | | |
| | | November 1, 2010**
to
April 30, 2011
(Unaudited) | |
Investment Income | | | | |
Dividends | | $ | 122,915 | |
| | | | |
Total Investment Income | | | 122,915 | |
| | | | |
Expenses | | | | |
Accounting and administration fees | | | 65,839 | |
Blue sky fees | | | 10,359 | |
Chief Compliance Officer fees | | | 11,666 | |
Custodian fees | | | 14,178 | |
Investment advisory fees | | | 140,474 | |
Organization fees | | | 4,192 | |
Professional fees | | | 37,459 | |
Shareholder reporting fees | | | 15,607 | |
Transfer agent fees | | | 48,036 | |
Trustee fees | | | 21,270 | |
Other expenses | | | 16,341 | |
| | | | |
Total expenses | | | 385,421 | |
| | | | |
Expenses waived/reimbursed net of amount recaptured | | | (185,800 | ) |
| | | | |
Net expenses | | | 199,621 | |
| | | | |
Net Investment Loss | | | (76,706 | ) |
| | | | |
| |
Realized and Unrealized Gain (Loss) | | | | |
Net realized gain (loss) from: | | | | |
Investment securities | | | (54,786 | ) |
| | | | |
Net realized loss on investments | | | (54,786 | ) |
| | | | |
Change in net unrealized appreciation (depreciation) on: | | | | |
Investment securities | | | 3,711,330 | |
| | | | |
Change in net unrealized appreciation on investments | | | 3,711,330 | |
| | | | |
Net realized and unrealized gain | | | 3,656,544 | |
| | | | |
Net Increase in Net Assets Resulting from Operations | | $ | 3,579,838 | |
| | | | |
| ** | Commencement of Operations. |
The accompanying notes are an integral part of these financial statements.
| | | | |
| Motley Fool Great America Fund | | | 29 | |
Statement of Changes in Net Assets
| | | | |
| | | November 1, 2010**
to
April 30, 2011
(Unaudited) | |
Operations: | | | | |
Net Investment Loss | | $ | (76,706 | ) |
Net Realized Loss on Investments | | | (54,786 | ) |
Change in net unrealized Appreciation on Investments | | | 3,711,330 | |
| | | | |
Net increase in net assets resulting from operations | | | 3,579,838 | |
| | | | |
Dividends and Distributions to Shareholders: | | | | |
Dividends from net investment income | | | (14,539 | ) |
| | | | |
Total dividends and distributions | | | (14,539 | ) |
| | | | |
Capital Share Transactions: | | | | |
Proceeds from shares sold (4,599,759 shares)*** | | | 51,447,912 | |
Reinvestment of dividends and distributions (1,286 shares) | | | 14,168 | |
Value of shares redeemed (352,030 shares) | | | (4,082,362 | ) |
| | | | |
Redemption fees | | | 19,728 | |
| | | | |
Net increase from capital share transactions | | | 47,399,446 | |
| | | | |
Total increase in net assets | | | 50,964,745 | |
| | | | |
Net Assets: | | | | |
Beginning of Period | | | — | |
| | | | |
End of Period* | | $ | 50,964,745 | |
| | | | |
* Including undistributed net investment income | | $ | (91,245 | ) |
| | | | |
| ** | Commencement of Operations. |
| *** | On November 1, 2010, 102,000 shares of the Fund were issued for cash at $10.00 per share to the Adviser. |
The accompanying notes are an integral part of these financial statements.
| | | | |
| | 30 | | | Motley Fool Great America Fund |
Financial Highlights
| | | | |
(for a share outstanding through the period) | | November 1, 2010
to
April 30, 2011
(Unaudited)(1)(2) | |
Net Asset Value, Beginning of Period | | $ | 10.00 | |
| | | | |
Income From Investment Operations (3) | | | | |
Net Investment Income (Loss) | | | (0.03 | ) |
Net Gains on Securities (Realized and Unrealized) | | | 2.02 | |
| | | | |
Total From Investment Operations | | | 1.99 | |
| | | | |
Less Distributions | | | | |
Net Investment Income | | | (0.01 | ) |
Net Realized Gains | | | — | |
| | | | |
Total Distributions | | | (0.01 | ) |
| | | | |
Redemption Fees | | | 0.01 | |
| | | | |
Net Asset Value, End of Period | | $ | 11.99 | |
| | | | |
Total Return(4)(5) | | | 20.05 | % |
Net Assets, End of Period (thousands) | | $ | 50,965 | |
| |
Ratios/Supplemental Data | | | | |
| |
Ratio of Expenses to Average Net Assets | | | 1.35 | % |
Ratio of Expenses to Average Net Assets (Before Waivers and Reimbursement of Expenses and/or Recapture of Previously Waived Fees) | | | 2.61 | % |
Ratio of Net Investment Income to Average Net Assets | | | (0.52 | )% |
Ratio of Income to Average Net Assets (Before Waivers and Reimbursement of Expenses and/or Recapture of Previously Waived Fees) | | | (1.78 | )% |
Portfolio Turnover | | | 4 | % |
| (1) | Because of commencement of operations and related preliminary transaction costs, these ratios are not necessarily indicative of future ratios. |
| (2) | Inception date of the Great America Fund was November 1, 2010. All ratios for the period have been annualized. Total return for the period has not been annualized. |
| (3) | Per share data calculated using average shares outstanding method. |
| (4) | During the period ended April 30, 2011, 0.10% of the Fund’s total return was attributable to redemption fees received as referenced in Note 4. Excluding this item, the total return would have been 19.95%. |
| (5) | Total return reflects the rate an investor would have earned on an investment in the Fund during each period, assuming reinvestment of all distributions. |
The accompanying notes are an integral part of these financial statements.
| | | | |
| Motley Fool Great America Fund | | | 31 | |
Notes to Financial Statements
1. Organization:
Motley Fool Independence Fund (“Independence Fund”) and Motley Fool Great America Fund (“Great America Fund”) (each a “Fund” and together the “Funds”) are diversified series of The Motley Fool Funds Trust (the “Trust”), an open-end management investment company (or mutual fund) organized on November 7, 2008, as a statutory trust under the laws of the State of Delaware. The investment objective of each Fund is to achieve long-term capital appreciation. The Independence Fund pursues its objective by investing primarily in common stocks of U.S. companies and of companies that are organized under the laws of other countries around the world. The Great America Fund pursues its objective by investing primarily in common stocks of companies that are organized in the United States and that are engaged in a broad range of industries.
Under the Trust’s organizational documents, its Trustees and officers are indemnified against certain liabilities arising out of the performance of their duties for the Trust by the Trust. In addition, in the normal course of business, the Trust enters into contracts with vendors and others that provide for general indemnifications. The Trust’s maximum exposure under these arrangements is unknown as this would involve future claims that may be made against the Trust. However, the Trust believes the risk of loss to be remote.
2. Significant Accounting Policies:
Basis of Preparation
The policies described below are followed consistently by the Funds in the preparation of their financial statements in conformity with accounting principles generally accepted in the United States of America (“U.S. GAAP”) for U.S. mutual funds.
The preparation of financial statements in accordance with U.S. GAAP requires management to make estimates and assumptions that affect the reported amounts and disclosures. Actual results could differ from those estimates.
Security Valuation
Securities held by the Trust are generally valued at fair value as of the close of regular trading on each business day (generally 4 pm Eastern time) that the New York Stock Exchange (“NYSE”) is open. Securities, other than stock options, listed on the NYSE or other exchanges are valued on the basis of the last quoted sale price on the exchange on which they are primarily traded. However, if the last sale price on the NYSE is different from the last sale price on any other exchange, the NYSE price will be used. If there are no sales on that day, then the securities are valued at the bid price on the NYSE or other primary exchange for that day. Securities traded in the OTC market are valued on the basis of the last sales price as reported by NASDAQ. If there are no sales on that day, then the securities are valued at the mean between the closing bid and asked prices as
| | | | |
| | 32 | | | The Motley Fool Funds Trust |
reported by NASDAQ. Stock options and stock index options traded on national securities exchanges or on NASDAQ are valued at the mean between the latest bid and asked prices for such options. Securities for which market quotations are not readily available or whose values have been affected by events occurring before the Funds’ pricing time but after the close of the securities markets, and other assets are valued at fair value as determined pursuant to procedures adopted in good faith by the Board of Trustees (the “Board”). Debt securities that mature in fewer than 60 days are valued at amortized cost (unless the Board determines that this method does not represent fair value), if their original maturity was 60 days or less or by amortizing the value as of the 61st day before maturity, if their original term to maturity exceeded 60 days.
When fair value pricing is employed, the prices of securities used by a fund to calculate its net asset value (the “NAV”) may differ from quoted or published prices for the same securities.
You’d think that it would be easy to determine what a share of the Fund is worth – just add up the value of everything it holds, and then divide by the number of shares. It’s not that simple, though. Some foreign markets have different operating hours (when it’s daytime in Chicago, for example, it is night in Shanghai). That means that when we calculate a Fund’s value at the end of the day, the market quotations for some of the securities held by the Fund could be several hours old, and intervening events may have affected what the stocks are worth. In addition, characteristics of the relevant markets and stocks might, in some cases, cast doubt on a particular valuation. For these reasons, we may rely on a pricing service to determine the value of particular securities. It is possible that when a Fund buys or sells the securities, the price on the real market will be different from the value used for the fair-value pricing.
The values of securities held by the Funds and other assets used in computing NAV are generally determined as of the time trading in such securities is completed each day, which, in the case of foreign securities, generally occurs at various times before the close of the NYSE. Trading in securities listed on foreign securities exchanges are valued at the last sale or, if no sales are reported, at the bid price as of the close of the exchange, subject to possible adjustment as described in the Prospectus. Foreign currency exchange rates are also generally determined before the close of the NYSE. On occasion, the values of such securities and exchange rates may be affected by events occurring between the time as of which determinations of such values or exchange rates are made and the close of the NYSE. When such events materially affect the value of securities held by the Funds or their liabilities, such securities and liabilities will be valued at fair value in accordance with procedures adopted in good faith by the Board. In this regard, the Trust has retained a third party fair value pricing service to quantitatively analyze the price movement of the Funds’ holdings on foreign exchanges and to automatically fair value if the variation from the prior day’s closing price exceeds specified parameters. As of April 30, 2011, such price movements for certain securities had exceeded specified parameters and the third party fair value service quantitatively fair
| | | | |
| The Motley Fool Funds Trust | | | 33 | |
valued the affected securities. The Board will review and monitor the methods used by the service to assure itself that securities are valued at their fair values. The values of any assets and liabilities initially expressed in foreign currencies will be converted to U.S. dollars based on exchange rates supplied by a quotation service.
Fair Value Measurements
The Financial Accounting Standards Board (“FASB”) “Fair Value Measurements and Disclosures” defines fair value as the price that a Fund would receive upon selling an investment in an orderly transaction to an independent buyer in the principal market, or in the absence of a principal market, the most advantageous market for the investment. Valuation techniques should maximize the use of observable market data and minimize the use of unobservable inputs. Inputs refer broadly to the assumptions that market participants would use in pricing an asset. Inputs may be observable or unobservable. Observable inputs are inputs that reflect the assumptions market participants would use in pricing the asset or liability developed based on market data obtained from sources independent of the reporting entity. Unobservable inputs are inputs that reflect the reporting entity’s own assumptions about the assumptions market participants would use in pricing the asset or liability developed based on the best information available in the circumstances.
Fair value measurements utilize a hierarchy based on the observability of inputs used to establish fair value.
Investment assets reported at fair value are classified based on the lowest level input that is significant to fair value:
Level 1 — quoted prices in active markets for identical securities
Investments whose values are based on quoted market prices in active markets, and whose values are therefore classified as Level 1 prices, include active listed domestic and foreign equity securities.
Level 2 — observable inputs other than Level 1 (including quoted prices for similar securities, interest rates, prepayment speeds, credit risk, etc.)
Investments that trade in markets that are not considered to be active, but whose values are based on quoted market prices, dealer quotations or valuations provided by alternative pricing sources supported by observable inputs are classified as Level 2 prices. These generally include investment grade corporate bonds and less liquid listed domestic and foreign equity securities.
Level 3 — significant unobservable inputs (including the Fund’s own assumptions in determining the fair value of investments)
Investments whose values are classified as Level 3 prices have significant unobservable inputs, as they may trade infrequently or not at all.
| | | | |
| | 34 | | | The Motley Fool Funds Trust |
The Funds did not have any significant transfers between Level 1 and Level 2 during the six months ended April 30, 2011.
| | | | |
| | | Independence
Fund | |
Valuation Inputs | | Value | |
Level 1 — Quoted Prices | | | | |
U.S. Common Stocks | | $ | 85,995,108 | |
Foreign Common Stocks | | | 53,123,971 | |
Temporary Cash Investment | | | 15,013,426 | |
Level 2 — Other Significant Observable Inputs | | | | |
Foreign Common Stocks | | | 39,246,241 | |
Participatory Note | | | 1,999,840 | |
Level 3 — Significant Unobservable Inputs | | | — | |
Total Value of Investments | | $ | 195,378,586 | |
| | | | |
| | | Great America
Fund | |
Valuation Inputs | | Value | |
Level 1 — Quoted Prices | | | | |
U.S. Common Stocks | | $ | 41,907,298 | |
Temporary Cash Investment | | | 8,252,749 | |
Level 2 — Other Significant Observable Inputs | | | — | |
Level 3 — Significant Unobservable Inputs | | | — | |
Total Value of Investments | | $ | 50,160,047 | |
The inputs or methodology used for valuing securities are not necessarily an indication of the risk associated with investing in those securities.
| | | | |
| The Motley Fool Funds Trust | | | 35 | |
Dividends and Distributions
When a Fund pays a dividend or other distribution, its net asset value (NAV) per share will decline by the per-share amount of the distribution. Investors are no poorer for this “distribution drop,” however. As this section explains, investors may elect to reinvest their dividend and distribution payments. Doing so would allow them to acquire additional shares at the post-distribution NAV per share. They may also choose to receive a check in the amount of their portion of the dividend or distribution.
Each Fund pays dividends from its net investment income and distributes any net capital gains that it realizes. Dividends and capital gains distributions are generally paid once a year. All dividends and other distributions will be reinvested in Fund shares unless a shareholder chooses either to (1) receive dividends in cash, while reinvesting capital gains distributions in additional Fund shares; or (2) receive all distributions in cash. Additionally, each Fund reports details of distribution-related transactions on quarterly account statements. You may not receive a separate confirmation statement for these transactions.
Securities Transactions, Investment Income and Expenses
Securities transactions are accounted for as of the trade date. Costs used in determining realized gains and losses on the sales of investment securities are on the basis of identified cost. Dividend income is recorded on the ex-dividend date. Interest income is recorded on an accrual basis. Discount and premium are amortized using the effective interest method. Expenses directly attributable to a Fund are directly charged to that Fund. Common expenses of the Trust are allocated using methods approved by the Board.
Foreign Currency Translation
The books and records of the Funds are maintained in U.S. dollars as follows: (1) the values of investment securities and other assets and liabilities stated in foreign currencies are translated at the exchange rates prevailing at the end of the period; and (2) purchases, sales and income are translated at the rates of exchange prevailing on the respective dates of such transactions. Transaction gains or losses resulting from changes in exchange rates during the reporting period or upon settlement from foreign currency transactions are reported in the Statements of Operations for the current period. The Funds do not isolate the portion of gains and losses on investments.
3. Investment Policies and Practices:
The sections below describe some of the different types of investments that may be made by the Funds and the investment practices in which the Funds may engage.
| | | | |
| | 36 | | | The Motley Fool Funds Trust |
When we say that the Funds may invest in other types of securities and in other asset classes, the “may” is well worth emphasizing, as the Fund’s primary focus is the common stock companies that the Adviser believes are both promising and undervalued.
Foreign Securities
The Independence Fund invests, and the Great America Fund may invest, in equity and fixed-income securities of foreign companies, including companies located in both developed and emerging-market countries. Investment in foreign securities may include the purchase of American Depositary Receipts (“ADRs”) and other depositary receipts (European Depository Receipts (“EDRs”) and Global Depository Receipts (“GDRs”)) that represent indirect interests in securities of foreign issuers. A significant portion of a Fund’s exposure to foreign investments may be composed of such investments. Investments in foreign securities are affected by risk factors generally not associated with investments in the securities of U.S. companies in the U.S. With respect to such securities, there may be more limited information publicly available concerning the issuer than would be the case with respect to domestic securities, foreign issuers may use different accounting standards, and foreign trading markets may not be as liquid as are U.S. markets. Foreign securities also involve such risks as currency risks, possible imposition of withholding or confiscatory taxes, possible currency transfer restrictions, expropriation or other adverse political or economic developments, and the difficulty of enforcing obligations in other countries. These risks may be greater in emerging-market countries and in less developed countries.
If a Fund holds a foreign stock, and the stock is traded on a foreign exchange, with its price denominated in that foreign currency, the value of the stock will change, for the Fund, whenever the relative value of the U.S. dollar and that foreign currency change. To take an imaginary example, if the Fund holds shares in Ruritania Telecom, traded on the Ruritanian Stock Exchange, those shares will be worth more to the Fund if the value of the Ruritanian ploof increases against the U.S. dollar, and vice versa, all other things being equal.
The purchase of securities denominated in foreign currencies will subject the value of the Funds’ investments in those securities to fluctuations caused by changes in foreign exchange rates. To hedge against the effects of changes in foreign exchange rates, the Funds may enter into forward foreign currency exchange contracts (“forward contracts”). These contracts represent agreements to exchange an amount of currency at an agreed-upon future date and rate. The Funds will generally use forward contracts only to “lock in” the price in U.S. dollars of a foreign security that a Fund plans to purchase or to sell, but in certain limited cases, it may use such contracts to hedge against an anticipated substantial decline in the price of a foreign currency against the U.S. dollar that would adversely affect the U.S. dollar value of foreign securities held by the Fund. Forward contracts will not be used in all cases and, in any event, cannot
| | | | |
| The Motley Fool Funds Trust | | | 37 | |
completely protect the Funds against all changes in the values of foreign securities resulting from fluctuations in foreign exchange rates. The Funds will not enter into a forward contract if, as a result, forward contracts would represent more than 20% of a Fund’s total assets. For hedging purposes, the Funds may also use options on foreign currencies, which expose the Funds to certain risks.
Some foreign securities are traded in the U.S. in the form of ADRs. ADRs are receipts typically issued by a U.S. bank or trust company evidencing ownership of the underlying securities of foreign issuers. EDRs and GDRs are receipts typically issued by foreign banks or trust companies, evidencing ownership of underlying securities issued by either a foreign or U.S. issuer. Generally, depositary receipts in registered form are designed for use in the U.S. and depositary receipts in bearer form are designed for use in securities markets outside the U.S. Depositary receipts may not necessarily be denominated in the same currency as the underlying securities into which they may be converted. Depositary receipts generally involve the same risks as other investments in foreign securities. However, holders of ADRs and other depositary receipts may not have all the legal rights of shareholders and may experience difficulty in receiving shareholder communications.
Types of Fixed-Income Securities
A Fund may invest in bonds and other types of debt obligations of U.S. and foreign issuers. Fixed income securities purchased by a Fund may include, among others, bonds, notes and debentures issued by corporations; debt securities issued or guaranteed by the U.S. government or one of its agencies or instrumentalities (“U.S. Government Securities”); municipal securities; mortgage-backed and asset-backed securities; and debt securities issued or guaranteed by foreign governments, their agencies, instrumentalities, or political subdivisions, or by government-owned, -controlled, or -sponsored entities, including central banks. These investments also include money market instruments and other types of obligations. Investors should recognize that, although securities ratings issued by Standard & Poor’s® Ratings Services (“S&P”), a division of The McGraw-Hill Companies, Inc., and Moody’s Investors Services©, Inc. (“Moody’s”), provide a generally useful guide as to credit risks, they do not offer any criteria to evaluate interest rate risk. Changes in interest rate levels generally cause fluctuations in the prices of fixed-income securities and will, therefore, cause fluctuations in the NAV per share of a Fund. Subsequent to the purchase of a fixed-income security by a Fund, the ratings or credit quality of such security may deteriorate. Any such subsequent adverse changes in the rating or quality of a security held by a Fund would not require a Fund to sell the security.
Participatory Notes
A participatory note, as used by a Fund, is an instrument used by investors to obtain exposure to an equity investment, including common stocks and warrants, in a local market where direct ownership is not permitted. In countries where direct ownership by a foreign investor, such as a Fund, is not allowed by local law, such as Saudi Arabia,
| | | | |
| | 38 | | | The Motley Fool Funds Trust |
an investor may gain exposure to the market through a participatory note, which derives its value from a group of underlying equity securities. A participatory note is intended (disregarding the effect of any fees and expenses) to reflect the performance of the underlying equity securities on a one-to-one basis so that investors will not normally gain more in absolute terms than they would have made had they invested in the underlying securities directly, and will not normally lose more than they would have lost had they invested in the underlying securities directly.
In addition to providing access to otherwise closed markets, participatory notes can also provide a less expensive option to direct investment (where ownership by foreign investors is permitted) by reducing registration and transaction costs in acquiring and selling local registered shares. The Funds’ investment manager also believes that participatory notes can offer greater liquidity in markets that restrict the ability of the Funds to dispose of an investment by either restricting transactions by size or requiring registration and/or regulatory approvals.
The purchase of participatory notes involves risks that are in addition to the risks normally associated with a direct investment in the underlying securities. The Fund is subject to the risk that the issuer of the participatory note (i.e., the issuing bank or broker-dealer), which is the only responsible party under the note, is unable or refuses to perform under the terms of the participatory note, also known as counterparty risk.
While the holder of a participatory note is entitled to receive from the bank or broker-dealer any dividends or other distributions paid on the underlying securities, the holder is not entitled to the same rights as an owner of the underlying securities, such as voting rights.
Participatory notes are also not traded on exchanges, are privately issued, and may be illiquid. To the extent a participatory note is determined to be illiquid, it would be subject to the Fund’s limitation on investments in illiquid securities. There can be no assurance that the trading price or value of participatory notes will equal the value of the underlying value of the equity securities they seek to replicate.
Real Estate Investment Trusts
Real estate investment trusts (“REITs”) are pooled investment vehicles that manage a portfolio of real estate or real estate-related loans to earn profits for their shareholders. REITs are generally classified as equity REITs, mortgage REITs, or a combination of equity and mortgage REITs. Investing in REITs involves certain unique risks in addition to those risks associated with investing in the real estate industry in general. Equity REITs may be affected by changes in the value of the underlying property owned by the REITs, while mortgage REITs may be affected by the quality of the borrower on any credit extended. REITs are dependent upon management skills, may not be diversified geographically or by property type, and are subject to heavy cash-flow dependency, default by borrowers, and self-liquidation. REITs must also meet certain requirements under the Internal Revenue Code of 1986, as amended (the “Code”), to avoid entity
| | | | |
| The Motley Fool Funds Trust | | | 39 | |
level tax and be eligible to pass through certain tax attributes of their income to shareholders. REITs are consequently subject to the risk of failing to meet these requirements for favorable tax treatment and of failing to maintain their exemptions from registration under the 1940 Act. REITs are also subject to the risks of changes in the Code, affecting their tax status.
REITs (especially mortgage REITs) are also subject to interest rate risks. When interest rates decline, the value of a REIT’s investment in fixed-rate obligations can be expected to rise. Conversely, when interest rates rise, the value of a REIT’s investment in fixed-rate obligations can be expected to decline. In contrast, as interest rates on adjustable-rate mortgage loans are reset periodically, yields on a REIT’s investments in such loans will gradually align themselves to reflect changes in market interest rates, causing the value of such investments to fluctuate less dramatically in response to interest rate fluctuations than would investments in fixed-rate obligations.
The management of a REIT may be subject to conflicts of interest with respect to the operation of the business of the REIT and may be involved in real estate activities competitive with the REIT. REITs may own properties through joint ventures or in other circumstances in which a REIT may not have control over its investments. REITs may use significant amounts of leverage.
REITs often do not provide complete tax information until after the end of the calendar year. Consequently, because of the delay, it may be necessary for a Fund, if invested in REITs, to request permission to extend the deadline for issuance of Forms 1099-DIV beyond January 31. Alternatively, amended Forms 1099-DIV may be sent. During the six months ended April 30, 2011, both Funds invested in REITs.
Temporary Investments
During periods of adverse market or economic conditions, a Fund may temporarily invest all or a substantial portion of its assets in high-quality, fixed-income securities, money market instruments, and shares of money market mutual funds, or it may hold cash. At such times, a Fund would not be pursuing its stated investment objective with its usual investment strategies. A Fund may also hold these investments for liquidity purposes. Fixed-income securities will be deemed to be of high quality if they are rated “A” or better by S&P or Moody’s or, if unrated, are determined to be of comparable quality by the Adviser. Money market instruments are high-quality, short-term fixed income obligations (which generally have remaining maturities of one year or less), and may include U.S. Government Securities, commercial paper, certificates of deposit and banker’s acceptances issued by domestic branches of United States banks that are members of the Federal Deposit Insurance Corporation, and repurchase agreements for US. Government Securities. In lieu of purchasing money market instruments, a Fund may purchase shares of money market mutual funds that invest primarily in U.S. Government Securities and repurchase agreements involving those securities, subject to certain limitations imposed by the 1940 Act. A Fund, as an investor in a money market fund, will indirectly bear the fees and expenses of the money market fund. These
| | | | |
| | 40 | | | The Motley Fool Funds Trust |
indirect fees and expenses will be in addition to the fees and expenses of the Funds. Repurchase Agreements involve certain risks not associated with direct investments in debt securities.
4. Fees and Transactions with Related Parties:
Fund Expenses
Each Fund pays all of its expenses other than those expressly assumed by the Adviser. Expenses of each Fund are deducted from the Funds’ total income before dividends are paid.
Investment Adviser
Subject to the supervision of the Board, Motley Fool Asset Management (the “Adviser”) manages the overall investment operations of the Funds in accordance with the Funds’ investment objective and policies and formulates a continuing investment strategy for the Funds pursuant to the terms of the Investment Advisory Agreement between the Adviser and the Trust on behalf of the Funds. The Adviser is a wholly owned subsidiary of The Motley Fool Holdings Inc. (“TMF Holdings”), a multimedia financial-services holding company that also owns The Motley Fool, LLC, which publishes investment information and analysis across a wide range of media, including investment newsletter services, websites, and books. TMF Holdings is controlled by David Gardner and Tom Gardner, along with other private shareholders.
Under the terms of the Advisory Agreement, each Fund pays the Adviser a fee that is computed and paid monthly at an annual rate of 0.95% of the Funds’ average daily net assets during the month (the “Basic Fee”). Commencing the first month after each Fund has completed 12 full calendar months of operations, the Basic Fee is subject to a monthly adjustment (the “Monthly Performance Adjustment”) based on the investment performance of each Fund relative to the performance of the MSCI World Index for the Independence Fund, and the Russell Midcap Index for the Great America Fund, measured over a trailing-36-month period ending on the last day of the month for which the fee is to be paid (or, if each Fund does not have 36 full calendar months of operations, the number of months since commencement of each Fund’s operations) (the “Performance Measurement Period”). The fee payable for each month (the “Total Advisory Fee”) will be the Basic Fee plus or minus the Monthly Performance Adjustment.
The Monthly Performance Adjustment is calculated by subtracting from the cumulative percentage performance of the Funds (essentially, the change in the Funds’ net asset value per share) during the Performance Measurement Period (net of all expenses, including advisory fees) the percentage change in the MSCI World Index for the Independence Fund and the Russell Midcap Index for the Great America Fund over the same period (including the value of dividends paid during the measurement period on stocks included in the MSCI World Index, or the Russell Midcap Index, respectively).
| | | | |
| The Motley Fool Funds Trust | | | 41 | |
The Monthly Performance Adjustment is based on an annual percentage rate determined by (i) subtracting 3 from the positive or negative percentage difference between the investment performance of the Funds and the investment performance of the MSCI World Index for the Independence Fund and the Russell Midcap Index for the Great America Fund during the Performance Measurement Period, and (ii) multiplying the result by 2%, but the annual percentage rate used in determining the Monthly Performance Adjustment will be limited to a rate of not more than +0.20% nor less than -0.20%. The dollar amount of the Monthly Performance Adjustment is then determined by dividing the annual percentage rate by 12 and (iii) multiplying the result by the average daily net assets of each Fund during the Performance Measurement Period. There is no Monthly Performance Adjustment if the difference between the investment performance of each Fund and the investment performance of its index is three percentage points or less. Because the operation of the Expense Limitation and Reimbursement Agreement will have a positive effect upon each Fund’s Investment performance, the agreement may result in an increase in the Monthly Performance Adjustment and the Total Advisory Fee. The Adviser has agreed to waive the amount of the increase in the Monthly Performance Adjustment that exceeds the amount that would have been payable to it in the absence of the Expense Limitation and Reimbursement Agreement to the extent that such increase exceeds the cumulative amount of expenses deferred, absorbed, or reimbursed by the Adviser that it has not previously recovered as a result of higher positive performance-based adjustments in one or more prior months resulting from the Expense Limitation and Reimbursement Agreement.
Under the terms of an Expense Limitation and Reimbursement Agreement entered into by the Adviser and the Funds, the Adviser has contractually agreed to pay, waive or absorb a portion of the Funds’ operating expenses through February 2012, to the extent necessary to limit the Funds’ annual operating expenses (excluding the advisory fee, brokerage commissions, taxes, interest expense, acquired fund fees and expenses, and any extraordinary expenses) to an amount not exceeding 0.40% annually of each Fund’s average daily net assets. The Adviser may recover from the Funds’ fees and expenses previously paid, waived or absorbed for a period of three years after such fees or expenses were incurred, provided that the repayments do not cause the Funds’ operating expenses (excluding the advisory fee, brokerage commissions, taxes, interest expense, acquired fund fees and expenses, and any extraordinary expenses) to exceed 0.40% annually of the Funds’ average daily net assets. Previously waived fees subject to future recovery by the Adviser over periods not exceeding April 30, 2014 for the Independence Fund and the Great America Fund are $1,174,340 and $185,800, respectively.
Trustees’ Fees
Effective April 1, 2011, each Trustee who is not an “interested person,” as defined by the 1940 Act, of the Trust is paid an annual retainer of $30,000. Prior to April 1, 2011, each Independent Trustee was paid (i) an annual retainer of $20,000, (ii) a fee of $1,250 for
| | | | |
| | 42 | | | The Motley Fool Funds Trust |
each quarterly meeting of the Board attended, and (iii) a fee of $500 for each meeting attended of any committee of the Board of which such Trustee is a member (if such meeting is not held on the same day as a meeting of the Board). Officers of the Trust, all of whom are members, officers, or employees of the Adviser, or their affiliates, receive no compensation from the Trust.
Other Service Providers
Administration and Accounting Services
The Trust has entered into an Administration and Accounting Services Agreement with BNY Mellon. Pursuant to the Administration and Accounting Services Agreement, BNY Mellon provides various administrative and accounting services necessary for the operations of the Trust and the Funds. Services provided by BNY Mellon include facilitating general Fund management; monitoring the Funds’ compliance with federal and state regulations; supervising the maintenance of the Funds’ general ledger, the preparation of the Funds’ financial statements, the determination of NAV and the payment of dividends and other distributions to shareholders; and preparing specified financial, tax and other reports. The Funds pays the Administrator an annual fee calculated based upon the Funds’ average net assets. The fee is paid monthly. The Funds also reimburse the Administrator for certain out-of-pocket expenses.
Transfer Agent
BNY Mellon serves as the Funds’ transfer agent and dividend disbursing agent. BNY Mellon receives a fee based mainly upon the number of accounts serviced. Certain minimum fees and transaction charges may apply.
For the six months ended April 30, 2011, BNY Mellon received $347,480 in aggregate fees and expenses for services rendered under the various agreements described above.
Custodian
PFPC Trust Company served as custodian of the Trust’s assets and was responsible for maintaining custody of the Funds’ cash and investments and retaining subcustodians, including in connection with the custody of foreign securities.
Custodian fees for the Funds are calculated based on the average daily gross assets of the Funds. PFPC Trust Company also received other transaction based charges and was reimbursed for out-of-pocket expenses.
For the six months ended April 30, 2011, PFPC Trust Company received $34,462 in aggregate fees and expenses for services rendered under the custody agreements described above.
Effective April 11, 2011, BNY Mellon replaced PFPC Trust Company as custodian of the Trust’s Assets.
| | | | |
The Motley Fool Funds Trust | | | 43 | |
Distribution
The Distributor serves as the principal underwriter of the Funds pursuant to an Underwriting Agreement for the limited purpose of acting as statutory underwriter to facilitate the distribution of shares of the Funds. The Funds do not pay any fees to the Distributor in its capacity as Underwriter. The fees are paid by the Adviser.
Redemption Fees
The Funds charge a redemption fee of 2.00% on proceeds from Shares redeemed or exchanged within 90 days following their acquisition. The redemption fee is calculated as a percentage of the net asset value of the total redemption proceeds and is retained by the Funds and accounted for as additional paid-in capital. Certain exceptions to the imposition of the redemption fee exist. Please see the Funds’ prospectus for more information.
5. Control Persons and Principal Holders:
Any person beneficially owning, directly or indirectly, more than 25% of the outstanding shares of a Fund is presumed to control the Fund. Through the exercise of voting rights with respect to shares of the Fund, such a person may be able to determine the outcome of shareholders voting on matters as to which the approval of shareholders of the Fund is required. Principal holders are persons who own beneficially 5% or more of the outstanding shares of the Fund. As of April 30, 2011, the Trust was not aware of any shareholders who beneficially owned 5% or more of each Fund’s outstanding shares.
6. Investment Transactions:
For the six months ended April 30, 2011, the cost of purchases and proceeds from sales and maturities of investment securities for the Funds were as follows:
Cost of Purchases and Proceeds from Sales and Maturities of Long-Term Securities
(other than Temporary Cash Investments)
| | | | | | | | |
Fund | | Purchases | | | Sales and Maturity Proceeds | |
Independence Fund | | $ | 63,244,584 | | | $ | 25,185,929 | |
Great America Fund | | | 39,460,621 | | | | 1,209,456 | |
7. Shares of Beneficial Interest:
The Trust is authorized to issue an unlimited number of shares of beneficial interest, $.001 par value. Currently, the Trust consists of two series of shares, the Independence Fund and the Great America Fund, and all shares of each series represent a single class. However, the Board has the authority to establish additional series of shares
| | | | |
| | 44 | | | The Motley Fool Funds Trust |
(representing interests in separate investment portfolios of the Trust in addition to these two series) and, subject to applicable rules, may establish two or more classes of shares of any series, with the differences in classes representing differences as to certain expenses and share distribution arrangements. Shares are fully paid and non-assessable and have no pre-emptive or conversion rights.
8. Federal Income Taxes:
Each Fund intends to qualify as a regulated investment company (“RIC”) under Subchapter M of the Code. If so qualified, a Fund will not be subject to federal income tax on that part of its net investment income and net capital gains that it distributes to its shareholders. Certain federal income and excise taxes would be imposed on a Fund if it fails to make certain required distributions of its income to shareholders. The Funds intend, however, to make distributions in a manner that will avoid the imposition of any such taxes. For this reason, no provision for excise or income taxes is required.
Net investment income (loss) and net realized gains (losses) may differ for financial statements and tax purposes primarily due to differing treatments for amortization of deferred organization costs, foreign currency transactions, foreign capital gains taxes and investments in partnerships and Passive Foreign Investment Companies (“PFIC’s”).
Distributions during the year ended October 31, 2010, for the Independence Fund were characterized as follows for tax purposes:
| | | | | | | | | | |
Tax Year End | | Ordinary
Income | | | Long-Term
Capital Gain | |
2010 | | $ | 390,863 | | | $ | — | |
There were no distributions for the period ended October 31, 2009, for the Independence Fund.
At October 31, 2010, the components of distributable earnings for the Independence Fund, on a tax basis were as follows:
| | | | | | | | | | | | | | |
Undistributed Ordinary Income | | | Undistributed
Long-Term
Capital Gain | | | Capital
Loss
Carryover | | | Net Unrealized
Appreciation
(Depreciation)
on Investments | |
| $ | 1,632,397 | | | $ | 625,977 | | | $ | — | | | $ | 16,248,329 | |
For federal income tax purposes, there was no capital loss carryover for the Independence Fund as of October 31, 2010.
At April 30, 2011, the aggregate cost of investment securities for federal income tax purposes (excluding foreign currency, securities sold short and derivative related items)
| | | | |
| The Motley Fool Funds Trust | | | 45 | |
and the net unrealized appreciation from investments for those securities having an excess of value over cost and net unrealized depreciation from investments for those securities having an excess of cost over value (based on cost for federal income tax purposes) were as follows:
Independence Fund
| | | | | | | | | | | | | | |
Federal Tax Cost | | | Net Unrealized
Appreciation
(Depreciation) | | | Appreciated
Securities | | | Depreciated
Securities | |
| $ | 166,709,620 | | | $ | 28,668,966 | | | $ | 30,605,661 | | | $ | (1,936,695 | ) |
Great America Fund
| | | | | | | | | | | | | | |
Federal Tax Cost | | | Net Unrealized
Appreciation
(Depreciation) | | | Appreciated
Securities | | | Depreciated
Securities | |
| $ | 46,448,717 | | | $ | 3,711,330 | | | $ | 4,926,952 | | | $ | (1,215,622 | ) |
The differences between book basis and tax basis unrealized appreciation is attributable primarily to the deferral of losses on wash sales and cumulative basis adjustments for partnerships and PFIC’s.
At October 31, 2010, capital contributions, accumulated undistributed net investment income and accumulated net realized gain (loss) from investments have been adjusted for current period permanent book/tax differences which arose principally from differing book/tax treatments of amortization of deferred organization costs, foreign currency transactions, and investments in partnerships and PFICs. The following amounts were reclassified within the capital accounts for the Independence Fund:
| | | | | | | | | | |
Paid in Capital | | | Accumulated
Undistributed Income | | | Accumulated
Net Realized
Gain (Loss)
on Investments | |
| $ | (5,631 | ) | | $ | (123,290 | ) | | $ | 128,921 | |
Management has analyzed the Funds’ tax positions and has concluded that no provision for income tax is required in the financial statements. The Funds are not aware of any tax positions for which it is reasonably possible that the total amounts of unrecognized tax benefits will significantly change in the next twelve months. However, management’s conclusions may be subject to review and adjustment at a later date based on certain factors including, but not limited to, further implementation guidance
| | | | |
| | 46 | | | The Motley Fool Funds Trust |
from the FASB, new tax laws, regulations and administrative interpretations (including court decisions).
9. Recent Accounting Pronouncements:
In May 2011, the FASB issued “Amendments to Achieve Common Fair Value Measurement and Disclosure Requirements in U.S. GAAP and IFRSs” (the “Standard”). The Standard includes common requirements for measurement of and disclosure about fair value between U.S. GAAP and IFRS. The Standard will require reporting entities to disclose quantitative information about the unobservable inputs used in the fair value measurements categorized within Level 3 of the fair value hierarchy. In addition, the Standard will require reporting entities to make disclosures about amounts and reasons for all transfers in and out of Level 1 and Level 2 fair value measurements. The new and revised disclosures are effective for interim and annual reporting periods beginning after December 15, 2011. At this time, management is evaluating the implications of the Standard and its impact on the financial statements has not been determined.
10. Subsequent Events:
Subsequent events have been evaluated through the date that the financial statements were available to be issued. All subsequent events determined to be relevant and material to the financial statements have been appropriately recorded or disclosed.
| | | | |
| The Motley Fool Funds Trust | | | 47 | |
Notice to Shareholders (Unaudited)
Information on Proxy Voting
The Trust’s proxy voting guidelines, used to determine how to vote proxies relating to portfolio securities and information regarding how the Trust voted proxies relating to portfolio securities of the Funds during the most recent 12-month period ended June 30 is available (i) without charge, upon request, by calling (888) 863-8803; (ii) on the U.S. Securities and Exchange Commission’s (“SEC”) website at http://www.sec.gov; and (iii) on the Funds’ website at http://www.foolfunds.com.
Quarterly Schedule of Investments
The Trust provides a complete list of each Fund’s holdings four times in each fiscal year, at the quarter-ends. For the second and fourth quarters, the Portfolio of Investments appears in the semiannual and annual reports to shareholders. For the first and third quarters, the Trust files the Portfolio of Investments with the SEC on Form N-Q. Shareholders can obtain the Form N-Q (i) without charge, upon request, by calling (888) 863-8803; (ii) on the SEC’s website at http://www.sec.gov; and (iii) on the Funds’ website at http://www.foolfunds.com. The Form N-Q may be reviewed or copied at the SEC Public Reference Room in Washington, D.C. Information on the operation of the Public Reference Room may be obtained by calling (800) SEC-0330.
| | | | |
| | 48 | | | The Motley Fool Funds Trust |
The Motley Fool Funds Trust Privacy Policy
We collect the following nonpublic personal information about you:
| • | | Information we receive from you on or in applications or other forms, our website, correspondence, or conversations, including, but not limited to, your name, address, phone number, Social Security number, assets, income, and date of birth. |
| • | | Information about your transactions with us, our affiliates, or others, including, but not limited to, your account number and balance, payments history, parties to transactions, cost-basis information, and other financial information. |
We do not disclose any nonpublic personal information about our current or former shareholders to nonaffiliated third parties, except as permitted by law. For example, we are permitted by law to disclose all of the information we collect, as described above, to our transfer agent to process your transactions. Furthermore, we restrict access to your nonpublic personal information to those persons who require such information to provide products or services to you. We maintain physical, electronic, and procedural safeguards that comply with federal standards to guard your nonpublic personal information.
In the event that you hold shares of a Fund through a financial intermediary, including, but not limited to, a securities dealer, bank, or trust company, the privacy policy of your financial intermediary would govern how your nonpublic personal information would be shared with nonaffiliated third parties.
| | | | |
| The Motley Fool Funds Trust | | | 49 | |
Directors and Officers
| | | | | | | | | | |
NAME, ADDRESS, AND AGE (1) | | POSITION(S)
HELD WITH
THE TRUST | | TERM OF
OFFICE AND
LENGTH OF
TIME
SERVED (2) | | PRINCIPAL OCCUPATIONS DURING PAST FIVE YEARS | | NUMBER OF
PORTFOLIOS IN
FUND COMPLEX
OVERSEEN
BY TRUSTEE | | OTHER
DIRECTORSHIPS HELD BY
TRUSTEE |
| INDEPENDENT TRUSTEES |
| | | | | |
Kathleen A. O’Neil 58 | | Trustee | | Since
March, 2009 | | President/CEO, Liberty Street Advisors (consultancy); Director, BMC Software, Guidance Software, MetLife Bank, N.A., John Carroll University (1999 to 2008) | | 2 | | BMC Software, Guidance Software, MetLife Bank N.A. |
Gary Langbaum 62. | | Trustee | | Since
March, 2009 | | Retired | | 2 | | None |
| | | | | |
Stephen L. Boyd 70 | | Trustee | | Since March,
2009 | | Advisory Director, Morgan Stanley Investment Management | | 2 | | None |
| | | |
| | INTERESTED TRUSTEES AND OFFICERS | | | | |
| | | | | |
Peter E. Jacobstein(3) 45 | | Trustee
President | | Since
November, 2008 | | President, Motley Fool Asset Management, LLC; SVP, The Motley Fool, Inc. (financial publishing); VP, Strategy and Development, Discovery Comm., Inc. (media) | | 2 | | None |
| | | | | |
Ollen C. Douglass 47 | | Treasurer | | Since
November, 2008 | | Chief Financial Officer, The Motley Fool Holdings, Inc. (and its predecessor, The Motley Fool, Inc.) (financial publishing). Director, Fool/Love Money.com Financial Services, Ltd. (U.K. mortgage adviser) (2008 to 2009); Lovemoney. com, Ltd. (U.K. financial information site) (2009 to 2009); and The Motley Fool, Ltd. (U.K. financial information site). Director, The Motley Fool Australia Pty Ltd. (financial publishing) (2010-present). | | N/A | | N/A |
| | | | | |
Lawrence T. Greenberg 48 | | Vice President
Secretary | | Since
March, 2009 | | SVP and Chief Legal Officer, The Motley Fool Holdings, Inc. (and its predecessor, The Motley Fool, Inc.) (financial publishing). Adjunct professor, Washington College of Law, American University, 2006-present, George Mason University School of Law (2000 to 2007). Director, Fool/Love Money.com Financial Services, Ltd. (U.K. mortgage adviser) (2008 to 2009), Lovemoney. com, Ltd. (U.K. financial information site) (2009 to 2009). Director, The Motley Fool Australia Pty Ltd. (financial publishing) (2010-present). | | N/A | | N/A |
| | | | | |
Salvatore Faia 48 | | Chief
Compliance
Officer | | Since
March, 2009 | | President, Vigilant Compliance Services since 2004; and Director of Energy Income Partnership since 2005.. | | N/A | | N/A |
| (1) | Each Trustee can be contacted by writing to The Motley Fool Funds Trust, 2000 Duke Street, Suite 175, Alexandria, VA 22314. |
| (2) | Each Trustee holds office until the next meeting of shareholders at which Trustees are elected (or otherwise appointed) and serve until his or her successor has been elected or qualified. |
| (3) | Mr. Jacobstein is an “interested person” (as defined by the 1940 Act) of the Trust. Mr. Jacobstein is the President and Chairman of the Adviser. |
For more information regarding the trustees and officers, please refer to the Statement of Additional Information, which is available, without charge, upon request by calling (888) 863-8803 or visiting www.foolfunds.com.
| | | | |
| | 50 | | | The Motley Fool Funds Trust |
Board Approval of Advisory Agreement (Unaudited)
At a meeting held in person on September 15, 2010, the Board, including the Trustees who are not “interested persons,” as defined by the Investment Company Act of 1940, as amended, of the Trust or the Adviser (the “Independent Trustees”), approved the Advisory Agreement between the Trust and the Adviser pursuant to which the Adviser provides investment advisory services to the Great America Fund.
In determining whether to approve the Advisory Agreement, the Board exercised its business judgment and considered various information regarding the Adviser and the Great America Fund, as well as various factors including those described below that the Board deemed to be relevant. In its deliberations, the Board did not rank the importance of any particular piece of information or factor considered, and it is assumed that each Trustee attributed different weights to the various factors. The following summarizes the materials and principal factors that the Board considered, and the conclusions the Board reached, in approving the Advisory Agreement for the Great America Fund.
In its deliberations, the Board considered many factors, including the nature, extent and quality of services provided by the Adviser; particularly, the qualifications and capabilities of the personnel responsible for providing services to the Great America Fund. It was provided with information regarding the Adviser and its personnel, including information regarding the Adviser’s financial condition. The Board reviewed the financial condition of the Adviser to determine that adequate resources would be available to provide the level of service expected to be provided to the Great America Fund. On the basis of this evaluation, the Board concluded that the Adviser and its personnel were well-qualified to provide all required services to the Great America Fund and to provide services that are of a high quality, and that the Adviser had the appropriate resources to provide such services to the Great America Fund.
The Board recognized that a fund’s investment performance is an important factor for a mutual fund board to consider in connection with the approval of an investment advisory agreement. However, it noted that, because the Great America Fund was a newly-formed entity at the time of the Board’s deliberations, no performance information relating to the Great America Fund was available for consideration. The Board did, however, review the performance of the Adviser and the Independence Fund over various periods of time as compared to relevant indices and concluded that the Independence Fund was delivering reasonable results, especially over the long-term, consistent with the investment strategies of that Fund.
The Board also considered the costs of services to be provided by the Adviser and the profits to be realized by the Adviser and its affiliates under the Advisory Agreement, as well as comparative fees and expenses of other mutual funds. In connection this review of this factor, the Board evaluated the structure of the advisory fee and noted that, after the Great America Fund had completed 12 full calendar months of operations, the fees payable by the Great America Fund would partially depend on the relative performance of the Great America Fund. It concluded that this should provide strong incentive for the Adviser to use its best efforts and commit the resources necessary for the
| | | | |
| The Motley Fool Funds Trust | | | 51 | |
management of the Great America Fund and thus increase the likelihood that the Great America Fund would perform well in the future. The Board also considered information regarding the advisory fees of other global mutual funds and information regarding fulcrum fees paid by other mutual funds to their investment advisers. It evaluated the proposed advisory fee arrangements of the Great America Fund in light of this information and, in this regard, considered various factors that judicial decisions have specified as pertinent generally and factors that the Securities and Exchange Commission has stated should be considered when implementing fulcrum fee arrangements of the type proposed for the Great America Fund. After its review of this information, the Board concluded that the fees to be paid under the Advisory Agreement compared favorably to the average management fees paid by peer group funds, and that the overall expense ratio of the Great America Fund can be expected to be below the average expense ratio of funds in the peer group. Based on the foregoing considerations, the Board determined that it was satisfied that the advisory fee proposed for the Great America Fund was consistent with applicable standards and was reasonable and fair.
The Board recognized the importance of considering economies of scale in costs of providing services to the Great America Fund when evaluating the proposed advisory fee, including the extent to which any such economies of scale would be shared with the Great America Fund for the benefit of shareholders. It concluded that, because the Great America Fund had not commenced operations at the time of its deliberations, economies of scale did not currently exist. However, the Board agreed to consider the question of whether economies of scale justify any reduction in advisory fees payable by the Great America Fund at such time there has been growth in the Great America Fund’s net assets so as to warrant such a review.
The Board further considered the potential benefits that might be received by the Adviser due to its relationship with the Great America Fund. It concluded that the opportunities for such benefits to exist were limited and were a matter of conjecture since the Great America Fund had not commenced operations at the time of the Board’s deliberations.
Based on its review of the information and factors described above, and other considerations deemed pertinent, the Board, including all of the Independent Trustees, unanimously approved the Advisory Agreement.
| | | | |
| | 52 | | | The Motley Fool Funds Trust |
Investment Adviser
Motley Fool Asset Management, LLC
2000 Duke Street
Suite 175
Alexandria, VA 22314
Administrator and Transfer Agent
BNY Mellon Investment Servicing (US) Inc.
P.O. Box 9780
Providence, RI 02940-9780
Custodian
BNY Mellon
One Wall Street
New York, NY 10286
Underwriter
BNY Mellon Distributors Inc.
760 Moore Road
King of Prussia, PA 19406
Legal Counsel
Morgan Lewis & Bockius LLP
1111 Pennsylvania Ave., NW
Washington, DC 20004-2541
| | | | |
| The Motley Fool Funds Trust | | | 53 | |
Left Blank for Foolish Use
(Not a Part of the Semiannual Report)
Motley Fool Funds Guiding Principles
At Motley Fool Funds, we aim to get right what we believe much of the fund industry gets wrong. Our approach all begins with a shareholder-centric philosophy that we think is unique.
| | • | | We are — and will remain — significant investors with you in Motley Fool Funds. |
| | • | | We will manage your investment in Motley Fool Funds as if it were our own. |
| | • | | We will keep our financial incentives aligned with those of our shareholders. |
| | • | | We will invest for the long term. We seek to maximize returns while we minimize business, regulatory, financial, and sovereign risks. |
| | • | | We will not impose loads or 12b-1 charges, and we will apply redemption fees only to discourage the short-term trading that can hurt all a Fund’s investors. |
| | • | | We will be advocates on your behalf with company managers and boards, in the interest of enhancing the value of your shares. |
| | • | | We will recognize that one of our most powerful analytical weapons is the phrase “I don’t know.” In that spirit, we will constantly review our successes and mistakes and remain passionate about learning. |
| | • | | We will communicate with our shareholders as clearly and candidly as possible. |

Have you signed up for Declarations yet?
Never has market commentary been so amusing, so fun and so Foolish! Sign up now to receive Declarations, the free monthly newsletter from Motley Fool Funds. Each month, you’ll get the latest thinking from Bill Mann, your Motley Fool Funds Portfolio Manager, plus top holdings, performance data, answers to YOUR questions about everything from international affairs to heavy metal music, and more! Simply log on to FoolFunds.com to claim your FREE subscription now....
Visit us online at www.foolfunds.com. You’ll find:
| | • | | Sign-up form for Declarations, our monthly e-mail newsletter |
| | • | | Monthly shareholder letters from Portfolio Manager Bill Mann |
| | • | | Bill’s answers to shareholder questions |
| | • | | Updated fund performance details |
| | • | | Access to shareholder account information |
Reach us by phone: 888.863.8803 or contact your securities dealer.
Contact us by mail:
Motley Fool Funds
P.O. Box 9780
Providence, RI 02940-9780
©All Rights Reserved
This report has been prepared for shareholders of Motley Fool Independence Fund and Motley Fool Great America Fund. It is not authorized for distribution to prospective investors unless accompanied or preceded by a current prospectus, which contains more complete information about the Fund. Investors are reminded to read the prospectus carefully before investing. Past performance is no guarantee of future results. Share prices will fluctuate and there may be a gain or loss when shares are redeemed. Fund shares are distributed by BNY Mellon Distributors Inc., 760 Moore Rd., King of Prussia, PA 19406.
MFF-SMI-002
Item 2. Code of Ethics.
Not applicable.
Item 3. Audit Committee Financial Expert.
Not applicable.
Item 4. Principal Accountant Fees and Services.
Not applicable.
Item 5. Audit Committee of Listed Registrants.
Not applicable.
Item 6. Investments.
| (a) | Schedule of Investments in securities of unaffiliated issuers as of the close of the reporting period is included as part of the report to shareholders filed under Item 1 of this form. |
Item 7. Disclosure of Proxy Voting Policies and Procedures for Closed-End Management Investment Companies.
Not applicable.
Item 8. Portfolio Managers of Closed-End Management Investment Companies.
Not applicable.
Item 9. Purchases of Equity Securities by Closed-End Management Investment Company and Affiliated Purchasers.
Not applicable.
Item 10. Submission of Matters to a Vote of Security Holders.
Not applicable.
Item 11. Controls and Procedures.
| | (a) | The registrant’s principal executive and principal financial officers, or persons performing similar functions, have concluded that the registrant’s disclosure controls and procedures (as defined in Rule 30a-3(c) under the Investment Company Act of 1940, as amended (the “1940 Act”) (17 CFR 270.30a-3(c))) are effective, as of a date within 90 days of the filing date of the report that includes the disclosure required by this paragraph, based on their evaluation of these controls and procedures required by Rule 30a-3(b) under the 1940 Act (17 CFR 270.30a-3(b)) and Rules 13a-15(b) or 15d-15(b) under the Securities Exchange Act of 1934, as amended (17 CFR 240.13a-15(b) or 240.15d-15(b)). |
| | (b) | There were no changes in the registrant’s internal control over financial reporting (as defined in Rule 30a-3(d) under the 1940 Act (17 CFR 270.30a-3(d)) that occurred during the registrant’s second fiscal quarter of the period covered by this report that has materially affected, or is reasonably likely to materially affect, the registrant’s internal control over financial reporting. |
Item 12. Exhibits.
| | (a)(2) | Certifications pursuant to Rule 30a-2(a) under the 1940 Act and Section 302 of the Sarbanes-Oxley Act of 2002 are attached hereto. |
| | (b) | Certifications pursuant to Rule 30a-2(b) under the 1940 Act and Section 906 of the Sarbanes-Oxley Act of 2002 are attached hereto. |
SIGNATURES
Pursuant to the requirements of the Securities Exchange Act of 1934 and the Investment Company Act of 1940, the registrant has duly caused this report to be signed on its behalf by the undersigned, thereunto duly authorized.
| | | | |
(registrant) | | The Motley Fool Funds Trust | | |
| | |
By (Signature and Title)* | | /s/ Peter E. Jacobstein | | |
| | Peter E. Jacobstein, President | | |
| | (principal executive officer) | | |
| | |
Date | | June 17, 2011 | | |
Pursuant to the requirements of the Securities Exchange Act of 1934 and the Investment Company Act of 1940, this report has been signed below by the following persons on behalf of the registrant and in the capacities and on the dates indicated.
| | | | |
By (Signature and Title)* | | /s/ Peter E. Jacobstein | | |
| | Peter E. Jacobstein, President | | |
| | (principal executive officer) | | |
| | |
Date | | June 17, 2011 | | |
| | |
By (Signature and Title)* | | /s/ Ollen C. Douglass | | |
| | Ollen C. Douglass, Treasurer | | |
| | (principal financial officer) | | |
| | |
Date | | June 17, 2011 | | |
| * | Print the name and title of each signing officer under his or her signature. |