UNITED STATES
SECURITIES AND EXCHANGE COMMISSION
Washington, D.C. 20549
FORM N-CSR
CERTIFIED SHAREHOLDER REPORT OF REGISTERED
MANAGEMENT INVESTMENT COMPANIES
Investment Company Act file number 811-22264
The Motley Fool Funds Trust
(Exact name of registrant as specified in charter)
Motley Fool Asset Management, LLC
2000 Duke Street, Suite 175
Alexandria, VA 22314
(Address of principal executive offices) (Zip code)
Peter E. Jacobstein
Motley Fool Asset Management, LLC
2000 Duke Street, Suite 175
Alexandria, VA 22314
(Name and address of agent for service)
Registrant’s telephone number, including area code: (703) 302-1100
Date of fiscal year end: October 31
Date of reporting period: April 30, 2012
Form N-CSR is to be used by management investment companies to file reports with the Commission not later than 10 days after the transmission to stockholders of any report that is required to be transmitted to stockholders under Rule 30e-1 under the Investment Company Act of 1940 (17 CFR 270.30e-1). The Commission may use the information provided on Form N-CSR in its regulatory, disclosure review, inspection, and policymaking roles.
A registrant is required to disclose the information specified by Form N-CSR, and the Commission will make this information public. A registrant is not required to respond to the collection of information contained in Form N-CSR unless the Form displays a currently valid Office of Management and Budget (“OMB”) control number. Please direct comments concerning the accuracy of the information collection burden estimate and any suggestions for reducing the burden to Secretary, Securities and Exchange Commission, 100 F Street, NE, Washington, DC 20549. The OMB has reviewed this collection of information under the clearance requirements of 44 U.S.C. § 3507.
Item 1. Reports to Stockholders.
The Report to Shareholders is attached herewith.
 Hello, and welcome to the semiannual report. Throughout, the Funds have included comments to help you understand the semiannual report, teach you some things to look for in a fund, and to make you chuckle a little. Our investment adviser is an affiliate of The Motley Fool, LLC(“The Motley Fool”), a publisher of investment information and analysis. Like The Motley Fool, our goal is to educate, amuse, and enrich you. Don’t forget to visit www.FoolFunds.com and sign up for our e-newsletter Declarations, featuring Bill Mann’s monthly Letter to Shareholders.
Motley Fool Independence Fund
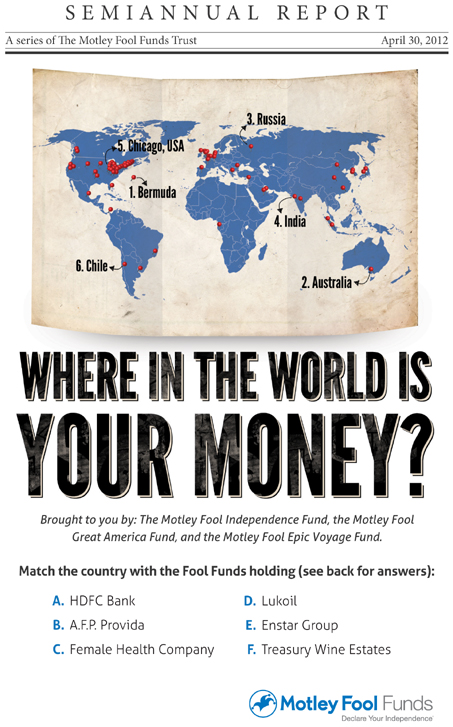
| | • | | During the period ended April 30, 2012, the Motley Fool Independence Fund returned 9.28% versus its benchmark index, which returned 7.87%. |
| | • | | We’ve mentioned in the past that we couldn’t find much value in European banks. Nothing’s changed in that department. Maybe someday |
| | • | | Consistent with the broader market averages, the majority of our more productive individual holdings have been U.S.-based companies, and most of our poorer performers have been foreign companies. That’s been the story of world markets recently. |
Motley Fool Great America Fund
| | • | | During the period ended April 30, 2012, the Motley Fool Great America Fund returned 12.87% versus its benchmark index, which returned 11.87%. |
| | • | | Consumer discretionary companies have contributed a lot to the first half performance of the portfolio. However, exceptional weather in the first quarter of the year isn’t likely to repeat as a contributor to company sales for the rest of the year. |
| | • | | Owning Under Armour has been very helpful, owning Heckmann has been less than helpful. |
Motley Fool Epic Voyage Fund
| | • | | During the period ended April 30, 2012, the Motley Fool Epic Voyage Fund returned 6.51% versus its benchmark index, which returned 7.32%. |
| | • | | Six percent returns in the first six months looks awfully calm. Too calm. Don’t expect that to be the norm. |
| | • | | Tod’s S.p.A. has been great for us; Telefonica, a lot less so. |
This report has been prepared for shareholders of Motley Fool Independence Fund, Motley Fool Great America Fund, and Motley Fool Epic Voyage Fund. It is not authorized for distribution to prospective investors unless accompanied or preceded by a current prospectus, which contains more complete information about the Funds. Investors are reminded to read the prospectus carefully before investing. Past performance is no guarantee of future results. Share prices will fluctuate and there may be a gain or loss when shares are redeemed. Fund shares are distributed by Foreside Funds Distributors LLC, 400 Berwyn Park, 899 Cassatt Road, Berwyn, PA 19312.
| | | | |
| | 2 | | | The Motley Fool Funds Trust |
TABLE OF CONTENTS
| | | | |
| The Motley Fool Funds Trust | | | 3 | |
Letter to Shareholders
| | |

Portfolio Manager Bill Mann | | “He never forgets that he is handling other people’s money, and this reinforces his normal strong aversion to loss.” – Warren Buffett, speaking about Walter Schloss |
| | Dear Fellow Fool Funds Shareholder: |
| | As always, we begin by reviewing the funds’ performance over the past six months (for this semiannual report, that’s from November 1, 2011 to April 30, 2012). We report these fairly short-term returns out of duty to our shareholders, not because we think how the funds perform over a six-month period is all that relevant. Like any six-month period, the last six are more a reflection of investor sentiment than they are developments in the underlying businesses whose shares we hold. |
| |
That said, here goes: From November 1, 2011 to April 30, 2012, the Motley Fool Independence Fund returned 9.28% versus a 7.87% return for its benchmark, the MSCI World Index. The Motley Fool Great America Fund generated returns of 12.87%, versus a return of 11.87% for its benchmark, the Russell Mid-cap Index. The Motley Fool Epic Voyage Fund ended its first six months in operation with a return of 6.51% versus a return of 7.32% for its benchmark, the Russell Global ex-US Index.
Fund manager ISO long-term investors, enjoys BBQ and scotch
If you agree with my opening paragraph, then chances are we are a compatible investor/asset manager match. If not, we’d prefer you not remain invested with us. Our goal, after all, is to compound capital over the long-term — and the day-to-day decisions we make to achieve that goal may sometimes lead to underperformance in the short- to medium-term.
Now, it has been the case with many a mutual fund that short-to-medium-term underperformance has led to redemptions from impatient investors. But money flowing in or out of a fund at the wrong time can cripple said fund’s performance by forcing it to do things that are inconsistent with its strategy (like selling shares of an undervalued security in a declining market). None of us want that.
This is not me being defensive (if you want to see that, make the case that Kan-sas City barbecue is superior to Carolina barbecue). While we had two funds outperform their benchmarks over this period and one trail, I wouldn’t feel much differently about our performance as capital allocators if all three had beaten their indices or if none had. Rather, the way I gauge if we had a good six months or not is to look over the period and see which companies we added and which companies we deleted from our portfolios, and to make sure that we have a world-class collection of firms with superior return profiles. In that regard, it’s been a
| | | | |
| | 4 | | | The Motley Fool Funds Trust |
good six months. From British currency printer De La Rue to American medical technology company Natus Medical to Hong Kong-based restaurant chain Ajisen, we have populated the portfolios with high-quality operators that have endured setbacks we believe can be overcome.
Would you like another jelly doughnut?
Of course, there are several elephants in the room as I talk about our tidy, bottoms-up approach, and they are the macroeconomic themes that have dominated investor discourse for the past few years. And while my team and I resist the urge to make macro calls, the fact is that they are also relevant. A lack of economic growth, after all, creates a tough environment for companies and therefore for investors. No investment thesis is more basic or more fundamental than increasing demand.
But we are not counting on a rising tide for any of our companies around the world. In the U.S., for example, the current “recovery” seems more attributable to unsustainable levels of money printing at the Federal Reserve rather than any underlying vitality in the economy. The incomparable David Einhorn of investment management firm Greenlight Capital likened the recent stimulus to a jelly doughnut: a great pick-me-up snack if you have one, but increasingly counterproductive after that. “Chairman Bernanke is presently force-feeding us what seems like the 36th Jelly Donut of easy money,” Einhorn observed in a recent article, “and wondering why it isn’t giving us energy or making us feel better.”
Other indicators of stability may be similarly illusory. Optimism at falling domestic unemployment rates, for example, should be tempered by the multi-decade low employment participation rates, which suggest that many out-of-work Americans have simply given up. Proposed austerity plans in Europe don’t even have the teeth to confront their massive entitlement time bombs — and recent anti-austerity election results reveal that voters aren’t even willing to put up with cosmetic changes. (If the U.S. is on its 36th jelly doughnut, Europe is well into the hundreds.) And in China, where one could count on stability if nothing else, the recent purging of senior party official Bo Xilai is a highly visible sign of the struggle between various factions within the Politburo to gain control of that massive and important nation.
Many have looked at the above facts (and more) and fled the equity markets, afraid of a repeat of the collapse of 2008. This is not wholly irrational. Every ounce of policy feedback we hear from central bankers worldwide suggests that investors have reason to be afraid: Rock-bottom interest rates around the world all but signal to investors that the economy is still in crisis. But allow me to suggest that even without the catalyst of rising global demand, now is a fine time to be investing capital, as we strive to do every day, in the world’s great companies.
Why even bother with Europe?
That great capital allocator Vladimir Lenin once noted, “There are decades where nothing happens, and there are weeks where decades happen.” The world, in other words, moves in fits and starts with long periods of build-up preceding significant and long lasting re-ratings.
| | | | |
| The Motley Fool Funds Trust | | | 5 | |
Consider, for example, that we may likely be nearing the climax of Europe’s secular decline. As billionaire businessman Sam Zell recently put it: “you go to Europe for wine, cheeses, and castles. That’s good ****, but you don’t go there for growth, or to invest.” Perhaps what’s more incredible, according to an analyst at HSBC, is that most Europeans can’t even afford their own good **** anymore —tourists now account for somewhere between 35% and 60% of luxury sales in Europe.
And yet, it’s against this backdrop that we’ve made Italian luxury leather goods maker Tod’s S.p.A. the largest holding in our Epic Voyage Fund and a significant holding in our Independence Fund, to good ends thus far. Why is Tod’s succeeding while the economy around it is falling apart? Tourists have kept sales somewhat stable in its core Italian market and sales are growing rapidly in emerging markets like China. This is only one example of an important point: Great companies are adaptable in the face of almost any macro environment anywhere. It is inevitable that Europe will no longer be the economic powerhouse it once was (its share of global GDP growth has shrunk by more than 70% in the last two decades), but companies like Tod’s will carry on.
This past year, I had the opportunity to sit down with the management of a Chinese sports apparel company that was trying to carve out a niche for its brand in a multibillion-dollar industry. As I left the meeting, I said to myself “Adidas [a current holding] is going to eat these guys’ lunch, so why in the hell wouldn’t I prefer Adidas?” This gets to the heart of how we invest your money. Watch the news and you might conclude that the most obvious move in the world is to get your money out of anything European. But in investing, things that are obvious have a strange tendency to be wrong, or at least to mask other opportunities that might work out even better. “The obvious” is occasionally freighted with emotion, and if it’s obvious to you, it may mean that it’s obvious to everybody.
This is why the Fool Funds team works so hard to view market moves in long-term contexts, and why we believe that you should, too. Ever notice that when investors panic it seems perfectly reasonable for them to do so? Your best move at these times is to do something else, like look for an opportunity to invest capital. It’s hard to do. Heck, if you’re investing in mutual funds, it might well mean that you don’t want to think about this stuff. But you should. It’s important.
If your money lived here, it would be home by now
There are lots of good reasons to be pessimistic about the macroeconomic environment, and it’s also true that that pessimism may manifest itself in below-average market returns for some time (and rest assured that our goal for our funds is not just to beat our benchmarks, but to generate attractive long-term returns). But just as Lenin noted that history moves in violent shifts, so too
| | | | |
| | 6 | | | The Motley Fool Funds Trust |
does the stock market. As companies we’ve invested in like Tod’s, Shimano, and Big Lots continue to adapt to the climate and even pick up market share from competitors who may not adapt as well, they will sell more stuff. Those increased sales will find their way to the bottom line, and eventually the global investment community will remember (as it always does) that there are companies creating massive economic benefits for their customers, employees, shareholders, and societies at large.
I won’t go on record predicting when that epiphany will occur, but until it does, we will continue to measure our performance (in part) by how many of the world’s great companies we are able to collect in our portfolios. Today, we’re seeing a target-rich environment mainly in American small-capitalization firms (what we might call the “engine of ingenuity”), emerging market companies (“the engine of demography”), and among the great brands of the world (“the engine of upward mobility”). That may seem like the obvious thing to be doing now, but our sense is that it’s only people who think differently who are doing it.
Now more than ever we remain focused on finding the world’s great companies, wherever they may be, and we thank you for joining us on the way.
Foolish best,

William H. Mann, III
The Letter to Shareholders seeks to describe some of the Adviser’s current opinions and views of the financial markets. Although the Adviser believes it has a reasonable basis for any opinions or views expressed, actual results may differ, sometimes significantly so, from those expected or expressed. The securities held by the Fund that are discussed in the Letter to Shareholders were held during the period covered by the semiannual report. They do not comprise the entire investment portfolio of the Fund, may be sold at any time, and may no longer be held by the Fund. The opinions of the Adviser with respect to those securities may change at any time.
| | | | |
The Motley Fool Funds Trust | | | 7 | |
Motley Fool Independence Fund Portfolio Characteristics (Unaudited)
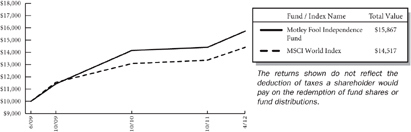
At April 30, 2012, the Motley Fool Independence Fund (the “Fund”) had an unaudited net asset value of $15.34 per share attributed to 13,721,829 shares outstanding. This compares with an unaudited net asset value as of June 16, 2009 of $10.00 per share attributed to 100,000 shares outstanding. From the Fund’s launch on June 16, 2009 to April 30, 2012, the Fund had an annual total return of 17.44% versus a return of 13.86% over the same period for its benchmark, MSCI World Index. The graph below shows the performance of $10,000 invested in the Fund at inception. The results shown below do not reflect the deduction of taxes that a shareholder would pay on fund distributions or the redemption of fund shares.
Average Annual Total Returns as of 04/30/2012
| | | | | | | | |
| | | Fund* | | | Benchmark** | |
One Year | | | -1.07 | % | | | -4.07 | % |
Since Inception | | | 17.44 | % | | | 13.86 | % |
Inception Date | | | 06/16/2009 | | | | | |
Total Annual Fund Operating Expenses Before Expense Limitation (February 29, 2012 Prospectus) | | | 1.58 | % | | | | |
The performance data quoted represents past performance and does not guarantee future results. Current performance may be lower or higher. Performance data current to the most recent month-end may be obtained at www.FoolFunds.com. The investment return and principal value of an investment will fluctuate so that shares, when redeemed, may be worth more or less than their original cost.
| * | These returns reflect expense waivers by the Fund’s investment adviser. Without these waivers, returns would have been lower. |
| ** | The MSCI World Index is a free float-adjusted market capitalization weighted index that is designed to measure the equity market performance of developed markets. The MSCI World Index consists of the following 24 developed market country indices: Australia, Austria, Belgium, Canada, Denmark, Finland, France, Germany, Greece, Hong Kong, Ireland, Israel, Italy, Japan, Netherlands, New Zealand, Norway, Portugal, Singapore, Spain, Sweden, Switzerland, the United Kingdom, and the United States. The MSCI World Index is not available for direct investment. The Fund may invest in countries that are not included within the MSCI World Index (such as emerging market countries) and its investment portfolio is not weighted in terms of countries or issuers the same as the MSCI World Index. For this reason, the Fund’s investment performance should not be expected to track, and may exceed or trail, the MSCI World Index. Since Inception returns for the Benchmark reflect the performance based on the Inception Date of the Fund. |
| | | | |
| | 8 | | | Motley Fool Independence Fund |
The investment objective of the Independence Fund is to achieve long-term capital appreciation. The Fund pursues this objective by investing primarily in common stocks of companies located anywhere in the world. The Fund invests in areas of the market that, in the view of Motley Fool Asset Management, LLC (the “Adviser”), offer the greatest potential for long-term capital appreciation. The Fund may invest in other types of securities and in other asset classes when, in the judgment of the Adviser, such investments offer attractive potential returns. As such, the Fund’s performance will deviate significantly from its benchmark from time to time. It is the view of the Adviser that this deviation is less meaningful over shorter time frames and is more relevant over multi-year periods.
Because the Independence Fund is free to invest in companies of any size around the world, at times, the Fund may be heavily invested in small-cap stocks and foreign securities, each of which presents extra risk. Small-cap stocks tend to be more volatile and less liquid than their large-cap counterparts. Fluctuations in currency exchange rates can cause losses when investing in foreign securities, with emerging markets presenting additional risks of illiquidity, political instability, and lax regulation. You are strongly encouraged to read more about the Fund’s strategies and risks in the prospectus.
The Independence Fund invests in securities of companies the Adviser believes are undervalued. Unlike mutual funds that are constrained by a style-box, the Fund may invest in any company, country, market, industry or sector where the Adviser’s analysis suggests that there is opportunity for gains that outweigh risks. In identifying investments for the Fund, the Adviser looks for companies it believes the market has irrationally undervalued and looks for companies that have high-quality businesses with strong market positions, manageable leverage, and robust streams of free cash flow. The following tables show the top 11 holdings, sector allocation and top 11 countries in which the Fund was invested as of April 30, 2012. Portfolio holdings are subject to change without notice.
Certain mutual fund ratings and review services have created style boxes, which look more or less like a tic-tac-toe board; arranging funds by the size of the companies they typically invest in (large-, mid-, and small-cap) along one axis, and along a “value” to “growth” basis on the other axis. This may be a helpful way – at times – to think about certain investment opportunities, but we don’t believe we’ll improve your returns by limiting ourselves to any one portion of that style box.
| | | | |
Top Eleven Holdings* | | % of Net
Assets | |
Yum! Brands, Inc. | | | 3.42 | % |
WellPoint, Inc. | | | 3.02 | |
HCC Insurance Holdings, Inc. | | | 2.75 | |
Loews Corp. | | | 2.57 | |
Brookfield Asset Management, Inc. | | | 2.45 | |
Brookfield Infrastructure Partners LP | | | 2.44 | |
Multiplus SA | | | 2.39 | |
Denbury Resources, Inc. | | | 2.37 | |
Markel Corp. | | | 2.34 | |
Lukoil OAO | | | 2.31 | |
Google, Inc. | | | 2.16 | |
| | | | |
| | | 28.22 | % |
| | | | |
| * | As of the date of the report the fund had a holding of 1.37% in the BNY Mellon Cash Reserve. |
| | | | |
| Motley Fool Independence Fund | | | 9 | |
The Motley Fool Independence Fund uses the Global Industry Classification StandardSM (“GICS SM”) as the basis for the classification of securities on the Schedule of Investments (“SOI”). We believe that this makes the SOI classifications more standard with the rest of the industry.
| | | | |
Sector Allocation | | % of Net
Assets | |
Financials | | | 23.00 | % |
Consumer Discretionary | | | 15.23 | |
Consumer Staples | | | 12.08 | |
Health Care | | | 11.91 | |
Information Technology | | | 11.15 | |
Industrials | | | 6.99 | |
Energy | | | 6.43 | |
Utilities | | | 4.42 | |
Materials | | | 4.16 | |
Telecommunication Services | | | 3.12 | |
| | | | |
| | | 98.49 | % |
| | | | |
| | | | |
Top Eleven Countries | | % of Net
Assets | |
United States* | | | 44.41 | % |
Japan | | | 4.72 | |
Hong Kong | | | 3.92 | |
South Korea | | | 3.79 | |
Bermuda | | | 3.45 | |
Brazil | | | 3.35 | |
United Kingdom | | | 3.07 | |
France | | | 2.65 | |
Canada | | | 2.45 | |
Russia | | | 2.31 | |
Indonesia | | | 2.22 | |
| | | | |
| | | 76.34 | % |
| | | | |
| * | As of the date of the report the fund had a holding of 1.37% in the BNY Mellon Cash Reserve. |
| | | | |
| | 10 | | | Motley Fool Independence Fund |
About Your Expenses
As a shareholder of the Independence Fund, you incur ongoing costs, including advisory fees and other Fund expenses. This example is intended to help you to understand your ongoing costs (in dollars) of investing in the Fund and to compare these costs with the ongoing costs of investing in other mutual funds. It is based on an investment of $1,000 invested at the beginning of the period and held for the entire period from November 1, 2011 to April 30, 2012.
Actual Expenses
The first section of the table below provides information about actual account values and actual expenses. You may use the information in this section, together with the amount you invested, to estimate the expenses that you incurred over the period. Simply divide your account value by $1,000 (for example, an $8,600 account value divided by $1,000 = 8.6), then multiply the result by the number in the first section under the heading entitled “Expenses Paid During Period” to estimate the expenses attributable to your investment during this period.
Hypothetical Example for Comparison Purposes
The second section of the table below provides information about hypothetical account values and hypothetical expenses based on the Independence Fund’s actual expense ratio and an assumed rate of return of 5% per year before expenses, which is not the Fund’s actual return. Thus, you should not use the hypothetical account values and expenses to estimate the actual ending account balance or your expenses for the period. Rather, these figures are provided to enable you to compare the ongoing costs of investing in the Fund as compared to the costs of investing in other funds. To do so, compare this 5% hypothetical example with the 5% hypothetical examples that appear in the shareholder reports of the other funds. Please note that the expenses shown in the table are meant to highlight your ongoing costs only. Therefore, the second section of the table is useful in comparing ongoing costs only and will not help you determine the relative total costs of owning different funds.
Do you know how many times a fund, or the market, has returned a smooth 5% over a long period of time? Never. But we have to pick some example. In reality, the market’s returns are always far bumpier, with the market returning 20% one year, followed by a loss of 10% the next year, followed by a 3% gain, etc. These variations affect actual expenses as well. Happily, over almost all time periods of 20 years or longer, according to the research of University of Pennsylvania’s Jeremy Siegel and others, the domestic market’s returns have been at least 5% per year on average.
| | | | | | | | | | | | | | | | |
| | | Beginning | | | Ending | | | | | | Expenses | |
| | | Account | | | Account | | | Annualized | | | Paid | |
| | | Value | | | Value | | | Expense | | | During | |
| | | 11/01/11 | | | 04/30/12 | | | Ratio(1) | | | Period(2) | |
Actual | | $ | 1,000 | | | $ | 1,092.12 | | | | 1.47 | % | | $ | 7.65 | |
Hypothetical | | $ | 1,000 | | | $ | 1,017.55 | | | | 1.47 | % | | $ | 7.37 | |
| (1) | These ratios reflect expenses waived by the Fund’s investment adviser. Without these Waivers, the Fund’s expenses would have been higher and the ending account values would have been lower. |
| (2) | Expenses are equal to the Fund’s annualized expense ratio for the period November 1, 2011 to April 30, 2012, multiplied by the average account value over the period, multiplied by the number of days (182) in the most recent fiscal half-year, then divided by 366. |
| | | | |
| Motley Fool Independence Fund (unaudited) | | | 11 | |
The Motley Fool Funds Trust
Motley Fool Independence Fund
Schedule of Investments
at April 30, 2012
(Unaudited)
| | | | | | | | |
Issues | | Shares | | | Value
(Note 2) | |
Equity Securities — 96.35% | | | | | | | | |
Beverages — 1.60% | | | | | | | | |
Coca Cola Hellenic Bottling Co. SA (Greece)* | | | 169,606 | | | $ | 3,368,791 | |
| | | | | | | | |
Capital Markets — 0.65% | | | | | | | | |
INTL FCStone, Inc. (United States)* | | | 63,513 | | | | 1,365,530 | |
| | | | | | | | |
Chemicals — 1.90% | | | | | | | | |
Innophos Holdings, Inc. (United States) | | | 81,164 | | | | 3,990,834 | |
| | | | | | | | |
Commercial Banks — 3.47% | | | | | | | | |
Banco Latinoamericano de Comercio Exterior SA (Panama) | | | 201,265 | | | | 4,196,375 | |
Qatar Islamic Bank (Qatar) | | | 146,650 | | | | 3,113,252 | |
| | | | | | | | |
| | | | | | | 7,309,627 | |
| | | | | | | | |
Commercial Services & Supplies — 4.81% | | | | | | | | |
De La Rue PLC (United Kingdom) | | | 240,900 | | | | 3,816,696 | |
Depa Ltd. (United Arab Emirates)* | | | 2,815,390 | | | | 1,266,926 | |
Multiplus SA (Brazil) | | | 231,600 | | | | 5,039,880 | |
| | | | | | | | |
| | | | | | | 10,123,502 | |
| | | | | | | | |
Communications Equipment — 2.91% | | | | | | | | |
Cisco Systems, Inc. (United States) | | | 105,000 | | | | 2,115,750 | |
Infinera Corp. (United States)* | | | 561,100 | | | | 4,017,476 | |
| | | | | | | | |
| | | | | | | 6,133,226 | |
| | | | | | | | |
Consumer Finance — 1.45% | | | | | | | | |
Compartamos SAB de CV (Mexico) | | | 2,500,000 | | | | 3,047,762 | |
| | | | | | | | |
Containers & Packaging — 0.70% | | | | | | | | |
Crown Holdings, Inc. (United States)* | | | 40,000 | | | | 1,479,200 | |
| | | | | | | | |
Diversified Consumer Services — 0.73% | | | | | | | | |
MegaStudy Co., Ltd. (South Korea) | | | 16,531 | | | | 1,537,154 | |
| | | | | | | | |
Diversified Financial Services — 0.05% | | | | | | | | |
Leucadia National Corp. (United States) | | | 4,000 | | | | 99,440 | |
| | | | | | | | |
Diversified Telecommunication Services — 1.58% | | | | | | | | |
Telefonica SA (Spain)(a) | | | 227,859 | | | | 3,333,577 | |
| | | | | | | | |
Electric Utilities — 2.44% | | | | | | | | |
Brookfield Infrastructure Partners LP (Bermuda) | | | 163,127 | | | | 5,145,026 | |
| | | | | | | | |
See Notes to Financial Statements.
| | | | |
| | 12 | | | Motley Fool Independence Fund |
| | | | | | | | |
| | | | | | Value | |
Issues | | Shares | | | (Note 2) | |
Equity Securities (continued) | | | | | | | | |
Electrical Equipment — 0.67% | | | | | | | | |
Legrand SA (France) | | | 42,076 | | | $ | 1,420,430 | |
| | | | | | | | |
Electronic Equipment, Instruments & Components — 0.78% | | | | | | | | |
CrucialTec Co., Ltd. (South Korea)* | | | 206,000 | | | | 1,633,524 | |
| | | | | | | | |
Food & Staples Retailing — 3.44% | | | | | | | | |
Costco Wholesale Corp. (United States) | | | 29,558 | | | | 2,606,129 | |
Olam International Ltd. (Singapore) | | | 1,765,139 | | | | 3,220,850 | |
PT Sumber Alfaria Trijaya Tbk (Indonesia)* | | | 2,448,000 | | | | 1,426,392 | |
| | | | | | | | |
| | | | | | | 7,253,371 | |
| | | | | | | | |
Food Products — 3.62% | | | | | | | | |
BRF—Brasil Foods SA (Brazil)(a) | | | 108,704 | | | | 2,003,415 | |
Nestle SA (Switzerland) | | | 38,694 | | | | 2,371,527 | |
PT Nippon Indosari Corpindo Tbk (Indonesia)* | | | 7,641,840 | | | | 3,240,157 | |
| | | | | | | | |
| | | | | | | 7,615,099 | |
| | | | | | | | |
Health Care Equipment & Supplies — 5.09% | | | | | | | | |
Covidien PLC (Ireland) | | | 41,000 | | | | 2,264,430 | |
Natus Medical, Inc. (United States)* | | | 243,900 | | | | 2,985,336 | |
Nihon Kohden Corp. (Japan) | | | 133,481 | | | | 3,893,382 | |
Zimmer Holdings, Inc. (United States) | | | 25,000 | | | | 1,573,250 | |
| | | | | | | | |
| | | | | | | 10,716,398 | |
| | | | | | | | |
Health Care Providers & Services — 3.02% | | | | | | | | |
WellPoint, Inc. (United States) | | | 93,697 | | | | 6,354,531 | |
| | | | | | | | |
Hotels, Restaurants & Leisure — 7.88% | | | | | | | | |
Ajisen China Holdings Ltd. (Hong Kong) | | | 2,350,000 | | | | 2,614,650 | |
Arcos Dorados Holdings, Inc. (Argentina) | | | 248,000 | | | | 4,431,760 | |
Penn National Gaming, Inc. (United States)* | | | 52,083 | | | | 2,342,693 | |
Yum! Brands, Inc. (United States) | | | 99,132 | | | | 7,209,871 | |
| | | | | | | | |
| | | | | | | 16,598,974 | |
| | | | | | | | |
Insurance — 10.55% | | | | | | | | |
Berkshire Hathaway, Inc. (United States)* | | | 33 | | | | 3,986,400 | |
Enstar Group Ltd. (Bermuda)* | | | 22,510 | | | | 2,119,767 | |
HCC Insurance Holdings, Inc. (United States) | | | 180,200 | | | | 5,759,192 | |
Loews Corp. (United States) | | | 131,690 | | | | 5,416,409 | |
Markel Corp. (United States)* | | | 11,200 | | | | 4,931,136 | |
| | | | | | | | |
| | | | | | | 22,212,904 | |
| | | | | | | | |
See Notes to Financial Statements.
| | | | |
Motley Fool Independence Fund | | | 13 | |
| | | | | | | | |
| | | | | | Value | |
Issues | | Shares | | | (Note 2) | |
Equity Securities (continued) | | | | | | | | |
Internet Software & Services — 3.89% | | | | | | | | |
Baidu, Inc. (China)*(a) | | | 27,500 | | | $ | 3,649,250 | |
Google, Inc. (United States)* | | | 7,500 | | | | 4,539,225 | |
| | | | | | | | |
| | | | | | | 8,188,475 | |
| | | | | | | | |
IT Services — 1.55% | | | | | | | | |
Paychex, Inc. (United States) | | | 105,702 | | | | 3,274,648 | |
| | | | | | | | |
Leisure Equipment & Products — 1.94% | | | | | | | | |
Shimano, Inc. (Japan) | | | 62,000 | | | | 4,076,725 | |
| | | | | | | | |
Machinery — 1.51% | | | | | | | | |
Flowserve Corp. (United States) | | | 27,700 | | | | 3,183,561 | |
| | | | | | | | |
Media — 0.73% | | | | | | | | |
DreamWorks Animation SKG, Inc. (United States)* | | | 85,000 | | | | 1,530,850 | |
| | | | | | | | |
Metals & Mining — 1.56% | | | | | | | | |
POSCO (South Korea)(a) | | | 39,491 | | | | 3,287,626 | |
| | | | | | | | |
Multiline Retail — 0.70% | | | | | | | | |
Big Lots, Inc. (United States)* | | | 40,000 | | | | 1,465,600 | |
| | | | | | | | |
Multi-Utilities — 1.98% | | | | | | | | |
GDF Suez S.A. (France) | | | 181,000 | | | | 4,167,379 | |
| | | | | | | | |
Oil, Gas & Consumable Fuels — 6.43% | | | | | | | | |
Denbury Resources, Inc. (United States)* | | | 262,200 | | | | 4,992,288 | |
Lukoil OAO (Russia)(a) | | | 79,350 | | | | 4,868,122 | |
Occidental Petroleum Corp. (United States) | | | 22,645 | | | | 2,065,677 | |
Total Gabon SA (Gabon) | | | 3,470 | | | | 1,604,715 | |
| | | | | | | | |
| | | | | | | 13,530,802 | |
| | | | | | | | |
Pharmaceuticals — 3.80% | | | | | | | | |
Astellas Pharma, Inc. (Japan) | | | 17,000 | | | | 689,445 | |
Astrazeneca PLC (United Kingdom)(a) | | | 60,100 | | | | 2,638,390 | |
Chugai Pharmaceutical Co., Ltd. (Japan) | | | 36,000 | | | | 647,934 | |
Dr. Reddy’s Laboratories Ltd. (India)(a) | | | 100,177 | | | | 3,388,988 | |
Santen Pharmaceutical Co., Ltd. (Japan) | | | 15,250 | | | | 638,196 | |
| | | | | | | | |
| | | | | | | 8,002,953 | |
| | | | | | | | |
Real Estate Investment Trusts — 1.70% | | | | | | | | |
Annaly Capital Management, Inc. (United States) | | | 219,989 | | | | 3,590,220 | |
| | | | | | | | |
Real Estate Management & Development — 5.13% | | | | | | | | |
Brookfield Asset Management, Inc. (Canada) | | | 156,374 | | | | 5,157,214 | |
See Notes to Financial Statements.
| | | | |
| | 14 | | | Motley Fool Independence Fund |
| | | | | | | | |
| | | | | | Value | |
Issues | | Shares | | | (Note 2) | |
Equity Securities (continued) | | | | | | | | |
Real Estate Management & Development (continued) | | | | | | | | |
Cheung Kong Holdings Ltd. (Hong Kong) | | | 170,337 | | | $ | 2,252,717 | |
Henderson Land Development Co., Ltd. (Hong Kong) | | | 596,764 | | | | 3,386,119 | |
| | | | | | | | |
| | | | | | | 10,796,050 | |
| | | | | | | | |
Semiconductors & Semiconductor Equipment — 1.30% | | | | | | | | |
Formfactor, Inc. (United States)* | | | 488,700 | | | | 2,736,720 | |
| | | | | | | | |
Software — 0.72% | | | | | | | | |
DuzonBizon Co., Ltd. (South Korea)* | | | 249,180 | �� | | | 1,513,928 | |
| | | | | | | | |
Textiles, Apparel & Luxury Goods — 3.26% | | | | | | | | |
Tod’s S.p.A. (Italy) | | | 25,000 | | | | 2,880,548 | |
Under Armour, Inc. (United States)* | | | 40,705 | | | | 3,986,241 | |
| | | | | | | | |
| | | | | | | 6,866,789 | |
| | | | | | | | |
Tobacco — 1.28% | | | | | | | | |
Philip Morris International, Inc. (United States) | | | 30,072 | | | | 2,691,745 | |
| | | | | | | | |
Wireless Telecommunication Services — 1.53% | | | | | | | | |
SBA Communications Corp. (United States)* | | | 60,000 | | | | 3,224,400 | |
| | | | | | | | |
Total Equity Securities (Cost $ 178,837,469) | | | | | | | 202,867,371 | |
| | | | | | | | |
Participatory Note — 2.14% | | | | | | | | |
Food Products — 2.14% | | | | | | | | |
Almarai Co. (Saudi Arabia)(b) | | | 252,173 | | | | 4,505,131 | |
| | | | | | | | |
Total Participatory Note (Cost $ 3,576,755) | | | | | | | 4,505,131 | |
| | | | | | | | |
See Notes to Financial Statements.
| | | | |
Motley Fool Independence Fund | | | 15 | |
| | | | | | | | |
| | | | | | Value | |
Issues | | Shares | | | (Note 2) | |
Rights — 0.00% | | | | | | | | |
GDF Suez+ | | | 181,000 | | | $ | — | |
| | | | | | | | |
Total Rights (Cost $0) | | | | | | | — | |
| | | | | | | | |
Other Investments — 1.37% | | | | | | | | |
Temporary Cash Investment — 1.37% | | | | | | | | |
BNY Mellon Cash Reserve | | | 2,888,247 | | | | 2,888,247 | |
| | | | | | | | |
Total Other Investments (Cost $ 2,888,247) | | | | | | | 2,888,247 | |
| | | | | | | | |
Total Investment Portfolio (Cost $ 185,302,471) — 99.86% | | | | | | | 210,260,749 | |
Other Assets in Excess of Liabilities — 0.14% | | | | | | | 296,143 | |
| | | | | | | | |
NET ASSETS — 100.00% | | | | | | | | |
(Applicable to 13,721,829 shares outstanding) | | | | | | $ | 210,556,892 | |
| | | | | | | | |
| * | Non-income producing security. |
| + | Security fair valued using procedures as approved by the Board of Trustees. |
| (a) | ADR — American Depositary Receipts |
| (b) | Security exempt from registration under Rule 144A of the Securities Act of 1933. These securities may be resold in transactions exempt from registration, normally to qualified institutional buyers. Total market value of Rule 144A securities is $4,505,131 and represents 2.14% of net assets as of April 30, 2012. |
LP — Limited Partnership
PLC — Public Limited Company
See Notes to Financial Statements.
| | | | |
| | 16 | | | Motley Fool Independence Fund |
Statement of Assets and Liabilities
| | | | |
| | | April 30, 2012 | |
| | | (Unaudited) | |
Assets: | | | | |
Investments in securities of unaffiliated issuers,at value (at cost, $185,302,471) | | $ | 210,260,749 | |
Foreign currency, at value (at cost, $271,980) | | | 273,197 | |
| |
Receivables: | | | | |
Dividends and Tax Reclaims | | | 368,792 | |
Interest | | | 103 | |
Shares of beneficial interest sold | | | 445,491 | |
Reimbursement due from adviser | | | 10,681 | |
Prepaid expenses and other assets | | | 27,096 | |
| | | | |
Total Assets | | | 211,386,109 | |
| | | | |
| |
Liabilities | | | | |
Payables: | | | | |
Shares of beneficial interest redeemed | | | 376,326 | |
Accrued expenses: | | | | |
Audit fees | | | 24,816 | |
Accounting and administration fees | | | 50,958 | |
Advisory fees | | | 184,442 | |
Custodian fees | | | 24,856 | |
Legal fees | | | 33,432 | |
Transfer agent fees | | | 87,270 | |
Other expenses | | | 47,117 | |
| | | | |
Total Liabilities | | | 829,217 | |
| | | | |
Net Assets | | $ | 210,556,892 | |
| | | | |
The accompanying notes are an integral part of these financial statements.
| | | | |
| Motley Fool Independence Fund | | | 17 | |
Statement of Assets and Liabilities
| | | | |
| | | April 30, 2012
(Unaudited) | |
Net Assets Consist of: | | | | |
Paid-in-Capital | | $ | 179,763,277 | |
Undistributed Net Investment Income | | | 203,920 | |
Accumulated Net Realized Gain/(Loss) on Investments and Foreign Currency Transactions | | | 5,628,537 | |
Net Unrealized Appreciation/(Depreciation) on Investments, Foreign Currencies, and Assets and Liabilities Denominated in Foreign Currencies | | | 24,961,158 | |
| | | | |
Net Assets | | $ | 210,556,892 | |
| | | | |
Net Asset Value: | | | | |
$0.001 par value, unlimited shares authorized | | | | |
Net assets applicable to capital shares outstanding | | $ | 210,556,892 | |
Shares outstanding | | | 13,721,829 | |
| | | | |
Net asset value, offering, and redemption price per share | | $ | 15.34 | |
| | | | |
The accompanying notes are an integral part of these financial statements.
| | | | |
| | 18 | | | Motley Fool Independence Fund |
Statement of Operations
| | | | |
| | | Six Months Ended
April 30, 2012
(Unaudited) | |
Investment Income | | | | |
Dividends | | $ | 2,657,257 | |
Interest | | | 6,651 | |
Less foreign taxes withheld | | | (166,353 | ) |
| | | | |
Total Investment Income | | | 2,497,555 | |
| | | | |
| |
Expenses | | | | |
Accounting and administration fees | | | 99,807 | |
Blue sky fees | | | 9,170 | |
Shareholder account-related services | | | 77,694 | |
Chief Compliance Officer fees | | | 7,786 | |
Custodian fees | | | 40,235 | |
Investment advisory fees | | | 1,079,842 | |
Professional fees | | | 29,678 | |
Shareholder reporting fees | | | 9,425 | |
Transfer agent fees | | | 180,734 | |
Trustee fees | | | 16,731 | |
Other expenses | | | 16,943 | |
| | | | |
Total expenses | | | 1,568,045 | |
| | | | |
Expenses waived/reimbursed net of amount recaptured | | | (83,965 | ) |
| | | | |
Net expenses | | | 1,484,080 | |
| | | | |
Net Investment Income | | | 1,013,475 | |
| | | | |
| |
Realized and Unrealized Gain | | | | |
| |
Net realized gain from: | | | | |
Investment securities | | | 5,619,361 | |
Foreign currency transactions | | | 13,695 | |
| | | | |
Net realized gain on investments and foreign currency transactions | | | 5,633,056 | |
| | | | |
Change in net unrealized appreciation on: | | | | |
Investment securities | | | 11,292,985 | �� |
Foreign currency translations | | | 140 | |
| | | | |
Change in net unrealized appreciation on investments, foreign currencies, and assets and liabilities denominated in foreign currencies | | | 11,293,125 | |
| | | | |
Net realized and unrealized gain | | | 16,926,181 | |
| | | | |
| |
Net Increase in Net Assets Resulting from Operations | | $ | 17,939,656 | |
| | | | |
The accompanying notes are an integral part of these financial statements.
| | | | |
| Motley Fool Independence Fund | | | 19 | |
Statements of Changes in Net Assets
| | | | | | | | |
| | | Six Months
Ended
April 30,
2012
(Unaudited) | | | Year
Ended
October 31,
2011 | |
Operations: | | | | | | | | |
Net Investment Income | | $ | 1,013,475 | | | $ | 1,374,875 | |
Net Realized Gain/(Loss) on Investments and | | | | | | | | |
Foreign Currency Transactions | | | 5,633,056 | | | | (9,585 | ) |
Change in Net Unrealized Appreciation/ | | | | | | | | |
(Depreciation) on Investments, Foreign | | | | | | | | |
Currencies, and Assets and Liabilities | | | | | | | | |
Denominated in Foreign Currencies | | | 11,293,125 | | | | (3,037,966 | ) |
| | | | | | | | |
| | |
Net increase/(decrease) in net assets resulting from operations | | | 17,939,656 | | | | (1,672,676 | ) |
| | | | | | | | |
| | |
Dividends and Distributions to Shareholders: | | | | | | | | |
Dividends from net investment income | | | (1,409,218 | ) | | | (1,465,155 | ) |
Distributions from net realized capital gains | | | — | | | | (1,105,695 | ) |
| | | | | | | | |
Total dividends and distributions | | | (1,409,218 | ) | | | (2,570,850 | ) |
| | | | | | | | |
| | |
Capital Share Transactions: | | | | | | | | |
Proceeds from shares sold (1,240,736 and 7,313,429 shares, respectively) | | | 18,322,479 | | | | 108,513,048 | |
Reinvestment of dividends and distributions (99,973 and 175,447 shares, respectively) | | | 1,385,628 | | | | 2,522,930 | |
Value of shares redeemed (1,629,412 and 2,559,545 shares, respectively) | | | (23,948,928 | ) | | | (37,047,015 | ) |
| | | | | | | | |
Redemption and small-balance account fees | | | 34,929 | | | | 80,714 | |
| | | | | | | | |
| | |
Net increase/(decrease) from capital share transactions | | | (4,205,892 | ) | | | 74,069,677 | |
| | | | | | | | |
Total increase in net assets | | | 12,324,546 | | | | 69,826,151 | |
| | | | | | | | |
| | |
Net Assets: | | | | | | | | |
Beginning of Period | | | 198,232,346 | | | | 128,406,195 | |
| | | | | | | | |
End of Period* | | $ | 210,556,892 | | | $ | 198,232,346 | |
| | | | | | | | |
| | |
* Including undistributed net investment income | | $ | 203,920 | | | $ | 599,663 | |
| | | | | | | | |
The accompanying notes are an integral part of these financial statements.
| | | | |
| | 20 | | | Motley Fool Independence Fund |
Financial Highlights
| | | | | | | | | | | | | | | | |
| | | Six Months
Ended April 30, | | | | | | | | | | |
| | | 2012 | | | Years ended October 31, | |
| | | (Unaudited)(1) | | | 2011 | | | 2010(2) | | | 2009(3)(4) | |
Net Asset Value, Beginning of Period | | $ | 14.15 | | | $ | 14.14 | | | $ | 11.48 | | | $ | 10.00 | |
| | | | | | | | | | | | | | | | |
Income From Investment Operations (5) | | | | | | | | | | | | | | | | |
Net Investment Income | | | 0.07 | | | | 0.11 | | | | 0.16 | | | | 0.02 | |
Net Gains on Securities (Realized and Unrealized) | | | 1.22 | | | | 0.15 | | | | 2.59 | | | | 1.46 | |
| | | | | | | | | | | | | | | | |
Total From Investment Operations | | | 1.29 | | | | 0.26 | | | | 2.75 | | | | 1.48 | |
| | | | | | | | | | | | | | | | |
Less Distributions | | | | | | | | | | | | | | | | |
Net Investment Income | | | (0.10 | ) | | | (0.15 | ) | | | (0.02 | ) | | | — | |
Net Realized Capital Gains | | | — | | | | (0.11 | ) | | | (0.08 | ) | | | — | |
| | | | | | | | | | | | | | | | |
Total Distributions | | | (0.10 | ) | | | (0.26 | ) | | | (0.10 | ) | | | — | |
| | | | | | | | | | | | | | | | |
Redemption and Small-Balance Account Fees | | | — | * | | | 0.01 | | | | 0.01 | | | | — | * |
| | | | | | | | | | | | | | | | |
Net Asset Value, End of Period | | $ | 15.34 | | | $ | 14.15 | | | $ | 14.14 | | | $ | 11.48 | |
| | | | | | | | | | | | | | | | |
Total Return(6)(7) | | | 9.21 | % | | | 1.91 | % | | | 24.18 | % | | | 14.80 | % |
Net Assets, End of Period (thousands) | | $ | 210,557 | | | $ | 198,232 | | | $ | 128,406 | | | $ | 30,427 | |
| | | | |
Ratios/Supplemental Data | | | | | | | | | | | | | | | | |
| | | | |
Ratio of Expenses to Average Net Assets | | | 1.47 | % | | | 1.43 | % | | | 1.38 | % | | | 1.35 | % |
Ratio of Expenses to Average Net Assets (Before Waivers and Reimbursement of Expenses and/or Recapture of Previously Waived Fees) | | | 1.55 | % | | | 1.58 | % | | | 2.20 | % | | | 7.01 | % |
Ratio of Net Investment Income to Average Net Assets | | | 1.00 | % | | | 0.76 | % | | | 1.29 | % | | | 0.41 | % |
Ratio of Income to Average Net Assets (Before Waivers and Reimbursement of Expenses and/or Recapture of Previously Waived Fees) | | | 0.92 | % | | | 0.61 | % | | | 0.47 | % | | | (5.25 | )% |
Portfolio Turnover | | | 24 | % | | | 37 | % | | | 37 | % | | | 50 | % |
| * | Amount represents less than $0.005 per share. |
| (1) | For the six months ended April 30, 2012, all ratios for the period have been annualized. Total return and portfolio turnover for the period have not been annualized. |
| (2) | Due to a clerical error, Net Gains on Securities (Realized and Unrealized) and Total From Investment Operations for the year ended October 31, 2010 were reported in the 2010 Annual Report as $2.39 and $2.55, respectively. Such amounts have been revised as shown above. |
| (3) | Because of commencement of operations and related preliminary transaction costs, these ratios are not necessarily indicative of future ratios. |
| (4) | Commenced operations on June 16, 2009. All ratios for the period have been annualized. Total return and portfolio turnover for the period have not been annualized. |
| (5) | Per share data calculated using average shares outstanding method. |
| (6) | During the years ended October 31, 2011 and October 31, 2010, 0.07% and 0.08%, respectively, of the Fund’s total return was attributable to redemption and small-balance account fees received as referenced in Note 4. Excluding this item, the total return would have been 1.84% and 24.10%, respectively. For the six months ended April 30, 2012 and the period ended October 31, 2009, redemption and small-balance account fees received had no effect on the Fund’s total return. |
| (7) | Total return reflects the rate an investor would have earned on an investment in the Fund during each period, assuming reinvestment of all distributions. |
The accompanying notes are an integral part of these financial statements.
| | | | |
| Motley Fool Independence Fund | | | 21 | |
Motley Fool Great America Fund Portfolio Characteristics (Unaudited)
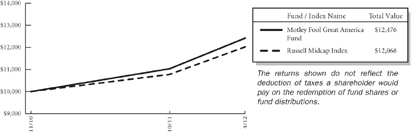
At April 30, 2012, the Motley Fool Great America Fund (the “Fund”) had an unaudited net asset value of $12.46 per share attributed to 5,137,237 shares outstanding. This compares with an unaudited net asset value as of November 1, 2010 of $10.00 per share attributed to 102,000 shares outstanding. From the Fund’s launch on November 1, 2010 to April 30, 2012, the Fund had an annual total return of 15.97% versus a return of 13.42% over the same period for its benchmark, Russell Midcap Index. The graph below shows the performance of $10,000 invested in the Fund at inception. The results shown below do not reflect the deduction of taxes that a shareholder would pay on fund distributions or the redemption of fund shares.
Let’s be serious though. A graph of the performance of any investment over less than two years tells you virtually nothing. In about five years, they’ll actually tell you quite a bit about how well we’re managing your money.
Average Annual Total Returns as of 04/30/2012
| | | | | | | | |
| | | Fund* | | | Benchmark** | |
One Year | | | 3.93 | % | | | -0.03 | % |
Since Inception | | | 15.97 | % | | | 13.42 | % |
Inception Date | | | 11/01/2010 | | | | | |
Total Annual Fund Operating Expenses Before Expense Limitation (February 29, 2012 Prospectus) | | | 2.16 | % | | | | |
The performance data quoted represents past performance and does not guarantee future results. Current performance may be lower or higher. Performance data current to the most recent month-end may be obtained at www.FoolFunds.com. The investment return and principal value of an investment will fluctuate so that shares, when redeemed, may be worth more or less than their original cost.
| * | These returns reflect expense waivers by the Fund’s investment adviser. Without these waivers, returns would have been lower. |
| ** | The Russell Midcap Index is an unmanaged, free float-adjusted, market capitalization weighted index that is designed to measure the performance of the mid-cap segment of the U.S. equity universe. The Russell Midcap Index is a subset of the Russell 1000® Index. It includes approximately 800 of the smallest securities based on a combination of their market cap and current index membership. The Russell Midcap Index represents approximately 31% of the total market capitalization of the Russell 1000 companies. The Fund may invest in companies that are not included within the Russell Midcap Index and its investment portfolio is not weighted in terms of issuers the same as the Russell Midcap Index. For this reason, the Fund’s investment performance should not be expected to track, and may exceed or trail, the Russell Midcap Index. Since Inception returns for the Benchmark reflect the performance based on the Inception Date of the Fund. |
| | | | |
| | 22 | | | Motley Fool Great America Fund |
The investment objective of the Great America Fund is to achieve long-term capital appreciation. The Fund pursues this objective by investing primarily in common stocks of companies organized in the United States. The Fund employs a value-based investment strategy and seeks long-term growth of capital by acquiring securities of companies at prices the investment adviser, Motley Fool Asset Management, LLC (the “Adviser”), believes to be significantly below their intrinsic value. The Fund may invest in other types of securities and in other asset classes when, in the judgment of the Adviser, such investments offer attractive potential returns. As such, the Fund’s performance will deviate significantly from its benchmark from time to time. It is the view of the Adviser that this deviation is less meaningful over shorter time frames and is more relevant over multi-year periods.
Although the Great America Fund may invest in companies with any market capitalization, the Adviser expects that investments in the securities of companies having smaller- and mid-market capitalizations will be important components of the Fund’s investment program. Investments in securities of these companies may involve greater risk than do investments in larger, more established companies. Small-and mid-cap stocks tend to be more volatile and less liquid than their large-cap counterparts. You are strongly encouraged to read more about the Fund’s strategies and risks in the prospectus.
The Great America Fund invests in securities of companies the Adviser believes are undervalued. Unlike mutual funds that hew to their benchmark, the Fund may invest in any company, industry or sector where the Adviser’s analysis suggests that there is opportunity for gains that outweigh risks. In identifying investments for the Fund, the Adviser looks for companies it believes the market has irrationally undervalued and looks for companies that have high-quality businesses with strong market positions, manageable leverage, and robust streams of free cash flow. The following tables show the top 11 holdings and sectors in which the Fund was invested as of April 30, 2012. Portfolio holdings are subject to change without notice.
Certain mutual fund ratings and review services have created style boxes, which look more or less like a tic-tac-toe board; arranging funds by the size of the companies they typically invest in (large-, mid-, and small-cap) along one axis, and along a “value” to “growth” basis on the other axis. This may be a helpful way – at times –to think about certain investment opportunities, but we don’t believe we’ll improve your returns by limiting ourselves to any one portion of that style box.
| | | | |
| | | % of Net | |
Top Eleven Holdings* | | Assets | |
HCC Insurance Holdings, Inc. | | | 4.34 | % |
Big Lots, Inc. | | | 3.66 | |
Natus Medical, Inc. | | | 3.46 | |
Flow International Corp. | | | 3.36 | |
Berkshire Hathaway, Inc. | | | 3.21 | |
Denbury Resources, Inc. | | | 3.16 | |
Markel Corp. | | | 3.09 | |
Under Armour, Inc. | | | 3.06 | |
Schweitzer-Mauduit International, Inc. | | | 3.03 | |
Trimas Corp. | | | 2.98 | |
Horsehead Holding Corp. | | | 2.88 | |
| | | | |
| | | 36.23 | % |
| | | | |
| * | As of the date of the report the fund had a holding of 4.39% in the BNY Mellon Cash Reserve. |
| | | | |
| Motley Fool Great America Fund | | | 23 | |
| | | | |
Sector Allocation | | % of Net
Assets | |
Consumer Discretionary | | | 23.20 | % |
Financials | | | 18.98 | |
Information Technology | | | 12.76 | |
Industrials | | | 10.60 | |
Materials | | | 9.66 | |
Health Care | | | 8.39 | |
Telecommunication Services | | | 4.70 | |
Energy | | | 4.38 | |
Consumer Staples | | | 1.22 | |
| | | | |
| | | 93.89 | % |
| | | | |
| | | | |
| | 24 | | | Motley Fool Great America Fund |
About Your Expenses
As a shareholder of the Great America Fund, you incur ongoing costs, including advisory fees and other Fund expenses. This example is intended to help you to understand your ongoing costs (in dollars) of investing in the Fund and to compare these costs with the ongoing costs of investing in other mutual funds. It is based on an investment of $1,000 invested at the beginning of the period and held for the entire period from November 1, 2011 to April 30, 2012.
Actual Expenses
The first section of the table below provides information about actual account values and actual expenses. You may use the information in this section, together with the amount you invested, to estimate the expenses that you incurred over the period. Simply divide your account value by $1,000 (for example, an $8,600 account value divided by $1,000 = 8.6), then multiply the result by the number in the first section under the heading entitled “Expenses Paid During Period” to estimate the expenses attributable to your investment during this period.
Hypothetical Example for Comparison Purposes
The second section of the table below provides information about hypothetical account values and hypothetical expenses based on the Fund’s actual expense ratio and an assumed rate of return of 5% per year before expenses, which is not the Fund’s actual return. Thus, you should not use the hypothetical account values and expenses to estimate the actual ending account balance or your expenses for the period. Rather, these figures are provided to enable you to compare the ongoing costs of investing in the Fund as compared to the costs of investing in other funds. To do so, compare this 5% hypothetical example with the 5% hypothetical examples that appear in the shareholder reports of the other funds. Please note that the expenses shown in the table are meant to highlight your ongoing costs only. Therefore, the second section of the table is useful in comparing ongoing costs only and will not help you determine the relative total costs of owning different funds.
Do you know how many times a fund, or the market, has returned a smooth 5% over a long period of time? Never. But we have to pick some example. In reality, the market’s returns are always far bumpier, with the market returning 20% one year, followed by a loss of 10% the next year, followed by a 3% gain, etc. These variations affect actual expenses as well. Happily, over almost all time periods of 20 years or longer, according to the research of University of Pennsylvania’s Jeremy Siegel and others, the domestic market’s returns have been at least 5% per year on average.
| | | | | | | | | | | | | | | | |
| | | Beginning
Account
Value
11/01/11 | | | Ending
Account
Value
04/30/12 | | | Annualized
Expense
Ratio(1) | | | Expenses
Paid
During
Period(2) | |
Actual | | $ | 1,000 | | | $ | 1,128.71 | | | | 1.37 | % | | $ | 7.25 | |
Hypothetical | | $ | 1,000 | | | $ | 1,018.05 | | | | 1.37 | % | | $ | 6.87 | |
| (1) | These ratios reflect expenses waived by the Fund’s investment adviser. Without these Waivers, the Fund’s expenses would have been higher and the ending account values would have been lower. |
| (2) | Expenses are equal to the Fund’s annualized expense ratio for the period November 1, 2011 to April 30, 2012, multiplied by the average account value over the period, multiplied by the number of days (182) in the most recent fiscal half-year, then divided by 366. |
| | | | |
| Motley Fool Great America Fund (Unaudited) | | | 25 | |
The Motley Fool Funds Trust
Motley Fool Great America Fund
Schedule of Investments
at April 30, 2012
(Unaudited)
| | | | | | | | |
Issues | | Shares | | | Value
(Note 2) | |
Equity Securities — 93.89% | | | | | | | | |
Auto Components — 1.43% | | | | | | | | |
Drew Industries, Inc. (United States)* | | | 30,811 | | | $ | 917,552 | |
| | | | | | | | |
Automobiles — 2.61% | | | | | | | | |
Thor Industries, Inc. (United States) | | | 49,488 | | | | 1,674,179 | |
| | | | | | | | |
Building Products — 1.94% | | | | | | | | |
American Woodmark Corp. (United States) | | | 69,200 | | | | 1,242,140 | |
| | | | | | | | |
Capital Markets — 3.01% | | | | | | | | |
Diamond Hill Investment Group, Inc. (United States) | | | 15,684 | | | | 1,190,259 | |
INTL FCStone, Inc. (United States)* | | | 34,300 | | | | 737,450 | |
| | | | | | | | |
| | | | | | | 1,927,709 | |
| | | | | | | | |
Communications Equipment — 5.08% | | | | | | | | |
Cisco Systems, Inc. (United States) | | | 87,000 | | | | 1,753,050 | |
Infinera Corp. (United States)* | | | 209,490 | | | | 1,499,948 | |
| | | | | | | | |
| | | | | | | 3,252,998 | |
| | | | | | | | |
Containers & Packaging — 2.59% | | | | | | | | |
Crown Holdings, Inc. (United States)* | | | 44,800 | | | | 1,656,704 | |
| | | | | | | | |
Diversified Telecommunication Services — 1.99% | | | | | | | | |
Level 3 Communications, Inc. (United States)* | | | 55,250 | | | | 1,274,065 | |
| | | | | | | | |
Energy Equipment & Services — 1.23% | | | | | | | | |
Heckmann Corp. (United States)* | | | 207,000 | | | | 786,600 | |
| | | | | | | | |
Health Care Equipment & Supplies — 3.45% | | | | | | | | |
Natus Medical, Inc. (United States)* | | | 180,700 | | | | 2,211,768 | |
| | | | | | | | |
Health Care Providers & Services — 4.94% | | | | | | | | |
Quest Diagnostics, Inc. (United States) | | | 24,000 | | | | 1,384,560 | |
WellPoint, Inc. (United States) | | | 26,200 | | | | 1,776,884 | |
| | | | | | | | |
| | | | | | | 3,161,444 | |
| | | | | | | | |
Hotels, Restaurants & Leisure — 6.22% | | | | | | | | |
Penn National Gaming, Inc. (United States)* | | | 30,617 | | | | 1,377,153 | |
Red Robin Gourmet Burgers, Inc. (United States)* | | | 45,000 | | | | 1,604,700 | |
Wynn Resorts Ltd. (United States) | | | 7,500 | | | | 1,000,500 | |
| | | | | | | | |
| | | | | | | 3,982,353 | |
| | | | | | | | |
See Notes to Financial Statements.
| | | | |
| | 26 | | | Motley Fool Great America Fund |
| | | | | | | | |
Issues | | Shares | | | Value
(Note 2) | |
Equity Securities (continued) | | | | | | | | |
Insurance — 12.25% | | | | | | | | |
Berkshire Hathaway, Inc. (United States)* | | | 17 | | | $ | 2,053,600 | |
HCC Insurance Holdings, Inc. (United States) | | | 87,000 | | | | 2,780,520 | |
Loews Corp. (United States) | | | 25,000 | | | | 1,028,250 | |
Markel Corp. (United States)* | | | 4,500 | | | | 1,981,260 | |
| | | | | | | | |
| | | | | | | 7,843,630 | |
| | | | | | | | |
Internet & Catalog Retail — 1.71% | | | | | | | | |
Liberty Interactive Corp. (United States)* | | | 58,150 | | | | 1,095,546 | |
| | | | | | | | |
Internet Software & Services — 1.65% | | | | | | | | |
Google, Inc. (United States)* | | | 1,750 | | | | 1,059,152 | |
| | | | | | | | |
IT Services — 2.23% | | | | | | | | |
Paychex, Inc. (United States) | | | 46,000 | | | | 1,425,080 | |
| | | | | | | | |
Machinery — 8.67% | | | | | | | | |
Flow International Corp. (United States)* | | | 523,400 | | | | 2,151,174 | |
Flowserve Corp. (United States) | | | 4,950 | | | | 568,904 | |
Illinois Tool Works, Inc. (United States) | | | 16,000 | | | | 918,080 | |
Trimas Corp. (United States)* | | | 86,800 | | | | 1,910,468 | |
| | | | | | | | |
| | | | | | | 5,548,626 | |
| | | | | | | | |
Media — 2.52% | | | | | | | | |
DreamWorks Animation SKG, Inc. (United States)* | | | 89,600 | | | | 1,613,696 | |
| | | | | | | | |
Metals & Mining — 2.88% | | | | | | | | |
Horsehead Holding Corp. (United States)* | | | 164,200 | | | | 1,843,966 | |
| | | | | | | | |
Multiline Retail — 3.66% | | | | | | | | |
Big Lots, Inc. (United States)* | | | 64,000 | | | | 2,344,960 | |
| | | | | | | | |
Oil, Gas & Consumable Fuels — 3.15% | | | | | | | | |
Denbury Resources, Inc. (United States)* | | | 106,100 | | | | 2,020,144 | |
| | | | | | | | |
Paper & Forest Products — 4.19% | | | | | | | | |
KapStone Paper and Packaging Corp. (United States)* | | | 41,200 | | | | 744,072 | |
Schweitzer-Mauduit International, Inc. (United States) | | | 28,600 | | | | 1,939,652 | |
| | | | | | | | |
| | | | | | | 2,683,724 | |
| | | | | | | | |
Personal Products — 1.22% | | | | | | | | |
Female Health Co. (United States) | | | 129,500 | | | | 778,295 | |
| | | | | | | | |
Real Estate Investment Trusts — 3.72% | | | | | | | | |
Annaly Capital Management, Inc. (United States) | | | 39,000 | | | | 636,480 | |
Retail Opportunity Investments Corp. (United States) | | | 143,560 | | | | 1,744,254 | |
| | | | | | | | |
| | | | | | | 2,380,734 | |
| | | | | | | | |
See Notes to Financial Statements.
| | | | |
| Motley Fool Great America Fund | | | 27 | |
| | | | | | | | |
Issues | | Shares | | | Value
(Note 2) | |
Equity Securities (continued) | | | | | | | | |
Semiconductors & Semiconductor Equipment — 3.78% | | | | | | | | |
Formfactor, Inc. (United States)* | | | 253,500 | | | $ | 1,419,600 | |
NVIDIA Corp. (United States)* | | | 77,000 | | | | 1,001,000 | |
| | | | | | | | |
| | | | | | | 2,420,600 | |
| | | | | | | | |
Software — 0.02% | | | | | | | | |
Datawatch Corp. (United States)* | | | 1,233 | | | | 15,930 | |
| | | | | | | | |
Specialty Retail — 1.98% | | | | | | | | |
Tractor Supply Co. (United States) | | | 12,900 | | | | 1,269,489 | |
| | | | | | | | |
Textiles, Apparel & Luxury Goods — 3.06% | | | | | | | | |
Under Armour, Inc. (United States)* | | | 20,000 | | | | 1,958,600 | |
| | | | | | | | |
Wireless Telecommunication Services — 2.71% | | | | | | | | |
SBA Communications Corp. (United States)* | | | 32,250 | | | | 1,733,115 | |
| | | | | | | | |
Total Equity Securities (Cost $ 54,476,206) | | | | | | | 60,122,799 | |
| | | | | | | | |
Other Investments — 4.39% | | | | | | | | |
Temporary Cash Investment — 4.39% | | | | | | | | |
BNY Mellon Cash Reserve | | | 2,807,024 | | | | 2,807,024 | |
| | | | | | | | |
Total Other Investments (Cost $ 2,807,024) | | | | | | | 2,807,024 | |
| | | | | | | | |
Total Investment Portfolio (Cost $57,283,230) — 98.28% | | | | | | | 62,929,823 | |
Other Assets in Excess of Liabilities — 1.72% | | | | | | | 1,103,344 | |
| | | | | | | | |
NET ASSETS — 100.00% | | | | | | | | |
(Applicable to 5,137,237 shares outstanding) | | | | | | $ | 64,033,167 | |
| | | | | | | | |
| * | Non-income producing security. |
See Notes to Financial Statements.
| | | | |
| | 28 | | | Motley Fool Great America Fund |
Statement of Assets and Liabilities
| | | | |
| | | April 30, 2012
(Unaudited) | |
Assets: | | | | |
| |
Investments in securities of unaffiliated issuers, at value (at cost, $57,283,230) | | $ | 62,929,823 | |
Receivables: | | | | |
Dividends | | | 7,770 | |
Interest | | | 60 | |
Shares of beneficial interest sold | | | 1,413,969 | |
Reimbursement due from adviser | | | 17,220 | |
Prepaid expenses and other assets | | | 29,496 | |
| | | | |
Total Assets | | | 64,398,338 | |
| | | | |
Liabilities | | | | |
Payables: | | | | |
Shares of beneficial interest redeemed | | | 171,997 | |
Accrued expenses: | | | | |
Audit fees | | | 25,300 | |
Accounting and administration fees | | | 28,727 | |
Advisory fees | | | 48,276 | |
Custodian fees | | | 3,706 | |
Legal fees | | | 28,172 | |
Transfer agent fees | | | 33,294 | |
Trustee fees | | | 400 | |
Other expenses | | | 25,299 | |
| | | | |
Total Liabilities | | | 365,171 | |
| | | | |
Net Assets | | $ | 64,033,167 | |
| | | | |
The accompanying notes are an integral part of these financial statements.
| | | | |
| Motley Fool Great America Fund | | | 29 | |
Statement of Assets and Liabilities
| | | | |
| | | April 30, 2012
(Unaudited) | |
Net Assets Consist of: | | | | |
Paid-in-Capital | | $ | 58,187,650 | |
Distributions in Excess of Net Investment Income | | | (107,219 | ) |
Accumulated Net Realized Gain/(Loss) on Investments | | | 306,143 | |
Net Unrealized Appreciation/(Depreciation) on Investments | | | 5,646,593 | |
| | | | |
Net Assets | | $ | 64,033,167 | |
| | | | |
Net Asset Value: | | | | |
$0.001 par value, unlimited shares authorized | | | | |
Net assets applicable to capital shares outstanding | | $ | 64,033,167 | |
Shares outstanding | | | 5,137,237 | |
| | | | |
Net asset value, offering, and redemption price per share | | $ | 12.46 | |
| | | | |
The accompanying notes are an integral part of these financial statements.
| | | | |
| | 30 | | | Motley Fool Great America Fund |
Statement of Operations
| | | | |
| | | Six Months Ended
April 30, 2012
(Unaudited) | |
Investment Income | | | | |
Dividends | | $ | 291,613 | |
| | | | |
Expenses | | | | |
Accounting and administration fees | | | 50,195 | |
Blue sky fees | | | 11,246 | |
Shareholder account-related services | | | 30,237 | |
Chief Compliance Officer fees | | | 7,801 | |
Custodian fees | | | 7,459 | |
Investment advisory fees | | | 279,627 | |
Organization fees | | | 94 | |
Professional fees | | | 27,706 | |
Shareholder reporting fees | | | 10,212 | |
Transfer agent fees | | | 68,812 | |
Trustee fees | | | 15,803 | |
Other expenses | | | 11,538 | |
| | | | |
Total expenses | | | 520,730 | |
| | | | |
Expenses waived/reimbursed net of amount recaptured | | | (126,188 | ) |
| | | | |
Net expenses | | | 394,542 | |
| | | | |
Net Investment Loss | | | (102,929 | ) |
| | | | |
| |
Realized and Unrealized Gain | | | | |
Net realized gain from: | | | | |
Investment securities | | | 981,532 | |
| | | | |
Net realized gain on investments | | | 981,532 | |
| | | | |
Change in net unrealized appreciation on: | | | | |
Investment securities | | | 6,054,499 | |
| | | | |
Change in net unrealized appreciation on investments | | | 6,054,499 | |
| | | | |
Net realized and unrealized gain | | | 7,036,031 | |
| | | | |
Net Increase in Net Assets Resulting from Operations | | $ | 6,933,102 | |
| | | | |
The accompanying notes are an integral part of these financial statements.
| | | | |
| Motley Fool Great America Fund | | | 31 | |
Statements of Changes in Net Assets
| | | | | | | | |
| | | Six Months
Ended
April 30,
2012
(Unaudited) | | | November 1, 2010**
to
October 31, 2011 | |
Operations: | | | | | | | | |
Net Investment Loss | | $ | (102,929 | ) | | $ | (205,039 | ) |
Net Realized Gain/(Loss) on Investments | | | 981,532 | | | | (675,389 | ) |
Change in Net Unrealized Appreciation/ (Depreciation) on Investments | | | 6,054,499 | | | | (407,906 | ) |
| | | | | | | | |
Net increase/(decrease) in net assets resulting from operations | | | 6,933,102 | | | | (1,288,334 | ) |
| | | | | | | | |
Dividends to Shareholders: | | | | | | | | |
Dividends from net investment income | | | (4,290 | ) | | | (14,540 | ) |
| | | | | | | | |
Capital Share Transactions: | | | | | | | | |
Proceeds from shares sold (859,624 and 6,270,751 shares, respectively)*** | | | 10,332,033 | | | | 70,605,428 | |
Reinvestment of dividends and distributions (382 and 1,286 shares, respectively) | | | 4,238 | | | | 14,168 | |
Value of shares redeemed (766,755 and 1,228,051 shares, respectively) | | | (8,934,028 | ) | | | (13,662,823 | ) |
| | | | | | | | |
Redemption and small-balance account fees | | | 10,689 | | | | 37,524 | |
| | | | | | | | |
Net increase from capital share transactions | | | 1,412,932 | | | | 56,994,297 | |
| | | | | | | | |
Total increase in net assets | | | 8,341,744 | | | | 55,691,423 | |
| | | | | | | | |
Net Assets: | | | | | | | | |
Beginning of Period | | | 55,691,423 | | | | — | |
| | | | | | | | |
End of Period* | | $ | 64,033,167 | | | $ | 55,691,423 | |
| | | | | | | | |
* Including distributions in excess of net investment | | $ | (107,219 | ) | | $ | — | |
| | | | | | | | |
| ** | Commencement of Operations. |
| *** | On November 1, 2010, 102,000 shares of the Fund were issued for cash at $10.00 per share to the Adviser. |
The accompanying notes are an integral part of these financial statements.
| | | | |
| | 32 | | | Motley Fool Great America Fund |
Financial Highlights
| | | | | | | | |
| | | Six
Months
Ended
April 30,
2012 | | | Period
ended
October
31, | |
| | | (Unaudited)(1) | | | 2011(2)(3) | |
Net Asset Value, Beginning of Period | | $ | 11.04 | | | $ | 10.00 | |
| | | | | | | | |
Income From Investment Operations (4) | | | | | | | | |
Net Investment Loss | | | (0.02 | ) | | | (0.05 | ) |
Net Gains on Securities (Realized and Unrealized) | | | 1.44 | | | | 1.09 | |
| | | | | | | | |
Total From Investment Operations | | | 1.42 | | | | 1.04 | |
| | | | | | | | |
Less Distributions | | | | | | | | |
Net Investment Income | | | — | * | | | (0.01 | ) |
| | | | | | | | |
Total Distributions | | | — | * | | | (0.01 | ) |
| | | | | | | | |
Redemption and Small-Balance Account Fees | | | — | * | | | 0.01 | |
| | | | | | | | |
Net Asset Value, End of Period | | $ | 12.46 | | | $ | 11.04 | |
| | | | | | | | |
Total Return(5)(6) | | | 12.87 | % | | | 10.54 | % |
Net Assets, End of Period (thousands) | | $ | 64,033 | | | $ | 55,691 | |
Ratios/Supplemental Data | | | | | | | | |
Ratio of Expenses to Average Net Assets | | | 1.37 | % | | | 1.35 | % |
Ratio of Expenses to Average Net Assets (Before Waivers and | | | | | | | | |
Reimbursement of Expenses and/or Recapture of Previously Waived Fees) | | | 1.81 | % | | | 2.16 | % |
Ratio of Net Investment Income to Average Net Assets | | | (0.36 | %) | | | (0.48 | %) |
Ratio of Income to Average Net Assets (Before Waivers and Reimbursement of Expenses and/or Recapture of Previously | | | | | | | | |
Waived Fees) | | | (0.80 | %) | | | (1.29 | %) |
Portfolio Turnover | | | 15 | % | | | 18 | % |
| * | Amount represents less than $0.005 per share. |
| (1) | For the six months ended April 30, 2012, all ratios for the period have been annualized. Total return and portfolio turnover for the period have not been annualized. |
| (2) | Because of commencement of operations and related preliminary transaction costs, these ratios are not necessarily indicative of future ratios. |
| (3) | Inception date of the Great America Fund was November 1, 2010. All ratios for the period have been annualized. Total return and portfolio turnover for the period have not been annualized. |
| (4) | Per share data calculated using average shares outstanding method. |
| (5) | During the period ended October 31, 2011, 0.10% of the Fund’s total return was attributable to redemption fees received as referenced in Note 4. Excluding this item, the total return would have been 10.44%. For the six months ended April 30, 2012, redemption and small-balance account fees received had no effect on the Fund’s total return. |
| (6) | Total return reflects the rate an investor would have earned on an investment in the Fund during each period, assuming reinvestment of all distributions. |
The accompanying notes are an integral part of these financial statements.
| | | | |
| Motley Fool Great America Fund | | | 33 | |
Motley Fool Epic Voyage Fund Portfolio Characteristics (Unaudited)
At April 30, 2012, the Motley Fool Epic Voyage Fund (the “Fund”) had an unaudited net asset value of $10.64 per share attributed to 1,171,144 shares outstanding. This compares with an unaudited net asset value as of November 1, 2011 of $10.00 per share attributed to 106,350 shares outstanding. From the Fund’s launch on November 1, 2011 to April 30, 2012, the Fund had an annual total return of 6.51% versus a return of 7.32% over the same period for its benchmark, Russell Global ex-U.S. Index. The graph below shows the performance of $10,000 invested in the Fund at inception. The results shown below do not reflect the deduction of taxes that a shareholder would pay on fund distributions or the redemption of fund shares.
Let’s be serious though. A graph of the performance of any investment over six months tells you virtually nothing. In about five years, they’ll actually tell you quite a bit about how well we’re managing your money.
Annual Total Returns as of 04/30/2012
| | | | | | | | |
| | | Fund* | | | Benchmark** | |
Since Inception | | | 6.51 | % | | | 7.32 | % |
Inception Date | | | 11/01/2011 | | | | | |
Total Annual Fund Operating Expenses Before Expense Limitation (February 29, 2012 Prospectus) | | | 1.71 | % | | | | |
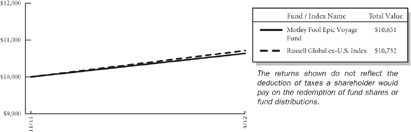
The performance data quoted represents past performance and does not guarantee future results. Current performance may be lower or higher. Performance data current to the most recent month-end may be obtained at www.FoolFunds.com. The investment return and principal value of an investment will fluctuate so that shares, when redeemed, may be worth more or less than their original cost.
| * | These returns reflect expense waivers by the Fund’s investment adviser. Without these waivers, returns would have been lower. |
| ** | The Russell Global ex-U.S. Index measures the performance of the global equity market based on all investable equity securities, excluding companies assigned to the United States. The Russell Global ex-U.S. Index is constructed to provide a comprehensive and unbiased barometer for the global segment and is completely reconstituted annually to accurately reflect the changes in the market over time, and it is widely recognized by investors in international markets as a benchmark for portfolios of foreign securities. However, the Epic Voyage Fund may invest in countries that are not included within the Russell Global ex-U.S. Index, and its investment portfolio is not weighted in terms of countries or issuers in correlation with the Russell Global ex-U.S. Index. For this reason, the Epic Voyage Fund’s investment performance should not be expected to track, and may exceed or trail, the Russell Global ex-U.S. Index. In addition, the performance of the Russell Global ex-U.S. Index may not correlate with the performance of U.S. markets. Under normal circumstances, the Epic Voyage Fund seeks to stay fully invested, primarily in common stocks, and does not attempt to time the market. Although current income in not an objective of the Epic Voyage Fund, the Adviser considers current income in assessing the intrinsic value of securities being considered for purchase by the Epic Voyage Fund. |
| | | | |
| | 34 | | | Motley Fool Epic Voyage Fund |
The investment objective of the Epic Voyage Fund is to achieve long-term capital appreciation. The Fund pursues this objective by investing primarily in common stocks of foreign companies. The Fund employs a value-based investment strategy and seeks long-term growth of capital by acquiring securities of companies at prices the investment adviser, Motley Fool Asset Management, LLC (the “Adviser”), believes to be significantly below their intrinsic value. The Fund may invest in other types of securities and in other asset classes when, in the judgment of the Adviser, such investments offer attractive potential returns. As such, the Fund’s performance will deviate significantly from its benchmark from time to time. It is the view of the Adviser that this deviation is less meaningful over shorter time frames and is more relevant over multi-year periods.
Because the Epic Voyage Fund is free to invest in companies of any size around the world, investments in the securities of foreign companies, including depositary receipts, companies with smaller market capitalizations (less than $2 billion), and companies in emerging market countries, will be important components of the Epic Voyage Fund’s investment program, although the Epic Voyage Fund may invest in issuers of all capitalization sizes. Small-cap stocks tend to be more volatile and less liquid than their large-cap counterparts. Fluctuations in currency exchange rates can cause losses when investing in foreign securities, with emerging markets presenting additional risks of illiquidity, political instability, and lax regulation. You are strongly encouraged to read more about the Fund’s strategies and risks in the prospectus.
The Epic Voyage Fund invests in securities of companies the Adviser believes are undervalued. Unlike mutual funds that are constrained by a style box, the Fund may invest in any company, industry or sector where the Adviser’s analysis suggests that there is opportunity for gains that outweigh risks. In identifying investments for the Fund, the Adviser looks for companies it believes the market has irrationally undervalued and companies that have high-quality businesses with strong market positions, manageable leverage, and robust streams of free cash flow. The following tables show the top 11 holdings and top 10 sectors in which the Fund was invested as of April 30, 2012. Portfolio holdings are subject to change without notice.
Certain mutual fund ratings and review services have created style boxes, which look more or less like a tic-tac-toe board; arranging funds by the size of the companies they typically invest in (large-, mid-, and small-cap) along one axis, and along a “value” to “growth” basis on the other axis. This may be a helpful way—at times—to think about certain investment opportunities, but we don’t believe we’ll improve your returns by limiting ourselves to any one portion of that style box.
| | | | |
Top Eleven Holdings* | | % of Net
Assets | |
Tod’s S.p.A. | | | 4.34 | % |
Coca Cola Hellenic Bottling Co. SA | | | 4.11 | |
Banco Latinoamericano de Comercio Exterior SA | | | 3.78 | |
Arcos Dorados Holdings, Inc. | | | 3.12 | |
GDF Suez | | | 3.02 | |
Adidas AG | | | 2.96 | |
De La Rue PLC | | | 2.94 | |
Covidien PLC | | | 2.94 | |
Compartamos SAB de CV | | | 2.75 | |
Swatch Group AG | | | 2.65 | |
Baidu, Inc. | | | 2.43 | |
| | | | |
| | | 35.04 | % |
| | | | |
| * | As of the date of the report the fund had a holding of 2.96% in the BNY Mellon Cash Reserve. |
| | | | |
| Motley Fool Epic Voyage Fund | | | 35 | |
| | | | |
Sector Allocation | | % of Net
Assets | |
Consumer Discretionary | | | 22.99 | % |
Financials | | | 19.10 | |
Consumer Staples | | | 16.03 | |
Health Care | | | 10.84 | |
Industrials | | | 8.92 | |
Information Technology | | | 4.85 | |
Materials | | | 4.76 | |
Utilities | | | 3.02 | |
Energy | | | 2.87 | |
Telecommunication Services | | | 2.02 | |
| | | | |
| | | 95.40 | % |
| | | | |
| |
Top Eleven Countries | | % of Net
Assets | |
United Kingdom | | | 7.63 | % |
Hong Kong | | | 5.67 | |
France | | | 5.52 | |
South Korea | | | 5.29 | |
India | | | 4.97 | |
Singapore | | | 4.76 | |
Switzerland | | | 4.41 | |
Italy | | | 4.35 | |
Greece | | | 4.11 | |
Japan | | | 4.11 | |
Panama | | | 3.78 | |
| | | | |
| | | 54.60 | % |
| | | | |
| | | | |
| | 36 | | | Motley Fool Epic Voyage Fund |
About Your Expenses
As a shareholder of the Epic Voyage Fund, you incur ongoing costs, including advisory fees and other Fund expenses. This example is intended to help you to understand your ongoing costs (in dollars) of investing in the Fund and to compare these costs with the ongoing costs of investing in other mutual funds. It is based on an investment of $1,000 invested at the beginning of the period and held for the entire period from November 1, 2011 to April 30, 2012.
Actual Expenses
The first section of the table below provides information about actual account values and actual expenses. You may use the information in this section, together with the amount you invested, to estimate the expenses that you incurred over the period. Simply divide your account value by $1,000 (for example, an $8,600 account value divided by $1,000 = 8.6), then multiply the result by the number in the first section under the heading entitled “Expenses Paid During Period” to estimate the expenses attributable to your investment during this period.
Hypothetical Example for Comparison Purposes
The second section of the table below provides information about hypothetical account values and hypothetical expenses based on the Fund’s actual expense ratio and an assumed rate of return of 5% per year before expenses, which is not the Fund’s actual return. Thus, you should not use the hypothetical account values and expenses to estimate the actual ending account balance or your expenses for the period. Rather, these figures are provided to enable you to compare the ongoing costs of investing in the Fund as compared to the costs of investing in other funds. To do so, compare this 5% hypothetical example with the 5% hypothetical examples that appear in the shareholder reports of the other funds. Please note that the expenses shown in the table are meant to highlight your ongoing costs only. Therefore, the second section of the table is useful in comparing ongoing costs only and will not help you determine the relative total costs of owning different funds.
Do you know how many times a fund, or the market, has returned a smooth 5% over a long period of time? Never. But we have to pick some example. In reality, the market’s returns are always far bumpier, with the market returning 20% one year, followed by a loss of 10% the next year, followed by a 3% gain, etc. These variations affect actual expenses as well. Happily, over almost all time periods of 20 years or longer, according to the research of University of Pennsylvania’s Jeremy Siegel and others, the domestic market’s returns have been at least 5% per year on average.
| | | | | | | | | | | | | | | | |
| | | Beginning
Account
Value
11/01/11 | | | Ending
Account
Value
04/30/12 | | | Annualized
Expense
Ratio(1) | | | Expenses
Paid
During
Period(2) | |
Actual | | $ | 1,000 | | | $ | 1,065.14 | | | | 1.35 | % | | $ | 6.93 | |
Hypothetical | | $ | 1,000 | | | $ | 1,018.15 | | | | 1.35 | % | | $ | 6.77 | |
| (1) | These ratios reflect expenses waived by the Fund’s investment adviser. Without these Waivers, the Fund’s expenses would have been higher and the ending account values would have been lower. |
| (2) | Expenses are equal to the Fund’s annualized expense ratio for the period November 1, 2011 to April 30, 2012, multiplied by the average account value over the period, multiplied by the number of days (182) in the most recent fiscal half-year, then divided by 366. |
| | | | |
| Motley Fool Epic Voyage Fund (Unaudited) | | | 37 | |
The Motley Fool Funds Trust
Motley Fool Epic Voyage Fund
Schedule of Investments
at April 30, 2012
(Unaudited)
| | | | | | | | |
Issues | | Shares | | | Value
(Note 2) | |
Equity Securities — 89.84% | | | | | | | | |
Beverages — 5.94% | | | | | | | | |
Coca Cola Hellenic Bottling Co. SA (Greece)* | | | 25,802 | | | $ | 512,491 | |
Treasury Wine Estates Ltd. (Australia) | | | 51,100 | | | | 228,311 | |
| | | | | | | | |
| | | | | | | 740,802 | |
| | | | | | | | |
Capital Markets — 2.70% | | | | | | | | |
Administradora de Fondos de Pensiones Provida SA (Chile)(a) | | | 2,714 | | | | 217,120 | |
City of London Investment Group PLC (United Kingdom) | | | 19,172 | | | | 118,851 | |
| | | | | | | | |
| | | | | | | 335,971 | |
| | | | | | | | |
Commercial Banks — 6.14% | | | | | | | | |
Banco Latinoamericano de Comercio Exterior SA (Panama) | | | 22,600 | | | | 471,210 | |
HDFC Bank Ltd. (India)(a) | | | 8,550 | | | | 293,522 | |
| | | | | | | | |
| | | | | | | 764,732 | |
| | | | | | | | |
Commercial Services & Supplies — 4.64% | | | | | | | | |
De La Rue PLC (United Kingdom) | | | 23,111 | | | | 366,159 | |
Depa Ltd. (United Arab Emirates)* | | | 141,600 | | | | 63,720 | |
Multiplus SA (Brazil) | | | 6,800 | | | | 147,976 | |
| | | | | | | | |
| | | | | | | 577,855 | |
| | | | | | | | |
Consumer Finance — 2.75% | | | | | | | | |
Compartamos SAB de CV (Mexico) | | | 280,853 | | | | 342,389 | |
| | | | | | | | |
Diversified Consumer Services — 1.72% | | | | | | | | |
MegaStudy Co., Ltd. (South Korea) | | | 2,307 | | | | 214,519 | |
| | | | | | | | |
Diversified Telecommunication Services — 2.02% | | | | | | | | |
Telefonica SA (Spain)(a) | | | 17,200 | | | | 251,636 | |
| | | | | | | | |
Electrical Equipment — 0.83% | | | | | | | | |
Legrand SA (France) | | | 3,082 | | | | 104,044 | |
| | | | | | | | |
Electronic Equipment, Instruments & Components — 1.67% | | | | | | | | |
CrucialTec Co., Ltd. (South Korea)* | | | 26,250 | | | | 208,155 | |
| | | | | | | | |
Food & Staples Retailing — 4.16% | | | | | | | | |
Breadtalk Group Ltd. (Singapore) | | | 275,000 | | | | 122,704 | |
Olam International Ltd. (Singapore) | | | 137,023 | | | | 250,026 | |
See Notes to Financial Statements.
| | | | |
| | 38 | | | Motley Fool Epic Voyage Fund |
| | | | | | | | |
Issues | | Shares | | | Value
(Note 2) | |
Equity Securities (continued) | | | | | | | | |
Food & Staples Retailing (continued) | | | | | | | | |
PT Sumber Alfaria Trijaya Tbk (Indonesia)* | | | 250,000 | | | $ | 145,669 | |
| | | | | | | | |
| | | | | | | 518,399 | |
| | | | | | | | |
Food Products — 4.00% | | | | | | | | |
Multiexport Foods SA (Chile) | | | 125,000 | | | | 33,756 | |
Nestle SA (Switzerland) | | | 2,885 | | | | 176,820 | |
PT Nippon Indosari Corpindo Tbk (Indonesia)* | | | 679,660 | | | | 288,177 | |
| | | | | | | | |
| | | | | | | 498,753 | |
| | | | | | | | |
Health Care Equipment & Supplies — 4.01% | | | | | | | | |
Covidien PLC (Ireland) | | | 6,628 | | | | 366,064 | |
Nihon Kohden Corp. (Japan) | | | 4,597 | | | | 134,086 | |
| | | | | | | | |
| | | | | | | 500,150 | |
| | | | | | | | |
Health Care Providers & Services — 1.87% | | | | | | | | |
Odontoprev SA (Brazil) | | | 44,000 | | | | 232,448 | |
| | | | | | | | |
Hotels, Restaurants & Leisure — 5.44% | | | | | | | | |
Ajisen China Holdings Ltd. (Hong Kong) | | | 260,000 | | | | 289,280 | |
Arcos Dorados Holdings, Inc. (Argentina) | | | 21,762 | | | | 388,887 | |
| | | | | | | | |
| | | | | | | 678,167 | |
| | | | | | | | |
Internet Software & Services — 2.43% | | | | | | | | |
Baidu, Inc. (China)*(a) | | | 2,286 | | | | 303,352 | |
| | | | | | | | |
Leisure Equipment & Products — 2.14% | | | | | | | | |
Shimano, Inc. (Japan) | | | 4,050 | | | | 266,302 | |
| | | | | | | | |
Media — 2.05% | | | | | | | | |
BrainJuicer Group PLC (United Kingdom) | | | 51,836 | | | | 256,042 | |
| | | | | | | | |
Metals & Mining — 2.97% | | | | | | | | |
Fortuna Silver Mines, Inc. (Canada)* | | | 15,000 | | | | 62,700 | |
POSCO (South Korea)(a) | | | 1,712 | | | | 142,524 | |
Sterlite Industries India Ltd. (India)(a) | | | 20,080 | | | | 164,455 | |
| | | | | | | | |
| | | | | | | 369,679 | |
| | | | | | | | |
Multi-Utilities — 3.02% | | | | | | | | |
GDF Suez S.A. (France) | | | 16,333 | | | | 376,054 | |
| | | | | | | | |
Oil, Gas & Consumable Fuels — 2.87% | | | | | | | | |
Lukoil OAO (Russia)(a) | | | 2,687 | | | | 164,847 | |
See Notes to Financial Statements.
| | | | |
| Motley Fool Epic Voyage Fund | | | 39 | |
| | | | | | | | |
Issues | | Shares | | | Value
(Note 2) | |
Equity Securities (continued) | | | | | | | | |
Oil, Gas & Consumable Fuels (continued) | | | | | | | | |
Total Gabon SA (Gabon) | | | 418 | | | $ | 193,306 | |
| | | | | | | | |
| | | | | | | 358,153 | |
| | | | | | | | |
Pharmaceuticals — 4.96% | | | | | | | | |
Astellas Pharma, Inc. (Japan) | | | 1,388 | | | | 56,291 | |
Dr. Reddy’s Laboratories Ltd. (India)(a) | | | 4,779 | | | | 161,673 | |
Roche Holding AG (Switzerland) | | | 230 | | | | 42,035 | |
Santen Pharmaceutical Co., Ltd. (Japan) | | | 1,333 | | | | 55,785 | |
Teva Pharmaceutical Industries Ltd. (Israel)(a) | | | 6,601 | | | | 301,930 | |
| | | | | | | | |
| | | | | | | 617,714 | |
| | | | | | | | |
Professional Services — 1.67% | | | | | | | | |
Bureau Veritas SA (France) | | | 2,336 | | | | 208,107 | |
| | | | | | | | |
Real Estate Management & Development — 5.68% | | | | | | | | |
Brookfield Asset Management, Inc. (Canada) | | | 8,800 | | | | 290,224 | |
Cheung Kong Holdings Ltd. (Hong Kong) | | | 14,188 | | | | 187,637 | |
Henderson Land Development Co., Ltd. (Hong Kong) | | | 40,560 | | | | 230,143 | |
| | | | | | | | |
| | | | | | | 708,004 | |
| | | | | | | | |
Software — 0.75% | | | | | | | | |
DuzonBizon Co., Ltd. (South Korea)* | | | 15,400 | | | | 93,565 | |
| | | | | | | | |
Specialty Retail — 1.68% | | | | | | | | |
Halfords Group PLC (United Kingdom) | | | 46,866 | | | | 209,287 | |
| | | | | | | | |
Textiles, Apparel & Luxury Goods — 9.96% | | | | | | | | |
Adidas AG (Germany) | | | 4,415 | | | | 368,254 | |
Swatch Group AG (Switzerland) | | | 716 | | | | 330,798 | |
Tod’s S.p.A. (Italy) | | | 4,700 | | | | 541,543 | |
| | | | | | | | |
| | | | | | | 1,240,595 | |
| | | | | | | | |
Transportation Infrastructure — 1.77% | | | | | | | | |
SATS Ltd. (Singapore) | | | 105,000 | | | | 221,060 | |
| | | | | | | | |
Total Equity Securities (Cost $ 10,480,034) | | | | | | | 11,195,934 | |
| | | | | | | | |
See Notes to Financial Statements.
| | | | |
| | 40 | | | Motley Fool Epic Voyage Fund |
| | | | | | | | |
Issues | | Shares | | | Value
(Note 2) | |
Participatory Notes — 5.55% | | | | | | | | |
Commercial Banks — 1.83% | | | | | | | | |
Al-Rajhi Banking & Investment Co. (Saudi Arabia)(b) | | | 11,000 | | | $ | 228,782 | |
| | | | | | | | |
Food Products — 1.92% | | | | | | | | |
Almarai Co. (Saudi Arabia)(b) | | | 13,391 | | | | 239,233 | |
| | | | | | | | |
Metals & Mining — 1.80% | | | | | | | | |
Aluminum Bahrain BSC (Bahrain)(b) | | | 146,998 | | | | 224,201 | |
| | | | | | | | |
Total Participatory Notes (Cost $ 645,452) | | | | | | | 692,216 | |
| | | | | | | | |
Rights — 0.00% | | | | | | | | |
GDF Suez+ | | | 14,333 | | | | — | |
| | | | | | | | |
Total Rights (Cost $0) | | | | | | | — | |
| | | | | | | | |
Other Investments — 2.96% | | | | | | | | |
Temporary Cash Investment — 2.96% | | | | | | | | |
BNY Mellon Cash Reserve | | | 368,676 | | | | 368,676 | |
| | | | | | | | |
Total Other Investments (Cost $ 368,676) | | | | | | | 368,676 | |
| | | | | | | | |
Total Investment Portfolio (Cost $ 11,494,162) — 98.35% | | | | | | | 12,256,826 | |
Other Assets in Excess of Liabilities — 1.65% | | | | | | | 205,074 | |
| | | | | | | | |
NET ASSETS — 100.00%
(Applicable to 1,171,144 shares outstanding) | | | | | | $ | 12,461,900 | |
| | | | | | | | |
| * | Non-income producing security. |
| + | Security fair valued using procedures as approved by the Board of Trustees. |
| (a) | ADR — American Depositary Receipts |
| (b) | Security exempt from registration under Rule 144A of the Securities Act of 1933. These securities may be resold in transactions exempt from registration, normally to qualified institutional buyers. Total market value of Rule 144A securities is $692,216 and represents 5.55% of net assets as of April 30, 2012. |
PLC — Public Limited Company
See Notes to Financial Statements.
| | | | |
| Motley Fool Epic Voyage Fund | | | 41 | |
Statement of Assets and Liabilities
| | | | |
| | | April 30, 2012
(Unaudited) | |
Assets: | | | | |
| |
Investments in securities of unaffiliated issuers, at value (at cost, $11,494,162) | | $ | 12,256,826 | |
| |
Foreign currency, at value (at cost, $136,547) | | | 135,250 | |
Receivables: | | | | |
Dividends | | | 26,491 | |
Interest | | | 160 | |
Shares of beneficial interest sold | | | 150,943 | |
Deferred offering costs | | | 5,446 | |
Reimbursement due from adviser | | | 27,136 | |
Prepaid expenses and other assets | | | 17,711 | |
| | | | |
Total Assets | | | 12,619,963 | |
| | | | |
| |
Liabilities | | | | |
Payables: | | | | |
Shares of beneficial interest redeemed | | | 10,528 | |
Accrued expenses: | | | | |
Audit fees | | | 9,047 | |
Accounting and administration fees | | | 35,230 | |
Advisory fees | | | 9,223 | |
Custodian fees | | | 4,622 | |
Legal fees | | | 17,205 | |
Transfer agent fees | | | 33,241 | |
Trustee fees | | | 6,067 | |
Other expenses | | | 32,900 | |
Total Liabilities | | | 158,063 | |
| | | | |
Net Assets | | $ | 12,461,900 | |
| | | | |
The accompanying notes are an integral part of these financial statements.
| | | | |
| | 42 | | | Motley Fool Epic Voyage Fund |
Statement of Assets and Liabilities
| | | | |
| | | April 30, 2012
(Unaudited) | |
Net Assets Consist of: | | | | |
Paid-in-Capital | | $ | 11,625,745 | |
Undistributed Net Investment Income | | | 23,555 | |
Accumulated Net Realized Gain/(Loss) on Investments and Foreign Currency Transactions | | | 51,081 | |
Net Unrealized Appreciation/(Depreciation) on Investments, Foreign Currencies, and Assets and Liabilities Denominated in Foreign Currencies | | | 761,519 | |
| | | | |
Net Assets | | $ | 12,461,900 | |
| | | | |
Net Asset Value: | | | | |
$0.001 par value, unlimited shares authorized | | | | |
Net assets applicable to capital shares outstanding | | $ | 12,461,900 | |
Shares outstanding | | | 1,171,144 | |
| | | | |
Net asset value, offering, and redemption price per share | | $ | 10.64 | |
| | | | |
The accompanying notes are an integral part of these financial statements.
| | | | |
| Motley Fool Epic Voyage Fund | | | 43 | |
Statement of Operations
| | | | |
| | | November 1, 2011**
to
April 30, 2012
(Unaudited) | |
Investment Income | | | | |
Dividends | | $ | 91,254 | |
Less foreign taxes withheld | | | (5,992 | ) |
| | | | |
Total Investment Income | | | 85,262 | |
| | | | |
Expenses | | | | |
Accounting and administration fees | | | 59,294 | |
Blue sky fees | | | 705 | |
Shareholder account-related services | | | 18,975 | |
Chief Compliance Officer fees | | | 7,788 | |
Custodian fees | | | 18,606 | |
Investment advisory fees | | | 38,457 | |
Organization fees | | | 4,630 | |
Professional fees | | | 31,213 | |
Shareholder reporting fees | | | 10,104 | |
Transfer agent fees | | | 37,640 | |
Trustee fees | | | 13,746 | |
Other expenses | | | 8,852 | |
| | | | |
Total expenses | | | 250,010 | |
| | | | |
Expenses waived/reimbursed net of amount recaptured | | | (195,361 | ) |
| | | | |
Net expenses | | | 54,649 | |
| | | | |
Net Investment Income | | | 30,613 | |
| | | | |
| |
Realized and Unrealized Gain | | | | |
Net realized gain from: | | | | |
Investment securities | | | 49,877 | |
Foreign currency transactions | | | 1,204 | |
| | | | |
Net realized gain on investments | | | 51,081 | |
| | | | |
Change in net unrealized appreciation/ (depreciation) on: | | | | |
Investment securities | | | 762,664 | |
Foreign currency translations | | | (1,145 | ) |
| | | | |
Change in net unrealized appreciation on investments | | | 761,519 | |
| | | | |
Net realized and unrealized gain | | | 812,600 | |
| | | | |
Net Increase in Net Assets Resulting from Operations | | $ | 843,213 | |
| | | | |
| ** | Commencement of Operations. |
The accompanying notes are an integral part of these financial statements.
| | | | |
| | 44 | | | Motley Fool Epic Voyage Fund |
Statement of Changes in Net Assets
| | | | |
| | | November 1, 2011**
to
April 30, 2012
(Unaudited) | |
Operations: | | | | |
Net Investment Income | | $ | 30,613 | |
Net Realized Gain on Investments and Foreign Currency Transactions | | | 51,081 | |
Change in Net Unrealized Appreciation on Investments and Foreign Currency Translation | | | 761,519 | |
| | | | |
Net increase in net assets resulting from operations | | | 843,213 | |
| | | | |
Dividends to Shareholders: | | | | |
Dividends from net investment income | | | (7,058 | ) |
| | | | |
Capital Share Transactions: | | | | |
Proceeds from shares sold (1,214,130 shares)*** | | | 12,074,541 | |
Reinvestment of dividends and distributions (741 shares) | | | 6,939 | |
Value of shares redeemed (43,727 shares) | | | (459,511 | ) |
| | | | |
Redemption fees | | | 3,776 | |
| | | | |
Net increase from capital share transactions | | | 11,625,745 | |
| | | | |
Total increase in net assets | | | 12,461,900 | |
| | | | |
Net Assets: | | | | |
Beginning of Period | | | — | |
End of Period* | | $ | 12,461,900 | |
| | | | |
* Including undistributed net investment income | | $ | 23,555 | |
| | | | |
| ** | Commencement of Operations. |
| *** | On November 1, 2011, 106,350 shares of the Fund were issued for cash at $10.00 per share to the Adviser. |
The accompanying notes are an integral part of these financial statements.
| | | | |
| Motley Fool Epic Voyage Fund | | | 45 | |
Financial Highlights
| | | | |
| | | November 1, 2011
to
April 30, 2012
(Unaudited)(1)(2) | |
Net Asset Value, Beginning of Period | | $ | 10.00 | |
| | | | |
Income From Investment Operations (3) | | | | |
Net Investment Income | | | 0.04 | |
Net Gains on Securities (Realized and Unrealized) | | | 0.61 | |
| | | | |
Total From Investment Operations | | | 0.65 | |
| | | | |
Less Distributions | | | | |
Net Investment Income | | | (0.01 | ) |
Net Realized Capital Gains | | | — | |
| | | | |
Total Distributions | | | (0.01 | ) |
| | | | |
Redemption Fees | | | — | * |
| | | | |
Net Asset Value, End of Period | | $ | 10.64 | |
| | | | |
Total Return(4)(5) | | | 6.51 | % |
Net Assets, End of Period (thousands) | | $ | 12,462 | |
| |
Ratios/Supplemental Data | | | | |
| |
Ratio of Expenses to Average Net Assets | | | 1.35 | % |
Ratio of Expenses to Average Net Assets (Before Waivers and Reimbursement of Expenses and/or Recapture of Previously Waived Fees) | | | 6.18 | % |
Ratio of Net Investment Income to Average Net Assets | | | 0.76 | % |
Ratio of Income to Average Net Assets (Before Waivers and Reimbursement of Expenses and/or Recapture of Previously Waived Fees) | | | (4.07 | %) |
Portfolio Turnover | | | 8 | % |
| * | Amount represents less than $0.005 per share. |
| (1) | Inception date of the Epic Voyage Fund was November 1, 2011. All ratios for the period have been annualized. Total return and portfolio turnover for the period have not been annualized. |
| (2) | Because of commencement of operations and related preliminary transaction costs, these ratios are not necessarily indicative of future ratios. |
| (3) | Per share data calculated using average shares outstanding method. |
| (4) | Redemption fees received during the period had no effect on the net asset value. |
| (5) | Total return reflects the rate an investor would have earned on an investment in the Fund during each period, assuming reinvestment of all distributions. For the period ended April 30, 2012, redemption fees received had no effect on the Fund’s total return. |
The accompanying notes are an integral part of these financial statements.
| | | | |
| | 46 | | | Motley Fool Epic Voyage Fund |
Notes to Financial Statements (Unaudited)
1. Organization:
Motley Fool Independence Fund (“Independence Fund”), Motley Fool Great America Fund (“Great America Fund”), and Motley Fool Epic Voyage Fund (“Epic Voyage Fund”) (each a “Fund” and together the “Funds”) are diversified series of The Motley Fool Funds Trust (the “Trust”), an open-end management investment company (or mutual fund) organized on November 7, 2008, as a statutory trust under the laws of the State of Delaware. The investment objective of each Fund is to achieve long-term capital appreciation. The Independence Fund pursues its objective by investing primarily in common stocks of U.S. companies and of companies that are organized under the laws of other countries around the world. The Great America Fund pursues its objective by investing primarily in common stocks of companies that are organized in the United States and that are engaged in a broad range of industries. The Epic Voyage Fund pursues its objective by investing primarily in common stocks of foreign companies.
Under the Trust’s organizational documents, its Trustees and officers are indemnified against certain liabilities arising out of the performance of their duties for the Trust by the Trust. In addition, in the normal course of business, the Trust enters into contracts with vendors and others that provide for general indemnifications. The Trust’s maximum exposure under these arrangements is unknown as this would involve future claims that may be made against the Trust. However, the Trust believes the risk of loss to be remote.
2. Significant Accounting Policies:
Basis of Preparation
The policies described below are followed consistently by the Funds in the preparation of their financial statements in conformity with accounting principles generally accepted in the United States of America (“U.S. GAAP”) for U.S. mutual funds.
The preparation of financial statements in accordance with U.S. GAAP requires management to make estimates and assumptions that affect the reported amounts and disclosures. Actual results could differ from those estimates.
Security Valuation
Securities held by the Trust are generally valued at fair value as of the close of regular trading on each business day (generally 4 pm Eastern time) that the New York Stock Exchange (“NYSE”) is open. Securities, other than stock options, listed on the NYSE or other exchanges are valued on the basis of the last quoted sale price on the exchange on which they are primarily traded. However, if the last sale price on the NYSE is different from the last sale price on any other exchange, the NYSE price will be used. If there are no sales on that day, then the securities are valued at the bid price on the NYSE or other primary exchange for that day. Securities traded in the OTC market are valued on the basis of the last sales price as reported by NASDAQ. If there are no sales on that day,
| | | | |
| The Motley Fool Funds Trust | | | 47 | |
then the securities are valued at the mean between the closing bid and asked prices as reported by NASDAQ. Stock options and stock index options traded on national securities exchanges or on NASDAQ are valued at the mean between the latest bid and asked prices for such options. Securities for which market quotations are not readily available or whose values have been affected by events occurring before the Funds’ pricing time but after the close of the securities markets, and other assets are valued at fair value as determined pursuant to procedures adopted in good faith by the Board of Trustees (the “Board”). Debt securities that mature in fewer than 60 days are valued at amortized cost (unless the Board determines that this method does not represent fair value), if their original maturity was 60 days or less or by amortizing the value as of the 61st day before maturity, if their original term to maturity exceeded 60 days.
When fair value pricing is employed, the prices of securities used by a fund to calculate its net asset value (the “NAV”) may differ from quoted or published prices for the same securities.
You’d think that it would be easy to determine what a share of the Fund is worth – just add up the value of everything it holds, and then divide by the number of shares. It’s not that simple, though. Some foreign markets have different operating hours (when it’s daytime in Chicago, for example, it is night in Shanghai). That means that when we calculate a Fund’s value at the end of the day, the market quotations for some of the securities held by the Fund could be several hours old, and intervening events may have affected what the stocks are worth. In addition, characteristics of the relevant markets and stocks might, in some cases, cast doubt on a particular valuation. For these reasons, we may rely on a pricing service to determine the value of particular securities. It is possible that when a Fund buys or sells the securities, the price on the real market will be different from the value used for the fair-value pricing.
The values of securities held by the Funds and other assets used in computing NAV are generally determined as of the time trading in such securities is completed each day, which, in the case of foreign securities, generally occurs at various times before the close of the NYSE. Trading in securities listed on foreign securities exchanges are valued at the last sale or, if no sales are reported, at the bid price as of the close of the exchange, subject to possible adjustment as described in the Prospectus. Foreign currency exchange rates are also generally determined before the close of the NYSE. On occasion, the values of such securities and exchange rates may be affected by events occurring between the time as of which determinations of such values or exchange rates are made and the close of the NYSE. When such events materially affect the value of securities held by the Funds or their liabilities, such securities and liabilities will be valued at fair value in accordance with procedures adopted in good faith by the Board. In this regard, the Trust has retained a third-party fair-value pricing service to quantitatively analyze the price movement of the Funds’ holdings on foreign exchanges and to automatically determine fair value if the variation from the prior day’s closing price exceeds specified parameters. As of April 30, 2012, such price movements for certain securities had
| | | | |
| | 48 | | | The Motley Fool Funds Trust |
exceeded specified parameters and the third-party fair-value service quantitatively fair valued the affected securities. The Board will review and monitor the methods used by the service to assure itself that securities are valued at their fair values. The values of any assets and liabilities initially expressed in foreign currencies will be converted to U.S. dollars based on exchange rates supplied by a quotation service.
Fair Value Measurements
The Financial Accounting Standards Board (“FASB”) “Fair Value Measurements and Disclosures” defines fair value as the price that a Fund would receive upon selling an investment in an orderly transaction to an independent buyer in the principal market, or in the absence of a principal market, the most advantageous market for the investment. Valuation techniques should maximize the use of observable market data and minimize the use of unobservable inputs. Inputs refer broadly to the assumptions that market participants would use in pricing an asset. Inputs may be observable or unobservable. Observable inputs are inputs that reflect the assumptions market participants would use in pricing the asset or liability developed based on market data obtained from sources independent of the reporting entity. Unobservable inputs are inputs that reflect the reporting entity’s own assumptions about the assumptions market participants would use in pricing the asset or liability developed based on the best information available in the circumstances.
Fair value measurements utilize a hierarchy based on the observability of inputs used to establish fair value.
Investment assets reported at fair value are classified based on the lowest level input that is significant to fair value:
Level 1 — quoted prices in active markets for identical securities
Investments whose values are based on quoted market prices in active markets, and whose values are therefore classified as Level 1 prices, include active listed domestic and foreign equity securities.
Level 2 — observable inputs other than Level 1 (including quoted prices for similar securities, interest rates, prepayment speeds, credit risk, etc.)
Investments that trade in markets that are not considered to be active, but whose values are based on quoted market prices, dealer quotations or valuations provided by alternative pricing sources supported by observable inputs are classified as Level 2 prices. These generally include investment grade corporate bonds and less liquid listed domestic and foreign equity securities.
Level 3 — significant unobservable inputs (including the Fund’s own assumptions in determining the fair value of investments)
Investments whose values are classified as Level 3 prices have significant unobservable inputs, as they may trade infrequently or not at all.
| | | | |
| The Motley Fool Funds Trust | | | 49 | |
The Funds did not have any transfers between Level 1 and Level 2 during the six months ended April 30, 2012.
| | | | |
| | | Independence
Fund | |
Valuation Inputs | | Value | |
Level 1 — Quoted Prices | | | | |
U.S. Common Stocks | | $ | 93,514,351 | |
Foreign Common Stocks | | | 55,838,508 | |
Participatory Note | | | 4,505,131 | |
Temporary Cash Investment | | | 2,888,247 | |
Level 2 — Other Significant Observable Inputs | | | | |
Foreign Common Stocks | | | 53,514,512 | |
Rights | | | — | |
Level 3 — Significant Unobservable Inputs | | | — | |
Total Value of Investments | | $ | 210,260,749 | |
| | | | |
| | | Great America
Fund | |
Valuation Inputs | | Value | |
Level 1 — Quoted Prices | | | | |
U.S. Common Stocks | | $ | 60,122,799 | |
Temporary Cash Investment | | | 2,807,024 | |
Level 2 — Other Significant Observable Inputs | | | — | |
Level 3 — Significant Unobservable Inputs | | | — | |
Total Value of Investments | | $ | 62,929,823 | |
| | | | |
| | 50 | | | The Motley Fool Funds Trust |
| | | | |
| | | Epic Voyage
Fund | |
Valuation Inputs | | Value | |
Level 1 — Quoted Prices | | | | |
Foreign Common Stocks | | $ | 4,400,433 | |
Participatory Notes | | | 692,216 | |
Temporary Cash Investment | | | 368,676 | |
Level 2 — Other Significant Observable Inputs | | | | |
Foreign Common Stocks | | | 6,795,501 | |
Rights | | | — | |
Level 3 — Significant Unobservable Inputs | | | — | |
Total Value of Investments | | $ | 12,256,826 | |
The inputs or methodology used for valuing securities are not necessarily an indication of the risk associated with investing in those securities.
Dividends and Distributions
When a Fund pays a dividend or other distribution, its net asset value (NAV) per share will decline by the per-share amount of the distribution. Investors are no poorer for this “distribution drop,” however. As this section explains, investors may elect to reinvest their dividend and distribution payments. Doing so would allow them to acquire additional shares at the post-distribution NAV per share. They may also choose to receive a check in the amount of the irportion of the dividend or distribution.
Each Fund pays dividends from its net investment income and distributes any net capital gains that it realizes. Dividends and capital gains distributions are generally paid once a year. All dividends and other distributions will be reinvested in Fund shares unless a shareholder chooses either to (1) receive dividends in cash, while reinvesting capital gains distributions in additional Fund shares; or (2) receive all distributions in cash. Additionally, each Fund reports details of distribution-related transactions on quarterly account statements. You may not receive a separate confirmation statement for these transactions.
Securities Transactions, Investment Income and Expenses
Securities transactions are accounted for as of the trade date. Costs used in determining realized gains and losses on the sales of investment securities are on the basis of identified cost. Dividend income is recorded on the ex-dividend date. Interest income is recorded on an accrual basis. Discount and premium are amortized using the effective
| | | | |
| The Motley Fool Funds Trust | | | 51 | |
interest method. Expenses directly attributable to a Fund are directly charged to that Fund. Common expenses of the Trust are allocated using methods approved by the Board.
Foreign Currency Translation
The books and records of the Funds are maintained in U.S. dollars as follows: (1) the values of investment securities and other assets and liabilities stated in foreign currencies are translated at the exchange rates prevailing at the end of the period; and (2) purchases, sales and income are translated at the rates of exchange prevailing on the respective dates of such transactions. Transaction gains or losses resulting from changes in exchange rates during the reporting period or upon settlement from foreign currency transactions are reported in the Statements of Operations for the current period. The Funds do not isolate the portion of gains and losses on investments.
3. Investment Policies and Practices:
The sections below describe some of the different types of investments that may be made by the Funds and the investment practices in which the Funds may engage.
When we say that the Funds may invest in other types of securities and in other asset classes, the “may” is well worth emphasizing, as the Fund’s primary focus is the common stock companies that the Adviser believes are both promising and undervalued.
Foreign Securities
The Independence Fund and Epic Voyage Fund invest, and the Great America Fund may invest, in equity and fixed-income securities of foreign companies, including companies located in both developed and emerging-market countries. Investment in foreign securities may include the purchase of American Depositary Receipts (“ADRs”) and other depositary receipts (European Depositary Receipts (“EDRs”) and Global Depositary Receipts (“GDRs”)) that represent indirect interests in securities of foreign issuers. A significant portion of a Fund’s exposure to foreign investments may be composed of such investments. Investments in foreign securities are affected by risk factors generally not associated with investments in the securities of U.S. companies in the U.S. With respect to such securities, there may be more limited information publicly available concerning the issuer than would be the case with respect to domestic securities, foreign issuers may use different accounting standards, and foreign trading markets may not be as liquid as are U.S. markets. Foreign securities also involve such risks as currency risks, possible imposition of withholding or confiscatory taxes, possible currency transfer restrictions, expropriation or other adverse political or economic developments, and the difficulty of enforcing obligations in other countries. These risks may be greater in emerging-market countries and in less-developed countries.
| | | | |
| | 52 | | | The Motley Fool Funds Trust |
If a Fund holds a foreign stock, and the stock is traded on a foreign exchange, with its price denominated in that foreign currency, the value of the stock will change, for the Fund, whenever the relative value of the U.S. dollar and that foreign currency change. To take an imaginary example, if the Fund holds shares in Ruritania Telecom, traded on the Ruritanian Stock Exchange, those shares will be worth more to the Fund if the value of the Ruritanian ploof increases against the U.S. dollar, and vice versa, all other things being equal.
The purchase of securities denominated in foreign currencies will subject the value of the Funds’ investments in those securities to fluctuations caused by changes in foreign exchange rates. To hedge against the effects of changes in foreign exchange rates, the Funds may enter into forward foreign currency exchange contracts (“forward contracts”). These contracts represent agreements to exchange an amount of currency at an agreed-upon future date and rate. The Funds will generally use forward contracts only to “lock in” the price in U.S. dollars of a foreign security that a Fund plans to purchase or to sell. In certain limited cases, it may use such contracts to hedge against an anticipated substantial decline in the price of a foreign currency against the U.S. dollar that would adversely affect the U.S. dollar value of foreign securities held by the Fund. Forward contracts will not be used in all cases and, in any event, cannot completely protect the Funds against all changes in the values of foreign securities resulting from fluctuations in foreign exchange rates. The Funds will not enter into a forward contract if, as a result, forward contracts would represent more than 20% of a Fund’s total assets. For hedging purposes, the Funds may also use options on foreign currencies, which expose the Funds to certain risks.
Some foreign securities are traded in the U.S. in the form of ADRs. ADRs are receipts typically issued by a U.S. bank or trust company evidencing ownership of the underlying securities of foreign issuers. EDRs and GDRs are receipts typically issued by foreign banks or trust companies, evidencing ownership of underlying securities issued by either a foreign or U.S. issuer. Generally, depositary receipts in registered form are designed for use in the U.S. and depositary receipts in bearer form are designed for use in securities markets outside the U.S. Depositary receipts may not necessarily be denominated in the same currency as the underlying securities into which they may be converted. Depositary receipts generally involve the same risks as other investments in foreign securities. However, holders of ADRs and other depositary receipts may not have all the legal rights of shareholders and may experience difficulty in receiving shareholder communications.
Types of Fixed-Income Securities
A Fund may invest in bonds and other types of debt obligations of U.S. and foreign issuers. Fixed income securities purchased by a Fund may include, among others, bonds, notes, and debentures issued by corporations; debt securities issued or guaranteed by the U.S. government or one of its agencies or instrumentalities (“U.S.
| | | | |
| The Motley Fool Funds Trust | | | 53 | |
Government Securities”); municipal securities; mortgage-backed and asset-backed securities; and debt securities issued or guaranteed by foreign governments, their agencies, instrumentalities, or political subdivisions, or by government-owned, -controlled, or -sponsored entities, including central banks. These investments also include money market instruments and other types of obligations. Investors should recognize that, although securities ratings issued by Standard & Poor’s® Ratings Services (“S&P”), a division of The McGraw-Hill Companies, Inc., and Moody’s Investors Services©, Inc. (“Moody’s”), provide a generally useful guide as to credit risks, they do not offer any criteria to evaluate interest rate risk. Changes in interest rate levels generally cause fluctuations in the prices of fixed-income securities and will, therefore, cause fluctuations in the NAV per share of a Fund. Subsequent to the purchase of a fixed-income security by a Fund, the ratings or credit quality of such security may deteriorate. Any such subsequent adverse changes in the rating or quality of a security held by a Fund would not require a Fund to sell the security.
Participatory Notes
A participatory note, as used by a Fund, is an instrument used by investors to obtain exposure to an equity investment, including common stocks and warrants, in a local market where direct ownership is not permitted. In countries where direct ownership by a foreign investor, such as a Fund, is not allowed by local law, such as Saudi Arabia, an investor may gain exposure to the market through a participatory note, which derives its value from a group of underlying equity securities. A participatory note is intended (disregarding the effect of any fees and expenses) to reflect the performance of the underlying equity securities on a one-to-one basis so that investors will not normally gain more in absolute terms than they would have made had they invested in the underlying securities directly, and will not normally lose more than they would have lost had they invested in the underlying securities directly.
In addition to providing access to otherwise closed markets, participatory notes can also provide a less expensive option to direct investment (where ownership by foreign investors is permitted) by reducing registration and transaction costs in acquiring and selling local registered shares. The Funds’ investment manager also believes that participatory notes can offer greater liquidity in markets that restrict the ability of the Funds to dispose of an investment by either restricting transactions by size or requiring registration and/or regulatory approvals.
The purchase of participatory notes involves risks that are in addition to the risks normally associated with a direct investment in the underlying securities. The Fund is subject to the risk that the issuer of the participatory note (i.e., the issuing bank or broker-dealer), which is the only responsible party under the note, is unable or refuses to perform under the terms of the participatory note, also known as counterparty risk.
| | | | |
| | 54 | | | The Motley Fool Funds Trust |
While the holder of a participatory note is entitled to receive from the bank or broker-dealer any dividends or other distributions paid on the underlying securities, the holder is not entitled to the same rights as an owner of the underlying securities, such as voting rights.
Participatory notes may not be traded on exchanges, are privately issued, and may be illiquid. To the extent a participatory note is determined to be illiquid, it would be subject to the Fund’s limitation on investments in illiquid securities. There can be no assurance that the trading price or value of participatory notes will equal the value of the underlying value of the equity securities they seek to replicate.
Real Estate Investment Trusts
Real estate investment trusts (“REITs”) are pooled investment vehicles that manage a portfolio of real estate or real estate-related loans to earn profits for their shareholders. REITs are generally classified as equity REITs, mortgage REITs, or a combination of equity and mortgage REITs. Investing in REITs involves certain unique risks in addition to those risks associated with investing in the real estate industry in general. Equity REITs may be affected by changes in the value of the underlying property owned by the REITs, while mortgage REITs may be affected by the quality of the borrower on any credit extended. REITs are dependent upon management skills, may not be diversified geographically or by property type, and are subject to heavy cash-flow dependency, default by borrowers, and self-liquidation. REITs must also meet certain requirements under the Internal Revenue Code of 1986, as amended (the “Code”), to avoid entity level tax and be eligible to pass through certain tax attributes of their income to shareholders. REITs are consequently subject to the risk of failing to meet these requirements for favorable tax treatment and of failing to maintain their exemptions from registration under the 1940 Act. REITs are also subject to the risks of changes in the Code, affecting their tax status.
REITs (especially mortgage REITs) are also subject to interest rate risks. When interest rates decline, the value of a REIT’s investment in fixed-rate obligations can be expected to rise. Conversely, when interest rates rise, the value of a REIT’s investment in fixed-rate obligations can be expected to decline. In contrast, as interest rates on adjustable-rate mortgage loans are reset periodically, yields on a REIT’s investments in such loans will gradually align themselves to reflect changes in market interest rates, causing the value of such investments to fluctuate less dramatically in response to interest rate fluctuations than would investments in fixed-rate obligations.
The management of a REIT may be subject to conflicts of interest with respect to the operation of the business of the REIT and may be involved in real estate activities competitive with the REIT. REITs may own properties through joint ventures or in other circumstances in which a REIT may not have control over its investments. REITs may use significant amounts of leverage.
REITs often do not provide complete tax information until after the end of the calendar year. Consequently, because of the delay, it may be necessary for a Fund, if invested in
| | | | |
| The Motley Fool Funds Trust | | | 55 | |
REITs, to request permission to extend the deadline for issuance of Forms 1099-DIV beyond January 31. Alternatively, amended Forms 1099-DIV may be sent. During the six months ended April 30, 2012, the Independence Fund and the Great America Fund invested in REITs.
Temporary Investments
During periods of adverse market or economic conditions, a Fund may temporarily invest all or a substantial portion of its assets in high-quality, fixed-income securities, money market instruments, and shares of money market mutual funds, or it may hold cash. At such times, a Fund would not be pursuing its stated investment objective with its usual investment strategies. A Fund may also hold these investments for liquidity purposes. Fixed-income securities will be deemed to be of high quality if they are rated “A” or better by S&P or Moody’s or, if unrated, are determined to be of comparable quality by the Adviser. Money market instruments are high-quality, short-term fixed income obligations (which generally have remaining maturities of one year or less), and may include U.S. Government Securities, commercial paper, certificates of deposit and banker’s acceptances issued by domestic branches of United States banks that are members of the Federal Deposit Insurance Corporation, and repurchase agreements for US. Government Securities. In lieu of purchasing money market instruments, a Fund may purchase shares of money market mutual funds that invest primarily in U.S. Government Securities and repurchase agreements involving those securities, subject to certain limitations imposed by the 1940 Act. A Fund, as an investor in a money market fund, will indirectly bear the fees and expenses of the money market fund. These indirect fees and expenses will be in addition to the fees and expenses of the Funds. Repurchase Agreements involve certain risks not associated with direct investments in debt securities.
4. Fees and Transactions with Related Parties:
Fund Expenses
Each Fund pays all of its expenses other than those expressly assumed by the Adviser. Expenses of each Fund are deducted from the Funds’ total income before dividends are paid.
Investment Adviser
Subject to the supervision of the Board, Motley Fool Asset Management (the “Adviser”) manages the overall investment operations of the Funds in accordance with the Funds’ investment objective and policies and formulates a continuing investment strategy for the Funds pursuant to the terms of the Investment Advisory Agreement between the Adviser and the Trust on behalf of the Funds. The Adviser is a wholly owned subsidiary of The Motley Fool Holdings Inc. (“TMF Holdings”), a multimedia financial-services holding company that also owns The Motley Fool, LLC, which publishes investment information and analysis across a wide range of media, including investment newsletter services, websites, and books. TMF Holdings is controlled by David Gardner and Tom Gardner, along with other private shareholders.
| | | | |
| | 56 | | | The Motley Fool Funds Trust |
Under the terms of the Advisory Agreement, each Fund pays the Adviser a fee that is computed and paid monthly at an annual rate of 0.95% of the Funds’ average daily net assets during the month (the “Basic Fee”). Commencing the first month after each Fund has completed 12 full calendar months of operations, the Basic Fee is subject to a monthly adjustment (the “Monthly Performance Adjustment”) based on the investment performance of each Fund relative to the performance of the MSCI World Index for the Independence Fund, the Russell Midcap Index for the Great America Fund, and the Russell Global ex-U.S. Index for the Epic Voyage Fund, measured over a trailing-36-month period ending on the last day of the month for which the fee is to be paid (or, if each Fund does not have 36 full calendar months of operations, the number of months since commencement of each Fund’s operations) (the “Performance Measurement Period”). The fee payable for each month (the “Total Advisory Fee”) will be the Basic Fee plus or minus the Monthly Performance Adjustment.
The Monthly Performance Adjustment is calculated by subtracting from the cumulative percentage performance of the Funds (essentially, the change in the Funds’ net asset value per share) during the Performance Measurement Period (net of all expenses, including advisory fees) the percentage change in the MSCI World Index for the Independence Fund, the Russell Midcap Index for the Great America Fund, and the Russell Global ex-U.S. Index for the Epic Voyage Fund over the same period (including the value of dividends paid during the measurement period on stocks included in the MSCI World Index, the Russell Midcap Index, or the Russell Global ex-U.S. Index, respectively). The Monthly Performance Adjustment is based on an annual percentage rate determined by (i) subtracting 3 from the positive or negative percentage difference between the investment performance of the Funds and the investment performance of the MSCI World Index for the Independence Fund, the Russell Midcap Index for the Great America Fund, and the Russell Global ex-U.S. Index for the Epic Voyage Fund during the Performance Measurement Period, and (ii) multiplying the result by 2%, but the annual percentage rate used in determining the Monthly Performance Adjustment will be limited to a rate of not more than +0.20% nor less than -0.20%. The dollar amount of the Monthly Performance Adjustment is then determined by dividing the annual percentage rate by 12, and (iii) multiplying the result by the average daily net assets of each Fund during the Performance Measurement Period. There is no Monthly Performance Adjustment if the difference between the investment performance of each Fund and the investment performance of its index is three percentage points or less. Because the operation of the Expense Limitation and Reimbursement Agreement will have a positive effect upon each Fund’s Investment performance, the agreement may result in an increase in the Monthly Performance Adjustment and the Total Advisory Fee. The Adviser has agreed to waive the amount of the increase in the Monthly Performance Adjustment that exceeds the amount that would have been payable to it in the absence of the Expense Limitation and Reimbursement Agreement to the extent that such increase exceeds the cumulative amount of expenses deferred, absorbed, or
| | | | |
| The Motley Fool Funds Trust | | | 57 | |
reimbursed by the Adviser that it has not previously recovered as a result of higher positive performance-based adjustments in one or more prior months resulting from the Expense Limitation and Reimbursement Agreement.
Under the terms of an Expense Limitation and Reimbursement Agreement entered into by the Adviser and the Funds, the Adviser has contractually agreed to pay, waive, or absorb a portion of the Funds’ operating expenses through at least February 2013, to the extent necessary to limit the Funds’ annual operating expenses (excluding the advisory fee, brokerage commissions, taxes, interest expense, acquired fund fees and expenses, and any extraordinary expenses) to an amount not exceeding 0.40% annually of each Fund’s average daily net assets. The Adviser may recover from the Funds’ fees and expenses previously paid, waived, or absorbed for a period of three years after such fees or expenses were incurred, provided that the repayments do not cause the Funds’ operating expenses (excluding the advisory fee, brokerage commissions, taxes, interest expense, acquired fund fees and expenses, and any extraordinary expenses) to exceed 0.40% annually of the Funds’ average daily net assets. Previously waived fees subject to future recovery by the Adviser are as follows:
Independence Fund
| | | | |
Year End | | Recovery
Available | |
2012 | | $ | 344,182 | |
2013 | | $ | 680,671 | |
2014 | | $ | 271,178 | |
2015 | | $ | 83,965 | |
Great America Fund
| | | | |
Year End | | Recovery
Available | |
2014 | | $ | 346,585 | |
2015 | | $ | 126,188 | |
Epic Voyage Fund
| | | | |
Year End | | Recovery
Available | |
2015 | | $ | 195,361 | |
| | | | |
| | 58 | | | The Motley Fool Funds Trust |
Trustees Fees
Effective April 1, 2011, each Trustee who is not an “interested person,” as defined by the 1940 Act, of the Trust is paid an annual retainer of $30,000. Prior to April 1, 2011, each Independent Trustee was paid (i) an annual retainer of $20,000, (ii) a fee of $1,250 for each quarterly meeting of the Board attended, and (iii) a fee of $500 for each meeting attended of any committee of the Board of which such Trustee is a member (if such meeting is not held on the same day as a meeting of the Board). Officers of the Trust, all of whom are members, officers, or employees of the Adviser, or their affiliates, receive no compensation from the Trust.
Other Service Providers
Administration and Accounting Services
The Trust has entered into an Administration and Accounting Services Agreement with BNY Mellon. Pursuant to the Administration and Accounting Services Agreement, BNY Mellon provides various administrative and accounting services necessary for the operations of the Trust and the Funds. Services provided by BNY Mellon include facilitating general Fund management; monitoring the Funds’ compliance with federal and state regulations; supervising the maintenance of the Funds’ general ledger, the preparation of the Funds’ financial statements, the determination of NAV, and the payment of dividends and other distributions to shareholders; and preparing specified financial, tax, and other reports. The Funds pays the Administrator an annual fee calculated based upon the Funds’ average net assets. The fee is paid monthly. The Funds also reimburse the Administrator for certain out-of-pocket expenses.
Transfer Agent
BNY Mellon serves as the Funds’ transfer agent and dividend disbursing agent. BNY Mellon receives a fee based mainly upon the number of accounts serviced. Certain minimum fees and transaction charges may apply.
For the six months ended April 30, 2012, BNY Mellon received $375,160 in aggregate fees and expenses for services rendered under the various agreements described above.
Custodian
BNY Mellon serves as custodian of the Trust’s assets and is responsible for maintaining custody of the Funds’ cash and investments and retaining subcustodians, including in connection with the custody of foreign securities.
Custodian fees for the Funds are calculated based on the average daily gross assets of the Funds. BNY Mellon also receives other transaction based charges and is reimbursed for out-of-pocket expenses.
For the six months ended April 30, 2012, BNY Mellon received $47,742 in aggregate fees and expenses for services rendered under the custody agreements described above.
| | | | |
| The Motley Fool Funds Trust | | | 59 | |
Distribution
The Distributor serves as the principal underwriter of the Funds pursuant to an Underwriting Agreement for the limited purpose of acting as statutory underwriter to facilitate the distribution of shares of the Funds. The Funds do not pay any fees to the Distributor in its capacity as Underwriter. The fees are paid by the Adviser.
Shareholder Account-related Services
The Trust’s board has authorized it to pay fees to financial intermediaries, including securities dealers, that provide shareholder account-related services to their customers who own shares of the Trust’s Funds, or to reimburse the Adviser for such expenses it paid on the Trust’s behalf. These financial intermediaries generally have omnibus accounts with the Trust’s Transfer Agent and provide shareholder services or sub-transfer agent services to the shareholders who are their customers. The fees paid by the Funds for these services will not exceed the fees they would have incurred if customers of the financial intermediaries maintained their accounts directly with the Trust. For the six months ended April 30, 2012, Motley Fool Independence Fund paid $73,548, Motley Fool Great America Fund paid $28,622, and Motley Fool Epic Voyage Fund paid $2,711 for such third-party shareholder account-related services.
Redemption Fees
The Funds charge a redemption fee of 2.00% on proceeds from Shares redeemed or exchanged within 90 days following their acquisition. The redemption fee is calculated as a percentage of the net asset value of the total redemption proceeds and is retained by the Funds and accounted for as additional paid-in capital. Certain exceptions to the imposition of the redemption fee exist. Please see the Funds’ prospectus for more information.
Small-Balance Account Fee
The Funds charge a small-balance account fee of $24 annually if the value of any fund position is less than $10,000. The fee is assessed by redeeming shares from that fund position. Certain exceptions to the imposition of the small-balance account fee exist. Please see the Funds’ prospectus for more information.
5. Control Persons and Principal Holders:
Any person beneficially owning, directly or indirectly, more than 25% of the outstanding shares of a Fund is presumed to control the Fund. Through the exercise of voting rights with respect to shares of the Fund, such a person may be able to determine the outcome of shareholders voting on matters as to which the approval of shareholders of the Fund is required. Principal holders are persons who own beneficially 5% or more of the outstanding shares of the Fund. As of April 30, 2012, the Trust was not aware of any shareholders who beneficially owned 5% or more of each Fund’s outstanding shares.
| | | | |
| | 60 | | | The Motley Fool Funds Trust |
6. Investment Transactions:
For the six months ended April 30, 2012, the cost of purchases and proceeds from sales and maturities of investment securities for the Funds were as follows:
Cost of Purchases and Proceeds from Sales and Maturities of Long-Term Securities
(other than Temporary Cash Investments)
| | | | | | | | |
Fund | | Purchases | | | Sales and Maturity Proceeds | |
Independence Fund | | $ | 48,579,189 | | | $ | 52,262,927 | |
Great America Fund | | | 8,726,677 | | | | 10,756,224 | |
Epic Voyage Fund | | | 11,713,305 | | | | 640,313 | |
7. Shares of Beneficial Interest:
The Trust is authorized to issue an unlimited number of shares of beneficial interest, $.001 par value. Currently, the Trust consists of three series of shares, the Independence Fund, the Great America Fund, and the Epic Voyage Fund, and all shares of each series represent a single class. However, the Board has the authority to establish additional series of shares (representing interests in separate investment portfolios of the Trust in addition to these three series) and, subject to applicable rules, may establish two or more classes of shares of any series, with the differences in classes representing differences as to certain expenses and share distribution arrangements. Shares are fully paid and non-assessable and have no pre-emptive or conversion rights.
8. Federal Income Taxes:
Each Fund intends to qualify as a regulated investment company (“RIC”) under Subchapter M of the Code. If so qualified, a Fund will not be subject to federal income tax on that part of its net investment income and net capital gains that it distributes to its shareholders. Certain federal income and excise taxes would be imposed on a Fund if it fails to make certain required distributions of its income to shareholders. The Funds intend, however, to make distributions in a manner that will avoid the imposition of any such taxes. For this reason, no provision for excise or income taxes is required.
Net investment income (loss) and net realized gains (losses) may differ for financial statements and tax purposes primarily due to differing treatments for amortization of deferred organization costs, foreign currency transactions, and investments in partnerships and Passive Foreign Investment Companies (“PFICs”).
Distributions during the years ended October 31, 2011 and October 31, 2010, were characterized as follows for tax purposes:
| | | | |
| The Motley Fool Funds Trust | | | 61 | |
Independence Fund
| | | | | | | | |
Tax Year End | | Ordinary
Income | | | Long-Term
Capital Gain | |
2011 | | $ | 1,944,873 | | | $ | 625,977 | |
2010 | | $ | 390,863 | | | $ | — | |
Great America Fund
| | | | | | | | |
Tax Year End | | Ordinary
Income | | | Long-Term
Capital Gain | |
2011 | | $ | 14,540 | | | | — | |
At October 31, 2011, the components of distributable earnings for the Funds, on a tax basis were as follows:
Independence Fund
| | | | | | | | | | | | | | |
Undistributed
Ordinary
Income | | | Undistributed
Long-Term
Capital Gain | | | Capital
Loss
Carryover | | | Net Unrealized
Appreciation
(Depreciation)
on Investments | |
| $ | 618,786 | | | | — | | | $ | (77,586 | ) | | $ | 13,721,977 | |
Great America Fund
| | | | | | | | | | | | | | |
Undistributed
Ordinary
Income | | | Undistributed
Long-Term
Capital Gain | | | Capital
Loss
Carryover | | | Net Unrealized
Appreciation
(Depreciation)
on Investments | |
| | — | | | | — | | | $ | (675,389 | ) | | $ | (407,906) | |
For Federal income tax purposes, realized capital losses may be carried forward and applied against future realized capital gains. The capital loss carryovers noted above will expire October 31, 2019.
The “Regulated Investment Company Modernization Act of 2010” (the “Act”) was enacted on December 22, 2010. The Act makes changes to several tax rules impacting the Funds. In general, the provisions of the Act will be effective for the Fund’s fiscal year beginning after October 31, 2011. Although the Act provides several benefits, including the unlimited carryover of future capital loses, there may be a greater likelihood that all or a portion of each Fund’s pre-enactment capital loss carryovers may
| | | | |
| | 62 | | | The Motley Fool Funds Trust |
expire without being utilized due to the fact that post-enactment capital losses get utilized before pre-enactment capital loss carryovers. Relevant information regarding the impact of the Act on the Funds will be contained within this section of the Funds’ fiscal year ending October 31, 2012 financial statements.
At April 30, 2012, the aggregate cost of investment securities for federal income tax purposes (excluding foreign currency, securities sold short, and derivative related items) and the net unrealized appreciation from investments for those securities having an excess of value over cost and net unrealized depreciation from investments for those securities having an excess of cost over value (based on cost for federal income tax purposes) were as follows:
Independence Fund
| | | | | | | | | | | | | | |
Federal Tax Cost | | | Net
Unrealized
Appreciation
(Depreciation) | | | Appreciated
Securities | | | Depreciated
Securities | |
| $ | 185,460,335 | | | $ | 24,800,414 | | | $ | 32,135,467 | | | $ | (7,335,053 | ) |
Great America Fund
| | | | | | | | | | | | | | |
Federal Tax Cost | | | Net Unrealized
Appreciation
(Depreciation) | | | Appreciated
Securities | | | Depreciated
Securities | |
| $ | 57,283,230 | | | $ | 5,646,593 | | | $ | 6,934,481 | | | $ | (1,287,888 | ) |
Epic Voyage Fund
| | | | | | | | | | | | | | |
Federal Tax Cost | | | Net Unrealized
Appreciation
(Depreciation) | | | Appreciated
Securities | | | Depreciated
Securities | |
| $ | 11,494,162 | | | $ | 762,664 | | | $ | 1,131,071 | | | $ | (368,407 | ) |
The differences between book basis and tax basis unrealized appreciation is attributable primarily to the deferral of losses on wash sales and cumulative basis adjustments for partnerships and PFICs.
At October 31, 2011, capital contributions, accumulated undistributed net investment income, and accumulated net realized gain (loss) from investments have been adjusted for current period permanent book/tax differences which arose principally from differing book/tax treatments of amortization of deferred organization costs, foreign currency transactions, and investments in partnerships and PFICs. The following amounts were reclassified within the capital accounts for the Independence Fund:
| | | | |
| The Motley Fool Funds Trust | | | 63 | |
Independence Fund
| | | | | | | | | | |
Paid in Capital | | | Accumulated
Undistributed Income | | | Accumulated
Net Realized
Gain (Loss)
on Investments | |
| | — | | | $ | (177,839 | ) | | $ | 177,839 | |
Great America Fund
| | | | | | | | | | |
Paid in Capital | | | Accumulated
Undistributed Income | | | Accumulated
Net Realized
Gain (Loss)
on Investments | |
| $ | (219,579 | ) | | $ | 219,579 | | | | — | |
Management has analyzed the Funds’ tax positions and has concluded that no provision for income tax is required in the financial statements. The Funds are not aware of any tax positions for which it is reasonably possible that the total amounts of unrecognized tax benefits will significantly change in the next twelve months. However, management’s conclusions may be subject to review and adjustment at a later date based on certain factors including, but not limited to, further implementation guidance from the FASB, new tax laws, regulations, and administrative interpretations (including court decisions).
9. Recent Accounting Pronouncements:
In May 2011, the FASB issued “Amendments to Achieve Common Fair Value Measurement and Disclosure Requirements in U.S. GAAP and IFRSs (the “Standard”). The Standard includes common requirements for measurement of and disclosure about fair value between U.S. GAAP and IFRS. The Standard will require reporting entities to disclose quantitative information about the unobservable inputs used in the fair value measurements categorized within Level 3 of the fair value hierarchy. In addition, the Standard will require reporting entities to make disclosures about amounts and reasons for all transfers in and out of Level 1 and Level 2 fair value measurements. The new and revised disclosures are effective for interim and annual reporting periods beginning after December 15, 2011. At this time, management is evaluating the implications of the Standard and its impact on the financial statements has not been determined.
10. Change in Independent Registered Public Accounting Firm:
In September 2011, Tait, Weller & Baker, LLP (“Tait, Weller & Baker”) succeeded Grant Thornton, LLP (“Grant Thornton”) as the Trust’s independent registered public
| | | | |
| | 64 | | | The Motley Fool Funds Trust |
accounting firm. The Trust’s selection of Tait, Weller & Baker as its independent registered public accounting firm was recommended by the Trust’s Audit Committee and was approved by the Trust’s Board of Trustees.
During the Trust’s fiscal years ended October 31, 2010 and October 31, 2009 and through September 14, 2011, (i) there were no disagreements with Grant Thornton on any matter of accounting principles or practices, financial statement disclosure or auditing scope or procedure, which disagreements, if not resolved to the satisfaction of Grant Thornton, would have caused it to make reference to the subject matter of the disagreements in connection with its reports on the Trust’s financial statements for such years, and (ii) there were no “reportable events” of the kind described in Item 304(a)(1)(v) of Regulation S-K under the Securities Exchange Act of 1934, as amended.
11. Subsequent Events:
Subsequent events have been evaluated through the date that the financial statements were issued. All subsequent events determined to be relevant and material to the financial statements have been appropriately recorded or disclosed.
| | | | |
| The Motley Fool Funds Trust | | | 65 | |
Notice to Shareholders (Unaudited)
Information on Proxy Voting
The Trust’s proxy voting guidelines, used to determine how to vote proxies relating to portfolio securities and information regarding how the Trust voted proxies relating to portfolio securities of the Fund during the most recent 12-month period ended June 30 is available (i) without charge, upon request, by calling (888) 863-8803; (ii) on the U.S. Securities and Exchange Commission’s (“SEC”) website at http://www.sec.gov; and (iii) on the Fund’s website at http://www.FoolFunds.com.
Quarterly Schedule of Investments
The Trust provides a complete list of the Fund’s holdings four times in each fiscal year, at the quarter-ends. For the second and fourth quarters, the Portfolio of Investments appears in the semi-annual and annual reports to shareholders. For the first and third quarters, the Trust files the Portfolio of Investments with the SEC on Form N-Q. Shareholders can obtain the Form N-Q (i) without charge, upon request, by calling (888) 863-8803; (ii) on the SEC’s website at http://www.sec.gov; and (iii) on the Fund’s website at http://www.FoolFunds.com. The Form N-Q may be reviewed or copied at the SEC Public Reference Room in Washington, D.C. Information on the operation of the Public Reference Room may be obtained by calling (800) SEC-0330.
| | | | |
| | 66 | | | The Motley Fool Funds Trust |
The Motley Fool Funds Trust Privacy Policy
What Does Motley Fool Funds Trust Do With Your Personal Information?
Why?: Financial companies choose how they share your personal information. Federal law gives consumers the right to limit some but not all sharing. Federal law also requires us to tell you how we collect, share, and protect your personal information. Please read this notice carefully to understand what we do.
What?: The type of personal information we collect and share, depends on the product or service you have with us. This information can include:
| | • | | Social Security number and transaction history |
| | • | | Account balances and checking account information |
| | • | | Account transactions and wire transfer instructions |
When you are no longer a customer, we continue to share your information as described in this notice.
How?: All financial companies need to share customers’ personal information to run their everyday business. In the section below, we list the reasons financial companies can share their customers’ personal information; the reasons The Motley Fool Funds Trust chooses to share; and whether you can limit this sharing.
| | | | |
Reasons we share your personal information | | Does the Motley Fool Funds Trust share? | | Can you limit this sharing? |
For our everyday business purposes — such as to process your transaction,maintain your account(s), provide you with necessary information, respond to court orders and legal investigation, or report to credit bureaus | | Yes | | No |
| | |
For our marketing purposes — to offer our products and services to you | | Yes | | Yes |
| | |
For joint marketing with other financial companies | | No | | We don’t share |
| | |
For our affiliates’ everyday business purposes — information about your transactions and experiences | | Yes | | No |
| | |
For our affiliates’ everyday business purposes — information about your creditworthiness | | No | | We don’t share |
| | |
For our affiliates to market to you | | Yes | | Yes |
| | |
For nonaffiliates to market to you | | No | | We don’t share |
To limit our sharing:
| | • | | Visit us online: http://www.FoolFunds.com/marketing/EmailRestriction.aspx |
Please note:
If you are a new customer, we can begin sharing your information 30 days from the days from the date we sent this notice. When you are no longer our customer, we continue to share your information as described in this notice.
| | | | |
| The Motley Fool Funds Trust | | | 67 | |
However, you can contact us at any time to limit our sharing.
Questions: Call 1-888-863-8803 or go to www.FoolFunds.com
What we do:
How does The Motley Fool Funds Trust protect my personal information?
To protect your personal information from unauthorized access and use, we use security measures that comply with federal law. These measures include physical, electronic, and procedural safeguards, including encryption, authentication, and secured buildings and files.
How does The Motley Fool Funds Trust collect my personal information?
We collect your personal information, for example, when you
| | • | | open an account or provide account information |
| | • | | make deposits or withdrawals from your account |
| | • | | make a wire transfer or tell us where to send the money |
We also collect your personal information from other companies.
Why can’t I limit all sharing?
Federal law gives you the right to limit only
| | • | | sharing for affiliates’ everyday business purposes — information about your creditworthiness |
| | • | | deposits or withdrawals from your account |
| | • | | sharing for nonaffiliates to market to you |
State laws and individual companies may give you additional rights to limit sharing.
What happens when I limit sharing for an account I hold jointly with someone else?
Your choices will apply to everyone on your account.
Definitions:
Affiliates — Companies related by common ownership or control. They can be financial and nonfinancial companies.
Our affiliates include companies with a Motley Fool name; financial companies such as Motley Fool Asset Management, LLC; and nonfinancial companies such as The Motley Fool, LLC and The Motley Fool Holdings, Inc.
Nonaffiliates — Companies not related by common ownership or control. They can be financial and nonfinancial companies.
The Motley Fool Funds Trust does not share with nonaffiliates so they can market to you.
Joint marketing — A formal agreement between nonaffiliated financial companies that together market financial products or services to you.
The Motley Fool Funds Trust doesn’t jointly market.
| | | | |
| | 68 | | | The Motley Fool Funds Trust |
Directors and Officers
| | | | | | | | | | |
NAME,
ADDRESS, AND AGE (1) | | POSITION(S)
HELD WITH
THE TRUST | | TERM OF
OFFICE AND
LENGTH OF
TIME
SERVED (2) | | PRINCIPAL OCCUPATIONS DURING PAST FIVE YEARS | | NUMBER OF
PORTFOLIOS IN
FUND COMPLEX
OVERSEEN
BY TRUSTEE | | OTHER
DIRECTORSHIPS HELD BY
TRUSTEE |
| INDEPENDENT TRUSTEES |
| | | | | |
| Kathleen A. O’Neil 60 | | Trustee | | Since
March,
2009 | | President/CEO, Liberty Street Advisors (consultancy); Director, BMC Software, Guidance Software, MetLife Bank, N.A., John Carroll University (1999 to 2008) | | 3 | | BMC Software, Guidance Software, MetLife Bank N.A. |
| Stephen L. Boyd 71 | | Trustee | | Since
March,
2009 | | Advisory Director, Morgan Stanley Investment Management | | 3 | | None |
| | | | |
| | | | INTERESTED TRUSTEES AND OFFICERS | | | | |
| | | | | |
| Peter E. Jacobstein(3) 46 | | Trustee
President | | Since
November,
2008 | | President, Motley Fool Asset Management, LLC; SVP, The Motley Fool, Inc. (financial publishing) | | 3 | | None |
| | | | | |
| Philip J. Biedronski, Jr. 44 | | Treasurer | | Since
September,
2011 | | Controller & Treasurer, The Motley Fool Holdings, Inc. (and its predecessor, The Motley Fool, Inc.) (financial publishing) | | N/A | | N/A |
| | | | | |
| Lawrence T. Greenberg 49 | | Vice
President
Secretary | | Since
March,
2009 | | SVP and Chief Legal Officer, The Motley Fool Holdings, Inc. (and its predecessor, The Motley Fool, Inc.) (financial publishing). Adjunct professor, Washington College of Law, American University, 2006-present, George Mason University School of Law (2000 to 2007). Director, Fool/Love Money.com Financial Services, Ltd. (U.K. mortgage adviser) (2008 to 2009), Lovemoney. com, Ltd. (U.K. financial information site) (2009 to 2009). Director, The Motley Fool Australia Pty Ltd. (financial publishing) (2010-present) | | N/A | | N/A |
| | | | | |
| Salvatore Faia 49 | | Chief
Compliance
Officer | | Since
March,
2009 | | President, Vigilant Compliance Services since 2004; and Director of EIP Growth and Income Fund since 2005 | | N/A | | N/A |
| (1) | Each Trustee can be contacted by writing to The Motley Fool Funds Trust, 2000 Duke Street, Suite 175, Alexandria, VA 22314. |
| (2) | Each Trustee holds office until the next meeting of shareholders at which Trustees are elected (or otherwise appointed) and serve until his or her successor has been elected or qualified. |
| (3) | Mr. Jacobstein is an “interested person” (as defined by the 1940 Act) of the Trust. Mr. Jacobstein is the President and Chairman of the Adviser. |
For more information regarding the trustees and officers, please refer to the Statement of Additional Information, which is available, without charge, upon request by calling (888) 863-8803 or visiting www.www.FoolFunds.com.
| | | | |
| The Motley Fool Funds Trust | | | 69 | |
Board Approval of Advisory Agreement (Unaudited)
At a meeting held in person on March 14, 2012, the Board, including the Trustees who are not “interested persons,” as defined by the Investment Company Act of 1940, as amended, of the Trust or the Adviser (the “Independent Trustees”), approved the continuation of the Advisory Agreement between the Trust and the Adviser pursuant to which the Adviser provides investment advisory services to the Independence Fund and Great America Fund. In determining whether to approve the Advisory Agreement, the Board exercised its business judgment and considered various information regarding the Adviser and the Independence Fund and Great America Fund, as well as various factors including those described below that the Board deemed to be relevant. In its deliberations, the Board did not rank the importance of any particular piece of information or factor considered, and it is assumed that each Trustee attributed different weights to the various factors. The following summarizes the materials and principal factors that the Board considered, and the conclusions the Board reached, in approving the Advisory Agreement for the Independence Fund and Great America Fund.
In its deliberations, the Board considered many factors, including the nature, quality and extent of services provided by the Adviser; particularly, the qualifications and capabilities of the personnel responsible for providing services to the Independence Fund and Great America Fund. It was provided with information regarding the Adviser and its personnel, including information regarding the Adviser’s financial condition. The Board reviewed the financial condition of the Adviser to determine that adequate resources would be available to provide the level of service expected to be provided to the Independence Fund and Great America Fund. On the basis of this evaluation, the Board concluded that the Adviser and its personnel were well-qualified to provide all required services to the Independence Fund and Great America Fund and to provide services that are of a high quality, and that the Adviser had the appropriate resources to provide such services to the Independence Fund and Great America Fund.
The Board recognized that a fund’s investment performance is an important factor for a mutual fund board to consider in connection with the approval of an investment advisory agreement. The Board reviewed the performance of the Adviser and the Independence Fund and Great America Fund over various periods of time, as compared to the relevant indices and determined that the Independence Fund and Great America Fund were each delivering positive and reasonable performance results, consistent with the investment strategies of these Funds.
The Board also considered the costs of services provided by the Adviser and the profits to be realized by the Adviser and its affiliates under the Advisory Agreement, as well as comparative fees and expenses of other mutual funds. In connection with their review of this factor, the Board evaluated the structure of the advisory fee and noted that the fees payable by the Independence Fund and Great America Fund would partially depend on their relative performance. It concluded that this should provide strong incentive for the Adviser to use its best efforts and commit the resources necessary for
| | | | |
| | 70 | | | The Motley Fool Funds Trust |
the management of the Independence Fund and Great America Fund and thus increase the likelihood that the Independence Fund and Great America Fund would perform well in the future. The Independent Trustees also considered the information they were provided about advisory fees of comparable funds, and evaluated the advisory fee arrangements in light of this information and the factors that judicial decisions have specified as pertinent generally and the factors that the SEC has said should be considered with respect to fulcrum fees. It was noted that the base fees paid by each of the Independence Fund and Great America Fund is within the range of fees paid by a peer group of funds, and that the overall expense ratio for each of the Independence Fund and Great America Fund, after giving effect to the Adviser’ expense limitation, is within the range of expense ratios of the peer group funds. It was also noted that the Adviser continues to subsidize the Funds through an expense cap and has committed to maintain that cap. Based on the foregoing considerations, the Independent Trustees determined that they were satisfied that the advisory fees proposed for the Independence Fund and Great America Fund are consistent with applicable standards and are reasonable and fair.
The Board recognized the importance of considering economies of scale in costs of providing services to the Independence Fund and Great America Fund when evaluating the advisory fee, including the extent to which any such economies of scale would be shared with the Independence Fund and Great America Fund for the benefit of shareholders. It concluded that, because the Independence Fund and Great America Fund had not accumulated sufficient assets to spread fixed costs across, and the total expenses of the Funds continue to run above the expense limitation, so that the Adviser continues to subsidize the Funds, meaningful economies of scale had not yet been realized. However, the Board agreed to consider the question of whether economies of scale justify any reduction in advisory fees payable by the Independence Fund and Great America Fund at such time when there has been growth in the Funds’ net assets so as to warrant such a review.
The Board further considered the potential benefits that might be received by the Adviser due to its relationship with the Independence Fund and Great America Fund. It concluded that the Adviser does receive limited research through soft dollar trading, but noted that the Adviser receives no other benefits beyond the advisory fee and soft dollar research as a result of serving as Adviser to the Independence Fund and Great America Fund.
Based on its review of the information and factors described above, and other considerations deemed pertinent, the Board, including all of the Independent Trustees, unanimously approved the continuation of the Advisory Agreement for an additional one-year period ending March 31, 2013.
| | | | |
| The Motley Fool Funds Trust | | | 71 | |
Investment Adviser
Motley Fool Asset Management, LLC
2000 Duke Street
Suite 175
Alexandria, VA 22314
Administrator and Transfer Agent
BNY Mellon Investment Servicing (US) Inc.
P.O. Box 9780
Providence, RI 02940-9780
Custodian
BNY Mellon
One Wall Street
New York, NY 10286
Underwriter
Foreside Funds Distributors LLC
400 Berwyn Park
899 Cassatt Road
Berwyn, PA 19312
Legal Counsel
Morgan Lewis & Bockius LLP
1111 Pennsylvania Ave., NW
Washington, DC 20004-2541
| | | | |
| | 72 | | | The Motley Fool Funds Trust |
Left Blank for Foolish Use
(Not a Part of the Semiannual Report)
Left Blank for Foolish Use
(Not a Part of the Semiannual Report)
Motley Fool Funds Guiding Principles
At Motley Fool Funds, we aim to get right what we believe much of the fund industry gets wrong. Our approach all begins with a shareholder-centric philosophy that we think is unique.
| | • | | We are — and will remain — significant investors with you in Motley Fool Funds. |
| | • | | We will manage your investment in Motley Fool Funds as if it were our own. |
| | • | | We will keep our financial incentives aligned with those of our shareholders. |
| | • | | We will invest for the long term. We seek to maximize returns while we mini- mize business, regulatory, financial, and sovereign risks. |
| | • | | We will not impose loads or 12b-1 charges, and we will apply redemption fees only to discourage the short-term trading that can hurt all a Fund’s investors. |
| | • | | We will be advocates on your behalf with company managers and boards, in the interest of enhancing the value of your shares. |
| | • | | We will recognize that one of our most powerful analytical weapons is the phrase “I don’t know.” In that spirit, we will constantly review our successes and mistakes and remain passionate about learning. |
| | • | | We will communicate with our shareholders as clearly and candidly as possible. |
Have you signed up for Declarations yet?
If you don’t subscribe to Declarations, the free monthly newsletter from the Fool Funds portfolio team, here’s just a sampling of what you’ve missed this year…
“The rapid growth of Asia and the stagnation of Europe seem to me to be outcomes of broader policy. It is not a sure thing that a society predicated on hard work will outperform one that has perfected the art of leisure, but that’s probably the best way to bet.” 4/2012
“The reckoning came in the form of a trial in which Galileo was found ‘vehemently suspect of heresy’ and forced to abandon his belief that the Earth moved around the sun. Legend has it that he then mumbled ‘e pur si muove,’ Italian for ‘and yet it still moves.’ Given that people were routinely executed for heresy at the time, this was a pretty metal thing for Galileo to say.” 3/2012
“In our shop, we make an attempt to qualify each company, ranging from breakthe- mold great at the top to how-in-the-world-do-they-stay-in business crappy at the bottom. For lack of a better term, we call this the ‘awesomeness continuum’. (OK ‘for lack of a better term’ is false modesty. ‘Awesomeness continuum’ is pretty sweet.)” 6/2011
“It has long been settled in all the right circles that the greatest superpower is the ability to turn into an invisible bear.” 9/2011
To subscribe, simply visit www.FoolFunds.com and enter your email address in the box on the right.
On the FoolFunds.com website, you’ll also find:
| | • | | Monthly shareholder letters from Portfolio Manager Bill Mann |
| | • | | Bill’s answers to shareholder questions |
| | • | | Updated fund performance details |
| | • | | Access to shareholder account information |
Reach us by phone: 888.863.8803 or contact your securities dealer.
Contact us by mail:
Motley Fool Funds
P.O. Box 9780
Providence, RI 02940-9780
©All Rights Reserved
This report has been prepared for shareholders of Motley Fool Independence Fund, Motley Fool Great America Fund, and Motley Fool Epic Voyage Fund. It is not authorized for distribution to prospective investors unless accompanied or preceded by a current prospectus, which contains more complete information about the Fund. Investors are reminded to read the prospectus carefully before investing. Past performance is no guarantee of future results. Share prices will fluctuate and there may be a gain or loss when shares are redeemed. Fund shares are distributed by Foreside Distributors LLC, Berwyn, PA.
MFF-SMI-003
| | |
| Quiz Answers: 1. E, 2. F, 3. D, 4. A, 5. C, 6. B | |  |
Item 2. Code of Ethics.
Not applicable.
Item 3. Audit Committee Financial Expert.
Not applicable.
Item 4. Principal Accountant Fees and Services.
Not applicable.
Item 5. Audit Committee of Listed Registrants.
Not applicable.
Item 6. Investments.
| (a) | Schedule of Investments in securities of unaffiliated issuers as of the close of the reporting period is included as part of the report to shareholders filed under Item 1 of this form. |
Item 7. Disclosure of Proxy Voting Policies and Procedures for Closed-End Management Investment Companies.
Not applicable.
Item 8. Portfolio Managers of Closed-End Management Investment Companies.
Not applicable.
Item 9. Purchases of Equity Securities by Closed-End Management Investment Company and Affiliated Purchasers.
Not applicable.
Item 10. Submission of Matters to a Vote of Security Holders.
There have been no material changes to the procedures by which members may recommend nominees to the Registrant’s board of directors, where those changes were implemented after the Registrant last provided disclosure in response to the requirements of Item 407(c)(2)(iv) of Regulation S-K (17 CFR 229.407) (as required by Item 22(b)(15) of Schedule 14A (17 CFR 240.14a-101)), or this Item.
Item 11. Controls and Procedures.
| | (a) | The registrant’s principal executive and principal financial officers, or persons performing similar functions, have concluded that the registrant’s disclosure controls and procedures (as defined in Rule 30a-3(c) under the Investment Company Act of 1940, as amended (the “1940 Act”) (17 CFR 270.30a-3(c))) are effective, as of a date within 90 days of the filing date of the report that includes the disclosure required by this paragraph, based on their evaluation of these controls and procedures required by Rule 30a-3(b) under the 1940 Act (17 CFR 270.30a-3(b)) and Rules 13a-15(b) or 15d-15(b) under the Securities Exchange Act of 1934, as amended (17 CFR 240.13a-15(b) or 240.15d-15(b)). |
| | (b) | There were no changes in the registrant’s internal control over financial reporting (as defined in Rule 30a-3(d) under the 1940 Act (17 CFR 270.30a-3(d)) that occurred during the registrant’s second fiscal quarter of the period covered by this report that has materially affected, or is reasonably likely to materially affect, the registrant’s internal control over financial reporting. |
Item 12. Exhibits.
| | (a)(2) | Certifications pursuant to Rule 30a-2(a) under the 1940 Act and Section 302 of the Sarbanes-Oxley Act of 2002 are attached hereto. |
| | (b) | Certifications pursuant to Rule 30a-2(b) under the 1940 Act and Section 906 of the Sarbanes-Oxley Act of 2002 are attached hereto. |
SIGNATURES
Pursuant to the requirements of the Securities Exchange Act of 1934 and the Investment Company Act of 1940, the registrant has duly caused this report to be signed on its behalf by the undersigned, thereunto duly authorized.
| | | | |
(Registrant) | | The Motley Fool Funds Trust | | |
| | |
By (Signature and Title)* | | /s/ Peter E. Jacobstein | | |
| | Peter E. Jacobstein, President | | |
| | (principal executive officer) | | |
| | |
Date | | July 2, 2012 | | |
Pursuant to the requirements of the Securities Exchange Act of 1934 and the Investment Company Act of 1940, this report has been signed below by the following persons on behalf of the registrant and in the capacities and on the dates indicated.
| | | | |
By (Signature and Title)* | | /s/ Peter E. Jacobstein | | |
| | Peter E. Jacobstein, President | | |
| | (principal executive officer) | | |
| | |
Date | | July 2, 2012 | | |
| | |
By (Signature and Title)* | | /s/ Phil Biedronski | | |
| | Phil Biedronski, Treasurer | | |
| | (principal financial officer) | | |
| | |
Date | | July 2, 2012 | | |
| * | Print the name and title of each signing officer under his or her signature. |