UNITED STATES
SECURITIES AND EXCHANGE COMMISSION
Washington, D.C. 20549
FORM N-CSR
CERTIFIED SHAREHOLDER REPORT OF REGISTERED MANAGEMENT
INVESTMENT COMPANIES
Investment Company Act file number: 811-22250
PIMCO ETF Trust
(Exact name of registrant as specified in charter)
650 Newport Center Drive, Newport Beach, CA 92660
(Address of principal executive office)
Trent W. Walker
Treasurer (Principal Financial & Accounting Officer)
PIMCO ETF Trust
650 Newport Center Drive
Newport Beach, CA 92660
(Name and address of agent for service)
Copies to:
Brendan C. Fox
Dechert LLP
1900 K Street, N.W.
Washington, D.C. 20006
Registrant’s telephone number, including area code: (888) 400-4383
Date of fiscal year end: June 30
Date of reporting period: June 30, 2017
Form N-CSR is to be used by management investment companies to file reports with the Commission not later than 10 days after the transmission to stockholders of any report that is required to be transmitted to stockholders under Rule 30e-1 under the Investment Company Act of 1940 (17 CFR 270.30e-1). The Commission may use the information provided on Form N-CSR in its regulatory, disclosure review, inspection, and policymaking roles.
A registrant is required to disclose the information specified by Form N-CSR, and the Commission will make this information public. A registrant is not required to respond to the collection of information contained in Form N-CSR unless the Form displays a currently valid Office of Management and Budget (“OMB”) control number. Please direct comments concerning the accuracy of the information collection burden estimate and any suggestions for reducing the burden to Secretary, Securities and Exchange Commission, 450 Fifth Street, NW, Washington, DC 20549-0609. The OMB has reviewed this collection of information under the clearance requirements of 44 U.S.C. § 3507.
| Item 1. | Reports to Shareholders. |
The following is a copy of the report transmitted to shareholders pursuant to Rule 30e-1 under the Investment Company Act of 1940, as amended (the “1940 Act”) (17 CFR 270.30e-1).

PIMCO ETF Trust
Annual Report
June 30, 2017

Index Exchange-Traded Funds
PIMCO 1-3 Year U.S. Treasury Index Exchange-Traded Fund
PIMCO 25+ Year Zero Coupon U.S. Treasury Index Exchange-Traded Fund
PIMCO 1-5 Year U.S. TIPS Index Exchange-Traded Fund
PIMCO 15+ Year U.S. TIPS Index Exchange-Traded Fund
PIMCO Broad U.S. TIPS Index Exchange-Traded Fund
PIMCO 0-5 Year High Yield Corporate Bond Index Exchange-Traded Fund
PIMCO Investment Grade Corporate Bond Index Exchange-Traded Fund
Actively-Managed Exchange-Traded Funds
PIMCO Active Bond Exchange-Traded Fund
PIMCO Enhanced Low Duration Active Exchange-Traded Fund
PIMCO Enhanced Short Maturity Active Exchange-Traded Fund
PIMCO Intermediate Municipal Bond Active Exchange-Traded Fund
PIMCO Short Term Municipal Bond Active Exchange-Traded Fund

Table of Contents
| | * | Effective May 17, 2017 the Fund’s name was changed. Prior to May 17, 2017 the Fund’s name was PIMCO Total Return Active Exchange-Traded Fund. |
| | ** | Effective May 8, 2017 the Fund’s name was changed. Prior to May 8, 2017 the Fund’s name was PIMCO Low Duration Active Exchange-Traded Fund. |
This material is authorized for use only when preceded or accompanied by the current PIMCO ETF Trust prospectus.
Chairman’s Letter
Dear Shareholder,
Please find enclosed the Annual Report for the PIMCO ETF Trust covering the twelve-month reporting period ended June 30, 2017. The following pages contain specific details about the investment performance of each Fund and a discussion of the factors that most affected performance over the reporting period.
Highlights of the financial markets during the twelve-month reporting period include:
| | ∎ | | The outcome of Brexit in June 2016, whereby U.K. voters opted to leave the European Union, prompted market volatility to rise, sovereign yields to rally significantly and risk assets to generally underperform. Investor risk appetite returned later, however, as investors viewed the global economy as stable and expectations for further central bank easing helped anchor risk appetite. Improving commodity prices and fiscal stimulus in China also contributed to renewed investor confidence. |
| | ∎ | | Leading up to the U.S. presidential election on November 8, investors generally shook off a number of political developments, including new leadership in the U.K. and Brazil, and a coup attempt in Turkey. In this environment, volatility generally remained low and risk assets rallied. Central banks were featured prominently in the headlines as monetary policy concerns (in particular, the longevity of central bank support) lingered beneath the seemingly benign market environment. In December, the Federal Reserve (“Fed”) raised its key lending rate, the Federal Funds Rate, by 0.25% to a range of 0.50% to 0.75%. Furthermore, equities moved higher (U.S. stock indices set record highs), credit spreads tightened, and emerging market (“EM”) assets continued to gain over this period. |
| | ∎ | | Through early 2017, the robust risk sentiment that marked the post-U.S. election period broadly continued, though there were some signs of moderation towards the end of March. Early challenges in President Donald Trump’s policy agenda left some investors less optimistic about the potential for other highly anticipated agenda items such as tax reform and infrastructure spending. Still, solid fundamental data, relatively easy financial conditions, and optimism among businesses and consumers helped encourage positive investor sentiment. This environment provided an opportunity for the Fed to continue on its path towards policy normalization, and led the Fed to raise the Federal Funds Rate again in March by 0.25% to a range of 0.75% to 1.00%. |
| | ∎ | | Geopolitics, including elections in several countries as well as political controversy in both the U.S. and Brazil, dominated headlines and contributed to brief periods of market volatility throughout the last quarter of the reporting period. The Fed raised the Federal Funds Rate once again in June by 0.25% to a range of 1.00% to 1.25%, and unveiled details of its plan to gradually unwind its balance sheet, contributing to a flattening yield curve. A perceived hawkish shift in tone from other major central banks, including the European Central Bank, the Bank of England, and the Bank of Canada, spurred most developed market yields to rise even as longer-term interest rates actually fell in the U.S. The fundamental economic backdrop remained largely intact and the broader risk rally continued as equities marched higher, credit spreads tightened, and EM assets strengthened. |
If you have any questions regarding the PIMCO ETF Trust, please contact your financial adviser, or call one of our shareholder associates at 888.400.4ETF (888.400.4383). We also invite you to visit our website at www.pimcoetfs.com to learn more about PIMCO ETFs.
Thank you again, for the trust you place in us. We are privileged to serve you through our ETF offerings.
| | |
 | | Sincerely, 
Brent R. Harris Chairman of the Board,
PIMCO ETF Trust August 24, 2017 |
Past performance is no guarantee of future results. Unless otherwise noted, index returns reflect the reinvestment of income distributions and capital gains, if any, but do not reflect fees, brokerage commissions or other expenses of investing. It is not possible to invest directly in an unmanaged index.
| | | | | | |
| | ANNUAL REPORT | | JUNE 30, 2017 | | 3 |
Important Information About the Funds
PIMCO ETF Trust (the “Trust”) is an open-end management investment company that includes the PIMCO 1-3 Year U.S. Treasury Index Exchange-Traded Fund, PIMCO 25+ Year Zero Coupon U.S. Treasury Index Exchange-Traded Fund, PIMCO 1-5 Year U.S. TIPS Index Exchange-Traded Fund, PIMCO 15+ Year U.S. TIPS Index Exchange-Traded Fund, PIMCO Broad U.S. TIPS Index Exchange-Traded Fund, PIMCO 0-5 Year High Yield Corporate Bond Index Exchange-Traded Fund, and PIMCO Investment Grade Corporate Bond Index Exchange-Traded Fund, which are exchange-traded funds (“ETFs”) that seek to provide total return that closely corresponds, before fees and expenses, to the total return of a specified index (collectively, the “Index Funds”). Each Index Fund employs a representative sampling strategy in seeking to achieve its investment objective. In using this strategy, PIMCO seeks to invest in a combination of instruments such that the portfolio effectively provides exposure to the underlying index. The Fund may not track its underlying index with the same degree of accuracy as a fund that replicates the composition and weighting of the underlying index. The PIMCO Active Bond Exchange-Traded Fund, PIMCO Enhanced Low Duration Active Exchange-Traded Fund, PIMCO Enhanced Short Maturity Active Exchange-Traded Fund, PIMCO Intermediate Municipal Bond Active Exchange-Traded Fund and PIMCO Short Term Municipal Bond Active Exchange-Traded Fund, unlike the Index Funds, are actively managed ETFs that do not seek to track the performance of a specified index (collectively, the “Active Funds” and together with the Index Funds, the “Funds”). Shares of the Funds will be listed and traded at market prices on NYSE Arca, Inc. (“NYSE Arca”) and other secondary markets. The market price for each Fund’s shares may be different from the Fund’s net asset value (“NAV”). Each Fund issues and redeems shares at its NAV only in blocks of a specified number of shares (“Creation Units”). Only certain large institutional investors may purchase or redeem Creation Units directly with the Funds at NAV (“Authorized Participants”). These transactions are in exchange for certain securities similar to a Fund’s portfolio and/or cash. Except when aggregated in Creation Units, shares of a Fund are not redeemable securities. Shareholders who are not Authorized Participants may not redeem shares from the Funds at NAV.
We believe that bond funds have an important role to play in a well-diversified investment portfolio. It is important to note, however, that in an environment where interest rates may trend upward, rising rates would negatively impact the performance of most bond funds, and fixed income securities and other instruments held by the Funds are likely to decrease in value. A wide variety of factors can cause interest rates to rise (e.g., central bank monetary policies, inflation rates, general economic conditions, etc.). In addition, changes in interest rates can be sudden and unpredictable, and there is no guarantee that management will anticipate such movement accurately. The Funds may lose money as a result of movements in interest rates.
As of the date of this report, interest rates in the U.S. and many parts of the world, including certain European countries, are at or near historically low levels. As such, bond funds may currently face an increased exposure to the risks associated with a rising interest rate environment. This is especially true as the Fed ended its quantitative easing program in October 2014 and has begun, and may continue, to raise interest rates. To the extent the Fed continues to raise interest rates, there is a risk that rates across the financial system may rise. Further, while bond markets have steadily grown over the past three decades, dealer inventories of corporate bonds are near historic lows in relation to market size. As a result, there has been a significant reduction in the ability of dealers to “make markets.”
Bond funds and individual bonds with a longer duration (a measure used to determine the sensitivity of a security’s price to changes in interest rates) tend to be more sensitive to changes in interest rates, usually making them more volatile than securities or funds with shorter durations. All of the factors mentioned above, individually or collectively, could lead to increased volatility and/or lower liquidity in the fixed income markets or negatively impact a Fund’s performance or cause a Fund to incur losses. As a result, there could be increased sales of shares which could further reduce the market price for a Fund’s shares.
The Funds may be subject to various risks as described in each Fund’s prospectus. Some of these risks may include, but are not limited to, the following: new/small fund risk, market trading risk, interest rate risk, call risk, inflation-indexed security risk, credit risk, high yield risk, market risk, municipal bond risk, issuer risk, liquidity risk, derivatives risk, equity risk, mortgage-related and other asset-backed securities risk, extension risk, prepayment risk, foreign (non-U.S.) investment risk, emerging markets risk, sovereign debt risk, currency risk, leveraging risk, management risk, municipal project-specific risk, short sale risk, convertible securities risk, tax-efficient investing risk, management and tracking error risk and indexing risk. A complete description of these and other risks is contained in each Fund’s prospectus.
Certain of the Funds may use derivative instruments for hedging purposes or as part of an investment strategy. Use of these instruments may involve certain costs and risks such as liquidity risk, interest rate risk, market risk, credit risk, leverage risk, management risk and the risk that a Fund may not be able to close out a position when it would be most advantageous to do so. Changes in regulation relating to a mutual fund’s use of derivatives and related instruments could potentially limit or impact a Fund’s ability to invest in derivatives, limit
a Fund’s ability to employ certain strategies that use derivatives and/or adversely affect the value or performance of derivatives and a Fund. Certain derivative transactions may have a leveraging effect on a Fund. For example, a small investment in a derivative instrument may have a
significant impact on a Fund’s exposure to interest rates, currency exchange rates or other investments. As a result, a relatively small price movement in an asset, instrument or component of the index underlying a derivative instrument may cause an immediate and substantial loss or gain, which translates into heightened volatility for the Fund. A Fund may engage in such transactions regardless of whether the Fund owns the asset, instrument or components of the index underlying the derivative instrument. A Fund may invest a significant portion of its assets in these types of instruments. If it does, the Fund’s investment exposure could far exceed the value of its portfolio securities and its investment performance could be primarily dependent upon securities it does not own. Investing in foreign (non-U.S.) securities may entail risk due to foreign (non-U.S.) economic and political developments; this risk may be increased when investing in emerging markets. For example, if a Fund invests in emerging market debt, it may face increased exposure to interest rate, liquidity, volatility, and redemption risk due to the specific economic, political, geographical, or legal background of the foreign (non-U.S.) issuer.
High yield bonds typically have a lower credit rating than other bonds. Lower-rated bonds generally involve a greater risk to principal than higher-rated bonds. Further, markets for lower-rated bonds are typically less liquid than for higher-rated bonds, and public information is usually less abundant in markets for lower-rated bonds. Thus, high yield investments increase the chance that a Fund will lose money. The credit quality of a particular security or group of securities does not ensure the stability or safety of the overall portfolio. Mortgage-related and asset-backed securities represent interests in “pools” of mortgages or other assets such as consumer loans or receivables. As a general matter, mortgage-related and asset-backed securities are subject to interest rate risk, extension risk, prepayment risk, and credit risk. These risks largely stem from the fact that returns on mortgage-related and asset-backed securities depend on the ability of the underlying assets to generate cash flow.
A Fund that invests in the municipal bond market is subject to certain risks associated with such investments. The amount of public information available about the municipal bonds held by a Fund is generally less than that for equities or corporate bonds, and the investment performance of the Fund may therefore be more dependent on the analytical abilities of PIMCO than if the Fund held other types of investments such as stocks or taxable bonds. The secondary market for municipal bonds also tends to be less well-developed or liquid than many other securities markets, which may adversely affect a Fund’s ability to sell its municipal bonds at attractive prices or value its municipal bonds.
The ability of municipal issuers to make timely payments of interest and principal may be diminished during general economic downturns and as governmental cost burdens are reallocated among federal, state and local governments. In addition, laws enacted in the future by Congress or state legislatures or referenda could extend the time for payment of principal and/or interest, or impose other constraints on enforcement of such obligations, or on the ability of municipal issuers to levy taxes. Issuers of municipal securities might seek protection under the bankruptcy laws. In the event of bankruptcy of such an issuer, a Fund investing in the issuer’s securities could experience delays in collecting principal and interest, and the Fund may not, in all circumstances, be able to collect all principal and interest to which it is entitled. To enforce its rights in the event of a default in the payment of interest or repayment of principal, or both, a Fund may take possession of, and manage, the assets securing the issuer’s obligations on such securities, which may increase the Fund’s operating expenses. Any income derived from the Fund’s ownership or operation of such assets may not be tax-exempt.
The geographical classification of foreign (non-U.S.) securities in this report are classified by the country of incorporation of a holding. In certain instances, a security’s country of incorporation may be different from its country of economic exposure.
On each individual Fund Summary page in this Shareholder Report, the Average Annual Total Return table and Cumulative Returns chart measure performance assuming that any dividend and capital gain distributions were reinvested. Returns do not reflect the deduction of taxes that a shareholder would pay on: (i) Fund distributions; or (ii) the sale of Fund shares. Each Fund’s performance is measured against the performance of at least one broad-based securities market index (“benchmark index”). A Fund’s past performance, before and after taxes, is not necessarily an indication of how the Fund will perform in the future. There is no assurance that any Fund, including any Fund that has experienced high or unusual performance for one or more periods, will experience similar levels of performance in the future. High performance is defined as a significant increase in either 1) a Fund’s total return in excess of that of the Fund’s benchmark between reporting periods or 2) a Fund’s total return in excess of the Fund’s historical returns between reporting periods. Unusual performance is defined as a significant change in a Fund’s performance as compared to one or more previous reporting periods.
| | | | | | |
| | ANNUAL REPORT | | JUNE 30, 2017 | | 5 |
Important Information About the Funds (Cont.)
The following table discloses the inception dates of each Fund along with each Fund’s diversification status as of period end:
| | | | | | | | | | |
| Fund Name | | | | | Fund
Inception | | | Diversification
Status |
PIMCO 1-3 Year U.S. Treasury Index Exchange-Traded Fund | | | | | | | 06/01/09 | | | Diversified |
PIMCO 25+ Year Zero Coupon U.S. Treasury Index Exchange-Traded Fund | | | | | | | 10/30/09 | | | Diversified |
PIMCO 1-5 Year U.S. TIPS Index Exchange-Traded Fund | | | | | | | 08/20/09 | | | Diversified |
PIMCO 15+ Year U.S. TIPS Index Exchange-Traded Fund | | | | | | | 09/03/09 | | | Diversified |
PIMCO Broad U.S. TIPS Index Exchange-Traded Fund | | | | | | | 09/03/09 | | | Diversified |
PIMCO 0-5 Year High Yield Corporate Bond Index Exchange-Traded Fund | | | | | | | 06/16/11 | | | Diversified |
PIMCO Investment Grade Corporate Bond Index Exchange-Traded Fund | | | | | | | 09/20/10 | | | Diversified |
PIMCO Active Bond Exchange-Traded Fund | | | | | | | 02/29/12 | | | Diversified |
PIMCO Enhanced Low Duration Active Exchange-Traded Fund | | | | | | | 01/22/14 | | | Diversified |
PIMCO Enhanced Short Maturity Active Exchange-Traded Fund | | | | | | | 11/16/09 | | | Diversified |
PIMCO Intermediate Municipal Bond Active Exchange-Traded Fund | | | | | | | 11/30/09 | | | Diversified |
PIMCO Short Term Municipal Bond Active Exchange-Traded Fund | | | | | | | 02/01/10 | | | Diversified |
An investment in a Fund is not a bank deposit and is not guaranteed or insured by the Federal Deposit Insurance Corporation (“FDIC”) or any other government agency. It is possible to lose money on investments in the Funds.
The Trustees are responsible generally for overseeing the management of the Trust. The Trustees authorize the Trust to enter into service agreements with the Adviser, the Distributor, the Administrator and other service providers in order to provide, and in some cases authorize service providers to procure through other parties, necessary or desirable services on behalf of the Trust and the Funds. Shareholders are not parties to or third-party beneficiaries of such service agreements. Neither a Fund’s prospectus nor a Fund’s summary prospectus, the Trust’s Statement of Additional Information (“SAI”), any contracts filed as exhibits to the Trust’s registration statement, nor any other communications, disclosure documents or regulatory filings (including this report) from or on behalf of the Trust or a Fund creates a contract between or among any shareholder of a Fund, on the one hand, and the Trust, a Fund, a service provider to the Trust or a Fund, and/or the Trustees or officers of the Trust, on the other hand. The Trustees (or the Trust and its officers, service providers or other delegates acting under authority of the Trustees) may amend the most recent prospectus or use a new prospectus, summary prospectus or SAI with respect to a Fund or the Trust, and/or amend, file and/or issue any other communications, disclosure documents or regulatory filings, and may amend or enter into any contracts to which the Trust or a Fund is a party, and interpret the investment objective(s), policies, restrictions and contractual provisions applicable to any Fund, without shareholder input or approval, except in circumstances in which shareholder approval is specifically required by law (such as changes to fundamental investment policies) or where a shareholder approval requirement is specifically disclosed in the Trust’s then-current prospectus or SAI.
The Index Funds may make available a complete schedule of portfolio holdings and the percentages they represent of the Index Fund’s net assets. On each business day, before commencement of trading on
NYSE Arca, each Active Fund will disclose on www.pimcoetfs.com the identities and quantities of the Active Fund’s portfolio holdings that will form the basis for the Active Fund’s calculation of NAV at the end of the business day. The frequency at which the daily market prices were at a discount or premium to each Fund’s NAV is disclosed on www.pimcoetfs.com. Please see “Disclosure of Portfolio Holdings” in the SAI for information about the availability of the complete schedule of each Fund’s holdings. Fund fact sheets provide additional information regarding a Fund and may be requested by calling (888) 400-4ETF and are available on the Fund’s website at www.pimcoetfs.com.
PIMCO has adopted written proxy voting policies and procedures (“Proxy Policy”) as required by Rule 206(4)-6 under the Investment Advisers Act of 1940, as amended. The Proxy Policy has been adopted by the Trust as the policies and procedures that PIMCO will use when voting proxies on behalf of the Funds. A description of the policies and procedures that PIMCO uses to vote proxies relating to portfolio securities of each Fund, and information about how each Fund voted proxies relating to portfolio securities held during the most recent twelve-month period ended June 30, are available without charge, upon request, by calling the Trust at (888) 400-4ETF, on the Funds’ website at www.pimcoetfs.com, and on the Securities and Exchange Commission’s (“SEC”) website at www.sec.gov.
The Trust files a complete schedule of each Fund’s holdings with the SEC for the first and third quarters of each fiscal year on Form N-Q. A copy of the Funds’ Form N-Q is available on the SEC’s website at www.sec.gov and may be reviewed and copied at the SEC’s Public Reference Room in Washington, D.C. A copy of the Funds’ Form N-Q is also available without charge, upon request, by calling the Trust at (888) 400-4ETF and on the Funds’ website at www.pimcoetfs.com. Information on the operation of the Public Reference Room may be obtained by calling 1-800-SEC-0330.
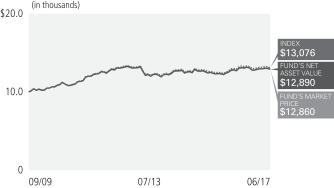
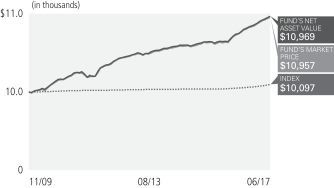
PIMCO 1-3 Year U.S. Treasury Index Exchange-Traded Fund
Cumulative Returns Through June 30, 2017
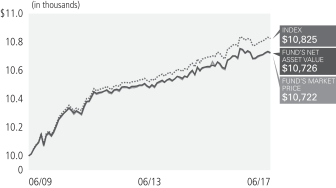
$10,000 invested at the end of the month when the Fund commenced operations.
Allocation Breakdown
as of 06/30/2017†§
| | | | |
U.S. Treasury Obligations | | | 99.8% | |
Short-Term Instruments | | | 0.2% | |
| | † | % of Investments, at value. |
| | § | Allocation Breakdown and % of investments exclude securities sold short and financial derivative instruments, if any. |
| | | | | | | | | | | | | | |
| Average Annual Total Return for the period ended June 30, 2017 | |
| | | | | 1 Year | | | 5 Year | | | Fund Inception
(06/01/2009) | |
 | | PIMCO 1-3 Year U.S. Treasury Index Exchange-Traded Fund (Based on Net Asset Value) | | | (0.26)% | | | | 0.50% | | | | 0.86% | |
 | | PIMCO 1-3 Year U.S. Treasury Index Exchange-Traded Fund
(At Market Price)(1) | | | (0.24)% | | | | 0.51% | | | | 0.86% | |
 | | BofA Merrill Lynch 1-3 Year U.S. Treasury IndexSM± | | | (0.11)% | | | | 0.63% | | | | 0.98% | |
All Fund returns are net of fees and expenses.
Market Returns do not include brokerage commissions that may be payable on secondary market transactions. If brokerage commissions were included, market returns would be lower. Market and NAV returns assume that dividends and capital gain distributions have been reinvested in the Fund at market price and NAV, respectively.
(1) The market price is determined using the midpoint between the highest bid and the lowest offer on the listing exchange, as of the time that the Fund’s NAV is calculated.
± The BofA Merrill Lynch 1-3 Year U.S. Treasury IndexSM is an unmanaged index comprised of U.S. Treasury securities, other than inflation-protection securities and STRIPS, with at least $1 billion in outstanding face value and a remaining term to final maturity of at least one year and less than three years.
It is not possible to invest directly in an unmanaged index.
Performance quoted represents past performance. Past performance is not a guarantee or a reliable indicator of future results. Current performance may be lower or higher than performance shown. Investment return and the principal value of an investment will fluctuate. Shares may be worth more or less than original cost when redeemed by authorized participants. Returns shown do not reflect the deduction of taxes that a shareholder would pay on Fund distributions or on the redemption of Fund shares. Differences in the Fund’s performance versus the index and related attribution information with respect to particular categories of securities or individual positions may be attributable, in part, to differences in the pricing methodologies used by the Fund and the index. Performance data current to the most recent month-end is available at www.pimcoetfs.com or call (888) 400-4ETF.
The Fund’s total annual operating expense ratio as stated in the Fund’s current prospectus, as supplemented, is 0.15%. Details regarding any Fund’s operating expenses can be found in the Fund’s prospectus.
Investment Objective and Strategy Overview
PIMCO 1-3 Year U.S. Treasury Index Exchange-Traded Fund seeks to provide total return that closely corresponds, before fees and expenses, to the total return of the BofA Merrill Lynch 1-3 Year US Treasury IndexSM (the “Underlying Index”), by investing under normal circumstances at least 80% of its total assets (exclusive of collateral held from securities lending) in the component securities (“Component Securities”) of the Underlying Index. The Fund may invest the remainder of its assets in Fixed Income Instruments that are not Component Securities, but which PIMCO believes will help the Fund track its Underlying Index, as well as in cash and investment grade, liquid short-term instruments, forwards or derivatives, such as options, futures contracts or swap agreements, and shares of affiliated bond funds. The Fund invests in a representative sample of securities included in the Underlying Index that collectively has an investment profile similar to the Underlying Index. Due to the use of representative sampling, the Fund may not hold all of the securities that are included in the Underlying Index. “Fixed Income Instruments” include bonds, debt securities and other similar instruments issued by various U.S. and non-U.S. public- or private-sector entities. Fund strategies may change from time to time. Please refer to the Fund’s current prospectus for more information regarding the Fund’s strategy.
Fund Insights at NAV
The following affected performance during the reporting period:
| » | | Yields in the 1- to 3-year segment of the U.S. Treasury yield curve rose, negatively impacting the price return of both the Fund and the Underlying Index. Returns due to income contributed to performance for both the Fund and the Underlying Index. The net result was negative absolute performance for both the Fund and the Underlying Index. |
| | | | | | |
| | ANNUAL REPORT | | JUNE 30, 2017 | | 7 |
PIMCO 25+ Year Zero Coupon U.S. Treasury Index Exchange-Traded Fund
Cumulative Returns Through June 30, 2017
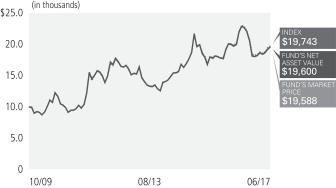
$10,000 invested at the end of the month when the Fund commenced operations.
Allocation Breakdown as of 06/30/2017†§
| | | | |
U.S. Treasury Obligations | | | 95.0% | |
Short-Term Instruments | | | 5.0% | |
| | † | % of Investments, at value. |
| | § | Allocation Breakdown and % of investments exclude securities sold short and financial derivative instruments, if any. |
| | | | | | | | | | | | | | |
| Average Annual Total Return for the period ended June 30, 2017 | |
| | | | | 1 Year | | | 5 Year | | | Fund Inception
(10/30/2009) | |
| | PIMCO 25+ Year Zero Coupon U.S. Treasury Index Exchange-Traded Fund (Based on Net Asset Value) | | | (10.88)% | | | | 3.19% | | | | 9.18% | |
| | PIMCO 25+ Year Zero Coupon U.S. Treasury Index Exchange-Traded Fund (At Market Price)(1) | | | (10.92)% | | | | 3.27% | | | | 9.17% | |
| | BofA Merrill Lynch Long U.S. Treasury Principal STRIPS IndexSM± | | | (10.49)% | | | | 3.48% | | | | 9.27% | |
All Fund returns are net of fees and expenses.
Market Returns do not include brokerage commissions that may be payable on secondary market transactions. If brokerage commissions were included, market returns would be lower. Market and NAV returns assume that dividends and capital gain distributions have been reinvested in the Fund at market price and NAV, respectively.
(1) The market price is determined using the midpoint between the highest bid and the lowest offer on the listing exchange, as of the time that the Fund’s NAV is calculated.
± BofA Merrill Lynch Long U.S. Treasury Principal STRIPS IndexSM is an unmanaged index comprised of long maturity Separate Trading of Registered Interest and Principal of Securities (“STRIPS”) representing the final principal payment of U.S. Treasury bonds. The principal STRIPS comprising the Underlying Index must have 25 years or more remaining term to final maturity and must be stripped from U.S. Treasury bonds having at least $1 billion in outstanding face value.
It is not possible to invest directly in an unmanaged index.
Performance quoted represents past performance. Past performance is not a guarantee or a reliable indicator of future results. Current performance may be lower or higher than performance shown. Investment return and the principal value of an investment will fluctuate. Shares may be worth more or less than original cost when redeemed by authorized participants. Returns shown do not reflect the deduction of taxes that a shareholder would pay on Fund distributions or on the redemption of Fund shares. Differences in the Fund’s performance versus the index and related attribution information with respect to particular categories of securities or individual positions may be attributable, in part, to differences in the pricing methodologies used by the Fund and the index. Performance data current to the most recent month-end is available at www.pimcoetfs.com or call (888) 400-4ETF.
The Fund’s total annual operating expense ratio as stated in the Fund’s current prospectus, as supplemented, is 0.15%. Details regarding any Fund’s operating expenses can be found in the Fund’s prospectus.
Investment Objective and Strategy Overview
PIMCO 25+ Year Zero Coupon U.S. Treasury Index Exchange-Traded Fund seeks to provide total return that closely corresponds, before fees and expenses, to the total return of the BofA Merrill Lynch Long US Treasury Principal STRIPS IndexSM (the “Underlying Index”), by investing under normal circumstances at least 80% of its total assets (exclusive of collateral held from securities lending) in the component securities (“Component Securities”) of the Underlying Index. The Fund may invest the remainder of its assets in Fixed Income Instruments that are not Component Securities, but which PIMCO believes will help the Fund track its Underlying Index, as well as in cash and investment grade, liquid short-term instruments, forwards or derivatives, such as options, futures contracts or swap agreements, and shares of affiliated bond funds. The Fund invests in a representative sample of securities included in the Underlying Index that collectively has an investment profile similar to the Underlying Index. Due to the use of representative sampling, the Fund may not hold all of the securities that are included in the Underlying Index. “Fixed Income Instruments” include bonds, debt securities and other similar instruments issued by various U.S. and non-U.S. public- or private-sector entities. Fund strategies may change from time to time. Please refer to the Fund’s current prospectus for more information regarding the Fund’s strategy.
Fund Insights at NAV
The following affected performance during the reporting period:
| » | | Yields in the 25+ year segment of the U.S. Treasury STRIPS yield curve rose, negatively impacting absolute performance for both the Fund and the Underlying Index. |
PIMCO 1-5 Year U.S. TIPS Index Exchange-Traded Fund
Cumulative Returns Through June 30, 2017
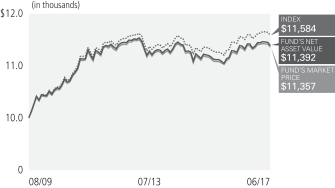
$10,000 invested at the end of the month when the Fund commenced operations.
Allocation Breakdown as of 06/30/2017†§
| | | | |
U.S. Treasury Obligations | | | 100.0% | |
Short-Term Instruments | | | 0.0% | |
| | † | % of Investments, at value. |
| | § | Allocation Breakdown and % of investments exclude securities sold short and financial derivative instruments, if any. |
| | | | | | | | | | | | | | |
| Average Annual Total Return for the period ended June 30, 2017 | |
| | | | | 1 Year | | | 5 Year | | | Fund Inception
(08/20/2009) | |
| | PIMCO 1-5 Year U.S. TIPS Index Exchange-Traded Fund
(Based on Net Asset Value) | | | 0.00% | | | | 0.11% | | | | 1.64% | |
| | PIMCO 1-5 Year U.S. TIPS Index Exchange-Traded Fund
(At Market Price)(1) | | | 0.02% | | | | 0.12% | | | | 1.64% | |
| | BofA Merrill Lynch 1-5 Year U.S. Inflation-Linked Treasury IndexSM± | | | 0.19% | | | | 0.33% | | | | 1.87% | |
All Fund returns are net of fees and expenses.
Market Returns do not include brokerage commissions that may be payable on secondary market transactions. If brokerage commissions were included, market returns would be lower. Market and NAV returns assume that dividends and capital gain distributions have been reinvested in the Fund at market price and NAV, respectively.
(1) The market price is determined using the midpoint between the highest bid and the lowest offer on the listing exchange, as of the time that the Fund’s NAV is calculated.
± BofA Merrill Lynch 1-5 Year US Inflation-Linked Treasury IndexSM is an unmanaged index comprised of U.S. Treasury Inflation Protected Securities with at least $1 billion in outstanding face value and a remaining term to final maturity of at least 1 year and less than 5 years.
It is not possible to invest directly in an unmanaged index.
Performance quoted represents past performance. Past performance is not a guarantee or a reliable indicator of future results. Current performance may be lower or higher than performance shown. Investment return and the principal value of an investment will fluctuate. Shares may be worth more or less than original cost when redeemed by authorized participants. Returns shown do not reflect the deduction of taxes that a shareholder would pay on Fund distributions or on the redemption of Fund shares. Differences in the Fund’s performance versus the index and related attribution information with respect to particular categories of securities or individual positions may be attributable, in part, to differences in the pricing methodologies used by the Fund and the index. Performance data current to the most recent month-end is available at www.pimcoetfs.com or call (888) 400-4ETF.
The Fund’s total annual operating expense ratio as stated in the Fund’s current prospectus, as supplemented, is 0.20%. Details regarding any Fund’s operating expenses can be found in the Fund’s prospectus.
Investment Objective and Strategy Overview
PIMCO 1-5 Year U.S. TIPS Index Exchange-Traded Fund seeks to provide total return that closely corresponds, before fees and expenses, to the total return of the BofA Merrill Lynch 1-5 Year US Inflation-Linked Treasury IndexSM (the “Underlying Index”), by investing under normal circumstances at least 80% of its total assets (exclusive of collateral held from securities lending) in the component securities (“Component Securities”) of the Underlying Index. The Fund may invest the remainder of its assets in Fixed Income Instruments that are not Component Securities, but which PIMCO believes will help the Fund track its Underlying Index, as well as in cash and investment grade, liquid short-term instruments, forwards or derivatives, such as options, futures contracts or swap agreements, and shares of affiliated bond funds. The Fund invests in a representative sample of securities included in the Underlying Index that collectively has an investment profile similar to the Underlying Index. Due to the use of representative sampling, the Fund may not hold all of the securities that are included in the Underlying Index. “Fixed Income Instruments” include bonds, debt securities and other similar instruments issued by various U.S. and non-U.S. public- or private-sector entities. Fund strategies may change from time to time. Please refer to the Fund’s current prospectus for more information regarding the Fund’s strategy.
Fund Insights at NAV
The following affected performance during the reporting period:
| » | | Real yields, or the rates of return in excess of expected future inflation, generally rose across the U.S. Treasury Inflation-Protected Securities (TIPS) yield curve, negatively impacting performance of both the Fund and the Underlying Index. |
| » | | A positive inflation accrual, or change in the Consumer Price Index (CPI), applied to the principal of the underlying TIPS, positively impacted performance of both the Fund and the Underlying Index. |
| | | | | | |
| | ANNUAL REPORT | | JUNE 30, 2017 | | 9 |
PIMCO 15+ Year U.S. TIPS Index Exchange-Traded Fund
Cumulative Returns Through June 30, 2017
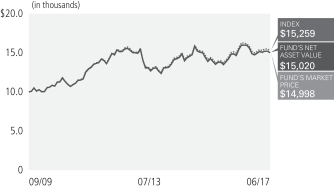
$10,000 invested at the end of the month when the Fund commenced operations.
Allocation Breakdown as of 06/30/2017†§
| | | | |
U.S. Treasury Obligations | | | 100.0% | |
| | † | % of Investments, at value. |
| | § | Allocation Breakdown and % of investments exclude securities sold short and financial derivative instruments, if any. |
| | | | | | | | | | | | | | |
| Average Annual Total Return for the period ended June 30, 2017 | |
| | | | | 1 Year | | | 5 Year | | | Fund Inception
(09/03/2009) | |
| | PIMCO 15+ Year U.S. TIPS Index Exchange-Traded Fund
(Based on Net Asset Value) | | | (2.82)% | | | | 0.34% | | | | 5.64% | |
| | PIMCO 15+ Year U.S. TIPS Index Exchange-Traded Fund
(At Market Price)(1) | | | (2.74)% | | | | 0.35% | | | | 5.64% | |
| | BofA Merrill Lynch 15+ Year U.S. Inflation-Linked Treasury IndexSM± | | | (2.54)% | | | | 0.56% | | | | 5.84% | |
All Fund returns are net of fees and expenses.
Market Returns do not include brokerage commissions that may be payable on secondary market transactions. If brokerage commissions were included, market returns would be lower. Market and NAV returns assume that dividends and capital gain distributions have been reinvested in the Fund at market price and NAV, respectively.
(1) The market price is determined using the midpoint between the highest bid and the lowest offer on the listing exchange, as of the time that the Fund’s NAV is calculated.
± BofA Merrill Lynch 15+ Year US Inflation-Linked Treasury IndexSM is an unmanaged index comprised of U.S. Treasury Inflation Protected Securities with at least $1 billion in outstanding face value and a remaining term to final maturity greater than 15 years.
It is not possible to invest directly in an unmanaged index.
Performance quoted represents past performance. Past performance is not a guarantee or a reliable indicator of future results. Current performance may be lower or higher than performance shown. Investment return and the principal value of an investment will fluctuate. Shares may be worth more or less than original cost when redeemed by authorized participants. Returns shown do not reflect the deduction of taxes that a shareholder would pay on Fund distributions or on the redemption of Fund shares. Differences in the Fund’s performance versus the index and related attribution information with respect to particular categories of securities or individual positions may be attributable, in part, to differences in the pricing methodologies used by the Fund and the index. Performance data current to the most recent month-end is available at www.pimcoetfs.com or call (888) 400-4ETF.
The Fund’s total annual operating expense ratio as stated in the Fund’s current prospectus, as supplemented, is 0.20%. Details regarding any Fund’s operating expenses can be found in the Fund’s prospectus.
Investment Objective and Strategy Overview
PIMCO 15+ Year U.S. TIPS Index Exchange-Traded Fund seeks to provide total return that closely corresponds, before fees and expenses, to the total return of the BofA Merrill Lynch 15+ Year US Inflation-Linked Treasury IndexSM (the “Underlying Index”), by investing under normal circumstances at least 80% of its total assets (exclusive of collateral held from securities lending) in the component securities (“Component Securities”) of the Underlying Index. The Fund may invest the remainder of its assets in Fixed Income Instruments that are not Component Securities, but which PIMCO believes will help the Fund track its Underlying Index, as well as in cash and investment grade, liquid short-term instruments, forwards or derivatives, such as options, futures contracts or swap agreements, and shares of affiliated bond funds. The Fund invests in a representative sample of securities included in the Underlying Index that collectively has an investment profile similar to the Underlying Index. Due to the use of representative sampling, the Fund may not hold all of the securities that are included in the Underlying Index. “Fixed Income Instruments” include bonds, debt securities and other similar instruments issued by various U.S. and non-U.S. public- or private-sector entities. Fund strategies may change from time to time. Please refer to the Fund’s current prospectus for more information regarding the Fund’s strategy.
Fund Insights at NAV
The following affected performance during the reporting period:
| » | | Real yields, or the rates of return in excess of expected future inflation, generally rose across the U.S. Treasury Inflation-Protected Securities (TIPS) yield curve, negatively impacting performance of both the Fund and the Underlying Index. |
| » | | A positive inflation accrual, or change in the Consumer Price Index (CPI), applied to the principal of the underlying TIPS, positively impacted performance of both the Fund and the Underlying Index. |
PIMCO Broad U.S. TIPS Index Exchange-Traded Fund
Cumulative Returns Through June 30, 2017
$10,000 invested at the end of the month when the Fund commenced operations.
Allocation Breakdown as of 06/30/2017†§
| | | | |
U.S. Treasury Obligations | | | 99.7% | |
Short-Term Instruments | | | 0.3% | |
| | † | % of Investments, at value. |
| | § | Allocation Breakdown and % of investments exclude securities sold short and financial derivative instruments, if any. |
| | | | | | | | | | | | | | |
| Average Annual Total Return for the period ended June 30, 2017 | |
| | | | | 1 Year | | | 5 Year | | | Fund Inception
(09/03/2009) | |
| | PIMCO Broad U.S. TIPS Index Exchange-Traded Fund
(Based on Net Asset Value) | | | (0.87)% | | | | 0.11% | | | | 3.49% | |
| | PIMCO Broad U.S. TIPS Index Exchange-Traded Fund
(At Market Price)(1) | | | (0.91)% | | | | 0.12% | | | | 3.48% | |
| | BofA Merrill Lynch U.S. Inflation-Linked Treasury IndexSM± | | | (0.75)% | | | | 0.30% | | | | 3.67% | |
All Fund returns are net of fees and expenses.
Market Returns do not include brokerage commissions that may be payable on secondary market transactions. If brokerage commissions were included, market returns would be lower. Market and NAV returns assume that dividends and capital gain distributions have been reinvested in the Fund at market price and NAV, respectively.
(1) The market price is determined using the midpoint between the highest bid and the lowest offer on the listing exchange, as of the time that the Fund’s NAV is calculated.
± BofA Merrill Lynch US Inflation-Linked Treasury IndexSM is an unmanaged index comprised of U.S. Treasury Inflation Protected Securities with at least $1 billion in outstanding face value.
It is not possible to invest directly in an unmanaged index.
Performance quoted represents past performance. Past performance is not a guarantee or a reliable indicator of future results. Current performance may be lower or higher than performance shown. Investment return and the principal value of an investment will fluctuate. Shares may be worth more or less than original cost when redeemed by authorized participants. Returns shown do not reflect the deduction of taxes that a shareholder would pay on Fund distributions or on the redemption of Fund shares. Differences in the Fund’s performance versus the index and related attribution information with respect to particular categories of securities or individual positions may be attributable, in part, to differences in the pricing methodologies used by the Fund and the index. Performance data current to the most recent month-end is available at www.pimcoetfs.com or call (888) 400-4ETF.
The Fund’s total annual operating expense ratio as stated in the Fund’s current prospectus, as supplemented, is 0.20%. Details regarding any Fund’s operating expenses can be found in the Fund’s prospectus.
Investment Objective and Strategy Overview
PIMCO Broad U.S. TIPS Index Exchange-Traded Fund seeks to provide total return that closely corresponds, before fees and expenses, to the total return of the BofA Merrill Lynch US Inflation-Linked Treasury IndexSM (the “Underlying Index”), by investing under normal circumstances at least 80% of its total assets (exclusive of collateral held from securities lending) in the component securities (“Component Securities”) of the Underlying Index. The Fund may invest the remainder of its assets in Fixed Income Instruments that are not Component Securities, but which PIMCO believes will help the Fund track its Underlying Index, as well as in cash and investment grade, liquid short-term instruments, forwards or derivatives, such as options, futures contracts or swap agreements, and shares of affiliated bond funds. The Fund invests in a representative sample of securities included in the Underlying Index that collectively has an investment profile similar to the Underlying Index. Due to the use of representative sampling, the Fund may not hold all of the securities that are included in the Underlying Index. “Fixed Income Instruments” include bonds, debt securities and other similar instruments issued by various U.S. and non-U.S. public- or private-sector entities. Fund strategies may change from time to time. Please refer to the Fund’s current prospectus for more information regarding the Fund’s strategy.
Fund Insights at NAV
The following affected performance during the reporting period:
| » | | Real yields, or the rates of return in excess of expected future inflation, generally rose across the U.S. Treasury Inflation-Protected Securities (TIPS) yield curve, negatively impacting performance of both the Fund and the Underlying Index. |
| » | | A positive inflation accrual, or change in the Consumer Price Index (CPI), applied to the principal of the underlying TIPS, positively impacted performance of both the Fund and the Underlying Index. |
| | | | | | |
| | ANNUAL REPORT | | JUNE 30, 2017 | | 11 |
PIMCO 0-5 Year High Yield Corporate Bond Index Exchange-Traded Fund
Cumulative Returns Through June 30, 2017
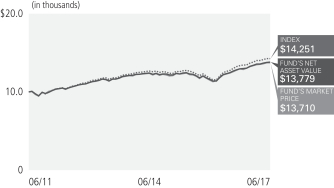
$10,000 invested at the end of the month when the Fund commenced operations.
Allocation Breakdown as of 06/30/2017†§
| | | | |
Corporate Bonds & Notes | | | 80.9% | |
Short-Term Instruments | | | 19.1% | |
| | † | % of Investments, at value. |
| | § | Allocation Breakdown and % of investments exclude securities sold short and financial derivative instruments, if any. |
| | | | | | | | | | | | | | |
| Average Annual Total Return for the period ended June 30, 2017 | |
| | | | | 1 Year | | | 5 Year | | | Fund Inception
(06/16/2011) | |
| | PIMCO 0-5 Year High Yield Corporate Bond Index Exchange-Traded Fund (Based on Net Asset Value) | | | 10.88% | | | | 5.55% | | | | 5.53% | |
| | PIMCO 0-5 Year High Yield Corporate Bond Index Exchange-Traded Fund (At Market Price)(1) | | | 10.40% | | | | 5.42% | | | | 5.48% | |
| | BofA Merrill Lynch 0-5 Year US High Yield Constrained IndexSM± | | | 12.01% | | | | 6.17% | | | | 6.09% | |
All Fund returns are net of fees and expenses.
Market Returns do not include brokerage commissions that may be payable on secondary market transactions. If brokerage commissions were included, market returns would be lower. Market and NAV returns assume that dividends and capital gain distributions have been reinvested in the Fund at market price and NAV, respectively.
(1) The market price is determined using the midpoint between the highest bid and the lowest offer on the listing exchange, as of the time that the Fund’s NAV is calculated.
± The BofA Merrill Lynch 0-5 Year US High Yield Constrained IndexSM tracks the performance of short-term U.S. dollar denominated below investment grade corporate debt issued in the U.S. domestic market with less than five years remaining term to final maturity, a fixed coupon schedule and a minimum amount outstanding of $250 million, issued publicly. Prior to September 30, 2016, securities with minimum amount outstanding of $100 million qualified. Allocations to an individual issuer will not exceed 2%.
It is not possible to invest directly in an unmanaged index.
Performance quoted represents past performance. Past performance is not a guarantee or a reliable indicator of future results. Current performance may be lower or higher than performance shown. Investment return and the principal value of an investment will fluctuate. Shares may be worth more or less than original cost when redeemed by authorized participants. Returns shown do not reflect the deduction of taxes that a shareholder would pay on Fund distributions or on the redemption of Fund shares. Differences in the Fund’s performance versus the index and related attribution information with respect to particular categories of securities or individual positions may be attributable, in part, to differences in the pricing methodologies used by the Fund and the index. Performance data current to the most recent month-end is available at www.pimcoetfs.com or call (888) 400-4ETF.
The Fund’s total annual operating expense ratio as stated in the Fund’s current prospectus, as supplemented, is 0.55%. Details regarding any Fund’s operating expenses can be found in the Fund’s prospectus.
Investment Objective and Strategy Overview
PIMCO 0-5 Year High Yield Corporate Bond Index Exchange-Traded Fund seeks to provide total return that closely corresponds, before fees and expenses, to the total return of the BofA Merrill Lynch 0-5 Year US High Yield Constrained IndexSM (the “Underlying Index”), by investing under normal circumstances at least 80% of its total assets (exclusive of collateral held from securities lending) in the component securities (“Component Securities”) of the Underlying Index. The Fund may invest the remainder of its assets in Fixed Income Instruments that are not Component Securities, but which PIMCO believes will help the Fund track its Underlying Index, as well as in cash and investment grade, liquid short-term instruments, forwards or derivatives, such as options, futures contracts or swap agreements, and shares of affiliated bond funds. The Fund invests in a representative sample of securities included in the Underlying Index that collectively has an investment profile similar to the Underlying Index. Due to the use of representative sampling, the Fund may not hold all of the securities that are included in the Underlying Index. “Fixed Income Instruments” include bonds, debt securities and other similar instruments issued by various U.S. and non-U.S. public- or private-sector entities. Fund strategies may change from time to time. Please refer to the Fund’s current prospectus for more information regarding the Fund’s strategy.
Fund Insights at NAV
The following affected performance during the reporting period:
| » | | Yields in the short-term segment of the U.S. high yield bond market decreased, which positively impacted price returns for these securities. Coupon income also positively contributed to performance for both the Fund and the Underlying Index. The result was positive performance for both the Fund and the Underlying Index. |
PIMCO Investment Grade Corporate Bond Index Exchange-Traded Fund
Cumulative Returns Through June 30, 2017

$10,000 invested at the end of the month when the Fund commenced operations.
Allocation Breakdown as of 06/30/2017†§
| | | | |
Industrials | | | 49.7% | |
Banking & Finance | | | 34.4% | |
Utilities | | | 12.7% | |
Short-Term Instruments | | | 3.1% | |
Sovereign Issues | | | 0.1% | |
| | † | % of Investments, at value. |
| | § | Allocation Breakdown and % of investments exclude securities sold short and financial derivative instruments, if any. |
| | | | | | | | | | | | | | |
| Average Annual Total Return for the period ended June 30, 2017 | |
| | | | | 1 Year | | | 5 Year | | | Fund Inception
(09/20/2010) | |
| | PIMCO Investment Grade Corporate Bond Index Exchange-Traded Fund (Based on Net Asset Value) | | | 2.19% | | | | 3.99% | | | | 4.64% | |
| | PIMCO Investment Grade Corporate Bond Index Exchange-Traded Fund (At Market Price)(1) | | | 1.81% | | | | 4.00% | | | | 4.67% | |
| | BofA Merrill Lynch US Corporate IndexSM± | | | 2.33% | | | | 4.05% | | | | 4.74% | |
All Fund returns are net of fees and expenses.
Market Returns do not include brokerage commissions that may be payable on secondary market transactions. If brokerage commissions were included, market returns would be lower. Market and NAV returns assume that dividends and capital gain distributions have been reinvested in the Fund at market price and NAV, respectively.
(1) The market price is determined using the midpoint between the highest bid and the lowest offer on the listing exchange, as of the time that the Fund’s NAV is calculated.
± BofA Merrill Lynch US Corporate IndexSM is an unmanaged index comprised of U.S. dollar denominated investment grade, fixed rate corporate debt securities publicly issued in the U.S. domestic market with at least one year remaining term to final maturity and at least $250 million outstanding.
It is not possible to invest directly in an unmanaged index.
Performance quoted represents past performance. Past performance is not a guarantee or a reliable indicator of future results. Current performance may be lower or higher than performance shown. Investment return and the principal value of an investment will fluctuate. Shares may be worth more or less than original cost when redeemed by authorized participants. Returns shown do not reflect the deduction of taxes that a shareholder would pay on Fund distributions or on the redemption of Fund shares. Differences in the Fund’s performance versus the index and related attribution information with respect to particular categories of securities or individual positions may be attributable, in part, to differences in the pricing methodologies used by the Fund and the index. Performance data current to the most recent month-end is available at www.pimcoetfs.com or call (888) 400-4ETF.
The Fund’s total annual operating expense ratio as stated in the Fund’s current prospectus, as supplemented, is 0.20%. Details regarding any Fund’s operating expenses can be found in the Fund’s prospectus.
Investment Objective and Strategy Overview
PIMCO Investment Grade Corporate Bond Index Exchange-Traded Fund seeks to provide total return that closely corresponds, before fees and expenses, to the total return of the BofA Merrill Lynch US Corporate IndexSM (the “Underlying Index”), by investing under normal circumstances at least 80% of its total assets (exclusive of collateral held from securities lending) in the component securities (“Component Securities”) of the Underlying Index. The Fund may invest the remainder of its assets in Fixed Income Instruments that are not Component Securities, but which PIMCO believes will help the Fund track its Underlying Index, as well as in cash and investment grade, liquid short-term instruments, forwards or derivatives, such as options, futures contracts or swap agreements, and shares of affiliated bond funds. The Fund invests in a representative sample of securities included in the Underlying Index that collectively has an investment profile similar to the Underlying Index. Due to the use of representative sampling, the Fund may not hold all of the securities that are included in the Underlying Index. “Fixed Income Instruments” include bonds, debt securities and other similar instruments issued by various U.S. and non-U.S. public- or private-sector entities. Fund strategies may change from time to time. Please refer to the Fund’s current prospectus for more information regarding the Fund’s strategy.
Fund Insights at NAV
The following affected performance during the reporting period:
| » | | An increase in bond yields negatively impacted price returns for both the Fund and the Underlying Index. |
| » | | Returns due to income positively contributed to performance, resulting in positive performance of both the Fund and the Underlying Index. |
| | | | | | |
| | ANNUAL REPORT | | JUNE 30, 2017 | | 13 |
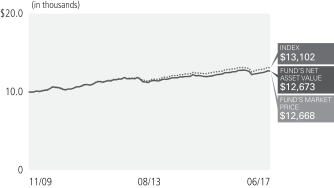
PIMCO Active Bond Exchange-Traded Fund
Cumulative Returns Through June 30, 2017
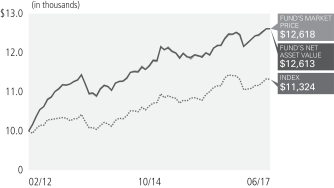
$10,000 invested at the end of the month when the Fund commenced operations.
Allocation Breakdown as of 06/30/2017†§
| | | | |
U.S. Government Agencies | | | 35.5% | |
Corporate Bonds & Notes | | | 23.4% | |
U.S. Treasury Obligations | | | 21.6% | |
Asset-Backed Securities | | | 11.1% | |
Non-Agency Mortgage-Backed Securities | | | 4.1% | |
Municipal Bonds & Notes | | | 1.7% | |
Sovereign Issues | | | 1.7% | |
Short-Term Instruments | | | 0.9% | |
| | † | % of Investments, at value. |
| | § | Allocation Breakdown and % of investments exclude securities sold short and financial derivative instruments, if any. |
| | | | | | | | | | | | | | |
| Average Annual Total Return for the period ended June 30, 2017 | |
| | | | | 1 Year | | | 5 Year | | | Fund Inception
(02/29/2012) | |
| | PIMCO Active Bond Exchange-Traded Fund
(Based on Net Asset Value) | | | 2.00% | | | | 3.49% | | | | 4.45% | |
| | PIMCO Active Bond Exchange-Traded Fund
(At Market Price)(1) | | | 2.16% | | | | 3.50% | | | | 4.46% | |
| | Bloomberg Barclays U.S. Aggregate Index± | | | (0.31)% | | | | 2.21% | | | | 2.36% | |
All Fund returns are net of fees and expenses.
Market Returns do not include brokerage commissions that may be payable on secondary market transactions. If brokerage commissions were included, market returns would be lower. Market and NAV returns assume that dividends and capital gain distributions have been reinvested in the Fund at market price and NAV, respectively.
(1) The market price is determined using the midpoint between the highest bid and the lowest offer on the listing exchange, as of the time that the Fund’s NAV is calculated.
± Bloomberg Barclays U.S. Aggregate Index represents securities that are SEC-registered, taxable, and dollar denominated. The index covers the U.S. investment grade fixed rate bond market, with index components for government and corporate securities, mortgage pass-through securities, and asset-backed securities. These major sectors are subdivided into more specific indices that are calculated and reported on a regular basis.
It is not possible to invest directly in an unmanaged index.
Performance quoted represents past performance. Past performance is not a guarantee or a reliable indicator of future results. Current performance may be lower or higher than performance shown. Investment return and the principal value of an investment will fluctuate. Shares may be worth more or less than original cost when redeemed by authorized participants. Returns shown do not reflect the deduction of taxes that a shareholder would pay on Fund distributions or on the redemption of Fund shares. Differences in the Fund’s performance versus the index and related attribution information with respect to particular categories of securities or individual positions may be attributable, in part, to differences in the pricing methodologies used by the Fund and the index. Performance data current to the most recent month-end is available at www.pimcoetfs.com or call (888) 400-4ETF.
The Fund’s total annual operating expense ratio as stated in the Fund’s current prospectus, as supplemented, is 0.56%. Details regarding any Fund’s operating expenses can be found in the Fund’s prospectus.
Investment Objective and Strategy Overview
PIMCO Active Bond Exchange-Traded Fund seeks current income and long-term capital appreciation, consistent with prudent investment management, by investing under normal circumstances at least 80% of its assets in a diversified portfolio of Fixed Income Instruments of varying maturities, which may be represented by forwards or derivatives such as options, futures contracts, or swap agreements. “Fixed Income Instruments” include bonds, debt securities and other similar instruments issued by various U.S. and non-U.S. public- or private-sector entities. Fund strategies may change from time to time. Please refer to the Fund’s current prospectus for more information regarding the Fund’s strategy.
Fund Insights at NAV
The following affected performance during the reporting period:
| » | | Positions in U.S. Treasury Inflation-Protected Securities (TIPS) contributed to relative performance, as breakeven inflation rates rose. |
| » | | Positions in student loans contributed to relative performance, as total returns were positive. |
| » | | Overweight exposure to investment grade corporate credit risk, particularly financials, benefited relative performance, as the sector outperformed the broader market. |
| » | | Short exposure to a basket of Asian emerging markets currencies detracted from relative performance, as the currencies appreciated against the U.S. dollar. |
| » | | Long exposure to the Brazilian real contributed to relative performance, as the currency appreciated against the U.S. dollar. |
| » | | Short exposure to the French OAT-German Bund spread detracted from relative performance, as the spread narrowed. |
PIMCO Enhanced Low Duration Active Exchange-Traded Fund
Cumulative Returns Through June 30, 2017
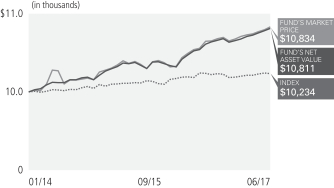
$10,000 invested at the end of the month when the Fund commenced operations.
Allocation Breakdown as of 06/30/2017†§
| | | | |
Corporate Bonds & Notes | | | 44.4% | |
U.S. Treasury Obligations | | | 38.4% | |
Asset-Backed Securities | | | 9.0% | |
U.S. Government Agencies | | | 2.6% | |
Short-Term Instruments | | | 1.8% | |
Other | | | 3.8% | |
| | † | % of Investments, at value. |
| | § | Allocation Breakdown and % of investments exclude securities sold short and financial derivative instruments, if any. |
| | | | | | | | | | |
| Average Annual Total Return for the period ended June 30, 2017 | |
| | | | | 1 Year | | | Fund Inception
(01/22/2014) | |
| | PIMCO Enhanced Low Duration Active Exchange-Traded Fund
(Based on Net Asset Value) | | | 2.54% | | | | 2.38% | |
| | PIMCO Enhanced Low Duration Active Exchange-Traded Fund
(At Market Price)(1) | | | 2.63% | | | | 2.43% | |
| | BofA Merrill Lynch 1-3 Year U.S. Treasury IndexSM± | | | (0.11)% | | | | 0.72% | |
All Fund returns are net of fees and expenses.
Market Returns do not include brokerage commissions that may be payable on secondary market transactions. If brokerage commissions were included, market returns would be lower. Market and NAV returns assume that dividends and capital gain distributions have been reinvested in the Fund at market price and NAV, respectively.
(1) The market price is determined using the midpoint between the highest bid and the lowest offer on the listing exchange, as of the time that the Fund’s NAV is calculated.
± The BofA Merrill Lynch 1-3 Year U.S. Treasury IndexSM is an unmanaged index comprised of U.S. Treasury securities, other than inflation-protection securities and STRIPS, with at least $1 billion in outstanding face value and a remaining term to final maturity of at least one year and less than three years.
It is not possible to invest directly in an unmanaged index.
Performance quoted represents past performance. Past performance is not a guarantee or a reliable indicator of future results. Current performance may be lower or higher than performance shown. Investment return and the principal value of an investment will fluctuate. Shares may be worth more or less than original cost when redeemed by authorized participants. Returns shown do not reflect the deduction of taxes that a shareholder would pay on Fund distributions or on the redemption of Fund shares. Differences in the Fund’s performance versus the index and related attribution information with respect to particular categories of securities or individual positions may be attributable, in part, to differences in the pricing methodologies used by the Fund and the index. Performance data current to the most recent month-end is available at www.pimcoetfs.com or call (888) 400-4ETF.
The Fund’s total annual operating expense ratio as stated in the Fund’s current prospectus, as supplemented, is 0.55%. Details regarding any Fund’s operating expenses can be found in the Fund’s prospectus.
Investment Objective and Strategy Overview
PIMCO Enhanced Low Duration Active Exchange-Traded Fund seeks maximum total return, consistent with preservation of capital and prudent investment management, by investing under normal circumstances at least 80% of its net assets in a diversified portfolio of Fixed Income Instruments of varying maturities, which may be represented by forwards or derivatives such as options, futures contracts, or swap agreements. “Fixed Income Instruments” include bonds, debt securities and other similar instruments issued by various U.S. and non-U.S. public- or private-sector entities. Fund strategies may change from time to time. Please refer to the Fund’s current prospectus for more information regarding the Fund’s strategy.
Fund Insights at NAV
The following affected performance during the reporting period:
| » | | Exposure to investment grade corporate credit contributed to relative performance, as this sector generally posted positive excess returns. |
| » | | Underweight exposure to U.S. interest rates, particularly an underweight to the front end of the yield curve, contributed to relative performance, as interest rates rose. |
| » | | Positions in non-agency mortgage-backed securities (MBS) contributed to relative performance, as total returns in these securities were positive. |
| » | | Holdings of short- to intermediate-term U.S. Treasury Inflation-Protected Securities (TIPS) benefited performance, as the sector generally posted positive total returns. |
| » | | Overweight exposure to Australian duration detracted from relative performance, as interest rates in Australia rose. |
| » | | Overweight exposure to Mexican duration detracted from relative performance, as interest rates in Mexico rose. |
| | | | | | |
| | ANNUAL REPORT | | JUNE 30, 2017 | | 15 |
PIMCO Enhanced Short Maturity Active Exchange-Traded Fund
Cumulative Returns Through June 30, 2017
$10,000 invested at the end of the month when the Fund commenced operations.
Allocation Breakdown as of 06/30/2017†§
| | | | |
Corporate Bonds & Notes | | | 60.1% | |
Asset-Backed Securities | | | 14.5% | |
Short-Term Instruments | | | 12.6% | |
Sovereign Issues | | | 7.1% | |
U.S. Government Agencies | | | 3.4% | |
Non-Agency Mortgage-Backed Securities | | | 1.6% | |
Other | | | 0.7% | |
| | † | % of Investments, at value. |
| | § | Allocation Breakdown and % of investments exclude securities sold short and financial derivative instruments, if any. |
| | | | | | | | | | | | | | |
| Average Annual Total Return for the period ended June 30, 2017 | |
| | | | | 1 Year | | | 5 Year | | | Fund Inception
(11/16/2009) | |
| | PIMCO Enhanced Short Maturity Exchange-Traded Fund
(Based on Net Asset Value) | | | 2.05% | | | | 1.14% | | | | 1.24% | |
| | PIMCO Enhanced Short Maturity Exchange-Traded Fund
(At Market Price)(1) | | | 2.01% | | | | 1.14% | | | | 1.23% | |
| | Citi 3-Month Treasury Bill Index± | | | 0.46% | | | | 0.15% | | | | 0.13%¨ | |
All Fund returns are net of fees and expenses.
¨ Average annual total return since 11/30/2009.
Market Returns do not include brokerage commissions that may be payable on secondary market transactions. If brokerage commissions were included, market returns would be lower. Market and NAV returns assume that dividends and capital gain distributions have been reinvested in the Fund at market price and NAV, respectively.
(1) The market price is determined using the midpoint between the highest bid and the lowest offer on the listing exchange, as of the time that the Fund’s NAV is calculated.
± Citi 3-Month Treasury Bill Index is an unmanaged index representing monthly return equivalents of yield averages of the last 3 month Treasury Bill issues.
It is not possible to invest directly in an unmanaged index.
Performance quoted represents past performance. Past performance is not a guarantee or a reliable indicator of future results. Current performance may be lower or higher than performance shown. Investment return and the principal value of an investment will fluctuate. Shares may be worth more or less than original cost when redeemed by authorized participants. Returns shown do not reflect the deduction of taxes that a shareholder would pay on Fund distributions or on the redemption of Fund shares. Differences in the Fund’s performance versus the index and related attribution information with respect to particular categories of securities or individual positions may be attributable, in part, to differences in the pricing methodologies used by the Fund and the index. Performance data current to the most recent month-end is available at www.pimcoetfs.com or call (888) 400-4ETF.
The Fund’s total annual operating expense ratio as stated in the Fund’s current prospectus, as supplemented, is 0.36%. Details regarding any Fund’s operating expenses can be found in the Fund’s prospectus.
Investment Objective and Strategy Overview
PIMCO Enhanced Short Maturity Active Exchange-Traded Fund seeks maximum current income, consistent with preservation of capital and daily liquidity, by investing under normal circumstances at least 80% of its net assets in a diversified portfolio of Fixed Income Instruments of varying maturities, which may be represented by forwards. “Fixed Income Instruments” include bonds, debt securities and other similar instruments issued by various U.S. and non-U.S. public- or private-sector entities. The Fund primarily invests in U.S. dollar-denominated investment grade debt securities, rated Baa or higher by Moody’s Investors Service, Inc. (“Moody’s”), or equivalently rated by Standard & Poor’s Ratings Services (“S&P”) or Fitch, Inc. (“Fitch”), or, if unrated, determined by PIMCO to be of comparable quality. Fund strategies may change from time to time. The Fund may invest, without limitation, in U.S. dollar-denominated securities and instruments of foreign issuers. Please refer to the Fund’s current prospectus for more information regarding the Fund’s strategy.
Fund Insights at NAV
The following affected performance during the reporting period:
| » | | Exposure to investment grade corporate credit contributed to relative performance, as this sector generally posted positive excess returns. |
| » | | U.S. interest rate strategies contributed to performance relative to the Fund’s benchmark by, generating higher carry from yield curve roll-down. |
| » | | Exposure to securitized debt benefited performance, as these securities generally posted positive excess returns. |
| » | | Holdings of U.S. dollar-denominated emerging market debt benefited performance, as the sector generally posted positive excess returns. |
PIMCO Intermediate Municipal Bond Active Exchange-Traded Fund
Cumulative Returns Through June 30, 2017
$10,000 invested at the end of the month when the Fund commenced operations.
Allocation Breakdown as of 06/30/2017†§
| | | | |
Municipal Bonds & Notes | | | | |
Health, Hospital & Nursing Home Revenue | | | 16.0% | |
Ad Valorem Property Tax | | | 13.2% | |
College & University Revenue | | | 9.0% | |
Highway Revenue Tolls | | | 8.8% | |
Water Revenue | | | 8.0% | |
Electric Power & Light Revenue | | | 5.0% | |
Income Tax Revenue | | | 4.7% | |
Port, Airport & Marina Revenue | | | 4.1% | |
Tobacco Settlement Funded | | | 3.9% | |
Natural Gas Revenue | | | 3.3% | |
Miscellaneous Taxes | | | 3.3% | |
Miscellaneous Revenue | | | 2.9% | |
Lease (Appropriation) | | | 2.4% | |
Sales Tax Revenue | | | 2.0% | |
Appropriations | | | 2.0% | |
Industrial Revenue | | | 1.7% | |
Transit Revenue | | | 1.6% | |
General Fund | | | 1.1% | |
Sewer Revenue | | | 1.1% | |
Economic Development Revenue | | | 1.0% | |
Other | | | 3.8% | |
Short-Term Instruments | | | 0.7% | |
U.S. Treasury Obligations | | | 0.4% | |
| | † | % of Investments, at value. |
| | § | Allocation Breakdown and % of investments exclude securities sold short and financial derivative instruments, if any. |
| | | | | | | | | | | | | | |
| Average Annual Total Return for the period ended June 30, 2017 | |
| | | | | 1 Year | | | 5 Year | | | Fund Inception
(11/30/2009) | |
| | PIMCO Intermediate Municipal Bond Exchange-Traded Fund (Based on Net Asset Value) | | | (0.69)% | | | | 2.11% | | | | 3.17% | |
| | PIMCO Intermediate Municipal Bond Exchange-Traded Fund
(At Market Price)(1) | | | (0.76)% | | | | 2.10% | | | | 3.17% | |
| | Bloomberg Barclays 1-15 Year Municipal Bond Index± | | | (0.15)% | | | | 2.70% | | | | 3.63% | |
All Fund returns are net of fees and expenses.
Market Returns do not include brokerage commissions that may be payable on secondary market transactions. If brokerage commissions were included, market returns would be lower. Market and NAV returns assume that dividends and capital gain distributions have been reinvested in the Fund at market price and NAV, respectively.
(1) The market price is determined using the midpoint between the highest bid and the lowest offer on the listing exchange, as of the time that the Fund’s NAV is calculated.
± Bloomberg Barclays 1-15 Year Municipal Bond Index consists of a broad selection of investment grade general obligation and revenue bonds of maturities ranging from one year to 17 years. It is an unmanaged index representative of the tax exempt bond market.
It is not possible to invest directly in an unmanaged index.
Performance quoted represents past performance. Past performance is not a guarantee or a reliable indicator of future results. Current performance may be lower or higher than performance shown. Investment return and the principal value of an investment will fluctuate. Shares may be worth more or less than original cost when redeemed by authorized participants. Returns shown do not reflect the deduction of taxes that a shareholder would pay on Fund distributions or on the redemption of Fund shares. Differences in the Fund’s performance versus the index and related attribution information with respect to particular categories of securities or individual positions may be attributable, in part, to differences in the pricing methodologies used by the Fund and the index. Performance data current to the most recent month-end is available at www.pimcoetfs.com or call (888) 400-4ETF.
The Fund’s total annual operating expense ratio as stated in the Fund’s current prospectus, as supplemented, is 0.35%. Details regarding any Fund’s operating expenses can be found in the Fund’s prospectus.
Investment Objective and Strategy Overview
PIMCO Intermediate Municipal Bond Active Exchange-Traded Fund seeks attractive tax-exempt income, consistent with preservation of capital, by investing under normal circumstances at least 80% of its assets in a diversified portfolio of debt securities whose interest is, in the opinion of bond counsel for the issuer at the time of issuance, exempt from federal income tax (“Municipal Bonds”). The Fund does not intend to invest in Municipal Bonds whose interest is subject to the federal alternative minimum tax. The Fund may only invest in U.S. dollar-denominated investment grade debt securities, rated Baa or higher by Moody’s Investors Service, Inc. (“Moody’s”), or equivalently rated by Standard & Poor’s Ratings Services (“S&P”) or Fitch, Inc. (“Fitch”), or, if unrated, determined by PIMCO to be of comparable quality. The Fund may invest 25% or more of its total assets in Municipal Bonds that finance similar projects, such as those relating to education, health care, housing, transportation, and utilities, and 25% or more of its total assets in industrial development bonds. Fund strategies may change from time to time. Please refer to the Fund’s current prospectus for more information regarding the Fund’s strategy.
Fund Insights at NAV
The following affected performance during the reporting period:
| » | | The Fund’s effective duration (or sensitivity to changes in market interest rates) positioning was managed below the benchmark index throughout the majority of the period, which contributed to performance as Municipal Bond yields moved higher across the curve. |
| » | | Overweight exposure to the transportation sector throughout the majority of the period contributed to performance, as the segment outperformed the general municipal bond market. |
| » | | Security selection within the healthcare sector detracted from performance versus the Fund’s benchmark. |
| » | | Overweight exposure to the special tax sector throughout the majority of the period detracted from performance, as the segment underperformed the general municipal bond market. |
| » | | Security selection within the industrial revenue sector detracted from performance versus the Fund’s benchmark. |
| | | | | | |
| | ANNUAL REPORT | | JUNE 30, 2017 | | 17 |
PIMCO Short Term Municipal Bond Active Exchange-Traded Fund
Cumulative Returns Through June 30, 2017
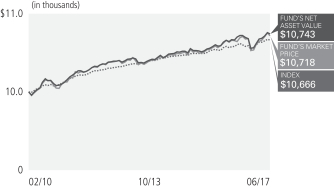
$10,000 invested at the end of the month when the Fund commenced operations.
Allocation Breakdown as of 06/30/2017†§
| | | | |
Municipal Bonds & Notes | | | | |
Health, Hospital & Nursing Home Revenue | | | 14.0% | |
Electric Power & Light Revenue | | | 13.0% | |
Ad Valorem Property Tax | | | 10.9% | |
Highway Revenue Tolls | | | 10.1% | |
Industrial Revenue | | | 6.8% | |
Miscellaneous Revenue | | | 5.3% | |
College & University Revenue | | | 3.8% | |
Resource Recovery Revenue | | | 3.7% | |
Port, Airport & Marina Revenue | | | 3.6% | |
Water Revenue | | | 3.4% | |
Sales Tax Revenue | | | 3.2% | |
Natural Gas Revenue | | | 2.7% | |
Tobacco Settlement Funded | | | 2.7% | |
Appropriations | | | 2.3% | |
General Fund | | | 1.9% | |
Miscellaneous Taxes | | | 1.8% | |
Fuel Sales Tax Revenue | | | 1.7% | |
Lease (Renewal) | | | 1.6% | |
Income Tax Revenue | | | 1.5% | |
Lease (Non-Terminable) | | | 1.2% | |
Local or Guaranteed Housing | | | 1.1% | |
Other | | | 1.7% | |
Short-Term Instruments | | | 2.0% | |
| | † | % of Investments, at value. |
| | § | Allocation Breakdown and % of investments exclude securities sold short and financial derivative instruments, if any. |
| | | | | | | | | | | | | | |
| Average Annual Total Return for the period ended June 30, 2017 | |
| | | | | 1 Year | | | 5 Year | | | Fund Inception
(02/01/2010) | |
| | PIMCO Short Term Municipal Bond Exchange-Traded Fund (Based on Net Asset Value) | | | 0.37% | | | | 0.73% | | | | 1.00% | |
| | PIMCO Short Term Municipal Bond Exchange-Traded Fund
(At Market Price)(1) | | | 0.67% | | | | 0.70% | | | | 0.97% | |
| | Bloomberg Barclays 1 Year Municipal Bond Index± | | | 0.60% | | | | 0.72% | | | | 0.90% | |
All Fund returns are net of fees and expenses.
Market Returns do not include brokerage commissions that may be payable on secondary market transactions. If brokerage commissions were included, market returns would be lower. Market and NAV returns assume that dividends and capital gain distributions have been reinvested in the Fund at market price and NAV, respectively.
(1) The market price is determined using the midpoint between the highest bid and the lowest offer on the listing exchange, as of the time that the Fund’s NAV is calculated.
± Bloomberg Barclays 1 Year Municipal Bond Index is is a rules-based, market-value-weighted index engineered for the long term tax-exempt bond market. To be included in the Index, bonds must be rated investment-grade (Baa3/BBB- or higher) by at least two of the following ratings agencies: Moody’s, S&P and Fitch. If only two of the three agencies rate the security, the lower rating is used to determine index eligibility. If only one of the three agencies rates a security, the rating must be investment-grade. They must have an outstanding par value of at least $7 million and be issued as part of a transaction of at least $75 million. The bonds must be fixed rate, have a dated-date after December 31, 1990, and must be at least one year from their maturity date. Remarketed issues, taxable municipal bonds, bonds with floating rates, and derivatives, are excluded from the benchmark.
It is not possible to invest directly in an unmanaged index.
Performance quoted represents past performance. Past performance is not a guarantee or a reliable indicator of future results. Current performance may be lower or higher than performance shown. Investment return and the principal value of an investment will fluctuate. Shares may be worth more or less than original cost when redeemed by authorized participants. Returns shown do not reflect the deduction of taxes that a shareholder would pay on Fund distributions or on the redemption of Fund shares. Differences in the Fund’s performance versus the index and related attribution information with respect to particular categories of securities or individual positions may be attributable, in part, to differences in the pricing methodologies used by the Fund and the index. Performance data current to the most recent month-end is available at www.pimcoetfs.com or call (888) 400-4ETF.
The Fund’s total annual operating expense ratio as stated in the Fund’s current prospectus, as supplemented, is 0.35%. Details regarding any Fund’s operating expenses can be found in the Fund’s prospectus.
Investment Objective and Strategy Overview
PIMCO Short Term Municipal Bond Active Exchange-Traded Fund seeks attractive tax-exempt income, consistent with preservation of capital, by investing under normal circumstances at least 80% of its assets in a diversified portfolio of debt securities whose interest is, in the opinion of bond counsel for the issuer at the time of issuance, exempt from federal income tax (“Municipal Bonds”). The Fund does not intend to invest in Municipal Bonds whose interest is subject to the federal alternative minimum tax. The Fund may only invest in U.S. dollar-denominated investment grade debt securities, rated Baa or higher by Moody’s Investors Service, Inc. (“Moody’s”), or equivalently rated by Standard & Poor’s Ratings Services (“S&P”) or Fitch, Inc. (“Fitch”), or, if unrated, determined by PIMCO to be of comparable quality. The Fund may invest 25% or more of its total assets in Municipal Bonds that finance similar projects, such as those relating to education, health care, housing, transportation, and utilities, and 25% or more of its total assets in industrial development bonds. Fund strategies may change from time to time. Please refer to the Fund’s current prospectus for more information regarding the Fund’s strategy.
Fund Insights at NAV
The following affected performance during the reporting period:
| » | | The Fund’s effective duration (or sensitivity to changes in market interest rates) positioning was managed above the benchmark index, which detracted from performance, as Municipal Bond yields moved higher across the curve. |
| » | | Security selection within the special tax sector contributed to performance versus the Fund’s benchmark index. |
| » | | Security selection within the electric utility sector contributed to performance versus the Fund’s benchmark index. |
| » | | Overweight to the health care sector contributed to performance, as the segment outperformed the general municipal bond market. |
| » | | Underweight exposure to the pre-refunded municipal bond sector detracted from performance, as the segment outperformed the general municipal bond market. |
Expense Examples
Example
As a shareholder of a Fund, you incur two types of costs: (1) transaction costs, including brokerage commissions paid on purchases and sales of Fund shares and (2) ongoing costs, including management fees and other Fund expenses. The Example is intended to help you understand your ongoing costs (in dollars) of investing in a Fund and to compare these costs with the ongoing costs of investing in other exchange-traded funds.
The Example is based on an investment of $1,000 invested at the beginning of the period and held for the entire period indicated, which for all Funds is from January 1, 2017 to June 30, 2017 unless noted otherwise in the table and footnotes below.
Actual Expenses
The information in the table under the heading “Actual” provides information about actual account values and actual expenses. You may use the information in these rows, together with the amount you invested, to estimate the expenses that you paid over the period. Simply divide your account value by $1,000 (for example, an $8,600 account value divided by $1,000 = 8.60), then multiply the result by the number in the column titled “Expenses Paid During Period” to estimate the expenses you paid on your account during this period.
Hypothetical Example For Comparison Purposes
The information in the table under the heading “Hypothetical (5% return before expenses)” provides information about hypothetical account values and hypothetical expenses based on a Fund’s actual expense ratio and an assumed rate of return of 5% per year before expenses, which is not the Fund’s actual return. The hypothetical account values and expenses may not be used to estimate the actual ending account balance or expenses you paid for the period. You may use this information to compare the ongoing costs of investing in a Fund and other exchange-traded funds. To do so, compare this 5% hypothetical example with the 5% hypothetical examples that appear in the shareholder reports of other exchange-traded funds.
Please note that the expenses shown in the table are meant to highlight your ongoing costs only and do not reflect any transactional costs, such as brokerage commissions paid on purchases and sales of shares of the Funds. Therefore, the information under the heading “Hypothetical (5% return before expenses)” is useful in comparing ongoing costs only, and will not help you determine the relative total costs of owning different exchange-traded funds. In addition, if these transactional costs were included, your costs would have been higher.
Expense ratios may vary period to period because of various factors, such as an increase in expenses not covered by the management fee (such as expenses of the independent trustees and their counsel, extraordinary expenses and interest expense).
| | | | | | | | | | | | | | | | | | | | | | | | | | | | | | | | | | | | | | | | |
| | | | | | Actual | | | | | | Hypothetical
(5% return before expenses) | | | | | | | |
| | | | | | Beginning
Account Value
(01/01/17) | | | Ending
Account Value
(06/30/17) | | | Expenses Paid
During Period* | | | | | | Beginning
Account Value
(01/01/17) | | | Ending
Account Value
(06/30/17) | | | Expenses Paid
During Period* | | | | | | Net Annualized
Expense Ratio** | |
| PIMCO 1-3 Year U.S. Treasury Index Exchange-Traded Fund | | | | | | $ | 1,000.00 | | | $ | 1,003.60 | | | $ | 0.75 | | | | | | | $ | 1,000.00 | | | $ | 1,024.05 | | | $ | 0.75 | | | | | | | | 0.15 | % |
| PIMCO 25+ Year Zero Coupon U.S. Treasury Index Exchange-Traded Fund | | | | | | | 1,000.00 | | | | 1,085.00 | | | | 0.78 | | | | | | | | 1,000.00 | | | | 1,024.05 | | | | 0.75 | | | | | | | | 0.15 | |
| PIMCO 1-5 Year U.S. TIPS Index Exchange-Traded Fund | | | | | | | 1,000.00 | | | | 1,001.30 | | | | 0.99 | | | | | | | | 1,000.00 | | | | 1,023.80 | | | | 1.00 | | | | | | | | 0.20 | |
| PIMCO 15+ Year U.S. TIPS Index Exchange-Traded Fund | | | | | | | 1,000.00 | | | | 1,017.60 | | | | 1.00 | | | | | | | | 1,000.00 | | | | 1,023.80 | | | | 1.00 | | | | | | | | 0.20 | |
| PIMCO Broad U.S. TIPS Index Exchange-Traded Fund | | | | | | | 1,000.00 | | | | 1,008.80 | | | | 1.00 | | | | | | | | 1,000.00 | | | | 1,023.80 | | | | 1.00 | | | | | | | | 0.20 | |
| PIMCO 0-5 Year High Yield Corporate Bond Index Exchange-Traded Fund | | | | | | | 1,000.00 | | | | 1,039.60 | | | | 2.78 | | | | | | | | 1,000.00 | | | | 1,022.07 | | | | 2.76 | | | | | | | | 0.55 | |
| PIMCO Investment Grade Corporate Bond Index Exchange-Traded Fund | | | | | | | 1,000.00 | | | | 1,038.90 | | | | 1.01 | | | | | | | | 1,000.00 | | | | 1,023.80 | | | | 1.00 | | | | | | | | 0.20 | |
| PIMCO Active Bond Exchange-Traded Fund | | | | | | | 1,000.00 | | | | 1,028.90 | | | | 3.22 | | | | | | | | 1,000.00 | | | | 1,021.62 | | | | 3.21 | | | | | | | | 0.64 | |
| PIMCO Enhanced Low Duration Active Exchange-Traded Fund | | | | | | | 1,000.00 | | | | 1,014.30 | | | | 3.80 | | | | | | | | 1,000.00 | | | | 1,021.03 | | | | 3.81 | | | | | | | | 0.76 | |
| PIMCO Enhanced Short Maturity Active Exchange-Traded Fund | | | | | | | 1,000.00 | | | | 1,010.40 | | | | 1.74 | | | | | | | | 1,000.00 | | | | 1,023.06 | | | | 1.76 | | | | | | | | 0.35 | |
| PIMCO Intermediate Municipal Bond Active Exchange-Traded Fund | | | | | | | 1,000.00 | | | | 1,029.90 | | | | 1.76 | | | | | | | | 1,000.00 | | | | 1,023.06 | | | | 1.76 | | | | | | | | 0.35 | |
| PIMCO Short Term Municipal Bond Active Exchange-Traded Fund | | | | | | | 1,000.00 | | | | 1,016.80 | | | | 1.75 | | | | | | | | 1,000.00 | | | | 1,023.06 | | | | 1.76 | | | | | | | | 0.35 | |
* Expenses Paid During Period are equal to the net annualized expense ratio for the Fund, multiplied by the average account value over the period, multiplied by 181/365 (to reflect the one-half year period).
** Net Annualized Expense Ratio is reflective of any applicable contractual fee waivers and/or expense reimbursements or voluntary fee waivers. Details regarding fee waivers, if any, can be found in Note 9, Fees and Expenses, in the Notes to Financial Statements.
| | | | | | |
| | ANNUAL REPORT | | JUNE 30, 2017 | | 19 |
Financial Highlights
| | | | | | | | | | | | | | | | | | | | | | | | | | | | | | | | | | | | |
| | | | | | Investment Operations | | | | | | Less Distributions(b) | |
| | | | | | | | | | | | | |
| Selected Per Share Data for the Year or Period Ended: | | Net Asset
Value
Beginning
of Year
or Period | | | Net
Investment
Income (Loss)(a) | | | Net
Realized/
Unrealized
Gain (Loss) | | | Total | | | | | | From Net
Investment
Income | | | From Net
Realized
Capital Gains | | | Tax Basis
Return of
Capital | | | Total | |
| | | | | | | | | |
PIMCO 1-3 Year U.S. Treasury Index Exchange-Traded Fund | | | | | | | | | | | | | | | | | | | | | | | | | | | | | | | | | | | | |
06/30/2017 | | $ | 51.26 | | | $ | 0.42 | | | $ | (0.55 | ) | | $ | (0.13 | ) | | | | | | $ | (0.42 | ) | | $ | (0.04 | ) | | $ | 0.00 | | | $ | (0.46 | ) |
06/30/2016 | | | 50.99 | | | | 0.35 | | | | 0.25 | | | | 0.60 | | | | | | | | (0.31 | ) | | | (0.02 | ) | | | 0.00 | | | | (0.33 | ) |
06/30/2015 | | | 50.94 | | | | 0.25 | | | | 0.11 | | | | 0.36 | | | | | | | | (0.25 | ) | | | (0.06 | ) | | | 0.00 | | | | (0.31 | ) |
06/30/2014 | | | 50.78 | | | | 0.16 | | | | 0.19 | | | | 0.35 | | | | | | | | (0.16 | ) | | | (0.03 | ) | | | 0.00 | | | | (0.19 | ) |
06/30/2013 | | | 50.98 | | | | 0.17 | | | | (0.07 | ) | | | 0.10 | | | | | | | | (0.16 | ) | | | (0.14 | ) | | | 0.00 | | | | (0.30 | ) |
| | | | | | | | | |
PIMCO 25+ Year Zero Coupon U.S. Treasury Index Exchange-Traded Fund | | | | | | | | | | | | | | | | | | | | | | | | | | | | | | | | | | | | |
06/30/2017 | | $ | 135.43 | | | $ | 3.10 | | | $ | (17.80 | ) | | $ | (14.70 | ) | | | | | | $ | (3.35 | ) | | $ | 0.00 | | | $ | 0.00 | | | $ | (3.35 | ) |
06/30/2016 | | | 105.39 | | | | 3.16 | | | | 29.17 | | | | 32.33 | | | | | | | | (2.29 | ) | | | 0.00 | | | | 0.00 | | | | (2.29 | ) |
06/30/2015 | | | 99.87 | | | | 3.18 | | | | 5.62 | | | | 8.80 | | | | | | | | (3.28 | ) | | | 0.00 | | | | 0.00 | | | | (3.28 | ) |
06/30/2014 | | | 94.57 | | | | 3.26 | | | | 5.46 | | | | 8.72 | | | | | | | | (3.42 | ) | | | 0.00 | | | | 0.00 | | | | (3.42 | ) |
06/30/2013 | | | 116.38 | | | | 3.20 | | | | (21.44 | ) | | | (18.24 | ) | | | | | | | (3.57 | ) | | | 0.00 | | | | 0.00 | | | | (3.57 | ) |
| | | | | | | | | |
PIMCO 1-5 Year U.S. TIPS Index
Exchange-Traded Fund | | | | | | | | | | | | | | | | | | | | | | | | | | | | | | | | | | | | |
06/30/2017 | | $ | 52.83 | | | $ | 0.87 | | | $ | (0.87 | ) | | $ | 0.00 | | | | | | | $ | (0.65 | ) | | $ | 0.00 | | | $ | 0.00 | | | $ | (0.65 | ) |
06/30/2016 | | | 52.18 | | | | 0.19 | | | | 0.71 | | | | 0.90 | | | | | | | | 0.00 | | | | 0.00 | | | | (0.25 | ) | | | (0.25 | ) |
06/30/2015 | | | 53.58 | | | | (0.67 | ) | | | (0.54 | ) | | | (1.21 | ) | | | | | | | (0.02 | ) | | | 0.00 | | | | (0.17 | ) | | | (0.19 | ) |
06/30/2014 | | | 52.69 | | | | 0.34 | | | | 0.86 | | | | 1.20 | | | | | | | | (0.31 | ) | | | 0.00 | | | | 0.00 | | | | (0.31 | ) |
06/30/2013 | | | 53.39 | | | | 0.02 | | | | (0.62 | ) | | | (0.60 | ) | | | | | | | (0.07 | ) | | | (0.03 | ) | | | 0.00 | | | | (0.10 | ) |
| | | | | | | | | |
PIMCO 15+ Year U.S. TIPS Index
Exchange-Traded Fund | | | | | | | | | | | | | | | | | | | | | | | | | | | | | | | | | | | | |
06/30/2017 | | $ | 69.55 | | | $ | 1.80 | | | $ | (3.74 | ) | | $ | (1.94 | ) | | | | | | $ | (1.97 | ) | | $ | 0.00 | | | $ | 0.00 | | | $ | (1.97 | ) |
06/30/2016 | | | 62.95 | | | | 1.01 | | | | 6.02 | | | | 7.03 | | | | | | | | (0.43 | ) | | | 0.00 | | | | 0.00 | | | | (0.43 | ) |
06/30/2015 | | | 65.02 | | | | 0.21 | | | | (1.83 | ) | | | (1.62 | ) | | | | | | | (0.45 | ) | | | 0.00 | | | | 0.00 | | | | (0.45 | ) |
06/30/2014 | | | 61.05 | | | | 1.09 | | | | 4.23 | | | | 5.32 | | | | | | | | (1.35 | ) | | | 0.00 | | | | 0.00 | | | | (1.35 | ) |
06/30/2013 | | | 69.22 | | | | 0.39 | | | | (8.19 | ) | | | (7.80 | ) | | | | | | | (0.37 | ) | | | 0.00 | | | | 0.00 | | | | (0.37 | ) |
| | | | | | | | | |
PIMCO Broad U.S. TIPS Index
Exchange-Traded Fund | | | | | | | | | | | | | | | | | | | | | | | | | | | | | | | | | | | | |
06/30/2017 | | $ | 59.09 | | | $ | 1.10 | | | $ | (1.61 | ) | | $ | (0.51 | ) | | | | | | $ | (0.97 | ) | | $ | 0.00 | | | $ | 0.00 | | | $ | (0.97 | ) |
06/30/2016 | | | 56.73 | | | | 0.54 | | | | 2.13 | | | | 2.67 | | | | | | | | (0.31 | ) | | | 0.00 | | | | 0.00 | | | | (0.31 | ) |
06/30/2015 | | | 58.14 | | | | 0.00 | | | | (1.17 | ) | | | (1.17 | ) | | | | | | | (0.09 | ) | | | 0.00 | | | | (0.15 | ) | | | (0.24 | ) |
06/30/2014 | | | 56.40 | | | | 0.71 | | | | 1.81 | | | | 2.52 | | | | | | | | (0.78 | ) | | | 0.00 | | | | 0.00 | | | | (0.78 | ) |
06/30/2013 | | | 59.93 | | | | 0.44 | | | | (3.66 | ) | | | (3.22 | ) | | | | | | | (0.31 | ) | | | (0.00 | )^ | | | 0.00 | | | | (0.31 | ) |
| | | | | | | | | |
PIMCO 0-5 Year High Yield Corporate Bond Index Exchange-Traded Fund | | | | | | | | | | | | | | | | | | | | | | | | | | | | | | | | | | | | |
06/30/2017 | | $ | 96.65 | | | $ | 4.60 | | | $ | 5.66 | | | $ | 10.26 | | | | | | | $ | (5.29 | ) | | $ | 0.00 | | | $ | 0.00 | | | $ | (5.29 | ) |
06/30/2016 | | | 100.37 | | | | 4.52 | | | | (3.69 | ) | | | 0.83 | | | | | | | | (4.55 | ) | | | 0.00 | | | | 0.00 | | | | (4.55 | ) |
06/30/2015 | | | 106.76 | | | | 4.06 | | | | (4.96 | ) | | | (0.90 | ) | | | | | | | (4.53 | ) | | | (0.96 | ) | | | 0.00 | | | | (5.49 | ) |
06/30/2014 | | | 102.54 | | | | 4.23 | | | | 4.83 | | | | 9.06 | | | | | | | | (4.59 | ) | | | (0.25 | ) | | | 0.00 | | | | (4.84 | ) |
06/30/2013 | | | 99.62 | | | | 4.70 | | | | 3.37 | | | | 8.07 | | | | | | | | (5.15 | ) | | | 0.00 | | | | 0.00 | | | | (5.15 | ) |
| | | | | | | | | |
PIMCO Investment Grade Corporate Bond Index Exchange-Traded Fund | | | | | | | | | | | | | | | | | | | | | | | | | | | | | | | | | | | | |
06/30/2017 | | $ | 105.72 | | | $ | 3.11 | | | $ | (0.86 | ) | | $ | 2.25 | | | | | | | $ | (3.07 | ) | | $ | 0.00 | | | $ | 0.00 | | | $ | (3.07 | ) |
06/30/2016 | | | 100.50 | | | | 3.10 | | | | 4.91 | | | | 8.01 | | | | | | | | (2.75 | ) | | | (0.04 | ) | | | 0.00 | | | | (2.79 | ) |
06/30/2015 | | | 103.21 | | | | 3.14 | | | | (2.35 | ) | | | 0.79 | | | | | | | | (3.17 | ) | | | (0.33 | ) | | | 0.00 | | | | (3.50 | ) |
06/30/2014 | | | 102.11 | | | | 3.42 | | | | 4.64 | | | | 8.06 | | | | | | | | (3.28 | ) | | | (3.68 | ) | | | 0.00 | | | | (6.96 | ) |
06/30/2013 | | | 105.46 | | | | 3.40 | | | | (2.29 | ) | | | 1.11 | | | | | | | | (3.71 | ) | | | (0.75 | ) | | | 0.00 | | | | (4.46 | ) |
| | | | | | | | | |
PIMCO Active Bond Exchange-Traded Fund | | | | | | | | | | | | | | | | | | | | | | | | | | | | | | | | | | | | |
06/30/2017 | | $ | 107.31 | | | $ | 2.88 | | | $ | (0.80 | ) | | $ | 2.08 | | | | | | | $ | (2.48 | ) | | $ | 0.00 | | | $ | (0.84 | ) | | $ | (3.32 | ) |
06/30/2016 | | | 106.69 | | | | 3.09 | | | | 1.31 | | | | 4.40 | | | | | | | | (3.78 | ) | | | 0.00 | | | | 0.00 | | | | (3.78 | ) |
06/30/2015 | | | 108.85 | | | | 2.83 | | | | 0.42 | | | | 3.25 | | | | | | | | (5.41 | ) | | | 0.00 | | | | 0.00 | | | | (5.41 | ) |
06/30/2014 | | | 105.66 | | | | 2.38 | | | | 2.94 | | | | 5.32 | | | | | | | | (1.69 | ) | | | (0.44 | ) | | | 0.00 | | | | (2.13 | ) |
06/30/2013 | | | 105.55 | | | | 2.46 | | | | 0.87 | | | | 3.33 | | | | | | | | (2.34 | ) | | | (0.88 | ) | | | 0.00 | | | | (3.22 | ) |
| | | | | | | | |
| 20 | | PIMCO ETF TRUST | | | | | See Accompanying Notes | |
| | | | | | | | | | | | | | | | | | | | | | | | | | | | | | | | | | |
| | | | | | | Ratios/Supplemental Data | |
| | | | | | | | | | Ratios to Average Net Assets | | | | |
Net Asset
Value End of
Year or
Period | | | Total Return | | | Net Assets
End of Year or
Period (000s) | | | Expenses | | | Expenses
Excluding
Waivers | | | Expenses
Excluding
Interest
Expense | | | Expenses
Excluding
Interest
Expense and
Waivers | | | Net
Investment
Income (Loss) | | | Portfolio
Turnover
Rate(c) | |
| | | | | | | | |
| | | | | | | | | | | | | | | | | | | | | | | | | | | | | | | | | | |
| $ | 50.67 | | | | (0.26 | )% | | $ | 119,187 | | | | 0.15 | % | | | 0.15 | % | | | 0.15 | % | | | 0.15 | % | | | 0.82 | % | | | 56 | % |
| | 51.26 | | | | 1.19 | | | | 151,316 | | | | 0.15 | | | | 0.15 | | | | 0.15 | | | | 0.15 | | | | 0.68 | | | | 66 | |
| | 50.99 | | | | 0.70 | | | | 107,175 | | | | 0.14 | | | | 0.16 | | | | 0.14 | | | | 0.16 | | | | 0.49 | | | | 60 | |
| | 50.94 | | | | 0.68 | | | | 127,442 | | | | 0.10 | | | | 0.16 | | | | 0.10 | | | | 0.16 | | | | 0.32 | | | | 61 | |
| | 50.78 | | | | 0.20 | | | | 129,595 | | | | 0.09 | | | | 0.15 | | | | 0.09 | | | | 0.15 | | | | 0.33 | | | | 15 | |
| | | | | | | | |
| | | | | | | | | | | | | | | | | | | | | | | | | | | | | | | | | | |
| $ | 117.38 | | | | (10.88 | )% | | $ | 166,683 | | | | 0.15 | % | | | 0.15 | % | | | 0.15 | % | | | 0.15 | % | | | 2.53 | % | | | 14 | % |
| | 135.43 | | | | 31.09 | | | | 442,851 | | | | 0.15 | | | | 0.15 | | | | 0.15 | | | | 0.15 | | | | 2.67 | | | | 23 | |
| | 105.39 | | | | 8.64 | | | | 96,960 | | | | 0.16 | | | | 0.16 | | | | 0.16 | | | | 0.16 | | | | 2.75 | | | | 18 | |
| | 99.87 | | | | 9.70 | | | | 76,902 | | | | 0.16 | | | | 0.16 | | | | 0.16 | | | | 0.16 | | | | 3.61 | | | | 18 | |
| | 94.57 | | | | (15.97 | ) | | | 82,276 | | | | 0.15 | | | | 0.15 | | | | 0.15 | | | | 0.15 | | | | 2.89 | | | | 8 | |
| | | | | | | | |
| | | | | | | | | | | | | | | | | | | | | | | | | | | | | | | | | | |
| $ | 52.18 | | | | 0.00 | % | | $ | 1,136,011 | | | | 0.20 | % | | | 0.20 | % | | | 0.20 | % | | | 0.20 | % | | | 1.64 | % | | | 38 | % |
| | 52.83 | | | | 1.74 | | | | 1,065,611 | | | | 0.20 | | | | 0.20 | | | | 0.20 | | | | 0.20 | | | | 0.36 | | | | 41 | |
| | 52.18 | | | | (2.27 | ) | | | 1,182,866 | | | | 0.20 | | | | 0.20 | | | | 0.20 | | | | 0.20 | | | | (1.28 | ) | | | 31 | |
| | 53.58 | | | | 2.28 | | | | 1,337,875 | | | | 0.20 | | | | 0.20 | | | | 0.20 | | | | 0.20 | | | | 0.63 | | | | 33 | |
| | 52.69 | | | | (1.13 | ) | | | 1,041,609 | | | | 0.20 | | | | 0.20 | | | | 0.20 | | | | 0.20 | | | | 0.04 | | | | 11 | |
| | | | | | | | |
| | | | | | | | | | | | | | | | | | | | | | | | | | | | | | | | | | |
| $ | 65.64 | | | | (2.82 | )% | | $ | 148,992 | | | | 0.20 | % | | | 0.20 | % | | | 0.20 | % | | | 0.20 | % | | | 2.66 | % | | | 16 | % |
| | 69.55 | | | | 11.25 | | | | 109,197 | | | | 0.20 | | | | 0.20 | | | | 0.20 | | | | 0.20 | | | | 1.59 | | | | 12 | |
| | 62.95 | | | | (2.52 | ) | | | 92,539 | | | | 0.21 | | | | 0.21 | | | | 0.21 | | | | 0.21 | | | | 0.31 | | | | 14 | |
| | 65.02 | | | | 8.83 | | | | 69,570 | | | | 0.21 | | | | 0.21 | | | | 0.21 | | | | 0.21 | | | | 1.81 | | | | 47 | |
| | 61.05 | | | | (11.33 | ) | | | 105,004 | | | | 0.20 | | | | 0.20 | | | | 0.20 | | | | 0.20 | | | | 0.56 | | | | 16 | |
| | | | | | | | |
| | | | | | | | | | | | | | | | | | | | | | | | | | | | | | | | | | |
| $ | 57.61 | | | | (0.87 | )% | | $ | 70,864 | | | | 0.20 | % | | | 0.20 | % | | | 0.20 | % | | | 0.20 | % | | | 1.88 | % | | | 8 | % |
| | 59.09 | | | | 4.73 | | | | 90,404 | | | | 0.20 | | | | 0.20 | | | | 0.20 | | | | 0.20 | | | | 0.96 | | | | 10 | |
| | 56.73 | | | | (2.02 | ) | | | 92,473 | | | | 0.21 | | | | 0.21 | | | | 0.21 | | | | 0.21 | | | | (0.01 | ) | | | 23 | |
| | 58.14 | | | | 4.50 | | | | 106,402 | | | | 0.21 | | | | 0.21 | | | | 0.21 | | | | 0.21 | | | | 1.26 | | | | 19 | |
| | 56.40 | | | | (5.41 | ) | | | 72,186 | | | | 0.20 | | | | 0.20 | | | | 0.20 | | | | 0.20 | | | | 0.72 | | | | 11 | |
| | | | | | | | |
| | | | | | | | | | | | | | | | | | | | | | | | | | | | | | | | | | |
| $ | 101.62 | | | | 10.88 | % | | $ | 1,824,151 | | | | 0.55 | % | | | 0.55 | % | | | 0.55 | % | | | 0.55 | % | | | 4.58 | % | | | 43 | % |
| | 96.65 | | | | 1.04 | | | | 2,044,168 | | | | 0.55 | | | | 0.55 | | | | 0.55 | | | | 0.55 | | | | 4.75 | | | | 34 | |
| | 100.37 | | | | (0.82 | ) | | | 2,805,241 | | | | 0.55 | | | | 0.55 | | | | 0.55 | | | | 0.55 | | | | 3.92 | | | | 28 | |
| | 106.76 | | | | 8.98 | | | | 5,119,202 | | | | 0.55 | | | | 0.55 | | | | 0.55 | | | | 0.55 | | | | 3.98 | | | | 28 | |
| | 102.54 | | | | 8.21 | | | | 2,307,178 | | | | 0.55 | | | | 0.55 | | | | 0.55 | | | | 0.55 | | | | 4.52 | | | | 33 | |
| | | | | | | | |
| | | | | | | | | | | | | | | | | | | | | | | | | | | | | | | | | | |
| $ | 104.90 | | | | 2.19 | % | | $ | 737,459 | | | | 0.20 | % | | | 0.20 | % | | | 0.20 | % | | | 0.20 | % | | | 2.97 | % | | | 7 | % |
| | 105.72 | | | | 8.14 | | | | 447,211 | | | | 0.20 | | | | 0.20 | | | | 0.20 | | | | 0.20 | | | | 3.05 | | | | 13 | |
| | 100.50 | | | | 0.74 | | | | 244,203 | | | | 0.20 | | | | 0.20 | | | | 0.20 | | | | 0.20 | | | | 3.04 | | | | 12 | |
| | 103.21 | | | | 8.24 | | | | 199,196 | | | | 0.20 | | | | 0.20 | | | | 0.20 | | | | 0.20 | | | | 3.36 | | | | 17 | |
| | 102.11 | | | | 0.92 | | | | 140,916 | | | | 0.20 | | | | 0.20 | | | | 0.20 | | | | 0.20 | | | | 3.15 | | | | 34 | |
| | | | | | | | |
| | | | | | | | | | | | | | | | | | | | | | | | | | | | | | | | | | |
| $ | 106.07 | | | | 2.00 | % | | $ | 2,039,657 | | | | 0.61 | % | | | 0.61 | % | | | 0.55 | % | | | 0.55 | % | | | 2.70 | % | | | 569 | % |
| | 107.31 | | | | 4.25 | | | | 2,594,821 | | | | 0.56 | | | | 0.58 | | | | 0.55 | | | | 0.57 | | | | 2.92 | | | | 475 | |
| | 106.69 | | | | 3.01 | | | | 2,489,072 | | | | 0.57 | | | | 0.63 | | | | 0.55 | | | | 0.61 | | | | 2.60 | | | | 180 | |
| | 108.85 | | | | 5.10 | | | | 3,431,844 | | | | 0.56 | | | | 0.57 | | | | 0.55 | | | | 0.56 | | | | 2.24 | | | | 577 | |
| | 105.66 | | | | 3.11 | | | | 4,398,592 | | | | 0.55 | | | | 0.55 | | | | 0.55 | | | | 0.55 | | | | 2.26 | | | | 449 | |
| | | | | | |
| | ANNUAL REPORT | | JUNE 30, 2017 | | 21 |
Financial Highlights (Cont.)
| | | | | | | | | | | | | | | | | | | | | | | | | | | | | | | | | | | | |
| | | | | | Investment Operations | | | | | | Less Distributions(b) | |
| | | | | | | | | | | | | |
| Selected Per Share Data for the Year or Period Ended: | | Net Asset
Value
Beginning
of Year
or Period | | | Net
Investment
Income (Loss)(a) | | | Net
Realized/
Unrealized
Gain (Loss) | | | Total | | | | | | From Net
Investment
Income | | | From Net
Realized
Capital Gains | | | Tax Basis
Return of
Capital | | | Total | |
| | | | | | | | | |
PIMCO Enhanced Low Duration Active Exchange-Traded Fund | | | | | | | | | | | | | | | | | | | | | | | | | | | | | | | | | | | | |
06/30/2017 | | $ | 100.23 | | | $ | 2.17 | | | $ | 0.35 | | | $ | 2.52 | | | | | | | $ | (1.73 | ) | | $ | 0.00 | | | $ | 0.00 | | | $ | (1.73 | ) |
06/30/2016 | | | 101.62 | | | | 1.97 | | | | (0.24 | ) | | | 1.73 | | | | | | | | (2.30 | ) | | | (0.82 | ) | | | 0.00 | | | | (3.12 | ) |
06/30/2015 | | | 101.27 | | | | 1.32 | | | | 1.05 | | | | 2.37 | | | | | | | | (1.77 | ) | | | (0.25 | ) | | | 0.00 | | | | (2.02 | ) |
01/22/2014 - 06/30/2014 | | | 100.00 | | | | 0.30 | | | | 1.22 | | | | 1.52 | | | | | | | | (0.25 | ) | | | 0.00 | | | | 0.00 | | | | (0.25 | ) |
| | | | | | | | | |
PIMCO Enhanced Short Maturity Active Exchange-Traded Fund | | | | | | | | | | | | | | | | | | | | | | | | | | | | | | | | | | | | |
06/30/2017 | | $ | 101.14 | | | $ | 1.45 | | | $ | 0.61 | | | $ | 2.06 | | | | | | | $ | (1.46 | ) | | $ | 0.00 | | | $ | 0.00 | | | $ | (1.46 | ) |
06/30/2016 | | | 101.15 | | | | 1.05 | | | | (0.02 | ) | | | 1.03 | | | | | | | | (1.02 | ) | | | (0.02 | ) | | | 0.00 | | | | (1.04 | ) |
06/30/2015 | | | 101.45 | | | | 0.62 | | | | (0.09 | ) | | | 0.53 | | | | | | | | (0.74 | ) | | | (0.09 | ) | | | 0.00 | | | | (0.83 | ) |
06/30/2014 | | | 101.26 | | | | 0.67 | | | | 0.36 | | | | 1.03 | | | | | | | | (0.69 | ) | | | (0.15 | ) | | | 0.00 | | | | (0.84 | ) |
06/30/2013 | | | 101.08 | | | | 0.88 | | | | 0.22 | | | | 1.10 | | | | | | | | (0.92 | ) | | | 0.00 | | | | 0.00 | | | | (0.92 | ) |
| | | | | | | | | |
PIMCO Intermediate Municipal Bond Active Exchange-Traded Fund | | | | | | | | | | | | | | | | | | | | | | | | | | | | | | | | | | | | |
06/30/2017 | | $ | 55.11 | | | $ | 1.25 | | | $ | (1.64 | ) | | $ | (0.39 | ) | | | | | | $ | (1.24 | ) | | $ | 0.00 | | | $ | 0.00 | | | $ | (1.24 | ) |
06/30/2016 | | | 52.84 | | | | 1.25 | | | | 2.15 | | | | 3.40 | | | | | | | | (1.13 | ) | | | 0.00 | | | | 0.00 | | | | (1.13 | ) |
06/30/2015 | | | 53.17 | | | | 1.12 | | | | (0.34 | ) | | | 0.78 | | | | | | | | (1.11 | ) | | | 0.00 | | | | 0.00 | | | | (1.11 | ) |
06/30/2014 | | | 52.06 | | | | 1.05 | | | | 1.13 | | | | 2.18 | | | | | | | | (1.07 | ) | | | 0.00 | | | | 0.00 | | | | (1.07 | ) |
06/30/2013 | | | 53.70 | | | | 1.23 | | | | (1.60 | ) | | | (0.37 | ) | | | | | | | (1.20 | ) | | | (0.07 | ) | | | 0.00 | | | | (1.27 | ) |
| | | | | | | | | |
PIMCO Short Term Municipal Bond Active Exchange-Traded Fund | | | | | | | | | | | | | | | | | | | | | | | | | | | | | | | | | | | | |
06/30/2017 | | $ | 50.65 | | | $ | 0.60 | | | $ | (0.41 | ) | | $ | 0.19 | | | | | | | $ | (0.59 | ) | | $ | 0.00 | | | $ | 0.00 | | | $ | (0.59 | ) |
06/30/2016 | | | 50.24 | | | | 0.48 | | | | 0.36 | | | | 0.84 | | | | | | | | (0.43 | ) | | | 0.00 | | | | 0.00 | | | | (0.43 | ) |
06/30/2015 | | | 50.47 | | | | 0.38 | | | | (0.19 | ) | | | 0.19 | | | | | | | | (0.42 | ) | | | 0.00 | | | | 0.00 | | | | (0.42 | ) |
06/30/2014 | | | 50.14 | | | | 0.26 | | | | 0.29 | | | | 0.55 | | | | | | | | (0.22 | ) | | | 0.00 | | | | 0.00 | | | | (0.22 | ) |
06/30/2013 | | | 50.54 | | | | 0.40 | | | | (0.33 | ) | | | 0.07 | | | | | | | | (0.47 | ) | | | (0.00 | )^ | | | 0.00 | | | | (0.47 | ) |
| ^ | Reflects an amount rounding to less than one cent. |
| (a) | Per share amounts based on average number of shares outstanding during the year or period. |
| (b) | The tax characterization of distributions is determined in accordance with federal income tax regulations. See Note 2, Distributions to Shareholders, in the Notes to Financial Statements for more information. |
| (c) | Portfolio turnover rate excludes securities received or delivered from in-kind processing of creation or redemptions. |
| (d) | Effective May 8, 2017, the Fund’s management fee was decreased by 0.09% to an annual rate of 0.46%. |
| | | | | | | | |
| 22 | | PIMCO ETF TRUST | | | | | See Accompanying Notes | |
| | | | | | | | | | | | | | | | | | | | | | | | | | | | | | | | | | |
| | | | | | | Ratios/Supplemental Data | |
| | | | | | | | | | Ratios to Average Net Assets | | | | |
Net Asset
Value End of
Year or
Period | | | Total Return | | | Net Assets
End of Year or
Period (000s) | | | Expenses | | | Expenses
Excluding
Waivers | | | Expenses
Excluding
Interest
Expense | | | Expenses
Excluding
Interest
Expense and
Waivers | | | Net
Investment
Income (Loss) | | | Portfolio
Turnover
Rate(c) | |
| | | | | | | | |
| | | | | | | | | | | | | | | | | | | | | | | | | | | | | | | | | | |
| $ | 101.02 | | | | 2.54 | % | | $ | 93,947 | | | | 0.67 | %(d) | | | 0.74 | %(d) | | | 0.47 | %(d) | | | 0.54 | %(d) | | | 2.15 | % | | | 651 | % |
| | 100.23 | | | | 1.75 | | | | 58,134 | | | | 0.57 | | | | 0.64 | | | | 0.55 | | | | 0.56 | | | | 1.96 | | | | 2,288 | |
| | 101.62 | | | | 2.37 | | | | 175,808 | | | | 0.52 | | | | 0.57 | | | | 0.50 | | | | 0.55 | | | | 1.30 | | | | 1,591 | |
| | 101.27 | | | | 1.52 | | | | 139,750 | | | | 0.56 | * | | | 0.69 | * | | | 0.56 | * | | | 0.69 | * | | | 0.69 | * | | | 4,098 | |
| | | | | | | | |
| | | | | | | | | | | | | | | | | | | | | | | | | | | | | | | | | | |
| $ | 101.74 | | | | 2.05 | % | | $ | 7,195,945 | | | | 0.35 | % | | | 0.35 | % | | | 0.35 | % | | | 0.35 | % | | | 1.43 | % | | | 82 | % |
| | 101.14 | | | | 1.03 | | | | 4,647,542 | | | | 0.36 | | | | 0.36 | | | | 0.35 | | | | 0.35 | | | | 1.04 | | | | 208 | |
| | 101.15 | | | | 0.53 | | | | 3,536,050 | | | | 0.36 | | | | 0.36 | | | | 0.35 | | | | 0.35 | | | | 0.61 | | | | 193 | |
| | 101.45 | | | | 1.02 | | | | 3,773,896 | | | | 0.35 | | | | 0.35 | | | | 0.35 | | | | 0.35 | | | | 0.66 | | | | 188 | |
| | 101.26 | | | | 1.09 | | | | 3,752,615 | | | | 0.35 | | | | 0.35 | | | | 0.35 | | | | 0.35 | | | | 0.87 | | | | 100 | |
| | | | | | | | |
| | | | | | | | | | | | | | | | | | | | | | | | | | | | | | | | | | |
| $ | 53.48 | | | | (0.69 | )% | | $ | 259,917 | | | | 0.35 | % | | | 0.35 | % | | | 0.35 | % | | | 0.35 | % | | | 2.33 | % | | | 30 | % |
| | 55.11 | | | | 6.52 | | | | 254,045 | | | | 0.35 | | | | 0.35 | | | | 0.35 | | | | 0.35 | | | | 2.32 | | | | 23 | |
| | 52.84 | | | | 1.45 | | | | 227,728 | | | | 0.35 | | | | 0.35 | | | | 0.35 | | | | 0.35 | | | | 2.09 | | | | 13 | |
| | 53.17 | | | | 4.23 | | | | 210,548 | | | | 0.35 | | | | 0.35 | | | | 0.35 | | | | 0.35 | | | | 2.01 | | | | 15 | |
| | 52.06 | | | | (0.76 | ) | | | 187,931 | | | | 0.35 | | | | 0.35 | | | | 0.35 | | | | 0.35 | | | | 2.26 | | | | 35 | |
| | | | | | | | |
| | | | | | | | | | | | | | | | | | | | | | | | | | | | | | | | | | |
| $ | 50.25 | | | | 0.37 | % | | $ | 65,826 | | | | 0.35 | % | | | 0.35 | % | | | 0.35 | % | | | 0.35 | % | | | 1.20 | % | | | 80 | % |
| | 50.65 | | | | 1.67 | | | | 68,881 | | | | 0.35 | | | | 0.35 | | | | 0.35 | | | | 0.35 | | | | 0.95 | | | | 36 | |
| | 50.24 | | | | 0.37 | | | | 55,765 | | | | 0.35 | | | | 0.35 | | | | 0.35 | | | | 0.35 | | | | 0.76 | | | | 20 | |
| | 50.47 | | | | 1.10 | | | | 76,211 | | | | 0.35 | | | | 0.35 | | | | 0.35 | | | | 0.35 | | | | 0.51 | | | | 44 | |
| | 50.14 | | | | 0.14 | | | | 60,671 | | | | 0.35 | | | | 0.35 | | | | 0.35 | | | | 0.35 | | | | 0.79 | | | | 42 | |
| | | | | | |
| | ANNUAL REPORT | | JUNE 30, 2017 | | 23 |
Statements of Assets and Liabilities
| | | | | | | | | | | | | | | | |
| (Amounts in thousands†, except per share amounts) | | PIMCO
1-3 Year U.S.
Treasury Index
Exchange-
Traded Fund | | | PIMCO
25+ Year Zero
Coupon U.S.
Treasury Index
Exchange-
Traded Fund | | | PIMCO
1-5 Year U.S.
TIPS Index
Exchange-
Traded Fund | | | PIMCO
15+ Year U.S.
TIPS Index
Exchange-
Traded Fund | |
| | | | |
Assets: | | | | | | | | | | | | | | | | |
Investments, at value | | | | | | | | | | | | | | | | |
Investments in securities*^ | | $ | 117,938 | | | $ | 174,530 | | | $ | 1,129,369 | | | $ | 147,725 | |
Investments in Affiliates | | | 0 | | | | 0 | | | | 0 | | | | 0 | |
Financial Derivative Instruments | | | | | | | | | | | | | | | | |
Exchange-traded or centrally cleared | | | 0 | | | | 0 | | | | 0 | | | | 0 | |
Over the counter | | | 0 | | | | 0 | | | | 0 | | | | 0 | |
Cash | | | 0 | | | | 0 | | | | 0 | | | | 16 | |
Deposits with counterparty | | | 0 | | | | 0 | | | | 0 | | | | 0 | |
Foreign currency, at value | | | 0 | | | | 0 | | | | 0 | | | | 0 | |
Receivable for investments sold | | | 6,350 | | | | 0 | | | | 3,480 | | | | 4,600 | |
Receivable for investments sold on a delayed-delivery basis | | | 0 | | | | 0 | | | | 0 | | | | 0 | |
Receivable for TBA investments sold | | | 0 | | | | 0 | | | | 0 | | | | 0 | |
Receivable for Fund shares sold | | | 0 | | | | 0 | | | | 0 | | | | 0 | |
Interest and/or dividends receivable | | | 541 | | | | 0 | | | | 3,370 | | | | 645 | |
Other assets | | | 0 | | | | 0 | | | | 0 | | | | 0 | |
Total Assets | | | 124,829 | | | | 174,530 | | | | 1,136,219 | | | | 152,986 | |
| | | | |
Liabilities: | | | | | | | | | | | | | | | | |
Borrowings & Other Financing Transactions | | | | | | | | | | | | | | | | |
Payable for reverse repurchase agreements | | $ | 0 | | | $ | 0 | | | $ | 0 | | | $ | 0 | |
Payable for sale-buyback transactions | | | 0 | | | | 0 | | | | 0 | | | | 0 | |
Payable for short sales | | | 0 | | | | 0 | | | | 0 | | | | 0 | |
Financial Derivative Instruments | | | | | | | | | | | | | | | | |
Exchange-traded or centrally cleared | | | 0 | | | | 0 | | | | 0 | | | | 0 | |
Over the counter | | | 0 | | | | 0 | | | | 0 | | | | 0 | |
Payable for investments purchased | | | 5,624 | | | | 7,821 | | | | 0 | | | | 3,965 | |
Payable for TBA investments purchased | | | 0 | | | | 0 | | | | 0 | | | | 0 | |
Payable upon return of securities loaned | | | 0 | | | | 0 | | | | 0 | | | | 0 | |
Deposits from counterparty | | | 0 | | | | 0 | | | | 0 | | | | 0 | |
Overdraft due to custodian | | | 0 | | | | 1 | | | | 0 | | | | 0 | |
Accrued management fees | | | 16 | | | | 23 | | | | 199 | | | | 27 | |
Accrued reimbursement to PIMCO | | | 2 | | | | 1 | | | | 0 | | | | 1 | |
Other liabilities | | | 0 | | | | 1 | | | | 9 | | | | 1 | |
Total Liabilities | | | 5,642 | | | | 7,847 | | | | 208 | | | | 3,994 | |
| | | | |
Net Assets | | $ | 119,187 | | | $ | 166,683 | | | $ | 1,136,011 | | | $ | 148,992 | |
| | | | |
Paid in capital | | | 119,688 | | | | 201,763 | | | | 1,155,421 | | | | 164,722 | |
Undistributed (overdistributed) net investment income | | | 84 | | | | 1,188 | | | | 2,601 | | | | 944 | |
Accumulated undistributed net realized gain (loss) | | | (94 | ) | | | (22,189 | ) | | | (14,425 | ) | | | (11,963 | ) |
Net unrealized appreciation (depreciation) | | | (491 | ) | | | (14,079 | ) | | | (7,586 | ) | | | (4,711 | ) |
| | | | |
Net Assets | | $ | 119,187 | | | $ | 166,683 | | | $ | 1,136,011 | | | $ | 148,992 | |
| | | | |
Shares Issued and Outstanding | | | 2,352 | | | | 1,420 | | | | 21,770 | | | | 2,270 | |
| | | | |
Net Asset Value Per Share Outstanding: | | $ | 50.67 | | | $ | 117.38 | | | $ | 52.18 | | | $ | 65.64 | |
| | | | |
Cost of investments in securities | | $ | 118,429 | | | $ | 188,609 | | | $ | 1,136,955 | | | $ | 152,436 | |
Cost of investments in Affiliates | | $ | 0 | | | $ | 0 | | | $ | 0 | | | $ | 0 | |
Cost of foreign currency held | | $ | 0 | | | $ | 0 | | | $ | 0 | | | $ | 0 | |
Proceeds received on short sales | | $ | 0 | | | $ | 0 | | | $ | 0 | | | $ | 0 | |
Cost or premiums of financial derivative instruments, net | | $ | 0 | | | $ | 0 | | | $ | 0 | | | $ | 0 | |
| | | | |
* Includes repurchase agreements of: | | $ | 178 | | | $ | 8,720 | | | $ | 417 | | | $ | 0 | |
^ Includes securities on loan of: | | $ | 0 | | | $ | 0 | | | $ | 0 | | | $ | 0 | |
| † | A zero balance may reflect actual amounts rounding to less than one thousand. |
| | | | | | | | |
| 24 | | PIMCO ETF TRUST | | | | | See Accompanying Notes | |
June 30, 2017
| | | | | | | | | | | | | | | | | | | | | | | | | | | | | | |
PIMCO
Broad U.S.
TIPS Index
Exchange-
Traded Fund | | | PIMCO
0-5 Year High
Yield Corporate
Bond Index
Exchange-
Traded Fund | | | PIMCO
Investment
Grade Corporate
Bond Index
Exchange-
Traded Fund | | | PIMCO
Active Bond
Exchange-
Traded Fund | | | PIMCO
Enhanced Low
Duration Active
Exchange-
Traded Fund | | | PIMCO
Enhanced Short
Maturity Active
Exchange-
Traded Fund | | | PIMCO
Intermediate
Municipal
Bond Active
Exchange-
Traded Fund | | | PIMCO
Short Term
Municipal
Bond Active
Exchange-
Traded Fund | |
| | | | | | | |
| | | | | | | | | | | | | | | | | | | | | | | | | | | | | | |
| | | | | | | | | | | | | | | | | | | | | | | | | | | | | | | |
| $ | 69,748 | | | $ | 1,974,740 | | | $ | 734,873 | | | $ | 2,657,036 | | | $ | 141,509 | | | $ | 7,259,845 | | | $ | 257,162 | | | $ | 67,146 | |
| | 0 | | | | 45,886 | | | | 0 | | | | 0 | | | | 0 | | | | 0 | | | | 0 | | | | 0 | |
| | | | | | | | | | | | | | | | | | | | | | | | | | | | | | | |
| | 0 | | | | 350 | | | | 12 | | | | 149 | | | | 35 | | | | 0 | | | | 0 | | | | 0 | |
| | 0 | | | | 0 | | | | 0 | | | | 7,985 | | | | 100 | | | | 0 | | | | 0 | | | | 0 | |
| | 0 | | | | 0 | | | | 0 | | | | 0 | | | | 83 | | | | 6,032 | | | | 0 | | | | 97 | |
| | 0 | | | | 10,646 | | | | 1,142 | | | | 1,722 | | | | 881 | | | | 0 | | | | 0 | | | | 0 | |
| | 0 | | | | 0 | | | | 0 | | | | 190 | | | | 20 | | | | 0 | | | | 0 | | | | 0 | |
| | 986 | | | | 21,245 | | | | 1,412 | | | | 4,828 | | | | 0 | | | | 545 | | | | 0 | | | | 0 | |
| | 0 | | | | 585 | | | | 0 | | | | 10,368 | | | | 0 | | | | 0 | | | | 0 | | | | 0 | |
| | 0 | | | | 0 | | | | 0 | | | | 567,814 | | | | 0 | | | | 0 | | | | 0 | | | | 0 | |
| | 0 | | | | 0 | | | | 0 | | | | 5,304 | | | | 0 | | | | 42,727 | | | | 0 | | | | 0 | |
| | 342 | | | | 26,091 | | | | 7,336 | | | | 13,603 | | | | 806 | | | | 32,535 | | | | 2,837 | | | | 481 | |
| | 0 | | | | 3,000 | | | | 0 | | | | 2 | | | | 0 | | | | 0 | | | | 0 | | | | 0 | |
| | 71,076 | | | | 2,082,543 | | | | 744,775 | | | | 3,269,001 | | | | 143,434 | | | | 7,341,684 | | | | 259,999 | | | | 67,724 | |
| | | | | | | |
| | | | | | | | | | | | | | | | | | | | | | | | | | | | | | |
| | | | | | | | | | | | | | | | | | | | | | | | | | | | | | | |
| $ | 0 | | | $ | 0 | | | $ | 0 | | | $ | 73,245 | | | $ | 39,403 | | | $ | 0 | | | $ | 0 | | | $ | 0 | |
| | 0 | | | | 0 | | | | 0 | | | | 484,101 | | | | 4,990 | | | | 0 | | | | 0 | | | | 0 | |
| | 0 | | | | 0 | | | | 0 | | | | 122,130 | | | | 0 | | | | 0 | | | | 0 | | | | 0 | |
| | | | | | | | | | | | | | | | | | | | | | | | | | | | | | | |
| | 0 | | | | 119 | | | | 0 | | | | 2 | | | | 9 | | | | 0 | | | | 0 | | | | 0 | |
| | 0 | | | | 0 | | | | 0 | | | | 16,687 | | | | 205 | | | | 0 | | | | 0 | | | | 0 | |
| | 198 | | | | 208,450 | | | | 7,183 | | | | 32,334 | | | | 4,847 | | | | 143,510 | | | | 0 | | | | 1,877 | |
| | 0 | | | | 0 | | | | 0 | | | | 494,952 | | | | 0 | | | | 0 | | | | 0 | | | | 0 | |
| | 0 | | | | 48,886 | | | | 0 | | | | 0 | | | | 0 | | | | 0 | | | | 0 | | | | 0 | |
| | 0 | | | | 0 | | | | 0 | | | | 4,893 | | | | 0 | | | | 0 | | | | 0 | | | | 0 | |
| | 0 | | | | 35 | | | | 0 | | | | 0 | | | | 0 | | | | 0 | | | | 0 | | | | 0 | |
| | 12 | | | | 885 | | | | 128 | | | | 982 | | | | 31 | | | | 2,175 | | | | 80 | | | | 20 | |
| | 1 | | | | 0 | | | | 0 | | | | 0 | | | | 1 | | | | 0 | | | | 0 | | | | 0 | |
| | 1 | | | | 17 | | | | 5 | | | | 18 | | | | 1 | | | | 54 | | | | 2 | | | | 1 | |
| | 212 | | | | 258,392 | | | | 7,316 | | | | 1,229,344 | | | | 49,487 | | | | 145,739 | | | | 82 | | | | 1,898 | |
| | | | | | | |
| $ | 70,864 | | | $ | 1,824,151 | | | $ | 737,459 | | | $ | 2,039,657 | | | $ | 93,947 | | | $ | 7,195,945 | | | $ | 259,917 | | | $ | 65,826 | |
| | | | | | | |
| | 73,510 | | | | 1,942,515 | | | | 723,995 | | | | 2,062,692 | | | | 95,465 | | | | 7,161,558 | | | | 255,588 | | | | 65,995 | |
| | 190 | | | | 5,459 | | | | 1,988 | | | | 7,723 | | | | 333 | | | | 10,918 | | | | 565 | | | | 40 | |
| | (930 | ) | | | (134,450 | ) | | | (702 | ) | | | (30,550 | ) | | | (2,419 | ) | | | (2,203 | ) | | | (4,088 | ) | | | (600 | ) |
| | (1,906 | ) | | | 10,627 | | | | 12,178 | | | | (208 | ) | | | 568 | | | | 25,672 | | | | 7,852 | | | | 391 | |
| | | | | | | |
| $ | 70,864 | | | $ | 1,824,151 | | | $ | 737,459 | | | $ | 2,039,657 | | | $ | 93,947 | | | $ | 7,195,945 | | | $ | 259,917 | | | $ | 65,826 | |
| | | | | | | |
| | 1,230 | | | | 17,950 | | | | 7,030 | | | | 19,230 | | | | 930 | | | | 70,730 | | | | 4,860 | | | | 1,310 | |
| | | | | | | |
| $ | 57.61 | | | $ | 101.62 | | | $ | 104.90 | | | $ | 106.07 | | | $ | 101.02 | | | $ | 101.74 | | | $ | 53.48 | | | $ | 50.25 | |
| | | | | | | |
| $ | 71,654 | | | $ | 1,971,242 | | | $ | 722,846 | | | $ | 2,651,585 | | | $ | 140,915 | | | $ | 7,234,173 | | | $ | 249,310 | | | $ | 66,755 | |
| $ | 0 | | | $ | 45,886 | | | $ | 0 | | | $ | 0 | | | $ | 0 | | | $ | 0 | | | $ | 0 | | | $ | 0 | |
| $ | 0 | | | $ | 0 | | | $ | 0 | | | $ | 186 | | | $ | 20 | | | $ | 0 | | | $ | 0 | | | $ | 0 | |
| $ | 0 | | | $ | 0 | | | $ | 0 | | | $ | 122,524 | | | $ | 0 | | | $ | 0 | | | $ | 0 | | | $ | 0 | |
| $ | 0 | | | $ | 0 | | | $ | 0 | | | $ | (2,344 | ) | | $ | 0 | | | $ | 0 | | | $ | 0 | | | $ | 0 | |
| | | | | | | |
| $ | 212 | | | $ | 339,141 | | | $ | 22,670 | | | $ | 1,404 | | | $ | 1,152 | | | $ | 24,200 | | | $ | 1,143 | | | $ | 0 | |
| $ | 0 | | | $ | 47,908 | | | $ | 0 | | | $ | 0 | | | $ | 0 | | | $ | 0 | | | $ | 0 | | | $ | 0 | |
| | | | | | |
| | ANNUAL REPORT | | JUNE 30, 2017 | | 25 |
Statements of Operations
| | | | | | | | | | | | | | | | |
| Year Ended June 30, 2017 | | | | | | | | | | | | |
| (Amounts in thousands†) | | PIMCO
1-3 Year U.S.
Treasury Index
Exchange-
Traded Fund | | | PIMCO
25+ Year Zero
Coupon U.S.
Treasury Index
Exchange-
Traded Fund | | | PIMCO
1-5 Year U.S.
TIPS Index
Exchange-
Traded Fund | | | PIMCO
15+ Year U.S.
TIPS Index
Exchange-
Traded Fund | |
| | | | |
Investment Income: | | | | | | | | | | | | | | | | |
Interest, net of foreign taxes* | | $ | 1,282 | | | $ | 5,562 | | | $ | 20,278 | | | $ | 3,347 | |
Dividends from Investments in Affiliates | | | 0 | | | | 0 | | | | 0 | | | | 0 | |
Securities lending income | | | 0 | | | | 0 | | | | 0 | | | | 0 | |
Total Income | | | 1,282 | | | | 5,562 | | | | 20,278 | | | | 3,347 | |
| | | | |
Expenses: | | | | | | | | | | | | | | | | |
Management fees | | | 198 | | | | 313 | | | | 2,194 | | | | 234 | |
Trustee fees | | | 6 | | | | 9 | | | | 47 | | | | 5 | |
Interest expense | | | 0 | | | | 1 | | | | 0 | | | | 0 | |
Miscellaneous expense | | | 7 | | | | 10 | | | | 0 | | | | 6 | |
Total Expenses | | | 211 | | | | 333 | | | | 2,241 | | | | 245 | |
Waiver and/or Reimbursement by PIMCO | | | (6 | ) | | | (9 | ) | | | 0 | | | | (5 | ) |
Net Expenses | | | 205 | | | | 324 | | | | 2,241 | | | | 240 | |
| | | | |
Net Investment Income (Loss) | | | 1,077 | | | | 5,238 | | | | 18,037 | | | | 3,107 | |
| | | | |
Net Realized Gain (Loss): | | | | | | | | | | | | | | | | |
Investments in securities | | | (63 | ) | | | (3,772 | ) | | | (1,054 | ) | | | (1,173 | ) |
In-kind redemptions | | | 108 | | | | 28,734 | | | | 1,516 | | | | 1,497 | |
Exchange-traded or centrally cleared financial derivative instruments | | | 0 | | | | 0 | | | | 0 | | | | 0 | |
Over the counter financial derivative instruments | | | 0 | | | | 0 | | | | 0 | | | | 0 | |
Short sales | | | 0 | | | | 0 | | | | 0 | | | | 0 | |
Foreign currency | | | 0 | | | | 0 | | | | 0 | | | | 0 | |
| | | | |
Net Realized Gain (Loss) | | | 45 | | | | 24,962 | | | | 462 | | | | 324 | |
| | | | |
Net Change in Unrealized Appreciation (Depreciation): | | | | | | | | | | | | | | | | |
Investments in securities | | | (1,384 | ) | | | (42,256 | ) | | | (18,307 | ) | | | (5,512 | ) |
Exchange-traded or centrally cleared financial derivative instruments | | | 0 | | | | 0 | | | | 0 | | | | 0 | |
Over the counter financial derivative instruments | | | 0 | | | | 0 | | | | 0 | | | | 0 | |
Short sales | | | 0 | | | | 0 | | | | 0 | | | | 0 | |
Foreign currency assets and liabilities | | | 0 | | | | 0 | | | | 0 | | | | 0 | |
| | | | |
Net Change in Unrealized Appreciation (Depreciation) | | | (1,384 | ) | | | (42,256 | ) | | | (18,307 | ) | | | (5,512 | ) |
| | | | |
Net Increase (Decrease) in Net Assets Resulting from Operations | | $ | (262 | ) | | $ | (12,056 | ) | | $ | 192 | | | $ | (2,081 | ) |
| | | | |
* Foreign tax withholdings | | $ | 0 | | | $ | 0 | | | $ | 0 | | | $ | 0 | |
| † | A zero balance may reflect actual amounts rounding to less than one thousand. |
| | | | | | | | |
| 26 | | PIMCO ETF TRUST | | | | | See Accompanying Notes | |
| | | | | | | | | | | | | | | | | | | | | | | | | | | | | | |
| | | | | | | | | | | | | | | | | | | | | | | |
PIMCO
Broad U.S.
TIPS Index
Exchange-
Traded Fund | | | PIMCO
0-5 Year High
Yield Corporate
Bond Index
Exchange-
Traded Fund | | | PIMCO
Investment
Grade Corporate
Bond Index
Exchange-
Traded Fund | | | PIMCO
Active Bond
Exchange-
Traded Fund | | | PIMCO
Enhanced Low
Duration Active
Exchange-
Traded Fund | | | PIMCO
Enhanced Short
Maturity Active
Exchange-
Traded Fund | | | PIMCO
Intermediate
Municipal
Bond Active
Exchange-
Traded Fund | | | PIMCO
Short Term
Municipal
Bond Active
Exchange-
Traded Fund | |
| | | | | | | |
| | | | | | | | | | | | | | | | | | | | | | | | | | | | | | |
| $ | 1,583 | | | $ | 100,688 | | | $ | 19,111 | | | $ | 75,671 | | | $ | 2,176 | | | $ | 101,835 | | | $ | 7,006 | | | $ | 1,051 | |
| | 0 | | | | 244 | | | | 0 | | | | 0 | | | | 0 | | | | 5 | | | | 0 | | | | 0 | |
| | 0 | | | | 859 | | | | 1 | | | | 0 | | | | 0 | | | | 5 | | | | 0 | | | | 0 | |
| | 1,583 | | | | 101,791 | | | | 19,112 | | | | 75,671 | | | | 2,176 | | | | 101,845 | | | | 7,006 | | | | 1,051 | |
| | | | | | | |
| | | | | | | | | | | | | | | | | | | | | | | | | | | | | | |
| | 152 | | | | 10,899 | | | | 1,204 | | | | 12,559 | | | | 411 | | | | 19,985 | | | | 915 | | | | 237 | |
| | 3 | | | | 88 | | | | 22 | | | | 103 | | | | 3 | | | | 222 | | | | 11 | | | | 3 | |
| | 0 | | | | 0 | | | | 0 | | | | 1,461 | | | | 156 | | | | 239 | | | | 0 | | | | 0 | |
| | 4 | | | | 0 | | | | 0 | | | | 5 | | | | 4 | | | | 0 | | | | 0 | | | | 0 | |
| | 159 | | | | 10,987 | | | | 1,226 | | | | 14,128 | | | | 574 | | | | 20,446 | | | | 926 | | | | 240 | |
| | (3 | ) | | | 0 | | | | 0 | | | | (104 | ) | | | (51 | ) | | | 0 | | | | 0 | | | | 0 | |
| | 156 | | | | 10,987 | | | | 1,226 | | | | 14,024 | | | | 523 | | | | 20,446 | | | | 926 | | | | 240 | |
| | | | | | | |
| | 1,427 | | | | 90,804 | | | | 17,886 | | | | 61,647 | | | | 1,653 | | | | 81,399 | | | | 6,080 | | | | 811 | |
| | | | | | | |
| | | | | | | | | | | | | | | | | | | | | | | | | | | | | | |
| | (27 | ) | | | (12,932 | ) | | | 279 | | | | (12,888 | ) | | | 854 | | | | 6,176 | | | | (2,191 | ) | | | (384 | ) |
| | 1,211 | | | | 31,265 | | | | (1,333 | ) | | | 0 | | | | 0 | | | | 122 | | | | 0 | | | | 0 | |
| | 0 | | | | 19,886 | | | | 464 | | | | (14,989 | ) | | | (914 | ) | | | 0 | | | | 0 | | | | 0 | |
| | 0 | | | | 35 | | | | 2 | | | | 8,052 | | | | 71 | | | | 0 | | | | 0 | | | | 0 | |
| | 0 | | | | 0 | | | | 0 | | | | 4 | | | | (7 | ) | | | 0 | | | | 0 | | | | 0 | |
| | 0 | | | | 0 | | | | 0 | | | | (6,341 | ) | | | 6 | | | | 0 | | | | 0 | | | | 0 | |
| | | | | | | |
| | 1,184 | | | | 38,254 | | | | (588 | ) | | | (26,162 | ) | | | 10 | | | | 6,298 | | | | (2,191 | ) | | | (384 | ) |
| | | | | | | |
| | | | | | | | | | | | | | | | | | | | | | | | | | | | | | |
| | (2,677 | ) | | | 72,493 | | | | (2,910 | ) | | | (68,528 | ) | | | 46 | | | | 26,398 | | | | (5,467 | ) | | | (249 | ) |
| | 0 | | | | 2,532 | | | | 137 | | | | 54,922 | | | | 381 | | | | 0 | | | | 0 | | | | 0 | |
| | 0 | | | | 0 | | | | 0 | | | | 13,517 | | | | (208 | ) | | | 0 | | | | 0 | | | | 0 | |
| | 0 | | | | 0 | | | | 0 | | | | 395 | | | | 0 | | | | 0 | | | | 0 | | | | 0 | |
| | 0 | | | | 0 | | | | 0 | | | | 59 | | | | (3 | ) | | | 0 | | | | 0 | | | | 0 | |
| | | | | | | |
| | (2,677 | ) | | | 75,025 | | | | (2,773 | ) | | | 365 | | | | 216 | | | | 26,398 | | | | (5,467 | ) | | | (249 | ) |
| | | | | | | |
| $ | (66 | ) | | $ | 204,083 | | | $ | 14,525 | | | $ | 35,850 | | | $ | 1,879 | | | $ | 114,095 | | | $ | (1,578 | ) | | $ | 178 | |
| | | | | | | |
| $ | 0 | | | $ | 1 | | | $ | 0 | | | $ | 0 | | | $ | 0 | | | $ | 0 | | | $ | 0 | | | $ | 0 | |
| | | | | | |
| | ANNUAL REPORT | | JUNE 30, 2017 | | 27 |
Statements of Changes in Net Assets
| | | | | | | | | | | | | | | | |
| | | PIMCO
1-3 Year U.S. Treasury Index
Exchange-Traded Fund | | | PIMCO
25+ Year Zero Coupon
U.S. Treasury Index
Exchange-Traded Fund | |
| | | | |
| (Amounts in thousands†) | | Year Ended
June 30, 2017 | | | Year Ended
June 30, 2016 | | | Year Ended
June 30, 2017 | | | Year Ended
June 30, 2016 | |
| | | | |
Increase (Decrease) in Net Assets from: | | | | | | | | | | | | | | | | |
| | | | |
Operations: | | | | | | | | | | | | | | | | |
Net investment income (loss) | | $ | 1,077 | | | $ | 872 | | | $ | 5,238 | | | $ | 5,361 | |
Net realized gain (loss) | | | 45 | | | | 147 | | | | 24,962 | | | | 2,619 | |
Net change in unrealized appreciation (depreciation) | | | (1,384 | ) | | | 712 | | | | (42,256 | ) | | | 43,834 | |
| | | | |
Net Increase (Decrease) in Net Assets Resulting from Operations | | | (262 | ) | | | 1,731 | | | | (12,056 | ) | | | 51,814 | |
| | | | |
Distributions to Shareholders: | | | | | | | | | | | | | | | | |
From net investment income | | | (1,065 | ) | | | (773 | ) | | | (5,636 | ) | | | (3,812 | ) |
From net realized capital gains | | | (71 | ) | | | (50 | ) | | | 0 | | | | 0 | |
Tax basis return of capital | | | 0 | | | | 0 | | | | 0 | | | | 0 | |
| | | | |
Total Distributions(a) | | | (1,136 | ) | | | (823 | ) | | | (5,636 | ) | | | (3,812 | ) |
| | | | |
Fund Share Transactions: | | | | | | | | | | | | | | | | |
Receipts for shares sold | | | 50,723 | | | | 86,563 | | | | 84,145 | | | | 436,758 | |
Cost of shares redeemed | | | (81,454 | ) | | | (43,330 | ) | | | (342,621 | ) | | | (138,869 | ) |
Net increase (decrease) resulting from Fund share transactions | | | (30,731 | ) | | | 43,233 | | | | (258,476 | ) | | | 297,889 | |
| | | | |
Total Increase (Decrease) in Net Assets | | | (32,129 | ) | | | 44,141 | | | | (276,168 | ) | | | 345,891 | |
| | | | |
Net Assets: | | | | | | | | | | | | | | | | |
Beginning of year | | | 151,316 | | | | 107,175 | | | | 442,851 | | | | 96,960 | |
End of year* | | $ | 119,187 | | | $ | 151,316 | | | $ | 166,683 | | | $ | 442,851 | |
| | | | |
* Including undistributed (overdistributed) net investment income of: | | $ | 84 | | | $ | 72 | | | $ | 1,188 | | | $ | 1,586 | |
| | | | |
Shares of Beneficial Interest: | | | | | | | | | | | | | | | | |
Shares sold | | | 1,000 | | | | 1,700 | | | | 750 | | | | 3,550 | |
Shares redeemed | | | (1,600 | ) | | | (850 | ) | | | (2,600 | ) | | | (1,200 | ) |
Net increase (decrease) in shares outstanding | | | (600 | ) | | | 850 | | | | (1,850 | ) | | | 2,350 | |
| † | A zero balance may reflect actual amounts rounding to less than one thousand. |
| (a) | The tax characterization of distributions is determined in accordance with federal income tax regulations. See Note 2, Distributions to Shareholders, in the Notes to Financial Statements for more information. |
| | | | | | | | |
| 28 | | PIMCO ETF TRUST | | | | | See Accompanying Notes | |
| | | | | | | | | | | | | | | | | | | | | | | | | | | | | | | | | | | | | | |
PIMCO
1-5 Year U.S. TIPS Index
Exchange-Traded Fund | | | PIMCO
15+ Year U.S. TIPS Index
Exchange-Traded Fund | | | PIMCO
Broad U.S. TIPS Index
Exchange-Traded Fund | | | PIMCO
0-5 Year High Yield
Corporate Bond Index
Exchange-Traded Fund | | | PIMCO
Investment Grade
Corporate Bond Index
Exchange-Traded Fund | |
| | | | | | | | | |
Year Ended
June 30, 2017 | | | Year Ended
June 30, 2016 | | | Year Ended
June 30, 2017 | | | Year Ended
June 30, 2016 | | | Year Ended
June 30, 2017 | | | Year Ended
June 30, 2016 | | | Year Ended
June 30, 2017 | | | Year Ended
June 30, 2016 | | | Year Ended
June 30, 2017 | | | Year Ended
June 30, 2016 | |
| | | | | | | | | |
| | | | | | | | | | | | | | | | | | | | | | | | | | | | | | | | | | | | | | |
| | | | | | | | | |
| | | | | | | | | | | | | | | | | | | | | | | | | | | | | | | | | | | | | | |
| $ | 18,037 | | | $ | 3,945 | | | $ | 3,107 | | | $ | 1,642 | | | $ | 1,427 | | | $ | 730 | | | $ | 90,804 | | | $ | 99,510 | | | $ | 17,886 | | | $ | 9,106 | |
| | 462 | | | | (5,579 | ) | | | 324 | | | | 2,963 | | | | 1,184 | | | | (70 | ) | | | 38,254 | | | | (140,449 | ) | | | (588 | ) | | | (647 | ) |
| | (18,307 | ) | | | 18,812 | | | | (5,512 | ) | | | 8,366 | | | | (2,677 | ) | | | 3,363 | | | | 75,025 | | | | 24,501 | | | | (2,773 | ) | | | 19,501 | |
| | | | | | | | | |
| | 192 | | | | 17,178 | | | | (2,081 | ) | | | 12,971 | | | | (66 | ) | | | 4,023 | | | | 204,083 | | | | (16,438 | ) | | | 14,525 | | | | 27,960 | |
| | | | | | | | | |
| | | | | | | | | | | | | | | | | | | | | | | | | | | | | | | | | | | | | | |
| | (13,498 | ) | | | 0 | | | | (3,191 | ) | | | (638 | ) | | | (1,369 | ) | | | (397 | ) | | | (105,587 | ) | | | (99,652 | ) | | | (17,186 | ) | | | (7,997 | ) |
| | 0 | | | | 0 | | | | 0 | | | | 0 | | | | 0 | | | | 0 | | | | 0 | | | | 0 | | | | 0 | | | | (97 | ) |
| | 0 | | | | (5,648 | ) | | | 0 | | | | 0 | | | | 0 | | | | 0 | | | | 0 | | | | 0 | | | | 0 | | | | 0 | |
| | | | | | | | | |
| | (13,498 | ) | | | (5,648 | ) | | | (3,191 | ) | | | (638 | ) | | | (1,369 | ) | | | (397 | ) | | | (105,587 | ) | | | (99,652 | ) | | | (17,186 | ) | | | (8,094 | ) |
| | | | | | | | | |
| | | | | | | | | | | | | | | | | | | | | | | | | | | | | | | | | | | | | | |
| | 220,618 | | | | 88,364 | | | | 69,647 | | | | 139,711 | | | | 32,134 | | | | 34,038 | | | | 983,067 | | | | 588,513 | | | | 364,630 | | | | 253,220 | |
| | (136,912 | ) | | | (217,149 | ) | | | (24,580 | ) | | | (135,386 | ) | | | (50,239 | ) | | | (39,733 | ) | | | (1,301,580 | ) | | | (1,233,496 | ) | | | (71,721 | ) | | | (70,078 | ) |
| | 83,706 | | | | (128,785 | ) | | | 45,067 | | | | 4,325 | | | | (18,105 | ) | | | (5,695 | ) | | | (318,513 | ) | | | (644,983 | ) | | | 292,909 | | | | 183,142 | |
| | | | | | | | | |
| | 70,400 | | | | (117,255 | ) | | | 39,795 | | | | 16,658 | | | | (19,540 | ) | | | (2,069 | ) | | | (220,017 | ) | | | (761,073 | ) | | | 290,248 | | | | 203,008 | |
| | | | | | | | | |
| | | | | | | | | | | | | | | | | | | | | | | | | | | | | | | | | | | | | | |
| | 1,065,611 | | | | 1,182,866 | | | | 109,197 | | | | 92,539 | | | | 90,404 | | | | 92,473 | | | | 2,044,168 | | | | 2,805,241 | | | | 447,211 | | | | 244,203 | |
| $ | 1,136,011 | | | $ | 1,065,611 | | | $ | 148,992 | | | $ | 109,197 | | | $ | 70,864 | | | $ | 90,404 | | | $ | 1,824,151 | | | $ | 2,044,168 | | | $ | 737,459 | | | $ | 447,211 | |
| | | | | | | | | |
| $ | 2,601 | | | $ | (2,435 | ) | | $ | 944 | | | $ | 1,028 | | | $ | 190 | | | $ | 107 | | | $ | 5,459 | | | $ | 8,062 | | | $ | 1,988 | | | $ | 1,065 | |
| | | | | | | | | |
| | | | | | | | | | | | | | | | | | | | | | | | | | | | | | | | | | | | | | |
| | 4,200 | | | | 1,700 | | | | 1,050 | | | | 2,200 | | | | 550 | | | | 600 | | | | 9,850 | | | | 6,250 | | | | 3,500 | | | | 2,500 | |
| | (2,600 | ) | | | (4,200 | ) | | | (350 | ) | | | (2,100 | ) | | | (850 | ) | | | (700 | ) | | | (13,050 | ) | | | (13,050 | ) | | | (700 | ) | | | (700 | ) |
| | 1,600 | | | | (2,500 | ) | | | 700 | | | | 100 | | | | (300 | ) | | | (100 | ) | | | (3,200 | ) | | | (6,800 | ) | | | 2,800 | | | | 1,800 | |
| | | | | | |
| | ANNUAL REPORT | | JUNE 30, 2017 | | 29 |
Statements of Changes in Net Assets (Cont.)
| | | | | | | | | | | | | | | | |
| | | PIMCO
Active Bond
Exchange-Traded Fund | | | PIMCO
Enhanced Low
Duration Active
Exchange-Traded Fund | |
| | | | |
| (Amounts in thousands†) | | Year Ended
June 30, 2017 | | | Year Ended
June 30, 2016 | | | Year Ended
June 30, 2017 | | | Year Ended
June 30, 2016 | |
| | | | |
Increase (Decrease) in Net Assets from: | | | | | | | | | | | | | | | | |
| | | | |
Operations: | | | | | | | | | | | | | | | | |
Net investment income (loss) | | $ | 61,647 | | | $ | 75,862 | | | $ | 1,653 | | | $ | 2,322 | |
Net realized gain (loss) | | | (26,162 | ) | | | 33,619 | | | | 10 | | | | (1,598 | ) |
Net change in unrealized appreciation (depreciation) | | | 365 | | | | (1,363 | ) | | | 216 | | | | 175 | |
| | | | |
Net Increase (Decrease) in Net Assets Resulting from Operations | | | 35,850 | | | | 108,118 | | | | 1,879 | | | | 899 | |
| | | | |
Distributions to Shareholders: | | | | | | | | | | | | | | | | |
From net investment income | | | (53,716 | ) | | | (93,619 | ) | | | (1,285 | ) | | | (2,867 | ) |
From net realized capital gains | | | 0 | | | | 0 | | | | 0 | | | | (1,051 | ) |
Tax basis return of capital | | | (17,981 | ) | | | 0 | | | | 0 | | | | 0 | |
| | | | |
Total Distributions(a) | | | (71,697 | ) | | | (93,619 | ) | | | (1,285 | ) | | | (3,918 | ) |
| | | | |
Fund Share Transactions: | | | | | | | | | | | | | | | | |
Receipts for shares sold | | | 133,005 | | | | 529,851 | | | | 35,219 | | | | 15,098 | |
Cost of shares redeemed | | | (652,322 | ) | | | (438,601 | ) | | | 0 | | | | (129,753 | ) |
Net increase (decrease) resulting from Fund share transactions | | | (519,317 | ) | | | 91,250 | | | | 35,219 | | | | (114,655 | ) |
| | | | |
Total Increase (Decrease) in Net Assets | | | (555,164 | ) | | | 105,749 | | | | 35,813 | | | | (117,674 | ) |
| | | | |
Net Assets: | | | | | | | | | | | | | | | | |
Beginning of year | | | 2,594,821 | | | | 2,489,072 | | | | 58,134 | | | | 175,808 | |
End of year* | | $ | 2,039,657 | | | $ | 2,594,821 | | | $ | 93,947 | | | $ | 58,134 | |
| | | | |
* Including undistributed (overdistributed) net investment income of: | | $ | 7,723 | | | $ | 9,705 | | | $ | 333 | | | $ | (218 | ) |
| | | | |
Shares of Beneficial Interest: | | | | | | | | | | | | | | | | |
Shares sold | | | 1,250 | | | | 5,000 | | | | 350 | | | | 150 | |
Shares redeemed | | | (6,200 | ) | | | (4,150 | ) | | | 0 | | | | (1,300 | ) |
Net increase (decrease) in shares outstanding | | | (4,950 | ) | | | 850 | | | | 350 | | | | (1,150 | ) |
| † | A zero balance may reflect actual amounts rounding to less than one thousand. |
| (a) | The tax characterization of distributions is determined in accordance with federal income tax regulations. See Note 2, Dividends and Distributions to Shareholders, in the Notes to Financial Statements for more information. |
| | | | | | | | |
| 30 | | PIMCO ETF TRUST | | | | | See Accompanying Notes | |
| | | | | | | | | | | | | | | | | | | | | | |
PIMCO
Enhanced Short Maturity Active
Exchange-Traded Fund | | |
PIMCO
Intermediate Municipal Bond Active
Exchange-Traded Fund | | | PIMCO
Short Term Municipal Bond Active
Exchange-Traded Fund | |
| | | | | |
Year Ended
June 30, 2017 | | | Year Ended
June 30, 2016 | | | Year Ended
June 30, 2017 | | | Year Ended
June 30, 2016 | | | Year Ended
June 30, 2017 | | | Year Ended
June 30, 2016 | |
| | | | | |
| | | | | | | | | | | | | | | | | | | | | | |
| | | | | |
| | | | | | | | | | | | | | | | | | | | | | |
| $ | 81,399 | | | $ | 43,357 | | | $ | 6,080 | | | $ | 5,554 | | | $ | 811 | | | $ | 584 | |
| | 6,298 | | | | (822 | ) | | | (2,191 | ) | | | (65 | ) | | | (384 | ) | | | 0 | |
| | 26,398 | | | | 642 | | | | (5,467 | ) | | | 9,681 | | | | (249 | ) | | | 418 | |
| | | | | |
| | 114,095 | | | | 43,177 | | | | (1,578 | ) | | | 15,170 | | | | 178 | | | | 1,002 | |
| | | | | |
| | | | | | | | | | | | | | | | | | | | | | |
| | (80,300 | ) | | | (42,103 | ) | | | (5,984 | ) | | | (5,050 | ) | | | (784 | ) | | | (518 | ) |
| | 0 | | | | (825 | ) | | | 0 | | | | 0 | | | | 0 | | | | 0 | |
| | 0 | | | | 0 | | | | 0 | | | | 0 | | | | 0 | | | | 0 | |
| | | | | |
| | (80,300 | ) | | | (42,928 | ) | | | (5,984 | ) | | | (5,050 | ) | | | (784 | ) | | | (518 | ) |
| | | | | |
| | | | | | | | | | | | | | | | | | | | | | |
| | 3,131,507 | | | | 2,437,791 | | | | 39,807 | | | | 29,643 | | | | 5,032 | | | | 15,148 | |
| | (616,899 | ) | | | (1,326,548 | ) | | | (26,373 | ) | | | (13,446 | ) | | | (7,481 | ) | | | (2,516 | ) |
| | 2,514,608 | | | | 1,111,243 | | | | 13,434 | | | | 16,197 | | | | (2,449 | ) | | | 12,632 | |
| | | | | |
| | 2,548,403 | | | | 1,111,492 | | | | 5,872 | | | | 26,317 | | | | (3,055 | ) | | | 13,116 | |
| | | | | |
| | | | | | | | | | | | | | | | | | | | | | |
| | 4,647,542 | | | | 3,536,050 | | | | 254,045 | | | | 227,728 | | | | 68,881 | | | | 55,765 | |
| $ | 7,195,945 | | | $ | 4,647,542 | | | $ | 259,917 | | | $ | 254,045 | | | $ | 65,826 | | | $ | 68,881 | |
| | | | | |
| $ | 10,918 | | | $ | 6,225 | | | $ | 565 | | | $ | 468 | | | $ | 40 | | | $ | 14 | |
| | | | | |
| | | | | | | | | | | | | | | | | | | | | | |
| | 30,870 | | | | 24,150 | | | | 750 | | | | 550 | | | | 100 | | | | 300 | |
| | (6,090 | ) | | | (13,160 | ) | | | (500 | ) | | | (250 | ) | | | (150 | ) | | | (50 | ) |
| | 24,780 | | | | 10,990 | | | | 250 | | | | 300 | | | | (50 | ) | | | 250 | |
| | | | | | |
| | ANNUAL REPORT | | JUNE 30, 2017 | | 31 |
Statement of Cash Flows
| | | | |
| Year Ended June 30, 2017 | | | |
| (Amounts in thousands) | | PIMCO
Enhanced Low
Duration Active
Exchange-Traded Fund | |
| |
Cash Flows Provided by (Used for) Operating Activities: | | | | |
| |
Net increase (decrease) in net assets resulting from operations | | $ | 1,879 | |
| |
Adjustments to Reconcile Net Increase (Decrease) in Net Assets from Operations to Net Cash Provided by (Used for) Operating Activities: | | | | |
Purchases of long-term securities | | | (679,141 | ) |
Proceeds from sales of long-term securities | | | 600,229 | |
(Purchases) Proceeds from sales of short-term portfolio investments, net | | | (1,077 | ) |
(Increase) decrease in deposits with counterparty | | | (431 | ) |
(Increase) decrease in receivable for investments sold | | | 18,332 | |
(Increase) decrease in interest and/or dividends receivable | | | (407 | ) |
Proceeds from (Payments on) exchange-traded or centrally cleared financial derivative instruments | | | (564 | ) |
Proceeds from (Payments on) over the counter financial derivative instruments | | | 52 | |
Increase (decrease) in payable for investments purchased | | | (13,890 | ) |
Increase (decrease) in deposits from counterparty | | | (530 | ) |
Increase (decrease) in accrued management fees | | | 8 | |
Increase (Decrease) in reimbursement receivable from PIMCO | | | (1 | ) |
Proceeds from (Payments on) short sales transactions, net | | | (7 | ) |
Proceeds from (Payments on) foreign currency transactions | | | 3 | |
Increase (decrease) in other liabilities | | | (11 | ) |
Net Realized (Gain) Loss | | | | |
Investments in securities | | | (854 | ) |
Exchange-traded or centrally cleared financial derivative instruments | | | 914 | |
Over the counter financial derivative instruments | | | (71 | ) |
Short sales | | | 7 | |
Foreign currency | | | (6 | ) |
Net Change in Unrealized (Appreciation) Depreciation | | | | |
Investments in securities | | | (46 | ) |
Exchange-traded or centrally cleared financial derivative instruments | | | (381 | ) |
Over the counter financial derivative instruments | | | 208 | |
Foreign currency assets and liabilities | | | 3 | |
Net amortization (accretion) on investments | | | 603 | |
| |
Net Cash Provided by (Used for) Operating Activities | | | (75,179 | ) |
| |
Cash Flows Received from (Used for) Financing Activities: | | | | |
Proceeds from shares sold | | | 35,219 | |
Cash distributions paid | | | (1,285 | ) |
Proceeds from reverse repurchase agreements | | | 866,374 | |
Payments on reverse repurchase agreements | | | (828,550 | ) |
Proceeds from sale-buyback transactions | | | 1,395,073 | |
Payments on sale-buyback transactions | | | (1,391,649 | ) |
| |
Net Cash Received from (Used for) Financing Activities | | | 75,182 | |
| |
Net Increase (Decrease) in Cash and Foreign Currency | | | 3 | |
| |
Cash and Foreign Currency: | | | | |
Beginning of year | | | 100 | |
End of year | | $ | 103 | |
| |
Supplemental Disclosure of Cash Flow Information: | | | | |
Interest expense paid during the year | | $ | 151 | |
A Statement of Cash Flows is presented when the Fund had a significant amount of borrowing during the year, based on the average total borrowing outstanding in relation to total assets or when substantially all of the Fund’s investments were not classified as Level 1 or 2 in the fair value hierarchy.
| | | | | | | | |
| 32 | | PIMCO ETF TRUST | | | | | See Accompanying Notes | |
Schedule of Investments PIMCO 1-3 Year U.S. Treasury Index Exchange-Traded Fund
June 30, 2017
| | | | | | | | | | | | |
| | | | | PRINCIPAL
AMOUNT
(000S) | | | | | MARKET
VALUE
(000S) | |
| INVESTMENTS IN SECURITIES 99.0% | |
| |
| U.S. TREASURY OBLIGATIONS 98.9% | |
U.S. Treasury Bonds | |
8.125% due 08/15/2019 | | $ | | | 4,240 | | | $ | | | 4,836 | |
U.S. Treasury Notes | |
0.750% due 02/15/2019 | | | | | 6,190 | | | | | | 6,131 | |
0.750% due 07/15/2019 | | | | | 1,870 | | | | | | 1,846 | |
0.875% due 07/15/2018 | | | | | 5,020 | | | | | | 4,999 | |
0.875% due 10/15/2018 | | | | | 6,070 | | | | | | 6,036 | |
0.875% due 04/15/2019 | | | | | 6,740 | | | | | | 6,682 | |
0.875% due 05/15/2019 | | | | | 4,990 | | | | | | 4,945 | |
0.875% due 06/15/2019 | | | | | 3,980 | | | | | | 3,942 | |
0.875% due 07/31/2019 | | | | | 3,450 | | | | | | 3,414 | |
0.875% due 09/15/2019 | | | | | 4,700 | | | | | | 4,645 | |
1.000% due 08/15/2018 | | | | | 4,700 | | | | | | 4,685 | |
| | | | | | | | | | | | |
| | | | | PRINCIPAL
AMOUNT
(000S) | | | | | MARKET
VALUE
(000S) | |
1.000% due 09/15/2018 | | $ | | | 3,600 | | | $ | | | 3,587 | |
1.000% due 03/15/2019 | | | | | 5,985 | | | | | | 5,949 | |
1.000% due 10/15/2019 | | | | | 5,420 | | | | | | 5,370 | |
1.125% due 01/15/2019 | | | | | 4,870 | | | | | | 4,853 | |
1.250% due 12/15/2018 | | | | | 3,925 | | | | | | 3,920 | |
1.375% due 12/15/2019 | | | | | 3,110 | | | | | | 3,104 | |
1.375% due 01/15/2020 | | | | | 5,015 | | | | | | 5,003 | |
1.500% due 04/15/2020 | | | | | 4,840 | | | | | | 4,837 | |
1.500% due 06/15/2020 | | | | | 2,500 | | | | | | 2,496 | |
1.625% due 03/15/2020 | | | | | 3,175 | | | | | | 3,185 | |
3.375% due 11/15/2019 | | | | | 3,720 | | | | | | 3,887 | |
3.500% due 05/15/2020 | | | | | 5,840 | | | | | | 6,162 | |
3.625% due 02/15/2020 | | | | | 5,345 | | | | | | 5,636 | |
3.750% due 11/15/2018 | | | | | 7,370 | | | | | | 7,610 | |
| | | | | | | | | | | | |
Total U.S. Treasury Obligations
(Cost $118,251) | | | | | | | | | | | 117,760 | |
| | | | | | | | | | | | |
| | | | | | | | | | | | |
| | | | | | | | | | MARKET
VALUE
(000S) | |
| SHORT-TERM INSTRUMENTS 0.1% | |
| |
| REPURCHASE AGREEMENTS (a) 0.1% | |
| | | | | | | | $ | | | 178 | |
| | | | | | | | | | | | |
Total Short-Term Instruments
(Cost $178) | | | | | | | | | | | 178 | |
| | | | | | | | | | | | |
| | | | | | | | | | | | |
Total Investments in Securities
(Cost $118,429) | | | | | | | | | | | 117,938 | |
| | | | | | | | | | | | |
Total Investments 99.0%
(Cost $118,429) | | | | | | | | $ | | | 117,938 | |
| |
| Other Assets and Liabilities, net 1.0% | | | | | | 1,249 | |
| | | | | | | | | | | | |
| Net Assets 100.0% | | | $ | | | 119,187 | |
| | | | | | | | | | | | |
NOTES TO SCHEDULE OF INVESTMENTS (AMOUNTS IN THOUSANDS*):
| * | A zero balance may reflect actual amounts rounding to less than one thousand. |
BORROWINGS AND OTHER FINANCING TRANSACTIONS
(a) REPURCHASE AGREEMENTS:
| | | | | | | | | | | | | | | | | | | | | | | | | | | | | | |
| Counterparty | | Lending
Rate | | | Settlement
Date | | | Maturity
Date | | | Principal
Amount | | | Collateralized By | | Collateral
(Received) | | | Repurchase
Agreements,
at Value | | | Repurchase
Agreement
Proceeds
to be
Received(1) | |
| SSB | | | 0.050 | % | | | 06/30/2017 | | | | 07/03/2017 | | | $ | 178 | | | U.S. Treasury Notes 2.000% due 08/31/2021(2) | | $ | (183 | ) | | $ | 178 | | | $ | 178 | |
| | | | | | | | | | | | | | | | | | | | | | | | | | | | | | |
Total Repurchase Agreements | | $ | (183 | ) | | $ | 178 | | | $ | 178 | |
| | | | | | | | | | | | | | | | | | | | | | | | | | | | | | |
BORROWINGS AND OTHER FINANCING TRANSACTIONS SUMMARY
The following is a summary by counterparty of the market value of Borrowings and Other Financing Transactions and collateral pledged/(received) as of June 30, 2017:
| | | | | | | | | | | | | | | | | | | | | | | | | | | | |
| Counterparty | | Repurchase
Agreement
Proceeds
to be
Received | | | Payable for
Reverse
Repurchase
Agreements | | | Payable for
Sale-Buyback
Transactions | | | Securities
Out on Loan | | | Total
Borrowings and
Other Financing
Transactions | | | Collateral
Pledged/(Received) | | | Net Exposure(3) | |
Global/Master Repurchase Agreement | | | | | | | | | | | | | | | | | | | | | | | | | | | | |
SSB | | $ | 178 | | | $ | 0 | | | $ | 0 | | | $ | 0 | | | $ | 178 | | | $ | (183 | ) | | $ | (5 | ) |
| | | | | | | | | | | | | | | | | | | | | | | | | | | | |
Total Borrowings and Other Financing Transactions | | $ | 178 | | | $ | 0 | | | $ | 0 | | | $ | 0 | | | | | | | | | | | | | |
| | | | | | | | | | | | | | | | | | | | | | | | | | | | |
| (1) | Includes accrued interest. |
| (2) | Collateral is held in custody by the counterparty. |
| (3) | Net Exposure represents the net receivable/(payable) that would be due from/to the counterparty in the event of default. Exposure from borrowings and other financing transactions can only be netted across transactions governed under the same master agreement with the same legal entity. See Note 8, Master Arrangements, in the Notes to Financial Statements for more information regarding master netting arrangements. |
FAIR VALUE MEASUREMENTS
The following is a summary of the fair valuations according to the inputs used as of June 30, 2017 in valuing the Fund’s assets and liabilities:
| | | | | | | | | | | | | | | | |
| Category and Subcategory | | Level 1 | | | Level 2 | | | Level 3 | | | Fair
Value at
06/30/2017 | |
Investments in Securities, at Value | | | | | | | | | | | | | | | | |
U.S. Treasury Obligations | | $ | 0 | | | $ | 117,760 | | | $ | 0 | | | $ | 117,760 | |
Short-Term Instruments | | | | | | | | | | | | | | | | |
Repurchase Agreements | | | 0 | | | | 178 | | | | 0 | | | | 178 | |
| | | | | | | | | | | | | | | | |
| | | | |
Total Investments | | $ | 0 | | | $ | 117,938 | | | $ | 0 | | | $ | 117,938 | |
| | | | | | | | | | | | | | | | |
There were no significant transfers among Levels 1, 2, or 3 during the period ended June 30, 2017.
| | | | | | |
| See Accompanying Notes | | ANNUAL REPORT | | JUNE 30, 2017 | | 33 |
Schedule of Investments PIMCO 25+ Year Zero Coupon U.S. Treasury Index Exchange-Traded Fund
June 30, 2017
| | | | | | | | | | | | |
| | | | | PRINCIPAL
AMOUNT
(000S) | | | | | MARKET
VALUE
(000S) | |
| INVESTMENTS IN SECURITIES 104.7% | |
| |
| U.S. TREASURY OBLIGATIONS 99.5% | |
U.S. Treasury STRIPS (a) | |
0.000% due 08/15/2042 | | $ | | | 18,877 | | | $ | | | 9,173 | |
0.000% due 11/15/2042 | | | | | 17,811 | | | | | | 8,583 | |
0.000% due 02/15/2043 | | | | | 18,521 | | | | | | 8,837 | |
0.000% due 05/15/2043 | | | | | 18,267 | | | | | | 8,651 | |
0.000% due 08/15/2043 | | | | | 18,945 | | | | | | 8,922 | |
0.000% due 11/15/2043 | | | | | 17,932 | | | | | | 8,377 | |
0.000% due 02/15/2044 | | | | | 18,436 | | | | | | 8,562 | |
0.000% due 05/15/2044 | | | | | 18,478 | | | | | | 8,512 | |
0.000% due 08/15/2044 | | | | | 18,094 | | | | | | 8,256 | |
| | | | | | | | | | | | |
| | | | | PRINCIPAL
AMOUNT
(000S) | | | | | MARKET
VALUE
(000S) | |
0.000% due 11/15/2044 | | $ | | | 18,512 | | | $ | | | 8,385 | |
0.000% due 02/15/2045 | | | | | 18,205 | | | | | | 8,162 | |
0.000% due 05/15/2045 | | | | | 18,210 | | | | | | 8,108 | |
0.000% due 08/15/2045 | | | | | 18,280 | | | | | | 8,067 | |
0.000% due 11/15/2045 | | | | | 18,482 | | | | | | 8,100 | |
0.000% due 02/15/2046 | | | | | 18,421 | | | | | | 8,008 | |
0.000% due 05/15/2046 | | | | | 18,140 | | | | | | 7,840 | |
0.000% due 08/15/2046 | | | | | 18,515 | | | | | | 7,944 | |
0.000% due 11/15/2046 | | | | | 18,139 | | | | | | 7,728 | |
0.000% due 02/15/2047 | | | | | 18,450 | | | | | | 7,791 | |
0.000% due 05/15/2047 | | | | | 18,600 | | | | | | 7,804 | |
| | | | | | | | | | | | |
Total U.S. Treasury Obligations
(Cost $179,889) | | | | | | | | | | | 165,810 | |
| | | | | | | | | | | | |
| | | | | | | | | | | | |
| | | | | | | | | | MARKET
VALUE
(000S) | |
| SHORT-TERM INSTRUMENTS 5.2% | |
| |
| REPURCHASE AGREEMENTS (b) 5.2% | |
| | | | | | | | $ | | | 8,720 | |
| | | | | | | | | | | | |
Total Short-Term Instruments
(Cost $8,720) | | | | | | | | | | | 8,720 | |
| | | | | | | | | | | | |
| | | | | | | | | | | | |
Total Investments in Securities
(Cost $188,609) | | | | | | | | | | | 174,530 | |
| | | | | | | | | | | | |
Total Investments 104.7%
(Cost $188,609) | | | | | | | | $ | | | 174,530 | |
| |
| Other Assets and Liabilities, net (4.7)% | | | | | | | | | (7,847 | ) |
| | | | | | | | | | | | |
| Net Assets 100.0% | | | $ | | | 166,683 | |
| | | | | | | | | | | | |
NOTES TO SCHEDULE OF INVESTMENTS (AMOUNTS IN THOUSANDS*):
| * | A zero balance may reflect actual amounts rounding to less than one thousand. |
BORROWINGS AND OTHER FINANCING TRANSACTIONS
(b) REPURCHASE AGREEMENTS:
| | | | | | | | | | | | | | | | | | | | | | | | | | | | | | |
| Counterparty | | Lending
Rate | | | Settlement
Date | | | Maturity
Date | | | Principal
Amount | | | Collateralized By | | Collateral
(Received) | | | Repurchase
Agreements,
at Value | | | Repurchase
Agreement
Proceeds
to be
Received(1) | |
| SSB | | | 0.050 | % | | | 06/30/2017 | | | | 07/03/2017 | | | $ | 8,720 | | | U.S. Treasury Notes 2.000% due 08/31/2021(2) | | $ | (8,897 | ) | | $ | 8,720 | | | $ | 8,720 | |
| | | | | | | | | | | | | | | | | | | | | | | | | | | | | | |
Total Repurchase Agreements | | $ | (8,897 | ) | | $ | 8,720 | | | $ | 8,720 | |
| | | | | | | | | | | | | | | | | | | | | | | | | | | | | | |
BORROWINGS AND OTHER FINANCING TRANSACTIONS SUMMARY
The following is a summary by counterparty of the market value of Borrowings and Other Financing Transactions and collateral pledged/(received) as of June 30, 2017:
| | | | | | | | | | | | | | | | | | | | | | | | | | | | |
| Counterparty | | Repurchase
Agreement
Proceeds
to be
Received | | | Payable for
Reverse
Repurchase
Agreements | | | Payable for
Sale-Buyback
Transactions | | | Securities
Out on Loan | | | Total
Borrowings and
Other Financing
Transactions | | | Collateral
Pledged/(Received) | | | Net Exposure(3) | |
Global/Master Repurchase Agreement | | | | | | | | | | | | | | | | | | | | | | | | | | | | |
SSB | | $ | 8,720 | | | $ | 0 | | | $ | 0 | | | $ | 0 | | | $ | 8,720 | | | $ | (8,897 | ) | | $ | (177 | ) |
| | | | | | | | | | | | | | | | | | | | | | | | | | | | |
Total Borrowings and Other Financing Transactions | | $ | 8,720 | | | $ | 0 | | | $ | 0 | | | $ | 0 | | | | | | | | | | | | | |
| | | | | | | | | | | | | | | | | | | | | | | | | | | | |
| (1) | Includes accrued interest. |
| (2) | Collateral is held in custody by the counterparty. |
| (3) | Net Exposure represents the net receivable/(payable) that would be due from/to the counterparty in the event of default. Exposure from borrowings and other financing transactions can only be netted across transactions governed under the same master agreement with the same legal entity. See Note 8, Master Arrangements, in the Notes to Financial Statements for more information regarding master netting arrangements. |
FAIR VALUE MEASUREMENTS
The following is a summary of the fair valuations according to the inputs used as of June 30, 2017 in valuing the Fund’s assets and liabilities:
| | | | | | | | | | | | | | | | |
| Category and Subcategory | | Level 1 | | | Level 2 | | | Level 3 | | | Fair
Value at
06/30/2017 | |
Investments in Securities, at Value | | | | | | | | | | | | | | | | |
U.S. Treasury Obligations | | $ | 0 | | | $ | 165,810 | | | $ | 0 | | | $ | 165,810 | |
Short-Term Instruments | | | | | | | | | | | | | | | | |
Repurchase Agreements | | | 0 | | | | 8,720 | | | | 0 | | | | 8,720 | |
| | | | | | | | | | | | | | | | |
| | | | |
Total Investments | | $ | 0 | | | $ | 174,530 | | | $ | 0 | | | $ | 174,530 | |
| | | | | | | | | | | | | | | | |
There were no significant transfers among Levels 1, 2, or 3 during the period ended June 30, 2017.
| | | | | | | | |
| 34 | | PIMCO ETF TRUST | | | | | See Accompanying Notes | |
Schedule of Investments PIMCO 1-5 Year U.S. TIPS Index Exchange-Traded Fund
June 30, 2017
| | | | | | | | | | | | |
| | | | | PRINCIPAL
AMOUNT
(000S) | | | | | MARKET
VALUE
(000S) | |
| INVESTMENTS IN SECURITIES 99.4% | |
| |
| U.S. TREASURY OBLIGATIONS 99.4% | |
U.S. Treasury Inflation Protected Securities (a) | |
0.125% due 04/15/2019 | | $ | | | 133,585 | | | $ | | | 133,693 | |
0.125% due 04/15/2020 | | | | | 152,205 | | | | | | 152,479 | |
0.125% due 04/15/2021 | | | | | 123,685 | | | | | | 123,534 | |
0.125% due 01/15/2022 | | | | | 113,722 | | | | | | 113,600 | |
0.125% due 04/15/2022 | | | | | 50,506 | | | | | | 50,280 | |
0.625% due 07/15/2021 | | | | | 114,902 | | | | | | 117,807 | |
1.125% due 01/15/2021 | | | | | 120,833 | | | | | | 125,502 | |
1.250% due 07/15/2020 | | | | | 94,892 | | | | | | 98,939 | |
1.375% due 07/15/2018 | | | | | 38,522 | | | | | | 39,149 | |
1.375% due 01/15/2020 | | | | | 53,257 | | | | | | 55,227 | |
1.875% due 07/15/2019 | | | | | 58,791 | | | | | | 61,309 | |
2.125% due 01/15/2019 | | | | | 55,605 | | | | | | 57,433 | |
| | | | | | | | | | | | |
Total U.S. Treasury Obligations
(Cost $1,136,538) | | | | | | 1,128,952 | |
| | | | | | | | | | | | |
| | | | | | | | | | | | |
| | | | | | | | | | MARKET
VALUE
(000S) | |
| SHORT-TERM INSTRUMENTS 0.0% | |
| |
| REPURCHASE AGREEMENTS (b) 0.0% | | | | |
| | | | | | | | $ | | | 417 | |
| | | | | | | | | | | | |
Total Short-Term Instruments
(Cost $417) | | | | | | 417 | |
| | | | | | | | | | | | |
| |
Total Investments in Securities
(Cost $1,136,955) | | | | | | 1,129,369 | |
| |
Total Investments 99.4%
(Cost $1,136,955) | | | $ | | | 1,129,369 | |
| |
| Other Assets and Liabilities, net 0.6% | | | | | | 6,642 | |
| | | | | | | | | | | | |
| Net Assets 100.0% | | | $ | | | 1,136,011 | |
| | | | | | | | | | | | |
NOTES TO SCHEDULE OF INVESTMENTS (AMOUNTS IN THOUSANDS*):
| * | A zero balance may reflect actual amounts rounding to less than one thousand. |
| (a) | Principal amount of security is adjusted for inflation. |
BORROWINGS AND OTHER FINANCING TRANSACTIONS
(b) REPURCHASE AGREEMENTS:
| | | | | | | | | | | | | | | | | | | | | | | | | | | | | | |
| Counterparty | | Lending
Rate | | | Settlement
Date | | | Maturity
Date | | | Principal
Amount | | | Collateralized By | | Collateral
(Received) | | | Repurchase
Agreements,
at Value | | | Repurchase
Agreement
Proceeds
to be
Received(1) | |
| SSB | | | 0.050 | % | | | 06/30/2017 | | | | 07/03/2017 | | | $ | 417 | | | U.S. Treasury Notes 2.000% due 08/31/2021(2) | | $ | (427 | ) | | $ | 417 | | | $ | 417 | |
| | | | | | | | | | | | | | | | | | | | | | | | | | | | | | |
Total Repurchase Agreements | | $ | (427 | ) | | $ | 417 | | | $ | 417 | |
| | | | | | | | | | | | | | | | | | | | | | | | | | | | | | |
BORROWINGS AND OTHER FINANCING TRANSACTIONS SUMMARY
The following is a summary by counterparty of the market value of Borrowings and Other Financing Transactions and collateral pledged/(received) as of June 30, 2017:
| | | | | | | | | | | | | | | | | | | | | | | | | | | | |
| Counterparty | | Repurchase
Agreement
Proceeds
to be
Received | | | Payable for
Reverse
Repurchase
Agreements | | | Payable for
Sale-Buyback
Transactions | | | Securities
Out on Loan | | | Total
Borrowings and
Other Financing
Transactions | | | Collateral
Pledged/(Received) | | | Net Exposure(3) | |
Global/Master Repurchase Agreement | | | | | | | | | | | | | | | | | | | | | | | | | | | | |
SSB | | $ | 417 | | | $ | 0 | | | $ | 0 | | | $ | 0 | | | $ | 417 | | | $ | (427 | ) | | $ | (10 | ) |
| | | | | | | | | | | | | | | | | | | | | | | | | | | | |
Total Borrowings and Other Financing Transactions | | $ | 417 | | | $ | 0 | | | $ | 0 | | | $ | 0 | | | | | | | | | | | | | |
| | | | | | | | | | | | | | | | | | | | | | | | | | | | |
| (1) | Includes accrued interest. |
| (2) | Collateral is held in custody by the counterparty. |
| (3) | Net Exposure represents the net receivable/(payable) that would be due from/to the counterparty in the event of default. Exposure from borrowings and other financing transactions can only be netted across transactions governed under the same master agreement with the same legal entity. See Note 8, Master Arrangements, in the Notes to Financial Statements for more information regarding master netting arrangements. |
FAIR VALUE MEASUREMENTS
The following is a summary of the fair valuations according to the inputs used as of June 30, 2017 in valuing the Fund’s assets and liabilities:
| | | | | | | | | | | | | | | | |
| Category and Subcategory | | Level 1 | | | Level 2 | | | Level 3 | | | Fair
Value at
06/30/2017 | |
Investments in Securities, at Value | | | | | | | | | | | | | | | | |
U.S. Treasury Obligations | | $ | 0 | | | $ | 1,128,952 | | | $ | 0 | | | $ | 1,128,952 | |
Short-Term Instruments | | | | | | | | | | | | | | | | |
Repurchase Agreements | | | 0 | | | | 417 | | | | 0 | | | | 417 | |
| | | | | | | | | | | | | | | | |
| | | | |
Total Investments | | $ | 0 | | | $ | 1,129,369 | | | $ | 0 | | | $ | 1,129,369 | |
| | | | | | | | | | | | | | | | |
There were no significant transfers among Levels 1, 2, or 3 during the period ended June 30, 2017.
| | | | | | |
| See Accompanying Notes | | ANNUAL REPORT | | JUNE 30, 2017 | | 35 |
Schedule of Investments PIMCO 15+ Year U.S. TIPS Index Exchange-Traded Fund
June 30, 2017
| | | | | | | | | | | | |
| | | | | PRINCIPAL
AMOUNT
(000S) | | | | | MARKET
VALUE
(000S) | |
| INVESTMENTS IN SECURITIES 99.1% | |
| |
| U.S. TREASURY OBLIGATIONS 99.1% | |
U.S. Treasury Inflation Protected Securities (a) | |
0.625% due 02/15/2043 | | $ | | | 20,352 | | | $ | | | 18,757 | |
0.750% due 02/15/2042 | | | | | 19,647 | | | | | | 18,726 | |
0.750% due 02/15/2045 | | | | | 19,835 | | | | | | 18,637 | |
0.875% due 02/15/2047 | | | | | 10,776 | | | | | | 10,469 | |
1.000% due 02/15/2046 | | | | | 16,362 | | | | | | 16,366 | |
1.375% due 02/15/2044 | | | | | 18,737 | | | | | | 20,411 | |
2.125% due 02/15/2040 | | | | | 13,318 | | | | | | 16,586 | |
2.125% due 02/15/2041 | | | | | 22,200 | | | | | | 27,773 | |
| | | | | | | | | | | | |
Total U.S. Treasury Obligations
(Cost $152,436) | | | | | | | | | | | 147,725 | |
| | | | | | | | | | | | |
| | | | | | | | | | | | |
Total Investments in Securities
(Cost $152,436) | | | | | | 147,725 | |
| | | | | | | | | | | | |
Total Investments 99.1%
(Cost $152,436) | | | $ | | | 147,725 | |
| |
| Other Assets and Liabilities, net 0.9% | | | | | | 1,267 | |
| | | | | | | | | | | | |
| Net Assets 100.0% | | | | | | | | $ | | | 148,992 | |
| | | | | | | | | | | | |
NOTES TO SCHEDULE OF INVESTMENTS (AMOUNTS IN THOUSANDS*):
| * | A zero balance may reflect actual amounts rounding to less than one thousand. |
| (a) | Principal amount of security is adjusted for inflation. |
FAIR VALUE MEASUREMENTS
The following is a summary of the fair valuations according to the inputs used as of June 30, 2017 in valuing the Fund’s assets and liabilities:
| | | | | | | | | | | | | | | | |
| Category and Subcategory | | Level 1 | | | Level 2 | | | Level 3 | | | Fair
Value at
06/30/2017 | |
Investments in Securities, at Value | | | | | | | | | | | | | | | | |
U.S. Treasury Obligations | | $ | 0 | | | $ | 147,725 | | | $ | 0 | | | $ | 147,725 | |
| | | | | | | | | | | | | | | | |
There were no significant transfers among Levels 1, 2, or 3 during the period ended June 30, 2017.
| | | | | | | | |
| 36 | | PIMCO ETF TRUST | | | | | See Accompanying Notes | |
Schedule of Investments PIMCO Broad U.S. TIPS Index Exchange-Traded Fund
June 30, 2017
| | | | | | | | | | | | |
| | | | | PRINCIPAL
AMOUNT
(000S) | | | | | MARKET
VALUE
(000S) | |
| INVESTMENTS IN SECURITIES 98.4% | |
| |
| U.S. TREASURY OBLIGATIONS 98.1% | |
U.S. Treasury Inflation Protected Securities (a) | |
0.125% due 01/15/2022 | | $ | | | 3,556 | | | $ | | | 3,552 | |
0.125% due 07/15/2022 | | | | | 3,897 | | | | | | 3,894 | |
0.125% due 01/15/2023 | | | | | 3,287 | | | | | | 3,259 | |
0.125% due 07/15/2026 | | | | | 1,670 | | | | | | 1,611 | |
0.375% due 07/15/2025 | | | | | 4,194 | | | | | | 4,164 | |
0.375% due 01/15/2027 | | | | | 1,377 | | | | | | 1,353 | |
0.625% due 01/15/2024 | | | | | 6,052 | | | | | | 6,140 | |
0.750% due 02/15/2042 | | | | | 3,701 | | | | | | 3,528 | |
0.875% due 02/15/2047 | | | | | 777 | | | | | | 755 | |
1.000% due 02/15/2046 | | | | | 1,025 | | | | | | 1,025 | |
| | | | | | | | | | | | |
| | | | | PRINCIPAL
AMOUNT
(000S) | | | | | MARKET
VALUE
(000S) | |
1.125% due 01/15/2021 | | $ | | | 6,886 | | | $ | | | 7,152 | |
1.375% due 07/15/2018 | | | | | 804 | | | | | | 817 | |
1.375% due 01/15/2020 | | | | | 5,172 | | | | | | 5,364 | |
1.375% due 02/15/2044 | | | | | 3,749 | | | | | | 4,084 | |
1.750% due 01/15/2028 | | | | | 2,588 | | | | | | 2,886 | |
1.875% due 07/15/2019 | | | | | 3,922 | | | | | | 4,090 | |
2.000% due 01/15/2026 | | | | | 4,064 | | | | | | 4,557 | |
2.125% due 02/15/2040 | | | | | 964 | | | | | | 1,200 | |
2.375% due 01/15/2025 | | | | | 4,481 | | | | | | 5,106 | |
2.500% due 01/15/2029 | | | | | 3,407 | | | | | | 4,099 | |
3.375% due 04/15/2032 | | | | | 654 | | | | | | 900 | |
| | | | | | | | | | | | |
Total U.S. Treasury Obligations
(Cost $71,442) | | | | | | | | | | | 69,536 | |
| | | | | | | | | | | | |
| | | | | | | | | | | | |
| | | | | | | | | | MARKET
VALUE
(000S) | |
| SHORT-TERM INSTRUMENTS 0.3% | |
| |
| REPURCHASE AGREEMENTS (b) 0.3% | |
| | | | | | | | $ | | | 212 | |
| | | | | | | | | | | | |
Total Short-Term Instruments
(Cost $212) | | | | | | 212 | |
| | | | | | | | | | | | |
| |
Total Investments in Securities
(Cost $71,654) | | | | | | 69,748 | |
| |
Total Investments 98.4%
(Cost $71,654) | | | $ | | | 69,748 | |
| |
| Other Assets and Liabilities, net 1.6% | | | | | | 1,116 | |
| | | | | | | | | | | | |
| Net Assets 100.0% | | | $ | | | 70,864 | |
| | | | | | | | | | | | |
NOTES TO SCHEDULE OF INVESTMENTS (AMOUNTS IN THOUSANDS*):
| * | A zero balance may reflect actual amounts rounding to less than one thousand. |
| (a) | Principal amount of security is adjusted for inflation. |
BORROWINGS AND OTHER FINANCING TRANSACTIONS
(b) REPURCHASE AGREEMENTS:
| | | | | | | | | | | | | | | | | | | | | | | | | | | | | | |
| Counterparty | | Lending
Rate | | | Settlement
Date | | | Maturity
Date | | | Principal
Amount | | | Collateralized By | | Collateral
(Received) | | | Repurchase
Agreements,
at Value | | | Repurchase
Agreement
Proceeds
to be
Received(1) | |
| SSB | | | 0.050 | % | | | 06/30/2017 | | | | 07/03/2017 | | | $ | 212 | | | U.S. Treasury Notes 2.000% due 08/31/2021(2) | | $ | (219 | ) | | $ | 212 | | | $ | 212 | |
| | | | | | | | | | | | | | | | | | | | | | | | | | | | | | |
Total Repurchase Agreements | | $ | (219 | ) | | $ | 212 | | | $ | 212 | |
| | | | | | | | | | | | | | | | | | | | | | | | | | | | | | |
BORROWINGS AND OTHER FINANCING TRANSACTIONS SUMMARY
The following is a summary by counterparty of the market value of Borrowings and Other Financing Transactions and collateral pledged/(received) as of June 30, 2017:
| | | | | | | | | | | | | | | | | | | | | | | | | | | | |
| Counterparty | | Repurchase
Agreement
Proceeds
to be
Received | | | Payable for
Reverse
Repurchase
Agreements | | | Payable for
Sale-Buyback
Transactions | | | Securities
Out on Loan | | | Total
Borrowings and
Other Financing
Transactions | | | Collateral
Pledged/(Received) | | | Net Exposure(3) | |
Global/Master Repurchase Agreement | | | | | | | | | | | | | | | | | | | | | | | | | | | | |
SSB | | $ | 212 | | | $ | 0 | | | $ | 0 | | | $ | 0 | | | $ | 212 | | | $ | (219 | ) | | $ | (7 | ) |
| | | | | | | | | | | | | | | | | | | | | | | | | | | | |
Total Borrowings and Other Financing Transactions | | $ | 212 | | | $ | 0 | | | $ | 0 | | | $ | 0 | | | | | | | | | | | | | |
| | | | | | | | | | | | | | | | | | | | | | | | | | | | |
| (1) | Includes accrued interest. |
| (2) | Collateral is held in custody by the counterparty. |
| (3) | Net Exposure represents the net receivable/(payable) that would be due from/to the counterparty in the event of default. Exposure from borrowings and other financing transactions can only be netted across transactions governed under the same master agreement with the same legal entity. See Note 8, Master Arrangements, in the Notes to Financial Statements for more information regarding master netting arrangements. |
FAIR VALUE MEASUREMENTS
The following is a summary of the fair valuations according to the inputs used as of June 30, 2017 in valuing the Fund’s assets and liabilities:
| | | | | | | | | | | | | | | | |
| Category and Subcategory | | Level 1 | | | Level 2 | | | Level 3 | | | Fair
Value at
06/30/2017 | |
Investments in Securities, at Value | | | | | | | | | | | | | | | | |
U.S. Treasury Obligations | | $ | 0 | | | $ | 69,536 | | | $ | 0 | | | $ | 69,536 | |
Short-Term Instruments | | | | | | | | | | | | | | | | |
Repurchase Agreements | | | 0 | | | | 212 | | | | 0 | | | | 212 | |
| | | | | | | | | | | | | | | | |
| | | | |
Total Investments | | $ | 0 | | | $ | 69,748 | | | $ | 0 | | | $ | 69,748 | |
| | | | | | | | | | | | | | | | |
There were no significant transfers among Levels 1, 2, or 3 during the period ended June 30, 2017.
| | | | | | |
| See Accompanying Notes | | ANNUAL REPORT | | JUNE 30, 2017 | | 37 |
Schedule of Investments PIMCO 0-5 Year High Yield Corporate Bond Index Exchange-Traded Fund
| | | | | | | | | | | | |
| | | | | PRINCIPAL
AMOUNT
(000S) | | | | | MARKET
VALUE
(000S) | |
| INVESTMENTS IN SECURITIES 108.3% | |
| |
| CORPORATE BONDS & NOTES 89.7% | |
| |
| BANKING & FINANCE 13.3% | |
AGFC Capital Trust | |
2.908% due 01/15/2067 | | $ | | | 1,500 | | | $ | | | 892 | |
Aircastle Ltd. | |
5.125% due 03/15/2021 | | | | | 2,800 | | | | | | 3,001 | |
5.500% due 02/15/2022 | | | | | 6,470 | | | | | | 7,085 | |
Ally Financial, Inc. | |
3.250% due 09/29/2017 | | | | | 1,100 | | | | | | 1,104 | |
3.500% due 01/27/2019 | | | | | 5,498 | | | | | | 5,587 | |
3.750% due 11/18/2019 | | | | | 2,530 | | | | | | 2,593 | |
4.125% due 03/30/2020 | | | | | 3,780 | | | | | | 3,893 | |
4.125% due 02/13/2022 | | | | | 4,900 | | | | | | 5,035 | |
4.250% due 04/15/2021 | | | | | 7,150 | | | | | | 7,418 | |
4.750% due 09/10/2018 | | | | | 6,825 | | | | | | 7,030 | |
6.250% due 12/01/2017 | | | | | 2,000 | | | | | | 2,037 | |
8.000% due 03/15/2020 | | | | | 2,465 | | | | | | 2,810 | |
American Equity Investment Life Holding Co. | |
6.625% due 07/15/2021 | | | | | 1,400 | | | | | | 1,448 | |
Barclays Bank PLC | |
7.750% due 04/10/2023 | | | | | 1,530 | | | | | | 1,597 | |
BPCE S.A. | |
4.500% due 03/15/2025 | | | | | 2,590 | | | | | | 2,667 | |
CIT Group, Inc. | |
3.875% due 02/19/2019 | | | | | 150 | | | | | | 154 | |
5.000% due 08/15/2022 | | | | | 2,375 | | | | | | 2,565 | |
5.375% due 05/15/2020 | | | | | 2,305 | | | | | | 2,487 | |
5.500% due 02/15/2019 | | | | | 1,797 | | | | | | 1,891 | |
Crescent Communities LLC | |
8.875% due 10/15/2021 | | | | | 2,000 | | | | | | 2,110 | |
Equinix, Inc. | |
5.375% due 01/01/2022 | | | | | 1,600 | | | | | | 1,692 | |
FBM Finance, Inc. | |
8.250% due 08/15/2021 | | | | | 4,780 | | | | | | 5,144 | |
Fly Leasing Ltd. | |
6.750% due 12/15/2020 | | | | | 2,100 | | | | | | 2,208 | |
Genworth Holdings, Inc. | |
7.200% due 02/15/2021 | | | | | 1,800 | | | | | | 1,733 | |
7.625% due 09/24/2021 | | | | | 5,765 | | | | | | 5,592 | |
HBOS PLC | |
6.750% due 05/21/2018 | | | | | 2,510 | | | | | | 2,611 | |
HUB International Ltd. | |
7.875% due 10/01/2021 | | | | | 3,465 | | | | | | 3,621 | |
Icahn Enterprises LP | |
4.875% due 03/15/2019 | | | | | 5,017 | | | | | | 5,092 | |
6.000% due 08/01/2020 | | | | | 5,014 | | | | | | 5,171 | |
6.250% due 02/01/2022 | | | | | 5,875 | | | | | | 6,139 | |
International Lease Finance Corp. | |
6.250% due 05/15/2019 | | | | | 5,155 | | | | | | 5,532 | |
Iron Mountain, Inc. | |
6.000% due 10/01/2020 | | | | | 2,760 | | | | | | 2,867 | |
iStar, Inc. | |
4.000% due 11/01/2017 | | | | | 2,610 | | | | | | 2,612 | |
4.875% due 07/01/2018 | | | | | 2,108 | | | | | | 2,127 | |
5.000% due 07/01/2019 | | | | | 2,578 | | | | | | 2,605 | |
7.125% due 02/15/2018 | | | | | 7,025 | | | | | | 7,227 | |
Jefferies Finance LLC | |
7.375% due 04/01/2020 | | | | | 5,875 | | | | | | 6,051 | |
7.500% due 04/15/2021 | | | | | 2,100 | | | | | | 2,181 | |
Jefferies LoanCore LLC | |
6.875% due 06/01/2020 | | | | | 2,100 | | | | | | 2,124 | |
KCG Holdings, Inc. | |
6.875% due 03/15/2020 | | | | | 4,200 | | | | | | 4,350 | |
Nationstar Mortgage LLC | |
6.500% due 08/01/2018 | | | | | 800 | | | | | | 803 | |
7.875% due 10/01/2020 | | | | | 2,490 | | | | | | 2,560 | |
9.625% due 05/01/2019 | | | | | 5,468 | | | | | | 5,620 | |
Navient Corp. | |
4.875% due 06/17/2019 | | | | | 7,104 | | | | | | 7,406 | |
5.000% due 10/26/2020 | | | | | 8,200 | | | | | | 8,507 | |
5.500% due 01/15/2019 | | | | | 2,981 | | | | | | 3,111 | |
6.625% due 07/26/2021 | | | | | 14,425 | | | | | | 15,561 | |
| | | | | | | | | | | | |
| | | | | PRINCIPAL
AMOUNT
(000S) | | | | | MARKET
VALUE
(000S) | |
7.250% due 01/25/2022 | | $ | | | 500 | | | $ | | | 548 | |
8.000% due 03/25/2020 | | | | | 2,180 | | | | | | 2,442 | |
OneMain Financial Holdings LLC | |
6.750% due 12/15/2019 | | | | | 3,751 | | | | | | 3,953 | |
Provident Funding Associates LP | |
6.750% due 06/15/2021 | | | | | 2,615 | | | | | | 2,705 | |
Radian Group, Inc. | |
5.250% due 06/15/2020 | | | | | 2,530 | | | | | | 2,694 | |
5.500% due 06/01/2019 | | | | | 2,008 | | | | | | 2,116 | |
7.000% due 03/15/2021 | | | | | 2,100 | | | | | | 2,357 | |
Realogy Group LLC | |
4.500% due 04/15/2019 | | | | | 2,505 | | | | | | 2,596 | |
Royal Bank of Scotland Group PLC | |
6.990% due 10/29/2049 (c) | | | | | 2,375 | | | | | | 2,702 | |
7.640% due 12/31/2049 (c)(e) | | | | | 2,000 | | | | | | 1,930 | |
7.648% due 12/31/2049 (c) | | | | | 233 | | | | | | 288 | |
Springleaf Finance Corp. | |
6.900% due 12/15/2017 | | | | | 17,782 | | | | | | 18,071 | |
7.750% due 10/01/2021 | | | | | 3,130 | | | | | | 3,513 | |
8.250% due 12/15/2020 | | | | | 2,630 | | | | | | 2,959 | |
Starwood Property Trust, Inc. | |
5.000% due 12/15/2021 | | | | | 2,305 | | | | | | 2,403 | |
Stearns Holdings LLC | |
9.375% due 08/15/2020 | | | | | 2,559 | | | | | | 2,649 | |
TMX Finance LLC | |
8.500% due 09/15/2018 | | | | | 5,875 | | | | | | 5,611 | |
VEREIT Operating Partnership LP | |
4.125% due 06/01/2021 | | | | | 100 | | | | | | 105 | |
| | | | | | | | | | | | |
| | | | | | | | | | | 243,293 | |
| | | | | | | | | | | | |
| |
| INDUSTRIALS 68.7% | |
Abengoa Abenewco S.A.U. (0.250% Cash or 0.250% PIK) | |
0.250% due 03/31/2023 (b) | | | | | 462 | | | | | | 54 | |
Accudyne Industries Borrower | |
7.750% due 12/15/2020 | | | | | 2,955 | | | | | | 2,970 | |
ADT Corp. | |
3.500% due 07/15/2022 | | | | | 575 | | | | | | 559 | |
5.250% due 03/15/2020 | | | | | 7,700 | | | | | | 8,181 | |
Alberta ULC | |
14.000% due 02/13/2020 ^(b) | | | | | 672 | | | | | | 0 | |
Alere, Inc. | |
6.500% due 06/15/2020 | | | | | 2,000 | | | | | | 2,038 | |
7.250% due 07/01/2018 | | | | | 870 | | | | | | 871 | |
Aleris International, Inc. | |
7.875% due 11/01/2020 | | | | | 8,273 | | | | | | 7,839 | |
9.500% due 04/01/2021 | | | | | 4,580 | | | | | | 4,732 | |
Algeco Scotsman Global Finance PLC | |
8.500% due 10/15/2018 | | | | | 9,620 | | | | | | 9,043 | |
Allegheny Technologies, Inc. | |
5.950% due 01/15/2021 | | | | | 3,700 | | | | | | 3,728 | |
Altice Financing S.A. | |
6.500% due 01/15/2022 | | | | | 5,441 | | | | | | 5,699 | |
Altice Luxembourg S.A. | |
7.750% due 05/15/2022 | | | | | 100 | | | | | | 106 | |
American Airlines Group, Inc. | |
5.500% due 10/01/2019 | | | | | 5,338 | | | | | | 5,618 | |
Anglo American Capital PLC | |
3.625% due 05/14/2020 | | | | | 7,475 | | | | | | 7,634 | |
3.750% due 04/10/2022 | | | | | 3,250 | | | | | | 3,274 | |
4.450% due 09/27/2020 | | | | | 2,100 | | | | | | 2,200 | |
9.375% due 04/08/2019 | | | | | 3,780 | | | | | | 4,248 | |
Anixter, Inc. | |
5.125% due 10/01/2021 | | | | | 1,200 | | | | | | 1,284 | |
Antero Resources Corp. | |
5.375% due 11/01/2021 | | | | | 6,395 | | | | | | 6,483 | |
APX Group, Inc. | |
6.375% due 12/01/2019 | | | | | 5,237 | | | | | | 5,388 | |
ArcelorMittal | |
5.125% due 06/01/2020 | | | | | 4,455 | | | | | | 4,733 | |
5.750% due 08/05/2020 | | | | | 3,725 | | | | | | 4,028 | |
6.000% due 03/01/2021 | | | | | 5,992 | | | | | | 6,479 | |
6.750% due 02/25/2022 | | | | | 2,100 | | | | | | 2,373 | |
| | | | | | | | | | | | |
| | | | | PRINCIPAL
AMOUNT
(000S) | | | | | MARKET
VALUE
(000S) | |
Arconic, Inc. | |
5.400% due 04/15/2021 | | $ | | | 3,626 | | | $ | | | 3,821 | |
5.720% due 02/23/2019 | | | | | 3,006 | | | | | | 3,143 | |
6.150% due 08/15/2020 | | | | | 1,985 | | | | | | 2,144 | |
Ardagh Packaging Finance PLC | |
6.000% due 06/30/2021 | | | | | 4,775 | | | | | | 4,960 | |
Ascent Resources Utica Holdings LLC | |
10.000% due 04/01/2022 | | | | | 3,230 | | | | | | 3,246 | |
Atwood Oceanics, Inc. | |
6.500% due 02/01/2020 (e) | | | | | 8,917 | | | | | | 8,884 | |
Avon Products, Inc. | |
6.500% due 03/01/2019 | | | | | 800 | | | | | | 830 | |
6.600% due 03/15/2020 | | | | | 4,022 | | | | | | 4,077 | |
Ball Corp. | |
4.375% due 12/15/2020 | | | | | 2,770 | | | | | | 2,919 | |
BlueScope Steel Finance Ltd. | |
6.500% due 05/15/2021 | | | | | 2,100 | | | | | | 2,221 | |
BMC Software Finance, Inc. | |
8.125% due 07/15/2021 | | | | | 2,555 | | | | | | 2,658 | |
Bombardier, Inc. | |
7.750% due 03/15/2020 | | | | | 2,850 | | | | | | 3,074 | |
8.750% due 12/01/2021 | | | | | 8,625 | | | | | | 9,595 | |
Boxer Parent Co., Inc. (9.000% Cash or 9.750% PIK) | |
9.000% due 10/15/2019 (b) | | | | | 8,425 | | | | | | 8,457 | |
Brookfield Residential Properties, Inc. | |
6.500% due 12/15/2020 | | | | | 1,800 | | | | | | 1,863 | |
Bumble Bee Holdings, Inc. | |
9.000% due 12/15/2017 | | | | | 8,787 | | | | | | 8,814 | |
Burger King Worldwide, Inc. | |
4.625% due 01/15/2022 | | | | | 2,680 | | | | | | 2,754 | |
6.000% due 04/01/2022 | | | | | 6,325 | | | | | | 6,570 | |
Cablevision Systems Corp. | |
7.750% due 04/15/2018 | | | | | 4,850 | | | | | | 5,044 | |
8.000% due 04/15/2020 | | | | | 2,330 | | | | | | 2,601 | |
8.625% due 09/15/2017 | | | | | 1,227 | | | | | | 1,244 | |
Caesars Entertainment Resort Properties LLC | |
8.000% due 10/01/2020 | | | | | 3,452 | | | | | | 3,564 | |
CalAtlantic Group, Inc. | |
6.625% due 05/01/2020 | | | | | 250 | | | | | | 278 | |
8.375% due 05/15/2018 | | | | | 2,625 | | | | | | 2,766 | |
Calumet Specialty Products Partners LP | |
6.500% due 04/15/2021 | | | | | 7,575 | | | | | | 6,590 | |
Capsugel S.A. (7.000% Cash or 7.750% PIK) | |
7.000% due 05/15/2019 (b) | | | | | 3,568 | | | | | | 3,568 | |
Carrizo Oil & Gas, Inc. | |
7.500% due 09/15/2020 | | | | | 2,100 | | | | | | 2,145 | |
CCO Holdings LLC | |
5.250% due 03/15/2021 | | | | | 3,000 | | | | | | 3,092 | |
Cenovus Energy, Inc. | |
5.700% due 10/15/2019 | | | | | 2,280 | | | | | | 2,408 | |
Centene Corp. | |
5.625% due 02/15/2021 | | | | | 5,755 | | | | | | 6,014 | |
Cenveo Corp. | |
6.000% due 08/01/2019 | | | | | 3,300 | | | | | | 2,805 | |
Cequel Communications Holdings LLC | |
5.125% due 12/15/2021 | | | | | 5,745 | | | | | | 5,874 | |
6.375% due 09/15/2020 | | | | | 6,233 | | | | | | 6,373 | |
CF Industries, Inc. | |
7.125% due 05/01/2020 | | | | | 7,639 | | | | | | 8,460 | |
Chesapeake Energy Corp. | |
6.625% due 08/15/2020 | | | | | 7,210 | | | | | | 7,264 | |
CITGO Holding, Inc. | |
10.750% due 02/15/2020 | | | | | 7,925 | | | | | | 8,648 | |
Claire’s Stores, Inc. | |
9.000% due 03/15/2019 | | | | | 5,500 | | | | | | 2,805 | |
Clean Harbors, Inc. | |
5.125% due 06/01/2021 | | | | | 1,200 | | | | | | 1,229 | |
Clear Channel Worldwide Holdings, Inc. | |
7.625% due 03/15/2020 | | | | | 8,670 | | | | | | 8,659 | |
Cliffs Natural Resources, Inc. | |
8.250% due 03/31/2020 | | | | | 5,406 | | | | | | 5,920 | |
CNH Industrial Capital LLC | |
3.625% due 04/15/2018 | | | | | 750 | | | | | | 758 | |
| | | | | | | | |
| 38 | | PIMCO ETF TRUST | | | | | See Accompanying Notes | |
June 30, 2017
| | | | | | | | | | | | |
| | | | | PRINCIPAL
AMOUNT
(000S) | | | | | MARKET
VALUE
(000S) | |
3.875% due 07/16/2018 | | $ | | | 6,228 | | | $ | | | 6,346 | |
3.875% due 10/15/2021 | | | | | 2,525 | | | | | | 2,598 | |
4.375% due 11/06/2020 | | | | | 2,706 | | | | | | 2,845 | |
4.375% due 04/05/2022 | | | | | 3,730 | | | | | | 3,913 | |
Community Health Systems, Inc. | |
6.875% due 02/01/2022 | | | | | 11,525 | | | | | | 10,113 | |
7.125% due 07/15/2020 | | | | | 3,390 | | | | | | 3,314 | |
8.000% due 11/15/2019 | | | | | 10,275 | | | | | | 10,365 | |
Comstock Resources, Inc. (10.000% Cash or 12.250% PIK) | |
10.000% due 03/15/2020 (b) | | | | | 1,800 | | | | | | 1,805 | |
CONSOL Energy, Inc. | |
5.875% due 04/15/2022 | | | | | 8,078 | | | | | | 7,977 | |
Corporate Risk Holdings LLC | |
9.500% due 07/01/2019 | | | | | 1,800 | | | | | | 1,917 | |
CSC Holdings LLC | |
6.750% due 11/15/2021 | | | | | 5,855 | | | | | | 6,499 | |
7.625% due 07/15/2018 | | | | | 2,400 | | | | | | 2,538 | |
8.625% due 02/15/2019 | | | | | 1,325 | | | | | | 1,455 | |
D.R. Horton, Inc. | |
3.750% due 03/01/2019 | | | | | 275 | | | | | | 281 | |
4.000% due 02/15/2020 | | | | | 2,530 | | | | | | 2,629 | |
DCP Midstream Operating LP | |
5.350% due 03/15/2020 | | | | | 2,340 | | | | | | 2,445 | |
Dell International LLC | |
5.875% due 06/15/2021 | | | | | 12,649 | | | | | | 13,281 | |
Dell, Inc. | |
4.625% due 04/01/2021 | | | | | 1,500 | | | | | | 1,571 | |
Denbury Resources, Inc. | |
9.000% due 05/15/2021 | | | | | 3,573 | | | | | | 3,421 | |
DISH DBS Corp. | |
4.250% due 04/01/2018 | | | | | 5,576 | | | | | | 5,661 | |
5.125% due 05/01/2020 | | | | | 8,302 | | | | | | 8,686 | |
6.750% due 06/01/2021 | | | | | 8,495 | | | | | | 9,451 | |
7.875% due 09/01/2019 | | | | | 3,365 | | | | | | 3,718 | |
DJO Finance LLC | |
10.750% due 04/15/2020 | | | | | 2,500 | | | | | | 2,131 | |
DJO Finco, Inc. | |
8.125% due 06/15/2021 | | | | | 3,370 | | | | | | 3,151 | |
Dollar Tree, Inc. | |
5.250% due 03/01/2020 | | | | | 960 | | | | | | 987 | |
DriveTime Automotive Group, Inc. | |
8.000% due 06/01/2021 | | | | | 2,180 | | | | | | 2,196 | |
DynCorp International, Inc. (10.375% Cash and 1.500% PIK) | |
11.875% due 11/30/2020 (b) | | | | | 905 | | | | | | 937 | |
Dynegy, Inc. | |
6.750% due 11/01/2019 | | | | | 10,810 | | | | | | 11,202 | |
EMC Corp. | |
1.875% due 06/01/2018 | | | | | 7,050 | | | | | | 7,012 | |
2.650% due 06/01/2020 | | | | | 7,200 | | | | | | 7,069 | |
Energy Transfer Equity LP | |
7.500% due 10/15/2020 | | | | | 9,225 | | | | | | 10,355 | |
Ensco PLC | |
4.700% due 03/15/2021 | | | | | 3,591 | | | | | | 3,528 | |
Everi Payments, Inc. | |
10.000% due 01/15/2022 | | | | | 1,300 | | | | | | 1,430 | |
Fiat Chrysler Automobiles NV | |
4.500% due 04/15/2020 | | | | | 8,625 | | | | | | 8,873 | |
First Quantum Minerals Ltd. | |
7.000% due 02/15/2021 | | | | | 8,108 | | | | | | 8,351 | |
Florida East Coast Holdings Corp. | |
6.750% due 05/01/2019 | | | | | 7,185 | | | | | | 7,372 | |
Freeport-McMoRan, Inc. | |
2.300% due 11/14/2017 | | | | | 2,620 | | | | | | 2,620 | |
2.375% due 03/15/2018 | | | | | 8,425 | | | | | | 8,404 | |
3.100% due 03/15/2020 | | | | | 4,425 | | | | | | 4,348 | |
3.550% due 03/01/2022 | | | | | 7,113 | | | | | | 6,702 | |
6.500% due 11/15/2020 | | | | | 2,000 | | | | | | 2,063 | |
Fresenius Medical Care U.S. Finance, Inc. | |
4.125% due 10/15/2020 | | | | | 5,155 | | | | | | 5,374 | |
5.625% due 07/31/2019 | | | | | 4,051 | | | | | | 4,299 | |
6.875% due 07/15/2017 | | | | | 3,120 | | | | | | 3,125 | |
| | | | | | | | | | | | |
| | | | | PRINCIPAL
AMOUNT
(000S) | | | | | MARKET
VALUE
(000S) | |
GameStop Corp. | |
6.750% due 03/15/2021 (e) | | $ | | | 1,800 | | | $ | | | 1,879 | |
GFL Environmental, Inc. | |
9.875% due 02/01/2021 | | | | | 2,100 | | | | | | 2,294 | |
Global Ship Lease, Inc. | |
10.000% due 04/01/2019 | | | | | 440 | | | | | | 443 | |
GLP Capital LP | |
4.375% due 11/01/2018 | | | | | 490 | | | | | | 503 | |
4.375% due 04/15/2021 | | | | | 300 | | | | | | 316 | |
4.875% due 11/01/2020 | | | | | 10,975 | | | | | | 11,757 | |
Griffon Corp. | |
5.250% due 03/01/2022 | | | | | 3,930 | | | | | | 4,018 | |
Guitar Center, Inc. | |
6.500% due 04/15/2019 | | | | | 300 | | | | | | 262 | |
Harland Clarke Holdings Corp. | |
8.375% due 08/15/2022 | | | | | 500 | | | | | | 534 | |
Harvest Operations Corp. | |
2.330% due 04/14/2021 | | | | | 2,483 | | | | | | 2,422 | |
HCA Healthcare, Inc. | |
6.250% due 02/15/2021 | | | | | 3,480 | | | | | | 3,811 | |
HCA, Inc. | |
3.750% due 03/15/2019 | | | | | 2,560 | | | | | | 2,618 | |
4.250% due 10/15/2019 | | | | | 50 | | | | | | 52 | |
5.875% due 03/15/2022 | | | | | 5,425 | | | | | | 6,029 | |
6.500% due 02/15/2020 | | | | | 16,625 | | | | | | 18,184 | |
7.500% due 02/15/2022 | | | | | 5,400 | | | | | | 6,230 | |
HD Supply, Inc. | |
5.250% due 12/15/2021 | | | | | 5,190 | | | | | | 5,466 | |
Hertz Corp. | |
5.875% due 10/15/2020 | | | | | 3,885 | | | | | | 3,778 | |
6.750% due 04/15/2019 | | | | | 2,553 | | | | | | 2,553 | |
7.625% due 06/01/2022 (e) | | | | | 3,150 | | | | | | 3,150 | |
Hexion, Inc. | |
6.625% due 04/15/2020 | | | | | 11,510 | | | | | | 10,560 | |
HRG Group, Inc. | |
7.750% due 01/15/2022 | | | | | 4,756 | | | | | | 5,018 | |
Hughes Satellite Systems Corp. | |
6.500% due 06/15/2019 | | | | | 2,657 | | | | | | 2,880 | |
7.625% due 06/15/2021 | | | | | 4,525 | | | | | | 5,158 | |
Huntsman International LLC | |
4.875% due 11/15/2020 | | | | | 10,079 | | | | | | 10,633 | |
IASIS Healthcare LLC | |
8.375% due 05/15/2019 | | | | | 3,835 | | | | | | 3,856 | |
iHeartCommunications, Inc. | |
9.000% due 12/15/2019 | | | | | 6,870 | | | | | | 5,419 | |
9.000% due 03/01/2021 | | | | | 9,650 | | | | | | 7,274 | |
11.250% due 03/01/2021 | | | | | 6,950 | | | | | | 5,247 | |
Immucor, Inc. | |
11.125% due 08/15/2019 | | | | | 2,100 | | | | | | 2,121 | |
Imperial Metals Corp. | |
7.000% due 03/15/2019 | | | | | 400 | | | | | | 363 | |
Infor Software Parent LLC (7.125% Cash or 7.875% PIK) | |
7.125% due 05/01/2021 (b) | | | | | 4,105 | | | | | | 4,249 | |
Intelsat Jackson Holdings S.A. | |
7.250% due 10/15/2020 | | | | | 2,630 | | | | | | 2,498 | |
Intelsat Luxembourg S.A. | |
6.750% due 06/01/2018 | | | | | 19,650 | | | | | | 18,667 | |
International Game Technology PLC | |
5.625% due 02/15/2020 | | | | | 3,305 | | | | | | 3,530 | |
6.250% due 02/15/2022 | | | | | 5,850 | | | | | | 6,420 | |
INVISTA Finance LLC | |
4.250% due 10/15/2019 | | | | | 2,610 | | | | | | 2,702 | |
Jack Ohio Finance LLC | |
6.750% due 11/15/2021 | | | | | 2,705 | | | | | | 2,833 | |
Jaguar Land Rover Automotive PLC | |
3.500% due 03/15/2020 | | | | | 2,580 | | | | | | 2,622 | |
4.125% due 12/15/2018 | | | | | 5,025 | | | | | | 5,138 | |
JC Penney Corp., Inc. | |
5.750% due 02/15/2018 | | | | | 591 | | | | | | 601 | |
8.125% due 10/01/2019 | | | | | 830 | | | | | | 909 | |
Jo-Ann Stores LLC | |
8.125% due 03/15/2019 | | | | | 1,459 | | | | | | 1,461 | |
| | | | | | | | | | | | |
| | | | | PRINCIPAL
AMOUNT
(000S) | | | | | MARKET
VALUE
(000S) | |
Jurassic Holdings, Inc. | |
6.875% due 02/15/2021 | | $ | | | 2,000 | | | $ | | | 1,630 | |
K Hovnanian Enterprises, Inc. | |
8.000% due 11/01/2019 | | | | | 2,495 | | | | | | 2,520 | |
KB Home | |
4.750% due 05/15/2019 | | | | | 2,936 | | | | | | 3,039 | |
8.000% due 03/15/2020 | | | | | 5,230 | | | | | | 5,910 | |
Kindred Healthcare, Inc. | |
8.000% due 01/15/2020 | | | | | 3,990 | | | | | | 4,209 | |
Kinetic Concepts, Inc. | |
7.875% due 02/15/2021 | | | | | 2,555 | | | | | | 2,708 | |
Kinross Gold Corp. | |
5.125% due 09/01/2021 | | | | | 2,000 | | | | | | 2,140 | |
Kratos Defense & Security Solutions, Inc. | |
7.000% due 05/15/2019 | | | | | 2,746 | | | | | | 2,808 | |
L Brands, Inc. | |
5.625% due 02/15/2022 | | | | | 3,775 | | | | | | 4,058 | |
6.625% due 04/01/2021 | | | | | 9,515 | | | | | | 10,585 | |
8.500% due 06/15/2019 | | | | | 755 | | | | | | 843 | |
Lennar Corp. | |
4.125% due 12/01/2018 | | | | | 500 | | | | | | 513 | |
4.125% due 01/15/2022 | | | | | 800 | | | | | | 830 | |
4.500% due 11/15/2019 | | | | | 3,100 | | | | | | 3,228 | |
4.750% due 12/15/2017 | | | | | 436 | | | | | | 440 | |
4.750% due 04/01/2021 | | | | | 7,904 | | | | | | 8,408 | |
LifePoint Health, Inc. | |
5.500% due 12/01/2021 | | | | | 4,399 | | | | | | 4,556 | |
Lightstream Resources Ltd. | |
8.625% due 02/01/2020 ^ | | | | | 3,575 | | | | | | 27 | |
Lundin Mining Corp. | |
7.500% due 11/01/2020 | | | | | 2,060 | | | | | | 2,171 | |
Mallinckrodt International Finance S.A. | |
3.500% due 04/15/2018 | | | | | 6,905 | | | | | | 6,931 | |
4.875% due 04/15/2020 | | | | | 3,057 | | | | | | 2,992 | |
MGM Resorts International | |
5.250% due 03/31/2020 | | | | | 2,380 | | | | | | 2,526 | |
6.625% due 12/15/2021 | | | | | 9,565 | | | | | | 10,761 | |
6.750% due 10/01/2020 | | | | | 7,618 | | | | | | 8,459 | |
7.750% due 03/15/2022 | | | | | 5,825 | | | | | | 6,852 | |
8.625% due 02/01/2019 | | | | | 5,447 | | | | | | 6,019 | |
Momentive Performance Materials, Inc. | |
3.880% due 10/24/2021 | | | | | 2,425 | | | | | | 2,413 | |
Murray Energy Corp. | |
11.250% due 04/15/2021 | | | | | 3,540 | | | | | | 2,690 | |
Nabors Industries, Inc. | |
5.000% due 09/15/2020 | | | | | 2,315 | | | | | | 2,315 | |
6.150% due 02/15/2018 | | | | | 3,033 | | | | | | 3,075 | |
Nature’s Bounty Co. | |
7.625% due 05/15/2021 | | | | | 10,787 | | | | | | 11,488 | |
Navios Maritime Holdings, Inc. | |
7.375% due 01/15/2022 | | | | | 3,660 | | | | | | 2,846 | |
Navistar International Corp. | |
8.250% due 11/01/2021 | | | | | 7,025 | | | | | | 7,130 | |
NCL Corp. Ltd. | |
4.625% due 11/15/2020 | | | | | 3,060 | | | | | | 3,157 | |
4.750% due 12/15/2021 | | | | | 2,000 | | | | | | 2,081 | |
Neiman Marcus Group Ltd. LLC | |
8.000% due 10/15/2021 | | | | | 3,295 | | | | | | 1,812 | |
Netflix, Inc. | |
5.500% due 02/15/2022 | | | | | 3,225 | | | | | | 3,518 | |
Nielsen Finance LLC | |
5.000% due 04/15/2022 | | | | | 6,175 | | | | | | 6,422 | |
Noble Holding International Ltd. | |
4.900% due 08/01/2020 (e) | | | | | 310 | | | | | | 281 | |
Nokia Oyj | |
5.375% due 05/15/2019 | | | | | 3,454 | | | | | | 3,662 | |
Nuance Communications, Inc. | |
5.375% due 08/15/2020 | | | | | 1,423 | | | | | | 1,450 | |
NuStar Logistics LP | |
4.800% due 09/01/2020 | | | | | 1,800 | | | | | | 1,881 | |
NXP BV | |
4.125% due 06/15/2020 | | | | | 1,500 | | | | | | 1,579 | |
4.125% due 06/01/2021 | | | | | 5,853 | | | | | | 6,178 | |
| | | | | | |
| See Accompanying Notes | | ANNUAL REPORT | | JUNE 30, 2017 | | 39 |
Schedule of Investments PIMCO 0-5 Year High Yield Corporate Bond Index Exchange-Traded Fund (Cont.)
| | | | | | | | | | | | |
| | | | | PRINCIPAL
AMOUNT
(000S) | | | | | MARKET
VALUE
(000S) | |
Oasis Petroleum, Inc. | |
6.500% due 11/01/2021 | | $ | | | 1,200 | | | $ | | | 1,170 | |
6.875% due 03/15/2022 (e) | | | | | 7,580 | | | | | | 7,390 | |
Ortho-Clinical Diagnostics, Inc. | |
6.625% due 05/15/2022 | | | | | 4,200 | | | | | | 4,032 | |
Pacific Drilling Ltd. | |
7.250% due 12/01/2017 | | | | | 2,000 | | | | | | 1,028 | |
Pacific Drilling S.A. | |
5.375% due 06/01/2020 (e) | | | | | 4,201 | | | | | | 1,953 | |
PaperWorks Industries, Inc. | |
9.500% due 08/15/2019 | | | | | 1,200 | | | | | | 894 | |
Permian Resources LLC | |
13.000% due 11/30/2020 | | | | | 4,916 | | | | | | 5,678 | |
PHI, Inc. | |
5.250% due 03/15/2019 | | | | | 2,675 | | | | | | 2,488 | |
Platform Specialty Products Corp. | |
6.500% due 02/01/2022 | | | | | 6,300 | | | | | | 6,536 | |
10.375% due 05/01/2021 | | | | | 1,000 | | | | | | 1,109 | |
Precision Drilling Corp. | |
6.625% due 11/15/2020 | | | | | 3,040 | | | | | | 2,995 | |
Pride International LLC | |
6.875% due 08/15/2020 (e) | | | | | 4,079 | | | | | | 4,201 | |
QEP Resources, Inc. | |
6.875% due 03/01/2021 | | | | | 2,180 | | | | | | 2,273 | |
Resolute Energy Corp. | |
8.500% due 05/01/2020 | | | | | 2,910 | | | | | | 2,903 | |
Revlon Consumer Products Corp. | |
5.750% due 02/15/2021 | | | | | 2,000 | | | | | | 1,850 | |
Reynolds Group Issuer, Inc. | |
5.750% due 10/15/2020 | | | | | 12,365 | | | | | | 12,669 | |
Rite Aid Corp. | |
6.750% due 06/15/2021 | | | | | 2,100 | | | | | | 2,167 | |
9.250% due 03/15/2020 | | | | | 7,000 | | | | | | 7,245 | |
Rivers Pittsburgh Borrower LP | |
6.125% due 08/15/2021 | | | | | 1,000 | | | | | | 1,018 | |
Rockies Express Pipeline LLC | |
5.625% due 04/15/2020 | | | | | 6,455 | | | | | | 6,891 | |
6.000% due 01/15/2019 | | | | | 3,579 | | | | | | 3,749 | |
6.850% due 07/15/2018 | | | | | 4,874 | | | | | | 5,099 | |
Rowan Cos., Inc. | |
7.875% due 08/01/2019 (e) | | | | | 3,897 | | | | | | 4,102 | |
RR Donnelley & Sons Co. | |
7.875% due 03/15/2021 | | | | | 2,400 | | | | | | 2,610 | |
Sabine Pass Liquefaction LLC | |
5.625% due 02/01/2021 | | | | | 7,075 | | | | | | 7,708 | |
Sanmina Corp. | |
4.375% due 06/01/2019 | | | | | 2,578 | | | | | | 2,655 | |
Scientific Games International, Inc. | |
7.000% due 01/01/2022 | | | | | 11,657 | | | | | | 12,444 | |
Sears Holdings Corp. | |
8.000% due 12/15/2019 (e) | | | | | 2,678 | | | | | | 2,109 | |
Select Medical Corp. | |
6.375% due 06/01/2021 | | | | | 4,990 | | | | | | 5,152 | |
SESI LLC | |
7.125% due 12/15/2021 | | | | | 2,100 | | | | | | 2,011 | |
SFR Group S.A. | |
6.000% due 05/15/2022 | | | | | 3,000 | | | | | | 3,142 | |
Sinclair Television Group, Inc. | |
5.375% due 04/01/2021 | | | | | 1,800 | | | | | | 1,853 | |
Sirius XM Radio, Inc. | |
3.875% due 08/01/2022 (a) | | | | | 2,600 | | | | | | 2,633 | |
SoftBank Group Corp. | |
4.500% due 04/15/2020 | | | | | 8,030 | | | | | | 8,368 | |
Southwestern Energy Co. | |
4.100% due 03/15/2022 | | | | | 3,906 | | | | | | 3,659 | |
5.800% due 01/23/2020 | | | | | 4,624 | | | | | | 4,749 | |
Springs Industries, Inc. | |
6.250% due 06/01/2021 | | | | | 3,328 | | | | | | 3,440 | |
Standard Industries, Inc. | |
5.125% due 02/15/2021 | | | | | 5,355 | | | | | | 5,576 | |
Sterigenics-Nordion Topco LLC (8.125% Cash or 8.875% PIK) | |
8.125% due 11/01/2021 (b) | | | | | 2,000 | | | | | | 2,055 | |
| | | | | | | | | | | | |
| | | | | PRINCIPAL
AMOUNT
(000S) | | | | | MARKET
VALUE
(000S) | |
Sunoco LP | |
5.500% due 08/01/2020 | | $ | | | 2,771 | | | $ | | | 2,844 | |
6.250% due 04/15/2021 | | | | | 4,525 | | | | | | 4,740 | |
Syniverse Foreign Holdings Corp. | |
9.125% due 01/15/2022 | | | | | 3,326 | | | | | | 3,330 | |
Syniverse Holdings, Inc. | |
9.125% due 01/15/2019 | | | | | 549 | | | | | | 535 | |
T-Mobile USA, Inc. | |
4.000% due 04/15/2022 | | | | | 3,265 | | | | | | 3,406 | |
6.125% due 01/15/2022 | | | | | 2,229 | | | | | | 2,348 | |
Taylor Morrison Communities, Inc. | |
5.250% due 04/15/2021 | | | | | 2,100 | | | | | | 2,155 | |
Teck Resources Ltd. | |
4.500% due 01/15/2021 | | | | | 3,590 | | | | | | 3,761 | |
4.750% due 01/15/2022 | | | | | 2,330 | | | | | | 2,423 | |
TEGNA, Inc. | |
5.125% due 10/15/2019 | | | | | 2,535 | | | | | | 2,592 | |
Tenet Healthcare Corp. | |
4.375% due 10/01/2021 | | | | | 7,675 | | | | | | 7,828 | |
4.500% due 04/01/2021 | | | | | 2,950 | | | | | | 3,013 | |
4.750% due 06/01/2020 | | | | | 2,485 | | | | | | 2,584 | |
5.000% due 03/01/2019 | | | | | 5,795 | | | | | | 6,087 | |
5.500% due 03/01/2019 | | | | | 7,250 | | | | | | 7,540 | |
6.000% due 10/01/2020 | | | | | 2,756 | | | | | | 2,959 | |
6.250% due 11/01/2018 | | | | | 2,520 | | | | | | 2,659 | |
7.500% due 01/01/2022 | | | | | 600 | | | | | | 652 | |
8.125% due 04/01/2022 | | | | | 9,230 | | | | | | 9,830 | |
Tesco PLC | |
5.500% due 11/15/2017 | | | | | 1,500 | | | | | | 1,519 | |
Tesoro Corp. | |
4.250% due 10/01/2017 | | | | | 2,000 | | | | | | 2,006 | |
Tesoro Logistics LP | |
5.500% due 10/15/2019 | | | | | 3,400 | | | | | | 3,604 | |
6.125% due 10/15/2021 | | | | | 1,400 | | | | | | 1,460 | |
Toll Brothers Finance Corp. | |
4.000% due 12/31/2018 | | | | | 3,000 | | | | | | 3,082 | |
5.875% due 02/15/2022 | | | | | 2,000 | | | | | | 2,222 | |
8.910% due 10/15/2017 | | | | | 2,410 | | | | | | 2,458 | |
Tops Holding Corp. (8.750% Cash or 9.500% PIK) | |
8.750% due 06/15/2018 (b) | | | | | 1,000 | | | | | | 855 | |
TransDigm, Inc. | |
5.500% due 10/15/2020 | | | | | 8,364 | | | | | | 8,500 | |
Transocean, Inc. | |
6.000% due 03/15/2018 | | | | | 443 | | | | | | 454 | |
TRI Pointe Group, Inc. | |
4.875% due 07/01/2021 | | | | | 1,300 | | | | | | 1,372 | |
Triumph Group, Inc. | |
4.875% due 04/01/2021 | | | | | 1,800 | | | | | | 1,798 | |
Tronox Finance LLC | |
6.375% due 08/15/2020 | | | | | 4,512 | | | | | | 4,535 | |
TRU Taj LLC | |
12.000% due 08/15/2021 (e) | | | | | 2,000 | | | | | | 1,875 | |
Tullow Oil PLC | |
6.000% due 11/01/2020 | | | | | 6,130 | | | | | | 5,854 | |
Unit Corp. | |
6.625% due 05/15/2021 | | | | | 4,090 | | | | | | 3,937 | |
United States Steel Corp. | |
7.375% due 04/01/2020 | | | | | 1,389 | | | | | | 1,509 | |
8.375% due 07/01/2021 | | | | | 6,405 | | | | | | 7,062 | |
Urban One, Inc. | |
9.250% due 02/15/2020 (e) | | | | | 1,400 | | | | | | 1,351 | |
Valeant Pharmaceuticals International, Inc. | |
5.375% due 03/15/2020 | | | | | 9,110 | | | | | | 8,814 | |
5.625% due 12/01/2021 | | | | | 2,430 | | | | | | 2,205 | |
6.375% due 10/15/2020 | | | | | 13,615 | | | | | | 13,258 | |
6.500% due 03/15/2022 | | | | | 600 | | | | | | 631 | |
6.750% due 08/15/2018 | | | | | 848 | | | | | | 852 | |
7.000% due 10/01/2020 | | | | | 2,775 | | | | | | 2,744 | |
7.500% due 07/15/2021 | | | | | 2,530 | | | | | | 2,460 | |
Vertiv Intermediate Holding Corp. (12.000% Cash or 13.000% PIK) | |
12.000% due 02/15/2022 (b) | | | | | 1,200 | | | | | | 1,289 | |
Virgin Media Secured Finance PLC | |
5.250% due 01/15/2021 | | | | | 1,200 | | | | | | 1,289 | |
| | | | | | | | | | | | |
| | | | | PRINCIPAL
AMOUNT
(000S) | | | | | MARKET
VALUE
(000S) | |
Wave Holdco LLC (8.250% Cash or 9.000% PIK) | |
8.250% due 07/15/2019 (b) | | $ | | | 437 | | | $ | | | 446 | |
Weatherford International Ltd. | |
7.750% due 06/15/2021 | | | | | 6,339 | | | | | | 6,394 | |
Welltec A/S | |
8.000% due 02/01/2019 | | | | | 900 | | | | | | 875 | |
Westlake Chemical Corp. | |
4.625% due 02/15/2021 | | | | | 2,505 | | | | | | 2,605 | |
Whiting Petroleum Corp. | |
5.000% due 03/15/2019 | | | | | 5,518 | | | | | | 5,511 | |
5.750% due 03/15/2021 (e) | | | | | 8,881 | | | | | | 8,393 | |
WideOpenWest Finance LLC | |
10.250% due 07/15/2019 | | | | | 3,332 | | | | | | 3,436 | |
Wind Acquisition Finance S.A. | |
4.750% due 07/15/2020 | | | | | 7,905 | | | | | | 8,008 | |
7.375% due 04/23/2021 | | | | | 13,550 | | | | | | 14,100 | |
Windstream Services LLC | |
7.750% due 10/01/2021 (e) | | | | | 4,285 | | | | | | 4,049 | |
WPX Energy, Inc. | |
6.000% due 01/15/2022 | | | | | 2,350 | | | | | | 2,338 | |
7.500% due 08/01/2020 | | | | | 2,663 | | | | | | 2,809 | |
WR Grace & Co-Conn | |
5.125% due 10/01/2021 | | | | | 4,825 | | | | | | 5,187 | |
Yum! Brands, Inc. | |
3.875% due 11/01/2020 | | | | | 1,690 | | | | | | 1,749 | |
ZF North America Capital, Inc. | |
4.000% due 04/29/2020 | | | | | 9,000 | | | | | | 9,349 | |
| | | | | | | | | | | | |
| | | | | | | | | | | 1,252,792 | |
| | | | | | | | | | | | |
| |
| UTILITIES 7.7% | |
AES Corp. | |
4.202% due 06/01/2019 | | | | | 579 | | | | | | 580 | |
7.375% due 07/01/2021 | | | | | 4,900 | | | | | | 5,635 | |
8.000% due 06/01/2020 | | | | | 2,295 | | | | | | 2,668 | |
CenturyLink, Inc. | |
5.625% due 04/01/2020 | | | | | 5,260 | | | | | | 5,584 | |
5.800% due 03/15/2022 | | | | | 6,025 | | | | | | 6,289 | |
6.450% due 06/15/2021 | | | | | 3,689 | | | | | | 4,003 | |
Drill Rigs Holdings, Inc. | |
6.500% due 10/01/2017 ^ | | | | | 501 | | | | | | 143 | |
Endeavor Energy Resources LP | |
7.000% due 08/15/2021 | | | | | 2,000 | | | | | | 2,077 | |
EP Energy LLC | |
9.375% due 05/01/2020 | | | | | 7,300 | | | | | | 5,794 | |
Extraction Oil & Gas, Inc. | |
7.875% due 07/15/2021 | | | | | 5,710 | | | | | | 5,896 | |
Frontier Communications Corp. | |
6.250% due 09/15/2021 | | | | | 2,480 | | | | | | 2,220 | |
8.125% due 10/01/2018 | | | | | 8,005 | | | | | | 8,475 | |
8.500% due 04/15/2020 | | | | | 2,632 | | | | | | 2,773 | |
8.875% due 09/15/2020 | | | | | 2,664 | | | | | | 2,825 | |
Genesis Energy LP | |
5.750% due 02/15/2021 | | | | | 2,525 | | | | | | 2,531 | |
Great Western Petroleum LLC | |
9.000% due 09/30/2021 | | | | | 2,172 | | | | | | 2,156 | |
NGPL PipeCo LLC | |
7.119% due 12/15/2017 | | | | | 9,303 | | | | | | 9,524 | |
Niska Gas Storage Ltd. | |
6.500% due 04/01/2019 | | | | | 1,900 | | | | | | 1,938 | |
NRG Energy, Inc. | |
7.625% due 01/15/2018 | | | | | 77 | | | | | | 80 | |
Permian Resources LLC | |
7.125% due 11/01/2020 | | | | | 1,500 | | | | | | 1,245 | |
Sprint Capital Corp. | |
6.900% due 05/01/2019 | | | | | 4,382 | | | | | | 4,699 | |
Sprint Communications, Inc. | |
7.000% due 03/01/2020 | | | | | 5,180 | | | | | | 5,698 | |
7.000% due 08/15/2020 | | | | | 8,350 | | | | | | 9,206 | |
9.000% due 11/15/2018 | | | | | 9,462 | | | | | | 10,281 | |
Sprint Corp. | |
7.250% due 09/15/2021 | | | | | 9,151 | | | | | | 10,192 | |
| | | | | | | | |
| 40 | | PIMCO ETF TRUST | | | | | See Accompanying Notes | |
June 30, 2017
| | | | | | | | | | | | |
| | | | | PRINCIPAL
AMOUNT
(000S) | | | | | MARKET
VALUE
(000S) | |
Talen Energy Supply LLC | |
4.600% due 12/15/2021 | | $ | | | 1,900 | | | $ | | | 1,454 | |
4.625% due 07/15/2019 | | | | | 1,271 | | | | | | 1,242 | |
9.500% due 07/15/2022 | | | | | 3,510 | | | | | | 3,027 | |
Talos Production LLC | |
9.750% due 02/15/2018 | | | | | 384 | | | | | | 249 | |
Targa Resources Partners LP | |
4.125% due 11/15/2019 | | | | | 3,960 | | | | | | 4,024 | |
Telecom Italia Capital S.A. | |
6.999% due 06/04/2018 | | | | | 16,254 | | | | | | 17,006 | |
| | | | | | | | | | | | |
| | | | | | | | | | | 139,514 | |
| | | | | | | | | | | | |
Total Corporate Bonds & Notes
(Cost $1,632,101) | | | | | | 1,635,599 | |
| | | | | | | | | | | | |
| |
| SHORT-TERM INSTRUMENTS 18.6% | |
| |
| REPURCHASE AGREEMENTS (f) 18.6% | |
| | | | | | | | | | | 339,141 | |
| | | | | | | | | | | | |
Total Short-Term Instruments
(Cost $339,141) | | | | | | 339,141 | |
| | | | | | | | | | | | |
| | | | | | | | | | | | |
Total Investments in Securities
(Cost $1,971,242) | | | | | | 1,974,740 | |
| | | | | | | | | | | | |
| | | | | | | | | | | | |
| | | SHARES | | | | | MARKET
VALUE
(000S) | |
| INVESTMENTS IN AFFILIATES 2.5% | |
| |
| SHORT-TERM INSTRUMENTS 2.5% | |
| |
| MUTUAL FUNDS 2.5% | |
PIMCO Government Money Market Fund (d)(e) | | | | | 45,886,432 | | | $ | | | 45,886 | |
| | | | | | | | | | | | |
Total Short-Term Instruments
(Cost $45,886) | | | | | | 45,886 | |
| | | | | | | | | | | | |
| |
Total Investments in Affiliates
(Cost $45,886) | | | | | | 45,886 | |
| | | | | | | | | | | | |
Total Investments 110.8%
(Cost $2,017,128) | | | $ | | | 2,020,626 | |
| |
Financial Derivative
Instruments (g)(j) 0.0% (Cost or Premiums, net $0) | | | 231 | |
| |
| Other Assets and Liabilities, net (10.8)% | | | (196,706 | ) |
| | | | | | | | | | | | |
| Net Assets 100.0% | | | $ | | | 1,824,151 | |
| | | | | | | | | | | | |
NOTES TO SCHEDULE OF INVESTMENTS (AMOUNTS IN THOUSANDS*, EXCEPT NUMBER OF CONTRACTS):
| * | A zero balance may reflect actual amounts rounding to less than one thousand. |
| (b) | Payment in-kind security. |
| (c) | Perpetual maturity; date shown, if applicable, represents next contractual call date. |
| (d) | Institutional Class Shares of each Fund. |
| (e) | Securities with an aggregate market value of $47,908 were out on loan in exchange for $48,886 of cash collateral as of June 30, 2017. See Note 5, Securities Lending, in the Notes to Financial Statements for more information regarding securities on loan and cash collateral. |
BORROWINGS AND OTHER FINANCING TRANSACTIONS
(f) REPURCHASE AGREEMENTS:
| | | | | | | | | | | | | | | | | | | | | | | | | | | | | | |
| Counterparty | | Lending
Rate | | | Settlement
Date | | | Maturity
Date | | | Principal
Amount | | | Collateralized By | | Collateral
(Received) | | | Repurchase
Agreements,
at Value | | | Repurchase
Agreement
Proceeds
to be
Received(1) | |
| BOS | | | 1.200 | % | | | 07/03/2017 | | | | 07/05/2017 | | | $ | 153,300 | | | U.S. Treasury Bonds 3.625% due 08/15/2043 | | $ | (158,212 | ) | | $ | 153,300 | | | $ | 153,310 | |
| | | 1.330 | | | | 06/30/2017 | | | | 07/03/2017 | | | | 150,000 | | | U.S. Treasury Bonds 3.625% due 02/15/2044 | | | (154,300 | ) | | | 150,000 | | | | 150,017 | |
| MBC | | | 1.400 | | | | 06/30/2017 | | | | 07/03/2017 | | | | 28,200 | | | U.S. Treasury Floating Rate Note 1.080%
due 07/31/2017 | | | (29,113 | ) | | | 28,200 | | | | 28,203 | |
| SSB | | | 0.050 | | | | 06/30/2017 | | | | 07/03/2017 | | | | 7,641 | | | U.S. Treasury Notes 2.000% due 08/31/2021(2) | | | (7,793 | ) | | | 7,641 | | | | 7,641 | |
| | | | | | | | | | | | | | | | | | | | | | | | | | | | | | |
Total Repurchase Agreements | | $ | (349,418 | ) | | $ | 339,141 | | | $ | 339,171 | |
| | | | | | | | | | | | | | | | | | | | | | | | | | | | | | |
BORROWINGS AND OTHER FINANCING TRANSACTIONS SUMMARY
The following is a summary by counterparty of the market value of Borrowings and Other Financing Transactions and collateral pledged/(received) as of June 30, 2017:
| | | | | | | | | | | | | | | | | | | | | | | | | | | | |
| Counterparty | | Repurchase
Agreement
Proceeds
to be
Received | | | Payable for
Reverse
Repurchase
Agreements | | | Payable for
Sale-Buyback
Transactions | | | Securities
Out on Loan | | | Total
Borrowings and
Other Financing
Transactions | | | Collateral
Pledged/(Received) | | | Net Exposure(3) | |
Global/Master Repurchase Agreement | |
BOS | | $ | 303,327 | | | $ | 0 | | | $ | 0 | | | $ | 0 | | | $ | 303,327 | | | $ | (312,512 | ) | | $ | (9,185 | ) |
MBC | | | 28,203 | | | | 0 | | | | 0 | | | | 0 | | | | 28,203 | | | | (29,113 | ) | | | (910 | ) |
SSB | | | 7,641 | | | | 0 | | | | 0 | | | | 0 | | | | 7,641 | | | | (7,793 | ) | | | (152 | ) |
| | | | | | |
| See Accompanying Notes | | ANNUAL REPORT | | JUNE 30, 2017 | | 41 |
Schedule of Investments PIMCO 0-5 Year High Yield Corporate Bond Index Exchange-Traded Fund (Cont.)
| | | | | | | | | | | | | | | | | | | | | | | | | | | | |
| Counterparty | | Repurchase
Agreement
Proceeds
to be
Received | | | Payable for
Reverse
Repurchase
Agreements | | | Payable for
Sale-Buyback
Transactions | | | Securities
Out on Loan | | | Total
Borrowings and
Other Financing
Transactions | | | Collateral
Pledged/(Received) | | | Net Exposure(3) | |
Master Securities Lending Agreement | |
BCY | | $ | 0 | | | $ | 0 | | | $ | 0 | | | $ | 35,788 | | | $ | 35,788 | | | $ | (36,504 | ) | | $ | (716 | ) |
DEU | | | 0 | | | | 0 | | | | 0 | | | | 3,121 | | | | 3,121 | | | | (3,188 | ) | | | (67 | ) |
FOB | | | 0 | | | | 0 | | | | 0 | | | | 1,303 | | | | 1,303 | | | | (1,329 | ) | | | (26 | ) |
JPM | | | 0 | | | | 0 | | | | 0 | | | | 2,301 | | | | 2,301 | | | | (2,347 | ) | | | (46 | ) |
RDR | | | 0 | | | | 0 | | | | 0 | | | | 2,799 | | | | 2,799 | | | | (2,872 | ) | | | (73 | ) |
SAL | | | 0 | | | | 0 | | | | 0 | | | | 2,596 | | | | 2,596 | | | | (2,647 | ) | | | (51 | ) |
| | | | | | | | | | | | | | | | | | | | | | | | | | | | |
Total Borrowings and Other Financing Transactions | | $ | 339,171 | | | $ | 0 | | | $ | 0 | | | $ | 47,908 | | | | | | | | | | | | | |
| | | | | | | | | | | | | | | | | | | | | | | | | | | | |
CERTAIN TRANSFERS ACCOUNTED FOR AS SECURED BORROWINGS
Remaining Contractual Maturity of the Agreements
| | | | | | | | | | | | | | | | | | | | |
| | | Overnight and
Continuous | | | Up to 30 days | | | 31-90 days | | | Greater Than 90 days | | | Total | |
Securities Lending Transactions(4) | |
Corporate Bonds & Notes | | $ | 48,886 | | | $ | 0 | | | $ | 0 | | | $ | 0 | | | $ | 48,886 | |
| | | | | | | | | | | | | | | | | | | | |
Total Borrowings | | $ | 48,886 | | | $ | 0 | | | $ | 0 | | | $ | 0 | | | $ | 48,886 | |
| | | | | | | | | | | | | | | | | | | | |
Gross amount of recognized liabilities for reverse repurchase agreements and securities lending transactions | | | $ | 48,886 | |
| | | | | | | | | | | | | | | | | | | | |
| (1) | Includes accrued interest. |
| (2) | Collateral is held in custody by the counterparty. |
| (3) | Net Exposure represents the net receivable/(payable) that would be due from/to the counterparty in the event of default. Exposure from borrowings and other financing transactions can only be netted across transactions governed under the same master agreement with the same legal entity. See Note 8, Master Arrangements, in the Notes to Financial Statements for more information regarding master netting arrangements. |
| (4) | Includes cash collateral as described in Note 5, Securities Lending, in the Notes to Financial Statements. |
The average amount of borrowings outstanding during the period ended June 30, 2017 was $(2,858) at a weighted average interest rate of (3.137)%. Average borrowings may include sale-buyback transactions and reverse repurchase agreements, if held during the period.
(g) FINANCIAL DERIVATIVE INSTRUMENTS: EXCHANGE-TRADED OR CENTRALLY CLEARED
FUTURES CONTRACTS:
LONG FUTURES CONTRACTS
| | | | | | | | | | | | | | | | | | | | | | | | |
| Description | | Expiration
Month | | | # of
Contracts | | | Notional
Amount | | | Unrealized
Appreciation/
(Depreciation) | | | Variation Margin | |
| | | | | | Asset | | | Liability | |
U.S. Treasury 5-Year Note September Futures | | | 09/2017 | | | | 695 | | | $ | 81,896 | | | $ | (186 | ) | | $ | 0 | | | $ | (119 | ) |
| | | | | | | | | | | | | | | | | | | | | | | | |
Total Futures Contracts | | | $ | (186 | ) | | $ | 0 | | | $ | (119 | ) |
| | | | | | | | | | | | | |
SWAP AGREEMENTS:
CREDIT DEFAULT SWAPS ON CREDIT INDICES - SELL PROTECTION(1)
| | | | | | | | | | | | | | | | | | | | | | | | | | | | | | | | |
| Index/Tranches | | Fixed
Receive Rate | | | Maturity
Date | | | Notional
Amount(2) | | | Premiums
Paid/(Received) | | | Unrealized
Appreciation/
(Depreciation) | | | Market
Value(3) | | | Variation Margin | |
| | | | | | | | Asset | | | Liability | |
CDX.HY-26 5-Year Index | | | 5.000% | | | | 06/20/2021 | | | $ | 151,272 | | | $ | 5,632 | | | $ | 6,424 | | | $ | 12,056 | | | $ | 224 | | | $ | 0 | |
CDX.HY-27 5-Year Index | | | 5.000 | | | | 12/20/2021 | | | | 58,707 | | | | 3,612 | | | | 891 | | | | 4,503 | | | | 126 | | | | 0 | |
| | | | | | | | | | | | | | | | | | | | | | | | | | | | | | | | |
| | | | | | | | | | | | | | $ | 9,244 | | | $ | 7,315 | | | $ | 16,559 | | | $ | 350 | | | $ | 0 | |
| | | | | | | | | | | | | | | | | | | | | | | | | | | | | | | | |
Total Swap Agreements | | | | | | | | | | | | | | $ | 9,244 | | | $ | 7,315 | | | $ | 16,559 | | | $ | 350 | | | $ | 0 | |
| | | | | | | | | | | | | | | | | | | | | | | | | | | | | | | | |
FINANCIAL DERIVATIVE INSTRUMENTS: EXCHANGE-TRADED OR CENTRALLY CLEARED SUMMARY
The following is a summary of the market value and variation margin of Exchange-Traded or Centrally Cleared Financial Derivative Instruments as of June 30, 2017:
| | | | | | | | | | | | | | | | | | | | | | | | | | | | | | | | | | | | |
| | | Financial Derivative Assets | | | | | | Financial Derivative Liabilities | |
| | | Market Value | | | Variation Margin
Asset | | | Total | | | | | | Market Value | | | Variation Margin
Liability | | | Total | |
| | | Purchased
Options | | | Futures | | | Swap
Agreements | | | | | | | Written
Options | | | Futures | | | Swap
Agreements | | |
Total Exchange-Traded or Centrally Cleared | | $ | 0 | | | $ | 0 | | | $ | 350 | | | $ | 350 | | | | | | | $ | 0 | | | $ | (119) | | | $ | 0 | | | $ | (119) | |
| | | | | | | | | | | | | | | | | | | | | | | | | | | | | | | | | | | | |
| | | | | | | | |
| 42 | | PIMCO ETF TRUST | | | | | See Accompanying Notes | |
June 30, 2017
Cash of $10,646 has been pledged as collateral for exchange-traded and centrally cleared financial derivative instruments as of June 30, 2017. See Note 8, Master Arrangements, in the Notes to Financial Statements for more information regarding master netting arrangements.
| (1) | If the Fund is a seller of protection and a credit event occurs, as defined under the terms of that particular swap agreement, the Fund will either (i) pay to the buyer of protection an amount equal to the notional amount of the swap and take delivery of the referenced obligation or underlying securities comprising the referenced index or (ii) pay a net settlement amount in the form of cash, securities or other deliverable obligations equal to the notional amount of the swap less the recovery value of the referenced obligation or underlying securities comprising the referenced index. |
| (2) | The maximum potential amount the Fund could be required to pay as a seller of credit protection or receive as a buyer of credit protection if a credit event occurs as defined under the terms of that particular swap agreement. |
| (3) | The prices and resulting values for credit default swap agreements on credit indices serve as indicators of the current status of the payment/performance risk and represent the likelihood of an expected liability (or profit) for the credit derivative should the notional amount of the swap agreement be closed/sold as of the period end. Increasing market values, in absolute terms when compared to the notional amount of the swap, represent a deterioration of the referenced indices’ credit soundness and a greater likelihood or risk of default or other credit event occurring as defined under the terms of the agreement. |
FAIR VALUE OF FINANCIAL DERIVATIVE INSTRUMENTS
The following is a summary of the fair valuation of the Fund’s derivative instruments categorized by risk exposure. See Note 7, Principal Risks, in the Notes to Financial Statements on risks of the Fund.
Fair Values of Financial Derivative Instruments on the Statements of Assets and Liabilities as of June 30, 2017:
| | | | | | | | | | | | | | | | | | | | | | | | |
| | | Derivatives not accounted for as hedging instruments | |
| | | Commodity
Contracts | | | Credit
Contracts | | | Equity
Contracts | | | Foreign
Exchange
Contracts | | | Interest
Rate Contracts | | | Total | |
Financial Derivative Instruments - Assets | | | | | | | | | | | | | | | | | | | | | | | | |
Exchange-traded or centrally cleared | | | | | | | | | | | | | | | | | | | | | | | | |
Swap Agreements | | $ | 0 | | | $ | 350 | | | $ | 0 | | | $ | 0 | | | $ | 0 | | | $ | 350 | |
| | | | | | | | | | | | | | | | | | | | | | | | |
| | | | | | |
Financial Derivative Instruments - Liabilities | | | | | | | | | | | | | | | | | | | | | | | | |
Exchange-traded or centrally cleared | | | | | | | | | | | | | | | | | | | | | | | | |
Futures | | $ | 0 | | | $ | 0 | | | $ | 0 | | | $ | 0 | | | $ | 119 | | | $ | 119 | |
| | | | | | | | | | | | | | | | | | | | | | | | |
The effect of Financial Derivative Instruments on the Statements of Operations for the period ended June 30, 2017:
| | | | | | | | | | | | | | | | | | | | | | | | |
| | | Derivatives not accounted for as hedging instruments | |
| | | Commodity
Contracts | | | Credit
Contracts | | | Equity
Contracts | | | Foreign
Exchange
Contracts | | | Interest
Rate Contracts | | | Total | |
Net Realized Gain (Loss) on Financial Derivative Instruments | | | | | | | | | | | | | | | | | |
Exchange-traded or centrally cleared | | | | | | | | | | | | | | | | | | | | | | | | |
Futures | | $ | 0 | | | $ | 0 | | | $ | 0 | | | $ | 0 | | | $ | (591 | ) | | $ | (591 | ) |
Swap Agreements | | | 0 | | | | 20,492 | | | | 0 | | | | 0 | | | | (15 | ) | | | 20,477 | |
| | | | | | | | | | | | | | | | | | | | | | | | |
| | $ | 0 | | | $ | 20,492 | | | $ | 0 | | | $ | 0 | | | $ | (606 | ) | | $ | 19,886 | |
| | | | | | | | | | | | | | | | | | | | | | | | |
Over the counter | | | | | | | | | | | | | | | | | | | | | | | | |
Swap Agreements | | $ | 0 | | | $ | 35 | | | $ | 0 | | | $ | 0 | | | $ | 0 | | | $ | 35 | |
| | | | | | | | | | | | | | | | | | | | | | | | |
| | $ | 0 | | | $ | 20,527 | | | $ | 0 | | | $ | 0 | | | $ | (606 | ) | | $ | 19,921 | |
| | | | | | | | | | | | | | | | | | | | | | | | |
| | |
Net Change in Unrealized Appreciation (Depreciation) on Financial Derivative Instruments | | | | | | | | | |
Exchange-traded or centrally cleared | | | | | | | | | | | | | | | | | | | | | | | | |
Futures | | $ | 0 | | | $ | 0 | | | $ | 0 | | | $ | 0 | | | $ | (1,298 | ) | | $ | (1,298 | ) |
Swap Agreements | | | 0 | | | | 3,830 | | | | 0 | | | | 0 | | | | 0 | | | | 3,830 | |
| | | | | | | | | | | | | | | | | | | | | | | | |
| | $ | 0 | | | $ | 3,830 | | | $ | 0 | | | $ | 0 | | | $ | (1,298 | ) | | $ | 2,532 | |
| | | | | | | | | | | | | | | | | | | | | | | | |
| | | | | | |
| See Accompanying Notes | | ANNUAL REPORT | | JUNE 30, 2017 | | 43 |
Schedule of Investments PIMCO 0-5 Year High Yield Corporate Bond Index Exchange-Traded Fund (Cont.)
June 30, 2017
FAIR VALUE MEASUREMENTS
The following is a summary of the fair valuations according to the inputs used as of June 30, 2017 in valuing the Fund’s assets and liabilities:
| | | | | | | | | | | | | | | | |
| Category and Subcategory | | Level 1 | | | Level 2 | | | Level 3 | | | Fair
Value at
06/30/2017 | |
Investments in Securities, at Value | | | | | | | | | |
Corporate Bonds & Notes | | | | | | | | | | | | | | | | |
Banking & Finance | | $ | 0 | | | $ | 243,293 | | | $ | 0 | | | $ | 243,293 | |
Industrials | | | 0 | | | | 1,252,792 | | | | 0 | | | | 1,252,792 | |
Utilities | | | 0 | | | | 139,514 | | | | 0 | | | | 139,514 | |
Short-Term Instruments | | | | | | | | | | | | | | | | |
Repurchase Agreements | | | 0 | | | | 339,141 | | | | 0 | | | | 339,141 | |
| | |
Investments in Affiliates, at Value | | | | | | | | | |
Short-Term Instruments | | | | | | | | | | | | | | | | |
Mutual Funds | | | 45,886 | | | | 0 | | | | 0 | | | | 45,886 | |
| | | | | | | | | | | | | | | | |
| | | | |
Total Investments | | $ | 45,886 | | | $ | 1,974,740 | | | $ | 0 | | | $ | 2,020,626 | |
| | | | | | | | | | | | | | | | |
| | | | | | | | | | | | | | | | |
| Category and Subcategory | | Level 1 | | | Level 2 | | | Level 3 | | | Fair
Value at
06/30/2017 | |
Financial Derivative Instruments - Assets | | | | | | | | | |
Exchange-traded or centrally cleared | | $ | 0 | | | $ | 350 | | | $ | 0 | | | $ | 350 | |
| | | | | | | | | | | | | | | | |
| | |
Financial Derivative Instruments - Liabilities | | | | | | | | | |
Exchange-traded or centrally cleared | | $ | (119 | ) | | $ | 0 | | | $ | 0 | | | $ | (119 | ) |
| | | | | | | | | | | | | | | | |
| | | | |
Total Financial Derivative Instruments | | $ | (119 | ) | | $ | 350 | | | $ | 0 | | | $ | 231 | |
| | | | | | | | | | | | | | | | |
| | | | |
Totals | | $ | 45,767 | | | $ | 1,975,090 | | | $ | 0 | | | $ | 2,020,857 | |
| | | | | | | | | | | | | | | | |
There were no significant transfers among Levels 1, 2, or 3 during the period ended June 30, 2017.
| | | | | | | | |
| 44 | | PIMCO ETF TRUST | | | | | See Accompanying Notes | |
Schedule of Investments PIMCO Investment Grade Corporate Bond Index Exchange-Traded Fund
June 30, 2017
| | | | | | | | | | | | |
| | | | | PRINCIPAL
AMOUNT
(000S) | | | | | MARKET
VALUE
(000S) | |
| INVESTMENTS IN SECURITIES 99.6% | |
| |
| CORPORATE BONDS & NOTES 96.4% | |
| |
| BANKING & FINANCE 34.3% | |
ABN AMRO Bank NV | |
4.750% due 07/28/2025 | | $ | | | 500 | | | $ | | | 528 | |
AerCap Ireland Capital DAC | |
4.500% due 05/15/2021 | | | | | 1,825 | | | | | | 1,938 | |
4.625% due 10/30/2020 | | | | | 3,750 | | | | | | 3,988 | |
Aflac, Inc. | |
3.625% due 11/15/2024 | | | | | 2,700 | | | | | | 2,830 | |
AIG Global Funding | |
1.777% due 07/02/2020 (a) | | | | | 1,800 | | | | | | 1,803 | |
American Express Co. | |
2.650% due 12/02/2022 | | | | | 250 | | | | | | 251 | |
4.050% due 12/03/2042 | | | | | 425 | | | | | | 438 | |
American Honda Finance Corp. | |
2.450% due 09/24/2020 | | | | | 2,550 | | | | | | 2,586 | |
American International Group, Inc. | |
3.750% due 07/10/2025 | | | | | 3,475 | | | | | | 3,546 | |
American Tower Corp. | |
3.125% due 01/15/2027 | | | | | 2,925 | | | | | | 2,814 | |
4.500% due 01/15/2018 | | | | | 420 | | | | | | 426 | |
Athene Global Funding | |
3.000% due 07/01/2022 (a) | | | | | 1,800 | | | | | | 1,790 | |
Aviation Capital Group Corp. | |
6.750% due 04/06/2021 | | | | | 100 | | | | | | 114 | |
7.125% due 10/15/2020 | | | | | 100 | | | | | | 114 | |
Banco do Brasil S.A. | |
6.000% due 01/22/2020 | | | | | 325 | | | | | | 344 | |
Banco Santander Mexico S.A. Institucion de Banca Multiple Grupo Financiero Santand | |
4.125% due 11/09/2022 | | | | | 375 | | | | | | 392 | |
Bank of America Corp. | |
2.650% due 04/01/2019 | | | | | 1,675 | | | | | | 1,696 | |
3.500% due 04/19/2026 | | | | | 3,325 | | | | | | 3,343 | |
4.000% due 04/01/2024 | | | | | 5,325 | | | | | | 5,585 | |
6.875% due 04/25/2018 | | | | | 250 | | | | | | 260 | |
7.750% due 05/14/2038 | | | | | 350 | | | | | | 505 | |
Bank of New York Mellon Corp. | |
3.000% due 02/24/2025 | | | | | 3,400 | | | | | | 3,398 | |
Barclays Bank PLC | |
6.050% due 12/04/2017 | | | | | 425 | | | | | | 432 | |
Barclays PLC | |
4.375% due 01/12/2026 | | | | | 3,700 | | | | | | 3,852 | |
BB&T Corp. | |
2.450% due 01/15/2020 | | | | | 3,819 | | | | | | 3,863 | |
Berkshire Hathaway Finance Corp. | |
5.750% due 01/15/2040 | | | | | 300 | | | | | | 386 | |
BM&FBovespa S.A. - Bolsa de Valores Mercadorias e Futuros | |
5.500% due 07/16/2020 | | | | | 1,400 | | | | | | 1,468 | |
BNP Paribas S.A. | |
5.000% due 01/15/2021 | | | | | 4,975 | | | | | | 5,442 | |
Boston Properties LP | |
3.800% due 02/01/2024 | | | | | 675 | | | | | | 701 | |
BPCE S.A. | |
4.500% due 03/15/2025 | | | | | 2,550 | | | | | | 2,626 | |
5.150% due 07/21/2024 | | | | | 625 | | | | | | 669 | |
Capital One Financial Corp. | |
4.750% due 07/15/2021 | | | | | 3,550 | | | | | | 3,833 | |
CBOE Holdings, Inc. | |
3.650% due 01/12/2027 | | | | | 300 | | | | | | 303 | |
Charles Schwab Corp. | |
3.000% due 03/10/2025 | | | | | 300 | | | | | | 300 | |
Chubb INA Holdings, Inc. | |
3.350% due 05/03/2026 | | | | | 3,075 | | | | | | 3,149 | |
4.350% due 11/03/2045 | | | | | 975 | | | | | | 1,073 | |
Citigroup, Inc. | |
2.700% due 03/30/2021 | | | | | 2,075 | | | | | | 2,090 | |
3.400% due 05/01/2026 | | | | | 2,876 | | | | | | 2,851 | |
3.700% due 01/12/2026 | | | | | 3,375 | | | | | | 3,420 | |
4.000% due 08/05/2024 | | | | | 3,425 | | | | | | 3,531 | |
8.125% due 07/15/2039 | | | | | 84 | | | | | | 130 | |
| | | | | | | | | | | | |
| | | | | PRINCIPAL
AMOUNT
(000S) | | | | | MARKET
VALUE
(000S) | |
Citizens Financial Group, Inc. | |
2.375% due 07/28/2021 | | $ | | | 100 | | | $ | | | 99 | |
CME Group, Inc. | |
3.000% due 09/15/2022 | | | | | 2,475 | | | | | | 2,535 | |
3.000% due 03/15/2025 | | | | | 400 | | | | | | 404 | |
Commonwealth Bank of Australia | |
2.750% due 03/10/2022 | | | | | 1,000 | | | | | | 1,009 | |
Compass Bank | |
6.400% due 10/01/2017 | | | | | 825 | | | | | | 834 | |
Cooperatieve Rabobank UA | |
3.875% due 02/08/2022 | | | | | 325 | | | | | | 345 | |
5.250% due 05/24/2041 | | | | | 3,630 | | | | | | 4,447 | |
Credit Suisse AG | |
3.000% due 10/29/2021 | | | | | 1,150 | | | | | | 1,173 | |
Credit Suisse Group Funding Guernsey Ltd. | |
3.800% due 06/09/2023 | | | | | 2,400 | | | | | | 2,477 | |
4.875% due 05/15/2045 | | | | | 1,000 | | | | | | 1,107 | |
Crown Castle International Corp. | |
4.450% due 02/15/2026 | | | | | 2,400 | | | | | | 2,554 | |
Deutsche Bank AG | |
4.100% due 01/13/2026 | | | | | 3,200 | | | | | | 3,252 | |
Duke Realty LP | |
3.875% due 10/15/2022 | | | | | 250 | | | | | | 260 | |
Essex Portfolio LP | |
3.250% due 05/01/2023 | | | | | 2,425 | | | | | | 2,433 | |
First Republic Bank | |
4.375% due 08/01/2046 | | | | | 250 | | | | | | 247 | |
Ford Motor Credit Co. LLC | |
2.375% due 03/12/2019 | | | | | 4,250 | | | | | | 4,271 | |
3.336% due 03/18/2021 | | | | | 1,000 | | | | | | 1,020 | |
5.875% due 08/02/2021 | | | | | 2,475 | | | | | | 2,762 | |
GE Capital International Funding Co. Unlimited Co. | |
2.342% due 11/15/2020 | | | | | 4,275 | | | | | | 4,311 | |
4.418% due 11/15/2035 | | | | | 2,777 | | | | | | 3,031 | |
General Motors Financial Co., Inc. | |
3.700% due 11/24/2020 | | | | | 1,000 | | | | | | 1,035 | |
Goldman Sachs Group, Inc. | |
2.375% due 01/22/2018 | | | | | 2,325 | | | | | | 2,336 | |
2.550% due 10/23/2019 | | | | | 4,625 | | | | | | 4,678 | |
3.500% due 01/23/2025 | | | | | 400 | | | | | | 405 | |
4.750% due 10/21/2045 | | | | | 625 | | | | | | 694 | |
6.750% due 10/01/2037 | | | | | 3,000 | | | | | | 3,910 | |
Harley-Davidson Financial Services, Inc. | |
2.550% due 06/09/2022 | | | | | 1,800 | | | | | | 1,785 | |
Healthcare Trust of America Holdings LP | |
2.950% due 07/01/2022 | | | | | 1,800 | | | | | | 1,798 | |
Hospitality Properties Trust | |
5.000% due 08/15/2022 | | | | | 959 | | | | | | 1,029 | |
HSBC Holdings PLC | |
3.900% due 05/25/2026 | | | | | 1,000 | | | | | | 1,033 | |
4.300% due 03/08/2026 | | | | | 2,950 | | | | | | 3,143 | |
HSBC USA, Inc. | |
2.375% due 11/13/2019 | | | | | 4,950 | | | | | | 4,993 | |
Hutchison Whampoa International Ltd. | |
7.450% due 11/24/2033 | | | | | 600 | | | | | | 848 | |
ING Bank NV | |
2.500% due 10/01/2019 | | | | | 3,010 | | | | | | 3,032 | |
Intercontinental Exchange, Inc. | |
2.500% due 10/15/2018 | | | | | 375 | | | | | | 379 | |
John Deere Capital Corp. | |
2.800% due 03/06/2023 | | | | | 2,850 | | | | | | 2,886 | |
3.900% due 07/12/2021 | | | | | 275 | | | | | | 292 | |
JPMorgan Chase & Co. | |
2.550% due 03/01/2021 | | | | | 3,825 | | | | | | 3,845 | |
2.950% due 10/01/2026 | | | | | 4,025 | | | | | | 3,890 | |
3.625% due 05/13/2024 | | | | | 3,325 | | | | | | 3,433 | |
4.850% due 02/01/2044 | | | | | 2,600 | | | | | | 3,007 | |
5.400% due 01/06/2042 | | | | | 300 | | | | | | 364 | |
KeyCorp | |
2.900% due 09/15/2020 | | | | | 2,492 | | | | | | 2,537 | |
Kilroy Realty LP | |
3.800% due 01/15/2023 | | | | | 875 | | | | | | 903 | |
Lazard Group LLC | |
3.750% due 02/13/2025 | | | | | 2,300 | | | | | | 2,323 | |
| | | | | | | | | | | | |
| | | | | PRINCIPAL
AMOUNT
(000S) | | | | | MARKET
VALUE
(000S) | |
LeasePlan Corp. NV | |
3.000% due 10/23/2017 | | $ | | | 425 | | | $ | | | 426 | |
Liberty Mutual Group, Inc. | |
4.850% due 08/01/2044 | | | | | 1,000 | | | | | | 1,079 | |
Lloyds Bank PLC | |
5.800% due 01/13/2020 | | | | | 400 | | | | | | 435 | |
Lloyds Banking Group PLC | |
3.750% due 01/11/2027 | | | | | 3,400 | | | | | | 3,428 | |
Macquarie Bank Ltd. | |
6.625% due 04/07/2021 | | | | | 49 | | | | | | 55 | |
Marsh & McLennan Cos., Inc. | |
3.750% due 03/14/2026 | | | | | 433 | | | | | | 452 | |
4.350% due 01/30/2047 | | | | | 200 | | | | | | 215 | |
MetLife, Inc. | |
5.875% due 02/06/2041 | | | | | 85 | | | | | | 108 | |
9.250% due 04/08/2038 | | | | | 975 | | | | | | 1,455 | |
Metropolitan Life Global Funding | |
2.650% due 04/08/2022 | | | | | 1,685 | | | | | | 1,691 | |
Mitsubishi UFJ Financial Group, Inc. | |
3.850% due 03/01/2026 | | | | | 1,850 | | | | | | 1,933 | |
Mizuho Financial Group, Inc. | |
2.632% due 04/12/2021 | | | | | 2,975 | | | | | | 2,976 | |
Morgan Stanley | |
3.875% due 01/27/2026 | | | | | 3,325 | | | | | | 3,427 | |
4.350% due 09/08/2026 | | | | | 3,320 | | | | | | 3,459 | |
7.300% due 05/13/2019 | | | | | 3,053 | | | | | | 3,339 | |
Nasdaq, Inc. | |
3.850% due 06/30/2026 | | | | | 100 | | | | | | 102 | |
National Australia Bank Ltd. | |
2.800% due 01/10/2022 | | | | | 1,000 | | | | | | 1,011 | |
National City Corp. | |
6.875% due 05/15/2019 | | | | | 2,395 | | | | | | 2,607 | |
Nationwide Building Society | |
2.450% due 07/27/2021 | | | | | 300 | | | | | | 300 | |
New York Life Global Funding | |
2.350% due 07/14/2026 | | | | | 100 | | | | | | 96 | |
New York Life Insurance Co. | |
6.750% due 11/15/2039 | | | | | 1,050 | | | | | | 1,480 | |
Nippon Life Insurance Co. | |
5.100% due 10/16/2044 | | | | | 1,000 | | | | | | 1,068 | |
PNC Bank N.A. | |
3.800% due 07/25/2023 | | | | | 400 | | | | | | 420 | |
Principal Life Global Funding | |
3.000% due 04/18/2026 | | | | | 1,172 | | | | | | 1,157 | |
Progressive Corp. | |
2.450% due 01/15/2027 | | | | | 200 | | | | | | 190 | |
Prudential Financial, Inc. | |
3.500% due 05/15/2024 | | | | | 3,375 | | | | | | 3,519 | |
Raymond James Financial, Inc. | |
3.625% due 09/15/2026 | | | | | 100 | | | | | | 100 | |
Santander Holdings USA, Inc. | |
4.500% due 07/17/2025 | | | | | 3,025 | | | | | | 3,119 | |
Societe Generale S.A. | |
4.250% due 04/14/2025 | | | | | 1,000 | | | | | | 1,016 | |
Standard Chartered PLC | |
3.050% due 01/15/2021 | | | | | 1,200 | | | | | | 1,216 | |
State Street Corp. | |
2.081% due 08/18/2020 | | | | | 1,200 | | | | | | 1,226 | |
Sumitomo Life Insurance Co. | |
6.500% due 09/20/2073 | | | | | 600 | | | | | | 692 | |
Sumitomo Mitsui Banking Corp. | |
3.200% due 07/18/2022 | | | | | 2,375 | | | | | | 2,440 | |
Sumitomo Mitsui Financial Group, Inc. | |
2.058% due 07/14/2021 | | | | | 1,000 | | | | | | 984 | |
Synchrony Financial | |
2.700% due 02/03/2020 | | | | | 250 | | | | | | 251 | |
Tanger Properties LP | |
3.750% due 12/01/2024 | | | | | 1,855 | | | | | | 1,864 | |
TIAA Asset Management Finance Co. LLC | |
4.125% due 11/01/2024 | | | | | 1,000 | | | | | | 1,036 | |
Toyota Motor Credit Corp. | |
1.900% due 04/08/2021 | | | | | 1,000 | | | | | | 990 | |
| | | | | | |
| See Accompanying Notes | | ANNUAL REPORT | | JUNE 30, 2017 | | 45 |
Schedule of Investments PIMCO Investment Grade Corporate Bond Index Exchange-Traded Fund (Cont.)
| | | | | | | | | | | | |
| | | | | PRINCIPAL
AMOUNT
(000S) | | | | | MARKET
VALUE
(000S) | |
U.S. Bancorp | |
2.950% due 07/15/2022 | | $ | | | 3,355 | | | $ | | | 3,415 | |
UBS AG | |
1.799% due 06/08/2020 | | | | | 1,800 | | | | | | 1,804 | |
1.800% due 03/26/2018 | | | | | 1,000 | | | | | | 1,002 | |
UBS Group Funding Switzerland AG | |
4.125% due 09/24/2025 | | | | | 2,875 | | | | | | 3,017 | |
Ventas Realty LP | |
4.000% due 04/30/2019 | | | | | 250 | | | | | | 257 | |
Visa, Inc. | |
4.300% due 12/14/2045 | | | | | 2,720 | | | | | | 2,995 | |
WEA Finance LLC | |
3.750% due 09/17/2024 | | | | | 2,550 | | | | | | 2,586 | |
Wells Fargo & Co. | |
1.400% due 09/08/2017 | | | | | 4,761 | | | | | | 4,761 | |
3.300% due 09/09/2024 | | | | | 4,440 | | | | | | 4,508 | |
4.125% due 08/15/2023 | | | | | 75 | | | | | | 79 | |
4.400% due 06/14/2046 | | | | | 1,000 | | | | | | 1,016 | |
Westpac Banking Corp. | |
2.850% due 05/13/2026 | | | | | 1,000 | | | | | | 974 | |
Weyerhaeuser Co. | |
7.375% due 03/15/2032 | | | | | 2,075 | | | | | | 2,865 | |
WR Berkley Corp. | |
4.625% due 03/15/2022 | | | | | 400 | | | | | | 431 | |
| | | | | | | | | | | | |
| | | | | | | | | | | 253,029 | |
| | | | | | | | | | | | |
| |
| INDUSTRIALS 49.5% | |
21st Century Fox America, Inc. | |
4.950% due 10/15/2045 | | | | | 1,200 | | | | | | 1,306 | |
6.400% due 12/15/2035 | | | | | 100 | | | | | | 127 | |
Abbott Laboratories
| |
2.550% due 03/15/2022 | | | | | 250 | | | | | | 248 | |
AbbVie, Inc. | | | | | | | | | | | | |
2.900% due 11/06/2022 | | | | | 3,525 | | | | | | 3,562 | |
3.200% due 05/14/2026 | | | | | 2,770 | | | | | | 2,743 | |
4.300% due 05/14/2036 | | | | | 500 | | | | | | 511 | |
4.450% due 05/14/2046 | | | | | 1,000 | | | | | | 1,038 | |
Activision Blizzard, Inc. | |
2.300% due 09/15/2021 | | | | | 300 | | | | | | 298 | |
3.400% due 09/15/2026 | | | | | 2,800 | | | | | | 2,813 | |
Alibaba Group Holding Ltd.
| |
3.600% due 11/28/2024 | | | | | 2,075 | | | | | | 2,141 | |
Allergan Funding SCS
| |
3.800% due 03/15/2025 | | | | | 3,204 | | | | | | 3,320 | |
Altria Group, Inc.
| |
2.950% due 05/02/2023 | | | | | 4,118 | | | | | | 4,153 | |
Amgen, Inc. | | | | | | | | | | | | |
3.450% due 10/01/2020 | | | | | 1,645 | | | | | | 1,714 | |
3.625% due 05/22/2024 | | | | | 4,700 | | | | | | 4,909 | |
4.400% due 05/01/2045 | | | | | 100 | | | | | | 103 | |
Anadarko Petroleum Corp.
| |
3.450% due 07/15/2024 | | | | | 2,900 | | | | | | 2,837 | |
Anglo American Capital PLC
| |
2.625% due 09/27/2017 | | | | | 25 | | | | | | 25 | |
Anheuser-Busch Cos. LLC
| |
5.500% due 01/15/2018 | | | | | 2,100 | | | | | | 2,143 | |
Anheuser-Busch InBev Finance, Inc. | |
3.650% due 02/01/2026 | | | | | 1,975 | | | | | | 2,039 | |
4.900% due 02/01/2046 | | | | | 4,800 | | | | | | 5,447 | |
Anheuser-Busch InBev Worldwide, Inc. | |
3.750% due 01/15/2022 | | | | | 3,575 | | | | | | 3,774 | |
7.750% due 01/15/2019 | | | | | 2,425 | | | | | | 2,639 | |
Anthem, Inc.
| |
3.500% due 08/15/2024 | | | | | 1,204 | | | | | | 1,240 | |
Apache Corp. | | | | | | | | | | | | |
4.750% due 04/15/2043 | | | | | 500 | | | | | | 504 | |
5.100% due 09/01/2040 | | | | | 1,125 | | | | | | 1,155 | |
Apple, Inc. | | | | | | | | | | | | |
2.500% due 02/09/2025 | | | | | 3,300 | | | | | | 3,231 | |
3.250% due 02/23/2026 | | | | | 2,950 | | | | | | 3,006 | |
3.450% due 05/06/2024 | | | | | 375 | | | | | | 391 | |
3.850% due 08/04/2046 | | | | | 1,000 | | | | | | 1,003 | |
| | | | | | | | | | | | |
| | | | | PRINCIPAL
AMOUNT
(000S) | | | | | MARKET
VALUE
(000S) | |
AstraZeneca PLC
| |
1.848% due 06/10/2022 | | $ | | | 1,800 | | | $ | | | 1,803 | |
Bacardi Ltd.
| |
2.750% due 07/15/2026 | | | | | 100 | | | | | | 96 | |
Barrick PD Australia Finance Pty. Ltd.
| |
4.950% due 01/15/2020 | | | | | 100 | | | | | | 107 | |
Baxalta, Inc.
| |
5.250% due 06/23/2045 | | | | | 1,800 | | | | | | 2,120 | |
Becton Dickinson and Co.
| |
2.675% due 12/15/2019 | | | | | 4,217 | | | | | | 4,271 | |
BHP Billiton Finance USA Ltd.
| |
5.000% due 09/30/2043 | | | | | 1,000 | | | | | | 1,161 | |
BorgWarner, Inc.
| |
3.375% due 03/15/2025 | | | | | 200 | | | | | | 201 | |
Boston Scientific Corp.
| |
2.650% due 10/01/2018 | | | | | 2,390 | | | | | | 2,413 | |
Broadcom Corp. | | | | | | | | | | | | |
2.375% due 01/15/2020 | | | | | 500 | | | | | | 501 | |
3.000% due 01/15/2022 | | | | | 500 | | | | | | 505 | |
3.625% due 01/15/2024 | | | | | 500 | | | | | | 512 | |
3.875% due 01/15/2027 | | | | | 500 | | | | | | 515 | |
Burlington Northern Santa Fe LLC
| |
5.400% due 06/01/2041 | | | | | 3,215 | | | | | | 3,930 | |
Cardinal Health, Inc.
| |
2.616% due 06/15/2022 | | | | | 1,800 | | | | | | 1,804 | |
Caterpillar, Inc.
| |
3.803% due 08/15/2042 | | | | | 3,298 | | | | | | 3,324 | |
CBS Corp. | | | | | | | | | | | | |
2.500% due 02/15/2023 (a) | | | | | 1,800 | | | | | | 1,781 | |
2.900% due 01/15/2027 | | | | | 200 | | | | | | 190 | |
Cenovus Energy, Inc.
| |
6.750% due 11/15/2039 | | | | | 260 | | | | | | 274 | |
Charter Communications Operating LLC | |
4.908% due 07/23/2025 | | | | | 3,400 | | | | | | 3,679 | |
Chevron Corp.
| |
2.100% due 05/16/2021 | | | | | 2,725 | | | | | | 2,718 | |
China Resources Gas Group Ltd.
| |
4.500% due 04/05/2022 | | | | | 750 | | | | | | 798 | |
Cigna Corp.
| |
5.375% due 02/15/2042 | | | | | 1,275 | | | | | | 1,541 | |
Cimarex Energy Co.
| |
4.375% due 06/01/2024 | | | | | 1,650 | | | | | | 1,732 | |
Cisco Systems, Inc.
| |
2.500% due 09/20/2026 | | | | | 1,000 | | | | | | 960 | |
Coca-Cola Co.
| |
1.650% due 03/14/2018 | | | | | 250 | | | | | | 250 | |
Comcast Corp. | | | | | | | | | | | | |
3.125% due 07/15/2022 | | | | | 3,795 | | | | | | 3,927 | |
3.150% due 03/01/2026 | | | | | 2,875 | | | | | | 2,893 | |
3.200% due 07/15/2036 | | | | | 1,000 | | | | | | 939 | |
3.600% due 03/01/2024 | | | | | 3,110 | | | | | | 3,267 | |
ConocoPhillips Co.
| |
2.875% due 11/15/2021 | | | | | 2,890 | | | | | | 2,939 | |
Continental Resources, Inc.
| |
4.500% due 04/15/2023 | | | | | 300 | | | | | | 287 | |
Corning, Inc.
| |
5.750% due 08/15/2040 | | | | | 285 | | | | | | 333 | |
Corp. Nacional del Cobre de Chile | |
3.000% due 07/17/2022 | | | | | 225 | | | | | | 227 | |
4.500% due 09/16/2025 | | | | | 1,575 | | | | | | 1,685 | |
Cox Communications, Inc.
| |
3.350% due 09/15/2026 | | | | | 100 | | | | | | 98 | |
CRH America Finance, Inc.
| |
3.400% due 05/09/2027 | | | | | 400 | | | | | | 401 | |
CSX Corp. | |
3.800% due 11/01/2046 | | | | | 1,000 | | | | | | 976 | |
6.220% due 04/30/2040 | | | | | 325 | | | | | | 429 | |
CVS Health Corp. | |
3.375% due 08/12/2024 | | | | | 3,065 | | | | | | 3,121 | |
5.125% due 07/20/2045 | | | | | 670 | | | | | | 772 | |
Dell International LLC | |
5.450% due 06/15/2023 | | | | | 500 | | | | | | 543 | |
6.020% due 06/15/2026 | | | | | 2,580 | | | | | | 2,847 | |
8.100% due 07/15/2036 | | | | | 500 | | | | | | 631 | |
| | | | | | | | | | | | |
| | | | | PRINCIPAL
AMOUNT
(000S) | | | | | MARKET
VALUE
(000S) | |
Deutsche Telekom International Finance BV
| |
3.600% due 01/19/2027 | | $ | | | 2,300 | | | $ | | | 2,345 | |
Dolphin Energy Ltd.
| |
5.500% due 12/15/2021 | | | | | 1,000 | | | | | | 1,095 | |
Dominion Energy Gas Holdings LLC
| |
3.600% due 12/15/2024 | | | | | 1,800 | | | | | | 1,847 | |
Dow Chemical Co. | | | | | | | | | | | | |
3.000% due 11/15/2022 | | | | | 1,000 | | | | | | 1,020 | |
5.250% due 11/15/2041 | | | | | 630 | | | | | | 734 | |
Eaton Corp.
| |
2.750% due 11/02/2022 | | | | | 1,000 | | | | | | 1,007 | |
Ecopetrol S.A.
| |
5.375% due 06/26/2026 | | | | | 1,875 | | | | | | 1,955 | |
Eli Lilly & Co.
| |
2.750% due 06/01/2025 | | | | | 2,825 | | | | | | 2,825 | |
Enbridge, Inc. | | | | | | | | | | | | |
1.946% due 06/15/2020 | | | | | 1,800 | | | | | | 1,800 | |
2.900% due 07/15/2022 (a) | | | | | 1,800 | | | | | | 1,798 | |
Encana Corp. | |
5.150% due 11/15/2041 | | | | | 30 | | | | | | 29 | |
Energy Transfer LP | | | | | | | | | | | | |
3.600% due 02/01/2023 | | | | | 3,750 | | | | | | 3,778 | |
4.200% due 04/15/2027 | | | | | 500 | | | | | | 499 | |
4.650% due 06/01/2021 | | | | | 100 | | | | | | 106 | |
5.300% due 04/15/2047 | | | | | 500 | | | | | | 497 | |
Enterprise Products Operating LLC | |
3.750% due 02/15/2025 | | | | | 2,675 | | | | | | 2,759 | |
3.950% due 02/15/2027 | | | | | 1,650 | | | | | | 1,709 | |
4.850% due 03/15/2044 | | | | | 800 | | | | | | 852 | |
6.650% due 04/15/2018 | | | | | 200 | | | | | | 207 | |
Equifax, Inc. | |
2.300% due 06/01/2021 | | | | | 300 | | | | | | 298 | |
ERAC USA Finance LLC | |
3.300% due 12/01/2026 | | | | | 1,000 | | | | | | 976 | |
Exxon Mobil Corp.
| |
3.176% due 03/15/2024 | | | | | 3,000 | | | | | | 3,083 | |
FedEx Corp.
| |
4.550% due 04/01/2046 | | | | | 975 | | | | | | 1,036 | |
Flex Ltd.
| |
4.750% due 06/15/2025 | | | | | 1,600 | | | | | | 1,702 | |
Forest Laboratories LLC
| |
4.375% due 02/01/2019 | | | | | 1,126 | | | | | | 1,162 | |
Freeport-McMoRan, Inc.
| |
3.550% due 03/01/2022 | | | | | 75 | | | | | | 71 | |
General Electric Co. | |
3.100% due 01/09/2023 | | | | | 75 | | | | | | 78 | |
5.500% due 01/08/2020 | | | | | 3,119 | | | | | | 3,398 | |
6.875% due 01/10/2039 | | | | | 416 | | | | | | 605 | |
General Motors Co.
| |
4.875% due 10/02/2023 | | | | | 3,275 | | | | | | 3,514 | |
Georgia-Pacific LLC
| |
3.163% due 11/15/2021 | | | | | 3,000 | | | | | | 3,065 | |
Gilead Sciences, Inc.
| |
3.500% due 02/01/2025 | | | | | 3,154 | | | | | | 3,240 | |
GlaxoSmithKline Capital, Inc. | |
2.800% due 03/18/2023 | | | | | 225 | | | | | | 229 | |
6.375% due 05/15/2038 | | | | | 1,825 | | | | | | 2,513 | |
Glencore Finance Canada Ltd.
| |
4.250% due 10/25/2022 | | | | | 4,222 | | | | | | 4,379 | |
Grupo Televisa S.A.B.
| |
5.000% due 05/13/2045 | | | | | 500 | | | | | | 484 | |
GTL Trade Finance, Inc.
| |
5.893% due 04/29/2024 | | | | | 2,825 | | | | | | 2,862 | |
Halliburton Co.
| |
5.000% due 11/15/2045 | | | | | 2,850 | | | | | | 3,048 | |
Hewlett Packard Enterprise Co.
| |
4.400% due 10/15/2022 | | | | | 1,575 | | | | | | 1,671 | |
Home Depot, Inc. | |
3.000% due 04/01/2026 | | | | | 3,690 | | | | | | 3,714 | |
3.500% due 09/15/2056 | | | | | 100 | | | | | | 91 | |
4.250% due 04/01/2046 | | | | | 7 | | | | | | 8 | |
Intel Corp.
| |
3.700% due 07/29/2025 | | | | | 3,405 | | | | | | 3,579 | |
| | | | | | | | |
| 46 | | PIMCO ETF TRUST | | | | | See Accompanying Notes | |
June 30, 2017
| | | | | | | | | | | | |
| | | | | PRINCIPAL
AMOUNT
(000S) | | | | | MARKET
VALUE
(000S) | |
International Business Machines Corp. | |
4.000% due 06/20/2042 | | $ | | | 92 | | | $ | | | 92 | |
5.600% due 11/30/2039 | | | | | 29 | | | | | | 36 | |
KazMunayGas National Co. JSC | |
7.000% due 05/05/2020 | | | | | 1,374 | | | | | | 1,496 | |
Kinder Morgan Energy Partners LP | |
3.950% due 09/01/2022 | | | | | 2,600 | | | | | | 2,689 | |
5.300% due 09/15/2020 | | | | | 485 | | | | | | 522 | |
Kinder Morgan, Inc. | |
3.050% due 12/01/2019 | | | | | 200 | | | | | | 204 | |
5.550% due 06/01/2045 | | | | | 2,615 | | | | | | 2,785 | |
KLA-Tencor Corp. | |
4.650% due 11/01/2024 | | | | | 1,650 | | | | | | 1,785 | |
Koninklijke Philips NV | |
3.750% due 03/15/2022 | | | | | 1,845 | | | | | | 1,947 | |
Kraft Heinz Foods Co. | |
4.375% due 06/01/2046 | | | | | 2,425 | | | | | | 2,373 | |
5.200% due 07/15/2045 | | | | | 450 | | | | | | 490 | |
6.125% due 08/23/2018 | | | | | 3,705 | | | | | | 3,882 | |
Kroger Co. | |
6.150% due 01/15/2020 | | | | | 275 | | | | | | 301 | |
L-3 Technologies, Inc. | |
4.750% due 07/15/2020 | | | | | 699 | | | | | | 747 | |
Lockheed Martin Corp. | |
4.700% due 05/15/2046 | | | | | 3,050 | | | | | | 3,446 | |
Lowe’s Cos., Inc. | |
4.650% due 04/15/2042 | | | | | 1,753 | | | | | | 1,945 | |
McDonald’s Corp. | |
3.700% due 01/30/2026 | | | | | 975 | | | | | | 1,012 | |
4.875% due 12/09/2045 | | | | | 2,600 | | | | | | 2,914 | |
Medtronic, Inc. | |
3.150% due 03/15/2022 | | | | | 2,950 | | | | | | 3,054 | |
3.500% due 03/15/2025 | | | | | 3,275 | | | | | | 3,411 | |
4.625% due 03/15/2045 | | | | | 1,825 | | | | | | 2,062 | |
Merck & Co., Inc.
| |
3.700% due 02/10/2045 | | | | | 2,385 | | | | | | 2,388 | |
Merck Sharp & Dohme Corp. | |
5.000% due 06/30/2019 | | | | | 160 | | | | | | 170 | |
Microsoft Corp. | |
2.700% due 02/12/2025 | | | | | 3,661 | | | | | | 3,640 | |
4.250% due 02/06/2047 | | | | | 1,000 | | | | | | 1,087 | |
4.450% due 11/03/2045 | | | | | 3,740 | | | | | | 4,178 | |
Moody’s Corp. | |
2.625% due 01/15/2023 | | | | | 1,800 | | | | | | 1,792 | |
4.875% due 02/15/2024 | | | | | 2,300 | | | | | | 2,536 | |
5.500% due 09/01/2020 | | | | | 300 | | | | | | 329 | |
Mylan, Inc. | |
3.125% due 01/15/2023 | | | | | 100 | | | | | | 100 | |
Newell Brands, Inc. | |
5.500% due 04/01/2046 | | | | | 2,435 | | | | | | 2,943 | |
Noble Holding International Ltd. | |
4.900% due 08/01/2020 | | | | | 12 | | | | | | 11 | |
Norfolk Southern Corp. | |
4.650% due 01/15/2046 | | | | | 2,525 | | | | | | 2,811 | |
Northrop Grumman Corp. | |
3.850% due 04/15/2045 | | | | | 565 | | | | | | 564 | |
Occidental Petroleum Corp. | |
3.400% due 04/15/2026 | | | | | 975 | | | | | | 985 | |
ONEOK Partners LP | |
3.200% due 09/15/2018 | | | | | 2,540 | | | | | | 2,570 | |
4.900% due 03/15/2025 | | | | | 1,600 | | | | | | 1,716 | |
5.000% due 09/15/2023 | | | | | 250 | | | | | | 270 | |
Oracle Corp. | |
2.800% due 07/08/2021 | | | | | 4,510 | | | | | | 4,615 | |
4.125% due 05/15/2045 | | | | | 2,350 | | | | | | 2,426 | |
Owens Corning | |
3.400% due 08/15/2026 | | | | | 100 | | | | | | 99 | |
Penske Truck Leasing Co. LP | |
3.400% due 11/15/2026 | | | | | 200 | | | | | | 197 | |
PepsiCo, Inc. | |
2.850% due 02/24/2026 | | | | | 1,000 | | | | | | 999 | |
5.500% due 01/15/2040 | | | | | 430 | | | | | | 538 | |
Pertamina Persero PT | |
4.300% due 05/20/2023 | | | | | 1,000 | | | | | | 1,038 | |
| | | | | | | | | | | | |
| | | | | PRINCIPAL
AMOUNT
(000S) | | | | | MARKET
VALUE
(000S) | |
Petroleos Mexicanos | |
4.250% due 01/15/2025 | | $ | | | 1,475 | | | $ | | | 1,438 | |
4.875% due 01/24/2022 | | | | | 325 | | | | | | 335 | |
5.750% due 03/01/2018 | | | | | 170 | | | | | | 174 | |
6.375% due 01/23/2045 | | | | | 2,430 | | | | | | 2,381 | |
6.875% due 08/04/2026 | | | | | 1,200 | | | | | | 1,333 | |
Pfizer, Inc. | |
4.400% due 05/15/2044 | | | | | 400 | | | | | | 441 | |
Philip Morris International, Inc. | |
2.750% due 02/25/2026 | | | | | 1,000 | | | | | | 978 | |
3.375% due 08/11/2025 | | | | | 425 | | | | | | 436 | |
3.600% due 11/15/2023 | | | | | 825 | | | | | | 860 | |
5.650% due 05/16/2018 | | | | | 2,625 | | | | | | 2,716 | |
Pioneer Natural Resources Co. | |
6.875% due 05/01/2018 | | | | | 200 | | | | | | 208 | |
QUALCOMM, Inc. | |
3.000% due 05/20/2022 | | | | | 975 | | | | | | 1,000 | |
3.450% due 05/20/2025 | | | | | 725 | | | | | | 746 | |
Ras Laffan Liquefied Natural Gas Co. Ltd. | |
5.838% due 09/30/2027 | | | | | 1,000 | | | | | | 1,124 | |
Reliance Industries Ltd. | |
4.125% due 01/28/2025 | | | | | 1,000 | | | | | | 1,036 | |
Republic Services, Inc. | |
5.250% due 11/15/2021 | | | | | 295 | | | | | | 328 | |
Reynolds American, Inc. | |
4.450% due 06/12/2025 | | | | | 2,645 | | | | | | 2,844 | |
Roche Holdings, Inc. | |
2.625% due 05/15/2026 | | | | | 2,050 | | | | | | 1,998 | |
Rogers Communications, Inc. | |
6.800% due 08/15/2018 | | | | | 3,100 | | | | | | 3,271 | |
Sabine Pass Liquefaction LLC | |
5.625% due 02/01/2021 | | | | | 4,300 | | | | | | 4,684 | |
Shire Acquisitions Investments Ireland DAC | |
1.900% due 09/23/2019 | | | | | 1,000 | | | | | | 996 | |
Sky PLC | |
3.750% due 09/16/2024 | | | | | 206 | | | | | | 212 | |
Southern Co. | |
1.993% due 09/30/2020 | | | | | 1,800 | | | | | | 1,809 | |
4.400% due 07/01/2046 | | | | | 1,000 | | | | | | 1,024 | |
Southern Copper Corp. | |
6.750% due 04/16/2040 | | | | | 2,150 | | | | | | 2,484 | |
Spectra Energy Partners LP | |
1.920% due 06/05/2020 | | | | | 1,800 | | | | | | 1,808 | |
Sprint Spectrum Co. LLC | |
3.360% due 03/20/2023 | | | | | 400 | | | | | | 405 | |
Stryker Corp. | |
2.625% due 03/15/2021 | | | | | 200 | | | | | | 202 | |
3.500% due 03/15/2026 | | | | | 1,000 | | | | | | 1,026 | |
4.375% due 01/15/2020 | | | | | 100 | | | | | | 106 | |
4.625% due 03/15/2046 | | | | | 1,200 | | | | | | 1,318 | |
Target Corp. | |
3.875% due 07/15/2020 | | | | | 250 | | | | | | 264 | |
Telefonica Emisiones S.A.U. | |
5.462% due 02/16/2021 | | | | | 125 | | | | | | 138 | |
7.045% due 06/20/2036 | | | | | 1,725 | | | | | | 2,275 | |
Teva Pharmaceutical Finance Netherlands BV | |
3.150% due 10/01/2026 | | | | | 2,300 | | | | | | 2,189 | |
Thermo Fisher Scientific, Inc. | |
2.950% due 09/19/2026 | | | | | 2,250 | | | | | | 2,192 | |
3.150% due 01/15/2023 | | | | | 100 | | | | | | 102 | |
Time Warner Cable LLC | |
5.000% due 02/01/2020 | | | | | 2,425 | | | | | | 2,588 | |
Time Warner, Inc. | |
3.400% due 06/15/2022 | | | | | 550 | | | | | | 566 | |
3.550% due 06/01/2024 | | | | | 3,675 | | | | | | 3,730 | |
TransCanada PipeLines Ltd. | |
3.800% due 10/01/2020 | | | | | 215 | | | | | | 226 | |
4.875% due 01/15/2026 | | | | | 2,150 | | | | | | 2,408 | |
Tyson Foods, Inc. | |
4.500% due 06/15/2022 | | | | | 4,678 | | | | | | 5,077 | |
4.875% due 08/15/2034 | | | | | 1,875 | | | | | | 2,059 | |
Union Pacific Corp. | |
3.799% due 10/01/2051 | | | | | 1,875 | | | | | | 1,844 | |
| | | | | | | | | | | | |
| | | | | PRINCIPAL
AMOUNT
(000S) | | | | | MARKET
VALUE
(000S) | |
United Technologies Corp. | |
3.100% due 06/01/2022 | | $ | | | 4,569 | | | $ | | | 4,724 | |
UnitedHealth Group, Inc. | |
4.750% due 07/15/2045 | | | | | 3,643 | | | | | | 4,201 | |
6.875% due 02/15/2038 | | | | | 415 | | | | | | 591 | |
Vale Overseas Ltd. | |
6.875% due 11/21/2036 | | | | | 2,615 | | | | | | 2,818 | |
Viacom, Inc. | |
4.250% due 09/01/2023 | | | | | 2,920 | | | | | | 3,052 | |
Wal-Mart Stores, Inc. | |
6.200% due 04/15/2038 | | | | | 3,836 | | | | | | 5,260 | |
Walt Disney Co. | |
4.125% due 06/01/2044 | | | | | 2,321 | | | | | | 2,446 | |
Western Gas Partners LP | |
4.650% due 07/01/2026 | | | | | 300 | | | | | | 308 | |
Whirlpool Corp. | |
3.700% due 03/01/2023 | | | | | 250 | | | | | | 259 | |
5.150% due 03/01/2043 | | | | | 300 | | | | | | 334 | |
Williams Partners LP | |
5.400% due 03/04/2044 | | | | | 1,864 | | | | | | 1,978 | |
Woodside Finance Ltd. | |
3.700% due 09/15/2026 | | | | | 400 | | | | | | 395 | |
Wyeth LLC | |
5.950% due 04/01/2037 | | | | | 1,000 | | | | | | 1,297 | |
Zimmer Biomet Holdings, Inc. | |
3.550% due 04/01/2025 | | | | | 3,000 | | | | | | 3,035 | |
| | | | | | | | | | | | |
| | | | | | | | | | | 364,861 | |
| | | | | | | | | | | | |
| |
| UTILITIES 12.6% | |
American Water Capital Corp. | |
3.850% due 03/01/2024 | | | | | 2,628 | | | | | | 2,791 | |
Appalachian Power Co. | |
7.000% due 04/01/2038 | | | | | 605 | | | | | | 841 | |
AT&T, Inc. | |
3.600% due 02/17/2023 | | | | | 1,000 | | | | | | 1,025 | |
3.800% due 03/01/2024 | | | | | 1,000 | | | | | | 1,026 | |
4.125% due 02/17/2026 | | | | | 2,425 | | | | | | 2,491 | |
4.800% due 06/15/2044 | | | | | 3,700 | | | | | | 3,686 | |
5.650% due 02/15/2047 | | | | | 975 | | | | | | 1,083 | |
Atmos Energy Corp. | |
4.150% due 01/15/2043 | | | | | 630 | | | | | | 655 | |
Berkshire Hathaway Energy Co. | |
6.125% due 04/01/2036 | | | | | 380 | | | | | | 490 | |
BG Energy Capital PLC | |
5.125% due 10/15/2041 | | | | | 115 | | | | | | 129 | |
Black Hills Corp. | |
3.150% due 01/15/2027 | | | | | 300 | | | | | | 291 | |
4.200% due 09/15/2046 | | | | | 100 | | | | | | 98 | |
BP Capital Markets PLC | |
2.237% due 05/10/2019 | | | | | 4,300 | | | | | | 4,334 | |
4.500% due 10/01/2020 | | | | | 275 | | | | | | 295 | |
CNOOC Finance Ltd. | |
3.000% due 05/09/2023 | | | | | 3,250 | | | | | | 3,219 | |
3.875% due 05/02/2022 | | | | | 550 | | | | | | 572 | |
Consolidated Edison Co. of New York, Inc. | |
3.850% due 06/15/2046 | | | | | 1,000 | | | | | | 1,012 | |
Consumers Energy Co. | |
3.125% due 08/31/2024 | | | | | 2,075 | | | | | | 2,106 | |
Delmarva Power & Light Co. | |
3.500% due 11/15/2023 | | | | | 2,467 | | | | | | 2,579 | |
Dominion Energy, Inc. | |
1.771% due 06/01/2019 | | | | | 1,200 | | | | | | 1,205 | |
4.450% due 03/15/2021 | | | | | 120 | | | | | | 128 | |
DTE Electric Co. | |
3.650% due 03/15/2024 | | | | | 2,500 | | | | | | 2,637 | |
Duke Energy Corp. | |
3.750% due 09/01/2046 | | | | | 100 | | | | | | 96 | |
3.950% due 10/15/2023 | | | | | 400 | | | | | | 423 | |
Duke Energy Ohio, Inc. | |
3.800% due 09/01/2023 | | | | | 4,235 | | | | | | 4,502 | |
E.ON International Finance BV | |
5.800% due 04/30/2018 | | | | | 45 | | | | | | 46 | |
| | | | | | |
| See Accompanying Notes | | ANNUAL REPORT | | JUNE 30, 2017 | | 47 |
Schedule of Investments PIMCO Investment Grade Corporate Bond Index Exchange-Traded Fund (Cont.)
| | | | | | | | | | | | |
| | | | | PRINCIPAL
AMOUNT
(000S) | | | | | MARKET
VALUE
(000S) | |
Electricite de France S.A. | |
4.600% due 01/27/2020 | | $ | | | 375 | | | $ | | | 398 | |
4.875% due 01/22/2044 | | | | | 2,475 | | | | | | 2,611 | |
Entergy Corp. | |
4.000% due 07/15/2022 | | | | | 1,650 | | | | | | 1,746 | |
5.125% due 09/15/2020 | | | | | 300 | | | | | | 324 | |
Exelon Corp. | |
3.950% due 06/15/2025 | | | | | 975 | | | | | | 1,011 | |
4.450% due 04/15/2046 | | | | | 1,000 | | | | | | 1,039 | |
Exelon Generation Co. LLC | |
5.600% due 06/15/2042 | | | | | 1,000 | | | | | | 1,009 | |
6.200% due 10/01/2017 | | | | | 100 | | | | | | 101 | |
FirstEnergy Corp. | |
2.850% due 07/15/2022 | | | | | 1,800 | | | | | | 1,796 | |
7.375% due 11/15/2031 | | | | | 2,693 | | | | | | 3,551 | |
Florida Power & Light Co. | |
4.125% due 02/01/2042 | | | | | 100 | | | | | | 106 | |
Great Plains Energy, Inc. | |
4.850% due 04/01/2047 | | | | | 1,000 | | | | | | 1,034 | |
Kentucky Utilities Co. | |
5.125% due 11/01/2040 | | | | | 100 | | | | | | 120 | |
KeySpan Gas East Corp. | |
2.742% due 08/15/2026 | | | | | 1,000 | | | | | | 966 | |
MidAmerican Energy Co. | |
3.500% due 10/15/2024 | | | | | 4,387 | | | | | | 4,579 | |
Pacific Gas & Electric Co. | |
3.500% due 10/01/2020 | | | | | 305 | | | | | | 317 | |
4.750% due 02/15/2044 | | | | | 4,472 | | | | | | 5,109 | |
5.800% due 03/01/2037 | | | | | 255 | | | | | | 326 | |
Pennsylvania Electric Co. | |
5.200% due 04/01/2020 | | | | | 70 | | | | | | 74 | |
| | | | | | | | | | | | |
| | | | | PRINCIPAL
AMOUNT
(000S) | | | | | MARKET
VALUE
(000S) | |
Petronas Global Sukuk Ltd. | |
2.707% due 03/18/2020 | | $ | | | 1,000 | | | $ | | | 1,014 | |
Plains All American Pipeline LP | |
4.500% due 12/15/2026 | | | | | 1,000 | | | | | | 1,013 | |
5.150% due 06/01/2042 | | | | | 725 | | | | | | 700 | |
Shell International Finance BV | |
4.000% due 05/10/2046 | | | | | 1,000 | | | | | | 992 | |
4.375% due 03/25/2020 | | | | | 230 | | | | | | 245 | |
6.375% due 12/15/2038 | | | | | 925 | | | | | | 1,235 | |
Sinopec Group Overseas Development Ltd. | |
2.500% due 04/28/2020 | | | | | 1,650 | | | | | | 1,659 | |
Southern California Gas Co. | |
3.150% due 09/15/2024 | | | | | 2,750 | | | | | | 2,829 | |
Southern Power Co. | |
5.150% due 09/15/2041 | | | | | 2,715 | | | | | | 2,872 | |
Southwestern Public Service Co. | |
6.000% due 10/01/2036 | | | | | 2,248 | | | | | | 2,776 | |
Verizon Communications, Inc. | |
2.946% due 03/15/2022 | | | | | 2,991 | | | | | | 3,015 | |
3.000% due 11/01/2021 | | | | | 652 | | | | | | 661 | |
4.400% due 11/01/2034 | | | | | 3,122 | | | | | | 3,104 | |
4.522% due 09/15/2048 | | | | | 64 | | | | | | 61 | |
4.862% due 08/21/2046 | | | | | 1,773 | | | | | | 1,779 | |
5.012% due 08/21/2054 | | | | | 2,952 | | | | | | 2,931 | |
Vodafone Group PLC | |
2.500% due 09/26/2022 | | | | | 2,610 | | | | | | 2,592 | |
| | | | | | | | | | | | |
| | | | | | | | | | | 93,455 | |
| | | | | | | | | | | | |
Total Corporate Bonds & Notes
(Cost $699,316) | | | | | | 711,345 | |
| | | | | | | | | | | | |
| |
| | | | | | | | | | | | |
| | | | | PRINCIPAL
AMOUNT
(000S) | | | | | MARKET
VALUE
(000S) | |
| SOVEREIGN ISSUES 0.1% | |
Korea Hydro & Nuclear Power Co. Ltd. | |
3.000% due 09/19/2022 | | $ | | | 850 | | | $ | | | 858 | |
| | | | | | | | | | | | |
Total Sovereign Issues (Cost $860) | | | | | | 858 | |
| | | | | | | | | | | | |
| |
| SHORT-TERM INSTRUMENTS 3.1% | |
| |
| REPURCHASE AGREEMENTS (b) 3.1% | |
| | | | | | | | | | | 22,670 | |
| | | | | | | | | | | | |
Total Short-Term Instruments
(Cost $22,670) | | | | | | 22,670 | |
| | | | | | | | | | | | |
| | | | | | | | | | | | |
Total Investments in Securities
(Cost $722,846) | | | | | | 734,873 | |
| | | | | | | | | | | | |
Total Investments 99.6%
(Cost $722,846) | | | $ | | | 734,873 | |
| |
Financial Derivative
Instruments (c) 0.0% (Cost or Premiums, net $0) | | | 12 | |
| |
| Other Assets and Liabilities, net 0.4% | | | | | | 2,574 | |
| | | | | | | | | | | | |
| Net Assets 100.0% | | | | | | | | $ | | | 737,459 | |
| | | | | | | | | | | | |
NOTES TO SCHEDULE OF INVESTMENTS (AMOUNTS IN THOUSANDS*):
| * | A zero balance may reflect actual amounts rounding to less than one thousand. |
BORROWINGS AND OTHER FINANCING TRANSACTIONS
(b) REPURCHASE AGREEMENTS:
| | | | | | | | | | | | | | | | | | | | | | | | | | | | | | |
| Counterparty | | Lending
Rate | | | Settlement
Date | | | Maturity
Date | | | Principal
Amount | | | Collateralized By | | Collateral
(Received) | | | Repurchase
Agreements,
at Value | | | Repurchase
Agreement
Proceeds
to be
Received(1) | |
| JPS | | | 1.400 | % | | | 06/30/2017 | | | | 07/03/2017 | | | $ | 22,100 | | | U.S. Treasury Notes 0.875% - 1.250% due 05/31/2018 - 10/31/2021 | | $ | (22,556 | ) | | $ | 22,100 | | | $ | 22,103 | |
| SSB | | | 0.050 | | | | 06/30/2017 | | | | 07/03/2017 | | | | 570 | | | U.S. Treasury Notes 2.000% due 08/31/2021(2) | | | (585 | ) | | | 570 | | | | 570 | |
| | | | | | | | | | | | | | | | | | | | | | | | | | | | | | |
Total Repurchase Agreements | | | | | $ | (23,141 | ) | | $ | 22,670 | | | $ | 22,673 | |
| | | | | | | | | | | | | | | | | | | | | | | | | | | | | | |
BORROWINGS AND OTHER FINANCING TRANSACTIONS SUMMARY
The following is a summary by counterparty of the market value of Borrowings and Other Financing Transactions and collateral pledged/(received) as of June 30, 2017:
| | | | | | | | | | | | | | | | | | | | | | | | | | | | |
| Counterparty | | Repurchase
Agreement
Proceeds
to be
Received | | | Payable for
Reverse
Repurchase
Agreements | | | Payable for
Sale-Buyback
Transactions | | | Securities
Out on Loan | | | Total
Borrowings and
Other Financing
Transactions | | | Collateral
Pledged/(Received) | | | Net Exposure(3) | |
Global/Master Repurchase Agreement | | | | | | | | | | | | | | | | | | | | | | | | | | | | |
JPS | | $ | 22,103 | | | $ | 0 | | | $ | 0 | | | $ | 0 | | | $ | 22,103 | | | $ | (22,556 | ) | | $ | (453 | ) |
SSB | | | 570 | | | | 0 | | | | 0 | | | | 0 | | | | 570 | | | | (585 | ) | | | (15 | ) |
| | | | | | | | | | | | | | | | | | | | | | | | | | | | |
Total Borrowings and Other Financing Transactions | | $ | 22,673 | | | $ | 0 | | | $ | 0 | | | $ | 0 | | | | | | | | | | | | | |
| | | | | | | | | | | | | | | | | | | | | | | | | | | | |
| (1) | Includes accrued interest. |
| (2) | Collateral is held in custody by the counterparty. |
| (3) | Net Exposure represents the net receivable/(payable) that would be due from/to the counterparty in the event of default. Exposure from borrowings and other financing transactions can only be netted across transactions governed under the same master agreement with the same legal entity. See Note 8, Master Arrangements, in the Notes to Financial Statements for more information regarding master netting arrangements. |
| | | | | | | | |
| 48 | | PIMCO ETF TRUST | | | | | See Accompanying Notes | |
June 30, 2017
The average amount of borrowings outstanding during the period ended June 30, 2017 was $(184) at a weighted average interest rate of (1.000)%. Average borrowings may include sale-buyback transactions and reverse repurchase agreements, if held during the period.
(c) FINANCIAL DERIVATIVE INSTRUMENTS: EXCHANGE-TRADED OR CENTRALLY CLEARED
SWAP AGREEMENTS:
CREDIT DEFAULT SWAPS ON CREDIT INDICES - SELL PROTECTION(1)
| | | | | | | | | | | | | | | | | | | | | | | | | | | | | | | | |
| Index/Tranches | | Fixed
Receive Rate | | | Maturity
Date | | | Notional
Amount(2) | | | Premiums
Paid/(Received) | | | Unrealized
Appreciation/
(Depreciation) | | | Market
Value(3) | | | Variation Margin | |
| | | | | | | | Asset | | | Liability | |
CDX.IG-26 5-Year Index | | | 1.000 | % | | | 06/20/2021 | | | $ | 6,800 | | | $ | 73 | | | $ | 76 | | | $ | 149 | | | $ | 3 | | | $ | 0 | |
CDX.IG-27 5-Year Index | | | 1.000 | | | | 12/20/2021 | | | | 8,300 | | | | 114 | | | | 59 | | | | 173 | | | | 4 | | | | 0 | |
CDX.IG-28 5-Year Index | | | 1.000 | | | | 06/20/2022 | | | | 11,000 | | | | 191 | | | | 16 | | | | 207 | | | | 5 | | | | 0 | |
| | | | | | | | | | | | | | | | | | | | | | | | | | | | | | | | |
| | | | | | | | | | | | | | $ | 378 | | | $ | 151 | | | $ | 529 | | | $ | 12 | | | $ | 0 | |
| | | | | | | | | | | | | | | | | | | | | | | | | | | | | | | | |
Total Swap Agreements | | | $ | 378 | | | $ | 151 | | | $ | 529 | | | $ | 12 | | | $ | 0 | |
| | | | | | | | | | | | | | | | | | | | | | | | | | | | | | | | |
FINANCIAL DERIVATIVE INSTRUMENTS: EXCHANGE-TRADED OR CENTRALLY CLEARED SUMMARY
The following is a summary of the market value and variation margin of Exchange-Traded or Centrally Cleared Financial Derivative Instruments as of June 30, 2017:
| | | | | | | | | | | | | | | | | | | | | | | | | | | | | | | | | | | | |
| | | Financial Derivative Assets | | | | | | Financial Derivative Liabilities | |
| | | Market Value | | | Variation Margin
Asset | | | Total | | | | | | Market Value | | | Variation Margin
Liability | | | Total | |
| | | Purchased
Options | | | Futures | | | Swap
Agreements | | | | | | | Written
Options | | | Futures | | | Swap
Agreements | | |
Total Exchange-Traded or Centrally Cleared | | $ | 0 | | | $ | 0 | | | $ | 12 | | | $ | 12 | | | | | | | $ | 0 | | | $ | 0 | | | $ | 0 | | | $ | 0 | |
| | | | | | | | | | | | | | | | | | | | | | | | | | | | | | | | | | | | |
Cash of $1,142 has been pledged as collateral for exchange-traded and centrally cleared financial derivative instruments as of June 30, 2017. See Note 8, Master Arrangements, in the Notes to Financial Statements for more information regarding master netting arrangements.
| (1) | If the Fund is a seller of protection and a credit event occurs, as defined under the terms of that particular swap agreement, the Fund will either (i) pay to the buyer of protection an amount equal to the notional amount of the swap and take delivery of the referenced obligation or underlying securities comprising the referenced index or (ii) pay a net settlement amount in the form of cash, securities or other deliverable obligations equal to the notional amount of the swap less the recovery value of the referenced obligation or underlying securities comprising the referenced index. |
| (2) | The maximum potential amount the Fund could be required to pay as a seller of credit protection or receive as a buyer of credit protection if a credit event occurs as defined under the terms of that particular swap agreement. |
| (3) | The prices and resulting values for credit default swap agreements on credit indices serve as indicators of the current status of the payment/performance risk and represent the likelihood of an expected liability (or profit) for the credit derivative should the notional amount of the swap agreement be closed/sold as of the period end. Increasing market values, in absolute terms when compared to the notional amount of the swap, represent a deterioration of the referenced indices’ credit soundness and a greater likelihood or risk of default or other credit event occurring as defined under the terms of the agreement. |
FAIR VALUE OF FINANCIAL DERIVATIVE INSTRUMENTS
The following is a summary of the fair valuation of the Fund’s derivative instruments categorized by risk exposure. See Note 7, Principal Risks, in the Notes to Financial Statements on risks of the Fund.
Fair Values of Financial Derivative Instruments on the Statements of Assets and Liabilities as of June 30, 2017:
| | | | | | | | | | | | | | | | | | | | | | | | |
| | | Derivatives not accounted for as hedging instruments | |
| | | Commodity
Contracts | | | Credit
Contracts | | | Equity
Contracts | | | Foreign
Exchange
Contracts | | | Interest
Rate Contracts | | | Total | |
Financial Derivative Instruments - Assets | | | | | | | | | | | | | | | | | | | | | | | | |
Exchange-traded or centrally cleared | | | | | | | | | | | | | | | | | | | | | | | | |
Swap Agreements | | $ | 0 | | | $ | 12 | | | $ | 0 | | | $ | 0 | | | $ | 0 | | | $ | 12 | |
| | | | | | | | | | | | | | | | | | | | | | | | |
| | | | | | |
| See Accompanying Notes | | ANNUAL REPORT | | JUNE 30, 2017 | | 49 |
Schedule of Investments PIMCO Investment Grade Corporate Bond Index Exchange-Traded Fund (Cont.)
June 30, 2017
The effect of Financial Derivative Instruments on the Statements of Operations for the period ended June 30, 2017:
| | | | | | | | | | | | | | | | | | | | | | | | |
| | | Derivatives not accounted for as hedging instruments | |
| | | Commodity
Contracts | | | Credit
Contracts | | | Equity
Contracts | | | Foreign
Exchange
Contracts | | | Interest
Rate Contracts | | | Total | |
Net Realized Gain (Loss) on Financial Derivative Instruments | | | | | | | | | | | | | | | | | | | | | |
Exchange-traded or centrally cleared | | | | | | | | | | | | | | | | | | | | | | | | |
Swap Agreements | | $ | 0 | | | $ | 465 | | | $ | 0 | | | $ | 0 | | | $ | (1 | ) | | $ | 464 | |
| | | | | | | | | | | | | | | | | | | | | | | | |
Over the counter | |
Swap Agreements | | $ | 0 | | | $ | 2 | | | $ | 0 | | | $ | 0 | | | $ | 0 | | | $ | 2 | |
| | | | | | | | | | | | | | | | | | | | | | | | |
| | $ | 0 | | | $ | 467 | | | $ | 0 | | | $ | 0 | | | $ | (1 | ) | | $ | 466 | |
| | | | | | | | | | | | | | | | | | | | | | | | |
|
Net Change in Unrealized Appreciation on Financial Derivative Instruments | |
Exchange-traded or centrally cleared | | | | | | | | | | | | | | | | | | | | | | | | |
Swap Agreements | | $ | 0 | | | $ | 137 | | | $ | 0 | | | $ | 0 | | | $ | 0 | | | $ | 137 | |
| | | | | | | | | | | | | | | | | | | | | | | | |
FAIR VALUE MEASUREMENTS
The following is a summary of the fair valuations according to the inputs used as of June 30, 2017 in valuing the Fund’s assets and liabilities:
| | | | | | | | | | | | | | | | |
| Category and Subcategory | | Level 1 | | | Level 2 | | | Level 3 | | | Fair
Value at
06/30/2017 | |
Investments in Securities, at Value | |
Corporate Bonds & Notes | |
Banking & Finance | | $ | 0 | | | $ | 253,029 | | | $ | 0 | | | $ | 253,029 | |
Industrials | | | 0 | | | | 364,861 | | | | 0 | | | | 364,861 | |
Utilities | | | 0 | | | | 93,455 | | | | 0 | | | | 93,455 | |
Sovereign Issues | | | 0 | | | | 858 | | | | 0 | | | | 858 | |
Short-Term Instruments | |
Repurchase Agreements | | | 0 | | | | 22,670 | | | | 0 | | | | 22,670 | |
| | | | | | | | | | | | | | | | |
| | | | |
Total Investments | | $ | 0 | | | $ | 734,873 | | | $ | 0 | | | $ | 734,873 | |
| | | | | | | | | | | | | | | | |
| | | | | | | | | | | | | | | | |
| Category and Subcategory | | Level 1 | | | Level 2 | | | Level 3 | | | Fair
Value at
06/30/2017 | |
Financial Derivative Instruments - Assets | |
Exchange-traded or centrally cleared | | $ | 0 | | | $ | 12 | | | $ | 0 | | | $ | 12 | |
| | | | | | | | | | | | | | | | |
| | | | |
Totals | | $ | 0 | | | $ | 734,885 | | | $ | 0 | | | $ | 734,885 | |
| | | | | | | | | | | | | | | | |
There were no significant transfers among Levels 1, 2, or 3 during the period ended June 30, 2017.
| | | | | | | | |
| 50 | | PIMCO ETF TRUST | | | | | See Accompanying Notes | |
Schedule of Investments PIMCO Active Bond Exchange-Traded Fund
June 30, 2017
| | | | | | | | | | | | |
| | | | | PRINCIPAL
AMOUNT
(000S) | | | | | MARKET
VALUE
(000S) | |
| INVESTMENTS IN SECURITIES 130.3% | |
| |
| CORPORATE BONDS & NOTES 30.4% | |
| |
| BANKING & FINANCE 22.6% | |
Air Lease Corp. | |
3.000% due 09/15/2023 | | $ | | | 5,000 | | | $ | | | 4,978 | |
Ally Financial, Inc. | | | | |
3.500% due 01/27/2019 | | | | | 10,000 | | | | | | 10,162 | |
American Tower Corp. | | | | | | | |
3.375% due 10/15/2026 | | | | | 3,300 | | | | | | 3,235 | |
Banca Monte dei Paschi di Siena SpA | |
5.000% due 02/09/2056 | | EUR | | | 400 | | | | | | 471 | |
Banco Espirito Santo S.A. | | | | | | | | | | |
4.750% due 01/15/2018 ^ | | | | | 2,500 | | | | | | 914 | |
Banco Santander Mexico S.A. Institucion de Banca Multiple Grupo Financiero Santand | |
4.125% due 11/09/2022 | | $ | | | 4,300 | | | | | | 4,489 | |
Bank of America Corp. | | | | | | | |
3.300% due 01/11/2023 | | | | | 4,200 | | | | | | 4,285 | |
3.500% due 04/19/2026 | | | | | 9,000 | | | | | | 9,049 | |
3.875% due 08/01/2025 | | | | | 13,107 | | | | | | 13,575 | |
5.700% due 01/24/2022 | | | | | 5,600 | | | | | | 6,334 | |
Barclays Bank PLC | |
7.625% due 11/21/2022 | | | | | 16,900 | | | | | | 19,361 | |
7.750% due 04/10/2023 | | | | | 4,900 | | | | | | 5,114 | |
14.000% due 06/15/2019 (h) | | GBP | | | 4,500 | | | | | | 7,137 | |
BBVA Bancomer S.A. | | | | |
6.500% due 03/10/2021 | | $ | | | 6,000 | | | | | | 6,637 | |
Black Diamond CLO Ltd. | |
1.000% due 02/06/2026 | | | | | 6,000 | | | | | | 5,999 | |
BNP Paribas S.A. | | | | |
3.800% due 01/10/2024 | | | | | 5,000 | | | | | | 5,213 | |
4.375% due 09/28/2025 | | | | | 1,000 | | | | | | 1,038 | |
BPCE S.A. | |
5.700% due 10/22/2023 | | | | | 6,000 | | | | | | 6,688 | |
Brixmor Operating Partnership LP | | | | | | | |
3.650% due 06/15/2024 | | | | | 7,000 | | | | | | 6,895 | |
Brookfield Finance LLC | | | | |
4.000% due 04/01/2024 | | | | | 3,000 | | | | | | 3,081 | |
Citicorp Lease Pass-Through Trust | | | | | | | |
8.040% due 12/15/2019 | | | | | 3,871 | | | | | | 4,389 | |
Citigroup, Inc. | | | | |
2.632% due 09/01/2023 | | | | | 4,800 | | | | | | 4,893 | |
3.300% due 04/27/2025 | | | | | 10,000 | | | | | | 10,021 | |
5.500% due 09/13/2025 | | | | | 4,000 | | | | | | 4,456 | |
Cooperatieve Rabobank UA | | | | |
3.375% due 05/21/2025 | | | | | 500 | | | | | | 515 | |
6.875% due 03/19/2020 | | EUR | | | 4,200 | | | | | | 5,641 | |
Credit Suisse AG | | | | |
6.500% due 08/08/2023 | | $ | | | 15,400 | | | | | | 17,354 | |
Credit Suisse Group Funding Guernsey Ltd. | | | | |
3.750% due 03/26/2025 | | | | | 5,700 | | | | | | 5,769 | |
3.800% due 09/15/2022 | | | | | 4,200 | | | | | | 4,368 | |
Deutsche Bank AG | | | | |
3.375% due 05/12/2021 | | | | | 13,100 | | | | | | 13,279 | |
4.250% due 10/14/2021 | | | | | 3,000 | | | | | | 3,144 | |
EPR Properties | |
4.500% due 06/01/2027 | | | | | 4,300 | | | | | | 4,335 | |
Ford Motor Credit Co. LLC | | | | | | | |
3.200% due 01/15/2021 | | | | | 700 | | | | | | 711 | |
General Motors Financial Co., Inc. | |
3.200% due 07/13/2020 | | | | | 7,400 | | | | | | 7,545 | |
6.750% due 06/01/2018 | | | | | 1,400 | | | | | | 1,461 | |
Goldman Sachs Group, Inc. | | | | | | | | | | |
3.691% due 06/05/2028 | | | | | 3,600 | | | | | | 3,619 | |
4.000% due 03/03/2024 | | | | | 13,000 | | | | | | 13,622 | |
Healthcare Trust of America Holdings LP | |
3.750% due 07/01/2027 | | | | | 4,600 | | | | | | 4,557 | |
Hospitality Properties Trust | | | | |
4.250% due 02/15/2021 | | | | | 2,200 | | | | | | 2,296 | |
HSBC Holdings PLC | |
3.600% due 05/25/2023 | | | | | 5,000 | | | | | | 5,170 | |
4.250% due 03/14/2024 | | | | | 12,000 | | | | | | 12,433 | |
4.250% due 08/18/2025 | | | | | 1,000 | | | | | | 1,029 | |
| | | | | | | | | | | | |
| | | | | PRINCIPAL
AMOUNT
(000S) | | | | | MARKET
VALUE
(000S) | |
International Lease Finance Corp. | |
5.875% due 08/15/2022 | | $ | | | 5,000 | | | $ | | | 5,657 | |
8.250% due 12/15/2020 | | | | | 600 | | | | | | 708 | |
Intesa Sanpaolo SpA | |
3.875% due 01/16/2018 | | | | | 7,500 | | | | | | 7,570 | |
JPMorgan Chase & Co. | |
3.125% due 01/23/2025 | | | | | 14,300 | | | | | | 14,232 | |
KBC Bank NV | |
8.000% due 01/25/2023 | | | | | 13,600 | | | | | | 14,023 | |
Lloyds Bank PLC | |
12.000% due 12/16/2024 (h) | | | | | 6,800 | | | | | | 9,272 | |
Lloyds Banking Group PLC | |
7.000% due 06/27/2019 (h) | | GBP | | | 7,300 | | | | | | 9,886 | |
Mid-America Apartments LP | |
4.000% due 11/15/2025 | | $ | | | 7,500 | | | | | | 7,775 | |
MMcapS Funding Ltd. | |
1.586% due 12/26/2039 | | | | | 934 | | | | | | 724 | |
Morgan Stanley | |
2.556% due 04/21/2021 | | | | | 1,800 | | | | | | 1,848 | |
3.875% due 04/29/2024 | | | | | 20,000 | | | | | | 20,810 | |
National Australia Bank Ltd. | |
2.250% due 03/16/2021 | | | | | 6,500 | | | | | | 6,491 | |
Navient Corp. | |
8.450% due 06/15/2018 | | | | | 2,800 | | | | | | 2,955 | |
Nordea Bank AB | |
6.125% due 09/23/2024 (h) | | | | | 550 | | | | | | 577 | |
Pacific Life Insurance Co. | |
9.250% due 06/15/2039 | | | | | 5,000 | | | | | | 8,183 | |
Piper Jaffray Cos. | |
5.060% due 10/09/2018 | | | | | 2,000 | | | | | | 2,030 | |
Preferred Term Securities Ltd. | |
1.546% due 03/22/2037 | | | | | 3,323 | | | | | | 2,675 | |
Royal Bank of Canada | |
2.300% due 03/22/2021 | | | | | 6,500 | | | | | | 6,524 | |
Royal Bank of Scotland Group PLC | |
8.000% due 08/10/2025 (h) | | | | | 3,000 | | | | | | 3,265 | |
Santander Holdings USA, Inc. | |
2.642% due 11/24/2017 | | | | | 3,700 | | | | | | 3,715 | |
2.700% due 05/24/2019 | | | | | 5,000 | | | | | | 5,039 | |
Societe Generale S.A. | |
8.250% due 11/29/2018 (h) | | | | | 6,000 | | | | | | 6,380 | |
SoQ Sukuk A QSC | |
2.099% due 01/18/2018 | | | | | 5,000 | | | | | | 4,993 | |
Springleaf Finance Corp. | |
6.125% due 05/15/2022 | | | | | 4,500 | | | | | | 4,759 | |
8.250% due 12/15/2020 | | | | | 5,500 | | | | | | 6,187 | |
Sumitomo Mitsui Financial Group, Inc. | | | | |
2.901% due 03/09/2021 | | | | | 6,500 | | | | | | 6,699 | |
Synchrony Bank | |
3.000% due 06/15/2022 | | | | | 5,500 | | | | | | 5,481 | |
Synchrony Financial | |
2.580% due 11/09/2017 | | | | | 4,000 | | | | | | 4,013 | |
UBS AG | |
7.625% due 08/17/2022 | | | | | 13,950 | | | | | | 16,412 | |
UBS Group Funding Switzerland AG | |
3.000% due 04/15/2021 | | | | | 2,400 | | | | | | 2,439 | |
UDR, Inc. | |
3.500% due 07/01/2027 | | | | | 2,400 | | | | | | 2,373 | |
Wells Fargo & Co. | |
2.402% due 10/31/2023 | | | | | 5,000 | | | | | | 5,093 | |
2.500% due 03/04/2021 | | | | | 2,000 | | | | | | 2,008 | |
2.550% due 12/07/2020 | | | | | 5,060 | | | | | | 5,120 | |
| | | | | | | | | | | | |
| | | | | | | | | | | 461,178 | |
| | | | | | | | | | | | |
| | | | | | | | | | | | |
| INDUSTRIALS 5.8% | |
AbbVie, Inc. | |
2.900% due 11/06/2022 | | | | | 3,000 | | | | | | 3,032 | |
Arrow Electronics, Inc. | |
3.875% due 01/12/2028 | | | | | 2,500 | | | | | | 2,494 | |
Charter Communications Operating LLC | |
4.908% due 07/23/2025 | | | | | 4,600 | | | | | | 4,978 | |
| | | | | | | | | | | | |
| | | | | PRINCIPAL
AMOUNT
(000S) | | | | | MARKET
VALUE
(000S) | |
Corp. Nacional del Cobre de Chile | | | | |
4.500% due 09/16/2025 | | $ | | | 3,500 | | | $ | | | 3,745 | |
CVS Health Corp. | |
2.250% due 12/05/2018 | | | | | 1,600 | | | | | | 1,611 | |
Dell International LLC | |
3.480% due 06/01/2019 | | | | | 800 | | | | | | 819 | |
5.450% due 06/15/2023 | | | | | 4,000 | | | | | | 4,346 | |
Ecopetrol S.A. | |
5.875% due 09/18/2023 | | | | | 5,000 | | | | | | 5,480 | |
Energy Transfer LP | |
5.200% due 02/01/2022 | | | | | 2,275 | | | | | | 2,448 | |
ERAC USA Finance LLC | |
3.800% due 11/01/2025 | | | | | 900 | | | | | | 919 | |
Hampton Roads PPV LLC | |
6.621% due 06/15/2053 | | | | | 35,946 | | | | | | 33,235 | |
Kansas City Southern | |
3.000% due 05/15/2023 | | | | | 2,500 | | | | | | 2,511 | |
Kinder Morgan Energy Partners LP | |
4.300% due 05/01/2024 | | | | | 850 | | | | | | 880 | |
6.850% due 02/15/2020 | | | | | 1,100 | | | | | | 1,213 | |
Kinder Morgan, Inc. | |
5.625% due 11/15/2023 | | | | | 2,000 | | | | | | 2,216 | |
Kraft Heinz Foods Co. | |
3.950% due 07/15/2025 | | | | | 5,000 | | | | | | 5,165 | |
Meccanica Holdings USA, Inc. | |
6.250% due 07/15/2019 | | | | | 6,900 | | | | | | 7,435 | |
QVC, Inc. | |
4.450% due 02/15/2025 | | | | | 1,250 | | | | | | 1,235 | |
Regency Energy Partners LP | |
4.500% due 11/01/2023 | | | | | 5,000 | | | | | | 5,194 | |
5.000% due 10/01/2022 | | | | | 2,500 | | | | | | 2,684 | |
Sabine Pass Liquefaction LLC | |
5.625% due 03/01/2025 | | | | | 2,000 | | | | | | 2,212 | |
5.875% due 06/30/2026 | | | | | 3,800 | | | | | | 4,260 | |
Shire Acquisitions Investments Ireland DAC | |
1.900% due 09/23/2019 | | | | | 5,000 | | | | | | 4,980 | |
Teva Pharmaceutical Finance Netherlands BV | |
2.800% due 07/21/2023 | | | | | 5,000 | | | | | | 4,869 | |
Western Gas Partners LP | |
3.950% due 06/01/2025 | | | | | 7,547 | | | | | | 7,511 | |
Zimmer Biomet Holdings, Inc. | |
2.700% due 04/01/2020 | | | | | 3,335 | | | | | | 3,367 | |
| | | | | | | | | | | | |
| | | | | | | | | | | 118,839 | |
| | | | | | | | | | | | |
| | | | | | | | | | | | |
| UTILITIES 2.0% | | | | | | | | | | | | |
AT&T, Inc. | |
3.600% due 02/17/2023 | | | | | 4,000 | | | | | | 4,098 | |
4.125% due 02/17/2026 | | | | | 7,000 | | | | | | 7,190 | |
Duke Energy Corp. | |
3.050% due 08/15/2022 | | | | | 5,720 | | | | | | 5,845 | |
FirstEnergy Corp. | |
3.900% due 07/15/2027 | | | | | 6,000 | | | | | | 6,014 | |
Kinder Morgan Finance Co. LLC | |
6.000% due 01/15/2018 | | | | | 1,680 | | | | | | 1,715 | |
Plains All American Pipeline LP | |
6.500% due 05/01/2018 | | | | | 2,130 | | | | | | 2,207 | |
Verizon Communications, Inc. | |
2.946% due 03/15/2022 | | | | | 2,821 | | | | | | 2,844 | |
5.150% due 09/15/2023 | | | | | 10,000 | | | | | | 11,121 | |
| | | | | | | | | | | | |
| | | | | | | | | | | 41,034 | |
| | | | | | | | | | | | |
Total Corporate Bonds & Notes
(Cost $613,221) | | | | | | 621,051 | |
| | | | | | | | | | | | |
| |
| MUNICIPAL BONDS & NOTES 2.2% | |
| |
| CALIFORNIA 0.5% | |
California State General Obligation Bonds, (BABs), Series 2010 | |
7.600% due 11/01/2040 | | | | | 2,000 | | | | | | 3,115 | |
7.950% due 03/01/2036 | | | | | 3,600 | | | | | | 4,112 | |
| | | | | | |
| See Accompanying Notes | | ANNUAL REPORT | | JUNE 30, 2017 | | 51 |
Schedule of Investments PIMCO Active Bond Exchange-Traded Fund (Cont.)
| | | | | | | | | | | | |
| | | | | PRINCIPAL
AMOUNT
(000S) | | | | | MARKET
VALUE
(000S) | |
San Diego Tobacco Settlement Funding Corp., California Revenue Bonds, Series 2006 | |
7.125% due 06/01/2032 | | $ | | | 3,100 | | | $ | | | 3,513 | |
| | | | | | | | | | | | |
| | | | | | | | | | | 10,740 | |
| | | | | | | | | | | | |
| |
| FLORIDA 0.5% | | | | | | | | | | | | |
Palm Beach County, Florida Revenue Bonds, Series 2013 | |
5.250% due 11/01/2043 | | | | | 7,520 | | | | | | 8,069 | |
State Board of Administration Finance Corp., Florida Revenue Notes, Series 2013 | |
2.995% due 07/01/2020 | | | | | 2,265 | | | | | | 2,315 | |
| | | | | | | | | | | | |
| | | | | | | | | | | 10,384 | |
| | | | | | | | | | | | |
| |
| ILLINOIS 0.6% | | | | | | | | | | | | |
Chicago, Illinois General Obligation Bonds, Series 2015 | |
7.750% due 01/01/2042 | | | | | 5,900 | | | | | | 6,019 | |
Illinois State General Obligation Bonds, (BABs), Series 2010 | |
7.350% due 07/01/2035 | | | | | 6,800 | | | | | | 7,283 | |
| | | | | | | | | | | | |
| | | | | | | | | | | 13,302 | |
| | | | | | | | | | | | |
| |
| SOUTH DAKOTA 0.4% | | | | | | | | | | | | |
Educational Enhancement Funding Corp., South Dakota Revenue Notes, Series 2013 | |
3.539% due 06/01/2022 | | | | | 8,000 | | | | | | 8,175 | |
| | | | | | | | | | | | |
| | | | | | | | | | | | |
| TEXAS 0.2% | | | | | | | | | | | | |
Texas Public Finance Authority Revenue Notes, Series 2014 | |
8.250% due 07/01/2024 | | | | | 3,000 | | | | | | 3,181 | |
| | | | | | | | | | | | |
Total Municipal Bonds & Notes
(Cost $44,534) | | | | | | 45,782 | |
| | | | | | | | | | | | |
| |
| U.S. GOVERNMENT AGENCIES 46.2% | |
Fannie Mae | |
0.000% due 07/25/2031 - 02/25/2040 (b)(e) | | | | | 466 | | | | | | 424 | |
0.733% due 08/25/2022 (a) | | | | | 17,343 | | | | | | 458 | |
2.500% due 03/25/2033 | | | | | 2 | | | | | | 2 | |
2.812% due 09/01/2034 | | | | | 51 | | | | | | 54 | |
3.000% due 03/25/2033 - 05/01/2047 | | | | | 121,910 | | | | | | 121,843 | |
3.500% due 04/01/2032 - 05/01/2047 | | | | | 164,063 | | | | | | 168,894 | |
3.567% due 04/01/2036 | | | | | 30 | | | | | | 32 | |
4.000% due 07/01/2042 - 05/01/2047 | | | | | 124,682 | | | | | | 131,867 | |
4.500% due 11/25/2035 - 09/01/2046 | | | | | 38,741 | | | | | | 42,001 | |
4.784% due 09/25/2042 (a) | | | | | 84,563 | | | | | | 17,125 | |
5.000% due 05/01/2026 - 11/01/2039 | | | | | 637 | | | | | | 679 | |
5.204% due 04/25/2040 (a) | | | | | 165 | | | | | | 25 | |
5.297% due 05/25/2042 | | | | | 219 | | | | | | 216 | |
5.500% due 09/01/2026 - 04/01/2039 | | | | | 1,068 | | | | | | 1,131 | |
5.984% due 05/25/2036 (a) | | | | | 2,621 | | | | | | 481 | |
6.000% due 05/25/2031 - 07/25/2037 | | | | | 100 | | | | | | 113 | |
17.108% due 01/25/2036 | | | | | 669 | | | | | | 848 | |
23.432% due 07/25/2023 | | | | | 16 | | | | | | 23 | |
Fannie Mae, TBA | |
3.500% due 07/01/2047 | | | | | 49,000 | | | | | | 50,315 | |
Freddie Mac | |
0.000% due 01/15/2033 - 07/15/2039 (b)(e) | | | | | 1,456 | | | | | | 1,324 | |
1.435% due 11/15/2042 | | | | | 9,295 | | | | | | 9,274 | |
1.674% due 09/25/2025 | | | | | 9,826 | | | | | | 9,880 | |
1.825% due 06/15/2040 (a) | | | | | 37,635 | | | | | | 2,313 | |
2.740% due 11/01/2023 | | | | | 1 | | | | | | 1 | |
2.907% due 07/01/2036 | | | | | 47 | | | | | | 50 | |
| | | | | | | | | | | | |
| | | | | PRINCIPAL
AMOUNT
(000S) | | | | | MARKET
VALUE
(000S) | |
3.000% due 01/15/2043 - 01/01/2047 | | $ | | | 43,726 | | | $ | | | 43,667 | |
3.019% due 12/01/2031 | | | | | 179 | | | | | | 189 | |
3.322% due 10/01/2036 | | | | | 6 | | | | | | 6 | |
3.500% due 12/15/2028 (a) | | | | | 5,104 | | | | | | 436 | |
3.500% due 02/15/2043 - 06/01/2047 | | | | | 120,118 | | | | | | 123,672 | |
3.871% due 05/15/2041 | | | | | 3,931 | | | | | | 3,839 | |
4.000% due 09/01/2033 - 01/01/2047 | | | | | 22,124 | | | | | | 23,402 | |
4.500% due 02/01/2034 - 11/01/2044 | | | | | 10,927 | | | | | | 11,853 | |
5.000% due 03/01/2033 - 07/15/2041 | | | | | 294 | | | | | | 319 | |
5.000% due 08/15/2039 (a) | | | | | 293 | | | | | | 26 | |
5.222% due 06/15/2042 | | | | | 2,040 | | | | | | 2,027 | |
5.250% due 04/15/2033 | | | | | 54 | | | | | | 60 | |
5.500% due 08/15/2033 - 09/01/2037 | | | | | 254 | | | | | | 275 | |
6.000% due 02/01/2033 - 08/01/2037 | | | | | 302 | | | | | | 331 | |
7.582% due 01/15/2041 | | | | | 5,689 | | | | | | 6,455 | |
16.253% due 10/15/2023 | | | | | 212 | | | | | | 274 | |
16.476% due 05/15/2033 | | | | | 97 | | | | | | 135 | |
Ginnie Mae | |
1.463% due 09/20/2065 | | | | | 10,537 | | | | | | 10,512 | |
1.563% due 06/20/2065 | | | | | 16,296 | | | | | | 16,244 | |
1.763% due 02/20/2066 | | | | | 11,882 | | | | | | 11,937 | |
1.793% due 05/20/2066 | | | | | 6,356 | | | | | | 6,409 | |
1.913% due 07/20/2065 | | | | | 11,545 | | | | | | 11,700 | |
2.143% due 03/20/2066 | | | | | 4,406 | | | | | | 4,520 | |
3.500% due 12/20/2040 - 03/20/2047 | | | | | 31,041 | | | | | | 32,184 | |
4.000% due 12/20/2040 - 06/15/2047 | | | | | 66,202 | | | | | | 70,772 | |
4.500% due 03/20/2039 - 07/20/2041 | | | | | 687 | | | | | | 712 | |
4.750% due 01/20/2035 | | | | | 36 | | | | | | 43 | |
5.000% due 04/20/2040 - 02/20/2047 | | | | | 464 | | | | | | 482 | |
5.500% due 04/16/2034 - 07/20/2037 | | | | | 80 | | | | | | 90 | |
| | | | | | | | | | | | |
Total U.S. Government Agencies
(Cost $946,041) | | | | | | 941,944 | |
| | | | | | | | | | | | |
| |
| U.S. TREASURY OBLIGATIONS 28.1% | |
U.S. Treasury Bonds | | | | | | | | | | | | |
2.875% due 08/15/2045 (j)(n) | | | | | 40,700 | | | | | | 41,001 | |
3.000% due
11/15/2044 (j)(l)(n) | | | 46,100 | | | | | | 47,655 | |
3.750% due 11/15/2043 (l)(n) | | | | | 17,500 | | | | | | 20,601 | |
U.S. Treasury Inflation Protected Securities (g) | |
1.750% due
01/15/2028 (j)(l)(n) | | | 43,188 | | | | | | 48,170 | |
U.S. Treasury Notes | | | | | | | | | | | | |
1.875% due 04/30/2022 (j) | | | | | 329,500 | | | | | | 329,455 | |
2.375% due 05/15/2027 (j) | | | | | 85,000 | | | | | | 85,561 | |
| | | | | | | | | | | | |
Total U.S. Treasury Obligations
(Cost $570,927) | | | | | | 572,443 | |
| | | | | | | | | | | | |
| |
| NON-AGENCY MORTGAGE-BACKED SECURITIES 5.4% | |
American Home Mortgage Investment Trust | |
2.914% due 09/25/2045 | | | | | 30 | | | | | | 30 | |
BAMLL Commercial Mortgage Securities Trust | |
1.789% due 06/15/2028 | | | | | 3,000 | | | | | | 3,004 | |
Banc of America Mortgage Trust | |
3.231% due 10/25/2034 | | | | | 639 | | | | | | 632 | |
Barclays Commercial Mortgage Securities Trust | |
3.323% due 09/10/2028 | | | | | 6,475 | | | | | | 6,665 | |
BCAP LLC Trust | |
4.000% due 04/26/2037 | | | | | 946 | | | | | | 948 | |
BCAP Ltd. | |
3.462% due 01/27/2037 | | | | | 862 | | | | | | 866 | |
Bear Stearns ALT-A Trust | |
1.856% due 04/25/2034 | | | | | 55 | | | | | | 53 | |
Business Mortgage Finance PLC | |
2.315% due 02/15/2041 | | GBP | | | 2,723 | | | | | | 3,472 | |
| | | | | | | | | | | | |
| | | | | PRINCIPAL
AMOUNT
(000S) | | | | | MARKET
VALUE
(000S) | |
Countrywide Home Loan Mortgage Pass-Through Trust | |
1.756% due 03/25/2035 | | $ | | | 199 | | | $ | | | 186 | |
Countrywide Home Loan Reperforming REMIC Trust | |
1.556% due 01/25/2036 | | | | | 4,459 | | | | | | 4,005 | |
Credit Suisse First Boston Mortgage Securities Corp. | |
1.866% due 11/25/2031 | | | | | 47 | | | | | | 40 | |
3.499% due 11/25/2034 | | | | | 68 | | | | | | 71 | |
Credit Suisse Mortgage Capital Certificates | |
3.357% due 10/27/2036 | | | | | 4 | | | | | | 4 | |
3.500% due 03/25/2054 | | | | | 6,004 | | | | | | 6,016 | |
6.000% due 05/27/2036 | | | | | 25 | | | | | | 25 | |
Great Hall Mortgages PLC | |
0.427% due 03/18/2039 | | GBP | | | 4,321 | | | | | | 5,534 | |
0.437% due 06/18/2039 | | | | | 26,581 | | | | | | 33,902 | |
0.447% due 06/18/2038 | | | | | 5,316 | | | | | | 6,787 | |
1.397% due 06/18/2039 | | $ | | | 4,021 | | | | | | 3,899 | |
GSR Mortgage Loan Trust | |
3.358% due 09/25/2034 | | | | | 564 | | | | | | 570 | |
HomeBanc Mortgage Trust | |
1.546% due 10/25/2035 | | | | | 3,048 | | | | | | 2,992 | |
JPMorgan Mortgage Trust | |
3.576% due 07/25/2035 | | | | | 67 | | | | | | 68 | |
JPMorgan Resecuritization Trust | |
5.401% due 07/27/2037 | | | | | 43 | | | | | | 45 | |
Lehman XS Trust | |
1.732% due 11/25/2035 | | | | | 132 | | | | | | 131 | |
MASTR Adjustable Rate Mortgages Trust | |
3.400% due 03/25/2035 | | | | | 3,570 | | | | | | 3,522 | |
Merrill Lynch Mortgage Investors Trust | |
3.040% due 05/25/2029 | | | | | 34 | | | | | | 34 | |
Morgan Stanley Capital Trust | |
3.516% due 07/13/2029 | | | | | 5,030 | | | | | | 5,209 | |
RBSGC Mortgage Loan Trust | |
1.596% due 12/25/2034 | | | | | 2,635 | | | | | | 2,291 | |
Residential Accredit Loans, Inc. Trust | |
5.500% due 11/25/2034 | | | | | 4,362 | | | | | | 4,414 | |
Residential Asset Securitization Trust | |
1.766% due 08/25/2033 | | | | | 56 | | | | | | 53 | |
RMAC Securities PLC | |
0.439% due 06/12/2044 | | GBP | | | 2,934 | | | | | | 3,656 | |
Sequoia Mortgage Trust | |
1.839% due 02/20/2035 | | $ | | | 2,080 | | | | | | 2,056 | |
Thornburg Mortgage Securities Trust | |
2.948% due 10/25/2046 | | | | | 5,251 | | | | | | 4,995 | |
Trinity Square PLC | |
1.486% due 07/15/2051 | | GBP | | | 2,861 | | | | | | 3,778 | |
| | | | | | | | | | | | |
Total Non-Agency Mortgage-Backed Securities (Cost $116,561) | | | 109,953 | |
| | | | | | | | | | | | |
| |
| ASSET-BACKED SECURITIES 14.5% | |
AASET Trust | |
3.967% due 05/16/2042 | | $ | | | 5,000 | | | | | | 5,013 | |
Adams Mill CLO Ltd. | |
0.000% due 07/15/2026 (c) | | | | | 1,400 | | | | | | 1,400 | |
ALESCO Preferred Funding Ltd. | |
1.619% due 12/23/2036 | | | | | 3,759 | | | | | | 2,894 | |
1.906% due 09/23/2038 | | | | | 3,739 | | | | | | 3,234 | |
Allegro CLO Ltd. | |
2.390% due 01/30/2026 | | | | | 5,000 | | | | | | 5,019 | |
Anchorage Capital CLO Ltd. | |
2.312% due 07/28/2026 | | | | | 10,000 | | | | | | 10,012 | |
Apidos CLO | |
2.189% due 01/19/2025 | | | | | 9,450 | | | | | | 9,446 | |
Asset-Backed Funding Certificates Trust | |
1.456% due 09/25/2036 | | | | | 3,913 | | | | | | 3,583 | |
Atrium CDO Corp. | |
2.036% due 07/16/2025 | | | | | 5,500 | | | | | | 5,509 | |
Avery Point CLO Ltd. | |
2.278% due 01/18/2025 | | | | | 10,000 | | | | | | 9,995 | |
BSPRT Issuer Ltd. | |
2.426% due 06/15/2027 | | | | | 4,000 | | | | | | 4,006 | |
| | | | | | | | |
| 52 | | PIMCO ETF TRUST | | | | | See Accompanying Notes | |
June 30, 2017
| | | | | | | | | | | | |
| | | | | PRINCIPAL
AMOUNT
(000S) | | | | | MARKET
VALUE
(000S) | |
CIT Mortgage Loan Trust | |
2.566% due 10/25/2037 | | $ | | | 4,799 | | | $ | | | 4,775 | |
Denali Capital CLO Ltd. | |
0.000% due 04/20/2027 (c) | | | | | 800 | | | | | | 800 | |
Dryden Senior Loan Fund | |
2.432% due 11/15/2025 | | | | | 5,300 | | | | | | 5,309 | |
EFS Volunteer LLC | |
2.096% due 07/26/2027 | | | | | 248 | | | | | | 249 | |
Figueroa CLO Ltd. | |
2.524% due 06/20/2027 | | | | | 9,500 | | | | | | 9,516 | |
First Franklin Mortgage Loan Asset-Backed Certificates | |
2.041% due 05/25/2034 | | | | | 4,297 | | | | | | 4,180 | |
GoldenTree Loan Opportunities Ltd. | |
2.540% due 10/29/2026 | | | | | 7,700 | | | | | | 7,758 | |
Halcyon Loan Advisors Funding Ltd. | |
1.000% due 10/22/2025 (c) | | | | | 7,000 | | | | | | 7,000 | |
Jamestown CLO Ltd. | |
2.298% due 01/15/2026 | | | | | 10,000 | | | | | | 9,999 | |
JPMorgan Mortgage Acquisition Corp. | |
1.606% due 05/25/2035 | | | | | 6,000 | | | | | | 5,317 | |
Long Beach Mortgage Loan Trust | |
2.116% due 06/25/2035 | | | | | 7,263 | | | | | | 7,060 | |
Mid-State Capital Corp. Trust | |
6.005% due 08/15/2037 | | | | | 41 | | | | | | 45 | |
Mid-State Trust | |
6.340% due 10/15/2036 | | | | | 6,080 | | | | | | 6,501 | |
Octagon Investment Partners Ltd. | |
2.105% due 10/25/2025 | | | | | 5,800 | | | | | | 5,797 | |
Palmer Square CLO Ltd. | |
2.152% due 05/15/2025 | | | | | 10,000 | | | | | | 10,024 | |
Securitized Asset-Backed Receivables LLC Trust | |
1.506% due 12/25/2035 | | | | | 5,729 | | | | | | 5,521 | |
SLM Student Loan Trust | |
0.219% due 12/15/2033 | | EUR | | | 33,002 | | | | | | 36,920 | |
1.906% due 04/25/2023 | | $ | | | 5,002 | | | | | | 4,983 | |
2.056% due 07/25/2023 | | | | | 6,800 | | | | | | 6,823 | |
| | | | | | | | | | | | |
| | | | | PRINCIPAL
AMOUNT
(000S) | | | | | MARKET
VALUE
(000S) | |
2.656% due 04/25/2023 | | $ | | | 8,301 | | | $ | | | 8,497 | |
2.856% due 07/25/2023 | | | | | 6,698 | | | | | | 6,886 | |
Sofi Consumer Loan Program LLC | |
2.770% due 05/25/2026 | | | | | 9,702 | | | | | | 9,756 | |
SoFi Professional Loan Program LLC | |
2.500% due 05/26/2026 (c) | | | | | 4,600 | | | | | | 4,603 | |
2.630% due 07/25/2040 | | | | | 10,000 | | | | | | 9,994 | |
SpringCastle America Funding LLC | |
3.050% due 04/25/2029 | | | | | 5,098 | | | | | | 5,134 | |
Telos CLO Ltd. | |
2.808% due 04/17/2025 | | | | | 3,850 | | | | | | 3,862 | |
THL Credit Wind River CLO Ltd. | |
2.218% due 01/22/2027 | | | | | 7,000 | | | | | | 6,996 | |
Venture CLO Ltd. | | | | | | | | | | | | |
0.000% due 07/15/2026 (c) | | | | | 8,000 | | | | | | 8,000 | |
VOLT LLC | |
3.125% due 06/25/2047 | | | | | 5,000 | | | | | | 5,000 | |
3.250% due 05/25/2047 | | | | | 7,389 | | | | | | 7,417 | |
3.250% due 04/25/2059 | | | | | 10,000 | | | | | | 10,016 | |
3.375% due 05/28/2047 | | | | | 6,527 | | | | | | 6,541 | |
3.875% due 04/25/2055 | | | | | 267 | | | | | | 268 | |
WhiteHorse Ltd. | |
1.000% due 07/17/2026 (c) | | | | | 3,800 | | | | | | 3,800 | |
| | | | | | | | | | | | |
Total Asset-Backed Securities
(Cost $288,882) | | | 295,458 | |
| | | | | | | | | | | | |
| |
| SOVEREIGN ISSUES 2.2% | |
Autonomous Community of Catalonia | |
4.750% due 06/04/2018 | | EUR | | | 900 | | | | | | 1,067 | |
4.950% due 02/11/2020 | | | | | 12,020 | | | | | | 14,733 | |
Brazil Letras do Tesouro Nacional | |
0.000% due 04/01/2018 (e) | | BRL | | | 51,000 | | | | | | 14,461 | |
Province of Quebec | |
2.625% due 02/13/2023 | | $ | | | 15,000 | | | | | | 15,239 | |
| | | | | | | | | | | | |
Total Sovereign Issues (Cost $46,958) | | | 45,500 | |
| | | | | | | | | | | | |
| | | | | | | | | | | | |
| | | | | PRINCIPAL
AMOUNT
(000S) | | | | | MARKET
VALUE
(000S) | |
| SHORT-TERM INSTRUMENTS 1.3% | |
| |
| REPURCHASE AGREEMENTS (i) 0.1% | |
| | | | | | | | $ | | | 1,404 | |
| | | | | | | | | | | | |
| |
| ARGENTINA TREASURY BILLS 0.2% | |
3.250% due
12/15/2017 (e)(f) | | $ | | | 4,000 | | | | | | 3,952 | |
| | | | | | | | | | | | |
| |
| MEXICO TREASURY BILLS 0.8% | |
7.059% due 03/01/2018 (e)(f) | | MXN | | | 300,000 | | | | | | 15,751 | |
| | | | | | | | | | | | |
| |
| U.S. TREASURY BILLS 0.2% | |
0.957% due
08/31/2017 (d)(e)(j)(n) | | $ | | | 3,804 | | | | | | 3,798 | |
| | | | | | | | | | | | |
| Total Short-Term Instruments (Cost $24,461) | | | 24,905 | |
| | | | | | | | | | | | |
| | | | | | | | | | | | |
| Total Investments in Securities (Cost $2,651,585) | | | | | | | | | 2,657,036 | |
| | | | | | | | | | | | |
| Total Investments 130.3% (Cost $2,651,585) | | | | | | $ | | | 2,657,036 | |
| |
Financial Derivative
Instruments (k)(m) (0.4)% (Cost or Premiums, net $(2,344)) | | | | | | (8,555 | ) |
| |
| Other Assets and Liabilities, net (29.9)% | | | (608,824 | ) |
| | | | | | | | | | | | |
| Net Assets 100.0% | | | | | | $ | | | 2,039,657 | |
| | | | | | | | | | | | |
NOTES TO SCHEDULE OF INVESTMENTS (AMOUNTS IN THOUSANDS*):
| * | A zero balance may reflect actual amounts rounding to less than one thousand. |
| (a) | Interest only security. |
| (b) | Principal only security. |
| (d) | Coupon represents a weighted average yield to maturity. |
| (f) | Coupon represents a yield to maturity. |
| (g) | Principal amount of security is adjusted for inflation. |
| (h) | Perpetual maturity; date shown, if applicable, represents next contractual call date. |
BORROWINGS AND OTHER FINANCING TRANSACTIONS
(i) REPURCHASE AGREEMENTS:
| | | | | | | | | | | | | | | | | | | | | | | | | | | | | | |
| Counterparty | | Lending
Rate | | | Settlement
Date | | | Maturity
Date | | | Principal
Amount | | | Collateralized By | | Collateral
(Received) | | | Repurchase
Agreements,
at Value | | | Repurchase
Agreement
Proceeds
to be
Received(1) | |
| SSB | | | 0.050 | % | | | 06/30/2017 | | | | 07/03/2017 | | | $ | 1,404 | | | U.S. Treasury Notes 2.000% due 08/31/2021(2) | | $ | (1,434 | ) | | $ | 1,404 | | | $ | 1,404 | |
| | | | | | | | | | | | | | | | | | | | | | | | | | | | | | |
Total Repurchase Agreements | | | | | $ | (1,434 | ) | | $ | 1,404 | | | $ | 1,404 | |
| | | | | | | | | | | | | | | | | | | | | | | | | | | | | | |
| | | | | | |
| See Accompanying Notes | | ANNUAL REPORT | | JUNE 30, 2017 | | 53 |
Schedule of Investments PIMCO Active Bond Exchange-Traded Fund (Cont.)
REVERSE REPURCHASE AGREEMENTS:
| | | | | | | | | | | | | | | | | | | | |
| Counterparty | | Borrowing Rate(3) | | | Settlement Date | | | Maturity Date | | | Amount
Borrowed(3) | | | Payable for
Reverse
Repurchase
Agreements | |
BOS | | | 1.000 | % | | | 06/29/2017 | | | | 07/06/2017 | | | $ | (2,642 | ) | | $ | (2,643 | ) |
| | | 1.300 | | | | 06/08/2017 | | | | 07/10/2017 | | | | (21,321 | ) | | | (21,340 | ) |
BSN | | | 1.000 | | | | 06/20/2017 | | | | 07/10/2017 | | | | (43,477 | ) | | | (43,493 | ) |
SGY | | | 1.000 | | | | 06/30/2017 | | | | 07/07/2017 | | | | (3,544 | ) | | | (3,544 | ) |
| | | 1.040 | | | | 06/29/2017 | | | | 07/13/2017 | | | | (2,225 | ) | | | (2,225 | ) |
| | | | | | | | | | | | | | | | | | | | |
Total Reverse Repurchase Agreements | | | | | | | | | | | $ | (73,245 | ) |
| | | | | | | | | | | | | | | | | | | | |
SALE-BUYBACK TRANSACTIONS:
| | | | | | | | | | | | | | | | | | | | |
| Counterparty | | Borrowing Rate(3) | | | Borrowing Date | | | Maturity Date | | | Amount
Borrowed(3) | | | Payable for
Sale-Buyback
Transactions(4) | |
GSC | | | 1.050 | % | | | 06/13/2017 | | | | 07/13/2017 | | | $ | (72,944 | ) | | $ | (72,987 | ) |
| | | 1.100 | | | | 06/22/2017 | | | | 07/06/2017 | | | | (5,005 | ) | | | (5,007 | ) |
| | | 1.200 | | | | 06/07/2017 | | | | 07/07/2017 | | | | (62,625 | ) | | | (62,679 | ) |
TDM | | | 1.200 | | | | 06/06/2017 | | | | 07/06/2017 | | | | (9,668 | ) | | | (9,677 | ) |
UBS | | | 1.200 | | | | 06/07/2017 | | | | 08/07/2017 | | | | (285,153 | ) | | | (285,400 | ) |
| | | 1.220 | | | | 06/08/2017 | | | | 08/08/2017 | | | | (48,310 | ) | | | (48,351 | ) |
| | | | | | | | | | | | | | | | | | | | |
Total Sale-Buyback Transactions | | | | | | | | | | | $ | (484,101 | ) |
| | | | | | | | | | | | | | | | | | | | |
SHORT SALES:
| | | | | | | | | | | | | | | | | | | | |
| Description | | Coupon | | | Maturity
Date | | | Principal
Amount | | | Proceeds | | | Payable for
Short Sales | |
U.S. Government Agencies (6.0)% | |
Fannie Mae, TBA | | | 3.500 | % | | | 07/01/2047 | | | $ | 110,000 | | | $ | (61,878 | ) | | $ | (61,611 | ) |
Fannie Mae, TBA | | | 3.500 | | | | 08/01/2047 | | | | 14,000 | | | | (14,372 | ) | | | (14,351 | ) |
Fannie Mae, TBA | | | 4.000 | | | | 08/01/2047 | | | | 44,000 | | | | (46,274 | ) | | | (46,168 | ) |
| | | | | | | | | | | | | | | | | | | | |
Total Short Sales (6.0)% | | | | | | | $ | (122,524 | ) | | $ | (122,130 | ) |
| | | | | | | | | | | | | | | | | | | | |
BORROWINGS AND OTHER FINANCING TRANSACTIONS SUMMARY
The following is a summary by counterparty of the market value of Borrowings and Other Financing Transactions and collateral pledged/(received) as of June 30, 2017:
| | | | | | | | | | | | | | | | | | | | | | | | | | | | |
| Counterparty | | Repurchase
Agreement
Proceeds
to be
Received | | | Payable for
Reverse
Repurchase
Agreements | | | Payable for
Sale-Buyback
Transactions | | | Securities
Out on Loan | | | Total
Borrowings and
Other Financing
Transactions | | | Collateral
Pledged/(Received) | | | Net Exposure(5) | |
Global/Master Repurchase Agreement | | | | | | | | | | | | | | | | | | | | | | | | | | | | |
BOS | | $ | 0 | | | $ | (23,983 | ) | | $ | 0 | | | $ | 0 | | | $ | (23,983 | ) | | $ | 23,822 | | | $ | (161 | ) |
BSN | | | 0 | | | | (43,493 | ) | | | 0 | | | | 0 | | | | (43,493 | ) | | | 42,957 | | | | (536 | ) |
SGY | | | 0 | | | | (5,769 | ) | | | 0 | | | | 0 | | | | (5,769 | ) | | | 5,738 | | | | (31 | ) |
SSB | | | 1,404 | | | | 0 | | | | 0 | | | | 0 | | | | 1,404 | | | | (1,434 | ) | | | (30 | ) |
| | | | | | | |
Master Securities Forward Transaction Agreement | | | | | | | | | | | | | | | | | | | | | | | | | | | | |
GSC | | | 0 | | | | 0 | | | | (140,673 | ) | | | 0 | | | | (140,673 | ) | | | 139,527 | | | | (1,146 | ) |
TDM | | | 0 | | | | 0 | | | | (9,677 | ) | | | 0 | | | | (9,677 | ) | | | 9,467 | | | | (210 | ) |
UBS | | | 0 | | | | 0 | | | | (333,751 | ) | | | 0 | | | | (333,751 | ) | | | 332,146 | | | | (1,605 | ) |
| | | | | | | | | | | | | | | | | | | | | | | | | | | | |
Total Borrowings and Other Financing Transactions | | $ | 1,404 | | | $ | (73,245 | ) | | $ | (484,101 | ) | | $ | 0 | | | | | | | | | | | | | |
| | | | | | | | | | | | | | | | | | | | | | | | | | | | |
| | | | | | | | |
| 54 | | PIMCO ETF TRUST | | | | | See Accompanying Notes | |
June 30, 2017
CERTAIN TRANSFERS ACCOUNTED FOR AS SECURED BORROWINGS
Remaining Contractual Maturity of the Agreements
| | | | | | | | | | | | | | | | | | | | |
| | | Overnight and Continuous | | | Up to 30 days | | | 31-90 days | | | Greater Than 90 days | | | Total | |
Reverse Repurchase Agreements | | | | | | | | | | | | | | | | | | | | |
U.S. Treasury Obligations | | $ | 0 | | | $ | (73,245 | ) | | $ | 0 | | | $ | 0 | | | $ | (73,245 | ) |
| | | | | | | | | | | | | | | | | | | | |
Total | | $ | 0 | | | $ | (73,245 | ) | | $ | 0 | | | $ | 0 | | | $ | (73,245 | ) |
| | | | | |
Sale-Buyback Transactions | | | | | | | | | | | | | | | | | | | | |
U.S. Treasury Obligations | | | 0 | | | | (150,350 | ) | | | (333,751 | ) | | | 0 | | | | (484,101 | ) |
| | | | | | | | | | | | | | | | | | | | |
Total | | $ | 0 | | | $ | (150,350 | ) | | $ | (333,751 | ) | | $ | 0 | | | $ | (484,101 | ) |
| | | | | | | | | | | | | | | | | | | | |
Total Borrowings | | $ | 0 | | | $ | (223,595 | ) | | $ | (333,751 | ) | | $ | 0 | | | $ | (557,346 | ) |
| | | | | | | | | | | | | | | | | | | | |
Gross amount of recognized liabilities for reverse repurchase agreements and sale-buyback financing transactions | | | | | | | $ | (557,346 | ) |
| | | | | | | | | | | | | | | | | | | | |
| (j) | Securities with an aggregate market value of $553,850 have been pledged as collateral under the terms of the above master agreements as of June 30, 2017. |
| (1) | Includes accrued interest. |
| (2) | Collateral is held in custody by the counterparty. |
| (3) | The average amount of borrowings outstanding during the period ended June 30, 2017 was $(161,348) at a weighted average interest rate of 0.789%. Average borrowings may include sale-buyback transactions and reverse repurchase agreements, if held during the period. |
| (4) | Payable for sale-buyback transactions includes $(423) of deferred price drop. |
| (5) | Net Exposure represents the net receivable/(payable) that would be due from/to the counterparty in the event of default. Exposure from borrowings and other financing transactions can only be netted across transactions governed under the same master agreement with the same legal entity. See Note 8, Master Arrangements, in the Notes to Financial Statements for more information regarding master netting arrangements. |
(k) FINANCIAL DERIVATIVE INSTRUMENTS: EXCHANGE-TRADED OR CENTRALLY CLEARED
SWAP AGREEMENTS:
CREDIT DEFAULT SWAPS ON CORPORATE ISSUES - SELL PROTECTION(1)
| | | | | | | | | | | | | | | | | | | | | | | | | | | | | | | | | | |
| Reference Entity | | Fixed Receive Rate | | Maturity
Date | | | Implied
Credit Spread at
June 30, 2017(2) | | | Notional
Amount(3) | | | Premiums
Paid/(Received) | | | Unrealized
Appreciation/
(Depreciation) | | | Market
Value(4) | | | Variation Margin | |
| | | | | | | | | Asset | | | Liability | |
Ford Motor Credit Co. LLC | | 5.000% | | | 06/20/2022 | | | | 1.325 | % | | $ | 14,000 | | | $ | 2,370 | | | $ | 54 | | | $ | 2,424 | | | $ | 3 | | | $ | 0 | |
General Motors Co. | | 5.000 | | | 06/20/2022 | | | | 1.420 | | | | 6,000 | | | | 988 | | | | 24 | | | | 1,012 | | | | 2 | | | | 0 | |
Goldman Sachs Group, Inc. | | 1.000 | | | 09/20/2020 | | | | 0.438 | | | | 8,200 | | | | 131 | | | | 17 | | | | 148 | | | | 2 | | | | 0 | |
Goldman Sachs Group, Inc. | | 1.000 | | | 06/20/2022 | | | | 0.658 | | | | 6,500 | | | | 77 | | | | 31 | | | | 108 | | | | 5 | | | | 0 | |
JPMorgan Chase & Co. | | 1.000 | | | 06/20/2022 | | | | 0.469 | | | | 12,000 | | | | 268 | | | | 39 | | | | 307 | | | | 0 | | | | 0 | |
MetLife, Inc. | | 1.000 | | | 06/20/2021 | | | | 0.414 | | | | 3,100 | | | | 51 | | | | 20 | | | | 71 | | | | 1 | | | | 0 | |
MetLife, Inc. | | 1.000 | | | 12/20/2021 | | | | 0.512 | | | | 8,100 | | | | 106 | | | | 67 | | | | 173 | | | | 0 | | | | (2 | ) |
Navient Corp. | | 5.000 | | | 06/20/2022 | | | | 2.914 | | | | 6,000 | | | | 392 | | | | 179 | | | | 571 | | | | 21 | | | | 0 | |
| | | | | | | | | | | | | | | | | | | | | | | | | | | | | | | | | | |
| | | | | | | | | | | | | | | | $ | 4,383 | | | $ | 431 | | | $ | 4,814 | | | $ | 34 | | | $ | (2 | ) |
| | | | | | | | | | | | | | | | | | | | | | | | | | | | | | | | | | |
CREDIT DEFAULT SWAPS ON CREDIT INDICES - SELL PROTECTION(1)
| | | | | | | | | | | | | | | | | | | | | | | | | | | | | | |
| | | Fixed
Receive Rate | | Maturity
Date | | | Notional
Amount(3) | | | Premiums
Paid/(Received) | | | Unrealized
Appreciation/
(Depreciation) | | | Market
Value(4) | | | Variation Margin | |
| Index/Tranches | | | | | | | | Asset | | | Liability | |
CDX.HY-28 5-Year Index | | 5.000% | | | 06/20/2022 | | | $ | 50,000 | | | $ | 3,681 | | | $ | (148 | ) | | $ | 3,533 | | | $ | 115 | | | $ | 0 | |
| | | | | | | | | | | | | | | | | | | | | | | | | | | | | | |
Total Swap Agreements | | | $ | 8,064 | | | $ | 283 | | | $ | 8,347 | | | $ | 149 | | | $ | (2 | ) |
| | | | | | | | | | | | | | | | | | | | | | | | | | | | | | |
FINANCIAL DERIVATIVE INSTRUMENTS: EXCHANGE-TRADED OR CENTRALLY CLEARED SUMMARY
The following is a summary of the market value and variation margin of Exchange-Traded or Centrally Cleared Financial Derivative Instruments as of June 30, 2017:
| | | | | | | | | | | | | | | | | | | | | | | | | | | | | | | | | | | | |
| | | Financial Derivative Assets | | | | | | Financial Derivative Liabilities | |
| | | Market Value | | | Variation Margin
Asset | | | Total | | | | | | Market Value | | | Variation Margin
Liability | | | Total | |
| | | Purchased
Options | | | Futures | | | Swap
Agreements | | | | | | | Written
Options | | | Futures | | | Swap
Agreements | | |
Total Exchange-Traded or Centrally Cleared | | $ | 0 | | | $ | 0 | | | $ | 149 | | | $ | 149 | | | | | | | $ | 0 | | | $ | 0 | | | $ | (2) | | | $ | (2) | |
| | | | | | | | | | | | | | | | | | | | | | | | | | | | | | | | | | | | |
| (l) | Securities with an aggregate market value of $17,885 and cash of $213 have been pledged as collateral for exchange-traded and centrally cleared financial derivative instruments as of June 30, 2017. See Note 8, Master Arrangements, in the Notes to Financial Statements for more information regarding master netting arrangements. |
| | | | | | |
| See Accompanying Notes | | ANNUAL REPORT | | JUNE 30, 2017 | | 55 |
Schedule of Investments PIMCO Active Bond Exchange-Traded Fund (Cont.)
| (1) | If the Fund is a seller of protection and a credit event occurs, as defined under the terms of that particular swap agreement, the Fund will either (i) pay to the buyer of protection an amount equal to the notional amount of the swap and take delivery of the referenced obligation or underlying securities comprising the referenced index or (ii) pay a net settlement amount in the form of cash, securities or other deliverable obligations equal to the notional amount of the swap less the recovery value of the referenced obligation or underlying securities comprising the referenced index. |
| (2) | Implied credit spreads, represented in absolute terms, utilized in determining the market value of credit default swap agreements on corporate or sovereign issues as of period end serve as indicators of the current status of the payment/performance risk and represent the likelihood or risk of default for the credit derivative. The implied credit spread of a particular referenced entity reflects the cost of buying/selling protection and may include upfront payments required to be made to enter into the agreement. Wider credit spreads represent a deterioration of the referenced entity’s credit soundness and a greater likelihood or risk of default or other credit event occurring as defined under the terms of the agreement. |
| (3) | The maximum potential amount the Fund could be required to pay as a seller of credit protection or receive as a buyer of credit protection if a credit event occurs as defined under the terms of that particular swap agreement. |
| (4) | The prices and resulting values for credit default swap agreements on credit indices serve as indicators of the current status of the payment/performance risk and represent the likelihood of an expected liability (or profit) for the credit derivative should the notional amount of the swap agreement be closed/sold as of the period end. Increasing market values, in absolute terms when compared to the notional amount of the swap, represent a deterioration of the referenced indices’ credit soundness and a greater likelihood or risk of default or other credit event occurring as defined under the terms of the agreement. |
(m) FINANCIAL DERIVATIVE INSTRUMENTS: OVER THE COUNTER
FORWARD FOREIGN CURRENCY CONTRACTS:
| | | | | | | | | | | | | | | | | | | | | | | | |
| Counterparty | | Settlement
Month | | | Currency to
be Delivered | | | Currency to
be Received | | | Unrealized Appreciation/
(Depreciation) | |
| | | | | Asset | | | Liability | |
AZD | | | 07/2017 | | | $ | | | 218 | | | CAD | | | 293 | | | $ | 8 | | | $ | 0 | |
BOA | | | 07/2017 | | | DKK | | | 785 | | | $ | | | 113 | | | | 0 | | | | (7 | ) |
| | | 07/2017 | | | EUR | | | 94,825 | | | | | | 106,583 | | | | 0 | | | | (1,721 | ) |
| | | 07/2017 | | | $ | | | 768 | | | DKK | | | 5,238 | | | | 37 | | | | 0 | |
| | | 07/2018 | | | DKK | | | 30,000 | | | $ | | | 4,444 | | | | 0 | | | | (264 | ) |
BPS | | | 07/2017 | | | GBP | | | 84,362 | | | | | | 108,591 | | | | 0 | | | | (1,286 | ) |
| | | 07/2017 | | | $ | | | 1,081 | | | JPY | | | 118,200 | | | | 0 | | | | (30 | ) |
| | | 10/2017 | | | BRL | | | 132,300 | | | $ | | | 36,339 | | | | 0 | | | | (2,885 | ) |
| | | 10/2017 | | | $ | | | 46,823 | | | BRL | | | 152,300 | | | | 0 | | | | (1,669 | ) |
| | | 01/2018 | | | | | | 73,565 | | | | | | 242,800 | | | | 0 | | | | (2,611 | ) |
BRC | | | 10/2017 | | | | | | 14,419 | | | DKK | | | 97,970 | | | | 704 | | | | 0 | |
| | | 01/2018 | | | | | | 9,532 | | | | | | 64,400 | | | | 463 | | | | 0 | |
DUB | | | 01/2018 | | | BRL | | | 200 | | | $ | | | 53 | | | | 0 | | | | (6 | ) |
FBF | | | 07/2017 | | | CNH | | | 612 | | | | | | 89 | | | | 0 | | | | (2 | ) |
| | | 07/2017 | | | $ | | | 59,287 | | | EUR | | | 52,304 | | | | 452 | | | | 0 | |
| | | 07/2017 | | | | | | 108 | | | INR | | | 7,113 | | | | 2 | | | | 0 | |
| | | 08/2017 | | | EUR | | | 52,304 | | | $ | | | 59,374 | | | | 0 | | | | (450 | ) |
GLM | | | 07/2017 | | | CAD | | | 293 | | | | | | 217 | | | | 0 | | | | (9 | ) |
| | | 07/2017 | | | JPY | | | 118,200 | | | | | | 1,068 | | | | 17 | | | | 0 | |
| | | 07/2017 | | | $ | | | 27,891 | | | EUR | | | 24,920 | | | | 571 | | | | 0 | |
| | | 07/2017 | | | | | | 2,864 | | | GBP | | | 2,263 | | | | 83 | | | | 0 | |
| | | 01/2018 | | | DKK | | | 33,615 | | | $ | | | 4,925 | | | | 0 | | | | (293 | ) |
| | | 04/2018 | | | | | | 189,925 | | | | | | 27,733 | | | | 0 | | | | (1,906 | ) |
HUS | | | 10/2017 | | | | | | 97,970 | | | | | | 15,003 | | | | 0 | | | | (121 | ) |
| | | 01/2018 | | | BRL | | | 68,000 | | | | | | 20,016 | | | | 144 | | | | 0 | |
| | | 04/2018 | | | | | | 69,200 | | | | | | 20,507 | | | | 564 | | | | 0 | |
| | | 04/2018 | | | $ | | | 28,269 | | | DKK | | | 189,925 | | | | 1,370 | | | | 0 | |
| | | 07/2018 | | | | | | 4,491 | | | | | | 30,000 | | | | 216 | | | | 0 | |
IND | | | 07/2017 | | | | | | 90 | | | CNH | | | 612 | | | | 0 | | | | 0 | |
JPM | | | 07/2017 | | | INR | | | 7,113 | | | $ | | | 110 | | | | 0 | | | | 0 | |
| | | 07/2017 | | | NZD | | | 669 | | | | | | 473 | | | | 0 | | | | (17 | ) |
| | | 07/2017 | | | $ | | | 481 | | | NZD | | | 669 | | | | 10 | | | | 0 | |
| | | 10/2017 | | | BRL | | | 20,000 | | | $ | | | 5,656 | | | | 0 | | | | (273 | ) |
| | | 10/2017 | | | IDR | | | 31,162,616 | | | | | | 2,308 | | | | 0 | | | | (5 | ) |
| | | 10/2017 | | | $ | | | 300 | | | IDR | | | 4,069,376 | | | | 2 | | | | 0 | |
| | | 01/2018 | | | BRL | | | 174,600 | | | $ | | | 52,217 | | | | 1,429 | | | | (235 | ) |
| | | 04/2018 | | | $ | | | 20,650 | | | BRL | | | 69,200 | | | | 0 | | | | (706 | ) |
MSB | | | 01/2018 | | | DKK | | | 30,785 | | | $ | | | 4,562 | | | | 0 | | | | (216 | ) |
SCX | | | 07/2017 | | | $ | | | 32,513 | | | GBP | | | 25,246 | | | | 369 | | | | 0 | |
| | | 10/2017 | | | | | | 2,002 | | | IDR | | | 27,093,240 | | | | 8 | | | | 0 | |
SOG | | | 07/2017 | | | DKK | | | 4,453 | | | $ | | | 676 | | | | 0 | | | | (8 | ) |
UAG | | | 07/2017 | | | $ | | | 19,798 | | | EUR | | | 17,601 | | | | 305 | | | | 0 | |
| | | 07/2017 | | | | | | 72,863 | | | GBP | | | 56,853 | | | | 1,185 | | | | 0 | |
| | | 08/2017 | | | GBP | | | 56,853 | | | $ | | | 72,928 | | | | 0 | | | | (1,186 | ) |
| | | | | | | | | | | | | | | | | | | | | | | | |
Total Forward Foreign Currency Contracts | | | | | | | | | | | | $ | 7,939 | | | $ | (15,906 | ) |
| | | | | | | | | | | | | | | | | | | | | | | | |
| | | | | | | | |
| 56 | | PIMCO ETF TRUST | | | | | See Accompanying Notes | |
June 30, 2017
WRITTEN OPTIONS:
TRANSACTIONS IN WRITTEN CALL AND PUT OPTIONS FOR THE PERIOD ENDED JUNE 30, 2017:
| | | | | | | | | | | | | | | | | | | | | | | | | | | | | | | | | | | | | | | | | | |
| | | Balance at
Beginning of Period | | | Sales | | | Closing Buys | | | Expirations | | | Exercised | | | Balance at
End of Period | |
# of Contracts | | | | | 420 | | | | | | 5,702 | | | | | | (1,067 | ) | | | | | | | (3,546 | ) | | | | | | | (1,509 | ) | | | | | | | 0 | |
Notional Amount in $ | | $ | | | 334,400 | | | $ | | | 916,800 | | | $ | | | (237,700 | ) | | | $ | | | | (790,200 | ) | | | $ | | | | (223,300 | ) | | | $ | | | | 0 | |
Notional Amount in AUD | | AUD | | | 52,000 | | | AUD | | | 127,300 | | | AUD | | | 0 | | | | AUD | | | | (149,500 | ) | | | AUD | | | | (29,800 | ) | | | AUD | | | | 0 | |
Notional Amount in EUR | | EUR | | | 46,500 | | | EUR | | | 10,000 | | | EUR | | | (26,400 | ) | | | EUR | | | | (30,100 | ) | | | EUR | | | | 0 | | | | EUR | | | | 0 | |
Notional Amount in GBP | | GBP | | | 17,200 | | | GBP | | | 44,700 | | | GBP | | | (14,100 | ) | | | GBP | | | | (35,000 | ) | | | GBP | | | | (12,800 | ) | | | GBP | | | | 0 | |
Premiums | | $ | | | (4,725 | ) | | $ | | | (8,044 | ) | | $ | | | 3,764 | | | | $ | | | | 6,720 | | | | $ | | | | 2,285 | | | | $ | | | | 0 | |
As of June 30, 2017, there were no open written options.
SWAP AGREEMENTS:
CREDIT DEFAULT SWAPS ON CORPORATE AND SOVEREIGN ISSUES - SELL PROTECTION(1)
| | | | | | | | | | | | | | | | | | | | | | | | | | | | | | | | |
| Counterparty | | Reference Entity | | Fixed
Receive Rate | | | Maturity
Date | | | Implied
Credit Spread at
June 30, 2017(2) | | | Notional
Amount(3) | | Premiums
Paid/(Received) | | | Unrealized
Appreciation/
(Depreciation) | | | Swap Agreements,
at Value | |
| | | | | | | | | Asset | | | Liability | |
BOA | | Colombia Government International Bond | | | 1.000% | | | | 06/20/2022 | | | | 1.359 | % | | $ 10,000 | | $ | (104 | ) | | $ | (60 | ) | | $ | 0 | | | $ | (164 | ) |
CBK | | Petroleos Mexicanos | | | 1.000 | | | | 06/20/2022 | | | | 2.147 | | | 5,000 | | | (252 | ) | | | (9 | ) | | | 0 | | | | (261 | ) |
GST | | Petrobras Global Finance BV | | | 1.000 | | | | 09/20/2020 | | | | 2.229 | | | 6,300 | | | (1,348 | ) | | | 1,112 | | | | 0 | | | | (236 | ) |
| | Springleaf Finance Corp. | | | 5.000 | | | | 06/20/2022 | | | | 2.972 | | | 500 | | | 43 | | | | 3 | | | | 46 | | | | 0 | |
JPM | | Petrobras Global Finance BV | | | 1.000 | | | | 09/20/2020 | | | | 2.229 | | | 3,200 | | | (683 | ) | | | 563 | | | | 0 | | | | (120 | ) |
| | | | | | | | | | | | | | | | | | | | | | | | | | | | | | | | |
| | | | | | | | | | | | | | | | | | $ | (2,344 | ) | | $ | 1,609 | | | $ | 46 | | | $ | (781 | ) |
| | | | | | | | | | | | | | | | | | | | | | | | | | | | | | | | |
Total Swap Agreements | | | | | | | | | | | | | $ | (2,344 | ) | | $ | 1,609 | | | $ | 46 | | | $ | (781 | ) |
| | | | | | | | | | | | | | | | | | | | | | | | | | | | | | | | |
FINANCIAL DERIVATIVE INSTRUMENTS: OVER THE COUNTER SUMMARY
The following is a summary by counterparty of the market value of OTC financial derivative instruments and collateral pledged/(received) as of June 30, 2017:
| | | | | | | | | | | | | | | | | | | | | | | | | | | | | | | | | | | | | | | | | | | | | | | | |
| | | Financial Derivative Assets | | | | | | Financial Derivative Liabilities | | | | | | | | | | |
| Counterparty | | Forward
Foreign
Currency
Contracts | | | Purchased
Options | | | Swap
Agreements | | | Total
Over the
Counter | | | | | | Forward
Foreign
Currency
Contracts | | | Written
Options | | | Swap
Agreements | | | Total
Over the
Counter | | | Net Market
Value of OTC
Derivatives | | | Collateral
Pledged/
(Received) | | | Net
Exposure(4) | |
AZD | | $ | 8 | | | $ | 0 | | | $ | 0 | | | $ | 8 | | | | | | | $ | 0 | | | $ | 0 | | | $ | 0 | | | $ | 0 | | | $ | 8 | | | $ | 0 | | | $ | 8 | |
BOA | | | 37 | | | | 0 | | | | 0 | | | | 37 | | | | | | | | (1,992 | ) | | | 0 | | | | (164 | ) | | | (2,156 | ) | | | (2,119 | ) | | | 2,302 | | | | 183 | |
BPS | | | 0 | | | | 0 | | | | 0 | | | | 0 | | | | | | | | (8,481 | ) | | | 0 | | | | 0 | | | | (8,481 | ) | | | (8,481 | ) | | | 8,190 | | | | (291 | ) |
BRC | | | 1,167 | | | | 0 | | | | 0 | | | | 1,167 | | | | | | | | 0 | | | | 0 | | | | 0 | | | | 0 | | | | 1,167 | | | | (1,050 | ) | | | 117 | |
CBK | | | 0 | | | | 0 | | | | 0 | | | | 0 | | | | | | | | 0 | | | | 0 | | | | (261 | ) | | | (261 | ) | | | (261 | ) | | | 265 | | | | 4 | |
DUB | | | 0 | | | | 0 | | | | 0 | | | | 0 | | | | | | | | (6 | ) | | | 0 | | | | 0 | | | | (6 | ) | | | (6 | ) | | | 251 | | | | 245 | |
FBF | | | 454 | | | | 0 | | | | 0 | | | | 454 | | | | | | | | (452 | ) | | | 0 | | | | 0 | | | | (452 | ) | | | 2 | | | | 0 | | | | 2 | |
GLM | | | 671 | | | | 0 | | | | 0 | | | | 671 | | | | | | | | (2,208 | ) | | | 0 | | | | 0 | | | | (2,208 | ) | | | (1,537 | ) | | | 1,609 | | | | 72 | |
GST | | | 0 | | | | 0 | | | | 46 | | | | 46 | | | | | | | | 0 | | | | 0 | | | | (236 | ) | | | (236 | ) | | | (190 | ) | | | 332 | | | | 142 | |
HUS | | | 2,294 | | | | 0 | | | | 0 | | | | 2,294 | | | | | | | | (121 | ) | | | 0 | | | | 0 | | | | (121 | ) | | | 2,173 | | | | (1,860 | ) | | | 313 | |
JPM | | | 1,441 | | | | 0 | | | | 0 | | | | 1,441 | | | | | | | | (1,236 | ) | | | 0 | | | | (120 | ) | | | (1,356 | ) | | | 85 | | | | 0 | | | | 85 | |
MSB | | | 0 | | | | 0 | | | | 0 | | | | 0 | | | | | | | | (216 | ) | | | 0 | | | | 0 | | | | (216 | ) | | | (216 | ) | | | 0 | | | | (216 | ) |
SCX | | | 377 | | | | 0 | | | | 0 | | | | 377 | | | | | | | | 0 | | | | 0 | | | | 0 | | | | 0 | | | | 377 | | | | (280 | ) | | | 97 | |
SOG | | | 0 | | | | 0 | | | | 0 | | | | 0 | | | | | | | | (8 | ) | | | 0 | | | | 0 | | | | (8 | ) | | | (8 | ) | | | 0 | | | | (8 | ) |
UAG | | | 1,490 | | | | 0 | | | | 0 | | | | 1,490 | | | | | | | | (1,186 | ) | | | 0 | | | | 0 | | | | (1,186 | ) | | | 304 | | | | (350 | ) | | | (46 | ) |
| | | | | | | | | | | | | | | | | | | | | | | | | | | | | | | | | | | | | | | | | | | | | | | | |
Total Over the Counter | | $ | 7,939 | | | $ | 0 | | | $ | 46 | | | $ | 7,985 | | | | | | | $ | (15,906 | ) | | $ | 0 | | | $ | (781 | ) | | $ | (16,687 | ) | | | | | | | | | | | | |
| | | | | | | | | | | | | | | | | | | | | | | | | | | | | | | | | | | | | | | | | | | | | | | | |
| (n) | Securities with an aggregate market value of $12,948 have been pledged as collateral for financial derivative instruments as governed by International Swaps and Derivatives Association, Inc. master agreements as of June 30, 2017. |
| (1) | If the Fund is a seller of protection and a credit event occurs, as defined under the terms of that particular swap agreement, the Fund will either (i) pay to the buyer of protection an amount equal to the notional amount of the swap and take delivery of the referenced obligation or underlying securities comprising the referenced index or (ii) pay a net settlement amount in the form of cash, securities or other deliverable obligations equal to the notional amount of the swap less the recovery value of the referenced obligation or underlying securities comprising the referenced index. |
| (2) | Implied credit spreads, represented in absolute terms, utilized in determining the market value of credit default swap agreements on corporate or sovereign issues as of period end serve as indicators of the current status of the payment/performance risk and represent the likelihood or risk of default for the credit derivative. The implied credit spread of a particular referenced entity reflects the cost of buying/selling protection and may include upfront payments required to be made to enter into the agreement. Wider credit spreads represent a deterioration of the referenced entity’s credit soundness and a greater likelihood or risk of default or other credit event occurring as defined under the terms of the agreement. |
| (3) | The maximum potential amount the Fund could be required to pay as a seller of credit protection or receive as a buyer of credit protection if a credit event occurs as defined under the terms of that particular swap agreement. |
| | | | | | |
| See Accompanying Notes | | ANNUAL REPORT | | JUNE 30, 2017 | | 57 |
Schedule of Investments PIMCO Active Bond Exchange-Traded Fund (Cont.)
| (4) | Net Exposure represents the net receivable/(payable) that would be due from/to the counterparty in the event of default. Exposure from OTC financial derivative instruments can only be netted across transactions governed under the same master agreement with the same legal entity. See Note 8, Master Arrangements, in the Notes to Financial Statements for more information regarding master netting arrangements. |
FAIR VALUE OF FINANCIAL DERIVATIVE INSTRUMENTS
The following is a summary of the fair valuation of the Fund’s derivative instruments categorized by risk exposure. See Note 7, Principal Risks, in the Notes to Financial Statements on risks of the Fund.
Fair Values of Financial Derivative Instruments on the Statements of Assets and Liabilities as of June 30, 2017:
| | | | | | | | | | | | | | | | | | | | | | | | |
| | | Derivatives not accounted for as hedging instruments | |
| | | Commodity
Contracts | | | Credit
Contracts | | | Equity
Contracts | | | Foreign
Exchange
Contracts | | | Interest
Rate Contracts | | | Total | |
Financial Derivative Instruments - Assets | | | | | | | | | | | | | | | | | | | | | | | | |
Exchange-traded or centrally cleared | | | | | | | | | | | | | | | | | | | | | | | | |
Swap Agreements | | $ | 0 | | | $ | 149 | | | $ | 0 | | | $ | 0 | | | $ | 0 | | | $ | 149 | |
| | | | | | | | | | | | | | | | | | | | | | | | |
Over the counter | | | | | | | | | | | | | | | | | | | | | | | | |
Forward Foreign Currency Contracts | | $ | 0 | | | $ | 0 | | | $ | 0 | | | $ | 7,939 | | | $ | 0 | | | $ | 7,939 | |
Swap Agreements | | | 0 | | | | 46 | | | | 0 | | | | 0 | | | | 0 | | | | 46 | |
| | | | | | | | | | | | | | | | | | | | | | | | |
| | $ | 0 | | | $ | 46 | | | $ | 0 | | | $ | 7,939 | | | $ | 0 | | | $ | 7,985 | |
| | | | | | | | | | | | | | | | | | | | | | | | |
| | $ | 0 | | | $ | 195 | | | $ | 0 | | | $ | 7,939 | | | $ | 0 | | | $ | 8,134 | |
| | | | | | | | | | | | | | | | | | | | | | | | |
| | | | | | |
Financial Derivative Instruments - Liabilities | | | | | | | | | | | | | | | | | | | | | | | | |
Exchange-traded or centrally cleared | | | | | | | | | | | | | | | | | | | | | | | | |
Swap Agreements | | $ | 0 | | | $ | 2 | | | $ | 0 | | | $ | 0 | | | $ | 0 | | | $ | 2 | |
| | | | | | | | | | | | | | | | | | | | | | | | |
Over the counter | | | | | | | | | | | | | | | | | | | | | | | | |
Forward Foreign Currency Contracts | | $ | 0 | | | $ | 0 | | | $ | 0 | | | $ | 15,906 | | | $ | 0 | | | $ | 15,906 | |
Swap Agreements | | | 0 | | | | 781 | | | | 0 | | | | 0 | | | | 0 | | | | 781 | |
| | | | | | | | | | | | | | | | | | | | | | | | |
| | $ | 0 | | | $ | 781 | | | $ | 0 | | | $ | 15,906 | | | $ | 0 | | | $ | 16,687 | |
| | | | | | | | | | | | | | | | | | | | | | | | |
| | $ | 0 | | | $ | 783 | | | $ | 0 | | | $ | 15,906 | | | $ | 0 | | | $ | 16,689 | |
| | | | | | | | | | | | | | | | | | | | | | | | |
The effect of Financial Derivative Instruments on the Statements of Operations for the period ended June 30, 2017:
| | | | | | | | | | | | | | | | | | | | | | | | |
| | | Derivatives not accounted for as hedging instruments | |
| | | Commodity
Contracts | | | Credit
Contracts | | | Equity
Contracts | | | Foreign
Exchange
Contracts | | | Interest
Rate Contracts | | | Total | |
Net Realized Gain (Loss) on Financial Derivative Instruments | | | | | | | | | | | | | | | | | | | | | |
Exchange-traded or centrally cleared | | | | | | | | | | | | | | | | | | | | | | | | |
Purchased Options | | $ | 0 | | | $ | 0 | | | $ | 0 | | | $ | 0 | | | $ | (281 | ) | | $ | (281 | ) |
Written Options | | | 0 | | | | 0 | | | | 0 | | | | 0 | | | | 1,014 | | | | 1,014 | |
Futures | | | 0 | | | | 0 | | | | 0 | | | | 0 | | | | (20,349 | ) | | | (20,349 | ) |
Swap Agreements | | | 0 | | | | 1,817 | | | | 0 | | | | 0 | | | | 2,810 | | | | 4,627 | |
| | | | | | | | | | | | | | | | | | | | | | | | |
| | $ | 0 | | | $ | 1,817 | | | $ | 0 | | | $ | 0 | | | $ | (16,806 | ) | | $ | (14,989 | ) |
| | | | | | | | | | | | | | | | | | | | | | | | |
Over the counter | | | | | | | | | | | | | | | | | | | | | | | | |
Forward Foreign Currency Contracts | | $ | 0 | | | $ | 0 | | | $ | 0 | | | $ | (5,891 | ) | | $ | 0 | | | $ | (5,891 | ) |
Purchased Options | | | 0 | | | | 0 | | | | 0 | | | | 0 | | | | (2,590 | ) | | | (2,590 | ) |
Written Options | | | 0 | | | | 36 | | | | 0 | | | | 5,037 | | | | 3,656 | | | | 8,729 | |
Swap Agreements | | | 0 | | | | 7,549 | | | | 0 | | | | 90 | | | | 165 | | | | 7,804 | |
| | | | | | | | | | | | | | | | | | | | | | | | |
| | $ | 0 | | | $ | 7,585 | | | $ | 0 | | | $ | (764 | ) | | $ | 1,231 | | | $ | 8,052 | |
| | | | | | | | | | | | | | | | | | | | | | | | |
| | $ | 0 | | | $ | 9,402 | | | $ | 0 | | | $ | (764 | ) | | $ | (15,575 | ) | | $ | (6,937 | ) |
| | | | | | | | | | | | | | | | | | | | | | | | |
| | | |
Net Change in Unrealized Appreciation (Depreciation) on Financial Derivative Instruments | | | | | | | | | | | | | |
Exchange-traded or centrally cleared | | | | | | | | | | | | | | | | | | | | | | | | |
Purchased Options | | $ | 0 | | | $ | 0 | | | $ | 0 | | | $ | 0 | | | $ | 13 | | | $ | 13 | |
Written Options | | | 0 | | | | 0 | | | | 0 | | | | 0 | | | | (21 | ) | | | (21 | ) |
Futures | | | 0 | | | | 0 | | | | 0 | | | | 0 | | | | (3,223 | ) | | | (3,223 | ) |
Swap Agreements | | | 0 | | | | 283 | | | | 0 | | | | 0 | | | | 57,870 | | | | 58,153 | |
| | | | | | | | | | | | | | | | | | | | | | | | |
| | $ | 0 | | | $ | 283 | | | $ | 0 | | | $ | 0 | | | $ | 54,639 | | | $ | 54,922 | |
| | | | | | | | | | | | | | | | | | | | | | | | |
Over the counter | | | | | | | | | | | | | | | | | | | | | | | | |
Forward Foreign Currency Contracts | | $ | 0 | | | $ | 0 | | | $ | 0 | | | $ | 15,852 | | | $ | 0 | | | $ | 15,852 | |
Purchased Options | | | 0 | | | | 0 | | | | 0 | | | | 0 | | | | 1,844 | | | | 1,844 | |
Written Options | | | 0 | | | | (28 | ) | | | 0 | | | | (712 | ) | | | (1,593 | ) | | | (2,333 | ) |
Swap Agreements | | | 0 | | | | (1,873 | ) | | | 0 | | | | (82 | ) | | | 109 | | | | (1,846 | ) |
| | | | | | | | | | | | | | | | | | | | | | | | |
| | $ | 0 | | | $ | (1,901 | ) | | $ | 0 | | | $ | 15,058 | | | $ | 360 | | | $ | 13,517 | |
| | | | | | | | | | | | | | | | | | | | | | | | |
| | $ | 0 | | | $ | (1,618 | ) | | $ | 0 | | | $ | 15,058 | | | $ | 54,999 | | | $ | 68,439 | |
| | | | | | | | | | | | | | | | | | | | | | | | |
| | | | | | | | |
| 58 | | PIMCO ETF TRUST | | | | | See Accompanying Notes | |
June 30, 2017
FAIR VALUE MEASUREMENTS
The following is a summary of the fair valuations according to the inputs used as of June 30, 2017 in valuing the Fund’s assets and liabilities:
| | | | | | | | | | | | | | | | |
| Category and Subcategory | | Level 1 | | | Level 2 | | | Level 3 | | | Fair
Value at
06/30/2017 | |
Investments in Securities, at Value | | | | | |
Corporate Bonds & Notes | | | | | | | | | | | | | | | | |
Banking & Finance | | $ | 0 | | | $ | 455,179 | | | $ | 5,999 | | | $ | 461,178 | |
Industrials | | | 0 | | | | 118,839 | | | | 0 | | | | 118,839 | |
Utilities | | | 0 | | | | 41,034 | | | | 0 | | | | 41,034 | |
Municipal Bonds & Notes | | | | | | | | | | | | | | | | |
California | | | 0 | | | | 10,740 | | | | 0 | | | | 10,740 | |
Florida | | | 0 | | | | 10,384 | | | | 0 | | | | 10,384 | |
Illinois | | | 0 | | | | 13,302 | | | | 0 | | | | 13,302 | |
South Dakota | | | 0 | | | | 8,175 | | | | 0 | | | | 8,175 | |
Texas | | | 0 | | | | 3,181 | | | | 0 | | | | 3,181 | |
U.S. Government Agencies | | | 0 | | | | 941,944 | | | | 0 | | | | 941,944 | |
U.S. Treasury Obligations | | | 0 | | | | 572,443 | | | | 0 | | | | 572,443 | |
Non-Agency Mortgage-Backed Securities | | | 0 | | | | 109,953 | | | | 0 | | | | 109,953 | |
Asset-Backed Securities | | | 7,000 | | | | 283,458 | | | | 5,000 | | | | 295,458 | |
Sovereign Issues | | | 0 | | | | 45,500 | | | | 0 | | | | 45,500 | |
Short-Term Instruments | | | | | | | | | | | | | | | | |
Repurchase Agreements | | | 0 | | | | 1,404 | | | | 0 | | | | 1,404 | |
Argentina Treasury Bills | | | 0 | | | | 3,952 | | | | 0 | | | | 3,952 | |
Mexico Treasury Bills | | | 0 | | | | 15,751 | | | | 0 | | | | 15,751 | |
U.S. Treasury Bills | | | 0 | | | | 3,798 | | | | 0 | | | | 3,798 | |
| | | | | | | | | | | | | | | | |
| | | | |
Total Investments | | $ | 7,000 | | | $ | 2,639,037 | | | $ | 10,999 | | | $ | 2,657,036 | |
| | | | | | | | | | | | | | | | |
| | | | | | | | | | | | | | | | |
| Category and Subcategory | | Level 1 | | | Level 2 | | | Level 3 | | | Fair
Value at
06/30/2017 | |
Short Sales, at Value - Liabilities | | | | | |
U.S. Government Agencies | | $ | 0 | | | $ | (122,130 | ) | | $ | 0 | | | $ | (122,130 | ) |
| | | | | | | | | | | | | | | | |
| |
Financial Derivative Instruments - Assets | | | | | |
Exchange-traded or centrally cleared | | | 0 | | | | 149 | | | | 0 | | | | 149 | |
Over the counter | | | 0 | | | | 7,985 | | | | 0 | | | | 7,985 | |
| | | | | | | | | | | | | | | | |
| | $ | 0 | | | $ | 8,134 | | | $ | 0 | | | $ | 8,134 | |
| | | | | | | | | | | | | | | | |
| |
Financial Derivative Instruments - Liabilities | | | | | |
Exchange-traded or centrally cleared | | | 0 | | | | (2 | ) | | | 0 | | | | (2 | ) |
Over the counter | | | 0 | | | | (16,687 | ) | | | 0 | | | | (16,687 | ) |
| | | | | | | | | | | | | | | | |
| | $ | 0 | | | $ | (16,689 | ) | | $ | 0 | | | $ | (16,689 | ) |
| | | | | | | | | | | | | | | | |
| | | | |
Total Financial Derivative Instruments | | $ | 0 | | | $ | (8,555 | ) | | $ | 0 | | | $ | (8,555 | ) |
| | | | | | | | | | | | | | | | |
| | | | |
Totals | | $ | 7,000 | | | $ | 2,508,352 | | | $ | 10,999 | | | $ | 2,526,351 | |
| | | | | | | | | | | | | | | | |
There were no significant transfers among Levels 1, 2, or 3 during the period ended June 30, 2017.
| | | | | | |
| See Accompanying Notes | | ANNUAL REPORT | | JUNE 30, 2017 | | 59 |
Schedule of Investments PIMCO Enhanced Low Duration Active Exchange-Traded Fund
| | | | | | | | | | | | |
| | | | | PRINCIPAL
AMOUNT
(000S) | | | | | MARKET
VALUE
(000S) | |
| INVESTMENTS IN SECURITIES 150.6% | |
| |
| CORPORATE BONDS & NOTES 66.8% | |
| |
| BANKING & FINANCE 29.2% | |
AerCap Ireland Capital DAC | |
4.625% due 10/30/2020 | | $ | | | 300 | | | $ | | | 319 | |
Ally Financial, Inc. | |
3.500% due 01/27/2019 | | | | | 600 | | | | | | 610 | |
3.600% due 05/21/2018 | | | | | 500 | | | | | | 507 | |
American Tower Corp. | |
2.250% due 01/15/2022 | | | | | 600 | | | | | | 586 | |
Athene Global Funding | | | | | | | | | | | | |
2.529% due 07/01/2022 (a) | | | | | 500 | | | | | | 503 | |
Aviation Capital Group Corp. | |
2.875% due 01/20/2022 | | | | | 400 | | | | | | 399 | |
4.625% due 01/31/2018 | | | | | 500 | | | | | | 508 | |
Bank of America Corp. | |
6.875% due 04/25/2018 | | | | | 1,000 | | | | | | 1,041 | |
Banque Federative du Credit Mutuel S.A. | |
2.000% due 04/12/2019 | | | | | 200 | | | | | | 200 | |
Barclays Bank PLC | |
6.050% due 12/04/2017 | | | | | 1,000 | | | | | | 1,017 | |
Barclays PLC | |
2.000% due 03/16/2018 | | | | | 300 | | | | | | 300 | |
8.250% due 12/15/2018 (e) | | | | | 250 | | | | | | 266 | |
BGC Partners, Inc. | |
5.125% due 05/27/2021 | | | | | 250 | | | | | | 264 | |
BOC Aviation Ltd. | |
2.875% due 10/10/2017 | | | | | 215 | | | | | | 215 | |
3.000% due 03/30/2020 | | | | | 250 | | | | | | 252 | |
3.875% due 05/09/2019 | | | | | 400 | | | | | | 409 | |
Cantor Fitzgerald LP | |
6.500% due 06/17/2022 | | | | | 400 | | | | | | 448 | |
CIT Group, Inc. | |
3.875% due 02/19/2019 | | | | | 200 | | | | | | 205 | |
Credit Suisse Group Funding Guernsey Ltd. | |
3.448% due 04/16/2021 | | | | | 500 | | | | | | 525 | |
3.800% due 09/15/2022 | | | | | 250 | | | | | | 260 | |
Five Corners Funding Trust | |
4.419% due 11/15/2023 | | | | | 400 | | | | | | 430 | |
General Motors Financial Co., Inc. | |
3.250% due 05/15/2018 | | | | | 250 | | | | | | 253 | |
Goodman Funding Pty. Ltd. | |
6.375% due 11/12/2020 | | | | | 300 | | | | | | 335 | |
Goodman U.S. Finance One LLC | |
6.375% due 04/15/2021 | | | | | 700 | | | | | | 784 | |
Hartford Financial Services Group, Inc. | |
5.500% due 03/30/2020 | | | | | 500 | | | | | | 544 | |
HBOS PLC | |
1.923% due 09/06/2017 | | | | | 1,000 | | | | | | 1,000 | |
HSBC Holdings PLC | |
2.849% due 05/25/2021 | | | | | 600 | | | | | | 621 | |
3.600% due 05/25/2023 | | | | | 200 | | | | | | 207 | |
ICICI Bank Ltd. | |
4.800% due 05/22/2019 | | | | | 965 | | | | | | 1,006 | |
International Lease Finance Corp. | |
8.250% due 12/15/2020 | | | | | 200 | | | | | | 236 | |
LeasePlan Corp. NV | |
2.500% due 05/16/2018 | | | | | 700 | | | | | | 702 | |
Mitsubishi UFJ Lease & Finance Co. Ltd. | |
1.928% due 07/23/2019 | | | | | 500 | | | | | | 500 | |
2.250% due 09/07/2021 | | | | | 200 | | | | | | 198 | |
Mizuho Financial Group, Inc. | |
2.376% due 09/13/2021 | | | | | 700 | | | | | | 710 | |
2.636% due 04/12/2021 | | | | | 400 | | | | | | 410 | |
Morgan Stanley | |
2.553% due 10/24/2023 | | | | | 200 | | | | | | 204 | |
Navient Corp. | |
5.500% due 01/15/2019 | | | | | 300 | | | | | | 313 | |
6.625% due 07/26/2021 | | | | | 200 | | | | | | 216 | |
8.000% due 03/25/2020 | | | | | 800 | | | | | | 896 | |
ORIX Corp. | |
2.650% due 04/13/2021 | | | | | 500 | | | | | | 502 | |
| | | | | | | | | | | | |
| | | | | PRINCIPAL
AMOUNT
(000S) | | | | | MARKET
VALUE
(000S) | |
QNB Finance Ltd. | |
2.125% due 02/14/2018 | | $ | | | 900 | | | $ | | | 897 | |
Reliance Standard Life Global Funding | |
2.150% due 10/15/2018 | | | | | 300 | | | | | | 301 | |
Royal Bank of Scotland Group PLC | |
2.652% due 05/15/2023 | | | | | 800 | | | | | | 807 | |
Santander UK Group Holdings PLC | |
2.875% due 08/05/2021 | | | | | 800 | | | | | | 803 | |
Siam Commercial Bank PCL | |
3.375% due 09/19/2017 | | | | | 700 | | | | | | 702 | |
SMBC Aviation Capital Finance DAC | |
2.650% due 07/15/2021 | | | | | 1,000 | | | | | | 983 | |
Springleaf Finance Corp. | |
5.250% due 12/15/2019 | | | | | 100 | | | | | | 104 | |
8.250% due 12/15/2020 | | | | | 450 | | | | | | 506 | |
Sumitomo Mitsui Trust Bank Ltd. | |
2.050% due 03/06/2019 | | | | | 700 | | | | | | 700 | |
Synchrony Financial | |
1.875% due 08/15/2017 | | | | | 800 | | | | | | 800 | |
2.402% due 02/03/2020 | | | | | 250 | | | | | | 252 | |
UBS AG | |
4.750% due 05/22/2023 | | | | | 900 | | | | | | 919 | |
WEA Finance LLC | |
2.700% due 09/17/2019 | | | | | 225 | | | | | | 227 | |
Welltower, Inc. | |
2.250% due 03/15/2018 | | | | | 300 | | | | | | 301 | |
Weyerhaeuser Co. | |
7.375% due 10/01/2019 | | | | | 200 | | | | | | 222 | |
| | | | | | | | | | | | |
| | | | | | | | | | | 27,425 | |
| | | | | | | | | | | | |
| |
| INDUSTRIALS 28.7% | |
AbbVie, Inc. | |
2.850% due 05/14/2023 | | | | | 600 | | | | | | 599 | |
AP Moller - Maersk A/S | |
2.875% due 09/28/2020 | | | | | 400 | | | | | | 408 | |
Arrow Electronics, Inc. | |
3.500% due 04/01/2022 | | | | | 600 | | | | | | 614 | |
Asciano Finance Ltd. | |
4.625% due 09/23/2020 | | | | | 311 | | | | | | 324 | |
5.000% due 04/07/2018 | | | | | 100 | | | | | | 102 | |
Central Nippon Expressway Co. Ltd. | |
2.028% due 03/03/2022 | | | | | 500 | | | | | | 502 | |
Charter Communications Operating LLC | |
4.464% due 07/23/2022 | | | | | 300 | | | | | | 320 | |
CNPC General Capital Ltd. | |
1.950% due 04/16/2018 | | | | | 700 | | | | | | 699 | |
Continental Airlines Pass-Through Trust | |
7.250% due 05/10/2021 | | | | | 488 | | | | | | 542 | |
Cox Communications, Inc. | |
9.375% due 01/15/2019 | | | | | 500 | | | | | | 551 | |
Crown Castle Towers LLC | |
3.222% due 05/15/2042 | | | | | 800 | | | | | | 821 | |
D.R. Horton, Inc. | |
3.750% due 03/01/2019 | | | | | 400 | | | | | | 409 | |
Dell International LLC | |
3.480% due 06/01/2019 | | | | | 500 | | | | | | 512 | |
4.420% due 06/15/2021 | | | | | 400 | | | | | | 422 | |
Delphi Automotive PLC | |
3.150% due 11/19/2020 | | | | | 700 | | | | | | 716 | |
DISH DBS Corp. | |
4.250% due 04/01/2018 | | | | | 600 | | | | | | 609 | |
7.875% due 09/01/2019 | | | | | 300 | | | | | | 331 | |
Energy Transfer LP | |
6.700% due 07/01/2018 | | | | | 300 | | | | | | 314 | |
Flex Ltd. | |
4.625% due 02/15/2020 | | | | | 500 | | | | | | 525 | |
Forest Laboratories LLC | |
4.375% due 02/01/2019 | | | | | 199 | | | | | | 205 | |
General Electric Co. | |
6.375% due 11/15/2067 | | | | | 100 | | | | | | 101 | |
Georgia-Pacific LLC | |
2.539% due 11/15/2019 | | | | | 400 | | | | | | 404 | |
| | | | | | | | | | | | |
| | | | | PRINCIPAL
AMOUNT
(000S) | | | | | MARKET
VALUE
(000S) | |
Heathrow Funding Ltd. | |
4.875% due 07/15/2023 | | $ | | | 950 | | | $ | | | 1,024 | |
Hewlett Packard Enterprise Co. | |
2.850% due 10/05/2018 | | | | | 300 | | | | | | 303 | |
Humana, Inc. | |
2.625% due 10/01/2019 | | | | | 500 | | | | | | 506 | |
Hyundai Capital America | |
1.750% due 09/27/2019 | | | | | 800 | | | | | | 788 | |
Imperial Brands Finance PLC | |
2.950% due 07/21/2020 | | | | | 700 | | | | | | 712 | |
Kansas City Southern | |
3.000% due 05/15/2023 | | | | | 800 | | | | | | 804 | |
KLA-Tencor Corp. | |
3.375% due 11/01/2019 | | | | | 100 | | | | | | 103 | |
Latam Airlines Pass-Through Trust | |
4.200% due 08/15/2029 | | | | | 139 | | | | | | 139 | |
Masco Corp. | |
7.125% due 03/15/2020 | | | | | 39 | | | | | | 44 | |
MGM Resorts International | |
8.625% due 02/01/2019 | | | | | 300 | | | | | | 332 | |
Nabors Industries, Inc. | |
6.150% due 02/15/2018 | | | | | 350 | | | | | | 355 | |
National Fuel Gas Co. | |
8.750% due 05/01/2019 | | | | | 500 | | | | | | 554 | |
Petroleos Mexicanos | |
3.125% due 01/23/2019 | | | | | 200 | | | | | | 202 | |
3.500% due 07/18/2018 | | | | | 900 | | | | | | 913 | |
Petronas Capital Ltd. | |
5.250% due 08/12/2019 | | | | | 300 | | | | | | 319 | |
Pioneer Natural Resources Co. | |
6.875% due 05/01/2018 | | | | | 700 | | | | | | 728 | |
Regency Energy Partners LP | |
5.750% due 09/01/2020 | | | | | 200 | | | | | | 216 | |
Reynolds American, Inc. | |
4.000% due 06/12/2022 | | | | | 700 | | | | | | 743 | |
S&P Global, Inc. | |
2.500% due 08/15/2018 | | | | | 300 | | | | | | 302 | |
Sabine Pass Liquefaction LLC | |
5.625% due 02/01/2021 | | | | | 500 | | | | | | 545 | |
6.250% due 03/15/2022 | | | | | 500 | | | | | | 567 | |
Shire Acquisitions Investments Ireland DAC | |
2.875% due 09/23/2023 | | | | | 300 | | | | | | 298 | |
SK Broadband Co. Ltd. | |
2.875% due 10/29/2018 | | | | | 250 | | | | | | 252 | |
Sky PLC | |
2.625% due 09/16/2019 | | | | | 500 | | | | | | 504 | |
9.500% due 11/15/2018 | | | | | 500 | | | | | | 550 | |
Southern Co. | |
2.950% due 07/01/2023 | | | | | 700 | | | | | | 696 | |
Teva Pharmaceutical Finance Netherlands BV | |
1.700% due 07/19/2019 | | | | | 700 | | | | | | 694 | |
Time Warner Cable LLC | |
8.750% due 02/14/2019 | | | | | 500 | | | | | | 550 | |
Volkswagen Group of America Finance LLC | |
1.612% due 11/20/2017 | | | | | 1,000 | | | | | | 1,001 | |
Western Gas Partners LP | |
2.600% due 08/15/2018 | | | | | 400 | | | | | | 401 | |
WestJet Airlines Ltd. | |
3.500% due 06/16/2021 | | | | | 250 | | | | | | 256 | |
Woodside Finance Ltd. | |
3.650% due 03/05/2025 | | | | | 100 | | | | | | 100 | |
3.700% due 09/15/2026 | | | | | 200 | | | | | | 197 | |
4.600% due 05/10/2021 | | | | | 200 | | | | | | 211 | |
Woolworths Ltd. | |
4.000% due 09/22/2020 | | | | | 300 | | | | | | 312 | |
ZF North America Capital, Inc. | |
4.000% due 04/29/2020 | | | | | 700 | | | | | | 727 | |
| | | | | | | | | | | | |
| | | | | | | | | | | 26,978 | |
| | | | | | | | | | | | |
| |
| UTILITIES 8.9% | |
AT&T, Inc. | |
2.023% due 07/15/2021 | | | | | 800 | | | | | | 809 | |
| | | | | | | | |
| 60 | | PIMCO ETF TRUST | | | | | See Accompanying Notes | |
June 30, 2017
| | | | | | | | | | | | |
| | | | | PRINCIPAL
AMOUNT
(000S) | | | | | MARKET
VALUE
(000S) | |
BG Energy Capital PLC | |
6.500% due 11/30/2072 | | $ | | | 500 | | | $ | | | 509 | |
BP Capital Markets PLC | |
2.120% due 09/16/2021 | | | | | 1,000 | | | | | | 1,018 | |
Chugoku Electric Power Co., Inc. | |
2.701% due 03/16/2020 | | | | | 200 | | | | | | 202 | |
CNOOC Finance Ltd. | |
1.750% due 05/09/2018 | | | | | 700 | | | | | | 699 | |
Duquesne Light Holdings, Inc. | |
5.900% due 12/01/2021 | | | | | 500 | | | | | | 559 | |
E.ON International Finance BV | |
5.800% due 04/30/2018 | | | | | 300 | | | | | | 309 | |
FirstEnergy Corp. | |
2.750% due 03/15/2018 | | | | | 1,000 | | | | | | 1,007 | |
Great Plains Energy, Inc. | |
3.150% due 04/01/2022 | | | | | 800 | | | | | | 809 | |
Kinder Morgan Finance Co. LLC | |
6.000% due 01/15/2018 | | | | | 1,000 | | | | | | 1,021 | |
Sinopec Group Overseas Development Ltd. | |
2.500% due 10/17/2018 | | | | | 800 | | | | | | 804 | |
Telecom Italia Capital S.A. | |
6.999% due 06/04/2018 | | | | | 600 | | | | | | 628 | |
| | | | | | | | | | | | |
| | | | | | | | | | | 8,374 | |
| | | | | | | | | | | | |
Total Corporate Bonds & Notes (Cost $62,261) | | | 62,777 | |
| | | | | | | | | | | | |
| |
| MUNICIPAL BONDS & NOTES 1.1% | |
| |
| CALIFORNIA 0.5% | |
California Earthquake Authority Revenue Notes, Series 2014 | |
2.805% due 07/01/2019 | | | | | 500 | | | | | | 503 | |
| | | | | | | | | | | | |
| |
| KANSAS 0.6% | |
Kansas Development Finance Authority Revenue Notes, Series 2015 | |
2.258% due 04/15/2019 | | | | | 500 | | | | | | 504 | |
| | | | | | | | | | | | |
Total Municipal Bonds & Notes (Cost $1,000) | | | 1,007 | |
| | | | | | | | | | | | |
| |
| U.S. GOVERNMENT AGENCIES 3.9% | |
Fannie Mae | |
5.000% due 02/01/2038 | | | | | 21 | | | | | | 22 | |
5.500% due 06/01/2018 - 05/01/2037 | | | | | 101 | | | | | | 103 | |
Freddie Mac | |
6.000% due 02/01/2028 | | | | | 37 | | | | | | 38 | |
Ginnie Mae | |
3.000% due 11/20/2046 | | | | | 252 | | | | | | 255 | |
4.000% due 11/20/2040 - 06/20/2043 | | | | | 575 | | | | | | 601 | |
4.500% due 03/20/2041 - 07/20/2041 | | | | | 1,456 | | | | | | 1,550 | |
5.500% due 04/20/2035 - 05/20/2041 | | | | | 337 | | | | | | 365 | |
6.000% due 09/20/2029 | | | | | 93 | | | | | | 104 | |
6.500% due 06/20/2038 - 07/20/2039 | | | | | 136 | | | | | | 146 | |
7.000% due 09/20/2038 - 06/20/2039 | | | | | 432 | | | | | | 462 | |
| | | | | | | | | | | | |
Total U.S. Government Agencies (Cost $3,659) | | | 3,646 | |
| | | | | | | | | | | | |
| |
| U.S. TREASURY OBLIGATIONS 57.9% | |
U.S. Treasury Inflation Protected Securities (d) | |
0.125% due 04/15/2020 | | | | | 1,775 | | | | | | 1,778 | |
0.125% due 04/15/2022 | | | | | 2,916 | | | | | | 2,903 | |
U.S. Treasury Notes | |
0.000% due
06/30/2019 (c)(g) | | | | | 12,600 | | | | | | 12,567 | |
0.750% due 07/31/2018 (g) | | | | | 5,000 | | | | | | 4,972 | |
0.750% due 09/30/2018 (g) | | | | | 5,000 | | | | | | 4,966 | |
0.750% due 10/31/2018 (g) | | | | | 5,000 | | | | | | 4,962 | |
1.500% due 08/31/2018 (g) | | | | | 22,200 | | �� | | | | 22,246 | |
| | | | | | | | | | | | |
Total U.S. Treasury Obligations (Cost $54,447) | | | 54,394 | |
| | | | | | | | | | | | |
| | | | | | | | | | | | |
| | | | | PRINCIPAL
AMOUNT
(000S) | | | | | MARKET
VALUE
(000S) | |
| NON-AGENCY MORTGAGE-BACKED SECURITIES 3.9% | |
Bear Stearns Adjustable Rate Mortgage Trust | |
2.950% due 02/25/2033 | | $ | | | 3 | | | | | $ | 2 | |
Chevy Chase Funding LLC Mortgage-Backed Certificates | |
1.562% due 10/25/2035 | | | | | 722 | | | | | | 684 | |
Citigroup Mortgage Loan Trust, Inc. | |
3.573% due 11/25/2038 | | | | | 2 | | | | | | 2 | |
First Horizon Mortgage Pass-Through Trust | |
2.991% due 09/25/2033 | | | | | 59 | | | | | | 60 | |
GSR Mortgage Loan Trust | |
3.209% due 09/25/2035 | | | | | 48 | | | | | | 49 | |
3.472% due 08/25/2033 | | | | | 509 | | | | | | 510 | |
JPMorgan Resecuritization Trust | |
2.845% due 07/27/2037 | | | | | 25 | | | | | | 25 | |
MASTR Adjustable Rate Mortgages Trust | |
3.081% due 04/21/2034 | | | | | 83 | | | | | | 85 | |
Nomura Resecuritization Trust | |
3.042% due 04/26/2037 | | | | | 912 | | | | | | 925 | |
Residential Accredit Loans, Inc. Trust | |
1.656% due 06/25/2034 | | | | | 80 | | | | | | 79 | |
Sequoia Mortgage Trust | |
1.730% due 11/22/2024 | | | | | 15 | | | | | | 15 | |
1.872% due 06/20/2033 | | | | | 6 | | | | | | 6 | |
Structured Asset Mortgage Investments Trust | |
1.789% due 07/19/2034 | | | | | 13 | | | | | | 13 | |
1.869% due 09/19/2032 | | | | | 31 | | | | | | 30 | |
Thornburg Mortgage Securities Trust | |
3.111% due 04/25/2045 | | | | | 229 | | | | | | 230 | |
WaMu Mortgage Pass-Through Certificates Trust | |
1.526% due 01/25/2045 | | | | | 36 | | | | | | 35 | |
1.616% due 06/25/2044 | | | | | 885 | | | | | | 869 | |
3.064% due 06/25/2033 | | | | | 5 | | | | | | 5 | |
Wells Fargo Mortgage-Backed Securities Trust | |
3.045% due 06/25/2035 | | | | | 6 | | | | | | 6 | |
| | | | | | | | | | | | |
Total Non-Agency Mortgage-Backed Securities (Cost $3,564) | | | 3,630 | |
| | | | | | | | | | | | |
| |
| ASSET-BACKED SECURITIES 13.5% | |
Ameriquest Mortgage Securities, Inc. Asset-Backed Pass-Through Certificates | |
1.976% due 09/25/2033 | | | | | 50 | | | | | | 49 | |
Apidos CLO | |
2.189% due 01/19/2025 | | | | | 600 | | | | | | 600 | |
Atlas Senior Loan Fund Ltd. | |
2.400% due 01/30/2024 | | | | | 380 | | | | | | 380 | |
Bear Stearns Asset-Backed Securities Trust | |
2.016% due 10/27/2032 | | | | | 48 | | | | | | 46 | |
BlueMountain CLO Ltd. | |
2.485% due 04/13/2027 | | | | | 300 | | | | | | 301 | |
Carlyle Global Market Strategies CLO Ltd. | |
2.298% due 10/16/2025 | | | | | 400 | | | | | | 400 | |
2.320% due 07/27/2026 | | | | | 300 | | | | | | 300 | |
Cavalry CLO Ltd. | |
2.528% due 01/16/2024 | | | | | 176 | | | | | | 176 | |
Cent CLO Ltd. | |
2.500% due 10/29/2025 | | | | | 300 | | | | | | 300 | |
Chase Funding Trust | |
1.816% due 07/25/2033 | | | | | 210 | | | | | | 204 | |
CIFC Funding Ltd. | |
2.173% due 10/24/2025 | | | | | 700 | | | | | | 702 | |
COA Summit CLO Ltd. | |
2.506% due 04/20/2023 | | | | | 50 | | | | | | 50 | |
Colony Starwood Homes Trust | |
2.709% due 07/17/2033 | | | | | 199 | | | | | | 202 | |
Credit Suisse Mortgage Capital Mortgage-Backed Trust | |
4.500% due 03/25/2021 | | | | | 265 | | | | | | 266 | |
Drug Royalty LP | |
4.008% due 07/15/2023 | | | | | 144 | | | | | | 145 | |
Dryden Senior Loan Fund | |
2.358% due 01/15/2025 | | | | | 279 | | | | | | 279 | |
Eagle Ltd. | |
2.570% due 12/15/2039 | | | | | 94 | | | | | | 93 | |
| | | | | | | | | | | | |
| | | | | PRINCIPAL
AMOUNT
(000S) | | | | | MARKET
VALUE
(000S) | |
Figueroa CLO Ltd. | |
2.524% due 06/20/2027 | | $ | | | 400 | | | $ | | | 401 | |
First Franklin Mortgage Loan Trust | |
1.966% due 11/25/2034 | | | | | 294 | | | | | | 289 | |
Galaxy CLO Ltd. | |
2.310% due 11/16/2025 | | | | | 500 | | | | | | 501 | |
JMP Credit Advisors CLO Ltd. | |
2.398% due 10/17/2025 | | | | | 500 | | | | | | 501 | |
National Collegiate Student Loan Trust | |
1.456% due 11/27/2028 | | | | | 20 | | | | | | 20 | |
Navient Private Education Loan Trust | |
2.359% due 12/15/2028 | | | | | 988 | | | | | | 1,002 | |
Navient Student Loan Trust | |
2.466% due 06/25/2065 | | | | | 91 | | | | | | 93 | |
Northwoods Capital Ltd. | |
2.254% due 11/04/2025 | | | | | 400 | | | | | | 401 | |
Regatta Funding Ltd. | |
2.316% due 10/25/2026 | | | | | 400 | | | | | | 400 | |
SLM Student Loan Trust | |
1.906% due 04/25/2023 | | | | | 676 | | | | | | 673 | |
2.656% due 04/25/2023 | | | | | 726 | | | | | | 742 | |
2.856% due 07/25/2023 | | | | | 638 | | | | | | 656 | |
SoFi Professional Loan Program LLC | |
3.020% due 02/25/2040 | | | | | 446 | | | | | | 448 | |
THL Credit Wind River CLO Ltd. | |
2.598% due 01/18/2026 | | | | | 300 | | | | | | 301 | |
U.S. Residential Opportunity Fund Trust | |
3.598% due 10/27/2036 | | | | | 420 | | | | | | 423 | |
VOLT LLC | |
3.375% due 05/28/2047 | | | | | 483 | | | | | | 485 | |
3.500% due 03/25/2047 | | | | | 374 | | | | | | 376 | |
4.375% due 11/27/2045 | | | | | 91 | | | | | | 91 | |
WhiteHorse Ltd. | |
1.000% due
07/17/2026 (a) | | | | | 400 | | | | | | 400 | |
| | | | | | | | | | | | |
Total Asset-Backed Securities (Cost $12,625) | | | 12,696 | |
| | | | | | | | | | | | |
| |
| SOVEREIGN ISSUES 0.9% | |
Export-Import Bank of India | |
3.875% due 10/02/2019 | | | | | 800 | | | | | | 823 | |
| | | | | | | | | | | | |
Total Sovereign Issues (Cost $824) | | | | | | 823 | |
| | | | | | | | | | | | |
| |
| SHORT-TERM INSTRUMENTS 2.6% | |
| |
| COMMERCIAL PAPER 0.6% | |
Ford Motor Credit Co. | |
2.016% due 04/12/2018 | | | | | 600 | | | | | | 591 | |
| | | | | | | | | | | | |
| |
| REPURCHASE AGREEMENTS (f) 1.2% | |
| | | | | | | | | | | 1,152 | |
| | | | | | | | | | | | |
| |
| SHORT-TERM NOTES 0.1% | |
Hewlett Packard Enterprise Co. | |
2.450% due 10/05/2017 | | | | | 100 | | | | | | 100 | |
| | | | | | | | | | | | |
| |
| ARGENTINA TREASURY BILLS 0.7% | |
2.979% due 09/29/2017 - 12/15/2017 (b)(c) | | | | | 700 | | | | | | 693 | |
| | | | | | | | | | | | |
| Total Short-Term Instruments (Cost $2,535) | | | 2,536 | |
| | | | | | | | | | | | |
| | | | | | | | | | | | |
Total Investments in Securities
(Cost $140,915) | | | 141,509 | |
| | | | | | | | | | | | |
Total Investments 150.6%
(Cost $140,915) | | | $ | | | 141,509 | |
| |
Financial Derivative
Instruments (h)(i) (0.1)% (Cost or Premiums, net $0) | | | | | | (79 | ) |
| | | | | | | | | | | | |
| Other Assets and Liabilities, net (50.5)% | | | (47,483 | ) |
| | | | | | | | | | | | |
| Net Assets 100.0% | | | $ | | | 93,947 | |
| | | | | | | | | | | | |
| | | | | | |
| See Accompanying Notes | | ANNUAL REPORT | | JUNE 30, 2017 | | 61 |
Schedule of Investments PIMCO Enhanced Low Duration Active Exchange-Traded Fund (Cont.)
NOTES TO SCHEDULE OF INVESTMENTS (AMOUNTS IN THOUSANDS*, EXCEPT NUMBER OF CONTRACTS):
| * | A zero balance may reflect actual amounts rounding to less than one thousand. |
| (b) | Coupon represents a weighted average yield to maturity. |
| (d) | Principal amount of security is adjusted for inflation. |
| (e) | Perpetual maturity; date shown, if applicable, represents next contractual call date. |
BORROWINGS AND OTHER FINANCING TRANSACTIONS
(f) REPURCHASE AGREEMENTS:
| | | | | | | | | | | | | | | | | | | | | | | | | | | | | | |
| Counterparty | | Lending
Rate | | | Settlement
Date | | | Maturity
Date | | | Principal
Amount | | | Collateralized By | | Collateral
(Received) | | | Repurchase
Agreements,
at Value | | | Repurchase
Agreement
Proceeds
to be
Received(1) | |
| SSB | | | 0.050 | % | | | 06/30/2017 | | | | 07/03/2017 | | | $ | 1,152 | | | U.S. Treasury Notes 2.000% due 08/31/2021(2) | | $ | (1,179 | ) | | $ | 1,152 | | | $ | 1,152 | |
| | | | | | | | | | | | | | | | | | | | | | |
Total Repurchase Agreements | | | | | $ | (1,179 | ) | | $ | 1,152 | | | $ | 1,152 | |
| | | | | | | | | | | | | | | | | | | | | | |
REVERSE REPURCHASE AGREEMENTS:
| | | | | | | | | | | | | | | | | | | | |
| Counterparty | | Borrowing
Rate(3) | | | Settlement
Date | | | Maturity
Date | | | Amount
Borrowed(3) | | | Payable for
Reverse
Repurchase
Agreements | |
| BOS | | | 1.130 | % | | | 06/26/2017 | | | | 08/31/2017 | | | $ | (22,366 | ) | | $ | (22,371 | ) |
| SCX | | | 1.020 | | | | 06/29/2017 | | | | 07/06/2017 | | | | (8,950 | ) | | | (8,951 | ) |
| SGY | | | 1.450 | | | | 06/30/2017 | | | | 07/03/2017 | | | | (8,080 | ) | | | (8,081 | ) |
| | | | | | | | | | | | | | | | | | | | |
Total Reverse Repurchase Agreements | | | | | | | $ | (39,403 | ) |
| | | | | | | | | | | | | | | | | | | | |
SALE-BUYBACK TRANSACTIONS:
| | | | | | | | | | | | | | | | | | | | |
| Counterparty | | Borrowing
Rate(3) | | | Borrowing
Date | | | Maturity
Date | | | Amount
Borrowed(3) | | | Payable for
Sale-Buyback
Transactions | |
| BCY | | | 1.500 | % | | | 06/28/2017 | | | | 07/05/2017 | | | $ | (4,989 | ) | | $ | (4,990 | ) |
| | | | | | | | | | | | | | | | | | | | |
Total Sale-Buyback Transactions | | | | | | | | | | | | | | | $ | (4,990 | ) |
| | | | | | | | | | | | | | | | | | | | |
BORROWINGS AND OTHER FINANCING TRANSACTIONS SUMMARY
The following is a summary by counterparty of the market value of Borrowings and Other Financing Transactions and collateral pledged/(received) as of June 30, 2017:
| | | | | | | | | | | | | | | | | | | | | | | | | | | | |
| Counterparty | | Repurchase
Agreement
Proceeds
to be
Received | | | Payable for
Reverse
Repurchase
Agreements | | | Payable for
Sale-Buyback
Transactions | | | Securities
Out on Loan | | | Total
Borrowings and
Other Financing
Transactions | | | Collateral
Pledged/(Received) | | | Net Exposure(4) | |
Global/Master Repurchase Agreement | | | | | | | | | | | | | | | | | | | | | | | | | | | | |
BOS | | $ | 0 | | | $ | (22,371 | ) | | $ | 0 | | | $ | 0 | | | $ | (22,371 | ) | | $ | 22,246 | | | $ | (125 | ) |
SCX | | | 0 | | | | (8,951 | ) | | | 0 | | | | 0 | | | | (8,951 | ) | | | 8,936 | | | | (15 | ) |
SGY | | | 0 | | | | (8,081 | ) | | | 0 | | | | 0 | | | | (8,081 | ) | | | 8,064 | | | | (17 | ) |
SSB | | | 1,152 | | | | 0 | | | | 0 | | | | 0 | | | | 1,152 | | | | (1,179 | ) | | | (27 | ) |
| | | | | | | |
Master Securities Forward Transaction Agreement | | | | | | | | | | | | | | | | | | | | | | | | | | | | |
BCY | | | 0 | | | | 0 | | | | (4,990 | ) | | | 0 | | | | (4,990 | ) | | | 4,972 | | | | (18 | ) |
| | | | | | | | | | | | | | | | | | | | |
Total Borrowings and Other Financing Transactions | | $ | 1,152 | | | $ | (39,403 | ) | | $ | (4,990 | ) | | | | | | | | | | | | | | | | |
| | | | | | | | | | | | | | | | | | | | |
| | | | | | | | |
| 62 | | PIMCO ETF TRUST | | | | | See Accompanying Notes | |
June 30, 2017
CERTAIN TRANSFERS ACCOUNTED FOR AS SECURED BORROWINGS
Remaining Contractual Maturity of the Agreements
| | | | | | | | | | | | | | | | | | | | |
| | | Overnight and
Continuous | | | Up to 30 days | | | 31-90 days | | | Greater Than 90 days | | | Total | |
Reverse Repurchase Agreements | |
U.S. Treasury Obligation | | $ | 0 | | | $ | (17,032 | ) | | $ | (22,371 | ) | | $ | 0 | | | $ | (39,403 | ) |
| | | | |
Total | | $ | 0 | | | $ | (17,032 | ) | | $ | (22,371 | ) | | $ | 0 | | | $ | (39,403 | ) |
| | | | | | | | | | | | | | | | | | | | |
| | | | | |
Sale-Buyback Transactions | | | | | | | | | | | | | | | | | | | | |
U.S. Treasury Obligations | | | 0 | | | | (4,990 | ) | | | 0 | | | | 0 | | | | (4,990 | ) |
| | | | |
Total | | $ | 0 | | | $ | (4,990 | ) | | $ | 0 | | | $ | 0 | | | $ | (4,990 | ) |
| | | | |
Total Borrowings | | $ | 0 | | | $ | (22,022 | ) | | $ | (22,371 | ) | | $ | 0 | | | $ | (44,393 | ) |
| | | | |
Gross amount of recognized liabilities for reverse repurchase agreements and sale-buyback financing transactions | | | $ | (44,393 | ) |
| | | | | | | | | | | | | | | | | | | | |
| (g) | Securities with an aggregate market value of $44,217 have been pledged as collateral under the terms of the above master agreements as of June 30, 2017. |
| (1) | Includes accrued interest. |
| (2) | Collateral is held in custody by the counterparty. |
| (3) | The average amount of borrowings outstanding during the period ended June 30, 2017 was $(21,131) at a weighted average interest rate of 0.696%. Average borrowings may include sale-buyback transactions and reverse repurchase agreements, if held during the period. |
| (4) | Net Exposure represents the net receivable/(payable) that would be due from/to the counterparty in the event of default. Exposure from borrowings and other financing transactions can only be netted across transactions governed under the same master agreement with the same legal entity. See Note 8, Master Arrangements, in the Notes to Financial Statements for more information regarding master netting arrangements. |
(h) FINANCIAL DERIVATIVE INSTRUMENTS: EXCHANGE-TRADED OR CENTRALLY CLEARED
FUTURES CONTRACTS:
SHORT FUTURES CONTRACTS
| | | | | | | | | | | | | | | | | | | | | | | | |
| | | Expiration
Month | | | # of
Contracts | | | Notional
Amount | | | Unrealized
Appreciation/
(Depreciation) | | | Variation Margin | |
| Description | | | | | | Asset | | | Liability | |
U.S. Treasury 5-Year Note September Futures | | | 09/2017 | | | | 76 | | | $ | 8,955 | | | $ | 21 | | | $ | 13 | | | $ | 0 | |
U.S. Treasury 10-Year Note September Futures | | | 09/2017 | | | | 77 | | | | 9,666 | | | | 87 | | | | 22 | | | | 0 | |
| | | | | | | | | | | | | | | | |
| | | | | | | | | | | | | | $ | 108 | | | $ | 35 | | | $ | 0 | |
| | | | | | | | | | | | | | | | |
Total Futures Contracts | | | $ | 108 | | | $ | 35 | | | $ | 0 | |
| | | | | | | | | | | | | | | | |
SWAP AGREEMENTS:
CREDIT DEFAULT SWAPS ON CORPORATE ISSUES - SELL PROTECTION(1)
| | | | | | | | | | | | | | | | | | | | | | | | | | | | | | | | | | |
| Reference Entity | | Fixed
Receive Rate | | Maturity
Date | | | Implied
Credit Spread
at June 30, 2017(3) | | | Notional
Amount(4) | | | Premiums
Paid/(Received) | | | Unrealized
Appreciation/
(Depreciation) | | | Market
Value(5) | | | Variation Margin | |
| | | | | | | | | Asset | | | Liability | |
Exelon Generation Co. LLC | | 1.000% | | | 12/20/2021 | | | | 1.298 | % | | $ | 600 | | | $ | (23 | ) | | $ | 16 | | | $ | (7 | ) | | $ | 0 | | | $ | 0 | |
| | | | | | | | | | | | | | | | | | |
CREDIT DEFAULT SWAPS ON CREDIT INDICES - BUY PROTECTION(2)
| | | | | | | | | | | | | | | | | | | | | | | | | | | | | | | | |
| | | Fixed
Receive Rate | | | Maturity
Date | | | Notional
Amount(4) | | | Premiums
Paid/(Received) | | | Unrealized
Appreciation/
(Depreciation) | | | Market
Value(5) | | | Variation Margin | |
| Index/Tranches | | | | | | | | Asset | | | Liability | |
CDX.HY-28 5-Year Index | | | 5.000 | % | | | 06/20/2022 | | | $ | 2,400 | | | $ | (167 | ) | | $ | (3 | ) | | $ | (170 | ) | | $ | 0 | | | $ | (6 | ) |
CDX.IG-26 5-Year Index | | | 1.000 | | | | 06/20/2021 | | | | 9,500 | | | | (165 | ) | | | (43 | ) | | | (208 | ) | | | 0 | | | | (3 | ) |
| | | | | | | | | | | | | | | | |
| | | | | | | | | | | | | | $ | (332 | ) | | $ | (46 | ) | | $ | (378 | ) | | $ | 0 | | | $ | (9 | ) |
| | | | | | | | | | | | | | | | |
Total Swap Agreements | | | $ | (355 | ) | | $ | (30 | ) | | $ | (385 | ) | | $ | 0 | | | $ | (9 | ) |
| | | | | | | | | | | | | | | | |
| | | | | | |
| See Accompanying Notes | | ANNUAL REPORT | | JUNE 30, 2017 | | 63 |
Schedule of Investments PIMCO Enhanced Low Duration Active Exchange-Traded Fund (Cont.)
FINANCIAL DERIVATIVE INSTRUMENTS: EXCHANGE-TRADED OR CENTRALLY CLEARED SUMMARY
The following is a summary of the market value and variation margin of Exchange-Traded or Centrally Cleared Financial Derivative Instruments as of June 30, 2017:
| | | | | | | | | | | | | | | | | | | | | | | | | | | | | | | | | | | | |
| | | Financial Derivative Assets | | | | | | Financial Derivative Liabilities | |
| | | Market Value | | | Variation Margin
Asset | | | Total | | | | | | Market Value | | | Variation Margin
Liability | | | Total | |
| | | Purchased
Options | | | Futures | | | Swap
Agreements | | | | | | | Written
Options | | | Futures | | | Swap
Agreements | | |
Total Exchange-Traded or Centrally Cleared | | $ | 0 | | | $ | 35 | | | $ | 0 | | | $ | 35 | | | | | | | $ | 0 | | | $ | 0 | | | $ | (9) | | | $ | (9) | |
| | | | | | | | | | | | |
Cash of $858 has been pledged as collateral for exchange-traded and centrally cleared financial derivative instruments as of June 30, 2017. See Note 8, Master Arrangements, in the Notes to Financial Statements for more information regarding master netting arrangements.
| (1) | If the Fund is a seller of protection and a credit event occurs, as defined under the terms of that particular swap agreement, the Fund will either (i) pay to the buyer of protection an amount equal to the notional amount of the swap and take delivery of the referenced obligation or underlying securities comprising the referenced index or (ii) pay a net settlement amount in the form of cash, securities or other deliverable obligations equal to the notional amount of the swap less the recovery value of the referenced obligation or underlying securities comprising the referenced index. |
| (2) | If the Fund is a buyer of protection and a credit event occurs, as defined under the terms of that particular swap agreement, the Fund will either (i) receive from the seller of protection an amount equal to the notional amount of the swap and deliver the referenced obligation or underlying securities comprising the referenced index or (ii) receive a net settlement amount in the form of cash, securities or other deliverable obligations equal to the notional amount of the swap less the recovery value of the referenced obligation or underlying securities comprising the referenced index. |
| (3) | Implied credit spreads, represented in absolute terms, utilized in determining the market value of credit default swap agreements on issues as of period end serve as indicators of the current status of the payment/performance risk and represent the likelihood or risk of default for the credit derivative. The implied credit spread of a particular referenced entity reflects the cost of buying/selling protection and may include upfront payments required to be made to enter into the agreement. Wider credit spreads represent a deterioration of the referenced entity’s credit soundness and a greater likelihood or risk of default or other credit event occurring as defined under the terms of the agreement. |
| (4) | The maximum potential amount the Fund could be required to pay as a seller of credit protection or receive as a buyer of credit protection if a credit event occurs as defined under the terms of that particular swap agreement. |
| (5) | The prices and resulting values for credit default swap agreements on credit indices serve as indicators of the current status of the payment/performance risk and represent the likelihood of an expected liability (or profit) for the credit derivative should the notional amount of the swap agreement be closed/sold as of the period end. Increasing market values, in absolute terms when compared to the notional amount of the swap, represent a deterioration of the referenced indices’ credit soundness and a greater likelihood or risk of default or other credit event occurring as defined under the terms of the agreement. |
(i) FINANCIAL DERIVATIVE INSTRUMENTS: OVER THE COUNTER
FORWARD FOREIGN CURRENCY CONTRACTS:
| | | | | | | | | | | | | | | | | | | | | | | | |
| Counterparty | | Settlement
Month | | | Currency to
be Delivered | | | Currency to
be Received | | | Unrealized Appreciation/
(Depreciation) | |
| | | | | Asset | | | Liability | |
AZD | | | 07/2017 | | | AUD | | | 92 | | | $ | | | 69 | | | $ | 0 | | | $ | (1 | ) |
| | | 07/2017 | | | $ | | | 2,328 | | | AUD | | | 3,069 | | | | 30 | | | | 0 | |
| | | 08/2017 | | | AUD | | | 3,069 | | | $ | | | 2,328 | | | | 0 | | | | (30 | ) |
BOA | | | 07/2017 | | | | | | 2,402 | | | | | | 1,789 | | | | 0 | | | | (58 | ) |
| | | 07/2017 | | | EUR | | | 805 | | | | | | 905 | | | | 0 | | | | (14 | ) |
| | | 08/2017 | | | MXN | | | 40,813 | | | | | | 2,157 | | | | 0 | | | | (79 | ) |
BPS | | | 07/2017 | | | $ | | | 954 | | | EUR | | | 839 | | | | 4 | | | | 0 | |
| | | 07/2017 | | | | | | 2,782 | | | JPY | | | 311,400 | | | | 0 | | | | (13 | ) |
| | | 08/2017 | | | EUR | | | 839 | | | $ | | | 956 | | | | 0 | | | | (4 | ) |
| | | 08/2017 | | | JPY | | | 311,400 | | | | | | 2,785 | | | | 13 | | | | 0 | |
BRC | | | 08/2017 | | | $ | | | 959 | | | EUR | | | 839 | | | | 1 | | | | 0 | |
GLM | | | 07/2017 | | | JPY | | | 298,700 | | | $ | | | 2,698 | | | | 42 | | | | 0 | |
| | | 08/2017 | | | $ | | | 2,188 | | | MXN | | | 40,000 | | | | 4 | | | | 0 | |
JPM | | | 07/2017 | | | AUD | | | 575 | | | $ | | | 437 | | | | 0 | | | | (5 | ) |
| | | 07/2017 | | | EUR | | | 34 | | | | | | 38 | | | | 0 | | | | (1 | ) |
| | | 07/2017 | | | JPY | | | 4,900 | | | | | | 44 | | | | 0 | | | | 0 | |
| | | 07/2017 | | | $ | | | 958 | | | EUR | | | 839 | | | | 1 | | | | 0 | |
NAB | | | 07/2017 | | | JPY | | | 12,700 | | | $ | | | 115 | | | | 3 | | | | 0 | |
SOG | | | 08/2017 | | | $ | | | 41 | | | MXN | | | 799 | | | | 2 | | | | 0 | |
| | | | | | | | | | | | | | | | | | | | |
Total Forward Foreign Currency Contracts | | | $ | 100 | | | $ | (205 | ) |
| | | | | | | | | | | | | | | | | | | | |
WRITTEN OPTIONS:
TRANSACTIONS IN WRITTEN CALL AND PUT OPTIONS FOR THE PERIOD ENDED JUNE 30, 2017:
| | | | | | | | | | | | | | | | | | | | | | | | | | | | | | | | | | | | | | | | | | | | |
| | | Balance at
Beginning of Period | | | Sales | | | Closing Buys | | | Expirations | | | Exercised | | | Balance at
End of Period | |
Notional Amount in $ | | | $ | | | | 7,200 | | | $ | | | 67,200 | | | $ | | | (66,500 | ) | | | $ | | | | 0 | | | | $ | | | | (7,900 | ) | | | $ | | | | 0 | |
Notional Amount in EUR | | | EUR | | | | 1,000 | | | EUR | | | 0 | | | EUR | | | 0 | | | | EUR | | | | (1,000 | ) | | | EUR | | | | 0 | | | | EUR | | | | 0 | |
Premiums | | | $ | | | | (18 | ) | | $ | | | (155 | ) | | $ | | | 164 | | | | $ | | | | 5 | | | | $ | | | | 4 | | | | $ | | | | 0 | |
As of June 30, 2017, there were no open written options.
| | | | | | | | |
| 64 | | PIMCO ETF TRUST | | | | | See Accompanying Notes | |
June 30, 2017
FINANCIAL DERIVATIVE INSTRUMENTS: OVER THE COUNTER SUMMARY
The following is a summary by counterparty of the market value of OTC financial derivative instruments and collateral pledged/(received) as of June 30, 2017:
| | | | | | | | | | | | | | | | | | | | | | | | | | | | | | | | | | | | | | | | | | | | | | | | |
| | | Financial Derivative Assets | | | | | | Financial Derivative Liabilities | | | | | | | | | | |
| Counterparty | | Forward
Foreign
Currency
Contracts | | | Purchased
Options | | | Swap
Agreements | | | Total
Over the
Counter | | | | | | Forward
Foreign
Currency
Contracts | | | Written
Options | | | Swap
Agreements | | | Total
Over the
Counter | | | Net Market
Value of OTC
Derivatives | | | Collateral
Pledged/
(Received) | | | Net
Exposure(1) | |
AZD | | $ | 30 | | | $ | 0 | | | $ | 0 | | | $ | 30 | | | | | | | $ | (31 | ) | | $ | 0 | | | $ | 0 | | | $ | (31 | ) | | $ | (1 | ) | | $ | 0 | | | $ | (1 | ) |
BOA | | | 0 | | | | 0 | | | | 0 | | | | 0 | | | | | | | | (151 | ) | | | 0 | | | | 0 | | | | (151 | ) | | | (151 | ) | | | 0 | | | | (151 | ) |
BPS | | | 17 | | | | 0 | | | | 0 | | | | 17 | | | | | | | | (17 | ) | | | 0 | | | | 0 | | | | (17 | ) | | | 0 | | | | 0 | | | | 0 | |
BRC | | | 1 | | | | 0 | | | | 0 | | | | 1 | | | | | | | | 0 | | | | 0 | | | | 0 | | | | 0 | | | | 1 | | | | 0 | | | | 1 | |
GLM | | | 46 | | | | 0 | | | | 0 | | | | 46 | | | | | | | | 0 | | | | 0 | | | | 0 | | | | 0 | | | | 46 | | | | 0 | | | | 46 | |
JPM | | | 1 | | | | 0 | | | | 0 | | | | 1 | | | | | | | | (6 | ) | | | 0 | | | | 0 | | | | (6 | ) | | | (5 | ) | | | 0 | | | | (5 | ) |
NAB | | | 3 | | | | 0 | | | | 0 | | | | 3 | | | | | | | | 0 | | | | 0 | | | | 0 | | | | 0 | | | | 3 | | | | 0 | | | | 3 | |
SOG | | | 2 | | | | 0 | | | | 0 | | | | 2 | | | | | | | | 0 | | | | 0 | | | | 0 | | | | 0 | | | | 2 | | | | 0 | | | | 2 | |
| | | | | | | | | | | | | | | | | | | | | | | | |
Total Over the Counter | | $ | 100 | | | $ | 0 | | | $ | 0 | | | $ | 100 | | | | | | | $ | (205 | ) | | $ | 0 | | | $ | 0 | | | $ | (205 | ) | | | | | | | | | | | | |
| | | | | | | | | | | | | | | | | | | | | | | | |
| (1) | Net Exposure represents the net receivable/(payable) that would be due from/to the counterparty in the event of default. Exposure from OTC financial derivative instruments can only be netted across transactions governed under the same master agreement with the same legal entity. See Note 8, Master Arrangements, in the Notes to Financial Statements for more information regarding master netting arrangements. |
FAIR VALUE OF FINANCIAL DERIVATIVE INSTRUMENTS
The following is a summary of the fair valuation of the Fund’s derivative instruments categorized by risk exposure. See Note 7, Principal Risks, in the Notes to Financial Statements on risks of the Fund.
Fair Values of Financial Derivative Instruments on the Statements of Assets and Liabilities as of June 30, 2017:
| | | | | | | | | | | | | | | | | | | | | | | | |
| | | Derivatives not accounted for as hedging instruments | |
| | | Commodity
Contracts | | | Credit
Contracts | | | Equity
Contracts | | | Foreign
Exchange
Contracts | | | Interest
Rate Contracts | | | Total | |
Financial Derivative Instruments - Assets | | | | | | | | | | | | | | | | | | | | | | | | |
Exchange-traded or centrally cleared | | | | | | | | | | | | | | | | | | | | | | | | |
Futures | | $ | 0 | | | $ | 0 | | | $ | 0 | | | $ | 0 | | | $ | 35 | | | $ | 35 | |
| | | | |
Over the counter | | | | | | | | | | | | | | | | | | | | | | | | |
Forward Foreign Currency Contracts | | $ | 0 | | | $ | 0 | | | $ | 0 | | | $ | 100 | | | $ | 0 | | | $ | 100 | |
| | | | |
| | $ | 0 | | | $ | 0 | | | $ | 0 | | | $ | 100 | | | $ | 35 | | | $ | 135 | |
| | | | |
| | | | | | |
Financial Derivative Instruments - Liabilities | | | | | | | | | | | | | | | | | | | | | | | | |
Exchange-traded or centrally cleared | | | | | | | | | | | | | | | | | | | | | | | | |
Swap Agreements | | $ | 0 | | | $ | 9 | | | $ | 0 | | | $ | 0 | | | $ | 0 | | | $ | 9 | |
| | | | |
Over the counter | | | | | | | | | | | | | | | | | | | | | | | | |
Forward Foreign Currency Contracts | | $ | 0 | | | $ | 0 | | | $ | 0 | | | $ | 205 | | | $ | 0 | | | $ | 205 | |
| | | | |
| | $ | 0 | | | $ | 9 | | | $ | 0 | | | $ | 205 | | | $ | 0 | | | $ | 214 | |
| | | | |
The effect of Financial Derivative Instruments on the Statements of Operations for the period ended June 30, 2017:
| | | | | | | | | | | | | | | | | | | | | | | | |
| | | Derivatives not accounted for as hedging instruments | |
| | | Commodity
Contracts | | | Credit
Contracts | | | Equity
Contracts | | | Foreign
Exchange
Contracts | | | Interest
Rate Contracts | | | Total | |
Net Realized Gain (Loss) on Financial Derivative Instruments | | | | | | | | | | | | | | | | | | | | | |
Exchange-traded or centrally cleared | | | | | | | | | | | | | | | | | | | | | | | | |
Purchased Options | | $ | 0 | | | $ | 0 | | | $ | 0 | | | $ | 0 | | | $ | (2 | ) | | $ | (2 | ) |
Futures | | | 0 | | | | 0 | | | | 0 | | | | 0 | | | | (49 | ) | | | (49 | ) |
Swap Agreements | | | 0 | | | | (407 | ) | | | 0 | | | | 0 | | | | (456 | ) | | | (863 | ) |
| | | | |
| | $ | 0 | | | $ | (407 | ) | | $ | 0 | | | $ | 0 | | | $ | (507 | ) | | $ | (914 | ) |
| | | | |
Over the counter | |
Forward Foreign Currency Contracts | | $ | 0 | | | $ | 0 | | | $ | 0 | | | $ | 61 | | | $ | 0 | | | $ | 61 | |
Purchased Options | | | 0 | | | | 0 | | | | 0 | | | | 0 | | | | 132 | | | | 132 | |
Written Options | | | 0 | | | | 11 | | | | 0 | | | | 5 | | | | (138 | ) | | | (122 | ) |
| | | | |
| | $ | 0 | | | $ | 11 | | | $ | 0 | | | $ | 66 | | | $ | (6 | ) | | $ | 71 | |
| | | | |
| | $ | 0 | | | $ | (396 | ) | | $ | 0 | | | $ | 66 | | | $ | (513 | ) | | $ | (843 | ) |
| | | | |
| | | | | | |
| See Accompanying Notes | | ANNUAL REPORT | | JUNE 30, 2017 | | 65 |
Schedule of Investments PIMCO Enhanced Low Duration Active Exchange-Traded Fund (Cont.)
June 30, 2017
| | | | | | | | | | | | | | | | | | | | | | | | |
| | | Derivatives not accounted for as hedging instruments | |
| | | Commodity
Contracts | | | Credit
Contracts | | | Equity
Contracts | | | Foreign
Exchange
Contracts | | | Interest
Rate Contracts | | | Total | |
Net Change in Unrealized Appreciation (Depreciation) on Financial Derivative Instruments | | | | | | | | | | | | | |
Exchange-traded or centrally cleared | |
Futures | | $ | 0 | | | $ | 0 | | | $ | 0 | | | $ | 0 | | | $ | 214 | | | $ | 214 | |
Swap Agreements | | | 0 | | | | (14 | ) | | | 0 | | | | 0 | | | | 181 | | | | 167 | |
| | | | |
| | $ | 0 | | | $ | (14 | ) | | $ | 0 | | | $ | 0 | | | $ | 395 | | | $ | 381 | |
| | | | |
Over the counter | |
Forward Foreign Currency Contracts | | $ | 0 | | | $ | 0 | | | $ | 0 | | | $ | (199 | ) | | $ | 0 | | | $ | (199 | ) |
Written Options | | | 0 | | | | (9 | ) | | | 0 | | | | 0 | | | | 0 | | | | (9 | ) |
| | | | |
| | $ | 0 | | | $ | (9 | ) | | $ | 0 | | | $ | (199 | ) | | $ | 0 | | | $ | (208 | ) |
| | | | |
| | $ | 0 | | | $ | (23 | ) | | $ | 0 | | | $ | (199 | ) | | $ | 395 | | | $ | 173 | |
| | | | |
FAIR VALUE MEASUREMENTS
The following is a summary of the fair valuations according to the inputs used as of June 30, 2017 in valuing the Fund’s assets and liabilities:
| | | | | | | | | | | | | | | | |
| Category and Subcategory | | Level 1 | | | Level 2 | | | Level 3 | | | Fair
Value at
06/30/2017 | |
Investments in Securities, at Value | | | | | | | | | | | | | | | | |
Corporate Bonds & Notes | | | | | | | | | | | | | | | | |
Banking & Finance | | $ | 0 | | | $ | 27,425 | | | $ | 0 | | | $ | 27,425 | |
Industrials | | | 0 | | | | 26,978 | | | | 0 | | | | 26,978 | |
Utilities | | | 0 | | | | 8,374 | | | | 0 | | | | 8,374 | |
Municipal Bonds & Notes | | | | | | | | | | | | | | | | |
California | | | 0 | | | | 503 | | | | 0 | | | | 503 | |
Kansas | | | 0 | | | | 504 | | | | 0 | | | | 504 | |
U.S. Government Agencies | | | 0 | | | | 3,646 | | | | 0 | | | | 3,646 | |
U.S. Treasury Obligations | | | 0 | | | | 54,394 | | | | 0 | | | | 54,394 | |
Non-Agency Mortgage-Backed Securities | | | 0 | | | | 3,630 | | | | 0 | | | | 3,630 | |
Asset-Backed Securities | | | 0 | | | | 12,696 | | | | 0 | | | | 12,696 | |
Sovereign Issues | | | 0 | | | | 823 | | | | 0 | | | | 823 | |
Short-Term Instruments | | | | | | | | | | | | | | | | |
Commercial Paper | | | 0 | | | | 591 | | | | 0 | | | | 591 | |
Repurchase Agreements | | | 0 | | | | 1,152 | | | | 0 | | | | 1,152 | |
Short-Term Notes | | | 0 | | | | 100 | | | | 0 | | | | 100 | |
Argentina Treasury Bills | | | 0 | | | | 693 | | | | 0 | | | | 693 | |
| | | | |
| | | | |
Total Investments | | $ | 0 | | | $ | 141,509 | | | $ | 0 | | | $ | 141,509 | |
| | | | |
| | | | | | | | | | | | | | | | |
| Category and Subcategory | | Level 1 | | | Level 2 | | | Level 3 | | | Fair
Value at
06/30/2017 | |
Financial Derivative Instruments - Assets | | | | | | | | | | | | | |
Exchange-traded or centrally cleared | | $ | 35 | | | $ | 0 | | | $ | 0 | | | $ | 35 | |
Over the counter | | | 0 | | | | 100 | | | | 0 | | | | 100 | |
| | | | |
| | $ | 35 | | | $ | 100 | | | $ | 0 | | | $ | 135 | |
| | | | |
|
Financial Derivative Instruments - Liabilities | |
Exchange-traded or centrally cleared | | | 0 | | | | (9 | ) | | | 0 | | | | (9 | ) |
Over the counter | | | 0 | | | | (205 | ) | | | 0 | | | | (205 | ) |
| | | | |
| | $ | 0 | | | $ | (214 | ) | | $ | 0 | | | $ | (214 | ) |
| | | | |
| | | | |
Total Financial Derivative Instruments | | $ | 35 | | | $ | (114 | ) | | $ | 0 | | | $ | (79 | ) |
| | | | |
| | | | |
Totals | | $ | 35 | | | $ | 141,395 | | | $ | 0 | | | $ | 141,430 | |
| | | | |
There were no significant transfers among Levels 1, 2, or 3 during the period ended June 30, 2017.
| | | | | | | | |
| 66 | | PIMCO ETF TRUST | | | | | See Accompanying Notes | |
Schedule of Investments PIMCO Enhanced Short Maturity Active Exchange-Traded Fund
June 30, 2017
| | | | | | | | | | | | |
| | | | | PRINCIPAL
AMOUNT
(000S) | | | | | MARKET
VALUE
(000S) | |
| INVESTMENTS IN SECURITIES 100.9% | |
| |
| CORPORATE BONDS & NOTES 60.6% | |
| |
| BANKING & FINANCE 31.5% | |
ADCB Finance Cayman Ltd. | |
3.000% due 03/04/2019 | | $ | | | 9,000 | | | $ | | | 9,099 | |
AerCap Ireland Capital DAC | |
3.750% due 05/15/2019 | | | | | 1,700 | | | | | | 1,747 | |
AIA Group Ltd. | |
1.750% due 03/13/2018 | | | | | 8,300 | | | | | | 8,283 | |
Air Lease Corp. | |
2.125% due 01/15/2018 | | | | | 23,647 | | | | | | 23,692 | |
American Express Credit Corp. | |
1.502% due 05/03/2019 | | | | | 3,000 | | | | | | 3,009 | |
1.587% due 09/22/2017 | | | | | 3,000 | | | | | | 3,001 | |
2.292% due 09/14/2020 | | | | | 8,900 | | | | | | 9,060 | |
American Honda Finance Corp. | |
1.831% due 09/09/2021 | | | | | 3,500 | | | | | | 3,545 | |
American International Group, Inc. | |
5.850% due 01/16/2018 | | | | | 417 | | | | | | 426 | |
American Tower Corp. | |
4.500% due 01/15/2018 | | | | | 6,403 | | | | | | 6,492 | |
Athene Global Funding | |
2.296% due 04/20/2020 | | | | | 24,700 | | | | | | 24,765 | |
2.529% due 07/01/2022 (a) | | | | | 22,300 | | | | | | 22,433 | |
Aviation Capital Group Corp. | |
2.875% due 09/17/2018 | | | | | 20,100 | | | | | | 20,300 | |
4.625% due 01/31/2018 | | | | | 21,265 | | | | | | 21,597 | |
Banco de Credito e Inversiones | |
3.000% due 09/13/2017 | | | | | 8,000 | | | | | | 8,002 | |
Banco del Estado de Chile | |
2.000% due 11/09/2017 | | | | | 2,000 | | | | | | 2,001 | |
Banco Santander Chile | |
3.095% due 06/07/2018 | | | | | 2,000 | | | | | | 2,030 | |
Bangkok Bank PCL | |
3.300% due 10/03/2018 | | | | | 8,750 | | | | | | 8,879 | |
Bank of America Corp. | |
1.799% due 08/25/2017 | | | | | 24,000 | | | | | | 24,016 | |
2.198% due 01/15/2019 | | | | | 13,783 | | | | | | 13,959 | |
5.650% due 05/01/2018 | | | | | 5,000 | | | | | | 5,158 | |
6.875% due 04/25/2018 | | | | | 20,675 | | | | | | 21,519 | |
Bank of Tokyo-Mitsubishi UFJ Ltd. | |
1.768% due 03/05/2018 | | | | | 20,500 | | | | | | 20,548 | |
2.262% due 09/14/2018 | | | | | 31,400 | | | | | | 31,673 | |
Barclays PLC | |
2.000% due 03/16/2018 | | | | | 37,000 | | | | | | 37,065 | |
Bayer U.S. Finance LLC | |
1.500% due 10/06/2017 | | | | | 1,000 | | | | | | 1,000 | |
1.579% due 10/06/2017 | | | | | 10,000 | | | | | | 10,002 | |
Bear Stearns Cos. LLC | |
6.400% due 10/02/2017 | | | | | 2,000 | | | | | | 2,023 | |
BNZ International Funding Ltd. | |
2.400% due 02/21/2020 | | | | | 2,500 | | | | | | 2,511 | |
BOC Aviation Ltd. | |
2.875% due 10/10/2017 | | | | | 4,682 | | | | | | 4,692 | |
Brandywine Operating Partnership LP | |
4.950% due 04/15/2018 | | | | | 1,400 | | | | | | 1,431 | |
Canadian Imperial Bank of Commerce | |
1.743% due 09/06/2019 | | | | | 1,860 | | | | | | 1,869 | |
CDP Financial, Inc. | |
4.400% due 11/25/2019 | | | | | 18,000 | | | | | | 19,029 | |
Citigroup, Inc. | |
2.052% due 07/30/2018 | | | | | 34,700 | | | | | | 34,934 | |
2.150% due 06/07/2019 | | | | | 19,300 | | | | | | 19,485 | |
2.360% due 08/02/2021 | | | | | 8,200 | | | | | | 8,333 | |
2.477% due 10/26/2020 | | | | | 11,200 | | | | | | 11,430 | |
2.676% due 03/30/2021 | | | | | 27,000 | | | | | | 27,625 | |
Commerzbank AG | |
1.157% due 09/20/2017 | | | | | 4,150 | | | | | | 4,142 | |
Cooperatieve Rabobank UA | |
1.985% due 01/10/2022 | | | | | 45,000 | | | | | | 45,511 | |
Credit Suisse Group Funding Guernsey Ltd. | |
3.448% due 04/16/2021 | | | | | 16,900 | | | | | | 17,740 | |
| | | | | | | | | | | | |
| | | | | PRINCIPAL
AMOUNT
(000S) | | | | | MARKET
VALUE
(000S) | |
Daegu Bank | |
2.250% due 04/29/2018 | | $ | | | 2,000 | | | $ | | | 2,003 | |
Danske Bank A/S | |
1.720% due 03/02/2020 | | | | | 10,000 | | | | | | 10,024 | |
DBS Group Holdings Ltd. | |
1.658% due 07/16/2019 | | | | | 11,400 | | | | | | 11,398 | |
1.709% due 06/08/2020 | | | | | 9,000 | | | | | | 9,032 | |
DDR Corp. | |
4.750% due 04/15/2018 | | | | | 680 | | | | | | 693 | |
Dexia Credit Local S.A. | |
1.875% due 03/28/2019 | | | | | 20,170 | | | | | | 20,161 | |
2.250% due 01/30/2019 | | | | | 40,700 | | | | | | 40,971 | |
Discover Bank | |
2.000% due 02/21/2018 | | | | | 34,465 | | | | | | 34,513 | |
Erste Abwicklungsanstalt | |
1.250% due 03/15/2018 | | | | | 8,000 | | | | | | 7,981 | |
Ford Motor Credit Co. LLC | |
1.897% due 08/12/2019 | | | | | 5,745 | | | | | | 5,704 | |
2.058% due 03/12/2019 | | | | | 14,700 | | | | | | 14,740 | |
2.095% due 01/09/2018 | | | | | 40,400 | | | | | | 40,527 | |
2.104% due 11/04/2019 | | | | | 830 | | | | | | 834 | |
2.146% due 06/15/2018 | | | | | 12,300 | | | | | | 12,361 | |
2.155% due 01/09/2020 | | | | | 14,900 | | | | | | 15,011 | |
2.735% due 01/08/2019 | | | | | 7,400 | | | | | | 7,504 | |
General Motors Financial Co., Inc. | |
2.400% due 04/10/2018 | | | | | 9,835 | | | | | | 9,874 | |
2.515% due 04/10/2018 | | | | | 22,250 | | | | | | 22,415 | |
2.718% due 01/15/2020 | | | | | 23,900 | | | | | | 24,361 | |
3.000% due 09/25/2017 | | | | | 5,745 | | | | | | 5,762 | |
3.250% due 05/15/2018 | | | | | 11,200 | | | | | | 11,334 | |
4.750% due 08/15/2017 | | | | | 21,691 | | | | | | 21,766 | |
6.750% due 06/01/2018 | | | | | 865 | | | | | | 903 | |
Goldman Sachs Group, Inc. | |
2.023% due 12/27/2020 | | | | | 4,866 | | | | | | 4,876 | |
2.277% due 04/26/2022 | | | | | 20,000 | | | | | | 20,163 | |
2.352% due 11/15/2021 | | | | | 27,625 | | | | | | 27,895 | |
2.446% due 09/15/2020 | | | | | 16,150 | | | | | | 16,435 | |
2.516% due 04/23/2021 | | | | | 6,656 | | | | | | 6,786 | |
6.150% due 04/01/2018 | | | | | 4,148 | | | | | | 4,282 | |
Harley-Davidson Financial Services, Inc. | |
1.569% due 03/08/2019 | | | | | 5,800 | | | | | | 5,810 | |
HDFC Bank Ltd. | |
3.000% due 03/06/2018 | | | | | 3,300 | | | | | | 3,319 | |
Hospitality Properties Trust | |
6.700% due 01/15/2018 | | | | | 6,500 | | | | | | 6,527 | |
HSBC Bank PLC | |
1.500% due 05/15/2018 | | | | | 1,000 | | | | | | 999 | |
HSBC Holdings PLC | |
2.849% due 05/25/2021 | | | | | 55,000 | | | | | | 56,927 | |
3.459% due 03/08/2021 | | | | | 7,000 | | | | | | 7,381 | |
HSBC USA, Inc. | |
1.625% due 01/16/2018 | | | | | 3,500 | | | | | | 3,502 | |
1.700% due 03/05/2018 | | | | | 2,275 | | | | | | 2,276 | |
Hutchison Whampoa Finance CI Ltd. | |
7.450% due 08/01/2017 | | | | | 1,400 | | | | | | 1,406 | |
Hutchison Whampoa International Ltd. | |
1.625% due 10/31/2017 | | | | | 10,800 | | | | | | 10,781 | |
Hyundai Capital Services, Inc. | |
3.500% due 09/13/2017 | | | | | 2,500 | | | | | | 2,509 | |
ICICI Bank Ltd. | |
4.700% due 02/21/2018 | | | | | 23,524 | | | | | | 23,920 | |
4.800% due 05/22/2019 | | | | | 14,650 | | | | | | 15,271 | |
Indian Railway Finance Corp. Ltd. | |
3.417% due 10/10/2017 | | | | | 600 | | | | | | 602 | |
Industrial Bank of Korea | |
2.375% due 07/17/2017 | | | | | 2,300 | | | | | | 2,300 | |
ING Bank NV | |
1.989% due 10/01/2019 | | | | | 24,225 | | | | | | 24,357 | |
International Lease Finance Corp. | |
3.875% due 04/15/2018 | | | | | 2,000 | | | | | | 2,031 | |
5.875% due 04/01/2019 | | | | | 3,200 | | | | | | 3,400 | |
6.250% due 05/15/2019 | | | | | 2,400 | | | | | | 2,575 | |
7.125% due 09/01/2018 | | | | | 1,013 | | | | | | 1,072 | |
8.875% due 09/01/2017 | | | | | 8,000 | | | | | | 8,108 | |
| | | | | | | | | | | | |
| | | | | PRINCIPAL
AMOUNT
(000S) | | | | | MARKET
VALUE
(000S) | |
Jackson National Life Global Funding | |
2.023% due 06/27/2022 | | $ | | | 34,000 | | | $ | | | 34,237 | |
JPMorgan Chase & Co. | |
1.712% due 03/01/2018 | | | | | 11,000 | | | | | | 11,028 | |
1.882% due 06/01/2021 | | | | | 2,600 | | | | | | 2,605 | |
2.682% due 03/01/2021 | | | | | 12,145 | | | | | | 12,529 | |
KEB Hana Bank | |
2.000% due 04/02/2018 | | | | | 3,000 | | | | | | 2,997 | |
3.500% due 10/25/2017 | | | | | 11,393 | | | | | | 11,455 | |
Kookmin Bank | |
1.625% due 07/14/2017 | | | | | 2,700 | | | | | | 2,700 | |
LeasePlan Corp. NV | |
2.500% due 05/16/2018 | | | | | 33,289 | | | | | | 33,386 | |
2.875% due 01/22/2019 | | | | | 23,600 | | | | | | 23,684 | |
3.000% due 10/23/2017 | | | | | 34,476 | | | | | | 34,585 | |
Lloyds Bank PLC | |
1.750% due 05/14/2018 | | | | | 10,000 | | | | | | 10,015 | |
Macquarie Bank Ltd. | |
1.797% due 10/27/2017 | | | | | 2,610 | | | | | | 2,615 | |
2.292% due 07/29/2020 | | | | | 51,650 | | | | | | 52,372 | |
Macquarie Group Ltd. | |
4.875% due 08/10/2017 | | | | | 1,550 | | | | | | 1,555 | |
7.625% due 08/13/2019 | | | | | 2,000 | | | | | | 2,215 | |
Mitsubishi UFJ Lease & Finance Co. Ltd. | |
1.928% due 07/23/2019 | | | | | 15,552 | | | | | | 15,565 | |
2.000% due 02/28/2018 | | | | | 8,900 | | | | | | 8,926 | |
2.097% due 02/20/2019 | | | | | 5,400 | | | | | | 5,421 | |
Mitsubishi UFJ Trust & Banking Corp. | |
1.600% due 10/16/2017 | | | | | 2,858 | | | | | | 2,859 | |
1.680% due 06/20/2018 | | | | | 7,300 | | | | | | 7,287 | |
Mizuho Bank Ltd. | |
2.346% due 10/20/2018 | | | | | 18,572 | | | | | | 18,767 | |
Mizuho Financial Group, Inc. | |
2.376% due 09/13/2021 | | | | | 3,455 | | | | | | 3,506 | |
2.636% due 04/12/2021 | | | | | 21,900 | | | | | | 22,443 | |
Morgan Stanley | |
1.893% due 07/23/2019 | | | | | 10,113 | | | | | | 10,187 | |
6.250% due 08/28/2017 | | | | | 7,800 | | | | | | 7,855 | |
MUFG Americas Holdings Corp. | |
1.750% due 02/09/2018 | | | | | 16,500 | | | | | | 16,507 | |
National Bank of Canada | |
1.758% due 01/17/2020 | | | | | 8,500 | | | | | | 8,530 | |
NRW Bank | |
1.352% due 02/11/2019 | | | | | 12,000 | | | | | | 12,028 | |
NTT Finance Corp. | |
1.500% due 07/25/2017 | | | | | 27,400 | | | | | | 27,401 | |
Protective Life Global Funding | |
1.575% due 03/29/2019 | | | | | 4,900 | | | | | | 4,907 | |
QBE Insurance Group Ltd. | |
2.400% due 05/01/2018 | | | | | 15,055 | | | | | | 15,071 | |
QNB Finance Ltd. | |
2.125% due 02/14/2018 | | | | | 3,800 | | | | | | 3,786 | |
2.224% due 05/04/2018 | | | | | 6,500 | | | | | | 6,489 | |
2.572% due 05/20/2018 | | | | | 1,100 | | | | | | 1,099 | |
2.750% due 10/31/2018 | | | | | 6,443 | | | | | | 6,428 | |
RCI Banque S.A. | |
3.500% due 04/03/2018 | | | | | 46,115 | | | | | | 46,660 | |
Reliance Standard Life Global Funding | |
2.500% due 04/24/2019 | | | | | 7,300 | | | | | | 7,351 | |
Royal Bank of Scotland Group PLC | |
2.652% due 05/15/2023 | | | | | 34,000 | | | | | | 34,299 | |
Santander Bank N.A. | |
2.000% due 01/12/2018 | | | | | 1,440 | | | | | | 1,440 | |
Santander Holdings USA, Inc. | |
2.642% due 11/24/2017 | | | | | 30,255 | | | | | | 30,377 | |
3.450% due 08/27/2018 | | | | | 6,304 | | | | | | 6,394 | |
Santander UK PLC | |
2.042% due 08/24/2018 | | | | | 11,463 | | | | | | 11,538 | |
2.722% due 03/14/2019 | | | | | 11,200 | | | | | | 11,406 | |
Shinhan Bank | |
4.375% due 07/27/2017 | | | | | 7,100 | | | | | | 7,109 | |
Standard Chartered PLC | |
1.500% due 09/08/2017 | | | | | 9,690 | | | | | | 9,694 | |
1.559% due 09/08/2017 | | | | | 11,000 | | | | | | 10,999 | |
| | | | | | |
| See Accompanying Notes | | ANNUAL REPORT | | JUNE 30, 2017 | | 67 |
Schedule of Investments PIMCO Enhanced Short Maturity Active Exchange-Traded Fund (Cont.)
| | | | | | | | | | | | |
| | | | | PRINCIPAL
AMOUNT
(000S) | | | | | MARKET
VALUE (000S) | |
1.700% due 04/17/2018 | | $ | | | 5,000 | | | $ | | | 4,998 | |
1.798% due 04/17/2018 | | | | | 10,500 | | | | | | 10,528 | |
2.308% due 08/19/2019 | | | | | 15,500 | | | | | | 15,651 | |
State Bank of India | |
2.100% due 04/06/2020 | | | | | 32,700 | | | | | | 32,700 | |
3.250% due 04/18/2018 | | | | | 20,015 | | | | | | 20,213 | |
3.622% due 04/17/2019 | | | | | 4,293 | | | | | | 4,373 | |
4.125% due 08/01/2017 | | | | | 4,000 | | | | | | 4,005 | |
Sumitomo Mitsui Banking Corp. | |
1.698% due 01/11/2019 | | | | | 33,000 | | | | | | 33,101 | |
Sumitomo Mitsui Trust Bank Ltd. | |
1.733% due 03/06/2019 | | | | | 54,000 | | | | | | 54,018 | |
SunTrust Bank | |
1.700% due 01/31/2020 | | | | | 3,000 | | | | | | 3,020 | |
Svenska Handelsbanken AB | |
1.757% due 06/17/2019 | | | | | 10,950 | | | | | | 11,002 | |
Synchrony Financial | |
1.875% due 08/15/2017 | | | | | 1,000 | | | | | | 1,000 | |
2.402% due 02/03/2020 | | | | | 12,000 | | | | | | 12,095 | |
2.580% due 11/09/2017 | | | | | 55,950 | | | | | | 56,130 | |
Toyota Motor Credit Corp. | |
1.848% due 01/11/2022 | | | | | 21,500 | | | | | | 21,810 | |
UBS AG | |
1.799% due 06/08/2020 | | | | | 9,000 | | | | | | 9,018 | |
1.822% due 08/14/2019 | | | | | 32,600 | | | | | | 32,763 | |
UBS Group Funding Switzerland AG | |
2.938% due 04/14/2021 | | | | | 28,300 | | | | | | 29,320 | |
Ventas Realty LP | |
2.000% due 02/15/2018 | | | | | 10,089 | | | | | | 10,104 | |
Vonovia Finance BV | |
3.200% due 10/02/2017 | | | | | 30,003 | | | | | | 30,076 | |
Voya Financial, Inc. | |
2.900% due 02/15/2018 | | | | | 22,543 | | | | | | 22,699 | |
WEA Finance LLC | |
1.750% due 09/15/2017 | | | | | 34,104 | | | | | | 34,106 | |
2.700% due 09/17/2019 | | | | | 10,461 | | | | | | 10,553 | |
Wells Fargo & Co. | |
1.613% due 04/22/2019 | | | | | 11,500 | | | | | | 11,555 | |
2.558% due 03/04/2021 | | | | | 4,000 | | | | | | 4,117 | |
Wells Fargo Bank N.A. | |
1.700% due 11/28/2018 | | | | | 9,000 | | | | | | 9,040 | |
1.770% due 09/07/2017 | | | | | 6,784 | | | | | | 6,790 | |
1.893% due 01/22/2018 | | | | | 6,200 | | | | | | 6,223 | |
Weyerhaeuser Co. | |
6.950% due 08/01/2017 | | | | | 8,099 | | | | | | 8,129 | |
| | | | | | | | | | | | |
| | | | | | | | | | | 2,268,882 | |
| | | | | | | | | | | | |
| |
| INDUSTRIALS 22.0% | |
Abu Dhabi National Energy Co. PJSC | |
2.500% due 01/12/2018 | | | | | 8,000 | | | | | | 8,019 | |
Allergan Funding SCS | |
2.308% due 03/12/2018 | | | | | 25,154 | | | | | | 25,292 | |
2.483% due 03/12/2020 | | | | | 68,841 | | | | | | 70,402 | |
Ameritech Capital Funding Corp. | |
6.450% due 01/15/2018 | | | | | 1,563 | | | | | | 1,602 | |
Amgen, Inc. | |
1.502% due 05/10/2019 | | | | | 5,000 | | | | | | 5,015 | |
Anheuser-Busch InBev Finance, Inc. | |
2.430% due 02/01/2021 | | | | | 30,300 | | | | | | 31,397 | |
Anstock Ltd. | |
2.125% due 07/24/2017 | | | | | 1,460 | | | | | | 1,460 | |
Asciano Finance Ltd. | |
5.000% due 04/07/2018 | | | | | 1,800 | | | | | | 1,833 | |
Baidu, Inc. | |
2.250% due 11/28/2017 | | | | | 5,100 | | | | | | 5,112 | |
3.250% due 08/06/2018 | | | | | 14,000 | | | | | | 14,178 | |
BAT International Finance PLC | |
1.756% due 06/15/2018 | | | | | 14,790 | | | | | | 14,832 | |
Baxalta, Inc. | |
2.067% due 06/22/2018 | | | | | 10,500 | | | | | | 10,553 | |
BMW U.S. Capital LLC | |
1.939% due 04/06/2022 | | | | | 6,234 | | | | | | 6,279 | |
| | | | | | | | | | | | |
| | | | | PRINCIPAL
AMOUNT
(000S) | | | | | MARKET
VALUE
(000S) | |
Canadian Natural Resources Ltd. | |
1.750% due 01/15/2018 | | $ | | | 4,500 | | | $ | | | 4,500 | |
Caterpillar Financial Services Corp. | |
1.665% due 01/10/2020 | | | | | 26,500 | | | | | | 26,669 | |
Central Nippon Expressway Co. Ltd. | |
2.028% due 03/03/2022 | | | | | 35,060 | | | | | | 35,174 | |
2.092% due 09/14/2021 | | | | | 16,450 | | | | | | 16,558 | |
2.150% due 02/16/2021 | | | | | 1,000 | | | | | | 1,002 | |
2.200% due 05/28/2021 | | | | | 28,000 | | | | | | 28,337 | |
2.223% due 04/23/2021 | | | | | 4,570 | | | | | | 4,623 | |
2.369% due 09/10/2018 | | | | | 16,085 | | | | | | 16,148 | |
Chevron Corp. | |
1.698% due 03/03/2022 | | | | | 12,100 | | | | | | 12,170 | |
1.712% due 11/15/2021 | | | | | 992 | | | | | | 997 | |
CNPC General Capital Ltd. | |
1.950% due 11/25/2017 | | | | | 23,454 | | | | | | 23,478 | |
1.950% due 04/16/2018 | | | | | 1,310 | | | | | | 1,309 | |
2.084% due 11/25/2017 | | | | | 12,700 | | | | | | 12,736 | |
ConocoPhillips Co. | |
1.512% due 05/15/2018 | | | | | 3,628 | | | | | | 3,635 | |
2.082% due 05/15/2022 | | | | | 20,779 | | | | | | 21,241 | |
D.R. Horton, Inc. | |
3.625% due 02/15/2018 | | | | | 3,925 | | | | | | 3,950 | |
Daimler Finance North America LLC | |
1.421% due 11/05/2018 | | | | | 2,000 | | | | | | 2,000 | |
1.631% due 05/18/2018 | | | | | 6,270 | | | | | | 6,285 | |
1.650% due 03/02/2018 | | | | | 11,180 | | | | | | 11,187 | |
1.701% due 05/05/2020 | | | | | 6,500 | | | | | | 6,515 | |
1.792% due 10/30/2019 | | | | | 32,106 | | | | | | 32,256 | |
2.030% due 08/01/2018 | | | | | 8,800 | | | | | | 8,855 | |
2.039% due 07/05/2019 | | | | | 47,000 | | | | | | 47,413 | |
2.375% due 08/01/2018 | | | | | 4,109 | | | | | | 4,136 | |
Dell International LLC | |
3.480% due 06/01/2019 | | | | | 31,900 | | | | | | 32,662 | |
Deutsche Telekom International Finance BV | |
1.717% due 09/19/2019 | | | | | 10,475 | | | | | | 10,483 | |
1.738% due 01/17/2020 | | | | | 3,300 | | | | | | 3,310 | |
DXC Technology Co | |
2.875% due 03/27/2020 | | | | | 4,700 | | | | | | 4,762 | |
eBay, Inc. | |
1.350% due 07/15/2017 | | | | | 24,194 | | | | | | 24,191 | |
1.650% due 08/01/2019 | | | | | 29,483 | | | | | | 29,567 | |
Enbridge, Inc. | |
1.946% due 06/15/2020 | | | | | 12,800 | | | | | | 12,798 | |
Energy Transfer LP | |
2.500% due 06/15/2018 | | | | | 8,769 | | | | | | 8,814 | |
Enterprise Products Operating LLC | |
1.650% due 05/07/2018 | | | | | 1,300 | | | | | | 1,299 | |
6.300% due 09/15/2017 | | | | | 25,891 | | | | | | 26,118 | |
6.650% due 04/15/2018 | | | | | 4,000 | | | | | | 4,147 | |
EQT Corp. | |
6.500% due 04/01/2018 | | | | | 16,641 | | | | | | 17,188 | |
FMC Technologies, Inc. | |
2.000% due 10/01/2017 | | | | | 250 | | | | | | 250 | |
General Motors Co. | |
3.500% due 10/02/2018 | | | | | 2,000 | | | | | | 2,036 | |
Harvest Operations Corp. | |
2.125% due 05/14/2018 | | | | | 4,600 | | | | | | 4,601 | |
Hewlett Packard Enterprise Co. | |
2.850% due 10/05/2018 | | | | | 6,300 | | | | | | 6,356 | |
3.229% due 10/05/2018 | | | | | 17,750 | | | | | | 18,091 | |
HPHT Finance Ltd. | |
2.250% due 03/17/2018 | | | | | 3,610 | | | | | | 3,609 | |
Hyundai Capital America | |
2.000% due 03/19/2018 | | | | | 1,563 | | | | | | 1,564 | |
2.099% due 04/03/2020 | | | | | 1,200 | | | | | | 1,204 | |
2.125% due 10/02/2017 | | | | | 9,411 | | | | | | 9,418 | |
2.875% due 08/09/2018 | | | | | 2,100 | | | | | | 2,118 | |
Imperial Brands Finance PLC | |
2.050% due 02/11/2018 | | | | | 55,990 | | | | | | 56,071 | |
2.050% due 07/20/2018 | | | | | 7,448 | | | | | | 7,453 | |
Intel Corp. | |
1.532% due 05/11/2022 | | | | | 5,500 | | | | | | 5,508 | |
Kinder Morgan Energy Partners LP | |
5.950% due 02/15/2018 | | | | | 3,025 | | | | | | 3,100 | |
| | | | | | | | | | | | |
| | | | | PRINCIPAL
AMOUNT
(000S) | | | | | MARKET
VALUE
(000S) | |
Kinder Morgan, Inc. | |
2.000% due 12/01/2017 | | $ | | | 20,629 | | | $ | | | 20,642 | |
7.250% due 06/01/2018 | | | | | 2,751 | | | | | | 2,880 | |
KLA-Tencor Corp. | |
2.375% due 11/01/2017 | | | | | 25,800 | | | | | | 25,862 | |
Kraft Heinz Foods Co. | |
6.125% due 08/23/2018 | | | | | 13,500 | | | | | | 14,146 | |
Martin Marietta Materials, Inc. | |
1.822% due 05/22/2020 | | | | | 7,000 | | | | | | 7,022 | |
Minera y Metalurgica del Boleo S.A. de C.V. | |
2.875% due 05/07/2019 | | | | | 7,499 | | | | | | 7,574 | |
Mitsubishi Corp. | |
1.875% due 07/13/2017 | | | | | 2,100 | | | | | | 2,100 | |
Mondelez International Holdings Netherlands BV | |
1.782% due 10/28/2019 | | | | | 8,000 | | | | | | 8,035 | |
Mylan NV | |
3.000% due 12/15/2018 | | | | | 5,810 | | | | | | 5,891 | |
NetApp, Inc. | |
2.000% due 12/15/2017 | | | | | 28,500 | | | | | | 28,540 | |
Nissan Motor Acceptance Corp. | |
1.756% due 09/13/2019 | | | | | 32,900 | | | | | | 33,018 | |
1.950% due 09/12/2017 | | | | | 2,500 | | | | | | 2,501 | |
2.045% due 01/13/2022 | | | | | 40,855 | | | | | | 41,276 | |
2.099% due 04/06/2018 | | | | | 8,000 | | | | | | 8,037 | |
2.229% due 03/08/2019 | | | | | 6,500 | | | | | | 6,567 | |
Ooredoo Tamweel Ltd. | |
3.039% due 12/03/2018 | | | | | 3,442 | | | | | | 3,445 | |
Penske Truck Leasing Co. LP | |
3.375% due 03/15/2018 | | | | | 4,728 | | | | | | 4,782 | |
Pentair Finance S.A. | |
1.875% due 09/15/2017 | | | | | 5,172 | | | | | | 5,174 | |
Petroleos Mexicanos | |
3.125% due 01/23/2019 | | | | | 3,435 | | | | | | 3,468 | |
3.178% due 07/18/2018 | | | | | 12,900 | | | | | | 13,061 | |
3.500% due 07/18/2018 | | | | | 1,431 | | | | | | 1,452 | |
5.750% due 03/01/2018 | | | | | 78,143 | | | | | | 80,032 | |
9.250% due 03/30/2018 | | | | | 5,981 | | | | | | 6,271 | |
Petronas Capital Ltd. | |
5.250% due 08/12/2019 | | | | | 5,500 | | | | | | 5,855 | |
Phillips 66 | |
1.786% due 04/15/2019 | | | | | 4,400 | | | | | | 4,411 | |
Pioneer Natural Resources Co. | |
6.875% due 05/01/2018 | | | | | 5,300 | | | | | | 5,513 | |
QUALCOMM, Inc. | |
1.722% due 05/20/2020 | | | | | 12,000 | | | | | | 12,089 | |
1.928% due 01/30/2023 | | | | | 15,000 | | | | | | 15,092 | |
Reckitt Benckiser Treasury Services PLC | |
1.856% due 06/24/2022 | | | | | 30,700 | | | | | | 30,752 | |
Reynolds American, Inc. | |
2.300% due 08/21/2017 | | | | | 5,859 | | | | | | 5,865 | |
SK Broadband Co. Ltd. | |
2.875% due 10/29/2018 | | | | | 2,220 | | | | | | 2,237 | |
SK Telecom Co. Ltd. | |
2.125% due 05/01/2018 | | | | | 14,100 | | | | | | 14,108 | |
Southern Co. | |
1.993% due 09/30/2020 | | | | | 2,700 | | | | | | 2,713 | |
Spectra Energy Partners LP | |
1.920% due 06/05/2020 | | | | | 11,000 | | | | | | 11,048 | |
Suntory Holdings Ltd. | |
1.650% due 09/29/2017 | | | | | 21,788 | | | | | | 21,791 | |
Telefonica Emisiones S.A.U. | |
3.192% due 04/27/2018 | | | | | 78,770 | | | | | | 79,620 | |
6.221% due 07/03/2017 | | | | | 40,535 | | | | | | 40,535 | |
Tencent Holdings Ltd. | |
3.375% due 03/05/2018 | | | | | 1,705 | | | | | | 1,722 | |
3.375% due 05/02/2019 | | | | | 5,071 | | | | | | 5,190 | |
Time Warner Cable LLC | |
6.750% due 07/01/2018 | | | | | 14,176 | | | | | | 14,835 | |
8.250% due 04/01/2019 | | | | | 2,100 | | | | | | 2,318 | |
Tyson Foods, Inc. | |
1.649% due 05/30/2019 | | | | | 5,200 | | | | | | 5,213 | |
1.760% due 06/02/2020 | | | | | 9,000 | | | | | | 9,045 | |
Volkswagen Group of America Finance LLC | |
1.600% due 11/20/2017 | | | | | 7,860 | | | | | | 7,855 | |
| | | | | | | | |
| 68 | | PIMCO ETF TRUST | | | | | See Accompanying Notes | |
June 30, 2017
| | | | | | | | | | | | |
| | | | | PRINCIPAL
AMOUNT
(000S) | | | | | MARKET
VALUE (000S) | |
1.612% due 11/20/2017 | | $ | | | 28,658 | | | $ | | | 28,679 | |
1.642% due 05/22/2018 | | | | | 33,300 | | | | | | 33,331 | |
1.650% due 05/22/2018 | | | | | 11,905 | | | | | | 11,896 | |
Volkswagen International Finance NV | |
1.600% due 11/20/2017 | | | | | 4,825 | | | | | | 4,823 | |
Wyndham Worldwide Corp. | |
2.500% due 03/01/2018 | | | | | 3,581 | | | | | | 3,597 | |
Zimmer Biomet Holdings, Inc. | |
2.000% due 04/01/2018 | | | | | 22,080 | | | | | | 22,124 | |
Zoetis, Inc. | |
1.875% due 02/01/2018 | | | | | 21,814 | | | | | | 21,831 | |
| | | | | | | | | | | | |
| | | | | | | | | | | 1,579,730 | |
| | | | | | | | | | | | |
| |
| UTILITIES 7.1% | |
American Electric Power Co., Inc. | |
1.650% due 12/15/2017 | | | | | 1,000 | | | | | | 1,000 | |
AT&T, Inc. | |
1.808% due 01/15/2020 | | | | | 25,100 | | | | | | 25,239 | |
2.023% due 07/15/2021 | | | | | 16,000 | | | | | | 16,175 | |
2.226% due 06/30/2020 | | | | | 10,585 | | | | | | 10,728 | |
BP Capital Markets PLC | |
1.725% due 05/10/2019 | | | | | 11,813 | | | | | | 11,872 | |
British Telecommunications PLC | |
5.950% due 01/15/2018 | | | | | 26,485 | | | | | | 27,082 | |
China Shenhua Overseas Capital Co. Ltd. | |
2.500% due 01/20/2018 | | | | | 1,500 | | | | | | 1,503 | |
Cleveland Electric Illuminating Co. | |
7.880% due 11/01/2017 | | | | | 2,203 | | | | | | 2,246 | |
CNOOC Finance Ltd. | |
1.750% due 05/09/2018 | | | | | 41,605 | | | | | | 41,552 | |
Dominion Energy, Inc. | |
1.400% due 09/15/2017 | | | | | 1,200 | | | | | | 1,200 | |
1.771% due 06/01/2019 | | | | | 1,300 | | | | | | 1,305 | |
2.125% due 02/15/2018 | | | | | 20,000 | | | | | | 20,008 | |
E.ON International Finance BV | |
5.800% due 04/30/2018 | | | | | 39,859 | | | | | | 41,084 | |
Enel Finance International NV | |
6.250% due 09/15/2017 | | | | | 47,775 | | | | | | 48,198 | |
Exelon Generation Co. LLC | |
6.200% due 10/01/2017 | | | | | 22,689 | | | | | | 22,925 | |
FirstEnergy Corp. | |
2.750% due 03/15/2018 | | | | | 4,100 | | | | | | 4,127 | |
Israel Electric Corp. Ltd. | |
5.625% due 06/21/2018 | | | | | 12,500 | | | | | | 12,919 | |
7.700% due 07/15/2018 | | | | | 3,000 | | | | | | 3,172 | |
Kentucky Power Co. | |
6.000% due 09/15/2017 | | | | | 1,800 | | | | | | 1,815 | |
Kinder Morgan Finance Co. LLC | |
6.000% due 01/15/2018 | | | | | 13,200 | | | | | | 13,476 | |
National Grid North America, Inc. | |
1.812% due 08/21/2017 | | | | | 35,000 | | | | | | 35,050 | |
Oncor Electric Delivery Co. LLC | |
5.000% due 09/30/2017 | | | | | 11,331 | | | | | | 11,425 | |
Pacific Gas & Electric Co. | |
5.625% due 11/30/2017 | | | | | 1,500 | | | | | | 1,525 | |
Pemex Finance Ltd. | | | | | | | | | | | | |
10.610% due 08/15/2017 | | | | | 74 | | | | | | 75 | |
Plains All American Pipeline LP | |
6.500% due 05/01/2018 | | | | | 11,847 | | | | | | 12,272 | |
Shell International Finance BV | |
1.632% due 05/11/2020 | | | | | 17,800 | | | | | | 17,969 | |
SingTel Group Treasury Pte. Ltd. | |
2.375% due 09/08/2017 | | | | | 32,000 | | | | | | 32,037 | |
Sinopec Capital Ltd. | |
1.875% due 04/24/2018 | | | | | 21,816 | | | | | | 21,797 | |
Sinopec Group Overseas Development Ltd. | |
2.075% due 04/10/2019 | | | | | 4,400 | | | | | | 4,422 | |
2.750% due 04/10/2019 | | | | | 2,368 | | | | | | 2,383 | |
TECO Finance, Inc. | |
1.755% due 04/10/2018 | | | | | 1,360 | | | | | | 1,363 | |
6.572% due 11/01/2017 | | | | | 1,869 | | | | | | 1,897 | |
| | | | | | | | | | | | |
| | | | | PRINCIPAL
AMOUNT
(000S) | | | | | MARKET VALUE (000S) | |
Verizon Communications, Inc. | |
2.250% due 03/16/2022 | | $ | | | 62,000 | | | $ | | | 62,770 | |
| | | | | | | | | | | | |
| | | | | | | | | | | 512,611 | |
| | | | | | | | | | | | |
Total Corporate Bonds & Notes
(Cost $4,341,019) | | | 4,361,223 | |
| | | | | | | | | | | | |
| |
| MUNICIPAL BONDS & NOTES 0.7% | |
| |
| ARKANSAS 0.0% | |
Arkansas Student Loan Authority Revenue Bonds, Series 2010 | |
2.089% due 11/25/2043 | | | | | 758 | | | | | | 753 | |
| | | | | | | | | | | | |
| |
| CALIFORNIA 0.5% | |
California Earthquake Authority Revenue Notes, Series 2014 | |
1.824% due 07/01/2017 | | | | | 8,000 | | | | | | 8,000 | |
California State General Obligation Bonds, Series 2017 | |
1.831% due 04/01/2047 | | | | | 27,950 | | | | | | 27,952 | |
| | | | | | | | | | | | |
| | | | | | | | | | | 35,952 | |
| | | | | | | | | | | | |
| |
| SOUTH CAROLINA 0.0% | |
South Carolina Student Loan Corp. Revenue Bonds, Series 2005 | |
1.342% due 12/01/2023 | | | | | 2,801 | | | | | | 2,798 | |
| | | | | | | | | | | | |
| |
| TEXAS 0.1% | |
Texas State General Obligation Notes, Series 2013 | |
1.451% due 06/01/2018 | | | | | 900 | | | | | | 900 | |
Texas State General Obligation Notes, Series 2014 | |
1.451% due 06/01/2019 | | | | | 2,000 | | | | | | 2,001 | |
| | | | | | | | | | | | |
| | | | | | | | | | | 2,901 | |
| | | | | | | | | | | | |
| |
| WASHINGTON 0.1% | |
Washington Health Care Facilities Authority Revenue Bonds, Series 2017 | |
1.920% due 01/01/2042 | | | | | 7,350 | | | | | | 7,358 | |
| | | | | | | | | | | | |
Total Municipal Bonds & Notes
(Cost $49,755) | | | 49,762 | |
| | | | | | | | | | | | |
| |
| U.S. GOVERNMENT AGENCIES 3.5% | |
Fannie Mae | |
1.295% due 03/25/2044 | | | | | 2,366 | | | | | | 2,349 | |
1.445% due 07/25/2046 | | | | | 30,938 | | | | | | 30,925 | |
1.466% due 05/25/2037 | | | | | 71 | | | | | | 71 | |
1.516% due 01/25/2037 | | | | | 927 | | | | | | 932 | |
1.546% due 02/25/2037 | | | | | 168 | | | | | | 168 | |
1.566% due 11/25/2036 | | | | | 208 | | | | | | 209 | |
1.609% due 04/18/2028 - 09/18/2031 | | | | | 1,675 | | | | | | 1,683 | |
1.616% due 06/25/2026 | | | | | 338 | | | | | | 339 | |
1.626% due 09/25/2035 | | | | | 761 | | | | | | 764 | |
1.636% due 03/25/2037 | | | | | 575 | | | | | | 577 | |
1.666% due 02/25/2038 - 06/25/2042 | | | | | 1,654 | | | | | | 1,660 | |
1.695% due 01/01/2021 | | | | | 3,133 | | | | | | 3,150 | |
1.709% due 05/18/2032 | | | | | 292 | | | | | | 294 | |
1.714% due 04/25/2023 | | | | | 6,040 | | | | | | 6,068 | |
1.716% due 06/25/2031 - 12/25/2040 | | | | | 632 | | | | | | 637 | |
1.759% due 03/18/2032 | | | | | 211 | | | | | | 214 | |
1.766% due 09/25/2041 | | | | | 2,140 | | | | | | 2,159 | |
1.896% due 12/25/2037 - 02/25/2041 | | | | | 1,804 | | | | | | 1,828 | |
1.916% due 05/25/2037 | | | | | 174 | | | | | | 175 | |
1.966% due 03/25/2037 - 02/25/2040 | | | | | 279 | | | | | | 285 | |
1.996% due 02/25/2038 | | | | | 1,392 | | | | | | 1,411 | |
2.066% due 07/25/2038 | | | | | 196 | | | | | | 200 | |
2.116% due 03/25/2032 | | | | | 53 | | | | | | 55 | |
2.967% due 01/01/2036 | | | | | 7,523 | | | | | | 7,939 | |
| | | | | | | | | | | | |
| | | | | PRINCIPAL
AMOUNT
(000S) | | | | | MARKET
VALUE
(000S) | |
3.240% due 05/01/2038 | | $ | | | 1,063 | | | $ | | | 1,125 | |
FDIC Structured Sale Guaranteed Bonds | |
1.551% due 11/29/2037 | | | | | 356 | | | | | | 355 | |
Freddie Mac | | | | | | | | | | | | |
1.394% due 12/15/2042 | | | | | 9,294 | | | | | | 9,287 | |
1.409% due 11/15/2036 - 01/15/2040 | | | | | 71 | | | | | | 71 | |
1.479% due 02/15/2037 | | | | | 1,802 | | | | | | 1,803 | |
1.579% due 04/15/2041 | | | | | 478 | | | | | | 478 | |
1.659% due 07/15/2039 | | | | | 158 | | | | | | 159 | |
2.890% due 09/01/2037 | | | | | 5,948 | | | | | | 6,261 | |
Ginnie Mae | |
1.000% due 01/20/2066 | | | | | 7,344 | | | | | | 7,480 | |
1.193% due 06/20/2066 | | | | | 42,180 | | | | | | 42,116 | |
1.363% due 06/20/2061 - 10/20/2066 | | | | | 5,729 | | | | | | 5,732 | |
1.393% due 10/20/2062 | | | | | 7,914 | | | | | | 7,893 | |
1.493% due 07/20/2063 - 04/20/2064 | | | | | 5,300 | | | | | | 5,298 | |
1.510% due 05/20/2063 | | | | | 1,359 | | | | | | 1,364 | |
1.543% due 04/20/2062 | | | | | 5,409 | | | | | | 5,419 | |
1.593% due 10/20/2065 | | | | | 6,781 | | | | | | 6,796 | |
1.693% due 02/20/2062 | | | | | 7,409 | | | | | | 7,459 | |
1.743% due 12/20/2065 - 08/20/2066 | | | | | 15,277 | | | | | | 15,367 | |
1.773% due 09/20/2066 | | | | | 2,488 | | | | | | 2,506 | |
1.793% due 05/20/2066 - 07/20/2066 | | | | | 15,414 | | | | | | 15,543 | |
1.823% due 08/20/2066 | | | | | 1,462 | | | | | | 1,477 | |
1.913% due 07/20/2065 | | | | | 7,105 | | | | | | 7,200 | |
2.043% due 02/20/2066 | | | | | 18,648 | | | | | | 19,022 | |
2.480% due 06/20/2067 | | | | | 8,600 | | | | | | 8,886 | |
2.550% due 04/20/2067 | | | | | 2,501 | | | | | | 2,583 | |
6.000% due 12/15/2033 | | | | | 30 | | | | | | 34 | |
6.500% due 11/15/2033 - 09/15/2034 | | | | | 28 | | | | | | 31 | |
7.000% due 01/15/2024 - 07/15/2032 | | | | | 136 | | | | | | 143 | |
7.500% due 07/15/2024 - 06/15/2028 | | | | | 124 | | | | | | 131 | |
10.000% due 04/15/2018 - 04/15/2025 | | | | | 10 | | | | | | 8 | |
NCUA Guaranteed Notes | |
1.446% due 12/07/2020 | | | | | 799 | | | | | | 800 | |
1.644% due 12/08/2020 | | | | | 2,515 | | | | | | 2,530 | |
| | | | | | | | | | | | |
Total U.S. Government Agencies
(Cost $248,368) | | | 249,449 | |
| | | | | | | | | | | | |
| |
| NON-AGENCY MORTGAGE-BACKED SECURITIES 1.6% | |
American Home Mortgage Investment Trust | |
1.796% due 02/25/2045 | | | | | 67 | | | | | | 66 | |
Asset Securitization Corp. | |
6.930% due 02/14/2043 | | | | | 469 | | | | | | 470 | |
BAMLL Commercial Mortgage Securities Trust | |
2.559% due 12/15/2031 | | | | | 10,000 | | | | | | 10,027 | |
Banc of America Mortgage Trust | |
3.619% due 03/25/2034 | | | | | 222 | | | | | | 224 | |
Barclays Commercial Mortgage Securities Trust | |
2.269% due 02/15/2028 | | | | | 23,336 | | | | | | 23,358 | |
Bear Stearns Adjustable Rate Mortgage Trust | |
3.312% due 08/25/2033 | | | | | 1,340 | | | | | | 1,324 | |
BXHTL Mortage Trust | |
2.389% due 05/15/2029 | | | | | 1,300 | | | | | | 1,303 | |
Citigroup Commercial Mortgage Trust | |
2.439% due 07/15/2027 | | | | | 4,100 | | | | | | 4,107 | |
Credit Suisse Mortgage Capital Certificates | |
1.846% due 07/15/2032 | | | | | 13,000 | | | | | | 13,013 | |
Fort Cre LLC | |
2.712% due 05/21/2036 | | | | | 2,750 | | | | | | 2,754 | |
Hyatt Hotel Portfolio Trust | |
2.459% due 11/15/2029 | | | | | 7,800 | | | | | | 7,810 | |
IMT Mortgage Trust | |
1.700% due 06/15/2034 (a) | | | | | 3,000 | | | | | | 3,000 | |
| | | | | | |
| See Accompanying Notes | | ANNUAL REPORT | | JUNE 30, 2017 | | 69 |
Schedule of Investments PIMCO Enhanced Short Maturity Active Exchange-Traded Fund (Cont.)
| | | | | | | | | | | | |
| | | | | PRINCIPAL
AMOUNT
(000S) | | | | | MARKET
VALUE
(000S) | |
JPMorgan Chase Commercial Mortgage Securities Trust | |
2.139% due 07/15/2031 | | $ | | | 4,109 | | | $ | | | 4,114 | |
Mellon Residential Funding Corp. Mortgage Pass-Through Certificates | |
1.859% due 11/15/2031 | | | | | 1,336 | | | | | | 1,264 | |
PFP Ltd. | |
2.222% due 01/14/2035 | | | | | 3,200 | | | | | | 3,207 | |
RBSSP Resecuritization Trust | |
1.524% due 10/26/2036 | | | | | 203 | | | | | | 201 | |
Resource Capital Corp. | |
1.889% due 07/15/2034 (a) | | | | | 15,000 | | | | | | 14,996 | |
Rosslyn Portfolio Trust | |
2.109% due 06/15/2033 | | | | | 4,500 | | | | | | 4,506 | |
UBS-Barclays Commercial Mortgage Trust | |
1.784% due 04/10/2046 | | | | | 15,000 | | | | | | 15,111 | |
Wells Fargo Commercial Mortgage Trust | |
2.051% due 07/15/2046 | | | | | 5,700 | | | | | | 5,772 | |
| | | | | | | | | | | | |
Total Non-Agency Mortgage-Backed Securities
(Cost $116,170) | | | 116,627 | |
| | | | | | | | | | | | |
| |
| ASSET-BACKED SECURITIES 14.6% | |
Allegro CLO Ltd. | |
2.390% due 01/30/2026 | | | | | 10,000 | | | | | | 10,037 | |
AmeriCredit Automobile Receivables Trust | |
1.200% due 05/18/2018 | | | | | 3,764 | | | | | | 3,764 | |
Atlas Senior Loan Fund Ltd. | |
2.400% due 01/30/2024 | | | | | 4,710 | | | | | | 4,718 | |
Atrium CDO Corp. | |
2.036% due 07/16/2025 | | | | | 7,700 | | | | | | 7,713 | |
Carlyle Global Market Strategies CLO Ltd. | |
2.320% due 07/27/2026 | | | | | 1,500 | | | | | | 1,502 | |
2.620% due 07/27/2026 | | | | | 30,000 | | | | | | 30,037 | |
Catamaran CLO Ltd. | |
2.464% due 12/20/2023 | | | | | 17,219 | | | | | | 17,240 | |
Cavalry CLO Ltd. | |
2.528% due 01/16/2024 | | | | | 1,264 | | | | | | 1,266 | |
Cent CLO Ltd. | |
2.256% due 01/25/2026 | | | | | 10,800 | | | | | | 10,802 | |
CIFC Funding Ltd. | |
2.173% due 10/24/2025 | | | | | 15,000 | | | | | | 15,050 | |
2.370% due 01/29/2025 | | | | | 6,728 | | | | | | 6,737 | |
2.568% due 12/05/2024 | | | | | 6,717 | | | | | | 6,733 | |
Citibank Credit Card Issuance Trust | |
1.836% due 04/22/2026 | | | | | 6,000 | | | | | | 6,039 | |
COA Summit CLO Ltd. | |
2.506% due 04/20/2023 | | | | | 498 | | | | | | 499 | |
Colony American Homes | |
2.166% due 07/17/2031 | | | | | 6,886 | | | | | | 6,891 | |
Commonbond Student Loan Trust | |
1.926% due 05/25/2041 | | | | | 2,500 | | | | | | 2,502 | |
CVP Cascade CLO Ltd. | |
2.308% due 01/16/2026 | | | | | 17,300 | | | | | | 17,306 | |
Denali Capital CLO Ltd. | |
2.317% due 04/28/2025 | | | | | 19,800 | | | | | | 19,818 | |
Drug Royalty LP | |
4.008% due 07/15/2023 | | | | | 1,584 | | | | | | 1,593 | |
Dryden Senior Loan Fund | |
2.358% due 01/15/2025 | | | | | 14,116 | | | | | | 14,133 | |
2.432% due 11/15/2025 | | | | | 11,900 | | | | | | 11,919 | |
Educational Services of America, Inc. | |
1.946% due 04/25/2039 | | | | | 1,878 | | | | | | 1,878 | |
2.366% due 09/25/2040 | | | | | 483 | | | | | | 481 | |
Emerson Park CLO Ltd. | |
2.138% due 07/15/2025 | | | | | 12,100 | | | | | | 12,111 | |
Evergreen Credit Card Trust | |
1.659% due 11/16/2020 | | | | | 15,600 | | | | | | 15,660 | |
1.879% due 04/15/2020 | | | | | 22,000 | | | | | | 22,101 | |
Finn Square CLO Ltd. | |
2.506% due 12/24/2023 | | | | | 2,252 | | | | | | 2,255 | |
Flagship Credit Auto Trust | |
1.470% due 03/16/2020 | | | | | 4,261 | | | | | | 4,256 | |
| | | | | | | | | | | | |
| | | | | PRINCIPAL
AMOUNT
(000S) | | | | | MARKET
VALUE
(000S) | |
Fortress Credit Investments Ltd. | |
2.408% due 07/17/2023 | | $ | | | 3,146 | | | $ | | | 3,145 | |
GM Financial Automobile Leasing Trust | |
1.510% due 03/16/2020 | | | | | 1,800 | | | | | | 1,800 | |
GoldenTree Loan Opportunities Ltd. | |
2.306% due 04/25/2025 | | | | | 9,600 | | | | | | 9,626 | |
Halcyon Loan Advisors Funding Ltd. | |
2.682% due 08/15/2023 | | | | | 6,134 | | | | | | 6,169 | |
Hildene CLO Ltd. | |
2.308% due 01/17/2026 | | | | | 12,300 | | | | | | 12,330 | |
ING Investment Management CLO Ltd. | |
1.383% due 06/14/2022 | | | | | 57 | | | | | | 57 | |
Invitation Homes Trust | |
2.509% due 08/17/2032 | | | | | 12,430 | | | | | | 12,497 | |
KKR Financial CLO Ltd. | |
2.603% due 01/23/2026 | | | | | 4,700 | | | | | | 4,716 | |
KVK CLO Ltd. | |
2.308% due 01/15/2026 | | | | | 10,000 | | | | | | 10,010 | |
LCM LP | |
2.418% due 10/19/2022 | | | | | 3,466 | | | | | | 3,474 | |
Lime Street CLO Ltd. | |
1.514% due 06/20/2021 | | | | | 4,385 | | | | | | 4,370 | |
Madison Park Funding Ltd. | |
1.420% due 02/26/2021 | | | | | 2,234 | | | | | | 2,235 | |
2.268% due 01/19/2025 | | | | | 20,900 | | | | | | 20,925 | |
Navient Student Loan Trust | |
1.816% due 06/25/2065 | | | | | 2,533 | | | | | | 2,539 | |
1.816% due 07/26/2066 | | | | | 11,500 | | | | | | 11,558 | |
1.966% due 07/26/2066 | | | | | 3,500 | | | | | | 3,535 | |
2.266% due 12/27/2066 | | | | | 29,608 | | | | | | 29,822 | |
2.466% due 06/25/2065 | | | | | 16,378 | | | | | | 16,660 | |
Nelnet Student Loan Trust | |
1.407% due 12/24/2035 | | | | | 6,407 | | | | | | 6,294 | |
1.624% due 03/25/2030 | | | | | 6,823 | | | | | | 6,860 | |
1.989% due 11/25/2048 | | | | | 2,530 | | | | | | 2,563 | |
2.016% due 09/25/2065 | | | | | 29,773 | | | | | | 30,126 | |
NewMark Capital Funding CLO Ltd. | |
2.372% due 06/30/2026 | | | | | 8,800 | | | | | | 8,802 | |
Nissan Auto Lease Trust | |
1.640% due 09/16/2019 | | | | | 7,000 | | | | | | 6,999 | |
Northstar Education Finance, Inc. | |
1.916% due 12/26/2031 | | | | | 1,999 | | | | | | 1,997 | |
Octagon Investment Partners Ltd. | |
2.278% due 07/17/2025 | | | | | 10,000 | | | | | | 10,015 | |
OHA Credit Partners Ltd. | |
2.286% due 07/20/2026 | | | | | 30,000 | | | | | | 30,083 | |
OZLM Funding Ltd. | |
2.288% due 01/17/2026 | | | | | 28,000 | | | | | | 28,051 | |
Palmer Square Loan Funding Ltd. | |
2.308% due 01/15/2025 | | | | | 15,977 | | | | | | 15,985 | |
Panhandle-Plains Higher Education Authority, Inc. | |
1.648% due 07/01/2021 | | | | | 171 | | | | | | 171 | |
2.278% due 10/01/2035 | | | | | 1,034 | | | | | | 1,032 | |
PHEAA Student Loan Trust | |
2.166% due 11/25/2065 | | | | | 13,879 | | | | | | 13,929 | |
Prestige Auto Receivables Trust | |
1.460% due 07/15/2020 | | | | | 3,766 | | | | | | 3,758 | |
Progress Residential Trust | |
2.572% due 01/17/2034 | | | | | 5,000 | | | | | | 5,081 | |
2.709% due 09/17/2033 | | | | | 9,955 | | | | | | 10,134 | |
Race Point CLO Ltd. | |
2.379% due 11/08/2024 | | | | | 2,638 | | | | | | 2,638 | |
Shackleton CLO Ltd. | |
2.275% due 01/13/2025 | | | | | 3,300 | | | | | | 3,308 | |
SLC Student Loan Trust | | | | | | | | | | | | |
1.346% due 09/15/2026 | | | | | 1,102 | | | | | | 1,100 | |
1.356% due 03/15/2027 | | | | | 5,304 | | | | | | 5,301 | |
1.366% due 06/15/2029 | | | | | 17,700 | | | | | | 17,578 | |
SLM Private Education Loan Trust | |
2.259% due 06/17/2030 | | | | | 5,000 | | | | | | 5,055 | |
3.659% due 01/15/2043 | | | | | 11,210 | | | | | | 11,646 | |
SLM Student Loan Trust | |
1.266% due 01/27/2025 | | | | | 6,723 | | | | | | 6,690 | |
1.266% due 10/27/2025 | | | | | 4,860 | | | | | | 4,857 | |
| | | | | | | | | | | | |
| | | | | PRINCIPAL
AMOUNT
(000S) | | | | | MARKET VALUE (000S) | |
1.266% due 07/27/2026 | | $ | | | 1,085 | | | $ | | | 1,085 | |
1.276% due 01/25/2027 | | | | | 1,864 | | | | | | 1,855 | |
1.296% due 10/25/2028 | | | | | 3,500 | | | | | | 3,462 | |
1.706% due 10/26/2026 | | | | | 10,397 | | | | | | 10,404 | |
1.706% due 01/25/2028 | | | | | 13,485 | | | | | | 13,566 | |
1.716% due 12/15/2027 | | | | | 20,648 | | | | | | 20,640 | |
1.916% due 01/25/2029 | | | | | 4,678 | | | | | | 4,692 | |
2.306% due 04/25/2019 | | | | | 7,532 | | | | | | 7,563 | |
2.656% due 04/25/2023 | | | | | 726 | | | | | | 742 | |
SMB Private Education Loan Trust | |
1.609% due 06/17/2024 | | | | | 9,611 | | | | | | 9,627 | |
1.709% due 11/15/2023 | | | | | 3,434 | | | | | | 3,439 | |
1.859% due 05/15/2023 | | | | | 7,440 | | | | | | 7,449 | |
2.059% due 07/15/2022 | | | | | 793 | | | | | | 794 | |
2.059% due 09/15/2034 | | | | | 19,000 | | | | | | 19,090 | |
2.259% due 09/15/2034 | | | | | 10,000 | | | | | | 10,181 | |
Sofi Consumer Loan Program LLC | |
2.770% due 05/25/2026 | | | | | 11,351 | | | | | | 11,415 | |
SoFi Professional Loan Program LLC | |
1.617% due 07/25/2040 | | | | | 3,700 | | | | | | 3,706 | |
1.750% due 07/25/2040 | | | | | 17,800 | | | | | | 17,788 | |
1.830% due 05/25/2040 | | | | | 7,366 | | | | | | 7,369 | |
2.066% due 07/25/2039 | | | | | 14,457 | | | | | | 14,570 | |
2.316% due 10/27/2036 | | | | | 4,383 | | | | | | 4,447 | |
2.500% due 05/26/2026 (a) | | | | | 12,000 | | | | | | 12,009 | |
2.516% due 02/25/2040 | | | | | 4,078 | | | | | | 4,105 | |
Sound Point CLO Ltd. | |
2.148% due 07/15/2025 | | | | | 12,100 | | | | | | 12,103 | |
2.256% due 01/21/2026 | | | | | 8,000 | | | | | | 7,997 | |
Staniford Street CLO Ltd. | |
2.426% due 06/15/2025 | | | | | 13,100 | | | | | | 13,100 | |
Structured Asset Investment Loan Trust | |
2.216% due 11/25/2033 | | | | | 1,488 | | | | | | 1,435 | |
Symphony CLO LP | |
2.255% due 01/09/2023 | | | | | 5,695 | | | | | | 5,709 | |
THL Credit Wind River CLO Ltd. | |
2.598% due 01/18/2026 | | | | | 2,700 | | | | | | 2,707 | |
2.608% due 01/15/2026 | | | | | 5,200 | | | | | | 5,225 | |
TICC CLO LLC | |
1.750% due 08/25/2023 | | | | | 213 | | | | | | 214 | |
Tralee CLO Ltd. | |
2.606% due 07/20/2026 | | | | | 14,150 | | | | | | 14,214 | |
Utah State Board of Regents | |
1.774% due 01/25/2057 | | | | | 11,075 | | | | | | 11,104 | |
1.966% due 09/25/2056 | | | | | 17,767 | | | | | | 17,816 | |
Venture CLO Ltd. | |
2.668% due 04/15/2026 | | | | | 8,800 | | | | | | 8,811 | |
VOLT LLC | |
3.125% due 06/25/2047 | | | | | 13,200 | | | | | | 13,200 | |
3.250% due 05/25/2047 | | | | | 28,000 | | | | | | 28,105 | |
3.250% due 04/25/2059 | | | | | 10,600 | | | | | | 10,617 | |
3.375% due 05/28/2047 | | | | | 38,196 | | | | | | 38,277 | |
Voya CLO Ltd. | |
2.458% due 10/15/2022 | | | | | 8,658 | | | | | | 8,649 | |
2.478% due 10/15/2022 | | | | | 4,892 | | | | | | 4,898 | |
WhiteHorse Ltd. | |
1.000% due 07/17/2026 (a) | | | | | 1,300 | | | | | | 1,300 | |
2.370% due 02/03/2025 | | | | | 8,622 | | | | | | 8,627 | |
| | | | | | | | | | | | |
Total Asset-Backed Securities
(Cost $1,051,349) | | | 1,054,668 | |
| | | | | | | | | | | | |
| |
| SOVEREIGN ISSUES 7.1% | |
Caisse des Depots et Consignations | |
1.321% due 09/09/2019 | | | | | 20,200 | | | | | | 20,183 | |
Development Bank of Japan, Inc. | |
1.412% due 01/28/2020 | | | | | 27,800 | | | | | | 27,655 | |
1.688% due 07/11/2018 | | | | | 8,000 | | | | | | 7,994 | |
1.689% due 11/08/2017 | | | | | 15,000 | | | | | | 15,013 | |
1.689% due 11/07/2018 | | | | | 5,000 | | | | | | 4,984 | |
1.858% due 04/16/2019 | | | | | 2,000 | | | | | | 1,994 | |
1.875% due 10/03/2018 | | | | | 27,000 | | | | | | 27,026 | |
Export-Import Bank of Korea | |
1.807% due 08/14/2017 | | | | | 14,790 | | | | | | 14,790 | |
1.881% due 02/18/2019 | | | | | 11,000 | | | | | | 11,015 | |
1.898% due 05/26/2019 | | | | | 9,400 | | | | | | 9,432 | |
| | | | | | | | |
| 70 | | PIMCO ETF TRUST | | | | | See Accompanying Notes | |
June 30, 2017
| | | | | | | | | | | | |
| | | | | PRINCIPAL
AMOUNT
(000S) | | | | | MARKET
VALUE
(000S) | |
Japan Bank for International Cooperation | |
1.542% due 11/13/2018 | | $ | | | 24,200 | | | $ | | | 24,164 | |
1.682% due 06/01/2020 | | | | | 8,700 | | | | | | 8,697 | |
1.750% due 07/31/2018 | | | | | 50,000 | | | | | | 49,999 | |
1.762% due 02/24/2020 | | | | | 34,900 | | | | | | 34,890 | |
Japan Finance Organization for Municipalities | |
1.375% due 02/05/2018 | | | | | 43,670 | | | | | | 43,557 | |
1.500% due 09/12/2017 | | | | | 23,850 | | | | | | 23,833 | |
2.125% due 03/06/2019 | | | | | 50,800 | | | | | | 50,827 | |
Korea East-West Power Co. Ltd. | |
2.500% due 07/16/2017 | | | | | 6,000 | | | | | | 6,000 | |
Korea Land & Housing Corp. | |
1.875% due 08/02/2017 | | | | | 23,550 | | | | | | 23,548 | |
Korea Resources Corp. | |
2.125% due 05/02/2018 | | | | | 31,700 | | | | | | 31,711 | |
Korea Southern Power Co. Ltd. | |
1.875% due 02/05/2018 | | | | | 2,500 | | | | | | 2,497 | |
Tokyo Metropolitan Government | |
1.625% due 06/06/2018 | | | | | 44,300 | | | | | | 44,308 | |
2.125% due 05/20/2019 | | | | | 26,800 | | | | | | 26,856 | |
| | | | | | | | | | | | |
Total Sovereign Issues (Cost $510,645) | | | 510,973 | |
| | | | | | | | | | | | |
| |
| SHORT-TERM INSTRUMENTS 12.8% | |
| |
| CERTIFICATES OF DEPOSIT 2.0% | |
Barclays Bank PLC | |
1.710% due 03/16/2018 | | | | | 77,300 | | | | | | 77,287 | |
1.949% due 11/06/2017 | | | | | 9,400 | | | | | | 9,421 | |
Mizuho Bank Ltd. | |
1.928% due 12/12/2017 | | | | | 37,400 | | | | | | 37,493 | |
Norinchukin Bank | |
1.871% due 10/10/2017 | | | | | 13,000 | | | | | | 13,026 | |
1.871% due 10/11/2017 | | | | | 3,700 | | | | | | 3,708 | |
| | | | | | | | | | | | |
| | | | | | | | | | | 140,935 | |
| | | | | | | | | | | | |
| |
| COMMERCIAL PAPER 9.9% | |
AutoNation, Inc. | |
1.725% due 07/07/2017 | | | | | 25,000 | | | | | | 24,992 | |
BAT International Finance PLC | |
1.475% due 07/19/2017 | | | | | 5,000 | | | | | | 4,996 | |
1.475% due 07/27/2017 | | | | | 10,000 | | | | | | 9,989 | |
Boston Scientific Corp. | |
1.654% due 07/11/2017 | | | | | 5,000 | | | | | | 4,998 | |
1.675% due 07/18/2017 | | | | | 20,000 | | | | | | 19,986 | |
1.833% due 09/25/2017 | | | | | 45,000 | | | | | | 44,833 | |
| | | | | | | | | | | | |
| | | | | PRINCIPAL
AMOUNT
(000S) | | | | | MARKET
VALUE
(000S) | |
Canadian Natural Resources Ltd. | |
1.778% due 08/03/2017 | | $ | | | 30,000 | | | $ | | | 29,954 | |
Deutsche Telekom AG | |
1.373% due 07/24/2017 | | | | | 10,000 | | | | | | 9,990 | |
Electricite de France S.A. | |
1.932% due 01/09/2018 | | | | | 5,000 | | | | | | 4,953 | |
2.036% due 01/09/2018 | | | | | 6,000 | | | | | | 5,944 | |
Enbridge Energy Partners LP | |
1.777% due 07/05/2017 | | | | | 10,000 | | | | | | 9,998 | |
1.820% due 07/05/2017 | | | | | 10,000 | | | | | | 9,998 | |
1.915% due 08/07/2017 | | | | | 9,800 | | | | | | 9,783 | |
1.915% due 08/08/2017 | | | | | 8,500 | | | | | | 8,485 | |
2.031% due 07/19/2017 | | | | | 15,000 | | | | | | 14,987 | |
Engie | |
1.521% due 10/03/2017 | | | | | 500 | | | | | | 498 | |
1.565% due 10/20/2017 | | | | | 10,500 | | | | | | 10,458 | |
1.596% due 11/01/2017 | | | | | 7,800 | | | | | | 7,765 | |
1.638% due 10/04/2017 | | | | | 6,000 | | | | | | 5,980 | |
1.649% due 10/03/2017 | | | | | 3,500 | | | | | | 3,488 | |
ENI Finance USA, Inc. | |
1.528% due 07/17/2017 | | | | | 18,000 | | | | | | 17,988 | |
1.754% due 07/14/2017 | | | | | 15,300 | | | | | | 15,292 | |
1.806% due 10/02/2017 | | | | | 9,500 | | | | | | 9,463 | |
2.048% due 05/07/2018 | | | | | 5,000 | | | | | | 4,924 | |
Entergy Corp. | |
1.463% due 07/14/2017 | | | | | 20,000 | | | | | | 19,988 | |
ERP Operating LP | |
1.523% due 07/26/2017 | | | | | 13,000 | | | | | | 12,986 | |
Ford Motor Credit Co. | |
2.016% due 04/12/2018 | | | | | 11,280 | | | | | | 11,112 | |
2.017% due 06/01/2018 | | | | | 4,000 | | | | | | 3,927 | |
Glencore Funding LLC | |
1.404% due 07/25/2017 | | | | | 4,000 | | | | | | 3,995 | |
HP, Inc. | |
1.554% due 07/25/2017 | | | | | 20,000 | | | | | | 19,985 | |
Kansas City Southern | |
1.726% due 07/28/2017 | | | | | 12,000 | | | | | | 11,984 | |
Monsanto Co. | |
1.576% due 08/21/2017 | | | | | 5,000 | | | | | | 4,989 | |
Nabors Industries, Inc. | |
2.133% due 07/20/2017 | | | | | 18,500 | | | | | | 18,483 | |
Nasdaq, Inc. | |
1.629% due 09/25/2017 | | | | | 10,000 | | | | | | 9,966 | |
Plains All American Pipeline LP | |
1.930% due 07/03/2017 | | | | | 8,000 | | | | | | 7,999 | |
2.183% due 07/26/2017 | | | | | 25,000 | | | | | | 24,974 | |
| | | | | | | | | | | | |
| | | | | PRINCIPAL
AMOUNT
(000S) | | | | | MARKET VALUE (000S) | |
Sempra Energy Holdings | |
1.512% due 08/21/2017 | | $ | | | 5,000 | | | $ | | | 4,989 | |
Southern Co. | |
1.372% due 07/06/2017 | | | | | 50,000 | | | | | | 49,988 | |
Spectra Energy Partners LP | |
1.523% due 07/26/2017 | | | | | 60,000 | | | | | | 59,936 | |
Syngenta Wilmington, Inc. | |
1.584% due 07/24/2017 | | | | | 15,000 | | | | | | 14,984 | |
2.053% due 09/14/2017 | | | | | 25,000 | | | | | | 24,912 | |
Telstra Corp. Ltd. | |
1.754% due 11/20/2017 | | | | | 24,600 | | | | | | 24,454 | |
TELUS Corp. | |
1.578% due 09/26/2017 | | | | | 13,000 | | | | | | 12,951 | |
Viacom, Inc. | |
1.828% due 08/10/2017 | | | | | 38,400 | | | | | | 38,335 | |
1.828% due 08/11/2017 | | | | | 35,000 | | | | | | 34,939 | |
Wyndham Worldwide | |
1.623% due 07/05/2017 | | | | | 5,000 | | | | | | 4,999 | |
| | | | | | | | | | | | |
| | | | | | | | | | | 710,617 | |
| | | | | | | | | | | | |
| |
| REPURCHASE AGREEMENTS (b) 0.3% | |
| | | | | | | | | | | 24,200 | |
| | | | | | | | | | | | |
| |
| SHORT-TERM NOTES 0.6% | |
Hewlett Packard Enterprise Co. | |
2.450% due 10/05/2017 | | | | | 16,601 | | | | | | 16,646 | |
3.039% due 10/05/2017 | | | | | 16,500 | | | | | | 16,553 | |
TechnipFMC PLC | |
2.000% due 10/01/2017 | | | | | 8,195 | | | | | | 8,192 | |
| | | | | | | | | | | | |
| | | | | | | | | | | 41,391 | |
| | | | | | | | | | | | |
Total Short-Term Instruments
(Cost $916,867) | | | | | | 917,143 | |
| | | | | | | | | | | | |
| | | | | | | | | | | | |
Total Investments in Securities
(Cost $7,234,173) | | | | | | 7,259,845 | |
| | | | | | | | | | | | |
Total Investments 100.9%
(Cost $7,234,173) | | | | | | $ | | | 7,259,845 | |
| |
| Other Assets and Liabilities, net (0.9)% | | | | | | (63,900 | ) |
| | | | | | | | | | | | |
| Net Assets 100.0% | | | | | | | | $ | | | 7,195,945 | |
| | | | | | | | | | | | |
NOTES TO SCHEDULE OF INVESTMENTS (AMOUNTS IN THOUSANDS*):
| * | A zero balance may reflect actual amounts rounding to less than one thousand. |
BORROWINGS AND OTHER FINANCING TRANSACTIONS
(b) REPURCHASE AGREEMENTS:
| | | | | | | | | | | | | | | | | | | | | | | | | | | | | | |
| Counterparty | | Lending
Rate | | | Settlement
Date | | | Maturity
Date | | | Principal
Amount | | | Collateralized By | | Collateral
(Received) | | | Repurchase
Agreements,
at Value | | | Repurchase
Agreement
Proceeds
to be
Received(1) | |
| BCY | | | 1.440 | % | | | 06/30/2017 | | | | 07/03/2017 | | | $ | 24,200 | | | Fannie Mae 4.000% due 04/01/2047 | | $ | (25,182 | ) | | $ | 24,200 | | | $ | 24,203 | |
| | | | | | | | | | | | | | | | | | | | | | | | | | | | | | |
Total Repurchase Agreements | | | | | $ | (25,182 | ) | | $ | 24,200 | | | $ | 24,203 | |
| | | | | | | | | | | | | | | | | | | | | | | | | | | | | | |
| | | | | | |
| See Accompanying Notes | | ANNUAL REPORT | | JUNE 30, 2017 | | 71 |
Schedule of Investments PIMCO Enhanced Short Maturity Active Exchange-Traded Fund (Cont.)
June 30, 2017
BORROWINGS AND OTHER FINANCING TRANSACTIONS SUMMARY
The following is a summary by counterparty of the market value of Borrowings and Other Financing Transactions and collateral pledged/(received) as of June 30, 2017:
| | | | | | | | | | | | | | | | | | | | | | | | | | | | |
| Counterparty | | Repurchase
Agreement
Proceeds
to be
Received | | | Payable for
Reverse
Repurchase
Agreements | | | Payable for
Sale-Buyback
Transactions | | | Securities
Out on Loan | | | Total
Borrowings and
Other Financing
Transactions | | | Collateral
Pledged/(Received) | | | Net Exposure(2) | |
Global/Master Repurchase Agreement | | | | | | | | | | | | | | | | | | | | | | | | | | | | |
BCY | | $ | 24,203 | | | $ | 0 | | | $ | 0 | | | $ | 0 | | | $ | 24,203 | | | $ | (25,182 | ) | | $ | (979 | ) |
| | | | | | | | | | | | | | | | | | | | | | | | | | | | |
Total Borrowings and Other Financing Transactions | | $ | 24,203 | | | $ | 0 | | | $ | 0 | | | $ | 0 | | | | | | | | | | | | | |
| | | | | | | | | | | | | | | | | | | | | | | | | | | | |
| (1) | Includes accrued interest. |
| (2) | Net Exposure represents the net receivable/(payable) that would be due from/to the counterparty in the event of default. Exposure from borrowings and other financing transactions can only be netted across transactions governed under the same master agreement with the same legal entity. See Note 8, Master Arrangements, in the Notes to Financial Statements for more information regarding master netting arrangements. |
The average amount of borrowings outstanding during the period ended June 30, 2017 was $(26,843) at a weighted average interest rate of 0.864%. Average borrowings may include sale-buyback transactions and reverse repurchase agreements, if held during the period.
FAIR VALUE MEASUREMENTS
The following is a summary of the fair valuations according to the inputs used as of June 30, 2017 in valuing the Fund’s assets and liabilities:
| | | | | | | | | | | | | | | | |
| Category and Subcategory | | Level 1 | | | Level 2 | | | Level 3 | | | Fair
Value at
06/30/2017 | |
Investments in Securities, at Value | |
Corporate Bonds & Notes | | | | | | | | | | | | | | | | |
Banking & Finance | | $ | 0 | | | $ | 2,268,882 | | | $ | 0 | | | $ | 2,268,882 | |
Industrials | | | 0 | | | | 1,579,730 | | | | 0 | | | | 1,579,730 | |
Utilities | | | 0 | | | | 512,611 | | | | 0 | | | | 512,611 | |
Municipal Bonds & Notes | | | | | | | | | | | | | | | | |
Arkansas | | | 0 | | | | 753 | | | | 0 | | | | 753 | |
California | | | 0 | | | | 35,952 | | | | 0 | | | | 35,952 | |
South Carolina | | | 0 | | | | 2,798 | | | | 0 | | | | 2,798 | |
Texas | | | 0 | | | | 2,901 | | | | 0 | | | | 2,901 | |
Washington | | | 0 | | | | 7,358 | | | | 0 | | | | 7,358 | |
U.S. Government Agencies | | | 0 | | | | 249,449 | | | | 0 | | | | 249,449 | |
| | | | | | | | | | | | | | | | |
| Category and Subcategory | | Level 1 | | | Level 2 | | | Level 3 | | | Fair
Value at
06/30/2017 | |
Non-Agency Mortgage-Backed Securities | | $ | 0 | | | $ | 101,631 | | | $ | 14,996 | | | $ | 116,627 | |
Asset-Backed Securities | | | 0 | | | | 1,041,468 | | | | 13,200 | | | | 1,054,668 | |
Sovereign Issues | | | 0 | | | | 510,973 | | | | 0 | | | | 510,973 | |
Short-Term Instruments | | | | | | | | | | | | | | | | |
Certificates of Deposit | | | 0 | | | | 140,935 | | | | 0 | | | | 140,935 | |
Commercial Paper | | | 0 | | | | 710,617 | | | | 0 | | | | 710,617 | |
Repurchase Agreements | | | 0 | | | | 24,200 | | | | 0 | | | | 24,200 | |
Short-Term Notes | | | 0 | | | | 41,391 | | | | 0 | | | | 41,391 | |
| | | | | | | | | | | | | | | | |
| | | | |
Total Investments | | $ | 0 | | | $ | 7,231,649 | | | $ | 28,196 | | | $ | 7,259,845 | |
| | | | | | | | | | | | | | | | |
There were no significant transfers among Levels 1, 2, or 3 during the period ended June 30, 2017.
| | | | | | | | |
| 72 | | PIMCO ETF TRUST | | | | | See Accompanying Notes | |
Schedule of Investments PIMCO Intermediate Municipal Bond Active Exchange-Traded Fund
June 30, 2017
| | | | | | | | | | | | |
| | | | | PRINCIPAL
AMOUNT
(000S) | | | | | MARKET
VALUE
(000S) | |
| INVESTMENTS IN SECURITIES 98.9% | |
| |
| MUNICIPAL BONDS & NOTES 97.9% | |
| |
| ARIZONA 4.1% | | | | | | | | | | | | |
Arizona Health Facilities Authority Revenue Bonds, Series 2015 | |
0.920% due 01/01/2046 | | $ | | | 2,500 | | | $ | | | 2,500 | |
Arizona Water Infrastructure Finance Authority Revenue Bonds, Series 2012 | |
5.000% due 10/01/2022 | | | | | 1,350 | | | | | | 1,589 | |
Arizona Water Infrastructure Finance Authority Revenue Bonds, Series 2014 | |
5.000% due 10/01/2026 | | | | | 1,250 | | | | | | 1,522 | |
Arizona Water Infrastructure Finance Authority Revenue Notes, Series 2009 | |
4.250% due 10/01/2019 | | | | | 730 | | | | | | 780 | |
Phoenix Civic Improvement Corp., Arizona Revenue Bonds, Series 2014 | |
5.000% due 07/01/2027 | | | | | 2,500 | | | | | | 2,990 | |
Salt River Project Agricultural Improvement & Power District, Arizona Revenue Bonds, Series 2016 | |
5.000% due 01/01/2028 | | | | | 1,000 | | | | | | 1,237 | |
| | | | | | | | | | | | |
| | | | | | | | | | | 10,618 | |
| | | | | | | | | | | | |
| |
| ARKANSAS 0.2% | | | | | | | | | | | | |
University of Arkansas Revenue Bonds, Series 2012 | |
5.000% due 05/01/2026 | | | | | 320 | | | | | | 370 | |
| | | | | | | | | | | | |
| |
| CALIFORNIA 6.0% | | | | | | | | | | | | |
Bay Area Toll Authority, California Revenue Bonds, Series 2007 | |
1.610% due 04/01/2047 | | | | | 1,000 | | | | | | 1,006 | |
California Health Facilities Financing Authority Revenue Bonds, Series 2009 | |
6.000% due 07/01/2039 | | | | | 1,000 | | | | | | 1,096 | |
California State Department of Water Resources Power Supply Revenue Notes, Series 2010 | |
5.000% due 05/01/2018 | | | | | 500 | | | | | | 517 | |
California State General Obligation Bonds, Series 2009 | |
5.000% due 07/01/2020 | | | | | 500 | | | | | | 539 | |
California State General Obligation Notes, Series 2009 | |
5.000% due 07/01/2018 | | | | | 500 | | | | | | 520 | |
California State General Obligation Notes, Series 2010 | |
5.000% due 11/01/2019 | | | | | 500 | | | | | | 545 | |
California State General Obligation Notes, Series 2013 | |
5.000% due 09/01/2021 | | | | | 3,000 | | | | | | 3,446 | |
Los Angeles Unified School District, California Certificates of Participation Notes, Series 2010 | |
5.000% due 12/01/2017 | | | | | 1,500 | | | | | | 1,525 | |
Los Angeles, California Wastewater System Revenue Bonds, Series 2015 | |
5.000% due 06/01/2029 | | | | | 1,350 | | | | | | 1,644 | |
Orange County, California Airport Revenue Notes, Series 2009 | |
4.000% due 07/01/2018 | | | | | 500 | | | | | | 515 | |
Regents of the University of California Medical Center Pooled Revenue Notes, Series 2010 | |
5.000% due 05/15/2018 | | | | | 500 | | | | | | 517 | |
Sacramento Municipal Utility District, California Revenue Bonds, Series 2013 | |
5.000% due 08/15/2029 | | | | | 1,000 | | | | | | 1,179 | |
San Juan Unified School District, California General Obligation Bonds, (AGM Insured), Series 2001 | |
0.000% due 08/01/2017 (a) | | | | | 750 | | | | | | 749 | |
Southern California Public Power Authority Revenue Bonds, Series 2007 | |
5.250% due 11/01/2020 | | | | | 575 | | | | | | 640 | |
University of California Revenue Bonds, Series 2009 | |
5.000% due 05/15/2020 | | | | | 1,000 | | | | | | 1,072 | |
| | | | | | | | | | | | |
| | | | | | | | | | | 15,510 | |
| | | | | | | | | | | | |
| | | | | | | | | | | | |
| | | | | PRINCIPAL
AMOUNT
(000S) | | | | | MARKET
VALUE
(000S) | |
| COLORADO 2.1% | | | | | | | | | | | | |
Board of Governors of Colorado State University System Revenue Bonds, Series 2015 | |
5.000% due 03/01/2028 | | $ | | | 1,580 | | | $ | | | 1,878 | |
Denver, Colorado City & County School District No. 1 General Obligation Bonds, Series 2017 | |
5.000% due 12/01/2028 | | | | | 3,000 | | | | | | 3,684 | |
| | | | | | | | | | | | |
| | | | | | | | | | | 5,562 | |
| | | | | | | | | | | | |
| |
| DISTRICT OF COLUMBIA 1.3% | |
District of Columbia Revenue Bonds, Series 2010 | |
5.000% due 12/01/2024 | | | | | 1,000 | | | | | | 1,107 | |
District of Columbia Revenue Bonds, Series 2015 | |
5.000% due 07/15/2028 | | | | | 2,000 | | | | | | 2,363 | |
| | | | | | | | | | | | |
| | | | | | | | | | | 3,470 | |
| | | | | | | | | | | | |
| |
| FLORIDA 4.8% | | | | | | | | | | | | |
Broward County, Florida Airport System Revenue Bonds, Series 2012 | |
5.000% due 10/01/2023 | | | | | 1,000 | | | | | | 1,162 | |
Citizens Property Insurance Corp., Florida Revenue Notes, Series 2011 | |
5.000% due 06/01/2019 | | | | | 1,000 | | | | | | 1,071 | |
Florida’s Turnpike Enterprise Revenue Bonds, Series 2017 | |
5.000% due 07/01/2029 | | | | | 2,555 | | | | | | 3,098 | |
Jacksonville, Florida Revenue Notes, Series 2012 | |
5.000% due 10/01/2021 | | | | | 1,000 | | | | | | 1,146 | |
JEA Water & Sewer System, Florida Revenue Bonds, Series 2012 | |
5.000% due 10/01/2025 | | | | | 1,500 | | | | | | 1,694 | |
Miami-Dade County, Florida General Obligation Notes, Series 2011 | |
3.000% due 07/01/2017 | | | | | 1,375 | | | | | | 1,375 | |
Orlando Utilities Commission, Florida Revenue Notes, Series 2010 | |
5.000% due 10/01/2017 | | | | | 250 | | | | | | 253 | |
Palm Beach County, Florida Revenue Bonds, Series 2012 | |
5.000% due 06/01/2023 | | | | | 1,300 | | | | | | 1,514 | |
Tampa, Florida Revenue Bonds, Series 2016 | |
5.000% due 11/15/2028 | | | | | 350 | | | | | | 418 | |
West Palm Beach, Florida Utility System Revenue Bonds, Series 2017 | |
5.000% due 10/01/2028 | | | | | 545 | | | | | | 676 | |
| | | | | | | | | | | | |
| | | | | | | | | | | 12,407 | |
| | | | | | | | | | | | |
| |
| GEORGIA 1.3% | | | | | | | | | | | | |
Atlanta Department of Aviation, Georgia Revenue Bonds, Series 2012 | |
5.000% due 01/01/2025 | | | | | 500 | | | | | | 576 | |
Floyd County, Georgia Development Authority Revenue Bonds, Series 2010 | |
2.350% due 07/01/2022 | | | | | 2,000 | | | | | | 2,020 | |
Marietta, Georgia General Obligation Notes, Series 2009 | |
5.000% due 02/01/2018 | | | | | 250 | | | | | | 256 | |
Municipal Electric Authority of Georgia Revenue Notes, Series 2010 | |
4.000% due 01/01/2018 | | | | | 350 | | | | | | 354 | |
Municipal Electric Authority of Georgia Revenue Notes, Series 2011 | |
5.000% due 01/01/2020 | | | | | 250 | | | | | | 269 | |
| | | | | | | | | | | | |
| | | | | | | | | | | 3,475 | |
| | | | | | | | | | | | |
| |
| GUAM 0.3% | | | | | | | | | | | | |
Guam Government Waterworks Authority Revenue Notes, Series 2014 | |
5.000% due 07/01/2023 | | | | | 770 | | | | | | 872 | |
| | | | | | | | | | | | |
| | | | | | | | | | | | |
| | | | | PRINCIPAL
AMOUNT
(000S) | | | | | MARKET
VALUE
(000S) | |
| HAWAII 0.9% | | | | | | | | | | | | |
Honolulu, Hawaii City & County General Obligation Bonds, Series 2015 | |
5.000% due 10/01/2030 | | $ | | | 2,000 | | | $ | | | 2,378 | |
| | | | | | | | | | | | |
| |
| ILLINOIS 8.1% | | | | | | | | | | | | |
Chicago Midway International Airport, Illinois Revenue Bonds, Series 2014 | |
5.000% due 01/01/2035 | | | | | 6,500 | | | | | | 7,265 | |
Chicago, Illinois General Obligation Bonds, Series 2002 | |
5.000% due 01/01/2018 | | | | | 1,200 | | | | | | 1,206 | |
Chicago, Illinois General Obligation Bonds, Series 2015 | |
5.250% due 01/01/2027 | | | | | 4,000 | | | | | | 4,062 | |
Chicago, Illinois General Obligation Notes, Series 2015 | |
5.000% due 01/01/2026 | | | | | 2,000 | | | | | | 2,012 | |
Chicago, Illinois Wastewater Transmission Revenue Bonds, (NPFGC Insured), Series 2001 | |
5.500% due 01/01/2018 | | | | | 1,000 | | | | | | 1,020 | |
Chicago, Illinois Waterworks Revenue Notes, Series 2012 | |
5.000% due 11/01/2020 | | | | | 1,000 | | | | | | 1,098 | |
Illinois State General Obligation Bonds, Series 2012 | |
4.000% due 01/01/2024 | | | | | 4,000 | | | | | | 3,922 | |
Railsplitter Tobacco Settlement Authority, Illinois Revenue Notes, Series 2010 | |
5.125% due 06/01/2019 | | | | | 500 | | | | | | 536 | |
| | | | | | | | | | | | |
| | | | | | | | | | | 21,121 | |
| | | | | | | | | | | | |
| |
| INDIANA 0.6% | | | | | | | | | | | | |
Indiana Finance Authority Revenue Notes, Series 2010 | |
5.000% due 02/01/2018 | | | | | 500 | | | | | | 512 | |
Indiana University Revenue Notes, Series 2012 | |
5.000% due 06/01/2021 | | | | | 1,000 | | | | | | 1,140 | |
| | | | | | | | | | | | |
| | | | | | | | | | | 1,652 | |
| | | | | | | | | | | | |
| |
| KANSAS 0.2% | | | | | | | | | | | | |
Kansas Development Finance Authority Revenue Notes, Series 2010 | |
5.000% due 11/01/2017 | | | | | 500 | | | | | | 506 | |
| | | | | | | | | | | | |
| |
| LOUISIANA 1.2% | | | | | | | | | | | | |
Louisiana Public Facilities Authority Revenue Bonds, Series 2016 | |
3.375% due 09/01/2028 | | | | | 2,000 | | | | | | 2,008 | |
Louisiana Public Facilities Authority Revenue Bonds, Series 2017 | |
5.000% due 05/15/2028 | | | | | 855 | | | | | | 1,013 | |
| | | | | | | | | | | | |
| | | | | | | | | | | 3,021 | |
| | | | | | | | | | | | |
| |
| MARYLAND 0.7% | | | | | | | | | | | | |
Baltimore, Maryland Revenue Bonds, Series 2017 | |
5.000% due 09/01/2027 | | | | | 1,500 | | | | | | 1,775 | |
Baltimore, Maryland Revenue Notes, Series 2011 | |
5.000% due 07/01/2021 | | | | | 60 | | | | | | 69 | |
| | | | | | | | | | | | |
| | | | | | | | | | | 1,844 | |
| | | | | | | | | | | | |
| |
| MASSACHUSETTS 1.8% | | | | | | | | | | | | |
Massachusetts Bay Transportation Authority Revenue Bonds, Series 2006 | |
5.500% due 07/01/2017 | | | | | 500 | | | | | | 500 | |
Massachusetts School Building Authority Revenue Notes, Series 2012 | |
5.000% due 08/15/2022 | | | | | 1,175 | | | | | | 1,380 | |
Massachusetts State College Building Authority Revenue Bonds, Series 2012 | |
5.000% due 05/01/2026 | | | | | 2,000 | | | | | | 2,314 | |
| | | | | | |
| See Accompanying Notes | | ANNUAL REPORT | | JUNE 30, 2017 | | 73 |
Schedule of Investments PIMCO Intermediate Municipal Bond Active Exchange-Traded Fund (Cont.)
| | | | | | | | | | | | |
| | | | | PRINCIPAL
AMOUNT
(000S) | | | | | MARKET
VALUE
(000S) | |
Taunton, Massachusetts General Obligation Notes, Series 2009 | |
5.000% due 12/01/2018 | | $ | | | 510 | | | $ | | | 538 | |
| | | | | | | | | | | | |
| | | | | | | | | | | 4,732 | |
| | | | | | | | | | | | |
| |
| MICHIGAN 1.4% | | | | | | | | | | | | |
Michigan Finance Authority Revenue Bonds, Series 2015 | |
5.000% due 07/01/2030 | | | | | 1,200 | | | | | | 1,367 | |
Michigan Finance Authority Revenue Notes, Series 2015 | |
5.000% due 07/01/2021 | | | | | 1,000 | | | | | | 1,119 | |
University of Michigan Revenue Bonds, Series 2017 | |
5.000% due 04/01/2028 | | | | | 1,000 | | | | | | 1,244 | |
| | | | | | | | | | | | |
| | | | | | | | | | | 3,730 | |
| | | | | | | | | | | | |
| |
| MINNESOTA 1.4% | | | | | | | | | | | | |
Rochester, Minnesota Electric Utility Revenue Bonds, Series 2017 | |
5.000% due 12/01/2029 | | | | | 1,000 | | | | | | 1,217 | |
Rochester, Minnesota Revenue Bonds, Series 2011 | |
4.000% due 11/15/2030 | | | | | 1,000 | | | | | | 1,039 | |
University of Minnesota Revenue Bonds, Series 2016 | |
5.000% due 04/01/2032 | | | | | 1,220 | | | | | | 1,454 | |
| | | | | | | | | | | | |
| | | | | | | | | | | 3,710 | |
| | | | | | | | | | | | |
| |
| MISSOURI 1.0% | | | | | | | | | | | | |
Missouri Development Finance Board Revenue Notes, Series 2012 | |
5.000% due 12/01/2020 | | | | | 1,335 | | | | | | 1,480 | |
Missouri State Health & Educational Facilities Authority Revenue Notes, Series 2010 | |
5.000% due 11/15/2017 | | | | | 1,000 | | | | | | 1,014 | |
| | | | | | | | | | | | |
| | | | | | | | | | | 2,494 | |
| | | | | | | | | | | | |
| |
| NEVADA 0.7% | | | | | | | | | | | | |
Las Vegas Valley Water District, Nevada General Obligation Bonds, Series 2015 | |
5.000% due 06/01/2034 | | | | | 1,500 | | | | | | 1,759 | |
| | | | | | | | | | | | |
| |
| NEW HAMPSHIRE 0.5% | | | | | | | | | | | | |
Merrimack County, New Hampshire General Obligation Notes, Series 2012 | |
5.000% due 12/01/2022 | | | | | 1,115 | | | | | | 1,314 | |
| | | | | | | | | | | | |
| |
| NEW JERSEY 4.1% | | | | | | | | | | | | |
New Jersey Economic Development Authority Revenue Bonds, Series 2012 | |
5.000% due 06/15/2023 | | | | | 1,000 | | | | | | 1,098 | |
New Jersey Economic Development Authority Revenue Notes, Series 2011 | |
5.000% due 09/01/2018 | | | | | 2,000 | | | | | | 2,084 | |
New Jersey Health Care Facilities Financing Authority Revenue Bonds, Series 2011 | |
5.000% due 07/01/2023 | | | | | 1,000 | | | | | | 1,149 | |
New Jersey Transportation Trust Fund Authority Revenue Bonds, Series 2011 | |
5.250% due 06/15/2024 | | | | | 2,500 | | | | | | 2,638 | |
New Jersey Transportation Trust Fund Authority Revenue Notes, Series 2015 | |
5.000% due 06/15/2022 | | | | | 1,000 | | | | | | 1,073 | |
New Jersey Turnpike Authority Revenue Bonds, Series 2017 | |
5.000% due 01/01/2030 | | | | | 2,250 | | | | | | 2,670 | |
| | | | | | | | | | | | |
| | | | | | | | | | | 10,712 | |
| | | | | | | | | | | | |
| | | | | | | | | | | | |
| | | | | PRINCIPAL
AMOUNT
(000S) | | | | | MARKET
VALUE
(000S) | |
| NEW MEXICO 0.9% | | | | | | | | | | | | |
Farmington, New Mexico Revenue Bonds, Series 2010 | |
2.125% due 06/01/2040 | | $ | | | 1,800 | | | $ | | | 1,812 | |
New Mexico State Severance Tax Permanent Fund Revenue Notes, Series 2010 | |
5.000% due 07/01/2017 | | | | | 500 | | | | | | 500 | |
| | | | | | | | | | | | |
| | | | | | | | | | | 2,312 | |
| | | | | | | | | | | | |
| |
| NEW YORK 14.7% | | | | | | | | | | | | |
Erie County, New York Industrial Development Agency Revenue Notes, Series 2012 | |
5.000% due 05/01/2022 | | | | | 1,000 | | | | | | 1,166 | |
Metropolitan Transportation Authority, New York Revenue Bonds, Series 2005 | |
5.000% due 11/15/2019 | | | | | 500 | | | | | | 544 | |
Metropolitan Transportation Authority, New York Revenue Bonds, Series 2014 | |
5.000% due 11/15/2029 | | | | | 3,000 | | | | | | 3,523 | |
Monroe County Industrial Development Corp., New York Revenue Bonds, Series 2017 | |
5.000% due 12/01/2027 | | | | | 1,000 | | | | | | 1,189 | |
Nassau County, New York General Obligation Notes, Series 2016 | |
5.000% due 04/01/2026 | | | | | 1,360 | | | | | | 1,656 | |
New York City Transitional Finance Authority Future Tax Secured, New York Revenue Bonds, Series 2014 | |
5.000% due 08/01/2031 | | | | | 5,000 | | | | | | 5,948 | |
New York City, New York General Obligation Notes, Series 2011 | |
5.000% due 08/01/2017 | | | | | 980 | | | | | | 983 | |
New York Convention Center Development Corp. Revenue Bonds, Series 2015 | |
5.000% due 11/15/2027 | | | | | 2,000 | | | | | | 2,425 | |
New York State Dormitory Authority Revenue Bonds, Series 2011 | |
5.000% due 05/01/2022 | | | | | 2,000 | | | | | | 2,257 | |
New York State Dormitory Authority Revenue Bonds, Series 2012 | |
5.000% due 12/15/2025 | | | | | 405 | | | | | | 477 | |
New York State Dormitory Authority Revenue Notes, Series 2008 | |
5.000% due 07/01/2017 | | | | | 2,000 | | | | | | 2,000 | |
New York State Dormitory Authority Revenue Notes, Series 2011 | |
4.000% due 07/01/2018 | | | | | 815 | | | | | | 839 | |
New York State Dormitory Authority Revenue Notes, Series 2012 | |
5.000% due 12/15/2019 | | | | | 1,450 | | | | | | 1,585 | |
New York State Dormitory Authority Revenue Notes, Series 2016 | |
5.000% due 02/15/2027 | | | | | 2,000 | | | | | | 2,466 | |
New York State Thruway Authority Revenue Notes, Series 2013 | |
5.000% due 05/01/2019 | | | | | 2,000 | | | | | | 2,138 | |
New York State Urban Development Corp. Revenue Notes, Series 2010 | |
5.000% due 03/15/2018 | | | | | 500 | | | | | | 514 | |
Tompkins County, New York Development Corp. Revenue Notes, Series 2013 | |
5.000% due 07/01/2019 | | | | | 1,090 | | | | | | 1,134 | |
Triborough Bridge & Tunnel Authority, New York Revenue Bonds, Series 2012 | |
5.000% due 11/15/2025 | | | | | 2,000 | | | | | | 2,351 | �� |
Triborough Bridge & Tunnel Authority, New York Revenue Bonds, Series 2013 | |
5.000% due 11/15/2027 | | | | | 2,075 | | | | | | 2,486 | |
5.000% due 11/15/2028 | | | | | 825 | | | | | | 986 | |
TSASC Inc., New York Revenue Notes, Series 2017
| |
5.000% due 06/01/2026 | | | | | 1,250 | | | | | | 1,478 | |
| | | | | | | | | | | | |
| | | | | | | | | | | 38,145 | |
| | | | | | | | | | | | |
| | | | | | | | | | | | |
| | | | | PRINCIPAL
AMOUNT
(000S) | | | | | MARKET
VALUE
(000S) | |
| NORTH CAROLINA 2.1% | | | | | | | | | | | | |
Mecklenburg County, North Carolina Certificates of Participation Notes, Series 2009 | |
5.000% due 02/01/2019 | | $ | | | 300 | | | $ | | | 318 | |
North Carolina Medical Care Commission Revenue Bonds, Series 2012 | |
5.000% due 06/01/2023 | | | | | 1,665 | | | | | | 1,901 | |
5.000% due 10/01/2027 | | | | | 1,100 | | | | | | 1,246 | |
North Carolina State Revenue Bonds, Series 2011 | |
5.000% due 11/01/2022 | | | | | 1,500 | | | | | | 1,728 | |
University of North Carolina at Greensboro Revenue Bonds, Series 2014 | |
5.000% due 04/01/2026 | | | | | 250 | | | | | | 294 | |
| | | | | | | | | | | | |
| | | | | | | | | | | 5,487 | |
| | | | | | | | | | | | |
| |
| OHIO 5.7% | | | | | | | | | | | | |
American Municipal Power, Inc., Ohio Revenue Notes, Series 2012 | |
5.000% due 02/15/2022 | | | | | 800 | | | | | | 917 | |
Cleveland Department of Public Utilities Division of Water, Ohio Revenue Bonds, Series 2012 | |
5.000% due 01/01/2026 | | | | | 1,000 | | | | | | 1,145 | |
Cuyahoga County, Ohio Certificates of Participation Bonds, Series 2014 | |
5.000% due 12/01/2025 | | | | | 3,000 | | | | | | 3,548 | |
Miami University/Oxford, Ohio Revenue Bonds, Series 2017 | |
5.000% due 09/01/2029 | | | | | 380 | | | | | | 458 | |
Ohio Higher Educational Facility Commission Revenue Bonds, Series 2008 | |
0.920% due 01/01/2043 | | | | | 2,700 | | | | | | 2,700 | |
Ohio State General Obligation Bonds, Series 2011 | |
5.000% due 08/01/2022 | | | | | 3,000 | | | | | | 3,520 | |
Ohio State General Obligation Notes, Series 2012 | |
5.000% due 09/15/2020 | | | | | 1,000 | | | | | | 1,119 | |
University of Cincinnati, Ohio Revenue Bonds, Series 2012 | |
5.000% due 06/01/2024 | | | | | 1,250 | | | | | | 1,460 | |
| | | | | | | | | | | | |
| | | | | | | | | | | 14,867 | |
| | | | | | | | | | | | |
| |
| OREGON 0.2% | |
Oregon State Facilities Authority Revenue Notes, Series 2010 | |
5.000% due 10/01/2017 | | | | | 500 | | | | | | 504 | |
| | | | | | | | | | | | |
| |
| PENNSYLVANIA 8.8% | |
Allegheny County, Pennsylvania Higher Education Building Authority Revenue Bonds, Series 2012 | |
5.000% due 03/01/2024 | | | | | 500 | | | | | | 576 | |
Commonwealth of Pennsylvania General Obligation Notes, Series 2016 | |
5.000% due 01/15/2027 | | | | | 2,000 | | | | | | 2,425 | |
Delaware River Port Authority, Pennsylvania Revenue Notes, Series 2012 | |
5.000% due 01/01/2023 | | | | | 900 | | | | | | 1,021 | |
Lehigh County, Pennsylvania Industrial Development Authority Revenue Bonds, Series 2016 | |
0.900% due 02/15/2027 | | | | | 1,000 | | | | | | 1,000 | |
Montgomery County Industrial Development Authority, Pennsylvania Revenue Bonds, Series 1994 | |
2.550% due 06/01/2029 | | | | | 1,500 | | | | | | 1,494 | |
Pennsylvania Higher Educational Facilities Authority Revenue Bonds, Series 2011 | |
5.250% due 06/15/2023 | | | | | 2,500 | | | | | | 2,849 | |
Pennsylvania Higher Educational Facilities Authority Revenue Bonds, Series 2015 | |
5.000% due 08/15/2029 | | | | | 340 | | | | | | 399 | |
5.000% due 08/15/2031 | | | | | 300 | | | | | | 348 | |
5.000% due 08/15/2033 | | | | | 1,000 | | | | | | 1,148 | |
Pennsylvania Higher Educational Facilities Authority Revenue Bonds, Series 2017 | |
5.000% due 08/15/2028 | | | | | 1,335 | | | | | | 1,648 | |
5.000% due 08/15/2029 | | | | | 1,250 | | | | | | 1,530 | |
| | | | | | | | |
| 74 | | PIMCO ETF TRUST | | | | | See Accompanying Notes | |
June 30, 2017
| | | | | | | | | | | | |
| | | | | PRINCIPAL
AMOUNT
(000S) | | | | | MARKET
VALUE
(000S) | |
Pennsylvania Turnpike Commission Revenue Notes, Series 2014 | |
1.790% due 12/01/2020 | | $ | | | 4,500 | | | $ | | | 4,517 | |
Philadelphia Gas Works, Co., Pennsylvania Revenue Bonds, Series 2015 | |
5.000% due 08/01/2027 | | | | | 750 | | | | | | 883 | |
Philadelphia Hospitals & Higher Education Facilities Authority, Pennsylvania Revenue Bonds, Series 2011 | |
0.920% due 07/01/2041 | | | | | 2,500 | | | | | | 2,500 | |
Southeastern Pennsylvania Transportation Authority Revenue Notes, Series 2010 | |
5.000% due 03/01/2018 | | | | | 500 | | | | | | 513 | |
| | | | | | | | | | | | |
| | | | | | | | | | | 22,851 | |
| | | | | | | | | | | | |
| |
| PUERTO RICO 0.4% | |
Puerto Rico Electric Power Authority Revenue Bonds, (AGM Insured), Series 2007 | |
1.289% due 07/01/2029 | | | | | 1,280 | | | | | | 1,024 | |
| | | | | | | | | | | | |
| |
| RHODE ISLAND 3.1% | |
Tobacco Settlement Financing Corp., Rhode Island Revenue Bonds, Series 2015 | |
5.000% due 06/01/2035 | | | | | 7,500 | | | | | | 8,051 | |
| | | | | | | | | | | | |
| |
| SOUTH DAKOTA 0.8% | |
South Dakota Health & Educational Facilities Authority Revenue Bonds, Series 2014 | |
5.000% due 11/01/2027 | | | | | 925 | | | | | | 1,072 | |
South Dakota Health & Educational Facilities Authority Revenue Bonds, Series 2015 | |
5.000% due 11/01/2028 | | | | | 900 | | | | | | 1,042 | |
| | | | | | | | | | | | |
| | | | | | | | | | | 2,114 | |
| | | | | | | | | | | | |
| |
| TENNESSEE 2.5% | |
Tennessee Energy Acquisition Corp. Revenue Bonds, Series 2006 | |
5.000% due 02/01/2021 | | | | | 870 | | | | | | 968 | |
5.000% due 02/01/2027 | | | | | 3,000 | | | | | | 3,542 | |
5.250% due 09/01/2026 | | | | | 1,595 | | | | | | 1,922 | |
| | | | | | | | | | | | |
| | | | | | | | | | | 6,432 | |
| | | | | | | | | | | | |
| |
| TEXAS 9.7% | |
Austin Convention Enterprises Inc., Texas Revenue Bonds, Series 2017 | |
5.000% due 01/01/2026 | | | | | 750 | | | | | | 881 | |
Barbers Hill Independent School District, Texas General Obligation Bonds, (PSF Insured), Series 2012 | |
4.000% due 02/15/2023 | | | | | 1,225 | | | | | | 1,340 | |
| | | | | | | | | | | | |
| | | | | PRINCIPAL
AMOUNT
(000S) | | | | | MARKET
VALUE
(000S) | |
Corpus Christi Independent School District, Texas General Obligation Notes, (PSF Insured), Series 2016 | |
5.000% due 08/15/2025 | | $ | | | 2,115 | | | $ | | | 2,609 | |
Dallas, Texas Waterworks & Sewer System Revenue Bonds, Series 2012 | |
5.000% due 10/01/2023 | | | | | 1,000 | | | | | | 1,176 | |
Harris County, Texas Cultural Education Facilities Finance Corp. Revenue Bonds, Series 2008 | |
0.950% due 12/01/2024 | | | | | 2,500 | | | | | | 2,500 | |
Harris County, Texas Cultural Education Facilities Finance Corp. Revenue Bonds, Series 2014 | |
1.490% due 12/01/2042 | | | | | 4,500 | | | | | | 4,504 | |
5.000% due 12/01/2025 | | | | | 500 | | | | | | 596 | |
Houston, Texas Combined Utility System Revenue Notes, Series 2017 | |
5.000% due 11/15/2026 | | | | | 2,050 | | | | | | 2,531 | |
North Central Texas Health Facility Development Corp. Revenue Notes, Series 2012 | |
5.000% due 08/15/2020 | | | | | 1,000 | | | | | | 1,107 | |
North Texas Tollway Authority Revenue Bonds, Series 2016 | |
5.000% due 01/01/2028 | | | | | 2,875 | | | | | | 3,431 | |
Northside Independent School District, Texas General Obligation Bonds, (PSF Insured), Series 2010 | |
1.200% due 08/01/2040 | | | | | 940 | | | | | | 940 | |
Pflugerville Independent School District, Texas General Obligation Bonds, (PSF Insured), Series 2012 | |
5.000% due 02/15/2024 | | | | | 1,165 | | | | | | 1,346 | |
San Antonio Public Facilities Corp., Texas Revenue Bonds, Series 2012 | |
5.000% due 09/15/2025 | | | | | 1,000 | | | | | | 1,159 | |
Texas Municipal Gas Acquisition & Supply Corp. Revenue Notes, Series 2008 | |
5.625% due 12/15/2017 | | | | | 505 | | | | | | 511 | |
University of Texas System Revenue Bonds, Series 2010 | |
5.000% due 08/15/2022 | | | | | 500 | | | | | | 588 | |
| | | | | | | | | | | | |
| | | | | | | | | | | 25,219 | |
| | | | | | | | | | | | |
| |
| UTAH 1.0% | |
Murray, Utah Revenue Bonds, Series 2005 | |
0.920% due 05/15/2037 | | | | | 2,500 | | | | | | 2,500 | |
| | | | | | | | | | | | |
| |
| VIRGINIA 1.8% | |
Louisa Industrial Development Authority, Virginia Revenue Bonds, Series 2008 | |
2.150% due 11/01/2035 | | | | | 2,250 | | | | | | 2,293 | |
Virginia College Building Authority Revenue Bonds, Series 2016 | |
5.000% due 09/01/2028 | | | | | 1,850 | | | | | | 2,274 | |
| | | | | | | | | | | | |
| | | | | | | | | | | 4,567 | |
| | | | | | | | | | | | |
| | | | | | | | | | | | |
| | | | | PRINCIPAL
AMOUNT
(000S) | | | | | MARKET
VALUE
(000S) | |
| WASHINGTON 3.0% | |
Central Puget Sound Regional Transit Authority, Washington Revenue Bonds, Series 2016 | |
5.000% due 11/01/2030 | | $ | | | 1,000 | | | $ | | | 1,213 | |
Pierce County, Washington School District No. 10 Tacoma General Obligation Bonds, Series 2012 | |
5.000% due 12/01/2024 | | | | | 1,000 | | | | | | 1,222 | |
Seattle, Washington Solid Waste Revenue Notes, Series 2014 | |
5.000% due 05/01/2024 | | | | | 545 | | | | | | 655 | |
Washington Health Care Facilities Authority Revenue Bonds, Series 2017 | |
1.960% due 01/01/2042 | | | | | 2,500 | | | | | | 2,496 | |
Washington State Revenue Bonds, Series 2012 | |
5.000% due 09/01/2023 | | | | | 2,000 | | | | | | 2,308 | |
| | | | | | | | | | | | |
| | | | | | | | | | | 7,894 | |
| | | | | | | | | | | | |
| |
| WISCONSIN 0.5% | |
Wisconsin State Clean Water Fund Leveraged Loan Portfolio Revenue Bonds, Series 2012 | |
5.000% due 06/01/2023 | | | | | 1,000 | | | | | | 1,197 | |
| | | | | | | | | | | | |
Total Municipal Bonds & Notes
(Cost $246,568) | | | | | | 254,421 | |
| | | | | | | | | | | | |
| |
| U.S. TREASURY OBLIGATIONS 0.4% | |
U.S. Treasury Notes | |
0.625% due 08/31/2017 | | | | | 1,000 | | | | | | 999 | |
| | | | | | | | | | | | |
Total U.S. Treasury Obligations
(Cost $1,000) | | | | | | 999 | |
| | | | | | | | | | | | |
| |
| SHORT-TERM INSTRUMENTS 0.6% | |
| |
| REPURCHASE AGREEMENTS (b) 0.4% | |
| | | | | | | | | | | 1,143 | |
| | | | | | | | | | | | |
| |
| U.S. TREASURY BILLS 0.2% | |
0.934% due 08/10/2017 (a) | | | | | 600 | | | | | | 599 | |
| | | | | | | | | | | | |
Total Short-Term Instruments
(Cost $1,742) | | | | | | 1,742 | |
| | | | | | | | | | | | |
| | | | | | | | | | | | |
Total Investments in Securities
(Cost $249,310) | | | | | | 257,162 | |
| | | | | | | | | | | | |
Total Investments 98.9%
(Cost $249,310) | | | $ | | | 257,162 | |
| |
| Other Assets and Liabilities, net 1.1% | | | | | | 2,755 | |
| | | | | | | | | | | | |
| Net Assets 100.0% | | | $ | | | 259,917 | |
| | | | | | | | | | | | |
NOTES TO SCHEDULE OF INVESTMENTS (AMOUNTS IN THOUSANDS*):
| * | A zero balance may reflect actual amounts rounding to less than one thousand. |
BORROWINGS AND OTHER FINANCING TRANSACTIONS
(b) REPURCHASE AGREEMENTS:
| | | | | | | | | | | | | | | | | | | | | | | | | | | | | | |
| Counterparty | | Lending
Rate | | | Settlement
Date | | | Maturity
Date | | | Principal
Amount | | | Collateralized By | | Collateral
(Received) | | | Repurchase
Agreements,
at Value | | | Repurchase
Agreement
Proceeds
to be
Received(1) | |
| SSB | | | 0.050 | % | | | 06/30/2017 | | | | 07/03/2017 | | | $ | 1,143 | | | U.S. Treasury Notes 2.000% due 08/31/2021(2) | | $ | (1,169 | ) | | $ | 1,143 | | | $ | 1,143 | |
| | | | | | | | | | | | | | | | | | | | | | | | | | | | | | |
Total Repurchase Agreements | | | | | $ | (1,169 | ) | | $ | 1,143 | | | $ | 1,143 | |
| | | | | | | | | | | | | | | | | | | | | | | | | | | | | | |
| | | | | | |
| See Accompanying Notes | | ANNUAL REPORT | | JUNE 30, 2017 | | 75 |
Schedule of Investments PIMCO Intermediate Municipal Bond Active Exchange-Traded Fund (Cont.)
June 30, 2017
BORROWINGS AND OTHER FINANCING TRANSACTIONS SUMMARY
The following is a summary by counterparty of the market value of Borrowings and Other Financing Transactions and collateral pledged/(received) as of June 30, 2017:
| | | | | | | | | | | | | | | | | | | | | | | | | | | | |
| Counterparty | | Repurchase
Agreement
Proceeds
to be
Received | | | Payable for
Reverse
Repurchase
Agreements | | | Payable for
Sale-Buyback
Transactions | | | Securities
Out on Loan | | | Total Borrowings and
Other Financing
Transactions | | | Collateral
Pledged/(Received) | | | Net Exposure(3) | |
Global/Master Repurchase Agreement | | | | | | | | | | | | | | | | | | | | | | | | | | | | |
SSB | | $ | 1,143 | | | $ | 0 | | | $ | 0 | | | $ | 0 | | | $ | 1,143 | | | $ | (1,169 | ) | | $ | (26 | ) |
| | | | | | | | | | | | | | | | | | | | | | | | | | | | |
Total Borrowings and Other Financing Transactions | | $ | 1,143 | | | $ | 0 | | | $ | 0 | | | $ | 0 | | | | | | | | | | | | | |
| | | | | | | | | | | | | | | | | | | | | | | | | | | | |
| (1) | Includes accrued interest. |
| (2) | Collateral is held in custody by the counterparty. |
| (3) | Net Exposure represents the net receivable/(payable) that would be due from/to the counterparty in the event of default. Exposure from borrowings and other financing transactions can only be netted across transactions governed under the same master agreement with the same legal entity. See Note 8, Master Arrangements, in the Notes to Financial Statements for more information regarding master netting arrangements. |
FAIR VALUE MEASUREMENTS
The following is a summary of the fair valuations according to the inputs used as of June 30, 2017 in valuing the Fund’s assets and liabilities:
| | | | | | | | | | | | | | | | |
| Category and Subcategory | | Level 1 | | | Level 2 | | | Level 3 | | | Fair
Value at
06/30/2017 | |
Investments in Securities, at Value | |
Municipal Bonds & Notes | |
Arizona | | $ | 0 | | | $ | 10,618 | | | $ | 0 | | | $ | 10,618 | |
Arkansas | | | 0 | | | | 370 | | | | 0 | | | | 370 | |
California | | | 0 | | | | 15,510 | | | | 0 | | | | 15,510 | |
Colorado | | | 0 | | | | 5,562 | | | | 0 | | | | 5,562 | |
District of Columbia | | | 0 | | | | 3,470 | | | | 0 | | | | 3,470 | |
Florida | | | 0 | | | | 12,407 | | | | 0 | | | | 12,407 | |
Georgia | | | 0 | | | | 3,475 | | | | 0 | | | | 3,475 | |
Guam | | | 0 | | | | 872 | | | | 0 | | | | 872 | |
Hawaii | | | 0 | | | | 2,378 | | | | 0 | | | | 2,378 | |
Illinois | | | 0 | | | | 21,121 | | | | 0 | | | | 21,121 | |
Indiana | | | 0 | | | | 1,652 | | | | 0 | | | | 1,652 | |
Kansas | | | 0 | | | | 506 | | | | 0 | | | | 506 | |
Louisiana | | | 0 | | | | 3,021 | | | | 0 | | | | 3,021 | |
Maryland | | | 0 | | | | 1,844 | | | | 0 | | | | 1,844 | |
Massachusetts | | | 0 | | | | 4,732 | | | | 0 | | | | 4,732 | |
Michigan | | | 0 | | | | 3,730 | | | | 0 | | | | 3,730 | |
Minnesota | | | 0 | | | | 3,710 | | | | 0 | | | | 3,710 | |
Missouri | | | 0 | | | | 2,494 | | | | 0 | | | | 2,494 | |
Nevada | | | 0 | | | | 1,759 | | | | 0 | | | | 1,759 | |
New Hampshire | | | 0 | | | | 1,314 | | | | 0 | | | | 1,314 | |
New Jersey | | | 0 | | | | 10,712 | | | | 0 | | | | 10,712 | |
| | | | | | | | | | | | | | | | |
| Category and Subcategory | | Level 1 | | | Level 2 | | | Level 3 | | | Fair
Value at
06/30/2017 | |
New Mexico | | $ | 0 | | | $ | 2,312 | | | $ | 0 | | | $ | 2,312 | |
New York | | | 0 | | | | 38,145 | | | | 0 | | | | 38,145 | |
North Carolina | | | 0 | | | | 5,487 | | | | 0 | | | | 5,487 | |
Ohio | | | 0 | | | | 14,867 | | | | 0 | | | | 14,867 | |
Oregon | | | 0 | | | | 504 | | | | 0 | | | | 504 | |
Pennsylvania | | | 0 | | | | 22,851 | | | | 0 | | | | 22,851 | |
Puerto Rico | | | 0 | | | | 1,024 | | | | 0 | | | | 1,024 | |
Rhode Island | | | 0 | | | | 8,051 | | | | 0 | | | | 8,051 | |
South Dakota | | | 0 | | | | 2,114 | | | | 0 | | | | 2,114 | |
Tennessee | | | 0 | | | | 6,432 | | | | 0 | | | | 6,432 | |
Texas | | | 0 | | | | 25,219 | | | | 0 | | | | 25,219 | |
Utah | | | 0 | | | | 2,500 | | | | 0 | | | | 2,500 | |
Virginia | | | 0 | | | | 4,567 | | | | 0 | | | | 4,567 | |
Washington | | | 0 | | | | 7,894 | | | | 0 | | | | 7,894 | |
Wisconsin | | | 0 | | | | 1,197 | | | | 0 | | | | 1,197 | |
U.S. Treasury Obligations | | | 0 | | | | 999 | | | | 0 | | | | 999 | |
Short-Term Instruments | | | | | | | | | | | | | | | | |
Repurchase Agreements | | | 0 | | | | 1,143 | | | | 0 | | | | 1,143 | |
U.S. Treasury Bills | | | 0 | | | | 599 | | | | 0 | | | | 599 | |
| | | | | | | | | | | | | | | | |
| | | | |
Total Investments | | $ | 0 | | | $ | 257,162 | | | $ | 0 | | | $ | 257,162 | |
| | | | | | | | | | | | | | | | |
There were no significant transfers among Levels 1, 2, or 3 during the period ended June 30, 2017.
| | | | | | | | |
| 76 | | PIMCO ETF TRUST | | | | | See Accompanying Notes | |
Schedule of Investments PIMCO Short Term Municipal Bond Active Exchange-Traded Fund
June 30, 2017
| | | | | | | | | | | | |
| | | | | PRINCIPAL
AMOUNT
(000S) | | | | | MARKET
VALUE
(000S) | |
| INVESTMENTS IN SECURITIES 102.0% | |
| |
| MUNICIPAL BONDS & NOTES 99.9% | |
| |
| ALABAMA 1.2% | |
Industrial Development Board of the City of Mobile Alabama Revenue Bonds, Series 2007 | |
1.850% due 06/01/2034 | | $ | | | 810 | | | $ | | | 815 | |
| | | | | | | | | | | | |
| |
| ARIZONA 3.6% | |
Arizona Sports & Tourism Authority Revenue Notes, Series 2012 | |
4.000% due 07/01/2017 | | | | | 1,000 | | | | | | 1,000 | |
Industrial Development Authority of the County, Arizona of Yavapai Revenue Bonds, Series 2010 | |
1.050% due 04/01/2029 | | | | | 750 | | | | | | 750 | |
Pima County, Arizona Sewer System Revenue Notes, Series 2016 | |
5.000% due 07/01/2022 | | | | | 500 | | | | | | 585 | |
| | | | | | | | | | | | |
| | | | | | | | | | | 2,335 | |
| | | | | | | | | | | | |
| |
| CALIFORNIA 2.7% | |
Bay Area Toll Authority, California Revenue Bonds, Series 2007 | |
1.610% due 04/01/2047 | | | | | 1,000 | | | | | | 1,006 | |
Foothill-Eastern Transportation Corridor Agency, California Revenue Bonds, Series 2014 | |
5.000% due 01/15/2053 | | | | | 250 | | | | | | 250 | |
Riverside County, California Revenue Notes, Series 2017 | |
2.000% due 06/29/2018 (a) | | | | | 500 | | | | | | 506 | |
| | | | | | | | | | | | |
| | | | | | | | | | | 1,762 | |
| | | | | | | | | | | | |
| |
| COLORADO 6.9% | |
Denver, Colorado Airport System City & County Revenue Bonds, Series 2016 | |
1.595% due 11/15/2031 | | | | | 1,000 | | | | | | 1,004 | |
Denver, Colorado Airport System City & County Revenue Notes, Series 2016 | |
5.000% due 11/15/2023 | | | | | 500 | | | | | | 596 | |
E-470 Public Highway Authority, Colorado Revenue Bonds, Series 2017 | |
1.722% due 09/01/2039 | | | | | 1,000 | | | | | | 1,004 | |
Regional Transportation District, Colorado Certificates of Participation Notes, Series 2015 | |
5.000% due 06/01/2020 | | | | | 1,000 | | | | | | 1,103 | |
University of Colorado Hospital Authority Revenue Bonds, Series 2017 | |
5.000% due 11/15/2038 | | | | | 750 | | | | | | 851 | |
| | | | | | | | | | | | |
| | | | | | | | | | | 4,558 | |
| | | | | | | | | | | | |
| |
| CONNECTICUT 3.3% | |
Connecticut Special Tax State Revenue Notes, Series 2016 | |
5.000% due 09/01/2022 | | | | | 1,000 | | | | | | 1,150 | |
Connecticut State Health & Educational Facility Authority Revenue Bonds, Series 2015 | |
1.664% due 07/01/2049 | | | | | 1,000 | | | | | | 1,003 | |
| | | | | | | | | | | | |
| | | | | | | | | | | 2,153 | |
| | | | | | | | | | | | |
| |
| DISTRICT OF COLUMBIA 0.9% | |
District of Columbia Revenue Notes, Series 2016 | |
5.000% due 04/01/2022 | | | | | 500 | | | | | | 571 | |
| | | | | | | | | | | | |
| |
| FLORIDA 9.6% | |
Citizens Property Insurance Corp., Florida Revenue Notes, Series 2012 | |
5.000% due 06/01/2022 | | | | | 1,000 | | | | | | 1,158 | |
Florida State General Obligation Notes, Series 2009 | |
5.000% due 06/01/2019 | | | | | 625 | | | | | | 671 | |
| | | | | | | | | | | | |
| | | | | PRINCIPAL
AMOUNT
(000S) | | | | | MARKET
VALUE
(000S) | |
Lakeland, Florida Department of Electric Utilities Revenue Notes, Series 2012 | |
1.660% due 10/01/2017 | | $ | | | 3,000 | | | $ | | | 3,002 | |
Miami-Dade County, Florida Industrial Development Authority Revenue Bonds, Series 2006 | |
1.500% due 10/01/2018 | | | | | 500 | | | | | | 503 | |
West Palm Beach, Florida Utility System Revenue Bonds, (AGC Insured), Series 2008 | |
0.940% due 10/01/2038 | | | | | 1,000 | | | | | | 1,000 | |
| | | | | | | | | | | | |
| | | | | | | | | | | 6,334 | |
| | | | | | | | | | | | |
| |
| GEORGIA 1.8% | |
Burke County, Georgia Development Authority Revenue Bonds, Series 1994 | |
2.200% due 10/01/2032 | | | | | 1,000 | | | | | | 1,007 | |
Main Street Natural Gas, Inc., Georgia Revenue Bonds, Series 2007 | |
5.000% due 03/15/2018 | | | | | 200 | | | | | | 205 | |
| | | | | | | | | | | | |
| | | | | | | | | | | 1,212 | |
| | | | | | | | | | | | |
| |
| ILLINOIS 5.5% | |
Chicago, Illinois General Obligation Bonds, Series 2012 | |
5.000% due 01/01/2023 | | | | | 1,000 | | | | | | 1,015 | |
Illinois Finance Authority Revenue Notes, Series 2015 | |
5.000% due 11/15/2020 | | | | | 540 | | | | | | 598 | |
Illinois State General Obligation Notes, Series 2016 | |
5.000% due 06/01/2022 | | | | | 750 | | | | | | 783 | |
Railsplitter Tobacco Settlement Authority, Illinois Revenue Notes, Series 2010 | |
5.250% due 06/01/2020 | | | | | 1,115 | | | | | | 1,237 | |
| | | | | | | | | | | | |
| | | | | | | | | | | 3,633 | |
| | | | | | | | | | | | |
| |
| KENTUCKY 1.5% | |
Louisville/Jefferson County, Kentucky Metropolitan Government Revenue Bonds, Series 2017 | |
1.250% due 06/01/2033 | | | | | 1,000 | | | | | | 998 | |
| | | | | | | | | | | | |
| |
| MASSACHUSETTS 1.4% | |
Commonwealth of Massachusetts General Obligation Bonds, Series 2006 | |
0.830% due 03/01/2026 | | | | | 900 | | | | | | 900 | |
| | | | | | | | | | | | |
| |
| MICHIGAN 3.0% | |
Michigan Finance Authority Revenue Notes, Series 2016 | |
5.000% due 04/01/2022 | | | | | 500 | | | | | | 560 | |
Michigan State Hospital Finance Authority Revenue Bonds, Series 2010 | |
1.900% due 11/15/2047 | | | | | 750 | | | | | | 756 | |
University of Michigan Revenue Notes, Series 2017 | |
5.000% due 04/01/2021 | | | | | 600 | | | | | | 682 | |
| | | | | | | | | | | | |
| | | | | | | | | | | 1,998 | |
| | | | | | | | | | | | |
| |
| MINNESOTA 1.6% | |
Minneapolis-St. Paul Metropolitan Airports Commission, Minnesota Revenue Notes, Series 2016 | |
4.000% due 01/01/2021 | | | | | 250 | | | | | | 273 | |
Northern Municipal Power Agency, Minnesota Revenue Notes, Series 2010 | |
5.000% due 01/01/2019 | | | | | 750 | | | | | | 794 | |
| | | | | | | | | | | | |
| | | | | | | | | | | 1,067 | |
| | | | | | | | | | | | |
| |
| NEBRASKA 1.8% | |
Nebraska Public Power District Revenue Notes, Series 2012 | |
5.000% due 01/01/2019 | | | | | 580 | | | | | | 613 | |
| | | | | | | | | | | | |
| | | | | PRINCIPAL
AMOUNT
(000S) | | | | | MARKET
VALUE
(000S) | |
Nebraska Public Power District Revenue Notes, Series 2014 | |
5.000% due 07/01/2020 | | $ | | | 500 | | | $ | | | 554 | |
| | | | | | | | | | | | |
| | | | | | | | | | | 1,167 | |
| | | | | | | | | | | | |
| |
| NEVADA 1.5% | |
Clark County, Nevada Revenue Bonds, Series 2010 | |
1.875% due 06/01/2031 | | | | | 500 | | | | | | 502 | |
Clark County, Nevada Revenue Bonds, Series 2017 | |
1.600% due 01/01/2036 | | | | | 500 | | | | | | 499 | |
| | | | | | | | | | | | |
| | | | | | | | | | | 1,001 | |
| | | | | | | | | | | | |
| |
| NEW JERSEY 1.6% | |
New Jersey Economic Development Authority Revenue Notes, Series 2016 | |
5.000% due 06/15/2020 | | | | | 500 | | | | | | 531 | |
New Jersey Turnpike Authority Revenue Notes, Series 2012 | |
5.000% due 01/01/2019 | | | | | 500 | | | | | | 528 | |
| | | | | | | | | | | | |
| | | | | | | | | | | 1,059 | |
| | | | | | | | | | | | |
| |
| NEW MEXICO 3.8% | |
Farmington, New Mexico Revenue Bonds, Series 2016 | |
1.875% due 04/01/2033 | | | | | 750 | | | | | | 749 | |
New Mexico Hospital Equipment Loan Council Revenue Notes, Series 2015 | |
5.000% due 08/01/2019 | | | | | 600 | | | | | | 646 | |
New Mexico Municipal Energy Acquisition Authority Revenue Bonds, Series 2014 | |
5.000% due 11/01/2039 | | | | | 1,000 | | | | | | 1,070 | |
| | | | | | | | | | | | |
| | | | | | | | | | | 2,465 | |
| | | | | | | | | | | | |
| |
| NEW YORK 9.4% | |
Nassau County, New York General Obligation Notes, Series 2010 | |
5.000% due 10/01/2020 | | | | | 500 | | | | | | 559 | |
New York City, New York General Obligation Bonds, Series 2008 | |
5.000% due 08/01/2020 | | | | | 750 | | | | | | 835 | |
New York City, New York General Obligation Bonds, Series 2014 | |
0.950% due 03/01/2040 | | | | | 1,000 | | | | | | 1,000 | |
New York State Dormitory Authority Revenue Notes, Series 2009 | | | | |
5.000% due 07/01/2018 | | | | | 1,000 | | | | | | 1,040 | |
New York State Dormitory Authority Revenue Notes, Series 2015 | |
4.000% due 05/01/2020 | | | | | 700 | | | | | | 751 | |
New York State Thruway Authority Revenue Notes, Series 2013 | |
5.000% due 05/01/2019 | | | | | 1,365 | | | | | | 1,459 | |
TSASC Inc., New York Revenue Notes, Series 2017 | |
5.000% due 06/01/2021 | | | | | 500 | | | | | | 563 | |
| | | | | | | | | | | | |
| | | | | | | | | | | 6,207 | |
| | | | | | | | | | | | |
| |
| NORTH CAROLINA 5.1% | |
North Carolina Medical Care Commission Revenue Notes, Series 2016 | |
5.000% due 06/01/2020 | | | | | 1,220 | | | | | | 1,352 | |
North Carolina State Revenue Notes, Series 2013 | |
5.000% due 05/01/2018 | | | | | 1,000 | | | | | | 1,033 | |
University of North Carolina at Chapel Hill Revenue Bonds, Series 2012 | |
1.454% due 12/01/2041 | | | | | 1,000 | | | | | | 1,000 | |
| | | | | | | | | | | | |
| | | | | | | | | | | 3,385 | |
| | | | | | | | | | | | |
| | | | | | |
| See Accompanying Notes | | ANNUAL REPORT | | JUNE 30, 2017 | | 77 |
Schedule of Investments PIMCO Short Term Municipal Bond Active Exchange-Traded Fund (Cont.)
| | | | | | | | | | | | |
| | | | | PRINCIPAL
AMOUNT
(000S) | | | | | MARKET
VALUE
(000S) | |
| OHIO 4.1% | |
Cincinnati, Ohio Water System Revenue Notes, Series 2009 | |
5.000% due 12/01/2017 | | $ | | | 1,000 | | | $ | | | 1,017 | |
Ohio Higher Educational Facility Commission Revenue Bonds, (NPFGC Insured), Series 2006 | |
5.250% due 12/01/2019 | | | | | 750 | | | | | | 819 | |
Ohio Higher Educational Facility Commission Revenue Notes, Series 2016 | |
5.000% due 12/01/2022 | | | | | 750 | | | | | | 877 | |
| | | | | | | | | | | | |
| | | | | | | | | | | 2,713 | |
| | | | | | | | | | | | |
| |
| PENNSYLVANIA 11.4% | |
Commonwealth of Pennsylvania General Obligation Notes, Series 2016 | |
5.000% due 09/15/2018 | | | | | 145 | | | | | | 152 | |
5.000% due 01/15/2021 | | | | | 1,000 | | | | | | 1,121 | |
Lehigh County, Pennsylvania Industrial Development Authority Revenue Bonds, Series 2016 | |
0.900% due 09/01/2029 | | | | | 1,000 | | | | | | 1,000 | |
Montgomery County Industrial Development Authority, Pennsylvania Revenue Bonds, Series 2002 | |
2.550% due 12/01/2029 | | | | | 1,000 | | | | | | 996 | |
Pennsylvania Economic Development Financing Authority Revenue Bonds, Series 2010 | |
1.150% due 12/01/2030 | | | | | 1,200 | | | | | | 1,200 | |
Pennsylvania Turnpike Commission Revenue Notes, Series 2016 | |
1.435% due 12/01/2018 | | | | | 2,500 | | | | | | 2,500 | |
Philadelphia Gas Works, Co., Pennsylvania Revenue Notes, Series 2015 | |
5.000% due 08/01/2020 | | | | | 500 | | | | | | 551 | |
| | | | | | | | | | | | |
| | | | | | | | | | | 7,520 | |
| | | | | | | | | | | | |
| |
| TEXAS 8.5% | |
Austin, Texas Water & Wastewater System Revenue Notes, Series 2009 | |
5.000% due 11/15/2017 | | | | | 250 | | | | | | 254 | |
| | | | | | | | | | | | |
| | | | | PRINCIPAL
AMOUNT
(000S) | | | | | MARKET
VALUE
(000S) | |
Dallas/Fort Worth International Airport, Texas Revenue Notes, Series 2013 | |
5.000% due 11/01/2018 | | $ | | | 500 | | | $ | | | 526 | |
Harris County, Texas Cultural Education Facilities Finance Corp. Revenue Bonds, Series 2008 | |
0.950% due 12/01/2024 | | | | | 1,000 | | | | | | 1,000 | |
Houston Independent School District, Texas General Obligation Bonds, (PSF Insured), Series 2012 | |
1.700% due 06/01/2030 | | | | | 1,000 | | | | | | 1,006 | |
Northside Independent School District, Texas General Obligation Bonds, (PSF Insured), Series 2017 | |
1.450% due 06/01/2047 | | | | | 1,000 | | | | | | 1,001 | |
San Antonio, Texas Electric & Gas Systems Revenue Bonds, Series 2012 | |
2.000% due 12/01/2027 | | | | | 750 | | | | | | 754 | |
Spring Branch Independent School District, Texas General Obligations Bonds, Series 2013 | |
3.000% due 06/15/2041 | | | | | 1,000 | | | | | | 1,033 | |
| | | | | | | | | | | | |
| | | | | | | | | | | 5,574 | |
| | | | | | | | | | | | |
| |
| UTAH 1.5% | |
Murray, Utah Revenue Bonds, Series 2003 | |
0.920% due 05/15/2036 | | | | | 1,000 | | | | | | 1,000 | |
| | | | | | | | | | | | |
| | | | | | | | | | | | |
| VIRGINIA 1.6% | | | | | | | | | | | | |
Louisa Industrial Development Authority, Virginia Revenue Bonds, Series 2008 | |
2.150% due 11/01/2035 | | | | | 1,000 | | | | | | 1,019 | |
| | | | | | | | | | | | |
| | | | | | | | | | | | |
| WASHINGTON 4.8% | | | | | | | | | | | | |
Central Puget Sound Regional Transit Authority, Washington Revenue Bonds, Series 2015 | |
1.610% due 11/01/2045 | | | | | 1,000 | | | | | | 1,002 | |
Central Puget Sound Regional Transit Authority, Washington Revenue Notes, Series 2016 | |
5.000% due 11/01/2021 | | | | | 1,000 | | | | | | 1,155 | |
| | | | | | | | | | | | |
| | | | | PRINCIPAL
AMOUNT
(000S) | | | | | MARKET
VALUE
(000S) | |
Washington Health Care Facilities Authority Revenue Bonds, Series 2017 | |
1.960% due 01/01/2042 | | $ | | | 1,000 | | | $ | | | 998 | |
| | | | | | | | | | | | |
| | | | | | | | | | | 3,155 | |
| | | | | | | | | | | | |
| |
| WISCONSIN 1.8% | | | | | | | | | | | | |
Wisconsin Health & Educational Facilities Authority Revenue Bonds, Series 2012 | |
5.000% due 08/15/2032 | | | | | 1,000 | | | | | | 1,173 | |
| | | | | | | | | | | | |
Total Municipal Bonds & Notes
(Cost $65,383) | | | | | | | | | | | 65,774 | |
| | | | | | | | | | | | |
| |
| SHORT-TERM INSTRUMENTS 2.1% | |
| |
| SHORT-TERM NOTES 1.2% | | | | | | | | | | | | |
Idaho State General Obligation Notes, Series 2017 | |
4.000% due 06/29/2018 (a) | | | | | 750 | | | | | | 773 | |
| | | | | | | | | | | | |
| |
| U.S. TREASURY BILLS 0.9% | |
0.965% due 08/24/2017 (b)(c) | | | 600 | | | | | | 599 | |
| | | | | | | | | | | | |
Total Short-Term Instruments
(Cost $1,372) | | | | | | 1,372 | |
| | | | | | | | | | | | |
| | | | | | | | | | | | |
Total Investments in Securities
(Cost $66,755) | | | | | | 67,146 | |
| | | | | | | | | | | | |
Total Investments 102.0%
(Cost $66,755) | | | $ | | | 67,146 | |
| |
| Other Assets and Liabilities, net (2.0)% | | | | | | (1,320 | ) |
| | | | | | | | | | | | |
| Net Assets 100.0% | | | $ | | | 65,826 | |
| | | | | | | | | | | | |
|
| NOTES TO SCHEDULE OF INVESTMENTS (AMOUNTS IN THOUSANDS*): |
| * | A zero balance may reflect actual amounts rounding to less than one thousand. |
| (c) | Coupon represents a weighted average yield to maturity. |
| | | | | | | | |
| 78 | | PIMCO ETF TRUST | | | | | See Accompanying Notes | |
June 30, 2017
BORROWINGS AND OTHER FINANCING TRANSACTIONS
FAIR VALUE MEASUREMENTS
The following is a summary of the fair valuations according to the inputs used as of June 30, 2017 in valuing the Fund’s assets and liabilities:
| | | | | | | | | | | | | | | | |
| Category and Subcategory | | Level 1 | | | Level 2 | | | Level 3 | | | Fair
Value at
06/30/2017 | |
Investments in Securities, at Value | | | | | | | | | | | | | | | | |
Municipal Bonds & Notes | | | | | | | | | | | | | | | | |
Alabama | | $ | 0 | | | $ | 815 | | | $ | 0 | | | $ | 815 | |
Arizona | | | 0 | | | | 2,335 | | | | 0 | | | | 2,335 | |
California | | | 0 | | | | 1,762 | | | | 0 | | | | 1,762 | |
Colorado | | | 0 | | | | 4,558 | | | | 0 | | | | 4,558 | |
Connecticut | | | 0 | | | | 2,153 | | | | 0 | | | | 2,153 | |
District of Columbia | | | 0 | | | | 571 | | | | 0 | | | | 571 | |
Florida | | | 0 | | | | 6,334 | | | | 0 | | | | 6,334 | |
Georgia | | | 0 | | | | 1,212 | | | | 0 | | | | 1,212 | |
Illinois | | | 0 | | | | 3,633 | | | | 0 | | | | 3,633 | |
Kentucky | | | 0 | | | | 998 | | | | 0 | | | | 998 | |
Massachusetts | | | 0 | | | | 900 | | | | 0 | | | | 900 | |
Michigan | | | 0 | | | | 1,998 | | | | 0 | | | | 1,998 | |
Minnesota | | | 0 | | | | 1,067 | | | | 0 | | | | 1,067 | |
Nebraska | | | 0 | | | | 1,167 | | | | 0 | | | | 1,167 | |
Nevada | | | 0 | | | | 1,001 | | | | 0 | | | | 1,001 | |
| | | | | | | | | | | | | | | | |
| Category and Subcategory | | Level 1 | | | Level 2 | | | Level 3 | | | Fair
Value at
06/30/2017 | |
New Jersey | | $ | 0 | | | $ | 1,059 | | | $ | 0 | | | $ | 1,059 | |
New Mexico | | | 0 | | | | 2,465 | | | | 0 | | | | 2,465 | |
New York | | | 0 | | | | 6,207 | | | | 0 | | | | 6,207 | |
North Carolina | | | 0 | | | | 3,385 | | | | 0 | | | | 3,385 | |
Ohio | | | 0 | | | | 2,713 | | | | 0 | | | | 2,713 | |
Pennsylvania | | | 0 | | | | 7,520 | | | | 0 | | | | 7,520 | |
Texas | | | 0 | | | | 5,574 | | | | 0 | | | | 5,574 | |
Utah | | | 0 | | | | 1,000 | | | | 0 | | | | 1,000 | |
Virginia | | | 0 | | | | 1,019 | | | | 0 | | | | 1,019 | |
Washington | | | 0 | | | | 3,155 | | | | 0 | | | | 3,155 | |
Wisconsin | | | 0 | | | | 1,173 | | | | 0 | | | | 1,173 | |
Short-Term Instruments | | | | | | | | | | | | | | | | |
Short-Term Notes | | | 0 | | | | 773 | | | | 0 | | | | 773 | |
U.S. Treasury Bills | | | 0 | | | | 599 | | | | 0 | | | | 599 | |
| | | | | | | | | | | | | | | | |
| | | | |
Total Investments | | $ | 0 | | | $ | 67,146 | | | $ | 0 | | | $ | 67,146 | |
| | | | | | | | | | | | | | | | |
There were no significant transfers among Levels 1, 2, or 3 during the period ended June 30, 2017.
| | | | | | |
| See Accompanying Notes | | ANNUAL REPORT | | JUNE 30, 2017 | | 79 |
Notes to Financial Statements
1. ORGANIZATION
PIMCO ETF Trust (the “Trust”) was established as a Delaware statutory trust on November 14, 2008. The Trust is registered under the Investment Company Act of 1940, as amended (the “Act”), as an open-end management investment company. Information presented in these financial statements pertains to the funds (each a “Fund” and collectively the “Funds”) offered by the Trust. Pacific Investment Management Company LLC (“PIMCO” or “Manager”) serves as the investment adviser for the Funds.
Each Fund is an exchange-traded fund (“ETF”). ETFs are funds that trade like other publicly-traded securities and may be designed to track an index or to be actively managed. Unlike shares of a mutual fund, which can be bought from and redeemed by the issuing fund by all shareholders at a price based on net asset value (“NAV”), shares of a Fund may be directly purchased from and redeemed by a Fund at NAV solely by certain large institutional investors. Also unlike shares of a mutual fund, shares of each Fund are listed on a national securities exchange and trade in the secondary market at market prices that change throughout the day.
2. SIGNIFICANT ACCOUNTING POLICIES
The following is a summary of significant accounting policies consistently followed by the Trust in the preparation of its financial statements in conformity with accounting principles generally accepted in the United States of America (“U.S. GAAP”). Each Fund is treated as an investment company under the reporting requirements of U.S. GAAP. The preparation of financial statements in accordance with U.S. GAAP requires management to make estimates and assumptions that affect the reported amounts of assets and liabilities and disclosure of contingent assets and liabilities at the date of the financial statements and the reported amounts of increases and decreases in net assets from operations during the reporting period. Actual results could differ from those estimates.
(a) Securities Transactions and Investment Income Securities transactions are recorded as of the trade date for financial reporting purposes. Securities purchased or sold on a when-issued or delayed-delivery basis may be settled beyond a standard settlement period for the security after the trade date. Realized gains (losses) from securities sold are recorded on the identified cost basis. Dividend income is recorded on the ex-dividend date, except certain dividends from foreign securities where the ex-dividend date may have passed, which are recorded as soon as a Fund is informed of the ex-dividend date. Interest income, adjusted for the accretion of discounts and amortization of premiums, is recorded on the accrual basis from settlement date, with the exception of securities with a forward starting effective date, where interest income is recorded on the accrual basis from effective date. For convertible securities, premiums attributable to
the conversion feature are not amortized. Estimated tax liabilities on certain foreign securities are recorded on an accrual basis and are reflected as components of interest income or net change in unrealized appreciation (depreciation) on investments on the Statements of Operations, as appropriate. Tax liabilities realized as a result of such security sales are reflected as a component of net realized gain (loss) on investments on the Statements of Operations. Paydown gains (losses) on mortgage-related and other asset-backed securities, if any, are recorded as components of interest income on the Statements of Operations. Income or short-term capital gain distributions received from registered investment companies, if any, are recorded as dividend income. Long-term capital gain distributions received from registered investment companies, if any, are recorded as realized gains.
Debt obligations may be placed on non-accrual status and related interest income may be reduced by ceasing current accruals and writing off interest receivable when the collection of all or a portion of interest has become doubtful based on consistently applied procedures. A debt obligation is removed from non-accrual status when the issuer resumes interest payments or when collectability of interest is probable.
(b) Cash and Foreign Currency The functional and reporting currency for the Funds is the U.S. dollar. The market values of foreign securities, currency holdings and other assets and liabilities denominated in foreign currencies are translated into U.S. dollars based on the current exchange rates each business day. Purchases and sales of securities and income and expense items denominated in foreign currencies, if any, are translated into U.S. dollars at the exchange rate in effect on the transaction date. The Funds do not separately report the effects of changes in foreign exchange rates from changes in market prices on securities held. Such changes are included in net realized gain (loss) and net change in unrealized appreciation (depreciation) from investments on the Statements of Operations. The Funds may invest in foreign currency-denominated securities and may engage in foreign currency transactions either on a spot (cash) basis at the rate prevailing in the currency exchange market at the time or through a forward foreign currency contract. Realized foreign exchange gains (losses) arising from sales of spot foreign currencies, currency gains (losses) realized between the trade and settlement dates on securities transactions and the difference between the recorded amounts of dividends, interest, and foreign withholding taxes and the U.S. dollar equivalent of the amounts actually received or paid are included in net realized gain (loss) on foreign currency transactions on the Statements of Operations. Net unrealized foreign exchange gains (losses) arising from changes in foreign exchange rates on foreign denominated assets and liabilities other than investments in securities held at the end of the reporting period are included in net change in unrealized appreciation (depreciation) on foreign currency assets and liabilities on the Statements of Operations.
June 30, 2017
(c) Distributions to Shareholders The following table shows the anticipated frequency of distributions from net investment income, if any, for each Fund.
| | | | | | | | | | | | |
| | | | | | Distribution Frequency | |
| Fund Name | | | | | Declared | | | Distributed | |
PIMCO 1-3 Year U.S. Treasury Index Exchange-Traded Fund | | | | | | | Monthly | | | | Monthly | |
PIMCO 1-5 Year U.S. TIPS Index Exchange-Traded Fund | | | | | | | Monthly | | | | Monthly | |
PIMCO 15+ Year U.S. TIPS Index Exchange-Traded Fund | | | | | | | Monthly | | | | Monthly | |
PIMCO Broad U.S. TIPS Index Exchange-Traded Fund | | | | | | | Monthly | | | | Monthly | |
PIMCO 0-5 Year High Yield Corporate Bond Index Exchange-Traded Fund | | | | | | | Monthly | | | | Monthly | |
PIMCO Investment Grade Corporate Bond Index Exchange-Traded Fund | | | | | | | Monthly | | | | Monthly | |
PIMCO Active Bond Exchange-Traded Fund | | | | | | | Monthly | | | | Monthly | |
PIMCO Enhanced Low Duration Active Exchange-Traded Fund | | | | | | | Monthly | | | | Monthly | |
PIMCO Enhanced Short Maturity Active Exchange-Traded Fund | | | | | | | Monthly | | | | Monthly | |
PIMCO Intermediate Municipal Bond Active Exchange-Traded Fund | | | | | | | Monthly | | | | Monthly | |
PIMCO Short Term Municipal Bond Active Exchange-Traded Fund | | | | | | | Monthly | | | | Monthly | |
PIMCO 25+ Year Zero Coupon U.S. Treasury Index Exchange-Traded Fund | | | | | | | Quarterly | | | | Quarterly | |
Net realized capital gains earned by each Fund, if any, will be distributed no less frequently than once each year. The Trust does not provide an automatic dividend and/or distributions reinvestment service.
Income distributions and capital gain distributions are determined in accordance with income tax regulations which may differ from U.S. GAAP. Differences between tax regulations and U.S. GAAP may cause timing differences between income and capital gain recognition. Further, the character of investment income and capital gains may be different for certain transactions under the two methods of accounting. As a result, income distributions and capital gain distributions declared during a fiscal period may differ significantly from the net investment income (loss) and realized gains (losses) reported on each Fund’s annual financial statements presented under U.S. GAAP.
If a Fund estimates that a portion of one of its dividend distributions may be comprised of amounts from sources other than net investment income, the Fund will notify shareholders of record of the estimated composition of such distribution through a Section 19 Notice. For these purposes, a Fund estimates the source or sources from which a distribution is paid, to the close of the period as of which it is paid, in reference to its internal accounting records and related accounting practices. If, based on such accounting records and practices, it is estimated that a particular distribution does not include capital gains or paid-in surplus or other capital sources, a Section 19 Notice generally would not be issued. It is important to note that differences exist
between a Fund’s daily internal accounting records and practices, a Fund’s financial statements presented in accordance with U.S. GAAP, and recordkeeping practices under income tax regulations. For instance, a Fund’s internal accounting records and practices may take into account, among other factors, tax-related characteristics of certain sources of distributions that differ from treatment under U.S. GAAP. Examples of such differences may include, among others, the treatment of paydowns on mortgage-backed securities purchased at a discount and periodic payments under interest rate swap contracts. Accordingly, among other consequences, it is possible that a Fund may not issue a Section 19 Notice in situations where the Fund’s financial statements prepared later and in accordance with U.S. GAAP and/or the final tax character of those distributions might later report that the sources of those distributions included capital gains and/or a return of capital. Please visit www.pimco.com for the most recent Section 19 Notice, if applicable, for additional information regarding the estimated composition of distributions. Final determination of a distribution’s tax character will be reported on Form 1099 DIV sent to shareholders for the calendar year.
Distributions classified as a tax basis return of capital, if any, are reflected on the Statements of Changes in Net Assets and have been recorded to paid in capital. In addition, other amounts have been reclassified between undistributed (overdistributed) net investment income (loss), accumulated undistributed (overdistributed) net realized gain (loss) and/or paid in capital to more appropriately conform U.S. GAAP to tax characterizations of distributions.
(d) New Accounting Pronouncements In August 2014, the Financial Accounting Standards Board (“FASB”) issued an Accounting Standards Update (“ASU”), ASU 2014-15 requiring management to evaluate whether there are conditions or events, considered in the aggregate, that raise substantial doubt about the entity’s ability to continue as a going concern. The ASU is effective prospectively for annual periods ending after December 15, 2016, and interim periods thereafter. The Funds have adopted the ASU. The implementation of the ASU did not have an impact on the Funds’ financial statements.
In May 2015, the FASB issued ASU 2015-07 which removes the requirement to categorize within the fair value hierarchy all investments for which fair value is measured using the NAV per share practical expedient. The ASU also removes the requirement to make certain disclosures for all investments that are eligible to be measured at fair value using the NAV per share practical expedient. The ASU is effective for annual periods beginning after December 15, 2015 and interim periods within those annual periods. The Funds have adopted the ASU. The implementation of the ASU did not have an impact on the Funds’ financial statements.
| | | | | | |
| | ANNUAL REPORT | | JUNE 30, 2017 | | 81 |
Notes to Financial Statements (Cont.)
In March 2016, the FASB issued ASU 2016-05 which provides guidance related to the impact of derivative contract novations on certain relationships under Accounting Standards Codification (“ASC”) 815. The ASU is effective for annual periods beginning after December 15, 2016, and interim periods within those annual periods. At this time, management is evaluating the implications of these changes on the financial statements.
In August 2016, the FASB issued ASU 2016-15 which amends ASC 230 to clarify guidance on the classification of certain cash receipts and cash payments in the Statement of Cash Flows. The ASU is effective for annual periods beginning after December 15, 2017, and interim periods within those annual periods. At this time, management is evaluating the implications of these changes on the financial statements.
In October 2016, the U.S. Securities and Exchange Commission (“SEC”) adopted new rules and forms, and amendments to certain current rules and forms, to modernize reporting and disclosure of information by registered investment companies. The amendments to Regulation S-X will require standardized, enhanced disclosure about derivatives in investment company financial statements, and will also change the rules governing the form and content of such financial statements. The compliance date for these amendments is August 1, 2017. Compliance is based on reporting period-end date. At this time, management is evaluating the implications of these changes on the financial statements.
In November 2016, the FASB issued ASU 2016-18 which amends ASC 230 to provide guidance on the classification and presentation of changes in restricted cash and restricted cash equivalents on the Statement of Cash Flows. The ASU is effective for annual periods beginning after December 15, 2017, and interim periods within those annual periods. At this time, management is evaluating the implications of these changes on the financial statements.
In March 2017, the FASB issued ASU 2017-08 which provides guidance related to the amortization period for certain purchased callable debt securities held at a premium. The ASU is effective for annual periods beginning after December 15, 2018, and interim periods within those annual periods. The Funds have adopted the ASU. The implementation of the ASU did not have an impact on the Funds’ financial statements.
3. INVESTMENT VALUATION AND FAIR VALUE MEASUREMENTS
(a) Investment Valuation Policies The NAV of the Fund’s shares is determined by dividing the total value of the Fund’s portfolio investments and other assets, less any liabilities attributable to that Fund, by the total number of shares outstanding.
On each day that the NYSE Arca is open, Fund shares are ordinarily valued as of the close of regular trading (“NYSE Close”). Information that becomes known to the Funds or their agents after the time as of which NAV has been calculated on a particular day will not generally be used to retroactively adjust the price of a security or the NAV determined earlier that day. Each Fund reserves the right to change the time as of which its respective NAV is calculated if the Fund closes earlier, or as permitted by the SEC.
For purposes of calculating NAV, portfolio securities and other assets for which market quotes are readily available are valued at market value. Market value is generally determined on the basis of official closing prices or the last reported sales prices, or if no sales are reported, based on quotes obtained from established market makers or prices (including evaluated prices) supplied by the Funds’ approved pricing services, quotation reporting systems and other third-party sources (together, “Pricing Services”). The Funds will normally use pricing data for domestic equity securities received shortly after the NYSE Close and do not normally take into account trading, clearances or settlements that take place after the NYSE Close. If market value pricing is used, a foreign (non-U.S.) equity security traded on a foreign exchange or on more than one exchange is typically valued using pricing information from the exchange considered by the Manager to be the primary exchange. A foreign (non-U.S.) equity security will be valued as of the close of trading on the foreign exchange, or the NYSE Close, if the NYSE Close occurs before the end of trading on the foreign exchange. Domestic and foreign (non-U.S.) fixed income securities, non-exchange traded derivatives, and equity options are normally valued on the basis of quotes obtained from brokers and dealers or Pricing Services using data reflecting the earlier closing of the principal markets for those securities. Prices obtained from Pricing Services may be based on, among other things, information provided by market makers or estimates of market values obtained from yield data relating to investments or securities with similar characteristics. Certain fixed income securities purchased on a delayed-delivery basis are marked to market daily until settlement at the forward settlement date. Exchange-traded options, except equity options, futures and options on futures are valued at the settlement price determined by the relevant exchange. Swap agreements are valued on the basis of bid quotes obtained from brokers and dealers or market-based prices supplied by Pricing Services. A Fund’s investments in open-end management investment companies, other than exchange-traded funds (“ETFs”), are valued at the NAVs of such investments.
If a foreign (non-U.S.) equity security’s value has materially changed after the close of the security’s primary exchange or principal market but before the NYSE Close, the security may be valued at fair value based on procedures established and approved by the Board of
June 30, 2017
Trustees of the Trust (the “Board”). Foreign (non-U.S.) equity securities that do not trade when the NYSE is open are also valued at fair value. With respect to foreign (non-U.S.) equity securities, the Fund may determine the fair value of investments based on information provided by Pricing Services and other third-party vendors, which may recommend fair value or adjustments with reference to other securities, indices or assets. In considering whether fair valuation is required and in determining fair values, the Fund may, among other things, consider significant events (which may be considered to include changes in the value of U.S. securities or securities indices) that occur after the close of the relevant market and before the NYSE Close. A Fund may utilize modeling tools provided by third-party vendors to determine fair values of foreign (non-U.S.) securities. Foreign exchanges may permit trading in foreign (non-U.S.) equity securities on days when the Trust is not open for business, which may result in a Fund’s portfolio investments being affected when shareholders are unable to buy or sell shares.
Senior secured floating rate loans for which an active secondary market exists to a reliable degree will be valued at the mean of the last available bid/ask prices in the market for such loans, as provided by a Pricing Service. Senior secured floating rate loans for which an active secondary market does not exist to a reliable degree will be valued at fair value, which is intended to approximate market value. In valuing a senior secured floating rate loan at fair value, the factors considered may include, but are not limited to, the following: (a) the creditworthiness of the borrower and any intermediate participants, (b) the terms of the loan, (c) recent prices in the market for similar loans, if any, and (d) recent prices in the market for instruments of similar quality, rate, period until next interest rate reset and maturity.
Investments valued in currencies other than the U.S. dollar are converted to the U.S. dollar using exchange rates obtained from Pricing Services. As a result, the value of such investments and, in turn, the NAV of a Fund’s shares may be affected by changes in the value of currencies in relation to the U.S. dollar. The value of investments traded in markets outside the United States or denominated in currencies other than the U.S. dollar may be affected significantly on a day that the Trust is not open for business. As a result, to the extent that a Fund holds foreign (non-U.S.) investments, the value of those investments may change at times when shareholders are unable to buy or sell shares and the value of such investments will be reflected in the Fund’s next calculated NAV.
Investments for which market quotes or market based valuations are not readily available are valued at fair value as determined in good faith by the Board or persons acting at their direction. The Board has adopted methods for valuing securities and other assets in circumstances where market quotes are not readily available, and has delegated to the Manager the responsibility for applying the fair
valuation methods. In the event that market quotes or market based valuations are not readily available, and the security or asset cannot be valued pursuant to a Board approved valuation method, the value of the security or asset will be determined in good faith by the Valuation Oversight Committee of the Board (“Valuation Oversight Committee”), generally based on recommendations provided by the Manager. Market quotes are considered not readily available in circumstances where there is an absence of current or reliable market-based data (e.g., trade information, bid/ask information, indicative market quotations (“Broker Quotes”), Pricing Services’ prices), including where events occur after the close of the relevant market, but prior to the NYSE Close, that materially affect the values of a Fund’s securities or assets. In addition, market quotes are considered not readily available when, due to extraordinary circumstances, the exchanges or markets on which the securities trade do not open for trading for the entire day and no other market prices are available. The Board has delegated to the Manager the responsibility for monitoring significant events that may materially affect the values of a Fund’s securities or assets and for determining whether the value of the applicable securities or assets should be reevaluated in light of such significant events.
When a Fund uses fair valuation to determine the value of a portfolio security or other asset for purposes of calculating its NAV, such investments will not be priced on the basis of quotes from the primary market in which they are traded, but rather may be priced by another method that the Board or persons acting at their direction believe reflects fair value. Fair valuation may require subjective determinations about the value of a security. While the Trust’s policy is intended to result in a calculation of the Fund’s NAV that fairly reflects security values as of the time of pricing, the Trust cannot ensure that fair values determined by the Board or persons acting at their direction would accurately reflect the price that a Fund could obtain for a security if it were to dispose of that security as of the time of pricing (for instance, in a forced or distressed sale). The prices used by a Fund may differ from the value that would be realized if the securities were sold.
(b) Fair Value Hierarchy U.S. GAAP describes fair value as the price that a Fund would receive to sell an asset or pay to transfer a liability in an orderly transaction between market participants at the measurement date. It establishes a fair value hierarchy that prioritizes inputs to valuation methods and requires disclosure of the fair value hierarchy, separately for each major category of assets and liabilities, that segregates fair value measurements into levels (Level 1, 2, or 3). The inputs or methodology used for valuing securities are not necessarily an indication of the risks associated with investing in those securities. Levels 1, 2, and 3 of the fair value hierarchy are defined as follows:
| ∎ | | Level 1 — Quoted prices in active markets or exchanges for identical assets and liabilities. |
| | | | | | |
| | ANNUAL REPORT | | JUNE 30, 2017 | | 83 |
Notes to Financial Statements (Cont.)
| ∎ | | Level 2 — Significant other observable inputs, which may include, but are not limited to, quoted prices for similar assets or liabilities in markets that are active, quoted prices for identical or similar assets or liabilities in markets that are not active, inputs other than quoted prices that are observable for the assets or liabilities (such as interest rates, yield curves, volatilities, prepayment speeds, loss severities, credit risks and default rates) or other market corroborated inputs. |
| ∎ | | Level 3 — Significant unobservable inputs based on the best information available in the circumstances, to the extent observable inputs are not available, which may include assumptions made by the Board or persons acting at their direction that are used in determining the fair value of investments. |
In accordance with the requirements of U.S. GAAP, the amounts of transfers between Levels 1 and 2 and transfers into and out of Level 3, if material, are disclosed in the Notes to Schedule of Investments for each respective Fund.
For fair valuations using significant unobservable inputs, U.S. GAAP requires a reconciliation of the beginning to ending balances for reported fair values that presents changes attributable to realized gain (loss), unrealized appreciation (depreciation), purchases and sales, accrued discounts (premiums), and transfers into and out of the Level 3 category during the period. The end of period value is used for the transfers between Levels of a Fund’s assets and liabilities. Additionally, U.S. GAAP requires quantitative information regarding the significant unobservable inputs used in the determination of fair value of assets or liabilities categorized as Level 3 in the fair value hierarchy. In accordance with the requirements of U.S. GAAP, a fair value hierarchy, and if material, a Level 3 reconciliation and details of significant unobservable inputs, have been included in the Notes to Schedule of Investments for each respective Fund.
(c) Valuation Techniques and the Fair Value Hierarchy Level 1 and Level 2 trading assets and trading liabilities, at fair value The valuation methods (or “techniques”) and significant inputs used in determining the fair values of portfolio securities or other assets and liabilities categorized as Level 1 and Level 2 of the fair value hierarchy are as follows:
Fixed income securities including corporate, convertible and municipal bonds and notes, U.S. government agencies, U.S. treasury obligations, sovereign issues, bank loans, convertible preferred securities and non-U.S. bonds are normally valued on the basis of quotes obtained from brokers and dealers or Pricing Services that use broker-dealer quotations, reported trades or valuation estimates from their internal pricing models. The Pricing Services’ internal models use inputs that are observable such as issuer details, interest rates, yield curves, prepayment speeds, credit risks/spreads, default rates and quoted
prices for similar assets. Securities that use similar valuation techniques and inputs as described above are categorized as Level 2 of the fair value hierarchy.
Fixed income securities purchased on a delayed-delivery basis or as a repurchase commitment in a sale-buyback transaction are marked to market daily until settlement at the forward settlement date and are categorized as Level 2 of the fair value hierarchy.
Mortgage-related and asset-backed securities are usually issued as separate tranches, or classes, of securities within each deal. These securities are also normally valued by Pricing Services that use broker-dealer quotations, reported trades or valuation estimates from their internal pricing models. The pricing models for these securities usually consider tranche-level attributes, current market data, estimated cash flows and market-based yield spreads for each tranche, and incorporate deal collateral performance, as available. Mortgage-related and asset-backed securities that use similar valuation techniques and inputs as described above are categorized as Level 2 of the fair value hierarchy.
Common stocks, ETFs, exchange-traded notes and financial derivative instruments, such as futures contracts, rights and warrants, or options on futures that are traded on a national securities exchange, are stated at the last reported sale or settlement price on the day of valuation. To the extent these securities are actively traded and valuation adjustments are not applied, they are categorized as Level 1 of the fair value hierarchy.
Valuation adjustments may be applied to certain securities that are solely traded on a foreign exchange to account for the market movement between the close of the foreign market and the NYSE Close. These securities are valued using Pricing Services that consider the correlation of the trading patterns of the foreign security to the intraday trading in the U.S. markets for investments. Securities using these valuation adjustments are categorized as Level 2 of the fair value hierarchy. Preferred securities and other equities traded on inactive markets or valued by reference to similar instruments are also categorized as Level 2 of the fair value hierarchy.
Equity exchange-traded options and over the counter financial derivative instruments, such as forward foreign currency contracts and options contracts derive their value from underlying asset prices, indices, reference rates, and other inputs or a combination of these factors. These contracts are normally valued on the basis of quotes obtained from a quotation reporting system, established market makers or Pricing Services (normally determined as of the NYSE Close). Depending on the product and the terms of the transaction, financial derivative instruments can be valued by Pricing Services using a series of techniques, including simulation pricing models. The pricing models use inputs that are observed from actively quoted markets such as quoted prices, issuer
June 30, 2017
details, indices, bid/ask spreads, interest rates, implied volatilities, yield curves, dividends and exchange rates. Financial derivative instruments that use similar valuation techniques and inputs as described above are categorized as Level 2 of the fair value hierarchy.
Centrally cleared swaps and over the counter swaps derive their value from underlying asset prices, indices, reference rates, and other inputs or a combination of these factors. They are valued using a broker-dealer bid quotation or on market-based prices provided by Pricing Services (normally determined as of the NYSE close). Centrally cleared swaps and over the counter swaps can be valued by Pricing Services using a series of techniques, including simulation pricing models. The pricing models may use inputs that are observed from actively quoted markets such as the overnight index swap rate (“OIS”), London Interbank Offered Rate (“LIBOR”) forward rate, interest rates, yield curves and credit spreads. These securities are categorized as Level 2 of the fair value hierarchy.
Level 3 trading assets and trading liabilities, at fair value When a fair valuation method is applied by the Manager that uses significant unobservable inputs, investments will be priced by a method that the Board or persons acting at their direction believe reflects fair value and are categorized as Level 3 of the fair value hierarchy.
Short-term debt instruments (such as commercial paper) having a remaining maturity of 60 days or less may be valued at amortized cost, so long as the amortized cost value of such short-term debt instruments is approximately the same as the fair value of the instrument as determined without the use of amortized cost valuation. These securities are categorized as Level 2 or Level 3 of the fair value hierarchy depending on the source of the base price.
4. SECURITIES AND OTHER INVESTMENTS
(a) Investments in Affiliates
Each Fund may invest the cash collateral received for securities out on loan in the PIMCO Government Money Market Fund and PIMCO Money Market Fund under the Securities Lending Agreement. PIMCO Government Money Market Fund and PIMCO Money Market Fund are considered to be affiliated with the Funds. The table below shows the Funds’ transactions in and earnings from investments in these affiliated Funds for the period ended June 30, 2017 (amounts in thousands†):
Investments in PIMCO Government Money Market Fund
| | | | | | | | | | | | | | | | | | | | | | | | | | | | | | | | |
| Fund Name | | | | | Market Value
06/30/2016 | | | Purchases
at Cost | | | Proceeds
from Sales | | | Net
Realized
Gain (Loss) | | | Change in
Unrealized
Appreciation
(Depreciation) | | | Market Value
06/30/2017 | | | Dividend Income(1) | |
PIMCO 0-5 Year High Yield Corporate Bond Index Exchange-Traded Fund | | | | | | $ | 0 | | | $ | 285,350 | | | $ | (239,464 | ) | | $ | 0 | | | $ | 0 | | | $ | 45,886 | | | $ | 204 | |
PIMCO Enhanced Short Maturity Active Exchange-Traded Fund | | | | | | | 0 | | | | 14,426 | | | | (14,426 | ) | | | 0 | | | | 0 | | | | 0 | | | | 3 | |
| † | A zero balance may reflect actual amounts rounding to less than one thousand. |
| (1) | The tax characterization of distributions is determined in accordance with Federal income tax regulations. The actual tax characterization of distributions paid are determined at the end of the fiscal year of the affiliated fund. See Note 2, Distributions to Shareholders, in the Notes to Financial Statements for more information. |
Investments in PIMCO Money Market Fund*
| | | | | | | | | | | | | | | | | | | | | | | | | | | | | | | | |
| Fund Name | | | | | Market Value
06/30/2016 | | | Purchases
at Cost | | | Proceeds
from Sales | | | Net
Realized
Gain (Loss) | | | Change in
Unrealized
Appreciation
(Depreciation) | | | Market Value
06/30/2017 | | | Dividend
Income(1) | |
PIMCO 0-5 Year High Yield Corporate Bond Index Exchange-Traded Fund | | | | | | $ | 87,953 | | | $ | 118,913 | | | $ | (206,866 | ) | | $ | 0 | | | $ | 0 | | | $ | 0 | | | $ | 40 | |
PIMCO Investment Grade Corporate Bond Exchange-Exchange Traded Fund | | | | | | | 1,691 | | | | 4,421 | | | | (6,112 | ) | | | 0 | | | | 0 | | | | 0 | | | | 0 | |
PIMCO Enhanced Short Maturity Active Exchange-Traded Fund | | | | | | | 0 | | | | 15,496 | | | | (15,496 | ) | | | 0 | | | | 0 | | | | 0 | | | | 2 | |
| † | A zero balance may reflect actual amounts rounding to less than one thousand. |
| * | Effective September 23, 2016, the Fund was reorganized into the PIMCO Government Money Market Fund. |
| (1) | The tax characterization of distributions is determined in accordance with Federal income tax regulations. The actual tax characterization of distributions paid are determined at the end of the fiscal year of the affiliated fund. See Note 2, Distributions to Shareholders, in the Notes to Financial Statements for more information. |
(b) Investments in Securities
Delayed-Delivery Transactions Certain Funds may purchase or sell securities on a delayed-delivery basis. These transactions involve a commitment by a Fund to purchase or sell securities for a predetermined price or yield, with payment and delivery taking place beyond the customary settlement period. When delayed-delivery
transactions are outstanding, a Fund will designate or receive as collateral liquid assets in an amount sufficient to meet the purchase price or respective obligations. When purchasing a security on a delayed-delivery basis, a Fund assumes the rights and risks of ownership of the security, including the risk of price and yield fluctuations, and takes such fluctuations into account when
| | | | | | |
| | ANNUAL REPORT | | JUNE 30, 2017 | | 85 |
Notes to Financial Statements (Cont.)
determining its NAV. A Fund may dispose of or renegotiate a delayed-delivery transaction after it is entered into, which may result in a realized gain (loss). When a Fund has sold a security on a delayed-delivery basis, the Fund does not participate in future gains (losses) with respect to the security.
Inflation-Indexed Bonds Certain Funds may invest in inflation-indexed bonds. Inflation-indexed bonds are fixed income securities whose principal value is periodically adjusted by the rate of inflation. The interest rate on these bonds is generally fixed at issuance at a rate lower than typical bonds. Over the life of an inflation-indexed bond, however, interest will be paid based on a principal value which is adjusted for inflation. Any increase or decrease in the principal amount of an inflation-indexed bond will be included as interest income on the Statements of Operations, even though investors do not receive their principal until maturity. Repayment of the original bond principal upon maturity (as adjusted for inflation) is guaranteed in the case of U.S. TIPS. For bonds that do not provide a similar guarantee, the adjusted principal value of the bond repaid at maturity may be less than the original principal.
Loan Participations, Assignments and Originations Certain Funds may invest in direct debt instruments which are interests in amounts owed to lenders or lending syndicates by corporate, governmental, or other borrowers. A Fund’s investments in loans may be in the form of participations in loans or assignments of all or a portion of loans from third parties or investments in or originations of loans by a Fund or Funds. A loan is often administered by a bank or other financial institution (the “agent”) that acts as agent for all holders. The agent administers the terms of the loan, as specified in the loan agreement. A Fund may invest in multiple series or tranches of a loan, which may have varying terms and carry different associated risks. When a Fund purchases assignments from agents it acquires direct rights against the borrowers of the loans. These loans may include participations in bridge loans, which are loans taken out by borrowers for a short period (typically less than one year) pending arrangement of more permanent financing through, for example, the issuance of bonds, frequently high yield bonds issued for the purpose of acquisitions.
The types of loans and related investments in which the Funds may invest include, among others, senior loans, subordinated loans (including second lien loans, B-Notes and mezzanine loans), whole loans, commercial real estate and other commercial loans and structured loans. The Funds may originate loans or acquire direct interests in loans through primary loan distributions and/or in private transactions. In the case of subordinated loans, there may be significant indebtedness ranking ahead of the borrower’s obligation to the holder of such a loan, including in the event of the borrower’s insolvency. Mezzanine loans are typically secured by a pledge of an
equity interest in the mortgage borrower that owns the real estate rather than an interest in a mortgage.
Investments in loans may include unfunded loan commitments, which are contractual obligations for funding. Unfunded loan commitments may include revolving credit facilities, which may obligate a Fund to supply additional cash to the borrower on demand. Unfunded loan commitments represent a future obligation in full, even though a percentage of the committed amount may not be utilized by the borrower. When investing in a loan participation, a Fund has the right to receive payments of principal, interest and any fees to which it is entitled only from the agent selling the loan agreement and only upon receipt of payments by the agent from the borrower. A Fund may receive a commitment fee based on the undrawn portion of the underlying line of credit portion of a loan. In certain circumstances, a Fund may receive a penalty fee upon the prepayment of a loan by a borrower. Fees earned or paid are recorded as a component of interest income or interest expense, respectively, on the Statements of Operations. As of June 30, 2017, the Funds had no unfunded loan commitments outstanding.
Mortgage-Related and Other Asset-Backed Securities Certain Funds may invest in mortgage-related and other asset-backed securities that directly or indirectly represent a participation in, or are secured by and payable from, loans on real property. Mortgage-related securities are created from pools of residential or commercial mortgage loans, including mortgage loans made by savings and loan institutions, mortgage bankers, commercial banks and others. These securities provide a monthly payment which consists of both interest and principal. Interest may be determined by fixed or adjustable rates. The rate of prepayments on underlying mortgages will affect the price and volatility of a mortgage-related security, and may have the effect of shortening or extending the effective duration of the security relative to what was anticipated at the time of purchase. The timely payment of principal and interest of certain mortgage-related securities is guaranteed with the full faith and credit of the U.S. Government. Pools created and guaranteed by non-governmental issuers, including government-sponsored corporations, may be supported by various forms of insurance or guarantees, but there can be no assurance that private insurers or guarantors can meet their obligations under the insurance policies or guarantee arrangements. Many of the risks of investing in mortgage-related securities secured by commercial mortgage loans reflect the effects of local and other economic conditions on real estate markets, the ability of tenants to make lease payments, and the ability of a property to attract and retain tenants. These securities may be less liquid and may exhibit greater price volatility than other types of mortgage-related or other asset-backed securities. Other asset-backed securities are created from many types of assets, including auto loans, credit card receivables, home equity loans, and student loans.
June 30, 2017
Collateralized Debt Obligations (“CDOs”) include Collateralized Bond Obligations (“CBOs”), Collateralized Loan Obligations (“CLOs”) and other similarly structured securities. CBOs and CLOs are types of asset-backed securities. A CBO is a trust which is backed by a diversified pool of high risk, below investment grade fixed income securities. A CLO is a trust typically collateralized by a pool of loans, which may include, among others, domestic and foreign senior secured loans, senior unsecured loans, and subordinate corporate loans, including loans that may be rated below investment grade or equivalent unrated loans. The risks of an investment in a CDO depend largely on the type of the collateral securities and the class of the CDO in which a Fund invests. In addition to the normal risks associated with fixed income securities discussed elsewhere in this report and each Fund’s prospectus and statement of additional information (e.g., prepayment risk, credit risk, liquidity risk, market risk, structural risk, legal risk and interest rate risk (which may be exacerbated if the interest rate payable on a structured financing changes based on multiples of changes in interest rates or inversely to changes in interest rates)), CBOs, CLOs and other CDOs carry additional risks including, but not limited to, (i) the possibility that distributions from collateral securities will not be adequate to make interest or other payments, (ii) the quality of the collateral may decline in value or default, (iii) a Fund may invest in CBOs, CLOs, or other CDOs that are subordinate to other classes, and (iv) the complex structure of the security may not be fully understood at the time of investment and may produce disputes with the issuer or unexpected investment results.
Collateralized Mortgage Obligations (“CMOs”) are debt obligations of a legal entity that are collateralized by whole mortgage loans or private mortgage bonds and divided into classes. CMOs are structured into multiple classes, often referred to as “tranches”, with each class bearing a different stated maturity and entitled to a different schedule for payments of principal and interest, including prepayments. CMOs may be less liquid and may exhibit greater price volatility than other types of mortgage-related or asset-backed securities.
Stripped Mortgage-Backed Securities (“SMBS”) are derivative multi-class mortgage securities. SMBS are usually structured with two classes that receive different proportions of the interest and principal distributions on a pool of mortgage assets. An SMBS will have one class that will receive all of the interest (the interest-only or “IO” class), while the other class will receive the entire principal (the principal-only or “PO” class). Payments received for IOs are included in interest income on the Statements of Operations. Because no principal will be received at the maturity of an IO, adjustments are made to the cost of the security on a monthly basis until maturity. These adjustments are included in interest income on the Statements of Operations. Payments received for POs are treated as reductions to the cost and par value of the securities.
Payment In-Kind Securities Certain Funds may invest in payment in-kind securities (“PIKs”). PIKs may give the issuer the option at each
interest payment date of making interest payments in either cash or additional debt securities. Those additional debt securities usually have the same terms, including maturity dates and interest rates, and associated risks as the original bonds. The daily market quotations of the original bonds may include the accrued interest (referred to as a dirty price) and require a pro rata adjustment from the unrealized appreciation or depreciation on investments to interest receivable on the Statements of Assets and Liabilities.
U.S. Government Agencies or Government-Sponsored Enterprises Certain Funds may invest in securities of U.S. Government agencies or government-sponsored enterprises. U.S. Government securities are obligations of and, in certain cases, guaranteed by, the U.S. Government, its agencies or instrumentalities. Some U.S. Government securities, such as Treasury bills, notes and bonds, and securities guaranteed by the Government National Mortgage Association (“GNMA” or “Ginnie Mae”), are supported by the full faith and credit of the U.S. Government; others, such as those of the Federal Home Loan Banks, are supported by the right of the issuer to borrow from the U.S. Department of the Treasury (the “U.S. Treasury”); and others, such as those of the Federal National Mortgage Association (“FNMA” or “Fannie Mae”), are supported by the discretionary authority of the U.S. Government to purchase the agency’s obligations. U.S. Government securities may include zero coupon securities. Zero coupon securities do not distribute interest on a current basis and tend to be subject to a greater risk than interest-paying securities.
Government-related guarantors (i.e., not backed by the full faith and credit of the U.S. Government) include FNMA and the Federal Home Loan Mortgage Corporation (“FHLMC” or “Freddie Mac”). FNMA is a government-sponsored corporation. FNMA purchases conventional (i.e., not insured or guaranteed by any government agency) residential mortgages from a list of approved seller/servicers which include state and federally chartered savings and loan associations, mutual savings banks, commercial banks and credit unions and mortgage bankers. Pass-through securities issued by FNMA are guaranteed as to timely payment of principal and interest by FNMA, but are not backed by the full faith and credit of the U.S. Government. FHLMC issues Participation Certificates (“PCs”), which are pass-through securities, each representing an undivided interest in a pool of residential mortgages. FHLMC guarantees the timely payment of interest and ultimate collection of principal, but PCs are not backed by the full faith and credit of the U.S. Government.
Certain Funds may engage in strategies where they seek to extend the expiration or maturity of a position, such as a To-Be-Announced (“TBA”) security on an underlying asset, by closing out the position before expiration and opening a new position with respect to the same underlying asset with a later expiration date. TBA securities purchased
| | | | | | |
| | ANNUAL REPORT | | JUNE 30, 2017 | | 87 |
Notes to Financial Statements (Cont.)
or sold are reflected on the Statements of Assets and Liabilities as an asset or liability, respectively.
Separate Trading of Registered Interest and Principal of Securities (“STRIPS”) are U.S. Treasury fixed income securities in which the principal is separated, or stripped, from the interest and each takes the form of zero coupon securities. A STRIP is sold at a significant discount to face value and offers no interest payments; rather, investors receive payment at maturity. Zero coupon securities do not distribute interest on a current basis and tend to be subject to greater risk than interest-paying securities.
When-Issued Transactions Certain Funds may purchase or sell securities on a when-issued basis. These transactions are made conditionally because a security, although authorized, has not yet been issued in the market. Transactions to purchase or sell securities on a when-issued basis involve a commitment by a Fund to purchase or sell these securities for a predetermined price or yield, with payment and delivery taking place beyond the customary settlement period. A Fund may sell when-issued securities before they are delivered, which may result in a realized gain (loss).
5. BORROWINGS AND OTHER FINANCING TRANSACTIONS
The following disclosures contain information on a Fund’s ability to lend or borrow cash or securities to the extent permitted under the Act, which may be viewed as borrowing or financing transactions by a Fund. The location of these instruments in each Fund’s financial statements is described below. For a detailed description of credit and counterparty risks that can be associated with borrowings and other financing transactions, please see Note 7, Principal Risks.
(a) Repurchase Agreements Certain Funds may engage in repurchase agreements. Under the terms of a typical repurchase agreement, a Fund purchases an underlying debt obligation (collateral) subject to an obligation of the seller to repurchase, and a Fund to resell, the obligation at an agreed-upon price and time. In an open maturity repurchase agreement, there is no pre-determined repurchase date and the agreement can be terminated by a Fund or counterparty at any time. The underlying securities for all repurchase agreements are held by a Fund’s custodian or designated subcustodians under tri-party repurchase agreements and in certain instances will remain in custody with the counterparty. The market value of the collateral must be equal to or exceed the total amount of the repurchase obligations, including interest. Repurchase agreements, if any, including accrued interest, are included on the Statements of Assets and Liabilities. Interest earned is recorded as a component of interest income on the Statements of Operations. In periods of increased demand for collateral, a Fund may pay a fee for the receipt of collateral, which may result in interest expense to the Fund.
(b) Reverse Repurchase Agreements Certain Funds may enter into reverse repurchase agreements. In a reverse repurchase agreement, a Fund delivers a security in exchange for cash to a financial institution, the counterparty, with a simultaneous agreement to repurchase the same or substantially the same security at an agreed upon price and date. In an open maturity reverse repurchase agreement, there is no pre-determined repurchase date and the agreement can be terminated by the Fund or counterparty at any time. A Fund is entitled to receive principal and interest payments, if any, made on the security delivered to the counterparty during the term of the agreement. Cash received in exchange for securities delivered plus accrued interest payments to be made by a Fund to counterparties are reflected as a liability on the Statements of Assets and Liabilities. Interest payments made by a Fund to counterparties are recorded as a component of interest expense on the Statements of Operations. In periods of increased demand for the security, a Fund may receive a fee for use of the security by the counterparty, which may result in interest income to the Fund. A Fund will segregate assets determined to be liquid by the Manager or will otherwise cover its obligations under reverse repurchase agreements.
(c) Sale-Buybacks Certain Funds may enter into financing transactions referred to as ‘sale-buybacks’. A sale-buyback transaction consists of a sale of a security by a Fund to a financial institution, the counterparty, with a simultaneous agreement to repurchase the same or substantially the same security at an agreed-upon price and date. A Fund is not entitled to receive principal and interest payments, if any, made on the security sold to the counterparty during the term of the agreement. The agreed-upon proceeds for securities to be repurchased by a Fund are reflected as a liability on the Statements of Assets and Liabilities. A Fund will recognize net income represented by the price differential between the price received for the transferred security and the agreed-upon repurchase price. This is commonly referred to as the ‘price drop’. A price drop consists of (i) the foregone interest and inflationary income adjustments, if any, a Fund would have otherwise received had the security not been sold and (ii) the negotiated financing terms between a Fund and counterparty. Foregone interest and inflationary income adjustments, if any, are recorded as components of interest income on the Statements of Operations. Interest payments based upon negotiated financing terms made by a Fund to counterparties are recorded as a component of interest expense on the Statements of Operations. In periods of increased demand for the security, a Fund may receive a fee for use of the security by the counterparty, which may result in interest income to the Fund. A Fund will segregate assets determined to be liquid by the Manager or will otherwise cover its obligations under sale-buyback transactions.
(d) Securities Lending The Funds listed below may seek to earn additional income by lending their securities to certain qualified broker-dealers and
June 30, 2017
institutions on a short-term or long-term basis via a lending agent. Securities on loan are required to be secured by cash collateral at least equal to 102% of the domestic, or 105% of the foreign security’s market value. If the market value of the collateral at the close of trading on a business day is less than 100% of the market value of the loaned securities at the close of trading on that day, the borrower shall be required to deliver, by the close of business on the following business day, an additional amount of collateral, so that the total amount of posted collateral is equal to at least 100% of the market value of all the loaned securities as of such preceeding day. The Funds will then invest the cash collateral received in the PIMCO Government Money Market Fund and record a liability for the return of the collateral during the period the securities are on loan. Each Fund is subject to a lending limit of 33.33% of total assets (including the value of collateral).
|
| Fund Name |
| PIMCO 1-3 Year U.S. Treasury Index Exchange-Traded Fund |
| PIMCO 25+ Year Zero Coupon U.S. Treasury Index Exchange-Traded Fund |
| PIMCO 1-5 Year U.S. TIPS Index Exchange-Traded Fund |
| PIMCO 15+ Year U.S. TIPS Index Exchange-Traded Fund |
| PIMCO Broad U.S. TIPS Index Exchange-Traded Fund |
| PIMCO 0-5 Year High Yield Corporate Bond Index Exchange-Traded Fund |
| PIMCO Investment Grade Corporate Bond Index Exchange-Traded Fund |
| PIMCO Enhanced Low Duration Active Exchange-Traded Fund |
| PIMCO Enhanced Short Maturity Active Exchange-Traded Fund |
The loans are subject to termination at the option of the borrower or the Fund. Upon termination of the loan, the borrower will return to the lender securities identical to the loaned securities. Should the borrower of the securities fail to return loaned securities, the Fund has the right to repurchase the securities using the collateral in the open market.
The borrower pays fees at the Funds’ direction to the lending agent. The lending agent may retain a portion of the fees and interest earned on the cash collateral invested as compensation for its services. Investments made with the cash collateral are disclosed on the Schedules of Investments, if applicable. The lending fees and the Funds’ portion of the interest income earned on cash collateral are included on the Statements of Operations as securities lending income, if applicable.
(e) Short Sales Certain Funds may enter into short sales transactions. Short sales are transactions in which a Fund sells a security that it may not own. A Fund may make short sales of securities to (i) offset potential declines in long positions in similar securities, (ii) to increase the flexibility of the Fund, (iii) for investment return, (iv) as part of a risk arbitrage strategy, and (v) as part of its overall portfolio management strategies involving the use of derivative instruments. When a Fund engages in a short sale, it may borrow the security sold short and deliver it to the counterparty. A Fund will ordinarily have to pay a fee or premium to borrow a security and be obligated to repay the lender of the security any dividend or interest that accrues on the security during
the period of the loan. Securities sold in short sale transactions and the dividend or interest payable on such securities, if any, are reflected as payable for short sales on the Statements of Assets and Liabilities. Short sales expose a Fund to the risk that it will be required to cover its short position at a time when the security or other asset has appreciated in value, thus resulting in losses to a Fund. A short sale is “against the box” if a Fund holds in its portfolio or has the right to acquire the security sold short at no additional cost. A Fund will be subject to additional risks to the extent that it engages in short sales that are not “against the box.” A Fund’s loss on a short sale could theoretically be unlimited in cases where a Fund is unable, for whatever reason, to close out its short position.
6. FINANCIAL DERIVATIVE INSTRUMENTS
The following disclosures contain information on how and why the Funds use financial derivative instruments, and how financial derivative instruments affect the Funds’ financial position, results of operations and cash flows. The location and fair value amounts of these instruments on the Statements of Assets and Liabilities and the net realized gain (loss) and net change in unrealized appreciation (depreciation) on the Statements of Operations, each categorized by type of financial derivative contract and related risk exposure, are included in a table in the Notes to Schedules of Investments. The financial derivative instruments outstanding as of period end and the amounts of net realized gain (loss) and net change in unrealized appreciation (depreciation) on financial derivative instruments during the period, as disclosed in the Notes to Schedules of Investments, serve as indicators of the volume of financial derivative activity for the Funds.
(a) Forward Foreign Currency Contracts Certain Funds may enter into forward foreign currency contracts in connection with settling planned purchases or sales of securities, to hedge the currency exposure associated with some or all of a Fund’s securities or as a part of an investment strategy. A forward foreign currency contract is an agreement between two parties to buy and sell a currency at a set price on a future date. The market value of a forward foreign currency contract fluctuates with changes in foreign currency exchange rates. Forward foreign currency contracts are marked to market daily, and the change in value is recorded by a Fund as an unrealized gain (loss). Realized gains (losses) are equal to the difference between the value of the contract at the time it was opened and the value at the time it was closed and are recorded upon delivery or receipt of the currency. These contracts may involve market risk in excess of the unrealized gain (loss) reflected on the Statements of Assets and Liabilities. In addition, a Fund could be exposed to risk if the counterparties are unable to meet the terms of the contracts or if the value of the currency changes unfavorably to the U.S. dollar. To mitigate such risk, cash or securities may be exchanged as collateral pursuant to the terms of the underlying contracts.
| | | | | | |
| | ANNUAL REPORT | | JUNE 30, 2017 | | 89 |
Notes to Financial Statements (Cont.)
(b) Futures Contracts Certain Funds may enter into futures contracts. A futures contract is an agreement to buy or sell a security or other asset for a set price on a future date. A Fund may use futures contracts to manage its exposure to the securities markets or to movements in interest rates and currency values. The primary risks associated with the use of futures contracts are the imperfect correlation between the change in market value of the securities held by a Fund and the prices of futures contracts and the possibility of an illiquid market. Futures contracts are valued based upon their quoted daily settlement prices. Upon entering into a futures contract, a Fund is required to deposit with its futures broker an amount of cash, U.S. Government and Agency Obligations, or select sovereign debt, in accordance with the initial margin requirements of the broker or exchange. Futures contracts are marked to market daily and based on such movements in the price of the contracts, an appropriate payable or receivable for the change in value may be posted or collected by the Fund (“Futures Variation Margin”). Gains (losses) are recognized but not considered realized until the contracts expire or close. Futures contracts involve, to varying degrees, risk of loss in excess of the Futures Variation Margin included within exchange traded or centrally cleared financial derivative instruments on the Statements of Assets and Liabilities.
(c) Options Contracts Certain Funds may write or purchase options to enhance returns or to hedge an existing position or future investment. A Fund may write call and put options on securities and financial derivative instruments it owns or in which it may invest. Writing put options tends to increase a Fund’s exposure to the underlying instrument. Writing call options tends to decrease a Fund’s exposure to the underlying instrument. When a Fund writes a call or put, an amount equal to the premium received is recorded as a liability and subsequently marked to market to reflect the current value of the option written. These liabilities are included on the Statements of Assets and Liabilities. Premiums received from writing options which expire are treated as realized gains. Premiums received from writing options which are exercised or closed are added to the proceeds or offset against amounts paid on the underlying futures, swap, security or currency transaction to determine the realized gain (loss). Certain options may be written with premiums to be determined on a future date. The premiums for these options are based upon implied volatility parameters at specified terms. A Fund as a writer of an option has no control over whether the underlying instrument may be sold (“call”) or purchased (“put”) and as a result bears the market risk of an unfavorable change in the price of the instrument underlying the written option. There is the risk a Fund may not be able to enter into a closing transaction because of an illiquid market.
Certain Funds may also purchase put and call options. Purchasing call options tends to increase a Fund’s exposure to the underlying
instrument. Purchasing put options tends to decrease a Fund’s exposure to the underlying instrument. A Fund pays a premium which is included as an asset on the Statements of Assets and Liabilities and subsequently marked to market to reflect the current value of the option. Premiums paid for purchasing options which expire are treated as realized losses. Certain options may be purchased with premiums to be determined on a future date. The premiums for these options are based upon implied volatility parameters at specified terms. The risk associated with purchasing put and call options is limited to the premium paid. Premiums paid for purchasing options which are exercised or closed are added to the amounts paid or offset against the proceeds on the underlying investment transaction to determine the realized gain (loss) when the underlying transaction is executed.
Credit Default Swaptions Certain Funds may write or purchase credit default swaptions to hedge exposure to the credit risk of an investment without making a commitment to the underlying instrument. A credit default swaption is an option to sell or buy credit protection on a specific reference by entering into a pre-defined swap agreement by some specified date in the future.
Foreign Currency Options Certain Funds may write or purchase foreign currency options. Purchasing foreign currency options gives a Fund the right, but not the obligation to buy or sell specified amounts of currency at a rate of exchange that may be exercised by a certain date. These options may be used as a short or long hedge against possible variations in foreign exchange rates or to gain exposure to foreign currencies.
Inflation-Capped Options Certain Funds may write or purchase inflation-capped options to enhance returns or for hedging opportunities. The purpose of purchasing inflation-capped options is to protect a Fund from inflation erosion above a certain rate on a given notional exposure. A floor can be used to give downside protection to investments in inflation-linked products.
Interest Rate-Capped Options Certain Funds may write or purchase interest rate-capped options to enhance returns or for hedging opportunities. The purpose of purchasing interest rate-capped options is to protect a Fund from floating rate risk above a certain rate on a given notional exposure. A floor can be used to give downside protection to investments in interest rate linked products.
Interest Rate Swaptions Certain Funds may write or purchase interest rate swaptions which are options to enter into a pre-defined swap agreement by some specified date in the future. The writer of the swaption becomes the counterparty to the swap if the buyer exercises. The interest rate swaption agreement will specify whether the buyer of the swaption will be a fixed-rate receiver or a fixed-rate payer upon exercise.
June 30, 2017
Options on Exchange-Traded Futures Contracts Certain Funds may write or purchase options on exchange-traded futures contracts (“Futures Option”) to hedge an existing position or future investment, for speculative purposes or to manage exposure to market movements. A Futures Option is an option contract in which the underlying instrument is a single futures contract.
Options on Securities Certain Funds may write or purchase options on securities. An option uses a specified security as the underlying instrument for the option contract. A Fund may write or purchase options to enhance returns or to hedge an existing position or future investment.
(d) Swap Agreements Certain Funds may invest in swap agreements. Swap agreements are bilaterally negotiated agreements between a Fund and a counterparty to exchange or swap investment cash flows, assets, foreign currencies or market-linked returns at specified, future intervals. Swap agreements may be privately negotiated in the over the counter market (“OTC swaps”) or may be cleared through a third party, known as a central counterparty or derivatives clearing organization (“Centrally Cleared Swaps”). A Fund may enter into asset, credit default, cross-currency, interest rate, total return, variance and other forms of swap agreements to manage its exposure to credit, currency, interest rate, commodity, equity and inflation risk. In connection with these agreements, securities or cash may be identified as collateral or margin in accordance with the terms of the respective swap agreements to provide assets of value and recourse in the event of default or bankruptcy/insolvency.
Centrally Cleared Swaps are marked to market daily based upon valuations as determined from the underlying contract or in accordance with the requirements of the central counterparty or derivatives clearing organization. Changes in market value, if any, are reflected as a component of net change in unrealized appreciation (depreciation) on the Statements of Operations. Daily changes in valuation of centrally cleared swaps (“Swap Variation Margin”), if any, are disclosed within centrally cleared financial derivative instruments on the Statements of Assets and Liabilities. OTC swap payments received or paid at the beginning of the measurement period are included on the Statements of Assets and Liabilities and represent premiums paid or received upon entering into the swap agreement to compensate for differences between the stated terms of the swap agreement and prevailing market conditions (credit spreads, currency exchange rates, interest rates, and other relevant factors). Upfront premiums received (paid) are initially recorded as liabilities (assets) and subsequently marked to market to reflect the current value of the swap. These upfront premiums are recorded as realized gain (loss) on the Statements of Operations upon termination or maturity of the swap. A liquidation payment received or made at the termination of the swap is recorded as realized gain (loss) on the Statements of Operations. Net periodic
payments received or paid by a Fund are included as part of realized gain (loss) on the Statements of Operations.
For purposes of applying a Fund’s investment policies and restrictions, swap agreements are generally valued by a Fund at market value. In the case of a credit default swap, in applying certain of a Fund’s investment policies and restrictions, the Funds will value the credit default swap at its notional value or its full exposure value (i.e., the sum of the notional amount for the contract plus the market value), but may value the credit default swap at market value for purposes of applying certain of a Fund’s other investment policies and restrictions. For example, a Fund may value credit default swaps at full exposure value for purposes of a Fund’s credit quality guidelines (if any) because such value in general better reflects a Fund’s actual economic exposure during the term of the credit default swap agreement. As a result, a Fund may, at times, have notional exposure to an asset class (before netting) that is greater or lesser than the stated limit or restriction noted in a Fund’s prospectus. In this context, both the notional amount and the market value may be positive or negative depending on whether a Fund is selling or buying protection through the credit default swap. The manner in which certain securities or other instruments are valued by a Fund for purposes of applying investment policies and restrictions may differ from the manner in which those investments are valued by other types of investors.
Entering into swap agreements involves, to varying degrees, elements of interest, credit, market and documentation risk in excess of the amounts recognized on the Statements of Assets and Liabilities. Such risks involve the possibility that there will be no liquid market for these agreements, that the counterparty to the agreements may default on its obligation to perform or disagree as to the meaning of contractual terms in the agreements and that there may be unfavorable changes in interest rates.
A Fund’s maximum risk of loss from counterparty credit risk is the discounted net value of the cash flows to be received from the counterparty over the contract’s remaining life, to the extent that amount is positive. The risk may be mitigated by having a master netting arrangement between a Fund and the counterparty and by the posting of collateral to a Fund to cover a Fund’s exposure to the counterparty. To the extent a Fund has a policy to limit the net amount owed to or to be received from a single counterparty under existing swap agreements, such limitation only applies to counterparties to OTC swaps and does not apply to centrally cleared swaps where the counterparty is a central counterparty or derivatives clearing organization.
Credit Default Swap Agreements Certain Funds may use credit default swaps on corporate, loan, sovereign, U.S. municipal or U.S. Treasury issues to provide a measure of protection against defaults of the issuers (i.e., to reduce risk where a Fund owns or has exposure to
| | | | | | |
| | ANNUAL REPORT | | JUNE 30, 2017 | | 91 |
Notes to Financial Statements (Cont.)
the referenced obligation) or to take an active long or short position with respect to the likelihood of a particular issuer’s default. Credit default swap agreements involve one party making a stream of payments (referred to as the buyer of protection) to another party (the seller of protection) in exchange for the right to receive a specified return in the event that the referenced entity, obligation or index, as specified in the swap agreement, undergoes a certain credit event. As a seller of protection on credit default swap agreements, a Fund will generally receive from the buyer of protection a fixed rate of income throughout the term of the swap provided that there is no credit event. As the seller, a Fund would effectively add leverage to its portfolio because, in addition to its total net assets, a Fund would be subject to investment exposure on the notional amount of the swap.
If a Fund is a seller of protection and a credit event occurs, as defined under the terms of that particular swap agreement, a Fund will either (i) pay to the buyer of protection an amount equal to the notional amount of the swap and take delivery of the referenced obligation, other deliverable obligations or underlying securities comprising the referenced index or (ii) pay a net settlement amount in the form of cash or securities equal to the notional amount of the swap less the recovery value of the referenced obligation or underlying securities comprising the referenced index. If a Fund is a buyer of protection and a credit event occurs, as defined under the terms of that particular swap agreement, a Fund will either (i) receive from the seller of protection an amount equal to the notional amount of the swap and deliver the referenced obligation, other deliverable obligations or underlying securities comprising the referenced index or (ii) receive a net settlement amount in the form of cash or securities equal to the notional amount of the swap less the recovery value of the referenced obligation or underlying securities comprising the referenced index. Recovery values are estimated by market makers considering either industry standard recovery rates or entity specific factors and considerations until a credit event occurs. If a credit event has occurred, the recovery value is determined by a facilitated auction whereby a minimum number of allowable broker bids, together with a specified valuation method, are used to calculate the settlement value. The ability to deliver other obligations may result in a cheapest-to-deliver option (the buyer of protection’s right to choose the deliverable obligation with the lowest value following a credit event).
Credit default swap agreements on credit indices involve one party making a stream of payments to another party in exchange for the right to receive a specified return in the event of a write-down, principal shortfall, interest shortfall or default of all or part of the referenced entities comprising the credit index. A credit index is a basket of credit instruments or exposures designed to be representative of some part of the credit market as a whole. These indices are made up of reference
credits that are judged by a poll of dealers to be the most liquid entities in the credit default swap market based on the sector of the index. Components of the indices may include, but are not limited to, investment grade securities, high yield securities, asset-backed securities, emerging markets, and/or various credit ratings within each sector. Credit indices are traded using credit default swaps with standardized terms including a fixed spread and standard maturity dates. An index credit default swap references all the names in the index, and if there is a default, the credit event is settled based on that name’s weight in the index. The composition of the indices changes periodically, usually every six months, and for most indices, each name has an equal weight in the index. A Fund may use credit default swaps on credit indices to hedge a portfolio of credit default swaps or bonds, which is less expensive than it would be to buy many credit default swaps to achieve a similar effect. Credit default swaps on indices are instruments for protecting investors owning bonds against default, and traders use them to speculate on changes in credit quality.
Implied credit spreads, represented in absolute terms, utilized in determining the market value of credit default swap agreements on corporate, loan, sovereign, U.S. municipal or U.S. Treasury issues as of period end, if any, are disclosed in the Notes to Schedules of Investments. They serve as an indicator of the current status of payment/performance risk and represent the likelihood or risk of default for the reference entity. The implied credit spread of a particular referenced entity reflects the cost of buying/selling protection and may include upfront payments required to be made to enter into the agreement. Wider credit spreads represent a deterioration of the referenced entity’s credit soundness and a greater likelihood or risk of default or other credit event occurring as defined under the terms of the agreement. For credit default swap agreements on asset-backed securities and credit indices, the quoted market prices and resulting values serve as the indicator of the current status of the payment/performance risk. Increasing market values, in absolute terms when compared to the notional amount of the swap, represent a deterioration of the referenced entity’s credit soundness and a greater likelihood or risk of default or other credit event occurring as defined under the terms of the agreement.
The maximum potential amount of future payments (undiscounted) that a Fund as a seller of protection could be required to make under a credit default swap agreement equals the notional amount of the agreement. Notional amounts of each individual credit default swap agreement outstanding as of period end for which a Fund is the seller of protection are disclosed in the Notes to Schedules of Investments. These potential amounts would be partially offset by any recovery values of the respective referenced obligations, upfront payments received upon entering into the agreement, or net amounts received
June 30, 2017
from the settlement of buy protection credit default swap agreements entered into by a Fund for the same referenced entity or entities.
Interest Rate Swap Agreements Certain Funds are subject to interest rate risk exposure in the normal course of pursuing their investment objectives. The value of the fixed rate bonds that the Funds hold may decrease if interest rates rise. To help hedge against this risk and to maintain its ability to generate income at prevailing market rates, a Fund may enter into interest rate swap agreements. Interest rate swap agreements involve the exchange by a Fund with another party for their respective commitment to pay or receive interest on the notional amount of principal. Certain forms of interest rate swap agreements may include: (i) interest rate caps, under which, in return for a premium, one party agrees to make payments to the other to the extent that interest rates exceed a specified rate, or “cap”, (ii) interest rate floors, under which, in return for a premium, one party agrees to make payments to the other to the extent that interest rates fall below a specified rate, or “floor”, (iii) interest rate collars, under which a party sells a cap and purchases a floor or vice versa in an attempt to protect itself against interest rate movements exceeding given minimum or maximum levels, (iv) callable interest rate swaps, under which the buyer pays an upfront fee in consideration for the right to early terminate the swap transaction in whole, at zero cost and at a predetermined date and time prior to the maturity date, (v) spreadlocks, which allow the interest rate swap users to lock in the forward differential (or spread) between the interest rate swap rate and a specified benchmark, or (vi) basis swaps, under which two parties can exchange variable interest rates based on different segments of money markets.
Volatility Swap Agreements Certain Funds also may enter into forward volatility agreements, also known as volatility swaps. In a volatility swap, the counterparties agree to make payments in connection with changes in the volatility (i.e., the magnitude of change over a specified period of time) of an underlying referenced instrument, such as a currency, rate, index, security or other financial instrument. Volatility swaps permit the parties to attempt to hedge volatility risk and/or take positions on the projected future volatility of an underlying referenced instrument. For example, a Fund may enter into a volatility swap in order to take the position that the referenced instrument’s volatility will increase over a particular period of time. If the referenced instrument’s volatility does increase over the specified time, the Fund will receive payment from its counterparty based upon the amount by which the referenced instrument’s realized volatility level exceeds a volatility level agreed upon by the parties. If the referenced instrument’s volatility does not increase over the specified time, the Fund will make a payment to the counterparty based upon the amount by which the referenced instrument’s realized volatility level falls below the volatility level agreed upon by the parties. At the maturity date, a
net cash flow is exchanged, where the payoff amount is equivalent to the difference between the realized price volatility of the referenced instrument and the strike multiplied by the notional amount. As a receiver of the realized price volatility, the Fund would receive the payoff amount when the realized price volatility of the referenced instrument is greater than the strike and would owe the payoff amount when the volatility is less than the strike. As a payer of the realized price volatility, the Fund would owe the payoff amount when the realized price volatility of the referenced instrument is greater than the strike and would receive the payoff amount when the volatility is less than the strike. Payments on a volatility swap will be greater if they are based upon the mathematical square of volatility (i.e., the measured volatility multiplied by itself, which is referred to as “variance”). This type of volatility swap is frequently referred to as a variance swap.
7. PRINCIPAL RISKS
In the normal course of business, the Funds trade financial instruments and enter into financial transactions where risk of potential loss exists due to such things as changes in the market (market risk) or failure or inability of the other party to a transaction to perform (credit and counterparty risk). See below for a detailed description of select principal risks. For a more comprehensive list of potential risks the Funds may be subject to, please see the Important Information About the Funds.
Market Risks A Fund’s investments in financial derivative instruments and other financial instruments expose the Fund to various risks such as, but not limited to, interest rate, foreign (non-U.S.) currency, equity and commodity risks.
Market trading risk is the risk that an active secondary trading market for a Fund’s shares does not develop or continue, that a Fund may not continue to meet a listing exchange’s trading or listing requirements, or that Fund shares trade at prices other than the Fund’s NAV.
Interest rate risk is the risk that fixed income securities and other instruments held by a Fund will decline in value because of changes in interest rates. As nominal interest rates rise, the value of certain fixed income securities held by a Fund is likely to decrease. A nominal interest rate can be described as the sum of a real interest rate and an expected inflation rate. Interest rate changes can be sudden and unpredictable, and a Fund may lose money if these changes are not anticipated by the Fund’s management. A Fund may not be able to hedge against changes in interest rates or may choose not to do so for cost or other reasons. In addition, any hedges may not work as intended.
Duration is a measure used to determine the sensitivity of a security’s price to changes in interest rates that incorporates a security’s yield, coupon, final maturity and call features, among other characteristics. Convexity is an additional measure of interest rate sensitivity that
| | | | | | |
| | ANNUAL REPORT | | JUNE 30, 2017 | | 93 |
Notes to Financial Statements (Cont.)
measures the rate of change of duration in response to changes in interest rates. Fixed income securities with longer durations tend to be more sensitive to changes in interest rates, usually making them more volatile than securities with shorter durations. A wide variety of factors can cause interest rates to rise (e.g., central bank monetary policies, inflation rates, general economic conditions, etc.). Under current economic conditions, interest rates are near historically low levels. Thus, the Funds may be subject to heightened interest rate risk because the Fed has ended its quantitative easing program and has begun, and may continue, to raise interest rates. To the extent that the Fed continues to raise interest rates, there is a risk that rates across the financial system may rise. Further, while bond markets have steadily grown over the past three decades, dealer “market making” ability has not kept pace and in some cases has decreased. Given the importance of intermediary “market making” in creating a robust and active market, fixed income securities are currently facing increased volatility and liquidity risks. All of these factors, collectively and/or individually, could cause a Fund to lose value. If a Fund lost enough value, the Fund could face increased shareholder redemptions, which could force the Fund to liquidate investments at disadvantageous times or prices, thereby adversely affecting the Fund. Also, a Fund may be adversely affected when a large shareholder purchases or redeems large amounts of shares, which can occur at any time and may impact the Fund in the same manner as a high volume of purchase or redemption requests. Large shareholder transactions may impact a Fund’s liquidity and net asset value. Such transactions may also increase a Fund’s transaction costs or otherwise cause a Fund to perform differently than intended. Moreover, the Funds are subject to the risk that other shareholders may make investment decisions based on the choices of a large shareholder.
If a Fund invests directly in foreign (non-U.S.) currencies or in securities that trade in, and receive revenues in, foreign (non-U.S.) currencies, or in financial derivative instruments that provide exposure to foreign (non-U.S.) currencies, it will be subject to the risk that those currencies will decline in value relative to the base currency of the Fund, or, in the case of hedging positions, that the Fund’s base currency will decline in value relative to the currency being hedged. Currency rates in foreign countries may fluctuate significantly over short periods of time for a number of reasons, including changes in interest rates, intervention (or the failure to intervene) by U.S. or foreign governments, central banks or supranational entities such as the International Monetary Fund, or by the imposition of currency controls or other political developments in the United States or abroad. As a result, a Fund’s investments in foreign currency-denominated securities may reduce the Fund’s returns.
The market values of equities, such as common stocks and preferred securities or equity related investments such as futures and options, have historically risen and fallen in periodic cycles and may decline due to general market conditions which are not specifically related to a
particular company, such as real or perceived adverse economic conditions, changes in the general outlook for corporate earnings, changes in interest or currency rates or adverse investor sentiment generally. They may also decline due to factors which affect a particular industry or industries, such as labor shortages or increased production costs and competitive conditions within an industry. Different types of equity securities may react differently to these developments. Equity securities and equity related investments generally have greater market price volatility than fixed income securities.
Management and Tracking Error Risk is the risk that the portfolio manager’s investment decisions may not produce the desired results or that an Index Fund’s portfolio may not correlate to the Fund’s Index.
Indexing risk is the risk that a Fund is negatively affected by general declines in the market segments or asset classes represented by the Fund’s Index.
Credit and Counterparty Risks A Fund will be exposed to credit risk to parties with whom it trades and will also bear the risk of settlement default. A Fund minimizes concentrations of credit risk by undertaking transactions with a large number of customers and counterparties on recognized and reputable exchanges, where applicable. Over the counter (“OTC”) derivative transactions are subject to the risk that a counterparty to the transaction will not fulfill its contractual obligations to the other party, as many of the protections afforded to centrally cleared derivative transactions might not be available for OTC derivative transactions. For derivatives traded on an exchange or through a central counterparty, credit risk resides with a Fund’s clearing broker, or the clearinghouse itself, rather than with a counterparty in an OTC derivative transaction. A Fund could lose money if the issuer or guarantor of a fixed income security, or the counterparty to a financial derivative instruments contract, repurchase agreement or a loan of portfolio securities, is unable or unwilling to make timely principal and/or interest payments, or to otherwise honor its obligations. Securities and financial derivative instruments are subject to varying degrees of credit risk, which may be reflected in credit ratings.
Similar to credit risk, a Fund may be exposed to counterparty risk, or the risk that an institution or other entity with which the Fund has unsettled or open transactions will default. PIMCO, as the Manager, seeks to minimize counterparty risks to the Funds through a number of ways. Prior to entering into transactions with a new counterparty, the PIMCO Counterparty Risk Committee conducts an extensive credit review of such counterparty and must approve the use of such counterparty. Furthermore, pursuant to the terms of the underlying contract, to the extent that unpaid amounts owed to a Fund exceed a predetermined threshold, such counterparty is required to advance collateral to the Fund in the form of cash or securities equal in value to the unpaid amount owed to the Fund. A Fund may invest such collateral in securities or other instruments and will typically pay interest to the counterparty on the collateral received. If the unpaid
June 30, 2017
amount owed to a Fund subsequently decreases, the Fund would be required to return to the counterparty all or a portion of the collateral previously advanced. PIMCO’s attempts to minimize counterparty risk may, however, be unsuccessful.
All transactions in listed securities are settled/paid for upon delivery using approved counterparties. The risk of default is considered minimal, as delivery of securities sold is only made once a Fund has received payment. Payment is made on a purchase once the securities have been delivered by the counterparty. The trade will fail if either party fails to meet its obligation.
8. MASTER ARRANGEMENTS
A Fund may be subject to various netting arrangements (“Master Agreements”) with select counterparties. Master Agreements govern the terms of certain transactions, and reduce the counterparty risk associated with relevant transactions by specifying credit protection mechanisms and providing standardization that improves legal certainty. Each type of Master Agreement governs certain types of transactions. Different types of transactions may be traded out of different legal entities or affiliates of a particular organization, resulting in the need for multiple agreements with a single counterparty. As the Master Agreements are specific to unique operations of different asset types, they allow a Fund to close out and net its total exposure to a counterparty in the event of a default with respect to all the transactions governed under a single Master Agreement with a counterparty. For financial reporting purposes the Statements of Assets and Liabilities generally present derivative assets and liabilities on a gross basis, which reflects the full risks and exposures prior to netting.
Master Agreements can also help limit counterparty risk by specifying collateral posting arrangements at pre-arranged exposure levels. Under most Master Agreements, collateral is routinely transferred if the total net exposure to certain transactions (net of existing collateral already in place) governed under the relevant Master Agreement with a counterparty in a given account exceeds a specified threshold, which typically ranges from zero to $250,000 depending on the counterparty and the type of Master Agreement. United States Treasury Bills and U.S. dollar cash are generally the preferred forms of collateral, although other forms of AAA rated paper or sovereign securities may be used depending on the terms outlined in the applicable Master Agreement. Securities and cash pledged as collateral are reflected as assets on the Statements of Assets and Liabilities as either a component of Investments at value (securities) or Deposits with counterparty. Cash collateral received is not typically held in a segregated account and as such is reflected as a liability on the Statements of Assets and Liabilities as Deposits from counterparty. The market value of any securities received as collateral is not reflected as a component of NAV. A Fund’s overall exposure to counterparty risk can change substantially within a short period, as it is affected by each transaction subject to the relevant Master Agreement.
Master Repurchase Agreements and Global Master Repurchase Agreements (individually and collectively “Master Repo Agreements”) govern repurchase, reverse repurchase, and sale-buyback transactions between a Fund and select counterparties. Master Repo Agreements maintain provisions for, among other things, initiation, income payments, events of default, and maintenance of collateral. The market value of transactions under the Master Repo Agreement, collateral pledged or received, and the net exposure by counterparty as of period end are disclosed in the Notes to Schedules of Investments.
Master Securities Forward Transaction Agreements (“Master Forward Agreements”) govern certain forward settling transactions, such as TBA securities, delayed-delivery or sale-buyback transactions by and between a Fund and select counterparties. The Master Forward Agreements maintain provisions for, among other things, transaction initiation and confirmation, payment and transfer, events of default, termination, and maintenance of collateral. The market value of forward settling transactions, collateral pledged or received, and the net exposure by counterparty as of period end is disclosed in the Notes to Schedules of Investments.
Customer Account Agreements and related addenda govern cleared derivatives transactions such as futures, options on futures, and cleared OTC derivatives. Such transactions require posting of initial margin as determined by each relevant clearing agency which is segregated in an account at a futures commission merchant (“FCM”) registered with the Commodity Futures Trading Commission (“CFTC”). In the United States, counterparty risk may be reduced as creditors of an FCM cannot have a claim to Fund assets in the segregated account. Portability of exposure reduces risk to the Funds. Variation margin, or changes in market value, are exchanged daily, but may not be netted between futures and cleared OTC derivatives unless the parties have agreed to a separate arrangement in respect of portfolio margining. The market value or accumulated unrealized appreciation (depreciation), initial margin posted, and any unsettled variation margin as of period end are disclosed in the Notes to Schedules of Investments.
Prime Broker Arrangements may be entered into to facilitate execution and/or clearing of listed equity option transactions or short sales of equity securities between a Fund and selected counterparties. The arrangements provide guidelines surrounding the rights, obligations, and other events, including, but not limited to, margin, execution, and settlement. These agreements maintain provisions for, among other things, payments, maintenance of collateral, events of default, and termination. Margin and other assets delivered as collateral are typically in the possession of the prime broker and would offset any obligations due to the prime broker. The market values of listed options and securities sold short and related collateral are disclosed in the Notes to Schedule of Investments.
| | | | | | |
| | ANNUAL REPORT | | JUNE 30, 2017 | | 95 |
Notes to Financial Statements (Cont.)
International Swaps and Derivatives Association, Inc. Master Agreements and Credit Support Annexes (“ISDA Master Agreements”) govern bilateral OTC derivative transactions entered into by a Fund with select counterparties. ISDA Master Agreements maintain provisions for general obligations, representations, agreements, collateral posting and events of default or termination. Events of termination include conditions that may entitle counterparties to elect to terminate early and cause settlement of all outstanding transactions under the applicable ISDA Master Agreement. Any election to terminate early could be material to the financial statements. In limited circumstances, the ISDA Master Agreement may contain additional provisions that add counterparty protection beyond coverage of existing daily exposure if the counterparty has a decline in credit quality below a predefined level. These amounts, if any, may be segregated with a third-party custodian. The market value of OTC financial derivative instruments, collateral received or pledged, and net exposure by counterparty as of period end are disclosed in the Notes to Schedules of Investments.
9. FEES AND EXPENSES
(a) Management Fee PIMCO, a majority-owned subsidiary of Allianz Asset Management of America L.P. (“Allianz Asset Management”), serves as the Manager to the Trust, pursuant to an investment management agreement. Each Fund pays PIMCO fees in return for providing investment advisory, supervisory and administrative services under an all-in fee structure. Each Fund will pay monthly management fees to PIMCO at an annual rate based on average daily net assets (the “Management Fee”), at an annual rate as noted in the table below.
| | | | | | | | |
| Fund Name | | | | | Management Fee | |
PIMCO 1-3 Year U.S. Treasury Index Exchange-Traded Fund | | | | | | | 0.15% | |
PIMCO 25+ Year Zero Coupon U.S. Treasury Index Exchange-Traded Fund | | | | | | | 0.15% | |
PIMCO 1-5 Year U.S. TIPS Index Exchange-Traded Fund | | | | | | | 0.20% | |
PIMCO 15+ Year U.S. TIPS Index Exchange-Traded Fund | | | | | | | 0.20% | |
PIMCO Broad U.S. TIPS Index Exchange-Traded Fund | | | | | | | 0.20% | |
PIMCO 0-5 Year High Yield Corporate Bond Index Exchange-Traded Fund | | | | | | | 0.55% | |
PIMCO Investment Grade Corporate Bond Index Exchange-Traded Fund | | | | | | | 0.20% | |
PIMCO Active Bond Exchange-Traded Fund | | | | | | | 0.55% | |
PIMCO Enhanced Low Duration Active Exchange-Traded Fund(1) | | | | | | | 0.46% | |
PIMCO Enhanced Short Maturity Active Exchange-Traded Fund | | | | | | | 0.35% | |
PIMCO Intermediate Municipal Bond Active Exchange-Traded Fund | | | | | | | 0.35% | |
PIMCO Short Term Municipal Bond Active Exchange-Traded Fund | | | | | | | 0.35% | |
| (1) | PIMCO has contractually agreed, through October 31, 2018, to waive its management fee by 0.07% of the average daily net assets attributable to the Fund. |
(b) Distribution and Servicing Fees PIMCO Investments LLC, a wholly-owned subsidiary of PIMCO, serves as the distributor (“Distributor”) of each Fund’s Creation Units. The Distributor does not maintain a secondary market in shares of the Funds. During the period ended
June 30, 2017 each Fund was permitted to compensate the Distributor at an annual rate of up to 0.25% of a Fund’s average daily net assets (the “12b-1 Plan Fee”). However, the Board of Trustees has determined not to authorize payment of a 12b-1 Plan Fee at this time. The 12b-1 Plan Fee may only be imposed or increased when the Board determines that it is in the best interests of shareholders to do so. Because these fees are paid out of a Fund’s assets on an ongoing basis, to the extent that a fee is authorized, over time it will increase the cost of an investment in the Fund. The 12b-1 Plan Fee may cost an investor more than other types of sales charges.
(c) Fund Expenses PIMCO provides or procures supervisory and administrative services for shareholders and also bears the costs of various third-party services required by the Funds, including audit, custodial, portfolio accounting, legal, transfer agency and printing costs. The Funds bear other expenses which are not covered under the Management Fee which may vary and affect the total level of expenses paid by shareholders, such as (i) taxes and governmental fees; (ii) brokerage fees and commissions and other portfolio transaction expenses; (iii) costs of borrowing money, including interest expense; (iv) securities lending fees and expenses; (v) fees and expenses of the Trustees who are not “interested persons” of PIMCO or the Trust, and any counsel retained exclusively for their benefit; (vi) extraordinary expense, including costs of litigation and indemnification expenses; and
(vii) organizational expenses. The ratio of expenses to average net
assets, as disclosed on the Financial Highlights, may differ from the annual fund operating expenses as disclosed in the Prospectus.
Each Trustee, other than those affiliated with PIMCO or its affiliates, receives an annual retainer of $36,850, plus $3,800 for each Board meeting attended in person, $775 for each committee meeting attended and $750 for each Board meeting attended telephonically, plus reimbursement of related expenses. In addition, the audit committee chair receives an additional annual retainer of $6,000, the valuation oversight committee lead receives an additional annual retainer of $4,250 (to the extent there are co-leads of the valuation oversight committee, the annual retainer will be split evenly between the co-leads, so that each co-lead individually receives an additional retainer of $2,125) and the governance committee chair receives an additional annual retainer of $2,750. The Lead Independent Trustee receives an additional annual retainer of $3,500.
These expenses are allocated on a pro rata basis to each Fund of the Trust according to its respective net assets. The Trust pays no compensation directly to any Trustee or any other officer who is affiliated with the Manager, all of whom receive remuneration for their services to the Trust from the Manager or its affiliates.
(d) Expense Limitation Pursuant to the Expense Limitation Agreement, PIMCO has agreed to waive a portion of the Funds’ Management Fee, or reimburse each Fund, to the extent that each Fund’s organizational
June 30, 2017
expenses and pro rata share of Trustee Fees exceed 0.0049%, the “Expense Limit” (calculated as a percentage of the Fund’s average daily net assets attributable to each class). The Expense Limitation Agreement will automatically renew for one-year terms unless PIMCO provides written notice to the Trust at least 30 days prior to the end of the then current term.
Pursuant to a Fee Waiver Agreement, PIMCO contractually agreed to reduce its Management Fee for the PIMCO Active Bond Exchange-Traded Fund.
Pursuant to a Fee Waiver Agreement, PIMCO contractually agreed to reduce its Management Fee for the PIMCO Enhanced Low Duration Active Exchange-Traded Fund. The Fee Waiver Agreements will automatically renew for one-year terms unless PIMCO provides written notice to the Trust at least 30 days prior to the end of the then current term. Each waiver is reflected on the Statements of Operations as a component of Waiver and/or Reimbursement by PIMCO.
Under certain conditions, PIMCO may be reimbursed for these waived amounts in future periods, not to exceed thirty-six months after the waiver. The total recoverable amounts to PIMCO (from the applicable Fee Waiver Agreements and Expense Limitation Agreement combined) at June 30, 2017, were as follows (amounts in thousands†):
| | | | | | | | | | | | | | | | | | | | |
| | | | | | Expiring Within | |
| Fund Name | | | | | 12 Months | | | 13-24 Months | | | 25-36 Months | | | Total | |
PIMCO 1-3 Year U.S. Treasury Index Exchange-Traded Fund | | | | | | $ | 0 | | | $ | 0 | | | $ | 5 | | | $ | 5 | |
PIMCO 25+ Year Zero Coupon U.S. Treasury Index Exchange-Traded Fund | | | | | | | 0 | | | | 0 | | | | 1 | | | | 1 | |
PIMCO 15+ Year U.S. TIPS Index Exchange-Traded Fund | | | | | | | 0 | | | | 0 | | | | 5 | | | | 5 | |
PIMCO Broad U.S. TIPS Index Exchange-Traded Fund | | | | | | | 0 | | | | 0 | | | | 2 | | | | 2 | |
PIMCO Enhanced Low Duration Active Exchange-Traded Fund | | | | | | | 76 | | | | 77 | | | | 51 | | | | 204 | |
| † | A zero balance may reflect actual amounts rounding to less than one thousand. |
10. RELATED PARTY TRANSACTIONS
The Manager and Distributor are related parties. Fees paid to these parties are disclosed in Note 9, Fees and Expenses, and the accrued related party fee amounts are disclosed on the Statements of Assets and Liabilities.
Certain Funds are permitted to purchase or sell securities from or to certain related affiliated funds under specified conditions outlined in procedures adopted by the Board. The procedures have been designed to ensure that any purchase or sale of securities by the Funds from or to another fund or portfolio that are, or could be, considered an affiliate, or an affiliate of an affiliate, by virtue of having a common investment adviser (or affiliated investment advisers), common Trustees and/or common officers complies with Rule 17a-7 under the Act. Further, as defined under the procedures, each transaction is effected at the current market price. During the period ended June 30, 2017, the Funds below engaged in purchases and sales of securities pursuant to Rule 17a-7 under the Act (amounts in thousands†):
| | | | | | | | | | | | |
| Fund Name | | | | | Purchases | | | Sales | |
PIMCO 0-5 Year High Yield Corporate Bond Index Exchange-Traded Fund | | | | | | $ | 80,650 | | | $ | 30,335 | |
PIMCO Investment Grade Corporate Bond Index Exchange-Traded Fund | | | | | | | 16,618 | | | | 0 | |
PIMCO Active Bond Exchange-Traded Fund | | | | | | | 33,248 | | | | 280,102 | |
PIMCO Enhanced Low Duration Active Exchange-Traded Fund | | | | | | | 4,391 | | | | 8,250 | |
PIMCO Enhanced Short Maturity Active Exchange-Traded Fund | | | | | | | 1,211,696 | | | | 1,551,969 | |
PIMCO Intermediate Municipal Bond Active Exchange-Traded Fund | | | | | | | 1,486 | | | | 0 | |
PIMCO Short Term Municipal Bond Active Exchange-Traded Fund | | | | | | | 566 | | | | 0 | |
| † | A zero balance may reflect actual amounts rounding to less than one thousand. |
11. GUARANTEES AND INDEMNIFICATIONS
Under the Trust’s organizational documents, each Trustee or officer of the Trust is indemnified and each employee or other agent of the Trust (including the Trust’s investment manager) may be indemnified, to the extent permitted by the Act, against certain liabilities that may arise out of performance of their duties to the Funds. Additionally, in the normal course of business, the Funds enter into contracts that contain a variety of indemnification clauses. The Funds’ maximum exposure under these arrangements is unknown as this would involve future claims that may be made against the Funds that have not yet occurred. However, the Funds have not had prior claims or losses pursuant to these contracts.
12. PURCHASES AND SALES OF SECURITIES
The length of time a Fund has held a particular security is not generally a consideration in investment decisions. A change in the securities held by a Fund is known as “portfolio turnover.” Each Fund may engage in frequent and active trading of portfolio securities to achieve its investment objective, particularly during periods of volatile market movements. High portfolio turnover may involve correspondingly greater transaction costs to a Fund, including brokerage commissions or dealer mark-ups and other transaction costs on the sale of securities and reinvestments in other securities. Such sales may also result in realization of taxable capital gains, including short-term capital gains (which are generally taxed at ordinary income tax rates). The transaction costs and tax effects associated with portfolio turnover may adversely affect a Fund’s performance. The portfolio turnover rates are reported in the Financial Highlights.
| | | | | | |
| | ANNUAL REPORT | | JUNE 30, 2017 | | 97 |
Notes to Financial Statements (Cont.)
Purchases and sales of securities (excluding short-term investments) for the period ended June 30, 2017, were as follows (amounts in thousands†):
| | | | | | | | | | | | | | | | | | | | |
| | | | | | U.S. Government/Agency | | | All Other | |
| Portfolio Name | | | | | Purchases | | | Sales | | | Purchases | | | Sales | |
PIMCO 1-3 Year U.S. Treasury Index Exchange-Traded Fund | | | | | | $ | 75,371 | | | $ | 73,321 | | | $ | 0 | | | $ | 0 | |
PIMCO 25+ Year Zero Coupon U.S. Treasury Index Exchange-Traded Fund | | | | | | | 31,349 | | | | 36,363 | | | | 0 | | | | 0 | |
PIMCO 1-5 Year U.S. TIPS Index Exchange-Traded Fund | | | | | | | 417,967 | | | | 423,472 | | | | 0 | | | | 0 | |
PIMCO 15+ Year U.S. TIPS Index Exchange-Traded Fund | | | | | | | 19,238 | | | | 21,788 | | | | 0 | | | | 0 | |
PIMCO Broad U.S. TIPS Index Exchange-Traded Fund | | | | | | | 6,170 | | | | 7,057 | | | | 0 | | | | 0 | |
PIMCO 0-5 Year High Yield Corporate Bond Index Exchange-Traded Fund | | | | | | | 0 | | | | 2,101 | | | | 824,232 | | | | 724,809 | |
PIMCO Investment Grade Corporate Bond Index Exchange-Traded Fund | | | | | | | 1,374 | | | | 2,041 | | | | 153,401 | | | | 36,605 | |
PIMCO Active Bond Exchange-Traded Fund | | | | | | | 16,210,512 | | | | 16,604,860 | | | | 676,021 | | | | 1,016,429 | |
PIMCO Enhanced Low Duration Active Exchange-Traded Fund | | | | | | | 598,684 | | | | 544,502 | | | | 77,870 | | | | 44,821 | |
PIMCO Enhanced Short Maturity Active Exchange-Traded Fund | | | | | | | 1,017,490 | | | | 849,692 | | | | 4,425,638 | | | | 2,595,890 | |
PIMCO Intermediate Municipal Bond Active Exchange-Traded Fund | | | | | | | 0 | | | | 0 | | | | 102,626 | | | | 73,689 | |
PIMCO Short Term Municipal Bond Active Exchange-Traded Fund | | | | | | | 0 | | | | 0 | | | | 53,567 | | | | 50,379 | |
| † | A zero balance may reflect actual amounts rounding to less than one thousand. |
13. CAPITAL SHARE TRANSACTIONS
Capital shares are issued and redeemed by a Fund only in Creation Units. Except when aggregated in Creation Units, shares of a Fund are not redeemable. Transactions in capital shares for a Fund are disclosed on detail in the Statements of Changes in Net Assets.
The consideration for the purchase of Creation Units of a Fund generally consists of a basket of cash and/or securities that the Fund specifies each business day. Authorized Participants may be charged transaction fees as set forth below. To offset transfer and other transaction costs associated with the issuance and redemption of Creation Units, Authorized Participants are subject to standard creation and redemption transaction fees payable directly to State Street Bank and Trust Company, the sub-administrator of the Funds. PIMCO may, from time to time, at its own expense, compensate purchasers of Creation Units who have purchased substantial amounts of Creation Units and other financial institutions for administrative or marketing services. Creations and redemptions for cash (when cash creations and redemptions are available or specified) may be subject to an additional variable charge up to the maximum amount shown in the table below.
| | | | | | | | | | |
Standard Creation/
Redemption
Transaction Fee* | | | Maximum
Variable Charge
for Cash Creations** | | | Maximum
Variable Charge
for Cash Redemptions** | |
| $ | 500 | | | | 3.00 | % | | | 2.00 | % |
| * | Applicable to in-kind contributions or redemptions only. |
| ** | As a percentage of the cash amount invested or received. |
14. INVESTMENT TRANSACTIONS
For the period ended June 30, 2017, certain Funds had in-kind contributions and in-kind redemptions as follows (amounts in thousands):
| | | | | | | | | | | | |
| Fund Name | | | | | Contributions | | | Redemptions | |
PIMCO 1-3 Year U.S. Treasury Index Exchange-Traded Fund | | | | | | $ | 50,241 | | | $ | 80,619 | |
PIMCO 25+ Year Zero Coupon U.S. Treasury Index Exchange-Traded Fund | | | | | | | 83,835 | | | | 342,230 | |
PIMCO 1-5 Year U.S. TIPS Index Exchange-Traded Fund | | | | | | | 220,382 | | | | 136,823 | |
PIMCO 15+ Year U.S. TIPS Index Exchange-Traded Fund | | | | | | | 69,251 | | | | 24,416 | |
PIMCO Broad U.S. TIPS Index Exchange-Traded Fund | | | | | | | 31,640 | | | | 49,816 | |
PIMCO 0-5 Year High Yield Corporate Bond Index Exchange-Traded Fund | | | | | | | 942,473 | | | | 1,217,469 | |
PIMCO Investment Grade Corporate Bond Index Exchange-Traded Fund | | | | | | | 252,675 | | | | 56,250 | |
PIMCO Enhanced Short Maturity Active Exchange-Traded Fund | | | | | | | 23,645 | | | | 23,644 | |
June 30, 2017
The in-kind contributions and in-kind redemptions in this table may not agree with the Fund Share Transactions on the Statements of Changes in Net Assets. The table represents the accumulation of each Fund’s daily net shareholder transactions while the Statements of Changes in Net Assets reflect gross shareholder transactions including any cash component of the transactions.
15. REGULATORY AND LITIGATION MATTERS
The Funds are not named as defendants in any material litigation or arbitration proceedings and are not aware of any material litigation or claim pending or threatened against them.
The foregoing speaks only as of the date of the preparation of this report.
16. FEDERAL INCOME TAX MATTERS
Each Fund intends to qualify as a regulated investment company under Subchapter M of the Internal Revenue Code (the “Code”) and distribute all of its taxable income and net realized gains, if applicable, to shareholders. Accordingly, no provision for Federal income taxes has been made.
A Fund may be subject to local withholding taxes, including those imposed on realized capital gains. Any applicable foreign capital gains tax is accrued daily based upon net unrealized gains, and may be payable following the sale of any applicable investments.
In accordance with U.S. GAAP, the Manager has reviewed the Funds’ tax positions for all open tax years. As of June 30, 2017, the Funds have recorded no liability for net unrecognized tax benefits relating to uncertain income tax positions they have taken or expect to take in future tax returns.
The Funds file U.S. tax returns. While the statute of limitations remains open to examine the Funds’ U.S. tax returns filed for the fiscal years ending in 2013-2016, no examinations are in progress or anticipated at this time. The Funds are not aware of any tax positions for which it is reasonably possible that the total amounts of unrecognized tax benefits will significantly change in the next twelve months.
As of June 30, 2017, the components of distributable taxable earnings are as follows (amounts in thousands†):
| | | | | | | | | | | | | | | | | | | | | | | | | | | | | | | | | | | | |
| | | | | | Undistributed
Tax Exempt
Income | | | Undistributed
Ordinary
Income(1) | | | Undistributed
Long-Term
Capital Gains | | | Net Tax Basis
Unrealized
Appreciation/
(Depreciation)(2) | | | Other
Book-to-Tax
Accounting
Differences(3) | | | Accumulated
Capital
Losses(4) | | | Qualified
Late-Year
Loss
Deferral -
Capital(5) | | | Qualified
Late-Year
Loss
Deferral -
Ordinary(6) | |
PIMCO 1-3 Year U.S. Treasury Index Exchange-Traded Fund | | | | | | $ | 0 | | | $ | 111 | | | $ | 0 | | | $ | (491 | ) | | $ | (27 | ) | | $ | 0 | | | $ | (94 | ) | | $ | 0 | |
PIMCO 25+ Year Zero Coupon U.S. Treasury Index Exchange-Traded Fund | | | | | | | 0 | | | | 1,218 | | | | 0 | | | | (14,079 | ) | | | (30 | ) | | | (22,189 | ) | | | 0 | | | | 0 | |
PIMCO 1-5 Year U.S. TIPS Index Exchange-Traded Fund | | | | | | | 0 | | | | 2,626 | | | | 0 | | | | (7,586 | ) | | | (25 | ) | | | (14,425 | ) | | | 0 | | | | 0 | |
PIMCO 15+ Year U.S. TIPS Index Exchange-Traded Fund | | | | | | | 0 | | | | 969 | | | | 0 | | | | (4,784 | ) | | | (25 | ) | | | (11,890 | ) | | | 0 | | | | 0 | |
PIMCO Broad U.S. TIPS Index Exchange-Traded Fund | | | | | | | 0 | | | | 232 | | | | 0 | | | | (1,923 | ) | | | (25 | ) | | | (930 | ) | | | 0 | | | | 0 | |
PIMCO 0-5 Year High Yield Corporate Bond Index Exchange-Traded Fund | | | | | | | 0 | | | | 5,877 | | | | 0 | | | | 342 | | | | (39 | ) | | | (124,544 | ) | | | 0 | | | | 0 | |
PIMCO Investment Grade Corporate Bond Exchange-Traded Fund | | | | | | | 0 | | | | 2,038 | | | | 0 | | | | 12,184 | | | | (40 | ) | | | (718 | ) | | | 0 | | | | 0 | |
PIMCO Active Bond Exchange-Traded Fund | | | | | | | 0 | | | | 0 | | | | 0 | | | | 5,840 | | | | (1,780 | ) | | | (27,095 | ) | | | 0 | | | | 0 | |
PIMCO Enhanced Low Duration Active Exchange-Traded Fund | | | | | | | 0 | | | | 238 | | | | 0 | | | | 536 | | | | (22 | ) | | | (2,270 | ) | | | 0 | | | | 0 | |
PIMCO Enhanced Short Maturity Active Exchange-Traded Fund | | | | | | | 0 | | | | 10,955 | | | | 0 | | | | 25,672 | | | | (37 | ) | | | (2,203 | ) | | | 0 | | | | 0 | |
PIMCO Intermediate Municipal Bond Active Exchange-Traded Fund | | | | | | | 602 | | | | 0 | | | | 0 | | | | 7,853 | | | | (38 | ) | | | (4,088 | ) | | | 0 | | | | 0 | |
PIMCO Short Term Municipal Bond Active Exchange-Traded Fund | | | | | | | 79 | | | | 0 | | | | 0 | | | | 390 | | | | (38 | ) | | | (600 | ) | | | 0 | | | | 0 | |
| † | A zero balance may reflect actual amounts rounding to less than one thousand. |
| (1) | Includes undistributed short-term capital gains, if any. |
| (2) | Adjusted for open wash sale loss deferrals and the accelerated recognition of unrealized gain or loss on certain futures, and forward contracts for federal income tax purposes. Also, adjusted for differences between book and tax realized and unrealized gain (loss) on swap contracts, treasury inflation-protected securities (TIPS), Passive Foreign Investment Companies (PFICs), sale/buyback transactions, and reversal of defaulted bond marked-to-market adjustments. |
| (3) | Represents differences in income tax regulations and financial accounting principles generally accepted in the United States of America, namely for straddle loss deferrals, and organizational expenditures. |
| (4) | Capital losses available to offset future net capital gains expire in varying amounts as shown below. |
| (5) | Capital losses realized during the period November 1, 2016 through June 30, 2017 which the Funds elected to defer to the following taxable year pursuant to income tax regulations. |
| (6) | Specified losses realized during the period November 1, 2016 through June 30, 2017 and Ordinary losses realized during the period January 1, 2017 through June 30, 2017, which the Funds elected to defer to the following taxable year pursuant to income tax regulations. |
| | | | | | |
| | ANNUAL REPORT | | JUNE 30, 2017 | | 99 |
Notes to Financial Statements (Cont.)
As of June 30, 2017, the Funds had accumulated capital losses expiring in the following years (amounts in thousands†). The Funds will resume capital gain distributions in the future to the extent gains are realized in excess of accumulated capital losses.
| | | | | | | | | | | | |
| | | | | | Expiration of Accumulated Capital Losses | |
| | | | | | 06/30/2018 | | | 06/30/2019 | |
PIMCO 1-3 Year U.S. Treasury Index Exchange-Traded Fund | | | | | | $ | 0 | | | $ | 0 | |
PIMCO 25+ Year Zero Coupon U.S. Treasury Index Exchange-Traded Fund | | | | | | | 0 | | | | 363 | |
PIMCO 1-5 Year U.S. TIPS Index Exchange-Traded Fund | | | | | | | 0 | | | | 0 | |
PIMCO 15+ Year U.S. TIPS Index Exchange-Traded Fund | | | | | | | 0 | | | | 0 | |
PIMCO Broad U.S. TIPS Index Exchange-Traded Fund | | | | | | | 0 | | | | 0 | |
PIMCO 0-5 Year High Yield Corporate Bond Index Exchange-Traded Fund | | | | | | | 0 | | | | 0 | |
PIMCO Investment Grade Corporate Bond Exchange-Traded Fund | | | | | | | 0 | | | | 0 | |
PIMCO Active Bond Exchange-Traded Fund | | | | | | | 0 | | | | 0 | |
PIMCO Enhanced Low Duration Active Exchange-Traded Fund | | | | | | | 0 | | | | 0 | |
PIMCO Enhanced Short Maturity Active Exchange-Traded Fund | | | | | | | 0 | | | | 0 | |
PIMCO Intermediate Municipal Bond Active Exchange-Traded Fund | | | | | | | 0 | | | | 0 | |
PIMCO Short Term Municipal Bond Active Exchange-Traded Fund | | | | | | | 0 | | | | 0 | |
| † | A zero balance may reflect actual amounts rounding to less than one thousand. |
Under the Regulated Investment Company Modernization Act of 2010, a fund is permitted to carry forward any new capital losses for an unlimited period. Additionally, such capital losses that are carried forward will retain their character as either short-term or long-term capital losses rather than being considered all short-term under previous law.
As of June 30, 2017, the Funds had the following post-effective capital losses with no expiration (amounts in thousands†):
| | | | | | | | | | | | |
| | | | | | Short-Term | | | Long-Term | |
PIMCO 1-3 Year U.S. Treasury Index Exchange-Traded Fund | | | | | | $ | 0 | | | $ | 0 | |
PIMCO 25+ Year Zero Coupon U.S. Treasury Index Exchange-Traded Fund | | | | | | | 16,151 | | | | 5,675 | |
PIMCO 1-5 Year U.S. TIPS Index Exchange-Traded Fund | | | | | | | 4,636 | | | | 9,789 | |
PIMCO 15+ Year U.S. TIPS Index Exchange-Traded Fund | | | | | | | 4,069 | | | | 7,821 | |
PIMCO Broad U.S. TIPS Index Exchange-Traded Fund | | | | | | | 164 | | | | 766 | |
PIMCO 0-5 Year High Yield Corporate Bond Index Exchange-Traded Fund | | | | | | | 28,750 | | | | 95,794 | |
PIMCO Investment Grade Corporate Bond Exchange-Traded Fund | | | | | | | 0 | | | | 718 | |
PIMCO Active Bond Exchange-Traded Fund | | | | | | | 0 | | | | 27,095 | |
PIMCO Enhanced Low Duration Active Exchange-Traded Fund | | | | | | | 1,618 | | | | 652 | |
PIMCO Enhanced Short Maturity Active Exchange-Traded Fund | | | | | | | 0 | | | | 2,203 | |
PIMCO Intermediate Municipal Bond Active Exchange-Traded Fund | | | | | | | 3,623 | | | | 465 | |
PIMCO Short Term Municipal Bond Active Exchange-Traded Fund | | | | | | | 526 | | | | 74 | |
| † | A zero balance may reflect actual amounts rounding to less than one thousand. |
June 30, 2017
As of June 30, 2017, the aggregate cost and the net unrealized appreciation/(depreciation) of investments for federal income tax purposes are as follows (amounts in thousands†):
| | | | | | | | | | | | | | | | | | | | |
| | | | | | Federal
Tax Cost | | | Unrealized
Appreciation | | | Unrealized
(Depreciation) | | | Net Unrealized
Appreciation/
(Depreciation)(7) | |
PIMCO 1-3 Year U.S. Treasury Index Exchange-Traded Fund | | | | | | $ | 118,429 | | | $ | 0 | | | $ | (491 | ) | | $ | (491 | ) |
PIMCO 25+ Year Zero Coupon U.S. Treasury Index Exchange-Traded Fund | | | | | | | 188,609 | | | | 788 | | | | (14,867 | ) | | | (14,079 | ) |
PIMCO 1-5 Year U.S. TIPS Index Exchange-Traded Fund | | | | | | | 1,136,955 | | | | 287 | | | | (7,873 | ) | | | (7,586 | ) |
PIMCO 15+ Year U.S. TIPS Index Exchange-Traded Fund | | | | | | | 152,509 | | | | 0 | | | | (4,784 | ) | | | (4,784 | ) |
PIMCO Broad U.S. TIPS Index Exchange-Traded Fund | | | | | | | 71,670 | | | | 0 | | | | (1,922 | ) | | | (1,922 | ) |
PIMCO 0-5 Year High Yield Corporate Bond Index Exchange-Traded Fund | | | | | | | 2,028,620 | | | | 13,287 | | | | (21,281 | ) | | | (7,994 | ) |
PIMCO Investment Grade Corporate Bond Exchange-Traded Fund | | | | | | | 722,846 | | | | 14,048 | | | | (2,021 | ) | | | 12,027 | |
PIMCO Active Bond Exchange-Traded Fund | | | | | | | 2,652,774 | | | | 28,077 | | | | (23,815 | ) | | | 4,262 | |
PIMCO Enhanced Low Duration Active Exchange-Traded Fund | | | | | | | 140,928 | | | | 725 | | | | (144 | ) | | | 581 | |
PIMCO Enhanced Short Maturity Active Exchange-Traded Fund | | | | | | | 7,234,173 | | | | 26,901 | | | | (1,229 | ) | | | 25,672 | |
PIMCO Intermediate Municipal Bond Active Exchange-Traded Fund | | | | | | | 249,309 | | | | 7,958 | | | | (105 | ) | | | 7,853 | |
PIMCO Short Term Municipal Bond Active Exchange-Traded Fund | | | | | | | 66,755 | | | | 433 | | | | (42 | ) | | | 391 | |
| † | A zero balance may reflect actual amounts rounding to less than one thousand. |
| (7) | Primary differences, if any, between book and tax net unrealized appreciation/(depreciation) on investments are attributable to open wash sale loss deferrals, treasury inflation-protected securities (TIPS), sale/buyback transactions, defaulted bond marked-to-market adjustment, and Passive Foreign Investment Companies (PFICs) for federal income tax purposes. |
For the fiscal years ended June 30, 2017 and June 30, 2016, respectively, the Funds made the following tax basis distributions (amounts in thousands†):
| | | | | | | | | | | | | | | | | | | | | | | | | | | | | | | | | | |
| | | | | June 30, 2017 | | | June 30, 2016 | |
| | | | | Tax-Exempt
Income
Distributions | | | Ordinary
Income
Distributions(8) | | | Long-Term
Capital Gain
Distributions | | | Return of
Capital(9) | | | Tax-Exempt
Income
Distributions | | | Ordinary
Income
Distributions(8) | | | Long-Term
Capital Gain
Distributions | | | Return
ofCapital(9) | |
PIMCO 1-3 Year U.S. Treasury Index Exchange-Traded Fund | | | | $ | 0 | | | $ | 1,115 | | | $ | 21 | | | $ | 0 | | | $ | 0 | | | $ | 789 | | | $ | 34 | | | $ | 0 | |
PIMCO 25+ Year Zero Coupon U.S. Treasury Index Exchange-Traded Fund | | | | | 0 | | | | 5,636 | | | | 0 | | | | 0 | | | | 0 | | | | 3,812 | | | | 0 | | | | 0 | |
PIMCO 1-5 Year U.S. TIPS Index Exchange-Traded Fund | | | | | 0 | | | | 13,498 | | | | 0 | | | | 0 | | | | 0 | | | | 0 | | | | 0 | | | | 5,648 | |
PIMCO 15+ Year U.S. TIPS Index Exchange-Traded Fund | | | | | 0 | | | | 3,191 | | | | 0 | | | | 0 | | | | 0 | | | | 638 | | | | 0 | | | | 0 | |
PIMCO Broad U.S. TIPS Index Exchange-Traded Fund | | | | | 0 | | | | 1,369 | | | | 0 | | | | 0 | | | | 0 | | | | 397 | | | | 0 | | | | 0 | |
PIMCO 0-5 Year High Yield Corporate Bond Index Exchange-Traded Fund | | | | | 0 | | | | 105,587 | | | | 0 | | | | 0 | | | | 0 | | | | 99,652 | | | | 0 | | | | 0 | |
PIMCO Investment Grade Corporate Bond Exchange-Traded Fund | | | | | 0 | | | | 17,186 | | | | 0 | | | | 0 | | | | 0 | | | | 7,997 | | | | 97 | | | | 0 | |
PIMCO Active Bond Exchange-Traded Fund | | | | | 0 | | | | 53,716 | | | | 0 | | | | 17,981 | | | | 0 | | | | 93,619 | | | | 0 | | | | 0 | |
PIMCO Enhanced Low Duration Active Exchange-Traded Fund | | | | | 0 | | | | 1,285 | | | | 0 | | | | 0 | | | | 0 | | | | 3,475 | | | | 443 | | | | 0 | |
PIMCO Enhanced Short Maturity Active Exchange-Traded Fund | | | | | 0 | | | | 80,300 | | | | 0 | | | | 0 | | | | 0 | | | | 42,928 | | | | 0 | | | | 0 | |
PIMCO Intermediate Municipal Bond Active Exchange-Traded Fund | | | | | 5,901 | | | | 83 | | | | 0 | | | | 0 | | | | 5,034 | | | | 16 | | | | 0 | | | | 0 | |
PIMCO Short Term Municipal Bond Active Exchange-Traded Fund | | | | | 770 | | | | 14 | | | | 0 | | | | 0 | | | | 506 | | | | 12 | | | | 0 | | | | 0 | |
| | | | | | |
| | ANNUAL REPORT | | JUNE 30, 2017 | | 101 |
Notes to Financial Statements (Cont.)
June 30, 2017
| † | A zero balance may reflect actual amounts rounding to less than one thousand. |
| (8) | Includes short-term capital gains, if any, distributed. |
| (9) | A portion of the distributions made represents a tax return of capital. Return of capital distributions have been reclassified from undistributed net investment income to paid-in capital to more appropriately conform financial accounting to tax accounting. |
Report of Independent Registered Public Accounting Firm
To the Board of Trustees of PIMCO ETF Trust and Shareholders of the PIMCO 1-3 Year U.S. Treasury Index Exchange-Traded Fund, PIMCO 25+ Year Zero Coupon U.S. Treasury Index Exchange-Traded Fund, PIMCO 1-5 Year U.S. TIPS Index Exchange-Traded Fund, PIMCO 15+ Year U.S. TIPS Index Exchange-Traded Fund, PIMCO Broad U.S. TIPS Index Exchange-Traded Fund, PIMCO 0-5 Year High Yield Corporate Bond Index Exchange-Traded Fund, PIMCO Investment Grade Corporate Bond Index Exchange-Traded Fund, PIMCO Active Bond Exchange-Traded Fund (formerly known as PIMCO Total Return Active Exchange-Traded Fund), PIMCO Enhanced Low Duration Active Exchange-Traded Fund (formerly known as PIMCO Low Duration Active Exchange-Traded Fund), PIMCO Enhanced Short Maturity Active Exchange-Traded Fund, PIMCO Intermediate Municipal Bond Active Exchange-Traded Fund, and PIMCO Short Term Municipal Bond Active Exchange-Traded Fund
In our opinion, the (i) accompanying statement of assets and liabilities, including the schedule of investments, and the related statements of operations, of changes in net assets, and of cash flows and the financial highlights present fairly, in all material respects, the financial position of the PIMCO Enhanced Low Duration Active Exchange-Traded Fund (formerly known as PIMCO Low Duration Active Exchange-Traded Fund) as of June 30, 2017, the results of its operations and its cash flows for the year then ended, the changes in its net assets for each of the two years in the period then ended and the financial highlights for each of the periods indicated, and (ii) accompanying statements of assets and liabilities, including the schedules of investments, and the related statements of operations and of changes in net assets and the financial highlights present fairly, in all material respects, the financial position of each of the PIMCO 1-3 Year U.S. Treasury Index Exchange-Traded Fund, PIMCO 25+ Year Zero Coupon U.S. Treasury Index Exchange-Traded Fund, PIMCO 1-5 Year U.S. TIPS Index Exchange-Traded Fund, PIMCO 15+ Year U.S. TIPS Index Exchange-Traded Fund, PIMCO Broad U.S. TIPS Index Exchange-Traded Fund, PIMCO 0-5 Year High Yield Corporate Bond Index Exchange-Traded Fund, PIMCO Investment Grade Corporate Bond Index Exchange-Traded Fund, PIMCO Active Bond Exchange-Traded Fund (formerly known as PIMCO Total Return Active Exchange-Traded Fund), PIMCO Enhanced Short Maturity Active Exchange-Traded Fund, PIMCO Intermediate Municipal Bond Active Exchange-Traded Fund, and PIMCO Short Term Municipal Bond Active Exchange-Traded Fund as of June 30, 2017, the results of each of their operations for the year then ended, the changes in each of their net assets for each of the two years in the period then ended and the financial highlights for each of the five years in the period then ended, (twelve of the funds constituting the PIMCO ETF Trust, hereafter referred to as the “Funds”), in conformity with accounting principles generally accepted in the United States of America. These financial statements and financial highlights (hereafter referred to as “financial statements”) are the responsibility of the Funds’ management. Our responsibility is to express an opinion on these financial statements based on our audits. We conducted our audits of these financial statements in accordance with the standards of the Public Company Accounting Oversight Board (United States). Those standards require that we plan and perform the audit to obtain reasonable assurance about whether the financial statements are free of material misstatement. An audit includes examining, on a test basis, evidence supporting the amounts and disclosures in the financial statements, assessing the accounting principles used and significant estimates made by management, and evaluating the overall financial statement presentation. We believe that our audits, which included confirmation of securities as of June 30, 2017 by correspondence with the custodian and brokers, provide a reasonable basis for our opinion.
/s/ PricewaterhouseCoopers LLP
Kansas City, Missouri
August 24, 2017
| | | | | | |
| | ANNUAL REPORT | | JUNE 30, 2017 | | 103 |
Glossary: (abbreviations that may be used in the preceding statements)
(Unaudited)
| | | | | | | | | | |
| | | | |
Counterparty Abbreviations: | | | | | | | | |
| AZD | | Australia and New Zealand Banking Group | | FOB | | Credit Suisse Securities (USA) LLC | | NAB | | National Australia Bank Ltd. |
| BCY | | Barclays Capital, Inc. | | GLM | | Goldman Sachs Bank USA | | RDR | | RBC Capital Markets |
| BOA | | Bank of America N.A. | | GRE | | RBS Securities, Inc. | | RYL | | Royal Bank of Scotland Group PLC |
| BOS | | Banc of America Securities LLC | | GST | | Goldman Sachs International | | SAL | | Citigroup Global Markets, Inc. |
| BPS | | BNP Paribas S.A. | | HUS | | HSBC Bank USA N.A. | | SCX | | Standard Chartered Bank |
| BRC | | Barclays Bank PLC | | JPM | | JPMorgan Chase Bank N.A. | | SGY | | Societe Generale, New York |
| BSN | | Bank of Nova Scotia | | JPS | | JPMorgan Securities, Inc. | | SOG | | Societe Generale |
| CBK | | Citibank N.A. | | KCG | | Knight Capital Group | | SSB | | State Street Bank and Trust Co. |
| DEU | | Deutsche Bank Securities, Inc. | | MBC | | HSBC Bank Plc | | TDM | | TD Securities (USA) LLC |
| DUB | | Deutsche Bank AG | | MSB | | Morgan Stanley Bank, N.A | | UAG | | UBS AG Stamford |
| FBF | | Credit Suisse International | | | | | | | | |
| | | | |
Currency Abbreviations: | | | | | | | | |
| AUD | | Australian Dollar | | EUR | | Euro | | JPY | | Japanese Yen |
| BRL | | Brazilian Real | | GBP | | British Pound | | MXN | | Mexican Peso |
| CAD | | Canadian Dollar | | IDR | | Indonesian Rupiah | | NZD | | New Zealand Dollar |
| CNH | | Chinese Renminbi (Offshore) | | INR | | Indian Rupee | | USD (or $) | | United States Dollar |
| DKK | | Danish Krone | | | | | | | | |
| | | | |
Exchange Abbreviations: | | | | | | | | |
| CME | | Chicago Mercantile Exchange | | OTC | | Over the Counter | | | | |
| | | | |
Index/Spread Abbreviations: | | | | | | | | |
| CDX.HY | | Credit Derivatives Index - High Yield | | CDX.IG | | Credit Derivatives Index - Investment Grade | | | | |
| | | | |
Municipal Bond or Agency Abbreviations: | | | | | | | | |
| AGC | | Assured Guaranty Corp. | | NPFGC | | National Public Finance Guarantee Corp. | | PSF | | Public School Fund |
| AGM | | Assured Guaranty Municipal | | | | | | | | |
| | | | |
Other Abbreviations: | | | | | | | | |
| BABs | | Build America Bonds | | FDIC | | Federal Deposit Insurance Corp. | | PIK | | Payment-in-Kind |
| CDO | | Collateralized Debt Obligation | | JSC | | Joint Stock Company | | REMIC | | Real Estate Mortgage Investment Conduit |
| CLO | | Collateralized Loan Obligation | | NCUA | | National Credit Union Administration | | TBA | | To-Be-Announced |
Federal Income Tax Information
(Unaudited)
As required by the Internal Revenue Code (“Code”) and Treasury Regulations, if applicable, shareholders must be notified within 60 days of the Funds’ fiscal year end regarding the status of qualified dividend income and the dividend received deduction.
Dividend Received Deduction. Corporate shareholders are generally entitled to take the dividend received deduction on the portion of a Fund’s dividend distribution that qualifies under tax law. The percentage of the following Funds’ Fiscal 2017 ordinary income dividend that qualifies for the corporate dividend received deduction is set forth in the table below.
Qualified Dividend Income. Under the Jobs and Growth Tax Relief Reconciliation Act of 2003 (the “Act”), the following percentage of ordinary dividends paid during the calendar year was designated as “qualified dividend income”, as defined in the Act, subject to reduced tax rates in 2017 is set forth in the table below.
Qualified Interest Income and Qualified Short-Term Capital Gain (for non-U.S. resident shareholders only). Under the American Jobs Creation Act of 2004, the following amounts of ordinary dividends paid during the fiscal year ended June 30, 2017 are considered to be derived from “qualified interest income,” as defined in Section 871(k)(1)(E) of the Code, and therefore are designated as interest-related dividends, as defined in Section 871(k)(1)(C) of the Code. Further, the following amounts of ordinary dividends paid during the fiscal year ended June 30, 2017 are considered to be derived from “qualified short-term capital gain,” as defined in Section 871(k)(2)(D) of the Code, and therefore are designated as qualified short-term gain dividends, as defined by Section 871(k)(2)(C) of the Code are also set forth in the table below.
| | | | | | | | | | | | | | | | | | | | |
| | | | | | Dividend
Received
Deduction
% | | | Qualified
Dividend
Income
% | | | Qualified
Interest
Income
(000s† ) | | | Qualified
Short-Term
Capital Gain
(000s†) | |
PIMCO 1-3 Year U.S. Treasury Index Exchange-Traded Fund | | | | | | | 0.00% | | | | 0.00% | | | $ | 962 | | | $ | 11 | |
PIMCO 25+ Year Zero Coupon U.S. Treasury Index Exchange-Traded Fund | | | | | | | 0.00% | | | | 0.00% | | | | 5,636 | | | | 0 | |
PIMCO 1-5 Year U.S. TIPS Index Exchange-Traded Fund | | | | | | | 0.00% | | | | 0.00% | | | | 13,498 | | | | 0 | |
PIMCO 15+ Year U.S. TIPS Index Exchange-Traded Fund | | | | | | | 0.00% | | | | 0.00% | | | | 3,191 | | | | 0 | |
PIMCO Broad U.S. TIPS Index Exchange-Traded Fund | | | | | | | 0.00% | | | | 0.00% | | | | 1,369 | | | | 0 | |
PIMCO 0-5 Year High Yield Corporate Bond Index Exchange-Traded Fund | | | | | | | 0.00% | | | | 0.00% | | | | 99,252 | | | | 0 | |
PIMCO Investment Grade Corporate Bond Exchange-Traded Fund | | | | | | | 0.00% | | | | 0.00% | | | | 14,780 | | | | 0 | |
PIMCO Active Bond Exchange-Traded Fund | | | | | | | 0.00% | | | | 0.00% | | | | 65,043 | | | | 0 | |
PIMCO Enhanced Low Duration Active Exchange-Traded Fund | | | | | | | 0.00% | | | | 0.00% | | | | 0 | | | | 0 | |
PIMCO Enhanced Short Maturity Active Exchange-Traded Fund | | | | | | | 0.00% | | | | 0.00% | | | | 977 | | | | 0 | |
PIMCO Intermediate Municipal Bond Active Exchange-Traded Fund | | | | | | | 0.00% | | | | 0.00% | | | | 0 | | | | 0 | |
PIMCO Short Term Municipal Bond Active Exchange-Traded Fund | | | | | | | 0.00% | | | | 0.00% | | | | 28,945 | | | | 0 | |
| † | A zero balance may reflect actual amounts rounding to less than one thousand. |
Shareholders are advised to consult their own tax advisor with respect to the tax consequences of their investment in the Trust. In January 2018, you will be advised on IRS Form 1099-DIV as to the federal tax status of the dividends and distributions received by you in calendar year 2017.
| | | | | | |
| | ANNUAL REPORT | | JUNE 30, 2017 | | 105 |
Management of the Trust
The charts below identify the Trustees and executive officers of the Trust. Unless otherwise indicated, the address of all persons below is 650 Newport Center Drive, Newport Beach, CA 92660.
The Funds’ Statement of Additional Information includes more information about the Trustees and Officers. To request a free copy, call PIMCO at (888) 400-4ETF or visit the Funds’ website at www.pimcoetfs.com.
| | | | | | | | |
Name, Year of Birth and
Position Held with Trust | | Term of
Office and
Length of
Time Served† | | Principal Occupation(s) During Past 5 Years | | Number of Funds
in Fund Complex
Overseen by Trustee | | Other Public Company and Investment Company
Directorships Held by Trustee During the Past 5 Years |
| | | | |
| Interested Trustees1 | | | | | | | | |
| | | | |
Brent R. Harris (1959) Chairman of the Board
and Trustee | | 02/2009 to present | | Managing Director, PIMCO. Formerly, member of Executive Committee, PIMCO. | | 163 | | Chairman and Trustee, PIMCO Funds, PIMCO Variable Insurance Trust, PIMCO Equity Series, PIMCO Equity Series VIT; Director, StocksPLUS® Management, Inc; and member of Board of Governors, Investment Company Institute. |
| | | | |
Peter G. Strelow* (1970) Trustee | | 05/2017 to present | | Managing Director, Chief Administrative Officer, and Co-Chief Operating Officer, PIMCO. President of the Trust, PIMCO Variable Insurance Trust, PIMCO ETF Trust, PIMCO Equity Series, PIMCO Equity Series VIT, PIMCO Managed Accounts Trust, PIMCO-Sponsored Interval Funds and PIMCO-Sponsored Closed-End Funds. | | 142 | | Trustee, PIMCO Variable Insurance Trust and PIMCO ETF Trust. |
| | | |
| Independent Trustees | | | | | | |
| | | | |
George E. Borst (1948) Trustee | | 04/2015 to present | | Executive Advisor, McKinsey & Company (since 10/14); Executive Advisor, Toyota Financial Services (10/13-12/14); CEO, Toyota Financial Services (1/01-9/13). | | 142 | | Trustee, PIMCO Funds and PIMCO Variable Insurance Trust. |
| | | | |
Jennifer Holden Dunbar (1963) Trustee | | 04/2015 to present | | Managing Director, Dunbar Partners, LLC (business consulting and investments). | | 163 | | Trustee, PIMCO Funds, PIMCO Variable Insurance Trust, PIMCO Equity Series, PIMCO Equity Series VIT; Director, PS Business Parks; Director, Big 5 Sporting Goods Corporation. |
| | | | |
Kym M. Hubbard (1957) Trustee | | 02/2017 to present | | Formerly, Global Head of Investments, Chief Investment Officer and Treasurer, Ernst & Young. | | 142 | | Trustee, PIMCO Funds and PIMCO Variable Insurance Trust. |
| | | | |
Gary F. Kennedy (1955) Trustee | | 04/2015 to present | | Formerly, Senior Vice President, General Counsel and Chief Compliance Officer, American Airlines and AMR Corporation (now American Airlines Group). | | 142 | | Trustee, PIMCO Funds and PIMCO Variable Insurance Trust. |
| | | | |
Peter B. McCarthy (1950) Trustee | | 04/2015 to present | | Formerly, Assistant Secretary and Chief Financial Officer, United States Department of Treasury; Deputy Managing Director, Institute of International Finance. | | 163 | | Trustee, PIMCO Funds, PIMCO Variable Insurance Trust, PIMCO Equity Series and PIMCO Equity Series VIT. |
| | | | |
Ronald C. Parker (1951) Lead Independent Trustee | | 07/2009 to present Lead Independent Trustee 02/2017 to present | | Director of Roseburg Forest Products Company. Formerly, Chairman of the Board, The Ford Family Foundation. Formerly President, Chief Executive Officer, Hampton Affiliates (forestry products). | | 163 | | Lead Independent Trustee, PIMCO Funds and PIMCO Variable Insurance Trust; Trustee, PIMCO Equity Series and PIMCO Equity Series VIT. |
| 1 | Mr. Harris and Mr. Strelow are “interested persons” of the Trust (as that term is defined in the 1940 Act) because of their affiliations with PIMCO. |
| † | Trustees serve until their successors are duly elected and qualified. |
| * | The information for the individuals listed is as of June 30, 2016. Mr. Strelow became a Trustee of the Trust effective May, 16 2017. |
(Unaudited)
Executive Officers
| | | | |
Name, Year of Birth and Position Held with Trust* | | Term of Office and
Length of Time Served | | Principal Occupation(s) During Past 5 Years† |
| | |
Peter G. Strelow (1970) President | | 01/2015 to present Senior Vice President 11/2013 to 01/2015 Vice President 02/2009 to 11/2013 | | Managing Director, Chief Administrative Officer and Co-Chief Operating Officer PIMCO. President, PIMCO Funds, PIMCO Variable Insurance Trust, PIMCO Equity Series, PIMCO Equity Series VIT, PIMCO Managed Accounts Trust, PIMCO-Sponsored Interval Funds and PIMCO-Sponsored Closed-End Funds. |
| | |
David C. Flattum (1964) Chief Legal Officer | | 02/2009 to present | | Managing Director and General Counsel, PIMCO. Chief Legal Officer, PIMCO Funds, PIMCO Variable Insurance Trust, PIMCO Equity Series and PIMCO Equity Series VIT. Formerly, Managing Director, Chief Operating Officer and General Counsel, Allianz Asset Management of America L.P. |
| | |
Jennifer E. Durham (1970) Chief Compliance Officer | | 02/2009 to present | | Managing Director and Chief Compliance Officer, PIMCO. Chief Compliance Officer, PIMCO Funds, PIMCO Variable Insurance Trust, PIMCO Equity Series and PIMCO Equity Series VIT. |
| | |
Brent R. Harris (1959) Senior Vice President | | 01/2015 to present President 03/2009 to 01/2015 | | Managing Director, PIMCO. Senior Vice President, PIMCO Funds, PIMCO Variable Insurance Trust, PIMCO Equity Series and PIMCO Equity Series VIT. Formerly, member of Executive Committee, PIMCO. |
| | |
Joshua D. Ratner (1976)** Vice President - Senior Counsel, Secretary | | 11/2013 to present Assistant Secretary 02/2009 to 01/2011 | | Executive Vice President and Senior Counsel, PIMCO. Chief Legal Officer, PIMCO Investments LLC. Vice President - Senior Counsel, Secretary, PIMCO Funds, PIMCO Variable Insurance Trust, PIMCO Equity Series and PIMCO Equity Series VIT. Vice President, Secretary and Chief Legal Officer, PIMCO Managed Accounts Trust, PIMCO-Sponsored Interval Funds and PIMCO-Sponsored Closed-End Funds. |
| | |
Ryan G. Leshaw (1980) Assistant Secretary | | 05/2012 to present | | Senior Vice President and Senior Counsel, PIMCO. Assistant Secretary, PIMCO Funds, PIMCO Variable Insurance Trust, PIMCO Equity Series, PIMCO Equity Series VIT, PIMCO Managed Accounts Trust, PIMCO-Sponsored Interval Funds and PIMCO-Sponsored Closed-End Funds. Formerly, Associate, Willkie Farr & Gallagher LLP. |
| | |
Stacie D. Anctil (1969) Vice President | | 05/2015 to present Assistant Treasurer 02/2009 to 05/2015 | | Executive Vice President, PIMCO. Vice President, PIMCO Funds, PIMCO Variable Insurance Trust, PIMCO Equity Series, PIMCO Equity Series VIT, PIMCO Managed Accounts Trust, PIMCO-Sponsored Interval Funds and PIMCO-Sponsored Closed-End Funds. |
| | |
William G. Galipeau (1974) Vice President | | 11/2013 to present | | Executive Vice President, PIMCO. Vice President, PIMCO Funds, PIMCO Variable Insurance Trust, PIMCO Equity Series and PIMCO Equity Series VIT. Treasurer, PIMCO Managed Accounts Trust, PIMCO-Sponsored Interval Funds and PIMCO-Sponsored Closed-End Funds. |
| | |
Eric D. Johnson (1970)** Vice President | | 05/2011 to present | | Executive Vice President, PIMCO. Vice President, PIMCO Funds, PIMCO Variable Insurance Trust, PIMCO Equity Series, PIMCO Equity Series VIT, PIMCO Managed Accounts Trust, PIMCO-Sponsored Interval Funds and PIMCO-Sponsored Closed-End Funds. |
| | |
Henrik P. Larsen (1970) Vice President | | 02/2009 to present | | Senior Vice President, PIMCO. Vice President, PIMCO Funds, PIMCO Variable Insurance Trust, PIMCO Equity Series and PIMCO Equity Series VIT. |
| | |
Bijal Y. Parikh (1978) Vice President | | 02/2017 to present | | Senior Vice President, PIMCO. Vice President, PIMCO Funds, PIMCO Variable Insurance Trust, PIMCO Equity Series, PIMCO Equity Series VIT, PIMCO Managed Accounts Trust, PIMCO-Sponsored Interval Funds and PIMCO-Sponsored Closed-End Funds. |
| | |
Greggory S. Wolf (1970) Vice President | | 05/2011 to present | | Senior Vice President, PIMCO. Vice President, PIMCO Funds, PIMCO Variable Insurance Trust, PIMCO Equity Series and PIMCO Equity Series VIT. |
| | |
Trent W. Walker (1974) Treasurer | | 11/2013 to present Assistant Treasurer 02/2009 to 11/2013 | | Executive Vice President, PIMCO. Treasurer, PIMCO Funds, PIMCO Variable Insurance Trust, PIMCO Equity Series and PIMCO Equity Series VIT. Assistant Treasurer, PIMCO Managed Accounts Trust, PIMCO-Sponsored Interval Funds and PIMCO-Sponsored Closed-End Funds. |
| | |
Erik C. Brown (1967) Assistant Treasurer | | 02/2009 to present | | Executive Vice President, PIMCO. Assistant Treasurer, PIMCO Funds, PIMCO Variable Insurance Trust, PIMCO Equity Series, PIMCO Equity Series VIT, PIMCO Managed Accounts Trust, PIMCO-Sponsored Interval Funds and PIMCO-Sponsored Closed-End Funds. |
| | |
Laura S. Melman (1966)** Assistant Treasurer | | 02/2017 to present | | Senior Vice President, PIMCO. Assistant Treasurer, PIMCO Funds, PIMCO Variable Insurance Trust, PIMCO Equity Series, PIMCO Equity Series VIT, PIMCO Managed Accounts Trust, PIMCO-Sponsored Interval Funds and PIMCO-Sponsored Closed-End Funds. |
| | |
Colleen D. Miller (1980)** Assistant Treasurer | | 02/2017 to present | | Vice President, PIMCO. Assistant Treasurer, PIMCO Funds, PIMCO Variable Insurance Trust, PIMCO Equity Series, PIMCO Equity Series VIT, PIMCO Managed Accounts Trust, PIMCO-Sponsored Interval Funds and PIMCO-Sponsored Closed-End Funds. Formerly, Vice President Cohen & Steers Capital Management. |
| | |
Christopher M. Morin (1980) Assistant Treasurer | | 08/2016 to present | | Vice President, PIMCO. Assistant Treasurer, PIMCO Funds, PIMCO Variable Insurance Trust, PIMCO Equity Series, PIMCO Equity Series VIT, PIMCO Managed Accounts Trust, PIMCO-Sponsored Interval Funds and PIMCO-Sponsored Closed-End Funds. Formerly, Vice President of Operations, Standard Life Investments USA; Assistant Vice President, Brown Brothers Harriman. |
| | | | | | |
| | ANNUAL REPORT | | JUNE 30, 2017 | | 107 |
Management of the Trust (Cont.)
(Unaudited)
| | | | |
Name, Year of Birth and Position Held with Trust* | | Term of Office and
Length of Time Served | | Principal Occupation(s) During Past 5 Years† |
| | |
Jason J. Nagler (1982)** Assistant Treasurer | | 05/2015 to present | | Vice President, PIMCO. Assistant Treasurer, PIMCO Funds, PIMCO Variable Insurance Trust, PIMCO Equity Series, PIMCO Equity Series VIT, PIMCO Managed Accounts Trust, PIMCO-Sponsored Interval Funds and PIMCO-Sponsored Closed-End Funds. Formerly, Head of Mutual Fund Reporting, GMO and Assistant Treasurer, GMO Trust and GMO Series Trust Funds. |
| * | Unless otherwise noted, the information for the individuals listed is as of June 30, 2017. |
| † | The term “PIMCO Closed-End Funds” as used herein includes: PIMCO California Municipal Income Fund, PIMCO California Municipal Income Fund II, PIMCO California Municipal Income Fund III, PIMCO Municipal Income Fund, PIMCO Municipal Income Fund II, PIMCO Municipal Income Fund III, PIMCO New York Municipal Income Fund, PIMCO New York Municipal Income Fund II, PIMCO New York Municipal Income Fund III, PCM Fund Inc., PIMCO Corporate & Income Opportunity Fund, PIMCO Corporate & Income Strategy Fund, PIMCO Dynamic Credit and Mortgage Income Fund, PIMCO Dynamic Income Fund, PIMCO Global StocksPLUS® & Income Fund, PIMCO High Income Fund, PIMCO Income Opportunity Fund, PIMCO Income Strategy Fund, PIMCO Income Strategy Fund II and PIMCO Strategic Income Fund, Inc.; the term “PIMCO-Sponsored Interval Funds” as used herein includes: PIMCO Flexible Credit Income Fund. |
| ** | The address of these officers is Pacific Investment Management Company LLC, 1633 Broadway, New York, New York 10019. |
Privacy Policy1
(Unaudited)
The Funds2,3 consider customer privacy to be a fundamental aspect of their relationships with shareholders and are committed to maintaining the confidentiality, integrity and security of their current, prospective and former shareholders’ non-public personal information. The Funds have developed policies that are designed to protect this confidentiality, while allowing shareholder needs to be served.
OBTAINING PERSONAL INFORMATION
In the course of providing shareholders with products and services, the Funds and certain service providers to the Funds, such as the Funds’ investment advisers or sub-advisers (“Advisers”), may obtain non-public personal information about shareholders, which may come from sources such as account applications and other forms, from other written, electronic or verbal correspondence, from shareholder transactions, from a shareholder’s brokerage or financial advisory firm, financial advisor or consultant, and/or from information captured on applicable websites.
RESPECTING YOUR PRIVACY
As a matter of policy, the Funds do not disclose any non-public personal information provided by shareholders or gathered by the Funds to non-affiliated third parties, except as required or permitted by law or as necessary for such third parties to perform their agreements with respect to the Funds. As is common in the industry, non-affiliated companies may from time to time be used to provide certain services, such as preparing and mailing prospectuses, reports, account statements and other information, conducting research on shareholder satisfaction and gathering shareholder proxies. The Funds or their affiliates may also retain non-affiliated companies to market Fund shares or products which use Fund shares and enter into joint marketing arrangements with them and other companies. These companies may have access to a shareholder’s personal and account information, but are permitted to use this information solely to provide the specific service or as otherwise permitted by law. In most cases, the shareholders will be clients of a third party, but the Funds may also provide a shareholder’s personal and account information to the shareholder’s respective brokerage or financial advisory firm and/or financial advisor or consultant.
SHARING INFORMATION WITH THIRD PARTIES
The Funds reserve the right to disclose or report personal or account information to non-affiliated third parties in limited circumstances where the Funds believe in good faith that disclosure is required under law, to cooperate with regulators or law enforcement authorities, to protect their rights or property, or upon reasonable request by any fund advised by PIMCO in which a shareholder has invested. In addition, the Funds may disclose information about a shareholder or a shareholder’s accounts to a non-affiliated third party at the shareholder’s request or with the consent of the shareholder.
SHARING INFORMATION WITH AFFILIATES
The Funds may share shareholder information with their affiliates in connection with servicing shareholders’ accounts, and subject to applicable law may provide shareholders with information about products and services that the Funds or their Advisers, distributors or their affiliates (“Service Affiliates”) believe may be of interest to such shareholders. The information that the Funds may share may include, for example, a shareholder’s participation in the Funds or in other investment programs sponsored by a Service Affiliate, a shareholder’s ownership of certain types of accounts (such as IRAs), information about the Funds’ experiences or transactions with a shareholder, information captured on applicable websites, or other data about a shareholder’s accounts, subject to applicable law. The Funds’ Service Affiliates, in turn, are not permitted to share shareholder information with non-affiliated entities, except as required or permitted by law.
PROCEDURES TO SAFEGUARD PRIVATE INFORMATION
The Funds take seriously the obligation to safeguard shareholder non-public personal information. In addition to this policy, the Funds have implemented procedures that are designed to restrict access to a shareholder’s non-public personal information to internal personnel who need to know that information to perform their jobs, such as servicing shareholder accounts or notifying shareholders of new products or services. Physical, electronic and procedural safeguards are in place to guard a shareholder’s non-public personal information.
INFORMATION COLLECTED FROM WEBSITES
Websites maintained by the Funds or their service providers may use a variety of technologies to collect information that help the Funds and their service providers understand how the website is used. Information collected from your web browser (including small files stored on your device that are commonly referred to as “cookies”) allow the websites to recognize your web browser and help to personalize and improve your user experience and enhance navigation of the website. In addition, the Funds or their Service Affiliates may use third parties to place advertisements for the Funds on other websites, including banner advertisements. Such third parties may collect anonymous information through the use of cookies or action tags (such as web beacons). The information these third parties collect is generally limited to technical and web navigation information, such as your IP address, web pages visited and browser type, and does not include personally identifiable information such as name, address, phone number or email address. If you are a registered user of the Funds’ website, the Funds or their service providers or third party firms engaged by the Funds or their service providers may collect or share information submitted by you, which may include personally identifiable information. This information can be useful to the Funds when assessing and offering services and website features. You can
| | | | | | |
| | ANNUAL REPORT | | JUNE 30, 2017 | | 109 |
Privacy Policy1 (Cont.)
(Unaudited)
change your cookie preferences by changing the setting on your web browser to delete or reject cookies. If you delete or reject cookies, some website pages may not function properly. The Funds do not look for web browser “do not track” requests.
CHANGES TO THE PRIVACY POLICY
From time to time, the Funds may update or revise this privacy policy. If there are changes to the terms of this privacy policy, documents containing the revised policy on the relevant website will be updated.
1 Amended as of February 14, 2017.
2 PIMCO Investments LLC (“PI”) serves as the Funds’ distributor. This Privacy Policy applies to the activities of PI to the extent that PI regularly effects or engages in transactions with or for a Fund shareholder who is the record owner of such shares. For purposes of this Privacy Policy, references to “the Funds” shall include PI when acting in this capacity.
3 When distributing this Policy, a Fund may combine the distribution with any similar distribution of its investment adviser’s privacy policy. The distributed, combined policy may be written in the first person (i.e., by using “we” instead of “the Funds”).
General Information
Investment Manager
Pacific Investment Management Company LLC
650 Newport Center Drive
Newport Beach, CA 92660
Distributor
PIMCO Investments LLC
1633 Broadway
New York, NY 10019
Custodian
State Street Bank and Trust Company
801 Pennsylvania Avenue
Kansas City, MO 64105
Transfer Agent
State Street Bank
1 Heritage Drive
Quincy, MA 02171
Legal Counsel
Dechert LLP
1900 K Street N.W.
Washington, D.C. 20006
Independent Registered Public Accounting Firm
PricewaterhouseCoopers LLP
1100 Walnut Street, Suite 1300
Kansas City, MO 64106
This report is submitted for the general information of the shareholders of the PIMCO ETF Trust.

ETF3001AR_063017
As of the end of the period covered by this report, the Registrant has adopted a code of ethics (the “Code”) that applies to the Registrant’s principal executive officer and principal financial officer. The Registrant did not grant any waivers, including implicit waivers, from any provisions of the Code to the principal executive officer or principal financial officer during the period covered by this report.
A copy of the Code is included as an exhibit to this report.
| Item 3. | Audit Committee Financial Expert. |
| | (a) | The Board of Trustees has determined that Ronald C. Parker, who serves on the Board’s audit committee, qualifies as an “audit committee financial expert” as such term is defined in the instructions to this Item 3. The Board has also determined that Mr. Parker is “independent” as such term is interpreted under this Item 3. |
| Item 4. | Principal Accountant Fees and Services. |
| | | | | | |
| (a) | | Fiscal Year Ended | | | | Audit Fees |
| | June 30, 2017 | | | | $392,539 |
| | June 30, 2016 | | | | $386,872 |
| | | |
| (b) | | Fiscal Year Ended | | | | Audit-Related Fees (1) |
| | June 30, 2017 | | | | $36,399 |
| | June 30, 2016 | | | | $121,077 |
| | | |
| (c) | | Fiscal Year Ended | | | | Tax Fees |
| | June 30, 2017 June 30, 2016 | | | | $2,000 $1,500 |
| | | |
| (d) | | Fiscal Year Ended | | | | All Other Fees (2) |
| | June 30, 2017 | | | | $— |
| | June 30, 2016 | | | | $— |
“Audit Fees” represents aggregate fees billed for each of the last two fiscal years for professional services rendered for the audit of the PIMCO ETF Trust (the “Trust” or “Registrant”) annual financial statements or services that are normally provided by the accountant in connection with statutory or regulatory filings or engagements for those fiscal years.
“Audit-Related Fees” represents aggregate fees billed for each of the last two fiscal years for assurance and related services reasonably related to the performance of the audit of the Trust’s annual financial statements for those years.
“Tax Fees” represents aggregate fees billed for each of the last two fiscal years for professional services related to tax compliance, tax advice and tax planning, including review of federal and state income tax returns, review of excise tax distribution requirements and preparation of excise tax returns.
“All Other Fees” represents aggregate fees, if any, billed for other products and services rendered by the principal accountant to the Trust for the last two fiscal years.
| (1) | Includes aggregate fees billed for review of the Registrant’s semi-annual reports to shareholders related to fair value securities held by the Trust. |
| (2) | There were no “All Other Fees” for the last two fiscal years. |
| | (e) | Pre-approval policies and procedures |
(1) The Registrant’s Audit Committee has adopted pre-approval policies and procedures (the “Procedures”) to govern the Audit Committee’s pre-approval of (i) all audit services and permissible non- audit services to be provided to the Registrant by its independent accountant, and (ii) all permissible non-audit services to be provided by such independent accountant to the Registrant’s investment adviser and to any entity controlling, controlled by, or under common control with the investment adviser that provides ongoing services to the Registrant (collectively, the “Service Affiliates”) if the services provided directly relate to the Registrant’s operations and financial reporting. In accordance with the Procedures, the Audit Committee is responsible for the engagement of the independent accountant to certify the Registrant’s financial statements for each fiscal year. With respect to the pre-approval of non-audit services provided to the Registrant and its Service Affiliates, the Procedures provide that the Audit Committee may annually pre-approve a list of types or categories of non-audit services that may be provided to the Registrant or its Service Affiliates, or the Audit Committee may pre-approve such services on a project-by-project basis as they arise. Unless a type of service has received general pre-approval, it will require specific pre-approval by the Audit Committee if it is to be provided by the independent accountant. The Procedures also permit the Audit Committee to delegate authority to one or more of its members to pre-approve any proposed non-audit services that have not been previously pre- approved by the Audit Committee, subject to the ratification by the full Audit Committee no later than its next scheduled meeting.
(2) With respect to the services described in paragraphs (b) through (d) of this Item 4, no amount was approved by the Audit Committee pursuant to paragraph (c)(7)(i)(C) of Rule 2-01 of Regulation S-X.
| | | | | | | | |
| | | Aggregate Non-Audit Fees Billed to Entity | |
Entity | | June 30, 2017 | | | June 30, 2016 | |
PIMCO ETF Trust | | $ | 38,399 | | | $ | 122,577 | |
Pacific Investment Management Company LLC (“PIMCO”) | | | 8,531,028 | | | | 7,767,308 | |
| | | | | | | | |
Totals | | $ | 8,569,427 | | | $ | 7,889,885 | |
| | | | | | | | |
| | (h) | The Registrant’s Audit Committee has considered whether the provision of non-audit services that were rendered to the Registrant’s investment adviser, and any entity controlling, controlled by, or under common control with the investment adviser that provides ongoing services to the Registrant which were not pre-approved (not requiring pre-approval) is compatible with maintaining the principal accountant’s independence. |
| Item 5. | Audit Committee of Listed Registrants. |
The Registrant has a separately-designated standing audit committee established in accordance with Section 3(a)(58)(A) of the Securities Exchange Act of 1934, as amended. The audit committee is comprised of:
George E. Borst
Jennifer Holden Dunbar
Kym Hubbard
Gary F. Kennedy
Peter B. McCarthy
Ronald C. Parker
| Item 6. | Schedule of Investments. |
The information required by this Item 6 is included as part of the annual report to shareholders filed under Item 1 of this Form N-CSR.
| Item 7. | Disclosure of Proxy Voting Policies and Procedures for Closed-End Management Investment Companies. |
Not applicable.
| Item 8. | Portfolio Managers of Closed-End Management Investment Companies. |
Not applicable.
| Item 9. | Purchases of Equity Securities by Closed-End Management Investment Company and Affiliated Purchasers. |
Not applicable.
| Item 10. | Submission of Matters to a Vote of Security Holders. |
There have been no material changes to the procedures by which shareholders may recommend nominees to the Trust’s Board of Trustees since the Trust last provided disclosure in response to this item.
| Item 11. | Controls and Procedures. |
(a) The principal executive officer and principal financial & accounting officer have concluded that the Registrant’s disclosure controls and procedures (as defined in Rule 30a-3(c) under the 1940 Act) provide reasonable assurances that material information relating to the Registrant is made known to them by the appropriate persons, based on their evaluation of these controls and procedures as of a date within 90 days of the filing of this report.
(b) There were no changes in the Registrant’s internal control over financial reporting (as defined in Rule 30a-3(d) under the 1940 Act) that occurred during the second fiscal quarter of the period covered by this report that have materially affected, or are reasonably likely to materially affect, the Registrant’s internal control over financial reporting.
| | (a)(1) | Exhibit 99.CODE—Code of Ethics pursuant to Section 406 of the Sarbanes-Oxley Act of 2002. |
| | (a)(2) | Exhibit 99.CERT—Certifications pursuant to Section 302 of the Sarbanes-Oxley Act of 2002. |
| | (b) | Exhibit 99.906CERT—Certifications pursuant to Section 906 of the Sarbanes-Oxley Act of 2002. |
Signatures
Pursuant to the requirements of the Securities Exchange Act of 1934 and the Investment Company Act of 1940, the registrant has duly caused this report to be signed on its behalf by the undersigned, thereunto duly authorized.
| | |
| PIMCO ETF Trust |
| |
| By: | | /s/ Peter G. Strelow |
| | Peter G. Strelow |
| | President (Principal Executive Officer) |
|
| Date: August 28, 2017 |
Pursuant to the requirements of the Securities Exchange Act of 1934 and the Investment Company Act of 1940, this report has been signed below by the following persons on behalf of the registrant and in the capacities and on the dates indicated.
| | |
| By: | | /s/ Peter G. Strelow |
| | Peter G. Strelow |
| | President (Principal Executive Officer) |
|
| Date: August 28, 2017 |
| |
| By: | | /s/ Trent W. Walker |
| | Trent W. Walker |
| | Treasurer (Principal Financial & Accounting Officer) |
|
| Date: August 28, 2017 |