UNITED STATES
SECURITIES AND EXCHANGE COMMISSION
Washington, D.C. 20549
FORM N-CSR
CERTIFIED SHAREHOLDER REPORT OF REGISTERED MANAGEMENT
INVESTMENT COMPANIES
Investment Company Act file number: 811-22250
PIMCO ETF Trust
(Exact name of registrant as specified in charter)
650 Newport Center Drive, Newport Beach, CA 92660
(Address of principal executive offices)
Trent W. Walker
Treasurer (Principal Financial & Accounting Officer)
PIMCO ETF Trust
650 Newport Center Drive, Newport Beach, CA 92660
(Name and address of agent for service)
Copies to:
Brendan C. Fox
Dechert LLP
1900 K Street, N.W.
Washington, D.C. 20006
Registrant’s telephone number, including area code: (888) 400-4383
Date of fiscal year end: June 30
Date of reporting period: June 30, 2015
Form N-CSR is to be used by management investment companies to file reports with the Commission not later than 10 days after the transmission to stockholders of any report that is required to be transmitted to stockholders under Rule 30e-1 under the Investment Company Act of 1940 (17 CFR 270.30e-1). The Commission may use the information provided on Form N-CSR in its regulatory, disclosure review, inspection, and policymaking roles.
A registrant is required to disclose the information specified by Form N-CSR, and the Commission will make this information public. A registrant is not required to respond to the collection of information contained in Form N-CSR unless the Form displays a currently valid Office of Management and Budget (“OMB”) control number. Please direct comments concerning the accuracy of the information collection burden estimate and any suggestions for reducing the burden to Secretary, Securities and Exchange Commission, 450 Fifth Street, NW, Washington, DC 20549-0609. The OMB has reviewed this collection of information under the clearance requirements of 44 U.S.C. § 3507.
| | | | | | | | |
Item 1. | | Reports to Shareholders. |
| |
| | The following is a copy of the report transmitted to shareholders pursuant to Rule 30e-1 under the Investment Company Act of 1940, as amended (the “1940 Act”) (17 CFR 270.30e-1). |
| |
| | • PIMCO ETF Trust |

Your Global Investment Authority
PIMCO ETF Trust
Annual Report
June 30, 2015

Index Exchange-Traded Funds
PIMCO 1-3 Year U.S. Treasury Index Exchange-Traded Fund
PIMCO 3-7 Year U.S. Treasury Index Exchange-Traded Fund
PIMCO 7-15 Year U.S. Treasury Index Exchange-Traded Fund
PIMCO 25+ Year Zero Coupon U.S. Treasury Index Exchange-Traded Fund
PIMCO 1-5 Year U.S. TIPS Index Exchange-Traded Fund
PIMCO 15+ Year U.S. TIPS Index Exchange-Traded Fund
PIMCO Broad U.S. TIPS Index Exchange-Traded Fund
PIMCO 0-5 Year High Yield Corporate Bond Index Exchange-Traded Fund
PIMCO Investment Grade Corporate Bond Index Exchange-Traded Fund
Actively-Managed Exchange-Traded Funds
PIMCO Diversified Income Active Exchange-Traded Fund
PIMCO Enhanced Short Maturity Active Exchange-Traded Fund
PIMCO Foreign Currency Strategy Active Exchange-Traded Fund
PIMCO Global Advantage® Inflation-Linked Bond Active Exchange-Traded Fund
PIMCO Intermediate Municipal Bond Active Exchange-Traded Fund
PIMCO Low Duration Active Exchange-Traded Fund
PIMCO Short Term Municipal Bond Active Exchange-Traded Fund
PIMCO Total Return Active Exchange-Traded Fund

Table of Contents
This material is authorized for use only when preceded or accompanied by the current PIMCO ETF Trust prospectus.
Chairman’s Letter
Dear Shareholder,
Please find enclosed the Annual Report for the PIMCO ETF Trust covering the twelve-month reporting period ended June 30, 2015. On the following pages, are specific details about the investment performance of each Fund and a discussion of the factors that most affected performance over the reporting period.
Highlights of the financial markets during our twelve-month reporting period include:
| | n | | Investor concerns over the potential for global deflation gradually receded as oil prices rose during the latter part of the reporting period after significantly declining in 2014 and early 2015. In addition, the outlook for economic growth brightened, particularly for developed market economies, led by continuing growth in the U.S. and improvement in Europe. Investors, however, were kept on edge by events in Greece, in which the debt crisis worsened sharply towards the latter part of the period and continues to be a concern outside of the reporting period as events remain fluid. Furthermore, Chinese equity markets experienced heightened volatility and data pointed to a slowing Chinese economy, prompting Chinese policymakers to lower interest rates. |
| | n | | U.S. Treasuries, as represented by the Barclays U.S. Treasury Index, returned 2.31% for the reporting period as yields at the front-end of the U.S. Treasury yield curve generally rose, while intermediate and longer-maturity yields declined. The benchmark ten-year U.S. Treasury note yielded 2.35% at the end of the reporting period, down from 2.53% on June 30, 2014. |
| | n | | U.S. Treasury Inflation-Protected Securities (“TIPS”), as represented by the Barclays U.S. TIPS Index, declined 1.73% over the reporting period. The collapse in oil prices that began in 2014 pushed inflation expectations to multi-year lows and caused U.S. TIPS to underperform nominal U.S. Treasuries by a large margin over the reporting period, despite the rise in oil prices towards the end of the period. Returns of global inflation-linked bonds (“ILBs”) outside of the U.S. varied across countries, depending on their respective inflation expectations. However, few ILB markets were able to keep pace with their nominal counterparts as global inflation expectations were similarly impacted by lower energy prices over the reporting period. |
| | n | | U.S. investment grade credit, as measured by the Barclays U.S. Credit Index, returned 0.93% over the reporting period. Global investment grade credit spreads widened amid a record pace of primary supply in the U.S. market. The U.S. short-dated high yield debt market, as measured by the BofA Merrill Lynch 0-5 Year U.S. High Yield Constrained Index, declined 0.27% as the asset class was primarily negatively affected by lower oil prices in the second half of 2014, heightened volatility from macro events such as a potential Greek default and decline in the Chinese equity market; and generally volatile retail fund flows for high yield bond mutual funds. |
| | n | | Tax-exempt municipal bonds, as represented by the Barclays Municipal Bond Index, returned 3.00% over the reporting period. Positive municipal bond returns were driven by positive retail demand, improved fundamentals, and lower U.S. Treasury yields. Demand for municipal bonds was concentrated in high yield and longer-duration segments. Despite negative credit headlines and associated volatility surrounding select large issuers, general municipal credit trends have improved as states have been adding to payrolls and rebuilding their cash reserves. |
If you have any questions regarding the PIMCO ETF Trust, please contact your financial adviser, or call one of our shareholder associates at 888.400.4ETF (888.400.4383). We also invite you to visit our website at www.pimcoetfs.com to learn more about PIMCO ETFs.
Thank you again for the trust you have placed in us. We are privileged to serve you through our ETF offerings.
| | |
 | | Sincerely, 
Brent R. Harris Chairman of the Board,
PIMCO ETF Trust August 20, 2015 |
Important Information About the Funds
PIMCO 1-3 Year U.S. Treasury Index Exchange-Traded Fund, PIMCO 3-7 Year U.S. Treasury Index Exchange-Traded Fund, PIMCO 7-15 Year U.S. Treasury Index Exchange-Traded Fund, PIMCO 25+ Year Zero Coupon U.S. Treasury Index Exchange-Traded Fund, PIMCO 1-5 Year U.S. TIPS Index Exchange-Traded Fund, PIMCO 15+ Year U.S. TIPS Index Exchange-Traded Fund, PIMCO Broad U.S. TIPS Index Exchange-Traded Fund, PIMCO 0-5 Year High Yield Corporate Bond Index Exchange-Traded Fund, and PIMCO Investment Grade Corporate Bond Index Exchange-Traded Fund are exchange-traded funds (“ETFs”) that seek to provide total return that closely corresponds, before fees and expenses, to the total return of a specified index (collectively, the “Index Funds”). Each Index Fund employs a representative sampling strategy in seeking to achieve its investment objective and as a result may not hold all of the securities that are included in the underlying index. The PIMCO Diversified Income Active Exchange-Traded Fund, PIMCO Enhanced Short Maturity Active Exchange-Traded Fund, PIMCO Foreign Currency Strategy Active Exchange-Traded Fund, PIMCO Global Advantage® Inflation-Linked Bond Active Exchange-Traded Fund, PIMCO Intermediate Municipal Bond Active Exchange-Traded Fund, PIMCO Low Duration Active Exchange-Traded Fund, PIMCO Short Term Municipal Bond Active Exchange-Traded Fund and PIMCO Total Return Active Exchange-Traded Fund, unlike the Index Funds, are actively managed ETFs that do not seek to track the performance of a specified index (collectively, the “Active Funds” and together with the Index Funds, the “Funds”). Shares of the Funds will be listed and traded at market prices on NYSE Arca, Inc. (“NYSE Arca”) and other secondary markets. The market price for each Fund’s shares may be different from the Fund’s net asset value (“NAV”). Each Fund issues and redeems shares at its NAV only in blocks of a specified number of shares (“Creation Units”). Only certain large institutional investors may purchase or redeem Creation Units directly with the Funds at NAV (“Authorized Participants”). These transactions are in exchange for certain securities similar to a Fund’s portfolio and/or cash. Except when aggregated in Creation Units, shares of a Fund are not redeemable securities. Shareholders who are not Authorized Participants may not redeem shares from the Funds at NAV.
The Funds invest in particular segments of the securities markets, which are not representative of the broader securities markets. We believe that bond funds have an important role to play in a well-diversified investment portfolio. It is important to note, however, that in an environment where interest rates may trend upward, rising rates would negatively impact the performance of most bond funds, and fixed-income securities held by the Funds are likely to decrease in value. A number of factors can cause interest rates to rise (e.g., central bank monetary policies, inflation rates, general economic conditions, etc.). Accordingly, changes in interest rates can be sudden and significant, and there is no guarantee that Fund management will anticipate such movement accurately.
As of the date of this report, interest rates in the U.S. are at or near historically low levels. As such, bond funds may currently face an
increased exposure to the risks associated with a rising interest rate environment. This is especially true as the Fed ended its quantitative easing program in October 2014. Further, while the U.S. bond market has steadily grown over the past three decades, dealer inventories of corporate bonds have remained relatively stagnant. As a result, there has been a significant reduction in the ability of dealers to “make markets.” All of the factors mentioned above, individually or collectively, could lead to increased volatility and/or lower liquidity in the fixed income markets, which could further reduce the net assets of a Fund.
Bond funds and individual bonds with a longer duration (a measure used to determine the sensitivity of a security’s price to changes in interest rates) tend to be more sensitive to changes in interest rates, usually making them more volatile than securities or funds with shorter durations. If the performance of a Fund were to be negatively impacted by rising interest rates, the Fund could face increased redemptions by its shareholders, which could further reduce the net assets of the Fund.
The Funds may be subject to various risks in addition to those described above. Some of these risks may include, but are not limited to, the following: market trading risk, interest rate risk, call risk, inflation-indexed security risk, credit risk, high yield risk, market risk, municipal bond risk, issuer risk, liquidity risk, derivatives risk, commodity risk, equity risk, issuer non-diversification risk, mortgage-related and other asset-backed securities risk, foreign (non-U.S.) investment risk, emerging markets risk, currency risk, leveraging risk, management risk, municipal project-specific risk, short sale risk, convertible securities risk, management and tracking error risk and indexing risk. A complete description of these and other risks is contained in each Fund’s prospectus. The Index Funds may use derivative instruments for hedging purposes or as part of an investment strategy. Use of these instruments may involve certain costs and risks such as liquidity risk, interest rate risk, market risk, credit risk, leverage risk, management risk and the risk that a Fund may not be able to close out a position when it would be most advantageous to do so. Certain derivative transactions may have a leveraging effect on an Index Fund. For example, a small investment in a derivative instrument may have a significant impact on an Index Fund’s exposure to interest rates, currency exchange rates or other investments. As a result, a relatively small price movement in an asset, instrument or component of the index underlying a derivative instrument may cause an immediate and substantial loss or gain, which translates into heightened volatility for the Fund. An Index Fund may engage in such transactions regardless of whether the Index Fund owns the asset, instrument or components of the index underlying the derivative instrument. An Index Fund may invest a significant portion of its assets in these types of instruments. If it does, the Index Fund’s investment exposure could far exceed the value of its portfolio securities and its investment performance could be primarily dependent upon securities it does not own. Investing in foreign (non-U.S.) securities may entail risk due to foreign (non-U.S.) economic and political developments; this risk may
| | | | | | |
| | ANNUAL REPORT | | JUNE 30, 2015 | | 3 |
Important Information About the Funds (Cont.)
be increased when investing in emerging markets. For example, if a Fund invests in emerging market debt, it may face increased exposure to interest rate, liquidity, volatility, and redemption risk due to the specific economic, political, geographical, or legal background of the foreign issuer.
High-yield bonds typically have a lower credit rating than other bonds. Lower-rated bonds generally involve a greater risk to principal than higher-rated bonds. Further, markets for lower-rated bonds are typically less liquid than for higher-rated bonds, and public information is usually less abundant in such markets. Thus, high yield investments increase the chance that a Fund will lose money. The credit quality of a particular security or group of securities does not ensure the stability or safety of the overall portfolio. Mortgage- and Asset-Backed Securities represent ownership interests in “pools” of mortgages or other assets such as consumer loans or receivables. As a general matter, Mortgage- and Asset-Backed Securities are subject to interest rate risk, extension risk, prepayment risk, and credit risk. These risks largely stem from the fact that returns on Mortgage- and Asset-Backed Securities depend on the ability of the underlying assets to generate cash flow.
Certain Funds may invest in securities and instruments that are economically tied to Russia. Investments in Russia are subject to political, economic, legal, market and currency risks, as well as the risk that further economic sanctions may be imposed by the United States and/or other countries. Such sanctions—which may impact companies in many sectors, including energy, financial services and defense, among others—may negatively impact the Fund’s performance and/or ability to achieve its investment objective. For example, certain transactions may be prohibited and/or existing investments may become illiquid (e.g., in the event that transacting in certain existing investments is prohibited), which could cause the Fund to sell other portfolio holdings at a disadvantageous time or price in order to meet shareholder redemptions.
The geographical classification of foreign (non-U.S.) securities in this report are classified by the country of incorporation of a holding. In certain instances, a security’s country of incorporation may be different from its country of economic exposure.
On each individual Fund Summary page in this Shareholder Report, the Average Annual Total Return table and Cumulative Returns chart measure performance assuming that any dividend and capital gain distributions were reinvested. Returns do not reflect the deduction of taxes that a shareholder would pay on: (i) Fund distributions; or (ii) the redemption of Fund shares. Each Fund’s performance is measured against the
performance of a broad-based securities market index (“benchmark index”). A Fund’s past performance, before and after taxes, is not necessarily an indication of how the Fund will perform in the future.
An investment in a Fund is not a deposit of a bank and is not guaranteed or insured by the Federal Deposit Insurance Corporation or any other government agency. It is possible to lose money on investments in the Funds.
The Index Funds may make available a complete schedule of portfolio holdings and the percentages they represent of the Index Fund’s net assets. On each business day, before commencement of trading on NYSE Arca, each Active Fund will disclose on www.pimcoetfs.com the identities and quantities of the Active Fund’s portfolio holdings that will form the basis for the Active Fund’s calculation of NAV at the end of the business day. The frequency at which the daily market prices were at a discount or premium to each Fund’s NAV is disclosed on www.pimcoetfs.com. Please see “Disclosure of Portfolio Holdings” in the Statement of Additional Information for information about the availability of the complete schedule of each Fund’s holdings. Fund fact sheets provide additional information regarding a Fund and may be requested by calling (888) 400-4ETF and are available on the Fund’s website at www.pimcoetfs.com.
PIMCO has adopted written proxy voting policies and procedures (“Proxy Policy”) as required by Rule 206(4)-6 under the Investment Advisers Act of 1940, as amended. The Proxy Policy has been adopted by PIMCO ETF Trust as the policies and procedures that PIMCO will use when voting proxies on behalf of the Funds. A description of the policies and procedures that PIMCO uses to vote proxies relating to portfolio securities of each Fund, and information about how each Fund voted proxies relating to portfolio securities held during the most recent twelve-month period ended June 30, are available without charge, upon request, by calling the Trust at (888) 400-4ETF, on the Funds’ website at www.pimcoetfs.com, and on the Securities and Exchange Commission’s (“SEC”) website at www.sec.gov.
PIMCO ETF Trust files a complete schedule of each Fund’s portfolio holdings with the SEC for the first and third quarters of each fiscal year on Form N-Q. A copy of the Funds’ Form N-Q is available on the SEC’s website at www.sec.gov and may be reviewed and copied at the SEC’s Public Reference Room in Washington, D.C., and is available without charge, upon request, by calling the Trust at (888) 400-4ETF and on the Funds’ website at www.pimcoetfs.com. Information on the operation of the Public Reference Room may be obtained by calling 1-800-SEC-0330.
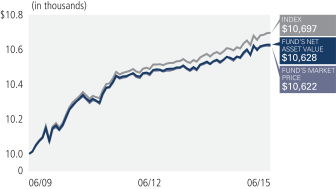
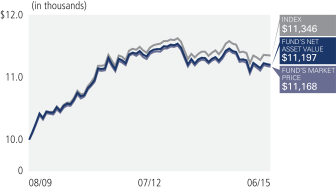
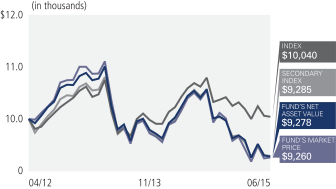
PIMCO 1-3 Year U.S. Treasury Index Exchange-Traded Fund
Cumulative Returns Through June 30, 2015
Allocation Breakdown†
| | | | |
| U.S. Treasury Obligations | | | 99.5% | |
| Short-Term Instruments | | | 0.5% | |
| † | % of Investments, at value as of 06/30/2015. Financial derivative instruments, if any, are excluded. |
| | | | | | | | | | | | | | |
| Average Annual Total Return for the period ended June 30, 2015 | |
| | | | | 1 Year | | | 5 Year | | | Fund Inception
(06/01/2009) | |
| | PIMCO 1-3 Year U.S. Treasury Index Exchange-Traded Fund
(Based on Net Asset Value) | | | 0.70% | | | | 0.72% | | | | 1.00% | |
| | PIMCO 1-3 Year U.S. Treasury Index Exchange-Traded Fund
(At Market Price)(1) | | | 0.70% | | | | 0.71% | | | | 0.99% | |
| | The BofA Merrill Lynch 1-3 Year U.S. Treasury IndexSM± | | | 0.88% | | | | 0.82% | | | | 1.11% | |
All Fund returns are net of fees and expenses.
Market Returns do not include brokerage commissions that may be payable on secondary market transactions. If brokerage commissions were included, market returns would be lower. Market and NAV returns assume that dividends and capital gain distributions have been reinvested in the Fund at market price and NAV, respectively.
(1) The market price is determined using the midpoint between the highest bid and the lowest offer on the listing exchange, as of the time that the Fund’s NAV is calculated.
± The BofA Merrill Lynch 1-3 Year U.S. Treasury IndexSM is an unmanaged index comprised of U.S. Treasury securities, other than inflation-protection securities and Separate Trading of Registered Interest and Principal of Securities (“STRIPS”), with at least $1 billion in outstanding face value and a remaining term to final maturity of at least one year and less than three years. It is not possible to invest directly in an unmanaged index.
Performance quoted represents past performance. Past performance is not a guarantee or a reliable indicator of future results. Current performance may be lower or higher than performance shown. Investment return and the principal value of an investment will fluctuate. Shares may be worth more or less than original cost when redeemed by authorized participants. Returns shown do not reflect the deduction of taxes that a shareholder would pay on Fund distributions or on the redemption of Fund shares. The Fund’s total annual operating expense ratio as stated in the Fund’s current prospectus, as supplemented to date, is 0.15%. Details regarding any Fund’s operating expenses can be found in the Fund’s prospectus. Performance data current to the most recent month-end is available at www.pimcoetfs.com.
Investment Objective and Strategy Overview
| » | | The PIMCO 1-3 Year U.S. Treasury Index Exchange-Traded Fund seeks to provide total return that closely corresponds, before fees and expenses, to the total return of The BofA Merrill Lynch 1-3 Year U.S. Treasury IndexSM (the “Underlying Index”), by investing under normal circumstances at least 80% of its total assets (exclusive of collateral held from securities lending) in the component securities (“Component Securities”) of the Underlying Index. The Fund may invest the remainder of its assets in Fixed Income Instruments that are not Component Securities, but which PIMCO believes will help the Fund track its Underlying Index, as well as in cash and investment grade, liquid short-term instruments, forwards or derivatives, such as options, futures contracts or swap agreements, and shares of affiliated bond funds. The Fund invests in a representative sample of securities included in the Underlying Index that collectively has an investment profile similar to the Underlying Index. Due to the use of representative sampling, the Fund may not hold all of the securities that are included in the Underlying Index. “Fixed Income Instruments” include bonds, debt securities and other similar instruments issued by various U.S. and non-U.S. public- or private-sector entities. |
Portfolio Insights
| » | | Yields in the 1- to 3-year segment of the U.S. Treasury yield curve increased over the course of the reporting period, negatively impacting the price return of both the Fund and the Underlying Index. Returns due to income positively contributed to performance for both the Fund and the Underlying Index. The net result was positive performance for both the Fund and the Underlying Index. |
| | | | | | |
| | ANNUAL REPORT | | JUNE 30, 2015 | | 5 |
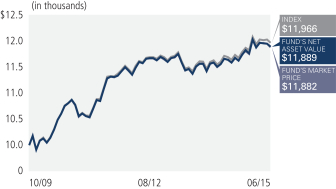
PIMCO 3-7 Year U.S. Treasury Index Exchange-Traded Fund
Cumulative Returns Through June 30, 2015
Allocation Breakdown†
| | | | |
| U.S. Treasury Obligations | | | 100.0% | |
| † | % of Investments, at value as of 06/30/15. Financial derivative instruments, if any, are excluded. |
| | | | | | | | | | | | | | |
| Average Annual Total Return for the period ended June 30, 2015 | |
| | | | | 1 Year | | | 5 Year | | | Fund Inception
(10/30/2009) | |
| | PIMCO 3-7 Year U.S. Treasury Index Exchange-Traded Fund
(Based on Net Asset Value) | | | 2.16% | | | | 2.55% | | | | 3.10% | |
| | PIMCO 3-7 Year U.S. Treasury Index Exchange-Traded Fund
(At Market Price)(1) | | | 2.15% | | | | 2.54% | | | | 3.09% | |
| | The BofA Merrill Lynch 3-7 Year U.S. Treasury IndexSM± | | | 2.37% | | | | 2.67% | | | | 3.22% | |
All Fund returns are net of fees and expenses.
Market Returns do not include brokerage commissions that may be payable on secondary market transactions. If brokerage commissions were included, market returns would be lower. Market and NAV returns assume that dividends and capital gain distributions have been reinvested in the Fund at market price and NAV, respectively.
(1) The market price is determined using the midpoint between the highest bid and the lowest offer on the listing exchange, as of the time that the Fund’s NAV is calculated.
± The BofA Merrill Lynch 3-7 Year U.S. Treasury IndexSM is an unmanaged index comprised of U.S. dollar denominated sovereign debt securities publicly issued by the U.S. Treasury having a maturity of at least 3 years and less than 7 years. It is not possible to invest directly in an unmanaged index.
Performance quoted represents past performance. Past performance is not a guarantee or a reliable indicator of future results. Current performance may be lower or higher than performance shown. Investment return and the principal value of an investment will fluctuate. Shares may be worth more or less than original cost when redeemed by authorized participants. Returns shown do not reflect the deduction of taxes that a shareholder would pay on Fund distributions or on the redemption of Fund shares. The Fund’s total annual operating expense ratio as stated in the Fund’s current prospectus, as supplemented to date, is 0.15%. Details regarding any Fund’s operating expenses can be found in the Fund’s prospectus. Performance data current to the most recent month-end is available at www.pimcoetfs.com.
Investment Objective and Strategy Overview
| » | | The PIMCO 3-7 Year U.S. Treasury Index Exchange-Traded Fund seeks to provide total return that closely corresponds, before fees and expenses, to the total return of The BofA Merrill Lynch 3-7 Year U.S. Treasury IndexSM (the “Underlying Index”), by investing under normal circumstances at least 80% of its total assets (exclusive of collateral held from securities lending) in the component securities (“Component Securities”) of the Underlying Index. The Fund may invest the remainder of its assets in Fixed Income Instruments that are not Component Securities, but which PIMCO believes will help the Fund track its Underlying Index, as well as in cash and investment grade, liquid short-term instruments, forwards or derivatives, such as options, futures contracts or swap agreements, and shares of affiliated bond funds. The Fund invests in a representative sample of securities included in the Underlying Index that collectively has an investment profile similar to the Underlying Index. Due to the use of representative sampling, the Fund may not hold all of the securities that are included in the Underlying Index. “Fixed Income Instruments” include bonds, debt securities and other similar instruments issued by various U.S. and non-U.S. public- or private-sector entities. |
Portfolio Insights
| » | | Changes in yields in the 3- to 7-year segment of the U.S. Treasury yield curve were mixed over the course of the reporting period, with a decline in 7-year yields positively impacting the price return of both the Fund and the Underlying Index. Returns due to income positively contributed to performance for both the Fund and the Underlying Index. |
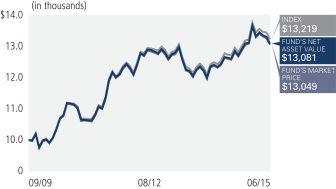
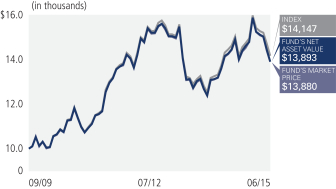
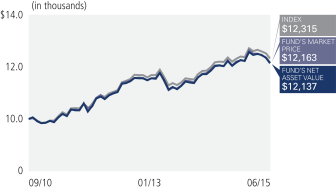
PIMCO 7-15 Year U.S. Treasury Index Exchange-Traded Fund
Cumulative Returns Through June 30, 2015
Allocation Breakdown†
| | | | |
| U.S. Treasury Obligations | | | 100.0% | |
| † | % of Investments, at value as of 06/30/2015. Financial derivative instruments, if any, are excluded. |
| | | | | | | | | | | | | | |
| Average Annual Total Return for the period ended June 30, 2015 | |
| | | | | 1 Year | | | 5 Year | | | Fund Inception
(09/10/2009) | |
| | PIMCO 7-15 Year U.S. Treasury Index Exchange-Traded Fund
(Based on Net Asset Value) | | | 3.58% | | | | 4.12% | | | | 4.85% | |
| | PIMCO 7-15 Year U.S. Treasury Index Exchange-Traded Fund
(At Market Price)(1) | | | 3.58% | | | | 4.09% | | | | 4.84% | |
| | The BofA Merrill Lynch 7-15 Year U.S. Treasury IndexSM± | | | 3.81% | | | | 4.33% | | | | 5.01% | |
All Fund returns are net of fees and expenses.
Market Returns do not include brokerage commissions that may be payable on secondary market transactions. If brokerage commissions were included, market returns would be lower. Market and NAV returns assume that dividends and capital gain distributions have been reinvested in the Fund at market price and NAV, respectively.
(1) The market price is determined using the midpoint between the highest bid and the lowest offer on the listing exchange, as of the time that the Fund’s NAV is calculated.
± The BofA Merrill Lynch 7-15 Year U.S. Treasury IndexSM is an unmanaged index comprised of U.S. dollar denominated sovereign debt securities publicly issued by the U.S. Treasury having a maturity of at least 7 years and less than 15 years. It is not possible to invest directly in an unmanaged index.
Performance quoted represents past performance. Past performance is not a guarantee or a reliable indicator of future results. Current performance may be lower or higher than performance shown. Investment return and the principal value of an investment will fluctuate. Shares may be worth more or less than original cost when redeemed by authorized participants. Returns shown do not reflect the deduction of taxes that a shareholder would pay on Fund distributions or on the redemption of Fund shares. The Fund’s total annual operating expense ratio as stated in the Fund’s current prospectus, as supplemented to date, is 0.15%. Details regarding any Fund’s operating expenses can be found in the Fund’s prospectus. Performance data current to the most recent month-end is available at www.pimcoetfs.com.
Investment Objective and Strategy Overview
| » | | The PIMCO 7-15 Year U.S. Treasury Index Exchange-Traded Fund seeks to provide total return that closely corresponds, before fees and expenses, to the total return of The BofA Merrill Lynch 7-15 Year U.S. Treasury IndexSM (the “Underlying Index”), by investing under normal circumstances at least 80% of its total assets (exclusive of collateral held from securities lending) in the component securities (“Component Securities”) of the Underlying Index. The Fund may invest the remainder of its assets in Fixed Income Instruments that are not Component Securities, but which PIMCO believes will help the Fund track its Underlying Index, as well as in cash and investment grade, liquid short-term instruments, forwards or derivatives, such as options, futures contracts or swap agreements, and shares of affiliated bond funds. The Fund invests in a representative sample of securities included in the Underlying Index that collectively has an investment profile similar to the Underlying Index. Due to the use of representative sampling, the Fund may not hold all of the securities that are included in the Underlying Index. “Fixed Income Instruments” include bonds, debt securities and other similar instruments issued by various U.S. and non-U.S. public- or private-sector entities. |
Portfolio Insights
| » | | Yields in the 7- to 15-year segment of the U.S. Treasury yield curve declined over the course of the reporting period, positively impacting the price return of both the Fund and the Underlying Index. Returns due to income positively contributed to performance for both the Fund and the Underlying Index. |
| | | | | | |
| | ANNUAL REPORT | | JUNE 30, 2015 | | 7 |
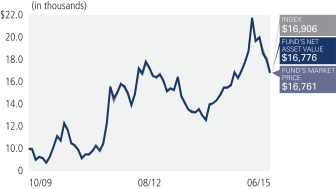
PIMCO 25+ Year Zero Coupon U.S. Treasury Index Exchange-Traded Fund
Cumulative Returns Through June 30, 2015
Allocation Breakdown†
| | | | |
| U.S. Treasury Obligations | | | 100.0% | |
| † | % of Investments, at value as of 06/30/2015. Financial derivative instruments, if any, are excluded. |
| | | | | | | | | | | | | | |
| Average Annual Total Return for the period ended June 30, 2015 | |
| | | | | 1 Year | | | 5 Year | | | Fund Inception
(10/30/2009) | |
| | PIMCO 25+ Year Zero Coupon U.S. Treasury Index Exchange-Traded Fund (Based on Net Asset Value) | | | 8.64% | | | | 8.60% | | | | 9.56% | |
| | PIMCO 25+ Year Zero Coupon U.S. Treasury Index Exchange-Traded Fund (At Market Price)(1) | | | 8.20% | | | | 8.50% | | | | 9.54% | |
| | The BofA Merrill Lynch Long U.S. Treasury Principal STRIPS IndexSM± | | | 9.07% | | | | 8.84% | | | | 9.71% | |
All Fund returns are net of fees and expenses.
Market Returns do not include brokerage commissions that may be payable on secondary market transactions. If brokerage commissions were included, market returns would be lower. Market and NAV returns assume that dividends and capital gain distributions have been reinvested in the Fund at market price and NAV, respectively.
(1) The market price is determined using the midpoint between the highest bid and the lowest offer on the listing exchange, as of the time that the Fund’s NAV is calculated.
± The BofA Merrill Lynch Long U.S. Treasury Principal STRIPS IndexSM is an unmanaged index comprised of long maturity Separate Trading of Registered Interest and Principal of Securities (“STRIPS”) representing the final principal payment of U.S. Treasury bonds. It is not possible to invest directly in an unmanaged index.
Performance quoted represents past performance. Past performance is not a guarantee or a reliable indicator of future results. Current performance may be lower or higher than performance shown. Investment return and the principal value of an investment will fluctuate. Shares may be worth more or less than original cost when redeemed by authorized participants. Returns shown do not reflect the deduction of taxes that a shareholder would pay on Fund distributions or on the redemption of Fund shares. The Fund’s total annual operating expense ratio as stated in the Fund’s current prospectus, as supplemented to date, is 0.15%. Details regarding any Fund’s operating expenses can be found in the Fund’s prospectus. Performance data current to the most recent month-end is available at www.pimcoetfs.com.
Investment Objective and Strategy Overview
| » | | The PIMCO 25+ Year Zero Coupon U.S. Treasury Index Exchange-Traded Fund seeks to provide total return that closely corresponds, before fees and expenses, to the total return of The BofA Merrill Lynch Long U.S. Treasury Principal STRIPS IndexSM (the “Underlying Index”), by investing under normal circumstances at least 80% of its total assets (exclusive of collateral held from securities lending) in the component securities (“Component Securities”) of the Underlying Index. The Fund may invest the remainder of its assets in Fixed Income Instruments that are not Component Securities, but which PIMCO believes will help the Fund track its Underlying Index, as well as in cash and investment grade, liquid short-term instruments, forwards or derivatives, such as options, futures contracts or swap agreements, and shares of affiliated bond funds. The Fund invests in a representative sample of securities included in the Underlying Index that collectively has an investment profile similar to the Underlying Index. Due to the use of representative sampling, the Fund may not hold all of the securities that are included in the Underlying Index. “Fixed Income Instruments” include bonds, debt securities and other similar instruments issued by various U.S. and non-U.S. public- or private-sector entities. |
Portfolio Insights
| » | | Yields in the 25+ year segment of the U.S. Treasury STRIPS yield curve declined over the reporting period, positively contributing to performance for both the Fund and the Underlying Index. |
PIMCO 1-5 Year U.S. TIPS Index Exchange-Traded Fund
Cumulative Returns Through June 30, 2015
Allocation Breakdown†
| | | | |
| U.S. Treasury Obligations | | | 99.8% | |
| Short-Term Instruments | | | 0.2% | |
| † | % of Investments, at value as of 06/30/2015. Financial derivative instruments, if any, are excluded. |
| | | | | | | | | | | | | | |
| Average Annual Total Return for the period ended June 30, 2015 | |
| | | | | 1 Year | | | 5 Year | | | Fund Inception
(08/20/2009) | |
| | PIMCO 1-5 Year U.S. TIPS Index Exchange-Traded Fund
(Based on Net Asset Value) | | | -2.27% | | | | 1.22% | | | | 1.91% | |
| | PIMCO 1-5 Year U.S. TIPS Index Exchange-Traded Fund
(At Market Price)(1) | | | -2.27% | | | | 1.22% | | | | 1.92% | |
| | The BofA Merrill Lynch 1-5 Year U.S. Inflation-Linked Treasury IndexSM± | | | -1.99% | | | | 1.45% | | | | 2.16% | |
All Fund returns are net of fees and expenses.
Market Returns do not include brokerage commissions that may be payable on secondary market transactions. If brokerage commissions were included, market returns would be lower. Market and NAV returns assume that dividends and capital gain distributions have been reinvested in the Fund at market price and NAV, respectively.
(1) The market price is determined using the midpoint between the highest bid and the lowest offer on the listing exchange, as of the time that the Fund’s NAV is calculated.
± The BofA Merrill Lynch 1-5 Year U.S. Inflation-Linked Treasury IndexSM is an unmanaged index comprised of TIPS (Treasury Inflation Protected Securities) with a maturity of at least 1 year and less than 5 years. It is not possible to invest directly in an unmanaged index.
Performance quoted represents past performance. Past performance is not a guarantee or a reliable indicator of future results. Current performance may be lower or higher than performance shown. Investment return and the principal value of an investment will fluctuate. Shares may be worth more or less than original cost when redeemed by authorized participants. Returns shown do not reflect the deduction of taxes that a shareholder would pay on Fund distributions or on the redemption of Fund shares. The Fund’s total annual operating expense ratio as stated in the Fund’s current prospectus, as supplemented to date, is 0.20%. Details regarding any Fund’s operating expenses can be found in the Fund’s prospectus. Performance data current to the most recent month-end is available at www.pimcoetfs.com.
Investment Objective and Strategy Overview
| » | | The PIMCO 1-5 Year U.S. TIPS Index Exchange-Traded Fund seeks to provide total return that closely corresponds, before fees and expenses, to the total return of The BofA Merrill Lynch 1-5 Year U.S. Inflation-Linked Treasury IndexSM (the “Underlying Index”), by investing under normal circumstances at least 80% of its total assets (exclusive of collateral held from securities lending) in the component securities (“Component Securities”) of the Underlying Index. The Fund may invest the remainder of its assets in Fixed Income Instruments that are not Component Securities, but which PIMCO believes will help the Fund track its Underlying Index, as well as in cash and investment grade, liquid short-term instruments, forwards or derivatives, such as options, futures contracts or swap agreements, and shares of affiliated bond funds. The Fund invests in a representative sample of securities included in the Underlying Index that collectively has an investment profile similar to the Underlying Index. Due to the use of representative sampling, the Fund may not hold all of the securities that are included in the Underlying Index. “Fixed Income Instruments” include bonds, debt securities and other similar instruments issued by various U.S. and non-U.S. public- or private-sector entities. |
Portfolio Insights
| » | | Real yields, or the rates of return in excess of expected future inflation, increased across the U.S. Treasury Inflation-Protected Securities (“TIPS”) yield curve, resulting in negative performance for both the Fund and the Underlying Index. A negative inflation accrual, or change in the Consumer Price Index (“CPI”), applied to the principal of underlying securities over the reporting period also had a negative impact on performance for both the Fund and the Underlying Index. |
| | | | | | |
| | ANNUAL REPORT | | JUNE 30, 2015 | | 9 |
PIMCO 15+ Year U.S. TIPS Index Exchange-Traded Fund
Cumulative Returns Through June 30, 2015
Allocation Breakdown†
| | | | |
| U.S. Treasury Obligations | | | 99.8% | |
| Short-Term Instruments | | | 0.2% | |
| † | % of Investments, at value as of 06/30/2015. Financial derivative instruments, if any, are excluded. |
| | | | | | | | | | | | | | |
| Average Annual Total Return for the period ended June 30, 2015 | |
| | | | | 1 Year | | | 5 Year | | | Fund Inception
(09/03/2009) | |
| | PIMCO 15+ Year U.S. TIPS Index Exchange-Traded Fund
(Based on Net Asset Value) | | | -2.52% | | | | 5.07% | | | | 6.22% | |
| | PIMCO 15+ Year U.S. TIPS Index Exchange-Traded Fund
(At Market Price)(1) | | | -2.46% | | | | 5.10% | | | | 6.23% | |
| | The BofA Merrill Lynch 15+ Year U.S. Inflation-Linked Treasury IndexSM± | | | -2.00% | | | | 5.43% | | | | 6.53% | |
All Fund returns are net of fees and expenses.
Market Returns do not include brokerage commissions that may be payable on secondary market transactions. If brokerage commissions were included, market returns would be lower. Market and NAV returns assume that dividends and capital gain distributions have been reinvested in the Fund at market price and NAV, respectively.
(1) The market price is determined using the midpoint between the highest bid and the lowest offer on the listing exchange, as of the time that the Fund’s NAV is calculated.
± The BofA Merrill Lynch 15+ Year U.S. Inflation-Linked Treasury IndexSM is an unmanaged index comprised of TIPS (Treasury Inflation Protected Securities) with a maturity of at least 15 years. It is not possible to invest directly in an unmanaged index.
Performance quoted represents past performance. Past performance is not a guarantee or a reliable indicator of future results. Current performance may be lower or higher than performance shown. Investment return and the principal value of an investment will fluctuate. Shares may be worth more or less than original cost when redeemed by authorized participants. Returns shown do not reflect the deduction of taxes that a shareholder would pay on Fund distributions or on the redemption of Fund shares. The Fund’s total annual operating expense ratio as stated in the Fund’s current prospectus, as supplemented to date, is 0.20%. Details regarding any Fund’s operating expenses can be found in the Fund’s prospectus. Performance data current to the most recent month-end is available at www.pimcoetfs.com.
Investment Objective and Strategy Overview
| » | | The PIMCO 15+ Year U.S. TIPS Index Exchange-Traded Fund seeks to provide total return that closely corresponds, before fees and expenses, to the total return of The BofA Merrill Lynch 15+ Year U.S. Inflation-Linked Treasury IndexSM (the “Underlying Index”), by investing under normal circumstances at least 80% of its total assets (exclusive of collateral held from securities lending) in the component securities (“Component Securities”) of the Underlying Index. The Fund may invest the remainder of its assets in Fixed Income Instruments that are not Component Securities, but which PIMCO believes will help the Fund track its Underlying Index, as well as in cash and investment grade, liquid short-term instruments, forwards or derivatives, such as options, futures contracts or swap agreements, and shares of affiliated bond funds. The Fund invests in a representative sample of securities included in the Underlying Index that collectively has an investment profile similar to the Underlying Index. Due to the use of representative sampling, the Fund may not hold all of the securities that are included in the Underlying Index. “Fixed Income Instruments” include bonds, debt securities and other similar instruments issued by various U.S. and non-U.S. public- or private-sector entities. |
Portfolio Insights
| » | | Real yields, or the rates of return in excess of expected future inflation, increased across the U.S. Treasury Inflation-Protected Securities (“TIPS”) yield curve, resulting in negative performance for both the Fund and the Underlying Index. A negative inflation accrual, or change in the Consumer Price Index (“CPI”), applied to the principal of underlying securities over the reporting period also had a negative impact on performance for both the Fund and the Underlying Index. |
PIMCO Broad U.S. TIPS Index Exchange-Traded Fund
Cumulative Returns Through June 30, 2015
Allocation Breakdown†
| | | | |
| U.S. Treasury Obligations | | | 99.5% | |
| Short-Term Instruments | | | 0.5% | |
| † | % of Investments, at value as of 06/30/2015. Financial derivative instruments, if any, are excluded. |
| | | | | | | | | | | | | | |
| Average Annual Total Return for the period ended June 30, 2015 | |
| | | | | 1 Year | | | 5 Year | | | Fund Inception
(09/03/2009) | |
| | PIMCO Broad U.S. TIPS Index Exchange-Traded Fund
(Based on Net Asset Value) | | | -2.02% | | | | 3.14% | | | | 4.04% | |
| | PIMCO Broad U.S. TIPS Index Exchange-Traded Fund
(At Market Price)(1) | | | -1.97% | | | | 3.14% | | | | 4.05% | |
| | The BofA Merrill Lynch U.S. Inflation-Linked Treasury IndexSM± | | | -1.64% | | | | 3.40% | | | | 4.28% | |
All Fund returns are net of fees and expenses.
Market Returns do not include brokerage commissions that may be payable on secondary market transactions. If brokerage commissions were included, market returns would be lower. Market and NAV returns assume that dividends and capital gain distributions have been reinvested in the Fund at market price and NAV, respectively.
(1) The market price is determined using the midpoint between the highest bid and the lowest offer on the listing exchange, as of the time that the Fund’s NAV is calculated.
± The BofA Merrill Lynch U.S. Inflation-Linked Treasury IndexSM is an unmanaged index comprised of TIPS (Treasury Inflation Protected Securities). It is not possible to invest directly in an unmanaged index.
Performance quoted represents past performance. Past performance is not a guarantee or a reliable indicator of future results. Current performance may be lower or higher than performance shown. Investment return and the principal value of an investment will fluctuate. Shares may be worth more or less than original cost when redeemed by authorized participants. Returns shown do not reflect the deduction of taxes that a shareholder would pay on Fund distributions or on the redemption of Fund shares. The Fund’s total annual operating expense ratio as stated in the Fund’s current prospectus, as supplemented to date, is 0.20%. Details regarding any Fund’s operating expenses can be found in the Fund’s prospectus. Performance data current to the most recent month-end is available at www.pimcoetfs.com.
Investment Objective and Strategy Overview
| » | | The PIMCO Broad U.S. TIPS Index Exchange-Traded Fund seeks to provide total return that closely corresponds, before fees and expenses, to the total return of The BofA Merrill Lynch U.S. Inflation-Linked Treasury IndexSM (the “Underlying Index”), by investing under normal circumstances at least 80% of its total assets (exclusive of collateral held from securities lending) in the component securities (“Component Securities”) of the Underlying Index. The Fund may invest the remainder of its assets in Fixed Income Instruments that are not Component Securities, but which PIMCO believes will help the Fund track its Underlying Index, as well as in cash and investment grade, liquid short-term instruments, forwards or derivatives, such as options, futures contracts or swap agreements, and shares of affiliated bond funds. The Fund invests in a representative sample of securities included in the Underlying Index that collectively has an investment profile similar to the Underlying Index. Due to the use of representative sampling, the Fund may not hold all of the securities that are included in the Underlying Index. “Fixed Income Instruments” include bonds, debt securities and other similar instruments issued by various U.S. and non-U.S. public- or private-sector entities. |
Portfolio Insights
| » | | Real yields, or the rates of return in excess of expected future inflation, increased across the U.S. Treasury Inflation-Protected Securities (“TIPS”) yield curve, resulting in negative performance for both the Fund and the Underlying Index. A negative inflation accrual, or change in the Consumer Price Index (“CPI”), applied to the principal of underlying securities over the reporting period also had a negative impact on performance for both the Fund and the Underlying Index. |
| | | | | | |
| | ANNUAL REPORT | | JUNE 30, 2015 | | 11 |
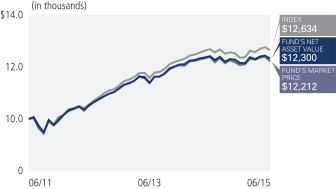
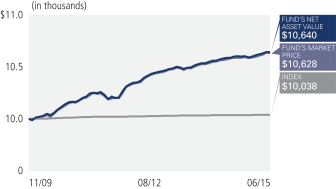
PIMCO 0-5 Year High Yield Corporate Bond Index Exchange-Traded Fund
Cumulative Returns Through June 30, 2015
Allocation Breakdown†
| | | | |
| Corporate Bonds & Notes | | | 96.1% | |
| Short-Term Instruments | | | 3.7% | |
| U.S. Treasury Obligations | | | 0.2% | |
| † | % of Investments, at value as of 06/30/2015. Financial derivative instruments, if any, are excluded. |
| | | | | | | | | | |
| Average Annual Total Return for the period ended June 30, 2015 | |
| | | | | 1 Year | | | Fund Inception
(06/16/2011) | |
| | PIMCO 0-5 Year High Yield Corporate Bond Index Exchange-Traded Fund
(Based on Net Asset Value) | | | -0.82% | | | | 5.38% | |
| | PIMCO 0-5 Year High Yield Corporate Bond Index Exchange-Traded Fund
(At Market Price)(1) | | | -1.38% | | | | 5.25% | |
| | BofA Merrill Lynch 0-5 Year U.S. High Yield Constrained IndexSM± | | | -0.27% | | | | 6.04% | |
All Fund returns are net of fees and expenses.
Market Returns do not include brokerage commissions that may be payable on secondary market transactions. If brokerage commissions were included, market returns would be lower. Market and NAV returns assume that dividends and capital gain distributions have been reinvested in the Fund at market price and NAV, respectively.
(1) The market price is determined using the midpoint between the highest bid and the lowest offer on the listing exchange, as of the time that the Fund’s NAV is calculated.
± The BofA Merrill Lynch 0-5 Year U.S. High Yield Constrained IndexSM tracks the performance of short-term U.S. dollar denominated below investment grade corporate debt issued in the U.S. domestic market with less than five years remaining term to final maturity, a fixed coupon schedule and a minimum amount outstanding of $100 million, issued publicly. Allocations to an individual issuer will not exceed 2%. It is not possible to invest directly in an unmanaged index.
Performance quoted represents past performance. Past performance is not a guarantee or a reliable indicator of future results. Current performance may be lower or higher than performance shown. Investment return and the principal value of an investment will fluctuate. Shares may be worth more or less than original cost when redeemed by authorized participants. Returns shown do not reflect the deduction of taxes that a shareholder would pay on Fund distributions or on the redemption of Fund shares. The Fund’s total annual operating expense ratio as stated in the Fund’s current prospectus, as supplemented to date, is 0.55%. Details regarding any Fund’s operating expenses can be found in the Fund’s prospectus. Performance data current to the most recent month-end is available at www.pimcoetfs.com.
Investment Objective and Strategy Overview
| » | | The PIMCO 0-5 Year High Yield Corporate Bond Index Exchange-Traded Fund seeks to provide total return that closely corresponds, before fees and expenses, to the total return of The BofA Merrill Lynch 0-5 Year U.S. High Yield Constrained IndexSM (the “Underlying Index”), by investing under normal circumstances at least 80% of its total assets (exclusive of collateral held from securities lending) in the component securities (“Component Securities”) of the Underlying Index. The Fund may invest the remainder of its assets in Fixed Income Instruments that are not Component Securities, but which PIMCO believes will help the Fund track its Underlying Index, as well as in cash and investment grade, liquid short-term instruments, forwards or derivatives, such as options, futures contracts or swap agreements, and shares of affiliated bond funds. The Fund invests in a representative sample of securities included in the Underlying Index that collectively has an investment profile similar to the Underlying Index. Due to the use of representative sampling, the Fund may not hold all of the securities that are included in the Underlying Index. “Fixed Income Instruments” include bonds, debt securities and other similar instruments issued by various U.S. and non-U.S. public- or private-sector entities. |
Portfolio Insights
| » | | Yields in the short-term segment of the U.S. high yield market increased over the reporting period, which negatively impacted performance. Coupon income positively contributed to performance for both the Fund and the Underlying Index. The net result was negative overall performance for both the Fund and the Underlying Index. |
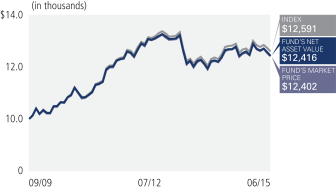
PIMCO Investment Grade Corporate Bond Index Exchange-Traded Fund
Cumulative Returns Through June 30, 2015
Allocation Breakdown†
| | | | |
| Industrials | | | 44.3% | |
| Banking & Finance | | | 38.7% | |
| Utilities | | | 15.4% | |
| Short-Term Instruments | | | 0.9% | |
| U.S. Treasury Obligations | | | 0.7% | |
| † | % of Investments, at value as of 06/30/2015. Financial derivative instruments, if any, are excluded. |
| | | | | | | | | | |
| Average Annual Total Return for the period ended June 30, 2015 | |
| | | | | 1 Year | | | Fund Inception
(09/20/2010) | |
| | PIMCO Investment Grade Corporate Bond Index Exchange-Traded Fund
(Based on Net Asset Value) | | | 0.74% | | | | 4.44% | |
| | PIMCO Investment Grade Corporate Bond Index Exchange-Traded Fund
(At Market Price)(1) | | | 0.85% | | | | 4.45% | |
| | BofA Merrill Lynch U.S. Corporate IndexSM± | | | 1.02% | | | | 4.70% | |
All Fund returns are net of fees and expenses.
Market Returns do not include brokerage commissions that may be payable on secondary market transactions. If brokerage commissions were included, market returns would be lower. Market and NAV returns assume that dividends and capital gain distributions have been reinvested in the Fund at market price and NAV, respectively.
(1) The market price is determined using the midpoint between the highest bid and the lowest offer on the listing exchange, as of the time that the Fund’s NAV is calculated.
± The BofA Merrill Lynch U.S. Corporate IndexSM is an unmanaged index comprised of U.S. dollar denominated investment grade, fixed rate corporate debt securities publicly issued in the U.S. domestic market with at least one year remaining term to final maturity and at least $250 million outstanding. It is not possible to invest directly in an unmanaged index.
Performance quoted represents past performance. Past performance is not a guarantee or a reliable indicator of future results. Current performance may be lower or higher than performance shown. Investment return and the principal value of an investment will fluctuate. Shares may be worth more or less than original cost when redeemed by authorized participants. Returns shown do not reflect the deduction of taxes that a shareholder would pay on Fund distributions or on the redemption of Fund shares. The Fund’s total annual operating expense ratio as stated in the Fund’s current prospectus, as supplemented to date, is 0.20%. Details regarding any Fund’s operating expenses can be found in the Fund’s prospectus. Performance data current to the most recent month-end is available at www.pimcoetfs.com.
Investment Objective and Strategy Overview
| » | | The PIMCO Investment Grade Corporate Bond Index Exchange-Traded Fund seeks to provide total return that closely corresponds, before fees and expenses, to the total return of The BofA Merrill Lynch U.S. Corporate IndexSM (the “Underlying Index”), by investing under normal circumstances at least 80% of its total assets (exclusive of collateral held from securities lending) in the component securities (“Component Securities”) of the Underlying Index. The Fund may invest the remainder of its assets in Fixed Income Instruments that are not Component Securities, but which PIMCO believes will help the Fund track its Underlying Index, as well as in cash and investment grade, liquid short-term instruments, forwards or derivatives, such as options, futures contracts or swap agreements, and shares of affiliated bond funds. The Fund invests in a representative sample of securities included in the Underlying Index that collectively has an investment profile similar to the Underlying Index. Due to the use of representative sampling, the Fund may not hold all of the securities that are included in the Underlying Index. “Fixed Income Instruments” include bonds, debt securities and other similar instruments issued by various U.S. and non-U.S. public- or private-sector entities. |
Portfolio Insights
| » | | An increase in yields and wider option-adjusted spreads for investment grade corporate bonds combined to negatively impact price returns for both the Fund and the Underlying Index over the reporting period. Returns due to income positively contributed to performance for both the Fund and the Underlying Index, resulting in positive overall performance for both the Fund and the Underlying Index. |
| | | | | | |
| | ANNUAL REPORT | | JUNE 30, 2015 | | 13 |
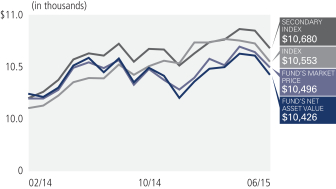
PIMCO Diversified Income Active Exchange-Traded Fund
Cumulative Returns Through June 30, 2015
Allocation Breakdown†
| | | | |
| Corporate Bonds & Notes | | | 67.2% | |
| Sovereign Issues | | | 11.9% | |
| Short-Term Instruments | | | 9.4% | |
| U.S. Government Agencies | | | 3.2% | |
| Bank Loan Obligations | | | 2.6% | |
| Other | | | 5.7% | |
| † | % of Investments, at value as of 06/30/2015. Financial derivative instruments, if any, are excluded. |
| | | | | | | | | | |
| Average Annual Total Return for the period ended June 30, 2015 | |
| | | | | 1 Year | | | Fund Inception
(01/22/2014) | |
| | PIMCO Diversified Income Active Exchange-Traded Fund
(Based on Net Asset Value) | | | -1.55% | | | | 2.55% | |
| | PIMCO Diversified Income Active Exchange-Traded Fund
(At Market Price)(1) | | | -0.47% | | | | 3.19% | |
| | Barclays Global Credit Hedged USD Index± | | | 1.53% | | | | 4.01% | |
| | 1/3 each — Barclays Global Aggregate Credit Component USD Hdgd, BofA Merrill Lynch Global High Yield BB-B Rated Constrained USD Hdgd, JPMorgan EMBI Global±± | | | 0.44% | | | | 4.35% | |
All Fund returns are net of fees and expenses.
Market Returns do not include brokerage commissions that may be payable on secondary market transactions. If brokerage commissions were included, market returns would be lower. Market and NAV returns assume that dividends and capital gain distributions have been reinvested in the Fund at market price and NAV, respectively.
(1) The market price is determined using the midpoint between the highest bid and the lowest offer on the listing exchange, as of the time that the Fund’s NAV is calculated.
± Barclays Global Credit Hedged USD contains investment grade and high yield credit securities from the Multiverse represented in U.S. Dollars on a hedged basis (Multiverse is the merger of two groups: the Global Aggregate and the Global High Yield). It is not possible to invest directly in an unmanaged index.
±± The benchmark is an equally weighted blend of the following three indices: Barclays Global Aggregate Credit Component, BofA Merrill Lynch Global High Yield BB-B Rated Constrained, JPMorgan EMBI Global; All USD Hedged. The Barclays Global Aggregate Credit Component provides a broad-based measure of the global investment-grade fixed income markets.The BofA Merrill Lynch Global High Yield, BB-B Rated Constrained Index tracks the performance of below investment grade bonds of corporate rated BB1 through B3, based on an average of Moody’s, S&P and Fitch. Qualifying bonds are capitalization-weighted provided the total allocation to an individual issuer (defined by Bloomberg tickers) does not exceed 2%. Issuers that exceed the limit are reduced to 2% and the face value of each of their bonds is adjusted on a pro-rata basis. Similarly, the face value of bonds of all other issuers that fall below the 2% cap are increased on a pro-rata basis. The index is rebalanced on the last calendar day of the month. The JPMorgan EMBI Global tracks total returns for U.S. dollar denominated debt instruments issued by emerging market sovereign and quasi-sovereign entities, Brady bonds, loans, Eurobonds and local market instruments. This index only tracks the particular region or country. It is not possible to invest directly in an unmanaged index.
Performance quoted represents past performance. Past performance is not a guarantee or a reliable indicator of future results. Current performance may be lower or higher than performance shown. Investment return and the principal value of an investment will fluctuate. Shares may be worth more or less than original cost when redeemed by authorized participants. Returns shown do not reflect the deduction of taxes that a shareholder would pay on Fund distributions or on the redemption of Fund shares. The Fund’s total annual operating expense ratio as stated in the Fund’s current prospectus, as supplemented to date, is 0.85%. Details regarding any Fund’s operating expenses can be found in the Fund’s prospectus. Performance data current to the most recent month-end is available at www.pimcoetfs.com.
Investment Objective and Strategy Overview
| » | | The PIMCO Diversified Income Active Exchange-Traded Fund seeks maximum total return, consistent with preservation of capital and prudent investment management, by investing under normal circumstances at least 65% of its total assets in a diversified portfolio of Fixed Income Instruments of varying maturities, which may be represented by forwards or derivatives such as options, futures contracts, or swap agreements. “Fixed Income Instruments” include bonds, debt securities and other similar instruments issued by various U.S. and non-U.S. public- or private-sector entities. |
Portfolio Insights
| » | | The Fund’s overweight to Russian and Brazilian spread duration detracted from performance as spreads on Russian and Brazilian debt widened during the reporting period. |
| » | | The Fund’s overweight to financial bonds benefited performance as the financial sector posted positive returns during the reporting period. |
| » | | An underweight to high yield energy bonds benefited relative performance as prices of energy bonds declined during the reporting period. |
| » | | Tactical exposure to select equity positions detracted from relative performance during the reporting period. |
| » | | The Fund’s underweight to the long end of the U.S. Treasury yield curve negatively impacted performance during the first half of the reporting period, which was attributable primarily to the decline in long term interest rates during that time period. |
| » | | Short exposures to the euro and to the Japanese yen benefited relative performance as the U.S. dollar strengthened versus these currencies during the reporting period. |
PIMCO Enhanced Short Maturity Active Exchange-Traded Fund
Cumulative Returns Through June 30, 2015
Allocation Breakdown†
| | | | |
| Corporate Bonds & Notes | | | 65.4% | |
| Asset-Backed Securities | | | 8.8% | |
| Mortgage-Backed Securities | | | 7.4% | |
| Short-Term Instruments | | | 6.9% | |
| U.S. Treasury Obligations | | | 3.9% | |
| Other | | | 7.6% | |
| † | % of Investments, at value as of 06/30/2015. Financial derivative instruments, if any, are excluded. |
| | | | | | | | | | | | | | |
| Average Annual Total Return for the period ended June 30, 2015 | |
| | | | | 1 Year | | | 5 Year | | | Fund Inception
(11/16/2009) | |
| | PIMCO Enhanced Short Maturity Active Exchange-Traded Fund
(Based on Net Asset Value) | | | 0.53% | | | | 1.13% | | | | 1.13% | |
| | PIMCO Enhanced Short Maturity Active Exchange-Traded Fund
(At Market Price)(1) | | | 0.55% | | | | 1.13% | | | | 1.13% | |
| | Citi 3-Month Treasury Bill Index± | | | 0.02% | | | | 0.06% | | | | 0.07% | * |
All Fund returns are net of fees and expenses.
* Average annual total return since 11/30/2009.
Market Returns do not include brokerage commissions that may be payable on secondary market transactions. If brokerage commissions were included, market returns would be lower. Market and NAV returns assume that dividends and capital gain distributions have been reinvested in the Fund at market price and NAV, respectively.
(1) The market price is determined using the midpoint between the highest bid and the lowest offer on the listing exchange, as of the time that the Fund’s NAV is calculated.
± Citigroup 3-Month U.S. Treasury Bill Index is an unmanaged index representing monthly return equivalents of yield averages of the last 3 month Treasury Bill issues. It is not possible to invest directly in an unmanaged index.
Performance quoted represents past performance. Past performance is not a guarantee or a reliable indicator of future results. Current performance may be lower or higher than performance shown. Investment return and the principal value of an investment will fluctuate. Shares may be worth more or less than original cost when redeemed by authorized participants. Returns shown do not reflect the deduction of taxes that a shareholder would pay on Fund distributions or on the redemption of Fund shares. The Fund’s total annual operating expense ratio as stated in the Fund’s current prospectus, as supplemented to date, is 0.35%. Details regarding any Fund’s operating expenses can be found in the Fund’s prospectus. Performance data current to the most recent month-end is available at www.pimcoetfs.com.
Investment Objective and Strategy Overview
| » | | The PIMCO Enhanced Short Maturity Active Exchange-Traded Fund seeks maximum current income, consistent with preservation of capital and daily liquidity, by investing under normal circumstances at least 65% of its total assets in a diversified portfolio of Fixed Income Instruments of varying maturities, which may be represented by forwards. “Fixed Income Instruments” include bonds, debt securities and other similar instruments issued by various U.S. and non-U.S. public- or private-sector entities. The Fund primarily invests in U.S. dollar-denominated investment grade debt securities, rated Baa or higher by Moody’s Investors Service, Inc. (“Moody’s”), or equivalently rated by Standard & Poor’s Ratings Services (“S&P”) or Fitch, Inc. (“Fitch”), or, if unrated, determined by PIMCO to be of comparable quality. |
Portfolio Insights
| » | | Exposure to investment grade credit benefited performance as these securities generally posted positive total returns during the reporting period. |
| » | | Exposure to securities with longer maturities relative to the Citigroup 3-Month Treasury Bill Index, the Fund’s benchmark index, benefited performance due to higher carry relative to the benchmark’s underlying constituents during the reporting period. |
| » | | Exposure to U.S. dollar denominated emerging market bonds benefited performance as these securities generally posted positive total returns during the reporting period. |
| » | | An overweight to commercial mortgage-backed securities benefited performance as these securities generally posted positive total returns during the reporting period. |
| » | | There were no detractors deemed to be notable during the reporting period. |
| | | | | | |
| | ANNUAL REPORT | | JUNE 30, 2015 | | 15 |
PIMCO Foreign Currency Strategy Active Exchange-Traded Fund
Cumulative Returns Through June 30, 2015
Allocation Breakdown†
| | | | |
| Short-Term Instruments | | | 32.0% | |
| Denmark | | | 16.1% | |
| Poland | | | 12.8% | |
| Brazil | | | 8.4% | |
| Italy | | | 7.6% | |
| Japan | | | 7.2% | |
| Netherlands | | | 5.3% | |
| Other | | | 10.6% | |
| † | % of Investments, at value as of 06/30/2015. Financial derivative instruments, if any, are excluded. |
| | | | | | | | | | |
| Average Annual Total Return for the period ended June 30, 2015 | |
| | | | | 1 Year | | | Fund Inception
(02/11/2013) | |
| | PIMCO Foreign Currency Strategy Active Exchange-Traded Fund
(Based on Net Asset Value) | | | -11.30% | | | | -5.97% | |
| | PIMCO Foreign Currency Strategy Active Exchange-Traded Fund
(At Market Price)(1) | | | -10.83% | | | | -6.00% | |
| | BofA Merrill Lynch 1-3 Year Trade-Weighted Global Government Index± | | | -15.58% | | | | -5.74% | |
All Fund returns are net of fees and expenses.
Market Returns do not include brokerage commissions that may be payable on secondary market transactions. If brokerage commissions were included, market returns would be lower. Market and NAV returns assume that dividends and capital gain distributions have been reinvested in the Fund at market price and NAV, respectively.
(1) The market price is determined using the midpoint between the highest bid and the lowest offer on the listing exchange, as of the time that the Fund’s NAV is calculated.
± The BofA Merrill Lynch 1-3 Year Trade-Weighted Global Government Index tracks the performance of a fixed-weighted blend of select short-dated sovereign indices whose securities are publicly issued and denominated in the issuer’s own domestic market and currency. The weights of constituent markets are re-set on each calendar month-end rebalancing date with the following weights: Canada (9.1%); Euro member countries (57.6%); Japan (13.6%); Sweden (4.2%); Switzerland (3.6%) and the U.K. (11.9%). It is not possible to invest directly in an unmanaged index.
Performance quoted represents past performance. Past performance is not a guarantee or a reliable indicator of future results. Current performance may be lower or higher than performance shown. Investment return and the principal value of an investment will fluctuate. Shares may be worth more or less than original cost when redeemed by authorized participants. Returns shown do not reflect the deduction of taxes that a shareholder would pay on Fund distributions or on the redemption of Fund shares. The Fund’s total annual operating expense ratio as stated in the Fund’s current prospectus, as supplemented to date, is 0.65%. Details regarding any Fund’s operating expenses can be found in the Fund’s prospectus. Performance data current to the most recent month-end is available at www.pimcoetfs.com.
Investment Objective and Strategy Overview
| » | | The PIMCO Foreign Currency Strategy Active Exchange-Traded Fund seeks maximum total return, consistent with prudent investment management, by investing under normal circumstances at least 80% of its assets in currencies of, or Fixed Income Instruments denominated in the currencies of, foreign (non-U.S.) countries, including, but not limited to, a combination of short-term Fixed Income Instruments, money market securities, currency forwards backed by high-quality, low duration securities and derivative instruments, such as options, futures contracts or swap agreements. “Foreign Currency Strategy” in the Fund’s name refers to the Fund’s proprietary investment strategy of seeking exposure to foreign (non-U.S.) currencies likely to outperform the U.S. dollar over the long-term. Assets not invested in currencies, currency forwards, Fixed Income Instruments denominated in currencies of non-U.S. countries or related derivative instruments may be invested in other types of Fixed Income Instruments. “Fixed Income Instruments” include bonds, debt securities and other similar instruments issued by various U.S. and non-U.S. public- or private-sector entities. |
Portfolio Insights
| » | | Exposure to the euro, Swedish krona, Norwegian krone, Canadian dollar and New Zealand dollar detracted from performance as these developed market currencies depreciated relative to the U.S. dollar during the reporting period. |
| » | | Short exposure to the Swiss franc during the first month of the year detracted from performance as this currency appreciated over the month relative to the U.S. dollar. |
| » | | Exposure to the British pound contributed positively to performance as this currency appreciated relative to the U.S. dollar during the reporting period. |
| » | | Exposure to the Chinese renminbi contributed positively to performance as this currency appreciated relative to the U.S. dollar during the reporting period. |
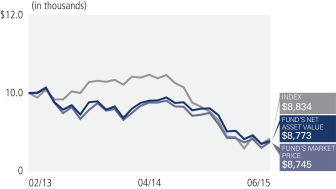
PIMCO Global Advantage® Inflation-Linked Bond Active Exchange-Traded Fund
Cumulative Returns Through June 30, 2015
Allocation Breakdown†
| | | | |
| United States | | | 35.2% | |
| Brazil | | | 10.2% | |
| Italy | | | 9.3% | |
| France | | | 7.1% | |
| United Kingdom | | | 6.9% | |
| Mexico | | | 5.9% | |
| Japan | | | 5.0% | |
| Other | | | 20.4% | |
| † | % of Investments, at value as of 06/30/2015. Financial derivative instruments, if any, are excluded. |
| | | | | | | | | | |
| Average Annual Total Return for the period ended June 30, 2015 | |
| | | | | 1 Year | | | Fund Inception
(04/30/2012) | |
| | PIMCO Global Advantage® Inflation-Linked Bond Active Exchange-Traded Fund
(Based on Net Asset Value) | | | -11.96% | | | | -2.34% | |
| | PIMCO Global Advantage® Inflation-Linked Bond Active Exchange-Traded Fund
(At Market Price)(1) | | | -11.82% | | | | -2.40% | |
| | Barclays Universal Government Inflation-Linked Bond Index± | | | -6.02% | | | | 0.13% | |
| | PIMCO Global Advantage Inflation-Linked Bond Index (USD Unhedged)
(NY Close)±± | | | -12.03% | | | | -2.32% | |
All Fund returns are net of fees and expenses.
Market Returns do not include brokerage commissions that may be payable on secondary market transactions. If brokerage commissions were included, market returns would be lower. Market and NAV returns assume that dividends and capital gain distributions have been reinvested in the Fund at market price and NAV, respectively.
(1) The market price is determined using the midpoint between the highest bid and the lowest offer on the listing exchange, as of the time that the Fund’s NAV is calculated.
± The Barclays Universal Government Inflation-Linked Bond Index combines the World, Euro and EM government indices to measure the performance of the major developed and emerging government inflation-linked bond markets. The index includes inflation-linked government bonds from 19 countries; in order of size, the US, UK, France, Brazil, Italy, Japan, Canada, Sweden, Germany, Argentina, Mexico, Greece, South Africa, Australia, Turkey, Colombia, Chile, Poland and South Korea. The index is market capitalization weighted and rebalances monthly. It is not possible to invest directly in an unmanaged index.
±± The PIMCO Global Advantage Inflation-Linked Bond Index® (USD Unhedged) (NY Close) represents the global bond market for inflation-linked government debt encompassing both developed and emerging markets. The index adheres to the principals of the PIMCO Global Advantage Indices when applicable to the global inflation-linked bond market. It is not possible to invest directly in an unmanaged index.
Performance quoted represents past performance. Past performance is not a guarantee or a reliable indicator of future results. Current performance may be lower or higher than performance shown. Investment return and the principal value of an investment will fluctuate. Shares may be worth more or less than original cost when redeemed by authorized participants. Returns shown do not reflect the deduction of taxes that a shareholder would pay on Fund distributions or on the redemption of Fund shares. The Fund’s total annual operating expense ratio as stated in the Fund’s current prospectus, as supplemented to date, is 0.61%. Details regarding any Fund’s operating expenses can be found in the Fund’s prospectus. Performance data current to the most recent month-end is available at www.pimcoetfs.com.
Investment Objective and Strategy Overview
| » | | The PIMCO Global Advantage® Inflation-Linked Bond Active Exchange-Traded Fund seeks total return which exceeds that of its benchmark indexes, consistent with prudent investment management, by investing under normal circumstances at least 80% of its assets in inflation-linked bonds that are economically tied to at least three developed and emerging market countries (one of which may be the United States), which may be represented by forwards or derivatives such as options, futures contracts, or swap agreements. Inflation-linked bonds are fixed income securities that are structured to provide protection against inflation. |
Portfolio Insights
| » | | Exposure to global inflation-linked bonds detracted from absolute performance as global inflation-linked bonds, measured by the Barclays Universal Government Inflation-Linked Bond Index, the Fund’s primary benchmark index, generally posted negative returns over the reporting period. |
| » | | Exposure to Danish real rates (i.e., rates of return in excess of expected inflation) benefited relative performance as yields in Denmark declined over the reporting period. |
| » | | Overweight exposure to Italian real rates benefited performance as yields in Italy generally declined over the reporting period. |
| » | | Short exposure to the euro for most of the reporting period benefited relative performance as this currency weakened relative to the U.S. dollar for most of the reporting period. |
| » | | Underweight exposure to French real rates detracted from relative performance as yields in France generally declined over the reporting period. |
| » | | Short exposure to longer-maturity nominal U.S. interest rates detracted from relative performance as longer-term yields generally declined in the U.S. over the reporting period. |
| » | | Exposure to the Polish zloty detracted from relative performance as this currency depreciated relative to the U.S. dollar over the reporting period. |
| | | | | | |
| | ANNUAL REPORT | | JUNE 30, 2015 | | 17 |
PIMCO Intermediate Municipal Bond Active Exchange-Traded Fund
Cumulative Returns Through June 30, 2015
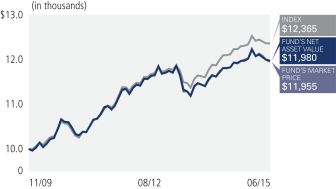
Allocation Breakdown†
| | | | |
| New York | | | 15.6% | |
| California | | | 11.5% | |
| Texas | | | 10.2% | |
| Ohio | | | 8.2% | |
| Illinois | | | 6.0% | |
| Short-Term Instruments | | | 5.8% | |
| Pennsylvania | | | 5.3% | |
| Other | | | 37.4% | |
| † | % of Investments, at value as of 06/30/2015. Financial derivative instruments, if any, are excluded. |
| | | | | | | | | | | | | | |
| Average Annual Total Return for the period ended June 30, 2015 | |
| | | | | 1 Year | | | 5 Year | | | Fund Inception
(11/30/2009) | |
| | PIMCO Intermediate Municipal Bond Active Exchange-Traded Fund
(Based on Net Asset Value) | | | 1.45% | | | | 3.17% | | | | 3.29% | |
| | PIMCO Intermediate Municipal Bond Active Exchange-Traded Fund
(At Market Price)(1) | | | 1.26% | | | | 3.15% | | | | 3.25% | |
| | Barclays 1-15 Year Municipal Bond Index± | | | 2.22% | | | | 3.76% | | | | 3.88% | |
All Fund returns are net of fees and expenses.
Market Returns do not include brokerage commissions that may be payable on secondary market transactions. If brokerage commissions were included, market returns would be lower. Market and NAV returns assume that dividends and capital gain distributions have been reinvested in the Fund at market price and NAV, respectively.
(1) The market price is determined using the midpoint between the highest bid and the lowest offer on the listing exchange, as of the time that the Fund’s NAV is calculated.
± Barclays 1-15 Year Municipal Bond Index consists of a broad selection of investment grade general obligation and revenue bonds of maturities ranging from one year to 17 years. It is an unmanaged index representative of the tax exempt bond market. It is not possible to invest directly in an unmanaged index.
Performance quoted represents past performance. Past performance is not a guarantee or a reliable indicator of future results. Current performance may be lower or higher than performance shown. Investment return and the principal value of an investment will fluctuate. Shares may be worth more or less than original cost when redeemed by authorized participants. Returns shown do not reflect the deduction of taxes that a shareholder would pay on Fund distributions or on the redemption of Fund shares. The Fund’s total annual operating expense ratio as stated in the Fund’s current prospectus, as supplemented to date, is 0.35%. Details regarding any Fund’s operating expenses can be found in the Fund’s prospectus. Performance data current to the most recent month-end is available at www.pimcoetfs.com.
Investment Objective and Strategy Overview
| » | | The PIMCO Intermediate Municipal Bond Active Exchange-Traded Fund seeks attractive tax-exempt income, consistent with preservation of capital, by investing under normal circumstances at least 80% of its assets in a diversified portfolio of debt securities whose interest is, in the opinion of bond counsel for the issuer at the time of issuance, exempt from federal income tax (“Municipal Bonds”). The Fund does not intend to invest in Municipal Bonds whose interest is subject to the federal alternative minimum tax. The Fund may only invest in U.S. dollar-denominated investment grade debt securities, rated Baa or higher by Moody’s Investors Service, Inc. (“Moody’s”), or equivalently rated by Standard & Poor’s Ratings Services (“S&P”) or Fitch, Inc. (“Fitch”), or, if unrated, determined by PIMCO to be of comparable quality. The Fund may invest 25% or more of its total assets in Municipal Bonds that finance similar projects, such as those relating to education, health care, housing, transportation, and utilities, and 25% or more of its total assets in industrial development bonds. |
Portfolio Insights
| » | | An overweight to duration (or sensitivity to changes in market interest rates) during March, April and May of the reporting period detracted from performance as municipal bond yields generally rose during this portion of the reporting period. |
| » | | An overweight to the education sector contributed positively to performance as this segment outperformed the general municipal bond market over the reporting period. |
| » | | An overweight to the water and sewer utility sectors contributed positively to performance as this segment outperformed the general municipal bond market over the reporting period. |
| » | | An overweight to the transportation sector during most of the reporting period contributed positively to performance as this segment outperformed the general municipal bond market. |
| » | | An overweight to the tobacco sector during the last quarter of the reporting period detracted from performance as this segment underperformed the general municipal bond market during that time period. |
| » | | An underweight to the housing sector detracted from performance as this segment outperformed the general municipal bond market over the reporting period. |
PIMCO Low Duration Active Exchange-Traded Fund
Cumulative Returns Through June 30, 2015
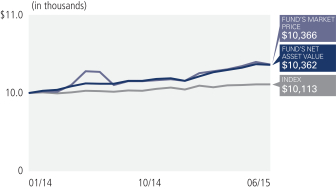
Allocation Breakdown†
| | | | |
| Corporate Bonds & Notes | | | 69.8% | |
| Short-Term Instruments | | | 9.0% | |
| Asset-Backed Securities | | | 8.6% | |
| Mortgage-Backed Securities | | | 6.1% | |
| Sovereign Issues | | | 4.8% | |
| Other | | | 1.7% | |
| † | % of Investments, at value as of 06/30/2015. Financial derivative instruments, if any, are excluded. |
| | | | | | | | | | |
| Average Annual Total Return for the period ended June 30, 2015 | |
| | | | | 1 Year | | | Fund Inception
(01/22/2014) | |
| | PIMCO Low Duration Active Exchange-Traded Fund
(Based on Net Asset Value) | | | 2.37% | | | | 2.72% | |
| | PIMCO Low Duration Active Exchange-Traded Fund
(At Market Price)(1) | | | 0.91% | | | | 2.70% | |
| | The BofA Merrill Lynch 1-3 Year U.S. Treasury IndexSM± | | | 0.88% | | | | 0.90% | |
All Fund returns are net of fees and expenses.
Market Returns do not include brokerage commissions that may be payable on secondary market transactions. If brokerage commissions were included, market returns would be lower. Market and NAV returns assume that dividends and capital gain distributions have been reinvested in the Fund at market price and NAV, respectively.
(1) The market price is determined using the midpoint between the highest bid and the lowest offer on the listing exchange, as of the time that the Fund’s NAV is calculated.
± The BofA Merrill Lynch 1-3 Year U.S. Treasury IndexSM is an unmanaged index comprised of U.S. Treasury securities, other than inflation-protection securities and Separate Trading of Registered Interest and Principal of Securities (“STRIPS”), with at least $1 billion in outstanding face value and a remaining term to final maturity of at least one year and less than three years. It is not possible to invest directly in an unmanaged index.
Performance quoted represents past performance. Past performance is not a guarantee or a reliable indicator of future results. Current performance may be lower or higher than performance shown. Investment return and the principal value of an investment will fluctuate. Shares may be worth more or less than original cost when redeemed by authorized participants. Returns shown do not reflect the deduction of taxes that a shareholder would pay on Fund distributions or on the redemption of Fund shares. The Fund’s total annual operating expense ratio as stated in the Fund’s current prospectus, as supplemented to date, is 0.55%. Details regarding any Fund’s operating expenses can be found in the Fund’s prospectus. Performance data current to the most recent month-end is available at www.pimcoetfs.com
Investment Objective and Strategy Overview
| » | | The PIMCO Low Duration Active Exchange-Traded Fund seeks maximum total return, consistent with preservation of capital and prudent investment management, by investing under normal circumstances at least 65% of its total assets in a diversified portfolio of Fixed Income Instruments of varying maturities, which may be represented by forwards or derivatives such as options, futures contracts, or swap agreements. “Fixed Income Instruments” include bonds, debt securities and other similar instruments issued by various U.S. and non-U.S. public- or private-sector entities. |
Portfolio Insights
| » | | Exposure to commercial mortgage-backed securities (“CMBS”) added to returns as these securities generally posted positive total returns during the reporting period. |
| » | | Exposure to investment grade corporates benefited performance as these securities generally posted positive total returns during the reporting period. |
| » | | Exposure to high yield financials benefited performance as these securities generally posted positive total returns during the reporting period. |
| » | | Exposure to U.S. dollar denominated emerging market bonds benefited performance as these securities generally posted positive total returns during the reporting period. |
| » | | Short exposure to the Japanese yen and the euro benefited performance as both of these currencies depreciated relative to the U.S. dollar during the reporting period. |
| » | | An underweight to U.S. duration (or sensitivity to changes in market interest rates) detracted from performance as income and carry in the Fund’s portfolio reduced over the reporting period relative to the BofA Merrill Lynch 1-3 Year U.S. Treasury Index, the Fund’s benchmark index. |
| | | | | | |
| | ANNUAL REPORT | | JUNE 30, 2015 | | 19 |
PIMCO Short Term Municipal Bond Active Exchange-Traded Fund
Cumulative Returns Through June 30, 2015
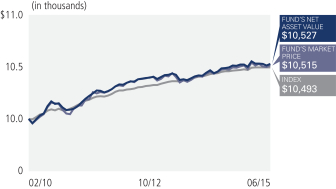
Allocation Breakdown†
| | | | |
| Texas | | | 16.9% | |
| New York | | | 12.1% | |
| Florida | | | 10.6% | |
| Ohio | | | 5.5% | |
| Pennsylvania | | | 4.5% | |
| Other | | | 50.4% | |
| † | % of Investments, at value as of 06/30/2015. Financial derivative instruments, if any, are excluded. |
| | | | | | | | | | | | | | |
| Average Annual Total Return for the period ended June 30, 2015 | |
| | | | | 1 Year | | | 5 Year | | | Fund Inception
(02/01/2010) | |
| | PIMCO Short Term Municipal Bond Active Exchange-Traded Fund
(Based on Net Asset Value) | | | 0.37% | | | | 0.93% | | | | 0.99% | |
| | PIMCO Short Term Municipal Bond Active Exchange-Traded Fund
(At Market Price)(1) | | | 0.35% | | | | 0.92% | | | | 0.98% | |
| | Barclays 1 Year Municipal Bond Index± | | | 0.34% | | | | 0.86% | | | | 0.93% | |
All Fund returns are net of fees and expenses.
Market Returns do not include brokerage commissions that may be payable on secondary market transactions. If brokerage commissions were included, market returns would be lower. Market and NAV returns assume that dividends and capital gain distributions have been reinvested in the Fund at market price and NAV, respectively.
(1) The market price is determined using the midpoint between the highest bid and the lowest offer on the listing exchange, as of the time that the Fund’s NAV is calculated.
± Barclays 1 Year Municipal Bond Index is an unmanaged index comprised of national municipal bond issues having a maturity of at least one year and less than two years. It is not possible to invest directly in an unmanaged index.
Performance quoted represents past performance. Past performance is not a guarantee or a reliable indicator of future results. Current performance may be lower or higher than performance shown. Investment return and the principal value of an investment will fluctuate. Shares may be worth more or less than original cost when redeemed by authorized participants. Returns shown do not reflect the deduction of taxes that a shareholder would pay on Fund distributions or on the redemption of Fund shares. The Fund’s total annual operating expense ratio as stated in the Fund’s current prospectus, as supplemented to date, is 0.35%. Details regarding any Fund’s operating expenses can be found in the Fund’s prospectus. Performance data current to the most recent month-end is available at www.pimcoetfs.com
Investment Objective and Strategy Overview
| » | | The PIMCO Short Term Municipal Bond Active Exchange-Traded Fund seeks attractive tax-exempt income, consistent with preservation of capital, by investing under normal circumstances at least 80% of its assets in a diversified portfolio of debt securities whose interest is, in the opinion of bond counsel for the issuer at the time of issuance, exempt from federal income tax (“Municipal Bonds”). The Fund does not intend to invest in Municipal Bonds whose interest is subject to the federal alternative minimum tax. The Fund may only invest in U.S. dollar-denominated investment grade debt securities, rated Baa or higher by Moody’s Investors Service, Inc. (“Moody’s”), or equivalently rated by Standard & Poor’s Ratings Services (“S&P”) or Fitch, Inc. (“Fitch”), or, if unrated, determined by PIMCO to be of comparable quality. The Fund may invest 25% or more of its total assets in Municipal Bonds that finance similar projects, such as those relating to education, health care, housing, transportation, and utilities, and 25% or more of its total assets in industrial development bonds. |
Portfolio Insights
| » | | An overweight to duration (or sensitivity to changes in market interest rates) in the 2-year portion of the yield curve detracted from performance as municipal yields generally moved higher in short maturities during the reporting period. |
| » | | An overweight to the revenue-backed sector contributed positively to performance as this segment outperformed the general municipal bond market over the reporting period. |
| » | | An overweight to the electric utility sector contributed positively to performance as this segment outperformed the general municipal bond market over the reporting period. |
| » | | An overweight to the education sector contributed positively to performance as this segment outperformed the general municipal bond market over the reporting period. |
| » | | An overweight to the industrial revenue sector contributed positively to performance as this segment outperformed the general municipal bond market over the reporting period. |
| » | | An underweight to the housing sector detracted from performance as this segment outperformed the general municipal bond market over the reporting period. |
PIMCO Total Return Active Exchange-Traded Fund
Cumulative Returns Through June 30, 2015
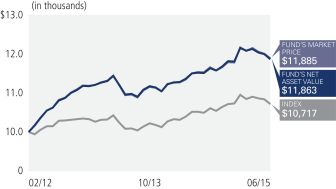
Allocation Breakdown†
| | | | |
| Corporate Bonds & Notes | | | 30.0% | |
| U.S. Treasury Obligations | | | 29.8% | |
| U.S. Government Agencies | | | 17.7% | |
| Sovereign Issues | | | 7.2% | |
| Mortgage-Backed Securities | | | 5.6% | |
| Short-Term Instruments | | | 5.6% | |
| Other | | | 4.1% | |
| † | % of Investments, at value as of 06/30/2015. Financial derivative instruments, if any, are excluded. |
| | | | | | | | | | |
| Average Annual Total Return for the period ended June 30, 2015 | |
| | | | | 1 Year | | | Fund Inception
(02/29/2012) | |
| | PIMCO Total Return Active Exchange-Traded Fund
(Based on Net Asset Value) | | | 3.01% | | | | 5.26% | |
| | PIMCO Total Return Active Exchange-Traded Fund
(At Market Price)(1) | | | 3.02% | | | | 5.32% | |
| | Barclays U.S. Aggregate Index± | | | 1.86% | | | | 2.10% | |
All Fund returns are net of fees and expenses.
Market Returns do not include brokerage commissions that may be payable on secondary market transactions. If brokerage commissions were included, market returns would be lower. Market and NAV returns assume that dividends and capital gain distributions have been reinvested in the Fund at market price and NAV, respectively.
(1) The market price is determined using the midpoint between the highest bid and the lowest offer on the listing exchange, as of the time that the Fund’s NAV is calculated.
± Barclays U.S. Aggregate Index represents securities that are SEC-registered, taxable, and dollar denominated. The index covers the U.S. investment grade fixed rate bond market, with index components for government and corporate securities, mortgage pass-through securities, and asset-backed securities. These major sectors are subdivided into more specific indices that are calculated and reported on a regular basis. It is not possible to invest directly in an unmanaged index.
Performance quoted represents past performance. Past performance is not a guarantee or a reliable indicator of future results. Current performance may be lower or higher than performance shown. Investment return and the principal value of an investment will fluctuate. Shares may be worth more or less than original cost when redeemed by authorized participants. Returns shown do not reflect the deduction of taxes that a shareholder would pay on Fund distributions or on the redemption of Fund shares. The Fund’s total annual operating expense ratio as stated in the Fund’s current prospectus, as supplemented to date, is 0.56%. Details regarding any Fund’s operating expenses can be found in the Fund’s prospectus. Performance data current to the most recent month-end is available at www.pimcoetfs.com
Investment Objective and Strategy Overview
| » | | The PIMCO Total Return Active Exchange-Traded Fund seeks maximum total return, consistent with preservation of capital and prudent investment management, by investing under normal circumstances at least 65% of its total assets in a diversified portfolio of Fixed Income Instruments of varying maturities, which may be represented by forwards or derivatives such as options, futures contracts, or swap agreements. “Fixed Income Instruments” include bonds, debt securities and other similar instruments issued by various U.S. and non-U.S. public- or private-sector entities. |
Portfolio Insights
| » | | Long-dollar positions against the euro and the Japanese yen added to performance as both of these currencies depreciated against the U.S. dollar during the reporting period. |
| » | | An underweight to investment grade corporate spread duration benefited performance as spreads to U.S. Treasuries widened during the reporting period. |
| » | | Duration exposure in peripheral Europe, particularly in Italy, added to performance as Italian interest rates declined during the reporting period. |
| » | | An underweight to duration exposure (or sensitivity to changes in market interest rates) on the long end of the U.S. yield curve detracted from performance as long end yields declined during the reporting period. |
| » | | Duration exposure to Germany during the last three months of the reporting period detracted from performance as German yields increased during this time period. |
| » | | A tactical long-U.S. dollar position versus the Brazilian real during the period from March 2015 through May 2015 detracted from performance as this currency appreciated relative to the U.S. dollar during this time period. |
| | | | | | |
| | ANNUAL REPORT | | JUNE 30, 2015 | | 21 |
Expense Examples
Example
As a shareholder of a Fund, you incur two types of costs: (1) transaction costs, including brokerage commissions paid on purchases and sales of Fund shares and (2) ongoing costs, including management fees and other Fund expenses. The Example is intended to help you understand your ongoing costs (in dollars) of investing in a Fund and to compare these costs with the ongoing costs of investing in other exchange-traded funds.
The Example is based on an investment of $1,000 invested at the beginning of the period and held for the entire period indicated, which for all Funds is from January 1, 2015 to June 30, 2015 unless noted otherwise in the table and footnotes below.
Actual Expenses
The information in the table under the heading “Actual” provides information about actual account values and actual expenses. You may use the information in these columns, together with the amount you invested, to estimate the expenses that you paid over the period. Simply divide your account value by $1,000 (for example, an $8,600 account value divided by $1,000 = $8.60), then multiply the result by the number in the column titled “Expenses Paid During Period” to estimate the expenses you paid on your account during this period.
Hypothetical Example For Comparison Purposes
The information in the table under the heading “Hypothetical (5% return before expenses)” provides information about hypothetical account values and hypothetical expenses based on a Fund’s actual expense ratio and an assumed rate of return of 5% per year before expenses, which is not the Fund’s actual return. The hypothetical account values and expenses may not be used to estimate the actual ending account balance or expenses you paid for the period. You may use this information to compare the ongoing costs of investing in a Fund and other exchange-traded funds. To do so, compare this 5% hypothetical example with the 5% hypothetical examples that appear in the shareholder reports of other exchange-traded funds.
Please note that the expenses shown in the table are meant to highlight your ongoing costs only and do not reflect any transactional costs, such as brokerage commissions paid on purchases and sales of shares of the Funds. Therefore, the information under the heading “Hypothetical (5% return before expenses)” is useful in comparing ongoing costs only, and will not help you determine the relative total costs of owning different exchange-traded funds. In addition, if these transactional costs were included, your costs would have been higher.
Expense ratios may vary period to period because of various factors, such as an increase in expenses not covered by the management fee (such as expenses of the independent trustees and their counsel, extraordinary expenses and interest expense).
| | | | | | | | | | | | | | | | | | | | | | | | | | | | | | | | | | |
| | | | | Actual | | | | | Hypothetical
(5% return before expenses) | | | | | | |
| | | | | Beginning
Account Value
(01/01/15) | | | Ending
Account Value
(06/30/15) | | | Expenses Paid
During Period* | | | | | Beginning
Account Value
(01/01/15) | | | Ending
Account Value
(06/30/15) | | | Expenses Paid
During Period* | | | | | Net Annualized
Expense
Ratio** | |
PIMCO 1-3 Year U.S. Treasury Index Exchange-Traded Fund | | | | $ | 1,000.00 | | | $ | 1,005.50 | | | $ | 0.69 | | | | | $ | 1,000.00 | | | $ | 1,023.97 | | | $ | 0.70 | | | | | | 0.14 | % |
PIMCO 3-7 Year U.S. Treasury Index Exchange-Traded Fund | | | | | 1,000.00 | | | | 1,010.60 | | | | 0.79 | | | | | | 1,000.00 | | | | 1,023.87 | | | | 0.80 | | | | | | 0.16 | |
PIMCO 7-15 Year U.S. Treasury Index Exchange-Traded Fund | | | | | 1,000.00 | | | | 998.00 | | | | 0.74 | | | | | | 1,000.00 | | | | 1,023.92 | | | | 0.75 | | | | | | 0.15 | |
PIMCO 25+ Year Zero Coupon U.S. Treasury Index Exchange-Traded Fund | | | | | 1,000.00 | | | | 895.40 | | | | 0.70 | | | | | | 1,000.00 | | | | 1,023.92 | | | | 0.75 | | | | | | 0.15 | |
PIMCO 1-5 Year U.S. TIPS Index Exchange-Traded Fund | | | | | 1,000.00 | | | | 1,009.10 | | | | 0.99 | | | | | | 1,000.00 | | | | 1,023.67 | | | | 1.00 | | | | | | 0.20 | |
PIMCO 15+ Year U.S. TIPS Index Exchange-Traded Fund | | | | | 1,000.00 | | | | 940.80 | | | | 1.01 | | | | | | 1,000.00 | | | | 1,023.62 | | | | 1.05 | | | | | | 0.21 | |
PIMCO Broad U.S. TIPS Index Exchange-Traded Fund | | | | | 1,000.00 | | | | 997.50 | | | | 1.03 | | | | | | 1,000.00 | | | | 1,023.62 | | | | 1.05 | | | | | | 0.21 | |
PIMCO 0-5 Year High Yield Corporate Bond Index Exchange-Traded Fund | | | | | 1,000.00 | | | | 1,012.90 | | | | 2.73 | | | | | | 1,000.00 | | | | 1,021.95 | | | | 2.74 | | | | | | 0.55 | |
PIMCO Investment Grade Corporate Bond Index Exchange-Traded Fund | | | | | 1,000.00 | | | | 993.40 | | | | 0.98 | | | | | | 1,000.00 | | | | 1,023.67 | | | | 1.00 | | | | | | 0.20 | |
PIMCO Diversified Income Active Exchange-Traded Fund | | | | | 1,000.00 | | | | 1,021.60 | | | | 4.24 | | | | | | 1,000.00 | | | | 1,020.47 | | | | 4.23 | | | | | | 0.85 | |
PIMCO Enhanced Short Maturity Active Exchange-Traded Fund | | | | | 1,000.00 | | | | 1,004.80 | | | | 1.83 | | | | | | 1,000.00 | | | | 1,022.83 | | | | 1.85 | | | | | | 0.37 | |
PIMCO Foreign Currency Strategy Active Exchange-Traded Fund | | | | | 1,000.00 | | | | 929.60 | | | | 3.14 | | | | | | 1,000.00 | | | | 1,021.40 | | | | 3.29 | | | | | | 0.66 | |
PIMCO Global Advantage® Inflation-Linked Bond Active Exchange-Traded Fund | | | | | 1,000.00 | | | | 963.40 | | | | 3.39 | | | | | | 1,000.00 | | | | 1,021.21 | | | | 3.49 | | | | | | 0.70 | |
PIMCO Intermediate Municipal Bond Active Exchange-Traded Fund | | | | | 1,000.00 | | | | 996.80 | | | | 1.72 | | | | | | 1,000.00 | | | | 1,022.93 | | | | 1.75 | | | | | | 0.35 | |
| | | | | | | | | | | | | | | | | | | | | | | | | | | | | | | | | | |
| | | | | Actual | | | | | Hypothetical
(5% return before expenses) | | | | | | |
| | | | | Beginning
Account Value
(01/01/15) | | | Ending
Account Value
(06/30/15) | | | Expenses Paid
During Period* | | | | | Beginning
Account Value
(01/01/15) | | | Ending
Account Value
(06/30/15) | | | Expenses Paid
During Period* | | | | | Net Annualized
Expense
Ratio** | |
PIMCO Low Duration Active Exchange-Traded Fund | | | | $ | 1,000.00 | | | $ | 1,020.20 | | | $ | 2.64 | | | | | $ | 1,000.00 | | | $ | 1,022.04 | | | $ | 2.64 | | | | | | 0.53 | % |
PIMCO Short Term Municipal Bond Active Exchange-Traded Fund | | | | | 1,000.00 | | | | 1,002.60 | | | | 1.73 | | | | | | 1,000.00 | | | | 1,022.93 | | | | 1.75 | | | | | | 0.35 | |
PIMCO Total Return Active Exchange-Traded Fund | | | | | 1,000.00 | | | | 1,005.10 | | | | 2.82 | | | | | | 1,000.00 | | | | 1,021.85 | | | | 2.84 | | | | | | 0.57 | |
* Expenses Paid During Period are equal to the net annualized expense ratio for the Fund, multiplied by the average account value over the period, multiplied by the number of days in the period/365 (to reflect the one-half year period).
** The Net Annualized Expense Ratio is reflective of any applicable waivers related to contractual agreements for contractual fee waivers or voluntary fee waivers. Details regarding fee waivers can be found in Note 8 in the Notes to Financial Statements.
| | | | | | |
| | ANNUAL REPORT | | JUNE 30, 2015 | | 23 |
Financial Highlights
| | | | | | | | | | | | | | | | | | | | | | | | |
| Selected Per Share Data for the Year or Period Ended: | | Net Asset Value
Beginning of
Year or Period | | | Net Investment
Income (Loss) (a) | | | Net Realized/
Unrealized
Gain (Loss) | | | Total from
Investment
Operations | | | Dividends from
Net Investment
Income | | | Distributions from
Net Realized
Capital Gains | |
| | | | | | |
PIMCO 1-3 Year U.S. Treasury Index Exchange-Traded Fund | | | | | | | | | | | | | | | | | | | | | | | | |
06/30/2015 | | $ | 50.94 | | | $ | 0.25 | | | $ | 0.11 | | | $ | 0.36 | | | $ | (0.25 | ) | | $ | (0.06 | ) |
06/30/2014 | | | 50.78 | | | | 0.16 | | | | 0.19 | | | | 0.35 | | | | (0.16 | ) | | | (0.03 | ) |
06/30/2013 | | | 50.98 | | | | 0.17 | | | | (0.07 | ) | | | 0.10 | | | | (0.16 | ) | | | (0.14 | ) |
06/30/2012 | | | 51.00 | | | | 0.29 | | | | 0.08 | | | | 0.37 | | | | (0.29 | ) | | | (0.10 | ) |
06/30/2011 | | | 50.76 | | | | 0.40 | | | | 0.24 | | | | 0.64 | | | | (0.40 | ) | | | 0.00 | |
| | | | | | |
PIMCO 3-7 Year U.S. Treasury Index Exchange-Traded Fund | | | | | | | | | | | | | | | | | | | | | | | | |
06/30/2015 | | $ | 79.51 | | | $ | 1.07 | | | $ | 0.64 | | | $ | 1.71 | | | $ | (1.09 | ) | | $ | (0.42 | ) |
06/30/2014 | | | 79.28 | | | | 1.01 | | | | 0.38 | | | | 1.39 | | | | (0.92 | ) | | | (0.24 | ) |
06/30/2013 | | | 81.94 | | | | 1.16 | | | | (2.11 | ) | | | (0.95 | ) | | | (1.09 | ) | | | (0.62 | ) |
06/30/2012 | | | 78.36 | | | | 1.29 | | | | 3.91 | | | | 5.20 | | | | (1.28 | ) | | | (0.34 | ) |
06/30/2011 | | | 77.91 | | | | 1.44 | | | | 1.24 | | | | 2.68 | | | | (1.49 | ) | | | (0.74 | ) |
| | | | | | |
PIMCO 7-15 Year U.S. Treasury Index Exchange-Traded Fund | | | | | | | | | | | | | | | | | | | | | | | | |
06/30/2015 | | $ | 83.42 | | | $ | 1.86 | | | $ | 1.13 | | | $ | 2.99 | | | $ | (1.87 | ) | | $ | 0.00 | |
06/30/2014 | | | 82.66 | | | | 1.80 | | | | 0.69 | | | | 2.49 | | | | (1.73 | ) | | | 0.00 | |
06/30/2013 | | | 87.76 | | | | 1.27 | | | | (4.35 | ) | | | (3.08 | ) | | | (1.47 | ) | | | (0.55 | ) |
06/30/2012 | | | 78.21 | | | | 1.86 | | | | 10.13 | | | | 11.99 | | | | (1.77 | ) | | | (0.67 | ) |
06/30/2011 | | | 79.23 | | | | 2.27 | | | | 0.05 | | | | 2.32 | | | | (2.29 | ) | | | (1.05 | ) |
| | | | | | |
PIMCO 25+ Year Zero Coupon U.S. Treasury Index Exchange-Traded Fund | | | | | | | | | | | | | | | | | | | | | | | | |
06/30/2015 | | $ | 99.87 | | | $ | 3.18 | | | $ | 5.62 | | | $ | 8.80 | | | $ | (3.28 | ) | | $ | 0.00 | |
06/30/2014 | | | 94.57 | | | | 3.26 | | | | 5.46 | | | | 8.72 | | | | (3.42 | ) | | | 0.00 | |
06/30/2013 | | | 116.38 | | | | 3.20 | | | | (21.44 | ) | | | (18.24 | ) | | | (3.57 | ) | | | 0.00 | |
06/30/2012 | | | 70.18 | | | | 3.27 | | | | 46.15 | | | | 49.42 | | | | (3.22 | ) | | | 0.00 | |
06/30/2011 | | | 83.02 | | | | 3.25 | | | | (12.86 | ) | | | (9.61 | ) | | | (3.23 | ) | | | 0.00 | |
| | | | | | |
PIMCO 1-5 Year U.S. TIPS Index Exchange-Traded Fund | | | | | | | | | | | | | | | | | | | | | | | | |
06/30/2015 | | $ | 53.58 | | | $ | (0.67 | ) | | $ | (0.54 | ) | | $ | (1.21 | ) | | $ | (0.02 | ) | | $ | 0.00 | |
06/30/2014 | | | 52.69 | | | | 0.34 | | | | 0.86 | | | | 1.20 | | | | (0.31 | ) | | | 0.00 | |
06/30/2013 | | | 53.39 | | | | 0.02 | | | | (0.62 | ) | | | (0.60 | ) | | | (0.07 | ) | | | (0.03 | ) |
06/30/2012 | | | 53.30 | | | | 0.81 | | | | 0.10 | | | | 0.91 | | | | (0.75 | ) | | | (0.07 | ) |
06/30/2011 | | | 51.79 | | | | 1.86 | | | | 1.08 | | | | 2.94 | | | | (1.42 | ) | | | (0.01 | ) |
| | | | | | |
PIMCO 15+ Year U.S. TIPS Index Exchange-Traded Fund | | | | | | | | | | | | | | | | | | | | | | | | |
06/30/2015 | | $ | 65.02 | | | $ | 0.21 | | | $ | (1.83 | ) | | $ | (1.62 | ) | | $ | (0.45 | ) | | $ | 0.00 | |
06/30/2014 | | | 61.05 | | | | 1.09 | | | | 4.23 | | | | 5.32 | | | | (1.35 | ) | | | 0.00 | |
06/30/2013 | | | 69.22 | | | | 0.39 | | | | (8.19 | ) | | | (7.80 | ) | | | (0.37 | ) | | | 0.00 | |
06/30/2012 | | | 56.04 | | | | 1.65 | | | | 13.11 | | | | 14.76 | | | | (1.58 | ) | | | 0.00 | |
06/30/2011 | | | 54.17 | | | | 2.63 | | | | 1.41 | | | | 4.04 | | | | (2.17 | ) | | | 0.00 | |
| | | | | | |
PIMCO Broad U.S. TIPS Index Exchange-Traded Fund | | | | | | | | | | | | | | | | | | | | | | | | |
06/30/2015 | | $ | 58.14 | | | $ | 0.00 | | | $ | (1.17 | ) | | $ | (1.17 | ) | | $ | (0.09 | ) | | $ | 0.00 | |
06/30/2014 | | | 56.40 | | | | 0.71 | | | | 1.81 | | | | 2.52 | | | | (0.78 | ) | | | 0.00 | |
06/30/2013 | | | 59.93 | | | | 0.44 | | | | (3.66 | ) | | | (3.22 | ) | | | (0.31 | ) | | | (0.00 | )^ |
06/30/2012 | | | 54.58 | | | | 1.40 | | | | 5.23 | | | | 6.63 | | | | (1.28 | ) | | | 0.00 | |
06/30/2011 | | | 52.95 | | | | 2.18 | | | | 1.67 | | | | 3.85 | | | | (1.91 | ) | | | (0.31 | ) |
| | | | | | |
PIMCO 0-5 Year High Yield Corporate Bond Index Exchange-Traded Fund | | | | | | | | | | | | | | | | | | | | | | | | |
06/30/2015 | | $ | 106.76 | | | $ | 4.06 | | | $ | (4.96 | ) | | $ | (0.90 | ) | | $ | (4.53 | ) | | $ | (0.96 | ) |
06/30/2014 | | | 102.54 | | | | 4.23 | | | | 4.83 | | | | 9.06 | | | | (4.59 | ) | | | (0.25 | ) |
06/30/2013 | | | 99.62 | | | | 4.70 | | | | 3.37 | | | | 8.07 | | | | (5.15 | ) | | | 0.00 | |
06/30/2012 | | | 100.29 | | | | 6.06 | | | | (1.13 | ) | | | 4.93 | | | | (5.60 | ) | | | 0.00 | |
06/16/2011 - 06/30/2011 | | | 100.00 | | | | 0.18 | | | | 0.27 | | | | 0.45 | | | | (0.16 | ) | | | 0.00 | |
| | | | | | |
PIMCO Investment Grade Corporate Bond Index Exchange-Traded Fund | | | | | | | | | | | | | | | | | | | | | | | | |
06/30/2015 | | $ | 103.21 | | | $ | 3.14 | | | $ | (2.35 | ) | | $ | 0.79 | | | $ | (3.17 | ) | | $ | (0.33 | ) |
06/30/2014 | | | 102.11 | | | | 3.42 | | | | 4.64 | | | | 8.06 | | | | (3.28 | ) | | | (3.68 | ) |
06/30/2013 | | | 105.46 | | | | 3.40 | | | | (2.29 | ) | | | 1.11 | | | | (3.71 | ) | | | (0.75 | ) |
06/30/2012 | | | 99.76 | | | | 3.44 | | | | 5.61 | | | | 9.05 | | | | (3.35 | ) | | | 0.00 | |
09/20/2010 - 06/30/2011 | | | 100.00 | | | | 2.60 | | | | (0.23 | ) | | | 2.37 | | | | (2.56 | ) | | | (0.05 | ) |
| | | | | | |
| 24 | | PIMCO ETF TRUST | | | | See Accompanying Notes |
| | | | | | | | | | | | | | | | | | | | | | | | | | | | | | | | | | |
Tax Basis
Return of
Capital | | | Total
Distributions | | | Net Asset
Value End
of Year or
Period | | | Total
Return | | | Net Assets
End of
Year or
Period (000s) | | | Ratio of
Expenses
to Average
Net Assets | | | Ratio of
Expenses
to Average
Net Assets
Excluding
Waivers | | | Net Investment
Income (Loss) to
Average
Net Assets | | | Portfolio
Turnover Rate (b) | |
| | | | | | | | |
| | | | | | | | | | | | | | | | | | | | | | | | | | | | | | | | | | |
| $ | 0.00 | | | $ | (0.31 | ) | | $ | 50.99 | | | | 0.70 | % | | $ | 107,175 | | | | 0.14 | % | | | 0.16 | % | | | 0.49 | % | | | 60 | % |
| | 0.00 | | | | (0.19 | ) | | | 50.94 | | | | 0.68 | | | | 127,442 | | | | 0.10 | | | | 0.16 | | | | 0.32 | | | | 61 | |
| | 0.00 | | | | (0.30 | ) | | | 50.78 | | | | 0.20 | | | | 129,595 | | | | 0.09 | | | | 0.15 | | | | 0.33 | | | | 15 | |
| | 0.00 | | | | (0.39 | ) | | | 50.98 | | | | 0.74 | | | | 132,657 | | | | 0.09 | | | | 0.15 | | | | 0.57 | | | | 8 | |
| | 0.00 | | | | (0.40 | ) | | | 51.00 | | | | 1.26 | | | | 107,206 | | | | 0.09 | | | | 0.15 | | | | 0.78 | | | | 18 | |
| | | | | | | | |
| | | | | | | | | | | | | | | | | | | | | | | | | | | | | | | | | | |
| $ | 0.00 | | | $ | (1.51 | ) | | $ | 79.71 | | | | 2.16 | % | | $ | 9,300 | | | | 0.16 | % | | | 0.16 | % | | | 1.34 | % | | | 47 | % |
| | 0.00 | | | | (1.16 | ) | | | 79.51 | | | | 1.78 | | | | 13,251 | | | | 0.16 | | | | 0.16 | | | | 1.28 | | | | 39 | |
| | 0.00 | | | | (1.71 | ) | | | 79.28 | | | | (1.20 | ) | | | 21,140 | | | | 0.15 | | | | 0.15 | | | | 1.42 | | | | 4 | |
| | 0.00 | | | | (1.62 | ) | | | 81.94 | | | | 6.67 | | | | 21,852 | | | | 0.15 | | | | 0.15 | | | | 1.59 | | | | 37 | |
| | 0.00 | | | | (2.23 | ) | | | 78.36 | | | | 3.49 | | | | 20,895 | | | | 0.15 | | | | 0.15 | | | | 1.83 | | | | 48 | |
| | | | | | | | |
| | | | | | | | | | | | | | | | | | | | | | | | | | | | | | | | | | |
| $ | 0.00 | | | $ | (1.87 | ) | | $ | 84.54 | | | | 3.58 | % | | $ | 20,009 | | | | 0.15 | % | | | 0.15 | % | | | 2.18 | % | | | 45 | % |
| | 0.00 | | | | (1.73 | ) | | | 83.42 | | | | 3.07 | | | | 73,969 | | | | 0.15 | | | | 0.15 | | | | 2.19 | | | | 52 | |
| | 0.00 | | | | (2.02 | ) | | | 82.66 | | | | (3.61 | ) | | | 11,296 | | | | 0.15 | | | | 0.15 | | | | 1.45 | | | | 26 | |
| | 0.00 | | | | (2.44 | ) | | | 87.76 | | | | 15.47 | | | | 37,446 | | | | 0.15 | | | | 0.15 | | | | 2.17 | | | | 24 | |
| | 0.00 | | | | (3.34 | ) | | | 78.21 | | | | 3.00 | | | | 8,342 | | | | 0.15 | | | | 0.15 | | | | 2.87 | | | | 76 | |
| | | | | | | | |
| | | | | | | | | | | | | | | | | | | | | | | | | | | | | | | | | | |
| $ | 0.00 | | | $ | (3.28 | ) | | $ | 105.39 | | | | 8.64 | % | | $ | 96,960 | | | | 0.16 | % | | | 0.16 | % | | | 2.75 | % | | | 18 | % |
| | 0.00 | | | | (3.42 | ) | | | 99.87 | | | | 9.70 | | | | 76,902 | | | | 0.16 | | | | 0.16 | | | | 3.61 | | | | 18 | |
| | 0.00 | | | | (3.57 | ) | | | 94.57 | | | | (15.97 | ) | | | 82,276 | | | | 0.15 | | | | 0.15 | | | | 2.89 | | | | 8 | |
| | 0.00 | | | | (3.22 | ) | | | 116.38 | | | | 70.82 | | | | 169,915 | | | | 0.15 | | | | 0.15 | | | | 3.15 | | | | 11 | |
| | 0.00 | | | | (3.23 | ) | | | 70.18 | | | | (11.69 | ) | | | 40,705 | | | | 0.15 | | | | 0.15 | | | | 4.41 | | | | 50 | |
| | | | | | | | |
| | | | | | | | | | | | | | | | | | | | | | | | | | | | | | | | | | |
| $ | (0.17 | ) | | $ | (0.19 | ) | | $ | 52.18 | | | | (2.27 | )% | | $ | 1,182,866 | | | | 0.20 | % | | | 0.20 | % | | | (1.28 | )% | | | 31 | % |
| | 0.00 | | | | (0.31 | ) | | | 53.58 | | | | 2.28 | | | | 1,337,875 | | | | 0.20 | | | | 0.20 | | | | 0.63 | | | | 33 | |
| | 0.00 | | | | (0.10 | ) | | | 52.69 | | | | (1.13 | ) | | | 1,041,609 | | | | 0.20 | | | | 0.20 | | | | 0.04 | | | | 11 | |
| | 0.00 | | | | (0.82 | ) | | | 53.39 | | | | 1.71 | | | | 999,496 | | | | 0.20 | | | | 0.20 | | | | 1.51 | | | | 31 | |
| | 0.00 | | | | (1.43 | ) | | | 53.30 | | | | 5.70 | | | | 1,184,369 | | | | 0.20 | | | | 0.21 | | | | 3.50 | | | | 17 | |
| | | | | | | | |
| | | | | | | | | | | | | | | | | | | | | | | | | | | | | | | | | | |
| $ | 0.00 | | | $ | (0.45 | ) | | $ | 62.95 | | | | (2.52 | )% | | $ | 92,539 | | | | 0.21 | % | | | 0.21 | % | | | 0.31 | % | | | 14 | % |
| | 0.00 | | | | (1.35 | ) | | | 65.02 | | | | 8.83 | | | | 69,570 | | | | 0.21 | | | | 0.21 | | | | 1.81 | | | | 47 | |
| | 0.00 | | | | (0.37 | ) | | | 61.05 | | | | (11.33 | ) | | | 105,004 | | | | 0.20 | | | | 0.20 | | | | 0.56 | | | | 16 | |
| | 0.00 | | | | (1.58 | ) | | | 69.22 | | | | 26.53 | | | | 375,182 | | | | 0.20 | | | | 0.20 | | | | 2.53 | | | | 11 | |
| | 0.00 | | | | (2.17 | ) | | | 56.04 | | | | 7.58 | | | | 258,901 | | | | 0.20 | | | | 0.20 | | | | 4.76 | | | | 38 | |
| | | | | | | | |
| | | | | | | | | | | | | | | | | | | | | | | | | | | | | | | | | | |
| $ | (0.15 | ) | | $ | (0.24 | ) | | $ | 56.73 | | | | (2.02 | )% | | $ | 92,473 | | | | 0.21 | % | | | 0.21 | % | | | (0.01 | )% | | | 23 | % |
| | 0.00 | | | | (0.78 | ) | | | 58.14 | | | | 4.50 | | | | 106,402 | | | | 0.21 | | | | 0.21 | | | | 1.26 | | | | 19 | |
| | 0.00 | | | | (0.31 | ) | | | 56.40 | | | | (5.41 | ) | | | 72,186 | | | | 0.20 | | | | 0.20 | | | | 0.72 | | | | 11 | |
| | 0.00 | | | | (1.28 | ) | | | 59.93 | | | | 12.21 | | | | 109,678 | | | | 0.20 | | | | 0.20 | | | | 2.38 | | | | 6 | |
| | 0.00 | | | | (2.22 | ) | | | 54.58 | | | | 7.39 | | | | 56,219 | | | | 0.20 | | | | 0.21 | | | | 4.04 | | | | 20 | |
| | | | | | | | |
| | | | | | | | | | | | | | | | | | | | | | | | | | | | | | | | | | |
| $ | 0.00 | | | $ | (5.49 | ) | | $ | 100.37 | | | | (0.82 | )% | | $ | 2,805,241 | | | | 0.55 | % | | | 0.55 | % | | | 3.92 | % | | | 28 | % |
| | 0.00 | | | | (4.84 | ) | | | 106.76 | | | | 8.98 | | | | 5,119,202 | | | | 0.55 | | | | 0.55 | | | | 3.98 | | | | 28 | |
| | 0.00 | | | | (5.15 | ) | | | 102.54 | | | | 8.21 | | | | 2,307,178 | | | | 0.55 | | | | 0.55 | | | | 4.52 | | | | 33 | |
| | 0.00 | | | | (5.60 | ) | | | 99.62 | | | | 5.16 | | | | 323,771 | | | | 0.55 | | | | 0.55 | | | | 6.14 | | | | 33 | |
| | 0.00 | | | | (0.16 | ) | | | 100.29 | | | | 0.45 | | | | 25,073 | | | | 0.55 | * | | | 7.30 | * | | | 4.65 | * | | | 0 | |
| | | | | | | | |
| | | | | | | | | | | | | | | | | | | | | | | | | | | | | | | | | | |
| $ | 0.00 | | | $ | (3.50 | ) | | $ | 100.50 | | | | 0.74 | % | | $ | 244,203 | | | | 0.20 | % | | | 0.20 | % | | | 3.04 | % | | | 12 | % |
| | 0.00 | | | | (6.96 | ) | | | 103.21 | | | | 8.24 | | | | 199,196 | | | | 0.20 | | | | 0.20 | | | | 3.36 | | | | 17 | |
| | 0.00 | | | | (4.46 | ) | | | 102.11 | | | | 0.92 | | | | 140,916 | | | | 0.20 | | | | 0.20 | | | | 3.15 | | | | 34 | |
| | 0.00 | | | | (3.35 | ) | | | 105.46 | | | | 9.20 | | | | 256,267 | | | | 0.20 | | | | 0.20 | | | | 3.32 | | | | 5 | |
| | 0.00 | | | | (2.61 | ) | | | 99.76 | | | | 2.40 | | | | 72,821 | | | | 0.20 | * | | | 0.34 | * | | | 3.36 | * | | | 69 | |
| | | | | | |
| | ANNUAL REPORT | | JUNE 30, 2015 | | 25 |
Financial Highlights (Cont.)
| | | | | | | | | | | | | | | | | | | | | | | | |
| Selected Per Share Data for the Year or Period Ended: | | Net Asset Value
Beginning of
Year or Period | | | Net Investment
Income (Loss) (a) | | | Net Realized/
Unrealized
Gain (Loss) | | | Total from
Investment
Operations | | | Dividends from
Net Investment
Income | | | Distributions from
Net Realized
Capital Gains | |
| | | | | | |
PIMCO Diversified Income Active Exchange-Traded Fund | | | | | | | | | | | | | | | | | | | | | | | | |
06/30/2015 | | $ | 51.98 | | | $ | 2.00 | | | $ | (2.81 | ) | | $ | (0.81 | ) | | $ | (2.48 | ) | | $ | (0.38 | ) |
01/22/2014 - 06/30/2014 | | | 50.00 | | | | 0.77 | | | | 1.87 | | | | 2.64 | | | | (0.66 | ) | | | 0.00 | |
| | | | | | |
PIMCO Enhanced Short Maturity Active Exchange-Traded Fund | | | | | | | | | | | | | | | | | | | | | | | | |
06/30/2015 | | $ | 101.45 | | | $ | 0.62 | | | $ | (0.09 | ) | | $ | 0.53 | | | $ | (0.74 | ) | | $ | (0.09 | ) |
06/30/2014 | | | 101.26 | | | | 0.67 | | | | 0.36 | | | | 1.03 | | | | (0.69 | ) | | | (0.15 | ) |
06/30/2013 | | | 101.08 | | | | 0.88 | | | | 0.22 | | | | 1.10 | | | | (0.92 | ) | | | 0.00 | |
06/30/2012 | | | 101.04 | | | | 1.06 | | | | 0.07 | | | | 1.13 | | | | (1.03 | ) | | | (0.06 | ) |
06/30/2011 | | | 100.34 | | | | 0.86 | | | | 1.03 | | | | 1.89 | | | | (0.90 | ) | | | (0.29 | ) |
| | | | | | |
PIMCO Foreign Currency Strategy Active Exchange-Traded Fund | | | | | | | | | | | | | | | | | | | | | | | | |
06/30/2015 | | $ | 48.68 | | | $ | 0.50 | | | $ | (6.00 | ) | | $ | (5.50 | ) | | $ | 0.00 | | | $ | 0.00 | |
06/30/2014 | | | 47.14 | | | | 0.35 | | | | 1.19 | | | | 1.54 | | | | 0.00 | | | | 0.00 | |
02/11/2013 - 06/30/2013 | | | 50.00 | | | | 0.13 | | | | (2.99 | ) | | | (2.86 | ) | | | 0.00 | | | | 0.00 | |
| | | | | | |
PIMCO Global Advantage® Inflation-Linked Bond Active Exchange-Traded Fund | | | | | | | | | | | | | | | | | | | | | | | | |
06/30/2015 | | $ | 51.66 | | | $ | 1.32 | | | $ | (7.35 | ) | | $ | (6.03 | ) | | $ | (2.12 | ) | | $ | 0.00 | |
06/30/2014 | | | 48.55 | | | | 1.94 | | | | 1.71 | | | | 3.65 | | | | (0.35 | ) | | | (0.19 | ) |
06/30/2013 | | | 50.28 | | | | 1.34 | | | | (2.57 | ) | | | (1.23 | ) | | | (0.34 | ) | | | (0.16 | ) |
04/30/2012 - 06/30/2012 | | | 50.00 | | | | 0.30 | | | | (0.02 | ) | | | 0.28 | | | | 0.00 | | | | 0.00 | |
| | | | | | |
PIMCO Intermediate Municipal Bond Active Exchange-Traded Fund | | | | | | | | | | | | | | | | | | | | | | | | |
06/30/2015 | | $ | 53.17 | | | $ | 1.12 | | | $ | (0.34 | ) | | $ | 0.78 | | | $ | (1.11 | ) | | $ | 0.00 | |
06/30/2014 | | | 52.06 | | | | 1.05 | | | | 1.13 | | | | 2.18 | | | | (1.07 | ) | | | 0.00 | |
06/30/2013 | | | 53.70 | | | | 1.23 | | | | (1.60 | ) | | | (0.37 | ) | | | (1.20 | ) | | | (0.07 | ) |
06/30/2012 | | | 51.44 | | | | 1.22 | | | | 2.29 | | | | 3.51 | | | | (1.19 | ) | | | (0.06 | ) |
06/30/2011 | | | 50.63 | | | | 1.21 | | | | 0.90 | | | | 2.11 | | | | (1.21 | ) | | | (0.09 | ) |
| | | | | | |
PIMCO Low Duration Active Exchange-Traded Fund | | | | | | | | | | | | | | | | | | | | | | | | |
06/30/2015 | | $ | 101.27 | | | $ | 1.32 | | | $ | 1.05 | | | $ | 2.37 | | | $ | (1.77 | ) | | $ | (0.25 | ) |
01/22/2014 - 06/30/2014 | | | 100.00 | | | | 0.30 | | | | 1.22 | | | | 1.52 | | | | (0.25 | ) | | | 0.00 | |
| | | | | | |
PIMCO Short Term Municipal Bond Active Exchange-Traded Fund | | | | | | | | | | | | | | | | | | | | | | | | |
06/30/2015 | | $ | 50.47 | | | $ | 0.38 | | | $ | (0.19 | ) | | $ | 0.19 | | | $ | (0.42 | ) | | $ | 0.00 | |
06/30/2014 | | | 50.14 | | | | 0.26 | | | | 0.29 | | | | 0.55 | | | | (0.22 | ) | | | 0.00 | |
06/30/2013 | | | 50.54 | | | | 0.40 | | | | (0.33 | ) | | | 0.07 | | | | (0.47 | ) | | | (0.00 | )^ |
06/30/2012 | | | 50.36 | | | | 0.48 | | | | 0.20 | | | | 0.68 | | | | (0.47 | ) | | | (0.03 | ) |
06/30/2011 | | | 50.13 | | | | 0.61 | | | | 0.22 | | | | 0.83 | | | | (0.60 | ) | | | 0.00 | |
| | | | | | |
PIMCO Total Return Active Exchange-Traded Fund | | | | | | | | | | | | | | | | | | | | | | | | |
06/30/2015 | | $ | 108.85 | | | $ | 2.83 | | | $ | 0.42 | | | $ | 3.25 | | | $ | (5.41 | ) | | $ | 0.00 | |
06/30/2014 | | | 105.66 | | | | 2.38 | | | | 2.94 | | | | 5.32 | | | | (1.69 | ) | | | (0.44 | ) |
06/30/2013 | | | 105.55 | | | | 2.46 | | | | 0.87 | | | | 3.33 | | | | (2.34 | ) | | | (0.88 | ) |
02/29/2012 - 06/30/2012 | | | 100.00 | | | | 1.00 | | | | 5.26 | | | | 6.26 | | | | (0.71 | ) | | | 0.00 | |
| ^ | Reflects an amount rounding to less than one cent. |
| † | Reflects an interest expense rounding to less than 0.01%. |
| (a) | Per share amounts based on average number of shares outstanding during the year or period. |
| (b) | Portfolio turnover rate excludes securities received or delivered from in-kind processing of creation or redemptions. |
| (c) | Ratio of expenses to average net assets excluding interest expense was 0.35%. |
| (d) | Ratio of expenses to average net assets excluding waivers and interest expense was 0.61%. |
| (e) | Ratio of expenses to average net assets excluding interest expense was 0.60%. |
| (f) | Ratio of expenses to average net assets excluding waivers and interest expense was 2.13%. |
| (g) | Ratio of expenses to average net assets excluding interest expense was 0.50% |
| (h) | Ratio of expenses to average net assets excluding waivers and interest expense was 0.55% |
| (i) | Ratio of expenses to average net assets excluding interest expense was 0.55% |
| (j) | Ratio of expenses to average net assets excluding waivers and interest expense was 0.56%. |
| | | | | | |
| 26 | | PIMCO ETF TRUST | | | | See Accompanying Notes |
| | | | | | | | | | | | | | | | | | | | | | | | | | | | | | | | | | |
Tax Basis
Return of
Capital | | | Total
Distributions | | | Net Asset
Value End
of Year or
Period | | | Total
Return | | | Net Assets
End of
Year or
Period (000s) | | | Ratio of
Expenses
to Average
Net Assets | | | Ratio of
Expenses
to Average
Net Assets
Excluding
Waivers | | | Net Investment
Income (Loss) to
Average
Net Assets | | | Portfolio
Turnover Rate (b) | |
| | | | | | | | |
| | | | | | | | | | | | | | | | | | | | | | | | | | | | | | | | | | |
| $ | 0.00 | | | $ | (2.86 | ) | | $ | 48.31 | | | | (1.55 | )% | | $ | 56,043 | | | | 0.85 | %† | | | 0.85 | %† | | | 4.01 | % | | | 44 | % |
| | 0.00 | | | | (0.66 | ) | | | 51.98 | | | | 5.30 | | | | 44,706 | | | | 0.85 | * | | | 1.04 | * | | | 3.45 | * | | | 61 | |
| | | | | | | | |
| | | | | | | | | | | | | | | | | | | | | | | | | | | | | | | | | | |
| $ | 0.00 | | | $ | (0.83 | ) | | $ | 101.15 | | | | 0.53 | % | | $ | 3,536,050 | | | | 0.36 | %(c) | | | 0.36 | %(c) | | | 0.61 | % | | | 193 | % |
| | 0.00 | | | | (0.84 | ) | | | 101.45 | | | | 1.02 | | | | 3,773,896 | | | | 0.35 | † | | | 0.35 | † | | | 0.66 | | | | 188 | |
| | 0.00 | | | | (0.92 | ) | | | 101.26 | | | | 1.09 | | | | 3,752,615 | | | | 0.35 | | | | 0.35 | | | | 0.87 | | | | 100 | |
| | 0.00 | | | | (1.09 | ) | | | 101.08 | | | | 1.13 | | | | 1,715,342 | | | | 0.35 | | | | 0.35 | | | | 1.05 | | | | 229 | |
| | 0.00 | | | | (1.19 | ) | | | 101.04 | | | | 1.89 | | | | 1,233,727 | | | | 0.35 | | | | 0.36 | | | | 0.85 | | | | 280 | |
| | | | | | | | |
| | | | | | | | | | | | | | | | | | | | | | | | | | | | | | | | | | |
| $ | 0.00 | | | $ | 0.00 | | | $ | 43.18 | | | | (11.30 | )% | | $ | 14,682 | | | | 0.66 | %† | | | 0.66 | %† | | | 1.09 | % | | | 61 | % |
| | 0.00 | | | | 0.00 | | | | 48.68 | | | | 3.27 | | | | 21,417 | | | | 0.66 | | | | 0.66 | | | | 0.73 | | | | 39 | |
| | 0.00 | | | | 0.00 | | | | 47.14 | | | | (5.72 | ) | | | 25,456 | | | | 0.65 | * | | | 1.22 | * | | | 0.70 | * | | | 37 | |
| | | | | | | | |
| | | | | | | | | | | | | | | | | | | | | | | | | | | | | | | | | | |
| $ | 0.00 | | | $ | (2.12 | ) | | $ | 43.51 | | | | (11.96 | )% | | $ | 102,680 | | | | 0.67 | %(d) | | | 0.67 | %(d) | | | 2.81 | % | | | 114 | % |
| | 0.00 | | | | (0.54 | ) | | | 51.66 | | | | 7.55 | | | | 137,415 | | | | 0.62 | (d) | | | 0.62 | (d) | | | 3.93 | * | | | 80 | |
| | 0.00 | | | | (0.50 | ) | | | 48.55 | | | | (2.55 | ) | | | 119,436 | | | | 0.63 | (e) | | | 0.64 | (d) | | | 2.54 | | | | 216 | |
| | 0.00 | | | | 0.00 | | | | 50.28 | | | | 0.56 | | | | 28,156 | | | | 0.61 | *(e) | | | 2.14 | *(f) | | | 3.63 | * | | | 381 | |
| | | | | | | | |
| | | | | | | | | | | | | | | | | | | | | | | | | | | | | | | | | | |
| $ | 0.00 | | | $ | (1.11 | ) | | $ | 52.84 | | | | 1.45 | % | | $ | 227,728 | | | | 0.35 | % | | | 0.35 | % | | | 2.09 | % | | | 13 | % |
| | 0.00 | | | | (1.07 | ) | | | 53.17 | | | | 4.23 | | | | 210,548 | | | | 0.35 | | | | 0.35 | | | | 2.01 | | | | 15 | |
| | 0.00 | | | | (1.27 | ) | | | 52.06 | | | | (0.76 | ) | | | 187,931 | | | | 0.35 | | | | 0.35 | | | | 2.26 | | | | 35 | |
| | 0.00 | | | | (1.25 | ) | | | 53.70 | | | | 6.88 | | | | 153,576 | | | | 0.35 | | | | 0.35 | | | | 2.30 | | | | 11 | |
| | 0.00 | | | | (1.30 | ) | | | 51.44 | | | | 4.20 | | | | 90,529 | | | | 0.35 | | | | 0.36 | | | | 2.37 | | | | 44 | |
| | | | | | | | |
| | | | | | | | | | | | | | | | | | | | | | | | | | | | | | | | | | |
| $ | 0.00 | | | $ | (2.02 | ) | | $ | 101.62 | | | | 2.37 | % | | $ | 175,808 | | | | 0.52 | %(g) | | | 0.57 | %(h) | | | 1.30 | % | | | 1,591 | % |
| | 0.00 | | | | (0.25 | ) | | | 101.27 | | | | 1.52 | | | | 139,750 | | | | 0.56 | * | | | 0.69 | * | | | 0.69 | * | | | 4,098 | |
| | | | | | | | |
| | | | | | | | | | | | | | | | | | | | | | | | | | | | | | | | | | |
| $ | 0.00 | | | $ | (0.42 | ) | | $ | 50.24 | | | | 0.37 | % | | $ | 55,765 | | | | 0.35 | % | | | 0.35 | % | | | 0.76 | % | | | 20 | % |
| | 0.00 | | | | (0.22 | ) | | | 50.47 | | | | 1.10 | | | | 76,211 | | | | 0.35 | | | | 0.35 | | | | 0.51 | | | | 44 | |
| | 0.00 | | | | (0.47 | ) | | | 50.14 | | | | 0.14 | | | | 60,671 | | | | 0.35 | | | | 0.35 | | | | 0.79 | | | | 42 | |
| | 0.00 | | | | (0.50 | ) | | | 50.54 | | | | 1.36 | | | | 43,463 | | | | 0.35 | | | | 0.35 | | | | 0.96 | | | | 17 | |
| | 0.00 | | | | (0.60 | ) | | | 50.36 | | | | 1.67 | | | | 23,168 | | | | 0.35 | | | | 0.35 | | | | 1.20 | | | | 35 | |
| | | | | | | | |
| | | | | | | | | | | | | | | | | | | | | | | | | | | | | | | | | | |
| $ | 0.00 | | | $ | (5.41 | ) | | $ | 106.69 | | | | 3.01 | % | | $ | 2,489,072 | | | | 0.57 | %(i) | | | 0.63 | %(d) | | | 2.60 | % | | | 180 | % |
| | 0.00 | | | | (2.13 | ) | | | 108.85 | | | | 5.10 | | | | 3,431,844 | | | | 0.56 | (i) | | | 0.57 | (j) | | | 2.24 | | | | 577 | |
| | 0.00 | | | | (3.22 | ) | | | 105.66 | | | | 3.11 | | | | 4,398,592 | | | | 0.55 | | | | 0.55 | | | | 2.26 | | | | 449 | |
| | 0.00 | | | | (0.71 | ) | | | 105.55 | | | | 6.27 | | | | 1,765,865 | | | | 0.55 | * | | | 0.62 | * | | | 2.86 | * | | | 322 | |
| | | | | | |
| | ANNUAL REPORT | | JUNE 30, 2015 | | 27 |
Statements of Assets and Liabilities
| | | | | | | | | | | | | | | | | | | | |
| (Amounts in thousands†, except per share amounts) | | PIMCO
1-3 Year
U.S. Treasury
Index Exchange-
Traded Fund | | | PIMCO
3-7 Year
U.S. Treasury
Index Exchange-
Traded Fund | | | PIMCO
7-15 Year
U.S. Treasury
Index Exchange-
Traded Fund | | | PIMCO
25+ Year
Zero Coupon
U.S. Treasury
Index Exchange-
Traded Fund | | | PIMCO
1-5 Year
U.S. TIPS
Index Exchange-
Traded Fund | |
| | | | | |
Assets: | | | | | | | | | | | | | | | | | | | | |
Investments, at value | | | | | | | | | | | | | | | | | | | | |
Investments in securities*^ | | $ | 106,962 | | | $ | 9,205 | | | $ | 19,789 | | | $ | 102,795 | | | $ | 1,177,978 | |
Investments in Affiliates | | | 0 | | | | 0 | | | | 0 | | | | 0 | | | | 0 | |
Financial Derivative Instruments | | | | | | | | | | | | | | | | | | | | |
Exchange-traded or centrally cleared | | | 0 | | | | 0 | | | | 0 | | | | 0 | | | | 0 | |
Over the counter | | | 0 | | | | 0 | | | | 0 | | | | 0 | | | | 0 | |
Cash | | | 0 | | | | 60 | | | | 26 | | | | 10 | | | | 0 | |
Deposits with counterparty | | | 0 | | | | 0 | | | | 0 | | | | 0 | | | | 0 | |
Foreign currency, at value | | | 0 | | | | 0 | | | | 0 | | | | 0 | | | | 0 | |
Receivable for investments sold~ | | | 5,394 | | | | 210 | | | | 4,302 | | | | 4,754 | | | | 5,216 | |
Receivable for Fund shares sold | | | 0 | | | | 0 | | | | 0 | | | | 0 | | | | 0 | |
Interest receivable | | | 417 | | | | 43 | | | | 169 | | | | 0 | | | | 5,090 | |
Reimbursement receivable from PIMCO | | | 7 | | | | 1 | | | | 0 | | | | 6 | | | | 0 | |
| | | | | |
Total Assets | | | 112,780 | | | | 9,519 | | | | 24,286 | | | | 107,565 | | | | 1,188,284 | |
| | | | | |
Liabilities: | | | | | | | | | | | | | | | | | | | | |
Borrowings & Other Financing Transactions | | | | | | | | | | | | | | | | | | | | |
Payable for reverse repurchase agreements | | $ | 0 | | | $ | 0 | | | $ | 0 | | | $ | 0 | | | $ | 0 | |
Payable for sale-buyback transactions | | | 0 | | | | 0 | | | | 0 | | | | 0 | | | | 0 | |
Payable for short sales | | | 0 | | | | 0 | | | | 0 | | | | 0 | | | | 0 | |
Financial Derivative Instruments | | | | | | | | | | | | | | | | | | | | |
Exchange-traded or centrally cleared | | | 0 | | | | 0 | | | | 0 | | | | 0 | | | | 0 | |
Over the counter | | | 0 | | | | 0 | | | | 0 | | | | 0 | | | | 0 | |
Payable for investments purchased~ | | | 5,525 | | | | 205 | | | | 0 | | | | 4,487 | | | | 0 | |
Payable upon return of securities loaned | | | 0 | | | | 0 | | | | 0 | | | | 0 | | | | 0 | |
Deposits from counterparty | | | 0 | | | | 0 | | | | 0 | | | | 0 | | | | 0 | |
Payable for Fund shares redeemed | | | 0 | | | | 0 | | | | 4,227 | | | | 5,270 | | | | 5,218 | |
Dividends payable | | | 53 | | | | 11 | | | | 46 | | | | 824 | | | | 0 | |
Accrued management fees | | | 14 | | | | 1 | | | | 3 | | | | 13 | | | | 194 | |
Accrued reimbursement to PIMCO | | | 0 | | | | 0 | | | | 0 | | | | 0 | | | | 0 | |
Other liabilities | | | 13 | | | | 2 | | | | 1 | | | | 11 | | | | 6 | |
| | | | | |
Total Liabilities | | | 5,605 | | | | 219 | | | | 4,277 | | | | 10,605 | | | | 5,418 | |
| | | | | |
Net Assets | | $ | 107,175 | | | $ | 9,300 | | | $ | 20,009 | | | $ | 96,960 | | | $ | 1,182,866 | |
| | | | | |
Net Assets Consist of: | | | | | | | | | | | | | | | | | | | | |
Paid in capital | | $ | 106,991 | | | $ | 9,320 | | | $ | 20,063 | | | $ | 130,357 | | | $ | 1,206,876 | |
Undistributed (overdistributed) net investment income | | | (27 | ) | | | (34 | ) | | | (24 | ) | | | 35 | | | | (9,183 | ) |
Accumulated undistributed net realized gain (loss) | | | 30 | | | | (2 | ) | | | 97 | | | | (17,775 | ) | | | (6,736 | ) |
Net unrealized appreciation (depreciation) | | | 181 | | | | 16 | | | | (127 | ) | | | (15,657 | ) | | | (8,091 | ) |
| | | $ | 107,175 | | | $ | 9,300 | | | $ | 20,009 | | | $ | 96,960 | | | $ | 1,182,866 | |
| | | | | |
Shares Issued and Outstanding | | | 2,102 | | | | 117 | | | | 237 | | | | 920 | | | | 22,670 | |
| | | | | |
Net Asset Value and Redemption Price Per Share Outstanding | | $ | 50.99 | | | $ | 79.71 | | | $ | 84.54 | | | $ | 105.39 | | | $ | 52.18 | |
| | | | | |
Cost of Investments in securities | | $ | 106,781 | | | $ | 9,189 | | | $ | 19,916 | | | $ | 118,452 | | | $ | 1,186,069 | |
Cost of Investments in Affiliates | | $ | 0 | | | $ | 0 | | | $ | 0 | | | $ | 0 | | | $ | 0 | |
Cost of Foreign Currency Held | | $ | 0 | | | $ | 0 | | | $ | 0 | | | $ | 0 | | | $ | 0 | |
Proceeds Received on Short Sales | | $ | 0 | | | $ | 0 | | | $ | 0 | | | $ | 0 | | | $ | 0 | |
| | | | | |
Cost or Premiums of Financial Derivative Instruments, net | | $ | 0 | | | $ | 0 | | | $ | 0 | | | $ | 0 | | | $ | 0 | |
| | | | | |
* Includes repurchase agreements of: | | $ | 565 | | | $ | 0 | | | $ | 0 | | | $ | 0 | | | $ | 2,804 | |
^ Includes securities on loan of: | | $ | 0 | | | $ | 0 | | | $ | 0 | | | $ | 0 | | | $ | 0 | |
| † | A zero balance may reflect actual amounts rounding to less than one thousand. |
| ~ | A portion of the balance may represent to-be-announced (TBA) securities. See Note 4 in the Notes to Financial Statements. |
| | | | | | |
| 28 | | PIMCO ETF TRUST | | | | See Accompanying Notes |
June 30, 2015
| | | | | | | | | | | | | | | | | | | | | | | | | | |
PIMCO
15+ Year
U.S. TIPS
Index Exchange-
Traded Fund | | | PIMCO
Broad
U.S. TIPS
Index Exchange-
Traded Fund | | | PIMCO
0-5 Year
High Yield
Corporate Bond
Index Exchange-
Traded Fund | | | PIMCO
Investment Grade
Corporate Bond
Index Exchange-
Traded Fund | | | PIMCO
Diversified
Income
Active Exchange-
Traded Fund | | | PIMCO
Enhanced
Short Maturity
Active Exchange-
Traded Fund | | | PIMCO
Foreign
Currency Strategy
Active Exchange-
Traded Fund | |
| | | | | | |
| | | | | | | | | | | | | | | | | | | | | | | | | | |
| | | | | | | | | | | | | | | | | | | | | | | | | | | |
| $ | 92,205 | | | $ | 92,228 | | | $ | 2,775,900 | | | $ | 242,549 | | | $ | 58,580 | | | $ | 3,804,250 | | | $ | 14,861 | |
| | 0 | | | | 0 | | | | 43,471 | | | | 1,693 | | | | 0 | | | | 0 | | | | 0 | |
| | | | | | | | | | | | | | | | | | | | | | | | | | | |
| | 0 | | | | 0 | | | | 1,761 | | | | 0 | | | | 32 | | | | 0 | | | | 0 | |
| | 0 | | | | 0 | | | | 0 | | | | 0 | | | | 43 | | | | 0 | | | | 358 | |
| | 0 | | | | 0 | | | | 1,067 | | | | 0 | | | | 9 | | | | 7 | | | | 0 | |
| | 0 | | | | 0 | | | | 4,063 | | | | 0 | | | | 249 | | | | 0 | | | | 0 | |
| | 0 | | | | 0 | | | | 0 | | | | 0 | | | | 55 | | | | 0 | | | | 22 | |
| | 2,807 | | | | 264 | | | | 6,986 | | | | 0 | | | | 4,322 | | | | 0 | | | | 0 | |
| | 0 | | | | 0 | | | | 0 | | | | 0 | | | | 0 | | | | 14,171 | | | | 0 | |
| | 430 | | | | 541 | | | | 46,327 | | | | 2,860 | | | | 775 | | | | 11,771 | | | | 66 | |
| | 7 | | | | 6 | | | | 0 | | | | 0 | | | | 0 | | | | 0 | | | | 1 | |
| | | | | | |
| | 95,449 | | | | 93,039 | | | | 2,879,575 | | | | 247,102 | | | | 64,065 | | | | 3,830,199 | | | | 15,308 | |
| | | | | | |
| | | | | | | | | | | | | | | | | | | | | | | | | | |
| | | | | | | | | | | | | | | | | | | | | | | | | | | |
| $ | 0 | | | $ | 0 | | | $ | 0 | | | $ | 0 | | | $ | 0 | | | $ | 260,770 | | | $ | 0 | |
| | 0 | | | | 0 | | | | 0 | | | | 0 | | | | 0 | | | | 0 | | | | 0 | |
| | 0 | | | | 0 | | | | 0 | | | | 0 | | | | 287 | | | | 0 | | | | 0 | |
| | | | | | | | | | | | | | | | | | | | | | | | | | | |
| | 0 | | | | 0 | | | | 16 | | | | 0 | | | | 2 | | | | 0 | | | | 0 | |
| | 0 | | | | 0 | | | | 0 | | | | 0 | | | | 1,429 | | | | 0 | | | | 527 | |
| | 2,883 | | | | 541 | | | | 17,756 | | | | 498 | | | | 6,044 | | | | 8,616 | | | | 0 | |
| | 0 | | | | 0 | | | | 43,471 | | | | 1,693 | | | | 0 | | | | 0 | | | | 0 | |
| | 0 | | | | 0 | | | | 0 | | | | 0 | | | | 0 | | | | 0 | | | | 90 | |
| | 0 | | | | 0 | | | | 0 | | | | 0 | | | | 0 | | | | 21,252 | | | | 0 | |
| | 0 | | | | 0 | | | | 11,739 | | | | 666 | | | | 220 | | | | 2,487 | | | | 0 | |
| | 15 | | | | 15 | | | | 1,338 | | | | 40 | | | | 38 | | | | 1,004 | | | | 8 | |
| | 0 | | | | 0 | | | | 0 | | | | 0 | | | | 0 | | | | 0 | | | | 0 | |
| | 12 | | | | 10 | | | | 14 | | | | 2 | | | | 2 | | | | 20 | | | | 1 | |
| | | | | | |
| | 2,910 | | | | 566 | | | | 74,334 | | | | 2,899 | | | | 8,022 | | | | 294,149 | | | | 626 | |
| | | | | | |
| $ | 92,539 | | | $ | 92,473 | | | $ | 2,805,241 | | | $ | 244,203 | | | $ | 56,043 | | | $ | 3,536,050 | | | $ | 14,682 | |
| | | | | | |
| | | | | | | | | | | | | | | | | | | | | | | | | | |
| $ | 109,355 | | | $ | 96,087 | | | $ | 2,935,810 | | | $ | 248,961 | | | $ | 57,744 | | | $ | 3,535,587 | | | $ | 17,041 | |
| | (39 | ) | | | (234 | ) | | | (2,168 | ) | | | (73 | ) | | | 401 | | | | 1,040 | | | | (937 | ) |
| | (9,212 | ) | | | (788 | ) | | | (39,502 | ) | | | (135 | ) | | | (890 | ) | | | 791 | | | | (465 | ) |
| | (7,565 | ) | | | (2,592 | ) | | | (88,899 | ) | | | (4,550 | ) | | | (1,212 | ) | | | (1,368 | ) | | | (957 | ) |
| $ | 92,539 | | | $ | 92,473 | | | $ | 2,805,241 | | | $ | 244,203 | | | $ | 56,043 | | | $ | 3,536,050 | | | $ | 14,682 | |
| | | | | | |
| | 1,470 | | | | 1,630 | | | | 27,950 | | | | 2,430 | | | | 1,160 | | | | 34,960 | | | | 340 | |
| | | | | | |
| $ | 62.95 | | | $ | 56.73 | | | $ | 100.37 | | | $ | 100.50 | | | $ | 48.31 | | | $ | 101.15 | | | $ | 43.18 | |
| | | | | | |
| $ | 99,770 | | | $ | 94,820 | | | $ | 2,861,235 | | | $ | 247,099 | | | $ | 59,658 | | | $ | 3,805,618 | | | $ | 15,642 | |
| $ | 0 | | | $ | 0 | | | $ | 43,471 | | | $ | 1,693 | | | $ | 0 | | | $ | 0 | | | $ | 0 | |
| $ | 0 | | | $ | 0 | | | $ | 0 | | | $ | 0 | | | $ | 55 | | | $ | 0 | | | $ | 23 | |
| $ | 0 | | | $ | 0 | | | $ | 0 | | | $ | 0 | | | $ | 290 | | | $ | 0 | | | $ | 0 | |
| | | | | | |
| $ | 0 | | | $ | 0 | | | $ | 0 | | | $ | 0 | | | $ | (1,269 | ) | | $ | 0 | | | $ | 4 | |
| | | | | | |
| $ | 168 | | | $ | 434 | | | $ | 49,590 | | | $ | 511 | | | $ | 499 | | | $ | 1,204 | | | $ | 156 | |
| $ | 0 | | | $ | 0 | | | $ | 47,370 | | | $ | 1,659 | | | $ | 0 | | | $ | 0 | | | $ | 0 | |
| | | | | | |
| | ANNUAL REPORT | | JUNE 30, 2015 | | 29 |
Statements of Assets and Liabilities (Cont.)
June 30, 2015
| | | | | | | | | | | | | | | | | | | | |
| (Amounts in thousands†, except per share amounts) | | PIMCO
Global Advantage®
Inflation-Linked Bond
Active Exchange-
Traded Fund | | | PIMCO
Intermediate
Municipal Bond
Active Exchange-
Traded Fund | | | PIMCO
Low Duration
Active Exchange-
Traded Fund | | | PIMCO
Short Term
Municipal Bond
Active Exchange-
Traded Fund | | | PIMCO
Total Return
Active Exchange-
Traded Fund | |
| | | | | |
Assets: | | | | | | | | | | | | | | | | | | | | |
Investments, at value | | | | | | | | | | | | | | | | | | | | |
Investments in securities* | | $ | 142,122 | | | $ | 228,964 | | | $ | 198,674 | | | $ | 55,198 | | | $ | 2,923,054 | |
Financial Derivative Instruments | | | | | | | | | | | | | | | | | | | | |
Exchange-traded or centrally cleared | | | 29 | | | | 8 | | | | 23 | | | | 0 | | | | 4,274 | |
Over the counter | | | 1,351 | | | | 0 | | | | 739 | | | | 0 | | | | 62,531 | |
Cash | | | 72 | | | | 0 | | | | 1,067 | | | | 92 | | | | 107 | |
Deposits with counterparty | | | 1,496 | | | | 453 | | | | 1,364 | | | | 0 | | | | 4,898 | |
Foreign currency, at value | | | 733 | | | | 0 | | | | 41 | | | | 0 | | | | 4,466 | |
Receivable for investments sold~ | | | 499 | | | | 0 | | | | 9,507 | | | | 0 | | | | 564,304 | |
Receivable for Fund shares sold | | | 0 | | | | 0 | | | | 0 | | | | 0 | | | | 10,669 | |
Interest receivable | | | 990 | | | | 2,277 | | | | 1,232 | | | | 539 | | | | 19,051 | |
Reimbursement receivable from PIMCO | | | 3 | | | | 0 | | | | 0 | | | | 0 | | | | 0 | |
| | | | | |
Total Assets | | | 147,295 | | | | 231,702 | | | | 212,647 | | | | 55,829 | | | | 3,593,354 | |
| | | | | |
Liabilities: | | | | | | | | | | | | | | | | | | | | |
Borrowings & Other Financing Transactions | | | | | | | | | | | | | | | | | | | | |
Payable for reverse repurchase agreements | | $ | 23,537 | | | $ | 0 | | | $ | 24,245 | | | $ | 0 | | | $ | 45,882 | |
Payable for sale-buyback transactions | | | 19,246 | | | | 0 | | | | 0 | | | | 0 | | | | 0 | |
Payable for short sales | | | 0 | | | | 0 | | | | 9,541 | | | | 0 | | | | 0 | |
Financial Derivative Instruments | | | | | | | | | | | | | | | | | | | | |
Exchange-traded or centrally cleared | | | 126 | | | | 0 | | | | 211 | | | | 0 | | | | 1,213 | |
Over the counter | | | 767 | | | | 0 | | | | 173 | | | | 0 | | | | 28,064 | |
Payable for investments purchased~ | | | 135 | | | | 3,500 | | | | 1,747 | | | | 0 | | | | 970,353 | |
Payable upon return of securities loaned | | | 0 | | | | 0 | | | | 0 | | | | 0 | | | | 0 | |
Deposits from counterparty | | | 740 | | | | 0 | | | | 640 | | | | 0 | | | | 50,509 | |
Payable for Fund shares redeemed | | | 0 | | | | 0 | | | | 0 | | | | 0 | | | | 0 | |
Dividends payable | | | 0 | | | | 405 | | | | 208 | | | | 44 | | | | 6,969 | |
Accrued management fees | | | 49 | | | | 66 | | | | 67 | | | | 16 | | | | 1,155 | |
Accrued reimbursement to PIMCO | | | 0 | | | | 0 | | | | 1 | | | | 0 | | | | 75 | |
Other liabilities | | | 15 | | | | 3 | | | | 6 | | | | 4 | | | | 62 | |
| | | | | |
Total Liabilities | | | 44,615 | | | | 3,974 | | | | 36,839 | | | | 64 | | | | 1,104,282 | |
| | | | | |
Net Assets | | $ | 102,680 | | | $ | 227,728 | | | $ | 175,808 | | | $ | 55,765 | | | $ | 2,489,072 | |
| | | | | |
Net Assets Consist of: | | | | | | | | | | | | | | | | | | | | |
Paid in capital | | $ | 126,387 | | | $ | 225,958 | | | $ | 174,901 | | | $ | 55,811 | | | $ | 2,508,741 | |
Undistributed (overdistributed) net investment income | | | (5,450 | ) | | | (36 | ) | | | (167 | ) | | | (52 | ) | | | 3,349 | |
Accumulated undistributed net realized gain (loss) | | | (4,633 | ) | | | (1,832 | ) | | | 897 | | | | (216 | ) | | | (23,808 | ) |
Net unrealized appreciation (depreciation) | | | (13,624 | ) | | | 3,638 | | | | 177 | | | | 222 | | | | 790 | |
| | | $ | 102,680 | | | $ | 227,728 | | | $ | 175,808 | | | $ | 55,765 | | | $ | 2,489,072 | |
| | | | | |
Shares Issued and Outstanding | | | 2,360 | | | | 4,310 | | | | 1,730 | | | | 1,110 | | | | 23,330 | |
| | | | | |
Net Asset Value and Redemption Price Per Share Outstanding | | $ | 43.51 | | | $ | 52.84 | | | $ | 101.62 | | | $ | 50.24 | | | $ | 106.69 | |
| | | | | |
Cost of Investments in securities | | $ | 156,520 | | | $ | 225,361 | | | $ | 199,065 | | | $ | 54,976 | | | $ | 2,951,968 | |
Cost of Foreign Currency Held | | $ | 745 | | | $ | 0 | | | $ | 42 | | | $ | 0 | | | $ | 4,470 | |
Proceeds Received on Short Sales | | $ | 0 | | | $ | 0 | | | $ | 9,437 | | | $ | 0 | | | $ | 0 | |
| | | | | |
Cost or Premiums of Financial Derivative Instruments, net | | $ | (144 | ) | | $ | 0 | | | $ | (259 | ) | | $ | 0 | | | $ | (2,471 | ) |
| | | | | |
* Includes repurchase agreements of: | | $ | 0 | | | $ | 227 | | | $ | 10,713 | | | $ | 0 | | | $ | 46,260 | |
| † | A zero balance may reflect actual amounts rounding to less than one thousand. |
| ~ | A portion of the balance may represent to-be-announced (TBA) securities. See Note 4 in the Notes to Financial Statements. |
| | | | | | |
| 30 | | PIMCO ETF TRUST | | | | See Accompanying Notes |
Statements of Operations
| | | | | | | | | | | | | | | | | | | | |
| Year Ended June 30, 2015 | | | | | | | | | | | | | | | |
| (Amounts in thousands†) | | PIMCO
1-3 Year
U.S. Treasury
Index Exchange-
Traded Fund | | | PIMCO
3-7 Year
U.S. Treasury
Index Exchange-
Traded Fund | | | PIMCO
7-15 Year
U.S. Treasury
Index Exchange-
Traded Fund | | | PIMCO
25+ Year
Zero Coupon
U.S. Treasury
Index Exchange-
Traded Fund | | | PIMCO
1-5 Year
U.S. TIPS
Index Exchange-
Traded Fund | |
| | | | | |
Investment Income: | | | | | | | | | | | | | | | | | | | | |
Interest | | $ | 744 | | | $ | 167 | | | $ | 1,718 | | | $ | 3,060 | | | $ | (13,755 | ) |
Total Income | | | 744 | | | | 167 | | | | 1,718 | | | | 3,060 | | | | (13,755 | ) |
| | | | | |
Expenses: | | | | | | | | | | | | | | | | | | | | |
Management fees | | | 180 | | | | 16 | | | | 110 | | | | 158 | | | | 2,564 | |
Trustee fees | | | 3 | | | | 0 | | | | 3 | | | | 2 | | | | 33 | |
Miscellaneous expense | | | 6 | | | | 1 | | | | 1 | | | | 5 | | | | 0 | |
Total Expenses | | | 189 | | | | 17 | | | | 114 | | | | 165 | | | | 2,597 | |
Waiver and/or Reimbursement by PIMCO | | | (29 | ) | | | 0 | | | | 0 | | | | (2 | ) | | | 0 | |
Net Expenses | | | 160 | | | | 17 | | | | 114 | | | | 163 | | | | 2,597 | |
| | | | | |
Net Investment Income (Loss) | | | 584 | | | | 150 | | | | 1,604 | | | | 2,897 | | | | (16,352 | ) |
| | | | | |
Net Realized Gain (Loss): | | | | | | | | | | | | | | | | | | | | |
Investments in securities | | | 75 | | | | 1 | | | | 590 | | | | 11 | | | | (2,670 | ) |
In-kind redemptions | | | 197 | | | | 34 | | | | 3,816 | | | | 6,199 | | | | (185 | ) |
| | | | | |
Net Realized Gain (Loss) | | | 272 | | | | 35 | | | | 4,406 | | | | 6,210 | | | | (2,855 | ) |
| | | | | |
Net Change in Unrealized Appreciation (Depreciation): | | | | | | | | | | | | | | | | | | | | |
Investments in securities | | | 15 | | | | 78 | | | | (660 | ) | | | (12,606 | ) | | | (13,900 | ) |
| | | | | |
Net Change in Unrealized Appreciation (Depreciation) | | | 15 | | | | 78 | | | | (660 | ) | | | (12,606 | ) | | | (13,900 | ) |
| | | | | |
Net Increase (Decrease) in Net Assets Resulting from Operations | | $ | 871 | | | $ | 263 | | | $ | 5,350 | | | $ | (3,499 | ) | | $ | (33,107 | ) |
| † | A zero balance may reflect actual amounts rounding to less than one thousand. |
| | | | | | |
| | ANNUAL REPORT | | JUNE 30, 2015 | | 31 |
Statements of Operations (Cont.)
| | | | | | | | | | | | | | | | | | | | |
| Year Ended June 30, 2015 | | | | | | | | | | | | | | | |
| (Amounts in thousands†) | | PIMCO
15+ Year
U.S. TIPS
Index Exchange-
Traded Fund | | | PIMCO
Broad
U.S. TIPS
Index Exchange-
Traded Fund | | | PIMCO
0-5 Year
High Yield
Corporate Bond
Index Exchange-
Traded Fund | | | PIMCO
Investment Grade
Corporate Bond
Index Exchange-
Traded Fund | | | PIMCO
Diversified
Income
Active Exchange-
Traded Fund | |
| | | | | |
Investment Income: | | | | | | | | | | | | | | | | | | | | |
Interest, net of foreign taxes* | | $ | 451 | | | $ | 174 | | | $ | 148,777 | | | $ | 7,409 | | | $ | 2,239 | |
Dividends | | | 0 | | | | 0 | | | | 0 | | | | 0 | | | | 26 | |
Dividends from Investments in Affiliates | | | 0 | | | | 0 | | | | 10 | | | | 0 | | | | 0 | |
Securities lending income | | | 0 | | | | 0 | | | | 782 | | | | 3 | | | | 0 | |
Total Income | | | 451 | | | | 174 | | | | 149,569 | | | | 7,412 | | | | 2,265 | |
| | | | | |
Expenses: | | | | | | | | | | | | | | | | | | | | |
Management fees | | | 174 | | | | 173 | | | | 18,426 | | | | 457 | | | | 395 | |
Trustee fees | | | 2 | | | | 2 | | | | 73 | | | | 5 | | | | 1 | |
Interest expense | | | 0 | | | | 0 | | | | 0 | | | | 0 | | | | 0 | |
Legal expense | | | 0 | | | | 0 | | | | 0 | | | | 0 | | | | 0 | |
Miscellaneous expense | | | 4 | | | | 4 | | | | 0 | | | | 0 | | | | 2 | |
Total Expenses | | | 180 | | | | 179 | | | | 18,499 | | | | 462 | | | | 398 | |
Waiver and/or Reimbursement by PIMCO | | | (2 | ) | | | (1 | ) | | | 0 | | | | 0 | | | | (1 | ) |
Net Expenses | | | 178 | | | | 178 | | | | 18,499 | | | | 462 | | | | 397 | |
| | | | | |
Net Investment Income (Loss) | | | 273 | | | | (4 | ) | | | 131,070 | | | | 6,950 | | | | 1,868 | |
| | | | | |
Net Realized Gain (Loss): | | | | | | | | | | | | | | | | | | | | |
Investments in securities | | | (1,269 | ) | | | (272 | ) | | | (40,708 | ) | | | (100 | ) | | | (957 | ) |
In-kind redemptions | | | 624 | | | | (720 | ) | | | (2,731 | ) | | | 4,397 | | | | 0 | |
Exchange-traded or centrally cleared financial derivative instruments | | | 0 | | | | 0 | | | | 14,689 | | | | 493 | | | | (158 | ) |
Over the counter financial derivative instruments | | | 0 | | | | 0 | | | | 0 | | | | 0 | | | | 995 | |
Foreign currency | | | 0 | | | | 0 | | | | 0 | | | | 0 | | | | 23 | |
| | | | | |
Net Realized Gain (Loss) | | | (645 | ) | | | (992 | ) | | | (28,750 | ) | | | 4,790 | | | | (97 | ) |
| | | | | |
Net Change in Unrealized Appreciation (Depreciation): | | | | | | | | | | | | | | | | | | | | |
Investments in securities | | | (3,665 | ) | | | (1,916 | ) | | | (146,509 | ) | | | (12,252 | ) | | | (2,409 | ) |
Exchange-traded or centrally cleared financial derivative instruments | | | 0 | | | | 0 | | | | (11,584 | ) | | | 0 | | | | (20 | ) |
Over the counter financial derivative instruments | | | 0 | | | | 0 | | | | 0 | | | | 0 | | | | (66 | ) |
Foreign currency assets and liabilities | | | 0 | | | | 0 | | | | 0 | | | | 0 | | | | (2 | ) |
| | | | | |
Net Change in Unrealized Appreciation (Depreciation) | | | (3,665 | ) | | | (1,916 | ) | | | (158,093 | ) | | | (12,252 | ) | | | (2,497 | ) |
| | | | | |
Net Increase (Decrease) in Net Assets Resulting from Operations | | $ | (4,037 | ) | | $ | (2,912 | ) | | $ | (55,773 | ) | | $ | (512 | ) | | $ | (726 | ) |
| | | | | |
* Foreign tax withholdings | | $ | 0 | | | $ | 0 | | | $ | 0 | | | $ | 0 | | | $ | 0 | |
| † | A zero balance may reflect actual amounts rounding to less than one thousand. |
| | | | | | |
| 32 | | PIMCO ETF TRUST | | | | See Accompanying Notes |
| | | | | | | | | | | | | | | | | | | | | | | | | | |
| | | | | | | | | | | | | | | | | | | | |
PIMCO
Enhanced
Short Maturity
Active Exchange-
Traded Fund | | | PIMCO
Foreign
Currency Strategy
Active Exchange-
Traded Fund | | | PIMCO
Global Advantage®
Inflation-Linked Bond
Active Exchange-
Traded Fund | | | PIMCO
Intermediate
Municipal Bond
Active Exchange-
Traded Fund | | | PIMCO
Low Duration
Active Exchange-
Traded Fund | | | PIMCO
Short Term
Municipal Bond
Active Exchange-
Traded Fund | | | PIMCO
Total Return
Active Exchange-
Traded Fund | |
| | | | | | |
| | | | | | | | | | | | | | | | | | | | | | | | | | |
| $ | 36,260 | | | $ | 302 | | | $ | 4,013 | | | $ | 5,437 | | | $ | 2,700 | | | $ | 735 | | | $ | 88,266 | |
| | 0 | | | | 0 | | | | 0 | | | | 0 | | | | 0 | | | | 0 | | | | 307 | |
| | 0 | | | | 0 | | | | 0 | | | | 0 | | | | 0 | | | | 0 | | | | 0 | |
| | 0 | | | | 0 | | | | 0 | | | | 0 | | | | 0 | | | | 0 | | | | 0 | |
| | 36,260 | | | | 302 | | | | 4,013 | | | | 5,437 | | | | 2,700 | | | | 735 | | | | 88,573 | |
| | | | | | |
| | | | | | | | | | | | | | | | | | | | | | | | | | |
| | 13,053 | | | | 113 | | | | 692 | | | | 778 | | | | 810 | | | | 231 | | | | 15,333 | |
| | 93 | | | | 0 | | | | 3 | | | | 5 | | | | 4 | | | | 2 | | | | 61 | |
| | 351 | | | | 0 | | | | 68 | | | | 0 | | | | 31 | | | | 0 | | | | 660 | |
| | 0 | | | | 0 | | | | 0 | | | | 0 | | | | 0 | | | | 0 | | | | 1,602 | |
| | 0 | | | | 1 | | | | 6 | | | | 1 | | | | 7 | | | | 3 | | | | 137 | |
| | 13,497 | | | | 114 | | | | 769 | | | | 784 | | | | 852 | | | | 236 | | | | 17,793 | |
| | 0 | | | | 0 | | | | (3 | ) | | | 0 | | | | (76 | ) | | | (2 | ) | | | (1,655 | ) |
| | 13,497 | | | | 114 | | | | 766 | | | | 784 | | | | 776 | | | | 234 | | | | 16,138 | |
| | | | | | |
| | 22,763 | | | | 188 | | | | 3,247 | | | | 4,653 | | | | 1,924 | | | | 501 | | | | 72,435 | |
| | | | | | |
| | | | | | | | | | | | | | | | | | | | | | | | | | |
| | 5,884 | | | | (1,612 | ) | | | (6,408 | ) | | | 16 | | | | (82 | ) | | | (34 | ) | | | (8,272 | ) |
| | 0 | | | | 0 | | | | 0 | | | | 0 | | | | 0 | | | | 0 | | | | 0 | |
| | 0 | | | | 0 | | | | (158 | ) | | | 0 | | | | 521 | | | | 0 | | | | 42,340 | |
| | 0 | | | | 545 | | | | 736 | | | | 0 | | | | 995 | | | | 0 | | | | 91,415 | |
| | 0 | | | | 75 | | | | (438 | ) | | | 0 | | | | 166 | | | | 0 | | | | 275 | |
| | | | | | |
| | 5,884 | | | | (992 | ) | | | (6,268 | ) | | | 16 | | | | 1,600 | | | | (34 | ) | | | 125,758 | |
| | | | | | |
| | | | | | | | | | | | | | | | | | | | | | | | | | |
| | (9,437 | ) | | | (938 | ) | | | (12,964 | ) | | | (1,768 | ) | | | (635 | ) | | | (203 | ) | | | (165,729 | ) |
| | 0 | | | | 0 | | | | 77 | | | | 35 | | | | 41 | | | | 0 | | | | (6,577 | ) |
| | 0 | | | | (288 | ) | | | 700 | | | | 0 | | | | 609 | | | | 0 | | | | 49,709 | |
| | 0 | | | | 2 | | | | (45 | ) | | | 0 | | | | (4 | ) | | | 0 | | | | (410 | ) |
| | | | | | |
| | (9,437 | ) | | | (1,224 | ) | | | (12,232 | ) | | | (1,733 | ) | | | 11 | | | | (203 | ) | | | (123,007 | ) |
| | | | | | |
$ | 19,210 | | | $ | (2,028 | ) | | $ | (15,253 | ) | | $ | 2,936 | | | $ | 3,535 | | | $ | 264 | | | $ | 75,186 | |
| | | | | | |
| $ | 0 | | | $ | 0 | | | $ | 26 | | | $ | 0 | | | $ | 1 | | | $ | 0 | | | $ | 0 | |
| | | | | | |
| | ANNUAL REPORT | | JUNE 30, 2015 | | 33 |
Statements of Changes in Net Assets
| | | | | | | | | | | | | | | | | | | | | | | | | | | | | | | | |
| | | PIMCO
1-3 Year
U.S. Treasury
Index Exchange-
Traded Fund | | | PIMCO
3-7 Year
U.S. Treasury
Index Exchange-
Traded Fund | | | PIMCO
7-15 Year
U.S. Treasury
Index Exchange-
Traded Fund | | | PIMCO
25+ Year
Zero Coupon
U.S. Treasury
Index Exchange-
Traded Fund | |
| | | | | | | | |
| (Amounts in thousands†) | | Year Ended
June 30, 2015 | | | Year Ended
June 30, 2014 | | | Year Ended
June 30, 2015 | | | Year Ended
June 30, 2014 | | | Year Ended
June 30, 2015 | | | Year Ended
June 30, 2014 | | | Year Ended
June 30, 2015 | | | Year Ended
June 30, 2014 | |
| | | | | | | | |
Increase (Decrease) in Net Assets from: | | | | | | | | | | | | | | | | | | | | | | | | | | | | | | | | |
| | | | | | | | |
Operations: | | | | | | | | | | | | | | | | | | | | | | | | | | | | | | | | |
Net investment income (loss) | | $ | 584 | | | $ | 429 | | | $ | 150 | | | $ | 197 | | | $ | 1,604 | | | $ | 936 | | | $ | 2,897 | | | $ | 2,840 | |
Net realized gain (loss) | | | 272 | | | | 246 | | | | 35 | | | | 240 | | | | 4,406 | | | | (707 | ) | | | 6,210 | | | | (8,619 | ) |
Net change in unrealized appreciation (depreciation) | | | 15 | | | | 271 | | | | 78 | | | | (138 | ) | | | (660 | ) | | | 1,108 | | | | (12,606 | ) | | | 7,861 | |
| | | | | | | | |
Net increase (decrease) in net assets resulting from operations | | | 871 | | | | 946 | | | | 263 | | | | 299 | | | | 5,350 | | | | 1,337 | | | | (3,499 | ) | | | 2,082 | |
| | | | | | | | |
Distributions to Shareholders: | | | | | | | | | | | | | | | | | | | | | | | | | | | | | | | | |
From net investment income | | | (573 | ) | | | (406 | ) | | | (147 | ) | | | (183 | ) | | | (1,623 | ) | | | (891 | ) | | | (2,862 | ) | | | (2,765 | ) |
From net realized capital gains | | | (134 | ) | | | (70 | ) | | | (71 | ) | | | (41 | ) | | | 0 | | | | 0 | | | | 0 | | | | 0 | |
Tax basis return of capital | | | 0 | | | | 0 | | | | 0 | | | | 0 | | | | 0 | | | | 0 | | | | 0 | | | | 0 | |
| | | | | | | | |
Total Distributions | | | (707 | ) | | | (476 | ) | | | (218 | ) | | | (224 | ) | | | (1,623 | ) | | | (891 | ) | | | (2,862 | ) | | | (2,765 | ) |
| | | | | | | | |
Fund Share Transactions: | | | | | | | | | | | | | | | | | | | | | | | | | | | | | | | | |
Receipts for shares sold | | | 45,872 | | | | 45,761 | | | | 0 | | | | 7,926 | | | | 45,916 | | | | 111,298 | | | | 142,709 | | | | 112,640 | |
Cost of shares redeemed | | | (66,303 | ) | | | (48,384 | ) | | | (3,996 | ) | | | (15,890 | ) | | | (103,603 | ) | | | (49,071 | ) | | | (116,290 | ) | | | (117,331 | ) |
Net increase (decrease) resulting from Fund share transactions | | | (20,431 | ) | | | (2,623 | ) | | | (3,996 | ) | | | (7,964 | ) | | | (57,687 | ) | | | 62,227 | | | | 26,419 | | | | (4,691 | ) |
| | | | | | | | |
Total Increase (Decrease) in Net Assets | | | (20,267 | ) | | | (2,153 | ) | | | (3,951 | ) | | | (7,889 | ) | | | (53,960 | ) | | | 62,673 | | | | 20,058 | | | | (5,374 | ) |
| | | | | | | | |
Net Assets: | | | | | | | | | | | | | | | | | | | | | | | | | | | | | | | | |
Beginning of year | | | 127,442 | | | | 129,595 | | | | 13,251 | | | | 21,140 | | | | 73,969 | | | | 11,296 | | | | 76,902 | | | | 82,276 | |
End of year* | | $ | 107,175 | | | $ | 127,442 | | | $ | 9,300 | | | $ | 13,251 | | | $ | 20,009 | | | $ | 73,969 | | | $ | 96,960 | | | $ | 76,902 | |
| | | | | | | | |
* Including undistributed (overdistributed) net investment income of: | | $ | (27 | ) | | $ | (39 | ) | | $ | (34 | ) | | $ | (37 | ) | | $ | (24 | ) | | $ | (5 | ) | | $ | 35 | | | $ | 0 | |
| | | | | | | | |
Shares of Beneficial Interest: | | | | | | | | | | | | | | | | | | | | | | | | | | | | | | | | |
Shares Sold | | | 900 | | | | 900 | | | | 0 | | | | 100 | | | | 550 | | | | 1,350 | | | | 1,200 | | | | 1,250 | |
Shares Redeemed | | | (1,300 | ) | | | (950 | ) | | | (50 | ) | | | (200 | ) | | | (1,200 | ) | | | (600 | ) | | | (1,050 | ) | | | (1,350 | ) |
Net increase (decrease) in shares outstanding | | | (400 | ) | | | (50 | ) | | | (50 | ) | | | (100 | ) | | | (650 | ) | | | 750 | | | | 150 | | | | (100 | ) |
| † | A zero balance may reflect actual amounts rounding to less than one thousand. |
| | | | | | |
| 34 | | PIMCO ETF TRUST | | | | See Accompanying Notes |
| | | | | | | | | | | | | | | | | | | | | | | | | | | | | | | | | | | | | | |
PIMCO
1-5 Year
U.S. TIPS
Index
Exchange-
Traded Fund | | | PIMCO
15+ Year
U.S. TIPS
Index
Exchange-
Traded Fund | | | PIMCO
Broad
U.S. TIPS
Index
Exchange-
Traded Fund | | | PIMCO
0-5 Year
High Yield
Corporate
Bond
Index
Exchange-
Traded Fund | | | PIMCO
Investment
Grade
Corporate
Bond
Index
Exchange-
Traded Fund | |
| | | | | | | | | |
Year Ended
June 30,
2015 | | | Year Ended
June 30,
2014 | | | Year Ended
June 30,
2015 | | | Year Ended
June 30,
2014 | | | Year Ended
June 30,
2015 | | | Year Ended
June 30,
2014 | | | Year Ended
June 30,
2015 | | | Year Ended
June 30,
2014 | | | Year Ended
June 30,
2015 | | | Year Ended
June 30,
2014 | |
| | | | | | | | | |
| | | | | | | | | | | | | | | | | | | | | | | | | | | | | | | | | | | | | | |
| | | | | | | | | |
| | | | | | | | | | | | | | | | | | | | | | | | | | | | | | | | | | | | | | |
| $ | (16,352 | ) | | $ | 8,084 | | | $ | 273 | | | $ | 1,408 | | | $ | (4 | ) | | $ | 742 | | | $ | 131,070 | | | $ | 153,109 | | | $ | 6,950 | | | $ | 5,669 | |
| | (2,855 | ) | | | 53 | | | | (645 | ) | | | (11,723 | ) | | | (992 | ) | | | (919 | ) | | | (28,750 | ) | | | 52,503 | | | | 4,790 | | | | 1,228 | |
| (13,900 | ) | | | 19,880 | | | | (3,665 | ) | | | 15,728 | | | | (1,916 | ) | | | 2,492 | | | | (158,093 | ) | | | 91,869 | | | | (12,252 | ) | | | 7,101 | |
| | | | | | | | | |
| (33,107 | ) | | | 28,017 | | | | (4,037 | ) | | | 5,413 | | | | (2,912 | ) | | | 2,315 | | | | (55,773 | ) | | | 297,481 | | | | (512 | ) | | | 13,998 | |
| | | | | | | | | |
| | | | | | | | | | | | | | | | | | | | | | | | | | | | | | | | | | | | | | |
| | (614 | ) | | | (7,653 | ) | | | (523 | ) | | | (1,698 | ) | | | (325 | ) | | | (933 | ) | | | (140,838 | ) | | | (170,299 | ) | | | (7,130 | ) | | | (5,512 | ) |
| | 0 | | | | 0 | | | | 0 | | | | 0 | | | | 0 | | | | 0 | | | | (28,504 | ) | | | (8,529 | ) | | | (558 | ) | | | (6,182 | ) |
| | (4,196 | ) | | | 0 | | | | 0 | | | | 0 | | | | (218 | ) | | | 0 | | | | 0 | | | | 0 | | | | 0 | | | | 0 | |
| | | | | | | | | |
| | (4,810 | ) | | | (7,653 | ) | | | (523 | ) | | | (1,698 | ) | | | (543 | ) | | | (933 | ) | | | (169,342 | ) | | | (178,828 | ) | | | (7,688 | ) | | | (11,694 | ) |
| | | | | | | | | |
| | | | | | | | | | | | | | | | | | | | | | | | | | | | | | | | | | | | | | |
| | 237,002 | | | | 429,595 | | | | 34,269 | | | | 3,018 | | | | 92,705 | | | | 60,731 | | | | 905,955 | | | | 2,968,939 | | | | 223,452 | | | | 86,738 | |
| | (354,094 | ) | | | (153,693 | ) | | | (6,740 | ) | | | (42,167 | ) | | | (103,179 | ) | | | (27,897 | ) | | | (2,994,801 | ) | | | (275,568 | ) | | | (170,245 | ) | | | (30,762 | ) |
| (117,092 | ) | | | 275,902 | | | | 27,529 | | | | (39,149 | ) | | | (10,474 | ) | | | 32,834 | | | | (2,088,846 | ) | | | 2,693,371 | | | | 53,207 | | | | 55,976 | |
| | | | | | | | | |
| | (155,009 | ) | | | 296,266 | | | | 22,969 | | | | (35,434 | ) | | | (13,929 | ) | | | 34,216 | | | | (2,313,961 | ) | | | 2,812,024 | | | | 45,007 | | | | 58,280 | |
| | | | | | | | | |
| | | | | | | | | | | | | | | | | | | | | | | | | | | | | | | | | | | | | | |
| | 1,337,875 | | | | 1,041,609 | | | | 69,570 | | | | 105,004 | | | | 106,402 | | | | 72,186 | | | | 5,119,202 | | | | 2,307,178 | | | | 199,196 | | | | 140,916 | |
| $ | 1,182,866 | | | $ | 1,337,875 | | | $ | 92,539 | | | $ | 69,570 | | | $ | 92,473 | | | $ | 106,402 | | | $ | 2,805,241 | | | $ | 5,119,202 | | | $ | 244,203 | | | $ | 199,196 | |
| | | | | | | | | |
$ | (9,183 | ) | | $ | 576 | | | $ | (39 | ) | | $ | 140 | | | $ | (234 | ) | | $ | 9 | | | $ | (2,168 | ) | | $ | (2,696 | ) | | $ | (73 | ) | | $ | 55 | |
| | | | | | | | | |
| | | | | | | | | | | | | | | | | | | | | | | | | | | | | | | | | | | | | | |
| | 4,500 | | | | 8,100 | | | | 500 | | | | 50 | | | | 1,600 | | | | 1,050 | | | | 8,800 | | | | 28,050 | | | | 2,150 | | | | 850 | |
| | (6,800 | ) | | | (2,900 | ) | | | (100 | ) | | | (700 | ) | | | (1,800 | ) | | | (500 | ) | | | (28,800 | ) | | | (2,600 | ) | | | (1,650 | ) | | | (300 | ) |
| | (2,300 | ) | | | 5,200 | | | | 400 | | | | (650 | ) | | | (200 | ) | | | 550 | | | | (20,000 | ) | | | 25,450 | | | | 500 | | | | 550 | |
| | | | | | |
| | ANNUAL REPORT | | JUNE 30, 2015 | | 35 |
Statements of Changes in Net Assets (Cont.)
| | | | | | | | | | | | | | | | | | | | | | | | | | | | | | | | |
| | | PIMCO
Diversified
Income
Active Exchange-
Traded Fund | | | PIMCO
Enhanced
Short Maturity
Active Exchange-
Traded Fund | | | PIMCO
Foreign
Currency Strategy
Active Exchange-
Traded Fund | | | PIMCO
Global Advantage®
Inflation-Linked Bond
Active Exchange-
Traded Fund | |
| | | | | | | | |
| (Amounts in thousands†) | | Year Ended
June 30,
2015 | | | Period from
January 22,
2014 to
June 30,
2014 | | | Year Ended
June 30,
2015 | | | Year Ended
June 30,
2014 | | | Year Ended
June 30,
2015 | | | Year Ended
June 30,
2014 | | | Year Ended
June 30,
2015 | | | Year Ended
June 30,
2014 | |
| | | | | | | | |
Increase (Decrease) in Net
Assets from: | | | | | | | | | | | | | | | | | | | | | | | | | | | | | | | | |
| | | | | | | | |
Operations: | | | | | | | | | | | | | | | | | | | | | | | | | | | | | | | | |
Net investment income | | $ | 1,868 | | | $ | 622 | | | $ | 22,763 | | | $ | 26,240 | | | $ | 188 | | | $ | 167 | | | $ | 3,247 | | | $ | 4,719 | |
Net realized gain (loss) | | | (97 | ) | | | 318 | | | | 5,884 | | | | 7,018 | | | | (992 | ) | | | (849 | ) | | | (6,268 | ) | | | (4,751 | ) |
Net change in unrealized
appreciation (depreciation) | | | (2,497 | ) | | | 1,285 | | | | (9,437 | ) | | | 7,016 | | | | (1,224 | ) | | | 1,369 | | | | (12,232 | ) | | | 10,207 | |
| | | | | | | | |
Net increase (decrease) in net assets resulting from operations | | | (726 | ) | | | 2,225 | | | | 19,210 | | | | 40,274 | | | | (2,028 | ) | | | 687 | | | | (15,253 | ) | | | 10,175 | |
| | | | | | | | |
Distributions to Shareholders: | | | | | | | | | | | | | | | | | | | | | | | | | | | | | | | | |
From net investment income | | | (2,308 | ) | | | (568 | ) | | | (27,034 | ) | | | (26,777 | ) | | | 0 | | | | 0 | | | | (5,282 | ) | | | (931 | ) |
From net realized capital gains | | | (325 | ) | | | 0 | | | | (3,333 | ) | | | (5,604 | ) | | | 0 | | | | 0 | | | | 0 | | | | (431 | ) |
| | | | | | | | |
Total Distributions | | | (2,633 | ) | | | (568 | ) | | | (30,367 | ) | | | (32,381 | ) | | | 0 | | | | 0 | | | | (5,282 | ) | | | (1,362 | ) |
| | | | | | | | |
Fund Share Transactions: | | | | | | | | | | | | | | | | | | | | | | | | | | | | | | | | |
Receipts for shares sold | | | 19,590 | | | | 63,166 | | | | 1,878,459 | | | | 1,469,252 | | | | 0 | | | | 0 | | | | 9,342 | | | | 33,649 | |
Cost of shares redeemed | | | (4,894 | ) | | | (20,117 | ) | | | (2,105,148 | ) | | | (1,455,864 | ) | | | (4,707 | ) | | | (4,726 | ) | | | (23,542 | ) | | | (24,483 | ) |
Net increase (decrease) resulting from
Fund share transactions | | | 14,696 | | | | 43,049 | | | | (226,689 | ) | | | 13,388 | | | | (4,707 | ) | | | (4,726 | ) | | | (14,200 | ) | | | 9,166 | |
| | | | | | | | |
Total Increase (Decrease) in Net Assets | | | 11,337 | | | | 44,706 | | | | (237,846 | ) | | | 21,281 | | | | (6,735 | ) | | | (4,039 | ) | | | (34,735 | ) | | | 17,979 | |
| | | | | | | | |
Net Assets: | | | | | | | | | | | | | | | | | | | | | | | | | | | | | | | | |
Beginning of year | | | 44,706 | | | | 0 | | | | 3,773,896 | | | | 3,752,615 | | | | 21,417 | | | | 25,456 | | | | 137,415 | | | | 119,436 | |
End of year* | | $ | 56,043 | | | $ | 44,706 | | | $ | 3,536,050 | | | $ | 3,773,896 | | | $ | 14,682 | | | $ | 21,417 | | | $ | 102,680 | | | $ | 137,415 | |
| | | | | | | | |
* Including undistributed (overdistributed)
net investment income of: | | $ | 401 | | | $ | 49 | | | $ | 1,040 | | | $ | 1,534 | | | $ | (937 | ) | | $ | (417 | ) | | $ | (5,450 | ) | | $ | 1,580 | |
| | | | | | | | |
Shares of Beneficial Interest: | | | | | | | | | | | | | | | | | | | | | | | | | | | | | | | | |
Shares Sold | | | 400 | | | | 1,260 | | | | 18,550 | | | | 14,490 | | | | 0 | | | | 0 | | | | 200 | | | | 700 | |
Shares Redeemed | | | (100 | ) | | | (400 | ) | | | (20,790 | ) | | | (14,350 | ) | | | (100 | ) | | | (100 | ) | | | (500 | ) | | | (500 | ) |
Net increase (decrease) in shares outstanding | | | 300 | | | | 860 | | | | (2,240 | ) | | | 140 | | | | (100 | ) | | | (100 | ) | | | (300 | ) | | | 200 | |
| † | A zero balance may reflect actual amounts rounding to less than one thousand. |
| | | | | | |
| 36 | | PIMCO ETF TRUST | | | | See Accompanying Notes |
| | | | | | | | | | | | | | | | | | | | | | | | | | | | | | |
PIMCO
Intermediate
Municipal Bond
Active Exchange-
Traded Fund | | | PIMCO
Low Duration
Active Exchange-
Traded Fund | | | PIMCO
Short Term
Municipal Bond
Active Exchange-
Traded Fund | | | PIMCO
Total Return
Active Exchange-
Traded Fund | |
| | | | | | | |
Year Ended
June 30, 2015 | | | Year Ended
June 30, 2014 | | | Year Ended
June 30, 2015 | | | Period from
January 22, 2014 to
June 30, 2014 | | | Year Ended
June 30, 2015 | | | Year Ended
June 30, 2014 | | | Year Ended
June 30, 2015 | | | Year Ended
June 30, 2014 | |
| | | | | | | |
| | | | | | | | | | | | | | | | | | | | | | | | | | | | | | |
| | | | | | | |
| | | | | | | | | | | | | | | | | | | | | | | | | | | | | | |
| $ | 4,653 | | | $ | 3,957 | | | $ | 1,924 | | | $ | 150 | | | $ | 501 | | | $ | 388 | | | $ | 72,435 | | | $ | 82,474 | |
| | 16 | | | | (1,260 | ) | | | 1,600 | | | | 86 | | | | (34 | ) | | | (180 | ) | | | 125,758 | | | | (133,776 | ) |
| | (1,733 | ) | | | 5,494 | | | | 11 | | | | 166 | | | | (203 | ) | | | 616 | | | | (123,007 | ) | | | 225,061 | |
| | | | | | | |
| 2,936 | | | | 8,191 | | | | 3,535 | | | | 402 | | | | 264 | | | | 824 | | | | 75,186 | | | | 173,759 | |
| | | | | | | |
| | | | | | | | | | | | | | | | | | | | | | | | | | | | | | |
| | (4,619 | ) | | | (4,026 | ) | | | (2,542 | ) | | | (138 | ) | | | (534 | ) | | | (332 | ) | | | (129,616 | ) | | | (60,989 | ) |
| | 0 | | | | 0 | | | | (349 | ) | | | 0 | | | | 0 | | | | 0 | | | | 0 | | | | (14,866 | ) |
| | | | | | | |
| | (4,619 | ) | | | (4,026 | ) | | | (2,891 | ) | | | (138 | ) | | | (534 | ) | | | (332 | ) | | | (129,616 | ) | | | (75,855 | ) |
| | | | | | | |
| | | | | | | | | | | | | | | | | | | | | | | | | | | | | | |
| | 26,858 | | | | 36,706 | | | | 45,528 | | | | 154,645 | | | | 0 | | | | 20,087 | | | | 482,627 | | | | 97,253 | |
| | (7,995 | ) | | | (18,254 | ) | | | (10,114 | ) | | | (15,159 | ) | | | (20,176 | ) | | | (5,039 | ) | | | (1,370,969 | ) | | | (1,161,905 | ) |
| 18,863 | | | | 18,452 | | | | 35,414 | | | | 139,486 | | | | (20,176 | ) | | | 15,048 | | | | (888,342 | ) | | | (1,064,652 | ) |
| | | | | | | |
| | 17,180 | | | | 22,617 | | | | 36,058 | | | | 139,750 | | | | (20,446 | ) | | | 15,540 | | | | (942,772 | ) | | | (966,748 | ) |
| | | | | | | |
| | | | | | | | | | | | | | | | | | | | | | | | | | | | | | |
| | 210,548 | | | | 187,931 | | | | 139,750 | | | | 0 | | | | 76,211 | | | | 60,671 | | | | 3,431,844 | | | | 4,398,592 | |
| $ | 227,728 | | | $ | 210,548 | | | $ | 175,808 | | | $ | 139,750 | | | $ | 55,765 | | | $ | 76,211 | | | $ | 2,489,072 | | | $ | 3,431,844 | |
| | | | | | | |
$ | (36 | ) | | $ | (69 | ) | | $ | (167 | ) | | $ | 0 | | | $ | (52 | ) | | $ | (19 | ) | | $ | 3,349 | | | $ | 559 | |
| | | | | | | |
| | | | | | | | | | | | | | | | | | | | | | | | | | | | | | |
| | 500 | | | | 700 | | | | 450 | | | | 1,530 | | | | 0 | | | | 400 | | | | 4,400 | | | | 900 | |
| | (150 | ) | | | (350 | ) | | | (100 | ) | | | (150 | ) | | | (400 | ) | | | (100 | ) | | | (12,600 | ) | | | (11,000 | ) |
| | 350 | | | | 350 | | | | 350 | | | | 1,380 | | | | (400 | ) | | | 300 | | | | (8,200 | ) | | | (10,100 | ) |
| | | | | | |
| | ANNUAL REPORT | | JUNE 30, 2015 | | 37 |
Statements of Cash Flows
| | | | | | | | |
| Year Ended June 30, 2015 | | | | | | |
| (Amounts in thousands†) | | PIMCO
Global Advantage®
Inflation-Linked Bond
Active Exchange-
Traded Fund | | | PIMCO
Low Duration
Active Exchange-
Traded Fund | |
| | |
Cash Flows (Used for) Operating Activities: | | | | | | | | |
Net increase (decrease) in net assets resulting from operations | | $ | (15,253 | ) | | $ | 3,535 | |
| | |
Adjustments to Reconcile Net Increase (Decrease) in Net Assets from Operations to Net Cash (Used for) Operating Activities: | | | | | | | | |
Purchases of long-term securities | | | (169,122 | ) | | | (2,459,093 | ) |
Proceeds from sales of long-term securities | | | 151,765 | | | | 1,936,142 | |
Proceeds from sales of short-term portfolio investments, net | | | 7,502 | | | | 481,640 | |
(Increase) in deposits with counterparty | | | (1,496 | ) | | | (1,362 | ) |
(Increase) decrease in receivable for investments sold | | | (499 | ) | | | 96,584 | |
(Increase) decrease in interest receivable | | | 233 | | | | (287 | ) |
(Increase) decrease in exchange-traded or centrally cleared financial derivative instruments | | | (197 | ) | | | 863 | |
Decrease in over the counter financial derivative instruments | | | 1,087 | | | | 882 | |
(Increase) in reimbursement receivable from PIMCO | | | (6 | ) | | | 0 | |
Increase (decrease) in payable for investments purchased | | | 135 | | | | (105,633 | ) |
Increase (decrease) in accrued management fees | | | (18 | ) | | | 4 | |
(Decrease) in accrued taxes payable | | | (20 | ) | | | 0 | |
Increase in accrued reimbursement to PIMCO | | | 0 | | | | 2 | |
Proceeds from short sales transactions, net | | | 0 | | | | 9,502 | |
Proceeds from (Payments on) currency transactions | | | (463 | ) | | | 162 | |
Increase in other liabilities | | | 5 | | | | 4 | |
Net Realized (Gain) Loss | | | | | | | | |
Investments in securities | | | 6,408 | | | | 82 | |
Exchange-traded or centrally cleared financial derivative instruments | | | 371 | | | | (634 | ) |
Over the counter financial derivative instruments | | | (949 | ) | | | (882 | ) |
Foreign currency | | | 438 | | | | (166 | ) |
Net Change in Unrealized (Appreciation) Depreciation | | | | | | | | |
Investments in securities | | | 12,964 | | | | 635 | |
Exchange-traded or centrally cleared financial derivative instruments | | | (77 | ) | | | (41 | ) |
Over the counter financial derivative instruments | | | (700 | ) | | | (609 | ) |
Foreign currency assets and liabilities | | | 45 | | | | 4 | |
Net amortization (accretion) on investments | | | 459 | | | | 1,658 | |
Net Cash (Used for) Operating Activities | | | (7,388 | ) | | | (37,008 | ) |
| | |
Cash Flows Received from Financing Activities: | | | | | | | | |
Proceeds from shares sold | | | 9,342 | | | | 45,528 | |
Payments on shares redeemed | | | (23,542 | ) | | | (10,114 | ) |
Cash dividend paid | | | (6,213 | ) | | | (2,752 | ) |
Proceeds from reverse repurchase agreements | | | 95,643 | | | | 1,963,071 | |
Payments on reverse repurchase agreements | | | (72,424 | ) | | | (1,959,000 | ) |
Proceeds from sale-buyback transactions | | | 294,074 | | | | 1,272,334 | |
Payments on sale-buyback transactions | | | (289,650 | ) | | | (1,272,334 | ) |
Proceeds from deposits from counterparty | | | 5,130 | | | | 1,160 | |
Payments on deposits from counterparty | | | (4,670 | ) | | | (520 | ) |
Net Cash Received from Financing Activities | | | 7,690 | | | | 37,373 | |
| | |
Net Increase in Cash and Foreign Currency | | | 302 | | | | 365 | |
| | |
Cash and Foreign Currency: | | | | | | | | |
Beginning of year | | | 503 | | | | 743 | |
End of year | | $ | 805 | | | $ | 1,108 | |
| | |
Supplemental Disclosure of Cash Flow Information: | | | | | | | | |
Interest expense paid during the year | | $ | 59 | | | $ | 0 | |
| † | A zero balance may reflect actual amounts rounding to less than one thousand. |
| | | | | | |
| 38 | | PIMCO ETF TRUST | | | | See Accompanying Notes |
Schedule of Investments PIMCO 1-3 Year U.S. Treasury Index Exchange-Traded Fund
June 30, 2015
| | | | | | | | | | | | |
| | | | | PRINCIPAL
AMOUNT
(000s) | | | | | MARKET
VALUE
(000s) | |
INVESTMENTS IN SECURITIES 99.8% | |
| |
U.S. TREASURY OBLIGATIONS 99.3% | |
|
U.S. Treasury Bonds | |
8.875% due 08/15/2017 | | $ | | | 2,520 | | | $ | | | 2,954 | |
|
U.S. Treasury Notes | |
0.500% due 06/15/2016 | | | | | 3,720 | | | | | | 3,726 | |
0.625% due 10/15/2016 | | | | | 3,880 | | | | | | 3,889 | |
0.625% due 11/15/2016 | | | | | 4,725 | | | | | | 4,736 | |
0.625% due 02/15/2017 | | | | | 3,155 | | | | | | 3,158 | |
0.750% due 03/15/2017 | | | | | 4,670 | | | | | | 4,686 | |
0.750% due 04/15/2018 | | | | | 4,435 | | | | | | 4,409 | |
0.875% due 09/15/2016 | | | | | 4,025 | | | | | | 4,047 | |
0.875% due 11/30/2016 | | | | | 4,370 | | | | | | 4,394 | |
0.875% due 12/31/2016 | | | | | 4,450 | | | | | | 4,475 | |
0.875% due 01/31/2017 | | | | | 4,370 | | | | | | 4,393 | |
0.875% due 04/15/2017 | | | | | 2,630 | | | | | | 2,643 | |
| | | | | | | | | | | | |
| | | | | PRINCIPAL
AMOUNT
(000s) | | | | | MARKET
VALUE
(000s) | |
0.875% due 06/15/2017 | | $ | | | 5,520 | | | $ | | | 5,545 | |
0.875% due 07/15/2017 | | | | | 4,200 | | | | | | 4,217 | |
0.875% due 10/15/2017 | | | | | 3,670 | | | | | | 3,677 | |
0.875% due 11/15/2017 | | | | | 3,890 | | | | | | 3,895 | |
0.875% due 01/15/2018 | | | | | 3,915 | | | | | | 3,915 | |
1.000% due 09/15/2017 | | | | | 3,360 | | | | | | 3,379 | |
1.000% due 12/15/2017 | | | | | 2,805 | | | | | | 2,816 | |
1.000% due 03/15/2018 | | | | | 3,260 | | | | | | 3,266 | |
1.125% due 06/15/2018 | | | | | 2,500 | | | | | | 2,509 | |
2.750% due 05/31/2017 | | | | | 4,410 | | | | | | 4,588 | |
3.000% due 08/31/2016 | | | | | 3,560 | | | | | | 3,667 | |
3.125% due 04/30/2017 | | | | | 4,805 | | | | | | 5,026 | |
3.250% due 07/31/2016 | | | | | 4,400 | | | | | | 4,535 | |
3.500% due 02/15/2018 | | | | | 3,575 | | | | | | 3,815 | |
3.875% due 05/15/2018 | | | | | 3,730 | | | | | | 4,037 | |
| | | | | | | | | | | | |
Total U.S. Treasury Obligations (Cost $106,216) | | | 106,397 | |
| | | | | | | | | | | | |
| | | | | | | | | | |
| | | | | | | | | MARKET
VALUE
(000s) | |
SHORT-TERM INSTRUMENTS 0.5% | |
| |
REPURCHASE AGREEMENTS (a) 0.5% | |
| | | | | | $ | | | 565 | |
| | | | | | | | | | |
Total Short-Term Instruments
(Cost $565) | | | 565 | |
| | | | | | | | | | |
| | | | | | | | | | |
Total Investments in Securities (Cost $106,781) | | | 106,962 | |
| | | | | | | | | | |
| | | | | | | | | | |
Total Investments 99.8%
(Cost $106,781) | | $ | | | 106,962 | |
| |
Other Assets and Liabilities, net 0.2% | | | 213 | |
| | | | | | | | | | |
Net Assets 100.0% | | $ | | | 107,175 | |
| | | | | | | | | | |
NOTES TO SCHEDULE OF INVESTMENTS (AMOUNTS IN THOUSANDS*):
| * | A zero balance may reflect actual amounts rounding to less than one thousand. |
BORROWINGS AND OTHER FINANCING TRANSACTIONS
(a) REPURCHASE AGREEMENTS:
| | | | | | | | | | | | | | | | | | | | | | | | | | | | | | | | |
| Counterparty | | | | Lending
Rate | | | Settlement
Date | | | Maturity
Date | | | Principal
Amount | | | Collateralized By | | Collateral
Received,
at Value | | | Repurchase
Agreements,
at Value | | | Repurchase
Agreement
Proceeds
to be
Received (1) | |
SSB | | | | | 0.000 | % | | | 06/30/2015 | | | | 07/01/2015 | | | $ | 565 | | | Fannie Mae 2.200% due 10/17/2022 | | $ | (577 | ) | | $ | 565 | | | $ | 565 | |
Total Repurchase Agreements | | | | | | | | | | | | | | | | | | | | | | $ | (577 | ) | | $ | 565 | | | $ | 565 | |
| (1) | Includes accrued interest. |
BORROWINGS AND OTHER FINANCING TRANSACTIONS SUMMARY
The following is a summary by counterparty of the market value of Borrowings and Other Financing Transactions and collateral (received) as of June 30, 2015:
| | | | | | | | | | | | | | | | | | | | | | | | | | | | | | |
| Counterparty | | | | Repurchase
Agreement
Proceeds
to be
Received | | | Payable for
Reverse
Repurchase
Agreements | | | Payable for
Sale-Buyback
Transactions | | | Securities
Out on Loan | | | Total
Borrowings and
Other Financing
Transactions | | | Collateral
(Received) | | | Net
Exposure (2) | |
Global/Master Repurchase Agreement | | | | | | | | | | | | | | | | | | | | | | | | | | | | | | |
SSB | | | | $ | 565 | | | $ | 0 | | | $ | 0 | | | $ | 0 | | | $ | 565 | | | $ | (577 | ) | | $ | (12 | ) |
Total Borrowings and Other Financing Transactions | | | | $ | 565 | | | $ | 0 | | | $ | 0 | | | $ | 0 | | | | | | | | | | | | | |
| (2) | Net Exposure represents the net receivable/(payable) that would be due from/to the counterparty in the event of default. Exposure from borrowings and other financing transactions can only be netted across transactions governed under the same master agreement with the same legal entity. See Note 7, Principal Risks, in the Notes to Financial Statements for more information regarding master netting arrangements. |
FAIR VALUE MEASUREMENTS
The following is a summary of the fair valuations according to the inputs used as of June 30, 2015 in valuing the Fund’s assets and liabilities:
| | | | | | | | | | | | | | | | | | |
| Category and Subcategory | | | | Level 1 | | | Level 2 | | | Level 3 | | | Fair Value at
06/30/2015 | |
Investments in Securities, at Value | | | | | | | | | | | | | | | | | | |
U.S. Treasury Obligations | | | | $ | 0 | | | $ | 106,397 | | | $ | 0 | | | $ | 106,397 | |
Short-Term Instruments | | | | | | | | | | | | | | | | | | |
Repurchase Agreements | | | | | 0 | | | | 565 | | | | 0 | | | | 565 | |
Total Investments | | | | $ | 0 | | | $ | 106,962 | | | $ | 0 | | | $ | 106,962 | |
There were no significant transfers between Levels 1, 2, or 3 during the period ended June 30, 2015.
| | | | | | |
| See Accompanying Notes | | ANNUAL REPORT | | JUNE 30, 2015 | | 39 |
Schedule of Investments PIMCO 3-7 Year U.S. Treasury Index Exchange-Traded Fund
June 30, 2015
| | | | | | | | | | | | |
| | | | | PRINCIPAL
AMOUNT
(000s) | | | | | MARKET
VALUE
(000s) | |
INVESTMENTS IN SECURITIES 99.0% | |
| |
U.S. TREASURY OBLIGATIONS 99.0% | |
| | | | |
U.S. Treasury Bonds | | | | | | | | | | | | |
7.875% due 02/15/2021 | | $ | | | 210 | | | $ | | | 278 | |
8.750% due 08/15/2020 | | | | | 200 | | | | | | 270 | |
| | | | |
U.S. Treasury Notes | | | | | | | | | | | | |
0.875% due 07/31/2019 | | | | | 315 | | | | | | 308 | |
1.000% due 06/30/2019 | | | | | 360 | | | | | | 355 | |
1.000% due 09/30/2019 | | | | | 440 | | | | | | 432 | |
1.000% due 11/30/2019 | | | | | 285 | | | | | | 279 | |
1.125% due 03/31/2020 | | | | | 155 | | | | | | 152 | |
1.125% due 04/30/2020 | | | | | 360 | | | | | | 351 | |
1.250% due 01/31/2019 | | | | | 448 | | | | | | 448 | |
1.375% due 11/30/2018 | | | | | 129 | | | | | | 130 | |
| | | | | | | | | | | | |
| | | | | PRINCIPAL
AMOUNT
(000s) | | | | | MARKET
VALUE
(000s) | |
1.375% due 12/31/2018 | | $ | | | 215 | | | $ | | | 216 | |
1.375% due 01/31/2020 | | | | | 460 | | | | | | 456 | |
1.375% due 05/31/2020 | | | | | 305 | | | | | | 301 | |
1.500% due 08/31/2018 | | | | | 195 | | | | | | 197 | |
1.500% due 03/31/2019 | | | | | 615 | | | | | | 619 | |
1.500% due 01/31/2022 | | | | | 375 | | | | | | 363 | |
1.750% due 10/31/2018 | | | | | 334 | | | | | | 341 | |
1.750% due 10/31/2020 | | | | | 595 | | | | | | 595 | |
1.750% due 04/30/2022 | | | | | 450 | | | | | | 441 | |
1.875% due 06/30/2020 | | | | | 110 | | | | | | 111 | |
2.000% due 09/30/2020 | | | | | 160 | �� | | | | | 162 | |
2.000% due 10/31/2021 | | | | | 350 | | | | | | 350 | |
2.250% due 07/31/2018 | | | | | 228 | | | | | | 236 | |
2.250% due 03/31/2021 | | | | | 300 | | | | | | 306 | |
2.250% due 07/31/2021 | | | | | 430 | | | | | | 438 | |
2.375% due 06/30/2018 | | | | | 338 | | | | | | 351 | |
| | | | | | | | | | | | |
| | | | | PRINCIPAL
AMOUNT
(000s) | | | | | MARKET
VALUE
(000s) | |
2.375% due 12/31/2020 | | $ | | | 260 | | | $ | | | 268 | |
3.125% due 05/15/2021 | | | | | 285 | | | | | | 305 | |
3.375% due 11/15/2019 | | | | | 135 | | | | | | 146 | |
| | | | | | | | | | | | |
Total U.S. Treasury Obligations
(Cost $9,189) | | | | | | | | | | | 9,205 | |
| | | | | | | | | | | | |
| | | | | | | | | | | | |
Total Investments in Securities
(Cost $9,189) | | | | | | | | | | | 9,205 | |
| | | | | | | | | | | | |
| | | | | | | | | | | | |
Total Investments 99.0%
(Cost $9,189) | | | | | | | | $ | | | 9,205 | |
| |
Other Assets and Liabilities, net 1.0% | | | 95 | |
| | | | | | | | | | | | |
Net Assets 100.0% | | | | | | | | $ | | | 9,300 | |
| | | | | | | | | | | | |
NOTES TO SCHEDULE OF INVESTMENTS (AMOUNTS IN THOUSANDS*):
| * | A zero balance may reflect actual amounts rounding to less than one thousand. |
FAIR VALUE MEASUREMENTS
The following is a summary of the fair valuations according to the inputs used as of June 30, 2015 in valuing the Fund’s assets and liabilities:
| | | | | | | | | | | | | | | | | | |
| Category and Subcategory | | | | Level 1 | | | Level 2 | | | Level 3 | | | Fair Value at
06/30/2015 | |
Investments in Securities, at Value | | | | | | | | | | | | | | | | | | |
U.S. Treasury Obligations | | | | $ | 0 | | | $ | 9,205 | | | $ | 0 | | | $ | 9,205 | |
There were no significant transfers between Levels 1, 2, or 3 during the period ended June 30, 2015.
| | | | | | |
| 40 | | PIMCO ETF TRUST | | | | See Accompanying Notes |
Schedule of Investments PIMCO 7-15 Year U.S. Treasury Index Exchange-Traded Fund
June 30, 2015
| | | | | | | | | | | | |
| | | | | PRINCIPAL
AMOUNT
(000s) | | | | | MARKET
VALUE
(000s) | |
INVESTMENTS IN SECURITIES 98.9% | |
| |
U.S. TREASURY OBLIGATIONS 98.9% | |
|
U.S. Treasury Bonds | |
5.500% due 08/15/2028 | | $ | | | 743 | | | $ | | | 986 | |
6.000% due 02/15/2026 | | | | | 958 | | | | | | 1,285 | |
6.125% due 08/15/2029 | | | | | 198 | | | | | | 280 | |
6.250% due 08/15/2023 | | | | | 1,195 | | | | | | 1,558 | |
6.250% due 05/15/2030 | | | | | 351 | | | | | | 506 | |
6.375% due 08/15/2027 | | | | | 586 | | | | | | 825 | |
7.625% due 02/15/2025 | | | | | 603 | | | | | | 882 | |
| | | | | | | | | | | | |
| | | | | PRINCIPAL
AMOUNT
(000s) | | | | | MARKET
VALUE
(000s) | |
|
U.S. Treasury Notes | |
1.625% due 11/15/2022 | | $ | | | 3,315 | | | $ | | | 3,200 | |
1.750% due 05/15/2023 | | | | | 974 | | | | | | 941 | |
2.000% due 02/15/2023 | | | | | 1,899 | | | | | | 1,876 | |
2.000% due 02/15/2025 | | | | | 2,105 | | | | | | 2,042 | |
2.250% due 11/15/2024 | | | | | 1,577 | | | | | | 1,565 | |
2.500% due 05/15/2024 | | | | | 1,181 | | | | | | 1,200 | |
2.750% due 11/15/2023 | | | | | 1,172 | | | | | | 1,217 | |
2.750% due 02/15/2024 | | | | | 1,375 | | | | | | 1,426 | |
| | | | | | | | | | | | |
Total U.S. Treasury Obligations
(Cost $19,916) | | | | | | | | | | | 19,789 | |
| | | | | | | | | | | | |
| | | | | | | | | | |
| | | | | | | | | MARKET
VALUE
(000s) | |
Total Investments in Securities
(Cost $19,916) | | | | | | $ | | | 19,789 | |
| | | | | | | | | | |
| | | | | | | | | | |
Total Investments 98.9%
(Cost $19,916) | | | | | | $ | | | 19,789 | |
| |
Other Assets and Liabilities, net 1.1% | | | 220 | |
| | | | | | | | | | |
Net Assets 100.0% | | | | | | $ | | | 20,009 | |
| | | | | | | | | | |
NOTES TO SCHEDULE OF INVESTMENTS (AMOUNTS IN THOUSANDS*):
| * | A zero balance may reflect actual amounts rounding to less than one thousand. |
FAIR VALUE MEASUREMENTS
The following is a summary of the fair valuations according to the inputs used as of June 30, 2015 in valuing the Fund’s assets and liabilities:
| | | | | | | | | | | | | | | | | | |
| Category and Subcategory | | | | Level 1 | | | Level 2 | | | Level 3 | | | Fair Value at
06/30/2015 | |
Investments in Securities, at Value | | | | | | | | | | | | | | | | | | |
U.S. Treasury Obligations | | | | $ | 0 | | | $ | 19,789 | | | $ | 0 | | | $ | 19,789 | |
There were no significant transfers between Levels 1, 2, or 3 during the period ended June 30, 2015.
| | | | | | |
| See Accompanying Notes | | ANNUAL REPORT | | JUNE 30, 2015 | | 41 |
Schedule of Investments PIMCO 25+ Year Zero Coupon U.S. Treasury Index Exchange-Traded Fund
June 30, 2015
| | | | | | | | | | | | |
| | | | | PRINCIPAL
AMOUNT
(000s) | | | | | MARKET
VALUE
(000s) | |
INVESTMENTS IN SECURITIES 106.0% | |
| |
U.S. TREASURY OBLIGATIONS 106.0% | |
|
U.S. Treasury Strips (a) | |
0.000% due 05/15/2040 | | $ | | | 12,280 | | | $ | | | 5,498 | |
0.000% due 08/15/2040 | | | | | 11,922 | | | | | | 5,259 | |
0.000% due 11/15/2040 | | | | | 11,598 | | | | | | 5,101 | |
0.000% due 02/15/2041 | | | | | 12,444 | | | | | | 5,430 | |
0.000% due 05/15/2041 | | | | | 11,154 | | | | | | 4,835 | |
0.000% due 08/15/2041 | | | | | 12,444 | | | | | | 5,363 | |
0.000% due 11/15/2041 | | | | | 11,154 | | | | | | 4,737 | |
0.000% due 02/15/2042 | | | | | 12,444 | | | | | | 5,251 | |
| | | | | | | | | | | | |
| | | | | PRINCIPAL
AMOUNT
(000s) | | | | | MARKET
VALUE
(000s) | |
0.000% due 05/15/2042 | | $ | | | 11,407 | | | $ | | | 4,745 | |
0.000% due 08/15/2042 | | | | | 12,892 | | | | | | 5,313 | |
0.000% due 11/15/2042 | | | | | 11,486 | | | | | | 4,688 | |
0.000% due 02/15/2043 | | | | | 11,794 | | | | | | 4,782 | |
0.000% due 05/15/2043 | | | | | 11,837 | | | | | | 4,760 | |
0.000% due 08/15/2043 | | | | | 12,031 | | | | | | 4,829 | |
0.000% due 11/15/2043 | | | | | 11,476 | | | | | | 4,580 | |
0.000% due 02/15/2044 | | | | | 11,946 | | | | | | 4,721 | |
0.000% due 05/15/2044 | | | | | 12,242 | | | | | | 4,778 | |
0.000% due 08/15/2044 | | | | | 11,606 | | | | | | 4,531 | |
0.000% due 11/15/2044 | | | | | 11,892 | | | | | | 4,573 | |
0.000% due 02/15/2045 | | | | | 11,795 | | | | | | 4,534 | |
| | | | | | | | | | | | |
| | | | | PRINCIPAL
AMOUNT
(000s) | | | | | MARKET
VALUE
(000s) | |
0.000% due 05/15/2045 | | $ | | | 11,800 | | | $ | | | 4,487 | |
| | | | | | | | | | | | |
Total U.S. Treasury Obligations
(Cost $118,452) | | | | | | | | | | | 102,795 | |
| | | | | | | | | | | | |
| | | | | | | | | | | | |
Total Investments in Securities
(Cost $118,452) | | | | | | | | | | | 102,795 | |
| | | | | | | | | | | | |
| | | | | | | | | | | | |
Total Investments 106.0%
(Cost $118,452) | | | | | | | | $ | | | 102,795 | |
| |
Other Assets and Liabilities, net (6.0%) | | | (5,835 | ) |
| | | | | | | | | | | | |
Net Assets 100.0% | | | | | | | | $ | | | 96,960 | |
| | | | | | | | | | | | |
NOTES TO SCHEDULE OF INVESTMENTS (AMOUNTS IN THOUSANDS*):
| * | A zero balance may reflect actual amounts rounding to less than one thousand. |
FAIR VALUE MEASUREMENTS
The following is a summary of the fair valuations according to the inputs used as of June 30, 2015 in valuing the Fund’s assets and liabilities:
| | | | | | | | | | | | | | | | | | |
| Category and Subcategory | | | | Level 1 | | | Level 2 | | | Level 3 | | | Fair Value at
06/30/2015 | |
Investments in Securities, at Value | | | | | | | | | | | | | | | | | | |
U.S. Treasury Obligations | | | | $ | 0 | | | $ | 102,795 | | | $ | 0 | | | $ | 102,795 | |
There were no significant transfers between Levels 1, 2, or 3 during the period ended June 30, 2015.
| | | | | | |
| 42 | | PIMCO ETF TRUST | | | | See Accompanying Notes |
Schedule of Investments PIMCO 1-5 Year U.S. TIPS Index Exchange-Traded Fund
June 30, 2015
| | | | | | | | | | | | |
| | | | | PRINCIPAL
AMOUNT
(000s) | | | | | MARKET
VALUE
(000s) | |
INVESTMENTS IN SECURITIES 99.6% | |
| |
U.S. TREASURY OBLIGATIONS 99.4% | |
|
U.S. Treasury Inflation Protected Securities (a) | |
0.125% due 04/15/2017 | | $ | | | 166,453 | | | $ | | | 168,677 | |
0.125% due 04/15/2018 | | | | | 184,949 | | | | | | 187,753 | |
0.125% due 04/15/2019 | | | | | 179,867 | | | | | | 182,045 | |
0.125% due 04/15/2020 | | | | | 65,517 | | | | | | 66,019 | |
1.375% due 07/15/2018 | | | | | 58,302 | | | | | | 61,791 | |
1.375% due 01/15/2020 | | | | | 74,162 | | | | | | 79,255 | |
1.625% due 01/15/2018 | | | | | 66,655 | | | | | | 70,399 | |
1.875% due 07/15/2019 | | | | | 63,157 | | | | | | 68,836 | |
2.125% due 01/15/2019 | | | | | 60,807 | | | | | | 66,146 | |
| | | | | | | | | | | | |
| | | | | PRINCIPAL
AMOUNT
(000s) | | | | | MARKET
VALUE
(000s) | |
2.375% due 01/15/2017 | | $ | | | 76,437 | | | $ | | | 80,163 | |
2.500% due 07/15/2016 | | | | | 78,412 | | | | | | 81,315 | |
2.625% due 07/15/2017 | | | | | 58,527 | | | | | | 62,775 | |
| | | | | | | | | | | | |
Total U.S. Treasury Obligations
(Cost $1,183,265) | | | | | | 1,175,174 | |
| | | | | | | | | | | | |
| |
SHORT-TERM INSTRUMENTS 0.2% | |
| |
REPURCHASE AGREEMENTS (b) 0.2% | |
| | | | | | | | | | | 2,804 | |
| | | | | | | | | | | | |
Total Short-Term Instruments
(Cost $2,804) | | | | | | | | | 2,804 | |
| | | | | | | | | | | | |
| | | | | | | | | | |
| | | | | | | | | MARKET
VALUE
(000s) | |
Total Investments in Securities
(Cost $1,186,069) | | $ | | | 1,177,978 | |
| | | | | | | | | | |
| | | | | | | | | | |
Total Investments 99.6%
(Cost $1,186,069) | | $ | | | 1,177,978 | |
| |
Other Assets and Liabilities, net 0.4% | | | 4,888 | |
| | | | | | | | | | |
Net Assets 100.0% | | $ | | | 1,182,866 | |
| | | | | | | | | | |
NOTES TO SCHEDULE OF INVESTMENTS (AMOUNTS IN THOUSANDS*):
| * | A zero balance may reflect actual amounts rounding to less than one thousand. |
| (a) | Principal amount of security is adjusted for inflation. |
BORROWINGS AND OTHER FINANCING TRANSACTIONS
(b) REPURCHASE AGREEMENTS:
| | | | | | | | | | | | | | | | | | | | | | | | | | | | | | | | |
| Counterparty | | | | Lending
Rate | | | Settlement
Date | | | Maturity
Date | | | Principal
Amount | | | Collateralized By | | Collateral
Received,
at Value | | | Repurchase
Agreements,
at Value | | | Repurchase
Agreement
Proceeds
to be
Received (1) | |
SSB | | | | | 0.000 | % | | | 06/30/2015 | | | | 07/01/2015 | | | $ | 2,804 | | | Fannie Mae 2.200% due 10/17/2022 | | $ | (2,861 | ) | | $ | 2,804 | | | $ | 2,804 | |
Total Repurchase Agreements | | | | | | | | | | | | | | | | | | | | | | $ | (2,861 | ) | | $ | 2,804 | | | $ | 2,804 | |
| (1) | Includes accrued interest. |
BORROWINGS AND OTHER FINANCING TRANSACTIONS SUMMARY
The following is a summary by counterparty of the market value of Borrowings and Other Financing Transactions and collateral (received) as of June 30, 2015:
| | | | | | | | | | | | | | | | | | | | | | | | | | | | | | |
| Counterparty | | | | Repurchase
Agreement
Proceeds
to be
Received | | | Payable for
Reverse
Repurchase
Agreements | | | Payable for
Sale-Buyback
Transactions | | | Securities
Out on Loan | | | Total
Borrowings and
Other Financing
Transactions | | | Collateral
(Received) | | | Net
Exposure (2) | |
Global/Master Repurchase Agreement | | | | | | | | | | | | | | | | | | | | | | | | | | | | | | |
SSB | | | | $ | 2,804 | | | $ | 0 | | | $ | 0 | | | $ | 0 | | | $ | 2,804 | | | $ | (2,861 | ) | | $ | (57 | ) |
Total Borrowings and Other Financing Transactions | | | | $ | 2,804 | | | $ | 0 | | | $ | 0 | | | $ | 0 | | | | | | | | | | | | | |
| (2) | Net Exposure represents the net receivable/(payable) that would be due from/to the counterparty in the event of default. Exposure from borrowings and other financing transactions can only be netted across transactions governed under the same master agreement with the same legal entity. See Note 7, Principal Risks, in the Notes to Financial Statements for more information regarding master netting arrangements. |
FAIR VALUE MEASUREMENTS
The following is a summary of the fair valuations according to the inputs used as of June 30, 2015 in valuing the Fund’s assets and liabilities:
| | | | | | | | | | | | | | | | | | |
| Category and Subcategory | | | | Level 1 | | | Level 2 | | | Level 3 | | | Fair Value at
06/30/2015 | |
Investments in Securities, at Value | | | | | | | | | | | | | | | | | | |
U.S. Treasury Obligations | | | | $ | 0 | | | $ | 1,175,174 | | | $ | 0 | | | $ | 1,175,174 | |
Short-Term Instruments | | | | | | | | | | | | | | | | | | |
Repurchase Agreements | | | | | 0 | | | | 2,804 | | | | 0 | | | | 2,804 | |
Total Investments | | | | $ | 0 | | | $ | 1,177,978 | | | $ | 0 | | | $ | 1,177,978 | |
There were no significant transfers between Levels 1, 2, or 3 during the period ended June 30, 2015.
| | | | | | |
| See Accompanying Notes | | ANNUAL REPORT | | JUNE 30, 2015 | | 43 |
Schedule of Investments PIMCO 15+ Year U.S. TIPS Index Exchange-Traded Fund
June 30, 2015
| | | | | | | | | | | | |
| | | | | PRINCIPAL
AMOUNT
(000s) | | | | | MARKET
VALUE
(000s) | |
INVESTMENTS IN SECURITIES 99.6% | |
| |
U.S. TREASURY OBLIGATIONS 99.4% | |
|
U.S. Treasury Inflation Protected Securities (a) | |
0.625% due 02/15/2043 | | $ | | | 15,960 | | | $ | | | 14,059 | |
0.750% due 02/15/2042 | | | | | 15,604 | | | | | | 14,250 | |
0.750% due 02/15/2045 | | | | | 9,967 | | | | | | 9,036 | |
1.375% due 02/15/2044 | | | | | 14,929 | | | | | | 15,822 | |
2.125% due 02/15/2040 | | | | | 10,169 | | | | | | 12,458 | |
2.125% due 02/15/2041 | | | | | 16,384 | | | | | | 20,214 | |
3.375% due 04/15/2032 | | | | | 4,409 | | | | | | 6,198 | |
| | | | | | | | | | | | |
Total U.S. Treasury Obligations
(Cost $99,602) | | | 92,037 | |
| | | | | | | | | | | | |
| | | | | | | | | | |
| | | | | | | | | MARKET
VALUE
(000s) | |
SHORT-TERM INSTRUMENTS 0.2% | |
| |
REPURCHASE AGREEMENTS (b) 0.2% | |
| | | | | | $ | | | 168 | |
| | | | | | | | | | |
Total Short-Term Instruments
(Cost $168) | | | | | 168 | |
| | | | | | | | | | |
| | | | | | | | | | |
Total Investments in Securities
(Cost $99,770) | | | | | 92,205 | |
| | | | | | | | | | |
| | | | | | | | | | |
Total Investments 99.6%
(Cost $99,770) | | $ | | | 92,205 | |
| |
Other Assets and Liabilities, net 0.4% | | | | | 334 | |
| | | | | | | | | | |
Net Assets 100.0% | | $ | | | 92,539 | |
| | | | | | | | | | |
NOTES TO SCHEDULE OF INVESTMENTS (AMOUNTS IN THOUSANDS*):
| * | A zero balance may reflect actual amounts rounding to less than one thousand. |
| (a) | Principal amount of security is adjusted for inflation. |
BORROWINGS AND OTHER FINANCING TRANSACTIONS
(b) REPURCHASE AGREEMENTS:
| | | | | | | | | | | | | | | | | | | | | | | | | | | | | | | | |
| Counterparty | | | | Lending
Rate | | | Settlement
Date | | | Maturity
Date | | | Principal
Amount | | | Collateralized By | | Collateral
Received,
at Value | | | Repurchase
Agreements,
at Value | | | Repurchase
Agreement
Proceeds
to be
Received (1) | |
SSB | | | | | 0.000 | % | | | 06/30/2015 | | | | 07/01/2015 | | | $ | 168 | | | Fannie Mae 2.200% due 10/17/2022 | | $ | (171 | ) | | $ | 168 | | | $ | 168 | |
Total Repurchase Agreements | | | | | | | | | | | | | | | | | | | | | | $ | (171 | ) | | $ | 168 | | | $ | 168 | |
| (1) | Includes accrued interest. |
BORROWINGS AND OTHER FINANCING TRANSACTIONS SUMMARY
The following is a summary by counterparty of the market value of Borrowings and Other Financing Transactions and collateral (received) as of June 30, 2015:
| | | | | | | | | | | | | | | | | | | | | | | | | | | | | | |
| Counterparty | | | | Repurchase
Agreement
Proceeds
to be
Received | | | Payable for
Reverse
Repurchase
Agreements | | | Payable for
Sale-Buyback
Transactions | | | Securities
Out on Loan | | | Total
Borrowings and
Other Financing
Transactions | | | Collateral
(Received) | | | Net
Exposure (2) | |
Global/Master Repurchase Agreement | | | | | | | | | | | | | | | | | | | | | | | | | | | | | | |
SSB | | | | $ | 168 | | | $ | 0 | | | $ | 0 | | | $ | 0 | | | $ | 168 | | | $ | (171 | ) | | $ | (3 | ) |
Total Borrowings and Other Financing Transactions | | | | $ | 168 | | | $ | 0 | | | $ | 0 | | | $ | 0 | | | | | | | | | | | | | |
| (2) | Net Exposure represents the net receivable/(payable) that would be due from/to the counterparty in the event of default. Exposure from borrowings and other financing transactions can only be netted across transactions governed under the same master agreement with the same legal entity. See Note 7, Principal Risks, in the Notes to Financial Statements for more information regarding master netting arrangements. |
FAIR VALUE MEASUREMENTS
The following is a summary of the fair valuations according to the inputs used as of June 30, 2015 in valuing the Fund’s assets and liabilities:
| | | | | | | | | | | | | | | | | | |
| Category and Subcategory | | | | Level 1 | | | Level 2 | | | Level 3 | | | Fair Value at
06/30/2015 | |
Investments in Securities, at Value | | | | | | | | | | | | | | | | | | |
U.S. Treasury Obligations | | | | $ | 0 | | | $ | 92,037 | | | $ | 0 | | | $ | 92,037 | |
Short-Term Instruments | | | | | | | | | | | | | | | | | | |
Repurchase Agreements | | | | | 0 | | | | 168 | | | | 0 | | | | 168 | |
Total Investments | | | | $ | 0 | | | $ | 92,205 | | | $ | 0 | | | $ | 92,205 | |
There were no significant transfers between Levels 1, 2, or 3 during the period ended June 30, 2015.
| | | | | | |
| 44 | | PIMCO ETF TRUST | | | | See Accompanying Notes |
Schedule of Investments PIMCO Broad U.S. TIPS Index Exchange-Traded Fund
June 30, 2015
| | | | | | | | | | | | |
| | | | | PRINCIPAL
AMOUNT
(000s) | | | | | MARKET
VALUE
(000s) | |
INVESTMENTS IN SECURITIES 99.7% | |
| |
U.S. TREASURY OBLIGATIONS 99.2% | |
|
U.S. Treasury Inflation Protected Securities (a) | |
0.125% due 01/15/2022 | | $ | | | 4,561 | | | $ | | | 4,518 | |
0.125% due 07/15/2022 | | | | | 3,863 | | | | | | 3,832 | |
0.125% due 01/15/2023 | | | | | 4,214 | | | | | | 4,137 | |
0.625% due 01/15/2024 | | | | | 7,762 | | | | | | 7,886 | |
0.750% due 02/15/2042 | | | | | 4,745 | | | | | | 4,333 | |
1.125% due 01/15/2021 | | | | | 8,825 | | | | | | 9,332 | |
1.375% due 07/15/2018 | | | | | 2,263 | | | | | | 2,399 | |
1.375% due 01/15/2020 | | | | | 4,641 | | | | | | 4,960 | |
1.375% due 02/15/2044 | | | | | 4,608 | | | | | | 4,883 | |
| | | | | | | | | | | | |
| | | | | PRINCIPAL
AMOUNT
(000s) | | | | | MARKET
VALUE
(000s) | |
1.625% due 01/15/2018 | | $ | | | 7,505 | | | $ | | | 7,927 | |
1.750% due 01/15/2028 | | | | | 3,317 | | | | | | 3,748 | |
1.875% due 07/15/2019 | | | | | 4,296 | | | | | | 4,682 | |
2.000% due 01/15/2026 | | | | | 4,750 | | | | | | 5,443 | |
2.125% due 02/15/2040 | | | | | 1,582 | | | | | | 1,938 | |
2.375% due 01/15/2017 | | | | | 4,756 | | | | | | 4,988 | |
2.375% due 01/15/2025 | | | | | 5,756 | | | | | | 6,763 | |
2.500% due 01/15/2029 | | | | | 4,444 | | | | | | 5,465 | |
2.625% due 07/15/2017 | | | | | 2,767 | | | | | | 2,968 | |
3.375% due 04/15/2032 | | | | | 1,133 | | | | | | 1,592 | |
| | | | | | | | | | | | |
Total U.S. Treasury Obligations
(Cost $94,386) | | | | | | | | | | | 91,794 | |
| | | | | | | | | | | | |
| | | | | | | | | | |
| | | | | | | | | MARKET
VALUE
(000s) | |
SHORT-TERM INSTRUMENTS 0.5% | |
| |
REPURCHASE AGREEMENTS (b) 0.5% | |
| | | | | | $ | | | 434 | |
| | | | | | | | | | |
Total Short-Term Instruments
(Cost $434) | | | | | | | | | 434 | |
| | | | | | | | | | |
| | | | | | | | | | |
Total Investments in Securities
(Cost $94,820) | | | | | | | | | 92,228 | |
| | | | | | | | | | |
| | | | | | | | | | |
Total Investments 99.7%
(Cost $94,820) | | | | | | $ | | | 92,228 | |
| |
Other Assets and Liabilities, net 0.3% | | | 245 | |
| | | | | | | | | | |
Net Assets 100.0% | | | | | | $ | | | 92,473 | |
| | | | | | | | | | |
NOTES TO SCHEDULE OF INVESTMENTS (AMOUNTS IN THOUSANDS*):
| * | A zero balance may reflect actual amounts rounding to less than one thousand. |
| (a) | Principal amount of security is adjusted for inflation. |
BORROWINGS AND OTHER FINANCING TRANSACTIONS
(b) REPURCHASE AGREEMENTS:
| | | | | | | | | | | | | | | | | | | | | | | | | | | | | | | | |
| Counterparty | | | | Lending
Rate | | | Settlement
Date | | | Maturity
Date | | | Principal
Amount | | | Collateralized By | | Collateral
Received,
at Value | | | Repurchase
Agreements,
at Value | | | Repurchase
Agreement
Proceeds
to be
Received (1) | |
SSB | | | | | 0.000 | % | | | 06/30/2015 | | | | 07/01/2015 | | | $ | 434 | | | Fannie Mae 2.200% due 10/17/2022 | | $ | (445 | ) | | $ | 434 | | | $ | 434 | |
Total Repurchase Agreements | | | | | | | | | | | | | | | | | | | | | | $ | (445 | ) | | $ | 434 | | | $ | 434 | |
| (1) | Includes accrued interest. |
BORROWINGS AND OTHER FINANCING TRANSACTIONS SUMMARY
The following is a summary by counterparty of the market value of Borrowings and Other Financing Transactions and collateral (received) as of June 30, 2015:
| | | | | | | | | | | | | | | | | | | | | | | | | | | | | | |
| Counterparty | | | | Repurchase
Agreement
Proceeds
to be
Received | | | Payable for
Reverse
Repurchase
Agreements | | | Payable for
Sale-Buyback
Transactions | | | Securities
Out on Loan | | | Total
Borrowings and
Other Financing
Transactions | | | Collateral
(Received) | | | Net
Exposure (2) | |
Global/Master Repurchase Agreement | | | | | | | | | | | | | | | | | | | | | | | | | | | | | | |
SSB | | | | $ | 434 | | | $ | 0 | | | $ | 0 | | | $ | 0 | | | $ | 434 | | | $ | (445 | ) | | $ | (11 | ) |
Total Borrowings and Other Financing Transactions | | | | $ | 434 | | | $ | 0 | | | $ | 0 | | | $ | 0 | | | | | | | | | | | | | |
| (2) | Net Exposure represents the net receivable/(payable) that would be due from/to the counterparty in the event of default. Exposure from borrowings and other financing transactions can only be netted across transactions governed under the same master agreement with the same legal entity. See Note 7, Principal Risks, in the Notes to Financial Statements for more information regarding master netting arrangements. |
FAIR VALUE MEASUREMENTS
The following is a summary of the fair valuations according to the inputs used as of June 30, 2015 in valuing the Fund’s assets and liabilities:
| | | | | | | | | | | | | | | | | | |
| Category and Subcategory | | | | Level 1 | | | Level 2 | | | Level 3 | | | Fair Value at
06/30/2015 | |
Investments in Securities, at Value | | | | | | | | | | | | | | | | | | |
U.S. Treasury Obligations | | | | $ | 0 | | | $ | 91,794 | | | $ | 0 | | | $ | 91,794 | |
Short-Term Instruments | | | | | | | | | | | | | | | | | | |
Repurchase Agreements | | | | | 0 | | | | 434 | | | | 0 | | | | 434 | |
Total Investments | | | | $ | 0 | | | $ | 92,228 | | | $ | 0 | | | $ | 92,228 | |
There were no significant transfers between Levels 1, 2, or 3 during the period ended June 30, 2015.
| | | | | | |
| See Accompanying Notes | | ANNUAL REPORT | | JUNE 30, 2015 | | 45 |
Schedule of Investments PIMCO 0-5 Year High Yield Corporate Bond Index Exchange-Traded Fund
| | | | | | | | | | | | |
| | | | | PRINCIPAL
AMOUNT
(000s) | | | | | MARKET
VALUE
(000s) | |
INVESTMENTS IN SECURITIES 99.0% | |
| |
CORPORATE BONDS & NOTES 96.6% | |
| |
BANKING & FINANCE 21.7% | |
|
AerCap Ireland Capital Ltd. | |
2.750% due 05/15/2017 | | $ | | | 400 | | | $ | | | 399 | |
3.750% due 05/15/2019 | | | | | 5,675 | | | | | | 5,625 | |
4.250% due 07/01/2020 | | | | | 3,600 | | | | | | 3,607 | |
|
Affinion Investments LLC | |
13.500% due 08/15/2018 | | | | | 6,300 | | | | | | 2,804 | |
|
AGFC Capital Trust | |
6.000% due 01/15/2067 | | | | | 1,500 | | | | | | 1,125 | |
| | | | |
Aircastle Ltd. | | | | | | | | | | | | |
6.750% due 04/15/2017 | | | | | 6,734 | | | | | | 7,189 | |
|
Ally Financial, Inc. | |
2.750% due 01/30/2017 | | | | | 1,800 | | | | | | 1,796 | |
3.125% due 01/15/2016 | | | | | 750 | | | | | | 754 | |
3.250% due 09/29/2017 | | | | | 1,100 | | | | | | 1,103 | |
3.500% due 07/18/2016 | | | | | 12,500 | | | | | | 12,719 | |
3.500% due 01/27/2019 | | | | | 2,448 | | | | | | 2,436 | |
4.750% due 09/10/2018 | | | | | 8,500 | | | | | | 8,787 | |
5.500% due 02/15/2017 | | | | | 33,600 | | | | | | 35,112 | |
6.250% due 12/01/2017 | | | | | 2,000 | | | | | | 2,140 | |
8.000% due 03/15/2020 | | | | | 8,000 | | | | | | 9,440 | |
|
ARC Properties Operating Partnership LP | |
2.000% due 02/06/2017 | | | | | 7,400 | | | | | | 7,196 | |
|
Barclays Bank PLC | |
7.750% due 04/10/2023 | | | | | 1,530 | | | | | | 1,660 | |
|
BPCE S.A. | |
4.500% due 03/15/2025 | | | | | 3,000 | | | | | | 2,902 | |
|
Cantor Commercial Real Estate Co. LP | |
7.750% due 02/15/2018 | | | | | 19,045 | | | | | | 19,997 | |
|
Chinos Intermediate Holdings A, Inc. (7.750% Cash or 8.500% PIK) | |
7.750% due 05/01/2019 (a) | | | | | 3,775 | | | | | | 3,058 | |
|
CIT Group, Inc. | |
3.875% due 02/19/2019 | | | | | 150 | | | | | | 149 | |
4.250% due 08/15/2017 | | | | | 32,108 | | | | | | 32,670 | |
5.000% due 05/15/2017 | | | | | 28,343 | | | | | | 29,298 | |
5.500% due 02/15/2019 | | | | | 7,000 | | | | | | 7,315 | |
6.625% due 04/01/2018 | | | | | 675 | | | | | | 724 | |
|
ContourGlobal Power Holdings S.A. | |
7.125% due 06/01/2019 | | | | | 500 | | | | | | 526 | |
| | | | |
Credit Agricole S.A. | | | | | | | | | | | | |
6.637% due 05/31/2017 (c) | | | | | 9,175 | | | | | | 9,588 | |
|
Eksportfinans ASA | |
2.000% due 09/15/2015 | | | | | 14,190 | | | | | | 14,208 | |
2.375% due 05/25/2016 | | | | | 24,393 | | | | | | 24,454 | |
5.500% due 05/25/2016 | | | | | 14,265 | | | | | | 14,693 | |
5.500% due 06/26/2017 | | | | | 1,375 | | | | | | 1,461 | |
|
General Motors Financial Co., Inc. | |
2.625% due 07/10/2017 | | | | | 2,275 | | | | | | 2,301 | |
2.750% due 05/15/2016 | | | | | 8,400 | | | | | | 8,502 | |
3.000% due 09/25/2017 | | | | | 2,225 | | | | | | 2,273 | |
3.250% due 05/15/2018 | | | | | 10,393 | | | | | | 10,644 | |
3.500% due 07/10/2019 | | | | | 1,200 | | | | | | 1,227 | |
4.750% due 08/15/2017 | | | | | 30,694 | | | | | | 32,416 | |
|
Genworth Holdings, Inc. | |
6.150% due 11/15/2066 | | | | | 750 | | | | | | 459 | |
|
HBOS PLC | |
6.750% due 05/21/2018 | | | | | 2,720 | | | | | | 3,021 | |
|
Icahn Enterprises LP | |
3.500% due 03/15/2017 | | | | | 855 | | | | | | 862 | |
4.875% due 03/15/2019 | | | | | 4,000 | | | | | | 4,041 | |
| | | | | | | | | | | | |
| | | | | PRINCIPAL
AMOUNT
(000s) | | | | | MARKET
VALUE
(000s) | |
|
International Lease Finance Corp. | |
6.250% due 05/15/2019 | | $ | | | 15,850 | | | $ | | | 17,177 | |
6.750% due 09/01/2016 | | | | | 5,395 | | | | | | 5,685 | |
8.625% due 09/15/2015 | | | | | 26,269 | | | | | | 26,630 | |
8.750% due 03/15/2017 | | | | | 16,344 | | | | | | 17,923 | |
|
iStar Financial, Inc. | |
4.000% due 11/01/2017 | | | | | 3,625 | | | | | | 3,575 | |
4.875% due 07/01/2018 | | | | | 6,408 | | | | | | 6,328 | |
5.000% due 07/01/2019 | | | | | 10,075 | | | | | | 9,974 | |
7.125% due 02/15/2018 | | | | | 7,025 | | | | | | 7,341 | |
9.000% due 06/01/2017 | | | | | 4,500 | | | | | | 4,911 | |
|
Jefferies Finance LLC | |
7.375% due 04/01/2020 | | | | | 850 | | | | | | 839 | |
|
KCG Holdings, Inc. | |
6.875% due 03/15/2020 | | | | | 3,725 | | | | | | 3,604 | |
|
Nationstar Mortgage LLC | |
6.500% due 08/01/2018 | | | | | 800 | | | | | | 803 | |
9.625% due 05/01/2019 | | | | | 4,500 | | | | | | 4,798 | |
|
Navient Corp. | |
4.875% due 06/17/2019 | | | | | 5,000 | | | | | | 4,963 | |
5.500% due 01/15/2019 | | | | | 3,245 | | | | | | 3,317 | |
6.000% due 01/25/2017 | | | | | 10,600 | | | | | | 11,050 | |
6.250% due 01/25/2016 | | | | | 3,117 | | | | | | 3,183 | |
7.250% due 01/25/2022 | | | | | 500 | | | | | | 529 | |
8.450% due 06/15/2018 | | | | | 29,582 | | | | | | 32,948 | |
|
OneMain Financial Holdings, Inc. | |
6.750% due 12/15/2019 | | | | | 4,950 | | | | | | 5,173 | |
|
PHH Corp. | |
7.375% due 09/01/2019 | | | | | 13,875 | | | | | | 14,742 | |
|
Radian Group, Inc. | |
5.250% due 06/15/2020 | | | | | 3,675 | | | | | | 3,666 | |
5.500% due 06/01/2019 | | | | | 2,008 | | | | | | 2,056 | |
|
Realogy Group LLC | |
4.500% due 04/15/2019 | | | | | 3,250 | | | | | | 3,299 | |
|
Resona Preferred Global Securities Cayman Ltd. | |
7.191% due 07/30/2015 (c) | | | | | 22,270 | | | | | | 22,437 | |
|
Royal Bank of Scotland Group PLC | |
6.990% due 10/05/2017 (c) | | | | | 1,500 | | | | | | 1,770 | |
7.648% due 09/30/2031 (c) | | | | | 233 | | | | | | 291 | |
|
Societe Generale S.A. | |
5.922% due 04/05/2017 (c) | | | | | 1,450 | | | | | | 1,492 | |
|
Sophia Holding Finance LP (9.625% Cash or 9.625% PIK) | |
9.625% due 12/01/2018 (a) | | | | | 2,475 | | | | | | 2,515 | |
|
Springleaf Finance Corp. | |
5.400% due 12/01/2015 | | | | | 5,515 | | | | | | 5,577 | |
5.750% due 09/15/2016 | | | | | 2,000 | | | | | | 2,073 | |
6.900% due 12/15/2017 | | | | | 36,952 | | | | | | 39,261 | |
|
TMX Finance LLC | |
8.500% due 09/15/2018 | | | | | 7,550 | | | | | | 6,229 | |
|
WEA Finance LLC | |
1.750% due 09/15/2017 | | | | | 1,700 | | | | | | 1,705 | |
| | | | | | | | | | | | |
| | | | | | | | | | | 608,545 | |
| | | | | | | | | | | | |
| |
INDUSTRIALS 65.1% | |
|
Abengoa Finance S.A.U. | |
8.875% due 11/01/2017 | | | | | 1,425 | | | | | | 1,489 | |
|
ADT Corp. | |
2.250% due 07/15/2017 | | | | | 200 | | | | | | 200 | |
3.500% due 07/15/2022 | | | | | 575 | | | | | | 525 | |
4.125% due 04/15/2019 (e) | | | | | 7,525 | | | | | | 7,675 | |
5.250% due 03/15/2020 | | | | | 15,675 | | | | | | 16,498 | |
|
Advanced Micro Devices, Inc. | |
6.750% due 03/01/2019 | | | | | 825 | | | | | | 753 | |
| | | | | | | | | | | | |
| | | | | PRINCIPAL
AMOUNT
(000s) | | | | | MARKET
VALUE
(000s) | |
|
Affinion Group Holdings, Inc. | |
11.625% due 11/15/2015 | | $ | | | 1,050 | | | $ | | | 1,024 | |
|
Affinion Group, Inc. | |
7.875% due 12/15/2018 | | | | | 1,750 | | | | | | 1,173 | |
11.500% due 10/15/2015 | | | | | 1,000 | | | | | | 990 | |
|
Afren PLC | |
11.500% due 02/01/2016 ^ | | | | | 6,750 | | | | | | 3,105 | |
|
Aguila S.A. | |
7.875% due 01/31/2018 | | | | | 14,618 | | | | | | 14,527 | |
|
Alberta ULC (14.000% Cash or 14.000% PIK) | |
14.000% due 02/13/2020 (a) | | | | | 650 | | | | | | 400 | |
|
Alcoa, Inc. | |
5.550% due 02/01/2017 | | | | | 950 | | | | | | 998 | |
5.720% due 02/23/2019 | | | | | 8,875 | | | | | | 9,479 | |
6.750% due 07/15/2018 | | | | | 1,075 | | | | | | 1,190 | |
|
Alere, Inc. | |
6.500% due 06/15/2020 | | | | | 2,000 | | | | | | 2,080 | |
7.250% due 07/01/2018 | | | | | 870 | | | | | | 915 | |
8.625% due 10/01/2018 | | | | | 12,552 | | | | | | 13,029 | |
|
Aleris International, Inc. | |
7.625% due 02/15/2018 | | | | | 5,525 | | | | | | 5,691 | |
7.875% due 11/01/2020 | | | | | 5,125 | | | | | | 5,343 | |
|
Algeco Scotsman Global Finance PLC | |
8.500% due 10/15/2018 (e) | | | | | 39,060 | | | | | | 37,888 | |
|
Alpha Natural Resources, Inc. | |
9.750% due 04/15/2018 | | | | | 2,860 | | | | | | 218 | |
|
Alphabet Holding Co., Inc. (7.750% Cash or 8.500% PIK) | |
7.750% due 11/01/2017 (a) | | | | | 6,975 | | | | | | 6,992 | |
|
American Achievement Corp. | |
10.875% due 04/15/2016 | | | | | 1,350 | | | | | | 1,277 | |
|
American Airlines Group, Inc. | |
5.500% due 10/01/2019 | | | | | 2,350 | | | | | | 2,373 | |
|
Ancestry.com Holdings LLC (9.625% Cash or 10.375% PIK) | |
9.625% due 10/15/2018 (a) | | | | | 11,481 | | | | | | 11,754 | |
|
APX Group, Inc. | |
6.375% due 12/01/2019 | | | | | 4,175 | | | | | | 4,065 | |
|
ArcelorMittal | |
4.500% due 08/05/2015 | | | | | 24,806 | | | | | | 24,829 | |
5.250% due 02/25/2017 | | | | | 22,026 | | | | | | 22,935 | |
6.125% due 06/01/2018 | | | | | 2,050 | | | | | | 2,188 | |
|
Arch Coal, Inc. | |
8.000% due 01/15/2019 | | | | | 13,250 | | | | | | 2,849 | |
|
Ardagh Finance Holdings S.A. (8.625 Cash or 8.625% PIK) | |
8.625% due 06/15/2019 (a) | | | | | 3,833 | | | | | | 3,987 | |
|
Ashland, Inc. | |
3.875% due 04/15/2018 | | | | | 18,529 | | | | | | 19,108 | |
|
Associated Materials LLC | |
9.125% due 11/01/2017 | | | | | 18,156 | | | | | | 15,160 | |
|
Avaya, Inc. | |
7.000% due 04/01/2019 | | | | | 2,350 | | | | | | 2,309 | |
|
Avon Products, Inc. | |
5.350% due 03/15/2020 | | | | | 3,650 | | | | | | 3,342 | |
6.500% due 03/01/2019 | | | | | 800 | | | | | | 776 | |
|
Beazer Homes USA, Inc. | |
8.125% due 06/15/2016 | | | | | 6,333 | | | | | | 6,665 | |
|
Beverage Packaging Holdings Luxembourg S.A. | |
5.625% due 12/15/2016 | | | | | 1,000 | | | | | | 1,002 | |
6.000% due 06/15/2017 | | | | | 11,125 | | | | | | 11,167 | |
|
BlueLine Rental Finance Corp. | |
7.000% due 02/01/2019 | | | | | 18,209 | | | | | | 18,801 | |
| | | | | | |
| 46 | | PIMCO ETF TRUST | | | | See Accompanying Notes |
June 30, 2015
| | | | | | | | | | | | |
| | | | | PRINCIPAL
AMOUNT
(000s) | | | | | MARKET
VALUE
(000s) | |
|
Bombardier, Inc. | |
7.500% due 03/15/2018 | | $ | | | 3,800 | | | $ | | | 3,990 | |
7.750% due 03/15/2020 | | | | | 12,100 | | | | | | 12,227 | |
|
Boxer Parent Co., Inc. (9.000% Cash or 9.750% PIK) | |
9.000% due 10/15/2019 (a)(e) | | | | | 15,500 | | | | | | 11,063 | |
|
Brinker International, Inc. | |
2.600% due 05/15/2018 | | | | | 2,840 | | | | | | 2,846 | |
|
Bumble Bee Holdings, Inc. | |
9.000% due 12/15/2017 | | | | | 17,869 | | | | | | 18,785 | |
|
Cablevision Systems Corp. | |
7.750% due 04/15/2018 | | | | | 6,000 | | | | | | 6,495 | |
8.625% due 09/15/2017 | | | | | 14,450 | | | | | | 15,931 | |
|
California Resources Corp. | |
5.000% due 01/15/2020 (e) | | | | | 7,500 | | | | | | 6,637 | |
|
Capella Healthcare, Inc. | |
9.250% due 07/01/2017 | | | | | 8,425 | | | | | | 8,646 | |
|
Capsugel S.A. (7.000% Cash or 7.750% PIK) | |
7.000% due 05/15/2019 (a) | | | | | 11,476 | | | | | | 11,700 | |
|
Carlson Wagonlit BV | |
6.875% due 06/15/2019 | | | | | 400 | | | | | | 423 | |
|
Case New Holland Industrial, Inc. | |
7.875% due 12/01/2017 | | | | | 10,880 | | | | | | 11,968 | |
|
CCO Holdings LLC | |
7.000% due 01/15/2019 | | | | | 5,750 | | | | | | 5,980 | |
|
Centex LLC | |
6.500% due 05/01/2016 | | | | | 1,025 | | | | | | 1,069 | |
|
Central Garden and Pet Co. | |
8.250% due 03/01/2018 | | | | | 1,291 | | | | | | 1,325 | |
|
Cenveo Corp. | |
6.000% due 08/01/2019 | | | | | 700 | | | | | | 662 | |
11.500% due 05/15/2017 (e) | | | | | 1,000 | | | | | | 1,024 | |
|
Chesapeake Energy Corp. | |
6.500% due 08/15/2017 | | | | | 5,750 | | | | | | 5,915 | |
7.250% due 12/15/2018 | | | | | 13,000 | | | | | | 13,455 | |
|
CITGO Holding, Inc. | |
10.750% due 02/15/2020 | | | | | 3,775 | | | | | | 3,879 | |
|
Claire’s Stores, Inc. | |
8.875% due 03/15/2019 (e) | | | | | 950 | | | | | | 432 | |
9.000% due 03/15/2019 | | | | | 11,925 | | | | | | 10,136 | |
|
Clear Channel Worldwide Holdings, Inc. | |
7.625% due 03/15/2020 | | | | | 13,275 | | | | | | 13,889 | |
|
Cliffs Natural Resources, Inc. | |
8.250% due 03/31/2020 | | | | | 7,875 | | | | | | 7,481 | |
|
CMA CGM S.A. | |
8.500% due 04/15/2017 | | | | | 6,350 | | | | | | 6,493 | |
|
CNH Industrial America LLC | |
7.250% due 01/15/2016 | | | | | 1,000 | | | | | | 1,025 | |
|
CNH Industrial Capital LLC | |
3.625% due 04/15/2018 | | | | | 750 | | | | | | 754 | |
3.875% due 11/01/2015 | | | | | 21,620 | | | | | | 21,728 | |
3.875% due 07/16/2018 | | | | | 5,000 | | | | | | 5,012 | |
|
Commercial Metals Co. | |
6.500% due 07/15/2017 | | | | | 750 | | | | | | 793 | |
|
CommScope, Inc. | |
4.375% due 06/15/2020 | | | | | 650 | | | | | | 658 | |
|
Community Health Systems, Inc. | |
5.125% due 08/15/2018 | | | | | 20,905 | | | | | | 21,490 | |
8.000% due 11/15/2019 | | | | | 18,625 | | | | | | 19,673 | |
|
Comstock Resources, Inc. | |
10.000% due 03/15/2020 | | | | | 8,525 | | | | | | 7,758 | |
|
Constellation Brands, Inc. | |
3.875% due 11/15/2019 | | | | | 4,400 | | | | | | 4,477 | |
7.250% due 09/01/2016 | | | | | 1,400 | | | | | | 1,485 | |
| | | | | | | | | | | | |
| | | | | PRINCIPAL
AMOUNT
(000s) | | | | | MARKET
VALUE
(000s) | |
7.250% due 05/15/2017 | | $ | | | 13,675 | | | $ | | | 14,932 | |
|
ConvaTec Finance International S.A. (8.250% Cash or 9.000% PIK) | |
8.250% due 01/15/2019 (a) | | | | | 23,825 | | | | | | 23,497 | |
|
CSC Holdings LLC | |
8.625% due 02/15/2019 | | | | | 1,325 | | | | | | 1,514 | |
|
D.R. Horton, Inc. | |
3.750% due 03/01/2019 | | | | | 275 | | | | | | 278 | |
4.000% due 02/15/2020 | | | | | 3,875 | | | | | | 3,874 | |
4.750% due 05/15/2017 | | | | | 8,709 | | | | | | 9,079 | |
|
Dell, Inc. | |
2.300% due 09/10/2015 | | | | | 4,141 | | | | | | 4,146 | |
3.100% due 04/01/2016 | | | | | 4,850 | | | | | | 4,862 | |
|
Diamond Foods, Inc. | |
7.000% due 03/15/2019 | | | | | 650 | | | | | | 668 | |
|
DISH DBS Corp. | |
4.250% due 04/01/2018 | | | | | 5,281 | | | | | | 5,387 | |
5.125% due 05/01/2020 | | | | | 5,500 | | | | | | 5,576 | |
7.125% due 02/01/2016 | | | | | 32,191 | | | | | | 33,076 | |
7.875% due 09/01/2019 | | | | | 8,450 | | | | | | 9,401 | |
|
DJO Finance LLC | |
10.750% due 04/15/2020 | | | | | 2,550 | | | | | | 2,626 | |
|
DynCorp International, Inc. | |
10.375% due 07/01/2017 | | | | | 1,000 | | | | | | 725 | |
|
Dynegy, Inc. | |
6.750% due 11/01/2019 | | | | | 11,100 | | | | | | 11,605 | |
|
Energy Gulf Coast, Inc. | |
9.250% due 12/15/2017 (e) | | | | | 9,075 | | | | | | 4,832 | |
11.000% due 03/15/2020 | | | | | 8,300 | | | | | | 7,325 | |
|
Enterprise Products Operating LLC | |
8.375% due 08/01/2066 | | | | | 1,250 | | | | | | 1,313 | |
|
Family Tree Escrow LLC | |
5.250% due 03/01/2020 | | | | | 960 | | | | | | 1,009 | |
|
Fiat Chrysler Automobiles NV | |
4.500% due 04/15/2020 | | | | | 10,625 | | | | | | 10,598 | |
|
First Data Corp. | |
7.375% due 06/15/2019 | | | | | 8,982 | | | | | | 9,359 | |
|
First Quantum Minerals Ltd. | |
6.750% due 02/15/2020 | | | | | 3,750 | | | | | | 3,647 | |
|
Florida East Coast Holdings Corp. | |
6.750% due 05/01/2019 | | | | | 550 | | | | | | 553 | |
|
FMG Resources Pty. Ltd. | |
8.250% due 11/01/2019 (e) | | | | | 8,325 | | | | | | 7,055 | |
|
Fresenius Medical Care U.S. Finance, Inc. | |
5.625% due 07/31/2019 | | | | | 5,000 | | | | | | 5,431 | |
6.875% due 07/15/2017 | | | | | 4,935 | | | | | | 5,367 | |
|
Fresenius U.S. Finance, Inc. | |
9.000% due 07/15/2015 | | | | | 17,851 | | | | | | 17,891 | |
|
General Motors Co. | |
3.500% due 10/02/2018 | | | | | 2,000 | | | | | | 2,070 | |
|
Global Ship Lease, Inc. | |
10.000% due 04/01/2019 | | | | | 500 | | | | | | 524 | |
|
GLP Capital LP | |
4.375% due 11/01/2018 | | | | | 490 | | | | | | 505 | |
|
Greif, Inc. | |
6.750% due 02/01/2017 | | | | | 10,821 | | | | | | 11,389 | |
|
Guitar Center, Inc. | |
6.500% due 04/15/2019 | | | | | 300 | | | | | | 276 | |
|
Hanson Ltd. | |
6.125% due 08/15/2016 | | | | | 6,210 | | | | | | 6,483 | |
|
Hapag-Lloyd AG | |
9.750% due 10/15/2017 | | | | | 9,180 | | | | | | 9,409 | |
| | | | | | | | | | | | |
| | | | | PRINCIPAL
AMOUNT
(000s) | | | | | MARKET
VALUE
(000s) | |
|
Harvest Operations Corp. | |
6.875% due 10/01/2017 | | $ | | | 9,020 | | | $ | | | 8,366 | |
|
HCA, Inc. | |
3.750% due 03/15/2019 | | | | | 350 | | | | | | 354 | |
4.250% due 10/15/2019 | | | | | 50 | | | | | | 51 | |
6.500% due 02/15/2016 | | | | | 28,141 | | | | | | 29,073 | |
6.500% due 02/15/2020 | | | | | 26,600 | | | | | | 29,792 | |
|
HD Supply, Inc. | |
5.250% due 12/15/2021 | | | | | 3,675 | | | | | | 3,739 | |
|
Headwaters, Inc. | |
7.250% due 01/15/2019 | | | | | 4,551 | | | | | | 4,756 | |
|
Hertz Corp. | |
4.250% due 04/01/2018 | | | | | 1,850 | | | | | | 1,887 | |
6.750% due 04/15/2019 | | | | | 11,697 | | | | | | 12,099 | |
|
Hexion, Inc. | |
8.875% due 02/01/2018 | | | | | 13,050 | | | | | | 11,843 | |
|
Hospira, Inc. | |
5.200% due 08/12/2020 | | | | | 716 | | | | | | 801 | |
6.050% due 03/30/2017 | | | | | 1,831 | | | | | | 1,971 | |
|
Hughes Satellite Systems Corp. | |
6.500% due 06/15/2019 | | | | | 2,952 | | | | | | 3,214 | |
|
Hyva Global BV | |
8.625% due 03/24/2016 | | | | | 10,525 | | | | | | 10,222 | |
|
Igloo Holdings Corp. (8.250% Cash or 9.000% PIK) | |
8.250% due 12/15/2017 (a) | | | | | 1,200 | | | | | | 1,217 | |
|
iHeartCommunications, Inc. | |
9.000% due 12/15/2019 | | | | | 8,925 | | | | | | 8,539 | |
10.000% due 01/15/2018 | | | | | 6,500 | | | | | | 5,257 | |
|
Imperial Metals Corp. | |
7.000% due 03/15/2019 | | | | | 400 | | | | | | 389 | |
|
INEOS Group Holdings S.A. | |
6.125% due 08/15/2018 (e) | | | | | 24,125 | | | | | | 24,728 | |
|
Intelsat Luxembourg S.A. | |
6.750% due 06/01/2018 | | | | | 24,825 | | | | | | 23,584 | |
|
Interactive Data Corp. | |
5.875% due 04/15/2019 | | | | | 12,550 | | | | | | 12,675 | |
|
International Game Technology PLC | |
5.625% due 02/15/2020 | | | | | 2,975 | | | | | | 2,923 | |
|
inVentiv Health, Inc. | |
9.000% due 01/15/2018 | | | | | 8,325 | | | | | | 8,694 | |
11.000% due 08/15/2018 | | | | | 1,331 | | | | | | 1,291 | |
|
inVentiv Health, Inc. (10.000% PIK) | |
10.000% due 08/15/2018 (a) | | | | | 1,960 | | | | | | 2,038 | |
|
Jaguar Holding Co. (9.375% Cash or 10.125% PIK) | |
9.375% due 10/15/2017 (a) | | | | | 13,101 | | | | | | 13,412 | |
|
Jaguar Land Rover Automotive PLC | |
3.500% due 03/15/2020 | | | | | 3,750 | | | | | | 3,694 | |
4.125% due 12/15/2018 | | | | | 7,000 | | | | | | 7,114 | |
|
Jarden Corp. | |
7.500% due 05/01/2017 | | | | | 1,500 | | | | | | 1,639 | |
|
JC Penney Corp., Inc. | |
5.750% due 02/15/2018 | | | | | 1,000 | | | | | | 984 | |
7.950% due 04/01/2017 | | | | | 829 | | | | | | 870 | |
8.125% due 10/01/2019 | | | | | 2,500 | | | | | | 2,487 | |
|
JMC Steel Group, Inc. | |
8.250% due 03/15/2018 | | | | | 8,465 | | | | | | 7,777 | |
|
Jo-Ann Stores LLC | |
8.125% due 03/15/2019 | | | | | 3,680 | | | | | | 3,482 | |
|
K Hovnanian Enterprises, Inc. | |
8.000% due 11/01/2019 | | | | | 3,150 | | | | | | 2,929 | |
|
KB Home | |
4.750% due 05/15/2019 | | | | | 5,521 | | | | | | 5,507 | |
8.000% due 03/15/2020 | | | | | 7,775 | | | | | | 8,591 | |
| | | | | | |
| See Accompanying Notes | | ANNUAL REPORT | | JUNE 30, 2015 | | 47 |
Schedule of Investments PIMCO 0-5 Year High Yield Corporate Bond Index Exchange-Traded Fund (Cont.)
| | | | | | | | | | | | |
| | | | | PRINCIPAL
AMOUNT
(000s) | | | | | MARKET
VALUE
(000s) | |
|
Kindred Healthcare, Inc. | |
8.000% due 01/15/2020 | | $ | | | 6,250 | | | $ | | | 6,703 | |
|
Kinetic Concepts, Inc. | |
10.500% due 11/01/2018 | | | | | 13,969 | | | | | | 14,947 | |
|
Kratos Defense & Security Solutions, Inc. | |
7.000% due 05/15/2019 | | | | | 3,650 | | | | | | 3,344 | |
|
L Brands, Inc. | |
6.900% due 07/15/2017 | | | | | 1,100 | | | | | | 1,202 | |
8.500% due 06/15/2019 | | | | | 755 | | | | | | 894 | |
|
Lafarge S.A. | |
6.200% due 07/09/2015 | | | | | 1,500 | | | | | | 1,501 | |
6.500% due 07/15/2016 | | | | | 6,331 | | | | | | 6,663 | |
|
Lantheus Medical Imaging, Inc. | |
9.750% due 05/15/2017 | | | | | 500 | | | | | | 515 | |
|
Laureate Education, Inc. | |
10.000% due 09/01/2019 | | | | | 1,675 | | | | | | 1,568 | |
|
Lennar Corp. | |
4.125% due 12/01/2018 | | | | | 500 | | | | | | 508 | |
4.500% due 11/15/2019 | | | | | 2,750 | | | | | | 2,798 | |
4.750% due 12/15/2017 | | | | | 436 | | | | | | 456 | |
6.500% due 04/15/2016 | | | | | 4,000 | | | | | | 4,135 | |
12.250% due 06/01/2017 | | | | | 1,000 | | | | | | 1,185 | |
|
Lightstream Resources Ltd. | |
8.625% due 02/01/2020 | | | | | 3,575 | | | | | | 2,315 | |
|
Logan’s Roadhouse, Inc. | |
10.750% due 10/15/2017 | | | | | 444 | | | | | | 331 | |
|
Mallinckrodt International Finance S.A. | |
3.500% due 04/15/2018 | | | | | 12,470 | | | | | | 12,564 | |
4.875% due 04/15/2020 | | | | | 2,050 | | | | | | 2,094 | |
|
Masco Corp. | |
6.125% due 10/03/2016 | | | | | 15,046 | | | | | | 15,911 | |
|
McClatchy Co. | |
9.000% due 12/15/2022 (e) | | | | | 20,161 | | | | | | 19,279 | |
|
MGM Resorts International | |
5.250% due 03/31/2020 | | | | | 3,450 | | | | | | 3,493 | |
6.625% due 07/15/2015 | | | | | 25,377 | | | | | | 25,405 | |
7.625% due 01/15/2017 | | | | | 8,320 | | | | | | 8,892 | |
10.000% due 11/01/2016 | | | | | 10,975 | | | | | | 11,963 | |
|
Midstates Petroleum Co., Inc. | |
10.000% due 06/01/2020 | | | | | 3,575 | | | | | | 3,441 | |
|
Modular Space Corp. | |
10.250% due 01/31/2019 | | | | | 800 | | | | | | 696 | |
|
NBTY, Inc. | |
9.000% due 10/01/2018 | | | | | 5,297 | | | | | | 5,489 | |
|
NCL Corp. Ltd. | |
5.250% due 11/15/2019 | | | | | 2,025 | | | | | | 2,083 | |
|
New Enterprise Stone & Lime Co., Inc. | |
11.000% due 09/01/2018 | | | | | 2,500 | | | | | | 2,238 | |
|
New York Times Co. | |
6.625% due 12/15/2016 | | | | | 250 | | | | | | 266 | |
|
Nokia OYJ | |
5.375% due 05/15/2019 | | | | | 1,100 | | | | | | 1,167 | |
|
Novelis, Inc. | |
8.375% due 12/15/2017 | | | | | 3,745 | | | | | | 3,881 | |
|
Numericable SFR S.A.S. | |
4.875% due 05/15/2019 | | | | | 41,220 | | | | | | 40,911 | |
|
NXP BV | |
3.500% due 09/15/2016 | | | | | 8,800 | | | | | | 8,910 | |
|
Offshore Group Investment Ltd. | |
7.500% due 11/01/2019 | | | | | 7,450 | | | | | | 4,619 | |
|
Owens-Brockway Glass Container, Inc. | |
7.375% due 05/15/2016 | | | | | 709 | | | | | | 745 | |
| | | | | | | | | | | | |
| | | | | PRINCIPAL
AMOUNT
(000s) | | | | | MARKET
VALUE
(000s) | |
|
Pacific Drilling Ltd. | |
7.250% due 12/01/2017 | | $ | | | 2,000 | | | $ | | | 1,730 | |
|
Peabody Energy Corp. | |
6.000% due 11/15/2018 (e) | | | | | 18,144 | | | | | | 8,800 | |
|
Perstorp Holding AB | |
8.750% due 05/15/2017 (e) | | | | | 1,965 | | | | | | 2,053 | |
11.000% due 08/15/2017 | | | | | 6,325 | | | | | | 6,720 | |
|
Petco Holdings, Inc. (8.500% Cash or 9.250% PIK) | |
8.500% due 10/15/2017 (a) | | | | | 24,680 | | | | | | 25,420 | |
|
PHI, Inc. | |
5.250% due 03/15/2019 | | | | | 2,550 | | | | | | 2,371 | |
|
Pittsburgh Glass Works LLC | |
8.000% due 11/15/2018 | | | | | 21,364 | | | | | | 22,592 | |
|
PQ Corp. | |
8.750% due 11/01/2018 | | | | | 10,610 | | | | | | 10,756 | |
|
Reynolds Group Issuer, Inc. | |
5.750% due 10/15/2020 | | | | | 1,000 | | | | | | 1,028 | |
7.875% due 08/15/2019 | | | | | 12,625 | | | | | | 13,177 | |
8.500% due 05/15/2018 | | | | | 17,880 | | | | | | 18,260 | |
9.875% due 08/15/2019 | | | | | 8,400 | | | | | | 8,836 | |
|
Rite Aid Corp. | |
9.250% due 03/15/2020 | | | | | 3,000 | | | | | | 3,259 | |
|
Rockies Express Pipeline LLC | |
6.000% due 01/15/2019 | | | | | 9,650 | | | | | | 10,108 | |
6.850% due 07/15/2018 | | | | | 4,550 | | | | | | 4,874 | |
|
Royal Caribbean Cruises Ltd. | |
11.875% due 07/15/2015 | | | | | 1,350 | | | | | | 1,353 | |
|
RR Donnelley & Sons Co. | |
6.125% due 01/15/2017 | | | | | 98 | | | | | | 101 | |
7.250% due 05/15/2018 | | | | | 12,210 | | | | | | 13,614 | |
|
Ryerson, Inc. | |
9.000% due 10/15/2017 | | | | | 9,305 | | | | | | 9,398 | |
|
Ryland Group, Inc. | |
6.625% due 05/01/2020 | | | | | 250 | | | | | | 278 | |
|
Sabine Pass LNG LP | |
7.500% due 11/30/2016 | | | | | 21,546 | | | | | | 22,785 | |
|
Sabre Holdings Corp. | |
8.350% due 03/15/2016 | | | | | 750 | | | | | | 782 | |
|
SandRidge Energy, Inc. | |
8.750% due 06/01/2020 | | | | | 5,375 | | | | | | 4,965 | |
|
Sanmina Corp. | |
4.375% due 06/01/2019 | | | | | 3,398 | | | | | | 3,398 | |
|
Schaeffler Holding Finance BV (6.875% Cash or 7.625% PIK) | |
6.875% due 08/15/2018 (a) | | | | | 3,900 | | | | | | 4,046 | |
|
Sears Holdings Corp. | |
6.625% due 10/15/2018 (e) | | | | | 8,550 | | | | | | 8,208 | |
|
Sequa Corp. | |
7.000% due 12/15/2017 | | | | | 28,068 | | | | | | 19,227 | |
|
Service Corp. International | |
7.000% due 06/15/2017 | | | | | 1,250 | | | | | | 1,350 | |
|
Seventy Seven Operating LLC | |
6.625% due 11/15/2019 | | | | | 2,600 | | | | | | 2,067 | |
|
Sitel LLC | |
11.000% due 08/01/2017 | | | | | 2,300 | | | | | | 2,346 | |
11.500% due 04/01/2018 | | | | | 6,650 | | | | | | 5,869 | |
|
Smithfield Foods, Inc. | |
7.750% due 07/01/2017 | | | | | 2,368 | | | | | | 2,602 | |
|
Softbank Corp. | |
4.500% due 04/15/2020 | | | | | 8,725 | | | | | | 8,780 | |
|
SPX Corp. | |
6.875% due 09/01/2017 | | | | | 1,250 | | | | | | 1,353 | |
| | | | | | | | | | | | |
| | | | | PRINCIPAL
AMOUNT
(000s) | | | | | MARKET
VALUE
(000s) | |
|
Standard Pacific Corp. | |
8.375% due 05/15/2018 | | $ | | | 3,000 | | | $ | | | 3,435 | |
|
SunGard Data Systems, Inc. | |
6.625% due 11/01/2019 | | | | | 18,541 | | | | | | 19,213 | |
|
SuperValu, Inc. | |
8.000% due 05/01/2016 | | | | | 1,346 | | | | | | 1,411 | |
|
Syniverse Holdings, Inc. | |
9.125% due 01/15/2019 | | | | | 7,425 | | | | | | 6,571 | |
|
T-Mobile USA, Inc. | |
5.250% due 09/01/2018 | | | | | 12,100 | | | | | | 12,493 | |
6.464% due 04/28/2019 | | | | | 20,400 | | | | | | 21,063 | |
|
Telesat Canada | |
6.000% due 05/15/2017 | | | | | 2,211 | | | | | | 2,252 | |
|
Tenet Healthcare Corp. | |
5.000% due 03/01/2019 | | | | | 6,830 | | | | | | 6,856 | |
5.500% due 03/01/2019 | | | | | 15,875 | | | | | | 16,073 | |
6.250% due 11/01/2018 | | | | | 5,300 | | | | | | 5,770 | |
|
Tervita Corp. | |
8.000% due 11/15/2018 | | | | | 3,550 | | | | | | 3,248 | |
|
Tesoro Corp. | |
4.250% due 10/01/2017 | | | | | 2,000 | | | | | | 2,045 | |
|
Tesoro Logistics LP | |
5.500% due 10/15/2019 | | | | | 600 | | | | | | 626 | |
|
Thompson Creek Metals Co., Inc. | |
9.750% due 12/01/2017 | | | | | 1,800 | | | | | | 1,881 | |
|
Toll Brothers Finance Corp. | |
8.910% due 10/15/2017 | | | | | 7,185 | | | | | | 8,191 | |
|
Tops Holding Corp. | |
8.750% due 06/15/2018 | | | | | 1,000 | | | | | | 990 | |
|
Toys “R” Us Property Co. LLC | |
8.500% due 12/01/2017 | | | | | 4,325 | | | | | | 4,366 | |
|
Toys “R” Us, Inc. | |
10.375% due 08/15/2017 | | | | | 2,000 | | | | | | 1,715 | |
|
Transocean, Inc. | |
5.550% due 12/15/2016 | | | | | 7,550 | | | | | | 7,871 | |
6.000% due 03/15/2018 (e) | | | | | 11,600 | | | | | | 11,828 | |
|
TransUnion (9.625% Cash or 10.375% PIK) | |
9.625% due 06/15/2018 (a) | | | | | 14,875 | | | | | | 14,935 | |
|
UCI International, Inc. | |
8.625% due 02/15/2019 | | | | | 6,300 | | | | | | 5,638 | |
|
United States Steel Corp. | |
6.050% due 06/01/2017 | | | | | 2,100 | | | | | | 2,195 | |
7.375% due 04/01/2020 | | | | | 2,950 | | | | | | 3,105 | |
|
Universal Health Services, Inc. | |
3.750% due 08/01/2019 | | | | | 2,300 | | | | | | 2,343 | |
|
USG Corp. | |
6.300% due 11/15/2016 | | | | | 19,212 | | | | | | 20,197 | |
9.750% due 01/15/2018 | | | | | 8,411 | | | | | | 9,610 | |
|
Valeant Pharmaceuticals International, Inc. | |
5.375% due 03/15/2020 | | | | | 11,825 | | | | | | 12,239 | |
6.750% due 08/15/2018 | | | | | 11,858 | | | | | | 12,458 | |
|
Vander Intermediate Holding Corp. (9.750% Cash or 10.500% PIK) | |
9.750% due 02/01/2019 (a) | | | | | 80 | | | | | | 79 | |
|
Venoco, Inc. | |
8.875% due 02/15/2019 | | | | | 2,400 | | | | | | 816 | |
|
Verso Paper Holdings LLC | |
11.750% due 01/15/2019 | | | | | 8,600 | | | | | | 4,334 | |
|
Visant Corp. | |
10.000% due 10/01/2017 | | | | | 2,000 | | | | | | 1,623 | |
|
Vulcan Materials Co. | |
7.000% due 06/15/2018 | | | | | 1,700 | | | | | | 1,930 | |
| | | | | | |
| 48 | | PIMCO ETF TRUST | | | | See Accompanying Notes |
June 30, 2015
| | | | | | | | | | | | |
| | | | | PRINCIPAL
AMOUNT
(000s) | | | | | MARKET
VALUE
(000s) | |
|
VWR Funding, Inc. | |
7.250% due 09/15/2017 | | $ | | | 8,792 | | | $ | | | 9,111 | |
|
W&T Offshore, Inc. | |
8.500% due 06/15/2019 | | | | | 3,675 | | | | | | 2,603 | |
|
Walter Energy, Inc. | |
9.500% due 10/15/2019 | | | | | 200 | | | | | | 111 | |
|
Wave Holdco LLC (8.250% Cash or 9.000% PIK) | |
8.250% due 07/15/2019 (a) | | | | | 400 | | | | | | 409 | |
|
Whiting Canadian Holding Co. ULC | |
8.125% due 12/01/2019 | | | | | 3,575 | | | | | | 3,776 | |
|
Whiting Petroleum Corp. | |
5.000% due 03/15/2019 | | | | | 7,775 | | | | | | 7,678 | |
6.500% due 10/01/2018 | | | | | 2,175 | | | | | | 2,213 | |
|
Windstream Services LLC | |
7.875% due 11/01/2017 | | | | | 11,486 | | | | | | 12,247 | |
|
Wise Metals Group LLC | |
8.750% due 12/15/2018 | | | | | 22,350 | | | | | | 23,719 | |
|
XPO Logistics, Inc. | |
7.875% due 09/01/2019 | | | | | 1,925 | | | | | | 2,067 | |
| | | | | | | | | | | | |
| | | | | | | | | | | 1,827,296 | |
| | | | | | | | | | | | |
| |
UTILITIES 9.8% | | | | | | | | | | | | |
|
AES Corp. | |
3.283% due 06/01/2019 | | | | | 1,775 | | | | | | 1,779 | |
|
Alcatel-Lucent USA, Inc. | |
4.625% due 07/01/2017 | | | | | 11,775 | | | | | | 12,128 | |
|
CenturyLink, Inc. | |
5.150% due 06/15/2017 | | | | | 6,070 | | | | | | 6,320 | |
5.625% due 04/01/2020 | | | | | 3,500 | | | | | | 3,579 | |
6.000% due 04/01/2017 | | | | | 6,467 | | | | | | 6,766 | |
|
DPL, Inc. | |
6.500% due 10/15/2016 | | | | | 105 | | | | | | 109 | |
|
Drill Rigs Holdings, Inc. | |
6.500% due 10/01/2017 | | | | | 501 | | | | | | 442 | |
|
EP Energy LLC | |
9.375% due 05/01/2020 | | | | | 9,525 | | | | | | 10,251 | |
|
EXCO Resources, Inc. | |
7.500% due 09/15/2018 | | | | | 1,859 | | | | | | 1,190 | |
| | | | | | | | | | | | |
| | | | | PRINCIPAL
AMOUNT
(000s) | | | | | MARKET
VALUE
(000s) | |
|
Frontier Communications Corp. | |
8.125% due 10/01/2018 | | $ | | | 16,561 | | | $ | | | 18,010 | |
8.250% due 04/15/2017 | | | | | 8,215 | | | | | | 8,862 | |
|
GenOn Energy, Inc. | |
7.875% due 06/15/2017 | | | | | 20,023 | | | | | | 20,273 | |
|
Linn Energy LLC | |
6.250% due 11/01/2019 | | | | | 19,205 | | | | | | 15,124 | |
6.500% due 05/15/2019 | | | | | 5,900 | | | | | | 4,794 | |
|
Midwest Generation LLC | |
8.560% due 01/02/2016 | | | | | 810 | | | | | | 810 | |
|
NGPL PipeCo LLC | |
7.119% due 12/15/2017 | | | | | 13,894 | | | | | | 14,311 | |
|
Niska Gas Storage Canada ULC | |
6.500% due 04/01/2019 | | | | | 1,900 | | | | | | 1,796 | |
|
NRG Energy, Inc. | |
7.625% due 01/15/2018 | | | | | 400 | | | | | | 440 | |
|
Penn Virginia Corp. | |
8.500% due 05/01/2020 | | | | | 1,775 | | | | | | 1,598 | |
|
Sprint Communications, Inc. | |
6.000% due 12/01/2016 | | | | | 52,315 | | | | | | 54,310 | |
8.375% due 08/15/2017 | | | | | 2,000 | | | | | | 2,170 | |
9.000% due 11/15/2018 | | | | | 26,612 | | | | | | 30,118 | |
|
Talen Energy Supply LLC | |
5.125% due 07/15/2019 | | | | | 6,300 | | | | | | 6,206 | |
|
Talos Production LLC | |
9.750% due 02/15/2018 | | | | | 400 | | | | | | 350 | |
|
Targa Resources Partners LP | |
5.000% due 01/15/2018 | | | | | 8,560 | | | | | | 8,795 | |
|
Telecom Italia Capital S.A. | |
5.250% due 10/01/2015 | | | | | 4,500 | | | | | | 4,543 | |
6.999% due 06/04/2018 | | | | | 34,671 | | | | | | 38,310 | |
|
Texas Competitive Electric Holdings Co. LLC | |
10.250% due 11/01/2015 ^ | | | | | 7,375 | | | | | | 783 | |
| | | | | | | | | | | | |
| | | | | | | | | | | 274,167 | |
| | | | | | | | | | | | |
Total Corporate Bonds & Notes
(Cost $2,795,345) | | | 2,710,008 | |
| | | | | | | | | | | | |
| |
| | | | | | | | | | | | |
| | | | | PRINCIPAL
AMOUNT
(000s) | | | | | MARKET
VALUE
(000s) | |
U.S. TREASURY OBLIGATIONS 0.2% | |
|
U.S. Treasury Notes | |
0.250% due 07/15/2015 (h) | | $ | | | 2,600 | | | $ | | | 2,601 | |
0.250% due 10/15/2015 (h) | | | 2,100 | | | | | | 2,101 | |
| | | | | | | | | | | | |
Total U.S. Treasury Obligations
(Cost $4,701) | | | 4,702 | |
| | | | | | | | | | | | |
| |
SHORT-TERM INSTRUMENTS 2.2% | |
| |
REPURCHASE AGREEMENTS (f) 1.8% | |
| | | | | | | | | | | 49,590 | |
| | | | | | | | | | | | |
| |
U.S. TREASURY BILLS 0.4% | |
0.038% due 08/06/2015 - 10/08/2015 (b)(h) | | | 11,600 | | | | | | 11,600 | |
| | | | | | | | | | | | |
Total Short-Term Instruments
(Cost $61,189) | | | 61,190 | |
| | | | | | | | | | | | |
| | | | | | | | | | | | |
Total Investments in Securities
(Cost $2,861,235) | | | 2,775,900 | |
| | | | | | | | | | | | |
| | | | |
| | | | | SHARES | | | | | | |
INVESTMENTS IN AFFILIATES 1.5% | |
| |
SHORT-TERM INSTRUMENTS 1.5% | |
| |
MUTUAL FUNDS 1.5% | |
| | | | |
PIMCO Money Market Fund (d)(e) | | | | | 43,471,153 | | | | | | 43,471 | |
| | | | | | | | | | | | |
Total Short-Term Instruments
(Cost $43,471) | | | | | | 43,471 | |
| | | | | | | | | | | | |
| | | | | | | | | | | | |
Total Investments in Affiliates
(Cost $43,471) | | | | | | 43,471 | |
| | | | | | | | | | | | |
| | | | | | | | | | | | |
Total Investments 100.5%
(Cost $2,904,706) | | | $ | | | 2,819,371 | |
| |
Financial Derivative
Instruments (g)(h) 0.1% (Cost or Premiums, net $0) | | | | | | 1,745 | |
| |
Other Assets and Liabilities, net (0.6%) | | | | | | (15,875 | ) |
| | | | | | | | | | | | |
Net Assets 100.0% | | | $ | | | 2,805,241 | |
| | | | | | | | | | | | |
NOTES TO SCHEDULE OF INVESTMENTS (AMOUNTS IN THOUSANDS*, EXCEPT NUMBER OF CONTRACTS):
| * | A zero balance may reflect actual amounts rounding to less than one thousand. |
| (a) | Payment in-kind bond security. |
| (b) | Coupon represents a weighted average yield to maturity. |
| (c) | Perpetual maturity; date shown, if applicable, represents next contractual call date. |
| (d) | Institutional Class Shares of each Fund. |
| (e) | Securities with an aggregate market value of $47,370 were out on loan in exchange for $43,471 of cash collateral as of June 30, 2015. The collateral was invested in a cash collateral reinvestment vehicle as described in Note 5(d) in the Notes to Financial Statements. |
BORROWINGS AND OTHER FINANCING TRANSACTIONS
(f) REPURCHASE AGREEMENTS:
| | | | | | | | | | | | | | | | | | | | | | | | | | | | | | | | |
| Counterparty | | | | Lending
Rate | | | Settlement
Date | | | Maturity
Date | | | Principal
Amount | | | Collateralized By | | Collateral
Received,
at Value | | | Repurchase
Agreements,
at Value | | | Repurchase
Agreement
Proceeds
to be
Received (1) | |
MBC | | | | | 0.240 | % | | | 06/30/2015 | | | | 07/01/2015 | | | $ | 36,000 | | | U.S. Treasury Inflation Protected Securities 0.125% due 04/15/2019 | | $ | (37,142 | ) | | $ | 36,000 | | | $ | 36,000 | |
SSB | | | | | 0.000 | % | | | 06/30/2015 | | | | 07/01/2015 | | | | 13,590 | | | Fannie Mae 2.200% due 10/17/2022 | | | (13,866 | ) | | | 13,590 | | | | 13,590 | |
Total Repurchase Agreements | | | | | | | | | | | | | | | | | | | | | | $ | (51,008 | ) | | $ | 49,590 | | | $ | 49,590 | |
| (1) | Includes accrued interest. |
| | | | | | |
| See Accompanying Notes | | ANNUAL REPORT | | JUNE 30, 2015 | | 49 |
Schedule of Investments PIMCO 0-5 Year High Yield Corporate Bond Index Exchange-Traded Fund (Cont.)
BORROWINGS AND OTHER FINANCING TRANSACTIONS SUMMARY
The following is a summary by counterparty of the market value of Borrowings and Other Financing Transactions and collateral (received)/pledged as of June 30, 2015:
| | | | | | | | | | | | | | | | | | | | | | | | | | | | | | |
| Counterparty | | | | Repurchase
Agreement
Proceeds
to be
Received | | | Payable for
Reverse
Repurchase
Agreements | | | Payable for
Sale-Buyback
Transactions | | | Securities
Out on Loan | | | Total
Borrowings and
Other Financing
Transactions | | | Collateral
(Received)/
Pledged | | | Net
Exposure (2) | |
Global/Master Repurchase Agreement | | | | | | | | | | | | | | | | | | | | | | | | | | | | | | |
MBC | | | | $ | 36,000 | | | $ | 0 | | | $ | 0 | | | $ | 0 | | | $ | 36,000 | | | $ | (37,142 | ) | | $ | (1,142 | ) |
SSB | | | | | 13,590 | | | | 0 | | | | 0 | | | | 0 | | | | 13,590 | | | | (13,866 | ) | | | (276 | ) |
| | | | | | | | |
Master Securities Lending Agreement | | | | | | | | | | | | | | | | | | | | | | | | | | | | | | |
BCY | | | | | 0 | | | | 0 | | | | 0 | | | | (30,207 | ) | | | (30,207 | ) | | | 30,821 | | | | 614 | |
DEU | | | | | 0 | | | | 0 | | | | 0 | | | | (2,923 | ) | | | (2,923 | ) | | | 2,981 | | | | 58 | |
JPM | | | | | 0 | | | | 0 | | | | 0 | | | | (3,398 | ) | | | (3,398 | ) | | | 3,466 | | | | 68 | |
RDR | | | | | 0 | | | | 0 | | | | 0 | | | | (5,656 | ) | | | (5,656 | ) | | | 912 | | | | (4,744 | ) |
SAL | | | | | 0 | | | | 0 | | | | 0 | | | | (5,186 | ) | | | (5,186 | ) | | | 5,291 | | | | 105 | |
Total Borrowings and Other Financing Transactions | | | | $ | 49,590 | | | $ | 0 | | | $ | 0 | | | $ | (47,370 | ) | | | | | | | | | | | | |
| (2) | Net Exposure represents the net receivable/(payable) that would be due from/to the counterparty in the event of default. Exposure from borrowings and other financing transactions can only be netted across transactions governed under the same master agreement with the same legal entity. See Note 7, Principal Risks, in the Notes to Financial Statements for more information regarding master netting arrangements. |
(g) FINANCIAL DERIVATIVE INSTRUMENTS: EXCHANGE-TRADED OR CENTRALLY CLEARED
FUTURES CONTRACTS:
| | | | | | | | | | | | | | | | | | | | | | | | | | |
| | | | | Type | | | Expiration
Month | | | # of
Contracts | | | Unrealized
(Depreciation) | | | Variation Margin | |
| Description | | | | | | | | Asset | | | Liability | |
U.S. Treasury 5-Year Note September Futures | | | | | Long | | | | 09/2015 | | | | 415 | | | $ | (39 | ) | | $ | 0 | | | $ | (16 | ) |
Total Futures Contracts | | | | | | | | | | | | | | | | $ | (39 | ) | | $ | 0 | | | $ | (16 | ) |
SWAP AGREEMENTS:
CREDIT DEFAULT SWAPS ON CREDIT INDICES - SELL PROTECTION (1)
| | | | | | | | | | | | | | | | | | | | | | | | | | | | | | |
| | | | | Fixed Deal
Receive Rate | | | Maturity
Date | | | Notional
Amount (2) | | | Market
Value (3) | | | Unrealized
(Depreciation) | | | Variation Margin | |
| Index/Tranches | | | | | | | | | Asset | | | Liability | |
CDX.HY-24 5-Year Index | | | | | 5.000 | % | | | 06/20/2020 | | | $ | 348,183 | | | $ | 22,178 | | | $ | (3,523 | ) | | $ | 1,761 | | | $ | 0 | |
Total Swap Agreements | | | | | | | | | | | | | | | | $ | 22,178 | | | $ | (3,523 | ) | | $ | 1,761 | | | $ | 0 | |
| (1) | If the Fund is a seller of protection and a credit event occurs, as defined under the terms of that particular swap agreement, the Fund will either (i) pay to the buyer of protection an amount equal to the notional amount of the swap and take delivery of the referenced obligation or underlying securities comprising the referenced index or (ii) pay a net settlement amount in the form of cash or securities equal to the notional amount of the swap less the recovery value of the referenced obligation or underlying securities comprising the referenced index. |
| (2) | The maximum potential amount the Fund could be required to pay as a seller of credit protection or receive as a buyer of credit protection if a credit event occurs as defined under the terms of that particular swap agreement. |
| (3) | The prices and resulting values for credit default swap agreements on credit indices serve as an indicator of the current status of the payment/performance risk and represent the likelihood of an expected liability (or profit) for the credit derivative should the notional amount of the swap agreement be closed/sold as of the period end. Increasing market values, in absolute terms when compared to the notional amount of the swap, represent a deterioration of the referenced indices’ credit soundness and a greater likelihood or risk of default or other credit event occurring as defined under the terms of the agreement. |
| | | | | | |
| 50 | | PIMCO ETF TRUST | | | | See Accompanying Notes |
June 30, 2015
FINANCIAL DERIVATIVE INSTRUMENTS: EXCHANGE-TRADED OR CENTRALLY CLEARED SUMMARY
The following is a summary of the market value and variation margin of Exchange-Traded or Centrally Cleared Financial Derivative Instruments as of June 30, 2015:
| (h) | Securities with an aggregate market value of $16,301 and cash of $4,063 have been pledged as collateral for exchange-traded and centrally cleared financial derivative instruments as of June 30, 2015. See Note 7, Principal Risks, in the Notes to Financial Statements for more information regarding master netting arrangements. |
| | | | | | | | | | | | | | | | | | | | | | | | | | | | | | | | | | | | |
| | | | | Financial Derivative Assets | | | | | Financial Derivative Liabilities | |
| | | | | Market Value | | | Variation Margin
Asset | | | | | | | | Market Value | | | Variation Margin
Liability | | | | |
| | | | | Purchased
Options | | | Futures | | | Swap
Agreements | | | Total | | | | | Written
Options | | | Futures | | | Swap
Agreements | | | Total | |
Total Exchange-Traded or Centrally Cleared | | | | $ | 0 | | | $ | 0 | | | $ | 1,761 | | | $ | 1,761 | | | | | $ | 0 | | | $ | (16 | ) | | $ | 0 | | | $ | (16 | ) |
FAIR VALUE OF FINANCIAL DERIVATIVE INSTRUMENTS
The following is a summary of the fair valuation of the Fund’s derivative instruments categorized by risk exposure. See Note 7, Principal Risks, in the Notes to Financial Statements on risks of the Fund.
Fair Values of Financial Derivative Instruments on the Statements of Assets and Liabilities as of June 30, 2015:
| | | | | | | | | | | | | | | | | | | | | | | | | | |
| | | | | Derivatives not accounted for as hedging instruments | |
| | | | | Commodity
Contracts | | | Credit
Contracts | | | Equity
Contracts | | | Foreign
Exchange
Contracts | | | Interest
Rate Contracts | | | Total | |
Financial Derivative Instruments - Assets | | | | | | | | | | | | | | | | | | | | | | | | | | |
Exchange-traded or centrally cleared Swap Agreements | | | | $ | 0 | | | $ | 1,761 | | | $ | 0 | | | $ | 0 | | | $ | 0 | | | $ | 1,761 | |
| | | | | | | |
Financial Derivative Instruments - Liabilities | | | | | | | | | | | | | | | | | | | | | | | | | | |
Exchange-traded or centrally cleared Futures | | | | $ | 0 | | | $ | 0 | | | $ | 0 | | | $ | 0 | | | $ | 16 | | | $ | 16 | |
The Effect of Financial Derivative Instruments on the Statements of Operations for the period ended June 30, 2015:
| | | | | | | | | | | | | | | | | | | | | | | | | | |
| | | | | Derivatives not accounted for as hedging instruments | |
| | | | | Commodity
Contracts | | | Credit
Contracts | | | Equity
Contracts | | | Foreign
Exchange
Contracts | | | Interest
Rate Contracts | | | Total | |
Net Realized Gain (Loss) on Financial Derivative Instruments | | | | | | | | | | | | | | | | | | | | | | | | | | |
Exchange-traded or centrally cleared | | | | | | | | | | | | | | | | | | | | | | | | | | |
Futures | | | | $ | 0 | | | $ | 0 | | | $ | 0 | | | $ | 0 | | | $ | (283 | ) | | $ | (283 | ) |
Swap Agreements | | | | | 0 | | | | 14,974 | | | | 0 | | | | 0 | | | | (2 | ) | | | 14,972 | |
| | | | $ | 0 | | | $ | 14,974 | | | $ | 0 | | | $ | 0 | | | $ | (285 | ) | | $ | 14,689 | |
Net Change in Unrealized (Depreciation) on Financial Derivative Instruments | | | | | | | | | | | | | | | | | | | | | | | | | | |
Exchange-traded or centrally cleared | | | | | | | | | | | | | | | | | | | | | | | | | | |
Futures | | | | $ | 0 | | | $ | 0 | | | $ | 0 | | | $ | 0 | | | $ | (40 | ) | | $ | (40 | ) |
Swap Agreements | | | | | 0 | | | | (11,544 | ) | | | 0 | | | | 0 | | | | 0 | | | | (11,544 | ) |
| | | | $ | 0 | | | $ | (11,544 | ) | | $ | 0 | | | $ | 0 | | | $ | (40 | ) | | $ | (11,584 | ) |
| | | | | | |
| See Accompanying Notes | | ANNUAL REPORT | | JUNE 30, 2015 | | 51 |
Schedule of Investments PIMCO 0-5 Year High Yield Corporate Bond Index Exchange-Traded Fund (Cont.)
June 30, 2015
FAIR VALUE MEASUREMENTS
The following is a summary of the fair valuations according to the inputs used as of June 30, 2015 in valuing the Fund’s assets and liabilities:
| | | | | | | | | | | | | | | | | | |
| Category and Subcategory | | | | Level 1 | | | Level 2 | | | Level 3 | | | Fair Value at
06/30/2015 | |
Investments in Securities, at Value | | | | | | | | | | | | | | | | | | |
Corporate Bonds & Notes | | | | | | | | | | | | | | | | | | |
Banking & Finance | | | | $ | 0 | | | $ | 608,545 | | | $ | 0 | | | $ | 608,545 | |
Industrials | | | | | 0 | | | | 1,827,296 | | | | 0 | | | | 1,827,296 | |
Utilities | | | | | 0 | | | | 273,357 | | | | 810 | | | | 274,167 | |
U.S. Treasury Obligations | | | | | 0 | | | | 4,702 | | | | 0 | | | | 4,702 | |
Short-Term Instruments | | | | | | | | | | | | | | | | �� | | |
Repurchase Agreements | | | | | 0 | | | | 49,590 | | | | 0 | | | | 49,590 | |
U.S. Treasury Bills | | | | | 0 | | | | 11,600 | | | | 0 | | | | 11,600 | |
| | | | | $ | 0 | | | $ | 2,775,090 | | | $ | 810 | | | $ | 2,775,900 | |
| | | | | |
Investments in Affiliates, at Value | | | | | | | | | | | | | | | | | | |
Short-Term Instruments | | | | | | | | | | | | | | | | | | |
Mutual Funds | | | | | 43,471 | | | | 0 | | | | 0 | | | | 43,471 | |
Total Investments | | | | $ | 43,471 | | | $ | 2,775,090 | | | $ | 810 | | | $ | 2,819,371 | |
| | | | | |
Financial Derivative Instruments - Assets | | | | | | | | | | | | | | | | | | |
Exchange-traded or centrally cleared | | | | $ | 0 | | | $ | 1,761 | | | $ | 0 | | | $ | 1,761 | |
| | | | | |
Financial Derivative Instruments - Liabilities | | | | | | | | | | | | | | | | | | |
Exchange-traded or centrally cleared | | | | $ | (16 | ) | | $ | 0 | | | $ | 0 | | | $ | (16 | ) |
Totals | | | | $ | 43,455 | | | $ | 2,776,851 | | | $ | 810 | | | $ | 2,821,116 | |
There were no significant transfers between Levels 1, 2, or 3 during the period ended June 30, 2015.
| | | | | | |
| 52 | | PIMCO ETF TRUST | | | | See Accompanying Notes |
Schedule of Investments PIMCO Investment Grade Corporate Bond Index Exchange-Traded Fund
June 30, 2015
| | | | | | | | | | | | |
| | | | | PRINCIPAL
AMOUNT
(000s) | | | | | MARKET
VALUE
(000s) | |
INVESTMENTS IN SECURITIES 99.3% | |
| |
CORPORATE BONDS & NOTES 98.4% | |
| |
BANKING & FINANCE 38.7% | |
|
American Express Co. | |
2.650% due 12/02/2022 | | $ | | | 250 | | | $ | | | 241 | |
|
American Honda Finance Corp. | |
2.600% due 09/20/2016 | | | | | 380 | | | | | | 388 | |
|
American International Group, Inc. | |
5.850% due 01/16/2018 | | | | | 2,950 | | | | | | 3,253 | |
|
American Tower Corp. | |
4.500% due 01/15/2018 | | | | | 445 | | | | | | 471 | |
|
Banco do Brasil S.A. | |
6.000% due 01/22/2020 | | | | | 325 | | | | | | 349 | |
|
Banco Santander Brasil S.A. | |
4.625% due 02/13/2017 | | | | | 925 | | | | | | 955 | |
|
Banco Santander Mexico S.A. Institucion de Banca Multiple Grupo Financiero Santand | |
4.125% due 11/09/2022 | | | | | 375 | | | | | | 375 | |
|
Bank of America Corp. | |
3.875% due 03/22/2017 | | | | | 250 | | | | | | 260 | |
4.000% due 04/01/2024 | | | | | 4,050 | | | | | | 4,123 | |
6.875% due 04/25/2018 | | | | | 250 | | | | | | 282 | |
7.750% due 05/14/2038 | | | | | 400 | | | | | | 533 | |
|
Bank of Tokyo-Mitsubishi UFJ Ltd. | |
2.350% due 02/23/2017 | | | | | 2,225 | | | | | | 2,256 | |
|
Barclays Bank PLC | |
3.750% due 05/15/2024 | | | | | 1,075 | | | | | | 1,079 | |
6.050% due 12/04/2017 | | | | | 400 | | | | | | 436 | |
|
BB&T Corp. | |
2.450% due 01/15/2020 | | | | | 2,650 | | | | | | 2,655 | |
|
Bear Stearns Cos. LLC | |
5.300% due 10/30/2015 | | | | | 275 | | | | | | 279 | |
|
Berkshire Hathaway Finance Corp. | |
5.750% due 01/15/2040 | | | | | 300 | | | | | | 350 | |
|
BM&FBovespa S.A. - Bolsa de Valores Mercadorias e Futuros | |
5.500% due 07/16/2020 | | | | | 500 | | | | | | 532 | |
|
BNP Paribas S.A. | |
5.000% due 01/15/2021 | | | | | 2,650 | | | | | | 2,928 | |
|
Boston Properties LP | |
3.800% due 02/01/2024 | | | | | 700 | | | | | | 709 | |
|
BPCE S.A. | |
4.500% due 03/15/2025 | | | | | 1,000 | | | | | | 967 | |
5.150% due 07/21/2024 | | | | | 500 | | | | | | 507 | |
|
Capital One Financial Corp. | |
4.750% due 07/15/2021 | | | | | 1,950 | | | | | | 2,131 | |
|
Charles Schwab Corp. | |
3.000% due 03/10/2025 | | | | | 300 | | | | | | 294 | |
|
Citigroup, Inc. | |
3.750% due 06/16/2024 | | | | | 1,000 | | | | | | 1,006 | |
4.000% due 08/05/2024 | | | | | 2,575 | | | | | | 2,542 | |
5.375% due 08/09/2020 | | | | | 10 | | | | | | 11 | |
5.500% due 02/15/2017 | | | | | 75 | | | | | | 80 | |
|
CME Group, Inc. | |
3.000% due 09/15/2022 | | | | | 425 | | | | | | 427 | |
3.000% due 03/15/2025 | | | | | 400 | | | | | | 388 | |
|
Compass Bank | |
6.400% due 10/01/2017 | | | | | 975 | | | | | | 1,061 | |
|
Credit Suisse | |
3.000% due 10/29/2021 | | | | | 1,175 | | | | | | 1,166 | |
|
Duke Realty LP | |
3.875% due 10/15/2022 | | | | | 250 | | | | | | 253 | |
| | | | | | | | | | | | |
| | | | | PRINCIPAL
AMOUNT
(000s) | | | | | MARKET
VALUE
(000s) | |
|
Essex Portfolio LP | |
3.250% due 05/01/2023 | | $ | | | 1,375 | | | $ | | | 1,325 | |
|
Ford Motor Credit Co. LLC | |
2.375% due 03/12/2019 | | | | | 2,950 | | | | | | 2,941 | |
5.875% due 08/02/2021 | | | | | 800 | | | | | | 911 | |
|
General Electric Capital Corp. | |
3.100% due 01/09/2023 | | | | | 75 | | | | | | 75 | |
5.500% due 01/08/2020 | | | | | 3,060 | | | | | | 3,468 | |
6.875% due 01/10/2039 | | | | | 1,500 | | | | | | 2,012 | |
|
Goldman Sachs Group, Inc. | |
2.375% due 01/22/2018 | | | | | 1,075 | | | | | | 1,091 | |
2.550% due 10/23/2019 | | | | | 3,200 | | | | | | 3,207 | |
3.500% due 01/23/2025 | | | | | 500 | | | | | | 485 | |
6.750% due 10/01/2037 | | | | | 600 | | | | | | 705 | |
|
Hospitality Properties Trust | |
5.000% due 08/15/2022 | | | | | 975 | | | | | | 1,016 | |
|
HSBC USA, Inc. | |
2.375% due 11/13/2019 | | | | | 3,925 | | | | | | 3,913 | |
|
ING Bank NV | |
2.500% due 10/01/2019 | | | | | 925 | | | | | | 931 | |
4.000% due 03/15/2016 | | | | | 1,150 | | | | | | 1,175 | |
|
Intercontinental Exchange, Inc. | |
2.500% due 10/15/2018 | | | | | 375 | | | | | | 383 | |
|
Intesa Sanpaolo SpA | |
2.375% due 01/13/2017 | | | | | 2,650 | | | | | | 2,664 | |
3.125% due 01/15/2016 | | | | | 50 | | | | | | 50 | |
|
Itau Unibanco Holding S.A. | |
5.650% due 03/19/2022 | | | | | 1,725 | | | | | | 1,749 | |
|
John Deere Capital Corp. | |
3.900% due 07/12/2021 | | | | | 275 | | | | | | 296 | |
|
JPMorgan Chase & Co. | |
3.625% due 05/13/2024 | | | | | 975 | | | | | | 971 | |
4.850% due 02/01/2044 | | | | | 1,675 | | | | | | 1,728 | |
5.400% due 01/06/2042 | | | | | 300 | | | | | | 334 | |
|
JPMorgan Chase Bank N.A. | |
5.875% due 06/13/2016 | | | | | 55 | | | | | | 57 | |
|
Kilroy Realty LP | |
3.800% due 01/15/2023 | | | | | 900 | | | | | | 898 | |
|
Lazard Group LLC | |
3.750% due 02/13/2025 | | | | | 1,000 | | | | | | 952 | |
|
LeasePlan Corp. NV | |
3.000% due 10/23/2017 | | | | | 425 | | | | | | 434 | |
|
Lloyds Bank PLC | |
3.500% due 05/14/2025 | | | | | 1,000 | | | | | | 982 | |
5.800% due 01/13/2020 | | | | | 400 | | | | | | 457 | |
|
Macquarie Bank Ltd. | |
6.625% due 04/07/2021 | | | | | 230 | | | | | | 263 | |
|
MetLife Capital Trust | |
9.250% due 04/08/2068 | | | | | 575 | | | | | | 809 | |
|
MetLife, Inc. | |
5.875% due 02/06/2041 | | | | | 85 | | | | | | 100 | |
|
Moody’s Corp. | |
4.875% due 02/15/2024 | | | | | 500 | | | | | | 537 | |
5.500% due 09/01/2020 | | | | | 300 | | | | | | 337 | |
|
Morgan Stanley | |
4.350% due 09/08/2026 | | | | | 2,000 | | | | | | 1,966 | |
7.300% due 05/13/2019 | | | | | 505 | | | | | | 594 | |
|
MUFG Capital Finance Ltd. | |
6.346% due 07/29/2049 | | | | | 575 | | | | | | 603 | |
|
National City Corp. | |
6.875% due 05/15/2019 | | | | | 2,175 | | | | | | 2,523 | |
|
PNC Bank N.A. | |
3.800% due 07/25/2023 | | | | | 525 | | | | | | 538 | |
| | | | | | | | | | | | |
| | | | | PRINCIPAL
AMOUNT
(000s) | | | | | MARKET
VALUE
(000s) | |
|
Prudential Financial, Inc. | |
4.750% due 09/17/2015 | | $ | | | 2,157 | | | $ | | | 2,174 | |
|
Rabobank Group | |
3.875% due 02/08/2022 | | | | | 325 | | | | | | 338 | |
5.250% due 05/24/2041 | | | | | 2,185 | | | | | | 2,394 | |
|
Sumitomo Life Insurance Co. | |
6.500% due 09/20/2073 | | | | | 575 | | | | | | 653 | |
|
Sumitomo Mitsui Banking Corp. | |
3.200% due 07/18/2022 | | | | | 1,950 | | | | | | 1,947 | |
|
Synchrony Financial | |
2.700% due 02/03/2020 | | | | | 250 | | | | | | 247 | |
|
Tanger Properties LP | |
3.750% due 12/01/2024 | | | | | 975 | | | | | | 964 | |
|
U.S. Bancorp | |
2.950% due 07/15/2022 | | | | | 900 | | | | | | 886 | |
|
Ventas Realty LP | |
4.000% due 04/30/2019 | | | | | 250 | | | | | | 264 | |
|
WEA Finance LLC | |
3.750% due 09/17/2024 | | | | | 975 | | | | | | 964 | |
|
Wells Fargo & Co. | |
1.400% due 09/08/2017 | | | | | 3,150 | | | | | | 3,158 | |
3.300% due 09/09/2024 | | | | | 1,675 | | | | | | 1,649 | |
4.125% due 08/15/2023 | | | | | 75 | | | | | | 78 | |
|
Weyerhaeuser Co. | |
7.375% due 03/15/2032 | | | | | 1,275 | | | | | | 1,595 | |
|
WR Berkley Corp. | |
4.625% due 03/15/2022 | | | | | 450 | | | | | | 479 | |
| | | | | | | | | | | | |
| | | | | | | | | | | 94,557 | |
| | | | | | | | | | | | |
| |
INDUSTRIALS 44.3% | |
|
21st Century Fox America, Inc. | |
6.400% due 12/15/2035 | | | | | 100 | | | | | | 118 | |
|
Abbott Laboratories | |
2.550% due 03/15/2022 | | | | | 250 | | | | | | 244 | |
|
AbbVie, Inc. | |
2.900% due 11/06/2022 | | | | | 1,575 | | | | | | 1,526 | |
|
Actavis Funding SCS | |
3.800% due 03/15/2025 | | | | | 500 | | | | | | 491 | |
|
Altria Group, Inc. | |
2.950% due 05/02/2023 | | | | | 2,193 | | | | | | 2,096 | |
|
America Movil S.A.B. de C.V. | |
6.125% due 03/30/2040 | | | | | 1,955 | | | | | | 2,268 | |
|
Amgen, Inc. | |
3.450% due 10/01/2020 | | | | | 570 | | | | | | 590 | |
3.625% due 05/22/2024 | | | | | 2,300 | | | | | | 2,283 | |
|
Anadarko Petroleum Corp. | |
3.450% due 07/15/2024 (c) | | | | | 1,600 | | | | | | 1,577 | |
6.375% due 09/15/2017 | | | | | 275 | | | | | | 302 | |
|
Anglo American Capital PLC | |
2.625% due 09/27/2017 | | | | | 25 | | | | | | 25 | |
|
Anheuser-Busch Cos. LLC | |
5.500% due 01/15/2018 | | | | | 475 | | | | | | 522 | |
|
Anheuser-Busch InBev Worldwide, Inc. | |
7.750% due 01/15/2019 | | | | | 675 | | | | | | 801 | |
|
Anthem, Inc. | |
3.500% due 08/15/2024 | | | | | 1,100 | | | | | | 1,057 | |
|
Apple, Inc. | |
2.500% due 02/09/2025 | | | | | 500 | | | | | | 469 | |
3.450% due 05/06/2024 | | | | | 375 | | | | | | 382 | |
|
Aviation Capital Group Corp. | |
3.875% due 09/27/2016 | | | | | 975 | | | | | | 992 | |
|
Barrick PD Australia Finance Pty. Ltd. | |
4.950% due 01/15/2020 | | | | | 1,100 | | | | | | 1,180 | |
| | | | | | |
| See Accompanying Notes | | ANNUAL REPORT | | JUNE 30, 2015 | | 53 |
Schedule of Investments PIMCO Investment Grade Corporate Bond Index Exchange-Traded Fund (Cont.)
| | | | | | | | | | | | |
| | | | | PRINCIPAL
AMOUNT
(000s) | | | | | MARKET
VALUE
(000s) | |
|
Baxalta, Inc. | |
5.250% due 06/23/2045 | | $ | | | 500 | | | $ | | | 502 | |
|
Becton Dickinson and Co. | |
2.675% due 12/15/2019 | | | | | 2,475 | | | | | | 2,475 | |
|
BHP Billiton Finance USA Ltd. | |
6.500% due 04/01/2019 | | | | | 1,775 | | | | | | 2,054 | |
|
BorgWarner, Inc. | |
3.375% due 03/15/2025 | | | | | 200 | | | | | | 197 | |
|
Boston Scientific Corp. | |
2.650% due 10/01/2018 | | | | | 2,375 | | | | | | 2,410 | |
|
Bunge Ltd. Finance Corp. | |
4.100% due 03/15/2016 | | | | | 675 | | | | | | 688 | |
|
Burlington Northern Santa Fe LLC | |
5.400% due 06/01/2041 | | | | | 1,115 | | | | | | 1,229 | |
|
Caterpillar, Inc. | |
3.803% due 08/15/2042 | | | | | 1,103 | | | | | | 1,014 | |
|
Cenovus Energy, Inc. | |
6.750% due 11/15/2039 | | | | | 260 | | | | | | 295 | |
|
China Resources Gas Group Ltd. | |
4.500% due 04/05/2022 | | | | | 700 | | | | | | 728 | |
|
Cigna Corp. | |
5.375% due 02/15/2042 | | | | | 575 | | | | | | 617 | |
|
CNOOC Finance Ltd. | |
3.875% due 05/02/2022 | | | | | 550 | | | | | | 558 | |
|
CNPC General Capital Ltd. | |
1.450% due 04/16/2016 | | | | | 675 | | | | | | 676 | |
|
Coca-Cola Co. | |
1.650% due 03/14/2018 | | | | | 250 | | | | | | 252 | |
|
Coca-Cola Enterprises, Inc. | |
2.000% due 08/19/2016 | | | | | 330 | | | | | | 334 | |
|
Comcast Corp. | |
3.125% due 07/15/2022 | | | | | 2,075 | | | | | | 2,065 | |
3.600% due 03/01/2024 | | | | | 2,300 | | | | | | 2,323 | |
|
ConAgra Foods, Inc. | |
2.100% due 03/15/2018 | | | | | 230 | | | | | | 228 | |
|
ConocoPhillips Co. | |
2.875% due 11/15/2021 | | | | | 1,000 | | | | | | 1,008 | |
|
Continental Resources, Inc. | |
4.500% due 04/15/2023 | | | | | 300 | | | | | | 289 | |
4.900% due 06/01/2044 | | | | | 675 | | | | | | 569 | |
|
Corning, Inc. | |
5.750% due 08/15/2040 | | | | | 285 | | | | | | 329 | |
|
Corp. Nacional del Cobre de Chile | |
3.000% due 07/17/2022 | | | | | 225 | | | | | | 217 | |
|
CSX Corp. | |
6.220% due 04/30/2040 | | | | | 375 | | | | | | 458 | |
|
CVS Health Corp. | |
3.375% due 08/12/2024 | | | | | 1,155 | | | | | | 1,135 | |
|
DIRECTV Holdings LLC | |
3.125% due 02/15/2016 | | | | | 400 | | | | | | 405 | |
|
Discovery Communications LLC | |
5.050% due 06/01/2020 | | | | | 250 | | | | | | 274 | |
|
Dominion Gas Holdings LLC | |
3.600% due 12/15/2024 | | | | | 950 | | | | | | 946 | |
|
Dow Chemical Co. | |
5.250% due 11/15/2041 | | | | | 750 | | | | | | 765 | |
|
Eli Lilly & Co. | |
2.750% due 06/01/2025 | | | | | 500 | | | | | | 483 | |
|
Encana Corp. | |
5.150% due 11/15/2041 | | | | | 30 | | | | | | 28 | |
|
Energy Transfer Partners LP | |
3.600% due 02/01/2023 | | | | | 2,000 | | | | | | 1,895 | |
4.650% due 06/01/2021 | | | | | 100 | | | | | | 103 | |
| | | | | | | | | | | | |
| | | | | PRINCIPAL
AMOUNT
(000s) | | | | | MARKET
VALUE
(000s) | |
|
Ensco PLC | |
4.700% due 03/15/2021 | | $ | | | 615 | | | $ | | | 627 | |
|
Enterprise Products Operating LLC | |
3.750% due 02/15/2025 | | | | | 1,300 | | | | | | 1,275 | |
4.850% due 03/15/2044 | | | | | 500 | | | | | | 470 | |
|
Exxon Mobil Corp. | |
3.176% due 03/15/2024 | | | | | 1,100 | | | | | | 1,116 | |
|
Flextronics International Ltd. | |
4.750% due 06/15/2025 | | | | | 500 | | | | | | 497 | |
|
Forest Laboratories LLC | |
4.375% due 02/01/2019 | | | | | 2,575 | | | | | | 2,726 | |
|
Freeport-McMoRan, Inc. | |
3.550% due 03/01/2022 | | | | | 75 | | | | | | 69 | |
|
Gilead Sciences, Inc. | |
3.500% due 02/01/2025 | | | | | 1,000 | | | | | | 1,001 | |
|
GlaxoSmithKline Capital, Inc. | |
2.800% due 03/18/2023 | | | | | 225 | | | | | | 220 | |
|
Glencore Finance Canada Ltd. | |
4.250% due 10/25/2022 | | | | | 1,425 | | | | | | 1,401 | |
|
GTL Trade Finance, Inc. | |
5.893% due 04/29/2024 | | | | | 1,000 | | | | | | 981 | |
|
Hewlett-Packard Co. | |
2.125% due 09/13/2015 | | | | | 160 | | | | | | 161 | |
2.750% due 01/14/2019 | | | | | 500 | | | | | | 506 | |
|
HJ Heinz Co. | |
5.200% due 07/15/2045 (a) | | | | | 500 | | | | | | 514 | |
|
Home Depot, Inc. | |
4.250% due 04/01/2046 | | | | | 500 | | | | | | 485 | |
5.400% due 03/01/2016 | | | | | 330 | | | | | | 340 | |
|
Hutchison Whampoa International Ltd. | |
7.450% due 11/24/2033 | | | | | 575 | | | | | | 786 | |
|
International Business Machines Corp. | |
4.000% due 06/20/2042 | | | | | 92 | | | | | | 83 | |
5.600% due 11/30/2039 | | | | | 29 | | | | | | 33 | |
|
KazMunayGas National Co. JSC | |
7.000% due 05/05/2020 | | | | | 1,125 | | | | | | 1,214 | |
|
Kinder Morgan Energy Partners LP | |
3.950% due 09/01/2022 | | | | | 1,075 | | | | | | 1,052 | |
5.300% due 09/15/2020 | | | | | 635 | | | | | | 690 | |
|
Kinder Morgan, Inc. | |
3.050% due 12/01/2019 | | | | | 200 | | | | | | 200 | |
5.550% due 06/01/2045 | | | | | 1,000 | | | | | | 924 | |
|
Kraft Foods Group, Inc. | |
6.125% due 08/23/2018 | | | | | 2,425 | | | | | | 2,712 | |
|
Kroger Co. | |
6.150% due 01/15/2020 | | | | | 275 | | | | | | 316 | |
|
L-3 Communications Corp. | |
4.750% due 07/15/2020 | | | | | 705 | | | | | | 744 | |
|
Lowe’s Cos., Inc. | |
4.650% due 04/15/2042 | | | | | 1,500 | | | | | | 1,544 | |
|
Marriott International, Inc. | |
6.200% due 06/15/2016 | | | | | 100 | | | | | | 105 | |
|
Medtronic, Inc. | |
3.150% due 03/15/2022 | | | | | 1,000 | | | | | | 1,004 | |
3.500% due 03/15/2025 | | | | | 2,650 | | | | | | 2,644 | |
4.450% due 03/15/2020 | | | | | 250 | | | | | | 273 | |
|
Merck Sharp & Dohme Corp. | |
5.000% due 06/30/2019 | | | | | 160 | | | | | | 178 | |
|
Microsoft Corp. | |
2.700% due 02/12/2025 | | | | | 1,000 | | | | | | 963 | |
|
Mondelez International, Inc. | |
2.250% due 02/01/2019 | | | | | 1,800 | | | | | | 1,803 | |
| | | | | | | | | | | | |
| | | | | PRINCIPAL
AMOUNT
(000s) | | | | | MARKET
VALUE
(000s) | |
|
Mylan, Inc. | |
3.125% due 01/15/2023 | | $ | | | 100 | | | $ | | | 95 | |
|
Noble Holding International Ltd. | |
4.900% due 08/01/2020 | | | | | 100 | | | | | | 103 | |
|
ONEOK Partners LP | |
3.200% due 09/15/2018 | | | | | 1,975 | | | | | | 2,019 | |
5.000% due 09/15/2023 | | | | | 250 | | | | | | 253 | |
|
Oracle Corp. | |
2.800% due 07/08/2021 | | | | | 2,350 | | | | | | 2,379 | |
4.125% due 05/15/2045 | | | | | 1,000 | | | | | | 929 | |
|
PepsiCo, Inc. | |
5.500% due 01/15/2040 | | | | | 475 | | | | | | 540 | |
|
Pfizer, Inc. | |
4.400% due 05/15/2044 | | | | | 500 | | | | | | 493 | |
6.200% due 03/15/2019 | | | | | 2,021 | | | | | | 2,311 | |
|
Philip Morris International, Inc. | |
3.600% due 11/15/2023 | | | | | 950 | | | | | | 964 | |
5.650% due 05/16/2018 | | | | | 400 | | | | | | 444 | |
|
Pioneer Natural Resources Co. | |
6.875% due 05/01/2018 | | | | | 200 | | | | | | 225 | |
|
Republic Services, Inc. | |
5.250% due 11/15/2021 | | | | | 295 | | | | | | 331 | |
|
Rio Tinto Finance USA Ltd. | |
3.750% due 09/20/2021 | | | | | 375 | | | | | | 389 | |
|
Roche Holdings, Inc. | |
6.000% due 03/01/2019 | | | | | 442 | | | | | | 503 | |
|
Rogers Communications, Inc. | |
6.800% due 08/15/2018 | | | | | 1,680 | | | | | | 1,919 | |
|
SABMiller Holdings, Inc. | |
3.750% due 01/15/2022 | | | | | 1,975 | | | | | | 2,040 | |
|
Southern Copper Corp. | |
6.750% due 04/16/2040 | | | | | 900 | | | | | | 934 | |
|
Target Corp. | |
3.875% due 07/15/2020 | | | | | 250 | | | | | | 270 | |
|
Teck Resources Ltd. | |
4.750% due 01/15/2022 | | | | | 900 | | | | | | 837 | |
|
Telefonica Emisiones S.A.U. | |
5.462% due 02/16/2021 | | | | | 125 | | | | | | 138 | |
|
Thermo Fisher Scientific, Inc. | |
3.150% due 01/15/2023 | | | | | 100 | | | | | | 98 | |
|
Time Warner Cable, Inc. | |
5.000% due 02/01/2020 | | | | | 1,525 | | | | | | 1,643 | |
|
Time Warner, Inc. | |
3.400% due 06/15/2022 | | | | | 575 | | | | | | 570 | |
3.550% due 06/01/2024 | | | | | 2,275 | | | | | | 2,220 | |
|
TransCanada PipeLines Ltd. | |
3.800% due 10/01/2020 | | | | | 215 | | | | | | 228 | |
|
Transocean, Inc. | |
6.500% due 11/15/2020 (c) | | | | | 180 | | | | | | 167 | |
|
Union Pacific Corp. | |
4.750% due 09/15/2041 | | | | | 1,275 | | | | | | 1,325 | |
|
United Technologies Corp. | |
3.100% due 06/01/2022 | | | | | 1,875 | | | | | | 1,889 | |
|
UnitedHealth Group, Inc. | |
6.875% due 02/15/2038 | | | | | 465 | | | | | | 608 | |
|
Vale Overseas Ltd. | |
6.875% due 11/21/2036 | | | | | 815 | | | | | | 790 | |
|
Viacom, Inc. | |
4.250% due 09/01/2023 | | | | | 1,275 | | | | | | 1,286 | |
|
Wal-Mart Stores, Inc. | |
2.250% due 07/08/2015 | | | | | 100 | | | | | | 100 | |
6.200% due 04/15/2038 | | | | | 2,062 | | | | | | 2,569 | |
| | | | | | |
| 54 | | PIMCO ETF TRUST | | | | See Accompanying Notes |
June 30, 2015
| | | | | | | | | | | | |
| | | | | PRINCIPAL
AMOUNT
(000s) | | | | | MARKET
VALUE
(000s) | |
|
Weatherford International Ltd. | |
5.125% due 09/15/2020 | | $ | | | 805 | | | $ | | | 820 | |
|
Whirlpool Corp. | |
3.700% due 03/01/2023 | | | | | 250 | | | | | | 252 | |
5.150% due 03/01/2043 | | | | | 300 | | | | | | 308 | |
|
Williams Partners LP | |
5.400% due 03/04/2044 | | | | | 693 | | | | | | 634 | |
|
Zimmer Biomet Holdings, Inc. | |
3.550% due 04/01/2025 | | | | | 500 | | | | | | 485 | |
| | | | | | | | | | | | |
| | | | | | | | | | | 108,237 | |
| | | | | | | | | | | | |
| |
UTILITIES 15.4% | |
|
American Water Capital Corp. | |
3.850% due 03/01/2024 | | | | | 600 | | | | | | 628 | |
|
Appalachian Power Co. | |
7.000% due 04/01/2038 | | | | | 750 | | | | | | 952 | |
|
AT&T, Inc. | |
2.500% due 08/15/2015 | | | | | 73 | | | | | | 73 | |
4.800% due 06/15/2044 | | | | | 2,200 | | | | | | 2,027 | |
|
Atmos Energy Corp. | |
4.150% due 01/15/2043 | | | | | 750 | | | | | | 706 | |
|
Berkshire Hathaway Energy Co. | |
6.125% due 04/01/2036 | | | | | 465 | | | | | | 548 | |
|
BG Energy Capital PLC | |
5.125% due 10/15/2041 | | | | | 115 | | | | | | 120 | |
|
BP Capital Markets PLC | |
2.237% due 05/10/2019 | | | | | 1,725 | | | | | | 1,738 | |
4.500% due 10/01/2020 | | | | | 275 | | | | | | 301 | |
|
Consumers Energy Co. | |
3.125% due 08/31/2024 | | | | | 1,000 | | | | | | 993 | |
|
Dominion Resources, Inc. | |
4.450% due 03/15/2021 | | | | | 120 | | | | | | 129 | |
|
DTE Electric Co. | |
3.650% due 03/15/2024 | | | | | 700 | | | | | | 723 | |
|
Duke Energy Corp. | |
3.950% due 10/15/2023 | | | | | 400 | | | | | | 415 | |
|
Duke Energy Ohio, Inc. | |
3.800% due 09/01/2023 | | | | | 635 | | | | | | 660 | |
|
E.ON International Finance BV | |
5.800% due 04/30/2018 | | | | | 45 | | | | | | 50 | |
|
Electricite de France S.A. | |
4.600% due 01/27/2020 | | | | | 375 | | | | | | 411 | |
4.875% due 01/22/2044 | | | | | 1,000 | | | | | | 1,043 | |
|
Entergy Corp. | |
5.125% due 09/15/2020 | | | | | 300 | | | | | | 326 | |
| | | | | | | | | | | | |
| | | | | PRINCIPAL
AMOUNT
(000s) | | | | | MARKET
VALUE
(000s) | |
|
Exelon Corp. | |
5.100% due 06/15/2045 | | $ | | | 500 | | | $ | | | 501 | |
|
Exelon Generation Co. LLC | |
6.200% due 10/01/2017 | | | | | 100 | | | | | | 109 | |
|
FirstEnergy Corp. | |
7.375% due 11/15/2031 | | | | | 910 | | | | | | 1,109 | |
|
Florida Power & Light Co. | |
4.125% due 02/01/2042 | | | | | 100 | | | | | | 99 | |
|
Gazprom OAO Via Gaz Capital S.A. | |
5.092% due 11/29/2015 | | | | | 455 | | | | | | 461 | |
|
Kentucky Utilities Co. | |
5.125% due 11/01/2040 | | | | | 100 | | | | | | 111 | |
|
Korea Hydro & Nuclear Power Co. Ltd. | |
3.000% due 09/19/2022 | | | | | 625 | | | | | | 623 | |
|
MidAmerican Energy Co. | |
3.500% due 10/15/2024 | | | | | 2,950 | | | | | | 3,006 | |
|
Novatek OAO Via Novatek Finance Ltd. | |
5.326% due 02/03/2016 | | | | | 1,000 | | | | | | 1,017 | |
|
Pacific Gas & Electric Co. | |
3.500% due 10/01/2020 | | | | | 305 | | | | | | 318 | |
4.750% due 02/15/2044 | | | | | 1,675 | | | | | | 1,727 | |
5.800% due 03/01/2037 | | | | | 255 | | | | | | 294 | |
|
Pennsylvania Electric Co. | |
5.200% due 04/01/2020 | | | | | 70 | | | | | | 77 | |
|
Petroleos Mexicanos | |
4.250% due 01/15/2025 | | | | | 575 | | | | | | 561 | |
4.875% due 01/24/2022 | | | | | 325 | | | | | | 339 | |
5.750% due 03/01/2018 | | | | | 170 | | | | | | 185 | |
6.375% due 01/23/2045 | | | | | 625 | | | | | | 648 | |
|
Plains All American Pipeline LP | |
5.150% due 06/01/2042 | | | | | 675 | | | | | | 653 | |
|
Rosneft Finance S.A. | |
7.500% due 07/18/2016 | | | | | 850 | | | | | | 887 | |
|
Sempra Energy | |
2.300% due 04/01/2017 | | | | | 225 | | | | | | 228 | |
|
Shell International Finance BV | |
4.375% due 03/25/2020 | | | | | 230 | | | | | | 252 | |
6.375% due 12/15/2038 | | | | | 950 | | | | | | 1,195 | |
|
Sinopec Group Overseas Development Ltd. | |
4.375% due 04/10/2024 | | | | | 600 | | | | | | 630 | |
|
Southern California Gas Co. | |
3.150% due 09/15/2024 | | | | | 1,200 | | | | | | 1,198 | |
|
Southern Power Co. | |
5.150% due 09/15/2041 | | | | | 1,665 | | | | | | 1,715 | |
|
Southwestern Public Service Co. | |
6.000% due 10/01/2036 | | | | | 1,210 | | | | | | 1,439 | |
| | | | | | | | | | | | |
| | | | �� | PRINCIPAL
AMOUNT
(000s) | | | | | MARKET
VALUE
(000s) | |
|
Verizon Communications, Inc. | |
2.625% due 02/21/2020 | | $ | | | 2,132 | | | $ | | | 2,128 | |
3.000% due 11/01/2021 | | | | | 575 | | | | | | 567 | |
4.400% due 11/01/2034 | | | | | 1,675 | | | | | | 1,573 | |
4.522% due 09/15/2048 | | | | | 64 | | | | | | 57 | |
4.862% due 08/21/2046 | | | | | 598 | | | | | | 560 | |
5.012% due 08/21/2054 | | | | | 1,050 | | | | | | 964 | |
|
Vodafone Group PLC | |
2.500% due 09/26/2022 | | | | | 510 | | | | | | 468 | |
| | | | | | | | | | | | |
| | | | | | | | | | | 37,542 | |
| | | | | | | | | | | | |
Total Corporate Bonds & Notes
(Cost $244,886) | | | 240,336 | |
| | | | | | | | | | | | |
| |
U.S. TREASURY OBLIGATIONS 0.7% | |
|
U.S. Treasury Notes | |
0.250% due 10/15/2015 | | | | | 100 | | | | | | 100 | |
0.250% due 10/31/2015 | | | | | 100 | | | | | | 100 | |
0.375% due 11/15/2015 | | | | | 1,500 | | | | | | 1,502 | |
| | | | | | | | | | | | |
Total U.S. Treasury Obligations
(Cost $1,702) | | | 1,702 | |
| | | | | | | | | | | | |
| |
SHORT-TERM INSTRUMENTS 0.2% | |
| |
REPURCHASE AGREEMENTS (d) 0.2% | |
| | | | | | | | | | | 511 | |
| | | | | | | | | | | | |
Total Short-Term Instruments
(Cost $511) | | | 511 | |
| | | | | | | | | | | | |
| |
Total Investments in Securities
(Cost $247,099) | | | 242,549 | |
| | | | | | | | | | | | |
| | | | |
| | | | | SHARES | | | | | | |
INVESTMENTS IN AFFILIATES 0.7% | |
| |
SHORT-TERM INSTRUMENTS 0.7% | |
| |
MUTUAL FUNDS 0.7% | |
| | | | |
PIMCO Money Market Fund (b)(c) | | | | | 1,692,820 | | | | | | 1,693 | |
| | | | | | | | | | | | |
Total Short-Term Instruments
(Cost $1,693) | | | 1,693 | |
| | | | | | | | | | | | |
| | | | | | | | | | | | |
Total Investments in Affiliates
(Cost $1,693) | | | 1,693 | |
| | | | | | | | | | | | |
| |
Total Investments 100.0%
(Cost $248,792) | | | $ | | | 244,242 | |
| |
Other Assets and Liabilities, net 0.0% | | | (39 | ) |
| | | | | | | | | | | | |
Net Assets 100.0% | | | $ | | | 244,203 | |
| | | | | | | | | | | | |
NOTES TO SCHEDULE OF INVESTMENTS (AMOUNTS IN THOUSANDS*):
| * | A zero balance may reflect actual amounts rounding to less than one thousand. |
| (b) | Institutional Class Shares of each Fund. |
| (c) | Securities with an aggregate market value of $1,659 were out on loan in exchange for $1,693 of cash collateral as of June 30, 2015. The collateral was invested in a cash collateral reinvestment vehicle as described in Note 5(d) in the Notes to Financial Statements. |
| | | | | | |
| See Accompanying Notes | | ANNUAL REPORT | | JUNE 30, 2015 | | 55 |
Schedule of Investments PIMCO Investment Grade Corporate Bond Index Exchange-Traded Fund (Cont.)
BORROWINGS AND OTHER FINANCING TRANSACTIONS
(d) REPURCHASE AGREEMENTS:
| | | | | | | | | | | | | | | | | | | | | | | | | | | | | | | | |
| Counterparty | | | | Lending
Rate | | | Settlement
Date | | | Maturity
Date | | | Principal
Amount | | | Collateralized By | | Collateral
Received,
at Value | | | Repurchase
Agreements,
at Value | | | Repurchase
Agreement
Proceeds
to be
Received (1) | |
SSB | | | | | 0.000 | % | | | 06/30/2015 | | | | 07/01/2015 | | | $ | 511 | | | Fannie Mae 2.200% due 10/17/2022 | | $ | (523 | ) | | $ | 511 | | | $ | 511 | |
Total Repurchase Agreements | | | | | | | | | | | | | | | | | | | | | | $ | (523 | ) | | $ | 511 | | | $ | 511 | |
| (1) | Includes accrued interest. |
BORROWINGS AND OTHER FINANCING TRANSACTIONS SUMMARY
The following is a summary by counterparty of the market value of Borrowings and Other Financing Transactions and collateral (received)/pledged as of June 30, 2015:
| | | | | | | | | | | | | | | | | | | | | | | | | | | | | | |
| Counterparty | | | | Repurchase
Agreement
Proceeds
to be
Received | | | Payable for
Reverse
Repurchase
Agreements | | | Payable for
Sale-Buyback
Transactions | | | Securities
Out on Loan | | | Total
Borrowings and
Other Financing
Transactions | | | Collateral
(Received)/
Pledged | | | Net
Exposure (2) | |
Global/Master Repurchase Agreement | | | | | | | | | | | | | | | | | | | | | | | | | | | | | | |
SSB | | | | $ | 511 | | | $ | 0 | | | $ | 0 | | | $ | 0 | | | $ | 511 | | | $ | (523 | ) | | $ | (12 | ) |
| | | | | | | | |
Master Securities Lending Agreement | | | | | | | | | | | | | | | | | | | | | | | | | | | | | | |
BCY | | | | | 0 | | | | 0 | | | | 0 | | | | (1,495 | ) | | | (1,495 | ) | | | 1,526 | | | | 31 | |
JPM | | | | | 0 | | | | 0 | | | | 0 | | | | (164 | ) | | | (164 | ) | | | 167 | | | | 3 | |
Total Borrowings and Other Financing Transactions | | | | $ | 511 | | | $ | 0 | | | $ | 0 | | | $ | (1,659 | ) | | | | | | | | | | | | |
| (2) | Net Exposure represents the net receivable/(payable) that would be due from/to the counterparty in the event of default. Exposure from borrowings and other financing transactions can only be netted across transactions governed under the same master agreement with the same legal entity. See Note 7, Principal Risks, in the Notes to Financial Statements for more information regarding master netting arrangements. |
The following is a summary of the fair valuation of the Fund’s derivative instruments categorized by risk exposure. See Note 7, Principal Risks, in the Notes to Financial Statements on risks of the Fund.
The Effect of Financial Derivative Instruments on the Statements of Operations for the Period Ended June 30, 2015:
| | | | | | | | | | | | | | | | | | | | | | | | | | |
| | | | | Derivatives not accounted for as hedging instruments | |
| | | | | Commodity
Contracts | | | Credit
Contracts | | | Equity
Contracts | | | Foreign
Exchange
Contracts | | | Interest
Rate Contracts | | | Total | |
Net Realized Gain on Financial Derivative Instruments | | | | | | | | | | | | | | | | | | | | | | | | | | |
Exchange-traded or centrally cleared | | | | | | | | | | | | | | | | | | | | | | | | | | |
Futures | | | | $ | 0 | | | $ | 0 | | | $ | 0 | | | $ | 0 | | | $ | 465 | | | $ | 465 | |
Swap Agreements | | | | | 0 | | | | 28 | | | | 0 | | | | 0 | | | | 0 | | | | 28 | |
| | | | $ | 0 | | | $ | 28 | | | $ | 0 | | | $ | 0 | | | $ | 465 | | | $ | 493 | |
| | | | | | |
| 56 | | PIMCO ETF TRUST | | | | See Accompanying Notes |
June 30, 2015
FAIR VALUE MEASUREMENTS
The following is a summary of the fair valuations according to the inputs used as of June 30, 2015 in valuing the Fund’s assets and liabilities:
| | | | | | | | | | | | | | | | | | |
| Category and Subcategory | | | | Level 1 | | | Level 2 | | | Level 3 | | | Fair Value at
06/30/2015 | |
Investments in Securities, at Value | | | | | | | | | | | | | | | | | | |
Corporate Bonds & Notes | | | | | | | | | | | | | | | | | | |
Banking & Finance | | | | $ | 0 | | | $ | 94,557 | | | $ | 0 | | | $ | 94,557 | |
Industrials | | | | | 0 | | | | 108,237 | | | | 0 | | | | 108,237 | |
Utilities | | | | | 0 | | | | 37,542 | | | | 0 | | | | 37,542 | |
U.S. Treasury Obligations | | | | | 0 | | | | 1,702 | | | | 0 | | | | 1,702 | |
Short-Term Instruments | | | | | | | | | | | | | | | | | | |
Repurchase Agreements | | | | | 0 | | | | 511 | | | | 0 | | | | 511 | |
| | | | | $ | 0 | | | $ | 242,549 | | | $ | 0 | | | $ | 242,549 | |
| | | | | |
Investments in Affiliates, at Value | | | | | | | | | | | | | | | | | | |
Short-Term Instruments | | | | | | | | | | | | | | | | | | |
Mutual Funds | | | | | 1,693 | | | | 0 | | | | 0 | | | | 1,693 | |
Total Investments | | | | $ | 1,693 | | | $ | 242,549 | | | $ | 0 | | | $ | 244,242 | |
There were no significant transfers between Levels 1, 2, or 3 during the period ended June 30, 2015.
| | | | | | |
| See Accompanying Notes | | ANNUAL REPORT | | JUNE 30, 2015 | | 57 |
Schedule of Investments PIMCO Diversified Income Active Exchange-Traded Fund
| | | | | | | | | | | | |
| | | | | PRINCIPAL
AMOUNT
(000s) | | | | | MARKET
VALUE
(000s) | |
INVESTMENTS IN SECURITIES 104.5% | |
| |
BANK LOAN OBLIGATIONS 2.7% | |
|
Amaya Holdings BV | |
5.000% due 08/01/2021 | | $ | �� | | 298 | | | $ | | | 298 | |
|
Avago Technologies Cayman Ltd. | |
3.750% due 05/06/2021 | | | | | 87 | | | | | | 87 | |
|
Charter Communications Operating LLC | |
3.000% due 07/01/2020 | | | | | 99 | | | | | | 98 | |
|
CSC Holdings, Inc. | |
2.687% due 04/17/2020 | | | | | 85 | | | | | | 84 | |
|
Dell International LLC | |
4.000% due 04/29/2020 | | | | | 199 | | | | | | 200 | |
|
Energy Future Intermediate Holding Co. LLC | |
4.250% due 06/19/2016 | | | | | 300 | | | | | | 301 | |
|
Gardner Denver, Inc. | |
4.250% due 07/30/2020 | | | | | 149 | | | | | | 145 | |
|
Hilton Worldwide Finance LLC | |
3.500% due 10/26/2020 | | | | | 187 | | | | | | 187 | |
|
Las Vegas Sands LLC | |
3.250% due 12/18/2020 | | | | | 99 | | | | | | 99 | |
| | | | | | | | | | | | |
Total Bank Loan Obligations
(Cost $1,488) | | | 1,499 | |
| | | | | | | | | | | | |
| |
CORPORATE BONDS & NOTES 70.2% | |
| |
BANKING & FINANCE 28.6% | |
|
AerCap Ireland Capital Ltd. | |
3.750% due 05/15/2019 | | | | | 150 | | | | | | 149 | |
4.500% due 05/15/2021 | | | | | 150 | | | | | | 151 | |
|
Ally Financial, Inc. | |
4.125% due 03/30/2020 | | | | | 200 | | | | | | 200 | |
|
Banco Bilbao Vizcaya Argentaria S.A. | |
9.000% due 05/09/2018 (c) | | | 200 | | | | | | 215 | |
|
Banco Popular Espanol S.A. | |
11.500% due 10/10/2018 (c) | | EUR | | | 200 | | | | | | 248 | |
|
Banco Santander Mexico S.A. Institucion de Banca Multiple Grupo Financiero Santand | |
4.125% due 11/09/2022 | | $ | | | 1,400 | | | | | | 1,401 | |
|
Bank of America Corp. | |
3.300% due 01/11/2023 | | | | | 500 | | | | | | 493 | |
6.100% due 03/17/2025 (c) | | | 500 | | | | | | 494 | |
|
Banque PSA Finance S.A. | |
5.750% due 04/04/2021 | | | | | 200 | | | | | | 215 | |
|
Barclays Bank PLC | |
7.625% due 11/21/2022 | | | | | 800 | | | | | | 913 | |
|
Barclays PLC | |
8.250% due 12/15/2018 (c) | | | 400 | | | | | | 423 | |
|
BPCE S.A. | |
4.625% due 07/11/2024 | | | | | 200 | | | | | | 196 | |
|
CIT Group, Inc. | |
6.625% due 04/01/2018 | | | | | 400 | | | | | | 429 | |
|
Co-operative Group Holdings Ltd. | |
6.875% due 07/08/2020 | | GBP | | | 150 | | | | | | 255 | |
|
Credit Agricole S.A. | |
7.875% due 01/23/2024 (c) | | $ | | | 200 | | | | | | 205 | |
8.125% due 09/19/2033 | | | | | 200 | | | | | | 221 | |
|
Credit Suisse AG | |
6.500% due 08/08/2023 | | | | | 400 | | | | | | 438 | |
|
Crown Castle International Corp. | |
5.250% due 01/15/2023 | | | | | 200 | | | | | | 202 | |
|
Denali Borrower LLC | |
5.625% due 10/15/2020 | | | | | 200 | | | | | | 211 | |
| | | | | | | | | | | | |
| | | | | PRINCIPAL
AMOUNT
(000s) | | | | | MARKET
VALUE
(000s) | |
|
Doric Nimrod Air Finance Alpha Ltd. Pass-Through Trust | |
5.125% due 11/30/2024 | | $ | | | 252 | | | $ | | | 267 | |
|
EDC Finance Ltd. | |
4.875% due 04/17/2020 | | | | | 500 | | | | | | 442 | |
|
General Motors Financial Co., Inc. | |
3.450% due 04/10/2022 | | | | | 100 | | | | | | 98 | |
|
Heta Asset Resolution AG | |
4.250% due 10/31/2016 ^ | | EUR | | | 200 | | | | | | 145 | |
4.375% due 01/24/2017 ^ | | | 100 | | | | | | 73 | |
|
HSBC Finance Corp. | |
6.676% due 01/15/2021 | | $ | | | 1,000 | | | | | | 1,157 | |
|
HUB International Ltd. | |
7.875% due 10/01/2021 | | | | | 200 | | | | | | 204 | |
|
Intesa Sanpaolo SpA | |
6.500% due 02/24/2021 | | | | | 300 | | | | | | 342 | |
|
iStar Financial, Inc. | |
5.000% due 07/01/2019 | | | | | 100 | | | | | | 99 | |
|
KBC Bank NV | |
8.000% due 01/25/2023 | | | | | 200 | | | | | | 219 | |
|
Lima Metro Line 2 Finance Ltd. | |
5.875% due 07/05/2034 | | | | | 200 | | | | | | 205 | |
|
Lloyds Banking Group PLC | |
7.625% due 06/27/2023 (c) | | GBP | | | 400 | | | | | | 650 | |
|
Navient Corp. | |
8.450% due 06/15/2018 | | $ | | | 800 | | | | | | 891 | |
|
Novo Banco S.A. | |
5.000% due 05/14/2019 | | EUR | | | 200 | | | | | | 227 | |
7.000% due 03/04/2016 | | | | | 100 | | | | | | 112 | |
|
OneMain Financial Holdings, Inc. | |
6.750% due 12/15/2019 | | $ | | | 100 | | | | | | 104 | |
7.250% due 12/15/2021 | | | | | 100 | | | | | | 104 | |
|
Rabobank Group | |
8.400% due 06/29/2017 (c) | | | 550 | | | | | | 596 | |
11.000% due 06/30/2019 (c) | | | 500 | | | | | | 636 | |
|
Rio Oil Finance Trust | |
6.250% due 07/06/2024 | | | | | 300 | | | | | | 295 | |
|
Sberbank of Russia Via SB Capital S.A. | |
5.717% due 06/16/2021 | | | | | 300 | | | | | | 289 | |
|
Stichting AK Rabobank Certificaten | |
6.500% due 12/29/2049 (c) | | EUR | | | 100 | | | | | | 120 | |
|
UBS AG | |
5.125% due 05/15/2024 | | $ | | | 200 | | | | | | 198 | |
7.625% due 08/17/2022 | | | | | 550 | | | | | | 645 | |
|
Virgin Media Secured Finance PLC | |
5.500% due 01/15/2021 | | GBP | | | 500 | | | | | | 836 | |
| | | | | | | | | | | | |
| | | | | | | | | | | 16,013 | |
| | | | | | | | | | | | |
| |
INDUSTRIALS 24.3% | |
|
Activision Blizzard, Inc. | |
6.125% due 09/15/2023 | | $ | | | 200 | | | | | | 215 | |
|
ADT Corp. | |
4.875% due 07/15/2042 | | | | | 140 | | | | | | 108 | |
|
ALROSA Finance S.A. | |
7.750% due 11/03/2020 | | | | | 300 | | | | | | 316 | |
|
California Resources Corp. | |
5.000% due 01/15/2020 | | | | | 100 | | | | | | 89 | |
5.500% due 09/15/2021 | | | | | 100 | | | | | | 87 | |
6.000% due 11/15/2024 | | | | | 100 | | | | | | 86 | |
|
Cemex S.A.B. de C.V. | |
4.375% due 03/05/2023 | | EUR | | | 100 | | | | | | 108 | |
6.500% due 12/10/2019 | | $ | | | 100 | | | | | | 105 | |
|
CNOOC Finance Ltd. | |
3.875% due 05/02/2022 | | | | | 400 | | | | | | 406 | |
| | | | | | | | | | | | |
| | | | | PRINCIPAL
AMOUNT
(000s) | | | | | MARKET
VALUE
(000s) | |
|
Columbus International, Inc. | |
7.375% due 03/30/2021 | | $ | | | 400 | | | $ | | | 431 | |
|
Community Health Systems, Inc. | |
6.875% due 02/01/2022 | | | | | 800 | | | | | | 847 | |
|
CONSOL Energy, Inc. | |
5.875% due 04/15/2022 | | | | | 100 | | | | | | 85 | |
|
Continental Airlines Pass-Through Trust | |
4.000% due 04/29/2026 | | | | | 461 | | | | | | 470 | |
|
Crimson Merger Sub, Inc. | |
6.625% due 05/15/2022 | | | | | 200 | | | | | | 177 | |
|
CVS Pass-Through Trust | |
7.507% due 01/10/2032 | | | | | 528 | | | | | | 665 | |
|
DISH DBS Corp. | |
7.875% due 09/01/2019 | | | | | 800 | | | | | | 890 | |
|
Ecopetrol S.A. | |
5.875% due 09/18/2023 | | | | | 100 | | | | | | 105 | |
7.625% due 07/23/2019 | | | | | 800 | | | | | | 931 | |
|
Empresa Nacional de Telecomunicaciones S.A. | |
4.875% due 10/30/2024 | | | | | 400 | | | | | | 404 | |
|
Endo Finance LLC | |
5.375% due 01/15/2023 | | | | | 100 | | | | | | 99 | |
|
Fiat Chrysler Finance Europe | |
7.750% due 10/17/2016 | | EUR | | | 200 | | | | | | 238 | |
|
GTL Trade Finance, Inc. | |
5.893% due 04/29/2024 | | $ | | | 500 | | | | | | 490 | |
|
HCA, Inc. | |
6.500% due 02/15/2020 | | | | | 900 | | | | | | 1,008 | |
|
KazMunayGas National Co. JSC | |
9.125% due 07/02/2018 | | | | | 100 | | | | | | 113 | |
|
Latam Airlines Pass-Through Trust | |
4.200% due 08/15/2029 | | | | | 100 | | | | | | 99 | |
4.500% due 08/15/2025 | | | | | 400 | | | | | | 402 | |
|
MCE Finance Ltd. | |
5.000% due 02/15/2021 | | | | | 200 | | | | | | 191 | |
|
Medtronic, Inc. | |
3.500% due 03/15/2025 | | | | | 100 | | | | | | 100 | |
|
Nielsen Co. Luxembourg SARL | |
5.500% due 10/01/2021 | | | | | 200 | | | | | | 203 | |
|
Numericable SFR S.A.S. | |
6.250% due 05/15/2024 | | | | | 600 | | | | | | 592 | |
|
Reynolds Group Issuer, Inc. | |
5.750% due 10/15/2020 | | | | | 400 | | | | | | 411 | |
|
Sabine Pass Liquefaction LLC | |
5.625% due 04/15/2023 | | | | | 200 | | | | | | 200 | |
5.750% due 05/15/2024 | | | | | 750 | | | | | | 751 | |
|
Schaeffler Holding Finance BV (6.500% PIK) | |
5.750% due 11/15/2021 (a) | | EUR | | | 100 | | | | | | 118 | |
|
Schaeffler Holding Finance BV (6.750% Cash or 6.750% PIK) | |
6.750% due 11/15/2022 (a) | | $ | | | 200 | | | | | | 217 | |
|
Sibur Securities Ltd. | |
3.914% due 01/31/2018 | | | | | 200 | | | | | | 191 | |
|
T-Mobile USA, Inc. | |
6.250% due 04/01/2021 | | | | | 100 | | | | | | 103 | |
|
Tenet Healthcare Corp. | |
5.000% due 03/01/2019 | | | | | 200 | | | | | | 201 | |
|
Tesoro Logistics LP | |
6.125% due 10/15/2021 | | | | | 200 | | | | | | 210 | |
|
Tullow Oil PLC | |
6.000% due 11/01/2020 | | | | | 400 | | | | | | 364 | |
|
Valeant Pharmaceuticals International, Inc. | |
5.375% due 03/15/2020 | | | | | 300 | | | | | | 311 | |
| | | | | | |
| 58 | | PIMCO ETF TRUST | | | | See Accompanying Notes |
June 30, 2015
| | | | | | | | | | | | |
| | | | | PRINCIPAL
AMOUNT
(000s) | | | | | MARKET
VALUE
(000s) | |
|
Whiting Petroleum Corp. | |
5.000% due 03/15/2019 | | $ | | | 100 | | | $ | | | 99 | |
|
Wind Acquisition Finance S.A. | |
7.375% due 04/23/2021 | | | | | 200 | | | | | | 203 | |
|
Zhaikmunai LLP | |
7.125% due 11/13/2019 | | | | | 200 | | | | | | 191 | |
| | | | | | | | | | | | |
| | | | | | | | | | | 13,630 | |
| | | | | | | | | | | | |
| |
UTILITIES 17.3% | |
|
BG Energy Capital PLC | |
6.500% due 11/30/2072 | | GBP | | | 300 | | | | | | 503 | |
6.500% due 11/30/2072 | | $ | | | 200 | | | | | | 215 | |
|
CenturyLink, Inc. | |
5.625% due 04/01/2020 | | | | | 200 | | | | | | 204 | |
|
CNOOC Nexen Finance ULC | |
4.250% due 04/30/2024 | | | | | 200 | | | | | | 204 | |
|
Electricite de France S.A. | |
5.250% due 01/29/2023 (c) | | | | | 300 | | | | | | 301 | |
|
FirstEnergy Corp. | |
7.375% due 11/15/2031 | | | | | 300 | | | | | | 366 | |
|
Gazprom OAO Via Gaz Capital S.A. | |
8.146% due 04/11/2018 | | | | | 400 | | | | | | 428 | |
|
Koninklijke KPN NV | |
6.125% due 09/14/2018 (c) | | EUR | | | 100 | | | | | | 119 | |
|
Majapahit Holding BV | |
7.750% due 01/20/2020 | | $ | | | 300 | | | | | | 348 | |
|
Novatek OAO Via Novatek Finance Ltd. | |
4.422% due 12/13/2022 | | | | | 300 | | | | | | 261 | |
|
Petrobras Global Finance BV | |
3.163% due 03/17/2020 | | | | | 100 | | | | | | 96 | |
4.375% due 05/20/2023 | | | | | 600 | | | | | | 525 | |
5.375% due 01/27/2021 | | | | | 500 | | | | | | 482 | |
6.250% due 03/17/2024 | | | | | 200 | | | | | | 194 | |
6.850% due 06/05/2115 | | | | | 100 | | | | | | 83 | |
7.250% due 03/17/2044 | | | | | 500 | | | | | | 467 | |
|
Petroleos Mexicanos | |
4.875% due 01/24/2022 | | | | | 900 | | | | | | 938 | |
6.375% due 01/23/2045 | | | | | 300 | | | | | | 311 | |
|
Rosneft Finance S.A. | |
7.500% due 07/18/2016 | | | | | 400 | | | | | | 417 | |
|
Sinopec Group Overseas Development Ltd. | |
4.375% due 04/10/2024 | | | | | 200 | | | | | | 210 | |
|
Sprint Capital Corp. | |
8.750% due 03/15/2032 | | | | | 1,200 | | | | | | 1,170 | |
|
SSE PLC | |
5.625% due 10/01/2017 (c) | | EUR | | | 100 | | | | | | 118 | |
5.625% due 10/01/2017 (c) | | $ | | | 200 | | | | | | 208 | |
|
Verizon Communications, Inc. | |
4.672% due 03/15/2055 | | | | | 1,182 | | | | | | 1,029 | |
6.550% due 09/15/2043 | | | | | 122 | | | | | | 143 | |
|
VimpelCom Holdings BV | |
5.950% due 02/13/2023 | | | | | 400 | | | | | | 355 | |
| | | | | | | | | | | | |
| | | | | | | | | | | 9,695 | |
| | | | | | | | | | | | |
Total Corporate Bonds & Notes
(Cost $40,085) | | | 39,338 | |
| | | | | | | | | | | | |
| |
MUNICIPAL BONDS & NOTES 2.5% | |
| |
IOWA 0.3% | |
|
Iowa Tobacco Settlement Authority Revenue Bonds, Series 2005 | |
6.500% due 06/01/2023 | | | | | 180 | | | | | | 178 | |
| | | | | | | | | | | | |
| |
| | | | | | | | | | | | |
| | | | | PRINCIPAL
AMOUNT
(000s) | | | | | MARKET
VALUE
(000s) | |
NEW JERSEY 0.3% | |
|
Tobacco Settlement Financing Corp., New Jersey Revenue Bonds, Series 2007 | |
5.000% due 06/01/2041 | | $ | | | 200 | | | $ | | | 148 | |
| | | | | | | | | | | | |
| |
OHIO 1.3% | |
|
Buckeye Tobacco Settlement Financing Authority, Ohio Revenue Bonds, Series 2007 | |
5.875% due 06/01/2047 | | | | | 400 | | | | | | 310 | |
6.000% due 06/01/2042 | | | | | 100 | | | | | | 79 | |
6.500% due 06/01/2047 | | | | | 400 | | | | | | 339 | |
| | | | | | | | | | | | |
| | | | | | | | | | | 728 | |
| | | | | | | | | | | | |
| |
TEXAS 0.6% | |
|
Texas Public Finance Authority Revenue Notes, Series 2014 | |
8.250% due 07/01/2024 | | | | | 350 | | | | | | 352 | |
| | | | | | | | | | | | |
Total Municipal Bonds & Notes
(Cost $1,429) | | | 1,406 | |
| | | | | | | | | | | | |
| |
U.S. GOVERNMENT AGENCIES 3.3% | |
|
Fannie Mae | |
3.500% due 08/01/2045 | | | | | 1,800 | | | | | | 1,847 | |
| | | | | | | | | | | | |
Total U.S. Government Agencies
(Cost $1,856) | | | 1,847 | |
| | | | | | | | | | | | |
| |
U.S. TREASURY OBLIGATIONS 0.4% | |
|
U.S. Treasury Floating Rate Notes | |
0.089% due 04/30/2017 (g) | | | | | 200 | | | | | | 200 | |
| | | | | | | | | | | | |
Total U.S. Treasury Obligations
(Cost $200) | | | 200 | |
| | | | | | | | | | | | |
| |
MORTGAGE-BACKED SECURITIES 1.0% | |
|
Countrywide Alternative Loan Trust | |
0.367% due 04/25/2046 | | | | | 267 | | | | | | 234 | |
|
Lehman Mortgage Trust | |
6.000% due 07/25/2036 ^ | | | | | 341 | | | | | | 259 | |
|
Luminent Mortgage Trust | |
0.367% due 12/25/2036 ^ | | | | | 106 | | | | | | 84 | |
| | | | | | | | | | | | |
Total Mortgage-Backed Securities
(Cost $587) | | | 577 | |
| | | | | | | | | | | | |
| |
ASSET-BACKED SECURITIES 2.1% | |
|
Accredited Mortgage Loan Trust | |
0.447% due 09/25/2036 | | | | | 400 | | | | | | 338 | |
|
Asset-Backed Funding Certificates Trust | |
0.407% due 01/25/2037 | | | | | 162 | | | | | | 102 | |
|
Bear Stearns Asset-Backed Securities Trust | |
1.137% due 10/25/2037 | | | | | 108 | | | | | | 90 | |
|
Countrywide Asset-Backed Certificates | |
0.367% due 11/25/2047 ^ | | | | | 46 | | | | | | 36 | |
0.447% due 11/25/2037 | | | | | 100 | | | | | | 63 | |
0.547% due 02/25/2036 | | | | | 140 | | | | | | 132 | |
|
Countrywide Asset-Backed Certificates Trust | |
0.767% due 11/25/2035 | | | | | 100 | | | | | | 91 | |
|
JPMorgan Mortgage Acquisition Trust | |
0.427% due 08/25/2036 | | | | | 100 | | | | | | 82 | |
|
Residential Asset Securities Corp. Trust | |
0.587% due 02/25/2036 | | | | | 300 | | | | | | 243 | |
| | | | | | | | | | | | |
Total Asset-Backed Securities
(Cost $1,156) | | | 1,177 | |
| | | | | | | | | | | | |
| |
| | | | | | | | | | | | |
| | | | | PRINCIPAL
AMOUNT
(000s) | | | | | MARKET
VALUE
(000s) | |
SOVEREIGN ISSUES 12.5% | |
|
Brazil Government International Bond | |
4.875% due 01/22/2021 | | $ | | | 1,400 | | | $ | | | 1,467 | |
|
Brazil Notas do Tesouro Nacional | |
10.000% due 01/01/2021 | | BRL | | | 600 | | | | | | 174 | |
|
Dominican Republic International Bond | |
6.850% due 01/27/2045 | | $ | | | 100 | | | | | | 103 | |
|
El Salvador Government International Bond | |
7.650% due 06/15/2035 | | | | | 100 | | | | | | 101 | |
|
Indonesia Government International Bond | |
5.875% due 03/13/2020 | | | | | 600 | | | | | | 669 | |
8.500% due 10/12/2035 | | | | | 1,000 | | | | | | 1,355 | |
|
Italy Buoni Poliennali Del Tesoro | |
5.000% due 03/01/2025 | | EUR | | | 100 | | | | | | 136 | |
|
Mexico Government International Bond | |
3.625% due 03/15/2022 | | $ | | | 400 | | | | | | 407 | |
4.750% due 03/08/2044 | | | | | 500 | | | | | | 480 | |
|
Morocco Government International Bond | |
4.500% due 10/05/2020 | | EUR | | | 100 | | | | | | 123 | |
|
Panama Government International Bond | |
6.700% due 01/26/2036 | | $ | | | 200 | | | | | | 248 | |
|
Poland Government International Bond | |
5.000% due 03/23/2022 | | | | | 600 | | | | | | 667 | |
|
Republic of Greece Government International Bond | |
3.000% due 02/24/2023 | | EUR | | | 10 | | | | | | 5 | |
3.000% due 02/24/2024 | | | | | 10 | | | | | | 5 | |
3.000% due 02/24/2025 | | | | | 10 | | | | | | 5 | |
3.000% due 02/24/2026 | | | | | 10 | | | | | | 5 | |
3.000% due 02/24/2027 | | | | | 10 | | | | | | 4 | |
3.000% due 02/24/2028 | | | | | 110 | | | | | | 49 | |
3.000% due 02/24/2029 | | | | | 10 | | | | | | 4 | |
3.000% due 02/24/2030 | | | | | 110 | | | | | | 48 | |
3.000% due 02/24/2031 | | | | | 10 | | | | | | 4 | |
3.000% due 02/24/2032 | | | | | 10 | | | | | | 4 | |
3.000% due 02/24/2033 | | | | | 10 | | | | | | 4 | |
3.000% due 02/24/2034 | | | | | 10 | | | | | | 4 | |
3.000% due 02/24/2035 | | | | | 10 | | | | | | 4 | |
3.000% due 02/24/2036 | | | | | 210 | | | | | | 90 | |
3.000% due 02/24/2037 | | | | | 110 | | | | | | 47 | |
3.000% due 02/24/2038 | | | | | 10 | | | | | | 4 | |
3.000% due 02/24/2039 | | | | | 10 | | | | | | 4 | |
3.000% due 02/24/2040 | | | | | 10 | | | | | | 4 | |
3.000% due 02/24/2041 | | | | | 10 | | | | | | 4 | |
3.000% due 02/24/2042 | | | | | 10 | | | | | | 4 | |
3.800% due 08/08/2017 | | JPY | | | 4,000 | | | | | | 18 | |
|
Romania Government International Bond | |
2.875% due 10/28/2024 | | EUR | | | 100 | | | | | | 111 | |
|
South Africa Government International Bond | |
3.750% due 07/24/2026 | | | | | 200 | | | | | | 230 | |
|
Turkey Government International Bond | |
5.750% due 03/22/2024 | | $ | | | 200 | | | | | | 218 | |
|
Uruguay Government International Bond | |
5.100% due 06/18/2050 | | | | | 200 | | | | | | 191 | |
| | | | | | | | | | | | |
Total Sovereign Issues
(Cost $7,322) | | | 7,000 | |
| | | | | | | | | | | | |
| | | | |
| | | | | SHARES | | | | | | |
PREFERRED SECURITIES 0.0% | |
| |
UTILITIES 0.0% | |
|
Entergy Texas, Inc. | |
5.625% due 06/01/2064 | | | | | 100 | | | | | | 3 | |
| | | | | | | | | | | | |
Total Preferred Securities
(Cost $3) | | | 3 | |
| | | | | | | | | | | | |
| | | | | | |
| See Accompanying Notes | | ANNUAL REPORT | | JUNE 30, 2015 | | 59 |
Schedule of Investments PIMCO Diversified Income Active Exchange-Traded Fund (Cont.)
| | | | | | | | | | | | |
| | | | | PRINCIPAL
AMOUNT
(000s) | | | | | MARKET
VALUE
(000s) | |
SHORT-TERM INSTRUMENTS 9.8% | |
| |
REPURCHASE AGREEMENTS (d) 0.9% | |
| | | | | | | | $ | | | 499 | |
| | | | | | | | | | | | |
| |
SHORT-TERM NOTES 7.1% | |
|
Federal Home Loan Bank | |
0.060% due 08/11/2015 - 08/12/2015 | | $ | | | 500 | | | | | | 500 | |
0.080% due 07/17/2015 - 07/24/2015 | | | | | 400 | | | | | | 400 | |
0.085% due 09/11/2015 - 09/17/2015 | | | | | 1,400 | | | | | | 1,400 | |
0.086% due 09/09/2015 - 09/16/2015 | | | | | 800 | | | | | | 800 | |
0.087% due 09/09/2015 | | | | | 100 | | | | | | 100 | |
0.090% due 08/26/2015 | | | | | 100 | | | | | | 100 | |
0.142% due 11/04/2015 | | | | | 700 | | | | | | 700 | |
| | | | | | | | | | | | |
| | | | | | | | | | | 4,000 | |
| | | | | | | | | | | | |
| | | | | | | | | | | | |
| | | | | PRINCIPAL
AMOUNT
(000s) | | | | | MARKET
VALUE
(000s) | |
U.S. TREASURY BILLS 1.8% | |
0.015% due 08/20/2015 - 09/17/2015 (b)(g) | | $ | | | 1,034 | | | $ | | | 1,034 | |
| | | | | | | | | | | | |
Total Short-Term Instruments
(Cost $5,532) | | | 5,533 | |
| | | | | | | | | | | | |
| | | | | | | | | | | | |
Total Investments in Securities
(Cost $59,658) | | | 58,580 | |
| | | | | | | | | | | | |
| | | | | | | | | | | | |
Total Investments 104.5%
(Cost $59,658) | | | $ | | | 58,580 | |
| |
Financial Derivative
Instruments (e)(f) (2.4%) (Cost or Premiums, net $(1,269)) | | | (1,356 | ) |
| |
Other Assets and Liabilities, net (2.1%) | | | (1,181 | ) |
| | | | | | | | | | | | |
Net Assets 100.0% | | | $ | | | 56,043 | |
| | | | | | | | | | | | |
NOTES TO SCHEDULE OF INVESTMENTS (AMOUNTS IN THOUSANDS*, EXCEPT NUMBER OF CONTRACTS):
| * | A zero balance may reflect actual amounts rounding to less than one thousand. |
| (a) | Payment in-kind bond security. |
| (b) | Coupon represents a weighted average yield to maturity. |
| (c) | Perpetual maturity; date shown, if applicable, represents next contractual call date. |
BORROWINGS AND OTHER FINANCING TRANSACTIONS
(d) REPURCHASE AGREEMENTS:
| | | | | | | | | | | | | | | | | | | | | | | | | | | | | | | | |
| Counterparty | | | | Lending
Rate | | | Settlement
Date | | | Maturity
Date | | | Principal
Amount | | | Collateralized By | | Collateral
Received,
at Value | | | Repurchase
Agreements,
at Value | | | Repurchase
Agreement
Proceeds
to be
Received (1) | |
SSB | | | | | 0.000 | % | | | 06/30/2015 | | | | 07/01/2015 | | | $ | 499 | | | Fannie Mae 2.260% due 10/17/2022 | | $ | (510 | ) | | $ | 499 | | | $ | 499 | |
Total Repurchase Agreements | | | | | | | | | | | | | | | | | | | | | | $ | (510 | ) | | $ | 499 | | | $ | 499 | |
| (1) | Includes accrued interest. |
SHORT SALES*
| | | | | | | | | | | | | | | | | | | | | | |
| Description | | | | Coupon | | | Maturity
Date | | | Principal
Amount | | | Proceeds | | | Payable for
Short Sales | |
Fannie Mae | | | | | 2.500 | % | | | 07/01/2045 | | | $ | 300 | | | $ | (290 | ) | | $ | (287 | ) |
Total Short Sales | | | | | | | | | | | | | | | | $ | (290 | ) | | $ | (287 | ) |
| * | Short Sales shown are To-Be-Announced (“TBA”) securities which are not subject to collateral pledging under the terms of any master agreements. |
BORROWINGS AND OTHER FINANCING TRANSACTIONS SUMMARY
The following is a summary by counterparty of the market value of Borrowings and Other Financing Transactions and collateral (received) as of June 30, 2015:
| | | | | | | | | | | | | | | | | | | | | | | | | | | | | | |
| Counterparty | | | | Repurchase
Agreement
Proceeds
to be
Received | | | Payable for
Reverse
Repurchase
Agreements | | | Payable for
Sale-Buyback
Transactions | | | Securities
Out on Loan | | | Total
Borrowings and
Other Financing
Transactions | | | Collateral
(Received) | | | Net
Exposure (2) | |
Global/Master Repurchase Agreement | | | | | | | | | | | | | | | | | | | | | | | | | | | | | | |
SSB | | | | $ | 499 | | | $ | 0 | | | $ | 0 | | | $ | 0 | | | $ | 499 | | | $ | (510 | ) | | $ | (11 | ) |
Total Borrowings and Other Financing Transactions | | | | $ | 499 | | | $ | 0 | | | $ | 0 | | | $ | 0 | | | | | | | | | | | | | |
| (2) | Net Exposure represents the net receivable/(payable) that would be due from/to the counterparty in the event of default. Exposure from borrowings and other financing transactions can only be netted across transactions governed under the same master agreement with the same legal entity. See Note 7, Principal Risks, in the Notes to Financial Statements for more information regarding master netting arrangements. |
| | | | | | |
| 60 | | PIMCO ETF TRUST | | | | See Accompanying Notes |
June 30, 2015
(e) FINANCIAL DERIVATIVE INSTRUMENTS: EXCHANGE-TRADED OR CENTRALLY CLEARED
FUTURES CONTRACTS:
| | | | | | | | | | | | | | | | | | | | | | | | | | |
Description | | | | Type | | | Expiration
Month | | | # of
Contracts | | | Unrealized
Appreciation/
(Depreciation) | | | Variation Margin | |
| | | | | | | | Asset | | | Liability | |
90-Day Eurodollar December Futures | | | | | Short | | | | 12/2017 | | | | 48 | | | $ | (1 | ) | | $ | 1 | | | $ | 0 | |
Euro-BTP Italy Government Bond September Futures | | | | | Long | | | | 09/2015 | | | | 2 | | | | 2 | | | | 2 | | | | 0 | |
Euro-Bund 10-Year Bond September Futures | | | | | Long | | | | 09/2015 | | | | 5 | | | | (14 | ) | | | 14 | | | | 0 | |
U.S. Treasury 10-Year Note September Futures | | | | | Long | | | | 09/2015 | | | | 3 | | | | (1 | ) | | | 0 | | | | (1 | ) |
United Kingdom Long Gilt September Futures | | | | | Long | | | | 09/2015 | | | | 3 | | | | (8 | ) | | | 7 | | | | 0 | |
Total Futures Contracts | | | | | | | | | | | | | | | | $ | (22 | ) | | $ | 24 | | | $ | (1 | ) |
SWAP AGREEMENTS:
INTEREST RATE SWAPS
| | | | | | | | | | | | | | | | | | | | | | | | | | | | | | | | | | | | |
Pay/Receive
Floating Rate | | Floating Rate Index | | | | Fixed Rate | | | Maturity
Date | | | Notional
Amount | | | Market
Value | | | Unrealized
Appreciation/
(Depreciation) | | | Variation Margin | |
| | | | | | | | | Asset | | | Liability | |
Pay | | 3-Month USD-LIBOR | | | | | 1.250 | % | | | 12/16/2016 | | | | $ | | | | 13,500 | | | $ | (55 | ) | | $ | (5 | ) | | $ | 1 | | | $ | 0 | |
Pay | | 3-Month USD-LIBOR | | | | | 2.500 | % | | | 12/16/2025 | | | | | | | | 400 | | | | 3 | | | | (3 | ) | | | 0 | | | | 0 | |
Pay | | 3-Month USD-LIBOR | | | | | 2.750 | % | | | 12/16/2045 | | | | | | | | 600 | | | | (31 | ) | | | 2 | | | | 0 | | | | (1 | ) |
Pay | | 6-Month EUR-EURIBOR | | | | | 0.750 | % | | | 09/16/2025 | | | | EUR | | | | 100 | | | | 5 | | | | 0 | | | | 0 | | | | 0 | |
Pay | | 28-Day MXN-TIIE | | | | | 6.000 | % | | | 06/07/2022 | | | | MXN | | | | 14,500 | | | | 7 | | | | 8 | | | | 7 | | | | 0 | |
| | | | | | | | | | | | | | | | | | | | | | | $ | (71 | ) | | $ | 2 | | | $ | 8 | | | $ | (1 | ) |
Total Swap Agreements | | | | | | | | | | | | | | | | | | | | $ | (71 | ) | | $ | 2 | | | $ | 8 | | | $ | (1 | ) |
FINANCIAL DERIVATIVE INSTRUMENTS: EXCHANGE-TRADED OR CENTRALLY CLEARED SUMMARY
The following is a summary of the market value and variation margin of Exchange-Traded or Centrally Cleared Financial Derivative Instruments as of June 30, 2015:
Cash of $213 has been pledged as collateral for exchange-traded and centrally cleared financial derivative instruments as of June 30, 2015. See Note 7, Principal Risks, in the Notes to Financial Statements for more information regarding master netting arrangements.
| | | | | | | | | | | | | | | | | | | | | | | | | | | | | | | | | | | | |
| | | | | Financial Derivative Assets | | | | | Financial Derivative Liabilities | |
| | | | | Market Value | | | Variation Margin
Asset | | | | | | | | Market
Value | | | Variation Margin
Liability | | | | |
| | | | | Purchased
Options | | | Futures | | | Swap
Agreements | | | Total | | | | | Written
Options | | | Futures | | | Swap
Agreements | | | Total | |
Total Exchange-Traded or Centrally Cleared | | | | $ | 0 | | | $ | 24 | | | $ | 8 | | | $ | 32 | | | | | $ | 0 | | | $ | (1 | ) | | $ | (1 | ) | | $ | (2 | ) |
(f) FINANCIAL DERIVATIVE INSTRUMENTS: OVER THE COUNTER
FORWARD FOREIGN CURRENCY CONTRACTS:
| | | | | | | | | | | | | | | | | | | | | | | | | | | | | | |
| Counterparty | | | | Settlement
Month | | | Currency to
be Delivered | | | Currency to
be Received | | | Unrealized
Appreciation/
(Depreciation) | |
| | | | | | Asset | | | Liability | |
BOA | | | | | 07/2015 | | | | JPY | | | | 83,400 | | | | $ | | | | 675 | | | $ | 0 | | | $ | (7 | ) |
BPS | | | | | 07/2015 | | | | BRL | | | | 686 | | | | | | | | 221 | | | | 1 | | | | 0 | |
| | | | | | 07/2015 | | | | $ | | | | 221 | | | | BRL | | | | 686 | | | | 0 | | | | 0 | |
| | | | | | 07/2015 | | | | | | | | 673 | | | | JPY | | | | 83,400 | | | | 9 | | | | 0 | |
| | | | | | 08/2015 | | | | BRL | | | | 686 | | | | $ | | | | 219 | | | | 0 | | | | 0 | |
| | | | | | 08/2015 | | | | JPY | | | | 83,400 | | | | | | | | 673 | | | | 0 | | | | (9 | ) |
BRC | | | | | 07/2015 | | | | EUR | | | | 10 | | | | | | | | 11 | | | | 0 | | | | 0 | |
CBK | | | | | 07/2015 | | | | | | | | 17 | | | | | | | | 19 | | | | 0 | | | | 0 | |
| | | | | | 07/2015 | | | | MXN | | | | 274 | | | | | | | | 17 | | | | 0 | | | | 0 | |
DUB | | | | | 07/2015 | | | | BRL | | | | 686 | | | | | | | | 248 | | | | 27 | | | | 0 | |
| | | | | | 07/2015 | | | | $ | | | | 221 | | | | BRL | | | | 686 | | | | 0 | | | | 0 | |
| | | | | | |
| See Accompanying Notes | | ANNUAL REPORT | | JUNE 30, 2015 | | 61 |
Schedule of Investments PIMCO Diversified Income Active Exchange-Traded Fund (Cont.)
| | | | | | | | | | | | | | | | | | | | | | | | | | | | | | |
| Counterparty | | | | Settlement
Month | | | Currency to
be Delivered | | | Currency to
be Received | | | Unrealized
Appreciation/
(Depreciation) | |
| | | | | | Asset | | | Liability | |
FBF | | | | | 08/2015 | | | | EUR | | | | 4,128 | | | | $ | | | | 4,606 | | | $ | 1 | | | $ | 0 | |
HUS | | | | | 07/2015 | | | | | | | | 99 | | | | | | | | 108 | | | | 0 | | | | (2 | ) |
| | | | | | 07/2015 | | | | GBP | | | | 1,337 | | | | | | | | 2,054 | | | | 0 | | | | (47 | ) |
| | | | | | 07/2015 | | | | $ | | | | 2,106 | | | | GBP | | | | 1,337 | | | | 0 | | | | (5 | ) |
| | | | | | 08/2015 | | | | GBP | | | | 1,337 | | | | $ | | | | 2,105 | | | | 5 | | | | 0 | |
UAG | | | | | 07/2015 | | | | EUR | | | | 15 | | | | | | | | 17 | | | | 0 | | | | 0 | |
Total Forward Foreign Currency Contracts | | | | | | | | | | | | | | | | | | | | | | | | $ | 43 | | | $ | (70 | ) |
WRITTEN OPTIONS:
CREDIT DEFAULT SWAPTIONS ON CREDIT INDICES
| | | | | | | | | | | | | | | | | | | | | | | | | | | | | | |
| Counterparty | | Description | | | | Buy/Sell
Protection | | Exercise
Rate | | | Expiration
Date | | | Notional
Amount | | | Premiums
(Received) | | | Market
Value | |
BPS | | Put - OTC iTraxx Europe 23 5-Year Index | | | | Sell | | | 0.850 | % | | | 08/19/2015 | | | | EUR | | | | 100 | | | $ | 0 | | | $ | 0 | |
BRC | | Put - OTC iTraxx Europe 23 5-Year Index | | | | Sell | | | 0.850 | % | | | 08/19/2015 | | | | | | | | 100 | | | | 0 | | | | 0 | |
CBK | | Call - OTC iTraxx Europe 23 5-Year Index | | | | Buy | | | 0.550 | % | | | 07/15/2015 | | | | | | | | 1,900 | | | | (3 | ) | | | 0 | |
| | | Put - OTC iTraxx Europe 23 5-Year Index | | | | Sell | | | 0.850 | % | | | 07/15/2015 | | | | | | | | 1,900 | | | | (3 | ) | | | (3 | ) |
| | | Put - OTC iTraxx Europe 23 5-Year Index | | | | Sell | | | 0.900 | % | | | 08/19/2015 | | | | | | | | 100 | | | | 0 | | | | 0 | |
FBF | | Put - OTC iTraxx Europe 23 5-Year Index | | | | Sell | | | 0.850 | % | | | 08/19/2015 | | | | | | | | 100 | | | | 0 | | | | 0 | |
SOG | | Put - OTC iTraxx Europe 23 5-Year Index | | | | Sell | | | 0.900 | % | | | 09/16/2015 | | | | | | | | 100 | | | | 0 | | | | (1 | ) |
| | | | | | | | | | | | | | | | | | | | | | $ | (6 | ) | | $ | (4 | ) |
FOREIGN CURRENCY OPTIONS
| | | | | | | | | | | | | | | | | | | | | | | | | | | | | | | | |
| Counterparty | | Description | | | | Strike
Price | | | Expiration
Date | | | Notional
Amount | | | Premiums
(Received) | | | Market
Value | |
BPS | | Put - OTC EUR versus USD | | | | | $ | | | | 1.030 | | | | 07/21/2015 | | | | EUR | | | | 439 | | | $ | (5 | ) | | $ | 0 | |
| | | Call - OTC GBP versus USD | | | | | | | | | 1.550 | | | | 07/21/2015 | | | | GBP | | | | 312 | | | | (3 | ) | | | (8 | ) |
| | | Put - OTC USD versus MXN | | | | | MXN | | | | 14.900 | | | | 07/24/2015 | | | $ | | | | | 478 | | | | (4 | ) | | | 0 | |
| | | Call - OTC USD versus MXN | | | | | | | | | 16.200 | | | | 07/24/2015 | | | | | | | | 478 | | | | (4 | ) | | | (2 | ) |
BRC | | Call - OTC AUD versus USD | | | | | $ | | | | 0.800 | | | | 07/21/2015 | | | | AUD | | | | 603 | | | | (3 | ) | | | (1 | ) |
CBK | | Put - OTC USD versus MYR | | | | | MYR | | | | 3.675 | | | | 09/14/2015 | | | $ | | | | | 500 | | | | (4 | ) | | | (3 | ) |
| | | Call - OTC USD versus MYR | | | | | | | | | 3.950 | | | | 09/14/2015 | | | | | | | | 500 | | | | (3 | ) | | | (3 | ) |
DUB | | Put - OTC USD versus COP | | | | | COP | | | | 2,440.000 | | | | 08/27/2015 | | | | | | | | 500 | | | | (7 | ) | | | (2 | ) |
| | | Call - OTC USD versus COP | | | | | | | | | 2,735.000 | | | | 08/27/2015 | | | | | | | | 500 | | | | (6 | ) | | | (6 | ) |
| | | | | | | | | | | | | | | | | | | | | | | | $ | (39 | ) | | $ | (25 | ) |
INTEREST RATE SWAPTIONS
| | | | | | | | | | | | | | | | | | | | | | | | | | | | |
| Counterparty | | Description | | Floating Rate Index | | | | Pay/Receive
Floating Rate | | Exercise
Rate | | | Expiration
Date | | | Notional
Amount | | | Premiums
(Received) | | | Market
Value | |
BOA | | Call - OTC 5-Year Interest Rate Swap | | 3-Month USD-LIBOR | | | | Receive | | | 1.550 | % | | | 09/17/2015 | | | $ | 2,100 | | | $ | (16 | ) | | $ | (4 | ) |
| | | Put - OTC 5-Year Interest Rate Swap | | 3-Month USD-LIBOR | | | | Pay | | | 2.050 | % | | | 09/17/2015 | | | | 2,100 | | | | (12 | ) | | | (11 | ) |
CBK | | Call - OTC 10-Year Interest Rate Swap | | 3-Month USD-LIBOR | | | | Receive | | | 2.250 | % | | | 08/12/2015 | | | | 1,500 | | | | (7 | ) | | | (5 | ) |
| | | Put - OTC 10-Year Interest Rate Swap | | 3-Month USD-LIBOR | | | | Pay | | | 2.750 | % | | | 08/12/2015 | | | | 1,500 | | | | (8 | ) | | | (6 | ) |
| | | | | | | | | | | | | | | | | | | | | | $ | (43 | ) | | $ | (26 | ) |
Total Written Options | | | | | | | | | | | | | | | | | | | | $ | (88 | ) | | $ | (55 | ) |
| | | | | | |
| 62 | | PIMCO ETF TRUST | | | | See Accompanying Notes |
June 30, 2015
TRANSACTIONS IN WRITTEN CALL AND PUT OPTIONS FOR THE PERIOD ENDED JUNE 30, 2015:
| | | | | | | | | | | | | | | | | | | | | | | | | | | | | | | | | | | | | | |
| | | | | # of
Contracts | | | Notional
Amount in $ | | | Notional
Amount in AUD | | | Notional
Amount in EUR | | | Notional
Amount in GBP | | | Premiums | |
Balance at Beginning of Period | | | | | 0 | | | $ | 0 | | | | AUD | | | | 0 | | | | EUR | | | | 0 | | | | GBP | | | | 0 | | | $ | 0 | |
Sales | | | | | 30 | | | | 11,257 | | | | | | | | 603 | | | | | | | | 5,539 | | | | | | | | 311 | | | | (103 | ) |
Closing Buys | | | | | 0 | | | | 0 | | | | | | | | 0 | | | | | | | | (200 | ) | | | | | | | 0 | | | | 0 | |
Expirations | | | | | (15 | ) | | | (1,100 | ) | | | | | | | 0 | | | | | | | | (400 | ) | | | | | | | 0 | | | | 10 | |
Exercised | | | | | (15 | ) | | | 0 | | | | | | | | 0 | | | | | | | | (200 | ) | | | | | | | 0 | | | | 5 | |
Balance at End of Period | | | | | 0 | | | $ | 10,157 | | | | AUD | | | | 603 | | | | EUR | | | | 4,739 | | | | GBP | | | | 311 | | | $ | (88 | ) |
SWAP AGREEMENTS:
CREDIT DEFAULT SWAPS ON SOVEREIGN ISSUES - SELL PROTECTION (1)
| | | | | | | | | | | | | | | | | | | | | | | | | | | | | | | | | | | | |
Counterparty | | Reference Entity | | | | Fixed Deal
Receive Rate | | | Maturity
Date | | | Implied
Credit Spread at
June 30,
2015 (2) | | | Notional
Amount (3) | | | Premiums
(Received) | | | Unrealized
Appreciation/
(Depreciation) | | | Swap Agreements, at Value | |
| | | | | | | | | | | Asset | | | Liability | |
BOA | | Venezuela Government International Bond | | | | | 5.000 | % | | | 06/20/2020 | | | | 47.639 | % | | $ | 2,000 | | | $ | (1,121 | ) | | $ | (120 | ) | | $ | 0 | | | $ | (1,241 | ) |
BRC | | Colombia Government International Bond | | | | | 1.000 | % | | | 06/20/2020 | | | | 1.640 | % | | | 400 | | | | (12 | ) | | | 0 | | | | 0 | | | | (12 | ) |
CBK | | Turkey Government International Bond | | | | | 1.000 | % | | | 03/20/2020 | | | | 2.100 | % | | | 1,000 | | | | (46 | ) | | | (2 | ) | | | 0 | | | | (48 | ) |
HUS | | Colombia Government International Bond | | | | | 1.000 | % | | | 03/20/2020 | | | | 1.590 | % | | | 100 | | | | (3 | ) | | | 0 | | | | 0 | | | | (3 | ) |
| | | | | | | | | | | | | | | | | | | | | | $ | (1,182 | ) | | $ | (122 | ) | | $ | 0 | | | $ | (1,304 | ) |
CREDIT DEFAULT SWAPS ON CREDIT INDICES - SELL PROTECTION (1)
| | | | | | | | | | | | | | | | | | | | | | | | | | | | | | | | |
Counterparty | | Index/Tranches | | | | Fixed Deal
Receive Rate | | | Maturity
Date | | | Notional
Amount (3) | | | Premiums
Paid/(Received) | | | Unrealized
Appreciation/
(Depreciation) | | | Swap Agreements, at Value (4) | |
| | | | | | | | | | Asset | | | Liability | |
CBK | | MCDX-24 5-Year Index | | | | | 1.000 | % | | | 06/20/2020 | | | $ | 200 | | | $ | 1 | | | $ | (1 | ) | | $ | 0 | | | $ | 0 | |
Total Swap Agreements | | | | | | | | | | | | | | | | $ | (1,181 | ) | | $ | (123 | ) | | $ | 0 | | | $ | (1,304 | ) |
| (1) | If the Fund is a seller of protection and a credit event occurs, as defined under the terms of that particular swap agreement, the Fund will either (i) pay to the buyer of protection an amount equal to the notional amount of the swap and take delivery of the referenced obligation or underlying securities comprising the referenced index or (ii) pay a net settlement amount in the form of cash or securities equal to the notional amount of the swap less the recovery value of the referenced obligation or underlying securities comprising the referenced index. |
| (2) | Implied credit spreads, represented in absolute terms, utilized in determining the market value of credit default swap agreements on sovereign issues as of period end serve as an indicator of the current status of the payment/performance risk and represent the likelihood or risk of default for the credit derivative. The implied credit spread of a particular referenced entity reflects the cost of buying/selling protection and may include upfront payments required to be made to enter into the agreement. Wider credit spreads represent a deterioration of the referenced entity’s credit soundness and a greater likelihood or risk of default or other credit event occurring as defined under the terms of the agreement. |
| (3) | The maximum potential amount the Fund could be required to pay as a seller of credit protection or receive as a buyer of credit protection if a credit event occurs as defined under the terms of that particular swap agreement. |
| (4) | The prices and resulting values for credit default swap agreements on credit indices serve as an indicator of the current status of the payment/performance risk and represent the likelihood of an expected liability (or profit) for the credit derivative should the notional amount of the swap agreement be closed/sold as of the period end. Increasing market values, in absolute terms when compared to the notional amount of the swap, represent a deterioration of the referenced indices’ credit soundness and a greater likelihood or risk of default or other credit event occurring as defined under the terms of the agreement. |
| | | | | | |
| See Accompanying Notes | | ANNUAL REPORT | | JUNE 30, 2015 | | 63 |
Schedule of Investments PIMCO Diversified Income Active Exchange-Traded Fund (Cont.)
FINANCIAL DERIVATIVE INSTRUMENTS: OVER THE COUNTER SUMMARY
The following is a summary by counterparty of the market value of OTC financial derivative instruments and collateral pledged as of June 30, 2015:
| (g) | Securities with an aggregate market value of $1,234 have been pledged as collateral for financial derivative instruments as governed by International Swaps and Derivatives Association, Inc. master agreements as of June 30, 2015. |
| | | | | | | | | | | | | | | | | | | | | | | | | | | | | | | | | | | | | | | | | | | | | | | | |
Counterparty | | | | Financial Derivative Assets | | | | | Financial Derivative Liabilities | | | | | | | | | | |
| | | | Forward
Foreign
Currency
Contracts | | | Purchased
Options | | | Swap
Agreements | | | Total
Over the
Counter | | | | | Forward
Foreign
Currency
Contracts | | | Written
Options | | | Swap
Agreements | | | Total
Over the
Counter | | | Net Market
Value of OTC
Derivatives | | | Collateral
Pledged | | | Net
Exposure (5) | |
BOA | | | | $ | 0 | | | $ | 0 | | | $ | 0 | | | $ | 0 | | | | | $ | (7 | ) | | $ | (15 | ) | | $ | (1,241 | ) | | $ | (1,263 | ) | | $ | (1,263 | ) | | $ | 1,234 | | | $ | (29 | ) |
BPS | | | | | 10 | | | | 0 | | | | 0 | | | | 10 | | | | | | (9 | ) | | | (10 | ) | | | 0 | | | | (19 | ) | | | (9 | ) | | | 0 | | | | (9 | ) |
BRC | | | | | 0 | | | | 0 | | | | 0 | | | | 0 | | | | | | 0 | | | | (1 | ) | | | (12 | ) | | | (13 | ) | | | (13 | ) | | | 0 | | | | (13 | ) |
CBK | | | | | 0 | | | | 0 | | | | 0 | | | | 0 | | | | | | 0 | | | | (20 | ) | | | (48 | ) | | | (68 | ) | | | (68 | ) | | | 0 | | | | (68 | ) |
DUB | | | | | 27 | | | | 0 | | | | 0 | | | | 27 | | | | | | 0 | | | | (8 | ) | | | 0 | | | | (8 | ) | | | 19 | | | | 0 | | | | 19 | |
FBF | | | | | 1 | | | | 0 | | | | 0 | | | | 1 | | | | | | 0 | | | | 0 | | | | 0 | | | | 0 | | | | 1 | | | | 0 | | | | 1 | |
HUS | | | | | 5 | | | | 0 | | | | 0 | | | | 5 | | | | | | (54 | ) | | | 0 | | | | (3 | ) | | | (57 | ) | | | (52 | ) | | | 0 | | | | (52 | ) |
SOG | | | | | 0 | | | | 0 | | | | 0 | | | | 0 | | | | | | 0 | | | | (1 | ) | | | 0 | | | | (1 | ) | | | (1 | ) | | | 0 | | | | (1 | ) |
Total Over the Counter | | | | $ | 43 | | | $ | 0 | | | $ | 0 | | | $ | 43 | | | | | $ | (70 | ) | | $ | (55 | ) | | $ | (1,304 | ) | | $ | (1,429 | ) | | | | | | | | | | | | |
| (5) | Net Exposure represents the net receivable/(payable) that would be due from/to the counterparty in the event of default. Exposure from OTC financial derivative instruments can only be netted across transactions governed under the same master agreement with the same legal entity. See Note 7, Principal Risks, in the Notes to Financial Statements for more information regarding master netting arrangements. |
FAIR VALUE OF FINANCIAL DERIVATIVE INSTRUMENTS
The following is a summary of the fair valuation of the Fund’s derivative instruments categorized by risk exposure. See Note 7, Principal Risks, in the Notes to Financial Statements on risks of the Fund.
Fair Values of Financial Derivative Instruments on the Statements of Assets and Liabilities as of June 30, 2015:
| | | | | | | | | | | | | | | | | | | | | | | | | | |
| | | | | Derivatives not accounted for as hedging instruments | |
| | | | | Commodity
Contracts | | | Credit
Contracts | | | Equity
Contracts | | | Foreign
Exchange
Contracts | | | Interest
Rate Contracts | | | Total | |
Financial Derivative Instruments - Assets | | | | | | | | | | | | | | | | | | | | | | | | | | |
Exchange-traded or centrally cleared | | | | | | | | | | | | | | | | | | | | | | | | | | |
Futures | | | | $ | 0 | | | $ | 0 | | | $ | 0 | | | $ | 0 | | | $ | 24 | | | $ | 24 | |
Swap Agreements | | | | | 0 | | | | 0 | | | | 0 | | | | 0 | | | | 8 | | | | 8 | |
| | | | $ | 0 | | | $ | 0 | | | $ | 0 | | | $ | 0 | | | $ | 32 | | | $ | 32 | |
Over the counter | | | | | | | | | | | | | | | | | | | | | | | | | | |
Forward Foreign Currency Contracts | | | | $ | 0 | | | $ | 0 | | | $ | 0 | | | $ | 43 | | | $ | 0 | | | $ | 43 | |
| | | | $ | 0 | | | $ | 0 | | | $ | 0 | | | $ | 43 | | | $ | 32 | | | $ | 75 | |
| | | | | | | |
Financial Derivative Instruments - Liabilities | | | | | | | | | | | | | | | | | | | | | | | | | | |
Exchange-traded or centrally cleared | | | | | | | | | | | | | | | | | | | | | | | | | | |
Futures | | | | $ | 0 | | | $ | 0 | | | $ | 0 | | | $ | 0 | | | $ | 1 | | | $ | 1 | |
Swap Agreements | | | | | 0 | | | | 0 | | | | 0 | | | | 0 | | | | 1 | | | | 1 | |
| | | | $ | 0 | | | $ | 0 | | | $ | 0 | | | $ | 0 | | | $ | 2 | | | $ | 2 | |
Over the counter | | | | | | | | | | | | | | | | | | | | | | | | | | |
Forward Foreign Currency Contracts | | | | $ | 0 | | | $ | 0 | | | $ | 0 | | | $ | 70 | | | $ | 0 | | | $ | 70 | |
Written Options | | | | | 0 | | | | 4 | | | | 0 | | | | 25 | | | | 26 | | | | 55 | |
Swap Agreements | | | | | 0 | | | | 1,304 | | | | 0 | | | | 0 | | | | 0 | | | | 1,304 | |
| | | | $ | 0 | | | $ | 1,308 | | | $ | 0 | | | $ | 95 | | | $ | 26 | | | $ | 1,429 | |
| | | | $ | 0 | | | $ | 1,308 | | | $ | 0 | | | $ | 95 | | | $ | 28 | | | $ | 1,431 | |
| | | | | | |
| 64 | | PIMCO ETF TRUST | | | | See Accompanying Notes |
June 30, 2015
The Effect of Financial Derivative Instruments on the Statements of Operations for the period ended June 30, 2015:
| | | | | | | | | | | | | | | | | | | | | | | | | | |
| | | | | Derivatives not accounted for as hedging instruments | |
| | | | | Commodity
Contracts | | | Credit
Contracts | | | Equity
Contracts | | | Foreign
Exchange
Contracts | | | Interest
Rate Contracts | | | Total | |
Net Realized Gain (Loss) on Financial Derivative Instruments | | | | | | | | | | | | | | | | | | | | | | | | | | |
Exchange-traded or centrally cleared | | | | | | | | | | | | | | | | | | | | | | | | | | |
Written Options | | | | $ | 0 | | | $ | 0 | | | $ | 0 | | | $ | 0 | | | $ | 6 | | | $ | 6 | |
Futures | | | | | 0 | | | | 0 | | | | 0 | | | | 0 | | | | (34 | ) | | | (34 | ) |
Swap Agreements | | | | | 0 | | | | 0 | | | | 0 | | | | 0 | | | | (130 | ) | | | (130 | ) |
| | | | $ | 0 | | | $ | 0 | | | $ | 0 | | | $ | 0 | | | $ | (158 | ) | | $ | (158 | ) |
Over the counter | | | | | | | | | | | | | | | | | | | | | | | | | | |
Forward Foreign Currency Contracts | | | | $ | 0 | | | $ | 0 | | | $ | 0 | | | $ | 986 | | | $ | 0 | | | $ | 986 | |
Written Options | | | | | 0 | | | | 3 | | | | 0 | | | | 0 | | | | 0 | | | | 3 | |
Swap Agreements | | | | | 0 | | | | 6 | | | | 0 | | | | 0 | | | | 0 | | | | 6 | |
| | | | $ | 0 | | | $ | 9 | | | $ | 0 | | | $ | 986 | | | $ | 0 | | | $ | 995 | |
| | | | $ | 0 | | | $ | 9 | | | $ | 0 | | | $ | 986 | | | $ | (158 | ) | | $ | 837 | |
| | | | | | | |
Net Change in Unrealized Appreciation (Depreciation) on Financial Derivative Instruments | | | | | | | | | | | | | | | | | | | | | | | | | | |
Exchange-traded or centrally cleared | | | | | | | | | | | | | | | | | | | | | | | | | | |
Futures | | | | $ | 0 | | | $ | 0 | | | $ | 0 | | | $ | 0 | | | $ | (22 | ) | | $ | (22 | ) |
Swap Agreements | | | | | 0 | | | | 0 | | | | 0 | | | | 0 | | | | 2 | | | | 2 | |
| | | | $ | 0 | | | $ | 0 | | | $ | 0 | | | $ | 0 | | | $ | (20 | ) | | $ | (20 | ) |
Over the counter | | | | | | | | | | | | | | | | | | | | | | | | | | |
Forward Foreign Currency Contracts | | | | $ | 0 | | | $ | 0 | | | $ | 0 | | | $ | 23 | | | $ | 0 | | | $ | 23 | |
Written Options | | | | | 0 | | | | 2 | | | | 0 | | | | 14 | | | | 18 | | | | 34 | |
Swap Agreements | | | | | 0 | | | | (123 | ) | | | 0 | | | | 0 | | | | 0 | | | | (123 | ) |
| | | | $ | 0 | | | $ | (121 | ) | | $ | 0 | | | $ | 37 | | | $ | 18 | | | $ | (66 | ) |
| | | | $ | 0 | | | $ | (121 | ) | | $ | 0 | | | $ | 37 | | | $ | (2 | ) | | $ | (86 | ) |
FAIR VALUE MEASUREMENTS
The following is a summary of the fair valuations according to the inputs used as of June 30, 2015 in valuing the Fund’s assets and liabilities:
| | | | | | | | | | | | | | | | | | |
| Category and Subcategory | | | | Level 1 | | | Level 2 | | | Level 3 | | | Fair Value at
06/30/2015 | |
Investments in Securities, at Value | | | | | | | | | | | | | | | | | | |
Bank Loan Obligations | | | | $ | 0 | | | $ | 1,499 | | | $ | 0 | | | $ | 1,499 | |
Corporate Bonds & Notes | | | | | | | | | | | | | | | | | | |
Banking & Finance | | | | | 120 | | | | 15,893 | | | | 0 | | | | 16,013 | |
Industrials | | | | | 0 | | | | 13,630 | | | | 0 | | | | 13,630 | |
Utilities | | | | | 0 | | | | 9,695 | | | | 0 | | | | 9,695 | |
Municipal Bonds & Notes | | | | | | | | | | | | | | | | | | |
Iowa | | | | | 0 | | | | 178 | | | | 0 | | | | 178 | |
New Jersey | | | | | 0 | | | | 148 | | | | 0 | | | | 148 | |
Ohio | | | | | 0 | | | | 728 | | | | 0 | | | | 728 | |
Texas | | | | | 0 | | | | 352 | | | | 0 | | | | 352 | |
U.S. Government Agencies | | | | | 0 | | | | 1,847 | | | | 0 | | | | 1,847 | |
U.S. Treasury Obligations | | | | | 0 | | | | 200 | | | | 0 | | | | 200 | |
Mortgage-Backed Securities | | | | | 0 | | | | 577 | | | | 0 | | | | 577 | |
Asset-Backed Securities | | | | | 0 | | | | 1,177 | | | | 0 | | | | 1,177 | |
Sovereign Issues | | | | | 0 | | | | 7,000 | | | | 0 | | | | 7,000 | |
Preferred Securities | | | | | | | | | | | | | | | | | | |
Utilities | | | | | 3 | | | | 0 | | | | 0 | | | | 3 | |
Short-Term Instruments | | | | | | | | | | | | | | | | | | |
Repurchase Agreements | | | | | 0 | | | | 499 | | | | 0 | | | | 499 | |
Short-Term Notes | | | | | 0 | | | | 4,000 | | | | 0 | | | | 4,000 | |
U.S. Treasury Bills | | | | | 0 | | | | 1,034 | | | | 0 | | | | 1,034 | |
Total Investments | | | | $ | 123 | | | $ | 58,457 | | | $ | 0 | | | $ | 58,580 | |
| | | | | | |
| See Accompanying Notes | | ANNUAL REPORT | | JUNE 30, 2015 | | 65 |
Schedule of Investments PIMCO Diversified Income Active Exchange-Traded Fund (Cont.)
June 30, 2015
| | | | | | | | | | | | | | | | | | |
| Category and Subcategory | | | | Level 1 | | | Level 2 | | | Level 3 | | | Fair Value at
06/30/2015 | |
Short Sales, at Value - Liabilities | | | | | | | | | | | | | | | | | | |
U.S. Government Agencies | | | | $ | 0 | | | $ | (287 | ) | | $ | 0 | | | $ | (287 | ) |
| | | | | |
Financial Derivative Instruments - Assets | | | | | | | | | | | | | | | | | | |
Exchange-traded or centrally cleared | | | | | 24 | | | | 8 | | | | 0 | | | | 32 | |
Over the counter | | | | | 0 | | | | 43 | | | | 0 | | | | 43 | |
| | | | | $ | 24 | | | $ | 51 | | | $ | 0 | | | $ | 75 | |
| | | | | |
Financial Derivative Instruments - Liabilities | | | | | | | | | | | | | | | | | | |
Exchange-traded or centrally cleared | | | | | (1 | ) | | | (1 | ) | | | 0 | | | | (2 | ) |
Over the counter | | | | | 0 | | | | (1,429 | ) | | | 0 | | | | (1,429 | ) |
| | | | | $ | (1 | ) | | $ | (1,430 | ) | | $ | 0 | | | $ | (1,431 | ) |
Totals | | | | $ | 146 | | | $ | 56,791 | | | $ | 0 | | | $ | 56,937 | |
There were no significant transfers between Levels 1, 2, or 3 during the period ended June 30, 2015.
| | | | | | |
| 66 | | PIMCO ETF TRUST | | | | See Accompanying Notes |
Schedule of Investments PIMCO Enhanced Short Maturity Active Exchange-Traded Fund
June 30, 2015
| | | | | | | | | | | | |
| | | | | PRINCIPAL
AMOUNT
(000s) | | | | | MARKET
VALUE
(000s) | |
INVESTMENTS IN SECURITIES 107.6% | |
| |
CORPORATE BONDS & NOTES 70.4% | |
| |
BANKING & FINANCE 35.0% | |
|
American Express Credit Corp. | |
0.764% due 08/15/2019 (b) | | $ | | | 36,700 | | | $ | | | 36,292 | |
|
Banco Bradesco S.A. | |
4.500% due 01/12/2017 | | | | | 6,000 | | | | | | 6,257 | |
|
Banco Continental S.A. Via Continental Senior Trustees Cayman Ltd. | |
5.750% due 01/18/2017 | | | | | 4,500 | | | | | | 4,759 | |
|
Banco Santander Brasil S.A. | |
4.250% due 01/14/2016 | | | | | 4,600 | | | | | | 4,668 | |
4.625% due 02/13/2017 | | | | | 8,400 | | | | | | 8,672 | |
|
Banco Santander Chile | |
1.176% due 04/11/2017 | | | | | 15,100 | | | | | | 15,067 | |
1.875% due 01/19/2016 | | | | | 3,250 | | | | | | 3,258 | |
2.154% due 06/07/2018 | | | | | 2,000 | | | | | | 2,035 | |
3.750% due 09/22/2015 | | | | | 1,900 | | | | | | 1,908 | |
|
Bank of America Corp. | |
0.892% due 08/25/2017 | | | | | 32,000 | | | | | | 31,953 | |
1.315% due 01/15/2019 | | | | | 13,783 | | | | | | 13,919 | |
|
Bank of Tokyo-Mitsubishi UFJ Ltd. | |
0.692% due 03/10/2017 | | | | | 8,700 | | | | | | 8,697 | |
0.829% due 03/05/2018 | | | | | 9,500 | | | | | | 9,518 | |
|
Banque Federative du Credit Mutuel S.A. | |
1.125% due 01/20/2017 (b) | | | | | 7,900 | | | | | | 7,953 | |
|
BB&T Corp. | |
0.990% due 01/15/2020 | | | | | 10,000 | | | | | | 9,986 | |
|
BBVA Banco Continental S.A. | |
2.250% due 07/29/2016 | | | | | 1,400 | | | | | | 1,408 | |
|
BBVA Bancomer S.A. | |
4.500% due 03/10/2016 | | | | | 11,400 | | | | | | 11,668 | |
|
BPCE S.A. | |
0.891% due 06/23/2017 | | | | | 5,270 | | | | | | 5,272 | |
0.913% due 06/17/2017 (b) | | | | | 34,600 | | | | | | 34,620 | |
|
Corp. Andina de Fomento | |
0.829% due 01/29/2018 | | | | | 2,800 | | | | | | 2,814 | |
3.750% due 01/15/2016 | | | | | 3,595 | | | | | | 3,632 | |
|
Credit Agricole S.A. | |
0.833% due 06/12/2017 | | | | | 12,000 | | | | | | 11,997 | |
1.075% due 04/15/2019 | | | | | 13,650 | | | | | | 13,760 | |
1.133% due 10/03/2016 | | | | | 5,400 | | | | | | 5,429 | |
1.252% due 06/10/2020 | | | | | 12,000 | | | | | | 12,007 | |
|
Credit Suisse | |
0.969% due 01/29/2018 (b) | | | | | 29,200 | | | | | | 29,159 | |
|
Danske Bank A/S | |
3.875% due 04/14/2016 | | | | | 7,100 | | | | | | 7,259 | |
|
DBS Group Holdings Ltd. | |
0.776% due 07/16/2019 | | | | | 17,200 | | | | | | 17,210 | |
|
Eksportfinans ASA | |
2.000% due 09/15/2015 | | | | | 46,300 | | | | | | 46,358 | |
2.375% due 05/25/2016 | | | | | 4,700 | | | | | | 4,712 | |
5.500% due 05/25/2016 | | | | | 4,500 | | | | | | 4,635 | |
5.500% due 06/26/2017 | | | | | 11,900 | | | | | | 12,640 | |
|
Erste Europaische Pfandbrief und Kommunalkreditbank AG S.A. | |
0.132% due 03/20/2017 | | | | | 4,100 | | | | | | 4,021 | |
|
First Horizon National Corp. | |
5.375% due 12/15/2015 | | | | | 8,575 | | | | | | 8,707 | |
|
Ford Motor Credit Co. LLC | |
0.799% due 09/08/2017 | | | | | 5,300 | | | | | | 5,272 | |
1.118% due 03/12/2019 | | | | | 14,700 | | | | | | 14,601 | |
1.186% due 06/15/2018 | | | | | 14,000 | | | | | | 14,018 | |
1.209% due 11/04/2019 | | | | | 830 | | | | | | 828 | |
| | | | | | | | | | | | |
| | | | | PRINCIPAL
AMOUNT
(000s) | | | | | MARKET
VALUE
(000s) | |
1.214% due 01/09/2018 | | $ | | | 32,900 | | | $ | | | 32,953 | |
4.207% due 04/15/2016 | | | | | 4,000 | | | | | | 4,092 | |
|
General Motors Financial Co., Inc. | |
1.631% due 04/10/2018 | | | | | 18,250 | | | | | | 18,401 | |
1.835% due 01/15/2020 | | | | | 22,100 | | | | | | 22,124 | |
2.625% due 07/10/2017 | | | | | 11,000 | | | | | | 11,123 | |
3.000% due 09/25/2017 | | | | | 1,800 | | | | | | 1,839 | |
4.750% due 08/15/2017 | | | | | 10,700 | | | | | | 11,300 | |
|
Goldman Sachs Group, Inc. | |
1.297% due 10/23/2019 | | | | | 6,000 | | | | | | 6,036 | |
1.437% due 04/23/2020 | | | | | 64,970 | | | | | | 65,681 | |
1.478% due 04/30/2018 | | | | | 11,982 | | | | | | 12,117 | |
|
Hana Bank | |
1.375% due 02/05/2016 | | | | | 7,900 | | | | | | 7,915 | |
1.404% due 11/09/2016 | | | | | 11,200 | | | | | | 11,264 | |
4.500% due 10/30/2015 | | | | | 125 | | | | | | 126 | |
|
Health Care REIT, Inc. | |
6.200% due 06/01/2016 | | | | | 1,400 | | | | | | 1,460 | |
|
HSBC Finance Corp. | |
0.713% due 06/01/2016 (b) | | | | | 39,263 | | | | | | 39,208 | |
|
HSBC USA, Inc. | |
0.887% due 11/13/2019 | | | | | 2,300 | | | | | | 2,294 | |
|
HSH Nordbank AG | |
0.430% due 12/31/2015 | | | | | 27,700 | | | | | | 27,627 | |
|
Hypothekenbank Frankfurt AG | |
0.132% due 09/20/2017 | | | | | 3,200 | | | | | | 3,151 | |
|
Hyundai Capital Services, Inc. | |
1.086% due 03/18/2017 | | | | | 22,900 | | | | | | 22,969 | |
|
Industrial Bank of Korea | |
3.750% due 09/29/2016 | | | | | 1,390 | | | | | | 1,433 | |
|
International Lease Finance Corp. | |
5.750% due 05/15/2016 | | | | | 1,150 | | | | | | 1,180 | |
8.625% due 09/15/2015 | | | | | 2,000 | | | | | | 2,028 | |
|
Intesa Sanpaolo SpA | |
3.125% due 01/15/2016 | | | | | 5,000 | | | | | | 5,039 | |
3.625% due 08/12/2015 | | | | | 800 | | | | | | 802 | |
|
IPIC GMTN Ltd. | |
1.750% due 11/30/2015 | | | | | 9,600 | | | | | | 9,663 | |
3.125% due 11/15/2015 | | | | | 9,400 | | | | | | 9,492 | |
|
Jefferies Group LLC | |
3.875% due 11/09/2015 | | | | | 4,895 | | | | | | 4,937 | |
|
JPMorgan Chase & Co. | |
0.793% due 03/01/2018 | | | | | 11,000 | | | | | | 10,975 | |
0.827% due 04/25/2018 | | | | | 14,600 | | | | | | 14,618 | |
|
Kilroy Realty LP | |
5.000% due 11/03/2015 | | | | | 6,281 | | | | | | 6,354 | |
|
Kookmin Bank | |
0.936% due 03/11/2016 | | | | | 8,000 | | | | | | 8,000 | |
1.036% due 03/14/2017 | | | | | 18,500 | | | | | | 18,481 | |
1.526% due 10/11/2016 | | | | | 6,400 | | | | | | 6,456 | |
|
Korea Exchange Bank | |
1.750% due 09/27/2015 | | | | | 6,130 | | | | | | 6,144 | |
3.125% due 06/26/2017 | | | | | 4,800 | | | | | | 4,929 | |
|
Landwirtschaftliche Rentenbank | |
0.389% due 12/05/2018 | | | �� | | 1,600 | | | | | | 1,605 | |
|
LeasePlan Corp. NV | |
3.000% due 10/23/2017 | | | | | 14,750 | | | | | | 15,062 | |
|
Lloyds Bank PLC | |
0.825% due 05/14/2018 | | | | | 23,000 | | | | | | 23,049 | |
|
Loews Corp. | |
5.250% due 03/15/2016 | | | | | 15,000 | | | | | | 15,464 | |
|
Macquarie Bank Ltd. | |
0.782% due 02/26/2017 | | | | | 5,150 | | | | | | 5,152 | |
1.072% due 03/24/2017 | | | | | 40,700 | | | | | | 40,915 | |
| | | | | | | | | | | | |
| | | | | PRINCIPAL
AMOUNT
(000s) | | | | | MARKET
VALUE
(000s) | |
1.600% due 10/27/2017 | | $ | | | 1,200 | | | $ | | | 1,200 | |
2.000% due 08/15/2016 | | | | | 2,275 | | | | | | 2,298 | |
|
Mizuho Bank Ltd. | |
0.706% due 04/16/2017 | | | | | 3,300 | | | | | | 3,296 | |
0.731% due 09/25/2017 | | | | | 5,100 | | | | | | 5,093 | |
0.921% due 03/26/2018 | | | | | 15,400 | | | | | | 15,443 | |
|
Morgan Stanley | |
5.750% due 10/18/2016 | | | | | 2,000 | | | | | | 2,114 | |
|
MUFG Americas Holdings Corp. | |
0.849% due 02/09/2018 | | | | | 9,000 | | | | | | 9,017 | |
|
ORIX Corp. | |
5.000% due 01/12/2016 | | | | | 10,641 | | | | | | 10,860 | |
|
Prudential Covered Trust | |
2.997% due 09/30/2015 | | | | | 20,720 | | | | | | 20,830 | |
|
Qatari Diar Finance Co. | |
3.500% due 07/21/2015 | | | | | 6,500 | | | | | | 6,503 | |
|
RCI Banque S.A. | |
4.600% due 04/12/2016 | | | | | 8,233 | | | | | | 8,436 | |
|
Royal Bank of Scotland Group PLC | |
2.550% due 09/18/2015 | | | | | 22,286 | | | | | | 22,349 | |
|
Santander Bank N.A. | |
1.206% due 01/12/2018 | | | | | 14,700 | | | | | | 14,694 | |
|
Santander Holdings USA, Inc. | |
3.000% due 09/24/2015 | | | | | 858 | | | | | | 860 | |
|
Shinhan Bank | |
0.924% due 04/08/2017 | | | | | 30,200 | | | | | | 30,187 | |
|
Standard Chartered PLC | |
0.619% due 09/08/2017 | | | | | 15,000 | | | | | | 14,893 | |
|
Stone Street Trust | |
5.902% due 12/15/2015 | | | | | 10,945 | | | | | | 11,159 | |
|
Synchrony Financial | |
1.509% due 02/03/2020 | | | | | 12,000 | | | | | | 12,066 | |
|
Temasek Financial Ltd. | |
4.500% due 09/21/2015 | | | | | 1,000 | | | | | | 1,008 | |
|
Toyota Motor Credit Corp. | |
0.664% due 01/17/2019 | | | | | 12,500 | | | | | | 12,550 | |
|
UBS AG | |
0.655% due 08/14/2017 | | | | | 13,000 | | | | | | 12,973 | |
0.915% due 08/14/2019 (b) | | | | | 35,000 | | | | | | 34,991 | |
0.981% due 03/26/2018 | | | | | 3,700 | | | | | | 3,701 | |
|
Ventas Realty LP | |
1.550% due 09/26/2016 | | | | | 550 | | | | | | 552 | |
3.125% due 11/30/2015 | | | | | 9,485 | | | | | | 9,562 | |
|
Wells Fargo & Co. | |
0.736% due 04/22/2019 | | | | | 20,000 | | | | | | 19,943 | |
| | | | | | | | | | | | |
| | | | | | | | | | | 1,237,005 | |
| | | | | | | | | | | | |
| | | | | | | | | | | | |
INDUSTRIALS 23.7% | |
|
AbbVie, Inc. | |
1.200% due 11/06/2015 (b) | | | | | 38,650 | | | | | | 38,689 | |
|
Actavis Funding SCS | |
1.158% due 09/01/2016 | | | | | 14,230 | | | | | | 14,285 | |
1.368% due 03/12/2018 | | | | | 16,665 | | | | | | 16,746 | |
1.543% due 03/12/2020 | | | | | 20,250 | | | | | | 20,498 | |
|
Allergan, Inc. | |
5.750% due 04/01/2016 | | | | | 4,000 | | | | | | 4,145 | |
|
Amgen, Inc. | |
0.664% due 05/22/2017 | | | | | 59,000 | | | | | | 59,001 | |
0.884% due 05/22/2019 | | | | | 1,000 | | | | | | 1,002 | |
|
Anglo American Capital PLC | |
1.225% due 04/15/2016 | | | | | 2,300 | | | | | | 2,295 | |
|
Anthem, Inc. | |
1.250% due 09/10/2015 | | | | | 4,000 | | | | | | 4,002 | |
| | | | | | |
| See Accompanying Notes | | ANNUAL REPORT | | JUNE 30, 2015 | | 67 |
Schedule of Investments PIMCO Enhanced Short Maturity Active Exchange-Traded Fund (Cont.)
| | | | | | | | | | | | |
| | | | | PRINCIPAL
AMOUNT
(000s) | | | | | MARKET
VALUE
(000s) | |
|
Asciano Finance Ltd. | |
3.125% due 09/23/2015 | | $ | | | 150 | | | $ | | | 151 | |
|
Aviation Capital Group Corp. | |
3.875% due 09/27/2016 | | | | | 3,860 | | | | | | 3,929 | |
|
BAT International Finance PLC | |
0.796% due 06/15/2018 | | | | | 10,900 | | | | | | 10,901 | |
|
Baxalta, Inc. | |
1.061% due 06/22/2018 | | | | | 5,900 | | | | | | 5,903 | |
|
BMW U.S. Capital LLC | |
0.624% due 06/02/2017 | | | | | 17,000 | | | | | | 16,956 | |
|
BSKYB Finance UK PLC | |
5.625% due 10/15/2015 | | | | | 30,500 | | | | | | 30,873 | |
|
Cameron International Corp. | |
1.150% due 12/15/2016 | | | | | 5,400 | | | | | | 5,370 | |
|
Canadian Natural Resources Ltd. | |
0.657% due 03/30/2016 | | | | | 6,000 | | | | | | 5,990 | |
|
Cheung Kong Infrastructure Finance BVI Ltd. | |
0.981% due 06/20/2017 | | | | | 8,300 | | | | | | 8,283 | |
|
Coca-Cola HBC Finance BV | |
5.500% due 09/17/2015 | | | | | 5,028 | | | | | | 5,057 | |
|
ConAgra Foods, Inc. | |
0.646% due 07/21/2016 | | | | | 29,485 | | | | | | 29,409 | |
1.300% due 01/25/2016 | | | | | 2,500 | | | | | | 2,501 | |
|
ConocoPhillips Co. | |
1.176% due 05/15/2022 | | | | | 5,300 | | | | | | 5,347 | |
|
Daimler Finance North America LLC | |
0.618% due 08/01/2017 | | | | | 6,150 | | | | | | 6,145 | |
0.632% due 03/10/2017 | | | | | 7,100 | | | | | | 7,100 | |
|
Devon Energy Corp. | |
0.736% due 12/15/2015 | | | | | 5,000 | | | | | | 4,996 | |
0.826% due 12/15/2016 | | | | | 10,985 | | | | | | 10,862 | |
|
DIRECTV Holdings LLC | |
3.125% due 02/15/2016 | | | | | 20,000 | | | | | | 20,239 | |
|
Ecolab, Inc. | |
1.000% due 08/09/2015 | | | | | 2,500 | | | | | | 2,497 | |
|
EMD Finance LLC | |
0.633% due 03/17/2017 | | | | | 3,700 | | | | | | 3,700 | |
|
Enbridge, Inc. | |
0.734% due 06/02/2017 | | | | | 6,500 | | | | | | 6,425 | |
|
Enterprise Products Operating LLC | |
1.250% due 08/13/2015 | | | | | 22,165 | | | | | | 22,176 | |
3.200% due 02/01/2016 | | | | | 1,300 | | | | | | 1,316 | |
|
Experian Finance PLC | |
2.375% due 06/15/2017 | | | | | 1,500 | | | | | | 1,508 | |
|
Glencore Canada Corp. | |
6.000% due 10/15/2015 | | | | | 2,600 | | | | | | 2,634 | |
|
Glencore Finance Canada Ltd. | |
2.050% due 10/23/2015 | | | | | 13,944 | | | | | | 13,981 | |
|
Glencore Funding LLC | |
1.445% due 05/27/2016 | | | | | 1,025 | | | | | | 1,028 | |
1.700% due 05/27/2016 | | | | | 4,500 | | | | | | 4,506 | |
|
Harvest Operations Corp. | |
2.125% due 05/14/2018 | | | | | 2,531 | | | | | | 2,546 | |
|
Hutchison Whampoa International Ltd. | |
3.500% due 01/13/2017 | | | | | 1,450 | | | | | | 1,495 | |
|
Hyundai Capital America | |
1.625% due 10/02/2015 | | | | | 11,355 | | | | | | 11,369 | |
|
Kansas City Southern de Mexico S.A. de C.V. | |
0.979% due 10/28/2016 | | | | | 13,920 | | | | | | 13,862 | |
|
Kia Motors Corp. | |
3.625% due 06/14/2016 | | | | | 2,000 | | | | | | 2,043 | |
|
Kinder Morgan Energy Partners LP | |
3.500% due 03/01/2016 | | | | | 5,045 | | | | | | 5,118 | |
4.100% due 11/15/2015 | | | | | 4,396 | | | | | | 4,442 | |
| | | | | | | | | | | | |
| | | | | PRINCIPAL
AMOUNT
(000s) | | | | | MARKET
VALUE
(000s) | |
|
Korea National Oil Corp. | |
2.875% due 11/09/2015 | | $ | | | 4,603 | | | $ | | | 4,639 | |
3.125% due 04/03/2017 | | | | | 5,000 | | | | | | 5,133 | |
4.000% due 10/27/2016 | | | | | 23,800 | | | | | | 24,663 | |
|
Lowe’s Cos., Inc. | |
0.702% due 09/10/2019 | | | | | 6,294 | | | | | | 6,305 | |
|
Medtronic, Inc. | |
1.086% due 03/15/2020 | | | | | 13,900 | | | | | | 14,055 | |
|
Mylan, Inc. | |
1.800% due 06/24/2016 | | | | | 10,400 | | | | | | 10,407 | |
|
Nabors Industries, Inc. | |
2.350% due 09/15/2016 | | | | | 2,750 | | | | | | 2,759 | |
|
NBCUniversal Enterprise, Inc. | |
0.960% due 04/15/2018 | | | | | 17,885 | | | | | | 17,979 | |
|
Nissan Motor Acceptance Corp. | |
0.833% due 03/03/2017 | | | | | 2,200 | | | | | | 2,209 | |
0.981% due 09/26/2016 (b) | | | | | 32,775 | | | | | | 32,942 | |
|
Oracle Corp. | |
0.784% due 10/08/2019 | | | | | 10,000 | | | | | | 10,090 | |
|
Penerbangan Malaysia Bhd. | |
5.625% due 03/15/2016 | | | | | 17,046 | | | | | | 17,552 | |
|
Penske Truck Leasing Co. LP | |
2.500% due 03/15/2016 | | | | | 16,311 | | | | | | 16,427 | |
|
Pioneer Natural Resources Co. | |
5.875% due 07/15/2016 | | | | | 15,330 | | | | | | 16,024 | |
|
Reynolds American, Inc. | |
1.050% due 10/30/2015 | | | | | 15,215 | | | | | | 15,164 | |
6.750% due 06/15/2017 | | | | | 2,000 | | | | | | 2,186 | |
|
Roche Holdings, Inc. | |
0.622% due 09/30/2019 | | | | | 14,900 | | | | | | 14,907 | |
|
SABIC Capital BV | |
3.000% due 11/02/2015 | | | | | 5,100 | | | | | | 5,134 | |
|
SABMiller Holdings, Inc. | |
0.968% due 08/01/2018 | | | | | 9,685 | | | | | | 9,719 | |
|
Symantec Corp. | |
2.750% due 09/15/2015 | | | | | 13,397 | | | | | | 13,444 | |
|
Telefonica Emisiones S.A.U. | |
0.931% due 06/23/2017 | | | | | 24,400 | | | | | | 24,347 | |
3.992% due 02/16/2016 | | | | | 12,985 | | | | | | 13,210 | |
6.421% due 06/20/2016 | | | | | 4,018 | | | | | | 4,202 | |
|
Tennessee Gas Pipeline Co. LLC | |
7.500% due 04/01/2017 | | | | | 4,000 | | | | | | 4,369 | |
8.000% due 02/01/2016 | | | | | 3,735 | | | | | | 3,876 | |
|
Thermo Fisher Scientific, Inc. | |
2.250% due 08/15/2016 | | | | | 500 | | | | | | 505 | |
3.200% due 03/01/2016 | | | | | 1,250 | | | | | | 1,269 | |
|
Transcontinental Gas Pipe Line Co. LLC | |
6.400% due 04/15/2016 | | | | | 4,000 | | | | | | 4,164 | |
|
Tyson Foods, Inc. | |
6.600% due 04/01/2016 | | | | | 2,000 | | | | | | 2,077 | |
|
UAL Pass-Through Trust | |
10.400% due 05/01/2018 | | | | | 727 | | | | | | 792 | |
|
Volkswagen Group of America Finance LLC | |
0.652% due 05/23/2017 | | | | | 9,400 | | | | | | 9,404 | |
0.716% due 11/20/2017 (b) | | | | | 23,100 | | | | | | 23,150 | |
0.754% due 05/22/2018 | | | | | 32,700 | | | | | | 32,713 | |
|
Walgreens Boots Alliance, Inc. | |
0.726% due 05/18/2016 | | | | | 24,600 | | | | | | 24,602 | |
|
Woolworths Ltd. | |
2.550% due 09/22/2015 | | | | | 4,200 | | | | | | 4,217 | |
5.550% due 11/15/2015 | | | | | 2,000 | | | | | | 2,033 | |
| | | | | | | | | | | | |
| | | | | | | | | | | 837,989 | |
| | | | | | | | | | | | |
| | | | | | | | | | | | |
| | | | | | | | | | | | |
| | | | | PRINCIPAL
AMOUNT
(000s) | | | | | MARKET
VALUE
(000s) | |
UTILITIES 11.7% | |
|
AT&T, Inc. | |
0.702% due 03/30/2017 | | $ | | | 4,900 | | | $ | | | 4,885 | |
1.212% due 06/30/2020 | | | | | 11,600 | | | | | | 11,659 | |
|
BellSouth Corp. | |
4.821% due 04/26/2021 | | | | | 37,100 | | | | | | 38,170 | |
|
BP Capital Markets PLC | |
0.702% due 02/13/2018 | | | | | 4,200 | | | | | | 4,206 | |
0.789% due 05/10/2018 | | | | | 1,892 | | | | | | 1,887 | |
0.819% due 05/10/2019 | | | | | 5,175 | | | | | | 5,160 | |
0.911% due 09/26/2018 | | | | | 40,384 | | | | | | 40,516 | |
|
Dominion Resources, Inc. | |
1.950% due 08/15/2016 | | | | | 2,445 | | | | | | 2,464 | |
|
Duke Energy Corp. | |
0.663% due 04/03/2017 | | | | | 3,000 | | | | | | 3,004 | |
|
Electricite de France S.A. | |
0.735% due 01/20/2017 | | | | | 22,300 | | | | | | 22,339 | |
|
Entergy Corp. | |
3.625% due 09/15/2015 | | | | | 8,600 | | | | | | 8,634 | |
|
Kinder Morgan Finance Co. LLC | |
5.700% due 01/05/2016 | | | | | 10,700 | | | | | | 10,938 | |
6.000% due 01/15/2018 | | | | | 2,000 | | | | | | 2,167 | |
|
Korea Hydro & Nuclear Power Co. Ltd. | |
1.064% due 05/22/2017 | | | | | 17,400 | | | | | | 17,397 | |
3.125% due 09/16/2015 | | | | | 13,703 | | | | | | 13,770 | |
|
KT Corp. | |
1.750% due 04/22/2017 | | | | | 2,000 | | | | | | 2,000 | |
4.875% due 07/15/2015 | | | | | 5,000 | | | | | | 5,005 | |
|
Laclede Group, Inc. | |
1.024% due 08/15/2017 | | | | | 8,100 | | | | | | 8,090 | |
|
LG&E and KU Energy LLC | |
2.125% due 11/15/2015 | | | | | 12,730 | | | | | | 12,778 | |
|
Ooredoo International Finance Ltd. | |
3.375% due 10/14/2016 | | | | | 7,550 | | | | | | 7,744 | |
|
Orange S.A. | |
2.125% due 09/16/2015 | | | | | 20,610 | | | | | | 20,660 | |
|
Petrobras Global Finance BV | |
1.896% due 05/20/2016 | | | | | 14,570 | | | | | | 14,391 | |
2.000% due 05/20/2016 | | | | | 1,000 | | | | | | 991 | |
3.875% due 01/27/2016 | | | | | 4,300 | | | | | | 4,324 | |
|
Petroleos Mexicanos | |
5.750% due 03/01/2018 | | | | | 950 | | | | | | 1,036 | |
|
Plains All American Pipeline LP | |
5.875% due 08/15/2016 | | | | | 2,100 | | | | | | 2,202 | |
|
Ras Laffan Liquefied Natural Gas Co. Ltd. | |
5.832% due 09/30/2016 | | | | | 151 | | | | | | 156 | |
|
Shell International Finance BV | |
0.729% due 05/11/2020 | | | | | 16,200 | | | | | | 16,150 | |
|
Sinopec Group Overseas Development Ltd. | |
1.051% due 04/10/2017 | | | | | 27,700 | | | | | | 27,679 | |
1.191% due 04/10/2019 | | | | | 6,500 | | | | | | 6,494 | |
|
Telecom Italia Capital S.A. | |
5.250% due 10/01/2015 | | | | | 15,027 | | | | | | 15,171 | |
|
Verizon Communications, Inc. | |
1.053% due 06/17/2019 (b) | | | | | 37,775 | | | | | | 37,574 | |
2.036% due 09/14/2018 | | | | | 42,773 | | | | | | 44,285 | |
| | | | | | | | | | | | |
| | | | | | | | | | | 413,926 | |
| | | | | | | | | | | | |
Total Corporate Bonds & Notes
(Cost $2,490,139) | | | | | | 2,488,920 | |
| | | | | | | | | | | | |
| |
| | | | | | |
| 68 | | PIMCO ETF TRUST | | | | See Accompanying Notes |
June 30, 2015
| | | | | | | | | | | | |
| | | | | PRINCIPAL
AMOUNT
(000s) | | | | | MARKET
VALUE
(000s) | |
MUNICIPAL BONDS & NOTES 1.0% | |
| |
ARKANSAS 0.0% | |
|
Arkansas Student Loan Authority Revenue Bonds, Series 2010 | |
1.182% due 11/25/2043 | | $ | | | 1,009 | | | $ | | | 1,009 | |
| | | | | | | | | | | | |
| | | | | | | | | | | | |
CALIFORNIA 0.5% | |
|
California Earthquake Authority Revenue Notes, Series 2014 | |
1.824% due 07/01/2017 | | | | | 8,900 | | | | | | 8,958 | |
|
California State General Obligation Notes, Series 2013 | |
1.250% due 11/01/2016 | | | | | 4,500 | | | | | | 4,537 | |
|
University of California Revenue Bonds, Series 2011 | |
0.684% due 07/01/2041 | | | | | 4,000 | | | | | | 4,002 | |
| | | | | | | | | | | | |
| | | | | | | | | | | 17,497 | |
| | | | | | | | | | | | |
| |
NEW JERSEY 0.2% | |
|
New Jersey Transit Corp. Revenue Notes, Series 2014 | |
0.800% due 09/15/2015 | | | | | 7,710 | | | | | | 7,711 | |
| | | | | | | | | | | | |
| |
NEW YORK 0.0% | |
|
New York State Dormitory Authority Revenue Notes, Series 2010 | |
3.125% due 12/01/2015 | | | | | 100 | | | | | | 101 | |
| | | | | | | | | | | | |
| |
OREGON 0.1% | |
|
Tri-County Metropolitan Transportation District, Oregon Revenue Notes, Series 2013 | |
3.000% due 11/01/2016 | | | | | 3,500 | | | | | | 3,504 | |
| | | | | | | | | | | | |
| |
TEXAS 0.2% | |
|
Texas State General Obligation Notes, Series 2013 | |
0.584% due 06/01/2018 | | | | | 2,900 | | | | | | 2,903 | |
|
Texas State General Obligation Notes, Series 2014 | |
0.584% due 06/01/2019 | | | | | 2,000 | | | | | | 2,010 | |
| | | | | | | | | | | | |
| | | | | | | | | | | 4,913 | |
| | | | | | | | | | | | |
Total Municipal Bonds & Notes
(Cost $34,626) | | | | | | 34,735 | |
| | | | | | | | | | | | |
| |
U.S. GOVERNMENT AGENCIES 3.1% | |
|
Fannie Mae | |
0.437% due 05/25/2037 | | | | | 228 | | | | | | 228 | |
0.537% due 11/25/2036 | | | | | 668 | | | | | | 671 | |
0.585% due 04/18/2028 - 09/18/2031 | | | | | 1,871 | | | | | | 1,890 | |
0.587% due 06/25/2026 - 12/25/2043 | | | | | 26,218 | | | | | | 26,394 | |
0.595% due 08/25/2015 | | | | | 489 | | | | | | 489 | |
0.607% due 03/25/2037 | | | | | 971 | | | | | | 977 | |
0.637% due 05/25/2017 - 06/25/2042 | | | | | 2,114 | | | | | | 2,131 | |
0.685% due 05/18/2032 | | | | | 430 | | | | | | 434 | |
0.687% due 06/25/2031 - 12/25/2040 | | | | | 947 | | | | | | 956 | |
0.735% due 03/18/2032 | | | | | 298 | | | | | | 303 | |
0.737% due 09/25/2041 | | | | | 6,647 | | | | | | 6,720 | |
0.767% due 06/25/2041 - 07/25/2041 | | | | | 23,126 | | | | | | 23,433 | |
0.867% due 12/25/2037 - 02/25/2041 | | | | | 2,899 | | | | | | 2,936 | |
0.881% due 01/01/2021 | | | | | 3,247 | | | | | | 3,284 | |
0.887% due 05/25/2037 | | | | | 340 | | | | | | 343 | |
0.937% due 03/25/2037 - 02/25/2040 | | | | | 786 | | | | | | 809 | |
1.037% due 07/25/2038 | | | | | 469 | | | | | | 480 | |
| | | | | | | | | | | | |
| | | | | PRINCIPAL
AMOUNT
(000s) | | | | | MARKET
VALUE
(000s) | |
|
FDIC Structured Sale Guaranteed Notes | |
0.684% due 11/29/2037 | | $ | | | 714 | | | $ | | | 712 | |
|
Freddie Mac | |
0.426% due 05/15/2036 | | | | | 97 | | | | | | 97 | |
0.436% due 11/15/2036 | | | | | 15 | | | | | | 15 | |
0.506% due 02/15/2037 | | | | | 2,701 | | | | | | 2,710 | |
0.606% due 04/15/2041 | | | | | 841 | | | | | | 846 | |
0.686% due 07/15/2039 | | | | | 392 | | | | | | 396 | |
|
Ginnie Mae | |
0.487% due 09/20/2033 | | | | | 14 | | | | | | 14 | |
0.732% due 04/20/2062 | | | | | 6,449 | | | | | | 6,488 | |
0.882% due 02/20/2062 | | | | | 8,758 | | | | | | 8,864 | |
1.232% due 02/20/2062 | | | | | 6,311 | | | | | | 6,470 | |
6.000% due 12/15/2033 | | | | | 42 | | | | | | 49 | |
6.500% due 11/15/2033 - 09/15/2034 | | | | | 43 | | | | | | 48 | |
7.000% due 01/15/2024 - 07/15/2032 | | | | | 263 | | | | | | 280 | |
7.500% due 07/15/2024 - 06/15/2028 | | | | | 218 | | | | | | 235 | |
10.000% due 02/15/2016 - 04/15/2025 | | | | | 28 | | | | | | 30 | |
11.000% due 08/15/2015 - 09/20/2019 | | | | | 1 | | | | | | 1 | |
|
NCUA Guaranteed Notes | |
0.524% due 12/07/2020 | | | | | 1,374 | | | | | | 1,375 | |
0.555% due 11/06/2017 | | | | | 4,063 | | | | | | 4,071 | |
0.565% due 03/06/2020 | | | | | 1,814 | | | | | | 1,817 | |
0.745% due 12/08/2020 | | | | | 3,264 | | | | | | 3,288 | |
1.600% due 10/29/2020 | | | | | 536 | | | | | | 536 | |
| | | | | | | | | | | | |
Total U.S. Government Agencies (Cost $110,071) | | | | | | 110,820 | |
| | | | | | | | | | | | |
| |
U.S. TREASURY OBLIGATIONS 4.2% | |
|
U.S. Treasury Notes | |
0.625% due 05/31/2017 (b) | | | | | 148,200 | | | | | | 148,130 | |
| | | | | | | | | | | | |
Total U.S. Treasury Obligations (Cost $147,963) | | | | | | 148,130 | |
| | | | | | | | | | | | |
| |
MORTGAGE-BACKED SECURITIES 8.0% | |
|
American Home Mortgage Investment Trust | |
0.477% due 02/25/2045 | | | | | 173 | | | | | | 172 | |
|
Asset Securitization Corp. | |
6.930% due 02/14/2043 | | | | | 6,955 | | | | | | 7,375 | |
|
BAMLL Commercial Mortgage Securities Trust | |
1.536% due 12/15/2029 | | | | | 12,000 | | | | | | 12,053 | |
1.586% due 12/15/2031 | | | | | 10,000 | | | | | | 10,035 | |
|
Banc of America Commercial Mortgage Trust | |
5.916% due 05/10/2045 | | | | | 1,300 | | | | | | 1,322 | |
|
Banc of America Mortgage Trust | |
2.687% due 03/25/2034 | | | | | 399 | | | | | | 404 | |
|
Barclays Commercial Mortgage Securities Trust | |
1.294% due 02/15/2028 | | | | | 26,000 | | | | | | 25,934 | |
|
Bear Stearns Adjustable Rate Mortgage Trust | |
2.564% due 08/25/2033 | | | | | 1,991 | | | | | | 1,995 | |
|
BNPP Mortgage Securities LLC Trust | |
6.000% due 08/27/2037 | | | | | 289 | | | | | | 299 | |
|
Carefree Portfolio Trust | |
1.506% due 11/15/2019 | | | | | 18,000 | | | | | | 18,088 | |
|
Citigroup/Deutsche Bank Commercial Mortgage Trust | |
5.289% due 12/11/2049 | | | | | 9,482 | | | | | | 9,935 | |
5.380% due 07/15/2044 | | | | | 942 | | | | | | 943 | |
5.480% due 01/15/2046 | | | | | 10,580 | | | | | | 10,661 | |
5.481% due 01/15/2046 | | | | | 3,888 | | | | | | 3,946 | |
| | | | | | | | | | | | |
| | | | | PRINCIPAL
AMOUNT
(000s) | | | | | MARKET
VALUE
(000s) | |
|
Credit Suisse Commercial Mortgage Trust | |
5.297% due 12/15/2039 | | $ | | | 4,818 | | | $ | | | 5,031 | |
5.311% due 12/15/2039 | | | | | 9,771 | | | | | | 10,109 | |
5.860% due 03/15/2039 | | | | | 4,783 | | | | | | 4,891 | |
6.000% due 06/15/2038 | | | | | 706 | | | | | | 729 | |
|
DBRR Trust | |
0.853% due 02/25/2045 | | | | | 416 | | | | | | 416 | |
|
Hilton USA Trust | |
1.185% due 11/05/2030 | | | | | 1,084 | | | | | | 1,084 | |
|
Hyatt Hotel Portfolio Trust | |
1.436% due 11/15/2029 | | | | | 7,800 | | | | | | 7,819 | |
|
JPMorgan Chase Commercial Mortgage Securities Trust | |
1.166% due 07/15/2031 | | | | | 12,000 | | | | | | 11,997 | |
5.440% due 06/12/2047 | | | | | 5,380 | | | | | | 5,631 | |
5.814% due 06/12/2043 | | | | | 2,531 | | | | | | 2,602 | |
5.868% due 02/12/2049 | | | | | 1,718 | | | | | | 1,772 | |
5.961% due 06/15/2049 | | | | | 1,320 | | | | | | 1,367 | |
|
LB-UBS Commercial Mortgage Trust | |
5.424% due 02/15/2040 | | | | | 1,912 | | | | | | 2,004 | |
|
Mellon Residential Funding Corp. Mortgage Pass-Through Certificates | |
0.886% due 11/15/2031 | | | | | 2,203 | | | | | | 2,167 | |
|
Merrill Lynch Mortgage Investors Trust | |
6.720% due 11/15/2026 | | | | | 479 | | | | | | 493 | |
|
Morgan Stanley Capital I | |
5.328% due 11/12/2041 | | | | | 6,393 | | | | | | 6,620 | |
|
Morgan Stanley Capital Trust | |
0.336% due 07/12/2044 | | | | | 28,396 | | | | | | 28,273 | |
1.085% due 03/15/2045 | | | | | 688 | | | | | | 690 | |
3.884% due 09/15/2047 | | | | | 14,115 | | | | | | 14,230 | |
5.439% due 02/12/2044 | | | | | 68 | | | | | | 68 | |
5.601% due 03/12/2044 | | | | | 4,432 | | | | | | 4,461 | |
5.610% due 04/15/2049 | | | | | 74 | | | | | | 75 | |
|
Morgan Stanley Re-REMIC Trust | |
5.989% due 08/12/2045 | | | | | 1,885 | | | | | | 1,998 | |
|
RBSSP Resecuritization Trust | |
0.685% due 10/26/2036 | | | | | 535 | | | | | | 526 | |
2.252% due 12/26/2036 | | | | | 1,721 | | | | | | 1,729 | |
2.714% due 05/26/2037 | | | | | 985 | | | | | | 988 | |
|
Selkirk Ltd. | |
1.183% due 02/20/2041 | | | | | 992 | | | | | | 993 | |
1.860% due 12/20/2041 | | | | | 13,442 | | | | | | 13,457 | |
|
UBS-Citigroup Commercial Mortgage Trust | |
1.524% due 01/10/2045 | | | | | 1,497 | | | | | | 1,503 | |
|
Wachovia Bank Commercial Mortgage Trust | |
0.210% due 04/15/2047 | | | | | 33,100 | | | | | | 32,596 | |
0.335% due 10/15/2048 | | | | | 4,347 | | | | | | 4,306 | |
0.360% due 06/15/2049 | | | | | 900 | | | | | | 884 | |
|
WaMu Commercial Mortgage Securities Trust | |
5.515% due 03/23/2045 | | | | | 6,289 | | | | | | 6,416 | |
|
Wells Fargo-RBS Commercial Mortgage Trust | |
1.456% due 11/15/2044 | | | 400 | | | | | | 401 | |
| | | | | | | | | | | | |
Total Mortgage-Backed Securities (Cost $283,563) | | | | | | 281,488 | |
| | | | | | | | | | | | |
| |
ASSET-BACKED SECURITIES 9.4% | |
|
Aimco CLO | |
0.526% due 08/20/2020 | | | | | 1,390 | | | | | | 1,387 | |
|
Aircraft Lease Securitisation Ltd. | |
0.445% due 05/10/2032 | | | | | 1,509 | | | | | | 1,500 | |
|
ALM Ltd. | |
1.507% due 02/13/2023 | | | | | 22,500 | | | | | | 22,506 | |
|
AmeriCredit Automobile Receivables Trust | |
0.504% due 04/09/2018 | | | | | 9,493 | | | | | | 9,495 | |
| | | | | | |
| See Accompanying Notes | | ANNUAL REPORT | | JUNE 30, 2015 | | 69 |
Schedule of Investments PIMCO Enhanced Short Maturity Active Exchange-Traded Fund (Cont.)
| | | | | | | | | | | | |
| | | | | PRINCIPAL
AMOUNT
(000s) | | | | | MARKET
VALUE
(000s) | |
|
Apidos Quattro CDO | |
0.525% due 01/20/2019 | | $ | | | 613 | | | $ | | | 612 | |
|
Ares CLO Ltd. | |
0.912% due 11/25/2020 | | | | | 6,178 | | | | | | 6,119 | |
|
Atrium CDO Corp. | |
1.376% due 11/16/2022 | | | | | 6,519 | | | | | | 6,527 | |
|
BA Credit Card Trust | |
0.516% due 06/15/2020 | | | | | 1,500 | | | | | | 1,502 | |
|
Babson CLO Ltd. | |
1.674% due 05/15/2023 | | | | | 8,800 | | | | | | 8,801 | |
|
BMI CLO | |
1.216% due 08/01/2021 | | | | | 1,729 | | | | | | 1,726 | |
|
California Republic Auto Receivables Trust | |
0.540% due 03/15/2017 | | | | | 2,619 | | | | | | 2,618 | |
|
Carlyle Global Market Strategies CLO LLC | |
1.505% due 04/20/2022 | | | | | 9,000 | | | | | | 9,001 | |
|
Cavalry CLO Ltd. | |
1.645% due 01/16/2024 | | | | | 7,200 | | | | | | 7,192 | |
|
CIFC Funding Ltd. | |
1.575% due 01/19/2023 | | | | | 6,700 | | | | | | 6,710 | |
1.634% due 12/05/2024 | | | | | 8,600 | | | | | | 8,601 | |
|
Citibank Credit Card Issuance Trust | |
0.424% due 02/07/2018 | | | | | 12,000 | | | | | | 12,004 | |
|
COA Summit CLO Ltd. | |
1.625% due 04/20/2023 | | | | | 3,000 | | | | | | 2,999 | |
|
ColumbusNova CLO Ltd. | |
0.535% due 07/18/2018 | | | | | 334 | | | | | | 333 | |
|
Cornerstone CLO Ltd. | |
0.495% due 07/15/2021 | | | | | 2,645 | | | | | | 2,617 | |
|
Dell Equipment Finance Trust | |
0.640% due 07/22/2016 | | | | | 4,910 | | | | | | 4,912 | |
|
Drug Royalty LP | |
3.081% due 07/15/2023 | | | | | 2,992 | | | | | | 3,034 | |
|
Dryden Leveraged Loan CDO | |
0.515% due 10/20/2020 | | | | | 1,464 | | | | | | 1,459 | |
|
Dryden Senior Loan Fund | |
1.445% due 01/15/2022 | | | | | 7,427 | | | | | | 7,423 | |
|
Duane Street CLO Ltd. | |
0.526% due 01/11/2021 | | | | | 487 | | | | | | 485 | |
|
Educational Services of America, Inc. | |
0.917% due 04/25/2039 | | | | | 2,941 | | | | | | 2,952 | |
|
Exeter Automobile Receivables Trust | |
1.060% due 08/15/2018 | | | | | 9,484 | | | | | | 9,471 | |
|
Flagship CLO | |
0.511% due 09/20/2019 | | | | | 190 | | | | | | 189 | |
|
Fore CLO Ltd. | |
0.520% due 07/20/2019 | | | | | 978 | | | | | | 976 | |
|
Fortress Credit Investments Ltd. | |
1.574% due 07/17/2023 | | | | | 8,600 | | | | | | 8,590 | |
|
Four Corners CLO Ltd. | |
0.551% due 01/26/2020 | | | | | 1,997 | | | | | | 1,990 | |
|
Franklin CLO Ltd. | |
0.546% due 06/15/2018 | | | | | 791 | | | | | | 788 | |
|
Fraser Sullivan CLO Ltd. | |
1.575% due 04/20/2023 | | | | | 8,600 | | | | | | 8,600 | |
|
Golden Knight CDO Ltd. | |
0.515% due 04/15/2019 | | | | | 1,015 | | | | | | 1,013 | |
|
Goldentree Loan Opportunities Ltd. | |
0.970% due 10/18/2021 | | | | | 780 | | | | | | 779 | |
|
Inwood Park CDO Ltd. | |
0.500% due 01/20/2021 | | | | | 6,398 | | | | | | 6,396 | |
| | | | | | | | | | | | |
| | | | | PRINCIPAL
AMOUNT
(000s) | | | | | MARKET
VALUE
(000s) | |
|
Jersey Street CLO Ltd. | |
0.525% due 10/20/2018 | | $ | | | 149 | | | $ | | | 149 | |
|
Landmark CLO Ltd. | |
0.515% due 10/19/2020 | | | | | 2,557 | | | | | | 2,550 | |
|
LCM LP | |
1.530% due 04/15/2022 | | | | | 20,000 | | | | | | 20,022 | |
1.540% due 10/19/2022 | | | | | 8,000 | | | | | | 7,996 | |
|
Madison Park Funding Ltd. | |
1.570% due 08/15/2022 | | | | | 10,600 | | | | | | 10,602 | |
|
MT Wilson CLO Ltd. | |
0.506% due 07/11/2020 | | | | | 313 | | | | | | 313 | |
|
Nelnet Student Loan Trust | |
0.401% due 12/24/2035 | | | | | 7,400 | | | | | | 7,277 | |
|
Northstar Education Finance, Inc. | |
0.419% due 01/30/2017 | | | | | 10 | | | | | | 10 | |
0.887% due 12/26/2031 | | | | | 3,361 | | | | | | 3,379 | |
|
Ocean Trails CLO | |
0.526% due 10/12/2020 | | | | | 1,815 | | | | | | 1,800 | |
|
Octagon Investment Partners Ltd. | |
1.549% due 05/05/2023 | | | | | 15,250 | | | | | | 15,220 | |
|
OHA Intrepid Leveraged Loan Fund Ltd. | |
1.195% due 04/20/2021 | | | | | 1,072 | | | | | | 1,072 | |
|
Panhandle-Plains Higher Education Authority, Inc. | |
0.784% due 07/01/2021 | | | | | 2,231 | | | | | | 2,235 | |
1.414% due 10/01/2035 | | | | | 1,431 | | | | | | 1,455 | |
|
Race Point CLO Ltd. | |
0.535% due 04/15/2020 | | | | | 1,228 | | | | | | 1,227 | |
|
SLM Private Education Loan Trust | |
0.936% due 10/16/2023 | | | | | 1,451 | | | | | | 1,455 | |
|
SLM Student Loan Trust | |
0.277% due 07/25/2017 | | | | | 130 | | | | | | 130 | |
0.486% due 03/15/2019 | | | | | 541 | | | | | | 541 | |
0.627% due 10/25/2016 | | | | | 542 | | | | | | 542 | |
0.677% due 04/25/2023 | | | | | 7,132 | | | | | | 7,136 | |
0.777% due 10/25/2017 | | | | | 591 | | | | | | 592 | |
0.827% due 10/25/2017 | | | | | 435 | | | | | | 436 | |
0.887% due 01/25/2029 | | | | | 6,417 | | | | | | 6,444 | |
1.777% due 04/25/2023 | | | | | 1,028 | | | | | | 1,055 | |
|
Stone Tower CLO Ltd. | |
0.494% due 04/17/2021 | | | | | 3,745 | | | | | | 3,715 | |
|
Structured Asset Investment Loan Trust | |
1.187% due 11/25/2033 | | | | | 1,735 | | | | | | 1,674 | |
|
Symphony CLO LP | |
1.374% due 01/09/2023 | | | | | 9,108 | | | | | | 9,083 | |
|
Symphony CLO Ltd. | |
1.529% due 07/28/2021 | | | | | 4,851 | | | | | | 4,855 | |
1.544% due 07/23/2023 | | | | | 18,400 | | | | | | 18,410 | |
|
Voya CLO Ltd. | |
0.496% due 12/13/2020 | | | | | 227 | | | | | | 227 | |
0.526% due 12/13/2020 | | | | | 1,330 | | | | | | 1,326 | |
1.575% due 10/15/2022 | | | | | 19,500 | | | | | | 19,497 | |
1.615% due 10/15/2022 | | | | | 9,800 | | | | | | 9,804 | |
|
WG Horizons CLO | |
0.545% due 05/24/2019 | | | | | 340 | | | | | | 338 | |
| | | | | | | | | | | | |
Total Asset-Backed Securities (Cost $333,192) | | | | | | 333,874 | |
| | | | | | | | | | | | |
| |
SOVEREIGN ISSUES 4.1% | |
|
Banco Nacional de Desenvolvimento Economico e Social | |
3.375% due 09/26/2016 | | | | | 6,800 | | | | | | 6,868 | |
|
Export-Import Bank of Korea | |
0.982% due 11/26/2016 | | | | | 7,000 | | | | | | 7,039 | |
1.027% due 01/14/2017 | | | | | 17,250 | | | | | | 17,327 | |
1.133% due 09/17/2016 | | | | | 24,600 | | | | | | 24,703 | |
| | | | | | | | | | | | |
| | | | | PRINCIPAL
AMOUNT
(000s) | | | | | MARKET
VALUE
(000s) | |
1.250% due 11/20/2015 | | $ | | | 20,550 | | | $ | | | 20,569 | |
3.750% due 10/20/2016 | | | | | 2,500 | | | | | | 2,585 | |
4.125% due 09/09/2015 | | | | | 1,500 | | | | | | 1,510 | |
|
Japan Finance Organization for Municipalities | |
0.934% due 05/22/2017 | | | | | 13,000 | | | | | | 13,119 | |
|
Korea Development Bank | |
0.901% due 01/22/2017 | | | | | 21,600 | | | | | | 21,600 | |
3.250% due 03/09/2016 | | | | | 4,495 | | | | | | 4,562 | |
|
Korea Housing Finance Corp. | |
3.500% due 12/15/2016 | | | | | 2,019 | | | | | | 2,081 | |
4.125% due 12/15/2015 | | | | | 7,400 | | | | | | 7,509 | |
|
Mexico Government International Bond | |
5.625% due 01/15/2017 | | | | | 13,500 | | | | | | 14,418 | |
| | | | | | | | | | | | |
Total Sovereign Issues
(Cost $143,765) | | | | | | 143,890 | |
| | | | | | | | | | | | |
| |
SHORT-TERM INSTRUMENTS 7.4% | |
| |
CERTIFICATES OF DEPOSIT 1.1% | |
|
Banco Bilbao Vizcaya Argentaria S.A. | |
1.027% due 10/23/2015 | | | 25,750 | | | | | | 25,740 | |
|
Intesa Sanpaolo SpA | |
1.656% due 04/11/2016 | | | 2,750 | | | | | | 2,757 | |
|
Itau Unibanco Holding S.A. | |
1.511% due 05/31/2016 | | | 7,300 | | | | | | 7,310 | |
|
Sumitomo Mitsui Banking Corp. | |
0.649% due 05/02/2017 | | | | | 3,600 | | | | | | 3,600 | |
| | | | | | | | | | | | |
| | | | | | | | | | | 39,407 | |
| | | | | | | | | | | | |
| | | | | | | | | | | | |
COMMERCIAL PAPER 6.3% | |
|
ENI Finance USA, Inc. | |
1.280% due 06/02/2016 | | | | | 24,000 | | | | | | 23,747 | |
1.280% due 06/03/2016 | | | | | 5,000 | | | | | | 4,947 | |
1.350% due 06/10/2016 | | | | | 7,000 | | | | | | 6,923 | |
|
Entergy Corp. | |
0.950% due 07/09/2015 | | | | | 28,000 | | | | | | 27,994 | |
|
Kinder Morgan, Inc. | |
1.250% due 07/16/2015 | | | | | 19,300 | | | | | | 19,290 | |
|
Newell Rubbermaid, Inc. | |
1.025% due 07/09/2015 | | | | | 21,000 | | | | | | 20,995 | |
|
Southwestern Energy Co. | |
1.014% due 07/06/2015 | | | | | 10,000 | | | | | | 9,998 | |
|
Tesco Treasury Services PLC | |
0.985% due 08/18/2015 | | | | | 4,100 | | | | | | 4,095 | |
1.024% due 08/17/2015 | | | | | 33,000 | | | | | | 32,957 | |
3.250% due 08/18/2015 | | | | | 400 | | | | | | 398 | |
|
Thermo Fisher Scientific, Inc. | |
0.940% due 08/26/2015 | | | | | 25,000 | | | | | | 24,963 | |
1.040% due 09/14/2015 | | | | | 7,800 | | | | | | 7,792 | |
|
Weatherford International Ltd. | |
1.060% due 07/23/2015 | | | | | 4,500 | | | | | | 4,497 | |
1.060% due 07/24/2015 | | | | | 5,000 | | | | | | 4,997 | |
1.060% due 07/27/2015 | | | | | 8,200 | | | | | | 8,194 | |
|
Wyndham Worldwide Corp. | |
0.970% due 07/02/2015 | | | | | 5,000 | | | | | | 5,000 | |
0.970% due 07/07/2015 | | | | | 8,000 | | | | | | 7,999 | |
0.970% due 07/23/2015 | | | | | 7,000 | | | | | | 6,996 | |
| | | | | | | | | | | | |
| | | | | | | | | | | 221,782 | |
| | | | | | | | | | | | |
| |
| | | | | | |
| 70 | | PIMCO ETF TRUST | | | | See Accompanying Notes |
June 30, 2015
| | | | | | | | | | |
| | | | | | | | | MARKET
VALUE
(000s) | |
REPURCHASE AGREEMENTS (a) 0.0% | |
| | | | | | $ | | | 1,204 | |
| | | | | | | | | | |
Total Short-Term Instruments
(Cost $262,299) | | | 262,393 | |
| | | | | | | | | | |
| | | | | | | | | | |
Total Investments in Securities
(Cost $3,805,618) | | | 3,804,250 | |
| | | | | | | | | | |
| | | | | | | | | | |
Total Investments 107.6%
(Cost $3,805,618) | | $ | | | 3,804,250 | |
| |
Other Assets and Liabilities, net (7.6%) | | | (268,200 | ) |
| | | | | | | | | | |
Net Assets 100.0% | | $ | | | 3,536,050 | |
| | | | | | | | | | |
NOTES TO SCHEDULE OF INVESTMENTS (AMOUNTS IN THOUSANDS*):
| * | A zero balance may reflect actual amounts rounding to less than one thousand. |
BORROWINGS AND OTHER FINANCING TRANSACTIONS
(a) REPURCHASE AGREEMENTS:
| | | | | | | | | | | | | | | | | | | | | | | | | | | | | | | | |
| Counterparty | | | | Lending
Rate | | | Settlement
Date | | | Maturity
Date | | | Principal
Amount | | | Collateralized By | | Collateral
Received,
at Value | | | Repurchase
Agreements,
at Value | | | Repurchase
Agreement
Proceeds
to be
Received (1) | |
SSB | | | | | 0.000 | % | | | 06/30/2015 | | | | 07/01/2015 | | | $ | 1,204 | | | Fannie Mae 2.200% due 10/17/2022 | | $ | (1,233 | ) | | $ | 1,204 | | | $ | 1,204 | |
Total Repurchase Agreements | | | | | | | | | | | | | | | | | | | | | | $ | (1,233 | ) | | $ | 1,204 | | | $ | 1,204 | |
| (1) | Includes accrued interest. |
REVERSE REPURCHASE AGREEMENTS:
| | | | | | | | | | | | | | | | | | | | | | |
| Counterparty | | | | Borrowing
Rate | | | Borrowing
Date | | | Maturity
Date | | | Amount
Borrowed (2) | | | Payable for
Reverse
Repurchase
Agreements | |
GSC | | | | | 3.500 | % | | | 04/27/2015 | | | | 04/27/2017 | | | $ | (1,077 | ) | | $ | (1,072 | ) |
JPS | | | | | 0.400 | % | | | 06/30/2015 | | | | 07/01/2015 | | | | (20,000 | ) | | | (20,000 | ) |
RDR | | | | | 0.420 | % | | | 05/29/2015 | | | | 07/06/2015 | | | | (104,756 | ) | | | (104,796 | ) |
| | | | | | 0.420 | % | | | 06/03/2015 | | | | 07/08/2015 | | | | (82,251 | ) | | | (82,278 | ) |
| | | | | | 0.420 | % | | | 06/05/2015 | | | | 07/07/2015 | | | | (23,969 | ) | | | (23,976 | ) |
| | | | | | 0.420 | % | | | 06/16/2015 | | | | 07/15/2015 | | | | (28,643 | ) | | | (28,648 | ) |
Total Reverse Repurchase Agreements | | | | | | | | | | | | | | | | | | | | $ | (260,770 | ) |
| (2) | As of June 30, 2015, there were no open sale-buyback transactions. The average amount of borrowings outstanding during the period ended June 30, 2015 was $106,656 at a weighted average interest rate of 0.344%. |
BORROWINGS AND OTHER FINANCING TRANSACTIONS SUMMARY
The following is a summary by counterparty of the market value of Borrowings and Other Financing Transactions and collateral (received)/pledged as of June 30, 2015:
| (b) | Securities with an aggregate market value of $273,058 have been pledged as collateral under the terms of the following master agreements as of June 30, 2015. |
| | | | | | | | | | | | | | | | | | | | | | | | | | | | | | |
| Counterparty | | | | Repurchase
Agreement
Proceeds
to be
Received | | | Payable for
Reverse
Repurchase
Agreements | | | Payable for
Sale-Buyback
Transactions | | | Securities
Out on Loan | | | Total
Borrowings and
Other Financing
Transactions | | | Collateral
(Received)/
Pledged | | | Net
Exposure (3) | |
Global/Master Repurchase Agreement | | | | | | | | | | | | | | | | | | | | | | | | | | | | | | |
GSC | | | | $ | 0 | | | $ | (1,072 | ) | | $ | 0 | | | $ | 0 | | | $ | (1,072 | ) | | $ | 1,132 | | | $ | 60 | |
JPS | | | | | 0 | | | | (20,000 | ) | | | 0 | | | | 0 | | | | (20,000 | ) | | | 19,991 | | | | (9 | ) |
RDR | | | | | 0 | | | | (239,698 | ) | | | 0 | | | | 0 | | | | (239,698 | ) | | | 251,934 | | | | 12,236 | |
SSB | | | | | 1,204 | | | | 0 | | | | 0 | | | | 0 | | | | 1,204 | | | | (1,233 | ) | | | (29 | ) |
Total Borrowings and Other Financing Transactions | | | | $ | 1,204 | | | $ | (260,770 | ) | | $ | 0 | | | $ | 0 | | | | | | | | | | | | | |
| (3) | Net Exposure represents the net receivable/(payable) that would be due from/to the counterparty in the event of default. Exposure from borrowings and other financing transactions can only be netted across transactions governed under the same master agreement with the same legal entity. See Note 7, Principal Risks, in the Notes to Financial Statements for more information regarding master netting arrangements. |
| | | | | | |
| See Accompanying Notes | | ANNUAL REPORT | | JUNE 30, 2015 | | 71 |
Schedule of Investments PIMCO Enhanced Short Maturity Active Exchange-Traded Fund (Cont.)
June 30, 2015
FAIR VALUE MEASUREMENTS
The following is a summary of the fair valuations according to the inputs used as of June 30, 2015 in valuing the Fund’s assets and liabilities:
| | | | | | | | | | | | | | | | | | |
| Category and Subcategory | | | | Level 1 | | | Level 2 | | | Level 3 | | | Fair Value at
06/30/2015 | |
Investments in Securities, at Value | | | | | | | | | | | | | | | | | | |
Corporate Bonds & Notes | | | | | | | | | | | | | | | | | | |
Banking & Finance | | | | $ | 0 | | | $ | 1,237,005 | | | $ | 0 | | | $ | 1,237,005 | |
Industrials | | | | | 0 | | | | 837,989 | | | | 0 | | | | 837,989 | |
Utilities | | | | | 0 | | | | 413,926 | | | | 0 | | | | 413,926 | |
Municipal Bonds & Notes | | | | | | | | | | | | | | | | | | |
Arkansas | | | | | 0 | | | | 1,009 | | | | 0 | | | | 1,009 | |
California | | | | | 0 | | | | 17,497 | | | | 0 | | | | 17,497 | |
New Jersey | | | | | 0 | | | | 7,711 | | | | 0 | | | | 7,711 | |
New York | | | | | 0 | | | | 101 | | | | 0 | | | | 101 | |
Oregon | | | | | 0 | | | | 3,504 | | | | 0 | | | | 3,504 | |
Texas | | | | | 0 | | | | 4,913 | | | | 0 | | | | 4,913 | |
U.S. Government Agencies | | | | | 0 | | | | 109,445 | | | | 1,375 | | | | 110,820 | |
U.S. Treasury Obligations | | | | | 0 | | | | 148,130 | | | | 0 | | | | 148,130 | |
Mortgage-Backed Securities | | | | | 0 | | | | 281,488 | | | | 0 | | | | 281,488 | |
Asset-Backed Securities | | | | | 0 | | | | 332,374 | | | | 1,500 | | | | 333,874 | |
Sovereign Issues | | | | | 0 | | | | 143,890 | | | | 0 | | | | 143,890 | |
Short-Term Instruments | | | | | | | | | | | | | | | | | | |
Certificates of Deposit | | | | | 0 | | | | 39,407 | | | | 0 | | | | 39,407 | |
Commercial Paper | | | | | 0 | | | | 221,782 | | | | 0 | | | | 221,782 | |
Repurchase Agreements | | | | | 0 | | | | 1,204 | | | | 0 | | | | 1,204 | |
Total Investments | | | | $ | 0 | | | $ | 3,801,375 | | | $ | 2,875 | | | $ | 3,804,250 | |
There were no significant transfers between Levels 1, 2, or 3 during the period ended June 30, 2015.
| | | | | | |
| 72 | | PIMCO ETF TRUST | | | | See Accompanying Notes |
Schedule of Investments PIMCO Foreign Currency Strategy Active Exchange-Traded Fund
June 30, 2015
| | | | | | | | | | | | |
| | | | | PRINCIPAL
AMOUNT
(000s) | | | | | MARKET
VALUE
(000s) | |
INVESTMENTS IN SECURITIES 101.2% | |
| |
BRAZIL 8.5% | |
| |
SOVEREIGN ISSUES 8.5% | |
|
Brazil Letras do Tesouro Nacional | |
0.000% due 10/01/2015 (a) | | BRL | | | 400 | | | $ | | | 124 | |
0.000% due 01/01/2016 (a) | | | | | 1,450 | | | | | | 436 | |
0.000% due 01/01/2017 (a) | | | | | 2,600 | | | | | | 687 | |
| | | | | | | | | | | | |
Total Brazil
(Cost $1,515) | | | 1,247 | |
| | | | | | | | | | | | |
| |
DENMARK 16.3% | |
| |
CORPORATE BONDS & NOTES 16.3% | |
|
Nordea Kredit Realkreditaktieselskab | |
1.000% due 10/01/2015 | | EUR | | | 950 | | | | | | 1,063 | |
|
Nykredit Realkredit A/S | |
2.000% due 01/01/2016 | | DKK | | | 4,400 | | | | | | 666 | |
|
Realkredit Danmark A/S | |
2.000% due 01/01/2016 | | | | | 4,400 | | | | | | 665 | |
| | | | | | | | | | | | |
Total Denmark
(Cost $2,671) | | | 2,394 | |
| | | | | | | | | | | | |
| |
ITALY 7.7% | |
| |
SOVEREIGN ISSUES 7.7% | |
|
Italy Buoni Poliennali Del Tesoro | |
2.750% due 12/01/2015 | | EUR | | | 1,000 | | | | | | 1,127 | |
| | | | | | | | | | | | |
Total Italy
(Cost $1,073) | | | 1,127 | |
| | | | | | | | | | | | |
| |
JAPAN 7.2% | |
| |
SOVEREIGN ISSUES 7.2% | |
|
Japan Government International Bond | |
0.300% due 09/20/2015 | | JPY | | | 130,000 | | | | | | 1,063 | |
| | | | | | | | | | | | |
Total Japan
(Cost $1,190) | | | 1,063 | |
| | | | | | | | | | | | |
| |
NETHERLANDS 5.3% | |
| |
SOVEREIGN ISSUES 5.3% | |
|
Netherlands Government International Bond | |
0.010% due 04/15/2016 | | EUR | | | 700 | | | | | | 782 | |
| | | | | | | | | | | | |
Total Netherlands
(Cost $763) | | | 782 | |
| | | | | | | | | | | | |
| | | | | | | | | | | | |
| | | | | PRINCIPAL
AMOUNT
(000s) | | | | | MARKET
VALUE
(000s) | |
NEW ZEALAND 3.2% | |
| |
SOVEREIGN ISSUES 3.2% | |
|
New Zealand Government Bond | |
6.000% due 12/15/2017 | | NZD | | | 650 | | | $ | | | 473 | |
| | | | | | | | | | | | |
Total New Zealand
(Cost $532) | | | 473 | |
| | | | | | | | | | | | |
| |
NORWAY 1.9% | |
| |
SOVEREIGN ISSUES 1.9% | |
|
Norway Government Bond | |
4.250% due 05/19/2017 | | NOK | | | 2,100 | | | | | | 285 | |
| | | | | | | | | | | | |
Total Norway
(Cost $292) | | | 285 | |
| | | | | | | | | | | | |
| |
POLAND 13.0% | |
| |
SOVEREIGN ISSUES 13.0% | |
|
Poland Government International Bond | |
3.250% due 07/25/2019 | | PLN | | | 3,000 | | | | | | 821 | |
3.750% due 04/25/2018 | | | | | 3,900 | | | | | | 1,082 | |
| | | | | | | | | | | | |
Total Poland
(Cost $2,050) | | | 1,903 | |
| | | | | | | | | | | | |
| |
SWEDEN 4.0% | |
| |
SOVEREIGN ISSUES 4.0% | |
|
Sweden Government International Bond | |
3.500% due 06/01/2022 | | SEK | | | 4,100 | | | | | | 590 | |
| | | | | | | | | | | | |
Total Sweden
(Cost $606) | | | 590 | |
| | | | | | | | | | | | |
| |
UNITED STATES 1.6% | |
| |
CORPORATE BONDS & NOTES 1.6% | |
|
WM Covered Bond Program | |
4.000% due 11/26/2016 | | EUR | | | 200 | | | | | | 233 | |
| | | | | | | | | | | | |
Total United States
(Cost $235) | | | 233 | |
| | | | | | | | | | | | |
| |
SHORT-TERM INSTRUMENTS 32.5% | |
| |
REPURCHASE AGREEMENTS (b) 1.1% | |
| | | | | | | | | | | 156 | |
| | | | | | | | | | | | |
| | | | | | | | | | | | |
| | | | | PRINCIPAL
AMOUNT
(000s) | | | | | MARKET
VALUE
(000s) | |
SHORT-TERM NOTES 15.7% | |
|
Federal Home Loan Bank | |
0.070% due 07/29/2015 | | $ | | | 600 | | | $ | | | 600 | |
0.080% due 07/24/2015 | | | | | 200 | | | | | | 200 | |
0.082% due 07/15/2015 | | | | | 100 | | | | | | 100 | |
0.085% due 09/16/2015 | | | | | 800 | | | | | | 800 | |
0.090% due 08/05/2015 - 09/11/2015 | | | | | 200 | | | | | | 200 | |
0.097% due 08/12/2015 | | | | | 400 | | | | | | 400 | |
| | | | | | | | | | | | |
| | | | | | | | | | | 2,300 | |
| | | | | | | | | | | | |
| |
FRANCE TREASURY BILLS 5.3% | |
(0.167%) due 02/03/2016 | | EUR | | | 700 | | | | | | 781 | |
| | | | | | | | | | | | |
| |
SPAIN TREASURY BILLS 8.3% | |
0.010% due 02/19/2016 | | | | | 1,100 | | | | | | 1,226 | |
| | | | | | | | | | | | |
| |
U.S. TREASURY BILLS 2.1% | |
0.026% due 10/08/2015 | | $ | | | 301 | | | | | | 301 | |
| | | | | | | | | | | | |
Total Short-Term Instruments
(Cost $4,715) | | | 4,764 | |
| | | | | | | | | | | | |
| | | | | | | | | | | | |
Total Investments in Securities
(Cost $15,642) | | | 14,861 | |
| | | | | | | | | | | | |
| | | | | | | | | | | | |
Total Investments 101.2%
(Cost $15,642) | | | $ | | | 14,861 | |
| |
Financial Derivative
Instruments (c) (1.2%) (Cost or Premiums, net $4) | | | (169 | ) |
| |
Other Assets and Liabilities, net 0.0% | | | (10 | ) |
| | | | | | | | | | | | |
Net Assets 100.0% | | | $ | | | 14,682 | |
| | | | | | | | | | | | |
NOTES TO SCHEDULE OF INVESTMENTS (AMOUNTS IN THOUSANDS*):
| * | A zero balance may reflect actual amounts rounding to less than one thousand. |
BORROWINGS AND OTHER FINANCING TRANSACTIONS
(b) REPURCHASE AGREEMENTS:
| | | | | | | | | | | | | | | | | | | | | | | | | | | | | | | | |
| Counterparty | | | | Lending
Rate | | | Settlement
Date | | | Maturity
Date | | | Principal
Amount | | | Collateralized By | | Collateral
Received,
at Value | | | Repurchase
Agreements,
at Value | | | Repurchase
Agreement
Proceeds
to be
Received (1) | |
SSB | | | | | 0.000 | % | | | 06/30/2015 | | | | 07/01/2015 | | | $ | 156 | | | Fannie Mae 2.200% due 10/17/2022 | | $ | (161 | ) | | $ | 156 | | | $ | 156 | |
Total Repurchase Agreements | | | | | | | | | | | | | | | | | | | | | | $ | (161 | ) | | $ | 156 | | | $ | 156 | |
| (1) | Includes accrued interest. |
| | | | | | |
| See Accompanying Notes | | ANNUAL REPORT | | JUNE 30, 2015 | | 73 |
Schedule of Investments PIMCO Foreign Currency Strategy Active Exchange-Traded Fund (Cont.)
BORROWINGS AND OTHER FINANCING TRANSACTIONS SUMMARY
The following is a summary by counterparty of the market value of Borrowings and Other Financing Transactions and collateral (received) as of June 30, 2015:
| | | | | | | | | | | | | | | | | | | | | | | | | | | | | | |
| Counterparty | | | | Repurchase
Agreement
Proceeds
to be
Received | | | Payable for
Reverse
Repurchase
Agreements | | | Payable for
Sale-Buyback
Transactions | | | Securities
Out on Loan | | | Total
Borrowings and
Other Financing
Transactions | | | Collateral
(Received) | | | Net
Exposure (2) | |
Global/Master Repurchase Agreement | | | | | | | | | | | | | | | | | | | | | | | | | | | | | | |
SSB | | | | $ | 156 | | | $ | 0 | | | $ | 0 | | | $ | 0 | | | $ | 156 | | | $ | (161 | ) | | $ | (5 | ) |
Total Borrowings and Other Financing Transactions | | | | $ | 156 | | | $ | 0 | | | $ | 0 | | | $ | 0 | | | | | | | | | | | | | |
| (2) | Net Exposure represents the net receivable/(payable) that would be due from/to the counterparty in the event of default. Exposure from borrowings and other financing transactions can only be netted across transactions governed under the same master agreement with the same legal entity. See Note 7, Principal Risks, in the Notes to Financial Statements for more information regarding master netting arrangements. |
(c) FINANCIAL DERIVATIVE INSTRUMENTS: OVER THE COUNTER
FORWARD FOREIGN CURRENCY CONTRACTS:
| | | | | | | | | | | | | | | | | | | | | | | | | | | | | | |
| Counterparty | | | | Settlement
Month | | | Currency to
be Delivered | | | Currency to
be Received | | | Unrealized
Appreciation/
(Depreciation) | |
| | | | | | Asset | | | Liability | |
BOA | | | | | 07/2015 | | | | INR | | | | 6,867 | | | | $ | | | | 105 | | | $ | 0 | | | $ | (2 | ) |
| | | | | | 07/2015 | | | | NZD | | | | 706 | | | | | | | | 503 | | | | 25 | | | | 0 | |
| | | | | | 07/2015 | | | | $ | | | | 905 | | | | JPY | | | | 111,868 | | | | 9 | | | | 0 | |
| | | | | | 07/2015 | | | | | | | | 8 | | | | MXN | | | | 123 | | | | 0 | | | | 0 | |
| | | | | | 08/2015 | | | | | | | | 371 | | | | NOK | | | | 2,870 | | | | 0 | | | | (5 | ) |
| | | | | | 08/2015 | | | | | | | | 762 | | | | SEK | | | | 6,375 | | | | 8 | | | | 0 | |
| | | | | | 10/2015 | | | | BRL | | | | 400 | | | | $ | | | | 126 | | | | 1 | | | | 0 | |
BPS | | | | | 07/2015 | | | | | | | | 2,172 | | | | | | | | 700 | | | | 2 | | | | 0 | |
| | | | | | 07/2015 | | | | JPY | | | | 117,268 | | | | | | | | 946 | | | | 0 | | | | (12 | ) |
| | | | | | 07/2015 | | | | MXN | | | | 4,565 | | | | | | | | 294 | | | | 4 | | | | 0 | |
| | | | | | 07/2015 | | | | $ | | | | 700 | | | | BRL | | | | 2,172 | | | | 0 | | | | (1 | ) |
| | | | | | 08/2015 | | | | BRL | | | | 2,172 | | | | $ | | | | 692 | | | | 1 | | | | 0 | |
| | | | | | 08/2015 | | | | $ | | | | 946 | | | | JPY | | | | 117,268 | | | | 12 | | | | 0 | |
BRC | | | | | 07/2015 | | | | | | | | 735 | | | | NZD | | | | 1,035 | | | | 0 | | | | (34 | ) |
| | | | | | 07/2015 | | | | ZAR | | | | 135 | | | | $ | | | | 11 | | | | 0 | | | | 0 | |
CBK | | | | | 07/2015 | | | | CAD | | | | 1,640 | | | | | | | | 1,329 | | | | 16 | | | | 0 | |
| | | | | | 07/2015 | | | | $ | | | | 13 | | | | EUR | | | | 12 | | | | 0 | | | | 0 | |
| | | | | | 08/2015 | | | | NOK | | | | 11,809 | | | | $ | | | | 1,461 | | | | 0 | | | | (44 | ) |
| | | | | | 08/2015 | | | | $ | | | | 1,328 | | | | CAD | | | | 1,640 | | | | 0 | | | | (16 | ) |
| | | | | | 08/2015 | | | | | | | | 1,421 | | | | DKK | | | | 9,500 | | | | 0 | | | | 0 | |
| | | | | | 08/2015 | | | | | | | | 1,886 | | | | GBP | | | | 1,226 | | | | 40 | | | | 0 | |
| | | | | | 08/2015 | | | | | | | | 682 | | | | NOK | | | | 5,195 | | | | 0 | | | | (20 | ) |
| | | | | | 09/2015 | | | | | | | | 1,010 | | | | MXN | | | | 15,965 | | | | 0 | | | | (1 | ) |
DUB | | | | | 07/2015 | | | | BRL | | | | 1,522 | | | | $ | | | | 499 | | | | 10 | | | | 0 | |
| | | | | | 07/2015 | | | | KRW | | | | 412,709 | | | | | | | | 381 | | | | 13 | | | | 0 | |
| | | | | | 07/2015 | | | | TRY | | | | 7 | | | | | | | | 3 | | | | 0 | | | | 0 | |
| | | | | | 07/2015 | | | | $ | | | | 491 | | | | BRL | | | | 1,522 | | | | 0 | | | | (1 | ) |
| | | | | | 08/2015 | | | | DKK | | | | 4,966 | | | | $ | | | | 729 | | | | 0 | | | | (14 | ) |
| | | | | | 08/2015 | | | | SEK | | | | 11,335 | | | | | | | | 1,331 | | | | 0 | | | | (37 | ) |
| | | | | | 08/2015 | | | | $ | | | | 161 | | | | DKK | | | | 1,045 | | | | 0 | | | | (5 | ) |
FBF | | | | | 07/2015 | | | | MXN | | | | 19,134 | | | | $ | | | | 1,245 | | | | 28 | | | | 0 | |
| | | | | | 09/2015 | | | | $ | | | | 2,216 | | | | CNY | | | | 13,621 | | | | 4 | | | | 0 | |
GLM | | | | | 07/2015 | | | | | | | | 1,441 | | | | CAD | | | | 1,790 | | | | 0 | | | | (8 | ) |
| | | | | | 07/2015 | | | | | | | | 373 | | | | KRW | | | | 412,840 | | | | 0 | | | | (5 | ) |
| | | | | | 08/2015 | | | | | | | | 732 | | | | GBP | | | | 477 | | | | 17 | | | | 0 | |
| | | | | | 08/2015 | | | | | | | | 1,258 | | | | NOK | | | | 9,495 | | | | 0 | | | | (49 | ) |
| | | | | | 09/2015 | | | | HKD | | | | 5,699 | | | | $ | | | | 735 | | | | 0 | | | | 0 | |
| | | | | | |
| 74 | | PIMCO ETF TRUST | | | | See Accompanying Notes |
June 30, 2015
| | | | | | | | | | | | | | | | | | | | | | | | | | | | | | |
| Counterparty | | | | Settlement
Month | | | Currency to
be Delivered | | | Currency to
be Received | | | Unrealized
Appreciation/
(Depreciation) | |
| | | | | | Asset | | | Liability | |
HUS | | | | | 07/2015 | | | | NZD | | | | 1,045 | | | | $ | | | | 727 | | | $ | 19 | | | $ | 0 | |
| | | | | | 07/2015 | | | | SGD | | | | 512 | | | | | | | | 377 | | | | 0 | | | | (3 | ) |
| | | | | | 08/2015 | | | | $ | | | | 17 | | | | SEK | | | | 140 | | | | 0 | | | | 0 | |
JPM | | | | | 07/2015 | | | | JPY | | | | 90,400 | | | | $ | | | | 728 | | | | 0 | | | | (11 | ) |
| | | | | | 07/2015 | | | | PLN | | | | 5,059 | | | | | | | | 1,347 | | | | 3 | | | | 0 | |
| | | | | | 08/2015 | | | | CHF | | | | 991 | | | | | | | | 1,054 | | | | 0 | | | | (8 | ) |
MSB | | | | | 07/2015 | | | | CAD | | | | 150 | | | | | | | | 122 | | | | 2 | | | | 0 | |
| | | | | | 07/2015 | | | | PLN | | | | 4,121 | | | | | | | | 1,120 | | | | 25 | | | | 0 | |
| | | | | | 08/2015 | | | | DKK | | | | 5,120 | | | | | | | | 739 | | | | 0 | | | | (27 | ) |
| | | | | | 08/2015 | | | | $ | | | | 3,150 | | | | CHF | | | | 2,939 | | | | 0 | | | | (1 | ) |
| | | | | | 01/2016 | | | | BRL | | | | 1,450 | | | | $ | | | | 462 | | | | 24 | | | | 0 | |
NGF | | | | | 07/2015 | | | | MXN | | | | 4,763 | | | | | | | | 308 | | | | 5 | | | | 0 | |
SCX | | | | | 07/2015 | | | | BRL | | | | 650 | | | | | | | | 214 | | | | 5 | | | | 0 | |
| | | | | | 07/2015 | | | | $ | | | | 210 | | | | BRL | | | | 650 | | | | 0 | | | | 0 | |
| | | | | | 07/2015 | | | | | | | | 3,802 | | | | EUR | | | | 3,393 | | | | 0 | | | | (19 | ) |
| | | | | | 07/2015 | | | | | | | | 773 | | | | JPY | | | | 95,800 | | | | 10 | | | | 0 | |
| | | | | | 07/2015 | | | | | | | | 1,022 | | | | MXN | | | | 15,940 | | | | 0 | | | | (9 | ) |
| | | | | | 08/2015 | | | | EUR | | | | 3,393 | | | | $ | | | | 3,804 | | | | 19 | | | | 0 | |
| | | | | | 08/2015 | | | | GBP | | | | 12 | | | | | | | | 19 | | | | 0 | | | | 0 | |
| | | | | | 08/2015 | | | | IDR | | | | 1,153,849 | | | | | | | | 85 | | | | 0 | | | | 0 | |
| | | | | | 08/2015 | | | | $ | | | | 1,053 | | | | DKK | | | | 7,145 | | | | 16 | | | | 0 | |
| | | | | | 09/2015 | | | | HKD | | | | 5,665 | | | | $ | | | | 731 | | | | 0 | | | | 0 | |
| | | | | | 09/2015 | | | | MXN | | | | 15,940 | | | | | | | | 1,017 | | | | 9 | | | | 0 | |
SOG | | | | | 08/2015 | | | | DKK | | | | 2,441 | | | | | | | | 354 | | | | 0 | | | | (11 | ) |
| | | | | | 08/2015 | | | | $ | | | | 381 | | | | DKK | | | | 2,490 | | | | 0 | | | | (8 | ) |
UAG | | | | | 07/2015 | | | | EUR | | | | 3,405 | | | | $ | | | | 3,760 | | | | 15 | | | | (51 | ) |
| | | | | | 07/2015 | | | | $ | | | | 83 | | | | IDR | | | | 1,109,710 | | | | 0 | | | | 0 | |
| | | | | | 07/2015 | | | | | | | | 109 | | | | INR | | | | 7,025 | | | | 1 | | | | 0 | |
| | | | | | 07/2015 | | | | | | | | 804 | | | | MXN | | | | 12,399 | | | | 0 | | | | (15 | ) |
| | | | | | 07/2015 | | | | | | | | 488 | | | | NZD | | | | 716 | | | | 0 | | | | (3 | ) |
| | | | | | 07/2015 | | | | | | | | 1,057 | | | | PLN | | | | 3,957 | | | | 0 | | | | (5 | ) |
| | | | | | 08/2015 | | | | MYR | | | | 30 | | | | $ | | | | 8 | | | | 0 | | | | 0 | |
| | | | | | 08/2015 | | | | NZD | | | | 716 | | | | | | | | 487 | | | | 3 | | | | 0 | |
| | | | | | 08/2015 | | | | $ | | | | 1,493 | | | | NOK | | | | 10,964 | | | | 0 | | | | (96 | ) |
Total Forward Foreign Currency Contracts | | | | | | | | | | | | | | | | | | | | | | | | $ | 346 | | | $ | (521 | ) |
PURCHASED OPTIONS:
FOREIGN CURRENCY OPTIONS
| | | | | | | | | | | | | | | | | | | | | | | | | | | | | | | | |
| Counterparty | | Description | | | | Strike
Price | | | Expiration
Date | | | Notional
Amount | | | Cost | | | Market
Value | |
BOA | | Put - OTC EUR versus USD | | | | | $ | | | | 1.085 | | | | 07/30/2015 | | | | EUR | | | | 1,300 | | | $ | 2 | | | $ | 1 | |
| | | Call - OTC EUR versus USD | | | | | | | | | 1.115 | | | | 07/30/2015 | | | | | | | | 1,300 | | | | 2 | | | | 3 | |
| | | Call - OTC USD versus JPY | | | | | JPY | | | | 126.000 | | | | 09/01/2015 | | | $ | | | | | 1,300 | | | | 2 | | | | 1 | |
UAG | | Call - OTC EUR versus CHF | | | | | CHF | | | | 1.063 | | | | 08/28/2015 | | | | EUR | | | | 1,000 | | | | 7 | | | | 7 | |
| | | | | | | | | | | | | | | | | | | | | | | | $ | 13 | | | $ | 12 | |
Total Purchased Options | | | | | | | | | | | | | | | | | | | | | | | | $ | 13 | | | $ | 12 | |
| | | | | | |
| See Accompanying Notes | | ANNUAL REPORT | | JUNE 30, 2015 | | 75 |
Schedule of Investments PIMCO Foreign Currency Strategy Active Exchange-Traded Fund (Cont.)
WRITTEN OPTIONS:
FOREIGN CURRENCY OPTIONS
| | | | | | | | | | | | | | | | | | | | | | | | | | | | | | | | |
| Counterparty | | Description | | | | Strike
Price | | | Expiration
Date | | | Notional
Amount | | | Premiums
(Received) | | | Market
Value | |
UAG | | Put - OTC EUR versus CHF | | | | | CHF | | | | 1.000 | | | | 08/28/2015 | | | | EUR | | | | 1,000 | | | $ | (9 | ) | | $ | (6 | ) |
Total Written Options | | | | | | | | | | | | | | | | | | | | | | | | $ | (9 | ) | | $ | (6 | ) |
TRANSACTIONS IN WRITTEN CALL AND PUT OPTIONS FOR THE PERIOD ENDED JUNE 30, 2015:
| | | | | | | | | | |
| | | | | Notional
Amount | | | Premiums | |
Balance at Beginning of Period | | | | EUR | 0 | | | $ | 0 | |
Sales | | | | | 1,000 | | | | (9 | ) |
Closing Buys | | | | | 0 | | | | 0 | |
Expirations | | | | | 0 | | | | 0 | |
Exercised | | | | | 0 | | | | 0 | |
Balance at End of Period | | | | EUR | 1,000 | | | $ | (9 | ) |
FINANCIAL DERIVATIVE INSTRUMENTS: OVER THE COUNTER SUMMARY
The following is a summary by counterparty of the market value of OTC financial derivative instruments and collateral (received) as of June 30, 2015:
| | | | | | | | | | | | | | | | | | | | | | | | | | | | | | | | | | | | | | | | | | | | | | | | |
| Counterparty | | | | Financial Derivative Assets | | | | | Financial Derivative Liabilities | | | | | | | | | | |
| | | | Forward
Foreign
Currency
Contracts | | | Purchased
Options | | | Swap
Agreements | | | Total
Over the
Counter | | | | | Forward
Foreign
Currency
Contracts | | | Written
Options | | | Swap
Agreements | | | Total
Over the
Counter | | | Net Market
Value of OTC
Derivatives | | | Collateral
(Received) | | | Net
Exposure (1) | |
BOA | | | | $ | 43 | | | $ | 5 | | | $ | 0 | | | $ | 48 | | | | | $ | (7 | ) | | $ | 0 | | | $ | 0 | | | $ | (7 | ) | | $ | 41 | | | $ | 0 | | | $ | 41 | |
BPS | | | | | 19 | | | | 0 | | | | 0 | | | | 19 | | | | | | (13 | ) | | | 0 | | | | 0 | | | | (13 | ) | | | 6 | | | | 0 | | | | 6 | |
BRC | | | | | 0 | | | | 0 | | | | 0 | | | | 0 | | | | | | (34 | ) | | | 0 | | | | 0 | | | | (34 | ) | | | (34 | ) | | | 0 | | | | (34 | ) |
CBK | | | | | 56 | | | | 0 | | | | 0 | | | | 56 | | | | | | (81 | ) | | | 0 | | | | 0 | | | | (81 | ) | | | (25 | ) | | | 0 | | | | (25 | ) |
DUB | | | | | 23 | | | | 0 | | | | 0 | | | | 23 | | | | | | (57 | ) | | | 0 | | | | 0 | | | | (57 | ) | | | (34 | ) | | | (90 | ) | | | (124 | ) |
FBF | | | | | 32 | | | | 0 | | | | 0 | | | | 32 | | | | | | 0 | | | | 0 | | | | 0 | | | | 0 | | | | 32 | | | | 0 | | | | 32 | |
GLM | | | | | 17 | | | | 0 | | | | 0 | | | | 17 | | | | | | (62 | ) | | | 0 | | | | 0 | | | | (62 | ) | | | (45 | ) | | | 0 | | | | (45 | ) |
HUS | | | | | 19 | | | | 0 | | | | 0 | | | | 19 | | | | | | (3 | ) | | | 0 | | | | 0 | | | | (3 | ) | | | 16 | | | | 0 | | | | 16 | |
JPM | | | | | 3 | | | | 0 | | | | 0 | | | | 3 | | | | | | (19 | ) | | | 0 | | | | 0 | | | | (19 | ) | | | (16 | ) | | | 0 | | | | (16 | ) |
MSB | | | | | 51 | | | | 0 | | | | 0 | | | | 51 | | | | | | (28 | ) | | | 0 | | | | 0 | | | | (28 | ) | | | 23 | | | | 0 | | | | 23 | |
NGF | | | | | 5 | | | | 0 | | | | 0 | | | | 5 | | | | | | 0 | | | | 0 | | | | 0 | | | | 0 | | | | 5 | | | | 0 | | | | 5 | |
SCX | | | | | 59 | | | | 0 | | | | 0 | | | | 59 | | | | | | (28 | ) | | | 0 | | | | 0 | | | | (28 | ) | | | 31 | | | | 0 | | | | 31 | |
SOG | | | | | 0 | | | | 0 | | | | 0 | | | | 0 | | | | | | (19 | ) | | | 0 | | | | 0 | | | | (19 | ) | | | (19 | ) | | | 0 | | | | (19 | ) |
UAG | | | | | 19 | | | | 7 | | | | 0 | | | | 26 | | | | | | (170 | ) | | | (6 | ) | | | 0 | | | | (176 | ) | | | (150 | ) | | | 0 | | | | (150 | ) |
Total Over the Counter | | | | $ | 346 | | | $ | 12 | | | $ | 0 | | | $ | 358 | | | | | $ | (521 | ) | | $ | (6 | ) | | $ | 0 | | | $ | (527 | ) | | | | | | | | | | | | |
| (1) | Net Exposure represents the net receivable/(payable) that would be due from/to the counterparty in the event of default. Exposure from OTC financial derivative instruments can only be netted across transactions governed under the same master agreement with the same legal entity. See Note 7, Principal Risks, in the Notes to Financial Statements for more information regarding master netting arrangements. |
| | | | | | |
| 76 | | PIMCO ETF TRUST | | | | See Accompanying Notes |
June 30, 2015
FAIR VALUE OF FINANCIAL DERIVATIVE INSTRUMENTS
The following is a summary of the fair valuation of the Fund’s derivative instruments categorized by risk exposure. See Note 7, Principal Risks, in the Notes to Financial Statements on risks of the Fund.
Fair Values of Financial Derivative Instruments on the Statements of Assets and Liabilities as of June 30, 2015:
| | | | | | | | | | | | | | | | | | | | | | | | | | |
| | | | | Derivatives not accounted for as hedging instruments | |
| | | | | Commodity
Contracts | | | Credit
Contracts | | | Equity
Contracts | | | Foreign
Exchange
Contracts | | | Interest
Rate Contracts | | | Total | |
Financial Derivative Instruments - Assets | | | | | | | | | | | | | | | | | | | | | | | | | | |
Over the counter | | | | | | | | | | | | | | | | | | | | | | | | | | |
Forward Foreign Currency Contracts | | | | $ | 0 | | | $ | 0 | | | $ | 0 | | | $ | 346 | | | $ | 0 | | | $ | 346 | |
Purchased Options | | | | | 0 | | | | 0 | | | | 0 | | | | 12 | | | | 0 | | | | 12 | |
| | | | $ | 0 | | | $ | 0 | | | $ | 0 | | | $ | 358 | | | $ | 0 | | | $ | 358 | |
| | | | | | | |
Financial Derivative Instruments - Liabilities | | | | | | | | | | | | | | | | | | | | | | | | | | |
Over the counter | | | | | | | | | | | | | | | | | | | | | | | | | | |
Forward Foreign Currency Contracts | | | | $ | 0 | | | $ | 0 | | | $ | 0 | | | $ | 521 | | | $ | 0 | | | $ | 521 | |
Written Options | | | | | 0 | | | | 0 | | | | 0 | | | | 6 | | | | 0 | | | | 6 | |
| | | | $ | 0 | | | $ | 0 | | | $ | 0 | | | $ | 527 | | | $ | 0 | | | $ | 527 | |
The Effect of Financial Derivative Instruments on the Statements of Operations for the period ended June 30, 2015:
| | | | | | | | | | | | | | | | | | | | | | | | | | |
| | | | | Derivatives not accounted for as hedging instruments | |
| | | | | Commodity
Contracts | | | Credit
Contracts | | | Equity
Contracts | | | Foreign
Exchange
Contracts | | | Interest
Rate Contracts | | | Total | |
Net Realized Gain (Loss) on Financial Derivative Instruments | | | | | | | | | | | | | | | | | | | | | | | | | | |
Over the counter | | | | | | | | | | | | | | | | | | | | | | | | | | |
Forward Foreign Currency Contracts | | | | $ | 0 | | | $ | 0 | | | $ | 0 | | | $ | 547 | | | $ | 0 | | | $ | 547 | |
Purchased Options | | | | | 0 | | | | 0 | | | | 0 | | | | (2 | ) | | | 0 | | | | (2 | ) |
| | | | $ | 0 | | | $ | 0 | | | $ | 0 | | | $ | 545 | | | $ | 0 | | | $ | 545 | |
| | | | | | | |
Net Change in Unrealized Appreciation (Depreciation) on Financial Derivative Instruments | | | | | | | | | | | | | | | | | | | | | | | | | | |
Over the counter | | | | | | | | | | | | | | | | | | | | | | | | | | |
Forward Foreign Currency Contracts | | | | $ | 0 | | | $ | 0 | | | $ | 0 | | | $ | (291 | ) | | $ | 0 | | | $ | (291 | ) |
Written Options | | | | | 0 | | | | 0 | | | | 0 | | | | 3 | | | | 0 | | | | 3 | |
| | | | $ | 0 | | | $ | 0 | | | $ | 0 | | | $ | (288 | ) | | $ | 0 | | | $ | (288 | ) |
FAIR VALUE MEASUREMENTS
The following is a summary of the fair valuations according to the inputs used as of June 30, 2015 in valuing the Fund’s assets and liabilities:
| | | | | | | | | | | | | | | | | | |
| Category and Subcategory | | | | Level 1 | | | Level 2 | | | Level 3 | | | Fair Value at 06/30/2015 | |
Investments in Securities, at Value | | | | | | | | | | | | | | | | | | |
Brazil | | | | | | | | | | | | | | | | | | |
Sovereign Issues | | | | $ | 0 | | | $ | 1,247 | | | $ | 0 | | | $ | 1,247 | |
Denmark | | | | | | | | | | | | | | | | | | |
Corporate Bonds & Notes | | | | | 0 | | | | 2,394 | | | | 0 | | | | 2,394 | |
Italy | | | | | | | | | | | | | | | | | | |
Sovereign Issues | | | | | 0 | | | | 1,127 | | | | 0 | | | | 1,127 | |
Japan | | | | | | | | | | | | | | | | | | |
Sovereign Issues | | | | | 0 | | | | 1,063 | | | | 0 | | | | 1,063 | |
Netherlands | | | | | | | | | | | | | | | | | | |
Sovereign Issues | | | | | 0 | | | | 782 | | | | 0 | | | | 782 | |
| | | | | | |
| See Accompanying Notes | | ANNUAL REPORT | | JUNE 30, 2015 | | 77 |
Schedule of Investments PIMCO Foreign Currency Strategy Active Exchange-Traded Fund (Cont.)
June 30, 2015
| | | | | | | | | | | | | | | | | | |
| Category and Subcategory | | | | Level 1 | | | Level 2 | | | Level 3 | | | Fair Value at 06/30/2015 | |
New Zealand | | | | | | | | | | | | | | | | | | |
Sovereign Issues | | | | $ | 0 | | | $ | 473 | | | $ | 0 | | | $ | 473 | |
Norway | | | | | | | | | | | | | | | | | | |
Sovereign Issues | | | | | 0 | | | | 285 | | | | 0 | | | | 285 | |
Poland | | | | | | | | | | | | | | | | | | |
Sovereign Issues | | | | | 0 | | | | 1,903 | | | | 0 | | | | 1,903 | |
Sweden | | | | | | | | | | | | | | | | | | |
Sovereign Issues | | | | | 0 | | | | 590 | | | | 0 | | | | 590 | |
United States | | | | | | | | | | | | | | | | | | |
Corporate Bonds & Notes | | | | | 0 | | | | 233 | | | | 0 | | | | 233 | |
Short-Term Instruments | | | | | | | | | | | | | | | | | | |
Repurchase Agreements | | | | | 0 | | | | 156 | | | | 0 | | | | 156 | |
Short-Term Notes | | | | | 0 | | | | 2,300 | | | | 0 | | | | 2,300 | |
France Treasury Bills | | | | | 0 | | | | 781 | | | | 0 | | | | 781 | |
Spain Treasury Bills | | | | | 0 | | | | 1,226 | | | | 0 | | | | 1,226 | |
U.S. Treasury Bills | | | | | 0 | | | | 301 | | | | 0 | | | | 301 | |
Total Investments | | | | $ | 0 | | | $ | 14,861 | | | $ | 0 | | | $ | 14,861 | |
| | | | | |
Financial Derivative Instruments - Assets | | | | | | | | | | | | | | | | | | |
Over the counter | | | | $ | 0 | | | $ | 358 | | | $ | 0 | | | $ | 358 | |
| | | | | |
Financial Derivative Instruments - Liabilities | | | | | | | | | | | | | | | | | | |
Over the counter | | | | $ | 0 | | | $ | (527 | ) | | $ | 0 | | | $ | (527 | ) |
Totals | | | | $ | 0 | | | $ | 14,692 | | | $ | 0 | | | $ | 14,692 | |
There were no significant transfers between Levels 1, 2, or 3 during the period ended June 30, 2015.
| | | | | | |
| 78 | | PIMCO ETF TRUST | | | | See Accompanying Notes |
Schedule of Investments PIMCO Global Advantage® Inflation-Linked Bond Active Exchange-Traded Fund
June 30, 2015
| | | | | | | | | | | | |
| | | | | PRINCIPAL
AMOUNT (000s) | | | | | MARKET
VALUE
(000s) | |
INVESTMENTS IN SECURITIES 138.4% | |
| |
AUSTRALIA 0.4% | |
| |
SOVEREIGN ISSUES 0.4% | |
|
Australia Government Bond | |
1.250% due 02/21/2022 | | AUD | | | 536 | | | $ | | | 435 | |
| | | | | | | | | | | | |
Total Australia
(Cost $507) | | | | | | | | | | | 435 | |
| | | | | | | | | | | | |
| |
BRAZIL 14.1% | |
| |
SOVEREIGN ISSUES 14.1% | |
|
Brazil Letras do Tesouro Nacional | |
0.000% due 01/01/2019 (a) | | BRL | | | 1,400 | | | | | | 294 | |
|
Brazil Notas do Tesouro Nacional | |
6.000% due 08/15/2022 | | | | | 13,230 | | | | | | 4,172 | |
6.000% due 08/15/2030 | | | | | 1,210 | | | | | | 386 | |
6.000% due 05/15/2035 | | | | | 5,531 | | | | | | 1,755 | |
6.000% due 08/15/2040 | | | | | 2,659 | | | | | | 846 | |
6.000% due 05/15/2045 | | | | | 3,244 | | | | | | 1,031 | |
6.000% due 08/15/2050 | | | | | 3,505 | | | | | | 1,122 | |
10.000% due 01/01/2021 | | | | | 16,649 | | | | | | 4,831 | |
| | | | | | | | | | | | |
Total Brazil
(Cost $18,786) | | | | | | | | | | | 14,437 | |
| | | | | | | | | | | | |
| |
CANADA 1.4% | |
| |
SOVEREIGN ISSUES 1.4% | |
|
Canada Government International Bond | |
1.250% due 12/01/2047 (b) | | CAD | | | 717 | | | | | | 706 | |
1.500% due 12/01/2044 (b) | | | | | 764 | | | | | | 770 | |
| | | | | | | | | | | | |
Total Canada
(Cost $1,647) | | | | | | | | | | | 1,476 | |
| | | | | | | | | | | | |
| |
CHILE 2.7% | |
| |
SOVEREIGN ISSUES 2.7% | |
|
Bonos del Banco Central de Chile en UF Inflation Linked Bond | |
3.000% due 02/01/2021 (b) | | CLP | | | 874,404 | | | | | | 1,503 | |
3.000% due 03/01/2022 (b) | | | | | 749,489 | | | | | | 1,298 | |
| | | | | | | | | | | | |
Total Chile
(Cost $3,458) | | | | | | | | | | | 2,801 | |
| | | | | | | | | | | | |
| |
COLOMBIA 3.7% | |
| |
SOVEREIGN ISSUES 3.7% | |
|
Colombian TES | |
3.000% due 03/25/2033 (b) | | COP | | | 6,227,557 | | | | | | 2,064 | |
3.500% due
03/10/2021 (b) | | | | | 2,224,048 | | | | | | 850 | |
4.250% due
05/17/2017 (b) | | | | | 2,224,048 | | | | | | 892 | |
| | | | | | | | | | | | |
Total Colombia
(Cost $5,101) | | | | | | | | | | | 3,806 | |
| | | | | | | | | | | | |
| |
DENMARK 4.2% | |
| |
SOVEREIGN ISSUES 4.2% | |
|
Denmark Government Bond | |
0.100% due
11/15/2023 (b) | | DKK | | | 27,136 | | | | | | 4,270 | |
| | | | | | | | | | | | |
Total Denmark
(Cost $4,901) | | | | | | | | | | | 4,270 | |
| | | | | | | | | | | | |
| | | | | | | | | | | | |
| | | | | PRINCIPAL
AMOUNT (000s) | | | | | MARKET
VALUE
(000s) | |
FRANCE 9.8% | |
| |
SOVEREIGN ISSUES 9.8% | |
|
France Government Bond | |
0.100% due 07/25/2021 (b) | | EUR | | | 203 | | | $ | | | 238 | |
0.250% due 07/25/2018 (b) | | | | | 5,419 | | | | | | 6,284 | |
0.250% due
07/25/2024 (b) | | | | | 1,832 | | | | | | 2,169 | |
0.700% due 07/25/2030 (b) | | | | | 201 | | | | | | 248 | |
3.500% due 04/25/2020 | | | | | 900 | | | | | | 1,157 | |
| | | | | | | | | | | | |
Total France
(Cost $10,928) | | | | | | | | | | | 10,096 | |
| | | | | | | | | | | | |
| |
GERMANY 0.2% | |
| |
SOVEREIGN ISSUES 0.2% | |
| | | | |
Republic of Germany | | | | | | | | | | | | |
0.100% due 04/15/2023 (b) | | | | | 83 | | | | | | 99 | |
0.750% due 04/15/2018 (b) | | | | | 64 | | | | | | 74 | |
| | | | | | | | | | | | |
Total Germany
(Cost $194) | | | | | | | | | | | 173 | |
| | | | | | | | | | | | |
| |
INDIA 1.3% | |
| |
CORPORATE BONDS & NOTES 1.3% | |
|
Export-Import Bank of India | |
2.432% due 03/30/2016 | | $ | | | 1,300 | | | | | | 1,308 | |
| | | | | | | | | | | | |
Total India
(Cost $1,304) | | | | | | | | | | | 1,308 | |
| | | | | | | | | | | | |
| |
ITALY 12.9% | |
| |
SOVEREIGN ISSUES 12.9% | |
|
Italy Buoni Poliennali Del Tesoro | |
1.700% due 09/15/2018 (b) | | EUR | | | 3,039 | | | | | | 3,565 | |
2.100% due 09/15/2021 (b) | | | | | 1,878 | | | | | | 2,272 | |
2.250% due 04/22/2017 (b) | | | | | 2,509 | | | | | | 2,879 | |
2.350% due 09/15/2019 (b) | | | | | 222 | | | | | | 268 | |
2.350% due 09/15/2024 (b) | | | | | 2,759 | | | | | | 3,390 | |
2.550% due 10/22/2016 (b) | | | | | 301 | | | | | | 344 | |
2.550% due 09/15/2041 (b) | | | | | 218 | | | | | | 275 | |
5.000% due 09/01/2040 | | | | | 200 | | | | | | 287 | |
| | | | | | | | | | | | |
Total Italy
(Cost $14,865) | | | | | | | | | | | 13,280 | |
| | | | | | | | | | | | |
| |
JAPAN 7.0% | |
| |
SOVEREIGN ISSUES 7.0% | |
|
Japan Government International Bond | |
0.100% due 09/10/2024 (b) | | JPY | | | 818,360 | | | | | | 7,174 | |
| | | | | | | | | | | | |
Total Japan
(Cost $7,220) | | | | | | | | | | | 7,174 | |
| | | | | | | | | | | | |
| |
MEXICO 8.2% | |
| |
SOVEREIGN ISSUES 8.2% | |
|
Mexico Government International Bond | |
2.000% due 06/09/2022 (b) | | MXN | | | 24,273 | | | | | | 1,492 | |
4.000% due 11/15/2040 (b) | | | | | 45,539 | | | | | | 3,121 | |
4.000% due 11/08/2046 (b) | | | | | 3,781 | | | | | | 262 | |
4.500% due 12/04/2025 (b) | | | | | 39,309 | | | | | | 2,865 | |
4.500% due 11/22/2035 (b) | | | | | 7,282 | | | | | | 537 | |
4.750% due 06/14/2018 | | | | | 2,005 | | | | | | 128 | |
| | | | | | | | | | | | |
Total Mexico
(Cost $9,757) | | | | | | | | | | | 8,405 | |
| | | | | | | | | | | | |
| |
| | | | | | | | | | | | |
| | | | | PRINCIPAL
AMOUNT (000s) | | | | | MARKET
VALUE
(000s) | |
NEW ZEALAND 2.9% | |
| |
SOVEREIGN ISSUES 2.9% | |
|
New Zealand Government Bond | |
2.000% due 09/20/2025 | | NZD | | | 2,676 | | | $ | | | 1,803 | |
4.500% due 02/15/2016 | | | | | 2,676 | | | | | | 725 | |
5.500% due 04/15/2023 | | | | | 600 | | | | | | 468 | |
| | | | | | | | | | | | |
Total New Zealand
(Cost $3,642) | | | | | | | | | | | 2,996 | |
| | | | | | | | | | | | |
| |
SLOVENIA 0.2% | |
| |
SOVEREIGN ISSUES 0.2% | |
|
Slovenia Government International Bond | |
4.700% due 11/01/2016 | | EUR | | | 200 | | | | | | 236 | |
| | | | | | | | | | | | |
Total Slovenia
(Cost $269) | | | | | | | | | | | 236 | |
| | | | | | | | | | | | |
| |
SOUTH AFRICA 3.8% | |
| |
SOVEREIGN ISSUES 3.8% | |
|
South Africa Government International Bond | |
7.250% due 01/15/2020 | | ZAR | | | 48,500 | | | | | | 3,908 | |
| | | | | | | | | | | | |
Total South Africa
(Cost $5,684) | | | | | | | | | | | 3,908 | |
| | | | | | | | | | | | |
| |
SOUTH KOREA 1.4% | |
| |
SOVEREIGN ISSUES 1.4% | |
|
Korea Treasury Bond | |
1.125% due 06/10/2023 (b) | | KRW | | | 1,631,482 | | | | | | 1,410 | |
| | | | | | | | | | | | |
Total South Korea
(Cost $1,387) | | | 1,410 | |
| | | | | | | | | | | | |
| |
SPAIN 1.6% | |
| |
SOVEREIGN ISSUES 1.6% | |
|
Spain Government International Bond | |
0.550% due
11/30/2019 (b) | | EUR | | | 903 | | | | | | 1,020 | |
1.000% due 11/30/2030 (b) | | | | | 100 | | | | | | 104 | |
5.400% due 01/31/2023 | | | | | 400 | | | | | | 554 | |
| | | | | | | | | | | | |
Total Spain
(Cost $1,801) | | | 1,678 | |
| | | | | | | | | | | | |
| |
SWEDEN 0.5% | |
| |
SOVEREIGN ISSUES 0.5% | |
|
Sweden Government International Bond | |
0.250% due 06/01/2022 | | SEK | | | 3,592 | | | | | | 464 | |
| | | | | | | | | | | | |
Total Sweden
(Cost $538) | | | 464 | |
| | | | | | | | | | | | |
| |
TURKEY 3.9% | |
| |
SOVEREIGN ISSUES 3.9% | |
|
Turkey Government International Bond | |
2.000% due
04/16/2025 (b) | | TRY | | | 2,057 | | | | | | 730 | |
2.400% due 05/08/2024 (b) | | | | | 3,841 | | | | | | 1,413 | |
4.000% due
04/01/2020 (b) | | | | | 4,588 | | | | | | 1,827 | |
| | | | | | | | | | | | |
Total Turkey
(Cost $4,131) | | | 3,970 | |
| | | | | | | | | | | | |
| |
| | | | | | |
| See Accompanying Notes | | ANNUAL REPORT | | JUNE 30, 2015 | | 79 |
Schedule of Investments PIMCO Global Advantage® Inflation-Linked Bond Active Exchange-Traded Fund (Cont.)
| | | | | | | | | | | | |
| | | | | PRINCIPAL
AMOUNT (000s) | | | | | MARKET
VALUE
(000s) | |
UNITED KINGDOM 9.5% | |
| |
SOVEREIGN ISSUES 9.5% | |
| | | | |
United Kingdom Gilt | | | | | | | | | | | | |
0.125% due 03/22/2024 (b) | | GBP | | | 3,618 | | | $ | | | 6,152 | |
0.125% due 03/22/2044 (b) | | | | | 245 | | | | | | 483 | |
0.750% due 03/22/2034 (b) | | | | | 111 | | | | | | 225 | |
1.125% due 11/22/2037 (b) | | | | | 255 | | | | | | 581 | |
1.250% due 11/22/2027 (b) | | | | | 1,196 | | | | | | 2,365 | |
| | | | | | | | | | | | |
Total United Kingdom
(Cost $9,575) | | | 9,806 | |
| | | | | | | | | | | | |
| |
UNITED STATES 48.7% | |
| |
U.S. GOVERNMENT AGENCIES 1.3% | |
2.625% due 09/06/2024 | | $ | | | 1,300 | | | | | | 1,300 | |
| | | | | | | | | | | | |
| |
| | | | | | | | | | | | |
| | | | | PRINCIPAL
AMOUNT (000s) | | | | | MARKET
VALUE
(000s) | |
U.S. TREASURY OBLIGATIONS 47.4% | |
| | | | |
U.S. Treasury Bonds | | | | | | | | | | | | |
2.500% due 02/15/2045 (c) | | $ | | | 200 | | | $ | | | 175 | |
3.000% due 11/15/2044 (c) | | | | | 1,330 | | | | | | 1,295 | |
3.000% due 05/15/2045 (c) | | | | | 1,150 | | | | | | 1,122 | |
|
U.S. Treasury Inflation Protected Securities (b) | |
0.125% due 04/15/2016 (c) | | | | | 1,286 | | | | | | 1,293 | |
0.125% due 04/15/2019 (c) | | | | | 6,765 | | | | | | 6,847 | |
0.125% due 04/15/2020 (c) | | | | | 2,980 | | | | | | 3,003 | |
0.125% due 01/15/2022 (c) | | | | | 1,518 | | | | | | 1,504 | |
0.125% due 07/15/2022 | | | | | 206 | | | | | | 204 | |
0.125% due 01/15/2023 (c) | | | | | 1,947 | | | | | | 1,912 | |
0.250% due 01/15/2025 (c) | | | | | 1,299 | | | | | | 1,272 | |
0.625% due 07/15/2021 (c) | | | | | 11,571 | | | | | | 11,939 | |
0.750% due 02/15/2042 (c) | | | | | 2,597 | | | | | | 2,371 | |
0.750% due 02/15/2045 | | | | | 1,638 | | | | | | 1,485 | |
1.250% due 07/15/2020 (c) | | | | | 1,085 | | | | | | 1,160 | |
1.375% due 02/15/2044 | | | | | 452 | | | | | | 479 | |
1.875% due 07/15/2015 (c) | | | | | 1,216 | | | | | | 1,220 | |
1.875% due 07/15/2019 (c) | | | | | 2,771 | | | | | | 3,020 | |
2.375% due 01/15/2025 (c) | | | | | 2,564 | | | | | | 3,012 | |
| | | | | | | | | | | | |
| | | | | PRINCIPAL
AMOUNT (000s) | | | | | MARKET
VALUE
(000s) | |
2.375% due 01/15/2027 (c) | | $ | | | 2,607 | | | $ | | | 3,112 | |
2.500% due 07/15/2016 | | | | | 633 | | | | | | 656 | |
2.500% due 01/15/2029 | | | | | 342 | | | | | | 420 | |
| | | | |
U.S. Treasury Notes | | | | | | | | | | | | |
1.500% due 05/31/2020 (c) | | | | | 1,200 | | | | | | 1,192 | |
| | | | | | | | | | | | |
| | | | | | | | | | | 48,693 | |
| | | | | | | | | | | | |
Total United States
(Cost $50,825) | | | 49,993 | |
| | | | | | | | | | | | |
| | | | | | | | | | | | |
Total Investments in Securities
(Cost $156,520) | | | 142,122 | |
| | | | | | | | | | | | |
| | | | | | | | | | | | |
Total Investments 138.4%
(Cost $156,520) | | | $ | | | 142,122 | |
| |
Financial Derivative
Instruments (d)(e) 0.5% (Cost or Premiums, net $(144)) | | | 487 | |
| |
Other Assets and Liabilities, net (38.9%) | | | (39,929 | ) |
| | | | | | | | | | | | |
Net Assets 100.0% | | | $ | | | 102,680 | |
| | | | | | | | | | | | |
NOTES TO SCHEDULE OF INVESTMENTS (AMOUNTS IN THOUSANDS*, EXCEPT NUMBER OF CONTRACTS):
| * | A zero balance may reflect actual amounts rounding to less than one thousand. |
| (b) | Principal amount of security is adjusted for inflation. |
BORROWINGS AND OTHER FINANCING TRANSACTIONS
REVERSE REPURCHASE AGREEMENTS:
| | | | | | | | | | | | | | | | | | | | | | |
| Counterparty | | | | Borrowing
Rate | | | Borrowing
Date | | | Maturity
Date | | | Amount
Borrowed (1) | | | Payable for
Reverse
Repurchase
Agreements | |
BOS | | | | | 0.400 | % | | | 06/15/2015 | | | | 07/06/2015 | | | $ | (615 | ) | | $ | (615 | ) |
| | | | | | 0.480 | % | | | 06/18/2015 | | | | 07/08/2015 | | | | (4,323 | ) | | | (4,324 | ) |
BSN | | | | | 0.270 | % | | | 04/10/2015 | | | | 07/10/2015 | | | | (608 | ) | | | (608 | ) |
| | | | | | 0.270 | % | | | 04/14/2015 | | | | 07/14/2015 | | | | (3,705 | ) | | | (3,707 | ) |
| | | | | | 0.280 | % | | | 05/26/2015 | | | | 07/27/2015 | | | | (487 | ) | | | (488 | ) |
GRE | | | | | 0.350 | % | | | 06/03/2015 | | | | 07/06/2015 | | | | (7,157 | ) | | | (7,159 | ) |
| | | | | | 0.380 | % | | | 06/18/2015 | | | | 07/07/2015 | | | | (737 | ) | | | (737 | ) |
| | | | | | 0.490 | % | | | 06/24/2015 | | | | 07/08/2015 | | | | (509 | ) | | | (509 | ) |
| | | | | | 0.580 | % | | | 06/29/2015 | | | | 07/06/2015 | | | | (2,330 | ) | | | (2,330 | ) |
JPS | | | | | 0.120 | % | | | 06/24/2015 | | | | 07/15/2015 | | | | (561 | ) | | | (561 | ) |
| | | | | | 0.450 | % | | | 06/26/2015 | | | | 07/02/2015 | | | | (1,189 | ) | | | (1,189 | ) |
SCX | | | | | 0.290 | % | | | 06/05/2015 | | | | 07/07/2015 | | | | (1,310 | ) | | | (1,310 | ) |
Total Reverse Repurchase Agreements | | | | | | | | | | | | | | | | | | | | $ | (23,537 | ) |
SALE-BUYBACK TRANSACTIONS:
| | | | | | | | | | | | | | | | | | | | | | |
| Counterparty | | | | Borrowing
Rate | | | Borrowing
Date | | | Maturity
Date | | | Amount
Borrowed (1) | | | Payable for
Sale-Buyback
Transactions (2) | |
GSC | | | | | 0.370 | % | | | 06/08/2015 | | | | 07/08/2015 | | | $ | (6,100 | ) | | $ | (6,107 | ) |
MSC | | | | | 0.510 | % | | | 06/19/2015 | | | | 07/09/2015 | | | | (1,192 | ) | | | (1,194 | ) |
TDM | | | | | 0.330 | % | | | 06/04/2015 | | | | 07/14/2015 | | | | (11,925 | ) | | | (11,945 | ) |
Total Sale-Buyback Transactions | | | | | | | | | | | | | | | | | | | | $ | (19,246 | ) |
| (1) | The average amount of borrowings outstanding during the period ended June 30, 2015 was $27,965 at a weighted average interest rate of 0.231%. |
| (2) | Payable for sale-buyback transactions includes $22 of deferred price drop. |
| | | | | | |
| 80 | | PIMCO ETF TRUST | | | | See Accompanying Notes |
June 30, 2015
BORROWINGS AND OTHER FINANCING TRANSACTIONS SUMMARY
The following is a summary by counterparty of the market value of Borrowings and Other Financing Transactions and collateral (received)/pledged as of June 30, 2015:
| (c) | Securities with an aggregate market value of $42,860 have been pledged as collateral under the terms of the following master agreements as of June 30, 2015. |
| | | | | | | | | | | | | | | | | | | | | | | | | | | | | | |
| Counterparty | | | | Repurchase
Agreement
Proceeds
to be
Received | | | Payable for
Reverse
Repurchase
Agreements | | | Payable for
Sale-Buyback
Transactions | | | Securities
Out on Loan | | | Total
Borrowings and
Other Financing
Transactions | | | Collateral
Pledged | | | Net
Exposure (2) | |
Global/Master Repurchase Agreement | | | | | | | | | | | | | | | | | | | | | | | | | | | | | | |
BOS | | | | $ | 0 | | | $ | (4,939 | ) | | $ | 0 | | | $ | 0 | | | $ | (4,939 | ) | | $ | 4,930 | | | $ | (9 | ) |
BSN | | | | | 0 | | | | (4,803 | ) | | | 0 | | | | 0 | | | | (4,803 | ) | | | 4,859 | | | | 56 | |
GRE | | | | | 0 | | | | (10,735 | ) | | | 0 | | | | 0 | | | | (10,735 | ) | | | 10,753 | | | | 18 | |
JPS | | | | | 0 | | | | (1,750 | ) | | | 0 | | | | 0 | | | | (1,750 | ) | | | 1,753 | | | | 3 | |
SCX | | | | | 0 | | | | (1,310 | ) | | | 0 | | | | 0 | | | | (1,310 | ) | | | 1,295 | | | | (15 | ) |
| | | | | | | | |
Master Securities Forward Transaction Agreement | | | | | | | | | | | | | | | | | | | | | | | | | | | | | | |
GSC | | | | | 0 | | | | 0 | | | | (6,107 | ) | | | 0 | | | | (6,107 | ) | | | 6,090 | | | | (17 | ) |
MSC | | | | | 0 | | | | 0 | | | | (1,194 | ) | | | 0 | | | | (1,194 | ) | | | 1,192 | | | | (2 | ) |
TDM | | | | | 0 | | | | 0 | | | | (11,945 | ) | | | 0 | | | | (11,945 | ) | | | 11,988 | | | | 43 | |
Total Borrowings and Other Financing Transactions | | | | $ | 0 | | | $ | (23,537 | ) | | $ | (19,246 | ) | | $ | 0 | | | | | | | | | | | | | |
| (2) | Net Exposure represents the net receivable/(payable) that would be due from/to the counterparty in the event of default. Exposure from borrowings and other financing transactions can only be netted across transactions governed under the same master agreement with the same legal entity. See Note 7, Principal Risks, in the Notes to Financial Statements for more information regarding master netting arrangements. |
(d) FINANCIAL DERIVATIVE INSTRUMENTS: EXCHANGE-TRADED OR CENTRALLY CLEARED
PURCHASED OPTIONS:
OPTIONS ON EXCHANGE-TRADED FUTURES CONTRACTS
| | | | | | | | | | | | | | | | | | | | | | |
| Description | | | | Strike
Price | | | Expiration
Date | | | # of
Contracts | | | Cost | | | Market
Value | |
Put - CME 90-Day Eurodollar December Futures | | | | $ | 99.375 | | | | 12/14/2015 | | | | 20 | | | $ | 3 | | | $ | 3 | |
WRITTEN OPTIONS:
OPTIONS ON EXCHANGE-TRADED FUTURES CONTRACTS
| | | | | | | | | | | | | | | | | | | | | | |
| Description | | | | Strike Price | | | Expiration
Date | | | # of
Contracts | | | Premiums
(Received) | | | Market
Value | |
Put - CBOT U.S. Treasury 10-Year Note September Futures | | | | $ | 124.000 | | | | 08/21/2015 | | | | 6 | | | $ | (5 | ) | | $ | (3 | ) |
Call - CBOT U.S. Treasury 10-Year Note September Futures | | | | | 127.000 | | | | 08/21/2015 | | | | 6 | | | | (4 | ) | | | (4 | ) |
| | | | | | | | | | | | | | | | | $ | (9 | ) | | $ | (7 | ) |
Total Written Options | | | | | | | | | | | | | | | | $ | (9 | ) | | $ | (7 | ) |
FUTURES CONTRACTS:
| | | | | | | | | | | | | | | | | | | | | | | | | | |
Description | | | | Type | | | Expiration
Month | | | # of
Contracts | | | Unrealized
Appreciation/
(Depreciation) | | | Variation Margin | |
| | | | | | | Asset | | | Liability | |
90-Day Eurodollar December Futures | | | | | Short | | | | 12/2015 | | | | 113 | | | $ | (19 | ) | | $ | 0 | | | $ | 0 | |
90-Day Eurodollar December Futures | | | | | Short | | | | 12/2016 | | | | 46 | | | | (16 | ) | | | 1 | | | | 0 | |
90-Day Eurodollar March Futures | | | | | Short | | | | 03/2016 | | | | 37 | | | | (17 | ) | | | 0 | | | | 0 | |
90-Day Eurodollar March Futures | | | | | Short | | | | 03/2017 | | | | 36 | | | | (9 | ) | | | 0 | | | | 0 | |
90-Day Eurodollar September Futures | | | | | Short | | | | 09/2016 | | | | 70 | | | | (56 | ) | | | 2 | | | | 0 | |
Call Options Strike @ EUR 154.500 on Euro-Bund 10-Year Bond September Futures | | | | | Long | | | | 08/2015 | | | | 7 | | | | (1 | ) | | | 4 | | | | 0 | |
Call Options Strike @ EUR 157.500 on Euro-Bund 10-Year Bond September Futures | | | | | Short | | | | 08/2015 | | | | 7 | | | | 0 | | | | 0 | | | | (1 | ) |
Euro-BTP Italy Government Bond September Futures | | | | | Long | | | | 09/2015 | | | | 2 | | | | (1 | ) | | | 2 | | | | (8 | ) |
| | | | | | |
| See Accompanying Notes | | ANNUAL REPORT | | JUNE 30, 2015 | | 81 |
Schedule of Investments PIMCO Global Advantage® Inflation-Linked Bond Active Exchange-Traded Fund (Cont.)
| | | | | | | | | | | | | | | | | | | | | | | | | | |
Description | | | | Type | | | Expiration
Month | | | # of
Contracts | | | Unrealized
Appreciation/
(Depreciation) | | | Variation Margin | |
| | | | | | | Asset | | | Liability | |
Put Options Strike @ EUR 147.000 on Euro-Bund 10-Year Bond September Futures | | | | | Short | | | | 08/2015 | | | | 7 | | | $ | 2 | | | $ | 2 | | | $ | 0 | |
U.S. Treasury 5-Year Note September Futures | | | | | Short | | | | 09/2015 | | | | 21 | | | | (8 | ) | | | 1 | | | | 0 | |
U.S. Treasury 10-Year Note September Futures | | | | | Long | | | | 09/2015 | | | | 11 | | | | (5 | ) | | | 0 | | | | (1 | ) |
U.S. Treasury 30-Year Bond September Futures | | | | | Short | | | | 09/2015 | | | | 39 | | | | 59 | | | | 3 | | | | 0 | |
Total Futures Contracts | | | | | | | | | | | | | | | | $ | (71 | ) | | $ | 15 | | | $ | (10 | ) |
SWAP AGREEMENTS:
CREDIT DEFAULT SWAPS ON CREDIT INDICES - SELL PROTECTION (1)
| | | | | | | | | | | | | | | | | | | | | | | | | | | | | | |
| Index/Tranches | | | | Fixed Deal
Receive Rate | | | Maturity Date | | | Notional
Amount (2) | | | Market
Value (3) | | | Unrealized
Appreciation/
(Depreciation) | | | Variation Margin | |
| | | | | | | | Asset | | | Liability | |
CDX.IG-24 5-Year Index | | | | | 1.000 | % | | | 06/20/2020 | | | | $ 900 | | | $ | 13 | | | $ | 0 | | | $ | 0 | | | $ | 0 | |
iTraxx Europe 23 5-Year Index | | | | | 1.000 | % | | | 06/20/2020 | | | | EUR 1,500 | | | | 20 | | | | (10 | ) | | | 0 | | | | (7 | ) |
| | | | | | | | | | | | | | | | | $ | 33 | | | $ | (10 | ) | | $ | 0 | | | $ | (7 | ) |
| (1) | If the Fund is a seller of protection and a credit event occurs, as defined under the terms of that particular swap agreement, the Fund will either (i) pay to the buyer of protection an amount equal to the notional amount of the swap and take delivery of the referenced obligation or underlying securities comprising the referenced index or (ii) pay a net settlement amount in the form of cash or securities equal to the notional amount of the swap less the recovery value of the referenced obligation or underlying securities comprising the referenced index. |
| (2) | The maximum potential amount the Fund could be required to pay as a seller of credit protection or receive as a buyer of credit protection if a credit event occurs as defined under the terms of that particular swap agreement. |
| (3) | The prices and resulting values for credit default swap agreements on credit indices serve as an indicator of the current status of the payment/performance risk and represent the likelihood of an expected liability (or profit) for the credit derivative should the notional amount of the swap agreement be closed/sold as of the period end. Increasing market values, in absolute terms when compared to the notional amount of the swap, represent a deterioration of the referenced indices’ credit soundness and a greater likelihood or risk of default or other credit event occurring as defined under the terms of the agreement. |
INTEREST RATE SWAPS
| | | | | | | | | | | | | | | | | | | | | | | | | | | | | | | | | | | | |
Pay/Receive
Floating Rate | | Floating Rate Index | | | | Fixed Rate | | | Maturity Date | | | Notional Amount | | | Market
Value | | | Unrealized
Appreciation/
(Depreciation) | | | Variation Margin | |
| | | | | | | | | Asset | | | Liability | |
Pay | | 3-Month USD-LIBOR | | | | | 1.300 | % | | | 05/06/2017 | | | | $ | | | | 6,100 | | | $ | (9 | ) | | $ | (9 | ) | | $ | 0 | | | $ | 0 | |
Pay | | 3-Month USD-LIBOR | | | | | 1.500 | % | | | 12/16/2017 | | | | | | | | 1,100 | | | | (6 | ) | | | (1 | ) | | | 0 | | | | 0 | |
Pay | | 3-Month USD-LIBOR | | | | | 2.000 | % | | | 12/16/2020 | | | | | | | | 800 | | | | (1 | ) | | | 2 | | | | 0 | | | | 0 | |
Pay | | 3-Month USD-LIBOR | | | | | 2.500 | % | | | 12/16/2025 | | | | | | | | 6,900 | | | | 54 | | | | (49 | ) | | | 5 | | | | 0 | |
Pay | | 3-Month USD-LIBOR | | | | | 2.750 | % | | | 12/16/2045 | | | | | | | | 1,500 | | | | 76 | | | | (10 | ) | | | 4 | | | | 0 | |
Pay | | 6-Month EUR-EURIBOR | | | | | 0.750 | % | | | 09/16/2025 | | | | EUR | | | | 1,000 | | | | 50 | | | | 62 | | | | 0 | | | | (12 | ) |
Pay | | 6-Month GBP-LIBOR | | | | | 1.250 | % | | | 06/17/2017 | | | | GBP | | | | 2,300 | | | | (11 | ) | | | 34 | | | | 0 | | | | (5 | ) |
Pay | | 6-Month GBP-LIBOR | | | | | 1.500 | % | | | 09/16/2017 | | | | | | | | 2,400 | | | | (21 | ) | | | 3 | | | | 0 | | | | (6 | ) |
Pay | | 6-Month GBP-LIBOR | | | | | 2.088 | % | | | 12/04/2024 | | | | | | | | 500 | | | | 2 | | | | 2 | | | | 0 | | | | (8 | ) |
Pay | | 6-Month GBP-LIBOR | | | | | 2.000 | % | | | 09/16/2025 | | | | | | | | 680 | | | | 21 | | | | 1 | | | | 0 | | | | (12 | ) |
Pay | | 6-Month GBP-LIBOR | | | | | 2.000 | % | | | 09/16/2045 | | | | | | | | 1,640 | | | | 216 | | | | 128 | | | | 0 | | | | (58 | ) |
Pay | | 28-Day MXN-TIIE | | | | | 4.035 | % | | | 02/03/2017 | | | | MXN | | | | 15,700 | | | | (1 | ) | | | (5 | ) | | | 0 | | | | (1 | ) |
Pay | | 28-Day MXN-TIIE | | | | | 5.560 | % | | | 11/11/2021 | | | | | | | | 1,700 | | | | (1 | ) | | | (1 | ) | | | 1 | | | | 0 | |
Pay | | 28-Day MXN-TIIE | | | | | 5.750 | % | | | 12/06/2021 | | | | | | | | 3,100 | | | | 0 | | | | 1 | | | | 1 | | | | 0 | |
Pay | | 28-Day MXN-TIIE | | | | | 6.710 | % | | | 09/20/2029 | | | | | | | | 300 | | | | 0 | | | | (1 | ) | | | 0 | | | | 0 | |
| | | | | | | | | | | | | | | | | | | | | | | $ | 369 | | | $ | 157 | | | $ | 11 | | | $ | (102 | ) |
Total Swap Agreements | | | | | | | | | | | | | | | | | | | | $ | 402 | | | $ | 147 | | | $ | 11 | | | $ | (109 | ) |
| | | | | | |
| 82 | | PIMCO ETF TRUST | | | | See Accompanying Notes |
June 30, 2015
FINANCIAL DERIVATIVE INSTRUMENTS: EXCHANGE-TRADED OR CENTRALLY CLEARED SUMMARY
The following is a summary of the market value and variation margin of Exchange-Traded or Centrally Cleared Financial Derivative Instruments as of June 30, 2015:
Cash of $1,384 has been pledged as collateral for exchange-traded and centrally cleared financial derivative instruments as of June 30, 2015. See Note 7, Principal Risks, in the Notes to Financial Statements for more information regarding master netting arrangements.
| | | | | | | | | | | | | | | | | | | | | | | | | | | | | | | | | | | | |
| | | | | Financial Derivative Assets | | | | | Financial Derivative Liabilities | |
| | | | | Market Value | | | Variation Margin
Asset | | | | | | | | Market Value | | | Variation Margin
Liability | | | | |
| | | | | Purchased
Options | | | Futures | | | Swap
Agreements | | | Total | | | | | Written
Options | | | Futures | | | Swap
Agreements | | | Total | |
Total Exchange-Traded or Centrally Cleared | | | | $ | 3 | | | $ | 15 | | | $ | 11 | | | $ | 29 | | | | | $ | (7 | ) | | $ | (10 | ) | | $ | (109 | ) | | $ | (126 | ) |
(e) FINANCIAL DERIVATIVE INSTRUMENTS: OVER THE COUNTER
FORWARD FOREIGN CURRENCY CONTRACTS:
| | | | | | | | | | | | | | | | | | | | | | | | | | | | | | |
| Counterparty | | | | Settlement
Month | | | Currency to
be Delivered | | | Currency to
be Received | | | Unrealized
Appreciation/
(Depreciation) | |
| | | | | | Asset | | | Liability | |
BOA | | | | | 07/2015 | | | | AUD | | | | 2,416 | | | | $ | | | | 1,862 | | | $ | 0 | | | $ | (2 | ) |
| | | | | | 07/2015 | | | | BRL | | | | 102 | | | | | | | | 33 | | | | 0 | | | | 0 | |
| | | | | | 07/2015 | | | | GBP | | | | 3,644 | | | | | | | | 5,600 | | | | 0 | | | | (126 | ) |
| | | | | | 07/2015 | | | | MXN | | | | 7,916 | | | | | | | | 513 | | | | 10 | | | | 0 | |
| | | | | | 07/2015 | | | | NZD | | | | 4,194 | | | | | | | | 2,992 | | | | 150 | | | | 0 | |
| | | | | | 07/2015 | | | | $ | | | | 33 | | | | BRL | | | | 101 | | | | 0 | | | | 0 | |
| | | | | | 07/2015 | | | | | | | | 1,096 | | | | INR | | | | 70,344 | | | | 10 | | | | (3 | ) |
| | | | | | 08/2015 | | | | | | | | 1,858 | | | | AUD | | | | 2,416 | | | | 2 | | | | 0 | |
| | | | | | 08/2015 | | | | | | | | 660 | | | | SEK | | | | 5,510 | | | | 5 | | | | 0 | |
BPS | | | | | 07/2015 | | | | BRL | | | | 8,695 | | | | $ | | | | 2,803 | | | | 6 | | | | 0 | |
| | | | | | 07/2015 | | | | CLP | | | | 703,071 | | | | | | | | 1,140 | | | | 41 | | | | 0 | |
| | | | | | 07/2015 | | | | MXN | | | | 15,210 | | | | | | | | 981 | | | | 13 | | | | 0 | |
| | | | | | 07/2015 | | | | $ | | | | 2,803 | | | | BRL | | | | 8,695 | | | | 0 | | | | (6 | ) |
| | | | | | 07/2015 | | | | | | | | 206 | | | | TRY | | | | 565 | | | | 3 | | | | 0 | |
| | | | | | 08/2015 | | | | | | | | 2,692 | | | | BRL | | | | 8,451 | | | | 0 | | | | (5 | ) |
BRC | | | | | 07/2015 | | | | PLN | | | | 8,618 | | | | $ | | | | 2,252 | | | | 0 | | | | (38 | ) |
| | | | | | 07/2015 | | | | ZAR | | | | 18,606 | | | | | | | | 1,521 | | | | 0 | | | | (1 | ) |
CBK | | | | | 07/2015 | | | | MXN | | | | 93 | | | | | | | | 6 | | | | 0 | | | | 0 | |
| | | | | | 07/2015 | | | | $ | | | | 568 | | | | EUR | | | | 500 | | | | 0 | | | | (10 | ) |
| | | | | | 08/2015 | | | | | | | | 1,866 | | | | ILS | | | | 7,217 | | | | 46 | | | | 0 | |
| | | | | | 09/2015 | | | | | | | | 1,004 | | | | MXN | | | | 15,874 | | | | 0 | | | | 0 | |
| | | | | | 01/2016 | | | | BRL | | | | 3,632 | | | | $ | | | | 1,089 | | | | 0 | | | | (7 | ) |
DUB | | | | | 07/2015 | | | | | | | | 9,378 | | | | | | | | 3,395 | | | | 378 | | | | 0 | |
| | | | | | 07/2015 | | | | KRW | | | | 426,796 | | | | | | | | 381 | | | | 0 | | | | 0 | |
| | | | | | 07/2015 | | | | MXN | | | | 113 | | | | | | | | 7 | | | | 0 | | | | 0 | |
| | | | | | 07/2015 | | | | $ | | | | 3,023 | | | | BRL | | | | 9,378 | | | | 0 | | | | (6 | ) |
| | | | | | 07/2015 | | | | | | | | 4,026 | | | | KRW | | | | 4,359,817 | | | | 0 | | | | (134 | ) |
| | | | | | 07/2015 | | | | | | | | 810 | | | | TRY | | | | 2,254 | | | | 24 | | | | 0 | |
| | | | | | 08/2015 | | | | | | | | 156 | | | | DKK | | | | 1,025 | | | | 0 | | | | (3 | ) |
FBF | | | | | 07/2015 | | | | BRL | | | | 4,136 | | | | $ | | | | 1,515 | | | | 185 | | | | 0 | |
| | | | | | 07/2015 | | | | MXN | | | | 3,068 | | | | | | | | 201 | | | | 6 | | | | 0 | |
| | | | | | 07/2015 | | | | $ | | | | 1,333 | | | | BRL | | | | 4,136 | | | | 0 | | | | (3 | ) |
| | | | | | 07/2015 | | | | | | | | 361 | | | | JPY | | | | 44,600 | | | | 4 | | | | 0 | |
| | | | | | 08/2015 | | | | EUR | | | | 7,439 | | | | $ | | | | 8,367 | | | | 69 | | | | 0 | |
GLM | | | | | 07/2015 | | | | BRL | | | | 3,588 | | | | | | | | 1,159 | | | | 5 | | | | 0 | |
| | | | | | 07/2015 | | | | CAD | | | | 827 | | | | | | | | 660 | | | | 0 | | | | (2 | ) |
| | | | | | 07/2015 | | | | MXN | | | | 5,687 | | | | | | | | 373 | | | | 11 | | | | 0 | |
| | | | | | |
| See Accompanying Notes | | ANNUAL REPORT | | JUNE 30, 2015 | | 83 |
Schedule of Investments PIMCO Global Advantage® Inflation-Linked Bond Active Exchange-Traded Fund (Cont.)
| | | | | | | | | | | | | | | | | | | | | | | | | | | | | | |
| Counterparty | | | | Settlement
Month | | | Currency to
be Delivered | | | Currency to
be Received | | | Unrealized
Appreciation/
(Depreciation) | |
| | | | | | Asset | | | Liability | |
| | | | | | 07/2015 | | | | $ | | | | 1,868 | | | | AUD | | | | 2,416 | | | $ | 0 | | | $ | (4 | ) |
| | | | | | 07/2015 | | | | | | | | 1,135 | | | | BRL | | | | 3,588 | | | | 19 | | | | 0 | |
| | | | | | 07/2015 | | | | | | | | 2,557 | | | | CAD | | | | 3,176 | | | | 0 | | | | (14 | ) |
| | | | | | 08/2015 | | | | EUR | | | | 582 | | | | $ | | | | 652 | | | | 3 | | | | 0 | |
HUS | | | | | 07/2015 | | | | COP | | | | 4,856,025 | | | | | | | | 1,902 | | | | 43 | | | | 0 | |
| | | | | | 07/2015 | | | | KRW | | | | 775,793 | | | | | | | | 692 | | | | 0 | | | | 0 | |
| | | | | | 07/2015 | | | | $ | | | | 153 | | | | KRW | | | | 170,730 | | | | 0 | | | | (1 | ) |
| | | | | | 07/2015 | | | | | | | | 313 | | | | MXN | | | | 4,815 | | | | 0 | | | | (7 | ) |
| | | | | | 07/2015 | | | | | | | | 107 | | | | ZAR | | | | 1,331 | | | | 2 | | | | 0 | |
JPM | | | | | 07/2015 | | | | EUR | | | | 938 | | | | $ | | | | 1,044 | | | | 0 | | | | (2 | ) |
| | | | | | 07/2015 | | | | KRW | | | | 771,843 | | | | | | | | 687 | | | | 0 | | | | (2 | ) |
| | | | | | 07/2015 | | | | $ | | | | 144 | | | | CAD | | | | 177 | | | | 0 | | | | (2 | ) |
| | | | | | 07/2015 | | | | | | | | 700 | | | | EUR | | | | 625 | | | | 1 | | | | (4 | ) |
| | | | | | 07/2015 | | | | | | | | 241 | | | | GBP | | | | 156 | | | | 4 | | | | 0 | |
| | | | | | 07/2015 | | | | | | | | 2,305 | | | | PLN | | | | 8,657 | | | | 0 | | | | (5 | ) |
| | | | | | 08/2015 | | | | | | | | 1,085 | | | | INR | | | | 70,489 | | | | 15 | | | | 0 | |
| | | | | | 04/2016 | | | | BRL | | | | 4,580 | | | | $ | | | | 1,400 | | | | 57 | | | | 0 | |
MSB | | | | | 07/2015 | | | | | | | | 4,078 | | | | | | | | 1,314 | | | | 3 | | | | 0 | |
| | | | | | 07/2015 | | | | $ | | | | 1,299 | | | | BRL | | | | 4,078 | | | | 13 | | | | 0 | |
NGF | | | | | 07/2015 | | | | MXN | | | | 6,097 | | | | $ | | | | 394 | | | | 7 | | | | 0 | |
SCX | | | | | 07/2015 | | | | BRL | | | | 15,887 | | | | | | | | 5,121 | | | | 11 | | | | 0 | |
| | | | | | 07/2015 | | | | CAD | | | | 2,526 | | | | | | | | 2,040 | | | | 17 | | | | 0 | |
| | | | | | 07/2015 | | | | $ | | | | 5,231 | | | | BRL | | | | 15,887 | | | | 0 | | | | (122 | ) |
| | | | | | 07/2015 | | | | | | | | 1,990 | | | | MXN | | | | 31,021 | | | | 0 | | | | (17 | ) |
| | | | | | 08/2015 | | | | | | | | 2,039 | | | | CAD | | | | 2,526 | | | | 0 | | | | (17 | ) |
| | | | | | 09/2015 | | | | MXN | | | | 31,021 | | | | $ | | | | 1,978 | | | | 17 | | | | 0 | |
UAG | | | | | 07/2015 | | | | $ | | | | 748 | | | | EUR | | | | 666 | | | | 3 | | | | (8 | ) |
| | | | | | 07/2015 | | | | | | | | 5,476 | | | | GBP | | | | 3,488 | | | | 4 | | | | 0 | |
| | | | | | 07/2015 | | | | | | | | 152 | | | | MXN | | | | 2,348 | | | | 0 | | | | (3 | ) |
| | | | | | 07/2015 | | | | | | | | 2,859 | | | | NZD | | | | 4,194 | | | | 0 | | | | (18 | ) |
| | | | | | 08/2015 | | | | DKK | | | | 27,744 | | | | $ | | | | 4,230 | | | | 79 | | | | 0 | |
| | | | | | 08/2015 | | | | EUR | | | | 1,564 | | | | | | | | 1,752 | | | | 8 | | | | 0 | |
| | | | | | 08/2015 | | | | GBP | | | | 3,488 | | | | | | | | 5,475 | | | | 0 | | | | (4 | ) |
| | | | | | 08/2015 | | | | NZD | | | | 4,194 | | | | | | | | 2,851 | | | | 18 | | | | 0 | |
Total Forward Foreign Currency Contracts | | | | | | | | | | | | | | | | | | | | | | | | $ | 1,292 | | | $ | (576 | ) |
PURCHASED OPTIONS:
INTEREST RATE SWAPTIONS
| | | | | | | | | | | | | | | | | | | | | | | | | | | | |
| Counterparty | | Description | | Floating Rate Index | | | | Pay/Receive
Floating Rate | | Exercise
Rate | | | Expiration
Date | | | Notional
Amount | | | Cost | | | Market
Value | |
CBK | | Put - OTC 1-Year Interest Rate Swap | | 3-Month USD-LIBOR | | | | Receive | | | 0.950 | % | | | 12/15/2015 | | | $ | 3,000 | | | $ | 4 | | | $ | 3 | |
Total Purchased Options | | | | | | | | | | | | | | | | | | | | $ | 4 | | | $ | 3 | |
WRITTEN OPTIONS:
CREDIT DEFAULT SWAPTIONS ON CREDIT INDICES
| | | | | | | | | | | | | | | | | | | | | | | | | | | | | | |
| Counterparty | | Description | | | | Buy/Sell
Protection | | Exercise
Rate | | | Expiration
Date | | | Notional
Amount | | | Premiums
(Received) | | | Market
Value | |
BPS | | Put - OTC iTraxx Europe 23 5-Year Index | | | | Sell | | | 0.850 | % | | | 08/19/2015 | | | | EUR | | | | 200 | | | $ | 0 | | | $ | (1 | ) |
BRC | | Put - OTC iTraxx Europe 23 5-Year Index | | | | Sell | | | 0.850 | % | | | 08/19/2015 | | | | | | | | 300 | | | | (1 | ) | | | (1 | ) |
| | | Put - OTC iTraxx Europe 23 5-Year Index | | | | Sell | | | 0.900 | % | | | 09/16/2015 | | | | | | | | 400 | | | | (1 | ) | | | (1 | ) |
CBK | | Put - OTC iTraxx Europe 23 5-Year Index | | | | Sell | | | 0.900 | % | | | 08/19/2015 | | | | | | | | 200 | | | | (1 | ) | | | (1 | ) |
| | | | | | |
| 84 | | PIMCO ETF TRUST | | | | See Accompanying Notes |
June 30, 2015
| | | | | | | | | | | | | | | | | | | | | | | | | | | | | | |
| Counterparty | | Description | | | | Buy/Sell
Protection | | Exercise
Rate | | | Expiration
Date | | | Notional
Amount | | | Premiums
(Received) | | | Market
Value | |
FBF | | Put - OTC iTraxx Europe 23 5-Year Index | | | | Sell | | | 0.850 | % | | | 08/19/2015 | | | | EUR | | | | 200 | | | $ | 0 | | | $ | (1 | ) |
GST | | Put - OTC iTraxx Europe 23 5-Year Index | | | | Sell | | | 0.850 | % | | | 08/19/2015 | | | | | | | | 200 | | | | 0 | | | | (1 | ) |
| | | Put - OTC iTraxx Europe 23 5-Year Index | | | | Sell | | | 0.900 | % | | | 09/16/2015 | | | | | | | | 2,100 | | | | (4 | ) | | | (7 | ) |
JPM | | Put - OTC iTraxx Europe 23 5-Year Index | | | | Sell | | | 0.900 | % | | | 09/16/2015 | | | | | | | | 200 | | | | (1 | ) | | | (1 | ) |
SOG | | Put - OTC iTraxx Europe 23 5-Year Index | | | | Sell | | | 0.900 | % | | | 09/16/2015 | | | | | | | | 500 | | | | (1 | ) | | | (1 | ) |
| | | | | | | | | | | | | | | | | | | | | | $ | (9 | ) | | $ | (15 | ) |
FOREIGN CURRENCY OPTIONS
| | | | | | | | | | | | | | | | | | | | | | | | | | | | | | | | |
| Counterparty | | Description | | | | Strike
Price | | | Expiration
Date | | | Notional
Amount | | | Premiums
(Received) | | | Market
Value | |
BPS | | Call - OTC EUR versus USD | | | | | $ | | | | 1.150 | | | | 07/02/2015 | | | | EUR | | | | 420 | | | $ | (2 | ) | | $ | 0 | |
| | | Put - OTC EUR versus USD | | | | | | | | | 1.110 | | | | 07/20/2015 | | | | | | | | 860 | | | | (4 | ) | | | (10 | ) |
| | | Call - OTC EUR versus USD | | | | | | | | | 1.170 | | | | 07/20/2015 | | | | | | | | 860 | | | | (5 | ) | | | (1 | ) |
BRC | | Call - OTC EUR versus USD | | | | | | | | | 1.150 | | | | 07/15/2015 | | | | | | | | 210 | | | | (1 | ) | | | 0 | |
FBF | | Call - OTC USD versus BRL | | | | | BRL | | | | 4.000 | | | | 03/17/2016 | | | | $ | | | | 800 | | | | (34 | ) | | | (13 | ) |
UAG | | Call - OTC EUR versus USD | | | | | $ | | | | 1.150 | | | | 07/02/2015 | | | | EUR | | | | 350 | | | | (2 | ) | | | 0 | |
| | | | | | | | | | | | | | | | | | | | | | | | $ | (48 | ) | | $ | (24 | ) |
INFLATION-CAPPED OPTIONS
| | | | | | | | | | | | | | | | | | | | | | | | | | |
| Counterparty | | Description | | Initial
Index | | | Floating Rate | | | | Expiration
Date (1) | | | Notional
Amount | | | Premiums
(Received) | | | Market
Value | |
DUB | | Cap - OTC CPURNSA Index | | | 236.119 | | | Maximum of [(Final Index/Initial Index - 1) - 3.000%] or 0 | | | | | 06/01/2016 | | | $ | 200 | | | $ | 0 | | | $ | 0 | |
GLM | | Cap - OTC CPALEMU Index | | | 117.93 | | | Maximum of [(Final Index/Initial Index - 1) - 3.000%] or 0 | | | | | 06/22/2035 | | | | 300 | | | | 0 | | | | (12 | ) |
JPM | | Cap - OTC YOY CPURNSA Index | | | 233.707 | | | Maximum of [(Final Index/Initial Index - 1) - 3.000%] or 0 | | | | | 04/10/2020 | | | | (3,900 | ) | | | 0 | | | | 7 | |
| | | Floor - OTC YOY CPURNSA Index | | | 233.707 | | | Maximum of [0.000% - (Final Index/Initial Index - 1)] or 0 | | | | | 04/10/2020 | | | | (3,900 | ) | | | 0 | | | | 8 | |
| | | Floor - OTC YOY CPURNSA Index | | | 234.81 | | | Maximum of [0.000% - (Final Index/Initial Index - 1)] or 0 | | | | | 03/24/2020 | | | | 1,100 | | | | (13 | ) | | | (12 | ) |
| | | | | | | | | | | | | | | | | | | | $ | (13 | ) | | $ | (9 | ) |
| (1) | YOY options may have a series of expirations. |
INTEREST RATE SWAPTIONS
| | | | | | | | | | | | | | | | | | | | | | | | | | | | | | | | |
| Counterparty | | Description | | Floating Rate Index | | | | Pay/Receive
Floating Rate | | Exercise
Rate | | | Expiration
Date | | | Notional
Amount | | | Premiums
(Received) | | | Market
Value | |
CBK | | Call - OTC 10-Year Interest Rate Swap | | 3-Month USD-LIBOR | | | | Receive | | | 2.050 | % | | | 07/13/2015 | | | | $ | | | | 1,400 | | | $ | (6 | ) | | $ | 0 | |
DUB | | Put - OTC 5-Year Interest Rate Swap | | 3-Month USD-LIBOR | | | | Pay | | | 1.950 | % | | | 07/13/2015 | | | | | | | | 5,300 | | | | (18 | ) | | | (7 | ) |
GLM | | Call - OTC 5-Year Interest Rate Swap (Effective 09/16/2010) | | 3-Month USD-LIBOR | | | | Receive | | | 2.910 | % | | | 09/14/2015 | | | | | | | | 2,800 | | | | (11 | ) | | | (9 | ) |
| | | Put - OTC 10-Year Interest Rate Swap | | 3-Month USD-LIBOR | | | | Pay | | | 2.400 | % | | | 07/15/2015 | | | | | | | | 2,200 | | | | (8 | ) | | | (28 | ) |
| | | Call - OTC 10-Year Interest Rate Swap | | 6-Month GBP-LIBOR | | | | Receive | | | 1.750 | % | | | 08/20/2015 | | | | GBP | | | | 400 | | | | (4 | ) | | | (1 | ) |
| | | Put - OTC 10-Year Interest Rate Swap | | 6-Month GBP-LIBOR | | | | Pay | | | 2.400 | % | | | 08/20/2015 | | | | | | | | 400 | | | | (3 | ) | | | (3 | ) |
JPM | | Call - OTC 5-Year Interest Rate Swap (Effective 09/16/2010) | | 3-Month USD-LIBOR | | | | Receive | | | 2.910 | % | | | 09/14/2015 | | | | $ | | | | 1,700 | | | | (5 | ) | | | (5 | ) |
| | | Call - OTC 10-Year Interest Rate Swap | | 6-Month GBP-LIBOR | | | | Receive | | | 1.900 | % | | | 09/09/2015 | | | | GBP | | | | 400 | | | | (4 | ) | | | (3 | ) |
| | | | | | | | | | | | | | | | | | | | | | | | | | $ | (59 | ) | | $ | (56 | ) |
Total Written Options | | | | | | | | | | | | | | | | | | | | | | | | $ | (129 | ) | | $ | (104 | ) |
TRANSACTIONS IN WRITTEN CALL AND PUT OPTIONS FOR THE PERIOD ENDED JUNE 30, 2015:
| | | | | | | | | | | | | | | | | | | | | | | | | | | | | | |
| | | | | # of
Contracts | | | Notional
Amount in $ | | | Notional
Amount in EUR | | | Notional
Amount in GBP | | | Premiums | |
Balance at Beginning of Period | | | | | 0 | | | $ | 0 | | | | EUR | | | | 0 | | | | GBP | | | | 0 | | | $ | 0 | |
Sales | | | | | 109 | | | | 47,779 | | | | | | | | 27,156 | | | | | | | | 1,200 | | | | (395 | ) |
Closing Buys | | | | | (28 | ) | | | (7,200 | ) | | | | | | | (400 | ) | | | | | | | 0 | | | | 63 | |
Expirations | | | | | (24 | ) | | | (14,600 | ) | | | | | | | (13,936 | ) | | | | | | | 0 | | | | 125 | |
Exercised | | | | | (45 | ) | | | (2,679 | ) | | | | | | | (5,520 | ) | | | | | | | 0 | | | | 69 | |
Balance at End of Period | | | | | 12 | | | $ | 23,300 | | | | EUR | | | | 7,300 | | | | GBP | | | | 1,200 | | | $ | (138 | ) |
| | | | | | |
| See Accompanying Notes | | ANNUAL REPORT | | JUNE 30, 2015 | | 85 |
Schedule of Investments PIMCO Global Advantage® Inflation-Linked Bond Active Exchange-Traded Fund (Cont.)
SWAP AGREEMENTS:
INTEREST RATE SWAPS
| | | | | | | | | | | | | | | | | | | | | | | | | | | | | | | | | | | | | | |
| Counterparty | | Pay/Receive
Floating Rate | | Floating Rate Index | | | | Fixed Rate | | | Maturity
Date | | | Notional
Amount | | | Premiums
Paid/(Received) | | | Unrealized
Appreciation/
(Depreciation) | | | Swap Agreements, at Value | |
| | | | | | | | | | Asset | | | Liability | |
BOA | | Pay | | 1-Year BRL-CDI | | | | | 13.030 | % | | | 01/02/2018 | | | | BRL | | | | 3,900 | | | $ | (6 | ) | | $ | 6 | | | $ | 0 | | | $ | 0 | |
BPS | | Pay | | 1-Year BRL-CDI | | | | | 13.030 | % | | | 01/02/2018 | | | | | | | | 1,200 | | | | 1 | | | | (1 | ) | | | 0 | | | | 0 | |
BRC | | Pay | | 1-Year BRL-CDI | | | | | 13.030 | % | | | 01/02/2018 | | | | | | | | 2,800 | | | | 0 | | | | 0 | | | | 0 | | | | 0 | |
CBK | | Pay | | 1-Month GBP-UKRPI | | | | | 3.190 | % | | | 04/15/2030 | | | | GBP | | | | 400 | | | | 0 | | | | (17 | ) | | | 0 | | | | (17 | ) |
| | | Pay | | 1-Month GBP-UKRPI | | | | | 3.350 | % | | | 05/15/2030 | | | | | | | | 300 | | | | 0 | | | | (1 | ) | | | 0 | | | | (1 | ) |
DUB | | Pay | | 1-Year BRL-CDI | | | | | 13.030 | % | | | 01/02/2018 | | | | BRL | | | | 4,700 | | | | (2 | ) | | | 2 | | | | 0 | | | | 0 | |
FBF | | Pay | | 1-Month GBP-UKRPI | | | | | 3.353 | % | | | 05/15/2030 | | | | GBP | | | | 100 | | | | 0 | | | | 0 | | | | 0 | | | | 0 | |
| | | Pay | | 1-Month GBP-UKRPI | | | | | 3.335 | % | | | 04/15/2035 | | | | | | | | 300 | | | | 0 | | | | (16 | ) | | | 0 | | | | (16 | ) |
| | | Pay | | 1-Month GBP-UKRPI | | | | | 3.550 | % | | | 11/15/2044 | | | | | | | | 900 | | | | (1 | ) | | | 56 | | | | 55 | | | | 0 | |
| | | Pay | | 1-Year BRL-CDI | | | | | 13.030 | % | | | 01/02/2018 | | | | BRL | | | | 1,900 | | | | (2 | ) | | | 2 | | | | 0 | | | | 0 | |
GLM | | Pay | | 1-Month GBP-UKRPI | | | | | 3.140 | % | | | 01/14/2030 | | | | GBP | | | | 950 | | | | 0 | | | | (37 | ) | | | 0 | | | | (37 | ) |
| | | Pay | | 1-Month GBP-UKRPI | | | | | 3.320 | % | | | 05/15/2030 | | | | | | | | 300 | | | | 0 | | | | (4 | ) | | | 0 | | | | (4 | ) |
| | | Pay | | 1-Month GBP-UKRPI | | | | | 3.358 | % | | | 04/15/2035 | | | | | | | | 100 | | | | 0 | | | | (4 | ) | | | 0 | | | | (4 | ) |
HUS | | Pay | | 1-Year BRL-CDI | | | | | 13.030 | % | | | 01/02/2018 | | | | BRL | | | | 2,400 | | | | (3 | ) | | | 3 | | | | 0 | | | | 0 | |
| | | Pay | | 1-Year BRL-CDI | | | | | 13.220 | % | | | 01/02/2018 | | | | | | | | 3,500 | | | | 0 | | | | 1 | | | | 1 | | | | 0 | |
UAG | | Pay | | 3-Month USD-CPURNSA Index | | | | | 2.063 | % | | | 05/12/2025 | | | $ | | | | | 1,300 | | | | 0 | | | | (8 | ) | | | 0 | | | | (8 | ) |
| | | | | | | | | | | | | | | | | | | | | | | | | $ | (13 | ) | | $ | (18 | ) | | $ | 56 | | | $ | (87 | ) |
Total Swap Agreements | | | | | | | | | | | | | | | | | | | | | | $ | (13 | ) | | $ | (18 | ) | | $ | 56 | | | $ | (87 | ) |
FINANCIAL DERIVATIVE INSTRUMENTS: OVER THE COUNTER SUMMARY
The following is a summary by counterparty of the market value of OTC financial derivative instruments and collateral (received) as of June 30, 2015:
| | | | | | | | | | | | | | | | | | | | | | | | | | | | | | | | | | | | | | | | | | | | | | | | |
Counterparty | | | | Financial Derivative Assets | | | | | Financial Derivative Liabilities | | | | | | | | | | |
| | | | Forward
Foreign
Currency
Contracts | | | Purchased
Options | | | Swap
Agreements | | | Total Over
the
Counter | | | | | Forward
Foreign
Currency
Contracts | | | Written
Options | | | Swap
Agreements | | | Total
Over the
Counter | | | Net Market
Value of OTC
Derivatives | | | Collateral
(Received) | | | Net
Exposure (3) | |
BOA | | | | $ | 177 | | | $ | 0 | | | $ | 0 | | | $ | 177 | | | | | $ | (131 | ) | | $ | 0 | | | $ | 0 | | | $ | (131 | ) | | $ | 46 | | | $ | 0 | | | $ | 46 | |
BPS | | | | | 63 | | | | 0 | | | | 0 | | | | 63 | | | | | | (11 | ) | | | (12 | ) | | | 0 | | | | (23 | ) | | | 40 | | | | (30 | ) | | | 10 | |
BRC | | | | | 0 | | | | 0 | | | | 0 | | | | 0 | | | | | | (39 | ) | | | (2 | ) | | | 0 | | | | (41 | ) | | | (41 | ) | | | 0 | | | | (41 | ) |
CBK | | | | | 46 | | | | 3 | | | | 0 | | | | 49 | | | | | | (17 | ) | | | (1 | ) | | | (18 | ) | | | (36 | ) | | | 13 | | | | 0 | | | | 13 | |
DUB | | | | | 402 | | | | 0 | | | | 0 | | | | 402 | | | | | | (143 | ) | | | (7 | ) | | | 0 | | | | (150 | ) | | | 252 | | | | (420 | ) | | | (168 | ) |
FBF | | | | | 264 | | | | 0 | | | | 55 | | | | 319 | | | | | | (3 | ) | | | (14 | ) | | | (16 | ) | | | (33 | ) | | | 286 | | | | (290 | ) | | | (4 | ) |
GLM | | | | | 38 | | | | 0 | | | | 0 | | | | 38 | | | | | | (20 | ) | | | (53 | ) | | | (45 | ) | | | (118 | ) | | | (80 | ) | | | 0 | | | | (80 | ) |
GST | | | | | 0 | | | | 0 | | | | 0 | | | | 0 | | | | | | 0 | | | | (8 | ) | | | 0 | | | | (8 | ) | | | (8 | ) | | | 0 | | | | (8 | ) |
HUS | | | | | 45 | | | | 0 | | | | 1 | | | | 46 | | | | | | (8 | ) | | | 0 | | | | 0 | | | | (8 | ) | | | 38 | | | | 0 | | | | 38 | |
JPM | | | | | 77 | | | | 0 | | | | 0 | | | | 77 | | | | | | (15 | ) | | | (6 | ) | | | 0 | | | | (21 | ) | | | 56 | | | | 0 | | | | 56 | |
MSB | | | | | 16 | | | | 0 | | | | 0 | | | | 16 | | | | | | 0 | | | | 0 | | | | 0 | | | | 0 | | | | 16 | | | | 0 | | | | 16 | |
NGF | | | | | 7 | | | | 0 | | | | 0 | | | | 7 | | | | | | 0 | | | | 0 | | | | 0 | | | | 0 | | | | 7 | | | | 0 | | | | 7 | |
SCX | | | | | 45 | | | | 0 | | | | 0 | | | | 45 | | | | | | (156 | ) | | | 0 | | | | 0 | | | | (156 | ) | | | (111 | ) | | | 0 | | | | (111 | ) |
SOG | | | | | 0 | | | | 0 | | | | 0 | | | | 0 | | | | | | 0 | | | | (1 | ) | | | 0 | | | | (1 | ) | | | (1 | ) | | | 0 | | | | (1 | ) |
UAG | | | | | 112 | | | | 0 | | | | 0 | | | | 112 | | | | | | (33 | ) | | | 0 | | | | (8 | ) | | | (41 | ) | | | 71 | | | | 0 | | | | 71 | |
Total Over the Counter | | | | $ | 1,292 | | | $ | 3 | | | $ | 56 | | | $ | 1,351 | | | | | $ | (576 | ) | | $ | (104 | ) | | $ | (87 | ) | | $ | (767 | ) | | | | | | | | | | | | |
| (3) | Net Exposure represents the net receivable/(payable) that would be due from/to the counterparty in the event of default. Exposure from OTC financial derivative instruments can only be netted across transactions governed under the same master agreement with the same legal entity. See Note 7, Principal Risks, in the Notes to Financial Statements for more information regarding master netting arrangements. |
| | | | | | |
| 86 | | PIMCO ETF TRUST | | | | See Accompanying Notes |
June 30, 2015
FAIR VALUE OF FINANCIAL DERIVATIVE INSTRUMENTS
The following is a summary of the fair valuation of the Fund’s derivative instruments categorized by risk exposure. See Note 7, Principal Risks, in the Notes to Financial Statements on risks of the Fund.
Fair Values of Financial Derivative Instruments on the Statements of Assets and Liabilities as of June 30, 2015:
| | | | | | | | | | | | | | | | | | | | | | | | | | |
| | | | | Derivatives not accounted for as hedging instruments | |
| | | | | Commodity
Contracts | | | Credit
Contracts | | | Equity
Contracts | | | Foreign
Exchange
Contracts | | | Interest
Rate Contracts | | | Total | |
Financial Derivative Instruments - Assets | | | | | | | | | | | | | | | | | | | | | | | | | | |
Exchange-traded or centrally cleared | | | | | | | | | | | | | | | | | | | | | | | | | | |
Purchased Options | | | | $ | 0 | | | $ | 0 | | | $ | 0 | | | $ | 0 | | | $ | 3 | | | $ | 3 | |
Futures | | | | | 0 | | | | 0 | | | | 0 | | | | 0 | | | | 15 | | | | 15 | |
Swap Agreements | | | | | 0 | | | | 0 | | | | 0 | | | | 0 | | | | 11 | | | | 11 | |
| | | | $ | 0 | | | $ | 0 | | | $ | 0 | | | $ | 0 | | | $ | 29 | | | $ | 29 | |
Over the counter | | | | | | | | | | | | | | | | | | | | | | | | | | |
Forward Foreign Currency Contracts | | | | $ | 0 | | | $ | 0 | | | $ | 0 | | | $ | 1,292 | | | $ | 0 | | | $ | 1,292 | |
Purchased Options | | | | | 0 | | | | 0 | | | | 0 | | | | 0 | | | | 3 | | | | 3 | |
Swap Agreements | | | | | 0 | | | | 0 | | | | 0 | | | | 0 | | | | 56 | | | | 56 | |
| | | | $ | 0 | | | $ | 0 | | | $ | 0 | | | $ | 1,292 | | | $ | 59 | | | $ | 1,351 | |
| | | | $ | 0 | | | $ | 0 | | | $ | 0 | | | $ | 1,292 | | | $ | 88 | | | $ | 1,380 | |
| | | | | | | |
Financial Derivative Instruments - Liabilities | | | | | | | | | | | | | | | | | | | | | | | | | | |
Exchange-traded or centrally cleared | | | | | | | | | | | | | | | | | | | | | | | | | | |
Written Options | | | | $ | 0 | | | $ | 0 | | | $ | 0 | | | $ | 0 | | | $ | 7 | | | $ | 7 | |
Futures | | | | | 0 | | | | 0 | | | | 0 | | | | 0 | | | | 10 | | | | 10 | |
Swap Agreements | | | | | 0 | | | | 7 | | | | 0 | | | | 0 | | | | 102 | | | | 109 | |
| | | | $ | 0 | | | $ | 7 | | | $ | 0 | | | $ | 0 | | | $ | 119 | | | $ | 126 | |
Over the counter | | | | | | | | | | | | | | | | | | | | | | | | | | |
Forward Foreign Currency Contracts | | | | $ | 0 | | | $ | 0 | | | $ | 0 | | | $ | 576 | | | $ | 0 | | | $ | 576 | |
Written Options | | | | | 0 | | | | 15 | | | | 0 | | | | 24 | | | | 65 | | | | 104 | |
Swap Agreements | | | | | 0 | | | | 0 | | | | 0 | | | | 0 | | | | 87 | | | | 87 | |
| | | | $ | 0 | | | $ | 15 | | | $ | 0 | | | $ | 600 | | | $ | 152 | | | $ | 767 | |
| | | | $ | 0 | | | $ | 22 | | | $ | 0 | | | $ | 600 | | | $ | 271 | | | $ | 893 | |
The Effect of Financial Derivative Instruments on the Statements of Operations for the period ended June 30, 2015:
| | | | | | | | | | | | | | | | | | | | | | | | | | |
| | | | | Derivatives not accounted for as hedging instruments | |
| | | | | Commodity
Contracts | | | Credit
Contracts | | | Equity
Contracts | | | Foreign
Exchange
Contracts | | | Interest
Rate Contracts | | | Total | |
Net Realized Gain (Loss) on Financial Derivative Instruments | | | | | | | | | | | | | | | | | | | | | | | | | | |
Exchange-traded or centrally cleared | | | | | | | | | | | | | | | | | | | | | | | | | | |
Written Options | | | | $ | 6 | | | $ | 0 | | | $ | 0 | | | $ | 0 | | | $ | 20 | | | $ | 26 | |
Futures | | | | | 5 | | | | 0 | | | | 0 | | | | 0 | | | | (397 | ) | | | (392 | ) |
Swap Agreements | | | | | 0 | | | | 1 | | | | 0 | | | | 0 | | | | 207 | | | | 208 | |
| | | | $ | 11 | | | $ | 1 | | | $ | 0 | | | $ | 0 | | | $ | (170 | ) | | $ | (158 | ) |
Over the counter | | | | | | | | | | | | | | | | | | | | | | | | | | |
Forward Foreign Currency Contracts | | | | $ | 0 | | | $ | 0 | �� | | $ | 0 | | | $ | 609 | | | $ | 0 | | | $ | 609 | |
Purchased Options | | | | | 0 | | | | 0 | | | | 0 | | | | 0 | | | | (36 | ) | | | (36 | ) |
Written Options | | | | | 0 | | | | 14 | | | | 0 | | | | 34 | | | | (52 | ) | | | (4 | ) |
Swap Agreements | | | | | 0 | | | | 12 | | | | 0 | | | | 4 | | | | 151 | | | | 167 | |
| | | | $ | 0 | | | $ | 26 | | | $ | 0 | | | $ | 647 | | | $ | 63 | | | $ | 736 | |
| | | | $ | 11 | | | $ | 27 | | | $ | 0 | | | $ | 647 | | | $ | (107 | ) | | $ | 578 | |
| | | | | | |
| See Accompanying Notes | | ANNUAL REPORT | | JUNE 30, 2015 | | 87 |
Schedule of Investments PIMCO Global Advantage® Inflation-Linked Bond Active Exchange-Traded Fund (Cont.)
| | | | | | | | | | | | | | | | | | | | | | | | | | |
| | | | | Derivatives not accounted for as hedging instruments | |
| | | | | Commodity
Contracts | | | Credit
Contracts | | | Equity
Contracts | | | Foreign
Exchange
Contracts | | | Interest
Rate Contracts | | | Total | |
Net Change in Unrealized Appreciation (Depreciation) on Financial Derivative Instruments | | | | | | | | | | | | | | | | | | | | | | | | | | |
Exchange-traded or centrally cleared | | | | | | | | | | | | | | | | | | | | | | | | | | |
Written Options | | | | $ | 0 | | | $ | 0 | | | $ | 0 | | | $ | 0 | | | $ | 1 | | | $ | 1 | |
Futures | | | | | 0 | | | | 0 | | | | 0 | | | | 0 | | | | (71 | ) | | | (71 | ) |
Swap Agreements | | | | | 0 | | | | (10 | ) | | | 0 | | | | 0 | | | | 157 | | | | 147 | |
| | | | $ | 0 | | | $ | (10 | ) | | $ | 0 | | | $ | 0 | | | $ | 87 | | | $ | 77 | |
Over the counter | | | | | | | | | | | | | | | | | | | | | | | | | | |
Forward Foreign Currency Contracts | | | | $ | 0 | | | $ | 0 | | | $ | 0 | | | $ | 693 | | | $ | 0 | | | $ | 693 | |
Purchased Options | | | | | 0 | | | | 0 | | | | 0 | | | | 0 | | | | (1 | ) | | | (1 | ) |
Written Options | | | | | 0 | | | | (6 | ) | | | 0 | | | | 24 | | | | 7 | | | | 25 | |
Swap Agreements | | | | | 0 | | | | 0 | | | | 0 | | | | 0 | | | | (17 | ) | | | (17 | ) |
| | | | $ | 0 | | | $ | (6 | ) | | $ | 0 | | | $ | 717 | | | $ | (11 | ) | | $ | 700 | |
| | | | $ | 0 | | | $ | (16 | ) | | $ | 0 | | | $ | 717 | | | $ | 76 | | | $ | 777 | |
FAIR VALUE MEASUREMENTS
The following is a summary of the fair valuations according to the inputs used as of June 30, 2015 in valuing the Fund’s assets and liabilities:
| | | | | | | | | | | | | | | | | | |
| Category and Subcategory | | | | Level 1 | | | Level 2 | | | Level 3 | | | Fair Value at
06/30/2015 | |
Investments in Securities, at Value | | | | | | | | | | | | | | | | | | |
Australia | | | | | | | | | | | | | | | | | | |
Sovereign Issues | | | | $ | 0 | | | $ | 435 | | | $ | 0 | | | $ | 435 | |
Brazil | | | | | | | | | | | | | | | | | | |
Sovereign Issues | | | | | 0 | | | | 14,437 | | | | 0 | | | | 14,437 | |
Canada | | | | | | | | | | | | | | | | | | |
Sovereign Issues | | | | | 0 | | | | 1,476 | | | | 0 | | | | 1,476 | |
Chile | | | | | | | | | | | | | | | | | | |
Sovereign Issues | | | | | 0 | | | | 2,801 | | | | 0 | | | | 2,801 | |
Colombia | | | | | | | | | | | | | | | | | | |
Sovereign Issues | | | | | 0 | | | | 3,806 | | | | 0 | | | | 3,806 | |
Denmark | | | | | | | | | | | | | | | | | | |
Sovereign Issues | | | | | 0 | | | | 4,270 | | | | 0 | | | | 4,270 | |
France | | | | | | | | | | | | | | | | | | |
Sovereign Issues | | | | | 0 | | | | 10,096 | | | | 0 | | | | 10,096 | |
Germany | | | | | | | | | | | | | | | | | | |
Sovereign Issues | | | | | 0 | | | | 173 | | | | 0 | | | | 173 | |
India | | | | | | | | | | | | | | | | | | |
Corporate Bonds & Notes | | | | | 0 | | | | 1,308 | | | | 0 | | | | 1,308 | |
Italy | | | | | | | | | | | | | | | | | | |
Sovereign Issues | | | | | 0 | | | | 13,280 | | | | 0 | | | | 13,280 | |
Japan | | | | | | | | | | | | | | | | | | |
Sovereign Issues | | | | | 0 | | | | 7,174 | | | | 0 | | | | 7,174 | |
Mexico | | | | | | | | | | | | | | | | | | |
Sovereign Issues | | | | | 0 | | | | 8,405 | | | | 0 | | | | 8,405 | |
New Zealand | | | | | | | | | | | | | | | | | | |
Sovereign Issues | | | | | 0 | | | | 2,996 | | | | 0 | | | | 2,996 | |
Slovenia | | | | | | | | | | | | | | | | | | |
Sovereign Issues | | | | | 0 | | | | 236 | | | | 0 | | | | 236 | |
South Africa | | | | | | | | | | | | | | | | | | |
Sovereign Issues | | | | | 0 | | | | 3,908 | | | | 0 | | | | 3,908 | |
| | | | | | |
| 88 | | PIMCO ETF TRUST | | | | See Accompanying Notes |
June 30, 2015
| | | | | | | | | | | | | | | | | | |
| Category and Subcategory | | | | Level 1 | | | Level 2 | | | Level 3 | | | Fair Value at
06/30/2015 | |
South Korea | | | | | | | | | | | | | | | | | | |
Sovereign Issues | | | | $ | 0 | | | $ | 1,410 | | | $ | 0 | | | $ | 1,410 | |
Spain | | | | | | | | | | | | | | | | | | |
Sovereign Issues | | | | | 0 | | | | 1,678 | | | | 0 | | | | 1,678 | |
Sweden | | | | | | | | | | | | | | | | | | |
Sovereign Issues | | | | | 0 | | | | 464 | | | | 0 | | | | 464 | |
Turkey | | | | | | | | | | | | | | | | | | |
Sovereign Issues | | | | | 0 | | | | 3,970 | | | | 0 | | | | 3,970 | |
United Kingdom | | | | | | | | | | | | | | | | | | |
Sovereign Issues | | | | | 0 | | | | 9,806 | | | | 0 | | | | 9,806 | |
United States | | | | | | | | | | | | | | | | | | |
U.S. Government Agencies | | | | | 0 | | | | 1,300 | | | | 0 | | | | 1,300 | |
U.S. Treasury Obligations | | | | | 0 | | | | 48,693 | | | | 0 | | | | 48,693 | |
Total Investments | | | | $ | 0 | | | $ | 142,122 | | | $ | 0 | | | $ | 142,122 | |
| | | | | |
Financial Derivative Instruments - Assets | | | | | | | | | | | | | | | | | | |
Exchange-traded or centrally cleared | | | | | 18 | | | | 11 | | | | 0 | | | | 29 | |
Over the counter | | | | | 0 | | | | 1,351 | | | | 0 | | | | 1,351 | |
| | | | | $ | 18 | | | $ | 1,362 | | | $ | 0 | | | $ | 1,380 | |
| | | | | |
Financial Derivative Instruments - Liabilities | | | | | | | | | | | | | | | | | | |
Exchange-traded or centrally cleared | | | | | (10 | ) | | | (116 | ) | | | 0 | | | | (126 | ) |
Over the counter | | | | | (5 | ) | | | (762 | ) | | | 0 | | | | (767 | ) |
| | | | | $ | (15 | ) | | $ | (878 | ) | | $ | 0 | | | $ | (893 | ) |
Totals | | | | $ | 3 | | | $ | 142,606 | | | $ | 0 | | | $ | 142,609 | |
There were no significant transfers between Levels 1, 2, or 3 during the period ended June 30, 2015.
| | | | | | |
| See Accompanying Notes | | ANNUAL REPORT | | JUNE 30, 2015 | | 89 |
Schedule of Investments PIMCO Intermediate Municipal Bond Active Exchange-Traded Fund
| | | | | | | | | | | | |
| | | | | PRINCIPAL
AMOUNT
(000s) | | | | | MARKET
VALUE
(000s) | |
INVESTMENTS IN SECURITIES 100.5% | |
| |
MUNICIPAL BONDS & NOTES 94.6% | |
| |
ALABAMA 0.8% | |
|
University of Alabama Revenue Bonds, Series 2012 | |
5.000% due 07/01/2025 | | $ | | | 1,610 | | | $ | | | 1,877 | |
| | | | | | | | | | | | |
| |
ARIZONA 3.2% | |
|
Arizona State University Revenue Notes, Series 2008 | |
5.250% due 07/01/2016 | | | | | 400 | | | | | | 419 | |
|
Arizona Water Infrastructure Finance Authority Revenue Bonds, Series 2009 | |
4.250% due 10/01/2019 | | | | | 730 | | | | | | 818 | |
|
Arizona Water Infrastructure Finance Authority Revenue Bonds, Series 2012 | |
5.000% due 10/01/2022 | | | | | 1,350 | | | | | | 1,620 | |
|
Arizona Water Infrastructure Finance Authority Revenue Bonds, Series 2014 | |
5.000% due 10/01/2026 | | | | | 1,250 | | | | | | 1,504 | |
|
Phoenix Civic Improvement Corp., Arizona Revenue Bonds, Series 2014 | |
5.000% due 07/01/2027 | | | | | 2,500 | | | | | | 2,952 | |
| | | | | | | | | | | | |
| | | | | | | | | | | 7,313 | |
| | | | | | | | | | | | |
| |
ARKANSAS 0.2% | |
|
University of Arkansas Revenue Bonds, Series 2012 | |
5.000% due 05/01/2026 | | | | | 320 | | | | | | 372 | |
| | | | | | | | | | | | |
| |
CALIFORNIA 11.5% | |
|
Bay Area Toll Authority, California Revenue Bonds, Series 2007 | |
0.770% due 04/01/2047 | | | | | 1,000 | | | | | | 996 | |
|
California Health Facilities Financing Authority Revenue Bonds, Series 2009 | |
6.000% due 07/01/2039 | | | | | 1,000 | | | | | | 1,138 | |
|
California State Department of Water Resources Power Supply Revenue Notes, Series 2010 | |
5.000% due 05/01/2018 | | | | | 500 | | | | | | 557 | |
5.000% due 05/01/2019 | | | | | 1,040 | | | | | | 1,190 | |
|
California State General Obligation Bonds, Series 2009 | |
5.000% due 07/01/2020 | | | | | 500 | | | | | | 575 | |
|
California State General Obligation Notes, Series 2009 | |
5.000% due 07/01/2018 | | | | | 500 | | | | | | 560 | |
|
California State General Obligation Notes, Series 2010 | |
5.000% due 11/01/2019 | | | | | 500 | | | | | | 578 | |
|
California State General Obligation Notes, Series 2013 | |
5.000% due 09/01/2021 | | | | | 3,000 | | | | | | 3,555 | |
|
Irvine Ranch Water District, California Special Assessment Bonds, Series 2009 | |
0.010% due 10/01/2041 | | | | | 900 | | | | | | 900 | |
|
Los Angeles Department of Airports, California Revenue Bonds, Series 2012 | |
5.000% due 05/15/2029 | | | | | 250 | | | | | | 289 | |
|
Los Angeles Unified School District, California Certificates of Participation Notes, Series 2010 | |
5.000% due 12/01/2017 | | | | | 1,500 | | | | | | 1,644 | |
|
Los Angeles, California Wastewater System Revenue Bonds, Series 2015 | |
5.000% due 06/01/2029 | | | | | 1,350 | | | | | | 1,593 | |
|
Metropolitan Water District of Southern California Revenue Bonds, Series 2012 | |
5.000% due 10/01/2026 | | | | | 2,000 | | | | | | 2,354 | |
|
Metropolitan Water District of Southern California Revenue Notes, Series 2012 | |
5.000% due 07/01/2022 | | | | | 510 | | | | | | 612 | |
| | | | | | | | | | | | |
| | | | | PRINCIPAL
AMOUNT
(000s) | | | | | MARKET
VALUE
(000s) | |
|
Mount San Antonio Community College District, California General Obligation Bonds, (NPFGC Insured), Series 2005 | |
0.000% due 08/01/2016 (b) | | $ | | | 1,000 | | | $ | | | 995 | |
|
Orange County, California Airport Revenue Notes, Series 2009 | |
4.000% due 07/01/2018 | | | | | 500 | | | | | | 541 | |
|
Pleasanton Unified School District, California Certificates of Participation Notes, (AGM Insured), Series 2010 | |
3.500% due 08/01/2015 | | | | | 450 | | | | | | 451 | |
|
Regents of the University of California Medical Center Pooled Revenue Notes, Series 2010 | |
5.000% due 05/15/2018 | | | | | 500 | | | | | | 558 | |
|
Sacramento Municipal Utility District, California Revenue Bonds, Series 2013 | |
5.000% due 08/15/2029 | | | | | 1,000 | | | | | | 1,148 | |
|
San Diego County, California Regional Airport Authority Revenue Notes, Series 2010 | |
4.000% due 07/01/2016 | | | | | 720 | | | | | | 744 | |
|
San Francisco, California City & County Airports Commission Revenue Notes, Series 2010 | |
5.000% due 05/01/2017 | | | | | 1,000 | | | | | | 1,079 | |
|
San Francisco, California City & County General Obligation Notes, Series 2011 | |
5.000% due 06/15/2021 | | | | | 370 | | | | | | 440 | |
|
San Jose, California Hotel Tax Revenue Notes, Series 2011 | |
5.000% due 05/01/2017 | | | | | 1,115 | | | | | | 1,198 | |
|
San Juan Unified School District, California General Obligation Bonds, (AGM Insured), Series 2001 | |
0.000% due 08/01/2017 (b) | | | | | 750 | | | | | | 734 | |
|
Southern California Public Power Authority Revenue Bonds, Series 2007 | |
5.250% due 11/01/2020 | | | | | 575 | | | | | | 652 | |
|
University of California Revenue Bonds, Series 2009 | |
5.000% due 05/15/2020 | | | | | 1,000 | | | | | | 1,144 | |
| | | | | | | | | | | | |
| | | | | | | | | | | 26,225 | |
| | | | | | | | | | | | |
| |
COLORADO 0.1% | |
|
Denver, Colorado Airport System City & County Revenue Bonds, (FGIC Insured), Series 2006 | |
4.000% due 11/15/2016 | | | | | 265 | | | | | | 277 | |
| | | | | | | | | | | | |
| |
DISTRICT OF COLUMBIA 0.5% | |
|
District of Columbia Revenue Bonds, Series 2010 | |
5.000% due 12/01/2024 | | | | | 1,000 | | | | | | 1,151 | |
| | | | | | | | | | | | |
| |
FLORIDA 5.0% | |
|
Broward County, Florida Airport System Revenue Bonds, Series 2012 | |
5.000% due 10/01/2023 | | | | | 1,000 | | | | | | 1,167 | |
|
Citizens Property Insurance Corp., Florida Revenue Notes, Series 2010 | |
5.000% due 06/01/2016 | | | | | 750 | | | | | | 780 | |
|
Citizens Property Insurance Corp., Florida Revenue Notes, Series 2011 | |
5.000% due 06/01/2019 | | | | | 1,000 | | | | | | 1,125 | |
|
Florida Municipal Power Agency Revenue Notes, Series 2009 | |
5.000% due 10/01/2015 | | | | | 250 | | | | | | 253 | |
|
Inland Protection Financing Corp., Florida Revenue Notes, Series 2010 | |
5.000% due 07/01/2016 | | | | | 500 | | | | | | 523 | |
|
Jacksonville, Florida Revenue Notes, Series 2012 | |
5.000% due 10/01/2021 | | | | | 1,000 | | | | | | 1,172 | |
| | | | | | | | | | | | |
| | | | | PRINCIPAL
AMOUNT
(000s) | | | | | MARKET
VALUE
(000s) | |
|
JEA Water & Sewer System, Florida Revenue Bonds, Series 2012 | |
5.000% due 10/01/2025 | | $ | | | 1,500 | | | $ | | | 1,734 | |
|
Miami-Dade County, Florida General Obligation Notes, Series 2011 | |
3.000% due 07/01/2017 | | | | | 1,375 | | | | | | 1,434 | |
|
Miami-Dade County, Florida Transit System Sales Surtax Revenue Notes, Series 2010 | |
4.000% due 07/01/2016 | | | | | 1,000 | | | | | | 1,035 | |
|
Orange County, Florida Health Facilities Authority Revenue Notes, Series 2009 | |
5.000% due 10/01/2015 | | | | | 250 | | | | | | 253 | |
|
Orlando Utilities Commission, Florida Revenue Notes, Series 2010 | |
5.000% due 10/01/2017 | | | | | 250 | | | | | | 273 | |
|
Palm Beach County, Florida Revenue Bonds, Series 2012 | |
5.000% due 06/01/2023 | | | | | 1,300 | | | | | | 1,545 | |
| | | | | | | | | | | | |
| | | | | | | | | | | 11,294 | |
| | | | | | | | | | | | |
| |
GEORGIA 0.7% | |
|
Atlanta Department of Aviation, Georgia Revenue Bonds, Series 2012 | |
5.000% due 01/01/2025 | | | | | 500 | | | | | | 581 | |
|
Marietta, Georgia General Obligation Notes, Series 2009 | |
5.000% due 02/01/2018 | | | | | 250 | | | | | | 274 | |
|
Municipal Electric Authority of Georgia Revenue Notes, Series 2010 | |
4.000% due 01/01/2018 | | | | | 350 | | | | | | 375 | |
|
Municipal Electric Authority of Georgia Revenue Notes, Series 2011 | |
5.000% due 01/01/2020 | | | | | 250 | | | | | | 287 | |
| | | | | | | | | | | | |
| | | | | | | | | | | 1,517 | |
| | | | | | | | | | | | |
| |
GUAM 0.4% | |
|
Guam Government Waterworks Authority Revenue Notes, Series 2014 | |
5.000% due 07/01/2023 | | | | | 770 | | | | | | 880 | |
| | | | | | | | | | | | |
| |
HAWAII 1.0% | |
|
Honolulu, Hawaii City & County General Obligation Bonds, Series 2015 | |
5.000% due 10/01/2030 | | | | | 2,000 | | | | | | 2,352 | |
| | | | | | | | | | | | |
| |
ILLINOIS 6.0% | |
|
Chicago, Illinois General Obligation Bonds, Series 2002 | |
5.000% due 01/01/2018 | | | | | 1,200 | | | | | | 1,239 | |
|
Chicago, Illinois Midway International Airport Revenue Bonds, Series 2014 | |
5.000% due 01/01/2035 | | | | | 6,500 | | | | | | 6,974 | |
|
Chicago, Illinois Wastewater Transmission Revenue Bonds, (NPFGC Insured), Series 2001 | |
5.500% due 01/01/2017 | | | | | 1,000 | | | | | | 1,058 | |
5.500% due 01/01/2018 | | | | | 1,000 | | | | | | 1,089 | |
|
Chicago, Illinois Waterworks Revenue Notes, Series 2012 | |
5.000% due 11/01/2020 | | | | | 1,000 | | | | | | 1,108 | |
|
Illinois Finance Authority Revenue Notes, Series 2009 | |
5.000% due 08/15/2015 | | | | | 375 | | | | | | 377 | |
|
Illinois State Revenue Notes, Series 2009 | |
4.500% due 06/15/2016 | | | | | 500 | | | | | | 519 | |
|
Illinois State Revenue Notes, Series 2010 | |
5.000% due 06/15/2016 | | | | | 750 | | | | | | 781 | |
| | | | | | |
| 90 | | PIMCO ETF TRUST | | | | See Accompanying Notes |
June 30, 2015
| | | | | | | | | | | | |
| | | | | PRINCIPAL
AMOUNT
(000s) | | | | | MARKET
VALUE
(000s) | |
|
Railsplitter Tobacco Settlement Authority, Illinois Revenue Notes, Series 2010 | |
5.125% due 06/01/2019 | | $ | | | 500 | | | $ | | | 556 | |
| | | | | | | | | | | | |
| | | | | | | | | | | 13,701 | |
| | | | | | | | | | | | |
| |
INDIANA 1.5% | |
|
Indiana Finance Authority Revenue Bonds, (FGIC Insured), Series 2007 | |
5.000% due 12/01/2017 | | | | | 300 | | | | | | 318 | |
|
Indiana Finance Authority Revenue Notes, Series 2010 | |
4.000% due 11/01/2016 | | | | | 500 | | | | | | 523 | |
5.000% due 02/01/2018 | | | | | 500 | | | | | | 552 | |
|
Indiana University Revenue Notes, Series 2012 | |
5.000% due 06/01/2021 | | | | | 1,000 | | | | | | 1,182 | |
|
Indianapolis, Indiana Local Public Improvement Bond Bank Revenue Bonds, (AMBAC Insured), Series 2005 | |
5.000% due 01/01/2016 | | | | | 300 | | | | | | 307 | |
|
Vincennes University, Indiana Revenue Notes, Series 2010 | |
4.000% due 06/01/2016 | | | | | 500 | | | | | | 516 | |
| | | | | | | | | | | | |
| | | | | | | | | | | 3,398 | |
| | | | | | | | | | | | |
| |
IOWA 0.2% | |
|
Iowa Higher Education Loan Authority Revenue Notes, Series 2010 | |
4.000% due 12/01/2016 | | | | | 500 | | | | | | 524 | |
| | | | | | | | | | | | |
| |
KANSAS 0.2% | |
|
Kansas Development Finance Authority Revenue Notes, Series 2010 | |
5.000% due 11/01/2017 | | | | | 500 | | | | | | 546 | |
| | | | | | | | | | | | |
| |
KENTUCKY 0.5% | |
|
Kentucky Turnpike Authority Revenue Notes, Series 2010 | |
5.000% due 07/01/2016 | | | | | 1,000 | | | | | | 1,046 | |
| | | | | | | | | | | | |
| |
MARYLAND 0.0% | |
|
Baltimore, Maryland Revenue Bonds, Series 2011 | |
5.000% due 07/01/2021 | | | | | 60 | | | | | | 71 | |
| | | | | | | | | | | | |
| |
MASSACHUSETTS 3.5% | |
|
Massachusetts Bay Transportation Authority Revenue Bonds, Series 2006 | |
5.500% due 07/01/2017 | | | | | 500 | | | | | | 548 | |
|
Massachusetts Development Finance Agency Revenue Notes, Series 2010 | |
4.000% due 10/01/2016 | | | | | 850 | | | | | | 886 | |
|
Massachusetts Development Finance Agency Revenue Notes, Series 2012 | |
4.000% due 10/01/2015 | | | | | 500 | | | | | | 504 | |
5.000% due 10/01/2016 | | | | | 600 | | | | | | 631 | |
|
Massachusetts Development Finance Agency Revenue Notes, Series 2014 | |
1.500% due 08/01/2019 | | | | | 1,000 | | | | | | 1,002 | |
|
Massachusetts School Building Authority Revenue Bonds, Series 2012 | |
5.000% due 08/15/2022 | | | | | 1,175 | | | | | | 1,406 | |
|
Massachusetts State College Building Authority Revenue Bonds, Series 2012 | |
5.000% due 05/01/2026 | | | | | 2,000 | | | | | | 2,329 | |
|
Taunton, Massachusetts General Obligation Notes, Series 2009 | |
5.000% due 12/01/2018 | | | | | 510 | | | | | | 577 | |
| | | | | | | | | | | | |
| | | | | | | | | | | 7,883 | |
| | | | | | | | | | | | |
| | | | | | | | | | | | |
| | | | | PRINCIPAL
AMOUNT
(000s) | | | | | MARKET
VALUE
(000s) | |
MICHIGAN 1.4% | |
|
Michigan Finance Authority Revenue Notes, Series 2012 | |
5.000% due 07/01/2017 | | $ | | | 1,000 | | | $ | | | 1,085 | |
|
Michigan State Hospital Finance Authority Revenue Bonds, Series 2010 | |
1.500% due 11/15/2047 | | | | | 2,000 | | | | | | 2,022 | |
| | | | | | | | | | | | |
| | | | | | | | | | | 3,107 | |
| | | | | | | | | | | | |
| |
MINNESOTA 0.5% | |
|
Rochester, Minnesota Revenue Bonds, Series 2011 | |
4.000% due 11/15/2030 | | | | | 1,000 | | | | | | 1,089 | |
| | | | | | | | | | | | |
| |
MISSOURI 1.1% | |
|
Missouri Development Finance Board Revenue Notes, Series 2012 | |
5.000% due 12/01/2020 | | | | | 1,335 | | | | | | 1,537 | |
|
Missouri State Health & Educational Facilities Authority Revenue Notes, Series 2010 | |
5.000% due 11/15/2017 | | | | | 1,000 | | | | | | 1,088 | |
| | | | | | | | | | | | |
| | | | | | | | | | | 2,625 | |
| | | | | | | | | | | | |
| |
NEVADA 1.7% | |
|
Clark Department of Aviation, Nevada Revenue Notes, Series 2014 | |
5.000% due 07/01/2018 | | | | | 2,000 | | | | | | 2,217 | |
|
Las Vegas Valley Water District, Nevada General Obligation Bonds, Series 2015 | |
5.000% due 06/01/2034 | | | | | 1,500 | | | | | | 1,689 | |
| | | | | | | | | | | | |
| | | | | | | | | | | 3,906 | |
| | | | | | | | | | | | |
| |
NEW HAMPSHIRE 0.7% | |
|
Merrimack County, New Hampshire General Obligation Bonds, Series 2012 | |
5.000% due 12/01/2022 | | | | | 1,115 | | | | | | 1,324 | |
|
New Hampshire Health & Education Facilities Authority Act Revenue Notes, Series 2009 | |
5.000% due 07/01/2016 | | | | | 250 | | | | | | 261 | |
| | | | | | | | | | | | |
| | | | | | | | | | | 1,585 | |
| | | | | | | | | | | | |
| |
NEW JERSEY 1.9% | |
|
New Jersey Economic Development Authority Revenue Bonds, (NPFGC Insured), Series 2005 | |
5.250% due 09/01/2016 | | | | | 1,000 | | | | | | 1,008 | |
|
New Jersey Economic Development Authority Revenue Bonds, Series 2012 | |
5.000% due 06/15/2023 | | | | | 1,000 | | | | | | 1,102 | |
|
New Jersey Economic Development Authority Revenue Notes, Series 2011 | |
5.000% due 09/01/2018 | | | | | 2,000 | | | | | | 2,149 | |
| | | | | | | | | | | | |
| | | | | | | | | | | 4,259 | |
| | | | | | | | | | | | |
| |
NEW MEXICO 0.2% | |
|
New Mexico State Severance Tax Permanent Fund Revenue Notes, Series 2010 | |
5.000% due 07/01/2017 | | | | | 500 | | | | | | 542 | |
| | | | | | | | | | | | |
| |
NEW YORK 15.7% | |
|
Erie County, New York Industrial Development Agency Revenue Bonds, Series 2012 | |
5.000% due 05/01/2022 | | | | | 1,000 | | | | | | 1,172 | |
|
Metropolitan Transportation Authority, New York Revenue Bonds, Series 2005 | |
5.000% due 11/15/2019 | | | | | 500 | | | | | | 574 | |
| | | | | | | | | | | | |
| | | | | PRINCIPAL
AMOUNT
(000s) | | | | | MARKET
VALUE
(000s) | |
|
Metropolitan Transportation Authority, New York Revenue Bonds, Series 2014 | |
5.000% due 11/15/2029 | | $ | | | 3,000 | | | $ | | | 3,421 | |
|
New York City, New York General Obligation Bonds, Series 2012 | |
5.000% due 08/01/2023 | | | | | 4,000 | | | | | | 4,732 | |
|
New York City, New York General Obligation Notes, Series 2011 | |
5.000% due 08/01/2017 | | | | | 980 | | | | | | 1,064 | |
|
New York City, New York Transitional Finance Authority Future Tax Secured Revenue Bonds, Series 2014 | |
5.000% due 08/01/2031 | | | | | 5,000 | | | | | | 5,704 | |
|
New York City, New York Water & Sewer System Revenue Notes, Series 2009 | |
5.000% due 06/15/2017 | | | | | 895 | | | | | | 970 | |
|
New York State Dormitory Authority Revenue Bonds, (FGIC Insured), Series 2005 | |
5.000% due 07/01/2016 | | | | | 370 | | | | | | 371 | |
|
New York State Dormitory Authority Revenue Bonds, Series 2011 | |
5.000% due 05/01/2022 | | | | | 2,000 | | | | | | 2,311 | |
|
New York State Dormitory Authority Revenue Bonds, Series 2012 | |
5.000% due 12/15/2025 | | | | | 405 | | | | | | 476 | |
|
New York State Dormitory Authority Revenue Notes, Series 2008 | |
5.000% due 07/01/2017 | | | | | 2,000 | | | | | | 2,165 | |
|
New York State Dormitory Authority Revenue Notes, Series 2011 | |
4.000% due 07/01/2018 | | | | | 815 | | | | | | 882 | |
|
New York State Dormitory Authority Revenue Notes, Series 2012 | |
5.000% due 12/15/2019 | | | | | 1,450 | | | | | | 1,676 | |
|
New York State Thruway Authority Revenue Notes, Series 2013 | |
5.000% due 05/01/2019 | | | | | 2,000 | | | | | | 2,260 | |
|
New York State Urban Development Corp. Revenue Notes, Series 2010 | |
5.000% due 03/15/2018 | | | | | 500 | | | | | | 553 | |
|
Syracuse Industrial Development Agency, New York Revenue Notes, Series 2010 | |
4.000% due 05/01/2017 | | | | | 500 | | | | | | 530 | |
|
Tompkins County, New York Development Corp. Revenue Notes, Series 2013 | |
5.000% due 07/01/2019 | | | | | 1,090 | | | | | | 1,191 | |
|
Triborough Bridge & Tunnel Authority, New York Revenue Bonds, Series 2012 | |
5.000% due 11/15/2025 | | | | | 2,000 | | | | | | 2,347 | |
|
Triborough Bridge & Tunnel Authority, New York Revenue Bonds, Series 2013 | |
5.000% due 11/15/2027 | | | | | 2,075 | | | | | | 2,415 | |
5.000% due 11/15/2028 | | | | | 825 | | | | | | 954 | |
| | | | | | | | | | | | |
| | | | | | | | | | | 35,768 | |
| | | | | | | | | | | | |
| |
NORTH CAROLINA 2.6% | |
|
Mecklenburg County, North Carolina Certificates of Participation Notes, Series 2009 | |
5.000% due 02/01/2019 | | | | | 300 | | | | | | 337 | |
|
North Carolina Medical Care Commission Revenue Bonds, Series 2012 | |
5.000% due 06/01/2023 | | | | | 1,665 | | | | | | 1,918 | |
5.000% due 10/01/2027 | | | | | 1,100 | | | | | | 1,247 | |
|
North Carolina State Revenue Bonds, Series 2011 | |
5.000% due 11/01/2022 | | | | | 1,500 | | | | | | 1,765 | |
| | | | | | |
| See Accompanying Notes | | ANNUAL REPORT | | JUNE 30, 2015 | | 91 |
Schedule of Investments PIMCO Intermediate Municipal Bond Active Exchange-Traded Fund (Cont.)
| | | | | | | | | | | | |
| | | | | PRINCIPAL
AMOUNT
(000s) | | | | | MARKET
VALUE
(000s) | |
|
Union County, North Carolina Certificates of Participation Bonds, (AMBAC Insured), Series 2006 | |
5.000% due 06/01/2022 | | $ | | | 360 | | | $ | | | 375 | |
|
University of North Carolina at Greensboro Revenue Bonds, Series 2014 | |
5.000% due 04/01/2026 | | | | | 250 | | | | | | 293 | |
| | | | | | | | | | | | |
| | | | | | | | | | | 5,935 | |
| | | | | | | | | | | | |
| |
OHIO 8.3% | |
|
American Municipal Power, Inc., Ohio Revenue Notes, Series 2009 | |
5.000% due 02/15/2017 | | | | | 500 | | | | | | 532 | |
|
American Municipal Power, Inc., Ohio Revenue Notes, Series 2012 | |
5.000% due 02/15/2022 | | | | | 800 | | | | | | 930 | |
|
Cleveland Department of Public Utilities Division of Water, Ohio Revenue Bonds, Series 2012 | |
5.000% due 01/01/2026 | | | | | 1,000 | | | | | | 1,155 | |
|
Cuyahoga County, Ohio Certificates of Participation Bonds, Series 2014 | |
5.000% due 12/01/2025 | | | | | 3,000 | | | | | | 3,471 | |
|
Kent State University, Ohio Revenue Notes, Series 2012 | |
5.000% due 05/01/2017 | | | | | 640 | | | | | | 688 | |
|
Ohio State General Obligation Bonds, Series 2011 | |
5.000% due 08/01/2022 | | | | | 3,000 | | | | | | 3,577 | |
|
Ohio State General Obligation Notes, Series 2012 | |
5.000% due 09/15/2020 | | | | | 1,000 | | | | | | 1,173 | |
|
Ohio State Turnpike Commission Revenue Bonds, (FGIC Insured), Series 1998 | |
5.500% due 02/15/2016 | | | | | 1,000 | | | | | | 1,032 | |
5.500% due 02/15/2017 | | | | | 225 | | | | | | 242 | |
|
Ohio State Water Development Authority Revenue Bonds, Series 2005 | |
4.000% due 01/01/2034 | | | | | 3,500 | | | | | | 3,505 | |
|
Ohio State Water Development Authority Revenue Notes, Series 2011 | |
5.000% due 06/01/2017 | | | | | 1,005 | | | | | | 1,087 | |
|
University of Cincinnati, Ohio Revenue Bonds, Series 2012 | |
5.000% due 06/01/2024 | | | | | 1,250 | | | | | | 1,459 | |
| | | | | | | | | | | | |
| | | | | | | | | | | 18,851 | |
| | | | | | | | | | | | |
| |
OREGON 2.9% | |
|
Oregon State Facilities Authority Revenue Notes, Series 2010 | |
5.000% due 10/01/2017 | | | | | 500 | | | | | | 543 | |
|
Oregon State General Obligation Bonds, Series 2015 | |
5.000% due 08/01/2028 | | | | | 5,080 | | | | | | 6,094 | |
| | | | | | | | | | | | |
| | | | | | | | | | | 6,637 | |
| | | | | | | | | | | | |
| | | | | | | | | | | | |
PENNSYLVANIA 5.4% | |
|
Allegheny County, Pennsylvania Higher Education Building Authority Revenue Bonds, Series 2012 | |
5.000% due 03/01/2024 | | | | | 500 | | | | | | 585 | |
|
Allegheny County, Pennsylvania Hospital Development Authority Revenue Notes, Series 2010 | |
5.000% due 05/15/2017 | | | | | 500 | | | | | | 539 | |
| | | | | | | | | | | | |
| | | | | PRINCIPAL
AMOUNT
(000s) | | | | | MARKET
VALUE
(000s) | |
|
Delaware River Port Authority, Pennsylvania Revenue Bonds, Series 2012 | |
5.000% due 01/01/2023 | | $ | | | 900 | | | $ | | | 1,014 | |
|
Pennsylvania Higher Educational Facilities Authority Revenue Bonds, Series 2011 | |
5.250% due 06/15/2023 | | | | | 2,500 | | | | | | 2,921 | |
|
Pennsylvania Higher Educational Facilities Authority Revenue Bonds, Series 2015 | |
5.000% due 08/15/2029 | | | | | 340 | | | | | | 391 | |
5.000% due 08/15/2031 | | | | | 300 | | | | | | 342 | |
5.000% due 08/15/2033 | | | | | 1,000 | | | | | | 1,129 | |
|
Pennsylvania Higher Educational Facilities Authority Revenue Notes, (NPFGC Insured), Series 2006 | |
5.000% due 04/01/2016 | | | | | 250 | | | | | | 258 | |
|
Pennsylvania Turnpike Commission Revenue Notes, Series 2014 | |
0.950% due 12/01/2020 | | | | | 4,500 | | | | | | 4,476 | |
|
Southeastern Pennsylvania Transportation Authority Revenue Notes, Series 2010 | |
5.000% due 03/01/2018 | | | | | 500 | | | | | | 550 | |
| | | | | | | | | | | | |
| | | | | | | | | | | 12,205 | |
| | | | | | | | | | | | |
| |
RHODE ISLAND 3.4% | |
|
Tobacco Settlement Financing Corp., Rhode Island Revenue Bonds, Series 2015 | |
5.000% due 06/01/2035 | | | | | 7,500 | | | | | | 7,778 | |
| | | | | | | | | | | | |
| |
TENNESSEE 0.9% | |
|
Tennessee Energy Acquisition Corp. Revenue Bonds, Series 2006 | |
5.000% due 02/01/2021 | | | | | 870 | | | | | | 969 | |
5.250% due 09/01/2026 | | | | | 1,000 | | | | | | 1,135 | |
| | | | | | | | | | | | |
| | | | | | | | | | | 2,104 | |
| | | | | | | | | | | | |
| |
TEXAS 10.3% | |
|
Barbers Hill Independent School District, Texas General Obligation Bonds, (PSF Insured), Series 2012 | |
4.000% due 02/15/2023 | | | | | 1,225 | | | | | | 1,359 | |
|
Dallas, Texas Waterworks & Sewer System Revenue Bonds, Series 2012 | |
5.000% due 10/01/2023 | | | | | 1,000 | | | | | | 1,189 | |
|
Harris County, Texas Cultural Education Facilities Finance Corp. Revenue Bonds, Series 2014 | |
0.650% due 12/01/2042 | | | | | 7,000 | | | | | | 6,931 | |
|
La Joya Independent School District, Texas General Obligation Bonds, (PSF Insured), Series 2012 | |
5.000% due 02/15/2027 | | | | | 1,000 | | | | | | 1,154 | |
|
North Central Texas Health Facility Development Corp. Revenue Notes, Series 2012 | |
5.000% due 08/15/2020 | | | | | 1,000 | | | | | | 1,161 | |
|
Northside Independent School District, Texas General Obligation Bonds, (PSF Insured), Series 2010 | |
1.200% due 08/01/2040 | | | | | 980 | | | | | | 983 | |
|
Pflugerville Independent School District, Texas General Obligation Bonds, (PSF Insured), Series 2012 | |
5.000% due 02/15/2024 | | | | | 1,165 | | | | | | 1,375 | |
| | | | | | | | | | | | |
| | | | | PRINCIPAL
AMOUNT
(000s) | | | | | MARKET
VALUE
(000s) | |
|
San Antonio Public Facilities Corp., Texas Revenue Bonds, Series 2012 | |
5.000% due 09/15/2025 | | $ | | | 1,000 | | | $ | | | 1,155 | |
|
San Antonio, Texas Water System Revenue Bonds, Series 2012 | |
5.000% due 05/15/2023 | | | | | 1,500 | | | | | | 1,772 | |
|
Texas Municipal Gas Acquisition & Supply Corp. Revenue Bonds, Series 2012 | |
5.000% due 12/15/2026 | | | | | 3,000 | | | | | | 3,322 | |
|
Texas Municipal Gas Acquisition & Supply Corp. Revenue Notes, Series 2008 | |
5.625% due 12/15/2017 | | | | | 1,440 | | | | | | 1,533 | |
|
Texas State General Obligation Notes, Series 2010 | |
4.000% due 12/01/2015 | | | | | 810 | | | | | | 822 | |
|
University of Texas System Revenue Bonds, Series 2010 | |
5.000% due 08/15/2022 | | | | | 500 | | | | | | 596 | |
| | | | | | | | | | | | |
| | | | | | | | | | | 23,352 | |
| | | | | | | | | | | | |
| |
WASHINGTON 1.8% | |
|
Pierce County, Washington School District No. 10 Tacoma General Obligation Bonds, Series 2012 | |
5.000% due 12/01/2024 | | | | | 1,000 | | | | | | 1,222 | |
|
Seattle, Washington Solid Waste Revenue Notes, Series 2014 | |
5.000% due 05/01/2024 | | | | | 545 | | | | | | 656 | |
|
Washington State Revenue Bonds, Series 2012 | |
5.000% due 09/01/2023 | | | | | 2,000 | | | | | | 2,336 | |
| | | | | | | | | | | | |
| | | | | | | | | | | 4,214 | |
| | | | | | | | | | | | |
| |
WISCONSIN 0.5% | |
|
Wisconsin State Clean Water Fund Leveraged Loan Portfolio Revenue Bonds, Series 2012 | |
5.000% due 06/01/2023 | | | | | 1,000 | | | | | | 1,204 | |
| | | | | | | | | | | | |
Total Municipal Bonds & Notes
(Cost $211,986) | | | 215,588 | |
| | | | | | | | | | | | |
| |
SHORT-TERM INSTRUMENTS 5.9% | |
| | | | | | | | | | | | |
REPURCHASE AGREEMENTS (c) 0.1% | |
| | | | | | | | | | | 227 | |
| | | | | | | | | | | | |
| |
U.S. TREASURY BILLS 5.8% | | | | | | | | | | | | |
0.020% due 09/17/2015 - 11/12/2015 (a) | | | | | 13,149 | | | | | | 13,149 | |
| | | | | | | | | | | | |
Total Short-Term Instruments
(Cost $13,375) | | | 13,376 | |
| | | | | | | | | | | | |
| | | | | | | | | | | | |
Total Investments in Securities
(Cost $225,361) | | | 228,964 | |
| | | | | | | | | | | | |
| | | | | | | | | | | | |
Total Investments 100.5%
(Cost $225,361) | | | $ | | | 228,964 | |
| |
Financial Derivative
Instruments (d) 0.0% (Cost or Premiums, net $0) | | | 8 | |
| |
Other Assets and Liabilities, net (0.5%) | | | (1,244 | ) |
| | | | | | | | | | | | |
Net Assets 100.0% | | | $ | | | 227,728 | |
| | | | | | | | | | | | |
NOTES TO SCHEDULE OF INVESTMENTS (AMOUNTS IN THOUSANDS*, EXCEPT NUMBER OF CONTRACTS):
| * | A zero balance may reflect actual amounts rounding to less than one thousand. |
| (a) | Coupon represents a weighted average yield to maturity. |
| | | | | | |
| 92 | | PIMCO ETF TRUST | | | | See Accompanying Notes |
June 30, 2015
BORROWINGS AND OTHER FINANCING TRANSACTIONS
(c) REPURCHASE AGREEMENTS:
| | | | | | | | | | | | | | | | | | | | | | | | | | | | | | | | |
| Counterparty | | | | Lending
Rate | | | Settlement
Date | | | Maturity
Date | | | Principal
Amount | | | Collateralized By | | Collateral
Received,
at Value | | | Repurchase
Agreements,
at Value | | | Repurchase
Agreement
Proceeds
to be
Received (1) | |
SSB | | | | | 0.000 | % | | | 06/30/2015 | | | | 07/01/2015 | | | $ | 227 | | | Fannie Mae 2.200% due 10/17/2022 | | $ | (235 | ) | | $ | 227 | | | $ | 227 | |
Total Repurchase Agreements | | | | | | | | | | | | | | | | | | | | | | $ | (235 | ) | | $ | 227 | | | $ | 227 | |
| (1) | Includes accrued interest. |
BORROWINGS AND OTHER FINANCING TRANSACTIONS SUMMARY
The following is a summary by counterparty of the market value of Borrowings and Other Financing Transactions and collateral (received) as of June 30, 2015:
| | | | | | | | | | | | | | | | | | | | | | | | | | | | | | |
| Counterparty | | | | Repurchase
Agreement
Proceeds
to be
Received | | | Payable for
Reverse
Repurchase
Agreements | | | Payable for
Sale-Buyback
Transactions | | | Securities
Out on Loan | | | Total
Borrowings and
Other Financing
Transactions | | | Collateral
(Received) | | | Net
Exposure (2) | |
Global/Master Repurchase Agreement | | | | | | | | | | | | | | | | | | | | | | | | | | | | | | |
SSB | | | | $ | 227 | | | $ | 0 | | | $ | 0 | | | $ | 0 | | | $ | 227 | | | $ | (235 | ) | | $ | (8 | ) |
Total Borrowings and Other Financing Transactions | | | | $ | 227 | | | $ | 0 | | | $ | 0 | | | $ | 0 | | | | | | | | | | | | | |
| (2) | Net Exposure represents the net receivable/(payable) that would be due from/to the counterparty in the event of default. Exposure from borrowings and other financing transactions can only be netted across transactions governed under the same master agreement with the same legal entity. See Note 7, Principal Risks, in the Notes to Financial Statements for more information regarding master netting arrangements. |
(d) FINANCIAL DERIVATIVE INSTRUMENTS: EXCHANGE-TRADED OR CENTRALLY CLEARED
FUTURES CONTRACTS:
| | | | | | | | | | | | | | | | | | | | | | | | | | |
| Description | | | | Type | | | Expiration
Month | | | # of
Contracts | | | Unrealized
Appreciation | | | Variation Margin | |
| | | | | | | | Asset | | | Liability | |
U.S. Treasury 10-Year Note September Futures | | | | | Short | | | | 09/2015 | | | | 251 | | | $ | 35 | | | $ | 8 | | | $ | 0 | |
Total Futures Contracts | | | | | | | | | | | | | | | | $ | 35 | | | $ | 8 | | | $ | 0 | |
FINANCIAL DERIVATIVE INSTRUMENTS: EXCHANGE-TRADED OR CENTRALLY CLEARED SUMMARY
The following is a summary of the market value and variation margin of Exchange-Traded or Centrally Cleared Financial Derivative Instruments as of June 30, 2015:
Cash of $453 has been pledged as collateral for exchange-traded and centrally cleared financial derivative instruments as of June 30, 2015. See Note 7, Principal Risks, in the Notes to Financial Statements for more information regarding master netting arrangements.
| | | | | | | | | | | | | | | | | | | | | | | | | | | | | | | | | | | | |
| | | | | Financial Derivative Assets | | | | | Financial Derivative Liabilities | |
| | | | | Market Value | | | Variation Margin
Asset | | | | | | | | Market Value | | | Variation Margin
Liability | | | | |
| | | | | Purchased
Options | | | Futures | | | Swap
Agreements | | | Total | | | | | Written
Options | | | Futures | | | Swap
Agreements | | | Total | |
Total Exchange-Traded or Centrally Cleared | | | | $ | 0 | | | $ | 8 | | | $ | 0 | | | $ | 8 | | | | | $ | 0 | | | $ | 0 | | | $ | 0 | | | $ | 0 | |
FAIR VALUE OF FINANCIAL DERIVATIVE INSTRUMENTS
The following is a summary of the fair valuation of the Fund’s derivative instruments categorized by risk exposure. See Note 7, Principal Risks, in the Notes to Financial Statements on risks of the Fund.
Fair Values of Financial Derivative Instruments on the Statements of Assets and Liabilities as of June 30, 2015:
| | | | | | | | | | | | | | | | | | | | | | | | | | |
| | | | | Derivatives not accounted for as hedging instruments | |
| | | | | Commodity
Contracts | | | Credit
Contracts | | | Equity
Contracts | | | Foreign
Exchange
Contracts | | | Interest
Rate Contracts | | | Total | |
Financial Derivative Instruments - Assets | | | | | | | | | | | | | | | | | | | | | | | | | | |
Exchange-traded or centrally cleared Futures | | | | $ | 0 | | | $ | 0 | | | $ | 0 | | | $ | 0 | | | $ | 8 | | | $ | 8 | |
| | | | | | |
| See Accompanying Notes | | ANNUAL REPORT | | JUNE 30, 2015 | | 93 |
Schedule of Investments PIMCO Intermediate Municipal Bond Active Exchange-Traded Fund (Cont.)
June 30, 2015
The Effect of Financial Derivative Instruments on the Statements of Operations for the period ended June 30, 2015:
| | | | | | | | | | | | | | | | | | | | | | | | | | |
| | | | | Derivatives not accounted for as hedging instruments | |
| | | | | Commodity
Contracts | | | Credit
Contracts | | | Equity
Contracts | | | Foreign
Exchange
Contracts | | | Interest
Rate Contracts | | | Total | |
Net Change in Unrealized Appreciation on Financial Derivative Instruments | | | | | | | | | | | | | | | | | | | | | | | | | | |
Exchange-traded or centrally cleared Futures | | | | $ | 0 | | | $ | 0 | | | $ | 0 | | | $ | 0 | | | $ | 35 | | | $ | 35 | |
FAIR VALUE MEASUREMENTS
The following is a summary of the fair valuations according to the inputs used as of June 30, 2015 in valuing the Fund’s assets and liabilities:
| | | | | | | | | | | | | | | | | | |
| Category and Subcategory | | | | Level 1 | | | Level 2 | | | Level 3 | | | Fair Value at
06/30/2015 | |
Investments in Securities, at Value | | | | | | | | | | | | | | | | | | |
Municipal Bonds & Notes | | | | | | | | | | | | | | | | | | |
Alabama | | | | $ | 0 | | | $ | 1,877 | | | $ | 0 | | | $ | 1,877 | |
Arizona | | | | | 0 | | | | 7,313 | | | | 0 | | | | 7,313 | |
Arkansas | | | | | 0 | | | | 372 | | | | 0 | | | | 372 | |
California | | | | | 0 | | | | 26,225 | | | | 0 | | | | 26,225 | |
Colorado | | | | | 0 | | | | 277 | | | | 0 | | | | 277 | |
District of Columbia | | | | | 0 | | | | 1,151 | | | | 0 | | | | 1,151 | |
Florida | | | | | 0 | | | | 11,294 | | | | 0 | | | | 11,294 | |
Georgia | | | | | 0 | | | | 1,517 | | | | 0 | | | | 1,517 | |
Guam | | | | | 0 | | | | 880 | | | | 0 | | | | 880 | |
Hawaii | | | | | 0 | | | | 2,352 | | | | 0 | | | | 2,352 | |
Illinois | | | | | 0 | | | | 13,701 | | | | 0 | | | | 13,701 | |
Indiana | | | | | 0 | | | | 3,398 | | | | 0 | | | | 3,398 | |
Iowa | | | | | 0 | | | | 524 | | | | 0 | | | | 524 | |
Kansas | | | | | 0 | | | | 546 | | | | 0 | | | | 546 | |
Kentucky | | | | | 0 | | | | 1,046 | | | | 0 | | | | 1,046 | |
Maryland | | | | | 0 | | | | 71 | | | | 0 | | | | 71 | |
Massachusetts | | | | | 0 | | | | 7,883 | | | | 0 | | | | 7,883 | |
Michigan | | | | | 0 | | | | 3,107 | | | | 0 | | | | 3,107 | |
Minnesota | | | | | 0 | | | | 1,089 | | | | 0 | | | | 1,089 | |
Missouri | | | | | 0 | | | | 2,625 | | | | 0 | | | | 2,625 | |
Nevada | | | | | 0 | | | | 3,906 | | | | 0 | | | | 3,906 | |
New Hampshire | | | | | 0 | | | | 1,585 | | | | 0 | | | | 1,585 | |
New Jersey | | | | | 0 | | | | 4,259 | | | | 0 | | | | 4,259 | |
New Mexico | | | | | 0 | | | | 542 | | | | 0 | | | | 542 | |
New York | | | | | 0 | | | | 35,768 | | | | 0 | | | | 35,768 | |
North Carolina | | | | | 0 | | | | 5,935 | | | | 0 | | | | 5,935 | |
Ohio | | | | | 0 | | | | 18,851 | | | | 0 | | | | 18,851 | |
Oregon | | | | | 0 | | | | 6,637 | | | | 0 | | | | 6,637 | |
Pennsylvania | | | | | 0 | | | | 12,205 | | | | 0 | | | | 12,205 | |
Rhode Island | | | | | 0 | | | | 7,778 | | | | 0 | | | | 7,778 | |
Tennessee | | | | | 0 | | | | 2,104 | | | | 0 | | | | 2,104 | |
Texas | | | | | 0 | | | | 23,352 | | | | 0 | | | | 23,352 | |
Washington | | | | | 0 | | | | 4,214 | | | | 0 | | | | 4,214 | |
Wisconsin | | | | | 0 | | | | 1,204 | | | | 0 | | | | 1,204 | |
Short-Term Instruments | | | | | | | | | | | | | | | | | | |
Repurchase Agreements | | | | | 0 | | | | 227 | | | | 0 | | | | 227 | |
U.S. Treasury Bills | | | | | 0 | | | | 13,149 | | | | 0 | | | | 13,149 | |
Total Investments | | | | $ | 0 | | | $ | 228,964 | | | $ | 0 | | | $ | 228,964 | |
| | | | | |
Financial Derivative Instruments - Assets | | | | | | | | | | | | | | | | | | |
Exchange-traded or centrally cleared | | | | $ | 8 | | | $ | 0 | | | $ | 0 | | | $ | 8 | |
Totals | | | | $ | 8 | | | $ | 228,964 | | | $ | 0 | | | $ | 228,972 | |
There were no significant transfers between Levels 1, 2, or 3 during the period ended June 30, 2015.
| | | | | | |
| 94 | | PIMCO ETF TRUST | | | | See Accompanying Notes |
Schedule of Investments PIMCO Low Duration Active Exchange-Traded Fund
June 30, 2015
| | | | | | | | | | | | |
| | | | | PRINCIPAL
AMOUNT
(000s) | | | | | MARKET
VALUE
(000s) | |
INVESTMENTS IN SECURITIES 113.0% | |
| |
BANK LOAN OBLIGATIONS 0.8% | |
|
Chrysler Group LLC | |
3.500% due 05/24/2017 | | $ | | | 696 | | | $ | | | 696 | |
|
Community Health Systems, Inc. | |
3.534% due 12/31/2018 | | | | | 698 | | | | | | 699 | |
| | | | | | | | | | | | |
Total Bank Loan Obligations
(Cost $1,396) | | | 1,395 | |
| | | | | | | | | | | | |
| |
CORPORATE BONDS & NOTES 78.9% | |
| |
BANKING & FINANCE 31.6% | |
|
Abbey National Treasury Services PLC | |
2.350% due 09/10/2019 | | | | | 1,000 | | | | | | 1,000 | |
|
Ally Financial, Inc. | |
3.125% due 01/15/2016 | | | | | 1,400 | | | | | | 1,407 | |
|
American Tower Corp. | |
2.800% due 06/01/2020 (d) | | | | | 1,500 | | | | | | 1,479 | |
|
Banco Bradesco S.A. | |
4.500% due 01/12/2017 | | | | | 200 | | | | | | 209 | |
|
Banco del Estado de Chile | |
2.000% due 11/09/2017 | | | | | 800 | | | | | | 806 | |
|
Banco Santander Brasil S.A. | |
4.250% due 01/14/2016 | | | | | 1,500 | | | | | | 1,522 | |
|
Banco Santander Chile | |
3.750% due 09/22/2015 | | | | | 200 | | | | | | 201 | |
|
Bank of America Corp. | |
6.500% due 08/01/2016 | | | | | 300 | | | | | | 317 | |
|
Bank of America N.A. | |
1.750% due 06/05/2018 | | | | | 300 | | | | | | 299 | |
|
Bank of Tokyo-Mitsubishi UFJ Ltd. | |
3.103% due 03/20/2018 | | AUD | | | 1,000 | | | | | | 774 | |
|
BBVA Bancomer S.A. | |
4.500% due 03/10/2016 | | $ | | | 1,200 | | | | | | 1,228 | |
|
BOC Aviation Pte Ltd. | |
2.875% due 10/10/2017 | | | | | 215 | | | | | | 218 | |
|
BOC Aviation Pte. Ltd. | |
3.875% due 05/09/2019 | | | | | 900 | | | | | | 928 | |
|
BPCE S.A. | |
0.913% due 06/17/2017 (d) | | | | | 1,250 | | | | | | 1,251 | |
|
Cantor Fitzgerald LP | |
6.500% due 06/17/2022 | | | | | 400 | | | | | | 413 | |
|
CIT Group, Inc. | |
3.875% due 02/19/2019 | | | | | 500 | | | | | | 497 | |
5.500% due 02/15/2019 | | | | | 600 | | | | | | 627 | |
6.625% due 04/01/2018 | | | | | 700 | | | | | | 751 | |
|
Credit Agricole S.A. | |
0.833% due 06/12/2017 | | | | | 1,000 | | | | | | 1,000 | |
1.252% due 06/10/2020 | | | | | 500 | | | | | | 500 | |
|
DBS Bank Ltd. | |
0.885% due 07/15/2021 | | | | | 105 | | | | | | 104 | |
|
DBS Group Holdings Ltd. | |
0.776% due 07/16/2019 | | | | | 1,000 | | | | | | 1,001 | |
|
Denali Borrower LLC | |
5.625% due 10/15/2020 | | | | | 850 | | | | | | 896 | |
|
Eksportfinans ASA | |
2.000% due 09/15/2015 | | | | | 200 | | | | | | 200 | |
2.375% due 05/25/2016 | | | | | 900 | | | | | | 902 | |
5.500% due 05/25/2016 | | | | | 600 | | | | | | 618 | |
|
Erste Europaische Pfandbrief und Kommunalkreditbank AG S.A. | |
0.132% due 03/20/2017 | | | | | 100 | | | | | | 98 | |
5.125% due 01/21/2016 | | | | | 150 | | | | | | 153 | |
| | | | | | | | | | | | |
| | | | | PRINCIPAL
AMOUNT
(000s) | | | | | MARKET
VALUE
(000s) | |
|
First Horizon National Corp. | |
5.375% due 12/15/2015 | | $ | | | 1,500 | | | $ | | | 1,523 | |
|
Ford Motor Credit Co. LLC | |
1.500% due 01/17/2017 (d) | | | | | 2,400 | | | | | | 2,398 | |
|
General Motors Financial Co., Inc. | |
1.631% due 04/10/2018 | | | | | 800 | | | | | | 807 | |
1.835% due 01/15/2020 | | | | | 250 | | | | | | 250 | |
3.250% due 05/15/2018 | | | | | 250 | | | | | | 256 | |
4.750% due 08/15/2017 | | | | | 1,625 | | | | | | 1,716 | |
|
Goldman Sachs Group, Inc. | |
1.478% due 04/30/2018 | | | | | 500 | | | | | | 506 | |
1.884% due 11/29/2023 (d) | | | | | 2,825 | | | | | | 2,877 | |
|
Hana Bank | |
1.375% due 02/05/2016 | | | | | 1,000 | | | | | | 1,002 | |
|
HBOS PLC | |
0.979% due 09/06/2017 | | | | | 1,000 | | | | | | 999 | |
0.982% due 09/30/2016 | | | | | 400 | | | | | | 400 | |
|
HSBC Finance Corp. | |
0.713% due 06/01/2016 (d) | | | | | 2,000 | | | | | | 1,997 | |
|
Hutchison Whampoa International Ltd. | |
1.625% due 10/31/2017 | | | | | 1,200 | | | | | | 1,197 | |
2.000% due 11/08/2017 | | | | | 1,000 | | | | | | 1,006 | |
|
Hyundai Capital Services, Inc. | |
1.086% due 03/18/2017 | | | | | 1,000 | | | | | | 1,003 | |
|
International Lease Finance Corp. | |
5.750% due 05/15/2016 | | | | | 300 | | | | | | 308 | |
8.625% due 09/15/2015 | | | | | 1,000 | | | | | | 1,014 | |
8.750% due 03/15/2017 | | | | | 500 | | | | | | 548 | |
|
Intesa Sanpaolo SpA | |
3.625% due 08/12/2015 | | | | | 1,000 | | | | | | 1,002 | |
|
Jackson National Life Global Funding | |
1.250% due 02/21/2017 | | | | | 200 | | | | | | 200 | |
|
JPMorgan Chase & Co. | |
1.232% due 01/23/2020 | | | | | 1,000 | | | | | | 1,010 | |
|
Kilroy Realty LP | |
5.000% due 11/03/2015 | | | | | 500 | | | | | | 506 | |
|
Korea Exchange Bank | |
3.125% due 06/26/2017 | | | | | 700 | | | | | | 719 | |
|
LeasePlan Corp. NV | |
2.500% due 05/16/2018 (d) | | | | | 1,700 | | | | | | 1,703 | |
|
Macquarie Bank Ltd. | |
4.875% due 06/10/2025 | | | | | 1,300 | | | | | | 1,280 | |
5.000% due 02/22/2017 | | | | | 1,722 | | | | | | 1,819 | |
|
Macquarie Group Ltd. | |
3.000% due 12/03/2018 | | | | | 250 | | | | | | 255 | |
|
Navient Corp. | |
8.450% due 06/15/2018 | | | | | 700 | | | | | | 780 | |
|
Piper Jaffray Cos. | |
3.282% due 05/31/2017 | | | | | 250 | | | | | | 250 | |
4.782% due 11/30/2015 | | | | | 1,100 | | | | | | 1,103 | |
|
RCI Banque S.A. | |
4.600% due 04/12/2016 | | | | | 200 | | | | | | 205 | |
|
Regions Bank | |
7.500% due 05/15/2018 | | | | | 250 | | | | | | 287 | |
|
Shinhan Bank | |
4.375% due 09/15/2015 | | | | | 1,000 | | | | | | 1,007 | |
4.375% due 07/27/2017 | | | | | 200 | | | | | | 211 | |
|
Springleaf Finance Corp. | |
6.900% due 12/15/2017 | | | | | 600 | | | | | | 637 | |
|
Synchrony Financial | |
1.509% due 02/03/2020 (d) | | | | | 1,200 | | | | | | 1,207 | |
1.875% due 08/15/2017 | | | | | 800 | | | | | | 800 | |
|
U.S. Bank N.A. | |
2.282% due 04/29/2020 | | | | | 250 | | | | | | 251 | |
| | | | | | | | | | | | |
| | | | | PRINCIPAL
AMOUNT
(000s) | | | | | MARKET
VALUE
(000s) | |
|
Weyerhaeuser Co. | |
6.950% due 08/01/2017 | | $ | | | 1,000 | | | $ | | | 1,101 | |
| | | | | | | | | | | | |
| | | | | | | | | | | 55,539 | |
| | | | | | | | | | | | |
| |
INDUSTRIALS 36.4% | |
|
AbbVie, Inc. | |
3.200% due 11/06/2022 (d) | | | | | 1,600 | | | | | | 1,585 | |
|
Actavis Funding SCS | |
1.543% due 03/12/2020 | | | | | 700 | | | | | | 709 | |
|
Actavis, Inc. | |
1.875% due 10/01/2017 | | | | | 500 | | | | | | 501 | |
|
Amgen, Inc. | |
2.125% due 05/15/2017 | | | | | 200 | | | | | | 203 | |
|
Anglo American Capital PLC | |
1.225% due 04/15/2016 | | | | | 200 | | | | | | 200 | |
|
Anheuser-Busch InBev Finance, Inc. | |
0.800% due 01/15/2016 | | | | | 100 | | | | | | 100 | |
|
Asciano Finance Ltd. | |
4.625% due 09/23/2020 | | | | | 400 | | | | | | 424 | |
5.000% due 04/07/2018 | | | | | 600 | | | | | | 643 | |
|
BAT International Finance PLC | |
2.750% due 06/15/2020 | | | | | 1,200 | | | | | | 1,209 | |
|
Becton Dickinson and Co. | |
1.800% due 12/15/2017 | | | | | 400 | | | | | | 400 | |
|
Boston Scientific Corp. | |
3.375% due 05/15/2022 (d) | | | | | 1,300 | | | | | | 1,274 | |
|
Cisco Systems, Inc. | |
0.783% due 03/01/2019 | | | | | 100 | | | | | | 100 | |
|
ConocoPhillips Co. | |
1.176% due 05/15/2022 | | | | | 800 | | | | | | 807 | |
|
Continental Airlines Pass-Through Trust | |
7.250% due 05/10/2021 | | | | | 561 | | | | | | 649 | |
9.000% due 01/08/2018 | | | | | 143 | | | | | | 153 | |
|
Cox Communications, Inc. | |
5.875% due 12/01/2016 | | | | | 1,028 | | | | | | 1,091 | |
|
Crown Castle Towers LLC | |
3.222% due 05/15/2042 | | | | | 800 | | | | | | 787 | |
|
Daimler Finance North America LLC | |
2.400% due 04/10/2017 | | | | | 200 | | | | | | 204 | |
|
Devon Energy Corp. | |
0.826% due 12/15/2016 | | | | | 1,000 | | | | | | 989 | |
|
DISH DBS Corp. | |
4.250% due 04/01/2018 | | | | | 200 | | | | | | 204 | |
7.125% due 02/01/2016 | | | | | 1,300 | | | | | | 1,336 | |
|
Dominion Gas Holdings LLC | |
2.500% due 12/15/2019 | | | | | 200 | | | | | | 202 | |
|
Enbridge, Inc. | |
0.734% due 06/02/2017 (d) | | | | | 1,200 | | | | | | 1,186 | |
|
Energy Transfer Partners LP | |
9.000% due 04/15/2019 (d) | | | | | 1,000 | | | | | | 1,200 | |
|
Enterprise Products Operating LLC | |
1.250% due 08/13/2015 | | | | | 1,000 | | | | | | 1,000 | |
|
Express Scripts Holding Co. | |
2.250% due 06/15/2019 | | | | | 500 | | | | | | 496 | |
|
Forest Laboratories LLC | |
4.375% due 02/01/2019 | | | | | 750 | | | | | | 794 | |
|
Freeport-McMoRan, Inc. | |
2.300% due 11/14/2017 | | | | | 200 | | | | | | 200 | |
|
Georgia-Pacific LLC | |
2.539% due 11/15/2019 | | | | | 400 | | | | | | 400 | |
|
HCA, Inc. | |
6.500% due 02/15/2016 | | | | | 300 | | | | | | 310 | |
| | | | | | |
| See Accompanying Notes | | ANNUAL REPORT | | JUNE 30, 2015 | | 95 |
Schedule of Investments PIMCO Low Duration Active Exchange-Traded Fund (Cont.)
| | | | | | | | | | | | |
| | | | | PRINCIPAL
AMOUNT
(000s) | | | | | MARKET
VALUE
(000s) | |
|
Heathrow Funding Ltd. | |
4.875% due 07/15/2023 (d) | | $ | | | 1,250 | | | $ | | | 1,371 | |
|
HJ Heinz Co. | |
2.000% due 07/02/2018 (a) | | | | | 700 | | | | | | 700 | |
|
Humana, Inc. | |
2.625% due 10/01/2019 | | | | | 500 | | | | | | 503 | |
|
Imperial Tobacco Finance PLC | |
2.050% due 02/11/2018 | | | | | 1,400 | | | | | | 1,394 | |
|
Kansas City Southern de Mexico S.A. de C.V. | |
0.979% due 10/28/2016 | | | | | 700 | | | | | | 697 | |
|
Kia Motors Corp. | |
3.625% due 06/14/2016 | | | | | 1,140 | | | | | | 1,165 | |
|
Kinder Morgan Energy Partners LP | |
5.000% due 10/01/2021 | | | | | 100 | | | | | | 106 | |
6.000% due 02/01/2017 | | | | | 1,000 | | | | | | 1,065 | |
|
Kinder Morgan, Inc. | |
4.300% due 06/01/2025 | | | | | 100 | | | | | | 97 | |
|
KLA-Tencor Corp. | |
3.375% due 11/01/2019 | | | | | 100 | | | | | | 103 | |
|
Korea National Oil Corp. | |
3.125% due 04/03/2017 | | | | | 2,000 | | | | | | 2,053 | |
|
Lafarge S.A. | |
6.200% due 07/09/2015 | | | | | 331 | | | | | | 331 | |
|
Latam Airlines Pass-Through Trust | |
4.200% due 08/15/2029 | | | | | 850 | | | | | | 843 | |
|
Life Technologies Corp. | |
3.500% due 01/15/2016 | | | | | 100 | | | | | | 101 | |
|
Lowe’s Cos., Inc. | |
0.702% due 09/10/2019 | | | | | 1,000 | | | | | | 1,002 | |
|
LyondellBasell Industries NV | |
5.000% due 04/15/2019 | | | | | 500 | | | | | | 542 | |
|
Marathon Oil Corp. | |
2.700% due 06/01/2020 | | | | | 200 | | | | | | 198 | |
|
Masco Corp. | |
6.125% due 10/03/2016 | | | | | 1,000 | | | | | | 1,058 | |
|
Medtronic, Inc. | |
2.500% due 03/15/2020 | | | | | 900 | | | | | | 901 | |
|
MGM Resorts International | |
6.625% due 07/15/2015 | | | | | 1,500 | | | | | | 1,502 | |
|
Mylan, Inc. | |
1.800% due 06/24/2016 | | | | | 1,700 | | | | | | 1,701 | |
|
Nissan Motor Acceptance Corp. | |
0.833% due 03/03/2017 | | | | | 1,000 | | | | | | 1,004 | |
|
Noble Holding International Ltd. | |
3.050% due 03/01/2016 | | | | | 1,000 | | | | | | 1,007 | |
|
Penerbangan Malaysia Bhd. | |
5.625% due 03/15/2016 | | | | | 1,000 | | | | | | 1,030 | |
|
Penske Truck Leasing Co. LP | |
2.500% due 03/15/2016 | | | | | 100 | | | | | | 101 | |
|
Philip Morris International, Inc. | |
1.625% due 03/20/2017 | | | | | 200 | | | | | | 202 | |
3.250% due 11/10/2024 | | | | | 200 | | | | | | 197 | |
|
Pioneer Natural Resources Co. | |
6.875% due 05/01/2018 | | | | | 700 | | | | | | 786 | |
|
QUALCOMM, Inc. | |
3.000% due 05/20/2022 | | | | | 600 | | | | | | 597 | |
|
Reynolds American, Inc. | |
1.050% due 10/30/2015 (d) | | | | | 1,100 | | | | | | 1,096 | |
4.000% due 06/12/2022 | | | | | 500 | | | | | | 511 | |
7.750% due 06/01/2018 | | | | | 200 | | | | | | 231 | |
|
SABIC Capital BV | |
3.000% due 11/02/2015 | | | | | 200 | | | | | | 201 | |
| | | | | | | | | | | | |
| | | | | PRINCIPAL
AMOUNT
(000s) | | | | | MARKET
VALUE
(000s) | |
|
Sabine Pass LNG LP | |
7.500% due 11/30/2016 | | $ | | | 1,150 | | | $ | | | 1,216 | |
|
SABMiller Holdings, Inc. | |
2.450% due 01/15/2017 | | | | | 700 | | | | | | 711 | |
|
Scripps Networks Interactive, Inc. | |
3.500% due 06/15/2022 | | | | | 500 | | | | | | 492 | |
|
Siemens Financieringsmaatschappij NV | |
2.900% due 05/27/2022 | | | | | 250 | | | | | | 247 | |
|
Sinopec Group Overseas Development Ltd. | |
2.750% due 05/17/2017 | | | | | 200 | | | | | | 204 | |
|
SK Broadband Co. Ltd. | |
2.875% due 10/29/2018 | | | | | 250 | | | | | | 255 | |
|
SK Telecom Co. Ltd. | |
2.125% due 05/01/2018 | | | | | 1,200 | | | | | | 1,212 | |
|
Sky PLC | |
2.625% due 09/16/2019 | | | | | 500 | | | | | | 497 | |
|
Southwestern Energy Co. | |
4.050% due 01/23/2020 | | | | | 1,000 | | | | | | 1,028 | |
7.500% due 02/01/2018 | | | | | 100 | | | | | | 112 | |
|
Telefonica Emisiones S.A.U. | |
3.992% due 02/16/2016 | | | | | 935 | | | | | | 951 | |
6.221% due 07/03/2017 | | | | | 400 | | | | | | 435 | |
6.421% due 06/20/2016 | | | | | 1,000 | | | | | | 1,046 | |
|
Thermo Fisher Scientific, Inc. | |
3.300% due 02/15/2022 | | | | | 800 | | | | | | 791 | |
|
Toll Brothers Finance Corp. | |
8.910% due 10/15/2017 | | | | | 500 | | | | | | 570 | |
|
Transocean, Inc. | |
4.950% due 11/15/2015 | | | | | 781 | | | | | | 792 | |
|
Tyson Foods, Inc. | |
2.650% due 08/15/2019 | | | | | 500 | | | | | | 503 | |
|
UAL Pass-Through Trust | |
10.400% due 05/01/2018 | | | | | 251 | | | | | | 273 | |
|
USG Corp. | |
6.300% due 11/15/2016 | | | | | 700 | | | | | | 736 | |
9.750% due 01/15/2018 | | | | | 595 | | | | | | 680 | |
|
Valeant Pharmaceuticals International, Inc. | |
5.375% due 03/15/2020 | | | | | 700 | | | | | | 725 | |
|
Walgreens Boots Alliance, Inc. | |
0.726% due 05/18/2016 | | | | | 700 | | | | | | 700 | |
|
Weatherford International Ltd. | |
5.500% due 02/15/2016 | | | | | 1,500 | | | | | | 1,532 | |
|
Williams Partners LP | |
3.600% due 03/15/2022 | | | | | 200 | | | | | | 194 | |
|
Woodside Finance Ltd. | |
3.650% due 03/05/2025 | | | | | 100 | | | | | | 96 | |
8.750% due 03/01/2019 | | | | | 1,000 | | | | | | 1,209 | |
|
Woolworths Ltd. | |
4.000% due 09/22/2020 | | | | | 1,000 | | | | | | 1,062 | |
|
Wyndham Worldwide Corp. | |
2.950% due 03/01/2017 | | | | | 1,000 | | | | | | 1,015 | |
|
Wynn Las Vegas LLC | |
5.500% due 03/01/2025 | | | | | 100 | | | | | | 96 | |
|
Wynn Macau Ltd. | |
5.250% due 10/15/2021 | | | | | 200 | | | | | | 190 | |
|
ZF North America Capital, Inc. | |
4.000% due 04/29/2020 | | | | | 700 | | | | | | 702 | |
| | | | | | | | | | | | |
| | | | | | | | | | | 64,024 | |
| | | | | | | | | | | | |
| |
UTILITIES 10.9% | |
|
AES Corp. | |
3.283% due 06/01/2019 | | | | | 1,000 | | | | | | 1,002 | |
| | | | | | | | | | | | |
| | | | | PRINCIPAL
AMOUNT
(000s) | | | | | MARKET
VALUE
(000s) | |
|
AT&T, Inc. | |
3.000% due 06/30/2022 (d) | | $ | | | 2,100 | | | $ | | | 2,029 | |
|
BG Energy Capital PLC | |
6.500% due 11/30/2072 | | | | | 1,200 | | | | | | 1,288 | |
|
British Telecommunications PLC | |
1.250% due 02/14/2017 | | | | | 200 | | | | | | 200 | |
|
Enable Midstream Partners LP | |
2.400% due 05/15/2019 | | | | | 200 | | | | | | 193 | |
|
FirstEnergy Corp. | |
2.750% due 03/15/2018 | | | | | 1,250 | | | | | | 1,269 | |
|
Kinder Morgan Finance Co. LLC | |
6.000% due 01/15/2018 | | | | | 200 | | | | | | 217 | |
|
Korea Hydro & Nuclear Power Co. Ltd. | |
2.875% due 10/02/2018 | | | | | 1,110 | | | | | | 1,139 | |
|
Korea Western Power Co. Ltd. | |
3.125% due 05/10/2017 | | | | | 200 | | | | | | 205 | |
|
KT Corp. | |
1.750% due 04/22/2017 | | | | | 1,000 | | | | | | 1,000 | |
3.875% due 01/20/2017 | | | | | 265 | | | | | | 274 | |
|
Orange S.A. | |
2.750% due 09/14/2016 (d) | | | | | 1,200 | | | | | | 1,222 | |
2.750% due 02/06/2019 | | | | | 100 | | | | | | 101 | |
|
Petrobras Global Finance BV | |
2.643% due 03/17/2017 | | | | | 1,700 | | | | | | 1,669 | |
3.250% due 03/17/2017 | | | | | 150 | | | | | | 148 | |
|
Petroleos Mexicanos | |
5.750% due 03/01/2018 | | | | | 950 | | | | | | 1,036 | |
|
Plains All American Pipeline LP | |
2.600% due 12/15/2019 | | | | | 400 | | | | | | 398 | |
|
Sinopec Group Overseas Development Ltd. | |
1.051% due 04/10/2017 | | | | | 900 | | | | | | 900 | |
1.191% due 04/10/2019 | | | | | 200 | | | | | | 200 | |
|
Sprint Communications, Inc. | |
6.000% due 12/01/2016 | | | | | 1,400 | | | | | | 1,453 | |
|
Telecom Italia Capital S.A. | |
5.250% due 10/01/2015 | | | | | 100 | | | | | | 101 | |
|
Telstra Corp. Ltd. | |
3.125% due 04/07/2025 | | | | | 500 | | | | | | 489 | |
|
Verizon Communications, Inc. | |
2.036% due 09/14/2018 (d) | | | | | 2,347 | | | | | | 2,430 | |
2.500% due 09/15/2016 | | | | | 137 | | | | | | 139 | |
| | | | | | | | | | | | |
| | | | | | | | | | | 19,102 | |
| | | | | | | | | | | | |
Total Corporate Bonds & Notes
(Cost $139,021) | | | 138,665 | |
| | | | | | | | | | | | |
| |
MUNICIPAL BONDS & NOTES 0.3% | |
| |
CALIFORNIA 0.3% | |
|
California Earthquake Authority Revenue Notes, Series 2014 | |
2.805% due 07/01/2019 | | | | | 500 | | | | | | 513 | |
| | | | | | | | | | | | |
Total Municipal Bonds & Notes
(Cost $500) | | | 513 | |
| | | | | | | | | | | | |
| |
U.S. GOVERNMENT AGENCIES 0.8% | |
|
Freddie Mac | |
2.000% due 08/25/2016 | | | | | 1,375 | | | | | | 1,400 | |
| | | | | | | | | | | | |
Total U.S. Government Agencies
(Cost $1,399) | | | 1,400 | |
| | | | | | | | | | | | |
| |
MORTGAGE-BACKED SECURITIES 6.9% | |
|
Banc of America Commercial Mortgage Trust | |
5.617% due 07/10/2046 | | | | | 116 | | | | | | 120 | |
| | | | | | |
| 96 | | PIMCO ETF TRUST | | | | See Accompanying Notes |
June 30, 2015
| | | | | | | | | | | | |
| | | | | PRINCIPAL
AMOUNT
(000s) | | | | | MARKET
VALUE
(000s) | |
|
BCAP LLC Trust | |
0.345% due 03/26/2037 | | $ | | | 124 | | | $ | | | 122 | |
|
Bear Stearns Adjustable Rate Mortgage Trust | |
2.354% due 02/25/2033 | | | | | 3 | | | | | | 3 | |
|
Carefree Portfolio Trust | |
1.506% due 11/15/2019 | | | | | 1,000 | | | | | | 1,005 | |
|
Citigroup Mortgage Loan Trust, Inc. | |
2.523% due 11/25/2038 | | | | | 77 | | | | | | 77 | |
|
Commercial Mortgage Trust | |
1.088% due 06/11/2027 | | | | | 1,300 | | | | | | 1,300 | |
|
Credit Suisse Mortgage Capital Certificates | |
2.580% due 09/27/2036 | | | | | 75 | | | | | | 76 | |
|
DBUBS Mortgage Trust | |
3.742% due 11/10/2046 | | | | | 662 | | | | | | 670 | |
|
Eurosail PLC | |
0.871% due 06/13/2045 | | GBP | | | 352 | | | | | | 548 | |
|
First Horizon Mortgage Pass-Through Trust | |
2.565% due 09/25/2033 | | $ | | | 100 | | | | | | 100 | |
|
Granite Mortgages PLC | |
0.561% due 09/20/2044 | | | | | 140 | | | | | | 140 | |
|
GS Mortgage Securities Trust | |
5.560% due 11/10/2039 | | | | | 722 | | | | | | 749 | |
|
GSR Mortgage Loan Trust | |
2.503% due 08/25/2033 | | | | | 783 | | | | | | 782 | |
2.703% due 09/25/2035 | | | | | 82 | | | | | | 83 | |
|
Jefferies Resecuritization Trust | |
3.970% due 07/26/2037 | | | | | 11 | | | | | | 11 | |
|
JPMorgan Chase Commercial Mortgage Securities Trust | |
1.166% due 07/15/2031 | | | | | 1,500 | | | | | | 1,500 | |
5.814% due 06/12/2043 | | | | | 253 | | | | | | 260 | |
|
JPMorgan Resecuritization Trust | |
2.103% due 07/27/2037 | | | | | 174 | | | | | | 175 | |
|
MASTR Adjustable Rate Mortgages Trust | |
2.666% due 04/21/2034 | | | | | 158 | | | | | | 162 | |
|
Residential Accredit Loans, Inc. Trust | |
0.627% due 06/25/2034 | | | | | 165 | | | | | | 163 | |
|
Royal Bank of Scotland Capital Funding Trust | |
6.104% due 06/16/2049 | | | | | 463 | | | | | | 483 | |
|
Selkirk Ltd. | |
1.183% due 02/20/2041 | | | | | 37 | | | | | | 37 | |
1.860% due 12/20/2041 | | | | | 1,344 | | | | | | 1,346 | |
|
Sequoia Mortgage Trust | |
0.847% due 06/20/2033 | | | | | 12 | | | | | | 11 | |
0.907% due 11/22/2024 | | | | | 24 | | | | | | 24 | |
|
Structured Asset Mortgage Investments Trust | |
0.768% due 07/19/2034 | | | | | 25 | | | | | | 25 | |
0.848% due 09/19/2032 | | | | | 45 | | | | | | 44 | |
|
Thornburg Mortgage Securities Trust | |
2.229% due 04/25/2045 | | | | | 363 | | | | | | 365 | |
|
Wachovia Bank Commercial Mortgage Trust | |
0.360% due 06/15/2049 | | | | | 600 | | | | | | 589 | |
|
WaMu Mortgage Pass-Through Certificates Trust | |
0.497% due 01/25/2045 | | | | | 48 | | | | | | 45 | |
0.587% due 06/25/2044 | | | | | 1,148 | | | | | | 1,069 | |
2.559% due 06/25/2033 | | | | | 8 | | | | | | 9 | |
|
Wells Fargo Mortgage-Backed Securities Trust | |
2.618% due 06/25/2035 | | | | | 10 | | | | | | 10 | |
| | | | | | | | | | | | |
Total Mortgage-Backed Securities
(Cost $12,080) | | | 12,103 | |
| | | | | | | | | | | | |
| |
ASSET-BACKED SECURITIES 9.7% | |
|
Alba SPV SRL | |
1.502% due 04/20/2040 | | EUR | | | 52 | | | | | | 58 | |
| | | | | | | | | | | | |
| | | | | PRINCIPAL
AMOUNT
(000s) | | | | | MARKET
VALUE
(000s) | |
|
Ameriquest Mortgage Securities, Inc. Asset-Backed Pass-Through Certificates | |
0.945% due 09/25/2033 | | $ | | | 68 | | | $ | | | 66 | |
|
Atrium CDO Corp. | |
1.376% due 11/16/2022 | | | | | 466 | | | | | | 466 | |
|
Bear Stearns Asset-Backed Securities Trust | |
0.987% due 10/27/2032 | | | | | 48 | | | | | | 46 | |
|
Carlyle Global Market Strategies CLO LLC | |
1.505% due 04/20/2022 | | | | | 750 | | | | | | 750 | |
|
Cavalry CLO Ltd. | |
1.645% due 01/16/2024 | | | | | 1,000 | | | | | | 999 | |
|
CIFC Funding Ltd. | |
1.575% due 01/19/2023 | | | | | 435 | | | | | | 436 | |
|
COA Summit CLO Ltd. | |
1.625% due 04/20/2023 | | | | | 300 | | | | | | 300 | |
|
Cordatus CLO PLC | |
0.370% due 01/30/2024 | | EUR | | | 1,397 | | | | | | 1,541 | |
|
Credit Suisse First Boston Mortgage Securities Corp. | |
2.437% due 10/25/2032 | | $ | | | 108 | | | | | | 108 | |
|
Doral CLO Ltd. | |
1.531% due 05/26/2023 | | | | | 600 | | | | | | 600 | |
|
Drug Royalty LP | |
3.081% due 07/15/2023 | | | | | 272 | | | | | | 276 | |
|
Duane Street CLO Ltd. | |
0.505% due 11/14/2021 | | | | | 165 | | | | | | 163 | |
|
Duchess CLO BV | |
0.207% due 02/28/2023 | | EUR | | | 92 | | | | | | 102 | |
|
Eagle Ltd. | |
2.570% due 12/15/2039 | | $ | | | 219 | | | | | | 218 | |
|
First Franklin Mortgage Loan Trust | |
0.937% due 11/25/2034 | | | | | 419 | | | | | | 397 | |
|
Gallatin CLO Ltd. | |
1.545% due 07/15/2023 | | | | | 1,000 | | | | | | 999 | |
|
Highbridge Loan Management Ltd. | |
1.436% due 09/20/2022 | | | | | 500 | | | | | | 498 | |
|
KVK CLO Ltd. | |
1.645% due 07/15/2023 | | | | | 1,500 | | | | | | 1,499 | |
|
Madison Park Funding Ltd. | |
1.536% due 06/15/2022 | | | | | 473 | | | | | | 473 | |
1.570% due 08/15/2022 | | | | | 500 | | | | | | 500 | |
|
National Collegiate Student Loan Trust | |
0.427% due 11/27/2028 | | | | | 299 | | | | | | 294 | |
|
Navient Private Education Loan Trust | |
1.386% due 12/15/2028 | | | | | 1,000 | | | | | | 1,013 | |
|
Neuberger Berman CLO Ltd. | |
1.427% due 07/25/2023 | | | | | 1,000 | | | | | | 1,003 | |
|
OneMain Financial Issuance Trust | |
2.570% due 07/18/2025 | | | | | 800 | | | | | | 801 | |
|
Park Place Securities, Inc. Asset-Backed Pass-Through Certificates | |
0.937% due 03/25/2035 | | | | | 125 | | | | | | 125 | |
|
Symphony CLO LP | |
1.374% due 01/09/2023 | | | | | 1,238 | | | | | | 1,234 | |
|
Venture CLO Ltd. | |
1.575% due 11/14/2022 | | | | | 1,500 | | | | | | 1,500 | |
|
Voya CLO Ltd. | |
1.575% due 10/15/2022 | | | | | 400 | | | | | | 400 | |
1.615% due 10/15/2022 | | | | | 300 | | | | | | 300 | |
| | | | | | | | | | | | |
Total Asset-Backed Securities
(Cost $17,147) | | | 17,165 | |
| | | | | | | | | | | | |
| | | | | | | | | | | | |
| | | | | PRINCIPAL
AMOUNT
(000s) | | | | | MARKET
VALUE
(000s) | |
SOVEREIGN ISSUES 5.4% | |
|
Banco Nacional de Desenvolvimento Economico e Social | |
3.375% due 09/26/2016 | | $ | | | 200 | | | $ | | | 202 | |
|
Brazil Letras do Tesouro Nacional | |
0.000% due 01/01/2016 (b) | | BRL | | | 10,400 | | | | | | 3,125 | |
|
Export-Import Bank of Korea | |
1.250% due 11/20/2015 | | $ | | | 550 | | | | | | 551 | |
|
Japan Finance Organization for Municipalities | |
1.500% due 09/12/2017 | | | | | 4,100 | | | | | | 4,125 | |
|
Korea Land & Housing Corp. | |
1.875% due 08/02/2017 | | | | | 1,000 | | | | | | 1,004 | |
|
Qatar Government International Bond | |
3.125% due 01/20/2017 | | | | | 500 | | | | | | 517 | |
| | | | | | | | | | | | |
Total Sovereign Issues
(Cost $9,616) | | | 9,524 | |
| | | | | | | | | | | | |
| |
SHORT-TERM INSTRUMENTS 10.2% | |
| |
COMMERCIAL PAPER 4.1% | |
|
Enbridge Enegry Partners LP | |
0.910% due 07/22/2015 | | | | | 1,700 | | | | | | 1,699 | |
|
ENI Finance USA, Inc. | |
1.350% due 06/10/2016 | | | | | 1,700 | | | | | | 1,681 | |
|
Entergy Corp. | |
0.950% due 07/10/2015 | | | | | 1,500 | | | | | | 1,500 | |
|
Tesco Treasury Services PLC | |
1.024% due 08/17/2015 | | | | | 1,400 | | | | | | 1,398 | |
2.750% due 08/17/2015 | | | | | 900 | | | | | | 897 | |
| | | | | | | | | | | | |
| | | | | | | | | | | 7,175 | |
| | | | | | | | | | | | |
| |
REPURCHASE AGREEMENTS (c) 6.1% | |
| | | | | | | | | | | 10,713 | |
| | | | | | | | | | | | |
| |
U.S. TREASURY BILLS 0.0% | |
0.016% due 08/27/2015 (g) | | | | | 21 | | | | | | 21 | |
| | | | | | | | | | | | |
Total Short-Term Instruments
(Cost $17,906) | | | 17,909 | |
| | | | | | | | | | | | |
| | | | | | | | | | | | |
Total Investments in Securities
(Cost $199,065) | | | 198,674 | |
| | | | | | | | | | | | |
| | | | | | | | | | | | |
Total Investments 113.0%
(Cost $199,065) | | | $ | | | 198,674 | |
| | | | | | | | | | | | |
Financial Derivative
Instruments (e)(f) 0.2% (Cost or Premiums, net $(259)) | | | 378 | |
| |
Other Assets and Liabilities, net (13.2%) | | | (23,244 | ) |
| | | | | | | | | | | | |
Net Assets 100.0% | | | $ | | | 175,808 | |
| | | | | | | | | | | | |
| | | | | | |
| See Accompanying Notes | | ANNUAL REPORT | | JUNE 30, 2015 | | 97 |
Schedule of Investments PIMCO Low Duration Active Exchange-Traded Fund (Cont.)
NOTES TO SCHEDULE OF INVESTMENTS (AMOUNTS IN THOUSANDS*, EXCEPT NUMBER OF CONTRACTS):
| * | A zero balance may reflect actual amounts rounding to less than one thousand. |
BORROWINGS AND OTHER FINANCING TRANSACTIONS
(c) REPURCHASE AGREEMENTS:
| | | | | | | | | | | | | | | | | | | | | | | | | | | | | | | | |
| Counterparty | | | | Lending
Rate | | | Settlement
Date | | | Maturity
Date | | | Principal
Amount | | | Collateralized By | | Collateral
Received,
at Value | | | Repurchase
Agreements,
at Value | | | Repurchase
Agreement
Proceeds
to be
Received (1) | |
BOS | | | | | 0.250 | % | | | 06/30/2015 | | | | 07/01/2015 | | | $ | 3,800 | | | U.S. Treasury Bonds 3.750% due 11/15/2043 | | $ | (3,879 | ) | | $ | 3,800 | | | $ | 3,800 | |
DEU | | | | | 0.140 | % | | | 06/30/2015 | | | | 07/01/2015 | | | | 6,400 | | | U.S. Treasury Bonds 3.750% due 11/15/2043 | | | (6,497 | ) | | | 6,400 | | | | 6,400 | |
SSB | | | | | 0.000 | % | | | 06/30/2015 | | | | 07/01/2015 | | | | 513 | | | Fannie Mae 2.260% due 10/17/2022 | | | (525 | ) | | | 513 | | | | 513 | |
Total Repurchase Agreements | | | | | | | | | | | | | | | | | | | | | | $ | (10,901 | ) | | $ | 10,713 | | | $ | 10,713 | |
| (1) | Includes accrued interest. |
REVERSE REPURCHASE AGREEMENTS:
| | | | | | | | | | | | | | | | | | | | | | |
| Counterparty | | | | Borrowing
Rate | | | Borrowing
Date | | | Maturity
Date | | | Amount
Borrowed (2) | | | Payable for
Reverse
Repurchase
Agreements | |
BPG | | | | | 0.470 | % | | | 06/03/2015 | | | | 07/09/2015 | | | $ | (4,916 | ) | | $ | (4,918 | ) |
| | | | | | 0.480 | % | | | 06/10/2015 | | | | 07/13/2015 | | | | (4,388 | ) | | | (4,389 | ) |
| | | | | | 0.490 | % | | | 06/12/2015 | | | | 07/17/2015 | | | | (3,550 | ) | | | (3,551 | ) |
| | | | | | 0.500 | % | | | 06/15/2015 | | | | 07/29/2015 | | | | (1,898 | ) | | | (1,898 | ) |
RDR | | | | | 0.420 | % | | | 06/03/2015 | | | | 07/08/2015 | | | | (2,436 | ) | | | (2,437 | ) |
| | | | | | 0.420 | % | | | 06/11/2015 | | | | 07/16/2015 | | | | (2,292 | ) | | | (2,293 | ) |
SOG | | | | | 0.490 | % | | | 06/15/2015 | | | | 07/29/2015 | | | | (4,758 | ) | | | (4,759 | ) |
Total Reverse Repurchase Agreements | | | | | | | | | | | | | | | | | | | | $ | (24,245 | ) |
| (2) | The average amount of borrowings outstanding during the period ended June 30, 2015 was $28,060 at a weighted average interest rate of (0.056%). |
SHORT SALES:
| | | | | | | | | | | | | | | | | | | | | | |
| Description | | | | Coupon | | | Maturity
Date | | | Principal
Amount | | | Proceeds | | | Payable for
Short Sales (3) | |
U.S. Treasury Notes | | | | | 1.625 | % | | | 07/31/2019 | | | $ | 9,400 | | | $ | (9,437 | ) | | $ | (9,541 | ) |
Total Short Sales | | | | | | | | | | | | | | | | $ | (9,437 | ) | | $ | (9,541 | ) |
| (3) | Payable for short sales includes $66 of accrued interest. |
| | | | | | |
| 98 | | PIMCO ETF TRUST | | | | See Accompanying Notes |
June 30, 2015
BORROWINGS AND OTHER FINANCING TRANSACTIONS SUMMARY
The following is a summary by counterparty of the market value of Borrowings and Other Financing Transactions and collateral (received)/pledged as of June 30, 2015:
| (d) | Securities with an aggregate market value of $25,299 have been pledged as collateral under the terms of the following master agreements as of June 30, 2015. |
| | | | | | | | | | | | | | | | | | | | | | | | | | |
| Counterparty | | | | Repurchase
Agreement
Proceeds
to be
Received | | | Payable for
Reverse
Repurchase
Agreements | | | Payable for
Sale-Buyback
Transactions | | | Total
Borrowings and
Other Financing
Transactions | | | Collateral
(Received)/
Pledged | | | Net
Exposure (4) | |
Global/Master Repurchase Agreement | | | | | | | | | | | | | | | | | | | | | | | | | | |
BOS | | | | $ | 3,800 | | | $ | 0 | | | $ | 0 | | | $ | 3,800 | | | $ | (3,878 | ) | | $ | (78 | ) |
BPG | | | | | 0 | | | | (14,756 | ) | | | 0 | | | | (14,756 | ) | | | 15,373 | | | | 617 | |
DEU | | | | | 6,400 | | | | 0 | | | | 0 | | | | 6,400 | | | | (6,497 | ) | | | (97 | ) |
RDR | | | | | 0 | | | | (4,730 | ) | | | 0 | | | | (4,730 | ) | | | 4,951 | | | | 221 | |
SOG | | | | | 0 | | | | (4,759 | ) | | | 0 | | | | (4,759 | ) | | | 4,976 | | | | 217 | |
SSB | | | | | 513 | | | | 0 | | | | 0 | | | | 513 | | | | (525 | ) | | | (12 | ) |
Total Borrowings and Other Financing Transactions | | | | $ | 10,713 | | | $ | (24,245 | ) | | $ | 0 | | | | | | | | | | | | | |
| (4) | Net Exposure represents the net receivable/(payable) that would be due from/to the counterparty in the event of default. Exposure from borrowings and other financing transactions can only be netted across transactions governed under the same master agreement with the same legal entity. See Note 7, Principal Risks, in the Notes to Financial Statements for more information regarding master netting arrangements. |
(e) FINANCIAL DERIVATIVE INSTRUMENTS: EXCHANGE-TRADED OR CENTRALLY CLEARED
WRITTEN OPTIONS:
OPTIONS ON EXCHANGE-TRADED FUTURES CONTRACTS
| | | | | | | | | | | | | | | | | | | | | | |
| Description | | | | Strike
Price | | | Expiration
Date | | | # of
Contracts | | | Premiums
(Received) | | | Market
Value | |
Call - CME 90-Day Eurodollar June Futures | | | | $ | 99.250 | | | | 03/14/2016 | | | | 73 | | | $ | (26 | ) | | $ | (30 | ) |
Call - CME 90-Day Eurodollar June Futures | | | | | 98.750 | | | | 06/13/2016 | | | | 111 | | | | (81 | ) | | | (116 | ) |
Put - CME 90-Day Eurodollar June Futures | | | | | 98.750 | | | | 06/13/2016 | | | | 111 | | | | (101 | ) | | | (27 | ) |
Put - CME 90-Day Eurodollar March Futures | | | | | 99.250 | | | | 03/14/2016 | | | | 73 | | | | (51 | ) | | | (24 | ) |
| | | | | | | | | | | | | | | | | $ | (259 | ) | | $ | (197 | ) |
Total Written Options | | | | | | | | | | | | | | | | $ | (259 | ) | | $ | (197 | ) |
FUTURES CONTRACTS:
| | | | | | | | | | | | | | | | | | | | | | | | | | |
| Description | | | | Type | | | Expiration
Month | | | # of
Contracts | | | Unrealized
Appreciation | | | Variation Margin | |
| | | | | | | | Asset | | | Liability | |
Euro-Bobl September Futures | | | | | Long | | | | 09/2015 | | | | 26 | | | $ | 14 | | | $ | 16 | | | $ | 0 | |
U.S. Treasury 2-Year Note September Futures | | | | | Long | | | | 09/2015 | | | | 288 | | | | 63 | | | | 0 | | | | (14 | ) |
Total Futures Contracts | | | | | | | | | | | | | | | | $ | 77 | | | $ | 16 | | | $ | (14 | ) |
SWAP AGREEMENTS:
INTEREST RATE SWAPS
| | | | | | | | | | | | | | | | | | | | | | | | | | | | | | | | |
Pay/Receive
Floating Rate | | Floating Rate Index | | | | Fixed Rate | | | Maturity
Date | | | Notional
Amount | | | Market
Value | | | Unrealized
(Depreciation) | | | Variation Margin | |
| | | | | | | | | Asset | | | Liability | |
Pay | | 3-Month USD-LIBOR | | | | | 2.000 | % | | | 12/16/2019 | | | $ | 200 | | | $ | (2 | ) | | $ | (1 | ) | | $ | 0 | | | $ | 0 | |
Pay | | 3-Month USD-LIBOR | | | | | 2.000 | % | | | 12/16/2020 | | | | 8,700 | | | | 3 | | | | (35 | ) | | | 3 | | | | 0 | |
Pay | | 3-Month USD-LIBOR | | | | | 2.250 | % | | | 12/16/2022 | | | | 8,800 | | | | 39 | | | | (61 | ) | | | 3 | | | | 0 | |
| | | | | | | | | | | | | | | | | | | $ | 40 | | | $ | (97 | ) | | $ | 6 | | | $ | 0 | |
Total Swap Agreements | | | | | | | | | | | | | | | | $ | 40 | | | $ | (97 | ) | | $ | 6 | | | $ | 0 | |
| | | | | | |
| See Accompanying Notes | | ANNUAL REPORT | | JUNE 30, 2015 | | 99 |
Schedule of Investments PIMCO Low Duration Active Exchange-Traded Fund (Cont.)
FINANCIAL DERIVATIVE INSTRUMENTS: EXCHANGE-TRADED OR CENTRALLY CLEARED SUMMARY
The following is a summary of the market value and variation margin of Exchange-Traded or Centrally Cleared Financial Derivative Instruments as of June 30, 2015:
Cash of $1,223 has been pledged as collateral for exchange-traded and centrally cleared financial derivative instruments as of June 30, 2015. See Note 7, Principal Risks, in the Notes to Financial Statements for more information regarding master netting arrangements.
| | | | | | | | | | | | | | | | | | | | | | | | | | | | | | | | | | | | |
| | | | | Financial Derivative Assets | | | | | Financial Derivative Liabilities | |
| | | | | Market Value | | | Variation Margin
Asset (1) | | | | | | | | Market Value | | | Variation Margin
Liability | | | | |
| | | | | Purchased
Options | | | Futures | | | Swap
Agreements | | | Total | | | | | Written
Options | | | Futures | | | Swap
Agreements | | | Total | |
Total Exchange-Traded or Centrally Cleared | | | | $ | 0 | | | $ | 17 | | | $ | 6 | | | $ | 23 | | | | | $ | (197 | ) | | $ | (14 | ) | | $ | 0 | | | $ | (211 | ) |
| (1) | Unsettled variation margin asset of $1 for closed futures is outstanding at period end. |
(f) FINANCIAL DERIVATIVE INSTRUMENTS: OVER THE COUNTER
FORWARD FOREIGN CURRENCY CONTRACTS:
| | | | | | | | | | | | | | | | | | | | | | | | | | | | | | |
| Counterparty | | | | Settlement
Month | | | Currency to
be Delivered | | | Currency to
be Received | | | Unrealized
Appreciation/
(Depreciation) | |
| | | | | | | Asset | | | Liability | |
BOA | | | | | 07/2015 | | | | JPY | | | | 555,900 | | | | $ | | | | 4,496 | | | $ | 0 | | | $ | (46 | ) |
BPS | | | | | 07/2015 | | | | $ | | | | 3,101 | | | | JPY | | | | 386,300 | | | | 55 | | | | 0 | |
| | | | | | 08/2015 | | | | JPY | | | | 194,800 | | | | $ | | | | 1,572 | | | | 0 | | | | (20 | ) |
| | | | | | 01/2016 | | | | BRL | | | | 4,100 | | | | | | | | 1,249 | | | | 11 | | | | 0 | |
CBK | | | | | 08/2015 | | | | ILS | | | | 7,849 | | | | | | | | 2,030 | | | | 0 | | | | (50 | ) |
DUB | | | | | 07/2015 | | | | BRL | | | | 6,000 | | | | | | | | 1,934 | | | | 4 | | | | 0 | |
| | | | | | 07/2015 | | | | $ | | | | 1,851 | | | | BRL | | | | 6,000 | | | | 79 | | | | 0 | |
| | | | | | 08/2015 | | | | | | | | 193 | | | | GBP | | | | 123 | | | | 0 | | | | 0 | |
FBF | | | | | 07/2015 | | | | BRL | | | | 6,000 | | | | $ | | | | 2,467 | | | | 538 | | | | 0 | |
| | | | | | 07/2015 | | | | $ | | | | 1,934 | | | | BRL | | | | 6,000 | | | | 0 | | | | (4 | ) |
| | | | | | 08/2015 | | | | EUR | | | | 7,238 | | | | $ | | | | 8,076 | | | | 2 | | | | 0 | |
HUS | | | | | 07/2015 | | | | | | | | 673 | | | | | | | | 757 | | | | 7 | | | | 0 | |
| | | | | | 07/2015 | | | | GBP | | | | 397 | | | | | | | | 604 | | | | 0 | | | | (20 | ) |
| | | | | | 01/2016 | | | | BRL | | | | 6,300 | | | | | | | | 1,918 | | | | 17 | | | | 0 | |
MSB | | | | | 07/2015 | | | | GBP | | | | 490 | | | | | | | | 746 | | | | 0 | | | | (24 | ) |
UAG | | | | | 07/2015 | | | | AUD | | | | 931 | | | | | | | | 710 | | | | 0 | | | | (9 | ) |
| | | | | | 07/2015 | | | | $ | | | | 1,359 | | | | JPY | | | | 169,600 | | | | 26 | | | | 0 | |
Total Forward Foreign Currency Contracts | | | | | | | | | | | | | | | | | | | | | | | | $ | 739 | | | $ | (173 | ) |
WRITTEN OPTIONS:
TRANSACTIONS IN WRITTEN CALL AND PUT OPTIONS FOR THE PERIOD ENDED JUNE 30, 2015:
| | | | | | | | | | | | | | | | | | | | | | | | | | | | | | |
| | | | | # of
Contracts | | | Notional
Amount in $ | | | Notional
Amount in AUD | | | Notional
Amount in GBP | | | Premiums | |
Balance at Beginning of Period | | | | | 0 | | | $ | 0 | | | | AUD | | | | 0 | | | | GBP | | | | 0 | | | $ | 0 | |
Sales | | | | | 958 | | | | 70,500 | | | | | | | | 3,915 | | | | | | | | 2,084 | | | | (802 | ) |
Closing Buys | | | | | (590 | ) | | | (51,100 | ) | | | | | | | (900 | ) | | | | | | | (1,563 | ) | | | 501 | |
Expirations | | | | | 0 | | | | 0 | | | | | | | | (3,015 | ) | | | | | | | 0 | | | | 12 | |
Exercised | | | | | 0 | | | | (19,400 | ) | | | | | | | 0 | | | | | | | | (521 | ) | | | 30 | |
Balance at End of Period | | | | | 368 | | | $ | 0 | | | | AUD | | | | 0 | | | | GBP | | | | 0 | | | $ | (259 | ) |
| | | | | | |
| 100 | | PIMCO ETF TRUST | | | | See Accompanying Notes |
June 30, 2015
FINANCIAL DERIVATIVE INSTRUMENTS: OVER THE COUNTER SUMMARY
The following is a summary by counterparty of the market value of OTC financial derivative instruments and collateral (received)/pledged as of June 30, 2015:
| (g) | Securities with an aggregate market value of $21 have been pledged as collateral for financial derivative instruments as governed by International Swaps and Derivatives Association, Inc. master agreements as of June 30, 2015. |
| | | | | | | | | | | | | | | | | | | | | | | | | | | | | | | | | | | | | | | | | | | | | | | | |
Counterparty | | | | Financial Derivative Assets | | | | | Financial Derivative Liabilities | | | | | | | | | | |
| | | | Forward
Foreign
Currency
Contracts | | | Purchased
Options | | | Swap
Agreements | | | Total
Over the
Counter | | | | | Forward
Foreign
Currency
Contracts | | | Written
Options | | | Swap
Agreements | | | Total
Over the
Counter | | | Net Market
Value of OTC
Derivatives | | | Collateral
(Received)/
Pledged | | | Net
Exposure (1) | |
BOA | | | | $ | 0 | | | $ | 0 | | | $ | 0 | | | $ | 0 | | | | | $ | (46 | ) | | $ | 0 | | | $ | 0 | | | $ | (46 | ) | | $ | (46 | ) | | $ | 0 | | | $ | (46 | ) |
BPS | | | | | 66 | | | | 0 | | | | 0 | | | | 66 | | | | | | (20 | ) | | | 0 | | | | 0 | | | | (20 | ) | | | 46 | | | | 0 | | | | 46 | |
CBK | | | | | 0 | | | | 0 | | | | 0 | | | | 0 | | | | | | (50 | ) | | | 0 | | | | 0 | | | | (50 | ) | | | (50 | ) | | | 0 | | | | (50 | ) |
DUB | | | | | 83 | | | | 0 | | | | 0 | | | | 83 | | | | | | 0 | | | | 0 | | | | 0 | | | | 0 | | | | 83 | | | | (100 | ) | | | (17 | ) |
FBF | | | | | 540 | | | | 0 | | | | 0 | | | | 540 | | | | | | (4 | ) | | | 0 | | | | 0 | | | | (4 | ) | | | 536 | | | | (540 | ) | | | (4 | ) |
HUS | | | | | 24 | | | | 0 | | | | 0 | | | | 24 | | | | | | (20 | ) | | | 0 | | | | 0 | | | | (20 | ) | | | 4 | | | | 0 | | | | 4 | |
MSB | | | | | 0 | | | | 0 | | | | 0 | | | | 0 | | | | | | (24 | ) | | | 0 | | | | 0 | | | | (24 | ) | | | (24 | ) | | | 21 | | | | (3 | ) |
UAG | | | | | 26 | | | | 0 | | | | 0 | | | | 26 | | | | | | (9 | ) | | | 0 | | | | 0 | | | | (9 | ) | | | 17 | | | | 0 | | | | 17 | |
Total Over the Counter | | | | $ | 739 | | | $ | 0 | | | $ | 0 | | | $ | 739 | | | | | $ | (173 | ) | | $ | 0 | | | $ | 0 | | | $ | (173 | ) | | | | | | | | | | | | |
| (1) | Net Exposure represents the net receivable/(payable) that would be due from/to the counterparty in the event of default. Exposure from OTC financial derivative instruments can only be netted across transactions governed under the same master agreement with the same legal entity. See Note 7, Principal Risks, in the Notes to Financial Statements for more information regarding master netting arrangements. |
FAIR VALUE OF FINANCIAL DERIVATIVE INSTRUMENTS
The following is a summary of the fair valuation of the Fund’s derivative instruments categorized by risk exposure. See Note 7, Principal Risks, in the Notes to Financial Statements on risks of the Fund.
Fair Values of Financial Derivative Instruments on the Statements of Assets and Liabilities as of June 30, 2015:
| | | | | | | | | | | | | | | | | | | | | | | | | | |
| | | | | Derivatives not accounted for as hedging instruments | |
| | | | | Commodity
Contracts | | | Credit
Contracts | | | Equity
Contracts | | | Foreign
Exchange
Contracts | | | Interest
Rate Contracts | | | Total | |
Financial Derivative Instruments - Assets | | | | | | | | | | | | | | | | | | | | | | | | | | |
Exchange-traded or centrally cleared | | | | | | | | | | | | | | | | | | | | | | | | | | |
Futures | | | | $ | 0 | | | $ | 0 | | | $ | 0 | | | $ | 0 | | | $ | 17 | | | $ | 17 | |
Swap Agreements | | | | | 0 | | | | 0 | | | | 0 | | | | 0 | | | | 6 | | | | 6 | |
| | | | $ | 0 | | | $ | 0 | | | $ | 0 | | | $ | 0 | | | $ | 23 | | | $ | 23 | |
Over the counter | | | | | | | | | | | | | | | | | | | | | | | | | | |
Forward Foreign Currency Contracts | | | | $ | 0 | | | $ | 0 | | | $ | 0 | | | $ | 739 | | | $ | 0 | | | $ | 739 | |
| | | | $ | 0 | | | $ | 0 | | | $ | 0 | | | $ | 739 | | | $ | 24 | | | $ | 762 | |
Financial Derivative Instruments - Liabilities | | | | | | | | | | | | | | | | | | | | | | | | | | |
Exchange-traded or centrally cleared | | | | | | | | | | | | | | | | | | | | | | | | | | |
Written Options | | | | $ | 0 | | | $ | 0 | | | $ | 0 | | | $ | 0 | | | $ | 197 | | | $ | 197 | |
Futures | | | | | 0 | | | | 0 | | | | 0 | | | | 0 | | | | 14 | | | | 14 | |
| | | | $ | 0 | | | $ | 0 | | | $ | 0 | | | $ | 0 | | | $ | 211 | | | $ | 211 | |
Over the counter | | | | | | | | | | | | | | | | | | | | | | | | | | |
Forward Foreign Currency Contracts | | | | $ | 0 | | | $ | 0 | | | $ | 0 | | | $ | 173 | | | $ | 0 | | | $ | 173 | |
| | | | $ | 0 | | | $ | 0 | | | $ | 0 | | | $ | 173 | | | $ | 211 | | | $ | 384 | |
| | | | | | |
| See Accompanying Notes | | ANNUAL REPORT | | JUNE 30, 2015 | | 101 |
Schedule of Investments PIMCO Low Duration Active Exchange-Traded Fund (Cont.)
The Effect of Financial Derivative Instruments on the Statements of Operations for the period ended June 30, 2015:
| | | | | | | | | | | | | | | | | | | | | | | | | | |
| | | | | Derivatives not accounted for as hedging instruments | |
| | | | | Commodity
Contracts | | | Credit
Contracts | | | Equity
Contracts | | | Foreign
Exchange
Contracts | | | Interest
Rate Contracts | | | Total | |
Net Realized Gain (Loss) on Financial Derivative Instruments | | | | | | | | | | | | | | | | | | | | | | | | | | |
Exchange-traded or centrally cleared | | | | | | | | | | | | | | | | | | | | | | | | | | |
Written Options | | | | $ | 0 | | | $ | 0 | | | $ | 0 | | | $ | 0 | | | $ | 89 | | | $ | 89 | |
Futures | | | | | 0 | | | | 0 | | | | 0 | | | | 0 | | | | 597 | | | | 597 | |
Swap Agreements | | | | | 0 | | | | 0 | | | | 0 | | | | 0 | | | | (165 | ) | | | (165 | ) |
| | | | $ | 0 | | | $ | 0 | | | $ | 0 | | | $ | 0 | | | $ | 521 | | | $ | 521 | |
Over the counter | | | | | | | | | | | | | | | | | | | | | | | | | | |
Forward Foreign Currency Contracts | | | | $ | 0 | | | $ | 0 | | | $ | 0 | | | $ | 853 | | | $ | 0 | | | $ | 853 | |
Written Options | | | | | 0 | | | | 0 | | | | 0 | | | | 43 | | | | 54 | | | | 97 | |
Swap Agreements | | | | | 0 | | | | 45 | | | | 0 | | | | 0 | | | | 0 | | | | 45 | |
| | | | $ | 0 | | | $ | 45 | | | $ | 0 | | | $ | 896 | | | $ | 54 | | | $ | 995 | |
| | | | $ | 0 | | | $ | 45 | | | $ | 0 | | | $ | 896 | | | $ | 575 | | | $ | 1,516 | |
Net Change in Unrealized Appreciation (Depreciation) on Financial Derivative Instruments | | | | | | | | | | | | | | | | | | | | | | | | | | |
Exchange-traded or centrally cleared | | | | | | | | | | | | | | | | | | | | | | | | | | |
Written Options | | | | $ | 0 | | | $ | 0 | | | $ | 0 | | | $ | 0 | | | $ | 61 | | | $ | 61 | |
Futures | | | | | 0 | | | | 0 | | | | 0 | | | | 0 | | | | 77 | | | | 77 | |
Swap Agreements | | | | | 0 | | | | 0 | | | | 0 | | | | 0 | | | | (97 | ) | | | (97 | ) |
| | | | $ | 0 | | | $ | 0 | | | $ | 0 | | | $ | 0 | | | $ | 41 | | | $ | 41 | |
Over the counter | | | | | | | | | | | | | | | | | | | | | | | | | | |
Forward Foreign Currency Contracts | | | | $ | 0 | | | $ | 0 | | | $ | 0 | | | $ | 609 | | | $ | 0 | | | $ | 609 | |
| | | | $ | 0 | | | $ | 0 | | | $ | 0 | | | $ | 609 | | | $ | 41 | | | $ | 650 | |
FAIR VALUE MEASUREMENTS
The following is a summary of the fair valuations according to the inputs used as of June 30, 2015 in valuing the Fund’s assets and liabilities:
| | | | | | | | | | | | | | | | | | |
| Category and Subcategory | | | | Level 1 | | | Level 2 | | | Level 3 | | | Fair Value at
06/30/2015 | |
Investments in Securities, at Value | | | | | | | | | | | | | | | | | | |
Bank Loan Obligations | | | | $ | 0 | | | $ | 1,395 | | | $ | 0 | | | $ | 1,395 | |
Corporate Bonds & Notes | | | | | | | | | | | | | | | | | | |
Banking & Finance | | | | | 0 | | | | 55,539 | | | | 0 | | | | 55,539 | |
Industrials | | | | | 0 | | | | 64,024 | | | | 0 | | | | 64,024 | |
Utilities | | | | | 0 | | | | 19,102 | | | | 0 | | | | 19,102 | |
Municipal Bonds & Notes | | | | | | | | | | | | | | | | | | |
California | | | | | 0 | | | | 513 | | | | 0 | | | | 513 | |
U.S. Government Agencies | | | | | 0 | | | | 1,400 | | | | 0 | | | | 1,400 | |
Mortgage-Backed Securities | | | | | 0 | | | | 12,103 | | | | 0 | | | | 12,103 | |
Asset-Backed Securities | | | | | 0 | | | | 16,146 | | | | 1,019 | | | | 17,165 | |
Sovereign Issues | | | | | 0 | | | | 9,524 | | | | 0 | | | | 9,524 | |
Short-Term Instruments | | | | | | | | | | | | | | | | | | |
Commercial Paper | | | | | 0 | | | | 7,175 | | | | 0 | | | | 7,175 | |
Repurchase Agreements | | | | | 0 | | | | 10,713 | | | | 0 | | | | 10,713 | |
U.S. Treasury Bills | | | | | 0 | | | | 21 | | | | 0 | | | | 21 | |
Total Investments | | | | $ | 0 | | | $ | 197,655 | | | $ | 1,019 | | | $ | 198,674 | |
| | | | | |
Short Sales, at Value - Liabilities | | | | | | | | | | | | | | | | | | |
U.S. Treasury Obligations | | | | $ | 0 | | | $ | (9,541 | ) | | $ | 0 | | | $ | (9,541 | ) |
| | | | | | |
| 102 | | PIMCO ETF TRUST | | | | See Accompanying Notes |
June 30, 2015
| | | | | | | | | | | | | | | | | | |
| Category and Subcategory | | | | Level 1 | | | Level 2 | | | Level 3 | | | Fair Value at
06/30/2015 | |
Financial Derivative Instruments - Assets | | | | | | | | | | | | | | | | | | |
Exchange-traded or centrally cleared | | | | $ | 16 | | | $ | 6 | | | $ | 0 | | | $ | 22 | |
Over the counter | | | | | 0 | | | | 739 | | | | 0 | | | | 739 | |
| | | | | $ | 16 | | | $ | 745 | | | $ | 0 | | | $ | 761 | |
| | | | | |
Financial Derivative Instruments - Liabilities | | | | | | | | | | | | | | | | | | |
Exchange-traded or centrally cleared | | | | | (211 | ) | | | 0 | | | | 0 | | | | (211 | ) |
Over the counter | | | | | 0 | | | | (173 | ) | | | 0 | | | | (173 | ) |
| | | | | $ | (211 | ) | | $ | (173 | ) | | $ | 0 | | | $ | (384 | ) |
Totals | | | | $ | (195 | ) | | $ | 188,686 | | | $ | 1,019 | | | $ | 189,510 | |
There were no significant transfers between Levels 1 and 2 during the period ended June 30, 2015. There were assets and liabilities valued at $1,826 transferred from Level 3 to Level 2 during the period ended June 30, 2015. There were no significant assets and liabilities transferred from Level 2 to Level 3 during the period ended June 30, 2015.
| | | | | | |
| See Accompanying Notes | | ANNUAL REPORT | | JUNE 30, 2015 | | 103 |
Schedule of Investments PIMCO Short Term Municipal Bond Active Exchange-Traded Fund
| | | | | | | | | | | | |
| | | | | PRINCIPAL
AMOUNT
(000s) | | | | | MARKET
VALUE
(000s) | |
INVESTMENTS IN SECURITIES 99.0% | |
| |
MUNICIPAL BONDS & NOTES 92.4% | |
| |
ARIZONA 1.9% | |
|
Arizona Sports & Tourism Authority Revenue Notes, Series 2012 | |
4.000% due 07/01/2017 | | $ | | | 1,000 | | | $ | | | 1,044 | |
| | | | | | | | | | | | |
| |
CALIFORNIA 3.3% | |
|
Bay Area Toll Authority, California Revenue Bonds, Series 2007 | |
0.770% due 04/01/2047 | | | | | 1,000 | | | | | | 996 | |
|
Foothill-Eastern Transportation Corridor Agency, California Revenue Bonds, Series 2014 | |
5.000% due 01/15/2053 | | | | | 250 | | | | | | 268 | |
|
Golden State, California Tobacco Securitization Corp. Revenue Notes, Series 2015 | |
5.000% due 06/01/2019 | | | | | 500 | | | | | | 566 | |
| | | | | | | | | | | | |
| | | | | | | | | | | 1,830 | |
| | | | | | | | | | | | |
| |
CONNECTICUT 2.9% | |
|
Stratford, Connecticut General Obligation Notes, Series 2011 | |
3.500% due 08/01/2015 | | | | | 1,635 | | | | | | 1,639 | |
| | | | | | | | | | | | |
| |
FLORIDA 10.5% | |
|
Citizens Property Insurance Corp., Florida Revenue Notes, Series 2010 | |
5.000% due 06/01/2016 | | | | | 1,000 | | | | | | 1,040 | |
|
Florida State General Obligation Notes, Series 2009 | |
5.000% due 06/01/2019 | | | | | 625 | | | | | | 715 | |
|
Lakeland, Florida Department of Electric Utilities Revenue Notes, Series 2012 | |
0.820% due 10/01/2017 | | | | | 3,000 | | | | | | 3,018 | |
|
Miami-Dade County, Florida Industrial Development Authority Revenue Bonds, Series 2006 | |
1.500% due 10/01/2018 | | | | | 500 | | | | | | 498 | |
|
Miami-Dade County, Florida Water & Sewer System Revenue Notes, Series 2008 | |
5.250% due 10/01/2018 | | | | | 500 | | | | | | 564 | |
| | | | | | | | | | | | |
| | | | | | | | | | | 5,835 | |
| | | | | | | | | | | | |
| |
GEORGIA 3.7% | |
|
Atlanta Department of Aviation, Georgia Revenue Notes, Series 2010 | |
5.000% due 01/01/2018 | | | | | 500 | | | | | | 548 | |
|
Burke County, Georgia Development Authority Revenue Bonds, Series 1994 | |
2.200% due 10/01/2032 | | | | | 1,000 | | | | | | 1,021 | |
|
Burke County, Georgia Development Authority Revenue Bonds, Series 2012 | |
1.300% due 01/01/2052 | | | | | 500 | | | | | | 500 | |
| | | | | | | | | | | | |
| | | | | | | | | | | 2,069 | |
| | | | | | | | | | | | |
| |
ILLINOIS 3.8% | |
|
Chicago, Illinois General Obligation Bonds, Series 2003 | |
5.000% due 01/01/2017 | | | | | 700 | | | | | | 715 | |
|
Illinois Finance Authority Revenue Bonds, Series 2008 | |
1.300% due 07/01/2042 | | | | | 390 | | | | | | 389 | |
|
Illinois State General Obligation Notes, Series 2012 | |
5.000% due 08/01/2016 | | | | | 1,000 | | | | | | 1,039 | |
| | | | | | | | | | | | |
| | | | | | | | | | | 2,143 | |
| | | | | | | | | | | | |
| |
MASSACHUSETTS 1.8% | |
|
Massachusetts Development Finance Agency Revenue Notes, Series 2014 | |
1.500% due 08/01/2019 | | | | | 1,000 | | | | | | 1,002 | |
| | | | | | | | | | | | |
| | | | | | | | | | | | |
| | | | | PRINCIPAL
AMOUNT
(000s) | | | | | MARKET
VALUE
(000s) | |
MICHIGAN 1.8% | |
|
Michigan State Hospital Finance Authority Revenue Bonds, Series 2010 | |
1.500% due 11/15/2047 | | $ | | | 1,000 | | | $ | | | 1,011 | |
| | | | | | | | | | | | |
| |
MINNESOTA 1.5% | |
|
Northern Municipal Power Agency, Minnesota Revenue Notes, Series 2010 | |
5.000% due 01/01/2019 | | | | | 750 | | | | | | 842 | |
| | | | | | | | | | | | |
| |
NEBRASKA 3.7% | |
|
Nebraska Public Power District Revenue Notes, Series 2012 | |
5.000% due 01/01/2019 | | | | | 1,330 | | | | | | 1,499 | |
|
Nebraska Public Power District Revenue Notes, Series 2014 | |
5.000% due 07/01/2020 | | | | | 500 | | | | | | 580 | |
| | | | | | | | | | | | |
| | | | | | | | | | | 2,079 | |
| | | | | | | | | | | | |
| |
NEVADA 3.8% | |
|
Clark County, Nevada Revenue Bonds, Series 2010 | |
1.875% due 06/01/2031 | | | | | 1,000 | | | | | | 993 | |
|
Clark Department of Aviation, Nevada Revenue Notes, Series 2014 | |
5.000% due 07/01/2018 | | | | | 1,000 | | | | | | 1,109 | |
| | | | | | | | | | | | |
| | | | | | | | | | | 2,102 | |
| | | | | | | | | | | | |
| |
NEW MEXICO 3.2% | |
|
New Mexico Hospital Equipment Loan Council Revenue Notes, Series 2015 | |
5.000% due 08/01/2019 | | | | | 600 | | | | | | 684 | |
|
New Mexico Municipal Energy Acquisition Authority Revenue Bonds, Series 2014 | |
5.000% due 11/01/2039 | | | | | 1,000 | | | | | | 1,127 | |
| | | | | | | | | | | | |
| | | | | | | | | | | 1,811 | |
| | | | | | | | | | | | |
| |
NEW YORK 12.0% | |
|
Metropolitan Transportation Authority, New York Revenue Bonds, (NPFGC Insured), Series 2005 | |
5.000% due 11/15/2015 | | | | | 220 | | | | | | 223 | |
|
Monroe County Industrial Development Corp., New York Revenue Notes, (FHA Insured), Series 2010 | |
4.000% due 08/15/2015 | | | | | 500 | | | | | | 502 | |
|
New York City, New York General Obligation Notes, Series 2007 | |
5.000% due 08/01/2016 | | | | | 1,040 | | | | | | 1,091 | |
|
New York State Dormitory Authority Revenue Notes, Series 2009 | |
5.000% due 07/01/2018 | | | | | 1,000 | | | | | | 1,116 | |
|
New York State Dormitory Authority Revenue Notes, Series 2010 | |
5.000% due 07/01/2016 | | | | | 250 | | | | | | 261 | |
5.000% due 07/01/2018 | | | | | 1,000 | | | | | | 1,115 | |
|
New York State Dormitory Authority Revenue Notes, Series 2012 | |
4.000% due 05/15/2017 | | | | | 450 | | | | | | 477 | |
|
New York State Dormitory Authority Revenue Notes, Series 2015 | |
4.000% due 05/01/2020 | | | | | 700 | | | | | | 770 | |
|
New York State Thruway Authority Revenue Notes, Series 2013 | |
5.000% due 05/01/2019 | | | | | 1,000 | | | | | | 1,130 | |
| | | | | | | | | | | | |
| | | | | | | | | | | 6,685 | |
| | | | | | | | | | | | |
| |
NORTH CAROLINA 2.5% | |
|
Durham, North Carolina Revenue Notes, Series 2010 | |
4.000% due 10/01/2016 | | | | | 250 | | | | | | 260 | |
| | | | | | | | | | | | |
| | | | | PRINCIPAL
AMOUNT
(000s) | | | | | MARKET
VALUE
(000s) | |
|
North Carolina State Revenue Notes, Series 2013 | |
5.000% due 05/01/2018 | | $ | | | 1,000 | | | $ | | | 1,111 | |
| | | | | | | | | | | | |
| | | | | | | | | | | 1,371 | |
| | | | | | | | | | | | |
| |
OHIO 5.4% | |
|
Cincinnati, Ohio Water System Revenue Notes, Series 2009 | |
5.000% due 12/01/2017 | | | | | 1,000 | | | | | | 1,099 | |
|
Ohio Air Quality Development Authority Revenue Bonds, Series 2006 | |
3.750% due 12/01/2023 | | | | | 1,000 | | | | | | 1,052 | |
|
Ohio Higher Educational Facility Commission Revenue Bonds, (NPFGC Insured), Series 2006 | |
5.250% due 12/01/2019 | | | | | 750 | | | | | | 869 | |
| | | | | | | | | | | | |
| | | | | | | | | | | 3,020 | |
| | | | | | | | | | | | |
| |
OKLAHOMA 0.8% | |
|
Grand River Dam Authority, Oklahoma Revenue Notes, (BHAC Insured), Series 2008 | |
5.000% due 06/01/2017 | | | | | 420 | | | | | | 454 | |
| | | | | | | | | | | | |
| | | | | | | | | | | | |
OREGON 0.5% | |
|
Oregon Health & Science University Revenue Notes, Series 2012 | |
5.000% due 07/01/2020 | | | | | 225 | | | | | | 260 | |
| | | | | | | | | | | | |
| |
PENNSYLVANIA 4.5% | |
|
Montgomery County Industrial Development Authority, Pennsylvania Revenue Bonds, Series 2002 | |
2.550% due 12/01/2029 | | | | | 1,000 | | | | | | 997 | |
|
Pennsylvania Economic Development Financing Authority Revenue Bonds, Series 2009 | |
1.750% due 12/01/2033 | | | | | 1,500 | | | | | | 1,507 | |
| | | | | | | | | | | | |
| | | | | | | | | | | 2,504 | |
| | | | | | | | | | | | |
| |
TEXAS 16.7% | |
|
Austin, Texas Water & Wastewater System Revenue Bonds, (AMBAC Insured), Series 2002 | |
5.500% due 11/15/2015 | | | | | 500 | | | | | | 510 | |
|
Austin, Texas Water & Wastewater System Revenue Notes, Series 2009 | |
5.000% due 11/15/2017 | | | | | 250 | | | | | | 274 | |
|
City Public Service Board of San Antonio, Texas Revenue Notes, Series 2014 | |
5.000% due 02/01/2020 | | | | | 750 | | | | | | 861 | |
|
Dallas/Fort Worth International Airport, Texas Revenue Notes, Series 2009 | |
5.000% due 11/01/2017 | | | | | 1,000 | | | | | | 1,097 | |
|
Dallas/Fort Worth International Airport, Texas Revenue Notes, Series 2012 | |
4.000% due 11/01/2015 | | | | | 500 | | | | | | 506 | |
|
Dallas/Fort Worth International Airport, Texas Revenue Notes, Series 2013 | |
5.000% due 11/01/2018 | | | | | 500 | | | | | | 563 | |
|
Fort Bend Independent School District, Texas General Obligation Notes, (PSF Insured), Series 2010 | |
5.000% due 08/15/2016 | | | | | 500 | | | | | | 525 | |
|
Houston Independent School District, Texas General Obligation Bonds, (PSF Insured), Series 2012 | |
1.700% due 06/01/2030 | | | | | 1,000 | | | | | | 1,003 | |
|
Lower Colorado River Authority, Texas Revenue Notes, Series 2013 | |
5.000% due 05/15/2017 | | | | | 1,595 | | | | | | 1,719 | |
|
San Antonio, Texas Water System Revenue Bonds, Series 2013 | |
0.750% due 05/01/2043 | | | | | 1,000 | | | | | | 1,000 | |
|
Texas Public Finance Authority Revenue Notes, Series 2010 | |
4.000% due 07/01/2015 | | | | | 1,000 | | | | | | 1,000 | |
| | | | | | |
| 104 | | PIMCO ETF TRUST | | | | See Accompanying Notes |
June 30, 2015
| | | | | | | | | | | | |
| | | | | PRINCIPAL
AMOUNT
(000s) | | | | | MARKET
VALUE
(000s) | |
|
University of North Texas Revenue Notes, Series 2010 | |
5.000% due 04/15/2016 | | $ | | | 250 | | | $ | | | 259 | |
| | | | | | | | | | | | |
| | | | | | | | | | | 9,317 | |
| | | | | | | | | | | | |
| |
UTAH 2.5% | |
|
Intermountain Power Agency, Utah Revenue Notes, Series 2013 | |
5.000% due 07/01/2018 | | | | | 760 | | | | | | 846 | |
|
Intermountain Power Agency, Utah Revenue Notes, Series 2014 | |
5.000% due 07/01/2018 | | | | | 500 | | | | | | 556 | |
| | | | | | | | | | | | |
| | | | | | | | | | | 1,402 | |
| | | | | | | | | | | | |
| |
VIRGINIA 2.3% | |
|
Virginia Public School Authority Revenue Notes, Series 2011 | |
5.000% due 08/01/2018 | | | | | 1,140 | | | | | | 1,276 | |
| | | | | | | | | | | | |
| | | | | | | | | | | | |
| | | | | PRINCIPAL
AMOUNT
(000s) | | | | | MARKET
VALUE
(000s) | |
WASHINGTON 1.8% | |
|
King County, Washington Public Hospital District No. 2 General Obligation Notes, Series 2010 | |
5.000% due 12/01/2015 | | $ | | | 1,000 | | | $ | | | 1,019 | |
| | | | | | | | | | | | |
| |
WISCONSIN 1.5% | |
|
Wisconsin Department of Transportation Revenue Notes, Series 2013 | |
4.000% due 07/01/2018 | | | | | 750 | | | | | | 815 | |
| | | | | | | | | | | | |
Total Municipal Bonds & Notes (Cost $51,309) | | | | | | 51,530 | |
| | | | | | | | | | | | |
| |
U.S. TREASURY OBLIGATIONS 4.1% | |
|
U.S. Treasury Notes | |
0.250% due 10/15/2015 | | | | | 1,700 | | | | | | 1,701 | |
0.250% due 10/31/2015 | | | | | 600 | | | | | | 601 | |
| | | | | | | | | | | | |
Total U.S. Treasury Obligations
(Cost $2,301) | | | | | | 2,302 | |
| | | | | | | | | | | | |
| | | | | | | | | | | | |
| | | | | PRINCIPAL
AMOUNT
(000s) | | | | | MARKET
VALUE
(000s) | |
SHORT-TERM INSTRUMENTS 2.5% | |
| |
U.S. TREASURY BILLS 2.5% | |
0.051% due 09/17/2015 | | $ | | | 1,366 | | | $ | | | 1,366 | |
| | | | | | | | | | | | |
Total Short-Term Instruments
(Cost $1,366) | | | 1,366 | |
| | | | | | | | | | | | |
| | | | | | | | | | | | |
Total Investments in Securities
(Cost $54,976) | | | 55,198 | |
| | | | | | | | | | | | |
| | | | | | | | | | | | |
Total Investments 99.0%
(Cost $54,976) | | | $ | | | 55,198 | |
| |
Other Assets and Liabilities, net 1.0% | | | 567 | |
| | | | | | | | | | | | |
Net Assets 100.0% | | | $ | | | 55,765 | |
| | | | | | | | | | | | |
NOTES TO SCHEDULE OF INVESTMENTS (AMOUNTS IN THOUSANDS*):
| * | A zero balance may reflect actual amounts rounding to less than one thousand. |
FAIR VALUE MEASUREMENTS
The following is a summary of the fair valuations according to the inputs used as of June 30, 2015 in valuing the Fund’s assets and liabilities:
| | | | | | | | | | | | | | | | | | |
| Category and Subcategory | | | | Level 1 | | | Level 2 | | | Level 3 | | | Fair Value at
06/30/2015 | |
Investments in Securities, at Value | | | | | | | | | | | | | | | | | | |
Municipal Bonds & Notes | | | | | | | | | | | | | | | | | | |
Arizona | | | | $ | 0 | | | $ | 1,044 | | | $ | 0 | | | $ | 1,044 | |
California | | | | | 0 | | | | 1,830 | | | | 0 | | | | 1,830 | |
Connecticut | | | | | 0 | | | | 1,639 | | | | 0 | | | | 1,639 | |
Florida | | | | | 0 | | | | 5,835 | | | | 0 | | | | 5,835 | |
Georgia | | | | | 0 | | | | 2,069 | | | | 0 | | | | 2,069 | |
Illinois | | | | | 0 | | | | 2,143 | | | | 0 | | | | 2,143 | |
Massachusetts | | | | | 0 | | | | 1,002 | | | | 0 | | | | 1,002 | |
Michigan | | | | | 0 | | | | 1,011 | | | | 0 | | | | 1,011 | |
Minnesota | | | | | 0 | | | | 842 | | | | 0 | | | | 842 | |
Nebraska | | | | | 0 | | | | 2,079 | | | | 0 | | | | 2,079 | |
Nevada | | | | | 0 | | | | 2,102 | | | | 0 | | | | 2,102 | |
New Mexico | | | | | 0 | | | | 1,811 | | | | 0 | | | | 1,811 | |
New York | | | | | 0 | | | | 6,685 | | | | 0 | | | | 6,685 | |
North Carolina | | | | | 0 | | | | 1,371 | | | | 0 | | | | 1,371 | |
Ohio | | | | | 0 | | | | 3,020 | | | | 0 | | | | 3,020 | |
Oklahoma | | | | | 0 | | | | 454 | | | | 0 | | | | 454 | |
Oregon | | | | | 0 | | | | 260 | | | | 0 | | | | 260 | |
Pennsylvania | | | | | 0 | | | | 2,504 | | | | 0 | | | | 2,504 | |
Texas | | | | | 0 | | | | 9,317 | | | | 0 | | | | 9,317 | |
Utah | | | | | 0 | | | | 1,402 | | | | 0 | | | | 1,402 | |
Virginia | | | | | 0 | | | | 1,276 | | | | 0 | | | | 1,276 | |
Washington | | | | | 0 | | | | 1,019 | | | | 0 | | | | 1,019 | |
Wisconsin | | | | | 0 | | | | 815 | | | | 0 | | | | 815 | |
U.S. Treasury Obligations | | | | | 0 | | | | 2,302 | | | | 0 | | | | 2,302 | |
Short-Term Instruments | | | | | | | | | | | | | | | | | | |
U.S. Treasury Bills | | | | | 0 | | | | 1,366 | | | | 0 | | | | 1,366 | |
Total Investments | | | | $ | 0 | | | $ | 55,198 | | | $ | 0 | | | $ | 55,198 | |
There were no significant transfers between Levels 1, 2, or 3 during the period ended June 30, 2015.
| | | | | | |
| See Accompanying Notes | | ANNUAL REPORT | | JUNE 30, 2015 | | 105 |
Schedule of Investments PIMCO Total Return Active Exchange-Traded Fund
| | | | | | | | | | | | |
| | | | | PRINCIPAL
AMOUNT
(000s) | | | | | MARKET
VALUE
(000s) | |
INVESTMENTS IN SECURITIES 117.4% | |
| |
BANK LOAN OBLIGATIONS 0.9% | |
|
H.J. Heinz Co. | |
3.250% due 06/05/2020 | | $ | | | 9,696 | | | $ | | | 9,709 | |
|
HCA, Inc. | |
3.032% due 05/01/2018 | | | | | 3,930 | | | | | | 3,934 | |
|
MGM Resorts International | |
2.937% due 12/20/2017 | | | | | 9,750 | | | | | | 9,732 | |
| | | | | | | | | | | | |
Total Bank Loan Obligations
(Cost $23,384) | | | | | | 23,375 | |
| | | | | | | | | | | | |
| |
CORPORATE BONDS & NOTES 35.2% | |
| |
BANKING & FINANCE 24.4% | |
|
Allstate Life Global Funding Trusts | |
2.941% due 11/25/2016 | | | | | 2,500 | | | | | | 2,488 | |
|
Ally Financial, Inc. | |
2.750% due 01/30/2017 | | | | | 2,100 | | | | | | 2,096 | |
2.955% due 07/18/2016 | | | | | 2,600 | | | | | | 2,630 | |
3.500% due 07/18/2016 | | | | | 2,000 | | | | | | 2,035 | |
3.500% due 01/27/2019 | | | | | 10,000 | | | | | | 9,950 | |
|
Banco Popolare SC | |
3.500% due 03/14/2019 | | EUR | | | 7,400 | | | | | | 8,479 | |
|
Bank of America Corp. | |
2.600% due 01/15/2019 | | $ | | | 28,900 | | | | | | 29,220 | |
6.875% due 04/25/2018 | | | | | 12,400 | | | | | | 14,010 | |
|
Bankia S.A. | |
0.198% due 01/25/2016 | | EUR | | | 500 | | | | | | 557 | |
3.500% due 01/17/2019 | | | | | 2,100 | | | | | | 2,443 | |
3.625% due 10/05/2016 | | | | | 5,050 | | | | | | 5,865 | |
4.375% due 02/14/2017 | | | | | 3,800 | | | | | | 4,450 | |
|
Barclays Bank PLC | |
7.625% due 11/21/2022 | | $ | | | 16,900 | | | | | | 19,277 | |
7.750% due 04/10/2023 | | | | | 5,400 | | | | | | 5,859 | |
14.000% due 06/15/2019 (f) | | GBP | | | 4,500 | | | | | | 9,235 | |
|
BPCE S.A. | |
4.625% due 07/11/2024 | | $ | | | 22,000 | | | | | | 21,523 | |
5.150% due 07/21/2024 | | | | | 10,000 | | | | | | 10,147 | |
|
CIT Group, Inc. | |
4.250% due 08/15/2017 | | | | | 6,000 | | | | | | 6,105 | |
5.000% due 05/15/2017 | | | | | 13,300 | | | | | | 13,748 | |
|
Citicorp Lease Pass-Through Trust | |
8.040% due 12/15/2019 | | | | | 5,200 | | | | | | 6,276 | |
|
Citigroup, Inc. | |
1.237% due 07/25/2016 | | | | | 10,000 | | | | | | 10,031 | |
|
Credit Agricole S.A. | |
8.125% due 09/19/2033 | | | | | 11,200 | | | | | | 12,362 | |
|
Credit Suisse AG | |
6.500% due 08/08/2023 | | | | | 18,400 | | | | | | 20,171 | |
|
Eksportfinans ASA | |
2.000% due 09/15/2015 | | | | | 6,800 | | | | | | 6,809 | |
2.375% due 05/25/2016 | | | | | 12,491 | | | | | | 12,522 | |
5.500% due 06/26/2017 | | | | | 1,000 | | | | | | 1,062 | |
|
Ford Motor Credit Co. LLC | |
1.500% due 01/17/2017 | | | | | 3,500 | | | | | | 3,497 | |
6.625% due 08/15/2017 | | | | | 15,600 | | | | | | 17,120 | |
|
General Electric Capital Corp. | |
6.375% due 11/15/2067 | | | | | 46,100 | | | | | | 49,673 | |
|
Goldman Sachs Group, Inc. | |
6.150% due 04/01/2018 | | | | | 11,000 | | | | | | 12,230 | |
|
International Lease Finance Corp. | |
5.750% due 05/15/2016 | | | | | 3,900 | | | | | | 4,002 | |
8.625% due 09/15/2015 | | | | | 8,500 | | | | | | 8,617 | |
8.750% due 03/15/2017 | | | | | 8,700 | | | | | | 9,541 | |
| | | | | | | | | | | | |
| | | | | PRINCIPAL
AMOUNT
(000s) | | | | | MARKET
VALUE
(000s) | |
|
Intesa Sanpaolo SpA | |
2.375% due 01/13/2017 | | $ | | | 10,000 | | | $ | | | 10,052 | |
3.125% due 01/15/2016 | | | | | 4,136 | | | | | | 4,168 | |
3.875% due 01/16/2018 | | | | | 7,500 | | | | | | 7,744 | |
|
JPMorgan Chase & Co. | |
1.068% due 05/30/2017 | | GBP | | | 6,200 | | | | | | 9,620 | |
6.300% due 04/23/2019 | | $ | | | 11,300 | | | | | | 12,943 | |
|
KBC Bank NV | |
8.000% due 01/25/2023 | | | | | 18,600 | | | | | | 20,390 | |
|
Korea Exchange Bank | |
3.125% due 06/26/2017 | | | | | 5,000 | | | | | | 5,134 | |
|
LBG Capital PLC | |
15.000% due 12/21/2019 | | GBP | | | 7,100 | | | | | | 15,869 | |
15.000% due 12/21/2019 | | EUR | | | 1,800 | | | | | | 3,040 | |
|
MassMutual Global Funding | |
2.350% due 04/09/2019 | | $ | | | 21,600 | | | | | | 21,816 | |
|
Navient Corp. | |
5.500% due 01/15/2019 | | | | | 1,900 | | | | | | 1,942 | |
8.450% due 06/15/2018 | | | | | 3,400 | | | | | | 3,787 | |
8.780% due 09/15/2016 | | MXN | | | 65,600 | | | | | | 4,241 | |
|
Novo Banco S.A. | |
5.875% due 11/09/2015 | | EUR | | | 3,700 | | | | | | 4,135 | |
|
Pacific Life Insurance Co. | |
9.250% due 06/15/2039 | | $ | | | 5,000 | | | | | | 7,468 | |
|
Rabobank Group | |
6.875% due 03/19/2020 | | EUR | | | 2,600 | | | | | | 3,421 | |
|
SLM Student Loan Trust | |
0.536% due 12/15/2033 | | | | | 41,359 | | | | | | 44,705 | |
0.548% due 07/25/2039 | | | | | 8,500 | | | | | | 8,890 | |
1.119% due 03/15/2038 | | GBP | | | 26,146 | | | | | | 37,733 | |
5.150% due 12/15/2039 | | | | | 9,710 | | | | | | 13,937 | |
|
Springleaf Finance Corp. | |
6.900% due 12/15/2017 | | $ | | | 1,400 | | | | | | 1,488 | |
|
Trafford Centre Finance Ltd. | |
0.773% due 07/28/2015 | | GBP | | | 109 | | | | | | 172 | |
| | | | |
UBS AG | | | | | | | | | | | | |
7.625% due 08/17/2022 | | $ | | | 16,950 | | | | | | 19,872 | |
| | | | | | | | | | | | |
| | | | | | | | | | | 606,597 | |
| | | | | | | | | | | | |
| |
INDUSTRIALS 7.3% | |
|
Anadarko Petroleum Corp. | |
8.700% due 03/15/2019 | | | | | 7,500 | | | | | | 9,070 | |
|
Apple, Inc. | |
2.850% due 05/06/2021 | | | | | 20,500 | | | | | | 20,796 | |
|
BAT International Finance PLC | |
9.500% due 11/15/2018 | | | | | 11,465 | | | | | | 14,200 | |
|
Canadian Natural Resources Ltd. | |
5.700% due 05/15/2017 | | | | | 16,000 | | | | | | 17,221 | |
|
CVS Health Corp. | |
2.250% due 12/05/2018 | | | | | 1,600 | | | | | | 1,620 | |
|
DISH DBS Corp. | |
7.125% due 02/01/2016 | | | | | 3,038 | | | | | | 3,122 | |
|
Enterprise Products Operating LLC | |
6.300% due 09/15/2017 | | | | | 11,715 | | | | | | 12,910 | |
|
Hampton Roads PPV LLC | |
6.621% due 06/15/2053 | | | | | 36,296 | | | | | | 34,403 | |
|
HCA, Inc. | |
7.190% due 11/15/2015 | | | | | 3,991 | | | | | | 4,076 | |
|
Hellenic Railways Organization S.A. | |
4.028% due 03/17/2017 | | EUR | | | 7,800 | | | | | | 4,652 | |
|
Hospira, Inc. | |
6.050% due 03/30/2017 | | $ | | | 4,200 | | | | | | 4,520 | |
|
Hyundai Capital America | |
2.550% due 02/06/2019 | | | | | 7,590 | | | | | | 7,651 | |
| | | | | | | | | | | | |
| | | | | PRINCIPAL
AMOUNT
(000s) | | | | | MARKET
VALUE
(000s) | |
|
McKesson Corp. | |
1.292% due 03/10/2017 | | $ | | | 7,000 | | | $ | | | 6,992 | |
|
Meccanica Holdings USA, Inc. | |
6.250% due 07/15/2019 | | | | | 6,900 | | | | | | 7,417 | |
|
Merck Sharp & Dohme Corp. | |
5.000% due 06/30/2019 | | | | | 10,000 | | | | | | 11,133 | |
|
MGM Resorts International | |
10.000% due 11/01/2016 | | | | | 1,100 | | | | | | 1,199 | |
|
Mondelez International, Inc. | |
0.798% due 02/01/2019 | | | | | 1,825 | | | | | | 1,806 | |
2.250% due 02/01/2019 | | | | | 16,200 | | | | | | 16,229 | |
|
Petrofac Ltd. | |
3.400% due 10/10/2018 | | | | | 1,550 | | | | | | 1,534 | |
|
Total Capital International S.A. | |
0.849% due 08/10/2018 | | | | | 1,100 | | | | | | 1,105 | |
| | | | | | | | | | | | |
| | | | | | | | | | | 181,656 | |
| | | | | | | | | | | | |
| |
UTILITIES 3.5% | |
|
AT&T, Inc. | |
0.956% due 03/11/2019 | | | | | 4,622 | | | | | | 4,626 | |
2.375% due 11/27/2018 | | | | | 9,302 | | | | | | 9,385 | |
|
Korea East-West Power Co. Ltd. | |
2.500% due 07/16/2017 | | | | | 2,200 | | | | | | 2,234 | |
|
Petrobras Global Finance BV | |
1.896% due 05/20/2016 | | | | | 1,600 | | | | | | 1,580 | |
2.000% due 05/20/2016 | | | | | 1,500 | | | | | | 1,486 | |
2.415% due 01/15/2019 | | | | | 400 | | | | | | 371 | |
2.643% due 03/17/2017 | | | | | 400 | | | | | | 393 | |
3.163% due 03/17/2020 | | | | | 2,600 | | | | | | 2,483 | |
3.500% due 02/06/2017 | | | | | 7,600 | | | | | | 7,537 | |
3.875% due 01/27/2016 | | | | | 1,818 | | | | | | 1,828 | |
4.875% due 03/17/2020 | | | | | 200 | | | | | | 191 | |
5.750% due 01/20/2020 | | | | | 7,382 | | | | | | 7,333 | |
6.850% due 06/05/2115 | | | | | 4,600 | | | | | | 3,815 | |
|
Plains All American Pipeline LP | |
6.500% due 05/01/2018 | | | | | 2,130 | | | | | | 2,398 | |
|
Telefonica Europe BV | |
6.500% due 09/18/2018 (f) | | EUR | | | 17,600 | | | | | | 21,531 | |
|
Verizon Communications, Inc. | |
3.650% due 09/14/2018 | | $ | | | 20,025 | | | | | | 21,050 | |
| | | | | | | | | | | | |
| | | | | | | | | | | 88,241 | |
| | | | | | | | | | | | |
Total Corporate Bonds & Notes
(Cost $886,181) | | | | | | 876,494 | |
| | | | | | | | | | | | |
| |
MUNICIPAL BONDS & NOTES 1.6% | |
| |
CALIFORNIA 0.9% | |
|
California State General Obligation Bonds, (BABs), Series 2009 | |
7.550% due 04/01/2039 | | | | | 4,500 | | | | | | 6,510 | |
|
California State General Obligation Bonds, (BABs), Series 2010 | |
7.600% due 11/01/2040 | | | | | 4,400 | | | | | | 6,434 | |
7.950% due 03/01/2036 | | | | | 5,500 | | | | | | 6,662 | |
|
Irvine Ranch Water District, California Special Assessment Bonds, (BABs), Series 2010 | |
6.622% due 05/01/2040 | | | | | 900 | | | | | | 1,159 | |
| | | | | | | | | | | | |
| | | | | | | | | | | 20,765 | |
| | | | | | | | | | | | |
| |
FLORIDA 0.4% | |
|
Palm Beach County, Florida Revenue Bonds, Series 2013 | |
5.250% due 11/01/2043 | | | | | 7,520 | | | | | | 8,027 | |
|
State Board of Administration Finance Corp., Florida Revenue Notes, Series 2013 | |
2.995% due 07/01/2020 | | | | | 2,265 | | | | | | 2,310 | |
| | | | | | | | | | | | |
| | | | | | | | | | | 10,337 | |
| | | | | | | | | | | | |
| | | | | | |
| 106 | | PIMCO ETF TRUST | | | | See Accompanying Notes |
June 30, 2015
| | | | | | | | | | | | |
| | | | | PRINCIPAL
AMOUNT
(000s) | | | | | MARKET
VALUE
(000s) | |
SOUTH DAKOTA 0.3% | |
|
Educational Enhancement Funding Corp., South Dakota Revenue Notes, Series 2013 | |
3.539% due 06/01/2022 | | $ | | | 8,000 | | | $ | | | 8,046 | |
| | | | | | | | | | | | |
Total Municipal Bonds & Notes
(Cost $38,818) | | | | | | 39,148 | |
| | | | | | | | | | | | |
| |
U.S. GOVERNMENT AGENCIES 20.7% | |
|
Fannie Mae | |
0.000% due 07/25/2031 - 02/25/2040 (b)(d) | | | | | 7,504 | | | | | | 7,031 | |
0.739% due 08/25/2022 (a) | | | | | 20,070 | | | | | | 692 | |
2.343% due 09/01/2034 | | | | | 72 | | | | | | 77 | |
2.500% due 03/25/2033 | | | | | 2 | | | | | | 2 | |
2.565% due 04/01/2036 | | | | | 44 | | | | | | 47 | |
3.000% due 03/25/2033 - 08/01/2045 | | | | | 99,011 | | | | | | 98,159 | |
3.500% due 06/25/2042 - 08/01/2045 | | | | | 161,617 | | | | | | 166,024 | |
4.000% due 07/01/2042 - 08/01/2045 | | | | | 142,339 | | | | | | 150,283 | |
4.463% due 09/25/2040 (a) | | | | | 16,300 | | | | | | 2,267 | |
4.500% due 11/25/2035 - 03/25/2041 | | | | | 223 | | | | | | 242 | |
5.000% due 02/01/2033 - 04/01/2038 | | | | | 923 | | | | | | 1,007 | |
5.500% due 09/01/2026 - 08/01/2038 | | | | | 916 | | | | | | 1,017 | |
5.813% due 09/25/2042 (a) | | | | | 115,620 | | | | | | 29,220 | |
6.000% due 05/25/2031 - 07/25/2037 | | | | | 143 | | | | | | 164 | |
6.233% due 04/25/2040 (a) | | | | | 308 | | | | | | 49 | |
6.738% due 05/25/2042 | | | | | 425 | | | | | | 432 | |
7.013% due 05/25/2036 (a) | | | | | 4,364 | | | | | | 870 | |
20.452% due 01/25/2036 | | | | | 1,508 | | | | | | 1,993 | |
23.312% due 07/25/2023 | | | | | 29 | | | | | | 43 | |
|
Freddie Mac | |
0.000% due 01/15/2033 - 07/15/2039 (b)(d) | | | | | 2,236 | | | | | | 1,985 | |
2.365% due 11/01/2023 - 10/01/2036 | | | | | 12 | | | | | | 13 | |
2.492% due 07/01/2036 | | | | | 73 | | | | | | 78 | |
2.584% due 12/01/2031 | | | | | 202 | | | | | | 217 | |
3.000% due 01/15/2043 - 02/15/2043 | | | | | 9 | | | | | | 8 | |
3.500% due 12/15/2028 (a) | | | | | 7,965 | | | | | | 810 | |
3.500% due 02/15/2043 - 04/15/2043 | | | | | 4 | | | | | | 4 | |
4.500% due 10/01/2037 | | | | | 395 | | | | | | 422 | |
4.845% due 05/15/2041 | | | | | 6,371 | | | | | | 6,555 | |
5.000% due 03/01/2033 - 07/15/2041 | | | | | 609 | | | | | | 666 | |
5.000% due 08/15/2039 (a) | | | | | 779 | | | | | | 74 | |
5.250% due 04/15/2033 | | | | | 78 | | | | | | 86 | |
5.500% due 08/15/2033 - 09/01/2037 | | | | | 496 | | | | | | 551 | |
6.000% due 02/01/2033 - 08/01/2037 | | | | | 608 | | | | | | 671 | |
6.738% due 06/15/2042 | | | | | 2,929 | | | | | | 2,784 | |
9.529% due 01/15/2041 | | | | | 7,628 | | | | | | 8,078 | |
18.784% due 10/15/2023 | | | | | 363 | | | | | | 518 | |
19.152% due 05/15/2033 | | | | | 152 | | | | | | 219 | |
|
Ginnie Mae | |
0.755% due 06/20/2065 | | | | | 14,000 | | | | | | 13,946 | |
0.765% due 06/20/2065 | | | | | 5,300 | | | | | | 5,285 | |
3.500% due 12/20/2040 - 08/01/2045 | | | | | 12,086 | | | | | | 12,502 | |
4.750% due 01/20/2035 | | | | | 33 | | | | | | 35 | |
| | | | | | | | | | | | |
| | | | | PRINCIPAL
AMOUNT
(000s) | | | | | MARKET
VALUE
(000s) | |
5.500% due 04/16/2034 - 07/20/2037 | | $ | | | 84 | | | $ | | | 96 | |
5.913% due 12/20/2035 (a) | | | | | 6,000 | | | | | | 1,318 | |
| | | | | | | | | | | | |
Total U.S. Government Agencies
(Cost $513,960) | | | | | | 516,540 | |
| | | | | | | | | | | | |
| |
U.S. TREASURY OBLIGATIONS 35.0% | |
|
U.S. Treasury Bonds | |
2.500% due 02/15/2045 (h) | | | | | 88,300 | | | | | | 77,359 | |
2.750% due 08/15/2042 | | | | | 5,800 | | | | | | 5,378 | |
2.750% due 11/15/2042 | | | | | 35,800 | | | | | | 33,157 | |
2.875% due 05/15/2043 | | | | | 3,700 | | | | | | 3,510 | |
3.000% due 05/15/2042 | | | | | 42,700 | | | | | | 41,649 | |
3.000% due 11/15/2044 | | | | | 37,600 | | | | | | 36,610 | |
3.125% due 08/15/2044 | | | | | 27,200 | | | | | | 27,119 | |
3.375% due 05/15/2044 | | | | | 32,600 | | | | | | 34,085 | |
6.125% due 11/15/2027 | | | | | 10,700 | | | | | | 14,816 | |
|
U.S. Treasury Inflation Protected Securities (e) | |
0.125% due 07/15/2024 (j) | | | | | 48,324 | | | | | | 47,082 | |
0.250% due 01/15/2025 (h) | | | | | 43,151 | | | | | | 42,271 | |
0.625% due 07/15/2021 | | | | | 76,312 | | | | | | 78,739 | |
0.750% due 02/15/2045 | | | | | 5,325 | | | | | | 4,828 | |
1.375% due 02/15/2044 | | | | | 4,771 | | | | | | 5,056 | |
1.750% due 01/15/2028 | | | | | 72,275 | | | | | | 81,676 | |
2.375% due 01/15/2025 | | | | | 43,677 | | | | | | 51,317 | |
2.375% due 01/15/2027 | | | | | 60,183 | | | | | | 71,843 | |
2.500% due 01/15/2029 | | | | | 20,386 | | | | | | 25,070 | |
|
U.S. Treasury Notes | |
2.125% due 05/15/2025 | | | | | 43,900 | | | | | | 43,036 | |
2.375% due 08/15/2024 (j)(l) | | | 55,000 | | | | | | 55,219 | |
2.500% due 05/15/2024 (j) | | | | | 90,900 | | | | | | 92,341 | |
| | | | | | | | | | | | |
Total U.S. Treasury Obligations
(Cost $896,797) | | | | | | 872,161 | |
| | | | | | | | | | | | |
| |
MORTGAGE-BACKED SECURITIES 6.5% | |
|
Alba PLC | |
2.821% due 12/16/2042 | | GBP | | | 7,121 | | | | | | 11,249 | |
|
American Home Mortgage Investment Trust | |
1.923% due 09/25/2045 | | $ | | | 57 | | | | | | 55 | |
|
BAMLL Commercial Mortgage Securities Trust | |
0.986% due 06/15/2028 | | | | | 3,000 | | | | | | 2,994 | |
|
Banc of America Alternative Loan Trust | |
6.000% due 03/25/2034 | | | | | 31 | | | | | | 32 | |
|
Banc of America Mortgage Trust | |
2.496% due 10/25/2034 | | | | | 1,504 | | | | | | 1,476 | |
|
Banc of America Re-REMIC Trust | |
5.670% due 06/24/2050 | | | | | 5,471 | | | | | | 5,659 | |
|
BCAP LLC Trust | |
4.000% due 04/26/2037 | | | | | 3,219 | | | | | | 3,272 | |
5.596% due 01/27/2037 | | | | | 4,313 | | | | | | 4,353 | |
|
Bear Stearns ALT-A Trust | |
0.827% due 04/25/2034 | | | | | 85 | | | | | | 83 | |
|
Berica ABS SRL | |
0.321% due 12/31/2055 | | EUR | | | 2,461 | | | | | | 2,726 | |
|
Business Mortgage Finance PLC | |
2.567% due 02/15/2041 | | GBP | | | 3,995 | | | | | | 6,157 | |
|
Countrywide Home Loan Mortgage Pass-Through Trust | |
0.727% due 03/25/2035 | | $ | | | 361 | | | | | | 339 | |
|
Credit Suisse First Boston Mortgage Securities Corp. | |
0.837% due 11/25/2031 | | | | | 55 | | | | | | 47 | |
2.745% due 11/25/2034 | | | | | 109 | | | | | | 110 | |
|
Credit Suisse Mortgage Capital Certificates | |
2.592% due 10/27/2036 | | | | | 61 | | | | | | 59 | |
5.509% due 04/15/2047 | | | | | 200 | | | | | | 205 | |
6.000% due 05/27/2036 | | | | | 75 | | | | | | 74 | |
| | | | | | | | | | | | |
| | | | | PRINCIPAL
AMOUNT
(000s) | | | | | MARKET
VALUE
(000s) | |
|
Granite Master Issuer PLC | |
0.327% due 12/20/2054 | | $ | | | 6 | | | $ | | | 6 | |
|
Great Hall Mortgages PLC | |
0.116% due 03/18/2039 | | EUR | | | 496 | | | | | | 525 | |
0.416% due 06/18/2039 | | $ | | | 5,347 | | | | | | 5,037 | |
0.702% due 03/18/2039 | | GBP | | | 5,895 | | | | | | 8,747 | |
0.712% due 06/18/2039 | | | | | 35,344 | | | | | | 52,517 | |
0.722% due 06/18/2038 | | | | | 7,535 | | | | | | 11,274 | |
|
GSR Mortgage Loan Trust | |
2.592% due 09/25/2034 | | $ | | | 834 | | | | | | 793 | |
|
HomeBanc Mortgage Trust | |
0.517% due 10/25/2035 | | | | | 5,311 | | | | | | 4,759 | |
|
JPMorgan Mortgage Trust | |
2.642% due 07/25/2035 | | | | | 109 | | | | | | 109 | |
|
JPMorgan Resecuritization Trust | |
5.627% due 07/27/2037 | | | | | 76 | | | | | | 74 | |
|
LB-UBS Commercial Mortgage Trust | |
4.568% due 01/15/2031 | | | | | 1,668 | | | | | | 1,687 | |
|
Leek Finance PLC | |
0.852% due 12/21/2037 | | GBP | | | 1,356 | | | | | | 2,222 | |
|
Lehman XS Trust | |
1.158% due 11/25/2035 | | $ | | | 173 | | | | | | 163 | |
| | | | |
Marche Mutui SRL | | | | | | | | | | | | |
2.248% due 01/27/2064 | | EUR | | | 5,401 | | | | | | 6,162 | |
|
MASTR Adjustable Rate Mortgages Trust | |
2.502% due 03/25/2035 | | $ | | | 6,197 | | | | | | 6,163 | |
|
Merrill Lynch Mortgage Investors Trust | |
2.013% due 05/25/2029 | | | | | 50 | | | | | | 50 | |
|
Residential Accredit Loans, Inc. Trust | |
5.500% due 11/25/2034 | | | | | 6,131 | | | | | | 6,224 | |
|
Residential Asset Securitization Trust | |
0.737% due 08/25/2033 | | | | | 78 | | | | | | 72 | |
|
RMAC Securities PLC | |
0.721% due 06/12/2044 | | GBP | | | 3,526 | | | | | | 5,124 | |
|
Royal Bank of Scotland Capital Funding Trust | |
5.223% due 08/16/2048 | | $ | | | 300 | | | | | | 309 | |
5.331% due 02/16/2044 | | | | | 314 | | | | | | 329 | |
5.336% due 05/16/2047 | | | | | 377 | | | | | | 388 | |
|
Sequoia Mortgage Trust | |
0.605% due 02/20/2035 | | | | | 3,076 | | | | | | 2,936 | |
|
Structured Adjustable Rate Mortgage Loan Trust | |
0.585% due 06/25/2035 | | | | | 73 | | | | | | 74 | |
|
Thornburg Mortgage Securities Trust | |
5.102% due 10/25/2046 | | | | | 8,025 | | | | | | 7,871 | |
|
Wachovia Bank Commercial Mortgage Trust | |
0.360% due 06/15/2049 | | | | | 378 | | | | | | 371 | |
| | | | | | | | | | | | |
Total Mortgage-Backed Securities
(Cost $158,627) | | | | | | 162,876 | |
| | | | | | | | | | | | |
| |
ASSET-BACKED SECURITIES 2.3% | |
|
Aquilae CLO PLC | |
0.401% due 01/17/2023 | | EUR | | | 118 | | | | | | 131 | |
|
EFS Volunteer LLC | |
1.065% due 07/26/2027 | | $ | | | 616 | | | | | | 619 | |
|
First Franklin Mortgage Loan Asset-Backed Certificates | |
1.012% due 05/25/2034 | | | | | 5,997 | | | | | | 5,552 | |
|
Hyde Park CDO BV | |
0.299% due 06/14/2022 | | EUR | | | 183 | | | | | | 203 | |
|
Long Beach Mortgage Loan Trust | |
1.087% due 06/25/2035 | | $ | | | 7,263 | | | | | | 6,749 | |
|
Magi Funding PLC | |
0.331% due 04/11/2021 | | EUR | | | 8 | | | | | | 10 | |
| | | | | | |
| See Accompanying Notes | | ANNUAL REPORT | | JUNE 30, 2015 | | 107 |
Schedule of Investments PIMCO Total Return Active Exchange-Traded Fund (Cont.)
| | | | | | | | | | | | |
| | | | | PRINCIPAL
AMOUNT
(000s) | | | | | MARKET
VALUE
(000s) | |
|
Mid-State Capital Corp. Trust | |
6.005% due 08/15/2037 | | $ | | | 52 | | | $ | | | 55 | |
|
Mid-State Trust | |
6.340% due 10/15/2036 | | | | | 7,538 | | | | | | 8,227 | |
|
North Carolina State Education Assistance Authority | |
0.727% due 10/26/2020 | | | | | 7 | | | | | | 7 | |
|
Securitized Asset-Backed Receivables LLC Trust | |
0.477% due 12/25/2035 | | | | | 7,156 | | | | | | 6,308 | |
|
SLM Student Loan Trust | |
0.098% due 01/25/2041 | | EUR | | | 10,000 | | | | | | 10,103 | |
0.548% due 01/25/2040 | | | | | 6,800 | | | | | | 6,654 | |
0.577% due 12/15/2027 | | | | | 10,089 | | | | | | 11,032 | |
|
Wood Street CLO BV | |
0.305% due 11/22/2021 | | | | | 482 | | | | | | 534 | |
| | | | | | | | | | | | |
Total Asset-Backed Securities
(Cost $53,150) | | | | | | 56,184 | |
| | | | | | | | | | | | |
| |
SOVEREIGN ISSUES 8.5% | |
|
Autonomous Community of Andalusia | |
5.200% due 07/15/2019 | | | | | 8,000 | | | | | | 10,252 | |
|
Autonomous Community of Catalonia | |
2.750% due 03/24/2016 | | CHF | | | 200 | | | | | | 217 | |
4.300% due 11/15/2016 | | EUR | | | 900 | | | | | | 1,045 | |
4.750% due 06/04/2018 | | | | | 900 | | | | | | 1,085 | |
4.950% due 02/11/2020 | | | | | 12,020 | | | | | | 14,753 | |
|
Autonomous Community of Valencia | |
4.375% due 07/16/2015 | | | | | 600 | | | | | | 673 | |
|
Banco Nacional de Desenvolvimento Economico e Social | |
3.375% due 09/26/2016 | | $ | | | 1,200 | | | | | | 1,212 | |
| | | | | | | | | | | | |
| | | | | PRINCIPAL
AMOUNT
(000s) | | | | | MARKET
VALUE
(000s) | |
|
Brazil Letras do Tesouro Nacional | |
0.000% due 10/01/2015 (d) | | BRL | | | 195,300 | | | $ | | | 60,699 | |
0.000% due 01/01/2016 (d) | | | | | 128,500 | | | | | | 38,612 | |
0.000% due 04/01/2016 (d) | | | | | 80,100 | | | | | | 23,293 | |
|
Mexico Government International Bond | |
4.000% due 11/08/2046 (e) | | MXN | | | 76,513 | | | | | | 5,295 | |
10.000% due 12/05/2024 | | | | | 21,600 | | | | | | 1,763 | |
|
Province of British Columbia | |
2.650% due 09/22/2021 | | $ | | | 10,000 | | | | | | 10,290 | |
|
Province of Quebec | |
2.625% due 02/13/2023 | | | | | 25,000 | | | | | | 25,155 | |
|
Republic of Germany | |
2.500% due 07/04/2044 | | EUR | | | 1,200 | | | | | | 1,633 | |
2.500% due 08/15/2046 | | | | | 3,600 | | | | | | 4,918 | |
3.250% due 07/04/2042 | | | | | 100 | | | | | | 153 | |
4.250% due 07/04/2039 | | | | | 5,300 | | | | | | 9,155 | |
4.750% due 07/04/2040 | | | | | 1,000 | | | | | | 1,862 | |
| | | | | | | | | | | | |
Total Sovereign Issues
(Cost $217,136) | | | | | | 212,065 | |
| | | | | | | | | | | | |
| |
SHORT-TERM INSTRUMENTS 6.7% | |
| |
REPURCHASE AGREEMENTS (g) 1.9% | | | | |
| | | | | | | | | | | 46,260 | |
| | | | | | | | | | | | |
| |
SHORT-TERM NOTES 3.1% | |
|
Federal Home Loan Bank | |
0.039% due 07/15/2015 | | $ | | | 13,300 | | | | | | 13,300 | |
0.040% due 07/06/2015 - 07/08/2015 | | | 16,500 | | | | | | 16,500 | |
| | | | | | | | | | | | |
| | | | | PRINCIPAL
AMOUNT
(000s) | | | | | MARKET
VALUE
(000s) | |
0.050% due 08/07/2015 | | $ | | | 1,200 | | | $ | | | 1,200 | |
0.060% due 08/28/2015 | | | | | 2,500 | | | | | | 2,500 | |
0.070% due 08/07/2015 - 08/19/2015 | | | 29,700 | | | | | | 29,698 | |
0.075% due 08/12/2015 | | | | | 7,900 | | | | | | 7,899 | |
0.090% due 08/26/2015 | | | | | 3,900 | | | | | | 3,899 | |
0.142% due 11/04/2015 | | | | | 2,400 | | | | | | 2,399 | |
| | | | | | | | | | | | |
| | | | | | | | | | | 77,395 | |
| | | | | | | | | | | | |
| |
JAPAN TREASURY BILLS 0.9% | |
(0.005%) due 08/31/2015 | | JPY | | | 2,700,000 | | | | | | 22,063 | |
| | | | | | | | | | | | |
| |
MEXICO TREASURY BILLS 0.2% | |
3.194% due 10/29/2015 | | MXN | | | 66,000 | | | | | | 4,156 | |
| | | | | | | | | | | | |
| |
U.S. TREASURY BILLS 0.6% | |
0.018% due 07/23/2015 - 11/12/2015 (c)(h)(j)(l) | | $ | | | 14,337 | | | | | | 14,337 | |
| | | | | | | | | | | | |
Total Short-Term Instruments
(Cost $163,915) | | | 164,211 | |
| | | | | | | | | | | | |
| | | | | | | | | | | | |
Total Investments in Securities
(Cost $2,951,968) | | | 2,923,054 | |
| | | | | | | | | | | | |
| | | | | | | | | | | | |
Total Investments 117.4%
(Cost $2,951,968) | | | $ | | | 2,923,054 | |
| |
Financial Derivative
Instruments (i)(k) 1.5% (Cost or Premiums, net $(2,471)) | | | | | | 37,528 | |
| |
Other Assets and Liabilities, net (18.9%) | | | (471,510 | ) |
| | | | | | | | | | | | |
Net Assets 100.0% | | | $ | | | 2,489,072 | |
| | | | | | | | | | | | |
NOTES TO SCHEDULE OF INVESTMENTS (AMOUNTS IN THOUSANDS*, EXCEPT NUMBER OF CONTRACTS):
| * | A zero balance may reflect actual amounts rounding to less than one thousand. |
| (a) | Interest only security. |
| (b) | Principal only security. |
| (c) | Coupon represents a weighted average yield to maturity. |
| (e) | Principal amount of security is adjusted for inflation. |
| (f) | Perpetual maturity; date shown, if applicable, represents next contractual call date. |
BORROWINGS AND OTHER FINANCING TRANSACTIONS
(g) REPURCHASE AGREEMENTS:
| | | | | | | | | | | | | | | | | | | | | | | | | | | | | | | | |
| Counterparty | | | | Lending
Rate | | | Settlement
Date | | | Maturity
Date | | | Principal
Amount | | | Collateralized By | | Collateral
Received,
at Value | | | Repurchase
Agreements,
at Value | | | Repurchase
Agreement
Proceeds
to be
Received (1) | |
JPS | | | | | 0.250 | % | | | 06/30/2015 | | | | 07/01/2015 | | | $ | 45,900 | | | U.S. Treasury Bonds 3.750% due 11/15/2043 | | $ | (40,886 | ) | | $ | 45,900 | | | $ | 45,900 | |
| | | | | | | | | | | | | | | | | | | | | U.S. Treasury Inflation Protected Securities 0.125% due 01/15/2022 | | | (6,026 | ) | | | | | | | | |
SSB | | | | | 0.000 | % | | | 06/30/2015 | | | | 07/01/2015 | | | | 360 | | | Fannie Mae 2.200% due 10/17/2022 | | | (367 | ) | | | 360 | | | | 360 | |
Total Repurchase Agreements | | | | | | | | | | | | | | | | | | | | | | $ | (47,279 | ) | | $ | 46,260 | | | $ | 46,260 | |
| (1) | Includes accrued interest. |
| | | | | | |
| 108 | | PIMCO ETF TRUST | | | | See Accompanying Notes |
June 30, 2015
REVERSE REPURCHASE AGREEMENTS:
| | | | | | | | | | | | | | | | | | | | | | |
| Counterparty | | | | Borrowing
Rate | | | Borrowing
Date | | | Maturity
Date | | | Amount
Borrowed (2) | | | Payable for
Reverse
Repurchase
Agreements | |
JPS | | | | | 0.100 | % | | | 06/30/2015 | | | | 07/01/2015 | | | $ | (5,887 | ) | | $ | (5,888 | ) |
| | | | | | 0.450 | % | | | 06/30/2015 | | | | 07/01/2015 | | | | (39,994 | ) | | | (39,994 | ) |
Total Reverse Repurchase Agreements | | | | | | | | | | | | | | | | | | | | $ | (45,882 | ) |
| (2) | The average amount of borrowings outstanding during the period ended June 30, 2015 was $269,279 at a weighted average interest rate of 0.205%. |
BORROWINGS AND OTHER FINANCING TRANSACTIONS SUMMARY
The following is a summary by counterparty of the market value of Borrowings and Other Financing Transactions and collateral (received)/pledged as of June 30, 2015:
| (h) | Securities with an aggregate market value of $47,877 have been pledged as collateral under the terms of the following master agreements as of June 30, 2015. |
| | | | | | | | | | | | | | | | | | | | | | | | | | | | | | |
| Counterparty | | | | Repurchase
Agreement
Proceeds
to be
Received | | | Payable for
Reverse
Repurchase
Agreements | | | Payable for
Sale-Buyback
Transactions | | | Securities
Out on Loan | | | Total
Borrowings and
Other Financing
Transactions | | | Collateral
(Received)/
Pledged | | | Net
Exposure (3) | |
Global/Master Repurchase Agreement | | | | | | | | | | | | | | | | | | | | | | | | | | | | | | |
JPS | | | | $ | 45,900 | | | $ | (45,882 | ) | | $ | 0 | | | $ | 0 | | | $ | 18 | | | $ | (1,617 | ) | | $ | (1,599 | ) |
SSB | | | | | 360 | | | | 0 | | | | 0 | | | | 0 | | | | 360 | | | | (367 | ) | | | (7 | ) |
Total Borrowings and Other Financing Transactions | | | | $ | 46,260 | | | $ | (45,882 | ) | | $ | 0 | | | $ | 0 | | | | | | | | | | | | | |
| (3) | Net Exposure represents the net receivable/(payable) that would be due from/to the counterparty in the event of default. Exposure from borrowings and other financing transactions can only be netted across transactions governed under the same master agreement with the same legal entity. See Note 7, Principal Risks, in the Notes to Financial Statements for more information regarding master netting arrangements. |
(i) FINANCIAL DERIVATIVE INSTRUMENTS: EXCHANGE-TRADED OR CENTRALLY CLEARED
WRITTEN OPTIONS:
OPTIONS ON EXCHANGE-TRADED FUTURES CONTRACTS
| | | | | | | | | | | | | | | | | | | | | | |
| Description | | | | Strike
Price | | | Expiration
Date | | | # of
Contracts | | | Premiums
(Received) | | | Market
Value | |
Put - CBOT U.S. Treasury 10-Year Note August Futures | | | | $ | 125.000 | | | | 07/24/2015 | | | | 177 | | | $ | (75 | ) | | $ | (74 | ) |
Put - CBOT U.S. Treasury 10-Year Note August Futures | | | | | 125.500 | | | | 07/24/2015 | | | | 103 | | | | (61 | ) | | | (61 | ) |
Call - CBOT U.S. Treasury 10-Year Note August Futures | | | | | 126.500 | | | | 07/24/2015 | | | | 148 | | | | (93 | ) | | | (102 | ) |
Call - CBOT U.S. Treasury 10-Year Note August Futures | | | | | 127.000 | | | | 07/24/2015 | | | | 297 | | | | (126 | ) | | | (148 | ) |
Call - CBOT U.S. Treasury 10-Year Note August Futures | | | | | 127.500 | | | | 07/24/2015 | | | | 148 | | | | (58 | ) | | | (60 | ) |
| | | | | | | | | | | | | | | | | $ | (413 | ) | | $ | (445 | ) |
Total Written Options | | | | | | | | | | | | | | | | $ | (413 | ) | | $ | (445 | ) |
FUTURES CONTRACTS:
| | | | | | | | | | | | | | | | | | | | | | | | | | |
| Description | | | | Type | | | Expiration
Month | | | # of
Contracts | | | Unrealized
Appreciation/
(Depreciation) | | | Variation Margin | |
| | | | | | | Asset | | | Liability | |
90-Day Eurodollar December Futures | | | | | Short | | | | 12/2016 | | | | 1,539 | | | $ | (609 | ) | | $ | 38 | | | $ | 0 | |
90-Day Eurodollar June Futures | | | | | Short | | | | 06/2016 | | | | 2,463 | | | | (277 | ) | | | 31 | | | | 0 | |
90-Day Eurodollar March Futures | | | | | Short | | | | 03/2017 | | | | 195 | | | | (18 | ) | | | 2 | | | | 0 | |
90-Day Eurodollar March Futures | | | | | Short | | | | 03/2018 | | | | 1,840 | | | | (275 | ) | | | 23 | | | | 0 | |
90-Day Eurodollar September Futures | | | | | Long | | | | 09/2015 | | | | 498 | | | | (3 | ) | | | 0 | | | | (3 | ) |
90-Day Eurodollar September Futures | | | | | Short | | | | 09/2016 | | | | 1,572 | | | | (605 | ) | | | 39 | | | | 0 | |
Australia Government 10-Year Bond September Futures | | | | | Long | | | | 09/2015 | | | | 38 | | | | 19 | | | | 56 | | | | (16 | ) |
Call Options Strike @ EUR 153.500 on Euro-Bund 10-Year Bond August Futures | | | | | Short | | | | 07/2015 | | | | 97 | | | | 32 | | | | 38 | | | | (5 | ) |
Call Options Strike @ EUR 154.000 on Euro-Bund 10-Year Bond August Futures | | | | | Short | | | | 07/2015 | | | | 166 | | | | 30 | | | | 36 | | | | (6 | ) |
| | | | | | |
| See Accompanying Notes | | ANNUAL REPORT | | JUNE 30, 2015 | | 109 |
Schedule of Investments PIMCO Total Return Active Exchange-Traded Fund (Cont.)
| | | | | | | | | | | | | | | | | | | | | | | | | | |
| Description | | | | Type | | | Expiration
Month | | | # of
Contracts | | | Unrealized
Appreciation/
(Depreciation) | | | Variation Margin | |
| | | | | | | Asset | | | Liability | |
Call Options Strike @ EUR 154.500 on Euro-Bund 10-Year Bond August Futures | | | | | Short | | | | 07/2015 | | | | 266 | | | $ | (2 | ) | | $ | 10 | | | $ | (11 | ) |
Call Options Strike @ EUR 155.000 on Euro-Bund 10-Year Bond August Futures | | | | | Short | | | | 07/2015 | | | | 204 | | | | 7 | | | | 11 | | | | (4 | ) |
Euro-Bobl September Futures | | | | | Long | | | | 09/2015 | | | | 63 | | | | 16 | | | | 63 | | | | 0 | |
Euro-Bund 10-Year Bond September Futures | | | | | Long | | | | 09/2015 | | | | 877 | | | | (1,317 | ) | | | 2,108 | | | | 0 | |
Euro-Buxl 30-Year Bond September Futures | | | | | Long | | | | 09/2015 | | | | 60 | | | | (659 | ) | | | 237 | | | | 0 | |
U.S. Treasury 5-Year Note September Futures | | | | | Short | | | | 09/2015 | | | | 690 | | | | 83 | | | | 27 | | | | 0 | |
U.S. Treasury 10-Year Note September Futures | | | | | Long | | | | 09/2015 | | | | 465 | | | | 250 | | | | 30 | | | | (15 | ) |
U.S. Treasury 10-Year Note September Futures | | | | | Short | | | | 09/2015 | | | | 957 | | | | 175 | | | | 0 | | | | 0 | |
U.S. Treasury 30-Year Bond September Futures | | | | | Short | | | | 09/2015 | | | | 131 | | | | (144 | ) | | | 8 | | | | 0 | |
United Kingdom 90-Day LIBOR Sterling Interest Rate June Futures | | | | | Short | | | | 06/2017 | | | | 76 | | | | 12 | | | | 0 | | | | (18 | ) |
United Kingdom 90-Day LIBOR Sterling Interest Rate March Futures | | | | | Short | | | | 03/2017 | | | | 477 | | | | 110 | | | | 0 | | | | (103 | ) |
Total Futures Contracts | | | | | | | | | | | | | | | | $ | (3,175 | ) | | $ | 2,757 | | | $ | (181 | ) |
SWAP AGREEMENTS:
INTEREST RATE SWAPS
| | | | | | | | | | | | | | | | | | | | | | | | | | | | | | | | | | | | |
Pay/Receive
Floating Rate | | Floating Rate Index | | | | Fixed Rate | | | Maturity
Date | | | Notional
Amount | | | Market
Value | | | Unrealized
Appreciation/
(Depreciation) | | | Variation Margin | |
| | | | | | | | | Asset | | | Liability | |
Pay | | 1-Day USD-Federal Funds Rate Compounded-OIS | | | | | 0.500 | % | | | 06/17/2016 | | | $ | | | | | 51,900 | | | $ | (97 | ) | | $ | (41 | ) | | $ | 2 | | | $ | 0 | |
Pay | | 3-Month USD-LIBOR | | | | | 2.250 | % | | | 12/16/2022 | | | | | | | | 79,700 | | | | 335 | | | | (171 | ) | | | 23 | | | | 0 | |
Pay | | 3-Month USD-LIBOR | | | | | 2.500 | % | | | 12/16/2025 | | | | | | | | 15,400 | | | | 121 | | | | (35 | ) | | | 11 | | | | 0 | |
Pay | | 3-Month USD-LIBOR | | | | | 2.750 | % | | | 12/16/2045 | | | | | | | | 210,700 | | | | 10,811 | | | | (2,614 | ) | | | 483 | | | | 0 | |
Pay | | 6-Month GBP-LIBOR | | | | | 1.500 | % | | | 09/16/2017 | | | | GBP | | | | 133,500 | | | | (1,151 | ) | | | 362 | | | | 0 | | | | (328 | ) |
Pay | | 6-Month GBP-LIBOR | | | | | 1.880 | % | | | 10/05/2017 | | | | | | | | 21,300 | | | | (418 | ) | | | (417 | ) | | | 0 | | | | (54 | ) |
Pay | | 6-Month GBP-LIBOR | | | | | 1.500 | % | | | 12/16/2017 | | | | | | | | 71,200 | | | | (313 | ) | | | (154 | ) | | | 0 | | | | (202 | ) |
Pay | | 6-Month GBP-LIBOR | | | | | 1.500 | % | | | 03/16/2018 | | | | | | | | 900 | | | | 0 | | | | 1 | | | | 0 | | | | (3 | ) |
Pay | | 28-Day MXN-TIIE | | | | | 3.960 | % | | | 05/16/2016 | | | | MXN | | | | 818,100 | | | | 176 | | | | 176 | | | | 19 | | | | 0 | |
Pay | | 28-Day MXN-TIIE | | | | | 4.925 | % | | | 01/13/2020 | | | | | | | | 142,500 | | | | (104 | ) | | | (104 | ) | | | 44 | | | | 0 | |
Pay | | 28-Day MXN-TIIE | | | | | 5.270 | % | | | 02/05/2020 | | | | | | | | 240,300 | | | | 42 | | | | 159 | | | | 76 | | | | 0 | |
Pay | | 28-Day MXN-TIIE | | | | | 5.615 | % | | | 06/02/2020 | | | | | | | | 96,500 | | | | 83 | | | | 37 | | | | 34 | | | | 0 | |
Pay | | 28-Day MXN-TIIE | | | | | 5.840 | % | | | 09/14/2021 | | | | | | | | 274,900 | | | | 111 | | | | 140 | | | | 123 | | | | 0 | |
Pay | | 28-Day MXN-TIIE | | | | | 5.430 | % | | | 11/17/2021 | | | | | | | | 1,021,300 | | | | (1,175 | ) | | | 211 | | | | 469 | | | | 0 | |
Pay | | 28-Day MXN-TIIE | | | | | 5.375 | % | | | 01/07/2022 | | | | | | | | 415,400 | | | | (617 | ) | | | (955 | ) | | | 194 | | | | 0 | |
Pay | | 28-Day MXN-TIIE | | | | | 6.530 | % | | | 06/05/2025 | | | | | | | | 85,300 | | | | 79 | | | | 36 | | | | 30 | | | | 0 | |
| | | | | | | | | | | | | | | | | | | | | | | $ | 7,883 | | | $ | (3,369 | ) | | $ | 1,508 | | | $ | (587 | ) |
Total Swap Agreements | | | | | | | | | | | | | | | | | | | | | | $ | 7,883 | | | $ | (3,369 | ) | | $ | 1,508 | | | $ | (587 | ) |
FINANCIAL DERIVATIVE INSTRUMENTS: EXCHANGE-TRADED OR CENTRALLY CLEARED SUMMARY
The following is a summary of the market value and variation margin of Exchange-Traded or Centrally Cleared Financial Derivative Instruments as of June 30, 2015:
| (j) | Securities with an aggregate market value of $39,833 and cash of $2,916 have been pledged as collateral for exchange-traded and centrally cleared financial derivative instruments as of June 30, 2015. See Note 7, Principal Risks, in the Notes to Financial Statements for more information regarding master netting arrangements. |
| | | | | | | | | | | | | | | | | | | | | | | | | | | | | | | | | | | | |
| | | | | Financial Derivative Assets | | | | | Financial Derivative Liabilities | |
| | | | | Market Value | | | Variation Margin
Asset (1) | | | | | | | | Market Value | | | Variation Margin
Liability | | | | |
| | | | | Purchased
Options | | | Futures | | | Swap
Agreements | | | Total | | | | | Written
Options | | | Futures | | | Swap
Agreements | | | Total | |
Total Exchange-Traded or Centrally Cleared | | | | $ | 0 | | | $ | 2,766 | | | $ | 1,508 | | | $ | 4,274 | | | | | $ | (445 | ) | | $ | (181 | ) | | $ | (587 | ) | | $ | (1,213 | ) |
| (1) | Unsettled variation margin asset of $9 for closed futures is outstanding at period end. |
| | | | | | |
| 110 | | PIMCO ETF TRUST | | | | See Accompanying Notes |
June 30, 2015
(k) FINANCIAL DERIVATIVE INSTRUMENTS: OVER THE COUNTER
FORWARD FOREIGN CURRENCY CONTRACTS:
| | | | | | | | | | | | | | | | | | | | | | | | | | | | | | |
| Counterparty | | | | Settlement
Month | | | Currency to
be Delivered | | | Currency to
be Received | | | Unrealized
Appreciation/
(Depreciation) | |
| | | | | | Asset | | | Liability | |
BOA | | | | | 07/2015 | | | | GBP | | | | 118,392 | | | | $ | | | | 181,927 | | | $ | 0 | | | $ | (4,096 | ) |
| | | | | | 07/2015 | | | | RUB | | | | 77,628 | | | | | | | | 1,372 | | | | 0 | | | | (32 | ) |
| | | | | | 07/2015 | | | | $ | | | | 4,879 | | | | MXN | | | | 73,584 | | | | 0 | | | | (199 | ) |
| | | | | | 08/2015 | | | | JPY | | | | 2,700,000 | | | | $ | | | | 21,738 | | | | 0 | | | | (338 | ) |
| | | | | | 06/2016 | | | | EUR | | | | 58,878 | | | | | | | | 80,612 | | | | 14,493 | | | | 0 | |
| | | | | | 06/2016 | | | | $ | | | | 3,452 | | | | EUR | | | | 2,556 | | | | 0 | | | | (582 | ) |
BPS | | | | | 07/2015 | | | | BRL | | | | 3,323 | | | | $ | | | | 1,044 | | | | 0 | | | | (25 | ) |
| | | | | | 07/2015 | | | | $ | | | | 1,071 | | | | BRL | | | | 3,323 | | | | 0 | | | | (2 | ) |
| | | | | | 07/2015 | | | | | | | | 3,387 | | | | JPY | | | | 418,300 | | | | 31 | | | | 0 | |
| | | | | | 07/2015 | | | | | | | | 2,842 | | | | MXN | | | | 44,075 | | | | 0 | | | | (39 | ) |
| | | | | | 10/2015 | | | | BRL | | | | 95,800 | | | | $ | | | | 30,069 | | | | 251 | | | | 0 | |
BRC | | | | | 07/2015 | | | | RUB | | | | 21,650 | | | | | | | | 388 | | | | 0 | | | | (4 | ) |
| | | | | | 07/2015 | | | | $ | | | | 3,653 | | | | INR | | | | 234,596 | | | | 26 | | | | 0 | |
| | | | | | 06/2016 | | | | EUR | | | | 11,049 | | | | $ | | | | 15,193 | | | | 2,781 | | | | 0 | |
CBK | | | | | 07/2015 | | | | AUD | | | | 3,880 | | | | | | | | 2,958 | | | | 0 | | | | (36 | ) |
| | | | | | 07/2015 | | | | BRL | | | | 5,100 | | | | | | | | 1,644 | | | | 3 | | | | 0 | |
| | | | | | 07/2015 | | | | MXN | | | | 34,018 | | | | | | | | 2,232 | | | | 68 | | | | 0 | |
| | | | | | 07/2015 | | | | $ | | | | 1,629 | | | | BRL | | | | 5,100 | | | | 12 | | | | 0 | |
| | | | | | 07/2015 | | | | | | | | 65,587 | | | | EUR | | | | 58,269 | | | | 0 | | | | (626 | ) |
| | | | | | 07/2015 | | | | | | | | 7,875 | | | | JPY | | | | 975,500 | | | | 96 | | | | 0 | |
| | | | | | 07/2015 | | | | | | | | 42,813 | | | | MXN | | | | 659,950 | | | | 0 | | | | (840 | ) |
| | | | | | 08/2015 | | | | GBP | | | | 3,606 | | | | $ | | | | 5,680 | | | | 15 | | | | 0 | |
| | | | | | 08/2015 | | | | $ | | | | 4,502 | | | | INR | | | | 291,883 | | | | 52 | | | | 0 | |
| | | | | | 09/2015 | | | | MXN | | | | 868,981 | | | | $ | | | | 54,969 | | | | 27 | | | | 0 | |
| | | | | | 04/2016 | | | | BRL | | | | 5,100 | | | | | | | | 1,506 | | | | 10 | | | | 0 | |
DUB | | | | | 07/2015 | | | | MXN | | | | 69,247 | | | | | | | | 4,560 | | | | 156 | | | | 0 | |
| | | | | | 07/2015 | | | | $ | | | | 3,562 | | | | MXN | | | | 54,013 | | | | 0 | | | | (127 | ) |
| | | | | | 08/2015 | | | | EUR | | | | 13,000 | | | | $ | | | | 17,424 | | | | 2,924 | | | | 0 | |
| | | | | | 01/2016 | | | | BRL | | | | 24,100 | | | | | | | | 8,016 | | | | 742 | | | | 0 | |
| | | | | | 02/2016 | | | | EUR | | | | 57,270 | | | | | | | | 77,068 | | | | 12,986 | | | | 0 | |
| | | | | | 06/2016 | | | | | | | | 6,201 | | | | | | | | 8,490 | | | | 1,527 | | | | 0 | |
| | | | | | 06/2016 | | | | $ | | | | 3,897 | | | | EUR | | | | 2,883 | | | | 0 | | | | (659 | ) |
FBF | | | | | 07/2015 | | | | MXN | | | | 39,721 | | | | $ | | | | 2,585 | | | | 59 | | | | 0 | |
| | | | | | 07/2015 | | | | RUB | | | | 421,349 | | | | | | | | 7,409 | | | | 0 | | | | (215 | ) |
| | | | | | 08/2015 | | | | | | | | 36,566 | | | | | | | | 668 | | | | 16 | | | | 0 | |
| | | | | | 10/2015 | | | | BRL | | | | 221,800 | | | | | | | | 64,818 | | | | 0 | | | | (4,218 | ) |
| | | | | | 04/2016 | | | | | | | | 75,000 | | | | | | | | 20,862 | | | | 0 | | | | (1,138 | ) |
GLM | | | | | 07/2015 | | | | CAD | | | | 10,191 | | | | | | | | 8,204 | | | | 44 | | | | 0 | |
| | | | | | 07/2015 | | | | MXN | | | | 99,358 | | | | | | | | 6,513 | | | | 193 | | | | 0 | |
| | | | | | 07/2015 | | | | NZD | | | | 155 | | | | | | | | 110 | | | | 5 | | | | 0 | |
| | | | | | 07/2015 | | | | $ | | | | 3,373 | | | | AUD | | | | 4,422 | | | | 38 | | | | 0 | |
| | | | | | 07/2015 | | | | | | | | 6,629 | | | | CAD | | | | 8,274 | | | | 0 | | | | (4 | ) |
| | | | | | 07/2015 | | | | | | | | 2,163 | | | | GBP | | | | 1,377 | | | | 15 | | | | (14 | ) |
| | | | | | 07/2015 | | | | | | | | 123,025 | | | | JPY | | | | 15,208,812 | | | | 1,245 | | | | 0 | |
| | | | | | 08/2015 | | | | CHF | | | | 556 | | | | $ | | | | 596 | | | | 0 | | | | 0 | |
| | | | | | 08/2015 | | | | EUR | | | | 8,175 | | | | | | | | 9,153 | | | | 36 | | | | 0 | |
| | | | | | 08/2015 | | | | JPY | | | | 10,246,812 | | | | | | | | 82,944 | | | | 0 | | | | (815 | ) |
| | | | | | 08/2015 | | | | $ | | | | 3,617 | | | | EUR | | | | 3,225 | | | | 0 | | | | (20 | ) |
| | | | | | 09/2015 | | | | MXN | | | | 30,430 | | | | $ | | | | 1,959 | | | | 35 | | | | 0 | |
| | | | | | |
| See Accompanying Notes | | ANNUAL REPORT | | JUNE 30, 2015 | | 111 |
Schedule of Investments PIMCO Total Return Active Exchange-Traded Fund (Cont.)
| | | | | | | | | | | | | | | | | | | | | | | | | | | | | | |
| Counterparty | | | | Settlement
Month | | | Currency to
be Delivered | | | Currency to
be Received | | | Unrealized
Appreciation/
(Depreciation) | |
| | | | | | Asset | | | Liability | |
HUS | | | | | 07/2015 | | | | JPY | | | | 14,686,812 | | | | $ | | | | 118,633 | | | $ | 0 | | | $ | (1,372 | ) |
| | | | | | 07/2015 | | | | MXN | | | | 12,489 | | | | | | | | 821 | | | | 27 | | | | 0 | |
| | | | | | 07/2015 | | | | RUB | | | | 350,556 | | | | | | | | 6,162 | | | | 0 | | | | (181 | ) |
| | | | | | 07/2015 | | | | $ | | | | 12,547 | | | | MXN | | | | 190,443 | | | | 0 | | | | (435 | ) |
| | | | | | 08/2015 | | | | ILS | | | | 183,688 | | | | $ | | | | 47,427 | | | | 0 | | | | (1,252 | ) |
| | | | | | 09/2015 | | | | MXN | | | | 48,860 | | | | | | | | 3,141 | | | | 52 | | | | 0 | |
| | | | | | 01/2016 | | | | BRL | | | | 44,000 | | | | | | | | 13,008 | | | | 0 | | | | (273 | ) |
JPM | | | | | 07/2015 | | | | EUR | | | | 13,045 | | | | | | | | 14,701 | | | | 171 | | | | (13 | ) |
| | | | | | 07/2015 | | | | RUB | | | | 228,874 | | | | | | | | 4,112 | | | | 0 | | | | (29 | ) |
| | | | | | 07/2015 | | | | $ | | | | 9,037 | | | | EUR | | | | 8,062 | | | | 24 | | | | (73 | ) |
| | | | | | 07/2015 | | | | | | | | 8,944 | | | | JPY | | | | 1,104,900 | | | | 84 | | | | 0 | |
| | | | | | 08/2015 | | | | | | | | 17,180 | | | | EUR | | | | 13,000 | | | | 0 | | | | (2,680 | ) |
| | | | | | 09/2015 | | | | KRW | | | | 8,680,622 | | | | $ | | | | 7,798 | | | | 59 | | | | 0 | |
| | | | | | 10/2015 | | | | BRL | | | | 46,600 | | | | | | | | 15,241 | | | | 737 | | | | 0 | |
| | | | | | 10/2015 | | | | $ | | | | 51,425 | | | | BRL | | | | 168,900 | | | | 1,146 | | | | 0 | |
MSB | | | | | 07/2015 | | | | MXN | | | | 8,411 | | | | $ | | | | 545 | | | | 10 | | | | 0 | |
| | | | | | 07/2015 | | | | $ | | | | 61,806 | | | | EUR | | | | 55,230 | | | | 0 | | | | (233 | ) |
| | | | | | 07/2015 | | | | | | | | 4,369 | | | | MXN | | | | 65,899 | | | | 0 | | | | (178 | ) |
| | | | | | 07/2015 | | | | | | | | 20,173 | | | | RUB | | | | 1,100,057 | | | | 0 | | | | (269 | ) |
| | | | | | 08/2015 | | | | EUR | | | | 55,230 | | | | $ | | | | 61,832 | | | | 233 | | | | 0 | |
| | | | | | 08/2015 | | | | RUB | | | | 1,100,057 | | | | | | | | 19,891 | | | | 266 | | | | 0 | |
| | | | | | 08/2015 | | | | SAR | | | | 4,150 | | | | | | | | 1,105 | | | | 0 | | | | (1 | ) |
| | | | | | 08/2015 | | | | $ | | | | 1,104 | | | | SAR | | | | 4,150 | | | | 3 | | | | 0 | |
| | | | | | 01/2016 | | | | BRL | | | | 60,400 | | | | $ | | | | 21,004 | | | | 2,772 | | | | 0 | |
| | | | | | 06/2016 | | | | EUR | | | | 15,595 | | | | | | | | 21,449 | | | | 3,937 | | | | 0 | |
NAB | | | | | 06/2016 | | | | | | | | 33,844 | | | | | | | | 46,470 | | | | 8,459 | | | | 0 | |
| | | | | | 07/2016 | | | | | | | | 17,634 | | | | | | | | 23,922 | | | | 4,088 | | | | 0 | |
NGF | | | | | 10/2015 | | | | MXN | | | | 65,286 | | | | | | | | 4,197 | | | | 78 | | | | 0 | |
SCX | | | | | 07/2015 | | | | $ | | | | 6,139 | | | | INR | | | | 395,167 | | | | 58 | | | | 0 | |
| | | | | | 08/2015 | | | | | | | | 10,695 | | | | | | | | 690,284 | | | | 77 | | | | 0 | |
SOG | | | | | 08/2015 | | | | RUB | | | | 267,197 | | | | $ | | | | 4,813 | | | | 46 | | | | 0 | |
UAG | | | | | 07/2015 | | | | EUR | | | | 108,516 | | | | | | | | 118,435 | | | | 23 | | | | (2,567 | ) |
| | | | | | 07/2015 | | | | JPY | | | | 3,419,300 | | | | | | | | 27,766 | | | | 0 | | | | (173 | ) |
| | | | | | 07/2015 | | | | MXN | | | | 171,865 | | | | | | | | 11,222 | | | | 291 | | | | 0 | |
| | | | | | 07/2015 | | | | $ | | | | 183,738 | | | | GBP | | | | 117,015 | | | | 139 | | | | (16 | ) |
| | | | | | 07/2015 | | | | | | | | 3,234 | | | | JPY | | | | 398,600 | | | | 23 | | | | 0 | |
| | | | | | 07/2015 | | | | | | | | 9,402 | | | | MXN | | | | 143,042 | | | | 0 | | | | (304 | ) |
| | | | | | 08/2015 | | | | EUR | | | | 25,256 | | | | $ | | | | 28,317 | | | | 148 | | | | 0 | |
| | | | | | 08/2015 | | | | GBP | | | | 115,763 | | | | | | | | 181,715 | | | | 0 | | | | (137 | ) |
| | | | | | 09/2015 | | | | MXN | | | | 30,887 | | | | | | | | 1,979 | | | | 26 | | | | 0 | |
Total Forward Foreign Currency Contracts | | | | | | | | | | | | | | | | | | | | | | | | $ | 60,863 | | | $ | (24,215 | ) |
PURCHASED OPTIONS:
FOREIGN CURRENCY OPTIONS
| | | | | | | | | | | | | | | | | | | | | | | | | | |
| Counterparty | | Description | | | | Strike
Price | | | Expiration
Date | | | Notional
Amount | | | Cost | | | Market
Value | |
GLM | | Call - OTC USD versus SAR | | | | SAR | | | 3.756 | | | | 08/05/2015 | | | $ | 9,400 | | | $ | 20 | | | $ | 2 | |
MSB | | Call - OTC USD versus SAR | | | | | | | 3.759 | | | | 07/30/2015 | | | | 3,100 | | | | 9 | | | | 0 | |
| | | | | | | | | | | | | | | | | | $ | 29 | | | $ | 2 | |
| | | | | | |
| 112 | | PIMCO ETF TRUST | | | | See Accompanying Notes |
June 30, 2015
INTEREST RATE SWAPTIONS
| | | | | | | | | | | | | | | | | | | | | | | | | | | | |
| Counterparty | | Description | | Floating Rate Index | | | | Pay/Receive
Floating Rate | | Exercise
Rate | | | Expiration
Date | | | Notional
Amount | | | Cost | | | Market
Value | |
MYC | | Put - OTC 10-Year Interest Rate Swap | | 3-Month USD-LIBOR | | | | Receive | | | 2.580 | % | | | 05/12/2016 | | | $ | 13,300 | | | $ | 426 | | | $ | 491 | |
| | | Put - OTC 10-Year Interest Rate Swap | | 3-Month USD-LIBOR | | | | Receive | | | 2.580 | % | | | 05/23/2016 | | | | 31,200 | | | | 882 | | | | 1,175 | |
| | | | | | | | | | | | | | | | | | | | | | $ | 1,308 | | | $ | 1,666 | |
Total Purchased Options | | | | | | | | | | | | | | | | | | | | $ | 1,337 | | | $ | 1,668 | |
WRITTEN OPTIONS:
CREDIT DEFAULT SWAPTIONS ON CREDIT INDICES
| | | | | | | | | | | | | | | | | | | | | | | | | | | | | | |
| Counterparty | | Description | | | | Buy/Sell
Protection | | Exercise
Rate | | | Expiration
Date | | | Notional
Amount | | | Premiums
(Received) | | | Market
Value | |
BPS | | Put - OTC iTraxx Europe 23 5-Year Index | | | | Sell | | | 0.950 | % | | | 08/19/2015 | | | | EUR | | | | 14,400 | | | $ | (29 | ) | | $ | (29 | ) |
GST | | Put - OTC iTraxx Europe 23 5-Year Index | | | | Sell | | | 0.950 | % | | | 08/19/2015 | | | | | | | | 15,500 | | | | (34 | ) | | | (31 | ) |
| | | | | | | | | | | | | | | | | | | | | | $ | (63 | ) | | $ | (60 | ) |
FOREIGN CURRENCY OPTIONS
| | | | | | | | | | | | | | | | | | | | | | | | | | | | | | | | |
| Counterparty | | Description | | | | Strike
Price | | | Expiration
Date | | | Notional
Amount | | | Premiums
(Received) | | | Market
Value | |
AZD | | Call - OTC USD versus JPY | | | | | JPY | | | | 123.150 | | | | 07/29/2015 | | | | $ | | | | 3,357 | | | $ | (22 | ) | | $ | (22 | ) |
BOA | | Call - OTC USD versus INR | | | | | INR | | | | 65.100 | | | | 07/15/2015 | | | | | | | | 4,000 | | | | (24 | ) | | | (2 | ) |
BPS | | Put - OTC EUR versus USD | | | | | $ | | | | 1.090 | | | | 08/06/2015 | | | | EUR | | | | 4,500 | | | | (43 | ) | | | (43 | ) |
BRC | | Put - OTC EUR versus USD | | | | | | | | | 1.110 | | | | 07/29/2015 | | | | | | | | 1,328 | | | | (16 | ) | | | (16 | ) |
CBK | | Put - OTC EUR versus USD | | | | | | | | | 1.110 | | | | 07/29/2015 | | | | | | | | 20,872 | | | | (260 | ) | | | (260 | ) |
| | | Call - OTC USD versus ILS | | | | | ILS | | | | 4.000 | | | | 07/29/2015 | | | | $ | | | | 3,900 | | | | (23 | ) | | | (1 | ) |
| | | Call - OTC USD versus JPY | | | | | JPY | | | | 123.550 | | | | 07/28/2015 | | | | | | | | 11,710 | | | | (55 | ) | | | (55 | ) |
| | | Put - OTC USD versus JPY | | | | | | | | | 99.000 | | | | 09/30/2015 | | | | | | | | 1,000 | | | | (8 | ) | | | 0 | |
DUB | | Call - OTC USD versus ILS | | | | | ILS | | | | 4.000 | | | | 07/27/2015 | | | | | | | | 6,200 | | | | (49 | ) | | | (1 | ) |
FBF | | Call - OTC EUR versus USD | | | | | $ | | | | 1.145 | | | | 07/30/2015 | | | | EUR | | | | 13,455 | | | | (78 | ) | | | (81 | ) |
GLM | | Call - OTC EUR versus USD | | | | | | | | | 1.140 | | | | 07/23/2015 | | | | | | | | 13,745 | | | | (94 | ) | | | (78 | ) |
| | | Call - OTC USD versus ILS | | | | | ILS | | | | 3.980 | | | | 08/04/2015 | | | | $ | | | | 2,500 | | | | (21 | ) | | | (2 | ) |
| | | Call - OTC USD versus INR | | | | | INR | | | | 65.500 | | | | 07/16/2015 | | | | | | | | 300 | | | | (2 | ) | | | 0 | |
| | | Call - OTC USD versus INR | | | | | | | | | 65.500 | | | | 07/24/2015 | | | | | | | | 2,400 | | | | (15 | ) | | | (2 | ) |
| | | Call - OTC USD versus INR | | | | | | | | | 65.250 | | | | 07/30/2015 | | | | | | | | 3,600 | | | | (19 | ) | | | (6 | ) |
| | | Call - OTC USD versus JPY | | | | | JPY | | | | 123.150 | | | | 07/29/2015 | | | | | | | | 12,343 | | | | (81 | ) | | | (81 | ) |
HUS | | Call - OTC USD versus INR | | | | | INR | | | | 65.000 | | | | 07/02/2015 | | | | | | | | 4,000 | | | | (22 | ) | | | 0 | |
| | | Call - OTC USD versus JPY | | | | | JPY | | | | 123.400 | | | | 07/28/2015 | | | | | | | | 2,890 | | | | (16 | ) | | | (16 | ) |
JPM | | Put - OTC EUR versus USD | | | | | $ | | | | 1.101 | | | | 07/28/2015 | | | | EUR | | | | 9,638 | | | | (100 | ) | | | (100 | ) |
| | | Put - OTC USD versus INR | | | | | INR | | | | 61.500 | | | | 07/15/2015 | | | | $ | | | | 3,000 | | | | (16 | ) | | | 0 | |
| | | Call - OTC USD versus INR | | | | | | | | | 65.000 | | | | 07/15/2015 | | | | | | | | 3,000 | | | | (26 | ) | | | (2 | ) |
MSB | | Call - OTC EUR versus USD | | | | | $ | | | | 1.140 | | | | 07/21/2015 | | | | EUR | | | | 8,500 | | | | (51 | ) | | | (45 | ) |
UAG | | Call - OTC USD versus INR | | | | | INR | | | | 65.400 | | | | 07/16/2015 | | | | $ | | | | 3,700 | | | | (22 | ) | | | (1 | ) |
UBS | | Put - OTC EUR versus USD | | | | | $ | | | | 1.104 | | | | 07/28/2015 | | | | EUR | | | | 2,062 | | | | (22 | ) | | | (22 | ) |
| | | | | | | | | | | | | | | | | | | | | | | | | | $ | (1,085 | ) | | $ | (836 | ) |
INTEREST RATE SWAPTIONS
| | | | | | | | | | | | | | | | | | | | | | | | | | | | |
| Counterparty | | Description | | Floating Rate Index | | | | Pay/Receive
Floating Rate | | Exercise
Rate | | | Expiration
Date | | | Notional
Amount | | | Premiums
(Received) | | | Market
Value | |
MYC | | Put - OTC 2-Year Interest Rate Swap (Effective 05/16/2018) | | 3-Month USD-LIBOR | | | | Pay | | | 2.500 | % | | | 05/12/2016 | | | $ | 126,800 | | | $ | (427 | ) | | $ | (407 | ) |
| | | Put - OTC 2-Year Interest Rate Swap (Effective 05/25/2018) | | 3-Month USD-LIBOR | | | | Pay | | | 2.500 | % | | | 05/23/2016 | | | | 296,200 | | | | (926 | ) | | | (989 | ) |
| | | Call - OTC 10-Year Interest Rate Swap | | 3-Month USD-LIBOR | | | | Receive | | | 2.350 | % | | | 08/03/2015 | | | | 29,900 | | | | (167 | ) | | | (142 | ) |
| | | Put - OTC 10-Year Interest Rate Swap | | 3-Month USD-LIBOR | | | | Pay | | | 2.750 | % | | | 08/03/2015 | | | | 29,900 | | | | (72 | ) | | | (91 | ) |
| | | | | | | | | | | | | | | | | | | | | | $ | (1,592 | ) | | $ | (1,629 | ) |
| | | | | | |
| See Accompanying Notes | | ANNUAL REPORT | | JUNE 30, 2015 | | 113 |
Schedule of Investments PIMCO Total Return Active Exchange-Traded Fund (Cont.)
OPTIONS ON SECURITIES
| | | | | | | | | | | | | | | | | | | | | | | | | | | | |
| Counterparty | | Description | | | | Strike
Price | | | Expiration
Date | | | Notional
Amount | | | Premiums
(Received) | | | Market
Value | |
FBF | | Put - OTC Fannie Mae 3.500% due 07/01/2045 | | | | $ | 101.906 | | | | 07/07/2015 | | | $ | | | | | 3,000 | | | $ | (10 | ) | | $ | (2 | ) |
| | | Put - OTC Fannie Mae 3.500% due 07/01/2045 | | | | | 102.102 | | | | 07/07/2015 | | | | | | | | 7,000 | | | | (23 | ) | | | (8 | ) |
JPM | | Put - OTC Fannie Mae 3.500% due 07/01/2045 | | | | | 101.770 | | | | 07/07/2015 | | | | | | | | 6,000 | | | | (21 | ) | | | (4 | ) |
| | | Put - OTC Fannie Mae 3.500% due 07/01/2045 | | | | | 102.277 | | | | 07/07/2015 | | | | | | | | 8,000 | | | | (28 | ) | | | (12 | ) |
| | | | | | | | | | | | | | | | | | | | | | | $ | (82 | ) | | $ | (26 | ) |
Total Written Options | | | | | | | | | | | | | | | | | | | | $ | (2,822 | ) | | $ | (2,551 | ) |
TRANSACTIONS IN WRITTEN CALL AND PUT OPTIONS FOR THE PERIOD ENDED JUNE 30, 2015:
| | | | | | | | | | | | | | | | | | | | | | |
| | | | | # of
Contracts | | | Notional
Amount in $ | | | Notional
Amount in EUR | | | Premiums | |
Balance at Beginning of Period | | | | | 0 | | | $ | 0 | | | | EUR | | | | 0 | | | $ | 0 | |
Sales | | | | | 7,734 | | | | 784,000 | | | | | | | | 104,000 | | | | (6,937 | ) |
Closing Buys | | | | | (2,413 | ) | | | (64,200 | ) | | | | | | | 0 | | | | 1,311 | |
Expirations | | | | | (2,681 | ) | | | (100,700 | ) | | | | | | | 0 | | | | 1,552 | |
Exercised | | | | | (1,767 | ) | | | (44,400 | ) | | | | | | | 0 | | | | 839 | |
Balance at End of Period | | | | | 873 | | | $ | 574,700 | | | | EUR | | | | 104,000 | | | $ | (3,235 | ) |
SWAP AGREEMENTS:
CREDIT DEFAULT SWAPS ON CORPORATE AND SOVEREIGN ISSUES - SELL PROTECTION (1)
| | | | | | | | | | | | | | | | | | | | | | | | | | | | | | | | | | | | | | | | |
| Counterparty | | Reference Entity | | | | Fixed
Deal
Receive
Rate | | | Maturity
Date | | | Implied
Credit
Spread at
June 30,
2015 (2) | | | Notional
Amount (3) | | | Premiums
Paid/(Received) | | | Unrealized
(Depreciation) | | | Swap Agreements, at Value | |
| | | | | | | | | | Asset | | | Liability | |
BPS | | Petrobras International Finance Co. | | | | | 1.000 | % | | | 12/20/2019 | | | | 4.087 | % | | $ | | | | | 2,600 | | | $ | (246 | ) | | $ | (72 | ) | | $ | 0 | | | $ | (318 | ) |
GST | | Petrobras International Finance Co. | | | | | 1.000 | % | | | 12/20/2019 | | | | 4.087 | % | | | | | | | 5,700 | | | | (560 | ) | | | (138 | ) | | | 0 | | | | (698 | ) |
HUS | | Mexico Government International Bond | | | | | 1.000 | % | | | 12/20/2019 | | | | 1.174 | % | | | | | | | 17,800 | | | | 106 | | | | (234 | ) | | | 0 | | | | (128 | ) |
JPM | | Mexico Government International Bond | | | | | 1.000 | % | | | 12/20/2019 | | | | 1.174 | % | | | | | | | 21,400 | | | | 127 | | | | (281 | ) | | | 0 | | | | (154 | ) |
| | | | | | | | | | | | | | | | | | | | | | | | | | | $ | (573 | ) | | $ | (725 | ) | | $ | 0 | | | $ | (1,298 | ) |
Total Swap Agreements | | | | | | | | | | | | | | | | | | | | | | | | $ | (573 | ) | | $ | (725 | ) | | $ | 0 | | | $ | (1,298 | ) |
| (1) | If the Fund is a seller of protection and a credit event occurs, as defined under the terms of that particular swap agreement, the Fund will either (i) pay to the buyer of protection an amount equal to the notional amount of the swap and take delivery of the referenced obligation or underlying securities comprising the referenced index or (ii) pay a net settlement amount in the form of cash or securities equal to the notional amount of the swap less the recovery value of the referenced obligation or underlying securities comprising the referenced index. |
| (2) | Implied credit spreads, represented in absolute terms, utilized in determining the market value of credit default swap agreements on corporate or sovereign issues as of period end serve as an indicator of the current status of the payment/performance risk and represent the likelihood or risk of default for the credit derivative. The implied credit spread of a particular referenced entity reflects the cost of buying/selling protection and may include upfront payments required to be made to enter into the agreement. Wider credit spreads represent a deterioration of the referenced entity’s credit soundness and a greater likelihood or risk of default or other credit event occurring as defined under the terms of the agreement. |
| (3) | The maximum potential amount the Fund could be required to pay as a seller of credit protection or receive as a buyer of credit protection if a credit event occurs as defined under the terms of that particular swap agreement. |
| | | | | | |
| 114 | | PIMCO ETF TRUST | | | | See Accompanying Notes |
June 30, 2015
FINANCIAL DERIVATIVE INSTRUMENTS: OVER THE COUNTER SUMMARY
The following is a summary by counterparty of the market value of OTC financial derivative instruments and collateral (received)/pledged as of June 30, 2015:
| (l) | Securities with an aggregate market value of $13,714 have been pledged as collateral for financial derivative instruments as governed by International Swaps and Derivatives Association, Inc. master agreements as of June 30, 2015. |
| | | | | | | | | | | | | | | | | | | | | | | | | | | | | | | | | | | | | | | | | | | | | | | | |
| Counterparty | | | | Financial Derivative Assets | | | | | Financial Derivative Liabilities | | | | | | | | | | |
| | | | Forward
Foreign
Currency
Contracts | | | Purchased
Options | | | Swap
Agreements | | | Total
Over the
Counter | | | | | Forward
Foreign
Currency
Contracts | | | Written
Options | | | Swap
Agreements | | | Total
Over the
Counter | | | Net Market
Value of OTC
Derivatives | | | Collateral
(Received)/
Pledged | | | Net
Exposure (4) | |
AZD | | | | $ | 0 | | | $ | 0 | | | $ | 0 | | | $ | 0 | | | | | $ | 0 | | | $ | (22 | ) | | $ | 0 | | | $ | (22 | ) | | $ | (22 | ) | | $ | 0 | | | $ | (22 | ) |
BOA | | | | | 14,493 | | | | 0 | | | | 0 | | | | 14,493 | | | | | | (5,247 | ) | | | (2 | ) | | | 0 | | | | (5,249 | ) | | | 9,244 | | | | (8,930 | ) | | | 314 | |
BPS | | | | | 282 | | | | 0 | | | | 0 | | | | 282 | | | | | | (66 | ) | | | (72 | ) | | | (318 | ) | | | (456 | ) | | | (174 | ) | | | 0 | | | | (174 | ) |
BRC | | | | | 2,807 | | | | 0 | | | | 0 | | | | 2,807 | | | | | | (4 | ) | | | (16 | ) | | | 0 | | | | (20 | ) | | | 2,787 | | | | (2,580 | ) | | | 207 | |
CBK | | | | | 283 | | | | 0 | | | | 0 | | | | 283 | | | | | | (1,502 | ) | | | (316 | ) | | | 0 | | | | (1,818 | ) | | | (1,535 | ) | | | 1,422 | | | | (113 | ) |
DUB | | | | | 18,335 | | | | 0 | | | | 0 | | | | 18,335 | | | | | | (786 | ) | | | (1 | ) | | | 0 | | | | (787 | ) | | | 17,548 | | | | (19,650 | ) | | | (2,102 | ) |
FBF | | | | | 75 | | | | 0 | | | | 0 | | | | 75 | | | | | | (5,571 | ) | | | (91 | ) | | | 0 | | | | (5,662 | ) | | | (5,587 | ) | | | 4,761 | | | | (826 | ) |
GLM | | | | | 1,611 | | | | 2 | | | | 0 | | | | 1,613 | | | | | | (853 | ) | | | (169 | ) | | | 0 | | | | (1,022 | ) | | | 591 | | | | (460 | ) | | | 131 | |
GST | | | | | 0 | | | | 0 | | | | 0 | | | | 0 | | | | | | 0 | | | | (31 | ) | | | (698 | ) | | | (729 | ) | | | (729 | ) | | | 755 | | | | 26 | |
HUS | | | | | 79 | | | | 0 | | | | 0 | | | | 79 | | | | | | (3,513 | ) | | | (16 | ) | | | (128 | ) | | | (3,657 | ) | | | (3,578 | ) | | | 3,099 | | | | (479 | ) |
JPM | | | | | 2,221 | | | | 0 | | | | 0 | | | | 2,221 | | | | | | (2,795 | ) | | | (118 | ) | | | (154 | ) | | | (3,067 | ) | | | (846 | ) | | | 1,092 | | | | 246 | |
MSB | | | | | 7,221 | | | | 0 | | | | 0 | | | | 7,221 | | | | | | (681 | ) | | | (45 | ) | | | 0 | | | | (726 | ) | | | 6,495 | | | | (6,480 | ) | | | 15 | |
MYC | | | | | 0 | | | | 1,666 | | | | 0 | | | | 1,666 | | | | | | 0 | | | | (1,629 | ) | | | 0 | | | | (1,629 | ) | | | 37 | | | | (300 | ) | | | (263 | ) |
NAB | | | | | 12,547 | | | | 0 | | | | 0 | | | | 12,547 | | | | | | 0 | | | | 0 | | | | 0 | | | | 0 | | | | 12,547 | | | | (12,290 | ) | | | 257 | |
NGF | | | | | 78 | | | | 0 | | | | 0 | | | | 78 | | | | | | 0 | | | | 0 | | | | 0 | | | | 0 | | | | 78 | | | | 0 | | | | 78 | |
SCX | | | | | 135 | | | | 0 | | | | 0 | | | | 135 | | | | | | 0 | | | | 0 | | | | 0 | | | | 0 | | | | 135 | | | | 0 | | | | 135 | |
SOG | | | | | 46 | | | | 0 | | | | 0 | | | | 46 | | | | | | 0 | | | | 0 | | | | 0 | | | | 0 | | | | 46 | | | | 0 | | | | 46 | |
UAG | | | | | 650 | | | | 0 | | | | 0 | | | | 650 | | | | | | (3,197 | ) | | | (1 | ) | | | 0 | | | | (3,198 | ) | | | (2,548 | ) | | | 2,585 | | | | 37 | |
UBS | | | | | 0 | | | | 0 | | | | 0 | | | | 0 | | | | | | 0 | | | | (22 | ) | | | 0 | | | | (22 | ) | | | (22 | ) | | | 0 | | | | (22 | ) |
Total Over
the Counter | | | | $ | 60,863 | | | $ | 1,668 | | | $ | 0 | | | $ | 62,531 | | | | | $ | (24,215 | ) | | $ | (2,551 | ) | | $ | (1,298 | ) | | $ | (28,064 | ) | | | | | | | | | | | | |
| (4) | Net Exposure represents the net receivable/(payable) that would be due from/to the counterparty in the event of default. Exposure from OTC financial derivative instruments can only be netted across transactions governed under the same master agreement with the same legal entity. See Note 7, Principal Risks, in the Notes to Financial Statements for more information regarding master netting arrangements. |
FAIR VALUE OF FINANCIAL DERIVATIVE INSTRUMENTS
The following is a summary of the fair valuation of the Fund’s derivative instruments categorized by risk exposure. See Note 7, Principal Risks, in the Notes to Financial Statements on risks of the Fund.
Fair Values of Financial Derivative Instruments on the Statements of Assets and Liabilities as of June 30, 2015:
| | | | | | | | | | | | | | | | | | | | | | | | | | |
| | | | | Derivatives not accounted for as hedging instruments | |
| | | | | Commodity
Contracts | | | Credit
Contracts | | | Equity
Contracts | | | Foreign
Exchange
Contracts | | | Interest
Rate Contracts | | | Total | |
Financial Derivative Instruments - Assets | | | | | | | | | | | | | | | | | | | | | | | | | | |
Exchange-traded or centrally cleared | | | | | | | | | | | | | | | | | | | | | | | | | | |
Futures | | | | $ | 0 | | | $ | 0 | | | $ | 0 | | | $ | 0 | | | $ | 2,766 | | | $ | 2,766 | |
Swap Agreements | | | | | 0 | | | | 0 | | | | 0 | | | | 0 | | | | 1,508 | | | | 1,508 | |
| | | | $ | 0 | | | $ | 0 | | | $ | 0 | | | $ | 0 | | | $ | 4,274 | | | $ | 4,274 | |
Over the counter | | | | | | | | | | | | | | | | | | | | | | | | | | |
Forward Foreign Currency Contracts | | | | $ | 0 | | | $ | 0 | | | $ | 0 | | | $ | 60,863 | | | $ | 0 | | | $ | 60,863 | |
Purchased Options | | | | | 0 | | | | 0 | | | | 0 | | | | 2 | | | | 1,666 | | | | 1,668 | |
| | | | $ | 0 | | | $ | 0 | | | $ | 0 | | | $ | 60,865 | | | $ | 1,666 | | | $ | 62,531 | |
| | | | $ | 0 | | | $ | 0 | | | $ | 0 | | | $ | 60,865 | | | $ | 5,940 | | | $ | 66,805 | |
| | | | | | |
| See Accompanying Notes | | ANNUAL REPORT | | JUNE 30, 2015 | | 115 |
Schedule of Investments PIMCO Total Return Active Exchange-Traded Fund (Cont.)
| | | | | | | | | | | | | | | | | | | | | | | | | | |
| | | | | Derivatives not accounted for as hedging instruments | |
| | | | | Commodity
Contracts | | | Credit
Contracts | | | Equity
Contracts | | | Foreign
Exchange
Contracts | | | Interest
Rate Contracts | | | Total | |
Financial Derivative Instruments - Liabilities | | | | | | | | | | | | | | | | | | | | | | | | | | |
Exchange-traded or centrally cleared | | | | | | | | | | | | | | | | | | | | | | | | | | |
Written Options | | | | $ | 0 | | | $ | 0 | | | $ | 0 | | | $ | 0 | | | $ | 445 | | | $ | 445 | |
Futures | | | | | 0 | | | | 0 | | | | 0 | | | | 0 | | | | 181 | | | | 181 | |
Swap Agreements | | | | | 0 | | | | 0 | | | | 0 | | | | 0 | | | | 587 | | | | 587 | |
| | | | $ | 0 | | | $ | 0 | | | $ | 0 | | | $ | 0 | | | $ | 1,213 | | | $ | 1,213 | |
Over the counter | | | | | | | | | | | | | | | | | | | | | | | | | | |
Forward Foreign Currency Contracts | | | | $ | 0 | | | $ | 0 | | | $ | 0 | | | $ | 24,215 | | | $ | 0 | | | $ | 24,215 | |
Written Options | | | | | 0 | | | | 60 | | | | 0 | | | | 836 | | | | 1,655 | | | | 2,551 | |
Swap Agreements | | | | | 0 | | | | 1,298 | | | | 0 | | | | 0 | | | | 0 | | | | 1,298 | |
| | | | $ | 0 | | | $ | 1,358 | | | $ | 0 | | | $ | 25,051 | | | $ | 1,655 | | | $ | 28,064 | |
| | | | $ | 0 | | | $ | 1,358 | | | $ | 0 | | | $ | 25,051 | | | $ | 2,868 | | | $ | 29,277 | |
The Effect of Financial Derivative Instruments on the Statements of Operations for the period ended June 30, 2015:
| | | | | | | | | | | | | | | | | | | | | | | | | | |
| | | | | Derivatives not accounted for as hedging instruments | |
| | | | | Commodity
Contracts | | | Credit
Contracts | | | Equity
Contracts | | | Foreign
Exchange
Contracts | | | Interest
Rate Contracts | | | Total | |
Net Realized Gain (Loss) on Financial Derivative Instruments | | | | | | | | | | | | | | | | | | | | | | | | | | |
Exchange-traded or centrally cleared | | | | | | | | | | | | | | | | | | | | | | | | | | |
Written Options | | | | $ | 0 | | | $ | 0 | | | $ | 0 | | | $ | 0 | | | $ | 1,695 | | | $ | 1,695 | |
Futures | | | | | 0 | | | | 0 | | | | 0 | | | | 0 | | | | 14,529 | | | | 14,529 | |
Swap Agreements | | | | | 0 | | | | 0 | | | | 0 | | | | 0 | | | | 26,116 | | | | 26,116 | |
| | | | $ | 0 | | | $ | 0 | | | $ | 0 | | | $ | 0 | | | $ | 42,340 | | | $ | 42,340 | |
Over the counter | | | | | | | | | | | | | | | | | | | | | | | | | | |
Forward Foreign Currency Contracts | | | | $ | 0 | | | $ | 0 | | | $ | 0 | | | $ | 95,949 | | | $ | 0 | | | $ | 95,949 | |
Purchased Options | | | | | 0 | | | | 0 | | | | 0 | | | | 9 | | | | 0 | | | | 9 | |
Written Options | | | | | 0 | | | | 0 | | | | 0 | | | | (2,069 | ) | | | 0 | | | | (2,069 | ) |
Swap Agreements | | | | | 0 | | | | (2,474 | ) | | | 0 | | | | 0 | | | | 0 | | | | (2,474 | ) |
| | | | $ | 0 | | | $ | (2,474 | ) | | $ | 0 | | | $ | 93,889 | | | $ | 0 | | | $ | 91,415 | |
| | | | $ | 0 | | | $ | (2,474 | ) | | $ | 0 | | | $ | 93,889 | | | $ | 42,340 | | | $ | 133,755 | |
| | | | | | | |
Net Change in Unrealized Appreciation (Depreciation) on Financial Derivative Instruments | | | | | | | | | | | | | | | | | | | | | | | | | | |
Exchange-traded or centrally cleared | | | | | | | | | | | | | | | | | | | | | | | | | | |
Written Options | | | | $ | 0 | | | $ | 0 | | | $ | 0 | | | $ | 0 | | | $ | (33 | ) | | $ | (33 | ) |
Futures | | | | | 0 | | | | 0 | | | | 0 | | | | 0 | | | | (3,175 | ) | | | (3,175 | ) |
Swap Agreements | | | | | 0 | | | | 0 | | | | 0 | | | | 0 | | | | (3,369 | ) | | | (3,369 | ) |
| | | | $ | 0 | | | $ | 0 | | | $ | 0 | | | $ | 0 | | | $ | (6,577 | ) | | $ | (6,577 | ) |
Over the counter | | | | | | | | | | | | | | | | | | | | | | | | | | |
Forward Foreign Currency Contracts | | | | $ | 0 | | | $ | 0 | | | $ | 0 | | | $ | 49,833 | | | $ | 0 | | | $ | 49,833 | |
Purchased Options | | | | | 0 | | | | 0 | | | | 0 | | | | (27 | ) | | | 357 | | | | 330 | |
Written Options | | | | | 0 | | | | 3 | | | | 0 | | | | 249 | | | | 20 | | | | 272 | |
Swap Agreements | | | | | 0 | | | | (726 | ) | | | 0 | | | | 0 | | | | 0 | | | | (726 | ) |
| | | | $ | 0 | | | $ | (723 | ) | | $ | 0 | | | $ | 50,055 | | | $ | 377 | | | $ | 49,709 | |
| | | | $ | 0 | | | $ | (723 | ) | | $ | 0 | | | $ | 50,055 | | | $ | (6,200 | ) | | $ | 43,132 | |
| | | | | | |
| 116 | | PIMCO ETF TRUST | | | | See Accompanying Notes |
June 30, 2015
FAIR VALUE MEASUREMENTS
The following is a summary of the fair valuations according to the inputs used as of June 30, 2015 in valuing the Fund’s assets and liabilities:
| | | | | | | | | | | | | | | | | | |
| Category and Subcategory | | | | Level 1 | | | Level 2 | | | Level 3 | | | Fair Value at
06/30/2015 | |
Investments in Securities, at Value | | | | | | | | | | | | | | | | | | |
Bank Loan Obligations | | | | $ | 0 | | | $ | 23,375 | | | $ | 0 | | | $ | 23,375 | |
Corporate Bonds & Notes | | | | | | | | | | | | | | | | | | |
Banking & Finance | | | | | 0 | | | | 606,597 | | | | 0 | | | | 606,597 | |
Industrials | | | | | 0 | | | | 181,656 | | | | 0 | | | | 181,656 | |
Utilities | | | | | 0 | | | | 88,241 | | | | 0 | | | | 88,241 | |
Municipal Bonds & Notes | | | | | | | | | | | | | | | | | | |
California | | | | | 0 | | | | 20,765 | | | | 0 | | | | 20,765 | |
Florida | | | | | 0 | | | | 10,337 | | | | 0 | | | | 10,337 | |
South Dakota | | | | | 0 | | | | 8,046 | | | | 0 | | | | 8,046 | |
U.S. Government Agencies | | | | | 5,285 | | | | 497,309 | | | | 13,946 | | | | 516,540 | |
U.S. Treasury Obligations | | | | | 0 | | | | 872,161 | | | | 0 | | | | 872,161 | |
Mortgage-Backed Securities | | | | | 0 | | | | 162,876 | | | | 0 | | | | 162,876 | |
Asset-Backed Securities | | | | | 0 | | | | 56,184 | | | | 0 | | | | 56,184 | |
Sovereign Issues | | | | | 0 | | | | 212,065 | | | | 0 | | | | 212,065 | |
Short-Term Instruments | | | | | | | | | | | | | | | | | | |
Repurchase Agreements | | | | | 0 | | | | 46,260 | | | | 0 | | | | 46,260 | |
Short-Term Notes | | | | | 0 | | | | 77,395 | | | | 0 | | | | 77,395 | |
Japan Treasury Bills | | | | | 0 | | | | 22,063 | | | | 0 | | | | 22,063 | |
Mexico Treasury Bills | | | | | 0 | | | | 4,156 | | | | 0 | | | | 4,156 | |
U.S. Treasury Bills | | | | | 0 | | | | 14,337 | | | | 0 | | | | 14,337 | |
Total Investments | | | | $ | 5,285 | | | $ | 2,903,823 | | | $ | 13,946 | | | $ | 2,923,054 | |
| | | | | |
Financial Derivative Instruments - Assets | | | | | | | | | | | | | | | | | | |
Exchange-traded or centrally cleared | | | | | 2,757 | | | | 1,508 | | | | 0 | | | | 4,265 | |
Over the counter | | | | | 0 | | | | 62,531 | | | | 0 | | | | 62,531 | |
| | | | | $ | 2,757 | | | $ | 64,039 | | | $ | 0 | | | $ | 66,796 | |
| | | | | |
Financial Derivative Instruments - Liabilities | | | | | | | | | | | | | | | | | | |
Exchange-traded or centrally cleared | | | | | (376 | ) | | | (837 | ) | | | 0 | | | | (1,213 | ) |
Over the counter | | | | | 0 | | | | (28,064 | ) | | | 0 | | | | (28,064 | ) |
| | | | | $ | (376 | ) | | $ | (28,901 | ) | | $ | 0 | | | $ | (29,277 | ) |
Totals | | | | $ | 7,666 | | | $ | 2,938,961 | | | $ | 13,946 | | | $ | 2,960,573 | |
There were no significant transfers between Levels 1 and 2 during the period ended June 30, 2015. There were assets and liabilities valued at $38,756 transferred from Level 3 to Level 2 during the period ended June 30, 2015. There were no significant assets and liabilities transferred from Level 2 to Level 3 during the period ended June 30, 2015.
| | | | | | |
| See Accompanying Notes | | ANNUAL REPORT | | JUNE 30, 2015 | | 117 |
Notes to Financial Statements
1. ORGANIZATION
PIMCO ETF Trust (the “Trust”) was established as a Delaware statutory trust on November 14, 2008. The Trust is registered under the Investment Company Act of 1940, as amended (the “Act”), as an open-end management investment company. Information presented in these financial statements pertains to the funds (each a “Fund” and collectively the “Funds”) offered by the Trust. Pacific Investment Management Company LLC (“PIMCO” or “Manager”) serves as the investment adviser for the Funds.
Each Fund is an exchange-traded fund (“ETF”). ETFs are funds that trade like other publicly-traded securities and may be designed to track an index or to be actively managed. Unlike shares of a mutual fund, which can be bought from and redeemed by the issuing fund by all shareholders at a price based on net asset value (“NAV”), shares of a Fund may be directly purchased from and redeemed by a Fund at NAV solely by certain large institutional investors. Also unlike shares of a mutual fund, shares of each Fund are listed on a national securities exchange and trade in the secondary market at market prices that change throughout the day.
Shares of the Funds are listed and traded at market prices on NYSE Arca, Inc. (“NYSE Arca”) and other secondary markets. The market price for a Fund’s shares may be different from the Fund’s NAV. The Funds issue and redeem shares at their respective NAV only in blocks of a specified number of shares or multiples thereof (“Creation Units”). Only certain large institutional investors who have entered into agreements with the Funds’ distributor may purchase or redeem Creation Units directly with the Funds at NAV (“Authorized Participants”). These transactions are in exchange for certain securities similar to a Fund’s portfolio and/or cash. Except when aggregated in Creation Units, shares of a Fund are not redeemable securities. Shareholders who are not Authorized Participants may not redeem shares directly from a Fund at NAV.
2. SIGNIFICANT ACCOUNTING POLICIES
The following is a summary of significant accounting policies consistently followed by the Trust in the preparation of its financial statements in conformity with accounting principles generally accepted in the United States of America (“U.S. GAAP”). Each Fund is treated as an investment company under the reporting requirements of U.S. GAAP. The preparation of financial statements in accordance with U.S. GAAP requires management to make estimates and assumptions that affect the reported amounts of assets and liabilities and disclosure of contingent assets and liabilities at the date of the financial statements and the reported amounts of increases and decreases in net assets from operations during the reporting period. Actual results could differ from those estimates.
(a) Securities Transactions and Investment Income Securities transactions are recorded as of the trade date for financial reporting purposes. Securities purchased or sold on a when-issued or delayed-delivery basis may be settled 15 days or more after the trade date. Realized gains and losses from securities sold are recorded on the identified cost basis. Dividend income is
recorded on the ex-dividend date, except certain dividends from foreign securities where the ex-dividend date may have passed, which are recorded as soon as the Fund is informed of the ex-dividend date. Interest income, adjusted for the accretion of discounts and amortization of premiums, is recorded on the accrual basis from settlement date. For convertible securities, premiums attributable to the conversion feature are not amortized. Estimated tax liabilities on certain foreign securities are recorded on an accrual basis and are reflected as components of interest income or net change in unrealized appreciation/depreciation on investments on the Statements of Operations, as appropriate. Tax liabilities realized as a result of such security sales are reflected as a component of net realized gain/loss on investments on the Statements of Operations. Paydown gains and losses on mortgage-related and other asset-backed securities are recorded as components of interest income on the Statements of Operations. Income or short-term capital gain distributions received from underlying funds are recorded as dividend income. Long-term capital gain distributions received from underlying funds are recorded as realized gains.
Debt obligations may be placed on non-accrual status and related interest income may be reduced by ceasing current accruals and writing off interest receivable when the collection of all or a portion of interest has become doubtful based on consistently applied procedures. A debt obligation is removed from non-accrual status when the issuer resumes interest payments or when collectability of interest is probable.
(b) Cash and Foreign Currency The functional and reporting currency for the Funds is the U.S. dollar. The market values of foreign securities, currency holdings and other assets and liabilities are translated into U.S. dollars based on the current exchange rates each business day. Purchases and sales of securities and income and expense items denominated in foreign currencies, if any, are translated into U.S. dollars at the exchange rate in effect on the transaction date. The Funds do not separately report the effects of changes in foreign exchange rates from changes in market prices on securities held. Such changes are included in net realized and net changes in unrealized gain or loss from investments on the Statements of Operations. The Funds may invest in foreign currency-denominated securities and may engage in foreign currency transactions either on a spot (cash) basis at the rate prevailing in the currency exchange market at the time or through a forward foreign currency contract (see financial derivative instruments). Realized foreign exchange gains or losses arising from sales of spot foreign currencies, currency gains or losses realized between the trade and settlement dates on securities transactions and the difference between the recorded amounts of dividends, interest, and foreign withholding taxes and the U.S. dollar equivalent of the amounts actually received or paid are included in net realized gain or loss on foreign currency transactions on the Statements of Operations. Net unrealized foreign exchange gains and losses arising from changes in foreign exchange rates on foreign denominated assets and liabilities other than investments in securities held at the end of
June 30, 2015
the reporting period are included in net change in unrealized appreciation or depreciation on foreign currency assets and liabilities on the Statements of Operations.
(c) Dividends and Distributions to Shareholders Dividends from net investment income, if any, of each Fund, except the PIMCO 25+ Year Zero Coupon U.S. Treasury Index Exchange-Traded Fund and the PIMCO Foreign Currency Strategy Active Exchange-Traded Fund, are declared and distributed to shareholders monthly. Dividends from net investment income, if any, of the PIMCO 25+ Year Zero Coupon U.S. Treasury Index Exchange-Traded Fund and the PIMCO Foreign Currency Strategy Active Exchange-Traded Fund are declared and distributed to shareholders quarterly. Net realized capital gains earned by each Fund, if any, will be distributed no less frequently than once each year. Dividends and distributions cannot be automatically reinvested in additional shares of a Fund.
Income dividends and capital gain distributions are determined in accordance with income tax regulations which may differ from U.S. GAAP. Differences between tax regulations and U.S. GAAP may cause timing differences between income and capital gain recognition. Examples of events that give rise to timing differences include tax events such as wash sales losses and capital loss carryforwards. Further, the character of investment income and capital gains may be different for certain transactions under the two methods of accounting. Examples of transactions that may cause character differences include the treatment of paydowns on mortgage-backed securities, swaps, foreign currency transactions and redeem-in-kind transactions. As a result, income dividends and capital gain distributions declared during a fiscal period may differ significantly from the net investment income (loss) and realized gains (losses) reported on each Fund’s annual financial statements presented under U.S. GAAP.
Distributions classified as a tax basis return of capital, if any, are reflected on the accompanying Statements of Changes in Net Assets and have been recorded to paid in capital. In addition, other amounts have been reclassified between undistributed (overdistributed) net investment income, accumulated undistributed/(overdistributed) net realized gains (losses) and/or paid in capital to more appropriately conform financial accounting to tax characterizations of dividend distributions.
(d) Statements of Cash Flows U.S. GAAP requires entities providing financial statements that report both financial position and results of operations to also provide a statement of cash flows for each period for which results of operations are provided, but exempts investment companies meeting certain conditions. One of the conditions is that substantially all of the enterprise’s investments were carried at fair value during the period and classified as Level 1 or Level 2 in the fair value hierarchy in accordance with the requirements of U.S. GAAP. Another condition is that the enterprise had little or no debt, based on the average debt outstanding during the period, in relation to average total assets. Funds with certain degrees of borrowing activity, typically through the use of reverse repurchase agreements, or
sale-buyback transactions have been determined to be at a level requiring a Statement of Cash Flows. Statements of Cash Flows, as applicable, have been prepared using the indirect method which requires net change in net assets resulting from operations to be adjusted to reconcile to net cash flows from operating activities.
(e) New Accounting Pronouncements In June 2014, the Financial Accounting Standards Board (“FASB”) issued an Accounting Standards Update (“ASU”), ASU 2014-11, that expanded secured borrowing accounting for certain repurchase agreements. The ASU also sets forth additional disclosure requirements for certain transactions accounted for as sales in order to provide financial statement users with information to compare to similar transactions accounted for as secured borrowings. The ASU became effective prospectively for annual periods beginning after December 15, 2014, and interim periods beginning after March 15, 2015. At this time, management is evaluating the implications of these changes on the financial statements.
In May 2015, the FASB issued ASU 2015-07 which removes the requirement to categorize within the fair value hierarchy all investments for which fair value is measured using the net asset value per share practical expedient. The ASU also removes the requirement to make certain disclosures for all investments that are eligible to be measured at fair value using the net asset value per share practical expedient. The ASU is effective for annual periods beginning after December 15, 2015 and interim periods within those annual periods. At this time, management is evaluating the implications of these changes on the financial statements.
3. INVESTMENT VALUATION AND FAIR VALUE MEASUREMENTS
(a) Investment Valuation Policies The NAV of the Fund’s shares is determined by dividing the total value of the Fund’s portfolio investments and other assets, less any liabilities, by the total number of shares outstanding.
Fund shares are ordinarily valued as of the NYSE Close on each day that the NYSE is open. Information that becomes known to the Funds or their agents after the time as of which NAV has been calculated on a particular day will not generally be used to retroactively adjust the price of a security or the NAV determined earlier that day. Each Fund reserves the right to change the time its respective NAV is calculated if the Fund closes earlier, or as permitted by the SEC.
For purposes of calculating NAV, portfolio securities and other assets for which market quotes are readily available are valued at market value. Market value is generally determined on the basis of official closing prices or the last reported sales prices, or if no sales are reported, based on quotes obtained from established market makers or prices (including evaluated prices) supplied by the Funds’ approved pricing services, quotation reporting systems and other third-party sources (together, “Pricing Services”). The Funds will normally use pricing data for domestic equity securities received
| | | | | | |
| | ANNUAL REPORT | | JUNE 30, 2015 | | 119 |
Notes to Financial Statements (Cont.)
shortly after the NYSE Close and do not normally take into account trading, clearances or settlements that take place after the NYSE Close. A foreign (non-U.S.) equity security traded on a foreign exchange or on more than one exchange is typically valued using pricing information from the exchange considered by the manager to be the primary exchange. A foreign (non-U.S.) equity security will be valued as of the close of trading on the foreign exchange, or the NYSE Close, if the NYSE Close occurs before the end of trading on the foreign exchange. Domestic and foreign (non-U.S.) fixed income securities, non-exchange traded derivatives, and equity options are normally valued on the basis of quotes obtained from brokers and dealers or Pricing Services using data reflecting the earlier closing of the principal markets for those securities. Prices obtained from Pricing Services may be based on, among other things, information provided by market makers or estimates of market values obtained from yield data relating to investments or securities with similar characteristics. Certain fixed income securities purchased on a delayed-delivery basis are marked to market daily until settlement at the forward settlement date. Exchange-traded options, except equity options, futures and options on futures are valued at the settlement price determined by the relevant exchange. Swap agreements are valued on the basis of bid quotes obtained from brokers and dealers or market-based prices supplied by Pricing Services or other pricing sources. With respect to any portion of the Fund’s assets that are invested in one or more open-end management investment companies, a Fund’s NAV will be calculated based upon the NAVs of such investments.
If a foreign (non-U.S.) equity security’s value has materially changed after the close of the security’s primary exchange or principal market but before the NYSE Close, the security may be valued at fair value based on procedures established and approved by the Board of Trustees. Foreign (non-U.S.) equity securities that do not trade when the NYSE is open are also valued at fair value. With respect to foreign (non-U.S.) equity securities, the Fund may determine the fair value of investments based on information provided by Pricing Services and other third-party vendors, which may recommend fair value or adjustments with reference to other securities, indices or assets. In considering whether fair valuation is required and in determining fair values, the Fund may, among other things, consider significant events (which may be considered to include changes in the value of U.S. securities or securities indices) that occur after the close of the relevant market and before the NYSE Close. A Fund may utilize modeling tools provided by third-party vendors to determine fair values of non-U.S. securities. Foreign (non-U.S.) exchanges may permit trading in foreign (non- U.S.) equity securities on days when the Trust is not open for business, which may result in a Fund’s portfolio investments being affected when you are unable to buy or sell shares.
Senior secured floating rate loans for which an active secondary market exists to a reliable degree will be valued at the mean of the last available bid/ask prices in the market for such loans, as provided by a Pricing Service. Senior secured floating rate loans for which an active secondary market
does not exist to a reliable degree will be valued at fair value, which is intended to approximate market value. In valuing a senior secured floating rate loan at fair value, the factors considered may include, but are not limited to, the following: (a) the creditworthiness of the borrower and any intermediate participants, (b) the terms of the loan, (c) recent prices in the market for similar loans, if any, and (d) recent prices in the market for instruments of similar quality, rate, period until next interest rate reset and maturity.
Investments valued in currencies other than the U.S. dollar are converted to the U.S. dollar using exchange rates obtained from Pricing Services. As a result, the NAV of the Fund’s shares may be affected by changes in the value of currencies in relation to the U.S. dollar. The value of securities traded in markets outside the United States or denominated in currencies other than the U.S. dollar may be affected significantly on a day that the Trust is not open for business. As a result, to the extent that a Fund holds foreign (non-U.S.) securities, the NAV of the Fund’s shares may change at times when you cannot purchase, redeem or exchange shares. Investments for which market quotes or market based valuations are not readily available are valued at fair value as determined in good faith by the Board of Trustees or persons acting at their direction. The Board of Trustees has adopted methods for valuing securities and other assets in circumstances where market quotes are not readily available, and has delegated to PIMCO the responsibility for applying the fair valuation methods. In the event that market quotes or market based valuations are not readily available, and the security or asset cannot be valued pursuant to a Board approved valuation method, the value of the security or asset will be determined in good faith by the Valuation Oversight Committee of the Board of Trustees, generally based on recommendations provided by PIMCO. Market quotes are considered not readily available in circumstances where there is an absence of current or reliable market-based data (e.g., trade information, bid/ask information, broker quotes, Pricing Services prices), including where events occur after the close of the relevant market, but prior to the NYSE Close, that materially affect the values of the Fund’s securities or assets. In addition, market quotes are considered not readily available when, due to extraordinary circumstances, the exchanges or markets on which the securities trade do not open for trading for the entire day and no other market prices are available. The Board has delegated to PIMCO the responsibility for monitoring significant events that may materially affect the values of the Fund’s securities or assets and for determining whether the value of the applicable securities or assets should be reevaluated in light of such significant events.
When the Fund uses fair valuation to determine its NAV, securities will not be priced on the basis of quotes from the primary market in which they are traded, but rather may be priced by another method that the Board of Trustees or persons acting at their direction believe reflects fair value. Fair valuation may require subjective determinations about the value of a security. While the Trust’s policy is intended to result in a calculation of the
June 30, 2015
Fund’s NAV that fairly reflects security values as of the time of pricing, the Trust cannot ensure that fair values determined by the Board of Trustees or persons acting at their direction would accurately reflect the price that a Fund could obtain for a security if it were to dispose of that security as of the time of pricing (for instance, in a forced or distressed sale). The prices used by the Fund may differ from the value that would be realized if the securities were sold.
(b) Fair Value Hierarchy U.S. GAAP describes fair value as the price that a Fund would receive to sell an asset or pay to transfer a liability in an orderly transaction between market participants at the measurement date. It establishes a fair value hierarchy that prioritizes inputs to valuation methods and requires disclosure of the fair value hierarchy, separately for each major category of assets and liabilities, that segregates fair value measurements into levels (Level 1, 2, or 3). The inputs or methodology used for valuing securities are not necessarily an indication of the risks associated with investing in those securities. Levels 1, 2, and 3 of the fair value hierarchy are defined as follows:
| | n | | Level 1 — Inputs using (unadjusted) quoted prices in active markets or exchanges for identical assets and liabilities. |
| | n | | Level 2 — Significant other observable inputs, which may include, but are not limited to, quoted prices for similar assets or liabilities in markets that are active, quoted prices for identical or similar assets or liabilities in markets that are not active, inputs other than quoted prices that are observable for the assets or liabilities (such as interest rates, yield curves, volatilities, prepayment speeds, loss severities, credit risks and default rates) or other market corroborated inputs. |
| | n | | Level 3 — Significant unobservable inputs based on the best information available in the circumstances, to the extent observable inputs are not available, which may include assumptions made by the Board or persons acting at their direction that are used in determining the fair value of investments. |
Assets or liabilities categorized as Level 2 or 3 as of period end have been transferred between Levels 2 and 3 since the prior period due to changes in the valuation method utilized in valuing the investments. Transfers from Level 3 to Level 2 are a result of the availability of current and reliable market-based data provided by third-party pricing services or other valuation techniques which utilize significant observable inputs. In accordance with the requirements of U.S. GAAP, the amounts of transfers between Levels 1 and 2 and transfers in and out of Level 3, if material, are disclosed in the Notes to Schedules of Investments for each respective Fund.
For fair valuations using significant unobservable inputs, U.S. GAAP requires a reconciliation of the beginning to ending balances for reported fair values that presents changes attributable to total realized and unrealized gains or losses, purchases and sales, and transfers in or out of the Level 3 category
during the period. The end of period timing recognition is used for the transfers between Levels of a Fund’s assets and liabilities. Additionally, U.S. GAAP requires quantitative information regarding the significant unobservable inputs used in the determination of fair value of assets or liabilities categorized as Level 3 in the fair value hierarchy. In accordance with the requirements of U.S. GAAP, a fair value hierarchy, and if material, a Level 3 reconciliation and details of significant unobservable inputs, have been included in the Notes to Schedules of Investments for each respective Fund.
| (c) | Valuation Techniques and the Fair Value Hierarchy |
Level 1 and Level 2 trading assets and trading liabilities, at fair value The valuation methods (or “techniques”) and significant inputs used in determining the fair values of portfolio securities or other assets categorized as Level 1 and Level 2 of the fair value hierarchy are as follows:
Fixed income securities including corporate, convertible and municipal bonds and notes, U.S. government agencies, U.S. treasury obligations, sovereign issues, bank loans, convertible preferred securities and non-U.S. bonds are normally valued on the basis of quotes obtained from brokers and dealers or pricing service providers that use broker-dealer quotations, reported trades or valuation estimates from their internal pricing models. The service providers’ internal models use inputs that are observable such as issuer details, interest rates, yield curves, prepayment speeds, credit risks/spreads, default rates and quoted prices for similar assets. Securities that use similar valuation techniques and inputs as described above are categorized as Level 2 of the fair value hierarchy.
Fixed income securities purchased on a delayed-delivery basis or as a repurchase commitment in a sale-buyback transaction are marked to market daily until settlement at the forward settlement date and are categorized as Level 2 of the fair value hierarchy.
Mortgage-related and asset-backed securities are usually issued as separate tranches, or classes, of securities within each deal. These securities are also normally valued by pricing service providers that use broker-dealer quotations, reported trades or valuation estimates from their internal pricing models. The pricing models for these securities usually consider tranche-level attributes, current market data, estimated cash flows and market-based yield spreads for each tranche, and incorporate deal collateral performance, as available. Mortgage-related and asset-backed securities that use similar valuation techniques and inputs as described above are categorized as Level 2 of the fair value hierarchy.
Common stocks, exchange-traded funds, exchange-traded notes and financial derivative instruments, such as futures contracts or options on futures that are traded on a national securities exchange, are stated at the last reported sale or settlement price on the day of valuation. To the extent these securities are actively traded and valuation adjustments are not applied, they are categorized as Level 1 of the fair value hierarchy.
| | | | | | |
| | ANNUAL REPORT | | JUNE 30, 2015 | | 121 |
Notes to Financial Statements (Cont.)
Investments valued (denominated) in currencies other than the U.S. dollar are converted to the U.S. dollar using exchange rates (currency spot and forward rates) obtained from pricing service providers. As a result, the NAV of a Fund’s shares may be affected by changes in the value of currencies in relation to the U.S. dollar. The value of securities traded in markets outside the United States or denominated in currencies other than the U.S. dollar may be affected significantly on a day that the Trust is not open for business. Valuation adjustments may be applied to certain securities that are solely traded on a foreign exchange to account for the market movement between the close of the foreign market and the NYSE Close. These securities are valued using pricing service providers that consider the correlation of the trading patterns of the foreign security to the intraday trading in the U.S. markets for investments. Securities using these valuation adjustments are categorized as Level 2 of the fair value hierarchy. Preferred securities and other equities traded on inactive markets or valued by reference to similar instruments are also categorized as Level 2 of the fair value hierarchy.
Short-term debt instruments (such as commercial paper) having a remaining maturity of 60 days or less may be valued at amortized cost, so long as the amortized cost value of such short-term debt instrument is approximately the same as the fair value of the instrument as determined without the use of amortized cost valuation. Prior to July 31, 2015, short-term investments having a maturity of 60 days or less and repurchase agreements were generally valued at amortized cost which approximates fair value. These investments are categorized as Level 2 of the fair value hierarchy.
Equity exchange-traded options and over the counter financial derivative instruments, such as foreign currency contracts, options contracts, or swap agreements, derive their value from underlying asset prices, indices, reference rates, and other inputs or a combination of these factors. Other than swap agreements, which are valued using a broker-dealer bid quotation or on market-based prices provided by pricing services or other pricing sources, these contracts are normally valued on the basis of quotes obtained from a quotation reporting system, established market makers or Pricing Services (normally determined at the close of the New York market). Depending on the product and the terms of the transaction, financial derivative instruments can be valued by a pricing service provider using a series of techniques, including simulation pricing models. The pricing models use inputs that are observed from actively quoted markets such as quoted prices, issuer details, indices, bid/ask spreads, interest rates, implied volatilities, yield curves, dividends and exchange rates. Financial derivative instruments that use similar valuation techniques and inputs as described above are categorized as Level 2 of the fair value hierarchy.
Centrally cleared swaps listed or traded on a multilateral or trade facility platform, such as a registered exchange, are valued at the daily settlement price determined by the respective exchange (if available). For centrally cleared credit default swaps the clearing facility requires its members to provide actionable price levels across complete term structures. These levels along with external third-party prices are used to produce daily settlement
prices. These securities are categorized as Level 2 of the fair value hierarchy. Centrally cleared interest rate swaps are valued using a pricing model that references the underlying rates including the overnight index swap rate and London Interbank Offered Rate (“LIBOR”) forward rate to produce the daily settlement price. These securities are categorized as Level 2 of the fair value hierarchy.
Level 3 trading assets and trading liabilities, at fair value When a fair valuation method is applied by PIMCO that uses significant unobservable inputs, securities will be priced by a method that the Board or persons acting at their direction believe reflects fair value and are categorized as Level 3 of the fair value hierarchy.
4. SECURITIES AND OTHER INVESTMENTS
(a) Investments in Securities
Inflation-Indexed Bonds Certain Funds may invest in inflation-indexed bonds. Inflation-indexed bonds are fixed income securities whose principal value is periodically adjusted to the rate of inflation. The interest rate on these bonds is generally fixed at issuance at a rate lower than typical bonds. Over the life of an inflation-indexed bond, however, interest will be paid based on a principal value which is adjusted for inflation. Any increase or decrease in the principal amount of an inflation-indexed bond will be included as interest income on the Statements of Operations, even though investors do not receive their principal until maturity.
Loan Participations, Assignments and Originations Certain Funds may invest in direct debt instruments which are interests in amounts owed to lenders or lending syndicates by corporate, governmental, or other borrowers. A Fund’s investments in loans may be in the form of participations in loans, assignments of all or a portion of loans from third parties, or originations of loans by a Fund or Funds. A loan is often administered by a bank or other financial institution (the “lender”) that acts as agent for all holders. The agent administers the terms of the loan, as specified in the loan agreement. A Fund may invest in multiple series or tranches of a loan, which may have varying terms and carry different associated risks. When a Fund purchases assignments from lenders it acquires direct rights against the borrower of the loan. These loans may include participations in bridge loans, which are loans taken out by borrowers for a short period (typically less than one year) pending arrangement of more permanent financing through, for example, the issuance of bonds, frequently high yield bonds issued for the purpose of acquisitions.
The types of loans and related investments in which the Funds may invest include, among others, senior loans, subordinated loans (including second lien loans, B-Notes and mezzanine loans), whole loans, commercial real estate and other commercial loans and structured loans. The Funds may originate loans or acquire direct interests in loans through primary loan distributions and/or in private transactions. In the case of subordinated loans, there may be significant indebtedness ranking ahead of the borrower’s obligation to the holder of such a loan, including in the event of the
June 30, 2015
borrower’s insolvency. Mezzanine loans are typically secured by a pledge of an equity interest in the mortgage borrower that owns the real estate rather than an interest in a mortgage.
Investments in loans may include unfunded loan commitments, which are contractual obligations for funding. Unfunded loan commitments may include revolving credit facilities, which may obligate a Fund to supply additional cash to the borrower on demand. Unfunded loan commitments represent a future obligation in full, even though a percentage of the committed amount may not be utilized by the borrower. When investing in a loan participation, a Fund has the right to receive payments of principal, interest and any fees to which it is entitled only from the lender selling the loan agreement and only upon receipt of payments by the lender from the borrower. A Fund may receive a commitment fee based on the undrawn portion of the underlying line of credit portion of a loan. In certain circumstances, a Fund may receive a penalty fee upon the prepayment of a loan by a borrower. Fees earned or paid are recorded as a component of interest income or interest expense, respectively, on the Statements of Operations. As of June 30, 2015, the Funds had no unfunded loan commitments outstanding.
Mortgage-Related and Other Asset-Backed Securities Certain Funds may invest in mortgage-related and other asset-backed securities that directly or indirectly represent a participation in, or are secured by and payable from, loans on real property. Mortgage-related securities are created from pools of residential or commercial mortgage loans, including mortgage loans made by savings and loan institutions, mortgage bankers, commercial banks and others. These securities provide a monthly payment which consists of both interest and principal. Interest may be determined by fixed or adjustable rates. The rate of prepayments on underlying mortgages will affect the price and volatility of a mortgage-related security, and may have the effect of shortening or extending the effective duration of the security relative to what was anticipated at the time of purchase. The timely payment of principal and interest of certain mortgage-related securities is guaranteed with the full faith and credit of the U.S. Government. Pools created and guaranteed by non-governmental issuers, including government-sponsored corporations, may be supported by various forms of insurance or guarantees, but there can be no assurance that private insurers or guarantors can meet their obligations under the insurance policies or guarantee arrangements. Many of the risks of investing in mortgage-related securities secured by commercial mortgage loans reflect the effects of local and other economic conditions on real estate markets, the ability of tenants to make lease payments, and the ability of a property to attract and retain tenants. These securities may be less liquid and may exhibit greater price volatility than other types of mortgage-related or other asset-backed securities. Other asset-backed securities are created from many types of assets, including auto loans, credit card receivables, home equity loans, and student loans.
Collateralized Mortgage Obligations (“CMOs”) are debt obligations of a legal entity that are collateralized by whole mortgage loans or private
mortgage bonds and divided into classes. CMOs are structured into multiple classes, often referred to as “tranches,” with each class bearing a different stated maturity and entitled to a different schedule for payments of principal and interest, including prepayments. CMOs may be less liquid and may exhibit greater price volatility than other types of mortgage-related or asset-backed securities.
Collateralized Debt Obligations (“CDOs”) include Collateralized Bond Obligations (“CBOs”), Collateralized Loan Obligations (“CLOs”) and other similarly structured securities. CBOs and CLOs are types of asset-backed securities. A CBO is a trust which is backed by a diversified pool of high risk, below investment grade fixed income securities. A CLO is a trust typically collateralized by a pool of loans, which may include, among others, domestic and foreign senior secured loans, senior unsecured loans, and subordinate corporate loans, including loans that may be rated below investment grade or equivalent unrated loans. The risks of an investment in a CDO depend largely on the type of the collateral securities and the class of the CDO in which a Fund invests. In addition to the normal risks associated with fixed income securities discussed elsewhere in this report and the Funds’ prospectus and statement of additional information (e.g., prepayment risk, credit risk, liquidity risk, market risk, structural risk, legal risk and interest rate risk (which may be exacerbated if the interest rate payable on a structured financing changes based on multiples of changes in interest rates or inversely to changes in interest rates)), CBOs, CLOs and other CDOs carry additional risks including, but not limited to, (i) the possibility that distributions from collateral securities will not be adequate to make interest or other payments, (ii) the quality of the collateral may decline in value or default, (iii) a Fund may invest in CBOs, CLOs, or other CDOs that are subordinate to other classes, and (iv) the complex structure of the security may not be fully understood at the time of investment and may produce disputes with the issuer or unexpected investment results.
Stripped Mortgage-Backed Securities (“SMBS”) are derivative multi-class mortgage securities. SMBS are usually structured with two classes that receive different proportions of the interest and principal distributions on a pool of mortgage assets. An SMBS will have one class that will receive all of the interest (the interest-only or “IO” class), while the other class will receive the entire principal (the principal-only or “PO” class). Payments received for IOs are included in interest income on the Statements of Operations. Because no principal will be received at the maturity of an IO, adjustments are made to the cost of the security on a monthly basis until maturity. These adjustments are included in interest income on the Statements of Operations. Payments received for POs are treated as reductions to the cost and par value of the securities.
Payment In-Kind Securities Certain Funds may invest in payment in-kind securities (“PIKs”). PIKs may give the issuer the option at each interest payment date of making interest payments in either cash or additional debt securities. Those additional debt securities usually have the same terms,
| | | | | | |
| | ANNUAL REPORT | | JUNE 30, 2015 | | 123 |
Notes to Financial Statements (Cont.)
including maturity dates and interest rates, and associated risks as the original bonds. The daily market quotations of the original bonds may include the accrued interest (referred to as a dirty price) and require a pro rata adjustment from the unrealized appreciation or depreciation on investments to interest receivable on the Statements of Assets and Liabilities.
U.S. Government Agencies or Government-Sponsored Enterprises Certain Funds may invest in securities of U.S. Government agencies or government-sponsored enterprises. U.S. Government securities are obligations of and, in certain cases, guaranteed by, the U.S. Government, its agencies or instrumentalities. Some U.S. Government securities, such as Treasury bills, notes and bonds, and securities guaranteed by the Government National Mortgage Association (“GNMA” or “Ginnie Mae”), are supported by the full faith and credit of the U.S. Government; others, such as those of the Federal Home Loan Banks, are supported by the right of the issuer to borrow from the U.S. Department of the Treasury (the “U.S. Treasury”); and others, such as those of the Federal National Mortgage Association (“FNMA” or “Fannie Mae”), are supported by the discretionary authority of the U.S. Government to purchase the agency’s obligations. U.S. Government securities may include zero coupon securities. Zero coupon securities do not distribute interest on a current basis and tend to be subject to a greater risk than interest-paying securities.
Government-related guarantors (i.e., not backed by the full faith and credit of the U.S. Government) include FNMA and the Federal Home Loan Mortgage Corporation (“FHLMC” or “Freddie Mac”). FNMA is a government-sponsored corporation. FNMA purchases conventional (i.e., not insured or guaranteed by any government agency) residential mortgages from a list of approved seller/servicers which include state and federally chartered savings and loan associations, mutual savings banks, commercial banks and credit
unions and mortgage bankers. Pass-through securities issued by FNMA are guaranteed as to timely payment of principal and interest by FNMA, but are not backed by the full faith and credit of the U.S. Government. FHLMC issues Participation Certificates (“PCs”), which are pass-through securities, each representing an undivided interest in a pool of residential mortgages. FHLMC guarantees the timely payment of interest and ultimate collection of principal, but PCs are not backed by the full faith and credit of the U.S. Government.
Certain Funds may engage in strategies where it seeks to extend the expiration or maturity of a position, such as a to-be-announced (“TBA”) security on an underlying asset, by closing out the position before expiration and opening a new position with respect to the same underlying asset with a later expiration date. TBA securities are purchased or sold on a delayed-delivery basis.
Separate Trading of Registered Interest and Principal of Securities (“STRIPS”) are U.S. Treasury fixed income securities in which the principal is separated, or stripped, from the interest and each takes the form of zero coupon securities. A STRIP is sold at a significant discount to face value and offers no interest payments; rather, investors receive payment at maturity. Zero coupon securities do not distribute interest on a current basis and tend to be subject to greater risk than interest-paying securities.
When-Issued Transactions Certain Funds may purchase or sell securities on a when-issued basis. These transactions are made conditionally because a security, although authorized, has not yet been issued in the market. A commitment is made by a Fund to purchase or sell these securities for a predetermined price or yield, with payment and delivery taking place beyond the customary settlement period. A Fund may sell when-issued securities before they are delivered, which may result in a realized gain or loss.
(b) Investments in Affiliates
Each Fund may invest the cash collateral received for securities out on loan in the PIMCO Government Money Market Fund and PIMCO Money Market Fund under the Securities Lending Agreement. PIMCO Government Money Market Fund and PIMCO Money Market Fund are considered to be affiliated with the Funds. The table below shows the Funds’ transactions in and earnings from investments in these affiliated Funds for the period ended June 30, 2015 (amounts in thousands†):
Investments in PIMCO Money Market Fund
| | | | | | | | | | | | | | | | | | | | | | | | | | | | | | |
| Fund Name | | | | Market Value
06/30/2014 | | | Purchases
at Cost | | | Proceeds
from Sales | | | Net
Realized
Gain/(Loss) | | | Change in
Unrealized
Appreciation/
(Depreciation) | | | Market Value
06/30/2015 | | | Dividend
Income (1) | |
PIMCO 0-5 Year High Yield Corporate Bond Index Exchange-Traded Fund | | | | $ | 70,609 | | | $ | 220,962 | | | $ | (248,100 | ) | | $ | 0 | | | $ | 0 | | | $ | 43,471 | | | $ | 10 | |
PIMCO Investment Grade Corporate Bond Exchange-Exchange Traded Fund | | | | | 0 | | | | 2,743 | | | | (1,050 | ) | | | 0 | | | | 0 | | | | 1,693 | | | | 0 | |
| † | A zero balance may reflect actual amounts rounding to less than one thousand. |
| (1) | A portion of this income may be recharacterized to return of capital and reflected as such on tax forms mailed to shareholders on or about January 31st following each calendar year. |
5. BORROWINGS AND OTHER FINANCING TRANSACTIONS
The following disclosures contain information on a Fund’s ability to lend or borrow cash or securities to the extent permitted under the Act, which may be viewed as borrowing or financing transactions by a Fund. The location
and fair value amounts of these instruments are described below. For a detailed description of credit and counterparty risks that can be associated with borrowings and other financing transactions, please see Note 7, Principal Risks.
June 30, 2015
(a) Repurchase Agreements Certain Funds may engage in repurchase agreements. Under the terms of a typical repurchase agreement, a Fund takes possession of an underlying debt obligation (collateral) subject to an obligation of the seller to repurchase, and a Fund to resell, the obligation at an agreed-upon price and time. The underlying securities for all repurchase agreements are held in safekeeping at the Fund’s custodian or designated subcustodians under tri-party repurchase agreements. The market value of the collateral must be equal to or exceed the total amount of the repurchase obligations, including interest. Repurchase agreements, including accrued interest, are included on the Statements of Assets and Liabilities. Interest earned is recorded as a component of interest income on the Statements of Operations. In periods of increased demand for collateral, a Fund may pay a fee for receipt of collateral, which may result in interest expense to the Fund.
(b) Reverse Repurchase Agreements Certain Funds may enter into reverse repurchase agreements. In a reverse repurchase agreement, a Fund delivers a security in exchange for cash to a financial institution, the counterparty, with a simultaneous agreement to repurchase the same or substantially the same security at an agreed upon price and date. A Fund is entitled to receive principal and interest payments, if any, made on the security delivered to the counterparty during the term of the agreement. Cash received in exchange for securities delivered plus accrued interest payments to be made by a Fund to counterparties are reflected as a liability on the Statements of Assets and Liabilities. Interest payments made by a Fund to counterparties are recorded as a component of interest expense on the Statements of Operations. In periods of increased demand for the security, a Fund may receive a fee for use of the security by the counterparty, which may result in interest income to the Fund. A Fund will segregate assets determined to be liquid by PIMCO or will otherwise cover its obligations under reverse repurchase agreements.
(c) Sale-Buybacks Certain Funds may enter into financing transactions referred to as ‘sale-buybacks’. A sale-buyback transaction consists of a sale of a security by a Fund to a financial institution, the counterparty, with a simultaneous agreement to repurchase the same or substantially the same security at an agreed-upon price and date. A Fund is not entitled to receive principal and interest payments, if any, made on the security sold to the counterparty during the term of the agreement. The agreed-upon proceeds for securities to be repurchased by a Fund are reflected as a liability on the Statements of Assets and Liabilities. A Fund will recognize net income represented by the price differential between the price received for the transferred security and the agreed-upon repurchase price. This is commonly referred to as the ‘price drop’. A price drop consists of (i) the foregone interest and inflationary income adjustments, if any, a Fund would have otherwise received had the security not been sold and (ii) the negotiated financing terms between a Fund and counterparty. Foregone interest and inflationary income adjustments, if any, are recorded as components of interest income on the Statements of Operations. Interest payments based upon negotiated financing terms made by a Fund to counterparties are recorded as a component of
interest expense on the Statements of Operations. In periods of increased demand for the security, a Fund may receive a fee for use of the security by the counterparty, which may result in interest income to the Fund. A Fund will segregate assets determined to be liquid by PIMCO or will otherwise cover its obligations under sale-buyback transactions.
(d) Securities Lending The Funds listed below may seek to earn additional income by lending their securities to certain qualified broker-dealers and institutions on a short-term or long-term basis via a lending agent. Securities on loan are required to be secured by cash collateral at least equal to 102% of the domestic, or 105% of the foreign security’s market value. The Fund will then invest the cash collateral received in the PIMCO Government Money Market Fund or PIMCO Money Market Fund (see table below for designations) and record a liability for the return of the collateral during the period the securities are on loan. Each fund is subject to a lending limit of 33.33% of total assets (including the value of collateral).
The loans are subject to termination at the option of the borrower or the Fund. Upon termination of the loan, the borrower will return to the lender securities identical to the loaned securities. Should the borrower of the securities fail to return loaned securities, the Fund has the right to repurchase the securities using the collateral in the open market.
The borrower pays fees at the Funds’ direction to the lending agent. The lending agent may retain a portion of the fees and interest earned on the cash collateral invested as compensation for its services. Investments made with the cash collateral are disclosed on the Schedules of Investments (if applicable). The lending fees and the Funds’ portion of the interest income earned on cash collateral are included on the Statements of Operations as securities lending income (if applicable).
| | | | |
| Fund Name | | | | Cash Collateral Reinvestment Vehicle |
PIMCO 1-3 Year U.S. Treasury Index Exchange-Traded Fund | | | | PIMCO Government Money Market Fund |
PIMCO 3-7 Year U.S. Treasury Index Exchange-Traded Fund | | | | PIMCO Government Money Market Fund |
PIMCO 7-15 Year U.S. Treasury Index Exchange-Traded Fund | | | | PIMCO Government Money Market Fund |
PIMCO 25+ Year Zero Coupon U.S. Treasury Index Exchange-Traded Fund | | | | PIMCO Government Money Market Fund |
PIMCO 1-5 Year U.S. TIPS Index Exchange-Traded Fund | | | | PIMCO Government Money Market Fund |
PIMCO 15+ Year U.S. TIPS Index Exchange-Traded Fund | | | | PIMCO Government Money Market Fund |
PIMCO Broad U.S. TIPS Index Exchange-Traded Fund | | | | PIMCO Government Money Market Fund |
PIMCO 0-5 Year High Yield Corporate Bond Index Exchange-Traded Fund | | | | PIMCO Money Market Fund |
PIMCO Investment Grade Corporate Bond Index Exchange-Traded Fund | | | | PIMCO Money Market Fund |
PIMCO Enhanced Short Maturity Active Exchange-Traded Fund | | | | PIMCO Money Market Fund |
(e) Short Sales Certain Funds may enter into short sales transactions. A short sale is a transaction in which a Fund sells securities it may not own in
| | | | | | |
| | ANNUAL REPORT | | JUNE 30, 2015 | | 125 |
Notes to Financial Statements (Cont.)
anticipation of a decline in the fair market value of the securities. Securities sold in short sale transactions and the interest payable on such securities, if any, are reflected as a liability on the Statements of Assets and Liabilities. A Fund is obligated to deliver securities at the trade price at the time the short position is covered. Possible losses from short sales may be unlimited, whereas losses from purchases cannot exceed the total amount invested.
6. FINANCIAL DERIVATIVE INSTRUMENTS
The following disclosures contain information on how and why the Funds use financial derivative instruments, the credit-risk-related contingent features in certain financial derivative instruments, and how financial derivative instruments affect the Funds’ financial positions, results of operations and cash flows. The location and fair value amounts of these instruments on the Statements of Assets and Liabilities and the realized and changes in unrealized gains and losses on the Statements of Operations, each categorized by type of financial derivative contract and related risk exposure, are included in a table in the Notes to Schedules of Investments. The financial derivative instruments outstanding as of period end and the amounts of realized and changes in unrealized gains and losses on financial derivative instruments during the period, as disclosed in the Notes to Schedules of Investments, serve as indicators of the volume of financial derivative activity for the Funds.
(a) Forward Foreign Currency Contracts Certain Funds may enter into forward foreign currency contracts in connection with settling planned purchases or sales of securities, to hedge the currency exposure associated with some or all of a Fund’s securities or as a part of an investment strategy. A forward foreign currency contract is an agreement between two parties to buy and sell a currency at a set price on a future date. The market value of a forward foreign currency contract fluctuates with changes in foreign currency exchange rates. Forward foreign currency contracts are marked to market daily, and the change in value is recorded by a Fund as an unrealized gain or loss. Realized gains or losses are equal to the difference between the value of the contract at the time it was opened and the value at the time it was closed and are recorded upon delivery or receipt of the currency. These contracts may involve market risk in excess of the unrealized gain or loss reflected on the Statements of Assets and Liabilities. In addition, a Fund could be exposed to risk if the counterparties are unable to meet the terms of the contracts or if the value of the currency changes unfavorably to the U.S. dollar. To mitigate such risk, cash or securities may be exchanged as collateral pursuant to the terms of the underlying contracts.
(b) Futures Contracts Certain Funds may enter into futures contracts. A Fund may use futures contracts to manage its exposure to the securities markets or to movements in interest rates and currency values. The primary risks associated with the use of futures contracts are the imperfect correlation between the change in market value of the securities held by a Fund and the prices of futures contracts and the possibility of an illiquid market. Futures contracts are valued based upon their quoted daily settlement
prices. Upon entering into a futures contract, a Fund is required to deposit with its futures broker an amount of cash, U.S. Government and Agency Obligations, or select sovereign debt, in accordance with the initial margin requirements of the broker or exchange. Futures contracts are marked to market daily and based on such movements in the price of the contracts, an appropriate payable or receivable for the change in value may be posted or collected by the Fund (“variation margin”). Gains or losses are recognized but not considered realized until the contracts expire or close. Futures contracts involve, to varying degrees, risk of loss in excess of variation margin disclosed within exchange traded or centrally cleared financial derivative instruments on the Statements of Assets and Liabilities.
(c) Options Contracts Certain Funds may write call and put options on securities and financial derivative instruments they own or in which they may invest. Writing put options tends to increase a Fund’s exposure to the underlying instrument. Writing call options tends to decrease a Fund’s exposure to the underlying instrument. When a Fund writes a call or put, an amount equal to the premium received is recorded as a liability and subsequently marked to market to reflect the current value of the option written. These liabilities are included on the Statements of Assets and Liabilities. Premiums received from writing options which expire are treated as realized gains. Premiums received from writing options which are exercised or closed are added to the proceeds or offset against amounts paid on the underlying futures, swap, security or currency transaction to determine the realized gain or loss. Certain options may be written with premiums to be determined on a future date. The premiums for these options are based upon implied volatility parameters at specified terms. A Fund as a writer of an option has no control over whether the underlying instrument may be sold (“call”) or purchased (“put”) and as a result bears the market risk of an unfavorable change in the price of the instrument underlying the written option. There is the risk a Fund may not be able to enter into a closing transaction because of an illiquid market.
Certain Funds may also purchase put and call options. Purchasing call options tends to increase a Fund’s exposure to the underlying instrument. Purchasing put options tends to decrease a Fund’s exposure to the underlying instrument. A Fund pays a premium which is included as an asset on the Statements of Assets and Liabilities and subsequently marked to market to reflect the current value of the option. Premiums paid for purchasing options which expire are treated as realized losses. Certain options may be purchased with premiums to be determined on a future date. The premiums for these options are based upon implied volatility parameters at specified terms. The risk associated with purchasing put and call options is limited to the premium paid. Premiums paid for purchasing options which are exercised or closed are added to the amounts paid or offset against the proceeds on the underlying investment transaction to determine the realized gain or loss when the underlying transaction is executed.
Inflation-Capped Options Certain Funds may write or purchase inflation-capped options to enhance returns or for hedging opportunities. When a
June 30, 2015
Fund writes an inflation-capped option, an amount equal to the premium received is recorded as a liability and subsequently marked to market to reflect the current value of the option written. When a Fund purchases an inflation-capped option, the Fund pays a premium which is recorded as an asset and subsequently marked to market to reflect the current value of the option. The purpose of purchasing inflation-capped options is to protect a Fund from inflation erosion above a certain rate on a given notional exposure. A floor can be used to give downside protection to investments in inflation-linked products.
Options on Exchange-Traded Futures Contracts Certain Funds may write or purchase options on exchange-traded futures contracts (“Futures Option”) to hedge an existing position or future investment, for speculative purposes or to manage exposure to market movements. A Futures Option is an option contract in which the underlying instrument is a single futures contract.
Credit Default Swaptions Certain Funds may write or purchase credit default swaption agreements to hedge exposure to the credit risk of an investment without making a commitment to the underlying instrument. A credit default swaption is an option to sell or buy credit protection to a specific reference by entering into a pre-defined swap agreement by some specified date in the future.
Interest Rate Swaptions Certain Funds may write or purchase interest rate swaption agreements which are options to enter into a pre-defined swap agreement by some specified date in the future. The writer of the swaption becomes the counterparty to the swap if the buyer exercises. The interest rate swaption agreement will specify whether the buyer of the swaption will be a fixed-rate receiver or a fixed-rate payer upon exercise.
Foreign Currency Options Certain Funds may write or purchase foreign currency options. Purchasing foreign currency options gives a Fund the right, but not the obligation to buy or sell the currency with specified amounts of currency and a rate of exchange that may be exercised by a certain date. These options may be used as a short or long hedge against possible variations in foreign exchange rates or to gain exposure to foreign currencies.
Options on Securities Certain Funds may write or purchase options on securities. An option uses a specified security as the underlying instrument for the option contract. A Fund may write or purchase options to enhance returns or to hedge an existing position or future investment.
(d) Swap Agreements Certain Funds may invest in swap agreements. Swap agreements are bilaterally negotiated agreements between a Fund and a counterparty to exchange or swap investment cash flows, assets, foreign currencies or market-linked returns at specified, future intervals. Swap agreements may be privately negotiated in the over the counter market (“OTC swaps”) or may be cleared through a third party, known as a central counterparty or derivatives clearing organization (“centrally cleared
swaps”). A Fund may enter into asset, credit default, cross-currency, interest rate, total return, variance and other forms of swap agreements to manage its exposure to credit, currency, interest rate, commodity, equity and inflation risk. In connection with these agreements, securities or cash may be identified as collateral or margin in accordance with the terms of the respective swap agreements to provide assets of value and recourse in the event of default or bankruptcy/insolvency.
Swaps are marked to market daily based upon valuations as determined from the underlying contract or in accordance with the requirements of the central counterparty or derivatives clearing organization. Changes in market value, if any, are reflected as a component of net change in unrealized appreciation/(depreciation) on the Statements of Operations. Daily changes in valuation of centrally cleared swaps, if any, are recorded as variation margin on the Statements of Assets and Liabilities. OTC swap payments received or paid at the beginning of the measurement period are included on the Statements of Assets and Liabilities and represent premiums paid or received upon entering into the swap agreement to compensate for differences between the stated terms of the swap agreement and prevailing market conditions (credit spreads, currency exchange rates, interest rates, and other relevant factors). Upfront premiums received (paid) are initially recorded as liabilities (assets) and subsequently marked to market to reflect the current value of the swap. These upfront premiums are recorded as realized gains or losses on the Statements of Operations upon termination or maturity of the swap. A liquidation payment received or made at the termination of the swap is recorded as realized gain or loss on the Statements of Operations. Net periodic payments received or paid by a Fund are included as part of realized gains or losses on the Statements of Operations.
For purposes of applying a Fund’s investment policies and restrictions, swap agreements are generally valued by a Fund at market value. In the case of a credit default swap (see below), however, in applying certain of a Fund’s investment policies and restrictions the Funds will value the credit default swap at its notional value or its full exposure value (i.e., the sum of the notional amount for the contract plus the market value), but may value the credit default swap at market value for purposes of applying certain of a Fund’s other investment policies and restrictions. For example, a Fund may value credit default swaps at full exposure value for purposes of a Fund’s credit quality guidelines (if any) because such value reflects a Fund’s actual economic exposure during the term of the credit default swap agreement. In this context, both the notional amount and the market value may be positive or negative depending on whether a Fund is selling or buying protection through the credit default swap. The manner in which certain securities or other instruments are valued by a Fund for purposes of applying investment policies and restrictions may differ from the manner in which those investments are valued by other types of investors.
Entering into these agreements involves, to varying degrees, elements of interest, credit, market and documentation risk in excess of the amounts
| | | | | | |
| | ANNUAL REPORT | | JUNE 30, 2015 | | 127 |
Notes to Financial Statements (Cont.)
recognized on the Statements of Assets and Liabilities. Such risks involve the possibility that there will be no liquid market for these agreements, that the counterparty to the agreements may default on its obligation to perform or disagree as to the meaning of contractual terms in the agreements and that there may be unfavorable changes in interest rates.
A Fund’s maximum risk of loss from counterparty credit risk is the discounted net value of the cash flows to be received from the counterparty over the contract’s remaining life, to the extent that amount is positive. The risk is mitigated by having a master netting arrangement between a Fund and the counterparty and by the posting of collateral to a Fund to cover a Fund’s exposure to the counterparty.
Credit Default Swap Agreements Credit default swap agreements involve one party making a stream of payments (referred to as the buyer of protection) to another party (the seller of protection) in exchange for the right to receive a specified return in the event that the referenced entity, obligation or index, as specified in the agreement, undergoes a certain credit event. As a seller of protection on credit default swap agreements, a Fund will generally receive from the buyer of protection a fixed rate of income throughout the term of the swap provided that there is no credit event. As the seller, a Fund would effectively add leverage to its portfolio because, in addition to its total net assets, a Fund would be subject to investment exposure on the notional amount of the swap.
If a Fund is a seller of protection and a credit event occurs, as defined under the terms of that particular swap agreement, a Fund will either (i) pay to the buyer of protection an amount equal to the notional amount of the swap and take delivery of the referenced obligation, other deliverable obligations or underlying securities comprising the referenced index or (ii) pay a net settlement amount in the form of cash or securities equal to the notional amount of the swap less the recovery value of the referenced obligation or underlying securities comprising the referenced index. If a Fund is a buyer of protection and a credit event occurs, as defined under the terms of that particular swap agreement, a Fund will either (i) receive from the seller of protection an amount equal to the notional amount of the swap and deliver the referenced obligation, other deliverable obligations or underlying securities comprising the referenced index or (ii) receive a net settlement amount in the form of cash or securities equal to the notional amount of the swap less the recovery value of the referenced obligation or underlying securities comprising the referenced index. Recovery values are estimated by market makers considering either industry standard recovery rates or entity specific factors and considerations until a credit event occurs. If a credit event has occurred, the recovery value is determined by a facilitated auction whereby a minimum number of allowable broker bids, together with a specified valuation method, are used to calculate the settlement value.
Credit default swap agreements on corporate or sovereign involve one party making a stream of payments to another party in exchange for the right to receive a specified return in the event that the referenced entity, obligation
or index, as specified in the agreement, undergoes a certain credit event. If a credit event occurs and cash settlement is not elected, a variety of other deliverable obligations may be delivered in lieu of the specific referenced obligation. The ability to deliver other obligations may result in a cheapest-to-deliver option (the buyer of protection’s right to choose the deliverable obligation with the lowest value following a credit event). A Fund may use credit default swaps on corporate or sovereign issues to provide a measure of protection against defaults of the issuers (i.e., to reduce risk where a Fund owns or has exposure to the referenced obligation) or to take an active long or short position with respect to the likelihood of a particular issuer’s default.
Credit default swap agreements on credit indices involve one party making a stream of payments to another party in exchange for the right to receive a specified return in the event of a write-down, principal shortfall, interest shortfall or default of all or part of the referenced entities comprising the credit index. A credit index is a basket of credit instruments or exposures designed to be representative of some part of the credit market as a whole. These indices are made up of reference credits that are judged by a poll of dealers to be the most liquid entities in the credit default swap market based on the sector of the index. Components of the indices may include, but are not limited to, investment grade securities, high yield securities, asset-backed securities, emerging markets, and/or various credit ratings within each sector. Credit indices are traded using credit default swaps with standardized terms including a fixed spread and standard maturity dates. An index credit default swap references all the names in the index, and if there is a default, the credit event is settled based on that name’s weight in the index. The composition of the indices changes periodically, usually every six months, and for most indices, each name has an equal weight in the index. A Fund may use credit default swaps on credit indices to hedge a portfolio of credit default swaps or bonds, which is less expensive than it would be to buy many credit default swaps to achieve a similar effect. Credit default swaps on indices are instruments for protecting investors owning bonds against default, and traders use them to speculate on changes in credit quality.
Implied credit spreads, represented in absolute terms, utilized in determining the market value of credit default swap agreements on corporate or sovereign issues as of period end are disclosed in the Notes to Schedules of Investments. They serve as an indicator of the current status of payment/performance risk and represent the likelihood or risk of default for the reference entity. The implied credit spread of a particular referenced entity reflects the cost of buying/selling protection and may include upfront payments required to be made to enter into the agreement. Wider credit spreads represent a deterioration of the referenced entity’s credit soundness and a greater likelihood or risk of default or other credit event occurring as defined under the terms of the agreement. For credit default swap agreements on asset-backed securities and credit indices, the quoted market prices and resulting values serve as the indicator of the current status of the
June 30, 2015
payment/performance risk. Increasing market values, in absolute terms when compared to the notional amount of the swap, represent a deterioration of the referenced entity’s credit soundness and a greater likelihood or risk of default or other credit event occurring as defined under the terms of the agreement.
The maximum potential amount of future payments (undiscounted) that a Fund as a seller of protection could be required to make under a credit default swap agreement equals the notional amount of the agreement. Notional amounts of each individual credit default swap agreement outstanding as of period end for which a Fund is the seller of protection are disclosed in the Notes to Schedules of Investments. These potential amounts would be partially offset by any recovery values of the respective referenced obligations, upfront payments received upon entering into the agreement, or net amounts received from the settlement of buy protection credit default swap agreements entered into by a Fund for the same referenced entity or entities.
Interest Rate Swap Agreements Certain Funds are subject to interest rate risk exposure in the normal course of pursuing their investment objectives. Because a Fund holds fixed rate bonds, the value of these bonds may decrease if interest rates rise. To help hedge against this risk and to maintain its ability to generate income at prevailing market rates, a Fund may enter into interest rate swap agreements. Interest rate swap agreements involve the exchange by a Fund with another party for their respective commitment to pay or receive interest on the notional amount of principal. Certain forms of interest rate swap agreements may include: (i) interest rate caps, under which, in return for a premium, one party agrees to make payments to the other to the extent that interest rates exceed a specified rate, or “cap”, (ii) interest rate floors, under which, in return for a premium, one party agrees to make payments to the other to the extent that interest rates fall below a specified rate, or “floor”, (iii) interest rate collars, under which a party sells a cap and purchases a floor or vice versa in an attempt to protect itself against interest rate movements exceeding given minimum or maximum levels, (iv) callable interest rate swaps, under which the buyer pays an upfront fee in consideration for the right to early terminate the swap transaction in whole, at zero cost and at a predetermined date and time prior to the maturity date, (v) spreadlocks, which allow the interest rate swap users to lock in the forward differential (or spread) between the interest rate swap rate and a specified benchmark, or (vi) basis swaps, under which two parties can exchange variable interest rates based on different segments of money markets.
7. PRINCIPAL RISKS
In the normal course of business, the Funds trade financial instruments and enter into financial transactions where risk of potential loss exists due to such things as changes in the market (market risk) or failure or inability of the other party to a transaction to perform (credit and counterparty risk). See below for a detailed description of select principal risks. For a more
comprehensive list of potential risks the Funds may be subject to, please see the Important Information About the Funds.
Market Risks A Fund’s investments in fixed income securities expose the Fund to various risks such as but not limited to, market trading, interest rate, foreign currency, commodity, equity, management and tracking error and indexing risks.
Market trading risk is the risk that an active secondary trading market for a Fund’s shares does not develop or continue, that a Fund may not continue to meet a listing exchange’s trading or listing requirements, or that Fund shares trade at prices other than the Fund’s NAV.
Interest rate risk is the risk that fixed income securities will decline in value because of an increase in interest rates. As nominal interest rates rise, the value of certain fixed income securities held by a Fund is likely to decrease. A nominal interest rate can be described as the sum of a real interest rate and an expected inflation rate. Interest rate changes can be sudden and unpredictable, and a Fund may lose money if these changes are not anticipated by Fund management. A Fund may not be able to hedge against changes in interest rates or may choose not to do so for cost or other reasons. In addition, any hedges may not work as intended.
Fixed income securities with longer durations tend to be more sensitive to changes in interest rates, usually making them more volatile than securities with shorter durations. Duration can be useful primarily as a measure of the sensitivity of a fixed income security’s market price to interest rate (i.e., yield) movements that incorporates a security’s yield, coupon, final maturity and call features, among other characteristics. A wide variety of factors can cause interest rates to rise (e.g., central bank monetary policies, inflation rates, general economic conditions). At present, the U.S. is experiencing historically low interest rates. This, combined with recent economic recovery and the end of the Fed’s quantitative easing program in October 2014, may increase the probability of an upward interest rate environment in the near future. Further, while U.S. bond markets have steadily grown over the past three decades, dealer “market making” ability has remained relatively stagnant. Given the importance of intermediary “market making” in creating a robust and active market, fixed income securities are currently facing increased volatility and liquidity risks. All of these factors, collectively and/or individually, could cause a Fund to lose value. If a Fund lost enough value, the Fund could face increased redemptions by shareholders, which could further impair its performance.
Certain Funds may invest in securities and instruments that are economically tied to Russia. Investments in Russia are subject to various risks such as, but not limited to political, economic, legal, market and currency risks. The risks include uncertain political and economic policies, short-term market volatility, poor accounting standards, corruption and crime, an inadequate regulatory system, and unpredictable taxation. Investments in Russia are particularly subject to the risk that further economic sanctions may be imposed by the United States and/or other countries. Such sanctions — which may impact
| | | | | | |
| | ANNUAL REPORT | | JUNE 30, 2015 | | 129 |
Notes to Financial Statements (Cont.)
companies in many sectors, including energy, financial services and defense, among others — may negatively impact a Fund’s performance and/or ability to achieve its investment objective. The Russian securities market is characterized by limited volume of trading, resulting in difficulty in obtaining accurate prices. The Russian securities market, as compared to U.S. markets, has significant price volatility, less liquidity, a smaller market capitalization and a smaller number of traded securities. There may be little publicly available information about issuers. Settlement, clearing and registration of securities transactions are subject to risks because of registration systems that may not be subject to effective government supervision. This may result in significant delays or problems in registering the transfer of securities. Russian securities laws may not recognize foreign nominee accounts held with a custodian bank, and therefore the custodian may be considered the ultimate owner of securities they hold for their clients. Ownership of securities issued by Russian companies is recorded by companies themselves and by registrars instead of through a central registration system. It is possible that the ownership rights of certain Funds could be lost through fraud or negligence. While applicable Russian regulations impose liability on registrars for losses resulting from their errors, it may be difficult for certain Funds to enforce any rights it may have against the registrar or issuer of the securities in the event of loss of share registration. Adverse currency exchange rates are a risk and there may be a lack of available currency hedging instruments. Investments in Russia may be subject to the risk of nationalization or expropriation of assets. Oil, natural gas, metals, and timber account for a significant portion of Russia’s exports, leaving the country vulnerable to swings in world prices.
If a Fund invests directly in foreign (non-U.S.) currencies or in securities that trade in, and receive revenues in, foreign (non-U.S.) currencies, or in financial derivatives that provide exposure to foreign (non-U.S.) currencies, it will be subject to the risk that those currencies will decline in value relative to the base currency of the Fund, or, in the case of hedging positions, that the Fund’s base currency will decline in value relative to the currency being hedged. Currency rates in foreign countries may fluctuate significantly over short periods of time for a number of reasons, including changes in interest rates, intervention (or the failure to intervene) by U.S. or foreign governments, central banks or supranational entities such as the International Monetary Fund, or by the imposition of currency controls or other political developments in the United States or abroad. As a result, a Fund’s investments in foreign currency-denominated securities may reduce the Fund’s returns.
A Fund’s investments in commodity-linked financial derivative instruments may subject the Fund to greater market price volatility than investments in traditional securities. The value of commodity-linked financial derivative instruments may be affected by changes in overall market movements, commodity index volatility, changes in interest rates, or factors affecting a particular industry or commodity, such as drought, floods, weather, livestock disease, embargoes, tariffs and international economic, political and regulatory developments.
The market values of equities, such as common stocks and preferred securities or equity related investments such as futures and options, have historically risen and fallen in periodic cycles and may decline due to general market conditions which are not specifically related to a particular company, such as real or perceived adverse economic conditions, changes in the general outlook for corporate earnings, changes in interest or currency rates or adverse investor sentiment generally. They may also decline due to factors which affect a particular industry or industries, such as labor shortages or increased production costs and competitive conditions within an industry. Different types of equity securities may react differently to these developments. Equity securities and equity related investments generally have greater market price volatility than fixed income securities.
Management and Tracking Error Risk is the risk that the portfolio manager’s investment decisions may not produce the desired results or that an Index Fund’s portfolio may not correlate to the Fund’s Index.
Indexing risk is the risk that a Fund is negatively affected by general declines in the market segments or asset classes represented by the Fund’s Index.
Credit and Counterparty Risks A Fund will be exposed to credit risk to parties with whom it trades and will also bear the risk of settlement default. A Fund minimizes concentrations of credit risk by undertaking transactions with a large number of customers and counterparties on recognized and reputable exchanges where applicable. For derivatives traded on exchanges, the primary credit risk is the creditworthiness of a Fund’s clearing broker or the exchange itself. A Fund could lose money if the issuer or guarantor of a fixed income security, or the counterparty to a financial derivatives contract, repurchase agreement or a loan of portfolio securities, is unable or unwilling to make timely principal and/or interest payments, or to otherwise honor its obligations. Securities are subject to varying degrees of credit risk, which are often reflected in credit ratings.
Similar to credit risk, a Fund may be exposed to counterparty risk, or the risk that an institution or other entity with which the Fund has unsettled or open transactions will default. PIMCO, as the Manager, minimizes counterparty risks to the Funds through a number of ways. Prior to entering into transactions with a new counterparty, the PIMCO Counterparty Risk Committee conducts an extensive credit review of such counterparty and must approve the use of such counterparty. Furthermore, pursuant to the terms of the underlying contract, to the extent that unpaid amounts owed to a Fund exceed a predetermined threshold, such counterparty shall advance collateral to the Fund in the form of cash or securities equal in value to the unpaid amount owed to the Fund. A Fund may invest such collateral in securities or other instruments and will typically pay interest to the counterparty on the collateral received. If the unpaid amount owed to a Fund subsequently decreases, the Fund would be required to return to the counterparty all or a portion of the collateral previously advanced.
All transactions in listed securities are settled/paid for upon delivery using approved counterparties. The risk of default is considered minimal, as
June 30, 2015
delivery of securities sold is only made once a Fund has received payment. Payment is made on a purchase once the securities have been delivered by the counterparty. The trade will fail if either party fails to meet its obligation.
Master Netting Arrangements The Funds may be subject to various netting arrangements with select counterparties (“Master Agreements”). Master Agreements govern the terms of certain transactions, and reduce the counterparty risk associated with relevant transactions by specifying credit protection mechanisms and providing standardization that improves legal certainty. Each type of Master Agreement governs certain types of transactions. Different types of transactions may be traded out of different legal entities or affiliates of a particular organization, resulting in the need for multiple agreements with a single counterparty. As the Master Agreements are specific to unique operations of different asset types, they allow a Fund to close out and net its total exposure to a counterparty in the event of a default with respect to all the transactions governed under a single Master Agreement with a counterparty. For financial reporting purposes the Statements of Assets and Liabilities generally show derivative assets and liabilities on a gross basis, which reflects the full risks and exposures prior to netting.
Master Agreements can also help limit counterparty risk by specifying collateral posting arrangements at pre-arranged exposure levels. Under the Master Agreements, collateral is routinely transferred if the total net exposure to certain transactions (net of existing collateral already in place) governed under the relevant Master Agreement with a counterparty in a given account exceeds a specified threshold, which typically ranges from zero to $250,000 depending on the counterparty and the type of Master Agreement. United States Treasury Bills and U.S. dollar cash are generally the preferred forms of collateral, although other forms of AAA rated paper or sovereign securities may be used. Securities and cash pledged as collateral are reflected as assets on the Statements of Assets and Liabilities as either a component of Investments at value (securities) or Deposits due from Counterparties (cash). Cash collateral received is not typically held in a segregated account and as such is reflected as a liability on the Statements of Assets and Liabilities as Deposits due to Counterparties. The market value of any securities received as collateral is not reflected as a component of NAV. A Fund’s overall exposure to counterparty risk can change substantially within a short period, as it is affected by each transaction subject to the relevant Master Agreement.
Master Repurchase Agreements and Global Master Repurchase Agreements (individually and collectively “Master Repo Agreements”) govern repurchase, reverse repurchase, and sale-buyback transactions between a Fund and select counterparties. Master Repo Agreements maintain provisions for, among other things, initiation, income payments, events of default, and maintenance of collateral. The market value of transactions under the Master Repo Agreement, collateral pledged or received, and the net exposure by counterparty as of period end are disclosed in the Notes to Schedule of Investments.
Master Securities Forward Transaction Agreements (“Master Forward Agreements”) govern certain forward settling transactions, such as TBA securities, delayed-delivery or sale-buyback transactions by and between a Fund and select counterparties. The Master Forward Agreements maintain provisions for, among other things, initiation and confirmation, payment and transfer, events of default, termination, and maintenance of collateral. The market value of forward settling transactions, collateral pledged or received, and the net exposure by counterparty as of period end is disclosed in the Notes to Schedule of Investments.
Customer Account Agreements and related addendums govern cleared derivatives transactions such as futures, options on futures, and cleared Over the Counter (“OTC”) derivatives. Such transactions require posting of initial margin as determined by each relevant clearing agency which is segregated at a broker account registered with the Commodity Futures Trading Commission (“CFTC”), or the applicable regulator. In the United States, counterparty risk is significantly reduced as creditors of a futures broker cannot have a claim to Fund assets in the segregated account. Additionally, portability of exposure in the event of a default scenario further reduces risk to the Funds. Variation margin, or changes in market value, are exchanged daily, but may not be netted between futures and cleared OTC derivatives. The market value or accumulated unrealized appreciation or depreciation, initial margin posted, and any unsettled variation margin as of period end is disclosed in the Notes to Schedule of Investments.
International Swaps and Derivatives Association, Inc. Master Agreements and Credit Support Annexes (“ISDA Master Agreements”) govern OTC derivative transactions entered into by a Fund with select counterparties. ISDA Master Agreements maintain provisions for general obligations, representations, agreements, collateral and events of default or termination. Events of termination include conditions that may entitle counterparties to elect to terminate early and cause settlement of all outstanding transactions under the applicable ISDA Master Agreement. Any election to terminate early could be material to the financial statements. In limited circumstances, the ISDA Master Agreement may contain additional provisions that add counterparty protection beyond coverage of existing daily exposure if the counterparty has a decline in credit quality below a predefined level. These amounts, if any, may be segregated with a third-party custodian. The market value of OTC financial derivative instruments, collateral received or pledged, and net exposure by counterparty as of period end are disclosed in the Notes to Schedule of Investments.
8. FEES AND EXPENSES
(a) Management Fee PIMCO, a majority-owned subsidiary of Allianz Asset Management of America L.P. (“Allianz Asset Management”), serves as the Manager to the Trust, pursuant to an investment management agreement. Each Fund pays PIMCO fees in return for providing investment advisory, supervisory and administrative services under an all-in fee structure. Each
| | | | | | |
| | ANNUAL REPORT | | JUNE 30, 2015 | | 131 |
Notes to Financial Statements (Cont.)
Fund will pay monthly management fees to PIMCO at an annual rate based on average daily net assets (the “Management Fee”), at an annual rate as noted in the table below.
| | | | | | |
| Fund Name | | | | Management Fee | |
PIMCO 1-3 Year U.S. Treasury Index Exchange-Traded Fund | | | | | 0.15 | % |
PIMCO 3-7 Year U.S. Treasury Index Exchange-Traded Fund | | | | | 0.15 | % |
PIMCO 7-15 Year U.S. Treasury Index Exchange-Traded Fund | | | | | 0.15 | % |
PIMCO 25+ Year Zero Coupon U.S. Treasury Index Exchange Traded Fund | | | | | 0.15 | % |
PIMCO 1-5 Year U.S. TIPS Index Exchange-Traded Fund | | | | | 0.20 | % |
PIMCO 15+ Year U.S. TIPS Index Exchange-Traded Fund | | | | | 0.20 | % |
PIMCO Broad U.S. TIPS Index Exchange-Traded Fund | | | | | 0.20 | % |
PIMCO 0-5 Year High Yield Corporate Bond Index Exchange-Traded Fund | | | | | 0.55 | % |
PIMCO Investment Grade Corporate Bond Index Exchange-Traded Fund | | | | | 0.20 | % |
PIMCO Diversified Income Active Exchange-Traded Fund | | | | | 0.85 | % |
PIMCO Enhanced Short Maturity Active Exchange-Traded Fund | | | | | 0.35 | % |
PIMCO Foreign Currency Strategy Active Exchange-Traded Fund | | | | | 0.65 | % |
PIMCO Global Advantage® Inflation-Linked Bond Active Exchange-Traded Fund | | | | | 0.60 | % |
PIMCO Intermediate Municipal Bond Active Exchange-Traded Fund | | | | | 0.35 | % |
PIMCO Low Duration Active Exchange-Traded Fund | | | | | 0.55 | % |
PIMCO Short Term Municipal Bond Active Exchange-Traded Fund | | | | | 0.35 | % |
PIMCO Total Return Active Exchange-Traded Fund | | | | | 0.55 | % |
(b) Distribution and Servicing Fees PIMCO Investments LLC (“PI”), a wholly-owned subsidiary of PIMCO, serves as the distributor (“Distributor”) of each Fund’s Creation Units. The Distributor does not maintain a secondary market in shares of the Funds. During the period ended June 30, 2015 each Fund was permitted to compensate the Distributor at an annual rate of up to 0.25% of a Fund’s average daily net assets (the “12b-1 Plan Fee”). However, the Board of Trustees has determined not to authorize payment of a 12b-1 Plan Fee at this time. The 12b-1 Plan Fee may only be imposed or increased when the Board determines that it is in the best interests of shareholders to do so. Because these fees are paid out of a Fund’s assets on an ongoing basis, to the extent that a fee is authorized, over time it will increase the cost of an investment in the Fund. The 12b-1 Plan Fee may cost an investor more than other types of sales charges.
(c) Fund Expenses PIMCO provides or procures supervisory and administrative services for shareholders and also bears the costs of various third-party services required by the Funds, including audit, custodial, portfolio accounting, legal, transfer agency and printing costs. The Funds bear other expenses which are not covered under the Management Fee which may vary and affect the total level of expenses paid by shareholders, such as (i) taxes and governmental fees; (ii) brokerage fees and commissions and other portfolio transaction expenses; (iii) costs of borrowing money, including interest expense; (iv) securities lending fees and expenses; (v) fees and expenses of the Trustees who are not “interested persons” of PIMCO or the Trust, and any counsel retained exclusively for their benefit; (vi) extraordinary expense,
including costs of litigation and indemnification expenses; and (vii) organizational expenses. The ratio of expenses to average net assets, as disclosed on the Financial Highlights, may differ from the annual fund operating expenses as disclosed in the Prospectus for the reasons set forth above.
Each unaffiliated Trustee receives an annual retainer of $35,000, plus $3,600 for each Board meeting attended in person, $750 for each committee meeting attended and $750 for each Board meeting attended telephonically, plus reimbursement of related expenses. In addition, the audit committee chair receives an additional annual retainer of $5,000, the valuation oversight committee lead receives an additional annual retainer of $3,150 (to the extent there are co-leads of the valuation oversight committee, the annual retainer will be split evenly between the co-leads) and the governance committee chair receives an additional annual retainer of $1,250.
These expenses are allocated on a pro rata basis to each Fund of the Trust according to its respective net assets. The Trust pays no compensation directly to any Trustee or any other officer who is affiliated with the Manager, all of whom receive remuneration for their services to the Trust from the Manager or its affiliates.
(d) Expense Limitation Through October 31, 2014 PIMCO agreed to waive a portion of PIMCO 1-3 Year U.S. Treasury Index Exchange-Traded Fund’s Management Fee equal to 0.06% of average daily net assets. Under the Fee Waiver Agreement, PIMCO is entitled to reimbursement by the Fund of any portion of the Management Fees waived, reduced or reimbursed pursuant to the Fee Waiver Agreement (the “Reimbursement Amount”) during the previous three years, provided that such amount paid to PIMCO did not: 1) together with any recoupment of organizational expenses and pro rata Trustees’ fees pursuant to the Expense Limitation Agreement, exceed the expense limit; 2) exceed the total Reimbursement Amount; or 3) include any amounts previously reimbursed to PIMCO.
PIMCO has contractually agreed, through October 31, 2015, to waive a portion of PIMCO Low Duration Active Exchange-Traded Fund’s Management Fee equal to 0.06% of average daily net assets. Under the Fee Waiver Agreement, PIMCO is entitled to reimbursement by the Fund of any portion of the Management Fees waived, reduced or reimbursed pursuant to the Fee Waiver Agreement (the “Reimbursement Amount”) during the previous three years, provided that such amount paid to PIMCO will not: 1) together with any recoupment of organizational expenses and pro rata Trustees’ fees pursuant to the Expense Limitation Agreement, exceed the expense limit; 2) exceed the total Reimbursement Amount; or 3) include any amounts previously reimbursed to PIMCO. The Fee Waiver Agreement will automatically renew for one-year terms unless PIMCO provides written notice to the Trust at least 30 days prior to the end of the then current term.
PIMCO has contractually agreed, through October 31, 2015, to waive its Management Fee, or reimburse a Fund, to the extent that organizational expenses and pro rata Trustees’ fees, and in the case of PIMCO Total Return
June 30, 2015
Active Exchange-Traded Fund, extraordinary legal expenses (excluding expenses related to litigation and regulatory proceedings), if any, exceed 0.0049% of that Fund’s average net assets. Under the Expense Limitation Agreement, which renews annually for a full year unless terminated by PIMCO upon at least 30 days’ notice prior to the end of the contract term, PIMCO may recoup these waivers and reimbursements in future periods, not exceeding three years, provided organizational expenses and pro rata Trustees’ fees plus such recoupment, do not exceed the Expense Limit. The recoverable amounts to PIMCO at June 30, 2015, were as follows (amounts in thousands):
| | | | | | |
| Fund Name | | | | Recoverable Amounts | |
PIMCO 1-3 Year U.S. Treasury Index Exchange-Traded Fund | | | | $ | 8 | |
PIMCO 3-7 Year U.S. Treasury Index Exchange-Traded Fund | | | | | 1 | |
PIMCO 25+ Year Zero Coupon U.S. Treasury Index Exchange-Traded Fund | | | | | 6 | |
PIMCO 15+ Year U.S. TIPS Index Exchange-Traded Fund | | | | | 7 | |
PIMCO Broad U.S. TIPS Index Exchange-Traded Fund | | | | | 5 | |
PIMCO Diversified Income Active Exchange-Traded Fund | | | | | 40 | |
PIMCO Foreign Currency Strategy Active Exchange-Traded Fund | | | | | 52 | |
PIMCO Global Advantage® Inflation-Linked Bond Active Exchange-Traded Fund | | | | | 8 | |
PIMCO Low Duration Active Exchange-Traded Fund | | | | | 25 | |
PIMCO Total Return Active Exchange-Traded Fund | | | | | 1,926 | |
9. RELATED PARTY TRANSACTIONS
The Manager and Distributor are related parties. Fees payable to these parties are disclosed in Note 8 and the accrued related party fee amounts are disclosed on the Statements of Assets and Liabilities.
Certain Funds are permitted to purchase or sell securities from or to certain related affiliated funds under specified conditions outlined in procedures adopted by the Board. The procedures have been designed to ensure that any purchase or sale of securities by the Funds from or to another fund or portfolio that are, or could be, considered an affiliate by virtue of having a common investment adviser (or affiliated investment advisers), common Trustees and/or common officers complies with Rule 17a-7 of the Act. Further, as defined under the procedures, each transaction is effected at the current market price. During the period ended June 30, 2015, the Funds below engaged in purchases and sales of securities pursuant to Rule 17a-7 of the Act (amounts in thousands):
| | | | | | | | | | |
| Fund Name | | | | Purchases | | | Sales | |
PIMCO 0-5 Year High Yield Corporate Bond Index Exchange-Traded Fund | | | | $ | 84,075 | | | $ | 81,815 | |
PIMCO Investment Grade Corporate Bond Index Exchange-Traded Fund | | | | | 5,731 | | | | 7,637 | |
PIMCO Diversified Income Active Exchange-Traded Fund | | | | | 12,107 | | | | 2,673 | |
PIMCO Enhanced Short Maturity Active Exchange-Traded Fund | | | | | 1,307,263 | | | | 1,744,587 | |
PIMCO Global Advantage® Inflation-Linked Bond Active Exchange-Traded Fund | | | | | 20,988 | | | | 12,336 | |
PIMCO Low Duration Active Exchange-Traded Fund | | | | | 38,215 | | | | 32,621 | |
PIMCO Total Return Active Exchange-Traded Fund | | | | | 403,104 | | | | 144,982 | |
10. GUARANTEES AND INDEMNIFICATIONS
Under the Trust’s organizational documents, each Trustee or officer of the Trust is indemnified and each employee or other agent of the Trust (including the Trust’s investment manager) may be indemnified, to the extent permitted by the Act, against certain liabilities that may arise out of performance of their duties to the Funds. Additionally, in the normal course of business, the Funds enter into contracts that contain a variety of indemnification clauses. The Funds’ maximum exposure under these arrangements is unknown as this would involve future claims that may be made against the Funds that have not yet occurred. However, the Funds have not had prior claims or losses pursuant to these contracts.
11. PURCHASES AND SALES OF SECURITIES
The length of time a Fund has held a particular security is not generally a consideration in investment decisions. A change in the securities held by a Fund is known as “portfolio turnover.” Each Fund may engage in frequent and active trading of portfolio securities to achieve its investment objective, particularly during periods of volatile market movements. High portfolio turnover involves correspondingly greater expenses to a Fund, including brokerage commissions or dealer mark-ups and other transaction costs on the sale of securities and reinvestments in other securities. Such sales may also result in realization of taxable capital gains, including short-term capital gains (which are generally taxed at ordinary income tax rates). The trading costs and tax effects associated with portfolio turnover may adversely affect a Fund’s performance. The portfolio turnover rates are reported in the Financial Highlights.
Purchases and sales of securities (excluding short-term investments) for the period ended June 30, 2015, were as follows (amounts in thousands†):
| | | | | | | | | | | | | | | | | | | | |
| | | | | U.S. Government/Agency | | | | | All Other | |
| Fund Name | | | | Purchases | | | Sales | | | | | Purchases | | | Sales | |
PIMCO 1-3 Year U.S. Treasury Index Exchange-Traded Fund | | | | $ | 85,521 | | | $ | 70,942 | | | | | $ | 0 | | | $ | 0 | |
PIMCO 3-7 Year U.S. Treasury Index Exchange-Traded Fund | | | | | 5,137 | | | | 5,141 | | | | | | 0 | | | | 0 | |
PIMCO 7-15 Year U.S. Treasury Index Exchange-Traded Fund | | | | | 33,757 | | | | 33,046 | | | | | | 0 | | | | 0 | |
PIMCO 25+ Year Zero Coupon U.S. Treasury Index Exchange Traded Fund | | | | | 19,085 | | | | 22,401 | | | | | | 0 | | | | 0 | |
PIMCO 1-5 Year U.S. TIPS Index Exchange-Traded Fund | | | | | 409,915 | | | | 396,934 | | | | | | 0 | | | | 0 | |
PIMCO 15+ Year U.S. TIPS Index Exchange-Traded Fund | | | | | 12,733 | | | | 12,215 | | | | | | 0 | | | | 0 | |
PIMCO Broad U.S. TIPS Index Exchange-Traded Fund | | | | | 21,846 | | | | 21,136 | | | | | | 0 | | | | 0 | |
| | | | | | |
| | ANNUAL REPORT | | JUNE 30, 2015 | | 133 |
Notes to Financial Statements (Cont.)
| | | | | | | | | | | | | | | | | | | | |
| | | | | U.S. Government/Agency | | | | | All Other | |
| Fund Name | | | | Purchases | | | Sales | | | | | Purchases | | | Sales | |
PIMCO 0-5 Year High Yield Corporate Bond Index Exchange-Traded Fund | | | | $ | 0 | | | $ | 62,416 | | | | | $ | 999,640 | | | $ | 826,923 | |
PIMCO Investment Grade Corporate Bond Index Exchange-Traded Fund | | | | | 0 | | | | 0 | | | | | | 132,893 | | | | 25,825 | |
PIMCO Diversified Income Active Exchange-Traded Fund | | | | | 6,106 | | | | 4,230 | | | | | | 27,904 | | | | 14,906 | |
PIMCO Enhanced Short Maturity Active Exchange-Traded Fund | | | | | 3,660,456 | | | | 3,559,334 | | | | | | 2,653,372 | | | | 2,591,948 | |
PIMCO Foreign Currency Strategy Active Exchange-Traded Fund | | | | | 0 | | | | 1,409 | | | | | | 5,446 | | | | 1,930 | |
PIMCO Global Advantage® Inflation-Linked Bond Active Exchange-Traded Fund | | | | | 114,010 | | | | 90,367 | | | | | | 54,607 | | | | 64,221 | |
PIMCO Intermediate Municipal Bond Active Exchange-Traded Fund | | | | | 0 | | | | 0 | | | | | | 55,534 | | | | 27,755 | |
PIMCO Low Duration Active Exchange-Traded Fund | | | | | 2,330,905 | | | | 2,362,707 | | | | | | 126,591 | | | | 62,893 | |
PIMCO Short Term Municipal Bond Active Exchange-Traded Fund | | | | | 0 | | | | 701 | | | | | | 12,829 | | | | 33,617 | |
PIMCO Total Return Active Exchange-Traded Fund | | | | | 4,767,252 | | | | 4,180,384 | | | | | | 397,959 | | | | 2,300,244 | |
| † | A zero balance may reflect actual amounts rounding to less than one thousand. |
12. CAPITAL SHARE TRANSACTIONS
Capital shares are issued and redeemed by a Fund only in Creation Units or multiples thereof. Except when aggregated in Creation Units, shares of a Fund are not redeemable. Transactions in capital shares for a Fund are disclosed in detail in the Statements of Changes in Net Assets.
The consideration for the purchase of Creation Units of a Fund generally consists of a basket of cash and/or securities that the Fund specifies each business day. Authorized Participants may be charged transaction fees as set forth below. To offset transfer and other transaction costs associated with the issuance and redemption of Creation Units, Authorized Participants are subject to standard creation and redemption transaction fees payable directly to State Street Bank and Trust Company, the sub-administrator of the Funds. PIMCO may, from time to time, at its own expense, compensate purchasers of Creation Units who have purchased substantial amounts of Creation Units and other financial institutions for administrative or marketing services. Creations and redemptions for cash (when cash creations and redemptions are available or specified) may be subject to an additional variable charge up to the maximum amount shown in the table below.
| | | | | | | | | | |
Standard Creation/
Redemption
Transaction Fee* | | | Maximum Additional
Variable Charge for
Cash Creations** | | | Maximum Additional
Variable Charge for
Cash Redemptions** | |
| $ | 500 | | | | 3.00 | % | | | 2.00 | % |
| * | Applicable to in-kind contributions or redemptions only. |
| ** | As a percentage of the cash amount invested or received. |
13. INVESTMENT TRANSACTIONS
For the period ended June 30, 2015, certain Funds had in-kind contributions and in-kind redemptions as follows (amounts in thousands†):
| | | | | | | | | | |
| Fund Name | | | | Contributions | | | Redemptions | |
PIMCO 1-3 Year U.S. Treasury Index Exchange-Traded Fund | | | | $ | 32,703 | | | $ | 65,524 | |
PIMCO 3-7 Year U.S. Treasury Index Exchange-Traded Fund | | | | | 0 | | | | 3,967 | |
PIMCO 7-15 Year U.S. Treasury Index Exchange-Traded Fund | | | | | 45,250 | | | | 102,890 | |
PIMCO 25+ Year Zero Coupon U.S. Treasury Index Exchange-Traded Fund | | | | | 142,691 | | | | 116,011 | |
PIMCO 1-5 Year U.S. TIPS Index Exchange-Traded Fund | | | | | 232,709 | | | | 351,811 | |
PIMCO 15+ Year U.S. TIPS Index Exchange-Traded Fund | | | | | 34,020 | | | | 6,706 | |
PIMCO Broad U.S. TIPS Index Exchange-Traded Fund | | | | | 91,766 | | | | 102,170 | |
PIMCO 0-5 Year High Yield Corporate Bond Index Exchange-Traded Fund | | | | | 883,038 | | | | 2,771,816 | |
PIMCO Investment Grade Corporate Bond Exchange-Traded Fund | | | | | 99,451 | | | | 150,270 | |
| † | A zero balance may reflect actual amounts rounding to less than one thousand. |
The in-kind contributions and in-kind redemptions in this table may not agree with the Fund Share Transactions on the Statements of Changes in Net Assets. The table represents the accumulation of each Fund’s daily net shareholder transactions while the Statements of Changes in Net Assets reflect gross shareholder transactions including any cash component of the transactions.
14. REGULATORY AND LITIGATION MATTERS
The Trust is not named as a defendant in any material litigation or arbitration proceedings and is not aware of any material litigation or claim pending or threatened against it.
PIMCO has received a Wells Notice from the staff of the U.S. Securities and Exchange Commission (“SEC”) that relates to the PIMCO Total Return Active Exchange-Traded Fund (“BOND”), a series of PIMCO ETF Trust. The notice indicates the staff’s preliminary determination to recommend that the SEC commence a civil action against PIMCO stemming from a nonpublic investigation relating to BOND. A Wells Notice is neither a formal allegation of wrongdoing nor a finding that any law was violated.
This matter principally pertains to the valuation of smaller sized positions in non-agency mortgage-backed securities purchased by BOND between its
June 30, 2015
inception on February 29, 2012 and June 30, 2012, BOND’s performance disclosures for that period, and PIMCO’s compliance policies and procedures related to these matters.
The Wells process provides PIMCO with its opportunity to demonstrate to the SEC staff why it believes its conduct was appropriate, in keeping with industry standards, and that no action should be taken. PIMCO believes that this matter is unlikely to have a material adverse effect on any Fund or on PIMCO’s ability to provide investment management services to any Fund.
The foregoing speaks only as of the date of this report.
15. FEDERAL INCOME TAX MATTERS
Each Fund intends to qualify as a regulated investment company under Subchapter M of the Internal Revenue Code (the “Code”) and distribute all of its taxable income and net realized gains, if applicable, to shareholders. Accordingly, no provision for Federal income taxes has been made.
A Fund may be subject to local withholding taxes, including those imposed on realized capital gains. Any applicable foreign capital gains tax is accrued daily based upon net unrealized gains, and may be payable following the sale of any applicable investments.
In accordance with U.S. GAAP, the Manager has reviewed the Funds’ tax positions for all open tax years. As of June 30, 2015, the Funds have recorded no liability for net unrecognized tax benefits relating to uncertain income tax positions they have taken or expect to take in future tax returns.
The Funds file U.S. tax returns. While the statute of limitations remains open to examine the Funds’ U.S. tax returns filed for the fiscal years ending in 2012-2014, no examinations are in progress or anticipated at this time. The Funds are not aware of any tax positions for which it is reasonably possible that the total amounts of unrecognized tax benefits will significantly change in the next twelve months.
As of June 30, 2015, the components of distributable taxable earnings are as follows (amounts in thousands):
| | | | | | | | | | | | | | | | | | | | | | | | | | | | | | | | | | |
| | | | | Undistributed
Tax Exempt
Income | | | Undistributed
Ordinary
Income | | | Undistributed
Long-Term
Capital Gains | | | Net Tax Basis
Unrealized
Appreciation/
(Depreciation) (1) | | | Other
Book-to-Tax
Accounting
Differences (2) | | | Accumulated
Capital
Losses (3) | | | Qualified
Late-Year
Loss
Deferral -
Capital (4) | | | Qualified
Late-Year
Loss
Deferral -
Ordinary (5) | |
PIMCO 1-3 Year U.S. Treasury Index Exchange-Traded Fund | | | | $ | — | | | $ | 70 | | | $ | 20 | | | $ | 181 | | | $ | (87 | ) | | $ | — | | | $ | — | | | $ | — | |
PIMCO 3-7 Year U.S. Treasury Index Exchange-Traded Fund | | | | | — | | | | 8 | | | | — | | | | 16 | | | | (42 | ) | | | — | | | | (2 | ) | | | — | |
PIMCO 7-15 Year U.S. Treasury Index Exchange-Traded Fund | | | | | — | | | | 152 | | | | — | | | | (128 | ) | | | (78 | ) | | | — | | | | — | | | | — | |
PIMCO 25+ Year Zero Coupon U.S. Treasury Index Exchange-Traded Fund | | | | | — | | | | 896 | | | | — | | | | (15,657 | ) | | | (861 | ) | | | (17,775 | ) | | | — | | | | — | |
PIMCO 1-5 Year U.S. TIPS Index
Exchange-Traded Fund | | | | | — | | | | — | | | | — | | | | (17,686 | ) | | | (33 | ) | | | (6,291 | ) | | | — | | | | — | |
PIMCO 15+ Year U.S. TIPS Index
Exchange-Traded Fund | | | | | — | | | | — | | | | — | | | | (7,572 | ) | | | (32 | ) | | | (9,212 | ) | | | — | | | | — | |
PIMCO Broad U.S. TIPS Index
Exchange-Traded Fund | | | | | — | | | | — | | | | — | | | | (2,793 | ) | | | (33 | ) | | | (788 | ) | | | — | | | | — | |
PIMCO 0-5 Year High Yield Corporate Bond Index Exchange-Traded Fund | | | | | — | | | | 10,054 | | | | — | | | | (88,230 | ) | | | (11,787 | ) | | | — | | | | (40,606 | ) | | | — | |
PIMCO Investment Grade Corporate Bond Index Exchange-Traded Fund | | | | | — | | | | 642 | | | | 74 | | | | (4,555 | ) | | | (716 | ) | | | — | | | | (203 | ) | | | — | |
PIMCO Diversified Income Active
Exchange-Traded Fund | | | | | — | | | | 626 | | | | — | | | | (1,200 | ) | | | (247 | ) | | | (880 | ) | | | — | | | | — | |
PIMCO Enhanced Short Maturity Active Exchange-Traded Fund | | | | | — | | | | 4,400 | | | | — | | | | (1,402 | ) | | | (2,535 | ) | | | — | | | | — | | | | — | |
PIMCO Foreign Currency Strategy Active Exchange-Traded Fund | | | | | — | | | | — | | | | — | | | | (835 | ) | | | (116 | ) | | | (551 | ) | | | — | | | | (857 | ) |
PIMCO Global Advantage® Inflation-Linked Bond Active Exchange-Traded Fund | | | | | — | | | | — | | | | — | | | | (14,447 | ) | | | (620 | ) | | | (4,431 | ) | | | — | | | | (4,209 | ) |
PIMCO Intermediate Municipal Bond Active Exchange-Traded Fund | | | | | 416 | | | | — | | | | — | | | | 3,603 | | | | (452 | ) | | | (1,797 | ) | | | — | | | | — | |
PIMCO Low Duration Active Exchange-Traded Fund | | | | | — | | | | 1,222 | | | | 443 | | | | (529 | ) | | | (229 | ) | | | — | | | | — | | | | — | |
PIMCO Short Term Municipal Bond Active Exchange-Traded Fund | | | | | 41 | | | | — | | | | — | | | | 222 | | | | (93 | ) | | | (216 | ) | | | — | | | | — | |
PIMCO Total Return Active Exchange-Traded Fund | | | | | — | | | | 51,118 | | | | — | | | | (38,769 | ) | | | (11,555 | ) | | | (20,463 | ) | | | — | | | | — | |
| (1) | Adjusted for open wash sale loss deferrals and the accelerated recognition of unrealized gain or loss on certain futures, options and forward contracts for federal income tax purposes. Also, adjusted for differences between book and tax realized and unrealized gain (loss) on swap contracts, treasury inflation-protected securities (TIPS), sale/buyback transactions, and convertible preferred stock. |
| | | | | | |
| | ANNUAL REPORT | | JUNE 30, 2015 | | 135 |
Notes to Financial Statements (Cont.)
| (2) | Represents differences in income tax regulations and financial accounting principles generally accepted in the United States of America, namely for straddle loss deferrals and distributions payable at fiscal year-end. |
| (3) | Capital losses available to offset future net capital gains expire in varying amounts in the years shown below. |
| (4) | Capital losses realized during the period November 1, 2014 through June 30, 2015 which the Funds elected to defer to the following taxable year pursuant to income tax regulations. |
| (5) | Specified losses realized during the period November 1, 2014 through June 30, 2015 and Ordinary losses realized during the period January 1, 2015 through June 30, 2015, which the Fund elected to defer to the following taxable year pursuant to income tax regulations. |
As of June 30, 2015, the Funds had accumulated capital losses expiring in the following years (amounts in thousands). The Funds will resume capital gain distributions in the future to the extent gains are realized in excess of accumulated capital losses.
| | | | | | | | | | | | | | | | | | |
| | | | | Expiration of Accumulated Capital Losses
(amounts in thousands) | |
| | | | | 6/30/2016 | | | 6/30/2017 | | | 6/30/2018 | | | 6/30/2019 | |
PIMCO 1-3 Year U.S. Treasury Index Exchange-Traded Fund | | | | $ | — | | | $ | — | | | $ | — | | | $ | — | |
PIMCO 3-7 Year U.S. Treasury Index Exchange-Traded Fund | | | | | — | | | | — | | | | — | | | | — | |
PIMCO 7-15 Year U.S. Treasury Index Exchange-Traded Fund | | | | | — | | | | — | | | | — | | | | — | |
PIMCO 25+ Year Zero Coupon U.S. Treasury Index Exchange-Traded Fund | | | | | — | | | | — | | | | — | | | | 363 | |
PIMCO 1-5 Year U.S. TIPS Index Exchange-Traded Fund | | | | | — | | | | — | | | | — | | | | — | |
PIMCO 15+ Year U.S. TIPS Index Exchange-Traded Fund | | | | | — | | | | — | | | | — | | | | — | |
PIMCO Broad U.S. TIPS Index Exchange-Traded Fund | | | | | — | | | | — | | | | — | | | | — | |
PIMCO 0-5 Year High Yield Corporate Bond Index Exchange-Traded Fund | | | | | — | | | | — | | | | — | | | | — | |
PIMCO Investment Grade Corporate Bond Index Exchange-Traded Fund | | | | | — | | | | — | | | | — | | | | — | |
PIMCO Diversified Income Active Exchange-Traded Fund | | | | | — | | | | — | | | | — | | | | — | |
PIMCO Enhanced Short Maturity Active Exchange-Traded Fund | | | | | — | | | | — | | | | — | | | | — | |
PIMCO Foreign Currency Strategy Active Exchange-Traded Fund | | | | | — | | | | — | | | | — | | | | — | |
PIMCO Global Advantage® Inflation-Linked Bond Active Exchange-Traded Fund | | | | | — | | | | — | | | | — | | | | — | |
PIMCO Intermediate Municipal Bond Active Exchange-Traded Fund | | | | | — | | | | — | | | | — | | | | — | |
PIMCO Low Duration Active Exchange-Traded Fund | | | | | — | | | | — | | | | — | | | | — | |
PIMCO Short Term Municipal Bond Active Exchange-Traded Fund | | | | | — | | | | — | | | | — | | | | — | |
PIMCO Total Return Active Exchange-Traded Fund | | | | | — | | | | — | | | | — | | | | — | |
Under the Regulated Investment Company Act of 2010, a Fund is permitted to carry forward any new capital losses for an unlimited period. Additionally, such capital losses that are carried forward will retain their character as either short-term or long-term capital losses rather than being considered all short-term under previous law.
As of June 30, 2015, the Funds had the following post-effective capital losses with no expiration:
| | | | | | | | | | |
| | | | | Short-Term | | | Long-Term | |
PIMCO 1-3 Year U.S. Treasury Index Exchange-Traded Fund | | | | $ | — | | | $ | — | |
PIMCO 3-7 Year U.S. Treasury Index Exchange-Traded Fund | | | | | — | | | | — | |
PIMCO 7-15 Year U.S. Treasury Index Exchange-Traded Fund | | | | | — | | | | — | |
PIMCO 25+ Year Zero Coupon U.S. Treasury Index Exchange-Traded Fund | | | | | 13,085 | | | | 4,327 | |
PIMCO 1-5 Year U.S. TIPS Index Exchange-Traded Fund | | | | | 2,565 | | | | 3,726 | |
PIMCO 15+ Year U.S. TIPS Index Exchange-Traded Fund | | | | | 3,847 | | | | 5,365 | |
PIMCO Broad U.S. TIPS Index Exchange-Traded Fund | | | | | 166 | | | | 622 | |
PIMCO 0-5 Year High Yield Corporate Bond Index Exchange-Traded Fund | | | | | — | | | | — | |
PIMCO Investment Grade Corporate Bond Index Exchange-Traded Fund | | | | | — | | | | — | |
PIMCO Diversified Income Active Exchange-Traded Fund | | | | | 532 | | | | 348 | |
PIMCO Enhanced Short Maturity Active Exchange-Traded Fund | | | | | — | | | | — | |
PIMCO Foreign Currency Strategy Active Exchange-Traded Fund | | | | | 129 | | | | 422 | |
PIMCO Global Advantage® Inflation-Linked Bond Active Exchange-Traded Fund | | | | | 1,527 | | | | 2,904 | |
PIMCO Intermediate Municipal Bond Active Exchange-Traded Fund | | | | | 1,439 | | | | 358 | |
PIMCO Low Duration Active Exchange-Traded Fund | | | | | — | | | | — | |
PIMCO Short Term Municipal Bond Active Exchange-Traded Fund | | | | | 192 | | | | 24 | |
PIMCO Total Return Active Exchange-Traded Fund | | | | | 14,091 | | | | 6,372 | |
June 30, 2015
As of June 30, 2015, the aggregate cost and the net unrealized appreciation/(depreciation) of investments for federal income tax purposes are as follows (amounts in thousands):
| | | | | | | | | | | | | | | | | | |
| | | | | Federal Tax
Cost | | | Unrealized
Appreciation | | | Unrealized
(Depreciation) | | | Net Unrealized
Appreciation/
(Depreciation) (6) | |
PIMCO 1-3 Year U.S. Treasury Index Exchange-Traded Fund | | | | $ | 106,781 | | | $ | 207 | | | $ | (26 | ) | | $ | 181 | |
PIMCO 3-7 Year U.S. Treasury Index Exchange-Traded Fund | | | | | 9,190 | | | | 48 | | | | (33 | ) | | | 15 | |
PIMCO 7-15 Year U.S. Treasury Index Exchange-Traded Fund | | | | | 19,916 | | | | 98 | | | | (225 | ) | | | (127 | ) |
PIMCO 25+ Year Zero Coupon U.S. Treasury Index Exchange-Traded Fund | | | | | 118,452 | | | | — | | | | (15,657 | ) | | | (15,657 | ) |
PIMCO 1-5 Year U.S. TIPS Index Exchange-Traded Fund | | | | | 1,195,664 | | | | — | | | | (17,686 | ) | | | (17,686 | ) |
PIMCO 15+ Year U.S. TIPS Index Exchange-Traded Fund | | | | | 99,776 | | | | — | | | | (7,571 | ) | | | (7,571 | ) |
PIMCO Broad U.S. TIPS Index Exchange-Traded Fund | | | | | 95,021 | | | | — | | | | (2,793 | ) | | | (2,793 | ) |
PIMCO 0-5 Year High Yield Corporate Bond Index Exchange-Traded Fund | | | | | 2,904,707 | | | | 12,960 | | | | (98,296 | ) | | | (85,336 | ) |
PIMCO Investment Grade Corporate Bond Index Exchange-Traded Fund | | | | | 248,796 | | | | 1,152 | | | | (5,706 | ) | | | (4,554 | ) |
PIMCO Diversified Income Active Exchange-Traded Fund | | | | | 59,661 | | | | 484 | | | | (1,565 | ) | | | (1,081 | ) |
PIMCO Enhanced Short Maturity Active Exchange-Traded Fund | | | | | 3,805,651 | | | | 5,272 | | | | (6,673 | ) | | | (1,401 | ) |
PIMCO Foreign Currency Strategy Active Exchange-Traded Fund | | | | | 15,642 | | | | 121 | | | | (902 | ) | | | (781 | ) |
PIMCO Global Advantage® Inflation-Linked Bond Active Exchange-Traded Fund | | | | | 156,859 | | | | 701 | | | | (15,437 | ) | | | (14,736 | ) |
PIMCO Intermediate Municipal Bond Active Exchange-Traded Fund | | | | | 225,361 | | | | 4,631 | | | | (1,028 | ) | | | 3,603 | |
PIMCO Low Duration Active Exchange-Traded Fund | | | | | 199,067 | | | | 449 | | | | (842 | ) | | | (393 | ) |
PIMCO Short Term Municipal Bond Active Exchange-Traded Fund | | | | | 54,976 | | | | 272 | | | | (50 | ) | | | 222 | |
PIMCO Total Return Active Exchange-Traded Fund | | | | | 2,957,931 | | | | 30,999 | | | | (65,875 | ) | | | (34,876 | ) |
| (6) | Primary differences, if any, between book and tax net unrealized appreciation/(depreciation) on investments are attributable to open wash sale loss deferrals, treasury inflation-protected securities (TIPS), sale/buyback transactions, and convertible preferred stock for federal income tax purposes. |
For the fiscal years ended June 30, 2015 and June 30, 2014, respectively, the Funds made the following tax basis distributions (amounts in thousands):
| | | | | | | | | | | | | | | | | | | | | | | | | | | | | | | | | | | | |
| | | | | June 30, 2015 | | | | | June 30, 2014 | |
| | | | | Tax-Exempt
Income
Distributions | | | Ordinary
Income
Distributions (7) | | | Long-Term
Capital Gain
Distributions | | | Return of
Capital (8) | | | | | Tax-Exempt
Income
Distributions | | | Ordinary
Income
Distributions (7) | | | Long-Term
Capital Gain
Distributions | | | Return of
Capital (8) | |
PIMCO 1-3 Year U.S. Treasury Index Exchange-Traded Fund | | | | $ | — | | | $ | 595 | | | $ | 112 | | | $ | — | | | | | $ | — | | | $ | 408 | | | $ | 68 | | | $ | — | |
PIMCO 3-7 Year U.S. Treasury Index Exchange-Traded Fund | | | | | — | | | | 147 | | | | 71 | | | | — | | | | | | — | | | | 183 | | | | 41 | | | | — | |
PIMCO 7-15 Year U.S. Treasury Index Exchange-Traded Fund | | | | | — | | | | 1,623 | | | | — | | | | — | | | | | | — | | | | 891 | | | | — | | | | — | |
PIMCO 25+ Year Zero Coupon U.S. Treasury Index Exchange-Traded Fund | | | | | — | | | | 2,862 | | | | — | | | | — | | | | | | — | | | | 2,765 | | | | — | | | | — | |
PIMCO 1-5 Year U.S. TIPS Index Exchange-Traded Fund | | | | | — | | | | 614 | | | | — | | | | 4,196 | | | | | | — | | | | 7,653 | | | | — | | | | — | |
PIMCO 15+ Year U.S. TIPS Index Exchange-Traded Fund | | | | | — | | | | 523 | | | | — | | | | — | | | | | | — | | | | 1,698 | | | | — | | | | — | |
PIMCO Broad U.S. TIPS Index Exchange-Traded Fund | | | | | — | | | | 325 | | | | — | | | | 218 | | | | | | — | | | | 933 | | | | — | | | | — | |
PIMCO 0-5 Year High Yield Corporate Bond Index Exchange-Traded Fund | | | | | — | | | | 160,666 | | | | 8,676 | | | | — | | | | | | — | | | | 176,989 | | | | 1,839 | | | | — | |
PIMCO Investment Grade Corporate Bond Index Exchange-Traded Fund | | | | | — | | | | 7,362 | | | | 326 | | | | — | | | | | | — | | | | 8,243 | | | | 3,451 | | | | — | |
PIMCO Diversified Income Active Exchange-Traded Fund | | | | | — | | | | 2,633 | | | | — | | | | — | | | | | | — | | | | 568 | | | | — | | | | — | |
PIMCO Enhanced Short Maturity Active Exchange-Traded Fund | | | | | — | | | | 29,862 | | | | 505 | | | | — | | | | | | — | | | | 31,339 | | | | 1,042 | | | | — | |
| | | | | | |
| | ANNUAL REPORT | | JUNE 30, 2015 | | 137 |
Notes to Financial Statements (Cont.)
June 30, 2015
| | | | | | | | | | | | | | | | | | | | | | | | | | | | | | | | | | | | |
| | | | | June 30, 2015 | | | | | June 30, 2014 | |
| | | | | Tax-Exempt
Income
Distributions | | | Ordinary
Income
Distributions (7) | | | Long-Term
Capital Gain
Distributions | | | Return of
Capital (8) | | | | | Tax-Exempt
Income
Distributions | | | Ordinary
Income
Distributions (7) | | | Long-Term
Capital Gain
Distributions | | | Return of
Capital (8) | |
PIMCO Foreign Currency Strategy Active Exchange-Traded Fund | | | | $ | — | | | $ | — | | | $ | — | | | $ | — | | | | | $ | — | | | $ | — | | | $ | — | | | $ | — | |
PIMCO Global Advantage® Inflation-Linked Bond Active Exchange-Traded Fund | | | | | — | | | | 5,282 | | | | — | | | | — | | | | | | — | | | | 1,337 | | | | 25 | | | | — | |
PIMCO Intermediate Municipal Bond Active Exchange-Traded Fund | | | | | 4,609 | | | | 10 | | | | — | | | | — | | | | | | 4,020 | | | | 6 | | | | — | | | | — | |
PIMCO Low Duration Active Exchange-Traded Fund | | | | | — | | | | 2,891 | | | | — | | | | — | | | | | | — | | | | 138 | | | | — | | | | — | |
PIMCO Short Term Municipal Bond Active Exchange-Traded Fund | | | | | 530 | | | | 4 | | | | — | | | | — | | | | | | 332 | | | | — | | | | — | | | | — | |
PIMCO Total Return Active Exchange-Traded Fund | | | | | — | | | | 129,616 | | | | — | | | | — | | | | | | — | | | | 75,855 | | | | — | | | | — | |
| (7) | Includes short-term capital gains, if any, distributed. |
| (8) | A portion of the distributions made represents a tax return of capital. Return of capital distributions have been reclassified from undistributed net investment income to paid-in capital to more appropriately conform financial accounting to tax accounting. |
16. SUBSEQUENT EVENTS
The Board approved the liquidation of PIMCO 3-7 Year U.S. Treasury Index Exchange-Traded Fund, PIMCO 7-15 Year U.S. Treasury Index Exchange-Traded Fund and PIMCO Foreign Currency Strategy Active Exchange-Traded Fund. The liquidation of the Funds is expected to be effective on or about September 30, 2015.
There were no other subsequent events identified that require recognition or disclosure.
Report of Independent Registered Public Accounting Firm
To the Board of Trustees and Shareholders of the PIMCO ETF Trust
In our opinion, the accompanying statements of assets and liabilities, including the schedules of investments, and the related statements of operations, of changes in net assets, and of cash flows and the financial highlights present fairly, in all material respects, the financial position of PIMCO 1-3 Year U.S. Treasury Index Exchange-Traded Fund, PIMCO 3-7 Year U.S. Treasury Index Exchange-Traded Fund, PIMCO 7-15 Year U.S. Treasury Index Exchange-Traded Fund, PIMCO 25+Year Zero Coupon U.S. Treasury Index Exchange-Traded Fund, PIMCO 1-5 Year U.S. TIPS Index Exchange-Traded Fund, PIMCO 15+ Year U.S. TIPS Index Exchange-Traded Fund, PIMCO Broad U.S. TIPS Index Exchange-Traded Fund, PIMCO 0-5 Year High Yield Corporate Bond Index Exchange-Traded Fund, PIMCO Investment Grade Corporate Bond Index Exchange-Traded Fund, PIMCO Diversified Income Active Exchange-Traded Fund, PIMCO Enhanced Short Maturity Active Exchange-Traded Fund, PIMCO Foreign Currency Strategy Active Exchange-Traded Fund, PIMCO Global Advantage® Inflation-Linked Bond Active Exchange-Traded Fund, PIMCO Intermediate Municipal Bond Active Exchange-Traded Fund, PIMCO Low Duration Active Exchange-Traded Fund, PIMCO Short Term Municipal Bond Active Exchange-Traded Fund, and PIMCO Total Return Active Exchange-Traded Fund (constituting the PIMCO ETF Trust, hereafter referred to as the “Funds”) at June 30, 2015, the results of each of their operations and the changes in each of their net assets, the cash flows for PIMCO Global Advantage® Inflation-Linked Bond Active Exchange-Traded Fund and PIMCO Low Duration Active Exchange-Traded Fund, and the financial highlights of the Funds for each of the periods presented, in conformity with accounting principles generally accepted in the United States of America. These financial statements and financial highlights (hereafter referred to as “financial statements”) are the responsibility of the Funds’ management. Our responsibility is to express an opinion on these financial statements based on our audits. We conducted our audits of these financial statements in accordance with the standards of the Public Company Accounting Oversight Board (United States). Those standards require that we plan and perform the audits to obtain reasonable assurance about whether the financial statements are free of material misstatement. An audit includes examining, on a test basis, evidence supporting the amounts and disclosures in the financial statements, assessing the accounting principles used and significant estimates made by management, and evaluating the overall financial statement presentation. We believe that our audits, which included confirmation of securities at June 30, 2015 by correspondence with the custodian and brokers, and the application of alternative auditing procedures where applicable, provide a reasonable basis for our opinion.
As disclosed in Note 16 of the Notes to Financial Statements, the PIMCO 3-7 Year U.S. Treasury Index Exchange Traded Fund, PIMCO 7-15 Year U.S. Treasury Index Exchange Traded Fund, and PIMCO Foreign Currency Strategy Active Exchange Traded Fund are expected to liquidate during 2015.
PricewaterhouseCoopers LLP
Kansas City, Missouri
August 20, 2015
| | | | | | |
| | ANNUAL REPORT | | JUNE 30, 2015 | | 139 |
Glossary: (abbreviations that may be used in the preceding statements)
(Unaudited)
| | | | | | | | | | |
| | | | |
| Counterparty Abbreviations: | | | | | | | | |
| AZD | | Australia and New Zealand Banking Group | | FBF | | Credit Suisse International | | MYC | | Morgan Stanley Capital Services, Inc. |
| BCY | | Barclays Capital, Inc. | | GLM | | Goldman Sachs Bank USA | | NAB | | National Australia Bank Ltd. |
| BOA | | Bank of America N.A. | | GRE | | RBS Securities, Inc. | | NGF | | Nomura Global Financial Products, Inc. |
| BOS | | Banc of America Securities LLC | | GSC | | Goldman Sachs & Co. | | RDR | | RBC Dain Rausher, Inc. |
| BPG | | BNP Paribas Securities Corp. | | GST | | Goldman Sachs International | | SAL | | Citigroup Global Markets, Inc. |
| BPS | | BNP Paribas S.A. | | HUS | | HSBC Bank USA N.A. | | SCX | | Standard Chartered Bank |
| BRC | | Barclays Bank PLC | | JPM | | JPMorgan Chase Bank N.A. | | SOG | | Societe Generale |
| BSN | | Bank of Nova Scotia | | JPS | | JPMorgan Securities, Inc. | | SSB | | State Street Bank and Trust Co. |
| CBK | | Citibank N.A. | | MBC | | HSBC Bank Plc | | TDM | | TD Securities (USA) LLC |
| DEU | | Deutsche Bank Securities, Inc. | | MSB | | Morgan Stanley Bank, N.A | | UAG | | UBS AG Stamford |
| DUB | | Deutsche Bank AG | | MSC | | Morgan Stanley & Co., Inc. | | UBS | | UBS Securities LLC |
| | | | |
| Currency Abbreviations: | | | | | | | | |
| AUD | | Australian Dollar | | HKD | | Hong Kong Dollar | | NZD | | New Zealand Dollar |
| BRL | | Brazilian Real | | IDR | | Indonesian Rupiah | | PLN | | Polish Zloty |
| CAD | | Canadian Dollar | | ILS | | Israeli Shekel | | RUB | | Russian Ruble |
| CHF | | Swiss Franc | | INR | | Indian Rupee | | SAR | | Saudi Riyal |
| CLP | | Chilean Peso | | JPY | | Japanese Yen | | SEK | | Swedish Krona |
| CNY | | Chinese Renminbi (Mainland) | | KRW | | South Korean Won | | SGD | | Singapore Dollar |
| DKK | | Danish Krone | | MXN | | Mexican Peso | | TRY | | Turkish New Lira |
| EUR | | Euro | | MYR | | Malaysian Ringgit | | USD (or $) | | United States Dollar |
| GBP | | British Pound | | NOK | | Norwegian Krone | | ZAR | | South African Rand |
| | | | |
| Exchange Abbreviations: | | | | | | | | |
| CBOT | | Chicago Board of Trade | | CME | | Chicago Mercantile Exchange | | OTC | | Over the Counter |
| | | | |
| Index/Spread Abbreviations: | | | | | | | | |
| CDX.HY | | Credit Derivatives Index - High Yield | | CPURNSA | | Consumer Price All Urban Non-Seasonally Adjusted Index | | UKRPI | | United Kingdom Retail Price Index |
| CDX.IG | | Credit Derivatives Index - Investment Grade | | MCDX | | Municipal Bond Credit Derivative Index | | | | |
| | | | |
| Municipal Bond or Agency Abbreviations: | | | | | | | | |
| AGM | | Assured Guaranty Municipal | | FGIC | | Financial Guaranty Insurance Co. | | NPFGC | | National Public Finance Guarantee Corp. |
| AMBAC | | American Municipal Bond Assurance Corp. | | FHA | | Federal Housing Administration | | PSF | | Public School Fund |
| BHAC | | Berkshire Hathaway Assurance Corporation | | | | | | | | |
| | | | |
| Other Abbreviations: | | | | | | | | |
| ABS | | Asset-Backed Security | | EURIBOR | | Euro Interbank Offered Rate | | PIK | | Payment-in-Kind |
| ALT | | Alternate Loan Trust | | FDIC | | Federal Deposit Insurance Corp. | | REIT | | Real Estate Investment Trust |
| BABs | | Build America Bonds | | JSC | | Joint Stock Company | | REMIC | | Real Estate Mortgage Investment Conduit |
| CDI | | Brazil Interbank Deposit Rate | | LIBOR | | London Interbank Offered Rate | | TIIE | | Tasa de Interés Interbancaria de Equilibrio |
| CDO | | Collateralized Debt Obligation | | NCUA | | National Credit Union Administration | | YOY | | Year-Over-Year |
| CLO | | Collateralized Loan Obligation | | OIS | | Overnight Index Swap | | | | |
Federal Income Tax Information
(Unaudited)
As required by the Internal Revenue Code (“Code”) and Treasury Regulations, if applicable, shareholders must be notified of the Trust’s fiscal year end regarding the status of dividend received deduction, qualified dividend income, qualified interest income, and qualified short-term capital gain.
Dividend Received Deduction. Corporate shareholders are generally entitled to take the dividend received deduction on the portion of a Fund’s dividend distribution that qualifies under tax law. The percentage of each Fund’s fiscal 2015 ordinary income dividends that qualifies for the corporate dividend received deduction is set forth below.
Qualified Dividend Income. Under the Jobs and Growth Tax Relief Reconciliation Act of 2003 (the “Act”), the following percentages of ordinary dividends paid during the fiscal year ended June 30, 2015 are designated as “qualified dividend income”, as defined in the Act, subject to reduced tax rates.
Qualified Interest Income and Qualified Short-Term Capital Gain (for non-U.S. resident shareholders only). Under the American Jobs Creation Act of 2004, the following amounts of ordinary dividends paid during the fiscal year ended June 30, 2015 are considered to be derived from “qualified interest income,” as defined in Section 871(k)(1)(E) of the Code, and therefore are designated as interest-related dividends, as defined in Section 871(k)(1)(C) of the Code. Further, the following amounts of ordinary dividends paid during the fiscal year ended June 30, 2015 are considered to be derived from “qualified short-term capital gain,” as defined in Section 871(k)(2)(D) of the Code, and therefore are designated as qualified short-term gain dividends, as defined by Section 871(k)(2)(C) of the Code.
| | | | | | | | | | | | | | | | | | |
| | | | | Dividend Received Deduction % | | | Qualified Dividend Income % | | | Interest Income (000s) | | | Short-Term Capital Gain (000s) | |
PIMCO 1-3 Year U.S. Treasury Index Exchange-Traded Fund | | | | | 0.00 | % | | | 0.00 | % | | $ | 573 | | | $ | 22 | |
PIMCO 3-7 Year U.S. Treasury Index Exchange-Traded Fund | | | | | 0.00 | % | | | 0.00 | % | | $ | 147 | | | $ | 0 | |
PIMCO 7-15 Year U.S. Treasury Index Exchange-Traded Fund | | | | | 0.00 | % | | | 0.00 | % | | $ | 1,623 | | | $ | 0 | |
PIMCO 25+ Year Zero Coupon U.S. Treasury Index Exchange-Traded Fund | | | | | 0.00 | % | | | 0.00 | % | | $ | 2,862 | | | $ | 0 | |
PIMCO 1-5 Year U.S. TIPS Index Exchange-Traded Fund | | | | | 0.00 | % | | | 0.00 | % | | $ | 4,810 | | | $ | 0 | |
PIMCO 15+ Year U.S. TIPS Index Exchange-Traded Fund | | | | | 0.00 | % | | | 0.00 | % | | $ | 452 | | | $ | 0 | |
PIMCO Broad U.S. TIPS Index Exchange-Traded Fund | | | | | 0.00 | % | | | 0.00 | % | | $ | 543 | | | $ | 0 | |
PIMCO 0-5 Year High Yield Corporate Bond Index Exchange-Traded Fund | | | | | 0.00 | % | | | 0.00 | % | | $ | 124,766 | | | $ | 19,765 | |
PIMCO Investment Grade Corporate Bond Index Exchange-Traded Fund | | | | | 0.00 | % | | | 0.00 | % | | $ | 5,550 | | | $ | 232 | |
PIMCO Diversified Income Active Exchange-Traded Fund | | | | | 0.19 | % | | | 0.26 | % | | $ | 1,192 | | | $ | 325 | |
PIMCO Enhanced Short Maturity Active Exchange-Traded Fund | | | | | 0.00 | % | | | 0.00 | % | | $ | 23,109 | | | $ | 2,828 | |
PIMCO Foreign Currency Strategy Active Exchange-Traded Fund | | | | | 0.00 | % | | | 0.00 | % | | $ | 0 | | | $ | 0 | |
PIMCO Global Advantage Inflation-Linked Bond Active Exchange-Traded Fund | | | | | 0.00 | % | | | 0.00 | % | | $ | 0 | | | $ | 0 | |
PIMCO Intermediate Municipal Bond Active Exchange-Traded Fund | | | | | 0.00 | % | | | 0.00 | % | | $ | 0 | | | $ | 0 | |
PIMCO Low Duration Active Exchange-Traded Fund | | | | | 0.00 | % | | | 0.00 | % | | $ | 1,756 | | | $ | 349 | |
PIMCO Short Term Municipal Bond Active Exchange-Traded Fund | | | | | 0.00 | % | | | 0.00 | % | | $ | 0 | | | $ | 0 | |
PIMCO Total Return Active Exchange-Traded Fund | | | | | 0.24 | % | | | 0.24 | % | | $ | 120,155 | | | $ | 0 | |
Shareholders are advised to consult their own tax advisor with respect to the tax consequences of their investment in the Trust.
The following Funds designate the amounts below as long term capital gain dividends paid during the year ended June 30, 2015 (amounts in thousands):
| | | | | | |
PIMCO 1-3 Year U.S. Treasury Index Exchange-Traded Fund | | | | $ | 112 | |
PIMCO 3-7 Year U.S. Treasury Index Exchange-Traded Fund | | | | | 71 | |
PIMCO 7-15 Year U.S. Treasury Index Exchange-Traded Fund | | | | | — | |
PIMCO 25+ Year Zero Coupon U.S. Treasury Index Exchange-Traded Fund | | | | | — | |
PIMCO 1-5 Year U.S. TIPS Index Exchange-Traded Fund | | | | | — | |
PIMCO 15+ Year U.S. TIPS Index Exchange-Traded Fund | | | | | — | |
PIMCO Broad U.S. TIPS Index Exchange-Traded Fund | | | | | — | |
PIMCO 0-5 Year High Yield Corporate Bond Index Exchange-Traded Fund | | | | | 8,676 | |
PIMCO Investment Grade Corporate Bond Index Exchange-Traded Fund | | | | | 326 | |
PIMCO Diversified Income Active Exchange-Traded Fund | | | | | — | |
PIMCO Enhanced Short Maturity Active Exchange-Traded Fund | | | | | 505 | |
PIMCO Foreign Currency Strategy Active Exchange-Traded Fund | | | | | — | |
PIMCO Global Advantage® Inflation-Linked Bond Active Exchange-Traded Fund | | | | | — | |
PIMCO Intermediate Municipal Bond Active Exchange-Traded Fund | | | | | — | |
PIMCO Low Duration Active Exchange-Traded Fund | | | | | — | |
PIMCO Short Term Municipal Bond Active Exchange-Traded Fund | | | | | — | |
PIMCO Total Return Active Exchange-Traded Fund | | | | | — | |
In January 2016, you will be advised on IRS Form 1099-DIV as to the federal tax status of the dividends and distributions received by you in calendar year 2015.
| | | | | | |
| | ANNUAL REPORT | | JUNE 30, 2015 | | 141 |
Management of the Trust
The charts below identify the Trustees and executive officers of the Trust. Unless otherwise indicated, the address of all persons below is 650 Newport Center Drive, Newport Beach, CA 92660. The Funds’ Statement of Additional Information includes more information about the Trustees and Officers. To request a free copy, call PIMCO at (888) 400-4ETF or visit the Funds’ website at www.pimcoetfs.com.
| | | | | | | | |
Name, Year of Birth and
Position Held with Trust | | Term of Office
and Length of
Time Served** | | Principal Occupation(s) During Past 5 Years | | Number of
Funds in
Fund Complex
Overseen
by Trustee | | Other Public Company and Investment Company
Directorships Held by Trustee During the Past 5 Years |
| | | |
Interested Trustees* | | | | | | |
| | | | |
Brent R. Harris (1959)
Chairman of the Board
and Trustee | | 02/2009 to present | | Managing Director and member of Executive Committee, PIMCO. | | 177 | | Chairman and Trustee, PIMCO Funds; Chairman and Trustee, PIMCO Variable Insurance Trust; Chairman and Trustee, PIMCO Equity Series; Chairman and Trustee, PIMCO Equity Series VIT; Director, StocksPLUS® Management, Inc; and member of Board of Governors, Investment Company Institute. Board Member and Owner, Harris Holdings, LLC (1992-present). |
| | | | |
Douglas M. Hodge (1957)
Trustee | | 02/2010 to present | | Managing Director, Chief Executive Officer, PIMCO (since 2/14); Chief Operating Officer, PIMCO (7/09-2/14); Member of Executive Committee and Head of PIMCO’s Asia Pacific region. Member Global Executive Committee, Allianz Asset Management. | | 152 | | Trustee, PIMCO Funds; Trustee, PIMCO Variable Insurance Trust. |
| | | |
Independent Trustees | | | | | | |
| | | | |
George E. Borst (1948) Trustee | | 04/2015 to present | | Executive Advisor, McKinsey & Company; Formerly, Executive Advisor, Toyota Financial Services; CEO, Toyota Financial Services. | | 152 | | Trustee, PIMCO Funds; Trustee, PIMCO Variable Insurance Trust. |
| | | | |
E. Philip Cannon (1940) Trustee | | 02/2009 to present | | Private Investor. Formerly, President, Houston Zoo. | | 177 | | Trustee, PIMCO Funds; Trustee, PIMCO Variable Insurance Trust; Trustee, PIMCO Equity Series; Trustee, PIMCO Equity Series VIT. Formerly, Trustee, Allianz Funds (formerly, PIMCO Funds: Multi-Manager Series. |
| | | | |
Jennifer Holden Dunbar (1963) Trustee | | 04/2015 to present | | Managing Director, Dunbar Partners, LLC (business consulting and investments). | | 152 | | Trustee, PIMCO Funds; Trustee, PIMCO Variable Insurance Trust; Director, PS Business Parks; Director, Big 5 Sporting Goods Corporation. |
| | | | |
J. Michael Hagan*** (1939) Trustee | | 02/2009 to present | | Private Investor and Business Advisor (primarily to manufacturing companies). | | 152 | | Trustee, PIMCO Funds; Trustee, PIMCO Variable Insurance Trust. |
| | | | |
Gary F. Kennedy (1955) Trustee | | 04/2015 to present | | Formerly, Senior Vice President, General Counsel and Chief Compliance Officer, American Airlines and AMR Corporation (now American Airlines Group). | | 152 | | Trustee, PIMCO Funds; Trustee, PIMCO Variable Insurance Trust. |
| | | | |
Peter B. McCarthy (1950) Trustee | | 04/2015 to present | | Formerly, Assistant Secretary and Chief Financial Officer, United States Department of Treasury; Deputy Managing Director, Institute of International Finance. | | 177 | | Trustee, PIMCO Funds; Trustee, PIMCO Variable Insurance Trust; Trustee, PIMCO Equity Series; and Trustee, PIMCO Equity Series VIT. |
| | | | |
| Ronald C. Parker (1951) Trustee | | 07/2009 to present | | Director of Roseburg Forest Products Company. Formerly, Chairman of the Board, The Ford Family Foundation. Formerly President, Chief Executive Officer, Hampton Affiliates (forestry products). | | 152 | | Trustee, PIMCO Funds; Trustee, PIMCO Variable Insurance Trust. |
| * | Mr. Harris and Mr. Hodge are “interested persons” of the Trust (as that term is defined in the 1940 Act) because of their affiliations with PIMCO. |
| ** | Trustees serve until their successors are duly elected and qualified. |
| *** | Effective August 11, 2015, Mr. Hagan no longer serves as a Trustee of the Trust. |
(Unaudited)
Executive Officers
| | | | |
Name, Year of Birth and Position Held with Trust | | Term of Office and
Length of Time Served | | Principal Occupation(s) During Past 5 Years* |
| | |
Peter G. Strelow (1970) President | | 01/2015 to present Senior Vice President 11/2013 to 01/2015 Vice President 02/2009 to 11/2013 | | Managing Director, PIMCO. President, PIMCO Funds, PIMCO Variable Insurance Trust, PIMCO Equity Series, PIMCO Equity Series VIT, PIMCO Managed Accounts Trust and PIMCO Closed-End Funds. |
| | |
David C. Flattum (1964) Chief Legal Officer | | 02/2009 to present | | Managing Director and General Counsel, PIMCO. Chief Legal Officer, PIMCO Funds, PIMCO Variable Insurance Trust, PIMCO Equity Series and PIMCO Equity Series VIT. Formerly, Managing Director, Chief Operating Officer and General Counsel, Allianz Asset Management of America L.P. |
| | |
Jennifer E. Durham (1970) Chief Compliance Officer | | 02/2009 to present | | Managing Director and Chief Compliance Officer, PIMCO. Chief Compliance Officer, PIMCO Funds, PIMCO Variable Insurance Trust, PIMCO Equity Series and PIMCO Equity Series VIT. |
| | |
Brent R. Harris (1959) Senior Vice President | | 01/2015 to present President 03/2009 to 01/2015 | | Managing Director and current member of Executive Committee, PIMCO. Senior Vice President, PIMCO Funds, PIMCO Variable Insurance Trust, PIMCO Equity Series and PIMCO Equity Series VIT. |
| | |
Douglas M. Hodge (1957) Senior Vice President | | 11/2013 to present | | Managing Director, Chief Executive Officer, PIMCO (since 2/14); Chief Operating Officer, PIMCO
(7/09-2/14); Member of Executive Committee and Head of PIMCO’s Asia Pacific region. Member Global Executive Committee, Allianz Asset Management. Senior Vice President, PIMCO Funds, PIMCO Variable Insurance Trust, PIMCO Equity Series and PIMCO Equity Series VIT. |
| | |
Kevin M. Broadwater (1964) Vice President - Senior Counsel | | 05/2012 to present | | Executive Vice President and Deputy General Counsel, PIMCO. Vice President - Senior Counsel, PIMCO Funds, PIMCO Variable Insurance Trust, PIMCO Equity Series and PIMCO Equity Series VIT. |
| | |
Joshua D. Ratner (1976)** Vice President - Senior Counsel, Secretary | | 11/2013 to present Assistant Secretary 02/2009 to 01/2011 | | Executive Vice President and Senior Counsel, PIMCO. Chief Legal Officer, PIMCO Investments LLC. Vice President - Senior Counsel, Secretary, PIMCO Funds, PIMCO Variable Insurance Trust, PIMCO Equity Series and PIMCO Equity Series VIT. Vice President, Secretary and Chief Legal Officer, PIMCO Managed Accounts Trust and PIMCO Closed-End Funds. |
| | |
Ryan G. Leshaw (1980) Assistant Secretary | | 05/2012 to present | | Vice President and Counsel, PIMCO. Assistant Secretary, PIMCO Funds, PIMCO Variable Insurance Trust, PIMCO Equity Series, PIMCO Equity Series VIT, PIMCO Managed Accounts Trust and PIMCO Closed-End Funds. Formerly, Associate, Willkie Farr & Gallagher LLP. |
| | |
Stacie D. Anctil (1969) Vice President | | 05/2015 to present Assistant Treasurer 02/2009 to 05/2015 | | Senior Vice President, PIMCO. Vice President, PIMCO Funds, PIMCO Variable Insurance Trust, PIMCO Equity Series, PIMCO Equity Series VIT, PIMCO Managed Accounts Trust and PIMCO Closed-End Funds. |
| | |
William G. Galipeau (1974) Vice President | | 11/2013 to present | | Executive Vice President, PIMCO. Vice President, PIMCO Funds, PIMCO Variable Insurance Trust, PIMCO Equity Series and PIMCO Equity Series VIT. Treasurer, PIMCO Managed Accounts Trust and PIMCO Closed-End Funds. Formerly, Vice President, Fidelity Investments. |
| | |
Eric D. Johnson (1970)** Vice President | | 05/2011 to present | | Executive Vice President, PIMCO. Vice President, PIMCO Funds, PIMCO Variable Insurance Trust, PIMCO Equity Series, PIMCO Equity Series VIT, PIMCO Managed Accounts Trust and PIMCO Closed-End Funds. |
| | |
Henrik P. Larsen (1970) Vice President | | 02/2009 to present | | Senior Vice President, PIMCO. Vice President, PIMCO Funds, PIMCO Variable Insurance Trust, PIMCO Equity Series and PIMCO Equity Series VIT. |
| | |
Donald W. Suskind (1973) Vice President | | 05/2009 to present | | Executive Vice President, PIMCO. |
| | |
Greggory S. Wolf (1970) Vice President | | 05/2011 to present | | Senior Vice President, PIMCO. Vice President, PIMCO Funds, PIMCO Variable Insurance Trust, PIMCO Equity Series and PIMCO Equity Series VIT. |
| | |
Trent W. Walker (1974) Treasurer | | 11/2013 to present Assistant Treasurer 02/2009 to 11/2013 | | Senior Vice President, PIMCO. Treasurer, PIMCO Funds, PIMCO Variable Insurance Trust, PIMCO Equity Series and PIMCO Equity Series VIT. Assistant Treasurer, PIMCO Managed Accounts Trust and PIMCO Closed-End Funds. |
| | |
Erik C. Brown (1967) Assistant Treasurer | | 02/2009 to present | | Executive Vice President, PIMCO. Assistant Treasurer, PIMCO Funds, PIMCO Variable Insurance Trust, PIMCO Equity Series, PIMCO Equity Series VIT, PIMCO Managed Accounts Trust and PIMCO Closed-End Funds. |
| | |
Jason J. Nagler (1982)** Assistant Treasurer | | 05/2015 to present | | Vice President, PIMCO. Assistant Treasurer, PIMCO Funds, PIMCO Variable Insurance Trust, PIMCO Equity Series, PIMCO Equity Series VIT, PIMCO Managed Accounts Trust and PIMCO Closed-End Funds. Formerly, Head of Mutual Fund Reporting, GMO and Assistant Treasurer, GMO Trust and GMO Series Trust Funds. |
| * | The term “PIMCO Closed-End Funds” as used herein includes: PIMCO California Municipal Income Fund, PIMCO California Municipal Income Fund II, PIMCO California Municipal Income Fund III, PIMCO Municipal Income Fund, PIMCO Municipal Income Fund II, PIMCO Municipal Income Fund III, PIMCO New York Municipal Income Fund, PIMCO New York Municipal Income Fund II, PIMCO New York Municipal Income Fund III, PCM Fund Inc., PIMCO Corporate & Income Opportunity Fund, PIMCO Corporate & Income Strategy Fund, PIMCO Dynamic Credit Income Fund, PIMCO Dynamic Income Fund, PIMCO Global StocksPLUS & Income Fund, PIMCO High Income Fund, PIMCO Income Opportunity Fund, PIMCO Income Strategy Fund, PIMCO Income Strategy Fund II and PIMCO Strategic Income Fund, Inc. |
| ** | The address of these officers is Pacific Investment Management Company LLC, 1633 Broadway, New York, New York 10019. |
| | | | | | |
| | ANNUAL REPORT | | JUNE 30, 2015 | | 143 |
Results of Proxy Voting
(Unaudited)
A special meeting of shareholders of the series of the Trust was held on April 20, 2015. The special meeting was held for the purpose of electing six (6) Trustees to the Trust’s Board of Trustees. Shareholders of all series of the Trust voted together on the proposal, and elected the following six (6) Trustees at the special meeting:
The results of the proxy solicitation on the preceding matter were as follows:
PIMCO ETF Trust
| | | | | | | | |
| Trustee Nominee | | | | For* | | | Withheld* |
George E. Borst | | | | | 116,365,075 | | | 2,628,402 |
Jennifer Holden Dunbar | | | | | 116,411,686 | | | 2,581,791 |
Douglas M. Hodge | | | | | 91,258,043 | | | 27,735,434 |
Gary F. Kennedy | | | | | 116,421,878 | | | 2,571,599 |
Peter B. McCarthy | | | | | 116,389,352 | | | 2,604,125 |
Ronald C. Parker | | | | | 116,387,168 | | | 2,606,309 |
| * | Certain series of the Trust’s shares were held by PIMCO-advised funds or accounts for which PIMCO had discretionary authority to vote proxies. Accordingly, PIMCO voted such shares in proportion to the votes of all other Trust shareholders voting on the proposal. |
Privacy Policy1
(Unaudited)
The Funds2,3 consider customer privacy to be a fundamental aspect of their relationships with shareholders and are committed to maintaining the confidentiality, integrity and security of their current, prospective and former shareholders’ non-public personal information. The Funds have developed policies that are designed to protect this confidentiality, while allowing shareholder needs to be served.
OBTAINING PERSONAL INFORMATION
In the course of providing shareholders with products and services, the Funds and certain service providers to the Funds, such as the Funds’ investment advisers or sub-advisers (“Advisers”), may obtain non-public personal information about shareholders, which may come from sources such as account applications and other forms, from other written, electronic or verbal correspondence, from shareholder transactions, from a shareholder’s brokerage or financial advisory firm, financial advisor or consultant, and/or from information captured on applicable websites.
RESPECTING YOUR PRIVACY
As a matter of policy, the Funds do not disclose any non-public personal information provided by shareholders or gathered by the Funds to non-affiliated third parties, except as required or permitted by law or as necessary for such third parties to perform their agreements with respect to the Funds. As is common in the industry, non-affiliated companies may from time to time be used to provide certain services, such as preparing and mailing prospectuses, reports, account statements and other information, conducting research on shareholder satisfaction and gathering shareholder proxies. The Funds or their affiliates may also retain non-affiliated companies to market Fund shares or products which use Fund shares and enter into joint marketing arrangements with them and other companies. These companies may have access to a shareholder’s personal and account information, but are permitted to use this information solely to provide the specific service or as otherwise permitted by law. In most cases, the shareholders will be clients of a third party, but the Funds may also provide a shareholder’s personal and account information to the shareholder’s respective brokerage or financial advisory firm and/or financial advisor or consultant.
SHARING INFORMATION WITH THIRD PARTIES
The Funds reserve the right to disclose or report personal or account information to non-affiliated third parties in limited circumstances where the Funds believe in good faith that disclosure is required under law, to cooperate with regulators or law enforcement authorities, to protect their rights or property, or upon reasonable request by any fund advised by PIMCO in which a shareholder has invested. In addition, the Funds may disclose information about a shareholder or a shareholder’s accounts to a non-affiliated third party at the shareholder’s request or with the consent of the shareholder.
SHARING INFORMATION WITH AFFILIATES
The Funds may share shareholder information with their affiliates in connection with servicing shareholders’ accounts, and subject to applicable law may provide shareholders with information about products and services that the Funds or their Advisers, distributors or their affiliates
(“Service Affiliates”) believe may be of interest to such shareholders. The information that the Funds may share may include, for example, a shareholder’s participation in the Funds or in other investment programs sponsored by a Service Affiliate, a shareholder’s ownership of certain types of accounts (such as IRAs), information about the Funds’ experiences or transactions with a shareholder, information captured on applicable websites, or other data about a shareholder’s accounts, subject to applicable law. The Funds’ Service Affiliates, in turn, are not permitted to share shareholder information with non-affiliated entities, except as required or permitted by law.
PROCEDURES TO SAFEGUARD PRIVATE INFORMATION
The Funds take seriously the obligation to safeguard shareholder non-public personal information. In addition to this policy, the Funds have implemented procedures that are designed to restrict access to a shareholder’s non-public personal information to internal personnel who need to know that information to perform their jobs, such as servicing shareholder accounts or notifying shareholders of new products or services. Physical, electronic and procedural safeguards are in place to guard a shareholder’s non-public personal information.
INFORMATION COLLECTED FROM WEBSITES
Websites maintained by the Funds or their service providers may use a variety of technologies to collect information that help the Funds and their service providers understand how the website is used. Information collected from your web browser (including small files stored on your device that are commonly referred to as “cookies”) allow the websites to recognize your web browser and help to personalize and improve your user experience and enhance navigation of the website. In addition, the Funds or their Service Affiliates may use third parties to place advertisements for the Funds on other websites, including banner advertisements. Such third parties may collect anonymous information through the use of cookies or action tags (such as web beacons). The information these third parties collect is generally limited to technical and web navigation information, such as your IP address, web pages visited and browser type, and does not include personally identifiable information such as name, address, phone number or email address.
You can change your cookie preferences by changing the setting on your web browser to delete or reject cookies. If you delete or reject cookies, some website pages may not function properly.
CHANGES TO THE PRIVACY POLICY
From time to time, the Funds may update or revise this privacy policy. If there are changes to the terms of this privacy policy, documents containing the revised policy on the relevant website will be updated.
| 1 | Effective as of September 5, 2014. |
| 2 | PIMCO Investments LLC (“PI”) serves as the Funds’ distributor. This Privacy Policy applies to the activities of PI to the extent that PI regularly effects or engages in transactions with or for a Fund shareholder who is the record owner of such shares. For purposes of this Privacy Policy, references to “the Funds” shall include PI when acting in this capacity. |
| 3 | When distributing this Policy, a Fund may combine the distribution with any similar distribution of its investment adviser’s privacy policy. The distributed, combined policy may be written in the first person (i.e., by using “we” instead of “the Funds”). |
| | | | | | |
| | ANNUAL REPORT | | JUNE 30, 2015 | | 145 |
General Information
Investment Manager
Pacific Investment Management Company LLC
650 Newport Center Drive
Newport Beach, CA 92660
Distributor
PIMCO Investments LLC
1633 Broadway
New York, NY 10019
Custodian
State Street Bank and Trust Company
801 Pennsylvania Avenue
Kansas City, MO 64105
Transfer Agent
State Street Bank and Trust Company
State Street Financial Center
One Lincoln Street
Boston, MA 02111
Legal Counsel
Dechert LLP
1900 K Street N.W.
Washington, D.C. 20006
Independent Registered Public Accounting Firm
PricewaterhouseCoopers LLP
1100 Walnut Street, Suite 1300
Kansas City, MO 64106
This report is submitted for the general information of the shareholders of the PIMCO ETF Trust.

ETF3001AR_063015
| | | | | | |
| |
Item 2. | | Code of Ethics. |
| |
| | As of the end of the period covered by this report, the Registrant has adopted a code of ethics (the “Code”) that applies to the Registrant’s principal executive officer and principal financial officer. The Registrant did not grant any waivers, including implicit waivers, from any provisions of the Code to the principal executive officer or principal financial officer during the period covered by this report. A copy of the Code is included as an exhibit to this report. |
| |
Item 3. | | Audit Committee Financial Expert. |
| |
| | (a) The Board of Trustees has determined that Ronald C. Parker, who serves on the Board’s audit committee, qualifies as an “audit committee financial expert” as such term is defined in the instructions to this Item 3. The Board has also determined that Mr. Parker is “independent” as such term is interpreted under this Item 3. |
| |
Item 4. | | Principal Accountant Fees and Services. |
| | | |
| | (a) Fiscal Year Ended | | Audit Fees | | |
| | June 30, 2015 | | $ 439,276 | | |
| | June 30, 2014 | | $ 467,556 | | |
| | | |
| | (b) Fiscal Year Ended | | Audit-Related Fees | | |
| | June 30, 2015 | | $ 420,164 | | |
| | June 30, 2014 | | $ 412,340 | | |
| | | |
| | (c) Fiscal Year Ended | | Tax Fees | | |
| | June 30, 2015 | | $ 2,000 | | |
| | June 30, 2014 | | $ — | | |
| | | |
| | (d) Fiscal Year Ended | | All Other Fees(1) | | |
| | June 30, 2015 | | $ — | | |
| | June 30, 2014 | | $ — | | |
| |
| | “Audit Fees” represents fees billed for each of the last two fiscal years for professional services rendered for the audit of the PIMCO ETF Trust (the “Trust” or “Registrant”) annual financial statements for those fiscal years or services that are normally provided by the accountant in connection with statutory or regulatory filings or engagements for those fiscal years. “Audit-Related Fees” represents fees billed for each of the last two fiscal years for assurance and related services reasonably related to the performance of the audit of the Trust’s annual financial statements for those years. “Tax Fees” represents fees billed for each of the last two fiscal years for professional services related to tax compliance, tax advice and tax planning, including review of federal and state income tax returns, review of excise tax distribution requirements and preparation of excise tax returns. “All Other Fees” represents fees, if any, billed for other products and services rendered by the principal accountant to the Trust for the last two fiscal years. (1)There were no “All Other Fees” for the last two fiscal years. |
| | | | | | |
| | (e) Pre-approval policies and procedures (1) The Registrant’s Audit Oversight Committee has adopted pre-approval policies and procedures (the “Procedures”) to govern the Audit Oversight Committee’s pre-approval of (i) all audit services and permissible non-audit services to be provided to the Registrant by its independent accountant, and (ii) all permissible non-audit services to be provided by such independent accountant to the Registrant’s investment adviser and to any entity controlling, controlled by, or under common control with the investment adviser that provides ongoing services to the Registrant (collectively, the “Service Affiliates”) if the services provided directly relate to the Registrant’s operations and financial reporting. In accordance with the Procedures, the Audit Oversight Committee is responsible for the engagement of the independent accountant to certify the Registrant’s financial statements for each fiscal year. With respect to the pre-approval of non-audit services provided to the Registrant and its Service Affiliates, the Procedures provide that the Audit Oversight Committee may annually pre-approve a list of types or categories of non-audit services that may be provided to the Registrant or its Service Affiliates, or the Audit Oversight Committee may pre-approve such services on a project-by-project basis as they arise. Unless a type of service has received general pre-approval, it will require specific pre-approval by the Audit Oversight Committee if it is to be provided by the independent accountant. The Procedures also permit the Audit Oversight Committee to delegate authority to one or more of its members to pre-approve any proposed non-audit services that have not been previously pre-approved by the Audit Oversight Committee, subject to the ratification by the full Audit Oversight Committee no later than its next scheduled meeting. (2) With respect to the services described in paragraphs (b) through (d) of this Item 4, no amount was approved by the Audit Oversight Committee pursuant to paragraph (c)(7)(i)(C) of Rule 2-01 of Regulation S-X. f) Not applicable. g) |
| | | | | | | | | | | | | | | | |
| | | Aggregate Non-Audit Fees Billed to Entity |
| Entity | | | | June 30, 2015 | | | | | | | June 30, 2014 | | | |
| | | | | |
PIMCO ETF Trust | | $ | | | 422,164 | | | | | | | $ | 412,340 | | | |
Pacific Investment Management Company LLC (“PIMCO”) | | | | | 9,815,893 | | | | | | | | 6,674,889 | | | |
| | | | | |
Total | | $ | | | 10,238,057 | | | | | | | $ | 7,087,229 | | | |
| | | | | | | | | | |
| | |
h) The Registrant’s Audit Oversight Committee has considered whether the provision of non-audit services that were rendered to the Registrant’s investment adviser, and any entity controlling, controlled by, or under common control with the investment adviser that provides ongoing services to the Registrant which were not pre-approved (not requiring pre-approval) is compatible with maintaining the principal accountant’s independence. |
| |
Item 5. | | Audit Committee of Listed Registrants. |
| |
| | The Registrant has a separately-designated standing audit committee established in accordance with Section 3(a)(58)(A) of the Securities Exchange Act of 1934, as amended. The audit committee is comprised of: George E. Borst; E. Philip Cannon; Jennifer Holden Dunbar; Gary F. Kennedy; Peter B. McCarthy; Ronald C. Parker |
| |
Item 6. | | Schedule of Investments. |
| |
| | The Schedule of Investments is included as part of the reports to shareholders under Item 1. |
| |
Item 7. | | Disclosure of Proxy Voting Policies and Procedures for Closed-End Management Investment Companies. |
| |
| | Not applicable. |
| | | | | | |
| |
Item 8. | | Portfolio Managers of Closed-End Management Investment Companies. |
| |
| | Not applicable. |
| |
Item 9. | | Purchases of Equity Securities by Closed-End Management Investment Company and Affiliated Purchasers. |
| |
| | Not applicable. |
| |
Item 10. | | Submission of Matters to a Vote of Security Holders. |
| |
| | Not applicable. |
| | | | | | |
| |
Item 11. | | Controls and Procedures. |
| | |
| | (a) | | The principal executive officer and principal financial & accounting officer have concluded that the Registrant’s disclosure controls and procedures (as defined in Rule 30a-3(c) under the 1940 Act) provide reasonable assurances that material information relating to the Registrant is made known to them by the appropriate persons, based on their evaluation of these controls and procedures as of a date within 90 days of the filing of this report. |
| | |
| | (b) | | There were no changes in the Registrant’s internal control over financial reporting (as defined in Rule 30a-3(d) under the 1940 Act) that occurred during the second fiscal quarter of the period covered by this report that have materially affected, or are reasonably likely to materially affect, the Registrant’s internal control over financial reporting. |
| |
Item 12. | | Exhibits. |
| | |
| | (a)(1) | | Exhibit 99.CODE—Code of Ethics pursuant to Section 406 of the Sarbanes-Oxley Act of 2002. |
| | |
| | (a)(2) | | Exhibit 99.CERT—Certifications pursuant to Section 302 of the Sarbanes-Oxley Act of 2002. |
| | |
| | (b) | | Exhibit 99.906CERT—Certifications pursuant to Section 906 of the Sarbanes-Oxley Act of 2002. |
Signatures
Pursuant to the requirements of the Securities Exchange Act of 1934 and the Investment Company Act of 1940, the registrant has duly caused this report to be signed on its behalf by the undersigned, thereunto duly authorized.
| | |
| PIMCO ETF Trust |
| |
| By: | | /s/ PETER G. STRELOW |
| |
| | |
| | Peter G. Strelow |
| | President (Principal Executive Officer) |
|
| Date: August 27, 2015 |
Pursuant to the requirements of the Securities Exchange Act of 1934 and the Investment Company Act of 1940, this report has been signed below by the following persons on behalf of the registrant and in the capacities and on the dates indicated.
| | |
By: | | /s/ PETER G. STRELOW |
| |
| | |
| | Peter G. Strelow |
| | President (Principal Executive Officer) |
|
Date: August 27, 2015 |
| |
By: | | /s/ TRENT W. WALKER |
| |
| | |
| | Trent W. Walker |
| | Treasurer (Principal Financial & Accounting Officer) |
|
Date: August 27, 2015 |