UNITED STATES
SECURITIES AND EXCHANGE COMMISSION
Washington, D.C. 20549
FORM N-CSR
CERTIFIED SHAREHOLDER REPORT OF REGISTERED MANAGEMENT
INVESTMENT COMPANIES
Investment Company Act file number: 811-22250
PIMCO ETF Trust
(Exact name of registrant as specified in charter)
840 Newport Center Drive, Newport Beach, CA 92660
(Address of principal executive offices)
John P. Hardaway
Treasurer and Principal Financial Officer
PIMCO ETF Trust
840 Newport Center Drive
Newport Beach, CA 92660
(Name and address of agent for service)
Copies to:
Brendan C. Fox
Dechert LLP
1775 I Street, N.W.
Washington, D.C. 20006
Registrant’s telephone number, including area code: (888) 400-4383
Date of fiscal year end: June 30
Date of reporting period: June 30, 2012
Form N-CSR is to be used by management investment companies to file reports with the Commission not later than 10 days after the transmission to stockholders of any report that is required to be transmitted to stockholders under Rule 30e-1 under the Investment Company Act of 1940 (17 CFR 270.30e-1). The Commission may use the information provided on Form N-CSR in its regulatory, disclosure review, inspection, and policymaking roles.
A registrant is required to disclose the information specified by Form N-CSR, and the Commission will make this information public. A registrant is not required to respond to the collection of information contained in Form N-CSR unless the Form displays a currently valid Office of Management and Budget (“OMB”) control number. Please direct comments concerning the accuracy of the information collection burden estimate and any suggestions for reducing the burden to Secretary, Securities and Exchange Commission, 450 Fifth Street, NW, Washington, DC 20549-0609. The OMB has reviewed this collection of information under the clearance requirements of 44 U.S.C. § 3507.
| | | | | | | | |
Item 1. | | Reports to Stockholders. |
The following is a copy of the report transmitted to stockholders pursuant to Rule 30e-1 under the Investment Company Act of 1940, as amended (the “1940 Act”) (17 CFR 270.30e-1).

Your Global Investment Authority
PIMCO ETF Trust
Annual Report
June 30, 2012

Index Exchange-Traded Funds
PIMCO 1-3 Year U.S. Treasury Index Fund
PIMCO 3-7 Year U.S. Treasury Index Fund
PIMCO 7-15 Year U.S. Treasury Index Fund
PIMCO 25+ Year Zero Coupon U.S. Treasury Index Fund
PIMCO Broad U.S. Treasury Index Fund
PIMCO 1-5 Year U.S. TIPS Index Fund
PIMCO 15+ Year U.S. TIPS Index Fund
PIMCO Broad U.S. TIPS Index Fund
PIMCO 0-5 Year High Yield Corporate Bond Index Fund
PIMCO Investment Grade Corporate Bond Index Fund
PIMCO Australia Bond Index Fund
PIMCO Canada Bond Index Fund
PIMCO Germany Bond Index Fund
Actively Managed Exchange-Traded Funds
PIMCO Build America Bond Strategy Fund
PIMCO Enhanced Short Maturity Strategy Fund
PIMCO Global Advantage® Inflation-Linked Bond Strategy Fund
PIMCO Intermediate Municipal Bond Strategy Fund
PIMCO Short Term Municipal Bond Strategy Fund
PIMCO Total Return Exchange-Traded Fund

Table of Contents
This material is authorized for use only when preceded or accompanied by the current PIMCO ETF Trust prospectus.
Chairman’s Letter
Dear Shareholder:
Please find enclosed the Annual Report for the PIMCO ETF Trust covering the twelve-month reporting period ended June 30, 2012. On the following pages, you’ll find specific details on investment performance and a discussion of the factors that most affected performance.
During our twelve-month reporting period, we introduced two new actively-managed exchange-traded funds (“ETFs”) as well as three new single-country Smart Passive index ETFs, which help expand investor access to PIMCO’s expertise through strategies and vehicles which appeal to a wide range of investor preferences:
| | n | | PIMCO Total Return Exchange-Traded Fund (Ticker: BOND), launched on February 29, 2012, is a diversified portfolio of high quality bonds that is actively managed in an effort to maximize return in a risk-controlled framework. BOND invests primarily in investment grade debt securities, and discloses all portfolio holdings on a daily basis. |
| | n | | PIMCO Global Advantage Inflation-Linked Bond Strategy Fund (Ticker: ILB), launched on April 30, 2012, is an actively-managed portfolio comprised of primarily high-quality inflation-linked bonds (which are fixed income securities tied to the consumer price index of a given country or region, and are designed to provide protection from inflation) that span developed and emerging markets. |
| | n | | PIMCO Canada Bond Index Fund (Ticker: CAD), launched on November 9, 2011, aims to provide focused exposure to the Canadian dollar-denominated, investment grade bond market. |
| | n | | PIMCO Germany Bond Index Fund (Ticker: BUND), launched on November 9, 2011, aims to provide focused exposure to euro-denominated, investment grade bonds issued by German issuers. |
| | n | | PIMCO Australia Bond Index Fund (Ticker: AUD), launched on October 31, 2011, aims to provide focused exposure to the Australian dollar-denominated, investment grade bond market. |
PIMCO ETFs are designed to provide well-engineered solutions to meet a broad range of investor needs, offering access to PIMCO’s unique investment process and world-class portfolio management expertise in the ETF vehicle, which features portfolio transparency and intra-day pricing in a conveniently traded format. PIMCO ETFs include a range of actively-managed and Smart Passive index strategies, providing investors access to a variety of sectors, geographical regions and investment objectives.
Highlights of the financial markets during our twelve-month reporting period include:
| | n | | Risk aversion drove down interest rates across developed markets, including in the U.S. and Germany where yields touched historic lows. By contrast, sovereign yields in Spain and Italy rose towards prohibitive levels. Yields on U.S. Treasury securities ended the period lower (with prices on these securities therefore higher), as investors looked to U.S. Treasuries for their perceived safety and quality due to increasing concern of a global economic slowdown and continued uncertainty in Europe. The benchmark ten-year U.S. Treasury note yielded 1.64% at the end of the reporting period, as compared to 3.16% on June 30, 2011. |
| | n | | U.S. Treasury Inflation-Protected Securities (“TIPS”) posted gains during the reporting period. Returns were driven primarily by declining intermediate and longer-dated real yields. Real yields longer than three years in maturity rallied due to overall tepid economic growth expectations and recognition that the Federal Reserve is likely to remain accommodative for a prolonged period of time. However, shorter term real yields sold off on weaker commodity prices, which translated into more muted short term inflation expectations. With nominal rates being fixed at nearly zero, any changes in short term inflation expectations cause the front end of the real yield curve to move. U.S. TIPS, however, underperformed nominal U.S. Treasuries as break-even inflation levels (or the difference between nominal and real yields) narrowed over the reporting period. |
| | n | | Municipal bonds, including both the tax-free and taxable Build America Bonds (“BABs”) sectors, struggled during the first half of the reporting period and were impacted by rising yields, an increase in new issuance, and sizeable redemptions out |
| | of municipal bond mutual funds. Yet, by the second half of the reporting period, municipal bond prices rallied as new issuances of tax-free municipal bonds declined, redemptions stabilized, and municipalities addressed budget concerns. |
| | n | | Investment grade corporate bonds lagged like-duration U.S. Treasuries amid renewed uncertainty in the eurozone and weak U.S. economic data, although corporate fundamentals generally remained robust. Despite uncertain market conditions, corporate bond issuance was resilient and primary market demand remained strong as investors continued to place a premium on liquidity. |
| | n | | High yield corporate bonds posted positive returns for the reporting period but underperformed like-duration U.S. Treasuries, as reignited contagion fears in Europe and worse than expected economic data in the U.S. weighed materially on risk assets, resulting in a flight-to-quality. |
If you have any questions regarding your PIMCO ETF Trust investment, please contact your financial advisor, or call one of our shareholder associates at (888) 400-4ETF. We also invite you to visit our website at www.pimcoetfs.com to learn more about PIMCO ETFs.
Thank you again for the trust you have placed in PIMCO. We are privileged to serve you through our ETF offerings.
| | |
| |
 | | Sincerely, 
Brent R. Harris President and Chairman of the Board, PIMCO ETF Trust July 25, 2012 |
| | | | | | |
| | ANNUAL REPORT | | JUNE 30, 2012 | | 3 |
Important Information About the Funds
The PIMCO 0-5 Year High Yield Corporate Bond Index Fund, PIMCO 1-3 Year U.S. Treasury Index Fund, PIMCO 1-5 Year U.S. TIPS Index Fund, PIMCO 3-7 Year U.S. Treasury Index Fund, PIMCO 7-15 Year U.S. Treasury Index Fund, PIMCO 15+ Year U.S. TIPS Index Fund, PIMCO 25+ Year Zero Coupon U.S. Treasury Index Fund, PIMCO Australia Bond Index Fund, PIMCO Broad U.S. TIPS Index Fund, PIMCO Broad U.S. Treasury Index Fund, PIMCO Canada Bond Index Fund, PIMCO Germany Bond Index Fund and PIMCO Investment Grade Corporate Bond Index Fund are exchange-traded funds (“ETFs”) that seek to provide total return that closely corresponds, before fees and expenses, to the total return of a specified index (collectively, the “Index Funds”). Each Index Fund employs a representative sampling strategy in seeking to achieve its investment objective and as a result may not hold all of the securities that are included in the underlying index. The PIMCO Build America Bond Strategy Fund, PIMCO Enhanced Short Maturity Strategy Fund, PIMCO Global Advantage® Inflation-Linked Bond Strategy Fund, PIMCO Intermediate Municipal Bond Strategy Fund, PIMCO Short Term Municipal Bond Strategy Fund and PIMCO Total Return Exchange-Traded Fund unlike the Index Funds, are actively managed ETFs that do not seek to track the performance of a specified index (collectively, the “Active Funds” and together with the Index Funds, the “Funds”). Shares of the Funds will be listed and traded at market prices on NYSE Arca, Inc. (“NYSE Arca”) and other secondary markets. The market price for each Fund’s shares may be different from the Fund’s net asset value (“NAV”). Each Fund issues and redeems shares at its NAV only in blocks of a specified number of shares (“Creation Units”). Only certain large institutional investors may purchase or redeem Creation Units directly with the Funds at NAV (“Authorized Participants”). These transactions are in exchange for certain securities similar to a Fund’s portfolio and/or cash. Except when aggregated in Creation Units, shares of a Fund are not redeemable securities. Shareholders who are not Authorized Participants may not redeem shares from the Funds at NAV.
The Funds invest in particular segments of the securities markets, which are not representative of the broader securities markets. While we believe that bond funds have an important role to play in a well-diversified investment portfolio, an investment in a Fund alone should not constitute an entire investment program. It is important to note that in an environment where interest rates may trend upward, rising rates would negatively impact the performance of most bond funds, and fixed-income securities held by the Funds are likely to decrease in value. The price volatility of fixed-income securities can also increase during periods of rising interest rates resulting in increased losses to the Funds. Bond funds and individual bonds with a longer duration (a measure used to determine the sensitivity of a security’s price to changes in interest rates) tend to be more sensitive to changes in interest rates, usually making them more volatile than securities or funds with shorter durations.
The Funds may be subject to various risks in addition to those described above. Some of these risks may include, but are not limited to, the following: market trading risk, limited issuance risk, interest rate risk, credit risk, high yield risk, market risk, liquidity risk, equity-risk, mortgage-related and other asset-backed risk, foreign (non-U.S.) investment risk, currency risk, short sale risk, convertible securities risk, derivatives risk, issuer non-diversification risk, leveraging risk, management and tracking error risk, indexing risk, issuer risk, emerging markets risk, management risk, municipal project-specific risk, Australian securities risk, Canadian securities risk and German securities risk. A complete description of these and other risks is contained in each Fund’s prospectus. The use of derivatives may subject the Funds to greater volatility than investments in traditional securities. The Index Funds may use derivative instruments for hedging purposes or as part of an investment strategy. Use of these instruments may involve certain costs and risks such as liquidity risk, interest rate risk, market risk, credit risk, management risk and the risk that a Fund could not close out a position when it would be most advantageous to do so. Certain derivative transactions may have a leveraging effect on an Index Fund. For example, a small investment in a derivative instrument may have a significant impact on an Index Fund’s exposure to interest rates, currency exchange rates or other investments. As a result, a relatively small price movement in a derivative instrument may cause an immediate and substantial loss or gain. An Index Fund may engage in such transactions regardless of whether the Index Fund owns the asset, instrument or components of the index underlying the derivative instrument. An Index Fund may invest a significant portion of its assets in these types of instruments. If it does, the Index Fund’s investment exposure could far exceed the value of its portfolio securities and its investment performance could be primarily dependent upon securities it does not own. The credit quality of a particular security or group of securities does not ensure the stability or safety of the overall portfolio.
On each individual Fund Summary page in this Annual Report (“Shareholder Report”), the Average Annual Total Return table and Cumulative Returns chart measure performance assuming that all dividend and capital gain distributions were reinvested. Returns do not reflect the deduction of taxes that a shareholder would pay on: (i) Fund distributions; or (ii) the redemption of Fund shares. Each Fund’s performance is measured against the performance of a broad-based securities market index (benchmark index). Each Fund’s past performance, before and after taxes, is not necessarily an indication of how the Fund will perform in the future.
An investment in a Fund is not a deposit of a bank and is not guaranteed or insured by the Federal Deposit Insurance Corporation or any other government agency. It is possible to lose money on investments in the Funds.
The Index Funds may make available a complete schedule of portfolio holdings and the percentages they represent of the Index Fund’s net assets. On each business day, before commencement of trading on NYSE Arca, each Active Fund will disclose on www.pimcoetfs.com the identities and quantities of the Active Fund’s portfolio holdings that will form the basis for the Active Fund’s calculation of NAV at the end of the business day. The frequency at which the daily market prices were at a discount or premium to each Fund’s NAV is disclosed on www.pimcoetfs.com. Please see “Disclosure of Portfolio Holdings” in the Statement of Additional Information for information about the availability of the complete schedule of each Fund’s holdings. Fund fact sheets provide additional information regarding a Fund and may be requested by calling (888) 400-4ETF.
PIMCO has adopted written proxy voting policies and procedures (“Proxy Policy”) as required by Rule 206(4)-6 under the Investment Advisers Act of 1940, as amended. The Proxy Policy has been adopted by PIMCO ETF Trust as the policies and procedures that PIMCO will use when voting
proxies on behalf of the Funds. A description of the policies and procedures that PIMCO uses to vote proxies relating to portfolio securities of each Fund, and information about how each Fund voted proxies relating to portfolio securities held during the most recent twelve-month period ended June 30, are available without charge, upon request, by calling the Trust at (888) 400-4ETF, on the Funds’ website at www.pimcoetfs.com, and on the Securities and Exchange Commission’s (“SEC”) website at http://www.sec.gov.
PIMCO ETF Trust files a complete schedule of each Fund’s portfolio holdings with the SEC for the first and third quarters of each fiscal year on Form N-Q. A copy of the Funds’ Form N-Q is available on the SEC’s website at http://www.sec.gov and may be reviewed and copied at the SEC’s Public Reference Room in Washington, D.C. and is available without charge, upon request, by calling the Trust at (888) 400-4ETF and on the Funds’ website at www.pimcoetfs.com. Information on the operation of the Public Reference Room may be obtained by calling 1-800-SEC-0330.
| | | | | | |
| | ANNUAL REPORT | | JUNE 30, 2012 | | 5 |
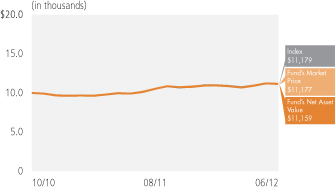
PIMCO 1-3 Year U.S. Treasury Index Fund
Cumulative Returns Through June 30, 2012
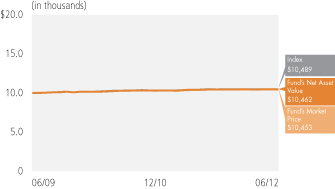
$10,000 invested at the end of the month when the Fund commenced operations.
Allocation Breakdown‡
| | | | |
| U.S. Treasury Obligations | | | 98.4% | |
| Short-Term Instruments | | | 1.6% | |
| ‡ | % of Total Investments as of 06/30/12 |
| | | | | | | | | | |
| Average Annual Total Return for the period ended June 30, 2012 | |
| | | | | 1 Year | | | Fund Inception
(06/01/2009) | |
| | PIMCO 1-3 Year Treasury Index Fund (Based on Net Asset Value) | | | 0.74% | | | | 1.45% | |
| | PIMCO 1-3 Year Treasury Index Fund (At Market Price)(1) | | | 0.70% | | | | 1.44% | |
| | The BofA Merrill Lynch 1-3 Year U.S. Treasury IndexSM± | | | 0.79% | | | | 1.55% | |
All Fund returns are net of fees and expenses.
Market Returns do not include brokerage commissions that may be payable on secondary market transactions. If brokerage commissions were included, market returns would be lower. Market and NAV returns assume that dividends and capital gain distributions have been reinvested in the Fund at market price and NAV, respectively.
(1) The market price is determined using the midpoint between the highest bid and the lowest offer on the listing exchange, as of the time that the Fund’s NAV is calculated.
± The BofA Merrill Lynch 1-3 Year U.S. Treasury IndexSM is an unmanaged index comprised of U.S. Treasury securities, other than inflation-protection securities and STRIPS, with at least $1 billion in outstanding face value and a remaining term to final maturity of at least one year and less than three years. It is not possible to invest directly in an unmanaged index.
Performance quoted represents past performance. Past performance is not a guarantee or a reliable indicator of future results. Current performance may be lower or higher than performance shown. Investment return and the principal value of an investment will fluctuate. Shares may be worth more or less than original cost when redeemed by authorized participants. Returns shown do not reflect the deduction of taxes that a shareholder would pay on Fund distributions or on the redemption of Fund shares. The Fund’s total annual operating expense ratio as stated in the Fund’s current prospectus, as supplemented to date, is 0.15%. Details regarding any Fund’s operating expenses can be found in the Fund’s prospectus. Performance data current to the most recent month-end is available at www.pimcoetfs.com.
Portfolio Insights
| » | | The PIMCO 1-3 Year U.S. Treasury Index Fund seeks to provide total return that closely corresponds, before fees and expenses, to the total return of The BofA Merrill Lynch 1-3 Year U.S. Treasury IndexSM (the “Underlying Index”), by investing under normal circumstances at least 80% of its total assets (exclusive of collateral held from securities lending) in the component securities of the Underlying Index. The Fund invests in a representative sample of securities included in the Underlying Index that collectively has an investment profile similar to the Underlying Index. Due to the use of representative sampling, the Fund may not hold all of the securities that are included in the Underlying Index. |
| » | | Yields in the 1- to 3-year segment of the U.S. Treasury yield curve were mixed over the course of the reporting period: at the 1-year point and below yields increased slightly, while yields above the 1-year point declined. The move in yields resulted in overall negative price performance of the underlying securities, though coupon returns drove positive performance for both the Fund and the Underlying Index over the reporting period. |
PIMCO 3-7 Year U.S. Treasury Index Fund
Cumulative Returns Through June 30, 2012
$10,000 invested at the end of the month when the Fund commenced operations.
Allocation Breakdown‡
| | | | |
| U.S. Treasury Obligations | | | 94.3% | |
| Short-Term Instruments | | | 5.7% | |
| ‡ | % of Total Investments as of 06/30/12 |
| | | | | | | | | | |
| Average Annual Total Return for the period ended June 30, 2012 | |
| | | | | 1 Year | | | Fund Inception
(10/30/2009) | |
| | PIMCO 3-7 Year U.S. Treasury Index Fund (Based on Net Asset Value) | | | 6.67% | | | | 5.63% | |
| | PIMCO 3-7 Year U.S. Treasury Index Fund (At Market Price)(1) | | | 6.69% | | | | 5.63% | |
| | The BofA Merrill Lynch 3-7 Year U.S. Treasury IndexSM± | | | 6.52% | | | | 5.69% | |
All Fund returns are net of fees and expenses.
Market Returns do not include brokerage commissions that may be payable on secondary market transactions. If brokerage commissions were included, market returns would be lower. Market and NAV returns assume that dividends and capital gain distributions have been reinvested in the Fund at market price and NAV, respectively.
(1) The market price is determined using the midpoint between the highest bid and the lowest offer on the listing exchange, as of the time that the Fund’s NAV is calculated.
± The BofA Merrill Lynch 3-7 Year U.S. Treasury IndexSM is an unmanaged index comprised of U.S. dollar denominated sovereign debt securities publicly issued by the U.S. Treasury having a maturity of at least 3 years and less than 7 years.
Performance quoted represents past performance. Past performance is not a guarantee or a reliable indicator of future results. Current performance may be lower or higher than performance shown. Investment return and the principal value of an investment will fluctuate. Shares may be worth more or less than original cost when redeemed by authorized participants. Returns shown do not reflect the deduction of taxes that a shareholder would pay on Fund distributions or on the redemption of Fund shares. The Fund’s total annual operating expense ratio as stated in the Fund’s current prospectus, as supplemented to date, is 0.15%. Details regarding any Fund’s operating expenses can be found in the Fund’s prospectus. Performance data current to the most recent month-end is available at www.pimcoetfs.com.
Portfolio Insights
| » | | The PIMCO 3-7 Year U.S. Treasury Index Fund seeks to provide total return that closely corresponds, before fees and expenses, to the total return of The BofA Merrill Lynch 3-7 Year U.S. Treasury IndexSM (the “Underlying Index”), by investing under normal circumstances at least 80% of its total assets (exclusive of collateral held from securities lending) in the component securities of the Underlying Index. The Fund invests in a representative sample of securities included in the Index that collectively has an investment profile similar to the Underlying Index. Due to the use of representative sampling, the Fund may not hold all of the securities that are included in the Underlying Index. |
| » | | Yields in the 3- to 7-year segment of the U.S. Treasury yield curve were down over the course of the reporting period. The overall decline in yields of the underlying securities and coupon returns drove positive performance for both the Fund and the Underlying Index over the reporting period. |
| | | | | | |
| | ANNUAL REPORT | | JUNE 30, 2012 | | 7 |
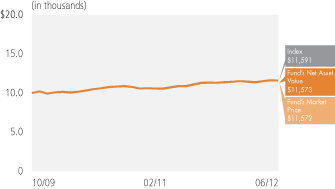
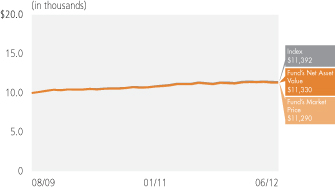
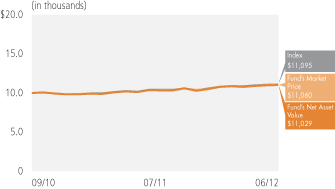
PIMCO 7-15 Year U.S. Treasury Index Fund
Cumulative Returns Through June 30, 2012
$10,000 invested at the end of the month when the Fund commenced operations.
Allocation Breakdown‡
| | | | |
| U.S. Treasury Obligations | | | 100.0% | |
| ‡ | % of Total Investments as of 06/30/12 |
| | | | | | | | | | |
| Average Annual Total Return for the period ended June 30, 2012 | |
| | | | | 1 Year | | | Fund Inception
(09/10/2009) | |
| | PIMCO 7-15 Year U.S. Treasury Index Fund (Based on Net Asset Value) | | | 15.47% | | | | 9.17% | |
| | PIMCO 7-15 Year U.S. Treasury Index Fund (At Market Price)(1) | | | 15.41% | | | | 9.17% | |
| | The BofA Merrill Lynch 7-15 Year U.S. Treasury IndexSM± | | | 15.38% | | | | 9.29% | |
All Fund returns are net of fees and expenses.
Market Returns do not include brokerage commissions that may be payable on secondary market transactions. If brokerage commissions were included, market returns would be lower. Market and NAV returns assume that dividends and capital gain distributions have been reinvested in the Fund at market price and NAV, respectively.
(1) The market price is determined using the midpoint between the highest bid and the lowest offer on the listing exchange, as of the time that the Fund’s NAV is calculated.
± The BofA Merrill Lynch 7-15 Year U.S. Treasury IndexSM is an unmanaged index that tracks the performance of the direct Sovereign debt of the U.S. Government with at least $1 billion in outstanding face value and a remaining term to final maturity of at least 7 years and less than 15 years. It is not possible to invest directly in an unmanaged index.
Performance quoted represents past performance. Past performance is not a guarantee or a reliable indicator of future results. Current performance may be lower or higher than performance shown. Investment return and the principal value of an investment will fluctuate. Shares may be worth more or less than original cost when redeemed by authorized participants. Returns shown do not reflect the deduction of taxes that a shareholder would pay on Fund distributions or on the redemption of Fund shares. The Fund’s total annual operating expense ratio as stated in the Fund’s current prospectus, as supplemented to date, is 0.15%. Details regarding any Fund’s operating expenses can be found in the Fund’s prospectus. Performance data current to the most recent month-end is available at www.pimcoetfs.com.
Portfolio Insights
| » | | The PIMCO 7-15 Year U.S. Treasury Index Fund seeks to provide total return that closely corresponds, before fees and expenses, to the total return of The BofA Merrill Lynch 7-15 Year U.S. Treasury IndexSM (the “Underlying Index”), by investing under normal circumstances at least 80% of its total assets (exclusive of collateral held from securities lending) in the component securities of the Underlying Index. The Fund invests in a representative sample of securities included in the Underlying Index that collectively has an investment profile similar to the Underlying Index. Due to the use of representative sampling, the Fund may not hold all of the securities that are included in the Underlying Index. |
| » | | Yields in the 7- to 15-year segment of the U.S. Treasury yield curve were down over the course of the reporting period. The overall decline in yields of the underlying securities and coupon returns drove positive performance for both the Fund and the Underlying Index over the reporting period. |
PIMCO 25+ Year Zero Coupon U.S. Treasury Index Fund
Cumulative Returns Through June 30, 2012
$10,000 invested at the end of the month when the Fund commenced operations.
Allocation Breakdown‡
| | | | |
| U.S. Treasury Obligations | | | 100.0% | |
| ‡ | % of Total Investments as of 06/30/12 |
| | | | | | | | | | |
| Average Annual Total Return for the period ended June 30, 2012 | |
| | | | | 1 Year | | | Fund Inception
(10/30/2009) | |
| | PIMCO 25+ Year Zero Coupon U.S. Treasury Index Fund (Based on Net Asset Value) | | | 70.82% | | | | 21.34% | |
| | PIMCO 25+ Year Zero Coupon U.S. Treasury Index Fund (At Market Price)(1) | | | 70.23% | | | | 21.15% | |
| | The BofA Merrill Lynch Long U.S. Treasury Principal STRIPS IndexSM± | | | 69.26% | | | | 21.01% | |
All Fund returns are net of fees and expenses.
Market Returns do not include brokerage commissions that may be payable on secondary market transactions. If brokerage commissions were included, market returns would be lower. Market and NAV returns assume that dividends and capital gain distributions have been reinvested in the Fund at market price and NAV, respectively.
(1) The market price is determined using the midpoint between the highest bid and the lowest offer on the listing exchange, as of the time that the Fund’s NAV is calculated.
± The BofA Merrill Lynch Long U.S. Treasury Principal STRIPS IndexSM is an unmanaged index comprised of long maturity Separate Trading of Registered Interest and Principal of Securities (“STRIPS”) representing the final principal payment of U.S. Treasury bonds. The principal STRIPS comprising the Underlying Index must have 25 years or more remaining term to final maturity and must be stripped from U.S. Treasury bonds having at least $1 billion in outstanding face value.
Performance quoted represents past performance. Past performance is not a guarantee or a reliable indicator of future results. Current performance may be lower or higher than performance shown. Investment return and the principal value of an investment will fluctuate. Shares may be worth more or less than original cost when redeemed by authorized participants. Returns shown do not reflect the deduction of taxes that a shareholder would pay on Fund distributions or on the redemption of Fund shares. The Fund’s total annual operating expense ratio as stated in the Fund’s current prospectus, as supplemented to date, is 0.15%. Details regarding any Fund’s operating expenses can be found in the Fund’s prospectus. Performance data current to the most recent month-end is available at www.pimcoetfs.com.
Portfolio Insights
| » | | The PIMCO 25+ Year Zero Coupon U.S. Treasury Index Fund seeks to provide total return that closely corresponds, before fees and expenses, to the total return of The BofA Merrill Lynch Long U.S. Treasury Principal STRIPS IndexSM (the “Underlying Index”), by investing under normal circumstances at least 80% of its total assets (exclusive of collateral held from securities lending) in the component securities of the Underlying Index. The Fund invests in a representative sample of securities included in the Underlying Index that collectively has an investment profile similar to the Underlying Index. Due to the use of representative sampling, the Fund may not hold all of the securities that are included in the Underlying Index. |
| » | | Yields in the 25+ year segment of the U.S. Treasury STRIPS yield curve were down over the reporting period. The fall in yields drove positive performance for the Fund and the Underlying Index over the course of the reporting period. |
| | | | | | |
| | ANNUAL REPORT | | JUNE 30, 2012 | | 9 |
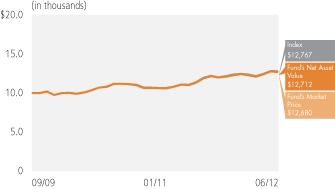
PIMCO Broad U.S. Treasury Index Fund
Cumulative Returns Through June 30, 2012
$10,000 invested at the end of the month when the Fund commenced operations.
Allocation Breakdown‡
| | | | |
| U.S. Treasury Obligations | | | 97.2% | |
| Short-Term Instruments | | | 2.8% | |
| ‡ | % of Total Investments as of 06/30/12 |
| | | | | | | | | | |
| Average Annual Total Return for the period ended June 30, 2012 | |
| | | | | 1 Year | | | Fund Inception
(10/29/2010) | |
| | PIMCO Broad U.S. Treasury Index Fund (Based on Net Asset Value) | | | 12.69% | | | | 6.79% | |
| | PIMCO Broad U.S. Treasury Index Fund (At Market Price)(1) | | | 12.64% | | | | 6.90% | |
| | The BofA Merrill Lynch Liquid US Treasury IndexSM± | | | 12.66% | | | | 6.90% | |
All Fund returns are net of fees and expenses.
Market Returns do not include brokerage commissions that may be payable on secondary market transactions. If brokerage commissions were included, market returns would be lower. Market and NAV returns assume that dividends and capital gain distributions have been reinvested in the Fund at market price and NAV, respectively.
(1) The market price is determined using the midpoint between the highest bid and the lowest offer on the listing exchange, as of the time that the Fund’s NAV is calculated.
± The BofA Merrill Lynch Liquid U.S. Treasury IndexSM is an unmanaged index that tracks the performance of the three most recently issued 2-year, 3- year, 5-year, 7-year, 10-year and 30-year U.S. Treasury notes and bonds. It is not possible to invest directly in an unmanaged index.
Performance quoted represents past performance. Past performance is not a guarantee or a reliable indicator of future results. Current performance may be lower or higher than performance shown. Investment return and the principal value of an investment will fluctuate. Shares may be worth more or less than original cost when redeemed by authorized participants. Returns shown do not reflect the deduction of taxes that a shareholder would pay on Fund distributions or on the redemption of Fund shares. The Fund’s total annual operating expense ratio as stated in the Fund’s current prospectus, as supplemented to date, is 0.15%. Details regarding any Fund’s operating expenses can be found in the Fund’s prospectus. Performance data current to the most recent month-end is available at www.pimcoetfs.com.
Portfolio Insights
| » | | The PIMCO Broad U.S. Treasury Index Fund seeks to provide total return that closely corresponds, before fees and expenses, to the total return of The BofA Merrill Lynch Liquid U.S. Treasury IndexSM (the “Underlying Index”), by investing under normal circumstances at least 80% of its total assets (exclusive of collateral held from securities lending) in the component securities of the Underlying Index. The Fund may invest the remainder of its assets in fixed-income instruments that are not component securities, but which PIMCO believes will help the Fund track its Underlying Index, as well as in cash and investment grade, liquid short-term instruments, forwards or derivatives, such as options, futures contracts or swap agreements, and shares of affiliated bond funds. The Fund invests in a representative sample of securities included in the Underlying Index that collectively has an investment profile similar to the Underlying Index. Due to the use of representative sampling, the Fund may not hold all of the securities that are included in the Underlying Index. |
| » | | Yields at the 1-year point and below on the U.S. Treasury yield curve were up over the course of the reporting period, and down at all other points. The overall decline in yields of the underlying securities and coupon returns drove positive performance for both the Fund and the Underlying Index over the reporting period. |
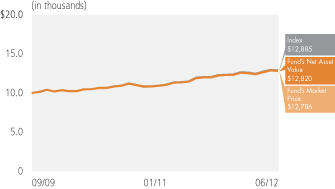
PIMCO 1-5 Year U.S. TIPS Index Fund
Cumulative Returns Through June 30, 2012
$10,000 invested at the end of the month when the Fund commenced operations.
Allocation Breakdown‡
| | | | |
| U.S. Treasury Obligations | | | 99.9% | |
| Short-Term Instruments | | | 0.1% | |
| ‡ | % of Total Investments as of 06/30/12 |
| | | | | | | | | | |
| Average Annual Total Return for the period ended June 30, 2012 | |
| | | | | 1 Year | | | Fund Inception
(08/20/2009) | |
| | PIMCO 1-5 Year U.S. TIPS Index Fund (Based on Net Asset Value) | | | 1.71% | | | | 4.39% | |
| | PIMCO 1-5 Year U.S. TIPS Index Fund (At Market Price)(1) | | | 1.62% | | | | 4.37% | |
| | The BofA Merrill Lynch 1-5 Year U.S. Inflation-Linked Treasury IndexSM± | | | 1.78% | | | | 4.61% | |
All Fund returns are net of fees and expenses.
Market Returns do not include brokerage commissions that may be payable on secondary market transactions. If brokerage commissions were included, market returns would be lower. Market and NAV returns assume that dividends and capital gain distributions have been reinvested in the Fund at market price and NAV, respectively.
(1) The market price is determined using the midpoint between the highest bid and the lowest offer on the listing exchange, as of the time that the Fund’s NAV is calculated.
± The BofA Merrill Lynch 1-5 Year U.S. Inflation-Linked Treasury IndexSM is an unmanaged index comprised of U.S. Treasury Inflation Protected Securities with at least $1 billion in outstanding face value and a remaining term to final maturity of at least 1 year and less than 5 years. It is not possible to invest directly in an unmanaged index.
Performance quoted represents past performance. Past performance is not a guarantee or a reliable indicator of future results. Current performance may be lower or higher than performance shown. Investment return and the principal value of an investment will fluctuate. Shares may be worth more or less than original cost when redeemed by authorized participants. Returns shown do not reflect the deduction of taxes that a shareholder would pay on Fund distributions or on the redemption of Fund shares. The Fund’s total annual operating expense ratio as stated in the Fund’s current prospectus, as supplemented to date, is 0.20%. Details regarding any Fund’s operating expenses can be found in the Fund’s prospectus. Performance data current to the most recent month-end is available at www.pimcoetfs.com.
Portfolio Insights
| » | | The PIMCO 1-5 Year U.S. TIPS Index Fund seeks to provide total return that closely corresponds, before fees and expenses, to the total return of The BofA Merrill Lynch 1-5 Year U.S. Inflation-Linked Treasury IndexSM (the “Underlying Index”), by investing under normal circumstances at least 80% of its total assets (exclusive of collateral held from securities lending) in the component securities of the Underlying Index. The Fund invests in a representative sample of securities included in the Underlying Index that collectively has an investment profile similar to the Underlying Index. Due to the use of representative sampling, the Fund may not hold all of the securities that are included in the Underlying Index. |
| » | | Real yields, or the rates of return in excess of expected future inflation, were mixed across the U.S. Treasury Inflation-Protected Securities (“TIPS”) yield curve: real yields were up from the 1- to 3-year points, but down otherwise. Overall, this drove positive performance for both the Fund and the Underlying Index. A net positive inflation accrual, or change in the Consumer Price Index (“CPI”), applied to the principal of underlying securities over the reporting period also contributed positively to returns. |
| | | | | | |
| | ANNUAL REPORT | | JUNE 30, 2012 | | 11 |
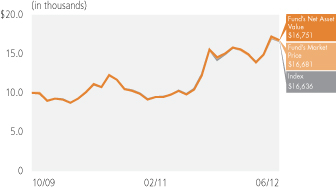
PIMCO 15+ Year U.S. TIPS Index Fund
Cumulative Returns Through June 30, 2012

$10,000 invested at the end of the month when the Fund commenced operations.
Allocation Breakdown‡
| | | | |
| U.S. Treasury Obligations | | | 100.0% | |
| ‡ | % of Total Investments as of 06/30/12 |
| | | | | | | | | | |
| Average Annual Total Return for the period ended June 30, 2012 | |
| | | | | 1 Year | | | Fund Inception
(09/03/2009) | |
| | PIMCO 15+ Year U.S. TIPS Index Fund (Based on Net Asset Value) | | | 26.53% | | | | 15.73% | |
| | PIMCO 15+ Year U.S. TIPS Index Fund (At Market Price)(1) | | | 26.40% | | | | 15.71% | |
| | The BofA Merrill Lynch 15+ Year U.S. Inflation-Linked Treasury IndexSM± | | | 26.60% | | | | 15.87% | |
All Fund returns are net of fees and expenses.
Market Returns do not include brokerage commissions that may be payable on secondary market transactions. If brokerage commissions were included, market returns would be lower. Market and NAV returns assume that dividends and capital gain distributions have been reinvested in the Fund at market price and NAV, respectively.
(1) The market price is determined using the midpoint between the highest bid and the lowest offer on the listing exchange, as of the time that the Fund’s NAV is calculated.
± The BofA Merrill Lynch 15+ Year U.S. Inflation-Linked Treasury IndexSM is an unmanaged index comprised of U.S. Treasury Inflation Protected Securities with at least $1 billion in outstanding face value and a remaining term to final maturity greater than 15 years. It is not possible to invest directly in an unmanaged index.
Performance quoted represents past performance. Past performance is not a guarantee or a reliable indicator of future results. Current performance may be lower or higher than performance shown. Investment return and the principal value of an investment will fluctuate. Shares may be worth more or less than original cost when redeemed by authorized participants. Returns shown do not reflect the deduction of taxes that a shareholder would pay on Fund distributions or on the redemption of Fund shares. The Fund’s total annual operating expense ratio as stated in the Fund’s current prospectus, as supplemented to date, is 0.20%. Details regarding any Fund’s operating expenses can be found in the Fund’s prospectus. Performance data current to the most recent month-end is available at www.pimcoetfs.com.
Portfolio Insights
| » | | The PIMCO 15+ Year U.S. TIPS Index Fund seeks to provide total return that closely corresponds, before fees and expenses, to the total return of The BofA Merrill Lynch 15+ Year U.S. Inflation-Linked Treasury IndexSM (the “Underlying Index”), by investing under normal circumstances at least 80% of its total assets (exclusive of collateral held from securities lending) in the component securities of the Underlying Index. The Fund invests in a representative sample of securities included in the Underlying Index that collectively has an investment profile similar to the Underlying Index. Due to the use of representative sampling, the Fund may not hold all of the securities that are included in the Underlying Index. |
| » | | Real yields, or the rates of return in excess of expected future inflation, declined in the longer maturity section of the U.S. Treasury Inflation-Protected Securities (“TIPS”) yield curve, driving positive performance for both the Fund and the Underlying Index. A net positive inflation accrual, or change in the Consumer Price Index (“CPI”), applied to the principal of underlying securities over the reporting period also contributed positively to returns. |
PIMCO Broad U.S. TIPS Index Fund
Cumulative Returns Through June 30, 2012
$10,000 invested at the end of the month when the Fund commenced operations.
Allocation Breakdown‡
| | | | |
| U.S. Treasury Obligations | | | 100.0% | |
| ‡ | % of Total Investments as of 06/30/12 |
| | | | | | | | | | |
| Average Annual Total Return for the period ended June 30, 2012 | |
| | | | | 1 Year | | | Fund Inception
(09/03/2009) | |
| | PIMCO Broad U.S. TIPS Index Fund (Based on Net Asset Value) | | | 12.21% | | | | 9.75% | |
| | PIMCO Broad U.S. TIPS Index Fund (At Market Price)(1) | | | 12.07% | | | | 9.72% | |
| | The BofA Merrill Lynch U.S. Inflation-Linked Treasury IndexSM± | | | 12.33% | | | | 9.93% | |
All Fund returns are net of fees and expenses.
Market Returns do not include brokerage commissions that may be payable on secondary market transactions. If brokerage commissions were included, market returns would be lower. Market and NAV returns assume that dividends and capital gain distributions have been reinvested in the Fund at market price and NAV, respectively.
(1) The market price is determined using the midpoint between the highest bid and the lowest offer on the listing exchange, as of the time that the Fund’s NAV is calculated.
± The BofA Merrill Lynch U.S. Inflation-Linked Treasury IndexSM is an unmanaged index comprised of U.S. Treasury Inflation Protected Securities with at least $1 billion in outstanding face value. It is not possible to invest directly in an unmanaged index.
Performance quoted represents past performance. Past performance is not a guarantee or a reliable indicator of future results. Current performance may be lower or higher than performance shown. Investment return and the principal value of an investment will fluctuate. Shares may be worth more or less than original cost when redeemed by authorized participants. Returns shown do not reflect the deduction of taxes that a shareholder would pay on Fund distributions or on the redemption of Fund shares. The Fund’s total annual operating expense ratio as stated in the Fund’s current prospectus, as supplemented to date, is 0.20%. Details regarding any Fund’s operating expenses can be found in the Fund’s prospectus. Performance data current to the most recent month-end is available at www.pimcoetfs.com.
Portfolio Insights
| » | | The PIMCO Broad U.S. TIPS Index Fund seeks to provide total return that closely corresponds, before fees and expenses, to the total return of The BofA Merrill Lynch U.S. Inflation-Linked Treasury IndexSM (the “Underlying Index”), by investing under normal circumstances at least 80% of its total assets (exclusive of collateral held from securities lending) in the component securities of the Underlying Index. The Fund invests in a representative sample of securities included in the Underlying Index that collectively has an investment profile similar to the Underlying Index. Due to the use of representative sampling, the Fund may not hold all of the securities that are included in the Underlying Index. |
| » | | Real yields, or the rates of return in excess of expected future inflation, were mixed across the U.S. Treasury Inflation-Protected Securities (“TIPS”) yield curve: real yields were up from the 1- to 3-year points, but down otherwise. Overall, this drove positive performance for both the Fund and the Underlying Index. A net positive inflation accrual, or change in the Consumer Price Index (“CPI”), applied to the principal of underlying securities over the reporting period also contributed positively to returns. |
| | | | | | |
| | ANNUAL REPORT | | JUNE 30, 2012 | | 13 |
PIMCO 0-5 Year High Yield Corporate Bond Index Fund
Cumulative Returns Through June 30, 2012
$10,000 invested at the end of the month when the Fund commenced operations.
Allocation Breakdown‡
| | | | |
| Corporate Bonds & Notes | | | 93.2% | |
| Short-Term Instruments | | | 6.8% | |
| ‡ | % of Total Investments as of 06/30/12 |
| | | | | | | | | | |
| Average Annual Total Return for the period ended June 30, 2012 | |
| | | | | 1 Year | | | Fund Inception
(06/16/2011) | |
| | PIMCO 0-5 Year High Yield Corporate Bond Index Fund (Based on Net Asset Value) | | | 5.16% | | | | 5.41% | |
| | PIMCO 0-5 Year High Yield Corporate Bond Index Fund (At Market Price)(1) | | | 5.32% | | | | 5.80% | |
| | The BofA Merrill Lynch 0-5 Year US High Yield Constrained IndexSM± | | | 5.65% | | | | 5.75% | |
All Fund returns are net of fees and expenses.
Market Returns do not include brokerage commissions that may be payable on secondary market transactions. If brokerage commissions were included, market returns would be lower. Market and NAV returns assume that dividends and capital gain distributions have been reinvested in the Fund at market price and NAV, respectively.
(1) The market price is determined using the midpoint between the highest bid and the lowest offer on the listing exchange, as of the time that the Fund’s NAV is calculated.
± The BofA Merrill Lynch 0-5 Year U.S. High Yield Constrained IndexSM tracks the performance of short-term U.S. dollar denominated below investment grade corporate debt issued in the U.S. domestic market with less than five years remaining term to final maturity, a fixed coupon schedule and a minimum amount outstanding of $100 million, issued publicly. Allocations to an individual issuer will not exceed 2%. It is not possible to invest directly in an unmanaged index.
Performance quoted represents past performance. Past performance is not a guarantee or a reliable indicator of future results. Current performance may be lower or higher than performance shown. Investment return and the principal value of an investment will fluctuate. Shares may be worth more or less than original cost when redeemed by authorized participants. Returns shown do not reflect the deduction of taxes that a shareholder would pay on Fund distributions or on the redemption of Fund shares. The Fund’s total annual operating expense ratio as stated in the Fund’s current prospectus, as supplemented to date, is 0.55%. Details regarding any Fund’s operating expenses can be found in the Fund’s prospectus. Performance data current to the most recent month-end is available at www.pimcoetfs.com.
Portfolio Insights
| » | | The PIMCO 0-5 Year High Yield Corporate Bond Index Fund seeks to provide total return that closely corresponds, before fees and expenses, to the total return of The BofA Merrill Lynch 0-5 Year U.S. High Yield Constrained IndexSM (the “Underlying Index”), by investing under normal circumstances at least 80% of its total assets (exclusive of collateral held from securities lending) in the component securities (“Component Securities”) of the Underlying Index. The Fund may invest the remainder of its assets in fixed-income instruments that are not Component Securities, but which PIMCO believes will help the Fund track its Underlying Index, as well as in cash and investment grade, liquid short-term instruments, forwards or derivatives, such as options, futures contracts or swap agreements, and shares of affiliated bond funds. The Fund invests in a representative sample of securities included in the Underlying Index that collectively has an investment profile similar to the Underlying Index. Due to the use of representative sampling, the Fund may not hold all of the securities that are included in the Underlying Index. |
| » | | Over the reporting period, yields in the short term segment of the U.S. high yield market rose. However, coupon returns were greater than the negative price performance of underlying securities, resulting in net positive performance for the Fund and the Underlying Index. |
PIMCO Investment Grade Corporate Bond Index Fund
Cumulative Returns Through June 30, 2012
$10,000 invested at the end of the month when the Fund commenced operations.
Allocation Breakdown‡
| | | | |
| Industrials | | | 52.5% | |
| Banking & Finance | | | 33.8% | |
| Utilities | | | 13.1% | |
| Short-Term Instruments | | | 0.6% | |
| ‡ | % of Total Investments as of 06/30/12 |
| | | | | | | | | | |
| Average Annual Total Return for the period ended June 30, 2012 | |
| | | | | 1 Year | | | Fund Inception
(09/20/2010) | |
| | PIMCO Investment Grade Corporate Bond Index Fund (Based on Net Asset Value) | | | 9.20% | | | | 6.49% | |
| | PIMCO Investment Grade Corporate Bond Index Fund (At Market Price)(1) | | | 9.32% | | | | 6.57% | |
| | The BofA Merrill Lynch US Corporate IndexSM± | | | 9.15% | | | | 6.70% | |
All Fund returns are net of fees and expenses.
Market Returns do not include brokerage commissions that may be payable on secondary market transactions. If brokerage commissions were included, market returns would be lower. Market and NAV returns assume that dividends and capital gain distributions have been reinvested in the Fund at market price and NAV, respectively.
(1) The market price is determined using the midpoint between the highest bid and the lowest offer on the listing exchange, as of the time that the Fund’s NAV is calculated.
± The BofA Merrill Lynch U.S. Corporate IndexSM is an unmanaged index comprised of U.S. dollar denominated investment grade, fixed rate corporate debt securities publicly issued in the U.S. domestic market with at least one year remaining term to final maturity and at least $250 million outstanding. It is not possible to invest directly in an unmanaged index.
Performance quoted represents past performance. Past performance is not a guarantee or a reliable indicator of future results. Current performance may be lower or higher than performance shown. Investment return and the principal value of an investment will fluctuate. Shares may be worth more or less than original cost when redeemed by authorized participants. Returns shown do not reflect the deduction of taxes that a shareholder would pay on Fund distributions or on the redemption of Fund shares. The Fund’s total annual operating expense ratio as stated in the Fund’s current prospectus, as supplemented to date, is 0.20%. Details regarding any Fund’s operating expenses can be found in the Fund’s prospectus. Performance data current to the most recent month-end is available at www.pimcoetfs.com.
Portfolio Insights
| » | | The PIMCO Investment Grade Corporate Bond Index Fund seeks to provide total return that closely corresponds, before fees and expenses, to the total return of The BofA Merrill Lynch U.S. Corporate IndexSM (the “Underlying Index”), by investing under normal circumstances at least 80% of its total assets (exclusive of collateral held from securities lending) in the component securities of the Underlying Index. The Fund may invest the remainder of its assets in fixed-income instruments that are not component securities, but which PIMCO believes will help the Fund track its Underlying Index, as well as in cash and investment grade, liquid short-term instruments, forwards or derivatives, such as options, futures contracts or swap agreements, and shares of affiliated bond funds. The Fund invests in a representative sample of securities included in the Underlying Index that collectively has an investment profile similar to the Underlying Index. Due to the use of representative sampling, the Fund may not hold all of the securities that are included in the Underlying Index. |
| » | | A decrease in U.S. Treasury yields beyond the 1-year point as well as coupon returns offset a widening of option-adjusted spreads, driving positive performance for both the Fund and the Underlying Index over the reporting period. |
| | | | | | |
| | ANNUAL REPORT | | JUNE 30, 2012 | | 15 |
PIMCO Australia Bond Index Fund
Cumulative Returns Through June 30, 2012

$10,000 invested at the end of the month when the Fund commenced operations.
Allocation Breakdown‡
| | | | |
| Australia | | | 71.6% | |
| Supranational | | | 19.0% | |
| Germany | | | 4.3% | |
| United Kingdom | | | 3.0% | |
| Netherlands | | | 2.1% | |
| ‡ | % of Total Investments as of 06/30/12 |
| | | | | | |
Cumulative Total Return for the period ended June 30, 2012 | |
| | | | | Fund Inception
(10/31/2011) | |
| | PIMCO Australia Bond Index Fund (Based on Net Asset Value) | | | 4.16% | |
| | PIMCO Australia Bond Index Fund (At Market Price)(1) | | | 3.36% | |
| | The BofA Merrill Lynch Diversified Australia Bond IndexSM± | | | 4.50% | |
All Fund returns are net of fees and expenses.
Market Returns do not include brokerage commissions that may be payable on secondary market transactions. If brokerage commissions were included, market returns would be lower. Market and NAV returns assume that dividends and capital gain distributions have been reinvested in the Fund at market price and NAV, respectively.
(1) The market price is determined using the midpoint between the highest bid and the lowest offer on the listing exchange, as of the time that the Fund’s NAV is calculated.
± The BofA Merrill Lynch Diversified Australia Bond IndexSM tracks the performance of large, Australian dollar (“AUD”)-denominated investment grade debt instruments publicly issued in the Australian domestic market, including sovereign, quasi government, corporate, securitized and collateralized securities. All qualifying securities must have at least one year remaining term to final maturity and a fixed coupon schedule. Qualifying Australian sovereign securities must have a minimum amount outstanding of AUD 1 billion. Qualifying non-sovereign securities must have a minimum amount outstanding of AUD 500 million and must be rated investment grade. Index constituents are capitalization-weighted adjusted, as necessary, to meet issuer concentration limits. The Underlying Index is rebalanced on the last calendar day of the month. It is not possible to invest directly in an unmanaged index.
Performance quoted represents past performance. Past performance is not a guarantee or a reliable indicator of future results. Current performance may be lower or higher than performance shown. Investment return and the principal value of an investment will fluctuate. Shares may be worth more or less than original cost when redeemed by authorized participants. Returns shown do not reflect the deduction of taxes that a shareholder would pay on Fund distributions or on the redemption of Fund shares. The Fund’s total annual operating expense ratio as stated in the Fund’s current prospectus, as supplemented to date, is 0.51%. Details regarding any Fund’s operating expenses can be found in the Fund’s prospectus. Performance data current to the most recent month-end is available at www.pimcoetfs.com.
Portfolio Insights
| » | | The PIMCO Australia Bond Index Fund seeks to provide total return that closely corresponds, before fees and expenses, to the total return of The BofA Merrill Lynch Diversified Australia Bond IndexSM (the “Underlying Index”), by investing under normal circumstances at least 80% of its total assets (exclusive of collateral held from securities lending) in the component securities of the Underlying Index. The Underlying Index tracks the performance of large, Australian dollar-denominated investment grade debt instruments publicly issued in the Australian domestic market, including sovereign, quasi-government, corporate securitized and collateralized securities. Qualifying constituents must have an investment-grade rating (based on an average of Moody’s Investors Service, Inc. (“Moody’s”), Standard & Poor’s Ratings Services (“S&P”) and Fitch, Inc. (“Fitch”)), an investment grade country of risk (based on an average of Moody’s, S&P and Fitch foreign currency long term sovereign debt ratings), at least one year remaining term to final maturity and a fixed coupon schedule. The Fund invests in a representative sample of securities included in the Underlying Index that collectively has an investment profile similar to the Underlying Index. Due to the use of representative sampling, the Fund may not hold all of the securities that are included in the Underlying Index. |
| » | | The Fund commenced operations on October 31, 2011. |
| » | | Australian government yields declined over the reporting period while the Australian dollar weakened versus the U.S. dollar. The net result was positive performance for both the Fund and the Underlying Index. |
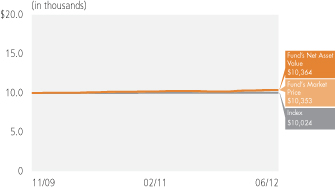
PIMCO Canada Bond Index Fund
Cumulative Returns Through June 30, 2012
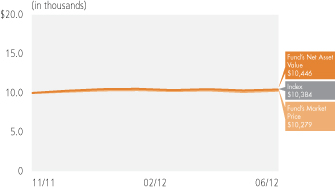
$10,000 invested at the end of the month when the Fund commenced operations.
Allocation Breakdown‡
| ‡ | % of Total Investments as of 06/30/12 |
| | | | | | |
| Cumulative Total Return for the period ended June 30, 2012 | |
| | | | | Fund Inception
(11/09/2011) | |
| | PIMCO Canada Bond Index Fund (Based on Net Asset Value) | | | 4.18% | |
| | PIMCO Canada Bond Index Fund (At Market Price)(1) | | | 4.18% | |
| | The BofA Merrill Lynch Diversified Canada Government Bond IndexSM± | | | 3.57% | |
All Fund returns are net of fees and expenses.
Market Returns do not include brokerage commissions that may be payable on secondary market transactions. If brokerage commissions were included, market returns would be lower. Market and NAV returns assume that dividends and capital gain distributions have been reinvested in the Fund at market price and NAV, respectively.
(1) The market price is determined using the midpoint between the highest bid and the lowest offer on the listing exchange, as of the time that the Fund’s NAV is calculated.
± The BofA Merrill Lynch Diversified Canada Government Bond IndexSM tracks the performance of large, Canadian dollar (“CAD”)-denominated investment grade debt instruments publicly issued in the Canadian domestic market including Canadian sovereign and quasi-government securities. All Qualifying securities must have at least one year remaining term to final maturity, a fixed coupon schedule and a minimum amount outstanding of CAD 1 billion for Canadian sovereign securities and a minimum amount outstanding of CAD 200 million for Canadian quasi-government-securities. Index constituents are capitalization-weighted adjusted, as necessary, to meet issuer concentration limits. The Underlying Index is rebalanced on the last calendar day of the month. It is not possible to invest directly in an unmanaged index.
Performance quoted represents past performance. Past performance is not a guarantee or a reliable indicator of future results. Current performance may be lower or higher than performance shown. Investment return and the principal value of an investment will fluctuate. Shares may be worth more or less than original cost when redeemed by authorized participants. Returns shown do not reflect the deduction of taxes that a shareholder would pay on Fund distributions or on the redemption of Fund shares. The Fund’s total annual operating expense ratio as stated in the Fund’s current prospectus, as supplemented to date, is 0.52%. Details regarding any Fund’s operating expenses can be found in the Fund’s prospectus. Performance data current to the most recent month-end is available at www.pimcoetfs.com.
Portfolio Insights
| » | | The PIMCO Canada Bond Index Fund seeks to provide total return that closely corresponds, before fees and expenses, to the total return of The BofA Merrill Lynch Diversified Canada Bond IndexSM (the “Underlying Index”), by investing under normal circumstances at least 80% of its total assets (exclusive of collateral held from securities lending) in the component securities of the Underlying Index. The Underlying Index tracks the performance of large, Canadian dollar-denominated investment grade debt instruments publicly issued in the Canadian domestic market, including Canadian sovereign and quasi-government securities. Qualifying constituents must have an investment-grade rating (based on an average of the ratings of Moody’s Investors Service, Inc. (“Moody’s”), Standard & Poor’s Ratings Services (“S&P”) and Fitch, Inc. (“Fitch”)), an investment grade country of risk (based on an average of Moody’s, S&P and Fitch foreign currency long term sovereign debt ratings), at least one year remaining term to final maturity and a fixed coupon schedule. The Fund invests in a representative sample of securities included in the Underlying Index that collectively has an investment profile similar to the Underlying Index. Due to the use of representative sampling, the Fund may not hold all of the securities that are included in the Underlying Index. |
| » | | The Fund commenced operations on November 9, 2011. |
| » | | Canadian government yields rose from the 6-month to 3-year portion of the yield curve, but otherwise fell while the Canadian dollar strengthened slightly versus the U.S. dollar. The net result was positive performance for both the Fund and the Underlying Index. |
| | | | | | |
| | ANNUAL REPORT | | JUNE 30, 2012 | | 17 |
PIMCO Germany Bond Index Fund
Cumulative Returns Through June 30, 2012
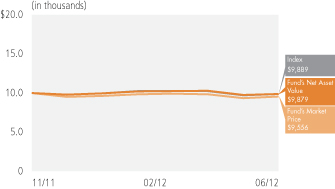
$10,000 invested at the end of the month when the Fund commenced operations.
Allocation Breakdown‡
| | | | |
| Germany | | | 83.7% | |
| Netherlands | | | 16.3% | |
| ‡ | % of Total Investments as of 06/30/12 |
| | | | | | |
| Cumulative Total Return for the period ended June 30, 2012 | |
| | | | | Fund Inception
(11/09/2011) | |
| | PIMCO Germany Bond Index Fund (Based on Net Asset Value) | | | -3.29 | % |
| | PIMCO Germany Bond Index Fund (At Market Price)(1) | | | -2.95 | % |
| | The BofA Merrill Lynch Diversified Germany Bond IndexSM± | | | -3.26 | % |
All Fund returns are net of fees and expenses.
Market Returns do not include brokerage commissions that may be payable on secondary market transactions. If brokerage commissions were included, market returns would be lower. Market and NAV returns assume that dividends and capital gain distributions have been reinvested in the Fund at market price and NAV, respectively.
(1) The market price is determined using the midpoint between the highest bid and the lowest offer on the listing exchange, as of the time that the Fund’s NAV is calculated.
± The BofA Merrill Lynch Diversified Germany Bond IndexSM tracks the performance of large, Euro (“EUR”)-denominated investment grade debt instruments of German issuers publicly issued in the eurobond or Euro member domestic markets, including sovereign, quasi-government, corporate, securitized and collateralized securities. All Qualifying securities must be an obligation of a German entity with at least one year remaining term to final maturity and a fixed coupon schedule. Qualifying German sovereign securities must have a minimum amount outstanding of EUR 1 billion. Qualifying non-sovereign securities must have a minimum amount outstanding of EUR 500 million and must be rated investment grade. Index constituents are capitalization-weighted adjusted, as necessary, to meet issuer concentration limits. The Underlying Index is rebalanced on the last calendar day of the month. It is not possible to invest directly in an unmanaged index.
Performance quoted represents past performance. Past performance is not a guarantee or a reliable indicator of future results. Current performance may be lower or higher than performance shown. Investment return and the principal value of an investment will fluctuate. Shares may be worth more or less than original cost when redeemed by authorized participants. Returns shown do not reflect the deduction of taxes that a shareholder would pay on Fund distributions or on the redemption of Fund shares. The Fund’s total annual operating expense ratio as stated in the Fund’s current prospectus, as supplemented to date, is 0.49%. Details regarding any Fund’s operating expenses can be found in the Fund’s prospectus. Performance data current to the most recent month-end is available at www.pimcoetfs.com.
Portfolio Insights
| » | | The PIMCO Germany Bond Index Fund seeks to provide total return that closely corresponds, before fees and expenses, to the total return of The BofA Merrill Lynch Diversified Germany Bond IndexSM (the “Underlying Index”), by investing under normal circumstances at least 80% of its total assets (exclusive of collateral held from securities lending) in the component securities of the Underlying Index. The Underlying Index tracks the performance of large, Euro-denominated investment grade debt instruments of German issuers publicly issued in the eurobond or Euromember domestic markets, including sovereign, quasi-government, corporate, securitized and collateralized securities. Qualifying constituents must be an obligation of a German entity with an investment-grade rating (based on an average of the ratings of Moody’s Investors Service, Inc. (“Moody’s”), Standard & Poor’s Ratings Services (“S&P”) and Fitch, Inc. (“Fitch”), at least one year remaining term to final maturity and a fixed coupon schedule. The Fund invests in a representative sample of securities included in the Underlying Index that collectively has an investment profile similar to the Underlying Index. Due to the use of representative sampling, the Fund may not hold all of the securities that are included in the Underlying Index. |
| » | | The Fund commenced operations on November 9, 2011. |
| » | | German government bond yields were down across the yield curve except at the 3-month point while the euro weakened versus the U.S. dollar. The net result was negative performance for both the Fund and the Underlying Index. |
PIMCO Build America Bond Strategy Fund
Cumulative Returns Through June 30, 2012
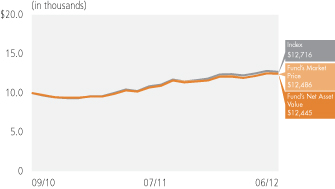
$10,000 invested at the end of the month when the Fund commenced operations.
Allocation Breakdown‡
| | | | |
| California | | | 39.6% | |
| New York | | | 14.2% | |
| Illinois | | | 12.6% | |
| New Jersey | | | 7.8% | |
| Short-Term Instruments | | | 5.4% | |
| Other | | | 20.4% | |
| ‡ | % of Total Investments as of 06/30/12 |
| | | | | | | | | | |
| Average Annual Total Return for the period ended June 30, 2012 | |
| | | | | 1 Year | | | Fund Inception
(09/20/2010) | |
| | PIMCO Build America Bond Strategy Fund (Based on Net Asset Value) | | | 22.27% | | | | 13.83% | |
| | PIMCO Build America Bond Strategy Fund (At Market Price)(1) | | | 23.04% | | | | 13.90% | |
| | Barclays Build America Bond Index± | | | 24.09% | | | | 15.61% | |
All Fund returns are net of fees and expenses.
Market Returns do not include brokerage commissions that may be payable on secondary market transactions. If brokerage commissions were included, market returns would be lower. Market and NAV returns assume that dividends and capital gain distributions have been reinvested in the Fund at market price and NAV, respectively.
(1) The market price is determined using the midpoint between the highest bid and the lowest offer on the listing exchange, as of the time that the Fund’s NAV is calculated.
± Barclays Build America Bond Index is a subset of the Barclays Taxable Municipal Bond Index. The sub-Index consists of all direct pay Build America Bonds that satisfy the rules of the Barclays Taxable Municipal Bond Index. The Barclays Taxable Municipal Bond Index represents securities that are SEC-registered, taxable, dollar denominated, and have at least one year to final maturity, at least $250 million par amount outstanding and are determined to be investment-grade by Barclays. It is not possible to invest directly in an unmanaged index.
Performance quoted represents past performance. Past performance is not a guarantee or a reliable indicator of future results. Current performance may be lower or higher than performance shown. Investment return and the principal value of an investment will fluctuate. Shares may be worth more or less than original cost when redeemed by authorized participants. Returns shown do not reflect the deduction of taxes that a shareholder would pay on Fund distributions or on the redemption of Fund shares. The Fund’s total annual operating expense ratio as stated in the Fund’s current prospectus, as supplemented to date, is 0.45%. Details regarding any Fund’s operating expenses can be found in the Fund’s prospectus. Performance data current to the most recent month-end is available at www.pimcoetfs.com.
Portfolio Insights
| » | | The PIMCO Build America Bond Strategy Fund seeks maximum income, consistent with preservation of capital, by investing under normal circumstances at least 80% of its assets in taxable municipal debt securities publicly issued under the Build America Bond program. |
| » | | The Fund’s 30 Day SEC yield(a) after fees for June 30, 2012 was 4.11% while the estimated yield to maturity(b) was 4.58%. |
| » | | An underweight duration position (or sensitivity to changes in market interest rates) throughout the reporting period detracted from performance as yields fell across the yield curve. |
| » | | A focus on revenue municipal bonds relative to general obligation municipal bonds contributed to performance as revenue bonds outperformed general obligation issues during the reporting period. |
| » | | An overweight exposure to transportation and healthcare securities contributed to performance as returns in these sectors outperformed the general municipal bond market. |
| » | | An overweight exposure to electric bonds detracted from returns as these securities underperformed the general municipal bond market. |
| » | | An underweight to education securities detracted from returns as the sector outperformed the general municipal bond market. |
(a) The 30 Day SEC Yield is a standard yield calculation developed by the Securities and Exchange Commission (“SEC”) that allows for fairer comparisons among bond funds. It is based on the most recent 30-day period covered by the Fund’s filings with the SEC. The yield figure reflects the dividends and interest earned during the period, after the deduction of the Fund’s expenses.
(b) The Yield to Maturity (“YTM”) is the rate of return anticipated on a bond if it is held until the maturity date. The calculation of YTM takes into account the current market price, par value, coupon interest rate and time to maturity. PIMCO calculates a Fund’s estimated YTM by averaging the YTM of each security held in the Fund on a market weighted basis by selecting each security’s YTM from PIMCO’s analytics database or from Bloomberg. A Fund’s estimated YTM may differ from its distribution yield or SEC yield due to a number of factors, including unsettled trades and Fund expenses.
| | | | | | |
| | ANNUAL REPORT | | JUNE 30, 2012 | | 19 |
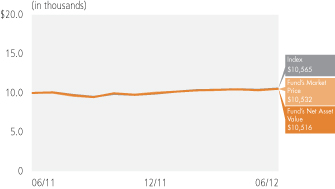
PIMCO Enhanced Short Maturity Strategy Fund
Cumulative Returns Through June 30, 2012
$10,000 invested at the end of the month when the Fund commenced operations.
Allocation Breakdown‡
| | | | |
| Corporate Bonds & Notes | | | 62.9% | |
| Short-Term Instruments | | | 8.8% | |
| U.S. Government Agencies | | | 8.4% | |
| Asset-Backed Securities | | | 7.8% | |
| Mortgage-Backed Securities | | | 5.1% | |
| Other | | | 7.0% | |
| ‡ | % of Total Investments as of 06/30/12 |
| | | | | | | | | | |
| Average Annual Total Return for the period ended June 30, 2012 | |
| | | | | 1 Year | | | Fund Inception
(11/16/2009) | |
| | PIMCO Enhanced Short Maturity Strategy Fund (Based on Net Asset Value) | | | 1.13% | | | | 1.42% | |
| | PIMCO Enhanced Short Maturity Strategy Fund (At Market Price)(1) | | | 1.11% | | | | 1.41% | |
| | Citigroup 3-Month Treasury Bill Index± | | | 0.04% | | | | 0.09% | * |
All Fund returns are net of fees and expenses.
* Average annual total return since 11/30/2009.
Market Returns do not include brokerage commissions that may be payable on secondary market transactions. If brokerage commissions were included, market returns would be lower. Market and NAV returns assume that dividends and capital gain distributions have been reinvested in the Fund at market price and NAV, respectively.
(1) The market price is determined using the midpoint between the highest bid and the lowest offer on the listing exchange, as of the time that the Fund’s NAV is calculated.
± Citigroup 3-Month Treasury Bill Index is an unmanaged index representing monthly return equivalents of yield averages of the last 3 month Treasury Bill issues. It is not possible to invest directly in an unmanaged index.
Performance quoted represents past performance. Past performance is not a guarantee or a reliable indicator of future results. Current performance may be lower or higher than performance shown. Investment return and the principal value of an investment will fluctuate. Shares may be worth more or less than original cost when redeemed by authorized participants. Returns shown do not reflect the deduction of taxes that a shareholder would pay on Fund distributions or on the redemption of Fund shares. The Fund’s total annual operating expense ratio as stated in the Fund’s current prospectus, as supplemented to date, is 0.35%. Details regarding any Fund’s operating expenses can be found in the Fund’s prospectus. Performance data current to the most recent month-end is available at www.pimcoetfs.com.
Portfolio Insights
| » | | The PIMCO Enhanced Short Maturity Strategy Fund seeks maximum current income, consistent with preservation of capital and daily liquidity, by investing under normal circumstances at least 65% of its total assets in a diversified portfolio of fixed income instruments of varying maturities, which may be represented by forwards. Fixed income instruments include bonds, debt securities and other similar instruments issued by various U.S. and non-U.S. public- or private-sector entities. The Fund primarily invests in U.S. dollar-denominated investment grade debt securities, rated Baa or higher by Moody’s Investors Service, Inc. (“Moody’s”), or equivalently rated by Standard & Poor’s Ratings Services (“S&P”) or Fitch, Inc. (“Fitch”), or, if unrated, determined by PIMCO to be of comparable quality. |
| » | | As of June 29, 2012, the Fund’s 30 Day SEC yield(a) was 0.98% while the estimated yield to maturity(b) was 1.22%. |
| » | | An above-benchmark duration (or sensitivity to changes in market interest rates) with emphasis on the 1- to 5-year portion of the yield curve was positive for performance as the U.S. Treasury yield curve flattened with intermediate rates falling more than short-term rates rose. |
| » | | An allocation to investment grade corporates added to returns as the sector outperformed like-duration U.S. Treasuries over the reporting period. |
| » | | Exposure to emerging markets external debt benefited performance. |
(a) The 30 Day SEC Yield is a standard yield calculation developed by the Securities and Exchange Commission (“SEC”) that allows for fairer comparisons among bond funds. It is based on the most recent 30-day period covered by the Fund’s filings with the SEC. The yield figure reflects the dividends and interest earned during the period, after the deduction of the Fund’s expenses.
(b) The Yield to Maturity (“YTM”) is the rate of return anticipated on a bond if it is held until the maturity date. The calculation of YTM takes into account the current market price, par value, coupon interest rate and time to maturity. PIMCO calculates a Fund’s estimated YTM by averaging the YTM of each security held in the Fund on a market weighted basis by selecting each security’s YTM from PIMCO’s analytics database or from Bloomberg. A Fund’s estimated YTM may differ from its distribution yield or SEC yield due to a number of factors, including unsettled trades and Fund expenses.
PIMCO Global Advantage® Inflation-Linked Bond Strategy Fund
| | | | |
| Allocation Breakdown‡ | | | |
| United States | | | 17.7% | |
| Mexico | | | 16.7% | |
| Short-Term Instruments | | | 12.2% | |
| Brazil | | | 11.0% | |
| Canada | | | 7.3% | |
| Japan | | | 6.7% | |
| Germany | | | 5.7% | |
| South Africa | | | 5.4% | |
| Other | | | 17.3% | |
‡ % of Total Investments as of 06/30/12
A line graph is not included since the Fund has less than six months of performance.
| | | | |
| Cumulative Total Return for the period ended June 30, 2012 | | | |
| | | Fund Inception
(04/30/2012) | |
| PIMCO Global Advantage® Inflation-Linked Bond Strategy Fund (Based on Net Asset Value) | | | 0.56 | % |
| PIMCO Global Advantage® Inflation-Linked Bond Strategy Fund (At Market Price)(1) | | | 1.12 | % |
| Barclays Universal Government Inflation-Linked Bond Index± | | | 1.06 | % |
| PIMCO Global Advantage Inflation-Linked Bond Index (USD Unhedged)±± | | | -1.26 | % |
All Fund returns are net of fees and expenses.
Market Returns do not include brokerage commissions that may be payable on secondary market transactions. If brokerage commissions were included, market returns would be lower. Market and NAV returns assume that dividends and capital gain distributions have been reinvested in the Fund at market price and NAV, respectively.
(1) The market price is determined using the midpoint between the highest bid and the lowest offer on the listing exchange, as of the time that the Fund’s NAV is calculated.
± The Barclays Universal Government Inflation-Linked Bond Index combines the World, Euro and EM government indices to measure the performance of the major developed and emerging government inflation-linked bond markets. The index includes inflation-linked government bonds from 19 countries; in order of size, the US, UK, France, Brazil, Italy, Japan, Canada, Sweden, Germany, Argentina, Mexico, Greece, South Africa, Australia, Turkey, Colombia, Chile, Poland and South Korea. The index is market capitalization weighted and rebalances monthly. It is not possible to invest directly in an unmanaged index.
±± PIMCO Global Advantage Inflation-Linked Bond Index (USD Unhedged). The PIMCO GLADI ILB represents the global bond market for inflation-linked government debt encompassing both developed and emerging markets. The index adheres to the principals of the PIMCO Global Advantage Indices when applicable to the global inflation-linked bond market.
Performance quoted represents past performance. Past performance is not a guarantee or a reliable indicator of future results. Current performance may be lower or higher than performance shown. Investment return and the principal value of an investment will fluctuate. Shares may be worth more or less than original cost when redeemed by authorized participants. Returns shown do not reflect the deduction of taxes that a shareholder would pay on Fund distributions or on the redemption of Fund shares. The Fund’s total annual operating expense ratio as stated in the Fund’s current prospectus, as supplemented to date, is 0.72%. Details regarding any Fund’s operating expenses can be found in the Fund’s prospectus. Performance data current to the most recent month-end is available at www.pimcoetfs.com.
Portfolio Insights
| » | | The PIMCO Global Advantage® Inflation-Linked Bond Strategy Fund seeks total return which exceeds that of its benchmark indexes, consistent with prudent investment management, by investing under normal circumstances at least 80% of its assets in inflation-linked bonds that are economically tied to at least three developed and emerging market countries (one of which may be the United States). Inflation-linked bonds are fixed income securities that are structured to provide protection against inflation. |
| » | | The Fund commenced operations on April 30, 2012. |
| » | | As of June 29, 2012, the Fund’s 30 Day SEC yield(a) was 2.91% while the estimated yield to maturity(b) was 3.44%. |
| » | | An overweight to real duration (or sensitivity to changes in real interest rates) in Mexico was positive for performance as real rates were down across the yield curve. |
| » | | A focus on intermediate-maturity U.S. Treasury Inflation-Protected Securities (“TIPS”) was positive for returns as real yields rallied in this portion of the U.S. TIPS yield curve; furthermore, an underweight to short-maturity U.S. TIPS also benefited returns as real yields sold off in this portion of the U.S. TIPS yield curve. |
| » | | Exposure to intermediate Brazilian real duration was positive for returns as real yields rallied. |
| » | | An overweight to Canadian real duration contributed to returns as yields rallied. |
| » | | Overweights in currency exposure to the Mexican peso and the South African rand detracted from returns as these currencies weakened versus the U.S. dollar. |
(a) The 30 Day SEC Yield is a standard yield calculation developed by the Securities and Exchange Commission (“SEC”) that allows for fairer comparisons among bond funds. It is based on the most recent 30-day period covered by the Fund’s filings with the SEC. The yield figure reflects the dividends and interest earned during the period, after the deduction of the Fund’s expenses.
(b) The Yield to Maturity (“YTM”) is the rate of return anticipated on a bond if it is held until the maturity date. The calculation of YTM takes into account the current market price, par value, coupon interest rate and time to maturity. PIMCO calculates a Fund’s estimated YTM by averaging the YTM of each security held in the Fund on a market weighted basis by selecting each security’s YTM from PIMCO’s analytics database or from Bloomberg. A Fund’s estimated YTM may differ from its distribution yield or SEC yield due to a number of factors, including unsettled trades and Fund expenses.
| | | | | | |
| | ANNUAL REPORT | | JUNE 30, 2012 | | 21 |
PIMCO Intermediate Municipal Bond Strategy Fund
Cumulative Returns Through June 30, 2012
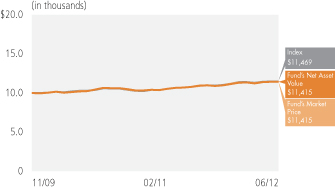
$10,000 invested at the end of the month when the Fund commenced operations.
Allocation Breakdown‡
| | | | |
| California | | | 13.7% | |
| Texas | | | 12.7% | |
| New York | | | 12.1% | |
| Florida | | | 7.6% | |
| Ohio | | | 6.0% | |
| Illinois | | | 5.7% | |
| New Jersey | | | 5.3% | |
| Other | | | 36.9% | |
| ‡ | % of Total Investments as of 06/30/12 |
| | | | | | | | | | |
| Average Annual Total Return for the period ended June 30, 2012 | |
| | | | | 1 Year | | | Fund Inception
(11/30/2009) | |
| | PIMCO Intermediate Municipal Bond Strategy Fund (Based on Net Asset Value) | | | 6.88% | | | | 5.26% | |
| | PIMCO Intermediate Municipal Bond Strategy Fund (At Market Price)(1) | | | 6.86% | | | | 5.25% | |
| | Barclays 1-15 Year Municipal Bond Index± | | | 7.50% | | | | 5.45% | |
All Fund returns are net of fees and expenses.
Market Returns do not include brokerage commissions that may be payable on secondary market transactions. If brokerage commissions were included, market returns would be lower. Market and NAV returns assume that dividends and capital gain distributions have been reinvested in the Fund at market price and NAV, respectively.
(1) The market price is determined using the midpoint between the highest bid and the lowest offer on the listing exchange, as of the time that the Fund’s NAV is calculated.
± Barclays 1-15 Year Municipal Bond Index consists of a broad selection of investment grade general obligation and revenue bonds of maturities ranging from one year to 17 years. It is an unmanaged index representative of the tax exempt bond market. It is not possible to invest directly in an unmanaged index.
Performance quoted represents past performance. Past performance is not a guarantee or a reliable indicator of future results. Current performance may be lower or higher than performance shown. Investment return and the principal value of an investment will fluctuate. Shares may be worth more or less than original cost when redeemed by authorized participants. Returns shown do not reflect the deduction of taxes that a shareholder would pay on Fund distributions or on the redemption of Fund shares. The Fund’s total annual operating expense ratio as stated in the Fund’s current prospectus, as supplemented to date, is 0.35%. Details regarding any Fund’s operating expenses can be found in the Fund’s prospectus. Performance data current to the most recent month-end is available at www.pimcoetfs.com.
Portfolio Insights
| » | | The PIMCO Intermediate Municipal Bond Strategy Fund seeks attractive tax-exempt income, consistent with preservation of capital, by investing under normal circumstances at least 80% of its total assets in a diversified portfolio of debt securities whose interest is, in the opinion of bond counsel for the issuer at the time of issuance, exempt from federal income tax. The Fund does not intend to invest in securities whose interest is subject to the federal alternative minimum tax. The Fund may only invest in U.S. dollar-denominated investment grade debt securities, rated Baa or higher by Moody’s Investors Service, Inc. (“Moody’s”), or equivalently rated by Standard & Poor’s Ratings Services (“S&P”) or Fitch, Inc. (“Fitch”), or, if unrated, determined by Pacific Investment Management Company LLC (“PIMCO”) to be of comparable quality. The Fund may invest 25% or more of its total assets in Municipal Bonds that finance similar projects, such as those relating to education, health care, housing, transportation, and utilities, and 25% or more of its total assets in industrial development bonds. |
| » | | The Fund’s 30 Day SEC Yield(a) after fees for June 30, 2012 was 1.45%, or 2.22% on a fully tax adjusted basis assuming a federal tax rate of 35.0%, or 1.61% assuming a federal tax rate of 10.0%. Your tax adjusted yield may differ depending on your tax bracket. |
| » | | Duration positioning (or sensitivity to changes in market interest rates) was generally managed below the benchmark throughout most of the reporting period, which detracted from returns as municipal yields moved lower throughout the reporting period. |
| » | | An overweight exposure to healthcare and corporate-backed sectors was positive for returns as these sectors outperformed the general municipal bond index. |
| » | | An underweight exposure to the transportation sector detracted from performance as the sector outperformed the general municipal bond index. |
(a) The 30 Day SEC Yield is a standard yield calculation developed by the Securities and Exchange Commission (“SEC”) that allows for fairer comparisons among bond funds. It is based on the most recent 30-day period covered by the Fund’s filings with the SEC. The yield figure reflects the dividends and interest earned during the period, after the deduction of the Fund’s expenses.
PIMCO Short Term Municipal Bond Strategy Fund
Cumulative Returns Through June 30, 2012
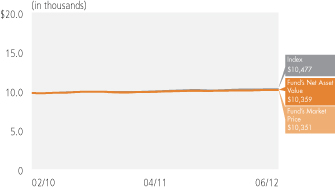
$10,000 invested at the end of the month when the Fund commenced operations.
Allocation Breakdown‡
| | | | |
New York | | | 19.7% | |
California | | | 12.9% | |
Illinois | | | 8.1% | |
Arizona | | | 6.6% | |
Connecticut | | | 6.4% | |
| Washington | | | 6.3% | |
| Texas | | | 6.1% | |
Other | | | 33.9% | |
| ‡ | % of Total Investments as of 06/30/12 |
| | | | | | | | | | |
| Average Annual Total Return for the period ended June 30, 2012 | |
| | | | | 1 Year | | | Fund Inception
(02/01/2010) | |
| | PIMCO Short Term Municipal Bond Strategy Fund (Based on Net Asset Value) | | | 1.36% | | | | 1.55% | |
| | PIMCO Short Term Municipal Bond Strategy Fund (At Market Price)(1) | | | 1.61% | | | | 1.54% | |
| | Barclays 1-3 Year Municipal Bond Index± | | | 1.97% | | | | 2.08% | |
All Fund returns are net of fees and expenses.
Market Returns do not include brokerage commissions that may be payable on secondary market transactions. If brokerage commissions were included, market returns would be lower. Market and NAV returns assume that dividends and capital gain distributions have been reinvested in the Fund at market price and NAV, respectively.
(1) The market price is determined using the midpoint between the highest bid and the lowest offer on the listing exchange, as of the time that the Fund’s NAV is calculated.
± Barclays 1-3 Year Municipal Bond Index consists of a broad selection of investment grade general obligation and revenue bonds of maturities ranging from one year to four years. It is an unmanaged index representative of the tax exempt bond market. It is not possible to invest directly in an unmanaged index.
Performance quoted represents past performance. Past performance is not a guarantee or a reliable indicator of future results. Current performance may be lower or higher than performance shown. Investment return and the principal value of an investment will fluctuate. Shares may be worth more or less than original cost when redeemed by authorized participants. Returns shown do not reflect the deduction of taxes that a shareholder would pay on Fund distributions or on the redemption of Fund shares. The Fund’s total annual operating expense ratio as stated in the Fund’s current prospectus, as supplemented to date, is 0.35%. Details regarding any Fund’s operating expenses can be found in the Fund’s prospectus. Performance data current to the most recent month-end is available at www.pimcoetfs.com.
Portfolio Insights
| » | | The PIMCO Short Term Municipal Bond Strategy Fund seeks attractive tax-exempt income, consistent with preservation of capital, by investing under normal circumstances at least 80% of its total assets in a diversified portfolio of debt securities whose interest is, in the opinion of bond counsel for the issuer at the time of issuance, exempt from federal income tax. The Fund does not intend to invest in securities whose interest is subject to the federal alternative minimum tax. The Fund may only invest in U.S. dollar-denominated investment grade debt securities, rated Baa or higher by Moody’s Investors Service, Inc. (“Moody’s”), or equivalently rated by Standard & Poor’s Ratings Services (“S&P”) or Fitch, Inc. (“Fitch”), or, if unrated, determined by Pacific Investment Management Company LLC (“PIMCO”) to be of comparable quality. The Fund may invest 25% or more of its total assets in Municipal Bonds that finance similar projects, such as those relating to education, health care, housing, transportation, and utilities, and 25% or more of its total assets in industrial development bonds. |
| » | | The Fund’s 30 Day SEC Yield(a) after fees for June 30, 2012 was 0.38%, or 0.59% on a fully tax adjusted basis assuming a federal tax rate of 35.0%, or 0.42% assuming a federal tax rate of 10.0%. Your tax adjusted yield may differ depending on your tax bracket. |
| » | | An underweight duration positioning (or sensitivity to changes in market interest rates) throughout most of the reporting period detracted from returns as municipal bond yields fell across the municipal yield curve. |
| » | | An overweight to dedicated revenue municipal bonds versus general obligation municipal bonds was positive for returns as revenue bonds outperformed general obligation bonds over the reporting period. |
| » | | An overweight exposure to healthcare and corporate-backed municipal bonds was positive for returns as these sectors outperformed the general municipal bond index. |
| » | | An underweight exposure to the lease-backed municipal bond sector detracted from performance as the sector outperformed the general municipal bond index. |
| » | | An overweight exposure to the transportation sector was positive for returns as the segment outperformed the general municipal bond index. |
(a) The 30 Day SEC Yield is a standard yield calculation developed by the Securities and Exchange Commission (“SEC”) that allows for fairer comparisons among bond funds. It is based on the most recent 30-day period covered by the Fund’s filings with the SEC. The yield figure reflects the dividends and interest earned during the period, after the deduction of the Fund’s expenses.
| | | | | | |
| | ANNUAL REPORT | | JUNE 30, 2012 | | 23 |
PIMCO Total Return Exchange-Traded Fund
| | | | |
| Allocation Breakdown‡ | | | |
| U.S. Government Agencies | | | 32.7% | |
| Short-Term Instruments | | | 15.6% | |
| Corporate Bonds & Notes | | | 14.4% | |
| Mortgage-Backed Securities | | | 13.8% | |
| U.S. Treasury Obligations | | | 12.5% | |
| Sovereign Issues | | | 8.3% | |
| Other | | | 2.7% | |
‡ % of Total Investments as of 06/30/12
A line graph is not included since the Fund has less than six months of performance.
| | | | |
| Cumulative Total Return for the period ended June 30, 2012 | |
| | | Fund Inception
(02/29/2012) | |
| PIMCO Total Return Exchange-Traded Fund (Based on Net Asset Value) | | | 6.27 | % |
| PIMCO Total Return Exchange-Traded Fund (At Market Price)(1) | | | 6.22 | % |
| Barclays U.S. Aggregate Index± | | | 1.50 | % |
All Fund returns are net of fees and expenses.
Market Returns do not include brokerage commissions that may be payable on secondary market transactions. If brokerage commissions were included, market returns would be lower. Market and NAV returns assume that dividends and capital gain distributions have been reinvested in the Fund at market price and NAV, respectively.
(1) The market price is determined using the midpoint between the highest bid and the lowest offer on the listing exchange, as of the time that the Fund’s NAV is calculated.
± Barclays U.S. Aggregate Index represents securities that are SEC-registered, taxable, and dollar denominated. The index covers the U.S. investment grade fixed rate bond market, with index components for government and corporate securities, mortgage pass-through securities, and asset-backed securities. These major sectors are subdivided into more specific indices that are calculated and reported on a regular basis. It is not possible to invest directly in an unmanaged index.
Performance quoted represents past performance. Past performance is not a guarantee or a reliable indicator of future results. Current performance may be lower or higher than performance shown. Investment return and the principal value of an investment will fluctuate. Shares may be worth more or less than original cost when redeemed by authorized participants. Returns shown do not reflect the deduction of taxes that a shareholder would pay on Fund distributions or on the redemption of Fund shares. The Fund’s total annual operating expense ratio as stated in the Fund’s current prospectus, as supplemented to date, is 0.59%. Details regarding any Fund’s operating expenses can be found in the Fund’s prospectus. Performance data current to the most recent month-end is available at www.pimcoetfs.com.
Portfolio Insights
| » | | The PIMCO Total Return Exchange-Traded Fund seeks to provide maximum total return, consistent with preservation of capital and prudent investment management, by investing under normal circumstances at least 65% of its total assets in a diversified portfolio of fixed income instruments of varying maturities. Fixed income instruments include bonds, debt securities and other similar instruments issued by various U.S. and non-U.S. public- or private-sector entities. |
| » | | The Fund commenced operations on February 29, 2012. |
| » | | As of June 29, 2012, the Fund’s 30 Day SEC yield(a) was 2.93% while the estimated yield to maturity(b) was 3.63%. |
| » | | An average overweight to U.S. duration (or sensitivity to changes in market interest rates), with a focus on the intermediate portion of the yield curve during the first half of the fiscal year, added to returns as the 10-year U.S. Treasury yield fell over this period. |
| » | | Non-Agency mortgage positions added to returns as prices on these securities rose. |
| » | | An overweight to Agency mortgage-backed securities in the first half of the fiscal year added to returns as lower coupons fared better than higher coupons. |
| » | | Duration exposure to local debt in Mexico added to performance as the interest rates fell in this country. |
| » | | Exposure to a basket of emerging market currencies, particularly the Mexican peso, detracted from performance as these currencies depreciated relative to the U.S. dollar. |
(a) The 30 Day SEC Yield is a standard yield calculation developed by the Securities and Exchange Commission (“SEC”) that allows for fairer comparisons among bond funds. It is based on the most recent 30-day period covered by the Fund’s filings with the SEC. The yield figure reflects the dividends and interest earned during the period, after the deduction of the Fund’s expenses.
(b) The Yield to Maturity (“YTM”) is the rate of return anticipated on a bond if it is held until the maturity date. The calculation of YTM takes into account the current market price, par value, coupon interest rate and time to maturity. PIMCO calculates a Fund’s estimated YTM by averaging the YTM of each security held in the Fund on a market weighted basis by selecting each security’s YTM from PIMCO’s analytics database or from Bloomberg. A Fund’s estimated YTM may differ from its distribution yield or SEC yield due to a number of factors, including unsettled trades and Fund expenses.
Expense Examples
Example
As a shareholder of a Fund, you incur two types of costs: (1) transaction costs, including brokerage commissions paid on purchases and sales of Fund shares and (2) ongoing costs, including management fees and other Fund expenses. The Example is intended to help you understand your ongoing costs (in dollars) of investing in a Fund and to compare these costs with the ongoing costs of investing in other exchange-traded funds.
The Example is based on an investment of $1,000 invested at the beginning of the period and held for the entire period indicated, which for all Funds is from January 1, 2012 to June 30, 2012 unless noted otherwise in the table and footnotes below.
Actual Expenses
The information in the table under the heading “Actual Performance” provides information about actual account values and actual expenses. You may use the information in these columns, together with the amount you invested, to estimate the expenses that you paid over the period. Simply divide your account value by $1,000 (for example, an $8,600 account value divided by $1,000 = $8.60), then multiply the result by the number in the row titled “Expenses Paid During Period” to estimate the expenses you paid on your account during this period.
Hypothetical Example For Comparison Purposes
The information in the table under the heading “Hypothetical Performance (5% return before expenses)” provides information about hypothetical account values and hypothetical expenses based on a Fund’s actual expense ratio and an assumed rate of return of 5% per year before expenses, which is not the Fund’s actual return. The hypothetical account values and expenses may not be used to estimate the actual ending account balance or expenses you paid for the period. You may use this information to compare the ongoing costs of investing in a Fund and other exchange-traded funds. To do so, compare this 5% hypothetical example with the 5% hypothetical examples that appear in the shareholder reports of other exchange-traded funds.
Please note that the expenses shown in the table are meant to highlight your ongoing costs only and do not reflect any transactional costs, such as brokerage commissions paid on purchases and sales of shares of the Funds. Therefore, the information under the heading “Hypothetical Performance (5% return before expenses)” is useful in comparing ongoing costs only, and will not help you determine the relative total costs of owning different exchange-traded funds. In addition, if these transactional costs were included, your costs would have been higher.
Expense ratios may vary period to period because of various factors, such as an increase in expenses not covered by the management fee (such as expenses of the independent trustees and their counsel, extraordinary expenses and interest expense).
| | | | | | | | | | | | | | | | | | | | | | | | | | | | | | | | | | |
| | | | | Actual Performance | | | | | Hypothetical Performance
(5% return before expenses) | | | | | | |
| | | | | Beginning
Account Value
(01/01/12) | | | Ending
Account Value
(06/30/12) | | | Expenses Paid
During Period* | | | | | Beginning
Account Value
(01/01/12) | | | Ending
Account Value
(06/30/12) | | | Expenses Paid
During Period* | | | | | Net Annualized
Expense
Ratio** | |
PIMCO 1-3 Year U.S. Treasury Index Fund | | | | $ | 1,000.00 | | | $ | 1,000.60 | | | $ | 0.45 | | | | | $ | 1,000.00 | | | $ | 1,024.42 | | | $ | 0.45 | | | | | | 0.09 | % |
PIMCO 3-7 Year U.S. Treasury Index Fund | | | | | 1,000.00 | | | | 1,014.00 | | | | 0.75 | | | | | | 1,000.00 | | | | 1,024.12 | | | | 0.75 | | | | | | 0.15 | |
PIMCO 7-15 Year U.S. Treasury Index Fund | | | | | 1,000.00 | | | | 1,032.50 | | | | 0.76 | | | | | | 1,000.00 | | | | 1,024.12 | | | | 0.75 | | | | | | 0.15 | |
PIMCO 25+ Year Zero Coupon U.S. Treasury Index Fund | | | | | 1,000.00 | | | | 1,061.10 | | | | 0.77 | | | | | | 1,000.00 | | | | 1,024.12 | | | | 0.75 | | | | | | 0.15 | |
PIMCO Broad U.S. Treasury Index Fund | | | | | 1,000.00 | | | | 1,020.90 | | | | 0.75 | | | | | | 1,000.00 | | | | 1,024.12 | | | | 0.75 | | | | | | 0.15 | |
PIMCO 1-5 Year U.S. TIPS Index Fund | | | | | 1,000.00 | | | | 1,009.70 | | | | 1.00 | | | | | | 1,000.00 | | | | 1,023.87 | | | | 1.01 | | | | | | 0.20 | |
PIMCO 15+ Year U.S. TIPS Index Fund | | | | | 1,000.00 | | | | 1,073.50 | | | | 1.03 | | | | | | 1,000.00 | | | | 1,023.87 | | | | 1.01 | | | | | | 0.20 | |
PIMCO Broad U.S. TIPS Index Fund | | | | | 1,000.00 | | | | 1,041.00 | | | | 1.01 | | | | | | 1,000.00 | | | | 1,023.87 | | | | 1.01 | | | | | | 0.20 | |
PIMCO 0-5 Year High Yield Corporate Bond Index Fund | | | | | 1,000.00 | | | | 1,057.40 | | | | 2.81 | | | | | | 1,000.00 | | | | 1,022.13 | | | | 2.77 | | | | | | 0.55 | |
PIMCO Investment Grade Corporate Bond Index Fund | | | | | 1,000.00 | | | | 1,051.10 | | | | 1.02 | | | | | | 1,000.00 | | | | 1,023.87 | | | | 1.01 | | | | | | 0.20 | |
PIMCO Australia Bond Index Fund | | | | | 1,000.00 | | | | 1,053.90 | | | | 2.30 | | | | | | 1,000.00 | | | | 1,022.63 | | | | 2.26 | | | | | | 0.45 | |
PIMCO Canada Bond Index Fund | | | | | 1,000.00 | | | | 1,017.80 | | | | 2.26 | | | | | | 1,000.00 | | | | 1,022.63 | | | | 2.26 | | | | | | 0.45 | |
PIMCO Germany Bond Index Fund | | | | | 1,000.00 | | | | 1,010.40 | | | | 2.25 | | | | | | 1,000.00 | | | | 1,022.63 | | | | 2.26 | | | | | | 0.45 | |
PIMCO Build America Bond Strategy Fund | | | | | 1,000.00 | | | | 1,072.10 | | | | 2.32 | | | | | | 1,000.00 | | | | 1,022.63 | | | | 2.26 | | | | | | 0.45 | |
PIMCO Enhanced Short Maturity Strategy Fund | | | | | 1,000.00 | | | | 1,015.70 | | | | 1.75 | | | | | | 1,000.00 | | | | 1,023.12 | | | | 1.76 | | | | | | 0.35 | |
PIMCO Global Advantage® Inflation-Linked Bond Strategy Fund(a) | | | | | 1,000.00 | | | | 1,005.60 | | | | 1.02 | | | | | | 1,000.00 | | | | 1,021.83 | | | | 3.07 | | | | | | 0.61 | |
| | | | | | |
| | ANNUAL REPORT | | JUNE 30, 2012 | | 25 |
Expense Examples (Cont.)
| | | | | | | | | | | | | | | | | | | | | | | | | | | | | | | | | | |
| | | | | Actual Performance | | | | | Hypothetical Performance
(5% return before expenses) | | | | | | |
| | | | | Beginning
Account Value
(01/01/12) | | | Ending
Account Value
(06/30/12) | | | Expenses Paid
During Period* | | | | | Beginning
Account Value
(01/01/12) | | | Ending
Account Value
(06/30/12) | | | Expenses Paid
During Period* | | | | | Net Annualized
Expense
Ratio** | |
PIMCO Intermediate Municipal Bond Strategy Fund | | | | $ | 1,000.00 | | | $ | 1,023.80 | | | $ | 1.76 | | | | | $ | 1,000.00 | | | $ | 1,023.12 | | | $ | 1.76 | | | | | | 0.35 | % |
PIMCO Short Term Municipal Bond Strategy Fund | | | | | 1,000.00 | | | | 1,007.20 | | | | 1.75 | | | | | | 1,000.00 | | | | 1,023.12 | | | | 1.76 | | | | | | 0.35 | |
PIMCO Total Return Exchange-Traded Fund(b) | | | | | 1,000.00 | | | | 1,062.70 | | | | 1.89 | | | | | | 1,000.00 | | | | 1,022.13 | | | | 2.77 | | | | | | 0.55 | |
* Expenses paid during the period are equal to the net annualized expense ratio for the Fund, multiplied by the average account value over the period, multiplied by 182/366 (to reflect the one-half year period).
** The net annualized expense ratio is reflective of any applicable waivers related to contractual agreements for contractual fee waivers or voluntary fee waivers. Details regarding fee waivers can be found in note 8 in the Notes to Financial Statements.
(a) The Beginning Account Value is reflective as of 4/30/12 for Actual Performance. Expenses paid in the Actual Performance section are equal to the net annualized expense ratio for the Fund, multiplied by the average account value over the period, multiplied by 61/366 for the PIMCO Global Advantage® Inflation-Linked Bond Strategy Fund (to reflect the period since the inception date of 4/30/12). Hypothetical expenses reflect an amount as if the Fund had been operational for the entire fiscal half year.
(b) The Beginning Account Value is reflective as of 2/29/12 for Actual Performance. Expenses paid in the Actual Performance section are equal to the net annualized expense ratio for the Fund, multiplied by the average account value over the period, multiplied by 122/366 for the PIMCO Total Return Exchange-Traded Fund (to reflect the period since the inception date of 2/29/12). Hypothetical expenses reflect an amount as if the Fund had been operational for the entire fiscal half year.
(THIS PAGE INTENTIONALLY LEFT BLANK)
| | | | | | |
| | ANNUAL REPORT | | JUNE 30, 2012 | | 27 |
Financial Highlights
| | | | | | | | | | | | | | | | | | | | | | | | |
| Selected Per Share Data for the Year or Period Ended: | | Net Asset Value
Beginning of
Year or Period | | | Net Investment
Income (a) | | | Net Realized/
Unrealized
Gain (Loss) on
Investments | | | Total
Income
(Loss) from
Investment
Operations | | | Dividends from
Net Investment
Income | | | Distributions from
Net Realized
Capital Gains | |
PIMCO 1-3 Year U.S. Treasury Index Fund | | | | | | | | | | | | | | | | | | | | | | | | |
06/30/2012 | | $ | 51.00 | | | $ | 0.29 | | | $ | 0.08 | | | $ | 0.37 | | | $ | (0.29 | ) | | $ | (0.10 | ) |
06/30/2011 | | | 50.76 | | | | 0.40 | | | | 0.24 | | | | 0.64 | | | | (0.40 | ) | | | 0.00 | |
06/30/2010 | | | 49.94 | | | | 0.43 | | | | 0.84 | | | | 1.27 | | | | (0.43 | ) | | | (0.02 | ) |
06/01/2009 - 06/30/2009 | | | 50.00 | | | | 0.03 | | | | (0.06 | ) | | | (0.03 | ) | | | (0.03 | ) | | | 0.00 | |
PIMCO 3-7 Year U.S. Treasury Index Fund | | | | | | | | | | | | | | | | | | | | | | | | |
06/30/2012 | | $ | 78.36 | | | $ | 1.29 | | | $ | 3.91 | | | $ | 5.20 | | | $ | (1.28 | ) | | $ | (0.34 | ) |
06/30/2011 | | | 77.91 | | | | 1.44 | | | | 1.24 | | | | 2.68 | | | | (1.49 | ) | | | (0.74 | ) |
10/30/2009 - 06/30/2010 | | | 75.34 | | | | 1.08 | | | | 2.53 | | | | 3.61 | | | | (1.04 | ) | | | 0.00 | |
PIMCO 7-15 Year U.S. Treasury Index Fund | | | | | | | | | | | | | | | | | | | | | | | | |
06/30/2012 | | $ | 78.21 | | | $ | 1.86 | | | $ | 10.13 | | | $ | 11.99 | | | $ | (1.77 | ) | | $ | (0.67 | ) |
06/30/2011 | | | 79.23 | | | | 2.27 | | | | 0.05 | | | | 2.32 | | | | (2.29 | ) | | | (1.05 | ) |
09/10/2009 - 06/30/2010 | | | 75.67 | | | | 1.94 | | | | 3.65 | | | | 5.59 | | | | (1.98 | ) | | | (0.05 | ) |
PIMCO 25+ Year Zero Coupon U.S. Treasury Index Fund | | | | | | | | | | | | | | | | | | | | | | | | |
06/30/2012 | | $ | 70.18 | | | $ | 3.27 | | | $ | 46.15 | | | $ | 49.42 | | | $ | (3.22 | ) | | $ | 0.00 | |
06/30/2011 | | | 83.02 | | | | 3.25 | | | | (12.86 | ) | | | (9.61 | ) | | | (3.23 | ) | | | 0.00 | |
10/30/2009 - 06/30/2010 | | | 76.98 | | | | 2.24 | | | | 5.93 | | | | 8.17 | | | | (2.13 | ) | | | 0.00 | |
PIMCO Broad U.S. Treasury Index Fund | | | | | | | | | | | | | | | | | | | | | | | | |
06/30/2012 | | $ | 98.11 | | | $ | 1.43 | | | $ | 10.95 | | | $ | 12.38 | | | $ | (1.36 | ) | | $ | (0.68 | ) |
10/29/2010 - 06/30/2011 | | | 100.36 | | | | 1.26 | | | | (2.26 | ) | | | (1.00 | ) | | | (1.25 | ) | | | 0.00 | |
PIMCO 1-5 Year U.S. TIPS Index Fund | | | | | | | | | | | | | | | | | | | | | | | | |
06/30/2012 | | $ | 53.30 | | | $ | 0.81 | | | $ | 0.10 | | | $ | 0.91 | | | $ | (0.75 | ) | | $ | (0.07 | ) |
06/30/2011 | | | 51.79 | | | | 1.86 | | | | 1.08 | | | | 2.94 | | | | (1.42 | ) | | | (0.01 | ) |
08/20/2009 - 06/30/2010 | | | 50.00 | | | | 0.86 | | | | 1.71 | | | | 2.57 | | | | (0.78 | ) | | | 0.00 | |
PIMCO 15+ Year U.S. TIPS Index Fund | | | | | | | | | | | | | | | | | | | | | | | | |
06/30/2012 | | $ | 56.04 | | | $ | 1.65 | | | $ | 13.11 | | | $ | 14.76 | | | $ | (1.58 | ) | | $ | 0.00 | |
06/30/2011 | | | 54.17 | | | | 2.63 | | | | 1.41 | | | | 4.04 | | | | (2.17 | ) | | | 0.00 | |
09/03/2009 - 06/30/2010 | | | 50.01 | | | | 1.22 | | | | 4.20 | | | | 5.42 | | | | (1.26 | ) | | | 0.00 | |
PIMCO Broad U.S. TIPS Index Fund | | | | | | | | | | | | | | | | | | | | | | | | |
06/30/2012 | | $ | 54.58 | | | $ | 1.40 | | | $ | 5.23 | | | $ | 6.63 | | | $ | (1.28 | ) | | $ | 0.00 | |
06/30/2011 | | | 52.95 | | | | 2.18 | | | | 1.67 | | | | 3.85 | | | | (1.91 | ) | | | (0.31 | ) |
09/03/2009 - 06/30/2010 | | | 50.01 | | | | 0.96 | | | | 2.97 | | | | 3.93 | | | | (0.92 | ) | | | (0.07 | ) |
PIMCO 0-5 Year High Yield Corporate Bond Index Fund | | | | | | | | | | | | | | | | | | | | | | | | |
06/30/2012 | | $ | 100.29 | | | $ | 6.06 | | | $ | (1.13 | ) | | $ | 4.93 | | | $ | (5.60 | ) | | $ | 0.00 | |
06/16/2011 - 06/30/2011 | | | 100.00 | | | | 0.18 | | | | 0.27 | | | | 0.45 | | | | (0.16 | ) | | | 0.00 | |
PIMCO Investment Grade Corporate Bond Index Fund | | | | | | | | | | | | | | | | | | | | | | | | |
06/30/2012 | | $ | 99.76 | | | $ | 3.44 | | | $ | 5.61 | | | $ | 9.05 | | | $ | (3.35 | ) | | $ | 0.00 | |
09/20/2010 - 06/30/2011 | | | 100.00 | | | | 2.60 | | | | (0.23 | ) | | | 2.37 | | | | (2.56 | ) | | | (0.05 | ) |
PIMCO Australia Bond Index Fund | | | | | | | | | | | | | | | | | | | | | | | | |
10/31/2011 - 06/30/2012 | | $ | 100.00 | | | $ | 2.53 | | | $ | 1.56 | | | $ | 4.09 | | | $ | (2.23 | ) | | $ | 0.00 | |
PIMCO Canada Bond Index Fund | | | | | | | | | | | | | | | | | | | | | | | | |
11/09/2011 - 06/30/2012 | | $ | 100.00 | | | $ | 1.32 | | | $ | 2.86 | | | $ | 4.18 | | | $ | (1.05 | ) | | $ | 0.00 | |
PIMCO Germany Bond Index Fund | | | | | | | | | | | | | | | | | | | | | | | | |
11/09/2011 - 06/30/2012 | | $ | 100.00 | | | $ | 0.88 | | | $ | (4.17 | ) | | $ | (3.29 | ) | | $ | (0.21 | ) | | $ | 0.00 | |
PIMCO Build America Bond Strategy Fund | | | | | | | | | | | | | | | | | | | | | | | | |
06/30/2012 | | $ | 49.36 | | | $ | 2.53 | | | $ | 8.17 | | | $ | 10.70 | | | $ | (2.55 | ) | | $ | (1.30 | ) |
09/20/2010 - 06/30/2011 | | | 50.00 | | | | 2.09 | | | | (0.72 | ) | | | 1.37 | | | | (2.01 | ) | | | 0.00 | |
PIMCO Enhanced Short Maturity Strategy Fund | | | | | | | | | | | | | | | | | | | | | | | | |
06/30/2012 | | $ | 101.04 | | | $ | 1.06 | | | $ | 0.07 | | | $ | 1.13 | | | $ | (1.03 | ) | | $ | (0.06 | ) |
06/30/2011 | | | 100.34 | | | | 0.86 | | | | 1.03 | | | | 1.89 | | | | (0.90 | ) | | | (0.29 | ) |
11/16/2009 - 06/30/2010 | | | 100.00 | | | | 0.32 | | | | 0.37 | | | | 0.69 | | | | (0.35 | ) | | | 0.00 | |
PIMCO Global Advantage® Inflation-Linked Bond Strategy Fund | | | | | | | | | | | | | | | | | | | | | | | | |
04/30/2012 - 06/30/2012 | | $ | 50.00 | | | $ | 0.30 | | | $ | (0.02 | ) | | $ | 0.28 | | | $ | 0.00 | | | $ | 0.00 | |
PIMCO Intermediate Municipal Bond Strategy Fund | | | | | | | | | | | | | | | | | | | | | | | | |
06/30/2012 | | $ | 51.44 | | | $ | 1.22 | | | $ | 2.29 | | | $ | 3.51 | | | $ | (1.19 | ) | | $ | (0.06 | ) |
06/30/2011 | | | 50.63 | | | | 1.21 | | | | 0.90 | | | | 2.11 | | | | (1.21 | ) | | | (0.09 | ) |
11/30/2009 - 06/30/2010 | | | 50.00 | | | | 0.63 | | | | 0.61 | | | | 1.24 | | | | (0.61 | ) | | | 0.00 | |
PIMCO Short Term Municipal Bond Strategy Fund | | | | | | | | | | | | | | | | | | | | | | | | |
06/30/2012 | | $ | 50.36 | | | $ | 0.48 | | | $ | 0.20 | | | $ | 0.68 | | | $ | (0.47 | ) | | $ | (0.03 | ) |
06/30/2011 | | | 50.13 | | | | 0.61 | | | | 0.22 | | | | 0.83 | | | | (0.60 | ) | | | 0.00 | |
02/01/2010 - 06/30/2010 | | | 50.00 | | | | 0.21 | | | | 0.14 | | | | 0.35 | | | | (0.22 | ) | | | 0.00 | |
PIMCO Total Return Exchange-Traded Fund | | | | | | | | | | | | | | | | | | | | | | | | |
02/29/2012 - 06/30/2012 | | $ | 100.00 | | | $ | 1.00 | | | $ | 5.26 | | | $ | 6.26 | | | $ | (0.71 | ) | | $ | 0.00 | |
| (a) | Per share amounts based on average number of shares outstanding during the year or period. |
| (b) | Portfolio Turnover rate excludes securities received or delivered from in-kind processing of creation or redemptions. |
| (c) | Ratio of expenses to average net assets includes interest expense of 1 basis point. |
| | | | | | |
| 28 | | PIMCO ETF TRUST | | | | See Accompanying Notes |
| | | | | | | | | | | | | | | | | | | | | | | | | | | | | | | | | | |
Tax Basis Return of Capital | | | Total
Distributions | | | Net Asset
Value End
of Year or
Period | | | Total Return | | | Net Assets
End of
Year or
Period (000s) | | | Ratio of
Expenses
to Average Net
Assets | | | Ratio of
Expenses
to Average Net
Assets
Excluding
Waivers | | | Ratio of
Net Investment
Income to
Average
Net Assets | | | Portfolio
Turnover Rate (b) | |
| | | | | | | | | | | | | | | | | | | | | | | | | | | | | | | | | | |
| $ | 0.00 | | | $ | (0.39 | ) | | $ | 50.98 | | | | 0.74 | % | | $ | 132,657 | | | | 0.09 | % | | | 0.15 | % | | | 0.57 | % | | | 8 | % |
| | 0.00 | | | | (0.40 | ) | | | 51.00 | | | | 1.26 | | | | 107,206 | | | | 0.09 | | | | 0.15 | | | | 0.78 | | | | 18 | |
| | 0.00 | | | | (0.45 | ) | | | 50.76 | | | | 2.56 | | | | 86,400 | | | | 0.09 | | | | 0.19 | | | | 0.83 | | | | 256 | |
| | 0.00 | | | | (0.03 | ) | | | 49.94 | | | | (0.06 | ) | | | 40,051 | | | | 0.09 | * | | | 1.88 | * | | | 0.76 | * | | | 18 | |
| | | | | | | | | | | | | | | | | | | | | | | | | | | | | | | | | | |
| $ | 0.00 | | | $ | (1.62 | ) | | $ | 81.94 | | | | 6.67 | % | | $ | 21,852 | | | | 0.15 | % | | | 0.15 | % | | | 1.59 | % | | | 37 | % |
| | 0.00 | | | | (2.23 | ) | | | 78.36 | | | | 3.49 | | | | 20,895 | | | | 0.15 | | | | 0.15 | | | | 1.83 | | | | 48 | |
| | 0.00 | | | | (1.04 | ) | | | 77.91 | | | | 4.85 | | | | 51,942 | | | | 0.15 | * | | | 0.41 | * | | | 2.14 | * | | | 178 | |
| | | | | | | | | | | | | | | | | | | | | | | | | | | | | | | | | | |
| $ | 0.00 | | | $ | (2.44 | ) | | $ | 87.76 | | | | 15.47 | % | | $ | 37,446 | | | | 0.15 | % | | | 0.15 | % | | | 2.17 | % | | | 24 | % |
| | 0.00 | | | | (3.34 | ) | | | 78.21 | | | | 3.00 | | | | 8,342 | | | | 0.15 | | | | 0.15 | | | | 2.87 | | | | 76 | |
| | 0.00 | | | | (2.03 | ) | | | 79.23 | | | | 7.54 | | | | 14,790 | | | | 0.15 | * | | | 0.86 | * | | | 3.31 | * | | | 209 | |
| | | | | | | | | | | | | | | | | | | | | | | | | | | | | | | | | | |
| $ | 0.00 | | | $ | (3.22 | ) | | $ | 116.38 | | | | 70.82 | % | | $ | 169,915 | | | | 0.15 | % | | | 0.15 | % | | | 3.15 | % | | | 11 | % |
| | 0.00 | | | | (3.23 | ) | | | 70.18 | | | | (11.69 | ) | | | 40,705 | | | | 0.15 | | | | 0.15 | | | | 4.41 | | | | 50 | |
| | 0.00 | | | | (2.13 | ) | | | 83.02 | | | | 11.02 | | | | 21,586 | | | | 0.15 | * | | | 0.83 | * | | | 4.56 | * | | | 39 | |
| | | | | | | | | | | | | | | | | | | | | | | | | | | | | | | | | | |
| $ | 0.00 | | | $ | (2.04 | ) | | $ | 108.45 | | | | 12.69 | % | | $ | 19,520 | | | | 0.15 | % | | | 0.15 | % | | | 1.35 | % | | | 211 | % |
| | 0.00 | | | | (1.25 | ) | | | 98.11 | | | | (0.98 | ) | | | 9,811 | | | | 0.15 | * | | | 0.99 | * | | | 1.95 | * | | | 219 | |
| | | | | | | | | | | | | | | | | | | | | | | | | | | | | | | | | | |
| $ | 0.00 | | | $ | (0.82 | ) | | $ | 53.39 | | | | 1.71 | % | | $ | 999,496 | | | | 0.20 | % | | | 0.20 | % | | | 1.51 | % | | | 31 | % |
| | 0.00 | | | | (1.43 | ) | | | 53.30 | | | | 5.70 | | | | 1,184,369 | | | | 0.20 | | | | 0.21 | | | | 3.50 | | | | 17 | |
| | 0.00 | | | | (0.78 | ) | | | 51.79 | | | | 5.17 | | | | 539,680 | | | | 0.20 | * | | | 0.23 | * | | | 2.02 | * | | | 5 | |
| | | | | | | | | | | | | | | | | | | | | | | | | | | | | | | | | | |
| $ | 0.00 | | | $ | (1.58 | ) | | $ | 69.22 | | | | 26.53 | % | | $ | 375,182 | | | | 0.20 | % | | | 0.20 | % | | | 2.53 | % | | | 11 | % |
| | 0.00 | | | | (2.17 | ) | | | 56.04 | | | | 7.58 | | | | 258,901 | | | | 0.20 | | | | 0.20 | | | | 4.76 | | | | 38 | |
| | 0.00 | | | | (1.26 | ) | | | 54.17 | | | | 10.95 | | | | 22,753 | | | | 0.20 | * | | | 0.70 | * | | | 3.02 | * | | | 35 | |
| | | | | | | | | | | | | | | | | | | | | | | | | | | | | | | | | | |
| $ | 0.00 | | | $ | (1.28 | ) | | $ | 59.93 | | | | 12.21 | % | | $ | 109,678 | | | | 0.20 | % | | | 0.20 | % | | | 2.38 | % | | | 6 | % |
| | 0.00 | | | | (2.22 | ) | | | 54.58 | | | | 7.39 | | | | 56,219 | | | | 0.20 | | | | 0.21 | | | | 4.04 | | | | 20 | |
| | 0.00 | | | | (0.99 | ) | | | 52.95 | | | | 7.91 | | | | 28,063 | | | | 0.20 | * | | | 0.61 | * | | | 2.35 | * | | | 122 | |
| | | | | | | | | | | | | | | | | | | | | | | | | | | | | | | | | | |
| $ | 0.00 | | | $ | (5.60 | ) | | $ | 99.62 | | | | 5.16 | % | | $ | 323,771 | | | | 0.55 | % | | | 0.55 | % | | | 6.14 | % | | | 33 | % |
| | 0.00 | | | | (0.16 | ) | | | 100.29 | | | | 0.45 | | | | 25,073 | | | | 0.55 | * | | | 7.30 | * | | | 4.65 | * | | | 0 | |
| | | | | | | | | | | | | | | | | | | | | | | | | | | | | | | | | | |
| $ | 0.00 | | | $ | (3.35 | ) | | $ | 105.46 | | | | 9.20 | % | | $ | 256,267 | | | | 0.20 | % | | | 0.20 | % | | | 3.32 | % | | | 5 | % |
| | 0.00 | | | | (2.61 | ) | | | 99.76 | | | | 2.40 | | | | 72,821 | | | | 0.20 | * | | | 0.34 | * | | | 3.36 | * | | | 69 | |
| | | | | | | | | | | | | | | | | | | | | | | | | | | | | | | | | | |
| $ | 0.00 | | | $ | (2.23 | ) | | $ | 101.86 | | | | 4.16 | % | | $ | 28,521 | | | | 0.45 | %* | | | 0.70 | %* | | | 3.89 | %* | | | 37 | % |
| | | | | | | | | | | | | | | | | | | | | | | | | | | | | | | | | | |
| $ | 0.00 | | | $ | (1.05 | ) | | $ | 103.13 | | | | 4.18 | % | | $ | 18,564 | | | | 0.45 | %* | | | 0.88 | %* | | | 2.05 | %* | | | 91 | % |
| | | | | | | | | | | | | | | | | | | | | | | | | | | | | | | | | | |
| $ | (0.59 | ) | | $ | (0.80 | ) | | $ | 95.91 | | | | (3.29 | )% | | $ | 2,877 | | | | 0.45 | %* | | | 0.95 | %* | | | 1.43 | %* | | | 130 | % |
| | | | | | | | | | | | | | | | | | | | | | | | | | | | | | | | | | |
| $ | 0.00 | | | $ | (3.85 | ) | | $ | 56.21 | | | | 22.27 | % | | $ | 37,101 | | | | 0.45 | % | | | 0.45 | % | | | 4.65 | % | | | 71 | % |
| | 0.00 | | | | (2.01 | ) | | | 49.36 | | | | 2.93 | | | | 27,644 | | | | 0.45 | * | | | 0.89 | * | | | 5.60 | * | | | 115 | |
| | | | | | | | | | | | | | | | | | | | | | | | | | | | | | | | | | |
| $ | 0.00 | | | $ | (1.09 | ) | | $ | 101.08 | | | | 1.13 | % | | $ | 1,715,342 | | | | 0.35 | % | | | 0.35 | % | | | 1.05 | % | | | 229 | % |
| | 0.00 | | | | (1.19 | ) | | | 101.04 | | | | 1.89 | | | | 1,233,727 | | | | 0.35 | | | | 0.36 | | | | 0.85 | | | | 280 | |
| | 0.00 | | | | (0.35 | ) | | | 100.34 | | | | 0.69 | | | | 656,227 | | | | 0.35 | * | | | 0.41 | * | | | 0.57 | * | | | 276 | |
| | | | | | | | | | | | | | | | | | | | | | | | | | | | | | | | | | |
| $ | 0.00 | | | $ | 0.00 | | | $ | 50.28 | | | | 0.56 | % | | $ | 28,156 | | | | 0.61 | %*(c) | | | 2.14 | %*(c) | | | 3.63 | %* | | | 381 | % |
| | | | | | | | | | | | | | | | | | | | | | | | | | | | | | | | | | |
| $ | 0.00 | | | $ | (1.25 | ) | | $ | 53.70 | | | | 6.88 | % | | $ | 153,576 | | | | 0.35 | % | | | 0.35 | % | | | 2.30 | % | | | 11 | % |
| | 0.00 | | | | (1.30 | ) | | | 51.44 | | | | 4.20 | | | | 90,529 | | | | 0.35 | | | | 0.36 | | | | 2.37 | | | | 44 | |
| | 0.00 | | | | (0.61 | ) | | | 50.63 | | | | 2.50 | | | | 43,543 | | | | 0.35 | * | | | 0.91 | * | | | 2.14 | * | | | 72 | |
| | | | | | | | | | | | | | | | | | | | | | | | | | | | | | | | | | |
| $ | 0.00 | | | $ | (0.50 | ) | | $ | 50.54 | | | | 1.36 | % | | $ | 43,463 | | | | 0.35 | % | | | 0.35 | % | | | 0.96 | % | | | 17 | % |
| | 0.00 | | | | (0.60 | ) | | | 50.36 | | | | 1.67 | | | | 23,168 | | | | 0.35 | | | | 0.35 | | | | 1.20 | | | | 35 | |
| | 0.00 | | | | (0.22 | ) | | | 50.13 | | | | 0.70 | | | | 18,046 | | | | 0.35 | * | | | 2.17 | * | | | 1.09 | * | | | 4 | |
| | | | | | | | | | | | | | | | | | | | | | | | | | | | | | | | | | |
| $ | 0.00 | | | $ | (0.71 | ) | | $ | 105.55 | | | | 6.27 | % | | $ | 1,765,865 | | | | 0.55 | %* | | | 0.62 | %* | | | 2.86 | %* | | | 322 | % |
| | | | | | |
| | ANNUAL REPORT | | JUNE 30, 2012 | | 29 |
Statements of Assets and Liabilities
| | | | | | | | | | | | | | | | | | | | | | | | |
| (Amounts in thousands, except per share amounts) | | PIMCO
1-3 Year
U.S. Treasury
Index Fund | | | PIMCO
3-7 Year
U.S. Treasury
Index Fund | | | PIMCO
7-15 Year
U.S. Treasury
Index Fund | | | PIMCO
25+ Year
Zero Coupon
U.S. Treasury
Index Fund | | | PIMCO
Broad
U.S. Treasury
Index Fund | | | PIMCO
1-5 Year
U.S. TIPS
Index Fund | |
| | | | | | |
Assets: | | | | | | | | | | | | | | | | | | | | | | | | |
Investments, at value | | $ | 132,300 | | | $ | 20,608 | | | $ | 37,076 | | | $ | 169,735 | | | $ | 18,917 | | | $ | 993,027 | |
Repurchase agreements, at value | | | 2,207 | | | | 1,240 | | | | 0 | | | | 0 | | | | 548 | | | | 561 | |
Cash | | | 0 | | | | 0 | | | | 26 | | | | 70 | | | | 0 | | | | 0 | |
Foreign currency, at value | | | 0 | | | | 0 | | | | 0 | | | | 0 | | | | 0 | | | | 0 | |
Receivable for investments sold | | | 6,337 | | | | 0 | | | | 0 | | | | 11,712 | | | | 0 | | | | 3,301 | |
Receivable for Fund shares sold | | | 0 | | | | 0 | | | | 0 | | | | 9,310 | | | | 0 | | | | 0 | |
Interest receivable | | | 220 | | | | 159 | | | | 398 | | | | 0 | | | | 78 | | | | 6,011 | |
Unrealized appreciation on foreign currency contracts | | | 0 | | | | 0 | | | | 0 | | | | 0 | | | | 0 | | | | 0 | |
| | | | 141,064 | | | | 22,007 | | | | 37,500 | | | | 190,827 | | | | 19,543 | | | | 1,002,900 | |
| | | | | | |
Liabilities: | | | | | | | | | | | | | | | | | | | | | | | | |
Payable for reverse repurchase agreements | | $ | 0 | | | $ | 0 | | | $ | 0 | | | $ | 0 | | | $ | 0 | | | $ | 0 | |
Payable for investments purchased | | | 3,247 | | | | 125 | | | | 0 | | | | 10,546 | | | | 0 | | | | 0 | |
Payable for Fund shares redeemed | | | 5,098 | | | | 0 | | | | 0 | | | | 9,310 | | | | 0 | | | | 0 | |
Dividends payable | | | 45 | | | | 26 | | | | 49 | | | | 1,029 | | | | 20 | | | | 3,183 | |
Accrued management fees | | | 11 | | | | 3 | | | | 4 | | | | 22 | | | | 2 | | | | 170 | |
Reimbursement to PIMCO | | | 6 | | | | 1 | | | | 1 | | | | 5 | | | | 1 | | | | 51 | |
Other liabilities | | | 0 | | | | 0 | | | | 0 | | | | 0 | | | | 0 | | | | 0 | |
| | | | 8,407 | | | | 155 | | | | 54 | | | | 20,912 | | | | 23 | | | | 3,404 | |
| | | | | | |
Net Assets | | $ | 132,657 | | | $ | 21,852 | | | $ | 37,446 | | | $ | 169,915 | | | $ | 19,520 | | | $ | 999,496 | |
| | | | | | |
Net Assets Consist of: | | | | | | | | | | | | | | | | | | | | | | | | |
Paid in capital | | $ | 132,022 | | | $ | 20,784 | | | $ | 35,954 | | | $ | 149,536 | | | $ | 18,474 | | | $ | 991,583 | |
Undistributed (overdistributed) net investment income | | | (92 | ) | | | (68 | ) | | | (8 | ) | | | 26 | | | | 7 | | | | 131 | |
Accumulated undistributed net realized gain (loss) | | | 332 | | | | 164 | | | | 98 | | | | (2,520 | ) | | | 509 | | | | 567 | |
Net unrealized appreciation (depreciation) | | | 395 | | | | 972 | | | | 1,402 | | | | 22,873 | | | | 530 | | | | 7,215 | |
| | | $ | 132,657 | | | $ | 21,852 | | | $ | 37,446 | | | $ | 169,915 | | | $ | 19,520 | | | $ | 999,496 | |
| | | | | | |
Shares Issued and Outstanding | | | 2,602 | | | | 267 | | | | 427 | | | | 1,460 | | | | 180 | | | | 18,720 | |
| | | | | | |
Net Asset Value Per Share | | $ | 50.98 | | | $ | 81.94 | | | $ | 87.76 | | | $ | 116.38 | | | $ | 108.45 | | | $ | 53.39 | |
| | | | | | |
Cost of Investments | | $ | 131,905 | | | $ | 19,636 | | | $ | 35,674 | | | $ | 146,862 | | | $ | 18,387 | | | $ | 985,812 | |
Cost of Repurchase Agreements | | $ | 2,207 | | | $ | 1,240 | | | $ | 0 | | | $ | 0 | | | $ | 548 | | | $ | 561 | |
Cost of Foreign Currency Held | | $ | 0 | | | $ | 0 | | | $ | 0 | | | $ | 0 | | | $ | 0 | | | $ | 0 | |
| | | | | | |
| 30 | | PIMCO ETF TRUST | | | | See Accompanying Notes |
June 30, 2012
| | | | | | | | | | | | | | | | | | | | | | | | | | | | | | |
PIMCO
15+ Year
U.S. TIPS
Index Fund | | | PIMCO
Broad
U.S. TIPS
Index Fund | | | PIMCO
0-5 Year
High Yield
Corporate Bond
Index Fund | | | PIMCO
Investment Grade
Corporate Bond
Index Fund | | | PIMCO
Australia Bond
Index Fund | | | PIMCO
Canada Bond
Index Fund | | | PIMCO
Germany Bond
Index Fund | | | PIMCO
Build
America Bond
Strategy Fund | |
| | | | | | | |
| | | | | | | | | | | | | | | | | | | | | | | | | | | | | | |
| $ | 374,316 | | | $ | 108,721 | | | $ | 299,771 | | | $ | 252,035 | | | $ | 25,627 | | | $ | 18,092 | | | $ | 2,811 | | | $ | 34,924 | |
| | 0 | | | | 0 | | | | 21,707 | | | | 1,551 | | | | 0 | | | | 0 | | | | 0 | | | | 1,901 | |
| | 30 | | | | 39 | | | | 0 | | | | 0 | | | | 0 | | | | 0 | | | | 0 | | | | 0 | |
| | 0 | | | | 0 | | | | 0 | | | | 0 | | | | 2,602 | | | | 390 | | | | 21 | | | | 0 | |
| | 6,943 | | | | 604 | | | | 0 | | | | 0 | | | | 0 | | | | 0 | | | | 227 | | | | 0 | |
| | 0 | | | | 0 | | | | 0 | | | | 0 | | | | 0 | | | | 0 | | | | 0 | | | | 0 | |
| | 2,055 | | | | 721 | | | | 6,503 | | | | 3,389 | | | | 305 | | | | 112 | | | | 56 | | | | 434 | |
| | 0 | | | | 0 | | | | 0 | | | | 0 | | | | 1 | | | | 1 | | | | 0 | | | | 0 | |
| | 383,344 | | | | 110,085 | | | | 327,981 | | | | 256,975 | | | | 28,535 | | | | 18,595 | | | | 3,115 | | | | 37,259 | |
| | | | | | | |
| | | | | | | | | | | | | | | | | | | | | | | | | | | | | | |
| $ | 0 | | | $ | 0 | | | $ | 2,180 | | | $ | 0 | | | $ | 0 | | | $ | 0 | | | $ | 0 | | | $ | 0 | |
| | 6,998 | | | | 0 | | | | 300 | | | | 0 | | | | 0 | | | | 0 | | | | 236 | | | | 0 | |
| | 0 | | | | 0 | | | | 0 | | | | 0 | | | | 0 | | | | 0 | | | | 0 | | | | 0 | |
| | 1,084 | | | | 384 | | | | 1,576 | | | | 656 | | | | 3 | | | | 23 | | | | 0 | | | | 142 | |
| | 64 | | | | 19 | | | | 146 | | | | 43 | | | | 10 | | | | 7 | | | | 1 | | | | 14 | |
| | 16 | | | | 4 | | | | 8 | | | | 8 | | | | 1 | | | | 1 | | | | 1 | | | | 2 | |
| | 0 | | | | 0 | | | | 0 | | | | 1 | | | | 0 | | | | 0 | | | | 0 | | | | 0 | |
| | 8,162 | | | | 407 | | | | 4,210 | | | | 708 | | | | 14 | | | | 31 | | | | 238 | | | | 158 | |
| | | | | | | |
| $ | 375,182 | | | $ | 109,678 | | | $ | 323,771 | | | $ | 256,267 | | | $ | 28,521 | | | $ | 18,564 | | | $ | 2,877 | | | $ | 37,101 | |
| | | | | | | |
| | | | | | | | | | | | | | | | | | | | | | | | | | | | | | |
| $ | 336,815 | | | $ | 100,870 | | | $ | 320,905 | | | $ | 247,450 | | | $ | 27,747 | | | $ | 18,159 | | | $ | 3,008 | | | $ | 33,528 | |
| | (77 | ) | | | 20 | | | | 347 | | | | 140 | | | | 21 | | | | 14 | | | | (23 | ) | | | (44 | ) |
| | (2,661 | ) | | | (19 | ) | | | (54 | ) | | | (519 | ) | | | (6 | ) | | | 70 | | | | 0 | | | | 1,034 | |
| | 41,105 | | | | 8,807 | | | | 2,573 | | | | 9,196 | | | | 759 | | | | 321 | | | | (108 | ) | | | 2,583 | |
| $ | 375,182 | | | $ | 109,678 | | | $ | 323,771 | | | $ | 256,267 | | | $ | 28,521 | | | $ | 18,564 | | | $ | 2,877 | | | $ | 37,101 | |
| | | | | | | |
| | 5,420 | | | | 1,830 | | | | 3,250 | | | | 2,430 | | | | 280 | | | | 180 | | | | 30 | | | | 660 | |
| | | | | | | |
| $ | 69.22 | | | $ | 59.93 | | | $ | 99.62 | | | $ | 105.46 | | | $ | 101.86 | | | $ | 103.13 | | | $ | 95.91 | | | $ | 56.21 | |
| | | | | | | |
| $ | 333,211 | | | $ | 99,914 | | | $ | 297,198 | | | $ | 242,839 | | | $ | 24,887 | | | $ | 17,773 | | | $ | 2,916 | | | $ | 32,341 | |
| $ | 0 | | | $ | 0 | | | $ | 21,707 | | | $ | 1,551 | | | $ | 0 | | | $ | 0 | | | $ | 0 | | | $ | 1,901 | |
| $ | 0 | | | $ | 0 | | | $ | 0 | | | $ | 0 | | | $ | 2,587 | | | $ | 388 | | | $ | 20 | | | $ | 0 | |
| | | | | | |
| | ANNUAL REPORT | | JUNE 30, 2012 | | 31 |
Statements of Assets and Liabilities (Cont.)
June 30, 2012
| | | | | | | | | | | | | | | | | | | | |
| (Amounts in thousands, except per share amounts) | | PIMCO
Enhanced Short
Maturity
Strategy Fund | | | PIMCO
Global
Advantage®
Inflation-
Linked Bond
Strategy Fund | | | PIMCO
Intermediate
Municipal Bond
Strategy Fund | | | PIMCO
Short Term
Municipal Bond
Strategy Fund | | | PIMCO
Total Return
Exchange-
Traded Fund | |
| | | | | |
Assets: | | | | | | | | | | | | | | | | | | | | |
Investments, at value | | $ | 1,709,516 | | | $ | 26,241 | | | $ | 152,207 | | | $ | 42,264 | | | $ | 2,062,723 | |
Repurchase agreements, at value | | | 2,100 | | | | 2,059 | | | | 1,395 | | | | 793 | | | | 129,387 | |
Cash | | | 148 | | | | 0 | | | | 3 | | | | 0 | | | | 271 | |
Foreign currency, at value | | | 0 | | | | 187 | | | | 0 | | | | 0 | | | | 3,923 | |
Receivable for investments sold | | | 27,286 | | | | 234 | | | | 0 | | | | 0 | | | | 361,327 | |
Receivable for Fund shares sold | | | 21,232 | | | | 0 | | | | 0 | | | | 0 | | | | 63,359 | |
Interest receivable | | | 11,148 | | | | 120 | | | | 1,515 | | | | 453 | | | | 6,018 | |
Unrealized appreciation on foreign currency contracts | | | 0 | | | | 93 | | | | 0 | | | | 0 | | | | 4,646 | |
| | | | 1,771,430 | | | | 28,934 | | | | 155,120 | | | | 43,510 | | | | 2,631,654 | |
| | | | | |
Liabilities: | | | | | | | | | | | | | | | | | | | | |
Payable for reverse repurchase agreements | | $ | 30,789 | | | $ | 0 | | | $ | 0 | | | $ | 0 | | | $ | 0 | |
Payable for investments purchased | | | 23,201 | | | | 111 | | | | 1,222 | | | | 0 | | | | 777,358 | |
Payable for investments purchased on a delayed-delivery basis | | | 0 | | | | 537 | | | | 0 | | | | 0 | | | | 8,912 | |
Payable for short sales | | | 0 | | | | 0 | | | | 0 | | | | 0 | | | | 59,511 | |
Deposits from counterparty | | | 0 | | | | 0 | | | | 0 | | | | 0 | | | | 7,130 | |
Dividends payable | | | 1,515 | | | | 0 | | | | 271 | | | | 32 | | | | 3,429 | |
Accrued management fees | | | 506 | | | | 14 | | | | 45 | | | | 13 | | | | 667 | |
Reimbursement to PIMCO | | | 76 | | | | 0 | | | | 6 | | | | 2 | | | | 12 | |
Unrealized depreciation on foreign currency contracts | | | 0 | | | | 116 | | | | 0 | | | | 0 | | | | 8,770 | |
Other liabilities | | | 1 | | | | 0 | | | | 0 | | | | 0 | | | | 0 | |
| | | | 56,088 | | | | 778 | | | | 1,544 | | | | 47 | | | | 865,789 | |
| | | | | |
Net Assets | | $ | 1,715,342 | | | $ | 28,156 | | | $ | 153,576 | | | $ | 43,463 | | | $ | 1,765,865 | |
| | | | | |
Net Assets Consist of: | | | | | | | | | | | | | | | | | | | | |
Paid in capital | | $ | 1,710,650 | | | $ | 28,231 | | | $ | 147,470 | | | $ | 43,206 | | | $ | 1,735,036 | |
Undistributed (overdistributed) net investment income | | | 157 | | | | (61 | ) | | | (38 | ) | | | 3 | | | | 905 | |
Accumulated undistributed net realized gain (loss) | | | (1,447 | ) | | | 269 | | | | 215 | | | | 5 | | | | 7,717 | |
Net unrealized appreciation (depreciation) | | | 5,982 | | | | (283 | ) | | | 5,929 | | | | 249 | | | | 22,207 | |
| | | $ | 1,715,342 | | | $ | 28,156 | | | $ | 153,576 | | | $ | 43,463 | | | $ | 1,765,865 | |
| | | | | |
Shares Issued and Outstanding | | | 16,970 | | | | 560 | | | | 2,860 | | | | 860 | | | | 16,730 | |
| | | | | |
Net Asset Value Per Share | | $ | 101.08 | | | $ | 50.28 | | | $ | 53.70 | | | $ | 50.54 | | | $ | 105.55 | |
| | | | | |
Cost of Investments | | $ | 1,703,534 | | | $ | 26,506 | | | $ | 146,278 | | | $ | 42,015 | | | $ | 2,036,436 | |
Cost of Repurchase Agreements | | $ | 2,100 | | | $ | 2,059 | | | $ | 1,395 | | | $ | 793 | | | $ | 129,387 | |
Cost of Foreign Currency Held | | $ | 0 | | | $ | 180 | | | $ | 0 | | | $ | 0 | | | $ | 3,840 | |
Proceeds Received on Short Sales | | $ | 0 | | | $ | 0 | | | $ | 0 | | | $ | 0 | | | $ | 59,391 | |
| | | | | | |
| 32 | | PIMCO ETF TRUST | | | | See Accompanying Notes |
(THIS PAGE INTENTIONALLY LEFT BLANK)
| | | | | | |
| | ANNUAL REPORT | | JUNE 30, 2012 | | 33 |
Statements of Operations
| | | | | | | | | | | | | | | | | | | | | | | | |
| Year Ended June 30, 2012 | | | | | | | | | | | | | | | | | | |
| (Amounts in thousands) | | PIMCO
1-3 Year
U.S. Treasury
Index Fund | | | PIMCO
3-7 Year
U.S. Treasury
Index Fund | | | PIMCO
7-15 Year
U.S. Treasury
Index Fund | | | PIMCO
25+ Year
Zero Coupon
U.S. Treasury
Index Fund | | | PIMCO
Broad
U.S. Treasury
Index Fund | | | PIMCO
1-5 Year
U.S. TIPS
Index Fund | |
| | | | | | |
Investment Income: | | | | | | | | | | | | | | | | | | | | | | | | |
Interest, net of foreign taxes* | | $ | 863 | | | $ | 379 | | | $ | 379 | | | $ | 2,905 | | | $ | 265 | | | $ | 17,962 | |
Miscellaneous income | | | 0 | | | | 0 | | | | 0 | | | | 0 | | | | 0 | | | | 0 | |
Total Income | | | 863 | | | | 379 | | | | 379 | | | | 2,905 | | | | 265 | | | | 17,962 | |
| | | | | | |
Expenses: | | | | | | | | | | | | | | | | | | | | | | | | |
Management fees | | | 194 | | | | 33 | | | | 24 | | | | 132 | | | | 26 | | | | 2,096 | |
Trustees’ fees | | | 6 | | | | 1 | | | | 1 | | | | 8 | | | | 1 | | | | 46 | |
Organization expense | | | 0 | | | | 0 | | | | 0 | | | | 0 | | | | 0 | | | | 0 | |
Miscellaneous expense | | | 0 | | | | 0 | | | | 0 | | | | 0 | | | | 0 | | | | 5 | |
Total Expenses | | | 200 | | | | 34 | | | | 25 | | | | 140 | | | | 27 | | | | 2,147 | |
Waiver and/or Reimbursement by PIMCO | | | (77 | ) | | | 0 | | | | 0 | | | | (4 | ) | | | 0 | | | | 0 | |
Net Expenses | | | 123 | | | | 34 | | | | 25 | | | | 136 | | | | 27 | | | | 2,147 | |
| | | | | | |
Net Investment Income | | | 740 | | | | 345 | | | | 354 | | | | 2,769 | | | | 238 | | | | 15,815 | |
| | | | | | |
Net Realized and Unrealized Gain (Loss): | | | | | | | | | | | | | | | | | | | | | | | | |
Net realized gain (loss) on investments | | | 421 | | | | 213 | | | | 172 | | | | 1,316 | | | | 837 | | | | 682 | |
Net realized gain on in-kind redemptions | | | 73 | | | | 0 | | | | 0 | | | | 26,507 | | | | 95 | | | | 10,146 | |
Net realized gain (loss) on futures contracts | | | 0 | | | | 0 | | | | 0 | | | | 0 | | | | 0 | | | | (4 | ) |
Net realized (loss) on swaps | | | 0 | | | | 0 | | | | 0 | | | | 0 | | | | 0 | | | | 0 | |
Net realized gain (loss) on foreign currency transactions | | | 0 | | | | 0 | | | | 0 | | | | 0 | | | | 0 | | | | 0 | |
Net change in unrealized appreciation (depreciation) on investments | | | (388 | ) | | | 832 | | | | 1,459 | | | | 26,916 | | | | 550 | | | | (9,676 | ) |
Net change in unrealized appreciation (depreciation) on translation of assets and liabilities denominated in foreign currencies | | | 0 | | | | 0 | | | | 0 | | | | 0 | | | | 0 | | | | 0 | |
Net Gain (Loss) | | | 106 | | | | 1,045 | | | | 1,631 | | | | 54,739 | | | | 1,482 | | | | 1,148 | |
| | | | | | |
Net Increase (Decrease) in Net Assets Resulting from Operations | | $ | 846 | | | $ | 1,390 | | | $ | 1,985 | | | $ | 57,508 | | | $ | 1,720 | | | $ | 16,963 | |
| | | | | | |
*Foreign tax withholdings | | $ | 0 | | | $ | 0 | | | $ | 0 | | | $ | 0 | | | $ | 0 | | | $ | 0 | |
| (1) | Period from October 31, 2011 to June 30, 2012. |
| (2) | Period from November 9, 2011 to June 30, 2012. |
| | | | | | |
| 34 | | PIMCO ETF TRUST | | | | See Accompanying Notes |
| | | | | | | | | | | | | | | | | | | | | | | | | | | | | | |
| | | | | | | | | | | | | | | | | | | | | | | |
PIMCO
15+ Year
U.S. TIPS
Index Fund | | | PIMCO
Broad
U.S. TIPS
Index Fund | | | PIMCO
0-5 Year
High Yield
Corporate Bond
Index Fund | | | PIMCO
Investment Grade
Corporate Bond
Index Fund | | | PIMCO
Australia Bond
Index Fund (1) | | | PIMCO
Canada Bond
Index Fund (2) | | | PIMCO
Germany Bond
Index Fund (2) | | | PIMCO
Build
America Bond
Strategy Fund | |
| | | | | | | |
| | | | | | | | | | | | | | | | | | | | | | | | | | | | | | |
| $ | 9,056 | | | $ | 2,223 | | | $ | 10,282 | | | $ | 5,521 | | | $ | 656 | | | $ | 240 | | | $ | 109 | | | $ | 1,507 | |
| | 0 | | | | 0 | | | | 0 | | | | 0 | | | | 6 | | | | 0 | | | | 0 | | | | 0 | |
| | 9,056 | | | | 2,223 | | | | 10,282 | | | | 5,521 | | | | 662 | | | | 240 | | | | 109 | | | | 1,507 | |
| | | | | | | |
| | | | | | | | | | | | | | | | | | | | | | | | | | | | | | |
| | 662 | | | | 172 | | | | 844 | | | | 313 | | | | 70 | | | | 44 | | | | 27 | | | | 133 | |
| | 17 | | | | 5 | | | | 14 | | | | 12 | | | | 1 | | | | 1 | | | | 0 | | | | 2 | |
| | 0 | | | | 0 | | | | 0 | | | | 0 | | | | 37 | | | | 40 | | | | 29 | | | | 0 | |
| | 0 | | | | 0 | | | | 0 | | | | 0 | | | | 0 | | | | 0 | | | | 0 | | | | 0 | |
| | 679 | | | | 177 | | | | 858 | | | | 325 | | | | 108 | | | | 85 | | | | 56 | | | | 135 | |
| | (1 | ) | | | (1 | ) | | | (6 | ) | | | (4 | ) | | | (38 | ) | | | (41 | ) | | | (29 | ) | | | 0 | |
| | 678 | | | | 176 | | | | 852 | | | | 321 | | | | 70 | | | | 44 | | | | 27 | | | | 135 | |
| | | | | | | |
| | 8,378 | | | | 2,047 | | | | 9,430 | | | | 5,200 | | | | 592 | | | | 196 | | | | 82 | | | | 1,372 | |
| | | | | | | |
| | | | | | | | | | | | | | | | | | | | | | | | | | | | | | |
| | (113 | ) | | | 20 | | | | (40 | ) | | | 172 | | | | (84 | ) | | | 56 | | | | (207 | ) | | | 2,211 | |
| | 24,984 | | | | 0 | | | | 0 | | | | 0 | | | | 0 | | | | 0 | | | | 0 | | | | 0 | |
| | 0 | | | | 0 | | | | 0 | | | | (8 | ) | | | 0 | | | | 0 | | | | 10 | | | | 0 | |
| | 0 | | | | 0 | | | | (7 | ) | | | (14 | ) | | | 0 | | | | 0 | | | | 0 | | | | 0 | |
| | 0 | | | | 0 | | | | 0 | | | | 0 | | | | 31 | | | | (15 | ) | | | 27 | | | | 0 | |
| | 39,653 | | | | 6,776 | | | | 2,504 | | | | 9,020 | | | | 740 | | | | 319 | | | | (105 | ) | | | 1,816 | |
|
0 |
| | | 0 | | | | 0 | | | | 0 | | | | 19 | | | | 2 | | | | (3 | ) | | | 0 | |
| | 64,524 | | | | 6,796 | | | | 2,457 | | | | 9,170 | | | | 706 | | | | 362 | | | | (278 | ) | | | 4,027 | |
| | | | | | | |
| $ | 72,902 | | | $ | 8,843 | | | $ | 11,887 | | | $ | 14,370 | | | $ | 1,298 | | | $ | 558 | | | $ | (196 | ) | | $ | 5,399 | |
| | | | | | | |
| $ | 0 | | | $ | 0 | | | $ | 0 | | | $ | 1 | | | $ | 0 | | | $ | 0 | | | $ | 0 | | | $ | 0 | |
| | | | | | |
| | ANNUAL REPORT | | JUNE 30, 2012 | | 35 |
Statements of Operations (Cont.)
| | | | | | | | | | | | | | | | | | | | |
| Year Ended June 30, 2012 | | | | | | | | | | | | | | | |
| (Amounts in thousands) | | PIMCO
Enhanced Short
Maturity
Strategy Fund | | | PIMCO
Global
Advantage®
Inflation-
Linked Bond
Strategy Fund (3) | | | PIMCO
Intermediate
Municipal Bond
Strategy Fund | | | PIMCO
Short Term
Municipal Bond
Strategy Fund | | | PIMCO
Total Return
Exchange-
Traded Fund (4) | |
| | | | | |
Investment Income: | | | | | | | | | | | | | | | | | | | | |
Interest, net of foreign taxes* | | $ | 21,803 | | | $ | 183 | | | $ | 3,090 | | | $ | 475 | | | $ | 8,460 | |
Total Income | | | 21,803 | | | | 183 | | | | 3,090 | | | | 475 | | | | 8,460 | |
| | | | | |
Expenses: | | | | | | | | | | | | | | | | | | | | |
Management fees | | | 5,430 | | | | 26 | | | | 407 | | | | 126 | | | | 1,357 | |
Trustees’ fees | | | 76 | | | | 1 | | | | 7 | | | | 2 | | | | 55 | |
Organization expense | | | 0 | | | | 65 | | | | 0 | | | | 0 | | | | 122 | |
Interest expense | | | 0 | | | | 1 | | | | 0 | | | | 0 | | | | 0 | |
Total Expenses | | | 5,506 | | | | 93 | | | | 414 | | | | 128 | | | | 1,534 | |
Waiver and/or Reimbursement by PIMCO | | | 0 | | | | (66 | ) | | | (1 | ) | | | 0 | | | | (165 | ) |
Net Expenses | | | 5,506 | | | | 27 | | | | 413 | | | | 128 | | | | 1,369 | |
| | | | | |
Net Investment Income | | | 16,297 | | | | 156 | | | | 2,677 | | | | 347 | | | | 7,091 | |
| | | | | |
Net Realized and Unrealized Gain (Loss): | | | | | | | | | | | | | | | | | | | | |
Net realized gain (loss) on investments | | | (902 | ) | | | 237 | | | | 222 | | | | 5 | | | | 7,176 | |
Net realized gain (loss) on foreign currency transactions | | | 0 | | | | (186 | ) | | | 0 | | | | 0 | | | | 1,595 | |
Net change in unrealized appreciation (depreciation) on investments | | | 3,882 | | | | (265 | ) | | | 4,119 | | | | 113 | | | | 26,167 | |
Net change in unrealized (depreciation) on translation of assets and liabilities denominated in foreign currencies | | | 0 | | | | (18 | ) | | | 0 | | | | 0 | | | | (3,960 | ) |
Net Gain (Loss) | | | 2,980 | | | | (232 | ) | | | 4,341 | | | | 118 | | | | 30,978 | |
| | | | | |
Net Increase (Decrease) in Net Assets Resulting from Operations | | $ | 19,277 | | | $ | (76 | ) | | $ | 7,018 | | | $ | 465 | | | $ | 38,069 | |
| | | | | |
*Foreign tax withholdings | | $ | 1 | | | $ | 0 | | | $ | 0 | | | $ | 0 | | | $ | 0 | |
| (3) | Period from April 30, 2012 to June 30, 2012. |
| (4) | Period from February 29, 2012 to June 30, 2012. |
| | | | | | |
| 36 | | PIMCO ETF TRUST | | | | See Accompanying Notes |
(THIS PAGE INTENTIONALLY LEFT BLANK)
| | | | | | |
| | ANNUAL REPORT | | JUNE 30, 2012 | | 37 |
Statements of Changes in Net Assets
| | | | | | | | | | | | | | | | | | | | | | | | |
| | | PIMCO
1-3 Year
U.S. Treasury
Index Fund | | | PIMCO
3-7 Year
U.S. Treasury
Index Fund | | |
PIMCO
7-15 Year
U.S. Treasury
Index Fund | |
| | | | | | |
| (Amounts in thousands) | | Year Ended
June 30, 2012 | | | Year Ended
June 30, 2011 | | | Year Ended
June 30, 2012 | | | Year Ended
June 30, 2011 | | | Year Ended
June 30, 2012 | | | Year Ended
June 30, 2011 | |
| | | | | | |
Increase (Decrease) in Net Assets from: | | | | | | | | | | | | | | | | | | | | | | | | |
| | | | | | |
Operations: | | | | | | | | | | | | | | | | | | | | | | | | |
Net investment income | | $ | 740 | | | $ | 817 | | | $ | 345 | | | $ | 728 | | | $ | 354 | | | $ | 444 | |
Net realized gain (loss) | | | 421 | | | | 247 | | | | 213 | | | | 231 | | | | 172 | | | | 402 | |
Net realized gain (loss) on in-kind redemptions | | | 73 | | | | 0 | | | | 0 | | | | 1,073 | | | | 0 | | | | 295 | |
Net change in unrealized appreciation (depreciation) | | | (388 | ) | | | 213 | | | | 832 | | | | (1,082 | ) | | | 1,459 | | | | (866 | ) |
Net increase (decrease) resulting from operations | | | 846 | | | | 1,277 | | | | 1,390 | | | | 950 | | | | 1,985 | | | | 275 | |
| | | | | | |
Net Equalization Credits and Charges | | | 11 | | | | 6 | | | | 0 | | | | 10 | | | | 15 | | | | 1 | |
| | | | | | |
Distributions to Shareholders: | | | | | | | | | | | | | | | | | | | | | | | | |
From net investment income | | | (735 | ) | | | (821 | ) | | | (342 | ) | | | (737 | ) | | | (348 | ) | | | (444 | ) |
From net realized capital gains | | | (263 | ) | | | 0 | | | | (91 | ) | | | (550 | ) | | | (125 | ) | | | (280 | ) |
| | | | | | |
Total Distributions | | | (998 | ) | | | (821 | ) | | | (433 | ) | | | (1,287 | ) | | | (473 | )�� | | | (724 | ) |
| | | | | | |
Fund Share Transactions: | | | | | | | | | | | | | | | | | | | | | | | | |
Receipts for shares sold | | | 35,808 | | | | 20,350 | | | | 0 | | | | 12,675 | | | | 27,592 | | | | 6,352 | |
Cost of shares redeemed | | | (10,205 | ) | | | 0 | | | | 0 | | | | (43,385 | ) | | | 0 | | | | (12,351 | ) |
Net Income Equalization | | | (11 | ) | | | (6 | ) | | | 0 | | | | (10 | ) | | | (15 | ) | | | (1 | ) |
Net increase (decrease) resulting from Fund share transactions | | | 25,592 | | | | 20,344 | | | | 0 | | | | (30,720 | ) | | | 27,577 | | | | (6,000 | ) |
| | | | | | |
Total Increase (Decrease) in Net Assets | | | 25,451 | | | | 20,806 | | | | 957 | | | | (31,047 | ) | | | 29,104 | | | | (6,448 | ) |
| | | | | | |
Net Assets: | | | | | | | | | | | | | | | | | | | | | | | | |
Beginning of year or period | | | 107,206 | | | | 86,400 | | | | 20,895 | | | | 51,942 | | | | 8,342 | | | | 14,790 | |
End of year or period* | | $ | 132,657 | | | $ | 107,206 | | | $ | 21,852 | | | $ | 20,895 | | | $ | 37,446 | | | $ | 8,342 | |
| | | | | | |
*Including undistributed (overdistributed) net investment income of: | | $ | (92 | ) | | $ | (121 | ) | | $ | (68 | ) | | $ | (73 | ) | | $ | (8 | ) | | $ | (14 | ) |
| | | | | | |
Shares of Beneficial Interest: | | | | | | | | | | | | | | | | | | | | | | | | |
Shares Sold | | | 700 | | | | 400 | | | | 0 | | | | 160 | | | | 320 | | | | 80 | |
Shares Redeemed | | | (200 | ) | | | 0 | | | | 0 | | | | (560 | ) | | | 0 | | | | (160 | ) |
Net increase (decrease) in shares outstanding | | | 500 | | | | 400 | | | | 0 | | | | (400 | ) | | | 320 | | | | (80 | ) |
| | | | | | |
| 38 | | PIMCO ETF TRUST | | | | See Accompanying Notes |
| | | | | | | | | | | | | | | | | | | | | | | | | | | | | | | | | | | | | | |
PIMCO
25+ Year
Zero Coupon
U.S. Treasury
Index Fund | | | PIMCO
Broad
U.S. Treasury
Index Fund | | | PIMCO
1-5 Year
U.S. TIPS
Index Fund | | | PIMCO
15+ Year
U.S. TIPS
Index Fund | | | PIMCO
Broad
U.S. TIPS
Index Fund | |
| | | | | | | | | |
Year Ended
June 30,
2012 | | | Year Ended
June 30,
2011 | | | Year Ended
June 30,
2012 | | | Period from
October 29,
2010 to
June 30,
2011 | | | Year Ended
June 30,
2012 | | | Year Ended
June 30,
2011 | | | Year Ended
June 30,
2012 | | | Year Ended
June 30,
2011 | | | Year Ended
June 30,
2012 | | | Year Ended
June 30,
2011 | |
| | | | | | | | | |
| | | | | | | | | | | | | | | | | | | | | | | | | | | | | | | | | | | | | | |
| | | | | | | | | |
| | | | | | | | | | | | | | | | | | | | | | | | | | | | | | | | | | | | | | |
| $ | 2,769 | | | $ | 1,829 | | | $ | 238 | | | $ | 126 | | | $ | 15,815 | | | $ | 27,307 | | | $ | 8,378 | | | $ | 9,207 | | | $ | 2,047 | | | $ | 1,591 | |
| | 1,316 | | | | (3,474 | ) | | | 837 | | | | (205 | ) | | | 678 | | | | 1,678 | | | | (113 | ) | | | (3,465 | ) | | | 20 | | | | 65 | |
| | 26,507 | | | | (591 | ) | | | 95 | | | | 0 | | | | 10,146 | | | | 1,982 | | | | 24,984 | | | | 707 | | | | 0 | | | | 0 | |
| | 26,916 | | | | (6,133 | ) | | | 550 | | | | (20 | ) | | | (9,676 | ) | | | 13,980 | | | | 39,653 | | | | 607 | | | | 6,776 | | | | 1,273 | |
| | 57,508 | | | | (8,369 | ) | | | 1,720 | | | | (99 | ) | | | 16,963 | | | | 44,947 | | | | 72,902 | | | | 7,056 | | | | 8,843 | | | | 2,929 | |
| | | | | | | | | |
| | (23 | ) | | | (26 | ) | | | 13 | | | | 0 | | | | (262 | ) | | | 943 | | | | 295 | | | | 323 | | | | 10 | | | | 79 | |
| | | | | | | | | |
| | | | | | | | | | | | | | | | | | | | | | | | | | | | | | | | | | | | | | |
| | (2,723 | ) | | | (1,798 | ) | | | (232 | ) | | | (126 | ) | | | (14,914 | ) | | | (28,030 | ) | | | (8,084 | ) | | | (9,472 | ) | | | (1,951 | ) | | | (1,658 | ) |
| | 0 | | | | 0 | | | | (122 | ) | | | 0 | | | | (1,221 | ) | | | (171 | ) | | | 0 | | | | 0 | | | | 0 | | | | (229 | ) |
| | | | | | | | | |
| | (2,723 | ) | | | (1,798 | ) | | | (354 | ) | | | (126 | ) | | | (16,135 | ) | | | (28,201 | ) | | | (8,084 | ) | | | (9,472 | ) | | | (1,951 | ) | | | (1,887 | ) |
| | | | | | | | | |
| | | | | | | | | | | | | | | | | | | | | | | | | | | | | | | | | | | | | | |
| | 194,319 | | | | 63,329 | | | | 25,479 | | | | 10,036 | | | | 296,546 | | | | 670,857 | | | | 216,823 | | | | 348,363 | | | | 46,567 | | | | 27,114 | |
| | (119,894 | ) | | | (34,043 | ) | | | (17,136 | ) | | | 0 | | | | (482,247 | ) | | | (42,914 | ) | | | (165,360 | ) | | | (109,799 | ) | | | 0 | | | | 0 | |
| | 23 | | | | 26 | | | | (13 | ) | | | 0 | | | | 262 | | | | (943 | ) | | | (295 | ) | | | (323 | ) | | | (10 | ) | | | (79 | ) |
| | 74,448 | | | | 29,312 | | | | 8,330 | | | | 10,036 | | | | (185,439 | ) | | | 627,000 | | | | 51,168 | | | | 238,241 | | | | 46,557 | | | | 27,035 | |
| | | | | | | | | |
| | 129,210 | | | | 19,119 | | | | 9,709 | | | | 9,811 | | | | (184,873 | ) | | | 644,689 | | | | 116,281 | | | | 236,148 | | | | 53,459 | | | | 28,156 | |
| | | | | | | | | |
| | | | | | | | | | | | | | | | | | | | | | | | | | | | | | | | | | | | | | |
| | 40,705 | | | | 21,586 | | | | 9,811 | | | | 0 | | | | 1,184,369 | | | | 539,680 | | | | 258,901 | | | | 22,753 | | | | 56,219 | | | | 28,063 | |
| $ | 169,915 | | | $ | 40,705 | | | $ | 19,520 | | | $ | 9,811 | | | $ | 999,496 | | | $ | 1,184,369 | | | $ | 375,182 | | | $ | 258,901 | | | $ | 109,678 | | | $ | 56,219 | |
| | | | | | | | | |
| $ | 26 | | | $ | (19 | ) | | $ | 7 | | | $ | 1 | | | $ | 131 | | | $ | (803 | ) | | $ | (77 | ) | | $ | (393 | ) | | $ | 20 | | | $ | (77 | ) |
| | | | | | | | | |
| | | | | | | | | | | | | | | | | | | | | | | | | | | | | | | | | | | | | | |
| | 2,000 | | | | 800 | | | | 240 | | | | 100 | | | | 5,500 | | | | 12,600 | | | | 3,300 | | | | 6,200 | | | | 800 | | | | 500 | |
| | (1,120 | ) | | | (480 | ) | | | (160 | ) | | | 0 | | | | (9,000 | ) | | | (800 | ) | | | (2,500 | ) | | | (2,000 | ) | | | 0 | | | | 0 | |
| | 880 | | | | 320 | | | | 80 | | | | 100 | | | | (3,500 | ) | | | 11,800 | | | | 800 | | | | 4,200 | | | | 800 | | | | 500 | |
| | | | | | |
| | ANNUAL REPORT | | JUNE 30, 2012 | | 39 |
Statements of Changes in Net Assets (Cont.)
| | | | | | | | | | | | | | | | | | | | |
| | | PIMCO 0-5 Year
High Yield
Corporate Bond
Index Fund | | | PIMCO
Investment Grade
Corporate Bond
Index Fund | | | PIMCO
Australia Bond
Index Fund | |
| | | | | |
| (Amounts in thousands) | | Year Ended
June 30, 2012 | | | Period from
June 16, 2011 to
June 30, 2011 | | | Year Ended
June 30, 2012 | | | Period from
September 20, 2010 to
June 30, 2011 | | | Period from
October 31, 2011 to
June 30, 2012 | |
| | | | | |
Increase in Net Assets from: | | | | | | | | | | | | | | | | | | | | |
| | | | | |
Operations: | | | | | | | | | | | | | | | | | | | | |
Net investment income | | $ | 9,430 | | | $ | 45 | | | $ | 5,200 | | | $ | 1,759 | | | $ | 592 | |
Net realized gain (loss) | | | (47 | ) | | | 0 | | | | 150 | | | | (633 | ) | | | (53 | ) |
Net change in unrealized appreciation (depreciation) | | | 2,504 | | | | 69 | | | | 9,020 | | | | 176 | | | | 759 | |
Net increase (decrease) resulting from operations | | | 11,887 | | | | 114 | | | | 14,370 | | | | 1,302 | | | | 1,298 | |
| | | | | |
Net Equalization Credits and Charges | | | 915 | | | | 0 | | | | 193 | | | | 12 | | | | 17 | |
| | | | | |
Distributions to Shareholders: | | | | | | | | | | | | | | | | | | | | |
From net investment income | | | (9,093 | ) | | | (41 | ) | | | (5,061 | ) | | | (1,764 | ) | | | (524 | ) |
From net realized capital gains | | | 0 | | | | 0 | | | | 0 | | | | (31 | ) | | | 0 | |
Tax basis return of capital | | | 0 | | | | 0 | | | | 0 | | | | 0 | | | | 0 | |
| | | | | |
Total Distributions | | | (9,093 | ) | | | (41 | ) | | | (5,061 | ) | | | (1,795 | ) | | | (524 | ) |
| | | | | |
Fund Share Transactions: | | | | | | | | | | | | | | | | | | | | |
Receipts for shares sold | | | 305,800 | | | | 25,000 | | | | 184,315 | | | | 103,090 | | | | 32,732 | |
Cost of shares redeemed | | | (9,896 | ) | | | 0 | | | | (10,178 | ) | | | (29,776 | ) | | | (4,985 | ) |
Net Income Equalization | | | (915 | ) | | | 0 | | | | (193 | ) | | | (12 | ) | | | (17 | ) |
Net increase resulting from Fund share transactions | | | 294,989 | | | | 25,000 | | | | 173,944 | | | | 73,302 | | | | 27,730 | |
| | | | | |
Total Increase in Net Assets | | | 298,698 | | | | 25,073 | | | | 183,446 | | | | 72,821 | | | | 28,521 | |
| | | | | |
Net Assets: | | | | | | | | | | | | | | | | | | | | |
Beginning of year or period | | | 25,073 | | | | 0 | | | | 72,821 | | | | 0 | | | | 0 | |
End of year or period* | | $ | 323,771 | | | $ | 25,073 | | | $ | 256,267 | | | $ | 72,821 | | | $ | 28,521 | |
| | | | | |
*Including undistributed (overdistributed) net investment income of: | | $ | 347 | | | $ | 4 | | | $ | 140 | | | $ | (5 | ) | | $ | 21 | |
| | | | | |
Shares of Beneficial Interest: | | | | | | | | | | | | | | | | | | | | |
Shares Sold | | | 3,100 | | | | 250 | | | | 1,800 | | | | 1,030 | | | | 330 | |
Shares Redeemed | | | (100 | ) | | | 0 | | | | (100 | ) | | | (300 | ) | | | (50 | ) |
Net increase in shares outstanding | | | 3,000 | | | | 250 | | | | 1,700 | | | | 730 | | | | 280 | |
| | | | | | |
| 40 | | PIMCO ETF TRUST | | | | See Accompanying Notes |
| | | | | | | | | | | | | | | | | | | | | | | | | | |
PIMCO
Canada Bond
Index Fund | | | PIMCO
Germany Bond
Index Fund | | | PIMCO
Build
America Bond
Strategy Fund | | | PIMCO
Enhanced
Short
Maturity
Strategy Fund | | | PIMCO
Global
Advantage®
Inflation-
Linked Bond
Strategy Fund | |
| | | | | | |
Period from
November 9, 2011 to
June 30, 2012 | | | Period from
November 9, 2011 to
June 30, 2012 | | | Year Ended
June 30, 2012 | | | Period from
September 20, 2010 to
June 30, 2011 | | | Year Ended
June 30, 2012 | | | Year Ended
June 30, 2011 | | | Period from
April 30, 2012 to
June 30, 2012 | |
| | | | | | |
| | | | | | | | | | | | | | | | | | | | | | | | | | |
| | | | | | |
| | | | | | | | | | | | | | | | | | | | | | | | | | |
| $ | 196 | | | $ | 82 | | | $ | 1,372 | | | $ | 1,203 | | | $ | 16,297 | | | $ | 6,374 | | | $ | 156 | |
| | 41 | | | | (170 | ) | | | 2,211 | | | | (577 | ) | | | (902 | ) | | | 4,604 | | | | 51 | |
| | 321 | | | | (108 | ) | | | 1,816 | | | | 767 | | | | 3,882 | | | | 1,179 | | | | (283 | ) |
| | 558 | | | | (196 | ) | | | 5,399 | | | | 1,393 | | | | 19,277 | | | | 12,157 | | | | (76 | ) |
| | | | | | |
| | 7 | | | | 4 | | | | (19 | ) | | | 64 | | | | 240 | | | | 288 | | | | 7 | |
| | | | | | |
| | | | | | | | | | | | | | | | | | | | | | | | | | |
| | (153 | ) | | | (22 | ) | | | (1,357 | ) | | | (1,263 | ) | | | (16,300 | ) | | | (6,919 | ) | | | 0 | |
| | 0 | | | | 0 | | | | (600 | ) | | | 0 | | | | (995 | ) | | | (2,432 | ) | | | 0 | |
| | 0 | | | | (62 | ) | | | 0 | | | | 0 | | | | 0 | | | | 0 | | | | 0 | |
| | | | | | |
| | (153 | ) | | | (84 | ) | | | (1,957 | ) | | | (1,263 | ) | | | (17,295 | ) | | | (9,351 | ) | | | 0 | |
| | | | | | |
| | | | | | | | | | | | | | | | | | | | | | | | | | |
| | 23,313 | | | | 13,005 | | | | 22,085 | | | | 42,084 | | | | 1,155,847 | | | | 1,653,921 | | | | 28,232 | |
| | (5,154 | ) | | | (9,848 | ) | | | (16,070 | ) | | | (14,570 | ) | | | (676,214 | ) | | | (1,079,227 | ) | | | 0 | |
| | (7 | ) | | | (4 | ) | | | 19 | | | | (64 | ) | | | (240 | ) | | | (288 | ) | | | (7 | ) |
| | 18,152 | | | | 3,153 | | | | 6,034 | | | | 27,450 | | | | 479,393 | | | | 574,406 | | | | 28,225 | |
| | | | | | |
| | 18,564 | | | | 2,877 | | | | 9,457 | | | | 27,644 | | | | 481,615 | | | | 577,500 | | | | 28,156 | |
| | | | | | |
| | | | | | | | | | | | | | | | | | | | | | | | | | |
| | 0 | | | | 0 | | | | 27,644 | | | | 0 | | | | 1,233,727 | | | | 656,227 | | | | 0 | |
| $ | 18,564 | | | $ | 2,877 | | | $ | 37,101 | | | $ | 27,644 | | | $ | 1,715,342 | | | $ | 1,233,727 | | | $ | 28,156 | |
| | | | | | |
| $ | 14 | | | $ | (23 | ) | | $ | (44 | ) | | $ | (59 | ) | | $ | 157 | | | $ | (378 | ) | | $ | (61 | ) |
| | | | | | |
| | | | | | | | | | | | | | | | | | | | | | | | | | |
| | 230 | | | | 130 | | | | 400 | | | | 860 | | | | 11,480 | | | | 16,380 | | | | 560 | |
| | (50 | ) | | | (100 | ) | | | (300 | ) | | | (300 | ) | | | (6,720 | ) | | | (10,710 | ) | | | 0 | |
| | 180 | | | | 30 | | | | 100 | | | | 560 | | | | 4,760 | | | | 5,670 | | | | 560 | |
| | | | | | |
| | ANNUAL REPORT | | JUNE 30, 2012 | | 41 |
Statements of Changes in Net Assets (Cont.)
| | | | | | | | | | | | | | | | | | | | |
| | | PIMCO
Intermediate
Municipal Bond
Strategy Fund | | | PIMCO
Short Term
Municipal Bond
Strategy Fund | | | PIMCO
Total Return
Exchange-
Traded Fund | |
| | | | | |
| (Amounts in thousands) | | Year Ended
June 30, 2012 | | | Year Ended
June 30, 2011 | | | Year Ended
June 30, 2012 | | | Year Ended
June 30, 2011 | | | Period from
February 29, 2012 to
June 30, 2012 | |
| | | | | |
Increase in Net Assets from: | | | | | | | | | | | | | | | | | | | | |
| | | | | |
Operations: | | | | | | | | | | | | | | | | | | | | |
Net investment income | | $ | 2,677 | | | $ | 1,519 | | | $ | 347 | | | $ | 273 | | | $ | 7,091 | |
Net realized gain | | | 222 | | | | 178 | | | | 5 | | | | 30 | | | | 8,771 | |
Net change in unrealized appreciation | | | 4,119 | | | | 1,412 | | | | 113 | | | | 74 | | | | 22,207 | |
Net increase resulting from operations | | | 7,018 | | | | 3,109 | | | | 465 | | | | 377 | | | | 38,069 | |
| | | | | |
Net Equalization Credits and Charges | | | 44 | | | | 37 | | | | 5 | | | | 0 | | | | 3,339 | |
| | | | | |
Distributions to Shareholders: | | | | | | | | | | | | | | | | | | | | |
From net investment income | | | (2,647 | ) | | | (1,550 | ) | | | (341 | ) | | | (273 | ) | | | (7,240 | ) |
From net realized capital gains | | | (118 | ) | | | (82 | ) | | | (24 | ) | | | 0 | | | | 0 | |
| | | | | |
Total Distributions | | | (2,765 | ) | | | (1,632 | ) | | | (365 | ) | | | (273 | ) | | | (7,240 | ) |
| | | | | |
Fund Share Transactions: | | | | | | | | | | | | | | | | | | | | |
Receipts for shares sold | | | 69,251 | | | | 45,509 | | | | 20,195 | | | | 10,053 | | | | 1,735,036 | |
Cost of shares redeemed | | | (10,457 | ) | | | 0 | | | | 0 | | | | (5,035 | ) | | | 0 | |
Net Income Equalization | | | (44 | ) | | | (37 | ) | | | (5 | ) | | | 0 | | | | (3,339 | ) |
Net increase resulting from Fund share transactions | | | 58,750 | | | | 45,472 | | | | 20,190 | | | | 5,018 | | | | 1,731,697 | |
| | | | | |
Total Increase in Net Assets | | | 63,047 | | | | 46,986 | | | | 20,295 | | | | 5,122 | | | | 1,765,865 | |
| | | | | |
Net Assets: | | | | | | | | | | | | | | | | | | | | |
Beginning of year or period | | | 90,529 | | | | 43,543 | | | | 23,168 | | | | 18,046 | | | | 0 | |
End of year or period* | | $ | 153,576 | | | $ | 90,529 | | | $ | 43,463 | | | $ | 23,168 | | | $ | 1,765,865 | |
| | | | | |
*Including undistributed (overdistributed) net investment income of: | | $ | (38 | ) | | $ | (67 | ) | | $ | 3 | | | $ | (3 | ) | | $ | 905 | |
| | | | | |
Shares of Beneficial Interest: | | | | | | | | | | | | | | | | | | | | |
Shares Sold | | | 1,300 | | | | 900 | | | | 400 | | | | 200 | | | | 16,730 | |
Shares Redeemed | | | (200 | ) | | | 0 | | | | 0 | | | | (100 | ) | | | 0 | |
Net increase in shares outstanding | | | 1,100 | | | | 900 | | | | 400 | | | | 100 | | | | 16,730 | |
| | | | | | |
| 42 | | PIMCO ETF TRUST | | | | See Accompanying Notes |
Schedule of Investments PIMCO 1-3 Year U.S. Treasury Index Fund
June 30, 2012
| | | | | | | | | | | | |
| | | | | PRINCIPAL
AMOUNT
(000s) | | | | | MARKET
VALUE
(000s) | |
U.S. TREASURY OBLIGATIONS 99.7% | |
| | | | |
U.S. Treasury Notes | | | | | | | | | | | | |
0.250% due 09/15/2014 | | $ | | | 4,285 | | | $ | | | 4,277 | |
0.250% due 12/15/2014 | | | | | 3,955 | | | | | | 3,946 | |
0.250% due 01/15/2015 | | | | | 6,038 | | | | | | 6,022 | |
0.250% due 02/15/2015 | | | | | 4,779 | | | | | | 4,763 | |
0.250% due 05/15/2015 | | | | | 4,810 | | | | | | 4,791 | |
0.375% due 07/31/2013 | | | | | 5,436 | | | | | | 5,443 | |
0.375% due 11/15/2014 | | | | | 5,581 | | | | | | 5,585 | |
0.375% due 03/15/2015 | | | | | 5,300 | | | | | | 5,298 | |
0.375% due 04/15/2015 | | | | | 7,220 | | | | | | 7,217 | |
0.375% due 06/15/2015 | | | | | 3,250 | | | | | | 3,248 | |
0.500% due 05/31/2013 | | | | | 8,207 | | | | | | 8,227 | |
0.500% due 10/15/2013 | | | | | 3,850 | | | | | | 3,861 | |
0.500% due 11/15/2013 | | | | | 5,272 | | | | | | 5,288 | |
| | | | | | | | | | | | |
| | | | | PRINCIPAL
AMOUNT
(000s) | | | | | MARKET
VALUE
(000s) | |
0.500% due 08/15/2014 | | $ | | | 5,242 | | | $ | | | 5,261 | |
0.500% due 10/15/2014 | | | | | 3,972 | | | | | | 3,988 | |
0.625% due 07/15/2014 | | | | | 5,838 | | | | | | 5,873 | |
0.750% due 08/15/2013 | | | | | 5,443 | | | | | | 5,473 | |
0.750% due 09/15/2013 | | | | | 7,441 | | | | | | 7,485 | |
0.750% due 12/15/2013 | | | | | 4,464 | | | | | | 4,494 | |
0.750% due 06/15/2014 | | | | | 6,384 | | | | | | 6,438 | |
1.000% due 07/15/2013 | | | | | 4,411 | | | | | | 4,446 | |
1.000% due 01/15/2014 | | | | | 6,443 | | | | | | 6,512 | |
1.000% due 05/15/2014 | | | | | 1,235 | | | | | | 1,251 | |
1.250% due 02/15/2014 | | | | | 5,405 | | | | | | 5,487 | |
1.250% due 03/15/2014 | | | | | 3,924 | | | | | | 3,987 | |
1.250% due 04/15/2014 | | | | | 3,580 | | | | | | 3,639 | |
| | | | | | | | | | | | |
Total U.S. Treasury Obligations
(Cost $131,905) | | | | | | | | | | | 132,300 | |
| | | | | | | | | | | | |
| | | | | | | | | | | | |
| | | | | PRINCIPAL
AMOUNT
(000s) | | | | | MARKET
VALUE
(000s) | |
SHORT-TERM INSTRUMENTS 1.7% | |
| |
REPURCHASE AGREEMENTS 1.7% | |
| | | | |
State Street Bank and Trust Co. | | | | | | | | | | | | |
0.010% due 07/02/2012 | | $ | | | 2,207 | | | $ | | | 2,207 | |
| | | | | | | | | | | | |
(Dated 06/29/2012. Collateralized by U.S. Treasury Notes 2.000% due 11/15/2021 valued at $2,254. Repurchase proceeds are $2,207.) | | | | |
| |
Total Short-Term Instruments
(Cost $2,207) | | | 2,207 | |
| | | | | | | | | | | | |
| |
| |
Total Investments 101.4%
(Cost $134,112) | | | $ | | | 134,507 | |
| |
Other Assets and Liabilities (Net) (1.4%) | | | | | | (1,850 | ) |
| | | | | | | | | | | | |
Net Assets 100.0% | | | $ | | | 132,657 | |
| | | | | | | | | | | | |
Notes to Schedule of Investments (amounts in thousands):
| (a) | Fair Value Measurements (1) |
The following is a summary of the fair valuations according to the inputs used as of June 30, 2012 in valuing the Fund’s assets and liabilities (2):
| | | | | | | | | | | | | | | | | | |
| Category and Subcategory (3) | | | | Level 1 (4) | | | Level 2 (5) | | | Level 3 (6) | | | Fair Value at
06/30/2012 | |
Investments, at value | | | | | | | | | | | | | | | | | | |
U.S. Treasury Obligations | | | | $ | 0 | | | $ | 132,300 | | | $ | 0 | | | $ | 132,300 | |
Short-Term Instruments | | | | | | | | | | | | | | | | | | |
Repurchase Agreements | | | | | 0 | | | | 2,207 | | | | 0 | | | | 2,207 | |
| | | | $ | 0 | | | $ | 134,507 | | | $ | 0 | | | $ | 134,507 | |
| (1) | See note 3 in the Notes to Financial Statements for more information regarding pricing inputs and valuation techniques. |
| (2) | There were no significant transfers into or out of level 1, 2, and 3 during the period ended June 30, 2012. |
| (3) | Refer to the Schedule of Investments for additional information. |
| (4) | Quoted prices in active markets for identical investments. |
| (5) | Significant other observable inputs. |
| (6) | Significant unobservable inputs. |
| | | | | | |
| See Accompanying Notes | | ANNUAL REPORT | | JUNE 30, 2012 | | 43 |
Schedule of Investments PIMCO 3-7 Year U.S. Treasury Index Fund
June 30, 2012
| | | | | | | | | | | | |
| | | | | PRINCIPAL
AMOUNT
(000s) | | | | | MARKET
VALUE
(000s) | |
U.S. TREASURY OBLIGATIONS 94.3% | |
|
U.S. Treasury Bonds | |
7.250% due 05/15/2016 | | $ | | | 1,111 | | | $ | | | 1,394 | |
9.250% due 02/15/2016 | | | | | 710 | | | | | | 931 | |
| | | | |
U.S. Treasury Notes | | | | | | | | | | | | |
1.000% due 08/31/2016 | | | | | 180 | | | | | | 183 | |
1.125% due 05/31/2019 | | | | | 125 | | | | | | 125 | |
1.250% due 01/31/2019 | | | | | 1,018 | | | | | | 1,033 | |
1.250% due 04/30/2019 | | | | | 400 | | | | | | 405 | |
1.375% due 11/30/2018 | | | | | 294 | | | | | | 301 | |
1.375% due 12/31/2018 | | | | | 500 | | | | | | 512 | |
1.500% due 08/31/2018 | | | | | 271 | | | | | | 280 | |
1.500% due 03/31/2019 | | | | | 1,400 | | | | | | 1,440 | |
1.750% due 10/31/2018 | | | | | 759 | | | | | | 795 | |
1.875% due 08/31/2017 | | | | | 635 | | | | | | 670 | |
1.875% due 10/31/2017 | | | | | 1,115 | | | | | | 1,177 | |
| | | | | | | | | | | | |
| | | | | PRINCIPAL
AMOUNT
(000s) | | | | | MARKET
VALUE
(000s) | |
2.250% due 07/31/2018 | | $ | | | 518 | | | $ | | | 558 | |
2.375% due 03/31/2016 | | | | | 1,536 | | | | | | 1,641 | |
2.375% due 05/31/2018 | | | | | 457 | | | | | | 496 | |
2.375% due 06/30/2018 | | | | | 293 | | | | | | 318 | |
2.500% due 06/30/2017 | | | | | 741 | | | | | | 805 | |
2.625% due 04/30/2018 | | | | | 605 | | | | | | 664 | |
2.750% due 12/31/2017 | | | | | 695 | | | | | | 766 | |
2.750% due 02/28/2018 | | | | | 300 | | | | | | 331 | |
3.000% due 02/28/2017 | | | | | 1,048 | | | | | | 1,159 | |
3.125% due 10/31/2016 | | | | | 1,016 | | | | | | 1,124 | |
3.125% due 04/30/2017 | | | | | 1,049 | | | | | | 1,169 | |
3.250% due 07/31/2016 | | | | | 1,046 | | | | | | 1,158 | |
3.250% due 12/31/2016 | | | | | 1,053 | | | | | | 1,173 | |
| | | | | | | | | | | | |
Total U.S. Treasury Obligations (Cost $19,636) | | | | | | | | | | | 20,608 | |
| | | | | | | | | | | | |
| | | | | | | | | | | | |
| | | | | PRINCIPAL
AMOUNT
(000s) | | | | | MARKET
VALUE
(000s) | |
SHORT-TERM INSTRUMENTS 5.7% | |
| |
REPURCHASE AGREEMENTS 5.7% | |
|
State Street Bank and Trust Co. | |
0.010% due 07/02/2012 | | $ | | | 1,240 | | | $ | | | 1,240 | |
| | | | | | | | | | | | |
(Dated 06/29/2012. Collateralized by U.S. Treasury Notes 2.000% due 11/15/2021 valued at $1,267. Repurchase proceeds are $1,240.) | | | | |
| |
Total Short-Term Instruments
(Cost $1,240) | | | 1,240 | |
| | | | | | | | | | | | |
| |
Total Investments 100.0%
(Cost $20,876) | | | $ | | | 21,848 | |
| |
Other Assets and Liabilities (Net) 0.0% | | | 4 | |
| | | | | | | | | | | | |
Net Assets 100.0% | | | $ | | | 21,852 | |
| | | | | | | | | | | | |
Notes to Schedule of Investments (amounts in thousands):
| (a) | Fair Value Measurements (1) |
The following is a summary of the fair valuations according to the inputs used as of June 30, 2012 in valuing the Fund’s assets and liabilities (2):
| | | | | | | | | | | | | | | | | | |
| Category and Subcategory (3) | | | | Level 1 (4) | | | Level 2 (5) | | | Level 3 (6) | | | Fair Value at
06/30/2012 | |
Investments, at value | | | | | | | | | | | | | | | | | | |
U.S. Treasury Obligations | | | | $ | 0 | | | $ | 20,608 | | | $ | 0 | | | $ | 20,608 | |
Short-Term Instruments | | | | | | | | | | | | | | | | | | |
Repurchase Agreements | | | | | 0 | | | | 1,240 | | | | 0 | | | | 1,240 | |
| | | | $ | 0 | | | $ | 21,848 | | | $ | 0 | | | $ | 21,848 | |
| (1) | See note 3 in the Notes to Financial Statements for more information regarding pricing inputs and valuation techniques. |
| (2) | There were no significant transfers into or out of level 1, 2, and 3 during the period ended June 30, 2012. |
| (3) | Refer to the Schedule of Investments for additional information. |
| (4) | Quoted prices in active markets for identical investments. |
| (5) | Significant other observable inputs. |
| (6) | Significant unobservable inputs. |
| | | | | | |
| 44 | | PIMCO ETF TRUST | | | | See Accompanying Notes |
Schedule of Investments PIMCO 7-15 Year U.S. Treasury Index Fund
June 30, 2012
| | | | | | | | | | | | |
| | | | | PRINCIPAL
AMOUNT
(000s) | | | | | MARKET
VALUE
(000s) | |
U.S. TREASURY OBLIGATIONS 99.0% | |
| | | | |
U.S. Treasury Bonds | | | | | | | | | | | | |
6.000% due 02/15/2026 | | $ | | | 1,510 | | | $ | | | 2,216 | |
6.250% due 08/15/2023 | | | | | 1,663 | | | | | | 2,418 | |
6.500% due 11/15/2026 | | | | | 1,111 | | | | | | 1,714 | |
7.625% due 11/15/2022 | | | | | 2,293 | | | | | | 3,606 | |
7.625% due 02/15/2025 | | | | | 928 | | | | | | 1,521 | |
7.875% due 02/15/2021 | | | | | 902 | | | | | | 1,381 | |
8.125% due 08/15/2021 | | | | | 2,765 | | | | | | 4,346 | |
8.750% due 05/15/2020 | | | | | 2,290 | | | | | | 3,585 | |
| | | | |
U.S. Treasury Notes | | | | | | | | | | | | |
1.750% due 05/15/2022 | | | | | 640 | | | | | | 646 | |
2.000% due 02/15/2022 | | | | | 2,180 | | | | | | 2,255 | |
2.625% due 08/15/2020 | | | | | 3,982 | | | | | | 4,386 | |
3.125% due 05/15/2019 | | | | | 689 | | | | | | 784 | |
3.375% due 11/15/2019 | | | | | 3,316 | | | | | | 3,839 | |
3.625% due 02/15/2020 | | | | | 3,720 | | | | | | 4,379 | |
| | | | | | | | | | | | |
Total U.S. Treasury Obligations
(Cost $35,674) | | | | | | | | | | | 37,076 | |
| | | | | | | | | | | | |
| |
| | | | | | | | | | | | |
Total Investments 99.0%
(Cost $35,674) | | | | | | | | $ | | | 37,076 | |
| |
Other Assets and Liabilities (Net) 1.0% | | | | | | 370 | |
| | | | | | | | | | | | |
Net Assets 100.0% | | | | | | | | $ | | | 37,446 | |
| | | | | | | | | | | | |
Notes to Schedule of Investments (amounts in thousands):
| (a) | Fair Value Measurements (1) |
The following is a summary of the fair valuations according to the inputs used as of June 30, 2012 in valuing the Fund’s assets and liabilities (2):
| | | | | | | | | | | | | | | | | | |
| Category and Subcategory (3) | | | | Level 1 (4) | | | Level 2 (5) | | | Level 3 (6) | | | Fair Value at
06/30/2012 | |
Investments, at value | | | | | | | | | | | | | | | | | | |
U.S Treasury Obligations | | | | $ | 0 | | | $ | 37,076 | | | $ | 0 | | | $ | 37,076 | |
| (1) | See note 3 in the Notes to Financial Statements for more information regarding pricing inputs and valuation techniques. |
| (2) | There were no significant transfers into or out of level 1, 2, and 3 during the period ended June 30, 2012. |
| (3) | Refer to the Schedule of Investments for additional information. |
| (4) | Quoted prices in active markets for identical investments. |
| (5) | Significant other observable inputs. |
| (6) | Significant unobservable inputs. |
| | | | | | |
| See Accompanying Notes | | ANNUAL REPORT | | JUNE 30, 2012 | | 45 |
Schedule of Investments PIMCO 25+ Year Zero Coupon U.S. Treasury Index Fund
June 30, 2012
| | | | | | | | | | | | |
| | | | | PRINCIPAL
AMOUNT
(000s) | | | | | MARKET
VALUE
(000s) | |
U.S. TREASURY OBLIGATIONS 99.9% | |
|
U.S. Treasury Strips | |
0.000% due 02/15/2038 | | $ | | | 23,375 | | | $ | | | 11,410 | |
0.000% due 05/15/2038 | | | | | 23,375 | | | | | | 11,326 | |
0.000% due 02/15/2039 | | | | | 23,375 | | | | | | 10,995 | |
0.000% due 05/15/2039 | | | | | 23,375 | | | | | | 10,913 | |
0.000% due 08/15/2039 | | | | | 23,375 | | | | | | 10,832 | |
0.000% due 11/15/2039 | | | | | 23,375 | | | | | | 10,706 | |
0.000% due 02/15/2040 | | | | | 23,375 | | | | | | 10,621 | |
0.000% due 05/15/2040 | | | | | 27,235 | | | | | | 12,237 | |
0.000% due 08/15/2040 | | | | | 23,375 | | | | | | 10,391 | |
0.000% due 11/15/2040 | | | | | 23,375 | | | | | | 10,304 | |
0.000% due 02/15/2041 | | | | | 23,375 | | | | | | 10,228 | |
0.000% due 05/15/2041 | | | | | 23,375 | | | | | | 10,123 | |
0.000% due 08/15/2041 | | | | | 23,375 | | | | | | 10,021 | |
0.000% due 11/15/2041 | | | | | 23,375 | | | | | | 9,948 | |
0.000% due 02/15/2042 | | | | | 23,375 | | | | | | 9,876 | |
0.000% due 05/15/2042 | | | | | 23,375 | | | | | | 9,804 | |
| | | | | | | | | | | | |
Total U.S. Treasury Obligations
(Cost $146,862) | | | 169,735 | |
| | | | | | | | | | | | |
| |
Total Investments 99.9%
(Cost $146,862) | | | | | $ | 169,735 | |
| |
Other Assets and Liabilities (Net) 0.1% | | | 180 | |
| | | | | | | | | | | | |
Net Assets 100.0% | | | | | $ | 169,915 | |
| | | | | | | | | | | | |
Notes to Schedule of Investments (amounts in thousands):
| (a) | Fair Value Measurements (1) |
The following is a summary of the fair valuations according to the inputs used as of June 30, 2012 in valuing the Fund’s assets and liabilities (2):
| | | | | | | | | | | | | | | | | | |
| Category and Subcategory (3) | | | | Level 1 (4) | | | Level 2 (5) | | | Level 3 (6) | | | Fair Value at
06/30/2012 | |
Investments, at value | | | | | | | | | | | | | | | | | | |
U.S. Treasury Obligations | | | | $ | 0 | | | $ | 169,735 | | | $ | 0 | | | $ | 169,735 | |
| (1) | See note 3 in the Notes to Financial Statements for more information regarding pricing inputs and valuation techniques. |
| (2) | There were no significant transfers into or out of level 1, 2, and 3 during the period ended June 30, 2012. |
| (3) | Refer to the Schedule of Investments for additional information. |
| (4) | Quoted prices in active markets for identical investments. |
| (5) | Significant other observable inputs. |
| (6) | Significant unobservable inputs. |
| | | | | | |
| 46 | | PIMCO ETF TRUST | | | | See Accompanying Notes |
Schedule of Investments PIMCO Broad U.S. Treasury Index Fund
June 30, 2012
| | | | | | | | | | | | |
| | | | | PRINCIPAL
AMOUNT
(000s) | | | | | MARKET
VALUE
(000s) | |
U.S. TREASURY OBLIGATIONS 96.9% | |
|
U.S. Treasury Bonds | |
3.000% due 05/15/2042 | | $ | | | 75 | | | $ | | | 79 | |
3.125% due 11/15/2041 | | | | | 1,049 | | | | | | 1,130 | |
3.125% due 02/15/2042 | | | | | 1,049 | | | | | | 1,129 | |
3.750% due 08/15/2041 | | | | | 1,049 | | | | | | 1,267 | |
|
U.S. Treasury Notes | |
0.250% due 02/28/2014 | | | | | 1,049 | | | | | | 1,048 | |
0.250% due 12/15/2014 | | | | | 1,049 | | | | | | 1,046 | |
0.250% due 01/15/2015 | | | | | 1,049 | | | | | | 1,046 | |
0.250% due 02/15/2015 | | | | | 1,049 | | | | | | 1,046 | |
0.375% due 04/15/2015 | | | | | 1,200 | | | | | | 1,199 | |
0.875% due 01/31/2017 | | | | | 1,049 | | | | | | 1,059 | |
0.875% due 02/28/2017 | | | | | 1,049 | | | | | | 1,059 | |
0.875% due 04/30/2017 | | | | | 1,200 | | | | | | 1,210 | |
1.250% due 01/31/2019 | | | | | 1,049 | | | | | | 1,064 | |
1.375% due 02/28/2019 | | | | | 1,000 | | | | | | 1,022 | |
1.500% due 03/31/2019 | | | | | 1,200 | | | | | | 1,235 | |
2.000% due 11/15/2021 | | | | | 1,049 | | | | | | 1,089 | |
2.000% due 02/15/2022 | | | | | 1,049 | | | | | | 1,085 | |
2.125% due 08/15/2021 | | | | | 1,049 | | | | | | 1,104 | |
| | | | | | | | | | | | |
Total U.S. Treasury Obligations
(Cost $18,387) | | | 18,917 | |
| | | | | | | | | | | | |
| | | | | | | | | | | | |
| | | | | PRINCIPAL
AMOUNT
(000s) | | | | | MARKET
VALUE
(000s) | |
SHORT-TERM INSTRUMENTS 2.8% | |
| | | | | | | | | | | | |
REPURCHASE AGREEMENTS 2.8% | |
|
State Street Bank and Trust Co. | |
0.010% due 07/02/2012 | | $ | | | 548 | | | $ | | | 548 | |
| | | | | | | | | | | | |
(Dated 06/29/2012. Collateralized by U.S. Treasury Notes 2.000% due 11/15/2021 valued at $561. Repurchase proceeds are $548.) | | | | |
| |
Total Short-Term Instruments
(Cost $548) | | | 548 | |
| | | | | | | | | | | | |
| | | | | | | | | | | | |
Total Investments 99.7%
(Cost $18,935) | | | $ | | | 19,465 | �� |
| |
Other Assets and Liabilities (Net) 0.3% | | | 55 | |
| | | | | | | | | | | | |
Net Assets 100.0% | | | $ | | | 19,520 | |
| | | | | | | | | | | | |
Notes to Schedule of Investments (amounts in thousands):
| (a) | Fair Value Measurements (1) |
The following is a summary of the fair valuations according to the inputs used as of June 30, 2012 in valuing the Fund’s assets and liabilities (2):
| | | | | | | | | | | | | | | | | | |
| Category and Subcategory (3) | | | | Level 1 (4) | | | Level 2 (5) | | | Level 3 (6) | | | Fair Value at
06/30/2012 | |
Investments, at value | | | | | | | | | | | | | | | | | | |
U.S. Treasury Obligations | | | | $ | 0 | | | $ | 18,917 | | | $ | 0 | | | $ | 18,917 | |
Short-Term Instruments | | | | | | | | | | | | | | | | | | |
Repurchase Agreements | | | | | 0 | | | | 548 | | | | 0 | | | | 548 | |
| | | | $ | 0 | | | $ | 19,465 | | | $ | 0 | | | $ | 19,465 | |
| (1) | See note 3 in the Notes to Financial Statements for more information regarding pricing inputs and valuation techniques. |
| (2) | There were no significant transfers into or out of level 1, 2, and 3 during the period ended June 30, 2012. |
| (3) | Refer to the Schedule of Investments for additional information. |
| (4) | Quoted prices in active markets for identical investments. |
| (5) | Significant other observable inputs. |
| (6) | Significant unobservable inputs. |
| | | | | | |
| See Accompanying Notes | | ANNUAL REPORT | | JUNE 30, 2012 | | 47 |
Schedule of Investments PIMCO 1-5 Year U.S. TIPS Index Fund
June 30, 2012
| | | | | | | | | | | | | | |
| | | | | PRINCIPAL
AMOUNT
(000s) | | | | | | MARKET
VALUE
(000s) | |
U.S. TREASURY OBLIGATIONS 99.3% | |
|
U.S. Treasury Inflation Protected Securities (a) | |
0.125% due 04/15/2016 | | $ | | | 136,128 | | | $ | | | | | 141,849 | |
0.125% due 04/15/2017 | | | | | 50,741 | | | | | | | | 53,626 | |
0.500% due 04/15/2015 | | | | | 76,734 | | | | | | | | 79,749 | |
1.250% due 04/15/2014 | | | | | 56,499 | | | | | | | | 58,375 | |
1.625% due 01/15/2015 | | | | | 77,931 | | | | | | | | 82,887 | |
1.875% due 07/15/2013 | | | | | 83,131 | | | | | | | | 85,203 | |
1.875% due 07/15/2015 | | | | | 68,452 | | | | | | | | 74,522 | |
2.000% due 01/15/2014 | | | | | 89,021 | | | | | | | | 92,498 | |
2.000% due 07/15/2014 | | | | | 78,948 | | | | | | | | 83,722 | |
2.000% due 01/15/2016 | | | | | 67,087 | | | | | | | | 74,304 | |
2.375% due 01/15/2017 | | | | | 66,993 | | | | | | | | 77,398 | |
2.500% due 07/15/2016 | | | | | 77,568 | | | | | | | | 88,894 | |
| | | | | | | | | | | | | | |
Total U.S. Treasury Obligations
(Cost $985,812) | | | | 993,027 | |
| | | | | | | | | | | | | | |
| | | | | | | | | | | | | | |
| | | | | PRINCIPAL
AMOUNT
(000s) | | | | | | MARKET
VALUE
(000s) | |
SHORT-TERM INSTRUMENTS 0.1% | |
| |
REPURCHASE AGREEMENTS 0.1% | |
|
State Street Bank and Trust Co. | |
0.010% due 07/02/2012 | | $ | | | 561 | | | $ | | | | | 561 | |
| | | | | | | | | | | | | | |
(Dated 06/29/2012. Collateralized by U.S. Treasury Notes 2.000% due 11/15/2021 valued at $576. Repurchase proceeds are $561.) | | | | | |
| |
Total Short-Term Instruments
(Cost $561) | | | | 561 | |
| | | | | | | | | | | | | | |
| | | | | | | | | | | | | | |
Total Investments 99.4%
(Cost $986,373) | | | $ | | | | | 993,588 | |
| |
Other Assets and Liabilities (Net) 0.6% | | | | | | | | 5,908 | |
| | | | | | | | | | | | | | |
Net Assets 100.0% | | | $ | | | | | 999,496 | |
| | | | | | | | | | | | | | |
Notes to Schedule of Investments (amounts in thousands):
| (a) | Principal amount of security is adjusted for inflation. |
| (b) | Fair Value Measurements (1) |
The following is a summary of the fair valuations according to the inputs used as of June 30, 2012 in valuing the Fund’s assets and liabilities (2):
| | | | | | | | | | | | | | | | | | |
| Category and Subcategory (3) | | | | Level 1 (4) | | | Level 2 (5) | | | Level 3 (6) | | | Fair Value at
06/30/2012 | |
Investments, at value | | | | | | | | | | | | | | | | | | |
U.S. Treasury Obligations | | | | $ | 0 | | | $ | 993,027 | | | $ | 0 | | | $ | 993,027 | |
Short-Term Instruments | | | | | | | | | | | | | | | | | | |
Repurchase Agreements | | | | | 0 | | | | 561 | | | | 0 | | | | 561 | |
| | | | $ | 0 | | | $ | 993,588 | | | $ | 0 | | | $ | 993,588 | |
| (1) | See note 3 in the Notes to Financial Statements for more information regarding pricing inputs and valuation techniques. |
| (2) | There were no significant transfers into or out of level 1, 2, and 3 during the period ended June 30, 2012. |
| (3) | Refer to the Schedule of Investments for additional information. |
| (4) | Quoted prices in active markets for identical investments. |
| (5) | Significant other observable inputs. |
| (6) | Significant unobservable inputs. |
| (c) | Fair Value of Financial Derivative Instruments (1) |
The following is a summary of the fair valuation of the Fund’s derivative instruments categorized by risk exposure:
The Effect of Financial Derivative Instruments on the Statements of Operations for the Period Ended June 30, 2012:
| | | | | | | | | | | | | | | | | | | | | | | | | | |
| | | | | Derivatives not accounted for as hedging instruments | |
| | | | | Commodity
Contracts | | | Credit
Contracts | | | Equity
Contracts | | | Foreign
Exchange
Contracts | | | Interest
Rate Contracts | | | Total | |
Realized (Loss) on Derivatives Recognized as a Result from Operations: | | | | | | | | | | | | | | | | | | | | | | | | | | |
Net realized (loss) on futures contracts | | | | $ | 0 | | | $ | 0 | | | $ | 0 | | | $ | 0 | | | $ | (4 | ) | | $ | (4 | ) |
| (1) | See note 6 in the Notes to Financial Statements for additional information. |
| | | | | | |
| 48 | | PIMCO ETF TRUST | | | | See Accompanying Notes |
Schedule of Investments PIMCO 15+ Year U.S. TIPS Index Fund
June 30, 2012
| | | | | | | | | | | | |
| | | | | PRINCIPAL
AMOUNT
(000s) | | | | | MARKET
VALUE
(000s) | |
U.S. TREASURY OBLIGATIONS 99.8% | |
|
U.S. Treasury Inflation Protected Securities (a) | |
0.750% due 02/15/2042 | | $ | | | 24,374 | | | $ | | | 25,718 | |
1.750% due 01/15/2028 | | | | | 25,773 | | | | | | 32,384 | |
2.125% due 02/15/2040 | | | | | 29,705 | | | | | | 42,330 | |
2.125% due 02/15/2041 | | | | | 46,347 | | | | | | 66,417 | |
2.500% due 01/15/2029 | | | | | 27,892 | | | | | | 38,809 | |
3.375% due 04/15/2032 | | | | | 12,019 | | | | | | 19,430 | |
3.625% due 04/15/2028 | | | | | 43,910 | | | | | | 67,889 | |
3.875% due 04/15/2029 | | | | | 50,190 | | | | | | 81,339 | |
| | | | | | | | | | | | |
Total U.S. Treasury Obligations
(Cost $333,211) | | | 374,316 | |
| | | | | | | | | | | | |
| | | | | | | | | | | | |
Total Investments 99.8%
(Cost $333,211) | | | $ | | | 374,316 | |
| |
Other Assets and Liabilities (Net) 0.2% | | | 866 | |
| | | | | | | | | | | | |
Net Assets 100.0% | | | $ | | | 375,182 | |
| | | | | | | | | | | | |
Notes to Schedule of Investments (amounts in thousands):
| (a) | Principal amount of security is adjusted for inflation. |
| (b) | Fair Value Measurements (1) |
The following is a summary of the fair valuations according to the inputs used as of June 30, 2012 in valuing the Fund’s assets and liabilities (2):
| | | | | | | | | | | | | | | | | | |
| Category and Subcategory (3) | | | | Level 1 (4) | | | Level 2 (5) | | | Level 3 (6) | | | Fair Value at
06/30/2012 | |
Investments, at value | | | | | | | | | | | | | | | | | | |
U.S. Treasury Obligations | | | | $ | 0 | | | $ | 374,316 | | | $ | 0 | | | $ | 374,316 | |
| (1) | See note 3 in the Notes to Financial Statements for more information regarding pricing inputs and valuation techniques. |
| (2) | There were no significant transfers into or out of level 1, 2, and 3 during the period ended June 30, 2012. |
| (3) | Refer to the Schedule of Investments for additional information. |
| (4) | Quoted prices in active markets for identical investments. |
| (5) | Significant other observable inputs. |
| (6) | Significant unobservable inputs. |
| | | | | | |
| See Accompanying Notes | | ANNUAL REPORT | | JUNE 30, 2012 | | 49 |
Schedule of Investments PIMCO Broad U.S. TIPS Index Fund
June 30, 2012
| | | | | | | | | | | | |
| | | | | PRINCIPAL
AMOUNT
(000s) | | | | | MARKET
VALUE
(000s) | |
U.S. TREASURY OBLIGATIONS 99.1% | |
|
U.S. Treasury Inflation Protected Securities (a) | |
0.125% due 01/15/2022 | | $ | | | 716 | | | $ | | | 759 | |
0.500% due 04/15/2015 | | | | | 2,270 | | | | | | 2,359 | |
0.625% due 04/15/2013 | | | | | 1,046 | | | | | | 1,049 | |
0.625% due 07/15/2021 | | | | | 3,471 | | | | | | 3,873 | |
0.750% due 02/15/2042 | | | | | 1,215 | | | | | | 1,282 | |
1.125% due 01/15/2021 | | | | | 6,042 | | | | | | 6,968 | |
1.250% due 04/15/2014 | | | | | 2,446 | | | | | | 2,527 | |
1.375% due 01/15/2020 | | | | | 7,126 | | | | | | 8,301 | |
1.625% due 01/15/2015 | | | | | 11,863 | | | | | | 12,617 | |
1.625% due 01/15/2018 | | | | | 8,162 | | | | | | 9,329 | |
1.750% due 01/15/2028 | | | | | 5,829 | | | | | | 7,324 | |
1.875% due 07/15/2019 | | | | | 2,482 | | | | | | 2,974 | |
2.000% due 01/15/2014 | | | | | 5,831 | | | | | | 6,059 | |
2.000% due 01/15/2026 | | | | | 5,174 | | | | | | 6,619 | |
2.125% due 02/15/2040 | | | | | 1,731 | | | | | | 2,467 | |
2.125% due 02/15/2041 | | | | | 3,307 | | | | | | 4,740 | |
2.375% due 01/15/2025 | | | | | 5,853 | | | | | | 7,728 | |
2.500% due 07/15/2016 | | | | | 9,135 | | | | | | 10,469 | |
2.500% due 01/15/2029 | | | | | 6,783 | | | | | | 9,437 | |
3.375% due 04/15/2032 | | | | | 1,138 | | | | | | 1,840 | |
| | | | | | | | | | | | |
Total U.S. Treasury Obligations
(Cost $99,914) | | | 108,721 | |
| | | | | | | | | | | | |
| | | | | | | | | | | | |
Total Investments 99.1%
(Cost $99,914) | | | $ | | | 108,721 | |
| |
Other Assets and Liabilities (Net) 0.9% | | | 957 | |
| | | | | | | | | | | | |
Net Assets 100.0% | | | $ | | | 109,678 | |
| | | | | | | | | | | | |
Notes to Schedule of Investments (amounts in thousands):
| (a) | Principal amount of security is adjusted for inflation. |
| (b) | Fair Value Measurements (1) |
The following is a summary of the fair valuations according to the inputs used as of June 30, 2012 in valuing the Fund’s assets and liabilities (2):
| | | | | | | | | | | | | | | | | | |
| Category and Subcategory (3) | | | | Level 1 (4) | | | Level 2 (5) | | | Level 3 (6) | | | Fair Value at
06/30/2012 | |
Investments, at value | | | | | | | | | | | | | | | | | | |
U.S. Treasury Obligations | | | | $ | 0 | | | $ | 108,721 | | | $ | 0 | | | $ | 108,721 | |
| (1) | See note 3 in the Notes to Financial Statements for more information regarding pricing inputs and valuation techniques. |
| (2) | There were no significant transfers into or out of level 1, 2, and 3 during the period ended June 30, 2012. |
| (3) | Refer to the Schedule of Investments for additional information. |
| (4) | Quoted prices in active markets for identical investments. |
| (5) | Significant other observable inputs. |
| (6) | Significant unobservable inputs. |
| | | | | | |
| 50 | | PIMCO ETF TRUST | | | | See Accompanying Notes |
Schedule of Investments PIMCO 0-5 Year High Yield Corporate Bond Index Fund
June 30, 2012
| | | | | | | | | | | | |
| | | | | PRINCIPAL
AMOUNT
(000s) | | | | | MARKET
VALUE
(000s) | |
CORPORATE BONDS & NOTES 92.6% | |
| |
BANKING & FINANCE 17.7% | | | | | | | | | | | | |
|
Ally Financial, Inc. | |
4.500% due 02/11/2014 | | $ | | | 7,775 | | | $ | | | 7,901 | |
4.625% due 06/26/2015 | | | | | 750 | | | | | | 755 | |
|
BAC Capital Trust | |
4.000% due 07/16/2012 (c) | | | | | 2,100 | | | | | | 1,504 | |
|
CIT Group, Inc. | |
4.750% due 02/15/2015 | | | | | 2,850 | | | | | | 2,928 | |
5.000% due 05/15/2017 | | | | | 1,500 | | | | | | 1,546 | |
5.250% due 04/01/2014 | | | | | 2,950 | | | | | | 3,068 | |
|
E*TRADE Financial Corp. | |
6.750% due 06/01/2016 | | | | | 1,500 | | | | | | 1,534 | |
|
Eksportfinans ASA | |
0.661% due 04/05/2013 | | | | | 650 | | | | | | 632 | |
1.875% due 04/02/2013 | | | | | 1,350 | | | | | | 1,323 | |
2.000% due 09/15/2015 | | | | | 2,475 | | | | | | 2,217 | |
2.375% due 05/25/2016 | | | | | 1,100 | | | | | | 979 | |
3.000% due 11/17/2014 | | | | | 800 | | | | | | 758 | |
5.500% due 05/25/2016 | | | | | 650 | | | | | | 640 | |
5.500% due 06/26/2017 | | | | | 725 | | | | | | 705 | |
|
HBOS Capital Funding LP | |
6.071% due 06/30/2014 (c) | | | | | 3,500 | | | | | | 2,310 | |
|
Icahn Enterprises LP | |
7.750% due 01/15/2016 | | | | | 1,100 | | | | | | 1,162 | |
|
Ineos Finance PLC | |
9.000% due 05/15/2015 | | | | | 750 | | | | | | 795 | |
|
International Lease Finance Corp. | |
6.500% due 09/01/2014 | | | | | 1,900 | | | | | | 2,014 | |
6.750% due 09/01/2016 | | | | | 2,250 | | | | | | 2,430 | |
8.625% due 09/15/2015 | | | | | 2,975 | | | | | | 3,299 | |
|
iStar Financial, Inc. | |
5.950% due 10/15/2013 | | | | | 1,325 | | | | | | 1,294 | |
9.000% due 06/01/2017 | | | | | 250 | | | | | | 246 | |
|
Leucadia National Corp. | |
7.000% due 08/15/2013 | | | | | 500 | | | | | | 523 | |
|
Nuveen Investments, Inc. | |
10.500% due 11/15/2015 | | | | | 1,500 | | | | | | 1,530 | |
|
RBS Capital Trust | |
5.512% due 09/30/2014 (c) | | | | | 2,925 | | | | | | 1,755 | |
|
Regions Financial Corp. | |
7.750% due 11/10/2014 | | | | | 2,375 | | | | | | 2,571 | |
|
Resona Preferred Global Securities Cayman Ltd. | |
7.191% due 07/30/2015 (c) | | | | | 2,825 | | | | | | 2,910 | |
|
Rouse Co. LLC | |
6.750% due 11/09/2015 | | | | | 1,750 | | | | | | 1,838 | |
|
Royal Bank of Scotland Group PLC | |
5.000% due 10/01/2014 | | | | | 750 | | | | | | 753 | |
5.050% due 01/08/2015 | | | | | 1,000 | | | | | | 999 | |
|
Springleaf Finance Corp. | |
5.375% due 10/01/2012 | | | | | 1,700 | | | | | | 1,689 | |
5.400% due 12/01/2015 | | | | | 1,900 | | | | | | 1,591 | |
|
Susser Holdings LLC | |
8.500% due 05/15/2016 | | | | | 1,050 | | | | | | 1,147 | |
| | | | | | | | | | | | |
| | | | | | | | | | | 57,346 | |
| | | | | | | | | | | | |
| |
INDUSTRIALS 64.2% | |
|
Air Canada | |
9.250% due 08/01/2015 | | | | | 1,750 | | | | | | 1,719 | |
|
Alere, Inc. | |
9.000% due 05/15/2016 | | | | | 2,000 | | | | | | 2,045 | |
|
Alliance One International, Inc. | |
10.000% due 07/15/2016 | | | | | 650 | | | | | | 655 | |
| | | | | | | | | | | | |
| | | | | PRINCIPAL
AMOUNT
(000s) | | | | | MARKET
VALUE
(000s) | |
|
Alliant Techsystems, Inc. | |
6.750% due 04/01/2016 | | $ | | | 750 | | | $ | | | 773 | |
| | | | |
American Airlines, Inc. | | | | | | | | | | | | |
10.500% due 10/15/2012 ^ | | | | | 125 | | | | | | 134 | |
|
American Axle & Manufacturing, Inc. | |
7.875% due 03/01/2017 | | | | | 1,000 | | | | | | 1,035 | |
|
Apria Healthcare Group, Inc. | |
11.250% due 11/01/2014 | | | | | 1,900 | | | | | | 1,976 | |
|
ARAMARK Corp. | |
8.500% due 02/01/2015 | | | | | 800 | | | | | | 820 | |
|
ARAMARK Holdings Corp. | |
8.625% due 05/01/2016 (b) | | | | | 1,850 | | | | | | 1,899 | |
|
Arch Coal, Inc. | |
8.750% due 08/01/2016 | | | | | 2,225 | | | | | | 2,136 | |
|
ATP Oil & Gas Corp. | |
11.875% due 05/01/2015 | | | | | 1,550 | | | | | | 729 | |
|
Avaya, Inc. | |
9.750% due 11/01/2015 | | | | | 850 | | | | | | 708 | |
10.125% due 11/01/2015 | | | | | 1,250 | | | | | | 1,044 | |
|
Avis Budget Car Rental LLC | |
7.750% due 05/15/2016 | | | | | 250 | | | | | | 258 | |
|
Bausch & Lomb, Inc. | |
9.875% due 11/01/2015 | | | | | 1,575 | | | | | | 1,654 | |
|
Beazer Homes USA, Inc. | |
8.125% due 06/15/2016 | | | | | 300 | | | | | | 289 | |
|
Berry Plastics Corp. | |
8.250% due 11/15/2015 | | | | | 350 | | | | | | 374 | |
10.250% due 03/01/2016 | | | | | 1,450 | | | | | | 1,501 | |
|
Caesars Entertainment Operating Co., Inc. | |
10.750% due 02/01/2016 | | | | | 1,575 | | | | | | 1,252 | |
|
Case New Holland, Inc. | |
7.750% due 09/01/2013 | | | | | 2,700 | | | | | | 2,882 | |
|
Catalent Pharma Solutions, Inc. | |
9.500% due 04/15/2015 | | | | | 1,263 | | | | | | 1,299 | |
|
CCH LLC | |
13.500% due 11/30/2016 | | | | | 1,260 | | | | | | 1,408 | |
|
Cengage Learning Acquisitions, Inc. | |
10.500% due 01/15/2015 | | | | | 1,400 | | | | | | 1,071 | |
|
Centex Corp. | |
6.500% due 05/01/2016 | | | | | 275 | | | | | | 298 | |
|
Ceridian Corp. | |
11.250% due 11/15/2015 | | | | | 1,100 | | | | | | 1,061 | |
|
Chesapeake Energy Corp. | |
9.500% due 02/15/2015 | | | | | 1,075 | | | | | | 1,164 | |
|
CityCenter Holdings LLC | |
7.625% due 01/15/2016 | | | | | 2,025 | | | | | | 2,146 | |
|
Clear Channel Communications, Inc. | |
5.500% due 09/15/2014 | | | | | 2,025 | | | | | | 1,741 | |
|
Clearwater Paper Corp. | |
10.625% due 06/15/2016 | | | | | 1,025 | | | | | | 1,143 | |
|
Clearwire Communications LLC | |
12.000% due 12/01/2015 | | | | | 2,975 | | | | | | 2,722 | |
|
Community Health Systems, Inc. | |
8.875% due 07/15/2015 | | | | | 611 | | | | | | 628 | |
|
CONSOL Energy, Inc. | |
8.000% due 04/01/2017 | | | | | 1,400 | | | | | | 1,459 | |
|
Constellation Brands, Inc. | |
7.250% due 09/01/2016 | | | | | 900 | | | | | | 1,024 | |
8.375% due 12/15/2014 | | | | | 1,600 | | | | | | 1,824 | |
|
Continental Airlines, Inc. | |
6.750% due 09/15/2015 | | | | | 750 | | | | | | 774 | |
| | | | | | | | | | | | |
| | | | | PRINCIPAL
AMOUNT
(000s) | | | | | MARKET
VALUE
(000s) | |
|
Crown Castle International Corp. | |
9.000% due 01/15/2015 | | $ | | | 1,950 | | | $ | | | 2,138 | |
|
CSC Holdings LLC | |
8.500% due 04/15/2014 | | | | | 1,125 | | | | | | 1,240 | |
8.500% due 06/15/2015 | | | | | 250 | | | | | | 262 | |
|
D.R. Horton, Inc. | |
4.750% due 05/15/2017 | | | | | 1,250 | | | | | | 1,291 | |
|
Dean Foods Co. | |
7.000% due 06/01/2016 | | | | | 1,425 | | | | | | 1,521 | |
|
Delta Air Lines, Inc. | |
9.500% due 09/15/2014 | | | | | 1,790 | | | | | | 1,900 | |
|
DISH DBS Corp. | |
6.625% due 10/01/2014 | | | | | 400 | | | | | | 431 | |
7.125% due 02/01/2016 | | | | | 3,825 | | | | | | 4,217 | |
7.750% due 05/31/2015 | | | | | 100 | | | | | | 112 | |
|
DJO Finance LLC | |
10.875% due 11/15/2014 | | | | | 1,925 | | | | | | 1,997 | |
|
Dole Food Co., Inc. | |
13.875% due 03/15/2014 | | | | | 800 | | | | | | 909 | |
|
Dollar General Corp. | |
4.125% due 07/15/2017 (a) | | | | | 300 | | | | | | 306 | |
|
Easton-Bell Sports, Inc. | |
9.750% due 12/01/2016 | | | | | 1,005 | | | | | | 1,104 | |
|
El Paso LLC | |
7.000% due 06/15/2017 | | | | | 1,750 | | | | | | 1,995 | |
|
Enterprise Products Operating LLC | |
8.375% due 08/01/2066 | | | | | 1,250 | | | | | | 1,356 | |
|
Equinox Holdings, Inc. | |
9.500% due 02/01/2016 | | | | | 1,100 | | | | | | 1,171 | |
|
Essar Steel Algoma, Inc. | |
9.875% due 06/15/2015 | | | | | 925 | | | | | | 789 | |
|
First Data Corp. | |
10.550% due 09/24/2015 | | | | | 1,537 | | | | | | 1,579 | |
11.250% due 03/31/2016 | | | | | 2,150 | | | | | | 2,037 | |
|
FMG Resources Pty. Ltd. | |
6.000% due 04/01/2017 | | | | | 2,700 | | | | | | 2,720 | |
6.375% due 02/01/2016 | | | | | 2,525 | | | | | | 2,569 | |
7.000% due 11/01/2015 | | | | | 325 | | | | | | 333 | |
|
Forest Oil Corp. | |
8.500% due 02/15/2014 | | | | | 1,825 | | | | | | 1,907 | |
|
Fresenius U.S. Finance, Inc. | |
9.000% due 07/15/2015 | | | | | 2,275 | | | | | | 2,625 | |
|
Gray Television, Inc. | |
10.500% due 06/29/2015 | | | | | 250 | | | | | | 261 | |
|
Hanson Ltd. | |
6.125% due 08/15/2016 | | | | | 3,200 | | | | | | 3,424 | |
|
Harbinger Group, Inc. | |
10.625% due 11/15/2015 | | | | | 1,150 | | | | | | 1,205 | |
|
HCA, Inc. | |
6.500% due 02/15/2016 | | | | | 5,375 | | | | | | 5,818 | |
6.750% due 07/15/2013 | | | | | 225 | | | | | | 236 | |
|
Huntsman International LLC | |
5.500% due 06/30/2016 | | | | | 800 | | | | | | 802 | |
|
iGate Corp. | |
9.000% due 05/01/2016 | | | | | 600 | | | | | | 645 | |
|
INEOS Group Holdings S.A. | |
8.500% due 02/15/2016 | | | | | 1,950 | | | | | | 1,799 | |
|
Intelsat Luxembourg S.A. | |
11.250% due 02/04/2017 | | | | | 3,000 | | | | | | 3,101 | |
11.500% due 02/04/2017 (b) | | | | | 2,350 | | | | | | 2,435 | |
|
JC Penney Corp., Inc. | |
9.000% due 08/01/2012 | | | | | 600 | | | | | | 605 | |
| | | | | | |
| See Accompanying Notes | | ANNUAL REPORT | | JUNE 30, 2012 | | 51 |
Schedule of Investments PIMCO 0-5 Year High Yield Corporate Bond Index Fund (Cont.)
| | | | | | | | | | | | |
| | | | | PRINCIPAL
AMOUNT
(000s) | | | | | MARKET
VALUE
(000s) | |
|
K Hovnanian Enterprises, Inc. | |
10.625% due 10/15/2016 | | $ | | | 750 | | | $ | | | 718 | |
|
KB Home | |
5.875% due 01/15/2015 | | | | | 375 | | | | | | 373 | |
6.250% due 06/15/2015 | | | | | 735 | | | | | | 731 | |
|
Lafarge S.A. | |
6.200% due 07/09/2015 | | | | | 1,500 | | | | | | 1,606 | |
6.500% due 07/15/2016 | | | | | 1,600 | | | | | | 1,736 | |
|
Lennar Corp. | |
5.600% due 05/31/2015 | | | | | 750 | | | | | | 791 | |
|
Level 3 Financing, Inc. | |
8.125% due 07/01/2019 | | | | | 250 | | | | | | 258 | |
|
Limited Brands, Inc. | |
8.500% due 06/15/2019 | | | | | 255 | | | | | | 301 | |
|
Longview Fibre Paper & Packaging, Inc. | |
8.000% due 06/01/2016 | | | | | 1,125 | | | | | | 1,131 | |
|
Masco Corp. | |
6.125% due 10/03/2016 | | | | | 1,985 | | | | | | 2,121 | |
|
McClatchy Co. | |
11.500% due 02/15/2017 | | | | | 1,600 | | | | | | 1,668 | |
|
McJunkin Red Man Corp. | |
9.500% due 12/15/2016 | | | | | 1,275 | | | | | | 1,383 | |
|
Meritor, Inc. | |
8.125% due 09/15/2015 | | | | | 1,050 | | | | | | 1,112 | |
|
MGM Resorts International | |
6.625% due 07/15/2015 | | | | | 4,675 | | | | | | 4,839 | |
6.750% due 04/01/2013 | | | | | 300 | | | | | | 309 | |
10.000% due 11/01/2016 | | | | | 450 | | | | | | 501 | |
10.375% due 05/15/2014 | | | | | 1,925 | | | | | | 2,180 | |
13.000% due 11/15/2013 | | | | | 100 | | | | | | 115 | |
|
Michaels Stores, Inc. | |
7.750% due 11/01/2018 | | | | | 500 | | | | | | 530 | |
|
Mohawk Industries, Inc. | |
6.375% due 01/15/2016 | | | | | 645 | | | | | | 714 | |
|
Mohegan Tribal Gaming Authority | |
7.125% due 08/15/2014 | | | | | 975 | | | | | | 780 | |
|
Momentive Performance Materials, Inc. | |
12.500% due 06/15/2014 | | | | | 975 | | | | | | 1,021 | |
|
New York Times Co. | |
6.625% due 12/15/2016 | | | | | 250 | | | | | | 261 | |
|
Newfield Exploration Co. | |
6.625% due 04/15/2016 | | | | | 1,525 | | | | | | 1,565 | |
|
Nielsen Finance LLC | |
11.500% due 05/01/2016 | | | | | 750 | | | | | | 857 | |
|
Office Depot, Inc. | |
6.250% due 08/15/2013 | | | | | 500 | | | | | | 511 | |
|
Offshore Group Investments Ltd. | |
11.500% due 08/01/2015 | | | | | 2,000 | | | | | | 2,180 | |
|
OSI Restaurant Partners LLC | |
10.000% due 06/15/2015 | | | | | 1,675 | | | | | | 1,727 | |
|
Owens-Brockway Glass Container, Inc. | |
7.375% due 05/15/2016 | | | | | 2,250 | | | | | | 2,520 | |
|
Packaging Dynamics Corp. | |
8.750% due 02/01/2016 | | | | | 1,875 | | | | | | 1,978 | |
|
Peabody Energy Corp. | |
7.375% due 11/01/2016 | | | | | 2,425 | | | | | | 2,680 | |
|
PHH Corp. | |
7.125% due 03/01/2013 | | | | | 1,875 | | | | | | 1,922 | |
|
Pinnacle Foods Finance LLC | |
9.250% due 04/01/2015 | | | | | 1,825 | | | | | | 1,884 | |
|
Plains Exploration & Production Co. | |
10.000% due 03/01/2016 | | | | | 600 | | | | | | 657 | |
| | | | | | | | | | | | |
| | | | | PRINCIPAL
AMOUNT
(000s) | | | | | MARKET
VALUE
(000s) | |
|
PulteGroup, Inc. | |
5.250% due 01/15/2014 | | $ | | | 395 | | | $ | | | 408 | |
|
Quebecor Media, Inc. | |
7.750% due 03/15/2016 | | | | | 2,525 | | | | | | 2,601 | |
|
Quicksilver Resources, Inc. | |
11.750% due 01/01/2016 | | | | | 2,050 | | | | | | 2,006 | |
|
Quiksilver, Inc. | |
6.875% due 04/15/2015 | | | | | 250 | | | | | | 243 | |
|
Reddy Ice Corp. | |
11.250% due 03/15/2015 ^ | | | | | 1,100 | | | | | | 1,056 | |
|
Regency Energy Partners LP | |
9.375% due 06/01/2016 | | | | | 1,111 | | | | | | 1,228 | |
|
Reynolds Group Issuer, Inc. | |
7.750% due 10/15/2016 | | | | | 2,425 | | | | | | 2,564 | |
|
Rite Aid Corp. | |
7.500% due 03/01/2017 | | | | | 1,250 | | | | | | 1,281 | |
|
Rockies Express Pipeline LLC | |
3.900% due 04/15/2015 | | | | | 750 | | | | | | 726 | |
|
Royal Caribbean Cruises Ltd. | |
11.875% due 07/15/2015 | | | | | 850 | | | | | | 1,033 | |
|
RR Donnelley & Sons Co. | |
6.125% due 01/15/2017 | | | | | 1,250 | | | | | | 1,187 | |
|
Ryerson, Inc. | |
12.000% due 11/01/2015 | | | | | 1,150 | | | | | | 1,161 | |
|
Ryland Group, Inc. | |
6.625% due 05/01/2020 | | | | | 250 | | | | | | 255 | |
|
Sabine Pass LNG LP | |
7.500% due 11/30/2016 | | | | | 1,850 | | | | | | 1,952 | |
|
Sable International Finance Ltd. | |
7.750% due 02/15/2017 | | | | | 1,000 | | | | | | 1,040 | |
|
SandRidge Energy, Inc. | |
9.875% due 05/15/2016 | | | | | 1,350 | | | | | | 1,485 | |
|
SBA Telecommunications, Inc. | |
8.000% due 08/15/2016 | | | | | 2,029 | | | | | | 2,171 | |
|
Scientific Games International, Inc. | |
7.875% due 06/15/2016 | | | | | 1,025 | | | | | | 1,071 | |
|
Seagate Technology HDD Holdings | |
6.800% due 10/01/2016 | | | | | 250 | | | | | | 279 | |
|
Sealed Air Corp. | |
5.625% due 07/15/2013 | | | | | 1,000 | | | | | | 1,037 | |
7.875% due 06/15/2017 | | | | | 750 | | | | | | 814 | |
|
Sealy Mattress Co. | |
10.875% due 04/15/2016 | | | | | 640 | | | | | | 696 | |
|
Sequa Corp. | |
11.750% due 12/01/2015 | | | | | 350 | | | | | | 371 | |
|
ServiceMaster Co. | |
10.750% due 07/15/2015 | | | | | 1,601 | | | | | | 1,655 | |
|
Shingle Springs Tribal Gaming Authority | |
9.375% due 06/15/2015 | | | | | 1,500 | | | | | | 1,155 | |
|
Sirius XM Radio, Inc. | |
8.750% due 04/01/2015 | | | | | 1,350 | | | | | | 1,525 | |
|
Smithfield Foods, Inc. | |
10.000% due 07/15/2014 | | | | | 2,100 | | | | | | 2,407 | |
|
Snoqualmie Entertainment Authority | |
9.125% due 02/01/2015 | | | | | 1,150 | | | | | | 1,160 | |
|
Speedway Motorsports, Inc. | |
8.750% due 06/01/2016 | | | | | 825 | | | | | | 901 | |
|
SPX Corp. | |
7.625% due 12/15/2014 | | | | | 1,300 | | | | | | 1,436 | |
|
Steel Dynamics, Inc. | |
7.750% due 04/15/2016 | | | | | 1,350 | | | | | | 1,397 | |
| | | | | | | | | | | | |
| | | | | PRINCIPAL
AMOUNT
(000s) | | | | | MARKET
VALUE
(000s) | |
|
SunGard Data Systems, Inc. | |
10.250% due 08/15/2015 | | $ | | | 1,901 | | | $ | | | 1,963 | |
|
Sunoco, Inc. | |
5.750% due 01/15/2017 | | | | | 650 | | | | | | 692 | |
|
SUPERVALU, Inc. | |
8.000% due 05/01/2016 (d) | | | | | 2,100 | | | | | | 2,137 | |
|
Telesat LLC | |
6.000% due 05/15/2017 | | | | | 1,500 | | | | | | 1,534 | |
|
Tenet Healthcare Corp. | |
9.250% due 02/01/2015 | | | | | 1,700 | | | | | | 1,900 | |
|
Terex Corp. | |
10.875% due 06/01/2016 | | | | | 975 | | | | | | 1,098 | |
|
Toll Brothers Finance Corp. | |
4.950% due 03/15/2014 | | | | | 625 | | | | | | 650 | |
|
Toys “R” Us - Delaware, Inc. | |
7.375% due 09/01/2016 | | | | | 600 | | | | | | 597 | |
|
Travelport LLC | |
9.875% due 09/01/2014 | | | | | 1,150 | | | | | | 847 | |
|
TRW Automotive, Inc. | |
7.250% due 03/15/2017 | | | | | 1,500 | | | | | | 1,721 | |
|
UR Merger Sub. Corp. | |
10.875% due 06/15/2016 | | | | | 750 | | | | | | 847 | |
|
USG Corp. | |
6.300% due 11/15/2016 | | | | | 1,200 | | | | | | 1,155 | |
|
Valeant Pharmaceuticals International | |
6.500% due 07/15/2016 | | | | | 1,850 | | | | | | 1,942 | |
|
Vertellus Specialties, Inc. | |
9.375% due 10/01/2015 | | | | | 100 | | | | | | 83 | |
|
ViaSat, Inc. | |
8.875% due 09/15/2016 | | | | | 250 | | | | | | 269 | |
|
VWR Funding, Inc. | |
10.250% due 07/15/2015 | | | | | 1,975 | | | | | | 2,044 | |
|
Windstream Corp. | |
8.125% due 08/01/2013 | | | | | 1,225 | | | | | | 1,297 | |
|
WMG Acquisition Corp. | |
9.500% due 06/15/2016 | | | | | 2,025 | | | | | | 2,217 | |
|
YCC Holdings LLC | |
10.250% due 02/15/2016 (b) | | | | | 2,225 | | | | | | 2,275 | |
| | | | | | | | | | | | |
| | | | | | | | | | | 207,714 | |
| | | | | | | | | | | | |
| | | | | | | | | | | | |
UTILITIES 10.7% | |
|
AES Corp. | |
7.750% due 03/01/2014 | | | | | 100 | | | | | | 109 | |
7.750% due 10/15/2015 | | | | | 3,600 | | | | | | 4,059 | |
|
Calpine Construction Finance Co. LP | |
8.000% due 06/01/2016 | | | | | 1,900 | | | | | | 2,061 | |
|
CMS Energy Corp. | |
6.875% due 12/15/2015 | | | | | 250 | | | | | | 278 | |
|
Cricket Communications, Inc. | |
7.750% due 05/15/2016 | | | | | 2,250 | | | | | | 2,399 | |
|
DPL, Inc. | |
6.500% due 10/15/2016 | | | | | 595 | | | | | | 646 | |
|
Expro Finance Luxembourg S.C.A. | |
8.500% due 12/15/2016 | | | | | 1,000 | | | | | | 962 | |
|
Frontier Communications Corp. | |
7.875% due 04/15/2015 | | | | | 1,350 | | | | | | 1,492 | |
8.250% due 05/01/2014 | | | | | 5 | | | | | | 6 | |
8.250% due 04/15/2017 | | | | | 1,250 | | | | | | 1,350 | |
|
GenOn Energy, Inc. | |
7.625% due 06/15/2014 | | | | | 1,400 | | | | | | 1,435 | |
|
Kinder Morgan Finance Co. ULC | |
5.700% due 01/05/2016 | | | | | 2,150 | | | | | | 2,274 | |
| | | | | | |
| 52 | | PIMCO ETF TRUST | | | | See Accompanying Notes |
June 30, 2012
| | | | | | | | | | | | |
| | | | | PRINCIPAL
AMOUNT
(000s) | | | | | MARKET
VALUE
(000s) | |
|
Midwest Generation LLC | |
8.560% due 01/02/2016 | | $ | | | 2,812 | | | $ | | | 2,685 | |
|
NRG Energy, Inc. | |
7.375% due 01/15/2017 | | | | | 750 | | | | | | 782 | |
|
Penn Virginia Corp. | |
10.375% due 06/15/2016 | | | | | 1,475 | | | | | | 1,423 | |
|
Qwest Communications International, Inc. | |
8.000% due 10/01/2015 | | | | | 3,130 | | | | | | 3,304 | |
|
Sprint Nextel Corp. | |
6.000% due 12/01/2016 | | | | | 6,925 | | | | | | 6,665 | |
|
Texas Competitive Electric Holdings Co. LLC | |
10.250% due 11/01/2015 | | | | | 2,275 | | | | | | 569 | |
|
Virgin Media Finance PLC | |
9.500% due 08/15/2016 | | | | | 1,975 | | | | | | 2,212 | |
| | | | | | | | | | | | |
| | | | | | | | | | | 34,711 | |
| | | | | | | | | | | | |
Total Corporate Bonds & Notes
(Cost $297,198) | | | | | | 299,771 | |
| | | | | | | |
| |
| | | | | | | | | | | | |
| | | | | PRINCIPAL
AMOUNT
(000s) | | | | | MARKET
VALUE
(000s) | |
SHORT-TERM INSTRUMENTS 6.7% | |
| | | | | | | | | | | | |
REPURCHASE AGREEMENTS 6.7% | |
|
Banc of America Securities LLC | |
0.190% due 07/02/2012 | | $ | | | 21,200 | | | $ | | | 21,200 | |
(Dated 06/29/2012. Collateralized by U.S. Treasury Notes 0.375% due 06/15/2015 valued at $21,646. Repurchase proceeds are $21,200.) | | | | |
|
State Street Bank and Trust Co. | |
0.010% due 07/02/2012 | | | | | 507 | | | | | | 507 | |
(Dated 06/29/2012. Collateralized by U.S. Treasury Notes 2.000% due 11/15/2021 valued at $519. Repurchase proceeds are $507.) | | | | |
| | | | |
| | | | |
Total Short-Term Instruments
(Cost $21,707) | | | | | | 21,707 | |
| | | | | | | | | | | | |
| | | | | | | | | | | | |
Total Investments 99.3%
(Cost $318,905) | | | $ | | | 321,478 | |
| |
Other Assets and Liabilities
(Net) 0.7% | | | 2,293 | |
| | | | | | | | | | | | |
Net Assets 100.0% | | | $ | | | 323,771 | |
| | | | | | | | | | | | |
Notes to Schedule of Investments (amounts in thousands*):
| * | A zero balance may reflect actual amounts rounding to less than one thousand. |
| (b) | Payment in-kind bond security. |
| (c) | Perpetual maturity, date shown represents next contractual call date. |
| (d) | On June 30, 2012, securities valued at $2,137 were pledged as collateral for the following open reverse repurchase agreements. |
| | | | | | | | | | | | | | | | | | | | | | |
| Counterparty | | | | Coupon Rate (1) | | | Settlement Date | | | Maturity Date | | | Principal
Amount | | | Payable for Reverse
Repurchase Agreements | |
BCY | | | | | (3.000 | %) | | | 03/15/2012 | | | | 03/15/2014 | | | $ | 2,200 | | | $ | (2,180 | ) |
| (1) | The average amount of borrowings while outstanding during the period ended June 30, 2012 was $2,233 at a weighted average interest rate of (2.597%). |
| (e) | Fair Value Measurements (1) |
The following is a summary of the fair valuations according to the inputs used as of June 30, 2012 in valuing the Fund’s assets and liabilities (2):
| | | | | | | | | | | | | | | | | | |
| Category and Subcategory (3) | | | | Level 1 (4) | | | Level 2 (5) | | | Level 3 (6) | | | Fair Value at
06/30/2012 | |
Investments, at value | | | | | | | | | | | | | | | | | | |
Corporate Bonds & Notes | | | | | | | | | | | | | | | | | | |
Banking & Finance | | | | $ | 0 | | | $ | 57,346 | | | $ | 0 | | | $ | 57,346 | |
Industrials | | | | | 0 | | | | 207,714 | | | | 0 | | | | 207,714 | |
Utilities | | | | | 0 | | | | 32,026 | | | | 2,685 | | | | 34,711 | |
Short-Term Instruments | | | | | | | | | | | | | | | | | | |
Repurchase Agreements | | | | | 0 | | | | 21,707 | | | | 0 | | | | 21,707 | |
| | | | $ | 0 | | | $ | 318,793 | | | $ | 2,685 | | | $ | 321,478 | |
| | | | | | |
| See Accompanying Notes | | ANNUAL REPORT | | JUNE 30, 2012 | | 53 |
Schedule of Investments PIMCO 0-5 Year High Yield Corporate Bond Index Fund (Cont.)
June 30, 2012
The following is a reconciliation of the fair valuations using significant unobservable inputs (Level 3) for the Fund during the period ended June 30, 2012:
| | | | | | | | | | | | | | | | | | | | | | | | | | | | | | | | | | | | | | | | | | |
| Category and Subcategory (3) | | | | Beginning
Balance at
06/30/2011 | | | Net
Purchases | | | Net
Sales | | | Accrued
Discounts/
(Premiums) | | | Realized
Gain/(Loss) | | | Net Change
in Unrealized
Appreciation/
(Depreciation) (7) | | | Transfers
into
Level 3 | | | Transfers
out of
Level 3 | | | Ending
Balance at
06/30/2012 | | | Net Change in
Unrealized
Appreciation/
(Depreciation)
on Investments
Held at
06/30/2012 (7) | |
Investments, at value | | | | | | | | | | | | | | | | | | | | | | | | | | | | | | | | | | | | | | | | | | |
Corporate Bonds & Notes | | | | | | | | | | | | | | | | | | | | | | | | | | | | | | | | | | | | | | | | | | |
Utilities | | | | $ | 194 | | | $ | 2,757 | | | $ | (150 | ) | | $ | (9 | ) | | $ | �� (3 | ) | | $ | (104 | ) | | $ | 0 | | | $ | 0 | | | $ | 2,685 | | | $ | (116 | ) |
| (1) | See note 3 in the Notes to Financial Statements for more information regarding pricing inputs and valuation techniques. |
| (2) | There were no significant transfers into or out of level 1, 2, and 3 during the period ended June 30, 2012. |
| (3) | Refer to the Schedule of Investments for additional information. |
| (4) | Quoted prices in active markets for identical investments. |
| (5) | Significant other observable inputs. |
| (6) | Significant unobservable inputs. |
| (7) | Any difference between Net Change in Unrealized Appreciation/(Depreciation) and Net Change in Unrealized Appreciation/(Depreciation) on Investments Held at June 30, 2012 may be due to an investment no longer held or categorized as level 3 at period end. |
| (f) | Fair Value of Financial Derivative Instruments (1) |
The following is a summary of the fair valuation of the Fund’s derivative instruments categorized by risk exposure:
The Effect of Financial Derivative Instruments on the Statements of Operations for the Period Ended June 30, 2012:
| | | | | | | | | | | | | | | | | | | | | | | | | | |
| | | | | Derivatives not accounted for as hedging instruments | |
| | | | | Commodity
Contracts | | | Credit
Contracts | | | Equity
Contracts | | | Foreign
Exchange
Contracts | | | Interest
Rate Contracts | | | Total | |
Realized (Loss) on Derivatives Recognized as a Result from Operations: | | | | | | | | | | | | | | | | | | | | | | | | | | |
Net realized (loss) on swaps | | | | $ | 0 | | | $ | (7 | ) | | $ | 0 | | | $ | 0 | | | $ | 0 | | | $ | (7 | ) |
| (1) | See note 6 in the Notes to Financial Statements for additional information. |
| | | | | | |
| 54 | | PIMCO ETF TRUST | | | | See Accompanying Notes |
Schedule of Investments PIMCO Investment Grade Corporate Bond Index Fund
June 30, 2012
| | | | | | | | | | | | |
| | | | | PRINCIPAL
AMOUNT
(000s) | | | | | MARKET
VALUE
(000s) | |
CORPORATE BONDS & NOTES 98.4% | |
| |
BANKING & FINANCE 33.4% | |
| | | | |
Allstate Corp. | | | | | | | | | | | | |
7.450% due 05/16/2019 | | $ | | | 750 | | | $ | | | 962 | |
| | | | |
American Express Co. | | | | | | | | | | | | |
6.150% due 08/28/2017 | | | | | 1,675 | | | | | | 1,988 | |
| | | | |
American Honda Finance Corp. | | | | | | | | | | | | |
2.600% due 09/20/2016 | | | | | 1,380 | | | | | | 1,428 | |
|
American International Group, Inc. | |
4.250% due 09/15/2014 | | | | | 100 | | | | | | 104 | |
5.850% due 01/16/2018 | | | | | 1,840 | | | | | | 2,040 | |
| | | | |
Bank of America Corp. | | | | | | | | | | | | |
5.625% due 07/01/2020 | | | | | 100 | | | | | | 107 | |
6.500% due 08/01/2016 | | | | | 375 | | | | | | 412 | |
7.375% due 05/15/2014 | | | | | 300 | | | | | | 323 | |
| | | | |
Bank of New York Mellon Corp. | | | | | | | | | | | | |
1.969% due 06/20/2017 | | | | | 750 | | | | | | 760 | |
| | | | |
Bank of Nova Scotia | | | | | | | | | | | | |
3.400% due 01/22/2015 | | | | | 1,300 | | | | | | 1,371 | |
| | | | |
Bank of Tokyo-Mitsubishi UFJ Ltd. | | | | | | | | | | | | |
2.350% due 02/23/2017 | | | | | 500 | | | | | | 512 | |
| | | | |
Barclays Bank PLC | | | | | | | | | | | | |
5.125% due 01/08/2020 | | | | | 2,165 | | | | | | 2,355 | |
| | | | |
Bear Stearns Cos. LLC | | | | | | | | | | | | |
5.300% due 10/30/2015 | | | | | 300 | | | | | | 326 | |
|
Berkshire Hathaway Finance Corp. | |
5.750% due 01/15/2040 | | | | | 300 | | | | | | 366 | |
| | | | |
BNP Paribas S.A. | | | | | | | | | | | | |
3.600% due 02/23/2016 | | | | | 1,140 | | | | | | 1,154 | |
| | | | |
Boeing Capital Corp. | | | | | | | | | | | | |
3.250% due 10/27/2014 | | | | | 1,085 | | | | | | 1,149 | |
| | | | |
Capital One Capital | | | | | | | | | | | | |
8.875% due 05/15/2040 | | | | | 1,200 | | | | | | 1,227 | |
| | | | |
Caterpillar Financial Services Corp. | | | | | | | | | | | | |
6.125% due 02/17/2014 | | | | | 820 | | | | | | 891 | |
| | | | |
Citigroup, Inc. | | | | | | | | | | | | |
5.375% due 08/09/2020 | | | | | 40 | | | | | | 43 | |
6.010% due 01/15/2015 | | | | | 300 | | | | | | 323 | |
6.125% due 05/15/2018 | | | | | 550 | | | | | | 615 | |
8.125% due 07/15/2039 | | | | | 3,025 | | | | | | 4,055 | |
| | | | |
Commonwealth Bank of Australia | | | | | | | | | | | | |
1.950% due 03/16/2015 | | | | | 1,500 | | | | | | 1,511 | |
| | | | |
Credit Suisse | | | | | | | | | | | | |
4.375% due 08/05/2020 | | | | | 100 | | | | | | 107 | |
5.000% due 05/15/2013 | | | | | 1,830 | | | | | | 1,888 | |
| | | | |
Deutsche Bank AG | | | | | | | | | | | | |
3.250% due 01/11/2016 | | | | | 500 | | | | | | 515 | |
| | | | |
Ford Motor Credit Co. LLC | | | | | | | | | | | | |
7.000% due 10/01/2013 | | | | | 825 | | | | | | 882 | |
8.000% due 06/01/2014 | | | | | 2,500 | | | | | | 2,775 | |
| | | | |
General Electric Capital Corp. | | | | | | | | | | | | |
5.500% due 01/08/2020 | | | | | 3,460 | | | | | | 3,969 | |
| | | | |
Goldman Sachs Group, Inc. | | | | | | | | | | | | |
5.250% due 10/15/2013 | | | | | 2,450 | | | | | | 2,549 | |
5.375% due 03/15/2020 | | | | | 2,545 | | | | | | 2,626 | |
6.750% due 10/01/2037 | | | | | 750 | | | | | | 738 | |
| | | | |
HSBC Bank USA N.A. | | | | | | | | | | | | |
4.625% due 04/01/2014 | | | | | 820 | | | | | | 855 | |
4.875% due 08/24/2020 | | | | | 1,960 | | | | | | 2,021 | |
| | | | |
HSBC Holdings PLC | | | | | | | | | | | | |
5.100% due 04/05/2021 | | | | | 750 | | | | | | 839 | |
| | | | | | | | | | | | |
| | | | | PRINCIPAL
AMOUNT
(000s) | | | | | MARKET
VALUE
(000s) | |
|
Hutchison Whampoa International Ltd. | |
4.625% due 01/13/2022 | | $ | | | 1,000 | | | $ | | | 1,054 | |
| | | | |
ING Bank NV | | | | | | | | | | | | |
4.000% due 03/15/2016 | | | | | 500 | | | | | | 504 | |
| | | | |
John Deere Capital Corp. | | | | | | | | | | | | |
2.950% due 03/09/2015 | | | | | 100 | | | | | | 106 | |
3.900% due 07/12/2021 | | | | | 275 | | | | | | 304 | |
5.750% due 09/10/2018 | | | | | 200 | | | | | | 243 | |
| | | | |
JPMorgan Chase & Co. | | | | | | | | | | | | |
3.700% due 01/20/2015 | | | | | 3,880 | | | | | | 4,050 | |
4.500% due 01/24/2022 | | | | | 500 | | | | | | 540 | |
| | | | |
JPMorgan Chase Bank N.A. | | | | | | | | | | | | |
5.875% due 06/13/2016 | | | | | 1,030 | | | | | | 1,131 | |
| | | | |
Kimco Realty Corp. | | | | | | | | | | | | |
6.875% due 10/01/2019 | | | | | 940 | | | | | | 1,127 | |
| | | | |
Lloyds TSB Bank PLC | | | | | | | | | | | | |
4.875% due 01/21/2016 | | | | | 1,560 | | | | | | 1,640 | |
|
Macquarie Bank Ltd. | |
6.625% due 04/07/2021 | | | | | 730 | | | | | | 734 | |
|
Merrill Lynch & Co., Inc. | |
6.875% due 04/25/2018 | | | | | 1,000 | | | | | | 1,121 | |
7.750% due 05/14/2038 | | | | | 3,400 | | | | | | 3,894 | |
|
MetLife, Inc. | |
5.700% due 06/15/2035 | | | | | 400 | | | | | | 476 | |
5.875% due 02/06/2041 | | | | | 1,510 | | | | | | 1,864 | |
|
Moody’s Corp. | |
5.500% due 09/01/2020 | | | | | 300 | | | | | | 325 | |
|
Morgan Stanley | |
5.500% due 07/24/2020 | | | | | 2,775 | | | | | | 2,721 | |
6.000% due 04/28/2015 | | | | | 400 | | | | | | 414 | |
7.300% due 05/13/2019 | | | | | 730 | | | | | | 790 | |
|
MUFG Capital Finance Ltd. | |
6.346% due 07/25/2016 (a) | | | | | 500 | | | | | | 538 | |
|
Nomura Holdings, Inc. | |
6.700% due 03/04/2020 | | | | | 660 | | | | | | 733 | |
|
Nordea Bank AB | |
4.875% due 01/14/2021 | | | | | 1,410 | | | | | | 1,538 | |
|
PNC Funding Corp. | |
3.300% due 03/08/2022 | | | | | 500 | | | | | | 511 | |
|
ProLogis LP | |
6.625% due 05/15/2018 | | | | | 710 | | | | | | 820 | |
|
Prudential Financial, Inc. | |
4.750% due 09/17/2015 | | | | | 1,875 | | | | | | 2,020 | |
|
Rabobank Group | |
5.250% due 05/24/2041 | | | | | 1,910 | | | | | | 2,068 | |
|
Royal Bank of Scotland Group PLC | |
4.875% due 03/16/2015 | | | | | 1,740 | | | | | | 1,802 | |
|
Simon Property Group LP | |
5.650% due 02/01/2020 | | | | | 100 | | | | | | 117 | |
6.750% due 05/15/2014 | | | | | 1,180 | | | | | | 1,280 | |
|
SLM Corp. | |
6.250% due 01/25/2016 | | | | | 1,500 | | | | | | 1,582 | |
|
Toyota Motor Credit Corp. | |
3.200% due 06/17/2015 | | | | | 650 | | | | | | 691 | |
|
UBS AG | |
5.750% due 04/25/2018 | | | | | 1,370 | | | | | | 1,520 | |
|
Wachovia Bank N.A. | |
6.600% due 01/15/2038 | | | | | 500 | | | | | | 634 | |
|
Wachovia Corp. | |
5.500% due 05/01/2013 | | | | | 2,810 | | | | | | 2,920 | |
| | | | | | | | | | | | |
| | | | | | | | | | | 85,598 | |
| | | | | | | | | | | | |
| | | | | | | | | | | | |
| | | | | PRINCIPAL
AMOUNT
(000s) | | | | | MARKET
VALUE
(000s) | |
INDUSTRIALS 52.0% | |
|
Abbott Laboratories | |
5.125% due 04/01/2019 | | $ | | | 1,370 | | | $ | | | 1,635 | |
|
Alcoa, Inc. | |
6.150% due 08/15/2020 | | | | | 815 | | | | | | 860 | |
|
Altria Group, Inc. | |
9.250% due 08/06/2019 | | | | | 1,270 | | | | | | 1,768 | |
|
America Movil S.A.B. de C.V. | |
6.125% due 03/30/2040 | | | | | 680 | | | | | | 845 | |
|
American Tower Corp. | |
4.500% due 01/15/2018 | | | | | 1,170 | | | | | | 1,239 | |
|
Amgen, Inc. | |
3.450% due 10/01/2020 | | | | | 1,920 | | | | | | 1,993 | |
6.150% due 06/01/2018 | | | | | 200 | | | | | | 240 | |
|
Anadarko Petroleum Corp. | |
6.375% due 09/15/2017 | | | | | 1,200 | | | | | | 1,396 | |
|
Anheuser-Busch Cos. LLC | |
5.500% due 01/15/2018 | | | | | 1,000 | | | | | | 1,189 | |
|
Anheuser-Busch InBev Worldwide, Inc. | |
7.750% due 01/15/2019 | | | | | 925 | | | | | | 1,224 | |
|
ArcelorMittal | |
6.125% due 06/01/2018 | | | | | 200 | | | | | | 203 | |
9.850% due 06/01/2019 | | | | | 1,165 | | | | | | 1,389 | |
|
Barrick PD Australia Finance Pty. Ltd. | |
4.950% due 01/15/2020 | | | | | 1,200 | | | | | | 1,326 | |
|
BG Energy Capital PLC | |
5.125% due 10/15/2041 | | | | | 1,240 | | | | | | 1,376 | |
|
BHP Billiton Finance USA Ltd. | |
6.500% due 04/01/2019 | | | | | 1,000 | | | | | | 1,275 | |
|
Boeing Co. | |
3.500% due 02/15/2015 | | | | | 400 | | | | | | 429 | |
|
Boston Scientific Corp. | |
4.500% due 01/15/2015 | | | | | 1,270 | | | | | | 1,354 | |
|
Bottling Group LLC | |
6.950% due 03/15/2014 | | | | | 975 | | | | | | 1,078 | |
|
Bunge Ltd. Finance Corp. | |
4.100% due 03/15/2016 | | | | | 400 | | | | | | 418 | |
|
Burlington Northern Santa Fe LLC | |
5.400% due 06/01/2041 | | | | | 1,140 | | | | | | 1,310 | |
|
Caterpillar, Inc. | |
5.200% due 05/27/2041 | | | | | 850 | | | | | | 1,037 | |
|
Cenovus Energy, Inc. | |
6.750% due 11/15/2039 | | | | | 760 | | | | | | 951 | |
|
CenterPoint Energy Resources Corp. | |
4.500% due 01/15/2021 | | | | | 980 | | | | | | 1,073 | |
|
Cisco Systems, Inc. | |
4.450% due 01/15/2020 | | | | | 1,770 | | | | | | 2,048 | |
|
Coca-Cola Co. | |
1.650% due 03/14/2018 | | | | | 750 | | | | | | 761 | |
|
Coca-Cola Enterprises, Inc. | |
2.000% due 08/19/2016 | | | | | 830 | | | | | | 839 | |
|
Comcast Corp. | |
5.300% due 01/15/2014 | | | | | 1,250 | | | | | | 1,331 | |
5.700% due 07/01/2019 | | | | | 1,650 | | | | | | 1,965 | |
|
ConocoPhillips | |
5.750% due 02/01/2019 | | | | | 1,720 | | | | | | 2,102 | |
|
Corning, Inc. | |
5.750% due 08/15/2040 | | | | | 785 | | | | | | 923 | |
|
CSX Corp. | |
6.220% due 04/30/2040 | | | | | 1,200 | | | | | | 1,487 | |
|
CVS Caremark Corp. | |
6.125% due 09/15/2039 | | | | | 1,350 | | | | | | 1,686 | |
| | | | | | |
| See Accompanying Notes | | ANNUAL REPORT | | JUNE 30, 2012 | | 55 |
Schedule of Investments PIMCO Investment Grade Corporate Bond Index Fund (Cont.)
| | | | | | | | | | | | |
| | | | | PRINCIPAL
AMOUNT
(000s) | | | | | MARKET
VALUE
(000s) | |
|
Danaher Corp. | |
1.300% due 06/23/2014 | | $ | | | 1,265 | | | $ | | | 1,279 | |
|
Deere & Co. | |
6.950% due 04/25/2014 | | | | | 1,000 | | | | | | 1,112 | |
|
Deutsche Telekom International Finance BV | |
3.125% due 04/11/2016 | | | | | 1,750 | | | | | | 1,812 | |
|
Devon Energy Corp. | |
3.250% due 05/15/2022 | | | | | 750 | | | | | | 765 | |
|
DIRECTV Holdings LLC | |
3.125% due 02/15/2016 | | | | | 1,300 | | | | | | 1,356 | |
|
Discovery Communications LLC | |
5.050% due 06/01/2020 | | | | | 1,250 | | | | | | 1,416 | |
|
Dow Chemical Co. | |
5.900% due 02/15/2015 | | | | | 740 | | | | | | 826 | |
7.600% due 05/15/2014 | | | | | 1,020 | | | | | | 1,136 | |
|
Eli Lilly & Co. | |
5.950% due 11/15/2037 | | | | | 930 | | | | | | 1,231 | |
|
Encana Corp. | |
5.150% due 11/15/2041 | | | | | 1,630 | | | | | | 1,565 | |
|
Energy Transfer Partners LP | |
8.500% due 04/15/2014 | | | | | 1,074 | | | | | | 1,190 | |
|
Ensco PLC | |
4.700% due 03/15/2021 | | | | | 940 | | | | | | 1,027 | |
|
Enterprise Products Operating LLC | |
5.200% due 09/01/2020 | | | | | 750 | | | | | | 860 | |
|
EOG Resources, Inc. | |
4.100% due 02/01/2021 | | | | | 1,000 | | | | | | 1,113 | |
|
General Electric Co. | |
5.250% due 12/06/2017 | | | | | 1,280 | | | | | | 1,497 | |
|
Gilead Sciences, Inc. | |
4.400% due 12/01/2021 | | | | | 750 | | | | | | 830 | |
|
GlaxoSmithKline Capital, Inc. | |
5.650% due 05/15/2018 | | | | | 750 | | | | | | 908 | |
|
Hewlett-Packard Co. | |
2.125% due 09/13/2015 | | | | | 1,860 | | | | | | 1,877 | |
|
Home Depot, Inc. | |
5.400% due 03/01/2016 | | | | | 1,280 | | | | | | 1,477 | |
|
Intel Corp. | |
1.950% due 10/01/2016 | | | | | 1,120 | | | | | | 1,162 | |
|
International Business Machines Corp. | |
1.000% due 08/05/2013 | | | | | 510 | | | | | | 513 | |
4.000% due 06/20/2042 | | | | | 567 | | | | | | 596 | |
5.600% due 11/30/2039 | | | | | 29 | | | | | | 38 | |
6.500% due 10/15/2013 | | | | | 840 | | | | | | 904 | |
|
International Paper Co. | |
7.500% due 08/15/2021 | | | | | 1,030 | | | | | | 1,317 | |
|
Johnson & Johnson | |
5.550% due 08/15/2017 | | | | | 500 | | | | | | 608 | |
|
Kellogg Co. | |
4.000% due 12/15/2020 | | | | | 750 | | | | | | 828 | |
|
Kinder Morgan Energy Partners LP | |
5.300% due 09/15/2020 | | | | | 1,110 | | | | | | 1,232 | |
|
Kraft Foods, Inc. | |
4.125% due 02/09/2016 | | | | | 100 | | | | | | 109 | |
5.375% due 02/10/2020 | | | | | 200 | | | | | | 237 | |
6.500% due 02/09/2040 | | | | | 1,350 | | | | | | 1,743 | |
|
Kroger Co. | |
6.150% due 01/15/2020 | | | | | 1,100 | | | | | | 1,320 | |
|
L-3 Communications Corp. | |
4.750% due 07/15/2020 | | | | | 1,230 | | | | | | 1,315 | |
|
Lockheed Martin Corp. | |
4.250% due 11/15/2019 | | | | | 1,160 | | | | | | 1,299 | |
| | | | | | | | | | | | |
| | | | | PRINCIPAL
AMOUNT
(000s) | | | | | MARKET
VALUE
(000s) | |
|
Marriott International, Inc. | |
6.200% due 06/15/2016 | | $ | | | 100 | | | $ | | | 114 | |
|
McDonald’s Corp. | |
2.625% due 01/15/2022 | | | | | 1,500 | | | | | | 1,532 | |
|
Medtronic, Inc. | |
4.450% due 03/15/2020 | | | | | 750 | | | | | | 863 | |
|
Merck & Co., Inc. | |
5.000% due 06/30/2019 | | | | | 1,485 | | | | | | 1,784 | |
|
Microsoft Corp. | |
1.625% due 09/25/2015 | | | | | 1,170 | | | | | | 1,211 | |
|
News America, Inc. | |
6.400% due 12/15/2035 | | | | | 500 | | | | | | 579 | |
|
Noble Holding International Ltd. | |
4.625% due 03/01/2021 | | | | | 860 | | | | | | 915 | |
4.900% due 08/01/2020 | | | | | 100 | | | | | | 109 | |
|
Norfolk Southern Corp. | |
3.250% due 12/01/2021 | | | | | 100 | | | | | | 104 | |
|
Novartis Capital Corp. | |
2.900% due 04/24/2015 | | | | | 660 | | | | | | 699 | |
|
Oracle Corp. | |
3.750% due 07/08/2014 | | | | | 1,940 | | | | | | 2,061 | |
|
Pemex Project Funding Master Trust | |
5.750% due 03/01/2018 | | | | | 1,995 | | | | | | 2,264 | |
|
PepsiCo, Inc. | |
3.100% due 01/15/2015 | | | | | 300 | | | | | | 316 | |
5.500% due 01/15/2040 | | | | | 400 | | | | | | 506 | |
|
Petrobras International Finance Co. | |
5.750% due 01/20/2020 | | | | | 500 | | | | | | 550 | |
6.875% due 01/20/2040 | | | | | 1,120 | | | | | | 1,345 | |
|
Pfizer, Inc. | |
6.200% due 03/15/2019 | | | | | 1,850 | | | | | | 2,323 | |
|
Philip Morris International, Inc. | |
5.650% due 05/16/2018 | | | | | 1,300 | | | | | | 1,573 | |
|
Praxair, Inc. | |
2.450% due 02/15/2022 | | | | | 1,000 | | | | | | 989 | |
|
Procter & Gamble Co. | |
3.500% due 02/15/2015 | | | | | 1,390 | | | | | | 1,491 | |
|
Raytheon Co. | |
3.125% due 10/15/2020 | | | | | 1,335 | | | | | | 1,405 | |
|
Republic Services, Inc. | |
5.000% due 03/01/2020 | | | | | 610 | | | | | | 692 | |
5.250% due 11/15/2021 | | | | | 320 | | | | | | 368 | |
|
Rio Tinto Finance USA Ltd. | |
3.750% due 09/20/2021 | | | | | 275 | | | | | | 296 | |
6.500% due 07/15/2018 | | | | | 1,450 | | | | | | 1,790 | |
|
Roche Holdings, Inc. | |
6.000% due 03/01/2019 | | | | | 1,390 | | | | | | 1,732 | |
|
Rogers Communications, Inc. | |
6.800% due 08/15/2018 | | | | | 680 | | | | | | 840 | |
|
SABMiller Holdings, Inc. | |
1.850% due 01/15/2015 | | | | | 500 | | | | | | 508 | |
|
Southern Copper Corp. | |
6.750% due 04/16/2040 | | | | | 700 | | | | | | 749 | |
|
Statoil ASA | |
3.125% due 08/17/2017 | | | | | 300 | | | | | | 324 | |
|
Target Corp. | |
3.875% due 07/15/2020 | | | | | 1,350 | | | | | | 1,491 | |
|
Teck Resources Ltd. | |
4.750% due 01/15/2022 | | | | | 1,000 | | | | | | 1,077 | |
|
Telefonica Emisiones S.A.U. | |
2.582% due 04/26/2013 | | | | | 300 | | | | | | 296 | |
3.729% due 04/27/2015 | | | | | 200 | | | | | | 182 | |
| | | | | | | | | | | | |
| | | | | PRINCIPAL
AMOUNT
(000s) | | | | | MARKET
VALUE
(000s) | |
|
Thermo Fisher Scientific, Inc. | |
3.600% due 08/15/2021 | | $ | | | 750 | | | $ | | | 809 | |
|
Time Warner Cable, Inc. | |
5.000% due 02/01/2020 | | | | | 400 | | | | | | 450 | |
5.875% due 11/15/2040 | | | | | 840 | | | | | | 945 | |
8.750% due 02/14/2019 | | | | | 250 | | | | | | 333 | |
|
Time Warner, Inc. | |
3.150% due 07/15/2015 | | | | | 2,190 | | | | | | 2,312 | |
|
Total Capital S.A. | |
3.000% due 06/24/2015 | | | | | 1,180 | | | | | | 1,253 | |
|
TransCanada PipeLines Ltd. | |
3.800% due 10/01/2020 | | | | | 1,340 | | | | | | 1,479 | |
|
Transocean, Inc. | |
4.950% due 11/15/2015 | | | | | 300 | | | | | | 323 | |
6.500% due 11/15/2020 | | | | | 580 | | | | | | 659 | |
|
Tyco International Finance S.A. | |
4.125% due 10/15/2014 | | | | | 920 | | | | | | 994 | |
|
Union Pacific Corp. | |
4.750% due 09/15/2041 | | | | | 1,375 | | | | | | 1,500 | |
|
United Parcel Service, Inc. | |
3.875% due 04/01/2014 | | | | | 1,500 | | | | | | 1,583 | |
|
United Technologies Corp. | |
3.100% due 06/01/2022 | | | | | 500 | | | | | | 526 | |
4.500% due 04/15/2020 | | | | | 1,260 | | | | | | 1,464 | |
| |
UnitedHealth Group, Inc. | | | | |
6.875% due 02/15/2038 | | | | | 1,600 | | | | | | 2,235 | |
| |
Vale Overseas Ltd. | | | | |
6.875% due 11/21/2036 | | | | | 640 | | | | | | 746 | |
| |
Wal-Mart Stores, Inc. | | | | |
2.250% due 07/08/2015 | | | | | 100 | | | | | | 105 | |
4.250% due 04/15/2021 | | | | | 1,000 | | | | | | 1,156 | |
5.375% due 04/05/2017 | | | | | 380 | | | | | | 452 | |
5.625% due 04/15/2041 | | | | | 100 | | | | | | 131 | |
6.200% due 04/15/2038 | | | | | 900 | | | | | | 1,230 | |
| |
Walt Disney Co. | | | | |
0.875% due 12/01/2014 | | | | | 500 | | | | | | 503 | |
| |
Waste Management, Inc. | | | | |
4.750% due 06/30/2020 | | | | | 1,005 | | | | | | 1,134 | |
| |
Weatherford International Ltd. | | | | |
5.125% due 09/15/2020 | | | | | 1,130 | | | | | | 1,216 | |
| |
WellPoint, Inc. | | | | |
3.125% due 05/15/2022 | | | | | 500 | | | | | | 506 | |
| |
WPP Finance UK | | | | |
8.000% due 09/15/2014 | | | | | 710 | | | | | | 801 | |
| | | | | | | | | | | | |
| | | | | | | | | | | 133,171 | |
| | | | | | | | | | | | |
| |
UTILITIES 13.0% | |
| |
Appalachian Power Co. | | | | |
4.600% due 03/30/2021 | | | | | 1,120 | | | | | | 1,259 | |
| |
AT&T, Inc. | | | | |
2.500% due 08/15/2015 | | | | | 110 | | | | | | 115 | |
6.300% due 01/15/2038 | | | | | 3,000 | | | | | | 3,755 | |
| |
BP Capital Markets PLC | | | | |
4.500% due 10/01/2020 | | | | | 300 | | | | | | 339 | |
5.250% due 11/07/2013 | | | | | 1,350 | | | | | | 1,431 | |
| |
Commonwealth Edison Co. | | | | |
4.000% due 08/01/2020 | | | | | 770 | | | | | | 858 | |
| |
Consumers Energy Co. | | | | |
2.850% due 05/15/2022 | | | | | 500 | | | | | | 510 | |
| |
Dominion Resources, Inc. | | | | |
4.450% due 03/15/2021 | | | | | 1,485 | | | | | | 1,693 | |
| | | | | | |
| 56 | | PIMCO ETF TRUST | | | | See Accompanying Notes |
June 30, 2012
| | | | | | | | | | | | |
| | | | | PRINCIPAL
AMOUNT
(000s) | | | | | MARKET
VALUE
(000s) | |
| |
Duke Energy Corp. | | | | |
2.150% due 11/15/2016 | | $ | | | 1,910 | | | $ | | | 1,959 | |
| |
E.ON International Finance BV | | | | |
5.800% due 04/30/2018 | | | | | 1,120 | | | | | | 1,314 | |
| |
Enel Finance International NV | | | | |
6.250% due 09/15/2017 | | | | | 340 | | | | | | 342 | |
| |
Entergy Corp. | | | | |
5.125% due 09/15/2020 | | | | | 300 | | | | | | 312 | |
| |
Exelon Generation Co. LLC | | | | |
6.200% due 10/01/2017 | | | | | 100 | | | | | | 115 | |
| |
FirstEnergy Corp. | | | | |
7.375% due 11/15/2031 | | | | | 1,210 | | | | | | 1,525 | |
| |
Gazprom OAO Via Gaz Capital S.A. | | | | |
5.092% due 11/29/2015 | | | | | 1,680 | | | | | | 1,777 | |
| |
MidAmerican Energy Holdings Co. | | | | |
6.125% due 04/01/2036 | | | | | 990 | | | | | | 1,244 | |
| |
Pacific Gas & Electric Co. | | | | |
3.500% due 10/01/2020 | | | | | 830 | | | | | | 896 | |
5.800% due 03/01/2037 | | | | | 780 | | | | | | 974 | |
| |
Pennsylvania Electric Co. | | | | |
5.200% due 04/01/2020 | | | | | 70 | | | | | | 79 | |
| | | | | | | | | | | | |
| | | | | PRINCIPAL
AMOUNT
(000s) | | | | | MARKET
VALUE
(000s) | |
| |
Plains All American Pipeline LP | | | | |
5.150% due 06/01/2042 | | $ | | | 750 | | | $ | | | 797 | |
| |
Progress Energy, Inc. | | | | |
4.400% due 01/15/2021 | | | | | 1,605 | | | | | | 1,789 | |
| |
Shell International Finance BV | | | | |
3.100% due 06/28/2015 | | | | | 1,370 | | | | | | 1,463 | |
4.375% due 03/25/2020 | | | | | 230 | | | | | | 268 | |
| |
Southern California Edison Co. | | | | |
3.875% due 06/01/2021 | | | | | 500 | | | | | | 558 | |
| |
Southern Power Co. | | | | |
5.150% due 09/15/2041 | | | | | 1,365 | | | | | | 1,491 | |
| |
Southwestern Public Service Co. | | | | |
6.000% due 10/01/2036 | | | | | 1,000 | | | | | | 1,183 | |
| |
Verizon Communications, Inc. | | | | |
8.750% due 11/01/2018 | | | | | 2,370 | | | | | | 3,264 | |
| |
Vodafone Group PLC | | | | |
4.375% due 03/16/2021 | | | | | 1,710 | | | | | | 1,956 | |
| | | | | | | | | | | | |
| | | | | | | | | | | 33,266 | |
| | | | | | | | | | | | |
Total Corporate Bonds & Notes
(Cost $242,839) | | | | | | | | | | | 252,035 | |
| | | | | | | | | | | | |
| | | | | | | | | | | | |
| | | | | PRINCIPAL
AMOUNT
(000s) | | | | | MARKET
VALUE
(000s) | |
SHORT-TERM INSTRUMENTS 0.6% | |
| |
REPURCHASE AGREEMENTS 0.6% | |
| |
Credit Suisse Securities (USA) LLC | | | | |
0.180% due 07/02/2012 | | $ | | | 1,000 | | | $ | | | 1,000 | |
(Dated 06/29/2012. Collateralized by U.S. Treasury Notes 2.375% due 10/31/2014 valued at $1,025. Repurchase proceeds are $1,000.) | | | | |
| |
State Street Bank and Trust Co. | | | | |
0.010% due 07/02/2012 | | | | | 551 | | | | | | 551 | |
(Dated 06/29/2012. Collateralized by U.S. Treasury Bonds 5.375% due 02/15/2031 valued at $569. Repurchase proceeds are $551.) | | | | |
| | | | | | | | | | | | |
| |
Total Short-Term Instruments
(Cost $1,551) | | | | | | | | | | | 1,551 | |
| | | | | | | | | | | | |
| | | | | | | | | | | | |
Total Investments 99.0%
(Cost $244,390) | | | | | | | | $ | | | 253,586 | |
| |
Other Assets and Liabilities (Net) 1.0% | | | | | | 2,681 | |
| | | | | | | | | | | | |
Net Assets 100.0% | | | | | | | | $ | | | 256,267 | |
| | | | | | | | | | | | |
Notes to Schedule of Investments (amounts in thousands):
| (a) | Perpetual maturity, date shown represents next contractual call date. |
| (b) | Fair Value Measurements (1) |
The following is a summary of the fair valuations according to the inputs used as of June 30, 2012 in valuing the Fund’s assets and liabilities (2):
| | | | | | | | | | | | | | | | | | |
| Category and Subcategory (3) | | | | Level 1 (4) | | | Level 2 (5) | | | Level 3 (6) | | | Fair Value at
06/30/2012 | |
Investments, at value | | | | | | | | | | | | | | | | | | |
Corporate Bonds & Notes | | | | | | | | | | | | | | | | | | |
Banking & Finance | | | | $ | 0 | | | $ | 85,598 | | | $ | 0 | | | $ | 85,598 | |
Industrials | | | | | 0 | | | | 133,171 | | | | 0 | | | | 133,171 | |
Utilities | | | | | 0 | | | | 33,266 | | | | 0 | | | | 33,266 | |
Short-Term Instruments | | | | | | | | | | | | | | | | | | |
Repurchase Agreements | | | | | 0 | | | | 1,551 | | | | 0 | | | | 1,551 | |
| | | | $ | 0 | | | $ | 253,586 | | | $ | 0 | | | $ | 253,586 | |
| (1) | See note 3 in the Notes to Financial Statements for more information regarding pricing inputs and valuation techniques. |
| (2) | There were no significant transfers into or out of level 1, 2, and 3 during the period ended June 30, 2012. |
| (3) | Refer to the Schedule of Investments for additional information. |
| (4) | Quoted prices in active markets for identical investments. |
| (5) | Significant other observable inputs. |
| (6) | Significant unobservable inputs. |
| | | | | | |
| See Accompanying Notes | | ANNUAL REPORT | | JUNE 30, 2012 | | 57 |
Schedule of Investments PIMCO Investment Grade Corporate Bond Index Fund (Cont.)
June 30, 2012
| (c) | Fair Value of Financial Derivative Instruments (1) |
The following is a summary of the fair valuation of the Fund’s derivative instruments categorized by risk exposure:
The Effect of Financial Derivative Instruments on the Statements of Operations for the Period Ended June 30, 2012:
| | | | | | | | | | | | | | | | | | | | | | | | | | |
| | | | | Derivatives not accounted for as hedging instruments | |
| | | | | Commodity
Contracts | | | Credit
Contracts | | | Equity
Contracts | | | Foreign
Exchange
Contracts | | | Interest
Rate Contracts | | | Total | |
Realized (Loss) on Derivatives Recognized as a Result from Operations: | | | | | | | | | | | | | | | | | | | | | | | | | | |
Net realized (loss) on futures contracts | | | | $ | 0 | | | $ | 0 | | | $ | 0 | | | $ | 0 | | | $ | (8 | ) | | $ | (8 | ) |
Net realized (loss) on swaps | | | | | 0 | | | | (14 | ) | | | 0 | | | | 0 | | | | 0 | | | | (14 | ) |
| | | | $ | 0 | | | $ | (14 | ) | | $ | 0 | | | $ | 0 | | | $ | (8 | ) | | $ | (22 | ) |
| (1) | See note 6 in the Notes to Financial Statements for additional information. |
| | | | | | |
| 58 | | PIMCO ETF TRUST | | | | See Accompanying Notes |
Schedule of Investments PIMCO Australia Bond Index Fund
June 30, 2012
| | | | | | | | | | | | |
| | | | | PRINCIPAL
AMOUNT
(000s) | | | | | MARKET
VALUE
(000s) | |
AUSTRALIA 64.4% | |
| |
CORPORATE BONDS & NOTES 14.1% | |
|
Australia & New Zealand Banking Group Ltd. | |
6.750% due 05/09/2016 | | AUD | | | 500 | | | $ | | | 548 | |
| |
Commonwealth Bank of Australia | | | | |
6.500% due 07/21/2015 | | | | | 500 | | | | | | 542 | |
| |
National Australia Bank Ltd. | | | | |
5.750% due 12/19/2013 | | | | | 500 | | | | | | 529 | |
7.250% due 03/07/2018 | | | | | 500 | | | | | | 565 | |
| |
Telstra Corp. Ltd. | | | | |
6.250% due 04/15/2015 | | | | | 700 | | | | | | 752 | |
| |
Westpac Banking Corp. | | | | |
6.500% due 11/09/2015 | | | | | 500 | | | | | | 543 | |
| |
Woolworths Ltd. | | | | |
6.000% due 03/21/2019 | | | | | 500 | | | | | | 539 | |
| | | | | | | | | | | | |
| | | | | | | | | | | 4,018 | |
| | | | | | | | | | | | |
| |
SOVEREIGN ISSUES 50.3% | |
| |
Australia Government Bond | | | | |
4.250% due 07/21/2017 | | | | | 500 | | | | | | 552 | |
4.750% due 04/21/2027 | | | | | 500 | | | | | | 593 | |
5.250% due 03/15/2019 | | | | | 600 | | | | | | 708 | |
5.500% due 04/21/2023 | | | | | 600 | | | | | | 747 | |
5.750% due 05/15/2021 | | | | | 300 | | | | | | 374 | |
| |
New South Wales Treasury Corp. | | | | |
5.500% due 08/01/2013 | | | | | 1,100 | | | | | | 1,154 | |
6.000% due 04/01/2016 | | | | | 1,000 | | | | | | 1,118 | |
6.000% due 02/01/2018 | | | | | 1,500 | | | | | | 1,715 | |
| |
Northern Territory Treasury Corp. | | | | |
6.250% due 10/20/2015 | | | | | 500 | | | | | | 554 | |
| | | | | | | | | | | | |
| | | | | PRINCIPAL
AMOUNT
(000s) | | | | | MARKET
VALUE
(000s) | |
|
Queensland Treasury Corp. | |
5.500% due 06/21/2021 | | AUD | | | 1,600 | | | $ | | | 1,763 | |
6.250% due 02/21/2020 | | | | | 700 | | | | | | 805 | |
|
South Australian Government Financing Authority | |
5.750% due 09/20/2017 | | | | | 1,000 | | | | | | 1,111 | |
|
Tasmanian Public Finance | |
5.500% due 06/23/2014 | | | | | 300 | | | | | | 320 | |
|
Treasury Corp. of Victoria | |
5.500% due 11/15/2018 | | | | | 900 | | | | | | 1,014 | |
5.500% due 12/17/2024 | | | | | 1,200 | | | | | | 1,380 | |
|
Western Australia Treasury Corp. | |
5.500% due 04/23/2014 | | | | | 400 | | | | | | 427 | |
| | | | | | | | | | | | |
| | | | | | | | | | | 14,335 | |
| | | | | | | | | | | | |
Total Australia
(Cost $17,739) | | | | | | | | | | | 18,353 | |
| | | | | | | | | | | | |
| |
GERMANY 3.8% | |
| |
CORPORATE BONDS & NOTES 3.8% | |
|
KFW | |
6.000% due 01/19/2016 | | | | | 1,000 | | | | | | 1,100 | |
| | | | | | | | | | | | |
Total Germany
(Cost $1,099) | | | | | | | | | | | 1,100 | |
| | | | | | | | | | | | |
| |
NETHERLANDS 1.9% | |
| |
CORPORATE BONDS & NOTES 1.9% | |
|
Rabobank Group | |
6.500% due 04/20/2015 | | | | | 500 | | | | | | 535 | |
| | | | | | | | | | | | |
Total Netherlands
(Cost $540) | | | | | | | | | | | 535 | |
| | | | | | | | | | | | |
| | | | | | | | | | | | |
| | | | | PRINCIPAL
AMOUNT
(000s) | | | | | MARKET
VALUE
(000s) | |
SUPRANATIONAL 17.1% | |
| |
CORPORATE BONDS & NOTES 17.1% | |
|
Asian Development Bank | |
5.250% due 05/13/2014 | | AUD | | | 500 | | | $ | | | 530 | |
6.000% due 02/22/2018 | | | | | 500 | | | | | | 571 | |
|
Council of Europe Development Bank | |
6.000% due 10/08/2020 | | | | | 500 | | | | | | 549 | |
|
European Investment Bank | |
6.250% due 06/08/2021 | | | | | 500 | | | | | | 557 | |
|
Inter-American Development Bank | |
5.375% due 05/27/2014 | | | | | 1,000 | | | | | | 1,064 | |
|
International Finance Corp. | |
5.750% due 06/24/2014 | | | | | 1,500 | | | | | | 1,610 | |
| | | | | | | | | | | | |
Total Supranational
(Cost $4,776) | | | | | | | | | | | 4,881 | |
| | | | | | | | | | | | |
| |
UNITED KINGDOM 2.7% | |
| |
CORPORATE BONDS & NOTES 2.7% | |
|
HSBC Bank PLC | |
6.750% due 03/12/2015 | | | | | 700 | | | | | | 758 | |
| | | | | | | | | | | | |
Total United Kingdom
(Cost $733) | | | | | | | | | | | 758 | |
| | | | | | | | | | | | |
| |
| | | | | | | | | | | | |
Total Investments 89.9%
(Cost $24,887) | | | | | | | | $ | | | 25,627 | |
| |
Other Assets and Liabilities (Net) 10.1% | | | 2,894 | |
| | | | | | | | | | | | |
Net Assets 100.0% | | | | | | | | $ | | | 28,521 | |
| | | | | | | | | | | | |
Notes to Schedule of Investments (amounts in thousands):
| (a) | Foreign currency contracts outstanding on June 30, 2012: |
| | | | | | | | | | | | | | | | | | | | | | | | | | |
Settlement
Month | | | Currency to
be Delivered | | | Currency to
be Received | | | Counterparty | | | Unrealized
Appreciation | | | Unrealized
(Depreciation) | | | Net Unrealized
Appreciation/
(Depreciation) | |
| | 07/2012 | | | $ | 14 | | | | AUD 14 | | | | BPS | | | $ | 1 | | | $ | 0 | | | $ | 1 | |
| (b) | Fair Value Measurements (1) |
The following is a summary of the fair valuations according to the inputs used as of June 30, 2012 in valuing the Fund’s assets and liabilities (2):
| | | | | | | | | | | | | | | | | | |
| Category and Subcategory (3) | | | | Level 1 (4) | | | Level 2 (5) | | | Level 3 (6) | | | Fair Value at
06/30/2012 | |
Investments, at value | | | | | | | | | | | | | | | | | | |
Australia | | | | | | | | | | | | | | | | | | |
Corporate Bonds & Notes | | | | $ | 0 | | | $ | 4,018 | | | $ | 0 | | | $ | 4,018 | |
Sovereign Issues | | | | | 0 | | | | 14,335 | | | | 0 | | | | 14,335 | |
Germany | | | | | | | | | | | | | | | | | | |
Corporate Bonds & Notes | | | | | 0 | | | | 1,100 | | | | 0 | | | | 1,100 | |
Netherlands | | | | | | | | | | | | | | | | | | |
Corporate Bonds & Notes | | | | | 0 | | | | 535 | | | | 0 | | | | 535 | |
Supranational | | | | | | | | | | | | | | | | | | |
Corporate Bonds & Notes | | | | | 0 | | | | 4,881 | | | | 0 | | | | 4,881 | |
United Kingdom | | | | | | | | | | | | | | | | | | |
Corporate Bonds & Notes | | | | | 0 | | | | 758 | | | | 0 | | | | 758 | |
| | | | | $ | 0 | | | $ | 25,627 | | | $ | 0 | | | $ | 25,627 | |
| | | | | | |
| See Accompanying Notes | | ANNUAL REPORT | | JUNE 30, 2012 | | 59 |
Schedule of Investments PIMCO Australia Bond Index Fund (Cont.)
June 30, 2012
| | | | | | | | | | | | | | | | | | |
| Category and Subcategory (3) | | | | Level 1 (4) | | | Level 2 (5) | | | Level 3 (6) | | | Fair Value at
06/30/2012 | |
Financial Derivative Instruments (7) - Assets | | | | | | | | | | | | | | | | | | |
Foreign Exchange Contracts | | | | $ | 0 | | | $ | 1 | | | $ | 0 | | | $ | 1 | |
Totals | | | | $ | 0 | | | $ | 25,628 | | | $ | 0 | | | $ | 25,628 | |
| (1) | See note 3 in the Notes to Financial Statements for more information regarding pricing inputs and valuation techniques. |
| (2) | There were no significant transfers into or out of level 1, 2, and 3 during the period ended June 30, 2012. |
| (3) | Refer to the Schedule of Investments for additional information. |
| (4) | Quoted prices in active markets for identical investments. |
| (5) | Significant other observable inputs. |
| (6) | Significant unobservable inputs. |
| (7) | Financial Derivative Instruments may include open futures contracts, swap agreements, written options, and foreign currency contracts. |
| (c) | Fair Value of Financial Derivative Instruments (1) |
The following is a summary of the fair valuation of the Fund’s derivative instruments categorized by risk exposure:
Fair Values of Financial Derivative Instruments on the Statements of Assets and Liabilities as of June 30, 2012:
| | | | | | | | | | | | | | | | | | | | | | | | | | |
| | | | | Derivatives not accounted for as hedging instruments | |
| | | | | Commodity
Contracts | | | Credit
Contracts | | | Equity
Contracts | | | Foreign
Exchange
Contracts | | | Interest
Rate Contracts | | | Total | |
Assets: | | | | | | | | | | | | | | | | | | | | | | | | | | |
Unrealized appreciation on foreign currency contracts | | | | $ | 0 | | | $ | 0 | | | $ | 0 | | | $ | 1 | | | $ | 0 | | | $ | 1 | |
The Effect of Financial Derivative Instruments on the Statements of Operations for the Period Ended June 30, 2012:
| | | | | | | | | | | | | | | | | | | | | | | | | | |
| | | | | Derivatives not accounted for as hedging instruments | |
| | | | | Commodity
Contracts | | | Credit
Contracts | | | Equity
Contracts | | | Foreign
Exchange
Contracts | | | Interest
Rate Contracts | | | Total | |
Realized (Loss) on Derivatives Recognized as a Result from Operations: | | | | | | | | | | | | | | | | | | | | | | | | | | |
Net realized (loss) on foreign currency transactions | | | | $ | 0 | | | $ | 0 | | | $ | 0 | | | $ | (261 | ) | | $ | 0 | | | $ | (261 | ) |
| | | | | | | |
Net Change in Unrealized Appreciation on Derivatives Recognized as a Result of Operations: | | | | | | | | | | | | | | | | | | | | | | | | | | |
Net change in unrealized appreciation on translation of assets and liabilities denominated in foreign currencies | | | | $ | 0 | | | $ | 0 | | | $ | 0 | | | $ | 1 | | | $ | 0 | | | $ | 1 | |
| (1) | See note 6 in the Notes to Financial Statements for additional information. |
| (d) | Collateral (Received)/Pledged for OTC Financial Derivative Instruments |
The following is a summary by counterparty of the market value of OTC financial derivative instruments and collateral (received)/pledged as of June 30, 2012:
| | | | | | | | | | | | | | |
| Counterparty | | | | Total Market
Value of OTC
Derivatives | | | Collateral
(Received)/
Pledged | | | Net
Exposures (1) | |
BPS | | | | $ | 1 | | | $ | 0 | | | $ | 1 | �� |
| (1) | Net Exposure represents the net receivable/(payable) that would be due from/to the counterparty in the event of default. See note 7, Principal Risks, in the Notes to Financial Statements for more information regarding credit and counterparty risks. |
| | | | | | |
| 60 | | PIMCO ETF TRUST | | | | See Accompanying Notes |
Schedule of Investments PIMCO Canada Bond Index Fund
June 30, 2012
| | | | | | | | | | | | |
| | | | | PRINCIPAL
AMOUNT
(000s) | | | | | MARKET
VALUE
(000s) | |
CANADA 97.5% | |
| |
SOVEREIGN ISSUES 97.5% | |
| |
Alberta Capital Finance Authority | | | | |
4.650% due 06/15/2017 | | CAD | | | 385 | | | $ | | | 429 | |
| |
Canada Government Bond | | | | |
2.000% due 06/01/2016 | | | | | 620 | | | | | | 627 | |
2.000% due 12/01/2041 (a) | | | | | 231 | | | | | | 324 | |
2.500% due 09/01/2013 | | | | | 1,940 | | | | | | 1,938 | |
4.000% due 06/01/2041 | | | | | 420 | | | | | | 557 | |
| |
Canada Housing Trust | | | | |
2.750% due 06/15/2016 | | | | | 970 | | | | | | 999 | |
| |
Canada Post Corp. | | | | |
4.080% due 07/16/2025 | | | | | 210 | | | | | | 244 | |
| |
City of Montreal Canada | | | | |
5.450% due 12/01/2019 | | | | | 655 | | | | | | 749 | |
| |
City of Toronto Canada | | | | |
4.500% due 12/02/2019 | | | | | 690 | | | | | | 759 | |
| |
Hydro Quebec | | | | |
5.000% due 02/15/2045 | | | | | 690 | | | | | | 871 | |
| | | | | | | | | | | | |
| | | | | PRINCIPAL
AMOUNT
(000s) | | | | | MARKET
VALUE
(000s) | |
| |
Municipal Finance Authority of British Columbia | | | | |
3.100% due 06/01/2014 | | CAD | | | 830 | | | $ | | | 842 | |
| |
Province of Alberta | | | | |
2.750% due 12/01/2014 | | | | | 35 | | | | | | 36 | |
4.000% due 12/01/2019 | | | | | 350 | | | | | | 387 | |
| |
Province of British Columbia | | | | |
4.100% due 12/18/2019 | | | | | 530 | | | | | | 587 | |
4.300% due 06/18/2042 | | | | | 260 | | | | | | 304 | |
| |
Province of Manitoba | | | | |
4.400% due 09/05/2025 | | | | | 725 | | | | | | 819 | |
| |
Province of New Brunswick | | | | |
4.500% due 06/02/2020 | | | | | 725 | | | | | | 811 | |
| |
Province of Newfoundland | | | | |
4.650% due 10/17/2040 | | | | | 595 | | | | | | 714 | |
| |
Province of Nova Scotia | | | | |
4.100% due 06/01/2021 | | | | | 490 | | | | | | 537 | |
4.400% due 06/01/2042 | | | | | 280 | | | | | | 323 | |
| | | | | | | | | | | | |
| | | | | PRINCIPAL
AMOUNT
(000s) | | | | | MARKET
VALUE
(000s) | |
| |
Province of Ontario | | | | |
4.000% due 06/02/2021 | | CAD | | | 420 | | | $ | | | 457 | |
4.650% due 06/02/2041 | | | | | 490 | | | | | | 590 | |
5.375% due 12/02/2012 | | | | | 420 | | | | | | 420 | |
5.850% due 03/08/2033 | | | | | 865 | | | | | | 1,156 | |
| |
Province of Quebec | | | | |
3.500% due 12/01/2022 | | | | | 830 | | | | | | 858 | |
5.000% due 12/01/2041 | | | | | 140 | | | | | | 174 | |
| |
Province of Saskatchewan | | | | |
5.800% due 09/05/2033 | | | | | 585 | | | | | | 802 | |
| |
Regional Municipality of Peel Ontario | | | | |
5.100% due 06/29/2040 | | | | | 280 | | | | | | 332 | |
| |
Regional Municipality of York | | | | |
4.000% due 06/30/2021 | | | | | 420 | | | | | | 446 | |
| | | | | | | | | | | | |
Total Canada
(Cost $17,773) | | | | | | 18,092 | |
| | | | | | | | | | | | |
| | | | | | | | | | | | |
Total Investments 97.5%
(Cost $17,773) | | | $ | | | 18,092 | |
| | | | |
Other Assets and Liabilities (Net) 2.5% | | | 472 | |
| | | | | | | | | | | | |
Net Assets 100.0% | | | $ | | | 18,564 | |
| | | | | | | | | | | | |
Notes to Schedule of Investments (amounts in thousands):
| (a) | Principal amount of security is adjusted for inflation. |
| (b) | Foreign currency contracts outstanding on June 30, 2012: |
| | | | | | | | | | | | | | | | | | | | | | | | | | |
Settlement
Month | | | Currency to
be Delivered | | | Currency to
be Received | | | Counterparty | | | Unrealized
Appreciation | | | Unrealized
(Depreciation) | | | Net Unrealized
Appreciation/
(Depreciation) | |
| | 07/2012 | | | $ | 27 | | | | CAD 28 | | | | BPS | | | $ | 1 | | | $ | 0 | | | $ | 1 | |
| (c) | Fair Value Measurements (1) |
The following is a summary of the fair valuations according to the inputs used as of June 30, 2012 in valuing the Fund’s assets and liabilities (2):
| | | | | | | | | | | | | | | | | | |
| Category and Subcategory (3) | | | | Level 1 (4) | | | Level 2 (5) | | | Level 3 (6) | | | Fair Value at
06/30/2012 | |
Investments, at value | | | | | | | | | | | | | | | | | | |
Canada | | | | | | | | | | | | | | | | | | |
Sovereign Issues | | | | $ | 0 | | | $ | 18,092 | | | $ | 0 | | | $ | 18,092 | |
| | | | | |
Financial Derivative Instruments (7) - Assets | | | | | | | | | | | | | | | | | | |
Foreign Exchange Contracts | | | | $ | 0 | | | $ | 1 | | | $ | 0 | | | $ | 1 | |
Totals | | | | $ | 0 | | | $ | 18,093 | | | $ | 0 | | | $ | 18,093 | |
| (1) | See note 3 in the Notes to Financial Statements for more information regarding pricing inputs and valuation techniques. |
| (2) | There were no significant transfers into or out of level 1, 2, and 3 during the period ended June 30, 2012. |
| (3) | Refer to the Schedule of Investments for additional information. |
| (4) | Quoted prices in active markets for identical investments. |
| (5) | Significant other observable inputs. |
| (6) | Significant unobservable inputs. |
| (7) | Financial Derivative Instruments may include open futures contracts, swap agreements, written options, and foreign currency contracts. |
| | | | | | |
| See Accompanying Notes | | ANNUAL REPORT | | JUNE 30, 2012 | | 61 |
Schedule of Investments PIMCO Canada Bond Index Fund (Cont.)
June 30, 2012
| (d) | Fair Value of Financial Derivative Instruments (1) |
The following is a summary of the fair valuation of the Fund’s derivative instruments categorized by risk exposure:
Fair Values of Financial Derivative Instruments on the Statements of Assets and Liabilities as of June 30, 2012:
| | | | | | | | | | | | | | | | | | | | | | | | | | |
| | | | | Derivatives not accounted for as hedging instruments | |
| | | | | Commodity
Contracts | | | Credit
Contracts | | | Equity
Contracts | | | Foreign
Exchange
Contracts | | | Interest
Rate Contracts | | | Total | |
Assets: | | | | | | | | | | | | | | | | | | | | | | | | | | |
Unrealized appreciation on foreign currency contracts | | | | $ | 0 | | | $ | 0 | | | $ | 0 | | | $ | 1 | | | $ | 0 | | | $ | 1 | |
The Effect of Financial Derivative Instruments on the Statements of Operations for the Period Ended June 30, 2012:
| | | | | | | | | | | | | | | | | | | | | | | | | | |
| | | | | Derivatives not accounted for as hedging instruments | |
| | | | | Commodity
Contracts | | | Credit
Contracts | | | Equity
Contracts | | | Foreign
Exchange
Contracts | | | Interest
Rate Contracts | | | Total | |
Realized (Loss) on Derivatives Recognized as a Result from Operations: | | | | | | | | | | | | | | | | | | | | | | | | | | |
Net realized (loss) on foreign currency transactions | | | | $ | 0 | | | $ | 0 | | | $ | 0 | | | $ | (6 | ) | | $ | 0 | | | $ | (6 | ) |
| | | | | | | |
Net Change in Unrealized Appreciation on Derivatives Recognized as a Result of Operations: | | | | | | | | | | | | | | | | | | | | | | | | | | |
Net change in unrealized appreciation on translation of assets and liabilities denominated in foreign currencies | | | | $ | 0 | | | $ | 0 | | | $ | 0 | | | $ | 1 | | | $ | 0 | | | $ | 1 | |
| (1) | See note 6 in the Notes to Financial Statements for additional information. |
| (e) | Collateral (Received)/Pledged for OTC Financial Derivative Instruments |
The following is a summary by counterparty of the market value of OTC financial derivative instruments and collateral (received)/pledged as of June 30, 2012:
| | | | | | | | | | | | | | |
| Counterparty | | | | Total Market
Value of OTC
Derivatives | | | Collateral
(Received)/
Pledged | | | Net
Exposures (1) | |
BPS | | | | $ | 1 | | | $ | 0 | | | $ | 1 | |
| (1) | Net Exposure represents the net receivable/(payable) that would be due from/to the counterparty in the event of default. See note 7, Principal Risks, in the Notes to Financial Statements for more information regarding credit and counterparty risks. |
| | | | | | |
| 62 | | PIMCO ETF TRUST | | | | See Accompanying Notes |
Schedule of Investments PIMCO Germany Bond Index Fund
June 30, 2012
| | | | | | | | | | | | |
| | | | | PRINCIPAL
AMOUNT
(000s) | | | | | MARKET
VALUE
(000s) | |
GERMANY 81.8% | |
| |
CORPORATE BONDS & NOTES 43.8% | |
|
Bayerische Landesbank | |
3.375% due 09/04/2017 | | EUR | | | 80 | | | $ | | | 111 | |
|
Deutsche Bank AG | |
5.125% due 08/31/2017 | | | | | 50 | | | | | | 72 | |
|
Deutsche Pfandbriefbank AG | |
3.750% due 05/31/2013 | | | | | 60 | | | | | | 78 | |
|
Deutsche Postbank AG | |
3.750% due 02/12/2014 | | | | | 20 | | | | | | 27 | |
|
Dexia Kommunalbank Deutschland AG | |
1.875% due 03/11/2013 | | | | | 20 | | | | | | 25 | |
|
Duesseldorfer Hypothekenbank AG | |
1.875% due 12/13/2013 | | | | | 20 | | | | | | 26 | |
|
Eurogrid GmbH | |
3.875% due 10/22/2020 | | | | | 50 | | | | | | 68 | |
|
Eurohypo AG | |
3.750% due 03/24/2014 | | | | | 50 | | | | | | 66 | |
4.500% due 08/28/2013 | | | | | 60 | | | | | | 79 | |
|
Evonik Industries AG | |
7.000% due 10/14/2014 | | | | | 20 | | | | | | 28 | |
|
HSH Nordbank AG | |
4.375% due 02/18/2014 | | | | | 40 | | | | | | 54 | |
|
K+S AG | |
5.000% due 09/24/2014 | | | | | 10 | | | | | | 14 | |
|
KFW | |
2.500% due 01/17/2022 | | | | | 80 | | | | | | 106 | |
3.625% due 01/20/2020 | | | | | 30 | | | | | | 43 | |
4.375% due 07/04/2018 | | | | | 40 | | | | | | 59 | |
|
Landeskreditbank Baden-Wuerttemberg Foerderbank | |
4.125% due 04/15/2013 | | | | | 70 | | | | | | 91 | |
|
LBBW | |
3.750% due 02/12/2014 | | | | | 20 | | | | | | 27 | |
|
Merck Financial Services GmbH | |
3.375% due 03/24/2015 | | | | | 30 | | | | | | 40 | |
| | | | | | | | | | | | |
| | | | | PRINCIPAL
AMOUNT
(000s) | | | | | MARKET
VALUE
(000s) | |
|
Metro AG | |
7.625% due 03/05/2015 | | EUR | | | 10 | | | $ | | | 15 | |
|
Norddeutsche Landesbank | |
3.250% due 01/18/2021 | | | | | 40 | | | | | | 55 | |
|
ThyssenKrupp AG | |
8.000% due 06/18/2014 | | | | | 30 | | | | | | 41 | |
|
UniCredit Bank AG | |
2.625% due 05/31/2017 | | | | | 60 | | | | | | 80 | |
|
Voith GmbH | |
5.375% due 06/21/2017 | | | | | 10 | | | | | | 14 | |
|
Volkswagen Financial Services AG | |
6.875% due 01/15/2014 | | | | | 30 | | | | | | 41 | |
| | | | | | | | | | | | |
| | | | | | | | | | | 1,260 | |
| | | | | | | | | | | | |
| |
SOVEREIGN ISSUES 38.0% | |
|
Land Sachsen-Anhalt | |
4.000% due 09/26/2016 | | | | | 20 | | | | | | 28 | |
|
Republic of Germany | |
1.750% due 07/04/2022 | | | | | 100 | | | | | | 129 | |
2.250% due 09/04/2021 | | | | | 110 | | | | | | 148 | |
3.750% due 10/17/2013 | | | | | 70 | | | | | | 92 | |
3.750% due 01/04/2019 | | | | | 100 | | | | | | 149 | |
5.625% due 01/04/2028 | | | | | 20 | | | | | | 37 | |
|
State of Berlin | |
3.500% due 02/13/2014 | | | | | 90 | | | | | | 119 | |
|
State of Brandenburg | |
3.625% due 01/26/2015 | | | | | 30 | | | | | | 41 | |
|
State of Hesse | |
2.250% due 01/29/2014 | | | | | 70 | | | | | | 91 | |
|
State of North Rhine-Westphalia | |
2.875% due 05/20/2016 | | | | | 130 | | | | | | 175 | |
3.500% due 07/07/2021 | | | | | 60 | | | | | | 85 | |
| | | | | | | | | | | | |
| | | | | | | | | | | 1,094 | |
| | | | | | | | | | | | |
Total Germany
(Cost $2,441) | | | 2,354 | |
| | | | | | | | | | | | |
| |
| | | | | | | | | | | | |
| | | | | PRINCIPAL
AMOUNT
(000s) | | | | | MARKET
VALUE
(000s) | |
NETHERLANDS 15.9% | |
| |
CORPORATE BONDS & NOTES 15.9% | |
|
Bayer Capital Corp. BV | |
4.625% due 09/26/2014 | | EUR | | | 20 | | | $ | | | 27 | |
|
BMW Finance NV | |
8.875% due 09/19/2013 | | | | | 50 | | | | | | 69 | |
|
Deutsche Bahn Finance BV | |
4.875% due 03/12/2019 | | | | | 50 | | | | | | 74 | |
|
Deutsche Telekom International Finance BV | |
6.000% due 01/20/2017 | | | | | 10 | | | | | | 15 | |
7.500% due 01/24/2033 | | | | | 40 | | | | | | 73 | |
|
E.ON International Finance BV | |
4.875% due 01/28/2014 | | | | | 20 | | | | | | 27 | |
6.375% due 05/29/2017 | | | | | 10 | | | | | | 16 | |
|
Enbw International Finance BV | |
4.125% due 07/07/2015 | | | | | 30 | | | | | | 41 | |
|
Lanxess Finance BV | |
7.750% due 04/09/2014 | | | | | 20 | | | | | | 28 | |
|
Metro Finance BV | |
4.250% due 02/22/2017 | | | | | 20 | | | | | | 27 | |
|
RWE Finance BV | |
5.125% due 07/23/2018 | | | | | 20 | | | | | | 30 | |
|
Siemens Financieringsmaatschappij NV | |
5.625% due 06/11/2018 | | | | | 10 | | | | | | 15 | |
|
Volkswagen International Finance NV | |
7.000% due 02/09/2016 | | | | | 10 | | | | | | 15 | |
| | | | | | | | | | | | |
Total Netherlands
(Cost $475) | | | 457 | |
| | | | | | | | | | | | |
| |
| | | | | | | | | | | | |
Total Investments 97.7%
(Cost $2,916) | | | $ | | | 2,811 | |
| |
Other Assets and Liabilities (Net) 2.3% | | | | | | 66 | |
| | | | | | | | | | | | |
Net Assets 100.0% | | | $ | | | 2,877 | |
| | | | | | | | | | | | |
Notes to Schedule of Investments (amounts in thousands*):
| * | A zero balance may reflect actual amounts rounding to less than one thousand. |
| (a) | Foreign currency contracts outstanding on June 30, 2012: |
| | | | | | | | | | | | | | | | | | | | | | | | | | |
Settlement
Month | | | Currency to
be Delivered | | | Currency to
be Received | | | Counterparty | | | Unrealized
Appreciation | | | Unrealized
(Depreciation) | | | Net Unrealized
Appreciation/
(Depreciation) | |
| | 07/2012 | | | $ | 5 | | | | EUR 4 | | | | BPS | | | $ | 0 | | | $ | 0 | | | $ | 0 | |
| (b) | Fair Value Measurements (1) |
The following is a summary of the fair valuations according to the inputs used as of June 30, 2012 in valuing the Fund’s assets and liabilities (2):
| | | | | | | | | | | | | | | | | | |
| Category and Subcategory (3) | | | | Level 1 (4) | | | Level 2 (5) | | | Level 3 (6) | | | Fair Value at
06/30/2012 | |
Investments, at value | | | | | | | | | | | | | | | | | | |
Germany | | | | | | | | | | | | | | | | | | |
Corporate Bonds & Notes | | | | $ | 0 | | | $ | 1,260 | | | $ | 0 | | | $ | 1,260 | |
Sovereign Issues | | | | | 0 | | | | 1,094 | | | | 0 | | | | 1,094 | |
Netherlands | | | | | | | | | | | | | | | | | | |
Corporate Bonds & Notes | | | | | 0 | | | | 457 | | | | 0 | | | | 457 | |
| | | | $ | 0 | | | $ | 2,811 | | | $ | 0 | | | $ | 2,811 | |
| | | | | | |
| See Accompanying Notes | | ANNUAL REPORT | | JUNE 30, 2012 | | 63 |
Schedule of Investments PIMCO Germany Bond Index Fund (Cont.)
June 30, 2012
| (1) | See note 3 in the Notes to Financial Statements for more information regarding pricing inputs and valuation techniques. |
| (2) | There were no significant transfers into or out of level 1, 2, and 3 during the period ended June 30, 2012. |
| (3) | Refer to the Schedule of Investments for additional information. |
| (4) | Quoted prices in active markets for identical investments. |
| (5) | Significant other observable inputs. |
| (6) | Significant unobservable inputs. |
| (c) | Fair Value of Financial Derivative Instruments (1) |
The following is a summary of the fair valuation of the Fund’s derivative instruments categorized by risk exposure:
The Effect of Financial Derivative Instruments on the Statements of Operations for the Period Ended June 30, 2012:
| | | | | | | | | | | | | | | | | | | | | | | | | | |
| | | | | Derivatives not accounted for as hedging instruments | |
| | | | | Commodity
Contracts | | | Credit
Contracts | | | Equity
Contracts | | | Foreign
Exchange
Contracts | | | Interest
Rate Contracts | | | Total | |
Realized Gain (Loss) on Derivatives Recognized as a Result from Operations: | | | | | | | | | | | | | | | | | | | | | | | | | | |
Net realized gain on futures contracts | | | | $ | 0 | | | $ | 0 | | | $ | 0 | | | $ | 0 | | | $ | 10 | | | $ | 10 | |
Net realized (loss) on foreign currency transactions | | | | | 0 | | | | 0 | | | | 0 | | | | (51 | ) | | | 0 | | | | (51 | ) |
| | | | $ | 0 | | | $ | 0 | | | $ | 0 | | | $ | (51 | ) | | $ | 10 | | | $ | (41 | ) |
| (1) | See note 6 in the Notes to Financial Statements for additional information. |
| | | | | | |
| 64 | | PIMCO ETF TRUST | | | | See Accompanying Notes |
Schedule of Investments PIMCO Build America Bond Strategy Fund
June 30, 2012
| | | | | | | | | | | | |
| | | | | PRINCIPAL
AMOUNT
(000s) | | | | | MARKET
VALUE
(000s) | |
MUNICIPAL BONDS & NOTES 93.9% | |
| |
CALIFORNIA 39.3% | |
|
Alameda County, California Joint Powers Authority Revenue Bonds, (BABs), Series 2010 | |
7.046% due 12/01/2044 | | $ | | | 350 | | | $ | | | 441 | |
|
Bay Area Toll Authority, California Revenue Bonds, (BABs), Series 2010 | |
7.043% due 04/01/2050 | | | | | 1,500 | | | | | | 2,123 | |
|
Los Angeles County, California Public Works Financing Authority Revenue Bonds, (BABs), Series 2010 | |
7.488% due 08/01/2033 | | | | | 1,000 | | | | | | 1,231 | |
|
Los Angeles Department of Airports, California Revenue Bonds, (BABs), Series 2009 | |
6.582% due 05/15/2039 | | | | | 740 | | | | | | 945 | |
|
Los Angeles Unified School District, California General Obligation Bonds, (BABs), Series 2010 | |
6.758% due 07/01/2034 | | | | | 130 | | | | | | 168 | |
|
Los Angeles Wastewater System, California Revenue Bonds, (BABs), Series 2010 | |
5.813% due 06/01/2040 | | | | | 450 | | | | | | 544 | |
|
Metropolitan Water District of Southern California Revenue Bonds, (BABs), Series 2010 | |
6.947% due 07/01/2040 | | | | | 500 | | | | | | 603 | |
|
Orange County, California Sanitation District Revenue Bonds, (BABs), Series 2010 | |
6.400% due 02/01/2044 | | | | | 500 | | | | | | 677 | |
|
Sacramento Municipal Utility District, California Revenue Bonds, (BABs), Series 2010 | |
6.156% due 05/15/2036 | | | | | 1,000 | | | | | | 1,211 | |
|
San Diego County, California Regional Airport Authority Revenue Bonds, (BABs), Series 2010 | |
6.628% due 07/01/2040 | | | | | 800 | | | | | | 879 | |
|
University of California Revenue Bonds, (BABs), Series 2009 | |
6.583% due 05/15/2049 | | | | | 3,450 | | | | | | 4,525 | |
|
University of California Revenue Bonds, (BABs), Series 2010 | |
6.296% due 05/15/2050 | | | | | 500 | | | | | | 594 | |
6.548% due 05/15/2048 | | | | | 500 | | | | | | 656 | |
| | | | | | | | | | | | |
| | | | | | | | | | | 14,597 | |
| | | | | | | | | | | | |
| |
DISTRICT OF COLUMBIA 2.4% | |
|
Metropolitan Washington Airports Authority, District of Columbia Revenue Bonds, (BABs), Series 2009 | |
7.462% due 10/01/2046 | | | | | 756 | | | | | | 897 | |
| | | | | | | | | | | | |
| |
GEORGIA 2.5% | |
|
Municipal Electric Authority of Georgia Revenue Bonds, (BABs), Series 2010 | |
6.655% due 04/01/2057 | | | | | 800 | | | | | | 918 | |
| | | | | | | | | | | | |
| | | | | | | | | | | | |
| | | | | PRINCIPAL
AMOUNT
(000s) | | | | | MARKET
VALUE
(000s) | |
ILLINOIS 12.5% | |
|
Chicago Transit Authority, Illinois Revenue Bonds, Series 2008 | |
6.899% due 12/01/2040 | | $ | | | 1,000 | | | $ | | | 1,191 | |
|
Greater Chicago Metropolitan Water Reclamation District, Illinois General Obligation Bonds, (BABs), Series 2009 | |
5.720% due 12/01/2038 | | | | | 2,095 | | | | | | 2,648 | |
|
Illinois State Toll Highway Authority Revenue Bonds, (BABs), Series 2009 | |
6.184% due 01/01/2034 | | | | | 655 | | | | | | 813 | |
| | | | | | | | | | | | |
| | | | | | | | | | | 4,652 | |
| | | | | | | | | | | | |
| |
MINNESOTA 1.4% | |
|
Southern Minnesota Municipal Power Agency Revenue Bonds, (BABs), Series 2010 | |
5.926% due 01/01/2043 | | | | | 450 | | | | | | 515 | |
| | | | | | | | | | | | |
| |
NEBRASKA 1.0% | |
|
Public Power Generation Agency, Nebraska Revenue Bonds, (BABs), Series 2009 | |
7.242% due 01/01/2041 | | | | | 300 | | | | | | 356 | |
| | | | | | | | | | | | |
| |
NEW JERSEY 7.8% | |
|
New Jersey State Turnpike Authority Revenue Bonds, (BABs), Series 2010 | |
7.102% due 01/01/2041 | | | | | 1,090 | | | | | | 1,538 | |
|
New Jersey Transportation Trust Fund Authority Revenue Bonds, (BABs), Series 2010 | |
6.561% due 12/15/2040 | | | | | 1,000 | | | | | | 1,341 | |
| | | | | | | | | | | | |
| | | | | | | | | | | 2,879 | |
| | | | | | | | | | | | |
| |
NEW YORK 14.1% | |
|
Metropolitan Transportation Authority, New York Revenue Bonds, (BABs), Series 2009 | |
5.871% due 11/15/2039 | | | | | 1,000 | | | | | | 1,157 | |
|
Metropolitan Transportation Authority, New York Revenue Bonds, (BABs), Series 2010 | |
6.548% due 11/15/2031 | | | | | 500 | | | | | | 617 | |
6.668% due 11/15/2039 | | | | | 1,200 | | | | | | 1,540 | |
|
New York City, New York Municipal Water Finance Authority Revenue Bonds, (BABs), Series 2009 | |
5.750% due 06/15/2041 | | | | | 800 | | | | | | 1,022 | |
|
New York City, New York Municipal Water Finance Authority Revenue Bonds, (BABs), Series 2010 | |
5.440% due 06/15/2043 | | | | | 700 | | | | | | 876 | |
| | | | | | | | | | | | |
| | | | | | | | | | | 5,212 | |
| | | | | | | | | | | | |
| | | | | | | | | | | | |
| | | | | PRINCIPAL
AMOUNT
(000s) | | | | | MARKET
VALUE
(000s) | |
OHIO 3.9% | |
|
American Municipal Power, Inc. Ohio Revenue Bonds, (BABs), Series 2010 | |
8.084% due 02/15/2050 | | $ | | | 1,000 | | | $ | | | 1,436 | |
| | | | | | | | | | | | |
| |
PENNSYLVANIA 3.2% | |
|
Pennsylvania Turnpike Commission Revenue Bonds, (BABs), Series 2010 | |
5.511% due 12/01/2045 | | | | | 1,000 | | | | | | 1,183 | |
| | | | | | | | | | | | |
| |
TEXAS 4.0% | |
|
Dallas Convention Center Hotel Development Corp., Texas Revenue Bonds, (BABs), Series 2009 | |
7.088% due 01/01/2042 | | | | | 290 | | | | | | 344 | |
|
North Texas Tollway Authority Revenue Bonds, (BABs), Series 2010 | |
8.910% due 02/01/2030 | | | | | 1,000 | | | | | | 1,154 | |
| | | | | | | | | | | | |
| | | | | | | | | | | 1,498 | |
| | | | | | | | | | | | |
| |
WASHINGTON 1.8% | |
|
Washington Biomedical Research Facilities 3 Revenue Bonds, (BABs), Series 2010 | |
6.516% due 07/01/2042 | | | | | 500 | | | | | | 681 | |
| | | | | | | | | | | | |
Total Municipal Bonds & Notes
(Cost $32,241) | | | | | | | | | | | 34,824 | |
| | | | | | | | | | | | |
| |
SHORT-TERM INSTRUMENTS 5.4% | |
| |
REPURCHASE AGREEMENTS 5.1% | |
| | | | |
JPMorgan Securities, Inc. | | | | | | | | | | | | |
0.200% due 07/02/2012 | | | | | 1,700 | | | | | | 1,700 | |
(Dated 06/29/2012. Collateralized by U.S. Treasury Notes 1.500% due 07/31/2016 valued at $1,736. Repurchase proceeds are $1,700.) | |
|
State Street Bank and Trust Co. | |
0.010% due 07/02/2012 | | | | | 201 | | | | | | 201 | |
(Dated 06/29/2012. Collateralized by U.S. Treasury Bonds 5.375% due 02/15/2031 valued at $207. Repurchase proceeds are $201.) | |
| | | | | | | | | | | | |
| | | | | | | | | | | 1,901 | |
| | | | | | | | | | | | |
| |
U.S. TREASURY BILLS 0.3% | |
0.183% due 05/30/2013 | | | | | 100 | | | | | | 100 | |
| | | | | | | | | | | | |
| |
Total Short-Term Instruments
(Cost $2,001) | | | | | | | | | | | 2,001 | |
| | | | | | | | | | | | |
| |
| | | | | | | | | | | | |
Total Investments 99.3%
(Cost $34,242) | | | | | | | | $ | | | 36,825 | |
| |
Other Assets and Liabilities (Net) 0.7% | | | | | | 276 | |
| | | | | | | | | | | | |
Net Assets 100.0% | | | | | | | | $ | | | 37,101 | |
| | | | | | | | | | | | |
Notes to Schedule of Investments (amounts in thousands):
| (a) | Fair Value Measurements (1) |
The following is a summary of the fair valuations according to the inputs used as of June 30, 2012 in valuing the Fund’s assets and liabilities (2):
| | | | | | | | | | | | | | | | | | |
| Category and Subcategory (3) | | | | Level 1 (4) | | | Level 2 (5) | | | Level 3 (6) | | | Fair Value at
06/30/2012 | |
Investments, at value | | | | | | | | | | | | | | | | | | |
Municipal Bonds & Notes | | | | | | | | | | | | | | | | | | |
California | | | | $ | 0 | | | $ | 14,597 | | | $ | 0 | | | $ | 14,597 | |
District of Columbia | | | | | 0 | | | | 897 | | | | 0 | | | | 897 | |
Georgia | | | | | 0 | | | | 918 | | | | 0 | | | | 918 | |
Illinois | | | | | 0 | | | | 4,652 | | | | 0 | | | | 4,652 | |
| | | | | | |
| See Accompanying Notes | | ANNUAL REPORT | | JUNE 30, 2012 | | 65 |
Schedule of Investments PIMCO Build America Bond Strategy Fund (Cont.)
June 30, 2012
| | | | | | | | | | | | | | | | | | |
| Category and Subcategory (3) | | | | Level 1 (4) | | | Level 2 (5) | | | Level 3 (6) | | | Fair Value at
06/30/2012 | |
Minnesota | | | | $ | 0 | | | $ | 515 | | | $ | 0 | | | $ | 515 | |
Nebraska | | | | | 0 | | | | 356 | | | | 0 | | | | 356 | |
New Jersey | | | | | 0 | | | | 2,879 | | | | 0 | | | | 2,879 | |
New York | | | | | 0 | | | | 5,212 | | | | 0 | | | | 5,212 | |
Ohio | | | | | 0 | | | | 1,436 | | | | 0 | | | | 1,436 | |
Pennsylvania | | | | | 0 | | | | 1,183 | | | | 0 | | | | 1,183 | |
Texas | | | | | 0 | | | | 1,498 | | | | 0 | | | | 1,498 | |
Washington | | | | | 0 | | | | 681 | | | | 0 | | | | 681 | |
Short-Term Instruments | | | | | | | | | | | | | | | | | | |
Repurchase Agreements | | | | | 0 | | | | 1,901 | | | | 0 | | | | 1,901 | |
U.S. Treasury Bills | | | | | 0 | | | | 100 | | | | 0 | | | | 100 | |
| | | | $ | 0 | | | $ | 36,825 | | | $ | 0 | | | $ | 36,825 | |
| (1) | See note 3 in the Notes to Financial Statements for more information regarding pricing inputs and valuation techniques. |
| (2) | There were no significant transfers into or out of level 1, 2, and 3 during the period ended June 30, 2012. |
| (3) | Refer to the Schedule of Investments for additional information. |
| (4) | Quoted prices in active markets for identical investments. |
| (5) | Significant other observable inputs. |
| (6) | Significant unobservable inputs. |
| | | | | | |
| 66 | | PIMCO ETF TRUST | | | | See Accompanying Notes |
Schedule of Investments PIMCO Enhanced Short Maturity Strategy Fund
June 30, 2012
| | | | | | | | | | | | |
| | | | | PRINCIPAL
AMOUNT
(000s) | | | | | MARKET
VALUE
(000s) | |
CORPORATE BONDS & NOTES 62.8% | |
| | | | | | | | | | | | |
BANKING & FINANCE 28.2% | |
| |
Achmea Hypotheekbank NV | | | | |
0.816% due 11/03/2014 | | $ | | | 500 | | | $ | | | 497 | |
| |
American Express Credit Corp. | | | | |
2.750% due 09/15/2015 | | | | | 4,100 | | | | | | 4,282 | |
| |
American Honda Finance Corp. | | | | |
0.916% due 05/08/2014 | | | | | 2,000 | | | | | | 2,004 | |
1.450% due 02/27/2015 | | | | | 13,775 | | | | | | 13,838 | |
| |
American International Group, Inc. | | | | |
3.750% due 11/30/2013 | | | | | 3,000 | | | | | | 3,038 | |
4.250% due 05/15/2013 | | | | | 4,000 | | | | | | 4,084 | |
| |
Arbejdernes Landsbank | | | | |
1.019% due 07/09/2013 | | | | | 2,500 | | | | | | 2,509 | |
| |
Bank of Montreal | | | | |
1.300% due 10/31/2014 | | | | | 7,500 | | | | | | 7,607 | |
| |
Bank of Nova Scotia | | | | |
1.250% due 11/07/2014 | | | | | 3,900 | | | | | | 3,952 | |
1.450% due 07/26/2014 | | | | | 7,575 | | | | | | 7,656 | |
1.750% due 03/22/2017 | | | | | 5,300 | | | | | | 5,415 | |
1.950% due 01/30/2017 | | | | | 1,400 | | | | | | 1,444 | |
| |
Boston Properties LP | | | | |
6.250% due 01/15/2013 | | | | | 630 | | | | | | 647 | |
| |
BRFkredit A/S | | | | |
0.717% due 04/15/2013 | | | | | 3,400 | | | | | | 3,401 | |
| |
Caisse Centrale Desjardins du Quebec | | | | |
1.600% due 03/06/2017 | | | | | 1,400 | | | | | | 1,417 | |
2.550% due 03/24/2016 | | | | | 10,000 | | | | | | 10,541 | |
| |
Canadian Imperial Bank of Commerce | | | | |
0.900% due 09/19/2014 | | | | | 16,480 | | | | | | 16,571 | |
1.500% due 12/12/2014 | | | | | 15,000 | | | | | | 15,283 | |
2.000% due 02/04/2013 | | | | | 25,000 | | | | | | 25,234 | |
2.600% due 07/02/2015 | | | | | 4,700 | | | | | | 4,947 | |
| |
Caterpillar Financial Services Corp. | | | | |
1.050% due 03/26/2015 | | | | | 2,210 | | | | | | 2,225 | |
| |
Citigroup, Inc. | | | | |
0.593% due 03/07/2014 | | | | | 2,175 | | | | | | 2,110 | |
| |
Commonwealth Bank of Australia | | | | |
0.916% due 07/23/2014 | | | | | 5,000 | | | | | | 5,027 | |
2.900% due 09/17/2014 | | | | | 6,000 | | | | | | 6,283 | |
| |
DanFin Funding Ltd. | | | | |
1.167% due 07/16/2013 | | | | | 28,500 | | | | | | 28,610 | |
| |
DNB Boligkreditt A/S | | | | |
2.100% due 10/14/2016 | | | | | 5,000 | | | | | | 5,107 | |
| |
EnCana Holdings Finance Corp. | | | | |
5.800% due 05/01/2014 | | | | | 9,320 | | | | | | 10,036 | |
| |
Export-Import Bank of Korea | | | | |
2.268% due 03/21/2015 | | | | | 7,000 | | | | | | 6,990 | |
| |
FIH Erhvervsbank A/S | | | | |
0.838% due 06/13/2013 | | | | | 5,400 | | | | | | 5,402 | |
| |
Ford Motor Credit Co. LLC | | | | |
7.000% due 10/01/2013 | | | | | 6,328 | | | | | | 6,768 | |
7.500% due 08/01/2012 | | | | | 400 | | | | | | 402 | |
8.700% due 10/01/2014 | | | | | 5,100 | | | | | | 5,819 | |
| |
General Electric Capital Corp. | | | | |
0.468% due 09/20/2013 | | | | | 1,000 | | | | | | 987 | |
0.588% due 06/20/2013 | | | | | 4,000 | | | | | | 3,932 | |
| |
Goldman Sachs Group, Inc. | | | | |
1.061% due 09/29/2014 | | | | | 1,225 | | | | | | 1,177 | |
1.466% due 07/29/2013 | | | | | 7,059 | | | | | | 7,024 | |
4.750% due 07/15/2013 | | | | | 7,025 | | | | | | 7,225 | |
| | | | | | | | | | | | |
| | | | | PRINCIPAL
AMOUNT
(000s) | | | | | MARKET
VALUE
(000s) | |
5.250% due 10/15/2013 | | $ | | | 580 | | | $ | | | 603 | |
5.500% due 11/15/2014 | | | | | 250 | | | | | | 264 | |
| |
HSBC Bank PLC | | | | |
1.625% due 07/07/2014 (a) | | | | | 6,900 | | | | | | 6,960 | |
| |
HSBC Finance Corp. | | | | |
0.717% due 01/15/2014 | | | | | 545 | | | | | | 539 | |
6.375% due 11/27/2012 | | | | | 9,971 | | | | | | 10,183 | |
| |
ICICI Bank Ltd. | | | | |
2.217% due 02/24/2014 | | | | | 400 | | | | | | 388 | |
6.625% due 10/03/2012 | | | | | 5,000 | | | | | | 5,055 | |
| |
John Deere Capital Corp. | | | | |
0.638% due 06/16/2014 | | | | | 600 | | | | | | 602 | |
0.705% due 04/25/2014 | | | | | 15,000 | | | | | | 15,022 | |
| |
Macquarie Bank Ltd. | | | | |
3.300% due 07/17/2014 | | | | | 4,000 | | | | | | 4,209 | |
4.100% due 12/17/2013 | | | | | 16,100 | | | | | | 16,919 | |
| |
Merrill Lynch & Co., Inc. | | | | |
5.450% due 02/05/2013 | | | | | 3,000 | | | | | | 3,061 | |
| |
Metropolitan Life Global Funding | | | | |
5.125% due 06/10/2014 | | | | | 3,902 | | | | | | 4,187 | |
| |
Monumental Global Funding Ltd. | | | | |
0.636% due 10/25/2013 | | | | | 1,250 | | | | | | 1,241 | |
| |
Morgan Stanley | | | | |
2.875% due 07/28/2014 | | | | | 250 | | | | | | 248 | |
| |
National Australia Bank Ltd. | | | | |
0.969% due 07/08/2014 | | | | | 11,300 | | | | | | 11,404 | |
| |
National Bank of Canada | | | | |
1.650% due 01/30/2014 | | | | | 6,800 | | | | | | 6,919 | |
| |
Nationwide Building Society | | | | |
5.500% due 07/18/2012 | | | | | 7,000 | | | | | | 7,014 | |
| |
Network Rail Infrastructure Finance PLC | | | | |
0.488% due 06/14/2013 | | | | | 8,000 | | | | | | 7,999 | |
| |
NIBC Bank NV | | | | |
0.847% due 12/02/2014 | | | | | 5,290 | | | | | | 5,246 | |
2.800% due 12/02/2014 | | | | | 6,400 | | | | | | 6,645 | |
| |
Nordea Bank AB | | | | |
1.367% due 01/14/2014 | | | | | 600 | | | | | | 600 | |
| |
Nordea Eiendomskreditt A/S | | | | |
0.889% due 04/07/2015 | | | | | 7,710 | | | | | | 7,708 | |
1.875% due 04/07/2014 | | | | | 13,925 | | | | | | 14,142 | |
| |
Pricoa Global Funding | | | | |
0.661% due 09/27/2013 | | | | | 3,600 | | | | | | 3,586 | |
| |
Prudential Covered Trust | | | | |
2.997% due 09/30/2015 | | | | | 12,000 | | | | | | 12,201 | |
| |
SLM Corp. | | | | |
5.125% due 08/27/2012 | | | | | 2,900 | | | | | | 2,911 | |
| |
SSIF Nevada LP | | | | |
1.167% due 04/14/2014 | | | | | 5,000 | | | | | | 4,969 | |
| |
Stadshypotek AB | | | | |
1.011% due 09/30/2013 | | | | | 11,010 | | | | | | 11,007 | |
1.450% due 09/30/2013 | | | | | 5,000 | | | | | | 5,041 | |
| |
Standard Chartered PLC | | | | |
1.417% due 05/12/2014 | | | | | 850 | | | | | | 850 | |
3.200% due 05/12/2016 | | | | | 3,260 | | | | | | 3,337 | |
3.850% due 04/27/2015 | | | | | 4,900 | | | | | | 5,130 | |
5.500% due 11/18/2014 | | | | | 350 | | | | | | 381 | |
| |
Svensk Exportkredit AB | | | | |
1.118% due 03/09/2015 | | | | | 15,000 | | | | | | 15,079 | |
1.217% due 08/14/2014 | | | | | 1,000 | | | | | | 1,002 | |
| | | | | | | | | | | | |
| | | | | PRINCIPAL
AMOUNT
(000s) | | | | | MARKET
VALUE
(000s) | |
| |
Swedbank Hypotek AB | | | | |
0.911% due 03/28/2014 | | $ | | | 12,230 | | | $ | | | 12,211 | |
2.950% due 03/28/2016 | | | | | 3,800 | | | | | | 3,962 | |
| |
TIAA Global Markets, Inc. | | | | |
4.950% due 07/15/2013 | | | | | 3,000 | | | | | | 3,119 | |
| |
Toronto-Dominion Bank | | | | |
0.875% due 09/12/2014 (a) | | | | | 9,700 | | | | | | 9,748 | |
1.625% due 09/14/2016 | | | | | 6,000 | | | | | | 6,120 | |
| |
Union Bank N.A. | | | | |
2.125% due 12/16/2013 | | | | | 2,700 | | | | | | 2,742 | |
| |
WCI Finance LLC | | | | |
5.400% due 10/01/2012 | | | | | 2,000 | | | | | | 2,020 | |
| |
Westpac Banking Corp. | | | | |
2.900% due 09/10/2014 | | | | | 1,000 | | | | | | 1,047 | |
| | | | | | | | | | | | |
| | | | | | | | | | | 483,112 | |
| | | | | | | | | | | | |
| |
INDUSTRIALS 28.4% | |
| |
Altria Group, Inc. | | | | |
8.500% due 11/10/2013 | | | | | 25 | | | | | | 28 | |
| |
Amgen, Inc. | | | | |
1.875% due 11/15/2014 | | | | | 10,000 | | | | | | 10,162 | |
2.300% due 06/15/2016 | | | | | 3,000 | | | | | | 3,087 | |
4.850% due 11/18/2014 | | | | | 3,200 | | | | | | 3,477 | |
| |
Anadarko Petroleum Corp. | | | | |
7.625% due 03/15/2014 | | | | | 3,000 | | | | | | 3,294 | |
| |
Anglo American Capital PLC | | | | |
2.150% due 09/27/2013 | | | | | 4,830 | | | | | | 4,868 | |
9.375% due 04/08/2014 | | | | | 8,539 | | | | | | 9,608 | |
| |
Anheuser-Busch InBev Worldwide, Inc. | | | | |
1.016% due 01/27/2014 | | | | | 7,770 | | | | | | 7,837 | |
2.500% due 03/26/2013 | | | | | 2,400 | | | | | | 2,434 | |
5.375% due 11/15/2014 | | | | | 3,100 | | | | | | 3,420 | |
| |
Barrick Gold Corp. | | | | |
1.750% due 05/30/2014 | | | | | 6,965 | | | | | | 7,054 | |
| |
Barrick Gold Financeco LLC | | | | |
6.125% due 09/15/2013 | | | | | 2,650 | | | | | | 2,815 | |
| |
BAT International Finance PLC | | | | |
8.125% due 11/15/2013 | | | 2,175 | | | | | | 2,373 | |
| |
BHP Billiton Finance USA Ltd. | | | | |
5.500% due 04/01/2014 | | | | | 1,230 | | | | | | 1,333 | |
| |
Boston Scientific Corp. | | | | |
4.500% due 01/15/2015 | | | | | 5,300 | | | | | | 5,652 | |
5.450% due 06/15/2014 | | | | | 10,213 | | | | | | 10,951 | |
|
Broadcom Corp. | |
1.500% due 11/01/2013 | | | | | 500 | | | | | | 506 | |
|
Canadian Natural Resources Ltd. | |
5.150% due 02/01/2013 | | | | | 4,128 | | | | | | 4,233 | |
5.450% due 10/01/2012 | | | | | 12,140 | | | | | | 12,282 | |
|
Canadian Oil Sands Ltd. | |
5.800% due 08/15/2013 | | | | | 1,000 | | | | | | 1,044 | |
|
Cisco Systems, Inc. | |
0.718% due 03/14/2014 | | | | | 50 | | | | | | 50 | |
|
Clorox Co. | |
5.000% due 03/01/2013 | | | | | 5,500 | | | | | | 5,656 | |
|
Comcast Cable Communications Holdings, Inc. | |
8.375% due 03/15/2013 | | | | | 6,400 | | | | | | 6,747 | |
|
Comcast Cable Holdings LLC | |
7.875% due 08/01/2013 | | | | | 1,000 | | | | | | 1,068 | |
|
Covidien International Finance S.A. | |
1.350% due 05/29/2015 | | | | | 5,500 | | | | | | 5,512 | |
1.875% due 06/15/2013 | | | | | 4,890 | | | | | | 4,939 | |
2.800% due 06/15/2015 | | | | | 2,000 | | | | | | 2,083 | |
| | | | | | |
| See Accompanying Notes | | ANNUAL REPORT | | JUNE 30, 2012 | | 67 |
Schedule of Investments PIMCO Enhanced Short Maturity Strategy Fund (Cont.)
| | | | | | | | | | | | |
| | | | | PRINCIPAL
AMOUNT
(000s) | | | | | MARKET
VALUE
(000s) | |
|
COX Communications, Inc. | |
4.625% due 06/01/2013 | | $ | | | 2,885 | | | $ | | | 2,987 | |
5.450% due 12/15/2014 | | | | | 4,700 | | | | | | 5,175 | |
5.500% due 10/01/2015 | | | | | 792 | | | | | | 892 | |
7.125% due 10/01/2012 | | | | | 4,265 | | | | | | 4,329 | |
|
CSN Islands Corp. | |
9.750% due 12/16/2013 | | | | | 2,900 | | | | | | 3,197 | |
|
CSX Corp. | |
5.300% due 02/15/2014 | | | | | 400 | | | | | | 426 | |
|
Daimler Finance North America LLC | |
1.071% due 03/28/2014 | | | | | 8,450 | | | | | | 8,434 | |
1.668% due 09/13/2013 | | | | | 1,500 | | | | | | 1,509 | |
|
Deutsche Telekom International Finance BV | |
5.250% due 07/22/2013 | | | | | 1,970 | | | | | | 2,057 | |
|
Diageo Capital PLC | |
7.375% due 01/15/2014 | | | | | 1,100 | | | | | | 1,211 | |
|
Dow Chemical Co. | |
6.000% due 10/01/2012 | | | | | 3,360 | | | | | | 3,401 | |
6.850% due 08/15/2013 | | | | | 3,060 | | | | | | 3,244 | |
7.600% due 05/15/2014 | | | | | 8,050 | | | | | | 8,966 | |
|
Eaton Corp. | |
0.798% due 06/16/2014 | | | | | 800 | | | | | | 803 | |
|
Encana Corp. | |
4.750% due 10/15/2013 | | | | | 4,200 | | | | | | 4,373 | |
|
Energy Transfer Partners LP | |
8.500% due 04/15/2014 | | | | | 689 | | | | | | 763 | |
|
Ensco PLC | |
3.250% due 03/15/2016 | | | | | 4,000 | | | | | | 4,205 | |
|
Enterprise Products Operating LLC | |
4.600% due 08/01/2012 | | | | | 6,000 | | | | | | 6,018 | |
5.900% due 04/15/2013 | | | | | 2,500 | | | | | | 2,589 | |
|
EOG Resources, Inc. | |
1.216% due 02/03/2014 | | | | | 1,020 | | | | | | 1,029 | |
6.125% due 10/01/2013 | | | | | 120 | | | | | | 128 | |
|
Express Scripts Holding Co. | |
2.750% due 11/21/2014 | | | | | 5,000 | | | | | | 5,111 | |
|
Gazprom OAO Via RBS AG | |
9.625% due 03/01/2013 | | | | | 3,180 | | | | | | 3,340 | |
|
General Mills, Inc. | |
0.816% due 05/16/2014 | | | | | 25 | | | | | | 25 | |
5.650% due 09/10/2012 | | | | | 1,052 | | | | | | 1,061 | |
|
Georgia-Pacific LLC | |
8.250% due 05/01/2016 | | | | | 6,400 | | | | | | 7,066 | |
|
Gilead Sciences, Inc. | |
2.400% due 12/01/2014 | | | | | 8,590 | | | | | | 8,859 | |
|
Harley-Davidson Funding Corp. | |
5.250% due 12/15/2012 | | | | | 8,600 | | | | | | 8,743 | |
|
Hewlett-Packard Co. | |
0.747% due 05/24/2013 | | | | | 500 | | | | | | 499 | |
|
Hutchison Whampoa International Ltd. | |
6.250% due 01/24/2014 | | | | | 1,000 | | | | | | 1,072 | |
6.500% due 02/13/2013 | | | | | 9,515 | | | | | | 9,821 | |
|
ICI Wilmington, Inc. | |
5.625% due 12/01/2013 | | | | | 2,000 | | | | | | 2,106 | |
|
International Business Machines Corp. | |
0.550% due 02/06/2015 | | | | | 1,150 | | | | | | 1,143 | |
|
Johnson Controls, Inc. | |
0.876% due 02/04/2014 | | | | | 9,850 | | | | | | 9,886 | |
|
Kinder Morgan Energy Partners LP | |
5.850% due 09/15/2012 | | | | | 9,150 | | | | | | 9,239 | |
|
Kraft Foods Group, Inc. | |
1.625% due 06/04/2015 | | | | | 1,500 | | | | | | 1,517 | |
| | | | | | | | | | | | |
| | | | | PRINCIPAL
AMOUNT
(000s) | | | | | MARKET
VALUE
(000s) | |
|
Kraft Foods, Inc. | |
1.344% due 07/10/2013 | | $ | | | 4,350 | | | $ | | | 4,367 | |
2.625% due 05/08/2013 | | | | | 3,500 | | | | | | 3,553 | |
5.250% due 10/01/2013 | | | | | 2,500 | | | | | | 2,633 | |
6.000% due 02/11/2013 | | | | | 3,150 | | | | | | 3,247 | |
6.750% due 02/19/2014 | | | | | 1,500 | | | | | | 1,644 | |
|
Kroger Co. | |
5.000% due 04/15/2013 | | | | | 2,400 | | | | | | 2,473 | |
|
Midcontinent Express Pipeline LLC | |
5.450% due 09/15/2014 | | | | | 2,000 | | | | | | 2,006 | |
|
NBCUniversal Media LLC | |
2.100% due 04/01/2014 | | | | | 3,500 | | | | | | 3,564 | |
2.875% due 04/01/2016 | | | | | 2,556 | | | | | | 2,669 | |
3.650% due 04/30/2015 | | | | | 1,300 | | | | | | 1,382 | |
|
Newell Rubbermaid, Inc. | |
2.000% due 06/15/2015 | | | | | 1,500 | | | | | | 1,506 | |
|
Nissan Motor Acceptance Corp. | |
3.250% due 01/30/2013 | | | | | 1,400 | | | | | | 1,414 | |
|
Occidental Petroleum Corp. | |
1.450% due 12/13/2013 | | | | | 160 | | | | | | 162 | |
|
Pearson Dollar Finance PLC | |
5.500% due 05/06/2013 | | | | | 5,240 | | | | | | 5,428 | |
5.700% due 06/01/2014 | | | | | 1,200 | | | | | | 1,286 | |
|
Pemex Project Funding Master Trust | |
1.067% due 12/03/2012 | | | | | 2,000 | | | | | | 1,996 | |
|
Penske Truck Leasing Co. LP | |
3.125% due 05/11/2015 | | | | | 2,950 | | | | | | 2,970 | |
3.750% due 05/11/2017 | | | | | 1,000 | | | | | | 1,009 | |
|
PepsiCo, Inc. | |
0.800% due 08/25/2014 | | | | | 700 | | | | | | 703 | |
|
Philip Morris International, Inc. | |
2.500% due 05/16/2016 | | | | | 90 | | | | | | 95 | |
4.875% due 05/16/2013 | | | | | 950 | | | | | | 985 | |
6.875% due 03/17/2014 | | | | | 12,155 | | | | | | 13,426 | |
|
Phillips 66 | |
1.950% due 03/05/2015 | | | | | 4,050 | | | | | | 4,082 | |
|
Rexam PLC | |
6.750% due 06/01/2013 | | | | | 3,000 | | | | | | 3,098 | |
|
Reynolds American, Inc. | |
7.250% due 06/01/2013 | | | | | 3,810 | | | | | | 4,023 | |
|
Rio Tinto Finance USA Ltd. | |
5.875% due 07/15/2013 | | | | | 1,075 | | | | | | 1,130 | |
8.950% due 05/01/2014 | | | | | 6,140 | | | | | | 7,015 | |
|
Rio Tinto Finance USA PLC | |
1.125% due 03/20/2015 | | | | | 4,000 | | | | | | 4,012 | |
|
Rockies Express Pipeline LLC | |
6.250% due 07/15/2013 | | | | | 3,000 | | | | | | 3,098 | |
|
Rogers Communications, Inc. | |
5.500% due 03/15/2014 | | | | | 2,870 | | | | | | 3,082 | |
6.250% due 06/15/2013 | | | | | 2,265 | | | | | | 2,380 | |
6.375% due 03/01/2014 | | | | | 4,075 | | | | | | 4,440 | |
|
SABMiller Holdings, Inc. | |
1.850% due 01/15/2015 | | | | | 10,000 | | | | | | 10,150 | |
|
Schlumberger Investment S.A. | |
1.018% due 09/12/2014 | | | | | 4,000 | | | | | | 4,006 | |
|
Spectra Energy Capital LLC | |
6.250% due 02/15/2013 | | | | | 5,000 | | | | | | 5,144 | |
|
Target Corp. | |
0.636% due 07/18/2014 | | | | | 500 | | | | | | 502 | |
|
Teck Resources Ltd. | |
7.000% due 09/15/2012 | | | | | 1,800 | | | | | | 1,820 | |
|
Telefonica Emisiones S.A.U. | |
0.796% due 02/04/2013 | | | | | 1,100 | | | | | | 1,078 | |
| | | | | | | | | | | | |
| | | | | PRINCIPAL
AMOUNT
(000s) | | | | | MARKET
VALUE
(000s) | |
|
Tesco PLC | |
2.000% due 12/05/2014 | | $ | | | 2,500 | | | $ | | | 2,527 | |
|
Teva Pharmaceutical Finance BV | |
0.968% due 03/21/2014 | | | | | 7,400 | | | | | | 7,417 | |
|
Teva Pharmaceutical Finance Co. BV | |
1.366% due 11/08/2013 | | | | | 7,894 | | | | | | 7,958 | |
|
Time Warner Cable, Inc. | |
5.400% due 07/02/2012 | | | | | 600 | | | | | | 600 | |
6.200% due 07/01/2013 | | | | | 4,000 | | | | | | 4,204 | |
|
Total Capital Canada Ltd. | |
0.846% due 01/17/2014 | | | | | 3,300 | | | | | | 3,317 | |
|
Total Capital S.A. | |
4.500% due 02/25/2013 | | | | | 7,000 | | | | | | 7,150 | |
|
Turner Broadcasting System, Inc. | |
8.375% due 07/01/2013 | | | | | 3,000 | | | | | | 3,205 | |
|
Tyco Electronics Group S.A. | |
6.000% due 10/01/2012 | | | | | 15,654 | | | | | | 15,856 | |
|
Union Pacific Corp. | |
5.125% due 02/15/2014 | | | | | 665 | | | | | | 709 | |
5.450% due 01/31/2013 | | | | | 2,500 | | | | | | 2,569 | |
|
United Technologies Corp. | |
0.737% due 12/02/2013 | | | | | 2,500 | | | | | | 2,510 | |
0.967% due 06/01/2015 | | | | | 3,200 | | | | | | 3,237 | |
|
UST LLC | |
6.625% due 07/15/2012 | | | | | 15,010 | | | | | | 15,035 | |
|
Verizon Wireless Capital LLC | |
7.375% due 11/15/2013 | | | | | 2,600 | | | | | | 2,824 | |
|
VF Corp. | |
1.217% due 08/23/2013 | | | | | 2,100 | | | | | | 2,101 | |
|
Vivendi S.A. | |
2.400% due 04/10/2015 | | | | | 3,000 | | | | | | 2,973 | |
|
Volkswagen International Finance NV | |
1.071% due 04/01/2014 | | | | | 10,730 | | | | | | 10,713 | |
1.625% due 08/12/2013 | | | | | 200 | | | | | | 202 | |
|
Wesfarmers Ltd. | |
2.983% due 05/18/2016 | | | | | 3,800 | | | | | | 3,917 | |
6.998% due 04/10/2013 | | | | | 1,400 | | | | | | 1,455 | |
|
WM Wrigley Jr. Co. | |
3.050% due 06/28/2013 | | | | | 1,785 | | | | | | 1,806 | |
|
Xerox Corp. | |
1.868% due 09/13/2013 | | | | | 650 | | | | | | 655 | |
|
Xstrata Canada Corp. | |
7.250% due 07/15/2012 | | | | | 9,431 | | | | | | 9,449 | |
| | | | | | | | | | | | |
| | | | | | | | | | | 487,704 | |
| | | | | | | | | | | | |
| |
UTILITIES 6.2% | |
|
AK Transneft OJSC Via TransCapitalInvest Ltd. | |
5.670% due 03/05/2014 | | | | | 3,250 | | | | | | 3,438 | |
|
Appalachian Power Co. | |
5.650% due 08/15/2012 | | | | | 2,900 | | | | | | 2,916 | |
|
BP Capital Markets PLC | |
3.125% due 10/01/2015 | | | | | 2,575 | | | | | | 2,740 | |
3.875% due 03/10/2015 | | | | | 6,535 | | | | | | 7,008 | |
|
Dominion Resources, Inc. | |
1.950% due 08/15/2016 | | | | | 2,445 | | | | | | 2,495 | |
5.000% due 03/15/2013 | | | | | 1,750 | | | | | | 1,802 | |
5.700% due 09/17/2012 | | | | | 9,460 | | | | | | 9,557 | |
|
Duke Energy Carolinas LLC | |
1.750% due 12/15/2016 | | | | | 9,000 | | | | | | 9,243 | |
5.625% due 11/30/2012 | | | | | 310 | | | | | | 316 | |
|
Gazprom OAO Via White Nights Finance BV | |
10.500% due 03/08/2014 | | | | | 800 | | | | | | 899 | |
10.500% due 03/25/2014 | | | | | 8,250 | | | | | | 9,268 | |
| | | | | | |
| 68 | | PIMCO ETF TRUST | | | | See Accompanying Notes |
June 30, 2012
| | | | | | | | | | | | |
| | | | | PRINCIPAL
AMOUNT
(000s) | | | | | MARKET
VALUE
(000s) | |
|
KCP&L Greater Missouri Operations Co. | |
11.875% due 07/01/2012 | | $ | | | 7,655 | | | $ | | | 7,655 | |
|
Metropolitan Edison Co. | |
4.950% due 03/15/2013 | | | | | 2,350 | | | | | | 2,410 | |
|
NextEra Energy Capital Holdings, Inc. | |
2.550% due 11/15/2013 | | | | | 2,085 | | | | | | 2,117 | |
|
Plains All American Pipeline LP | |
4.250% due 09/01/2012 | | | | | 1,315 | | | | | | 1,321 | |
5.625% due 12/15/2013 | | | | | 490 | | | | | | 522 | |
5.875% due 08/15/2016 | | | | | 1,000 | | | | | | 1,125 | |
|
Public Service Co. of Colorado | |
7.875% due 10/01/2012 | | | | | 7,500 | | | | | | 7,632 | |
|
Qtel International Finance Ltd. | |
6.500% due 06/10/2014 | | | | | 1,500 | | | | | | 1,641 | |
|
Qwest Corp. | |
3.718% due 06/15/2013 | | | | | 7,910 | | | | | | 7,919 | |
|
Ras Laffan Liquefied Natural Gas Co. Ltd. | |
4.500% due 09/30/2012 | | | | | 1,200 | | | | | | 1,212 | |
5.500% due 09/30/2014 | | | | | 12,300 | | | | | | 13,299 | |
|
Southern California Edison Co. | |
0.918% due 09/15/2014 | | | | | 4,000 | | | | | | 4,019 | |
|
TNK-BP Finance S.A. | |
7.500% due 03/13/2013 | | | | | 5,100 | | | | | | 5,304 | |
|
Virginia Electric and Power Co. | |
5.100% due 11/30/2012 | | | | | 140 | | | | | | 143 | |
| | | | | | | | | | | | |
| | | | | | | | | | | 106,001 | |
| | | | | | | | | | | | |
Total Corporate Bonds & Notes
(Cost $1,072,721) | | | | | | 1,076,817 | |
| | | | | | | | | | | | |
| |
CONVERTIBLE BONDS & NOTES 0.1% | |
| |
INDUSTRIALS 0.1% | |
|
Transocean, Inc. | |
1.500% due 12/15/2037 | | | | | 1,900 | | | | | | 1,900 | |
| | | | | | | | | | | | |
Total Convertible Bonds & Notes
(Cost $1,858) | | | 1,900 | |
| | | | | | | | | | | | |
| |
MUNICIPAL BONDS & NOTES 2.0% | |
| |
ARKANSAS 0.1% | |
|
Arkansas Student Loan Authority Revenue Bonds, Series 2010 | |
1.367% due 11/25/2043 | | | | | 1,597 | | | | | | 1,579 | |
| | | | | | | | | | | | |
| |
CALIFORNIA 0.6% | |
|
University of California Revenue Bonds, Series 2011 | |
0.818% due 07/01/2041 | | | | | 6,000 | | | | | | 6,000 | |
|
University of California Revenue Notes, Series 2011 | |
0.887% due 07/01/2013 | | | | | 3,500 | | | | | | 3,517 | |
| | | | | | | | | | | | |
| | | | | | | | | | | 9,517 | |
| | | | | | | | | | | | |
| |
NEW JERSEY 0.2% | |
|
New Jersey Economic Development Authority Revenue Notes, (BABs), Series 2010 | |
1.468% due 06/15/2013 | | | | | 3,500 | | | | | | 3,504 | |
| | | | | | | | | | | | |
| |
NEW YORK 1.0% | |
New York City, New York General Obligation Bonds, Series 2003 | |
5.000% due 10/15/2014 | | | | | 3,000 | | | | | | 3,291 | |
|
New York City, New York General Obligation Notes, Series 2007 | |
5.000% due 10/01/2014 | | | | | 6,000 | | | | | | 6,566 | |
5.125% due 10/01/2015 | | | | | 7,000 | | | | | | 7,944 | |
| | | | | | | | | | | | |
| | | | | | | | | | | 17,801 | |
| | | | | | | | | | | | |
| | | | | | | | | | | | |
| | | | | PRINCIPAL
AMOUNT
(000s) | | | | | MARKET
VALUE
(000s) | |
SOUTH CAROLINA 0.1% | |
|
South Carolina Student Loan Corp. Revenue Notes Series 2010 | |
0.916% due 01/25/2021 | | $ | | | 1,942 | | | $ | | | 1,931 | |
| | | | | | | | | | | | |
Total Municipal Bonds & Notes
(Cost $34,310) | | | 34,332 | |
| | | | | | | | | | | | |
| |
U.S. GOVERNMENT AGENCIES 8.4% | |
| | | | |
Fannie Mae | | | | | | | | | | | | |
0.495% due 05/25/2037 | | | | | 1,009 | | | | | | 1,010 | |
0.595% due 11/25/2036 | | | | | 3,002 | | | | | | 3,009 | |
0.643% due 04/18/2028 - 09/18/2031 | | | | | 3,331 | | | | | | 3,347 | |
0.645% due 06/25/2026 | | | | | 960 | | | | | | 966 | |
0.695% due 05/25/2017 - 06/25/2042 | | | | | 9,681 | | | | | | 9,700 | |
0.743% due 05/18/2032 | | | | | 858 | | | | | | 865 | |
0.745% due 06/25/2031 | | | | | 646 | | | | | | 652 | |
0.793% due 03/18/2032 | | | | | 621 | | | | | | 623 | |
0.795% due 09/25/2041 | | | | | 14,454 | | | | | | 14,527 | |
0.825% due 06/25/2041 | | | | | 7,620 | | | | | | 7,656 | |
0.925% due 12/25/2037 | | | | | 2,386 | | | | | | 2,405 | |
0.939% due 01/01/2021 | | | | | 3,419 | | | | | | 3,429 | |
0.995% due 02/25/2040 | | | | | 1,227 | | | | | | 1,239 | |
1.095% due 07/25/2038 | | | | | 2,352 | | | | | | 2,380 | |
3.970% due 11/27/2019 (a) | | | | | 15,000 | | | | | | 15,194 | |
4.404% due 09/01/2013 | | | | | 260 | | | | | | 266 | |
4.607% due 04/01/2014 | | | | | 605 | | | | | | 634 | |
6.255% due 09/01/2013 | | | | | 255 | | | | | | 269 | |
|
FDIC Structured Sale Guaranteed Notes | |
0.745% due 11/29/2037 | | | | | 1,642 | | | | | | 1,634 | |
|
Freddie Mac | |
0.482% due 05/15/2036 | | | | | 697 | | | | | | 697 | |
0.562% due 02/15/2037 | | | | | 3,831 | | | | | | 3,837 | |
0.592% due 12/15/2030 - 06/15/2034 | | | | | 13,537 | | | | | | 13,547 | |
0.642% due 06/15/2033 | | | | | 6 | | | | | | 6 | |
0.662% due 04/15/2041 | | | | | 3,191 | | | | | | 3,201 | |
0.742% due 07/15/2039 | | | | | 1,500 | | | | | | 1,507 | |
|
Ginnie Mae | |
0.544% due 09/20/2033 | | | | | 243 | | | | | | 244 | |
0.789% due 04/20/2062 | | | | | 8,001 | | | | | | 8,040 | |
0.939% due 02/20/2062 | | | | | 10,001 | | | | | | 10,136 | |
1.289% due 02/20/2062 | | | | | 7,998 | | | | | | 8,253 | |
5.074% due 10/16/2027 | | | | | 253 | | | | | | 256 | |
6.000% due 12/15/2033 | | | | | 83 | | | | | | 96 | |
6.500% due 11/15/2033 - 12/15/2034 | | | | | 106 | | | | | | 122 | |
7.000% due 01/15/2024 - 11/15/2032 | | | | | 349 | | | | | | 413 | |
7.500% due 12/15/2012 - 06/15/2028 | | | | | 468 | | | | | | 538 | |
8.500% due 04/15/2030 | | | | | 3 | | | | | | 4 | |
10.000% due 02/15/2016 - 04/15/2025 | | | | | 64 | | | | | | 70 | |
10.500% due 09/15/2015 - 07/15/2019 | | | | | 4 | �� | | | | | 4 | |
11.000% due 07/15/2013 - 09/20/2019 | | | | | 12 | | | | | | 11 | |
11.500% due 01/15/2013 - 11/15/2019 | | | | | 3 | | | | | | 2 | |
12.000% due 01/15/2013 - 04/15/2015 | | | | | 2 | | | | | | 0 | |
12.500% due 11/15/2013 - 07/15/2015 | | | | | 2 | | | | | | 1 | |
13.000% due 08/15/2014 - 09/20/2015 | | | | | 4 | | | | | | 4 | |
13.500% due 11/15/2012 - 09/15/2014 | | | | | 1 | | | | | | 0 | |
| | | | | | | | | | | | |
| | | | | PRINCIPAL
AMOUNT
(000s) | | | | | MARKET
VALUE
(000s) | |
|
NCUA Guaranteed Notes | |
0.589% due 12/07/2020 | | $ | | | 2,966 | | | $ | | | 2,977 | |
0.610% due 11/06/2017 | | | | | 7,988 | | | | | | 7,990 | |
0.621% due 03/06/2020 | | | | | 4,891 | | | | | | 4,894 | |
0.800% due 12/08/2020 | | | | | 4,386 | | | | | | 4,404 | |
1.600% due 10/29/2020 | | | | | 3,476 | | | | | | 3,523 | |
| | | | | | | | | | | | |
Total U.S. Government Agencies
(Cost $144,126) | | | 144,582 | |
| | | | | | | | | | | | |
| |
MORTGAGE-BACKED SECURITIES 5.1% | |
|
Banc of America Mortgage Securities, Inc. | |
3.045% due 03/25/2034 | | | | | 880 | | | | | | 868 | |
| |
BCAP LLC Trust | | | | |
2.713% due 05/26/2036 | | | | | 6,156 | | | | | | 6,118 | |
| |
Bear Stearns Adjustable Rate Mortgage Trust | | | | |
2.738% due 08/25/2033 | | | | | 3,704 | | | | | | 3,658 | |
|
Bear Stearns Commercial Mortgage Securities | |
4.735% due 09/11/2042 | | | | | 3,483 | | | | | | 3,541 | |
| |
Citigroup/Deutsche Bank Commercial Mortgage Trust | | | | |
5.205% due 12/11/2049 | | | | | 491 | | | | | | 500 | |
|
Commercial Mortgage Pass-Through Certificates | |
0.342% due 12/15/2020 | | | | | 494 | | | | | | 474 | |
4.305% due 12/10/2024 | | | | | 5,220 | | | | | | 5,254 | |
4.755% due 12/10/2024 | | | | | 350 | | | | | | 352 | |
| |
Credit Suisse First Boston Mortgage Securities Corp. | | | | |
6.133% due 04/15/2037 | | | | | 176 | | | | | | 176 | |
| |
Entertainment Properties Trust | | | | |
4.239% due 02/15/2018 | | | | | 809 | | | | | | 814 | |
| |
Fosse Master Issuer PLC | | | | |
1.866% due 10/18/2054 | | | | | 4,000 | | | | | | 4,024 | |
| |
GS Mortgage Securities Corp. | | | | |
1.103% due 03/06/2020 | | | | | 210 | | | | | | 209 | |
1.260% due 03/06/2020 | | | | | 300 | | | | | | 296 | |
1.456% due 03/06/2020 | | | | | 4,000 | | | | | | 3,948 | |
5.396% due 08/10/2038 | | | | | 1,000 | | | | | | 1,073 | |
| |
Holmes Master Issuer PLC | | | | |
0.567% due 07/15/2020 | | | | | 12,000 | | | | | | 11,999 | |
| |
JPMorgan Chase Commercial Mortgage Securities Corp. | | | | |
4.928% due 09/12/2037 | | | | | 1,012 | | | | | | 1,028 | |
5.247% due 01/12/2043 | | | | | 4,157 | | | | | | 4,163 | |
5.289% due 05/15/2045 | | | | | 1,695 | | | | | | 1,702 | |
5.352% due 12/15/2044 | | | | | 5,583 | | | | | | 5,835 | |
| |
Lehman Brothers Floating Rate Commercial Mortgage Trust | | | | |
0.592% due 06/15/2022 | | | | | 2,631 | | | | | | 2,608 | |
| |
Mellon Residential Funding Corp. | | | | |
0.942% due 11/15/2031 | | | | | 4,314 | | | | | | 4,211 | |
| |
Morgan Stanley Capital, Inc. | | | | |
5.439% due 02/12/2044 | | | | | 400 | | | | | | 421 | |
5.610% due 04/15/2049 | | | | | 361 | | | | | | 374 | |
| |
Morgan Stanley Dean Witter Capital | | | | |
4.740% due 11/13/2036 | | | | | 3,507 | | | | | | 3,540 | |
| |
Nationslink Funding Corp. | | | | |
5.000% due 08/20/2030 | | | | | 1,510 | | | | | | 1,545 | |
| |
RBSSP Resecuritization Trust | | | | |
0.745% due 10/26/2036 | | | | | 1,037 | | | | | | 947 | |
2.655% due 12/26/2036 | | | | | 7,577 | | | | | | 7,587 | |
2.729% due 05/26/2037 | | | | | 7,267 | | | | | | 7,125 | |
| | | | | | |
| See Accompanying Notes | | ANNUAL REPORT | | JUNE 30, 2012 | | 69 |
Schedule of Investments PIMCO Enhanced Short Maturity Strategy Fund (Cont.)
| | | | | | | | | | | | |
| | | | | PRINCIPAL
AMOUNT
(000s) | | | | | MARKET
VALUE
(000s) | |
| |
Wachovia Bank Commercial Mortgage Trust | | | | |
0.322% due 06/15/2020 | | $ | | | 152 | | | $ | | | 142 | |
5.922% due 06/15/2049 | | | | | 2,218 | | | | | | 2,285 | |
| | | | | | | | | | | | |
Total Mortgage-Backed Securities
(Cost $86,260) | | | | | | | | | | | 86,817 | |
| | | | | | | | | | | | |
| |
ASSET-BACKED SECURITIES 7.8% | |
| |
ARES CLO Ltd. | | | | |
1.097% due 11/25/2020 | | | | | 5,000 | | | | | | 4,854 | |
| |
Avenue CLO Fund Ltd. | | | | |
0.817% due 02/15/2017 | | | | | 1,687 | | | | | | 1,669 | |
| |
Babson CLO Ltd. | | | | |
0.787% due 11/15/2016 | | | | | 649 | | | | | | 641 | |
| |
Citibank Omni Master Trust | | | | |
2.992% due 08/15/2018 | | | | | 22,000 | | | | | | 23,114 | |
3.350% due 08/15/2016 | | | | | 5,190 | | | | | | 5,209 | |
4.900% due 11/15/2018 | | | | | 15,400 | | | | | | 16,825 | |
5.350% due 08/15/2018 | | | | | 2,500 | | | | | | 2,732 | |
|
Collegiate Funding Services Education Loan Trust | |
0.561% due 12/28/2021 | | | | | 1,385 | | | | | | 1,375 | |
| |
Education Funding Capital Trust | | | | |
0.738% due 03/16/2020 | | | | | 492 | | | | | | 492 | |
| |
First CLO Ltd. | | | | |
0.778% due 12/14/2016 | | | | | 94 | | | | | | 94 | |
|
GCO Education Loan Funding Trust | |
0.547% due 11/25/2020 | | | | | 108 | | | | | | 108 | |
| |
Gracechurch Card Funding PLC | | | | |
0.942% due 02/15/2017 | | | | | 14,400 | | | | | | 14,426 | |
|
Honda Auto Receivables Owner Trust | |
0.570% due 08/15/2014 | | | | | 5,700 | | | | | | 5,703 | |
| |
Hyundai Capital Auto Funding Ltd. | | | | |
1.243% due 09/20/2016 | | | | | 1,500 | | | | | | 1,476 | |
|
Illinois Student Assistance Commission | |
0.946% due 04/25/2017 | | | | | 1,009 | | | | | | 1,010 | |
|
MBNA Credit Card Master Note Trust | |
0.302% due 06/15/2015 | | | | | 2,000 | | | | | | 2,000 | |
| |
Nelnet Student Loan Trust | | | | |
0.528% due 12/22/2016 | | | | | 100 | | | | | | 100 | |
| |
Nissan Auto Receivables Owner Trust | | | | |
0.540% due 10/15/2014 | | | | | 2,000 | | | | | | 2,000 | |
| |
Olympic CLO Ltd. | | | | |
1.217% due 05/15/2016 | | | | | 373 | | | | | | 373 | |
|
Panhandle-Plains Higher Education Authority, Inc. | |
0.961% due 10/01/2018 | | | | | 595 | | | | | | 594 | |
0.961% due 07/01/2021 | | | | | 7,112 | | | | | | 7,053 | |
1.591% due 10/01/2035 | | | | | 2,391 | | | | | | 2,429 | |
| |
Rockwall CDO Ltd. | | | | |
0.826% due 08/01/2013 | | | | | 2,917 | | | | | | 2,891 | |
| |
SLM Student Loan Trust | | | | |
0.466% due 07/25/2017 | | | | | 1,275 | | | | | | 1,271 | |
0.496% due 10/25/2019 | | | | | 423 | | | | | | 423 | |
0.546% due 04/25/2023 | | | | | 2,948 | | | | | | 2,939 | |
0.616% due 01/25/2021 | | | | | 5,731 | | | | | | 5,724 | |
0.658% due 12/17/2018 | | | | | 5,779 | | | | | | 5,777 | |
0.668% due 03/15/2019 | | | | | 1,984 | | | | | | 1,984 | |
0.945% due 01/25/2029 | | | | | 9,557 | | | | | | 9,656 | |
0.966% due 10/25/2017 | | | | | 3,542 | | | | | | 3,554 | |
1.566% due 10/25/2016 | | | | | 2,175 | | | | | | 2,195 | |
1.966% due 04/25/2023 | | | | | 1,574 | | | | | | 1,627 | |
| |
SMART Trust | | | | |
0.543% due 11/14/2012 | | | | | 84 | | | | | | 84 | |
| | | | | | | | | | | | |
| | | | | PRINCIPAL
AMOUNT
(000s) | | | | | MARKET
VALUE
(000s) | |
|
Structured Asset Investment Loan Trust | |
1.245% due 11/25/2033 | | $ | | | 1,874 | | | $ | | | 1,412 | |
| | | | | | | | | | | | |
Total Asset-Backed Securities
(Cost $133,583) | | | | | | | | | | | 133,814 | |
| | | | | | | | | | | | |
| |
SOVEREIGN ISSUES 4.9% | |
| |
Emirate of Abu Dhabi Government International Bond | | | | |
5.500% due 04/08/2014 | | | | | 9,550 | | | | | | 10,316 | |
|
Japan Bank for International Cooperation | |
2.125% due 11/05/2012 | | | | | 4,235 | | | | | | 4,259 | |
| |
Kommunalbanken A/S | | | | |
0.841% due 03/27/2017 | | | | | 7,000 | | | | | | 7,002 | |
|
Mexico Government International Bond | |
6.375% due 01/16/2013 | | | | | 7,024 | | | | | | 7,238 | |
|
Poland Government International Bond | |
6.250% due 07/03/2012 | | | | | 3,850 | | | | | | 3,850 | |
| |
Province of Ontario | | | | |
0.611% due 04/01/2015 | | | | | 7,000 | | | | | | 7,000 | |
1.875% due 11/19/2012 | | | | | 7,262 | | | | | | 7,302 | |
4.100% due 06/16/2014 | | | | | 6,160 | | | | | | 6,576 | |
| |
Province of Quebec | | | | |
4.600% due 05/26/2015 | | | | | 5,000 | | | | | | 5,560 | |
|
Qatar Government International Bond | |
5.150% due 04/09/2014 | | | | | 15,875 | | | | | | 16,867 | |
| |
Republic of Korea | | | | |
4.250% due 06/01/2013 | | | | | 7,050 | | | | | | 7,245 | |
| | | | | | | | | | | | |
Total Sovereign Issues
(Cost $82,797) | | | | | | | | | | | 83,215 | |
| | | | | | | | | | | | |
| |
SHORT-TERM INSTRUMENTS 8.7% | |
| |
CERTIFICATES OF DEPOSIT 1.7% | |
|
Abbey National Treasury Services PLC | |
1.818% due 06/10/2013 | | | | | 5,300 | | | | | | 5,201 | |
| |
Banco do Brasil S.A. | | | | |
0.000% due 03/26/2013 | | | | | 9,180 | | | | | | 9,120 | |
0.000% due 03/28/2013 | | | | | 5,000 | | | | | | 4,939 | |
| |
Itau Unibanco Holding S.A. | | | | |
0.000% due 03/26/2013 | | | | | 10,000 | | | | | | 9,828 | |
| | | | | | | | | | | | |
| | | | | | | | | | | 29,088 | |
| | | | | | | | | | | | |
| |
COMMERCIAL PAPER 4.3% | |
| |
BMW U.S. Capital LLC | | | | |
0.716% due 07/25/2012 | | | | | 3,300 | | | | | | 3,300 | |
| |
BP Capital Markets PLC | | | | |
0.780% due 04/18/2013 | | | | | 6,500 | | | | | | 6,484 | |
| |
British Telecommunications PLC | | | | |
1.600% due 05/15/2013 | | | | | 1,000 | | | | | | 989 | |
1.640% due 05/15/2013 | | | | | 15,600 | | | | | | 15,428 | |
|
Daimler Finance North America LLC | |
1.130% due 03/15/2013 | | | | | 4,000 | | | | | | 3,972 | |
| |
Ford Motor Credit Co. | | | | |
1.280% due 07/06/2012 | | | | | 4,900 | | | | | | 4,899 | |
| |
Korea Development Bank | | | | |
0.350% due 07/19/2012 | | | | | 2,000 | | | | | | 2,000 | |
0.370% due 07/18/2012 | | | | | 2,000 | | | | | | 2,000 | |
| |
Newell Rubbermaid, Inc. | | | | |
1.500% due 10/03/2012 | | | | | 7,000 | | | | | | 6,986 | |
| |
Pacific Gas & Electric Co. | | | | |
0.430% due 07/16/2012 | | | | | 2,900 | | | | | | 2,899 | |
| | | | | | | | | | | | |
| | | | | PRINCIPAL
AMOUNT
(000s) | | | | | MARKET
VALUE
(000s) | |
| |
Spectra Energy Capital LLC | | | | |
0.460% due 07/10/2012 | | $ | | | 5,500 | | | $ | | | 5,499 | |
| |
Vodafone Group PLC | | | | |
1.200% due 06/11/2013 | | | | | 10,000 | | | | | | 9,894 | |
| |
Xstrata Finance Canada Ltd. | | | | |
0.470% due 07/02/2012 | | | | | 4,600 | | | | | | 4,600 | |
0.480% due 07/16/2012 | | | | | 4,600 | | | | | | 4,599 | |
| | | | | | | | | | | | |
| | | | | | | | | | | 73,549 | |
| | | | | | | | | | | | |
| |
REPURCHASE AGREEMENTS 0.1% | |
| |
Banc of America Securities LLC | | | | |
0.170% due 07/02/2012 | | | | | 100 | | | | | | 100 | |
(Dated 06/29/2012. Collateralized by U.S. Treasury Notes 0.250% due 04/30/2014 valued at $103. Repurchase proceeds are $100.) | | | | |
| |
JPMorgan Securities, Inc. | | | | |
0.200% due 07/02/2012 | | | | | 2,000 | | | | | | 2,000 | |
(Dated 06/29/2012. Collateralized by U.S. Treasury Notes 1.500% due 07/31/2016 valued at $2,042. Repurchase proceeds are $2,000.) | | | | |
| | | | | | | | | | | | |
| | | | | | | | | | | 2,100 | |
| | | | | | | | | | | | |
| |
SHORT-TERM NOTES 2.6% | |
| |
Holmes Master Issuer PLC | | | | |
0.372% due 07/15/2012 | | | | | 6,000 | | | | | | 6,008 | |
0.442% due 01/15/2013 | | | | | 17,000 | | | | | | 17,029 | |
| |
Pacific Gas & Electric Co. | | | | |
0.917% due 11/20/2012 | | | | | 14,340 | | | | | | 14,365 | |
| |
University of California Revenue Notes, Series 2011 | | | | |
0.480% due 07/01/2012 | | | | | 8,000 | | | | | | 8,000 | |
| | | | | | | | | | | | |
| | | | | | | | | | | 45,402 | |
| | | | | | | | | | | | |
| |
Total Short-Term Instruments
(Cost $149,979) | | | | | | 150,139 | |
| | | | | | | | | | | | |
| | | | | | | | | | | | |
Total Investments 99.8%
(Cost $1,705,634) | | | $ | | | 1,711,616 | |
| |
Other Assets and Liabilities (Net) 0.2% | | | 3,726 | |
| | | | | | | | | | | | |
Net Assets 100.0% | | | $ | | | 1,715,342 | |
| | | | | | | | | | | | |
| | | | | | |
| 70 | | PIMCO ETF TRUST | | | | See Accompanying Notes |
June 30, 2012
Notes to Schedule of Investments (amounts in thousands*):
| * | A zero balance may reflect actual amounts rounding to less than one thousand. |
| (a) | On June 30, 2012, securities valued at $31,350 were pledged as collateral for the following open reverse repurchase agreements. |
| | | | | | | | | | | | | | | | | | | | | | |
| Counterparty | | | | Coupon Rate (1) | | | Settlement Date | | | Maturity Date | | | Principal
Amount | | | Payable for Reverse
Repurchase Agreements | |
BCY | | | | | (1.000 | %) | | | 06/06/2012 | | | | 07/03/2012 | | | $ | 11,738 | | | $ | (11,738 | ) |
| | | | | | (1.000 | %) | | | 06/26/2012 | | | | 06/05/2014 | | | | 1,743 | | | | (1,743 | ) |
DEU | | | | | 0.280 | % | | | 06/27/2012 | | | | 07/02/2012 | | | | 11,003 | | | | (11,003 | ) |
| | | | | | (0.750 | %) | | | 11/28/2011 | | | | 11/28/2013 | | | | 2,408 | | | | (2,397 | ) |
SAL | | | | | (1.000 | %) | | | 06/25/2012 | | | | 06/22/2014 | | | | 3,909 | | | | (3,908 | ) |
| | | | | | | | | | | | | | | | | | | | $ | (30,789 | ) |
| (1) | The average amount of borrowings while outstanding during the period ended June 30, 2012 was $13,041 at a weighted average interest rate of (0.614%). |
| (b) | Fair Value Measurements (1) |
The following is a summary of the fair valuations according to the inputs used as of June 30, 2012 in valuing the Fund’s assets and liabilities (2):
| | | | | | | | | | | | | | | | | | |
| Category and Subcategory (3) | | | | Level 1 (4) | | | Level 2 (5) | | | Level 3 (6) | | | Fair Value
at 06/30/2012 | |
Investments, at value | | | | | | | | | | | | | | | | | | |
Corporate Bonds & Notes | | | | | | | | | | | | | | | | | | |
Banking & Finance | | | | $ | 0 | | | $ | 483,112 | | | $ | 0 | | | $ | 483,112 | |
Industrials | | | | | 0 | | | | 487,704 | | | | 0 | | | �� | 487,704 | |
Utilities | | | | | 0 | | | | 106,001 | | | | 0 | | | | 106,001 | |
Convertible Bonds & Notes | | | | | | | | | | | | | | | | | | |
Industrials | | | | | 0 | | | | 1,900 | | | | 0 | | | | 1,900 | |
Municipal Bonds & Notes | | | | | | | | | | | | | | | | | | |
Arkansas | | | | | 0 | | | | 1,579 | | | | 0 | | | | 1,579 | |
California | | | | | 0 | | | | 9,517 | | | | 0 | | | | 9,517 | |
New Jersey | | | | | 0 | | | | 3,504 | | | | 0 | | | | 3,504 | |
New York | | | | | | | | | 17,801 | | | | | | | | 17,801 | |
South Carolina | | | | | 0 | | | | 1,931 | | | | 0 | | | | 1,931 | |
U.S. Government Agencies | | | | | 0 | | | | 119,160 | | | | 25,422 | | | | 144,582 | |
Mortgage-Backed Securities | | | | | 0 | | | | 86,817 | | | | 0 | | | | 86,817 | |
Asset-Backed Securities | | | | | 0 | | | | 129,447 | | | | 4,367 | | | | 133,814 | |
Sovereign Issues | | | | | 0 | | | | 83,215 | | | | 0 | | | | 83,215 | |
Short-Term Instruments | | | | | | | | | | | | | | | | | | |
Certificates of Deposit | | | | | 0 | | | | 29,088 | | | | 0 | | | | 29,088 | |
Commercial Paper | | | | | 0 | | | | 73,549 | | | | 0 | | | | 73,549 | |
Repurchase Agreements | | | | | 0 | | | | 2,100 | | | | 0 | | | | 2,100 | |
Short-Term Notes | | | | | 0 | | | | 45,402 | | | | 0 | | | | 45,402 | |
| | | | $ | 0 | | | $ | 1,681,827 | | | $ | 29,789 | | | $ | 1,711,616 | |
| | | | | | |
| See Accompanying Notes | | ANNUAL REPORT | | JUNE 30, 2012 | | 71 |
Schedule of Investments PIMCO Enhanced Short Maturity Strategy Fund (Cont.)
June 30, 2012
The following is a reconciliation of the fair valuations using significant unobservable inputs (Level 3) for the Fund during the period ended June 30, 2012:
| | | | | | | | | | | | | | | | | | | | | | | | | | | | | | | | | | | | | | | | | | |
| Category and Subcategory (3) | | | | Beginning
Balance at
06/30/2011 | | | Net
Purchases | | | Net Sales | | | Accrued
Discounts/
(Premiums) | | | Realized
Gain/
(Loss) | | | Net Change
in Unrealized
Appreciation/
(Depreciation) (7) | | | Transfers
into
Level 3 | | | Transfers
out of
Level 3 | | | Ending
Balance at
06/30/2012 | | | Net Change in
Unrealized
Appreciation/
(Depreciation)
on Investments
Held at
06/30/2012 (7) | |
Investments, at value | | | | | | | | | | | | | | | | | | | | | | | | | | | | | | | | | | | | | | | | | | |
Corporate Bonds & Notes | | | | | | | | | | | | | | | | | | | | | | | | | | | | | | | | | | | | | | | | | | |
Banking & Finance | | | | $ | 8,586 | | | $ | 0 | | | $ | (8,600 | ) | | $ | 0 | | | $ | 0 | | | $ | 14 | | | $ | 0 | | | $ | 0 | | | $ | 0 | | | $ | 0 | |
Industrials | | | | | 5,663 | | | | 3,748 | | | | (9,293 | ) | | | (132 | ) | | | 0 | | | | 14 | | | | 0 | | | | 0 | | | | 0 | | | | 0 | |
U.S. Government Agencies | | | | | 27,590 | | | | 0 | | | | (5,677 | ) | | | 0 | | | | 0 | | | | (14 | ) | | | 3,523 | | | | 0 | | | | 25,422 | | | | (10 | ) |
Asset-Backed Securities | | | | | 1,490 | | | | 3,475 | | | | (583 | ) | | | 13 | | | | 4 | | | | (32 | ) | | | 0 | | | | 0 | | | | 4,367 | | | | (32 | ) |
Totals | | | | $ | 43,329 | | | $ | 7,223 | | | $ | (24,153 | ) | | $ | (119 | ) | | $ | 4 | | | $ | (18 | ) | | $ | 3,523 | | | $ | 0 | | | $ | 29,789 | | | $ | (42 | ) |
| (1) | See note 3 in the Notes to Financial Statements for more information regarding pricing inputs and valuation techniques. |
| (2) | There were no significant transfers into or out of level 1, 2, and 3 during the period ended June 30, 2012. |
| (3) | Refer to the Schedule of Investments for additional information. |
| (4) | Quoted prices in active markets for identical investments. |
| (5) | Significant other observable inputs. |
| (6) | Significant unobservable inputs. |
| (7) | Any difference between Net Change in Unrealized Appreciation/(Depreciation) and Net Change in Unrealized Appreciation/(Depreciation) on Investments Held at June 30, 2012 may be due to an investment no longer held or categorized as level 3 at period end. |
| | | | | | |
| 72 | | PIMCO ETF TRUST | | | | See Accompanying Notes |
Schedule of Investments PIMCO Global Advantage® Inflation-Linked Bond Strategy Fund
June 30, 2012
| | | | | | | | | | | | |
| | | | | PRINCIPAL
AMOUNT
(000s) | | | | | MARKET
VALUE
(000s) | |
AUSTRALIA 4.7% | |
| |
SOVEREIGN ISSUES 4.7% | |
| |
Australia Government CPI Linked Bond | | | | |
1.250% due 02/21/2022 | | AUD | | | 500 | | | $ | | | 544 | |
3.000% due 09/20/2025 | | | | | 340 | | | | | | 481 | |
4.000% due 08/20/2020 | | | | | 150 | | | | | | 296 | |
| | | | | | | | | | | | |
Total Australia
(Cost $1,284) | | | | | | | | | | | 1,321 | |
| | | | | | | | | | | | |
| |
BRAZIL 11.0% | |
| |
SOVEREIGN ISSUES 11.0% | |
| |
Brazil Notas do Tesouro Nacional (a) | | | | |
6.000% due 08/15/2020 | | BRL | | | 632 | | | | | | 750 | |
6.000% due 08/15/2024 | | | | | 597 | | | | | | 724 | |
6.000% due 08/15/2030 | | | | | 455 | | | | | | 565 | |
6.000% due 05/15/2045 | | | | | 820 | | | | | | 1,063 | |
| | | | | | | | | | | | |
Total Brazil
(Cost $3,300) | | | | | | | | | | | 3,102 | |
| | | | | | | | | | | | |
| |
CANADA 7.3% | |
| |
SOVEREIGN ISSUES 7.3% | |
| |
Canada Government Bond (a) | | | | |
4.250% due 12/01/2021 | | CAD | | | 1,471 | | | | | | 2,053 | |
| | | | | | | | | | | | |
Total Canada
(Cost $2,082) | | | | | | | | | | | 2,053 | |
| | | | | | | | | | | | |
| |
FRANCE 2.0% | |
| |
SOVEREIGN ISSUES 2.0% | |
| |
France Government Bond (a) | | | | |
1.300% due 07/25/2019 | | EUR | | | 423 | | | | | | 560 | |
| | | | | | | | | | | | |
Total France
(Cost $580) | | | | | | | | | | | 560 | |
| | | | | | | | | | | | |
| |
GERMANY 5.7% | |
| |
SOVEREIGN ISSUES 5.7% | |
| |
Republic of Germany (a) | | | | |
0.750% due 04/15/2018 | | EUR | | | 681 | | | | | | 911 | |
1.750% due 04/15/2020 | | | | | 486 | | | | | | 706 | |
| | | | | | | | | | | | |
Total Germany
(Cost $1,728) | | | | | | | | | | | 1,617 | |
| | | | | | | | | | | | |
| |
ISRAEL 1.8% | |
| |
SOVEREIGN ISSUES 1.8% | |
| |
Israel Government Bond (a) | | | | |
3.000% due 10/31/2019 | | ILS | | | 1,710 | | | | | | 516 | |
| | | | | | | | | | | | |
Total Israel
(Cost $532) | | | | | | | | | | | 516 | |
| | | | | | | | | | | | |
| | | | | | | | | | | | |
| | | | | PRINCIPAL
AMOUNT
(000s) | | | | | MARKET
VALUE
(000s) | |
ITALY 4.0% | |
| |
SOVEREIGN ISSUES 4.0% | |
| |
Italy Buoni Poliennali Del Tesoro | | | | |
2.100% due 09/15/2021 (a) | | EUR | | | 427 | | | $ | | | 425 | |
5.500% due 09/01/2022 | | | | | 570 | | | | | | 710 | |
| | | | | | | | | | | | |
Total Italy
(Cost $1,192) | | | | | | | | | | | 1,135 | |
| | | | | | | | | | | | |
| |
JAPAN 6.8% | |
| |
SOVEREIGN ISSUES 6.8% | |
|
Japan Government International CPI Linked Bond | |
1.400% due 06/10/2018 | | JPY | | | 138,880 | | | | | | 1,910 | |
| | | | | | | | | | | | |
Total Japan
(Cost $1,900) | | | | | | | | | | | 1,910 | |
| | | | | | | | | | | | |
| |
MEXICO 16.8% | |
| |
SOVEREIGN ISSUES 16.8% | |
| |
Mexico Government International Bond (a) | | | | |
2.500% due 12/10/2020 | | MXN | | | 21,907 | | | | | | 1,770 | |
4.000% due 11/15/2040 | | | | | 8,986 | | | | | | 799 | |
4.500% due 12/04/2025 | | | | | 3,983 | | | | | | 387 | |
5.000% due 06/16/2016 | | | | | 20,342 | | | | | | 1,779 | |
| | | | | | | | | | | | |
Total Mexico
(Cost $4,572) | | | | | | | | | | | 4,735 | |
| | | | | | | | | | | | |
| |
SOUTH AFRICA 5.4% | |
| |
SOVEREIGN ISSUES 5.4% | | | | | | | | | | | | |
|
South Africa Government International Bond (a) | |
2.750% due 01/31/2022 | | ZAR | | | 7,543 | | | | | | 984 | |
5.500% due 12/07/2023 | | | | | 3,204 | | | | | | 540 | |
| | | | | | | | | | | | |
Total South Africa
(Cost $1,561) | | | | | | | | | | | 1,524 | |
| | | | | | | | | | | | |
| |
SWEDEN 1.0% | |
| |
SOVEREIGN ISSUES 1.0% | | | | | | | | | | | | |
| |
Sweden Government Bond CPI Linked Bond | | | | |
0.250% due 06/01/2022 | | SEK | | | 1,800 | | | | | | 269 | |
| | | | | | | | | | | | |
Total Sweden
(Cost $272) | | | | | | | | | | | 269 | |
| | | | | | | | | | | | |
| |
UNITED KINGDOM 3.9% | |
| |
CORPORATE BONDS & NOTES 0.8% | |
| |
Network Rail Infrastructure Finance PLC (a) | | | | |
1.375% due 11/22/2037 | | GBP | | | 119 | | | | | | 235 | |
| | | | | | | | | | | | |
| |
SOVEREIGN ISSUES 3.1% | |
| |
United Kingdom Gilt (a) | | | | |
0.375% due 03/22/2062 | | | | | 51 | | | | | | 92 | |
0.625% due 11/22/2042 | | | | | 57 | | | | | | 105 | |
| | | | | | | | | | | | |
| | | | | PRINCIPAL
AMOUNT
(000s) | | | | | MARKET
VALUE
(000s) | |
0.750% due 03/22/2034 | | GBP | | | 104 | | | $ | | | 190 | |
1.125% due 11/22/2037 | | | | | 120 | | | | | | 240 | |
1.875% due 11/22/2022 | | | | | 118 | | | | | | 234 | |
| | | | | | | | | | | | |
| | | | | | | | | | | 861 | |
| | | | | | | | | | | | |
Total United Kingdom
(Cost $1,124) | | | | | | | | | | | 1,096 | |
| | | | | | | | | | | | |
| |
UNITED STATES 17.8% | |
| |
U.S. TREASURY OBLIGATIONS 17.8% | |
|
U.S. Treasury Inflation Protected Securities (a) | |
0.125% due 04/15/2016 | | $ | | | 1,042 | | | | | | 1,086 | |
0.125% due 01/15/2022 | | | | | 2,440 | | | | | | 2,587 | |
0.750% due 02/15/2042 | | | | | 204 | | | | | | 215 | |
2.375% due 01/15/2025 | | | | | 732 | | | | | | 967 | |
2.500% due 01/15/2029 | | | | | 107 | | | | | | 149 | |
| | | | | | | | | | | | |
Total United States
(Cost $4,980) | | | | | | | | | | | 5,004 | |
| | | | | | | | | | | | |
| |
SHORT-TERM INSTRUMENTS 12.3% | |
| |
REPURCHASE AGREEMENTS 7.3% | |
| |
JPMorgan Securities, Inc. | | | | |
0.200% due 07/02/2012 | | | | | 1,800 | | | | | | 1,800 | |
(Dated 06/29/2012. Collateralized by U.S. Treasury Notes 1.500% due 07/31/2016 valued at $1,838. Repurchase proceeds are $1,800.) | | | | |
| |
State Street Bank and Trust Co. | | | | |
0.010% due 07/02/2012 | | | | | 259 | | | | | | 259 | |
(Dated 06/29/2012. Collateralized by U.S. Treasury Notes 2.000% due 11/15/2021 valued at $265. Repurchase proceeds are $259.) | | | | |
| | | | | | | | | | | | |
| | | | | | | | | | | 2,059 | |
| | | | | | | | | | | | |
| |
SHORT-TERM NOTES 5.0% | |
| |
Freddie Mac | | | | |
0.162% due 12/10/2012 - 12/17/2012 | | | | | 1,400 | | | | | | 1,399 | |
| | | | | | | | | | | | |
| |
Total Short-Term Instruments
(Cost $3,458) | | | | | | 3,458 | |
| | | | | | | | | | | | |
| | | | | | | | | | | | |
Total Investments 100.5%
(Cost $28,565) | | | $ | | | 28,300 | |
| |
Other Assets and Liabilities (Net) (0.5%) | | | (144 | ) |
| | | | | | | | | | | | |
Net Assets 100.0% | | | $ | | | 28,156 | |
| | | | | | | | | | | | |
Notes to Schedule of Investments (amounts in thousands*):
| * | A zero balance may reflect actual amounts rounding to less than one thousand. |
| (a) | Principal amount of security is adjusted for inflation. |
| | | | | | |
| See Accompanying Notes | | ANNUAL REPORT | | JUNE 30, 2012 | | 73 |
Schedule of Investments PIMCO Global Advantage® Inflation-Linked Bond Strategy Fund (Cont.)
| (b) | Foreign currency contracts outstanding on June 30, 2012: |
| | | | | | | | | | | | | | | | | | | | | | | | | | |
Settlement
Month | | | Currency to
be Delivered | | | Currency to
be Received | | | Counterparty | | | Unrealized
Appreciation | | | Unrealized
(Depreciation) | | | Net Unrealized
Appreciation/
(Depreciation) | |
| | 07/2012 | | | AUD | 666 | | | $ | 648 | | | | JPM | | | $ | 0 | | | $ | (33 | ) | | $ | (33 | ) |
| | 07/2012 | | | | 14 | | | | 14 | | | | MSC | | | | 0 | | | | (1 | ) | | | (1 | ) |
| | 07/2012 | | | ILS | 77 | | | | 20 | | | | UAG | | | | 0 | | | | 0 | | | | 0 | |
| | 07/2012 | | | $ | 20 | | | ILS | 77 | | | | BRC | | | | 0 | | | | 0 | | | | 0 | |
| | 07/2012 | | | | 10 | | | ZAR | 84 | | | | DUB | | | | 0 | | | | 0 | | | | 0 | |
| | 07/2012 | | | ZAR | 3,849 | | | $ | 456 | | | | BRC | | | | 0 | | | | (13 | ) | | | (13 | ) |
| | 07/2012 | | | | 2,395 | | | | 300 | | | | DUB | | | | 9 | | | | (1 | ) | | | 8 | |
| | 08/2012 | | | BRL | 61 | | | | 30 | | | | BRC | | | | 0 | | | | 0 | | | | 0 | |
| | 08/2012 | | | | 35 | | | | 17 | | | | GSC | | | | 0 | | | | 0 | | | | 0 | |
| | 08/2012 | | | | 12 | | | | 6 | | | | HUS | | | | 0 | | | | 0 | | | | 0 | |
| | 08/2012 | | | MXN | 24,564 | | | | 1,861 | | | | JPM | | | | 27 | | | | 0 | | | | 27 | |
| | 08/2012 | | | $ | 599 | | | BRL | 1,170 | | | | BRC | | | | 0 | | | | (20 | ) | | | (20 | ) |
| | 08/2012 | | | | 210 | | | | 438 | | | | HUS | | | | 7 | | | | 0 | | | | 7 | |
| | 08/2012 | | | | 700 | | | | 1,395 | | | | MSC | | | | 0 | | | | (10 | ) | | | (10 | ) |
| | 08/2012 | | | | 30 | | | | 62 | | | | UAG | | | | 1 | | | | 0 | | | | 1 | |
| | 08/2012 | | | | 90 | | | CLP | 45,243 | | | | BRC | | | | 0 | | | | 0 | | | | 0 | |
| | 08/2012 | | | | 75 | | | | 36,795 | | | | HUS | | | | 0 | | | | (2 | ) | | | (2 | ) |
| | 08/2012 | | | | 90 | | | | 43,884 | | | | JPM | | | | 0 | | | | (3 | ) | | | (3 | ) |
| | 08/2012 | | | | 90 | | | | 44,033 | | | | MSC | | | | 0 | | | | (3 | ) | | | (3 | ) |
| | 08/2012 | | | | 155 | | | | 76,136 | | | | UAG | | | | 0 | | | | (4 | ) | | | (4 | ) |
| | 08/2012 | | | | 20 | | | MXN | 272 | | | | DUB | | | | 1 | | | | 0 | | | | 1 | |
| | 08/2012 | | | | 170 | | | | 2,359 | | | | JPM | | | | 7 | | | | 0 | | | | 7 | |
| | 09/2012 | | | CAD | 1,199 | | | $ | 1,166 | | | | UAG | | | | 0 | | | | (9 | ) | | | (9 | ) |
| | 09/2012 | | | GBP | 292 | | | | 451 | | | | BPS | | | | 0 | | | | (6 | ) | | | (6 | ) |
| | 09/2012 | | | | 64 | | | | 99 | | | | RYL | | | | 0 | | | | (1 | ) | | | (1 | ) |
| | 09/2012 | | | $ | 141 | | | EUR | 112 | | | | BPS | | | | 1 | | | | 0 | | | | 1 | |
| | 09/2012 | | | | 429 | | | | 344 | | | | CBK | | | | 6 | | | | 0 | | | | 6 | |
| | 09/2012 | | | | 1,771 | | | | 1,420 | | | | JPM | | | | 27 | | | | 0 | | | | 27 | |
| | 09/2012 | | | | 231 | | | GBP | 149 | | | | BRC | | | | 2 | | | | 0 | | | | 2 | |
| | 09/2012 | | | | 467 | | | | 300 | | | | DUB | | | | 3 | | | | 0 | | | | 3 | |
| | 09/2012 | | | | 236 | | | | 152 | | | | MSC | | | | 2 | | | | 0 | | | | 2 | |
| | 09/2012 | | | | 508 | | | JPY | 39,777 | | | | BPS | | | | 0 | | | | (10 | ) | | | (10 | ) |
| | 10/2012 | | | | 20 | | | ILS | 77 | | | | UAG | | | | 0 | | | | 0 | | | | 0 | |
| | | | | | | | | | | | | | | | $ | 93 | | | $ | (116 | ) | | $ | (23 | ) |
| (c) | Fair Value Measurements (1) |
The following is a summary of the fair valuations according to the inputs used as of June 30, 2012 in valuing the Fund’s assets and liabilities (2):
| | | | | | | | | | | | | | | | | | |
| Category and Subcategory (3) | | | | Level 1 (4) | | | Level 2 (5) | | | Level 3 (6) | | | Fair Value at
06/30/2012 | |
Investments, at value | | | | | | | | | | | | | | | | | | |
Australia | | | | | | | | | | | | | | | | | | |
Sovereign Issues | | | | $ | 0 | | | $ | 1,321 | | | $ | 0 | | | $ | 1,321 | |
Brazil | | | | | | | | | | | | | | | | | | |
Sovereign Issues | | | | | 0 | | | | 3,102 | | | | 0 | | | | 3,102 | |
Canada | | | | | | | | | | | | | | | | | | |
Sovereign Issues | | | | | 0 | | | | 2,053 | | | | 0 | | | | 2,053 | |
France | | | | | | | | | | | | | | | | | | |
Sovereign Issues | | | | | 0 | | | | 560 | | | | 0 | | | | 560 | |
Germany | | | | | | | | | | | | | | | | | | |
Sovereign Issues | | | | | 0 | | | | 1,617 | | | | 0 | | | | 1,617 | |
| | | | | | |
| 74 | | PIMCO ETF TRUST | | | | See Accompanying Notes |
June 30, 2012
| | | | | | | | | | | | | | | | | | |
| Category and Subcategory (3) | | | | Level 1 (4) | | | Level 2 (5) | | | Level 3 (6) | | | Fair Value at
06/30/2012 | |
Israel | | | | | | | | | | | | | | | | | | |
Sovereign Issues | | | | $ | 0 | | | $ | 516 | | | $ | 0 | | | $ | 516 | |
Italy | | | | | | | | | | | | | | | | | | |
Sovereign Issues | | | | | 0 | | | | 1,135 | | | | 0 | | | | 1,135 | |
Japan | | | | | | | | | | | | | | | | | | |
Sovereign Issues | | | | | 0 | | | | 1,910 | | | | 0 | | | | 1,910 | |
Mexico | | | | | | | | | | | | | | | | | | |
Sovereign Issues | | | | | 0 | | | | 4,735 | | | | 0 | | | | 4,735 | |
South Africa | | | | | | | | | | | | | | | | | | |
Sovereign Issues | | | | | 0 | | | | 1,524 | | | | 0 | | | | 1,524 | |
Sweden | | | | | | | | | | | | | | | | | | |
Sovereign Issues | | | | | 0 | | | | 269 | | | | 0 | | | | 269 | |
United Kingdom | | | | | | | | | | | | | | | | | | |
Corporate Bonds & Notes | | | | | 0 | | | | 235 | | | | 0 | | | | 235 | |
Sovereign Issues | | | | | 0 | | | | 861 | | | | 0 | | | | 861 | |
United States | | | | | | | | | | | | | | | | | | |
U.S. Treasury Obligations | | | | | 0 | | | | 5,004 | | | | 0 | | | | 5,004 | |
Short-Term Instruments | | | | | | | | | | | | | | | | | | |
Repurchase Agreements | | | | | 0 | | | | 2,059 | | | | 0 | | | | 2,059 | |
Short-Term Notes | | | | | 0 | | | | 1,399 | | | | 0 | | | | 1,399 | |
| | | | | $ | 0 | | | $ | 28,300 | | | $ | 0 | | | $ | 28,300 | |
| | | | | |
Financial Derivative Instruments (7) - Assets | | | | | | | | | | | | | | | | | | |
Foreign Exchange Contracts | | | | $ | 0 | | | $ | 93 | | | $ | 0 | | | $ | 93 | |
| | | | | |
Financial Derivative Instruments (7) - Liabilities | | | | | | | | | | | | | | | | | | |
Foreign Exchange Contracts | | | | $ | 0 | | | $ | (116 | ) | | $ | 0 | | | $ | (116 | ) |
Totals | | | | $ | 0 | | | $ | 28,277 | | | $ | 0 | | | $ | 28,277 | |
| (1) | See note 3 in the Notes to Financial Statements for more information regarding pricing inputs and valuation techniques. |
| (2) | There were no significant transfers into or out of level 1, 2, and 3 during the period ended June 30, 2012. |
| (3) | Refer to the Schedule of Investments for additional information. |
| (4) | Quoted prices in active markets for identical investments. |
| (5) | Significant other observable inputs. |
| (6) | Significant unobservable inputs. |
| (7) | Financial Derivative Instruments may include open futures contracts, swap agreements, written options, and foreign currency contracts. |
| (d) | Fair Value of Financial Derivative Instruments (1) |
The following is a summary of the fair valuation of the Fund’s derivative instruments categorized by risk exposure:
Fair Values of Financial Derivative Instruments on the Statements of Assets and Liabilities as of June 30, 2012:
| | | | | | | | | | | | | | | | | | | | | | | | | | |
| | | | | Derivatives not accounted for as hedging instruments | |
| | | | | Commodity
Contracts | | | Credit
Contracts | | | Equity
Contracts | | | Foreign
Exchange
Contracts | | | Interest
Rate Contracts | | | Total | |
Assets: | | | | | | | | | | | | | | | | | | | | | | | | | | |
Unrealized appreciation on foreign currency contracts | | | | $ | 0 | | | $ | 0 | | | $ | 0 | | | $ | 93 | | | $ | 0 | | | $ | 93 | |
| | | | | | | |
Liabilities: | | | | | | | | | | | | | | | | | | | | | | | | | | |
Unrealized depreciation on foreign currency contracts | | | | $ | 0 | | | $ | 0 | | | $ | 0 | | | $ | 116 | | | $ | 0 | | | $ | 116 | |
| | | | | | |
| See Accompanying Notes | | ANNUAL REPORT | | JUNE 30, 2012 | | 75 |
Schedule of Investments PIMCO Global Advantage® Inflation-Linked Bond Strategy Fund (Cont.)
June 30, 2012
The Effect of Financial Derivative Instruments on the Statements of Operations for the Period Ended June 30, 2012:
| | | | | | | | | | | | | | | | | | | | | | | | | | |
| | | | | Derivatives not accounted for as hedging instruments | |
| | | | | Commodity
Contracts | | | Credit
Contracts | | | Equity
Contracts | | | Foreign
Exchange
Contracts | | | Interest
Rate Contracts | | | Total | |
Realized (Loss) on Derivatives Recognized as a Result from Operations: | | | | | | | | | | | | | | | | | | | | | | | | | | |
Net realized (loss) on foreign currency transactions | | | | $ | 0 | | | $ | 0 | | | $ | 0 | | | $ | (9 | ) | | $ | 0 | | | $ | (9 | ) |
| | | | | | | |
Net Change in Unrealized (Depreciation) on Derivatives Recognized as a Result of Operations: | | | | | | | | | | | | | | | | | | | | | | | | | | |
Net change in unrealized (depreciation) on translation of assets and liabilities denominated in foreign currencies | | | | $ | 0 | | | $ | 0 | | | $ | 0 | | | $ | (23 | ) | | $ | 0 | | | $ | (23 | ) |
| (1) | See note 6 in the Notes to Financial Statements for additional information. |
| (e) | Collateral (Received)/Pledged for OTC Financial Derivative Instruments |
The following is a summary by counterparty of the market value of OTC financial derivative instruments and collateral (received)/pledged as of June 30, 2012:
| | | | | | | | | | | | | | |
| Counterparty | | | | Total Market
Value of OTC
Derivatives | | | Collateral
(Received)/ Pledged | | | Net
Exposures (1) | |
BPS | | | | $ | (15 | ) | | $ | 0 | | | $ | (15 | ) |
BRC | | | | | (31 | ) | | | 0 | | | | (31 | ) |
CBK | | | | | 6 | | | | 0 | | | | 6 | |
DUB | | | | | 12 | | | | 0 | | | | 12 | |
HUS | | | | | 5 | | | | 0 | | | | 5 | |
JPM | | | | | 25 | | | | 0 | | | | 25 | |
MSC | | | | | (12 | ) | | | 0 | | | | (12 | ) |
RYL | | | | | (1 | ) | | | 0 | | | | (1 | ) |
UAG | | | | | (12 | ) | | | 0 | | | | (12 | ) |
| (1) | Net Exposure represents the net receivable/(payable) that would be due from/to the counterparty in the event of default. See note 7, Principal Risks, in the Notes to Financial Statements for more information regarding credit and counterparty risks. |
| | | | | | |
| 76 | | PIMCO ETF TRUST | | | | See Accompanying Notes |
Schedule of Investments PIMCO Intermediate Municipal Bond Strategy Fund
June 30, 2012
| | | | | | | | | | | | |
| | | | | PRINCIPAL
AMOUNT
(000s) | | | | | MARKET
VALUE
(000s) | |
MUNICIPAL BONDS & NOTES 99.1% | |
| |
ALASKA 0.6% | |
|
Valdez, Alaska Revenue Bonds, Series 2003 | |
5.000% due 01/01/2014 | | $ | | | 850 | | | $ | | | 904 | |
| | | | | | | | | | | | |
| |
ARIZONA 1.4% | |
|
Arizona State University Revenue Notes, Series 2008 | |
5.250% due 07/01/2016 | | | | | 400 | | | | | | 466 | |
|
Arizona Water Infrastructure Finance Authority Revenue Bonds, Series 2012 | |
5.000% due 10/01/2022 | | | | | 1,350 | | | | | | 1,703 | |
| | | | | | | | | | | | |
| | | | | | | | | | | 2,169 | |
| | | | | | | | | | | | |
| |
CALIFORNIA 13.7% | |
|
California Health Facilities Financing Authority Revenue Bonds, Series 2009 | |
6.000% due 07/01/2039 | | | | | 1,000 | | | | | | 1,156 | |
|
California State Department of Water Resources Revenue Notes, Series 2010 | |
5.000% due 05/01/2018 | | | | | 500 | | | | | | 605 | |
5.000% due 05/01/2019 | | | | | 1,040 | | | | | | 1,276 | |
|
California State General Obligation Bonds, (NPFGC/FGIC Insured), Series 2004 | |
5.250% due 07/01/2014 | | | | | 750 | | | | | | 821 | |
|
California State General Obligation Bonds, Series 2009 | |
5.000% due 07/01/2020 | | | | | 500 | | | | | | 599 | |
|
California State General Obligation Notes, Series 2009 | |
5.000% due 07/01/2018 | | | | | 500 | | | | | | 603 | |
|
California State General Obligation Notes, Series 2010 | |
5.000% due 11/01/2019 | | | | | 500 | | | | | | 599 | |
|
Carlsbad Unified School District, California General Obligation Notes, Series 2009 | |
0.000% due 05/01/2014 | | | | | 250 | | | | | | 246 | |
|
Irvine Ranch Water District, California General Obligation Bonds, Series 2009 | |
0.170% due 10/01/2041 | | | | | 2,200 | | | | | | 2,200 | |
|
Los Angeles Unified School District, California Certificates of Participation Notes, Series 2010 | |
5.000% due 12/01/2017 | | | | | 1,500 | | | | | | 1,743 | |
|
Metropolitan Water District of Southern California Revenue Bonds, Series 2012 | |
5.000% due 10/01/2026 | | | | | 1,500 | | | | | | 1,828 | |
|
Mount San Antonio Community College District, California General Obligation Bonds, (NPFGC Insured), Series 2005 | |
0.000% due 08/01/2016 | | | | | 1,000 | | | | | | 931 | |
|
Newport Beach, California Revenue Bonds, Series 2009 | |
5.000% due 12/01/2038 | | | | | 1,000 | | | | | | 1,026 | |
|
Orange County, California Airport Revenue Notes, Series 2009 | |
4.000% due 07/01/2018 | | | | | 500 | | | | | | 571 | |
|
Pleasanton Unified School District, California Certificates of Participation Notes, (AGM Insured), Series 2010 | |
3.500% due 08/01/2015 | | | | | 450 | | | | | | 475 | |
|
San Diego County, California Regional Airport Authority Revenue Notes, Series 2010 | |
4.000% due 07/01/2016 | | | | | 720 | | | | | | 803 | |
|
San Francisco, California City & County Airports Commission Revenue Notes, Series 2010 | |
5.000% due 05/01/2017 | | | | | 1,000 | | | | | | 1,171 | |
|
San Jose, California Hotel Tax Revenue Notes, Series 2011 | |
5.000% due 05/01/2017 | | | | | 1,115 | | | | | | 1,234 | |
| | | | | | | | | | | | |
| | | | | PRINCIPAL
AMOUNT
(000s) | | | | | MARKET
VALUE
(000s) | |
|
San Juan Unified School District, California General Obligation Bonds, (AGM Insured), Series 2001 | |
0.000% due 08/01/2017 | | $ | | | 750 | | | $ | | | 678 | |
|
Southern California Public Power Authority Revenue Bonds, Series 2007 | |
5.250% due 11/01/2020 | | | | | 575 | | | | | | 625 | |
|
University of California Revenue Bonds, Series 2009 | |
5.000% due 05/15/2020 | | | | | 1,000 | | | | | | 1,203 | |
|
University of California Revenue Notes, Series 2010 | |
5.000% due 05/15/2018 | | | | | 500 | | | | | | 596 | |
| | | | | | | | | | | | |
| | | | | | | | | | | 20,989 | |
| | | | | | | | | | | | |
| |
COLORADO 0.8% | |
|
Denver, Colorado City & County Revenue Bonds, (NPFGC/FGIC Insured), Series 2006 | |
4.000% due 11/15/2016 | | | | | 265 | | | | | | 296 | |
|
Denver, Colorado City & County Revenue Notes, Series 2009 | |
5.000% due 11/15/2016 | | | | | 250 | | | | | | 289 | |
|
Glenwood Springs, Colorado Revenue Notes, Series 2010 | |
5.000% due 10/01/2018 | | | | | 500 | | | | | | 580 | |
| | | | | | | | | | | | |
| | | | | | | | | | | 1,165 | |
| | | | | | | | | | | | |
| |
CONNECTICUT 3.5% | |
|
Connecticut State Health & Educational Facility Authority Revenue Bonds, Series 2011 | |
5.000% due 07/01/2032 | | | | | 5,000 | | | | | | 5,402 | |
| | | | | | | | | | | | |
| |
FLORIDA 7.7% | |
|
Citizens Property Insurance Corp., Florida Revenue Notes, Series 2010 | |
5.000% due 06/01/2016 | | | | | 750 | | | | | | 835 | |
|
Citizens Property Insurance Corp., Florida Revenue Notes, Series 2011 | |
5.000% due 06/01/2019 | | | | | 1,000 | | | | | | 1,131 | |
|
Citizens Property Insurance Corp., Florida Revenue Notes, Series 2012 | |
5.000% due 06/01/2019 | | | | | 1,000 | | | | | | 1,131 | |
|
Florida Municipal Power Agency Revenue Notes, Series 2009 | |
5.000% due 10/01/2015 | | | | | 250 | | | | | | 275 | |
|
Florida State Board of Governors Revenue Notes, Series 2008 | |
5.500% due 07/01/2018 | | | | | 105 | | | | | | 127 | |
|
Florida State JEA Water & Sewer System Revenue Bonds, Series 2012 | |
5.000% due 10/01/2025 | | | | | 1,500 | | | | | | 1,758 | |
|
Inland Protection Financing Corp., Florida Revenue Notes, Series 2010 | |
5.000% due 07/01/2016 | | | | | 500 | | | | | | 564 | |
|
Jacksonville, Florida Revenue Notes, Series 2012 | |
5.000% due 10/01/2021 | | | | | 1,000 | | | | | | 1,172 | |
|
Miami-Dade County, Florida General Obligation Notes, Series 2011 | |
3.000% due 07/01/2017 | | | | | 1,375 | | | | | | 1,487 | |
|
Miami-Dade County, Florida Revenue Notes, Series 2010 | |
4.000% due 07/01/2016 | | | | | 1,000 | | | | | | 1,133 | |
|
Orange County, Florida Health Facilities Authority Revenue Notes, Series 2009 | |
5.000% due 10/01/2015 | | | | | 250 | | | | | | 276 | |
|
Orlando Utilities Commission, Florida Revenue Notes, Series 2010 | |
5.000% due 10/01/2017 | | | | | 250 | | | | | | 298 | |
| | | | | | | | | | | | |
| | | | | PRINCIPAL
AMOUNT
(000s) | | | | | MARKET
VALUE
(000s) | |
|
Palm Beach County, Florida Revenue Bonds, Series 2012 | |
5.000% due 06/01/2023 | | $ | | | 1,300 | | | $ | | | 1,582 | |
| | | | | | | | | | | | |
| | | | | | | | | | | 11,769 | |
| | | | | | | | | | | | |
| |
GEORGIA 0.8% | |
|
Marietta, Georgia General Obligation Notes, Series 2009 | |
5.000% due 02/01/2018 | | | | | 250 | | | | | | 302 | |
|
Municipal Electric Authority of Georgia Revenue Notes, Series 2010 | |
4.000% due 01/01/2018 | | | | | 350 | | | | | | 388 | |
|
Municipal Electric Authority of Georgia Revenue Notes, Series 2011 | |
3.000% due 01/01/2014 | | | | | 250 | | | | | | 259 | |
5.000% due 01/01/2020 | | | | | 250 | | | | | | 299 | |
| | | | | | | | | | | | |
| | | | | | | | | | | 1,248 | |
| | | | | | | | | | | | |
| |
ILLINOIS 5.7% | |
|
Chicago Board of Education, Illinois General Obligation Bonds, (NPFGC/FGIC Insured), Series 1999 | |
0.000% due 12/01/2016 | | | | | 250 | | | | | | 230 | |
|
Chicago, Illinois Midway Airport Revenue Bonds, Series 2010 | |
5.000% due 01/01/2034 | | | | | 200 | | | | | | 216 | |
|
Chicago, Illinois O’Hare International Airport Revenue Notes, Series 2011 | |
3.000% due 01/01/2014 | | | | | 650 | | | | | | 670 | |
|
Chicago, Illinois Wastewater Transmission Revenue Bonds, (NPFGC Insured), Series 2001 | |
5.500% due 01/01/2017 | | | | | 1,000 | | | | | | 1,170 | |
5.500% due 01/01/2018 | | | | | 1,000 | | | | | | 1,186 | |
|
Chicago, Illinois Waterworks Revenue Notes, (AGM Insured), Series 2008 | |
5.000% due 11/01/2016 | | | | | 350 | | | | | | 408 | |
|
Chicago, Illinois Waterworks Revenue Notes, Series 2012 | |
5.000% due 11/01/2020 | | | | | 1,000 | | | | | | 1,219 | |
|
Illinois Finance Authority Revenue Notes, Series 2009 | |
5.000% due 08/15/2015 | | | | | 375 | | | | | | 419 | |
|
Illinois State General Obligation Bonds, (NPFGC Insured), Series 2002 | |
5.250% due 08/01/2012 | | | | | 250 | | | | | | 251 | |
|
Illinois State General Obligation Notes, Series 2004 | |
5.000% due 03/01/2013 | | | | | 1,000 | | | | | | 1,029 | |
|
Illinois State Revenue Notes, Series 2009 | |
4.500% due 06/15/2016 | | | | | 500 | | | | | | 567 | |
|
Illinois State Revenue Notes, Series 2010 | |
5.000% due 06/15/2016 | | | | | 750 | | | | | | 866 | |
|
Railsplitter Tobacco Settlement Authority, Illinois Revenue Notes, Series 2010 | |
5.125% due 06/01/2019 | | | | | 500 | | | | | | 576 | |
| | | | | | | | | | | | |
| | | | | | | | | | | 8,807 | |
| | | | | | | | | | | | |
| |
INDIANA 2.9% | |
|
Indiana Finance Authority Revenue Bonds, (NPFGC/FGIC Insured), Series 2007 | |
5.000% due 12/01/2017 | | | | | 300 | | | | | | 353 | |
|
Indiana Finance Authority Revenue Notes, Series 2010 | |
4.000% due 11/01/2016 | | | | | 500 | | | | | | 558 | |
5.000% due 02/01/2018 | | | | | 500 | | | | | | 602 | |
|
Indiana University Revenue Notes, Series 2012 | |
5.000% due 06/01/2021 | | | | | 1,000 | | | | | | 1,260 | |
| | | | | | |
| See Accompanying Notes | | ANNUAL REPORT | | JUNE 30, 2012 | | 77 |
Schedule of Investments PIMCO Intermediate Municipal Bond Strategy Fund (Cont.)
| | | | | | | | | | | | |
| | | | | PRINCIPAL
AMOUNT
(000s) | | | | | MARKET
VALUE
(000s) | |
|
Indianapolis, Indiana Local Public Improvement Bond Bank Revenue Notes, (AMBAC Insured), Series 2006 | |
5.000% due 01/01/2016 | | $ | | | 300 | | | $ | | | 343 | |
|
Purdue University, Indiana Certificates of Participation Bonds, Series 2006 | |
5.250% due 07/01/2017 | | | | | 640 | | | | | | 756 | |
|
Vincennes University, Indiana Revenue Notes, Series 2010 | |
4.000% due 06/01/2016 | | | | | 500 | | | | | | 549 | |
|
Warsaw Multi-School Building Corp., Indiana Revenue Notes, Series 2008 | |
5.500% due 01/15/2017 | | | | | 100 | | | | | | 115 | |
| | | | | | | | | | | | |
| | | | | | | | | | | 4,536 | |
| | | | | | | | | | | | |
| |
IOWA 0.4% | |
|
Iowa Higher Education Loan Authority Revenue Notes, Series 2010 | |
4.000% due 12/01/2016 | | | | | 500 | | | | | | 566 | |
| | | | | | | | | | | | |
| |
KANSAS 0.5% | |
|
Kansas Development Finance Authority Revenue Notes, Series 2010 | |
5.000% due 11/01/2017 | | | | | 500 | | | | | | 598 | |
|
Wyandotte County-Kansas City, Kansas Unified Government Utility System Revenue Notes, Series 2010 | |
5.000% due 09/01/2015 | | | | | 200 | | | | | | 224 | |
| | | | | | | | | | | | |
| | | | | | | | | | | 822 | |
| | | | | | | | | | | | |
| |
KENTUCKY 1.4% | |
|
Kentucky Municipal Power Agency Revenue Notes, (AGM Insured), Series 2010 | |
4.000% due 09/01/2016 | | | | | 900 | | | | | | 972 | |
|
Kentucky Turnpike Authority Revenue Notes, Series 2010 | |
5.000% due 07/01/2016 | | | | | 1,000 | | | | | | 1,160 | |
| | | | | | | | | | | | |
| | | | | | | | | | | 2,132 | |
| | | | | | | | | | | | |
| |
MASSACHUSETTS 3.8% | |
|
Massachusetts Bay Transportation Authority Revenue Bonds, Series 2006 | |
5.500% due 07/01/2017 | | | | | 500 | | | | | | 610 | |
|
Massachusetts Development Finance Agency Revenue Notes, Series 2010 | |
4.000% due 10/01/2016 | | | | | 850 | | | | | | 938 | |
|
Massachusetts Development Finance Agency Revenue Notes, Series 2012 | |
4.000% due 10/01/2015 | | | | | 500 | | | | | | 541 | |
5.000% due 10/01/2016 | | | | | 600 | | | | | | 681 | |
|
Massachusetts State College Building Authority Revenue Bonds, Series 2012 | |
5.000% due 05/01/2026 | | | | | 2,000 | | | | | | 2,406 | |
|
Taunton, Massachusetts General Obligation Notes, Series 2009 | |
5.000% due 12/01/2018 | | | | | 510 | | | | | | 609 | |
| | | | | | | | | | | | |
| | | | | | | | | | | 5,785 | |
| | | | | | | | | | | | |
| |
MICHIGAN 2.1% | |
|
Michigan Finance Authority Revenue Notes, Series 2012 | |
5.000% due 07/01/2017 | | | | | 1,000 | | | | | | 1,187 | |
|
Michigan State Hospital Finance Authority Revenue Bonds, Series 2010 | |
1.500% due 11/15/2047 | | | | | 2,000 | | | | | | 2,004 | |
| | | | | | | | | | | | |
| | | | | | | | | | | 3,191 | |
| | | | | | | | | | | | |
| | | | | | | | | | | | |
| | | | | PRINCIPAL
AMOUNT
(000s) | | | | | MARKET
VALUE
(000s) | |
MINNESOTA 0.7% | |
|
Rochester, Minnesota Revenue Bonds, Series 2011 | |
4.000% due 11/15/2030 | | $ | | | 1,000 | | | $ | | | 1,147 | |
| | | | | | | | | | | | |
| |
MISSOURI 2.0% | |
|
Missouri Joint Municipal Electric Utility Commission Revenue Notes, (AMBAC Insured), Series 2007 | |
5.000% due 01/01/2016 | | | | | 800 | | | | | | 888 | |
|
Missouri State Health & Educational Facilities Authority Revenue Bonds, Series 1996 | |
0.180% due 09/01/2030 | | | | | 1,000 | | | | | | 1,000 | |
|
Missouri State Health & Educational Facilities Authority Revenue Notes, Series 2010 | |
5.000% due 11/15/2017 | | | | | 1,000 | | | | | | 1,155 | |
| | | | | | | | | | | | |
| | | | | | | | | | | 3,043 | |
| | | | | | | | | | | | |
| |
NEW HAMPSHIRE 1.0% | |
|
Merrimack County, New Hampshire General Obligation Bonds, Series 2012 | |
5.000% due 12/01/2022 | | | | | 1,115 | | | | | | 1,317 | |
|
New Hampshire Health & Education Facilities Authority Revenue Notes, Series 2009 | |
5.000% due 07/01/2016 | | | | | 250 | | | | | | 288 | |
| | | | | | | | | | | | |
| | | | | | | | | | | 1,605 | |
| | | | | | | | | | | | |
| |
NEW JERSEY 5.3% | |
|
New Jersey Economic Development Authority Revenue Bonds, (NPFGC Insured), Series 2005 | |
5.250% due 09/01/2016 | | | | | 1,000 | | | | | | 1,142 | |
|
New Jersey Economic Development Authority Revenue Bonds, Series 2012 | |
5.000% due 06/15/2023 | | | | | 1,000 | | | | | | 1,111 | |
|
New Jersey Economic Development Authority Revenue Notes, (AGM Insured), Series 2008 | |
5.000% due 03/01/2014 | | | | | 1,000 | | | | | | 1,072 | |
|
New Jersey Economic Development Authority Revenue Notes, Series 2011 | |
5.000% due 09/01/2018 | | | | | 2,000 | | | | | | 2,380 | |
|
New Jersey Transportation Trust Fund Authority Revenue Bonds, Series 2010 | |
5.000% due 12/15/2023 | | | | | 2,000 | | | | | | 2,424 | |
| | | | | | | | | | | | |
| | | | | | | | | | | 8,129 | |
| | | | | | | | | | | | |
| |
NEW MEXICO 0.4% | |
|
New Mexico State Revenue Notes, Series 2010 | |
5.000% due 07/01/2017 | | | | | 500 | | | | | | 599 | |
| | | | | | | | | | | | |
| |
NEW YORK 12.1% | |
|
Erie County, New York Industrial Development Agency Revenue Bonds, Series 2012 | |
5.000% due 05/01/2022 | | | | | 1,000 | | | | | | 1,211 | |
|
Erie County, New York Industrial Development Agency Revenue Notes, Series 2011 | |
5.000% due 05/01/2015 | | | | | 500 | | | | | | 559 | |
|
Long Island Power Authority, New York Revenue Bonds, Series 2006 | |
5.000% due 12/01/2017 | | | | | 500 | | | | | | 582 | |
|
Metropolitan Transportation Authority, New York Revenue Bonds, Series 2005 | |
5.000% due 11/15/2019 | | | | | 500 | | | | | | 600 | |
|
New York City, New York General Obligation Notes, Series 2011 | |
5.000% due 08/01/2012 | | | | | 750 | | | | | | 753 | |
5.000% due 08/01/2017 | | | | | 980 | | | | | | 1,163 | |
| | | | | | | | | | | | |
| | | | | PRINCIPAL
AMOUNT
(000s) | | | | | MARKET
VALUE
(000s) | |
|
New York City, New York Municipal Water Finance Authority Revenue Notes, Series 2009 | |
5.000% due 06/15/2017 | | $ | | | 895 | | | $ | | | 1,068 | |
|
New York City, New York Transitional Finance Authority Future Tax Secured Revenue Notes, Series 2007 | |
5.000% due 11/01/2015 | | | | | 200 | | | | | | 229 | |
|
New York Liberty Development Corp. Revenue Bonds, Series 2011 | |
0.270% due 12/01/2049 | | | | | 1,000 | | | | | | 1,000 | |
|
New York State Dormitory Authority Revenue Bonds, (NPFGC/FGIC Insured), Series 2005 | |
5.000% due 07/01/2016 | | | | | 370 | | | | | | 416 | |
|
New York State Dormitory Authority Revenue Bonds, Series 2005 | |
5.000% due 03/15/2030 | | | | | 1,635 | | | | | | 1,774 | |
|
New York State Dormitory Authority Revenue Bonds, Series 2011 | |
5.000% due 05/01/2022 | | | | | 2,000 | | | | | | 2,347 | |
|
New York State Dormitory Authority Revenue Notes, Series 2008 | |
5.000% due 07/01/2017 | | | | | 2,000 | | | | | | 2,363 | |
|
New York State Dormitory Authority Revenue Notes, Series 2010 | |
5.000% due 07/01/2019 | | | | | 1,000 | | | | | | 1,157 | |
|
New York State Dormitory Authority Revenue Notes, Series 2011 | |
4.000% due 07/01/2018 | | | | | 815 | | | | | | 903 | |
|
New York State Urban Development Corp. Revenue Notes, Series 2009 | |
5.000% due 12/15/2013 | | | | | 1,000 | | | | | | 1,067 | |
|
New York State Urban Development Corp. Revenue Notes, Series 2010 | |
5.000% due 03/15/2018 | | | | | 500 | | | | | | 599 | |
|
Riverhead Central School District, New York General Obligation Notes, Series 2010 | |
4.000% due 10/01/2017 | | | | | 250 | | | | | | 282 | |
|
Syracuse Industrial Development Agency, New York Revenue Notes, Series 2010 | |
4.000% due 05/01/2017 | | | | | 500 | | | | | | 549 | |
| | | | | | | | | | | | |
| | | | | | | | | | | 18,622 | |
| | | | | | | | | | | | |
| |
NORTH CAROLINA 3.9% | |
|
Mecklenburg County, North Carolina Certificates of Participation Notes, Series 2009 | |
5.000% due 02/01/2019 | | | | | 300 | | | | | | 361 | |
|
North Carolina Medical Care Commission Revenue Bonds, Series 2012 | |
5.000% due 06/01/2023 | | | | | 1,665 | | | | | | 1,911 | |
5.000% due 10/01/2027 (a) | | | | | 1,100 | | | | | | 1,222 | |
|
North Carolina State Revenue Bonds, Series 2011 | |
5.000% due 11/01/2022 | | | | | 1,500 | | | | | | 1,836 | |
|
Union County, North Carolina Certificates of Participation Bonds, (AMBAC Insured), Series 2006 | |
5.000% due 06/01/2022 | | | | | 360 | | | | | | 421 | |
|
University of North Carolina at Chapel Hill Revenue Notes, Series 2005 | |
5.000% due 02/01/2015 | | | | | 250 | | | | | | 271 | |
| | | | | | | | | | | | |
| | | | | | | | | | | 6,022 | |
| | | | | | | | | | | | |
| |
OHIO 6.0% | |
|
American Municipal Power Inc., Ohio Revenue Notes, Series 2012 | |
5.000% due 02/15/2022 | | | | | 800 | | | | | | 949 | |
| | | | | | |
| 78 | | PIMCO ETF TRUST | | | | See Accompanying Notes |
June 30, 2012
| | | | | | | | | | | | |
| | | | | PRINCIPAL
AMOUNT
(000s) | | | | | MARKET
VALUE
(000s) | |
|
American Municipal Power, Inc. Ohio Revenue Notes, Series 2009 | |
5.000% due 02/15/2017 | | $ | | | 500 | | | $ | | | 565 | |
|
Kent State University, Ohio Revenue Notes, Series 2012 | |
5.000% due 05/01/2017 | | | | | 640 | | | | | | 742 | |
|
Ohio State General Obligation Bonds, Series 2011 | |
5.000% due 08/01/2022 | | | | | 2,000 | | | | | | 2,503 | |
|
Ohio State Revenue Bonds, (NPFGC Insured), Series 2005 | |
5.000% due 08/01/2016 | | | | | 300 | | | | | | 331 | |
|
Ohio State Turnpike Commission Revenue Bonds, (NPFGC/FGIC Insured), Series 1998 | |
5.500% due 02/15/2016 | | | | | 1,000 | | | | | | 1,156 | |
5.500% due 02/15/2017 | | | | | 225 | | | | | | 267 | |
|
Ohio State Water Development Authority Revenue Notes, Series 2011 | |
5.000% due 06/01/2017 | | | | | 1,005 | | | | | | 1,185 | |
|
University of Cincinnati, Ohio Revenue Bonds, Series 2012 | |
5.000% due 06/01/2024 | | | | | 1,250 | | | | | | 1,488 | |
| | | | | | | | | | | | |
| | | | | | | | | | | 9,186 | |
| | | | | | | | | | | | |
| |
OREGON 0.4% | |
|
Oregon State Facilities Authority Revenue Notes, Series 2010 | |
5.000% due 10/01/2017 | | | | | 500 | | | | | | 568 | |
| | | | | | | | | | | | |
| |
PENNSYLVANIA 3.3% | |
|
Allegheny County, Pennsylvania Higher Education Building Authority Revenue Bonds, Series 2012 | |
5.000% due 03/01/2024 | | | | | 500 | | | | | | 605 | |
|
Allegheny County, Pennsylvania Hospital Development Authority Revenue Notes, Series 2010 | |
5.000% due 05/15/2017 | | | | | 500 | | | | | | 584 | |
|
Pennsylvania Higher Educational Facilities Authority Revenue Bonds, Series 2011 | |
5.250% due 06/15/2023 | | | | | 2,500 | | | | | | 3,068 | |
|
Pennsylvania Higher Educational Facilities Authority Revenue Notes, (NPFGC Insured), Series 2006 | |
5.000% due 04/01/2016 | | | | | 250 | | | | | | 286 | |
|
Southeastern Pennsylvania Transportation Authority Revenue Notes, Series 2010 | |
5.000% due 03/01/2018 | | | | | 500 | | | | | | 590 | |
| | | | | | | | | | | | |
| | | | | | | | | | | 5,133 | |
| | | | | | | | | | | | |
| |
PUERTO RICO 0.2% | |
|
Puerto Rico Electric Power Authority Revenue Bonds, (SGI Insured), Series 2002 | |
5.375% due 07/01/2016 | | | | | 250 | | | | | | 283 | |
| | | | | | | | | | | | |
| | | | | | | | | | | | |
| | | | | PRINCIPAL
AMOUNT
(000s) | | | | | MARKET
VALUE
(000s) | |
SOUTH CAROLINA 0.2% | |
|
Piedmont Municipal Power Agency, South Carolina Revenue Notes, Series 2009 | |
5.000% due 01/01/2015 | | $ | | | 250 | | | $ | | | 272 | |
| | | | | | | | | | | | |
| |
TENNESSEE 0.3% | |
|
Tennessee Energy Acquisition Corp. Revenue Bonds, Series 2006 | |
5.000% due 02/01/2021 | | | | | 500 | | | | | | 536 | |
| | | | | | | | | | | | |
| |
TEXAS 12.7% | |
|
Barbers Hill Independent School District, Texas General Obligation Bonds, (PSF/GTD Insured), Series 2012 | |
4.000% due 02/15/2023 | | | | | 1,225 | | | | | | 1,408 | |
4.000% due 02/15/2025 | | | | | 2,565 | | | | | | 2,855 | |
|
Eagle Mountain & Saginaw Independent School District, Texas General Obligation Notes, Series 2010 | |
0.000% due 08/15/2017 | | | | | 250 | | | | | | 227 | |
|
Katy Independent School District, Texas General Obligation Notes, (PSF/GTD Insured), Series 2012 | |
5.000% due 02/15/2020 | | | | | 1,500 | | | | | | 1,841 | |
|
North Central Texas Health Facility Development Corp. Revenue Notes, Series 2012 | |
5.000% due 08/15/2020 | | | | | 1,000 | | | | | | 1,193 | |
|
Northside Independent School District, Texas General Obligation Bonds, (PSF/GTD Insured), Series 2011 | |
0.950% due 08/01/2034 | | | | | 700 | | | | | | 703 | |
1.350% due 06/01/2039 | | | | | 1,475 | | | | | | 1,493 | |
|
Pflugerville Independent School District, Texas General Obligation Bonds, (PSF/GTD Insured), Series 2012 | |
5.000% due 02/15/2024 | | | | | 1,165 | | | | | | 1,424 | |
|
San Antonio, Texas Water System Revenue Bonds, Series 2012 | |
5.000% due 05/15/2023 | | | | | 1,500 | | | | | | 1,855 | |
|
Texas Municipal Gas Acquisition & Supply Corp. I Revenue Bonds, Series 2006 | |
5.250% due 12/15/2023 | | | | | 250 | | | | | | 269 | |
|
Texas Municipal Gas Acquisition & Supply Corp. I Revenue Notes, Series 2008 | |
5.625% due 12/15/2017 | | | | | 2,500 | | | | | | 2,749 | |
|
Texas State General Obligation Notes, Series 2010 | |
4.000% due 12/01/2015 | | | | | 810 | | | | | | 903 | |
|
Texas Transportation Commission Revenue Bonds, Series 2007 | |
5.000% due 04/01/2026 | | | | | 100 | | | | | | 113 | |
|
University of Houston, Texas Revenue Bonds, Series 2011 | |
5.000% due 02/15/2022 | | | | | 2,000 | | | | | | 2,441 | |
| | | | | | | | | | | | |
| | | | | | | | | | | 19,474 | |
| | | | | | | | | | | | |
| | | | | | | | | | | | |
| | | | | PRINCIPAL
AMOUNT
(000s) | | | | | MARKET
VALUE
(000s) | |
WASHINGTON 2.5% | |
|
King County, Washington Public Hospital District No. 2 General Obligation Notes, Series 2010 | |
5.000% due 12/01/2015 | | $ | | | 1,000 | | | $ | | | 1,109 | |
|
Washington Higher Education Facilities Authority Revenue Notes, Series 2010 | |
4.000% due 04/01/2013 | | | | | 250 | | | | | | 255 | |
|
Washington State Revenue Bonds, Series 2012 | |
5.000% due 09/01/2023 | | | | | 2,000 | | | | | | 2,422 | |
| | | | | | | | | | | | |
| | | | | | | | | | | 3,786 | |
| | | | | | | | | | | | |
| |
WISCONSIN 2.7% | |
|
Wisconsin Department of Transportation Revenue Bonds, Series 2012 | |
5.000% due 07/01/2022 | | | | | 2,500 | | | | | | 3,138 | |
|
Wisconsin Department of Transportation Revenue Notes, Series 2012 | |
5.000% due 07/01/2018 | | | | | 300 | | | | | | 363 | |
5.000% due 07/01/2019 | | | | | 275 | | | | | | 337 | |
|
Wisconsin State General Obligation Bonds, (NPFGC Insured), Series 2005 | |
5.000% due 05/01/2017 | | | | | 225 | | | | | | 252 | |
| | | | | | | | | | | | |
| | | | | | | | | | | 4,090 | |
| | | | | | | | | | | | |
| |
WYOMING 0.1% | |
|
Campbell County, Wyoming Hospital District Revenue Notes, Series 2009 | |
5.000% due 12/01/2017 | | | | | 200 | | | | | | 227 | |
| | | | | | | | | | | | |
Total Municipal Bonds & Notes
(Cost $146,278) | | | 152,207 | |
| | | | | | | | | | | | |
| |
SHORT-TERM INSTRUMENTS 0.9% | |
| |
REPURCHASE AGREEMENTS 0.9% | |
| |
State Street Bank and Trust Co. | | | | |
0.010% due 07/02/2012 | | | | | 1,395 | | | | | | 1,395 | |
| | | | | | | | | | | | |
(Dated 06/29/2012. Collateralized by U.S. Treasury Notes 2.000% due 11/15/2021 valued at $1,428. Repurchase proceeds are $1,395.) | | | | |
| |
Total Short-Term Instruments
(Cost $1,395) | | | 1,395 | |
| | | | | | | | | | | | |
| |
Total Investments 100.0%
(Cost $147,673) | | | $ | | | 153,602 | |
| |
Other Assets and Liabilities (Net) 0.0% | | | | | | (26 | ) |
| | | | | | | | | | | | |
Net Assets 100.0% | | | | | | | | $ | | | 153,576 | |
| | | | | | | | | | | | |
Notes to Schedule of Investments (amounts in thousands):
| | | | | | |
| See Accompanying Notes | | ANNUAL REPORT | | JUNE 30, 2012 | | 79 |
Schedule of Investments PIMCO Intermediate Municipal Bond Strategy Fund (Cont.)
June 30, 2012
| (b) | Fair Value Measurements (1) |
The following is a summary of the fair valuations according to the inputs used as of June 30, 2012 in valuing the Fund’s assets and liabilities (2):
| | | | | | | | | | | | | | | | | | |
| Category and Subcategory (3) | | | | Level 1 (4) | | | Level 2 (5) | | | Level 3 (6) | | | Fair Value at
06/30/2012 | |
Investments, at value | | | | | | | | | | | | | | | | | | |
Municipal Bonds & Notes | | | | | | | | | | | | | | | | | | |
Alaska | | | | $ | 0 | | | $ | 904 | | | $ | 0 | | | $ | 904 | |
Arizona | | | | | 0 | | | | 2,169 | | | | 0 | | | | 2,169 | |
California | | | | | 0 | | | | 20,989 | | | | 0 | | | | 20,989 | |
Colorado | | | | | 0 | | | | 1,165 | | | | 0 | | | | 1,165 | |
Connecticut | | | | | 0 | | | | 5,402 | | | | 0 | | | | 5,402 | |
Florida | | | | | 0 | | | | 11,769 | | | | 0 | | | | 11,769 | |
Georgia | | | | | 0 | | | | 1,248 | | | | 0 | | | | 1,248 | |
Illinois | | | | | 0 | | | | 8,807 | | | | 0 | | | | 8,807 | |
Indiana | | | | | 0 | | | | 4,536 | | | | 0 | | | | 4,536 | |
Iowa | | | | | 0 | | | | 566 | | | | 0 | | | | 566 | |
Kansas | | | | | 0 | | | | 822 | | | | 0 | | | | 822 | |
Kentucky | | | | | 0 | | | | 2,132 | | | | 0 | | | | 2,132 | |
Massachusetts | | | | | 0 | | | | 5,785 | | | | 0 | | | | 5,785 | |
Michigan | | | | | 0 | | | | 3,191 | | | | 0 | | | | 3,191 | |
Minnesota | | | | | 0 | | | | 1,147 | | | | 0 | | | | 1,147 | |
Missouri | | | | | 0 | | | | 3,043 | | | | 0 | | | | 3,043 | |
New Hampshire | | | | | 0 | | | | 1,605 | | | | 0 | | | | 1,605 | |
New Jersey | | | | | 0 | | | | 8,129 | | | | 0 | | | | 8,129 | |
New Mexico | | | | | 0 | | | | 599 | | | | 0 | | | | 599 | |
New York | | | | | 0 | | | | 18,622 | | | | 0 | | | | 18,622 | |
North Carolina | | | | | 0 | | | | 6,022 | | | | 0 | | | | 6,022 | |
Ohio | | | | | 0 | | | | 9,186 | | | | 0 | | | | 9,186 | |
Oregon | | | | | 0 | | | | 568 | | | | 0 | | | | 568 | |
Pennsylvania | | | | | 0 | | | | 5,133 | | | | 0 | | | | 5,133 | |
Puerto Rico | | | | | 0 | | | | 283 | | | | 0 | | | | 283 | |
South Carolina | | | | | 0 | | | | 272 | | | | 0 | | | | 272 | |
Tennessee | | | | | 0 | | | | 536 | | | | 0 | | | | 536 | |
Texas | | | | | 0 | | | | 19,474 | | | | 0 | | | | 19,474 | |
Washington | | | | | 0 | | | | 3,786 | | | | 0 | | | | 3,786 | |
Wisconsin | | | | | 0 | | | | 4,090 | | | | 0 | | | | 4,090 | |
Wyoming | | | | | 0 | | | | 227 | | | | 0 | | | | 227 | |
Short-Term Instruments | | | | | | | | | | | | | | | | | | |
Repurchase Agreements | | | | | 0 | | | | 1,395 | | | | 0 | | | | 1,395 | |
| | | | $ | 0 | | | $ | 153,602 | | | $ | 0 | | | $ | 153,602 | |
| (1) | See note 3 in the Notes to Financial Statements for more information regarding pricing inputs and valuation techniques. |
| (2) | There were no significant transfers into or out of level 1, 2, and 3 during the period ended June 30, 2012. |
| (3) | Refer to the Schedule of Investments for additional information. |
| (4) | Quoted prices in active markets for identical investments. |
| (5) | Significant other observable inputs. |
| (6) | Significant unobservable inputs. |
| | | | | | |
| 80 | | PIMCO ETF TRUST | | | | See Accompanying Notes |
Schedule of Investments PIMCO Short Term Municipal Bond Strategy Fund
June 30, 2012
| | | | | | | | | | | | |
| | | | | PRINCIPAL
AMOUNT
(000s) | | | | | MARKET
VALUE
(000s) | |
MUNICIPAL BONDS & NOTES 97.3% | |
| |
ALASKA 0.6% | |
|
Valdez, Alaska Revenue Bonds, Series 2003 | |
5.000% due 01/01/2014 | | $ | | | 250 | | | $ | | | 266 | |
| | | | | | | | | | | | |
| |
ARIZONA 6.6% | |
|
Arizona Sports & Tourism Authority Revenue Notes, Series 2012 | |
4.000% due 07/01/2017 | | | | | 1,000 | | | | | | 1,115 | |
|
Salt River Project Agricultural Improvement & Power District, Arizona Revenue Notes, Series 2011 | |
4.000% due 12/01/2014 | | | | | 1,600 | | | | | | 1,737 | |
| | | | | | | | | | | | |
| | | | | | | | | | | 2,852 | |
| | | | | | | | | | | | |
| |
CALIFORNIA 12.8% | |
|
California Health Facilities Financing Authority Revenue Bonds, Series 2004 | |
4.950% due 07/01/2026 | | | | | 250 | | | | | | 270 | |
|
California State Department of Water Resources Revenue Notes, Series 2010 | |
5.000% due 05/01/2013 | | | | | 500 | | | | | | 519 | |
|
California State General Obligation Bonds, (NPFGC/FGIC Insured), Series 2004 | |
5.250% due 07/01/2014 | | | | | 550 | | | | | | 602 | |
|
California State General Obligation Notes, Series 2010 | |
4.000% due 11/01/2013 | | | | | 500 | | | | | | 523 | |
|
California Statewide Communities Development Authority Revenue Notes, Series 2010 | |
3.000% due 11/01/2012 | | | | | 100 | | | | | | 101 | |
|
Long Beach, California Revenue Notes, Series 2010 | |
3.000% due 06/01/2013 | | | | | 165 | | | | | | 169 | |
|
Los Angeles Unified School District, California General Obligation Notes, Series 2011 | |
4.000% due 07/01/2014 | | | | | 1,000 | | | | | | 1,070 | |
|
Newport Beach, California Revenue Bonds, Series 2009 | |
5.000% due 12/01/2038 | | | | | 500 | | | | | | 513 | |
|
Northern California Power Agency Revenue Notes, Series 2010 | |
3.000% due 06/01/2013 | | | | | 250 | | | | | | 255 | |
|
San Francisco, California City & County Public Utilities Commission Water Revenue Notes, Series 2010 | |
3.000% due 11/01/2013 | | | | | 750 | | | | | | 777 | |
|
San Jose Evergreen Community College District, California General Obligation Notes, Series 2012 | |
3.000% due 08/01/2013 | | | | | 500 | | | | | | 515 | |
|
South Placer Wastewater Authority, California Revenue Notes, Series 2011 | |
1.010% due 11/01/2014 | | | | | 250 | | | | | | 250 | |
| | | | | | | | | | | | |
| | | | | | | | | | | 5,564 | |
| | | | | | | | | | | | |
| |
COLORADO 1.2% | |
|
University of Colorado Revenue Notes, Series 2010 | |
3.000% due 06/01/2013 | | | | | 500 | | | | | | 513 | |
| | | | | | | | | | | | |
| |
CONNECTICUT 6.4% | |
|
Connecticut State Development Authority Revenue Bonds, Series 2011 | |
1.250% due 09/01/2028 | | | | | 1,000 | | | | | | 1,005 | |
|
Stratford, Connecticut General Obligation Notes, Series 2011 | |
3.500% due 08/01/2015 | | | | | 1,635 | | | | | | 1,766 | |
| | | | | | | | | | | | |
| | | | | | | | | | | 2,771 | |
| | | | | | | | | | | | |
| |
| | | | | | | | | | | | |
| | | | | PRINCIPAL
AMOUNT
(000s) | | | | | MARKET
VALUE
(000s) | |
DELAWARE 1.1% | |
|
Delaware Solid Waste Authority Revenue Notes, Series 2010 | |
3.500% due 06/01/2013 | | $ | | | 450 | | | $ | | | 461 | |
| | | | | | | | | | | | |
| |
DISTRICT OF COLUMBIA 0.2% | |
|
District of Columbia General Obligation Notes, (AGM Insured), Series 2005 | |
5.000% due 06/01/2013 | | | | | 100 | | | | | | 104 | |
| | | | | | | | | | | | |
| |
GEORGIA 1.8% | |
|
Atlanta, Georgia Revenue Notes, Series 2010 | |
5.000% due 01/01/2014 | | | | | 500 | | | | | | 533 | |
|
Municipal Electric Authority of Georgia Revenue Notes, Series 2008 | |
5.000% due 01/01/2013 | | | | | 250 | | | | | | 255 | |
| | | | | | | | | | | | |
| | | | | | | | | | | 788 | |
| | | | | | | | | | | | |
| |
ILLINOIS 8.0% | |
|
Chicago, Illinois Midway Airport Revenue Bonds, Series 2010 | |
5.000% due 01/01/2034 | | | | | 500 | | | | | | 541 | |
|
Chicago, Illinois O’Hare International Airport Revenue Notes, Series 2010 | |
4.000% due 01/01/2013 | | | | | 250 | | | | | | 254 | |
|
Chicago, Illinois Waterworks Revenue Notes, Series 2012 | |
5.000% due 11/01/2016 | | | | | 850 | | | | | | 991 | |
|
Cook County, Illinois School District No. 63 East Maine General Obligation Notes, Series 2010 | |
2.000% due 12/01/2012 | | | | | 155 | | | | | | 156 | |
|
Decatur Park District, Illinois General Obligation Notes, Series 2010 | |
2.250% due 03/01/2013 | | | | | 175 | | | | | | 177 | |
|
Illinois Finance Authority Revenue Bonds, Series 2004 | |
5.500% due 10/01/2014 | | | | | 200 | | | | | | 218 | |
|
Illinois Municipal Electric Agency Revenue Notes, (NPFGC/FGIC Insured), Series 2007 | |
5.000% due 02/01/2014 | | | | | 300 | | | | | | 317 | |
|
Illinois State Toll Highway Authority Revenue Bonds, (AGM Insured), Series 1998 | |
5.500% due 01/01/2014 | | | | | 250 | | | | | | 267 | |
|
Metropolitan Pier & Exposition Authority, Illinois Revenue Bonds, (NPFGC Insured), Series 1996 | |
0.000% due 12/15/2012 | | | | | 300 | | | | | | 298 | |
|
Railsplitter Tobacco Settlement Authority, Illinois Revenue Notes, Series 2010 | |
4.000% due 06/01/2013 | | | | | 250 | | | | | | 257 | |
| | | | | | | | | | | | |
| | | | | | | | | | | 3,476 | |
| | | | | | | | | | | | |
| |
INDIANA 2.5% | |
|
Indiana Finance Authority Revenue Notes, Series 2006 | |
5.500% due 02/01/2013 | | | | | 300 | | | | | | 309 | |
|
Indiana University Revenue Notes, Series 2010 | |
4.000% due 08/01/2013 | | | | | 240 | | | | | | 249 | |
|
Indianapolis, Indiana Thermal Energy System Revenue Notes, Series 2010 | |
3.000% due 10/01/2013 | | | | | 500 | | | | | | 515 | |
| | | | | | | | | | | | |
| | | | | | | | | | | 1,073 | |
| | | | | | | | | | | | |
| |
IOWA 1.5% | |
|
Dubuque Community School District, Iowa Revenue Notes, Series 2010 | |
2.000% due 01/01/2013 | | | | | 250 | | | | | | 252 | |
| | | | | | | | | | | | |
| | | | | PRINCIPAL
AMOUNT
(000s) | | | | | MARKET
VALUE
(000s) | |
|
Iowa State University of Science & Technology Revenue Notes, Series 2011 | |
2.000% due 07/01/2013 | | $ | | | 410 | | | $ | | | 417 | |
| | | | | | | | | | | | |
| | | | | | | | | | | 669 | |
| | | | | | | | | | | | |
| |
KENTUCKY 1.8% | |
|
Jefferson County, Kentucky Capital Projects Corp. Revenue Notes, (AGM Insured), Series 2007 | |
4.000% due 06/01/2013 | | | | | 250 | | | | | | 257 | |
|
Kentucky Turnpike Authority Revenue Notes, Series 2010 | |
2.500% due 07/01/2013 | | | | | 500 | | | | | | 511 | |
| | | | | | | | | | | | |
| | | | | | | | | | | 768 | |
| | | | | | | | | | | | |
| |
LOUISIANA 1.2% | |
|
Louisiana Offshore Terminal Authority Revenue Bonds, Series 2010 | |
2.100% due 10/01/2040 | | | | | 500 | | | | | | 508 | |
| | | | | | | | | | | | |
| |
MAINE 0.6% | |
|
Maine Health & Higher Educational Facilities Authority Revenue Notes, Series 2010 | |
3.000% due 07/01/2013 | | | | | 250 | | | | | | 256 | |
| | | | | | | | | | | | |
| |
MASSACHUSETTS 1.4% | |
|
Massachusetts Development Finance Agency Revenue Notes, Series 2012 | |
4.000% due 10/01/2013 | | | | | 600 | | | | | | 623 | |
| | | | | | | | | | | | |
| |
MICHIGAN 2.9% | |
|
Hamilton Community School District, Michigan General Obligation Notes, (AGM/Q-SBLF Insured), Series 2005 | |
5.000% due 05/01/2013 | | | | | 250 | | | | | | 260 | |
|
Michigan State Hospital Finance Authority Revenue Bonds, Series 2010 | |
1.500% due 11/15/2047 | | | | | 1,000 | | | | | | 1,002 | |
| | | | | | | | | | | | |
| | | | | | | | | | | 1,262 | |
| | | | | | | | | | | | |
| |
MINNESOTA 1.1% | |
|
Savage, Minnesota General Obligation Notes, Series 2011 | |
2.000% due 02/01/2013 | | | | | 460 | | | | | | 465 | |
| | | | | | | | | | | | |
| |
MISSOURI 1.1% | |
|
Missouri State Health & Educational Facilities Authority Revenue Bonds, Series 1996 | |
0.180% due 09/01/2030 | | | | | 500 | | | | | | 500 | |
| | | | | | | | | | | | |
| |
NEBRASKA 0.5% | |
|
Central Plains Energy Project, Nebraska Revenue Notes, Series 2007 | |
5.000% due 12/01/2012 | | | | | 210 | | | | | | 213 | |
| | | | | | | | | | | | |
| |
NEVADA 0.3% | |
|
Clark County, Nevada Revenue Notes, Series 2010 | |
3.000% due 07/01/2013 | | | | | 150 | | | | | | 154 | |
| | | | | | | | | | | | |
| |
NEW YORK 19.5% | |
|
Essex County, New York General Obligation Notes, (NPFGC Insured), Series 2005 | |
4.000% due 05/15/2013 | | | | | 200 | | | | | | 206 | |
| | | | | | |
| See Accompanying Notes | | ANNUAL REPORT | | JUNE 30, 2012 | | 81 |
Schedule of Investments PIMCO Short Term Municipal Bond Strategy Fund (Cont.)
| | | | | | | | | | | | |
| | | | | PRINCIPAL
AMOUNT
(000s) | | | | | MARKET
VALUE
(000s) | |
|
Metropolitan Transportation Authority, New York Revenue Notes, (NPFGC Insured), Series 2005 | |
5.000% due 11/15/2014 | | $ | | | 590 | | | $ | | | 650 | |
|
Monroe County Industrial Development Corp., New York Revenue Notes, (FHA Insured), Series 2010 | |
4.000% due 08/15/2015 | | | | | 500 | | | | | | 545 | |
|
New York City, New York General Obligation Bonds, Series 2002 | |
5.750% due 08/01/2012 | | | | | 350 | | | | | | 351 | |
|
New York City, New York General Obligation Notes, Series 2007 | |
5.000% due 08/01/2016 | | | | | 1,040 | | | | | | 1,208 | |
|
New York City, New York Health & Hospital Corp. Revenue Notes, Series 2010 | |
3.000% due 02/15/2014 | | | | | 500 | | | | | | 519 | |
|
New York City, New York Transitional Finance Authority Future Tax Secured Revenue Notes, Series 2010 | |
5.000% due 11/01/2013 | | | | | 250 | | | | | | 265 | |
|
New York Liberty Development Corp. Revenue Bonds, Series 2011 | |
0.270% due 12/01/2049 | | | | | 300 | | | | | | 300 | |
|
New York State Dormitory Authority Revenue Notes, (AMBAC Insured), Series 2007 | |
5.000% due 07/01/2013 | | | | | 300 | | | | | | 314 | |
|
New York State Dormitory Authority Revenue Notes, Series 2010 | |
5.000% due 07/01/2016 | | | | | 250 | | | | | | 281 | |
|
New York State Dormitory Authority Revenue Notes, Series 2011 | |
5.000% due 05/01/2014 | | | | | 350 | | | | | | 375 | |
|
New York State Dormitory Authority Revenue Notes, Series 2012 | |
4.000% due 05/15/2017 | | | | | 450 | | | | | | 508 | |
|
New York State Energy Research & Development Authority Revenue Notes, Series 2011 | |
2.125% due 03/15/2015 | | | | | 1,500 | | | | | | 1,534 | |
|
New York State Thruway Authority Revenue Notes, (AGM Insured), Series 2005 | |
5.000% due 04/01/2014 | | | | | 125 | | | | | | 135 | |
|
New York State Urban Development Corp. Revenue Notes, Series 2008 | |
5.000% due 01/01/2014 | | | | | 250 | | | | | | 267 | |
|
New York State Urban Development Corp. Revenue Notes, Series 2010 | |
5.000% due 01/01/2013 | | | | | 750 | | | | | | 767 | |
|
Oneida-Herkimer Solid Waste Management Authority, New York Revenue Notes, Series 2011 | |
4.000% due 04/01/2014 | | | | | 250 | | | | | | 262 | |
| | | | | | | | | | | | |
| | | | | | | | | | | 8,487 | |
| | | | | | | | | | | | |
| |
NORTH CAROLINA 1.2% | |
|
Buncombe County, North Carolina Certificates of Participation Notes, Series 2009 | |
5.000% due 06/01/2013 | | | | | 500 | | | | | | 522 | |
| | | | | | | | | | | | |
| | | | | | | | | | | | |
| | | | | PRINCIPAL
AMOUNT
(000s) | | | | | MARKET
VALUE
(000s) | |
OHIO 3.4% | |
|
Columbus, Ohio General Obligation Notes, Series 2010 | |
1.250% due 06/01/2013 | | $ | | | 340 | | | $ | | | 343 | |
|
Ohio State Water Development Authority Revenue Bonds, Series 2003 | |
5.250% due 06/01/2015 | | | | | 1,000 | | | | | | 1,135 | |
| | | | | | | | | | | | |
| | | | | | | | | | | 1,478 | |
| | | | | | | | | | | | |
| |
PENNSYLVANIA 2.0% | |
|
Bristol Township, Pennsylvania General Obligation Notes, (AGM Insured), Series 2010 | |
4.000% due 09/01/2012 | | | | | 105 | | | | | | 106 | |
|
Chester County, Pennsylvania Health & Education Facilities Authority Revenue Notes, Series 2010 | |
3.000% due 05/15/2013 | | | | | 250 | | | | | | 256 | |
|
Delaware Valley Regional Financial Authority, Pennsylvania Revenue Bonds, Series 2002 | |
5.500% due 07/01/2012 | | | | | 265 | | | | | | 265 | |
|
Philadelphia, Pennsylvania Water & Sewer Revenue Notes, Series 2010 | |
4.000% due 06/15/2013 | | | | | 250 | | | | | | 258 | |
| | | | | | | | | | | | |
| | | | | | | | | | | 885 | |
| | | | | | | | | | | | |
| |
PUERTO RICO 0.6% | |
|
Puerto Rico Electric Power Authority Revenue Bonds, (NPFGC Insured), Series 2002 | |
5.250% due 07/01/2013 | | | | | 250 | | | | | | 260 | |
| | | | | | | | | | | | |
| |
SOUTH CAROLINA 1.9% | |
|
South Carolina State General Obligation Notes, Series 2009 | |
5.000% due 10/01/2014 | | | | | 750 | | | | | | 827 | |
| | | | | | | | | | | | |
| |
TEXAS 6.1% | |
|
El Paso Independent School District, Texas General Obligation Notes, Series 2009 | |
5.000% due 08/15/2013 | | | | | 580 | | | | | | 610 | |
|
Harris County, Texas Health Facilities Development Corp. Revenue Bonds, Series 1999 | |
0.180% due 10/01/2029 | | | | | 200 | | | | | | 200 | |
|
Houston Community College System, Texas General Obligation Notes, Series 2011 | |
4.000% due 02/15/2014 | | | | | 500 | | | | | | 529 | |
|
Northside Independent School District, Texas General Obligation Bonds, (PSF/GTD Insured), Series 2011 | |
0.950% due 08/01/2034 | | | | | 200 | | | | | | 201 | |
|
Texas Public Finance Authority Revenue Notes, Series 2010 | |
4.000% due 07/01/2015 | | | | | 1,000 | | | | | | 1,101 | |
| | | | | | | | | | | | |
| | | | | | | | | | | 2,641 | |
| | | | | | | | | | | | |
| | | | | | | | | | | | |
| | | | | PRINCIPAL
AMOUNT
(000s) | | | | | MARKET
VALUE
(000s) | |
VIRGINIA 1.4% | |
|
Commonwealth of Virginia General Obligation Notes, Series 2008 | |
3.000% due 06/01/2013 | | $ | | | 400 | | | $ | | | 410 | |
|
Roanoke Economic Development Authority, Virginia Revenue Notes, (AGM Insured), Series 2005 | |
5.000% due 07/01/2012 | | | | | 200 | | | | | | 200 | |
| | | | | | | | | | | | |
| | | | | | | | | | | 610 | |
| | | | | | | | | | | | |
| |
WASHINGTON 6.3% | |
|
Energy Northwest, Washington Revenue Notes, Series 2007 | |
5.000% due 07/01/2015 | | | | | 1,000 | | | | | | 1,129 | |
|
Grays Harbor County, Washington School District No. 5 Aberdeen General Obligation Notes, (AGM Insured), Series 2004 | |
4.000% due 12/01/2013 | | | | | 400 | | | | | | 420 | |
|
King County, Washington Public Hospital District No. 2 General Obligation Notes, Series 2010 | |
3.000% due 12/01/2012 | | | | | 315 | | | | | | 318 | |
|
Washington State Revenue Notes, Series 2012 | |
5.000% due 09/01/2015 | | | | | 750 | | | | | | 851 | |
| | | | | | | | | | | | |
| | | | | | | | | | | 2,718 | |
| | | | | | | | | | | | |
| |
WISCONSIN 1.3% | |
|
Wisconsin Department of Transportation Revenue Notes, Series 2012 | |
5.000% due 07/01/2016 | | | | | 100 | | | | | | 116 | |
|
Wisconsin State Revenue Notes, Series 2009 | |
5.000% due 07/01/2014 | | | | | 400 | | | | | | 434 | |
| | | | | | | | | | | | |
| | | | | | | | | | | 550 | |
| | | | | | | | | | | | |
Total Municipal Bonds & Notes
(Cost $42,015) | | | 42,264 | |
| | | | | | | | | | | | |
| |
SHORT-TERM INSTRUMENTS 1.8% | |
| |
REPURCHASE AGREEMENTS 1.8% | |
|
State Street Bank and Trust Co. | |
0.010% due 07/02/2012 | | | | | 793 | | | | | | 793 | |
| | | | | | | | | | | | |
(Dated 06/29/2012. Collateralized by U.S. Treasury Notes 2.000% due 11/15/2021 valued at $810. Repurchase proceeds are $793.) | | | | |
| |
Total Short-Term Instruments
(Cost $793) | | | | | | 793 | |
| | | | | | | | | | | | |
| | | | | | | | | | | | |
Total Investments 99.1%
(Cost $42,808) | | | $ | | | 43,057 | |
| |
Other Assets and Liabilities (Net) 0.9% | | | | | | 406 | |
| | | | | | | | | | | | |
Net Assets 100.0% | | | $ | | | 43,463 | |
| | | | | | | | | | | | |
| | | | | | |
| 82 | | PIMCO ETF TRUST | | | | See Accompanying Notes |
June 30, 2012
Notes to Schedule of Investments (amounts in thousands):
| (a) | Fair Value Measurements (1) |
The following is a summary of the fair valuations according to the inputs used as of June 30, 2012 in valuing the Fund’s assets and liabilities (2):
| | | | | | | | | | | | | | | | | | |
| Category and Subcategory (3) | | | | Level 1 (4) | | | Level 2 (5) | | | Level 3 (6) | | | Fair Value at
06/30/2012 | |
Investments, at value | | | | | | | | | | | | | | | | | | |
Municipal Bonds & Notes | | | | | | | | | | | | | | | | | | |
Alaska | | | | $ | 0 | | | $ | 266 | | | $ | 0 | | | $ | 266 | |
Arizona | | | | | 0 | | | | 2,852 | | | | 0 | | | | 2,852 | |
California | | | | | 0 | | | | 5,564 | | | | 0 | | | | 5,564 | |
Colorado | | | | | 0 | | | | 513 | | | | 0 | | | | 513 | |
Connecticut | | | | | 0 | | | | 2,771 | | | | 0 | | | | 2,771 | |
Delaware | | | | | 0 | | | | 461 | | | | 0 | | | | 461 | |
District of Columbia | | | | | 0 | | | | 104 | | | | 0 | | | | 104 | |
Georgia | | | | | 0 | | | | 788 | | | | 0 | | | | 788 | |
Illinois | | | | | 0 | | | | 3,476 | | | | 0 | | | | 3,476 | |
Indiana | | | | | 0 | | | | 1,073 | | | | 0 | | | | 1,073 | |
Iowa | | | | | 0 | | | | 669 | | | | 0 | | | | 669 | |
Kentucky | | | | | 0 | | | | 768 | | | | 0 | | | | 768 | |
Louisiana | | | | | 0 | | | | 508 | | | | 0 | | | | 508 | |
Maine | | | | | 0 | | | | 256 | | | | 0 | | | | 256 | |
Massachusetts | | | | | 0 | | | | 623 | | | | 0 | | | | 623 | |
Michigan | | | | | 0 | | | | 1,262 | | | | 0 | | | | 1,262 | |
Minnesota | | | | | 0 | | | | 465 | | | | 0 | | | | 465 | |
Missouri | | | | | 0 | | | | 500 | | | | 0 | | | | 500 | |
Nebraska | | | | | 0 | | | | 213 | | | | 0 | | | | 213 | |
Nevada | | | | | 0 | | | | 154 | | | | 0 | | | | 154 | |
New York | | | | | 0 | | | | 8,487 | | | | 0 | | | | 8,487 | |
North Carolina | | | | | 0 | | | | 522 | | | | 0 | | | | 522 | |
Ohio | | | | | 0 | | | | 1,478 | | | | 0 | | | | 1,478 | |
Pennsylvania | | | | | 0 | | | | 885 | | | | 0 | | | | 885 | |
Puerto Rico | | | | | 0 | | | | 260 | | | | 0 | | | | 260 | |
South Carolina | | | | | 0 | | | | 827 | | | | 0 | | | | 827 | |
Texas | | | | | 0 | | | | 2,641 | | | | 0 | | | | 2,641 | |
Virginia | | | | | 0 | | | | 610 | | | | 0 | | | | 610 | |
Washington | | | | | 0 | | | | 2,718 | | | | 0 | | | | 2,718 | |
Wisconsin | | | | | 0 | | | | 550 | | | | 0 | | | | 550 | |
Short-Term Instruments | | | | | | | | | | | | | | | | | | |
Repurchase Agreements | | | | | 0 | | | | 793 | | | | 0 | | | | 793 | |
| | | | $ | 0 | | | $ | 43,057 | | | $ | 0 | | | $ | 43,057 | |
| (1) | See note 3 in the Notes to Financial Statements for more information regarding pricing inputs and valuation techniques. |
| (2) | There were no significant transfers into or out of level 1, 2, and 3 during the period ended June 30, 2012. |
| (3) | Refer to the Schedule of Investments for additional information. |
| (4) | Quoted prices in active markets for identical investments. |
| (5) | Significant other observable inputs. |
| (6) | Significant unobservable inputs. |
| | | | | | |
| See Accompanying Notes | | ANNUAL REPORT | | JUNE 30, 2012 | | 83 |
Schedule of Investments PIMCO Total Return Exchange-Traded Fund
| | | | | | | | | | | | |
| | | | | PRINCIPAL
AMOUNT
(000s) | | | | | MARKET
VALUE
(000s) | |
BANK LOAN OBLIGATIONS 0.6% | |
|
Awas Aviation Capital Ltd. | |
3.250% due 06/25/2018 | | $ | | | 10,000 | | | $ | | | 10,004 | |
| | | | | | | | | | | | |
Total Bank Loan Obligations
(Cost $9,900) | | | 10,004 | |
| | | | | | | | | | | | |
| |
CORPORATE BONDS & NOTES 17.9% | |
| |
BANKING & FINANCE 15.5% | |
|
Ally Financial, Inc. | |
2.667% due 12/01/2014 | | | | | 4,000 | | | | | | 3,840 | |
3.667% due 02/11/2014 | | | | | 2,000 | | | | | | 1,995 | |
3.868% due 06/20/2014 | | | | | 5,788 | | | | | | 5,762 | |
5.900% due 12/15/2013 | | | | | 40 | | | | | | 39 | |
6.000% due 11/15/2013 | | | | | 50 | | | | | | 49 | |
6.250% due 10/15/2013 | | | | | 10 | | | | | | 10 | |
6.375% due 08/01/2013 | | | | | 22 | | | | | | 22 | |
6.500% due 02/15/2013 | | | | | 24 | | | | | | 24 | |
6.500% due 03/15/2013 | | | | | 15 | | | | | | 15 | |
6.500% due 05/15/2013 | | | | | 50 | | | | | | 50 | |
6.750% due 12/01/2014 | | | | | 2,211 | | | | | | 2,338 | |
6.750% due 07/15/2016 | | | | | 85 | | | | | | 82 | |
6.800% due 02/15/2013 | | | | | 25 | | | | | | 25 | |
6.800% due 04/15/2013 | | | | | 35 | | | | | | 35 | |
6.875% due 08/28/2012 | | | | | 1,877 | | | | | | 1,889 | |
7.000% due 08/15/2013 | | | | | 200 | | | | | | 197 | |
7.100% due 01/15/2013 | | | | | 25 | | | | | | 25 | |
|
American Express Bank FSB | |
6.000% due 09/13/2017 | | | | | 755 | | | | | | 893 | |
|
American General Capital | |
8.500% due 07/01/2030 | | | | | 3,300 | | | | | | 3,639 | |
|
American General Institutional Capital | |
7.570% due 12/01/2045 | | | | | 2,000 | | | | | | 2,015 | |
|
American International Group, Inc. | |
3.750% due 11/30/2013 | | | | | 570 | | | | | | 577 | |
8.175% due 05/15/2068 | | | | | 11,250 | | | | | | 12,262 | |
8.625% due 05/22/2068 | | GBP | | | 2,000 | | | | | | 3,176 | |
|
Barclays Bank PLC | |
14.000% due 06/15/2019 (f) | | | | | 250 | | | | | | 446 | |
|
Caledonia Generating LLC | |
1.950% due 02/28/2022 (c) | | $ | | | 20,000 | | | | | | 20,000 | |
|
Capital One Financial Corp. | |
6.750% due 09/15/2017 | | | | | 262 | | | | | | 311 | |
|
Citigroup Capital | |
8.300% due 12/21/2077 | | | | | 16,240 | | | | | | 16,321 | |
|
Citigroup, Inc. | |
5.000% due 09/15/2014 | | | | | 26,000 | | | | | | 26,668 | |
|
Dexia Credit Local S.A. | |
0.867% due 03/05/2013 | | | | | 5,915 | | | | | | 5,803 | |
0.946% due 04/29/2014 | | | | | 2,000 | | | | | | 1,882 | |
2.000% due 03/05/2013 | | | | | 900 | | | | | | 896 | |
2.750% due 01/10/2014 | | | | | 1,000 | | | | | | 989 | |
2.750% due 04/29/2014 | | | | | 2,300 | | | | | | 2,259 | |
|
Eksportfinans ASA | |
0.661% due 04/05/2013 | | | | | 7,000 | | | | | | 6,801 | |
0.669% due 10/07/2013 | | | | | 800 | | | | | | 763 | |
1.600% due 03/20/2014 | | JPY | | | 150,000 | | | | | | 1,778 | |
1.875% due 04/02/2013 | | $ | | | 2,090 | | | | | | 2,049 | |
2.000% due 09/15/2015 | | | | | 3,500 | | | | | | 3,135 | |
3.000% due 11/17/2014 | | | | | 5,200 | | | | | | 4,930 | |
5.500% due 05/25/2016 | | | | | 5,900 | | | | | | 5,805 | |
|
Export-Import Bank of Korea | |
5.125% due 06/29/2020 | | | | | 1,189 | | | | | | 1,333 | |
|
Fannie Mae | |
2.680% due 02/01/2022 (c) | | | | | 15,000 | | | | | | 15,047 | |
| | | | | | | | | | | | |
| | | | | PRINCIPAL
AMOUNT
(000s) | | | | | MARKET
VALUE
(000s) | |
|
Ford Motor Credit Co. LLC | |
7.000% due 04/15/2015 | | $ | | | 4,000 | | | $ | | | 4,456 | |
8.000% due 06/01/2014 | | | | | 2,000 | | | | | | 2,220 | |
8.700% due 10/01/2014 | | | | | 2,000 | | | | | | 2,282 | |
|
Intesa Sanpaolo SpA | |
6.500% due 02/24/2021 | | | | | 4,240 | | | | | | 3,716 | |
|
Korea Exchange Bank | |
3.125% due 06/26/2017 | | | | | 5,000 | | | | | | 4,999 | |
|
LBG Capital PLC | |
7.867% due 12/17/2019 | | GBP | | | 3,000 | | | | | | 4,088 | |
7.869% due 08/25/2020 | | | | | 1,500 | | | | | | 2,031 | |
|
Lloyds TSB Bank PLC | |
12.000% due 12/16/2024 (f) | | $ | | | 478 | | | | | | 501 | |
|
Murray Street Investment Trust | |
4.647% due 03/09/2017 | | | | | 14,912 | | | | | | 14,963 | |
|
Rabobank Group | |
11.000% due 06/30/2019 (f) | | | | | 134 | | | | | | 169 | |
|
Santander Issuances S.A.U. | |
5.911% due 06/20/2016 | | | | | 1,000 | | | | | | 928 | |
|
SLM Student Loan Trust | |
1.212% due 12/15/2033 | | EUR | | | 68,366 | | | | | | 71,448 | |
|
Springleaf Finance Corp. | |
4.875% due 07/15/2012 | | $ | | | 2,000 | | | | | | 2,000 | |
|
SunAmerica Financial Group, Inc. | |
7.500% due 07/15/2025 | | | | | 600 | | | | | | 698 | |
|
Trafford Centre Finance Ltd. | |
1.213% due 07/28/2015 | | GBP | | | 2,108 | | | | | | 3,217 | |
|
UBS AG | |
5.875% due 12/20/2017 | | $ | | | 250 | | | | | | 280 | |
| | | | | | | | | | | | |
| | | | | | | | | | | 274,171 | |
| | | | | | | | | | | | |
| |
INDUSTRIALS 1.6% | |
|
Altria Group, Inc. | |
9.700% due 11/10/2018 | | | | | 2,000 | | | | | | 2,772 | |
|
DISH DBS Corp. | |
6.625% due 10/01/2014 | | | | | 4,000 | | | | | | 4,310 | |
|
HCA, Inc. | |
5.750% due 03/15/2014 | | | | | 5,000 | | | | | | 5,256 | |
|
International Business Machines Corp. | |
5.700% due 09/14/2017 | | | | | 2,250 | | | | | | 2,710 | |
|
Meccanica Holdings USA, Inc. | |
6.250% due 01/15/2040 | | | | | 600 | | | | | | 455 | |
|
MGM Resorts International | |
10.375% due 05/15/2014 | | | | | 4,000 | | | | | | 4,530 | |
11.125% due 11/15/2017 | | | | | 3,000 | | | | | | 3,383 | |
|
News America, Inc. | |
6.400% due 12/15/2035 | | | | | 1,380 | | | | | | 1,598 | |
|
Petrobras International Finance Co. | |
5.875% due 03/01/2018 | | | | | 1,300 | | | | | | 1,448 | |
|
President and Fellows of Harvard College | |
6.000% due 01/15/2019 | | | | | 250 | | | | | | 317 | |
|
Time Warner, Inc. | |
5.875% due 11/15/2016 | | | | | 2,000 | | | | | | 2,345 | |
| | | | | | | | | | | | |
| | | | | | | | | | | 29,124 | |
| | | | | | | | | | | | |
| |
UTILITIES 0.8% | |
|
EDF S.A. | |
6.500% due 01/26/2019 | | | | | 2,150 | | | | | | 2,535 | |
|
Petroleos Mexicanos | |
5.500% due 06/27/2044 | | | | | 300 | | | | | | 308 | |
8.000% due 05/03/2019 | | | | | 987 | | | | | | 1,258 | |
| | | | | | | | | | | | |
| | | | | PRINCIPAL
AMOUNT
(000s) | | | | | MARKET
VALUE
(000s) | |
|
Tokyo Electric Power Co., Inc. | |
4.500% due 03/24/2014 | | EUR | | | 7,400 | | | $ | | | 9,353 | |
| | | | | | | | | | | | |
| | | | | | | | | | | 13,454 | |
| | | | | | | | | | | | |
Total Corporate Bonds & Notes
(Cost $316,650) | | | | | | 316,749 | |
| | | | | | | | | | | | |
| |
MUNICIPAL BONDS & NOTES 0.6% | |
| |
CALIFORNIA 0.2% | |
|
California State General Obligation Bonds, (BABs), Series 2009 | |
7.500% due 04/01/2034 | | $ | | | 638 | | | | | | 798 | |
|
University of California Revenue Bonds, (BABs), Series 2009 | |
6.583% due 05/15/2049 | | | | | 2,000 | | | | | | 2,623 | |
| | | | | | | | | | | | |
| | | | | | | | | | | 3,421 | |
| | | | | | | | | | | | |
| |
ILLINOIS 0.0% | |
|
Chicago Transit Authority, Illinois Revenue Bonds, Series 2008 | |
6.899% due 12/01/2040 | | | | | 675 | | | | | | 804 | |
| | | | | | | | | | | | |
| |
NEW YORK 0.3% | |
|
New York City, New York Municipal Water Finance Authority Revenue Bonds, (BABs), Series 2010 | |
5.440% due 06/15/2043 | | | | | 684 | | | | | | 856 | |
5.790% due 06/15/2041 | | | | | 4,000 | | | | | | 4,480 | |
| | | | | | | | | | | | |
| | | | | | | | | | | 5,336 | |
| | | | | | | | | | | | |
| |
OHIO 0.1% | |
|
American Municipal Power, Inc. Ohio Revenue Bonds, (BABs), Series 2009 | |
6.449% due 02/15/2044 | | | | | 723 | | | | | | 859 | |
| | | | | | | | | | | | |
| |
SOUTH CAROLINA 0.0% | |
|
South Carolina Student Loan Corp. Revenue Notes Series 2010 | |
0.916% due 01/25/2021 | | | | | 369 | | | | | | 367 | |
| | | | | | | | | | | | |
Total Municipal Bonds & Notes
(Cost $10,708) | | | | | | 10,787 | |
| | | | | | | | | | | | |
| |
U.S. GOVERNMENT AGENCIES 40.6% | |
|
Fannie Mae | |
0.000% due 06/25/2035 (b) | | | | | 269 | | | | | | 261 | |
2.342% due 09/01/2034 | | | | | 128 | | | | | | 133 | |
2.500% due 07/01/2027 - 08/01/2027 | | | | | 14,000 | | | | | | 14,416 | |
2.800% due 06/01/2022 | | | | | 5,000 | | | | | | 5,158 | |
2.840% due 08/01/2022 | | | | | 12,310 | | | | | | 12,310 | |
3.000% due 12/01/2025 - 07/01/2042 | | | | | 73,861 | | | | | | 76,258 | |
3.300% due 10/01/2021 | | | | | 13,054 | | | | | | 13,966 | |
3.380% due 11/01/2021 | | | | | 6,785 | | | | | | 7,295 | |
3.500% due 05/01/2042 - 08/01/2042 | | | | | 142,986 | | | | | | 149,995 | |
4.000% due 10/01/2013 - 08/01/2042 | | | | | 157,580 | | | | | | 167,942 | |
4.330% due 04/01/2021 | | | | | 197 | | | | | | 224 | |
4.500% due 11/25/2035 - 07/01/2042 | | | | | 50,503 | | | | | | 54,564 | |
5.000% due 01/25/2040 - 07/01/2042 | | | | | 25,100 | | | | | | 27,176 | |
5.500% due 08/01/2035 - 08/01/2042 | | | | | 15,643 | | | | | | 17,098 | |
5.680% due 06/25/2037 | | | | | 249 | | | | | | 293 | |
| | | | | | |
| 84 | | PIMCO ETF TRUST | | | | See Accompanying Notes |
June 30, 2012
| | | | | | | | | | | | |
| | | | | PRINCIPAL
AMOUNT
(000s) | | | | | MARKET
VALUE
(000s) | |
6.000% due 02/25/2034 - 07/25/2035 | | $ | | | 2,635 | | | $ | | | 3,117 | |
6.175% due 04/25/2040 (a) | | | | | 1,195 | | | | | | 174 | |
6.955% due 05/25/2036 (a) | | | | | 12,610 | | | | | | 1,950 | |
21.740% due 07/25/2023 | | | | | 64 | | | | | | 101 | |
|
Freddie Mac | |
1.000% due 06/29/2017 | | | | | 9,400 | | | | | | 9,439 | |
1.250% due 05/12/2017 | | | | | 43,800 | | | | | | 44,452 | |
2.375% due 01/13/2022 | | | | | 57,600 | | | | | | 59,289 | |
4.000% due 09/15/2039 - 04/15/2042 | | | | | 6,235 | | | | | | 6,770 | |
4.500% due 05/15/2036 - 04/15/2042 | | | | | 5,995 | | | | | | 6,690 | |
4.565% due 12/01/2031 | | | | | 261 | | | | | | 281 | |
5.000% due 05/15/2033 - 07/15/2041 | | | | | 14,194 | | | | | | 16,609 | |
5.000% due 08/15/2039 (a) | | | | | 1,747 | | | | | | 242 | |
5.250% due 03/15/2032 - 04/15/2033 | | | | | 339 | | | | | | 385 | |
5.500% due 08/15/2033 - 08/15/2036 | | | | | 2,106 | | | | | | 2,483 | |
6.000% due 10/15/2031 - 08/01/2037 | | | | | 3,676 | | | | | | 4,480 | |
|
Ginnie Mae | |
4.000% due 02/20/2041 | | | | | 5,270 | | | | | | 5,734 | |
4.500% due 12/20/2040 | | | | | 734 | | | | | | 854 | |
5.000% due 07/20/2039 - 10/20/2039 | | | | | 3,694 | | | | | | 4,373 | |
5.500% due 02/17/2033 - 07/20/2037 | | | | | 236 | | | | | | 275 | |
5.856% due 12/20/2035 (a) | | | | | 6,000 | | | | | | 1,856 | |
| | | | | | | | | | | | |
Total U.S. Government Agencies
(Cost $711,190) | | | | | | 716,643 | |
| | | | | | | | | | | | |
| |
U.S. TREASURY OBLIGATIONS 15.5% | |
|
U.S. Treasury Bonds | |
3.000% due 05/15/2042 (g) | | | | | 31,900 | | | | | | 33,490 | |
|
U.S. Treasury Inflation Protected Securities (e) | |
0.125% due 01/15/2022 | | | | | 68,110 | | | | | | 72,213 | |
0.625% due 07/15/2021 | | | | | 2,249 | | | | | | 2,509 | |
0.750% due 02/15/2042 | | | | | 13,339 | | | | | | 14,075 | |
1.125% due 01/15/2021 | | | | | 135 | | | | | | 155 | |
1.250% due 07/15/2020 | | | | | 189 | | | | | | 220 | |
1.375% due 01/15/2020 | | | | | 211 | | | | | | 245 | |
1.750% due 01/15/2028 | | | | | 825 | | | | | | 1,036 | |
2.000% due 01/15/2026 | | | | | 26,083 | | | | | | 33,370 | |
2.375% due 01/15/2025 | | | | | 9,254 | | | | | | 12,218 | |
2.375% due 01/15/2027 | | | | | 23,541 | | | | | | 31,672 | |
3.875% due 04/15/2029 | | | | | 213 | | | | | | 345 | |
|
U.S. Treasury Notes | |
1.000% due 06/30/2019 (c) | | | | | 5,000 | | | | | | 4,964 | |
1.125% due 05/31/2019 | | | | | 18,400 | | | | | | 18,443 | |
1.750% due 05/15/2022 (g) | | | | | 46,200 | | | | | | 46,626 | |
1.875% due 09/30/2017 | | | | | 1,400 | | | | | | 1,478 | |
| | | | | | | | | | | | |
Total U.S. Treasury Obligations
(Cost $271,248) | | | | | | 273,059 | |
| | | | | | | | | | | | |
| |
MORTGAGE-BACKED SECURITIES 17.1% | |
|
ABN AMRO Mortgage Corp. | |
5.500% due 01/25/2034 | | | | | 1,075 | | | | | | 1,094 | |
|
Adjustable Rate Mortgage Trust | |
1.045% due 01/25/2035 | | | | | 61 | | | | | | 60 | |
2.691% due 01/25/2035 | | | | | 781 | | | | | | 768 | |
2.914% due 07/25/2035 | | | | | 3,094 | | | | | | 2,661 | |
|
American Home Mortgage Investment Trust | |
2.237% due 09/25/2045 | | | | | 97 | | | | | | 81 | |
2.736% due 02/25/2045 | | | | | 1,900 | | | | | | 1,654 | |
| | | | | | | | | | | | |
| | | | | PRINCIPAL
AMOUNT
(000s) | | | | | MARKET
VALUE
(000s) | |
|
Arkle Master Issuer PLC | |
1.616% due 05/17/2060 | | $ | | | 529 | | | $ | | | 530 | |
|
Arran Residential Mortgages Funding PLC | |
2.089% due 05/16/2047 | | EUR | | | 366 | | | | | | 465 | |
|
ASG Resecuritization Trust | |
2.655% due 03/26/2037 | | $ | | | 134 | | | | | | 132 | |
|
Banc of America Funding Corp. | |
0.464% due 07/20/2036 | | | | | 61 | | | | | | 49 | |
0.494% due 05/20/2035 | | | | | 6,391 | | | | | | 4,685 | |
0.745% due 06/26/2035 | | | | | 1,000 | | | | | | 872 | |
2.628% due 05/25/2035 | | | | | 112 | | | | | | 114 | |
2.643% due 02/20/2036 | | | | | 532 | | | | | | 490 | |
2.835% due 12/20/2034 | | | | | 1,292 | | | | | | 690 | |
|
Banc of America Large Loan, Inc. | |
1.992% due 11/15/2015 | | | | | 175 | | | | | | 166 | |
5.692% due 06/24/2050 | | | | | 5,974 | | | | | | 6,688 | |
|
Banc of America Mortgage Securities, Inc. | |
2.621% due 10/25/2034 | | | | | 2,221 | | | | | | 1,928 | |
2.966% due 02/25/2034 | | | | | 290 | | | | | | 269 | |
3.112% due 06/25/2035 | | | | | 1,026 | | | | | | 1,000 | |
|
Banc of America/Merrill Lynch Commercial Mortgage, Inc. | |
4.891% due 07/10/2045 | | | | | 6,180 | | | | | | 6,203 | |
|
BCAP LLC Trust | |
5.253% due 07/26/2037 | | | | | 1,833 | | | | | | 1,571 | |
|
Bear Stearns Adjustable Rate Mortgage Trust | |
2.520% due 02/25/2036 | | | | | 1,108 | | | | | | 957 | |
2.736% due 04/25/2034 | | | | | 23 | | | | | | 21 | |
2.749% due 01/25/2035 | | | | | 653 | | | | | | 589 | |
2.831% due 10/25/2034 | | | | | 2,564 | | | | | | 1,935 | |
2.867% due 11/25/2034 | | | | | 133 | | | | | | 115 | |
2.951% due 10/25/2034 | | | | | 424 | | | | | | 331 | |
3.248% due 04/25/2034 | | | | | 188 | | | | | | 159 | |
|
Bear Stearns Alt-A Trust | |
0.515% due 08/25/2035 | | | | | 1,010 | | | | | | 742 | |
0.885% due 04/25/2034 | | | | | 86 | | | | | | 77 | |
2.746% due 06/25/2034 | | | | | 602 | | | | | | 509 | |
2.936% due 11/25/2034 | | | | | 932 | | | | | | 644 | |
|
Bear Stearns Commercial Mortgage Securities | |
4.868% due 09/11/2042 | | | | | 3,000 | | | | | | 3,105 | |
|
Bella Vista Mortgage Trust | |
0.545% due 01/22/2045 | | | | | 798 | | | | | | 594 | |
|
Citigroup Mortgage Loan Trust, Inc. | |
0.485% due 11/25/2036 | | | | | 2,700 | | | | | | 1,606 | |
2.230% due 09/25/2035 | | | | | 548 | | | | | | 512 | |
2.340% due 09/25/2035 | | | | | 354 | | | | | | 312 | |
2.600% due 05/25/2035 | | | | | 93 | | | | | | 86 | |
2.644% due 08/25/2035 | | | | | 1,998 | | | | | | 1,879 | |
2.869% due 09/25/2034 | | | | | 303 | | | | | | 302 | |
2.893% due 03/25/2034 | | | | | 948 | | | | | | 866 | |
|
Countrywide Alternative Loan Trust | |
6.000% due 11/25/2034 | | | | | 172 | | | | | | 167 | |
|
Countrywide Home Loan Mortgage Pass-Through Trust | |
0.515% due 03/25/2035 | | | | | 489 | | | | | | 412 | |
0.645% due 07/25/2018 | | | | | 841 | | | | | | 818 | |
0.645% due 08/25/2033 | | | | | 3,820 | | | | | | 3,694 | |
0.745% due 06/25/2018 | | | | | 3,719 | | | | | | 3,625 | |
0.785% due 02/25/2035 | | | | | 83 | | | | | | 70 | |
2.824% due 12/25/2033 | | | | | 2,180 | | | | | | 1,861 | |
5.000% due 04/25/2035 | | | | | 73 | | | | | | 73 | |
|
Credit Suisse First Boston Mortgage Securities Corp. | |
0.895% due 11/25/2031 | | | | | 73 | | | | | | 59 | |
2.459% due 06/25/2033 | | | | | 47 | | | | | | 45 | |
2.932% due 11/25/2034 | | | | | 168 | | | | | | 162 | |
4.832% due 04/15/2037 | | | | | 2,000 | | | | | | 2,124 | |
| | | | | | | | | | | | |
| | | | | PRINCIPAL
AMOUNT
(000s) | | | | | MARKET
VALUE
(000s) | |
|
Credit Suisse Mortgage Capital Certificates | |
2.838% due 04/26/2037 | | $ | | | 115 | | | $ | | | 114 | |
3.016% due 07/27/2036 | | | | | 283 | | | | | | 281 | |
3.285% due 03/27/2036 | | | | | 411 | | | | | | 403 | |
4.949% due 10/27/2036 | | | | | 130 | | | | | | 126 | |
5.112% due 07/27/2037 | | | | | 144 | | | | | | 146 | |
5.448% due 01/15/2049 | | | | | 4,850 | | | | | | 4,904 | |
5.509% due 04/15/2047 | | | | | 200 | | | | | | 223 | |
6.000% due 05/27/2036 | | | | | 128 | | | | | | 129 | |
|
Deutsche Mortgage Securities, Inc. | |
5.248% due 06/26/2035 | | | | | 2,000 | | | | | | 1,939 | |
|
DLJ Commercial Mortgage Corp. | |
6.100% due 06/10/2032 | | | | | 12,772 | | | | | | 12,877 | |
|
Epic Opera PLC | |
1.263% due 07/28/2016 | | GBP | | | 4,450 | | | | | | 6,586 | |
|
First Horizon Alternative Mortgage Securities | |
2.560% due 09/25/2034 | | $ | | | 381 | | | | | | 336 | |
2.592% due 06/25/2034 | | | | | 30 | | | | | | 26 | |
2.599% due 04/25/2035 | | | | | 2,802 | | | | | | 2,327 | |
|
First Horizon Asset Securities, Inc. | |
2.628% due 12/25/2034 | | | | | 1,474 | | | | | | 1,352 | |
5.242% due 06/25/2035 | | | | | 988 | | | | | | 933 | |
|
GMAC Mortgage Corp. Loan Trust | |
3.214% due 08/19/2034 | | | | | 116 | | | | | | 107 | |
|
Granite Master Issuer PLC | |
0.384% due 12/20/2054 | | | | | 18 | | | | | | 17 | |
|
Greenwich Capital Commercial Funding Corp. | |
5.381% due 03/10/2039 | | | | | 3,516 | | | | | | 3,601 | |
|
GS Mortgage Securities Corp. | |
4.761% due 07/10/2039 | | | | | 11,240 | | | | | | 12,140 | |
|
GSR Mortgage Loan Trust | |
0.545% due 04/25/2032 | | | | | 311 | | | | | | 260 | |
0.685% due 05/25/2035 | | | | | 33 | | | | | | 27 | |
1.956% due 05/25/2034 | | | | | 169 | | | | | | 142 | |
2.651% due 09/25/2035 | | | | | 604 | | | | | | 591 | |
2.659% due 09/25/2035 | | | | | 925 | | | | | | 748 | |
2.751% due 06/25/2034 | | | | | 1,645 | | | | | | 1,318 | |
2.792% due 09/25/2034 | | | | | 1,271 | | | | | | 1,019 | |
2.848% due 12/25/2034 | | | | | 1,363 | | | | | | 1,034 | |
2.858% due 01/25/2035 | | | | | 479 | | | | | | 430 | |
2.864% due 04/25/2035 | | | | | 60 | | | | | | 54 | |
3.011% due 05/25/2035 | | | | | 122 | | | | | | 100 | |
4.895% due 06/25/2034 | | | | | 33 | | | | | | 33 | |
|
Harborview Mortgage Loan Trust | |
2.643% due 06/19/2034 | | | | | 579 | | | | | | 527 | |
2.811% due 01/19/2035 | | | | | 487 | | | | | | 386 | |
3.026% due 05/19/2033 | | | | | 257 | | | | | | 251 | |
|
Holmes Master Issuer PLC | |
2.107% due 10/15/2054 | | EUR | | | 265 | | | | | | 337 | |
|
Homestar Mortgage Acceptance Corp. | |
0.565% due 03/25/2034 | | $ | | | 164 | | | | | | 149 | |
|
Impac CMB Trust | |
0.765% due 04/25/2035 | | | | | 424 | | | | | | 334 | |
0.885% due 10/25/2033 | | | | | 12 | | | | | | 10 | |
|
Indymac Index Mortgage Loan Trust | |
0.555% due 10/25/2036 | | | | | 1,329 | | | | | | 795 | |
1.105% due 08/25/2034 | | | | | 128 | | | | | | 83 | |
2.670% due 08/25/2034 | | | | | 169 | | | | | | 143 | |
|
Indymac Mortgage Loan Trust | |
5.495% due 08/25/2036 | | | | | 731 | | | | | | 713 | |
|
JPMorgan Chase Commercial Mortgage Securities Corp. | |
5.994% due 06/15/2049 | | | | | 2,382 | | | | | | 2,386 | |
|
JPMorgan Mortgage Trust | |
2.573% due 12/25/2034 | | | | | 731 | | | | | | 707 | |
2.764% due 07/25/2035 | | | | | 1,247 | | | | | | 1,131 | |
| | | | | | |
| See Accompanying Notes | | ANNUAL REPORT | | JUNE 30, 2012 | | 85 |
Schedule of Investments PIMCO Total Return Exchange-Traded Fund (Cont.)
| | | | | | | | | | | | |
| | | | | PRINCIPAL
AMOUNT
(000s) | | | | | MARKET
VALUE
(000s) | |
2.776% due 09/25/2035 | | $ | | | 1,014 | | | $ | | | 869 | |
2.924% due 08/25/2034 | | | | | 1,095 | | | | | | 1,073 | |
2.957% due 06/25/2035 | | | | | 86 | | | | | | 68 | |
3.055% due 07/25/2035 | | | | | 204 | | | | | | 197 | |
|
JPMorgan Re-REMIC | |
2.160% due 01/26/2037 | | | | | 126 | | | | | | 125 | |
5.068% due 08/27/2037 | | | | | 187 | | | | | | 186 | |
5.132% due 11/26/2035 | | | | | 1,376 | | | | | | 1,221 | |
5.437% due 01/27/2047 | | | | | 156 | | | | | | 159 | |
5.961% due 07/27/2037 | | | | | 117 | | | | | | 117 | |
6.000% due 02/27/2037 | | | | | 372 | | | | | | 378 | |
|
MASTR Adjustable Rate Mortgages Trust | |
2.736% due 03/25/2035 | | | | | 9,695 | | | | | | 8,344 | |
|
Mellon Residential Funding Corp. | |
0.722% due 06/15/2030 | | | | | 227 | | | | | | 217 | |
|
Merrill Lynch Floating Trust | |
0.779% due 07/09/2021 | | | | | 30,003 | | | | | | 29,098 | |
|
Merrill Lynch Mortgage Investors, Inc. | |
0.455% due 02/25/2036 | | | | | 886 | | | | | | 651 | |
2.227% due 03/25/2033 | | | | | 173 | | | | | | 171 | |
|
Merrill Lynch/Countrywide Commercial Mortgage Trust | |
5.656% due 02/12/2039 | | | | | 1,000 | | | | | | 1,010 | |
|
MLCC Mortgage Investors, Inc. | |
0.475% due 04/25/2029 | | | | | 181 | | | | | | 164 | |
0.495% due 11/25/2035 | | | | | 527 | | | | | | 441 | |
0.705% due 03/25/2030 | | | | | 130 | | | | | | 115 | |
0.745% due 05/25/2029 | | | | | 568 | | | | | | 525 | |
0.805% due 01/25/2030 | | | | | 404 | | | | | | 364 | |
1.239% due 10/25/2035 | | | | | 843 | | | | | | 735 | |
2.208% due 04/25/2029 | | | | | 846 | | | | | | 734 | |
2.283% due 02/25/2036 | | | | | 1,713 | | | | | | 1,516 | |
2.303% due 04/25/2035 | | | | | 3,843 | | | | | | 3,434 | |
2.306% due 05/25/2029 | | | | | 85 | | | | | | 81 | |
|
Morgan Stanley Capital, Inc. | |
5.037% due 01/14/2042 | | | | | 12,378 | | | | | | 12,628 | |
5.439% due 02/12/2044 | | | | | 15,269 | | | | | | 16,089 | |
5.610% due 04/15/2049 | | | | | 924 | | | | | | 953 | |
5.781% due 04/12/2049 | | | | | 8,805 | | | | | | 9,026 | |
5.852% due 12/12/2049 | | | | | 17 | | | | | | 18 | |
|
Morgan Stanley Dean Witter Capital | |
1.927% due 03/25/2033 | | | | | 913 | | | | | | 806 | |
|
Morgan Stanley Mortgage Loan Trust | |
0.515% due 09/25/2035 | | | | | 66 | | | | | | 58 | |
0.695% due 07/25/2034 | | | | | 293 | | | | | | 264 | |
5.438% due 01/25/2035 | | | | | 4,255 | | | | | | 4,031 | |
|
MortgageIT Trust | |
0.545% due 08/25/2035 | | | | | 486 | | | | | | 402 | |
|
RBSCF Trust | |
5.223% due 08/16/2048 | | | | | 400 | | | | | | 443 | |
5.331% due 02/16/2044 | | | | | 400 | | | | | | 446 | |
5.336% due 05/16/2047 | | | | | 400 | | | | | | 437 | |
|
RBSSP Resecuritization Trust | |
0.745% due 03/26/2036 | | | | | 931 | | | | | | 901 | |
|
Residential Asset Securitization Trust | |
0.795% due 08/25/2033 | | | | | 144 | | | | | | 133 | |
|
RMAC Securities PLC | |
1.141% due 06/12/2044 | | GBP | | | 4,764 | | | | | | 5,694 | |
|
Sequoia Mortgage Trust | |
0.514% due 01/20/2035 | | $ | | | 100 | | | | | | 83 | |
0.544% due 12/20/2034 | | | | | 683 | | | | | | 623 | |
0.564% due 11/20/2034 | | | | | 138 | | | | | | 123 | |
0.965% due 11/22/2024 | | | | | 19 | | | | | | 18 | |
1.144% due 12/20/2032 | | | | | 4,685 | | | | | | 4,225 | |
2.632% due 04/20/2035 | | | | | 502 | | | | | | 481 | |
|
Structured Adjustable Rate Mortgage Loan Trust | |
0.645% due 06/25/2035 | | | | | 344 | | | | | | 322 | |
2.736% due 07/25/2034 | | | | | 401 | | | | | | 375 | |
| | | | | | | | | | | | |
| | | | | PRINCIPAL
AMOUNT
(000s) | | | | | MARKET
VALUE
(000s) | |
2.740% due 02/25/2034 | | $ | | | 67 | | | $ | | | 65 | |
2.768% due 03/25/2035 | | | | | 3,903 | | | | | | 3,293 | |
2.818% due 04/25/2034 | | | | | 366 | | | | | | 316 | |
2.819% due 02/25/2035 | | | | | 2,226 | | | | | | 1,651 | |
2.840% due 11/25/2034 | | | | | 8,020 | | | | | | 7,319 | |
2.853% due 03/25/2034 | | | | | 201 | | | | | | 195 | |
|
Structured Asset Mortgage Investments, Inc. | |
0.493% due 07/19/2035 | | | | | 1,312 | | | | | | 1,151 | |
0.903% due 10/19/2034 | | | | | 1,494 | | | | | | 1,331 | |
0.943% due 02/19/2035 | | | | | 259 | | | | | | 219 | |
1.083% due 02/19/2033 | | | | | 1,197 | | | | | | 996 | |
2.587% due 12/19/2034 | | | | | 2,857 | | | | | | 2,496 | |
|
Structured Asset Securities Corp. | |
2.601% due 01/25/2032 | | | | | 13 | | | | | | 10 | |
2.712% due 06/25/2033 | | | | | 82 | | | | | | 77 | |
2.758% due 01/25/2034 | | | | | 198 | | | | | | 180 | |
2.772% due 04/25/2033 | | | | | 62 | | | | | | 59 | |
3.025% due 11/25/2032 | | | | | 1,419 | | | | | | 1,166 | |
5.500% due 05/25/2035 | | | | | 2,964 | | | | | | 2,942 | |
|
Thornburg Mortgage Securities Trust | |
0.465% due 06/25/2047 | | | | | 9,687 | | | | | | 9,664 | |
0.785% due 03/25/2044 | | | | | 187 | | | | | | 156 | |
5.520% due 10/25/2046 | | | | | 129 | | | | | | 126 | |
5.554% due 07/25/2036 | | | | | 137 | | | | | | 136 | |
|
Wachovia Bank Commercial Mortgage Trust | |
0.322% due 06/15/2020 | | | | | 7,658 | | | | | | 7,134 | |
0.417% due 06/15/2049 | | | | | 378 | | | | | | 330 | |
5.421% due 04/15/2047 | | | | | 5,111 | | | | | | 5,292 | |
5.922% due 06/15/2049 | | | | | 3,604 | | | | | | 3,712 | |
|
WaMu Mortgage Pass-Through Certificates | |
0.515% due 07/25/2045 | | | | | 110 | | | | | | 88 | |
0.555% due 01/25/2045 | | | | | 89 | | | | | | 74 | |
0.565% due 07/25/2045 | | | | | 132 | | | | | | 109 | |
0.575% due 01/25/2045 | | | | | 6,072 | | | | | | 4,951 | |
0.578% due 10/25/2044 | | | | | 1,765 | | | | | | 1,389 | |
0.605% due 01/25/2045 | | | | | 876 | | | | | | 644 | |
0.608% due 06/25/2044 | | | | | 334 | | | | | | 235 | |
1.147% due 02/25/2046 | | | | | 141 | | | | | | 109 | |
1.401% due 11/25/2041 | | | | | 1,022 | | | | | | 852 | |
1.547% due 04/25/2044 | | | | | 82 | | | | | | 66 | |
2.390% due 02/27/2034 | | | | | 175 | | | | | | 175 | |
2.413% due 11/25/2041 | | | | | 1,976 | | | | | | 1,639 | |
2.447% due 12/25/2035 | | | | | 290 | | | | | | 250 | |
2.475% due 10/25/2034 | | | | | 140 | | | | | | 136 | |
2.483% due 03/25/2035 | | | | | 416 | | | | | | 384 | |
2.589% due 06/25/2034 | | | | | 341 | | | | | | 341 | |
|
Wells Fargo Mortgage-Backed Securities Trust | |
2.508% due 09/25/2033 | | | | | 310 | | | | | | 311 | |
2.616% due 01/25/2035 | | | | | 767 | | | | | | 690 | |
2.616% due 03/25/2035 | | | | | 1,518 | | | | | | 1,413 | |
2.627% due 06/25/2035 | | | | | 827 | | | | | | 830 | |
2.628% due 06/25/2035 | | | | | 78 | | | | | | 78 | |
4.699% due 01/25/2034 | | | | | 194 | | | | | | 195 | |
4.744% due 12/25/2033 | | | | | 77 | | | | | | 77 | |
5.610% due 04/25/2036 | | | | | 186 | | | | | | 175 | |
5.750% due 01/25/2036 | | | | | 640 | | | | | | 662 | |
|
Windermere CMBS PLC | |
0.864% due 08/22/2016 | | EUR | | | 1,971 | | | | | | 2,356 | |
| | | | | | | | | | | | |
Total Mortgage-Backed Securities
(Cost $294,008) | | | | | | 301,713 | |
| | | | | | | | | | | | |
| |
ASSET-BACKED SECURITIES 2.2% | |
|
Asset-Backed Securities Corp. Home Equity | |
0.520% due 09/25/2034 | | $ | | | 25 | | | | | | 22 | |
|
Bear Stearns Asset-Backed Securities Trust | |
0.695% due 11/25/2039 | | | | | 111 | | | | | | 101 | |
0.695% due 12/25/2042 | | | | | 77 | | | | | | 69 | |
1.445% due 03/25/2043 | | | | | 112 | | | | | | 87 | |
| | | | | | | | | | | | |
| | | | | PRINCIPAL
AMOUNT
(000s) | | | | | MARKET
VALUE
(000s) | |
|
Chase Funding Mortgage Loan Asset-Backed Certificates | |
0.985% due 10/25/2032 | | $ | | | 60 | | | $ | | | 51 | |
4.396% due 02/25/2030 | | | | | 66 | | | | | | 66 | |
|
Citibank Omni Master Trust | |
2.992% due 08/15/2018 | | | | | 450 | | | | | | 473 | |
|
Countrywide Asset-Backed Certificates | |
0.525% due 11/25/2035 | | | | | 230 | | | | | | 225 | |
0.635% due 11/25/2034 | | | | | 74 | | | | | | 69 | |
0.945% due 12/25/2033 | | | | | 85 | | | | | | 69 | |
1.095% due 04/25/2035 | | | | | 2,260 | | | | | | 1,447 | |
|
Credit Suisse First Boston Mortgage Securities Corp. | |
0.995% due 10/25/2032 | | | | | 48 | | | | | | 36 | |
|
EFS Volunteer LLC | |
1.120% due 07/26/2027 | | | | | 1,300 | | | | | | 1,302 | |
|
Equity One ABS, Inc. | |
4.860% due 07/25/2033 | | | | | 258 | | | | | | 217 | |
|
First Franklin Mortgage Loan Asset-Backed Certificates | |
0.545% due 01/25/2036 | | | | | 5,000 | | | | | | 3,849 | |
1.070% due 05/25/2034 | | | | | 8,567 | | | | | | 6,600 | |
|
Green Tree | |
7.000% due 04/25/2038 | | | | | 22 | | | | | | 22 | |
|
Harvest CLO S.A. | |
1.587% due 03/29/2017 | | EUR | | | 2,477 | | | | | | 3,086 | |
|
JPMorgan Mortgage Acquisition Corp. | |
0.435% due 05/25/2035 | | $ | | | 2,683 | | | | | | 2,404 | |
|
Lehman XS Trust | |
0.515% due 12/25/2035 | | | | | 4,380 | | | | | | 2,918 | |
0.525% due 08/25/2035 | | | | | 361 | | | | | | 285 | |
1.147% due 11/25/2035 | | | | | 233 | | | | | | 162 | |
|
Leopard CLO BV | |
1.268% due 04/07/2019 | | EUR | | | 1,141 | | | | | | 1,426 | |
|
Magi Funding PLC | |
1.314% due 04/11/2021 | | | | | 232 | | | | | | 277 | |
|
Mid-State Trust | |
5.745% due 01/15/2040 | | $ | | | 730 | | | | | | 769 | |
5.787% due 10/15/2040 | | | | | 116 | | | | | | 122 | |
6.005% due 08/15/2037 | | | | | 65 | | | | | | 69 | |
6.340% due 10/15/2036 | | | | | 9,634 | | | | | | 9,493 | |
7.340% due 07/01/2035 | | | | | 28 | | | | | | 29 | |
|
Morgan Stanley ABS Capital | |
1.100% due 03/25/2034 | | | | | 1,381 | | | | | | 1,104 | |
|
Morgan Stanley Home Equity Loan Trust | |
0.920% due 12/25/2034 | | | | | 23 | | | | | | 23 | |
|
North Carolina State Education Assistance Authority | |
0.916% due 10/26/2020 | | | | | 157 | | | | | | 156 | |
|
Option One Mortgage Loan Trust | |
0.845% due 04/25/2033 | | | | | 85 | | | | | | 71 | |
1.085% due 02/25/2033 | | | | | 51 | | | | | | 41 | |
|
Origen Manufactured Housing | |
6.480% due 01/15/2037 | | | | | 90 | | | | | | 93 | |
|
Residential Asset Securities Corp. | |
1.025% due 11/25/2034 | | | | | 83 | | | | | | 72 | |
|
SLM Student Loan Trust | |
0.616% due 01/25/2021 | | | | | 142 | | | | | | 142 | |
1.966% due 04/25/2023 | | | | | 463 | | | | | | 479 | |
3.500% due 08/17/2043 | | | | | 254 | | | | | | 250 | |
|
Structured Asset Securities Corp. | |
0.645% due 05/25/2034 | | | | | 130 | | | | | | 115 | |
|
Vanderbilt Mortgage Finance | |
9.000% due 10/07/2030 | | | | | 381 | | | | | | 397 | |
| | | | | | | | | | | | |
Total Asset-Backed Securities
(Cost $38,115) | | | | | | 38,688 | |
| | | | | | | | | | | | |
| |
| | | | | | |
| 86 | | PIMCO ETF TRUST | | | | See Accompanying Notes |
June 30, 2012
| | | | | | | | | | | | |
| | | | | PRINCIPAL
AMOUNT
(000s) | | | | | MARKET
VALUE
(000s) | |
SOVEREIGN ISSUES 10.3% | |
|
Banco Nacional de Desenvolvimento Economico e Social | |
6.369% due 06/16/2018 | | $ | | | 5,000 | | | $ | | | 5,888 | |
6.500% due 06/10/2019 | | | | | 15,000 | | | | | | 17,962 | |
|
Canada Housing Trust | |
3.800% due 06/15/2021 | | CAD | | | 850 | | | | | | 946 | |
|
Mexico Government International Bond | |
6.250% due 06/16/2016 | | MXN | | | 10,100 | | | | | | 798 | |
6.500% due 06/10/2021 | | | | | 403,000 | | | | | | 32,826 | |
6.500% due 06/09/2022 | | | | | 130,000 | | | | | | 10,578 | |
7.750% due 12/14/2017 | | | | | 200,000 | | | | | | 17,029 | |
10.000% due 12/05/2024 | | | | | 523,800 | | | | | | 55,116 | |
|
Province of Ontario | |
2.450% due 06/29/2022 | | $ | | | 25,900 | | | | | | 25,643 | |
4.000% due 06/02/2021 | | CAD | | | 2,000 | | | | | | 2,177 | |
|
Province of Quebec | |
3.500% due 07/29/2020 | | $ | | | 1,200 | | | | | | 1,323 | |
4.500% due 12/01/2020 | | CAD | | | 1,400 | | | | | | 1,568 | |
|
Russia Government International Bond | |
7.500% due 03/31/2030 | | $ | | | 1,005 | | | | | | 1,210 | |
| |
South Africa Government International Bond | | | | |
8.250% due 09/15/2017 | | ZAR | | | 73,600 | | | | | | 9,662 | |
| | | | | | | | | | | | |
Total Sovereign Issues
(Cost $173,177) | | | 182,726 | |
| | | | | | | | | | | | |
| |
SHORT-TERM INSTRUMENTS 19.3% | |
| |
CERTIFICATES OF DEPOSIT 0.7% | |
| |
Banco do Brasil S.A. | | | | |
0.000% due 06/28/2013 | | $ | | | 12,600 | | | | | | 12,469 | |
| | | | | | | | | | | | |
| |
COMMERCIAL PAPER 1.0% | |
| |
British Telecommunications PLC | | | | |
0.900% due 10/29/2012 | | | | | 800 | | | | | | 798 | |
| |
Xstrata Finance Canada Ltd. | | | | |
0.480% due 07/09/2012 | | | | | 15,800 | | | | | | 15,798 | |
| | | | | | | | | | | | |
| | | | | | | | | | | 16,596 | |
| | | | | | | | | | | | |
| |
| | | | | | | | | | | | |
| | | | | PRINCIPAL
AMOUNT
(000s) | | | | | MARKET
VALUE
(000s) | |
REPURCHASE AGREEMENTS 7.3% | |
| |
Banc of America Securities LLC | | | | |
0.190% due 07/02/2012 | | $ | | | 33,200 | | | $ | | | 33,200 | |
(Dated 06/29/2012. Collateralized by U.S. Treasury Notes 0.375% - 1.250% due 03/15/2014 - 06/15/2015 valued at $33,946. Repurchase proceeds are $33,201) | | | | |
0.200% due 07/02/2012 | | | | | 33,200 | | | | | | 33,200 | |
(Dated 06/29/2012. Collateralized by U.S. Treasury Notes 0.875% - 2.000% due 02/28/2017 - 02/15/2022 valued at $34,079. Repurchase proceeds are $33,201) | | | | |
| |
Barclays Capital, Inc. | | | | |
0.160% due 07/02/2012 | | | | | 4,400 | | | | | | 4,400 | |
(Dated 06/29/2012. Collateralized by U.S. Treasury Bonds 4.500% due 08/15/2039 valued at $2,243 and U.S. Treasury Inflation Protected Securities 1.875% due 07/15/2013 valued at $2,246. Repurchase proceeds are $4,400.) | | | | |
| |
BNP Paribas Securities Corp. | | | | |
0.280% due 07/02/2012 | | | | | 15,000 | | | | | | 15,000 | |
(Dated 06/29/2012. Collateralized by Fannie Mae 4.000% due 06/01/2042 valued at $15,622. Repurchase proceeds are $15,000.) | | | | |
| |
Goldman Sachs Group, Inc. (The) | | | | |
0.190% due 07/02/2012 | | | | | 5,800 | | | | | | 5,800 | |
(Dated 06/29/2012. Collateralized by Fannie Mae 3.500% due 07/01/2042 valued at $5,998. Repurchase proceeds are $5,800.) | | | | |
| |
JPMorgan Securities, Inc. | | | | |
0.200% due 07/02/2012 | | | | | 37,400 | | | | | | 37,400 | |
(Dated 06/29/2012. Collateralized by U.S. Treasury Notes 0.250% - 1.500% due 04/30/2014 - 07/31/2016 valued at $38,197. Repurchase proceeds are $37,401.) | | | | |
| | | | | | | | | | | | |
| | | | | PRINCIPAL
AMOUNT
(000s) | | | | | MARKET
VALUE
(000s) | |
| |
State Street Bank and Trust Co. | | | | |
0.010% due 07/02/2012 | | $ | | | 387 | | | $ | | | 387 | |
(Dated 06/29/2012. Collateralized by U.S. Treasury Bonds 6.250% due 05/15/2030 valued at $397. Repurchase proceeds are $387.) | | | | |
| | | | | | | | | | | | |
| | | | | | | | | | | 129,387 | |
| | | | | | | | | | | | |
| |
SHORT-TERM NOTES 0.2% | |
| |
Export-Import Bank of Korea | | | | |
2.000% due 10/21/2012 | | | | | 4,000 | | | | | | 4,007 | |
| | | | | | | | | | | | |
| |
JAPAN TREASURY BILLS 4.7% | |
0.099% due 09/10/2012 - 10/01/2012 (d) | | JPY | | | 6,610,000 | | | | | | 82,677 | |
| | | | | | | | | | | | |
| |
MEXICO TREASURY BILLS 5.4% | |
4.488% due 07/05/2012 - 09/27/2012 (d) | | MXN | | | 1,289,800 | | | | | | 95,906 | |
| | | | | | | | | | | | |
| |
U.S. TREASURY BILLS 0.0% | |
0.206% due 06/27/2013 (g) | | $ | | | 700 | | | | | | 699 | |
| | | | | | | | | | | | |
| |
Total Short-Term Instruments
(Cost $340,827) | | | 341,741 | |
| | | | | | | | | | | | |
| |
| | | | | | | | | | | | |
Total Investments 124.1%
(Cost $2,165,823) | | | $ | | | 2,192,110 | |
| |
Other Assets and Liabilities (Net) (24.1%) | | | (426,245 | ) |
| | | | | | | | | | | | |
Net Assets 100.0% | | | | | | | | $ | | | 1,765,865 | |
| | | | | | | | | | | | |
Notes to Schedule of Investments (amounts in thousands*):
| * | A zero balance may reflect actual amounts rounding to less than one thousand. |
| (a) | Interest only security. |
| (b) | Principal only security. |
| (d) | Coupon represents a weighted average yield to maturity. |
| (e) | Principal amount of security is adjusted for inflation. |
| (f) | Perpetual maturity, date shown represents next contractual call date. |
| (g) | Securities with an aggregate market value of $1,554 have been pledged as collateral as of June 30, 2012 for foreign currency contracts as governed by International Swaps and Derivatives Association, Inc. Master Agreements. |
| (h) | The average amount of borrowings while outstanding during the period ended June 30, 2012 was $16,177 at a weighted average interest rate of (0.955%). On June 30, 2012, there were no open reverse repurchase agreements. |
| (i) | Short sales outstanding on June 30, 2012: |
| | | | | | | | | | | | | | | | | | | | | | |
| Description | | | | Coupon | | | Maturity
Date | | | Principal
Amount | | | Proceeds | | | Market
Value | |
Fannie Mae | | | | | 3.000 | % | | | 07/01/2042 | | | $ | 40,000 | | | $ | 40,925 | | | $ | (41,044 | ) |
Fannie Mae | | | | | 3.500 | % | | | 07/01/2042 | | | | 2,000 | | | | 2,101 | | | | (2,103 | ) |
Fannie Mae | | | | | 5.500 | % | | | 07/01/2042 | | | | 15,000 | | | | 16,365 | | | | (16,364 | ) |
| | | | | | | | | | | | | | | | $ | 59,391 | | | $ | (59,511 | ) |
| | | | | | |
| See Accompanying Notes | | ANNUAL REPORT | | JUNE 30, 2012 | | 87 |
Schedule of Investments PIMCO Total Return Exchange-Traded Fund (Cont.)
| (j) | Foreign currency contracts outstanding on June 30, 2012: |
| | | | | | | | | | | | | | | | | | | | | | | | | | |
Settlement
Month | | | Currency to
be Delivered | | | Currency to
be Received | | | Counterparty | | | Unrealized
Appreciation | | | Unrealized
(Depreciation) | | | Net Unrealized
Appreciation/
(Depreciation) | |
| | 07/2012 | | | EUR | 5,179 | | | $ | 6,771 | | | | BOA | | | $ | 216 | | | $ | 0 | | | $ | 216 | |
| | 07/2012 | | | | 10,416 | | | | 13,490 | | | | BPS | | | | 308 | | | | 0 | | | | 308 | |
| | 07/2012 | | | | 1,912 | | | | 2,502 | | | | BRC | | | | 82 | | | | 0 | | | | 82 | |
| | 07/2012 | | | | 3,564 | | | | 4,665 | | | | FBF | | | | 154 | | | | 0 | | | | 154 | |
| | 07/2012 | | | | 26,314 | | | | 34,794 | | | | HUS | | | | 1,490 | | | | 0 | | | | 1,490 | |
| | 07/2012 | | | | 14,033 | | | | 18,128 | | | | JPM | | | | 368 | | | | 0 | | | | 368 | |
| | 07/2012 | | | | 11,437 | | | | 14,548 | | | | RBC | | | | 79 | | | | (6 | ) | | | 73 | |
| | 07/2012 | | | | 1,900 | | | | 2,418 | | | | RYL | | | | 14 | | | | 0 | | | | 14 | |
| | 07/2012 | | | MXN | 270,800 | | | | 21,077 | | | | HUS | | | | 780 | | | | 0 | | | | 780 | |
| | 07/2012 | | | $ | 3,607 | | | EUR | 2,880 | | | | BPS | | | | 38 | | | | 0 | | | | 38 | |
| | 07/2012 | | | | 1,534 | | | | 1,161 | | | | HUS | | | | 0 | | | | (64 | ) | | | (64 | ) |
| | 07/2012 | | | | 323 | | | | 256 | | | | JPM | | | | 1 | | | | 0 | | | | 1 | |
| | 07/2012 | | | | 2,562 | | | | 2,048 | | | | UAG | | | | 30 | | | | 0 | | | | 30 | |
| | 07/2012 | | | | 6,026 | | | JPY | 480,000 | | | | FBF | | | | 0 | | | | (21 | ) | | | (21 | ) |
| | 07/2012 | | | | 10,078 | | | | 800,000 | | | | UAG | | | | 0 | | | | (70 | ) | | | (70 | ) |
| | 07/2012 | | | ZAR | 78,030 | | | $ | 9,869 | | | | HUS | | | | 357 | | | | 0 | | | | 357 | |
| | 08/2012 | | | EUR | 1,463 | | | | 1,826 | | | | BPS | | | | 0 | | | | (25 | ) | | | (25 | ) |
| | 08/2012 | | | MXN | 139,040 | | | | 9,884 | | | | BRC | | | | 0 | | | | (481 | ) | | | (481 | ) |
| | 08/2012 | | | | 370,810 | | | | 26,264 | | | | HUS | | | | 0 | | | | (1,418 | ) | | | (1,418 | ) |
| | 08/2012 | | | | 493,462 | | | | 35,093 | | | | JPM | | | | 0 | | | | (1,745 | ) | | | (1,745 | ) |
| | 08/2012 | | | | 384,319 | | | | 27,683 | | | | MSC | | | | 0 | | | | (1,008 | ) | | | (1,008 | ) |
| | 08/2012 | | | | 290,695 | | | | 20,287 | | | | UAG | | | | 0 | | | | (1,414 | ) | | | (1,414 | ) |
| | 08/2012 | | | $ | 294 | | | MXN | 3,887 | | | | JPM | | | | 2 | �� | | | (6 | ) | | | (4 | ) |
| | 09/2012 | | | CAD | 4,779 | | | $ | 4,649 | | | | UAG | | | | 0 | | | | (37 | ) | | | (37 | ) |
| | 09/2012 | | | GBP | 6,283 | | | | 9,715 | | | | BPS | | | | 0 | | | | (123 | ) | | | (123 | ) |
| | 09/2012 | | | | 3,808 | | | | 5,899 | | | | BRC | | | | 0 | | | | (64 | ) | | | (64 | ) |
| | 09/2012 | | | | 6,273 | | | | 9,756 | | | | JPM | | | | 0 | | | | (67 | ) | | | (67 | ) |
| | 09/2012 | | | JPY | 1,070,000 | | | | 13,504 | | | | BRC | | | | 104 | | | | 0 | | | | 104 | |
| | 09/2012 | | | | 650,490 | | | | 8,222 | | | | CBK | | | | 76 | | | | 0 | | | | 76 | |
| | 09/2012 | | | | 1,280,000 | | | | 16,117 | | | | FBF | | | | 85 | | | | 0 | | | | 85 | |
| | 09/2012 | | | | 134,118 | | | | 1,674 | | | | GSC | | | | 0 | | | | (6 | ) | | | (6 | ) |
| | 09/2012 | | | | 247,315 | | | | 3,087 | | | | JPM | | | | 1 | | | | (12 | ) | | | (11 | ) |
| | 09/2012 | | | | 2,950,000 | | | | 37,331 | | | | UAG | | | | 386 | | | | 0 | | | | 386 | |
| | 09/2012 | | | MXN | 596,802 | | | | 42,865 | | | | MSC | | | | 0 | | | | (1,507 | ) | | | (1,507 | ) |
| | 09/2012 | | | | 272,011 | | | | 19,541 | | | | UAG | | | | 0 | | | | (696 | ) | | | (696 | ) |
| | 09/2012 | | | $ | 559 | | | GBP | 360 | | | | RYL | | | | 5 | | | | 0 | | | | 5 | |
| | 10/2012 | | | JPY | 800,000 | | | $ | 10,091 | | | | UAG | | | | 70 | | | | 0 | | | | 70 | |
| | | | | | | | | | | | | | | | $ | 4,646 | | | $ | (8,770 | ) | | $ | (4,124 | ) |
| (k) | Fair Value Measurements (1) |
The following is a summary of the fair valuations according to the inputs used as of June 30, 2012 in valuing the Fund’s assets and liabilities (2):
| | | | | | | | | | | | | | | | | | |
| Category and Subcategory (3) | | | | Level 1 (4) | | | Level 2 (5) | | | Level 3 (6) | | | Fair Value at
06/30/2012 | |
Investments, at value | | | | | | | | | | | | | | | | | | |
Bank Loan Obligations | | | | $ | 0 | | | $ | 10,004 | | | $ | 0 | | | $ | 10,004 | |
Corporate Bonds & Notes | | | | | | | | | | | | | | | | | | |
Banking & Finance | | | | | 35,047 | | | | 239,124 | | | | 0 | | | | 274,171 | |
Industrials | | | | | 0 | | | | 29,124 | | | | 0 | | | | 29,124 | |
Utilities | | | | | 0 | | | | 13,454 | | | | 0 | | | | 13,454 | |
Municipal Bonds & Notes | | | | | | | | | | | | | | | | | | |
California | | | | | 0 | | | | 3,421 | | | | 0 | | | | 3,421 | |
| | | | | | |
| 88 | | PIMCO ETF TRUST | | | | See Accompanying Notes |
June 30, 2012
| | | | | | | | | | | | | | | | | | |
| Category and Subcategory (3) | | | | Level 1 (4) | | | Level 2 (5) | | | Level 3 (6) | | | Fair Value at
06/30/2012 | |
Illinois | | | | $ | 0 | | | $ | 804 | | | $ | 0 | | | $ | 804 | |
New York | | | | | 0 | | | | 5,336 | | | | 0 | | | | 5,336 | |
Ohio | | | | | 0 | | | | 859 | | | | 0 | | | | 859 | |
South Carolina | | | | | 0 | | | | 367 | | | | 0 | | | | 367 | |
U.S. Government Agencies | | | | | 0 | | | | 704,333 | | | | 12,310 | | | | 716,643 | |
U.S. Treasury Obligations | | | | | 0 | | | | 273,059 | | | | 0 | | | | 273,059 | |
Mortgage-Backed Securities | | | | | 0 | | | | 301,713 | | | | 0 | | | | 301,713 | |
Asset-Backed Securities | | | | | 0 | | | | 38,688 | | | | 0 | | | | 38,688 | |
Sovereign Issues | | | | | 0 | | | | 182,726 | | | | 0 | | | | 182,726 | |
Short-Term Instruments | | | | | | | | | | | | | | | | | | |
Certificates of Deposit | | | | | 0 | | | | 12,469 | | | | 0 | | | | 12,469 | |
Commercial Paper | | | | | 0 | | | | 16,596 | | | | 0 | | | | 16,596 | |
Repurchase Agreements | | | | | 0 | | | | 129,387 | | | | 0 | | | | 129,387 | |
Short-Term Notes | | | | | 0 | | | | 4,007 | | | | 0 | | | | 4,007 | |
Japan Treasury Bills | | | | | 0 | | | | 82,677 | | | | 0 | | | | 82,677 | |
Mexico Treasury Bills | | | | | 0 | | | | 51,158 | | | | 44,748 | | | | 95,906 | |
U.S. Treasury Bills | | | | | 0 | | | | 699 | | | | 0 | | | | 699 | |
| | | | | $ | 35,047 | | | $ | 2,100,005 | | | $ | 57,058 | | | $ | 2,192,110 | |
| | | | | |
Short Sales, at value | | | | $ | 0 | | | $ | (59,511 | ) | | $ | 0 | | | $ | (59,511 | ) |
| | | | | |
Financial Derivative Instruments (7) - Assets | | | | | | | | | | | | | | | | | | |
Foreign Exchange Contracts | | | | $ | 0 | | | $ | 4,646 | | | $ | 0 | | | $ | 4,646 | |
| | | | | |
Financial Derivative Instruments (7) - Liabilities | | | | | | | | | | | | | | | | | | |
Foreign Exchange Contracts | | | | $ | 0 | | | $ | (8,770 | ) | | $ | 0 | | | $ | (8,770 | ) |
Totals | | | | $ | 35,047 | | | $ | 2,036,370 | | | $ | 57,058 | | | $ | 2,128,475 | |
The following is a reconciliation of the fair valuations using significant unobservable inputs (Level 3) for the Fund during the period ended June 30, 2012:
| | | | | | | | | | | | | | | | | | | | | | | | | | | | | | | | | | | | | | | | | | |
| Category and Subcategory | | | | Beginning
Balance at
02/29/2012 | | | Net
Purchases | | | Net Sales | | | Accrued
Discounts/
(Premiums) | | | Realized
Gain/
(Loss) | | | Net Change
in Unrealized
Appreciation/
(Depreciation) (8) | | | Transfers
into
Level 3 | | | Transfers
out of
Level 3 | | | Ending
Balance at
06/30/2012 | | | Net Change in
Unrealized
Appreciation/
(Depreciation)
on Investments
Held at
06/30/2012 (8) | |
Investments, at value | | | | | | | | | | | | | | | | | | | | | | | | | | | | | | | | | | | | | | | | | | |
U.S. Government Agencies | | | | $ | 0 | | | $ | 12,381 | | | $ | 0 | | | $ | 0 | | | $ | 0 | | | $ | (71 | ) | | $ | 0 | | | $ | 0 | | | $ | 12,310 | | | $ | (71 | ) |
Short-Term Instruments | | | | | | | | | | | | | | | | | | | | | | | | | | | | | | | | | | | | | | | | | | |
Mexico Treasury Bills | | | | | 0 | | | | 43,454 | | | | 0 | | | | 22 | | | | 0 | | | | 1,272 | | | | 0 | | | | 0 | | | | 44,748 | | | | 1,272 | |
Totals | | | | $ | 0 | | | $ | 55,835 | | | $ | 0 | | | $ | 22 | | | $ | 0 | | | $ | 1,201 | | | $ | 0 | | | $ | 0 | | | $ | 57,058 | | | $ | 1,201 | |
| (1) | See note 3 in the Notes to Financial Statements for more information regarding pricing inputs and valuation techniques. |
| (2) | There were no significant transfers into or out of level 1, 2, and 3 during the period ended June 30, 2012. |
| (3) | Refer to the Schedule of Investments for additional information. |
| (4) | Quoted prices in active markets for identical investments. |
| (5) | Significant other observable inputs. |
| (6) | Significant unobservable inputs. |
| (7) | Financial Derivative Instruments may include open futures contracts, swap agreements, written options, and foreign currency contracts. |
| (8) | Any difference between Net Change in Unrealized Appreciation/(Depreciation) and Net Change in Unrealized Appreciation/(Depreciation) on Investments Held at June 30, 2012 may be due to an investment no longer held or categorized as level 3 at period end. |
| | | | | | |
| See Accompanying Notes | | ANNUAL REPORT | | JUNE 30, 2012 | | 89 |
Schedule of Investments PIMCO Total Return Exchange-Traded Fund (Cont.)
June 30, 2012
| (l) | Fair Value of Financial Derivative Instruments (1) |
The following is a summary of the fair valuation of the Fund’s derivative instruments categorized by risk exposure:
Fair Values of Financial Derivative Instruments on the Statements of Assets and Liabilities as of June 30, 2012:
| | | | | | | | | | | | | | | | | | | | | | | | | | |
| | | | | Derivatives not accounted for as hedging instruments | |
| | | | | Commodity
Contracts | | | Credit
Contracts | | | Equity
Contracts | | | Foreign
Exchange
Contracts | | | Interest
Rate Contracts | | | Total | |
Assets: | | | | | | | | | | | | | | | | | | | | | | | | | | |
Unrealized appreciation on foreign currency contracts | | | | $ | 0 | | | $ | 0 | | | $ | 0 | | | $ | 4,646 | | | $ | 0 | | | $ | 4,646 | |
| | | | | | | |
Liabilities: | | | | | | | | | | | | | | | | | | | | | | | | | | |
Unrealized depreciation on foreign currency contracts | | | | $ | 0 | | | $ | 0 | | | $ | 0 | | | $ | 8,770 | | | $ | 0 | | | $ | 8,770 | |
The Effect of Financial Derivative Instruments on the Statements of Operations for the Period Ended June 30, 2012:
| | | | | | | | | | | | | | | | | | | | | | | | | | |
| | | | | Derivatives not accounted for as hedging instruments | |
| | | | | Commodity
Contracts | | | Credit
Contracts | | | Equity
Contracts | | | Foreign
Exchange
Contracts | | | Interest
Rate Contracts | | | Total | |
Realized Gain on Derivatives Recognized as a Result from Operations: | | | | | | | | | | | | | | | | | | | | | | | | | | |
Net realized gain on foreign currency transactions | | | | $ | 0 | | | $ | 0 | | | $ | 0 | | | $ | 980 | | | $ | 0 | | | $ | 980 | |
| | | | | | | |
Net Change in Unrealized (Depreciation) on Derivatives Recognized as a Result of Operations: | | | | | | | | | | | | | | | | | | | | | | | | | | |
Net change in unrealized (depreciation) on translation of assets and liabilities denominated in foreign currencies | | | | $ | 0 | | | $ | 0 | | | $ | 0 | | | $ | (4,124 | ) | | $ | 0 | | | $ | (4,124 | ) |
| (1) | See note 6 in the Notes to Financial Statements for additional information. |
| (m) | Collateral (Received)/Pledged for OTC Financial Derivative Instruments |
The following is a summary by counterparty of the market value of OTC financial derivative instruments and collateral (received)/pledged as of June 30, 2012:
| | | | | | | | | | | | | | |
| Counterparty | | | | Total Market
Value of OTC
Derivatives | | | Collateral
(Received)/
Pledged | | | Net
Exposures (1) | |
BOA | | | | $ | 216 | | | $ | (260 | ) | | $ | (44 | ) |
BPS | | | | | 197 | | | | (360 | ) | | | (163 | ) |
BRC | | | | | (359 | ) | | | 0 | | | | (359 | ) |
CBK | | | | | 75 | | | | 0 | | | | 75 | |
FBF | | | | | 218 | | | | (270 | ) | | | (52 | ) |
GSC | | | | | (6 | ) | | | 0 | | | | (6 | ) |
HUS | | | | | 1,145 | | | | (3,240 | ) | | | (2,095 | ) |
JPM | | | | | (1,456 | ) | | | 0 | | | | (1,456 | ) |
MSC | | | | | (2,515 | ) | | | (646 | ) | | | (3,161 | ) |
RBC | | | | | 73 | | | | (140 | ) | | | (67 | ) |
RYL | | | | | 19 | | | | 0 | | | | 19 | |
UAG | | | | | (1,731 | ) | | | 855 | | | | (876 | ) |
| (1) | Net Exposure represents the net receivable/(payable) that would be due from/to the counterparty in the event of default. See note 7, Principal Risks, in the Notes to Financial Statements for more information regarding credit and counterparty risks. |
| | | | | | |
| 90 | | PIMCO ETF TRUST | | | | See Accompanying Notes |
Notes to Financial Statements
June 30, 2012
1. ORGANIZATION
PIMCO ETF Trust (the “Trust”) was established as a Delaware statutory trust on November 14, 2008. The Trust is registered under the Investment Company Act of 1940, as amended (the “Act”), as an open-end management investment company. Information presented in these financial statements pertains to nineteen funds (each a “Fund” and collectively the “Funds”) offered by the Trust.
Each Fund is an exchange-traded fund (“ETF”). ETFs are funds that trade like other publicly-traded securities and may be designed to track an index or to be actively managed. Unlike shares of a mutual fund, which can be bought from and redeemed by the issuing fund by all shareholders at a price based on net asset value (“NAV”), shares of a Fund may be directly purchased from and redeemed by a Fund at NAV solely by certain large institutional investors. Also unlike shares of a mutual fund, shares of each Fund are listed on a national securities exchange and trade in the secondary market at market prices that change throughout the day.
Shares of the Funds are listed and traded at market prices on NYSE Arca, Inc. (“NYSE Arca”) and other secondary markets. The market price for a Fund’s shares may be different from the Fund’s NAV. The Funds issue and redeem shares at their respective NAV only in blocks of a specified number of shares or multiples thereof (“Creation Units”). Only certain large institutional investors may purchase or redeem Creation Units directly with the Funds at NAV (“Authorized Participants”). These transactions are in exchange for certain securities similar to a Fund’s portfolio and/or cash. Except when aggregated in Creation Units, shares of a Fund are not redeemable securities. Shareholders who are not Authorized Participants may not redeem shares directly from a Fund at NAV.
2. SIGNIFICANT ACCOUNTING POLICIES
The following is a summary of significant accounting policies consistently followed by the Trust in the preparation of its financial statements in conformity with accounting principles generally accepted in the United States of America (“U.S. GAAP”). The preparation of financial statements in accordance with U.S. GAAP requires management to make estimates and assumptions that affect the reported amounts of assets and liabilities and disclosure of contingent assets and liabilities at the date of the financial statements and the reported amounts of increases and decreases in net assets from operations during the reporting period. Actual results could differ from those estimates.
(a) Determination of Net Asset Value The NAV of a Fund’s shares is valued as of the close of regular trading (normally 4:00 p.m., Eastern time) (the “NYSE Close”) on each day that the NYSE Arca and the bond markets, as determined by Securities Industry and Financial Markets Association (“SIFMA”), are open. Information that becomes known to a Fund or its agents after the NAV has been calculated on a particular day will not generally be used to retroactively adjust the price of a security or the NAV determined earlier that day.
(b) Securities Transactions and Investment Income Securities transactions are recorded as of the trade date for financial reporting purposes. Securities purchased or sold on a when-issued or delayed-delivery basis may be settled 15 days or more after the trade date. Realized gains and losses from securities sold are recorded on the identified cost basis. Dividend income is recorded on the ex-dividend date. Interest income, adjusted for the accretion of discounts and amortization of premiums, is recorded on the accrual basis from settlement date. Estimated tax liabilities on certain foreign securities are recorded on an accrual basis and are reflected as components of interest income or net change in unrealized gain/loss on investments on the Statements of Operations, as appropriate. Tax liabilities realized as a result of such security sales are reflected as a component of net realized gain/loss on investments on the Statements of Operations. Paydown gains and losses on mortgage-related and other asset-backed securities are recorded as components of interest income on the Statements of Operations. Income or short-term capital gain distributions received from underlying funds are recorded as dividend income. Long-term capital gain distributions received from underlying funds are recorded as realized gains.
Debt obligations may be placed on non-accrual status and related interest income may be reduced by ceasing current accruals and writing off interest receivable when the collection of all or a portion of interest has become doubtful based on consistently applied procedures. A debt obligation is removed from non-accrual status when the issuer resumes interest payments or when collectability of interest is reasonably assured.
(c) Cash and Foreign Currency The functional and reporting currency for the Funds is the U.S. dollar. The market values of foreign securities, currency holdings and other assets and liabilities are translated into U.S. dollars based on the current exchange rates each business day. Fluctuations in the value of currency holdings and other assets and liabilities resulting from changes in exchange rates are recorded as unrealized foreign currency gains or losses. Realized gains or losses and unrealized appreciation or depreciation on investment securities and income and expenses are translated on the respective dates of such transactions. The effects of changes in foreign currency exchange rates on investments in securities are not segregated on the Statements of Operations from the effects of changes in market prices of those securities, but are included with the net realized and unrealized gain or loss on investment securities.
(d) Dividends and Distributions to Shareholders Dividends from net investment income, if any, of each Fund, except the PIMCO 25+ Year Zero Coupon U.S. Treasury Index Fund, are declared and distributed to shareholders monthly. Dividends from net investment income, if any, of the PIMCO 25+ Year Zero Coupon U.S. Treasury Index Fund are declared and distributed to shareholders quarterly. Net realized capital gains earned by each Fund, if any, will be distributed no less frequently than once each year. Dividends and distributions cannot be automatically reinvested in additional shares of a Fund.
| | | | | | |
| | ANNUAL REPORT | | JUNE 30, 2012 | | 91 |
Notes to Financial Statements (Cont.)
Income dividends and capital gain distributions are determined in accordance with income tax regulations which may differ from U.S. GAAP. Differences between tax regulations and U.S. GAAP may cause timing differences between income and capital gain recognition. Examples of events that give rise to timing differences include tax events such as wash sales losses and capital loss carryforwards. Further, the character of investment income and capital gains may be different for certain transactions under the two methods of accounting. Examples of transactions that may cause character differences include the treatment of paydowns on mortgage-backed securities, swaps, foreign currency transactions and redeem-in-kind transactions. As a result, income dividends and capital gain distributions declared during a fiscal period may differ significantly from the net investment income and realized gains reported on each Fund’s annual financial statements presented under U.S. GAAP.
Distributions classified as a tax basis return of capital, if any, are reflected on the accompanying Statements of Changes in Net Assets and have been recorded to paid in capital. In addition, other amounts have been reclassified between undistributed net investment income, accumulated undistributed net realized gains or losses and/or paid in capital to more appropriately conform financial accounting to tax characterizations of dividend distributions.
(e) Equalization Each Fund follows the accounting practice known as “Equalization” by which a portion of the proceeds from sales and costs of reacquiring Fund shares, equivalent on a per share basis to the amount of distributable net investment income on the date of the transaction, is credited or charged to undistributed net investment income. As a result, undistributed net investment income per share is unaffected by sales or reacquisition of Fund shares.
(f) New Accounting Pronouncements In April 2011, the Financial Accounting Standards Board (“FASB”) issued an Accounting Standards Update (“ASU”) related to the accounting for repurchase agreements and similar agreements that both entitle and obligate a transferor to repurchase or redeem financial assets before their maturity. The ASU modifies the criteria for determining effective control of transferred assets and as a result certain agreements may now be accounted for as secured borrowings. The ASU is effective prospectively for new transfers and existing transactions that are modified in the first interim or annual period beginning on or after December 15, 2011. Management anticipates certain Funds may recognize additional borrowing expense (interest expense) as a result of the change of accounting treatment. The magnitude of this change has not been determined at this time.
In May 2011, FASB issued an ASU to develop common requirements for measuring fair value and for disclosing information about fair value measurements in accordance with U.S. GAAP and International Financial Reporting Standards (“IFRS”). FASB concluded that the amendments in this ASU will improve the comparability of fair value measurements presented
and disclosed in financial statements prepared in accordance with U.S. GAAP and IFRS. The ASU is effective prospectively during interim or annual periods beginning on or after December 15, 2011. Management has evaluated the amendments to the ASU and anticipates modifications to the fair value disclosure to enhance the description of the valuation methods.
In December 2011, FASB issued an ASU to enhance disclosures about financial instruments and derivative instruments that are subject to offsetting (“netting”) on the Statements of Assets and Liabilities. This information will enable users of the entity’s financial statements to evaluate the effect or potential effect of netting arrangements on the entity’s financial position. The ASU is effective prospectively during interim or annual periods beginning on or after January 1, 2013. At this time, management is evaluating the implications of these changes on the financial statements.
3. INVESTMENT VALUATION AND FAIR VALUE MEASUREMENTS
For purposes of calculating the NAV, portfolio securities and other assets for which market quotes are readily available are valued at fair market value. Fair market value is generally determined on the basis of last reported sales prices, or if no sales are reported, based on quotes obtained from a quotation reporting system, established market makers, or pricing services.
Investments initially valued in currencies other than the U.S. dollar are converted to the U.S. dollar using exchange rates obtained from pricing service providers. As a result, the NAV of a Fund’s shares may be affected by changes in the value of currencies in relation to the U.S. dollar. The value of securities traded in markets outside the United States or denominated in currencies other than the U.S. dollar may be affected significantly on a day that the New York Stock Exchange (“NYSE”) is closed and the NAV may change on days when an investor is not able to purchase, redeem or exchange shares.
U.S. GAAP defines fair market value as the price that a Fund would receive to sell an asset or pay to transfer a liability in an orderly transaction between market participants at the measurement date. It establishes a fair value hierarchy that prioritizes inputs to valuation methods and requires disclosure of the fair value hierarchy, separately for each major category of assets and liabilities, that segregates fair value measurements into levels (Level 1, 2, and 3). The inputs or methodology used for valuing securities are not necessarily an indication of the risk associated with investing in those securities. Levels 1, 2, and 3 of the fair value hierarchy are defined as follows:
| | n | | Level 1—Inputs using quoted prices in active markets or exchanges for identical assets and liabilities. |
| | n | | Level 2—Significant other observable inputs, which may include, but are not limited to, quoted prices for similar assets or liabilities in markets that are active, quoted prices for identical or similar assets or liabilities in markets that are not active, inputs other |
June 30, 2012
| | | than quoted prices that are observable for the assets or liabilities (such as interest rates, yield curves, volatilities, prepayment speeds, loss severities, credit risks and default rates) or other market corroborated inputs. |
| | n | | Level 3—Significant unobservable inputs based on the best information available in the circumstances, to the extent observable inputs are not available, which may include assumptions made by the Board of Trustees (the “Board”) or persons acting at their direction that are used in determining the fair value of investments. |
Level 1 and Level 2 trading assets and trading liabilities, at fair market value The valuation techniques and significant inputs used in determining the fair market values of financial instruments classified as Level 1 and Level 2 of the fair value hierarchy are as follows:
Fixed income securities including corporate, convertible and municipal bonds and notes, U.S. government agencies, U.S. treasury obligations, sovereign issues, bank loans, convertible preferred securities and non-U.S. bonds are normally valued by pricing service providers that use broker dealer quotations, reported trades or valuation estimates from their internal pricing models. The service providers’ internal models use inputs that are observable such as issuer details, interest rates, yield curves, prepayment speeds, credit risks/spreads, default rates and quoted prices for similar assets. Securities that use similar valuation techniques and inputs as described above are categorized as Level 2 of the fair value hierarchy.
Fixed income securities purchased on a delayed-delivery basis are marked to market daily until settlement at the forward settlement date are categorized as Level 2 of the fair value hierarchy.
Mortgage-related and asset-backed securities are usually issued as separate tranches, or classes, of securities within each deal. These securities are also normally valued by pricing service providers that use broker dealer quotations or valuation estimates from their internal pricing models. The pricing models for these securities usually consider tranche-level attributes, current market data, estimated cash flows and market-based yield spreads for each tranche, and incorporate deal collateral performance, as available. Mortgage-related and asset-backed securities that use similar valuation techniques and inputs as described above are categorized as Level 2 of the fair value hierarchy.
Investments in registered open-end investment management companies will be valued based upon the NAVs of such investments and are categorized as Level 1 of the fair value hierarchy. Investments in unregistered open-end management investment companies will be calculated based upon the NAVs of such investments and are considered Level 1 provided that the NAVs are observable, calculated daily and are the value at which both purchases and sales will be conducted. Investments in privately held investment funds with significant restrictions on redemptions where the
inputs of NAVs are observable will be valued based upon the NAVs of such investments and are categorized as Level 2 of the fair value hierarchy.
Short-term investments having a maturity of 60 days or less are generally valued at amortized cost which approximates fair market value. These investments are categorized as Level 2 of the fair value hierarchy.
Over-the-counter financial derivative instruments, such as foreign currency contracts or swap agreements, derive their value from underlying asset prices, indices, reference rates, and other inputs or a combination of these factors. These contracts are normally valued on the basis of broker dealer quotations or by pricing service providers. Depending on the product and the terms of the transaction, the value of financial derivatives can be estimated by a pricing service provider using a series of techniques, including simulation pricing models. The pricing models use inputs that are observed from actively quoted markets such as issuer details, indices, spreads, interest rates, yield curves, dividends and exchange rates. Financial derivatives that use similar valuation techniques and inputs as described above are categorized as Level 2 of the fair value hierarchy.
Level 3 trading assets and trading liabilities, at fair value The valuation techniques and significant inputs used in determining the fair values of financial instruments classified as Level 3 of the fair value hierarchy are as follows:
Securities and other assets for which market quotes are not readily available are valued at fair value as determined in good faith by the Board or persons acting at their direction and are categorized as Level 3 of the fair value hierarchy.
Market quotes are considered not readily available in circumstances where there is an absence of current or reliable market-based data (e.g., trade information or broker quotes), including where events occur after the close of the relevant market, but prior to the NYSE Close, that materially affect the values of a Fund’s securities or assets. In addition, market quotes are considered not readily available when, due to extraordinary circumstances, the exchanges or markets on which the securities trade do not open for trading for the entire day and no other market prices are available. The Board has delegated to the investment Manager (the “Manager”), Pacific Investment Management Company LLC (“PIMCO”), the responsibility for monitoring significant events that may materially affect the values of a Fund’s securities or assets and for determining whether the value of the applicable securities or assets should be re-evaluated in light of such significant events.
The Board has adopted methods for valuing securities and other assets in circumstances where market quotes are not readily available, and has delegated the responsibility for applying the valuation methods to PIMCO. For instances in which daily market quotes are not readily available, investments may be valued, pursuant to guidelines established by the Board, with reference to other securities or indices. In the event that the security or asset
| | | | | | |
| | ANNUAL REPORT | | JUNE 30, 2012 | | 93 |
Notes to Financial Statements (Cont.)
cannot be valued pursuant to one of the valuation methods established by the Board, the value of the security or asset will be determined in good faith by the Valuation Committee of the Board, generally based upon recommendations provided by PIMCO. When a fair valuation method is applied by PIMCO that uses significant unobservable inputs, securities will be priced by a method that the Board or persons acting at their direction believe accurately reflects fair value and are categorized as Level 3 of the fair value hierarchy. These methods may require subjective determinations about the value of a security. While the Trust’s policy is intended to result in a calculation of a Fund’s NAV that fairly reflects security values as of the time of pricing, the Trust cannot guarantee that values determined by the Board or persons acting at their direction would accurately reflect the price that a Fund could obtain for a security if it were to dispose of that security as of the time of pricing (for instance, in a forced or distressed sale). The prices used by a Fund may differ from the value that would be realized if the securities were sold.
For fair valuations using significant unobservable inputs, U.S. GAAP requires a reconciliation of the beginning to ending balances for reported fair values that presents changes attributable to total realized and unrealized gains or losses, purchases and sales, and transfers in or out of the Level 3 category during the period. The end of period timing recognition is used for the significant transfers between Levels of the Funds’ assets and liabilities. In accordance with the requirements of U.S. GAAP, a fair value hierarchy and Level 3 reconciliation, if any, have been included in the Notes to the Schedule of Investments for each respective Fund.
4. SECURITIES AND OTHER INVESTMENTS
(a) Delayed-Delivery Transactions Certain Funds may purchase or sell securities on a delayed-delivery basis. These transactions involve a commitment by a Fund to purchase or sell securities for a predetermined price or yield, with payment and delivery taking place beyond the customary settlement period. When delayed-delivery transactions are outstanding, a Fund will designate or receive as collateral liquid assets in an amount sufficient to meet the purchase price or respective obligations. When purchasing a security on a delayed-delivery basis, a Fund assumes the rights and risks of ownership of the security, including the risk of price and yield fluctuations, and takes such fluctuations into account when determining its NAV. A Fund may dispose of or renegotiate a delayed-delivery transaction after it is entered into which may result in a realized gain or loss. When a Fund has sold a security on a delayed-delivery basis, the Fund does not participate in future gains and losses with respect to the security.
(b) Inflation-Indexed Bonds Certain Funds may invest in inflation-indexed bonds. Inflation-indexed bonds are fixed-income securities whose principal value is periodically adjusted to the rate of inflation. The interest rate on these bonds is generally fixed at issuance at a rate lower than typical bonds. Over the life of an inflation-indexed bond, however, interest will be paid based on a principal value which is adjusted for inflation. Any increase or
decrease in the principal amount of an inflation-indexed bond will be included as interest income on the Statements of Operations, even though investors do not receive their principal until maturity.
(c) Loan Participations and Assignments Certain Funds may invest in direct debt instruments which are interests in amounts owed to lenders or lending syndicates by corporate, governmental, or other borrowers. A Fund’s investments in loans may be in the form of participations in loans or assignments of all or a portion of loans from third parties. A loan is often administered by a bank or other financial institution (the “lender”) that acts as agent for all holders. The agent administers the terms of the loan, as specified in the loan agreement. A Fund may invest in multiple series or tranches of a loan, which may have varying terms and carry different associated risks. A Fund generally has no right to enforce compliance with the terms of the loan agreement with the borrower. As a result, a Fund may be subject to the credit risk of both the borrower and the lender that is selling the loan agreement. When a Fund purchases assignments from lenders it acquires direct rights against the borrower of the loan. Certain Funds may also enter into unfunded loan commitments, which are contractual obligations for future funding. Unfunded loan commitments may include revolving credit facilities, which may obligate Funds to supply additional cash to the borrower on demand. Unfunded loan commitments represent a future obligation in full, even though a percentage of the notional loan amounts may not be utilized by the borrower. When investing in a loan participation, a Fund has the right to receive payments of principal, interest and any fees to which it is entitled only from the lender selling the loan agreement and only upon receipt of payments by the lender from the borrower. A Fund may receive a commitment fee based on the undrawn portion of the underlying line of credit portion of a floating rate loan. In certain circumstances, a Fund may receive a penalty fee upon the prepayment of a floating rate loan by a borrower. Fees earned or paid are recorded as a component of interest income or interest expense, respectively, on the Statements of Operations. As of June 30, 2012, the Funds had no unfunded loan commitments.
(d) Mortgage-Related and Other Asset-Backed Securities Certain Funds may invest in mortgage-related and other asset-backed securities. These securities include mortgage pass-through securities, collateralized mortgage obligations, commercial mortgage-backed securities, asset-backed securities, collateralized debt obligations and other securities that directly or indirectly represent a participation in, or are secured by and payable from, mortgage loans on real property. Mortgage-related and other asset-backed securities are interests in pools of loans or other receivables. Mortgage-related securities are created from pools of residential or commercial mortgage loans, including mortgage loans made by savings and loan institutions, mortgage bankers, commercial banks and others. Asset-backed securities are created from many types of assets, including auto loans, credit card receivables, home equity loans, and student loans. These securities provide a monthly payment which consists of both interest and principal payments. Interest payments may be determined by fixed or adjustable
June 30, 2012
rates. The rate of prepayments on underlying mortgages will affect the price and volatility of a mortgage-related security, and may have the effect of shortening or extending the effective duration of the security relative to what was anticipated at the time of purchase. The timely payment of principal and interest of certain mortgage-related securities is guaranteed with the full faith and credit of the U.S. Government. Pools created and guaranteed by non-governmental issuers, including government-sponsored corporations, may be supported by various forms of insurance or guarantees, but there can be no assurance that the private insurers or guarantors can meet their obligations under the insurance policies or guarantee arrangements.
Collateralized Mortgage Obligations (“CMOs”) are debt obligations of a legal entity that are collateralized by mortgages and divided into classes. CMOs are structured into multiple classes, often referred to as “tranches,” with each class bearing a different stated maturity and entitled to a different schedule for payments of principal and interest, including prepayments. Commercial Mortgage-Backed Securities (“CMBS”) include securities that reflect an interest in, and are secured by, mortgage loans on commercial real property. Many of the risks of investing in CMBS reflect the risks of investing in the real estate securing the underlying mortgage loans. These risks reflect the effects of local and other economic conditions on real estate markets, the ability of tenants to make loan payments, and the ability of a property to attract and retain tenants. CMOs and CMBS may be less liquid and may exhibit greater price volatility than other types of mortgage-related or asset-backed securities.
Collateralized Debt Obligations (“CDOs”) include Collateralized Bond Obligations (“CBOs”), Collateralized Loan Obligations (“CLOs”) and other similarly structured securities. CBOs and CLOs are types of asset-backed securities. A CBO is a trust which is backed by a diversified pool of high risk, below investment grade fixed income securities. A CLO is a trust typically collateralized by a pool of loans, which may include, among others, domestic and foreign senior secured loans, senior unsecured loans, and subordinate corporate loans, including loans that may be rated below investment grade or equivalent unrated loans. The risks of an investment in a CDO depend largely on the type of the collateral securities and the class of the CDO in which a Fund invests. CDOs carry additional risks including, but not limited to, (i) the possibility that distributions from collateral securities will not be adequate to make interest or other payments, (ii) the collateral may decline in value or default, (iii) a Fund may invest in CDOs that are subordinate to other classes, and (iv) the complex structure of the security may not be fully understood at the time of investment and may produce disputes with the issuer or unexpected investment results.
(e) Payment In-Kind Securities Certain Funds may invest in payment in-kind securities (“PIKs”). PIKs give the issuer the option at each interest payment date of making interest payments in either cash or additional debt securities. Those additional debt securities usually have the same terms,
including maturity dates and interest rates, and associated risks as the original bonds. The daily market quotations of the original bonds may include the accrued interest (referred to as a dirty price) and require a pro-rata adjustment from the unrealized appreciation or depreciation on investments to interest receivable on the Statements of Assets and Liabilities.
(f) Short Sales Certain Funds may enter into short sales transactions. A short sale is a transaction in which a Fund sells securities it may not own in anticipation of a decline in the fair market value of the securities. Securities sold in short sale transactions and the interest payable on such securities, if any, are reflected as a liability on the Statements of Assets and Liabilities. A Fund is obligated to deliver securities at the trade price at the time the short position is covered. Possible losses from short sales may be unlimited, whereas losses from purchases cannot exceed the total amount invested.
(g) U.S. Government Agencies or Government-Sponsored Enterprises Certain Funds may invest in securities of U.S. Government agencies or government-sponsored enterprises. U.S. Government securities are obligations of and, in certain cases, guaranteed by, the U.S. Government, its agencies or instrumentalities. Some U.S. Government securities, such as Treasury bills, notes and bonds, and securities guaranteed by the Government National Mortgage Association (“GNMA” or “Ginnie Mae”), are supported by the full faith and credit of the U.S. Government; others, such as those of the Federal Home Loan Banks, are supported by the right of the issuer to borrow from the U.S. Department of the Treasury (the “U.S. Treasury”); others, such as those of the Federal National Mortgage Association (“FNMA” or “Fannie Mae”), are supported by the discretionary authority of the U.S. Government to purchase the agency’s obligations. U.S. Government securities may include zero coupon securities, which do not distribute interest on a current basis and tend to be subject to greater risk than interest-paying securities of similar maturities such as U.S. Treasury Strips which are Treasury fixed-income securities sold at a discount to face value and offer no interest payments; rather, investors receive par at maturity.
Government-related guarantors (i.e., not backed by the full faith and credit of the U.S. Government) include FNMA and the Federal Home Loan Mortgage Corporation (“FHLMC” or “Freddie Mac”). FNMA is a government-sponsored corporation. FNMA purchases conventional (i.e., not insured or guaranteed by any government agency) residential mortgages from a list of approved seller/servicers which include state and federally chartered savings and loan associations, mutual savings banks, commercial banks and credit unions and mortgage bankers. Pass-through securities issued by FNMA are guaranteed as to timely payment of principal and interest by FNMA, but are not backed by the full faith and credit of the U.S. Government. FHLMC issues Participation Certificates (“PCs”), which are pass-through securities, each representing an undivided interest in a pool of residential mortgages. FHLMC guarantees the timely payment of interest and ultimate collection of principal, but PCs are not backed by the full faith and credit of the U.S. Government.
| | | | | | |
| | ANNUAL REPORT | | JUNE 30, 2012 | | 95 |
Notes to Financial Statements (Cont.)
(h) When-Issued Transactions Certain Funds may purchase or sell securities on a when-issued basis. These transactions are made conditionally because a security, although authorized, has not yet been issued in the market. A commitment by a Fund is made regarding these transactions to purchase or sell securities for a predetermined price or yield, with payment and delivery taking place beyond the customary settlement period. A Fund may sell when-issued securities before they are delivered, which may result in a realized gain or loss.
5. BORROWINGS AND OTHER FINANCING TRANSACTIONS
The following disclosures contain information on a Fund’s ability to lend or borrow cash or securities to the extent permitted under the Act, which may be viewed as borrowing or financing transactions by the Fund. The location and fair value amounts of these instruments are described below. For a detailed description of credit and counterparty risks that can be associated with borrowings and other financing transactions, please see Note 7, Principal Risks.
(a) Repurchase Agreements Each Fund may engage in repurchase agreements. Under the terms of a typical repurchase agreement, a Fund takes possession of an underlying debt obligation (collateral) subject to an obligation of the seller to repurchase, and a Fund to resell, the obligation at an agreed-upon price and time. The underlying securities for all repurchase agreements are held in safekeeping at the Fund’s custodian or designated subcustodians under tri-party repurchase agreements. The market value of the collateral must be equal to or exceed the total amount of the repurchase obligations, including interest. Securities purchased under repurchase agreements are reflected as an asset on the Statements of Assets and Liabilities. Interest earned is recorded as a component of interest income on the Statements of Operations. In periods of increased demand for collateral, a Fund may pay a fee (or receipt of collateral, which may result in interest expense to the Fund.
(b) Reverse Repurchase Agreements Certain Funds may enter into reverse repurchase agreements. In a reverse repurchase agreement, a Fund delivers a security in exchange for cash to a financial institution, the counterparty, with a simultaneous agreement to repurchase the same or substantially the same security at an agreed-upon price and date. A Fund is entitled to receive principal and interest payments, if any, made on the security delivered to the counterparty during the term of the agreement. Cash received in exchange for securities delivered plus accrued interest payments to be made by a Fund to counterparties are reflected as a liability on the Statements of Assets and Liabilities. Interest payments made by a Fund to counterparties are recorded as a component of interest expense on the Statements of Operations. In periods of increased demand for the security, a Fund may
receive a fee for use of the security by the counterparty, which may result in interest income to the Fund. A Fund will segregate assets determined to be liquid by PIMCO or otherwise cover its obligations under reverse repurchase agreements.
(c) Securities Lending The Funds listed below may seek to earn additional income through lending their securities to certain qualified broker-dealers and institutions on a short-term or long-term basis via a lending agent. The securities out on loan are required to be secured by cash collateral at least equal to 102% of the domestic and 105% of the foreign loans market value. The Fund will then invest the cash collateral received in the PIMCO Government Money Market Fund and PIMCO Money Market Fund (see table below for designations), and records a liability for the return of the collateral, during the period the securities are on loan. Each fund is subject to a lending limit of 33.33% of total assets (including the value of collateral).
The loans are subject to termination at the option of the borrower or the Fund. Upon termination of the loan, the borrower will return to the lender securities identical to the loaned securities. Should the borrower of the securities fail to return loaned securities, the Fund has the right to repurchase the securities using the collateral in the open market.
The borrower pays fees at the Funds’ direction to the lending agent. The lending agent may retain a portion of the interest earned on the cash collateral invested. The cash collateral invested by the lending agent is disclosed on the Schedules of Investments (if applicable). The lending fees and the Funds’ portion of the interest income earned on cash collateral are included on the Statements of Operations as securities lending income (if applicable).
The Funds did not have any securities on loan at the close of the period.
| | | | |
| Fund Name | | | | Cash Collateral Reinvestment Vehicle |
PIMCO 1-3 Year U.S. Treasury Index Fund | | | | PIMCO Government Money Market Fund |
PIMCO 1-5 Year U.S. TIPS Index Fund | | | | PIMCO Government Money Market Fund |
PIMCO 3-7 Year U.S. Treasury Index Fund | | | | PIMCO Government Money Market Fund |
PIMCO 7-15 Year U.S. Treasury Index Fund | | | | PIMCO Government Money Market Fund |
PIMCO 15+ Year U.S. TIPS Index Fund | | | | PIMCO Government Money Market Fund |
PIMCO 25+ Year Zero Coupon U.S. Treasury Index Fund | | | | PIMCO Government Money Market Fund |
PIMCO Broad U.S. TIPS Index Fund | | | | PIMCO Government Money Market Fund |
PIMCO Broad U.S. Treasury Index Fund | | | | PIMCO Government Money Market Fund |
PIMCO Investment Grade Corporate Bond Index Fund | | | | PIMCO Money Market Fund |
PIMCO Enhanced Short Maturity Strategy Fund | | | | PIMCO Money Market Fund |
June 30, 2012
6. FINANCIAL DERIVATIVE INSTRUMENTS
The following disclosures contain information on how and why the Funds use financial derivative instruments, the credit-risk-related contingent features in certain financial derivative instruments, and how financial derivative instruments affect the Funds’ financial position, results of operations and cash flows. The location and fair value amounts of these instruments on the Statements of Assets and Liabilities and the realized and changes in unrealized gains and losses on the Statements of Operations, each categorized by type of financial derivative contract and related risk exposure, are included in a table in the Notes to Schedules of Investments. The financial derivative instruments outstanding as of period end as disclosed in the Notes to Schedules of Investments and the amounts of realized and changes in unrealized gains and losses on financial derivative instruments during the period as disclosed on the Statements of Operations serve as indicators of the volume of financial derivative activity for the Funds.
(a) Foreign Currency Contracts Certain Funds may enter into foreign currency contracts in connection with settling planned purchases or sales of securities, to hedge the currency exposure associated with some or all of a Fund’s securities or as a part of an investment strategy. A foreign currency contract is an agreement between two parties to buy and sell a currency at a set price on a future date. The market value of a foreign currency contract fluctuates with changes in foreign currency exchange rates. Foreign currency contracts are marked to market daily and the change in value is recorded by a Fund as an unrealized gain or loss. Realized gains or losses equal to the difference between the value of the contract at the time it was opened and the value at the time it was closed are recorded upon delivery or receipt of the currency. These contracts may involve market risk in excess of the unrealized gain or loss reflected on the Statements of Assets and Liabilities. In addition, a Fund could be exposed to risk if the counterparties are unable to meet the terms of the contracts or if the value of the currency changes unfavorably to the U.S. dollar. In connection with these contracts, securities may be identified as collateral in accordance with the terms of the respective contracts.
(b) Futures Contracts Certain Funds may enter into futures contracts. A Fund may use futures contracts to manage its exposure to the securities markets or to movements in interest rates and currency values. The primary risks associated with the use of futures contracts are the imperfect correlation between the change in market value of the securities held by a Fund and the prices of futures contracts and the possibility of an illiquid market. Futures contracts are valued based upon their quoted daily settlement prices. Upon entering into a futures contract, a Fund is required to deposit with its futures broker, an amount of cash, or U.S. Government and Agency Obligations, or select sovereign debt, in accordance with the initial margin requirements of the broker or exchange. Futures contracts are marked to market daily and an appropriate payable or receivable for the change in value (“variation margin”) is recorded by the Fund. Gains or losses are recognized but not considered realized until the contracts expire or are
closed. Futures contracts involve, to varying degrees, risk of loss in excess of the variation margin disclosed on the Statements of Assets and Liabilities.
(c) Swap Agreements Certain Funds may invest in swap agreements. Swap agreements are bilaterally negotiated agreements between a Fund and a counterparty to exchange or swap investment cash flows, assets, foreign currencies or market-linked returns at specified, future intervals. Swap agreements are privately negotiated in the over-the-counter market (“OTC swaps”) or may be executed in a multilateral or other trade facility platform, such as a registered exchange (“centrally cleared swaps”). A Fund may enter into credit default and other forms of swap agreements to manage its exposure to credit, currency, interest rate, commodity, equity and inflation risk. In connection with these agreements, securities or cash may be identified as collateral or margin in accordance with the terms of the respective swap agreements to provide assets of value and recourse in the event of default or bankruptcy/insolvency.
Swaps are marked to market daily based upon values from third party vendors, which may include a registered exchange, or quotations from market makers to the extent available. In the event that market quotes are not readily available and the swap cannot be valued pursuant to one of the valuation methods, the value of the swap will be determined in good faith by the Valuation Committee of the Board of Trustees, generally based upon recommendations provided by PIMCO. Changes in market value, if any, are reflected as a component of net changes in unrealized appreciation/(depreciation) on the Statements of Operations. Daily changes in valuation of centrally cleared swaps, if any, are recorded as a receivable or payable for the change in value as appropriate (“variation margin”) on the Statements of Assets and Liabilities. OTC swap payments received or made at the beginning of the measurement period are reflected as such on the Statements of Assets and Liabilities and represent premiums paid or received upon entering into the swap agreement to compensate for differences between the stated terms of the swap agreement and prevailing market conditions (credit spreads, currency exchange rates, interest rates, and other relevant factors). These upfront premiums are recorded as realized gains or losses on the Statements of Operations upon termination or maturity of the swap. A liquidation payment received or made at the termination of the swap is recorded as realized gain or loss on the Statements of Operations. Net periodic payments received or paid by a Fund are included as part of realized gains or losses on the Statements of Operations.
Entering into these agreements involves, to varying degrees, elements of interest, credit, market and documentation risk in excess of the amounts recognized on the Statements of Assets and Liabilities. Such risks involve the possibility that there will be no liquid market for these agreements, that the counterparty to the agreements may default on its obligation to perform or disagree as to the meaning of contractual terms in the agreements and that there may be unfavorable changes in interest rates.
A Fund’s maximum risk of loss from counterparty credit risk is the discounted net value of the cash flows to be received from the counterparty
| | | | | | |
| | ANNUAL REPORT | | JUNE 30, 2012 | | 97 |
Notes to Financial Statements (Cont.)
over the contract’s remaining life, to the extent that amount is positive. The risk is mitigated by having a master netting arrangement between a Fund and the counterparty and by the posting of collateral to a Fund to cover a Fund’s exposure to the counterparty.
Credit Default Swap Agreements Credit default swap agreements involve one party making a stream of payments (referred to as the buyer of protection) to another party (the seller of protection) in exchange for the right to receive a specified return in the event of a default or other credit event for the referenced entity, obligation or index. As a seller of protection on credit default swap agreements, a Fund will generally receive from the buyer of protection a fixed rate of income throughout the term of the swap provided that there is no credit event. As the seller, a Fund would effectively add leverage to its portfolio because, in addition to its total net assets, a Fund would be subject to investment exposure on the notional amount of the swap.
If a Fund is a seller of protection and a credit event occurs, as defined under the terms of that particular swap agreement, a Fund will either (i) pay to the buyer of protection an amount equal to the notional amount of the swap and take delivery of the referenced obligation, other deliverable obligations or underlying securities comprising the referenced index or (ii) pay a net settlement amount in the form of cash or securities equal to the notional amount of the swap less the recovery value of the referenced obligation or underlying securities comprising the referenced index. If a Fund is a buyer of protection and a credit event occurs, as defined under the terms of that particular swap agreement, a Fund will either (i) receive from the seller of protection an amount equal to the notional amount of the swap and deliver the referenced obligation, other deliverable obligations or underlying securities comprising the referenced index or (ii) receive a net settlement amount in the form of cash or securities equal to the notional amount of the swap less the recovery value of the referenced obligation or underlying securities comprising the referenced index. Recovery values are estimated by market makers considering either industry standard recovery rates or entity specific factors and considerations until a credit event occurs. If a credit event has occurred, the recovery value is determined by a facilitated auction whereby a minimum number of allowable broker bids, together with a specified valuation method, are used to calculate the settlement value.
Credit default swap agreements on corporate issues involve one party making a stream of payments to another party in exchange for the right to receive a specified return in the event of a default or other credit event. If a credit event occurs and cash settlement is not elected, a variety of other deliverable obligations may be delivered in lieu of the specific referenced obligation. The ability to deliver other obligations may result in a cheapest-to-deliver option (the buyer of protection’s right to choose the deliverable obligation with the lowest value following a credit event). A Fund may use credit default swaps on corporate issues to provide a measure of protection against defaults of the issuers (i.e., to reduce risk where a Fund owns or has exposure to the referenced obligation) or to take an
active long or short position with respect to the likelihood of a particular issuer’s default.
Credit default swap agreements on credit indices involve one party making a stream of payments to another party in exchange for the right to receive a specified return in the event of a write-down, principal shortfall, interest shortfall or default of all or part of the referenced entities comprising the credit index. A credit index is a basket of credit instruments or exposures designed to be representative of some part of the credit market as a whole. These indices are made up of reference credits that are judged by a poll of dealers to be the most liquid entities in the credit default swap market based on the sector of the index. Components of the indices may include, but are not limited to, investment grade securities, high yield securities, asset-backed securities, emerging markets, and/or various credit ratings within each sector. Credit indices are traded using credit default swaps with standardized terms including a fixed spread and standard maturity dates. An index credit default swap references all the names in the index, and if there is a default, the credit event is settled based on that name’s weight in the index. The composition of the indices changes periodically, usually every six months, and for most indices, each name has an equal weight in the index. A Fund may use credit default swaps on credit indices to hedge a portfolio of credit default swaps or bonds, which is less expensive than it would be to buy many credit default swaps to achieve a similar effect. Credit default swaps on indices are benchmarks for protecting investors owning bonds against default, and traders use them to speculate on changes in credit quality.
7. PRINCIPAL RISKS
In the normal course of business the Funds trade financial instruments and enter into financial transactions where risk of potential loss exists due to changes in the market (market risk), or failure or inability of the other party to a transaction to perform (credit and counterparty risk). See below for a detailed description of select principal risks. For a list of potential risks the Funds may be subject to, please see the Important Information About the Funds.
Market Risks A Fund’s investments in fixed income securities expose the Fund to various risks such as but not limited to, market trading, interest rate, foreign currency, equity, management and tracking error and indexing risks.
Market trading risk is the risk that an active secondary trading market for a Fund’s shares does not develop or continue, that a Fund may not continue to meet a listing exchange’s trading or listing requirements, or that Fund shares trade at prices other than the Fund’s NAV.
Interest rate risk is the risk that fixed income securities will decline in value because of changes in interest rates. As nominal interest rates rise, the value of certain fixed income securities held by a Fund is likely to decrease. A nominal interest rate can be described as the sum of a real interest rate and an expected inflation rate. Fixed income securities with longer durations
June 30, 2012
tend to be more sensitive to changes in interest rates, usually making them more volatile than securities with shorter durations. Duration is useful primarily as a measure of the sensitivity of a fixed income’s market price to interest rate (i.e. yield) movements.
If a Fund invests directly in foreign currencies or in securities that trade in, and receive revenues in, foreign currencies, or in financial derivatives that provide exposure to foreign currencies, it will be subject to the risk that those currencies will decline in value relative to the base currency of the Fund, or, in the case of hedging positions, that the Fund’s base currency will decline in value relative to the currency being hedged. Currency rates in foreign countries may fluctuate significantly over short periods of time for a number of reasons, including changes in interest rates, intervention (or the failure to intervene) by U.S. or foreign governments, central banks or supranational entities such as the International Monetary Fund, or by the imposition of currency controls or other political developments in the United States or abroad. As a result, a Fund’s investments in foreign currency denominated securities may reduce the returns of the Fund.
The market values of equities, such as common stocks and preferred securities or equity related investments such as futures and options, may decline due to general market conditions which are not specifically related to a particular company, such as real or perceived adverse economic conditions, changes in the general outlook for corporate earnings, changes in interest or currency rates or adverse investor sentiment generally. They may also decline due to factors which affect a particular industry or industries, such as labor shortages or increased production costs and competitive conditions within an industry. Equity securities and equity related investments generally have greater market price volatility than fixed income securities.
Management and Tracking Error Risk is the risk that the portfolio manager’s investment decisions may not produce the desired results or that an Index Fund’s portfolio may not correlate to the Fund’s Index.
Indexing risk is the risk that a Fund is negatively affected by general declines in the market segments or asset classes represented by the Fund’s Index.
Credit and Counterparty Risks A Fund will be exposed to credit risk on parties with whom it trades and will also bear the risk of settlement default. A Fund minimizes concentrations of credit risk by undertaking transactions with a large number of customers and counterparties on recognized and reputable exchanges. A Fund could lose money if the issuer or guarantor of a fixed income security or repurchase agreement is unable or unwilling to make timely principal and/or interest payments, or to otherwise honor its obligations. Securities are subject to varying degrees of credit risk, which are often reflected in credit ratings.
Similar to credit risk, a Fund may be exposed to counterparty risk, or the risk that an institution or other entity with which the Fund has unsettled or open transactions will default. Financial assets, which potentially expose a Fund to counterparty risk, consist principally of cash due from counterparties and investments. PIMCO, as the Manager, minimizes counterparty risks to the
Funds by performing extensive reviews of each counterparty and obtaining approval from the Counterparty Risk Committee prior to entering into transactions with a third party. Furthermore, to the extent that unpaid amounts owed to a Fund exceed a predetermined threshold agreed to with the counterparty, such counterparty shall advance collateral to the Fund in the form of cash or cash equivalents equal in value to the unpaid amount owed to the Fund. A Fund may invest such collateral in securities or other instruments and will typically pay interest to the counterparty on the collateral received. If the unpaid amount owed to a Fund subsequently decreases, the Fund would be required to return to the counterparty all or a portion of the collateral previously advanced to the Fund.
All transactions in listed securities are settled/paid for upon delivery using approved counterparties. The risk of default is considered minimal, as delivery of securities sold is only made once a Fund has received payment. Payment is made on a purchase once the securities have been delivered by the counterparty. The trade will fail if either party fails to meet its obligation.
A Fund is subject to various Master Agreements, which govern the terms of certain transactions with select counterparties. These Master Agreements reduce the counterparty risk associated with relevant transactions by specifying credit protection mechanisms and providing standardization that improves legal certainty. Since different types of forward and OTC financial derivative transactions have different mechanics and are sometimes traded out of different legal entities of a particular counterparty organization, each type of transaction may be covered by a different Master Agreement, resulting in the need for multiple agreements with a single counterparty. As the Master Agreements are specific to unique operations of different asset types, they allow a Fund to close out and net its total exposure to a counterparty in the event of a default with respect to all the transactions governed under a single agreement with a counterparty.
Master Agreements can also help limit counterparty risk by specifying collateral posting arrangements at pre-arranged exposure levels. Under the Master Agreements, collateral is routinely transferred if the total net exposure to certain transactions (net of existing collateral already in place) governed under the relevant master agreement with a counterparty in a given account exceeds a specified threshold, which typically ranges from zero to $250,000 depending on the counterparty and the type of Master Agreement. United States Treasury Bills and U.S. dollar cash are generally the preferred forms of collateral, although other forms of AAA rated paper may be used. A Fund’s overall exposure to counterparty risk can change substantially within a short period, as it is affected by each transaction subject to the relevant Master Agreement.
Master Repurchase Agreements (“Master Repo Agreements”) govern transactions between a Fund and select counterparties. The Master Repo Agreements maintain provisions for, among other things, initiation, income payments, events of default, and maintenance of collateral for Repurchase and Reverse Repurchase Agreements.
| | | | | | |
| | ANNUAL REPORT | | JUNE 30, 2012 | | 99 |
Notes to Financial Statements (Cont.)
Master Securities Forward Transaction Agreements (“Master Forward Agreements”) govern the considerations and factors surrounding the settlement of certain purchases and sales made on a delayed-delivery basis by and between a Fund and select counterparties. The Master Forward Agreements maintain provisions for, among other things, initiation and confirmation, payment and transfer, events of default, termination, and maintenance of collateral.
International Swaps and Derivatives Association, Inc. Master Agreements (“ISDA Master Agreements”) govern OTC financial derivative transactions entered into by a Fund and select counterparties. The ISDA Master Agreements maintain provisions for general obligations, representations, agreements, collateral and events of default or termination. Events of termination include conditions that may entitle counterparties to elect to terminate early and cause settlement of all outstanding transactions under the applicable ISDA Master Agreement. Any election to terminate early could be material to the financial statements. The market value of OTC financial derivative transactions, net of collateral received in or pledged by counterparty as of period end, is disclosed in the Notes to the Schedules of Investments.
8. FEES AND EXPENSES
(a) Management Fee PIMCO, a majority-owned subsidiary of Allianz Asset Management of America L.P. (“Allianz Asset Management”), serves as the Manager to the Trust, pursuant to an investment management agreement. Each Fund pays PIMCO fees in return for providing investment advisory, supervisory and administrative services under an all-in fee structure. Each Fund will pay monthly management fees to PIMCO at the annual rate based on average daily net assets (the “Management Fee”). The Management Fee for each Fund is charged at an annual rate as noted in the table below.
| | | | | | |
| Fund Name | | | | Management Fee | |
PIMCO 1-3 Year U.S. Treasury Index Fund | | | | | 0.15 | % |
PIMCO 3-7 Year U.S. Treasury Index Fund | | | | | 0.15 | % |
PIMCO 7-15 Year U.S. Treasury Index Fund | | | | | 0.15 | % |
PIMCO 25+ Year Zero Coupon U.S. Treasury Index Fund | | | | | 0.15 | % |
PIMCO Broad U.S. Treasury Index Fund | | | | | 0.15 | % |
PIMCO 1-5 Year U.S. TIPS Index Fund | | | | | 0.20 | % |
PIMCO 15+ Year U.S. TIPS Index Fund | | | | | 0.20 | % |
PIMCO Broad U.S. TIPS Index Fund | | | | | 0.20 | % |
PIMCO 0-5 Year High Yield Corporate Bond Index Fund | | | | | 0.55 | % |
PIMCO Investment Grade Corporate Bond Index Fund | | | | | 0.20 | % |
PIMCO Australia Bond Index Fund | | | | | 0.45 | % |
PIMCO Canada Bond Index Fund | | | | | 0.45 | % |
PIMCO Germany Bond Index Fund | | | | | 0.45 | % |
PIMCO Build America Bond Strategy Fund | | | | | 0.45 | % |
PIMCO Enhanced Short Maturity Strategy Fund | | | | | 0.35 | % |
PIMCO Global Advantage® Inflation-Linked Bond Strategy Fund | | | | | 0.60 | % |
PIMCO Intermediate Municipal Bond Strategy Fund | | | | | 0.35 | % |
PIMCO Short Term Municipal Bond Strategy Fund | | | | | 0.35 | % |
PIMCO Total Return Exchange-Traded Fund | | | | | 0.55 | % |
(b) Distribution and Servicing Fees PIMCO Investments LLC (“PI”), a wholly-owned subsidiary of PIMCO, serves as the distributor (“Distributor”)
of each Fund’s Creation Units. The Distributor does not maintain a secondary market in shares of the Funds. During the period ended June 30, 2012, each Fund was permitted to reimburse the Distributor at an annual rate of up to 0.25% of a Fund’s average daily net assets. However, the Board of Trustees has determined not to authorize payment of a 12b-1 Plan fee at this time. The 12b-1 fee may only be imposed or increased when the Board of Trustees determines that it is in the best interests of shareholders to do so. Because these fees are paid out of a Fund’s assets on an ongoing basis, to the extent that a fee is authorized, over time they will increase the cost of an investment in the Fund. The 12b-1 Plan fee may cost an investor more than other types of sales charges.
(c) Fund Expenses The Funds bear other expenses which are not covered under the management fee which may vary and affect the total level of expenses paid by shareholders, such as (i) salaries and other compensation of any of the Trust’s executive officers and employees who are not officers, directors, stockholders, or employees of PIMCO or its subsidiaries or affiliates; (ii) taxes and governmental fees; (iii) brokerage fees and commissions and other portfolio transaction expenses; (iv) costs of borrowing money, including interest expense; (v) securities lending fees and expenses; (vi) fees and expenses of the Trustees who are not “interested persons” of PIMCO or the Trust, and any counsel retained exclusively for their benefit; (vii) extraordinary expense, including costs of litigation and indemnification expenses; and (viii) organization expenses. The ratio of expenses to average net assets, as disclosed on the Financial Highlights, may differ from the annual fund operating expenses as disclosed in the Prospectus for the reasons set forth above.
Each unaffiliated Trustee receives an annual retainer of $30,000, plus $3,500 for each Board of Trustees meeting attended in person, $750 for each committee meeting attended and $750 for each Board of Trustees meeting attended telephonically, plus reimbursement of related expenses. In addition, the audit committee chair receives an additional annual retainer of $4,000 and each other committee chair receives an additional annual retainer of $500.
These expenses are allocated on a pro-rata basis to each Fund of the Trust according to its respective net assets. The Trust pays no compensation directly to any Trustee or any other officer who is affiliated with the Manager, all of whom receive remuneration for their services to the Trust from the Manager or its affiliates.
(d) Expense Limitation PIMCO has contractually agreed, until October 31, 2012, to waive a portion of PIMCO 1-3 Year U.S. Treasury Index Fund’s Management Fee equal to 0.06% of average daily net assets. Under the Fee Waiver Agreement, PIMCO is entitled to reimbursement by the Fund of any portion of the Management Fees waived, reduced or reimbursed pursuant to the Fee Waiver Agreement (the “Reimbursement Amount”) during the previous three years, provided that such amount paid to PIMCO will not: 1) together with any recoupment of organizational expenses and
June 30, 2012
pro rata Trustees’ fees pursuant to the Expense Limitation Agreement, exceed the expense limit; 2) exceed the total Reimbursement Amount; or 3) include any amounts previously reimbursed to PIMCO. The Fee Waiver Agreement will automatically renew for one-year terms unless PIMCO provides written notice to the Trust at least 30 days prior to the end of the then current term.
PIMCO has contractually agreed, until October 31, 2012, to waive its Management Fee, or reimburse a Fund, to the extent that organizational expenses and pro rata Trustees’ fees, if any, exceed 0.0049% of that Fund’s average net assets. Under the Expense Limitation Agreement, which renews annually for a full year unless terminated by PIMCO upon at least 30 days’ notice prior to the end of the contract term, PIMCO may recoup these waivers and reimbursements in future periods, not exceeding three years, provided organizational expenses and pro rata Trustees’ fees plus such recoupment, do not exceed the Expense Limit. The recoverable amounts to PIMCO at June 30, 2012, were as follows (amounts in thousands):
| | | | | | |
| Fund Name | | | | Recoverable Amounts | |
PIMCO 1-3 Year U.S. Treasury Index Fund | | | | $ | 299 | |
PIMCO 3-7 Year U.S. Treasury Index Fund | | | | | 66 | |
PIMCO 7-15 Year U.S. Treasury Index Fund | | | | | 68 | |
PIMCO 25+ Year Zero Coupon U.S. Treasury Index Fund | | | | | 79 | |
PIMCO Broad U.S. Treasury Index Fund | | | | | 54 | |
PIMCO 1-5 Year U.S. TIPS Index Fund | | | | | 99 | |
PIMCO 15+ Year U.S. TIPS Index Fund | | | | | 74 | |
PIMCO Broad U.S. TIPS Index Fund | | | | | 70 | |
PIMCO 0-5 Year High Yield Corporate Bond Index Fund | | | | | 71 | |
PIMCO Investment Grade Corporate Bond Index Fund | | | | | 79 | |
PIMCO Australia Bond Index Fund | | | | | 38 | |
PIMCO Canada Bond Index Fund | | | | | 41 | |
PIMCO Germany Bond Index Fund | | | | | 29 | |
PIMCO Build America Bond Strategy Fund | | | | | 94 | |
PIMCO Enhanced Short Maturity Strategy Fund | | | | | 119 | |
PIMCO Global Advantage® Inflation-Linked Bond Strategy Fund | | | | | 66 | |
PIMCO Intermediate Municipal Bond Strategy Fund | | | | | 88 | |
PIMCO Short Term Municipal Bond Strategy Fund | | | | | 85 | |
PIMCO Total Return Exchange-Traded Fund | | | | | 165 | |
9. RELATED PARTY TRANSACTIONS
The Manager and Distributor are related parties. Fees payable to these parties are disclosed in Note 8 and the accrued related party fee amounts are disclosed on the Statements of Assets and Liabilities.
Certain Funds are permitted to purchase or sell securities from or to certain related affiliated funds under specified conditions outlined in procedures adopted by the Board. The procedures have been designed to ensure that any purchase or sale of securities by the Funds from or to another fund or portfolio that are, or could be, considered an affiliate by virtue of having a common investment adviser (or affiliated investment advisers), common Trustees and/or common officers complies with Rule 17a-7 of the Act. Further, as defined under the procedures, each transaction is effected at the current market price. During the period ended June 30, 2012, the Funds below engaged in purchases and sales of securities pursuant to Rule 17a-7 of the Act (amounts in thousands):
| | | | | | | | | | |
| Fund Name | | | | Purchases | | | Sales | |
PIMCO 1-5 Year U.S. TIPS Index Fund | | | | $ | 0 | | | $ | 146,599 | |
PIMCO 0-5 Year High Yield Corporate Bond Index Fund | | | | | 5,488 | | | | 9,639 | |
PIMCO Investment Grade Corporate Bond Index Fund | | | | | 4,498 | | | | 0 | |
PIMCO Build America Bond Strategy Fund | | | | | 0 | | | | 9,616 | |
PIMCO Enhanced Short Maturity Strategy Fund | | | | | 366,157 | | | | 529,964 | |
PIMCO Global Advantage® Inflation-Linked Bond Strategy Fund | | | | | 4,516 | | | | 0 | |
PIMCO Short Term Municipal Bond Strategy Fund | | | | | 0 | | | | 0 | |
PIMCO Total Return Exchange-Traded Fund | | | | | 81,304 | | | | 6,530 | |
Each Fund may invest in the PIMCO Short-Term Floating NAV Portfolio and PIMCO Short-Term Floating NAV Portfolio III (“PIMCO Short-Term Floating NAV Portfolios”) to the extent permitted by the Act and rules thereunder. The PIMCO Short-Term Floating NAV Portfolios are registered investment companies created for use solely by the series of the Trust and series of the PIMCO Funds, PIMCO Variable Insurance Trust, PIMCO Equity Series, PIMCO Equity Series VIT, and other series of registered investment companies advised by PIMCO, in connection with their cash management activities. The PIMCO Short-Term Floating NAV Portfolios may incur expenses related to their investment activities, but do not pay Investment Advisory or Supervisory and Administrative Fees to PIMCO. The PIMCO Short-Term Floating NAV Portfolios are considered to be affiliated with the Funds. The table below shows each Fund’s transactions in and earnings from investments in the PIMCO Short-Term Floating NAV Portfolios for the period ended June 30, 2012 (amounts in thousands):
Investments in PIMCO Short-Term Floating NAV Portfolio
| | | | | | | | | | | | | | | | | | | | | | | | | | | | | | |
| Fund Name | | | | Market Value
06/30/2011 | | | Purchases
at Cost | | | Proceeds
from Sales | | | Net Capital
and Realized
Gain/(Loss) | | | Unrealized
Appreciation/
(Depreciation) | | | Market Value
06/30/2012 | | | Dividend
Income | |
PIMCO Build America Bond Strategy Fund | | | | $ | 0 | | | $ | 1,700 | | | $ | (1,700 | ) | | $ | 0 | | | $ | 0 | | | $ | 0 | | | $ | 0 | |
| | | | | | |
| | ANNUAL REPORT | | JUNE 30, 2012 | | 101 |
Notes to Financial Statements (Cont.)
10. GUARANTEES AND INDEMNIFICATIONS
Under the Trust’s organizational documents, each Trustee or officer of the Trust is indemnified and each employee or other agent of the Trust (including the Trust’s investment manager) may be indemnified, to the extent permitted by the Act, against certain liabilities that may arise out of performance of their duties to the Funds. Additionally, in the normal course of business, the Funds enter into contracts that contain a variety of indemnification clauses. The Funds’ maximum exposure under these arrangements is unknown as this would involve future claims that may be made against the Funds that have not yet occurred. However, the Funds have not had prior claims or losses pursuant to these contracts.
11. PURCHASES AND SALES OF SECURITIES
The length of time a Fund has held a particular security is not generally a consideration in investment decisions. A change in the securities held by a Fund is known as “portfolio turnover.” Each Fund may engage in frequent and active trading of portfolio securities to achieve its investment objective, including, without limitation, to reflect changes in the component securities of the Index, such as reconstitutions, additions or deletions of component securities. To the extent that Creation Unit purchases from and redemptions by a Fund are effected in cash, frequent purchases and redemptions may increase the rate of portfolio turnover. High portfolio turnover (e.g., over 100%) involves correspondingly greater expenses to a Fund, including brokerage commissions or dealer mark-ups and other transaction costs on the sale of securities and reinvestments in other securities. Such sales may also result in realization of taxable capital gains, including short-term capital gains (which are generally taxed at ordinary income tax rates). The trading costs and tax effects associated with portfolio turnover may adversely affect a Fund’s performance. The portfolio turnover rates are reported in the Financial Highlights.
Purchases and sales of securities (excluding short-term investments) for the period ended June 30, 2012, were as follows (amounts in thousands):
| | | | | | | | | | | | | | | | | | |
| | | | | U.S. Government/Agency | | | All Other | |
| Fund Name | | | | Purchases | | | Sales | | | Purchases | | | Sales | |
PIMCO 1-3 Year U.S. Treasury Index Fund | | | | $ | 75,778 | | | $ | 10,602 | | | $ | 0 | | | $ | 0 | |
PIMCO 3-7 Year U.S. Treasury Index Fund | | | | | 7,757 | | | | 8,630 | | | | 0 | | | | 0 | |
PIMCO 7-15 Year U.S. Treasury Index Fund | | | | | 4,115 | | | | 3,979 | | | | 0 | | | | 0 | |
PIMCO 25+ Year Zero Coupon U.S. Treasury Index Fund | | | | | 9,659 | | | | 10,627 | | | | 0 | | | | 0 | |
PIMCO Broad U.S. Treasury Index Fund | | | | | 36,913 | | | | 37,404 | | | | 0 | | | | 0 | |
PIMCO 1-5 Year U.S. TIPS Index Fund | | | | | 324,662 | | | | 325,794 | | | | 0 | | | | 0 | |
PIMCO 15+ Year U.S. TIPS Index Fund | | | | | 36,801 | | | | 37,624 | | | | 0 | | | | 0 | |
PIMCO Broad U.S. TIPS Index Fund | | | | | 5,101 | | | | 5,947 | | | | 0 | | | | 0 | |
PIMCO 0-5 Year High Yield Corporate Bond Index Fund | | | | | 0 | | | | 0 | | | | 320,672 | | | | 45,716 | |
PIMCO Investment Grade Corporate Bond Index Fund | | | | | 0 | | | | 0 | | | | 182,113 | | | | 8,049 | |
PIMCO Australia Bond Index Fund | | | | | 0 | | | | 0 | | | | 32,889 | | | | 7,786 | |
PIMCO Canada Bond Index Fund | | | | | 0 | | | | 0 | | | | 30,541 | | | | 13,165 | |
PIMCO Germany Bond Index Fund | | | | | 0 | | | | 0 | | | | 14,085 | | | | 10,853 | |
PIMCO Build America Bond Strategy Fund | | | | | 0 | | | | 0 | | | | 24,519 | | | | 19,597 | |
PIMCO Enhanced Short Maturity Strategy Fund | | | | | 2,040,203 | | | | 2,046,429 | | | | 1,485,909 | | | | 924,133 | |
PIMCO Global Advantage® Inflation-Linked Bond Strategy Fund | | | | | 59,103 | | | | 65,360 | | | | 46,589 | | | | 15,548 | |
PIMCO Intermediate Municipal Bond Strategy Fund | | | | | 0 | | | | 0 | | | | 74,374 | | | | 12,324 | |
PIMCO Short Term Municipal Bond Strategy Fund | | | | | 0 | | | | 0 | | | | 25,879 | | | | 5,868 | |
PIMCO Total Return Exchange-Traded Fund | | | | | 3,865,253 | | | | 2,875,024 | | | | 928,118 | | | | 120,090 | |
12. CAPITAL SHARE TRANSACTIONS
Capital shares are issued and redeemed by a Fund only in Creation Units or multiples thereof. Except when aggregated in Creation Units, shares of a Fund are not redeemable. Transactions in capital shares for a Fund are disclosed in detail in the Statements of Changes in Net Assets.
The consideration for the purchase of Creation Units of a Fund generally consists of a basket of securities included in its Index together with a deposit of a specified cash payment. Authorized Participants may be charged transaction fees as set forth below. To offset transfer and other transaction costs associated with the issuance and redemption of Creation Units, Authorized Participants are subject to standard creation and redemption transaction fees payable directly to State Street Bank and Trust Company, the administrator of the Funds. PIMCO may, from time to time, at its own expense, compensate purchasers of Creation Units who have purchased substantial amounts of Creation Units and other financial institutions for administrative or marketing
June 30, 2012
services. Creations and redemptions for cash (when cash creations and redemptions are available or specified) may be subject to an additional variable charge up to the maximum amount shown in the table below.
| | | | | | | | | | | | | | |
| | | | | Standard Creation/
Redemption
Transaction Fee* | | | Maximum Additional
Variable Charge for
Cash Creations** | | | Maximum Additional
Variable Charge for
Cash Redemptions** | |
All Funds (except PIMCO Australia Bond Index Fund, PIMCO Canada Bond Index Fund and PIMCO Germany Bond Index Fund) | | | | $ | 500 | | | | 3.00 | % | | | 2.00 | % |
PIMCO Australia Bond Index Fund, PIMCO Canada Bond Index Fund and PIMCO Germany Bond Index Fund | | | | $ | 1,000 | | | | 3.00 | % | | | 2.00 | % |
| * | Applicable to in-kind contributions or redemptions only. |
| ** | As a percentage of the cash amount invested or received. |
13. INVESTMENT TRANSACTIONS
For the period ended June 30, 2012, certain Funds had in-kind contributions and in-kind redemptions as follows (amounts in thousands):
| | | | | | | | | | |
| Fund Name | | | | Contributions | | | Redemptions | |
PIMCO 1-3 Year U.S. Treasury Index Fund | | | | $ | 35,716 | | | $ | 10,034 | |
PIMCO 7-15 Year U.S. Treasury Index Fund | | | | | 27,320 | | | | 0 | |
PIMCO 25+ Year Zero Coupon U.S. Treasury Index Fund | | | | | 191,364 | | | | 118,992 | |
PIMCO Broad U.S. Treasury Index Fund | | | | | 15,461 | | | | 7,248 | |
PIMCO 1-5 Year U.S. TIPS Index Fund | | | | | 294,931 | | | | 481,222 | |
PIMCO 15+ Year U.S. TIPS Index Fund | | | | | 213,728 | | | | 162,369 | |
PIMCO Broad U.S. TIPS Index Fund | | | | | 46,088 | | | | 0 | |
The in-kind contributions and in-kind redemptions in this table may not agree with the Fund Share Transactions on the Statements of Changes in Net Assets. The table represents the accumulation of each Fund’s daily net shareholder transactions while the Statements of Changes in Net Assets reflect gross shareholder transactions including any cash component of the transactions.
14. REGULATORY AND LITIGATION MATTERS
The Trust is not engaged in any material litigation or arbitration proceedings and is not aware of any material litigation or claim pending or threatened by or against it.
15. FEDERAL INCOME TAX MATTERS
Each Fund intends to qualify as a regulated investment company under Subchapter M of the Internal Revenue Code (the “Code”) and distribute all
of its taxable income and net realized gains, if applicable, to shareholders. Accordingly, no provision for Federal income taxes has been made.
In accordance with provisions set forth under U.S. GAAP, the Manager has reviewed the Funds’ tax positions for all open tax years. As of June 30, 2012, the Funds have recorded no liability for net unrecognized tax benefits relating to uncertain income tax positions they have taken or expect to take in future tax returns.
The Funds file U.S. tax returns. While the statute of limitations remains open to examine the Funds’ U.S. tax returns filed for the fiscal years ending in 2009-2011, no examinations are in progress or anticipated at this time. The Funds are not aware of any tax positions for which it is reasonably possible that the total amounts of unrecognized tax benefits will significantly change in the next twelve months.
On December 22, 2010, the Regulated Investment Company Modernization Act of 2010 (the “Act”) was enacted. Under the Act, net capital losses may be carried forward indefinitely, and their character is retained as short-term and/or long term losses. Previously, net capital losses were carried forward for eight years and treated as short-term losses. The Act requires that post-enactment net capital losses be used before pre-enactment net capital losses. As a result of this ordering rule, pre-enactment capital loss carryforwards may be more likely to expire unused.
| | | | | | |
| | ANNUAL REPORT | | JUNE 30, 2012 | | 103 |
Notes to Financial Statements (Cont.)
As of June 30, 2012, the components of distributable taxable earnings are as follows (amounts in thousands):
| | | | | | | | | | | | | | | | | | | | | | | | | | | | | | | | | | |
| | | | | Undistributed
Tax Exempt
Income | | | Undistributed
Ordinary
Income | | | Undistributed
Long-Term
Capital Gains | | | Net Tax Basis
Unrealized
Appreciation/
(Depreciation)(1) | | | Other
Book-to-Tax
Accounting
Differences(2) | | | Accumulated
Capital
Losses(3) | | | Post-
October
Deferral(4) | | | Qualified
Late-Year Loss
Deferral(5) | |
PIMCO 1-3 Year U.S. Treasury Index Fund | | | | $ | 0 | | | $ | 0 | | | $ | 335 | | | | 393 | | | $ | (92 | ) | | $ | 0 | | | $ | 0 | | | $ | 0 | |
PIMCO 3-7 Year U.S. Treasury Index Fund | | | | | 0 | | | | 17 | | | | 148 | | | | 971 | | | | (68 | ) | | | 0 | | | | 0 | | | | 0 | |
PIMCO 7-15 Year U.S. Treasury Index Fund | | | | | 0 | | | | 91 | | | | 91 | | | | 1,401 | | | | (92 | ) | | | 0 | | | | 0 | | | | 0 | |
PIMCO 25+ Year Zero Coupon U.S. Treasury Index Fund | | | | | 0 | | | | 1,106 | | | | 0 | | | | 22,873 | | | | (1,080 | ) | | | (2,520 | ) | | | 0 | | | | 0 | |
PIMCO Broad U.S. Treasury Index Fund | | | | | 0 | | | | 582 | | | | 0 | | | | 530 | | | | (66 | ) | | | 0 | | | | 0 | | | | 0 | |
PIMCO 1-5 Year U.S. TIPS Index Fund | | | | | 0 | | | | 3,404 | | | | 552 | | | | 7,183 | | | | (3,225 | ) | | | 0 | | | | 0 | | | | 0 | |
PIMCO 15+ Year U.S. TIPS Index Fund | | | | | 0 | | | | 1,050 | | | | 0 | | | | 41,084 | | | | (1,127 | ) | | | (2,560 | ) | | | (80 | ) | | | 0 | |
PIMCO Broad U.S. TIPS Index Fund | | | | | 0 | | | | 447 | | | | 10 | | | | 8,778 | | | | (427 | ) | | | 0 | | | | 0 | | | | 0 | |
PIMCO 0-5 Year High Yield Corporate Bond Index Fund | | | | | 0 | | | | 1,984 | | | | 0 | | | | 2,569 | | | | (1,636 | ) | | | (50 | ) | | | 0 | | | | 0 | |
PIMCO Investment Grade Corporate Bond Index Fund | | | | | 0 | | | | 861 | | | | 0 | | | | 9,101 | | | | (721 | ) | | | (408 | ) | | | (17 | ) | | | 0 | |
PIMCO Australia Bond Index Fund | | | | | 0 | | | | 56 | | | | 0 | | | | 758 | | | | (33 | ) | | | 0 | | | | (6 | ) | | | 0 | |
PIMCO Canada Bond Index Fund | | | | | 0 | | | | 151 | | | | 0 | | | | 319 | | | | (65 | ) | | | 0 | | | | 0 | | | | 0 | |
PIMCO Germany Bond Index Fund | | | | | 0 | | | | 0 | | | | 0 | | | | (108 | ) | | | (23 | ) | | | 0 | | | | 0 | | | | 0 | |
PIMCO Build America Bond Strategy Fund | | | | | 0 | | | | 721 | | | | 492 | | | | 2,583 | | | | (224 | ) | | | 0 | | | | 0 | | | | 0 | |
PIMCO Enhanced Short Maturity Strategy Fund | | | | | 0 | | | | 1,734 | | | | 0 | | | | 5,814 | | | | (1,577 | ) | | | 0 | | | | (1,280 | ) | | | 0 | |
PIMCO Global Advantage Inflation Linked-Bond Strategy Fund | | | | | 0 | | | | 269 | | | | 0 | | | | (272 | ) | | | (73 | ) | | | 0 | | | | 0 | | | | 0 | |
PIMCO Intermediate Municipal Bond Strategy Fund | | | | | 297 | | | | 167 | | | | 48 | | | | 5,929 | | | | (335 | ) | | | 0 | | | | 0 | | | | 0 | |
PIMCO Short-Term Municipal Bond Strategy Fund | | | | | 98 | | | | 0 | | | | 5 | | | | 249 | | | | (96 | ) | | | 0 | | | | 0 | | | | 0 | |
PIMCO Total Return Exchange-Traded Fund | | | | | 0 | | | | 16,514 | | | | 0 | | | | 26,114 | | | | (11,799 | ) | | | 0 | | | | 0 | | | | 0 | |
| (1) | Adjusted for open wash sale loss deferrals for federal income tax purposes. |
| (2) | Represents differences in income tax regulations and financial accounting principles generally accepted in the United States of America, mainly for distributions payable at fiscal year-end. |
| (3) | Capital losses available to offset future net capital gains expire in varying amounts in the years shown below. |
| (4) | Capital losses realized during the period November 1, 2011 through June 30, 2012 which the Fund elected to defer to the following taxable year pursuant to federal income tax regulations. |
| (5) | Specified losses realized during the period November 1, 2011 through June 30, 2012 and Ordinary losses realized during the period January 1, 2012 through June 30, 2012, which the Fund elected to defer to the following taxable year pursuant to income tax regulations. |
As of June 30, 2012, the Funds had accumulated capital losses expiring in the following years (amounts in thousands). The Funds will resume capital gain distributions in the future to the extent gains are realized in excess of accumulated capital losses.
| | | | | | | | | | | | | | | | | | | | | | | | | | | | | | |
| | | | | Expiration Year of Accumulated Capital Losses (amounts in thousands) | |
| | | | | 2013 | | | 2014 | | | 2015 | | | 2016 | | | 2017 | | | 2018 | | | 2019 | |
PIMCO 1-3 Year U.S. Treasury Index Fund | | | | $ | 0 | | | $ | 0 | | | $ | 0 | | | $ | 0 | | | $ | 0 | | | $ | 0 | | | $ | 0 | |
PIMCO 3-7 Year U.S. Treasury Index Fund | | | | | 0 | | | | 0 | | | | 0 | | | | 0 | | | | 0 | | | | 0 | | | | 0 | |
PIMCO 7-15 Year U.S. Treasury Index Fund | | | | | 0 | | | | 0 | | | | 0 | | | | 0 | | | | 0 | | | | 0 | | | | 0 | |
PIMCO 25+ Year Zero Coupon U.S. Treasury Index Fund | | | | | 0 | | | | 0 | | | | 0 | | | | 0 | | | | 0 | | | | 0 | | | | 363 | |
PIMCO Broad U.S. Treasury Index Fund | | | | | 0 | | | | 0 | | | | 0 | | | | 0 | | | | 0 | | | | 0 | | | | 0 | |
PIMCO 1-5 Year U.S. TIPS Index Fund | | | | | 0 | | | | 0 | | | | 0 | | | | 0 | | | | 0 | | | | 0 | | | | 0 | |
PIMCO 15+ Year U.S. TIPS Index Fund | | | | | 0 | | | | 0 | | | | 0 | | | | 0 | | | | 0 | | | | 0 | | | | 0 | |
PIMCO Broad U.S. TIPS Index Fund | | | | | 0 | | | | 0 | | | | 0 | | | | 0 | | | | 0 | | | | 0 | | | | 0 | |
PIMCO 0-5 Year High Yield Corporate Bond Index Fund | | | | | 0 | | | | 0 | | | | 0 | | | | 0 | | | | 0 | | | | 0 | | | | 0 | |
PIMCO Investment Grade Corporate Bond Index Fund | | | | | 0 | | | | 0 | | | | 0 | | | | 0 | | | | 0 | | | | 0 | | | | 0 | |
PIMCO Australia Bond Index Fund | | | | | 0 | | | | 0 | | | | 0 | | | | 0 | | | | 0 | | | | 0 | | | | 0 | |
PIMCO Canada Bond Index Fund | | | | | 0 | | | | 0 | | | | 0 | | | | 0 | | | | 0 | | | | 0 | | | | 0 | |
PIMCO Germany Bond Index Fund | | | | | 0 | | | | 0 | | | | 0 | | | | 0 | | | | 0 | | | | 0 | | | | 0 | |
PIMCO Build America Bond Strategy Fund | | | | | 0 | | | | 0 | | | | 0 | | | | 0 | | | | 0 | | | | 0 | | | | 0 | |
PIMCO Enhanced Short Maturity Strategy Fund | | | | | 0 | | | | 0 | | | | 0 | | | | 0 | | | | 0 | | | | 0 | | | | 0 | |
PIMCO Global Advantage Inflation Linked-Bond Strategy Fund | | | | | 0 | | | | 0 | | | | 0 | | | | 0 | | | | 0 | | | | 0 | | | | 0 | |
PIMCO Intermediate Municipal Bond Strategy Fund | | | | | 0 | | | | 0 | | | | 0 | | | | 0 | | | | 0 | | | | 0 | | | | 0 | |
PIMCO Short-Term Municipal Bond Strategy Fund | | | | | 0 | | | | 0 | | | | 0 | | | | 0 | | | | 0 | | | | 0 | | | | 0 | |
PIMCO Total Return Exchange-Traded Fund | | | | | 0 | | | | 0 | | | | 0 | | | | 0 | | | | 0 | | | | 0 | | | | 0 | |
June 30, 2012
Under the recently enacted Regulated Investment Company Modernization Act of 2010, a fund is permitted to carry forward any new losses for an unlimited period. Additionally, such capital losses that are carried over retain their character as either short-term or long-term losses rather than being considered all short-term as under previous law. As of June 30, 2012, the Funds had the following post-effective capital losses with no expiration:
| | | | | | | | | | |
| | | | | Short-Term | | | Long-Term | |
PIMCO 1-3 Year U.S. Treasury Index Fund | | | | $ | 0 | | | $ | 0 | |
PIMCO 3-7 Year U.S. Treasury Index Fund | | | | | 0 | | | | 0 | |
PIMCO 7-15 Year U.S. Treasury Index Fund | | | | | 0 | | | | 0 | |
PIMCO 25+ Year Zero Coupon U.S. Treasury Index Fund | | | | | 2,119 | | | | 37 | |
PIMCO Broad U.S. Treasury Index Fund | | | | | 0 | | | | 0 | |
PIMCO 1-5 Year U.S. TIPS Index Fund | | | | | 0 | | | | 0 | |
PIMCO 15+ Year U.S. TIPS Index Fund | | | | | 2,560 | | | | 0 | |
PIMCO Broad U.S. TIPS Index Fund | | | | | 0 | | | | 0 | |
PIMCO 0-5 Year High Yield Corporate Bond Index Fund | | | | | 50 | | | | 0 | |
PIMCO Investment Grade Corporate Bond Index Fund | | | | | 408 | | | | 0 | |
PIMCO Australia Bond Index Fund | | | | | 0 | | | | 0 | |
PIMCO Canada Bond Index Fund | | | | | 0 | | | | 0 | |
PIMCO Germany Bond Index Fund | | | | | 0 | | | | 0 | |
PIMCO Build America Bond Strategy Fund | | | | | 0 | | | | 0 | |
PIMCO Enhanced Short Maturity Strategy Fund | | | | | 0 | | | | 0 | |
PIMCO Global Advantage Inflation Linked-Bond Strategy Fund | | | | | 0 | | | | 0 | |
PIMCO Intermediate Municipal Bond Strategy Fund | | | | | 0 | | | | 0 | |
PIMCO Short-Term Municipal Bond Strategy Fund | | | | | 0 | | | | 0 | |
PIMCO Total Return Exchange-Traded Fund | | | | | 0 | | | | 0 | |
As of June 30, 2012, the aggregate cost and the net unrealized appreciation/(depreciation) of investments for federal income tax purposes are as follows (amounts in thousands):
| | | | | | | | | | | | | | | | | | |
| | | | | Federal Tax
Cost | | | Unrealized
Appreciation | | | Unrealized
(Depreciation) | | | Net Unrealized
Appreciation/
(Depreciation)(6) | |
PIMCO 1-3 Year U.S. Treasury Index Fund | | | | $ | 134,114 | | | $ | 408 | | | $ | (15 | ) | | $ | 393 | |
PIMCO 3-7 Year U.S. Treasury Index Fund | | | | | 20,877 | | | | 973 | | | | (2 | ) | | | 971 | |
PIMCO 7-15 Year U.S. Treasury Index Fund | | | | | 35,675 | | | | 1,405 | | | | (4 | ) | | | 1,401 | |
PIMCO 25+ Year Zero Coupon U.S. Treasury Index Fund | | | | | 146,862 | | | | 22,873 | | | | 0 | | | | 22,873 | |
PIMCO Broad U.S. Treasury Index Fund | | | | | 18,935 | | | | 535 | | | | (5 | ) | | | 530 | |
PIMCO 1-5 Year U.S. TIPS Index Fund | | | | | 986,406 | | | | 8,404 | | | | (1,221 | ) | | | 7,183 | |
PIMCO 15+ Year U.S. TIPS Index Fund | | | | | 333,231 | | | | 41,085 | | | | (1 | ) | | | 41,084 | |
PIMCO Broad U.S. TIPS Index Fund | | | | | 99,942 | | | | 8,781 | | | | (3 | ) | | | 8,778 | |
PIMCO 0-5 Year High Yield Corporate Bond Index Fund | | | | | 318,909 | | | | 5,412 | | | | (2,843 | ) | | | 2,569 | |
PIMCO Investment Grade Corporate Bond Index Fund | | | | | 244,485 | | | | 9,292 | | | | (191 | ) | | | 9,101 | |
PIMCO Australia Bond Index Fund | | | | | 24,887 | | | | 756 | | | | (16 | ) | | | 740 | |
PIMCO Canada Bond Index Fund | | | | | 17,774 | | | | 319 | | | | 0 | | | | 319 | |
PIMCO Germany Bond Index Fund | | | | | 2,917 | | | | 5 | | | | (111 | ) | | | (106 | ) |
PIMCO Build America Bond Strategy Fund | | | | | 34,242 | | | | 2,594 | | | | (11 | ) | | | 2,583 | |
PIMCO Enhanced Short Maturity Strategy Fund | | | | | 1,705,801 | | | | 7,194 | | | | (1,380 | ) | | | 5,814 | |
PIMCO Global Advantage Inflation Linked-Bond Strategy Fund | | | | | 28,566 | | | | 248 | | | | (514 | ) | | | (266 | ) |
PIMCO Intermediate Municipal Bond Strategy Fund | | | | | 147,673 | | | | 6,212 | | | | (283 | ) | | | 5,929 | |
PIMCO Short-Term Municipal Bond Strategy Fund | | | | | 42,808 | | | | 284 | | | | (34 | ) | | | 250 | |
PIMCO Total Return Exchange-Traded Fund | | | | | 2,166,040 | | | | 31,234 | | | | (5,164 | ) | | | 26,070 | |
| (6) | Primary differences between book and tax net unrealized appreciation/(depreciation) are attributable to wash sale loss deferrals and straddle loss deferral on foreign currency contracts for federal income tax purposes. |
| | | | | | |
| | ANNUAL REPORT | | JUNE 30, 2012 | | 105 |
Notes to Financial Statements (Cont.)
June 30, 2012
For the fiscal years ended June 30, 2012 and June 30, 2011, respectively, the Funds made the following tax basis distributions (amounts in thousands):
| | | | | | | | | | | | | | | | | | | | | | | | | | | | | | | | | | | | |
| | | | | June 30, 2012 | | | | | June 30, 2011 | |
| | | | | Tax-Exempt
Income
Distributions | | | Ordinary
Income
Distributions(7) | | | Long-Term
Capital Gain
Distributions | | | Return of
Capital(8) | | | | | Tax-Exempt
Income
Distributions | | | Ordinary
Income
Distributions(7) | | | Long-Term
Capital Gain
Distributions | | | Return of
Capital(8) | |
PIMCO 1-3 Year U.S. Treasury Index Fund | | | | $ | 0 | | | $ | 874 | | | $ | 124 | | | $ | 0 | | | | | $ | 0 | | | $ | 821 | | | $ | 0 | | | $ | 0 | |
PIMCO 3-7 Year U.S. Treasury Index Fund | | | | | 0 | | | | 372 | | | | 61 | | | | 0 | | | | | | 0 | | | | 1,280 | | | | 7 | | | | 0 | |
PIMCO 7-15 Year U.S. Treasury Index Fund | | | | | 0 | | | | 433 | | | | 40 | | | | 0 | | | | | | 0 | | | | 724 | | | | 0 | | | | 0 | |
PIMCO 25+ Year Zero Coupon U.S. Treasury Index Fund | | | | | 0 | | | | 2,723 | | | | 0 | | | | 0 | | | | | | 0 | | | | 1,798 | | | | 0 | | | | 0 | |
PIMCO Broad U.S. Treasury Index Fund | | | | | 0 | | | | 354 | | | | 0 | | | | 0 | | | | | | 0 | | | | 126 | | | | 0 | | | | 0 | |
PIMCO 1-5 Year U.S. TIPS Index Fund | | | | | 0 | | | | 15,747 | | | | 388 | | | | 0 | | | | | | 0 | | | | 28,201 | | | | 0 | | | | 0 | |
PIMCO 15+ Year U.S. TIPS Index Fund | | | | | 0 | | | | 8,084 | | | | 0 | | | | 0 | | | | | | 0 | | | | 9,472 | | | | 0 | | | | 0 | |
PIMCO Broad U.S. TIPS Index Fund | | | | | 0 | | | | 1,951 | | | | 0 | | | | 0 | | | | | | 0 | | | | 1,887 | | | | 0 | | | | 0 | |
PIMCO 0-5 Year High Yield Corporate Bond Index Fund | | | | | 0 | | | | 9,093 | | | | 0 | | | | 0 | | | | | | 0 | | | | 41 | | | | 0 | | | | 0 | |
PIMCO Investment Grade Corporate Bond Index Fund | | | | | 0 | | | | 5,061 | | | | 0 | | | | 0 | | | | | | 0 | | | | 1,795 | | | | 0 | | | | 0 | |
PIMCO Australia Bond Index Fund | | | | | 0 | | | | 524 | | | | 0 | | | | 0 | | | | | | NA | | | | NA | | | | NA | | | | NA | |
PIMCO Canada Bond Index Fund | | | | | 0 | | | | 153 | | | | 0 | | | | 0 | | | | | | NA | | | | NA | | | | NA | | | | NA | |
PIMCO Germany Bond Index Fund | | | | | 0 | | | | 22 | | | | 0 | | | | 62 | | | | | | NA | | | | NA | | | | NA | | | | NA | |
PIMCO Build America Bond Strategy Fund | | | | | 0 | | | | 1,957 | | | | 0 | | | | 0 | | | | | | 0 | | | | 1,263 | | | | 0 | | | | 0 | |
PIMCO Enhanced Short Maturity Strategy Fund | | | | | 0 | | | | 17,295 | | | | 0 | | | | 0 | | | | | | 0 | | | | 9,351 | | | | 0 | | | | 0 | |
PIMCO Global Advantage Inflation Linked-Bond Strategy Fund | | | | | 0 | | | | 0 | | | | 0 | | | | 0 | | | | | | NA | | | | NA | | | | NA | | | | NA | |
PIMCO Intermediate Municipal Bond Strategy Fund | | | | | 2,633 | | | | 94 | | | | 38 | | | | 0 | | | | | | 1,550 | | | | 82 | | | | 0 | | | | 0 | |
PIMCO Short-Term Municipal Bond Strategy Fund | | | | | 340 | | | | 12 | | | | 12 | | | | 0 | | | | | | 273 | | | | 0 | | | | 0 | | | | 0 | |
PIMCO Total Return Exchange-Traded Fund | | | | | 0 | | | | 7,240 | | | | 0 | | | | 0 | | | | | | NA | | | | NA | | | | NA | | | | NA | |
| (7) | Includes short-term capital gains, if any, distributed. |
| (8) | Portion of distributions made that represents a tax return of capital. Return of capital distribution have been reclassified from undistributed net investment income to paid-in capital to more appropriately conform financial accounting to tax accounting. |
16. SUBSEQUENT EVENTS
The Manager has evaluated the possibility of subsequent events through the date the financial statements were issued and has determined that there are no material events that would require disclosure in the Funds’ financial statements.
Report of Independent Registered Public Accounting Firm
To the Board of Trustees and Shareholders of PIMCO ETF Trust:
In our opinion, the accompanying statements of assets and liabilities, including the schedules of investments, and the related statements of operations and of changes in net assets and the financial highlights present fairly, in all material respects, the financial position of PIMCO 1-3 Year U.S. Treasury Index Fund, PIMCO 3-7 Year U.S. Treasury Index Fund, PIMCO 7-15 Year U.S. Treasury Index Fund, PIMCO 25+Year Zero Coupon U.S. Treasury Index Fund, PIMCO Broad U.S. Treasury Index Fund, PIMCO 1-5 Year U.S. TIPS Index Fund, PIMCO 15+ Year U.S. TIPS Index Fund, PIMCO Broad U.S. TIPS Index Fund, PIMCO 0-5 Year High Yield Corporate Bond Index Fund, PIMCO Investment Grade Corporate Bond Index Fund, PIMCO Australia Bond Index Fund, PIMCO Canada Bond Index Fund, PIMCO Germany Bond Index Fund, PIMCO Build America Bond Strategy Fund, PIMCO Enhanced Short Maturity Strategy Fund, PIMCO Global Advantage® Inflation-Linked Bond Strategy Fund, PIMCO Intermediate Municipal Bond Strategy Fund, PIMCO Short Term Municipal Bond Strategy Fund, and PIMCO Total Return Exchange-Traded Fund (constituting PIMCO ETF Trust, hereafter referred to as the “Funds”) at June 30 2012, the results of each of their operations, the changes in each of their net assets and the financial highlights for each of the periods indicated, in conformity with accounting principles generally accepted in the United States of America. These financial statements and financial highlights (hereafter referred to as “financial statements”) are the responsibility of the Funds’ management; our responsibility is to express an opinion on these financial statements based on our audits. We conducted our audits of these financial statements in accordance with the standards of the Public Company Accounting Oversight Board (United States). Those standards require that we plan and perform the audits to obtain reasonable assurance about whether the financial statements are free of material misstatement. An audit includes examining, on a test basis, evidence supporting the amounts and disclosures in the financial statements, assessing the accounting principles used and significant estimates made by management, and evaluating the overall financial statement presentation. We believe that our audits, which included confirmation of securities at June 30, 2012 by correspondence with the custodian and counterparties, provide a reasonable basis for our opinion.
PricewaterhouseCoopers LLP
Kansas City, Missouri
August 17, 2012
| | | | | | |
| | ANNUAL REPORT | | JUNE 30, 2012 | | 107 |
Federal Income Tax Information
(Unaudited)
Exempt Interest Dividends. Pursuant to Section 852(b)(5) of the Internal Revenue Code, the Funds below designated the following percentages of income dividends paid as exempt interest dividends for the fiscal year ended June 30, 2012:
| | | | | | |
PIMCO Intermediate Municipal Bond Strategy Fund | | | | | 100 | % |
PIMCO Short-Term Municipal Bond Strategy Fund | | | | | 100 | % |
Long Term Capital Gain Designations. Pursuant to Section 852(b)(3) of the Internal Revenue Code, the Funds designated the following amounts as capital gain dividends for the fiscal year ended June 30, 2012:
| | | | | | |
PIMCO 1-3 Year U.S. Treasury Index Fund | | | | $ | 124,166 | |
PIMCO 3-7 Year U.S. Treasury Index Fund | | | | | 60,709 | |
PIMCO 7-15 Year U.S. Treasury Index Fund | | | | | 40,166 | |
PIMCO 1-5 Year U.S. TIPS Index Fund | | | | | 387,679 | |
PIMCO Intermediate Municipal Bond Strategy Fund | | | | | 37,904 | |
PIMCO Short-Term Municipal Bond Strategy Fund | | | | | 12,283 | |
Glossary: (abbreviations that may be used in the preceding statements)
(Unaudited)
| | | | | | | | | | |
| | | | |
| Counterparty Abbreviations: | | | | | | | | |
| BOA | | Bank of America N.A. | | FBF | | Credit Suisse International | | MSC | | Morgan Stanley & Co., Inc. |
| BPS | | BNP Paribas S.A. | | GSC | | Goldman Sachs & Co. | | RBC | | Royal Bank of Canada |
| BRC | | Barclays Bank PLC | | HUS | | HSBC Bank USA N.A. | | RYL | | Royal Bank of Scotland Group PLC |
| CBK | | Citibank N.A. | | JPM | | JPMorgan Chase Bank N.A. | | UAG | | UBS AG Stamford |
| DUB | | Deutsche Bank AG | | | | | | | | |
| | | | |
| Currency Abbreviations: | | | | | | | | |
| AUD | | Australian Dollar | | EUR | | Euro | | MXN | | Mexican Peso |
| BRL | | Brazilian Real | | GBP | | British Pound | | SEK | | Swedish Krona |
| CAD | | Canadian Dollar | | ILS | | Israeli Shekel | | USD | | United States Dollar |
| CLP | | Chilean Peso | | JPY | | Japanese Yen | | ZAR | | South African Rand |
| | | | |
| Municipal Bond or Agency Abbreviations: | | | | | | | | |
| AGM | | Assured Guaranty Municipal | | FHA | | Federal Housing Administration | | PSF | | Public School Fund |
| AMBAC | | American Municipal Bond Assurance Corp. | | GTD | | Guaranteed | | Q-SBLF | | Qualified School Bond Loan Fund |
| FGIC | | Financial Guaranty Insurance Co. | | NPFGC | | National Public Finance Guarantee Corp. | | SGI | | Syncora Guarantee, Inc. |
| | | | |
| Other Abbreviations: | | | | | | | | |
| ABS | | Asset-Backed Security | | CDO | | Collateralized Debt Obligation | | FDIC | | Federal Deposit Insurance Corp. |
| ALT | | Alternate Loan Trust | | CLO | | Collateralized Loan Obligation | | NCUA | | National Credit Union Administration |
| BABs | | Build America Bonds | | CMBS | | Collateralized Mortgage-Backed Security | | | | |
| | | | | | |
| | ANNUAL REPORT | | JUNE 30, 2012 | | 109 |
Management of the Trust
The chart below identifies the Trustees and Officers of the Trust. Each “interested” Trustee as defined by the 1940 Act, is indicated by an asterisk (*). Unless otherwise indicated, the address of all persons below is 840 Newport Center Drive, Newport Beach, CA 92660.
The Funds’ Statement of Additional Information includes more information about the Trustees and Officers. To request a free copy, call PIMCO at (888) 400-4ETF or visit the Funds’ website at www.pimcoetfs.com.
Trustees
| | | | | | | | |
Name, Year of Birth and
Position Held with Trust* | | Term of Office**
and Length of
Time Served | | Principal Occupation(s) During Past 5 Years | | Number of
Funds in
Fund Complex
Overseen
by Trustee* | | Other Directorships Held by Trustee |
| | | | |
Interested Trustees | | | | | | | | |
| | | | |
| Brent R. Harris* (1959) Chairman of the Board and Trustee | | 02/2009 to Present | | Managing Director and member of Executive Committee, PIMCO; Formerly, Chairman and Director, PCM Fund, Inc. Formerly, Chairman and Director PIMCO Strategic Global Government Fund, Inc. | | 161 | | Chairman and Trustee, PIMCO Funds, PIMCO Variable Insurance Trust, PIMCO Equity Series, PIMCO Equity Series VIT; Director, StocksPLUS® Management, Inc; and member of Board of Governors, Investment Company Institute. Board Member and Owner, Harris Holdings, LLC (1992-present). |
| | | | |
| Douglas M. Hodge* (1957) Trustee | | 02/2010 to Present | | Managing Director; Chief Operating Officer (since 7/09); Member of Executive Committee and Head of PIMCO’s Asia Pacific region. Member Global Executive Committee, Allianz Asset Management. | | 154 | | Trustee, PIMCO Funds and PIMCO Variable Insurance Trust. |
| | | | |
Independent Trustees | | | | | | | | |
| | | | |
| E. Philip Cannon (1940) Trustee | | 02/2009 to Present | | Private Investor; Formerly, President, Houston Zoo. Formerly, Director, PCM Fund, Inc. | | 161 | | Trustee, PIMCO Funds, PIMCO Variable Insurance Trust, PIMCO Equity Series and PIMCO Equity Series VIT. |
| | | | |
| Vern O. Curtis (1934) Trustee | | 02/2009 to Present | | Private Investor; Formerly, Director, PCM Fund, Inc. | | 161 | | Trustee, PIMCO Funds, PIMCO Variable Insurance Trust, PIMCO Equity Series and PIMCO Equity Series VIT. |
| | | | |
| J. Michael Hagan (1939) Trustee | | 02/2009 to Present | | Private Investor and Business Advisor (primarily to manufacturing companies); Formerly, Director, PCM Fund, Inc. | | 154 | | Trustee, PIMCO Funds and PIMCO Variable Insurance Trust; |
| | | | |
Ronald C. Parker (1951) Trustee | | 07/2009 to Present | | Chairman of the Board, The Ford Family Foundation. Formerly President, Chief Executive Officer, Hampton Affiliates (forestry products). | | 154 | | Trustee, PIMCO Funds and PIMCO Variable Insurance Trust. |
| | | | |
| William J. Popejoy (1938) Trustee | | 02/2009 to Present | | Private Investor; Formerly, Director, PCM Fund, Inc. | | 154 | | Trustee, PIMCO Funds and PIMCO Variable Insurance Trust. |
| * | Mr. Harris and Mr. Hodge are “interested persons” of the Trust (as that term is defined in the 1940 Act) because of their affiliation with PIMCO. |
| ** | Trustees serve until their successors are duly elected and qualified. |
(Unaudited)
Executive Officers
| | | | |
Name, Year of Birth and
Position Held with Trust | | Term of Office and
Length of Time Served | | Principal Occupation(s) During Past 5 Years |
| | |
Brent R. Harris (1959)
President | | 03/2009 to present | | Managing Director and member of Executive Committee, PIMCO. |
| | |
David C. Flattum (1964)
Chief Legal Officer | | 02/2009 to present | | Managing Director and General Counsel, PIMCO. Formerly, Managing Director, Chief Operating Officer and General Counsel, Allianz Asset Management America L.P. and Partner at Latham & Watkins LLP. |
| | |
| Jennifer E. Durham (1970) Chief Compliance Officer | | 02/2009 to present | | Managing Director, and Chief Compliance Officer, PIMCO. |
| | |
William H. Gross (1944)
Senior Vice President | | 02/2009 to present | | Managing Director and Co-Chief Investment Officer, PIMCO. |
| | |
Mohamed El-Erian (1958)
Senior Vice President | | 02/2009 to present | | Managing Director, Co-Chief Investment Officer and Chief Executive Officer, PIMCO. Formerly, President and CEO of Harvard Management Company. |
| | |
Douglas M. Hodge (1957)
Senior Vice President | | 05/2010 to present | | Managing Director; Chief Operation Officer (since 7/09); Member of Executive Committee and Head of PIMCO’s Asia Pacific Region. Member Global Executive Committee, Allianz Asset Management. |
| | |
J. Stephen King, Jr. (1962)
Vice President - Senior Counsel, Secretary | | 11/2008 to present | | Senior Vice President and Attorney, PIMCO. Formerly, Associate, Dechert LLP. |
| | |
Kevin M. Broadwater (1964)
Vice President - Senior Counsel | | 05/2012 to present | | Executive Vice President and Attorney, PIMCO. |
| | |
Peter G. Strelow (1970)
Vice President | | 02/2009 to present | | Managing Director, PIMCO. |
| | |
Henrik P. Larsen (1970)
Vice President | | 02/2009 to present | | Senior Vice President, PIMCO. |
| | |
Eric D. Johnson (1970)
Vice President | | 05/2011 to present | | Senior Vice President, PIMCO. |
| | |
Greggory S. Wolf (1970)
Vice President | | 05/2011 to present | | Senior Vice President, PIMCO. |
| | |
Donald W. Suskind (1973) Vice President | | 05/2009 to present | | Senior Vice President, PIMCO. |
| | |
John P. Hardaway (1957)
Treasurer | | 11/2008 to present | | Executive Vice President, PIMCO. |
| | |
Ryan G. Leshaw (1980)
Assistant Secretary | | 05/2012 to present | | Vice President and Attorney, PIMCO. Formerly, Associate, Willkie Farr & Gallagher LLP. |
| | |
| Stacie D. Anctil (1969) Assistant Treasurer | | 02/2009 to present | | Senior Vice President, PIMCO. |
| | |
| Erik C. Brown (1967) Assistant Treasurer | | 02/2009 to present | | Senior Vice President, PIMCO. |
| | |
Trent W. Walker (1974) Assistant Treasurer | | 02/2009 to present | | Senior Vice President, PIMCO. |
| | | | | | |
| | ANNUAL REPORT | | JUNE 30, 2012 | | 111 |
Privacy Policy
(Unaudited)
The Funds consider customer privacy to be a fundamental aspect of their relationships with shareholders and are committed to maintaining the confidentiality, integrity and security of their current, prospective and former shareholders’ personal information. The Funds have developed policies that are designed to protect this confidentiality, while allowing shareholder needs to be served.
OBTAINING PERSONAL INFORMATION
In the course of providing shareholders with products and services, the Funds and certain service providers to the Funds, such as the Funds’ investment adviser (“Adviser”), may obtain non-public personal information about shareholders, which may come from sources such as account applications and other forms, from other written, electronic or verbal correspondence, from shareholder transactions, from a shareholder’s brokerage or financial advisory firm, financial adviser or consultant, and/or from information captured on the Funds’ internet websites.
RESPECTING YOUR PRIVACY
As a matter of policy, the Funds do not disclose any personal or account information provided by shareholders or gathered by the Funds to non-affiliated third parties, except as required or permitted by law or as necessary for such third parties to perform their agreements with respect to the Funds. As is common in the industry, non-affiliated companies may from time to time be used to provide certain services, such as preparing and mailing prospectuses, reports, account statements and other information, conducting research on shareholder satisfaction and gathering shareholder proxies. The Funds’ Distributor may also retain non-affiliated companies to market the Funds’ shares or products which use the Funds’ shares and enter into joint marketing arrangements with them and other companies. These companies may have access to a shareholder’s personal and account information, but are permitted to use this information solely to provide the specific service or as otherwise permitted by law. In most cases, the shareholders will be clients of a third party, but the Funds may also provide a shareholder’s personal and account information to the shareholder’s respective brokerage or financial advisory firm.
SHARING INFORMATION WITH THIRD PARTIES
The Funds reserve the right to disclose or report personal information to non-affiliated third parties, in limited circumstances, where the Funds believe in good faith that disclosure is required under law to cooperate with regulators or law enforcement authorities, to protect their rights or property or upon reasonable request by any Fund in which a shareholder has invested. In addition, the Funds may disclose information about a shareholder’s accounts to a non-affiliated third party at the shareholder’s request or with the consent of the shareholder.
SHARING INFORMATION WITH AFFILIATES
The Funds may share shareholder information with their affiliates in connection with servicing their shareholders’ accounts, and subject to applicable law may provide shareholders with information about products and services that the Funds or their Adviser, principal underwriters or their affiliates (“Service Affiliates”) believe may be of interest to such shareholders. The information that the Funds share may include, for example, a shareholder’s participation in one of the Funds or in other investment programs sponsored by a Service Affiliate, a shareholder’s ownership of certain types of accounts (such as IRAs), information about the Funds’ experiences or transactions with a shareholder, information captured on the Funds’ internet websites, or other data about a shareholder’s accounts, subject to applicable law. The Funds’ Service Affiliates, in turn, are not permitted to share shareholder information with non-affiliated entities, except as required or permitted by law.
PROCEDURES TO SAFEGUARD PRIVATE INFORMATION
The Funds take seriously the obligation to safeguard shareholder non-public personal information. In addition to this policy, the Funds have implemented procedures that are designed to restrict access to a shareholder’s non-public personal information to internal personnel who need to know that information to perform their jobs, such as servicing shareholder accounts or notifying shareholders of new products or services. Physical, electronic and procedural safeguards are in place to guard a shareholder’s non-public personal information.
Approval of the Investment Management Agreement for the PIMCO Global Advantage Inflation-Linked Bond Strategy Fund and PIMCO Total Return Exchange-Traded Fund
(Unaudited)
On November 8, 2010, the Board of Trustees (the “Board”) of PIMCO ETF Trust (the “Trust”), including all of the independent Trustees (the “Independent Trustees”), approved the Trust’s Investment Management Agreement (the “Agreement”) with Pacific Investment Management Company LLC (“PIMCO”) on behalf of the PIMCO Global Advantage Inflation-Linked Bond Strategy Fund, a new series of the Trust, for an initial two-year term.
On May 23, 2011, the Board of the Trust, including all of the Independent Trustees, approved the Agreement with PIMCO on behalf of the PIMCO Total Return Exchange-Traded Fund, a new series of the Trust (together with the PIMCO Global Advantage Inflation-Linked Bond Strategy Fund, the “New Funds”), for an initial two-year term. Under the Agreement, PIMCO provides investment advisory services, as well as supervisory and administrative services, to each series of the Trust for a single management fee (“unified fee”).
The information, material factors and conclusions that formed the basis for the Board’s approvals are described below.
(a) Materials Reviewed: The Trustees received a wide variety of materials relating to the services to be provided by PIMCO. The Board reviewed information relating to proposed fund operations, including the New Funds’ compliance program, shareholder services, valuation, custody, distribution, and other information relating to the nature, extent and quality of services proposed to be provided by PIMCO to the Trust. In considering whether to approve the Agreement, the Board also reviewed materials provided by PIMCO, which included, among other things, comparative industry data with regard to expense ratios of funds with investment objectives and policies similar to those of the New Funds. The Board also reviewed material provided by counsel to the Trust and the Independent Trustees, which included, among other things, memoranda outlining legal duties of the Board. The Board also reviewed information about the personnel who would be providing investment management services and supervisory and administrative services to the New Funds.
(b) Review Process: In connection with the approval of the Agreement, the Board reviewed written materials prepared by PIMCO, which included, among other things, comparative fee data for funds in the appropriate Lipper, Inc. (“Lipper”) peer group. Lipper is an independent provider of investment company performance and fee and expense data. The Board also requested and received assistance and advice regarding applicable legal standards from Trust counsel. The Board also heard oral presentations on
matters related to the Agreement. The approval determinations were made on the basis of each Trustee’s business judgment after consideration of all the information presented. Individual Trustees may have given different weights to certain factors and assigned various degrees of materiality to information received in connection with the approval process. In deciding to approve the Agreement, the Board did not identify any single factor or particular information that, in isolation, was controlling. This summary describes the most important, but not all, of the factors considered by the Board.
| 2. | NATURE, EXTENT AND QUALITY OF SERVICES |
(a) PIMCO, its Personnel, and Resources: The Board considered the depth and quality of PIMCO’s investment management process, including: its global research capabilities; the experience, capability and integrity of its senior management and other personnel; the low turnover rates of its key personnel; the overall financial strength and stability of its organization; and the ability of its organizational structure to address the recent growth in assets under management. The Board also considered that PIMCO makes available to its investment professionals a variety of resources and systems relating to investment management, compliance, trading, performance and portfolio accounting. The Board noted PIMCO’s commitment to investing in information technology supporting investment management and compliance, as well as PIMCO’s continuing efforts to attract and retain qualified personnel and to maintain and enhance its resources and systems.
Ultimately, the Board concluded that the nature, extent and quality of services proposed to be provided by PIMCO under the Agreement are likely to benefit the New Funds and their shareholders.
(b) Other Services: The Board considered PIMCO’s policies, procedures and systems to assure compliance with applicable laws and regulations and its commitment to these programs; its efforts to keep the Trustees informed about matters relevant to the Trust and its shareholders; and its attention to matters that may involve conflicts of interest with the Trust. The Board also considered the nature, extent and quality of the supervisory and administrative services to be provided by PIMCO to the New Funds under the Agreement. The Board considered PIMCO’s provision of these services to the other series of the Trust and its supervision of the Trust’s third party service providers to assure that these service providers provide a high level of service relative to alternatives in the market. Ultimately, the Board concluded that the nature, extent and quality of the services to be provided by PIMCO would likely benefit the New Funds and their shareholders.
| | | | | | |
| | ANNUAL REPORT | | JUNE 30, 2012 | | 113 |
Approval of the Investment Management Agreement for the PIMCO Global Advantage Inflation-Linked Bond Strategy Fund and PIMCO Total Return Exchange-Traded Fund (Cont.)
As the New Funds had not yet commenced operations at the time the Agreement was considered, the Trustees did not receive or consider investment performance information.
| 4. | MANAGEMENT FEE AND TOTAL EXPENSES |
The Board considered that PIMCO strives to price funds with total expense ratios at or below the respective Lipper median, while providing premium investment offerings. PIMCO reported to the Board that, in proposing the management fees for the New Funds, it considers a number of factors, including the type and complexity of the services to be provided, the cost of providing services, the risk assumed by PIMCO in the provision of services, the impact on potential returns from different levels of fees, the competitive marketplace for financial products, and the attractiveness of potential returns to potential investors in the New Funds.
The Board reviewed the proposed management fee and estimated total expenses of each New Fund (each as a percentage of average net assets) and compared such amounts with the average and median fees and expenses of other similar funds. With respect to the management fees, the Board reviewed data from Lipper that compared the average and median management fees of other funds in a “Peer Group Expense Comparison” of comparable funds, as well as the universe of other similar funds. The Board compared the New Funds’ estimated total expenses to other funds in the Peer Group Expense Comparisons provided by Lipper and found the New Funds’ estimated total expenses to be reasonable.
With respect to the PIMCO Total Return Exchange-Traded Fund, the Board discussed the proposed fees in light of the fees charged by the PIMCO Total Return Fund, a series of PIMCO Funds with similar strategies. The Board noted the differences between the two products, which justified different fees. The Board also considered that PIMCO manages a separate account with investment strategies that are similar to that of the PIMCO Total Return Exchange-Traded Fund; however, the management fee for the Fund includes supervisory and administration services in addition to investment management services and, thus, the separate account does not provide a meaningful comparison. At the time the Board considered the Agreements, PIMCO did not manage any separate accounts with similar investment strategies to the PIMCO Global Advantage Inflation-Linked Bond Strategy Fund; therefore, the Board did not consider the fees charged by PIMCO to comparable separate accounts.
The Board also considered the Trust’s unified fee structure, under which the Trust pays for the advisory and supervisory and admin-
istrative services it requires for a unified fee, and in return, PIMCO provides or procures such services and bear the costs of various third party services required by the New Funds, including audit, custodial, portfolio accounting, legal, transfer agency and printing costs. The Board noted that the unified fee leads to fund fees that are fixed, rather than variable. The Board concluded that the New Funds’ proposed management fees were reasonable in relation to the value of the services to be provided and that the supervisory and administrative expenses assumed contractually by PIMCO under the Agreement represent, in effect, a cap on fund fees that would be beneficial to the New Funds and their shareholders. The Board further noted that, although the unified fee structure does not have break points, it implicitly reflects economies of scale by fixing the absolute level of Fund fees at competitive levels, in effect, setting the fees as if each New Fund was already at scale.
The Board also noted that PIMCO had contractually agreed to reduce total annual fund operating expenses for each New Fund by waiving a portion of its management fee or reimbursing the New Fund, to the extent that any organizational expenses and the pro rata share of the Trust’s Trustees’ fees attributable to the New Fund exceeds 0.49 basis points during the New Fund’s first fiscal year.
Based on the information presented by PIMCO and Lipper, members of the Board then determined, in the exercise of their business judgment, that the level of the advisory and supervisory and administrative fees to be charged by PIMCO, as well as the estimated total expenses of the New Funds, are reasonable and approval of the Agreement would likely benefit the New Funds and their shareholders.
| 5. | ADVISER COSTS, LEVEL OF PROFITS AND ECONOMIES OF SCALE |
As the New Funds are newly organized, information regarding PIMCO’s costs in providing services to the New Funds and the profitability of PIMCO’s relationship with the New Funds was not available.
With respect to potential economies of scale, the Board found that because the unified fee protects shareholders against unanticipated increases in expense ratios due to redemptions, declines in asset values, or increases in the costs of services provided or procured by PIMCO, economies of scale are implicitly recognized in the level of the unified fee (which, together with the advisory fee, serves as a proxy for each New Fund’s overall expense ratio).
The Board concluded that each New Fund’s proposed cost structure was reasonable and that the unified fee structure inherently involves the sharing of economies of scale between PIMCO and the New Funds, to the benefit of the New Funds’ shareholders.
(Unaudited)
The Board considered other benefits received by PIMCO and its affiliates as a result of PIMCO’s relationship with the Trust, including possible ancillary benefits to PIMCO’s institutional investment management business due to the reputation and market penetration of the Trust. The Board reviewed PIMCO’s soft dollar policies and procedures, noting that while PIMCO has the authority to receive the benefit of research provided by broker-dealers executing portfolio transactions on behalf of the New Funds, it has adopted a policy not to enter into contractual soft dollar arrangements.
Based on its review, including its consideration of each of the factors referred to above, the Board concluded that the Agreement was fair and reasonable to the New Funds and their shareholders, that the New Funds’ shareholders would likely receive reasonable value in return for the fees and other amounts paid to PIMCO by the New Funds, and that the approval of the Agreement was in the best interests of the New Funds and their shareholders.
| | | | | | |
| | ANNUAL REPORT | | JUNE 30, 2012 | | 115 |
General Information
Investment Manager
Pacific Investment Management Company LLC
840 Newport Center Drive
Newport Beach, CA 92660
Distributor
PIMCO Investments LLC
1633 Broadway
New York, NY 10019
Custodian
State Street Bank and Trust Company
State Street Financial Center
One Lincoln Street
Boston, MA 02111
Transfer Agent
State Street Bank and Trust Company
State Street Financial Center
One Lincoln Street
Boston, MA 02111
Legal Counsel
Dechert LLP
1775 I Street N.W.
Washington, D.C. 20006
Independent Registered Public Accounting Firm
PricewaterhouseCoopers LLP
1100 Walnut Street
Kansas City, MO 64106
This report is submitted for the general information of the shareholders of the PIMCO ETF Trust.

Sign up for e-delivery
To get future shareholder reports online and to eliminate mailings, go to: pimcoetfs.com/edelivery
pimcoetfs.com

ETF3001AR_063012
| | | | | | | | |
| |
Item 2. | | Code of Ethics. |
| |
| | As of the end of the period covered by this report, the Registrant has adopted a code of ethics (the “Code”) that applies to the Registrant’s principal executive officer and principal financial officer. The Registrant did not grant any waivers, including implicit waivers, from any provisions of the Code to the principal executive officer or principal financial officer during the period covered by this report. A copy of the Code is included as an exhibit to this report. |
| |
Item 3. | | Audit Committee Financial Expert. |
| |
| | (a) The Board of Trustees has determined that J. Michael Hagan, who serves on the Board’s audit committee, qualifies as an “audit committee financial expert” as such term is defined in the instructions to this Item 3. The Board has also determined that Mr. Hagan is “independent” as such term is interpreted under this Item 3. |
| |
Item 4. | | Principal Accountant Fees and Services. |
| | | |
| | (a) Fiscal Year Ended | | | Audit Fees | | | |
| | June 30, 2012 | | $ | 389,124 | | | |
| | June 30, 2011 | | | 275,871 | | | |
| | | |
| | (b) Fiscal Year Ended | | | Audit-Related Fees(1) | | | |
| | June 30, 2012 | | | | | | |
| | June 30, 2011 | | | — | | | |
| | | |
| | (c) Fiscal Year Ended | | | Tax Fees(2) | | | |
| | June 30, 2012 | | | | | | |
| | June 30, 2011 | | | — | | | |
| | | |
| | (d) Fiscal Year Ended | | | All Other Fees(3) | | | |
| | June 30, 2012 | | | | | | |
| | June 30, 2011 | | | — | | | |
| |
| | “Audit Fees” represents fees billed for each of the last two fiscal years for professional services rendered for the audit of the PIMCO ETF Trust (the “Trust” or “Registrant”) annual financial statements for those fiscal years or services that are normally provided by the accountant in connection with statutory or regulatory filings or engagements for those fiscal years. “Audit-Related Fees” represents fees billed for each of the last two fiscal years for assurance and related services reasonably related to the performance of the audit of the Trust’s annual financial statements for those years. “Tax Fees” represents fees billed for each of the last two fiscal years for professional services related to tax compliance, tax advice and tax planning, including review of federal and state income tax returns, review of excise tax distribution requirements and preparation of excise tax returns. “All Other Fees” represents fees, if any, billed for other products and services rendered by the principal accountant to the Trust for the last two fiscal years. (1) There were no “Audit-Related Fees” for the last two fiscal years. (2) There were no “Tax Fees” for the last two fiscal years. (3) There were no “All Other Fees” for the last two fiscal years. (e) Pre-approval policies and procedures (1) The Registrant’s Audit Committee has adopted pre-approval policies and procedures (the “Procedures”) to govern the Audit Committee’s pre-approval of (i) all audit services and permissible non-audit services to be provided to the Registrant by its independent accountant, and (ii) all permissible non-audit services to be provided by such independent accountant to the Registrant’s investment adviser and to any entity controlling, controlled by, or under common control with the investment adviser that provides ongoing services to the Registrant (collectively, the “Service Affiliates”) if the services provided directly relate to the Registrant’s operations and financial reporting. In accordance with the Procedures, the Audit Committee is responsible for the engagement of the independent accountant to certify the Registrant’s financial statements for each fiscal year. With respect to the pre-approval of non-audit services provided to the Registrant and its Service Affiliates, the Procedures provide that the Audit Committee may annually pre-approve a list of types or categories of non-audit services that may be provided to the Registrant or its Service Affiliates, or the Audit Committee may pre-approve such services on a project-by-project basis as they arise. Unless a type of service has received general pre-approval, it will require specific pre-approval by the Audit Committee if it is to be provided by the independent accountant. The Procedures also permit the Audit Committee to delegate authority to one or more of its members to pre-approve any proposed non-audit services that have not been previously pre-approved by the Committee, subject to the ratification by the full Audit Committee no later than its next scheduled meeting. (2) With respect to the services described in paragraphs (b) through (d) of this Item 4, no amount was approved by the Audit Committee pursuant to paragraph (c)(7)(i)(C) of Rule 2-01 of Regulation S-X. f) Not applicable. g) |
| | | | | | | | |
| Entity | | Aggregate Non-Audit Fees Billed to
Entity | |
| | | June 30, 2012 | | | June 30, 2011 | |
PIMCO ETF Trust | | $ | - | | | $ | - | |
Pacific Investment Management Company LLC (“PIMCO”) | | | 4,957,898 | | | | 2,712,636 | |
Allianz Global Investors Fund Management LLC | | | 787,530 | | | | 797,685 | |
Allianz Asset Management of America L.P. (formerly known as Allianz Global Investors of America L.P.) | | | 4,118,031 | | | | 3,373,920 | |
| | | | | | | | |
Totals | | $ | 9,863,459 | | | $ | 6,884,241 | |
| | | | | | | | |
| | h) | The Registrant’s Audit Committee has considered whether the provision of non-audit services that were rendered to the Registrant’s investment adviser, and any entity controlling, controlled by, or under common control with the investment adviser that provides ongoing services to the Registrant which were not pre-approved (not requiring pre-approval) is compatible with maintaining the principal accountant’s independence. |
| | | | | | | | |
| |
Item 5. | | Audit Committee of Listed Registrants. |
| |
| | The Registrant has a separately-designated standing audit committee established in accordance with Section 3(a)(58)(A) of the Securities Exchange Act of 1934, as amended. The audit committee is comprised of: E. Philip Cannon; Vern O. Curtis; J. Michael Hagan; Ronald C. Parker; William J. Popejoy |
| |
Item 6. | | Schedule of Investments. |
| |
| | The Schedule of Investments is included as part of the report to shareholders under Item 1. |
| | | | | | |
| |
Item 7. | | Disclosure of Proxy Voting Policies and Procedures for Closed-End Management Investment Companies. |
| |
| | Not applicable. |
| |
Item 8. | | Portfolio Managers of Closed-End Management Investment Companies. |
| |
| | Not applicable. |
| |
Item 9. | | Purchases of Equity Securities by Closed-End Management Investment Company and Affiliated Purchases. |
| |
| | Not applicable. |
| |
Item 10. | | Submission of Matters to a Vote of Security Holders. |
| |
| | Not applicable. |
| | | | | | |
| |
Item 11. | | Controls and Procedures. |
| | |
| | (a) | | The principal executive officer and principal financial officer have concluded that the Registrant’s disclosure controls and procedures (as defined in Rule 30a-3(c) under the Investment Company Act of 1940, as amended (“1940 Act”)) provide reasonable assurances that material information relating to the Trust is made known to them by the appropriate persons, based on their evaluation of these controls and procedures as of a date within 90 days of the filing of this report. |
| | |
| | (b) | | There were no changes in the Registrant’s internal control over financial reporting (as defined in Rule 30a-3(d) under the 1940 Act) that occurred during the second fiscal quarter of the period covered by this report that have materially affected, or are reasonably likely to materially affect, the Registrant’s internal control over financial reporting. |
| | |
Item 12. | | Exhibits. | | |
| | |
| | (a)(1) | | Exhibit 99.CODE—Code of Ethics pursuant to Section 406 of the Sarbanes-Oxley Act of 2002. |
| | |
| | (a)(2) | | Exhibit 99.CERT—Certifications pursuant to Section 302 of the Sarbanes-Oxley Act of 2002. |
| | |
| | (b) | | Exhibit 99.906CERT—Certifications pursuant to Section 906 of the Sarbanes-Oxley Act of 2002. |
Signatures
Pursuant to the requirements of the Securities Exchange Act of 1934 and the Investment Company Act of 1940, the registrant has duly caused this report to be signed on its behalf by the undersigned, thereunto duly authorized.
| | |
| PIMCO ETF Trust |
| |
| By: | | /s/ BRENT R. HARRIS |
| | Brent R. Harris |
| | President and Chairman of the Board, Principal Executive Officer |
| |
| | Date: August 31, 2012 |
Pursuant to the requirements of the Securities Exchange Act of 1934 and the Investment Company Act of 1940, this report has been signed below by the following persons on behalf of the registrant and in the capacities and on the dates indicated.
| | |
| |
| By: | | /s/ BRENT R. HARRIS |
| | Brent R. Harris |
| | President and Chairman of the Board, Principal Executive Officer |
| |
| | Date: August 31, 2012 |
| |
| By: | | /s/ JOHN P. HARDAWAY |
| | John P. Hardaway |
| | Treasurer, Principal Financial Officer |
| |
| | Date: August 30, 2012 |