Table of Contents
UNITED STATES
SECURITIES AND EXCHANGE COMMISSION
Washington, D.C. 20549
FORM N-CSR
CERTIFIED SHAREHOLDER REPORT OF REGISTERED MANAGEMENT
INVESTMENT COMPANIES
Investment Company Act file number: 811-22250
PIMCO ETF Trust
(Exact name of registrant as specified in charter)
840 Newport Center Drive, Newport Beach, CA 92660
(Address of principal executive offices)
John P. Hardaway
Treasurer and Principal Financial Officer
PIMCO ETF Trust
840 Newport Center Drive
Newport Beach, CA 92660
(Name and address of agent for service)
Copies to:
Brendan C. Fox
Dechert LLP
1775 I Street, N.W.
Washington, D.C. 20006
Registrant’s telephone number, including area code: (888) 400-4383
Date of fiscal year end: June 30
Date of reporting period: June 30, 2011
Form N-CSR is to be used by management investment companies to file reports with the Commission not later than 10 days after the transmission to stockholders of any report that is required to be transmitted to stockholders under Rule 30e-1 under the Investment Company Act of 1940 (17 CFR 270.30e-1). The Commission may use the information provided on Form N-CSR in its regulatory, disclosure review, inspection, and policymaking roles.
A registrant is required to disclose the information specified by Form N-CSR, and the Commission will make this information public. A registrant is not required to respond to the collection of information contained in Form N-CSR unless the Form displays a currently valid Office of Management and Budget (“OMB”) control number. Please direct comments concerning the accuracy of the information collection burden estimate and any suggestions for reducing the burden to Secretary, Securities and Exchange Commission, 450 Fifth Street, NW, Washington, DC 20549-0609. The OMB has reviewed this collection of information under the clearance requirements of 44 U.S.C. § 3507.
Table of Contents
Item 1. Reports to Stockholders.
The following is a copy of the report transmitted to stockholders pursuant to Rule 30e-1 under the Investment Company Act of 1940, as amended (the “1940 Act”) (17 CFR 270.30e-1).
| • | PIMCO ETF Trust |
Table of Contents
Annual Report June 30, 2011


PIMCO ETF Trust
Index Exchange-Traded Funds
PIMCO 0-5 Year High Yield Corporate Bond Index Fund
PIMCO 1-3 Year U.S. Treasury Index Fund
PIMCO 1-5 Year U.S. TIPS Index Fund
PIMCO 3-7 Year U.S. Treasury Index Fund
PIMCO 7-15 Year U.S. Treasury Index Fund
PIMCO 15+ Year U.S. TIPS Index Fund
PIMCO 25+ Year Zero Coupon U.S. Treasury Index Fund
PIMCO Broad U.S. TIPS Index Fund
PIMCO Broad U.S. Treasury Index Fund
PIMCO Investment Grade Corporate Bond Index Fund
Actively Managed Exchange-Traded Funds
PIMCO Build America Bond Strategy Fund
PIMCO Enhanced Short Maturity Strategy Fund
PIMCO Intermediate Municipal Bond Strategy Fund
PIMCO Short Term Municipal Bond Strategy Fund

Table of Contents
| Page | ||||||||
| 2 | ||||||||
| 4 | ||||||||
Expense Examples | 21 | |||||||
| 22 | ||||||||
| 24 | ||||||||
| 26 | ||||||||
| 28 | ||||||||
| 57 | ||||||||
| 68 | ||||||||
| 69 | ||||||||
| 70 | ||||||||
| 71 | ||||||||
| 73 | ||||||||
| 74 | ||||||||
| FUND | Fund Summary | Schedule of Investments | ||||||
| 7 | 31 | |||||||
| 8 | 33 | |||||||
| 9 | 34 | |||||||
| 10 | 35 | |||||||
| 11 | 36 | |||||||
| 12 | 37 | |||||||
| 13 | 38 | |||||||
| 14 | 39 | |||||||
| 15 | 40 | |||||||
| 16 | 41 | |||||||
| 17 | 43 | |||||||
| 18 | 45 | |||||||
| 19 | 50 | |||||||
| 20 | 54 | |||||||
PIMCO has adopted written proxy voting policies and procedures (“Proxy Policy”) as required by Rule 206(4)-6 under the Investment Advisers Act of 1940, as amended. The Proxy Policy has been adopted by PIMCO ETF Trust as the policies and procedures that PIMCO will use when voting proxies on behalf of the Funds. A description of the policies and procedures that PIMCO uses to vote proxies relating to portfolio securities of each Fund, and information about how each Fund voted proxies relating to portfolio securities held during the most recent twelve-month period ended June 30, are available without charge, upon request, by calling the Trust at 1-888-400-4ETF (1-888-400-4383), on the Funds’ website at www.pimcoetfs.com, and on the Securities and Exchange Commission’s (“SEC”) website at http://www.sec.gov.
PIMCO ETF Trust files a complete schedule of each Fund’s portfolio holdings with the SEC for the first and third quarters of each fiscal year on Form N-Q. A copy of the Funds’ Form N-Q is available on the SEC’s website at http://www.sec.gov and may be reviewed and copied at the SEC’s Public Reference Room in Washington, D.C. and is available without charge, upon request, by calling the Trust at 1-888-400-4ETF (1-888-400-4383) and on the Funds’ website at www.pimcoetfs.com. Information on the operation of the Public Reference Room may be obtained by calling 1-800-SEC-0330.
PIMCO ETF Trust is distributed by PIMCO Investments LLC, 1633 Broadway, New York, NY 10019, www.pimcoetfs.com, 1-888-400-4ETF (1-888-400-4383).
Table of Contents
Dear Shareholder:
Please find enclosed the Annual Report for the PIMCO ETF Trust covering the twelve-month reporting period ended June 30, 2011.
During the reporting period, we introduced the PIMCO 0-5 Year High Yield Corporate Bond Index Fund (Ticker: HYS), which employs PIMCO’s “smart passive” approach to indexation, while providing investors access to the short-term high yield U.S. corporate credit market via an exchange-traded fund. All of our ETF strategies bring investors convenient and transparent exposure to important segments of the fixed-income universe through the highly accessible ETF vehicle, and reflect PIMCO’s thought leadership, risk management, and product design expertise.
Current PIMCO ETF offerings as of the end of the reporting period include:
| PIMCO ETF | NYSE Arca Ticker | |||||
| Index ETFs | ||||||
| U.S. Treasury | ||||||
| PIMCO 1-3 Year U.S. Treasury Index Fund | TUZ | |||||
| PIMCO 3-7 Year U.S. Treasury Index Fund | FIVZ | |||||
| PIMCO 7-15 Year U.S. Treasury Index Fund | TENZ | |||||
| PIMCO Broad U.S. Treasury Index Fund | TRSY | |||||
| PIMCO 25+ Year Zero Coupon U.S. Treasury Index Fund | ZROZ | |||||
| U.S. Treasury Inflation-Protected Securities (TIPS) | ||||||
| PIMCO 1-5 Year U.S. TIPS Index Fund | STPZ | |||||
| PIMCO Broad U.S. TIPS Index Fund | TIPZ | |||||
| PIMCO 15+ Year U.S. TIPS Index Fund | LTPZ | |||||
| Corporate | ||||||
| PIMCO 0-5 Year High Yield Corporate Bond Index Fund | HYS | |||||
| PIMCO Investment Grade Corporate Bond Index Fund | CORP | |||||
| Actively-managed ETFs | ||||||
| Cash Management | ||||||
| PIMCO Enhanced Short Maturity Strategy Fund | MINT | |||||
| Tax-Exempt Municipal | ||||||
| PIMCO Short Term Municipal Bond Strategy Fund | SMMU | |||||
| PIMCO Intermediate Municipal Bond Strategy Fund | MUNI | |||||
| Taxable Municipal | ||||||
| PIMCO Build America Bond Strategy Fund | BABZ | |||||
Outside of the reporting period on August 5, 2011, Standard & Poor’s (an independent credit rating agency), downgraded its credit rating on U.S. sovereign debt from AAA to AA+, followed by a similar downgrade announced on August 8, 2011 on debt issued by the Federal National Mortgage Association (“Fannie Mae”), the Federal Home Loan Mortgage Corporation (“Freddie Mac”), as well as farm lenders and U.S. government-backed debt issued by certain banks and credit unions. Furthermore, in reaction to the growing sovereign debt crisis in the Eurozone, the European Central Bank announced on August 7, 2011 that it will begin buying debt issued by Italy and Spain to help prevent contagion. As such, these events present investors with heightened allocation challenges amidst market price disruptions.
In this market environment and more generally in all market environments, PIMCO remains highly focused on risk management and on how best to mitigate risks in each of our investment strategies. As investors, the importance of being prepared and vigilant to multiple scenarios is crucial to successful investing, while searching for attractive investment opportunities throughout the global marketplace.
| 2 | PIMCO ETF Trust |
Table of Contents
Chairman’s Letter (Cont.)
Highlights of the financial markets during our twelve-month reporting period include:
| n | Yields on U.S. Treasury securities were volatile during the reporting period and generally ended lower for maturities of five years and less, but higher for longer-term maturities. Continued concern over the European sovereign debt crisis resulted in a flight-to-quality towards the latter part of the period, boosting demand for U.S. Treasury securities, which generally outperformed other developed sovereign bond markets on a hedged basis. The benchmark ten-year U.S. Treasury note yielded 3.16% at the end of the reporting period, as compared to 2.93% on June 30, 2010. |
| n | U.S. Treasury Inflation-Protected Securities (“TIPS”) gained during the reporting period. As longer-maturity real yields remained relatively flat, positive longer-dated TIPS returns were driven primarily by inflation accruals and coupon income. Short and intermediate TIPS benefited from declining real yields, in addition to inflation accruals, and posted positive performance. TIPS outperformed nominal U.S. Treasuries as break-even inflation levels (or the difference between nominal and real yields) widened. |
| n | Municipal bonds, including both the tax-free and taxable Build America Bonds (“BABs”) sectors, struggled during the first half of the reporting period and were impacted by rising yields, an increase in new issuance, and sizeable redemptions out of municipal bond mutual funds. However, during the second half of the reporting period, municipal bond markets rallied as new issuances of tax-free municipal bonds declined, redemptions stabilized, and municipalities addressed budget concerns. |
| n | Corporate bonds generally outperformed U.S. Treasury securities as credit fundamentals improved. High yield corporate bonds in particular benefited from strong investor demand in a low interest rate environment. The financials’ sector was among the best performing corporate bond sectors due to improving corporate balance sheets. |
On the following pages, you’ll find specific details on investment performance and a discussion of the factors that affected performance during the reporting period. If you have any questions regarding your PIMCO ETF Trust investment, please contact your financial advisor, or call one of our shareholder associates at 1-888-400-4ETF (1-888-400-4383). We also invite you to visit our ETF website at www.pimcoetfs.com to learn more about PIMCO ETFs.
Thank you again for the trust you have placed in PIMCO. We are privileged to serve you through our ETF offerings.
 | Sincerely,
Brent R. Harris President and Chairman of the Board, PIMCO ETF Trust
August 8, 2011 | |

| Annual Report | June 30, 2011 | 3 |
Table of Contents
Important Information About the Funds
This material is authorized for use only when preceded or accompanied by the current PIMCO ETF Trust prospectus. Investors should consider the investment objectives, risks, charges and expenses of each Fund carefully before investing. This and other information is contained in each Fund’s prospectus. Please read the prospectus carefully before you invest or send money.
The PIMCO 0-5 Year High Yield Corporate Bond Index Fund, PIMCO 1-3 Year U.S. Treasury Index Fund, PIMCO 1-5 Year U.S. TIPS Index Fund, PIMCO 3-7 Year U.S. Treasury Index Fund, PIMCO 7-15 Year U.S. Treasury Index Fund, PIMCO 15+ Year U.S. TIPS Index Fund, PIMCO 25+ Year Zero Coupon U.S. Treasury Index Fund, PIMCO Broad U.S. TIPS Index Fund, PIMCO Broad U.S. Treasury Index Fund and PIMCO Investment Grade Corporate Bond Index Fund are exchange-traded funds (“ETFs”) that seek to provide total return that closely corresponds, before fees and expenses, to the total return of a specified index (collectively, the “Index Funds”). Each Index Fund employs a representative sampling strategy in seeking to achieve its investment objective and as a result may not hold all of the securities that are included in the underlying index. The PIMCO Build America Bond Strategy Fund, PIMCO Enhanced Short Maturity Strategy Fund, PIMCO Intermediate Municipal Bond Strategy Fund and PIMCO Short Term Municipal Bond Strategy Fund, unlike the Index Funds, are actively managed ETFs that do not seek to track the performance of a specified index (collectively, the “Active Funds” and together with the Index Funds, the “Funds”). Shares of the Funds will be listed and traded at market prices on NYSE Arca, Inc. (“NYSE Arca”) and other secondary markets. The market price for each Fund’s shares may be different from the Fund’s net asset value (“NAV”). Each Fund issues and redeems shares at its NAV only in blocks of a specified number of shares (“Creation Units”). Only certain large institutional investors may purchase or redeem Creation Units directly with the Funds at NAV (“Authorized Participants”). These transactions are in exchange for certain securities similar to a Fund’s portfolio and/or cash. Except when aggregated in Creation Units, shares of a Fund are not redeemable securities. Shareholders who are not Authorized Participants may not redeem shares from the Funds at NAV.
The Funds invest in particular segments of the securities markets, which are not representative of the broader securities markets. While we believe that bond funds have an important role to play in a well-diversified investment portfolio, an investment in a Fund alone should not constitute an entire investment program. It is important to note that in an environment where interest rates may trend upward, rising rates would negatively impact the performance of most bond funds, and fixed-income securities held by the Funds are likely to decrease in value. The price volatility of fixed-income securities can also increase during periods of rising interest rates resulting in increased losses to the Funds. Bond funds and individual bonds with a longer duration (a measure used to determine the sensitivity of a security’s price to changes in interest rates) tend to be more sensitive to changes in interest rates, usually making them more volatile than securities or funds with shorter durations.
The Funds may be subject to various risks in addition to those described above. Some of these risks may include, but are not limited to, the following: market trading risk, limited issuance risk, interest rate risk, credit risk, market risk, liquidity risk, derivatives risk, issuer non-diversification risk, leveraging risk, management and tracking error risk, indexing risk, issuer risk, mortgage-related and other asset backed risk, foreign (non-U.S.) investment risk, emerging markets risk, management risk and municipal project-specific risk. A complete description of these and other risks is contained in each Fund’s prospectus. The Index Funds may use derivative instruments for hedging purposes or as part of an investment strategy. Use of these instruments may involve certain costs and risks such as liquidity risk, interest rate risk, market risk, credit risk, management risk and the risk that a Fund could not close out a position when it would be most advantageous to do so. An Index Fund could lose more than the principal amount invested in these derivative instruments. The credit quality of a particular security or group of securities does not ensure the stability or safety of the overall portfolio.
On each individual Fund Summary page in this Annual Report (“Shareholder Report”), the Average Annual Total Return table and Cumulative Returns chart measure performance assuming that all dividend and capital gain distributions were reinvested. Returns do not reflect the deduction of taxes that a shareholder would pay on: (i) Fund distributions; or (ii) the redemption of Fund shares. Each Fund’s performance is measured against the performance of a broad-based securities market index (benchmark index). Each Fund’s past performance, before and after taxes, is not necessarily an indication of how the Fund will perform in the future.
An investment in a Fund is not a deposit of a bank and is not guaranteed or insured by the Federal Deposit Insurance Corporation or any other government agency. It is possible to lose money on investments in the Funds.
The Index Funds may make available a complete schedule of portfolio holdings and the percentages they represent of the Index Fund’s net assets. On each business day, before commencement of trading on NYSE Arca, each Active Fund will disclose on www.pimcoetfs.com the identities and quantities of the Active Fund’s portfolio holdings that will form the basis for the Active Fund’s calculation of NAV at the end of the business day. Please see “Disclosure of Portfolio Holdings” in the Statement of Additional Information for information about the availability of the complete schedule of each Fund’s holdings. Fund fact sheets provide additional information regarding a Fund and may be requested by calling 1-888-400-4ETF (1-888-400-4383).
PIMCO advised funds are distributed by PIMCO Investments LLC.
| 4 | PIMCO ETF Trust |
Table of Contents
The following disclosure provides important information regarding a Fund’s Expense Example (“Example” or “Expense Example”), which appears in this Shareholder Report. Please refer to this information when reviewing the Expense Example for a Fund.
EXAMPLE
As a shareholder of a Fund, you incur two types of costs: (1) transaction costs, including brokerage commissions paid on purchases and sales of Fund shares; and (2) ongoing costs, including management fees and other Fund expenses. The Example is intended to help you understand your ongoing costs (in dollars) of investing in a Fund and to compare these costs with the ongoing costs of investing in other exchange-traded funds. The Example is based on an investment of $1,000 invested at the beginning of the period and held for the entire period indicated, which for most Funds is from January 1, 2011 to June 30, 2011; with the exception of the PIMCO 0-5 Year High Yield Corporate Bond Index Fund, which is from June 16, 2011 (the date the Fund commenced operations) to June 30, 2011.
ACTUAL EXPENSES
The information in the table under the heading “Actual Performance” provides information about actual account values and actual expenses. You may use the information in these columns, together with the amount you invested, to estimate the expenses that you paid over the period. Simply divide your account value by $1,000 (for example, an $8,600 account value divided by $1,000 = $8.60), then multiply the result by the number in the row titled “Expenses Paid During Period” to estimate the expenses you paid on your account during this period.
HYPOTHETICAL EXAMPLE FOR COMPARISON PURPOSES
The information in the table under the heading “Hypothetical Performance (5% return before expenses)” provides information about hypothetical account values and hypothetical expenses based on a Fund’s actual expense ratio and an assumed rate of return of 5% per year before expenses, which is not the Fund’s actual return. The hypothetical account values and expenses may not be used to estimate the actual ending account balance or expenses you paid for the period. You may use this information to compare the ongoing costs of investing in a Fund and other exchange-traded funds. To do so, compare this 5% hypothetical example with the 5% hypothetical examples that appear in the shareholder reports of other exchange-traded funds.
Please note that the expenses shown in the table are meant to highlight your ongoing costs only and do not reflect any transactional costs, such as brokerage commissions paid on purchases and sales of shares of the Funds. Therefore, the information under the heading “Hypothetical Performance (5% return before expenses)” is useful in comparing ongoing costs only, and will not help you determine the relative total costs of owning different exchange-traded funds. In addition, if these transactional costs were included, your costs would have been higher. The expense ratio may vary period to period because of various factors, such as an increase in expenses not covered by the management fee (such as expenses of the independent trustees and their counsel, extraordinary expenses and interest expense).
| Annual Report | June 30, 2011 | 5 |
Table of Contents
Important Information About the Funds (Cont.)
FREQUENCY OF DISCOUNTS AND PREMIUMS: MARKET PRICE VS. NAV AS OF JUNE 30, 2011
The following chart is provided to show the frequency at which the daily market prices on the NYSE Arca, Inc. (the “Exchange”), the primary listing exchange for shares of the Funds were at a discount or premium to each Fund’s NAV. The “Market Price” of each Fund generally is determined using the midpoint between the highest bid and the lowest offer on the Exchange, as of the time that each Fund’s NAV is calculated. Each Fund’s Market Price may at times be at, above or below its NAV. The NAV of each Fund will fluctuate with changes in the market value of its portfolio holdings. The Market Price of each Fund will fluctuate in accordance with changes in its NAV, as well as supply and demand.
The discount or premium is the percentage difference between the NAV and the Market Price of each Fund. A discount is the amount that each Fund is trading below the reported NAV, expressed as a percentage of the NAV. A premium is the amount that each Fund is trading above the reported NAV, expressed as a percentage of NAV.
Each column in the chart shows the number of trading days in which each Fund traded within the premium/discount range indicated.
Frequency Distribution of Discounts and Premiums: Market Price vs. NAV (July 1, 2010 through June 30, 2011)
| Market Price Above or Equal to NAV | Market Price Below NAV | |||||||||||||||||||||||||||||||||
0-50 bps | 50-99 bps | 100-149 bps | 150-199 bps | 0-50 bps | 50-99 bps | 100-149 bps | 150-199 bps | |||||||||||||||||||||||||||
| PIMCO 1-3 Year U.S. Treasury Index Fund | 125 | 0 | 0 | 0 | 128 | 0 | 0 | 0 | ||||||||||||||||||||||||||
| PIMCO 1-5 Year U.S. TIPS Index Fund | 226 | 1 | 0 | 0 | 25 | 1 | 0 | 0 | ||||||||||||||||||||||||||
| PIMCO 3-7 Year U.S. Treasury Index Fund | 106 | 0 | 0 | 0 | 147 | 0 | 0 | 0 | ||||||||||||||||||||||||||
| PIMCO 7-15 Year U.S. Treasury Index Fund | 167 | 0 | 0 | 0 | 86 | 0 | 0 | 0 | ||||||||||||||||||||||||||
| PIMCO 15+ Year U.S. TIPS Index Fund | 148 | 1 | 0 | 0 | 104 | 0 | 0 | 0 | ||||||||||||||||||||||||||
| PIMCO 25+ Year Zero Coupon Year U.S. Treasury Index Fund | 103 | 4 | 0 | 0 | 144 | 2 | 0 | 0 | ||||||||||||||||||||||||||
| PIMCO Broad U.S. TIPS Index Fund | 171 | 1 | 0 | 0 | 81 | 0 | 0 | 0 | ||||||||||||||||||||||||||
| PIMCO Enhanced Short Maturity Strategy Fund | 199 | 0 | 0 | 0 | 54 | 0 | 0 | 0 | ||||||||||||||||||||||||||
| PIMCO Intermediate Municipal Bond Strategy Fund | 112 | 1 | 0 | 1 | 138 | 0 | 0 | 1 | ||||||||||||||||||||||||||
| PIMCO Short Term Municipal Bond Strategy Fund | 100 | 0 | 0 | 0 | 147 | 6 | 0 | 0 | ||||||||||||||||||||||||||
Frequency Distribution of Discounts and Premiums for New Funds: Market Price vs. NAV (since inception through June 30, 2011)
| Market Price Above or Equal to NAV | Market Price Below NAV | |||||||||||||||||||||||||||||||||
0-50 bps | 50-99 bps | 100-149 bps | 150-199 bps | 0-50 bps | 50-99 bps | 100-149 bps | 150-199 bps | |||||||||||||||||||||||||||
| PIMCO 0-5 Year High Yield Corporate Bond Index Fund | 8 | 0 | 0 | 0 | 3 | 0 | 0 | 0 | ||||||||||||||||||||||||||
| PIMCO Broad U.S. Treasury Index Fund | 158 | 0 | 0 | 0 | 11 | 0 | 0 | 0 | ||||||||||||||||||||||||||
| PIMCO Investment Grade Corporate Bond Index Fund | 43 | 0 | 0 | 0 | 155 | 0 | 0 | 0 | ||||||||||||||||||||||||||
| PIMCO Build America Bond Strategy Fund | 88 | 10 | 3 | 0 | 86 | 10 | 1 | 0 | ||||||||||||||||||||||||||
For additional historical data, please refer to the Fund’s website www.pimcoetfs.com. The data presented represents past performance and cannot be used to predict future results.
| 6 | PIMCO ETF Trust |
Table of Contents
PIMCO 0-5 Year High Yield Corporate Bond Index Fund
| Ticker Symbol | HYS |
| Allocation Breakdown‡ | ||||
| Industrials | 67.6% | |||
| Banking & Finance | 16.3% | |||
| Utilities | 8.1% | |||
| Short-Term Instruments | 8.0% | |||
| ‡ | % of Total Investments as of 06/30/11 |
A line graph is not included since the Fund has less than six months of performance.
| Cumulative Total Return for the period ended June 30, 2011 | ||||
| Fund Inception (06/16/2011) | ||||
| PIMCO 0-5 Year High Yield Corporate Bond Index Fund (Based on Net Asset Value) | 0.45 | % | ||
| PIMCO 0-5 Year High Yield Corporate Bond Index Fund (At Market Price)(1) | 0.69 | % | ||
| The BofA Merrill Lynch 0-5 Year US High Yield Constrained IndexSM(2)(3) | 0.33 | % | ||
All Fund returns are net of fees and expenses.
Market returns do not include brokerage commissions that may be payable on secondary market transactions. If brokerage commissions were included, market returns would be lower. Market and NAV returns assume that dividends and capital gain distributions have been reinvested in the Fund at market price and NAV, respectively.
(1) The market price is determined using the midpoint between the highest bid and the lowest offer on the listing exchange, as of the time that the Fund’s NAV is calculated.
(2) The BofA Merrill Lynch 0-5 Year US High Yield Constrained IndexSM tracks the performance of short-term U.S. dollar denominated below investment grade corporate debt issued in the U.S. domestic market with less than five years remaining term to final maturity, a fixed coupon schedule and a minimum amount outstanding of $100 million, issued publicly. Allocations to an individual issuer will not exceed 2%. It is not possible to invest directly in an unmanaged index.
(3) “BofA Merrill Lynch” and “The BofA Merrill Lynch 0-5 Year US High Yield Constrained IndexSM” are reprinted with permission. ©Copyright 2011 Merrill Lynch, Pierce, Fenner & Smith Incorporated (“BofA Merrill Lynch”). All rights reserved. “BofA Merrill Lynch” and “The BofA Merrill Lynch 0-5 Year US High Yield Constrained IndexSM” are service marks of BofA Merrill Lynch and/or its affiliates and have been licensed for use for certain purposes by PIMCO on behalf of the Fund that is based on the Index, and is not issued, sponsored, endorsed or promoted by BofA Merrill Lynch and/or BofA Merrill Lynch’s affiliates nor is BofA Merrill Lynch and/or BofA Merrill Lynch’s affiliates an adviser to the Fund. BofA Merrill Lynch and BofA Merrill Lynch’s affiliates make no representation, express or implied, regarding the advisability of investing in this product or the Index and do not guarantee the quality, accuracy or completeness of the Index, Index values or any Index related data included herein, provided herewith or derived therefrom and assume no liability in connection with their use. As the Index provider, BofA Merrill Lynch is licensing certain trademarks, the Index and trade names which are composed by BofA Merrill Lynch without regard to PIMCO, this product or any investor. BofA Merrill Lynch and BofA Merrill Lynch’s affiliates do not provide investment advice to the Fund and are not responsible for the performance of the Fund. BofA Merrill Lynch compiles and publishes the Index. PIMCO has entered into a license agreement with BofA Merrill Lynch to use the Index.
Performance quoted represents past performance. Past performance is not a guarantee or a reliable indicator of future results. Current performance may be lower or higher than performance shown. Investment return and principal value will fluctuate, so that Fund shares may be worth more or less than their original cost when redeemed by authorized participants. Returns shown do not reflect the deduction of taxes that a shareholder would pay on Fund distributions or on the redemption of Fund shares. The Fund’s total annual operating expense ratio as stated in the Fund’s current prospectus dated 10/29/10, as supplemented to date, is 0.65%. Details regarding any Fund’s operating expenses can be found in the Fund’s prospectus. Performance data current to the most recent month-end is available at www.pimcoetfs.com or by calling 1-888-400-4ETF.
Portfolio Insights
| » | The PIMCO 0-5 Year High Yield Corporate Bond Index Fund seeks to provide total return that closely corresponds, before fees and expenses, to the total return of The BofA Merrill Lynch 0-5 Year US High Yield Constrained IndexSM (the “Underlying Index”), by investing under normal circumstances at least 80% of its total assets (exclusive of collateral held from securities lending) in the component securities (“Component Securities”) of the Underlying Index. The Fund may invest the remainder of its assets in fixed-income instruments that are not Component Securities, but which PIMCO believes will help the Fund track its Underlying Index, as well as in cash and investment grade, liquid short-term instruments, forwards or derivatives, such as options, futures contracts or swap agreements, and shares of affiliated bond funds. |
| » | The Fund commenced operations on June 16, 2011. |
| » | Since the inception of the Fund, option-adjusted spreads in the short-term segment of the U.S. high yield market tightened while U.S. Treasury yields rose across the curve at all points except for the 3-month point. The net result was positive performance for the Fund and the Underlying Index since the Fund’s inception. |
| Annual Report | June 30, 2011 | 7 |
Table of Contents
PIMCO 1-3 Year U.S. Treasury Index Fund
| Ticker Symbol | TUZ |
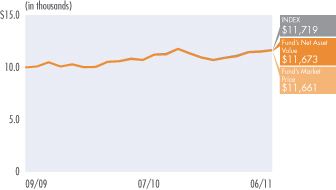
Cumulative Returns Through June 30, 2011
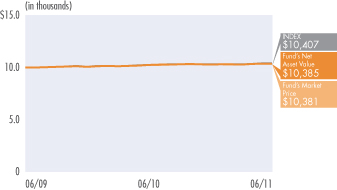
$10,000 invested at the end of the month when the Fund commenced operations.
Allocation Breakdown‡
| U.S. Treasury Obligations | 99.6% | |||
| Short-Term Instruments | 0.4% |
| ‡ | % of Total Investments as of 06/30/11 |
| Average Annual Total Return for the period ended June 30, 2011 | ||||||||||
| 1 Year | Fund Inception (06/01/2009) | |||||||||
| PIMCO 1-3 Year Treasury Index Fund (Based on Net Asset Value) | 1.26% | 1.80% | |||||||
| PIMCO 1-3 Year Treasury Index Fund (At Market Price)(1) | 1.24% | 1.80% | |||||||
| The BofA Merrill Lynch 1-3 Year U.S. Treasury IndexSM(2)(3) | 1.34% | 1.92% | |||||||
All Fund returns are net of fees and expenses.
Market returns do not include brokerage commissions that may be payable on secondary market transactions. If brokerage commissions were included, market returns would be lower. Market and NAV returns assume that dividends and capital gain distributions have been reinvested in the Fund at market price and NAV, respectively.
(1) The market price is determined using the midpoint between the highest bid and the lowest offer on the listing exchange, as of the time that the Fund’s NAV is calculated.
(2) The BofA Merrill Lynch 1-3 Year US Treasury IndexSM is an unmanaged index comprised of U.S. Treasury securities, other than inflation-protection securities and STRIPS, with at least $1 billion in outstanding face value and a remaining term to final maturity of at least one year and less than three years. It is not possible to invest directly in an unmanaged index.
(3) “BofA Merrill Lynch” and “The BofA Merrill Lynch 1-3 Year US Treasury IndexSM” are reprinted with permission. ©Copyright 2011 Merrill Lynch, Pierce, Fenner & Smith Incorporated (“BofA Merrill Lynch”). All rights reserved. “BofA Merrill Lynch” and “The BofA Merrill Lynch 1-3 Year US Treasury IndexSM” are service marks of BofA Merrill Lynch and/or its affiliates and have been licensed for use for certain purposes by PIMCO on behalf of the Fund that is based on the Index, and is not issued, sponsored, endorsed or promoted by BofA Merrill Lynch and/or BofA Merrill Lynch’s affiliates nor is BofA Merrill Lynch and/or BofA Merrill Lynch’s affiliates an adviser to the Fund. BofA Merrill Lynch and BofA Merrill Lynch’s affiliates make no representation, express or implied, regarding the advisability of investing in this product or the Index and do not guarantee the quality, accuracy or completeness of the Index, Index values or any Index related data included herein, provided herewith or derived therefrom and assume no liability in connection with their use. As the Index provider, BofA Merrill Lynch is licensing certain trademarks, the Index and trade names which are composed by BofA Merrill Lynch without regard to PIMCO, this product or any investor. BofA Merrill Lynch and BofA Merrill Lynch’s affiliates do not provide investment advice to the Fund and are not responsible for the performance of the Fund. BofA Merrill Lynch compiles and publishes the Index. PIMCO has entered into a license agreement with BofA Merrill Lynch to use the Index.
Performance quoted represents past performance. Past performance is not a guarantee or a reliable indicator of future results. Current performance may be lower or higher than performance shown. Investment return and principal value will fluctuate, so that Fund shares may be worth more or less than their original cost when redeemed by authorized participants. Returns shown do not reflect the deduction of taxes that a shareholder would pay on Fund distributions or on the redemption of Fund shares. The Fund’s total annual operating expense ratio as stated in the Fund’s current prospectus dated 10/29/10, as supplemented to date, is 0.15%. Details regarding any Fund’s operating expenses can be found in the Fund’s prospectus. Performance data current to the most recent month-end is available at www.pimcoetfs.com or by calling 1-888-400-4ETF.
Portfolio Insights
| » | The PIMCO 1-3 Year U.S. Treasury Index Fund seeks to provide total return that closely corresponds, before fees and expenses, to the total return of The BofA Merrill Lynch 1-3 Year US Treasury IndexSM (the “Underlying Index”), by investing under normal circumstances at least 80% of its total assets (exclusive of collateral held from securities lending) in the component securities of the Underlying Index. The Fund invests in a representative sample of securities included in the Underlying Index that collectively has an investment profile similar to the Underlying Index. Due to the use of representative sampling, the Fund may not hold all of the securities that are included in the Underlying Index. |
| » | Yields in the 1 to 3-year segment of the U.S. Treasury yield curve were down over the course of the reporting period. The overall decline in yields of underlying securities and coupon returns drove positive performance for both the Fund and the Underlying Index over the reporting period. |
| 8 | PIMCO ETF Trust |
Table of Contents
PIMCO 1-5 Year U.S. TIPS Index Fund
| Ticker Symbol | STPZ |
Cumulative Returns Through June 30, 2011
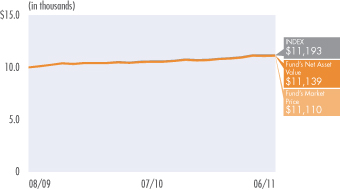
$10,000 invested at the end of the month when the Fund commenced operations.
Allocation Breakdown‡
| U.S. Treasury Obligations | 100.0% |
| ‡ | % of Total Investments as of 06/30/11 |
| Average Annual Total Return for the period ended June 30, 2011 | ||||||||||
| 1 Year | Fund Inception (08/20/2009) | |||||||||
| PIMCO 1-5 Year U.S. TIPS Index Fund (Based on Net Asset Value) | 5.70% | 5.85% | |||||||
| PIMCO 1-5 Year U.S. TIPS Index Fund (At Market Price)(1) | 5.70% | 5.87% | |||||||
| The BofA Merrill Lynch 1-5 Year U.S. Inflation-Linked Treasury IndexSM(2)(3) | 6.02% | 6.18% | |||||||
All Fund returns are net of fees and expenses.
Market returns do not include brokerage commissions that may be payable on secondary market transactions. If brokerage commissions were included, market returns would be lower. Market and NAV returns assume that dividends and capital gain distributions have been reinvested in the Fund at market price and NAV, respectively.
(1) The market price is determined using the midpoint between the highest bid and the lowest offer on the listing exchange, as of the time that the Fund’s NAV is calculated.
(2) The BofA Merrill Lynch 1-5 Year US Inflation-Linked Treasury IndexSM is an unmanaged index comprised of U.S. Treasury Inflation Protected Securities with at least $1 billion in outstanding face value and a remaining term to final maturity of at least 1 year and less than 5 years. It is not possible to invest directly in an unmanaged index.
(3) “BofA Merrill Lynch” and “The BofA Merrill Lynch 1-5 Year US Inflation-Linked Treasury IndexSM” are reprinted with permission. ©Copyright 2011 Merrill Lynch, Pierce, Fenner & Smith Incorporated (“BofA Merrill Lynch”). All rights reserved. “BofA Merrill Lynch” and “The BofA Merrill Lynch 1-5 Year US Inflation-Linked Treasury IndexSM” are service marks of BofA Merrill Lynch and/or its affiliates and have been licensed for use for certain purposes by PIMCO on behalf of the Fund that is based on the Index, and is not issued, sponsored, endorsed or promoted by BofA Merrill Lynch and/or BofA Merrill Lynch’s affiliates nor is BofA Merrill Lynch and/or BofA Merrill Lynch’s affiliates an adviser to the Fund. BofA Merrill Lynch and BofA Merrill Lynch’s affiliates make no representation, express or implied, regarding the advisability of investing in this product or the Index and do not guarantee the quality, accuracy or completeness of the Index, Index Values or any Index related data included herein, provided herewith or derived therefrom and assume no liability in connection with their use. As the Index provider, BofA Merrill Lynch is licensing certain trademarks, the underlying Index and trade names which are composed by BofA Merrill Lynch without regard to PIMCO, this product or any investor. BofA Merrill Lynch and BofA Merrill Lynch’s affiliates do not provide investment advice to PIMCO or the Fund and are not responsible for the performance of the Fund. BofA Merrill Lynch compiles and publishes the Index. PIMCO has entered into a license agreement with BofA Merrill Lynch to use the Index.
Performance quoted represents past performance. Past performance is not a guarantee or a reliable indicator of future results. Current performance may be lower or higher than performance shown. Investment return and principal value will fluctuate, so that Fund shares may be worth more or less than their original cost when redeemed by authorized participants. Returns shown do not reflect the deduction of taxes that a shareholder would pay on Fund distributions or on the redemption of Fund shares. The Fund’s total annual operating expense ratio as stated in the Fund’s current prospectus dated 10/29/10, as supplemented to date, is 0.20%. Details regarding any Fund’s operating expenses can be found in the Fund’s prospectus. Performance data current to the most recent month-end is available at www.pimcoetfs.com or by calling 1-888-400-4ETF.
Portfolio Insights
| » | The PIMCO 1-5 Year U.S. TIPS Index Fund seeks to provide total return that closely corresponds, before fees and expenses, to the total return of The BofA Merrill Lynch 1-5 Year US Inflation-Linked Treasury IndexSM (the “Underlying Index”), by investing under normal circumstances at least 80% of its total assets (exclusive of collateral held from securities lending) in the component securities of the Underlying Index. The Fund invests in a representative sample of securities included in the Underlying Index that collectively has an investment profile similar to the Underlying Index. Due to the use of representative sampling, the Fund may not hold all of the securities that are included in the Underlying Index. |
| » | Real yields, or the rates of return in excess of expected future inflation, declined across the 1 to 5-year segment of the U.S. Treasury Inflation Protected Securities (“TIPS”) yield curve, driving positive performance for both the Fund and the Underlying Index. A net positive inflation accrual, or change in the Consumer Price Index (“CPI”), applied to the principal of underlying securities over the reporting period also contributed positively to returns. |
| Annual Report | June 30, 2011 | 9 |
Table of Contents
PIMCO 3-7 Year U.S. Treasury Index Fund
| Ticker Symbol | FIVZ |
Cumulative Returns Through June 30, 2011
$10,000 invested at the end of the month when the Fund commenced operations.
Allocation Breakdown‡
| U.S. Treasury Obligations | 100.0% |
| ‡ | % of Total Investments as of 06/30/11 |
| Average Annual Total Return for the period ended June 30, 2011 | ||||||||||
| 1 Year | Fund Inception (10/30/2009) | |||||||||
| PIMCO 3-7 Year U.S. Treasury Index Fund (Based on Net Asset Value) | 3.49% | 5.02% | |||||||
| PIMCO 3-7 Year U.S. Treasury Index Fund (At Market Price)(1) | 3.47% | 5.00% | |||||||
| The BofA Merrill Lynch 3-7 Year U.S. Treasury IndexSM(2)(3) | 3.74% | 5.21% | |||||||
All Fund returns are net of fees and expenses.
Market returns do not include brokerage commissions that may be payable on secondary market transactions. If brokerage commissions were included, market returns would be lower. Market and NAV returns assume that dividends and capital gain distributions have been reinvested in the Fund at market price and NAV, respectively.
(1) The market price is determined using the midpoint between the highest bid and the lowest offer on the listing exchange, as of the time that the Fund’s NAV is calculated.
(2) The BofA Merrill Lynch 3-7 Year U.S. Treasury IndexSM is an unmanaged index comprised of U.S. dollar denominated sovereign debt securities publicly issued by the U.S. Treasury having a maturity of at least 3 years and less than 7 years. It is not possible to invest directly in an unmanaged index.
(3) “BofA Merrill Lynch” and “The BofA Merrill Lynch 3-7 Year US Treasury IndexSM” are reprinted with permission. ©Copyright 2011 Merrill Lynch, Pierce, Fenner & Smith Incorporated (“BofA Merrill Lynch”). All rights reserved. “BofA Merrill Lynch” and “The BofA Merrill Lynch 3-7 Year US Treasury IndexSM” are service marks of BofA Merrill Lynch and/or its affiliates and have been licensed for use for certain purposes by PIMCO on behalf of the Fund that is based on the Index, and is not issued, sponsored, endorsed or promoted by BofA Merrill Lynch and/or BofA Merrill Lynch’s affiliates nor is BofA Merrill Lynch and/or BofA Merrill Lynch’s affiliates an adviser to the Fund. BofA Merrill Lynch and BofA Merrill Lynch’s affiliates make no representation, express or implied, regarding the advisability of investing in this product or the Index and do not guarantee the quality, accuracy or completeness of the Index, Index Values or any Index related data included herein, provided herewith or derived therefrom and assume no liability in connection with their use. As the Index provider, BofA Merrill Lynch is licensing certain trademarks, the underlying Index and trade names which are composed by BofA Merrill Lynch without regard to PIMCO, this product or any investor. BofA Merrill Lynch and BofA Merrill Lynch’s affiliates do not provide investment advice to PIMCO or the Fund and are not responsible for the performance of the Fund. BofA Merrill Lynch compiles and publishes the Index. PIMCO has entered into a license agreement with BofA Merrill Lynch to use the Index.
Performance quoted represents past performance. Past performance is not a guarantee or a reliable indicator of future results. Current performance may be lower or higher than performance shown. Investment return and principal value will fluctuate, so that Fund shares may be worth more or less than their original cost when redeemed by authorized participants. Returns shown do not reflect the deduction of taxes that a shareholder would pay on Fund distributions or on the redemption of Fund shares. The Fund’s total annual operating expense ratio as stated in the Fund’s current prospectus dated 10/29/10, as supplemented to date, is 0.15%. Details regarding any Fund’s operating expenses can be found in the Fund’s prospectus. Performance data current to the most recent month-end is available at www.pimcoetfs.com or by calling 1-888-400-4ETF.
Portfolio Insights
| » | The PIMCO 3-7 Year U.S. Treasury Index Fund seeks to provide total return that closely corresponds, before fees and expenses, to the total return of The BofA Merrill Lynch 3-7 Year US Treasury IndexSM (the “Underlying Index”), by investing under normal circumstances at least 80% of its total assets (exclusive of collateral held from securities lending) in the component securities of the Underlying Index. The Fund invests in a representative sample of securities included in the Index that collectively has an investment profile similar to the Underlying Index. Due to the use of representative sampling, the Fund may not hold all of the securities that are included in the Underlying Index. |
| » | Yields in the 3 to 7-year segment of the U.S. Treasury yield curve were mixed over the course of the reporting period, with 3-year yields falling and 7-year yields rising. Five-year yields were down slightly. The overall decline in shorter-term yields of underlying securities and coupon returns drove positive performance for both the Fund and the Underlying Index over the reporting period. |
| 10 | PIMCO ETF Trust |
Table of Contents
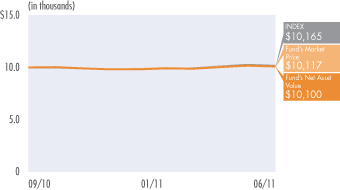
PIMCO 7-15 Year U.S. Treasury Index Fund
| Ticker Symbol | TENZ |
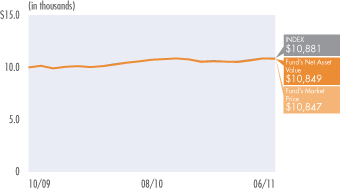
Cumulative Returns Through June 30, 2011
$10,000 invested at the end of the month when the Fund commenced operations.
Allocation Breakdown‡
| U.S. Treasury Obligations | 100.0% |
| ‡ | % of Total Investments as of 06/30/11 |
| Average Annual Total Return for the period ended June 30, 2011 | ||||||||||
| 1 Year | Fund Inception (09/10/2009) | |||||||||
| PIMCO 7-15 Year U.S. Treasury Index Fund (Based on Net Asset Value) | 3.00% | 5.84% | |||||||
| PIMCO 7-15 Year U.S. Treasury Index Fund (At Market Price)(1) | 2.91% | 5.85% | |||||||
| The BofA Merrill Lynch 7-15 Year U.S. Treasury IndexSM(2)(3) | 3.45% | 6.06% | |||||||
All Fund returns are net of fees and expenses.
Market returns do not include brokerage commissions that may be payable on secondary market transactions. If brokerage commissions were included, market returns would be lower. Market and NAV returns assume that dividends and capital gain distributions have been reinvested in the Fund at market price and NAV, respectively.
(1) The market price is determined using the midpoint between the highest bid and the lowest offer on the listing exchange, as of the time that the Fund’s NAV is calculated.
(2) The BofA Merrill Lynch 7-15 Year US Treasury IndexSM is an unmanaged index that tracks the performance of the direct Sovereign debt of the U.S. Government with at least $1 billion in outstanding face value and a remaining term to final maturity of at least 7 years and less than 15 years. It is not possible to invest directly in an unmanaged index.
(3) “BofA Merrill Lynch” and “The BofA Merrill Lynch 7-15 Year US Treasury IndexSM” are reprinted with permission. ©Copyright 2011 Merrill Lynch, Pierce, Fenner & Smith Incorporated (“BofA Merrill Lynch”). All rights reserved. “BofA Merrill Lynch” and “The BofA Merrill Lynch 7-15 Year US Treasury IndexSM” are service marks of BofA Merrill Lynch and/or its affiliates and have been licensed for use for certain purposes by PIMCO on behalf of the Fund that is based on the Index, and is not issued, sponsored, endorsed or promoted by BofA Merrill Lynch and/or BofA Merrill Lynch’s affiliates nor is BofA Merrill Lynch and/or BofA Merrill Lynch’s affiliates an adviser to the Fund. BofA Merrill Lynch and BofA Merrill Lynch’s affiliates make no representation, express or implied, regarding the advisability of investing in this product or the Index and do not guarantee the quality, accuracy or completeness of the Index, Index Values or any Index related data included herein, provided herewith or derived therefrom and assume no liability in connection with their use. As the Index provider, BofA Merrill Lynch is licensing certain trademarks, the underlying Index and trade names which are composed by BofA Merrill Lynch without regard to PIMCO, this product or any investor. BofA Merrill Lynch and BofA Merrill Lynch’s affiliates do not provide investment advice to PIMCO or the Fund and are not responsible for the performance of the Fund. BofA Merrill Lynch compiles and publishes the Index. PIMCO has entered into a license agreement with BofA Merrill Lynch to use the Index.
Performance quoted represents past performance. Past performance is not a guarantee or a reliable indicator of future results. Current performance may be lower or higher than performance shown. Investment return and principal value will fluctuate, so that Fund shares may be worth more or less than their original cost when redeemed by authorized participants. Returns shown do not reflect the deduction of taxes that a shareholder would pay on Fund distributions or on the redemption of Fund shares. The Fund’s total annual operating expense ratio as stated in the Fund’s current prospectus dated 10/29/10, as supplemented to date, is 0.15%. Details regarding any Fund’s operating expenses can be found in the Fund’s prospectus. Performance data current to the most recent month-end is available at www.pimcoetfs.com or by calling 1-888-400-4ETF.
Portfolio Insights
| » | The PIMCO 7-15 Year U.S. Treasury Index Fund seeks to provide total return that closely corresponds, before fees and expenses, to the total return of The BofA Merrill Lynch 7-15 Year US Treasury IndexSM (the “Underlying Index”), by investing under normal circumstances at least 80% of its total assets (exclusive of collateral held from securities lending) in the component securities of the Underlying Index. The Fund invests in a representative sample of securities included in the Underlying Index that collectively has an investment profile similar to the Underlying Index. Due to the use of representative sampling, the Fund may not hold all of the securities that are included in the Underlying Index. |
| » | Yields in the 7 to 15-year segment of the U.S. Treasury yield curve ended slightly higher relative to the beginning of the period. The overall rise in yields led to negative price performance for the Fund, but coupon returns left both the Fund and the Underlying Index with positive performance over the reporting period. |
| Annual Report | June 30, 2011 | 11 |
Table of Contents
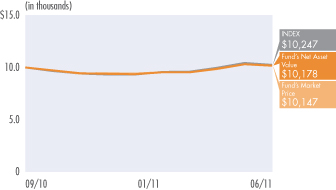
PIMCO 15+ Year U.S. TIPS Index Fund
| Ticker Symbol | LTPZ |
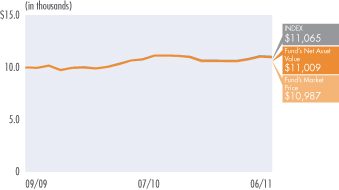
Cumulative Returns Through June 30, 2011
$10,000 invested at the end of the month when the Fund commenced operations.
Allocation Breakdown‡
| U.S. Treasury Obligations | 99.7% | |||
| Short-Term Instruments | 0.3% |
| ‡ | % of Total Investments as of 06/30/11 |
Average Annual Total Return for the period ended June 30, 2011 | ||||||||||
| 1 Year | Fund Inception (09/03/2009) | |||||||||
| PIMCO 15+ Year U.S. TIPS Index Fund (Based on Net Asset Value) | 7.58% | 10.20% | |||||||
| PIMCO 15+ Year U.S. TIPS Index Fund (At Market Price)(1) | 7.72% | 10.23% | |||||||
| The BofA Merrill Lynch 15+ Year U.S. Inflation-Linked Treasury IndexSM(2)(3) | 7.88% | 10.40% | |||||||
All Fund returns are net of fees and expenses.
Market returns do not include brokerage commissions that may be payable on secondary market transactions. If brokerage commissions were included, market returns would be lower. Market and NAV returns assume that dividends and capital gain distributions have been reinvested in the Fund at market price and NAV, respectively.
(1) The market price is determined using the midpoint between the highest bid and the lowest offer on the listing exchange, as of the time that the Fund’s NAV is calculated.
(2) The BofA Merrill Lynch 15+ Year US Inflation-Linked Treasury IndexSM is an unmanaged index comprised of U.S. Treasury Inflation Protected Securities with at least $1 billion in outstanding face value and a remaining term to final maturity greater than 15 years. It is not possible to invest directly in an unmanaged index.
(3) “BofA Merrill Lynch” and “The BofA Merrill Lynch 15+ Year US Inflation-Linked Treasury IndexSM” are reprinted with permission. ©Copyright 2011 Merrill Lynch, Pierce, Fenner & Smith Incorporated (“BofA Merrill Lynch”). All rights reserved. “BofA Merrill Lynch” and “The BofA Merrill Lynch 15+ Year US Inflation-Linked Treasury IndexSM” are service marks of BofA Merrill Lynch and/or its affiliates and have been licensed for use for certain purposes by PIMCO on behalf of the Fund that is based on the Index, and is not issued, sponsored, endorsed or promoted by BofA Merrill Lynch and/or BofA Merrill Lynch’s affiliates nor is BofA Merrill Lynch and/or BofA Merrill Lynch’s affiliates an adviser to the Fund. BofA Merrill Lynch and BofA Merrill Lynch’s affiliates make no representation, express or implied, regarding the advisability of investing in this product or the Index and do not guarantee the quality, accuracy or completeness of the Index, Index Values or any Index related data included herein, provided herewith or derived therefrom and assume no liability in connection with their use. As the Index provider, BofA Merrill Lynch is licensing certain trademarks, the underlying Index and trade names which are composed by BofA Merrill Lynch without regard to PIMCO, this product or any investor. BofA Merrill Lynch and BofA Merrill Lynch’s affiliates do not provide investment advice to PIMCO or the Fund and are not responsible for the performance of the Fund. BofA Merrill Lynch compiles and publishes the Index. PIMCO has entered into a license agreement with BofA Merrill Lynch to use the Index.
Performance quoted represents past performance. Past performance is not a guarantee or a reliable indicator of future results. Current performance may be lower or higher than performance shown. Investment return and principal value will fluctuate, so that Fund shares may be worth more or less than their original cost when redeemed by authorized participants. Returns shown do not reflect the deduction of taxes that a shareholder would pay on Fund distributions or on the redemption of Fund shares. The Fund’s total annual operating expense ratio as stated in the Fund’s current prospectus dated 10/29/10, as supplemented to date, is 0.20%. Details regarding any Fund’s operating expenses can be found in the Fund’s prospectus. Performance data current to the most recent month-end is available at www.pimcoetfs.com or by calling 1-888-400-4ETF.
Portfolio Insights
| » | The PIMCO 15+ Year U.S. TIPS Index Fund seeks to provide total return that closely corresponds, before fees and expenses, to the total return of The BofA Merrill Lynch 15+ Year US Inflation-Linked Treasury IndexSM (the “Underlying Index”), by investing under normal circumstances at least 80% of its total assets (exclusive of collateral held from securities lending) in the component securities of the Underlying Index. The Fund invests in a representative sample of securities included in the Underlying Index that collectively has an investment profile similar to the Underlying Index. Due to the use of representative sampling, the Fund may not hold all of the securities that are included in the Underlying Index. |
| » | Real yields, or the rates of return in excess of expected future inflation, declined across the U.S. Treasury Inflation Protected Securities (“TIPS”) yield curve for all maturities except for the 30-year point, driving positive performance for both the Fund and the Underlying Index. A net positive inflation accrual, or change in the Consumer Price Index (“CPI”), applied to the principal of underlying securities over the reporting period also contributed positively to returns. |
| 12 | PIMCO ETF Trust |
Table of Contents
PIMCO 25+ Year Zero Coupon U.S. Treasury Index Fund
| Ticker Symbol | ZROZ |
Cumulative Returns Through June 30, 2011
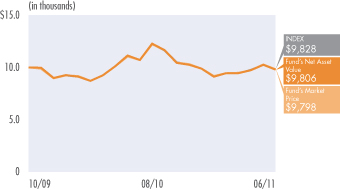
$10,000 invested at the end of the month when the Fund commenced operations.
Allocation Breakdown‡
| U.S. Treasury Obligations | 100.0% |
| ‡ | % of Total Investments as of 06/30/11 |
| Average Annual Total Return for the period ended June 30, 2011 | ||||||||||
| 1 Year | Fund Inception (10/30/2009) | |||||||||
| PIMCO 25+ Year Zero Coupon U.S. Treasury Index Fund (Based on Net Asset Value) | -11.69% | -1.17% | |||||||
| PIMCO 25+ Year Zero Coupon U.S. Treasury Index Fund (At Market Price)(1) | -12.08% | -1.21% | |||||||
| The BofA Merrill Lynch Long U.S. Treasury Principal STRIPS IndexSM(2)(3) | -11.22% | -1.03% | |||||||
All Fund returns are net of fees and expenses.
Market returns do not include brokerage commissions that may be payable on secondary market transactions. If brokerage commissions were included, market returns would be lower. Market and NAV returns assume that dividends and capital gain distributions have been reinvested in the Fund at market price and NAV, respectively.
(1) The market price is determined using the midpoint between the highest bid and the lowest offer on the listing exchange, as of the time that the Fund’s NAV is calculated.
(2) The BofA Merrill Lynch Long U.S. Treasury Principal STRIPS IndexSM is an unmanaged index comprised of long maturity Separate Trading of Registered Interest and Principal of Securities (“STRIPS”) representing the final principal payment of U.S. Treasury bonds. The principal STRIPS comprising the Underlying Index must have 25 years or more remaining term to final maturity and must be stripped from U.S. Treasury bonds having at least $1 billion in outstanding face value.
(3) “BofA Merrill Lynch” and “The BofA Merrill Lynch Long US Treasury Principal STRIPS IndexSM” are reprinted with permission. ©Copyright 2011 Merrill Lynch, Pierce, Fenner & Smith Incorporated (“BofA Merrill Lynch”). All rights reserved. “BofA Merrill Lynch” and “The BofA Merrill Lynch Long US Treasury Principal STRIPS IndexSM” are service marks of BofA Merrill Lynch and/or its affiliates and have been licensed for use for certain purposes by PIMCO on behalf of the Fund that is based on the Index, and is not issued, sponsored, endorsed or promoted by BofA Merrill Lynch and/or BofA Merrill Lynch’s affiliates nor is BofA Merrill Lynch and/or BofA Merrill Lynch’s affiliates an adviser to the Fund. BofA Merrill Lynch and BofA Merrill Lynch’s affiliates make no representation, express or implied, regarding the advisability of investing in this product or the Index and do not guarantee the quality, accuracy or completeness of the Index, Index Values or any Index related data included herein, provided herewith or derived therefrom and assume no liability in connection with their use. As the Index provider, BofA Merrill Lynch is licensing certain trademarks, the underlying Index and trade names which are composed by BofA Merrill Lynch without regard to PIMCO, this product or any investor. BofA Merrill Lynch and BofA Merrill Lynch’s affiliates do not provide investment advice to PIMCO or the Fund and are not responsible for the performance of the Fund. BofA Merrill Lynch compiles and publishes the Index. PIMCO has entered into a license agreement with BofA Merrill Lynch to use the Index.
Performance quoted represents past performance. Past performance is not a guarantee or a reliable indicator of future results. Current performance may be lower or higher than performance shown. Investment return and principal value will fluctuate, so that Fund shares may be worth more or less than their original cost when redeemed by authorized participants. Returns shown do not reflect the deduction of taxes that a shareholder would pay on Fund distributions or on the redemption of Fund shares. The Fund’s total annual operating expense ratio as stated in the Fund’s current prospectus dated 10/29/10, as supplemented to date, is 0.15%. Details regarding any Fund’s operating expenses can be found in the Fund’s prospectus. Performance data current to the most recent month-end is available at www.pimcoetfs.com or by calling 1-888-400-4ETF.
Portfolio Insights
| » | The PIMCO 25+ Year Zero Coupon U.S. Treasury Index Fund seeks to provide total return that closely corresponds, before fees and expenses, to the total return of The BofA Merrill Lynch Long US Treasury Principal STRIPS IndexSM (the “Underlying Index”), by investing under normal circumstances at least 80% of its total assets (exclusive of collateral held from securities lending) in the component securities of the Underlying Index. The Fund invests in a representative sample of securities included in the Underlying Index that collectively has an investment profile similar to the Underlying Index. Due to the use of representative sampling, the Fund may not hold all of the securities that are included in the Underlying Index. |
| » | Yields in the 25+ year segment of the U.S. Treasury STRIPS yield curve rose and fell over the reporting period, yet ended up slightly higher. The rise in yields drove negative performance for the Fund and the Underlying Index over the course of the reporting period. |
| Annual Report | June 30, 2011 | 13 |
Table of Contents
PIMCO Broad U.S. TIPS Index Fund
| Ticker Symbol | TIPZ |
Cumulative Returns Through June 30, 2011
$10,000 invested at the end of the month when the Fund commenced operations.
Allocation Breakdown‡
| U.S. Treasury Obligations | 100.0% |
| ‡ | % of Total Investments as of 06/30/11 |
| Average Annual Total Return for the period ended June 30, 2011 | ||||||||||
| 1 Year | Fund Inception (09/03/2009) | |||||||||
| PIMCO Broad U.S. TIPS Index Fund (Based on Net Asset Value) | 7.39% | 8.42% | |||||||
| PIMCO Broad U.S. TIPS Index Fund (At Market Price)(1) | 7.39% | 8.46% | |||||||
| The BofA Merrill Lynch U.S. Inflation-Linked Treasury IndexSM(2)(3) | 7.68% | 8.64% | |||||||
All Fund returns are net of fees and expenses.
Market returns do not include brokerage commissions that may be payable on secondary market transactions. If brokerage commissions were included, market returns would be lower. Market and NAV returns assume that dividends and capital gain distributions have been reinvested in the Fund at market price and NAV, respectively.
(1) The market price is determined using the midpoint between the highest bid and the lowest offer on the listing exchange, as of the time that the Fund’s NAV is calculated.
(2) The BofA Merrill Lynch US Inflation-Linked Treasury IndexSM is an unmanaged index comprised of U.S. Treasury Inflation Protected Securities with at least $1 billion in outstanding face value. It is not possible to invest directly in an unmanaged index.
(3) “BofA Merrill Lynch” and “The BofA Merrill Lynch US Inflation-Linked Treasury IndexSM” are reprinted with permission. ©Copyright 2011 Merrill Lynch, Pierce, Fenner & Smith Incorporated (“BofA Merrill Lynch”). All rights reserved. “BofA Merrill Lynch” and “The BofA Merrill Lynch US Inflation-Linked Treasury IndexSM” are service marks of BofA Merrill Lynch and/or its affiliates and have been licensed for use for certain purposes by PIMCO on behalf of the Fund that is based on the Index, and is not issued, sponsored, endorsed or promoted by BofA Merrill Lynch and/or BofA Merrill Lynch’s affiliates nor is BofA Merrill Lynch and/or BofA Merrill Lynch’s affiliates an adviser to the Fund. BofA Merrill Lynch and BofA Merrill Lynch’s affiliates make no representation, express or implied, regarding the advisability of investing in this product or the Index and do not guarantee the quality, accuracy or completeness of the Index, Index Values or any Index related data included herein, provided herewith or derived therefrom and assume no liability in connection with their use. As the Index provider, BofA Merrill Lynch is licensing certain trademarks, the underlying Index and trade names which are composed by BofA Merrill Lynch without regard to PIMCO, this product or any investor. BofA Merrill Lynch and BofA Merrill Lynch’s affiliates do not provide investment advice to PIMCO or the Fund and are not responsible for the performance of the Fund. BofA Merrill Lynch compiles and publishes the Index. PIMCO has entered into a license agreement with BofA Merrill Lynch to use the Index.
Performance quoted represents past performance. Past performance is not a guarantee or a reliable indicator of future results. Current performance may be lower or higher than performance shown. Investment return and principal value will fluctuate, so that Fund shares may be worth more or less than their original cost when redeemed by authorized participants. Returns shown do not reflect the deduction of taxes that a shareholder would pay on Fund distributions or on the redemption of Fund shares. The Fund’s total annual operating expense ratio as stated in the Fund’s current prospectus dated 10/29/10, as supplemented to date, is 0.20%. Details regarding any Fund’s operating expenses can be found in the Fund’s prospectus. Performance data current to the most recent month-end is available at www.pimcoetfs.com or by calling 1-888-400-4ETF.
Portfolio Insights
| » | The PIMCO Broad U.S. TIPS Index Fund seeks to provide total return that closely corresponds, before fees and expenses, to the total return of The BofA Merrill Lynch US Inflation-Linked Treasury IndexSM (the “Underlying Index”), by investing under normal circumstances at least 80% of its total assets (exclusive of collateral held from securities lending) in the component securities of the Underlying Index. The Fund invests in a representative sample of securities included in the Underlying Index that collectively has an investment profile similar to the Underlying Index. Due to the use of representative sampling, the Fund may not hold all of the securities that are included in the Underlying Index. |
| » | Real yields, or the rates of return in excess of expected future inflation, declined across the U.S. Treasury Inflation Protected Securities (“TIPS”) yield curve for all maturities except for the 30-year point, driving positive performance for both the Fund and the Underlying Index. A net positive inflation accrual, or change in the Consumer Price Index (“CPI”), applied to the principal of underlying securities over the reporting period also contributed positively to returns. |
| 14 | PIMCO ETF Trust |
Table of Contents
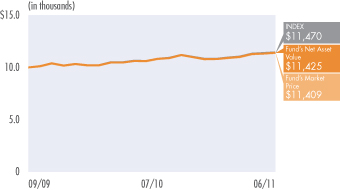
PIMCO Broad U.S. Treasury Index Fund
| Ticker Symbol | TRSY |
Cumulative Returns Through June 30, 2011
$10,000 invested at the end of the month when the Fund commenced operations.
Allocation Breakdown‡
| U.S. Treasury Obligations | 100.0% |
| ‡ | % of Total Investments as of 06/30/11 |
| Cumulative Total Return for the period ended June 30, 2011 | ||||||
| Fund Inception (10/29/2010) | ||||||
| PIMCO Broad U.S. Treasury Index Fund (Based on Net Asset Value) | -0.98% | ||||
| PIMCO Broad U.S. Treasury Index Fund (At Market Price)(1) | -0.77% | ||||
| The BofA Merrill Lynch Liquid US Treasury IndexSM(2)(3) | -0.78% | ||||
All Fund returns are net of fees and expenses.
Market returns do not include brokerage commissions that may be payable on secondary market transactions. If brokerage commissions were included, market returns would be lower. Market and NAV returns assume that dividends and capital gain distributions have been reinvested in the Fund at market price and NAV, respectively.
(1) The market price is determined using the midpoint between the highest bid and the lowest offer on the listing exchange, as of the time that the Fund’s NAV is calculated.
(2) The BofA Merrill Lynch Liquid US Treasury IndexSM is an unmanaged index that tracks the performance of the three most recently issued 2-year, 3- year, 5-year, 7-year, 10-year and 30-year U.S. Treasury notes and bonds. It is not possible to invest directly in an unmanaged index.
(3) “BofA Merrill Lynch” and “The BofA Merrill Lynch Liquid US Treasury IndexSM” are reprinted with permission. ©Copyright 2011 Merrill Lynch, Pierce, Fenner & Smith Incorporated (“BofA Merrill Lynch”). All rights reserved. “BofA Merrill Lynch” and “The BofA Merrill Lynch Liquid US Treasury IndexSM” are service marks of BofA Merrill Lynch and/or its affiliates and have been licensed for use for certain purposes by PIMCO on behalf of the Fund that is based on the Index, and is not issued, sponsored, endorsed or promoted by BofA Merrill Lynch and/or BofA Merrill Lynch’s affiliates nor is BofA Merrill Lynch and/or BofA Merrill Lynch’s affiliates an adviser to the Fund. BofA Merrill Lynch and BofA Merrill Lynch’s affiliates make no representation, express or implied, regarding the advisability of investing in this product or the Index and do not guarantee the quality, accuracy or completeness of the Index, Index values or any Index related data included herein, provided herewith or derived therefrom and assume no liability in connection with their use. As the Index provider, BofA Merrill Lynch is licensing certain trademarks, the Index and trade names which are composed by BofA Merrill Lynch without regard to PIMCO, this product or any investor. BofA Merrill Lynch and BofA Merrill Lynch’s affiliates do not provide investment advice to the Fund and are not responsible for the performance of the Fund. BofA Merrill Lynch compiles and publishes the Index. PIMCO has entered into a license agreement with BofA Merrill Lynch to use the Index.
Performance quoted represents past performance. Past performance is not a guarantee or a reliable indicator of future results. Current performance may be lower or higher than performance shown. Investment return and principal value will fluctuate, so that Fund shares may be worth more or less than their original cost when redeemed by authorized participants. Returns shown do not reflect the deduction of taxes that a shareholder would pay on Fund distributions or on the redemption of Fund shares. The Fund’s total annual operating expense ratio as stated in the Fund’s current prospectus dated 10/29/10, as supplemented to date, is 0.25%. Details regarding any Fund’s operating expenses can be found in the Fund’s prospectus. Performance data current to the most recent month-end is available at www.pimcoetfs.com or by calling 1-888-400-4ETF.
Portfolio Insights
| » | The PIMCO Broad U.S. Treasury Index Fund seeks to provide total return that closely corresponds, before fees and expenses, to the total return of The BofA Merrill Lynch Liquid US Treasury IndexSM (the “Underlying Index”), by investing under normal circumstances at least 80% of its total assets (exclusive of collateral held from securities lending) in the component securities of the Underlying Index. The Fund may invest the remainder of its assets in fixed-income instruments that are not component securities, but which PIMCO believes will help the Fund track its Underlying Index, as well as in cash and investment grade, liquid short-term instruments, forwards or derivatives, such as options, futures contracts or swap agreements, and shares of affiliated bond funds. |
| » | The Fund commenced operations on October 29, 2010. |
| » | For the period since the Fund’s inception through the end of the reporting period, shorter-term yields fell while longer term yields rose. The net result was negative performance for both the Fund and the Underlying Index since the Fund’s inception. |
| Annual Report | June 30, 2011 | 15 |
Table of Contents
PIMCO Investment Grade Corporate Bond Index Fund
| Ticker Symbol | CORP |
Cumulative Returns Through June 30, 2011
$10,000 invested at the end of the month when the Fund commenced operations.
Allocation Breakdown‡
| Industrials | 46.6% | |||
| Banking & Finance | 40.1% | |||
| Utilities | 11.2% | |||
| Short-Term Instruments | 2.1% |
| ‡ | % of Total Investments as of 06/30/11 |
| Cumulative Total Return for the period ended June 30, 2011 | ||||||
| Fund Inception (09/20/2010) | ||||||
| PIMCO Investment Grade Corporate Bond Index Fund (Based on Net Asset Value) | 2.40% | ||||
| PIMCO Investment Grade Corporate Bond Index Fund (At Market Price)(1) | 2.41% | ||||
| The BofA Merrill Lynch US Corporate IndexSM(2)(3) | 2.81% | ||||
All Fund returns are net of fees and expenses.
Market returns do not include brokerage commissions that may be payable on secondary market transactions. If brokerage commissions were included, market returns would be lower. Market and NAV returns assume that dividends and capital gain distributions have been reinvested in the Fund at market price and NAV, respectively.
(1) The market price is determined using the midpoint between the highest bid and the lowest offer on the listing exchange, as of the time that the Fund’s NAV is calculated.
(2) The BofA Merrill Lynch US Corporate IndexSM is an unmanaged index comprised of U.S. dollar denominated investment grade, fixed rate corporate debt securities publicly issued in the U.S. domestic market with at least one year remaining term to final maturity and at least $250 million outstanding. It is not possible to invest directly in an unmanaged index.
(3) “BofA Merrill Lynch” and “The BofA Merrill Lynch US Corporate IndexSM” are reprinted with permission. ©Copyright 2011 Merrill Lynch, Pierce, Fenner & Smith Incorporated (“BofA Merrill Lynch”). All rights reserved. “BofA Merrill Lynch” and “The BofA Merrill Lynch US Corporate IndexSM” are service marks of BofA Merrill Lynch and/or its affiliates and have been licensed for use for certain purposes by PIMCO on behalf of the Fund that is based on the Index, and is not issued, sponsored, endorsed or promoted by BofA Merrill Lynch and/or BofA Merrill Lynch’s affiliates nor is BofA Merrill Lynch and/or BofA Merrill Lynch’s affiliates an adviser to the Fund. BofA Merrill Lynch and BofA Merrill Lynch’s affiliates make no representation, express or implied, regarding the advisability of investing in this product or the Index and do not guarantee the quality, accuracy or completeness of the Index, Index values or any Index related data included herein, provided herewith or derived therefrom and assume no liability in connection with their use. As the Index provider, BofA Merrill Lynch is licensing certain trademarks, the Index and trade names which are composed by BofA Merrill Lynch without regard to PIMCO, this product or any investor. BofA Merrill Lynch and BofA Merrill Lynch’s affiliates do not provide investment advice to the Fund and are not responsible for the performance of the Fund. BofA Merrill Lynch compiles and publishes the Index. PIMCO has entered into a license agreement with BofA Merrill Lynch to use the Index.
Performance quoted represents past performance. Past performance is not a guarantee or a reliable indicator of future results. Current performance may be lower or higher than performance shown. Investment return and principal value will fluctuate, so that Fund shares may be worth more or less than their original cost when redeemed by authorized participants. Returns shown do not reflect the deduction of taxes that a shareholder would pay on Fund distributions or on the redemption of Fund shares. The Fund’s total annual operating expense ratio as stated in the Fund’s current prospectus dated 10/29/10, as supplemented to date, is 0.32%. Details regarding any Fund’s operating expenses can be found in the Fund’s prospectus. Performance data current to the most recent month-end is available at www.pimcoetfs.com or by calling 1-888-400-4ETF.
Portfolio Insights
| » | The PIMCO Investment Grade Corporate Bond Index Fund seeks to provide total return that closely corresponds, before fees and expenses, to the total return of The BofA Merrill Lynch US Corporate IndexSM (the “Underlying Index”), by investing under normal circumstances at least 80% of its total assets (exclusive of collateral held from securities lending) in the component securities of the Underlying Index. The Fund may invest the remainder of its assets in fixed-income instruments that are not component securities, but which PIMCO believes will help the Fund track its Underlying Index, as well as in cash and investment grade, liquid short-term instruments, forwards or derivatives, such as options, futures contracts or swap agreements, and shares of affiliated bond funds. |
| » | The Fund commenced operations on September 20, 2010. |
| » | A tightening of option-adjusted spreads offset a steepening of the U.S. Treasury yield curve and an overall increase in yields, driving positive performance for both the Fund and the Underlying Index since the Fund’s inception. |
| 16 | PIMCO ETF Trust |
Table of Contents
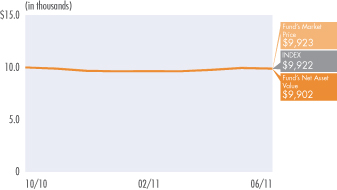
PIMCO Build America Bond Strategy Fund
| Ticker Symbol | BABZ |
Cumulative Returns Through June 30, 2011
$10,000 invested at the end of the month when the Fund commenced operations.
Allocation Breakdown‡
| California | 49.0% | |||
| New York | 12.5% | |||
| Texas | 9.5% | |||
| Illinois | 9.2% | |||
| Ohio | 5.9% | |||
| Other | 13.9% |
| ‡ | % of Total Investments as of 06/30/11 |
Cumulative Total Return for the period ended June 30, 2011 | ||||||
| Fund Inception (09/20/2010) | ||||||
| PIMCO Build America Bond Strategy Fund (Based on Net Asset Value) | 2.93% | ||||
| PIMCO Build America Bond Strategy Fund (At Market Price)(1) | 2.40% | ||||
| Barclays Capital Build America Bond Index(2) | 4.30% | ||||
All Fund returns are net of fees and expenses.
Market returns do not include brokerage commissions that may be payable on secondary market transactions. If brokerage commissions were included, market returns would be lower. Market and NAV returns assume that dividends and capital gain distributions have been reinvested in the Fund at market price and NAV, respectively.
(1)The market price is determined using the midpoint between the highest bid and the lowest offer on the listing exchange, as of the time that the Fund’s NAV is calculated.
(2)Barclays Capital Build America Bond Index is a subset of the Barclays Capital Taxable Municipal Bond Index. The sub-Index consists of all direct pay Build America Bonds that satisfy the rules of the Barclays Capital Taxable Municipal Bond Index. The Barclays Capital Taxable Municipal Bond Index represents securities that are SEC-registered, taxable, dollar denominated, and have at least one year to final maturity, at least $250 million par amount outstanding and are determined to be investment-grade by Barclays Capital. It is not possible to invest directly in an unmanaged index.
Performance quoted represents past performance. Past performance is not a guarantee or a reliable indicator of future results. Current performance may be lower or higher than performance shown. Investment return and principal value will fluctuate, so that Fund shares may be worth more or less than their original cost when redeemed by authorized participants. Returns shown do not reflect the deduction of taxes that a shareholder would pay on Fund distributions or on the redemption of Fund shares. The Fund’s total annual operating expense ratio as stated in the Fund’s current prospectus dated 10/29/10, as supplemented to date, is 0.57%. Details regarding any Fund’s operating expenses can be found in the Fund’s prospectus. Performance data current to the most recent month-end is available at www.pimcoetfs.com or by calling 1-888-400-4ETF.
Portfolio Insights
| » | The PIMCO Build America Bond Strategy Fund seeks maximum income, consistent with preservation of capital, by investing under normal circumstances at least 80% of its assets in taxable municipal debt securities publicly issued under the Build America Bond program. |
| » | The Fund commenced operations on September 20, 2010. |
| » | As of June 30, 2011, the Fund’s 30 Day SEC yield1 was 5.82% while the estimated yield to maturity2 was 4.65%. |
| » | An emphasis on transportation sector municipal bonds resulted in lower than benchmark returns as these bonds underperformed, while exposure to general obligation municipal bonds was positive for returns as this sector outperformed over the reporting period. |
| » | Build America Bonds (“BABs”) outperformed the Barclays Capital Long U.S. Credit Index as new issue supply was eliminated mid-way through the reporting period, with expiration of the BABs program on December 31, 2010. |
1 The 30 Day SEC Yield is a standard yield calculation developed by the Securities and Exchange Commission (“SEC”) that allows for fairer comparisons among bond funds. It is based on the most recent 30-day period covered by the Fund’s filings with the SEC. The yield figure reflects the dividends and interest earned during the period, after the deduction of the Fund’s expenses.
2 The Yield to Maturity (“YTM”) is the rate of return anticipated on a bond if it is held until the maturity date. The calculation of YTM takes into account the current market price, par value, coupon interest rate and time to maturity. PIMCO calculates a Fund’s Estimated YTM by averaging the YTM of each security held in the Fund on a market weighted basis by selecting each security’s YTM from PIMCO’s analytics database or from Bloomberg. A Fund’s estimated YTM may differ from its distribution yield or SEC yield due to a number of factors, including unsettled trades and Fund expenses.
| Annual Report | June 30, 2011 | 17 |
Table of Contents
PIMCO Enhanced Short Maturity Strategy Fund
| Ticker Symbol | MINT |
Cumulative Returns Through June 30, 2011
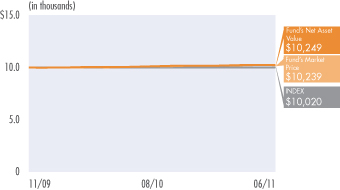
$10,000 invested at the end of the month when the Fund commenced operations.
Allocation Breakdown‡
| Corporate Bonds & Notes | 63.5% | |||
| Short-Term Instruments | 13.1% | |||
| U.S. Government Agencies | 12.7% | |||
| Asset-Backed Securities | 5.0% | |||
| Sovereign Issues | 3.5% | |||
| Other | 2.2% |
| ‡ | % of Total Investments as of 06/30/11 |
Average Annual Total Return for the period ended June 30, 2011 | ||||||||||
| 1 Year | Fund Inception (11/16/2009) | |||||||||
| PIMCO Enhanced Short Maturity Strategy Fund (Based on Net Asset Value) | 1.89% | 1.59% | |||||||
| PIMCO Enhanced Short Maturity Strategy Fund (At Market Price)(1) | 1.91% | 1.60% | |||||||
| Citigroup 3-Month Treasury Bill Index(2) | 0.14% | 0.12% | * | ||||||
All Fund returns are net of fees and expenses.
* Average annual total return since 11/30/2009.
Market returns do not include brokerage commissions that may be payable on secondary market transactions. If brokerage commissions were included, market returns would be lower. Market and NAV returns assume that dividends and capital gain distributions have been reinvested in the Fund at market price and NAV, respectively.
(1) The market price is determined using the midpoint between the highest bid and the lowest offer on the listing exchange, as of the time that the Fund’s NAV is calculated.
(2) Citigroup 3-Month Treasury Bill Index is an unmanaged index representing monthly return equivalents of yield averages of the last 3 month Treasury Bill issues. It is not possible to invest directly in an unmanaged index.
Performance quoted represents past performance. Past performance is not a guarantee or a reliable indicator of future results. Current performance may be lower or higher than performance shown. Investment return and principal value will fluctuate, so that Fund shares may be worth more or less than their original cost when redeemed by authorized participants. Returns shown do not reflect the deduction of taxes that a shareholder would pay on Fund distributions or on the redemption of Fund shares. The Fund’s total annual operating expense ratio as stated in the Fund’s current prospectus dated 10/29/10, as supplemented to date, is 0.35%. Details regarding any Fund’s operating expenses can be found in the Fund’s prospectus. Performance data current to the most recent month-end is available at www.pimcoetfs.com or by calling 1-888-400-4ETF.
Portfolio Insights
| » | The PIMCO Enhanced Short Maturity Strategy Fund seeks maximum current income, consistent with preservation of capital and daily liquidity, by investing under normal circumstances at least 65% of its total assets in a diversified portfolio of fixed income instruments of varying maturities, which may be represented by forwards. |
| » | As of June 30, 2011, the Fund’s 30 Day SEC yield1 was 0.76% while the estimated yield to maturity2 was 1.22% |
| » | Above benchmark U.S. duration (or sensitivity to changes in market interest rates) was positive for returns as short-term interest rates moved lower across the yield curve. |
| » | The Fund’s exposure to U.S. Agency mortgage-backed securities was positive for performance as the sector posted strong returns over the reporting period. |
| » | Exposure to the corporate sector added to returns as the sector posted strong performance over the reporting period. |
1 The 30 Day SEC Yield is a standard yield calculation developed by the Securities and Exchange Commission (“SEC”) that allows for fairer comparisons among bond funds. It is based on the most recent 30-day period covered by the Fund’s filings with the SEC. The yield figure reflects the dividends and interest earned during the period, after the deduction of the Fund’s expenses.
2 The Yield to Maturity (“YTM”) is the rate of return anticipated on a bond if it is held until the maturity date. The calculation of YTM takes into account the current market price, par value, coupon interest rate and time to maturity. PIMCO calculates a Fund’s Estimated YTM by averaging the YTM of each security held in the Fund on a market weighted basis by selecting each security’s YTM from PIMCO’s analytics database or from Bloomberg. A Fund’s estimated YTM may differ from its distribution yield or SEC yield due to a number of factors, including unsettled trades and Fund expenses.
| 18 | PIMCO ETF Trust |
Table of Contents
PIMCO Intermediate Municipal Bond Strategy Fund
| Ticker Symbol | MUNI |
Cumulative Returns Through June 30, 2011
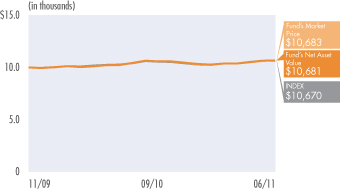
$10,000 invested at the end of the month when the Fund commenced operations.
Allocation Breakdown‡
| California | 21.9% | |||
| New York | 17.5% | |||
| Illinois | 9.3% | |||
| Florida | 6.4% | |||
| Texas | 5.3% | |||
| Other | 39.6% |
| ‡ | % of Total Investments as of 06/30/11 |
| Average Annual Total Return for the period ended June 30, 2011 | ||||||||||
| 1 Year | Fund Inception (11/30/2009) | |||||||||
| PIMCO Intermediate Municipal Bond Strategy Fund (Based on Net Asset Value) | 4.20% | 4.25% | |||||||
| PIMCO Intermediate Municipal Bond Strategy Fund (At Market Price)(1) | 4.34% | 4.27% | |||||||
| Barclays Capital 1-15 Year Municipal Bond Index(2) | 3.77% | 4.18% | |||||||
All Fund returns are net of fees and expenses.
Market returns do not include brokerage commissions that may be payable on secondary market transactions. If brokerage commissions were included, market returns would be lower. Market and NAV returns assume that dividends and capital gain distributions have been reinvested in the Fund at market price and NAV, respectively.
(1) The market price is determined using the midpoint between the highest bid and the lowest offer on the listing exchange, as of the time that the Fund’s NAV is calculated.
(2) Barclays Capital 1-15 Year Municipal Bond Index consists of a broad selection of investment grade general obligation and revenue bonds of maturities ranging from one year to 17 years. It is an unmanaged index representative of the taxexempt bond market. It is not possible to invest directly in an unmanaged index.
Performance quoted represents past performance. Past performance is not a guarantee or a reliable indicator of future results. Current performance may be lower or higher than performance shown. Investment return and principal value will fluctuate, so that Fund shares may be worth more or less than their original cost when redeemed by authorized participants. Returns shown do not reflect the deduction of taxes that a shareholder would pay on Fund distributions or on the redemption of Fund shares. The Fund’s total annual operating expense ratio as stated in the Fund’s current prospectus dated 10/29/10, as supplemented to date, is 0.35%. Details regarding any Fund’s operating expenses can be found in the Fund’s prospectus. Performance data current to the most recent month-end is available at www.pimcoetfs.com or by calling 1-888-400-4ETF.
Portfolio Insights
| » | The PIMCO Intermediate Municipal Bond Strategy Fund seeks attractive tax-exempt income, consistent with preservation of capital, by investing under normal circumstances at least 80% of its total assets in a diversified portfolio of debt securities whose interest is, in the opinion of bond counsel for the issuer at the time of issuance, exempt from federal income tax. |
| » | The Fund’s 30 Day SEC Yield1 after fees for June 30, 2011 was 1.89%. The yield was 2.91% on a fully tax adjusted basis assuming a federal tax rate of 35.0%, or 2.10% assuming a federal tax rate of 10.0%. Your tax adjusted yield may differ depending on your tax bracket. |
| » | The portfolio was structured with a higher quality and lower risk than its benchmark. Duration (or sensitivity to changes in market interest rates) was generally managed below the benchmark throughout the reporting period, which resulted in underperformance relative to the benchmark, as municipal bond yields generally moved lower over the reporting period. |
| » | An emphasis on dedicated revenue municipal bonds versus general obligation municipal bonds resulted in lower than benchmark returns as revenue municipal bonds underperformed general obligation municipal bonds over the reporting period. |
| » | Exposure to healthcare and corporate-backed municipal bonds resulted in lower than benchmark returns as these sectors underperformed over the reporting period. |
| » | Exposure to the water and sewer and power municipal bond sectors was positive for returns as these sectors outperformed over the reporting period. |
1 The 30 Day SEC Yield is a standard yield calculation developed by the Securities and Exchange Commission (“SEC”) that allows for fairer comparisons among bond funds. It is based on the most recent 30-day period covered by the Fund’s filings with the SEC. The yield figure reflects the dividends and interest earned during the period, after the deduction of the Fund’s expenses.
| Annual Report | June 30, 2011 | 19 |
Table of Contents
PIMCO Short Term Municipal Bond Strategy Fund
| Ticker Symbol | SMMU |
Cumulative Returns Through June 30, 2011
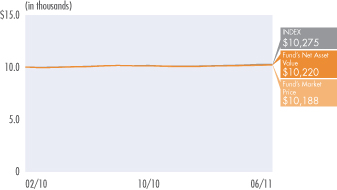
$10,000 invested at the end of the month when the Fund commenced operations.
Allocation Breakdown‡
| California | 21.4 | % | ||
| New York | 15.2 | % | ||
| Illinois | 12.9 | % | ||
| Texas | 5.3 | % | ||
| Other | 45.2 | % |
| ‡ | % of Total Investments as of 06/30/11 |
| Average Annual Total Return for the period ended June 30, 2011 | ||||||||||
| 1 Year | Fund Inception (02/01/2010) | |||||||||
| PIMCO Short Term Municipal Bond Strategy Fund (Based on Net Asset Value) | 1.67% | 1.69% | |||||||
| PIMCO Short Term Municipal Bond Strategy Fund (At Market Price)(1) | 1.41% | 1.50% | |||||||
| Barclays Capital 1-3 Year Municipal Bond Index(2) | 2.06% | 2.17% | |||||||
All Fund returns are net of fees and expenses.
Market returns do not include brokerage commissions that may be payable on secondary market transactions. If brokerage commissions were included, market returns would be lower. Market and NAV returns assume that dividends and capital gain distributions have been reinvested in the Fund at market price and NAV, respectively.
(1) The market price is determined using the midpoint between the highest bid and the lowest offer on the listing exchange, as of the time that the Fund’s NAV is calculated.
(2) Barclays Capital 1-3 Year Municipal Bond Index consists of a broad selection of investment grade general obligation and revenue bonds of maturities ranging from one year to four years. It is an unmanaged index representative of the tax exempt bond market. It is not possible to invest directly in an unmanaged index.
Performance quoted represents past performance. Past performance is not a guarantee or a reliable indicator of future results. Current performance may be lower or higher than performance shown. Investment return and principal value will fluctuate, so that Fund shares may be worth more or less than their original cost when redeemed by authorized participants. Returns shown do not reflect the deduction of taxes that a shareholder would pay on Fund distributions or on the redemption of Fund shares. The Fund’s total annual operating expense ratio as stated in the Fund’s current prospectus dated 10/29/10, as supplemented to date, is 0.35%. Details regarding any Fund’s operating expenses can be found in the Fund’s prospectus. Performance data current to the most recent month-end is available at www.pimcoetfs.com or by calling 1-888-400-4ETF.
Portfolio Insights
| » | The PIMCO Short Term Municipal Bond Strategy Fund seeks attractive tax-exempt income, consistent with preservation of capital, by investing under normal circumstances at least 80% of its total assets in a diversified portfolio of debt securities whose interest is, in the opinion of bond counsel for the issuer at the time of issuance, exempt from federal income tax. |
| » | The Fund’s 30 Day SEC Yield1 after fees for June 30, 2011 was 0.82%. The yield was 1.26% on a fully tax adjusted basis assuming a federal tax rate of 35.0%, or 0.91% assuming a federal tax rate of 10.0%. Your tax adjusted yield may differ depending on your tax bracket. |
| » | An emphasis on dedicated revenue municipal bonds versus general obligation municipal bonds resulted in lower than benchmark returns as revenue municipal bonds underperformed general obligation municipal bonds over the reporting period. |
| » | Exposure to healthcare municipal bonds resulted in lower than benchmark returns as this sector underperformed over the reporting period. |
| » | Exposure to the water and sewer and power municipal bond sectors was positive for returns as these sectors outperformed over the reporting period. |
1The 30 Day SEC Yield is a standard yield calculation developed by the Securities and Exchange Commission (“SEC”) that allows for fairer comparisons among bond funds. It is based on the most recent 30-day period covered by the Fund’s filings with the SEC. The yield figure reflects the dividends and interest earned during the period, after the deduction of the Fund’s expenses.
| 20 | PIMCO ETF Trust |
Table of Contents
Expense Examples
| Actual Performance | Hypothetical Performance (5% return before expenses) | |||||||||||||||||||||||||||||||||
| Beginning Account Value (01/01/11) | Ending Account Value (06/30/11) | Expenses Paid During Period† | Beginning Account Value (01/01/11) | Ending Account Value (06/30/11) | Expenses Paid During Period† | Net Annualized Expense Ratio | ||||||||||||||||||||||||||||
| PIMCO 0-5 Year High Yield Corporate Bond Index Fund | $ | 1,000.00 | ††† | $ | 1,004.52 | $ | 0.21 | $ | 1,000.00 | $ | 1,022.07 | $ | 2.76 | 0.55 | % | |||||||||||||||||||
| PIMCO 1-3 Year U.S. Treasury Index Fund | 1,000.00 | 1,008.01 | 0.45 | 1,000.00 | 1,024.35 | 0.45 | 0.09 | †† | ||||||||||||||||||||||||||
| PIMCO 1-5 Year U.S. TIPS Index Fund | 1,000.00 | 1,039.88 | 1.01 | 1,000.00 | 1,023.80 | 1.00 | 0.20 | |||||||||||||||||||||||||||
| PIMCO 3-7 Year U.S. Treasury Index Fund | 1,000.00 | 1,027.77 | 0.75 | 1,000.00 | 1,024.05 | 0.75 | 0.15 | |||||||||||||||||||||||||||
| PIMCO 7-15 Year U.S. Treasury Index Fund | 1,000.00 | 1,033.63 | 0.76 | 1,000.00 | 1,024.05 | 0.75 | 0.15 | |||||||||||||||||||||||||||
| PIMCO 15+ Year U.S. TIPS Index Fund | 1,000.00 | 1,063.58 | 1.02 | 1,000.00 | 1,023.80 | 1.00 | 0.20 | |||||||||||||||||||||||||||
| PIMCO 25+ Year Zero Coupon Year U.S. Treasury Index Fund | 1,000.00 | 992.48 | 0.74 | 1,000.00 | 1,024.05 | 0.75 | 0.15 | |||||||||||||||||||||||||||
| PIMCO Broad U.S. TIPS Index Fund | 1,000.00 | 1,055.75 | 1.02 | 1,000.00 | 1,023.80 | 1.00 | 0.20 | |||||||||||||||||||||||||||
| PIMCO Broad U.S. Treasury Index Fund | 1,000.00 | 1,022.41 | 0.75 | 1,000.00 | 1,024.05 | 0.75 | 0.15 | |||||||||||||||||||||||||||
| PIMCO Investment Grade Corporate Bond Index Fund | 1,000.00 | 1,026.74 | 1.01 | 1,000.00 | 1,023.80 | 1.00 | 0.20 | |||||||||||||||||||||||||||
| PIMCO Build America Bond Strategy Fund | 1,000.00 | 1,084.19 | 2.33 | 1,000.00 | 1,022.56 | 2.26 | 0.45 | |||||||||||||||||||||||||||
| PIMCO Enhanced Short Maturity Strategy Fund | 1,000.00 | 1,008.55 | 1.74 | 1,000.00 | 1,023.06 | 1.76 | 0.35 | |||||||||||||||||||||||||||
| PIMCO Intermediate Municipal Bond Strategy Fund | 1,000.00 | 1,033.13 | 1.76 | 1,000.00 | 1,023.06 | 1.76 | 0.35 | |||||||||||||||||||||||||||
| PIMCO Short Term Municipal Bond Strategy Fund | 1,000.00 | 1,013.45 | 1.75 | 1,000.00 | 1,023.06 | 1.76 | 0.35 | |||||||||||||||||||||||||||
† Expenses are equal to the net annualized expense ratio for the class, multiplied by the average account value over the period, multiplied by 181/365 (to reflect the one-half year period) and 14/365 for PIMCO 0-5 Year High Yield Corporate Bond Index Fund (to reflect the period since inception date of 06/16/11). The PIMCO 0-5 Year High Yield Corporate Bond Index Fund’s hypothetical expenses reflect an amount as if the Fund had been operational for the entire fiscal half year.
†† The annualized expense ratio in the PIMCO 1-3 Year U.S. Treasury Index Fund reflects net annualized expenses after an application of an expense waiver of 0.06%.
††† Reflects a Beginning Account Value as of 06/16/11.
Please refer to the Important Information Section for an explanation of the information presented in the above Expense Example.
| Annual Report | June 30, 2011 | 21 |
Table of Contents
| Selected Per Share Data for the Year or Period Ended: | Net Asset Value Beginning of Year or Period | Net Investment Income (a) | Net Realized/ Unrealized Gain (Loss) on Investments (b) | Total Income (Loss) from Investment Operations | Dividends from Net Investment Income | Distributions from Net Realized Capital Gains | ||||||||||||||||||
PIMCO 0-5 Year High Yield Corporate Bond Index Fund | ||||||||||||||||||||||||
06/16/2011 - 06/30/2011 | $ | 100.00 | $ | 0.18 | $ | 0.27 | $ | 0.45 | $ | (0.16 | ) | $ | 0.00 | |||||||||||
PIMCO 1-3 Year U.S. Treasury Index Fund | ||||||||||||||||||||||||
06/30/2011 | $ | 50.76 | $ | 0.40 | $ | 0.24 | $ | 0.64 | $ | (0.40 | ) | $ | 0.00 | |||||||||||
06/30/2010 | 49.94 | 0.43 | 0.84 | 1.27 | (0.43 | ) | (0.02 | ) | ||||||||||||||||
06/01/2009 - 06/30/2009 | 50.00 | 0.03 | (0.06 | ) | (0.03 | ) | (0.03 | ) | 0.00 | |||||||||||||||
PIMCO 1-5 Year U.S. TIPS Index Fund | ||||||||||||||||||||||||
06/30/2011 | $ | 51.79 | $ | 1.86 | $ | 1.08 | $ | 2.94 | $ | (1.42 | ) | $ | (0.01 | ) | ||||||||||
08/20/2009 - 06/30/2010 | 50.00 | 0.86 | 1.71 | 2.57 | (0.78 | ) | 0.00 | |||||||||||||||||
PIMCO 3-7 Year U.S. Treasury Index Fund | ||||||||||||||||||||||||
06/30/2011 | $ | 77.91 | $ | 1.44 | $ | 1.24 | $ | 2.68 | $ | (1.49 | ) | $ | (0.74 | ) | ||||||||||
10/30/2009 - 06/30/2010 | 75.34 | 1.08 | 2.53 | 3.61 | (1.04 | ) | 0.00 | |||||||||||||||||
PIMCO 7-15 Year U.S. Treasury Index Fund | ||||||||||||||||||||||||
06/30/2011 | $ | 79.23 | $ | 2.27 | $ | 0.05 | $ | 2.32 | $ | (2.29 | ) | $ | (1.05 | ) | ||||||||||
09/10/2009 - 06/30/2010 | 75.67 | 1.94 | 3.65 | 5.59 | (1.98 | ) | (0.05 | ) | ||||||||||||||||
PIMCO 15+ Year U.S. TIPS Index Fund | ||||||||||||||||||||||||
06/30/2011 | $ | 54.17 | $ | 2.63 | $ | 1.41 | $ | 4.04 | $ | (2.17 | ) | $ | 0.00 | |||||||||||
09/03/2009 - 06/30/2010 | 50.01 | 1.22 | 4.20 | 5.42 | (1.26 | ) | 0.00 | |||||||||||||||||
PIMCO 25+ Year Zero Coupon U.S. Treasury Index Fund | ||||||||||||||||||||||||
06/30/2011 | $ | 83.02 | $ | 3.25 | $ | (12.86 | ) | $ | (9.61 | ) | $ | (3.23 | ) | $ | 0.00 | |||||||||
10/30/2009 - 06/30/2010 | 76.98 | 2.24 | 5.93 | 8.17 | (2.13 | ) | 0.00 | |||||||||||||||||
PIMCO Broad U.S. TIPS Index Fund | ||||||||||||||||||||||||
06/30/2011 | $ | 52.95 | $ | 2.18 | $ | 1.67 | $ | 3.85 | $ | (1.91 | ) | $ | (0.31 | ) | ||||||||||
09/03/2009 - 06/30/2010 | 50.01 | 0.96 | 2.97 | 3.93 | (0.92 | ) | (0.07 | ) | ||||||||||||||||
PIMCO Broad U.S. Treasury Index Fund | ||||||||||||||||||||||||
10/29/2010 - 06/30/2011 | $ | 100.36 | $ | 1.26 | $ | (2.26 | ) | $ | (1.00 | ) | $ | (1.25 | ) | $ | 0.00 | |||||||||
PIMCO Investment Grade Corporate Bond Index Fund | ||||||||||||||||||||||||
09/20/2010 - 06/30/2011 | $ | 100.00 | $ | 2.60 | $ | (0.23 | ) | $ | 2.37 | $ | (2.56 | ) | $ | (0.05 | ) | |||||||||
PIMCO Build America Bond Strategy Fund | ||||||||||||||||||||||||
09/20/2010 - 06/30/2011 | $ | 50.00 | $ | 2.09 | $ | (0.72 | ) | $ | 1.37 | $ | (2.01 | ) | $ | 0.00 | ||||||||||
PIMCO Enhanced Short Maturity Strategy Fund | ||||||||||||||||||||||||
06/30/2011 | $ | 100.34 | $ | 0.86 | $ | 1.03 | $ | 1.89 | $ | (0.90 | ) | $ | (0.29 | ) | ||||||||||
11/16/2009 - 06/30/2010 | 100.00 | 0.32 | 0.37 | 0.69 | (0.35 | ) | 0.00 | |||||||||||||||||
PIMCO Intermediate Municipal Bond Strategy Fund | ||||||||||||||||||||||||
06/30/2011 | $ | 50.63 | $ | 1.21 | $ | 0.90 | $ | 2.11 | $ | (1.21 | ) | $ | (0.09 | ) | ||||||||||
11/30/2009 - 06/30/2010 | 50.00 | 0.63 | 0.61 | 1.24 | (0.61 | ) | 0.00 | |||||||||||||||||
PIMCO Short Term Municipal Bond Strategy Fund | ||||||||||||||||||||||||
06/30/2011 | $ | 50.13 | $ | 0.61 | $ | 0.22 | $ | 0.83 | $ | (0.60 | ) | $ | 0.00 | |||||||||||
02/01/2010 - 06/30/2010 | 50.00 | 0.21 | 0.14 | 0.35 | (0.22 | ) | 0.00 | |||||||||||||||||
| * | Annualized |
| (a) | Per share amounts based on average number of shares outstanding during the year or period. |
| (b) | Portfolio Turnover rate excludes securities received or delivered from in-kind processing of creation or redemptions. |
| 22 | PIMCO ETF Trust | See Accompanying Notes |
Table of Contents
| Total Distributions | Net Asset Value End of Year or Period | Total Return | Net Assets End of Year or Period (000s) | Ratio of Expenses to Average Net Assets | Ratio of Expenses to Average Net Assets Excluding Waivers | Ratio of Net Investment Income to Average Net Assets | Portfolio Turnover Rate (b) | |||||||||||||||||||||||
| $ | (0.16 | ) | $ | 100.29 | 0.45 | % | $ | 25,073 | 0.55 | %* | 7.30 | %* | 4.65 | %* | 0 | % | ||||||||||||||
| $ | (0.40 | ) | $ | 51.00 | 1.26 | % | $ | 107,206 | 0.09 | % | 0.15 | % | 0.78 | % | 18 | % | ||||||||||||||
| (0.45 | ) | 50.76 | 2.56 | 86,400 | 0.09 | 0.19 | 0.83 | 256 | ||||||||||||||||||||||
| (0.03 | ) | 49.94 | (0.06 | ) | 40,051 | 0.09 | * | 1.88 | * | 0.76 | * | 18 | ||||||||||||||||||
| $ | (1.43 | ) | $ | 53.30 | 5.70 | % | $ | 1,184,369 | 0.20 | % | 0.21 | % | 3.50 | % | 17 | % | ||||||||||||||
| (0.78 | ) | 51.79 | 5.17 | 539,680 | 0.20 | * | 0.23 | * | 2.02 | * | 5 | |||||||||||||||||||
| $ | (2.23 | ) | $ | 78.36 | 3.49 | % | $ | 20,895 | 0.15 | % | 0.15 | % | 1.83 | % | 48 | % | ||||||||||||||
| (1.04 | ) | 77.91 | 4.85 | 51,942 | 0.15 | * | 0.41 | * | 2.14 | * | 178 | |||||||||||||||||||
| $ | (3.34 | ) | $ | 78.21 | 3.00 | % | $ | 8,342 | 0.15 | % | 0.15 | % | 2.87 | % | 76 | % | ||||||||||||||
| (2.03 | ) | 79.23 | 7.54 | 14,790 | 0.15 | * | 0.86 | * | 3.31 | * | 209 | |||||||||||||||||||
| $ | (2.17 | ) | $ | 56.04 | 7.58 | % | $ | 258,901 | 0.20 | % | 0.20 | % | 4.76 | % | 38 | % | ||||||||||||||
| (1.26 | ) | 54.17 | 10.95 | 22,753 | 0.20 | * | 0.70 | * | 3.02 | * | 35 | |||||||||||||||||||
| $ | (3.23 | ) | $ | 70.18 | (11.69 | )% | $ | 40,705 | 0.15 | % | 0.15 | % | 4.41 | % | 50 | % | ||||||||||||||
| (2.13 | )�� | 83.02 | 11.02 | 21,586 | 0.15 | * | 0.83 | * | 4.56 | * | 39 | |||||||||||||||||||
| $ | (2.22 | ) | $ | 54.58 | 7.39 | % | $ | 56,219 | 0.20 | % | 0.21 | % | 4.04 | % | 20 | % | ||||||||||||||
| (0.99 | ) | 52.95 | 7.91 | 28,063 | 0.20 | * | 0.61 | * | 2.35 | * | 122 | |||||||||||||||||||
| $ | (1.25 | ) | $ | 98.11 | (0.98 | )% | $ | 9,811 | 0.15 | %* | 0.99 | %* | 1.95 | %* | 219 | % | ||||||||||||||
| $ | (2.61 | ) | $ | 99.76 | 2.40 | % | $ | 72,821 | 0.20 | %* | 0.34 | %* | 3.36 | %* | 69 | % | ||||||||||||||
| $ | (2.01 | ) | $ | 49.36 | 2.93 | % | $ | 27,644 | 0.45 | %* | 0.89 | %* | 5.60 | %* | 115 | % | ||||||||||||||
| $ | (1.19 | ) | $ | 101.04 | 1.89 | % | $ | 1,233,727 | 0.35 | % | 0.36 | % | 0.85 | % | 280 | % | ||||||||||||||
| (0.35 | ) | 100.34 | 0.69 | 656,227 | 0.35 | * | 0.41 | * | 0.57 | * | 276 | |||||||||||||||||||
| $ | (1.30 | ) | $ | 51.44 | 4.20 | % | $ | 90,529 | 0.35 | % | 0.36 | % | 2.37 | % | 44 | % | ||||||||||||||
| (0.61 | ) | 50.63 | 2.50 | 43,543 | 0.35 | * | 0.91 | * | 2.14 | * | 72 | |||||||||||||||||||
| $ | (0.60 | ) | $ | 50.36 | 1.67 | % | $ | 23,168 | 0.35 | % | 0.35 | % | 1.20 | % | 35 | % | ||||||||||||||
| (0.22 | ) | 50.13 | 0.70 | 18,046 | 0.35 | * | 2.17 | * | 1.09 | * | 4 | |||||||||||||||||||
| Annual Report | June 30, 2011 | 23 |
Table of Contents
Statements of Assets and Liabilities
| (Amounts in thousands, except per share amounts) | PIMCO 0-5 Year High Yield Corporate Bond Index Fund | PIMCO 1-3 Year U.S. Treasury Index Fund | PIMCO 1-5 Year U.S. TIPS Index Fund | PIMCO 3-7 Year U.S. Treasury Index Fund | PIMCO 7-15 Year U.S. Treasury Index Fund | PIMCO 15+ Year U.S. TIPS Index Fund | ||||||||||||||||||
Assets: | ||||||||||||||||||||||||
Investments, at value | $ | 23,287 | $ | 106,844 | $ | 1,176,001 | $ | 20,759 | $ | 8,248 | $ | 256,794 | ||||||||||||
Repurchase agreements, at value | 2,030 | 421 | 483 | 0 | 0 | 745 | ||||||||||||||||||
Cash | 489 | 0 | 0 | 62 | 18 | 0 | ||||||||||||||||||
Receivable for investments sold | 0 | 4,857 | 7,019 | 436 | 123 | 12,473 | ||||||||||||||||||
Receivable for Fund shares sold | 0 | 0 | 0 | 0 | 0 | 0 | ||||||||||||||||||
Interest receivable | 527 | 312 | 7,911 | 129 | 84 | 1,859 | ||||||||||||||||||
Manager reimbursement receivable | 0 | 5 | 0 | 0 | 0 | 0 | ||||||||||||||||||
| 26,333 | 112,439 | 1,191,414 | 21,386 | 8,473 | 271,871 | |||||||||||||||||||
Liabilities: | ||||||||||||||||||||||||
Payable for reverse repurchase agreements | $ | 0 | $ | 0 | $ | 0 | $ | 0 | $ | 0 | $ | 0 | ||||||||||||
Payable for investments purchased | 1,214 | 5,163 | 0 | 457 | 111 | 11,178 | ||||||||||||||||||
Payable for Fund shares redeemed | 0 | 0 | 0 | 0 | 0 | 0 | ||||||||||||||||||
Dividends payable | 41 | 70 | 6,805 | 28 | 18 | 1,740 | ||||||||||||||||||
Accrued related party fees | 5 | 0 | 240 | 6 | 2 | 52 | ||||||||||||||||||
| 1,260 | 5,233 | 7,045 | 491 | 131 | 12,970 | |||||||||||||||||||
Net Assets | $ | 25,073 | $ | 107,206 | $ | 1,184,369 | $ | 20,895 | $ | 8,342 | $ | 258,901 | ||||||||||||
Net Assets Consist of: | ||||||||||||||||||||||||
Paid in capital | $ | 25,000 | $ | 106,346 | $ | 1,167,160 | $ | 20,783 | $ | 8,363 | $ | 260,935 | ||||||||||||
Undistributed (overdistributed) net investment income | 4 | (121 | ) | (803 | ) | (73 | ) | (14 | ) | (393 | ) | |||||||||||||
Accumulated undistributed net realized gain (loss) | 0 | 198 | 1,121 | 45 | 50 | (3,093 | ) | |||||||||||||||||
Net unrealized appreciation (depreciation) | 69 | 783 | 16,891 | 140 | (57 | ) | 1,452 | |||||||||||||||||
| $ | 25,073 | $ | 107,206 | $ | 1,184,369 | $ | 20,895 | $ | 8,342 | $ | 258,901 | |||||||||||||
Shares Issued and Outstanding: | 250 | 2,102 | 22,220 | 267 | 107 | 4,620 | ||||||||||||||||||
Net Asset Value Per Share | $ | 100.29 | $ | 51.00 | $ | 53.30 | $ | 78.36 | $ | 78.21 | $ | 56.04 | ||||||||||||
Cost of Investments | $ | 23,218 | $ | 106,061 | $ | 1,159,110 | $ | 20,619 | $ | 8,305 | $ | 255,342 | ||||||||||||
Cost of Repurchase Agreements | $ | 2,030 | $ | 421 | $ | 483 | $ | 0 | $ | 0 | $ | 745 | ||||||||||||
| 24 | PIMCO ETF Trust | See Accompanying Notes |
Table of Contents
June 30, 2011
| PIMCO 25+ Year Zero Coupon U.S. Treasury Index Fund | PIMCO Broad U.S. TIPS Index Fund | PIMCO Broad U.S. Treasury Index Fund | PIMCO Investment Grade Corporate Bond Index Fund | PIMCO Build America Bond Strategy Fund | PIMCO Enhanced Short Maturity Strategy Fund | PIMCO Intermediate Municipal Bond Strategy Fund | PIMCO Short Term Municipal Bond Strategy Fund | |||||||||||||||||||||||
| $ | 40,686 | $ | 55,765 | $ | 9,724 | $ | 70,520 | $ | 25,918 | $ | 1,189,603 | $ | 86,919 | $ | 22,817 | |||||||||||||||
| 0 | 0 | 0 | 1,532 | 218 | 54,308 | 4,471 | 141 | |||||||||||||||||||||||
| 46 | 79 | 10 | 4 | 0 | 1,243 | 0 | 0 | |||||||||||||||||||||||
| 3,069 | 553 | 1,089 | 0 | 10,898 | 4,025 | 0 | 0 | |||||||||||||||||||||||
| 0 | 0 | 0 | 0 | 0 | 7,073 | 0 | 0 | |||||||||||||||||||||||
| 0 | 422 | 43 | 999 | 679 | 6,497 | 937 | 243 | |||||||||||||||||||||||
| 0 | 0 | 0 | 0 | 0 | 0 | 0 | 0 | |||||||||||||||||||||||
| 43,801 | 56,819 | 10,866 | 73,055 | 37,713 | 1,262,749 | 92,327 | 23,201 | |||||||||||||||||||||||
| $ | 0 | $ | 0 | $ | 0 | $ | 0 | $ | 0 | $ | 12,749 | $ | 0 | $ | 0 | |||||||||||||||
| 2,610 | 224 | 1,038 | 0 | 0 | 15,109 | 1,594 | 0 | |||||||||||||||||||||||
| 0 | 0 | 0 | 0 | 9,873 | 0 | 0 | 0 | |||||||||||||||||||||||
| 478 | 365 | 16 | 218 | 182 | 806 | 174 | 25 | |||||||||||||||||||||||
| 8 | 11 | 1 | 16 | 14 | 358 | 30 | 8 | |||||||||||||||||||||||
| 3,096 | 600 | 1,055 | 234 | 10,069 | 29,022 | 1,798 | 33 | |||||||||||||||||||||||
| $ | 40,705 | $ | 56,219 | $ | 9,811 | $ | 72,821 | $ | 27,644 | $ | 1,233,727 | $ | 90,529 | $ | 23,168 | |||||||||||||||
| $ | 48,603 | $ | 54,304 | $ | 10,036 | $ | 73,313 | $ | 27,513 | $ | 1,231,016 | $ | 88,676 | $ | 23,011 | |||||||||||||||
| (19 | ) | (77 | ) | 1 | (5 | ) | (59 | ) | (378 | ) | (67 | ) | (3 | ) | ||||||||||||||||
| (3,836 | ) | (39 | ) | (206 | ) | (663 | ) | (577 | ) | 989 | 110 | 24 | ||||||||||||||||||
| (4,043 | ) | 2,031 | (20 | ) | 176 | 767 | 2,100 | 1,810 | 136 | |||||||||||||||||||||
| $ | 40,705 | $ | 56,219 | $ | 9,811 | $ | 72,821 | $ | 27,644 | $ | 1,233,727 | $ | 90,529 | $ | 23,168 | |||||||||||||||
| 580 | 1,030 | 100 | 730 | 560 | 12,210 | 1,760 | 460 | |||||||||||||||||||||||
| $ | 70.18 | $ | 54.58 | $ | 98.11 | $ | 99.76 | $ | 49.36 | $ | 101.04 | $ | 51.44 | $ | 50.36 | |||||||||||||||
| $ | 44,729 | $ | 53,734 | $ | 9,744 | $ | 70,344 | $ | 25,151 | $ | 1,187,503 | $ | 85,109 | $ | 22,681 | |||||||||||||||
| $ | 0 | $ | 0 | $ | 0 | $ | 1,532 | $ | 218 | $ | 54,308 | $ | 4,471 | $ | 141 | |||||||||||||||
| Annual Report | June 30, 2011 | 25 |
Table of Contents
| Year or Period Ended June 30, 2011 | ||||||||||||||||||||||||
| (Amounts in thousands) | PIMCO 0-5 Year High Yield Corporate Bond Index Fund (1) | PIMCO 1-3 Year U.S. Treasury Index Fund | PIMCO 1-5 Year U.S. TIPS Index Fund | PIMCO 3-7 Year U.S. Treasury Index Fund | PIMCO 7-15 Year U.S. Treasury Index Fund | PIMCO 15+ Year U.S. TIPS Index Fund | ||||||||||||||||||
Investment Income: | ||||||||||||||||||||||||
Interest | $ | 50 | $ | 916 | $ | 28,901 | $ | 790 | $ | 468 | $ | 9,602 | ||||||||||||
Total Income | 50 | 916 | 28,901 | 790 | 468 | 9,602 | ||||||||||||||||||
Expenses: | ||||||||||||||||||||||||
Management fees | 5 | 157 | 1,555 | 60 | 23 | 386 | ||||||||||||||||||
Trustees’ fees | 0 | 9 | 86 | 3 | 1 | 15 | ||||||||||||||||||
Organization expense | 65 | 0 | 0 | 0 | 0 | 0 | ||||||||||||||||||
Total Expenses | 70 | 166 | 1,641 | 63 | 24 | 401 | ||||||||||||||||||
Waiver and/or Reimbursement by PIMCO | (65 | ) | (67 | ) | (47 | ) | (1 | ) | 0 | (6 | ) | |||||||||||||
Net Expenses | 5 | 99 | 1,594 | 62 | 24 | 395 | ||||||||||||||||||
Net Investment Income | 45 | 817 | 27,307 | 728 | 444 | 9,207 | ||||||||||||||||||
Net Realized and Unrealized Gain (Loss): | ||||||||||||||||||||||||
Net realized gain (loss) on investments | 0 | 247 | 1,678 | 231 | 402 | (3,465 | ) | |||||||||||||||||
Net realized gain (loss) on in-kind redemptions | 0 | 0 | 1,982 | 1,073 | 295 | 707 | ||||||||||||||||||
Net change in unrealized appreciation (depreciation) on investments | 69 | 213 | 13,980 | (1,082 | ) | (866 | ) | 607 | ||||||||||||||||
Net Gain (Loss) | 69 | 460 | 17,640 | 222 | (169 | ) | (2,151 | ) | ||||||||||||||||
Net Increase (Decrease) in Net Assets Resulting from Operations | $ | 114 | $ | 1,277 | $ | 44,947 | $ | 950 | $ | 275 | $ | 7,056 | ||||||||||||
| (1) | Period from June 16, 2011 to June 30, 2011. |
| (2) | Period from October 29, 2010 to June 30, 2011. |
| (3) | Period from September 20, 2010 to June 30, 2011. |
| 26 | PIMCO ETF Trust | See Accompanying Notes |
Table of Contents
| PIMCO 25+ Year Zero Coupon U.S. Treasury Index Fund | PIMCO Broad U.S. TIPS Index Fund | PIMCO Broad U.S. Treasury Index Fund (2) | PIMCO Investment Grade Corporate Bond Index Fund (3) | PIMCO Build America Bond Strategy Fund (3) | PIMCO Enhanced Short Maturity Strategy Fund | PIMCO Intermediate Municipal Bond Strategy Fund | PIMCO Short Term Municipal Bond Strategy Fund | |||||||||||||||||||||||
| $ | 1,893 | $ | 1,672 | $ | 136 | $ | 1,866 | $ | 1,300 | $ | 9,033 | $ | 1,746 | $ | 353 | |||||||||||||||
| 1,893 | 1,672 | 136 | 1,866 | 1,300 | 9,033 | 1,746 | 353 | |||||||||||||||||||||||
| 62 | 79 | 9 | 104 | 96 | 2,622 | 224 | 79 | |||||||||||||||||||||||
| 4 | 4 | 1 | 5 | 2 | 78 | 6 | 2 | |||||||||||||||||||||||
| 0 | 0 | 54 | 73 | 93 | 0 | 0 | 0 | |||||||||||||||||||||||
| 66 | 83 | 64 | 182 | 191 | 2,700 | 230 | 81 | |||||||||||||||||||||||
| (2 | ) | (2 | ) | (54 | ) | (75 | ) | (94 | ) | (41 | ) | (3 | ) | (1 | ) | |||||||||||||||
| 64 | 81 | 10 | 107 | 97 | 2,659 | 227 | 80 | |||||||||||||||||||||||
| 1,829 | 1,591 | 126 | 1,759 | 1,203 | 6,374 | 1,519 | 273 | |||||||||||||||||||||||
| (3,474 | ) | 65 | (205 | ) | (633 | ) | (577 | ) | 4,604 | 178 | 30 | |||||||||||||||||||
| (591 | ) | 0 | 0 | 0 | 0 | 0 | 0 | 0 | ||||||||||||||||||||||
| (6,133 | ) | 1,273 | (20 | ) | 176 | 767 | 1,179 | 1,412 | 74 | |||||||||||||||||||||
| (10,198 | ) | 1,338 | (225 | ) | (457 | ) | 190 | 5,783 | 1,590 | 104 | ||||||||||||||||||||
| $ | (8,369 | ) | $ | 2,929 | $ | (99 | ) | $ | 1,302 | $ | 1,393 | $ | 12,157 | $ | 3,109 | $ | 377 | |||||||||||||
| Annual Report | June 30, 2011 | 27 |
Table of Contents
Statements of Changes in Net Assets
| PIMCO 0-5 Year High Yield Corporate Bond Index Fund | PIMCO 1-3 Year U.S. Treasury Index Fund | PIMCO U.S. TIPS | PIMCO | |||||||||||||||||||||||||
| (Amounts in thousands) | Period from June 16, 2011 to June 30, 2011 | Year Ended June 30, 2011 | Year Ended June 30, 2010 | Year Ended June 30, 2011 | Period from August 20, 2009 to June 30, 2010 | Year Ended June 30, 2011 | Period from October 30, 2009 to June 30, 2010 | |||||||||||||||||||||
Increase (Decrease) in Net Assets from: | ||||||||||||||||||||||||||||
Operations: | ||||||||||||||||||||||||||||
Net investment income | $ | 45 | $ | 817 | $ | 912 | $ | 27,307 | $ | 4,212 | $ | 728 | $ | 528 | ||||||||||||||
Net realized gain (loss) | 0 | 247 | 275 | 1,678 | 236 | 231 | 345 | |||||||||||||||||||||
Net realized gain (loss) on in-kind redemptions | 0 | 0 | 574 | 1,982 | 174 | 1,073 | 0 | |||||||||||||||||||||
Net change in unrealized appreciation (depreciation) | 69 | 213 | 555 | 13,980 | 2,911 | (1,082 | ) | 1,222 | ||||||||||||||||||||
Net increase (decrease) resulting from operations | 114 | 1,277 | 2,316 | 44,947 | 7,533 | 950 | 2,095 | |||||||||||||||||||||
Net Equalization Credits and Charges | 0 | 6 | (15 | ) | 943 | 110 | 10 | 48 | ||||||||||||||||||||
Distributions to Shareholders: | ||||||||||||||||||||||||||||
From net investment income | (41 | ) | (821 | ) | (895 | ) | (28,030 | ) | (4,292 | ) | (737 | ) | (574 | ) | ||||||||||||||
From net realized capital gains | 0 | 0 | (100 | ) | (171 | ) | (7 | ) | (550 | ) | 0 | |||||||||||||||||
Total Distributions | (41 | ) | (821 | ) | (995 | ) | (28,201 | ) | (4,299 | ) | (1,287 | ) | (574 | ) | ||||||||||||||
Fund Share Transactions: | ||||||||||||||||||||||||||||
Receipts for shares sold | 25,000 | 20,350 | 296,615 | 670,857 | 546,745 | 12,675 | 50,421 | |||||||||||||||||||||
Cost of shares redeemed | 0 | 0 | (251,587 | ) | (42,914 | ) | (10,299 | ) | (43,385 | ) | 0 | |||||||||||||||||
Net Income Equalization | 0 | (6 | ) | 15 | (943 | ) | (110 | ) | (10 | ) | (48 | ) | ||||||||||||||||
Net increase (decrease) resulting from Fund share transactions | 25,000 | 20,344 | 45,043 | 627,000 | 536,336 | (30,720 | ) | 50,373 | ||||||||||||||||||||
Total Increase (Decrease) in Net Assets | 25,073 | 20,806 | 46,349 | 644,689 | 539,680 | (31,047 | ) | 51,942 | ||||||||||||||||||||
Net Assets: | ||||||||||||||||||||||||||||
Beginning of year or period | 0 | 86,400 | 40,051 | 539,680 | 0 | 51,942 | 0 | |||||||||||||||||||||
End of year or period* | $ | 25,073 | $ | 107,206 | $ | 86,400 | $ | 1,184,369 | $ | 539,680 | $ | 20,895 | $ | 51,942 | ||||||||||||||
*Including undistributed (overdistributed) net investment income of: | $ | 4 | $ | (121 | ) | $ | (4 | ) | $ | (803 | ) | $ | (81 | ) | $ | (73 | ) | $ | (45 | ) | ||||||||
Shares of Beneficial Interest: | ||||||||||||||||||||||||||||
Shares Sold | 250 | 400 | 5,900 | 12,600 | 10,620 | 160 | 667 | |||||||||||||||||||||
Shares Redeemed | 0 | 0 | (5,000 | ) | (800 | ) | (200 | ) | (560 | ) | 0 | |||||||||||||||||
Net increase (decrease) in shares outstanding | 250 | 400 | 900 | 11,800 | 10,420 | (400 | ) | 667 | ||||||||||||||||||||
| 28 | PIMCO ETF Trust | See Accompanying Notes |
Table of Contents
| PIMCO 7-15 Year U.S. Treasury Index Fund | PIMCO 15+ Year U.S. TIPS Index Fund | PIMCO 25+ Year Zero Coupon U.S. Treasury Index Fund | PIMCO Broad U.S. TIPS Index Fund | PIMCO Broad U.S. Treasury Index Fund | PIMCO Investment Grade Corporate Bond Index Fund | |||||||||||||||||||||||||||||||||
| Year Ended June 30, 2011 | Period from September 10 , 2009 to June 30, 2010 | Year Ended June 30, 2011 | Period from September 3, 2009 to June 30, 2010 | Year Ended June 30, 2011 | Period from October 30, 2009 to June 30, 2010 | Year Ended June 30, 2011 | Period from September 3, 2009 to June 30, 2010 | Period from October 29, 2010 to June 30, 2011 | Period from September 20, 2010 to June 30, 2011 | |||||||||||||||||||||||||||||
| $ | 444 | $ | 315 | $ | 9,207 | $ | 402 | $ | 1,829 | $ | 502 | $ | 1,591 | $ | 383 | $ | 126 | $ | 1,759 | |||||||||||||||||||
| 402 | 11 | (3,465 | ) | 65 | (3,474 | ) | (368 | ) | 65 | 210 | (205 | ) | (633 | ) | ||||||||||||||||||||||||
| 295 | 0 | 707 | 207 | (591 | ) | (13 | ) | 0 | 78 | 0 | 0 | |||||||||||||||||||||||||||
| (866 | ) | 809 | 607 | 845 | (6,133 | ) | 2,090 | 1,273 | 758 | (20 | ) | 176 | ||||||||||||||||||||||||||
| 275 | 1,135 | 7,056 | 1,519 | (8,369 | ) | 2,211 | 2,929 | 1,429 | (99 | ) | 1,302 | |||||||||||||||||||||||||||
| 1 | 15 | 323 | 30 | (26 | ) | 53 | 79 | 13 | 0 | 12 | ||||||||||||||||||||||||||||
| (444 | ) | (329 | ) | (9,472 | ) | (430 | ) | (1,798 | ) | (553 | ) | (1,658 | ) | (394 | ) | (126 | ) | (1,764 | ) | |||||||||||||||||||
| (280 | ) | (5 | ) | 0 | (1 | ) | 0 | 0 | (229 | ) | (22 | ) | 0 | (31 | ) | |||||||||||||||||||||||
| (724 | ) | (334 | ) | (9,472 | ) | (431 | ) | (1,798 | ) | (553 | ) | (1,887 | ) | (416 | ) | (126 | ) | (1,795 | ) | |||||||||||||||||||
| 6,352 | 13,989 | 348,363 | 37,148 | 63,329 | 25,767 | 27,114 | 32,195 | 10,036 | 103,090 | |||||||||||||||||||||||||||||
| (12,351 | ) | 0 | (109,799 | ) | (15,483 | ) | (34,043 | ) | (5,839 | ) | 0 | (5,145 | ) | 0 | (29,776 | ) | ||||||||||||||||||||||
| (1 | ) | (15 | ) | (323 | ) | (30 | ) | 26 | (53 | ) | (79 | ) | (13 | ) | 0 | (12 | ) | |||||||||||||||||||||
| | (6,000 | ) | 13,974 | 238,241 | 21,635 | 29,312 | 19,875 | 27,035 | 27,037 | 10,036 | 73,302 | |||||||||||||||||||||||||||
| (6,448 | ) | 14,790 | 236,148 | 22,753 | 19,119 | 21,586 | 28,156 | 28,063 | 9,811 | 72,821 | ||||||||||||||||||||||||||||
| 14,790 | 0 | 22,753 | 0 | 21,586 | 0 | 28,063 | 0 | 0 | 0 | |||||||||||||||||||||||||||||
| $ | 8,342 | $ | 14,790 | $ | 258,901 | $ | 22,753 | $ | 40,705 | $ | 21,586 | $ | 56,219 | $ | 28,063 | $ | 9,811 | $ | 72,821 | |||||||||||||||||||
$ | (14 | ) | $ | (13 | ) | $ | (393 | ) | $ | (28 | ) | $ | (19 | ) | $ | (51 | ) | $ | (77 | ) | $ | (10 | ) | $ | 1 | $ | (5 | ) | ||||||||||
| 80 | 187 | 6,200 | 720 | 800 | 340 | 500 | 630 | 100 | 1,030 | |||||||||||||||||||||||||||||
| (160 | ) | 0 | (2,000 | ) | (300 | ) | (480 | ) | (80 | ) | 0 | (100 | ) | 0 | (300 | ) | ||||||||||||||||||||||
| (80 | ) | 187 | 4,200 | 420 | 320 | 260 | 500 | 530 | 100 | 730 | ||||||||||||||||||||||||||||
| Annual Report | June 30, 2011 | 29 |
Table of Contents
Statements of Changes in Net Assets (Cont.)
| Build America Bond Strategy Fund | PIMCO Enhanced Short Maturity Strategy Fund | PIMCO Intermediate Municipal Bond Strategy Fund | PIMCO Short Term Municipal Bond Strategy Fund | |||||||||||||||||||||||||
| (Amounts in thousands) | Period from September 20, 2010 to June 30, 2011 | Year Ended June 30, 2011 | Period from November 16, 2009 to June 30, 2010 | Year Ended June 30, 2011 | Period from November 30, 2009 to June 30, 2010 | Year Ended June 30, 2011 | Period from February 1, 2010 to June 30, 2010 | |||||||||||||||||||||
Increase in Net Assets from: | ||||||||||||||||||||||||||||
Operations: | ||||||||||||||||||||||||||||
Net investment income | $ | 1,203 | $ | 6,374 | $ | 846 | $ | 1,519 | $ | 321 | $ | 273 | $ | 51 | ||||||||||||||
Net realized gain (loss) | (577 | ) | 4,604 | 297 | 178 | 57 | 30 | 0 | ||||||||||||||||||||
Net change in unrealized appreciation | 767 | 1,179 | 921 | 1,412 | 398 | 74 | 62 | |||||||||||||||||||||
Net increase resulting from operations | 1,393 | 12,157 | 2,064 | 3,109 | 776 | 377 | 113 | |||||||||||||||||||||
Net Equalization Credits and Charges | 64 | 288 | 181 | 37 | 40 | 0 | 4 | |||||||||||||||||||||
Distributions to Shareholders: | ||||||||||||||||||||||||||||
From net investment income | (1,263 | ) | (6,919 | ) | (1,041 | ) | (1,550 | ) | (358 | ) | (273 | ) | (54 | ) | ||||||||||||||
From net realized capital gains | 0 | (2,432 | ) | 0 | (82 | ) | 0 | 0 | 0 | |||||||||||||||||||
Total Distributions | (1,263 | ) | (9,351 | ) | (1,041 | ) | (1,632 | ) | (358 | ) | (273 | ) | (54 | ) | ||||||||||||||
Fund Share Transactions: | ||||||||||||||||||||||||||||
Receipts for shares sold | 42,084 | 1,653,921 | 886,921 | 45,509 | 63,288 | 10,053 | 17,987 | |||||||||||||||||||||
Cost of shares redeemed | (14,570 | ) | (1,079,227 | ) | (231,717 | ) | 0 | (20,163 | ) | (5,035 | ) | 0 | ||||||||||||||||
Net Income Equalization | (64 | ) | (288 | ) | (181 | ) | (37 | ) | (40 | ) | 0 | (4 | ) | |||||||||||||||
Net increase resulting from Fund share transactions | 27,450 | 574,406 | 655,023 | 45,472 | 43,085 | 5,018 | 17,983 | |||||||||||||||||||||
Total Increase in Net Assets | 27,644 | 577,500 | 656,227 | 46,986 | 43,543 | 5,122 | 18,046 | |||||||||||||||||||||
Net Assets: | ||||||||||||||||||||||||||||
Beginning of year or period | 0 | 656,227 | 0 | 43,543 | 0 | 18,046 | 0 | |||||||||||||||||||||
End of year or period* | $ | 27,644 | $ | 1,233,727 | $ | 656,227 | $ | 90,529 | $ | 43,543 | $ | 23,168 | $ | 18,046 | ||||||||||||||
*Including (overdistributed) net investment income of: | $ | (59 | ) | $ | (378 | ) | $ | (170 | ) | $ | (67 | ) | $ | (36 | ) | $ | (3 | ) | $ | (4 | ) | |||||||
Shares of Beneficial Interest: | ||||||||||||||||||||||||||||
Shares Sold | 860 | 16,380 | 8,850 | 900 | 1,260 | 200 | 360 | |||||||||||||||||||||
Shares Redeemed | (300 | ) | (10,710 | ) | (2,310 | ) | 0 | (400 | ) | (100 | ) | 0 | ||||||||||||||||
Net increase in shares outstanding | 560 | 5,670 | 6,540 | 900 | 860 | 100 | 360 | |||||||||||||||||||||
| 30 | PIMCO ETF Trust | See Accompanying Notes |
Table of Contents
Schedule of Investments PIMCO 0-5 Year High Yield Corporate Bond Index Fund
June 30, 2011
| PRINCIPAL AMOUNT (000s) | MARKET VALUE (000s) | |||||||||||
CORPORATE BONDS & NOTES 92.9% |
| |||||||||||
BANKING & FINANCE 16.5% |
| |||||||||||
Ally Financial, Inc. |
| |||||||||||
4.500% due 02/11/2014 | $ | 600 | $ | 602 | ||||||||
BAC Capital Trust XIV |
| |||||||||||
5.630% due 09/29/2049 | 425 | 319 | ||||||||||
CIT Group, Inc. |
| |||||||||||
7.000% due 05/01/2014 | 139 | 141 | ||||||||||
7.000% due 05/01/2015 | 125 | 125 | ||||||||||
7.000% due 05/01/2016 | 350 | 349 | ||||||||||
Ford Motor Credit Co. LLC |
| |||||||||||
7.000% due 10/01/2013 | 100 | 107 | ||||||||||
8.000% due 06/01/2014 | 575 | 631 | ||||||||||
HBOS Capital Funding LP |
| |||||||||||
6.071% due 06/29/2049 | 400 | 348 | ||||||||||
Ineos Finance PLC |
| |||||||||||
9.000% due 05/15/2015 | 100 | 106 | ||||||||||
ING Groep NV |
| |||||||||||
5.775% due 12/29/2049 | 100 | 93 | ||||||||||
International Lease Finance Corp. |
| |||||||||||
8.625% due 09/15/2015 | 575 | 625 | ||||||||||
Nuveen Investments, Inc. |
| |||||||||||
10.500% due 11/15/2015 | 125 | 128 | ||||||||||
Springleaf Finance Corp. |
| |||||||||||
5.375% due 10/01/2012 | 550 | 549 | ||||||||||
|
| |||||||||||
| 4,123 | ||||||||||||
|
| |||||||||||
INDUSTRIALS 68.2% |
| |||||||||||
Air Canada |
| |||||||||||
9.250% due 08/01/2015 | 300 | 309 | ||||||||||
ARAMARK Corp. |
| |||||||||||
8.500% due 02/01/2015 | 400 | 417 | ||||||||||
ATP Oil & Gas Corp. |
| |||||||||||
11.875% due 05/01/2015 | 125 | 127 | ||||||||||
Avaya, Inc. |
| |||||||||||
9.750% due 11/01/2015 | 275 | 282 | ||||||||||
10.125% due 11/01/2015 (a) | 100 | 103 | ||||||||||
Bausch & Lomb, Inc. |
| |||||||||||
9.875% due 11/01/2015 | 125 | 133 | ||||||||||
Berry Plastics Corp. |
| |||||||||||
10.250% due 03/01/2016 | 300 | 293 | ||||||||||
Bon-Ton Department Stores, Inc. |
| |||||||||||
10.250% due 03/15/2014 | 50 | 50 | ||||||||||
Charter Communications Operating LLC |
| |||||||||||
10.875% due 09/15/2014 | 350 | 387 | ||||||||||
Chesapeake Energy Corp. |
| |||||||||||
9.500% due 02/15/2015 | 350 | 408 | ||||||||||
CityCenter Holdings LLC |
| |||||||||||
7.625% due 01/15/2016 | 300 | 311 | ||||||||||
Clear Channel Communications, Inc. |
| |||||||||||
5.500% due 09/15/2014 | 375 | 330 | ||||||||||
Community Health Systems, Inc. |
| |||||||||||
8.875% due 07/15/2015 | 400 | 413 | ||||||||||
Crown Castle International Corp. |
| |||||||||||
9.000% due 01/15/2015 | 300 | 327 | ||||||||||
CSC Holdings LLC |
| |||||||||||
8.500% due 04/15/2014 | 275 | 306 | ||||||||||
8.500% due 06/15/2015 | 100 | 108 | ||||||||||
Delta Air Lines, Inc. |
| |||||||||||
9.500% due 09/15/2014 | 425 | 455 | ||||||||||
DISH DBS Corp. | ||||||||||||
6.625% due 10/01/2014 | 100 | 105 | ||||||||||
| PRINCIPAL AMOUNT (000s) | �� | MARKET VALUE (000s) | ||||||||||
7.125% due 02/01/2016 | $ | 400 | $ | 424 | ||||||||
7.750% due 05/31/2015 | 100 | 109 | ||||||||||
DJO Finance LLC |
| |||||||||||
10.875% due 11/15/2014 | 275 | 294 | ||||||||||
Dole Food Co., Inc. |
| |||||||||||
13.875% due 03/15/2014 | 100 | 120 | ||||||||||
Dynegy Holdings, Inc. |
| |||||||||||
7.500% due 06/01/2015 | 125 | 102 | ||||||||||
FGI Operating Co., Inc. |
| |||||||||||
10.250% due 08/01/2015 | 250 | 267 | ||||||||||
First Data Corp. |
| |||||||||||
10.550% due 09/24/2015 (a) | 250 | 261 | ||||||||||
11.250% due 03/31/2016 | 250 | 247 | ||||||||||
FMG Resources Pty. Ltd. |
| |||||||||||
6.375% due 02/01/2016 | 300 | 301 | ||||||||||
7.000% due 11/01/2015 | 150 | 154 | ||||||||||
Forest Oil Corp. |
| |||||||||||
8.500% due 02/15/2014 | 300 | 327 | ||||||||||
Fresenius U.S. Finance II, Inc. |
| |||||||||||
9.000% due 07/15/2015 | 225 | 256 | ||||||||||
Goodyear Tire & Rubber Co. |
| |||||||||||
10.500% due 05/15/2016 | 275 | 311 | ||||||||||
Harrah’s Operating Co., Inc. |
| |||||||||||
10.750% due 02/01/2016 | 325 | 320 | ||||||||||
HCA, Inc. |
| |||||||||||
6.500% due 02/15/2016 | 325 | 332 | ||||||||||
6.750% due 07/15/2013 | 100 | 105 | ||||||||||
Ineos Group Holdings PLC |
| |||||||||||
8.500% due 02/15/2016 | 250 | 248 | ||||||||||
Lamar Media Corp. |
| |||||||||||
6.625% due 08/15/2015 | 350 | 357 | ||||||||||
Meritor, Inc. |
| |||||||||||
8.125% due 09/15/2015 | 250 | 262 | ||||||||||
MGM Resorts International |
| |||||||||||
6.625% due 07/15/2015 | 300 | 283 | ||||||||||
6.750% due 04/01/2013 | 100 | 101 | ||||||||||
10.375% due 05/15/2014 | 100 | 114 | ||||||||||
13.000% due 11/15/2013 | 100 | 119 | ||||||||||
Momentive Performance Materials, Inc. |
| |||||||||||
12.500% due 06/15/2014 | 225 | 246 | ||||||||||
Newfield Exploration Co. |
| |||||||||||
6.625% due 04/15/2016 | 275 | 285 | ||||||||||
NewPage Corp. |
| |||||||||||
11.375% due 12/31/2014 | 150 | 141 | ||||||||||
OSI Restaurant Partners LLC |
| |||||||||||
10.000% due 06/15/2015 | 250 | 264 | ||||||||||
Packaging Dynamics Corp. |
| |||||||||||
8.750% due 02/01/2016 | 275 | 280 | ||||||||||
Pactiv Corp. |
| |||||||||||
5.875% due 07/15/2012 | 250 | 258 | ||||||||||
Petrohawk Energy Corp. |
| |||||||||||
7.875% due 06/01/2015 | 350 | 368 | ||||||||||
Petroplus Finance Ltd. |
| |||||||||||
6.750% due 05/01/2014 | 100 | 98 | ||||||||||
PHH Corp. |
| |||||||||||
7.125% due 03/01/2013 | 300 | 314 | ||||||||||
Pinnacle Foods Finance LLC |
| |||||||||||
9.250% due 04/01/2015 | 275 | 287 | ||||||||||
Plains Exploration & Production Co. |
| |||||||||||
10.000% due 03/01/2016 | 300 | 339 | ||||||||||
Quebecor Media, Inc. |
| |||||||||||
7.750% due 03/15/2016 | 400 | 416 | ||||||||||
| PRINCIPAL AMOUNT (000s) | MARKET VALUE (000s) | |||||||||||
Quicksilver Resources, Inc. |
| |||||||||||
11.750% due 01/01/2016 | $ | 100 | $ | 115 | ||||||||
RSC Equipment Rental, Inc. |
| |||||||||||
9.500% due 12/01/2014 | 275 | 283 | ||||||||||
SandRidge Energy, Inc. |
| |||||||||||
9.875% due 05/15/2016 | 250 | 276 | ||||||||||
Sealed Air Corp. |
| |||||||||||
5.625% due 07/15/2013 | 200 | 210 | ||||||||||
Shingle Springs Tribal Gaming Authority |
| |||||||||||
9.375% due 06/15/2015 | 100 | 70 | ||||||||||
Smithfield Foods, Inc. |
| |||||||||||
10.000% due 07/15/2014 | 275 | 320 | ||||||||||
Snoqualmie Entertainment Authority |
| |||||||||||
9.125% due 02/01/2015 | 250 | 246 | ||||||||||
SPX Corp. |
| |||||||||||
7.625% due 12/15/2014 | 250 | 278 | ||||||||||
Steel Dynamics, Inc. |
| |||||||||||
7.750% due 04/15/2016 | 375 | 396 | ||||||||||
SunGard Data Systems, Inc. |
| |||||||||||
10.250% due 08/15/2015 | 376 | 390 | ||||||||||
Tenet Healthcare Corp. |
| |||||||||||
9.000% due 05/01/2015 | 100 | 108 | ||||||||||
9.250% due 02/01/2015 | 250 | 275 | ||||||||||
VWR Funding, Inc. |
| |||||||||||
10.250% due 07/15/2015 (a) | 275 | 289 | ||||||||||
YCC Holdings LLC |
| |||||||||||
10.250% due 02/15/2016 (a) | 275 | 277 | ||||||||||
|
| |||||||||||
| 17,107 | ||||||||||||
|
| |||||||||||
UTILITIES 8.2% |
| |||||||||||
GenOn Energy, Inc. |
| |||||||||||
7.625% due 06/15/2014 | 275 | 285 | ||||||||||
Kinder Morgan Finance Co. ULC |
| |||||||||||
5.700% due 01/05/2016 | 375 | 392 | ||||||||||
Midwest Generation LLC |
| |||||||||||
8.560% due 01/02/2016 | 189 | 194 | ||||||||||
Sprint Capital Corp. |
| |||||||||||
8.375% due 03/15/2012 | 700 | 732 | ||||||||||
Telesat LLC |
| |||||||||||
11.000% due 11/01/2015 | 275 | 302 | ||||||||||
Texas Competitive Electric Holdings Co. LLC |
| |||||||||||
10.250% due 11/01/2015 | 250 | 152 | ||||||||||
|
| |||||||||||
| 2,057 | ||||||||||||
|
| |||||||||||
Total Corporate Bonds & Notes (Cost $23,218) | 23,287 | |||||||||||
|
| |||||||||||
SHORT-TERM INSTRUMENTS 8.1% |
| |||||||||||
REPURCHASE AGREEMENTS 8.1% |
| |||||||||||
State Street Bank and Trust Co. |
| |||||||||||
0.010% due 07/01/2011 | 2,030 | 2,030 | ||||||||||
|
| |||||||||||
(Dated 06/30/2011. Collateralized by U.S. Treasury Bills 0.000% due 08/11/2011 valued at $2,075. Repurchase proceeds are $2,030.) |
| |||||||||||
Total Short-Term Instruments | 2,030 | |||||||||||
|
| |||||||||||
Total Investments 101.0% | $ | 25,317 | ||||||||||
Other Assets and Liabilities (Net) (1.0%) |
| (244 | ) | |||||||||
|
| |||||||||||
Net Assets 100.0% | $ | 25,073 | ||||||||||
|
| |||||||||||
| See Accompanying Notes | Annual Report | June 30, 2011 | 31 |
Table of Contents
Schedule of Investments PIMCO 0-5 Year High Yield Corporate Bond Index Fund (Cont.)
June 30, 2011
| 32 | PIMCO ETF Trust | See Accompanying Notes |
Notes to Schedule of Investments (amounts in thousands):
| (a) | Payment in-kind bond security. |
| (b) | Fair Value Measurements (1) |
The following is a summary of the fair valuations according to the inputs used as of June 30, 2011 in valuing the Fund’s assets and liabilities (2):
| Category and Subcategory (3) | Level 1 (4) | Level 2 (5) | Level 3 (6) | Fair Value at 06/30/2011 | ||||||||||||||
| Investments, at value | ||||||||||||||||||
| Corporate Bonds & Notes | ||||||||||||||||||
Banking & Finance | $ | 0 | $ | 4,123 | $ | 0 | $ | 4,123 | ||||||||||
Industrials | 0 | 17,107 | 0 | 17,107 | ||||||||||||||
Utilities | 0 | 1,863 | 194 | 2,057 | ||||||||||||||
| Short-Term Instruments | ||||||||||||||||||
Repurchase Agreements | 0 | 2,030 | 0 | 2,030 | ||||||||||||||
| $ | 0 | $ | 25,123 | $ | 194 | $ | 25,317 | |||||||||||
The following is a reconciliation of the fair valuations using significant unobservable inputs (Level 3) for the Fund during the year ended June 30, 2011:
| Category and Subcategory (3) | Beginning Balance at 06/30/2010 | Net Purchases | Net Sales | Accrued Discounts/ (Premiums) | Realized Gain/(Loss) | Net Change in Unrealized Appreciation/ (Depreciation) | Transfers into Level 3 | Transfers out of Level 3 | Ending Balance at 06/30/2011 | Net Change in Unrealized Appreciation/ (Depreciation) on Investments Held at 06/30/2011 | ||||||||||||||||||||||||||||||||
| Investments, at value | ||||||||||||||||||||||||||||||||||||||||||
| Corporate Bonds & Notes | ||||||||||||||||||||||||||||||||||||||||||
Utilities | $ | 0 | $ | 197 | $ | 0 | $ | 7 | $ | 0 | $ | (10 | ) | $ | 0 | $ | 0 | $ | 194 | $ | (10 | ) | ||||||||||||||||||||
| (1) | See note 3 in the Notes to Financial Statements for more information regarding pricing inputs and valuation techniques. |
| (2) | There were no significant transfers into or out of level 1, 2, and 3 during the period ended June 30, 2011. |
| (3) | Refer to the Schedule of Investments for additional information. |
| (4) | Quoted prices in active markets for identical investments. |
| (5) | Significant other observable inputs. |
| (6) | Significant unobservable inputs. |
Table of Contents
Schedule of Investments PIMCO 1-3 Year U.S. Treasury Index Fund
June 30, 2011
| PRINCIPAL AMOUNT (000s) | MARKET VALUE (000s) | |||||||||||
U.S. TREASURY OBLIGATIONS 99.7% |
| |||||||||||
U.S. Treasury Notes | ||||||||||||
0.500% due 05/31/2013 | $ | 6,650 | $ | 6,657 | ||||||||
0.500% due 10/15/2013 | 3,121 | 3,116 | ||||||||||
0.500% due 11/15/2013 | 4,266 | 4,256 | ||||||||||
0.625% due 06/30/2012 | 4,301 | 4,318 | ||||||||||
0.750% due 08/15/2013 | 4,404 | 4,428 | ||||||||||
0.750% due 09/15/2013 | 5,478 | 5,504 | ||||||||||
0.750% due 12/15/2013 | 3,218 | 3,228 | ||||||||||
0.750% due 06/15/2014 | 5,172 | 5,165 | ||||||||||
1.000% due 07/15/2013 | 3,943 | 3,985 | ||||||||||
1.000% due 01/15/2014 | 2,733 | 2,757 | ||||||||||
1.000% due 05/15/2014 | 1,000 | 1,006 | ||||||||||
1.125% due 12/15/2012 | 3,084 | 3,119 | ||||||||||
1.125% due 06/15/2013 | 1,058 | 1,072 | ||||||||||
1.250% due 02/15/2014 | 4,379 | 4,443 | ||||||||||
1.250% due 03/15/2014 | 2,130 | 2,161 | ||||||||||
1.250% due 04/15/2014 | 2,900 | 2,941 | ||||||||||
1.375% due 09/15/2012 | 3,959 | 4,011 | ||||||||||
1.375% due 10/15/2012 | 4,787 | 4,853 | ||||||||||
1.375% due 11/15/2012 | 4,824 | 4,893 | ||||||||||
1.375% due 01/15/2013 | 7,828 | 7,949 | ||||||||||
1.375% due 02/15/2013 | 4,319 | 4,388 | ||||||||||
1.375% due 03/15/2013 | 4,198 | 4,267 | ||||||||||
1.375% due 05/15/2013 | 3,902 | 3,970 | ||||||||||
1.750% due 08/15/2012 | 6,811 | 6,925 | ||||||||||
1.750% due 04/15/2013 | 7,261 | 7,432 | ||||||||||
Total U.S. Treasury Obligations | 106,844 | |||||||||||
| PRINCIPAL AMOUNT (000s) | MARKET VALUE (000s) | |||||||||||
SHORT-TERM INSTRUMENTS 0.4% |
| |||||||||||
REPURCHASE AGREEMENTS 0.4% |
| |||||||||||
State Street Bank and Trust Co. | ||||||||||||
0.010% due 07/01/2011 | $ | 421 | $ | 421 | ||||||||
(Dated 06/30/2011. Collateralized by U.S. Treasury Bills 0.000% due 08/11/2011 valued at $430. Repurchase proceeds are $421.) | ||||||||||||
Total Short-Term Instruments | 421 | |||||||||||
Total Investments 100.1% | $ | 107,265 | ||||||||||
Other Assets and Liabilities (Net) (0.1%) |
| (59 | ) | |||||||||
Net Assets 100.0% | $ | 107,206 | ||||||||||
Notes to Schedule of Investments (amounts in thousands):
| (a) | Fair Value Measurements (1) |
The following is a summary of the fair valuations according to the inputs used as of June 30, 2011 in valuing the Fund’s assets and liabilities (2):
| Category and Subcategory (3) | Level 1 (4) | Level 2 (5) | Level 3 (6) | Fair Value at 06/30/2011 | ||||||||||||||
| Investments, at value | ||||||||||||||||||
| U.S. Treasury Obligations | $ | 0 | $ | 106,844 | $ | 0 | $ | 106,844 | ||||||||||
| Short-Term Instruments | ||||||||||||||||||
Repurchase Agreements | 0 | 421 | 0 | 421 | ||||||||||||||
| $ | 0 | $ | 107,265 | $ | 0 | $ | 107,265 | |||||||||||
| (1) | See note 3 in the Notes to Financial Statements for more information regarding pricing inputs and valuation techniques. |
| (2) | There were no significant transfers into or out of level 1, 2, and 3 during the period ended June 30, 2011. |
| (3) | Refer to the Schedule of Investments for additional information. |
| (4) | Quoted prices in active markets for identical investments. |
| (5) | Significant other observable inputs. |
| (6) | Significant unobservable inputs. |
| See Accompanying Notes | Annual Report | June 30, 2011 | 33 |
Table of Contents
Schedule of Investments PIMCO 1-5 Year U.S. TIPS Index Fund
June 30, 2011
| PRINCIPAL AMOUNT (000s) | MARKET VALUE (000s) | |||||||||||
U.S. TREASURY OBLIGATIONS 99.3% |
| |||||||||||
Treasury Inflation Protected Securities (a) | ||||||||||||
0.125% due 04/15/2016 | $ | 67,924 | $ | 69,452 | ||||||||
0.500% due 04/15/2015 | 104,930 | 109,472 | ||||||||||
0.625% due 04/15/2013 | 75,967 | 78,246 | ||||||||||
1.250% due 04/15/2014 | 77,243 | 81,968 | ||||||||||
1.625% due 01/15/2015 | 106,566 | 115,599 | ||||||||||
1.875% due 07/15/2013 | 116,661 | 123,998 | ||||||||||
1.875% due 07/15/2015 | 93,595 | 103,225 | ||||||||||
2.000% due 01/15/2014 | 121,721 | 131,202 | ||||||||||
2.000% due 07/15/2014 | 107,956 | 117,790 | ||||||||||
2.000% due 01/15/2016 | 91,728 | 101,955 | ||||||||||
3.000% due 07/15/2012 | 137,096 | 143,094 | ||||||||||
Total U.S. Treasury Obligations | 1,176,001 | |||||||||||
| PRINCIPAL AMOUNT (000s) | MARKET VALUE (000s) | |||||||||||
SHORT-TERM INSTRUMENTS 0.0% |
| |||||||||||
REPURCHASE AGREEMENTS 0.0% |
| |||||||||||
State Street Bank and Trust Co. | ||||||||||||
0.010% due 07/01/2011 | $ | 483 | $ | 483 | ||||||||
(Dated 06/30/2011. Collateralized by U.S. Treasury Bills 0.000% due 08/11/2011 valued at $495. Repurchase proceeds are $483.) |
| |||||||||||
Total Short-Term Instruments | 483 | |||||||||||
Total Investments 99.3% | $ | 1,176,484 | ||||||||||
Other Assets and Liabilities (Net) 0.7% |
| 7,885 | ||||||||||
Net Assets 100.0% | $ | 1,184,369 | ||||||||||
Notes to Schedule of Investments (amounts in thousands):
| (a) | Principal amount of security is adjusted for inflation. |
| (b) | Fair Value Measurements (1) |
The following is a summary of the fair valuations according to the inputs used as of June 30, 2011 in valuing the Fund’s assets and liabilities (2):
| Category and Subcategory (3) | Level 1 (4) | Level 2 (5) | Level 3 (6) | Fair Value at 06/30/2011 | ||||||||||||||
| Investments, at value | ||||||||||||||||||
| U.S. Treasury Obligations | $ | 0 | $ | 1,176,001 | $ | 0 | $ | 1,176,001 | ||||||||||
| Short-Term Instruments | ||||||||||||||||||
Repurchase Agreements | 0 | 483 | 0 | 483 | ||||||||||||||
| $ | 0 | $ | 1,176,484 | $ | 0 | $ | 1,176,484 | |||||||||||
| (1) | See note 3 in the Notes to Financial Statements for more information regarding pricing inputs and valuation techniques. |
| (2) | There were no significant transfers into or out of level 1, 2, and 3 during the period ended June 30, 2011. |
| (3) | Refer to the Schedule of Investments for additional information. |
| (4) | Quoted prices in active markets for identical investments. |
| (5) | Significant other observable inputs. |
| (6) | Significant unobservable inputs. |
| 34 | PIMCO ETF Trust | See Accompanying Notes |
Table of Contents
Schedule of Investments PIMCO 3-7 Year U.S. Treasury Index Fund
June 30, 2011
| PRINCIPAL AMOUNT (000s) | MARKET VALUE (000s) | |||||||||||
U.S. TREASURY OBLIGATIONS 99.3% |
| |||||||||||
U.S. Treasury Bonds | ||||||||||||
7.250% due 05/15/2016 | $ | 1,116 | $ | 1,409 | ||||||||
9.250% due 02/15/2016 | 713 | 959 | ||||||||||
9.875% due 11/15/2015 | 397 | 539 | ||||||||||
10.625% due 08/15/2015 | 147 | 202 | ||||||||||
11.250% due 02/15/2015 | 143 | 194 | ||||||||||
U.S. Treasury Notes | ||||||||||||
1.875% due 08/31/2017 | 519 | 508 | ||||||||||
1.875% due 10/31/2017 | 1,120 | 1,092 | ||||||||||
2.125% due 11/30/2014 | 1,606 | 1,665 | ||||||||||
2.375% due 09/30/2014 | 1,659 | 1,736 | ||||||||||
2.375% due 03/31/2016 | 1,543 | 1,596 | ||||||||||
2.375% due 05/31/2018 | 459 | 456 | ||||||||||
2.500% due 06/30/2017 | 744 | 758 | ||||||||||
2.625% due 06/30/2014 | 1,167 | 1,229 | ||||||||||
2.625% due 04/30/2018 | 608 | 615 | ||||||||||
2.750% due 12/31/2017 | 698 | 716 | ||||||||||
2.750% due 02/28/2018 | 301 | 308 | ||||||||||
3.000% due 02/28/2017 | 1,053 | 1,107 | ||||||||||
3.125% due 10/31/2016 | 1,124 | 1,194 | ||||||||||
3.125% due 04/30/2017 | 1,054 | 1,114 | ||||||||||
3.250% due 07/31/2016 | 997 | 1,069 | ||||||||||
3.250% due 12/31/2016 | 1,058 | 1,128 | ||||||||||
4.125% due 05/15/2015 | 1,050 | 1,165 | ||||||||||
Total U.S. Treasury Obligations | 20,759 | |||||||||||
Total Investments 99.3% | $ | 20,759 | ||||||||||
Other Assets and Liabilities (Net) 0.7% |
| 136 | ||||||||||
Net Assets 100.0% | $ | 20,895 | ||||||||||
Notes to Schedule of Investments (amounts in thousands):
| (a) | Fair Value Measurements (1) |
The following is a summary of the fair valuations according to the inputs used as of June 30, 2011 in valuing the Fund’s assets and liabilities (2):
| Category and Subcategory (3) | Level 1 (4) | Level 2 (5) | Level 3 (6) | Fair Value at 06/30/2011 | ||||||||||||||
| Investments, at value | ||||||||||||||||||
| U.S. Treasury Obligations | $ | 0 | $ | 20,759 | $ | 0 | $ | 20,759 | ||||||||||
| (1) | See note 3 in the Notes to Financial Statements for more information regarding pricing inputs and valuation techniques. |
| (2) | There were no significant transfers into or out of level 1, 2, and 3 during the period ended June 30, 2011. |
| (3) | Refer to the Schedule of Investments for additional information. |
| (4) | Quoted prices in active markets for identical investments. |
| (5) | Significant other observable inputs. |
| (6) | Significant unobservable inputs. |
| See Accompanying Notes | Annual Report | June 30, 2011 | 35 |
Table of Contents
Schedule of Investments PIMCO 7-15 Year U.S. Treasury Index Fund
June 30, 2011
| PRINCIPAL AMOUNT (000s) | MARKET VALUE (000s) | |||||||||||
U.S. TREASURY OBLIGATIONS 98.9% |
| |||||||||||
U.S. Treasury Bonds | ||||||||||||
6.000% due 02/15/2026 | $ | 341 | $ | 424 | ||||||||
6.250% due 08/15/2023 | 191 | 242 | ||||||||||
7.625% due 11/15/2022 | 321 | 450 | ||||||||||
7.625% due 02/15/2025 | 103 | 147 | ||||||||||
7.875% due 02/15/2021 | 227 | 318 | ||||||||||
8.125% due 08/15/2021 | 562 | 804 | ||||||||||
8.750% due 05/15/2020 | 577 | 842 | ||||||||||
U.S. Treasury Notes | ||||||||||||
2.625% due 08/15/2020 | 1,025 | 991 | ||||||||||
3.125% due 05/15/2019 | 969 | 1,000 | ||||||||||
3.375% due 11/15/2019 | 1,038 | 1,082 | ||||||||||
3.625% due 02/15/2020 | 936 | 989 | ||||||||||
3.750% due 11/15/2018 | 886 | 959 | ||||||||||
Total U.S. Treasury Obligations | 8,248 | |||||||||||
Total Investments 98.9% | $ | 8,248 | ||||||||||
Other Assets and Liabilities (Net) 1.1% | 94 | |||||||||||
Net Assets 100.0% | $ | 8,342 | ||||||||||
Notes to Schedule of Investments (amounts in thousands):
| (a) | Fair Value Measurements (1) |
The following is a summary of the fair valuations according to the inputs used as of June 30, 2011 in valuing the Fund’s assets and liabilities (2):
| Category and Subcategory (3) | Level 1 (4) | Level 2 (5) | Level 3 (6) | Fair Value at 06/30/2011 | ||||||||||||||
| Investments, at value | ||||||||||||||||||
| U.S. Treasury Obligations | $ | 0 | $ | 8,248 | $ | 0 | $ | 8,248 | ||||||||||
| (1) | See note 3 in the Notes to Financial Statements for more information regarding pricing inputs and valuation techniques. |
| (2) | There were no significant transfers into or out of level 1, 2, and 3 during the period ended June 30, 2011. |
| (3) | Refer to the Schedule of Investments for additional information. |
| (4) | Quoted prices in active markets for identical investments. |
| (5) | Significant other observable inputs. |
| (6) | Significant unobservable inputs. |
| 36 | PIMCO ETF Trust | See Accompanying Notes |
Table of Contents
Schedule of Investments PIMCO 15+ Year U.S. TIPS Index Fund
June 30, 2011
| PRINCIPAL AMOUNT (000s) | MARKET VALUE (000s) | |||||||||||
U.S. TREASURY OBLIGATIONS 99.2% |
| |||||||||||
Treasury Inflation Protected Securities (a) |
| |||||||||||
1.750% due 01/15/2028 | $ | 25,794 | $ | 27,019 | ||||||||
2.125% due 02/15/2040 | 24,260 | 26,386 | ||||||||||
2.125% due 02/15/2041 | 26,036 | 28,270 | ||||||||||
2.375% due 01/15/2027 | 28,250 | 32,225 | ||||||||||
2.500% due 01/15/2029 | 22,781 | 26,497 | ||||||||||
3.375% due 04/15/2032 | 9,760 | 12,921 | ||||||||||
3.625% due 04/15/2028 | 35,865 | 47,264 | ||||||||||
3.875% due 04/15/2029 | 40,993 | 56,212 | ||||||||||
|
| |||||||||||
Total U.S. Treasury Obligations (Cost $255,342) | 256,794 | |||||||||||
|
| |||||||||||
SHORT-TERM INSTRUMENTS 0.3% |
| |||||||||||
REPURCHASE AGREEMENTS 0.3% |
| |||||||||||
State Street Bank and Trust Co. |
| |||||||||||
0.010% due 07/01/2011 | 745 | 745 | ||||||||||
|
| |||||||||||
(Dated 06/30/2011. Collateralized by U.S. Treasury Bills 0.000% due 08/11/2011 valued at $760. Repurchase proceeds are $745.) | ||||||||||||
Total Short-Term Instruments (Cost $745) | 745 | |||||||||||
|
| |||||||||||
Total Investments 99.5% (Cost $256,087) | $ | 257,539 | ||||||||||
Other Assets and Liabilities (Net) 0.5% |
| 1,362 | ||||||||||
|
| |||||||||||
Net Assets 100.0% | $ | 258,901 | ||||||||||
|
| |||||||||||
Notes to Schedule of Investments (amounts in thousands):
| (a) | Principal amount of security is adjusted for inflation. |
| (b) | Fair Value Measurements (1) |
The following is a summary of the fair valuations according to the inputs used as of June 30, 2011 in valuing the Fund’s assets and liabilities (2):
| Category and Subcategory (3) | Level 1 (4) | Level 2 (5) | Level 3 (6) | Fair Value at 06/30/2011 | ||||||||||||||
| Investments, at value | ||||||||||||||||||
| U.S. Treasury Obligations | $ | 0 | $ | 256,794 | $ | 0 | $ | 256,794 | ||||||||||
| Short-Term Instruments | ||||||||||||||||||
Repurchase Agreements | 0 | 745 | 0 | 745 | ||||||||||||||
| $ | 0 | $ | 257,539 | $ | 0 | $ | 257,539 | |||||||||||
| (1) | See note 3 in the Notes to Financial Statements for more information regarding pricing inputs and valuation techniques. |
| (2) | There were no significant transfers into or out of level 1, 2, and 3 during the period ended June 30, 2011. |
| (3) | Refer to the Schedule of Investments for additional information. |
| (4) | Quoted prices in active markets for identical investments. |
| (5) | Significant other observable inputs. |
| (6) | Significant unobservable inputs. |
| See Accompanying Notes | Annual Report | June 30, 2011 | 37 |
Table of Contents
Schedule of Investments PIMCO 25+ Year Zero Coupon U.S. Treasury Index Fund
June 30, 2011
| PRINCIPAL AMOUNT (000s) | MARKET VALUE (000s) | |||||||||||
U.S. TREASURY OBLIGATIONS 100.0% |
| |||||||||||
U.S. Treasury Strips | ||||||||||||
0.000% due 02/15/2037 | $ | 10,712 | $ | 3,286 | ||||||||
0.000% due 05/15/2037 | 10,712 | 3,245 | ||||||||||
0.000% due 02/15/2038 | 10,712 | 3,123 | ||||||||||
0.000% due 05/15/2038 | 10,712 | 3,081 | ||||||||||
0.000% due 02/15/2039 | 10,712 | 2,974 | ||||||||||
0.000% due 05/15/2039 | 10,712 | 2,913 | ||||||||||
0.000% due 08/15/2039 | 10,712 | 2,880 | ||||||||||
0.000% due 11/15/2039 | 10,712 | 2,837 | ||||||||||
0.000% due 02/15/2040 | 10,712 | 2,809 | ||||||||||
0.000% due 05/15/2040 | 10,712 | 2,766 | ||||||||||
0.000% due 08/15/2040 | 10,712 | 2,753 | ||||||||||
0.000% due 11/15/2040 | 10,712 | 2,704 | ||||||||||
0.000% due 02/15/2041 | 10,712 | 2,673 | ||||||||||
0.000% due 05/15/2041 | 10,712 | 2,642 | ||||||||||
Total U.S. Treasury Obligations | 40,686 | |||||||||||
Total Investments 100.0% |
| $ | 40,686 | |||||||||
Other Assets and Liabilities (Net) 0.0% | 19 | |||||||||||
Net Assets 100.0% |
| $ | 40,705 | |||||||||
Notes to Schedule of Investments (amounts in thousands):
| (a) | Fair Value Measurements (1) |
The following is a summary of the fair valuations according to the inputs used as of June 30, 2011 in valuing the Fund’s assets and liabilities (2):
| Category and Subcategory (3) | Level 1 (4) | Level 2 (5) | Level 3 (6) | Fair Value at 06/30/2011 | ||||||||||||||
| Investments, at value | ||||||||||||||||||
| U.S. Treasury Obligations | $ | 0 | $ | 40,686 | $ | 0 | $ | 40,686 | ||||||||||
| (1) | See note 3 in the Notes to Financial Statements for more information regarding pricing inputs and valuation techniques. |
| (2) | There were no significant transfers into or out of level 1, 2, and 3 during the period ended June 30, 2011. |
| (3) | Refer to the Schedule of Investments for additional information. |
| (4) | Quoted prices in active markets for identical investments. |
| (5) | Significant other observable inputs. |
| (6) | Significant unobservable inputs. |
| 38 | PIMCO ETF Trust | See Accompanying Notes |
Table of Contents
Schedule of Investments PIMCO Broad U.S. TIPS Index Fund
June 30, 2011
| PRINCIPAL AMOUNT (000s) | MARKET VALUE (000s) | |||||||||||
U.S. TREASURY OBLIGATIONS 99.2% |
| |||||||||||
Treasury Inflation Protected Securities (a) |
| |||||||||||
0.500% due 04/15/2015 | $ | 1,247 | $ | 1,301 | ||||||||
0.625% due 04/15/2013 | 1,520 | 1,566 | ||||||||||
1.125% due 01/15/2021 | 3,323 | 3,450 | ||||||||||
1.250% due 04/15/2014 | 1,345 | 1,427 | ||||||||||
1.375% due 01/15/2020 | 4,517 | 4,843 | ||||||||||
1.625% due 01/15/2015 | 6,525 | 7,078 | ||||||||||
1.625% due 01/15/2018 | 4,216 | 4,638 | ||||||||||
1.750% due 01/15/2028 | 3,206 | 3,358 | ||||||||||
1.875% due 07/15/2019 | 1,364 | 1,525 | ||||||||||
2.000% due 01/15/2014 | 3,530 | 3,805 | ||||||||||
2.000% due 01/15/2026 | 2,845 | 3,111 | ||||||||||
2.125% due 02/15/2040 | 951 | 1,034 | ||||||||||
2.125% due 02/15/2041 | 1,293 | 1,404 | ||||||||||
2.375% due 01/15/2025 | 3,220 | 3,703 | ||||||||||
2.500% due 07/15/2016 | 5,026 | 5,753 | ||||||||||
2.500% due 01/15/2029 | 4,036 | 4,695 | ||||||||||
3.000% due 07/15/2012 | 2,151 | 2,245 | ||||||||||
3.375% due 04/15/2032 | 626 | 829 | ||||||||||
Total U.S. Treasury Obligations | 55,765 | |||||||||||
Total Investments 99.2% | $ | 55,765 | ||||||||||
Other Assets and Liabilities (Net) 0.8% |
| 454 | ||||||||||
Net Assets 100.0% | $ | 56,219 | ||||||||||
Notes to Schedule of Investments (amounts in thousands):
| (a) | Principal amount of security is adjusted for inflation. |
| (b) | Fair Value Measurements (1) |
The following is a summary of the fair valuations according to the inputs used as of June 30, 2011 in valuing the Fund’s assets and liabilities (2):
| Category and Subcategory (3) | Level 1 (4) | Level 2 (5) | Level 3 (6) | Fair Value at 06/30/2011 | ||||||||||||||
| Investments, at value | ||||||||||||||||||
| U.S. Treasury Obligations | $ | 0 | $ | 55,765 | $ | 0 | $ | 55,765 | ||||||||||
| (1) | See note 3 in the Notes to Financial Statements for more information regarding pricing inputs and valuation techniques. |
| (2) | There were no significant transfers into or out of level 1, 2, and 3 during the period ended June 30, 2011. |
| (3) | Refer to the Schedule of Investments for additional information. |
| (4) | Quoted prices in active markets for identical investments. |
| (5) | Significant other observable inputs. |
| (6) | Significant unobservable inputs. |
| See Accompanying Notes | Annual Report | June 30, 2011 | 39 |
Table of Contents
Schedule of Investments PIMCO Broad U.S. Treasury Index Fund
June 30, 2011
| PRINCIPAL AMOUNT (000s) | MARKET VALUE (000s) | |||||||||||
U.S. TREASURY OBLIGATIONS 99.1% |
| |||||||||||
U.S. Treasury Bonds | ||||||||||||
2.625% due 11/15/2020 | $ | 538 | $ | 518 | ||||||||
3.625% due 02/15/2021 | 538 | 561 | ||||||||||
4.250% due 11/15/2040 | 538 | 526 | ||||||||||
4.375% due 05/15/2041 | 538 | 537 | ||||||||||
4.750% due 02/15/2041 | 538 | 572 | ||||||||||
U.S. Treasury Notes | ||||||||||||
0.375% due 06/30/2013 | 520 | 519 | ||||||||||
0.500% due 05/31/2013 | 538 | 539 | ||||||||||
0.625% due 04/30/2013 | 538 | 540 | ||||||||||
0.750% due 06/15/2014 | 520 | 519 | ||||||||||
1.000% due 05/15/2014 | 538 | 541 | ||||||||||
1.250% due 04/15/2014 | 538 | 545 | ||||||||||
1.750% due 05/31/2016 | 538 | 539 | ||||||||||
2.000% due 04/30/2016 | 538 | 546 | ||||||||||
2.250% due 03/31/2016 | 538 | 553 | ||||||||||
2.375% due 05/31/2018 | 538 | 535 | ||||||||||
2.625% due 04/30/2018 | 538 | 544 | ||||||||||
2.875% due 03/31/2018 | 538 | 554 | ||||||||||
3.125% due 05/15/2021 | 538 | 536 | ||||||||||
Total U.S. Treasury Obligations | 9,724 | |||||||||||
Total Investments 99.1% | $ | 9,724 | ||||||||||
Other Assets and Liabilities (Net) 0.9% |
| 87 | ||||||||||
Net Assets 100.0% | $ | 9,811 | ||||||||||
Notes to Schedule of Investments (amounts in thousands):
| (a) | Fair Value Measurements (1) |
The following is a summary of the fair valuations according to the inputs used as of June 30, 2011 in valuing the Fund’s assets and liabilities (2):
| Category and Subcategory (3) | Level 1 (4) | Level 2 (5) | Level 3 (6) | Fair Value at 06/30/2011 | ||||||||||||||
| Investments, at value | ||||||||||||||||||
| U.S. Treasury Obligations | $ | 0 | $ | 9,724 | $ | 0 | $ | 9,724 | ||||||||||
| (1) | See note 3 in the Notes to Financial Statements for more information regarding pricing inputs and valuation techniques. |
| (2) | There were no significant transfers into or out of level 1, 2, and 3 during the period ended June 30, 2011. |
| (3) | Refer to the Schedule of Investments for additional information. |
| (4) | Quoted prices in active markets for identical investments. |
| (5) | Significant other observable inputs. |
| (6) | Significant unobservable inputs. |
| 40 | PIMCO ETF Trust | See Accompanying Notes |
Table of Contents
Schedule of Investments PIMCO Investment Grade Corporate Bond Index Fund
June 30, 2011
| �� | PRINCIPAL AMOUNT (000s) | MARKET VALUE (000s) | ||||||||||
CORPORATE BONDS & NOTES 96.8% |
| |||||||||||
BANKING & FINANCE 39.7% |
| |||||||||||
American International Group, Inc. |
| |||||||||||
5.850% due 01/16/2018 | $ | 980 | $ | 1,028 | ||||||||
Bank of America Corp. | ||||||||||||
5.375% due 09/11/2012 | 500 | 524 | ||||||||||
5.625% due 07/01/2020 | 100 | 103 | ||||||||||
7.375% due 05/15/2014 | 300 | 337 | ||||||||||
Bank of Nova Scotia | ||||||||||||
3.400% due 01/22/2015 | 450 | 473 | ||||||||||
Barclays Bank PLC | ||||||||||||
5.125% due 01/08/2020 | 1,000 | 1,016 | ||||||||||
Bear Stearns Cos. LLC | ||||||||||||
5.300% due 10/30/2015 | 300 | 329 | ||||||||||
6.950% due 08/10/2012 | 400 | 427 | ||||||||||
Berkshire Hathaway Finance Corp. |
| |||||||||||
5.750% due 01/15/2040 | 300 | 313 | ||||||||||
Capital One Capital VI | ||||||||||||
8.875% due 05/15/2040 | 400 | 415 | ||||||||||
Caterpillar Financial Services Corp. |
| |||||||||||
6.125% due 02/17/2014 | 820 | 922 | ||||||||||
Citigroup, Inc. | ||||||||||||
5.375% due 08/09/2020 | 40 | 42 | ||||||||||
6.010% due 01/15/2015 | 300 | 330 | ||||||||||
6.125% due 05/15/2018 | 550 | 606 | ||||||||||
8.125% due 07/15/2039 | 900 | 1,130 | ||||||||||
Credit Suisse | ||||||||||||
4.375% due 08/05/2020 | 100 | 98 | ||||||||||
5.000% due 05/15/2013 | 1,100 | 1,174 | ||||||||||
Deutsche Bank AG | ||||||||||||
5.375% due 10/12/2012 | 430 | 454 | ||||||||||
General Electric Capital Corp. | ||||||||||||
5.500% due 01/08/2020 | 680 | 729 | ||||||||||
6.000% due 06/15/2012 | 1,000 | 1,052 | ||||||||||
Goldman Sachs Group, Inc. | ||||||||||||
5.250% due 10/15/2013 | 800 | 859 | ||||||||||
5.375% due 03/15/2020 | 1,200 | 1,241 | ||||||||||
HSBC Bank USA N.A. | ||||||||||||
4.625% due 04/01/2014 | 820 | 874 | ||||||||||
4.875% due 08/24/2020 | 700 | 690 | ||||||||||
John Deere Capital Corp. | ||||||||||||
2.950% due 03/09/2015 | 100 | 104 | ||||||||||
5.750% due 09/10/2018 | 200 | 230 | ||||||||||
JPMorgan Chase & Co. | ||||||||||||
3.700% due 01/20/2015 | 700 | 728 | ||||||||||
JPMorgan Chase Bank N.A. | ||||||||||||
5.875% due 06/13/2016 | 200 | 221 | ||||||||||
Kimco Realty Corp. | ||||||||||||
6.875% due 10/01/2019 | 490 | 570 | ||||||||||
Macquarie Bank Ltd. | ||||||||||||
6.625% due 04/07/2021 | 300 | 302 | ||||||||||
Merrill Lynch & Co., Inc. | ||||||||||||
6.875% due 04/25/2018 | 1,000 | 1,107 | ||||||||||
7.750% due 05/14/2038 | 100 | 111 | ||||||||||
MetLife, Inc. | ||||||||||||
5.700% due 06/15/2035 | 300 | 302 | ||||||||||
5.875% due 02/06/2041 | 800 | 807 | ||||||||||
Moody’s Corp. | ||||||||||||
5.500% due 09/01/2020 | 300 | 308 | ||||||||||
Morgan Stanley | ||||||||||||
5.500% due 07/24/2020 | 680 | 689 | ||||||||||
6.000% due 04/28/2015 | 400 | 434 | ||||||||||
| PRINCIPAL AMOUNT (000s) | MARKET VALUE (000s) | |||||||||||
7.300% due 05/13/2019 | $ | 730 | $ | 829 | ||||||||
Nomura Holdings, Inc. | ||||||||||||
6.700% due 03/04/2020 | 700 | 766 | ||||||||||
Prudential Financial, Inc. | ||||||||||||
4.750% due 09/17/2015 | 980 | 1,055 | ||||||||||
Royal Bank of Scotland Group PLC |
| |||||||||||
4.875% due 03/16/2015 | 900 | 934 | ||||||||||
Simon Property Group LP |
| |||||||||||
5.650% due 02/01/2020 | 100 | 108 | ||||||||||
6.750% due 05/15/2014 | 570 | 646 | ||||||||||
Toyota Motor Credit Corp. |
| |||||||||||
3.200% due 06/17/2015 | 650 | 676 | ||||||||||
UBS AG | ||||||||||||
5.750% due 04/25/2018 | 900 | 977 | ||||||||||
Wachovia Corp. |
| |||||||||||
5.500% due 05/01/2013 | 1,710 | 1,839 | ||||||||||
|
| |||||||||||
| 28,909 | ||||||||||||
|
| |||||||||||
INDUSTRIALS 46.1% |
| |||||||||||
Abbott Laboratories |
| |||||||||||
5.125% due 04/01/2019 | 750 | 826 | ||||||||||
Alcoa, Inc. | ||||||||||||
6.150% due 08/15/2020 | 790 | 838 | ||||||||||
Altria Group, Inc. | ||||||||||||
9.250% due 08/06/2019 | 770 | 1,005 | ||||||||||
America Movil S.A.B. de C.V. | ||||||||||||
6.125% due 03/30/2040 | 580 | 609 | ||||||||||
American Tower Corp. | ||||||||||||
4.500% due 01/15/2018 | 300 | 300 | ||||||||||
Amgen, Inc. | ||||||||||||
3.450% due 10/01/2020 | 300 | 286 | ||||||||||
6.150% due 06/01/2018 | 200 | 232 | ||||||||||
Anadarko Petroleum Corp. |
| |||||||||||
6.375% due 09/15/2017 | 730 | 837 | ||||||||||
Anheuser-Busch Cos., Inc. |
| |||||||||||
5.500% due 01/15/2018 | 1,000 | 1,115 | ||||||||||
ArcelorMittal |
| |||||||||||
6.125% due 06/01/2018 | 200 | 214 | ||||||||||
9.850% due 06/01/2019 | 100 | 127 | ||||||||||
Barrick PD Australia Finance Pty. Ltd. |
| |||||||||||
4.950% due 01/15/2020 | 100 | 105 | ||||||||||
Boeing Co. | ||||||||||||
3.500% due 02/15/2015 | 400 | 425 | ||||||||||
Bunge Ltd. Finance Corp. |
| |||||||||||
4.100% due 03/15/2016 | 400 | 417 | ||||||||||
Cenovus Energy, Inc. |
| |||||||||||
6.750% due 11/15/2039 | 560 | 635 | ||||||||||
CenterPoint Energy Resources Corp. |
| |||||||||||
4.500% due 01/15/2021 | 400 | 403 | ||||||||||
Cisco Systems, Inc. | ||||||||||||
4.450% due 01/15/2020 | 270 | 281 | ||||||||||
Comcast Corp. | ||||||||||||
5.300% due 01/15/2014 | 140 | 154 | ||||||||||
5.700% due 07/01/2019 | 430 | 479 | ||||||||||
ConocoPhillips | ||||||||||||
5.750% due 02/01/2019 | 920 | 1,059 | ||||||||||
Corning, Inc. | ||||||||||||
5.750% due 08/15/2040 | 500 | 501 | ||||||||||
CSX Corp. | ||||||||||||
6.220% due 04/30/2040 | 500 | 542 | ||||||||||
| PRINCIPAL AMOUNT (000s) | MARKET VALUE (000s) | |||||||||||
CVS Caremark Corp. |
| |||||||||||
6.125% due 09/15/2039 | $ | 930 | $ | 957 | ||||||||
Deere & Co. | ||||||||||||
6.950% due 04/25/2014 | 100 | 116 | ||||||||||
DirecTV Holdings LLC |
| |||||||||||
3.125% due 02/15/2016 | 810 | 822 | ||||||||||
Dow Chemical Co. | ||||||||||||
5.900% due 02/15/2015 | 630 | 708 | ||||||||||
7.600% due 05/15/2014 | 200 | 232 | ||||||||||
Eli Lilly & Co. | ||||||||||||
5.950% due 11/15/2037 | 710 | 776 | ||||||||||
Energy Transfer Partners LP |
| |||||||||||
8.500% due 04/15/2014 | 200 | 233 | ||||||||||
Ensco PLC | ||||||||||||
4.700% due 03/15/2021 | 300 | 303 | ||||||||||
General Electric Co. |
| |||||||||||
5.250% due 12/06/2017 | 330 | 366 | ||||||||||
Hewlett-Packard Co. |
| |||||||||||
2.125% due 09/13/2015 | 510 | 509 | ||||||||||
Home Depot, Inc. |
| |||||||||||
5.400% due 03/01/2016 | 800 | 894 | ||||||||||
International Business Machines Corp. |
| |||||||||||
1.000% due 08/05/2013 | 510 | 512 | ||||||||||
5.600% due 11/30/2039 | 520 | 551 | ||||||||||
International Paper Co. |
| |||||||||||
7.500% due 08/15/2021 | 400 | 468 | ||||||||||
Kinder Morgan Energy Partners LP |
| |||||||||||
5.300% due 09/15/2020 | 100 | 105 | ||||||||||
Kraft Foods, Inc. | ||||||||||||
4.125% due 02/09/2016 | 100 | 107 | ||||||||||
5.375% due 02/10/2020 | 100 | 109 | ||||||||||
Kroger Co. | ||||||||||||
6.150% due 01/15/2020 | 200 | 231 | ||||||||||
L-3 Communications Corp. |
| |||||||||||
4.750% due 07/15/2020 | 490 | 486 | ||||||||||
Lockheed Martin Corp. |
| |||||||||||
4.250% due 11/15/2019 | 100 | 103 | ||||||||||
Marriott International, Inc. |
| |||||||||||
6.200% due 06/15/2016 | 100 | 112 | ||||||||||
Microsoft Corp. |
| |||||||||||
1.625% due 09/25/2015 | 100 | 99 | ||||||||||
Noble Holding International Ltd. |
| |||||||||||
4.625% due 03/01/2021 | 600 | 611 | ||||||||||
Novartis Capital Corp. |
| |||||||||||
2.900% due 04/24/2015 | 440 | 458 | ||||||||||
Pemex Project Funding Master Trust |
| |||||||||||
5.750% due 03/01/2018 | 890 | 980 | ||||||||||
PepsiCo, Inc. | ||||||||||||
3.100% due 01/15/2015 | 300 | 315 | ||||||||||
5.500% due 01/15/2040 | 300 | 318 | ||||||||||
Petrobras International Finance Co. |
| |||||||||||
5.750% due 01/20/2020 | 100 | 107 | ||||||||||
6.875% due 01/20/2040 | 100 | 107 | ||||||||||
Pfizer, Inc. | ||||||||||||
6.200% due 03/15/2019 | 420 | 492 | ||||||||||
Philip Morris International, Inc. |
| |||||||||||
4.875% due 05/16/2013 | 400 | 429 | ||||||||||
5.650% due 05/16/2018 | 280 | 315 | ||||||||||
Procter & Gamble Co. | ||||||||||||
1.375% due 08/01/2012 | 480 | 484 | ||||||||||
3.500% due 02/15/2015 | 200 | 214 | ||||||||||
| See Accompanying Notes | Annual Report | June 30, 2011 | 41 |
Table of Contents
Schedule of Investments PIMCO Investment Grade Corporate Bond Index Fund (Cont.)
June 30, 2011
| PRINCIPAL AMOUNT (000s) | MARKET VALUE (000s) | |||||||||||
Raytheon Co. | ||||||||||||
3.125% due 10/15/2020 | $ | 590 | $ | 555 | ||||||||
Republic Services, Inc. | ||||||||||||
5.000% due 03/01/2020 | 100 | 106 | ||||||||||
Shell International Finance BV |
| |||||||||||
3.100% due 06/28/2015 | 500 | 523 | ||||||||||
4.375% due 03/25/2020 | 230 | 242 | ||||||||||
Southern Copper Corp. | ||||||||||||
6.750% due 04/16/2040 | 700 | 684 | ||||||||||
Target Corp. | ||||||||||||
3.875% due 07/15/2020 | 310 | 310 | ||||||||||
Telefonica Emisiones S.A.U. | ||||||||||||
2.582% due 04/26/2013 | 800 | 809 | ||||||||||
3.729% due 04/27/2015 | 200 | 204 | ||||||||||
Time Warner Cable, Inc. |
| |||||||||||
5.000% due 02/01/2020 | 400 | 416 | ||||||||||
5.875% due 11/15/2040 | 200 | 198 | ||||||||||
8.750% due 02/14/2019 | 250 | 319 | ||||||||||
Time Warner, Inc. |
| |||||||||||
3.150% due 07/15/2015 | 300 | 310 | ||||||||||
Total Capital S.A. |
| |||||||||||
3.000% due 06/24/2015 | 100 | 104 | ||||||||||
Transocean, Inc. |
| |||||||||||
4.950% due 11/15/2015 | 300 | 325 | ||||||||||
6.500% due 11/15/2020 | 400 | 448 | ||||||||||
Tyco International Finance S.A. |
| |||||||||||
4.125% due 10/15/2014 | 100 | 106 | ||||||||||
United Parcel Service, Inc. |
| |||||||||||
3.875% due 04/01/2014 | 820 | 884 | ||||||||||
United Technologies Corp. |
| |||||||||||
4.500% due 04/15/2020 | 800 | 848 | ||||||||||
| PRINCIPAL AMOUNT (000s) | MARKET VALUE (000s) | |||||||||||
Vale Overseas Ltd. |
| |||||||||||
6.875% due 11/21/2036 | $ | 260 | $ | 283 | ||||||||
Wal-Mart Stores, Inc. |
| |||||||||||
2.250% due 07/08/2015 | 100 | 101 | ||||||||||
5.375% due 04/05/2017 | 30 | 34 | ||||||||||
Waste Management, Inc. |
| |||||||||||
4.750% due 06/30/2020 | 180 | 187 | ||||||||||
Weatherford International Ltd. |
| |||||||||||
5.125% due 09/15/2020 | 300 | 307 | ||||||||||
WPP Finance UK |
| |||||||||||
8.000% due 09/15/2014 | 200 | 235 | ||||||||||
| 33,557 | ||||||||||||
UTILITIES 11.0% | ||||||||||||
AT&T, Inc. | ||||||||||||
2.500% due 08/15/2015 | 110 | 111 | ||||||||||
6.300% due 01/15/2038 | 1,500 | 1,594 | ||||||||||
BP Capital Markets PLC |
| |||||||||||
4.500% due 10/01/2020 | 300 | 306 | ||||||||||
5.250% due 11/07/2013 | 640 | 694 | ||||||||||
Commonwealth Edison Co. |
| |||||||||||
4.000% due 08/01/2020 | 770 | 764 | ||||||||||
Dominion Resources, Inc. |
| |||||||||||
4.450% due 03/15/2021 | 300 | 306 | ||||||||||
EDP Finance BV | ||||||||||||
4.900% due 10/01/2019 | 100 | 86 | ||||||||||
Entergy Corp. | ||||||||||||
5.125% due 09/15/2020 | 300 | 297 | ||||||||||
Exelon Generation Co. LLC |
| |||||||||||
6.200% due 10/01/2017 | 100 | 113 | ||||||||||
| PRINCIPAL AMOUNT (000s) | MARKET VALUE (000s) | |||||||||||
FirstEnergy Corp. |
| |||||||||||
7.375% due 11/15/2031 | $ | 740 | $ | 845 | ||||||||
MidAmerican Energy Holdings Co. |
| |||||||||||
6.125% due 04/01/2036 | 800 | 864 | ||||||||||
Pacific Gas & Electric Co. |
| |||||||||||
3.500% due 10/01/2020 | 830 | 790 | ||||||||||
5.800% due 03/01/2037 | 100 | 103 | ||||||||||
Pennsylvania Electric Co. |
| |||||||||||
5.200% due 04/01/2020 | 70 | 74 | ||||||||||
Verizon Communications, Inc. |
| |||||||||||
8.750% due 11/01/2018 | 850 | 1,107 | ||||||||||
| 8,054 | ||||||||||||
Total Corporate Bonds & Notes | 70,520 | |||||||||||
SHORT-TERM INSTRUMENTS 2.1% |
| |||||||||||
REPURCHASE AGREEMENTS 2.1% | ||||||||||||
State Street Bank and Trust Co. | ||||||||||||
0.010% due 07/01/2011 | 1,532 | 1,532 | ||||||||||
(Dated 06/30/2011. Collateralized by U.S. Treasury Notes 1.000% due 04/30/2012 valued at $1,568. Repurchase proceeds are $1,532.) | ||||||||||||
Total Short-Term Instruments | 1,532 | |||||||||||
Total Investments 98.9% | $ | 72,052 | ||||||||||
Other Assets and Liabilities (Net) 1.1% | 769 | |||||||||||
Net Assets 100.0% | $ | 72,821 | ||||||||||
| 42 | PIMCO ETF Trust | See Accompanying Notes |
Notes to Schedule of Investments (amounts in thousands):
| (a) | Fair Value Measurements (1) |
The following is a summary of the fair valuations according to the inputs used as of June 30, 2011 in valuing the Fund’s assets and liabilities (2):
| Category and Subcategory (3) | Level 1 (4) | Level 2 (5) | Level 3 (6) | Fair Value at 06/30/2011 | ||||||||||||||
| Investments, at value | ||||||||||||||||||
| Corporate Bonds & Notes | ||||||||||||||||||
Banking & Finance | $ | 0 | $ | 28,909 | $ | 0 | $ | 28,909 | ||||||||||
Industrials | 0 | 33,557 | 0 | 33,557 | ||||||||||||||
Utilities | 0 | 8,054 | 0 | 8,054 | ||||||||||||||
| Short-Term Instruments | ||||||||||||||||||
Repurchase Agreements | 0 | 1,532 | 0 | 1,532 | ||||||||||||||
| $ | 0 | $ | 72,052 | $ | 0 | $ | 72,052 | |||||||||||
| (1) | See note 3 in the Notes to Financial Statements for more information regarding pricing inputs and valuation techniques. |
| (2) | There were no significant transfers into or out of level 1, 2, and 3 during the period ended June 30, 2011. |
| (3) | Refer to the Schedule of Investments for additional information. |
| (4) | Quoted prices in active markets for identical investments. |
| (5) | Significant other observable inputs. |
| (6) | Significant unobservable inputs. |
Table of Contents
Schedule of Investments PIMCO Build America Bond Strategy Fund
June 30, 2011
| PRINCIPAL AMOUNT (000s) | MARKET VALUE (000s) | |||||||||
MUNICIPAL BONDS & NOTES 93.8% |
| |||||||||
CALIFORNIA 46.3% |
| |||||||||
Alameda County, California Joint Powers Authority Revenue Bonds, (BABs), Series 2010 |
| |||||||||
7.046% due 12/01/2044 | $ | 350 | $ | 362 | ||||||
California State Bay Area Toll Authority Revenue Bonds, (BABs), Series 2010 |
| |||||||||
7.043% due 04/01/2050 | 1,000 | 1,096 | ||||||||
California State General Obligation Bonds, (BABs), Series 2010 |
| |||||||||
7.700% due 11/01/2030 | 2,250 | 2,443 | ||||||||
7.950% due 03/01/2036 | 1,000 | 1,091 | ||||||||
Los Angeles County, California Public Works Financing Authority, Revenue Bonds, (BABs), Series 2010 |
| |||||||||
7.618% due 08/01/2040 | 1,000 | 1,075 | ||||||||
Los Angeles, California Community College District General Obligation Bonds, (BABs), Series 2010 |
| |||||||||
6.750% due 08/01/2049 | 1,100 | 1,254 | ||||||||
Los Angeles, California Department of Airports Revenue Bonds, (BABs), Series 2009 |
| |||||||||
6.582% due 05/15/2039 | 740 | 791 | ||||||||
Los Angeles, California Unified School District General Obligation Bonds, (BABs), Series 2010 |
| |||||||||
6.758% due 07/01/2034 | 130 | 147 | ||||||||
Los Angeles, California Wastewater System Revenue Bonds, (BABs), Series 2010 |
| |||||||||
5.813% due 06/01/2040 | 450 | 431 | ||||||||
Orange County, California Sanitation District Revenue Bonds, (BABs), Series 2010 |
| |||||||||
6.400% due 02/01/2044 | 1,000 | 1,082 | ||||||||
San Diego County, California Regional Airport Authority Revenue Bonds, (BABs), Series 2010 |
| |||||||||
6.628% due 07/01/2040 | 1,000 | 1,003 | ||||||||
Southern California State Metropolitan Water District Revenue Bonds, (BABs), Series 2010 |
| |||||||||
6.947% due 07/01/2040 | 500 | 541 | ||||||||
University of California Regents Medical Center Revenue Bonds, (BABs), Series 2009 |
| |||||||||
6.583% due 05/15/2049 | 450 | 474 | ||||||||
University of California Regents Medical Center Revenue Bonds, (BABs), Series 2010 |
| |||||||||
6.548% due 05/15/2048 | 500 | 525 | ||||||||
University of California Revenue Bonds, (BABs), Series 2010 |
| |||||||||
6.296% due 05/15/2050 | 500 | 480 | ||||||||
|
| |||||||||
| 12,795 | ||||||||||
|
| |||||||||
| PRINCIPAL AMOUNT (000s) | MARKET VALUE (000s) | |||||||||
DISTRICT OF COLUMBIA 2.7% |
| |||||||||
District of Columbia Metropolitan Airports Authority Revenue Bonds, (BABs), Series 2009 |
| |||||||||
7.462% due 10/01/2046 | $ | 756 | $ | 748 | ||||||
|
| |||||||||
GEORGIA 3.4% |
| |||||||||
Georgia State Municipal Electric Authority Revenue Bonds, (BABs), Series 2010 |
| |||||||||
6.655% due 04/01/2057 | 1,000 | 944 | ||||||||
|
| |||||||||
ILLINOIS 8.7% |
| |||||||||
Chicago, Illinois Airport Revenue Bonds, (BABs), Series 2010 |
| |||||||||
6.395% due 01/01/2040 | 1,000 | 1,040 | ||||||||
6.845% due 01/01/2038 | 680 | 698 | ||||||||
Illinois State Toll Highway Authority Revenue Bonds, (BABs), Series 2009 |
| |||||||||
6.184% due 01/01/2034 | 655 | 679 | ||||||||
|
| |||||||||
| 2,417 | ||||||||||
|
| |||||||||
MINNESOTA 1.6% |
| |||||||||
Southern Minnesota State Municipal Power Agency Revenue Bonds, (BABs), Series 2010 |
| |||||||||
5.926% due 01/01/2043 | 450 | 430 | ||||||||
|
| |||||||||
NEBRASKA 1.1% |
| |||||||||
Nebraska State Public Power Generation Agency Revenue Bonds, (BABs), Series 2009 |
| |||||||||
7.242% due 01/01/2041 | 300 | 310 | ||||||||
|
| |||||||||
NEW JERSEY 1.8% |
| |||||||||
New Jersey State Turnpike Authority Revenue Bonds, (BABs), Series 2009 |
| |||||||||
7.414% due 01/01/2040 | 400 | 483 | ||||||||
|
| |||||||||
NEW YORK 11.8% |
| |||||||||
New York City, New York General Obligation Bonds, (BABs), Series 2010 |
| |||||||||
6.246% due 06/01/2035 | 500 | 514 | ||||||||
New York City, New York Municipal Water Finance Authority Revenue Bonds, (BABs), Series 2010 |
| |||||||||
6.282% due 06/15/2042 | 775 | 799 | ||||||||
New York State Metropolitan Transportation Authority Revenue Bonds, (BABs), Series 2010 |
| |||||||||
6.814% due 11/15/2040 | 500 | 551 | ||||||||
7.134% due 11/15/2030 | 1,310 | 1,392 | ||||||||
|
| |||||||||
| 3,256 | ||||||||||
|
| |||||||||
| PRINCIPAL AMOUNT (000s) | MARKET VALUE (000s) | |||||||||
OHIO 5.6% |
| |||||||||
Ohio State American Municipal Power, Inc. Revenue Bonds, (BABs), Series 2010 |
| |||||||||
8.084% due 02/15/2050 | $ | 1,250 | $ | 1,556 | ||||||
|
| |||||||||
TEXAS 9.0% |
| |||||||||
Dallas, Texas Convention Center Hotel Development Corp. Revenue Bonds, (BABs), Series 2009 |
| |||||||||
7.088% due 01/01/2042 | 290 | 304 | ||||||||
North Texas State Tollway Authority Revenue Bonds, (BABs), Series 2009 |
| |||||||||
6.718% due 01/01/2049 | 1,000 | 1,091 | ||||||||
North Texas State Tollway Authority Revenue Bonds, (BABs), Series 2010 |
| |||||||||
8.910% due 02/01/2030 | 1,000 | 1,078 | ||||||||
|
| |||||||||
| 2,473 | ||||||||||
|
| |||||||||
WASHINGTON 1.8% |
| |||||||||
Washington State Biomedical Research Facilities 3 Revenue Bonds, (BABs), Series 2010 |
| |||||||||
6.516% due 07/01/2042 | 500 | 506 | ||||||||
|
| |||||||||
Total Municipal Bonds & Notes | 25,918 | |||||||||
|
| |||||||||
SHORT-TERM INSTRUMENTS 0.8% |
| |||||||||
REPURCHASE AGREEMENTS 0.8% |
| |||||||||
State Street Bank and Trust Co. |
| |||||||||
0.010% due 07/01/2011 | 218 | 218 | ||||||||
|
| |||||||||
(Dated 06/30/2011. Collateralized by U.S. Treasury Notes 1.000% due 04/30/2012 valued at $227. Repurchase proceeds are $218.) | ||||||||||
Total Short-Term Instruments | 218 | |||||||||
|
| |||||||||
Total Investments 94.6% | $ | 26,136 | ||||||||
Other Assets and Liabilities (Net) 5.4% | 1,508 | |||||||||
|
| |||||||||
Net Assets 100.0% | $ | 27,644 | ||||||||
|
| |||||||||
| See Accompanying Notes | Annual Report | June 30, 2011 | 43 |
Table of Contents
Schedule of Investments PIMCO Build America Bond Strategy Fund (Cont.)
June 30, 2011
Notes to Schedule of Investments (amounts in thousands):
| (a) | Fair Value Measurements (1) |
The following is a summary of the fair valuations according to the inputs used as of June 30, 2011 in valuing the Fund’s assets and liabilities (2):
| Category and Subcategory (3) | Level 1 (4) | Level 2 (5) | Level 3 (6) | Fair Value at 06/30/2011 | ||||||||||||||
| Investments, at value | ||||||||||||||||||
| Municipal Bonds & Notes | ||||||||||||||||||
California | $ | 0 | $ | 12,795 | $ | 0 | $ | 12,795 | ||||||||||
District of Columbia | 0 | 748 | 0 | 748 | ||||||||||||||
Georgia | 0 | 944 | 0 | 944 | ||||||||||||||
Illinois | 0 | 2,417 | 0 | 2,417 | ||||||||||||||
Minnesota | 0 | 430 | 0 | 430 | ||||||||||||||
Nebraska | 0 | 310 | 0 | 310 | ||||||||||||||
New Jersey | 0 | 483 | 0 | 483 | ||||||||||||||
New York | 0 | 3,256 | 0 | 3,256 | ||||||||||||||
Ohio | 0 | 1,556 | 0 | 1,556 | ||||||||||||||
Texas | 0 | 2,473 | 0 | 2,473 | ||||||||||||||
Washington | 0 | 506 | 0 | 506 | ||||||||||||||
| Short-Term Instruments | ||||||||||||||||||
Repurchase Agreements | 0 | 218 | 0 | 218 | ||||||||||||||
| $ | 0 | $ | 26,136 | $ | 0 | $ | 26,136 | |||||||||||
| (1) | See note 3 in the Notes to Financial Statements for more information regarding pricing inputs and valuation techniques. |
| (2) | There were no significant transfers into or out of level 1, 2, and 3 during the period ended June 30, 2011. |
| (3) | Refer to the Schedule of Investments for additional information. |
| (4) | Quoted prices in active markets for identical investments. |
| (5) | Significant other observable inputs. |
| (6) | Significant unobservable inputs. |
| 44 | PIMCO ETF Trust | See Accompanying Notes |
Table of Contents
Schedule of Investments PIMCO Enhanced Short Maturity Strategy Fund
June 30, 2011
| PRINCIPAL AMOUNT (000s) | MARKET VALUE (000s) | |||||||||||
CORPORATE BONDS & NOTES 64.1% |
| |||||||||||
BANKING & FINANCE 35.8% |
| |||||||||||
Abbey National Treasury Services PLC |
| |||||||||||
1.854% due 04/25/2014 | $ | 3,700 | $ | 3,681 | ||||||||
Achmea Hypotheekbank NV | ||||||||||||
0.623% due 11/03/2014 | 500 | 498 | ||||||||||
American Express Bank FSB | ||||||||||||
0.490% due 06/12/2017 | 3,875 | 3,686 | ||||||||||
3.150% due 12/09/2011 | 506 | 513 | ||||||||||
American Express Co. | ||||||||||||
7.250% due 05/20/2014 | 2,000 | 2,288 | ||||||||||
American International Group, Inc. | ||||||||||||
0.346% due 03/20/2012 | 2,000 | 1,988 | ||||||||||
3.750% due 11/30/2013 | 3,000 | 3,071 | ||||||||||
4.950% due 03/20/2012 | 5,300 | 5,402 | ||||||||||
5.375% due 10/18/2011 | 3,647 | 3,693 | ||||||||||
Arbejdernes Landsbank | ||||||||||||
0.840% due 07/09/2013 | 2,500 | 2,518 | ||||||||||
Australia & New Zealand Banking Group Ltd. | ||||||||||||
0.526% due 06/18/2012 | 175 | 176 | ||||||||||
Banco Santander Chile | ||||||||||||
1.524% due 04/20/2012 | 3,850 | 3,854 | ||||||||||
Bank of America Corp. | ||||||||||||
0.573% due 04/30/2012 | 1,500 | 1,505 | ||||||||||
0.750% due 09/11/2012 | 2,650 | 2,647 | ||||||||||
1.693% due 01/30/2014 | 10,400 | 10,432 | ||||||||||
Bank of Scotland PLC | ||||||||||||
5.000% due 11/21/2011 | 550 | 558 | ||||||||||
Banque PSA Finance | ||||||||||||
2.146% due 04/04/2014 | 5,850 | 5,844 | ||||||||||
Barclays Bank PLC | ||||||||||||
1.323% due 01/13/2014 | 5,000 | 5,019 | ||||||||||
2.500% due 01/23/2013 | 150 | 153 | ||||||||||
Boston Properties LP | ||||||||||||
6.250% due 01/15/2013 | 387 | 416 | ||||||||||
BRFkredit A/S | ||||||||||||
0.528% due 04/15/2013 | 3,400 | 3,403 | ||||||||||
Citibank N.A. | ||||||||||||
0.222% due 06/04/2012 | 900 | 901 | ||||||||||
0.261% due 11/15/2012 | 500 | 501 | ||||||||||
Citigroup Funding, Inc. | ||||||||||||
0.546% due 03/30/2012 | 1,640 | 1,644 | ||||||||||
0.603% due 04/30/2012 | 2,208 | 2,216 | ||||||||||
Citigroup, Inc. | ||||||||||||
0.377% due 03/07/2014 | 2,175 | 2,096 | ||||||||||
0.552% due 11/05/2014 | 4,300 | 4,108 | ||||||||||
1.111% due 02/15/2013 | 1,700 | 1,694 | ||||||||||
1.733% due 01/13/2014 (b) | 4,000 | 4,029 | ||||||||||
2.262% due 08/13/2013 | 2,580 | 2,630 | ||||||||||
2.875% due 12/09/2011 | 950 | 961 | ||||||||||
Commonwealth Bank of Australia | ||||||||||||
0.630% due 12/10/2012 | 400 | 402 | ||||||||||
0.724% due 07/23/2014 | 5,000 | 5,033 | ||||||||||
2.400% due 01/12/2012 | 3,000 | 3,032 | ||||||||||
Credit Agricole Home Loan SFH | ||||||||||||
1.024% due 07/21/2014 | 13,200 | 13,216 | ||||||||||
Credit Agricole S.A. | ||||||||||||
0.623% due 02/02/2012 | 7,000 | 6,988 | ||||||||||
2.625% due 01/21/2014 | 1,250 | 1,251 | ||||||||||
DanFin Funding Ltd. | ||||||||||||
0.976% due 07/16/2013 | 13,500 | 13,503 | ||||||||||
| PRINCIPAL AMOUNT (000s) | MARKET VALUE (000s) | |||||||||||
Danske Bank A/S | ||||||||||||
2.500% due 05/10/2012 | $ | 4,000 | $ | 4,058 | ||||||||
Dexia Credit Local | ||||||||||||
0.652% due 03/05/2013 | 12,400 | 12,371 | ||||||||||
FIH Erhvervsbank A/S | ||||||||||||
0.620% due 06/13/2013 | 5,400 | 5,400 | ||||||||||
General Electric Capital Corp. | ||||||||||||
0.246% due 09/20/2013 | 2,700 | 2,643 | ||||||||||
0.366% due 06/20/2013 | 4,000 | 3,951 | ||||||||||
0.450% due 03/12/2012 | 2,500 | 2,507 | ||||||||||
3.000% due 12/09/2011 | 4,605 | 4,662 | ||||||||||
Genworth Global Funding Trusts | ||||||||||||
5.250% due 05/15/2012 | 2,000 | 2,070 | ||||||||||
Goldman Sachs Group, Inc. | ||||||||||||
0.447% due 03/15/2012 | 5,234 | 5,246 | ||||||||||
0.785% due 01/12/2015 | 3,700 | 3,571 | ||||||||||
0.846% due 09/29/2014 | 6,375 | 6,229 | ||||||||||
HSBC Bank PLC | ||||||||||||
1.076% due 01/17/2014 | 1,750 | 1,761 | ||||||||||
1.625% due 07/07/2014 (a) | 6,000 | 6,011 | ||||||||||
HSBC Finance Corp. | ||||||||||||
0.528% due 01/15/2014 | 10,350 | 10,187 | ||||||||||
0.684% due 06/01/2016 | 3,900 | 3,702 | ||||||||||
HSBC USA, Inc. | ||||||||||||
3.125% due 12/16/2011 | 1,268 | 1,285 | ||||||||||
ICICI Bank Ltd. | ||||||||||||
2.007% due 02/24/2014 | 1,800 | 1,790 | ||||||||||
ING Bank NV | ||||||||||||
1.596% due 10/18/2013 | 1,000 | 1,009 | ||||||||||
Intesa Sanpaolo SpA | ||||||||||||
2.658% due 02/24/2014 | 1,300 | 1,298 | ||||||||||
JPMorgan Chase & Co. | ||||||||||||
3.125% due 12/01/2011 | 17,934 | 18,156 | ||||||||||
Landesbank Baden-Wuerttemberg | ||||||||||||
0.466% due 06/22/2012 | 8,600 | 8,586 | ||||||||||
Lloyds TSB Bank PLC | ||||||||||||
2.624% due 01/24/2014 | 4,200 | 4,262 | ||||||||||
Merrill Lynch & Co., Inc. | ||||||||||||
5.450% due 02/05/2013 | 1,890 | 2,005 | ||||||||||
MetLife Institutional Funding II | ||||||||||||
1.201% due 04/04/2014 | 500 | 501 | ||||||||||
Metropolitan Life Global Funding I | ||||||||||||
5.125% due 04/10/2013 | 600 | 639 | ||||||||||
Monumental Global Funding II | ||||||||||||
0.444% due 10/25/2013 | 1,250 | 1,214 | ||||||||||
Monumental Global Funding III | ||||||||||||
0.444% due 01/25/2013 | 3,550 | 3,514 | ||||||||||
Morgan Stanley | ||||||||||||
0.450% due 03/13/2012 | 4,545 | 4,556 | ||||||||||
0.547% due 02/10/2012 | 245 | 246 | ||||||||||
0.590% due 01/09/2014 | 250 | 244 | ||||||||||
1.874% due 01/24/2014 | 13,910 | 14,018 | ||||||||||
National Australia Bank Ltd. | ||||||||||||
0.793% due 07/08/2014 | 11,300 | 11,415 | ||||||||||
5.350% due 06/12/2013 | 1,600 | 1,717 | ||||||||||
Nationwide Building Society | ||||||||||||
0.440% due 05/17/2012 | 2,600 | 2,608 | ||||||||||
5.500% due 07/18/2012 | 2,000 | 2,091 | ||||||||||
New York Community Bank | ||||||||||||
3.000% due 12/16/2011 | 680 | 689 | ||||||||||
NIBC Bank NV | ||||||||||||
0.633% due 12/02/2014 | 5,290 | 5,301 | ||||||||||
| PRINCIPAL AMOUNT (000s) | MARKET VALUE (000s) | |||||||||||
2.800% due 12/02/2014 | $ | 1,400 | $ | 1,458 | ||||||||
Nordea Eiendomskreditt A/S | ||||||||||||
0.714% due 04/07/2014 | 7,710 | 7,710 | ||||||||||
Pacific Life Global Funding | ||||||||||||
5.150% due 04/15/2013 | 3,000 | 3,195 | ||||||||||
PNC Funding Corp. | ||||||||||||
0.504% due 04/01/2012 | 10,225 | 10,250 | ||||||||||
Pricoa Global Funding I | ||||||||||||
0.446% due 09/27/2013 | 3,600 | 3,558 | ||||||||||
4.625% due 06/25/2012 | 700 | 721 | ||||||||||
5.400% due 10/18/2012 | 1,185 | 1,246 | ||||||||||
RCI Banque S.A. | ||||||||||||
2.155% due 04/11/2014 | 3,400 | 3,409 | ||||||||||
Regions Bank | ||||||||||||
3.250% due 12/09/2011 | 5,878 | 5,958 | ||||||||||
Royal Bank of Scotland Group PLC | ||||||||||||
0.964% due 05/11/2012 | 200 | 201 | ||||||||||
1.008% due 02/23/2012 | 4,000 | 4,017 | ||||||||||
1.450% due 10/20/2011 | 6,200 | 6,221 | ||||||||||
2.678% due 08/23/2013 | 3,900 | 4,003 | ||||||||||
3.000% due 12/09/2011 | 1,624 | 1,643 | ||||||||||
Societe Generale S.A. | ||||||||||||
1.326% due 04/11/2014 | 7,500 | 7,435 | ||||||||||
2.200% due 09/14/2013 | 2,000 | 2,009 | ||||||||||
Standard Chartered PLC | ||||||||||||
1.214% due 05/12/2014 | 5,500 | 5,497 | ||||||||||
Sumitomo Mitsui Banking Corp. | ||||||||||||
1.950% due 01/14/2014 | 2,000 | 2,016 | ||||||||||
Sun Life Financial Global Funding LP | ||||||||||||
0.496% due 10/06/2013 | 4,000 | 3,971 | ||||||||||
Suncorp-Metway Ltd. | ||||||||||||
0.505% due 10/19/2012 | 1,200 | 1,201 | ||||||||||
1.778% due 07/16/2012 | 10,800 | 10,967 | ||||||||||
SunTrust Bank | ||||||||||||
3.000% due 11/16/2011 | 12,500 | 12,632 | ||||||||||
Swedbank AB | ||||||||||||
0.731% due 01/14/2013 | 1,100 | 1,100 | ||||||||||
1.117% due 02/10/2012 | 1,600 | 1,604 | ||||||||||
Swedbank Hypotek AB | ||||||||||||
0.696% due 03/28/2014 | 12,030 | 12,106 | ||||||||||
Toyota Motor Credit Corp. | ||||||||||||
5.125% due 10/25/2011 | 1,400 | 1,419 | ||||||||||
U.S. Central Federal Credit Union | ||||||||||||
1.250% due 10/19/2011 | 600 | 602 | ||||||||||
UBS AG | ||||||||||||
1.273% due 01/28/2014 | 6,200 | 6,231 | ||||||||||
Union Bank N.A. | ||||||||||||
2.125% due 12/16/2013 | 4,000 | 4,023 | ||||||||||
WCI Finance LLC | ||||||||||||
5.400% due 10/01/2012 | 1,360 | 1,429 | ||||||||||
Wells Fargo & Co. | ||||||||||||
0.473% due 10/28/2015 (b) | 13,000 | 12,578 | ||||||||||
3.000% due 12/09/2011 | 10,345 | 10,474 | ||||||||||
Westpac Banking Corp. | ||||||||||||
0.976% due 03/31/2014 | 3,100 | 3,105 | ||||||||||
3.250% due 12/16/2011 | 350 | 354 | ||||||||||
| 441,406 | ||||||||||||
INDUSTRIALS 22.8% |
| |||||||||||
American Airlines Pass-Through Trust | ||||||||||||
7.858% due 04/01/2013 | 5,593 | 5,663 | ||||||||||
| See Accompanying Notes | Annual Report | June 30, 2011 | 45 |
Table of Contents
Schedule of Investments PIMCO Enhanced Short Maturity Strategy Fund (Cont.)
| PRINCIPAL AMOUNT (000s) | MARKET VALUE (000s) | |||||||||||
Anadarko Petroleum Corp. | ||||||||||||
7.625% due 03/15/2014 | $ | 3,000 | $ | 3,441 | ||||||||
Anglo American Capital PLC | ||||||||||||
2.150% due 09/27/2013 | 4,500 | 4,561 | ||||||||||
9.375% due 04/08/2014 | 3,950 | 4,724 | ||||||||||
Anheuser-Busch InBev Worldwide, Inc. | ||||||||||||
0.824% due 01/27/2014 | 7,900 | 7,934 | ||||||||||
5.375% due 11/15/2014 | 2,000 | 2,234 | ||||||||||
Apache Corp. | ||||||||||||
5.250% due 04/15/2013 | 645 | 695 | ||||||||||
ArcelorMittal USA, Inc. | ||||||||||||
6.500% due 04/15/2014 | 2,500 | 2,773 | ||||||||||
Barrick Gold Corp. | ||||||||||||
1.750% due 05/30/2014 | 1,650 | 1,654 | ||||||||||
Barrick Gold Financeco LLC | ||||||||||||
6.125% due 09/15/2013 | 1,450 | 1,604 | ||||||||||
BAT International Finance PLC |
| |||||||||||
8.125% due 11/15/2013 | 2,175 | 2,500 | ||||||||||
BHP Billiton Finance USA Ltd. |
| |||||||||||
5.500% due 04/01/2014 | 500 | 557 | ||||||||||
BMW U.S. Capital LLC |
| |||||||||||
1.104% due 07/25/2011 | 1,200 | 1,200 | ||||||||||
Broadcom Corp. |
| |||||||||||
1.500% due 11/01/2013 | 500 | 501 | ||||||||||
Canadian Oil Sands Ltd. |
| |||||||||||
5.800% due 08/15/2013 | 1,000 | 1,074 | ||||||||||
Comcast Cable Communications Holdings, Inc. |
| |||||||||||
8.375% due 03/15/2013 | 2,685 | 3,008 | ||||||||||
Comcast Cable Holdings LLC |
| |||||||||||
9.800% due 02/01/2012 | 4,000 | 4,207 | ||||||||||
Cox Communications, Inc. |
| |||||||||||
4.625% due 06/01/2013 | 2,185 | 2,321 | ||||||||||
7.125% due 10/01/2012 | 5,150 | 5,525 | ||||||||||
CRH America, Inc. |
| |||||||||||
5.625% due 09/30/2011 | 4,000 | 4,044 | ||||||||||
CSN Islands VIII Corp. |
| |||||||||||
9.750% due 12/16/2013 | 2,900 | 3,371 | ||||||||||
CVS Caremark Corp. |
| |||||||||||
5.750% due 08/15/2011 | 2,770 | 2,786 | ||||||||||
Daimler Finance North America LLC |
| |||||||||||
0.856% due 03/28/2014 | 11,450 | 11,464 | ||||||||||
Danaher Corp. |
| |||||||||||
0.496% due 06/21/2013 | 8,700 | 8,717 | ||||||||||
Devon Financing Corp. ULC |
| |||||||||||
6.875% due 09/30/2011 | 7,786 | 7,904 | ||||||||||
Diageo Capital PLC |
| |||||||||||
5.125% due 01/30/2012 | 3,130 | 3,215 | ||||||||||
7.375% due 01/15/2014 | 900 | 1,034 | ||||||||||
Dow Chemical Co. |
| |||||||||||
6.000% due 10/01/2012 | 2,400 | 2,545 | ||||||||||
7.600% due 05/15/2014 | 3,100 | 3,596 | ||||||||||
Eaton Corp. |
| |||||||||||
0.575% due 06/16/2014 | 800 | 802 | ||||||||||
Encana Corp. |
| |||||||||||
4.750% due 10/15/2013 | 750 | 807 | ||||||||||
6.300% due 11/01/2011 | 4,000 | 4,075 | ||||||||||
Energy Transfer Partners LP |
| |||||||||||
5.650% due 08/01/2012 | 300 | 314 | ||||||||||
8.500% due 04/15/2014 | 860 | 1,001 | ||||||||||
Enterprise Products Operating LLC |
| |||||||||||
7.625% due 02/15/2012 | 6,400 | 6,658 | ||||||||||
| PRINCIPAL AMOUNT (000s) | MARKET VALUE (000s) | |||||||||||
9.750% due 01/31/2014 | $ | 310 | $ | 370 | ||||||||
Gazprom OAO Via Royal Bank of Scotland AG |
| |||||||||||
9.625% due 03/01/2013 | 6,750 | 7,563 | ||||||||||
Georgia-Pacific LLC |
| |||||||||||
8.250% due 05/01/2016 | 6,400 | 7,257 | ||||||||||
9.500% due 12/01/2011 | 1,100 | 1,132 | ||||||||||
Hewlett-Packard Co. |
| |||||||||||
0.654% due 05/30/2014 | 6,150 | 6,184 | ||||||||||
4.250% due 02/24/2012 | 850 | 871 | ||||||||||
Husky Energy, Inc. |
| |||||||||||
6.250% due 06/15/2012 | 1,475 | 1,551 | ||||||||||
Hutchison Whampoa International Ltd. |
| |||||||||||
6.500% due 02/13/2013 | 8,800 | 9,523 | ||||||||||
Johnson Controls, Inc. |
| |||||||||||
0.683% due 02/04/2014 | 9,900 | 9,941 | ||||||||||
Kinder Morgan Energy Partners LP |
| |||||||||||
5.125% due 11/15/2014 | 2,000 | 2,196 | ||||||||||
5.850% due 09/15/2012 | 1,900 | 2,002 | ||||||||||
7.125% due 03/15/2012 | 5,155 | 5,382 | ||||||||||
Kraft Foods, Inc. |
| |||||||||||
5.250% due 10/01/2013 | 2,500 | 2,718 | ||||||||||
6.000% due 02/11/2013 | 3,150 | 3,397 | ||||||||||
6.250% due 06/01/2012 | 918 | 964 | ||||||||||
6.750% due 02/19/2014 | 1,500 | 1,700 | ||||||||||
NBC Universal Media LLC |
| |||||||||||
2.100% due 04/01/2014 | 1,500 | 1,520 | ||||||||||
Nissan Motor Acceptance Corp. |
| |||||||||||
3.250% due 01/30/2013 | 1,000 | 1,022 | ||||||||||
Pearson Dollar Finance PLC |
| |||||||||||
5.500% due 05/06/2013 | 2,000 | 2,141 | ||||||||||
Pemex Project Funding Master Trust |
| |||||||||||
0.853% due 12/03/2012 | 1,850 | 1,855 | ||||||||||
Reed Elsevier Capital, Inc. |
| |||||||||||
4.625% due 06/15/2012 | 9,000 | 9,299 | ||||||||||
Republic Services, Inc. |
| |||||||||||
6.750% due 08/15/2011 | 2,000 | 2,012 | ||||||||||
Reynolds American, Inc. |
| |||||||||||
7.250% due 06/01/2012 | 470 | 497 | ||||||||||
Rio Tinto Finance USA Ltd. |
| |||||||||||
8.950% due 05/01/2014 | 2,000 | 2,403 | ||||||||||
SABMiller PLC |
| |||||||||||
6.200% due 07/01/2011 | 1,145 | 1,145 | ||||||||||
Siemens Financieringsmaatschappij NV |
| |||||||||||
0.395% due 03/16/2012 | 1,040 | 1,039 | ||||||||||
Southern Co. |
| |||||||||||
5.300% due 01/15/2012 | 3,215 | 3,296 | ||||||||||
Southwest Airlines Co. |
| |||||||||||
6.500% due 03/01/2012 | 700 | 725 | ||||||||||
10.500% due 12/15/2011 | 4,900 | 5,088 | ||||||||||
Teck Resources Ltd. |
| |||||||||||
9.750% due 05/15/2014 | 1,500 | 1,816 | ||||||||||
Telefonica Emisiones S.A.U. |
| |||||||||||
0.603% due 02/04/2013 | 1,100 | 1,084 | ||||||||||
Teva Pharmaceutical Finance III BV |
| |||||||||||
0.746% due 03/21/2014 | 7,500 | 7,535 | ||||||||||
Teva Pharmaceutical Finance III LLC |
| |||||||||||
1.500% due 06/15/2012 | 749 | 756 | ||||||||||
Time Warner Cable, Inc. |
| |||||||||||
5.400% due 07/02/2012 | 600 | 627 | ||||||||||
Time Warner, Inc. |
| |||||||||||
6.875% due 05/01/2012 | 1,550 | 1,629 | ||||||||||
| PRINCIPAL AMOUNT (000s) | MARKET VALUE (000s) | |||||||||||
Total Capital Canada Ltd. |
| |||||||||||
0.656% due 01/17/2014 | $ | 3,300 | $ | 3,324 | ||||||||
Total Capital S.A. |
| |||||||||||
4.500% due 02/25/2013 | 7,000 | 7,392 | ||||||||||
TransCanada Pipelines Ltd. |
| |||||||||||
8.625% due 05/15/2012 | 2,490 | 2,658 | ||||||||||
Turner Broadcasting System, Inc. |
| |||||||||||
8.375% due 07/01/2013 | 3,000 | 3,406 | ||||||||||
Tyco Electronics Group S.A. |
| |||||||||||
6.000% due 10/01/2012 | 1,169 | 1,240 | ||||||||||
UST LLC |
| |||||||||||
6.625% due 07/15/2012 | 10,535 | 11,136 | ||||||||||
Vivendi S.A. |
| |||||||||||
5.750% due 04/04/2013 | 2,815 | 3,018 | ||||||||||
Volkswagen International Finance NV |
| |||||||||||
0.917% due 04/01/2014 | 10,000 | 10,042 | ||||||||||
WM Wrigley Jr. Co. |
| |||||||||||
2.450% due 06/28/2012 | 140 | 141 | ||||||||||
3.050% due 06/28/2013 | 1,785 | 1,825 | ||||||||||
Xerox Corp. |
| |||||||||||
6.875% due 08/15/2011 | 8,100 | 8,155 | ||||||||||
Xstrata Canada Corp. |
| |||||||||||
7.350% due 06/05/2012 | 2,100 | 2,216 | ||||||||||
| 281,302 | ||||||||||||
UTILITIES 5.5% |
| |||||||||||
AK Transneft OJSC Via TransCapitalInvest Ltd. |
| |||||||||||
5.670% due 03/05/2014 | 3,250 | 3,469 | ||||||||||
Appalachian Power Co. |
| |||||||||||
5.650% due 08/15/2012 | 100 | 105 | ||||||||||
AT&T, Inc. |
| |||||||||||
4.950% due 01/15/2013 | 518 | 549 | ||||||||||
5.875% due 08/15/2012 | 1,150 | 1,215 | ||||||||||
BP Capital Markets PLC |
| |||||||||||
2.375% due 12/14/2011 | 1,000 | 1,008 | ||||||||||
3.625% due 05/08/2014 | 750 | 789 | ||||||||||
3.750% due 06/17/2013 | 1,800 | 1,879 | ||||||||||
5.250% due 11/07/2013 | 1,000 | 1,084 | ||||||||||
Consumers Energy Co. |
| |||||||||||
5.000% due 02/15/2012 | 650 | 667 | ||||||||||
Dominion Resources, Inc. |
| |||||||||||
5.000% due 03/15/2013 | 1,500 | 1,600 | ||||||||||
6.250% due 06/30/2012 | 200 | 210 | ||||||||||
Duke Energy Carolinas LLC |
| |||||||||||
5.625% due 11/30/2012 | 310 | 330 | ||||||||||
KCP&L Greater Missouri Operations Co. |
| |||||||||||
11.875% due 07/01/2012 | 4,500 | 4,959 | ||||||||||
NextEra Energy Capital Holdings, Inc. |
| |||||||||||
2.550% due 11/15/2013 | 2,085 | 2,132 | ||||||||||
5.625% due 09/01/2011 | 4,125 | 4,156 | ||||||||||
NGPL PipeCo LLC |
| |||||||||||
6.514% due 12/15/2012 | 5,500 | 5,785 | ||||||||||
PSEG Power LLC |
| |||||||||||
6.950% due 06/01/2012 | 937 | 988 | ||||||||||
Public Service Co. of Colorado |
| |||||||||||
7.875% due 10/01/2012 | 900 | 978 | ||||||||||
Qwest Corp. |
| |||||||||||
3.497% due 06/15/2013 | 8,000 | 8,220 | ||||||||||
8.875% due 03/15/2012 | 2,000 | 2,110 | ||||||||||
| 46 | PIMCO ETF Trust | See Accompanying Notes |
Table of Contents
June 30, 2011
| PRINCIPAL AMOUNT (000s) | MARKET VALUE (000s) | |||||||||||
Ras Laffan Liquefied Natural Gas Co. Ltd. III |
| |||||||||||
4.500% due 09/30/2012 | $ | 2,000 | $ | 2,090 | ||||||||
5.500% due 09/30/2014 | 3,500 | 3,831 | ||||||||||
Telecom Italia Capital S.A. |
| |||||||||||
0.886% due 07/18/2011 | 9,000 | 8,999 | ||||||||||
6.200% due 07/18/2011 | 1,000 | 1,002 | ||||||||||
Telstra Corp. Ltd. |
| |||||||||||
6.375% due 04/01/2012 | 1,600 | 1,666 | ||||||||||
Verizon Communications, Inc. |
| |||||||||||
0.856% due 03/28/2014 | 4,800 | 4,849 | ||||||||||
Verizon Wireless Capital LLC |
| |||||||||||
7.375% due 11/15/2013 | 2,600 | 2,957 | ||||||||||
|
| |||||||||||
| 67,627 | ||||||||||||
|
| |||||||||||
Total Corporate Bonds & Notes | 790,335 | |||||||||||
|
| |||||||||||
CONVERTIBLE BONDS & NOTES 0.2% |
| |||||||||||
INDUSTRIALS 0.2% |
| |||||||||||
Transocean, Inc. |
| |||||||||||
1.500% due 12/15/2037 | 2,900 | 2,875 | ||||||||||
|
| |||||||||||
Total Convertible Bonds & Notes | 2,875 | |||||||||||
|
| |||||||||||
MUNICIPAL BONDS & NOTES 0.2% |
| |||||||||||
NEW JERSEY 0.2% |
| |||||||||||
New Jersey State Economic Development Authority Revenue Notes, (BABs), Series 2010 |
| |||||||||||
1.247% due 06/15/2013 | 2,500 | 2,498 | ||||||||||
|
| |||||||||||
Total Municipal Bonds & Notes (Cost $2,499) | 2,498 | |||||||||||
|
| |||||||||||
U.S. GOVERNMENT AGENCIES 12.8% |
| |||||||||||
Fannie Mae |
| |||||||||||
0.206% due 08/23/2012 | 6,240 | 6,246 | ||||||||||
0.215% due 09/17/2012 | 2,338 | 2,341 | ||||||||||
0.586% due 06/25/2026 - 09/18/2031 | 5,070 | 5,090 | ||||||||||
0.636% due 05/25/2017 | 71 | 72 | ||||||||||
0.686% due 06/25/2031 - 05/18/2032 | 1,894 | 1,906 | ||||||||||
0.736% due 03/18/2032 | 774 | 776 | ||||||||||
0.910% due 01/01/2021 | 3,476 | 3,468 | ||||||||||
1.000% due 02/17/2026 | 7,000 | 6,999 | ||||||||||
3.500% due 03/08/2016 | 5,000 | 5,027 | ||||||||||
4.000% due 01/01/2041 - 02/01/2041 | 795 | 796 | ||||||||||
FDIC Structured Sale Guaranteed Notes |
| |||||||||||
0.691% due 11/29/2037 | 2,267 | 2,267 | ||||||||||
Freddie Mac |
| |||||||||||
0.130% due 11/02/2012 | 29,550 | 29,547 | ||||||||||
0.141% due 06/03/2013 | 50,000 | 49,974 | ||||||||||
0.427% due 05/15/2036 | 965 | 965 | ||||||||||
0.537% due 12/15/2030 | 177 | 177 | ||||||||||
0.587% due 06/15/2033 | 95 | 95 | ||||||||||
0.607% due 04/15/2041 | 4,755 | 4,775 | ||||||||||
0.687% due 02/15/2041 | 4,451 | 4,482 | ||||||||||
7.000% due 11/01/2026 - 09/01/2027 | 427 | 492 | ||||||||||
7.500% due 04/01/2016 - 10/01/2017 | 555 | 629 | ||||||||||
8.500% due 07/01/2030 | 5 | 6 | ||||||||||
Ginnie Mae |
| |||||||||||
0.486% due 09/20/2033 | 322 | 322 | ||||||||||
5.110% due 10/16/2027 | 1,115 | 1,160 | ||||||||||
| PRINCIPAL AMOUNT (000s) | MARKET VALUE (000s) | |||||||||||
6.000% due 12/15/2033 | $ | 102 | $ | 114 | ||||||||
6.500% due 11/15/2033 - 12/15/2034 | 188 | 214 | ||||||||||
7.000% due 03/15/2023 - 11/15/2032 | 381 | 444 | ||||||||||
7.500% due 12/15/2012 - 06/15/2028 | 584 | 673 | ||||||||||
8.500% due 04/15/2030 | 4 | 4 | ||||||||||
10.000% due 02/15/2016 - 04/15/2025 | 76 | 85 | ||||||||||
10.500% due 09/15/2015 - 07/15/2019 | 5 | 5 | ||||||||||
11.000% due 07/15/2013 - 09/20/2019 | 17 | 18 | ||||||||||
11.500% due 01/15/2013 - 11/15/2019 | 7 | 7 | ||||||||||
12.000% due 01/15/2013 - 04/15/2015 | 4 | 5 | ||||||||||
12.500% due 11/15/2013 - 07/15/2015 | 3 | 3 | ||||||||||
13.000% due 08/15/2014 - 09/20/2015 | 6 | 6 | ||||||||||
NCUA Guaranteed Notes |
| |||||||||||
0.540% due 12/07/2020 | 3,474 | 3,484 | ||||||||||
0.560% due 11/06/2017 | 10,512 | 10,515 | ||||||||||
0.570% due 03/06/2020 | 6,530 | 6,530 | ||||||||||
0.750% due 12/08/2020 | 4,767 | 4,794 | ||||||||||
1.600% due 10/29/2020 | 3,915 | 3,909 | ||||||||||
|
| |||||||||||
Total U.S. Government Agencies (Cost $158,142) | 158,422 | |||||||||||
|
| |||||||||||
MORTGAGE-BACKED SECURITIES 1.8% |
| |||||||||||
Arran Residential Mortgages Funding PLC |
| |||||||||||
0.336% due 09/20/2056 | 4,000 | 3,989 | ||||||||||
BCRR Trust |
| |||||||||||
4.230% due 12/22/2035 | 1,767 | 1,795 | ||||||||||
4.230% due 02/22/2041 | 1,500 | 1,544 | ||||||||||
Citigroup/Deutsche Bank Commercial Mortgage Trust |
| |||||||||||
5.205% due 12/11/2049 | 2,000 | 2,043 | ||||||||||
Commercial Mortgage Pass-Through Certificates |
| |||||||||||
0.277% due 06/15/2022 | 349 | 335 | ||||||||||
0.287% due 12/15/2020 | 975 | 949 | ||||||||||
Credit Suisse Mortgage Capital Certificates |
| |||||||||||
0.257% due 02/15/2022 | 1,238 | 1,203 | ||||||||||
First Union National Bank Commercial Mortgage |
| |||||||||||
6.141% due 02/12/2034 | 1,627 | 1,651 | ||||||||||
Fosse Master Issuer PLC |
| |||||||||||
1.619% due 10/18/2054 | 4,000 | 3,995 | ||||||||||
GE Capital Commercial Mortgage Corp. |
| |||||||||||
4.353% due 06/10/2048 | 1,251 | 1,253 | ||||||||||
GS Mortgage Securities Corp. II |
| |||||||||||
1.142% due 03/06/2020 | 232 | 229 | ||||||||||
Wachovia Bank Commercial Mortgage Trust |
| |||||||||||
0.267% due 06/15/2020 | 211 | 191 | ||||||||||
5.927% due 06/15/2049 | 2,606 | 2,695 | ||||||||||
|
| |||||||||||
Total Mortgage-Backed Securities (Cost $21,912) | 21,872 | |||||||||||
|
| |||||||||||
ASSET-BACKED SECURITIES 5.0% |
| |||||||||||
Arkansas Student Loan Authority |
| |||||||||||
1.157% due 11/25/2043 | 1,804 | 1,794 | ||||||||||
BA Credit Card Trust | ||||||||||||
0.207% due 03/15/2014 | 1,799 | 1,798 | ||||||||||
Bank One Issuance Trust | ||||||||||||
0.307% due 05/15/2014 | 3,700 | 3,700 | ||||||||||
| PRINCIPAL AMOUNT (000s) | MARKET VALUE (000s) | |||||||||||
Citibank Omni Master Trust |
| |||||||||||
2.287% due 05/16/2016 | $ | 11,850 | $ | 11,995 | ||||||||
2.937% due 08/15/2018 | 3,000 | 3,156 | ||||||||||
Collegiate Funding Services Education Loan Trust I |
| |||||||||||
0.346% due 12/28/2021 | 2,169 | 2,153 | ||||||||||
Education Funding Capital Trust I |
| |||||||||||
0.517% due 03/16/2020 | 1,845 | 1,844 | ||||||||||
First CLO Ltd. |
| |||||||||||
0.558% due 12/14/2016 | 379 | 369 | ||||||||||
Ford Credit Auto Lease Trust |
| |||||||||||
1.040% due 03/15/2013 | 128 | 128 | ||||||||||
Ford Credit Auto Owner Trust |
| |||||||||||
2.687% due 05/15/2013 | 1,595 | 1,605 | ||||||||||
GCO Education Loan Funding Trust |
| |||||||||||
0.337% due 11/25/2020 | 165 | 165 | ||||||||||
Hyundai Capital Auto Funding Ltd. |
| |||||||||||
1.186% due 09/20/2016 | 1,500 | 1,490 | ||||||||||
Illinois Student Assistance Commission |
| |||||||||||
0.754% due 04/25/2017 | 2,653 | 2,653 | ||||||||||
Panhandle-Plains Higher Education Authority, Inc. |
| |||||||||||
1.434% due 10/01/2035 | 2,791 | 2,827 | ||||||||||
SLM Student Loan Trust |
| |||||||||||
0.404% due 04/25/2017 | 491 | 491 | ||||||||||
0.774% due 10/25/2017 | 3,100 | 3,106 | ||||||||||
1.374% due 10/25/2016 | 3,188 | 3,224 | ||||||||||
1.774% due 04/25/2023 | 1,749 | 1,808 | ||||||||||
4.500% due 11/16/2043 | 3,798 | 3,664 | ||||||||||
6.187% due 07/15/2042 | 11,658 | 11,100 | ||||||||||
South Carolina Student Loan Corp. |
| |||||||||||
0.724% due 01/25/2021 | 2,700 | 2,697 | ||||||||||
|
| |||||||||||
Total Asset-Backed Securities | 61,767 | |||||||||||
|
| |||||||||||
SOVEREIGN ISSUES 3.5% |
| |||||||||||
Emirate of Abu Dhabi |
| |||||||||||
5.500% due 04/08/2014 | 9,200 | 10,154 | ||||||||||
Export-Import Bank of Korea |
| |||||||||||
1.300% due 03/13/2012 | 5,000 | 5,001 | ||||||||||
Korea Government Bond |
| |||||||||||
4.250% due 06/01/2013 | 7,050 | 7,433 | ||||||||||
Poland Government International Bond |
| |||||||||||
6.250% due 07/03/2012 | 3,600 | 3,792 | ||||||||||
Province of Ontario Canada |
| |||||||||||
0.708% due 05/22/2012 | 1,000 | 1,004 | ||||||||||
5.000% due 10/18/2011 | 2,922 | 2,962 | ||||||||||
Qatar Government International Bond |
| |||||||||||
5.150% due 04/09/2014 | 9,100 | 9,905 | ||||||||||
Swedish Housing Finance Corp. |
| |||||||||||
3.125% due 03/23/2012 | 3,375 | 3,440 | ||||||||||
|
| |||||||||||
Total Sovereign Issues | 43,691 | |||||||||||
|
| |||||||||||
SHORT-TERM INSTRUMENTS 13.2% |
| |||||||||||
CERTIFICATES OF DEPOSIT 1.6% |
| |||||||||||
Abbey National Treasury Services PLC |
| |||||||||||
1.600% due 06/10/2013 | 5,300 | 5,303 | ||||||||||
Banco Do Brasil S.A. |
| |||||||||||
0.000% due 02/15/2012 | 3,000 | 3,020 | ||||||||||
Industrial & Commercial Bank of China Ltd. |
| |||||||||||
0.540% due 08/18/2011 | 4,300 | 4,302 | ||||||||||
| See Accompanying Notes | Annual Report | June 30, 2011 | 47 |
Table of Contents
Schedule of Investments PIMCO Enhanced Short Maturity Strategy Fund (Cont.)
| PRINCIPAL AMOUNT (000s) | MARKET VALUE (000s) | |||||||||||
Intesa Sanpaolo SpA |
| |||||||||||
0.775% due 01/19/2012 | $ | 6,000 | $ | 5,991 | ||||||||
Royal Bank of Scotland Group PLC |
| |||||||||||
1.653% due 10/15/2012 | 450 | 456 | ||||||||||
|
| |||||||||||
| 19,072 | ||||||||||||
|
| |||||||||||
COMMERCIAL PAPER 6.5% |
| |||||||||||
BP Capital Markets PLC |
| |||||||||||
0.780% due 06/05/2012 | 8,000 | 7,980 | ||||||||||
Deutsche Telekom AG |
| |||||||||||
0.410% due 07/29/2011 | 10,000 | 9,998 | ||||||||||
Kinder Morgan Energy Partners LP |
| |||||||||||
0.380% due 08/03/2011 | 2,000 | 1,999 | ||||||||||
Straight-A Funding LLC |
| |||||||||||
0.108% due 07/05/2011 | 48,200 | 48,199 | ||||||||||
Urenco Finance NV |
| |||||||||||
0.710% due 07/08/2011 | 10,800 | 10,800 | ||||||||||
Vodafone Group PLC |
| |||||||||||
0.568% due 01/19/2012 | 1,200 | 1,197 | ||||||||||
|
| |||||||||||
| 80,173 | ||||||||||||
|
| |||||||||||
REPURCHASE AGREEMENTS 4.4% |
| |||||||||||
Banc of America Securities LLC |
| |||||||||||
0.010% due 07/01/2011 | 23,400 | 23,400 | ||||||||||
(Dated 06/30/2011. Collateralized by U.S. Treasury Bonds 4.750% due 02/15/2037 valued at $24,326. Repurchase proceeds are $23,401.) | ||||||||||||
| PRINCIPAL AMOUNT (000s) | MARKET VALUE (000s) | |||||||||||
Barclays Capital, Inc. |
| |||||||||||
0.010% due 07/01/2011 | $ | 2,500 | $ | 2,500 | ||||||||
(Dated 06/30/2011. Collateralized by U.S. Treasury Inflation Protected Securities 1.875% due 07/15/2015 valued at $2,942. Repurchase proceeds are $2,500.) | ||||||||||||
Citigroup Global Markets, Inc. |
| |||||||||||
0.040% due 07/01/2011 | 6,600 | 6,600 | ||||||||||
(Dated 06/30/2011. Collateralized by Fannie Mae 3.650% due 12/08/2020 valued at $6,743. Repurchase proceeds are $6,600.) | ||||||||||||
JPMorgan Securities, Inc. |
| |||||||||||
0.040% due 07/01/2011 | 7,500 | 7,500 | ||||||||||
(Dated 06/30/2011. Collateralized by Federal Farm Credit Bank 2.270% due 12/24/2013 valued at $7,667. Repurchase proceeds are $7,500.) | ||||||||||||
Morgan Stanley & Co., Inc. |
| |||||||||||
0.010% due 07/01/2011 | 14,200 | 14,200 | ||||||||||
(Dated 06/30/2011. Collateralized by U.S. Treasury Bills 0.000% due 06/28/2012 valued at $14,552. Repurchase proceeds are $14,200.) | ||||||||||||
| PRINCIPAL AMOUNT (000s) | MARKET VALUE (000s) | |||||||||||
State Street Bank and Trust Co. |
| |||||||||||
0.010% due 07/01/2011 | $ | 108 | $ | 108 | ||||||||
(Dated 06/30/2011. Collateralized by U.S. Treasury Bills 0.000% due 08/11/2011 valued at $115. Repurchase proceeds are $108.) | ||||||||||||
|
| |||||||||||
| 54,308 | ||||||||||||
|
| |||||||||||
SHORT-TERM NOTES 0.7% |
| |||||||||||
Banco Santander Brasil S.A. |
| |||||||||||
1.764% due 10/13/2011 | 1,000 | 1,000 | ||||||||||
Holmes Master Issuer PLC |
| |||||||||||
0.337% due 10/15/2011 | 4,000 | 3,998 | ||||||||||
Pacific Gas & Electric Co. |
| |||||||||||
0.870% due 10/11/2011 | 3,900 | 3,900 | ||||||||||
|
| |||||||||||
| 8,898 | ||||||||||||
|
| |||||||||||
Total Short-Term Instruments | 162,451 | |||||||||||
|
| |||||||||||
Total Investments 100.8% | $ | 1,243,911 | ||||||||||
Other Assets and Liabilities (Net) (0.8%) |
| (10,184 | ) | |||||||||
|
| |||||||||||
Net Assets 100.0% | $ | 1,233,727 | ||||||||||
|
| |||||||||||
Notes to Schedule of Investments (amounts in thousands*):
| * | A zero balance may reflect actual amounts rounding to less than one thousand. |
| (a) | When-Issued security. |
| (b) | The average amount of borrowings while outstanding during the period ended June 30, 2011 was $2,798 at a weighted average interest rate of -1.080%. On June 30, 2011, securities valued at $13,100 were pledged as collateral for reverse repurchase agreements. |
| (c) | Fair Value Measurements (1) |
The following is a summary of the fair valuations according to the inputs used as of June 30, 2011 in valuing the Fund’s assets and liabilities (2):
| Category and Subcategory (3) | Level 1 (4) | Level 2 (5) | Level 3 (6) | Fair Value at 06/30/2011 | ||||||||||||||
| Investments, at value | ||||||||||||||||||
| Corporate Bonds & Notes | ||||||||||||||||||
Banking & Finance | $ | 0 | $ | 432,820 | $ | 8,586 | $ | 441,406 | ||||||||||
Industrials | 0 | 275,639 | 5,663 | 281,302 | ||||||||||||||
Utilities | 0 | 67,627 | 0 | 67,627 | ||||||||||||||
| Convertible Bonds & Notes | ||||||||||||||||||
Industrials | 0 | 2,875 | 0 | 2,875 | ||||||||||||||
| Municipal Bonds & Notes | ||||||||||||||||||
New Jersey | 0 | 2,498 | 0 | 2,498 | ||||||||||||||
| U.S. Government Agencies | 0 | 130,832 | 27,590 | 158,422 | ||||||||||||||
| Mortgage-Backed Securities | 0 | 21,872 | 0 | 21,872 | ||||||||||||||
| Asset-Backed Securities | 0 | 60,277 | 1,490 | 61,767 | ||||||||||||||
| 48 | PIMCO ETF Trust | See Accompanying Notes |
Table of Contents
June 30, 2011
| Category and Subcategory(3) | Level 1 (4) | Level 2 (5) | Level 3 (6) | Fair Value at 06/30/2011 | ||||||||||||||
| Sovereign Issues | $ | 0 | $ | 43,691 | $ | 0 | $ | 43,691 | ||||||||||
| Short-Term Instruments | ||||||||||||||||||
Certificates of Deposit | 0 | 19,072 | 0 | 19,072 | ||||||||||||||
Commercial Paper | 1,999 | 78,174 | 0 | 80,173 | ||||||||||||||
Repurchase Agreements | 0 | 54,308 | 0 | 54,308 | ||||||||||||||
Short-Term Notes | 0 | 8,898 | 0 | 8,898 | ||||||||||||||
| $ | 1,999 | $ | 1,198,583 | $ | 43,329 | $ | 1,243,911 | |||||||||||
The following is a reconciliation of the fair valuations using significant unobservable inputs (Level 3) for the Fund during the year ended June 30, 2011:
| Category and Subcategory (3) | Beginning Balance at 06/30/2010 | Net Purchases | Net Sales | Accrued Discounts/ (Premiums) | Realized Gain/ (Loss) | Net Change in Unrealized Appreciation/ (Depreciation) | Transfers into Level 3 | Transfers out of Level 3 | Ending Balance at 06/30/2011 | Net Change in Unrealized Appreciation/ (Depreciation) on Investments Held at 06/30/2011 | ||||||||||||||||||||||||||||||||
| Investments, at value | ||||||||||||||||||||||||||||||||||||||||||
| Corporate Bonds & Notes | ||||||||||||||||||||||||||||||||||||||||||
Banking & Finance | $ | 0 | $ | 8,600 | $ | 0 | $ | 0 | $ | 0 | $ | (14 | ) | $ | 0 | $ | 0 | $ | 8,586 | $ | (14 | ) | ||||||||||||||||||||
Industrials | 0 | 5,961 | (104 | ) | (180 | ) | 0 | (14 | ) | 0 | 0 | 5,663 | (14 | ) | ||||||||||||||||||||||||||||
| U.S. Government Agencies | 0 | 30,585 | (3,033 | ) | 0 | 0 | 38 | 0 | 0 | 27,590 | 38 | |||||||||||||||||||||||||||||||
| Asset-Backed Securities | 0 | 1,465 | 0 | 2 | 0 | 23 | 0 | 0 | 1,490 | 23 | ||||||||||||||||||||||||||||||||
| $ | 0 | $ | 46,611 | $ | (3,137 | ) | $ | (178 | ) | $ | 0 | $ | 33 | $ | 0 | $ | 0 | $ | 43,329 | $ | 33 | |||||||||||||||||||||
| (1) | See note 3 in the Notes to Financial Statements for more information regarding pricing inputs and valuation techniques. |
| (2) | There were no significant transfers into or out of level 1, 2, and 3 during the period ended June 30, 2011. |
| (3) | Refer to the Schedule of Investments for additional information. |
| (4) | Quoted prices in active markets for identical investments. |
| (5) | Significant other observable inputs. |
| (6) | Significant unobservable inputs. |
| See Accompanying Notes | Annual Report | June 30, 2011 | 49 |
Table of Contents
Schedule of Investments PIMCO Intermediate Municipal Bond Strategy Fund
| PRINCIPAL AMOUNT (000s) | MARKET VALUE (000s) | |||||||||||
MUNICIPAL BONDS & NOTES 96.0% |
| |||||||||||
ALASKA 1.0% |
| |||||||||||
Valdez, Alaska Revenue Bonds, Series 2003 |
| |||||||||||
5.000% due 01/01/2014 | $ | 850 | $ | 925 | ||||||||
|
| |||||||||||
ARIZONA 0.5% |
| |||||||||||
Arizona State University Revenue Notes, Series 2008 |
| |||||||||||
5.250% due 07/01/2016 | 400 | 461 | ||||||||||
|
| |||||||||||
CALIFORNIA 22.2% |
| |||||||||||
California State Department of Water Resources Revenue Notes, Series 2010 |
| |||||||||||
5.000% due 05/01/2018 | 500 | 585 | ||||||||||
California State General Obligation Bonds, (NPFGC/FGIC Insured), Series 2004 |
| |||||||||||
5.250% due 07/01/2014 | 750 | 845 | ||||||||||
California State General Obligation Bonds, Series 2007 |
| |||||||||||
5.000% due 12/01/2017 | 1,000 | 1,135 | ||||||||||
California State General Obligation Bonds, Series 2009 |
| |||||||||||
5.000% due 07/01/2020 | 500 | 573 | ||||||||||
California State General Obligation Notes, Series 2009 |
| |||||||||||
5.000% due 07/01/2018 | 500 | 585 | ||||||||||
California State General Obligation Notes, Series 2010 |
| |||||||||||
5.000% due 11/01/2019 | 500 | 563 | ||||||||||
California State Health Facilities Financing Authority Revenue Bonds, Series 2009 |
| |||||||||||
6.000% due 07/01/2039 | 1,000 | 1,036 | ||||||||||
Carlsbad, California Unified School District General Obligation Notes, Series 2009 |
| |||||||||||
0.000% due 05/01/2014 | 250 | 237 | ||||||||||
Irvine, California Ranch Water District General Obligation Bonds, Series 2009 |
| |||||||||||
0.030% due 10/01/2041 | 2,200 | 2,200 | ||||||||||
Los Angeles, California Department of Water & Power Revenue Bonds, Series 2001 |
| |||||||||||
0.030% due 07/01/2035 | 1,800 | 1,800 | ||||||||||
Los Angeles, California Unified School District Certificates of Participation Notes, Series 2010 |
| |||||||||||
5.000% due 12/01/2017 | 1,500 | 1,601 | ||||||||||
Mount San Antonio, California Community College District General Obligation Bonds, (NPFGC Insured), Series 2005 |
| |||||||||||
0.000% due 08/01/2016 | 1,000 | 853 | ||||||||||
Newport Beach, California Revenue Bonds, Series 2009 |
| |||||||||||
5.000% due 12/01/2038 | 1,000 | 1,064 | ||||||||||
Orange County, California Revenue Notes, Series 2009 |
| |||||||||||
4.000% due 07/01/2018 | 500 | 538 | ||||||||||
Pleasanton, California Unified School District Certificates of Participation Notes, (AGM Insured), Series 2010 |
| |||||||||||
3.500% due 08/01/2015 | 450 | 476 | ||||||||||
San Diego County, California Regional Airport Authority Revenue Notes, Series 2010 |
| |||||||||||
4.000% due 07/01/2016 | 720 | 777 | ||||||||||
San Francisco, California City & County Airports Commission Revenue Notes, Series 2010 |
| |||||||||||
5.000% due 05/01/2017 | 1,000 | 1,113 | ||||||||||
San Jose, California Revenue Notes, Series 2011 |
| |||||||||||
5.000% due 05/01/2017 | 1,115 | 1,192 | ||||||||||
San Juan, California Unified School District General Obligation Bonds, (AGM Insured), Series 2001 |
| |||||||||||
0.000% due 08/01/2017 | 750 | 588 | ||||||||||
| PRINCIPAL AMOUNT (000s) | MARKET VALUE (000s) | |||||||||||
Southern California State Public Power Authority Revenue Bonds, Series 2007 |
| |||||||||||
5.250% due 11/01/2020 | $ | 575 | $ | 586 | ||||||||
University of California Regents Medical Center Revenue Notes, Series 2010 |
| |||||||||||
5.000% due 05/15/2018 | 500 | 569 | ||||||||||
University of California Revenue Bonds, Series 2009 |
| |||||||||||
5.000% due 05/15/2020 | 1,000 | 1,135 | ||||||||||
|
| |||||||||||
| 20,051 | ||||||||||||
|
| |||||||||||
COLORADO 1.3% |
| |||||||||||
Denver, Colorado City & County Revenue Bonds, (NPFGC/FGIC Insured), Series 2006 |
| |||||||||||
4.000% due 11/15/2016 | 265 | 286 | ||||||||||
Denver, Colorado City & County Revenue Notes, Series 2009 |
| |||||||||||
5.000% due 11/15/2016 | 250 | 282 | ||||||||||
Glenwood Springs, Colorado Revenue Notes, Series 2010 |
| |||||||||||
5.000% due 10/01/2018 | 500 | 564 | ||||||||||
|
| |||||||||||
| 1,132 | ||||||||||||
|
| |||||||||||
FLORIDA 6.5% |
| |||||||||||
Florida State Board of Governors Revenue Notes, Series 2008 |
| |||||||||||
5.500% due 07/01/2018 | 105 | 123 | ||||||||||
Florida State Citizens Property Insurance Corp. Revenue Notes, Series 2010 |
| |||||||||||
5.000% due 06/01/2016 | 750 | 803 | ||||||||||
Florida State Citizens Property Insurance Corp. Revenue Notes, Series 2011 |
| |||||||||||
5.000% due 06/01/2019 (a) | 1,000 | 1,030 | ||||||||||
Florida State Inland Protection Financing Corp. Revenue Notes, Series 2010 |
| |||||||||||
5.000% due 07/01/2016 | 500 | 555 | ||||||||||
Florida State Municipal Power Agency Revenue Notes, Series 2009 |
| |||||||||||
5.000% due 10/01/2015 | 250 | 277 | ||||||||||
Miami-Dade County, Florida General Obligation Bonds, Series 2011 |
| |||||||||||
3.000% due 07/01/2017 | 1,375 | 1,422 | ||||||||||
Miami-Dade County, Florida Revenue Notes, Series 2010 |
| |||||||||||
4.000% due 07/01/2016 | 1,000 | 1,083 | ||||||||||
Orange County, Florida Health Facilities Authority Revenue Notes, Series 2009 |
| |||||||||||
5.000% due 10/01/2015 | 250 | 272 | ||||||||||
Orlando, Florida Utilities Commission Revenue Notes, Series 2010 |
| |||||||||||
5.000% due 10/01/2017 | 250 | 292 | ||||||||||
|
| |||||||||||
| 5,857 | ||||||||||||
|
| |||||||||||
GEORGIA 1.3% |
| |||||||||||
Georgia State Municipal Electric Authority Revenue Notes, Series 2010 |
| |||||||||||
4.000% due 01/01/2018 | 350 | 374 | ||||||||||
Georgia State Municipal Electric Authority Revenue Notes, Series 2011 |
| |||||||||||
3.000% due 01/01/2014 | 250 | 261 | ||||||||||
5.000% due 01/01/2020 | 250 | 279 | ||||||||||
Marietta, Georgia General Obligation Notes, Series 2009 |
| |||||||||||
5.000% due 02/01/2018 | 250 | 293 | ||||||||||
|
| |||||||||||
| 1,207 | ||||||||||||
|
| |||||||||||
| PRINCIPAL AMOUNT (000s) | MARKET VALUE (000s) | |||||||||||
ILLINOIS 9.3% |
| |||||||||||
Chicago, Illinois Airport Revenue Bonds, (NPFGC Insured), Series 2005 |
| |||||||||||
5.250% due 01/01/2018 | $ | 1,000 | $ | 1,115 | ||||||||
Chicago, Illinois Airport Revenue Bonds, Series 2010 |
| |||||||||||
5.000% due 01/01/2034 | 200 | 217 | ||||||||||
Chicago, Illinois Board of Education General Obligation Bonds, (NPFGC/FGIC Insured), Series 1999 |
| |||||||||||
0.000% due 12/01/2016 | 250 | 208 | ||||||||||
Chicago, Illinois Revenue Notes, (AGM Insured), Series 2008 |
| |||||||||||
5.000% due 11/01/2016 | 350 | 394 | ||||||||||
Chicago, Illinois Revenue Notes, Series 2011 |
| |||||||||||
3.000% due 01/01/2014 | 650 | 669 | ||||||||||
Chicago, Illinois Wastewater Revenue Bonds, (NPFGC Insured), Series 2001 |
| |||||||||||
5.500% due 01/01/2018 | 1,000 | 1,093 | ||||||||||
Chicago, Illinois Wastewater Revenue Bonds, (NPFGC Insured), Series 2011 |
| |||||||||||
5.500% due 01/01/2017 | 1,000 | 1,106 | ||||||||||
Illinois State Finance Authority Revenue Notes, Series 2009 |
| |||||||||||
5.000% due 08/15/2015 | 375 | 420 | ||||||||||
Illinois State General Obligation Bonds, (NPFGC Insured), Series 2002 |
| |||||||||||
5.250% due 08/01/2012 | 250 | 261 | ||||||||||
Illinois State General Obligation Notes, Series 2004 |
| |||||||||||
5.000% due 03/01/2013 | 1,000 | 1,055 | ||||||||||
Illinois State Railsplitter Tobacco Settlement Authority Revenue Notes, Series 2010 |
| |||||||||||
5.125% due 06/01/2019 | 500 | 527 | ||||||||||
Illinois State Revenue Notes, Series 2009 |
| |||||||||||
4.500% due 06/15/2016 | 500 | 552 | ||||||||||
Illinois State Revenue Notes, Series 2010 |
| |||||||||||
5.000% due 06/15/2016 | 750 | 836 | ||||||||||
|
| |||||||||||
| 8,453 | ||||||||||||
|
| |||||||||||
INDIANA 3.5% |
| |||||||||||
Indiana State Finance Authority Revenue Bonds, (NPFGC/FGIC Insured), Series 2007 |
| |||||||||||
5.000% due 12/01/2017 | 300 | 340 | ||||||||||
Indiana State Finance Authority Revenue Notes, Series 2010 |
| |||||||||||
4.000% due 11/01/2016 | 500 | 553 | ||||||||||
5.000% due 02/01/2018 | 500 | 584 | ||||||||||
Indiana State Purdue University Certificates of Participation Bonds, Series 2006 |
| |||||||||||
5.250% due 07/01/2017 | 640 | 735 | ||||||||||
Indianapolis, Indiana Local Public Improvement Revenue Notes, (AMBAC Insured), Series 2006 |
| |||||||||||
5.000% due 01/01/2016 | 300 | 341 | ||||||||||
Vincennes, Indiana University Revenue Notes, Series 2010 |
| |||||||||||
4.000% due 06/01/2016 | 500 | 544 | ||||||||||
Warsaw, Indiana Multi-School Building Corp. Revenue Notes, Series 2008 |
| |||||||||||
5.500% due 01/15/2017 | 100 | 113 | ||||||||||
|
| |||||||||||
| 3,210 | ||||||||||||
|
| |||||||||||
IOWA 0.6% |
| |||||||||||
Iowa State Higher Education Loan Authority Revenue Notes, Series 2010 |
| |||||||||||
4.000% due 12/01/2016 | 500 | 556 | ||||||||||
|
| |||||||||||
| 50 | PIMCO ETF Trust | See Accompanying Notes |
Table of Contents
June 30, 2011
| PRINCIPAL AMOUNT (000s) | MARKET VALUE (000s) | |||||||||||
KANSAS 0.9% |
| |||||||||||
Kansas State Development Finance Authority Revenue Notes, Series 2010 |
| |||||||||||
5.000% due 11/01/2017 | $ | 500 | $ | 581 | ||||||||
Wyandotte County-Kansas City, Kansas Unified Government Revenue Notes, Series 2010 |
| |||||||||||
5.000% due 09/01/2015 | 200 | 226 | ||||||||||
| 807 | ||||||||||||
KENTUCKY 2.3% |
| |||||||||||
Kentucky State Municipal Power Agency Revenue Notes, (AGM Insured), Series 2010 |
| |||||||||||
4.000% due 09/01/2016 | 900 | 966 | ||||||||||
Kentucky State Turnpike Authority Revenue Notes, Series 2010 |
| |||||||||||
5.000% due 07/01/2016 | 1,000 | 1,152 | ||||||||||
| 2,118 | ||||||||||||
MASSACHUSETTS 2.3% |
| |||||||||||
Massachusetts State Bay Transportation Authority Revenue Bonds, Series 2006 |
| |||||||||||
5.500% due 07/01/2017 | 500 | 602 | ||||||||||
Massachusetts State Development Finance Agency Revenue Notes, Series 2010 |
| |||||||||||
4.000% due 10/01/2016 | 850 | 921 | ||||||||||
Taunton, Massachusetts General Obligation Notes, Series 2009 |
| |||||||||||
5.000% due 12/01/2018 | 510 | 589 | ||||||||||
| 2,112 | ||||||||||||
MINNESOTA 1.2% |
| |||||||||||
Rochester, Minnesota Revenue Bonds, Series 2011 |
| |||||||||||
4.000% due 11/15/2030 | 1,000 | 1,070 | ||||||||||
MISSOURI 3.3% |
| |||||||||||
Missouri State Health & Educational Facilities Authority Revenue Bonds, Series 1996 |
| |||||||||||
0.060% due 09/01/2030 | 1,000 | 1,000 | ||||||||||
Missouri State Health & Educational Facilities Authority Revenue Notes, Series 2010 |
| |||||||||||
5.000% due 11/15/2017 | 1,000 | 1,090 | ||||||||||
Missouri State Joint Municipal Electric Utility Commission Revenue Notes, (AMBAC Insured), Series 2007 |
| |||||||||||
5.000% due 01/01/2016 | 800 | 884 | ||||||||||
| 2,974 | ||||||||||||
NEW HAMPSHIRE 0.3% |
| |||||||||||
New Hampshire State Health & Education Facilities Authority Revenue Notes, Series 2009 |
| |||||||||||
5.000% due 07/01/2016 | 250 | 285 | ||||||||||
NEW JERSEY 4.8% |
| |||||||||||
New Jersey State Economic Development Authority Revenue Bonds, (AGM Insured), Series 2008 |
| |||||||||||
5.000% due 03/01/2014 | 1,000 | 1,079 | ||||||||||
New Jersey State Economic Development Authority Revenue Bonds, (NPFGC Insured), Series 2005 |
| |||||||||||
5.250% due 09/01/2016 | 1,000 | 1,104 | ||||||||||
New Jersey State Economic Development Authority Revenue Notes, Series 2011 |
| |||||||||||
5.000% due 09/01/2018 | 2,000 | 2,200 | ||||||||||
| 4,383 | ||||||||||||
| PRINCIPAL AMOUNT (000s) | MARKET VALUE (000s) | |||||||||||
NEW MEXICO 0.7% |
| |||||||||||
New Mexico State Revenue Notes, Series 2010 |
| |||||||||||
5.000% due 07/01/2017 | $ | 500 | $ | 590 | ||||||||
NEW YORK 17.7% |
| |||||||||||
Erie County, New York Industrial Development Agency Revenue Notes, Series 2011 |
| |||||||||||
5.000% due 05/01/2015 (a) | 500 | 564 | ||||||||||
Liberty, New York Development Corp. Revenue Bonds, Series 2009 |
| |||||||||||
0.350% due 12/01/2049 | 1,000 | 1,000 | ||||||||||
Long Island, New York Power Authority Revenue Bonds, Series 2006 |
| |||||||||||
5.000% due 12/01/2017 | 500 | 564 | ||||||||||
New York City, New York General Obligation Notes, |
| |||||||||||
5.000% due 08/01/2012 | 750 | 786 | ||||||||||
5.000% due 08/01/2017 | 980 | 1,138 | ||||||||||
New York City, New York Municipal Water Finance Authority Revenue Notes, Series 2009 |
| |||||||||||
5.000% due 06/15/2017 | 895 | 1,051 | ||||||||||
New York City, New York Transitional Finance Authority Revenue Notes, Series 2007 |
| |||||||||||
5.000% due 11/01/2015 | 200 | 232 | ||||||||||
New York City, New York Trust for Cultural Resources Revenue Bonds, Series 2008 |
| |||||||||||
0.040% due 12/01/2035 | 1,250 | 1,250 | ||||||||||
New York State Dormitory Authority Revenue Bonds, (NPFGC/FGIC Insured), Series 2005 |
| |||||||||||
5.000% due 07/01/2016 | 370 | 413 | ||||||||||
New York State Dormitory Authority Revenue Bonds, |
| |||||||||||
5.000% due 03/15/2030 | 1,635 | 1,691 | ||||||||||
New York State Dormitory Authority Revenue Notes, |
| |||||||||||
5.000% due 07/01/2017 | 2,000 | 2,278 | ||||||||||
New York State Dormitory Authority Revenue Notes, |
| |||||||||||
5.000% due 07/01/2019 | 1,000 | 1,086 | ||||||||||
New York State Dormitory Authority Revenue Notes, |
| |||||||||||
4.000% due 07/01/2018 | 815 | 868 | ||||||||||
New York State Metropolitan Transportation Authority Revenue Notes, Series 2005 |
| |||||||||||
5.000% due 11/15/2019 | 500 | 555 | ||||||||||
New York State Urban Development Corp. Revenue Notes, Series 2009 |
| |||||||||||
5.000% due 12/15/2013 | 1,000 | 1,106 | ||||||||||
New York State Urban Development Corp. Revenue Notes, Series 2010 |
| |||||||||||
5.000% due 03/15/2018 | 500 | 587 | ||||||||||
Riverhead, New York Central School District General Obligation Notes, Series 2010 |
| |||||||||||
4.000% due 10/01/2017 | 250 | 276 | ||||||||||
Syracuse, New York Industrial Development Agency Revenue Notes, Series 2010 |
| |||||||||||
4.000% due 05/01/2017 | 500 | 536 | ||||||||||
| 15,981 | ||||||||||||
NORTH CAROLINA 1.1% |
| |||||||||||
Mecklenburg County, North Carolina Certificates of Participation Notes, Series 2009 |
| |||||||||||
5.000% due 02/01/2019 | 300 | 336 | ||||||||||
| PRINCIPAL AMOUNT (000s) | MARKET VALUE (000s) | |||||||||||
Union County, North Carolina Certificates of Participation Bonds, (AMBAC Insured), Series 2006 |
| |||||||||||
5.000% due 06/01/2022 | $ | 360 | $ | 381 | ||||||||
University of North Carolina at Chapel Hill Revenue Notes, Series 2005 |
| |||||||||||
5.000% due 02/01/2015 | 250 | 276 | ||||||||||
| 993 | ||||||||||||
OHIO 4.5% |
| |||||||||||
Ohio State American Municipal Power, Inc. Revenue Notes, Series 2009 |
| |||||||||||
5.000% due 02/15/2017 | 500 | 546 | ||||||||||
Ohio State Buckeye Tobacco Settlement Financing Authority Revenue Bonds, Series 2007 |
| |||||||||||
5.875% due 06/01/2030 | 500 | 397 | ||||||||||
5.875% due 06/01/2047 | 250 | 183 | ||||||||||
Ohio State Revenue Bonds, (NPFGC Insured), Series 2005 |
| |||||||||||
5.000% due 08/01/2016 | 300 | 327 | ||||||||||
Ohio State Turnpike Commission Revenue Bonds, (NPFGC/FGIC Insured), Series 1998 |
| |||||||||||
5.500% due 02/15/2016 | 1,000 | 1,165 | ||||||||||
5.500% due 02/15/2017 | 225 | 264 | ||||||||||
Ohio State Water Development Authority Revenue Bonds, Series 2011 |
| |||||||||||
5.000% due 06/01/2017 | 1,005 | 1,172 | ||||||||||
| 4,054 | ||||||||||||
OREGON 0.6% |
| |||||||||||
Oregon State Facilities Authority Revenue Notes, Series 2010 |
| |||||||||||
5.000% due 10/01/2017 | 500 | 545 | ||||||||||
PENNSYLVANIA 1.6% |
| |||||||||||
Allegheny County, Pennsylvania Hospital Development Authority Revenue Notes, Series 2010 |
| |||||||||||
5.000% due 05/15/2017 | 500 | 564 | ||||||||||
Pennsylvania State Higher Education Facilities Authority Revenue Notes, (NPFGC Insured), Series 2006 |
| |||||||||||
5.000% due 04/01/2016 | 250 | 283 | ||||||||||
Southeastern Pennsylvania State Transportation Authority Revenue Notes, Series 2010 |
| |||||||||||
5.000% due 03/01/2018 | 500 | 566 | ||||||||||
| 1,413 | ||||||||||||
PUERTO RICO 0.3% |
| |||||||||||
Puerto Rico Electric Power Authority Revenue Bonds, (SGI Insured), Series 2002 |
| |||||||||||
5.375% due 07/01/2016 | 250 | 278 | ||||||||||
SOUTH CAROLINA 0.3% |
| |||||||||||
Piedmont, South Carolina Municipal Power Agency Revenue Notes, Series 2009 |
| |||||||||||
5.000% due 01/01/2015 | 250 | 276 | ||||||||||
TENNESSEE 0.6% |
| |||||||||||
Tennessee State Energy Acquisition Corp. Revenue Bonds, Series 2006 |
| |||||||||||
5.000% due 02/01/2021 | 500 | 500 | ||||||||||
TEXAS 5.3% |
| |||||||||||
Austin, Texas Electrical Utilities System Revenue Notes, Series 2010 | ||||||||||||
5.000% due 11/15/2017 | 1,000 | 1,154 | ||||||||||
| See Accompanying Notes | Annual Report | June 30, 2011 | 51 |
Table of Contents
Schedule of Investments PIMCO Intermediate Municipal Bond Strategy Fund (Cont.)
| PRINCIPAL AMOUNT (000s) | MARKET VALUE (000s) | |||||||||||
Eagle Mountain & Saginaw, Texas Independent School District General Obligation Notes, Series 2010 |
| |||||||||||
0.000% due 08/15/2017 | $ | 250 | $ | 212 | ||||||||
Northside, Texas Independent School District General Obligation bonds, (PFS/GTD Insured), Series 2011 |
| |||||||||||
0.950% due 08/01/2034 | 700 | 700 | ||||||||||
1.350% due 06/01/2039 | 1,500 | 1,507 | ||||||||||
Texas State General Obligation Notes, Series 2010 |
| |||||||||||
4.000% due 12/01/2015 | 810 | 907 | ||||||||||
Texas State Municipal Gas Acquisition & Supply |
| |||||||||||
5.250% due 12/15/2023 | 250 | 248 | ||||||||||
Texas State Transportation Commission Revenue Bonds, Series 2007 |
| |||||||||||
5.000% due 04/01/2026 | 100 | 108 | ||||||||||
|
| |||||||||||
| 4,836 | ||||||||||||
|
| |||||||||||
| PRINCIPAL AMOUNT (000s) | MARKET VALUE (000s) | |||||||||||
WASHINGTON 1.5% |
| |||||||||||
King County, Washington Public Hospital District No. 2 General Obligation Notes, Series 2010 |
| |||||||||||
5.000% due 12/01/2015 | $ | 1,000 | $ | 1,128 | ||||||||
Washington State Higher Education Facilities Authority Revenue Notes, Series 2010 |
| |||||||||||
4.000% due 04/01/2013 | 250 | 260 | ||||||||||
|
| |||||||||||
| 1,388 | ||||||||||||
|
| |||||||||||
WISCONSIN 0.3% |
| |||||||||||
Wisconsin State Clean Water Revenue Bonds, (NPFGC Insured), Series 2005 |
| |||||||||||
5.000% due 05/01/2017 | 225 | 251 | ||||||||||
|
| |||||||||||
WYOMING 0.2% |
| |||||||||||
Campbell County, Wyoming Hospital District Revenue Notes, Series 2009 |
| |||||||||||
5.000% due 12/01/2017 | 200 | 213 | ||||||||||
|
| |||||||||||
Total Municipal Bonds & Notes |
| 86,919 | ||||||||||
|
| |||||||||||
| PRINCIPAL AMOUNT (000s) | MARKET VALUE (000s) | |||||||||||
SHORT-TERM INSTRUMENTS 5.0% |
| |||||||||||
REPURCHASE AGREEMENTS 5.0% |
| |||||||||||
State Street Bank and Trust Co. |
| |||||||||||
0.010% due 07/01/2011 | $ | 4,471 | $ | 4,471 | ||||||||
|
| |||||||||||
(Dated 06/30/2011. Collateralized by U.S. Treasury Bills 0.000% due 08/11/2011 valued at $4,565. Repurchase proceeds are $4,471.) | ||||||||||||
Total Short-Term Instruments |
| 4,471 | ||||||||||
|
| |||||||||||
Total Investments 101.0% |
| $ | 91,390 | |||||||||
Other Assets and Liabilities (Net) (1.0%) |
| (861 | ) | |||||||||
|
| |||||||||||
Net Assets 100.0% | $ | 90,529 | ||||||||||
|
| |||||||||||
Notes to Schedule of Investments (amounts in thousands):
| (a) | When-Issued security. |
| (b) | Fair Value Measurements (1) |
The following is a summary of the fair valuations according to the inputs used as of June 30, 2011 in valuing the Fund’s assets and liabilities (2):
| Category and Subcategory (3) | Level 1 (4) | Level 2 (5) | Level 3 (6) | Fair Value at 06/30/2011 | ||||||||||||||
| Investments, at value | ||||||||||||||||||
| Municipal Bonds & Notes | ||||||||||||||||||
Alaska | $ | 0 | $ | 925 | $ | 0 | $ | 925 | ||||||||||
Arizona | 0 | 461 | 0 | 461 | ||||||||||||||
California | 0 | 20,051 | 0 | 20,051 | ||||||||||||||
Colorado | 0 | 1,132 | 0 | 1,132 | ||||||||||||||
Florida | 0 | 5,857 | 0 | 5,857 | ||||||||||||||
Georgia | 0 | 1,207 | 0 | 1,207 | ||||||||||||||
Illinois | 0 | 8,453 | 0 | 8,453 | ||||||||||||||
Indiana | 0 | 3,210 | 0 | 3,210 | ||||||||||||||
Iowa | 0 | 556 | 0 | 556 | ||||||||||||||
Kansas | 0 | 807 | 0 | 807 | ||||||||||||||
Kentucky | 0 | 2,118 | 0 | 2,118 | ||||||||||||||
Massachusetts | 0 | 2,112 | 0 | 2,112 | ||||||||||||||
Minnesota | 0 | 1,070 | 0 | 1,070 | ||||||||||||||
Missouri | 0 | 2,974 | 0 | 2,974 | ||||||||||||||
New Hampshire | 0 | 285 | 0 | 285 | ||||||||||||||
New Jersey | 0 | 4,383 | 0 | 4,383 | ||||||||||||||
New Mexico | 0 | 590 | 0 | 590 | ||||||||||||||
New York | 0 | 15,981 | 0 | 15,981 | ||||||||||||||
North Carolina | 0 | 993 | 0 | 993 | ||||||||||||||
Ohio | 0 | 4,054 | 0 | 4,054 | ||||||||||||||
Oregon | 0 | 545 | 0 | 545 | ||||||||||||||
Pennsylvania | 0 | 1,413 | 0 | 1,413 | ||||||||||||||
Puerto Rico | 0 | 278 | 0 | 278 | ||||||||||||||
South Carolina | 0 | 276 | 0 | 276 | ||||||||||||||
Tennessee | 0 | 500 | 0 | 500 | ||||||||||||||
| 52 | PIMCO ETF Trust | See Accompanying Notes |
Table of Contents
June 30, 2011
| Category and Subcategory (3) | Level 1 (4) | Level 2 (5) | Level 3 (6) | Fair Value at 06/30/2011 | ||||||||||||||
Texas | $ | 0 | $ | 4,836 | $ | 0 | $ | 4,836 | ||||||||||
Washington | 0 | 1,388 | 0 | 1,388 | ||||||||||||||
Wisconsin | 0 | 251 | 0 | 251 | ||||||||||||||
Wyoming | 0 | 213 | 0 | 213 | ||||||||||||||
| Short-Term Instruments | ||||||||||||||||||
Repurchase Agreements | 0 | 4,471 | 0 | 4,471 | ||||||||||||||
| $ | 0 | $ | 91,390 | $ | 0 | $ | 91,390 | |||||||||||
| (1) | See note 3 in the Notes to Financial Statements for more information regarding pricing inputs and valuation techniques. |
| (2) | There were no significant transfers into or out of level 1, 2, and 3 during the period ended June 30, 2011. |
| (3) | Refer to the Schedule of Investments for additional information. |
| (4) | Quoted prices in active markets for identical investments. |
| (5) | Significant other observable inputs. |
| (6) | Significant unobservable inputs. |
| See Accompanying Notes | Annual Report | June 30, 2011 | 53 |
Table of Contents
Schedule of Investments PIMCO Short Term Municipal Bond Strategy Fund
| PRINCIPAL AMOUNT (000s) | MARKET VALUE (000s) | |||||||||||
MUNICIPAL BONDS & NOTES 95.2% |
| |||||||||||
ALASKA 1.2% |
| |||||||||||
Valdez, Alaska Revenue Bonds, Series 2003 |
| |||||||||||
5.000% due 01/01/2014 | $ | 250 | $ | 272 | ||||||||
|
| |||||||||||
CALIFORNIA 21.2% |
| |||||||||||
California State General Obligation Bonds, (NPFGC/FGIC Insured), Series 2004 |
| |||||||||||
5.250% due 07/01/2014 | 550 | 620 | ||||||||||
California State General Obligation Notes, Series 2010 |
| |||||||||||
4.000% due 11/01/2013 | 500 | 533 | ||||||||||
California State Health Facilities Financing Authority Revenue Bonds, Series 2004 |
| |||||||||||
4.950% due 07/01/2026 | 250 | 271 | ||||||||||
California State Northern Power Agency Revenue Notes, Series 2010 |
| |||||||||||
3.000% due 06/01/2013 | 250 | 258 | ||||||||||
California Statewide Communities Development Authority Revenue Notes, Series 2010 |
| |||||||||||
3.000% due 11/01/2012 | 100 | 102 | ||||||||||
Long Beach, California Revenue Notes, Series 2010 |
| |||||||||||
3.000% due 06/01/2013 | 165 | 168 | ||||||||||
Los Angeles, California Department of Water & Power Revenue Bonds, Series 2001 |
| |||||||||||
0.030% due 07/01/2035 | 500 | 500 | ||||||||||
0.040% due 07/01/2034 | 700 | 700 | ||||||||||
Los Angeles, California Municipal Improvement Corp. Revenue Notes, Series 2010 |
| |||||||||||
3.000% due 11/01/2012 | 750 | 768 | ||||||||||
Newport Beach, California Revenue Bonds, Series 2009 |
| |||||||||||
5.000% due 12/01/2038 | 500 | 532 | ||||||||||
San Francisco, California City & County Redevelopment Agency Tax Allocation Notes, (NPFGC/FGIC Insured), Series 2004 |
| |||||||||||
5.000% due 08/01/2012 | 200 | 205 | ||||||||||
South Placer County, California Wastewater Authority Revenue Notes, Series 2011 |
| |||||||||||
0.920% due 11/01/2014 | 250 | 249 | ||||||||||
|
| |||||||||||
| 4,906 | ||||||||||||
|
| |||||||||||
COLORADO 2.2% |
| |||||||||||
University of Colorado Revenue Notes, Series 2010 |
| |||||||||||
3.000% due 06/01/2013 | 500 | 523 | ||||||||||
|
| |||||||||||
DELAWARE 2.0% |
| |||||||||||
Delaware State Solid Waste Authority Revenue Notes, Series 2010 |
| |||||||||||
3.500% due 06/01/2013 | 450 | 469 | ||||||||||
|
| |||||||||||
DISTRICT OF COLUMBIA 0.4% |
| |||||||||||
District of Columbia General Obligation Notes, (AGM Insured), Series 2005 |
| |||||||||||
5.000% due 06/01/2013 | 100 | 108 | ||||||||||
|
| |||||||||||
FLORIDA 1.1% |
| |||||||||||
Florida State Hurricane Catastrophe Fund Finance Corp. Revenue Notes, Series 2006 |
| |||||||||||
5.250% due 07/01/2012 | 250 | 261 | ||||||||||
|
| |||||||||||
GEORGIA 3.4% |
| |||||||||||
Atlanta, Georgia Revenue Notes, Series 2010 |
| |||||||||||
5.000% due 01/01/2014 | 500 | 544 | ||||||||||
| PRINCIPAL AMOUNT (000s) | MARKET VALUE (000s) | |||||||||||
Georgia State Municipal Electric Authority Revenue Notes, Series 2008 |
| |||||||||||
5.000% due 01/01/2013 | $ | 250 | $ | 264 | ||||||||
|
| |||||||||||
| 808 | ||||||||||||
|
| |||||||||||
ILLINOIS 12.8% |
| |||||||||||
Chicago, Illinois Airport Revenue Bonds, Series 2010 |
| |||||||||||
5.000% due 01/01/2034 | 500 | 542 | ||||||||||
Chicago, Illinois International Airport Revenue Notes, Series 2010 |
| |||||||||||
4.000% due 01/01/2013 | 250 | 261 | ||||||||||
Cook County, Illinois East Maine School District No. 63 General Obligation Notes, Series 2010 |
| |||||||||||
2.000% due 12/01/2012 | 155 | 157 | ||||||||||
Decatur, Illinois Park District General Obligation Notes, Series 2010 |
| |||||||||||
2.000% due 03/01/2012 | 100 | 101 | ||||||||||
2.250% due 03/01/2013 | 175 | 178 | ||||||||||
Illinois State Finance Authority Revenue Bonds, Series 2004 |
| |||||||||||
5.500% due 10/01/2014 | 200 | 224 | ||||||||||
Illinois State Finance Authority Revenue Notes, Series 2010 |
| |||||||||||
4.000% due 02/15/2012 | 100 | 102 | ||||||||||
Illinois State Metropolitan Pier & Exposition Authority Revenue Bonds, (NPFGC Insured), Series 1996 |
| |||||||||||
0.000% due 12/15/2012 | 300 | 292 | ||||||||||
Illinois State Municipal Electric Agency Revenue Bonds, (NPFGC/FGIC Insured), Series 2007 |
| |||||||||||
5.000% due 02/01/2014 | 300 | 322 | ||||||||||
Illinois State Railsplitter Tobacco Settlement Authority Revenue Notes, Series 2010 |
| |||||||||||
4.000% due 06/01/2013 | 250 | 259 | ||||||||||
Illinois State Toll Highway Authority Revenue Bonds, (AGM Insured), Series 1998 |
| |||||||||||
5.500% due 01/01/2014 | 250 | 273 | ||||||||||
Will & Kendall Counties, Illinois Community Consolidated School District No. 202 General Obligation Notes, Series 2010 |
| |||||||||||
2.000% due 01/01/2012 | 250 | 251 | ||||||||||
|
| |||||||||||
| 2,962 | ||||||||||||
|
| |||||||||||
INDIANA 4.7% |
| |||||||||||
Indiana State Finance Authority Revenue Notes, Series 2006 |
| |||||||||||
5.500% due 02/01/2013 | 300 | 324 | ||||||||||
Indiana University Revenue Notes, Series 2010 |
| |||||||||||
4.000% due 08/01/2013 | 240 | 256 | ||||||||||
Indianapolis, Indiana Revenue Notes, Series 2010 |
| |||||||||||
3.000% due 10/01/2013 | 500 | 516 | ||||||||||
|
| |||||||||||
| 1,096 | ||||||||||||
|
| |||||||||||
IOWA 2.2% |
| |||||||||||
Des Moines, Iowa Independent Community School District Revenue Notes, Series 2010 |
| |||||||||||
5.000% due 06/01/2012 | 250 | 260 | ||||||||||
Dubuque, Iowa Community School District Revenue Notes, Series 2010 |
| |||||||||||
2.000% due 01/01/2013 | 250 | 253 | ||||||||||
|
| |||||||||||
| 513 | ||||||||||||
|
| |||||||||||
| PRINCIPAL AMOUNT (000s) | MARKET VALUE (000s) | |||||||||||
KENTUCKY 3.4% |
| |||||||||||
Jefferson County, Kentucky Capital Projects Corp. Revenue Notes, (AGM Insured), Series 2007 |
| |||||||||||
4.000% due 06/01/2013 | $ | 250 | $ | 263 | ||||||||
Kentucky State Turnpike Authority Revenue Notes, Series 2010 |
| |||||||||||
2.500% due 07/01/2013 | 500 | 516 | ||||||||||
|
| |||||||||||
| 779 | ||||||||||||
|
| |||||||||||
LOUISIANA 2.1% |
| |||||||||||
Louisiana State Offshore Terminal Authority Revenue Bonds, Series 2010 |
| |||||||||||
2.100% due 10/01/2040 | 500 | 497 | ||||||||||
|
| |||||||||||
MAINE 1.1% |
| |||||||||||
Maine State Health & Higher Educational Facilities Authority Revenue Notes, Series 2010 |
| |||||||||||
3.000% due 07/01/2013 | 250 | 258 | ||||||||||
|
| |||||||||||
MASSACHUSETTS 1.5% |
| |||||||||||
Massachusetts State Educational Financing Authority Revenue Notes, Series 2010 |
| |||||||||||
2.000% due 01/01/2012 | 240 | 241 | ||||||||||
Massachusetts State General Obligation Notes, (AGM Insured), Series 2002 |
| |||||||||||
5.500% due 11/01/2011 | 100 | 102 | ||||||||||
|
| |||||||||||
| 343 | ||||||||||||
|
| |||||||||||
MICHIGAN 1.2% |
| |||||||||||
Hamilton, Michigan Community School District General Obligation Notes, (AGM/Q-SBLF Insured), Series 2005 |
| |||||||||||
5.000% due 05/01/2013 | 250 | 268 | ||||||||||
|
| |||||||||||
MISSOURI 2.2% |
| |||||||||||
Missouri State Health & Educational Facilities Authority Revenue Bonds, Series 1996 |
| |||||||||||
0.060% due 09/01/2030 | 500 | 500 | ||||||||||
|
| |||||||||||
NEBRASKA 0.9% |
| |||||||||||
Nebraska State Central Plains Energy Project Revenue Notes, Series 2007 |
| |||||||||||
5.000% due 12/01/2012 | 210 | 219 | ||||||||||
|
| |||||||||||
NEVADA 0.7% |
| |||||||||||
Clark County, Nevada Revenue Notes, Series 2010 |
| |||||||||||
3.000% due 07/01/2013 | 150 | 156 | ||||||||||
|
| |||||||||||
NEW JERSEY 0.5% |
| |||||||||||
New Jersey State Transit Corp. Certificates of Participation Bonds, (AMBAC Insured), Series 2002 |
| |||||||||||
5.500% due 09/15/2012 | 100 | 105 | ||||||||||
|
| |||||||||||
NEW YORK 15.1% |
| |||||||||||
Essex County, New York General Obligation Notes, (NPFGC Insured), Series 2005 |
| |||||||||||
4.000% due 05/15/2013 | 200 | 211 | ||||||||||
Liberty, New York Development Corp. Revenue Bonds, Series 2009 |
| |||||||||||
0.350% due 12/01/2049 | 300 | 300 | ||||||||||
Monroe County, New York Industrial Development Corp. Revenue Notes, (FHA Insured), Series 2010 |
| |||||||||||
4.000% due 08/15/2015 | 500 | 543 | ||||||||||
| 54 | PIMCO ETF Trust | See Accompanying Notes |
Table of Contents
June 30, 2011
| PRINCIPAL AMOUNT (000s) | MARKET VALUE (000s) | |||||||||||
New York City, New York General Obligation Bonds, Series 2002 |
| |||||||||||
5.750% due 08/01/2012 | $ | 350 | $ | 367 | ||||||||
New York City, New York Health & Hospital Corp. Revenue Notes, Series 2010 |
| |||||||||||
3.000% due 02/15/2014 | 500 | 519 | ||||||||||
New York City, New York Transitional Finance Authority Revenue Notes, Series 2010 |
| |||||||||||
5.000% due 11/01/2013 | 250 | 274 | ||||||||||
New York State Dormitory Authority Revenue Notes, (AMBAC Insured), Series 2007 |
| |||||||||||
5.000% due 07/01/2013 | 300 | 323 | ||||||||||
New York State Dormitory Authority Revenue Notes, Series 2010 |
| |||||||||||
5.000% due 07/01/2016 | 250 | 279 | ||||||||||
New York State Thruway Authority Revenue Notes, (AGM Insured), Series 2005 |
| |||||||||||
5.000% due 04/01/2014 | 125 | 139 | ||||||||||
New York State Urban Development Corp. Revenue Notes, Series 2008 |
| |||||||||||
5.000% due 01/01/2014 | 250 | 274 | ||||||||||
Onieda Herkimer, New York Solid Waste Management Authority Revenue Notes, Series 2011 |
| |||||||||||
4.000% due 04/01/2014 | 250 | 264 | ||||||||||
|
| |||||||||||
| 3,493 | ||||||||||||
|
| |||||||||||
PENNSYLVANIA 4.6% |
| |||||||||||
Bristol, Pennsylvania General Obligation Notes, (AGM Insured), Series 2010 |
| |||||||||||
4.000% due 09/01/2012 | 105 | 109 | ||||||||||
Chester County, Pennsylvania Health & Education Facilities Authority Revenue Notes, Series 2010 |
| |||||||||||
3.000% due 05/15/2013 | 250 | 258 | ||||||||||
| PRINCIPAL AMOUNT (000s) | MARKET VALUE (000s) | |||||||||||
Pennsylvania State Delaware Valley Regional Financial Authority Revenue Bonds, Series 2002 |
| |||||||||||
5.500% due 07/01/2012 | $ | 265 | $ | 275 | ||||||||
Philadelphia, Pennsylvania Revenue Notes, Series 2010 |
| |||||||||||
4.000% due 06/15/2013 | 250 | 263 | ||||||||||
South Fork, Pennsylvania Municipal Authority Revenue Notes, Series 2010 |
| |||||||||||
3.000% due 07/01/2011 | 150 | 150 | ||||||||||
|
| |||||||||||
| 1,055 | ||||||||||||
|
| |||||||||||
PUERTO RICO 1.2% |
| |||||||||||
Puerto Rico Electric Power Authority Revenue Bonds, (NPFGC Insured), Series 2002 |
| |||||||||||
5.250% due 07/01/2013 | 250 | 267 | ||||||||||
|
| |||||||||||
TEXAS 5.3% |
| |||||||||||
Harris County, Texas Health Facilities Development Corp. Revenue Bonds, Series 1999 |
| |||||||||||
0.100% due 10/01/2029 | 700 | 700 | ||||||||||
Northside, Texas Independent School District General Obligation bonds, (PFS/GTD Insured), Series 2011 |
| |||||||||||
0.950% due 08/01/2034 | 200 | 200 | ||||||||||
Texas State Lower Colorado River Authority Revenue Notes, Series 2010 |
| |||||||||||
5.000% due 05/15/2013 | 300 | 324 | ||||||||||
|
| |||||||||||
| 1,224 | ||||||||||||
|
| |||||||||||
VIRGINIA 0.9% |
| |||||||||||
Roanoke, Virginia Economic Development Authority Revenue Notes, (AGM Insured), Series 2005 |
| |||||||||||
5.000% due 07/01/2012 | 200 | 208 | ||||||||||
|
| |||||||||||
| PRINCIPAL AMOUNT (000s) | MARKET VALUE (000s) | |||||||||||
WASHINGTON 1.4% |
| |||||||||||
King County, Washington Public Hospital District No. 2 General Obligation Notes, Series 2010 |
| |||||||||||
3.000% due 12/01/2012 | $ | 315 | $ | 325 | ||||||||
|
| |||||||||||
WISCONSIN 1.9% |
| |||||||||||
Wisconsin State Petroleum Revenue Notes, Series 2009 |
| |||||||||||
5.000% due 07/01/2014 | 400 | 445 | ||||||||||
|
| |||||||||||
Total Municipal Bonds & Notes | 22,060 | |||||||||||
|
| |||||||||||
SHORT-TERM INSTRUMENTS 3.9% |
| |||||||||||
REPURCHASE AGREEMENTS 0.6% |
| |||||||||||
State Street Bank and Trust Co. |
| |||||||||||
0.010% due 07/01/2011 | 141 | 141 | ||||||||||
|
| |||||||||||
(Dated 06/30/2011. Collateralized by U.S. Treasury Bills 0.000% due 08/11/2011 valued at $145. Repurchase proceeds are $141.) |
| |||||||||||
SHORT-TERM NOTES 3.3% |
| |||||||||||
New York State Dormitory Authority Revenue Notes, Series 2010 |
| |||||||||||
4.000% due 07/01/2011 | 250 | 250 | ||||||||||
Oregon State Facilities Authority Revenue Notes, Series 2011 |
| |||||||||||
3.000% due 05/01/2012 | 500 | 507 | ||||||||||
|
| |||||||||||
| 757 | ||||||||||||
|
| |||||||||||
Total Short-Term Instruments |
| 898 | ||||||||||
|
| |||||||||||
Total Investments 99.1% |
| $ | 22,958 | |||||||||
Other Assets and Liabilities (Net) 0.9% |
| 210 | ||||||||||
|
| |||||||||||
Net Assets 100.0% | $ | 23,168 | ||||||||||
|
| |||||||||||
Notes to Schedule of Investments (amounts in thousands):
| (a) | Fair Value Measurements (1) |
The following is a summary of the fair valuations according to the inputs used as of June 30, 2011 in valuing the Fund’s assets and liabilities (2):
| Category and Subcategory (3) | Level 1 (4) | Level 2 (5) | Level 3 (6) | Fair Value at 06/30/2011 | ||||||||||||||
| Investments, at value | ||||||||||||||||||
| Municipal Bonds & Notes | ||||||||||||||||||
Alaska | $ | 0 | $ | 272 | $ | 0 | $ | 272 | ||||||||||
California | 0 | 4,906 | 0 | 4,906 | ||||||||||||||
Colorado | 0 | 523 | 0 | 523 | ||||||||||||||
Delaware | 0 | 469 | 0 | 469 | ||||||||||||||
District of Columbia | 0 | 108 | 0 | 108 | ||||||||||||||
Florida | 0 | 261 | 0 | 261 | ||||||||||||||
Georgia | 0 | 808 | 0 | 808 | ||||||||||||||
Illinois | 0 | 2,962 | 0 | 2,962 | ||||||||||||||
Indiana | 0 | 1,096 | 0 | 1,096 | ||||||||||||||
Iowa | 0 | 513 | 0 | 513 | ||||||||||||||
Kentucky | 0 | 779 | 0 | 779 | ||||||||||||||
Louisiana | 0 | 497 | 0 | 497 | ||||||||||||||
| See Accompanying Notes | Annual Report | June 30, 2011 | 55 |
Table of Contents
Schedule of Investments PIMCO Short Term Municipal Bond Strategy Fund (Cont.)
June 30, 2011
| Category and Subcategory (3) | Level 1 (4) | Level 2 (5) | Level 3 (6) | Fair Value at 06/30/2011 | ||||||||||||||
Maine | $ | 0 | $ | 258 | $ | 0 | $ | 258 | ||||||||||
Massachusetts | 0 | 343 | 0 | 343 | ||||||||||||||
Michigan | 0 | 268 | 0 | 268 | ||||||||||||||
Missouri | 0 | 500 | 0 | 500 | ||||||||||||||
Nebraska | 0 | 219 | 0 | 219 | ||||||||||||||
Nevada | 0 | 156 | 0 | 156 | ||||||||||||||
New Jersey | 0 | 105 | 0 | 105 | ||||||||||||||
New York | 0 | 3,493 | 0 | 3,493 | ||||||||||||||
Pennsylvania | 0 | 1,055 | 0 | 1,055 | ||||||||||||||
Puerto Rico | 0 | 267 | 0 | 267 | ||||||||||||||
Texas | 0 | 1,224 | 0 | 1,224 | ||||||||||||||
Virginia | 0 | 208 | 0 | 208 | ||||||||||||||
Washington | 0 | 325 | 0 | 325 | ||||||||||||||
Wisconsin | 0 | 445 | 0 | 445 | ||||||||||||||
| Short-Term Instruments | ||||||||||||||||||
Repurchase Agreements | 0 | 141 | 0 | 141 | ||||||||||||||
Short-Term Notes | 0 | 757 | 0 | 757 | ||||||||||||||
| $ | 0 | $ | 22,958 | $ | 0 | $ | 22,958 | |||||||||||
| (1) | See note 3 in the Notes to Financial Statements for more information regarding pricing inputs and valuation techniques. |
| (2) | There were no significant transfers into or out of level 1, 2, and 3 during the period ended June 30, 2011. |
| (3) | Refer to the Schedule of Investments for additional information. |
| (4) | Quoted prices in active markets for identical investments. |
| (5) | Significant other observable inputs. |
| (6) | Significant unobservable inputs. |
| 56 | PIMCO ETF Trust | See Accompanying Notes |
Table of Contents
June 30, 2011
1. ORGANIZATION
PIMCO ETF Trust (the “Trust”) was established as a Delaware business trust on November 14, 2008. The Trust is registered under the Investment Company Act of 1940, as amended (the “Act”), as an open-end management investment company. Information presented in these financial statements pertains to fourteen funds (the “Funds”) offered by the Trust.
Each Fund is an exchange-traded fund (“ETF”). ETFs are funds that trade like other publicly-traded securities and may be designed to track an index or to be actively managed. Unlike shares of a mutual fund, which can be bought from and redeemed by the issuing fund by all shareholders at a price based on net asset value (“NAV”), shares of a Fund may be directly purchased from and redeemed by a Fund at NAV solely by certain large institutional investors. Also unlike shares of a mutual fund, shares of each Fund are listed on a national securities exchange and trade in the secondary market at market prices that change throughout the day.
Shares of the Funds are listed and traded at market prices on NYSE Arca, Inc. (“NYSE Arca”) and other secondary markets. The market price for a Fund’s shares may be different from the Fund’s NAV. The Funds issue and redeem shares at their respective NAV only in blocks of a specified number of shares or multiples thereof (“Creation Units”). Only certain large institutional investors may purchase or redeem Creation Units directly with the Funds at NAV (“Authorized Participants”). These transactions are in exchange for certain securities similar to a Fund’s portfolio and/or cash. Except when aggregated in Creation Units, shares of a Fund are not redeemable securities. Shareholders who are not Authorized Participants may not redeem shares directly from a Fund at NAV.
2. SIGNIFICANT ACCOUNTING POLICIES
The following is a summary of significant accounting policies consistently followed by the Trust in the preparation of its financial statements in conformity with accounting principles generally accepted in the United States of America (“U.S. GAAP”). The preparation of financial statements in accordance with U.S. GAAP may require management to make estimates and assumptions that affect the reported amounts of assets and liabilities and disclosure of contingent assets and liabilities at the date of the financial statements and the reported amounts of increases and decreases in net assets from operations during the reporting period. Actual results could differ from those estimates.
(a) Determination of Net Asset Value The NAV of a Fund’s shares is valued as of the close of regular trading (normally 4:00 p.m., Eastern time) (the “NYSE Close”) on each day that the
NYSE Arca and the bond markets, as determined by Securities Industry and Financial Markets Association (“SIFMA”), are open. Information that becomes known to a Fund or its agents after the NAV has been calculated on a particular day will not generally be used to retroactively adjust the price of a security or the NAV determined earlier that day.
(b) Securities Transactions and Investment Income Securities transactions are recorded as of the trade date for financial reporting purposes. Realized gains and losses from securities sold are recorded on the identified cost basis. Interest income, adjusted for the accretion of discounts and amortization of premiums, is recorded on the accrual basis.
(c) Dividends and Distributions to Shareholders Dividends from net investment income, if any, of each Fund, except the PIMCO 25+ Year Zero Coupon U.S. Treasury Index Fund, are declared and distributed to shareholders monthly. Dividends from net investment income, if any, of the PIMCO 25+ Year Zero Coupon U.S. Treasury Index Fund are declared and distributed to shareholders quarterly. Net realized capital gains earned by each Fund, if any, will be distributed no less frequently than once each year. Dividends and distributions cannot be automatically reinvested in additional shares of a Fund.
Income dividends and capital gain distributions are determined in accordance with income tax regulations which may differ from U.S. GAAP. Differences between tax regulations and U.S. GAAP may change the fiscal year when income and capital items are recognized for tax and U.S. GAAP purposes. Examples of events that give rise to timing differences include wash sales and capital loss carryforwards. Further, the character of investment income and capital gains may be different for certain transactions under the two methods of accounting. As a result, income dividends and capital gain distributions declared during a fiscal period may differ significantly from the net investment income and realized capital gain reported on each Fund’s annual financial statements presented under U.S. GAAP.
Distributions classified as a tax basis return of capital, if any, are reflected on the accompanying Statements of Changes in Net Assets and have been reclassified to paid in capital. In addition, other amounts have been reclassified between undistributed net investment income, accumulated undistributed net realized gains or losses and/or paid in capital to more appropriately conform financial accounting to tax characterizations of dividend distributions.
(d) Equalization Each Fund follows the accounting practice known as “Equalization” by which a portion of the proceeds from sales and costs of reacquiring Fund shares, equivalent on a
| Annual Report | June 30, 2011 | 57 |
Table of Contents
Notes to Financial Statements (Cont.)
per share basis to the amount of distributable net investment income on the date of the transaction, is credited or charged to undistributed net investment income. As a result, undistributed net investment income per share is unaffected by sales or reacquisition of Fund shares.
(e) New Accounting Pronouncements In April 2011, the Financial Accounting Standards Board (“FASB”) issued an Accounting Standards Update (“ASU”) related to the accounting for repurchase agreements and similar agreements that both entitle and obligate a transferor to repurchase or redeem financial assets before their maturity. The ASU modifies the criteria for determining effective control of transferred assets and as a result certain agreements may now be accounted for as secured borrowings. The ASU is effective prospectively for new transfers and existing transactions that are modified in the first interim or annual period beginning on or after December 15, 2011.
In May 2011, FASB issued an ASU to develop common requirements for measuring fair value and for disclosing information about fair value measurements in accordance with U.S. GAAP and International Financial Reporting Standards (IFRSs). FASB concluded that the amendments in this ASU will improve the comparability of fair value measurements presented and disclosed in financial statements prepared in accordance with U.S. GAAP and IFRSs. The ASU is effective prospectively during interim or annual periods beginning on or after December 15, 2011.
At this time, management is evaluating the implications of these changes and their impact on the financial statements have not been determined.
| 3. | INVESTMENT VALUATION AND FAIR VALUE MEASUREMENTS |
For purposes of calculating the NAV, portfolio securities and other assets for which market quotes are readily available are valued at fair market value. Fair market value is generally determined on the basis of last reported sales prices, or if no sales are reported, based on quotes obtained from a quotation reporting system, established market makers, or pricing services.
Investments initially valued in currencies other than the U.S. dollar are converted to the U.S. dollar using exchange rates obtained from pricing service providers. As a result, the NAV of a Fund’s shares may be affected by changes in the value of currencies in relation to the U.S. dollar. The value of securities traded in markets outside the United States or denominated in currencies other than the U.S. dollar may be affected significantly on a day that the NYSE is closed and the NAV may change on days when an investor is not able to purchase, redeem or exchange shares.
U.S. GAAP defines fair market value as the price that a Fund would receive to sell an asset or pay to transfer a liability in an orderly transaction between market participants at the measurement date. It establishes a fair value hierarchy that prioritizes inputs to valuation methods and requires disclosure of the fair value hierarchy, separately for each major category of assets and liabilities, that segregates fair value measurements into levels (Level 1, 2, and 3). The inputs or methodology used for valuing securities are not necessarily an indication of the risk associated with investing in those securities. Levels 1, 2 and 3 of the fair value hierarchy are defined as follows:
| • | Level 1—Inputs using quoted prices in active markets or exchanges for identical assets and liabilities. |
| • | Level 2—Significant other observable inputs, which may include, but are not limited to, quoted prices for similar assets or liabilities in markets that are active, quoted prices for identical or similar assets or liabilities in markets that are not active, inputs other than quoted prices that are observable for the assets or liabilities (such as interest rates, yield curves, volatilities, prepayment speeds, loss severities, credit risks and default rates) or other market corroborated inputs. |
| • | Level 3—Significant unobservable inputs based on the best information available in the circumstances, to the extent observable inputs are not available, which may include assumptions made by the Board of Trustees (the “Board”) or persons acting at their direction that are used in determining the fair market value of investments. |
Level 1 and Level 2 trading assets and trading liabilities, at fair market value The valuation techniques and significant inputs used in determining the fair market values of financial instruments classified as Level 1 and Level 2 of the fair value hierarchy are as follows:
Fixed income securities including corporate, convertible and municipal bonds and notes, U.S. government agencies, U.S. treasury obligations, sovereign issues, bank loans, convertible preferred securities and non-U.S. bonds are normally valued by pricing service providers that use broker dealer quotations, reported trades or valuation estimates from their internal pricing models. The service providers’ internal models use inputs that are observable such as issuer details, interest rates, yield curves, prepayment speeds, credit risks/spreads, default rates and quoted prices for similar assets. Securities that use similar valuation techniques and inputs as described above are categorized as Level 2 of the fair value hierarchy.
Mortgage-related and asset-backed securities are usually issued as separate tranches, or classes, of securities within each deal.
| 58 | PIMCO ETF Trust |
Table of Contents
June 30, 2011
These securities are also normally valued by pricing service providers that use broker dealer quotations or valuation estimates from their internal pricing models. The pricing models for these securities usually consider tranche-level attributes, current market data, estimated cash flows and market-based yield spreads for each tranche, and incorporate deal collateral performance, as available. Mortgage-related and asset-backed securities that use similar valuation techniques and inputs as described above are categorized as Level 2 of the fair value hierarchy.
Short-term investments having a maturity of 60 days or less are generally valued at amortized cost which approximates fair market value. These investments are categorized as Level 2 of the fair value hierarchy.
Level 3 trading assets and trading liabilities, at fair market value The valuation techniques and significant inputs used in determining the fair market values of financial instruments classified as Level 3 of the fair value hierarchy are as follows:
Securities and other assets for which market quotes are not readily available are valued at fair market value as determined in good faith by the Board or persons acting at their direction and are categorized as Level 3 of the fair value hierarchy.
Market quotes are considered not readily available in circumstances where there is an absence of current or reliable market-based data (e.g., trade information or broker quotes), including where events occur after the close of the relevant market, but prior to the NYSE Close, that materially affect the values of a Fund’s securities or assets. In addition, market quotes are considered not readily available when, due to extraordinary circumstances, the exchanges or markets on which the securities trade, do not open for trading for the entire day and no other market prices are available. The Board has delegated to the investment adviser, Pacific Investment Management Company LLC (“PIMCO”), the responsibility for monitoring significant events that may materially affect the values of a Fund’s securities or assets and for determining whether the value of the applicable securities or assets should be re-evaluated in light of such significant events.
The Board has adopted methods for valuing securities and other assets in circumstances where market quotes are not readily available, and has delegated the responsibility for applying the valuation methods to PIMCO. For instances in which daily market quotes are not readily available, investments may be valued, pursuant to guidelines established by the Board, with reference to other securities or indices. In the event that the security or asset cannot be valued pursuant to one of the valuation methods established by the Board, the value of the security or asset will be determined in good faith by the Valuation Commit-
tee of the Board, generally based upon recommendations provided by PIMCO. When a Fund uses fair valuation methods applied by PIMCO that use significant unobservable inputs to determine its NAV, securities will be priced by another method that the Board or persons acting at their direction believe accurately reflects fair market value and are categorized as Level 3 of the fair value hierarchy. These methods may require subjective determinations about the value of a security. While the Trust’s policy is intended to result in a calculation of a Fund’s NAV that fairly reflects security values as of the time of pricing, the Trust cannot guarantee that values determined by the Board or persons acting at their direction would accurately reflect the price that a Fund could obtain for a security if it were to dispose of that security as of the time of pricing (for instance, in a forced or distressed sale). The prices used by a Fund may differ from the value that would be realized if the securities were sold.
For fair valuations using significant unobservable inputs, U.S. GAAP requires a reconciliation of the beginning to ending balances for reported fair market values that presents changes attributable to total realized and unrealized gains or losses, purchases and sales, and transfers in or out of the Level 3 category during the period. The end of period timing recognition is used for the significant transfers between Levels of the Funds’ assets and liabilities. In accordance with the requirements of U.S. GAAP, a fair value hierarchy and Level 3 reconciliation, if any, have been included in the Notes to the Schedule of Investments for each respective Fund.
4. SECURITIES AND OTHER INVESTMENTS
(a) Inflation-Indexed Bonds Certain Funds may invest in inflation-indexed bonds. Inflation-indexed bonds are fixed-income securities whose principal value is periodically adjusted to the rate of inflation. The interest rate on these bonds is generally fixed at issuance at a rate lower than typical bonds. Over the life of an inflation-indexed bond, however, interest will be paid based on a principal value, which is adjusted for inflation. Any increase or decrease in the principal amount of an inflation-indexed bond will be included as interest income on the Statements of Operations, even though investors do not receive their principal until maturity.
(b) Mortgage-Related and Other Asset-Backed Securities Certain Funds may invest in mortgage-related and other asset-backed securities. These securities include mortgage pass-through securities, collateralized mortgage obligations, commercial mortgage-backed securities and other securities that directly or indirectly represent a participation in, or are secured by and payable from, mortgage loans on real property. Mortgage-related and other asset-backed securities are interests in pools of loans or
| Annual Report | June 30, 2011 | 59 |
Table of Contents
Notes to Financial Statements (Cont.)
other receivables. Mortgage-related securities are created from pools of residential or commercial mortgage loans, including mortgage loans made by savings and loan institutions, mortgage bankers, commercial banks and others. Asset-backed securities are created from many types of assets, including auto loans, credit card receivables, home equity loans, and student loans. These securities provide a monthly payment which consists of both interest and principal payments. Interest payments may be determined by fixed or adjustable rates. The rate of pre-payments on underlying mortgages will affect the price and volatility of a mortgage-related security, and may have the effect of shortening or extending the effective duration of the security relative to what was anticipated at the time of purchase. The timely payment of principal and interest of certain mortgage-related securities is guaranteed with the full faith and credit of the U.S. Government. Pools created and guaranteed by non-governmental issuers, including government-sponsored corporations, may be supported by various forms of insurance or guarantees, but there can be no assurance that the private insurers or guarantors can meet their obligations under the insurance policies or guarantee arrangements.
Collateralized Mortgage Obligations (“CMOs”) are debt obligations of a legal entity that is collateralized by mortgages and divided into classes. CMOs are structured into multiple classes, often referred to as “tranches,” with each class bearing a different stated maturity and entitled to a different schedule for payments of principal and interest, including pre-payments. Commercial Mortgage-Backed Securities (“CMBS”) include securities that reflect an interest in, and are secured by, mortgage loans on commercial real property. Many of the risks of investing in CMBS reflect the risks of investing in the real estate securing the underlying mortgage loans. These risks reflect the effects of local and other economic conditions on real estate markets, the ability of tenants to make loan payments, and the ability of a property to attract and retain tenants. CMOs and CMBS may be less liquid and may exhibit greater price volatility than other types of mortgage- or asset-backed securities.
(c) Payment In-Kind Securities Certain Funds may invest in payment in-kind securities. Payment in-kind securities (“PIKs”) give the issuer the option at each interest payment date of making interest payments in either cash or additional debt securities. Those additional debt securities usually have the same terms, including maturity dates and interest rates, and associated risks as the original bonds. The daily market quotations of the original bonds may include the accrued interest (referred to as a dirty price) and require a pro-rata adjustment from the unrealized appreciation or depreciation on investment to interest receivable in the Statements of Assets and Liabilities.
(d) Repurchase Agreements Each Fund may engage in repurchase transactions. Under the terms of a typical repurchase agreement, a Fund takes possession of an underlying debt obligation (collateral) subject to an obligation of the seller to repurchase, and a Fund to resell, the obligation at an agreed-upon price and time. The underlying securities for all repurchase agreements are held in safekeeping at the Fund’s custodian or designated subcustodians under tri-party repurchase agreements. The market value of the collateral must be equal to or exceed the total amount of the repurchase obligations, including interest. Securities purchased under repurchase agreements are reflected as an asset in the Statements of Assets and Liabilities. Interest earned is recorded as a component of interest income on the Statements of Operations. In periods of increased demand for collateral, a Fund may pay a fee for receipt of collateral, which may result in interest expense to the Fund. Generally, in the event of counterparty default, a Fund has the right to use the collateral to offset losses incurred. If the counterparty should default, a Fund will seek to sell the securities which it holds as collateral. This could involve procedural costs or delays in addition to a loss on the securities if their value should fall below their repurchase price.
(e) Reverse Repurchase Agreements Certain Funds may enter into reverse repurchase agreements. In a reverse repurchase agreement, a Fund sells to a financial institution a security that it holds with an agreement to repurchase the same security at an agreed-upon price and date. Securities sold under reverse repurchase agreements are reflected as a liability on the Statements of Assets and Liabilities. Interest payments made are recorded as a component of interest expense on the Statements of Operations. In periods of increased demand for the security, a Fund may receive a fee for use of the security by the counterparty, which may result in interest income to the Fund. A reverse repurchase agreement involves the risk that the market value of the security sold by a Fund may decline below the repurchase price of the security. A Fund will segregate assets determined to be liquid by the investment adviser or otherwise cover its obligations under reverse repurchase agreements.
(f) U.S. Government Agencies or Government-Sponsored Enterprises Certain Funds may invest in U.S. Government agencies or government-sponsored enterprises. U.S. Government securities are obligations of and, in certain cases, guaranteed by, the U.S. Government, its agencies or instrumentalities. Some U.S. Government securities, such as Treasury bills, notes and bonds, and securities guaranteed by the Government National Mortgage Association (“GNMA” or “Ginnie Mae”), are supported by the full faith and credit of the U.S. Government; others, such as those of the Federal Home Loan Bank, are supported by the right of the
| 60 | PIMCO ETF Trust |
Table of Contents
June 30, 2011
issuer to borrow from the U.S. Department of the Treasury (the “U.S. Treasury”); others, such as those of the Federal National Mortgage Association (“FNMA” or “Fannie Mae”), are supported by the discretionary authority of the U.S. Government to purchase the agency’s obligations. U.S. Government securities may include zero coupon securities, which do not distribute interest on a current basis and tend to be subject to greater risk than interest-paying securities of similar maturities such as U.S. Treasury Strips which are Treasury fixed-income securities sold at a discount to face value and offer no interest payments; rather investors receive par at maturity.
Government-related guarantors (i.e., not backed by the full faith and credit of the U.S. Government) include FNMA and the Federal Home Loan Mortgage Corporation (“FHLMC” or “Freddie Mac”). FNMA is a government-sponsored corporation, the common stock of which is owned entirely by private stockholders. FNMA purchases conventional (i.e., not insured or guaranteed by any government agency) residential mortgages from a list of approved seller/servicers which include state and federally chartered savings and loan associations, mutual savings banks, commercial banks and credit unions and mortgage bankers. Pass-through securities issued by FNMA are guaranteed as to timely payment of principal and interest by FNMA, but are not backed by the full faith and credit of the U.S. Government. FHLMC issues Participation Certificates (“PCs”), which are pass-through securities, each representing an undivided interest in a pool of residential mortgages. FHLMC guarantees the timely payment of interest and ultimate collection of principal, but PCs are not backed by the full faith and credit of the U.S. Government.
(g) When-Issued Transactions Certain Funds may purchase or sell securities on a when-issued basis. These transactions are made conditionally because a security, although authorized, has not yet been issued in the market. A commitment by a Fund is made regarding these transactions to purchase or sell securities for a predetermined price or yield, with payment and delivery taking place beyond the customary settlement period. A Fund may sell when-issued securities before they are delivered, which may result in a capital gain or loss.
5. PRINCIPAL RISKS
In the normal course of business the Funds trade financial instruments and enter into financial transactions where risk of potential loss exists due to changes in the market (market risk), or failure or inability of the other party to a transaction to perform (credit and counterparty risk). See below for a detailed description of select principal risks. For a list of potential risks the Funds may be subject to, please see the Important Information About the Funds.
Market Risks A Fund’s investments in fixed income securities expose the Fund to various risks such as but not limited to, market trading, interest rate, management and tracking error and indexing risks.
Market trading risk is the risk that an active secondary trading market for a Fund’s shares does not develop or continue, that a Fund may not continue to meet a listing exchange’s trading or listing requirements, or that Fund shares trade at prices other than the Fund’s NAV.
Interest rate risk is the risk that fixed income securities will decline in value because of changes in interest rates. As nominal interest rates rise, the value of certain fixed income securities held by a Fund is likely to decrease. A nominal interest rate can be described as the sum of a real interest rate and an expected inflation rate. Fixed income securities with longer durations tend to be more sensitive to changes in interest rates, usually making them more volatile than securities with shorter durations. Duration is useful primarily as a measure of the sensitivity of a fixed income’s market price to interest rate (i.e. yield) movements.
Management and Tracking Error Risk is the risk that the portfolio manager’s investment decisions may not produce the desired results or that an Index Fund’s portfolio may not correlate to the Fund’s Index.
Indexing risk is the risk that a Fund is negatively affected by general declines in the market segments or asset classes represented by the Fund’s Index.
Credit and Counterparty Risks A Fund will be exposed to credit risk on parties with whom it trades and will also bear the risk of settlement default. A Fund minimizes concentrations of credit risk by undertaking transactions with a large number of customers and counterparties on recognized and reputable exchanges. A Fund could lose money if the issuer or guarantor of a fixed income security or repurchase agreement is unable or unwilling to make timely principal and/or interest payments, or to otherwise honor its obligations. Securities are subject to varying degrees of credit risk, which are often reflected in credit ratings.
Similar to credit risk, a Fund may be exposed to counterparty risk, or the risk that an institution or other entity with which the Fund has unsettled or open transactions will default. Financial assets, which potentially expose a Fund to counterparty risk, consist principally of cash due from counterparties and investments. PIMCO, as the investment adviser, minimizes counterparty risks to the Funds by performing extensive reviews of each counterparty and obtaining approval from the Counterparty Risk Committee prior to entering into transactions with a third party. Furthermore, to the extent that unpaid amounts owed to a Fund
| Annual Report | June 30, 2011 | 61 |
Table of Contents
Notes to Financial Statements (Cont.)
exceed a predetermined threshold agreed to with the counterparty, such counterparty shall advance collateral to the Fund in the form of cash or cash equivalents equal in value to the unpaid amount owed to the Fund. A Fund may invest such collateral in securities or other instruments and will typically pay interest to the counterparty on the collateral received. If the unpaid amount owed to a Fund subsequently decreases, the Fund would be required to return to the counterparty all or a portion of the collateral previously advanced to the Fund.
All transactions in listed securities are settled/paid for upon delivery using approved counterparties. The risk of default is considered minimal, as delivery of securities sold is only made once a Fund has received payment. Payment is made on a purchase once the securities have been delivered by the counterparty. The trade will fail if either party fails to meet its obligation.
Master Repurchase Agreements (“Master Repo Agreements”) govern transactions between a Fund and select counterparties. The Master Repo Agreements maintain provisions for, among other things, initiation, income payments, events of default, and maintenance of collateral for Repurchase Agreements.
6. FEES AND EXPENSES
(a) Management Fee PIMCO, a majority-owned subsidiary of Allianz Global Investors of America L.P. (“AGI”), serves as the investment manager (the “Manager”) to the Trust, pursuant to an investment management agreement. Each Fund pays PIMCO fees in return for providing investment advisory, supervisory and administrative services under an all-in fee structure. Each Fund will pay monthly management fees to PIMCO at the annual rate based on average daily net assets (the “Management Fee”). The Management Fee for each Fund is charged at an annual rate as noted in the table below.
| Fund Name | Management Fee | |||||
| PIMCO 0-5 Year High Yield Corporate Bond Index Fund | 0.55 | % | ||||
| PIMCO 1-3 Year U.S. Treasury Index Fund | 0.15 | % (1) | ||||
| PIMCO 1-5 Year U.S. TIPS Index Fund | 0.20 | % | ||||
| PIMCO 3-7 Year U.S. Treasury Index Fund | 0.15 | % | ||||
| PIMCO 7-15 Year U.S. Treasury Index Fund | 0.15 | % | ||||
| PIMCO 15+ Year U.S. TIPS Index Fund | 0.20 | % | ||||
| PIMCO 25+ Year Zero Coupon U.S. Treasury Index Fund | 0.15 | % | ||||
| PIMCO Broad U.S. TIPS Index Fund | 0.20 | % | ||||
| PIMCO Broad U.S. Treasury Index Fund | 0.15 | % | ||||
| PIMCO Investment Grade Corporate Bond Index Fund | 0.20 | % | ||||
| PIMCO Build America Bond Strategy Fund | 0.45 | % | ||||
| PIMCO Enhanced Short Maturity Strategy Fund | 0.35 | % | ||||
| PIMCO Intermediate Municipal Bond Strategy Fund | 0.35 | % | ||||
| PIMCO Short Term Municipal Bond Strategy Fund | 0.35 | % | ||||
| (1) | PIMCO has contractually agreed, until October 31, 2011, to waive a portion of its Management Fee equal to 0.06% of average daily net assets. Under the Fee Waiver Agreement, PIMCO is entitled to reimbursement by the Fund of any portion of the Management Fees waived, reduced or reimbursed pursuant to the Fee Waiver Agreement (the “Reimbursement Amount”) during the previous three years, provided that such amount paid to PIMCO will not: 1) together with any recoupment of organizational expenses and pro rata Trustees’ fees pursuant to the Expense Limitation Agreement, exceed the Expense Limit; 2) exceed the total Reimbursement Amount; or 3) include any amounts previously reimbursed to PIMCO. The Fee Waiver Agreement will automatically renew for one-year terms unless PIMCO provides written notice to the Trust at least 30 days prior to the end of the then current term. As of June 30, 2011, the recoverable Management Fee amount to PIMCO was $130,426. |
(b) Distribution and Servicing Fees PIMCO Investments LLC (“PI”), a wholly-owned subsidiary of PIMCO, serves as the distributor (“Distributor”) of each Fund’s Creation Units. Prior to February 14, 2011, Allianz Global Investors Distributors LLC, an indirect wholly-owned subsidiary of AGI, was the Distributor of each Fund’s Creation Units. The Distributors do not maintain a secondary market in shares of the Funds. During the period ended June 30, 2011, each Fund was permitted to reimburse the Distributors at an annual rate of up to 0.25% of a Fund’s average daily net assets. However, the Board of Trustees has determined not to authorize payment of a 12b-1 Plan fee at this time. The 12b-1 fee may only be imposed or increased when the Board of Trustees determines that it is in the best interests of shareholders to do so. Because these fees are paid out of a Fund’s assets on an ongoing basis, to the extent that a fee is authorized, over time they will increase the cost of an investment in the Fund. The 12b-1 Plan fee may cost an investor more than other types of sales charges.
(c) Fund Expenses The Funds bear other expenses which are not covered under the management fee which may vary and affect the total level of expenses paid by shareholders, such as taxes and governmental fees, brokerage fees, commissions and other transaction expenses, costs of borrowing money, including interest expenses, extraordinary expenses (such as litigation and indemnification expenses) and fees and expenses of the Trust’s Independent Trustees and their counsel. The ratio of expenses to average net assets, as disclosed on the Financial Highlights, may differ from the annual fund operating expenses as disclosed in the Prospectus for the reasons set forth above.
Effective January 1, 2011, each unaffiliated Trustee receives an annual retainer of $30,000, plus $3,500 for each Board of Trustees meeting attended in person, $750 for each committee meeting attended and $750 for each Board of Trustees meeting attended telephonically, plus reimbursement of related expenses. In addition, the audit committee chair receives an additional annual retainer of $4,000 and each other committee chair receives an additional annual retainer of $500.
| 62 | PIMCO ETF Trust |
Table of Contents
June 30, 2011
Prior to January 1, 2011, each unaffiliated Trustee received an annual retainer of $20,000, plus $3,000 for each Board of Trustees meeting attended in person, $250 ($750 in the case of the audit committee chair with respect to audit committee meetings) for each committee meeting attended and $750 for each Board of Trustees meeting attended telephonically, plus reimbursement of related expenses. In addition, the audit committee chair received an additional annual retainer of $4,000 and each other committee chair received an additional annual retainer of $500.
(d) Expense Limitation PIMCO has contractually agreed, until October 31, 2011, to waive its management fee, or reimburse a Fund, to the extent that organizational expenses and pro rata Trustees’ fees, if any, exceed 0.0049% of that Fund’s average net assets. Under the Expense Limitation Agreement, which renews annually for a full year unless terminated by PIMCO upon at least 30 days’ notice prior to the end of the contract term, PIMCO may recoup these waivers and reimbursements in future periods,
not exceeding three years, provided organizational expenses and pro rata Trustees’ fees plus such recoupment, do not exceed the Expense Limit. The recoverable amounts to PIMCO at June 30, 2011, were as follows (amounts in thousands):
| Fund Name | Recoverable Amounts | |||||
| PIMCO 0-5 Year High Yield Corporate Bond Index Fund | $ | 65 | ||||
| PIMCO 1-3 Year U.S. Treasury Index Fund | 92 | |||||
| PIMCO 1-5 Year U.S. TIPS Index Fund | 105 | |||||
| PIMCO 3-7 Year U.S. Treasury Index Fund | 66 | |||||
| PIMCO 7-15 Year U.S. Treasury Index Fund | 68 | |||||
| PIMCO 15+ Year U.S. TIPS Index Fund | 73 | |||||
| PIMCO 25+ Year Zero Coupon U.S. Treasury Index Fund | 76 | |||||
| PIMCO Broad U.S. TIPS Index Fund | 69 | |||||
| PIMCO Broad U.S. Treasury Index Fund | 54 | |||||
| PIMCO Investment Grade Corporate Bond Index Fund | 75 | |||||
| PIMCO Build America Bond Strategy Fund | 94 | |||||
| PIMCO Enhanced Short Maturity Strategy Fund | 118 | |||||
| PIMCO Intermediate Municipal Bond Strategy Fund | 87 | |||||
| PIMCO Short Term Municipal Bond Strategy Fund | 85 | |||||
7. RELATED PARTY TRANSACTIONS
The Manager and Distributors are related parties. Fees payable to these parties are disclosed in Note 6 and the accrued related party fees amounts are disclosed in the Statements of Assets and Liabilities.
Certain Funds are permitted to purchase or sell securities from or to certain related affiliated funds under specified conditions outlined in procedures adopted by the Board. The procedures have been designed to ensure that any purchase or sale of securities by the Funds from or to another fund or portfolio that are, or could be, considered an affiliate by virtue of having a common investment adviser (or affiliated investment advisers), common Trustees and/or common officers complies with Rule 17a-7 of the Act. Further, as defined under the procedures, each transaction is effected at the current market price. During the period ended June 30, 2011, the Funds below engaged in purchases and sales of securities pursuant to Rule 17a-7 of the Act (amounts in thousands):
| Fund Name | Purchases | Sales | ||||||||
| PIMCO Investment Grade Corporate Bond Index Fund | $ | 0 | $ | 236 | ||||||
| PIMCO Build America Bond Strategy Fund | 0 | 12,612 | ||||||||
| PIMCO Enhanced Short Maturity Strategy Fund | 59,701 | 521,400 | ||||||||
| PIMCO Intermediate Municipal Bond Strategy Fund | 10,077 | 2,167 | ||||||||
| PIMCO Short Term Municipal Bond Strategy Fund | 280 | 4,446 | ||||||||
8. GUARANTEES AND INDEMNIFICATIONS
Under the Trust’s organizational documents, each Trustee or officer of the Trust is indemnified and each employee or other agent of the Trust (including the Trust’s investment manager) may be indemnified, to the extent permitted by the Act, against certain liabilities that may arise out of performance of their duties to the Funds. Additionally, in the normal course of business, the Funds enter into contracts that contain a variety of indemnification clauses. The Funds’ maximum exposure under these arrangements is unknown as this would involve future claims that may be made against the Funds that have not yet occurred. However, the Funds have not had prior claims or losses pursuant to these contracts.
9. PURCHASES AND SALES OF SECURITIES
The length of time a Fund has held a particular security is not generally a consideration in investment decisions. A change in the securities held by a Fund is known as “portfolio turnover.” Each Fund may engage in active trading of portfolio securities to achieve its investment objective, including, without limitation, to reflect changes in the component securities of the Index, such as reconstitutions, additions or deletions of component securities. To the extent that Creation Unit purchases from and redemptions by a Fund are effected in cash, frequent purchases and redemptions may increase the rate of portfolio turnover. High portfolio turnover (e.g., over 100%) involves correspondingly
| Annual Report | June 30, 2011 | 63 |
Table of Contents
Notes to Financial Statements (Cont.)
greater expenses to a Fund, including brokerage commissions or dealer mark-ups and other transaction costs on the sale of securities and reinvestments in other securities. Such sales may also result in realization of taxable capital gains, including short-term
capital gains (which are generally taxed at ordinary income tax rates). The trading costs and tax effects associated with portfolio turnover may adversely affect a Fund’s performance. The portfolio turnover rates are reported in the Financial Highlights.
Purchases and sales of securities (excluding short-term investments) for the period ended June 30, 2011, were as follows (amounts in thousands):
| U.S. Government/Agency | All Other | |||||||||||||||||
| Fund Name | Purchases | Sales | Purchases | Sales | ||||||||||||||
| PIMCO 0-5 Year High Yield Corporate Bond Index Fund | $ | 0 | $ | 0 | $ | 22,488 | $ | 0 | ||||||||||
| PIMCO 1-3 Year U.S. Treasury Index Fund | 75,909 | 18,816 | 0 | 0 | ||||||||||||||
| PIMCO 1-5 Year U.S. TIPS Index Fund | 224,543 | 132,288 | 0 | 0 | ||||||||||||||
| PIMCO 3-7 Year U.S. Treasury Index Fund | 18,792 | 18,911 | 0 | 0 | ||||||||||||||
| PIMCO 7-15 Year U.S. Treasury Index Fund | 11,550 | 11,580 | 0 | 0 | ||||||||||||||
| PIMCO 15+ Year U.S. TIPS Index Fund | 69,969 | 74,181 | 0 | 0 | ||||||||||||||
| PIMCO 25+ Year Zero Coupon U.S. Treasury Index Fund | 33,923 | 20,932 | 0 | 0 | ||||||||||||||
| PIMCO Broad U.S. TIPS Index Fund | 8,163 | 8,669 | 0 | 0 | ||||||||||||||
| PIMCO Broad U.S. Treasury Index Fund | 23,277 | 21,304 | 0 | 0 | ||||||||||||||
| PIMCO Investment Grade Corporate Bond Index Fund | 0 | 0 | 108,350 | 44,356 | ||||||||||||||
| PIMCO Build America Bond Strategy Fund | 0 | 0 | 55,341 | 29,599 | ||||||||||||||
| PIMCO Enhanced Short Maturity Strategy Fund | 1,071,058 | 918,673 | 1,209,209 | 822,882 | ||||||||||||||
| PIMCO Intermediate Municipal Bond Strategy Fund | 0 | 0 | 67,385 | 26,638 | ||||||||||||||
| PIMCO Short Term Municipal Bond Strategy Fund | 0 | 0 | 14,210 | 7,369 | ||||||||||||||
10. CAPITAL SHARE TRANSACTIONS
Capital shares are issued and redeemed by a Fund only in Creation Units or multiples thereof. Except when aggregated in Creation Units, shares of a Fund are not redeemable. Transactions in capital shares for a Fund are disclosed in detail in the Statements of Changes in Net Assets.
The consideration for the purchase of Creation Units of a Fund generally consists of a basket of securities included in its Index together with a deposit of a specified cash payment. Authorized Participants may be charged transaction fees as set forth below. To offset transfer and other transaction costs associated with the issuance and redemption of Creation Units, Authorized Participants are subject to standard creation and redemption transaction fees payable directly to State Street Bank and Trust Company, the administrator of the Funds. PIMCO may, from time to time, at its own expense, compensate purchasers of Creation Units who have purchased substantial amounts of Creation Units and other financial institutions for administrative or marketing services. Creations and redemptions for cash (when cash creations and redemptions are available or specified) may be subject to an additional variable charge up to the maximum amount shown in the table below.
| Standard Creation/ Redemption Transaction Fee* | Maximum Additional Variable Charge for Cash Creations** | Maximum Additional Variable Charge for Cash Redemptions** | ||||||||||||
| All Funds | $ | 500 | 3.00 | % | 2.00 | % | ||||||||
| * | Applicable to in-kind transactions only. |
| ** | As a percentage of the cash amount invested or received. |
| 64 | PIMCO ETF Trust |
Table of Contents
June 30, 2011
11. INVESTMENT TRANSACTIONS
For the period ended June 30, 2011, certain Funds had in-kind contributions and in-kind redemptions as follows (amounts in thousands):
| Fund Name | Contributions | Redemptions | ||||||||
| PIMCO 1-3 Year U.S. Treasury Index Fund | $ | 20,261 | $ | 0 | ||||||
| PIMCO 1-5 Year U.S. TIPS Index Fund | 667,818 | 42,682 | ||||||||
| PIMCO 3-7 Year U.S. Treasury Index Fund | 12,562 | 43,039 | ||||||||
| PIMCO 7-15 Year U.S. Treasury Index Fund | 6,282 | 12,329 | ||||||||
| PIMCO 15+ Year U.S. TIPS Index Fund | 340,107 | 104,558 | ||||||||
| PIMCO 25+ Year Zero Coupon U.S. Treasury Index Fund | 42,781 | 28,354 | ||||||||
| PIMCO Broad U.S. TIPS Index Fund | 26,931 | 0 | ||||||||
| PIMCO Broad U.S. Treasury Index Fund | 7,980 | 0 | ||||||||
| PIMCO Investment Grade Corporate Bond Index Fund | 8,261 | 0 | ||||||||
The in-kind contributions and in-kind redemptions in this table may not agree with the Fund Share Transactions on the Statements of Changes in Net Assets. The table represents the accumulation of each Fund’s daily net shareholder transactions while the Statements of Changes in Net Assets reflect gross shareholder transactions including any cash component of the transactions.
12. REGULATORY AND LITIGATION MATTERS
The Trust is not engaged in any material litigation or arbitration proceedings and is not aware of any material litigation or claim pending or threatened by or against it.
13. FEDERAL INCOME TAX MATTERS
Each Fund intends to qualify as a regulated investment company under sub-chapter M of the Internal Revenue Code (the “Code”) and distribute all of its taxable income and net realized gains, if applicable, to shareholders. Accordingly, no provision for Federal income taxes has been made.
In accordance with provisions set forth under U.S. GAAP, the Investment Adviser has reviewed the Funds’ tax positions for all open tax years. As of June 30, 2011, the Funds have recorded no liability for net unrecognized tax benefits relating to uncertain income tax positions they have taken or expect to take in future tax returns.
The Funds file U.S. tax returns. While the statute of limitations remains open to examine the Funds’ U.S. tax returns filed for the fiscal years from 2009-2010, no examinations are in progress or anticipated at this time. The Funds are not aware of any tax positions for which it is reasonably possible that the total amounts of unrecognized tax benefits will significantly change in the next twelve months.
On December 22, 2010, the Regulated Investment Company Modernization Act of 2010 (the “Act”) was enacted. Under the Act, net capital losses may be carried forward indefinitely, and their character is retained as short-term and/or long term losses. Previously, net capital losses were carried forward for eight years and treated as short-term losses. The Act requires that post-enactment net capital losses be used before pre-enactment net capital losses. As a result of this ordering rule, pre-enactment capital loss carryforwards may be more likely to expire unused.
As of June 30, 2011, the components of distributable taxable earnings are as follows (amounts in thousands):
| Undistributed Tax Exempt Income | Undistributed | Undistributed | Net Tax Basis | Other Book-to-Tax Accounting Differences(2) | Accumulated Capital Losses(3) | Post- | ||||||||||||||||||||||||
| 0-5 Year High Yield Corporate Bond Index Fund | $ | — | $ | 109 | $ | — | $ | 69 | $ | (105 | ) | $ | — | $ | — | |||||||||||||||
| 1-3 Year U.S. Treasury Index Fund | — | 143 | 82 | 756 | (121 | ) | — | — | ||||||||||||||||||||||
| 1-5 Year U.S. TIPS Index Fund | — | 6,882 | 388 | 16,791 | (6,852 | ) | — | — | ||||||||||||||||||||||
| 3-7 Year U.S. Treasury Index Fund | — | — | 46 | 139 | (73 | ) | — | — | ||||||||||||||||||||||
| 7-15 Year U.S. Treasury Index Fund | — | 102 | — | (57 | ) | (66 | ) | — | — | |||||||||||||||||||||
| 15+ Year U.S. TIPS Index Fund | — | 1,394 | — | 865 | (1,786 | ) | — | (2,507 | ) | |||||||||||||||||||||
| 25+ Year Zero Coupon U.S. Treasury Index Fund | — | 513 | — | (4,043 | ) | (533 | ) | (363 | ) | (3,472 | ) | |||||||||||||||||||
| Broad U.S. TIPS Index Fund | — | 334 | — | 2,003 | (412 | ) | — | (10 | ) | |||||||||||||||||||||
| Broad U.S. Treasury Index Fund | — | 67 | — | (19 | ) | (66 | ) | — | (206 | ) | ||||||||||||||||||||
| Investment Grade Corporate Bond Index Fund | — | 283 | — | 81 | (287 | ) | — | (569 | ) | |||||||||||||||||||||
| Build America Bond Strategy Fund | — | 211 | — | 752 | (270 | ) | — | (562 | ) | |||||||||||||||||||||
| Enhanced Short Maturity Strategy Fund | — | 1,489 | — | 2,095 | (873 | ) | — | — | ||||||||||||||||||||||
| Intermediate Municipal Bond Strategy Fund | 170 | 77 | 38 | 1,810 | (242 | ) | — | — | ||||||||||||||||||||||
| Short-Term Municipal Bond Strategy Fund | 90 | 12 | 12 | 135 | (92 | ) | — | — | ||||||||||||||||||||||
| (1) | Adjusted for open wash sale loss deferrals for federal income tax purposes. |
| (2) | Represents differences in income tax regulations and financial accounting principles generally accepted in the United States of America, mainly for distributions payable at fiscal year-end. |
| (3) | Capital losses available to offset future net capital gains expire in varying amounts in the years shown below. |
| (4) | Capital losses realized during the period November 1, 2010 through June 30, 2011 which the Fund elected to defer to the following taxable year pursuant to federal income tax regulations. |
| Annual Report | June 30, 2011 | 65 |
Table of Contents
Notes to Financial Statements (Cont.)
As of June 30, 2011, the Funds had accumulated capital losses expiring in the following years (amounts in thousands). The Funds will resume capital gain distributions in the future to the extent gains are realized in excess of accumulated capital losses.
Expiration of (amounts in thousands) | ||||||
| 2019(5) | ||||||
| 1-3 Year U.S. Treasury Index Fund | $ | — | ||||
| 1-5 Year U.S. TIPS Index Fund | — | |||||
| 3-7 Year U.S. Treasury Index Fund | — | |||||
| 7-15 Year U.S. Treasury Index Fund | — | |||||
| 15+ Year U.S. TIPS Index Fund | — | |||||
| 25+ Year Zero Coupon U.S. Treasury Index Fund | 363 | |||||
| Broad U.S. TIPS Index Fund | — | |||||
| Broad U.S. Treasury Index Fund | — | |||||
| Investment Grade Corporate Bond Index Fund | — | |||||
| Build America Bond Strategy Fund | — | |||||
| Enhanced Short Maturity Strategy Fund | — | |||||
| Intermediate Municipal Bond Strategy Fund | — | |||||
| Short-Term Municipal Bond Strategy Fund | — | |||||
| (5) | The 0-5 Year High Yield Corporate Bond Index Fund is subject to the provisions of the RIC Modernization Act of 2010. The fund had no capital gain/losses for the fiscal year ending June 30, 2011. |
As of June 30, 2011, the aggregate cost and the net unrealized appreciation/(depreciation) of investments for federal income tax purposes are as follows (amounts in thousands):
| Federal Tax Cost | Unrealized Appreciation | Unrealized (Depreciation) | Net Unrealized Appreciation/ (Depreciation)(6) | |||||||||||||||
| 0-5 Year High Yield Corporate Bond Index Fund | $ | 25,248 | $ | 115 | $ | (46 | ) | $ | 69 | |||||||||
| 1-3 Year U.S. Treasury Index Fund | 106,509 | 757 | (1 | ) | 756 | |||||||||||||
| 1-5 Year U.S. TIPS Index Fund | 1,159,693 | 17,150 | (359 | ) | 16,791 | |||||||||||||
| 3-7 Year U.S. Treasury Index Fund | 20,620 | 177 | (38 | ) | 139 | |||||||||||||
| 7-15 Year U.S. Treasury Index Fund | 8,305 | 50 | (107 | ) | (57 | ) | ||||||||||||
| 15+ Year U.S. TIPS Index Fund | 256,674 | 1,191 | (326 | ) | 865 | |||||||||||||
| 25+ Year Zero Coupon U.S. Treasury Index Fund | 44,729 | 88 | (4,131 | ) | (4,043 | ) | ||||||||||||
| Broad U.S. TIPS Index Fund | 53,762 | 2,006 | (3 | ) | 2,003 | |||||||||||||
| Broad U.S. Treasury Index Fund | 9,744 | 48 | (67 | ) | (19 | ) | ||||||||||||
| Investment Grade Corporate Bond Index Fund | 71,971 | 576 | (495 | ) | 81 | |||||||||||||
| Build America Bond Strategy Fund | 25,384 | 925 | (173 | ) | 752 | |||||||||||||
| Enhanced Short Maturity Strategy Fund | 1,241,816 | 3,328 | (1,233 | ) | 2,095 | |||||||||||||
| Intermediate Municipal Bond Strategy Fund | 89,580 | 1,977 | (167 | ) | 1,810 | |||||||||||||
| Short-Term Municipal Bond Strategy Fund | 22,823 | 154 | (19 | ) | 135 | |||||||||||||
| (6) | Primary differences between book and tax net unrealized appreciation/(depreciation) are attributable to wash sale loss deferrals for federal income tax purposes. |
| 66 | PIMCO ETF Trust |
Table of Contents
June 30, 2011
For the fiscal years ended June 30, 2011 and June 30, 2010, respectively, the Funds made the following tax basis distributions (amounts in thousands):
| June 30, 2011 | June 30, 2010 | |||||||||||||||||||||||||||||||||
| Tax-Exempt Income Distributions | Ordinary Income Distributions(7) | Long-Term Capital Gain Distributions | Return of Capital | Tax-Exempt Income Distributions | Ordinary Income Distributions(7) | Long-Term Capital Gain Distributions | Return of Capital | |||||||||||||||||||||||||||
| 0-5 Year High Yield Corporate Bond Index Fund | $ | — | $ | 41 | $ | — | $ | — | $ | N/A | $ | N/A | $ | N/A | $ | N/A | ||||||||||||||||||
| 1-3 Year U.S. Treasury Index Fund | — | 821 | — | — | — | 995 | — | — | ||||||||||||||||||||||||||
| 1-5 Year U.S. TIPS Index Fund | — | 28,201 | — | — | — | 4,299 | — | — | ||||||||||||||||||||||||||
| 3-7 Year U.S. Treasury Index Fund | — | 1,280 | 7 | — | — | 574 | — | — | ||||||||||||||||||||||||||
| 7-15 Year U.S. Treasury Index Fund | — | 724 | — | — | — | 334 | — | — | ||||||||||||||||||||||||||
| 15+ Year U.S. TIPS Index Fund | — | 9,472 | — | — | — | 431 | — | — | ||||||||||||||||||||||||||
| 25+ Year Zero Coupon U.S. Treasury Index Fund | — | 1,798 | — | — | — | 553 | — | — | ||||||||||||||||||||||||||
| Broad U.S. TIPS Index Fund | — | 1,887 | — | — | — | 416 | — | — | ||||||||||||||||||||||||||
| Broad U.S. Treasury Index Fund | — | 126 | — | — | N/A | N/A | N/A | N/A | ||||||||||||||||||||||||||
| Investment Grade Corporate Bond Index Fund | — | 1,795 | — | — | N/A | N/A | N/A | N/A | ||||||||||||||||||||||||||
| Build America Bond Strategy Fund | — | 1,263 | — | — | N/A | N/A | N/A | N/A | ||||||||||||||||||||||||||
| Enhanced Short Maturity Strategy Fund | — | 9,351 | — | — | — | 1,041 | — | — | ||||||||||||||||||||||||||
| Intermediate Municipal Bond Strategy Fund | 1,550 | 82 | — | — | 358 | — | — | — | ||||||||||||||||||||||||||
| Short-Term Municipal Bond Strategy Fund | 273 | — | — | — | 54 | — | — | — | ||||||||||||||||||||||||||
| (7) | Includes short-term capital gains, if any, distributed. |
14. SUBSEQUENT EVENTS
The investment manager has evaluated the possibility of subsequent events and has determined that there are no additional material events that would require disclosure in the Funds’ financial statements.
| Annual Report | June 30, 2011 | 67 |
Table of Contents
Report of Independent Registered Public Accounting Firm
To the Board of Trustees and Shareholders of PIMCO ETF Trust:
In our opinion, the accompanying statements of assets and liabilities, including the schedules of investments, and the related statements of operations and of changes in net assets and the financial highlights present fairly, in all material respects, the financial position of PIMCO 1-3 Year U.S. Treasury Index Fund, PIMCO 1-5 Year U.S. TIPS Index Fund, PIMCO 3-7 Year U.S. Treasury Index Fund, PIMCO 7-15 Year U.S. Treasury Index Fund, PIMCO 15+ Year U.S. TIPS Index Fund, PIMCO 25+ Year Zero Coupon U.S. Treasury Index Fund, PIMCO Broad U.S. TIPS Index Fund, PIMCO Enhanced Short Maturity Strategy Fund, PIMCO Intermediate Municipal Bond Strategy Fund, PIMCO Short Term Municipal Bond Strategy Fund, PIMCO Broad U.S. Treasury Index Fund, PIMCO Build America Bond Strategy Fund, PIMCO Investment Grade Corporate Bond Fund, and PIMCO 0-5 Year High Yield Corporate Bond Index Fund (constituting PIMCO ETF Trust, hereafter referred to as the “Funds”) at June 30 2011, the results of each of their operations, the changes in each of their net assets and the financial highlights for each of the periods indicated, in conformity with accounting principles generally accepted in the United States of America. These financial statements and financial highlights (hereafter referred to as “financial statements”) are the responsibility of the Funds’ management; our responsibility is to express an opinion on these financial statements based on our audits. We conducted our audits of these financial statements in accordance with the standards of the Public Company Accounting Oversight Board (United States). Those standards require that we plan and perform the audits to obtain reasonable assurance about whether the financial statements are free of material misstatement. An audit includes examining, on a test basis, evidence supporting the amounts and disclosures in the financial statements, assessing the accounting principles used and significant estimates made by management, and evaluating the overall financial statement presentation. We believe that our audits, which included confirmation of securities at June 30, 2011 by correspondence with the custodian and brokers, provide a reasonable basis for our opinion.
PricewaterhouseCoopers LLP
Kansas City, Missouri
August 16, 2011
| 68 | PIMCO ETF Trust |
Table of Contents
Federal Income Tax Information
(Unaudited)
Exempt Interest Dividends. For the benefit of shareholders of the Intermediate Municipal Bond Strategy Fund and the Short-Term Municipal Bond Strategy Fund, this is to inform you that for the fiscal year ended June 30, 2011, 100% and 100%, respectively, of the dividends paid by the Funds during its fiscal year qualify as exempt-interest dividends. For the fiscal year ended June 30, 2010, 100% and 100%, respectively, of the dividends paid by the Funds during its fiscal year qualify as exempt-interest dividends.
Long Term Capital Gain Designations. Pursuant to Section 852 of the Internal Revenue Code, the Funds designated the following capital gain dividends for the fiscal year ended June 30, 2011 (amounts in thousands):
| 1-5 Year U.S. TIPS Index Fund | $ | 522 | ||||
| 3-7 Year U.S. Treasury Index Fund | 7 | |||||
| 7-15 Year U.S. Treasury Index Fund | 37 | |||||
| Enhanced Short Maturity Strategy Fund | 92 | |||||
| Short-Term Municipal Bond Strategy Fund | 6 |
Shareholders are advised to consult their own tax advisor with respect to the tax consequences of their investment in the Trust. In January 2012, you will be advised on IRS Form 1099-DIV as to the federal tax status of the dividends and distributions received by you in calendar year 2011.
| Annual Report | June 30, 2011 | 69 |
Table of Contents
Glossary: (abbreviations that may be used in the preceding statements)
(Unaudited)
| Municipal Bond or Agency Abbreviations: | ||||||||||
| AGM | Assured Guaranty Municipal | FHA | Federal Housing Administration | NPFGC | National Public Finance Guarantee Corp. | |||||
| AMBAC | American Municipal Bond Assurance Corp. | GTD | Guaranteed | Q-SBLF | Qualified School Bond Loan Fund | |||||
| FGIC | Financial Guaranty Insurance Co. | |||||||||
| Other Abbreviations: | ||||||||||
| BABs | Build America Bonds | CLO | Collateralized Loan Obligation | NCUA | National Credit Union Administration | |||||
| 70 | PIMCO ETF Trust |
Table of Contents
(Unaudited)
The chart below identifies the Trustees and Officers of the Trust. Each “interested” Trustee as defined by the 1940 Act, is indicated by an asterisk (*). Unless otherwise indicated, the address of all persons below is 840 Newport Center Drive, Newport Beach, CA 92660.
The Funds’ Statement of Additional Information includes more information about the Trustees and Officers. To request a free copy, call PIMCO at 1-888-400-4ETF (1-888-400-4383) or visit the Funds’ website at www.pimcoetfs.com.
Trustees
| Name, Year of Birth and Position Held with Trust* | Term of Office** and Length of Time Served | Principal Occupation(s) During Past 5 Years | Number of Funds in Fund Complex Overseen by Trustee* | Other Directorships Held by Trustee | ||||
Interested Trustees | ||||||||
| Brent R. Harris* (1959) Chairman of the Board and Trustee | 02/2009 to Present | Managing Director and member of Executive Committee, PIMCO; Formerly, Chairman and Director, PCM Fund, Inc. | 151 | Chairman and Trustee, PIMCO Funds, PIMCO Variable Insurance Trust, PIMCO Equity Series, PIMCO Equity Series VIT; Director, StocksPLUS® Management, Inc; and member of Board of Governors and Executive Committee, Investment Company Institute. Board Member and Owner, Harris Holdings, LLC (1992-present). | ||||
| Douglas M. Hodge* (1957) Trustee | 02/2010 to Present | Managing Director; Chief Operating Officer (since 7/09); Member of Executive Committee and Head of PIMCO’s Asia Pacific region. Member Global Executive Committee, Allianz Global Investors. | 147 | Trustee, PIMCO Funds and PIMCO Variable Insurance Trust. | ||||
Independent Trustees | ||||||||
| E. Philip Cannon (1940) Trustee | 02/2009 to Present | Private Investor; Formerly, President, Houston Zoo. Formerly, Director, PCM Fund, Inc. | 151 | Trustee, PIMCO Funds, PIMCO Variable Insurance Trust, PIMCO Equity Series and PIMCO Equity Series VIT. | ||||
| Vern O. Curtis (1934) Trustee | 02/2009 to Present | Private Investor; Formerly, Director, PCM Fund, Inc. | 151 | Trustee, PIMCO Funds, PIMCO Variable Insurance Trust, PIMCO Equity Series and PIMCO Equity Series VIT. | ||||
| J. Michael Hagan (1939) Trustee | 02/2009 to Present | Private Investor and Business Advisor (primarily to manufacturing companies); Formerly, Director, PCM Fund, Inc. | 147 | Trustee, PIMCO Funds and PIMCO Variable Insurance Trust; Director, Ameron International (manufacturing); and Director, Fleetwood Enterprises (manufacturer of housing and recreational vehicles). | ||||
Ronald C. Parker (1951) Trustee | 07/2009 to Present | Chairman of the Board, The Ford Family Foundation. Formerly President, Chief Executive Officer, Hampton Affiliates (forestry products). | 147 | Trustee, PIMCO Funds and PIMCO Variable Insurance Trust. | ||||
| William J. Popejoy (1938) Trustee | 02/2009 to Present | Private Investor; Formerly, Director, New Century Financial Corporation (mortgage banking); Formerly, Director, PCM Fund, Inc. | 147 | Trustee, PIMCO Funds and PIMCO Variable Insurance Trust. | ||||
| * | Mr. Harris and Mr. Hodge are “interested persons” of the Trust (as that term is defined in the 1940 Act) because of their affiliation with PIMCO. |
| ** | Trustees serve until their successors are duly elected and qualified. |
| Annual Report | June 30, 2011 | 71 |
Table of Contents
Management of the Trust (Cont.)
(Unaudited)
Executive Officers
| Name, Year of Birth and Position Held with Trust | Term of Office and Length of Time Served | Principal Occupation(s) During Past 5 Years | ||
| Brent R. Harris (1959) President | 03/2009 to present | Managing Director and member of Executive Committee, PIMCO. | ||
| David C. Flattum (1964) Chief Legal Officer | 02/2009 to present | Managing Director and General Counsel, PIMCO. Formerly, Executive Vice President, PIMCO, Managing Director, Chief Operating Officer and General Counsel, Allianz Global Investors of America L.P. and Partner at Latham & Watkins LLP. | ||
| Jennifer E. Durham (1970) Chief Compliance Officer | 02/2009 to present | Executive Vice President and Chief Compliance Officer, PIMCO. Formerly; Senior Vice President, PIMCO. Formerly, Vice President and Legal/Compliance Manager, PIMCO. | ||
| William H. Gross (1944) Senior Vice President | 02/2009 to present | Managing Director and Co-Chief Investment Officer, PIMCO. | ||
| Mohamed El-Erian (1958) Senior Vice President | 02/2009 to present | Managing Director, Co-Chief Investment Officer and Chief Executive Officer, PIMCO. Formerly, President and CEO of Harvard Management Company. Formerly, Managing Director, PIMCO. | ||
| Douglas M. Hodge (1957) Senior Vice President | 05/2010 to present | Managing Director; Chief Operation Officer (since 7/09); Member of Executive Committee and Head of PIMCO’s Asia Pacific Region. Member Global Executive Committee, Allianz Global Investors. | ||
| J. Stephen King, Jr. (1962) Vice President - Senior Counsel, Secretary | 11/2008 to present | Senior Vice President and Attorney, PIMCO. Formerly Vice President, PIMCO and Associate, Dechert LLP. | ||
| Peter G. Strelow (1970) Vice President | 02/2009 to present | Executive Vice President, PIMCO. Formerly, Senior Vice President and Vice President, PIMCO. | ||
| Henrik P. Larsen (1970) Vice President | 02/2009 to present | Senior Vice President, PIMCO. Formerly, Vice President, PIMCO. | ||
| Eric D. Johnson (1970) Vice President | 05/2011 to present | Senior Vice President, PIMCO. Formerly, Vice President, PIMCO. | ||
| Greggory S. Wolf (1970) Vice President | 05/2011 to present | Senior Vice President, PIMCO. Formerly, Vice President and Manager, PIMCO. | ||
Donald W. Suskind (1973) Vice President | 05/2009 to present | Senior Vice President, PIMCO. | ||
| John P. Hardaway (1957) Treasurer | 11/2008 to present | Executive Vice President, PIMCO. Formerly, Senior Vice President, PIMCO. | ||
| Audrey L. Cheng (1975) Assistant Secretary | 11/2010 to present | Vice President and Attorney, PIMCO. Formerly, Associate, Morrison & Foerster LLP. | ||
| Stacie D. Anctil (1969) Assistant Treasurer | 02/2009 to present | Senior Vice President, PIMCO. Formerly, Vice President, PIMCO. | ||
| Erik C. Brown (1967) Assistant Treasurer | 02/2009 to present | Senior Vice President, PIMCO. Formerly, Vice President, PIMCO. | ||
Trent W. Walker (1974) Assistant Treasurer | 02/2009 to present | Senior Vice President, PIMCO. Formerly, Vice President, PIMCO. | ||
| 72 | PIMCO ETF Trust |
Table of Contents
(Unaudited)
The Funds consider customer privacy to be a fundamental aspect of their relationships with shareholders and are committed to maintaining the confidentiality, integrity and security of their current, prospective and former shareholders’ personal information. To ensure their shareholders’ privacy, the Funds have developed policies that are designed to protect this confidentiality, while allowing shareholder needs to be served.
Obtaining Personal Information
In the course of providing shareholders with products and services, the Funds and certain service providers to the Funds, such as the Funds’ investment adviser (“Adviser”), may obtain non-public personal information about shareholders, which may come from sources such as account applications and other forms, from other written, electronic or verbal correspondence, from shareholder transactions, from a shareholder’s brokerage or financial advisory firm, financial adviser or consultant, and/or from information captured on the Funds’ internet websites.
Respecting Your Privacy
As a matter of policy, the Funds do not disclose any personal or account information provided by shareholders or gathered by the Funds to non-affiliated third parties, except as required or permitted by law or as necessary for such third parties to perform their agreements with respect to the Funds. As is common in the industry, non-affiliated companies may from time to time be used to provide certain services, such as preparing and mailing prospectuses, reports, account statements and other information, conducting research on shareholder satisfaction and gathering shareholder proxies. The Funds’ Distributor may also retain non-affiliated companies to market the Funds’ shares or products which use the Funds’ shares and enter into joint marketing agreements with other companies. These companies may have access to a shareholder’s personal and account information, but are permitted to use this information solely to provide the specific service or as otherwise permitted by law. In most cases, the shareholders will be clients of a third party, but the Funds may also provide a shareholder’s personal and account information to the shareholder’s respective brokerage or financial advisory firm.
Sharing Information with Third Parties
The Funds reserve the right to disclose or report personal information to non-affiliated third parties, in limited circumstances, where the Funds believe in good faith that disclosure is required under law to cooperate with regulators or law enforcement authorities, to protect their rights or property or upon reasonable request by any Fund in which a shareholder has chosen to invest. In addition, the Funds may disclose information about a shareholder’s accounts to a non-affiliated third party with the consent of the shareholder.
Sharing Information with Affiliates
The Funds may share shareholder information with their affiliates in connection with servicing their shareholders’ accounts, and subject to applicable law may provide shareholders with information about products and services that the Funds or their Adviser, principal underwriters or their affiliates (“Service Affiliates”) believe may be of interest to such shareholders. The information that the Funds share may include, for example, a shareholder’s participation in one of the Funds or in other investment programs sponsored by a Service Affiliate, a shareholder’s ownership of certain types of accounts (such as IRAs), or other data about a shareholder’s accounts, subject to applicable law. The Funds’ Service Affiliates, in turn, are not permitted to share shareholder information with non-affiliated entities, except as required or permitted by law.
Procedures to Safeguard Private Information
The Funds take seriously the obligation to safeguard shareholder non-public personal information. In addition to this policy, the Funds have also implemented procedures that are designed to restrict access to a shareholder’s non-public personal information only to internal personnel who need to know that information in order to provide products or services to such shareholders. In order to guard a shareholder’s non-public personal information, physical, electronic and procedural safeguards are in place.
| Annual Report | June 30, 2011 | 73 |
Table of Contents
Approval of Renewal of the Investment Management Agreement
On February 23, 2010, the Board of Trustees (the “Board”) of PIMCO ETF Trust (the “Trust”), including all of the independent Trustees, approved the Trust’s Investment Management Agreement (the “Agreement”) with Pacific Investment Management Company LLC (“PIMCO”) on behalf of the PIMCO 0-5 Year High Yield Corporate Bond Index Fund (the “Fund”) for an initial two-year term. Under the Agreement, PIMCO provides investment advisory services, as well as supervisory and administrative services, to the Fund for a single management fee (“unified fee”).
The information, material factors and conclusions that formed the basis for the Board’s approval of the Agreement are described below.
| 1. | INFORMATION RECEIVED |
| A. | Materials Reviewed |
The Trustees received a wide variety of materials relating to the services proposed to be provided by PIMCO. The Board reviewed information relating to the proposed fund operations, including the Fund’s compliance program, shareholder services, valuation, custody, distribution, and other information relating to the nature, extent and quality of services proposed to be provided by PIMCO to the Trust. In considering whether to approve the Agreement, the Board also reviewed comparative industry data with regard to fees and expenses of funds with investment objectives and policies similar to those of the Fund. The Board also received and reviewed materials provided by counsel to the Trust and the independent Trustees, which included, among other things, a memorandum outlining legal duties of the Board in considering the approval of the Agreement. The Board also reviewed information about the personnel who would be providing investment management services and supervisory and administrative services to the Fund.
| B. | Review Process |
In connection with the approval of the Agreement, the Board reviewed written materials prepared by PIMCO, which included, among other things, comparative fee data for funds in the appropriate Lipper, Inc. (“Lipper”) peer group. Lipper is an independent provider of investment company performance and fee and expense data. The Board also requested and received assistance and advice regarding applicable legal standards from Trust counsel. The Board also heard oral presentations on matters related to the Agreement. The approval determinations were made on the basis of each Trustee’s business judgment after consideration of all the information presented. Individual Trustees may have given different weights to certain factors and assigned various degrees of materiality to information received in connection with the approval process. In deciding to approve the Agreement, the Board did not identify any single factor or particular information that, in isolation, was controlling. This summary describes the most important, but not all, of the factors considered by the Board.
| 2. | NATURE, EXTENT AND QUALITY OF SERVICES |
| A. | PIMCO, its Personnel, and Resources |
The Board considered the depth and quality of PIMCO’s investment management process, including: its global research capabilities; the experience, capability and integrity of its senior management and other personnel; the low turnover rates of its key personnel; the overall financial strength and stability of its organization; and the ability of its organizational structure to address the recent growth in assets under management. The Board also considered that PIMCO makes available to its investment professionals a variety of resources and systems relating to investment management and research, compliance, trading, performance and portfolio accounting. The Board noted PIMCO’s commitment to investing in information technology supporting investment management and compliance, as well as PIMCO’s continuing efforts to attract and retain qualified personnel and to maintain and enhance its resources and systems.
Ultimately, the Board concluded that the nature, extent and quality of services proposed to be provided by PIMCO under the Agreement are likely to benefit the Fund and its shareholders.
| B. | Other Services |
The Board considered PIMCO’s policies, procedures and systems to assure compliance with applicable laws and regulations and its commitment to these programs; its efforts to keep the Trustees informed about matters relevant to the Trust and its shareholders; and its attention to matters that may involve conflicts of interest with the Trust. The Board also considered the nature, extent, and quality of supervisory and administrative services to be provided by PIMCO to the Fund under the Agreement.
The Board considered PIMCO’s provision of these services and supervision of the Trust’s third party service providers to assure that these service providers continue to provide a high level of service relative to alternatives in the market. Ultimately, the Board concluded that the nature, extent and quality of the services to be provided by PIMCO would likely benefit the Fund and its shareholders.
| 3. | INVESTMENT PERFORMANCE |
As the Fund had not yet commenced operations at the time the Agreement was considered, the Trustees did not receive nor consider investment performance information for the Fund.
| 4. | MANAGEMENT FEE AND TOTAL EXPENSES |
PIMCO reported to the Board that, in proposing the management fee for the Fund, it considered a number of factors, including the type and complexity of the services to be provided, the cost of providing services, the risk assumed by PIMCO in the provision of services, the impact on potential returns from different levels of fees, the competitive marketplace for financial products, and the attractiveness of potential returns to the Fund’s potential investors.
| 74 | PIMCO ETF Trust |
Table of Contents
(Unaudited)
The Board reviewed the proposed management fee and estimated total expenses of the Fund (as a percentage of average net assets) and compared such amounts with the average and median fee and expense levels of other similar funds. With respect to the management fee, the Board reviewed data from Lipper that compared the average and median management fees of other funds in an “Expense Group” of comparable funds, as well as the universe of other similar funds. The Board compared the Fund’s estimated total expenses to other funds in the Lipper Expense Group, and found the Fund’s estimated total expenses to be reasonable. The Board considered that PIMCO manages a separate account with investment strategies that are similar to that of the Fund; however, the management fee for the Fund includes supervisory and administration services in addition to investment management services and, thus, the separate account does not provide a meaningful comparison.
The Board also considered the Fund’s unified fee structure, under which the Fund would pay for the advisory and supervisory and administrative services it requires for a unified fee, and in return, PIMCO would provide or procure such services and bear the costs of various third party services required by the Fund, including audit, custodial, portfolio accounting, legal, transfer agency and printing costs, as well as the costs of qualifying and listing Fund shares with any securities exchange or other trading system. The Board noted that the unified fee leads to fund fees that are fixed, rather than variable. The Board further noted that, although the unified fee structure does not have break points, it implicitly reflects economies of scale by fixing the absolute level of Fund fees at competitive levels. The Board concluded that the Fund’s proposed fees were reasonable in relation to the value of the services to be provided, and that the unified fee represents, in effect, a cap on fund fees that would be beneficial to the Fund and its shareholders.
The Board also noted that PIMCO had contractually agreed to reduce total annual fund operating expenses for the Fund by waiving a portion of its management fee or reimbursing the Fund, to the extent that any organizational expenses and the pro rata share of the Trust’s Trustees’ fees attributable to the Fund exceeds 0.0049% in any year.
Based on the information presented by PIMCO and Lipper, members of the Board then determined, in the exercise of their business judgment, that the level of the management fee to be charged by PIMCO, as well as the estimated total expenses of the Fund, are reasonable and approval of the Agreement would likely benefit the Fund and its shareholders.
| 5. | ADVISER COSTS, LEVEL OF PROFITS AND ECONOMIES OF SCALE |
As the ETF had not yet commenced operations at the time of the Board meeting, information regarding PIMCO’s costs and the profitability of PIMCO’s relationship with the ETF was not available.
With respect to potential economies of scale, the Board found that because the unified fee protects shareholders against unanticipated increases in the expense ratio due to redemptions, declines in asset values, or increases in the costs of services provided or procured by PIMCO, economies of scale are implicitly recognized in the level of the unified fee. The Board noted that PIMCO may share the benefits of economies of scale with the Fund and its shareholders by offering enhanced or additional services. The Board noted that PIMCO had taken on the risk that Fund expenses would increase or that assets would decline over time.
The Board concluded that the Fund’s proposed cost structure was reasonable and that the unified fee structure inherently involves the sharing of economies of scale between PIMCO and the Fund, to the benefit of Fund shareholders.
| 6. | ANCILLARY BENEFITS |
The Board considered other benefits received by PIMCO and its affiliates as a result of PIMCO’s relationship with the Trust, including possible ancillary benefits to PIMCO’s institutional investment management business due to the reputation and market penetration of the Fund. The Board also reviewed PIMCO’s soft dollar policies and procedures, noting that while PIMCO has the authority to receive the benefit of research provided by broker-dealers executing portfolio transactions on behalf of the Fund, it has adopted a policy not to accept soft dollars.
| 7. | CONCLUSIONS |
Based on its review, including its consideration of each of the factors referenced above, the Board concluded that the Agreement was fair and reasonable to the Fund and its shareholders, that the Fund’s shareholders would likely receive reasonable value in return for the management fee and other amounts paid to PIMCO by the Fund, and that the approval of the Fund’s Agreement was in the best interests of the Fund and its shareholders.
| Annual Report | June 30, 2011 | 75 |
Table of Contents
General Information
Investment Manager
Pacific Investment Management Company LLC
840 Newport Center Drive
Newport Beach, CA 92660
Distributor
PIMCO Investments LLC
1633 Broadway
New York, NY 10019
Custodian
State Street Bank & Trust Company
State Street Financial Center
One Lincoln Street
Boston, MA 02111
Transfer Agent
State Street Bank & Trust Company
State Street Financial Center
One Lincoln Street
Boston, MA 02111
Legal Counsel
Dechert LLP
1775 I Street N.W.
Washington, D.C. 20006
Independent Registered Public Accounting Firm
PricewaterhouseCoopers LLP
1100 Walnut Street
Kansas City, MO 64106
Table of Contents

ETF3001AR_063011
Table of Contents
Item 2. | Code of Ethics. | |||||||
As of the end of the period covered by this report, the Registrant has adopted a code of ethics (the “Code”) that applies to the Registrant’s principal executive officer and principal financial officer. During the period, the Code was amended to reflect a change in the principal underwriter of the series of the Registrant. The Registrant did not grant any waivers, including implicit waivers, from any provisions of the Code to the principal executive officer or principal financial officer during the period covered by this report. A copy of the Code is included as an exhibit to this report. | ||||||||
Item 3. | Audit Committee Financial Expert. | |||||||
(a) The Board of Trustees has determined that J. Michael Hagan, who serves on the Board’s audit committee, qualifies as an “audit committee financial expert” as such term is defined in the instructions to this Item 3. The Board has also determined that Mr. Hagan is “independent” as such term is interpreted under this Item 3. | ||||||||
Item 4. | Principal Accountant Fees and Services. | |||||||
(a) Fiscal Year Ended | Audit Fees | |||||||||
June 31, 2011 | $ | 74,248 | ||||||||
June 31, 2010 | 25,858 | |||||||||
(b) Fiscal Year Ended | Audit-Related Fees(1) | |||||||||
June 31, 2011 | — | |||||||||
June 31, 2010 | — | |||||||||
(c) Fiscal Year Ended | Tax Fees(2) | |||||||||
June 31, 2011 | — | |||||||||
June 31, 2010 | — | |||||||||
(d) Fiscal Year Ended | All Other Fees(3) | |||||||||
June 31, 2011 | — | |||||||||
June 31, 2010 | — | |||||||||
“Audit Fees” represents fees billed for each of the last two fiscal years for professional services rendered for the audit of the PIMCO ETF Trust (the “Trust”) annual financial statements for those fiscal years or services that are normally provided by the accountant in connection with statutory or regulatory filings or engagements for those fiscal years.
“Audit-Related Fees” represents fees billed for each of the last two fiscal years for assurance and related services reasonably related to the performance of the audit of the Trust’s annual financial statements for those years.
“Tax Fees” represents fees billed for each of the last two fiscal years for professional services related to tax compliance, tax advice and tax planning, including review of federal and state income tax returns, review of excise tax distribution requirements and preparation of excise tax returns.
“All Other Fees” represents fees, if any, billed for other products and services rendered by the principal accountant to the Trust for the last two fiscal years.
(1) There were no “Audit-Related Fees” for the last two fiscal years.
(2) There were no “Tax Fees” for the last two fiscal years.
(3) There were no “All Other Fees” for the last two fiscal years.
| (e) | Pre-approval policies and procedures |
(1) The registrant’s Audit Committee has adopted pre-approval policies and procedures (the “Procedures”) to govern the Audit Committee’s pre-approval of (i) all audit services and permissible non-audit services to be provided to the registrant by its independent accountant, and (ii) all permissible non-audit services to be provided by such independent accountant to the registrant’s investment adviser and to any entity controlling, controlled by, or under common control with the investment adviser that provides ongoing services to the registrant (collectively, the “Service Affiliates”) if the services provided directly relate to the registrant’s operations and financial reporting. In accordance with the Procedures, the Audit Committee is responsible for the engagement of the independent accountant to certify the registrant’s financial statements for each fiscal year. With respect to the pre-approval of non-audit services provided to the registrant and its Service Affiliates, the Procedures provide that the Audit Committee may annually pre-approve a list of types or categories of non-audit services that may be provided to the registrant or its Service Affiliates, or the Audit Committee may pre-approve such services on a project by-project basis as they arise. Unless a type of service has received general pre-approval, it will require specific pre-approval by the Audit Committee if it is to be provided by the independent accountant. The Procedures also permit the Audit Committee to delegate authority to one or more of its members to pre-approve any proposed non-audit services that have not been previously pre-approved by the Committee, subject to the ratification by the full Audit Committee no later than its next scheduled meeting.
(2) With respect to the services described in paragraphs (b) through (d) of this Item 4, no amount was approved by the Audit Committee pursuant to paragraph (c)(7)(i)(C) of Rule 2-01 of Regulation S-X.
| f) | Not applicable. |
g)
| Entity | Aggregate Non-Audit Fees Billed to Entity | |||||||
| June 30, 2011 | June 30, 2010 | |||||||
PIMCO ETF Trust | $ | - | $ | - | ||||
Pacific Investment Management Company LLC (“PIMCO”) | 3,347,964 | 1,764,216 | ||||||
Allianz Global Investors Fund Management LLC | 667,385 | 833,690 | ||||||
Allianz Global Investor of America L.P. | 3,367,420 | 1,934,774 | ||||||
|
|
|
| |||||
Totals | $ | 7,382,769 | $ | 4,532,680 | ||||
|
|
|
| |||||
| h) | The registrant’s Audit Committee has considered whether the provision of non-audit services that were rendered to the Registrant’s investment adviser, and any entity controlling, controlled by, or under common control with the investment adviser that provides ongoing services to the Registrant’s which were not pre-approved (not requiring pre-approval) is compatible with maintaining the principal accountant’s independence. |
Item 5. | Audit Committee of Listed Registrants. | |||||||
The registrant has a separately-designated standing audit committee established in accordance with Section 3(a)(58)(A) of the Securities Exchange Act of 1934, as amended. The audit committee is comprised of:
E. Philip Cannon; Vern O. Curtis; J. Michael Hagan; William J. Popejoy; Ronald C. Parker | ||||||||
Item 6. | Schedule of Investments. | |||||||
| The Schedule of Investments is included as part of the report to shareholders under Item 1. | ||||||||
Table of Contents
Item 7. | Disclosure of Proxy Voting Policies and Procedures for Closed-End Management Investment Companies. | |||||
| Not applicable. | ||||||
Item 8. | Portfolio Managers of Closed-End Management Investment Companies | |||||
| Not applicable. | ||||||
Item 9. | Purchases of Equity Securities by Closed-End Management Investment Company and Affiliated Purchases. | |||||
| Not applicable. | ||||||
Item 10. | Submission of Matters to a Vote of Security Holders. | |||||
| Not applicable. | ||||||
Item 11. | Controls and Procedures. | |||||
| (a) | The principal executive officer and principal financial officer have concluded that the Registrant’s disclosure controls and procedures (as defined in Rule 30a-3(c) under the Investment Company Act of 1940, as amended) provide reasonable assurances that material information relating to the Trust is made known to them by the appropriate persons, based on their evaluation of these controls and procedures as of a date within 90 days of the filing of this report. | |||||
| (b) | There were no changes in the Registrant’s internal control over financial reporting (as defined in Rule 30a-3(d) under the 1940 Act) that occurred during the second fiscal quarter of the period covered by this report that have materially affected, or are reasonably likely to materially affect, the Trust’s internal control over financial reporting. | |||||
Item 12. | Exhibits. | |||||
(a)(1) | Exhibit 99.CODE—Code of Ethics pursuant to Section 406 of the Sarbanes-Oxley Act of 2002. | |||||
(a)(2) | Exhibit 99.CERT—Certifications pursuant to Section 302 of the Sarbanes-Oxley Act of 2002. | |||||
(b) | Exhibit 99.906CERT—Certifications pursuant to Section 906 of the Sarbanes-Oxley Act of 2002. | |||||
Table of Contents
Signatures
Pursuant to the requirements of the Securities Exchange Act of 1934 and the Investment Company Act of 1940, the registrant has duly caused this report to be signed on its behalf by the undersigned, thereunto duly authorized.
| PIMCO ETF Trust | ||
| By: | /s/ BRENT R. HARRIS | |
| Brent R. Harris | ||
President and Chairman of the Board, Principal Executive Officer | ||
| Date: August 30, 2011 | ||
Pursuant to the requirements of the Securities Exchange Act of 1934 and the Investment Company Act of 1940, this report has been signed below by the following persons on behalf of the registrant and in the capacities and on the dates indicated.
| By: | /s/ BRENT R. HARRIS | |
| Brent R. Harris | ||
President and Chairman of the Board, Principal Executive Officer | ||
| Date: August 30, 2011 | ||
| By: | /s/ JOHN P. HARDAWAY | |
| John P. Hardaway | ||
| Treasurer, Principal Financial Officer | ||
| Date: August 24, 2011 | ||