UNITED STATES
SECURITIES AND EXCHANGE COMMISSION
Washington, D.C. 20549
FORM N-CSR
CERTIFIED SHAREHOLDER REPORT OF REGISTERED MANAGEMENT
INVESTMENT COMPANIES
Investment Company Act file number: 811-22250
PIMCO ETF Trust
(Exact name of registrant as specified in charter)
650 Newport Center Drive, Newport Beach, CA 92660
(Address of principal executive office)
Bradley Todd
Treasurer (Principal Financial & Accounting Officer)
PIMCO ETF Trust
650 Newport Center Drive, Newport Beach, CA 92660
(Name and address of agent for service)
Copies to:
Brendan C. Fox
Dechert LLP
1900 K Street, N.W.
Washington, D.C. 20006
Registrant’s telephone number, including area code: (888) 877-4626
Date of fiscal year end: June 30
Date of reporting period: June 30, 2020
Form N-CSR is to be used by management investment companies to file reports with the Commission not later than 10 days after the transmission to stockholders of any report that is required to be transmitted to stockholders under Rule 30e-1 under the Investment Company Act of 1940 (17 CFR 270.30e-1). The Commission may use the information provided on Form N-CSR in its regulatory, disclosure review, inspection, and policymaking roles.
A registrant is required to disclose the information specified by Form N-CSR, and the Commission will make this information public. A registrant is not required to respond to the collection of information contained in Form N-CSR unless the Form displays a currently valid Office of Management and Budget (“OMB”) control number. Please direct comments concerning the accuracy of the information collection burden estimate and any suggestions for reducing the burden to Secretary, Securities and Exchange Commission, 450 Fifth Street, NW, Washington, DC 20549-0609. The OMB has reviewed this collection of information under the clearance requirements of 44 U.S.C. § 3507.
| Item 1. | Reports to Shareholders. |
The following is a copy of the report transmitted to shareholders pursuant to Rule 30e-1 under the Investment Company Act of 1940, as amended (the “Act”) (17 CFR 270.30e-1).

PIMCO ETF TRUST
Annual Report
June 30, 2020
Index Exchange-Traded Funds
PIMCO 25+ Year Zero Coupon U.S. Treasury Index Exchange-Traded Fund | ZROZ | NYSE Arca
PIMCO 1-5 Year U.S. TIPS Index Exchange-Traded Fund | STPZ | NYSE Arca
PIMCO 15+ Year U.S. TIPS Index Exchange-Traded Fund | LTPZ | NYSE Arca
PIMCO Broad U.S. TIPS Index Exchange-Traded Fund | TIPZ | NYSE Arca
PIMCO 0-5 Year High Yield Corporate Bond Index Exchange-Traded Fund | HYS | NYSE Arca
PIMCO Investment Grade Corporate Bond Index Exchange-Traded Fund | CORP | NYSE Arca
Actively-Managed Exchange-Traded Funds
PIMCO Active Bond Exchange-Traded Fund | BOND | NYSE Arca
PIMCO Enhanced Low Duration Active Exchange-Traded Fund | LDUR | NYSE Arca
PIMCO Enhanced Short Maturity Active ESG Exchange-Traded Fund | EMNT | NYSE Arca
PIMCO Enhanced Short Maturity Active Exchange-Traded Fund | MINT | NYSE Arca
PIMCO Intermediate Municipal Bond Active Exchange-Traded Fund | MUNI | NYSE Arca
PIMCO Short Term Municipal Bond Active Exchange-Traded Fund | SMMU | NYSE Arca
Beginning on January 1, 2021, as permitted by regulations adopted by the Securities and Exchange Commission, paper copies of the Fund’s annual and semi-annual shareholder reports will no longer be sent by mail from the financial intermediary, such as a broker-dealer or bank, which offers the Fund unless you specifically request paper copies of the reports from the financial intermediary. Instead, the shareholder reports will be made available on a website, and the financial intermediary will notify you by mail each time a report is posted and provide you with a website link to access the report. Instructions for requesting paper copies will be provided by your financial intermediary.
If you already elected to receive shareholder reports electronically, you will not be affected by this change and you need not take any action. You may elect to receive shareholder reports and other communications from the financial intermediary electronically by following the instructions provided by the financial intermediary.
You may elect to receive all future reports in paper free of charge from the financial intermediary. You should contact the financial intermediary if you wish to continue receiving paper copies of your shareholder reports. Your election to receive reports in paper will apply to all funds held in your account at the financial intermediary.
Table of Contents
This material is authorized for use only when preceded or accompanied by the current PIMCO ETF Trust prospectus.
Chairman’s Letter
Dear Shareholder,
We hope that you and your family are staying safe and healthy during these challenging times. We continue to work tirelessly to navigate markets and manage the assets that you have entrusted with us. Following this letter is the PIMCO ETF Trust Annual Report, which covers the 12-month reporting period ended June 30, 2020. On the subsequent pages, you will find specific details regarding investment results and discussion of the factors that most affected performance during the reporting period.
For the 12-month reporting period ended June 30, 2020
The coronavirus took its toll on the U.S. economy, as it entered its first recession since the 2008 financial crisis. Looking back, U.S. gross domestic product (“GDP”) grew at a revised annual pace of 2.6% and 2.4% during the third and fourth quarters of 2019, respectively. The pandemic then caused the economy to significantly weaken, as annualized GDP growth in the first quarter of 2020 was -5.0%. The Commerce Department’s initial estimate for second quarter annualized GDP growth — released after the reporting period ended — was -32.9%. This represented the sharpest quarterly decline on record.
The Federal Reserve (the “Fed”) took unprecedented actions to support the economy and keep markets functioning properly. In early March 2020, the Fed lowered the federal funds rate to a range between 1.00% and 1.25%. Later in the month, the Fed lowered the rate to a range between 0.00% and 0.25%. On March 23, the Fed announced, “It has become clear that our economy will face severe disruptions. Aggressive efforts must be taken across the public and private sectors to limit the losses to jobs and incomes and to promote a swift recovery once the disruptions abate.” The Fed’s efforts included the ability to make unlimited purchases of Treasury and mortgage securities. It also announced that, for the first time, it would purchase existing corporate bonds on the open market. In addition, the U.S. government passed a $2 trillion fiscal stimulus bill to aid the economy in March.
In its June 2020 World Economic Outlook Update, the International Monetary Fund (“IMF”) stated that it expects the U.S. economy to contract 8.0% in 2020, compared to the 2.3% GDP expansion in 2019. Elsewhere, the IMF has also stated that it anticipates that 2020 GDP growth in the eurozone, U.K. and Japan will be -10.2%, -10.2% and -5.8%, respectively. For comparison purposes, the GDP of these economies expanded 1.3%, 1.4% and 0.7%, respectively, in 2019.
Against this backdrop, central banks around the world took a number of aggressive actions. In Europe, the European Central Bank (the “ECB”) unveiled a new €750 billion bond-buying program, which was subsequently expanded by another €600 billion in June 2020. Finally, in July — after the reporting period ended — the European Union agreed on a $2.06 trillion spending package to bolster its economy. In March, the Bank of England reduced its key lending rate to 0.10% — a record low. Elsewhere, the Bank of Japan maintained its short-term interest rates at -0.1%, while increasing the target for its holdings of corporate bonds to ¥4.2 trillion from ¥3.2 trillion. Japan’s central bank also doubled its purchases of exchange-traded stock funds. Meanwhile, in May 2020, the Japanese government doubled its stimulus measures with a ¥117 trillion package.
Both short- and long-term U.S. Treasury yields fell sharply during the reporting period. In our view, this was due to a combination of declining global growth given the coronavirus, the Fed’s accommodative monetary policy and periods of extreme investor risk aversion. The yield on the benchmark 10-year U.S. Treasury note was 0.66% at the end of the reporting period, versus 2.00% on June 30, 2019. The Bloomberg Barclays Global Treasury Index (USD Hedged), which tracks fixed-rate, local currency government debt of investment grade countries, including both developed and emerging markets, returned 6.01%. Meanwhile, the Bloomberg Barclays Global Aggregate Credit Index (USD Hedged), a widely used index of global investment grade credit bonds, returned 6.90%. Riskier fixed income asset classes, including high yield corporate bonds and emerging market debt, generated weaker results. The ICE BofAML Developed Markets High Yield Constrained Index (USD Hedged), a widely used index of below investment grade bonds, returned -0.75%, whereas emerging market external debt, as represented by the JPMorgan Emerging Markets
Bond Index (EMBI) Global (USD Hedged), returned 1.52%. Emerging market local bonds, as represented by the JPMorgan Government Bond Index-Emerging Markets Global Diversified Index (Unhedged), returned -2.82%.
After initially rising, global equities experienced a sharp decline in February and March 2020. We believe this was largely due to concerns over the impact of the coronavirus. In March 2020, the U.S. equity market ended its 11-year bull market run, and then posted the fastest fall on record from its all-time high to bear market territory. However, global equities rallied sharply in April, May and June 2020, in our view because investor sentiment improved given significant stimulus efforts from central banks around the world. All told, during the 12-months ended June 30, 2020, U.S. equities, as represented by the S&P 500 Index, returned 7.51% and global equities, as represented by the MSCI World Index, returned 2.84%. Meanwhile, Japanese equities, as represented by the Nikkei 225 Index (in JPY), returned 6.98% and European equities, as represented by the MSCI Europe Index (in EUR), returned -5.48%. Finally, emerging market equities, as measured by the MSCI Emerging Markets Index, returned -3.39%.
Commodity prices were extremely volatile and generated mixed results. When the reporting period began, Brent crude oil was approximately $67 a barrel. It ended the reporting period at roughly $41 a barrel after briefly trading below $15. Elsewhere, copper prices were relatively flat, whereas gold prices moved higher.
Finally, there were periods of volatility in the foreign exchange markets, due in part, in our view, to signs of moderating global growth, trade conflicts and changing central bank monetary policies, along with a number of geopolitical events. The U.S. dollar strengthened against a number of other major currencies. For example, the U.S. dollar returned 1.22%, 2.32% and 0.07% versus the euro, the British pound and the Japanese yen, respectively.
Thank you for the assets you have placed with us. We deeply value your trust, and we will continue to work diligently to meet your broad investment needs. For any questions regarding the PIMCO ETF Trust, please contact your financial adviser, or call one of our shareholder associates at (888) 400-4ETF. We also invite you to visit our website at www.pimco.com to learn more about PIMCO ETFs.
| | |
 | | Sincerely, 
Peter G. Strelow Chairman of the Board
PIMCO ETF Trust |
Past performance is no guarantee of future results. Unless otherwise noted, index returns reflect the reinvestment of income distributions and capital gains, if any, but do not reflect fees, brokerage commissions or other expenses of investing. It is not possible to invest directly in an unmanaged index.
| | | | | | |
| | ANNUAL REPORT | | JUNE 30, 2020 | | 3 |
Important Information About the Funds
PIMCO ETF Trust (the “Trust”) is an open-end management investment company that includes the PIMCO 25+ Year Zero Coupon U.S. Treasury Index Exchange-Traded Fund, PIMCO 1-5 Year U.S. TIPS Index Exchange-Traded Fund, PIMCO 15+ Year U.S. TIPS Index Exchange-Traded Fund, PIMCO Broad U.S. TIPS Index Exchange-Traded Fund, PIMCO 0-5 Year High Yield Corporate Bond Index Exchange-Traded Fund, and PIMCO Investment Grade Corporate Bond Index Exchange-Traded Fund, which are exchange-traded funds (“ETFs”) that seek to provide total return that closely corresponds, before fees and expenses, to the total return of a specified index (collectively, the “Index Funds”). Each Index Fund employs a representative sampling strategy in seeking to achieve its investment objective. In using this strategy, PIMCO seeks to invest in a combination of instruments such that the portfolio effectively provides exposure to the underlying index. An Index Fund may not track its underlying index with the same degree of accuracy as a fund that replicates the composition and weighting of the underlying index. The PIMCO Active Bond Exchange-Traded Fund, PIMCO Enhanced Low Duration Active Exchange-Traded Fund, PIMCO Enhanced Short Maturity Active Exchange-Traded Fund, PIMCO Enhanced Short Maturity Active ESG Exchange-Traded Fund, PIMCO Intermediate Municipal Bond Active Exchange-Traded Fund and PIMCO Short Term Municipal Bond Active Exchange-Traded Fund, unlike the Index Funds, are actively managed ETFs that do not seek to track the performance of a specified index (collectively, the “Active Funds” and together with the Index Funds, a “Fund” or the “Funds”). Shares of the Funds will be listed and traded at market prices on NYSE Arca, Inc. (“NYSE Arca”) and other secondary markets. The market price for each Fund’s shares may be different from the Fund’s net asset value (“NAV”). Each Fund issues and redeems shares at its NAV only in blocks of a specified number of shares (“Creation Units”). Only certain large institutional investors may purchase or redeem Creation Units directly with the Funds at NAV (“Authorized Participants”). These transactions are in exchange for certain securities similar to a Fund’s portfolio and/or cash. Except when aggregated in Creation Units, shares of a Fund are not redeemable securities. Shareholders who are not Authorized Participants may not redeem shares from the Funds at NAV.
We believe that bond funds have an important role to play in a well-diversified investment portfolio. It is important to note, however, that in an environment where interest rates may trend upward, rising rates would negatively impact the performance of most bond funds, and fixed income securities and other instruments held by the Funds are likely to decrease in value. A wide variety of factors can cause interest rates to rise (e.g., central bank monetary policies, inflation rates, general economic conditions, etc.). In addition, changes in interest rates can be sudden and unpredictable, and there is no guarantee that management will anticipate such movement accurately. The Funds may lose money as a result of movements in interest rates.
As of the date of this report, interest rates in the United States and many parts of the world, including certain European countries, are at or near historically low levels. Thus, the Funds currently face a heightened level of risk associated with rising interest rates and/or bond yields. This could be driven by a variety of factors, including but not limited to central bank monetary policies, changing inflation or real growth rates, general economic conditions, increasing bond issuances or reduced market demand for low yielding investments. Further, while bond markets have steadily grown over the past three decades, dealer inventories of corporate bonds are near historic lows in relation to market size. As a result, there has been a significant reduction in the ability of dealers to “make markets.”
Bond funds and individual bonds with a longer duration (a measure used to determine the sensitivity of a security’s price to changes in interest rates) tend to be more sensitive to changes in interest rates, usually making them more volatile than securities or funds with shorter durations. All of the factors mentioned above, individually or collectively, could lead to increased volatility and/or lower liquidity in the fixed income markets or negatively impact a Fund’s performance or cause a Fund to incur losses. As a result, there could be increased sales of shares which could further reduce the market price for a Fund’s shares.
The Funds may be subject to various risks as described in each Fund’s prospectus and in the Principal Risks in the Notes to Financial Statements.
Classifications of the Funds’ portfolio holdings in this report are made according to financial reporting standards. The classification of a particular portfolio holding as shown in the Allocation Breakdown and Schedule of Investments sections of this report may differ from the classification used for the Funds’ compliance calculations, including those used in the Funds’ prospectus, investment objectives, regulatory, and other investment limitations and policies, which may be based on different asset class, sector or geographical classifications. Each Fund is separately monitored for compliance with respect to prospectus and regulatory requirements.
The geographical classification of foreign (non-U.S.) securities in this report, if any, are classified by the country of incorporation of a holding. In certain instances, a security’s country of incorporation may be different from its country of economic exposure.
Beginning in January 2020, global financial markets have experienced and may continue to experience significant volatility resulting from the spread of a novel coronavirus known as COVID-19. The outbreak of COVID-19 has resulted in travel and border restrictions, quarantines, supply chain disruptions, lower consumer demand and general market uncertainty. The effects of COVID-19 have and may continue to adversely affect the global economy, the economies of certain nations
and individual issuers, all of which may negatively impact the Funds’ performance. In addition, COVID-19 and governmental responses to COVID-19 may negatively impact the capabilities of the Funds’ service providers and disrupt the Funds’ operations.
The United States presidential administration’s enforcement of tariffs on goods from other countries, with a focus on China, has contributed to international trade tensions and may impact portfolio securities.
The United Kingdom’s withdrawal from the European Union may impact Fund returns. The withdrawal may cause substantial volatility in foreign exchange markets, lead to weakness in the exchange rate of the British pound, result in a sustained period of market uncertainty, and destabilize some or all of the other European Union member countries and/or the Eurozone.
A Fund may invest in certain instruments that rely in some fashion upon the London Interbank Offered Rate (“LIBOR”). LIBOR is an average interest rate, determined by the ICE Benchmark Administration, that banks charge one another for the use of short-term money. The United Kingdom’s Financial Conduct Authority, which regulates LIBOR, has announced plans to phase out the use of LIBOR by the end of 2021. The transition may result in a reduction in the value of certain instruments held by a Fund or a reduction in the effectiveness of related Fund transactions such as hedges. There remains uncertainty regarding future utilization of LIBOR and the nature of any replacement rate (e.g., the Secured Overnight Financing Rate, which is intended to replace U.S. dollar LIBOR and measures the cost of overnight borrowings through repurchase agreement transactions collateralized with U.S. Treasury securities), and any potential effects of the transition away from LIBOR on a Fund or on certain instruments in which a Fund invests are not known and could result in losses to a Fund.
Under the direction of the Federal Housing Finance Agency, the Federal National Mortgage Association (“FNMA”) and the Federal Home Loan Mortgage Corporation (“FHLMC”) have entered into a joint initiative to develop a common securitization platform for the issuance of a uniform mortgage-backed security (the “Single Security Initiative”) that aligns the characteristics of FNMA and FHLMC certificates. The Single Security Initiative was implemented on June 3, 2019, and the effects it may have on the market for mortgage-backed securities are uncertain.
Engaging in a responsible investment strategy, which may select or exclude securities of certain issuers for reasons other than performance, carries the risk that a Fund may underperform funds that do not utilize a responsible investment strategy. The application of this strategy may affect a Fund’s exposure to certain sectors or types of investments, which could negatively impact the Fund’s performance. Responsible investing is qualitative and subjective by nature, and there is no guarantee that the criteria utilized or any judgment exercised in pursuing a responsible investment strategy will reflect the beliefs or values of any particular investor. In evaluating a company, the information and data obtained through voluntary or third-party reporting may be incomplete, inaccurate or unavailable, which could cause an incorrect assessment of a company’s business practices with respect to the environment, social responsibility and corporate governance (“ESG practices”). Socially responsible norms differ by region, and a company’s ESG practices or the assessment of a company’s ESG practices may change over time.
On each individual Fund Summary page in this Shareholder Report, the Average Annual Total Return table and Cumulative Returns chart measure performance assuming that any dividend and capital gain distributions were reinvested. Returns do not reflect the deduction of taxes that a shareholder would pay on: (i) Fund distributions; or (ii) the sale of Fund shares. Each Fund’s performance is measured against the performance of at least one broad-based securities market index (“benchmark index”). A Fund’s past performance, before and after taxes, is not necessarily an indication of how the Fund will perform in the future. There is no assurance that any Fund, including any Fund that has experienced high or unusual performance for one or more periods, will experience similar levels of performance in the future. High performance is defined as a significant increase in either 1) a Fund’s total return in excess of that of the Fund’s benchmark between reporting periods or 2) a Fund’s total return in excess of the Fund’s historical returns between reporting periods. Unusual performance is defined as a significant change in a Fund’s performance as compared to one or more previous reporting periods. Historical performance for a Fund may have been positively impacted by fee waivers or expense limitations in place during some or all of the periods shown, if applicable. Future performance (including total return or yield) and distributions may be negatively impacted by the expiration or reduction of any such fee waivers or expense limitations.
The following table discloses the inception dates of each Fund along with each Fund’s diversification status as of period end:
| | | | | | | | | | | | |
| Fund Name | | | | | Fund
Inception | | | Diversification
Status | |
PIMCO 25+ Year Zero Coupon U.S. Treasury Index Exchange-Traded Fund | | | | | | | 10/30/09 | | | | Diversified | |
PIMCO 1-5 Year U.S. TIPS Index Exchange-Traded Fund | | | | | | | 08/20/09 | | | | Diversified | |
PIMCO 15+ Year U.S. TIPS Index Exchange-Traded Fund | | | | | | | 09/03/09 | | | | Diversified | |
PIMCO Broad U.S. TIPS Index Exchange-Traded Fund | | | | | | | 09/03/09 | | | | Diversified | |
PIMCO 0-5 Year High Yield Corporate Bond Index Exchange-Traded Fund | | | | | | | 06/16/11 | | | | Diversified | |
| | | | | | |
| | ANNUAL REPORT | | JUNE 30, 2020 | | 5 |
Important Information About the Funds (Cont.)
| | | | | | | | | | | | |
| Fund Name (Cont.) | | | | | Fund
Inception | | | Diversification
Status | |
PIMCO Investment Grade Corporate Bond Index Exchange-Traded Fund | | | | | | | 09/20/10 | | | | Diversified | |
PIMCO Active Bond Exchange-Traded Fund | | | | | | | 02/29/12 | | | | Diversified | |
PIMCO Enhanced Low Duration Active Exchange-Traded Fund | | | | | | | 01/22/14 | | | | Diversified | |
PIMCO Enhanced Short Maturity Active ESG Exchange-Traded Fund | | | | | | | 12/10/19 | | | | Diversified | |
PIMCO Enhanced Short Maturity Active Exchange-Traded Fund | | | | | | | 11/16/09 | | | | Diversified | |
PIMCO Intermediate Municipal Bond Active Exchange-Traded Fund | | | | | | | 11/30/09 | | | | Diversified | |
PIMCO Short Term Municipal Bond Active Exchange-Traded Fund | | | | | | | 02/01/10 | | | | Diversified | |
An investment in a Fund is not a bank deposit and is not guaranteed or insured by the Federal Deposit Insurance Corporation or any other government agency. It is possible to lose money on investments in the Funds.
The Trustees are responsible generally for overseeing the management of the Trust. The Trustees authorize the Trust to enter into service agreements with the Adviser, the Distributor, the Administrator and other service providers in order to provide, and in some cases authorize service providers to procure through other parties, necessary or desirable services on behalf of the Trust and the Funds. Shareholders are not parties to or third-party beneficiaries of such service agreements. Neither a Fund’s prospectus nor a Fund’s summary prospectus, the Trust’s Statement of Additional Information (“SAI”), any contracts filed as exhibits to the Trust’s registration statement, nor any other communications, disclosure documents or regulatory filings (including this report) from or on behalf of the Trust or a Fund creates a contract between or among any shareholder of a Fund, on the one hand, and the Trust, a Fund, a service provider to the Trust or a Fund, and/or the Trustees or officers of the Trust, on the other hand. The Trustees (or the Trust and its officers, service providers or other delegates acting under authority of the Trustees) may amend the most recent prospectus or use a new prospectus, summary prospectus or SAI with respect to a Fund or the Trust, and/or amend, file and/or issue any other communications, disclosure documents or regulatory filings, and may amend or enter into any contracts to which the Trust or a Fund is a party, and interpret the investment objective(s), policies, restrictions and contractual provisions applicable to any Fund, without shareholder input or approval, except in circumstances in which shareholder approval is specifically required by law (such as changes to fundamental investment policies) or where a shareholder approval requirement is specifically disclosed in the Trust’s then-current prospectus or SAI.
The Index Funds may make available a complete schedule of portfolio holdings and the percentages they represent of the Index Fund’s net assets. On each business day, before commencement of trading on NYSE Arca, each Active Fund will disclose on www.pimcoetfs.com the identities and quantities of the Active Fund’s portfolio holdings that will form the basis for the Active Fund’s calculation of NAV at the end of
the business day. The frequency at which the daily market prices were at a discount or premium to each Fund’s NAV is disclosed on www.pimcoetfs.com. Please see “Disclosure of Portfolio Holdings” in the SAI for information about the availability of the complete schedule of each Fund’s holdings. Fund fact sheets provide additional information regarding a Fund and may be requested by calling (888) 400-4ETF and are available on the Fund’s website at www.pimcoetfs.com.
PIMCO has adopted written proxy voting policies and procedures (“Proxy Policy”) as required by Rule 206(4)-6 under the Investment Advisers Act of 1940, as amended. The Proxy Policy has been adopted by the Trust as the policies and procedures that PIMCO will use when voting proxies on behalf of the Funds. A description of the policies and procedures that PIMCO uses to vote proxies relating to portfolio securities of each Fund, and information about how each Fund voted proxies relating to portfolio securities held during the most recent twelve-month period ended June 30, are available without charge, upon request, by calling the Trust at (888) 400-4ETF, on the Funds’ website at www.pimcoetfs.com, and on the Securities and Exchange Commission’s (“SEC”) website at www.sec.gov.
The Funds file portfolio holdings information with the SEC on Form N-PORT within 60 days of the end of each fiscal quarter. The Funds’ complete schedules of securities holdings as of the end of each fiscal quarter will be made available to the public on the SEC’s website at www.sec.gov and on PIMCO’s website at www.pimcoetfs.com, and will be made available, upon request, by calling PIMCO at (888) 400-4ETF. Prior to its use of Form N-PORT, each Fund filed its complete schedule of its portfolio holdings with the SEC on Form N-Q, which is available online at www.sec.gov.
The SEC adopted a rule that, beginning in 2021, generally will allow the Funds to fulfill their obligation to deliver shareholder reports to investors by providing access to such reports online free of charge and by mailing a notice that the report is electronically available. Pursuant to the rule, investors may still elect to receive a complete shareholder report in the mail. Instructions for electing to receive paper copies of a Fund’s shareholder reports going forward may be found on the front cover of this report.
In November 2019, the SEC published a proposed rulemaking related to the use of derivatives and certain other transactions by registered investment companies. If the proposal is adopted in substantially the same form as it was proposed, these requirements could limit the ability of a Fund to use derivatives and reverse repurchase agreements and similar financing transactions as part of its investment strategies. Any new requirements, if adopted, may increase the cost of the Funds’ investments and cost of doing business, which could adversely affect investors.
In April 2020, the SEC issued a proposed rulemaking setting forth a proposed framework for fair valuation of fund investments. If the proposal is adopted in substantially the same form as it was proposed,
the rule would set forth requirements for good faith determinations of fair value, establish conditions under which a market quotation is considered readily available for purposes of the definition of “value” under the Investment Company Act of 1940, and address the roles and responsibilities of a fund’s board of trustees and investment adviser with respect to fair valuation of fund investments. The impact that any such requirements may have on the Funds is uncertain.
On August 5, 2020, the SEC proposed changes to the mutual fund and ETF shareholder report and registration statement disclosure requirements and the registered fund advertising rules, which, if adopted, will change the disclosures provided to shareholders.
| | | | | | |
| | ANNUAL REPORT | | JUNE 30, 2020 | | 7 |
PIMCO 25+ Year Zero Coupon U.S. Treasury Index Exchange-Traded Fund
Cumulative Returns Through June 30, 2020
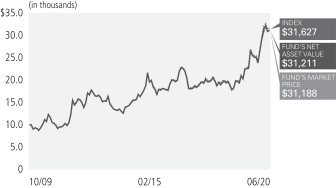
$10,000 invested at the end of the month when the Fund commenced operations.
Allocation Breakdown as of June 30, 2020†§
| | | | |
U.S. Treasury Obligations | | | 99.9% | |
| |
Short-Term Instruments | | | 0.1% | |
| | † | % of Investments, at value. |
| | § | Allocation Breakdown and % of investments exclude securities sold short and financial derivative instruments, if any. |
| | | | | | | | | | | | | | | | | | |
|
| Average Annual Total Return for the period ended June 30, 2020 | |
| | | | | |
| | | | | 1 Year | | | 5 Year | | | 10 Years | | | Fund Inception
(10/30/2009) | |
 | | PIMCO 25+ Year Zero Coupon U.S. Treasury Index Exchange-Traded Fund (Based on Net Asset Value) | | | 37.97% | | | | 13.22% | | | | 10.89% | | | | 11.26% | |
 | | PIMCO 25+ Year Zero Coupon U.S. Treasury Index Exchange-Traded Fund (At Market Price)(1) | | | 37.86% | | | | 13.22% | | | | 10.84% | | | | 11.25% | |
 | | The ICE BofAML Long U.S. Treasury Principal STRIPS Index± | | | 38.05% | | | | 13.35% | | | | 11.07% | | | | 11.39% | |
All Fund returns are net of fees and expenses and include applicable fee waivers and/or expense limitations. Absent any applicable fee waivers and/or expense limitations, performance would have been lower and there can be no assurance that any such waivers or limitations will continue in the future.
Market Returns do not include brokerage commissions that may be payable on secondary market transactions. If brokerage commissions were included, market returns would be lower. Market and NAV returns assume that dividends and capital gain distributions have been reinvested in the Fund at market price and NAV, respectively.
| (1) | The market price is determined using the midpoint between the highest bid and the lowest offer on the listing exchange, as of the time that the Fund’s NAV is calculated. |
± The ICE BofAML Long US Treasury Principal STRIPS Index is an unmanaged index comprised of long maturity Separate Trading of Registered Interest and Principal of Securities (STRIPS) representing the final principal payment of U.S. Treasury bonds.
It is not possible to invest directly in an unmanaged index.
Performance quoted represents past performance. Past performance is not a guarantee or a reliable indicator of future results. Current performance may be lower or higher than performance shown. Investment return and the principal value of an investment will fluctuate. Shares may be worth more or less than original cost when redeemed by authorized participants. Returns shown do not reflect the deduction of taxes that a shareholder would pay on Fund distributions or on the redemption of Fund shares. Differences in the Fund’s performance versus the index and related attribution information with respect to particular categories of securities or individual positions may be attributable, in part, to differences in the pricing methodologies used by the Fund and the index. Performance data current to the most recent month-end is available at www.pimcoetfs.com or via (888) 400-4ETF.
The Fund’s total annual operating expense ratio in effect as of period end was 0.15%. Details regarding any changes to the Fund’s operating expenses, subsequent to period end, can be found in the Fund’s current prospectus, as supplemented.
Investment Objective and Strategy Overview
PIMCO 25+ Year Zero Coupon U.S. Treasury Index Exchange-Traded Fund seeks to provide total return that closely corresponds, before fees and expenses, to the total return of the ICE BofAML Long US Treasury Principal STRIPS Index (the “Underlying Index”), by investing under normal circumstances at least 80% of its total assets (exclusive of collateral held from securities lending) in the component securities (“Component Securities”) of the Underlying Index. The Fund may invest the remainder of its assets in Fixed Income Instruments that are not Component Securities, but which PIMCO believes will help the Fund track its Underlying Index, as well as in cash and investment grade, liquid short-term instruments, forwards or derivatives, such as options, futures contracts or swap agreements, and shares of affiliated bond funds. “Fixed Income Instruments” include bonds, debt securities and other similar instruments issued by various U.S. and non-U.S. public- or private-sector entities. Fund strategies may change from time to time. Please refer to the Fund’s current prospectus for more information regarding the Fund’s strategy.
Fund Insights at NAV
The following affected performance (on a gross basis) during the reporting period:
| » | | Rates in the 25+ year segment of the U.S. Treasury Separate Trading of Registered Interest and Principal of Securities (“STRIPS”) (zero-coupon) curve declined, positively impacting the return of both the Fund and the Underlying Index. |
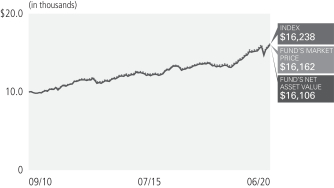
PIMCO 1-5 Year U.S. TIPS Index Exchange-Traded Fund
Cumulative Returns Through June 30, 2020
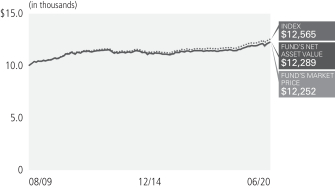
$10,000 invested at the end of the month when the Fund commenced operations.
Allocation Breakdown
as of June 30, 2020†§
| | | | |
| |
U.S. Treasury Obligations | | | 99.9% | |
| |
Short-Term Instruments | | | 0.1% | |
| | † | % of Investments, at value. |
| | § | Allocation Breakdown and % of investments exclude securities sold short and financial derivative instruments, if any. |
| | | | | | | | | | | | | | | | | | |
|
| Average Annual Total Return for the period ended June 30, 2020 | |
| | | | | |
| | | | | 1 Year | | | 5 Year | | | 10 Years | | | Fund Inception
(08/20/2009) | |
| | PIMCO 1-5 Year U.S. TIPS Index Exchange-Traded Fund (Based on Net Asset Value) | | | 3.52% | | | | 1.88% | | | | 1.55% | | | | 1.90% | |
| | PIMCO 1-5 Year U.S. TIPS Index Exchange-Traded Fund (At Market Price)(1) | | | 3.55% | | | | 1.87% | | | | 1.54% | | | | 1.90% | |
| | The ICE BofAML 1-5 Year U.S. Inflation-Linked Treasury Index± | | | 3.64% | | | | 2.06% | | | | 1.76% | | | | 2.11% | |
All Fund returns are net of fees and expenses and include applicable fee waivers and/or expense limitations. Absent any applicable fee waivers and/or expense limitations, performance would have been lower and there can be no assurance that any such waivers or limitations will continue in the future.
Market Returns do not include brokerage commissions that may be payable on secondary market transactions. If brokerage commissions were included, market returns would be lower. Market and NAV returns assume that dividends and capital gain distributions have been reinvested in the Fund at market price and NAV, respectively.
| (1) | The market price is determined using the midpoint between the highest bid and the lowest offer on the listing exchange, as of the time that the Fund’s NAV is calculated. |
± The ICE BofAML 1-5 Year US Inflation-Linked Treasury Index is an unmanaged index comprised of TIPS (Treasury Inflation Protected Securities) with a maturity of at least 1 year and less than 5 years.
It is not possible to invest directly in an unmanaged index.
Performance quoted represents past performance. Past performance is not a guarantee or a reliable indicator of future results. Current performance may be lower or higher than performance shown. Investment return and the principal value of an investment will fluctuate. Shares may be worth more or less than original cost when redeemed by authorized participants. Returns shown do not reflect the deduction of taxes that a shareholder would pay on Fund distributions or on the redemption of Fund shares. Differences in the Fund’s performance versus the index and related attribution information with respect to particular categories of securities or individual positions may be attributable, in part, to differences in the pricing methodologies used by the Fund and the index. Performance data current to the most recent month-end is available at www.pimcoetfs.com or via (888) 400-4ETF.
The Fund’s total annual operating expense ratio in effect as of period end was 0.20%. Details regarding any changes to the Fund’s operating expenses, subsequent to period end, can be found in the Fund’s current prospectus, as supplemented.
Investment Objective and Strategy Overview
PIMCO 1-5 Year U.S. TIPS Index Exchange-Traded Fund seeks to provide total return that closely corresponds, before fees and expenses, to the total return of the ICE BofAML 1-5 Year US Inflation-Linked Treasury Index (the “Underlying Index”), by investing under normal circumstances at least 80% of its total assets (exclusive of collateral held from securities lending) in the component securities (“Component Securities”) of the Underlying Index. The Fund may invest the remainder of its assets in Fixed Income Instruments that are not Component Securities, but which PIMCO believes will help the Fund track its Underlying Index, as well as in cash and investment grade, liquid short-term instruments, forwards or derivatives, such as options, futures contracts or swap agreements, and shares of affiliated bond funds. “Fixed Income Instruments” include bonds, debt securities and other similar instruments issued by various U.S. and non-U.S. public- or private-sector entities. Fund strategies may change from time to time. Please refer to the Fund’s current prospectus for more information regarding the Fund’s strategy.
Fund Insights at NAV
The following affected performance (on a gross basis) during the reporting period:
| » | | U.S. real yields moved lower across the U.S. Treasury inflation-protected securities (“TIPS”) yield curve, resulting in positive performance for both the Fund and the 1-5 Year U.S. TIPS Index. |
| » | | A positive inflation accrual, or the change in the Consumer Price Index, applied to the principal of underlying securities had a positive impact on performance for both the Fund and the index. |
| | | | | | |
| | ANNUAL REPORT | | JUNE 30, 2020 | | 9 |
PIMCO 15+ Year U.S. TIPS Index Exchange-Traded Fund
Cumulative Returns Through June 30, 2020
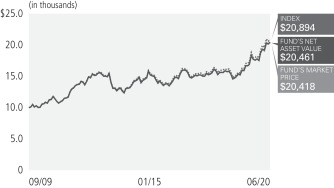
$10,000 invested at the end of the month when the Fund commenced operations.
Allocation Breakdown
as of June 30, 2020†§
| | | | |
U.S. Treasury Obligations | | | 99.9% | |
| |
Short-Term Instruments | | | 0.1% | |
| | † | % of Investments, at value. |
| | § | Allocation Breakdown and % of investments exclude securities sold short and financial derivative instruments, if any. |
| | | | | | | | | | | | | | | | | | |
|
| Average Annual Total Return for the period ended June 30, 2020 | |
| | | | | |
| | | | | 1 Year | | | 5 Year | | | 10 Years | | | Fund Inception
(09/03/2009) | |
| | PIMCO 15+ Year U.S. TIPS Index Exchange-Traded Fund (Based on Net Asset Value) | | | 22.47% | | | | 8.05% | | | | 6.55% | | | | 7.06% | |
| | PIMCO 15+ Year U.S. TIPS Index Exchange-Traded Fund (At Market Price)(1) | | | 22.39% | | | | 8.03% | | | | 6.55% | | | | 7.06% | |
| | The ICE BofAML 15+ Year U.S. Inflation-Linked Treasury Index± | | | 22.44% | | | | 8.11% | | | | 6.76% | | | | 7.25% | |
All Fund returns are net of fees and expenses and include applicable fee waivers and/or expense limitations. Absent any applicable fee waivers and/or expense limitations, performance would have been lower and there can be no assurance that any such waivers or limitations will continue in the future.
Market Returns do not include brokerage commissions that may be payable on secondary market transactions. If brokerage commissions were included, market returns would be lower. Market and NAV returns assume that dividends and capital gain distributions have been reinvested in the Fund at market price and NAV, respectively.
| (1) | The market price is determined using the midpoint between the highest bid and the lowest offer on the listing exchange, as of the time that the Fund’s NAV is calculated. |
± The ICE BofAML 15+ Year US Inflation-Linked Treasury Index is an unmanaged index comprised of TIPS (Treasury Inflation Protected Securities) with a maturity of at least 15 years.
It is not possible to invest directly in an unmanaged index.
Performance quoted represents past performance. Past performance is not a guarantee or a reliable indicator of future results. Current performance may be lower or higher than performance shown. Investment return and the principal value of an investment will fluctuate. Shares may be worth more or less than original cost when redeemed by authorized participants. Returns shown do not reflect the deduction of taxes that a shareholder would pay on Fund distributions or on the redemption of Fund shares. Differences in the Fund’s performance versus the index and related attribution information with respect to particular categories of securities or individual positions may be attributable, in part, to differences in the pricing methodologies used by the Fund and the index. Performance data current to the most recent month-end is available at www.pimcoetfs.com or via (888) 400-4ETF.
The Fund’s total annual operating expense ratio in effect as of period end was 0.20%. Details regarding any changes to the Fund’s operating expenses, subsequent to period end, can be found in the Fund’s current prospectus, as supplemented.
Investment Objective and Strategy Overview
PIMCO 15+ Year U.S. TIPS Index Exchange-Traded Fund seeks to provide total return that closely corresponds, before fees and expenses, to the total return of the ICE BofAML 15+ Year US Inflation-Linked Treasury Index (the “Underlying Index”), by investing under normal circumstances at least 80% of its total assets (exclusive of collateral held from securities lending) in the component securities (“Component Securities”) of the Underlying Index. The Fund may invest the remainder of its assets in Fixed Income Instruments that are not Component Securities, but which PIMCO believes will help the Fund track its Underlying Index, as well as in cash and investment grade, liquid short-term instruments, forwards or derivatives, such as options, futures contracts or swap agreements, and shares of affiliated bond funds. “Fixed Income Instruments” include bonds, debt securities and other similar instruments issued by various U.S. and non-U.S. public- or private-sector entities. Fund strategies may change from time to time. Please refer to the Fund’s current prospectus for more information regarding the Fund’s strategy.
Fund Insights at NAV
The following affected performance (on a gross basis) during the reporting period:
| » | | U.S. real yields moved lower across the U.S. Treasury inflation-protected securities (“TIPS”) yield curve, resulting in positive performance for both the Fund and the 15+ Year U.S. TIPS Index. |
| » | | A positive inflation accrual, or the change in the Consumer Price Index, applied to the principal of underlying securities had a positive impact on performance for both the Fund and the index. |
PIMCO Broad U.S. TIPS Index Exchange-Traded Fund
Cumulative Returns Through June 30, 2020
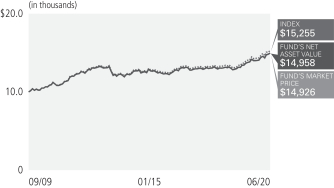
$10,000 invested at the end of the month when the Fund commenced operations.
Allocation Breakdown
as of June 30, 2020†§
| | | | |
U.S. Treasury Obligations | | | 98.1% | |
| |
Short-Term Instruments | | | 1.9% | |
| | † | % of Investments, at value. |
| | § | Allocation Breakdown and % of investments exclude securities sold short and financial derivative instruments, if any. |
| | | | | | | | | | | | | | | | | | |
|
| Average Annual Total Return for the period ended June 30, 2020 | �� |
| | | | | |
| | | | | 1 Year | | | 5 Year | | | 10 Years | | | Fund Inception
(09/03/2009) | |
| | PIMCO Broad U.S. TIPS Index Exchange-Traded Fund (Based on Net Asset Value) | | | 8.61% | | | | 3.80% | | | | 3.47% | | | | 3.93% | |
| | PIMCO Broad U.S. TIPS Index Exchange-Traded Fund (At Market Price)(1) | | | 8.63% | | | | 3.77% | | | | 3.46% | | | | 3.92% | |
| | The ICE BofAML U.S. Inflation-Linked Treasury Index± | | | 8.69% | | | | 3.91% | | | | 3.66% | | | | 4.11% | |
All Fund returns are net of fees and expenses and include applicable fee waivers and/or expense limitations. Absent any applicable fee waivers and/or expense limitations, performance would have been lower and there can be no assurance that any such waivers or limitations will continue in the future.
Market Returns do not include brokerage commissions that may be payable on secondary market transactions. If brokerage commissions were included, market returns would be lower. Market and NAV returns assume that dividends and capital gain distributions have been reinvested in the Fund at market price and NAV, respectively.
| (1) | The market price is determined using the midpoint between the highest bid and the lowest offer on the listing exchange, as of the time that the Fund’s NAV is calculated. |
± The ICE BofAML US Inflation-Linked Treasury Index is an unmanaged index comprised of TIPS (Treasury Inflation Protected Securities).
It is not possible to invest directly in an unmanaged index.
Performance quoted represents past performance. Past performance is not a guarantee or a reliable indicator of future results. Current performance may be lower or higher than performance shown. Investment return and the principal value of an investment will fluctuate. Shares may be worth more or less than original cost when redeemed by authorized participants. Returns shown do not reflect the deduction of taxes that a shareholder would pay on Fund distributions or on the redemption of Fund shares. Differences in the Fund’s performance versus the index and related attribution information with respect to particular categories of securities or individual positions may be attributable, in part, to differences in the pricing methodologies used by the Fund and the index. Performance data current to the most recent month-end is available at www.pimcoetfs.com or via (888) 400-4ETF.
The Fund’s total annual operating expense ratio in effect as of period end was 0.20%. Details regarding any changes to the Fund’s operating expenses, subsequent to period end, can be found in the Fund’s current prospectus, as supplemented.
Investment Objective and Strategy Overview
PIMCO Broad U.S. TIPS Index Exchange-Traded Fund seeks to provide total return that closely corresponds, before fees and expenses, to the total return of the ICE BofAML US Inflation-Linked Treasury Index (the “Underlying Index”), by investing under normal circumstances at least 80% of its total assets (exclusive of collateral held from securities lending) in the component securities (“Component Securities”) of the Underlying Index. The Fund may invest the remainder of its assets in Fixed Income Instruments that are not Component Securities, but which PIMCO believes will help the Fund track its Underlying Index, as well as in cash and investment grade, liquid short-term instruments, forwards or derivatives, such as options, futures contracts or swap agreements, and shares of affiliated bond funds. PIMCO uses an indexing approach in managing the Fund’s investments. “Fixed Income Instruments” include bonds, debt securities and other similar instruments issued by various U.S. and non-U.S. public- or private-sector entities. Fund strategies may change from time to time. Please refer to the Fund’s current prospectus for more information regarding the Fund’s strategy.
Fund Insights at NAV
The following affected performance (on a gross basis) during the reporting period:
| » | | U.S. real yields moved lower across the U.S. Treasury inflation-protected securities (“TIPS”) yield curve, resulting in positive performance for both the Fund and the U.S. TIPS Index. |
| » | | A positive inflation accrual, or the change in the Consumer Price Index, applied to the principal of underlying securities had a positive impact on performance for both the Fund and the index. |
| | | | | | |
| | ANNUAL REPORT | | JUNE 30, 2020 | | 11 |
PIMCO 0-5 Year High Yield Corporate Bond Index Exchange-Traded Fund
Cumulative Returns Through June 30, 2020
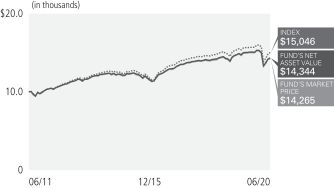
$10,000 invested at the end of the month when the Fund commenced operations.
Allocation Breakdown as of June 30, 2020†§
| | | | |
Corporate Bonds & Notes | | | 92.5% | |
| |
Short-Term Instruments | | | 7.3% | |
| |
Other | | | 0.2% | |
| | † | % of Investments, at value. |
| | § | Allocation Breakdown and % of investments exclude securities sold short and financial derivative instruments, if any. |
| | | | | | | | | | | | | | |
|
| Average Annual Total Return for the period ended June 30, 2020 | |
| | | | |
| | | | | 1 Year | | | 5 Year | | | Fund Inception
(06/16/2011) | |
| | PIMCO 0-5 Year High Yield Corporate Bond Index Exchange-Traded Fund (Based on Net Asset Value) | | | (4.56)% | | | | 3.12% | | | | 4.12% | |
| | PIMCO 0-5 Year High Yield Corporate Bond Index Exchange-Traded Fund (At Market Price)(1) | | | (4.65)% | | | | 3.16% | | | | 4.09% | |
| | ICE BofAML 0-5 Year US High Yield Constrained Index± | | | (3.67)% | | | | 3.56% | | | | 4.66% | |
All Fund returns are net of fees and expenses and include applicable fee waivers and/or expense limitations. Absent any applicable fee waivers and/or expense limitations, performance would have been lower and there can be no assurance that any such waivers or limitations will continue in the future.
Market Returns do not include brokerage commissions that may be payable on secondary market transactions. If brokerage commissions were included, market returns would be lower. Market and NAV returns assume that dividends and capital gain distributions have been reinvested in the Fund at market price and NAV, respectively.
| (1) | The market price is determined using the midpoint between the highest bid and the lowest offer on the listing exchange, as of the time that the Fund’s NAV is calculated. |
± The ICE BofAML 0-5 Year US High Yield Constrained Index tracks the performance of short-term U.S. dollar denominated below investment grade corporate debt issued in the U.S. domestic market with less than five years remaining term to final maturity, a fixed coupon schedule and a minimum amount outstanding of $100 million, issued publicly. Allocations to an individual issuer will not exceed 2%.
It is not possible to invest directly in an unmanaged index.
Performance quoted represents past performance. Past performance is not a guarantee or a reliable indicator of future results. Current performance may be lower or higher than performance shown. Investment return and the principal value of an investment will fluctuate. Shares may be worth more or less than original cost when redeemed by authorized participants. Returns shown do not reflect the deduction of taxes that a shareholder would pay on Fund distributions or on the redemption of Fund shares. Differences in the Fund’s performance versus the index and related attribution information with respect to particular categories of securities or individual positions may be attributable, in part, to differences in the pricing methodologies used by the Fund and the index. Performance data current to the most recent month-end is available at www.pimcoetfs.com or via (888) 400-4ETF.
The Fund’s total annual operating expense ratio in effect as of period end was 0.56%. Details regarding any changes to the Fund’s operating expenses, subsequent to period end, can be found in the Fund’s current prospectus, as supplemented.
Investment Objective and Strategy Overview
PIMCO 0-5 Year High Yield Corporate Bond Index Exchange-Traded Fund seeks to provide total return that closely corresponds, before fees and expenses, to the total return of the ICE BofAML 0-5 Year US High Yield Constrained Index (the “Underlying Index”), by investing under normal circumstances at least 80% of its total assets (exclusive of collateral held from securities lending) in the component securities (“Component Securities”) of the Underlying Index. The Fund may invest the remainder of its assets in Fixed Income Instruments that are not Component Securities, but which PIMCO believes will help the Fund track its Underlying Index, as well as in cash and investment grade, liquid short-term instruments, forwards or derivatives, such as options, futures contracts or swap agreements, and shares of affiliated bond funds. “Fixed Income Instruments” include bonds, debt securities and other similar instruments issued by various U.S. and non-U.S. public- or private-sector entities. Fund strategies may change from time to time. Please refer to the Fund’s current prospectus for more information regarding the Fund’s strategy.
Fund Insights at NAV
The following affected performance (on a gross basis) during the reporting period:
| » | | Security selection in the energy sector contributed to performance, as the Fund’s energy positions outperformed the broader sector. |
| » | | Security selection in the support services sector contributed to performance, as the Fund’s support services positions outperformed the broader sector. |
| » | | Overweight exposure to the banking sector contributed to performance, as the banking sector outperformed the broader market. |
| » | | Security selection in the retail sector detracted from performance, as the Fund’s retail sector positions underperformed the broader sector. |
| » | | Overweight exposure to the energy sector detracted from performance, as the energy sector underperformed the broader market. |
| » | | Security selection in the telecommunications sector detracted from performance, as the Fund’s telecommuncations positions underperformed the broader sector. |
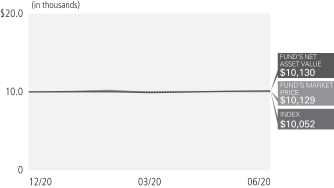
PIMCO Investment Grade Corporate Bond Index Exchange-Traded Fund
Cumulative Returns Through June 30, 2020
$10,000 invested at the end of the month when the Fund commenced operations.
Allocation Breakdown
as of June 30, 2020†§
| | | | |
Industrials | | | 44.7% | |
| |
Banking & Finance | | | 39.6% | |
| |
Utilities | | | 13.3% | |
| |
Short-Term Instruments | | | 2.2% | |
| |
Sovereign Issues | | | 0.2% | |
| | † | % of Investments, at value. |
| | § | Allocation Breakdown and % of investments exclude securities sold short and financial derivative instruments, if any. |
| | | | | | | | | | | | | | |
|
| Average Annual Total Return for the period ended June 30, 2020 | |
| | | | |
| | | | | 1 Year | | | 5 Year | | | Fund Inception
(09/20/2010) | |
| | PIMCO Investment Grade Corporate Bond Index Exchange-Traded Fund (Based on Net Asset Value) | | | 9.76% | | | | 5.82% | | | | 5.14% | |
| | PIMCO Investment Grade Corporate Bond Index Exchange-Traded Fund (At Market Price)(1) | | | 9.88% | | | | 5.85% | | | | 5.17% | |
| | ICE BofAML US Corporate IndexSM± | | | 9.30% | | | | 5.69% | | | | 5.20% | |
All Fund returns are net of fees and expenses and include applicable fee waivers and/or expense limitations. Absent any applicable fee waivers and/or expense limitations, performance would have been lower and there can be no assurance that any such waivers or limitations will continue in the future.
Market Returns do not include brokerage commissions that may be payable on secondary market transactions. If brokerage commissions were included, market returns would be lower. Market and NAV returns assume that dividends and capital gain distributions have been reinvested in the Fund at market price and NAV, respectively.
| (1) | The market price is determined using the midpoint between the highest bid and the lowest offer on the listing exchange, as of the time that the Fund’s NAV is calculated. |
± ICE BofAML US Corporate Indexsm is an unmanaged index comprised of U.S. dollar denominated investment grade, fixed rate corporate debt securities publicly issued in the U.S. domestic market with at least one year remaining term to final maturity and at least $250 million outstanding.
It is not possible to invest directly in an unmanaged index.
Performance quoted represents past performance. Past performance is not a guarantee or a reliable indicator of future results. Current performance may be lower or higher than performance shown. Investment return and the principal value of an investment will fluctuate. Shares may be worth more or less than original cost when redeemed by authorized participants. Returns shown do not reflect the deduction of taxes that a shareholder would pay on Fund distributions or on the redemption of Fund shares. Differences in the Fund’s performance versus the index and related attribution information with respect to particular categories of securities or individual positions may be attributable, in part, to differences in the pricing methodologies used by the Fund and the index. Performance data current to the most recent month-end is available at www.pimcoetfs.com or via (888) 400-4ETF.
The Fund’s total annual operating expense ratio in effect as of period end was 0.20%. Details regarding any changes to the Fund’s operating expenses, subsequent to period end, can be found in the Fund’s current prospectus, as supplemented.
Investment Objective and Strategy Overview
PIMCO Investment Grade Corporate Bond Index Exchange-Traded Fund seeks to provide total return that closely corresponds, before fees and expenses, to the total return of the ICE BofAML US Corporate Index (the “Underlying Index”), by investing under normal circumstances at least 80% of its total assets (exclusive of collateral held from securities lending) in the component securities (“Component Securities”) of the Underlying Index. The Fund may invest the remainder of its assets in Fixed Income Instruments that are not Component Securities, but which PIMCO believes will help the Fund track its Underlying Index, as well as in cash and investment grade, liquid short-term instruments, forwards or derivatives, such as options, futures contracts or swap agreements, and shares of affiliated bond funds. “Fixed Income Instruments” include bonds, debt securities and other similar instruments issued by various U.S. and non-U.S. public- or private-sector entities. Fund strategies may change from time to time. Please refer to the Fund’s current prospectus for more information regarding the Fund’s strategy.
Fund Insights at NAV
The following affected performance (on a gross basis) during the reporting period:
| » | | The Fund had positive performance over the period as the index had positive performance over period. |
| | | | | | |
| | ANNUAL REPORT | | JUNE 30, 2020 | | 13 |
PIMCO Active Bond Exchange-Traded Fund
Cumulative Returns Through June 30, 2020
$10,000 invested at the end of the month when the Fund commenced operations.
Allocation Breakdown
as of June 30, 2020†§
| | | | |
U.S. Government Agencies | | | 41.0% | |
| |
Corporate Bonds & Notes | | | 28.0% | |
| |
Asset-Backed Securities | | | 9.5% | |
| |
U.S. Treasury Obligations | | | 6.7% | |
| |
Short-Term Instruments | | | 5.7% | |
| |
Non-Agency Mortgage-Backed Securities | | | 5.4% | |
| |
Municipal Bonds & Notes | | | 1.7% | |
| |
Other | | | 2.0% | |
| | † | % of Investments, at value. |
| | § | Allocation Breakdown and % of investments exclude securities sold short and financial derivative instruments, if any. |
| | | | | | | | | | | | | | |
|
Average Annual Total Return for the period ended June 30, 2020 | |
| | | | |
| | | | | 1 Year | | | 5 Year | | | Fund Inception
(02/29/2012) | |
| | PIMCO Active Bond Exchange-Traded Fund (Based on Net Asset Value) | | | 6.92% | | | | 4.27% | | | | 4.67% | |
| | PIMCO Active Bond Exchange-Traded Fund (At Market Price)(1) | | | 7.09% | | | | 4.27% | | | | 4.69% | |
| | Bloomberg Barclays U.S. Aggregate Index± | | | 8.74% | | | | 4.30% | | | | 3.41% | |
All Fund returns are net of fees and expenses and include applicable fee waivers and/or expense limitations. Absent any applicable fee waivers and/or expense limitations, performance would have been lower and there can be no assurance that any such waivers or limitations will continue in the future.
Market Returns do not include brokerage commissions that may be payable on secondary market transactions. If brokerage commissions were included, market returns would be lower. Market and NAV returns assume that dividends and capital gain distributions have been reinvested in the Fund at market price and NAV, respectively.
| (1) | The market price is determined using the midpoint between the highest bid and the lowest offer on the listing exchange, as of the time that the Fund’s NAV is calculated. |
± Bloomberg Barclays U.S. Aggregate Index represents securities that are SEC-registered, taxable, and dollar denominated. The index covers the U.S. investment grade fixed rate bond market, with index components for government and corporate securities, mortgage pass-through securities, and asset-backed securities. These major sectors are subdivided into more specific indices that are calculated and reported on a regular basis.
It is not possible to invest directly in an unmanaged index.
Performance quoted represents past performance. Past performance is not a guarantee or a reliable indicator of future results. Current performance may be lower or higher than performance shown. Investment return and the principal value of an investment will fluctuate. Shares may be worth more or less than original cost when redeemed by authorized participants. Returns shown do not reflect the deduction of taxes that a shareholder would pay on Fund distributions or on the redemption of Fund shares. Differences in the Fund’s performance versus the index and related attribution information with respect to particular categories of securities or individual positions may be attributable, in part, to differences in the pricing methodologies used by the Fund and the index. Performance data current to the most recent month-end is available at www.pimcoetfs.com or via (888) 400-4ETF.
The Fund’s total annual operating expense ratio in effect as of period end was 0.73%. Details regarding any changes to the Fund’s operating expenses, subsequent to period end, can be found in the Fund’s current prospectus, as supplemented.
Investment Objective and Strategy Overview
PIMCO Active Bond Exchange-Traded Fund seeks current income and long-term capital appreciation, consistent with prudent investment management, by investing under normal circumstances at least 80% of its assets in a diversified portfolio of Fixed Income Instruments of varying maturities, which may be represented by forwards or derivatives such as options, futures contracts, or swap agreements. “Fixed Income Instruments” include bonds, debt securities and other similar instruments issued by various U.S. and non-U.S. public- or private-sector entities. Fund strategies may change from time to time. Please refer to the Fund’s current prospectus for more information regarding the Fund’s strategy.
Fund Insights at NAV
The following affected performance (on a gross basis) during the reporting period:
| » | | Underweight exposure to investment-grade corporate spread duration contributed to relative performance, as spreads widened. |
| » | | Exposure to duration in Canada contributed to relative performance, as interest rates decreased. |
| » | | Overweight exposure to Agency mortgage-backed securities contributed to relative performance, as excess returns for these securities were positive. |
| » | | Underweight exposure to U.S. duration detracted from relative performance, as interest rates decreased. |
| » | | Overweight exposure to securitized assets, particularly asset backed securities, detracted from relative performance, as spreads widened. |
| » | | Select holdings of taxable municipals detracted from relative performance, as spreads widened. |
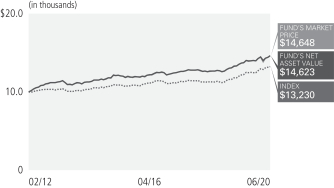
PIMCO Enhanced Low Duration Active Exchange-Traded Fund
Cumulative Returns Through June 30, 2020
$10,000 invested at the end of the month when the Fund commenced operations.
Allocation Breakdown
as of June 30, 2020†§
| | | | |
U.S. Treasury Obligations | | | 42.7% | |
| |
Corporate Bonds & Notes | | | 34.7% | |
| |
Asset-Backed Securities | | | 7.0% | |
| |
U.S. Government Agencies | | | 5.2% | |
| |
Short-Term Instruments | | | 5.1% | |
| |
Non-Agency Mortgage-Backed Securities | | | 4.8% | |
| |
Other | | | 0.5% | |
| | † | % of Investments, at value. |
| | § | Allocation Breakdown and % of investments exclude securities sold short and financial derivative instruments, if any. |
| | | | | | | | | | | | | | |
|
| Average Annual Total Return for the period ended June 30, 2020 | |
| | | | |
| | | | | 1 Year | | | 5 Year | | | Fund Inception
(01/22/2014) | |
| | PIMCO Enhanced Low Duration Active Exchange-Traded Fund (Based on Net Asset Value) | | | 4.77% | | | | 2.75% | | | | 2.74% | |
| | PIMCO Enhanced Low Duration Active Exchange-Traded Fund (At Market Price)(1) | | | 4.89% | | | | 2.78% | | | | 2.77% | |
| | ICE BofAML 1-3 Year U.S. Treasury Index± | | | 4.07% | | | | 1.84% | | | | 1.63% | |
All Fund returns are net of fees and expenses and include applicable fee waivers and/or expense limitations. Absent any applicable fee waivers and/or expense limitations, performance would have been lower and there can be no assurance that any such waivers or limitations will continue in the future.
Market Returns do not include brokerage commissions that may be payable on secondary market transactions. If brokerage commissions were included, market returns would be lower. Market and NAV returns assume that dividends and capital gain distributions have been reinvested in the Fund at market price and NAV, respectively.
| (1) | The market price is determined using the midpoint between the highest bid and the lowest offer on the listing exchange, as of the time that the Fund’s NAV is calculated. |
± The ICE BofAML 1-3 Year U.S. Treasury Index is an unmanaged index comprised of U.S. Treasury securities, other than inflation-protection securities and STRIPS, with at least $1 billion in outstanding face value and a remaining term to final maturity of at least one year and less than three years.
It is not possible to invest directly in an unmanaged index.
Performance quoted represents past performance. Past performance is not a guarantee or a reliable indicator of future results. Current performance may be lower or higher than performance shown. Investment return and the principal value of an investment will fluctuate. Shares may be worth more or less than original cost when redeemed by authorized participants. Returns shown do not reflect the deduction of taxes that a shareholder would pay on Fund distributions or on the redemption of Fund shares. Differences in the Fund’s performance versus the index and related attribution information with respect to particular categories of securities or individual positions may be attributable, in part, to differences in the pricing methodologies used by the Fund and the index. Performance data current to the most recent month-end is available at www.pimcoetfs.com or via (888) 400-4ETF.
The Fund’s total annual operating expense ratio in effect as of period end was 0.86%. Details regarding any changes to the Fund’s operating expenses, subsequent to period end, can be found in the Fund’s current prospectus, as supplemented.
Investment Objective and Strategy Overview
PIMCO Enhanced Low Duration Active Exchange-Traded Fund seeks maximum total return, consistent with preservation of capital and prudent investment management, by investing under normal circumstances at least 80% of its net assets in a diversified portfolio of Fixed Income Instruments of varying maturities, which may be represented by forwards or derivatives such as options, futures contracts, or swap agreements. “Fixed Income Instruments” include bonds, debt securities and other similar instruments issued by various U.S. and non-U.S. public- or private-sector entities. Fund strategies may change from time to time. Please refer to the Fund’s current prospectus for more information regarding the Fund’s strategy.
Fund Insights at NAV
The following affected performance (on a gross basis) during the reporting period:
| » | | Overweight exposure to U.S. duration contributed to relative performance, as rates declined. |
| » | | Overweight exposure to Agency mortgage-backed securities (“MBS”) contributed to relative performance, as total returns for these securities were positive. |
| » | | Short exposure to the Australian dollar contributed to relative performance, as the currency depreciated relative to the U.S. dollar. |
| » | | Positions in U.S. Treasury inflation-protected securities detracted from relative performance, as breakeven inflation rates declined. |
| » | | Positions in non-Agency MBS detracted from relative performance, as excess returns for these securities were negative. |
| | | | | | |
| | ANNUAL REPORT | | JUNE 30, 2020 | | 15 |
PIMCO Enhanced Short Maturity Active ESG Exchange-Traded Fund
Cumulative Returns Through June 30, 2020
$10,000 invested at the end of the month when the Fund commenced operations.
Allocation Breakdown
as of June 30, 2020†§
| | | | |
Corporate Bonds & Notes | | | 56.1% | |
| |
U.S. Government Agencies | | | 23.2% | |
| |
Short-Term Instruments | | | 10.8% | |
| |
Asset-Backed Securities | | | 9.1% | |
| |
Other | | | 0.8% | |
| | † | % of Investments, at value. |
| | § | Allocation Breakdown and % of investments exclude securities sold short and financial derivative instruments, if any. |
| | | | | | |
|
| Cumulative Total Return for the period ended June 30, 2020 | |
| | |
| | | | | Fund Inception
(12/10/2019) | |
| | PIMCO Enhanced Short Maturity Active ESG Exchange-Traded Fund (Based on Net Asset Value) | | | 1.53% | |
| | PIMCO Enhanced Short Maturity Active ESG Exchange-Traded Fund (At Market Price)(1)(2) | | | 1.51% | |
| | FTSE 3-Month Treasury Bill Index± | | | 0.62% | |
All Fund returns are net of fees and expenses and include applicable fee waivers and/or expense limitations. Absent any applicable fee waivers and/or expense limitations, performance would have been lower and there can be no assurance that any such waivers or limitations will continue in the future.
Market Returns do not include brokerage commissions that may be payable on secondary market transactions. If brokerage commissions were included, market returns would be lower. Market and NAV returns assume that dividends and capital gain distributions have been reinvested in the Fund at market price and NAV, respectively.
| (1) | The market price is determined using the midpoint between the highest bid and the lowest offer on the listing exchange, as of the time that the Fund’s NAV is calculated. |
| (2) | The Fund was seeded on December 10, 2019, but was not listed for trading until December 12, 2019. Accordingly, there is no Market Price information for December 10, 2019 through December 11, 2019. |
± FTSE 3-Month Treasury Bill Index is an unmanaged index representing monthly return equivalents of yield averages of the last 3 month Treasury Bill issues.
It is not possible to invest directly in an unmanaged index.
Performance quoted represents past performance. Past performance is not a guarantee or a reliable indicator of future results. Current performance may be lower or higher than performance shown. Investment return and the principal value of an investment will fluctuate. Shares may be worth more or less than original cost when redeemed by authorized participants. Returns shown do not reflect the deduction of taxes that a shareholder would pay on Fund distributions or on the redemption of Fund shares. Differences in the Fund’s performance versus the index and related attribution information with respect to particular categories of securities or individual positions may be attributable, in part, to differences in the pricing methodologies used by the Fund and the index. Performance data current to the most recent month-end is available at www.pimcoetfs.com or via (888) 400-4ETF.
The Fund’s total annual operating expense ratio in effect as of period end was 0.50%. Details regarding any changes to the Fund’s operating expenses, subsequent to period end, can be found in the Fund’s current prospectus, as supplemented.
Investment Objective and Strategy Overview
PIMCO Enhanced Short Maturity Active ESG Exchange-Traded Fund seeks maximum current income, consistent with preservation of capital and daily liquidity, while incorporating PIMCO’s ESG investment strategy. The Fund seeks to achieve its investment objective by investing under normal circumstances at least 80% of its net assets in a diversified portfolio of Fixed Income Instruments of varying maturities, which may be represented by forwards. “Fixed Income Instruments” include bonds, debt securities and other similar instruments issued by various U.S. and non-U.S. public- or private-sector entities. The Fund will not invest in the securities of any issuer determined by PIMCO to be engaged principally in the manufacture of alcoholic beverages, tobacco products or military equipment, the operation of gambling casinos, the production of coal, or in the production or trade of pornographic materials. To the extent possible on the basis of information available to PIMCO, an issuer will be deemed to be principally engaged in an activity if it derives more than 10% of its gross revenues from such activities. Fund strategies may change from time to time. Please refer to the Fund’s current prospectus for more information regarding the Fund’s strategy.
Fund Insights at NAV
The following affected performance (on a gross basis) during the reporting period:
| » | | Overweight exposure to U.S. duration contributed to relative performance, as rates declined. |
| » | | Overweight exposure to investment grade corporate spread duration contributed to relative performance, as the sector generated positive total carry. |
| » | | Holdings of select emerging market debt detracted from relative performance, as spreads widened. |
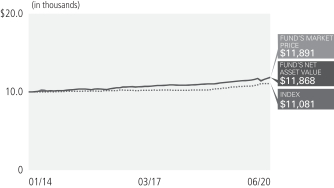
PIMCO Enhanced Short Maturity Active Exchange-Traded Fund
Cumulative Returns Through June 30, 2020
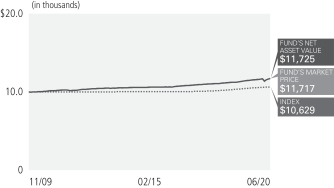
$10,000 invested at the end of the month when the Fund commenced operations.
Allocation Breakdown as of June 30, 2020†§
| | | | |
Corporate Bonds & Notes | | | 53.0% | |
| |
Short-Term Instruments | | | 16.7% | |
| |
Asset-Backed Securities | | | 15.6% | |
| |
U.S. Government Agencies | | | 10.9% | |
| |
Non-Agency Mortgage-Backed Securities | | | 2.7% | |
| |
Other | | | 1.1% | |
| | † | % of Investments, at value. |
| | § | Allocation Breakdown and % of investments exclude securities sold short and financial derivative instruments, if any. |
| | | | | | | | | | | | | | | | | | |
|
| Average Annual Total Return for the period ended June 30, 2020 | |
| | | | | |
| | | | | 1 Year | | | 5 Year | | | 10 Years | | | Fund Inception
(11/16/2009) | |
| | PIMCO Enhanced Short Maturity Active Exchange-Traded Fund (Based on Net Asset Value) | | | 2.21% | | | | 1.96% | | | | 1.55% | | | | 1.52% | |
| | PIMCO Enhanced Short Maturity Active Exchange-Traded Fund (At Market Price)(1) | | | 2.25% | | | | 1.97% | | | | 1.55% | | | | 1.52% | |
| | FTSE 3-Month Treasury Bill Index± | | | 1.56% | | | | 1.15% | | | | 0.61% | | | | 0.58%¨ | |
All Fund returns are net of fees and expenses and include applicable fee waivers and/or expense limitations. Absent any applicable fee waivers and/or expense limitations, performance would have been lower and there can be no assurance that any such waivers or limitations will continue in the future.
¨ Average annual total return since 11/30/2009.
Market Returns do not include brokerage commissions that may be payable on secondary market transactions. If brokerage commissions were included, market returns would be lower. Market and NAV returns assume that dividends and capital gain distributions have been reinvested in the Fund at market price and NAV, respectively.
| (1) | The market price is determined using the midpoint between the highest bid and the lowest offer on the listing exchange, as of the time that the Fund’s NAV is calculated. |
± FTSE 3-Month Treasury Bill Index is an unmanaged index representing monthly return equivalents of yield averages of the last 3 month Treasury Bill issues.
It is not possible to invest directly in an unmanaged index.
Performance quoted represents past performance. Past performance is not a guarantee or a reliable indicator of future results. Current performance may be lower or higher than performance shown. Investment return and the principal value of an investment will fluctuate. Shares may be worth more or less than original cost when redeemed by authorized participants. Returns shown do not reflect the deduction of taxes that a shareholder would pay on Fund distributions or on the redemption of Fund shares. Differences in the Fund’s performance versus the index and related attribution information with respect to particular categories of securities or individual positions may be attributable, in part, to differences in the pricing methodologies used by the Fund and the index. Performance data current to the most recent month-end is available at www.pimcoetfs.com or via (888) 400-4ETF.
The Fund’s total annual operating expense ratio in effect as of period end was 0.36%. Details regarding any changes to the Fund’s operating expenses, subsequent to period end, can be found in the Fund’s current prospectus, as supplemented.
Investment Objective and Strategy Overview
PIMCO Enhanced Short Maturity Active Exchange-Traded Fund seeks maximum current income, consistent with preservation of capital and daily liquidity, by investing under normal circumstances at least 80% of its net assets in a diversified portfolio of Fixed Income Instruments of varying maturities, which may be represented by forwards. “Fixed Income Instruments” include bonds, debt securities and other similar instruments issued by various U.S. and non-U.S. public- or private-sector entities. The Fund primarily invests in U.S. dollar-denominated investment grade debt securities, rated Baa or higher by Moody’s Investors Service, Inc. (“Moody’s”), or equivalently rated by Standard & Poor’s Ratings Services (“S&P”) or Fitch, Inc. (“Fitch”), or, if unrated, determined by PIMCO to be of comparable quality. The Fund may invest, without limitation, in U.S. dollar-denominated securities and instruments of foreign issuers. Fund strategies may change from time to time. Please refer to the Fund’s current prospectus for more information regarding the Fund’s strategy.
Fund Insights at NAV
The following affected performance (on a gross basis) during the reporting period:
| » | | Overweight exposure to U.S. duration contributed to relative performance, as rates declined. |
| » | | Overweight exposure to investment grade corporate spread duration contributed to relative performance, as the sector generated positive total carry. |
| » | | There were no material detractors for this Fund. |
| | | | | | |
| | ANNUAL REPORT | | JUNE 30, 2020 | | 17 |
PIMCO Intermediate Municipal Bond Active Exchange-Traded Fund
Cumulative Returns Through June 30, 2020
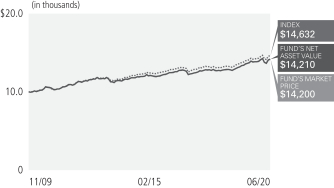
$10,000 invested at the end of the month when the Fund commenced operations.
Allocation Breakdown as of June 30, 2020†§
| | | | |
Municipal Bonds & Notes | | | | |
| |
Ad Valorem Property Tax | | | 11.1% | |
| |
Health, Hospital & Nursing Home Revenue | | | 10.3% | |
| |
Electric Power & Light Revenue | | | 8.0% | |
| |
Tobacco Settlement Funded | | | 5.9% | |
| |
Water Revenue | | | 5.6% | |
| |
Natural Gas Revenue | | | 5.1% | |
| |
Highway Revenue Tolls | | | 4.0% | |
| |
Miscellaneous Revenue | | | 4.0% | |
| |
College & University Revenue | | | 3.7% | |
| |
Sales Tax Revenue | | | 3.3% | |
| |
Port, Airport & Marina Revenue | | | 3.2% | |
| |
Industrial Revenue | | | 3.2% | |
| |
Fuel Sales Tax Revenue | | | 2.8% | |
| |
Lease (Appropriation) | | | 2.3% | |
| |
Transit Revenue | | | 2.2% | |
| |
Income Tax Revenue | | | 2.2% | |
| |
Appropriations | | | 2.1% | |
| |
Nuclear Revenue | | | 2.0% | |
| |
Sewer Revenue | | | 1.0% | |
| |
Other | | | 4.2% | |
| |
Short-Term Instruments | | | 13.8% | |
| | † | % of Investments, at value. |
| | § | Allocation Breakdown and % of investments exclude securities sold short and financial derivative instruments, if any. |
| | | | | | | | | | | | | | | | | | |
|
| Average Annual Total Return for the period ended June 30, 2020 | |
| | | | | |
| | | | | 1 Year | | | 5 Year | | | 10 Years | | | Fund Inception
(11/30/2009) | |
| | PIMCO Intermediate Municipal Bond Active Exchange-Traded Fund (Based on Net Asset Value) | | | 4.06% | | | | 3.47% | | | | 3.32% | | | | 3.38% | |
| | PIMCO Intermediate Municipal Bond Active Exchange-Traded Fund (At Market Price)(1) | | | 3.80% | | | | 3.50% | | | | 3.33% | | | | 3.37% | |
| | Bloomberg Barclays 1-15 Year Municipal Bond Index± | | | 4.18% | | | | 3.42% | | | | 3.59% | | | | 3.66% | |
All Fund returns are net of fees and expenses and include applicable fee waivers and/or expense limitations. Absent any applicable fee waivers and/or expense limitations, performance would have been lower and there can be no assurance that any such waivers or limitations will continue in the future.
Market Returns do not include brokerage commissions that may be payable on secondary market transactions. If brokerage commissions were included, market returns would be lower. Market and NAV returns assume that dividends and capital gain distributions have been reinvested in the Fund at market price and NAV, respectively.
| (1) | The market price is determined using the midpoint between the highest bid and the lowest offer on the listing exchange, as of the time that the Fund’s NAV is calculated. |
± Bloomberg Barclays 1-15 Year Municipal Bond Index consists of a broad selection of investment grade general obligation and revenue bonds of maturities ranging from one year to 17 years.
It is not possible to invest directly in an unmanaged index.
Performance quoted represents past performance. Past performance is not a guarantee or a reliable indicator of future results. Current performance may be lower or higher than performance shown. Investment return and the principal value of an investment will fluctuate. Shares may be worth more or less than original cost when redeemed by authorized participants. Returns shown do not reflect the deduction of taxes that a shareholder would pay on Fund distributions or on the redemption of Fund shares. Differences in the Fund’s performance versus the index and related attribution information with respect to particular categories of securities or individual positions may be attributable, in part, to differences in the pricing methodologies used by the Fund and the index. Performance data current to the most recent month-end is available at www.pimcoetfs.com or via (888) 400-4ETF.
The Fund’s total annual operating expense ratio in effect as of period end was 0.35%. Details regarding any changes to the Fund’s operating expenses, subsequent to period end, can be found in the Fund’s current prospectus, as supplemented.
Investment Objective and Strategy Overview
PIMCO Intermediate Municipal Bond Active Exchange-Traded Fund seeks attractive tax-exempt income, consistent with preservation of capital, by investing under normal circumstances at least 80% of its assets in a diversified portfolio of debt securities whose interest is, in the opinion of bond counsel for the issuer at the time of issuance, exempt from federal income tax (“Municipal Bonds”). The Fund does not intend to invest in Municipal Bonds whose interest is subject to the federal alternative minimum tax. The Fund may only invest in U.S. dollar-denominated investment grade debt securities, rated Baa or higher by Moody’s Investors Service, Inc. (“Moody’s”), or equivalently rated by Standard & Poor’s Ratings Services (“S&P”) or Fitch, Inc. (“Fitch”), or, if unrated, determined by PIMCO to be of comparable quality. The Fund may invest 25% or more of its total assets in Municipal Bonds that finance similar projects, such as those relating to education, health care, housing, transportation, and utilities, and 25% or more of its total assets in industrial development bonds. Fund strategies may change from time to time. Please refer to the Fund’s current prospectus for more information regarding the Fund’s strategy.
Fund Insights at NAV
The following affected performance (on a gross basis) during the reporting period:
| » | | Security selection within the revenue segment contributed to performance, as the Fund’s holdings outperformed the general municipal market. |
| » | | Security selection within the industrial revenue sector contributed to performance, as the Fund’s holdings outperformed the general municipal market. |
| » | | Security selection within the healthcare sector contributed to performance, as the Fund’s holdings outperformed the general municipal market. |
| » | | Underweight exposure to a duration position detracted from performance, as municipal yields declined across the curve. |
| » | | Security selection within the lease-backed sector detracted from performance, as the Fund’s holdings underperformed the general municipal market. |
| » | | Underweight exposure to the education sector detracted from performance, as the sector outperformed the general municipal market. |
PIMCO Short Term Municipal Bond Active Exchange-Traded Fund
Cumulative Returns Through June 30, 2020
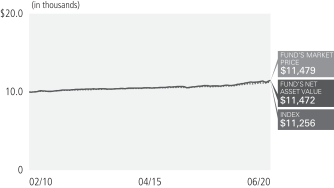
$10,000 invested at the end of the month when the Fund commenced operations.
Allocation Breakdown
as of June 30, 2020†§
| | | | |
| |
Municipal Bonds & Notes | | | | |
| |
Health, Hospital & Nursing Home Revenue | | | 12.1% | |
| |
Electric Power & Light Revenue | | | 10.7% | |
| |
Ad Valorem Property Tax | | | 10.4% | |
| |
College & University Revenue | | | 5.4% | |
| |
Miscellaneous Revenue | | | 5.4% | |
| |
Natural Gas Revenue | | | 5.2% | |
| |
Highway Revenue Tolls | | | 4.5% | |
| |
Industrial Revenue | | | 3.0% | |
| |
Fuel Sales Tax Revenue | | | 3.0% | |
| |
Port, Airport & Marina Revenue | | | 2.8% | |
| |
Sales Tax Revenue | | | 2.5% | |
| |
Transit Revenue | | | 2.2% | |
| |
Resource Recovery Revenue | | | 1.7% | |
| |
Local or Guaranteed Housing | | | 1.5% | |
| |
Water Revenue | | | 1.4% | |
| |
Tobacco Settlement Funded | | | 1.3% | |
| |
Income Tax Revenue | | | 1.0% | |
| |
Other | | | 4.6% | |
| |
Short-Term Instruments | | | 21.3% | |
| | † | % of Investments, at value. |
| | § | Allocation Breakdown and % of investments exclude securities sold short and financial derivative instruments, if any. |
| | | | | | | | | | | | | | | | | | |
|
| Average Annual Total Return for the period ended June 30, 2020 | |
| | | | | |
| | | | | 1 Year | | | 5 Year | | | 10 Years | | | Fund Inception
(02/01/2010) | |
| | PIMCO Short Term Municipal Bond Active Exchange-Traded Fund (Based on Net Asset Value) | | | 2.64% | | | | 1.73% | | | | 1.33% | | | | 1.34% | |
| | PIMCO Short Term Municipal Bond Active Exchange-Traded Fund (At Market Price)(1) | | | 2.66% | | | | 1.77% | | | | 1.34% | | | | 1.36% | |
| | Bloomberg Barclays 1-Year Municipal Bond Index± | | | 2.16% | | | | 1.42% | | | | 1.14% | | | | 1.16% | |
All Fund returns are net of fees and expenses and include applicable fee waivers and/or expense limitations. Absent any applicable fee waivers and/or expense limitations, performance would have been lower and there can be no assurance that any such waivers or limitations will continue in the future.
Market Returns do not include brokerage commissions that may be payable on secondary market transactions. If brokerage commissions were included, market returns would be lower. Market and NAV returns assume that dividends and capital gain distributions have been reinvested in the Fund at market price and NAV, respectively.
| (1) | The market price is determined using the midpoint between the highest bid and the lowest offer on the listing exchange, as of the time that the Fund’s NAV is calculated. |
± The Bloomberg Barclays 1-Year Municipal Bond Index is the 1 Year (1-2) component of the Municipal Bond Index. The Index is a rules-based, market-value-weighted index engineered for the long term tax-exempt bond market. To be included in the Index, bonds must be rated investment-grade (Baa3/BBB- or higher) by at least two of the following ratings agencies: Moody’s, S&P and Fitch. If only two of the three agencies rate the security, the lower rating is used to determine index eligibility. If only one of the three agencies rates a security, the rating must be investment-grade. They must have an outstanding par value of at least $7 million and be issued as part of a transaction of at least $75 million. The bonds must be fixed rate, have a dated-date after December 31, 1990, and must be at least one year from their maturity date. Remarketed issues, taxable municipal bonds, bonds with floating rates, and derivatives, are excluded from the benchmark.
It is not possible to invest directly in an unmanaged index.
Performance quoted represents past performance. Past performance is not a guarantee or a reliable indicator of future results. Current performance may be lower or higher than performance shown. Investment return and the principal value of an investment will fluctuate. Shares may be worth more or less than original cost when redeemed by authorized participants. Returns shown do not reflect the deduction of taxes that a shareholder would pay on Fund distributions or on the redemption of Fund shares. Differences in the Fund’s performance versus the index and related attribution information with respect to particular categories of securities or individual positions may be attributable, in part, to differences in the pricing methodologies used by the Fund and the index. Performance data current to the most recent month-end is available at www.pimcoetfs.com or via (888) 400-4ETF.
The Fund’s total annual operating expense ratio in effect as of period end was 0.35%. Details regarding any changes to the Fund’s operating expenses, subsequent to period end, can be found in the Fund’s current prospectus, as supplemented.
Investment Objective and Strategy Overview
PIMCO Short Term Municipal Bond Active Exchange-Traded Fund seeks attractive tax-exempt income, consistent with preservation of capital, by investing under normal circumstances at least 80% of its assets in a diversified portfolio of debt securities whose interest is, in the opinion of bond counsel for the issuer at the time of issuance, exempt from federal income tax (“Municipal Bonds”). The Fund does not intend to invest in Municipal Bonds whose interest is subject to the federal alternative minimum tax. The Fund may only invest in U.S. dollar-denominated investment grade debt securities, rated Baa or higher by Moody’s Investors Service, Inc. (“Moody’s”), or equivalently rated by Standard & Poor’s Ratings Services (“S&P”) or Fitch, Inc. (“Fitch”), or, if unrated, determined by PIMCO to be of comparable quality. The Fund may invest 25% or more of its total assets in Municipal Bonds that finance similar projects, such as those relating to education, health care, housing, transportation, and utilities, and 25% or more of its total assets in industrial development bonds. Fund strategies may change from time to time. Please refer to the Fund’s current prospectus for more information regarding the Fund’s strategy.
Fund Insights at NAV
The following affected performance (on a gross basis) during the reporting period:
| » | | The Fund’s overweight duration exposure positioning contributed to performance, as municipal bond yields decreased. |
| » | | Security selection within the industrial revenue sector contributed to performance, as the securities outperformed the broader market. |
| » | | An overweight exposure to the electric utility sector contributed to performance, as the sector outperformed the broader municipal market. |
| » | | Security selection within pre-refunded debt detracted from performance, as the securities underperformed the broader market. |
| » | | An underweight exposure to the water and sewer sector detracted from performance, as the sector outperformed the general municipal market. |
| » | | Security selection within the lease-backed sector detracted from performance, as the securities underperformed the broader market. |
| | | | | | |
| | ANNUAL REPORT | | JUNE 30, 2020 | | 19 |
Expense Examples
Example
As a shareholder of a Fund, you incur two types of costs: (1) transaction costs, including brokerage commissions paid on purchases and sales of Fund shares and (2) ongoing costs, management fees and other Fund expenses. The Example is intended to help you understand your ongoing costs (in dollars) of investing in a Fund and to compare these costs with the ongoing costs of investing in other exchange-traded funds.
The Example is based on an investment of $1,000 invested at the beginning of the period and held for the entire period indicated, which for all Funds is from January 1, 2020 to June 30, 2020 unless noted otherwise in the table and footnotes below.
Actual Expenses
The information in the table under the heading “Actual” provides information about actual account values and actual expenses. You may use this information, together with the amount you invested, to estimate the expenses that you paid over the period. Simply divide your account value by $1,000 (for example, an $8,600 account value divided by $1,000 = 8.60), then multiply the result by the number in the column titled “Expenses Paid During Period” to estimate the expenses you paid on your account during this period.
Hypothetical Example for Comparison Purposes
The information in the table under the heading “Hypothetical (5% return before expenses)” provides information about hypothetical account values and hypothetical expenses based on a Fund’s actual expense ratio and an assumed rate of return of 5% per year before expenses, which is not the Fund’s actual return. The hypothetical account values and expenses may not be used to estimate the actual ending account balance or expenses you paid for the period. You may use this information to compare the ongoing costs of investing in a Fund and other exchange-traded funds. To do so, compare this 5% hypothetical example with the 5% hypothetical examples that appear in the shareholder reports of other exchange-traded funds.
Please note that the expenses shown in the table are meant to highlight your ongoing costs only and do not reflect any transactional costs, such as brokerage commissions paid on purchases and sales of shares of the Funds. Therefore, the information under the heading “Hypothetical (5% return before expenses)” is useful in comparing ongoing costs only, and will not help you determine the relative total costs of owning different exchange-traded funds. In addition, if these transactional costs were included, your costs would have been higher.
Expense ratios may vary period to period because of various factors, such as an increase in expenses not covered by the management fees (such as expenses of the independent trustees and their counsel, extraordinary expenses and interest expense).
| | | | | | | | | | | | | | | | | | | | | | | | | | | | | | | | | | | | | | | | |
| | | | | | Actual | | | | | | Hypothetical
(5% return before expenses) | | | | | | | |
| | | | | | Beginning
Account Value
(01/01/20) | | | Ending
Account Value
(06/30/20) | | | Expenses Paid
During Period* | | | | | | Beginning
Account Value
(01/01/20) | | | Ending
Account Value
(06/30/20) | | | Expenses Paid
During Period* | | | | | | Net Annualized
Expense Ratio** | |
| PIMCO 25+ Year Zero Coupon U.S. Treasury Index Exchange-Traded Fund | | | | | | $ | 1,000.00 | | | $ | 1,305.40 | | | $ | 0.86 | | | | | | | $ | 1,000.00 | | | $ | 1,023.99 | | | $ | 0.75 | | | | | | | | 0.15 | % |
| PIMCO 1-5 Year U.S. TIPS Index Exchange-Traded Fund | | | | | | | 1,000.00 | | | | 1,021.80 | | | | 1.00 | | | | | | | | 1,000.00 | | | | 1,023.74 | | | | 1.00 | | | | | | | | 0.20 | |
| PIMCO 15+ Year U.S. TIPS Index Exchange-Traded Fund | | | | | | | 1,000.00 | | | | 1,166.20 | | | | 1.07 | | | | | | | | 1,000.00 | | | | 1,023.74 | | | | 1.00 | | | | | | | | 0.20 | |
| PIMCO Broad U.S. TIPS Index Exchange-Traded Fund | | | | | | | 1,000.00 | | | | 1,064.00 | | | | 1.02 | | | | | | | | 1,000.00 | | | | 1,023.74 | | | | 1.00 | | | | | | | | 0.20 | |
| PIMCO 0-5 Year High Yield Corporate Bond Index Exchange-Traded Fund | | | | | | | 1,000.00 | | | | 935.60 | | | | 2.68 | | | | | | | | 1,000.00 | | | | 1,021.96 | | | | 2.80 | | | | | | | | 0.56 | |
| PIMCO Investment Grade Corporate Bond Index Exchange-Traded Fund | | | | | | | 1,000.00 | | | | 1,053.10 | | | | 1.02 | | | | | | | | 1,000.00 | | | | 1,023.74 | | | | 1.00 | | | | | | | | 0.20 | |
| PIMCO Active Bond Exchange-Traded Fund | | | | | | | 1,000.00 | | | | 1,046.00 | | | | 2.93 | | | | | | | | 1,000.00 | | | | 1,021.86 | | | | 2.90 | | | | | | | | 0.58 | |
| PIMCO Enhanced Low Duration Active Exchange-Traded Fund | | | | | | | 1,000.00 | | | | 1,031.00 | | | | 2.46 | | | | | | | | 1,000.00 | | | | 1,022.30 | | | | 2.45 | | | | | | | | 0.49 | |
| PIMCO Enhanced Short Maturity Active ESG Exchange-Traded Fund | | | | | | | 1,000.00 | | | | 1,013.00 | | | | 1.34 | | | | | | | | 1,000.00 | | | | 1,023.39 | | | | 1.35 | | | | | | | | 0.27 | |
| PIMCO Enhanced Short Maturity Active Exchange-Traded Fund | | | | | | | 1,000.00 | | | | 1,008.80 | | | | 1.89 | | | | | | | | 1,000.00 | | | | 1,022.85 | | | | 1.90 | | | | | | | | 0.38 | |
| PIMCO Intermediate Municipal Bond Active Exchange-Traded Fund | | | | | | | 1,000.00 | | | | 1,020.70 | | | | 1.75 | | | | | | | | 1,000.00 | | | | 1,023.00 | | | | 1.75 | | | | | | | | 0.35 | |
| PIMCO Short Term Municipal Bond Active Exchange-Traded Fund | | | | | | | 1,000.00 | | | | 1,015.20 | | | | 1.74 | | | | | | | | 1,000.00 | | | | 1,023.00 | | | | 1.75 | | | | | | | | 0.35 | |
* Expenses Paid During Period are equal to the net annualized expense ratio for the Fund, multiplied by the average account value over the period, multiplied by 181/366 (to reflect the one-half year period).
** Net Annualized Expense Ratio is reflective of any applicable contractual fee waivers and/or expense reimbursements or voluntary fee waivers. Details regarding fee waivers, if any, can be found in Note 9, Fees and Expenses, in the Notes to Financial Statements.
(THIS PAGE INTENTIONALLY LEFT BLANK)
| | | | | | |
| | ANNUAL REPORT | | JUNE 30, 2020 | | 21 |
Financial Highlights
| | | | | | | | | | | | | | | | | | | | | | | | | | | | | | | | |
| | | | | | Investment Operations | | | Less Distributions(c) | |
| | | | | | | | | | | | | | | | | | | | | | | | | |
| Selected Per Share Data for the Year or Period Ended^: | | Net Asset
Value
Beginning
of Year
or Period(a) | | | Net
Investment
Income (Loss)(b) | | | Net
Realized/
Unrealized
Gain (Loss) | | | Total | | | From Net
Investment
Income | | | From Net
Realized
Capital
Gains | | | Tax Basis
Return of
Capital | | | Total | |
| | | | | | | | |
PIMCO 25+ Year Zero Coupon U.S. Treasury Index
Exchange-Traded Fund | | | | | | | | | | | | | | | | | | | | | | | | | | | | | | | | |
| | | | | | | | |
06/30/2020 | | $ | 128.17 | | | $ | 2.99 | | | $ | 45.06 | | | $ | 48.05 | | | $ | (3.08 | ) | | $ | 0.00 | | | $ | 0.00 | | | $ | (3.08 | ) |
| | | | | | | | |
06/30/2019 | | | 115.51 | | | | 3.15 | | | | 12.73 | | | | 15.88 | | | | (3.22 | ) | | | 0.00 | | | | 0.00 | | | | (3.22 | ) |
| | | | | | | | |
06/30/2018 | | | 117.38 | | | | 3.11 | | | | (1.85 | ) | | | 1.26 | | | | (3.13 | ) | | | 0.00 | | | | 0.00 | | | | (3.13 | ) |
| | | | | | | | |
06/30/2017 | | | 135.43 | | | | 3.10 | | | | (17.80 | ) | | | (14.70 | ) | | | (3.35 | ) | | | 0.00 | | | | 0.00 | | | | (3.35 | ) |
| | | | | | | | |
06/30/2016 | | | 105.39 | | | | 3.16 | | | | 29.17 | | | | 32.33 | | | | (2.29 | ) | | | 0.00 | | | | 0.00 | | | | (2.29 | ) |
| | | | | | | | |
PIMCO 1-5 Year U.S. TIPS Index
Exchange-Traded Fund | | | | | | | | | | | | | | | | | | | | | | | | | | | | | | | | |
| | | | | | | | |
06/30/2020 | | $ | 52.62 | | | $ | 0.26 | | | $ | 1.56 | | | $ | 1.82 | | | $ | (1.07 | ) | | $ | 0.00 | | | $ | (0.16 | ) | | $ | (1.23 | ) |
| | | | | | | | |
06/30/2019 | | | 51.76 | | | | 0.97 | | | | 0.64 | | | | 1.61 | | | | (0.75 | ) | | | 0.00 | | | | 0.00 | | | | (0.75 | ) |
| | | | | | | | |
06/30/2018 | | | 52.18 | | | | 1.04 | | | | (0.51 | ) | | | 0.53 | | | | (0.95 | ) | | | 0.00 | | | | 0.00 | | | | (0.95 | ) |
| | | | | | | | |
06/30/2017 | | | 52.83 | | | | 0.87 | | | | (0.87 | ) | | | 0.00 | | | | (0.65 | ) | | | 0.00 | | | | 0.00 | | | | (0.65 | ) |
| | | | | | | | |
06/30/2016 | | | 52.18 | | | | 0.19 | | | | 0.71 | | | | 0.90 | | | | 0.00 | | | | 0.00 | | | | (0.25 | ) | | | (0.25 | ) |
| | | | | | | | |
PIMCO 15+ Year U.S. TIPS Index
Exchange-Traded Fund | | | | | | | | | | | | | | | | | | | | | | | | | | | | | | | | |
| | | | | | | | |
06/30/2020 | | $ | 69.61 | | | $ | 0.19 | | | $ | 15.22 | | | $ | 15.41 | | | $ | (1.71 | ) | | $ | 0.00 | | | $ | (0.00 | ) | | $ | (1.71 | ) |
| | | | | | | | |
06/30/2019 | | | 67.57 | | | | 1.58 | | | | 1.72 | | | | 3.30 | | | | (1.26 | ) | | | 0.00 | | | | 0.00 | | | | (1.26 | ) |
| | | | | | | | |
06/30/2018 | | | 65.64 | | | | 2.03 | | | | 1.79 | | | | 3.82 | | | | (1.89 | ) | | | 0.00 | | | | 0.00 | | | | (1.89 | ) |
| | | | | | | | |
06/30/2017 | | | 69.55 | | | | 1.80 | | | | (3.74 | ) | | | (1.94 | ) | | | (1.97 | ) | | | 0.00 | | | | 0.00 | | | | (1.97 | ) |
| | | | | | | | |
06/30/2016 | | | 62.95 | | | | 1.01 | | | | 6.02 | | | | 7.03 | | | | (0.43 | ) | | | 0.00 | | | | 0.00 | | | | (0.43 | ) |
| | | | | | | | |
PIMCO Broad U.S. TIPS Index
Exchange-Traded Fund | | | | | | | | | | | | | | | | | | | | | | | | | | | | | | | | |
| | | | | | | | |
06/30/2020 | | $ | 59.46 | | | $ | 0.22 | | | $ | 4.82 | | | $ | 5.04 | | | $ | (1.09 | ) | | $ | 0.00 | | | $ | (0.21 | ) | | $ | (1.30 | ) |
| | | | | | | | |
06/30/2019 | | | 57.61 | | | | 1.08 | | | | 1.57 | | | | 2.65 | | | | (0.80 | ) | | | 0.00 | | | | 0.00 | | | | (0.80 | ) |
| | | | | | | | |
06/30/2018 | | | 57.61 | | | | 1.25 | | | | (0.07 | ) | | | 1.18 | | | | (1.18 | ) | | | 0.00 | | | | 0.00 | | | | (1.18 | ) |
| | | | | | | | |
06/30/2017 | | | 59.09 | | | | 1.10 | | | | (1.61 | ) | | | (0.51 | ) | | | (0.97 | ) | | | 0.00 | | | | 0.00 | | | | (0.97 | ) |
| | | | | | | | |
06/30/2016 | | | 56.73 | | | | 0.54 | | | | 2.13 | | | | 2.67 | | | | (0.31 | ) | | | 0.00 | | | | 0.00 | | | | (0.31 | ) |
| | | | | | | | |
PIMCO 0-5 Year High Yield Corporate Bond Index
Exchange-Traded Fund | | | | | | | | | | | | | | | | | | | | | | | | | | | | | | | | |
| | | | | | | | |
06/30/2020 | | $ | 100.71 | | | $ | 4.08 | | | $ | (8.54 | ) | | $ | (4.46 | ) | | $ | (4.80 | ) | | $ | 0.00 | | | $ | 0.00 | | | $ | (4.80 | ) |
| | | | | | | | |
06/30/2019 | | | 100.07 | | | | 4.63 | | | | 0.90 | | | | 5.53 | | | | (4.89 | ) | | | 0.00 | | | | 0.00 | | | | (4.89 | ) |
| | | | | | | | |
06/30/2018 | | | 101.62 | | | | 4.44 | | | | (1.28 | ) | | | 3.16 | | | | (4.71 | ) | | | 0.00 | | | | 0.00 | | | | (4.71 | ) |
| | | | | | | | |
06/30/2017 | | | 96.65 | | | | 4.60 | | | | 5.66 | | | | 10.26 | | | | (5.29 | ) | | | 0.00 | | | | 0.00 | | | | (5.29 | ) |
| | | | | | | | |
06/30/2016 | | | 100.37 | | | | 4.52 | | | | (3.69 | ) | | | 0.83 | | | | (4.55 | ) | | | 0.00 | | | | 0.00 | | | | (4.55 | ) |
| | | | | | | | |
PIMCO Investment Grade Corporate Bond Index
Exchange-Traded Fund | | | | | | | | | | | | | | | | | | | | | | | | | | | | | | | | |
| | | | | | | | |
06/30/2020 | | $ | 107.27 | | | $ | 3.40 | | | $ | 6.88 | | | $ | 10.28 | | | $ | (3.51 | ) | | $ | 0.00 | | | $ | 0.00 | | | $ | (3.51 | ) |
| | | | | | | | |
06/30/2019 | | | 100.41 | | | | 3.44 | | | | 6.96 | | | | 10.40 | | | | (3.54 | ) | | | 0.00 | | | | 0.00 | | | | (3.54 | ) |
| | | | | | | | |
06/30/2018 | | | 104.90 | | | | 3.31 | | | | (4.43 | ) | | | (1.12 | ) | | | (3.31 | ) | | | (0.06 | ) | | | 0.00 | | | | (3.37 | ) |
| | | | | | | | |
06/30/2017 | | | 105.72 | | | | 3.11 | | | | (0.86 | ) | | | 2.25 | | | | (3.07 | ) | | | 0.00 | | | | 0.00 | | | | (3.07 | ) |
| | | | | | | | |
06/30/2016 | | | 100.50 | | | | 3.10 | | | | 4.91 | | | | 8.01 | | | | (2.75 | ) | | | (0.04 | ) | | | 0.00 | | | | (2.79 | ) |
| | | | | | | | |
PIMCO Active Bond
Exchange-Traded Fund | | | | | | | | | | | | | | | | | | | | | | | | | | | | | | | | |
| | | | | | | | |
06/30/2020 | | $ | 107.54 | | | $ | 2.88 | | | $ | 4.42 | | | $ | 7.30 | | | $ | (3.45 | ) | | $ | 0.00 | | | $ | 0.00 | | | $ | (3.45 | ) |
| | | | | | | | |
06/30/2019 | | | 103.19 | | | | 3.54 | | | | 4.49 | | | | 8.03 | | | | (3.68 | ) | | | 0.00 | | | | 0.00 | | | | (3.68 | ) |
| | | | | | | | |
06/30/2018 | | | 106.07 | | | | 3.17 | | | | (2.73 | ) | | | 0.44 | | | | (3.06 | ) | | | 0.00 | | | | (0.26 | ) | | | (3.32 | ) |
| | | | | | | | |
06/30/2017 | | | 107.31 | | | | 2.88 | | | | (0.80 | ) | | | 2.08 | | | | (2.48 | ) | | | 0.00 | | | | (0.84 | ) | | | (3.32 | ) |
| | | | | | | | |
06/30/2016 | | | 106.69 | | | | 3.09 | | | | 1.31 | | | | 4.40 | | | | (3.78 | ) | | | 0.00 | | | | 0.00 | | | | (3.78 | ) |
| | | | | | | | |
PIMCO Enhanced Low Duration Active
Exchange-Traded Fund | | | | | | | | | | | | | | | | | | | | | | | | | | | | | | | | |
| | | | | | | | |
06/30/2020 | | $ | 100.15 | | | $ | 2.61 | | | $ | 2.06 | | | $ | 4.67 | | | $ | (3.03 | ) | | $ | 0.00 | | | $ | 0.00 | | | $ | (3.03 | ) |
| | | | | | | | |
06/30/2019 | | | 99.61 | | | | 2.96 | | | | 0.62 | | | | 3.58 | | | | (3.04 | ) | | | 0.00 | | | | 0.00 | | | | (3.04 | ) |
| | | | | | | | |
06/30/2018 | | | 101.02 | | | | 2.51 | | | | (1.42 | ) | | | 1.09 | | | | (2.50 | ) | | | 0.00 | | | | 0.00 | | | | (2.50 | ) |
| | | | | | | | |
06/30/2017 | | | 100.23 | | | | 2.17 | | | | 0.35 | | | | 2.52 | | | | (1.73 | ) | | | 0.00 | | | | 0.00 | | | | (1.73 | ) |
| | | | | | | | |
06/30/2016 | | | 101.62 | | | | 1.97 | | | | (0.24 | ) | | | 1.73 | | | | (2.30 | ) | | | (0.82 | ) | | | 0.00 | | | | (3.12 | ) |
| | | | | | | | |
PIMCO Enhanced Short Maturity Active ESG
Exchange-Traded Fund | | | | | | | | | | | | | | | | | | | | | | | | | | | | | | | | |
| | | | | | | | |
12/10/2019 - 06/30/2020 | | $ | 100.00 | | | $ | 1.04 | | | $ | 0.49 | | | $ | 1.53 | | | $ | (0.89 | ) | | $ | 0.00 | | | $ | 0.00 | | | $ | (0.89 | ) |
| | | | | | | | |
| 22 | | PIMCO ETF TRUST | | | | | See Accompanying Notes | |
| | | | | | | | | | | | | | | | | | | | | | | | | | | | | | | | | | |
| | | | | | | Ratios/Supplemental Data | |
| | | | | | | | | | Ratios to Average Net Assets | | | | |
Net Asset
Value End of
Year or
Period(a) | | | Total
Return(a) | | | Net Assets
End of Year
or. Period
(000s) | | | Expenses | | | Expenses
Excluding
Waivers | | | Expenses
Excluding
Interest
Expense | | | Expenses
Excluding
Interest
Expense and
Waivers | | | Net
Investment
Income (Loss) | | | Portfolio
Turnover
Rate(d) | |
| | | | | | | | |
|
|
| | | | | | | | | | | | | | | | | | | | | | | | | | | | | | | | |
| | | | | | | | |
| $ | 173.14 | | | | 37.97 | % | | $ | 375,713 | | | | 0.15 | % | | | 0.15 | % | | | 0.15 | % | | | 0.15 | % | | | 1.98 | % | | | 14 | % |
| | | | | | | | |
| | 128.17 | | | | 14.17 | | | | 265,315 | | | | 0.15 | | | | 0.15 | | | | 0.15 | | | | 0.15 | | | | 2.79 | | | | 21 | |
| | | | | | | | |
| | 115.51 | | | | 1.08 | | | | 164,028 | | | | 0.15 | | | | 0.15 | | | | 0.15 | | | | 0.15 | | | | 2.71 | | | | 19 | |
| | | | | | | | |
| | 117.38 | | | | (10.88 | ) | | | 166,683 | | | | 0.15 | | | | 0.15 | | | | 0.15 | | | | 0.15 | | | | 2.53 | | | | 14 | |
| | | | | | | | |
| | 135.43 | | | | 31.09 | | | | 442,851 | | | | 0.15 | | | | 0.15 | | | | 0.15 | | | | 0.15 | | | | 2.67 | | | | 23 | |
| | | | | | | | |
|
|
| | | | | | | | | | | | | | | | | | | | | | | | | | | | | | | | |
| | | | | | | | |
| $ | 53.21 | | | | 3.52 | % | | $ | 628,978 | | | | 0.20 | % | | | 0.20 | % | | | 0.20 | % | | | 0.20 | % | | | 0.49 | % | | | 30 | % |
| | | | | | | | |
| | 52.62 | | | | 3.17 | | | | 748,304 | | | | 0.20 | | | | 0.20 | | | | 0.20 | | | | 0.20 | | | | 1.89 | | | | 36 | |
| | | | | | | | |
| | 51.76 | | | | 1.02 | | | | 826,530 | | | | 0.20 | | | | 0.20 | | | | 0.20 | | | | 0.20 | | | | 2.01 | | | | 32 | |
| | | | | | | | |
| | 52.18 | | | | 0.00 | | | | 1,136,011 | | | | 0.20 | | | | 0.20 | | | | 0.20 | | | | 0.20 | | | | 1.64 | | | | 38 | |
| | | | | | | | |
| | 52.83 | | | | 1.74 | | | | 1,065,611 | | | | 0.20 | | | | 0.20 | | | | 0.20 | | | | 0.20 | | | | 0.36 | | | | 41 | |
| | | | | | | | |
|
|
| | | | | | | | | | | | | | | | | | | | | | | | | | | | | | | | |
| | | | | | | | |
| $ | 83.31 | | | | 22.47 | % | | $ | 614,024 | | | | 0.20 | % | | | 0.20 | % | | | 0.20 | % | | | 0.20 | % | | | 0.25 | % | | | 9 | % |
| | | | | | | | |
| | 69.61 | | | | 5.06 | | | | 178,903 | | | | 0.20 | | | | 0.20 | | | | 0.20 | | | | 0.20 | | | | 2.45 | | | | 6 | |
| | | | | | | | |
| | 67.57 | | | | 5.88 | | | | 254,745 | | | | 0.20 | | | | 0.20 | | | | 0.20 | | | | 0.20 | | | | 3.05 | | | | 10 | |
| | | | | | | | |
| | 65.64 | | | | (2.82 | ) | | | 148,992 | | | | 0.20 | | | | 0.20 | | | | 0.20 | | | | 0.20 | | | | 2.66 | | | | 16 | |
| | | | | | | | |
| | 69.55 | | | | 11.25 | | | | 109,197 | | | | 0.20 | | | | 0.20 | | | | 0.20 | | | | 0.20 | | | | 1.59 | | | | 12 | |
| | | | | | | | |
|
|
| | | | | | | | | | | | | | | | | | | | | | | | | | | | | | | | |
| | | | | | | | |
| $ | 63.20 | | | | 8.61 | % | | $ | 61,936 | | | | 0.20 | % | | | 0.20 | % | | | 0.20 | % | | | 0.20 | % | | | 0.35 | % | | | 10 | % |
| | | | | | | | |
| | 59.46 | | | | 4.69 | | | | 52,327 | | | | 0.20 | | | | 0.20 | | | | 0.20 | | | | 0.20 | | | | 1.89 | | | | 9 | |
| | | | | | | | |
| | 57.61 | | | | 2.07 | | | | 50,695 | | | | 0.21 | | | | 0.21 | | | | 0.21 | | | | 0.21 | | | | 2.18 | | | | 8 | |
| | | | | | | | |
| | 57.61 | | | | (0.87 | ) | | | 70,864 | | | | 0.20 | | | | 0.20 | | | | 0.20 | | | | 0.20 | | | | 1.88 | | | | 8 | |
| | | | | | | | |
| | 59.09 | | | | 4.73 | | | | 90,404 | | | | 0.20 | | | | 0.20 | | | | 0.20 | | | | 0.20 | | | | 0.96 | | | | 10 | |
| | | | | | | | |
|
|
| | | | | | | | | | | | | | | | | | | | | | | | | | | | | | | | |
| | | | | | | | |
| $ | 91.45 | | | | (4.56 | )% | | $ | 1,156,826 | | | | 0.56 | % | | | 0.56 | % | | | 0.55 | % | | | 0.55 | % | | | 4.22 | % | | | 36 | % |
| | | | | | | | |
| | 100.71 | | | | 5.71 | | | | 1,460,224 | | | | 0.56 | | | | 0.56 | | | | 0.55 | | | | 0.55 | | | | 4.66 | | | | 27 | |
| | | | | | | | |
| | 100.07 | | | | 3.18 | | | | 1,666,164 | | | | 0.56 | | | | 0.56 | | | | 0.55 | | | | 0.55 | | | | 4.41 | | | | 42 | |
| | | | | | | | |
| | 101.62 | | | | 10.88 | | | | 1,824,151 | | | | 0.55 | | | | 0.55 | | | | 0.55 | | | | 0.55 | | | | 4.58 | | | | 43 | |
| | | | | | | | |
| | 96.65 | | | | 1.04 | | | | 2,044,168 | | | | 0.55 | | | | 0.55 | | | | 0.55 | | | | 0.55 | | | | 4.75 | | | | 34 | |
| | | | | | | | |
|
|
| | | | | | | | | | | | | | | | | | | | | | | | | | | | | | | | |
| | | | | | | | |
| $ | 114.04 | | | | 9.76 | % | | $ | 659,123 | | | | 0.20 | % | | | 0.20 | % | | | 0.20 | % | | | 0.20 | % | | | 3.10 | % | | | 18 | % |
| | | | | | | | |
| | 107.27 | | | | 10.65 | | | | 797,018 | | | | 0.20 | | | | 0.20 | | | | 0.20 | | | | 0.20 | | | | 3.41 | | | | 27 | |
| | | | | | | | |
| | 100.41 | | | | (1.12 | ) | | | 756,084 | | | | 0.20 | | | | 0.20 | | | | 0.20 | | | | 0.20 | | | | 3.20 | | | | 10 | |
| | | | | | | | |
| | 104.90 | | | | 2.19 | | | | 737,459 | | | | 0.20 | | | | 0.20 | | | | 0.20 | | | | 0.20 | | | | 2.97 | | | | 7 | |
| | | | | | | | |
| | 105.72 | | | | 8.14 | | | | 447,211 | | | | 0.20 | | | | 0.20 | | | | 0.20 | | | | 0.20 | | | | 3.05 | | | | 13 | |
| | | | | | | | |
|
|
| | | | | | | | | | | | | | | | | | | | | | | | | | | | | | | | |
| | | | | | | | |
| $ | 111.39 | | | | 6.92 | % | | $ | 3,400,704 | | | | 0.57 | % | | | 0.57 | % | | | 0.55 | % | | | 0.55 | % | | | 2.65 | % | | | 146 | % |
| | | | | | | | |
| | 107.54 | | | | 7.99 | | | | 2,422,925 | | | | 0.73 | | | | 0.73 | | | | 0.55 | | | | 0.55 | | | | 3.42 | | | | 155 | |
| | | | | | | | |
| | 103.19 | | | | 0.41 | | | | 2,072,132 | | | | 0.76 | | | | 0.76 | | | | 0.55 | | | | 0.55 | | | | 3.03 | | | | 142 | |
| | | | | | | | |
| | 106.07 | | | | 2.00 | | | | 2,039,657 | | | | 0.61 | | | | 0.61 | | | | 0.55 | | | | 0.55 | | | | 2.70 | | | | 569 | |
| | | | | | | | |
| | 107.31 | | | | 4.25 | | | | 2,594,821 | | | | 0.56 | | | | 0.58 | | | | 0.55 | | | | 0.57 | | | | 2.92 | | | | 475 | |
| | | | | | | | |
|
|
| | | | | | | | | | | | | | | | | | | | | | | | | | | | | | | | |
| | | | | | | | |
| $ | 101.79 | | | | 4.77 | % | | $ | 496,743 | | | | 0.49 | % | | | 0.56 | % | | | 0.39 | % | | | 0.46 | % | | | 2.61 | % | | | 378 | % |
| | | | | | | | |
| | 100.15 | | | | 3.66 | | | | 352,514 | | | | 0.79 | | | | 0.86 | | | | 0.39 | | | | 0.46 | | | | 2.98 | | | | 1,613 | |
| | | | | | | | |
| | 99.61 | | | | 1.09 | | | | 157,382 | | | | 1.02 | | | | 1.09 | | | | 0.39 | | | | 0.46 | | | | 2.51 | | | | 326 | |
| | | | | | | | |
| | 101.02 | | | | 2.54 | | | | 93,947 | | | | 0.67 | (e) | | | 0.74 | (e) | | | 0.47 | (e) | | | 0.54 | (e) | | | 2.15 | | | | 651 | |
| | | | | | | | |
| | 100.23 | | | | 1.75 | | | | 58,134 | | | | 0.57 | | | | 0.64 | | | | 0.55 | | | | 0.56 | | | | 1.96 | | | | 2,288 | |
| | | | | | | | |
|
|
| | | | | | | | | | | | | | | | | | | | | | | | | | | | | | | | |
| | | | | | | | |
| $ | 100.64 | | | | 1.54 | % | | $ | 87,553 | | | | 0.27 | %* | | | 0.51 | %* | | | 0.24 | %* | | | 0.48 | %* | | | 1.87 | %* | | | 102 | % |
| | | | | | |
| | ANNUAL REPORT | | JUNE 30, 2020 | | 23 |
Financial Highlights (Cont.)
| | | | | | | | | | | | | | | | | | | | | | | | | | | | | | | | |
| | | | | | Investment Operations | | | Less Distributions(c) | |
| | | | | | | | | | | | | | | | | | | | | | | | | |
| Selected Per Share Data for the Year or Period Ended^: | | Net Asset
Value
Beginning
of Year
or Period(a) | | | Net
Investment
Income (Loss)(b) | | | Net
Realized/
Unrealized
Gain (Loss) | | | Total | | | From Net
Investment
Income | | | From Net
Realized
Capital
Gains | | | Tax Basis
Return of
Capital | | | Total | |
| | | | | | | | |
PIMCO Enhanced Short Maturity Active
Exchange-Traded Fund | | | | | | | | | | | | | | | | | | | | | | | | | | | | | | | | |
| | | | | | | | |
06/30/2020 | | $ | 101.75 | | | $ | 2.06 | | | $ | 0.15 | | | $ | 2.21 | | | $ | (2.31 | ) | | $ | 0.00 | | | $ | 0.00 | | | $ | (2.31 | ) |
| | | | | | | | |
06/30/2019 | | | 101.58 | | | | 2.73 | | | | 0.11 | | | | 2.84 | | | | (2.67 | ) | | | 0.00 | | | | 0.00 | | | | (2.67 | ) |
| | | | | | | | |
06/30/2018 | | | 101.74 | | | | 1.95 | | | | (0.23 | ) | | | 1.72 | | | | (1.85 | ) | | | (0.03 | ) | | | 0.00 | | | | (1.88 | ) |
| | | | | | | | |
06/30/2017 | | | 101.14 | | | | 1.45 | | | | 0.61 | | | | 2.06 | | | | (1.46 | ) | | | 0.00 | | | | 0.00 | | | | (1.46 | ) |
| | | | | | | | |
06/30/2016 | | | 101.15 | | | | 1.05 | | | | (0.02 | ) | | | 1.03 | | | | (1.02 | ) | | | (0.02 | ) | | | 0.00 | | | | (1.04 | ) |
| | | | | | | | |
PIMCO Intermediate Municipal Bond Active
Exchange-Traded Fund | | | | | | | | | | | | | | | | | | | | | | | | | | | | | | | | |
| | | | | | | | |
06/30/2020 | | $ | 54.77 | | | $ | 1.24 | | | $ | 0.96 | | | $ | 2.20 | | | $ | (1.24 | ) | | $ | 0.00 | | | $ | 0.00 | | | $ | (1.24 | ) |
| | | | | | | | |
06/30/2019 | | | 52.84 | | | | 1.40 | | | | 1.93 | | | | 3.33 | | | | (1.40 | ) | | | 0.00 | | | | 0.00 | | | | (1.40 | ) |
| | | | | | | | |
06/30/2018 | | | 53.48 | | | | 1.30 | | | | (0.64 | ) | | | 0.66 | | | | (1.30 | ) | | | 0.00 | | | | 0.00 | | | | (1.30 | ) |
| | | | | | | | |
06/30/2017 | | | 55.11 | | | | 1.25 | | | | (1.64 | ) | | | (0.39 | ) | | | (1.24 | ) | | | 0.00 | | | | 0.00 | | | | (1.24 | ) |
| | | | | | | | |
06/30/2016 | | | 52.84 | | | | 1.25 | | | | 2.15 | | | | 3.40 | | | | (1.13 | ) | | | 0.00 | | | | 0.00 | | | | (1.13 | ) |
| | | | | | | | |
PIMCO Short Term Municipal Bond Active
Exchange-Traded Fund | | | | | | | | | | | | | | | | | | | | | | | | | | | | | | | | |
| | | | | | | | |
06/30/2020 | | $ | 50.53 | | | $ | 0.81 | | | $ | 0.51 | | | $ | 1.32 | | | $ | (0.81 | ) | | $ | 0.00 | | | $ | 0.00 | | | $ | (0.81 | ) |
| | | | | | | | |
06/30/2019 | | | 49.91 | | | | 0.95 | | | | 0.61 | | | | 1.56 | | | | (0.94 | ) | | | 0.00 | | | | 0.00 | | | | (0.94 | ) |
| | | | | | | | |
06/30/2018 | | | 50.25 | | | | 0.77 | | | | (0.35 | ) | | | 0.42 | | | | (0.76 | ) | | | 0.00 | | | | 0.00 | | | | (0.76 | ) |
| | | | | | | | |
06/30/2017 | | | 50.65 | | | | 0.60 | | | | (0.41 | ) | | | 0.19 | | | | (0.59 | ) | | | 0.00 | | | | 0.00 | | | | (0.59 | ) |
| | | | | | | | |
06/30/2016 | | | 50.24 | | | | 0.48 | | | | 0.36 | | | | 0.84 | | | | (0.43 | ) | | | 0.00 | | | | 0.00 | | | | (0.43 | ) |
| ^ | A zero balance may reflect actual amounts rounding to less than $0.01 or 0.01%. |
| (a) | Includes adjustments required by U.S. GAAP and may differ from net asset values and performance reported elsewhere by the Funds. |
| (b) | Per share amounts based on average number of shares outstanding during the year or period. |
| (c) | The tax characterization of distributions is determined in accordance with Federal income tax regulations. See Note 2, Distributions to Shareholders, in the Notes to Financial Statements for more information. |
| (d) | Portfolio turnover rate excludes securities received or delivered from in-kind processing of creation or redemptions. |
| (e) | Effective May 8, 2017, the Fund’s Management fees was decreased by 0.09% to an annual rate of 0.46%. |
| | | | | | | | |
| 24 | | PIMCO ETF TRUST | | | | | See Accompanying Notes | |
| | | | | | | | | | | | | | | | | | | | | | | | | | | | | | | | | | |
| | | | | | | Ratios/Supplemental Data | |
| | | | | | | | | | Ratios to Average Net Assets | | | | |
Net Asset
Value End of
Year or
Period(a) | | | Total
Return(a) | | | Net Assets
End of Year
or. Period
(000s) | | | Expenses | | | Expenses
Excluding
Waivers | | | Expenses
Excluding
Interest
Expense | | | Expenses
Excluding
Interest
Expense and
Waivers | | | Net
Investment
Income (Loss) | | | Portfolio
Turnover
Rate(d) | |
| | | | | | | | |
|
|
| | | | | | | | | | | | | | | | | | | | | | | | | | | | | | | | |
| | | | | | | | |
| $ | 101.65 | | | | 2.21 | % | | $ | 13,914,440 | | | | 0.37 | % | | | 0.37 | % | | | 0.35 | % | | | 0.35 | % | | | 2.03 | % | | | 81 | % |
| | | | | | | | |
| | 101.75 | | | | 2.84 | | | | 11,939,913 | | | | 0.36 | | | | 0.36 | | | | 0.35 | | | | 0.35 | | | | 2.70 | | | | 72 | |
| | | | | | | | |
| | 101.58 | | | | 1.70 | | | | 9,410,140 | | | | 0.42 | | | | 0.42 | | | | 0.35 | | | | 0.35 | | | | 1.92 | | | | 86 | |
| | | | | | | | |
| | 101.74 | | | | 2.05 | | | | 7,195,945 | | | | 0.35 | | | | 0.35 | | | | 0.35 | | | | 0.35 | | | | 1.43 | | | | 82 | |
| | | | | | | | |
| | 101.14 | | | | 1.03 | | | | 4,647,542 | | | | 0.36 | | | | 0.36 | | | | 0.35 | | | | 0.35 | | | | 1.04 | | | | 208 | |
| | | | | | | | |
|
|
| | | | | | | | | | | | | | | | | | | | | | | | | | | | | | | | |
| | | | | | | | |
| $ | 55.73 | | | | 4.06 | % | | $ | 468,662 | | | | 0.35 | % | | | 0.35 | % | | | 0.35 | % | | | 0.35 | % | | | 2.25 | % | | | 34 | % |
| | | | | | | | |
| | 54.77 | | | | 6.41 | | | | 304,515 | | | | 0.35 | | | | 0.35 | | | | 0.35 | | | | 0.35 | | | | 2.63 | | | | 39 | |
| | | | | | | | |
| | 52.84 | | | | 1.25 | | | | 275,309 | | | | 0.35 | | | | 0.35 | | | | 0.35 | | | | 0.35 | | | | 2.44 | | | | 27 | |
| | | | | | | | |
| | 53.48 | | | | (0.69 | ) | | | 259,917 | | | | 0.35 | | | | 0.35 | | | | 0.35 | | | | 0.35 | | | | 2.33 | | | | 30 | |
| | | | | | | | |
| | 55.11 | | | | 6.52 | | | | 254,045 | | | | 0.35 | | | | 0.35 | | | | 0.35 | | | | 0.35 | | | | 2.32 | | | | 23 | |
| | | | | | | | |
|
|
| | | | | | | | | | | | | | | | | | | | | | | | | | | | | | | | |
| | | | | | | | |
| $ | 51.04 | | | | 2.64 | % | | $ | 176,581 | | | | 0.35 | % | | | 0.35 | % | | | 0.35 | % | | | 0.35 | % | | | 1.60 | % | | | 55 | % |
| | | | | | | | |
| | 50.53 | | | | 3.17 | | | | 96,505 | | | | 0.35 | | | | 0.35 | | | | 0.35 | | | | 0.35 | | | | 1.91 | | | | 49 | |
| | | | | | | | |
| | 49.91 | | | | 0.83 | | | | 67,874 | | | | 0.35 | | | | 0.35 | | | | 0.35 | | | | 0.35 | | | | 1.55 | | | | 87 | |
| | | | | | | | |
| | 50.25 | | | | 0.37 | | | | 65,826 | | | | 0.35 | | | | 0.35 | | | | 0.35 | | | | 0.35 | | | | 1.20 | | | | 80 | |
| | | | | | | | |
| | 50.65 | | | | 1.67 | | | | 68,881 | | | | 0.35 | | | | 0.35 | | | | 0.35 | | | | 0.35 | | | | 0.95 | | | | 36 | |
| | | | | | |
| | ANNUAL REPORT | | JUNE 30, 2020 | | 25 |
Statements of Assets and Liabilities
| | | | | | | | | | | | | | | | |
| (Amounts in thousands†, except per share amounts) | | PIMCO 25+ Year Zero
Coupon U.S.
Treasury Index
Exchange-
Traded Fund | | | PIMCO 1-5 Year U.S.
TIPS Index
Exchange-
Traded Fund | | | PIMCO 15+ Year U.S.
TIPS Index
Exchange-
Traded Fund | | | PIMCO Broad U.S.
TIPS Index
Exchange-
Traded Fund | |
| | | | |
Assets: | | | | | | | | | | | | | | | | |
| | | | |
Investments, at value | | | | | | | | | | | | | | | | |
Investments in securities*^ | | $ | 375,757 | | | $ | 628,060 | | | $ | 612,129 | | | $ | 61,716 | |
Investments in Affiliates | | | 0 | | | | 0 | | | | 0 | | | | 0 | |
Financial Derivative Instruments | | | | | | | | | | | | | | | | |
Exchange-traded or centrally cleared | | | 0 | | | | 0 | | | | 0 | | | | 0 | |
Over the counter | | | 0 | | | | 0 | | | | 0 | | | | 0 | |
Cash | | | 0 | | | | 0 | | | | 0 | | | | 0 | |
Deposits with counterparty | | | 0 | | | | 0 | | | | 0 | | | | 0 | |
Foreign currency, at value | | | 0 | | | | 0 | | | | 0 | | | | 0 | |
Receivable for investments sold | | | 0 | | | | 5,345 | | | | 0 | | | | 0 | |
Receivable for TBA investments sold | | | 0 | | | | 0 | | | | 0 | | | | 0 | |
Receivable for Fund shares sold | | | 0 | | | | 0 | | | | 0 | | | | 0 | |
Interest and/or dividends receivable | | | 0 | | | | 998 | | | | 1,970 | | | | 230 | |
Reimbursement receivable from PIMCO | | | 0 | | | | 0 | | | | 0 | | | | 0 | |
Total Assets | | | 375,757 | | | | 634,403 | | | | 614,099 | | | | 61,946 | |
| | | | |
Liabilities: | | | | | | | | | | | | | | | | |
| | | | |
Borrowings & Other Financing Transactions | | | | | | | | | | | | | | | | |
Payable for reverse repurchase agreements | | $ | 0 | | | $ | 0 | | | $ | 0 | | | $ | 0 | |
Payable for short sales | | | 0 | | | | 0 | | | | 0 | | | | 0 | |
Financial Derivative Instruments | | | | | | | | | | | | | | | | |
Exchange-traded or centrally cleared | | | 0 | | | | 0 | | | | 0 | | | | 0 | |
Over the counter | | | 0 | | | | 0 | | | | 0 | | | | 0 | |
Payable for investments purchased | | | 0 | | | | 0 | | | | 0 | | | | 0 | |
Payable for TBA investments purchased | | | 0 | | | | 0 | | | | 0 | | | | 0 | |
Payable for unfunded loan commitments | | | 0 | | | | 0 | | | | 0 | | | | 0 | |
Payable upon return of securities loaned | | | 0 | | | | 0 | | | | 0 | | | | 0 | |
Deposits from counterparty | | | 0 | | | | 0 | | | | 0 | | | | 0 | |
Payable for Fund shares redeemed | | | 0 | | | | 5,322 | | | | 0 | | | | 0 | |
Accrued management fees | | | 44 | | | | 103 | | | | 75 | | | | 10 | |
Other liabilities | | | 0 | | | | 0 | | | | 0 | | | | 0 | |
Total Liabilities | | | 44 | | | | 5,425 | | | | 75 | | | | 10 | |
| | | | |
Net Assets | | $ | 375,713 | | | $ | 628,978 | | | $ | 614,024 | | | $ | 61,936 | |
| | | | |
Net Assets Consist of: | | | | | | | | | | | | | | | | |
| | | | |
Paid in capital | | $ | 349,247 | | | $ | 632,695 | | | $ | 588,720 | | | $ | 58,900 | |
Distributable earnings (accumulated loss) | | | 26,466 | | | | (3,717 | ) | | | 25,304 | | | | 3,036 | |
| | | | |
Net Assets | | $ | 375,713 | | | $ | 628,978 | | | $ | 614,024 | | | $ | 61,936 | |
| | | | |
Shares Issued and Outstanding | | | 2,170 | | | | 11,820 | | | | 7,370 | | | | 980 | |
| | | | |
Net Asset Value Per Share Outstanding(a): | | $ | 173.14 | | | $ | 53.21 | | | $ | 83.31 | | | $ | 63.20 | |
| | | | |
Cost of investments in securities | | $ | 327,473 | | | $ | 608,292 | | | $ | 571,333 | | | $ | 57,418 | |
Cost of investments in Affiliates | | $ | 0 | | | $ | 0 | | | $ | 0 | | | $ | 0 | |
Cost of foreign currency held | | $ | 0 | | | $ | 0 | | | $ | 0 | | | $ | 0 | |
Proceeds received on short sales | | $ | 0 | | | $ | 0 | | | $ | 0 | | | $ | 0 | |
Cost or premiums of financial derivative instruments, net | | $ | 0 | | | $ | 0 | | | $ | 0 | | | $ | 0 | |
| | | | |
* Includes repurchase agreements of: | | $ | 363 | | | $ | 479 | | | $ | 600 | | | $ | 1,168 | |
^ Includes securities on loan of: | | $ | 0 | | | $ | 0 | | | $ | 0 | | | $ | 0 | |
| † | A zero balance may reflect actual amounts rounding to less than one thousand. |
| (a) | Includes adjustments required by U.S. GAAP and may differ from net asset values and performance reported elsewhere by the Funds. |
| | | | | | | | |
| 26 | | PIMCO ETF TRUST | | | | | See Accompanying Notes | |
June 30, 2020
| | | | | | | | | | | | | | | | | | | | | | | | | | | | | | |
PIMCO 0-5 Year High
Yield Corporate
Bond Index
Exchange- Traded Fund | | | PIMCO Investment Grade Corporate
Bond Index
Exchange- Traded Fund | | | PIMCO Active Bond
Exchange- Traded Fund | | | PIMCO Enhanced Low
Duration Active
Exchange- Traded Fund | | | PIMCO Enhanced Short
Maturity Active ESG Exchange-
Traded Fund | | | PIMCO Enhanced Short
Maturity Active
Exchange- Traded Fund | | | PIMCO Intermediate
Municipal Bond Active
Exchange- Traded Fund | | | PIMCO Short Term
Municipal Bond Active
Exchange- Traded Fund | |
| | | | | | | |
| | | | | | | | | | | | | | | | | | | | | | | | | | | | | | |
| | | | | | | |
| | | | | | | | | | | | | | | | | | | | | | | | | | | | | | | |
| $ | 1,149,338 | | | $ | 645,660 | | | $ | 3,932,251 | | | $ | 893,649 | | | $ | 93,415 | | | $ | 13,864,303 | | | $ | 465,655 | | | $ | 181,180 | |
| | 28,120 | | | | 0 | | | | 0 | | | | 0 | | | | 0 | | | | 515 | | | | 0 | | | | 0 | |
| | | | | | | | | | | | | | | | | | | | | | | | | | | | | | | |
| | 1,046 | | | | 116 | | | | 70 | | | | 60 | | | | 0 | | | | 0 | | | | 0 | | | | 0 | |
| | 0 | | | | 0 | | | | 18 | | | | 655 | | | | 0 | | | | 0 | | | | 0 | | | | 0 | |
| | 2,920 | | | | 0 | | | | 88 | | | | 408 | | | | 53 | | | | 288 | | | | 0 | | | | 0 | |
| | 18,094 | | | | 5,169 | | | | 4,675 | | | | 2,334 | | | | 0 | | | | 0 | | | | 0 | | | | 0 | |
| | 0 | | | | 0 | | | | 1,546 | | | | 23 | | | | 0 | | | | 0 | | | | 0 | | | | 0 | |
| | 30,717 | | | | 2,250 | | | | 760 | | | | 32,620 | | | | 1,805 | | | | 2,407 | | | | 7,994 | | | | 1,119 | |
| | 0 | | | | 0 | | | | 864,061 | | | | 0 | | | | 0 | | | | 0 | | | | 0 | | | | 0 | |
| | 0 | | | | 0 | | | | 11,139 | | | | 0 | | | | 0 | | | | 35,579 | | | | 0 | | | | 0 | |
| | 18,105 | | | | 6,143 | | | | 18,330 | | | | 2,810 | | | | 340 | | | | 24,773 | | | | 4,191 | | | | 1,180 | |
| | 0 | | | | 0 | | | | 0 | | | | 25 | | | | 7 | | | | 0 | | | | 0 | | | | 0 | |
| | 1,248,340 | | | | 659,338 | | | | 4,832,938 | | | | 932,584 | | | | 95,620 | | | | 13,927,865 | | | | 477,840 | | | | 183,479 | |
| | | | | | | |
| | | | | | | | | | | | | | | | | | | | | | | | | | | | | | |
| | | | | | | |
| | | | | | | | | | | | | | | | | | | | | | | | | | | | | | | |
| $ | 0 | | | $ | 0 | | | $ | 0 | | | $ | 373,549 | | | $ | 0 | | | $ | 0 | | | $ | 0 | | | $ | 0 | |
| | 0 | | | | 0 | | | | 0 | | | | 55,759 | | | | 0 | | | | 0 | | | | 0 | | | | 0 | |
| | | | | | | | | | | | | | | | | | | | | | | | | | | | | | | |
| | 10 | | | | 111 | | | | 90 | | | | 293 | | | | 0 | | | | 0 | | | | 0 | | | | 0 | |
| | 0 | | | | 0 | | | | 385 | | | | 663 | | | | 44 | | | | 0 | | | | 0 | | | | 0 | |
| | 23,120 | | | | 0 | | | | 215,192 | | | | 5,085 | | | | 7,997 | | | | 9,017 | | | | 9,049 | | | | 6,851 | |
| | 0 | | | | 0 | | | | 1,212,448 | | | | 0 | | | | 0 | | | | 0 | | | | 0 | | | | 0 | |
| | 203 | | | | 0 | | | | 0 | | | | 0 | | | | 0 | | | | 0 | | | | 0 | | | | 0 | |
| | 31,041 | | | | 0 | | | | 0 | | | | 0 | | | | 0 | | | | 515 | | | | 0 | | | | 0 | |
| | 0 | | | | 0 | | | | 2,615 | | | | 280 | | | | 0 | | | | 0 | | | | 0 | | | | 0 | |
| | 36,580 | | | | 0 | | | | 0 | | | | 0 | | | | 0 | | | | 0 | | | | 0 | | | | 0 | |
| | 560 | | | | 104 | | | | 1,502 | | | | 178 | | | | 26 | | | | 3,893 | | | | 129 | | | | 47 | |
| | 0 | | | | 0 | | | | 2 | | | | 34 | | | | 0 | | | | 0 | | | | 0 | | | | 0 | |
| | 91,514 | | | | 215 | | | | 1,432,234 | | | | 435,841 | | | | 8,067 | | | | 13,425 | | | | 9,178 | | | | 6,898 | |
| | | | | | | |
| $ | 1,156,826 | | | $ | 659,123 | | | $ | 3,400,704 | | | $ | 496,743 | | | $ | 87,553 | | | $ | 13,914,440 | | | $ | 468,662 | | | $ | 176,581 | |
| | | | | | | |
| | | | | | | | | | | | | | | | | | | | | | | | | | | | | | |
| | | | | | | |
| $ | 1,437,925 | | | $ | 615,748 | | | $ | 3,287,950 | | | $ | 491,806 | | | $ | 87,004 | | | $ | 13,930,182 | | | $ | 451,343 | | | $ | 174,678 | |
| | (281,099 | ) | | | 43,375 | | | | 112,754 | | | | 4,937 | | | | 549 | | | | (15,742 | ) | | | 17,319 | | | | 1,903 | |
| | | | | | | |
| $ | 1,156,826 | | | $ | 659,123 | | | $ | 3,400,704 | | | $ | 496,743 | | | $ | 87,553 | | | $ | 13,914,440 | | | $ | 468,662 | | | $ | 176,581 | |
| | | | | | | |
| | 12,650 | | | | 5,780 | | | | 30,530 | | | | 4,880 | | | | 870 | | | | 136,880 | | | | 8,410 | | | | 3,460 | |
| | | | | | | |
| $ | 91.45 | | | $ | 114.04 | | | $ | 111.39 | | | $ | 101.79 | | | $ | 100.64 | | | $ | 101.65 | | | $ | 55.73 | | | $ | 51.04 | |
| | | | | | | |
| $ | 1,254,141 | | | $ | 604,533 | | | $ | 3,791,772 | | | $ | 889,755 | | | $ | 92,952 | | | $ | 13,881,560 | | | $ | 444,186 | | | $ | 178,156 | |
| $ | 28,120 | | | $ | 0 | | | $ | 0 | | | $ | 0 | | | $ | 0 | | | $ | 515 | | | $ | 0 | | | $ | 0 | |
| $ | 0 | | | $ | 0 | | | $ | 1,592 | | | $ | 28 | | | $ | 0 | | | $ | 0 | | | $ | 0 | | | $ | 0 | |
| $ | 0 | | | $ | 0 | | | $ | 0 | | | $ | 55,604 | | | $ | 0 | | | $ | 0 | | | $ | 0 | | | $ | 0 | |
| $ | 2,139 | | | $ | 422 | | | $ | (33 | ) | | $ | 1,229 | | | $ | 0 | | | $ | 0 | | | $ | 0 | | | $ | 0 | |
| | | | | | | |
| $ | 55,818 | | | $ | 14,255 | | | $ | 142,487 | | | $ | 24,646 | | | $ | 0 | | | $ | 412,889 | | | $ | 560 | | | $ | 1,650 | |
| $ | 30,415 | | | $ | 0 | | | $ | 0 | | | $ | 0 | | | $ | 0 | | | $ | 497 | | | $ | 0 | | | $ | 0 | |
| | | | | | |
| | ANNUAL REPORT | | JUNE 30, 2020 | | 27 |
Statements of Operations
| | | | | | | | | | | | | | | | |
| Year Ended June 30, 2020 | | | | | | | | | | | | |
| (Amounts in thousands†) | |
PIMCO 25+ Year Zero
Coupon U.S.
Treasury Index
Exchange-
Traded Fund | | | PIMCO 1-5 Year U.S.
TIPS Index
Exchange-
Traded Fund | | | PIMCO 15+ Year U.S.
TIPS Index
Exchange-
Traded Fund | | | PIMCO Broad U.S.
TIPS Index
Exchange-
Traded Fund | |
| | | | |
Investment Income: | | | | | | | | | | | | | | | | |
| | | | |
Interest, net of foreign taxes* | | $ | 6,975 | | | $ | 4,766 | | | $ | 1,250 | | | $ | 299 | |
Securities lending income | | | 0 | | | | 0 | | | | 0 | | | | 0 | |
Total Income | | | 6,975 | | | | 4,766 | | | | 1,250 | | | | 299 | |
| | | | |
Expenses: | | | | | | | | | | | | | | | | |
| | | | |
Management fees | | | 489 | | | | 1,387 | | | | 549 | | | | 107 | |
Trustee fees | | | 4 | | | | 10 | | | | 3 | | | | 1 | |
Interest expense | | | 0 | | | | 0 | | | | 0 | | | | 0 | |
Organizational expense | | | 0 | | | | 0 | | | | 0 | | | | 0 | |
Miscellaneous expense | | | 0 | | | | 0 | | | | 0 | | | | 0 | |
Total Expenses | | | 493 | | | | 1,397 | | | | 552 | | | | 108 | |
Waiver and/or Reimbursement by PIMCO | | | 0 | | | | 0 | | | | 0 | | | | 0 | |
Net Expenses | | | 493 | | | | 1,397 | | | | 552 | | | | 108 | |
| | | | |
Net Investment Income (Loss) | | | 6,482 | | | | 3,369 | | | | 698 | | | | 191 | |
| | | | |
Net Realized Gain (Loss): | | | | | | | | | | | | | | | | |
| | | | |
Investments in securities | | | 5,573 | | | | (1,272 | ) | | | 509 | | | | (4 | ) |
In-kind redemptions | | | 56,564 | | | | 1,354 | | | | 15,953 | | | | 71 | |
Exchange-traded or centrally cleared financial derivative instruments | | | 0 | | | | 0 | | | | 0 | | | | 0 | |
Over the counter financial derivative instruments | | | 0 | | | | 0 | | | | 0 | | | | 0 | |
Short sales | | | 0 | | | | 0 | | | | 0 | | | | 0 | |
Foreign currency | | | 0 | | | | 0 | | | | 0 | | | | 0 | |
| | | | |
Net Realized Gain (Loss) | | | 62,137 | | | | 82 | | | | 16,462 | | | | 67 | |
| | | | |
Net Change in Unrealized Appreciation (Depreciation): | | | | | | | | | | | | | | | | |
| | | | |
Investments in securities | | | 35,076 | | | | 19,392 | | | | 36,467 | | | | 4,355 | |
Exchange-traded or centrally cleared financial derivative instruments | | | 0 | | | | 0 | | | | 0 | | | | 0 | |
Over the counter financial derivative instruments | | | 0 | | | | 0 | | | | 0 | | | | 0 | |
Short sales | | | 0 | | | | 0 | | | | 0 | | | | 0 | |
Foreign currency assets and liabilities | | | 0 | | | | 0 | | | | 0 | | | | 0 | |
| | | | |
Net Change in Unrealized Appreciation (Depreciation) | | | 35,076 | | | | 19,392 | | | | 36,467 | | | | 4,355 | |
| | | | |
Net Increase (Decrease) in Net Assets Resulting from Operations | | $ | 103,695 | | | $ | 22,843 | | | $ | 53,627 | | | $ | 4,613 | |
| | | | |
* Foreign tax withholdings | | $ | 0 | | | $ | 0 | | | $ | 0 | | | $ | 0 | |
| † | A zero balance may reflect actual amounts rounding to less than one thousand. |
| (a) | Inception date of the Fund was December 10, 2019. |
| | | | | | | | |
| 28 | | PIMCO ETF TRUST | | | | | See Accompanying Notes | |
| | | | | | | | | | | | | | | | | | | | | | | | | | | | | | |
| | | | | | | | | | | | | | | | | | | | | | | |
PIMCO 0-5 Year High Yield Corporate Bond Index Exchange- Traded Fund | | | PIMCO Investment Grade Corporate
Bond Index
Exchange- Traded Fund | | | PIMCO Active Bond
Exchange- Traded Fund | | | PIMCO Enhanced Low
Duration Active
Exchange- Traded Fund | | | PIMCO Enhanced Short
Maturity Active ESG Exchange-
Traded Fund(a) | | | PIMCO Enhanced Short
Maturity Active
Exchange- Traded Fund | | | PIMCO Intermediate
Municipal Bond Active
Exchange- Traded Fund | | | PIMCO Short Term
Municipal Bond Active
Exchange- Traded Fund | |
| | | | | | | |
| | | | | | | | | | | | | | | | | | | | | | | | | | | | | | |
| | | | | | | |
| $ | 68,457 | | | $ | 21,559 | | | $ | 93,564 | | | $ | 13,419 | | | $ | 810 | | | $ | 316,031 | | | $ | 9,517 | | | $ | 2,380 | |
| | 441 | | | | 1 | | | | 0 | | | | 0 | | | | 0 | | | | 2 | | | | 0 | | | | 0 | |
| | 68,898 | | | | 21,560 | | | | 93,564 | | | | 13,419 | | | | 810 | | | | 316,033 | | | | 9,517 | | | | 2,380 | |
| | | | | | | |
| | | | | | | | | | | | | | | | | | | | | | | | | | | | | | |
| | | | | | | |
| | 7,918 | | | | 1,304 | | | | 15,960 | | | | 1,986 | | | | 135 | | | | 45,916 | | | | 1,277 | | | | 425 | |
| | 20 | | | | 9 | | | | 36 | | | | 6 | | | | 0 | | | | 173 | | | | 4 | | | | 2 | |
| | 176 | | | | 7 | | | | 615 | | | | 417 | | | | 12 | | | | 2,891 | | | | 0 | | | | 1 | |
| | 0 | | | | 0 | | | | 0 | | | | 0 | | | | 85 | | | | 0 | | | | 0 | | | | 0 | |
| | 0 | | | | 1 | | | | 5 | | | | 21 | | | | 0 | | | | 0 | | | | 0 | | | | 0 | |
| | 8,114 | | | | 1,321 | | | | 16,616 | | | | 2,430 | | | | 232 | | | | 48,980 | | | | 1,281 | | | | 428 | |
| | 0 | | | | 0 | | | | 0 | | | | (308 | ) | | | (128 | ) | | | 0 | | | | 0 | | | | 0 | |
| | 8,114 | | | | 1,321 | | | | 16,616 | | | | 2,122 | | | | 104 | | | | 48,980 | | | | 1,281 | | | | 428 | |
| | | | | | | |
| | 60,784 | | | | 20,239 | | | | 76,948 | | | | 11,297 | | | | 706 | | | | 267,053 | | | | 8,236 | | | | 1,952 | |
| | | | | | | |
| | | | | | | | | | | | | | | | | | | | | | | | | | | | | | |
| | | | | | | |
| | (11,994 | ) | | | 3,215 | | | | 19,937 | | | | 2,568 | | | | 67 | | | | 8,068 | | | | (684 | ) | | | (381 | ) |
| | (6,964 | ) | | | 16,037 | | | | 0 | | | | 0 | | | | 0 | | | | 0 | | | | 0 | | | | 0 | |
| | (11,664 | ) | | | 5,144 | | | | 6,336 | | | | (627 | ) | | | 0 | | | | 0 | | | | 0 | | | | 0 | |
| | 1,981 | | | | 0 | | | | (242 | ) | | | 4,095 | | | | (33 | ) | | | 0 | | | | 0 | | | | 0 | |
| | 0 | | | | 0 | | | | 0 | | | | (66 | ) | | | 0 | | | | 0 | | | | 0 | | | | 0 | |
| | 0 | | | | 0 | | | | 14 | | | | (344 | ) | | | (2 | ) | | | 0 | | | | 0 | | | | 0 | |
| | | | | | | |
| | (28,641 | ) | | | 24,396 | | | | 26,045 | | | | 5,626 | | | | 32 | | | | 8,068 | | | | (684 | ) | | | (381 | ) |
| | | | | | | |
| | | | | | | | | | | | | | | | | | | | | | | | | | | | | | |
| | | | | | | |
| | (91,639 | ) | | | 16,584 | | | | 87,378 | | | | 1,247 | | | | 463 | | | | (39,711 | ) | | | 6,592 | | | | 1,727 | |
| | (4,268 | ) | | | (668 | ) | | | (367 | ) | | | 1,466 | | | | 0 | | | | 0 | | | | 0 | | | | 0 | |
| | (1,209 | ) | | | 0 | | | | (364 | ) | | | (280 | ) | | | (44 | ) | | | 0 | | | | 0 | | | | 0 | |
| | 0 | | | | 0 | | | | 0 | | | | (121 | ) | | | 0 | | | | 0 | | | | 0 | | | | 0 | |
| | 0 | | | | 0 | | | | (77 | ) | | | (3 | ) | | | 0 | | | | 0 | | | | 0 | | | | 0 | |
| | | | | | | |
| | (97,116 | ) | | | 15,916 | | | | 86,570 | | | | 2,309 | | | | 419 | | | | (39,711 | ) | | | 6,592 | | | | 1,727 | |
| | | | | | | |
| $ | (64,973 | ) | | $ | 60,551 | | | $ | 189,563 | | | $ | 19,232 | | | $ | 1,157 | | | $ | 235,410 | | | $ | 14,144 | | | $ | 3,298 | |
| | | | | | | |
| $ | 0 | | | $ | 0 | | | $ | 2 | | | $ | 0 | | | $ | 0 | | | $ | 1 | | | $ | 0 | | | $ | 0 | |
| | | | | | |
| | ANNUAL REPORT | | JUNE 30, 2020 | | 29 |
Statements of Changes in Net Assets
| | | | | | | | | | | | | | | | |
| | | PIMCO 25+ Year Zero Coupon U.S.
Treasury Index Exchange-
Traded Fund | | | PIMCO 1-5 Year U.S. TIPS Index
Exchange-Traded Fund | |
| | | | |
| (Amounts in thousands†) | | Year Ended
June 30, 2020 | | | Year Ended
June 30, 2019 | | | Year Ended
June 30, 2020 | | | Year Ended
June 30, 2019 | |
| | | | |
Increase (Decrease) in Net Assets from: | | | | | | | | | | | | | | | | |
| | | | |
Operations: | | | | | | | | | | | | | | | | |
| | | | |
Net investment income (loss) | | $ | 6,482 | | | $ | 4,820 | | | $ | 3,369 | | | $ | 15,125 | |
Net realized gain (loss) | | | 62,137 | | | | (4,304 | ) | | | 82 | | | | (4,877 | ) |
Net change in unrealized appreciation (depreciation) | | | 35,076 | | | | 26,764 | | | | 19,392 | | | | 13,921 | |
| | | | |
Net Increase (Decrease) in Net Assets Resulting from Operations | | | 103,695 | | | | 27,280 | | | | 22,843 | | | | 24,169 | |
| | | | |
Distributions to Shareholders: | | | | | | | | | | | | | | | | |
| | | | |
From net investment income and/or net realized capital gains | | | (6,364 | ) | | | (4,651 | ) | | | (14,551 | ) | | | (11,921 | ) |
Tax basis return of capital | | | 0 | | | | 0 | | | | (2,072 | ) | | | 0 | |
| | | | |
Total Distributions(a) | | | (6,364 | ) | | | (4,651 | ) | | | (16,623 | ) | | | (11,921 | ) |
| | | | |
Fund Share Transactions: | | | | | | | | | | | | | | | | |
| | | | |
Receipts for shares sold | | | 263,721 | | | | 100,956 | | | | 36,739 | | | | 79,717 | |
Cost of shares redeemed | | | (250,654 | ) | | | (22,298 | ) | | | (162,285 | ) | | | (170,191 | ) |
Net increase (decrease) resulting from Fund share transactions | | | 13,067 | | | | 78,658 | | | | (125,546 | ) | | | (90,474 | ) |
| | | | |
Total Increase (Decrease) in Net Assets | | | 110,398 | | | | 101,287 | | | | (119,326 | ) | | | (78,226 | ) |
| | | | |
Net Assets: | | | | | | | | | | | | | | | | |
| | | | |
Beginning of year | | | 265,315 | | | | 164,028 | | | | 748,304 | | | | 826,530 | |
End of year | | $ | 375,713 | | | $ | 265,315 | | | $ | 628,978 | | | $ | 748,304 | |
| | | | |
Shares of Beneficial Interest: | | | | | | | | | | | | | | | | |
| | | | |
Shares sold | | | 1,700 | | | | 850 | | | | 700 | | | | 1,550 | |
Shares redeemed | | | (1,600 | ) | | | (200 | ) | | | (3,100 | ) | | | (3,300 | ) |
Net increase (decrease) in shares outstanding | | | 100 | | | | 650 | | | | (2,400 | ) | | | (1,750 | ) |
| † | A zero balance may reflect actual amounts rounding to less than one thousand. |
| (a) | The tax characterization of distributions is determined in accordance with Federal income tax regulations. See Note 2, Distributions to Shareholders, in the Notes to Financial Statements for more information. |
(a) The tax characterization of distributions is determined in accordance with Federal income tax regulations. See Note 2, Distributions to Shareholders, in the Notes to Financial Statements for more information.
| | | | | | | | |
| 30 | | PIMCO ETF TRUST | | | | | See Accompanying Notes | |
| | | | | | | | | | | | | | | | | | | | | | | | | | | | | | | | | | | | | | |
PIMCO 15+ Year U.S. TIPS Index
Exchange-Traded Fund | | | PIMCO Broad U.S. TIPS Index
Exchange-Traded Fund | | | PIMCO 0-5 Year High Yield Corporate Bond Index Exchange-Traded Fund | | | PIMCO Investment Grade Corporate Bond Index Exchange-Traded Fund | | | PIMCO Active Bond Exchange-Traded Fund | |
| | | | | | | | | |
Year Ended
June 30, 2020 | | | Year Ended
June 30, 2019 | | | Year Ended
June 30, 2020 | | | Year Ended
June 30, 2019 | | | Year Ended
June 30, 2020 | | | Year Ended
June 30, 2019 | | | Year Ended
June 30, 2020 | | | Year Ended
June 30, 2019 | | | Year Ended
June 30, 2020 | | | Year Ended
June 30, 2019 | |
| | | | | | | | | |
| | | | | | | | | | | | | | | | | | | | | | | | | | | | | | | | | | | | | | |
| | | | | | | | | |
| | | | | | | | | | | | | | | | | | | | | | | | | | | | | | | | | | | | | | |
| | | | | | | | | |
| $ | 698 | | | $ | 4,955 | | | $ | 191 | | | $ | 1,005 | | | $ | 60,784 | | | $ | 72,641 | | | $ | 20,239 | | | $ | 24,075 | | | $ | 76,948 | | | $ | 70,561 | |
| | 16,462 | | | | (2,029 | ) | | | 67 | | | | (79 | ) | | | (28,641 | ) | | | (14,545 | ) | | | 24,396 | | | | (9,494 | ) | | | 26,045 | | | | 16,592 | |
| | 36,467 | | | | 1,698 | | | | 4,355 | | | | 1,562 | | | | (97,116 | ) | | | 24,403 | | | | 15,916 | | | | 51,681 | | | | 86,570 | | | | 77,667 | |
| | | | | | | | | |
| | 53,627 | | | | 4,624 | | | | 4,613 | | | | 2,488 | | | | (64,973 | ) | | | 82,499 | | | | 60,551 | | | | 66,262 | | | | 189,563 | | | | 164,820 | |
| | | | | | | | | |
| | | | | | | | | | | | | | | | | | | | | | | | | | | | | | | | | | | | | | |
| | | | | | | | | |
| | (5,557 | ) | | | (4,419 | ) | | | (955 | ) | | | (738 | ) | | | (71,011 | ) | | | (76,687 | ) | | | (21,128 | ) | | | (24,777 | ) | | | (90,615 | ) | | | (73,021 | ) |
| | 0 | | | | 0 | | | | (189 | ) | | | 0 | | | | 0 | | | | 0 | | | | 0 | | | | 0 | | | | 0 | | | | 0 | |
| | | | | | | | | |
| | (5,557 | ) | | | (4,419 | ) | | | (1,144 | ) | | | (738 | ) | | | (71,011 | ) | | | (76,687 | ) | | | (21,128 | ) | | | (24,777 | ) | | | (90,615 | ) | | | (73,021 | ) |
| | | | | | | | | |
| | | | | | | | | | | | | | | | | | | | | | | | | | | | | | | | | | | | | | |
| | | | | | | | | |
| | 520,191 | | | | 43,461 | | | | 9,122 | | | | 5,629 | | | | 1,592,636 | | | | 2,250,839 | | | | 122,390 | | | | 228,373 | | | | 1,183,283 | | | | 511,170 | |
| | (133,140 | ) | | | (119,508 | ) | | | (2,982 | ) | | | (5,747 | ) | | | (1,760,050 | ) | | | (2,462,591 | ) | | | (299,708 | ) | | | (228,924 | ) | | | (304,452 | ) | | | (252,176 | ) |
| | 387,051 | | | | (76,047 | ) | | | 6,140 | | | | (118 | ) | | | (167,414 | ) | | | (211,752 | ) | | | (177,318 | ) | | | (551 | ) | | | 878,831 | | | | 258,994 | |
| | | | | | | | | |
| | 435,121 | | | | (75,842 | ) | | | 9,609 | | | | 1,632 | | | | (303,398 | ) | | | (205,940) | | | | (137,895 | ) | | | 40,934 | | | | 977,779 | | | | 350,793 | |
| | | | | | | | | |
| | | | | | | | | | | | | | | | | | | | | | | | | | | | | | | | | | | | | | |
| | | | | | | | | |
| | 178,903 | | | | 254,745 | | | | 52,327 | | | | 50,695 | | | | 1,460,224 | | | | 1,666,164 | | | | 797,018 | | | | 756,084 | | | | 2,422,925 | | | | 2,072,132 | |
| $ | 614,024 | | | $ | 178,903 | | | $ | 61,936 | | | $ | 52,327 | | | $ | 1,156,826 | | | $ | 1,460,224 | | | $ | 659,123 | | | $ | 797,018 | | | $ | 3,400,704 | | | $ | 2,422,925 | |
| | | | | | | | | |
| | | | | | | | | | | | | | | | | | | | | | | | | | | | | | | | | | | | | | |
| | | | | | | | | |
| | 6,550 | | | | 650 | | | | 150 | | | | 100 | | | | 16,350 | | | | 22,850 | | | | 1,100 | | | | 2,200 | | | | 10,850 | | | | 4,900 | |
| | (1,750 | ) | | | (1,850 | ) | | | (50 | ) | | | (100 | ) | | | (18,200 | ) | | | (25,000 | ) | | | (2,750 | ) | | | (2,300 | ) | | | (2,850 | ) | | | (2,450 | ) |
| | 4,800 | | | | (1,200 | ) | | | 100 | | | | 0 | | | | (1,850 | ) | | | (2,150 | ) | | | (1,650 | ) | | | (100 | ) | | | 8,000 | | | | 2,450 | |
| | | | | | |
| | ANNUAL REPORT | | JUNE 30, 2020 | | 31 |
Statements of Changes in Net Assets (Cont.)
| | | | | | | | | | | | |
| | | PIMCO
Enhanced Low
Duration Active
Exchange-Traded Fund | | | PIMCO
Enhanced Short
Maturity Active ESG
Exchange-Traded Fund | |
| | | |
| (Amounts in thousands†) | | Year Ended
June 30, 2020 | | | Year Ended
June 30, 2019 | | | Inception date through
June 30, 2020 | |
| | | |
Increase (Decrease) in Net Assets from: | | | | | | | | | | | | |
| | | |
Operations: | | | | | | | | | | | | |
| | | |
Net investment income (loss) | | $ | 11,297 | | | $ | 7,207 | | | $ | 706 | |
Net realized gain (loss) | | | 5,626 | | | | 1,065 | | | | 32 | |
Net change in unrealized appreciation (depreciation) | | | 2,309 | | | | 1,084 | | | | 419 | |
| | | |
Net Increase (Decrease) in Net Assets Resulting from Operations | | | 19,232 | | | | 9,356 | | | | 1,157 | |
| | | |
Distributions to Shareholders: | | | | | | | | | | | | |
| | | |
From net investment income and/or net realized capital gains | | | (12,814 | ) | | | (7,088 | ) | | | (608 | ) |
Tax basis return of capital | | | 0 | | | | 0 | | | | 0 | |
| | | |
Total Distributions(a) | | | (12,814 | ) | | | (7,088 | ) | | | (608 | ) |
| | | |
Fund Share Transactions: | | | | | | | | | | | | |
| | | |
Receipts for shares sold | | | 213,202 | | | | 192,864 | | | | 87,004 | |
Cost of shares redeemed | | | (75,391 | ) | | | 0 | | | | 0 | |
Net increase (decrease) resulting from Fund share transactions | | | 137,811 | | | | 192,864 | | | | 87,004 | |
| | | |
Total Increase (Decrease) in Net Assets | | | 144,229 | | | | 195,132 | | | | 87,553 | |
| | | |
Net Assets: | | | | | | | | | | | | |
| | | |
Beginning of year | | | 352,514 | | | | 157,382 | | | | 0 | |
End of year | | $ | 496,743 | | | $ | 352,514 | | | $ | 87,553 | |
| | | |
Shares of Beneficial Interest: | | | | | | | | | | | | |
| | | |
Shares sold | | | 2,120 | | | | 1,940 | | | | 870 | |
Shares redeemed | | | (760 | ) | | | 0 | | | | 0 | |
Net increase (decrease) in shares outstanding | | | 1,360 | | | | 1,940 | | | | 870 | |
| † | A zero balance may reflect actual amounts rounding to less than one thousand. |
| (a) | The tax characterization of distributions is determined in accordance with Federal income tax regulations. See Note 2, Distributions to Shareholders, in the Notes to Financial Statements for more information. |
| | | | | | | | |
| 32 | | PIMCO ETF TRUST | | | | | See Accompanying Notes | |
| | | | | | | | | | | | | | | | | | | | | | |
PIMCO
Enhanced Short Maturity Active
Exchange-Traded Fund | | |
PIMCO
Intermediate Municipal Bond Active
Exchange-Traded Fund | | | PIMCO
Short Term Municipal Bond Active
Exchange-Traded Fund | |
| | | | | |
Year Ended
June 30, 2020 | | | Year Ended
June 30, 2019 | | | Year Ended
June 30, 2020 | | | Year Ended
June 30, 2019 | | | Year Ended
June 30, 2020 | | | Year Ended
June 30, 2019 | |
| | | | | |
| | | | | | | | | | | | | | | | | | | | | | |
| | | | | |
| | | | | | | | | | | | | | | | | | | | | | |
| | | | | |
| $ | 267,053 | | | $ | 305,066 | | | $ | 8,236 | | | $ | 7,465 | | | $ | 1,952 | | | $ | 1,533 | |
| | 8,068 | | | | 3,414 | | | | (684 | ) | | | 318 | | | | (381 | ) | | | (80 | ) |
| | (39,711 | ) | | | 9,848 | | | | 6,592 | | | | 9,995 | | | | 1,727 | | | | 1,174 | |
| | | | | |
| | 235,410 | | | | 318,328 | | | | 14,144 | | | | 17,778 | | | | 3,298 | | | | 2,627 | |
| | | | | |
| | | | | | | | | | | | | | | | | | | | | | |
| | | | | |
| | (295,040 | ) | | | (297,054 | ) | | | (8,015 | ) | | | (7,507 | ) | | | (1,882 | ) | | | (1,504 | ) |
| | 0 | | | | 0 | | | | 0 | | | | 0 | | | | 0 | | | | 0 | |
| | | | | |
| | (295,040 | ) | | | (297,054 | ) | | | (8,015 | ) | | | (7,507 | ) | | | (1,882 | ) | | | (1,504 | ) |
| | | | | |
| | | | | | | | | | | | | | | | | | | | | | |
| | | | | |
| | 6,351,234 | | | | 6,881,703 | | | | 184,530 | | | | 74,488 | | | | 83,613 | | | | 27,508 | |
| | (4,317,077 | ) | | | (4,373,204 | ) | | | (26,512 | ) | | | (55,553 | ) | | | (4,953 | ) | | | 0 | |
| | 2,034,157 | | | | 2,508,499 | | | | 158,018 | | | | 18,935 | | | | 78,660 | | | | 27,508 | |
| | | | | |
| | 1,974,527 | | | | 2,529,773 | | | | 164,147 | | | | 29,206 | | | | 80,076 | | | | 28,631 | |
| | | | | |
| | | | | | | | | | | | | | | | | | | | | | |
| | | | | |
| | 11,939,913 | | | | 9,410,140 | | | | 304,515 | | | | 275,309 | | | | 96,505 | | | | 67,874 | |
| $ | 13,914,440 | | | $ | 11,939,913 | | | $ | 468,662 | | | $ | 304,515 | | | $ | 176,581 | | | $ | 96,505 | |
| | | | | |
| | | | | | | | | | | | | | | | | | | | | | |
| | | | | |
| | 62,510 | | | | 67,830 | | | | 3,350 | | | | 1,400 | | | | 1,650 | | | | 550 | |
| | (42,980 | ) | | | (43,120 | ) | | | (500 | ) | | | (1,050 | ) | | | (100 | ) | | | 0 | |
| | 19,530 | | | | 24,710 | | | | 2,850 | | | | 350 | | | | 1,550 | | | | 550 | |
| | | | | | |
| | ANNUAL REPORT | | JUNE 30, 2020 | | 33 |
Schedule of Investments PIMCO 25+ Year Zero Coupon U.S. Treasury Index Exchange-Traded Fund
June 30, 2020
(Amounts in thousands*, except number of shares, contracts and units, if any)
| | | | | | | | | | | | |
| | | | | PRINCIPAL
AMOUNT
(000S) | | | | | MARKET
VALUE
(000S) | |
| INVESTMENTS IN SECURITIES 100.0% | |
| |
| U.S. TREASURY OBLIGATIONS 99.9% | |
|
U.S. Treasury STRIPS (a) | |
0.000% due 05/15/2045 | | $ | | | 27,919 | | | $ | | | 19,369 | |
0.000% due 08/15/2045 | | | | | 28,158 | | | | | | 19,464 | |
0.000% due 11/15/2045 | | | | | 28,373 | | | | | | 19,533 | |
0.000% due 02/15/2046 | | | | | 28,174 | | | | | | 19,306 | |
0.000% due 05/15/2046 | | | | | 27,942 | | | | | | 19,080 | |
0.000% due 08/15/2046 | | | | | 28,331 | | | | | | 19,280 | |
0.000% due 11/15/2046 | | | | | 28,004 | | | | | | 19,007 | |
0.000% due 02/15/2047 | | | | | 28,218 | | | | | | 19,139 | |
0.000% due 05/15/2047 | | | | | 28,286 | | | | | | 19,061 | |
0.000% due 08/15/2047 | | | | | 28,024 | | | | | | 18,789 | |
0.000% due 11/15/2047 | | | | | 28,156 | | | | | | 18,805 | |
0.000% due 02/15/2048 | | | | | 28,297 | | | | | | 18,826 | |
0.000% due 05/15/2048 | | | | | 28,125 | | | | | | 18,650 | |
0.000% due 08/15/2048 | | | | | 28,200 | | | | | | 18,648 | |
0.000% due 11/15/2048 | | | | | 28,000 | | | | | | 18,514 | |
0.000% due 02/15/2049 | | | | | 28,169 | | | | | | 18,507 | |
0.000% due 05/15/2049 | | | | | 27,916 | | | | | | 18,281 | |
| | | | | | | | | | | | |
| | | | | PRINCIPAL
AMOUNT
(000S) | | | | | MARKET
VALUE
(000S) | |
0.000% due 08/15/2049 | | $ | | | 28,012 | | | $ | | | 18,284 | |
0.000% due 11/15/2049 | | | | | 27,015 | | | | | | 17,584 | |
0.000% due 02/15/2050 | | | | | 26,533 | | | | | | 17,267 | |
| | | | | | | | | | | | |
Total U.S. Treasury Obligations (Cost $327,110) | | | 375,394 | |
| | | | |
| |
| SHORT-TERM INSTRUMENTS 0.1% | |
| | | | | | | | | | | | |
| REPURCHASE AGREEMENTS (b) 0.1% | | | | |
| | | | | | | | | | | 363 | |
| | | | | | | | | | | | |
Total Short-Term Instruments (Cost $363) | | | 363 | |
| | | | |
| | | | |
| | | | | | | | | | | | |
| Total Investments in Securities (Cost $327,473) | | | | | | | | | | | 375,757 | |
| | | | |
| | | | | | | | | | | | |
Total Investments 100.0% (Cost $327,473) | | | $ | | | 375,757 | |
| | | | |
| Other Assets and Liabilities, net 0.0% | | | | | | (44 | ) |
| |
| Net Assets 100.0% | | | $ | | | 375,713 | |
| | | | |
NOTES TO SCHEDULE OF INVESTMENTS:
| * | A zero balance may reflect actual amounts rounding to less than one thousand. |
BORROWINGS AND OTHER FINANCING TRANSACTIONS
(b) REPURCHASE AGREEMENTS:
| | | | | | | | | | | | | | | | | | | | | | | | | | | | | | |
| Counterparty | | Lending
Rate | | | Settlement
Date | | | Maturity
Date | | | Principal
Amount | | | Collateralized By | | Collateral
(Received) | | | Repurchase
Agreements,
at Value | | | Repurchase
Agreement
Proceeds
to be
Received | |
| FICC | | | 0.000 | % | | | 06/30/2020 | | | | 07/01/2020 | | | $ | 363 | | | U.S. Treasury Inflation Protected Securities 0.125% due 07/15/2024 | | $ | (370 | ) | | $ | 363 | | | $ | 363 | |
| | | | | | | | | | | | | | | | | | | | | | | | | | | | | | |
Total Repurchase Agreements | | | | | $ | (370 | ) | | $ | 363 | | | $ | 363 | |
| | | | | | | | | | | | | | | |
BORROWINGS AND OTHER FINANCING TRANSACTIONS SUMMARY
The following is a summary by counterparty of the market value of Borrowings and Other Financing Transactions and collateral pledged/(received) as of June 30, 2020:
| | | | | | | | | | | | | | | | | | | | | | | | | | | | |
| Counterparty | | Repurchase
Agreement
Proceeds
to be
Received | | | Payable for
Reverse
Repurchase
Agreements | | | Payable for
Sale-Buyback
Transactions | | | Securities
Out on
Loan | | | Total
Borrowings and
Other Financing
Transactions | | | Collateral
Pledged/(Received) | | | Net
Exposure(1) | |
Global/Master Repurchase Agreement | |
FICC | | $ | 363 | | | $ | 0 | | | $ | 0 | | | $ | 0 | | | $ | 363 | | | $ | (370 | ) | | $ | (7 | ) |
| | | | | | | | | | | | | | | | | | | | | | | | | | | | |
Total Borrowings and Other Financing Transactions | | $ | 363 | | | $ | 0 | | | $ | 0 | | | $ | 0 | | | | | | | | | | | | | |
| | | | | | | | | | | | | | | | | | | | | | | | | | | | |
| (1) | Net Exposure represents the net receivable/(payable) that would be due from/to the counterparty in the event of default. Exposure from borrowings and other financing transactions can only be netted across transactions governed under the same master agreement with the same legal entity. See Note 8, Master Netting Arrangements, in the Notes to Financial Statements for more information. |
FAIR VALUE MEASUREMENTS
The following is a summary of the fair valuations according to the inputs used as of June 30, 2020 in valuing the Fund’s assets and liabilities:
| | | | | | | | | | | | | | | | |
| Category and Subcategory | | Level 1 | | | Level 2 | | | Level 3 | | | Fair
Value at
06/30/2020 | |
Investments in Securities, at Value | |
U.S. Treasury Obligations | | $ | 0 | | | $ | 375,394 | | | $ | 0 | | | $ | 375,394 | |
Short-Term Instruments | |
Repurchase Agreements | | | 0 | | | | 363 | | | | 0 | | | | 363 | |
| | | | | | | | | | | | | | | | |
Total Investments | | $ | 0 | | | $ | 375,757 | | | $ | 0 | | | $ | 375,757 | |
| | | | | | | | | | | | | | | | |
There were no significant transfers into or out of Level 3 during the period ended June 30, 2020.
| | | | | | | | |
| 34 | | PIMCO ETF TRUST | | | | | See Accompanying Notes | |
Schedule of Investments PIMCO 1-5 Year U.S. TIPS Index Exchange-Traded Fund
June 30, 2020
(Amounts in thousands*, except number of shares, contracts and units, if any)
| | | | | | | | | | | | |
| | | | | PRINCIPAL
AMOUNT
(000S) | | | | | MARKET
VALUE
(000S) | |
| INVESTMENTS IN SECURITIES 99.9% | |
| |
| U.S. TREASURY OBLIGATIONS 99.8% | |
|
U.S. Treasury Inflation Protected Securities (a) | |
0.125% due 01/15/2022 | | $ | | | 49,542 | | | $ | | | 50,264 | |
0.125% due 04/15/2022 | | | | | 45,496 | | | | | | 46,208 | |
0.125% due 07/15/2022 | | | | | 49,023 | | | | | | 50,228 | |
0.125% due 01/15/2023 | | | | | 44,179 | | | | | | 45,305 | |
0.125% due 07/15/2024 | | | | | 49,708 | | | | | | 51,986 | |
0.125% due 10/15/2024 | | | | | 19,436 | | | | | | 20,382 | |
0.125% due 04/15/2025 | | | | | 40,879 | | | | | | 42,875 | |
0.250% due 01/15/2025 | | | | | 36,488 | | | | | | 38,439 | |
0.375% due 07/15/2023 | | | | | 56,387 | | | | | | 58,783 | |
0.500% due 04/15/2024 | | | | | 39,294 | | | | | | 41,348 | |
0.625% due 07/15/2021 | | | | | 36,336 | | | | | | 37,006 | |
0.625% due 04/15/2023 | | | | | 53,098 | | | | | | 55,272 | |
0.625% due 01/15/2024 | | | | | 48,771 | | | | | | 51,422 | |
2.375% due 01/15/2025 | | | | | 33,019 | | | | | | 38,063 | |
| | | | | | | | | | | | |
Total U.S. Treasury Obligations (Cost $607,813) | | | 627,581 | |
| | | | |
| | | | | | | | | | | | |
| | | | | | | | | | MARKET
VALUE
(000S) | |
| SHORT-TERM INSTRUMENTS 0.1% | |
| | | | | | | | | | | | |
| REPURCHASE AGREEMENTS (b) 0.1% | | | | |
| | | | | | | | $ | | | 479 | |
| | | | | | | | | | | | |
Total Short-Term Instruments (Cost $479) | | | 479 | |
| | | | |
| | | | |
| | | | | | | | | | | | |
Total Investments in Securities (Cost $608,292) | | | 628,060 | |
| |
| | | | |
Total Investments 99.9% (Cost $608,292) | | | $ | | | 628,060 | |
| |
| Other Assets and Liabilities, net 0.1% | | | 918 | |
| | | | |
| Net Assets 100.0% | | | $ | | | 628,978 | |
| | | | | | | | | | | | |
NOTES TO SCHEDULE OF INVESTMENTS:
| * | A zero balance may reflect actual amounts rounding to less than one thousand. |
| (a) | Principal amount of security is adjusted for inflation. |
BORROWINGS AND OTHER FINANCING TRANSACTIONS
(b) REPURCHASE AGREEMENTS:
| | | | | | | | | | | | | | | | | | | | | | | | | | | | | | |
| Counterparty | | Lending
Rate | | | Settlement
Date | | | Maturity
Date | | | Principal
Amount | | | Collateralized By | | Collateral
(Received) | | | Repurchase
Agreements,
at Value | | | Repurchase
Agreement
Proceeds
to be
Received | |
| FICC | | | 0.000 | % | | | 06/30/2020 | | | | 07/01/2020 | | | $ | 479 | | | U.S. Treasury Inflation Protected Securities 0.125% due 07/15/2024 | | $ | (489 | ) | | $ | 479 | | | $ | 479 | |
| | | | | | | | | | | | | | | | | | | | | | | | | | | | | | |
Total Repurchase Agreements | | | | | $ | (489 | ) | | $ | 479 | | | $ | 479 | |
| | | | | | | | | | | | | | | |
BORROWINGS AND OTHER FINANCING TRANSACTIONS SUMMARY
The following is a summary by counterparty of the market value of Borrowings and Other Financing Transactions and collateral pledged/(received) as of June 30, 2020:
| | | | | | | | | | | | | | | | | | | | | | | | | | | | |
| Counterparty | | Repurchase
Agreement
Proceeds
to be
Received | | | Payable for
Reverse
Repurchase
Agreements | | | Payable for
Sale-Buyback
Transactions | | | Securities
Out on
Loan | | | Total
Borrowings and
Other Financing
Transactions | | | Collateral
Pledged/(Received) | | | Net
Exposure(1) | |
Global/Master Repurchase Agreement | |
FICC | | $ | 479 | | | $ | 0 | | | $ | 0 | | | $ | 0 | | | $ | 479 | | | $ | (489 | ) | | $ | (10 | ) |
| | | | | | | | | | | | | | | | | | | | | | | | | | | | |
Total Borrowings and Other Financing Transactions | | $ | 479 | | | $ | 0 | | | $ | 0 | | | $ | 0 | | | | | | | | | | | | | |
| | | | | | | | | | | | | | | | | | | | | | | | | | | | |
| (1) | Net Exposure represents the net receivable/(payable) that would be due from/to the counterparty in the event of default. Exposure from borrowings and other financing transactions can only be netted across transactions governed under the same master agreement with the same legal entity. See Note 8, Master Netting Arrangements, in the Notes to Financial Statements for more information. |
FAIR VALUE MEASUREMENTS
The following is a summary of the fair valuations according to the inputs used as of June 30, 2020 in valuing the Fund’s assets and liabilities:
| | | | | | | | | | | | | | | | |
| Category and Subcategory | | Level 1 | | | Level 2 | | | Level 3 | | | Fair
Value at
06/30/2020 | |
Investments in Securities, at Value | |
U.S. Treasury Obligations | | $ | 0 | | | $ | 627,581 | | | $ | 0 | | | $ | 627,581 | |
Short-Term Instruments | |
Repurchase Agreements | | | 0 | | | | 479 | | | | 0 | | | | 479 | |
| | | | | | | | | | | | | | | | |
Total Investments | | $ | 0 | | | $ | 628,060 | | | $ | 0 | | | $ | 628,060 | |
| | | | | | | | | | | | | | | | |
There were no significant transfers into or out of Level 3 during the period ended June 30, 2020.
| | | | | | |
| See Accompanying Notes | | ANNUAL REPORT | | JUNE 30, 2020 | | 35 |
Schedule of Investments PIMCO 15+ Year U.S. TIPS Index Exchange-Traded Fund
June 30, 2020
(Amounts in thousands*, except number of shares, contracts and units, if any)
| | | | | | | | | | | | |
| | | | | PRINCIPAL
AMOUNT
(000S) | | | | | MARKET
VALUE
(000S) | |
| INVESTMENTS IN SECURITIES 99.7% | |
| |
| U.S. TREASURY OBLIGATIONS 99.6% | |
|
U.S. Treasury Inflation Protected Securities (a) | |
0.625% due 02/15/2043 | | $ | | | 54,498 | | | $ | | | 64,319 | |
0.750% due 02/15/2042 | | | | | 53,265 | | | | | | 63,877 | |
0.750% due 02/15/2045 | | | | | 53,153 | | | | | | 65,127 | |
0.875% due 02/15/2047 | | | | | 42,150 | | | | | | 53,851 | |
1.000% due 02/15/2046 | | | | | 44,876 | | | | | | 58,119 | |
1.000% due 02/15/2048 | | | | | 40,068 | | | | | | 53,077 | |
1.000% due 02/15/2049 | | | | | 47,621 | | | | | | 63,682 | |
1.375% due 02/15/2044 | | | | | 51,963 | | | | | | 71,019 | |
2.125% due 02/15/2040 | | | | | 19,832 | | | | | | 29,274 | |
2.125% due 02/15/2041 | | | | | 59,618 | | | | | | 89,184 | |
| | | | | | | | | | | | |
Total U.S. Treasury Obligations
(Cost $570,733) | | | | | | | | | | | 611,529 | |
| | | | | | | | | | | | |
| | | | | | | | | | | | |
| | | | | | | | | | MARKET
VALUE
(000S) | |
| SHORT-TERM INSTRUMENTS 0.1% | |
| |
| REPURCHASE AGREEMENTS (b) 0.1% | |
| | | | | | | | $ | | | 600 | |
| | | | | | | | | | | | |
Total Short-Term Instruments
(Cost $600) | | | | | | | | | | | 600 | |
| | | | | | | | | | | | |
| | | | |
| | | | | | | | | | | | |
Total Investments in Securities
(Cost $571,333) | | | | | | | | | | | 612,129 | |
| | | | |
| | | | | | | | | | | | |
Total Investments 99.7%
(Cost $571,333) | | | | | | | | $ | | | 612,129 | |
| |
| Other Assets and Liabilities, net 0.3% | | | | | | 1,895 | |
| | | | | | | | | | | | |
| Net Assets 100.0% | | | | | | | | $ | | | 614,024 | |
| | | | | | | | | | | | |
NOTES TO SCHEDULE OF INVESTMENTS:
| * | A zero balance may reflect actual amounts rounding to less than one thousand. |
| (a) | Principal amount of security is adjusted for inflation. |
BORROWINGS AND OTHER FINANCING TRANSACTIONS
(b) REPURCHASE AGREEMENTS:
| | | | | | | | | | | | | | | | | | | | | | | | | | | | | | |
| Counterparty | | Lending
Rate | | | Settlement
Date | | | Maturity
Date | | | Principal
Amount | | | Collateralized By | | Collateral
(Received) | | | Repurchase
Agreements,
at Value | | | Repurchase
Agreement
Proceeds
to be
Received | |
| FICC | | | 0.000 | % | | | 06/30/2020 | | | | 07/01/2020 | | | $ | 600 | | | U.S. Treasury Inflation Protected Securities 0.125% due 07/15/2024 | | $ | (612 | ) | | $ | 600 | | | $ | 600 | |
| | | | | | | | | | | | | | | | | | | | | | | | | | | | | | |
Total Repurchase Agreements | | | | | $ | (612 | ) | | $ | 600 | | | $ | 600 | |
| | | | | | | | | | | | | | | | | | | | | | | | | | | | | | |
BORROWINGS AND OTHER FINANCING TRANSACTIONS SUMMARY
The following is a summary by counterparty of the market value of Borrowings and Other Financing Transactions and collateral pledged/(received) as of June 30, 2020:
| | | | | | | | | | | | | | | | | | | | | | | | | | | | |
| Counterparty | | Repurchase
Agreement
Proceeds
to be
Received | | | Payable for
Reverse
Repurchase
Agreements | | | Payable for
Sale-Buyback
Transactions | | | Securities
Out on Loan | | | Total
Borrowings and
Other Financing
Transactions | | | Collateral
Pledged/(Received) | | | Net Exposure(1) | |
Global/Master Repurchase Agreement | |
FICC | | $ | 600 | | | $ | 0 | | | $ | 0 | | | $ | 0 | | | $ | 600 | | | $ | (612 | ) | | $ | (12 | ) |
| | | | | | | | | | | | | | | | | | | | | | | | | | | | |
Total Borrowings and Other Financing Transactions | | $ | 600 | | | $ | 0 | | | $ | 0 | | | $ | 0 | | | | | | | | | | | | | |
| | | | | | | | | | | | | | | | | | | | | | | | | | | | |
| (1) | Net Exposure represents the net receivable/(payable) that would be due from/to the counterparty in the event of default. Exposure from borrowings and other financing transactions can only be netted across transactions governed under the same master agreement with the same legal entity. See Note 8, Master Netting Arrangements, in the Notes to Financial Statements for more information. |
FAIR VALUE MEASUREMENTS
The following is a summary of the fair valuations according to the inputs used as of June 30, 2020 in valuing the Fund’s assets and liabilities:
| | | | | | | | | | | | | | | | |
| Category and Subcategory | | Level 1 | | | Level 2 | | | Level 3 | | | Fair Value at 06/30/2020 | |
Investments in Securities, at Value | |
U.S. Treasury Obligations | | $ | 0 | | | $ | 611,529 | | | $ | 0 | | | $ | 611,529 | |
Short-Term Instruments | |
Repurchase Agreements | | | 0 | | | | 600 | | | | 0 | | | | 600 | |
| | | | | | | | | | | | | | | | |
| | | | |
Total Investments | | $ | 0 | | | $ | 612,129 | | | $ | 0 | | | $ | 612,129 | |
| | | | | | | | | | | | | | | | |
There were no significant transfers into or out of Level 3 during the period ended June 30, 2020.
| | | | | | | | |
| 36 | | PIMCO ETF TRUST | | | | | See Accompanying Notes | |
Schedule of Investments PIMCO Broad U.S. TIPS Index Exchange-Traded Fund
June 30, 2020
(Amounts in thousands*, except number of shares, contracts and units, if any)
| | | | | | | | | | | | |
| | | | | PRINCIPAL
AMOUNT
(000S) | | | | | MARKET
VALUE
(000S) | |
| INVESTMENTS IN SECURITIES 99.6% | |
| |
| U.S. TREASURY OBLIGATIONS 97.7% | |
|
U.S. Treasury Inflation Protected Securities (a) | |
0.125% due 01/15/2022 | | $ | | | 4,162 | | | $ | | | 4,222 | |
0.125% due 07/15/2022 | | | | | 3,256 | | | | | | 3,336 | |
0.125% due 01/15/2023 | | | | | 3,041 | | | | | | 3,118 | |
0.125% due 07/15/2024 | | | | | 1,082 | | | | | | 1,132 | |
0.125% due 07/15/2026 | | | | | 1,396 | | | | | | 1,485 | |
0.250% due 07/15/2029 | | | | | 1,117 | | | | | | 1,223 | |
0.250% due 02/15/2050 | | | | | 528 | | | | | | 593 | |
0.375% due 07/15/2025 | | | | | 3,506 | | | | | | 3,749 | |
0.375% due 01/15/2027 | | | | | 3,171 | | | | | | 3,422 | |
0.500% due 01/15/2028 | | | | | 464 | | | | | | 508 | |
0.625% due 01/15/2024 | | | | | 5,056 | | | | | | 5,330 | |
0.750% due 07/15/2028 | | | | | 1,008 | | | | | | 1,138 | |
0.750% due 02/15/2042 | | | | | 2,877 | | | | | | 3,450 | |
0.750% due 02/15/2045 | | | | | 393 | | | | | | 482 | |
0.875% due 02/15/2047 | | | | | 787 | | | | | | 1,006 | |
1.000% due 02/15/2046 | | | | | 1,222 | | | | | | 1,583 | |
1.000% due 02/15/2048 | | | | | 790 | | | | | | 1,047 | |
1.000% due 02/15/2049 | | | | | 556 | | | | | | 744 | |
1.375% due 02/15/2044 | | | | | 1,443 | | | | | | 1,972 | |
1.750% due 01/15/2028 | | | | | 3,905 | | | | | | 4,663 | |
| | | | | | | | | | | | |
| | | | | PRINCIPAL
AMOUNT
(000S) | | | | | MARKET
VALUE
(000S) | |
2.000% due 01/15/2026 | | $ | | | 3,397 | | | $ | | | 3,953 | |
2.125% due 02/15/2040 | | | | | 1,124 | | | | | | 1,659 | |
2.375% due 01/15/2025 | | | | | 3,744 | | | | | | 4,316 | |
2.500% due 01/15/2029 | | | | | 3,284 | | | | | | 4,213 | |
3.375% due 04/15/2032 | | | | | 1,479 | | | | | | 2,204 | |
| | | | | | | | | | | | |
Total U.S. Treasury Obligations (Cost $56,250) | | | | | | | | | | | 60,548 | |
| | | | | | | | | | | | |
| | | | | | | | | | | | |
| SHORT-TERM INSTRUMENTS 1.9% | |
| |
| REPURCHASE AGREEMENTS (b) 1.9% | |
| | | | | | | | | | | 1,168 | |
| | | | | | | | | | | | |
| Total Short-Term Instruments (Cost $1,168) | | | | | | | | | | | 1,168 | |
| | | | | | | | | | | | |
| | | | |
| | | | | | | | | | | | |
| Total Investments in Securities (Cost $57,418) | | | | | | | | | | | 61,716 | |
| | | | |
| | | | | | | | | | | | |
| Total Investments 99.6% (Cost $57,418) | | | | | | | | $ | | | 61,716 | |
| |
| Other Assets and Liabilities, net 0.4% | | | | | | 220 | |
| | | | | | | | | | | | |
| Net Assets 100.0% | | | | | | | | $ | | | 61,936 | |
| | | | | | | | | | | | |
NOTES TO SCHEDULE OF INVESTMENTS:
| * | A zero balance may reflect actual amounts rounding to less than one thousand. |
| (a) | Principal amount of security is adjusted for inflation. |
BORROWINGS AND OTHER FINANCING TRANSACTIONS
(b) REPURCHASE AGREEMENTS:
| | | | | | | | | | | | | | | | | | | | | | | | | | | | | | |
| Counterparty | | Lending
Rate | | | Settlement
Date | | | Maturity
Date | | | Principal
Amount | | | Collateralized By | | Collateral
(Received) | | | Repurchase
Agreements,
at Value | | | Repurchase
Agreement
Proceeds
to be
Received | |
| FICC | | | 0.000 | % | | | 06/30/2020 | | | | 07/01/2020 | | | $ | 1,168 | | | U.S. Treasury Inflation Protected Securities 0.125% due 07/15/2024 | | $ | (1,191 | ) | | $ | 1,168 | | | $ | 1,168 | |
| | | | | | | | | | | | | | | | | | | | | | | | | | | | | | |
Total Repurchase Agreements | | | | | $ | (1,191 | ) | | $ | 1,168 | | | $ | 1,168 | |
| | | | | | | | | | | | | | | | | | | | | | | | | | | | | | |
BORROWINGS AND OTHER FINANCING TRANSACTIONS SUMMARY
The following is a summary by counterparty of the market value of Borrowings and Other Financing Transactions and collateral pledged/(received) as of June 30, 2020:
| | | | | | | | | | | | | | | | | | | | | | | | | | | | |
| Counterparty | | Repurchase
Agreement
Proceeds
to be
Received | | | Payable for
Reverse
Repurchase
Agreements | | | Payable for
Sale-Buyback
Transactions | | | Securities
Out on Loan | | | Total
Borrowings and
Other Financing
Transactions | | | Collateral
Pledged/(Received) | | | Net Exposure(1) | |
Global/Master Repurchase Agreement | |
FICC | | $ | 1,168 | | | $ | 0 | | | $ | 0 | | | $ | 0 | | | $ | 1,168 | | | $ | (1,191 | ) | | $ | (23 | ) |
| | | | | | | | | | | | | | | | | | | | | | | | | | | | |
Total Borrowings and Other Financing Transactions | | $ | 1,168 | | | $ | 0 | | | $ | 0 | | | $ | 0 | | | | | | | | | | | | | |
| | | | | | | | | | | | | | | | | | | | | | | | | | | | |
| (1) | Net Exposure represents the net receivable/(payable) that would be due from/to the counterparty in the event of default. Exposure from borrowings and other financing transactions can only be netted across transactions governed under the same master agreement with the same legal entity. See Note 8, Master Netting Arrangements, in the Notes to Financial Statements for more information. |
FAIR VALUE MEASUREMENTS
The following is a summary of the fair valuations according to the inputs used as of June 30, 2020 in valuing the Fund’s assets and liabilities:
| | | | | | | | | | | | | | | | |
| Category and Subcategory | | Level 1 | | | Level 2 | | | Level 3 | | | Fair Value at 06/30/2020 | |
Investments in Securities, at Value | |
U.S. Treasury Obligations | | $ | 0 | | | $ | 60,548 | | | $ | 0 | | | $ | 60,548 | |
Short-Term Instruments | |
Repurchase Agreements | | | 0 | | | | 1,168 | | | | 0 | | | | 1,168 | |
| | | | | | | | | | | | | | | | |
| | | | |
Total Investments | | $ | 0 | | | $ | 61,716 | | | $ | 0 | | | $ | 61,716 | |
| | | | | | | | | | | | | | | | |
There were no significant transfers into or out of Level 3 during the period ended June 30, 2020.
| | | | | | |
| See Accompanying Notes | | ANNUAL REPORT | | JUNE 30, 2020 | | 37 |
Schedule of Investments PIMCO 0-5 Year High Yield Corporate Bond Index Exchange-Traded Fund
(Amounts in thousands*, except number of shares, contracts and units, if any)
| | | | | | | | | | | | |
| | | | | PRINCIPAL AMOUNT (000S) | | | | | MARKET VALUE (000S) | |
| INVESTMENTS IN SECURITIES 99.4% | |
| |
| LOAN PARTICIPATIONS AND ASSIGNMENTS 0.1% | |
|
Intelsat Jackson Holdings S.A. | |
6.500% (LIBOR03M + 5.500%) due 07/13/2022 ~µ | | $ | | | 401 | | | $ | | | 408 | |
| | | | | | | | | | | | |
Total Loan Participations and Assignments (Cost $401) | | | | | | | | | | | 408 | |
| | | | | | | | | | | | |
| |
| CORPORATE BONDS & NOTES 94.1% | |
| |
| BANKING & FINANCE 14.9% | |
|
Ally Financial, Inc. | |
3.875% due 05/21/2024 | | | | | 3,155 | | | | | | 3,265 | |
4.125% due 02/13/2022 | | | | | 2,856 | | | | | | 2,938 | |
4.250% due 04/15/2021 | | | | | 3,002 | | | | | | 3,057 | |
|
Ardonagh Midco PLC | |
8.625% due 07/15/2023 | | | | | 3,417 | | | | | | 3,578 | |
|
CBL & Associates LP | |
5.250% due 12/01/2023 ^(c)(i) | | | | | 3,144 | | | | | | 868 | |
|
CIT Group, Inc. | |
4.750% due 02/16/2024 | | | | | 2,245 | | | | | | 2,281 | |
5.000% due 08/15/2022 | | | | | 8,355 | | | | | | 8,559 | |
5.000% due 08/01/2023 | | | | | 2,991 | | | | | | 3,058 | |
|
CoreCivic, Inc. | |
5.000% due 10/15/2022 | | | | | 2,183 | | | | | | 2,147 | |
|
Ford Motor Credit Co. LLC | |
4.063% due 11/01/2024 | | | | | 3,175 | | | | | | 3,034 | |
5.584% due 03/18/2024 | | | | | 2,275 | | | | | | 2,302 | |
|
Fortress Transportation & Infrastructure Investors LLC | |
6.750% due 03/15/2022 | | | | | 9,212 | | | | | | 8,868 | |
|
Freedom Mortgage Corp. | |
8.125% due 11/15/2024 | | | | | 3,233 | | | | | | 3,148 | |
8.250% due 04/15/2025 | | | | | 4,929 | | | | | | 4,895 | |
10.750% due 04/01/2024 | | | | | 2,570 | | | | | | 2,658 | |
|
Genworth Holdings, Inc. | |
4.900% due 08/15/2023 | | | | | 1,702 | | | | | | 1,367 | |
7.625% due 09/24/2021 | | | | | 1,131 | | | | | | 1,062 | |
|
Geo Group, Inc. | |
5.125% due 04/01/2023 | | | | | 1,693 | | | | | | 1,470 | |
|
HAT Holdings LLC | |
5.250% due 07/15/2024 | | | | | 3,396 | | | | | | 3,471 | |
|
Icahn Enterprises LP | |
4.750% due 09/15/2024 | | | | | 4,357 | | | | | | 4,124 | |
|
Intesa Sanpaolo SpA | |
5.017% due 06/26/2024 | | | | | 3,722 | | | | | | 3,816 | |
|
Iron Mountain, Inc. | |
5.750% due 08/15/2024 | | | | | 932 | | | | | | 944 | |
|
iStar, Inc. | |
4.750% due 10/01/2024 | | | | | 3,320 | | | | | | 3,107 | |
5.250% due 09/15/2022 | | | | | 4,347 | | | | | | 4,232 | |
|
JPMorgan Chase & Co. | |
2.250% (US0003M + 1.230%) due 10/24/2023 ~ | | | | | 1,784 | | | | | | 1,804 | |
|
KCA Deutag UK Finance PLC | |
9.875% due 04/01/2022 ^(c) | | | | | 1,100 | | | | | | 526 | |
|
Kennedy-Wilson, Inc. | |
5.875% due 04/01/2024 | | | | | 13,806 | | | | | | 13,780 | |
|
MGIC Investment Corp. | |
5.750% due 08/15/2023 | | | | | 1,891 | | | | | | 1,959 | |
|
MGM Growth Properties Operating Partnership LP | |
5.625% due 05/01/2024 | | | | | 4,222 | | | | | | 4,402 | |
|
Nationstar Mortgage Holdings, Inc. | |
8.125% due 07/15/2023 | | | | | 4,612 | | | | | | 4,745 | |
|
Navient Corp. | |
5.000% due 10/26/2020 | | | | | 1,009 | | | | | | 1,006 | |
5.500% due 01/25/2023 | | | | | 2,290 | | | | | | 2,203 | |
6.500% due 06/15/2022 | | | | | 2,768 | | | | | | 2,728 | |
6.625% due 07/26/2021 | | | | | 2,494 | | | | | | 2,451 | |
7.250% due 01/25/2022 | | | | | 263 | | | | | | 264 | |
|
Park Aerospace Holdings Ltd. | |
5.250% due 08/15/2022 | | | | | 18,361 | | | | | | 17,244 | |
| | | | | | | | | | | | |
| | | | | PRINCIPAL AMOUNT (000S) | | | | | MARKET VALUE (000S) | |
|
Royal Bank of Scotland Group PLC | |
7.648% due 09/30/2031 •(f) | | $ | | | 302 | | | $ | | | 438 | |
|
SBA Communications Corp. | |
4.000% due 10/01/2022 | | | | | 8,710 | | | | | | 8,828 | |
| | | | |
Springleaf Finance Corp. | | | | | | | | | | | | |
5.625% due 03/15/2023 | | | | | 2,204 | | | | | | 2,236 | |
6.125% due 05/15/2022 | | | | | 4,439 | | | | | | 4,534 | |
6.125% due 03/15/2024 | | | | | 5,096 | | | | | | 5,189 | |
7.750% due 10/01/2021 | | | | | 2,836 | | | | | | 2,957 | |
8.250% due 12/15/2020 | | | | | 2,267 | | | | | | 2,343 | |
| | | | |
Starwood Property Trust, Inc. | | | | | | | | | | | | |
5.000% due 12/15/2021 | | | | | 5,511 | | | | | | 5,361 | |
| | | | |
Stearns Holdings LLC | | | | | | | | | | | | |
5.000% due 11/05/2024 | | | | | 78 | | | | | | 47 | |
9.375% due 08/15/2020 ^« | | | | | 2,946 | | | | | | 0 | |
| | | | |
Uniti Group LP | | | | | | | | | | | | |
7.875% due 02/15/2025 | | | | | 4,940 | | | | | | 5,022 | |
| | | | |
Voya Financial, Inc. | | | | | | | | | | | | |
5.650% due 05/15/2053 • | | | | | 243 | | | | | | 245 | |
| | | | |
Voyager Aviation Holdings LLC | | | | | | | | | | | | |
8.500% due 08/15/2021 | | | | | 2,866 | | | | | | 2,103 | |
| | | | |
Washington Prime Group LP | | | | | | | | | | | | |
6.450% due 08/15/2024 (a)(h) | | | | | 3,316 | | | | | | 1,879 | |
| | | | | | | | | | | | |
| | | | | | | | | | | 172,543 | |
| | | | | | | | | | | | |
| |
| INDUSTRIALS 71.7% | |
| | | | |
24 Hour Fitness Worldwide, Inc. | | | | | | | | | | | | |
8.000% due 06/01/2022 | | | | | 3,264 | | | | | | 90 | |
| | | | |
Acadia Healthcare Co., Inc. | | | | | | | | | | | | |
5.625% due 02/15/2023 | | | | | 6,939 | | | | | | 6,959 | |
| | | | |
ADT Security Corp. | | | | | | | | | | | | |
3.500% due 07/15/2022 | | | | | 2,846 | | | | | | 2,838 | |
6.250% due 10/15/2021 | | | | | 4,215 | | | | | | 4,351 | |
| | | | |
Aker BP ASA | | | | | | | | | | | | |
4.750% due 06/15/2024 | | | | | 6,454 | | | | | | 6,506 | |
| | | | |
Albertsons Cos., Inc. | | | | | | | | | | | | |
3.500% due 02/15/2023 | | | | | 2,153 | | | | | | 2,182 | |
4.625% due 01/15/2027 | | | | | 900 | | | | | | 901 | |
| | | | |
Algeco Global Finance PLC | | | | | | | | | | | | |
8.000% due 02/15/2023 | | | | | 3,535 | | | | | | 3,405 | |
| | | | |
Allegheny Technologies, Inc. | | | | | | | | | | | | |
7.875% due 08/15/2023 | | | | | 5,264 | | | | | | 5,403 | |
| | | | |
AMC Networks, Inc. | | | | | | | | | | | | |
5.000% due 04/01/2024 | | | | | 2,725 | | | | | | 2,706 | |
| | | | |
American Airlines Group, Inc. | | | | | | | | | | | | |
5.000% due 06/01/2022 | | | | | 1,941 | | | | | | 1,132 | |
| | | | |
Anixter, Inc. | | | | | | | | | | | | |
5.125% due 10/01/2021 | | | | | 6,695 | | | | | | 7,050 | |
| | | | |
Antero Resources Corp. | | | | | | | | | | | | |
5.125% due 12/01/2022 | | | | | 1,559 | | | | | | 1,130 | |
5.375% due 11/01/2021 (a)(h) | | | | | 3,004 | | | | | | 2,789 | |
5.625% due 06/01/2023 (a)(h) | | | | | 1,901 | | | | | | 1,223 | |
| | | | |
Ardagh Packaging Finance PLC | | | | | | | | | | | | |
6.000% due 02/15/2025 | | | | | 522 | | | | | | 535 | |
|
Ascent Resources Utica Holdings LLC | |
10.000% due 04/01/2022 | | | | | 6,582 | | | | | | 5,632 | |
| | | | |
Ashland LLC | | | | | | | | | | | | |
4.750% due 08/15/2022 | | | | | 595 | | | | | | 629 | |
|
Avon International Operations, Inc. | |
7.875% due 08/15/2022 | | | | | 250 | | | | | | 251 | |
| | | | |
Avon Products, Inc. | | | | | | | | | | | | |
7.000% due 03/15/2023 | | | | | 3,965 | | | | | | 3,953 | |
| | | | |
B.C. Unlimited Liability Co. | | | | | | | | | | | | |
4.250% due 05/15/2024 | | | | | 11,598 | | | | | | 11,630 | |
| | | | |
Ball Corp. | | | | | | | | | | | | |
4.000% due 11/15/2023 | | | | | 3,537 | | | | | | 3,672 | |
| | | | |
Barminco Finance Pty. Ltd. | | | | | | | | | | | | |
6.625% due 05/15/2022 | | | | | 3,105 | | | | | | 3,076 | |
| | | | |
Bausch Health Cos., Inc. | | | | | | | | | | | | |
5.500% due 03/01/2023 | | | | | 4,473 | | | | | | 4,462 | |
5.875% due 05/15/2023 | | | | | 3,054 | | | | | | 3,049 | |
6.125% due 04/15/2025 | | | | | 4,000 | | | | | | 4,054 | |
| | | | | | | | | | | | |
| | | | | PRINCIPAL AMOUNT (000S) | | | | | MARKET VALUE (000S) | |
| | | | |
BCD Acquisition, Inc. | | | | | | | | | | | | |
9.625% due 09/15/2023 | | $ | | | 5,263 | | | $ | | | 5,043 | |
| | | | |
Bombardier, Inc. | | | | | | | | | | | | |
6.000% due 10/15/2022 | | | | | 50 | | | | | | 35 | |
6.125% due 01/15/2023 | | | | | 4,255 | | | | | | 2,931 | |
8.750% due 12/01/2021 | | | | | 6,644 | | | | | | 5,430 | |
| | | | |
Boyd Gaming Corp. | | | | | | | | | | | | |
8.625% due 06/01/2025 | | | | | 746 | | | | | | 781 | |
| | | | |
Bruin E&P Partners LLC | | | | | | | | | | | | |
8.875% due 08/01/2023 | | | | | 4,350 | | | | | | 152 | |
| | | | |
California Resources Corp. | | | | | | | | | | | | |
8.000% due 12/15/2022 | | | | | 2,155 | | | | | | 98 | |
| | | | |
Carnival Corp. | | | | | | | | | | | | |
11.500% due 04/01/2023 | | | | | 10,000 | | | | | | 10,875 | |
|
Carvana Co. | |
8.875% due 10/01/2023 | | | | | 3,096 | | | | | | 3,114 | |
|
CCO Holdings LLC | |
4.500% due 08/15/2030 | | | | | 900 | | | | | | 922 | |
|
Centene Corp. | |
4.750% due 05/15/2022 | | | | | 6,197 | | | | | | 6,296 | |
|
CF Industries, Inc. | |
3.450% due 06/01/2023 | | | | | 3,826 | | | | | | 3,905 | |
|
Chemours Co. | |
6.625% due 05/15/2023 | | | | | 11,310 | | | | | | 10,887 | |
|
Cheniere Corpus Christi Holdings LLC | |
7.000% due 06/30/2024 | | | | | 10,045 | | | | | | 11,440 | |
|
Chesapeake Energy Corp. | |
5.750% due 03/15/2023 ^(c) | | | | | 3,765 | | | | | | 132 | |
6.625% due 08/15/2020 ^(c) | | | | | 1,006 | | | | | | 33 | |
|
Clear Channel Worldwide Holdings, Inc. | |
9.250% due 02/15/2024 | | | | | 8,986 | | | | | | 8,359 | |
|
Clearwater Paper Corp. | |
4.500% due 02/01/2023 | | | | | 1,570 | | | | | | 1,567 | |
|
CNX Resources Corp. | |
5.875% due 04/15/2022 | | | | | 1,359 | | | | | | 1,339 | |
|
Cogent Communications Group, Inc. | |
5.375% due 03/01/2022 | | | | | 2,938 | | | | | | 3,033 | |
|
CommScope, Inc. | |
5.000% due 06/15/2021 | | | | | 371 | | | | | | 371 | |
5.500% due 03/01/2024 | | | | | 4,748 | | | | | | 4,807 | |
5.500% due 06/15/2024 | | | | | 3,220 | | | | | | 3,279 | |
|
Community Health Systems, Inc. | |
6.250% due 03/31/2023 | | | | | 15,366 | | | | | | 14,504 | |
6.625% due 02/15/2025 | | | | | 1,493 | | | | | | 1,407 | |
8.000% due 03/15/2026 | | | | | 120 | | | | | | 114 | |
8.125% due 06/30/2024 | | | | | 2,570 | | | | | | 1,730 | |
8.625% due 01/15/2024 | | | | | 50 | | | | | | 49 | |
9.875% due 06/30/2023 þ | | | | | 2,284 | | | | | | 1,785 | |
|
Consolidated Communications, Inc. | |
6.500% due 10/01/2022 (a)(h) | | | | | 3,015 | | | | | | 2,787 | |
|
Continental Resources, Inc. | |
4.500% due 04/15/2023 | | | | | 248 | | | | | | 237 | |
5.000% due 09/15/2022 | | | | | 986 | | | | | | 972 | |
|
Crown Americas LLC | |
4.500% due 01/15/2023 | | | | | 11,658 | | | | | | 11,927 | |
|
CSC Holdings LLC | |
ss5.250% due 06/01/2024 | | | | | 5,812 | | | | | | 6,187 | |
5.875% due 09/15/2022 | | | | | 9,570 | | | | | | 10,022 | |
6.750% due 11/15/2021 | | | | | 11,779 | | | | | | 12,398 | |
|
DAE Funding LLC | |
4.500% due 08/01/2022 | | | | | 100 | | | | | | 96 | |
|
DaVita, Inc. | |
5.125% due 07/15/2024 | | | | | 13,406 | | | | | | 13,654 | |
|
DCP Midstream Operating LP | |
3.875% due 03/15/2023 | | | | | 2,530 | | | | | | 2,462 | |
4.950% due 04/01/2022 | | | | | 2,417 | | | | | | 2,439 | |
5.850% due 05/21/2043 • | | | | | 1,894 | | | | | | 1,334 | |
|
Dell International LLC | |
5.875% due 06/15/2021 | | | | | 2,766 | | | | | | 2,771 | |
|
Dell, Inc. | |
4.625% due 04/01/2021 | | | | | 3,743 | | | | | | 3,813 | |
|
Delta Air Lines, Inc. | |
3.625% due 03/15/2022 | | | | | 4,676 | | | | | | 4,431 | |
| | | | | | | | |
| 38 | | PIMCO ETF TRUST | | | | | See Accompanying Notes | |
June 30, 2020
| | | | | | | | | | | | |
| | | | | PRINCIPAL AMOUNT (000S) | | | | | MARKET VALUE (000S) | |
|
Denbury Resources, Inc. | |
7.750% due 02/15/2024 | | $ | | | 2,427 | | | $ | | | 930 | |
9.000% due 05/15/2021 | | | | | 3,068 | | | | | | 1,197 | |
|
Diamond Offshore Drilling, Inc. | |
3.450% due 11/01/2023 ^(c) | | | | | 2,407 | | | | | | 268 | |
|
Diamond Resorts International, Inc. | |
7.750% due 09/01/2023 | | | | | 200 | | | | | | 192 | |
|
DISH DBS Corp. | |
5.875% due 07/15/2022 | | | | | 9,996 | | | | | | 10,186 | |
6.750% due 06/01/2021 | | | | | 9,008 | | | | | | 9,192 | |
|
DKT Finance ApS | |
9.375% due 06/17/2023 | | | | | 3,612 | | | | | | 3,644 | |
|
DriveTime Automotive Group, Inc. | |
8.000% due 06/01/2021 | | | | | 2,277 | | | | | | 2,163 | |
|
Eldorado Resorts, Inc. | |
7.000% due 08/01/2023 | | | | | 3,352 | | | | | | 3,457 | |
|
EMC Corp. | |
3.375% due 06/01/2023 | | | | | 3,169 | | | | | | 3,215 | |
|
Endo Dac | |
6.000% due 06/30/2028 | | | | | 1,509 | | | | | | 981 | |
9.500% due 07/31/2027 | | | | | 1,191 | | | | | | 1,266 | |
|
Energy Transfer Operating LP | |
6.250% due 02/15/2023 •(f) | | | | | 2,774 | | | | | | 2,134 | |
|
Ensign Drilling, Inc. | |
9.250% due 04/15/2024 | | | | | 6,127 | | | | | | 2,746 | |
|
EQT Corp. | |
6.125% due 02/01/2025 | | | | | 1,825 | | | | | | 1,822 | |
|
Extraction Oil & Gas, Inc. | |
7.375% due 05/15/2024 ^(c) | | | | | 3,756 | | | | | | 737 | |
|
Fairstone Financial, Inc. | |
7.875% due 07/15/2024 | | | | | 6,072 | | | | | | 5,969 | |
|
Ferrellgas LP | |
6.750% due 01/15/2022 | | | | | 4,461 | | | | | | 3,763 | |
|
Fiat Chrysler Automobiles NV | |
5.250% due 04/15/2023 | | | | | 3,547 | | | | | | 3,674 | |
|
FMG Resources Pty. Ltd. | |
4.750% due 05/15/2022 | | | | | 6,700 | | | | | | 6,844 | |
5.125% due 03/15/2023 | | | | | 3,191 | | | | | | 3,289 | |
5.125% due 05/15/2024 | | | | | 2,710 | | | | | | 2,798 | |
|
Ford Motor Co. | |
8.500% due 04/21/2023 | | | | | 4,676 | | | | | | 4,954 | |
9.000% due 04/22/2025 | | | | | 4,676 | | | | | | 5,065 | |
|
Freeport-McMoRan, Inc. | |
3.550% due 03/01/2022 | | | | | 9,756 | | | | | | 9,778 | |
3.875% due 03/15/2023 | | | | | 11,347 | | | | | | 11,384 | |
|
GameStop Corp. | |
6.750% due 03/15/2021 (a)(h) | | | | | 2,945 | | | | | | 2,350 | |
|
Global Ship Lease, Inc. | |
9.875% due 11/15/2022 | | | | | 358 | | | | | | 337 | |
|
Great Lakes Dredge & Dock Corp. | |
8.000% due 05/15/2022 | | | | | 2,945 | | | | | | 3,029 | |
|
Griffon Corp. | |
5.250% due 03/01/2022 | | | | | 6,968 | | | | | | 6,990 | |
|
Grinding Media, Inc. | |
7.375% due 12/15/2023 | | | | | 3,165 | | | | | | 3,159 | |
|
Gulfport Energy Corp. | |
6.625% due 05/01/2023 | | | | | 3,645 | | | | | | 2,182 | |
|
Hanesbrands, Inc. | |
4.625% due 05/15/2024 | | | | | 4,545 | | | | | | 4,534 | |
|
Harvest Operations Corp. | |
2.330% due 04/14/2021 | | | | | 10 | | | | | | 10 | |
|
HCA, Inc. | |
5.875% due 05/01/2023 | | | | | 8,078 | | | | | | 8,756 | |
|
Hertz Corp. ^ | |
7.625% due 06/01/2022 (a)(h) | | | | | 3,293 | | | | | | 2,480 | |
|
HudBay Minerals, Inc. | |
7.250% due 01/15/2023 | | | | | 5,306 | | | | | | 5,246 | |
|
iHeartCommunications, Inc. | |
6.375% due 05/01/2026 | | | | | 1,483 | | | | | | 1,472 | |
8.375% due 05/01/2027 | | | | | 2,188 | | | | | | 2,009 | |
|
Intelsat Connect Finance S.A. | |
9.500% due 02/15/2023 ^(c) | | | | | 4,276 | | | | | | 1,082 | |
| | | | | | | | | | | | |
| | | | | PRINCIPAL AMOUNT (000S) | | | | | MARKET VALUE (000S) | |
|
Intelsat Jackson Holdings S.A. | |
5.500% due 08/01/2023 ^(c) | | $ | | | 5,633 | | | $ | | | 3,223 | |
8.500% due 10/15/2024 ^(c) | | | | | 2,975 | | | | | | 1,798 | |
9.500% due 09/30/2022 | | | | | 1,707 | | | | | | 1,901 | |
|
Intelsat Luxembourg S.A. | |
8.125% due 06/01/2023 ^(c) | | | | | 3,915 | | | | | | 245 | |
|
International Game Technology PLC | |
6.250% due 02/15/2022 | | | | | 3,749 | | | | | | 3,792 | |
|
Ithaca Energy North Sea PLC | |
9.375% due 07/15/2024 | | | | | 4,686 | | | | | | 3,772 | |
|
JC Penney Corp., Inc. | |
5.650% due 06/01/2049 ^(c) | | | | | 24 | | | | | | 1 | |
|
KB Home | |
7.000% due 12/15/2021 | | | | | 4,460 | | | | | | 4,679 | |
7.500% due 09/15/2022 | | | | | 4,306 | | | | | | 4,709 | |
|
Kenan Advantage Group, Inc. | |
7.875% due 07/31/2023 | | | | | 85 | | | | | | 75 | |
|
KGA Escrow LLC | |
7.500% due 08/15/2023 | | | | | 1,073 | | | | | | 1,076 | |
|
Kraft Heinz Foods Co. | |
3.500% due 06/06/2022 | | | | | 1,500 | | | | | | 1,569 | |
|
Kronos Acquisition Holdings, Inc. | |
9.000% due 08/15/2023 | | | | | 4,986 | | | | | | 4,792 | |
|
L Brands, Inc. | |
5.625% due 02/15/2022 | | | | | 2,595 | | | | | | 2,542 | |
5.625% due 10/15/2023 | | | | | 2,530 | | | | | | 2,398 | |
6.625% due 04/01/2021 | | | | | 2,662 | | | | | | 2,751 | |
|
Lamb Weston Holdings, Inc. | |
4.625% due 11/01/2024 | | | | | 2,869 | | | | | | 2,984 | |
|
Laredo Petroleum, Inc. | |
9.500% due 01/15/2025 | | | | | 2,108 | | | | | | 1,459 | |
|
Lennar Corp. | |
4.750% due 04/01/2021 | | | | | 2,159 | | | | | | 2,190 | |
4.750% due 11/15/2022 | | | | | 1,247 | | | | | | 1,298 | |
6.250% due 12/15/2021 | | | | | 3,394 | | | | | | 3,517 | |
|
Mattel, Inc. | |
3.150% due 03/15/2023 | | | | | 3,052 | | | | | | 2,886 | |
|
Mauser Packaging Solutions Holding Co. | |
5.500% due 04/15/2024 | | | | | 11,703 | | | | | | 11,520 | |
|
MEG Energy Corp. | |
7.000% due 03/31/2024 | | | | | 1,148 | | | | | | 987 | |
|
MGM Resorts International | |
6.750% due 05/01/2025 | | | | | 1,000 | | | | | | 995 | |
7.750% due 03/15/2022 | | | | | 2,406 | | | | | | 2,453 | |
|
Midas Intermediate Holdco LLC | |
7.875% due 10/01/2022 (a)(h) | | | | | 2,538 | | | | | | 2,200 | |
|
MPH Acquisition Holdings LLC | |
7.125% due 06/01/2024 | | | | | 4,503 | | | | | | 4,205 | |
|
Murray Energy Corp. | |
11.250% due 04/15/2021 ^(c) | | | | | 3,255 | | | | | | 4 | |
|
Nabors Industries, Inc. | |
4.625% due 09/15/2021 (a)(h) | | | | | 1,935 | | | | | | 1,514 | |
5.000% due 09/15/2020 (a)(h) | | | | | 1,683 | | | | | | 1,681 | |
|
Navios Maritime Holdings, Inc. | |
7.375% due 01/15/2022 | | | | | 4,022 | | | | | | 1,702 | |
|
NCR Corp. | |
5.000% due 07/15/2022 | | | | | 3,361 | | | | | | 3,362 | |
|
Netflix, Inc. | |
5.500% due 02/15/2022 | | | | | 5,440 | | | | | | 5,690 | |
|
Newfield Exploration Co. | |
5.750% due 01/30/2022 | | | | | 2,099 | | | | | | 2,104 | |
|
Nielsen Finance LLC | |
5.000% due 04/15/2022 | | | | | 19,114 | | | | | | 19,080 | |
|
Nine Energy Service, Inc. | |
8.750% due 11/01/2023 | | | | | 4,208 | | | | | | 2,068 | |
|
Nokia Oyj | |
3.375% due 06/12/2022 | | | | | 2,631 | | | | | | 2,692 | |
|
Northwest Acquisitions ULC | |
7.125% due 11/01/2022 ^(c) | | | | | 2,388 | | | | | | 27 | |
|
NuStar Logistics LP | |
4.750% due 02/01/2022 | | | | | 3,110 | | | | | | 3,059 | |
4.800% due 09/01/2020 | | | | | 1,359 | | | | | | 1,364 | |
| | | | | | | | | | | | |
| | | | | PRINCIPAL AMOUNT (000S) | | | | | MARKET VALUE (000S) | |
|
NXP BV | |
3.875% due 09/01/2022 | | $ | | | 246 | | | $ | | | 260 | |
|
Oasis Petroleum, Inc. | |
6.875% due 03/15/2022 | | | | | 1,809 | | | | | | 304 | |
|
Occidental Petroleum Corp. | |
2.700% due 08/15/2022 | | | | | 4,820 | | | | | | 4,496 | |
2.900% due 08/15/2024 | | | | | 9,451 | | | | | | 8,099 | |
6.950% due 07/01/2024 | | | | | 5,007 | | | | | | 4,932 | |
|
Ortho-Clinical Diagnostics, Inc. | |
7.375% due 06/01/2025 | | | | | 1,392 | | | | | | 1,417 | |
|
Owens-Brockway Glass Container, Inc. | |
5.000% due 01/15/2022 | | | | | 1,083 | | | | | | 1,085 | |
|
Par Pharmaceutical, Inc. | |
7.500% due 04/01/2027 | | | | | 604 | | | | | | 622 | |
|
Party City Holdings, Inc. | |
6.125% due 08/15/2023 | | | | | 6,012 | | | | | | 1,353 | |
|
PetSmart, Inc. | |
7.125% due 03/15/2023 | | | | | 6,641 | | | | | | 6,562 | |
|
Polaris Intermediate Corp. (8.500% Cash or 9.250% PIK) | |
8.500% due 12/01/2022 (b) | | | | | 6,834 | | | | | | 6,035 | |
|
PolyOne Corp. | |
5.250% due 03/15/2023 | | | | | 2,374 | | | | | | 2,571 | |
|
Precision Drilling Corp. | |
6.500% due 12/15/2021 | | | | | 9 | | | | | | 8 | |
7.750% due 12/15/2023 | | | | | 3,069 | | | | | | 2,113 | |
|
Prime Security Services Borrower LLC | |
5.250% due 04/15/2024 | | | | | 2,088 | | | | | | 2,140 | |
|
QEP Resources, Inc. | |
5.375% due 10/01/2022 | | | | | 3,431 | | | | | | 2,620 | |
|
QVC, Inc. | |
4.850% due 04/01/2024 | | | | | 3,359 | | | | | | 3,398 | |
|
Rackspace Hosting, Inc. | |
8.625% due 11/15/2024 (a)(h) | | | | | 8,726 | | | | | | 8,892 | |
|
Radiate Holdco LLC | |
6.875% due 02/15/2023 | | | | | 7,420 | | | | | | 7,540 | |
|
Range Resources Corp. | |
5.000% due 08/15/2022 | | | | | 6,776 | | | | | | 6,187 | |
|
Revlon Consumer Products Corp. | |
5.750% due 02/15/2021 (a)(h) | | | | | 5,548 | | | | | | 3,400 | |
6.250% due 08/01/2024 | | | | | 1,289 | | | | | | 293 | |
|
Reynolds Group Issuer, Inc. | |
5.125% due 07/15/2023 | | | | | 10,229 | | | | | | 10,364 | |
|
Rite Aid Corp. | |
6.125% due 04/01/2023 | | | | | 1,959 | | | | | | 1,908 | |
7.500% due 07/01/2025 | | | | | 1,201 | | | | | | 1,204 | |
|
Riverbed Technology, Inc. | |
8.875% due 03/01/2023 (a)(h) | | | | | 1,499 | | | | | | 918 | |
|
Rockpoint Gas Storage Canada Ltd. | |
7.000% due 03/31/2023 | | | | | 4,874 | | | | | | 4,484 | |
|
Royal Caribbean Cruises Ltd. | |
10.875% due 06/01/2023 | | | | | 2,056 | | | | | | 2,114 | |
11.500% due 06/01/2025 | | | | | 2,338 | | | | | | 2,439 | |
|
RR Donnelley & Sons Co. | |
7.875% due 03/15/2021 | | | | | 70 | | | | | | 70 | |
|
Sabre GLBL, Inc. | |
5.375% due 04/15/2023 | | | | | 3,215 | | | | | | 3,010 | |
|
Sanchez Energy Corp. | |
7.750% due 06/15/2021 ^(c) | | | | | 2,029 | | | | | | 8 | |
|
Sensata Technologies BV | |
4.875% due 10/15/2023 | | | | | 1,873 | | | | | | 1,950 | |
|
ServiceMaster Co. LLC | |
5.125% due 11/15/2024 | | | | | 4,923 | | | | | | 5,004 | |
|
Sirius XM Radio, Inc. | |
3.875% due 08/01/2022 | | | | | 156 | | | | | | 157 | |
4.625% due 07/15/2024 | | | | | 6,042 | | | | | | 6,214 | |
|
Solera LLC | |
10.500% due 03/01/2024 | | | | | 2,725 | | | | | | 2,785 | |
|
Sophia LP | |
9.000% due 09/30/2023 | | | | | 2,153 | | | | | | 2,182 | |
|
Southwestern Energy Co. | |
4.100% due 03/15/2022 | | | | | 60 | | | | | | 57 | |
| | | | | | |
| See Accompanying Notes | | ANNUAL REPORT | | JUNE 30, 2020 | | 39 |
Schedule of Investments PIMCO 0-5 Year High Yield Corporate Bond Index Exchange-Traded Fund (Cont.)
| | | | | | | | | | | | |
| | | | | PRINCIPAL AMOUNT (000S) | | | | | MARKET VALUE (000S) | |
|
Spirit AeroSystems, Inc. | |
3.950% due 06/15/2023 | | $ | | | 4,424 | | | $ | | | 3,760 | |
7.500% due 04/15/2025 | | | | | 5,604 | | | | | | 5,551 | |
|
Sunoco LP | |
4.875% due 01/15/2023 | | | | | 6,448 | | | | | | 6,375 | |
|
T-Mobile USA, Inc. | |
4.000% due 04/15/2022 | | | | | 1,711 | | | | | | 1,757 | |
6.375% due 03/01/2025 | | | | | 3,000 | | | | | | 3,085 | |
|
Teine Energy Ltd. | |
6.875% due 09/30/2022 | | | | | 2,230 | | | | | | 2,210 | |
|
Tenet Healthcare Corp. | |
4.625% due 09/01/2024 | | | | | 5,133 | | | | | | 5,022 | |
6.750% due 06/15/2023 | | | | | 11,846 | | | | | | 11,769 | |
8.125% due 04/01/2022 | | | | | 10,024 | | | | | | 10,543 | |
|
THQ, Inc. | |
12.000% due 08/15/2021 ^«(c) | | | | | 2,000 | | | | | | 73 | |
|
Toll Brothers Finance Corp. | |
5.875% due 02/15/2022 | | | | | 4,188 | | | | | | 4,375 | |
|
TransDigm, Inc. | |
6.500% due 05/15/2025 | | | | | 3,730 | | | | | | 3,498 | |
|
Trident TPI Holdings, Inc. | |
9.250% due 08/01/2024 | | | | | 2,626 | | | | | | 2,700 | |
|
Triumph Group, Inc. | |
6.250% due 09/15/2024 | | | | | 9,131 | | | | | | 7,779 | |
|
U.S. Foods, Inc. | |
6.250% due 04/15/2025 | | | | | 900 | | | | | | 927 | |
|
Uber Technologies, Inc. | |
7.500% due 05/15/2025 | | | | | 928 | | | | | | 939 | |
|
Unit Corp. | |
6.625% due 05/15/2021 ^(c) | | | | | 4,064 | | | | | | 549 | |
|
United Airlines Holdings, Inc. | |
4.250% due 10/01/2022 | | | | | 1,702 | | | | | | 1,449 | |
|
Univision Communications, Inc. | |
5.125% due 05/15/2023 | | | | | 19,670 | | | | | | 19,910 | |
|
Valaris PLC | |
4.875% due 06/01/2022 | | | | | 3,050 | | | | | | 346 | |
8.000% due 01/31/2024 ^(c) | | | | | 3,454 | | | | | | 289 | |
|
Vericast Corp. | |
8.375% due 08/15/2022 | | | | | 3,668 | | | | | | 3,087 | |
|
VeriSign, Inc. | |
4.625% due 05/01/2023 | | | | | 5,575 | | | | | | 5,624 | |
|
Veritas U.S., Inc. | |
10.500% due 02/01/2024 (h) | | | | | 1,419 | | | | | | 1,275 | |
|
Videotron Ltd. | |
5.000% due 07/15/2022 | | | | | 4,036 | | | | | | 4,184 | |
|
Virgin Australia Holdings Ltd. | |
7.875% due 10/15/2021 ^(c) | | | | | 3,100 | | | | | | 540 | |
|
Western Midstream Operating LP | |
3.100% due 02/01/2025 | | | | | 1,250 | | | | | | 1,187 | |
|
WEX, Inc. | |
4.750% due 02/01/2023 | | | | | 788 | | | | | | 785 | |
|
Whiting Petroleum Corp. | |
5.750% due 03/15/2021 ^(c) | | | | | 2,826 | | | | | | 548 | |
6.250% due 04/01/2023 ^(c) | | | | | 1,834 | | | | | | 324 | |
|
Williams Scotsman International, Inc. | |
6.875% due 08/15/2023 | | | | | 3,434 | | | | | | 3,537 | |
|
WPX Energy, Inc. | |
5.250% due 09/15/2024 | | | | | 5,499 | | | | | | 5,434 | |
8.250% due 08/01/2023 | | | | | 6,328 | | | | | | 7,047 | |
| | | | | | | | | | | | |
| | | | | PRINCIPAL AMOUNT (000S) | | | | | MARKET VALUE (000S) | |
|
WR Grace & Co-Conn | |
5.125% due 10/01/2021 | | $ | | | 7,726 | | | $ | | | 8,139 | |
|
Wyndham Destinations, Inc. | |
4.250% due 03/01/2022 | | | | | 1,162 | | | | | | 1,146 | |
5.400% due 04/01/2024 | | | | | 5,744 | | | | | | 5,564 | |
|
Wynn Las Vegas LLC | |
5.500% due 03/01/2025 | | | | | 4,676 | | | | | | 4,293 | |
|
XPO Logistics, Inc. | |
6.125% due 09/01/2023 | | | | | 2,858 | | | | | | 2,901 | |
6.500% due 06/15/2022 | | | | | 8,657 | | | | | | 8,687 | |
6.750% due 08/15/2024 | | | | | 13,178 | | | | | | 13,840 | |
|
Yum! Brands, Inc. | |
3.875% due 11/01/2020 | | | | | 1,805 | | | | | | 1,812 | |
3.875% due 11/01/2023 | | | | | 2,752 | | | | | | 2,841 | |
| | | | | | | | | | | | |
| | | | | | | | | | | 830,100 | |
| | | | | | | | | | | | |
| |
| UTILITIES 7.5% | |
|
American Midstream Partners LP | |
9.500% due 12/15/2021 | | | | | 2,216 | | | | | | 2,025 | |
|
Blue Racer Midstream LLC | |
6.125% due 11/15/2022 | | | | | 6,498 | | | | | | 6,480 | |
|
Calpine Corp. | |
5.250% due 06/01/2026 | | | | | 900 | | | | | | 911 | |
|
CenturyLink, Inc. | |
5.800% due 03/15/2022 | | | | | 3,773 | | | | | | 3,885 | |
6.450% due 06/15/2021 | | | | | 5,208 | | | | | | 5,343 | |
7.500% due 04/01/2024 | | | | | 3,022 | | | | | | 3,326 | |
|
Crestwood Midstream Partners LP | |
6.250% due 04/01/2023 | | | | | 7,782 | | | | | | 6,946 | |
|
Frontier Communications Corp. | |
10.500% due 09/15/2022 ^(c) | | | | | 4,445 | | | | | | 1,549 | |
|
Great Western Petroleum LLC | |
9.000% due 09/30/2021 | | | | | 1,230 | | | | | | 750 | |
|
NGPL PipeCo LLC | |
4.375% due 08/15/2022 | | | | | 6,900 | | | | | | 7,122 | |
|
Parsley Energy LLC | |
5.375% due 01/15/2025 | | | | | 4,223 | | | | | | 4,116 | |
|
PBF Logistics LP | |
6.875% due 05/15/2023 | | | | | 2,134 | | | | | | 2,062 | |
|
Qwest Corp. | |
6.750% due 12/01/2021 | | | | | 2,751 | | | | | | 2,908 | |
|
Sprint Communications, Inc. | |
6.000% due 11/15/2022 | | | | | 3,306 | | | | | | 3,492 | |
7.000% due 08/15/2020 | | | | | 2,382 | | | | | | 2,396 | |
|
Sprint Corp. | |
7.125% due 06/15/2024 | | | | | 5,604 | | | | | | 6,338 | |
7.250% due 09/15/2021 | | | | | 1,891 | | | | | | 1,985 | |
7.875% due 09/15/2023 | | | | | 12,647 | | | | | | 14,259 | |
|
Targa Resources Partners LP | |
4.250% due 11/15/2023 | | | | | 4,255 | | | | | | 4,084 | |
|
Telecom Italia SpA | |
5.303% due 05/30/2024 | | | | | 6,046 | | | | | | 6,314 | |
| | | | | | | | | | | | |
| | | | | | | | | | | 86,291 | |
| | | | | | | | | | | | |
Total Corporate Bonds & Notes
(Cost $1,190,533) | | | | | | | | | 1,088,934 | |
| | | | | | | | | | | | |
| |
| | | | | | | | | | | | |
| | | | | SHARES | | | | | MARKET VALUE (000S) | |
| WARRANTS 0.2% | |
| |
| COMMUNICATION SERVICES 0.2% | |
| | | | |
iHeartMedia, Inc. - Exp. 05/01/2039 | | | | | 243,827 | | | $ | | | 2,036 | |
| | | | | | | | | | | | |
| |
| FINANCIALS 0.0% | |
| | | | |
Stearns Holdings LLC - Exp. 11/05/2039 « | | | | | 216,813 | | | | | | 0 | |
| | | | | | | | | | | | |
Total Warrants (Cost $5,035) | | | | | | 2,036 | |
| | | | | | | | | | | | |
| |
| PREFERRED SECURITIES 0.0% | |
| |
| BANKING & FINANCE 0.0% | |
|
AGFC Capital Trust | |
2.969% (US0003M + 1.750%) due 01/15/2067 ~ | | | | | 806,000 | | | | | | 267 | |
| | | | | | | | | | | | |
| Total Preferred Securities (Cost $479) | | | | | | 267 | |
| | | | | | | | | | | | |
| |
| | | | | PRINCIPAL
AMOUNT
(000S) | | | | | | |
| SHORT-TERM INSTRUMENTS 5.0% | |
| |
| REPURCHASE AGREEMENTS (k) 4.8% | |
| | | | | | | | | | | 55,818 | |
| | | | | | | | | | | | |
| |
| U.S. TREASURY BILLS 0.2% | |
0.102% due 07/23/2020 - 09/24/2020 (d)(e)(m) | | $ | | | 1,876 | | | | | | 1,875 | |
| | | | | | | | | | | | |
Total Short-Term Instruments
(Cost $57,693) | | | 57,693 | |
| | | | |
| | | | |
| | | | | | | | | | | | |
Total Investments in Securities
(Cost $1,254,141) | | | 1,149,338 | |
| | | | | | | | | | | | |
| |
| | | | | SHARES | | | | | | |
| INVESTMENTS IN AFFILIATES 2.4% | |
| |
| SHORT-TERM INSTRUMENTS 2.4% | |
| |
| MUTUAL FUNDS 2.4% | |
| | |
PIMCO Government Money Market Fund | | | | | | | |
0.180% (g)(h)(j) | | | | | 28,120,002 | | | | | | 28,120 | |
| | | | | | | | | | | | |
Total Short-Term Instruments
(Cost $28,120) | | | 28,120 | |
| | | | |
| | | | |
| | | | | | | | | | | | |
Total Investments in Affiliates
(Cost $28,120) | | | 28,120 | |
| |
| | | | |
Total Investments 101.8%
(Cost $1,282,261) | | | $ | | | 1,177,458 | |
| |
Financial Derivative
Instruments (l) 0.1% (Cost or Premiums, net $2,139) | | | | | | 1,036 | |
| |
| Other Assets and Liabilities, net (1.9)% | | | (21,668 | ) |
| | | | |
| Net Assets 100.0% | | | $ | | | 1,156,826 | |
| | | | | | | |
NOTES TO SCHEDULE OF INVESTMENTS:
| * | A zero balance may reflect actual amounts rounding to less than one thousand. |
| « | Security valued using significant unobservable inputs (Level 3). |
| µ | All or a portion of this amount represents unfunded loan commitments. The interest rate for the unfunded portion will be determined at the time of funding. See Note 4, Securities and Other Investments, in the Notes to Financial Statements for more information regarding unfunded loan commitments. |
| ~ | Variable or Floating rate security. Rate shown is the rate in effect as of period end. Certain variable rate securities are not based on a published reference rate and spread, rather are determined by the issuer or agent and are based on current market conditions. Reference rate is as of reset date, which may vary by security. These securities may not indicate a reference rate and/or spread in their description. |
| | | | | | | | |
| 40 | | PIMCO ETF TRUST | | | | | See Accompanying Notes | |
June 30, 2020
| • | Rate shown is the rate in effect as of period end. The rate may be based on a fixed rate, a capped rate or a floor rate and may convert to a variable or floating rate in the future. These securities do not indicate a reference rate and spread in their description. |
| þ | Coupon represents a rate which changes periodically based on a predetermined schedule or event. Rate shown is the rate in effect as of period end. |
| (b) | Payment in-kind security. |
| (c) | Security is not accruing income as of the date of this report. |
| (d) | Coupon represents a weighted average yield to maturity. |
| (f) | Perpetual maturity; date shown, if applicable, represents next contractual call date. |
| (g) | Institutional Class Shares of each Fund. |
| (h) | Securities with an aggregate market value of $30,415 were out on loan in exchange for $31,041 of cash collateral as of June 30, 2020. See Note 5, Securities Lending, in the Notes to Financial Statements for more information regarding securities on loan and cash collateral. |
| (i) | Security is subject to a forbearance agreement entered into by the Fund which forbears the Fund from taking action to, among other things, accelerate and collect payments on the subject note with respect to specified events of default. |
| (j) | Coupon represents a 7-Day Yield. |
BORROWINGS AND OTHER FINANCING TRANSACTIONS
(k) REPURCHASE AGREEMENTS:
| | | | | | | | | | | | | | | | | | | | | | | | | | | | | | |
| Counterparty | | Lending
Rate | | | Settlement
Date | | | Maturity
Date | | | Principal
Amount | | | Collateralized By | | Collateral
(Received) | | | Repurchase
Agreements,
at Value | | | Repurchase
Agreement
Proceeds
to be
Received(1) | |
| FICC | | | 0.000 | % | | | 06/30/2020 | | | | 07/01/2020 | | | $ | 5,118 | | | U.S. Treasury Inflation Protected Securities
0.125% due 07/15/2024 | | $ | (5,220 | ) | | $ | 5,118 | | | $ | 5,118 | |
| MBC | | | 0.130 | | | | 06/30/2020 | | | | 07/01/2020 | | | | 50,700 | | | U.S. Treasury Notes
1.625% - 2.625% due 06/30/2021 - 07/15/2021 | | | (52,326 | ) | | | 50,700 | | | | 50,700 | |
| | | | | | | | | | | | | | | | | | | | | | | | | | | | | | |
Total Repurchase Agreements | | | | | $ | (57,546 | ) | | $ | 55,818 | | | $ | 55,818 | |
| | | | | | | | | | | | | | | |
BORROWINGS AND OTHER FINANCING TRANSACTIONS SUMMARY
The following is a summary by counterparty of the market value of Borrowings and Other Financing Transactions and collateral pledged/(received) as of June 30, 2020:
| | | | | | | | | | | | | | | | | | | | | | | | | | | | |
| Counterparty | | Repurchase
Agreement
Proceeds
to be
Received(1) | | | Payable for
Reverse
Repurchase
Agreements | | | Payable for
Sale-Buyback
Transactions | | | Securities
Out on Loan | | | Total
Borrowings and
Other Financing
Transactions | | | Collateral
Pledged/(Received) | | | Net Exposure(2) | |
Global/Master Repurchase Agreement | |
FICC | | $ | 5,118 | | | $ | 0 | | | $ | 0 | | | $ | 0 | | | $ | 5,118 | | | $ | (5,220 | ) | | $ | (102 | ) |
MBC | | | 50,700 | | | | 0 | | | | 0 | | | | 0 | | | | 50,700 | | | | (52,326 | ) | | | (1,626 | ) |
|
Master Securities Forward Transaction Agreement | |
BCY | | | 0 | | | | 0 | | | | 0 | | | | 9,415 | | | | 9,415 | | | | (9,602 | ) | | | (187 | ) |
BMO | | | 0 | | | | 0 | | | | 0 | | | | 8,775 | | | | 8,775 | | | | (8,950 | ) | | | (175 | ) |
GSC | | | 0 | | | | 0 | | | | 0 | | | | 10,179 | | | | 10,179 | | | | (10,383 | ) | | | (204 | ) |
RDR | | | 0 | | | | 0 | | | | 0 | | | | 1,733 | | | | 1,733 | | | | (1,786 | ) | | | (53 | ) |
WFS | | | 0 | | | | 0 | | | | 0 | | | | 313 | | | | 313 | | | | (320 | ) | | | (7 | ) |
| | | | | | | | | | | | | | | | | | | | | | | | | | | | |
Total Borrowings and Other Financing Transactions | | $ | 55,818 | | | $ | 0 | | | $ | 0 | | | $ | 30,415 | | | | | | | | | | | | | |
| | | | | | | | | | | | | | | | | | | | | | | | | | | | |
CERTAIN TRANSFERS ACCOUNTED FOR AS SECURED BORROWINGS
Remaining Contractual Maturity of the Agreements
| | | | | | | | | | | | | | | | | | | | |
| | | Overnight and
Continuous | | | Up to 30 days | | | 31-90 days | | | Greater Than 90 days | | | Total | |
Securities Lending Transactions(3) | |
Corporate Bonds & Notes | | $ | 31,041 | | | $ | 0 | | | $ | 0 | | | $ | 0 | | | $ | 31,041 | |
| | | | | | | | | | | | | | | | | | | | |
Total Borrowings | | $ | 31,041 | | | $ | 0 | | | $ | 0 | | | $ | 0 | | | $ | 31,041 | |
| | | | | | | | | | | | | | | | | | | | |
Payable for securities on loan - cash collateral | | | $ | 31,041 | |
| | | | | |
| (1) | Includes accrued interest. |
| (2) | Net Exposure represents the net receivable/(payable) that would be due from/to the counterparty in the event of default. Exposure from borrowings and other financing transactions can only be netted across transactions governed under the same master agreement with the same legal entity. See Note 8, Master Netting Arrangements, in the Notes to Financial Statements for more information. |
| (3) | Includes cash collateral as described in Note 5 in the Notes to Financial Statements. |
| | | | | | |
| See Accompanying Notes | | ANNUAL REPORT | | JUNE 30, 2020 | | 41 |
Schedule of Investments PIMCO 0-5 Year High Yield Corporate Bond Index Exchange-Traded Fund (Cont.)
(l) FINANCIAL DERIVATIVE INSTRUMENTS: EXCHANGE-TRADED OR CENTRALLY CLEARED
FUTURES CONTRACTS:
LONG FUTURES CONTRACTS
| | | | | | | | | | | | | | | | | | | | | | | | |
Description | | Expiration
Month | | | # of
Contracts | | | Notional
Amount | | | Unrealized
Appreciation/
(Depreciation) | | | Variation Margin | |
| | Asset | | | Liability | |
U.S. Treasury 5-Year Note September Futures | | | 09/2020 | | | | 335 | | | $ | 42,124 | | | $ | 95 | | | $ | 0 | | | $ | (10 | ) |
| | | | | | | | | | | | | | | | | | | | | | | | |
Total Futures Contracts | | | $ | 95 | | | $ | 0 | | | $ | (10 | ) |
| | | | | | | | | | | | | | | | | | | | | | | | |
SWAP AGREEMENTS:
CREDIT DEFAULT SWAPS ON CREDIT INDICES - SELL PROTECTION(1)
| | | | | | | | | | | | | | | | | | | | | | | | | | | | | | | | | | | | |
Index/Tranches | | Fixed
Receive Rate | | | Payment
Frequency | | | Maturity
Date | | | Notional
Amount(2) | | | Premiums
Paid/(Received) | | | Unrealized
Appreciation/
(Depreciation) | | | Market
Value(3) | | | Variation Margin | |
| | Asset | | | Liability | |
CDX.HY-32 5-Year Index | | | 5.000 | % | | | Quarterly | | | | 06/20/2024 | | | | 53,053 | | | $ | 3,390 | | | $ | (3,277 | ) | | $ | 113 | | | $ | 302 | | | $ | 0 | |
CDX.HY-34 5-Year Index | | | 5.000 | | | | Quarterly | | | | 06/20/2025 | | | | 96,140 | | | | (1,251 | ) | | | 671 | | | | (580 | ) | | | 742 | | | | 0 | |
| | | | | | | | | | | | | | | | | | | | | | | | | | | | | | | | | | | | |
Total Swap Agreements | | | $ | 2,139 | | | $ | (2,606 | ) | | $ | (467 | ) | | $ | 1,044 | | | $ | 0 | |
| | | | | | | | | | | | | | | | | | | | | |
FINANCIAL DERIVATIVE INSTRUMENTS: EXCHANGE-TRADED OR CENTRALLY CLEARED SUMMARY
The following is a summary of the market value and variation margin of Exchange-Traded or Centrally Cleared Financial Derivative Instruments as of June 30, 2020:
| | | | | | | | | | | | | | | | | | | | | | | | | | | | | | | | | | | | |
| | | Financial Derivative Assets | | | | | | Financial Derivative Liabilities | |
| | | Market Value | | | Variation Margin
Asset(4) | | | | | | | | | Market Value | | | Variation Margin
Liability | | | | |
| | | Purchased
Options | | | Futures | | | Swap
Agreements | | | Total | | | | | | Written
Options | | | Futures | | | Swap
Agreements | | | Total | |
Total Exchange-Traded or Centrally Cleared | | $ | 0 | | | $ | 0 | | | $ | 1,046 | | | $ | 1,046 | | | | | | | $ | 0 | | | $ | (10) | | | $ | 0 | | | | $ (10) | |
| | | | | | | | | | | | | | | | | | | | | | | | | | | | | | | | | | | | |
| (m) | Securities with an aggregate market value of $1,684 and cash of $18,094 have been pledged as collateral for exchange-traded and centrally cleared financial derivative instruments as of June 30, 2020. See Note 8, Master Netting Arrangements, in the Notes to Financial Statements for more information. |
| (1) | If the Fund is a seller of protection and a credit event occurs, as defined under the terms of that particular swap agreement, the Fund will either (i) pay to the buyer of protection an amount equal to the notional amount of the swap and take delivery of the referenced obligation or underlying securities comprising the referenced index or (ii) pay a net settlement amount in the form of cash, securities or other deliverable obligations equal to the notional amount of the swap less the recovery value of the referenced obligation or underlying securities comprising the referenced index. |
| (2) | The maximum potential amount the Fund could be required to pay as a seller of credit protection or receive as a buyer of credit protection if a credit event occurs as defined under the terms of that particular swap agreement. |
| (3) | The prices and resulting values for credit default swap agreements serve as indicators of the current status of the payment/performance risk and represent the likelihood of an expected liability (or profit) for the credit derivative should the notional amount of the swap agreement be closed/sold as of the period end. Increasing market values, in absolute terms when compared to the notional amount of the swap, represent a deterioration of the underlying referenced instrument’s credit soundness and a greater likelihood or risk of default or other credit event occurring as defined under the terms of the agreement. |
| (4) | Unsettled variation margin asset of $2 for closed swap agreements is outstanding at period end. |
FAIR VALUE OF FINANCIAL DERIVATIVE INSTRUMENTS
The following is a summary of the fair valuation of the Fund’s derivative instruments categorized by risk exposure. See Note 7, Principal Risks, in the Notes to Financial Statements on risks of the Fund.
Fair Values of Financial Derivative Instruments on the Statements of Assets and Liabilities as of June 30, 2020:
| | | | | | | | | | | | | | | | | | | | | | | | |
| | | Derivatives not accounted for as hedging instruments | |
| | | Commodity
Contracts | | | Credit
Contracts | | | Equity
Contracts | | | Foreign
Exchange
Contracts | | | Interest
Rate
Contracts | | | Total | |
Financial Derivative Instruments - Assets | | | | | | | | | | | | | | | | | | | | | | | | |
Exchange-traded or centrally cleared | | | | | | | | | | | | | | | | | | | | | | | | |
Swap Agreements | | $ | 0 | | | $ | 1,046 | | | $ | 0 | | | $ | 0 | | | $ | 0 | | | $ | 1,046 | |
| | | | | | | | | | | | | | | | | | | | | | | | |
|
Financial Derivative Instruments - Liabilities | |
Exchange-traded or centrally cleared | | | | | | | | | | | | | | | | | | | | | | | | |
Futures | | $ | 0 | | | $ | 0 | | | $ | 0 | | | $ | 0 | | | $ | 10 | | | $ | 10 | |
| | | | | | | | | | | | | | | | | | | | | | | | |
| | | | | | | | |
| 42 | | PIMCO ETF TRUST | | | | | See Accompanying Notes | |
June 30, 2020
The effect of Financial Derivative Instruments on the Statements of Operations for the period ended June 30, 2020:
| | | | | | | | | | | | | | | | | | | | | | | | |
| | | Derivatives not accounted for as hedging instruments | |
| | | Commodity
Contracts | | | Credit
Contracts | | | Equity
Contracts | | | Foreign
Exchange
Contracts | | | Interest
Rate Contracts | | | Total | |
Net Realized Gain (Loss) on Financial Derivative Instruments | |
Exchange-traded or centrally cleared | | | | | | | | | | | | | | | | | | | | | | | | |
Futures | | $ | 0 | | | $ | 0 | | | $ | 0 | | | $ | 0 | | | $ | 2,464 | | | $ | 2,464 | |
Swap Agreements | | | 0 | | | | (14,139 | ) | | | 0 | | | | 0 | | | | 11 | | | | (14,128 | ) |
| | | | | | | | | | | | | | | | | | | | | | | | |
| | $ | 0 | | | $ | (14,139 | ) | | $ | 0 | | | $ | 0 | | | $ | 2,475 | | | $ | (11,664 | ) |
| | | | | | | | | | | | | | | | | | | | | | | | |
Over the counter | |
Swap Agreements | | $ | 0 | | | $ | 3 | | | $ | 0 | | | $ | 0 | | | $ | 1,978 | | | $ | 1,981 | |
| | | | | | | | | | | | | | | | | | | | | | | | |
| | $ | 0 | | | $ | (14,136 | ) | | $ | 0 | | | $ | 0 | | | $ | 4,453 | | | $ | (9,683 | ) |
| | | | | | | | | | | | | | | | | | | | | | | | |
|
Net Change in Unrealized (Depreciation) on Financial Derivative Instruments | |
Exchange-traded or centrally cleared | |
Futures | | $ | 0 | | | $ | 0 | | | $ | 0 | | | $ | 0 | | | $ | (34 | ) | | $ | (34 | ) |
Swap Agreements | | | 0 | | | | (4,234 | ) | | | 0 | | | | 0 | | | | 0 | | | | (4,234 | ) |
| | | | | | | | | | | | | | | | | | | | | | | | |
| | $ | 0 | | | $ | (4,234 | ) | | $ | 0 | | | $ | 0 | | | $ | (34 | ) | | $ | (4,268 | ) |
| | | | | | | | | | | | | | | | | | | | | | | | |
Over the counter | |
Swap Agreements | | $ | 0 | | | $ | 0 | | | $ | 0 | | | $ | 0 | | | $ | (1,209 | ) | | $ | (1,209 | ) |
| | | | | | | | | | | | | | | | | | | | | | | | |
| | $ | 0 | | | $ | (4,234 | ) | | $ | 0 | | | $ | 0 | | | $ | (1,243 | ) | | $ | (5,477 | ) |
| | | | | | | | | | | | | | | | | | | | | | | | |
FAIR VALUE MEASUREMENTS
The following is a summary of the fair valuations according to the inputs used as of June 30, 2020 in valuing the Fund’s assets and liabilities:
| | | | | | | | | | | | | | | | |
| Category and Subcategory | | Level 1 | | | Level 2 | | | Level 3 | | | Fair
Value at
06/30/2020 | |
Investments in Securities, at Value | |
Loan Participations and Assignments | | $ | 0 | | | $ | 408 | | | $ | 0 | | | $ | 408 | |
Corporate Bonds & Notes | | | | | | | | | | | | | | | | |
Banking & Finance | | | 0 | | | | 172,543 | | | | 0 | | | | 172,543 | |
Industrials | | | 0 | | | | 830,027 | | | | 73 | | | | 830,100 | |
Utilities | | | 0 | | | | 86,291 | | | | 0 | | | | 86,291 | |
Warrants | |
Communication Services | | | 0 | | | | 2,036 | | | | 0 | | | | 2,036 | |
Preferred Securities | |
Banking & Finance | | | 0 | | | | 267 | | | | 0 | | | | 267 | |
Short-Term Instruments | | | | | | | | | | | | | | | | |
Repurchase Agreements | | | 0 | | | | 55,818 | | | | 0 | | | | 55,818 | |
U.S. Treasury Bills | | | 0 | | | | 1,875 | | | | 0 | | | | 1,875 | |
| | | | | | | | | | | | | | | | |
| | $ | 0 | | | $ | 1,149,265 | | | $ | 73 | | | $ | 1,149,338 | |
| | | | | | | | | | | | | | | | |
Investments in Affiliates, at Value | |
Short-Term Instruments | | | | | | | | | | | | | | | | |
Mutual Funds | | | 28,120 | | | | 0 | | | | 0 | | | | 28,120 | |
| | | | | | | | | | | | | | | | |
| | | | |
Total Investments | | $ | 28,120 | | | $ | 1,149,265 | | | $ | 73 | | | $ | 1,177,458 | |
| | | | | | | | | | | | | | | | |
| | | | | | | | | | | | | | | | |
| Category and Subcategory | | Level 1 | | | Level 2 | | | Level 3 | | | Fair
Value at
06/30/2020 | |
Financial Derivative Instruments - Assets | |
Exchange-traded or centrally cleared | | $ | 0 | | | $ | 1,044 | | | $ | 0 | | | $ | 1,044 | |
| | | | | | | | | | | | | | | | |
|
Financial Derivative Instruments - Liabilities | |
Exchange-traded or centrally cleared | | $ | (10 | ) | | $ | 0 | | | $ | 0 | | | $ | (10 | ) |
| | | | | | | | | | | | | | | | |
| | | | |
Total Financial Derivative Instruments | | $ | (10 | ) | | $ | 1,044 | | | $ | 0 | | | $ | 1,034 | |
| | | | | | | | | | | | | | | | |
| | | | |
Totals | | $ | 28,110 | | | $ | 1,150,309 | | | $ | 73 | | | $ | 1,178,492 | |
| | | | | | | | | | | | | | | | |
There were no significant transfers into or out of Level 3 during the period ended June 30, 2020.
| | | | | | |
| See Accompanying Notes | | ANNUAL REPORT | | JUNE 30, 2020 | | 43 |
Schedule of Investments PIMCO Investment Grade Corporate Bond Index Exchange-Traded Fund
(Amounts in thousands*, except number of shares, contracts and units, if any)
| | | | | | | | | | | | |
| | | | | PRINCIPAL
AMOUNT
(000S) | | | | | MARKET
VALUE
(000S) | |
| INVESTMENTS IN SECURITIES 98.0% | |
| |
| CORPORATE BONDS & NOTES 95.6% | |
| |
| BANKING & FINANCE 38.8% | |
|
AerCap Ireland Capital DAC | |
4.500% due 05/15/2021 | | $ | | | 1,195 | | | $ | | | 1,203 | |
4.625% due 10/30/2020 | | | | | 3,222 | | | | | | 3,236 | |
|
Aflac, Inc. | |
3.625% due 11/15/2024 | | | | | 3,110 | | | | | | 3,524 | |
|
AIG Global Funding | |
1.931% (US0003M + 0.480%) due 07/02/2020 ~ | | | | | 1,240 | | | | | | 1,240 | |
|
Air Lease Corp. | |
3.500% due 01/15/2022 | | | | | 7 | | | | | | 7 | |
|
American Express Co. | |
2.650% due 12/02/2022 | | | | | 685 | | | | | | 718 | |
4.050% due 12/03/2042 | | | | | 477 | | | | | | 578 | |
|
American Honda Finance Corp. | |
2.450% due 09/24/2020 | | | | | 1,483 | | | | | | 1,489 | |
|
American International Group, Inc. | |
3.750% due 07/10/2025 | | | | | 2,627 | | | | | | 2,910 | |
3.875% due 01/15/2035 | | | | | 640 | | | | | | 735 | |
3.900% due 04/01/2026 | | | | | 375 | | | | | | 424 | |
4.500% due 07/16/2044 | | | | | 260 | | | | | | 304 | |
|
American Tower Corp. | |
2.400% due 03/15/2025 | | | | | 930 | | | | | | 979 | |
2.750% due 01/15/2027 | | | | | 1,180 | | | | | | 1,268 | |
3.125% due 01/15/2027 | | | | | 1,275 | | | | | | 1,397 | |
3.375% due 10/15/2026 | | | | | 937 | | | | | | 1,043 | |
3.500% due 01/31/2023 | | | | | 1,485 | | | | | | 1,588 | |
3.600% due 01/15/2028 | | | | | 725 | | | | | | 810 | |
|
Athene Global Funding | |
3.000% due 07/01/2022 | | | | | 1,009 | | | | | | 1,034 | |
|
Athene Holding Ltd. | |
4.125% due 01/12/2028 | | | | | 1,458 | | | | | | 1,505 | |
|
Aviation Capital Group LLC | |
6.750% due 04/06/2021 | | | | | 100 | | | | | | 101 | |
7.125% due 10/15/2020 | | | | | 100 | | | | | | 100 | |
|
Avolon Holdings Funding Ltd. | |
2.875% due 02/15/2025 | | | | | 2,900 | | | | | | 2,439 | |
|
B3 S.A. - Brasil Bolsa Balcao | |
5.500% due 07/16/2020 | | | | | 620 | | | | | | 620 | |
|
Banco de Credito e Inversiones S.A. | |
3.500% due 10/12/2027 | | | | | 2,025 | | | | | | 2,133 | |
|
Banco Santander Mexico S.A. | |
4.125% due 11/09/2022 | | | | | 265 | | | | | | 277 | |
|
Bank of America Corp. | |
2.369% due 07/21/2021 • | | | | | 1,870 | | | | | | 1,872 | |
3.419% due 12/20/2028 • | | | | | 2,408 | | | | | | 2,683 | |
3.500% due 04/19/2026 | | | | | 1,862 | | | | | | 2,098 | |
4.000% due 04/01/2024 | | | | | 2,329 | | | | | | 2,587 | |
4.271% due 07/23/2029 • | | | | | 2,294 | | | | | | 2,702 | |
7.750% due 05/14/2038 | | | | | 401 | | | | | | 658 | |
|
Bank of New York Mellon Corp. | |
3.000% due 02/24/2025 | | | | | 2,421 | | | | | | 2,652 | |
|
Barclays PLC | |
4.375% due 01/12/2026 | | | | | 4,005 | | | | | | 4,527 | |
|
Berkshire Hathaway Finance Corp. | |
5.750% due 01/15/2040 | | | | | 612 | | | | | | 926 | |
|
Berkshire Hathaway, Inc. | |
4.500% due 02/11/2043 | | | | | 765 | | | | | | 1,018 | |
|
BNP Paribas S.A. | |
4.400% due 08/14/2028 | | | | | 975 | | | | | | 1,125 | |
5.000% due 01/15/2021 | | | | | 3,666 | | | | | | 3,755 | |
|
Boston Properties LP | |
3.800% due 02/01/2024 | | | | | 1,080 | | | | | | 1,173 | |
|
BPCE S.A. | |
4.500% due 03/15/2025 | | | | | 545 | | | | | | 596 | |
4.625% due 09/12/2028 | | | | | 525 | | | | | | 618 | |
5.150% due 07/21/2024 | | | | | 195 | | | | | | 218 | |
|
Brookfield Finance, Inc. | |
4.850% due 03/29/2029 | | | | | 1,562 | | | | | | 1,841 | |
|
Cboe Global Markets, Inc. | |
3.650% due 01/12/2027 | | | | | 635 | | | | | | 714 | |
| | | | | | | | | | | | |
| | | | | PRINCIPAL
AMOUNT
(000S) | | | | | MARKET
VALUE
(000S) | |
|
Charles Schwab Corp. | |
3.000% due 03/10/2025 | | $ | | | 250 | | | $ | | | 274 | |
|
China Cinda Finance Ltd. | |
4.250% due 04/23/2025 | | | | | 430 | | | | | | 473 | |
|
Chubb INA Holdings, Inc. | |
3.350% due 05/03/2026 | | | | | 3,080 | | | | | | 3,515 | |
4.350% due 11/03/2045 | | | | | 616 | | | | | | 805 | |
|
Citibank N.A. | |
3.650% due 01/23/2024 | | | | | 1,391 | | | | | | 1,527 | |
|
Citigroup, Inc. | |
2.700% due 03/30/2021 | | | | | 2,268 | | | | | | 2,305 | |
2.876% due 07/24/2023 • | | | | | 1,059 | | | | | | 1,103 | |
3.400% due 05/01/2026 | | | | | 2,571 | | | | | | 2,853 | |
3.700% due 01/12/2026 | | | | | 2,189 | | | | | | 2,448 | |
4.000% due 08/05/2024 | | | | | 682 | | | | | | 744 | |
8.125% due 07/15/2039 | | | | | 84 | | | | | | 146 | |
|
Citizens Financial Group, Inc. | |
2.375% due 07/28/2021 | | | | | 100 | | | | | | 101 | |
|
CME Group, Inc. | |
3.000% due 09/15/2022 | | | | | 1,822 | | | | | | 1,923 | |
3.000% due 03/15/2025 | | | | | 785 | | | | | | 867 | |
3.750% due 06/15/2028 | | | | | 420 | | | | | | 505 | |
4.150% due 06/15/2048 | | | | | 675 | | | | | | 910 | |
|
Cooperatieve Rabobank UA | |
3.875% due 02/08/2022 | | | | | 565 | | | | | | 597 | |
5.250% due 05/24/2041 | | | | | 2,256 | | | | | | 3,207 | |
|
Credit Suisse AG | |
3.000% due 10/29/2021 | | | | | 1,065 | | | | | | 1,100 | |
|
Credit Suisse Group Funding Guernsey Ltd. | |
3.800% due 06/09/2023 | | | | | 1,849 | | | | | | 1,993 | |
4.875% due 05/15/2045 | | | | | 905 | | | | | | 1,206 | |
|
Crown Castle International Corp. | |
3.100% due 11/15/2029 | | | | | 819 | | | | | | 880 | |
4.450% due 02/15/2026 | | | | | 1,463 | | | | | | 1,678 | |
5.250% due 01/15/2023 | | | | | 3 | | | | | | 3 | |
|
CubeSmart LP | |
3.000% due 02/15/2030 | | | | | 200 | | | | | | 213 | |
|
Deutsche Bank AG | |
2.281% (US0003M + 0.970%) due 07/13/2020 ~ | | | | | 1,335 | | | | | | 1,335 | |
4.100% due 01/13/2026 | | | | | 1,527 | | | | | | 1,617 | |
|
Discover Bank | |
4.650% due 09/13/2028 | | | | | 1,450 | | | | | | 1,667 | |
|
Duke Realty LP | |
4.000% due 09/15/2028 | | | | | 905 | | | | | | 1,063 | |
|
EPR Properties | |
4.950% due 04/15/2028 | | | | | 1,245 | | | | | | 1,190 | |
|
Equitable Holdings, Inc. | |
4.350% due 04/20/2028 | | | | | 762 | | | | | | 854 | |
5.000% due 04/20/2048 | | | | | 960 | | | | | | 1,095 | |
|
Essex Portfolio LP | |
2.650% due 03/15/2032 | | | | | 1,950 | | | | | | 2,062 | |
3.250% due 05/01/2023 | | | | | 1,871 | | | | | | 1,972 | |
|
Fairfax Financial Holdings Ltd. | |
4.850% due 04/17/2028 | | | | | 563 | | | | | | 604 | |
|
First Republic Bank | |
4.375% due 08/01/2046 | | | | | 200 | | | | | | 233 | |
|
Five Corners Funding Trust | |
4.419% due 11/15/2023 | | | | | 3,709 | | | | | | 4,133 | |
|
Ford Motor Credit Co. LLC | |
3.087% due 01/09/2023 | | | | | 1,720 | | | | | | 1,639 | |
3.336% due 03/18/2021 | | | | | 1,629 | | | | | | 1,617 | |
|
GE Capital International Funding Co. Unlimited Co. | |
2.342% due 11/15/2020 | | | | | 3,120 | | | | | | 3,140 | |
4.418% due 11/15/2035 | | | | | 2,462 | | | | | | 2,502 | |
| | | | |
General Motors Financial Co., Inc. | | | | | | | | | | | | |
3.700% due 11/24/2020 | | | | | 878 | | | | | | 883 | |
|
GLP Capital LP | |
4.000% due 01/15/2030 | | | | | 1,345 | | | | | | 1,340 | |
4.000% due 01/15/2031 | | | | | 300 | | | | | | 297 | |
5.300% due 01/15/2029 | | | | | 875 | | | | | | 949 | |
|
Goldman Sachs Group, Inc. | |
2.020% (US0003M + 1.000%) due 07/24/2023 ~ | | | | | 1,255 | | | | | | 1,258 | |
| | | | | | | | | | | | |
| | | | | PRINCIPAL
AMOUNT
(000S) | | | | | MARKET
VALUE
(000S) | |
2.875% due 02/25/2021 | | $ | | | 1,725 | | | $ | | | 1,748 | |
3.500% due 01/23/2025 | | | | | 260 | | | | | | 283 | |
4.750% due 10/21/2045 | | | | | 2,390 | | | | | | 3,138 | |
6.750% due 10/01/2037 | | | | | 2,647 | | | | | | 3,821 | |
|
Guardian Life Insurance Co. of America | |
4.850% due 01/24/2077 | | | | | 200 | | | | | | 255 | |
|
Highwoods Realty LP | |
3.050% due 02/15/2030 | | | | | 1,345 | | | | | | 1,341 | |
|
HSBC Holdings PLC | |
2.650% due 01/05/2022 | | | | | 1,455 | | | | | | 1,500 | |
3.900% due 05/25/2026 | | | | | 2,055 | | | | | | 2,283 | |
4.300% due 03/08/2026 | | | | | 1,616 | | | | | | 1,826 | |
4.583% due 06/19/2029 • | | | | | 986 | | | | | | 1,140 | |
|
Hutchison Whampoa International Ltd. | |
7.450% due 11/24/2033 | | | | | 1,268 | | | | | | 1,973 | |
|
JPMorgan Chase & Co. | |
2.950% due 10/01/2026 | | | | | 3,756 | | | | | | 4,129 | |
3.625% due 05/13/2024 | | | | | 3,585 | | | | | | 3,961 | |
4.850% due 02/01/2044 | | | | | 1,506 | | | | | | 2,058 | |
5.400% due 01/06/2042 | | | | | 250 | | | | | | 353 | |
|
KeyCorp | |
2.900% due 09/15/2020 | | | | | 1,604 | | | | | | 1,612 | |
|
Kilroy Realty LP | |
3.800% due 01/15/2023 | | | | | 800 | | | | | | 827 | |
|
Kimco Realty Corp. | |
4.450% due 09/01/2047 | | | | | 630 | | | | | | 646 | |
|
Lazard Group LLC | |
3.750% due 02/13/2025 | | | | | 2,518 | | | | | | 2,677 | |
|
Liberty Mutual Group, Inc. | |
3.951% due 10/15/2050 | | | | | 820 | | | | | | 869 | |
|
Lloyds Banking Group PLC | |
3.750% due 01/11/2027 | | | | | 3,350 | | | | | | 3,713 | |
|
Macquarie Bank Ltd. | |
6.625% due 04/07/2021 | | | | | 49 | | | | | | 51 | |
|
Manulife Financial Corp. | |
4.150% due 03/04/2026 | | | | | 1,163 | | | | | | 1,372 | |
|
Marsh & McLennan Cos., Inc. | |
3.750% due 03/14/2026 | | | | | 273 | | | | | | 310 | |
4.350% due 01/30/2047 | | | | | 150 | | | | | | 188 | |
4.900% due 03/15/2049 | | | | | 250 | | | | | | 341 | |
|
MetLife, Inc. | |
4.050% due 03/01/2045 | | | | | 310 | | | | | | 365 | |
5.700% due 06/15/2035 | | | | | 240 | | | | | | 348 | |
5.875% due 02/06/2041 | | | | | 85 | | | | | | 121 | |
9.250% due 04/08/2068 | | | | | 305 | | | | | | 424 | |
|
Metropolitan Life Global Funding | |
2.650% due 04/08/2022 | | | | | 940 | | | | | | 977 | |
|
Mitsubishi UFJ Financial Group, Inc. | |
2.665% due 07/25/2022 | | | | | 2,648 | | | | | | 2,752 | |
3.850% due 03/01/2026 | | | | | 1,788 | | | | | | 2,036 | |
|
Mizuho Financial Group, Inc. | |
2.273% due 09/13/2021 | | | | | 2,060 | | | | | | 2,102 | |
2.632% due 04/12/2021 | | | | | 2,175 | | | | | | 2,212 | |
|
Morgan Stanley | |
3.875% due 01/27/2026 | | | | | 1,380 | | | | | | 1,562 | |
4.350% due 09/08/2026 | | | | | 2,397 | | | | | | 2,766 | |
5.750% due 01/25/2021 | | | | | 2,125 | | | | | | 2,189 | |
|
MUFG Union Bank N.A. | |
2.100% due 12/09/2022 | | | | | 4,740 | | | | | | 4,888 | |
|
Nasdaq, Inc. | |
3.850% due 06/30/2026 | | | | | 100 | | | | | | 112 | |
|
National Australia Bank Ltd. | |
2.800% due 01/10/2022 | | | | | 713 | | | | | | 738 | |
|
Nationwide Building Society | |
3.960% due 07/18/2030 • | | | | | 1,275 | | | | | | 1,437 | |
|
New York Life Global Funding | |
2.350% due 07/14/2026 | | | | | 100 | | | | | | 107 | |
|
New York Life Insurance Co. | |
4.450% due 05/15/2069 | | | | | 250 | | | | | | 306 | |
6.750% due 11/15/2039 | | | | | 860 | | | | | | 1,310 | |
|
Nippon Life Insurance Co. | |
3.400% due 01/23/2050 • | | | | | 1,180 | | | | | | 1,224 | |
4.700% due 01/20/2046 • | | | | | 600 | | | | | | 664 | |
5.100% due 10/16/2044 • | | | | | 355 | | | | | | 395 | |
| | | | | | | | |
| 44 | | PIMCO ETF TRUST | | | | | See Accompanying Notes | |
June 30, 2020
| | | | | | | | | | | | |
| | | | | PRINCIPAL
AMOUNT
(000S) | | | | | MARKET
VALUE
(000S) | |
|
Nissan Motor Acceptance Corp. | |
1.701% (US0003M + 0.390%) due 07/13/2020 ~ | | $ | | | 490 | | | $ | | | 490 | |
|
Nomura Holdings, Inc. | |
2.648% due 01/16/2025 | | | | | 2,750 | | | | | | 2,870 | |
|
Nuveen Finance LLC | |
4.125% due 11/01/2024 | | | | | 805 | | | | | | 909 | |
|
ORIX Corp. | |
2.900% due 07/18/2022 | | | | | 905 | | | | | | 937 | |
|
PNC Bank N.A. | |
3.800% due 07/25/2023 | | | | | 735 | | | | | | 799 | |
|
Principal Life Global Funding | |
3.000% due 04/18/2026 | | | | | 604 | | | | | | 667 | |
|
Progressive Corp. | |
2.450% due 01/15/2027 | | | | | 150 | | | | | | 160 | |
|
Raymond James Financial, Inc. | |
3.625% due 09/15/2026 | | | | | 100 | | | | | | 111 | |
|
Regency Centers LP | |
2.950% due 09/15/2029 | | | | | 1,213 | | | | | | 1,232 | |
|
Reinsurance Group of America, Inc. | |
3.950% due 09/15/2026 | | | | | 1,070 | | | | | | 1,187 | |
|
Royal Bank of Scotland Group PLC | |
4.892% due 05/18/2029 • | | | | | 1,475 | | | | | | 1,741 | |
5.076% due 01/27/2030 • | | | | | 790 | | | | | | 950 | |
|
Santander Holdings USA, Inc. | |
4.500% due 07/17/2025 | | | | | 3,381 | | | | | | 3,660 | |
|
Service Properties Trust | |
5.000% due 08/15/2022 | | | | | 309 | | | | | | 304 | |
|
Societe Generale S.A. | |
4.250% due 04/14/2025 | | | | | 685 | | | | | | 725 | |
|
Spirit Realty LP | |
3.400% due 01/15/2030 | | | | | 835 | | | | | | 791 | |
4.450% due 09/15/2026 | | | | | 1,300 | | | | | | 1,349 | |
|
Standard Chartered PLC | |
3.050% due 01/15/2021 | | | | | 825 | | | | | | 835 | |
|
State Street Corp. | |
1.286% (US0003M + 0.900%) due 08/18/2020 ~ | | | | | 795 | | | | | | 796 | |
|
Sumitomo Life Insurance Co. | |
6.500% due 09/20/2073 • | | | | | 250 | | | | | | 283 | |
|
Sumitomo Mitsui Banking Corp. | |
3.200% due 07/18/2022 | | | | | 1,459 | | | | | | 1,524 | |
|
Sumitomo Mitsui Financial Group, Inc. | |
2.058% due 07/14/2021 | | | | | 588 | | | | | | 598 | |
2.091% (US0003M + 0.780%) due 07/12/2022 ~ | | | | | 1,150 | | | | | | 1,153 | |
2.750% due 01/15/2030 | | | | | 3,050 | | | | | | 3,241 | |
2.784% due 07/12/2022 | | | | | 1,680 | | | | | | 1,751 | |
3.102% due 01/17/2023 | | | | | 1,414 | | | | | | 1,496 | |
|
Synchrony Financial | |
3.950% due 12/01/2027 | | | | | 1,299 | | | | | | 1,358 | |
|
Tanger Properties LP | |
3.750% due 12/01/2024 | | | | | 1,235 | | | | | | 1,200 | |
|
Toyota Motor Credit Corp. | |
1.900% due 04/08/2021 | | | | | 25 | | | | | | 25 | |
|
Travelers Cos., Inc. | |
4.100% due 03/04/2049 | | | | | 590 | | | | | | 743 | |
|
UBS Group AG | |
4.125% due 09/24/2025 | | | | | 2,810 | | | | | | 3,189 | |
|
Visa, Inc. | |
4.300% due 12/14/2045 | | | | | 1,786 | | | | | | 2,365 | |
|
WEA Finance LLC | |
3.750% due 09/17/2024 | | | | | 1,670 | | | | | | 1,725 | |
|
Wells Fargo & Co. | |
2.625% due 07/22/2022 | | | | | 2,095 | | | | | | 2,184 | |
3.300% due 09/09/2024 | | | | | 2,930 | | | | | | 3,205 | |
3.500% due 03/08/2022 | | | | | 1,575 | | | | | | 1,650 | |
3.900% due 05/01/2045 | | | | | 699 | | | | | | 826 | |
4.125% due 08/15/2023 | | | | | 75 | | | | | | 82 | |
4.150% due 01/24/2029 | | | | | 861 | | | | | | 1,011 | |
4.400% due 06/14/2046 | | | | | 448 | | | | | | 542 | |
4.750% due 12/07/2046 | | | | | 270 | | | | | | 346 | |
5.013% due 04/04/2051 • | | | | | 1,500 | | | | | | 2,081 | |
| | | | | | | | | | | | |
| | | | | PRINCIPAL
AMOUNT
(000S) | | | | | MARKET
VALUE
(000S) | |
|
Welltower, Inc. | |
4.250% due 04/15/2028 | | $ | | | 1,218 | | | $ | | | 1,363 | |
|
Westpac Banking Corp. | |
2.850% due 05/13/2026 | | | | | 475 | | | | | | 523 | |
|
Weyerhaeuser Co. | |
4.000% due 11/15/2029 | | | | | 2,279 | | | | | | 2,577 | |
|
WR Berkley Corp. | |
4.625% due 03/15/2022 | | | | | 251 | | | | | | 265 | |
| | | | | | | | | | | | |
| | | | | | | | | | | 255,520 | |
| | | | | | | | | | | | |
| |
| INDUSTRIALS 43.8% | |
|
Abbott Laboratories | |
2.550% due 03/15/2022 | | | | | 270 | | | | | | 280 | |
|
AbbVie, Inc. | |
3.200% due 05/14/2026 | | | | | 25 | | | | | | 28 | |
3.450% due 03/15/2022 | | | | | 985 | | | | | | 1,024 | |
|
Activision Blizzard, Inc. | |
2.300% due 09/15/2021 | | | | | 268 | | | | | | 273 | |
3.400% due 09/15/2026 | | | | | 1,845 | | | | | | 2,098 | |
|
AEP Transmission Co. LLC | |
4.250% due 09/15/2048 | | | | | 815 | | | | | | 1,015 | |
|
Aetna, Inc. | |
3.875% due 08/15/2047 | | | | | 630 | | | | | | 712 | |
|
Aker BP ASA | |
3.000% due 01/15/2025 | | | | | 5,350 | | | | | | 5,221 | |
|
Alibaba Group Holding Ltd. | |
2.800% due 06/06/2023 | | | | | 260 | | | | | | 273 | |
3.125% due 11/28/2021 | | | | | 1,391 | | | | | | 1,431 | |
3.400% due 12/06/2027 | | | | | 1,570 | | | | | | 1,745 | |
3.600% due 11/28/2024 | | | | | 1,935 | | | | | | 2,112 | |
|
Altria Group, Inc. | |
2.950% due 05/02/2023 | | | | | 920 | | | | | | 969 | |
|
Amazon.com, Inc. | |
3.875% due 08/22/2037 | | | | | 2,354 | | | | | | 2,918 | |
|
Amgen, Inc. | |
3.150% due 02/21/2040 | | | | | 1,600 | | | | | | 1,707 | |
3.200% due 11/02/2027 | | | | | 475 | | | | | | 536 | |
3.625% due 05/22/2024 | | | | | 2,590 | | | | | | 2,842 | |
4.400% due 05/01/2045 | | | | | 410 | | | | | | 509 | |
4.663% due 06/15/2051 | | | | | 915 | | | | | | 1,216 | |
4.950% due 10/01/2041 | | | | | 535 | | | | | | 694 | |
|
Anheuser-Busch Cos. LLC | |
4.900% due 02/01/2046 | | | | | 2,872 | | | | | | 3,524 | |
|
Anheuser-Busch InBev Worldwide, Inc. | |
5.450% due 01/23/2039 | | | | | 250 | | | | | | 316 | |
5.550% due 01/23/2049 | | | | | 660 | | | | | | 885 | |
5.800% due 01/23/2059 | | | | | 250 | | | | | | 357 | |
|
Anthem, Inc. | |
3.500% due 08/15/2024 | | | | | 1,123 | | | | | | 1,230 | |
3.650% due 12/01/2027 | | | | | 583 | | | | | | 665 | |
4.550% due 03/01/2048 | | | | | 325 | | | | | | 414 | |
|
Apache Corp. | |
4.750% due 04/15/2043 | | | | | 263 | | | | | | 212 | |
5.100% due 09/01/2040 | | | | | 77 | | | | | | 63 | |
|
Apple, Inc. | |
2.500% due 02/09/2022 | | | | | 885 | | | | | | 915 | |
3.250% due 02/23/2026 | | | | | 3,315 | | | | | | 3,725 | |
3.450% due 05/06/2024 | | | | | 265 | | | | | | 293 | |
3.850% due 08/04/2046 | | | | | 371 | | | | | | 464 | |
4.650% due 02/23/2046 | | | | | 710 | | | | | | 974 | |
|
AstraZeneca PLC | |
4.000% due 01/17/2029 | | | | | 800 | | | | | | 981 | |
6.450% due 09/15/2037 | | | | | 2,495 | | | | | | 3,773 | |
|
Bacardi Ltd. | |
2.750% due 07/15/2026 | | | | | 100 | | | | | | 102 | |
|
Baidu, Inc. | |
3.625% due 07/06/2027 | | | | | 1,040 | | | | | | 1,127 | |
|
BAT Capital Corp. | |
3.222% due 08/15/2024 | | | | | 770 | | | | | | 826 | |
4.540% due 08/15/2047 | | | | | 1,800 | | | | | | 1,962 | |
|
Baxalta, Inc. | |
5.250% due 06/23/2045 | | | | | 252 | | | | | | 343 | |
| | | | | | | | | | | | |
| | | | | PRINCIPAL
AMOUNT
(000S) | | | | | MARKET
VALUE
(000S) | |
|
Bayer U.S. Finance LLC | |
3.000% due 10/08/2021 | | $ | | | 2,200 | | | $ | | | 2,259 | |
4.375% due 12/15/2028 | | | | | 90 | | | | | | 105 | |
4.875% due 06/25/2048 | | | | | 1,335 | | | | | | 1,714 | |
|
BHP Billiton Finance USA Ltd. | |
5.000% due 09/30/2043 | | | | | 1,452 | | | | | | 2,009 | |
|
BorgWarner, Inc. | |
3.375% due 03/15/2025 | | | | | 150 | | | | | | 159 | |
|
Boston Scientific Corp. | |
3.750% due 03/01/2026 | | | | | 925 | | | | | | 1,051 | |
4.550% due 03/01/2039 | | | | | 715 | | | | | | 880 | |
|
BP Capital Markets America, Inc. | |
3.937% due 09/21/2028 | | | | | 1,334 | | | | | | 1,527 | |
|
Bristol-Myers Squibb Co. | |
3.400% due 07/26/2029 | | | | | 3,570 | | | | | | 4,164 | |
4.350% due 11/15/2047 | | | | | 870 | | | | | | 1,159 | |
|
Broadcom Corp. | |
3.000% due 01/15/2022 | | | | | 420 | | | | | | 432 | |
3.625% due 01/15/2024 | | | | | 625 | | | | | | 673 | |
3.875% due 01/15/2027 | | | | | 260 | | | | | | 281 | |
|
Broadcom, Inc. | |
3.125% due 04/15/2021 | | | | | 3,405 | | | | | | 3,461 | |
3.125% due 10/15/2022 | | | | | 635 | | | | | | 662 | |
4.750% due 04/15/2029 | | | | | 1,430 | | | | | | 1,624 | |
|
Burlington Northern Santa Fe LLC | |
5.400% due 06/01/2041 | | | | | 1,698 | | | | | | 2,336 | |
|
Campbell Soup Co. | |
4.800% due 03/15/2048 | | | | | 915 | | | | | | 1,205 | |
|
Cardinal Health, Inc. | |
2.616% due 06/15/2022 | | | | | 50 | | | | | | 52 | |
| | | | |
Cenovus Energy, Inc. | | | | | | | | | | | | |
6.750% due 11/15/2039 | | | | | 218 | | | | | | 215 | |
|
Charter Communications Operating LLC | |
4.464% due 07/23/2022 | | | | | 2,135 | | | | | | 2,277 | |
4.500% due 02/01/2024 | | | | | 1,520 | | | | | | 1,683 | |
4.800% due 03/01/2050 | | | | | 2,270 | | | | | | 2,583 | |
4.908% due 07/23/2025 | | | | | 3,517 | | | | | | 4,036 | |
|
China Resources Gas Group Ltd. | |
4.500% due 04/05/2022 | | | | | 600 | | | | | | 629 | |
|
Citrix Systems, Inc. | |
3.300% due 03/01/2030 | | | | | 2,000 | | | | | | 2,142 | |
4.500% due 12/01/2027 | | | | | 1,360 | | | | | | 1,565 | |
|
Comcast Corp. | |
3.125% due 07/15/2022 | | | | | 1,551 | | | | | | 1,637 | |
3.200% due 07/15/2036 | | | | | 575 | | | | | | 641 | |
3.600% due 03/01/2024 | | | | | 593 | | | | | | 659 | |
|
Conagra Brands, Inc. | |
5.300% due 11/01/2038 | | | | | 20 | | | | | | 26 | |
5.400% due 11/01/2048 | | | | | 140 | | | | | | 194 | |
|
Concho Resources, Inc. | |
4.875% due 10/01/2047 | | | | | 1,300 | | | | | | 1,467 | |
|
Constellation Brands, Inc. | |
4.100% due 02/15/2048 | | | | | 259 | | | | | | 300 | |
5.250% due 11/15/2048 | | | | | 750 | | | | | | 985 | |
|
Continental Resources, Inc. | |
4.500% due 04/15/2023 | | | | | 250 | | | | | | 239 | |
|
Corning, Inc. | |
5.750% due 08/15/2040 | | | | | 235 | | | | | | 308 | |
|
Cox Communications, Inc. | |
3.350% due 09/15/2026 | | | | | 100 | | | | | | 111 | |
|
CRH America Finance, Inc. | |
3.400% due 05/09/2027 | | | | | 385 | | | | | | 406 | |
|
CSX Corp. | |
3.800% due 11/01/2046 | | | | | 555 | | | | | | 631 | |
6.220% due 04/30/2040 | | | | | 125 | | | | | | 182 | |
|
CVS Health Corp. | |
3.250% due 08/15/2029 | | | | | 536 | | | | | | 593 | |
3.375% due 08/12/2024 | | | | | 1,675 | | | | | | 1,827 | |
5.050% due 03/25/2048 | | | | | 925 | | | | | | 1,205 | |
5.125% due 07/20/2045 | | | | | 393 | | | | | | 507 | |
|
Dell International LLC | |
4.420% due 06/15/2021 | | | | | 3,347 | | | | | | 3,441 | |
5.450% due 06/15/2023 | | | | | 2,885 | | | | | | 3,157 | |
8.100% due 07/15/2036 | | | | | 914 | | | | | | 1,192 | |
8.350% due 07/15/2046 | | | | | 615 | | | | | | 800 | |
| | | | | | |
| See Accompanying Notes | | ANNUAL REPORT | | JUNE 30, 2020 | | 45 |
Schedule of Investments PIMCO Investment Grade Corporate Bond Index Exchange-Traded Fund (Cont.)
| | | | | | | | | | | | |
| | | | | PRINCIPAL
AMOUNT
(000S) | | | | | MARKET
VALUE
(000S) | |
|
Delta Air Lines, Inc. | |
3.625% due 03/15/2022 | | $ | | | 565 | | | $ | | | 535 | |
4.375% due 04/19/2028 | | | | | 527 | | | | | | 440 | |
|
Deutsche Telekom International Finance BV | |
3.600% due 01/19/2027 | | | | | 1,760 | | | | | | 1,972 | |
|
Discovery Communications LLC | |
5.000% due 09/20/2037 | | | | | 250 | | | | | | 296 | |
|
Dolphin Energy Ltd. LLC | |
5.500% due 12/15/2021 | | | | | 335 | | | | | | 352 | |
|
Dominion Energy Gas Holdings LLC | |
3.600% due 12/15/2024 | | | | | 772 | | | | | | 848 | |
|
Dow Chemical Co. | |
5.250% due 11/15/2041 | | | | | 571 | | | | | | 686 | |
|
DP World PLC | |
5.625% due 09/25/2048 | | | | | 690 | | | | | | 756 | |
|
eBay, Inc. | |
4.000% due 07/15/2042 | | | | | 974 | | | | | | 1,061 | |
|
Ecopetrol S.A. | |
5.375% due 06/26/2026 | | | | | 683 | | | | | | 718 | |
|
Eli Lilly & Co. | |
2.750% due 06/01/2025 | | | | | 944 | | | | | | 1,039 | |
|
Empresa Nacional de Telecomunicaciones S.A. | |
4.875% due 10/30/2024 | | | | | 375 | | | | | | 396 | |
|
Enbridge, Inc. | |
2.900% due 07/15/2022 | | | | | 2,296 | | | | | | 2,383 | |
|
Energy Transfer Operating LP | |
3.600% due 02/01/2023 | | | | | 2,358 | | | | | | 2,440 | |
4.200% due 04/15/2027 | | | | | 355 | | | | | | 372 | |
4.250% due 03/15/2023 | | | | | 360 | | | | | | 380 | |
4.650% due 06/01/2021 | | | | | 100 | | | | | | 102 | |
5.300% due 04/15/2047 | | | | | 710 | | | | | | 688 | |
6.250% due 04/15/2049 | | | | | 250 | | | | | | 265 | |
|
Eni SpA | |
4.000% due 09/12/2023 | | | | | 995 | | | | | | 1,078 | |
4.750% due 09/12/2028 | | | | | 875 | | | | | | 976 | |
|
Entergy Louisiana LLC | |
4.200% due 09/01/2048 | | | | | 1,125 | | | | | | 1,437 | |
|
Enterprise Products Operating LLC | |
3.750% due 02/15/2025 | | | | | 2,264 | | | | | | 2,507 | |
3.950% due 02/15/2027 | | | | | 791 | | | | | | 903 | |
4.850% due 03/15/2044 | | | | | 758 | | | | | | 879 | |
|
Equifax, Inc. | |
2.300% due 06/01/2021 | | | | | 250 | | | | | | 254 | |
7.000% due 07/01/2037 | | | | | 630 | | | | | | 796 | |
|
ERAC USA Finance LLC | |
3.300% due 12/01/2026 | | | | | 275 | | | | | | 280 | |
4.200% due 11/01/2046 | | | | | 590 | | | | | | 577 | |
7.000% due 10/15/2037 | | | | | 515 | | | | | | 661 | |
|
Exxon Mobil Corp. | |
3.176% due 03/15/2024 | | | | | 13 | | | | | | 14 | |
|
FedEx Corp. | |
4.550% due 04/01/2046 | | | | | 766 | | | | | | 828 | |
|
Fomento Economico Mexicano S.A.B. de C.V. | |
2.875% due 05/10/2023 | | | | | 940 | | | | | | 977 | |
|
Fox Corp. | |
5.476% due 01/25/2039 | | | | | 250 | | | | | | 335 | |
|
Freeport-McMoRan, Inc. | |
3.550% due 03/01/2022 | | | | | 75 | | | | | | 75 | |
|
GATX Corp. | |
4.700% due 04/01/2029 | | | | | 1,370 | | | | | | 1,545 | |
|
General Electric Co. | |
3.100% due 01/09/2023 | | | | | 1,055 | | | | | | 1,104 | |
6.875% due 01/10/2039 | | | | | 261 | | | | | | 321 | |
|
General Motors Co. | |
5.400% due 04/01/2048 | | | | | 675 | | | | | | 668 | |
|
Georgia-Pacific LLC | |
3.163% due 11/15/2021 | | | | | 1,850 | | | | | | 1,903 | |
|
GlaxoSmithKline Capital, Inc. | |
2.800% due 03/18/2023 | | | | | 175 | | | | | | 185 | |
|
Glencore Finance Canada Ltd. | |
4.250% due 10/25/2022 | | | | | 2,429 | | | | | | 2,569 | |
|
Grupo Televisa S.A.B. | |
5.000% due 05/13/2045 | | | | | 275 | | | | | | 304 | |
6.625% due 01/15/2040 | | | | | 821 | | | | | | 1,066 | |
| | | | | | | | | | | | |
| | | | | PRINCIPAL
AMOUNT
(000S) | | | | | MARKET
VALUE
(000S) | |
|
GTL Trade Finance, Inc. | |
5.893% due 04/29/2024 | | $ | | | 2,589 | | | $ | | | 2,822 | |
|
Halliburton Co. | |
5.000% due 11/15/2045 | | | | | 1,830 | | | | | | 1,893 | |
|
HCA, Inc. | |
4.125% due 06/15/2029 | | | | | 1,069 | | | | | | 1,180 | |
5.250% due 06/15/2049 | | | | | 1,400 | | | | | | 1,690 | |
|
Hess Corp. | |
5.800% due 04/01/2047 | | | | | 985 | | | | | | 1,070 | |
|
Home Depot, Inc. | |
3.000% due 04/01/2026 | | | | | 1,367 | | | | | | 1,538 | |
3.500% due 09/15/2056 | | | | | 100 | | | | | | 116 | |
4.250% due 04/01/2046 | | | | | 7 | | | | | | 9 | |
|
IHS Markit Ltd. | |
4.125% due 08/01/2023 | | | | | 1,030 | | | | | | 1,127 | |
4.250% due 05/01/2029 | | | | | 1,177 | | | | | | 1,348 | |
4.750% due 08/01/2028 | | | | | 715 | | | | | | 841 | |
|
Imperial Brands Finance PLC | |
3.125% due 07/26/2024 | | | | | 2,650 | | | | | | 2,756 | |
3.500% due 07/26/2026 | | | | | 3,730 | | | | | | 3,994 | |
|
International Business Machines Corp. | |
4.000% due 06/20/2042 | | | | | 92 | | | | | | 111 | |
5.600% due 11/30/2039 | | | | | 29 | | | | | | 41 | |
|
International Flavors & Fragrances, Inc. | |
4.450% due 09/26/2028 | | | | | 1,165 | | | | | | 1,327 | |
|
Keurig Dr Pepper, Inc. | |
4.985% due 05/25/2038 | | | | | 250 | | | | | | 322 | |
|
Kinder Morgan Energy Partners LP | |
3.950% due 09/01/2022 | | | | | 1,140 | | | | | | 1,202 | |
5.300% due 09/15/2020 | | | | | 425 | | | | | | 429 | |
|
Kinder Morgan, Inc. | |
5.550% due 06/01/2045 | | | | | 1,531 | | | | | | 1,861 | |
|
KLA Corp. | |
4.650% due 11/01/2024 | | | | | 1,668 | | | | | | 1,914 | |
|
Kraft Heinz Foods Co. | |
4.375% due 06/01/2046 | | | | | 100 | | | | | | 98 | |
4.625% due 01/30/2029 | | | | | 380 | | | | | | 410 | |
5.200% due 07/15/2045 | | | | | 240 | | | | | | 261 | |
6.500% due 02/09/2040 | | | | | 275 | | | | | | 332 | |
|
Lockheed Martin Corp. | |
4.090% due 09/15/2052 | | | | | 1,458 | | | | | | 1,913 | |
|
Lowe’s Cos., Inc. | |
4.650% due 04/15/2042 | | | | | 1,038 | | | | | | 1,301 | |
|
Massachusetts Institute of Technology | |
3.885% due 07/01/2116 | | | | | 250 | | | | | | 312 | |
|
McDonald’s Corp. | |
3.700% due 01/30/2026 | | | | | 660 | | | | | | 750 | |
4.875% due 12/09/2045 | | | | | 2,820 | | | | | | 3,654 | |
|
Medtronic, Inc. | |
3.150% due 03/15/2022 | | | | | 949 | | | | | | 995 | |
3.500% due 03/15/2025 | | | | | 987 | | | | | | 1,114 | |
4.625% due 03/15/2045 | | | | | 194 | | | | | | 262 | |
|
Microsoft Corp. | |
2.525% due 06/01/2050 | | | | | 3,504 | | | | | | 3,645 | |
|
Moody’s Corp. | |
2.625% due 01/15/2023 | | | | | 1,205 | | | | | | 1,262 | |
4.875% due 02/15/2024 | | | | | 2,990 | | | | | | 3,380 | |
|
Motorola Solutions, Inc. | |
5.500% due 09/01/2044 | | | | | 510 | | | | | | 574 | |
|
MPLX LP | |
4.125% due 03/01/2027 | | | | | 1,246 | | | | | | 1,330 | |
4.700% due 04/15/2048 | | | | | 40 | | | | | | 41 | |
5.200% due 03/01/2047 | | | | | 716 | | | | | | 771 | |
|
Nexen, Inc. | |
5.875% due 03/10/2035 | | | | | 250 | | | | | | 348 | |
6.400% due 05/15/2037 | | | | | 575 | | | | | | 820 | |
|
Norfolk Southern Corp. | |
4.650% due 01/15/2046 | | | | | 1,160 | | | | | | 1,516 | |
|
Northrop Grumman Corp. | |
3.850% due 04/15/2045 | | | | | 675 | | | | | | 796 | |
|
NXP BV | |
4.125% due 06/01/2021 | | | | | 1,400 | | | | | | 1,442 | |
|
Occidental Petroleum Corp. | |
2.700% due 08/15/2022 | | | | | 200 | | | | | | 187 | |
2.900% due 08/15/2024 | | | | | 270 | | | | | | 231 | |
| | | | | | | | | | | | |
| | | | | PRINCIPAL
AMOUNT
(000S) | | | | | MARKET
VALUE
(000S) | |
|
ONEOK Partners LP | |
4.900% due 03/15/2025 | | $ | | | 730 | | | $ | | | 793 | |
5.000% due 09/15/2023 | | | | | 200 | | | | | | 216 | |
|
Oracle Corp. | |
4.125% due 05/15/2045 | | | | | 2,041 | | | | | | 2,456 | |
|
Ovintiv, Inc. | |
5.150% due 11/15/2041 | | | | | 30 | | | | | | 21 | |
|
Owens Corning | |
3.400% due 08/15/2026 | | | | | 100 | | | | | | 105 | |
|
PayPal Holdings, Inc. | |
2.300% due 06/01/2030 | | | | | 2,250 | | | | | | 2,343 | |
3.250% due 06/01/2050 | | | | | 1,600 | | | | | | 1,751 | |
|
Penske Truck Leasing Co. LP | |
3.300% due 04/01/2021 | | | | | 2,160 | | | | | | 2,190 | |
3.400% due 11/15/2026 | | | | | 150 | | | | | | 158 | |
|
PepsiCo, Inc. | |
2.850% due 02/24/2026 | | | | | 151 | | | | | | 167 | |
|
Pertamina Persero PT | |
4.300% due 05/20/2023 | | | | | 335 | | | | | | 355 | |
6.000% due 05/03/2042 | | | | | 805 | | | | | | 962 | |
|
Petroleos Mexicanos | |
6.840% due 01/23/2030 | | | | | 275 | | | | | | 242 | |
6.875% due 08/04/2026 | | | | | 690 | | | | | | 654 | |
|
Pfizer, Inc. | |
4.400% due 05/15/2044 | | | | | 953 | | | | | | 1,240 | |
|
Philip Morris International, Inc. | |
2.750% due 02/25/2026 | | | | | 218 | | | | | | 238 | |
3.375% due 08/11/2025 | | | | | 265 | | | | | | 295 | |
3.600% due 11/15/2023 | | | | | 430 | | | | | | 474 | |
3.875% due 08/21/2042 | | | | | 740 | | | | | | 849 | |
6.375% due 05/16/2038 | | | | | 450 | | | | | | 679 | |
|
Phillips 66 Partners LP | |
4.900% due 10/01/2046 | | | | | 365 | | | | | | 396 | |
|
Ras Laffan Liquefied Natural Gas Co. Ltd. | |
5.838% due 09/30/2027 | | | | | 625 | | | | | | 727 | |
|
Raytheon Technologies Corp. | |
4.800% due 12/15/2043 | | | | | 1,060 | | | | | | 1,358 | |
|
Reliance Industries Ltd. | |
4.125% due 01/28/2025 | | | | | 390 | | | | | | 423 | |
|
RELX Capital, Inc. | |
4.000% due 03/18/2029 | | | | | 850 | | | | | | 988 | |
|
Republic Services, Inc. | |
3.375% due 11/15/2027 | | | | | 1,307 | | | | | | 1,467 | |
5.250% due 11/15/2021 | | | | | 245 | | | | | | 260 | |
|
Reynolds American, Inc. | |
4.450% due 06/12/2025 | | | | | 1,694 | | | | | | 1,910 | |
|
Roche Holdings, Inc. | |
2.625% due 05/15/2026 | | | | | 1,065 | | | | | | 1,171 | |
|
Sasol Financing USA LLC | |
6.500% due 09/27/2028 | | | | | 1,135 | | | | | | 1,009 | |
|
Saudi Arabian Oil Co. | |
4.250% due 04/16/2039 | | | | | 1,180 | | | | | | 1,317 | |
|
Seagate HDD Cayman | |
4.091% due 06/01/2029 | | | | | 997 | | | | | | 1,045 | |
4.875% due 03/01/2024 | | | | | 260 | | | | | | 279 | |
|
Sky Ltd. | |
3.750% due 09/16/2024 | | | | | 256 | | | | | | 285 | |
|
Southern Co. | |
4.400% due 07/01/2046 | | | | | 969 | | | | | | 1,151 | |
|
Southern Copper Corp. | |
6.750% due 04/16/2040 | | | | | 1,260 | | | | | | 1,711 | |
|
Sprint Spectrum Co. LLC | |
3.360% due 03/20/2023 | | | | | 130 | | | | | | 131 | |
|
Steel Dynamics, Inc. | |
2.800% due 12/15/2024 | | | | | 432 | | | | | | 450 | |
|
Stryker Corp. | |
2.625% due 03/15/2021 | | | | | 150 | | | | | | 152 | |
3.500% due 03/15/2026 | | | | | 874 | | | | | | 984 | |
4.625% due 03/15/2046 | | | | | 580 | | | | | | 746 | |
|
Suncor Energy, Inc. | |
5.950% due 05/15/2035 | | | | | 670 | | | | | | 796 | |
|
Teck Resources Ltd. | |
6.000% due 08/15/2040 | | | | | 460 | | | | | | 488 | |
6.125% due 10/01/2035 | | | | | 1,105 | | | | | | 1,252 | |
| | | | | | | | |
| 46 | | PIMCO ETF TRUST | | | | | See Accompanying Notes | |
June 30, 2020
| | | | | | | | | | | | |
| | | | | PRINCIPAL
AMOUNT
(000S) | | | | | MARKET
VALUE
(000S) | |
|
Telefonica Emisiones S.A. | |
5.462% due 02/16/2021 | | $ | | | 125 | | | $ | | | 129 | |
7.045% due 06/20/2036 | | | | | 1,375 | | | | | | 2,003 | |
|
Tencent Holdings Ltd. | |
3.280% due 04/11/2024 | | | | | 1,215 | | | | | | 1,292 | |
3.975% due 04/11/2029 | | | | | 1,030 | | | | | | 1,165 | |
|
Thermo Fisher Scientific, Inc. | |
2.950% due 09/19/2026 | | | | | 2,491 | | | | | | 2,758 | |
|
Toyota Industries Corp. | |
3.566% due 03/16/2028 | | | | | 1,140 | | | | | | 1,258 | |
|
TransCanada PipeLines Ltd. | |
3.800% due 10/01/2020 | | | | | 165 | | | | | | 166 | |
4.625% due 03/01/2034 | | | | | 875 | | | | | | 1,007 | |
4.875% due 05/15/2048 | | | | | 2,005 | | | | | | 2,482 | |
5.100% due 03/15/2049 | | | | | 550 | | | | | | 703 | |
7.625% due 01/15/2039 | | | | | 825 | | | | | | 1,278 | |
|
TWDC Enterprises 18 Corp. | |
4.125% due 06/01/2044 | | | | | 1,306 | | | | | | 1,579 | |
|
Tyson Foods, Inc. | |
4.500% due 06/15/2022 | | | | | 3,564 | | | | | | 3,791 | |
4.875% due 08/15/2034 | | | | | 1,517 | | | | | | 1,930 | |
|
Union Pacific Corp. | |
3.799% due 10/01/2051 | | | | | 1,420 | | | | | | 1,710 | |
|
UnitedHealth Group, Inc. | |
4.750% due 07/15/2045 | | | | | 2,559 | | | | | | 3,451 | |
6.875% due 02/15/2038 | | | | | 260 | | | | | | 409 | |
|
Vale Overseas Ltd. | |
6.875% due 11/21/2036 | | | | | 2,022 | | | | | | 2,650 | |
|
Valero Energy Corp. | |
4.350% due 06/01/2028 | | | | | 1,502 | | | | | | 1,702 | |
|
ViacomCBS, Inc. | |
2.900% due 01/15/2027 | | | | | 150 | | | | | | 158 | |
|
Walmart, Inc. | |
3.250% due 10/25/2020 | | | | | 1,459 | | | | | | 1,470 | |
|
Walt Disney Co. | |
4.950% due 10/15/2045 | | | | | 1,315 | | | | | | 1,695 | |
6.400% due 12/15/2035 | | | | | 77 | | | | | | 116 | |
|
Western Midstream Operating LP | |
4.650% due 07/01/2026 | | | | | 250 | | | | | | 241 | |
|
Westinghouse Air Brake Technologies Corp. | |
4.950% due 09/15/2028 | | | | | 1,786 | | | | | | 1,990 | |
|
Whirlpool Corp. | |
3.700% due 03/01/2023 | | | | | 200 | | | | | | 215 | |
5.150% due 03/01/2043 | | | | | 250 | | | | | | 286 | |
|
Williams Cos., Inc. | |
5.400% due 03/04/2044 | | | | | 1,083 | | | | | | 1,207 | |
|
Woodside Finance Ltd. | |
3.700% due 09/15/2026 | | | | | 610 | | | | | | 646 | |
|
Wyeth LLC | |
5.950% due 04/01/2037 | | | | | 1,225 | | | | | | 1,790 | |
|
Yara International ASA | |
4.750% due 06/01/2028 | | | | | 1,231 | | | | | | 1,419 | |
|
Zoetis, Inc. | |
2.000% due 05/15/2030 | | | | | 730 | | | | | | 746 | |
3.000% due 05/15/2050 | | | | | 1,000 | | | | | | 1,033 | |
3.900% due 08/20/2028 | | | | | 475 | | | | | | 560 | |
4.700% due 02/01/2043 | | | | | 1,032 | | | | | | 1,365 | |
| | | | | | | | | | | | |
| | | | | | | | | | | 288,536 | |
| | | | | | | | | | | | |
| |
| UTILITIES 13.0% | |
|
Acwa Power Management And Investments One Ltd. | |
5.950% due 12/15/2039 | | | | | 765 | | | | | | 833 | |
|
AEP Texas, Inc. | |
3.450% due 01/15/2050 | | | | | 805 | | | | | | 875 | |
|
American Water Capital Corp. | |
3.850% due 03/01/2024 | | | | | 703 | | | | | | 780 | |
|
Appalachian Power Co. | |
7.000% due 04/01/2038 | | | | | 260 | | | | | | 388 | |
|
AT&T, Inc. | |
3.000% due 06/30/2022 | | | | | 1,620 | | | | | | 1,692 | |
3.400% due 06/15/2022 | | | | | 250 | | | | | | 263 | |
3.550% due 06/01/2024 | | | | | 2,336 | | | | | | 2,556 | |
3.800% due 03/01/2024 | | | | | 544 | | | | | | 598 | |
4.100% due 02/15/2028 | | | | | 1,436 | | | | | | 1,647 | |
4.125% due 02/17/2026 | | | | | 1,224 | | | | | | 1,396 | |
4.300% due 02/15/2030 | | | | | 380 | | | | | | 444 | |
| | | | | | | | | | | | |
| | | | | PRINCIPAL
AMOUNT
(000S) | | | | | MARKET
VALUE
(000S) | |
4.350% due 03/01/2029 | | $ | | | 265 | | | $ | | | 309 | |
4.450% due 04/01/2024 | | | | | 773 | | | | | | 866 | |
4.500% due 03/09/2048 | | | | | 350 | | | | | | 411 | |
4.800% due 06/15/2044 | | | | | 2,595 | | | | | | 3,077 | |
5.150% due 02/15/2050 | | | | | 385 | | | | | | 494 | |
5.250% due 03/01/2037 | | | | | 560 | | | | | | 693 | |
5.650% due 02/15/2047 | | | | | 265 | | | | | | 347 | |
6.000% due 08/15/2040 | | | | | 200 | | | | | | 270 | |
|
Atmos Energy Corp. | |
4.150% due 01/15/2043 | | | | | 405 | | | | | | 493 | |
|
Berkshire Hathaway Energy Co. | |
6.125% due 04/01/2036 | | | | | 1,009 | | | | | | 1,456 | |
|
BG Energy Capital PLC | |
5.125% due 10/15/2041 | | | | | 115 | | | | | | 147 | |
|
Black Hills Corp. | |
3.150% due 01/15/2027 | | | | | 250 | | | | | | 263 | |
4.200% due 09/15/2046 | | | | | 100 | | | | | | 109 | |
|
CNOOC Finance Ltd. | |
3.000% due 05/09/2023 | | | | | 2,630 | | | | | | 2,748 | |
3.875% due 05/02/2022 | | | | | 255 | | | | | | 267 | |
|
CNOOC Finance USA LLC | |
4.375% due 05/02/2028 | | | | | 1,435 | | | | | | 1,676 | |
|
Commonwealth Edison Co. | |
4.000% due 03/01/2048 | | | | | 725 | | | | | | 896 | |
|
Consolidated Edison Co. of New York, Inc. | |
3.850% due 06/15/2046 | | | | | 805 | | | | | | 927 | |
|
Consumers Energy Co. | |
3.125% due 08/31/2024 | | | | | 1,310 | | | | | | 1,426 | |
|
Delmarva Power & Light Co. | |
3.500% due 11/15/2023 | | | | | 1,037 | | | | | | 1,130 | |
|
DTE Electric Co. | |
3.650% due 03/15/2024 | | | | | 1,410 | | | | | | 1,544 | |
|
Duke Energy Carolinas LLC | |
3.950% due 11/15/2028 | | | | | 450 | | | | | | 536 | |
|
Duke Energy Corp. | |
3.750% due 09/01/2046 | | | | | 100 | | | | | | 113 | |
3.950% due 10/15/2023 | | | | | 685 | | | | | | 748 | |
|
Duke Energy Ohio, Inc. | |
3.800% due 09/01/2023 | | | | | 2,200 | | | | | | 2,388 | |
|
E.ON International Finance BV | |
6.650% due 04/30/2038 | | | | | 895 | | | | | | 1,237 | |
|
Electricite de France S.A. | |
4.875% due 01/22/2044 | | | | | 1,226 | | | | | | 1,451 | |
|
Enable Midstream Partners LP | |
4.950% due 05/15/2028 | | | | | 1,115 | | | | | | 1,036 | |
|
Enel Finance International NV | |
6.000% due 10/07/2039 | | | | | 1,544 | | | | | | 2,060 | |
|
Entergy Corp. | |
4.000% due 07/15/2022 | | | | | 1,188 | | | | | | 1,261 | |
|
Exelon Corp. | |
3.950% due 06/15/2025 | | | | | 655 | | | | | | 737 | |
4.450% due 04/15/2046 | | | | | 400 | | | | | | 487 | |
|
Exelon Generation Co. LLC | |
5.600% due 06/15/2042 | | | | | 440 | | | | | | 495 | |
|
FirstEnergy Corp. | |
2.850% due 07/15/2022 | | | | | 925 | | | | | | 960 | |
7.375% due 11/15/2031 | | | | | 2,192 | | | | | | 3,205 | |
|
Florida Power & Light Co. | |
4.125% due 02/01/2042 | | | | | 100 | | | | | | 125 | |
|
Gazprom OAO Via Gaz Capital S.A. | |
6.510% due 03/07/2022 | | | | | 990 | | | | | | 1,064 | |
|
Georgia Power Co. | |
2.100% due 07/30/2023 | | | | | 1,155 | | | | | | 1,204 | |
|
Indiana Michigan Power Co. | |
4.250% due 08/15/2048 | | | | | 870 | | | | | | 1,076 | |
|
Infraestructura Energetica Nova S.A.B. de C.V. | |
4.875% due 01/14/2048 | | | | | 540 | | | | | | 514 | |
|
Kentucky Utilities Co. | |
5.125% due 11/01/2040 | | | | | 100 | | | | | | 132 | |
|
KeySpan Gas East Corp. | |
2.742% due 08/15/2026 | | | | | 505 | | | | | | 541 | |
|
LLPL Capital Pte Ltd. | |
6.875% due 02/04/2039 | | | | | 566 | | | | | | 621 | |
|
MidAmerican Energy Co. | |
3.500% due 10/15/2024 | | | | | 2,262 | | | | | | 2,514 | |
4.250% due 07/15/2049 | | | | | 325 | | | | | | 423 | |
| | | | | | | | | | | | |
| | | | | PRINCIPAL
AMOUNT
(000S) | | | | | MARKET
VALUE
(000S) | |
|
National Rural Utilities Cooperative Finance Corp. | |
4.400% due 11/01/2048 | | $ | | | 250 | | | $ | | | 324 | |
|
NextEra Energy Capital Holdings, Inc. | |
2.750% due 11/01/2029 | | | | | 1,005 | | | | | | 1,086 | |
3.150% due 04/01/2024 | | | | | 100 | | | | | | 109 | |
|
Oncor Electric Delivery Co. LLC | |
3.100% due 09/15/2049 | | | | | 250 | | | | | | 276 | |
|
ONEOK, Inc. | |
3.400% due 09/01/2029 | | | | | 1,300 | | | | | | 1,269 | |
4.550% due 07/15/2028 | | | | | 818 | | | | | | 859 | |
5.200% due 07/15/2048 | | | | | 970 | | | | | | 967 | |
|
Pacific Gas & Electric Co. | |
3.500% due 10/01/2020 ^(a) | | | | | 255 | | | | | | 278 | |
5.800% due 03/01/2037 ^(a) | | | | | 205 | | | | | | 245 | |
|
Plains All American Pipeline LP | |
4.500% due 12/15/2026 | | | | | 300 | | | | | | 318 | |
5.150% due 06/01/2042 | | | | | 765 | | | | | | 743 | |
|
Shell International Finance BV | |
2.875% due 05/10/2026 | | | | | 2,100 | | | | | | 2,303 | |
3.875% due 11/13/2028 | | | | | 1,210 | | | | | | 1,408 | |
4.000% due 05/10/2046 | | | | | 575 | | | | | | 680 | |
6.375% due 12/15/2038 | | | | | 945 | | | | | | 1,419 | |
|
Southern California Edison Co. | |
2.850% due 08/01/2029 | | | | | 910 | | | | | | 965 | |
3.650% due 02/01/2050 | | | | | 1,230 | | | | | | 1,357 | |
4.125% due 03/01/2048 | | | | | 1,105 | | | | | | 1,295 | |
|
Southern California Gas Co. | |
3.150% due 09/15/2024 | | | | | 1,365 | | | | | | 1,493 | |
4.125% due 06/01/2048 | | | | | 780 | | | | | | 975 | |
|
Southern Power Co. | |
5.150% due 09/15/2041 | | | | | 1,360 | | | | | | 1,550 | |
|
Southwestern Electric Power Co. | |
4.100% due 09/15/2028 | | | | | 870 | | | | | | 990 | |
|
Southwestern Public Service Co. | |
6.000% due 10/01/2036 | | | | | 1,243 | | | | | | 1,669 | |
|
Verizon Communications, Inc. | |
3.376% due 02/15/2025 | | | | | 69 | | | | | | 77 | |
4.016% due 12/03/2029 | | | | | 695 | | | | | | 832 | |
4.125% due 08/15/2046 | | | | | 770 | | | | | | 963 | |
4.400% due 11/01/2034 | | | | | 759 | | | | | | 944 | |
4.522% due 09/15/2048 | | | | | 64 | | | | | | 85 | |
4.672% due 03/15/2055 | | | | | 1,015 | | | | | | 1,382 | |
4.812% due 03/15/2039 | | | | | 250 | | | | | | 327 | |
4.862% due 08/21/2046 | | | | | 1,012 | | | | | | 1,378 | |
| | | | |
Virginia Electric & Power Co. | | | | | | | | | | | | |
8.875% due 11/15/2038 | | | | | 811 | | | | | | 1,460 | |
| | | | | | | | | | | | |
| | | | | | | | | | | 85,975 | |
| | | | | | | | | | | | |
Total Corporate Bonds & Notes (Cost $589,014) | | | 630,031 | |
| | | | | | | | | | | | |
| |
| SOVEREIGN ISSUES 0.2% | |
|
Korea Hydro & Nuclear Power Co. Ltd. | |
3.000% due 09/19/2022 | | | | | 260 | | | | | | 272 | |
3.125% due 07/25/2027 | | | | | 1,010 | | | | | | 1,102 | |
| | | | | | | | | | | | |
Total Sovereign Issues (Cost $1,264) | | | 1,374 | |
| | | | | | | | | | | | |
| |
| SHORT-TERM INSTRUMENTS 2.2% | |
| |
| REPURCHASE AGREEMENTS (b) 2.2% | |
| | | | | | | | | | | 14,255 | |
| | | | | | | | | | | | |
Total Short-Term Instruments (Cost $14,255) | | | 14,255 | |
| | | | | | | | | | | | |
| | | | |
| | | | | | | | | | | | |
Total Investments in Securities (Cost $604,533) | | | 645,660 | |
| | | | |
| | | | | | | | | | | | |
Total Investments 98.0% (Cost $604,533) | | | $ | | | 645,660 | |
| |
Financial Derivative
Instruments (c) 0.0% (Cost or Premiums, net $422) | | | 5 | |
| |
| Other Assets and Liabilities, net 2.0% | | | 13,458 | |
| | | | | | | | | | | | |
| Net Assets 100.0% | | | $ | | | 659,123 | |
| | | | | | | | | | | | |
| | | | | | |
| See Accompanying Notes | | ANNUAL REPORT | | JUNE 30, 2020 | | 47 |
Schedule of Investments PIMCO Investment Grade Corporate Bond Index Exchange-Traded Fund (Cont.)
NOTES TO SCHEDULE OF INVESTMENTS:
| * | A zero balance may reflect actual amounts rounding to less than one thousand. |
| ~ | Variable or Floating rate security. Rate shown is the rate in effect as of period end. Certain variable rate securities are not based on a published reference rate and spread, rather are determined by the issuer or agent and are based on current market conditions. Reference rate is as of reset date, which may vary by security. These securities may not indicate a reference rate and/or spread in their description. |
| • | Rate shown is the rate in effect as of period end. The rate may be based on a fixed rate, a capped rate or a floor rate and may convert to a variable or floating rate in the future. These securities do not indicate a reference rate and spread in their description. |
| (a) | Security is not accruing income as of the date of this report. |
BORROWINGS AND OTHER FINANCING TRANSACTIONS
(b) REPURCHASE AGREEMENTS:
| | | | | | | | | | | | | | | | | | | | | | | | | | | | | | |
| Counterparty | | Lending
Rate | | | Settlement
Date | | | Maturity
Date | | | Principal
Amount | | | Collateralized By | | Collateral
(Received) | | | Repurchase
Agreements,
at Value | | | Repurchase
Agreement
Proceeds
to be
Received(1) | |
| BPS | | | 0.130 | % | | | 06/30/2020 | | | | 07/01/2020 | | | $ | 12,600 | | | U.S. Treasury Bonds 3.000% due 02/15/2047 | | $ | (12,749 | ) | | $ | 12,600 | | | $ | 12,600 | |
| FICC | | | 0.000 | | | | 06/30/2020 | | | | 07/01/2020 | | | | 1,655 | | | U.S. Treasury Inflation Protected Securities 0.125% due 07/15/2024 | | | (1,688 | ) | | | 1,655 | | | | 1,655 | |
| | | | | | | | | | | | | | | | | | | | | | | | | | | | | | |
Total Repurchase Agreements | | | | | | | | | | | | | $ | (14,437 | ) | | $ | 14,255 | | | $ | 14,255 | |
| | | | | | | | | | | | | | | | | | | | | | | | | | | | | | |
BORROWINGS AND OTHER FINANCING TRANSACTIONS SUMMARY
The following is a summary by counterparty of the market value of Borrowings and Other Financing Transactions and collateral pledged/(received) as of June 30, 2020:
| | | | | | | | | | | | | | | | | | | | | | | | | | | | |
| Counterparty | | Repurchase
Agreement
Proceeds
to be
Received(1) | | | Payable for
Reverse
Repurchase
Agreements | | | Payable for
Sale-Buyback
Transactions | | | Securities
Out on Loan | | | Total
Borrowings and
Other Financing
Transactions | | | Collateral
Pledged/(Received) | | | Net Exposure(2) | |
Global/Master Repurchase Agreement | |
BPS | | $ | 12,600 | | | $ | 0 | | | $ | 0 | | | $ | 0 | | | $ | 12,600 | | | $ | (12,749 | ) | | $ | (149 | ) |
FICC | | | 1,655 | | | | 0 | | | | 0 | | | | 0 | | | | 1,655 | | | | (1,688 | ) | | | (33 | ) |
| | | | | | | | | | | | | | | | | | | | | | | | | | | | |
Total Borrowings and Other Financing Transactions | | $ | 14,255 | | | $ | 0 | | | $ | 0 | | | $ | 0 | | | | | | | | | | | | | |
| | | | | | | | | | | | | | | | | | | | | | | | | | | | |
| (1) | Includes accrued interest. |
| (2) | Net Exposure represents the net receivable/(payable) that would be due from/to the counterparty in the event of default. Exposure from borrowings and other financing transactions can only be netted across transactions governed under the same master agreement with the same legal entity. See Note 8, Master Netting Arrangements, in the Notes to Financial Statements for more information. |
(c) FINANCIAL DERIVATIVE INSTRUMENTS: EXCHANGE-TRADED OR CENTRALLY CLEARED
FUTURES CONTRACTS:
LONG FUTURES CONTRACTS
| | | | | | | | | | | | | | | | | | | | | | | | |
Description | | Expiration
Month | | | # of
Contracts | | | Notional
Amount | | | Unrealized
Appreciation/
(Depreciation) | | | Variation Margin | |
| | Asset | | | Liability | |
U.S. Treasury 10-Year Ultra September Futures | | | 09/2020 | | | | 30 | | | $ | 4,725 | | | $ | 19 | | | $ | 0 | | | $ | (8 | ) |
U.S. Treasury 30-Year Bond September Futures | | | 09/2020 | | | | 82 | | | | 14,642 | | | | 61 | | | | 0 | | | | (38 | ) |
U.S. Treasury Ultra Long-Term Bond September Futures | | | 09/2020 | | | | 63 | | | | 13,744 | | | | (4 | ) | | | 0 | | | | (65 | ) |
| | | | | | | | | | | | | | | | | | | | | | | | |
Total Futures Contracts | | | $ | 76 | | | $ | 0 | | | $ | (111 | ) |
| | | | | | | | | | | | | | | | | | | | | | | | |
SWAP AGREEMENTS:
CREDIT DEFAULT SWAPS ON CREDIT INDICES - SELL PROTECTION(1)
| | | | | | | | | | | | | | | | | | | | | | | | | | | | | | | | | | | | |
Index/Tranches | | Fixed
Receive Rate | | | Payment
Frequency | | | Maturity
Date | | | Notional
Amount(2) | | | Premiums
Paid/
(Received) | | | Unrealized
Appreciation/
(Depreciation) | | | Market
Value(3) | | | Variation Margin | |
| | Asset | | | Liability | |
CDX.IG-31 5-Year Index | | | 1.000 | % | | | Quarterly | | | | 12/20/2023 | | | $ | 1,600 | | | $ | 9 | | | $ | 9 | | | $ | 18 | | | $ | 2 | | | $ | 0 | |
CDX.IG-33 5-Year Index | | | 1.000 | | | | Quarterly | | | | 12/20/2024 | | | | 13,100 | | | | 330 | | | | (175 | ) | | | 155 | | | | 14 | | | | 0 | |
CDX.IG-33 10-Year Index | | | 1.000 | | | | Quarterly | | | | 12/20/2029 | | | | 32,200 | | | | (52 | ) | | | (240 | ) | | | (292 | ) | | | 53 | | | | 0 | |
CDX.IG-34 5-Year Index | | | 1.000 | | | | Quarterly | | | | 06/20/2025 | | | | 36,700 | | | | 135 | | | | 294 | | | | 429 | | | | 47 | | | | 0 | |
| | | | | | | | | | | | | | | | | | | | | | | | | | | | | | | | | | | | |
Total Swap Agreements | | | $ | 422 | | | $ | (112 | ) | | $ | 310 | | | $ | 116 | | | $ | 0 | |
| | | | | | | | | | | | | | | | | | | | | | | | | | | | | | | | | | | | |
| | | | | | | | |
| 48 | | PIMCO ETF TRUST | | | | | See Accompanying Notes | |
June 30, 2020
FINANCIAL DERIVATIVE INSTRUMENTS: EXCHANGE-TRADED OR CENTRALLY CLEARED SUMMARY
The following is a summary of the market value and variation margin of Exchange-Traded or Centrally Cleared Financial Derivative Instruments as of June 30, 2020:
| | | | | | | | | | | | | | | | | | | | | | | | | | | | | | | | | | | | |
| | | Financial Derivative Assets | | | | | | Financial Derivative Liabilities | |
| | | Market Value | | | Variation Margin
Asset | | | Total | | | | | | Market Value | | | Variation Margin
Liability | | | Total | |
| | | Purchased
Options | | | Futures | | | Swap
Agreements | | | | | | Written
Options | | | Futures | | | Swap
Agreements | |
Total Exchange-Traded or Centrally Cleared | | $ | 0 | | | $ | 0 | | | $ | 116 | | | $ | 116 | | | | | | | $ | 0 | | | $ | (111 | ) | | $ | 0 | | | $ | (111 | ) |
| | | | | | | | | | | | | | | | | | | | | | | | | | | | | | | | | | | | |
Cash of $5,169 has been pledged as collateral for exchange-traded and centrally cleared financial derivative instruments as of June 30, 2020. See Note 8, Master Netting Arrangements, in the Notes to Financial Statements for more information.
| (1) | If the Fund is a seller of protection and a credit event occurs, as defined under the terms of that particular swap agreement, the Fund will either (i) pay to the buyer of protection an amount equal to the notional amount of the swap and take delivery of the referenced obligation or underlying securities comprising the referenced index or (ii) pay a net settlement amount in the form of cash, securities or other deliverable obligations equal to the notional amount of the swap less the recovery value of the referenced obligation or underlying securities comprising the referenced index. |
| (2) | The maximum potential amount the Fund could be required to pay as a seller of credit protection or receive as a buyer of credit protection if a credit event occurs as defined under the terms of that particular swap agreement. |
| (3) | The prices and resulting values for credit default swap agreements serve as indicators of the current status of the payment/performance risk and represent the likelihood of an expected liability (or profit) for the credit derivative should the notional amount of the swap agreement be closed/sold as of the period end. Increasing market values, in absolute terms when compared to the notional amount of the swap, represent a deterioration of the underlying referenced instrument’s credit soundness and a greater likelihood or risk of default or other credit event occurring as defined under the terms of the agreement. |
FAIR VALUE OF FINANCIAL DERIVATIVE INSTRUMENTS
The following is a summary of the fair valuation of the Fund’s derivative instruments categorized by risk exposure. See Note 7, Principal Risks, in the Notes to Financial Statements on risks of the Fund.
Fair Values of Financial Derivative Instruments on the Statements of Assets and Liabilities as of June 30, 2020:
| | | | | | | | | | | | | | | | | | | | | | | | |
| | | Derivatives not accounted for as hedging instruments | |
| | | Commodity
Contracts | | | Credit
Contracts | | | Equity
Contracts | | | Foreign
Exchange
Contracts | | | Interest
Rate Contracts | | | Total | |
Financial Derivative Instruments - Assets | |
Exchange-traded or centrally cleared | |
Swap Agreements | | $ | 0 | | | $ | 116 | | | $ | 0 | | | $ | 0 | | | $ | 0 | | | $ | 116 | |
| | | | | | | | | | | | | | | | | | | | | | | | |
|
Financial Derivative Instruments - Liabilities | |
Exchange-traded or centrally cleared | |
Futures | | $ | 0 | | | $ | 0 | | | $ | 0 | | | $ | 0 | | | $ | 111 | | | $ | 111 | |
| | | | | | | | | | | | | | | | | | | | | | | | |
The effect of Financial Derivative Instruments on the Statements of Operations for the period ended June 30, 2020:
| | | | | | | | | | | | | | | | | | | | | | | | |
| | | Derivatives not accounted for as hedging instruments | |
| | | Commodity
Contracts | | | Credit
Contracts | | | Equity
Contracts | | | Foreign
Exchange
Contracts | | | Interest Rate Contracts | | | Total | |
Net Realized Gain (Loss) on Financial Derivative Instruments | |
Exchange-traded or centrally cleared | |
Futures | | $ | 0 | | | $ | 0 | | | $ | 0 | | | $ | 0 | | | $ | 4,557 | | | $ | 4,557 | |
Swap Agreements | | | 0 | | | | 589 | | | | 0 | | | | 0 | | | | (2 | ) | | | 587 | |
| | | | | | | | | | | | | | | | | | | | | | | | |
| | $ | 0 | | | $ | 589 | | | $ | 0 | | | $ | 0 | | | $ | 4,555 | | | $ | 5,144 | |
| | | | | | | | | | | | | | | | | | | | | | | | |
|
Net Change in Unrealized (Depreciation) on Financial Derivative Instruments | |
Exchange-traded or centrally cleared | |
Futures | | $ | 0 | | | $ | 0 | | | $ | 0 | | | $ | 0 | | | $ | (280 | ) | | $ | (280 | ) |
Swap Agreements | | | 0 | | | | (388 | ) | | | 0 | | | | 0 | | | | 0 | | | | (388 | ) |
| | | | | | | | | | | | | | | | | | | | | | | | |
| | $ | 0 | | | $ | (388 | ) | | $ | 0 | | | $ | 0 | | | $ | (280 | ) | | $ | (668 | ) |
| | | | | | | | | | | | | | | | | | | | | | | | |
| | | | | | |
| See Accompanying Notes | | ANNUAL REPORT | | JUNE 30, 2020 | | 49 |
Schedule of Investments PIMCO Investment Grade Corporate Bond Index Exchange-Traded Fund (Cont.)
June 30, 2020
FAIR VALUE MEASUREMENTS
The following is a summary of the fair valuations according to the inputs used as of June 30, 2020 in valuing the Fund’s assets and liabilities:
| | | | | | | | | | | | | | | | |
| Category and Subcategory | | Level 1 | | | Level 2 | | | Level 3 | | | Fair Value at 06/30/2020 | |
Investments in Securities, at Value | |
Corporate Bonds & Notes | | | | | | | | | | | | | | | | |
Banking & Finance | | $ | 0 | | | $ | 255,520 | | | $ | 0 | | | $ | 255,520 | |
Industrials | | | 0 | | | | 288,536 | | | | 0 | | | | 288,536 | |
Utilities | | | 0 | | | | 85,975 | | | | 0 | | | | 85,975 | |
Sovereign Issues | | | 0 | | | | 1,374 | | | | 0 | | | | 1,374 | |
Short-Term Instruments | |
Repurchase Agreements | | | 0 | | | | 14,255 | | | | 0 | | | | 14,255 | |
| | | | | | | | | | | | | | | | |
| | | | |
Total Investments | | $ | 0 | | | $ | 645,660 | | | $ | 0 | | | $ | 645,660 | |
| | | | | | | | | | | | | | | | |
| | | | | | | | | | | | | | | | |
| Category and Subcategory | | Level 1 | | | Level 2 | | | Level 3 | | | Fair Value at 06/30/2020 | |
Financial Derivative Instruments - Assets | |
Exchange-traded or centrally cleared | | $ | 0 | | | $ | 116 | | | $ | 0 | | | $ | 116 | |
| | | | | | | | | | | | | | | | |
|
Financial Derivative Instruments - Liabilities | |
Exchange-traded or centrally cleared | | $ | (111 | ) | | $ | 0 | | | $ | 0 | | | $ | (111 | ) |
| | | | | | | | | | | | | | | | |
| | | | |
Total Financial Derivative Instruments | | $ | (111 | ) | | $ | 116 | | | $ | 0 | | | $ | 5 | |
| | | | | | | | | | | | | | | | |
| | | | |
Totals | | $ | (111 | ) | | $ | 645,776 | | | $ | 0 | | | $ | 645,665 | |
| | | | | | | | | | | | | | | | |
There were no significant transfers into or out of Level 3 during the period ended June 30, 2020.
| | | | | | | | |
| 50 | | PIMCO ETF TRUST | | | | | See Accompanying Notes | |
Schedule of Investments PIMCO Active Bond Exchange-Traded Fund
June 30, 2020
(Amounts in thousands*, except number of shares, contracts and units, if any)
| | | | | | | | | | | | |
| | | | | PRINCIPAL
AMOUNT
(000S) | | | | | MARKET
VALUE
(000S) | |
| INVESTMENTS IN SECURITIES 115.6% | |
| |
| LOAN PARTICIPATIONS AND ASSIGNMENTS 0.6% | |
|
Castlelake Aircraft Securitization Trust | |
3.967% due 07/15/2042 | | | | $ | 3,806 | | | | | $ | 3,438 | |
| | | | |
Jefferies Finance LLC | | | | | | | | | | | | |
3.188% (LIBOR03M + 3.000%)
due 06/03/2026 ~ | | | | | 2,283 | | | | | | 2,166 | |
| | | | |
PG&E Corp. | | | | | | | | | | | | |
2.440% (LIBOR03M + 2.250%)
due 12/31/2020 ~ | | | | | 5,000 | | | | | | 4,984 | |
| | | | |
State of Qatar | | | | | | | | | | | | |
1.156% (LIBOR03M + 0.800%)
due 12/21/2020 «~ | | | | | 2,500 | | | | | | 2,500 | |
2.571% (LIBOR03M + 0.800%)
due 12/21/2020 «~ | | | | | 2,500 | | | | | | 2,500 | |
| | | | |
State of Rio de Janeiro | | | | | | | | | | | | |
6.024% (LIBOR03M + 3.250%)
due 12/20/2020 «~ | | | | | 2,400 | | | | | | 2,413 | |
|
Zephyrus Capital Aviation Partners LLC | |
4.605% due 10/15/2038 | | | | | 3,334 | | | | | | 3,060 | |
| | | | | | | | | | | | |
Total Loan Participations and Assignments
(Cost $21,736) | | | | | | 21,061 | |
| | | | | | | | | | | | |
| |
| CORPORATE BONDS & NOTES 32.4% | |
| |
| BANKING & FINANCE 19.5% | |
|
AerCap Ireland Capital DAC | |
3.875% due 01/23/2028 | | | | | 2,100 | | | | | | 1,897 | |
| | | | |
Aircastle Ltd. | | | | | | | | | | | | |
4.250% due 06/15/2026 | | | | | 3,800 | | | | | | 3,493 | |
| | | | |
American Homes 4 Rent LP | | | | | | | | | | | | |
4.250% due 02/15/2028 | | | | | 2,900 | | | | | | 3,105 | |
|
American International Group, Inc. | |
4.200% due 04/01/2028 | | | | | 1,000 | | | | | | 1,139 | |
|
American Tower Corp. | |
1.300% due 09/15/2025 | | | | | 4,000 | | | | | | 4,018 | |
3.375% due 10/15/2026 | | | | | 3,300 | | | | | | 3,673 | |
| | | | |
Arch Capital Group Ltd. | | | | | | | | | | | | |
3.635% due 06/30/2050 | | | | | 6,900 | | | | | | 7,253 | |
| | | | |
Ares Finance Co. LLC | | | | | | | | | | | | |
3.250% due 06/15/2030 | | | | | 3,500 | | | | | | 3,574 | |
|
AvalonBay Communities, Inc. | |
2.450% due 01/15/2031 | | | | | 2,550 | | | | | | 2,722 | |
| | | | |
Aviation Capital Group LLC | | | | | | | | | | | | |
3.500% due 11/01/2027 | | | | | 500 | | | | | | 412 | |
| | | | |
Avolon Holdings Funding Ltd. | | | | | | | | | | | | |
2.875% due 02/15/2025 | | | | | 3,900 | | | | | | 3,280 | |
3.950% due 07/01/2024 | | | | | 3,500 | | | | | | 3,065 | |
|
Banco Santander Mexico S.A. | |
4.125% due 11/09/2022 | | | | | 4,300 | | | | | | 4,491 | |
|
Banco Santander S.A. | |
3.490% due 05/28/2030 | | | | | 3,400 | | | | | | 3,647 | |
|
Bank of America Corp. | |
3.093% due 10/01/2025 • | | | | | 6,500 | | | | | | 7,021 | |
3.419% due 12/20/2028 • | | | | | 20,118 | | | | | | 22,419 | |
3.593% due 07/21/2028 • | | | | | 9,000 | | | | | | 10,117 | |
| | | | |
Bank of New York Mellon Corp. | | | | | | | | | | | | |
4.700% due 09/20/2025 •(g) | | | | | 2,400 | | | | | | 2,502 | |
| | | | |
Barclays Bank PLC | | | | | | | | | | | | |
7.625% due 11/21/2022 (h) | | | | | 17,400 | | | | | | 18,954 | |
| | | | |
Barclays PLC | | | | | | | | | | | | |
4.375% due 01/12/2026 | | | | | 1,500 | | | | | | 1,695 | |
| | | | |
BBVA Bancomer S.A. | | | | | | | | | | | | |
6.500% due 03/10/2021 | | | | | 6,000 | | | | | | 6,156 | |
| | | | |
BGC Partners, Inc. | | | | | | | | | | | | |
5.375% due 07/24/2023 | | | | | 5,000 | | | | | | 5,208 | |
|
Blackstone Holdings Finance Co. LLC | |
3.500% due 09/10/2049 | | | | | 5,400 | | | | | | 5,604 | |
| | | | |
BNP Paribas S.A. | | | | | | | | | | | | |
2.219% due 06/09/2026 • | | | | | 9,250 | | | | | | 9,461 | |
4.400% due 08/14/2028 | | | | | 700 | | | | | | 808 | |
| | | | |
BOC Aviation Ltd. | | | | | | | | | | | | |
2.375% due 09/15/2021 | | | | | 5,000 | | | | | | 5,006 | |
| | | | | | | | | | | | |
| | | | | PRINCIPAL
AMOUNT
(000S) | | | | | MARKET
VALUE
(000S) | |
| | | | |
BPCE S.A. | | | | | | | | | | | | |
5.700% due 10/22/2023 | | $ | | | 6,600 | | | $ | | | 7,388 | |
|
Brandywine Operating Partnership LP | |
3.950% due 11/15/2027 | | | | | 1,500 | | | | | | 1,542 | |
|
Brixmor Operating Partnership LP | |
3.650% due 06/15/2024 | | | | | 7,000 | | | | | | 7,260 | |
4.125% due 05/15/2029 | | | | | 5,000 | | | | | | 5,200 | |
|
Cantor Fitzgerald LP | |
4.875% due 05/01/2024 | | | | | 1,300 | | | | | | 1,403 | |
| | | | |
Carlyle Finance Subsidiary LLC | | | | | | | | | | | | |
3.500% due 09/19/2029 | | | | | 4,500 | | | | | | 4,671 | |
| | | | |
Charles Schwab Corp. | | | | | | | | | | | | |
5.375% due 06/01/2025 •(g) | | | | | 2,000 | | | | | | 2,142 | |
| | | | |
CIT Group, Inc. | | | | | | | | | | | | |
4.750% due 02/16/2024 | | | | | 4,000 | | | | | | 4,063 | |
| | | | |
Citigroup, Inc. | | | | | | | | | | | | |
3.668% due 07/24/2028 • | | | | | 5,000 | | | | | | 5,577 | |
3.887% due 01/10/2028 • | | | | | 10,000 | | | | | | 11,277 | |
5.500% due 09/13/2025 | | | | | 4,000 | | | | | | 4,745 | |
| | | | |
Cooperatieve Rabobank UA | | | | | | | | | | | | |
3.875% due 09/26/2023 | | | | | 6,150 | | | | | | 6,724 | |
| | | | |
Credit Suisse AG | | | | | | | | | | | | |
6.500% due 08/08/2023 (h) | | | | | 15,400 | | | | | | 16,881 | |
| | | | |
Credit Suisse Group AG | | | | | | | | | | | | |
7.500% due 12/11/2023 •(g)(h) | | | | | 4,400 | | | | | | 4,752 | |
|
Credit Suisse Group Funding Guernsey Ltd. | |
3.750% due 03/26/2025 | | | | | 5,600 | | | | | | 6,180 | |
| | | | |
Crown Castle International Corp. | | | | | | | | | | | | |
4.300% due 02/15/2029 | | | | | 2,000 | | | | | | 2,322 | |
4.450% due 02/15/2026 | | | | | 5,200 | | | | | | 5,965 | |
| | | | |
CyrusOne LP | | | | | | | | | | | | |
2.900% due 11/15/2024 | | | | | 5,600 | | | | | | 5,890 | |
| | | | |
Deutsche Bank AG | | | | | | | | | | | | |
3.375% due 05/12/2021 | | | | | 13,100 | | | | | | 13,219 | |
3.961% due 11/26/2025 • | | | | | 2,500 | | | | | | 2,625 | |
4.250% due 10/14/2021 | | | | | 3,600 | | | | | | 3,696 | |
| | | | |
Discover Financial Services | | | | | | | | | | | | |
4.500% due 01/30/2026 | | | | | 5,400 | | | | | | 6,060 | |
|
Doric Nimrod Air Alpha Pass-Through Trust | |
5.250% due 05/30/2025 | | | | | 614 | | | | | | 559 | |
|
Doric Nimrod Air Finance Alpha Ltd. Pass-Through Trust | |
5.125% due 11/30/2024 | | | | | 312 | | | | | | 289 | |
| | | | |
E*TRADE Financial Corp. | | | | | | | | | | | | |
4.500% due 06/20/2028 | | | | | 1,000 | | | | | | 1,158 | |
| | | | |
EPR Properties | | | | | | | | | | | | |
4.500% due 06/01/2027 | | | | | 4,300 | | | | | | 3,991 | |
4.750% due 12/15/2026 | | | | | 700 | | | | | | 669 | |
| | | | |
Equitable Holdings, Inc. | | | | | | | | | | | | |
4.350% due 04/20/2028 | | | | | 1,000 | | | | | | 1,121 | |
| | | | |
Farmers Insurance Exchange | | | | | | | | | | | | |
4.747% due 11/01/2057 • | | | | | 2,000 | | | | | | 2,025 | |
| | | | |
First American Financial Corp. | | | | | | | | | | | | |
4.000% due 05/15/2030 | | | | | 4,000 | | | | | | 4,394 | |
| | | | |
Ford Motor Credit Co. LLC | | | | | | | | | | | | |
3.350% due 11/01/2022 | | | | | 3,100 | | | | | | 2,981 | |
3.550% due 10/07/2022 | | | | | 5,000 | | | | | | 4,873 | |
5.596% due 01/07/2022 | | | | | 3,000 | | | | | | 3,032 | |
5.875% due 08/02/2021 | | | | | 3,900 | | | | | | 3,946 | |
|
GE Capital International Funding Co. Unlimited Co. | |
4.418% due 11/15/2035 | | | | | 5,800 | | | | | | 5,895 | |
|
Global Atlantic Fin Co. | |
4.400% due 10/15/2029 | | | | | 6,000 | | | | | | 5,531 | |
| | | | |
GLP Capital LP | | | | | | | | | | | | |
4.000% due 01/15/2030 | | | | | 5,100 | | | | | | 5,083 | |
5.750% due 06/01/2028 | | | | | 2,600 | | | | | | 2,872 | |
| | | | |
Goldman Sachs Group, Inc. | | | | | | | | | | | | |
3.691% due 06/05/2028 • | | | | | 7,600 | | | | | | 8,517 | |
3.850% due 01/26/2027 | | | | | 13,000 | | | | | | 14,675 | |
| | | | |
Goodman U.S. Finance Three LLC | | | | | | | | | | | | |
3.700% due 03/15/2028 | | | | | 5,000 | | | | | | 5,413 | |
| | | | |
Hampton Roads PPV LLC | | | | | | | | | | | | |
6.621% due 06/15/2053 | | | | | 35,321 | | | | | | 38,978 | |
| | | | |
Harborwalk Funding Trust | | | | | | | | | | | | |
5.077% due 02/15/2069 • | | | | | 3,250 | | | | | | 3,983 | |
| | | | | | | | | | | | |
| | | | | PRINCIPAL
AMOUNT
(000S) | | | | | MARKET
VALUE
(000S) | |
|
Healthcare Trust of America Holdings LP | |
3.750% due 07/01/2027 | | $ | | | 4,600 | | | $ | | | 4,860 | |
| | | | |
HSBC Holdings PLC | | | | | | | | | | | | |
2.099% due 06/04/2026 • | | | | | 3,500 | | | | | | 3,539 | |
4.250% due 03/14/2024 | | | | | 6,000 | | | | | | 6,461 | |
4.250% due 08/18/2025 | | | | | 7,400 | | | | | | 8,082 | |
4.583% due 06/19/2029 • | | | | | 5,300 | | | | | | 6,126 | |
| | | | |
Hudson Pacific Properties LP | | | | | | | | | | | | |
3.950% due 11/01/2027 | | | | | 900 | | | | | | 934 | |
|
JPMorgan Chase & Co. | |
3.782% due 02/01/2028 • | | | | | 19,000 | | | | | | 21,540 | |
| | | | |
KKR Group Finance Co. LLC | | | | | | | | | | | | |
3.750% due 07/01/2029 | | | | | 1,250 | | | | | | 1,437 | |
| | | | |
LeasePlan Corp. NV | | | | | | | | | | | | |
2.875% due 10/24/2024 | | | | | 3,300 | | | | | | 3,395 | |
| | | | |
Life Storage LP | | | | | | | | | | | | |
3.875% due 12/15/2027 | | | | | 2,100 | | | | | | 2,293 | |
| | | | |
Lloyds Banking Group PLC | | | | | | | | | | | | |
3.574% due 11/07/2028 • | | | | | 1,300 | | | | | | 1,413 | |
7.500% due 09/27/2025 •(g)(h) | | | | | 5,000 | | | | | | 5,191 | |
| | | | |
Loews Corp. | | | | | | | | | | | | |
3.200% due 05/15/2030 | | | | | 1,950 | | | | | | 2,121 | |
| | | | |
Low Income Investment Fund | | | | | | | | | | | | |
3.711% due 07/01/2029 | | | | | 2,500 | | | | | | 2,617 | |
| | | | |
Mid-America Apartments LP | | | | | | | | | | | | |
4.000% due 11/15/2025 | | | | | 7,500 | | | | | | 8,341 | |
| | | | |
MMcapS Funding Ltd. | | | | | | | | | | | | |
0.574% (US0003M + 0.290%)
due 12/26/2039 ~ | | | | | 772 | | | | | | 683 | |
| | | | |
Morgan Stanley | | | | | | | | | | | | |
3.772% due 01/24/2029 • | | | | | 17,500 | | | | | | 19,933 | |
7.500% due 04/02/2032 þ(i) | | | | | 9,000 | | | | | | 7,820 | |
| | | | |
Navient Corp. | | | | | | | | | | | | |
5.875% due 03/25/2021 | | | | | 400 | | | | | | 394 | |
6.500% due 06/15/2022 | | | | | 950 | | | | | | 936 | |
| | | | |
New York Life Insurance Co. | | | | | | | | | | | | |
4.450% due 05/15/2069 | | | | | 3,700 | | | | | | 4,533 | |
| | | | |
Nissan Motor Acceptance Corp. | | | | | | | | | | | | |
3.875% due 09/21/2023 | | | | | 2,300 | | | | | | 2,306 | |
| | | | |
Nomura Holdings, Inc. | | | | | | | | | | | | |
2.648% due 01/16/2025 | | | | | 2,300 | | | | | | 2,400 | |
| | | | |
Nordea Bank Abp | | | | | | | | | | | | |
6.125% due 09/23/2024 •(g)(h) | | | | | 550 | | | | | | 560 | |
6.625% due 03/26/2026 •(g)(h) | | | | | 5,600 | | | | | | 5,982 | |
|
Ohio National Financial Services, Inc. | |
5.550% due 01/24/2030 | | | | | 3,300 | | | | | | 3,157 | |
| | | | |
Omega Healthcare Investors, Inc. | | | | | | | | | | | | |
4.750% due 01/15/2028 | | | | | 3,350 | | | | | | 3,549 | |
| | | | |
Pacific Life Insurance Co. | | | | | | | | | | | | |
9.250% due 06/15/2039 | | | | | 5,000 | | | | | | 8,248 | |
| | | | |
Park Aerospace Holdings Ltd. | | | | | | | | | | | | |
5.500% due 02/15/2024 | | | | | 2,500 | | | | | | 2,289 | |
| | | | |
Physicians Realty LP | | | | | | | | | | | | |
4.300% due 03/15/2027 | | | | | 2,000 | | | | | | 2,086 | |
| | | | |
Piper Jaffray Cos. | | | | | | | | | | | | |
4.740% due 10/15/2021 | | | | | 4,000 | | | | | | 3,910 | |
| | | | |
Preferred Term Securities Ltd. | | | | | | | | | | | | |
0.613% (US0003M + 0.300%)
due 03/22/2037 ~ | | | | | 2,985 | | | | | | 2,552 | |
|
Royal Bank of Scotland Group PLC | |
4.519% due 06/25/2024 • | | | | | 5,000 | | | | | | 5,437 | |
4.800% due 04/05/2026 | | | | | 1,000 | | | | | | 1,159 | |
8.625% due 08/15/2021 •(g)(h) | | | | | 3,000 | | | | | | 3,126 | |
| | | | |
Sabra Health Care LP | | | | | | | | | | | | |
4.800% due 06/01/2024 | | | | | 3,600 | | | | | | 3,612 | |
|
Santander UK Group Holdings PLC | |
3.373% due 01/05/2024 • | | | | | 2,900 | | | | | | 3,042 | |
3.823% due 11/03/2028 • | | | | | 5,000 | | | | | | 5,513 | |
| | | | |
Service Properties Trust | | | | | | | | | | | | |
3.950% due 01/15/2028 | | | | | 3,000 | | | | | | 2,419 | |
4.250% due 02/15/2021 | | | | | 133 | | | | | | 133 | |
4.375% due 02/15/2030 | | | | | 1,300 | | | | | | 1,046 | |
| | | | | | |
| See Accompanying Notes | | ANNUAL REPORT | | JUNE 30, 2020 | | 51 |
Schedule of Investments PIMCO Active Bond Exchange-Traded Fund (Cont.)
| | | | | | | | | | | | |
| | | | | PRINCIPAL
AMOUNT
(000S) | | | | | MARKET
VALUE
(000S) | |
| | | | |
Spirit Realty LP | | | | | | | | | | | | |
4.450% due 09/15/2026 | | $ | | | 700 | | | $ | | | 726 | |
| | | | |
Springleaf Finance Corp. | | | | | | | | | | | | |
6.125% due 05/15/2022 | | | | | 4,500 | | | | | | 4,597 | |
8.250% due 12/15/2020 | | | | | 5,500 | | | | | | 5,685 | |
| | | | |
State Bank of India | | | | | | | | | | | | |
4.000% due 01/24/2022 | | | | | 5,000 | | | | | | 5,126 | |
| | | | |
State Street Corp. | | | | | | | | | | | | |
5.250% due 09/15/2020 •(g) | | | | | 500 | | | | | | 477 | |
| | | | |
STORE Capital Corp. | | | | | | | | | | | | |
4.625% due 03/15/2029 | | | | | 2,100 | | | | | | 2,148 | |
|
Sumitomo Mitsui Financial Group, Inc. | |
2.448% due 09/27/2024 | | | | | 6,800 | | | | | | 7,144 | |
|
Teachers Insurance & Annuity Association of America | |
3.300% due 05/15/2050 | | | | | 6,050 | | | | | | 6,250 | |
| | | | |
Truist Financial Corp. | | | | | | | | | | | | |
5.100% due 03/01/2030 •(g) | | | | | 3,500 | | | | | | 3,623 | |
| | | | |
Trust Fibra Uno | | | | | | | | | | | | |
4.869% due 01/15/2030 | | | | | 4,500 | | | | | | 4,548 | |
| | | | |
UBS AG | | | | | | | | | | | | |
5.125% due 05/15/2024 (h) | | | | | 1,800 | | | | | | 1,959 | |
7.625% due 08/17/2022 (h) | | | | | 15,700 | | | | | | 17,516 | |
| | | | |
UBS Group AG | | | | | | | | | | | | |
7.000% due 02/19/2025 •(g)(h) | | | | | 200 | | | | | | 221 | |
| | | | |
UDR, Inc. | | | | | | | | | | | | |
3.500% due 07/01/2027 | | | | | 2,400 | | | | | | 2,631 | |
| | | | |
UniCredit SpA | | | | | | | | | | | | |
7.830% due 12/04/2023 | | | | | 5,000 | | | | | | 5,789 | |
| | | | |
Unum Group | | | | | | | | | | | | |
4.500% due 03/15/2025 | | | | | 3,000 | | | | | | 3,226 | |
| | | | |
VEREIT Operating Partnership LP | | | | | | | | | | | | |
3.100% due 12/15/2029 | | | | | 4,000 | | | | | | 3,857 | |
| | | | |
Wells Fargo & Co. | | | | | | | | | | | | |
3.584% due 05/22/2028 • | | | | | 15,000 | | | | | | 16,658 | |
| | | | |
Welltower, Inc. | | | | | | | | | | | | |
3.625% due 03/15/2024 | | | | | 5,000 | | | | | | 5,345 | |
| | | | |
Willis North America, Inc. | | | | | | | | | | | | |
2.950% due 09/15/2029 | | | | | 1,300 | | | | | | 1,380 | |
| | | | | | | | | | | | |
| | | | | | | | | | | 664,368 | |
| | | | | | | | | | | | |
| |
| INDUSTRIALS 10.8% | |
| | | | |
Adani Electricity Mumbai Ltd. | | | | | | | | | | | | |
3.949% due 02/12/2030 | | | | | 3,000 | | | | | | 2,804 | |
| | | | |
Alcon Finance Corp. | | | | | | | | | | | | |
2.600% due 05/27/2030 | | | | | 3,200 | | | | | | 3,293 | |
|
American Airlines Pass-Through Trust | |
5.250% due 07/31/2022 | | | | | 163 | | | | | | 143 | |
| | | | |
AP Moller - Maersk A/S | | | | | | | | | | | | |
3.750% due 09/22/2024 | | | | | 2,500 | | | | | | 2,627 | |
| | | | |
Arrow Electronics, Inc. | | | | | | | | | | | | |
3.250% due 09/08/2024 | | | | | 5,000 | | | | | | 5,306 | |
3.875% due 01/12/2028 | | | | | 2,500 | | | | | | 2,621 | |
| | | | |
Ashtead Capital, Inc. | | | | | | | | | | | | |
4.250% due 11/01/2029 | | | | | 5,000 | | | | | | 5,012 | |
| | | | |
Bacardi Ltd. | | | | | | | | | | | | |
4.450% due 05/15/2025 | | | | | 5,000 | | | | | | 5,474 | |
5.150% due 05/15/2038 | | | | | 1,200 | | | | | | 1,411 | |
| | | | |
Baidu, Inc. | | | | | | | | | | | | |
3.875% due 09/29/2023 | | | | | 1,100 | | | | | | 1,173 | |
| | | | |
BAT Capital Corp. | | | | | | | | | | | | |
4.390% due 08/15/2037 | | | | | 3,100 | | | | | | 3,386 | |
| | | | |
Boeing Co. | | | | | | | | | | | | |
5.705% due 05/01/2040 | | | | | 100 | | | | | | 113 | |
5.805% due 05/01/2050 | | | | | 100 | | | | | | 118 | |
| | | | |
Bowdoin College | | | | | | | | | | | | |
4.693% due 07/01/2112 | | | | | 3,400 | | | | | | 3,943 | |
| | | | |
Broadcom, Inc. | | | | | | | | | | | | |
4.110% due 09/15/2028 | | | | | 7,435 | | | | | | 8,146 | |
| | | | |
Campbell Soup Co. | | | | | | | | | | | | |
3.650% due 03/15/2023 | | | | | 3,400 | | | | | | 3,629 | |
| | | | |
CH Robinson Worldwide, Inc. | | | | | | | | | | | | |
4.200% due 04/15/2028 | | | | | 1,000 | | | | | | 1,141 | |
| | | | | | | | | | | | |
| | | | | PRINCIPAL
AMOUNT
(000S) | | | | | MARKET
VALUE
(000S) | |
|
Charter Communications Operating LLC | |
4.908% due 07/23/2025 | | $ | | | 4,600 | | | $ | | | 5,278 | |
| | | | |
Choice Hotels International, Inc. | | | | | | | | | | | | |
3.700% due 12/01/2029 | | | | | 6,700 | | | | | | 6,733 | |
| | | | |
Citrix Systems, Inc. | | | | | | | | | | | | |
3.300% due 03/01/2030 | | | | | 3,200 | | | | | | 3,427 | |
4.500% due 12/01/2027 | | | | | 3,000 | | | | | | 3,452 | |
| | | | |
CommonSpirit Health | | | | | | | | | | | | |
4.187% due 10/01/2049 | | | | | 7,300 | | | | | | 7,463 | |
| | | | |
Corp. Nacional del Cobre de Chile | | | | | | | | | | | | |
3.625% due 08/01/2027 | | | | | 4,000 | | | | | | 4,300 | |
4.500% due 09/16/2025 | | | | | 3,500 | | | | | | 3,929 | |
| | | | |
CSX Corp. | | | | | | | | | | | | |
3.800% due 04/15/2050 | | | | | 1,800 | | | | | | 2,144 | |
| | | | |
CVS Health Corp. | | | | | | | | | | | | |
3.000% due 08/15/2026 | | | | | 4,000 | | | | | | 4,379 | |
3.700% due 03/09/2023 | | | | | 4,700 | | | | | | 5,052 | |
3.750% due 04/01/2030 | | | | | 2,600 | | | | | | 2,996 | |
4.100% due 03/25/2025 | | | | | 10,000 | | | | | | 11,311 | |
4.125% due 04/01/2040 | | | | | 7,150 | | | | | | 8,462 | |
4.250% due 04/01/2050 | | | | | 3,400 | | | | | | 4,108 | |
| | | | |
Dell International LLC | | | | | | | | | | | | |
4.000% due 07/15/2024 | | | | | 6,500 | | | | | | 7,014 | |
5.450% due 06/15/2023 | | | | | 4,000 | | | | | | 4,377 | |
| | | | |
Diageo Capital PLC | | | | | | | | | | | | |
2.125% due 04/29/2032 | | | | | 300 | | | | | | 311 | |
| | | | |
Diamondback Energy, Inc. | | | | | | | | | | | | |
3.500% due 12/01/2029 | | | | | 200 | | | | | | 194 | |
| | | | |
eBay, Inc. | | | | | | | | | | | | |
3.600% due 06/05/2027 | | | | | 1,000 | | | | | | 1,130 | |
| | | | |
Ecopetrol S.A. | | | | | | | | | | | | |
5.875% due 09/18/2023 | | | | | 5,200 | | | | | | 5,583 | |
| | | | |
Energy Transfer Operating LP | | | | | | | | | | | | |
5.200% due 02/01/2022 | | | | | 2,275 | | | | | | 2,382 | |
| | | | |
Energy Transfer Partners LP | | | | | | | | | | | | |
4.500% due 11/01/2023 | | | | | 5,000 | | | | | | 5,374 | |
5.000% due 10/01/2022 | | | | | 2,500 | | | | | | 2,663 | |
|
Enterprise Products Operating LLC | |
5.700% due 02/15/2042 | | | | | 200 | | | | | | 249 | |
| | | | |
Equinor ASA | | | | | | | | | | | | |
3.125% due 04/06/2030 | | | | | 2,100 | | | | | | 2,321 | |
| | | | |
ERAC USA Finance LLC | | | | | | | | | | | | |
3.800% due 11/01/2025 | | | | | 900 | | | | | | 953 | |
| | | | |
Expedia Group, Inc. | | | | | | | | | | | | |
3.800% due 02/15/2028 | | | | | 2,500 | | | | | | 2,404 | |
| | | | |
Fairstone Financial, Inc. | | | | | | | | | | | | |
7.875% due 07/15/2024 | | | | | 2,000 | | | | | | 1,966 | |
| | | | |
Ferguson Finance PLC | | | | | | | | | | | | |
3.250% due 06/02/2030 | | | | | 2,000 | | | | | | 2,053 | |
| | | | |
Flex Ltd. | | | | | | | | | | | | |
4.750% due 06/15/2025 | | | | | 1,600 | | | | | | 1,788 | |
4.875% due 06/15/2029 | | | | | 2,000 | | | | | | 2,211 | |
| | | | |
Ford Foundation | | | | | | | | | | | | |
2.815% due 06/01/2070 | | | | | 4,400 | | | | | | 4,579 | |
| | | | |
General Electric Co. | | | | | | | | | | | | |
4.250% due 05/01/2040 | | | | | 6,000 | | | | | | 5,911 | |
| | | | |
Georgetown University | | | | | | | | | | | | |
5.215% due 10/01/2118 | | | | | 6,560 | | | | | | 9,062 | |
| | | | |
Global Payments, Inc. | | | | | | | | | | | | |
2.650% due 02/15/2025 | | | | | 2,600 | | | | | | 2,763 | |
3.200% due 08/15/2029 | | | | | 2,600 | | | | | | 2,790 | |
| | | | |
Imperial Brands Finance PLC | | | | | | | | | | | | |
3.500% due 07/26/2026 | | | | | 5,000 | | | | | | 5,353 | |
| | | | |
Infor, Inc. | | | | | | | | | | | | |
1.750% due 07/15/2025 | | | | | 6,100 | | | | | | 6,133 | |
|
Kinder Morgan Energy Partners LP | |
4.300% due 05/01/2024 | | | | | 850 | | | | | | 929 | |
| | | | |
Kinder Morgan, Inc. | | | | | | | | | | | | |
5.625% due 11/15/2023 | | | | | 2,000 | | | | | | 2,260 | |
| | | | |
KLA Corp. | | | | | | | | | | | | |
3.300% due 03/01/2050 | | | | | 200 | | | | | | 207 | |
| | | | |
Kraft Heinz Foods Co. | | | | | | | | | | | | |
3.950% due 07/15/2025 | | | | | 3,131 | | | | | | 3,348 | |
| | | | | | | | | | | | |
| | | | | PRINCIPAL
AMOUNT
(000S) | | | | | MARKET
VALUE
(000S) | |
| | | | |
Las Vegas Sands Corp. | | | | | | | | | | | | |
3.200% due 08/08/2024 | | $ | | | 3,600 | | | $ | | | 3,587 | |
| | | | |
Magellan Health, Inc. | | | | | | | | | | | | |
4.900% due 09/22/2024 | | | | | 5,500 | | | | | | 5,611 | |
| | | | |
Marvell Technology Group Ltd. | | | | | | | | | | | | |
4.200% due 06/22/2023 | | | | | 3,000 | | | | | | 3,227 | |
|
Massachusetts Institute of Technology | |
4.678% due 07/01/2114 | | | | | 1,360 | | | | | | 1,992 | |
| | | | |
Micron Technology, Inc. | | | | | | | | | | | | |
4.185% due 02/15/2027 | | | | | 6,000 | | | | | | 6,653 | |
| | | | |
MPLX LP | | | | | | | | | | | | |
4.250% due 12/01/2027 | | | | | 4,200 | | | | | | 4,560 | |
|
New York and Presbyterian Hospital | |
4.763% due 08/01/2116 | | | | | 3,000 | | | | | | 3,692 | |
|
Norwegian Air Shuttle ASA Pass-Through Trust | |
4.875% due 11/10/2029 | | | | | 9,692 | | | | | | 8,578 | |
| | | | |
NVIDIA Corp. | | | | | | | | | | | | |
3.500% due 04/01/2050 | | | | | 2,400 | | | | | | 2,797 | |
3.700% due 04/01/2060 | | | | | 4,100 | | | | | | 4,898 | |
| | | | |
NXP BV | | | | | | | | | | | | |
3.150% due 05/01/2027 | | | | | 700 | | | | | | 744 | |
3.400% due 05/01/2030 | | | | | 1,000 | | | | | | 1,078 | |
| | | | |
ONEOK Partners LP | | | | | | | | | | | | |
3.375% due 10/01/2022 | | | | | 3,200 | | | | | | 3,315 | |
| | | | |
Oracle Corp. | | | | | | | | | | | | |
3.600% due 04/01/2050 | | | | | 16,400 | | | | | | 18,570 | |
|
Pacific National Finance Pty. Ltd. | |
4.750% due 03/22/2028 | | | | | 4,300 | | | | | | 4,488 | |
| | | | |
Petroleos Mexicanos | | | | | | | | | | | | |
6.490% due 01/23/2027 | | | | | 311 | | | | | | 284 | |
| | | | |
Petronas Capital Ltd. | | | | | | | | | | | | |
4.550% due 04/21/2050 | | | | | 1,600 | | | | | | 2,037 | |
| | | | |
Prosus NV | | | | | | | | | | | | |
3.680% due 01/21/2030 | | | | | 2,700 | | | | | | 2,833 | |
| | | | |
QVC, Inc. | | | | | | | | | | | | |
4.450% due 02/15/2025 | | | | | 1,250 | | | | | | 1,232 | |
| | | | |
RELX Capital, Inc. | | | | | | | | | | | | |
3.000% due 05/22/2030 | | | | | 500 | | | | | | 542 | |
| | | | |
Rockies Express Pipeline LLC | | | | | | | | | | | | |
3.600% due 05/15/2025 | | | | | 3,000 | | | | | | 2,782 | |
| | | | |
Rolls-Royce PLC | | | | | | | | | | | | |
3.625% due 10/14/2025 | | | | | 2,000 | | | | | | 1,931 | |
| | | | |
Sabine Pass Liquefaction LLC | | | | | | | | | | | | |
5.625% due 03/01/2025 | | | | | 2,000 | | | | | | 2,287 | |
5.750% due 05/15/2024 | | | | | 800 | | | | | | 901 | |
5.875% due 06/30/2026 | | | | | 3,000 | | | | | | 3,528 | |
| | | | |
Sands China Ltd. | | | | | | | | | | | | |
4.600% due 08/08/2023 | | | | | 6,600 | | | | | | 6,965 | |
5.400% due 08/08/2028 | | | | | 1,200 | | | | | | 1,329 | |
| | | | |
Sprint Spectrum Co. LLC | | | | | | | | | | | | |
4.738% due 09/20/2029 | | | | | 6,500 | | | | | | 7,060 | |
| | | | |
Starbucks Corp. | | | | | | | | | | | | |
4.450% due 08/15/2049 | | | | | 200 | | | | | | 242 | |
|
Sunoco Logistics Partners Operations LP | |
5.950% due 12/01/2025 | | | | | 2,300 | | | | | | 2,625 | |
| | | | |
Syngenta Finance NV | | | | | | | | | | | | |
4.441% due 04/24/2023 | | | | | 5,400 | | | | | | 5,672 | |
| | | | |
T-Mobile USA, Inc. | | | | | | | | | | | | |
1.500% due 02/15/2026 | | | | | 900 | | | | | | 902 | |
2.050% due 02/15/2028 | | | | | 5,000 | | | | | | 5,015 | |
|
Teck Resources Ltd. | |
6.250% due 07/15/2041 | | | | | 200 | | | | | | 219 | |
|
Tennessee Gas Pipeline Co. LLC | |
2.900% due 03/01/2030 | | | | | 8,000 | | | | | | 8,214 | |
|
Teva Pharmaceutical Finance Netherlands BV | |
2.800% due 07/21/2023 | | | | | 5,500 | | | | | | 5,213 | |
|
Turkish Airlines Pass-Through Trust | |
4.200% due 09/15/2028 | | | | | 3,801 | | | | | | 2,838 | |
|
United Airlines Pass-Through Trust | |
3.450% due 01/07/2030 | | | | | 2,691 | | | | | | 2,249 | |
|
UnitedHealth Group, Inc. | |
3.125% due 05/15/2060 | | | | | 100 | | | | | | 107 | |
| | | | | | | | |
| 52 | | PIMCO ETF TRUST | | | | | See Accompanying Notes | |
June 30, 2020
| | | | | | | | | | | | |
| | | | | PRINCIPAL
AMOUNT
(000S) | | | | | MARKET
VALUE
(000S) | |
|
Wesleyan University | |
4.781% due 07/01/2116 | | $ | | | 3,248 | | | $ | | | 3,837 | |
|
Westinghouse Air Brake Technologies Corp. | |
4.400% due 03/15/2024 | | | | | 1,800 | | | | | | 1,910 | |
4.950% due 09/15/2028 | | | | | 5,930 | | | | | | 6,607 | |
|
WRKCo, Inc. | |
3.900% due 06/01/2028 | | | | | 500 | | | | | | 554 | |
|
Yara International ASA
| |
3.148% due 06/04/2030 | | | | | 1,500 | | | | | | 1,563 | |
|
ZF North America Capital, Inc. | |
4.500% due 04/29/2022 | | | | | 2,500 | | | | | | 2,576 | |
| | | | | | | | | | | | |
| | | | | | | | | | | 367,526 | |
| | | | | | | | | | | | |
| |
| UTILITIES 2.1% | |
|
Arizona Public Service Co. | |
3.350% due 05/15/2050 | | | | | 400 | | | | | | 428 | |
|
AT&T, Inc. | |
3.850% due 06/01/2060 | | | | | 12,000 | | | | | | 12,784 | |
4.300% due 02/15/2030 | | | | | 4,163 | | | | | | 4,868 | |
4.500% due 03/09/2048 | | | | | 600 | | | | | | 705 | |
|
Consolidated Edison Co. of New York, Inc. | |
3.950% due 04/01/2050 | | | | | 3,000 | | | | | | 3,586 | |
|
Consumers Energy Co. | |
2.500% due 05/01/2060 | | | | | 300 | | | | | | 287 | |
|
Duke Energy Carolinas LLC | |
4.250% due 12/15/2041 | | | | | 400 | | | | | | 494 | |
|
Edison International | |
2.950% due 03/15/2023 | | | | | 700 | | | | | | 717 | |
|
Enable Midstream Partners LP | |
3.900% due 05/15/2024 | | | | | 2,750 | | | | | | 2,695 | |
|
Exelon Corp. | |
4.050% due 04/15/2030 | | | | | 3,250 | | | | | | 3,759 | |
|
FirstEnergy Corp. | |
3.900% due 07/15/2027 | | | | | 6,000 | | | | | | 6,797 | |
|
Georgia Power Co. | |
3.700% due 01/30/2050 | | | | | 200 | | | | | | 223 | |
|
IPALCO Enterprises, Inc. | |
3.700% due 09/01/2024 | | | | | 4,450 | | | | | | 4,766 | |
|
NGPL PipeCo LLC | |
4.875% due 08/15/2027 | | | | | 3,200 | | | | | | 3,518 | |
|
Odebrecht Drilling Norbe Ltd. | |
6.350% due 12/01/2021 ^ | | | | | 575 | | | | | | 493 | |
|
ONEOK, Inc. | |
7.150% due 01/15/2051 | | | | | 100 | | | | | | 122 | |
|
Pacific Gas & Electric Co. | |
3.300% due 03/15/2027 ^(c) | | | | | 900 | | | | | | 979 | |
|
Pacific Gas and Electric Co. | |
3.300% due 08/01/2040 | | | | | 4,200 | | | | | | 4,097 | |
|
Piedmont Natural Gas Co., Inc. | |
3.350% due 06/01/2050 | | | | | 300 | | | | | | 329 | |
|
Plains All American Pipeline LP | |
3.600% due 11/01/2024 | | | | | 7,987 | | | | | | 8,167 | |
3.650% due 06/01/2022 | | | | | 650 | | | | | | 665 | |
3.850% due 10/15/2023 | | | | | 125 | | | | | | 130 | |
|
San Diego Gas & Electric Co. | |
3.320% due 04/15/2050 | | | | | 3,200 | | | | | | 3,493 | |
|
SES S.A. | |
3.600% due 04/04/2023 | | | | | 1,700 | | | | | | 1,760 | |
|
Shell International Finance BV | |
3.250% due 04/06/2050 | | | | | 100 | | | | | | 108 | |
|
Southern California Gas Co. | |
4.300% due 01/15/2049 | | | | | 3,500 | | | | | | 4,458 | |
| | | | | | | | | | | | |
| | | | | | | | | | | 70,428 | |
| | | | | | | | | | | | |
Total Corporate Bonds & Notes (Cost $1,032,310) | | | | | | | | | 1,102,322 | |
| | | | | | | | | | | | |
| |
| MUNICIPAL BONDS & NOTES 1.9% | |
| |
| CALIFORNIA 0.4% | |
|
Regents of the University of California Medical Center Pooled Revenue Bonds, Series 2020 | |
3.706% due 05/15/2120 | | | | | 6,000 | | | | | | 6,252 | |
| |
| | | | | | | | | | | | |
| | | | | PRINCIPAL
AMOUNT
(000S) | | | | | MARKET
VALUE
(000S) | |
|
University of California Revenue Bonds, Series 2012 | |
4.858% due 05/15/2112 | | $ | | | 2,191 | | | $ | | | 3,053 | |
|
University of California Revenue Bonds, Series 2015 | |
4.767% due 05/15/2115 | | | | | 2,100 | | | | | | 2,854 | |
| | | | | | | | | | | | |
| | | | | | | | | | | 12,159 | |
| | | | | | | | | | | | |
| |
| FLORIDA 0.2% | |
|
Palm Beach County, Florida Revenue Bonds, Series 2013 | |
5.250% due 11/01/2043 | | | | | 7,520 | | | | | | 8,537 | |
| | | | | | | | | | | | |
| |
| ILLINOIS 0.2% | |
|
Illinois State General Obligation Bonds, (BABs), Series 2010 | |
7.350% due 07/01/2035 | | | | | 6,800 | | | | | | 7,724 | |
| | | | | | | | | | | | |
| |
| NEW JERSEY 0.3% | |
|
New Jersey Economic Development Authority Revenue Notes, Series 2017 | |
3.800% due 07/01/2022 | | | | | 1,000 | | | | | | 1,026 | |
|
Rutgers The State University of New Jersey Revenue Bonds, Series 2019 | |
3.915% due 05/01/2119 | | | | | 7,900 | | | | | | 9,667 | |
| | | | | | | | | | | | |
| | | | | | | | | | | 10,693 | |
| | | | | | | | | | | | |
| |
| NEW YORK 0.3% | |
|
Port Authority of New York & New Jersey Revenue Bonds, Series 2015
| |
4.810% due 10/15/2065 | | | | | 1,000 | | | | | | 1,377 | |
|
Port Authority of New York & New Jersey Revenue Bonds, Series 2019
| |
3.287% due 08/01/2069 | | | | | 7,500 | | | | | | 7,978 | |
| | | | | | | | | | | | |
| | | | | | | | | | | 9,355 | |
| | | | | | | | | | | | |
| |
| TEXAS 0.2% | |
|
Texas Private Activity Bond Surface Transportation Corp. Revenue Bonds, Series 2019
| |
3.922% due 12/31/2049 | | | | | 4,200 | | | | | | 4,337 | |
|
Texas Public Finance Authority Revenue Notes, Series 2014
| |
8.250% due 07/01/2024 | | | | | 2,000 | | | | | | 2,008 | |
| | | | | | | | | | | | |
| | | | | | | | | | | 6,345 | |
| | | | | | | | | | | | |
| |
| VIRGINIA 0.2% | |
|
University of Virginia Revenue Bonds, Series 2017
| |
4.179% due 09/01/2117 | | | | | 870 | | | | | | 1,192 | |
|
University of Virginia Revenue Bonds, Series 2019
| |
3.227% due 09/01/2119 | | | | | 5,300 | | | | | | 5,659 | |
| | | | | | | | | | | | |
| | | | | | | | | | | 6,851 | |
| | | | | | | | | | | | |
| |
| WEST VIRGINIA 0.1% | |
|
Tobacco Settlement Finance Authority, West Virginia Revenue Bonds, Series 2007
| |
7.467% due 06/01/2047 | | | | | 3,220 | | | | | | 3,246 | |
| | | | | | | | | | | | |
Total Municipal Bonds & Notes (Cost $58,312) | | | | | | | | | | | 64,910 | |
| | | | | | | | | | | | |
| |
| U.S. GOVERNMENT AGENCIES 47.4% | |
|
Fannie Mae | |
0.000% due 07/25/2031 - 02/25/2040 (b)(e) | | | | | 172 | | | | | | 160 | |
0.643% due 08/25/2022 ~(a) | | | | | 10,396 | | | | | | 85 | |
2.500% due 03/25/2033 | | | | | 1 | | | | | | 1 | |
3.000% due 03/25/2033 - 04/25/2043 | | | | | 10 | | | | | | 12 | |
3.154% due 12/01/2028 • | | | | | 201 | | | | | | 202 | |
3.360% due 01/01/2037 • | | | | | 16 | | | | | | 16 | |
| | | | | | | | | | | | |
| | | | | PRINCIPAL
AMOUNT
(000S) | | | | | MARKET
VALUE
(000S) | |
3.500% due 06/25/2042 - 05/25/2043 | | $ | | | 616 | | | $ | | | 701 | |
3.695% due 04/01/2036 • | | | | | 11 | | | | | | 11 | |
3.905% due 11/01/2035 • | | | | | 2 | | | | | | 2 | |
4.000% due 10/01/2026 - 07/01/2044 | | | | | 2,377 | | | | | | 2,507 | |
4.085% due 10/01/2035 • | | | | | 3 | | | | | | 3 | |
4.218% due 09/01/2034 • | | | | | 33 | | | | | | 33 | |
4.500% due 09/01/2023 - 06/01/2051 | | | | | 2,412 | | | | | | 2,584 | |
5.000% due 05/01/2026 - 11/01/2039 | | | | | 1,575 | | | | | | 1,689 | |
5.500% due 12/01/2031 - 04/01/2039 | | | | | 1,351 | | | | | | 1,474 | |
5.816% due 09/25/2042 •(a) | | | | | 53,432 | | | | | | 10,105 | |
6.000% due 05/25/2031 - 09/01/2037 | | | | | 1,540 | | | | | | 1,696 | |
6.236% due 04/25/2040 •(a) | | | | | 71 | | | | | | 12 | |
6.500% due 01/01/2036 - 05/01/2038 | | | | | 108 | | | | | | 122 | |
6.742% due 05/25/2042 • | | | | | 206 | | | | | | 261 | |
7.000% due 04/01/2037 - 11/01/2038 | | | | | 266 | | | | | | 288 | |
7.016% due 05/25/2036 •(a) | | | | | 1,464 | | | | | | 288 | |
7.500% due 10/01/2037 | | | | | 79 | | | | | | 93 | |
20.460% due 01/25/2036 • | | | | | 151 | | | | | | 217 | |
23.107% due 07/25/2023 • | | | | | 5 | | | | | | 6 | |
|
Freddie Mac | |
0.000% due 01/15/2033 - 07/15/2039 (b)(e) | | | | | 752 | | | | | | 736 | |
3.000% due 01/01/2043 - 04/01/2043 | | | | | 19 | | | | | | 21 | |
3.331% due 06/15/2040 ~(a) | | | | | 15,662 | | | | | | 824 | |
3.500% due 12/15/2028 (a) | | | | | 2,295 | | | | | | 149 | |
3.500% due 10/01/2033 - 04/01/2049 | | | | | 162,184 | | | | | | 172,088 | |
3.678% due 10/01/2036 • | | | | | 1 | | | | | | 1 | |
3.990% due 11/01/2023 • | | | | | 1 | | | | | | 1 | |
4.000% due 09/01/2033 - 06/01/2049 | | | | | 193,010 | | | | | | 205,510 | |
4.130% due 12/01/2031 • | | | | | 68 | | | | | | 69 | |
4.495% due 07/01/2036 • | | | | | 20 | | | | | | 21 | |
4.500% due 02/01/2034 - 02/01/2045 | | | | | 7,768 | | | | | | 8,662 | |
4.845% due 05/15/2041 • | | | | | 2,072 | | | | | | 2,317 | |
5.000% due 03/01/2033 - 07/15/2041 | | | | | 600 | | | | | | 677 | |
5.000% due 08/15/2039 (a) | | | | | 44 | | | | | | 1 | |
5.250% due 04/15/2033 | | | | | 33 | | | | | | 37 | |
5.500% due 01/01/2023 - 10/01/2037 | | | | | 1,889 | | | | | | 2,114 | |
6.000% due 01/01/2034 - 08/01/2037 | | | | | 146 | | | | | | 160 | |
6.500% due 01/01/2037 - 07/01/2037 | | | | | 26 | | | | | | 28 | |
6.758% due 06/15/2042 • | | | | | 2,040 | | | | | | 2,468 | |
8.500% due 12/01/2022 - 03/01/2023 | | | | | 21 | | | | | | 22 | |
9.000% due 12/01/2025 - 08/01/2030 | | | | | 5 | | | | | | 5 | |
9.500% due 01/01/2025 | | | | | 9 | | | | | | 9 | |
9.531% due 01/15/2041 • | | | | | 5,689 | | | | | | 7,419 | |
10.000% due 06/01/2020 - 04/01/2025 | | | | | 2 | | | | | | 2 | |
18.786% due 10/15/2023 • | | | | | 72 | | | | | | 88 | |
19.154% due 05/15/2033 • | | | | | 51 | | | | | | 79 | |
|
Ginnie Mae | |
3.000% due 05/20/2050 | | | | | 8,981 | | | | | | 9,532 | |
3.500% due 12/20/2040 - 03/20/2047 | | | | | 21,102 | | | | | | 22,569 | |
4.000% due 09/20/2040 - 06/15/2047 | | | | | 43,002 | | | | | | 45,944 | |
4.500% due 08/20/2038 - 02/20/2047 | | | | | 3,406 | | | | | | 3,645 | |
4.750% due 01/20/2035 | | | | | 42 | | | | | | 50 | |
5.000% due 03/20/2034 - 05/20/2047 | | | | | 766 | | | | | | 831 | |
5.500% due 04/16/2034 - 11/20/2038 | | | | | 66 | | | | | | 77 | |
6.000% due 08/20/2038 - 02/20/2039 | | | | | 90 | | | | | | 97 | |
6.500% due 12/20/2038 | | | | | 27 | | | | | | 30 | |
| | | | | | |
| See Accompanying Notes | | ANNUAL REPORT | | JUNE 30, 2020 | | 53 |
Schedule of Investments PIMCO Active Bond Exchange-Traded Fund (Cont.)
| | | | | | | | | | | | |
| | | | | PRINCIPAL
AMOUNT
(000S) | | | | | MARKET
VALUE
(000S) | |
|
Ginnie Mae, TBA | |
3.000% due 08/01/2050 | | $ | | | 7,000 | | | $ | | | 7,400 | |
|
Tennessee Valley Authority STRIPS | |
0.000% due 06/15/2038 (e) | | | | | 2,500 | | | | | | 1,676 | |
4.250% due 09/15/2065 | | | | | 10,000 | | | | | | 15,079 | |
|
Uniform Mortgage-Backed Security | |
2.500% due 06/01/2050 - 07/01/2050 | | | | | 79,077 | | | | | | 82,524 | |
3.000% due 03/01/2050 - 07/01/2050 | | | | | 206,975 | | | | | | 218,345 | |
3.500% due 09/01/2045 - 08/01/2049 | | | | | 160,315 | | | | | | 169,598 | |
4.000% due 12/01/2020 - 08/01/2049 | | | | | 190,817 | | | | | | 206,035 | |
4.500% due 08/01/2020 - 02/01/2049 | | | | | 54,071 | | | | | | 58,952 | |
4.750% due 09/01/2033 | | | | | 136 | | | | | | 147 | |
5.000% due 09/01/2020 - 09/01/2025 | | | | | 161 | | | | | | 168 | |
7.000% due 10/01/2020 - 01/01/2023 | | | | | 402 | | | | | | 417 | |
7.500% due 10/01/2021 - 01/01/2022 | | | | | 39 | | | | | | 40 | |
|
Uniform Mortgage-Backed Security, TBA | |
2.000% due 07/01/2050 - 09/01/2050 | | | | | 51,900 | | | | | | 52,851 | |
2.500% due 07/01/2050 - 09/01/2050 | | | | | 279,078 | | | | | | 290,159 | |
| | | | | | | | | | | | |
Total U.S. Government Agencies (Cost $1,578,761) | | | 1,612,242 | |
| | | | | | | | | | | | |
| |
| U.S. TREASURY OBLIGATIONS 7.7% | |
|
U.S. Treasury Bonds | |
2.250% due 08/15/2049 | | | | | 144,600 | | | | | | 173,876 | |
2.375% due 11/15/2049 | | | | | 41,100 | | | | | | 50,752 | |
3.000% due 02/15/2049 (l)(n) | | | | | 2,000 | | | | | | 2,760 | |
|
U.S. Treasury Notes | |
0.625% due 05/15/2030 | | | | | 34,200 | | | | | | 34,101 | |
| | | | | | | | | | | | |
Total U.S. Treasury Obligations (Cost $223,365) | | | 261,489 | |
| | | | | | | | | | | | |
| |
| NON-AGENCY MORTGAGE-BACKED SECURITIES 6.2% | |
|
American Home Mortgage Investment Trust | |
2.015% due 09/25/2045 • | | | | | 9 | | | | | | 9 | |
|
Arbor Multifamily Mortgage Securities Trust | |
2.756% due 05/15/2053 | | | | | 4,600 | | | | | | 4,969 | |
|
BAMLL Commercial Mortgage Securities Trust | |
1.385% due 03/15/2034 • | | | | | 5,385 | | | | | | 5,036 | |
|
Banc of America Alternative Loan Trust | |
6.500% due 04/25/2036 ^ | | | | | 1,128 | | | | | | 1,155 | |
|
Banc of America Funding Trust | |
0.308% due 08/27/2036 ~ | | | | | 8,613 | | | | | | 7,441 | |
|
BBCMS Mortgage Trust | |
4.314% due 12/15/2051 | | | | | 1,000 | | | | | | 1,187 | |
|
BCAP LLC Trust | |
0.335% due 05/25/2047 ^• | | | | | 3,383 | | | | | | 3,047 | |
|
Bear Stearns ALT-A Trust | |
0.825% due 04/25/2034 • | | | | | 29 | | | | | | 28 | |
|
Chase Mortgage Finance Trust | |
6.000% due 05/25/2036 | | | | | 5,211 | | | | | | 3,805 | |
|
ChaseFlex Trust | |
6.500% due 02/25/2037 | | | | | 4,573 | | | | | | 2,558 | |
|
Citigroup Commercial Mortgage Trust | |
3.209% due 05/10/2049 | | | | | 7,800 | | | | | | 8,486 | |
3.778% due 09/10/2058 | | | | | 8,100 | | | | | | 8,996 | |
|
Citigroup Mortgage Loan Trust | |
0.985% due 08/25/2035 ^• | | | | | 916 | | | | | | 823 | |
3.228% due 09/25/2059 þ | | | | | 3,708 | | | | | | 3,734 | |
|
Citigroup Mortgage Loan Trust, Inc.
| |
5.500% due 08/25/2034 | | | | | 2,929 | | | | | | 3,051 | |
|
Countrywide Alternative Loan Trust | |
0.365% due 05/25/2047 • | | | | | 262 | | | | | | 228 | |
0.435% due 06/25/2037 ^• | | | | | 748 | | | | | | 562 | |
0.510% due 12/20/2035 • | | | | | 4,913 | | | | | | 4,447 | |
| | | | | | | | | | | | |
| | | | | PRINCIPAL
AMOUNT
(000S) | | | | | MARKET
VALUE
(000S) | |
5.500% due 07/25/2035 | | $ | | | 1,745 | | | $ | | | 1,544 | |
5.500% due 08/25/2035 | | | | | 551 | | | | | | 543 | |
5.500% due 12/25/2035 | | | | | 1,153 | | | | | | 1,033 | |
5.500% due 02/25/2036 | | | | | 2,294 | | | | | | 2,160 | |
5.750% due 05/25/2036 | | | | | 522 | | | | | | 363 | |
6.000% due 04/25/2037 | | | | | 5,237 | | | | | | 5,255 | |
6.250% due 08/25/2036 | | | | | 459 | | | | | | 373 | |
|
Countrywide Home Loan Mortgage Pass-Through Trust | |
0.725% due 03/25/2035 • | | | | | 116 | | | | | | 111 | |
3.418% due 03/20/2036 ~ | | | | | 1,006 | | | | | | 944 | |
3.681% due 02/20/2036 ~ | | | | | 1,243 | | | | | | 1,178 | |
3.720% due 11/25/2037 ~ | | | | | 4,068 | | | | | | 3,808 | |
|
Countrywide Home Loan Reperforming REMIC Trust
| |
0.525% due 01/25/2036 • | | | | | 2,491 | | | | | | 2,373 | |
|
Credit Suisse First Boston Mortgage Securities Corp. | |
0.835% due 11/25/2031 • | | | | | 36 | | | | | | 24 | |
3.749% due 11/25/2034 ~ | | | | | 35 | | | | | | 35 | |
|
Credit Suisse Mortgage Capital Certificates | |
3.522% due 08/26/2058 | | | | | 4,619 | | | | | | 4,762 | |
6.000% due 07/25/2037 ^ | | | | | 915 | | | | | | 862 | |
|
Credit Suisse Mortgage Capital Mortgage-Backed Trust | |
5.500% due 03/25/2037 | | | | | 1,134 | | | | | | 933 | |
6.421% due 10/25/2037 ~ | | | | | 4,534 | | | | | | 3,866 | |
|
Credit Suisse Mortgage Capital Trust | |
3.092% due 10/27/2059 ~ | | | | | 6,469 | | | | | | 6,712 | |
3.322% due 10/25/2058 ~ | | | | | 3,753 | | | | | | 3,845 | |
|
Deutsche ALT-A Securities, Inc. Mortgage Loan Trust
| |
0.425% due 01/25/2047 • | | | | | 4,372 | | | | | | 3,481 | |
|
Deutsche ALT-B Securities, Inc. Mortgage Loan Trust | |
5.431% due 02/25/2036 ~ | | | | | 222 | | | | | | 218 | |
5.665% due 02/25/2036 ~ | | | | | 2,057 | | | | | | 2,026 | |
| | | | |
Great Hall Mortgages PLC
| | | | | | | | | | | | |
0.438% due 06/18/2039 • | | | | | 2,438 | | | | | | 2,389 | |
| | | | |
GSMPS Mortgage Loan Trust
| | | | | | | | | | | | |
0.535% due 01/25/2036 • | | | | | 2,797 | | | | | | 2,265 | |
| | | | |
GSR Mortgage Loan Trust | | | | | | | | | | | | |
3.852% due 01/25/2036 ~ | | | | | 2,133 | | | | | | 2,078 | |
4.097% due 11/25/2035 ~ | | | | | 17 | | | | | | 16 | |
4.679% due 09/25/2034 ~ | | | | | 251 | | | | | | 245 | |
6.000% due 03/25/2036 | | | | | 5,865 | | | | | | 3,810 | |
6.500% due 05/25/2036 | | | | | 844 | | | | | | 417 | |
| | | | |
HarborView Mortgage Loan Trust | | | | | | | | | | | | |
0.384% due 01/19/2038 • | | | | | 5,057 | | | | | | 4,483 | |
0.399% due 12/19/2036 • | | | | | 2,911 | | | | | | 2,346 | |
0.734% due 03/19/2035 • | | | | | 1,838 | | | | | | 1,762 | |
| | | | |
HomeBanc Mortgage Trust
| | | | | | | | | | | | |
0.515% due 10/25/2035 • | | | | | 930 | | | | | | 935 | |
| | | | |
Impac Secured Assets Trust
| | | | | | | | | | | | |
0.385% due 11/25/2036 • | | | | | 3,772 | | | | | | 3,509 | |
| | | | |
IndyMac Mortgage Loan Trust
| | | | | | | | | | | | |
3.760% due 09/25/2036 ~ | | | | | 2,127 | | | | | | 1,685 | |
| | | | |
JPMorgan Alternative Loan Trust
| | | | | | | | | | | | |
3.824% due 12/25/2035 ^~ | | | | | 738 | | | | | | 609 | |
|
JPMorgan Chase Commercial Mortgage Securities Trust | |
3.648% due 12/15/2049 ~ | | | | | 3,700 | | | | | | 4,148 | |
| | | | |
JPMorgan Mortgage Trust | | | | | | | | | | | | |
3.721% due 07/25/2035 ~ | | | | | 28 | | | | | | 28 | |
3.948% due 02/25/2036 ^~ | | | | | 1,174 | | | | | | 1,020 | |
6.000% due 08/25/2037 ^ | | | | | 1,098 | | | | | | 820 | |
6.500% due 01/25/2036 ^ | | | | | 6,355 | | | | | | 5,207 | |
| | | | |
JPMorgan Resecuritization Trust
| | | | | | | | | | | | |
5.500% due 07/27/2037 ~ | | | | | 14 | | | | | | 14 | |
| | | | |
Legacy Mortgage Asset Trust
| | | | | | | | | | | | |
3.000% due 06/25/2059 þ | | | | | 5,023 | | | | | | 5,069 | |
| | | | |
Lehman XS Trust | | | | | | | | | | | | |
0.375% due 11/25/2046 • | | | | | 4,146 | | | | | | 3,677 | |
2.504% due 11/25/2035 • | | | | | 62 | | | | | | 61 | |
|
MASTR Adjustable Rate Mortgages Trust | |
1.521% due 04/25/2034 ~ | | | | | 1,049 | | | | | | 966 | |
2.427% (US0012M + 1.750%) due 12/25/2035 ~ | | | | | 7,049 | | | | | | 6,801 | |
3.720% due 03/25/2035 ~ | | | | | 599 | | | | | | 595 | |
|
Merrill Lynch Mortgage Investors Trust | |
0.745% due 07/25/2029 • | | | | | 420 | | | | | | 396 | |
3.407% due 05/25/2029 ~ | | | | | 15 | | | | | | 15 | |
| | | | | | | | | | | | |
| | | | | PRINCIPAL
AMOUNT
(000S) | | | | | MARKET
VALUE
(000S) | |
| | | | |
Mill City Mortgage Loan Trust | | | | | | | | | | | | |
2.750% due 07/25/2059 ~ | | $ | | | 6,808 | | | $ | | | 7,130 | |
2.750% due 08/25/2059 ~ | | | | | 1,688 | | | | | | 1,777 | |
|
Morgan Stanley Mortgage Loan Trust | |
3.226% due 06/25/2036 ~ | | | | | 3,939 | | | | | | 3,917 | |
|
Nomura Asset Acceptance Corp. Alternative Loan Trust | |
0.435% due 06/25/2037 • | | | | | 3,759 | | | | | | 2,982 | |
| | | | |
Nomura Resecuritization Trust | | | | | | | | | | | | |
6.500% due 10/26/2037 | | | | | 2,848 | | | | | | 2,116 | |
| | | | |
RBSGC Mortgage Loan Trust
| | | | | | | | | | | | |
0.565% due 12/25/2034 • | | | | | 1,941 | | | | | | 1,628 | |
|
Residential Asset Securitization Trust | |
0.735% due 08/25/2033 • | | | | | 38 | | | | | | 34 | |
5.500% due 08/25/2034 | | | | | 1,922 | | | | | | 2,029 | |
|
Residential Funding Mortgage Securities, Inc. Trust | |
6.000% due 06/25/2036 ^ | | | | | 917 | | | | | | 890 | |
| | | | |
Sequoia Mortgage Trust | | | | | | | | | | | | |
0.540% due 07/20/2033 • | | | | | 36 | | | | | | 34 | |
2.099% due 02/20/2035 • | | | | | 880 | | | | | | 845 | |
|
Thornburg Mortgage Securities Trust | |
1.815% due 06/25/2037 • | | | | | 332 | | | | | | 301 | |
4.085% due 10/25/2046 • | | | | | 2,445 | | | | | | 2,346 | |
| | | | |
Verus Securitization Trust | | | | | | | | | | | | |
3.035% due 04/25/2060 | | | | | 100 | | | | | | 101 | |
3.889% due 04/25/2060 | | | | | 300 | | | | | | 302 | |
|
WaMu Mortgage Pass-Through Certificates Trust | |
2.240% due 10/25/2046 • | | | | | 1,898 | | | | | | 1,685 | |
|
Wells Fargo Commercial Mortgage Trust | |
2.448% due 06/15/2053 | | | | | 13,900 | | | | | | 14,781 | |
3.451% due 02/15/2048 | | | | | 3,500 | | | | | | 3,807 | |
|
Wells Fargo Mortgage-Backed Securities Trust | |
4.120% due 08/25/2036 ^~ | | | | | 575 | | | | | | 545 | |
4.379% due 12/28/2037 ~ | | | | | 3,540 | | | | | | 3,322 | |
| | | | | | | | | | | | |
Total Non-Agency Mortgage-Backed Securities (Cost $214,102) | | | 211,949 | |
| | | | | | | | | | | | |
| |
| ASSET-BACKED SECURITIES 11.0% | |
| | | | |
AASET Trust
| | | | | | | | | | | | |
3.967% due 05/16/2042 | | | | | 2,095 | | | | | | 1,798 | |
| | | | |
AASET U.S. Ltd.
| | | | | | | | | | | | |
3.844% due 01/16/2038 | | | | | 2,569 | | | | | | 2,330 | |
|
ACE Securities Corp. Home Equity Loan Trust
| |
0.435% due 10/25/2036 • | | | | | 5,845 | | | | | | 3,181 | |
| | | | |
Adams Mill CLO Ltd.
| | | | | | | | | | | | |
2.319% due 07/15/2026 • | | | | | 850 | | | | | | 843 | |
|
Aegis Asset-Backed Securities Trust
| |
0.665% due 08/25/2035 • | | | | | 402 | | | | | | 391 | |
| | | | |
ALESCO Preferred Funding Ltd. | | | | | | | | | | | | |
1.055% due 09/23/2038 • | | | | | 3,079 | | | | | | 2,818 | |
2.258% due 12/23/2036 • | | | | | 1,636 | | | | | | 1,481 | |
|
Ameriquest Mortgage Securities, Inc. Asset-Backed Pass-Through Certificates
| |
3.396% due 06/25/2033 • | | | | | 4,483 | | | | | | 4,538 | |
| | | | |
Anchorage Capital CLO Ltd.
| | | | | | | | | | | | |
2.589% due 07/15/2032 • | | | | | 3,000 | | | | | | 2,968 | |
|
Arbor Realty Commercial Real Estate Notes Ltd.
| |
1.335% due 05/15/2037 • | | | | | 6,500 | | | | | | 6,343 | |
| | | | |
Argent Securities Trust
| | | | | | | | | | | | |
0.375% due 03/25/2036 • | | | | | 4,493 | | | | | | 4,074 | |
|
Argent Securities, Inc. Asset-Backed Pass-Through Certificates
| |
0.415% due 01/25/2036 • | | | | | 1,925 | | | | | | 1,758 | |
|
Asset-Backed Funding Certificates Trust | |
0.325% due 10/25/2036 • | | | | | 2,095 | | | | | | 1,953 | |
0.425% due 09/25/2036 • | | | | | 3,913 | | | | | | 3,547 | |
|
Asset-Backed Securities Corp. Home Equity Loan Trust | |
0.995% due 06/25/2034 • | | | | | 3,399 | | | | | | 3,235 | |
3.410% due 08/15/2032 • | | | | | 510 | | | | | | 496 | |
| | | | |
Atrium Corp.
| | | | | | | | | | | | |
1.928% due 04/22/2027 • | | | | | 1,884 | | | | | | 1,854 | |
|
Bayview Opportunity Master Fund Trust
| |
3.475% due 06/28/2034 þ | | | | | 4,049 | | | | | | 4,042 | |
| | | | | | | | |
| 54 | | PIMCO ETF TRUST | | | | | See Accompanying Notes | |
June 30, 2020
| | | | | | | | | | | | |
| | | | | PRINCIPAL
AMOUNT
(000S) | | | | | MARKET
VALUE
(000S) | |
|
Bear Stearns Asset-Backed Securities Trust | |
0.415% due 11/25/2036 • | | $ | | | 3,200 | | | $ | | | 2,377 | |
1.085% due 03/25/2034 • | | | | | 3,055 | | | | | | 2,961 | |
1.160% due 12/25/2034 • | | | | | 2,989 | | | | | | 2,888 | |
1.385% due 08/25/2043 • | | | | | 1,023 | | | | | | 1,020 | |
| | | | |
BlueMountain CLO Ltd.
| | | | | | | | | | | | |
2.635% due 07/18/2027 • | | | | | 1,700 | | | | | | 1,637 | |
| | | | |
Carrington Mortgage Loan Trust | | | | | | | | | | | | |
0.345% due 10/25/2036 • | | | | | 3,446 | | | | | | 2,858 | |
1.235% due 05/25/2035 • | | | | | 5,100 | | | | | | 4,744 | |
|
Castlelake Aircraft Securitization Trust
| |
4.125% due 06/15/2043 | | | | | 1,622 | | | | | | 1,530 | |
| | | | |
Cent CLO Ltd.
| | | | | | | | | | | | |
2.869% due 10/15/2026 • | | | | | 2,000 | | | | | | 1,951 | |
| | | | |
CIT Mortgage Loan Trust | | | | | | | | | | | | |
1.535% due 10/25/2037 • | | | | | 2,538 | | | | | | 2,536 | |
1.685% due 10/25/2037 • | | | | | 5,000 | | | | | | 4,794 | |
| | | | |
Citigroup Mortgage Loan Trust | | | | | | | | | | | | |
0.345% due 09/25/2036 • | | | | | 1,610 | | | | | | 1,373 | |
6.164% due 05/25/2036 þ | | | | | 5,299 | | | | | | 2,744 | |
|
Citigroup Mortgage Loan Trust Asset-Backed Pass-Through Certificates
| |
1.160% due 05/25/2035 • | | | | | 7,301 | | | | | | 6,840 | |
|
Citigroup Mortgage Loan Trust, Inc.
| |
0.445% due 03/25/2037 • | | | | | 357 | | | | | | 318 | |
| | | | |
CLNC FL1 Ltd.
| | | | | | | | | | | | |
1.444% due 08/20/2035 • | | | | | 5,000 | | | | | | 4,881 | |
|
Countrywide Asset-Backed Certificates | |
0.405% due 09/25/2037 ^• | | | | | 2,912 | | | | | | 2,483 | |
0.415% due 04/25/2047 • | | | | | 6,800 | | | | | | 5,273 | |
1.460% due 10/25/2034 • | | | | | 279 | | | | | | 276 | |
|
Countrywide Asset-Backed Certificates Trust, Inc.
| |
1.235% due 09/25/2034 • | | | | | 1,590 | | | | | | 1,553 | |
|
Credit Suisse Mortgage Capital Trust
| |
4.125% due 07/25/2058 ~ | | | | | 1,700 | | | | | | 1,758 | |
| | | | |
EMC Mortgage Loan Trust
| | | | | | | | | | | | |
1.285% due 08/25/2040 • | | | | | 1,758 | | | | | | 1,697 | |
|
First Franklin Mortgage Loan Asset-Backed Certificates | |
1.010% due 05/25/2034 • | | | | | 2,722 | | | | | | 2,652 | |
| | | | |
First Franklin Mortgage Loan Trust | | | | | | | | | | | | |
0.345% due 10/25/2036 • | | | | | 4,868 | | | | | | 3,568 | |
0.485% due 11/25/2035 • | | | | | 456 | | | | | | 439 | |
| | | | |
Flagship CLO Ltd.
| | | | | | | | | | | | |
2.026% due 01/16/2026 • | | | | | 2,869 | | | | | | 2,851 | |
| | | | |
Fremont Home Loan Trust
| | | | | | | | | | | | |
1.235% due 11/25/2034 • | | | | | 636 | | | | | | 621 | |
| | | | |
GSAA Home Equity Trust
| | | | | | | | | | | | |
0.405% due 03/25/2047 • | | | | | 3,749 | | | | | | 1,867 | |
| | | | |
GSAMP Trust
| | | | | | | | | | | | |
0.935% due 01/25/2034 • | | | | | 1,459 | | | | | | 1,378 | |
|
Halcyon Loan Advisors Funding Ltd. | |
2.055% due 04/20/2027 • | | | | | 985 | | | | | | 975 | |
2.198% due 10/22/2025 • | | | | | 1,541 | | | | | | 1,539 | |
| | | | |
Home Equity Asset Trust
| | | | | | | | | | | | |
0.425% due 08/25/2037 • | | | | | 2,612 | | | | | | 2,497 | |
|
Home Equity Mortgage Loan Asset-Backed Trust | |
0.375% due 07/25/2037 • | | | | | 9,561 | | | | | | 4,758 | |
0.425% due 11/25/2036 • | | | | | 6,800 | | | | | | 5,780 | |
| | | | |
Horizon Aircraft Finance Ltd.
| | | | | | | | | | | | |
3.721% due 07/15/2039 | | | | | 4,725 | | | | | | 4,204 | |
| | | | |
IXIS Real Estate Capital Trust
| | | | | | | | | | | | |
0.815% due 02/25/2036 • | | | | | 3,157 | | | | | | 3,149 | |
| | | | |
Jamestown CLO Ltd.
| | | | | | | | | | | | |
1.909% due 07/15/2026 • | | | | | 325 | | | | | | 324 | |
|
JPMorgan Mortgage Acquisition Corp.
| |
0.575% due 05/25/2035 • | | | | | 6,000 | | | | | | 5,897 | |
|
JPMorgan Mortgage Acquisition Trust | |
0.485% due 07/25/2036 • | | | | | 1,510 | | | | | | 1,333 | |
0.565% due 07/25/2036 • | | | | | 1,100 | | | | | | 1,001 | |
| | | | |
KDAC Aviation Finance Ltd.
| | | | | | | | | | | | |
4.212% due 12/15/2042 | | | | | 4,236 | | | | | | 3,657 | |
| | | | |
Legacy Mortgage Asset Trust | | | | | | | | | | | | |
3.438% due 05/25/2059 þ | | | | | 4,673 | | | | | | 4,711 | |
3.750% due 04/25/2059 þ | | | | | 8,229 | | | | | | 8,436 | |
| | | | | | | | | | | | |
| | | | | PRINCIPAL
AMOUNT
(000S) | | | | | MARKET
VALUE
(000S) | |
| | | | |
Lehman XS Trust | | | | | | | | | | | | |
0.355% due 12/25/2036 • | | $ | | | 520 | | | $ | | | 580 | |
5.019% due 06/25/2036 þ | | | | | 3,064 | | | | | | 3,129 | |
5.760% due 11/25/2035 þ | | | | | 4,550 | | | | | | 2,935 | |
| | | | |
Long Beach Mortgage Loan Trust
| | | | | | | | | | | | |
1.085% due 06/25/2035 • | | | | | 3,422 | | | | | | 3,410 | |
| | | | |
Loomis Sayles CLO Ltd.
| | | | | | | | | | | | |
2.119% due 04/15/2028 • | | | | | 5,461 | | | | | | 5,321 | |
| | | | |
Lunar Aircraft Ltd.
| | | | | | | | | | | | |
3.376% due 02/15/2045 | | | | | 4,867 | | | | | | 4,516 | |
| | | | |
M360 Advisors LLC
| | | | | | | | | | | | |
4.395% due 07/24/2028 | | | | | 2,718 | | | | | | 2,716 | |
| | | | |
Mariner CLO Ltd.
| | | | | | | | | | | | |
2.101% due 04/25/2031 • | | | | | 3,750 | | | | | | 3,689 | |
|
Merrill Lynch Mortgage Investors Trust
| |
4.180% due 02/25/2037 ^þ | | | | | 13,311 | | | | | | 2,715 | |
| | | | |
METAL LLC
| | | | | | | | | | | | |
4.581% due 10/15/2042 | | | | | 3,084 | | | | | | 2,297 | |
| | | | |
Mid-State Capital Corp. Trust
| | | | | | | | | | | | |
6.005% due 08/15/2037 | | | | | 24 | | | | | | 26 | |
| | | | |
Mid-State Trust
| | | | | | | | | | | | |
6.340% due 12/15/2036 | | | | | 3,456 | | | | | | 3,666 | |
|
Morgan Stanley ABS Capital, Inc. Trust | |
0.255% due 10/25/2036 • | | | | | 91 | | | | | | 47 | |
0.315% due 01/25/2037 • | | | | | 2,199 | | | | | | 1,236 | |
0.325% due 05/25/2037 • | | | | | 173 | | | | | | 150 | |
0.405% due 11/25/2036 • | | | | | 3,652 | | | | | | 2,136 | |
0.435% due 07/25/2036 • | | | | | 1,822 | | | | | | 960 | |
0.435% due 08/25/2036 • | | | | | 17,044 | | | | | | 9,957 | |
0.965% due 01/25/2035 • | | | | | 270 | | | | | | 261 | |
1.435% due 07/25/2037 • | | | | | 6,420 | | | | | | 5,449 | |
|
Morgan Stanley Mortgage Loan Trust
| |
5.965% due 09/25/2046 ^þ | | | | | 3,473 | | | | | | 1,792 | |
| | | | |
Mountain View CLO Ltd. | | | | | | | | | | | | |
2.019% due 10/15/2026 • | | | | | 3,070 | | | | | | 3,030 | |
2.266% due 10/16/2029 • | | | | | 3,600 | | | | | | 3,521 | |
|
Nomura Home Equity Loan, Inc. Home Equity Loan Trust
| |
0.695% due 05/25/2035 • | | | | | 1,300 | | | | | | 1,165 | |
| | | | |
Option One Mortgage Loan Trust | | | | | | | | | | | | |
0.365% due 04/25/2037 • | | | | | 2,736 | | | | | | 1,727 | |
| | | | |
Palmer Square Loan Funding Ltd. | | | | | | | | | | | | |
1.177% due 02/20/2028 • | | | | | 8,415 | | | | | | 8,292 | |
1.227% due 08/20/2027 • | | | | | 7,576 | | | | | | 7,503 | |
| | | | |
Raptor Aircraft Finance LLC
| | | | | | | | | | | | |
4.213% due 08/23/2044 | | | | | 2,319 | | | | | | 1,931 | |
|
Renaissance Home Equity Loan Trust | |
0.565% due 11/25/2035 • | | | | | 1,038 | | | | | | 922 | |
5.586% due 11/25/2036 þ | | | | | 683 | | | | | | 359 | |
6.120% due 11/25/2036 þ | | | | | 1,204 | | | | | | 690 | |
|
Residential Asset Mortgage Products Trust
| |
2.210% due 03/25/2032 • | | | | | 1,221 | | | | | | 1,143 | |
|
Residential Asset Securities Corp. Trust | |
0.335% due 07/25/2036 • | | | | | 1,234 | | | | | | 1,206 | |
0.405% due 02/25/2037 • | | | | | 5,500 | | | | | | 4,961 | |
| | | | |
S-Jets Ltd.
| | | | | | | | | | | | |
3.967% due 08/15/2042 | | | | | 5,084 | | | | | | 4,549 | |
|
Santander Retail Auto Lease Trust
| |
2.510% due 01/26/2032 | | | | | 3,500 | | | | | | 3,665 | |
| | | | |
Sapphire Aviation Finance Ltd.
| | | | | | | | | | | | |
4.250% due 03/15/2040 | | | | | 3,641 | | | | | | 3,288 | |
| | | | |
Saxon Asset Securities Trust | | | | | | | | | | | | |
0.965% due 05/25/2035 • | | | | | 595 | | | | | | 525 | |
0.980% due 03/25/2035 ^• | | | | | 1,067 | | | | | | 1,025 | |
1.935% due 12/25/2037 • | | | | | 1,095 | | | | | | 1,068 | |
|
Securitized Asset-Backed Receivables LLC Trust
| |
0.475% due 12/25/2035 • | | | | | 4,022 | | | | | | 3,887 | |
|
SLM Private Credit Student Loan Trust
| |
0.583% due 12/15/2039 • | | | | | 4,005 | | | | | | 3,699 | |
| | | | |
SLM Student Loan Trust | | | | | | | | | | | | |
1.741% due 04/25/2023 • | | | | | 3,197 | | | | | | 2,986 | |
1.891% due 07/25/2023 • | | | | | 4,925 | | | | | | 4,662 | |
2.491% due 04/25/2023 • | | | | | 3,453 | | | | | | 3,408 | |
2.691% due 07/25/2023 • | | | | | 2,316 | | | | | | 2,280 | |
| | | | | | | | | | | | |
| | | | | PRINCIPAL
AMOUNT
(000S) | | | | | MARKET
VALUE
(000S) | |
| | | | |
Soundview Home Loan Trust
| | | | | | | | | | | | |
0.435% due 07/25/2037 • | | $ | | | 2,831 | | | $ | | | 2,333 | |
|
Specialty Underwriting & Residential Finance Trust | |
1.790% due 02/25/2035 • | | | | | 256 | | | | | | 256 | |
|
SpringCastle Funding Asset-Backed Notes
| |
3.200% due 05/27/2036 | | | | | 3,482 | | | | | | 3,526 | |
| | | | |
Sprite Ltd.
| | | | | | | | | | | | |
4.250% due 12/15/2037 | | | | | 4,564 | | | | | | 3,826 | |
|
Stanwich Mortgage Loan Co. LLC
| |
3.375% due 08/15/2024 þ | | | | | 3,631 | | | | | | 3,663 | |
|
Structured Asset Investment Loan Trust | |
0.605% due 11/25/2035 • | | | | | 4,100 | | | | | | 4,019 | |
0.890% due 03/25/2034 • | | | | | 3,818 | | | | | | 3,660 | |
|
Structured Asset Securities Corp. Mortgage Loan Trust
| |
1.055% due 07/25/2035 • | | | | | 3,693 | | | | | | 3,525 | |
|
THL Credit Wind River CLO Ltd.
| |
2.099% due 01/15/2026 • | | | | | 1,808 | | | | | | 1,801 | |
| | | | |
TICP CLO Ltd.
| | | | | | | | | | | | |
1.975% due 04/20/2028 • | | | | | 8,700 | | | | | | 8,575 | |
| | | | |
Tralee CLO Ltd.
| | | | | | | | | | | | |
2.165% due 10/20/2027 • | | | | | 5,844 | | | | | | 5,769 | |
| | | | |
Venture CLO Ltd. | | | | | | | | | | | | |
1.171% due 02/28/2026 • | | | | | 1,341 | | | | | | 1,323 | |
1.401% due 08/28/2029 • | | | | | 13,000 | | | | | | 12,700 | |
2.099% due 04/15/2027 • | | | | | 8,931 | | | | | | 8,775 | |
2.365% due 04/20/2029 • | | | | | 4,000 | | | | | | 3,940 | |
|
WaMu Asset-Backed Certificates WaMu Trust
| |
0.410% due 05/25/2037 • | | | | | 3,258 | | | | | | 2,978 | |
| | | | |
WAVE LLC
| | | | | | | | | | | | |
3.597% due 09/15/2044 | | | | | 4,779 | | | | | | 4,409 | |
|
Wells Fargo Home Equity Asset-Backed Securities Trust | |
0.685% due 12/25/2035 • | | | | | 3,100 | | | | | | 2,927 | |
2.735% due 04/25/2035 • | | | | | 131 | | | | | | 130 | |
| | | | |
WhiteHorse Ltd.
| | | | | | | | | | | | |
2.295% due 07/17/2026 • | | | | | 883 | | | | | | 881 | |
| | | | | | | | | | | | |
Total Asset-Backed Securities (Cost $379,615) | | | 375,275 | |
| | | | | | | | | | | | |
| |
| SOVEREIGN ISSUES 0.6% | |
|
Mexico Government International Bond
| |
5.750% due 10/12/2110 | | | | | 4,000 | | | | | | 4,447 | |
|
Qatar Government International Bond | |
3.875% due 04/23/2023 | | | | | 4,000 | | | | | | 4,299 | |
4.817% due 03/14/2049 | | | | | 250 | | | | | | 330 | |
|
Saudi Government International Bond | |
4.000% due 04/17/2025 | | | | | 9,500 | | | | | | 10,554 | |
| | | | | | | | | | | | |
Total Sovereign Issues (Cost $17,956) | | | 19,630 | |
| | | | | | | | | | | | |
| |
| | | | | SHARES | | | | | | |
| PREFERRED SECURITIES 1.2% | |
| |
| BANKING & FINANCE 0.9% | |
|
Bank of America Corp. | |
5.875% due 03/15/2028 •(g) | | | | | 5,300,000 | | | | | | 5,425 | |
|
Charles Schwab Corp. | |
5.000% due 12/01/2027 •(g) | | | | | 5,500,000 | | | | | | 5,422 | |
|
JPMorgan Chase & Co. | |
5.000% due 08/01/2024 •(g) | | | | | 4,100,000 | | | | | | 3,947 | |
6.100% due 10/01/2024 •(g) | | | | | 7,700,000 | | | | | | 7,896 | |
|
MetLife, Inc. | |
3.888% due 07/31/2020 ~(g) | | | | | 500,000 | | | | | | 452 | |
|
State Street Corp. | |
5.625% due 12/15/2023 •(g) | | | | | 5,000,000 | | | | | | 4,856 | |
|
U.S. Bancorp | |
5.300% due 04/15/2027 •(g) | | | | | 700,000 | | | | | | 707 | |
|
Wells Fargo & Co. | |
5.875% due 06/15/2025 •(g) | | | | | 700,000 | | | | | | 729 | |
| | | | | | | | | | | | |
| | | | | | | | | | | 29,434 | |
| | | | | | | | | | | | |
| |
| | | | | | |
| See Accompanying Notes | | ANNUAL REPORT | | JUNE 30, 2020 | | 55 |
Schedule of Investments PIMCO Active Bond Exchange-Traded Fund (Cont.)
| | | | | | | | | | | | |
| | | | | SHARES | | | | | MARKET
VALUE
(000S) | |
| INDUSTRIALS 0.3% | |
|
Energy Transfer Operating LP | |
6.750% due 05/15/2025 •(g) | | | | | 3,000,000 | | | $ | | | 2,526 | |
|
General Electric Co. | |
5.000% due 01/21/2021 •(g) | | | | | 9,200,000 | | | | | | 7,237 | |
| | | | | | | | | | | | |
| | | | | | | | | | | 9,763 | |
| | | | | | | | | | | | |
Total Preferred Securities (Cost $41,440) | | | 39,197 | |
| | | | | | | | | | | | |
| |
| | | | | PRINCIPAL
AMOUNT
(000S) | | | | | | |
| SHORT-TERM INSTRUMENTS 6.6% | |
| |
| REPURCHASE AGREEMENTS (j) 4.2% | |
| | | | | | | | | | | 142,487 | |
| | | | | | | | | | | | |
| |
| U.S. TREASURY BILLS 1.7% | |
0.114% due 07/09/2020 - 08/20/2020 (d)(e)(n) | | $ | | | 56,500 | | | | | | 56,496 | |
| | | | | | | | | | | | |
| | | | | | | | | | | | |
| | | | | PRINCIPAL
AMOUNT
(000S) | | | | | MARKET
VALUE
(000S) | |
| U.S. TREASURY CASH MANAGEMENT BILLS 0.7% | |
0.133% due 09/22/2020 (e)(f) | | $ | | | 25,200 | | | $ | | | 25,193 | |
| | | | | | | | | | | | |
Total Short-Term Instruments (Cost $224,175) | | | | | | 224,176 | |
| | | | | | | | | | | | |
| | | | |
| | | | | | | | | | | | |
Total Investments in Securities (Cost $3,791,772) | | | | | | 3,932,251 | |
| | | | |
| | | | | | | | | | | | |
Total Investments 115.6% (Cost $3,791,772) | | | $ | | | 3,932,251 | |
| |
Financial Derivative
Instruments (k)(m) (0.0)% (Cost or Premiums, net $(33)) | | | | | | (387 | ) |
| |
Other Assets and Liabilities,
net (15.6)% | | | | | | (531,160 | ) |
| | | | | | | | | | | | |
| Net Assets 100.0% | | | | | | | | $ | | | 3,400,704 | |
| | | | | | | | | | | | |
NOTES TO SCHEDULE OF INVESTMENTS:
| * | A zero balance may reflect actual amounts rounding to less than one thousand. |
| « | Security valued using significant unobservable inputs (Level 3). |
| ~ | Variable or Floating rate security. Rate shown is the rate in effect as of period end. Certain variable rate securities are not based on a published reference rate and spread, rather are determined by the issuer or agent and are based on current market conditions. Reference rate is as of reset date, which may vary by security. These securities may not indicate a reference rate and/or spread in their description. |
| • | Rate shown is the rate in effect as of period end. The rate may be based on a fixed rate, a capped rate or a floor rate and may convert to a variable or floating rate in the future. These securities do not indicate a reference rate and spread in their description. |
| þ | Coupon represents a rate which changes periodically based on a predetermined schedule or event. Rate shown is the rate in effect as of period end. |
| (a) | Security is an Interest Only (“IO”) or IO Strip. |
| (b) | Principal only security. |
| (c) | Security is not accruing income as of the date of this report. |
| (d) | Coupon represents a weighted average yield to maturity. |
| (f) | Coupon represents a yield to maturity. |
| (g) | Perpetual maturity; date shown, if applicable, represents next contractual call date. |
| (h) | Contingent convertible security. |
(i) RESTRICTED SECURITIES:
| | | | | | | | | | | | | | | | | | | | | | |
| Issuer Description | | Coupon | | Maturity
Date | | | Acquisition
Date | | | Cost | | | Market
Value | | | Market Value
as Percentage
of Net Assets | |
Morgan Stanley | | 7.500% | | | 04/02/2032 | | | | 02/11/2020 | | | | $ 7,660 | | | $ | 7,820 | | | | 0.23% | |
| | | | | | | | | | | | | | | | | | | | | | |
BORROWINGS AND OTHER FINANCING TRANSACTIONS
(j) REPURCHASE AGREEMENTS:
| | | | | | | | | | | | | | | | | | | | | | | | | | | | | | |
| Counterparty | | Lending
Rate | | | Settlement
Date | | | Maturity
Date | | | Principal
Amount | | | Collateralized By | | Collateral
(Received) | | | Repurchase
Agreements,
at Value | | | Repurchase
Agreement
Proceeds
to be
Received(1) | |
| BOS | | | 0.120 | % | | | 06/30/2020 | | | | 07/01/2020 | | | $ | 59,800 | | | U.S. Treasury Notes 1.500% due 09/30/2024 | | $ | (60,981 | ) | | $ | 59,800 | | | $ | 59,800 | |
| FICC | | | 0.000 | | | | 06/30/2020 | | | | 07/01/2020 | | | | 3,587 | | | U.S. Treasury Inflation Protected Securities 0.125% due 07/15/2024 | | | (3,659 | ) | | | 3,587 | | | | 3,587 | |
| JPS | | | 0.120 | | | | 07/01/2020 | | | | 07/02/2020 | | | | 52,900 | | | U.S. Treasury Bonds 3.000% due 11/15/2044 | | | (54,024 | ) | | | 52,900 | | | | 52,900 | |
| MBC | | | 0.130 | | | | 06/30/2020 | | | | 07/01/2020 | | | | 26,200 | | | U.S. Treasury Notes 1.625% due 06/30/2021 | | | (27,041 | ) | | | 26,200 | | | | 26,200 | |
| | | | | | | | | | | | | | | | | | | | | | | | | | | | | | |
Total Repurchase Agreements | | | | | $ | (145,705 | ) | | $ | 142,487 | | | $ | 142,487 | |
| | | | | | | | | | | | | | | |
| | | | | | | | |
| 56 | | PIMCO ETF TRUST | | | | | See Accompanying Notes | |
June 30, 2020
BORROWINGS AND OTHER FINANCING TRANSACTIONS SUMMARY
The following is a summary by counterparty of the market value of Borrowings and Other Financing Transactions and collateral pledged/(received) as of June 30, 2020:
| | | | | | | | | | | | | | | | | | | | | | | | | | | | |
| Counterparty | | Repurchase
Agreement
Proceeds
to be
Received(1) | | | Payable for
Reverse
Repurchase
Agreements | | | Payable for
Sale-Buyback
Transactions | | | Securities
Out on Loan | | | Total
Borrowings and
Other Financing
Transactions | | | Collateral
Pledged/(Received) | | | Net Exposure(2) | |
Global/Master Repurchase Agreement | | | | | | | | | | | | | | | | | | | | | | | | | | | | |
BOS | | $ | 59,800 | | | $ | 0 | | | $ | 0 | | | | | | | $ | 59,800 | | | $ | (60,981 | ) | | $ | (1,181 | ) |
FICC | | | 3,587 | | | | 0 | | | | 0 | | | | | | | | 3,587 | | | | (3,659 | ) | | | (72 | ) |
JPS | | | 52,900 | | | | 0 | | | | 0 | | | | | | | | 52,900 | | | | (54,024 | ) | | | (1,124 | ) |
MBC | | | 26,200 | | | | 0 | | | | 0 | | | | | | | | 26,200 | | | | (27,041 | ) | | | (841 | ) |
| | | | | | | | | | | | | | | | | | | | | | | | | | | | |
Total Borrowings and Other Financing Transactions | | $ | 142,487 | | | $ | 0 | | | $ | 0 | | | | | | | | | | | | | | | | | |
| | | | | | | | | | | | | | | | | | | | | | | | | | | | |
| (1) | Includes accrued interest. |
| (2) | Net Exposure represents the net receivable/(payable) that would be due from/to the counterparty in the event of default. Exposure from borrowings and other financing transactions can only be netted across transactions governed under the same master agreement with the same legal entity. See Note 8, Master Netting Arrangements, in the Notes to Financial Statements for more information. |
The average amount of borrowings outstanding during the period ended June 30, 2020 was $(40,536) at a weighted average interest rate of 1.402%. Average borrowings may include reverse repurchase agreements and sale-buyback transactions, if held during the period.
(k) FINANCIAL DERIVATIVE INSTRUMENTS: EXCHANGE-TRADED OR CENTRALLY CLEARED
FUTURES CONTRACTS:
SHORT FUTURES CONTRACTS
| | | | | | | | | | | | | | | | | | | | | | | | | | | | |
| Description | | Expiration
Month | | | # of
Contracts | | | Notional
Amount | | | Unrealized
Appreciation/
(Depreciation) | | | Variation Margin | |
| | Asset | | | Liability | |
U.S. Treasury 10-Year Ultra September Futures | | | 09/2020 | | | | 281 | | | | | | | $ | (44,253 | ) | | $ | (234 | ) | | $ | 70 | | | $ | 0 | |
| | | | | | | | | | | | | | | | | | | | | | | | | | | | |
Total Futures Contracts | | | $ | (234 | ) | | $ | 70 | | | $ | 0 | |
| | | | | | | | | | | | | |
SWAP AGREEMENTS:
INTEREST RATE SWAPS
| | | | | | | | | | | | | | | | | | | | | | | | | | | | | | | | | | | | | | |
Pay/Receive
Floating Rate | | Floating Rate Index | | Fixed Rate | | | Payment
Frequency | | | Maturity
Date | | | Notional
Amount | | | Premiums
Paid/(Received) | | | Unrealized
Appreciation/
(Depreciation) | | | Market
Value | | | Variation Margin | |
| | Asset | | | Liability | |
Pay | | 3-Month CAD-Bank Bill | | | 1.275 | % | | | Semi-Annual | | | | 03/03/2025 | | | | CAD 46,700 | | | $ | 0 | | | $ | 836 | | | $ | 836 | | | $ | 0 | | | $ | (30 | ) |
Pay | | 3-Month CAD-Bank Bill | | | 1.276 | | | | Semi-Annual | | | | 03/03/2025 | | | | 28,000 | | | | 0 | | | | 502 | | | | 502 | | | | 0 | | | | (18 | ) |
Pay | | 3-Month CAD-Bank Bill | | | 1.290 | | | | Semi-Annual | | | | 03/03/2025 | | | | 14,000 | | | | 0 | | | | 258 | | | | 258 | | | | 0 | | | | (9 | ) |
Pay | | 3-Month CAD-Bank Bill | | | 1.235 | | | | Semi-Annual | | | | 03/04/2025 | | | | 42,400 | | | | 29 | | | | 682 | | | | 711 | | | | 0 | | | | (27 | ) |
Pay | | 3-Month CAD-Bank Bill | | | 1.900 | | | | Semi-Annual | | | | 12/18/2029 | | | | 3,500 | | | | 147 | | | | 71 | | | | 218 | | | | 0 | | | | (6 | ) |
| | | | | | | | | | | | | | | | | | | | | |
Total Swap Agreements | | | $ | 176 | | | $ | 2,349 | | | $ | 2,525 | | | $ | 0 | | | $ | (90 | ) |
| | | | | | | | | | | | | | | | | | | | | |
FINANCIAL DERIVATIVE INSTRUMENTS: EXCHANGE-TRADED OR CENTRALLY CLEARED SUMMARY
The following is a summary of the market value and variation margin of Exchange-Traded or Centrally Cleared Financial Derivative Instruments as of June 30, 2020:
| | | | | | | | | | | | | | | | | | | | | | | | | | | | | | | | | | | | |
| | | Financial Derivative Assets | | | | | | Financial Derivative Liabilities | |
| | | Market Value | | | Variation Margin
Asset | | | Total | | | | | | Market Value | | | Variation Margin
Liability | | | Total | |
| | | Purchased
Options | | | Futures | | | Swap
Agreements | | | | | | Written
Options | | | Futures | | | Swap
Agreements | |
Total Exchange-Traded or Centrally Cleared | | $ | 0 | | | $ | 70 | | | $ | 0 | | | $ | 70 | | | | | | | $ | 0 | | | $ | 0 | | | $ | | (90) | | $ | (90 | ) |
| | | | | | | | | | | | | | | | | | | | | | | | | | | | | | | | | | | | |
| (l) | Securities with an aggregate market value of $1,930 and cash of $4,675 have been pledged as collateral for exchange-traded and centrally cleared financial derivative instruments as of June 30, 2020. See Note 8, Master Netting Arrangements, in the Notes to Financial Statements for more information. |
| | | | | | |
| See Accompanying Notes | | ANNUAL REPORT | | JUNE 30, 2020 | | 57 |
Schedule of Investments PIMCO Active Bond Exchange-Traded Fund (Cont.)
(m) FINANCIAL DERIVATIVE INSTRUMENTS: OVER THE COUNTER
FORWARD FOREIGN CURRENCY CONTRACTS:
| | | | | | | | | | | | | | | | | | | | | | | | |
| Counterparty | | Settlement
Month | | | Currency to
be Delivered | | | Currency to
be Received | | | Unrealized Appreciation/ (Depreciation) | |
| | Asset | | | Liability | |
BPS | | | 07/2020 | | | EUR | | | 354 | | | $ | | | 394 | | | $ | 0 | | | $ | (4 | ) |
| | | | | | | | | | | | | | | | | | | | | | | | |
Total Forward Foreign Currency Contracts | | | $ | 0 | | | $ | (4 | ) |
| | | | | | | | | | | | | | | | | | | | | | | | |
SWAP AGREEMENTS:
CREDIT DEFAULT SWAPS ON CORPORATE ISSUES - SELL PROTECTION(1)
| | | | | | | | | | | | | | | | | | | | | | | | | | | | | | | | | | | | | | |
Counterparty | | Reference Entity | | Fixed
Receive Rate | | | Payment
Frequency | | | Maturity
Date | | | Implied
Credit Spread at
June 30, 2020(2) | | | Notional
Amount(3) | | | Premiums
Paid/(Received) | | | Unrealized
Appreciation/
(Depreciation) | | | Swap Agreements,
at Value(4) | |
| | Asset | | | Liability | |
| CBK | | Petroleos Mexicanos | | | 1.000 | % | | | Quarterly | | | | 06/20/2022 | | | | 5.084 | % | | $ | 5,000 | | | $ | (252 | ) | | $ | (129 | ) | | $ | 0 | | | $ | (381 | ) |
| | | | | | | | | | |
| GST | | Springleaf Finance Corp. | | | 5.000 | | | | Quarterly | | | | 06/20/2022 | | | | 3.169 | | | | 500 | | | | 43 | | | | (25 | ) | | | 18 | | | | 0 | |
| | | | | | | | | | | | | | | | | | | | | | | | | | | | | | | | | | | | | | |
Total Swap Agreements | | | $ | (209 | ) | | $ | (154 | ) | | $ | 18 | | | $ | (381 | ) |
| | | | | | | | | | | | | | | | | | | | | | | | | | | | | | | | | | | | | | |
FINANCIAL DERIVATIVE INSTRUMENTS: OVER THE COUNTER SUMMARY
The following is a summary by counterparty of the market value of OTC financial derivative instruments and collateral pledged/(received) as of June 30, 2020:
| | | | | | | | | | | | | | | | | | | | | | | | | | | | | | | | | | | | | | | | | | | | | | | | |
| | | Financial Derivative Assets | | | | | | Financial Derivative Liabilities | | | | | | | | | | |
| Counterparty | | Forward
Foreign
Currency
Contracts | | | Purchased
Options | | | Swap
Agreements | | | Total
Over the
Counter | | | | | | Forward
Foreign
Currency
Contracts | | | Written
Options | | | Swap
Agreements | | | Total
Over the
Counter | | | Net Market
Value of OTC
Derivatives | | | Collateral
Pledged/
(Received) | | | Net
Exposure(5) | |
BPS | | $ | 0 | | | $ | 0 | | | $ | 0 | | | $ | 0 | | | | | | | $ | (4 | ) | | $ | 0 | | | $ | 0 | | | $ | (4 | ) | | $ | (4 | ) | | $ | 4 | | | $ | 0 | |
CBK | | | 0 | | | | 0 | | | | 0 | | | | 0 | | | | | | | | 0 | | | | 0 | | | | (381 | ) | | | (381 | ) | | | (381 | ) | | | 455 | | | | 74 | |
DUB | | | 0 | | | | 0 | | | | 0 | | | | 0 | | | | | | | | 0 | | | | 0 | | | | 0 | | | | 0 | | | | 0 | | | | (10 | ) | | | (10 | ) |
GST | | | 0 | | | | 0 | | | | 18 | | | | 18 | | | | | | | | 0 | | | | 0 | | | | 0 | | | | 0 | | | | 18 | | | | 0 | | | | 18 | |
| | | | | | | | | | | | | | | | | | | | | | | | | | | | | | | | | | | | | | | | | | | | | | | | |
Total Over the Counter | | $ | 0 | | | $ | 0 | | | $ | 18 | | | $ | 18 | | | | | | | $ | (4 | ) | | $ | 0 | | | $ | (381 | ) | | $ | (385 | ) | | | | | | | | | | | | |
| | | | | | | | | | | | | | | | | | | | | | | | | | | | | | | | | | | | | | | | | | | | | | | | |
| (n) | Securities with an aggregate market value of $459 have been pledged as collateral for financial derivative instruments as governed by International Swaps and Derivatives Association, Inc. master agreements as of June 30, 2020. |
| (1) | If the Fund is a seller of protection and a credit event occurs, as defined under the terms of that particular swap agreement, the Fund will either (i) pay to the buyer of protection an amount equal to the notional amount of the swap and take delivery of the referenced obligation or underlying securities comprising the referenced index or (ii) pay a net settlement amount in the form of cash, securities or other deliverable obligations equal to the notional amount of the swap less the recovery value of the referenced obligation or underlying securities comprising the referenced index. |
| (2) | Implied credit spreads, represented in absolute terms, utilized in determining the market value of credit default swap agreements on corporate issues as of period end serve as indicators of the current status of the payment/performance risk and represent the likelihood or risk of default for the credit derivative. The implied credit spread of a particular referenced entity reflects the cost of buying/selling protection and may include upfront payments required to be made to enter into the agreement. Wider credit spreads represent a deterioration of the referenced entity’s credit soundness and a greater likelihood or risk of default or other credit event occurring as defined under the terms of the agreement. |
| (3) | The maximum potential amount the Fund could be required to pay as a seller of credit protection or receive as a buyer of credit protection if a credit event occurs as defined under the terms of that particular swap agreement. |
| (4) | The prices and resulting values for credit default swap agreements serve as indicators of the current status of the payment/performance risk and represent the likelihood of an expected liability (or profit) for the credit derivative should the notional amount of the swap agreement be closed/sold as of the period end. Increasing market values, in absolute terms when compared to the notional amount of the swap, represent a deterioration of the underlying referenced instrument’s credit soundness and a greater likelihood or risk of default or other credit event occurring as defined under the terms of the agreement. |
| (5) | Net Exposure represents the net receivable/(payable) that would be due from/to the counterparty in the event of default. Exposure from OTC financial derivative instruments can only be netted across transactions governed under the same master agreement with the same legal entity. See Note 8, Master Netting Arrangements, in the Notes to Financial Statements for more information. |
| | | | | | | | |
| 58 | | PIMCO ETF TRUST | | | | | See Accompanying Notes | |
June 30, 2020
FAIR VALUE OF FINANCIAL DERIVATIVE INSTRUMENTS
The following is a summary of the fair valuation of the Fund’s derivative instruments categorized by risk exposure. See Note 7, Principal Risks, in the Notes to Financial Statements on risks of the Fund.
Fair Values of Financial Derivative Instruments on the Statements of Assets and Liabilities as of June 30, 2020:
| | | | | | | | | | | | | | | | | | | | | | | | |
| | | Derivatives not accounted for as hedging instruments | |
| | | Commodity
Contracts | | | Credit
Contracts | | | Equity
Contracts | | | Foreign
Exchange
Contracts | | | Interest
Rate
Contracts | | | Total | |
Financial Derivative Instruments - Assets | |
Exchange-traded or centrally cleared | | | | | | | | | | | | | | | | | | | | | | | | |
Futures | | $ | 0 | | | $ | 0 | | | $ | 0 | | | $ | 0 | | | $ | 70 | | | $ | 70 | |
| | | | | | | | | | | | | | | | | | | | | | | | |
Over the counter | | | | | | | | | | | | | | | | | | | | | | | | |
Swap Agreements | | $ | 0 | | | $ | 18 | | | $ | 0 | | | $ | 0 | | | $ | 0 | | | $ | 18 | |
| | | | | | | | | | | | | | | | | | | | | | | | |
| | $ | 0 | | | $ | 18 | | | $ | 0 | | | $ | 0 | | | $ | 70 | | | $ | 88 | |
| | | | | | | | | | | | | | | | | | | | | | | | |
|
Financial Derivative Instruments - Liabilities | |
Exchange-traded or centrally cleared | |
Swap Agreements | | $ | 0 | | | $ | 0 | | | $ | 0 | | | $ | 0 | | | $ | 90 | | | $ | 90 | |
| | | | | | | | | | | | | | | | | | | | | | | | |
Over the counter | |
Forward Foreign Currency Contracts | | $ | 0 | | | $ | 0 | | | $ | 0 | | | $ | 4 | | | $ | 0 | | | $ | 4 | |
Swap Agreements | | | 0 | | | | 381 | | | | 0 | | | | 0 | | | | 0 | | | | 381 | |
| | | | | | | | | | | | | | | | | | | | | | | | |
| | $ | 0 | | | $ | 381 | | | $ | 0 | | | $ | 4 | | | $ | 0 | | | $ | 385 | |
| | | | | | | | | | | | | | | | | | | | | | | | |
| | $ | 0 | | | $ | 381 | | | $ | 0 | | | $ | 4 | | | $ | 90 | | | $ | 475 | |
| | | | | | | | | | | | | | | | | | | | | | | | |
The effect of Financial Derivative Instruments on the Statements of Operations for the period ended June 30, 2020:
| | | | | | | | | | | | | | | | | | | | | | | | |
| | | Derivatives not accounted for as hedging instruments | |
| | | Commodity
Contracts | | | Credit
Contracts | | | Equity
Contracts | | | Foreign
Exchange
Contracts | | | Interest
Rate Contracts | | | Total | |
Net Realized Gain (Loss) on Financial Derivative Instruments | |
Exchange-traded or centrally cleared | | | | | | | | | | | | | | | | | | | | | | | | |
Written Options | | $ | 0 | | | $ | 0 | | | $ | 0 | | | $ | 0 | | | $ | 166 | | | $ | 166 | |
Futures | | | 0 | | | | 0 | | | | 0 | | | | 0 | | | | 8,097 | | | | 8,097 | |
Swap Agreements | | | 0 | | | | (1,491 | ) | | | 0 | | | | 0 | | | | (436 | ) | | | (1,927 | ) |
| | | | | | | | | | | | | | | | | | | | | | | | |
| | $ | 0 | | | $ | (1,491 | ) | | $ | 0 | | | $ | 0 | | | $ | 7,827 | | | $ | 6,336 | |
| | | | | | | | | | | | | | | | | | | | | | | | |
Over the counter | |
Forward Foreign Currency Contracts | | $ | 0 | | | $ | 0 | | | $ | 0 | | | $ | (790 | ) | | $ | 0 | | | $ | (790 | ) |
Written Options | | | 0 | | | | 250 | | | | 0 | | | | 0 | | | | 0 | | | | 250 | |
Swap Agreements | | | 0 | | | | 298 | | | | 0 | | | | 0 | | | | 0 | | | | 298 | |
| | | | | | | | | | | | | | | | | | | | | | | | |
| | $ | 0 | | | $ | 548 | | | $ | 0 | | | $ | (790 | ) | | $ | 0 | | | $ | (242 | ) |
| | | | | | | | | | | | | | | | | | | | | | | | |
| | $ | 0 | | | $ | (943 | ) | | $ | 0 | | | $ | (790 | ) | | $ | 7,827 | | | $ | 6,094 | |
| | | | | | | | | | | | | | | | | | | | | | | | |
|
Net Change in Unrealized Appreciation (Depreciation) on Financial Derivative Instruments | |
Exchange-traded or centrally cleared | |
Written Options | | $ | 0 | | | $ | 0 | | | $ | 0 | | | $ | 0 | | | $ | (19 | ) | | $ | (19 | ) |
Futures | | | 0 | | | | 0 | | | | 0 | | | | 0 | | | | (3,036 | ) | | | (3,036 | ) |
Swap Agreements | | | 0 | | | | 340 | | | | 0 | | | | 0 | | | | 2,348 | | | | 2,688 | |
| | | | | | | | | | | | | | | | | | | | | | | | |
| | $ | 0 | | | $ | 340 | | | $ | 0 | | | $ | 0 | | | $ | (707 | ) | | $ | (367 | ) |
| | | | | | | | | | | | | | | | | | | | | | | | |
Over the counter | |
Forward Foreign Currency Contracts | | $ | 0 | | | $ | 0 | | | $ | 0 | | | $ | 28 | | | $ | 0 | | | $ | 28 | |
Written Options | | | 0 | | | | (7 | ) | | | 0 | | | | 0 | | | | 0 | | | | (7 | ) |
Swap Agreements | | | 0 | | | | (385 | ) | | | 0 | | | | 0 | | | | 0 | | | | (385 | ) |
| | | | | | | | | | | | | | | | | | | | | | | | |
| | $ | 0 | | | $ | (392 | ) | | $ | 0 | | | $ | 28 | | | $ | 0 | | | $ | (364 | ) |
| | | | | | | | | | | | | | | | | | | | | | | | |
| | $ | 0 | | | $ | (52 | ) | | $ | 0 | | | $ | 28 | | | $ | (707 | ) | | $ | (731 | ) |
| | | | | | | | | | | | | | | | | | | | | | | | |
| | | | | | |
| See Accompanying Notes | | ANNUAL REPORT | | JUNE 30, 2020 | | 59 |
Schedule of Investments PIMCO Active Bond Exchange-Traded Fund (Cont.)
June 30, 2020
FAIR VALUE MEASUREMENTS
The following is a summary of the fair valuations according to the inputs used as of June 30, 2020 in valuing the Fund’s assets and liabilities:
| | | | | | | | | | | | | | | | |
| Category and Subcategory | | Level 1 | | | Level 2 | | | Level 3 | | | Fair
Value at
06/30/2020 | |
Investments in Securities, at Value | |
Loan Participations and Assignments | | $ | 0 | | | $ | 13,648 | | | $ | 7,413 | | | $ | 21,061 | |
Corporate Bonds & Notes | | | | | | | | | | | | | | | | |
Banking & Finance | | | 0 | | | | 664,368 | | | | 0 | | | | 664,368 | |
Industrials | | | 0 | | | | 367,526 | | | | 0 | | | | 367,526 | |
Utilities | | | 0 | | | | 70,428 | | | | 0 | | | | 70,428 | |
Municipal Bonds & Notes | | | | | | | | | | | | | | | | |
California | | | 0 | | | | 12,159 | | | | 0 | | | | 12,159 | |
Florida | | | 0 | | | | 8,537 | | | | 0 | | | | 8,537 | |
Illinois | | | 0 | | | | 7,724 | | | | 0 | | | | 7,724 | |
New Jersey | | | 0 | | | | 10,693 | | | | 0 | | | | 10,693 | |
New York | | | 0 | | | | 9,355 | | | | 0 | | | | 9,355 | |
Texas | | | 0 | | | | 6,345 | | | | 0 | | | | 6,345 | |
Virginia | | | 0 | | | | 6,851 | | | | 0 | | | | 6,851 | |
West Virginia | | | 0 | | | | 3,246 | | | | 0 | | | | 3,246 | |
U.S. Government Agencies | | | 0 | | | | 1,612,242 | | | | 0 | | | | 1,612,242 | |
U.S. Treasury Obligations | | | 0 | | | | 261,489 | | | | 0 | | | | 261,489 | |
Non-Agency Mortgage-Backed Securities | | | 0 | | | | 211,949 | | | | 0 | | | | 211,949 | |
Asset-Backed Securities | | | 0 | | | | 375,275 | | | | 0 | | | | 375,275 | |
Sovereign Issues | | | 0 | | | | 19,630 | | | | 0 | | | | 19,630 | |
Preferred Securities | | | | | | | | | | | | | | | | |
Banking & Finance | | | 0 | | | | 29,434 | | | | 0 | | | | 29,434 | |
Industrials | | | 0 | | | | 9,763 | | | | 0 | | | | 9,763 | |
Short-Term Instruments | | | | | | | | | | | | | | | | |
| | | | | | | | | | | | | | | | |
| Category and Subcategory | | Level 1 | | | Level 2 | | | Level 3 | | | Fair
Value at
06/30/2020 | |
Repurchase Agreements | | $ | 0 | | | $ | 142,487 | | | $ | 0 | | | $ | 142,487 | |
U.S. Treasury Bills | | | 0 | | | | 56,496 | | | | 0 | | | | 56,496 | |
U.S. Treasury Cash Management Bills | | | 0 | | | | 25,193 | | | | 0 | | | | 25,193 | |
| | | | | | | | | | | | | | | | |
| | | | |
Total Investments | | $ | 0 | | | $ | 3,924,838 | | | $ | 7,413 | | | $ | 3,932,251 | |
| | | | | | | | | | | | | | | | |
|
Financial Derivative Instruments - Assets | |
Exchange-traded or centrally cleared | | | 70 | | | | 0 | | | | 0 | | | | 70 | |
Over the counter | | | 0 | | | | 18 | | | | 0 | | | | 18 | |
| | | | | | | | | | | | | | | | |
| | $ | 70 | | | $ | 18 | | | $ | 0 | | | $ | 88 | |
|
Financial Derivative Instruments - Liabilities | |
Exchange-traded or centrally cleared | | | 0 | | | | (90 | ) | | | 0 | | | | (90 | ) |
Over the counter | | | 0 | | | | (385 | ) | | | 0 | | | | (385 | ) |
| | | | | | | | | | | | | | | | |
| | $ | 0 | | | $ | (475 | ) | | $ | 0 | | | $ | (475 | ) |
| | | | | | | | | | | | | | | | |
| | | | |
Total Financial Derivative Instruments | | $ | 70 | | | $ | (457 | ) | | $ | 0 | | | $ | (387 | ) |
| | | | | | | | | | | | | | | | |
| | | | |
Totals | | $ | 70 | | | $ | 3,924,381 | | | $ | 7,413 | | | $ | 3,931,864 | |
| | | | | | | | | | | | | | | | |
There were no significant transfers into or out of Level 3 during the period ended June 30, 2020.
| | | | | | | | |
| 60 | | PIMCO ETF TRUST | | | | | See Accompanying Notes | |
Schedule of Investments PIMCO Enhanced Low Duration Active Exchange-Traded Fund
June 30, 2020
(Amounts in thousands*, except number of shares, contracts and units, if any)
| | | | | | | | | | | | |
| | | | | PRINCIPAL
AMOUNT
(000S) | | | | | MARKET
VALUE
(000S) | |
| INVESTMENTS IN SECURITIES 179.9% | |
| |
| LOAN PARTICIPATIONS AND ASSIGNMENTS 0.4% | |
|
Qatar National Bank SAQ | |
1.277% (LIBOR03M +
0.900%) due 12/22/2020 «~ | | $ | | | 1,000 | | | $ | | | 998 | |
| | | | | | | | | | | | |
| | | | |
State of Qatar | | | | | | | | | | | | |
1.156% (LIBOR03M + 0.800%) due 12/21/2020 «~ | | | | | 1,000 | | | | | | 1,000 | |
| | | | | | | | | | | | |
Total Loan Participations and Assignments
(Cost $1,998) | | | 1,998 | |
| | | | | | | | | | | | |
| |
| CORPORATE BONDS & NOTES 62.4% | |
| |
| BANKING & FINANCE 36.7% | |
|
AerCap Ireland Capital DAC | |
3.950% due 02/01/2022 | | | | | 750 | | | | | | 751 | |
4.450% due 12/16/2021 | | | | | 500 | | | | | | 505 | |
4.625% due 10/30/2020 | | | | | 1,800 | | | | | | 1,808 | |
5.000% due 10/01/2021 | | | | | 500 | | | | | | 506 | |
| | | | |
Air Lease Corp. | | | | | | | | | | | | |
2.500% due 03/01/2021 | | | | | 600 | | | | | | 600 | |
2.750% due 01/15/2023 | | | | | 1,300 | | | | | | 1,284 | |
3.500% due 01/15/2022 | | | | | 1,400 | | | | | | 1,415 | |
| | | | |
Aircastle Ltd. | | | | | | | | | | | | |
5.125% due 03/15/2021 | | | | | 1,000 | | | | | | 1,004 | |
5.500% due 02/15/2022 (e) | | | | | 2,200 | | | | | | 2,222 | |
| | | | |
Ally Financial, Inc. | | | | | | | | | | | | |
4.125% due 02/13/2022 | | | | | 200 | | | | | | 206 | |
4.625% due 05/19/2022 | | | | | 300 | | | | | | 312 | |
7.500% due 09/15/2020 | | | | | 3,600 | | | | | | 3,636 | |
|
American Tower Corp. | |
1.300% due 09/15/2025 | | | | | 1,100 | | | | | | 1,105 | |
2.250% due 01/15/2022 | | | | | 600 | | | | | | 615 | |
3.300% due 02/15/2021 | | | | | 400 | | | | | | 407 | |
3.375% due 05/15/2024 | | | | | 1,000 | | | | | | 1,086 | |
| | | | |
Aozora Bank Ltd. | | | | | | | | | | | | |
3.810% due 09/07/2021 | | | | | 5,300 | | | | | | 5,459 | |
| | | | |
Assurant, Inc.
| | | | | | | | | | | | |
1.534% (US0003M + 1.250%) due 03/26/2021 ~ | | | | | 67 | | | | | | 67 | |
|
Athene Global Funding | |
2.667% (US0003M + 1.230%) due 07/01/2022 ~ | | | | | 4,500 | | | | | | 4,460 | |
|
Aviation Capital Group LLC | |
1.300% (US0003M + 0.950%) due 06/01/2021 ~ | | | | | 3,850 | | | | | | 3,662 | |
4.125% due 08/01/2025 | | | | | 400 | | | | | | 361 | |
4.375% due 01/30/2024 | | | | | 1,300 | | | | | | 1,223 | |
7.125% due 10/15/2020 | | | | | 750 | | | | | | 754 | |
|
Avolon Holdings Funding Ltd. | |
3.625% due 05/01/2022 | | | | | 1,500 | | | | | | 1,415 | |
5.125% due 10/01/2023 | | | | | 400 | | | | | | 371 | |
5.500% due 01/15/2023 | | | | | 1,100 | | | | | | 1,036 | |
|
Banco Santander Chile | |
1.571% (US0003M + 1.200%) due 11/28/2021 ~ | | | | | 3,000 | | | | | | 2,979 | |
|
Bank of America Corp. | |
1.117% (US0003M + 0.790%) due 03/05/2024 ~ | | | | | 500 | | | | | | 498 | |
|
Bank of New Zealand | |
3.500% due 02/20/2024 | | | | | 1,000 | | | | | | 1,085 | |
| | | | |
Barclays PLC | | | | | | | | | | | | |
3.200% due 08/10/2021 | | | | | 800 | | | | | | 818 | |
4.338% due 05/16/2024 • | | | | | 3,800 | | | | | | 4,094 | |
| | | | |
BGC Partners, Inc. | | | | | | | | | | | | |
5.125% due 05/27/2021 | | | | | 250 | | | | | | 254 | |
| | | | |
BOC Aviation Ltd. | | | | | | | | | | | | |
1.409% (US0003M + 1.125%) due 09/26/2023 ~ | | | | | 1,700 | | | | | | 1,650 | |
1.606% (US0003M + 1.050%) due 05/02/2021 ~ | | | | | 1,455 | | | | | | 1,443 | |
2.375% due 09/15/2021 | | | | | 200 | | | | | | 200 | |
3.000% due 05/23/2022 | | | | | 500 | | | | | | 509 | |
| | | | | | | | | | | | |
| | | | | PRINCIPAL
AMOUNT
(000S) | | | | | MARKET
VALUE
(000S) | |
|
Canadian Imperial Bank of Commerce | |
0.881% (SOFRRATE + 0.800%) due 03/17/2023 ~ | | $ | | | 1,020 | | | $ | | | 1,015 | |
|
Cantor Fitzgerald LP | |
6.500% due 06/17/2022 | | | | | 400 | | | | | | 425 | |
| | | | |
Citibank N.A.
| | | | | | | | | | | | |
2.844% due 05/20/2022 • | | | | | 3,000 | | | | | | 3,060 | |
|
Citigroup, Inc. | |
1.486% (US0003M + 1.100%) due 05/17/2024 ~ | | | | | 1,000 | | | | | | 1,001 | |
1.970% (US0003M + 0.950%) due 07/24/2023 ~ | | | | | 1,500 | | | | | | 1,501 | |
|
CK Hutchison International Ltd.
| |
3.250% due 04/11/2024 | | | | | 3,100 | | | | | | 3,286 | |
|
CNH Industrial Capital LLC
| |
4.375% due 11/06/2020 | | | | | 1,000 | | | | | | 1,009 | |
|
Credit Suisse Group Funding Guernsey Ltd.
| |
3.800% due 09/15/2022 | | | | | 500 | | | | | | 531 | |
|
Danske Bank A/S | |
1.378% (US0003M + 1.060%) due 09/12/2023 ~ | | | | | 1,400 | | | | | | 1,375 | |
3.001% due 09/20/2022 • | | | | | 2,950 | | | | | | 2,997 | |
|
First Abu Dhabi Bank PJSC
| |
2.126% (US0003M + 0.950%) due 04/16/2022 ~ | | | | | 1,800 | | | | | | 1,803 | |
|
Five Corners Funding Trust
| |
4.419% due 11/15/2023 | | | | | 400 | | | | | | 446 | |
|
Ford Motor Credit Co. LLC | |
1.227% (US0003M + 0.930%) due 09/24/2020 ~ | | | | | 2,000 | | | | | | 1,984 | |
2.183% (US0003M + 0.810%) due 04/05/2021 ~ | | | | | 500 | | | | | | 480 | |
2.191% (US0003M + 0.880%) due 10/12/2021 ~ | | | | | 200 | | | | | | 190 | |
4.250% due 09/20/2022 | | | | | 1,625 | | | | | | 1,599 | |
5.750% due 02/01/2021 | | | | | 500 | | | | | | 504 | |
|
General Motors Financial Co., Inc. | |
1.618% (US0003M + 1.310%) due 06/30/2022 ~ | | | | | 3,100 | | | | | | 3,038 | |
3.550% due 07/08/2022 | | | | | 1,500 | | | | | | 1,539 | |
3.700% due 11/24/2020 | | | | | 1,000 | | | | | | 1,005 | |
|
Goldman Sachs Group, Inc. | |
1.540% (US0003M + 0.780%) due 10/31/2022 ~ | | | | | 1,100 | | | | | | 1,100 | |
2.101% (US0003M + 1.110%) due 04/26/2022 ~ | | | | | 1,000 | | | | | | 1,005 | |
2.819% (US0003M + 1.600%) due 07/15/2020 ~ | | | | | 1,000 | | | | | | 1,001 | |
3.000% due 04/26/2022 | | | | | 1,000 | | | | | | 1,020 | |
|
Goodman U.S. Finance Two LLC
| |
6.000% due 03/22/2022 (e) | | | | | 2,000 | | | | | | 2,131 | |
|
Harley-Davidson Financial Services, Inc. | |
1.284% (US0003M + 0.940%) due 03/02/2021 ~ | | | | | 300 | | | | | | 298 | |
3.550% due 05/21/2021 | | | | | 372 | | | | | | 378 | |
|
HSBC Holdings PLC | |
1.386% (US0003M + 1.000%) due 05/18/2024 ~ | | | | | 500 | | | | | | 496 | |
3.600% due 05/25/2023 | | | | | 1,700 | | | | | | 1,826 | |
3.950% due 05/18/2024 • | | | | | 2,000 | | | | | | 2,150 | |
|
Hyundai Capital Services, Inc.
| |
2.875% due 03/16/2021 | | | | | 1,000 | | | | | | 1,008 | |
|
ICICI Bank Ltd. | |
3.125% due 08/12/2020 | | | | | 1,465 | | | | | | 1,466 | |
5.750% due 11/16/2020 | | | | | 3,500 | | | | | | 3,546 | |
|
ING Groep NV
| |
1.456% (US0003M + 1.150%) due 03/29/2022 ~ | | | | | 1,500 | | | | | | 1,511 | |
|
International Lease Finance Corp. | |
4.625% due 04/15/2021 | | | | | 500 | | | | | | 505 | |
8.250% due 12/15/2020 | | | | | 200 | | | | | | 205 | |
8.625% due 01/15/2022 | | | | | 500 | | | | | | 537 | |
| | | | |
JPMorgan Chase & Co. | | | | | | | | | | | | |
3.207% due 04/01/2023 • | | | | | 600 | | | | | | 625 | |
| | | | | | | | | | | | |
| | | | | PRINCIPAL
AMOUNT
(000S) | | | | | MARKET
VALUE
(000S) | |
|
LeasePlan Corp. NV
| |
2.875% due 10/24/2024 | | $ | | | 4,600 | | | $ | | | 4,733 | |
|
Lloyds Bank PLC
| |
6.500% due 09/14/2020 | | | | | 1,175 | | | | | | 1,187 | |
|
Lloyds Banking Group PLC
| |
2.858% due 03/17/2023 • | | | | | 2,800 | | | | | | 2,885 | |
|
Mitsubishi UFJ Financial Group, Inc. | |
1.781% (US0003M + 0.790%) due 07/25/2022 ~ | | | | | 1,000 | | | | | | 1,004 | |
1.851% (US0003M + 0.860%) due 07/26/2023 ~ | | | | | 2,000 | | | | | | 1,994 | |
2.623% due 07/18/2022 | | | | | 1,000 | | | | | | 1,038 | |
2.665% due 07/25/2022 | | | | | 500 | | | | | | 520 | |
|
Mitsubishi UFJ Lease & Finance Co. Ltd. | |
2.250% due 09/07/2021 | | | | | 200 | | | | | | 203 | |
3.406% due 02/28/2022 | | | | | 700 | | | | | | 722 | |
|
Mizuho Financial Group, Inc. | |
0.990% (US0003M + 0.630%) due 05/25/2024 ~ | | | | | 2,000 | | | | | | 1,961 | |
1.117% (US0003M + 0.790%) due 03/05/2023 ~ | | | | | 1,300 | | | | | | 1,295 | |
1.163% (US0003M + 0.850%) due 09/13/2023 ~ | | | | | 750 | | | | | | 746 | |
1.195% (US0003M + 0.880%) due 09/11/2022 ~ | | | | | 1,500 | | | | | | 1,505 | |
| | | | |
Morgan Stanley | | | | | | | | | | | | |
0.761% (SOFRRATE + 0.700%) due 01/20/2023 ~ | | | | | 2,100 | | | | | | 2,095 | |
2.420% (US0003M + 1.400%) due 10/24/2023 ~ | | | | | 824 | | | | | | 833 | |
2.750% due 05/19/2022 | | | | | 400 | | | | | | 416 | |
|
Nationwide Building Society | |
2.000% due 01/27/2023 | | | | | 1,800 | | | | | | 1,855 | |
3.622% due 04/26/2023 • | | | | | 1,600 | | | | | | 1,663 | |
|
Navient Corp. | |
5.000% due 10/26/2020 | | | | | 800 | | | | | | 798 | |
5.875% due 03/25/2021 | | | | | 200 | | | | | | 197 | |
6.625% due 07/26/2021 | | | | | 1,200 | | | | | | 1,179 | |
|
Nissan Motor Acceptance Corp. | |
0.996% due 09/28/2022 • | | | | | 2,200 | | | | | | 2,035 | |
2.201% (US0003M + 0.890%) due 01/13/2022 ~ | | | | | 500 | | | | | | 481 | |
|
Nomura Holdings, Inc.
| |
2.648% due 01/16/2025 | | | | | 4,600 | | | | | | 4,800 | |
|
Nordea Bank Abp
| |
1.303% (US0003M + 0.940%) due 08/30/2023 ~ | | | | | 2,000 | | | | | | 1,989 | |
| | | | |
ORIX Corp. | | | | | | | | | | | | |
2.650% due 04/13/2021 | | | | | 500 | | | | | | 506 | |
2.900% due 07/18/2022 | | | | | 500 | | | | | | 518 | |
2.950% due 07/23/2020 | | | | | 500 | | | | | | 501 | |
3.200% due 01/19/2022 | | | | | 2,000 | | | | | | 2,061 | |
|
Park Aerospace Holdings Ltd. | |
3.625% due 03/15/2021 | | | | | 400 | | | | | | 395 | |
| | | | |
Piper Jaffray Cos. | | | | | | | | | | | | |
4.740% due 10/15/2021 | | | | | 200 | | | | | | 196 | |
5.200% due 10/15/2023 | | | | | 600 | | | | | | 587 | |
| | | | |
QNB Finance Ltd. | | | | | | | | | | | | |
1.556% (US0003M + 1.000%) due 05/02/2022 ~ | | | | | 2,000 | | | | | | 1,981 | |
1.898% (US0003M + 1.450%) due 08/11/2021 ~ | | | | | 600 | | | | | | 602 | |
2.125% due 09/07/2021 | | | | | 580 | | | | | | 583 | |
|
Reliance Standard Life Global Funding
| |
2.750% due 01/21/2027 | | | | | 2,400 | | | | | | 2,354 | |
|
Royal Bank of Scotland Group PLC | |
1.862% (US0003M + 1.470%) due 05/15/2023 ~ | | | | | 1,800 | | | | | | 1,801 | |
4.519% due 06/25/2024 • | | | | | 2,100 | | | | | | 2,283 | |
|
Santander Holdings USA, Inc. | |
4.450% due 12/03/2021 | | | | | 200 | | | | | | 208 | |
|
Santander UK Group Holdings PLC | |
2.875% due 08/05/2021 | | | | | 800 | | | | | | 819 | |
| | | | |
Santander UK PLC
| | | | | | | | | | | | |
3.400% due 06/01/2021 | | | | | 1,000 | | | | | | 1,027 | |
| | | | | | |
| See Accompanying Notes | | ANNUAL REPORT | | JUNE 30, 2020 | | 61 |
Schedule of Investments PIMCO Enhanced Low Duration Active Exchange-Traded Fund (Cont.)
| | | | | | | | | | | | |
| | | | | PRINCIPAL
AMOUNT
(000S) | | | | | MARKET
VALUE
(000S) | |
| | | | |
SBA Tower Trust
| | | | | | | | | | | | |
3.156% due 10/10/2045 | | $ | | | 1,600 | | | $ | | | 1,604 | |
|
Sinochem Overseas Capital Co. Ltd.
| |
4.500% due 11/12/2020 | | | | | 1,000 | | | | | | 1,012 | |
|
SL Green Operating Partnership LP
| |
1.366% (US0003M + 0.980%) due 08/16/2021 ~ | | | | | 200 | | | | | | 197 | |
|
SMBC Aviation Capital Finance DAC | |
2.650% due 07/15/2021 | | | | | 2,510 | | | | | | 2,521 | |
3.000% due 07/15/2022 | | | | | 200 | | | | | | 201 | |
3.550% due 04/15/2024 | | | | | 1,500 | | | | | | 1,537 | |
4.125% due 07/15/2023 | | | | | 900 | | | | | | 935 | |
|
Springleaf Finance Corp. | |
6.125% due 05/15/2022 | | | | | 1,300 | | | | | | 1,328 | |
7.750% due 10/01/2021 | | | | | 800 | | | | | | 834 | |
8.250% due 12/15/2020 | | | | | 1,150 | | | | | | 1,189 | |
|
Standard Chartered PLC | |
1.510% (US0003M + 1.200%) due 09/10/2022 ~ | | | | | 1,900 | | | | | | 1,905 | |
2.744% due 09/10/2022 • | | | | | 3,000 | | | | | | 3,035 | |
|
Starwood Property Trust, Inc.
| |
3.625% due 02/01/2021 | | | | | 1,000 | | | | | | 986 | |
| | | | |
State Bank of India
| | | | | | | | | | | | |
4.000% due 01/24/2022 | | | | | 400 | | | | | | 410 | |
| | | | |
Synchrony Financial
| | | | | | | | | | | | |
2.850% due 07/25/2022 | | | | | 1,700 | | | | | | 1,730 | |
| | | | |
UBS Group AG
| | | | | | | | | | | | |
2.217% due 02/01/2022 • | | | | | 1,700 | | | | | | 1,732 | |
|
Wells Fargo & Co. | |
1.990% (US0003M + 1.230%) due 10/31/2023 ~ | | | | | 3,500 | | | | | | 3,526 | |
2.130% (US0003M + 1.110%) due 01/24/2023 ~ | | | | | 1,500 | | | | | | 1,508 | |
| | | | |
Weyerhaeuser Co.
| | | | | | | | | | | | |
7.125% due 07/15/2023 | | | | | 1,600 | | | | | | 1,846 | |
| | | | | | | | | | | | |
| | | | | | | | | | | 181,988 | |
| | | | | | | | | | | | |
| |
| INDUSTRIALS 20.2% | |
| | | | |
AbbVie, Inc.
| | | | | | | | | | | | |
2.300% due 11/21/2022 (e) | | | | | 2,000 | | | | | | 2,068 | |
|
American Airlines Pass-Through Trust
| |
4.000% due 01/15/2027 | | | | | 563 | | | | | | 432 | |
|
Anheuser-Busch North American Holding Corp.
| |
3.750% due 01/15/2022 | | | | | 2,500 | | | | | | 2,608 | |
|
Arrow Electronics, Inc.
| |
3.500% due 04/01/2022 | | | | | 900 | | | | | | 924 | |
| | | | |
Bacardi Ltd.
| | | | | | | | | | | | |
4.500% due 01/15/2021 | | | | | 3,800 | | | | | | 3,829 | |
| | | | |
BAT Capital Corp.
| | | | | | | | | | | | |
2.764% due 08/15/2022 | | | | | 2,600 | | | | | | 2,694 | |
| | | | |
Boeing Co.
| | | | | | | | | | | | |
2.300% due 08/01/2021 | | | | | 900 | | | | | | 908 | |
|
Boral Finance Pty. Ltd.
| |
3.000% due 11/01/2022 | | | | | 1,400 | | | | | | 1,412 | |
|
Boston Scientific Corp.
| |
3.450% due 03/01/2024 | | | | | 500 | | | | | | 542 | |
| | | | |
Broadcom Corp.
| | | | | | | | | | | | |
2.200% due 01/15/2021 | | | | | 400 | | | | | | 403 | |
| | | | |
Broadcom, Inc. | | | | | | | | | | | | |
3.459% due 09/15/2026 | | | | | 2,038 | | | | | | 2,191 | |
4.250% due 04/15/2026 | | | | | 600 | | | | | | 669 | |
|
Carrier Global Corp.
| |
2.242% due 02/15/2025 | | | | | 2,000 | | | | | | 2,053 | |
|
Central Nippon Expressway Co. Ltd. | |
1.147% due 03/03/2022 • | | | | | 500 | | | | | | 501 | |
1.163% (US0003M + 0.850%) due 09/14/2021 ~ | | | | | 500 | | | | | | 503 | |
2.849% due 03/03/2022 | | | | | 1,000 | | | | | | 1,027 | |
|
Charter Communications Operating LLC | |
2.337% (US0003M + 1.650%) due 02/01/2024 ~ | | | | | 2,400 | | | | | | 2,409 | |
4.464% due 07/23/2022 | | | | | 2,000 | | | | | | 2,133 | |
4.500% due 02/01/2024 | | | | | 500 | | | | | | 554 | |
| | | | | | | | | | | | |
| | | | | PRINCIPAL
AMOUNT
(000S) | | | | | MARKET
VALUE
(000S) | |
| | | | |
Cigna Corp.
| | | | | | | | | | | | |
3.750% due 07/15/2023 | | $ | | | 665 | | | $ | | | 722 | |
| | | | |
Conagra Brands, Inc. | | | | | | | | | | | | |
4.300% due 05/01/2024 | | | | | 500 | | | | | | 553 | |
4.600% due 11/01/2025 | | | | | 500 | | | | | | 577 | |
|
Continental Airlines Pass-Through Trust
| |
5.983% due 10/19/2023 | | | | | 1,214 | | | | | | 1,151 | |
|
Cox Communications, Inc.
| |
3.250% due 12/15/2022 | | | | | 300 | | | | | | 316 | |
| | | | |
Crown Castle Towers LLC
| | | | | | | | | | | | |
3.222% due 05/15/2042 | | | | | 800 | | | | | | 814 | |
| | | | |
CVS Health Corp.
| | | | | | | | | | | | |
1.033% (US0003M + 0.720%) due 03/09/2021 ~ | | | | | 1,500 | | | | | | 1,506 | |
|
Daimler Finance North America LLC
| |
2.550% due 08/15/2022 | | | | | 4,400 | | | | | | 4,517 | |
| | | | |
Dell International LLC | | | | | | | | | | | | |
4.420% due 06/15/2021 | | | | | 1,600 | | | | | | 1,645 | |
4.900% due 10/01/2026 | | | | | 1,100 | | | | | | 1,212 | |
5.450% due 06/15/2023 | | | | | 500 | | | | | | 547 | |
| | | | |
Delta Air Lines, Inc.
| | | | | | | | | | | | |
3.625% due 03/15/2022 | | | | | 900 | | | | | | 853 | |
|
Dominion Energy Gas Holdings LLC
| |
0.913% (US0003M + 0.600%) due 06/15/2021 ~ | | | | | 300 | | | | | | 300 | |
|
Energy Transfer Operating LP
| |
4.250% due 03/15/2023 | | | | | 500 | | | | | | 528 | |
| | | | |
Equifax, Inc. | | | | | | | | | | | | |
1.262% (US0003M + 0.870%) due 08/15/2021 ~ | | | | | 800 | | | | | | 799 | |
3.600% due 08/15/2021 | | | | | 1,200 | | | | | | 1,239 | |
| | | | |
ERAC USA Finance LLC
| | | | | | | | | | | | |
4.500% due 08/16/2021 | | | | | 1,000 | | | | | | 1,032 | |
| | | | |
GATX Corp.
| | | | | | | | | | | | |
1.261% (US0003M + 0.720%) due 11/05/2021 ~ | | | | | 500 | | | | | | 493 | |
| | | | |
General Mills, Inc.
| | | | | | | | | | | | |
6.610% due 10/15/2022 | | | | | 500 | | | | | | 509 | |
|
Hyundai Capital America | |
2.292% (US0003M + 0.940%) due 07/08/2021 ~ | | | | | 900 | | | | | | 891 | |
3.450% due 03/12/2021 | | | | | 1,750 | | | | | | 1,770 | |
| | | | |
Imperial Brands Finance PLC | | | | | | | | | | | | |
3.125% due 07/26/2024 | | | | | 1,700 | | | | | | 1,768 | |
3.750% due 07/21/2022 | | | | | 3,000 | | | | | | 3,133 | |
| | | | |
Kansas City Southern | | | | | | | | | | | | |
3.000% due 05/15/2023 | | | | | 1,100 | | | | | | 1,124 | |
3.125% due 06/01/2026 | | | | | 700 | | | | | | 737 | |
| | | | |
Kia Motors Corp.
| | | | | | | | | | | | |
2.625% due 04/21/2021 | | | | | 500 | | | | | | 504 | |
|
Kinder Morgan Energy Partners LP
| |
5.000% due 10/01/2021 | | | | | 900 | | | | | | 936 | |
|
Komatsu Finance America, Inc.
| |
2.118% due 09/11/2020 | | | | | 1,520 | | | | | | 1,523 | |
| | | | |
Leidos, Inc.
| | | | | | | | | | | | |
2.950% due 05/15/2023 | | | | | 200 | | | | | | 209 | |
|
Mead Johnson Nutrition Co.
| |
3.000% due 11/15/2020 | | | | | 103 | | | | | | 104 | |
|
Micron Technology, Inc.
| |
4.185% due 02/15/2027 | | | | | 1,800 | | | | | | 1,996 | |
| | | | |
Mylan NV | | | | | | | | | | | | |
3.150% due 06/15/2021 | | | | | 3,100 | | | | | | 3,165 | |
3.750% due 12/15/2020 | | | | | 100 | | | | | | 101 | |
| | | | |
NXP BV | | | | | | | | | | | | |
4.125% due 06/01/2021 | | | | | 2,200 | | | | | | 2,266 | |
4.625% due 06/15/2022 (e) | | | | | 2,000 | | | | | | 2,131 | |
|
Occidental Petroleum Corp.
| |
1.842% (US0003M + 1.450%) due 08/15/2022 ~ | | | | | 4,600 | | | | | | 4,234 | |
| | | | |
Otis Worldwide Corp.
| | | | | | | | | | | | |
2.056% due 04/05/2025 | | | | | 2,500 | | | | | | 2,623 | |
|
Pacific National Finance Pty. Ltd. | |
4.625% due 09/23/2020 | | | | | 1,411 | | | | | | 1,419 | |
6.000% due 04/07/2023 | | | | | 1,000 | | | | | | 1,103 | |
| | | | | | | | | | | | |
| | | | | PRINCIPAL
AMOUNT
(000S) | | | | | MARKET
VALUE
(000S) | |
|
Penske Truck Leasing Co. LP | |
3.300% due 04/01/2021 | | $ | | | 850 | | | $ | | | 862 | |
3.450% due 07/01/2024 | | | | | 1,000 | | | | | | 1,059 | |
|
Reynolds American, Inc.
| |
4.000% due 06/12/2022 | | | | | 700 | | | | | | 740 | |
|
Ryder System, Inc.
| |
2.875% due 06/01/2022 | | | | | 900 | | | | | | 932 | |
|
Sabine Pass Liquefaction LLC
| |
6.250% due 03/15/2022 | | | | | 500 | | | | | | 533 | |
|
Shire Acquisitions Investments Ireland DAC
| |
2.875% due 09/23/2023 | | | | | 800 | | | | | | 848 | |
|
Spirit AeroSystems, Inc. | |
1.113% (US0003M + 0.800%) due 06/15/2021 ~ | | | | | 2,076 | | | | | | 1,934 | |
3.950% due 06/15/2023 | | | | | 2,800 | | | | | | 2,380 | |
| | | | |
Sprint Spectrum Co. LLC
| | | | | | | | | | | | |
3.360% due 03/20/2023 | | | | | 313 | | | | | | 317 | |
|
Sydney Airport Finance Co. Pty. Ltd.
| |
5.125% due 02/22/2021 | | | | | 1,000 | | | | | | 1,020 | |
| | | | |
Syngenta Finance NV
| | | | | | | | | | | | |
3.933% due 04/23/2021 | | | | | 1,500 | | | | | | 1,515 | |
|
Takeda Pharmaceutical Co. Ltd.
| |
2.450% due 01/18/2022 | | | | | 1,000 | | | | | | 1,022 | |
|
Volkswagen Group of America Finance LLC
| |
4.000% due 11/12/2021 | | | | | 1,700 | | | | | | 1,771 | |
| | | | |
Wabtec Corp.
| | | | | | | | | | | | |
1.613% (US0003M + 1.300%) due 09/15/2021 ~ | | | | | 1,558 | | | | | | 1,558 | |
|
Westinghouse Air Brake Technologies Corp.
| |
4.400% due 03/15/2024 | | | | | 2,000 | | | | | | 2,123 | |
|
Woodside Finance Ltd. | |
3.650% due 03/05/2025 | | | | | 100 | | | | | | 105 | |
3.700% due 09/15/2026 | | | | | 200 | | | | | | 212 | |
4.600% due 05/10/2021 | | | | | 1,800 | | | | | | 1,833 | |
|
Woolworths Group Ltd.
| |
4.000% due 09/22/2020 | | | | | 300 | | | | | | 302 | |
|
Zimmer Biomet Holdings, Inc.
| |
3.375% due 11/30/2021 | | | | | 500 | | | | | | 516 | |
| | | | | | | | | | | | |
| | | | | | | | | | | 100,492 | |
| | | | | | | | | | | | |
| |
| UTILITIES 5.5% | |
| | | | |
AT&T, Inc. | | | | | | | | | | | | |
1.314% (US0003M + 0.890%) due 02/15/2023 ~ | | | | | 1,100 | | | | | | 1,095 | |
1.498% (US0003M + 1.180%) due 06/12/2024 ~ | | | | | 3,215 | | | | | | 3,223 | |
3.000% due 06/30/2022 | | | | | 500 | | | | | | 522 | |
|
Duke Energy Corp.
| |
0.924% (US0003M + 0.500%) due 05/14/2021 ~ | | | | | 600 | | | | | | 601 | |
|
Duquesne Light Holdings, Inc.
| |
5.900% due 12/01/2021 | | | | | 500 | | | | | | 528 | |
|
Enel Finance International NV
| |
4.250% due 09/14/2023 | | | | | 200 | | | | | | 218 | |
|
FirstEnergy Corp.
| |
2.850% due 07/15/2022 | | | | | 970 | | | | | | 1,007 | |
|
Israel Electric Corp. Ltd.
| |
5.000% due 11/12/2024 | | | | | 2,100 | | | | | | 2,360 | |
|
NextEra Energy Capital Holdings, Inc. | |
1.950% due 09/01/2022 | | | | | 2,000 | | | | | | 2,058 | |
|
Pacific Gas & Electric Co.
| |
2.950% due 03/01/2026 ^(a) | | | | | 100 | | | | | | 108 | |
|
Pacific Gas and Electric Co. | |
1.750% due 06/16/2022 | | | | | 2,800 | | | | | | 2,811 | |
2.100% due 08/01/2027 | | | | | 700 | | | | | | 693 | |
| | | | |
PPL WEM Ltd.
| | | | | | | | | | | | |
5.375% due 05/01/2021 (e) | | | | | 2,000 | | | | | | 2,049 | |
|
Ras Laffan Liquefied Natural Gas Co. Ltd.
| |
5.298% due 09/30/2020 | | | | | 141 | | | | | | 143 | |
|
Sempra Energy
| |
1.719% (US0003M + 0.500%) due 01/15/2021 ~ | | | | | 2,500 | | | | | | 2,500 | |
| | | | | | | | |
| 62 | | PIMCO ETF TRUST | | | | | See Accompanying Notes | |
June 30, 2020
| | | | | | | | | | | | |
| | | | | PRINCIPAL
AMOUNT
(000S) | | | | | MARKET
VALUE
(000S) | |
|
Southern California Gas Co.
| |
2.550% due 02/01/2030 | | $ | | | 1,800 | | | $ | | | 1,942 | |
|
Sprint Communications, Inc.
| |
6.000% due 11/15/2022 | | | | | 400 | | | | | | 422 | |
| | | | |
Sprint Corp. | | | | | | | | | | | | |
7.250% due 09/15/2021 | | | | | 3,100 | | | | | | 3,253 | |
7.875% due 09/15/2023 | | | | | 400 | | | | | | 451 | |
|
Verizon Communications, Inc.
| |
1.492% (US0003M + 1.100%) due 05/15/2025 ~ | | | | | 1,000 | | | | | | 1,013 | |
| | | | |
Wisconsin Electric Power Co.
| | | | | | | | | | | | |
2.050% due 12/15/2024 | | | | | 300 | | | | | | 316 | |
| | | | | | | | | | | | |
| | | | | | | | | | | 27,313 | |
| | | | | | | | | | | | |
Total Corporate Bonds & Notes
(Cost $306,723) | | | 309,793 | |
| | | | | | | | | | | | |
| |
| MUNICIPAL BONDS & NOTES 0.1% | |
| |
| ILLINOIS 0.1% | |
|
Illinois State General Obligation Notes, Series 2020
| |
5.375% due 05/01/2023 | | | | | 450 | | | | | | 479 | |
| | | | | | | | | | | | |
Total Municipal Bonds & Notes
(Cost $450) | | | 479 | |
| | | | | | | | | | | | |
| |
| U.S. GOVERNMENT AGENCIES 9.4% | |
| | | | |
Fannie Mae | | | | | | | | | | | | |
4.000% due 09/01/2039 - 03/01/2047 | | | | | 1,212 | | | | | | 1,310 | |
5.000% due 04/01/2033 - 09/01/2047 | | | | | 3,490 | | | | | | 3,763 | |
5.150% due 05/01/2035 | | | | | 47 | | | | | | 48 | |
5.350% due 02/01/2035 - 01/01/2038 | | | | | 555 | | | | | | 593 | |
5.450% due 04/01/2036 | | | | | 133 | | | | | | 146 | |
5.500% due 12/01/2028 - 07/01/2050 | | | | | 2,378 | | | | | | 2,652 | |
6.000% due 09/01/2028 - 04/01/2048 | | | | | 1,760 | | | | | | 1,941 | |
6.500% due 03/01/2026 - 09/01/2048 | | | | | 866 | | | | | | 970 | |
| | | | |
Freddie Mac | | | | | | | | | | | | |
2.000% due 02/01/2028 - 04/01/2028 | | | | | 9 | | | | | | 9 | |
2.235% due 07/15/2035 • | | | | | 4,600 | | | | | | 4,636 | |
2.500% due 06/25/2034 -
07/25/2034 (e) | | | | | 7,930 | | | | | | 8,032 | |
2.500% due 10/25/2048 | | | | | 3,687 | | | | | | 3,751 | |
4.500% due 07/01/2021 | | | | | 1 | | | | | | 1 | |
5.000% due 12/01/2020 - 02/01/2038 | | | | | 853 | | | | | | 926 | |
5.400% due 09/01/2037 - 11/01/2038 | | | | | 552 | | | | | | 607 | |
5.490% due 10/01/2038 | | | | | 30 | | | | | | 33 | |
5.500% due 11/01/2021 - 06/01/2047 | | | | | 2,479 | | | | | | 2,736 | |
5.550% due 06/01/2037 - 07/01/2037 | | | | | 189 | | | | | | 208 | |
5.650% due 01/01/2037 | | | | | 42 | | | | | | 46 | |
6.000% due 02/01/2028 - 06/01/2037 | | | | | 731 | | | | | | 798 | |
6.500% due 08/01/2022 - 10/17/2038 | | | | | 614 | | | | | | 704 | |
7.000% due 05/01/2029 - 10/01/2037 | | | | | 99 | | | | | | 103 | |
| | | | |
Ginnie Mae | | | | | | | | | | | | |
1.195% due 08/16/2039 • | | | | | 7 | | | | | | 7 | |
2.500% due 10/20/2049 | | | | | 3,868 | | | | | | 3,961 | |
3.000% due 11/20/2046 | | | | | 180 | | | | | | 193 | |
3.500% due 05/20/2042 - 09/20/2044 | | | | | 389 | | | | | | 409 | |
3.700% due 04/15/2042 | | | | | 145 | | | | | | 153 | |
3.740% due 03/20/2042 - 07/20/2042 | | | | | 267 | | | | | | 280 | |
3.750% due 04/15/2042 - 03/20/2044 | | | | | 206 | | | | | | 219 | |
4.000% due 04/20/2040 - 06/20/2043 | | | | | 1,841 | | | | | | 1,931 | |
| | | | | | | | | | | | |
| | | | | PRINCIPAL
AMOUNT
(000S) | | | | | MARKET
VALUE
(000S) | |
4.500% due 08/20/2038 - 11/20/2048 | | $ | | | 1,453 | | | $ | | | 1,569 | |
5.000% due 02/20/2039 | | | | | 11 | | | | | | 12 | |
5.350% due 12/15/2036 - 01/15/2038 | | | | | 647 | | | | | | 712 | |
5.400% due 12/20/2038 - 06/20/2039 | | | | | 309 | | | | | | 338 | |
5.500% due 03/20/2034 - 08/20/2041 | | | | | 602 | | | | | | 651 | |
6.000% due 09/20/2038 | | | | | 44 | | | | | | 47 | |
6.500% due 09/20/2025 - 07/20/2039 | | | | | 111 | | | | | | 122 | |
7.000% due 09/15/2024 - 06/20/2039 | | | | | 685 | | | | | | 748 | |
|
Uniform Mortgage-Backed Security | |
4.000% due 01/01/2049 | | | | | 398 | | | | | | 422 | |
4.250% due 11/01/2035 - 01/01/2036 | | | | | 323 | | | | | | 344 | |
4.750% due 09/01/2034 - 04/01/2036 | | | | | 575 | | | | | | 626 | |
5.340% due 09/01/2029 | | | | | 68 | | | | | | 74 | |
5.500% due 05/01/2021 | | | | | 1 | | | | | | 1 | |
6.000% due 06/01/2031 | | | | | 3 | | | | | | 3 | |
6.500% due 09/01/2021 - 02/01/2022 | | | | | 3 | | | | | | 3 | |
| | | | | | | | | | | | |
Total U.S. Government Agencies
(Cost $45,999) | | | 46,838 | |
| | | | | | | | | | | | |
| |
| U.S. TREASURY OBLIGATIONS 76.8% | |
|
U.S. Treasury Inflation Protected Securities (b) | |
0.750% due 07/15/2028 | | | | | 204 | | | | | | 231 | |
0.875% due 01/15/2029 | | | | | 2,234 | | | | | | 2,548 | |
| | | | |
U.S. Treasury Notes | | | | | | | | | | | | |
0.125% due 05/31/2022 (e) | | | | | 339,200 | | | | | | 338,988 | |
0.250% due 06/15/2023 | | | | | 7,300 | | | | | | 7,316 | |
0.375% due 03/31/2022 (e)(g)(i) | | | | | 32,400 | | | | | | 32,521 | |
| | | | | | | | | | | | |
Total U.S. Treasury Obligations
(Cost $381,315) | | | 381,604 | |
| | | | | | | | | | | | |
| |
| NON-AGENCY MORTGAGE-BACKED SECURITIES 8.6% | |
| | | | |
AREIT Trust | | | | | | | | | | | | |
1.215% due 09/14/2036 • | | | | | 500 | | | | | | 482 | |
2.805% due 04/14/2037 • | | | | | 1,100 | | | | | | 1,106 | |
|
Bancorp Commercial Mortgage Trust | |
1.185% due 03/15/2036 • | | | | | 414 | | | | | | 400 | |
1.235% due 09/15/2036 • | | | | | 491 | | | | | | 472 | |
|
Bear Stearns Adjustable Rate Mortgage Trust
| |
3.967% due 02/25/2033 ~ | | | | | 2 | | | | | | 2 | |
|
Bear Stearns ALT-A Trust | |
0.345% due 02/25/2034 • | | | | | 1,364 | | | | | | 1,245 | |
3.769% due 05/25/2035 ~ | | | | | 51 | | | | | | 50 | |
| | | | |
Brass PLC
| | | | | | | | | | | | |
1.086% due 11/16/2066 • | | | | | 345 | | | | | | 345 | |
|
Chase Mortgage Finance Trust
| |
4.258% due 02/25/2037 ~ | | | | | 804 | | | | | | 793 | |
|
Chevy Chase Funding LLC Mortgage-Backed Certificates | |
0.385% due 01/25/2036 • | | | | | 77 | | | | | | 70 | |
0.415% due 10/25/2035 • | | | | | 391 | | | | | | 371 | |
0.485% due 08/25/2035 • | | | | | 44 | | | | | | 43 | |
|
Citigroup Mortgage Loan Trust
| |
3.228% due 09/25/2059 þ | | | | | 185 | | | | | | 187 | |
|
Countrywide Alternative Loan Trust
| |
0.325% due 06/25/2037 • | | | | | 92 | | | | | | 81 | |
|
Credit Suisse Mortgage Capital Trust | |
3.092% due 10/27/2059 ~ | | | | | 1,947 | | | | | | 2,020 | |
3.135% due 12/26/2059 ~ | | | | | 1,472 | | | | | | 1,523 | |
3.322% due 10/25/2058 ~ | | | | | 188 | | | | | | 192 | |
|
Exantas Capital Corp. Ltd.
| |
1.194% due 04/15/2036 • | | | | | 1,027 | | | | | | 999 | |
|
First Horizon Alternative Mortgage Securities Trust
| |
3.482% due 02/25/2035 ~ | | | | | 387 | | | | | | 377 | |
| | | | |
GCAT Trust
| | | | | | | | | | | | |
2.650% due 10/25/2068 ~ | | | | | 898 | | | | | | 934 | |
| | | | | | | | | | | | |
| | | | | PRINCIPAL
AMOUNT
(000S) | | | | | MARKET
VALUE
(000S) | |
|
GSR Mortgage Loan Trust | |
2.427% due 08/25/2033 • | | $ | | | 128 | | | $ | | | 124 | |
4.121% due 09/25/2035 ~ | | | | | 12 | | | | | | 12 | |
|
Holmes Master Issuer PLC
| |
1.639% due 10/15/2054 • | | | | | 996 | | | | | | 996 | |
| | | | |
Impac CMB Trust
| | | | | | | | | | | | |
0.825% due 03/25/2035 • | | | | | 177 | | | | | | 169 | |
|
JPMorgan Chase Commercial Mortgage Securities Trust | |
1.635% due 12/15/2031 • | | | | | 2,000 | | | | | | 1,963 | |
3.379% due 09/15/2050 | | | | | 300 | | | | | | 319 | |
|
JPMorgan Mortgage Trust
| |
3.721% due 07/25/2035 ~ | | | | | 420 | | | | | | 407 | |
| | | | |
Lanark Master Issuer PLC
| | | | | | | | | | | | |
1.128% due 12/22/2069 • | | | | | 1,824 | | | | | | 1,829 | |
|
Legacy Mortgage Asset Trust
| |
3.000% due 06/25/2059 þ | | | | | 2,325 | | | | | | 2,347 | |
|
MASTR Adjustable Rate Mortgages Trust
| |
4.331% due 04/21/2034 ~ | | | | | 32 | | | | | | 32 | |
|
Merrill Lynch Mortgage Investors Trust | |
0.645% due 04/25/2029 • | | | | | 288 | | | | | | 273 | |
3.848% due 12/25/2035 ~ | | | | | 469 | | | | | | 444 | |
| | | | |
MF1 Ltd.
| | | | | | | | | | | | |
1.315% due 12/25/2034 • | | | | | 2,000 | | | | | | 1,973 | |
|
Morgan Stanley Mortgage Loan Trust
| |
0.905% due 11/25/2035 • | | | | | 755 | | | | | | 725 | |
|
New Century Home Equity Loan Trust | |
2.750% due 11/25/2059 ~ | | | | | 4,301 | | | | | | 4,541 | |
3.500% due 10/25/2059 ~ | | | | | 896 | | | | | | 953 | |
|
New Residential Mortgage Loan Trust | |
2.750% due 07/25/2059 ~ | | | | | 3,698 | | | | | | 3,886 | |
4.500% due 05/25/2058 ~ | | | | | 214 | | | | | | 232 | |
|
Sequoia Mortgage Trust | |
0.390% due 07/20/2036 • | | | | | 1,292 | | | | | | 1,214 | |
0.850% due 06/20/2033 • | | | | | 3 | | | | | | 3 | |
0.893% due 11/22/2024 • | | | | | 1 | | | | | | 1 | |
|
Silverstone Master Issuer PLC
| |
1.679% due 01/21/2070 • | | | | | 161 | | | | | | 161 | |
|
Structured Asset Mortgage Investments Trust | |
0.774% due 07/19/2034 • | | | | | 7 | | | | | | 7 | |
0.854% due 09/19/2032 • | | | | | 14 | | | | | | 13 | |
|
Thornburg Mortgage Securities Trust
| |
3.647% due 04/25/2045 ~ | | | | | 87 | | | | | | 83 | |
| | | | |
VMC Finance LLC | | | | | | | | | | | | |
1.114% due 10/15/2035 • | | | | | 1,690 | | | | | | 1,613 | |
1.294% due 09/15/2036 • | | | | | 1,008 | | | | | | 981 | |
|
WaMu Mortgage Pass-Through Certificates Trust | |
0.495% due 01/25/2045 • | | | | | 18 | | | | | | 17 | |
0.585% due 06/25/2044 • | | | | | 812 | | | | | | 776 | |
0.615% due 10/25/2045 • | | | | | 146 | | | | | | 141 | |
2.484% due 06/25/2046 • | | | | | 43 | | | | | | 40 | |
3.352% due 07/25/2037 ^~ | | | | | 597 | | | | | | 514 | |
3.740% due 06/25/2033 ~ | | | | | 2 | | | | | | 2 | |
|
Wells Fargo Commercial Mortgage Trust | |
1.325% due 01/15/2035 • | | | | | 2,200 | | | | | | 2,091 | |
4.218% due 07/15/2046 ~ | | | | | 1,000 | | | | | | 1,079 | |
|
Wells Fargo-RBS Commercial Mortgage Trust
| |
1.644% due 06/15/2044 • | | | | | 1,098 | | | | | | 1,099 | |
| | | | | | | | | | | | |
Total Non-Agency Mortgage-Backed Securities (Cost $42,746) | | | 42,752 | |
| | | | | | | | | | | | |
| |
| ASSET-BACKED SECURITIES 12.6% | |
|
ACE Securities Corp. Home Equity Loan Trust
| |
0.860% due 05/25/2035 • | | | | | 71 | | | | | | 71 | |
|
Arbor Realty Commercial Real Estate Notes Ltd.
| |
1.335% due 05/15/2037 • | | | | | 300 | | | | | | 293 | |
|
Asset-Backed Securities Corp. Home Equity Loan Trust
| |
0.995% due 06/25/2034 • | | | | | 91 | | | | | | 86 | |
|
Barings BDC Static CLO Ltd.
| |
2.239% due 04/15/2027 • | | | | | 943 | | | | | | 937 | |
|
Bear Stearns Asset-Backed Securities Trust | |
0.675% due 09/25/2035 • | | | | | 1,417 | | | | | | 1,407 | |
0.985% due 10/27/2032 • | | | | | 38 | | | | | | 37 | |
1.085% due 08/25/2034 • | | | | | 679 | | | | | | 646 | |
| | | | | | |
| See Accompanying Notes | | ANNUAL REPORT | | JUNE 30, 2020 | | 63 |
Schedule of Investments PIMCO Enhanced Low Duration Active Exchange-Traded Fund (Cont.)
| | | | | | | | | | | | |
| | | | | PRINCIPAL
AMOUNT
(000S) | | | | | MARKET
VALUE
(000S) | |
|
Bear Stearns Second Lien Trust
| |
1.535% due 01/25/2036 • | | $ | | | 1,088 | | | $ | | | 1,083 | |
|
BlueMountain CLO Ltd.
| |
2.641% due 04/13/2027 • | | | | | 101 | | | | | | 100 | |
| | | | |
Cent CLO Ltd.
| | | | | | | | | | | | |
2.171% due 10/29/2025 • | | | | | 109 | | | | | | 108 | |
|
Chase Funding Trust
| |
0.785% due 07/25/2033 • | | | | | 210 | | | | | | 194 | |
| | | | |
CIFC Funding Ltd.
| | | | | | | | | | | | |
1.851% due 10/25/2027 • | | | | | 300 | | | | | | 296 | |
|
Countrywide Asset-Backed Certificates
| |
0.635% due 03/25/2036 • | | | | | 275 | | | | | | 254 | |
|
Countrywide Asset-Backed Certificates Trust
| |
0.885% due 11/25/2035 • | | | | | 848 | | | | | | 844 | |
| | | | |
Crown Point CLO Ltd.
| | | | | | | | | | | | |
2.075% due 07/17/2028 • | | | | | 699 | | | | | | 690 | |
|
Dryden Senior Loan Fund
| |
2.119% due 10/15/2027 • | | | | | 292 | | | | | | 290 | |
|
Finance America Mortgage Loan Trust
| |
1.010% due 08/25/2034 • | | | | | 175 | | | | | | 171 | |
|
First Franklin Mortgage Loan Trust | |
0.345% due 04/25/2036 • | | | | | 1,579 | | | | | | 1,512 | |
0.935% due 11/25/2034 • | | | | | 229 | | | | | | 224 | |
1.115% due 07/25/2034 • | | | | | 777 | | | | | | 775 | |
|
GoldentTree Loan Management U.S. CLO Ltd.
| |
2.085% due 04/20/2029 • | | | | | 2,500 | | | | | | 2,463 | |
|
Greystone Commercial Real Estate Notes Ltd.
| |
1.365% due 09/15/2037 • | | | | | 1,000 | | | | | | 973 | |
|
GSAA Home Equity Trust
| |
0.455% due 07/25/2037 • | | | | | 434 | | | | | | 416 | |
| | | | |
GSAMP Trust
| | | | | | | | | | | | |
0.445% due 06/25/2036 • | | | | | 1,000 | | | | | | 936 | |
|
Home Equity Asset Trust
| |
1.235% due 11/25/2034 • | | | | | 871 | | | | | | 840 | |
| | | | |
LCM LP
| | | | | | | | | | | | |
2.175% due 10/20/2027 • | | | | | 500 | | | | | | 492 | |
|
LoanCore Issuer Ltd.
| |
1.315% due 05/15/2036 • | | | | | 700 | | | | | | 693 | |
|
Morgan Stanley ABS Capital, Inc. Trust
| |
1.985% due 03/25/2034 • | | | | | 248 | | | | | | 247 | |
| | | | |
Nassau Ltd.
| | | | | | | | | | | | |
2.369% due 10/15/2029 • | | | | | 2,000 | | | | | | 1,962 | |
|
Navient Private Education Loan Trust
| |
1.385% due 12/15/2028 • | | | | | 407 | | | | | | 406 | |
|
Navient Private Education Refi Loan Trust
| |
2.460% due 11/15/2068 | | | | | 1,200 | | | | | | 1,229 | |
|
New Century Home Equity Loan Trust
| |
1.115% due 11/25/2034 • | | | | | 510 | | | | | | 485 | |
|
NovaStar Mortgage Funding Trust
| |
0.845% due 01/25/2036 • | | | | | 981 | | | | | | 964 | |
| | | | |
Ocean Trails CLO
| | | | | | | | | | | | |
2.369% due 07/15/2028 • | | | | | 1,491 | | | | | | 1,476 | |
|
Palmer Square Loan Funding Ltd. | |
1.177% due 02/20/2028 • | | | | | 2,460 | | | | | | 2,424 | |
2.105% due 04/20/2027 • | | | | | 1,205 | | | | | | 1,193 | |
|
Popular ABS Mortgage Pass-Through Trust
| |
0.435% due 06/25/2047 ^• | | | | | 349 | | | | | | 343 | |
| | | | |
RAAC Trust
| | | | | | | | | | | | |
0.735% due 01/25/2046 • | | | | | 953 | | | | | | 937 | |
| | | | | | | | | | | | |
| | | | | PRINCIPAL
AMOUNT
(000S) | | | | | MARKET
VALUE
(000S) | |
|
Residential Asset Securities Corp. Trust | |
1.235% due 06/25/2035 • | | $ | | | 1,528 | | | $ | | | 1,530 | |
1.280% due 03/25/2035 • | | | | | 253 | | | | | | 242 | |
| | | | |
Saxon Asset Securities Trust
| | | | | | | | | | | | |
0.905% due 05/25/2035 • | | | | | 195 | | | | | | 187 | |
|
Securitized Asset-Backed Receivables LLC Trust | |
0.575% due 10/25/2035 • | | | | | 437 | | | | | | 433 | |
0.860% due 01/25/2035 • | | | | | 181 | | | | | | 172 | |
|
SLM Student Loan Trust | |
1.741% due 04/25/2023 • | | | | | 432 | | | | | | 404 | |
2.491% due 04/25/2023 • | | | | | 256 | | | | | | 251 | |
2.691% due 07/25/2023 • | | | | | 221 | | | | | | 217 | |
|
SMB Private Education Loan Trust | |
1.035% due 09/15/2054 • | | | | | 4,000 | | | | | | 3,866 | |
2.230% due 09/15/2037 | | | | | 2,800 | | | | | | 2,857 | |
2.980% due 07/15/2027 | | | | | 817 | | | | | | 831 | |
|
SoFi Professional Loan Program LLC
| |
3.020% due 02/25/2040 | | | | | 173 | | | | | | 178 | |
|
SoFi Professional Loan Program Trust
| |
1.950% due 02/15/2046 | | | | | 2,000 | | | | | | 2,032 | |
|
Soundview Home Loan Trust
| |
0.860% due 06/25/2035 • | | | | | 845 | | | | | | 834 | |
|
SpringCastle Funding Asset-Backed Notes
| |
3.200% due 05/27/2036 | | | | | 508 | | | | | | 514 | |
|
Starwood Waypoint Homes Trust
| |
1.135% due 01/17/2035 • | | | | | 916 | | | | | | 914 | |
|
Structured Asset Investment Loan Trust | |
0.735% due 09/25/2034 • | | | | | 1,906 | | | | | | 1,761 | |
0.890% due 03/25/2034 • | | | | | 782 | | | | | | 750 | |
|
Structured Asset Securities Corp. Mortgage Loan Trust
| |
0.320% due 07/25/2036 • | | | | | 1,242 | | | | | | 1,197 | |
|
Towd Point Mortgage Trust | |
0.785% due 02/25/2057 • | | | | | 394 | | | | | | 392 | |
1.185% due 05/25/2058 • | | | | | 2,652 | | | | | | 2,643 | |
1.185% due 10/25/2059 • | | | | | 1,678 | | | | | | 1,673 | |
3.000% due 11/25/2058 ~ | | | | | 868 | | | | | | 887 | |
3.000% due 11/25/2059 ~ | | | | | 2,082 | | | | | | 2,118 | |
|
Tralee CLO Ltd.
| |
2.245% due 10/20/2028 • | | | | | 1,000 | | | | | | 986 | |
|
Venture CLO Ltd.
| |
2.365% due 04/20/2029 • | | | | | 2,100 | | | | | | 2,068 | |
|
Wells Fargo Home Equity Asset-Backed Securities Trust | |
1.130% due 03/25/2035 • | | | | | 847 | | | | | | 847 | |
|
Wells Fargo Home Equity Trust Mortgage Pass-Through Certificates
| |
0.485% due 04/25/2034 • | | | | | 1,579 | | | | | | 1,508 | |
| | | | |
WhiteHorse Ltd. | | | | | | | | | | | | |
2.065% due 04/17/2027 • | | | | | 414 | | | | | | 411 | |
2.295% due 07/17/2026 • | | | | | 93 | | | | | | 93 | |
| | | | |
Zais CLO Ltd.
| | | | | | | | | | | | |
2.369% due 04/15/2028 • | | | | | 1,482 | | | | | | 1,468 | |
| | | | | | | | | | | | |
Total Asset-Backed Securities
(Cost $63,106) | | | 62,761 | |
| | | | | | | | | | | | |
| |
| SOVEREIGN ISSUES 0.2% | |
Export-Import Bank of India
1.374% (US0003M + 1.000%) due 08/21/2022 ~ | | | | | 1,000 | | | | | | 976 | |
| | | | | | | | | | | | |
| Total Sovereign Issues (Cost $998) | | | 976 | |
| | | | | | | | | | | | |
| |
| | | | | | | | | | | | |
| | | | | SHARES | | | | | MARKET
VALUE
(000S) | |
| PREFERRED SECURITIES 0.1% | |
| |
| BANKING & FINANCE 0.1% | |
JPMorgan Chase & Co.
4.230% (US0003M + 3.470%) due 07/30/2020 ~(c) | | | | | 761,000 | | | $ | | | 694 | |
| | | | | | | | | | | | |
| Total Preferred Securities (Cost $761) | | | 694 | |
| | | | | | | | | | | | |
| |
| | | | | PRINCIPAL
AMOUNT
(000S) | | | | | | |
| SHORT-TERM INSTRUMENTS 9.3% | |
| |
| COMMERCIAL PAPER 4.0% | |
|
American Honda Finance Corp.
| |
2.000% due 09/03/2020 | | | | $ | 4,400 | | | | | | 4,396 | |
| | | | |
BAYER Corp. | | | | | | | | | | | | |
2.350% due 08/03/2020 | | | | | 4,400 | | | | | | 4,398 | |
| | | | |
BP Capital Markets PLC
| | | | | | | | | | | | |
1.620% due 09/08/2020 | | | | | 4,000 | | | | | | 3,998 | |
| | | | |
Exxon Mobil Corp.
| | | | | | | | | | | | |
0.670% due 07/28/2020 | | | | | 3,104 | | | | | | 3,104 | |
|
Shell International Finance B.V.
| |
2.300% due 01/19/2021 | | | | | 4,000 | | | | | | 3,990 | |
| | | | | | | | | | | | |
| | | | | | | | | | | 19,886 | |
| | | | | | | | | | | | |
| |
REPURCHASE AGREEMENTS (d) 5.0%
| | | | |
| | | | | | | | | | | 24,646 | |
| | | | | | | | | | | | |
| |
| MUNICIPAL BONDS & NOTES 0.3% | |
|
Illinois State General Obligation Notes, Series 2020
| |
4.875% due 05/01/2021 | | | | | 1,200 | | | | | | 1,222 | |
| | | | | | | | | | | | |
Total Municipal Bonds & Notes
(Cost $1,200) | | | 1,222 | |
| | | | | | | | | | | | |
Total Short-Term Instruments
(Cost $45,659) | | | 45,754 | |
| | | | | | | | | | | | |
| |
| | | | |
Total Investments in Securities
(Cost $889,755) | | | | | | 893,649 | |
| |
| | | | |
| Total Investments 179.9% (Cost $889,755) | | | | | $ | 893,649 | |
| |
Financial Derivative
Instruments (f)(h) (0.0)% (Cost or Premiums, net $1,229) | | | | | | (241 | ) |
| |
| Other Assets and Liabilities, net (79.9)% | | | (396,665 | ) |
| | | | | | | | | | | | |
| Net Assets 100.0% | | | | | $ | 496,743 | |
| | | | | | | | | | | | |
NOTES TO SCHEDULE OF INVESTMENTS:
| * | A zero balance may reflect actual amounts rounding to less than one thousand. |
| « | Security valued using significant unobservable inputs (Level 3). |
| ~ | Variable or Floating rate security. Rate shown is the rate in effect as of period end. Certain variable rate securities are not based on a published reference rate and spread, rather are determined by the issuer or agent and are based on current market conditions. Reference rate is as of reset date, which may vary by security. These securities may not indicate a reference rate and/or spread in their description. |
| | | | | | | | |
| 64 | | PIMCO ETF TRUST | | | | | See Accompanying Notes | |
June 30, 2020
| • | Rate shown is the rate in effect as of period end. The rate may be based on a fixed rate, a capped rate or a floor rate and may convert to a variable or floating rate in the future. These securities do not indicate a reference rate and spread in their description. |
| þ | Coupon represents a rate which changes periodically based on a predetermined schedule or event. Rate shown is the rate in effect as of period end. |
| (a) | Security is not accruing income as of the date of this report. |
| (b) | Principal amount of security is adjusted for inflation. |
| (c) | Perpetual maturity; date shown, if applicable, represents next contractual call date. |
BORROWINGS AND OTHER FINANCING TRANSACTIONS
(d) REPURCHASE AGREEMENTS:
| | | | | | | | | | | | | | | | | | | | | | | | | | | | | | |
| Counterparty | | Lending
Rate | | | Settlement
Date | | | Maturity
Date | | | Principal
Amount | | | Collateralized By | | Collateral
(Received) | | | Repurchase
Agreements,
at Value | | | Repurchase
Agreement
Proceeds
to be
Received(1) | |
| BOS | | | 0.100 | % | | | 06/30/2020 | | | | 07/01/2020 | | | $ | 23,071 | | | U.S. Treasury Notes 0.250% due 06/30/2025 | | $ | (23,057 | ) | | $ | 23,071 | | | $ | 23,071 | |
| FICC | | | 0.000 | | | | 06/30/2020 | | | | 07/01/2020 | | | | 1,575 | | | U.S. Treasury Inflation Protected Securities 0.125% due 07/15/2024 | | | (1,606 | ) | | | 1,575 | | | | 1,575 | |
| | | | | | | | | | | | | | | | | | | | | | | | | | | | | | |
Total Repurchase Agreements | | | | | $ | (24,663 | ) | | $ | 24,646 | | | $ | 24,646 | |
| | | | | | | | | | | | | | | |
REVERSE REPURCHASE AGREEMENTS:
| | | | | | | | | | | | | | | | | | | | |
| Counterparty | | Borrowing
Rate(2) | | | Settlement
Date | | | Maturity
Date | | | Amount
Borrowed(2) | | | Payable for
Reverse
Repurchase
Agreements | |
JPS | | | 0.120 | % | | | 06/25/2020 | | | | 07/02/2020 | | | $ | (326,891 | ) | | $ | (326,897 | ) |
| | | 0.170 | | | | 06/30/2020 | | | | 07/02/2020 | | | | (16,884 | ) | | | (16,884 | ) |
| | | 0.180 | | | | 06/30/2020 | | | | 07/02/2020 | | | | (11,900 | ) | | | (11,900 | ) |
SCX | | | 0.270 | | | | 06/22/2020 | | | | 07/23/2020 | | | | (7,714 | ) | | | (7,715 | ) |
TDM | | | 0.500 | | | | 06/12/2020 | | | | TBD | (3) | | | (10,150 | ) | | | (10,153 | ) |
| | | | | | | | | | | | | | | | | | | | |
Total Reverse Repurchase Agreements | | | | | | | $ | (373,549 | ) |
| | | | | | | | | | | | | | | | | | | | |
SHORT SALES:
| | | | | | | | | | | | | | | | | | | | |
| Description | | Coupon | | | Maturity
Date | | | Principal
Amount | | | Proceeds | | | Payable for
Short Sales(4) | |
U.S. Treasury Obligations (11.2)% | | | | | | | | | | | | | | | | | | | | |
U.S. Treasury Inflation Protected Securities | | | 0.625 | % | | | 04/15/2023 | | | $ | 5,667 | | | $ | (5,883 | ) | | $ | (5,913 | ) |
U.S. Treasury Inflation Protected Securities | | | 0.750 | | | | 07/15/2028 | | | | 5,005 | | | | (5,600 | ) | | | (5,652 | ) |
U.S. Treasury Inflation Protected Securities | | | 0.875 | | | | 01/15/2029 | | | | 3,656 | | | | (4,119 | ) | | | (4,173 | ) |
U.S. Treasury Notes | | | 0.250 | | | | 06/30/2025 | | | | 23,100 | | | | (23,018 | ) | | | (23,057 | ) |
U.S. Treasury Notes | | | 0.625 | | | | 05/15/2030 | | | | 17,000 | | | | (16,984 | ) | | | (16,964 | ) |
| | | | | | | | | | | | | | | | | | | | |
Total Short Sales (11.2)% | | | | | | | | | | | | | | $ | (55,604 | ) | | $ | (55,759 | ) |
| | | | | | | | | | | | | | | | | | | | |
BORROWINGS AND OTHER FINANCING TRANSACTIONS SUMMARY
The following is a summary by counterparty of the market value of Borrowings and Other Financing Transactions and collateral pledged/(received) as of June 30, 2020:
| | | | | | | | | | | | | | | | | | | | | | | | | | | | |
| Counterparty | | Repurchase
Agreement
Proceeds
to be
Received(1) | | | Payable for
Reverse
Repurchase
Agreements | | | Payable for
Sale-
Buyback
Transactions | | | Payable for
Short Sales(4) | | | Total
Borrowings and
Other Financing
Transactions | | | Collateral
Pledged/(Received) | | | Net Exposure(5) | |
Global/Master Repurchase Agreement | | | | | | | | | | | | | | | | | | | | | | | | | | | | |
BOS | | $ | 23,071 | | | $ | 0 | | | $ | 0 | | | $ | 0 | | | $ | 23,071 | | | $ | (23,057 | ) | | $ | 14 | |
DEU | | | 0 | | | | 0 | | | | 0 | | | | 0 | | | | 0 | | | | (286 | ) | | | (286 | ) |
FICC | | | 1,575 | | | | 0 | | | | 0 | | | | 0 | | | | 1,575 | | | | (1,606 | ) | | | (31 | ) |
JPS | | | 0 | | | | (355,681 | ) | | | 0 | | | | 0 | | | | (355,681 | ) | | | 355,851 | | | | 170 | |
SCX | | | 0 | | | | (7,715 | ) | | | 0 | | | | 0 | | | | (7,715 | ) | | | 8,032 | | | | 317 | |
TDM | | | 0 | | | | (10,153 | ) | | | 0 | | | | 0 | | | | (10,153 | ) | | | 10,601 | | | | 448 | |
| | | | | | | |
Master Securities Forward Transaction Agreement | | | | | | | | | | | | | | | | | | | | | | | | | | | | |
BCY | | | 0 | | | | 0 | | | | 0 | | | | (16,964 | ) | | | (16,964 | ) | | | 0 | | | | (16,964 | ) |
BPG | | | 0 | | | | 0 | | | | 0 | | | | (15,738 | ) | | | (15,738 | ) | | | 0 | | | | (15,738 | ) |
SGY | | | 0 | | | | 0 | | | | 0 | | | | (23,057 | ) | | | (23,057 | ) | | | 0 | | | | (23,057 | ) |
| | | | | | | | | | | | | | | | | | | | | | | | | | | | |
Total Borrowings and Other Financing Transactions | | $ | 24,646 | | | $ | (373,549 | ) | | $ | 0 | | | $ | (55,759 | ) | | | | | | | | | | | | |
| | | | | | | | | | | | | | | | | | | | | | | | | | | | |
| | | | | | |
| See Accompanying Notes | | ANNUAL REPORT | | JUNE 30, 2020 | | 65 |
Schedule of Investments PIMCO Enhanced Low Duration Active Exchange-Traded Fund (Cont.)
CERTAIN TRANSFERS ACCOUNTED FOR AS SECURED BORROWINGS
Remaining Contractual Maturity of the Agreements
| | | | | | | | | | | | | | | | | | | | |
| | | Overnight and
Continuous | | | Up to 30 days | | | 31-90 days | | | Greater Than 90 days | | | Total | |
Reverse Repurchase Agreements | |
Corporate Bonds & Notes | | $ | 0 | | | $ | 0 | | | $ | 0 | | | $ | (10,153 | ) | | $ | (10,153 | ) |
U.S. Government Agencies | | | 0 | | | | (7,715 | ) | | | 0 | | | | 0 | | | | (7,715 | ) |
U.S. Treasury Obligations | | | 0 | | | | (355,681 | ) | | | 0 | | | | 0 | | | | (355,681 | ) |
| | | | | | | | | | | | | | | | | | | | |
Total Borrowings | | $ | 0 | | | $ | (363,396 | ) | | $ | 0 | | | $ | (10,153 | ) | | $ | (373,549 | ) |
| | | | | | | | | | | | | | | | | | | | |
Payable for reverse repurchase agreements | | | $ | (373,549 | ) |
| | | | | |
| (e) | Securities with an aggregate market value of $374,483 have been pledged as collateral under the terms of the above master agreements as of June 30, 2020. |
| (1) | Includes accrued interest. |
| (2) | The average amount of borrowings outstanding during the period ended June 30, 2020 was $(46,916) at a weighted average interest rate of 0.807%. Average borrowings may include reverse repurchase agreements and sale-buyback transactions, if held during the period. |
| (3) | Open maturity reverse repurchase agreement. |
| (4) | Payable for short sales includes $33 of accrued interest. |
| (5) | Net Exposure represents the net receivable/(payable) that would be due from/to the counterparty in the event of default. Exposure from borrowings and other financing transactions can only be netted across transactions governed under the same master agreement with the same legal entity. See Note 8, Master Netting Arrangements, in the Notes to Financial Statements for more information. |
(f) FINANCIAL DERIVATIVE INSTRUMENTS: EXCHANGE-TRADED OR CENTRALLY CLEARED
PURCHASED OPTIONS:
OPTIONS ON EXCHANGE-TRADED FUTURES CONTRACTS
| | | | | | | | | | | | | | | | | | | | | | | | |
| Description | | Strike
Price | | | Expiration
Date | | | # of
Contracts | | | Notional
Amount | | | Cost | | | Market
Value | |
Put - CBOT U.S. Treasury 2-Year Note September 2020 Futures | | $ | 104.625 | | | | 08/21/2020 | | | | 250 | | | $ | 500 | | | $ | 2 | | | $ | 0 | |
| | | | | | | | | | | | | | | | | | | | | | | | |
Total Purchased Options | | | $ | 2 | | | $ | 0 | |
| | | | | | | | | |
FUTURES CONTRACTS:
LONG FUTURES CONTRACTS
| | | | | | | | | | | | | | | | | | | | | | | | | | | | |
| | | Expiration
Month | | | # of
Contracts | | | Notional
Amount | | | Unrealized
Appreciation/
(Depreciation) | | | Variation Margin | |
| Description | | Asset | | | Liability | |
U.S. Treasury 2-Year Note September Futures | | | 09/2020 | | | | 335 | | | $ | | | | | 73,977 | | | $ | 49 | | | $ | 5 | | | $ | 0 | |
| | | | | | | | | | | | | | | | | | | | | | | | | | | | |
SHORT FUTURES CONTRACTS
| | | | | | | | | | | | | | | | | | | | | | | | | | | | |
| | | Expiration
Month | | | # of
Contracts | | | Notional
Amount | | | Unrealized
Appreciation/
(Depreciation) | | | Variation Margin | |
| Description | | Asset | | | Liability | |
U.S. Treasury 10-Year Note September Futures | | | 09/2020 | | | | 4 | | | $ | | | | | (557 | ) | | $ | (1 | ) | | $ | 1 | | | $ | 0 | |
U.S. Treasury Ultra Long-Term Bond September Futures | | | 09/2020 | | | | 31 | | | | | | | | (6,763 | ) | | | 26 | | | | 32 | | | | 0 | |
| | | | | | | | | | | | | | | | | | | | | | | | | | | | |
| | | | | | | | | | | | | | | | | | $ | 25 | | | $ | 33 | | | $ | 0 | |
| | | | | | | | | | | | | | | | | | | | | | | | | | | | |
Total Futures Contracts | | | $ | 74 | | | $ | 38 | | | $ | 0 | |
| | | | | | �� | | | | | | | |
SWAP AGREEMENTS:
CREDIT DEFAULT SWAPS ON CREDIT INDICES - BUY PROTECTION(1)
| | | | | | | | | | | | | | | | | | | | | | | | | | | | | | | | | | | | |
Index/Tranches | | Fixed
(Pay) Rate | | | Payment
Frequency | | | Maturity
Date | | | Notional
Amount(2) | | | Premiums
Paid/
(Received) | | | Unrealized
Appreciation/
(Depreciation) | | | Market
Value(3) | | | Variation Margin | |
| | Asset | | | Liability | |
CDX.HY-33 5-Year Index | | | (5.000 | )% | | | Quarterly | | | | 12/20/2024 | | | $ | 5,520 | | | $ | (68 | ) | | $ | 94 | | | $ | 26 | | | $ | 0 | | | $ | (40 | ) |
CDX.HY-34 5-Year Index | | | (5.000 | ) | | | Quarterly | | | | 06/20/2025 | | | | 31,730 | | | | 1,709 | | | | (1,517 | ) | | | 192 | | | | 0 | | | | (251 | ) |
| | | | | | | | | | | | | | | | | | | | | | | | | | | | | | | | | | | | |
| | | | | | | | | | | | | | | $ | 1,641 | | | $ | (1,423 | ) | | $ | 218 | | | $ | 0 | | | $ | (291 | ) |
| | | | | | | | | | | | | | | | | | | | | | | | | | | | | | | | | |
| | | | | | | | |
| 66 | | PIMCO ETF TRUST | | | | | See Accompanying Notes | |
June 30, 2020
INTEREST RATE SWAPS - BASIS SWAPS
| | | | | | | | | | | | | | | | | | | | | | | | | | | | | | | | |
Pay Floating Rate Index | | Receive Floating
Rate Index | | Payment
Frequency | | Maturity
Date | | | Notional
Amount | | | Premiums
Paid/(Received) | | | Unrealized
Appreciation/
(Depreciation) | | | Market
Value | | | Variation Margin | |
| | Asset | | | Liability | |
3-Month USD-LIBOR(4) | | 01-Month USD-
LIBOR + 0.098% | | Quarterly | | | 01/13/2023 | | | $ | 18,000 | | | $ | 0 | | | $ | (2 | ) | | $ | (2 | ) | | $ | 0 | | | $ | (1 | ) |
3-Month USD-LIBOR(4) | | 01-Month USD-
LIBOR + 0.098% | | Quarterly | | | 01/13/2023 | | | | 13,800 | | | | 0 | | | | (1 | ) | | | (1 | ) | | | 0 | | | | (1 | ) |
| | | | | | | | | | | | | | | | | | | | | | | | | | | | | | | | |
| | | $ | 0 | | | $ | (3 | ) | | $ | (3 | ) | | $ | 0 | | | $ | (2 | ) |
| | | | | | | | | | | | | | | | | | | | | |
INTEREST RATE SWAPS
| | | | | | | | | | | | | | | | | | | | | | | | | | | | | | | | | | | | |
Pay/Receive
Floating Rate | | Floating Rate Index | | Fixed
Rate | | | Payment
Frequency | | Maturity
Date | | | Notional
Amount | | | Premiums
Paid/(Received) | | | Unrealized
Appreciation/
(Depreciation) | | | Market
Value | | | Variation Margin | |
| | Asset | | | Liability | |
Receive(4) | | 3-Month USD-LIBOR | | | 1.000 | % | | Semi-Annual | | | 12/16/2027 | | | $ | 12,500 | | | $ | (370 | ) | | $ | (55 | ) | | $ | (425 | ) | | $ | 15 | | | $ | 0 | |
Receive | | 3-Month USD-LIBOR | | | 1.625 | | | Semi-Annual | | | 01/06/2030 | | | | 3,400 | | | | (18 | ) | | | (320 | ) | | | (338 | ) | | | 7 | | | | 0 | |
| | | | | | | | | | | | | | | | | | | | | | | | | | | | | | | | | | | | |
| | | $ | (388 | ) | | $ | (375 | ) | | $ | (763 | ) | | $ | 22 | | | $ | 0 | |
| | | | | | | | | | | | | | | | | | | | | |
Total Swap Agreements | | | $ | 1,253 | | | $ | (1,801 | ) | | $ | (548 | ) | | $ | 22 | | | $ | (293 | ) |
| | | | | | | | | | | | | | | | | | | | | |
FINANCIAL DERIVATIVE INSTRUMENTS: EXCHANGE-TRADED OR CENTRALLY CLEARED SUMMARY
The following is a summary of the market value and variation margin of Exchange-Traded or Centrally Cleared Financial Derivative Instruments as of June 30, 2020:
| | | | | | | | | | | | | | | | | | | | | | | | | | | | | | | | | | | | |
| | | Financial Derivative Assets | | | | | | Financial Derivative Liabilities | |
| | | Market Value | | | Variation Margin
Asset | | | | | | | | | Market Value | | | Variation Margin
Liability | | | Total | |
| | | Purchased
Options | | | Futures | | | Swap
Agreements | | | Total | | | | | | Written
Options | | | Futures | | | Swap
Agreements | |
Total Exchange-Traded or Centrally Cleared | | $ | 0 | | | $ | 38 | | | $ | 22 | | | $ | 60 | | | | | | | $ | 0 | | | $ | 0 | | | $ | | (293) | | | $ (293) | |
| | | | | | | | | | | | | | | | | | | | | | | | | | | | | | | | | | | | |
| (g) | Securities with an aggregate market value of $1,657 and cash of $2,334 have been pledged as collateral for exchange-traded and centrally cleared financial derivative instruments as of June 30, 2020. See Note 8, Master Netting Arrangements, in the Notes to Financial Statements for more information. |
| (1) | If the Fund is a buyer of protection and a credit event occurs, as defined under the terms of that particular swap agreement, the Fund will either (i) receive from the seller of protection an amount equal to the notional amount of the swap and deliver the referenced obligation or underlying securities comprising the referenced index or (ii) receive a net settlement amount in the form of cash, securities or other deliverable obligations equal to the notional amount of the swap less the recovery value of the referenced obligation or underlying securities comprising the referenced index. |
| (2) | The maximum potential amount the Fund could be required to pay as a seller of credit protection or receive as a buyer of credit protection if a credit event occurs as defined under the terms of that particular swap agreement. |
| (3) | The prices and resulting values for credit default swap agreements serve as indicators of the current status of the payment/performance risk and represent the likelihood of an expected liability (or profit) for the credit derivative should the notional amount of the swap agreement be closed/sold as of the period end. Increasing market values, in absolute terms when compared to the notional amount of the swap, represent a deterioration of the underlying referenced instrument’s credit soundness and a greater likelihood or risk of default or other credit event occurring as defined under the terms of the agreement. |
| (4) | This instrument has a forward starting effective date. See Note 2, Securities Transactions and Investment Income, in the Notes to Financial Statements for further information. |
(h) FINANCIAL DERIVATIVE INSTRUMENTS: OVER THE COUNTER
FORWARD FOREIGN CURRENCY CONTRACTS:
| | | | | | | | | | | | | | | | | | | | |
| Counterparty | | Settlement
Month | | | | | Currency to
be Delivered | | | | Currency to
be Received | | Unrealized Appreciation/
(Depreciation) | |
| | Asset | | | Liability | |
BOA | | | 07/2020 | | | CAD | | 162 | | $ | | 119 | | $ | 0 | | | $ | 0 | |
| | | | | | | |
CBK | | | 07/2020 | | | EUR | | 236 | | | | 266 | | | 1 | | | | 0 | |
| | | | | | | |
HUS | | | 07/2020 | | | CAD | | 153 | | | | 113 | | | 0 | | | | 0 | |
| | | 07/2020 | | | EUR | | 4,067 | | | | 4,545 | | | 0 | | | | (24 | ) |
| | | | | | | |
MYI | | | 07/2020 | | | AUD | | 10,551 | | | | 7,009 | | | 0 | | | | (273 | ) |
| | | 07/2020 | | | $ | | 6,753 | | AUD | | 10,236 | | | 311 | | | | 0 | |
| | | | | | | |
SCX | | | 07/2020 | | | | | 7,259 | | | | 10,551 | | | 23 | | | | 0 | |
| | | 08/2020 | | | AUD | | 10,551 | | | | $7,260 | | | 0 | | | | (23 | ) |
| | | | | | | |
TOR | | | 07/2020 | | | | | 10,236 | | | | 6,803 | | | 0 | | | | (261 | ) |
| | | 07/2020 | | | CAD | | 6,237 | | | | 4,528 | | | 0 | | | | (66 | ) |
| | | 07/2020 | | | | | $1,553 | | CAD | | 2,120 | | | 8 | | | | 0 | |
| | | 08/2020 | | | CAD | | 2,120 | | $ | | 1,554 | | | 0 | | | | (8 | ) |
| | | | | | | | | | | | | | | | | | | | |
Total Forward Foreign Currency Contracts | | $ | 343 | | | $ | (655 | ) |
| | | | | | | | |
| | | | | | |
| See Accompanying Notes | | ANNUAL REPORT | | JUNE 30, 2020 | | 67 |
Schedule of Investments PIMCO Enhanced Low Duration Active Exchange-Traded Fund (Cont.)
WRITTEN OPTIONS:
CREDIT DEFAULT SWAPTIONS ON CREDIT INDICES
| | | | | | | | | | | | | | | | | | | | | | |
| Counterparty | | Description | | Buy/Sell
Protection | | Exercise
Rate | | | Expiration
Date | | | Notional
Amount(1) | | Premiums
(Received) | | | Market
Value | |
GST | | Put - OTC CDX.IG-33 5-Year Index | | Sell | | | 2.500 | % | | | 01/20/2021 | | | 1,700 | | $ | (1 | ) | | $ | (2 | ) |
| | | | | | | | | | | | | | | | | | | | | | |
OPTIONS ON SECURITIES
| | | | | | | | | | | | | | | | | | |
| Counterparty | | Description | | Strike
Price | | Expiration
Date | | | Notional
Amount(1) | | | Premiums
(Received) | | Market
Value | |
JPM | | Put - OTC Uniform Mortgage-Backed Security, TBA 2.500% due 08/01/2050 | | $102.094 | | | 08/06/2020 | | | | 6,300 | | | $ (25) | | $ | (6 | ) |
| | | | | | | | | | | | | | | | | | |
Total Written Options | | | $ (26) | | $ | (8 | ) |
| | | | | | | | | | | | | | | | | | |
SWAP AGREEMENTS:
TOTAL RETURN SWAPS ON SECURITIES
| | | | | | | | | | | | | | | | | | | | | | | | | | | | | | | | | | |
Counterparty | | Pay/
Receive(2) | | Underlying
Reference | | # of Shares | | Financing
Rate | | Payment
Frequency | | Maturity
Date | | | Notional
Amount | | | Premiums
Paid/(Received) | | | Unrealized
Appreciation/
(Depreciation) | | | Swap Agreements,
at Value | |
| | Asset | | | Liability | |
| BPS | | Receive | | United States Treasury Inflation Indexed Bonds | | N/A | | 0.230% | | Maturity | | | 07/27/2020 | | | $ | 3,200 | | | $ | 0 | | | $ | 47 | | | $ | 47 | | | $ | 0 | |
| | Receive | | United States Treasury Inflation Indexed Bonds | | N/A | | 0.230% | | Maturity | | | 08/10/2020 | | | | 4,900 | | | | 0 | | | | 101 | | | | 101 | | | | 0 | |
| | Receive | | United States Treasury Inflation Indexed Bonds | | N/A | | 0.220% | | Maturity | | | 08/20/2020 | | | | 4,500 | | | | 0 | | | | 55 | | | | 55 | | | | 0 | |
| | Receive | | United States Treasury Inflation Indexed Bonds | | N/A | | 0.220% | | Maturity | | | 08/27/2020 | | | | 9,090 | | | | 0 | | | | 109 | | | | 109 | | | | 0 | |
| | | | | | | | | | | | | | | | | | | | | | | | | | | | | | | | | | |
Total Swap Agreements | | | $ | 0 | | | $ | 312 | | | $ | 312 | | | $ | 0 | |
| | | | | | | | | | | | | | | | | | | | | | | | | | | | | | | | | | |
FINANCIAL DERIVATIVE INSTRUMENTS: OVER THE COUNTER SUMMARY
The following is a summary by counterparty of the market value of OTC financial derivative instruments and collateral pledged/(received) as of June 30, 2020:
| | | | | | | | | | | | | | | | | | | | | | | | | | | | | | | | | | | | | | | | | | | | | | | | |
| | | Financial Derivative Assets | | | | | | Financial Derivative Liabilities | | | | | | | | | | |
| Counterparty | | Forward
Foreign
Currency
Contracts | | | Purchased
Options | | | Swap
Agreements | | | Total
Over the
Counter | | | | | | Forward
Foreign
Currency
Contracts | | | Written
Options | | | Swap
Agreements | | | Total
Over the
Counter | | | Net Market
Value of OTC
Derivatives | | | Collateral
Pledged/
(Received) | | | Net
Exposure(3) | |
BPS | | $ | 0 | | | $ | 0 | | | $ | 312 | | | $ | 312 | | | | | | | $ | 0 | | | $ | 0 | | | $ | 0 | | | $ | 0 | | | $ | 312 | | | $ | (280 | ) | | $ | 32 | |
CBK | | | 1 | | | | 0 | | | | 0 | | | | 1 | | | | | | | | 0 | | | | 0 | | | | 0 | | | | 0 | | | | 1 | | | | 0 | | | | 1 | |
GST | | | 0 | | | | 0 | | | | 0 | | | | 0 | | | | | | | | 0 | | | | (2 | ) | | | 0 | | | | (2 | ) | | | (2 | ) | | | 0 | | | | (2 | ) |
HUS | | | 0 | | | | 0 | | | | 0 | | | | 0 | | | | | | | | (24 | ) | | | 0 | | | | 0 | | | | (24 | ) | | | (24 | ) | | | 0 | | | | (24 | ) |
JPM | | | 0 | | | | 0 | | | | 0 | | | | 0 | | | | | | | | 0 | | | | (6 | ) | | | 0 | | | | (6 | ) | | | (6 | ) | | | 0 | | | | (6 | ) |
MYI | | | 311 | | | | 0 | | | | 0 | | | | 311 | | | | | | | | (273 | ) | | | 0 | | | | 0 | | | | (273 | ) | | | 38 | | | | 0 | | | | 38 | |
SCX | | | 23 | | | | 0 | | | | 0 | | | | 23 | | | | | | | | (23 | ) | | | 0 | | | | 0 | | | | (23 | ) | | | 0 | | | | 0 | | | | 0 | |
TOR | | | 8 | | | | 0 | | | | 0 | | | | 8 | | | | | | | | (335 | ) | | | 0 | | | | 0 | | | | (335 | ) | | | (327 | ) | | | 339 | | | | 12 | |
| | | | | | | | | | | | | | | | | | | | | | | | | | | | | | | | | | | | | | | | | | | | | | | | |
Total Over the Counter | | $ | 343 | | | $ | 0 | | | $ | 312 | | | $ | 655 | | | | | | | $ | (655 | ) | | $ | (8 | ) | | $ | 0 | | | $ | (663 | ) | | | | | | | | | | | | |
| | | | | | | | | | | | | | | | | | | | | | | | | | | | | | | | | | | | | | | | | | | | | | | | |
| (i) | Securities with an aggregate market value of $339 have been pledged as collateral for financial derivative instruments as governed by International Swaps and Derivatives Association, Inc. master agreements as of June 30, 2020. |
| (1) | Notional Amount represents the number of contracts. |
| (2) | Receive represents that the Fund receives payments for any positive net return on the underlying reference. The Fund makes payments for any negative net return on such underlying reference. Pay represents that the Fund receives payments for any negative net return on the underlying reference. The Fund makes payments for any positive net return on such underlying reference. |
| (3) | Net Exposure represents the net receivable/(payable) that would be due from/to the counterparty in the event of default. Exposure from OTC financial derivative instruments can only be netted across transactions governed under the same master agreement with the same legal entity. See Note 8, Master Netting Arrangements, in the Notes to Financial Statements for more information. |
| | | | | | | | |
| 68 | | PIMCO ETF TRUST | | | | | See Accompanying Notes | |
June 30, 2020
FAIR VALUE OF FINANCIAL DERIVATIVE INSTRUMENTS
The following is a summary of the fair valuation of the Fund’s derivative instruments categorized by risk exposure. See Note 7, Principal Risks, in the Notes to Financial Statements on risks of the Fund.
Fair Values of Financial Derivative Instruments on the Statements of Assets and Liabilities as of June 30, 2020:
| | | | | | | | | | | | | | | | | | | | | | | | |
| | | Derivatives not accounted for as hedging instruments | |
| | | Commodity
Contracts | | | Credit
Contracts | | | Equity
Contracts | | | Foreign
Exchange
Contracts | | | Interest
Rate Contracts | | | Total | |
Financial Derivative Instruments - Assets | |
Exchange-traded or centrally cleared | |
Futures | | $ | 0 | | | $ | 0 | | | $ | 0 | | | $ | 0 | | | $ | 38 | | | $ | 38 | |
Swap Agreements | | | 0 | | | | 0 | | | | 0 | | | | 0 | | | | 22 | | | | 22 | |
| | | | | | | | | | | | | | | | | | | | | | | | |
| | $ | 0 | | | $ | 0 | | | $ | 0 | | | $ | 0 | | | $ | 60 | | | $ | 60 | |
| | | | | | | | | | | | | | | | | | | | | | | | |
Over the counter | |
Forward Foreign Currency Contracts | | $ | 0 | | | $ | 0 | | | $ | 0 | | | $ | 343 | | | $ | 0 | | | $ | 343 | |
Swap Agreements | | | 0 | | | | 0 | | | | 0 | | | | 0 | | | | 312 | | | | 312 | |
| | | | | | | | | | | | | | | | | | | | | | | | |
| | $ | 0 | | | $ | 0 | | | $ | 0 | | | $ | 343 | | | $ | 312 | | | $ | 655 | |
| | | | | | | | | | | | | | | | | | | | | | | | |
| | $ | 0 | | | $ | 0 | | | $ | 0 | | | $ | 343 | | | $ | 372 | | | $ | 715 | |
| | | | | | | | | | | | | | | | | | | | | | | | |
|
Financial Derivative Instruments - Liabilities | |
Exchange-traded or centrally cleared | |
Swap Agreements | | $ | 0 | | | $ | 291 | | | $ | 0 | | | $ | 0 | | | $ | 2 | | | $ | 293 | |
| | | | | | | | | | | | | | | | | | | | | | | | |
Over the counter | |
Forward Foreign Currency Contracts | | $ | 0 | | | $ | 0 | | | $ | 0 | | | $ | 655 | | | $ | 0 | | | $ | 655 | |
Written Options | | | 0 | | | | 2 | | | | 0 | | | | 0 | | | | 6 | | | | 8 | |
| | | | | | | | | | | | | | | | | | | | | | | | |
| | $ | 0 | | | $ | 2 | | | $ | 0 | | | $ | 655 | | | $ | 6 | | | $ | 663 | |
| | | | | | | | | | | | | | | | | | | | | | | | |
| | $ | 0 | | | $ | 293 | | | $ | 0 | | | $ | 655 | | | $ | 8 | | | $ | 956 | |
| | | | | | | | | | | | | | | | | | | | | | | | |
The effect of Financial Derivative Instruments on the Statements of Operations for the period ended June 30, 2020:
| | | | | | | | | | | | | | | | | | | | | | | | |
| | | Derivatives not accounted for as hedging instruments | |
| | | Commodity
Contracts | | | Credit
Contracts | | | Equity
Contracts | | | Foreign
Exchange
Contracts | | | Interest
Rate Contracts | | | Total | |
Net Realized Gain (Loss) on Financial Derivative Instruments | |
Exchange-traded or centrally cleared | | | | | | | | | | | | | | | | | | | | | | | | |
Purchased Options | | $ | 0 | | | $ | 0 | | | $ | 0 | | | $ | 0 | | | $ | (12 | ) | | $ | (12 | ) |
Futures | | | 0 | | | | 0 | | | | 0 | | | | 0 | | | | 192 | | | | 192 | |
Swap Agreements | | | 0 | | | | 3,151 | | | | 0 | | | | 0 | | | | (3,958 | ) | | | (807 | ) |
| | | | | | | | | | | | | | | | | | | | | | | | |
| | $ | 0 | | | $ | 3,151 | | | $ | 0 | | | $ | 0 | | | $ | (3,778 | ) | | $ | (627 | ) |
| | | | | | | | | | | | | | | | | | | | | | | | |
Over the counter | |
Forward Foreign Currency Contracts | | $ | 0 | | | $ | 0 | | | $ | 0 | | | $ | 1,700 | | | $ | 0 | | | $ | 1,700 | |
Written Options | | | 0 | | | | 136 | | | | 0 | | | | 0 | | | | 521 | | | | 657 | |
Swap Agreements | | | 0 | | | | 0 | | | | 0 | | | | 0 | | | | 1,738 | | | | 1,738 | |
| | | | | | | | | | | | | | | | | | | | | | | | |
| | $ | 0 | | | $ | 136 | | | $ | 0 | | | $ | 1,700 | | | $ | 2,259 | | | $ | 4,095 | |
| | | | | | | | | | | | | | | | | | | | | | | | |
| | $ | 0 | | | $ | 3,287 | | | $ | 0 | | | $ | 1,700 | | | $ | (1,519 | ) | | $ | 3,468 | |
| | | | | | | | | | | | | | | | | | | | | | | | |
|
Net Change in Unrealized Appreciation (Depreciation) on Financial Derivative Instruments | |
Exchange-traded or centrally cleared | |
Purchased Options | | $ | 0 | | | $ | 0 | | | $ | 0 | | | $ | 0 | | | $ | (2 | ) | | $ | (2 | ) |
Futures | | | 0 | | | | 0 | | | | 0 | | | | 0 | | | | 542 | | | | 542 | |
Swap Agreements | | | 0 | | | | (961 | ) | | | 0 | | | | 0 | | | | 1,887 | | | | 926 | |
| | | | | | | | | | | | | | | | | | | | | | | | |
| | $ | 0 | | | $ | (961 | ) | | $ | 0 | | | $ | 0 | | | $ | 2,427 | | | $ | 1,466 | |
| | | | | | | | | | | | | | | | | | | | | | | | |
Over the counter | |
Forward Foreign Currency Contracts | | $ | 0 | | | $ | 0 | | | $ | 0 | | | $ | (5 | ) | | $ | 0 | | | $ | (5 | ) |
Written Options | | | 0 | | | | (27 | ) | | | 0 | | | | 0 | | | | (19 | ) | | | (46 | ) |
Swap Agreements | | | 0 | | | | 0 | | | | 0 | | | | 0 | | | | (229 | ) | | | (229 | ) |
| | | | | | | | | | | | | | | | | | | | | | | | |
| | $ | 0 | | | $ | (27 | ) | | $ | 0 | | | $ | (5 | ) | | $ | (248 | ) | | $ | (280 | ) |
| | | | | | | | | | | | | | | | | | | | | | | | |
| | $ | 0 | | | $ | (988 | ) | | $ | 0 | | | $ | (5 | ) | | $ | 2,179 | | | $ | 1,186 | |
| | | | | | | | | | | | | | | | | | | | | | | | |
| | | | | | |
| See Accompanying Notes | | ANNUAL REPORT | | JUNE 30, 2020 | | 69 |
Schedule of Investments PIMCO Enhanced Low Duration Active Exchange-Traded Fund (Cont.)
June 30, 2020
FAIR VALUE MEASUREMENTS
The following is a summary of the fair valuations according to the inputs used as of June 30, 2020 in valuing the Fund’s assets and liabilities:
| | | | | | | | | | | | | | | | |
| Category and Subcategory | | Level 1 | | | Level 2 | | | Level 3 | | | Fair
Value at
06/30/2020 | |
Investments in Securities, at Value | |
Loan Participations and Assignments | | $ | 0 | | | $ | 0 | | | $ | 1,998 | | | $ | 1,998 | |
Corporate Bonds & Notes | |
Banking & Finance | | | 0 | | | | 181,988 | | | | 0 | | | | 181,988 | |
Industrials | | | 0 | | | | 100,492 | | | | 0 | | | | 100,492 | |
Utilities | | | 0 | | | | 27,313 | | | | 0 | | | | 27,313 | |
Municipal Bonds & Notes | |
Illinois | | | 0 | | | | 479 | | | | 0 | | | | 479 | |
U.S. Government Agencies | | | 0 | | | | 46,838 | | | | 0 | | | | 46,838 | |
U.S. Treasury Obligations | | | 0 | | | | 381,604 | | | | 0 | | | | 381,604 | |
Non-Agency Mortgage-Backed Securities | | | 0 | | | | 42,752 | | | | 0 | | | | 42,752 | |
Asset-Backed Securities | | | 0 | | | | 62,761 | | | | 0 | | | | 62,761 | |
Sovereign Issues | | | 0 | | | | 976 | | | | 0 | | | | 976 | |
Preferred Securities | |
Banking & Finance | | | 0 | | | | 694 | | | | 0 | | | | 694 | |
Short-Term Instruments | |
Commercial Paper | | | 0 | | | | 19,886 | | | | 0 | | | | 19,886 | |
Repurchase Agreements | | | 0 | | | | 24,646 | | | | 0 | | | | 24,646 | |
Municipal Bonds & Notes | | | 0 | | | | 1,222 | | | | 0 | | | | 1,222 | |
| | | | | | | | | | | | | | | | |
| | | | |
Total Investments | | $ | 0 | | | $ | 891,651 | | | $ | 1,998 | | | $ | 893,649 | |
| | | | | | | | | | | | | | | | |
| | | | | | | | | | | | | | | | |
| Category and Subcategory | | Level 1 | | | Level 2 | | | Level 3 | | | Fair
Value at
06/30/2020 | |
Short Sales, at Value - Liabilities | |
U.S. Treasury Obligations | | $ | 0 | | | $ | (55,759 | ) | | $ | 0 | | | $ | (55,759 | ) |
| | | | | | | | | | | | | | | | |
|
Financial Derivative Instruments - Assets | |
Exchange-traded or centrally cleared | | | 38 | | | | 22 | | | | 0 | | | | 60 | |
Over the counter | | | 0 | | | | 655 | | | | 0 | | | | 655 | |
| | | | | | | | | | | | | | | | |
| | $ | 38 | | | $ | 677 | | | $ | 0 | | | $ | 715 | |
| | | | | | | | | | | | | | | | |
|
Financial Derivative Instruments - Liabilities | |
Exchange-traded or centrally cleared | | | 0 | | | | (293 | ) | | | 0 | | | | (293 | ) |
Over the counter | | | 0 | | | | (663 | ) | | | 0 | | | | (663 | ) |
| | | | | | | | | | | | | | | | |
| | $ | 0 | | | $ | (956 | ) | | $ | 0 | | | $ | (956 | ) |
| | | | | | | | | | | | | | | | |
| | | | |
Total Financial Derivative Instruments | | $ | 38 | | | $ | (279 | ) | | $ | 0 | | | $ | (241 | ) |
| | | | | | | | | | | | | | | | |
| | | | |
Totals | | $ | 38 | | | $ | 835,613 | | | $ | 1,998 | | | $ | 837,649 | |
| | | | | | | | | | | | | | | | |
There were no significant transfers into or out of Level 3 during the period ended June 30, 2020.
| | | | | | | | |
| 70 | | PIMCO ETF TRUST | | | | | See Accompanying Notes | |
Schedule of Investments PIMCO Enhanced Short Maturity Active ESG Exchange-Traded Fund
June 30, 2020
(Amounts in thousands*, except number of shares, contracts and units, if any)
| | | | | | | | | | | | |
| | | | | PRINCIPAL
AMOUNT
(000S) | | | | | MARKET
VALUE
(000S) | |
| INVESTMENTS IN SECURITIES 106.7% | |
| |
| CORPORATE BONDS & NOTES 59.9% | |
| |
| BANKING & FINANCE 36.0% | |
|
AerCap Ireland Capital DAC
| |
4.500% due 05/15/2021 | | $ | | | 500 | | | $ | | | 503 | |
|
Aircastle Ltd.
| |
5.125% due 03/15/2021 | | | | | 650 | | | | | | 653 | |
|
Allstate Corp. | |
0.736% (US0003M + 0.430%) due 03/29/2021 ~ | | | | | 235 | | | | | | 235 | |
0.936% (US0003M + 0.630%) due 03/29/2023 ~ | | | | | 300 | | | | | | 299 | |
|
Ally Financial, Inc. | |
4.250% due 04/15/2021 | | | | | 300 | | | | | | 306 | |
7.500% due 09/15/2020 | | | | | 900 | | | | | | 909 | |
|
American Express Co. | |
0.911% (US0003M + 0.525%) due 05/17/2021 ~ | | | | | 310 | | | | | | 311 | |
1.297% (US0003M + 0.610%) due 08/01/2022 ~ | | | | | 400 | | | | | | 401 | |
|
Aviation Capital Group LLC
| |
1.300% (US0003M + 0.950%) due 06/01/2021 ~ | | | | | 800 | | | | | | 761 | |
|
Bank of America Corp.
| |
3.499% due 05/17/2022 • | | | | | 589 | | | | | | 603 | |
|
Barclays PLC | |
1.822% (US0003M + 1.430%) due 02/15/2023 ~ | | | | | 400 | | | | | | 399 | |
2.558% (US0003M + 2.110%) due 08/10/2021 ~ | | | | | 100 | | | | | | 102 | |
3.200% due 08/10/2021 | | | | | 500 | | | | | | 512 | |
|
BBVA USA
| |
3.500% due 06/11/2021 | | | | | 1,000 | | | | | | 1,022 | |
|
Boston Properties LP
| |
4.125% due 05/15/2021 | | | | | 1,000 | | | | | | 1,020 | |
|
Brixmor Operating Partnership LP
| |
1.737% (US0003M + 1.050%) due 02/01/2022 ~ | | | | | 700 | | | | | | 687 | |
|
Canadian Imperial Bank of Commerce
| |
0.881% (SOFRRATE + 0.800%) due 03/17/2023 ~ | | | | | 900 | | | | | | 895 | |
|
Caterpillar Financial Services Corp.
| |
0.618% (US0003M + 0.300%) due 03/08/2021 ~ | | | | | 500 | | | | | | 500 | |
|
Citigroup, Inc.
| |
1.678% due 05/15/2024 • | | | | | 1,000 | | | | | | 1,020 | |
|
CNH Industrial Capital LLC | |
4.375% due 11/06/2020 | | | | | 1,100 | | | | | | 1,110 | |
4.875% due 04/01/2021 | | | | | 200 | | | | | | 205 | |
|
Credit Agricole Corporate & Investment Bank S.A. | |
2.062% due 10/03/2021 • | | | | | 1,000 | | | | | | 1,001 | |
|
DBS Group Holdings Ltd.
| |
1.611% (US0003M + 0.620%) due 07/25/2022 ~ | | | | | 1,000 | | | | | | 1,000 | |
|
Goodman U.S. Finance One LLC
| |
6.375% due 04/15/2021 | | | | | 500 | | | | | | 518 | |
|
Goodman U.S. Finance Two LLC
| |
6.000% due 03/22/2022 | | | | | 500 | | | | | | 533 | |
|
Hyundai Capital Services, Inc.
| |
2.875% due 03/16/2021 | | | | | 1,300 | | | | | | 1,310 | |
|
International Bank for Reconstruction & Development
| |
1.411% (US0003M + 0.100%) due 10/13/2020 ~ | | | | | 600 | | | | | | 600 | |
|
Jackson National Life Global Funding | |
0.631% (US0003M + 0.310%) due 03/16/2021 ~ | | | | | 250 | | | | | | 250 | |
0.795% (US0003M + 0.480%) due 06/11/2021 ~ | | | | | 500 | | | | | | 501 | |
|
John Deere Capital Corp.
| |
0.570% (US0003M + 0.260%) due 09/10/2021 ~ | | | | | 28 | | | | | | 28 | |
| | | | | | | | | | | | |
| | | | | PRINCIPAL
AMOUNT
(000S) | | | | | MARKET
VALUE
(000S) | |
|
JPMorgan Chase & Co.
| |
2.250% (US0003M + 1.230%) due 10/24/2023 ~ | | $ | | | 700 | | | $ | | | 708 | |
|
Lloyds Banking Group PLC
| |
1.326% due 06/15/2023 • | | | | | 500 | | | | | | 503 | |
|
Marsh & McLennan Cos., Inc.
| |
1.506% (US0003M + 1.200%) due 12/29/2021 ~ | | | | | 1,050 | | | | | | 1,051 | |
|
Mitsubishi UFJ Financial Group, Inc.
| |
1.781% (US0003M + 0.790%) due 07/25/2022 ~ | | | | | 509 | | | | | | 511 | |
|
Mizuho Financial Group, Inc.
| |
1.117% (US0003M + 0.790%) due 03/05/2023 ~ | | | | | 1,000 | | | | | | 997 | |
|
Nationwide Building Society
| |
2.450% due 07/27/2021 | | | | | 400 | | | | | | 409 | |
|
NatWest Markets PLC
| |
1.706% (US0003M + 1.400%) due 09/29/2022 ~ | | | | | 300 | | | | | | 301 | |
|
NTT Finance Corp.
| |
1.900% due 07/21/2021 | | | | | 500 | | | | | | 506 | |
|
ORIX Corp. | |
2.650% due 04/13/2021 | | | | | 900 | | | | | | 911 | |
2.950% due 07/23/2020 | | | | | 200 | | | | | | 200 | |
|
PNC Bank N.A. | |
1.348% (US0003M + 0.250%) due 01/22/2021 ~ | | | | | 500 | | | | | | 501 | |
1.548% (US0003M + 0.450%) due 07/22/2022 ~ | | | | | 500 | | | | | | 501 | |
|
Royal Bank of Canada
| |
1.495% (US0003M + 0.360%) due 01/17/2023 ~ | | | | | 547 | | | | | | 545 | |
|
Royal Bank of Scotland Group PLC
| |
2.359% due 05/22/2024 • | | | | | 400 | | | | | | 411 | |
|
Skandinaviska Enskilda Banken AB
| |
0.963% (US0003M + 0.645%) due 12/12/2022 ~ | | | | | 500 | | | | | | 502 | |
|
Sumitomo Mitsui Banking Corp.
| |
2.450% due 10/20/2020 | | | | | 1,000 | | | | | | 1,006 | |
|
UBS Group AG
| |
3.091% due 04/14/2021 • | | | | | 900 | | | | | | 912 | |
|
United Overseas Bank Ltd. | |
1.523% (US0003M + 0.480%) due 04/23/2021 ~ | | | | | 200 | | | | | | 200 | |
3.200% due 04/23/2021 | | | | | 605 | | | | | | 617 | |
|
USAA Capital Corp.
| |
1.500% due 05/01/2023 | | | | | 1,000 | | | | | | 1,026 | |
|
WEA Finance LLC
| |
3.250% due 10/05/2020 | | | | | 1,000 | | | | | | 1,001 | |
| | | | | | | | | | | | |
| | | | | | | | | | | 31,513 | |
| | | | | | | | | | | | |
| |
| INDUSTRIALS 22.3% | |
|
AbbVie, Inc.
| |
0.724% (US0003M + 0.350%) due 05/21/2021 ~ | | | | | 1,000 | | | | | | 1,001 | |
|
Apple, Inc.
| |
0.948% (US0003M + 0.500%) due 02/09/2022 ~ | | | | | 1,200 | | | | | | 1,207 | |
|
Becton Dickinson and Co.
| |
1.181% (US0003M + 0.875%) due 12/29/2020 ~ | | | | | 1,000 | | | | | | 1,000 | |
|
BMW U.S. Capital LLC | |
0.934% (US0003M + 0.500%) due 08/13/2021 ~ | | | | | 325 | | | | | | 323 | |
1.721% (US0003M + 0.410%) due 04/12/2021 ~ | | | | | 400 | | | | | | 399 | |
|
Bureau Veritas S.A.
| |
3.125% due 01/21/2021 | | EUR | | | 1,000 | | | | | | 1,138 | |
|
Campbell Soup Co.
| |
0.943% (US0003M + 0.630%) due 03/15/2021 ~ | | $ | | | 987 | | | | | | 988 | |
| | | | | | | | | | | | |
| | | | | PRINCIPAL
AMOUNT
(000S) | | | | | MARKET
VALUE
(000S) | |
|
Celgene Corp. | |
2.875% due 08/15/2020 | | $ | | | 200 | | | $ | | | 201 | |
3.550% due 08/15/2022 | | | | | 1,000 | | | | | | 1,044 | |
|
CRH America, Inc.
| |
5.750% due 01/15/2021 | | | | | 816 | | | | | | 833 | |
|
CVS Health Corp.
| |
1.033% (US0003M + 0.720%) due 03/09/2021 ~ | | | | | 650 | | | | | | 653 | |
|
Delta Air Lines, Inc.
| |
2.600% due 12/04/2020 | | | | | 1,100 | | | | | | 1,088 | |
|
Fresenius Medical Care U.S. Finance, Inc.
| |
5.750% due 02/15/2021 | | | | | 1,300 | | | | | | 1,337 | |
|
General Mills, Inc.
| |
1.716% (US0003M + 0.540%) due 04/16/2021 ~ | | | | | 495 | | | | | | 496 | |
|
International Flavors & Fragrances, Inc.
| |
3.400% due 09/25/2020 | | | | | 1,202 | | | | | | 1,208 | |
|
Keurig Dr Pepper, Inc.
| |
3.551% due 05/25/2021 | | | | | 1,000 | | | | | | 1,028 | |
|
Komatsu Finance America, Inc. | |
2.118% due 09/11/2020 | | | | | 600 | | | | | | 601 | |
2.437% due 09/11/2022 | | | | | 200 | | | | | | 205 | |
|
Kraft Heinz Foods Co.
| |
2.800% due 07/02/2020 | | | | | 155 | | | | | | 155 | |
|
PayPal Holdings, Inc.
| |
2.200% due 09/26/2022 | | | | | 1,000 | | | | | | 1,036 | |
|
Reckitt Benckiser Treasury Services PLC
| |
0.857% (US0003M + 0.560%) due 06/24/2022 ~ | | | | | 700 | | | | | | 699 | |
|
Rogers Communications, Inc.
| |
0.906% (US0003M + 0.600%) due 03/22/2022 ~ | | | | | 700 | | | | | | 703 | |
|
Starbucks Corp.
| |
1.300% due 05/07/2022 | | | | | 1,000 | | | | | | 1,014 | |
|
Telefonica Emisiones S.A.
| |
5.462% due 02/16/2021 | | | | | 1,100 | | | | | | 1,133 | |
| | | | | | | | | | | | |
| | | | | | | | | | | 19,490 | |
| | | | | | | | | | | | |
| |
| UTILITIES 1.6% | |
|
SingTel Group Treasury Pte Ltd.
| |
4.500% due 09/08/2021 | | | | | 800 | | | | | | 831 | |
|
Verizon Communications, Inc.
| |
1.321% (US0003M + 1.000%) due 03/16/2022 ~ | | | | | 600 | | | | | | 608 | |
| | | | | | | | | | | | |
| | | | | | | | | | | 1,439 | |
| | | | | | | | | | | | |
Total Corporate Bonds & Notes (Cost $52,028) | | | 52,442 | |
| | | | |
| |
| MUNICIPAL BONDS & NOTES 0.9% | |
| |
| CALIFORNIA 0.9% | |
|
California Municipal Finance Authority Revenue Notes, Series 2020
| |
1.486% due 11/01/2022 | | | | | 750 | | | | | | 751 | |
| | | | | | | | | | | | |
Total Municipal Bonds & Notes (Cost $750) | | | 751 | |
| | | | |
| |
| U.S. GOVERNMENT AGENCIES 24.7% | |
|
Fannie Mae | |
0.635% due 03/25/2049 | | | | | 859 | | | | | | 860 | |
0.635% due 11/25/2059 • | | | | | 1,845 | | | | | | 1,846 | |
0.685% due 05/25/2046 - 11/25/2059 • | | | | | 4,054 | | | | | | 4,063 | |
1.931% due 08/25/2044 | | | | | 1,853 | | | | | | 1,844 | |
|
Freddie Mac | |
0.585% due 09/15/2045 • | | | | | 972 | | | | | | 972 | |
0.635% due 11/15/2044 • | | | | | 2,956 | | | | | | 2,966 | |
0.635% due 09/25/2049 | | | | | 876 | | | | | | 877 | |
0.785% due 01/15/2054 • | | | | | 962 | | | | | | 968 | |
0.900% due 05/06/2025 | | | | | 6,000 | | | | | | 6,002 | |
2.500% due 06/25/2034 | | | | | 873 | | | | | | 883 | |
| | | | | | |
| See Accompanying Notes | | ANNUAL REPORT | | JUNE 30, 2020 | | 71 |
Schedule of Investments PIMCO Enhanced Short Maturity Active ESG Exchange-Traded Fund (Cont.)
| | | | | | | | | | | | |
| | | | | PRINCIPAL
AMOUNT
(000S) | | | | | MARKET
VALUE
(000S) | |
|
Ginnie Mae
| |
0.640% due 02/20/2049 • | | $ | | | 354 | | | $ | | | 354 | |
| | | | | | | | | | | | |
Total U.S. Government Agencies
(Cost $21,582) | | | 21,635 | |
| | | | |
| |
| ASSET-BACKED SECURITIES 9.7% | |
|
Dell Equipment Finance Trust
| |
1.983% due 05/21/2021 | | | | | 370 | | | | | | 371 | |
|
Gallatin CLO Ltd.
| |
2.159% due 01/21/2028 • | | | | | 498 | | | | | | 491 | |
|
Golden Credit Card Trust
| |
0.535% due 10/15/2023 • | | | | | 500 | | | | | | 499 | |
|
KVK CLO Ltd.
| |
2.211% due 01/14/2028 • | | | | | 411 | | | | | | 404 | |
|
Nassau Ltd.
| |
2.369% due 10/15/2029 • | | | | | 500 | | | | | | 490 | |
|
Navient Private Education Loan Trust
| |
1.435% due 02/15/2029 • | | | | | 738 | | | | | | 738 | |
|
Navient Private Education Refi Loan Trust
| |
2.390% due 05/15/2068 | | | | | 842 | | | | | | 846 | |
|
Navient Student Loan Trust
| |
1.235% due 06/25/2065 • | | | | | 344 | | | | | | 344 | |
|
OneMain Financial Issuance Trust
| |
3.480% due 02/14/2031 | | | | | 875 | | | | | | 890 | |
| | | | | | | | | | | | |
| | | | | PRINCIPAL
AMOUNT
(000S) | | | | | MARKET
VALUE
(000S) | |
|
Oscar U.S. Funding Trust LLC
| |
2.450% due 12/10/2021 | | $ | | | 76 | | | $ | | | 76 | |
|
SLM Student Loan Trust
| |
1.101% due 01/27/2025 • | | | | | 180 | | | | | | 179 | |
|
SMB Private Education Loan Trust
| |
0.485% due 09/15/2054 • | | | | | 256 | | | | | | 254 | |
|
SoFi Consumer Loan Program Trust | |
3.540% due 11/26/2027 | | | | | 245 | | | | | | 248 | |
3.670% due 08/25/2027 | | | | | 74 | | | | | | 75 | |
|
SoFi Professional Loan Program LLC | |
1.135% due 01/25/2039 • | | | | | 630 | | | | | | 631 | |
1.285% due 10/27/2036 • | | | | | 449 | | | | | | 449 | |
2.390% due 02/25/2042 | | | | | 508 | | | | | | 510 | |
|
Tesla Auto Lease Trust
| |
2.130% due 04/20/2022 | | | | | 985 | | | | | | 996 | |
| | | | | | | | | | | | |
| Total Asset-Backed Securities (Cost $8,498) | | | 8,491 | |
| | | | |
| |
| SHORT-TERM INSTRUMENTS 11.5% | |
| |
| COMMERCIAL PAPER 2.4% | |
|
American Honda Finance Corp. | |
0.600% due 09/04/2020 | | | | | 300 | | | | | | 300 | |
2.000% due 09/03/2020 | | | | | 500 | | | | | | 500 | |
|
Walgreens Boots Alliance, Inc.
| |
0.650% due 08/17/2020 | | | | | 1,000 | | | | | | 999 | |
| | | | | | | | | | | | |
| | | | | PRINCIPAL
AMOUNT
(000S) | | | | | MARKET
VALUE
(000S) | |
|
Walt Disney Co.
| |
1.810% due 07/20/2020 | | $ | | | 300 | | | $ | | | 300 | |
| | | | | | | | | | | | |
| | | | | | | | | | | 2,099 | |
| | | | |
| |
| U.S. TREASURY BILLS 9.1% | |
0.152% due 10/01/2020 (a)(b) | | | | | 8,000 | | | | | | 7,997 | |
| | | | | | | | | | | | |
Total Short-Term Instruments
(Cost $10,094) | | | 10,096 | |
| | | | |
| | | | |
| | | | | | | | | | | | |
Total Investments in Securities
(Cost $92,952) | | | 93,415 | |
| | | | |
| | | | | | | | | | | | |
Total Investments 106.7%
(Cost $92,952) | | | $ | | | 93,415 | |
| |
Financial Derivative
Instruments (c) (0.1)%
(Cost or Premiums, net $0) | | | | | | (44 | ) |
| |
| Other Assets and Liabilities, net (6.6)% | | | (5,818 | ) |
| | | | |
| Net Assets 100.0% | | | $ | | | 87,553 | |
| | | | | | | |
NOTES TO SCHEDULE OF INVESTMENTS:
| * | A zero balance may reflect actual amounts rounding to less than one thousand. |
| ~ | Variable or Floating rate security. Rate shown is the rate in effect as of period end. Certain variable rate securities are not based on a published reference rate and spread, rather are determined by the issuer or agent and are based on current market conditions. Reference rate is as of reset date, which may vary by security. These securities may not indicate a reference rate and/or spread in their description. |
| • | Rate shown is the rate in effect as of period end. The rate may be based on a fixed rate, a capped rate or a floor rate and may convert to a variable or floating rate in the future. These securities do not indicate a reference rate and spread in their description. |
| (b) | Coupon represents a yield to maturity. |
The average amount of borrowings outstanding during the period ended June 30, 2020 was $(1,191) at a weighted average interest rate of 0.636%. Average borrowings may include reverse repurchase agreements and sale-buyback transactions, if held during the period.
(c) FINANCIAL DERIVATIVE INSTRUMENTS: OVER THE COUNTER
FORWARD FOREIGN CURRENCY CONTRACTS:
| | | | | | | | | | | | | | | | | | | | | | | | |
| Counterparty | | Settlement
Month | | | Currency to
be Delivered | | | Currency to
be Received | | | Unrealized Appreciation/
(Depreciation) | |
| | Asset | | | Liability | |
BOA | | | 01/2021 | | | EUR | | | 1,000 | | | $ | | | 1,085 | | | $ | 0 | | | $ | (44 | ) |
| | | | | | | | | | | | | | | | | | | | | | | | |
Total Forward Foreign Currency Contracts | | | $ | 0 | | | $ | (44 | ) |
| | | | | | | | | | | | | | | | | | | | | | | | |
FINANCIAL DERIVATIVE INSTRUMENTS: OVER THE COUNTER SUMMARY
The following is a summary by counterparty of the market value of OTC financial derivative instruments and collateral pledged/(received) as of June 30, 2020:
| | | | | | | | | | | | | | | | | | | | | | | | | | | | | | | | | | | | | | | | | | | | | | | | |
| | | Financial Derivative Assets | | | | | | Financial Derivative Liabilities | | | | | | | | | | |
| Counterparty | | Forward
Foreign
Currency
Contracts | | | Purchased
Options | | | Swap
Agreements | | | Total
Over the
Counter | | | | | | Forward
Foreign
Currency
Contracts | | | Written
Options | | | Swap
Agreements | | | Total
Over the
Counter | | | Net Market
Value of OTC
Derivatives | | | Collateral
Pledged/
(Received) | | | Net
Exposure(1) | |
BOA | | $ | 0 | | | $ | 0 | | | $ | 0 | | | $ | 0 | | | | | | | $ | (44 | ) | | $ | 0 | | | $ | 0 | | | $ | (44 | ) | | $ | (44 | ) | | $ | 0 | | | $ | (44 | ) |
| | | | | | | | | | | | | | | | | | | | | | | | | | | | | | | | | | | | | | | | | | | | | | | | |
| (1) | Net Exposure represents the net receivable/(payable) that would be due from/to the counterparty in the event of default. Exposure from OTC financial derivative instruments can only be netted across transactions governed under the same master agreement with the same legal entity. See Note 8, Master Netting Arrangements, in the Notes to Financial Statements for more information. |
| | | | | | | | |
| 72 | | PIMCO ETF TRUST | | | | | See Accompanying Notes | |
June 30, 2020
FAIR VALUE OF FINANCIAL DERIVATIVE INSTRUMENTS
The following is a summary of the fair valuation of the Fund’s derivative instruments categorized by risk exposure. See Note 7, Principal Risks, in the Notes to Financial Statements on risks of the Fund.
Fair Values of Financial Derivative Instruments on the Statements of Assets and Liabilities as of June 30, 2020:
| | | | | | | | | | | | | | | | | | | | | | | | |
| | | Derivatives not accounted for as hedging instruments | |
| | | Commodity
Contracts | | | Credit
Contracts | | | Equity
Contracts | | | Foreign
Exchange
Contracts | | | Interest
Rate
Contracts | | | Total | |
Financial Derivative Instruments - Liabilities | | | | | | | | | | | | | | | | | | | | | | | | |
Over the counter | | | | | | | | | | | | | | | | | | | | | | | | |
Forward Foreign Currency Contracts | | $ | 0 | | | $ | 0 | | | $ | 0 | | | $ | 44 | | | $ | 0 | | | $ | 44 | |
| | | | | | | | | | | | | | | | | | | | | | | | |
The effect of Financial Derivative Instruments on the Statements of Operations for the period ended June 30, 2020:
| | | | | | | | | | | | | | | | | | | | | | | | |
| | | Derivatives not accounted for as hedging instruments | |
| | | Commodity
Contracts | | | Credit
Contracts | | | Equity
Contracts | | | Foreign
Exchange
Contracts | | | Interest
Rate
Contracts | | | Total | |
Net Realized (Loss) on Financial Derivative Instruments | | | | | | | | | | | | | | | | | |
Over the counter | | | | | | | | | | | | | | | | | | | | | | | | |
Forward Foreign Currency Contracts | | $ | 0 | | | $ | 0 | | | $ | 0 | | | $ | (33 | ) | | $ | 0 | | | $ | (33 | ) |
| | | | | | | | | | | | | | | | | | | | | | | | |
| | | | |
Net Change in Unrealized (Depreciation) on Financial Derivative Instruments | | | | | | | | | | | | | | | | | |
Over the counter | | | | | | | | | | | | | | | | | | | | | | | | |
Forward Foreign Currency Contracts | | $ | 0 | | | $ | 0 | | | $ | 0 | | | $ | (44 | ) | | $ | 0 | | | $ | (44 | ) |
| | | | | | | | | | | | | | | | | | | | | | | | |
FAIR VALUE MEASUREMENTS
The following is a summary of the fair valuations according to the inputs used as of June 30, 2020 in valuing the Fund’s assets and liabilities:
| | | | | | | | | | | | | | | | |
| Category and Subcategory | | Level 1 | | | Level 2 | | | Level 3 | | | Fair
Value at
06/30/2020 | |
Investments in Securities, at Value | |
Corporate Bonds & Notes | | | | | | | | | | | | | | | | |
Banking & Finance | | $ | 0 | | | $ | 31,513 | | | $ | 0 | | | $ | 31,513 | |
Industrials | | | 0 | | | | 19,490 | | | | 0 | | | | 19,490 | |
Utilities | | | 0 | | | | 1,439 | | | | 0 | | | | 1,439 | |
Municipal Bonds & Notes | | | | | | | | | | | | | | | | |
California | | | 0 | | | | 751 | | | | 0 | | | | 751 | |
U.S. Government Agencies | | | 0 | | | | 21,635 | | | | 0 | | | | 21,635 | |
Asset-Backed Securities | | | 0 | | | | 8,491 | | | | 0 | | | | 8,491 | |
Short-Term Instruments | | | | | | | | | | | | | | | | |
Commercial Paper | | | 0 | | | | 2,099 | | | | 0 | | | | 2,099 | |
U.S. Treasury Bills | | | 0 | | | | 7,997 | | | | 0 | | | | 7,997 | |
| | | | | | | | | | | | | | | | |
| | | | |
Total Investments | | $ | 0 | | | $ | 93,415 | | | $ | 0 | | | $ | 93,415 | |
| | | | | | | | | | | | | | | | |
|
Financial Derivative Instruments - Liabilities | |
Over the counter | | $ | 0 | | | $ | (44 | ) | | $ | 0 | | | $ | (44 | ) |
| | | | | | | | | | | | | | | | |
| | | | |
Total Financial Derivative Instruments | | $ | 0 | | | $ | (44 | ) | | $ | 0 | | | $ | (44 | ) |
| | | | | | | | | | | | | | | | |
| | | | |
Totals | | $ | 0 | | | $ | 93,371 | | | $ | 0 | | | $ | 93,371 | |
| | | | | | | | | | | | | | | | |
There were no significant transfers into or out of Level 3 during the period ended June 30, 2020.
| | | | | | |
| See Accompanying Notes | | ANNUAL REPORT | | JUNE 30, 2020 | | 73 |
Schedule of Investments PIMCO Enhanced Short Maturity Active Exchange-Traded Fund
(Amounts in thousands*, except number of shares, contracts and units, if any)
| | | | | | | | | | | | |
| | | | | PRINCIPAL
AMOUNT
(000S) | | | | | MARKET
VALUE
(000S) | |
| INVESTMENTS IN SECURITIES 99.6% | |
| |
| CORPORATE BONDS & NOTES 52.8% | |
| |
| BANKING & FINANCE 33.7% | |
|
ABN AMRO Bank NV | |
0.939% (US0003M + 0.570%) due 08/27/2021 ~ | | $ | | | 30,950 | | | $ | | | 31,111 | |
1.935% (US0003M + 0.800%) due 07/19/2022 ~ | | | | | 7,200 | | | | | | 7,242 | |
|
AerCap Ireland Capital DAC | |
4.500% due 05/15/2021 | | | | | 33,078 | | | | | | 33,288 | |
4.625% due 10/30/2020 | | | | | 57,315 | | | | | | 57,566 | |
5.000% due 10/01/2021 | | | | | 13,976 | | | | | | 14,140 | |
|
AIA Group Ltd. | |
0.826% (US0003M + 0.520%) due 09/20/2021 ~ | | | | | 61,854 | | | | | | 61,936 | |
|
AIG Global Funding | |
0.757% (US0003M + 0.460%) due 06/25/2021 ~ | | | | | 20,400 | | | | | | 20,437 | |
1.931% (US0003M + 0.480%) due 07/02/2020 ~ | | | | | 6,208 | | | | | | 6,208 | |
|
Air Lease Corp. | |
2.500% due 03/01/2021 | | | | | 500 | | | | | | 500 | |
3.375% due 06/01/2021 | | | | | 1,700 | | | | | | 1,707 | |
|
Aircastle Ltd. | |
5.125% due 03/15/2021 | | | | | 9,806 | | | | | | 9,847 | |
|
Ally Financial, Inc. | |
4.250% due 04/15/2021 | | | | | 4,687 | | | | | | 4,772 | |
7.500% due 09/15/2020 | | | | | 6,375 | | | | | | 6,438 | |
|
American Express Co. | |
0.997% (US0003M + 0.620%) due 05/20/2022 ~ | | | | | 37,000 | | | | | | 37,072 | |
1.090% (US0003M + 0.330%) due 10/30/2020 ~ | | | | | 5,500 | | | | | | 5,504 | |
1.297% (US0003M + 0.610%) due 08/01/2022 ~ | | | | | 14,200 | | | | | | 14,231 | |
|
American Honda Finance Corp. | |
0.600% (US0003M + 0.290%) due 12/10/2021 ~ | | | | | 33,000 | | | | | | 32,909 | |
0.665% (US0003M + 0.350%) due 06/11/2021 ~ | | | | | 5,363 | | | | | | 5,354 | |
0.842% (US0003M + 0.450%) due 02/15/2022 ~ | | | | | 29,600 | | | | | | 29,541 | |
0.846% (US0003M + 0.540%) due 06/27/2022 ~ | | | | | 53,300 | | | | | | 53,162 | |
| | | | |
Athene Global Funding | | | | | | | | | | | | |
2.667% (US0003M + 1.230%) due 07/01/2022 ~ | | | | | 37,559 | | | | | | 37,228 | |
|
Aviation Capital Group LLC | |
1.300% (US0003M + 0.950%) due 06/01/2021 ~ | | | | | 35,694 | | | | | | 33,953 | |
1.430% (US0003M + 0.670%) due 07/30/2021 ~ | | | | | 15,607 | | | | | | 14,719 | |
6.750% due 04/06/2021 | | | | | 6,030 | | | | | | 6,061 | |
7.125% due 10/15/2020 | | | | | 11,236 | | | | | | 11,292 | |
| | | | |
Banco Santander Chile | | | | | | | | | | | | |
2.500% due 12/15/2020 | | | | | 4,143 | | | | | | 4,177 | |
|
Bank of America Corp. | |
0.946% (US0003M + 0.650%) due 10/01/2021 ~ | | | | | 48,300 | | | | | | 48,340 | |
2.555% (US0003M + 1.420%) due 04/19/2021 ~ | | | | | 500 | | | | | | 505 | |
| | | | |
Bank of Montreal | | | | | | | | | | | | |
1.771% (US0003M + 0.460%) due 04/13/2021 ~ | | | | | 500 | | | | | | 502 | |
|
Bank of Nova Scotia | |
1.950% due 02/01/2023 | | | | | 25,600 | | | | | | 26,380 | |
|
Barclays Bank PLC | |
1.124% (US0003M + 0.650%) due 08/07/2020 ~ | | | | | 1,308 | | | | | | 1,309 | |
1.771% (US0003M + 0.460%) due 01/11/2021 ~ | | | | | 2,275 | | | | | | 2,280 | |
2.650% due 01/11/2021 | | | | | 3,100 | | | | | | 3,131 | |
|
Barclays PLC | |
1.766% (US0003M + 1.380%) due 05/16/2024 ~ | | | | | 19,000 | | | | | | 18,833 | |
| | | | | | | | | | | | |
| | | | | PRINCIPAL
AMOUNT
(000S) | | | | | MARKET
VALUE
(000S) | |
1.822% (US0003M + 1.430%) due 02/15/2023 ~ | | $ | | | 5,600 | | | $ | | | 5,586 | |
2.558% (US0003M + 2.110%) due 08/10/2021 ~ | | | | | 60,309 | | | | | | 61,249 | |
3.200% due 08/10/2021 | | | | | 4,144 | | | | | | 4,240 | |
|
BNZ International Funding Ltd. | |
1.293% (US0003M + 0.980%) due 09/14/2021 ~ | | | | | 13,000 | | | | | | 13,082 | |
|
BOC Aviation Ltd. | |
1.606% (US0003M + 1.050%) due 05/02/2021 ~ | | | | | 15,215 | | | | | | 15,086 | |
|
Boston Properties LP | |
4.125% due 05/15/2021 | | | | | 3,357 | | | | | | 3,425 | |
|
Canadian Imperial Bank of Commerce | |
0.881% (SOFRRATE + 0.800%) due 03/17/2023 ~ | | | | | 54,700 | | | | | | 54,408 | |
|
Caterpillar Financial Services Corp. | |
0.598% (US0003M + 0.280%) due 09/07/2021 ~ | | | | | 14,000 | | | | | | 14,012 | |
0.618% (US0003M + 0.300%) due 03/08/2021 ~ | | | | | 10,000 | | | | | | 10,006 | |
0.902% (US0003M + 0.510%) due 05/15/2023 ~ | | | | | 8,400 | | | | | | 8,408 | |
|
Citibank N.A. | |
0.977% (US0003M + 0.600%) due 05/20/2022 ~ | | | | | 94,300 | | | | | | 94,482 | |
|
Citigroup, Inc. | |
0.940% (SOFRRATE + 0.870%) due 11/04/2022 ~ | | | | | 15,600 | | | | | | 15,559 | |
1.373% (US0003M + 1.023%) due 06/01/2024 ~ | | | | | 37,800 | | | | | | 37,718 | |
1.780% (US0003M + 1.430%) due 09/01/2023 ~ | | | | | 21,200 | | | | | | 21,420 | |
|
CNH Industrial Capital LLC | |
4.875% due 04/01/2021 | | | | | 11,562 | | | | | | 11,865 | |
|
Cooperatieve Rabobank UA | |
2.141% (US0003M + 0.830%) due 01/10/2022 ~ | | | | | 45,000 | | | | | | 45,377 | |
|
Credit Suisse AG | |
0.518% (SOFRRATE + 0.450%) due 02/04/2022 ~ | | | | | 3,779 | | | | | | 3,763 | |
1.000% due 05/05/2023 | | | | | 47,000 | | | | | | 47,278 | |
2.100% due 11/12/2021 | | | | | 26,000 | | | | | | 26,550 | |
|
Credit Suisse Group AG | |
1.558% (US0003M + 1.240%) due 06/12/2024 ~ | | | | | 5,000 | | | | | | 5,027 | |
|
Credit Suisse Group Funding Guernsey Ltd. | |
3.425% (US0003M + 2.290%) due 04/16/2021 ~ | | | | | 22,028 | | | | | | 22,373 | |
3.450% due 04/16/2021 | | | | | 12,170 | | | | | | 12,460 | |
|
Danske Bank A/S | |
2.000% due 09/08/2021 | | | | | 11,453 | | | | | | 11,634 | |
2.750% due 09/17/2020 | | | | | 27,058 | | | | | | 27,179 | |
2.800% due 03/10/2021 | | | | | 3,475 | | | | | | 3,529 | |
3.001% due 09/20/2022 • | | | | | 1,500 | | | | | | 1,524 | |
|
DBS Group Holdings Ltd. | |
1.611% (US0003M + 0.620%) due 07/25/2022 ~ | | | | | 58,930 | | | | | | 58,938 | |
|
Dexia Credit Local S.A. | |
1.161% (US0003M + 0.320%) due 09/29/2020 ~ | | | | | 35,000 | | | | | | 35,043 | |
|
DNB Bank ASA | |
0.672% (US0003M + 0.370%) due 10/02/2020 ~ | | | | | 11,000 | | | | | | 11,009 | |
0.964% (US0003M + 0.620%) due 12/02/2022 ~ | | | | | 71,300 | | | | | | 71,467 | |
1.414% (US0003M + 1.070%) due 06/02/2021 ~ | | | | | 11,600 | | | | | | 11,697 | |
|
First Abu Dhabi Bank PJSC | |
2.126% (US0003M + 0.950%) due 04/16/2022 ~ | | | | | 9,700 | | | | | | 9,716 | |
|
Ford Motor Credit Co. LLC | |
0.986% (US0003M + 0.430%) due 11/02/2020 ~ | | | | | 3,500 | | | | | | 3,462 | |
1.227% (US0003M + 0.930%) due 09/24/2020 ~ | | | | | 58,100 | | | | | | 57,637 | |
| | | | | | | | | | | | |
| | | | | PRINCIPAL
AMOUNT
(000S) | | | | | MARKET
VALUE
(000S) | |
3.937% (US0003M + 2.550%) due 01/07/2021 ~ | | $ | | | 12,875 | | | $ | | | 12,684 | |
|
General Motors Financial Co., Inc. | |
1.041% (US0003M + 0.540%) due 11/06/2020 ~ | | | | | 6,908 | | | | | | 6,881 | |
1.601% (US0003M + 1.100%) due 11/06/2021 ~ | | | | | 37,612 | | | | | | 37,228 | |
2.170% (US0003M + 0.850%) due 04/09/2021 ~ | | | | | 31,793 | | | | | | 31,606 | |
2.450% due 11/06/2020 | | | | | 10,026 | | | | | | 10,042 | |
2.861% (US0003M + 1.550%) due 01/14/2022 ~ | | | | | 5,026 | | | | | | 4,994 | |
3.200% due 07/13/2020 | | | | | 575 | | | | | | 575 | |
3.700% due 11/24/2020 | | | | | 1,057 | | | | | | 1,063 | |
|
Goldman Sachs Group, Inc. | |
1.540% (US0003M + 0.780%) due 10/31/2022 ~ | | | | | 9,945 | | | | | | 9,944 | |
1.562% (US0003M + 1.170%) due 11/15/2021 ~ | | | | | 54,748 | | | | | | 54,913 | |
2.101% (US0003M + 1.110%) due 04/26/2022 ~ | | | | | 34,795 | | | | | | 34,961 | |
2.351% (US0003M + 1.360%) due 04/23/2021 ~ | | | | | 19,400 | | | | | | 19,549 | |
|
Harley-Davidson Financial Services, Inc. | |
1.284% (US0003M + 0.940%) due 03/02/2021 ~ | | | | | 78,400 | | | | | | 77,953 | |
3.550% due 05/21/2021 | | | | | 11,092 | | | | | | 11,267 | |
|
Hitachi Capital UK PLC | |
1.067% (US0003M + 0.690%) due 11/20/2020 ~ | | | | | 4,200 | | | | | | 4,212 | |
|
HSBC Bank Canada | |
0.950% due 05/14/2023 | | | | | 10,000 | | | | | | 10,072 | |
3.300% due 11/28/2021 | | | | | 6,500 | | | | | | 6,748 | |
|
HSBC Holdings PLC | |
0.968% (US0003M + 0.650%) due 09/11/2021 ~ | | | | | 92,017 | | | | | | 92,062 | |
1.386% (US0003M + 1.000%) due 05/18/2024 ~ | | | | | 6,000 | | | | | | 5,955 | |
2.873% (US0003M + 1.500%) due 01/05/2022 ~ | | | | | 68,373 | | | | | | 69,366 | |
|
HSBC USA, Inc. | |
2.750% due 08/07/2020 | | | | | 1,500 | | | | | | 1,503 | |
|
Hyundai Capital Services, Inc. | |
2.625% due 09/29/2020 | | | | | 28,328 | | | | | | 28,395 | |
2.875% due 03/16/2021 | | | | | 10,361 | | | | | | 10,443 | |
3.000% due 03/06/2022 | | | | | 299 | | | | | | 304 | |
|
ICICI Bank Ltd. | |
3.125% due 08/12/2020 | | | | | 4,130 | | | | | | 4,134 | |
5.750% due 11/16/2020 | | | | | 3,344 | | | | | | 3,388 | |
|
ING Bank NV | |
1.356% (US0003M + 0.970%) due 08/17/2020 ~ | | | | | 2,000 | | | | | | 2,002 | |
|
ING Groep NV | |
1.456% (US0003M + 1.150%) due 03/29/2022 ~ | | | | | 24,800 | | | | | | 24,985 | |
|
International Lease Finance Corp. | |
4.625% due 04/15/2021 | | | | | 16,816 | | | | | | 16,998 | |
8.250% due 12/15/2020 | | | | | 2,224 | | | | | | 2,277 | |
|
Jackson National Life Global Funding | |
0.795% (US0003M + 0.480%) due 06/11/2021 ~ | | | | | 5,000 | | | | | | 5,013 | |
1.036% (US0003M + 0.730%) due 06/27/2022 ~ | | | | | 25,750 | | | | | | 25,883 | |
1.519% (US0003M + 0.300%) due 10/15/2020 ~ | | | | | 17,400 | | | | | | 17,411 | |
|
John Deere Capital Corp. | |
0.798% (US0003M + 0.480%) due 09/08/2022 ~ | | | | | 10,146 | | | | | | 10,193 | |
0.803% (US0003M + 0.490%) due 06/13/2022 ~ | | | | | 27,000 | | | | | | 27,113 | |
0.868% (US0003M + 0.550%) due 06/07/2023 ~ | | | | | 18,000 | | | | | | 18,047 | |
|
JPMorgan Chase & Co. | |
0.918% (US0003M + 0.610%) due 06/18/2022 ~ | | | | | 89,000 | | | | | | 89,154 | |
1.418% (US0003M + 1.100%) due 06/07/2021 ~ | | | | | 3,895 | | | | | | 3,926 | |
| | | | | | | | |
| 74 | | PIMCO ETF TRUST | | | | | See Accompanying Notes | |
June 30, 2020
| | | | | | | | | | | | |
| | | | | PRINCIPAL
AMOUNT
(000S) | | | | | MARKET
VALUE
(000S) | |
1.830% (US0003M + 1.480%) due 03/01/2021 ~ | | $ | | | 12,595 | | | $ | | | 12,684 | |
1.891% (US0003M + 0.900%) due 04/25/2023 ~ | | | | | 19,046 | | | | | | 19,119 | |
2.250% (US0003M + 1.230%) due 10/24/2023 ~ | | | | | 10,275 | | | | | | 10,392 | |
|
KEB Hana Bank | |
0.996% (US0003M + 0.700%) due 10/02/2022 ~ | | | | | 21,330 | | | | | | 21,344 | |
1.188% (US0003M + 0.875%) due 09/14/2022 ~ | | | | | 9,400 | | | | | | 9,422 | |
2.125% due 10/18/2021 | | | | | 7,300 | | | | | | 7,420 | |
|
Kookmin Bank | |
3.625% due 10/23/2021 | | | | | 1,600 | | | | | | 1,659 | |
|
Lloyds Bank PLC | |
0.964% (US0003M + 0.490%) due 05/07/2021 ~ | | | | | 46,400 | | | | | | 46,497 | |
|
Lloyds Banking Group PLC | |
1.106% (US0003M + 0.800%) due 06/21/2021 ~ | | | | | 30,655 | | | | | | 30,786 | |
1.326% due 06/15/2023 • | | | | | 10,000 | | | | | | 10,062 | |
|
Macquarie Bank Ltd. | |
1.961% (US0003M + 1.120%) due 07/29/2020 ~ | | | | | 51,650 | | | | | | 51,704 | |
|
Marsh & McLennan Cos., Inc. | |
1.506% (US0003M + 1.200%) due 12/29/2021 ~ | | | | | 4,941 | | | | | | 4,944 | |
|
MassMutual Global Funding | |
0.456% (US0003M + 0.125%) due 03/04/2021 ~ | | | | | 3,700 | | | | | | 3,696 | |
|
MET Tower Global Funding | |
0.608% due 01/17/2023 • | | | | | 56,400 | | | | | | 55,991 | |
|
Metropolitan Life Global Funding | |
0.624% (SOFRRATE + 0.570%) due 01/13/2023 ~ | | | | | 26,000 | | | | | | 25,846 | |
|
Mitsubishi UFJ Financial Group, Inc. | |
1.018% (US0003M + 0.700%) due 03/07/2022 ~ | | | | | 13,600 | | | | | | 13,621 | |
1.084% (US0003M + 0.740%) due 03/02/2023 ~ | | | | | 16,000 | | | | | | 15,940 | |
1.278% (US0003M + 0.920%) due 02/22/2022 ~ | | | | | 33,789 | | | | | | 34,004 | |
1.373% (US0003M + 1.060%) due 09/13/2021 ~ | | | | | 36,004 | | | | | | 36,305 | |
1.781% (US0003M + 0.790%) due 07/25/2022 ~ | | | | | 60,396 | | | | | | 60,622 | |
1.851% (US0003M + 0.860%) due 07/26/2023 ~ | | | | | 3,600 | | | | | | 3,590 | |
|
Mitsubishi UFJ Lease & Finance Co. Ltd. | |
2.250% due 09/07/2021 | | | | | 4,400 | | | | | | 4,465 | |
2.750% due 10/21/2020 | | | | | 14,278 | | | | | | 14,360 | |
|
Mizuho Financial Group, Inc. | |
0.990% (US0003M + 0.630%) due 05/25/2024 ~ | | | | | 31,660 | | | | | | 31,045 | |
1.163% (US0003M + 0.850%) due 09/13/2023 ~ | | | | | 26,520 | | | | | | 26,384 | |
1.195% (US0003M + 0.880%) due 09/11/2022 ~ | | | | | 47,100 | | | | | | 47,258 | |
1.311% (US0003M + 0.940%) due 02/28/2022 ~ | | | | | 24,990 | | | | | | 25,152 | |
2.016% (US0003M + 0.840%) due 07/16/2023 ~ | | | | | 39,623 | | | | | | 39,588 | |
|
Morgan Stanley | |
0.761% (SOFRRATE + 0.700%) due 01/20/2023 ~ | | | | | 91,445 | | | | | | 91,237 | |
2.028% (US0003M + 0.930%) due 07/22/2022 ~ | | | | | 46,460 | | | | | | 46,705 | |
2.420% (US0003M + 1.400%) due 10/24/2023 ~ | | | | | 11,052 | | | | | | 11,171 | |
|
MUFG Union Bank N.A. | |
0.791% (SOFRRATE + 0.710%) due 12/09/2022 ~ | | | | | 15,050 | | | | | | 14,999 | |
|
Nationwide Building Society | |
2.000% due 01/27/2023 | | | | | 22,000 | | | | | | 22,670 | |
|
NatWest Markets PLC | |
1.706% (US0003M + 1.400%) due 09/29/2022 ~ | | | | | 59,125 | | | | | | 59,216 | |
| | | | | | | | | | | | |
| | | | | PRINCIPAL
AMOUNT
(000S) | | | | | MARKET
VALUE
(000S) | |
|
Natwest Markets PLC | |
5.625% due 08/24/2020 | | $ | | | 6,308 | | | $ | | | 6,349 | |
|
New York Life Global Funding | |
1.389% (US0003M + 0.280%) due 01/21/2022 ~ | | | | | 34,000 | | | | | | 34,076 | |
1.751% (US0003M + 0.440%) due 07/12/2022 ~ | | | | | 30,000 | | | | | | 30,142 | |
|
Nissan Motor Acceptance Corp. | |
0.696% (US0003M + 0.390%) due 09/28/2020 ~ | | | | | 11,446 | | | | | | 11,360 | |
0.696% due 09/28/2020 • | | | | | 3,200 | | | | | | 3,176 | |
0.833% (US0003M + 0.520%) due 03/15/2021 ~ | | | | | 8,710 | | | | | | 8,514 | |
0.936% (US0003M + 0.630%) due 09/21/2021 ~ | | | | | 44,740 | | | | | | 43,007 | |
0.996% due 09/28/2022 • | | | | | 9,850 | | | | | | 9,109 | |
1.701% (US0003M + 0.390%) due 07/13/2020 ~ | | | | | 20,900 | | | | | | 20,895 | |
1.961% (US0003M + 0.650%) due 07/13/2022 ~ | | | | | 9,550 | | | | | | 8,893 | |
2.150% due 07/13/2020 | | | | | 4,350 | | | | | | 4,349 | |
2.150% due 09/28/2020 | | | | | 17,660 | | | | | | 17,609 | |
2.201% (US0003M + 0.890%) due 01/13/2022 ~ | | | | | 24,045 | | | | | | 23,116 | |
|
ORIX Corp. | |
2.650% due 04/13/2021 | | | | | 1,100 | | | | | | 1,113 | |
|
PNC Bank N.A. | |
0.685% (US0003M + 0.325%) due 02/24/2023 ~ | | | | | 71,700 | | | | | | 71,656 | |
1.548% (US0003M + 0.450%) due 07/22/2022 ~ | | | | | 111,900 | | | | | | 112,165 | |
|
Protective Life Global Funding | |
0.826% (US0003M + 0.520%) due 06/28/2021 ~ | | | | | 9,700 | | | | | | 9,724 | |
|
Qatari Diar Finance QSC | |
5.000% due 07/21/2020 | | | | | 25,925 | | | | | | 26,038 | |
|
QNB Finance Ltd. | |
1.556% (US0003M + 1.000%) due 05/02/2022 ~ | | | | | 21,360 | | | | | | 21,155 | |
1.638% (US0003M + 1.320%) due 12/06/2021 ~(g) | | | | | 8,400 | | | | | | 8,364 | |
1.713% (US0003M + 1.350%) due 05/31/2021 ~ | | | | | 79,427 | | | | | | 79,882 | |
2.125% due 09/07/2021 | | | | | 6,464 | | | | | | 6,497 | |
2.705% (US0003M + 1.570%) due 07/18/2021 ~ | | | | | 13,400 | | | | | | 13,468 | |
|
Royal Bank of Canada | |
1.311% (US0003M + 0.470%) due 04/29/2022 ~ | | | | | 36,100 | | | | | | 36,206 | |
1.495% (US0003M + 0.360%) due 01/17/2023 ~ | | | | | 21,100 | | | | | | 21,022 | |
|
Royal Bank of Scotland Group PLC | |
1.862% (US0003M + 1.470%) due 05/15/2023 ~ | | | | | 52,482 | | | | | | 52,524 | |
|
Santander Holdings USA, Inc. | |
4.450% due 12/03/2021 | | | | | 1,500 | | | | | | 1,564 | |
|
Santander UK Group Holdings PLC | |
2.875% due 10/16/2020 | | | | | 11,900 | | | | | | 11,984 | |
|
Santander UK PLC | |
0.856% (US0003M + 0.300%) due 11/03/2020 ~ | | | | | 2,400 | | | | | | 2,402 | |
0.970% (US0003M + 0.620%) due 06/01/2021 ~ | | | | | 89,414 | | | | | | 89,716 | |
1.052% (US0003M + 0.660%) due 11/15/2021 ~ | | | | | 34,342 | | | | | | 34,533 | |
2.100% due 01/13/2023 | | | | | 14,000 | | | | | | 14,459 | |
|
SBA Tower Trust | |
2.877% due 07/15/2046 | | | | | 6,000 | | | | | | 6,017 | |
|
Skandinaviska Enskilda Banken AB | |
0.963% (US0003M + 0.645%) due 12/12/2022 ~ | | | | | 65,700 | | | | | | 65,957 | |
|
SL Green Operating Partnership LP | |
1.366% (US0003M + 0.980%) due 08/16/2021 ~ | | | | | 13,800 | | | | | | 13,601 | |
|
Standard Chartered PLC | |
1.510% (US0003M + 1.200%) due 09/10/2022 ~ | | | | | 31,300 | | | | | | 31,380 | |
| | | | | | | | | | | | |
| | | | | PRINCIPAL
AMOUNT
(000S) | | | | | MARKET
VALUE
(000S) | |
2.744% due 09/10/2022 • | | $ | | | 4,500 | | | $ | | | 4,553 | |
3.050% due 01/15/2021 | | | | | 3,120 | | | | | | 3,158 | |
|
SumitG Guaranteed Secured Obligation Issuer DAC | |
2.251% due 11/02/2020 | | | | | 4,500 | | | | | | 4,518 | |
|
Sumitomo Mitsui Banking Corp. | |
1.546% (US0003M + 0.370%) due 10/16/2020 ~ | | | | | 56,400 | | | | | | 56,470 | |
|
Sumitomo Mitsui Financial Group, Inc. | |
1.875% (US0003M + 0.740%) due 10/18/2022 ~ | | | | | 4,500 | | | | | | 4,503 | |
1.993% (US0003M + 1.680%) due 03/09/2021 ~ | | | | | 6,000 | | | | | | 6,060 | |
2.091% (US0003M + 0.780%) due 07/12/2022 ~ | | | | | 40,065 | | | | | | 40,163 | |
2.281% (US0003M + 0.970%) due 01/11/2022 ~ | | | | | 12,000 | | | | | | 12,060 | |
2.421% (US0003M + 1.110%) due 07/14/2021 ~ | | | | | 14,389 | | | | | | 14,504 | |
|
Toronto-Dominion Bank | |
0.543% (SOFRRATE + 0.480%) due 01/27/2023 ~ | | | | | 24,800 | | | | | | 24,650 | |
|
Toyota Motor Credit Corp. | |
0.559% (US0003M + 0.125%) due 08/13/2021 ~ | | | | | 46,000 | | | | | | 45,941 | |
0.786% due 05/17/2022 • | | | | | 13,250 | | | | | | 13,237 | |
1.677% (US0003M + 0.290%) due 10/07/2021 ~ | | | | | 3,200 | | | | | | 3,199 | |
|
UBS Group AG | |
1.342% (US0003M + 0.950%) due 08/15/2023 ~ | | | | | 39,250 | | | | | | 39,318 | |
1.578% due 05/23/2023 • | | | | | 1,480 | | | | | | 1,492 | |
2.217% due 02/01/2022 • | | | | | 20,340 | | | | | | 20,719 | |
3.091% due 04/14/2021 • | | | | | 34,040 | | | | | | 34,499 | |
|
United Overseas Bank Ltd. | |
1.523% (US0003M + 0.480%) due 04/23/2021 ~ | | | | | 15,200 | | | | | | 15,176 | |
3.200% due 04/23/2021 | | | | | 8,100 | | | | | | 8,260 | |
|
Wells Fargo & Co. | |
1.378% (US0003M + 0.930%) due 02/11/2022 ~ | | | | | 70,713 | | | | | | 70,934 | |
1.990% (US0003M + 1.230%) due 10/31/2023 ~ | | | | | 8,200 | | | | | | 8,260 | |
|
Wells Fargo Bank N.A. | |
0.973% (US0003M + 0.660%) due 09/09/2022 ~ | | | | | 64,415 | | | | | | 64,620 | |
0.989% (US0003M + 0.620%) due 05/27/2022 ~ | | | | | 63,100 | | | | | | 63,252 | |
| | | | | | | | | | | | |
| | | | | | | | | | | 4,692,594 | |
| | | | | | | | | | | | |
| |
| INDUSTRIALS 15.5% | |
|
AbbVie, Inc. | |
0.724% (US0003M + 0.350%) due 05/21/2021 ~ | | | | | 41,000 | | | | | | 41,029 | |
0.841% (US0003M + 0.460%) due 11/19/2021 ~ | | | | | 33,600 | | | | | | 33,589 | |
1.024% (US0003M + 0.650%) due 11/21/2022 ~ | | | | | 33,800 | | | | | | 33,913 | |
|
American Airlines Pass-Through Trust | |
5.250% due 07/31/2022 | | | | | 325 | | | | | | 287 | |
|
Apple, Inc. | |
0.798% (US0003M + 0.350%) due 05/11/2022 ~ | | | | | 100 | | | | | | 100 | |
|
BAT Capital Corp. | |
1.014% due 08/14/2020 • | | | | | 97,476 | | | | | | 97,485 | |
1.272% (US0003M + 0.880%) due 08/15/2022 ~ | | | | | 46,600 | | | | | | 46,400 | |
|
Bayer U.S. Finance LLC | |
0.927% (US0003M + 0.630%) due 06/25/2021 ~ | | | | | 42,551 | | | | | | 42,505 | |
3.500% due 06/25/2021 | | | | | 32,450 | | | | | | 33,247 | |
|
Becton Dickinson and Co. | |
1.181% (US0003M + 0.875%) due 12/29/2020 ~ | | | | | 8,913 | | | | | | 8,914 | |
|
BMW Finance NV | |
1.225% (US0003M + 0.790%) due 08/12/2022 ~ | | | | | 32,000 | | | | | | 31,682 | |
| | | | | | |
| See Accompanying Notes | | ANNUAL REPORT | | JUNE 30, 2020 | | 75 |
Schedule of Investments PIMCO Enhanced Short Maturity Active Exchange-Traded Fund (Cont.)
| | | | | | | | | | | | |
| | | | | PRINCIPAL
AMOUNT
(000S) | | | | | MARKET
VALUE
(000S) | |
|
BMW U.S. Capital LLC | |
0.794% (US0003M + 0.370%) due 08/14/2020 ~ | | $ | | | 7,476 | | | $ | | | 7,480 | |
1.721% (US0003M + 0.410%) due 04/12/2021 ~ | | | | | 26,799 | | | | | | 26,719 | |
1.841% (US0003M + 0.530%) due 04/14/2022 ~ | | | | | 12,400 | | | | | | 12,276 | |
2.000% due 04/11/2021 | | | | | 5,000 | | | | | | 5,045 | |
2.013% (US0003M + 0.640%) due 04/06/2022 ~ | | | | | 18,334 | | | | | | 18,145 | |
|
BP Capital Markets America, Inc. | |
0.966% (US0003M + 0.650%) due 09/19/2022 ~ | | | | | 26,000 | | | | | | 26,136 | |
|
Bristol-Myers Squibb Co. | |
0.766% (US0003M + 0.380%) due 05/16/2022 ~ | | | | | 56,600 | | | | | | 56,755 | |
|
Broadcom Corp. | |
2.200% due 01/15/2021 | | | | | 3,534 | | | | | | 3,561 | |
|
Campbell Soup Co. | |
0.943% (US0003M + 0.630%) due 03/15/2021 ~ | | | | | 7,085 | | | | | | 7,093 | |
|
Central Nippon Expressway Co. Ltd. | |
0.852% (US0003M + 0.460%) due 02/15/2022 ~ | | | | | 19,800 | | | | | | 19,734 | |
1.014% (US0003M + 0.540%) due 08/04/2020 ~ | | | | | 35,300 | | | | | | 35,322 | |
1.034% (US0003M + 0.560%) due 11/02/2021 ~ | | | | | 32,900 | | | | | | 32,954 | |
1.147% due 03/03/2022 • | | | | | 77,560 | | | | | | 77,727 | |
1.163% (US0003M + 0.850%) due 09/14/2021 ~ | | | | | 22,050 | | | | | | 22,202 | |
1.356% (US0003M + 0.970%) due 02/16/2021 ~ | | | | | 1,200 | | | | | | 1,204 | |
1.371% (US0003M + 1.000%) due 05/28/2021 ~ | | | | | 32,000 | | | | | | 32,143 | |
2.113% (US0003M + 1.070%) due 04/23/2021 ~ | | | | | 7,570 | | | | | | 7,605 | |
2.241% due 02/16/2021 | | | | | 200 | | | | | | 201 | |
2.381% due 09/17/2020 | | | | | 5,500 | | | | | | 5,516 | |
2.567% due 11/02/2021 | | | | | 9,700 | | | | | | 9,898 | |
|
Cigna Corp. | |
0.949% (US0003M + 0.650%) due 09/17/2021 ~ | | | | | 51,000 | | | | | | 51,002 | |
3.200% due 09/17/2020 | | | | | 2,871 | | | | | | 2,887 | |
|
Comcast Corp. | |
0.736% (US0003M + 0.440%) due 10/01/2021 ~ | | | | | 109 | | | | | | 109 | |
|
Conagra Brands, Inc. | |
1.820% (US0003M + 0.500%) due 10/09/2020 ~ | | | | | 31,576 | | | | | | 31,595 | |
3.800% due 10/22/2021 | | | | | 8,780 | | | | | | 9,129 | |
|
Constellation Brands, Inc. | |
1.092% (US0003M + 0.700%) due 11/15/2021 ~ | | | | | 40,415 | | | | | | 40,421 | |
|
CVS Health Corp. | |
1.033% (US0003M + 0.720%) due 03/09/2021 ~ | | | | | 20,260 | | | | | | 20,339 | |
|
Daimler Finance North America LLC | |
0.865% (US0003M + 0.430%) due 02/12/2021 ~ | | | | | 9,375 | | | | | | 9,338 | |
1.106% (US0003M + 0.550%) due 05/04/2021 ~ | | | | | 43,938 | | | | | | 43,715 | |
1.211% (US0003M + 0.670%) due 11/05/2021 ~ | | | | | 47,000 | | | | | | 46,507 | |
1.238% (US0003M + 0.880%) due 02/22/2022 ~ | | | | | 39,900 | | | | | | 39,499 | |
1.292% (US0003M + 0.900%) due 02/15/2022 ~ | | | | | 27,000 | | | | | | 26,686 | |
1.396% (US0003M + 0.840%) due 05/04/2023 ~ | | | | | 3,200 | | | | | | 3,091 | |
2.700% due 08/03/2020 | | | | | 5,960 | | | | | | 5,969 | |
|
Dell International LLC | |
4.420% due 06/15/2021 | | | | | 100,221 | | | | | | 103,022 | |
|
Delta Air Lines, Inc. | |
2.600% due 12/04/2020 | | | | | 3,644 | | | | | | 3,604 | |
|
Dominion Energy Gas Holdings LLC | |
0.913% (US0003M + 0.600%) due 06/15/2021 ~ | | | | | 44,900 | | | | | | 44,840 | |
| | | | | | | | | | | | |
| | | | | PRINCIPAL
AMOUNT
(000S) | | | | | MARKET
VALUE
(000S) | |
|
Equifax, Inc. | |
3.600% due 08/15/2021 | | $ | | | 600 | | | $ | | | 618 | |
|
Expedia Group, Inc. | |
5.950% due 08/15/2020 | | | | | 6,500 | | | | | | 6,519 | |
|
Florida Gas Transmission Co. LLC | |
5.450% due 07/15/2020 | | | | | 550 | | | | | | 551 | |
|
GATX Corp. | |
1.261% (US0003M + 0.720%) due 11/05/2021 ~ | | | | | 10,700 | | | | | | 10,557 | |
|
General Mills, Inc. | |
6.610% due 10/15/2022 | | | | | 10,800 | | | | | | 10,992 | |
|
General Motors Co. | |
1.210% (US0003M + 0.900%) due 09/10/2021 ~ | | | | | 1,906 | | | | | | 1,885 | |
1.274% (US0003M + 0.800%) due 08/07/2020 ~ | | | | | 43,207 | | | | | | 43,198 | |
|
GlaxoSmithKline Capital PLC | |
0.774% (US0003M + 0.350%) due 05/14/2021 ~ | | | | | 6,400 | | | | | | 6,411 | |
|
Hewlett Packard Enterprise Co. | |
0.998% (US0003M + 0.680%) due 03/12/2021 ~ | | | | | 11,700 | | | | | | 11,694 | |
2.093% (US0003M + 0.720%) due 10/05/2021 ~ | | | | | 21,200 | | | | | | 21,164 | |
3.600% due 10/15/2020 | | | | | 13,500 | | | | | | 13,585 | |
|
Hyundai Capital America | |
1.108% due 09/18/2020 • | | | | | 11,500 | | | | | | 11,476 | |
1.138% (US0003M + 0.820%) due 03/12/2021 ~ | | | | | 21,394 | | | | | | 21,216 | |
1.308% (US0003M + 1.000%) due 09/18/2020 ~ | | | | | 13,038 | | | | | | 13,017 | |
2.292% due 07/08/2021 • | | | | | 4,803 | | | | | | 4,753 | |
2.450% due 06/15/2021 (a)(e) | | | | | 1,700 | | | | | | 1,711 | |
2.750% due 09/18/2020 | | | | | 13,385 | | | | | | 13,415 | |
3.000% due 10/30/2020 | | | | | 14,517 | | | | | | 14,585 | |
3.000% due 03/18/2021 | | | | | 14,818 | | | | | | 14,963 | |
3.450% due 03/12/2021 | | | | | 13,292 | | | | | | 13,450 | |
|
Imperial Brands Finance PLC | |
2.950% due 07/21/2020 | | | | | 93,222 | | | | | | 93,313 | |
|
Japan Tobacco, Inc. | |
2.000% due 04/13/2021 | | | | | 9,000 | | | | | | 9,060 | |
|
Kia Motors Corp. | |
2.625% due 04/21/2021 | | | | | 1,540 | | | | | | 1,551 | |
|
Kraft Heinz Foods Co. | |
2.800% due 07/02/2020 | | | | | 4,088 | | | | | | 4,088 | |
|
Marriott International, Inc. | |
0.950% (US0003M + 0.600%) due 12/01/2020 ~ | | | | | 45,825 | | | | | | 45,622 | |
0.968% (US0003M + 0.650%) due 03/08/2021 ~ | | | | | 12,158 | | | | | | 12,042 | |
|
Microchip Technology, Inc. | |
3.922% due 06/01/2021 | | | | | 4,725 | | | | | | 4,818 | |
|
Molson Coors Brewing Co. | |
2.100% due 07/15/2021 | | | | | 3,848 | | | | | | 3,896 | |
|
Mylan NV | |
3.750% due 12/15/2020 | | | | | 3,250 | | | | | | 3,285 | |
|
NXP BV | |
4.125% due 06/01/2021 | | | | | 24,285 | | | | | | 25,015 | |
|
Occidental Petroleum Corp. | |
1.398% (US0003M + 0.950%) due 02/08/2021 ~ | | | | | 45,870 | | | | | | 45,194 | |
1.842% (US0003M + 1.450%) due 08/15/2022 ~ | | | | | 41,275 | | | | | | 37,989 | |
|
Otis Worldwide Corp. | |
2.088% (US0003M + 0.450%) due 04/05/2023 ~ | | | | | 5,800 | | | | | | 5,739 | |
|
Penske Truck Leasing Co. LP | |
3.300% due 04/01/2021 | | | | | 440 | | | | | | 446 | |
3.650% due 07/29/2021 | | | | | 1,200 | | | | | | 1,229 | |
|
Phillips 66 | |
0.960% (US0003M + 0.600%) due 02/26/2021 ~ | | | | | 7,905 | | | | | | 7,894 | |
|
Reckitt Benckiser Treasury Services PLC | |
0.857% (US0003M + 0.560%) due 06/24/2022 ~ | | | | | 31,650 | | | | | | 31,610 | |
| | | | | | | | | | | | |
| | | | | PRINCIPAL
AMOUNT
(000S) | | | | | MARKET
VALUE
(000S) | |
|
Rogers Communications, Inc. | |
0.906% (US0003M + 0.600%) due 03/22/2022 ~ | | $ | | | 73,800 | | | $ | | | 74,163 | |
|
Rolls-Royce PLC | |
2.375% due 10/14/2020 | | | | | 9,600 | | | | | | 9,580 | |
|
Telefonica Emisiones S.A. | |
5.462% due 02/16/2021 | | | | | 3,075 | | | | | | 3,166 | |
|
Textron, Inc. | |
0.998% (US0003M + 0.550%) due 11/10/2020 ~ | | | | | 27,300 | | | | | | 27,219 | |
|
Time Warner Cable LLC | |
4.125% due 02/15/2021 | | | | | 2,465 | | | | | | 2,493 | |
|
Tyson Foods, Inc. | |
0.824% (US0003M + 0.450%) due 08/21/2020 ~ | | | | | 19,890 | | | | | | 19,892 | |
|
Volkswagen Group of America Finance LLC | |
1.157% (US0003M + 0.860%) due 09/24/2021 ~ | | | | | 15,000 | | | | | | 14,950 | |
1.204% (US0003M + 0.770%) due 11/13/2020 ~ | | | | | 90,765 | | | | | | 90,824 | |
1.375% (US0003M + 0.940%) due 11/12/2021 ~ | | | | | 23,700 | | | | | | 23,632 | |
3.875% due 11/13/2020 | | | | | 1,910 | | | | | | 1,928 | |
|
Wabtec Corp. | |
1.613% (US0003M + 1.300%) due 09/15/2021 ~ | | | | | 18,200 | | | | | | 18,200 | |
|
Walt Disney Co. | |
0.740% (US0003M + 0.390%) due 09/01/2022 ~ | | | | | 28,900 | | | | | | 28,816 | |
|
Woolworths Group Ltd. | |
4.000% due 09/22/2020 | | | | | 1,325 | | | | | | 1,333 | |
|
Zoetis, Inc. | |
0.817% (US0003M + 0.440%) due 08/20/2021 ~ | | | | | 5,075 | | | | | | 5,083 | |
| | | | | | | | | | | | |
| | | | | | | | | | | 2,148,450 | |
| | | | | | | | | | | | |
| |
| UTILITIES 3.6% | |
|
AT&T, Inc. | |
1.100% (US0003M + 0.750%) due 06/01/2021 ~ | | | | | 34,400 | | | | | | 34,577 | |
1.314% (US0003M + 0.890%) due 02/15/2023 ~ | | | | | 35,185 | | | | | | 35,021 | |
2.169% (US0003M + 0.950%) due 07/15/2021 ~ | | | | | 58,281 | | | | | | 58,765 | |
|
BP Capital Markets PLC | |
1.191% (US0003M + 0.870%) due 09/16/2021 ~ | | | | | 21,500 | | | | | | 21,593 | |
|
Consolidated Edison Co. of New York, Inc. | |
0.697% (US0003M + 0.400%) due 06/25/2021 ~ | | | | | 49,481 | | | | | | 49,587 | |
|
Duke Energy Corp. | |
0.924% (US0003M + 0.500%) due 05/14/2021 ~ | | | | | 2,400 | | | | | | 2,405 | |
0.965% (US0003M + 0.650%) due 03/11/2022 ~ | | | | | 25,500 | | | | | | 25,486 | |
|
NextEra Energy Capital Holdings, Inc. | |
0.756% (US0003M + 0.450%) due 09/28/2020 ~ | | | | | 1,000 | | | | | | 1,001 | |
0.921% (US0003M + 0.550%) due 08/28/2021 ~ | | | | | 14,260 | | | | | | 14,265 | |
1.080% (US0003M + 0.720%) due 02/25/2022 ~ | | | | | 3,200 | | | | | | 3,218 | |
3.342% due 09/01/2020 | | | | | 10,000 | | | | | | 10,050 | |
|
Pacific Gas and Electric Co. | |
1.795% (US0003M + 1.480%) due 06/16/2022 ~ | | | | | 67,900 | | | | | | 68,017 | |
4.250% due 08/01/2023 | | | | | 1,600 | | | | | | 1,830 | |
|
Plains All American Pipeline LP | |
5.000% due 02/01/2021 | | | | | 6,000 | | | | | | 6,055 | |
|
Ras Laffan Liquefied Natural Gas Co. Ltd. | |
5.298% due 09/30/2020 | | | | | 1,059 | | | | | | 1,071 | |
|
Sempra Energy | |
0.763% (US0003M + 0.450%) due 03/15/2021 ~ | | | | | 34,033 | | | | | | 34,094 | |
1.719% (US0003M + 0.500%) due 01/15/2021 ~ | | | | | 2,658 | | | | | | 2,658 | |
| | | | | | | | |
| 76 | | PIMCO ETF TRUST | | | | | See Accompanying Notes | |
June 30, 2020
| | | | | | | | | | | | |
| | | | | PRINCIPAL
AMOUNT
(000S) | | | | | MARKET
VALUE
(000S) | |
|
Sinopec Group Overseas Development Ltd. | |
2.250% due 09/13/2020 | | $ | | | 12,850 | | | $ | | | 12,875 | |
|
Southern Power Co. | |
0.856% (US0003M + 0.550%) due 12/20/2020 ~ | | | | | 62,559 | | | | | | 62,563 | |
|
Verizon Communications, Inc. | |
1.321% (US0003M + 1.000%) due 03/16/2022 ~ | | | | | 33,300 | | | | | | 33,753 | |
1.492% (US0003M + 1.100%) due 05/15/2025 ~ | | | | | 24,300 | | | | | | 24,613 | |
| | | | | | | | | | | | |
| | | | | | | | | | | 503,497 | |
| | | | | | | | | | | | |
Total Corporate Bonds & Notes (Cost $7,352,504) | | | | | | 7,344,541 | |
| | | | | | | | | | | | |
| |
| MUNICIPAL BONDS & NOTES 0.2% | |
| |
| CALIFORNIA 0.1% | |
|
California State General Obligation Bonds, Series 2017 | |
0.962% (US0001M + 0.780%) due 04/01/2047 ~ | | | | | 27,950 | | | | | | 27,907 | |
| | | | | | | | | | | | |
| |
| WASHINGTON 0.1% | |
|
Washington Health Care Facilities Authority Revenue Bonds, Series 2017 | |
1.224% (0.67*US0001M + 1.100%) due 01/01/2042 ~ | | | | | 7,350 | | | | | | 7,348 | |
| | | | | | | | | | | | |
Total Municipal Bonds & Notes (Cost $35,301) | | | | | | 35,255 | |
| | | | | | | | | | | | |
| |
| U.S. GOVERNMENT AGENCIES 10.9% | |
|
Fannie Mae | |
0.435% due 05/25/2037 • | | | | | 25 | | | | | | 25 | |
0.468% due 01/25/2037 • | | | | | 486 | | | | | | 481 | |
0.485% due 12/25/2045 • | | | | | 3,383 | | | | | | 3,374 | |
0.515% due 02/25/2037 • | | | | | 75 | | | | | | 74 | |
0.535% due 11/25/2036 • | | | | | 98 | | | | | | 98 | |
0.568% due 08/25/2049 • | | | | | 23,590 | | | | | | 23,496 | |
0.585% due 06/25/2026 • | | | | | 145 | | | | | | 145 | |
0.594% due 04/18/2028 - 09/18/2031 • | | | | | 770 | | | | | | 770 | |
0.595% due 09/25/2035 • | | | | | 432 | | | | | | 432 | |
0.605% due 03/25/2037 • | | | | | 308 | | | | | | 309 | |
0.635% due 02/25/2038 - 06/25/2059 • | | | | | 11,280 | | | | | | 11,304 | |
0.635% due 07/25/2049 | | | | | 9,792 | | | | | | 9,819 | |
0.670% due 06/25/2048 • | | | | | 16,116 | | | | | | 16,021 | |
0.685% due 06/25/2031 - 11/25/2059 • | | | | | 56,588 | | | | | | 56,716 | |
0.690% due 08/25/2044 • | | | | | 5,529 | | | | | | 5,526 | |
0.694% due 05/18/2032 • | | | | | 140 | | | | | | 141 | |
0.720% due 08/25/2044 - 12/25/2048 • | | | | | 47,972 | | | | | | 47,938 | |
0.744% due 03/18/2032 • | | | | | 124 | | | | | | 125 | |
0.770% due 07/25/2044 - 03/25/2060 • | | | | | 49,793 | | | | | | 49,921 | |
0.820% due 07/25/2046 • | | | | | 13,519 | | | | | | 13,508 | |
0.865% due 12/25/2037 • | | | | | 489 | | | | | | 497 | |
0.870% due 07/25/2046 • | | | | | 9,719 | | | | | | 9,754 | |
0.885% due 05/25/2037 • | | | | | 99 | | | | | | 100 | |
0.935% due 03/25/2037 - 02/25/2040 • | | | | | 115 | | | | | | 120 | |
0.965% due 02/25/2038 • | | | | | 835 | | | | | | 846 | |
1.035% due 07/25/2038 • | | | | | 103 | | | | | | 105 | |
1.085% due 03/25/2032 • | | | | | 26 | | | | | | 26 | |
1.438% due 04/25/2023 • | | | | | 842 | | | | | | 844 | |
1.931% due 08/25/2044 | | | | | 18,089 | | | | | | 18,010 | |
2.000% due 12/25/2044 | | | | | 4,315 | | | | | | 4,391 | |
3.780% due 01/01/2036 • | | | | | 3,406 | | | | | | 3,572 | |
3.809% due 05/01/2038 • | | | | | 446 | | | | | | 472 | |
|
FDIC Structured Sale Guaranteed Notes | |
0.673% due 11/29/2037 • | | | | | 2 | | | | | | 2 | |
|
Freddie Mac | |
0.435% due 11/15/2036 - 01/15/2040 • | | | | | 33 | | | | | | 33 | |
0.483% due 11/25/2024 • | | | | | 4,999 | | | | | | 5,025 | |
0.505% due 02/15/2037 • | | | | | 1,133 | | | | | | 1,130 | |
| | | | | | | | | | | | |
| | | | | PRINCIPAL
AMOUNT
(000S) | | | | | MARKET
VALUE
(000S) | |
0.605% due 04/15/2041 • | | $ | | | 297 | | | $ | | | 297 | |
0.635% due 09/15/2048 - 09/25/2049 • | | | | | 34,756 | | | | | | 34,805 | |
0.685% due 07/15/2039 - 12/25/2049 • | | | | | 16,702 | | | | | | 16,741 | |
0.690% due 05/15/2038 • | | | | | 3,737 | | | | | | 3,744 | |
0.700% due 05/15/2041 • | | | | | 4,215 | | | | | | 4,222 | |
0.720% due 03/15/2037 - 03/15/2043 • | | | | | 69,400 | | | | | | 69,286 | |
0.770% due 12/15/2042 - 11/15/2044 • | | | | | 9,684 | | | | | | 9,740 | |
0.790% due 06/15/2044 • | | | | | 13,366 | | | | | | 13,360 | |
0.820% due 12/15/2037 • | | | | | 2,447 | | | | | | 2,445 | |
0.900% due 05/28/2025 - 06/30/2025 | | | | | 129,800 | | | | | | 129,886 | |
0.950% due 06/10/2025 | | | | | 44,600 | | | | | | 44,637 | |
1.200% due 04/06/2023 - 04/17/2025 | | | | | 106,900 | | | | | | 106,944 | |
1.500% due 04/03/2025 | | | | | 124,255 | | | | | | 124,264 | |
2.500% due 06/25/2034 - 07/25/2034 | | | | | 148,299 | | | | | | 150,257 | |
4.062% due 09/01/2037 • | | | | | 2,550 | | | | | | 2,679 | |
|
Ginnie Mae | |
0.503% due 06/20/2066 • | | | | | 1,054 | | | | | | 1,051 | |
0.573% due 06/20/2046 • | | | | | 36,671 | | | | | | 36,608 | |
0.590% due 07/20/2049 • | | | | | 16,580 | | | | | | 16,581 | |
0.620% due 05/20/2063 • | | | | | 874 | | | | | | 867 | |
0.640% due 03/20/2049 - 01/20/2050 • | | | | | 76,886 | | | | | | 76,955 | |
0.653% due 08/20/2065 • | | | | | 26,002 | | | | | | 25,900 | |
0.673% due 10/20/2066 • | | | | | 158 | | | | | | 158 | |
0.703% due 10/20/2062 • | | | | | 4,937 | | | | | | 4,925 | |
0.773% due 06/20/2067 • | | | | | 1,757 | | | | | | 1,755 | |
0.790% due 09/20/2040 • | | | | | 6,777 | | | | | | 6,813 | |
0.803% due 03/20/2061 - 07/20/2067 • | | | | | 8,913 | | | | | | 8,911 | |
0.810% due 05/20/2041 • | | | | | 13,526 | | | | | | 13,562 | |
0.820% due 10/20/2040 • | | | | | 12,869 | | | | | | 12,904 | |
0.840% due 05/20/2041 • | | | | | 3,876 | | | | | | 3,890 | |
0.853% due 04/20/2062 • | | | | | 3,296 | | | | | | 3,299 | |
0.890% due 04/20/2070 • | | | | | 61,028 | | | | | | 61,906 | |
0.895% due 01/16/2040 • | | | | | 4,500 | | | | | | 4,545 | |
0.903% due 05/20/2065 - 10/20/2065 • | | | | | 13,571 | | | | | | 13,598 | |
0.930% due 02/20/2040 • | | | | | 4,324 | | | | | | 4,370 | |
0.940% due 03/20/2040 | | | | | 12,752 | | | | | | 12,892 | |
0.953% due 12/20/2064 - 10/20/2065 • | | | | | 23,006 | | | | | | 23,090 | |
0.960% due 04/20/2040 • | | | | | 9,334 | | | | | | 9,455 | |
0.990% due 03/20/2040 • | | | | | 9,883 | | | | | | 10,020 | |
1.003% due 02/20/2062 • | | | | | 4,842 | | | | | | 4,863 | |
1.053% due 12/20/2065 - 08/20/2066 • | | | | | 12,603 | | | | | | 12,700 | |
1.083% due 09/20/2066 • | | | | | 2,049 | | | | | | 2,067 | |
1.103% due 05/20/2066 - 07/20/2066 • | | | | | 12,499 | | | | | | 12,618 | |
1.133% due 08/20/2066 • | | | | | 1,241 | | | | | | 1,255 | |
1.223% due 07/20/2065 • | | | | | 5,867 | | | | | | 5,943 | |
1.303% due 01/20/2066 • | | | | | 5,714 | | | | | | 5,814 | |
1.353% due 02/20/2066 • | | | | | 14,289 | | | | | | 14,532 | |
1.586% due 06/20/2067 • | | | | | 7,555 | | | | | | 7,697 | |
1.904% due 04/20/2067 • | | | | | 2,134 | | | | | | 2,177 | |
2.213% due 12/20/2068 • | | | | | 10,496 | | | | | | 10,504 | |
2.500% due 01/20/2049 - 10/20/2049 | | | | | 69,506 | | | | | | 71,185 | |
3.000% due 07/20/2046 | | | | | 3,659 | | | | | | 3,759 | |
6.000% due 12/15/2033 | | | | | 18 | | | | | | 22 | |
6.500% due 11/15/2033 - 09/15/2034 | | | | | 22 | | | | | | 25 | |
7.000% due 01/15/2024 - 07/15/2032 | | | | | 78 | | | | | | 78 | |
7.500% due 07/15/2024 - 06/15/2028 | | | | | 55 | | | | | | 60 | |
|
NCUA Guaranteed Notes | |
0.530% due 12/07/2020 • | | | | | 505 | | | | | | 505 | |
0.644% due 11/05/2020 • | | | | | 3,277 | | | | | | 3,278 | |
0.734% due 12/08/2020 • | | | | | 1,567 | | | | | | 1,567 | |
| | | | | | | | | | | | |
Total U.S. Government Agencies (Cost $1,509,142) | | | | | | 1,513,161 | |
| | | | | | | | | | | | |
| | | | | | | | | | | | |
| | | | | PRINCIPAL
AMOUNT
(000S) | | | | | MARKET
VALUE
(000S) | |
| NON-AGENCY MORTGAGE-BACKED SECURITIES 2.6% | |
|
AREIT Trust | |
1.215% due 09/14/2036 • | | $ | | | 14,000 | | | $ | | | 13,508 | |
|
Bancorp Commercial Mortgage Trust | |
1.235% due 09/15/2036 • | | | | | 17,590 | | | | | | 16,898 | |
|
Bear Stearns Adjustable Rate Mortgage Trust | |
3.171% due 08/25/2033 ~ | | | | | 555 | | | | | | 544 | |
|
Brass PLC | |
1.086% due 11/16/2066 • | | | | | 11,130 | | | | | | 11,125 | |
|
BX Commercial Mortgage Trust | |
0.935% due 11/15/2035 • | | | | | 11,714 | | | | | | 11,620 | |
|
Credit Suisse Mortgage Capital Trust | |
0.935% due 07/15/2032 • | | | | | 13,000 | | | | | | 12,258 | |
|
Exantas Capital Corp. Ltd. | |
1.194% due 04/15/2036 • | | | | | 25,291 | | | | | | 24,616 | |
|
GCAT Trust | |
2.650% due 10/25/2068 ~ | | | | | 4,268 | | | | | | 4,439 | |
|
Gosforth Funding PLC | |
0.786% due 12/19/2059 • | | | | | 3,392 | | | | | | 3,393 | |
0.810% due 08/25/2060 • | | | | | 12,988 | | | | | | 12,987 | |
|
GPMT Ltd. | |
1.094% due 11/21/2035 • | | | | | 3,936 | | | | | | 3,855 | |
|
GS Mortgage Securities Corp. Trust | |
0.885% due 07/15/2032 • | | | | | 16,300 | | | | | | 16,178 | |
|
GS Mortgage Securities Trust | |
3.648% due 01/10/2047 | | | | | 7,227 | | | | | | 7,484 | |
|
IMT Trust | |
0.885% due 06/15/2034 • | | | | | 2,711 | | | | | | 2,661 | |
|
JPMorgan Chase Commercial Mortgage Securities Trust | |
1.185% due 09/15/2029 • | | | | | 45,400 | | | | | | 44,178 | |
|
Lanark Master Issuer PLC | |
1.128% due 12/22/2069 • | | | | | 9,120 | | | | | | 9,147 | |
|
Mellon Residential Funding Corp. Mortgage Pass-Through Certificates | |
0.885% due 11/15/2031 • | | | | | 695 | | | | | | 681 | |
|
MF1 Ltd. | |
1.315% due 12/25/2034 • | | | | | 50,000 | | | | | | 49,313 | |
|
Mill City Mortgage Loan Trust | |
2.750% due 07/25/2059 ~ | | | | | 1,378 | | | | | | 1,443 | |
|
Motel 6 Trust | |
1.105% due 08/15/2034 • | | | | | 13,785 | | | | | | 13,551 | |
|
Permanent Master Issuer PLC | |
1.599% due 07/15/2058 • | | | | | 2,250 | | | | | | 2,250 | |
|
PFP Ltd. | |
1.245% due 04/14/2037 • | | | | | 45,200 | | | | | | 43,977 | |
|
Rosslyn Portfolio Trust | |
1.939% due 06/15/2033 • | | | | | 4,500 | | | | | | 4,422 | |
|
Shellpoint Co-Originator Trust | |
3.500% due 08/25/2045 ~ | | | | | 5,043 | | | | | | 5,106 | |
|
UBS-Barclays Commercial Mortgage Trust | |
0.981% due 04/10/2046 • | | | | | 14,981 | | | | | | 14,923 | |
|
VMC Finance LLC | |
1.114% due 10/15/2035 • | | | | | 8,450 | | | | | | 8,063 | |
|
Wells Fargo Commercial Mortgage Trust | |
1.035% due 12/13/2031 • | | | | | 5,400 | | | | | | 5,132 | |
1.244% due 07/15/2046 • | | | | | 5,700 | | | | | | 5,655 | |
|
Wells Fargo-RBS Commercial Mortgage Trust | |
1.644% due 06/15/2044 • | | | | | 21,451 | | | | | | 21,470 | |
| | | | | | | | | | | | |
Total Non-Agency Mortgage-Backed Securities (Cost $378,052) | | | 370,877 | |
| | | | | | | | | | | | |
| |
| ASSET-BACKED SECURITIES 15.6% | |
|
Ally Auto Receivables Trust | |
1.750% due 12/15/2021 | | | | | 72 | | | | | | 73 | |
|
Ally Master Owner Trust | |
0.505% due 07/15/2022 • | | | | | 20,000 | | | | | | 20,007 | |
|
ARI Fleet Lease Trust | |
0.665% due 11/15/2027 • | | | | | 8,819 | | | | | | 8,817 | |
|
Arkansas Student Loan Authority | |
1.260% due 11/25/2043 • | | | | | 494 | | | | | | 484 | |
| | | | | | |
| See Accompanying Notes | | ANNUAL REPORT | | JUNE 30, 2020 | | 77 |
Schedule of Investments PIMCO Enhanced Short Maturity Active Exchange-Traded Fund (Cont.)
| | | | | | | | | | | | |
| | | | | PRINCIPAL
AMOUNT
(000S) | | | | | MARKET
VALUE
(000S) | |
|
Atlas Senior Loan Fund Ltd. | |
2.005% due 04/20/2028 • | | $ | | | 4,173 | | | $ | | | 4,110 | |
|
B&M CLO Ltd. | |
1.906% due 04/16/2026 • | | | | | 436 | | | | | | 434 | |
|
Barings BDC Static CLO Ltd. | |
2.239% due 04/15/2027 • | | | | | 25,170 | | | | | | 24,993 | |
|
Canadian Pacer Auto Receivables Trust | |
0.394% due 11/21/2022 • | | | | | 20,000 | | | | | | 19,955 | |
3.000% due 06/21/2021 | | | | | 487 | | | | | | 488 | |
|
CARDS Trust | |
0.575% due 05/15/2024 • | | | | | 34,400 | | | | | | 34,450 | |
|
CarMax Auto Owner Trust | |
0.495% due 07/15/2022 • | | | | | 5,044 | | | | | | 5,047 | |
1.400% due 08/15/2021 | | | | | 137 | | | | | | 137 | |
| | | | |
Chesapeake Funding LLC | | | | | | | | | | | | |
0.555% due 08/15/2030 • | | | | | 21,857 | | | | | | 21,475 | |
0.585% due 04/15/2031 • | | | | | 12,983 | | | | | | 12,660 | |
0.665% due 09/15/2031 • | | | | | 11,678 | | | | | | 11,635 | |
1.910% due 08/15/2029 | | | | | 3,342 | | | | | | 3,354 | |
1.990% due 05/15/2029 | | | | | 488 | | | | | | 490 | |
3.040% due 04/15/2030 | | | | | 3,362 | | | | | | 3,439 | |
|
CIFC Funding Ltd. | |
1.851% due 10/25/2027 • | | | | | 8,800 | | | | | | 8,678 | |
|
Citibank Credit Card Issuance Trust | |
0.810% due 04/22/2026 • | | | | | 6,000 | | | | | | 6,046 | |
|
Commonbond Student Loan Trust | |
1.035% due 05/25/2041 • | | | | | 675 | | | | | | 671 | |
|
Crown Point CLO Ltd. | |
2.075% due 07/17/2028 • | | | | | 20,984 | | | | | | 20,688 | |
2.305% due 10/20/2028 • | | | | | 39,583 | | | | | | 39,078 | |
|
CVP Cascade CLO Ltd. | |
2.326% due 01/16/2026 • | | | | | 1,911 | | | | | | 1,911 | |
|
Dell Equipment Finance Trust | |
1.983% due 05/21/2021 | | | | | 17,968 | | | | | | 18,041 | |
3.160% due 02/22/2021 | | | | | 1,095 | | | | | | 1,098 | |
|
Denali Capital CLO LLC | |
2.041% due 10/26/2027 • | | | | | 15,180 | | | | | | 15,022 | |
|
Dryden Senior Loan Fund | |
2.119% due 10/15/2027 • | | | | | 14,799 | | | | | | 14,673 | |
|
DT Auto Owner Trust | |
1.140% due 01/16/2024 | | | | | 5,200 | | | | | | 5,210 | |
|
Earnest Student Loan Program LLC | |
| | | | |
2.680% due 07/25/2035 | | | | | 7,823 | | | | | | 7,895 | |
|
Edsouth Indenture LLC | |
0.915% due 04/25/2039 • | | | | | 963 | | | | | | 949 | |
1.335% due 09/25/2040 • | | | | | 193 | | | | | | 193 | |
|
Enterprise Fleet Financing LLC | |
2.870% due 10/20/2023 | | | | | 196 | | | | | | 197 | |
3.140% due 02/20/2024 | | | | | 632 | | | | | | 639 | |
|
Evergreen Credit Card Trust | |
0.535% due 07/15/2022 • | | | | | 25,000 | | | | | | 25,002 | |
0.555% due 10/16/2023 • | | | | | 84,000 | | | | | | 84,160 | |
0.665% due 01/15/2023 • | | | | | 42,000 | | | | | | 42,082 | |
|
Exeter Automobile Receivables Trust | |
1.130% due 08/15/2023 | | | | | 13,000 | | | | | | 13,020 | |
2.590% due 09/15/2022 | | | | | 3,209 | | | | | | 3,223 | |
|
Figueroa CLO Ltd. | |
2.119% due 01/15/2027 • | | | | | 3,925 | | | | | | 3,922 | |
|
Flagship CLO Ltd. | |
2.026% due 01/16/2026 • | | | | | 1,025 | | | | | | 1,018 | |
|
Flagship Credit Auto Trust | |
1.490% due 07/15/2024 | | | | | 11,850 | | | | | | 11,923 | |
|
Ford Credit Auto Lease Trust | |
0.445% due 02/15/2022 • | | | | | 23,370 | | | | | | 23,373 | |
2.280% due 02/15/2022 | | | | | 311 | | | | | | 313 | |
|
Ford Credit Auto Owner Trust | |
1.030% due 10/15/2022 | | | | | 12,100 | | | | | | 12,155 | |
1.690% due 11/15/2021 | | | | | 709 | | | | | | 710 | |
|
Ford Credit Floorplan Master Owner Trust | |
0.785% due 09/15/2024 • | | | | | 20,400 | | | | | | 20,084 | |
|
Gallatin CLO Ltd. | |
2.269% (US0003M + 1.050%) due 07/15/2027 ~ | | | | | 7,503 | | | | | | 7,420 | |
| | | | | | | | | | | | |
| | | | | PRINCIPAL
AMOUNT
(000S) | | | | | MARKET
VALUE
(000S) | |
|
GM Financial Automobile Leasing Trust | |
0.710% due 10/20/2022 | | $ | | | 15,000 | | | $ | | | 15,014 | |
3.180% due 06/21/2021 | | | | | 610 | | | | | | 613 | |
|
GMF Floorplan Owner Revolving Trust | |
0.595% due 09/15/2023 • | | | | | 28,400 | | | | | | 28,283 | |
|
Golden Credit Card Trust | |
0.505% due 05/15/2023 • | | | | | 6,500 | | | | | | 6,500 | |
0.535% due 10/15/2023 • | | | | | 41,195 | | | | | | 41,112 | |
2.620% due 01/15/2023 | | | | | 3,000 | | | | | | 3,036 | |
|
Gracechurch Card Funding PLC | |
0.585% due 07/15/2022 • | | | | | 26,810 | | | | | | 26,817 | |
|
Gulf Stream Meridian Ltd. | |
2.478% due 10/15/2029 • | | | | | 7,000 | | | | | | 7,040 | |
|
Halcyon Loan Advisors Funding Ltd. | |
2.055% due 04/20/2027 • | | | | | 2,906 | | | | | | 2,876 | |
|
Hertz Fleet Lease Funding LP | |
0.647% due 01/10/2033 • | | | | | 89,219 | | | | | | 88,231 | |
0.677% due 05/10/2032 • | | | | | 3,590 | | | | | | 3,576 | |
|
Hyundai Auto Lease Securitization Trust | |
2.080% due 12/15/2021 | | | | | 5,939 | | | | | | 5,976 | |
|
KVK CLO Ltd. | |
2.211% due 01/14/2028 • | | | | | 4,481 | | | | | | 4,400 | |
|
LCM LP | |
2.175% due 10/20/2027 • | | | | | 3,500 | | | | | | 3,441 | |
|
Limerock CLO LLC | |
2.335% due 10/20/2026 • | | | | | 3,116 | | | | | | 3,106 | |
|
Madison Park Funding Ltd. | |
2.395% due 07/20/2026 • | | | | | 2,771 | | | | | | 2,760 | |
|
Marlette Funding Trust | |
2.690% due 09/17/2029 | | | | | 4,453 | | | | | | 4,482 | |
3.130% due 07/16/2029 | | | | | 1,786 | | | | | | 1,802 | |
|
Master Credit Card Trust | |
0.680% due 07/21/2024 • | | | | | 12,000 | | | | | | 11,925 | |
|
Mercedes-Benz Auto Lease Trust | |
2.010% due 12/15/2021 | | | | | 686 | | | | | | 690 | |
3.010% due 02/16/2021 | | | | | 670 | | | | | | 671 | |
|
MMAF Equipment Finance LLC | |
2.330% due 12/08/2025 | | | | | 3,180 | | | | | | 3,225 | |
|
Mountain View CLO Ltd. | |
2.266% due 10/16/2029 • | | | | | 10,000 | | | | | | 9,780 | |
|
Nassau Ltd. | |
2.369% due 10/15/2029 • | | | | | 26,500 | | | | | | 25,999 | |
|
Navient Private Education Loan Trust | |
1.435% due 02/15/2029 • | | | | | 1,919 | | | | | | 1,917 | |
|
Navient Private Education Refi Loan Trust | |
0.485% due 12/15/2059 • | | | | | 875 | | | | | | 874 | |
0.535% due 11/15/2068 • | | | | | 4,978 | | | | | | 4,961 | |
1.690% due 05/15/2069 | | | | | 26,900 | | | | | | 27,028 | |
3.010% due 06/16/2042 | | | | | 2,030 | | | | | | 2,034 | |
3.130% due 02/15/2068 | | | | | 7,500 | | | | | | 7,747 | |
|
Navient Student Loan Trust | |
0.585% due 12/15/2059 • | | | | | 17,494 | | | | | | 17,433 | |
0.785% due 07/26/2066 • | | | | | 10,287 | | | | | | 10,249 | |
0.935% due 07/26/2066 • | | | | | 1,178 | | | | | | 1,176 | |
0.985% due 07/26/2066 • | | | | | 7,823 | | | | | | 7,469 | |
1.235% due 12/27/2066 • | | | | | 17,990 | | | | | | 17,465 | |
|
Nelnet Student Loan Trust | |
0.426% due 12/24/2035 • | | | | | 4,076 | | | | | | 3,902 | |
0.470% due 08/23/2027 • | | | | | 2,932 | | | | | | 2,926 | |
0.785% due 03/25/2030 • | | | | | 3,114 | | | | | | 3,083 | |
0.985% due 09/25/2065 • | | | | | 17,290 | | | | | | 17,149 | |
0.985% due 08/25/2067 • | | | | | 29,282 | | | | | | 28,797 | |
1.035% due 02/25/2066 • | | | | | 11,714 | | | | | | 11,379 | |
|
Nissan Auto Lease Trust | |
1.800% due 05/16/2022 | | | | | 710 | | | | | | 716 | |
2.710% due 07/15/2021 | | | | | 770 | | | | | | 773 | |
2.760% due 03/15/2022 | | | | | 500 | | | | | | 508 | |
|
Nissan Master Owner Trust Receivables | |
0.615% due 11/15/2023 • | | | | | 64,900 | | | | | | 64,583 | |
|
Northstar Education Finance, Inc. | |
0.885% due 12/26/2031 • | | | | | 824 | | | | | | 796 | |
|
OCP CLO Ltd. | |
1.811% due 10/26/2027 • | | | | | 5,107 | | | | | | 5,057 | |
|
OneMain Financial Issuance Trust | |
2.370% due 09/14/2032 | | | | | 6,269 | | | | | | 6,290 | |
| | | | | | | | | | | | |
| | | | | PRINCIPAL
AMOUNT
(000S) | | | | | MARKET
VALUE
(000S) | |
|
Oscar U.S. Funding LLC | |
2.490% due 08/10/2022 | | $ | | | 3,286 | | | $ | | | 3,305 | |
3.100% due 04/11/2022 | | | | | 5,029 | | | | | | 5,063 | |
|
Oscar U.S. Funding Trust LLC | |
0.647% due 08/10/2021 • | | | | | 223 | | | | | | 223 | |
|
Palmer Square CLO Ltd. | |
1.242% due 08/15/2026 • | | | | | 4,515 | | | | | | 4,484 | |
|
Palmer Square Loan Funding Ltd. | |
1.177% due 02/20/2028 • | | | | | 36,906 | | | | | | 36,367 | |
1.227% due 08/20/2027 • | | | | | 33,270 | | | | | | 32,950 | |
1.292% due 11/15/2026 • | | | | | 6,865 | | | | | | 6,787 | |
1.819% due 04/15/2026 • | | | | | 25,698 | | | | | | 25,514 | |
1.920% due 10/24/2027 • | | | | | 12,414 | | | | | | 12,289 | |
2.005% due 07/20/2028 • | | | | | 44,400 | | | | | | 44,160 | |
|
Penarth Master Issuer PLC | |
0.644% due 09/18/2022 • | | | | | 39,530 | | | | | | 39,502 | |
0.734% due 07/18/2023 • | | | | | 24,045 | | | | | | 24,016 | |
|
PFS Financing Corp. | |
1.210% due 06/17/2024 | | | | | 16,800 | | | | | | 16,847 | |
|
PHEAA Student Loan Trust | |
1.135% due 11/25/2065 • | | | | | 7,960 | | | | | | 7,746 | |
|
Santander Consumer Auto Receivables Trust | |
1.370% due 10/15/2024 | | | | | 13,454 | | | | | | 13,538 | |
|
Santander Retail Auto Lease Trust | |
0.530% due 09/20/2022 • | | | | | 13,797 | | | | | | 13,783 | |
1.690% due 01/20/2023 | | | | | 10,700 | | | | | | 10,817 | |
1.890% due 09/20/2022 | | | | | 8,922 | | | | | | 9,008 | |
2.290% due 04/20/2022 | | | | | 2,971 | | | | | | 3,001 | |
2.720% due 01/20/2022 | | | | | 1,518 | | | | | | 1,533 | |
|
Securitized Term Auto Receivables Trust | |
2.289% due 03/25/2022 | | | | | 1,285 | | | | | | 1,291 | |
2.862% due 05/25/2021 | | | | | 817 | | | | | | 820 | |
|
Seneca Park CLO Ltd. | |
2.255% due 07/17/2026 • | | | | | 2,733 | | | | | | 2,726 | |
| | | | |
SLC Student Loan Trust | | | | | | | | | | | | |
0.413% due 09/15/2026 • | | | | | 3,973 | | | | | | 3,970 | |
0.423% due 03/15/2027 • | | | | | 6,493 | | | | | | 6,431 | |
0.433% due 06/15/2029 • | | | | | 19,338 | | | | | | 19,043 | |
|
SLM Private Education Loan Trust | |
1.685% due 03/15/2032 • | | | | | 7,420 | | | | | | 7,450 | |
2.435% due 06/16/2042 • | | | | | 1,901 | | | | | | 1,906 | |
|
SLM Student Loan Trust | |
0.783% due 12/15/2027 • | | | | | 19,856 | | | | | | 19,703 | |
0.835% due 12/27/2038 • | | | | | 2,793 | | | | | | 2,707 | |
0.863% due 12/15/2025 • | | | | | 4,208 | | | | | | 4,178 | |
0.885% due 01/25/2029 • | | | | | 3,154 | | | | | | 2,935 | |
1.081% due 01/26/2026 • | | | | | 4,961 | | | | | | 4,932 | |
1.101% due 01/27/2025 • | | | | | 1,559 | | | | | | 1,552 | |
1.111% due 01/25/2027 • | | | | | 14,311 | | | | | | 14,110 | |
1.131% due 10/25/2028 • | | | | | 2,155 | | | | | | 2,110 | |
1.541% due 01/25/2028 • | | | | | 3,524 | | | | | | 3,518 | |
2.491% due 04/25/2023 • | | | | | 256 | | | | | | 251 | |
|
SMB Private Education Loan Trust | |
0.485% due 09/15/2054 • | | | | | 37,672 | | | | | | 37,400 | |
0.535% due 02/16/2026 • | | | | | 3,001 | | | | | | 2,998 | |
1.085% due 09/15/2034 • | | | | | 13,086 | | | | | | 12,942 | |
1.285% due 09/15/2034 • | | | | | 6,129 | | | | | | 6,087 | |
1.385% due 07/15/2027 • | | | | | 4,660 | | | | | | 4,655 | |
2.340% due 09/15/2034 | | | | | 7,850 | | | | | | 7,982 | |
2.490% due 06/15/2027 | | | | | 2,611 | | | | | | 2,624 | |
2.980% due 07/15/2027 | | | | | 4,349 | | | | | | 4,424 | |
3.050% due 05/15/2026 | | | | | 634 | | | | | | 641 | |
|
SoFi Consumer Loan Program LLC | |
2.500% due 05/26/2026 | | | | | 3,271 | | | | | | 3,303 | |
2.770% due 05/25/2026 | | | | | 1,584 | | | | | | 1,594 | |
3.280% due 01/26/2026 | | | | | 791 | | | | | | 793 | |
|
SoFi Consumer Loan Program Trust | |
2.900% due 05/25/2028 | | | | | 6,951 | | | | | | 7,050 | |
3.010% due 04/25/2028 | | | | | 6,101 | | | | | | 6,189 | |
3.240% due 02/25/2028 | | | | | 5,272 | | | | | | 5,327 | |
|
SoFi Professional Loan Program LLC | |
0.535% due 02/25/2042 • | | | | | 888 | | | | | | 881 | |
0.785% due 07/25/2040 • | | | | | 1,385 | | | | | | 1,379 | |
0.885% due 03/26/2040 • | | | | | 1,177 | | | | | | 1,168 | |
1.035% due 07/25/2039 • | | | | | 2,214 | | | | | | 2,208 | |
1.135% due 01/25/2039 • | | | | | 249 | | | | | | 249 | |
1.235% due 04/25/2035 • | | | | | 876 | | | | | | 873 | |
| | | | | | | | |
| 78 | | PIMCO ETF TRUST | | | | | See Accompanying Notes | |
June 30, 2020
| | | | | | | | | | | | |
| | | | | PRINCIPAL
AMOUNT
(000S) | | | | | MARKET
VALUE
(000S) | |
1.235% due 08/27/2035 • | | $ | | | 3,089 | | | $ | | | 3,090 | |
1.285% due 10/27/2036 • | | | | | 3,219 | | | | | | 3,217 | |
1.485% due 02/25/2040 • | | | | | 1,174 | | | | | | 1,180 | |
1.935% due 08/25/2036 • | | | | | 1,081 | | | | | | 1,087 | |
2.360% due 12/27/2032 | | | | | 958 | | | | | | 967 | |
2.510% due 09/27/2032 | | | | | 833 | | | | | | 842 | |
2.650% due 09/25/2040 | | | | | 4,907 | | | | | | 5,035 | |
2.740% due 05/25/2040 | | | | | 6,007 | | | | | | 6,106 | |
|
SoFi Professional Loan Program Trust | |
1.950% due 02/15/2046 | | | | | 40,000 | | | | | | 40,638 | |
2.060% due 05/15/2046 | | | | | 15,131 | | | | | | 15,282 | |
2.640% due 08/25/2047 | | | | | 914 | | | | | | 916 | |
3.080% due 01/25/2048 | | | | | 3,805 | | | | | | 3,833 | |
|
Sound Point CLO Ltd. | |
2.193% due 01/23/2029 • | | | | | 20,000 | | | | | | 19,650 | |
|
Starwood Waypoint Homes Trust | |
1.135% due 01/17/2035 • | | | | | 9,161 | | | | | | 9,136 | |
|
Symphony CLO Ltd. | |
2.261% due 07/14/2026 • | | | | | 20,408 | | | | | | 20,215 | |
|
Tesla Auto Lease Trust | |
2.130% due 04/20/2022 | | | | | 20,000 | | | | | | 20,229 | |
|
Thacher Park CLO Ltd. | |
2.295% due 10/20/2026 • | | | | | 1,153 | | | | | | 1,148 | |
|
THL Credit Wind River CLO Ltd. | |
2.099% due 01/15/2026 • | | | | | 2,380 | | | | | | 2,370 | |
|
Towd Point Mortgage Trust | |
0.785% due 02/25/2057 • | | | | | 2,957 | | | | | | 2,938 | |
1.185% due 10/25/2059 • | | | | | 4,194 | | | | | | 4,183 | |
|
Toyota Auto Loan Extended Note Trust | |
1.350% due 05/25/2033 | | | | | 52,600 | | | | | | 53,481 | |
|
Trillium Credit Card Trust | |
0.530% due 09/26/2023 • | | | | | 53,000 | | | | | | 52,998 | |
0.550% due 12/26/2024 • | | | | | 85,400 | | | | | | 85,427 | |
0.660% due 01/26/2024 • | | | | | 19,100 | | | | | | 19,130 | |
|
Upstart Securitization Trust | |
2.322% due 04/22/2030 | | | | | 3,583 | | | | | | 3,590 | |
|
Utah State Board of Regents | |
0.918% due 01/25/2057 • | | | | | 6,233 | | | | | | 6,104 | |
0.935% due 09/25/2056 • | | | | | 9,959 | | | | | | 9,705 | |
|
Venture CLO Ltd. | |
1.401% due 08/28/2029 • | | | | | 35,900 | | | | | | 35,072 | |
2.248% due 10/22/2031 • | | | | | 25,000 | | | | | | 24,636 | |
2.365% due 04/20/2029 • | | | | | 31,200 | | | | | | 30,732 | |
|
Volkswagen Auto Lease Trust | |
0.490% due 03/21/2022 • | | | | | 8,773 | | | | | | 8,778 | |
|
Volkswagen Auto Loan Enhanced Trust | |
3.050% due 08/20/2021 | | | | | 159 | | | | | | 160 | |
|
Voya CLO Ltd. | |
1.711% due 07/25/2026 • | | | | | 2,950 | | | | | | 2,934 | |
|
Westlake Automobile Receivables Trust | |
2.570% due 02/15/2023 | | | | | 948 | | | | | | 955 | |
|
WhiteHorse Ltd. | |
2.065% due 04/17/2027 • | | | | | 4,137 | | | | | | 4,112 | |
2.295% due 07/17/2026 • | | | | | 349 | | | | | | 348 | |
|
World Omni Auto Receivables Trust | |
1.300% due 02/15/2022 | | | | | 273 | | | | | | 274 | |
|
World Omni Automobile Lease Securitization Trust | |
0.445% due 07/15/2022 • | | | | | 15,368 | | | | | | 15,362 | |
|
Zais CLO Ltd. | |
2.369% due 04/15/2028 • | | | | | 23,809 | | | | | | 23,581 | |
| | | | | | | | | | | | |
Total Asset-Backed Securities
(Cost $2,175,305) | | | | | | 2,167,883 | |
| | | | | | | | | | | | |
| |
| SOVEREIGN ISSUES 0.8% | |
|
Development Bank of Japan, Inc. | |
1.613% (US0003M + 0.570%) due 04/23/2021 ~ | | | | | 6,000 | | | | | | 6,016 | |
| | | | | | | | | | | | |
| | | | | PRINCIPAL
AMOUNT
(000S) | | | | | MARKET
VALUE
(000S) | |
|
Export-Import Bank of India | |
1.374% (US0003M + 1.000%) due 08/21/2022 ~ | | $ | | | 31,468 | | | $ | | | 30,697 | |
2.750% due 08/12/2020 | | | | | 1,604 | | | | | | 1,606 | |
|
Export-Import Bank of Korea | |
0.925% (US0003M + 0.575%) due 06/01/2021 ~ | | | | | 1,000 | | | | | | 1,002 | |
1.481% (US0003M + 0.925%) due 11/01/2022 ~ | | | | | 7,000 | | | | | | 7,047 | |
1.866% (US0003M + 0.875%) due 01/25/2022 ~ | | | | | 4,610 | | | | | | 4,636 | |
2.173% (US0003M + 0.800%) due 07/05/2022 ~ | | | | | 1,600 | | | | | | 1,608 | |
|
Industrial Bank of Korea | |
1.493% (US0003M + 0.450%) due 10/23/2022 ~ | | | | | 29,000 | | | | | | 28,828 | |
|
Korea Development Bank | |
1.074% (US0003M + 0.705%) due 02/27/2022 ~ | | | | | 32,100 | | | | | | 32,143 | |
|
Korea Expressway Corp. | |
3.625% due 10/22/2021 | | | | | 2,800 | | | | | | 2,901 | |
| | | | | | | | | | | | |
Total Sovereign Issues (Cost $117,471) | | | | | | 116,484 | |
| | | | | | | | | | | | |
| |
| SHORT-TERM INSTRUMENTS 16.7% | |
| |
| CERTIFICATES OF DEPOSIT 1.3% | |
|
Bank of Montreal | |
0.480% (SOFRRATE + 0.400%) due 10/02/2020 ~ | | | | | 65,000 | | | | | | 65,051 | |
|
Lloyds Bank Corporate Markets PLC | |
1.820% (US0003M + 0.500%) due 10/26/2020 ~ | | | | | 48,600 | | | | | | 48,672 | |
|
Sumitomo Mitsui Banking Corp. | |
0.891% (US0003M + 0.350%) due 11/05/2021 ~ | | | | | 23,400 | | | | | | 23,405 | |
0.911% (US0003M + 0.370%) due 11/05/2021 ~ | | | | | 21,000 | | | | | | 21,010 | |
1.691% (US0003M + 0.380%) due 10/12/2021 ~ | | | | | 20,000 | | | | | | 20,011 | |
| | | | | | | | | | | | |
| | | | | | | | | | | 178,149 | |
| | | | | | | | | | | | |
| |
| COMMERCIAL PAPER 5.5% | |
|
American Honda Finance Corp. | |
1.900% due 07/20/2020 | | | | | 25,500 | | | | | | 25,497 | |
1.950% due 07/06/2020 | | | | | 5,000 | | | | | | 5,000 | |
1.950% due 09/03/2020 | | | | | 35,200 | | | | | | 35,165 | |
2.000% due 09/03/2020 | | | | | 5,000 | | | | | | 4,995 | |
|
AstraZeneca PLC | |
2.000% due 10/28/2020 | | | | | 40,861 | | | | | | 40,791 | |
|
AT&T, Inc. | |
1.370% due 09/01/2020 | | | | | 12,000 | | | | | | 11,993 | |
1.500% due 09/03/2020 | | | | | 5,000 | | | | | | 4,997 | |
|
BAYER Corp. | |
2.350% due 08/03/2020 | | | | | 51,800 | | | | | | 51,784 | |
| |
BP Capital Markets PLC | | | |
1.500% due 10/07/2020 | | | | | 12,000 | | | | | | 11,990 | |
1.680% due 07/13/2020 | | | | | 78,300 | | | | | | 78,296 | |
1.800% due 08/03/2020 | | | | | 1,000 | | | | | | 1,000 | |
|
Chevron Corp. | |
0.750% due 08/27/2020 | | | | | 21,700 | | | | | | 21,694 | |
|
Exxon Mobil Corp. | |
0.950% due 07/08/2020 | | | | | 123,000 | | | | | | 122,997 | |
|
GlaxoSmithKline Capital PLC | |
1.100% due 08/17/2020 | | | | | 69,500 | | | | | | 69,448 | |
1.200% due 08/04/2020 | | | | | 17,000 | | | | | | 16,991 | |
| | | | | | | | | | | | |
| | | | | PRINCIPAL
AMOUNT
(000S) | | | | | MARKET
VALUE
(000S) | |
|
Schlumberger Investment S.A. | |
1.950% due 10/27/2020 | | $ | | | 13,500 | | | $ | | | 13,457 | |
1.950% due 10/28/2020 | | | | | 50,000 | | | | | | 49,837 | |
|
Shell International Finance B.V. | |
1.310% due 08/31/2020 | | | | | 7,250 | | | | | | 7,246 | |
1.700% due 09/28/2020 | | | | | 13,500 | | | | | | 13,489 | |
2.070% due 02/03/2021 | | | | | 12,000 | | | | | | 11,968 | |
2.300% due 01/19/2021 | | | | | 95,000 | | | | | | 94,771 | |
|
Trustees of Columbia University | |
2.200% due 07/15/2020 | | | | | 11,200 | | | | | | 11,191 | |
2.200% due 07/22/2020 | | | | | 14,000 | | | | | | 13,980 | |
|
Walt Disney Co. | |
1.400% due 07/31/2020 | | | | | 5,949 | | | | | | 5,948 | |
1.650% due 07/21/2020 | | | | | 3,000 | | | | | | 3,000 | |
1.750% due 08/19/2020 | | | | | 6,500 | | | | | | 6,498 | |
1.820% due 07/09/2020 | | | | | 23,700 | | | | | | 23,699 | |
1.850% due 08/31/2020 | | | | | 4,600 | | | | | | 4,598 | |
1.850% due 09/22/2020 | | | | | 2,100 | | | | | | 2,098 | |
| | | | | | | | | | | | |
| | | | | | | | | | | 764,418 | |
| | | | | | | | | | | | |
| |
| REPURCHASE AGREEMENTS (h) 3.0% | |
| | | | | | | | | | | 412,889 | |
| | | | | | | | | | | | |
| |
| U.S. TREASURY BILLS 3.4% | |
0.173% due 07/21/2020 - 10/08/2020 (b)(c) | | | | | 476,900 | | | | | | 476,803 | |
| | | | | | | | | | | | |
| |
| U.S. TREASURY CASH MANAGEMENT BILLS 3.5% | |
0.184% due 09/08/2020 - 10/06/2020 (b)(c) | | | | | 484,000 | | | | | | 483,843 | |
| | | | | | | | | | | | |
Total Short-Term Instruments
(Cost $2,313,785) | | | | | | | | | | | 2,316,102 | |
| | | | | | | | | | | | |
| | | | |
| | | | | | | | | | | | |
Total Investments in Securities
(Cost $13,881,560) | | | | | | | | | | | 13,864,303 | |
| | | | | | | | | | | | |
| |
| | | | | SHARES | | | | | | |
| INVESTMENTS IN AFFILIATES 0.0% | |
| |
| SHORT-TERM INSTRUMENTS 0.0% | |
| |
| MUTUAL FUNDS 0.0% | |
| | | | |
PIMCO Government Money Market Fund | | | | | | | | | | | | |
0.180% (d)(e)(f) | | | | | 514,748 | | | | | | 515 | |
| | | | | | | | | | | | |
Total Short-Term Instruments
(Cost $515) | | | | | | | | | | | 515 | |
| | | | | | | | | | | | |
| | | | |
| | | | | | | | | | | | |
Total Investments in Affiliates
(Cost $515) | | | | | | | | | | | 515 | |
| | | | |
| | | | | | | | | | | | |
Total Investments 99.6%
(Cost $13,882,075) | | | | | | | | $ | | | 13,864,818 | |
| |
| Other Assets and Liabilities, net 0.4% | | | | | | | | | | | 49,622 | |
| | | | | | | | | | | | |
| Net Assets 100.0% | | | | | | | | $ | | | 13,914,440 | |
| | | | | | | | | | | | |
| | | | | | |
| See Accompanying Notes | | ANNUAL REPORT | | JUNE 30, 2020 | | 79 |
Schedule of Investments PIMCO Enhanced Short Maturity Active Exchange-Traded Fund (Cont.)
NOTES TO SCHEDULE OF INVESTMENTS:
| * | A zero balance may reflect actual amounts rounding to less than one thousand. |
| ~ | Variable or Floating rate security. Rate shown is the rate in effect as of period end. Certain variable rate securities are not based on a published reference rate and spread, rather are determined by the issuer or agent and are based on current market conditions. Reference rate is as of reset date, which may vary by security. These securities may not indicate a reference rate and/or spread in their description. |
| • | Rate shown is the rate in effect as of period end. The rate may be based on a fixed rate, a capped rate or a floor rate and may convert to a variable or floating rate in the future. These securities do not indicate a reference rate and spread in their description. |
| (b) | Coupon represents a weighted average yield to maturity. |
| (d) | Institutional Class Shares of each Fund. |
| (e) | Securities with an aggregate market value of $497 were out on loan in exchange for $515 of cash collateral as of June 30, 2020. See Note 5, Securities Lending, in the Notes to Financial Statements for more information regarding securities on loan and cash collateral. |
| (f) | Coupon represents a 7-Day Yield. |
(g) RESTRICTED SECURITIES:
| | | | | | | | | | | | | | | | | | | | | | | | |
| Issuer Description | | Coupon | | | Maturity
Date | | | Acquisition
Date | | | Cost | | | Market
Value | | | Market Value
as Percentage
of Net Assets
| |
QNB Finance Ltd. | | | 1.638% | | | | 12/06/2021 | | | | 06/20/2019 | | | $ | 8,452 | | | $ | 8,364 | | | | 0.06% | |
| | | | | | | | | | | | | | | | | | | | | | | | |
BORROWINGS AND OTHER FINANCING TRANSACTIONS
(h) REPURCHASE AGREEMENTS:
| | | | | | | | | | | | | | | | | | | | | | | | | | | | | | |
| Counterparty | | Lending
Rate | | | Settlement
Date | | | Maturity
Date | | | Principal
Amount | | | Collateralized By | | Collateral
(Received) | | | Repurchase
Agreements,
at Value | | | Repurchase
Agreement
Proceeds
to be
Received(1) | |
| BPS | | | 0.130 | % | | | 06/30/2020 | | | | 07/01/2020 | | | $ | 121,900 | | | U.S. Treasury Inflation Protected Securities 0.250% due 01/15/2025 | | $ | (124,474 | ) | | $ | 121,900 | | | $ | 121,900 | |
| FICC | | | 0.000 | | | | 06/30/2020 | | | | 07/01/2020 | | | | 2,989 | | | U.S. Treasury Inflation Protected Securities 0.125% due 07/15/2024 | | | (3,049 | ) | | | 2,989 | | | | 2,989 | |
| SAL | | | 0.130 | | | | 06/30/2020 | | | | 07/01/2020 | | | | 198,500 | | | U.S. Treasury Bonds 2.875% due 05/15/2049 | | | (201,061 | ) | | | 198,500 | | | | 198,501 | |
| SGY | | | 0.130 | | | | 06/30/2020 | | | | 07/01/2020 | | | | 89,500 | | | U.S. Treasury Notes 2.500% due 03/31/2023 | | | (91,318 | ) | | | 89,500 | | | | 89,500 | |
| | | | | | | | | | | | | | | | | | | | | | | | | | | | | | |
Total Repurchase Agreements | | | | | | | | | | | | | $ | (419,902 | ) | | $ | 412,889 | | | $ | 412,890 | |
| | | | | | | | | | | | | | | | | | | | | | | | | | | | | | |
BORROWINGS AND OTHER FINANCING TRANSACTIONS SUMMARY
The following is a summary by counterparty of the market value of Borrowings and Other Financing Transactions and collateral pledged/(received) as of June 30, 2020:
| | | | | | | | | | | | | | | | | | | | | | | | | | | | |
| Counterparty | | Repurchase
Agreement
Proceeds
to be
Received(1) | | | Payable for
Reverse
Repurchase
Agreements | | | Payable for
Sale-Buyback
Transactions | | | Securities
Out on Loan | | | Total
Borrowings and
Other Financing
Transactions | | | Collateral
Pledged/(Received) | | | Net Exposure(2) | |
Global/Master Repurchase Agreement | | | | | | | | | | | | | | | | | | | | | | | | | | | | |
BPS | | $ | 121,900 | | | $ | 0 | | | $ | 0 | | | $ | 0 | | | $ | 121,900 | | | $ | (124,474 | ) | | $ | (2,574 | ) |
FICC | | | 2,989 | | | | 0 | | | | 0 | | | | 0 | | | | 2,989 | | | | (3,049 | ) | | | (60 | ) |
SAL | | | 198,501 | | | | 0 | | | | 0 | | | | 0 | | | | 198,501 | | | | (201,061 | ) | | | (2,560 | ) |
SGY | | | 89,500 | | | | 0 | | | | 0 | | | | 0 | | | | 89,500 | | | | (91,318 | ) | | | (1,818 | ) |
| | | | | | | |
Master Securities Forward Transaction Agreement | | | | | | | | | | | | | | | | | | | | | | | | | | | | |
BCY | | | 0 | | | | 0 | | | | 0 | | | | 497 | | | | 497 | | | | (515 | ) | | | (18 | ) |
| | | | | | | | | | | | | | | | | | | | | | | | | | | | |
Total Borrowings and Other Financing Transactions | | $ | 412,890 | | | $ | 0 | | | $ | 0 | | | $ | 497 | | | | | | | | | | | | | |
| | | | | | | | | | | | | | | | | | | | | | | | | | | | |
| | | | | | | | |
| 80 | | PIMCO ETF TRUST | | | | | See Accompanying Notes | |
June 30, 2020
CERTAIN TRANSFERS ACCOUNTED FOR AS SECURED BORROWINGS
Remaining Contractual Maturity of the Agreements
| | | | | | | | | | | | | | | | | | | | |
| | | Overnight and
Continuous | | | Up to 30 days | | | 31-90 days | | | Greater Than 90 days | | | Total | |
Securities Lending Transactions | | | | | | | | | | | | | |
Corporate Bonds & Notes | | $ | 515 | | | $ | 0 | | | $ | 0 | | | $ | 0 | | | $ | 515 | |
| | | | | | | | | | | | | | | | | | | | |
Total Borrowings | | $ | 515 | | | $ | 0 | | | $ | 0 | | | $ | 0 | | | $ | 515 | |
| | | | | | | | | | | | | | | | | | | | |
Payable for securities on loan-cash collateral | | | $ | 515 | |
| | | | | | | | | | | | | | | | | | | | |
| (1) | Includes accrued interest. |
| (2) | Net Exposure represents the net receivable/(payable) that would be due from/to the counterparty in the event of default. Exposure from borrowings and other financing transactions can only be netted across transactions governed under the same master agreement with the same legal entity. See Note 8, Master Netting Arrangements, in the Notes to Financial Statements for more information. |
The average amount of borrowings outstanding during the period ended June 30, 2020 was $(269,473) at a weighted average interest rate of 1.043%. Average borrowings may include reverse repurchase agreements and sale-buyback transactions, if held during the period.
FAIR VALUE MEASUREMENTS
The following is a summary of the fair valuations according to the inputs used as of June 30, 2020 in valuing the Fund’s assets and liabilities:
| | | | | | | | | | | | | | | | |
| Category and Subcategory | | Level 1 | | | Level 2 | | | Level 3 | | | Fair Value at
06/30/2020 | |
Investments in Securities, at Value | | | | | | | | | |
Corporate Bonds & Notes | | | | | | | | | | | | | | | | |
Banking & Finance | | $ | 0 | | | $ | 4,692,594 | | | $ | 0 | | | $ | 4,692,594 | |
Industrials | | | 0 | | | | 2,148,450 | | | | 0 | | | | 2,148,450 | |
Utilities | | | 0 | | | | 503,497 | | | | 0 | | | | 503,497 | |
Municipal Bonds & Notes | | | | | | | | | | | | | | | | |
California | | | 0 | | | | 27,907 | | | | 0 | | | | 27,907 | |
Washington | | | 0 | | | | 7,348 | | | | 0 | | | | 7,348 | |
U.S. Government Agencies | | | 0 | | | | 1,513,161 | | | | 0 | | | | 1,513,161 | |
Non-Agency Mortgage-Backed Securities | | | 0 | | | | 370,877 | | | | 0 | | | | 370,877 | |
Asset-Backed Securities | | | 0 | | | | 2,167,883 | | | | 0 | | | | 2,167,883 | |
Sovereign Issues | | | 0 | | | | 116,484 | | | | 0 | | | | 116,484 | |
Short-Term Instruments | |
Certificates of Deposit | | | 0 | | | | 178,149 | | | | 0 | | | | 178,149 | |
| | | | | | | | | | | | | | | | |
| Category and Subcategory | | Level 1 | | | Level 2 | | | Level 3 | | | Fair Value at
06/30/2020 | |
Commercial Paper | | $ | 0 | | | $ | 764,418 | | | $ | 0 | | | $ | 764,418 | |
Repurchase Agreements | | | 0 | | | | 412,889 | | | | 0 | | | | 412,889 | |
U.S. Treasury Bills | | | 0 | | | | 476,803 | | | | 0 | | | | 476,803 | |
U.S. Treasury Cash Management Bills | | | 0 | | | | 483,843 | | | | 0 | | | | 483,843 | |
| | | | | | | | | | | | | | | | |
| | $ | 0 | | | $ | 13,864,303 | | | $ | 0 | | | $ | 13,864,303 | |
| | | | | | | | | | | | | | | | |
| | | |
Investments in Affiliates, at Value | | | | | | | | | | | | | |
Short-Term Instruments | | | | | | | | | | | | | | | | |
Mutual Funds | | | 515 | | | | 0 | | | | 0 | | | | 515 | |
| | | | | | | | | | | | | | | | |
| | | | |
Total Investments | | $ | 515 | | | $ | 13,864,303 | | | $ | 0 | | | $ | 13,864,818 | |
| | | | | | | | | | | | | | | | |
There were no significant transfers into or out of Level 3 during the period ended June 30, 2020.
| | | | | | |
| See Accompanying Notes | | ANNUAL REPORT | | JUNE 30, 2020 | | 81 |
Schedule of Investments PIMCO Intermediate Municipal Bond Active Exchange-Traded Fund
(Amounts in thousands*, except number of shares, contracts, and units, if any)
| | | | | | | | | | | | |
| | | | | PRINCIPAL
AMOUNT
(000S) | | | | | MARKET
VALUE
(000S) | |
| INVESTMENTS IN SECURITIES 99.4% | |
| |
| MUNICIPAL BONDS & NOTES 85.7% | |
| |
| ALABAMA 1.2% | |
|
Industrial Development Board of the City of Mobile Alabama Revenue Bonds, Series 2007
| |
1.000% due 06/01/2034 | | $ | | | 4,250 | | | $ | | | 4,250 | |
|
Selma Industrial Development Board, Alabama Revenue Bonds, Series 2019
| |
2.000% due 11/01/2033 | | | | | 1,350 | | | | | | 1,397 | |
| | | | | | | | | | | | |
| | | | | | | | | | | 5,647 | |
| | | | | | | | | | | | |
| |
| ARIZONA 1.2% | |
|
Chandler Industrial Development Authority, Arizona Revenue Bonds, Series 2005
| |
2.400% due 12/01/2035 | | | | | 2,750 | | | | | | 2,855 | |
|
Maricopa County, Arizona Special Health Care District General Obligation Bonds, Series 2018
| |
5.000% due 07/01/2029 | | | | | 1,940 | | | | | | 2,463 | |
|
Phoenix Civic Improvement Corp., Arizona Revenue Bonds, Series 2017
| |
3.125% due 07/01/2034 | | | | | 425 | | | | | | 446 | |
| | | | | | | | | | | | |
| | | | | | | | | | | 5,764 | |
| | | | | | | | | | | | |
| |
| CALIFORNIA 1.4% | |
|
California State General Obligation Notes, Series 2013
| |
5.000% due 09/01/2021 | | | | | 3,000 | | | | | | 3,165 | |
|
Los Angeles, California Wastewater System Revenue Bonds, Series 2015
| |
5.000% due 06/01/2029 | | | | | 1,350 | | | | | | 1,636 | |
|
Sacramento Municipal Utility District, California Revenue Bonds, Series 2013
| |
5.000% due 08/15/2029 | | | | | 1,000 | | | | | | 1,140 | |
|
Southern California Public Power Authority Revenue Bonds, Series 2007
| |
5.250% due 11/01/2020 | | | | | 575 | | | | | | 582 | |
| | | | | | | | | | | | |
| | | | | | | | | | | 6,523 | |
| | | | | | | | | | | | |
| |
| COLORADO 2.3% | |
|
Board of Governors of Colorado State University System Revenue Bonds, Series 2015
| |
5.000% due 03/01/2028 | | | | | 1,580 | | | | | | 1,916 | |
|
Colorado Health Facilities Authority Revenue Bonds, Series 2018
| |
5.000% due 11/15/2048 | | | | | 2,500 | | | | | | 3,040 | |
|
Colorado Health Facilities Authority Revenue Bonds, Series 2019 | |
5.000% due 08/01/2031 | | | | | 850 | | | | | | 1,045 | |
5.000% due 11/15/2049 | | | | | 1,500 | | | | | | 1,850 | |
|
E-470 Public Highway Authority, Colorado Revenue Bonds, Series 2020
| |
5.000% due 09/01/2034 | | | | | 1,300 | | | | | | 1,711 | |
|
E-470 Public Highway Authority, Colorado Revenue Notes, Series 2020
| |
5.000% due 09/01/2028 | | | | | 1,050 | | | | | | 1,365 | |
| | | | | | | | | | | | |
| | | | | | | | | | | 10,927 | |
| | | | | | | | | | | | |
| |
| CONNECTICUT 6.3% | |
|
Bridgeport, Connecticut General Obligation Notes, Series 2017 | |
5.000% due 08/15/2023 | | | | | 1,635 | | | | | | 1,808 | |
5.000% due 08/15/2027 | | | | | 3,000 | | | | | | 3,605 | |
|
Connecticut Special Tax Revenue State Special Tax Bonds, Series 2020 | |
5.000% due 05/01/2031 | | | | | 3,500 | | | | | | 4,581 | |
5.000% due 05/01/2032 | | | | | 1,380 | | | | | | 1,792 | |
|
Connecticut Special Tax State Revenue Bonds, Series 2018 | |
5.000% due 01/01/2030 | | | | | 3,000 | | | | | | 3,746 | |
5.000% due 10/01/2033 | | | | | 1,020 | | | | | | 1,270 | |
| | | | | | | | | | | | |
| | | | | PRINCIPAL
AMOUNT
(000S) | | | | | MARKET
VALUE
(000S) | |
|
Connecticut State General Obligation Bonds, Series 2018
| |
5.000% due 09/15/2030 | | $ | | | 3,640 | | | $ | | | 4,597 | |
|
Connecticut State Health & Educational Facilities Authority Revenue Bonds, Series 2014
| |
1.100% due 07/01/2048 | | | | | 1,750 | | | | | | 1,782 | |
|
Connecticut State Health & Educational Facilities Authority Revenue Bonds, Series 2018
| |
5.000% due 07/01/2029 | | | | | 1,200 | | | | | | 1,481 | |
|
Metropolitan District, Connecticut General Obligation Bonds, Series 2018
| |
5.000% due 07/15/2029 | | | | | 1,845 | | | | | | 2,312 | |
|
Metropolitan District, Connecticut General Obligation Bonds, Series 2019
| |
5.000% due 07/15/2030 | | | | | 2,000 | | | | | | 2,549 | |
| | | | | | | | | | | | |
| | | | | | | | | | | 29,523 | |
| | | | | | | | | | | | |
| |
| DISTRICT OF COLUMBIA 0.5% | |
|
District of Columbia Revenue Bonds, Series 2015
| |
5.000% due 07/15/2028 | | | | | 2,000 | | | | | | 2,373 | |
| | | | | | | | | | | | |
| |
| FLORIDA 3.5% | |
|
Broward County, Florida Airport System Revenue Bonds, Series 2012
| |
5.000% due 10/01/2023 | | | | | 1,000 | | | | | | 1,089 | |
|
Central Florida Expressway Authority Revenue Bonds, Series 2018 | |
5.000% due 07/01/2030 | | | | | 450 | | | | | | 558 | |
5.000% due 07/01/2031 | | | | | 900 | | | | | | 1,110 | |
|
Florida Municipal Power Agency Revenue Bonds, Series 2019
| |
5.000% due 10/01/2031 | | | | | 3,000 | | | | | | 4,042 | |
|
Florida Municipal Power Agency Revenue Notes, Series 2019
| |
5.000% due 10/01/2028 | | | | | 1,000 | | | | | | 1,282 | |
|
Jacksonville, Florida Revenue Notes, Series 2012
| |
5.000% due 10/01/2021 | | | | | 1,000 | | | | | | 1,052 | |
|
JEA Water & Sewer System, Florida Revenue Bonds, Series 2012
| |
5.000% due 10/01/2025 | | | | | 1,500 | | | | | | 1,552 | |
|
Lakeland, Florida Department of Electric Utilities Revenue Bonds, Series 2016
| |
5.000% due 10/01/2026 | | | | | 505 | | | | | | 621 | |
|
Osceola County, Florida Transportation Revenue Notes, Series 2020 | |
0.000% due 10/01/2026 (c) | | | | | 275 | | | | | | 240 | |
0.000% due 10/01/2028 (c) | | | | | 475 | | | | | | 391 | |
|
Palm Beach County, Florida Revenue Bonds, Series 2012
| |
5.000% due 06/01/2023 | | | | | 1,300 | | | | | | 1,415 | |
|
School District of Broward County, Florida Certificates of Participation Bonds, Series 2020
| |
5.000% due 07/01/2032 | | | | | 2,000 | | | | | | 2,593 | |
|
Tampa, Florida Revenue Bonds, Series 2020 | |
0.000% due 09/01/2033 (c) | | | | | 200 | | | | | | 133 | |
5.000% due 07/01/2031 | | | | | 350 | | | | | | 446 | |
| | | | | | | | | | | | |
| | | | | | | | | | | 16,524 | |
| | | | | | | | | | | | |
| |
| GEORGIA 3.3% | |
|
Atlanta Department of Aviation, Georgia Revenue Bonds, Series 2012
| |
5.000% due 01/01/2025 | | | | | 500 | | | | | | 532 | |
|
Burke County, Georgia Development Authority Revenue Bonds, Series 2008
| |
2.925% due 11/01/2048 | | | | | 3,000 | | | | | | 3,146 | |
|
Burke County, Georgia Development Authority Revenue Bonds, Series 2012
| |
1.700% due 12/01/2049 | | | | | 2,000 | | | | | | 2,010 | |
|
Burke County, Georgia Development Authority Revenue Bonds, Series 2017
| |
3.250% due 11/01/2045 | | | | | 3,750 | | | | | | 4,010 | |
| | | | | | | | | | | | |
| | | | | PRINCIPAL
AMOUNT
(000S) | | | | | MARKET
VALUE
(000S) | |
|
Cobb County, Georgia Kennestone Hospital Authority Revenue Bonds, Series 2017
| |
5.000% due 04/01/2028 | | $ | | | 600 | | | $ | | | 712 | |
|
LaGrange-Troup County, Georgia Hospital Authority Revenue Bonds, Series 2017
| |
5.000% due 04/01/2028 | | | | | 700 | | | | | | 831 | |
|
Main Street Natural Gas Inc., Georgia Revenue Bonds, Series 2018
| |
0.946% (0.67*US0001M + 0.830%) due 08/01/2048 ~ | | | | | 1,510 | | | | | | 1,500 | |
|
Municipal Electric Authority of Georgia Revenue Bonds, Series 2019
| |
5.000% due 01/01/2031 | | | | | 1,200 | | | | | | 1,477 | |
|
Municipal Electric Authority of Georgia Revenue Notes, Series 2019
| |
5.000% due 01/01/2029 | | | | | 1,000 | | | | | | 1,244 | |
| | | | | | | | | | | | |
| | | | | | | | | | | 15,462 | |
| | | | | | | | | | | | |
| |
| GUAM 0.2% | |
|
Guam Government Waterworks Authority Revenue Notes, Series 2014 | |
5.000% due 07/01/2023 | | | | | 770 | | | | | | 851 | |
| | | | | | | | | | | | |
| |
| HAWAII 0.5% | |
|
Honolulu, Hawaii City & County General Obligation Bonds, Series 2015
| |
5.000% due 10/01/2030 | | | | | 2,000 | | | | | | 2,420 | |
| | | | | | | | | | | | |
| |
| ILLINOIS 9.6% | |
|
Chicago Midway International Airport, Illinois Revenue Bonds, Series 2014
| |
5.000% due 01/01/2035 | | | | | 6,500 | | | | | | 7,131 | |
|
Chicago, Illinois General Obligation Bonds, Series 2015
| |
5.250% due 01/01/2027 | | | | | 4,000 | | | | | | 4,295 | |
|
Chicago, Illinois General Obligation Notes, Series 2015
| |
5.000% due 01/01/2026 | | | | | 2,000 | | | | | | 2,130 | |
|
Illinois Finance Authority Revenue Bonds, Series 2008
| |
4.000% due 11/01/2030 | | | | | 1,000 | | | | | | 1,144 | |
|
Illinois Finance Authority Revenue Bonds, Series 2019
| |
2.450% due 10/01/2039 | | | | | 2,000 | | | | | | 2,159 | |
|
Illinois Finance Authority Revenue Bonds, Series 2020
| |
5.000% due 08/15/2033 | | | | | 1,750 | | | | | | 2,245 | |
|
Illinois State General Obligation Bonds, Series 2012 | |
4.000% due 01/01/2024 | | | | | 4,000 | | | | | | 4,042 | |
5.000% due 08/01/2023 | | | | | 2,590 | | | | | | 2,739 | |
|
Illinois State General Obligation Notes, Series 2017 | |
5.000% due 11/01/2020 | | | | | 535 | | | | | | 539 | |
5.000% due 11/01/2023 | | | | | 2,765 | | | | | | 2,934 | |
|
Illinois State Revenue Bonds, Series 2013
| |
5.000% due 06/15/2026 | | | | | 1,500 | | | | | | 1,592 | |
|
Illinois State Toll Highway Authority Revenue Bonds, Series 2019 | |
5.000% due 01/01/2030 | | | | | 2,500 | | | | | | 3,168 | |
|
Illinois State Toll Highway Authority Revenue Notes, Series 2019 | |
5.000% due 01/01/2027 | | | | | 1,525 | | | | | | 1,870 | |
|
Railsplitter Tobacco Settlement Authority, Illinois Revenue Notes, Series 2017 | |
5.000% due 06/01/2023 | | | | | 1,100 | | | | | | 1,215 | |
|
Regional Transportation Authority, Illinois Revenue Bonds, (NPFGC Insured), Series 2003 | |
5.750% due 06/01/2033 | | | | | 1,800 | | | | | | 2,428 | |
|
Sales Tax Securitization Corp., Illinois Revenue Notes, Series 2020 | |
5.000% due 01/01/2028 | | | | | 4,500 | | | | | | 5,407 | |
| | | | | | | | | | | | |
| | | | | | | | | | | 45,038 | |
| | | | | | | | | | | | |
| |
| INDIANA 1.8% | |
|
Indiana Finance Authority Revenue Bonds, Series 2012 | |
3.000% due 11/01/2030 « | | | | | 4,500 | | | | | | 4,507 | |
|
Indiana Finance Authority Revenue Bonds, Series 2018 | |
5.000% due 02/01/2030 | | | | | 1,500 | | | | | | 1,951 | |
| | | | | | | | |
| 82 | | PIMCO ETF TRUST | | | | | See Accompanying Notes | |
June 30, 2020
| | | | | | | | | | | | |
| | | | | PRINCIPAL
AMOUNT
(000S) | | | | | MARKET
VALUE
(000S) | |
|
Indiana Municipal Power Agency Revenue Notes, Series 2019 | |
5.000% due 01/01/2029 | | $ | | | 285 | | | $ | | | 374 | |
|
Rockport, Indiana Revenue Bonds, Series 2009 | |
3.050% due 06/01/2025 | | | | | 1,500 | | | | | | 1,638 | |
| | | | | | | | | | | | |
| | | | | | | | | | | 8,470 | |
| | | | | | | | | | | | |
| |
| KENTUCKY 1.8% | |
|
Kentucky Public Energy Authority Revenue Bonds, Series 2018 | |
4.000% due 04/01/2048 | | | | | 2,000 | | | | | | 2,198 | |
|
Kentucky Public Energy Authority Revenue Bonds, Series 2020 | |
4.000% due 12/01/2050 | | | | | 3,000 | | | | | | 3,391 | |
|
Kentucky State Property & Building Commission Revenue Bonds, Series 2019 | |
5.000% due 11/01/2031 | | | | | 2,500 | | | | | | 2,957 | |
| | | | | | | | | | | | |
| | | | | | | | | | | 8,546 | |
| | | | | | | | | | | | |
| |
| LOUISIANA 1.5% | |
|
East Baton Rouge Sewerage Commission, Louisiana Revenue Bonds, Series 2019 | |
5.000% due 02/01/2031 | | | | | 2,330 | | | | | | 3,182 | |
|
Louisiana Public Facilities Authority Revenue Bonds, Series 2016 | |
3.375% due 09/01/2028 | | | | | 2,000 | | | | | | 2,024 | |
|
Louisiana Public Facilities Authority Revenue Bonds, Series 2017 | |
5.000% due 05/15/2028 | | | | | 855 | | | | | | 1,031 | |
|
Parish of St John the Baptist, Louisiana Revenue Bonds, Series 2017 | |
2.100% due 06/01/2037 | | | | | 900 | | | | | | 881 | |
| | | | | | | | | | | | |
| | | | | | | | | | | 7,118 | |
| | | | | | | | | | | | |
| |
| MAINE 0.2% | |
|
Portland, Maine General Airport Revenue Notes,
Series 2019 | |
5.000% due 01/01/2028 | | | | | 300 | | | | | | 372 | |
5.000% due 01/01/2029 | | | | | 225 | | | | | | 284 | |
5.000% due 01/01/2030 | | | | | 270 | | | | | | 346 | |
| | | | | | | | | | | | |
| | | | | | | | | | | 1,002 | |
| | | | | | | | | | | | |
| |
| MARYLAND 0.4% | |
|
Maryland Department of Transportation State Revenue Bonds, Series 2019 | |
4.000% due 10/01/2032 | | | | | 1,450 | | | | | | 1,717 | |
| | | | | | | | | | | | |
| |
| MASSACHUSETTS 1.8% | |
|
Commonwealth of Massachusetts General Obligation Bonds, Series 2020 | |
5.000% due 06/01/2044 | | | | | 2,000 | | | | | | 2,260 | |
|
Massachusetts Development Finance Agency Revenue Bonds, Series 2018 | |
5.000% due 07/01/2030 | | | | | 1,500 | | | | | | 1,849 | |
|
Massachusetts School Building Authority Revenue Bonds, Series 2015 | |
5.000% due 01/15/2029 | | | | | 2,390 | | | | | | 2,879 | |
|
Massachusetts School Building Authority Revenue Notes, Series 2012 | |
5.000% due 08/15/2022 | | | | | 1,175 | | | | | | 1,291 | |
| | | | | | | | | �� | | | |
| | | | | | | | | | | 8,279 | |
| | | | | | | | | | | | |
| |
| MICHIGAN 2.2% | |
|
Detroit City School District, Michigan General Obligation Bonds, (AGM/Q-SBLF Insured), Series 2001 | |
6.000% due 05/01/2029 | | | | | 4,380 | | | | | | 5,583 | |
|
Michigan Finance Authority Revenue Bonds, Series 2015 | |
5.000% due 07/01/2030 | | | | | 1,200 | | | | | | 1,404 | |
| | | | | | | | | | | | |
| | | | | PRINCIPAL
AMOUNT
(000S) | | | | | MARKET
VALUE
(000S) | |
|
Michigan State Hospital Finance Authority Revenue Bonds, Series 2010 | |
5.000% due 11/15/2047 | | $ | | | 1,500 | | | $ | | | 1,878 | |
|
University of Michigan Revenue Bonds, Series 2020 | |
5.000% due 04/01/2033 | | | | | 1,100 | | | | | | 1,486 | |
| | | | | | | | | | | | |
| | | | | | | | | | | 10,351 | |
| | | | | | | | | | | | |
| |
| MINNESOTA 0.3% | |
|
Rochester, Minnesota Electric Utility Revenue Bonds, Series 2017 | |
5.000% due 12/01/2029 | | | | | 1,000 | | | | | | 1,247 | |
| | | | | | | | | | | | |
| |
| MISSISSIPPI 0.3% | |
|
Mississippi Business Finance Corp. Revenue Bonds, Series 2002 | |
3.200% due 09/01/2028 | | | | | 1,500 | | | | | | 1,572 | |
| | | | | | | | | | | | |
| |
| MISSOURI 0.3% | |
|
Kansas City, Missouri Water Revenue Bonds,
Series 2020 | |
4.000% due 12/01/2034 | | | | | 1,000 | | | | | | 1,241 | |
| | | | | | | | | | | | |
| | | | | | | | | | | | |
| NEBRASKA 0.8% | |
|
Public Power Generation Agency, Nebraska Revenue Bonds, Series 2015 | |
5.000% due 01/01/2030 | | | | | 1,085 | | | | | | 1,273 | |
|
Public Power Generation Agency, Nebraska Revenue Notes, Series 2015 | |
5.000% due 01/01/2025 | | | | | 1,905 | | | | | | 2,270 | |
| | | | | | | | | | | | |
| | | | | | | | | | | 3,543 | |
| | | | | | | | | | | | |
| |
| NEVADA 0.4% | |
|
Las Vegas Valley Water District, Nevada General Obligation Bonds, Series 2015 | |
5.000% due 06/01/2034 | | | | | 1,500 | | | | | | 1,748 | |
| | | | | | | | | | | | |
| |
| NEW HAMPSHIRE 0.3% | |
|
Merrimack County, New Hampshire General Obligation Notes, Series 2012 | |
5.000% due 12/01/2022 | | | | | 1,115 | | | | | | 1,242 | |
| | | | | | | | | | | | |
| |
| NEW JERSEY 3.2% | |
|
New Jersey Economic Development Authority Revenue Bonds, Series 2012 | |
5.000% due 06/15/2023 | | | | | 1,000 | | | | | | 1,038 | |
|
New Jersey Economic Development Authority Revenue Bonds, Series 2013 | |
1.680% (MUNIPSA + 1.550%) due 09/01/2027 ~ | | | | | 3,000 | | | | | | 2,905 | |
|
New Jersey Health Care Facilities Financing Authority Revenue Bonds, Series 2011 | |
5.000% due 07/01/2023 | | | | | 1,000 | | | | | | 1,092 | |
|
New Jersey Transportation Trust Fund Authority Revenue Bonds, Series 2011 | |
5.250% due 06/15/2024 | | | | | 2,500 | | | | | | 2,619 | |
|
New Jersey Transportation Trust Fund Authority Revenue Notes, Series 2015 | |
5.000% due 06/15/2022 | | | | | 1,000 | | | | | | 1,052 | |
|
New Jersey Turnpike Authority Revenue Bonds,
Series 2017 | |
5.000% due 01/01/2030 | | | | | 2,250 | | | | | | 2,740 | |
|
Tobacco Settlement Financing Corp., New Jersey Revenue Notes, Series 2018 | |
5.000% due 06/01/2025 | | | | | 1,020 | | | | | | 1,209 | |
5.000% due 06/01/2028 | | | | | 2,000 | | | | | | 2,520 | |
| | | | | | | | | | | | |
| | | | | | | | | | | 15,175 | |
| | | | | | | | | | | | |
| |
| | | | | | | | | | | | |
| | | | | PRINCIPAL
AMOUNT
(000S) | | | | | MARKET
VALUE
(000S) | |
| NEW MEXICO 0.8% | |
|
New Mexico Municipal Energy Acquisition Authority Revenue Bonds, Series 2019 | |
5.000% due 11/01/2039 | | $ | | | 3,000 | | | $ | | | 3,530 | |
| | | | | | | | | | | | |
| |
| NEW YORK 10.2% | |
|
Erie County, New York Industrial Development Agency Revenue Notes, Series 2012 | |
5.000% due 05/01/2022 | | | | | 1,000 | | | | | | 1,087 | |
|
Metropolitan Transportation Authority, New York Revenue Bonds, Series 2013 | |
0.936% (0.67* US0001M + 0.820%) due 11/01/2026 ~ | | | | | 1,500 | | | | | | 1,443 | |
|
Metropolitan Transportation Authority, New York Revenue Bonds, Series 2014 | |
5.000% due 11/15/2029 | | | | | 3,000 | | | | | | 3,603 | |
|
Metropolitan Transportation Authority, New York Revenue Notes, Series 2019 | |
5.000% due 05/15/2022 | | | | | 1,695 | | | | | | 1,771 | |
5.000% due 09/01/2022 | | | | | 805 | | | | | | 846 | |
|
Metropolitan Transportation Authority, New York Revenue Notes, Series 2020 | |
4.000% due 02/01/2022 | | | | | 2,500 | | | | | | 2,563 | |
|
Monroe County Industrial Development Corp., New York Revenue Bonds, Series 2017 | |
5.000% due 12/01/2027 | | | | | 1,000 | | | | | | 1,200 | |
|
Nassau County, New York General Obligation Notes, Series 2016 | |
5.000% due 04/01/2026 | | | | | 1,360 | | | | | | 1,651 | |
|
New York City Housing Development Corp. Revenue Bonds, Series 2013 | |
5.250% due 07/01/2031 | | | | | 2,500 | | | | | | 2,806 | |
|
New York City Transitional Finance Authority Future Tax Secured, New York Revenue Bonds, Series 2014 | |
5.000% due 08/01/2031 | | | | | 5,000 | | | | | | 5,797 | |
|
New York City, New York Transitional Finance Authority Building Aid Revenue Bonds, Series 2018 | |
5.000% due 07/15/2031 | | | | | 1,520 | | | | | | 1,936 | |
|
New York Convention Center Development Corp. Revenue Bonds, Series 2015 | |
5.000% due 11/15/2027 | | | | | 2,000 | | | | | | 2,242 | |
|
New York State Dormitory Authority Revenue Bonds, Series 2011 | |
5.000% due 05/01/2022 | | | | | 2,000 | | | | | | 2,079 | |
|
New York State Dormitory Authority Revenue Bonds, Series 2012 | |
5.000% due 12/15/2025 | | | | | 405 | | | | | | 447 | |
|
New York State Dormitory Authority Revenue Bonds, Series 2018 | |
5.000% due 03/15/2031 | | | | | 3,000 | | | | | | 3,868 | |
5.000% due 01/15/2032 | | | | | 500 | | | | | | 610 | |
|
New York State Dormitory Authority Revenue Bonds, Series 2019 | |
5.000% due 05/01/2048 | | | | | 2,535 | | | | | | 2,853 | |
|
New York State Energy Research & Development Authority Revenue Bonds, Series 1994 | |
3.500% due 10/01/2029 | | | | | 3,000 | | | | | | 3,399 | |
|
Onondaga County, New York Trust for Cultural Resources Revenue Bonds, Series 2019 | |
5.000% due 12/01/2043 | | | | | 2,000 | | | | | | 2,547 | |
|
TSASC, Inc., New York Revenue Notes, Series 2017 | |
5.000% due 06/01/2026 | | | | | 1,270 | | | | | | 1,514 | |
5.000% due 06/01/2027 | | | | | 2,800 | | | | | | 3,408 | |
| | | | | | | | | | | | |
| | | | | | | | | | | 47,670 | |
| | | | | | | | | | | | |
| |
| NORTH CAROLINA 0.7% | |
|
North Carolina Medical Care Commission Revenue Bonds, Series 2012 | |
5.000% due 06/01/2023 | | | | | 1,665 | | | | | | 1,812 | |
5.000% due 10/01/2027 | | | | | 1,120 | | | | | | 1,208 | |
|
University of North Carolina at Greensboro Revenue Bonds, Series 2014 | |
5.000% due 04/01/2026 | | | | | 250 | | | | | | 288 | |
| | | | | | | | | | | | |
| | | | | | | | | | | 3,308 | |
| | | | | | | | | | | | |
| | | | | | |
| See Accompanying Notes | | ANNUAL REPORT | | JUNE 30, 2020 | | 83 |
Schedule of Investments PIMCO Intermediate Municipal Bond Active Exchange-Traded Fund (Cont.)
| | | | | | | | | | | | |
| | | | | PRINCIPAL
AMOUNT
(000S) | | | | | MARKET
VALUE
(000S) | |
| OHIO 5.2% | |
|
Allen County, Ohio Hospital Facilities Revenue Notes, Series 2020 | |
5.000% due 12/01/2029 | | $ | | | 1,500 | | | $ | | | 1,931 | |
|
American Municipal Power, Inc., Ohio Revenue Notes, Series 2012 | |
5.000% due 02/15/2022 | | | | | 800 | | | | | | 860 | |
|
Buckeye Tobacco Settlement Financing Authority, Ohio Revenue Bonds, Series 2020 | |
4.000% due 06/01/2048 | | | | | 3,500 | | | | | | 3,789 | |
5.000% due 06/01/2033 | | | | | 1,650 | | | | | | 2,134 | |
|
Butler County, Ohio Revenue Bonds, Series 2017 | |
5.000% due 11/15/2030 | | | | | 1,235 | | | | | | 1,507 | |
|
Cleveland Department of Public Utilities Division of Water, Ohio Revenue Bonds, Series 2020 | |
5.000% due 01/01/2032 | | | | | 1,000 | | | | | | 1,336 | |
|
Cuyahoga County, Ohio Certificates of Participation Bonds, Series 2014 | |
5.000% due 12/01/2025 | | | | | 3,000 | | | | | | 3,318 | |
|
Hamilton County, Ohio Sales Tax Revenue Notes, Series 2016 | |
5.000% due 12/01/2026 | | | | | 750 | | | | | | 927 | |
|
Ohio Air Quality Development Authority Revenue Bonds, Series 2014 | |
2.400% due 12/01/2038 | | | | | 3,200 | | | | | | 3,252 | |
|
Ohio Water Development Authority Revenue Notes, Series 2019 | |
5.000% due 12/01/2028 | | | | | 1,000 | | | | | | 1,338 | |
|
Ohio Water Development Authority Water Pollution Control Loan Fund Revenue Bonds, Series 2020 | |
5.000% due 12/01/2032 | | | | | 2,000 | | | | | | 2,720 | |
|
University of Cincinnati, Ohio Revenue Bonds, Series 2012 | |
5.000% due 06/01/2024 | | | | | 1,250 | | | | | | 1,363 | |
| | | | | | | | | | | | |
| | | | | | | | | | | 24,475 | |
| | | | | | | | | | | | |
| |
| OREGON 0.8% | |
|
Salem-Keizer School District No 24J, Oregon General Obligation Notes, Series 2020 | |
0.000% due 06/15/2027 (a)(e) | | | | | 500 | | | | | | 612 | |
0.000% due 06/15/2028 (a)(e) | | | | | 700 | | | | | | 880 | |
0.000% due 06/15/2029 (a)(e) | | | | | 800 | | | | | | 1,030 | |
0.000% due 06/15/2030 (a)(e) | | | | | 925 | | | | | | 1,216 | |
| | | | | | | | | | | | |
| | | | | | | | | | | 3,738 | |
| | | | | | | | | | | | |
| |
| PENNSYLVANIA 6.3% | |
|
Berks County, Pennsylvania Municipal Authority Revenue Bonds, Series 2020 | |
5.000% due 02/01/2040 | | | | | 4,000 | | | | | | 4,588 | |
|
Commonwealth Financing Authority, Pennsylvania Revenue Bonds, Series 2018 | |
5.000% due 06/01/2031 | | | | | 1,340 | | | | | | 1,665 | |
|
Commonwealth Financing Authority, Pennsylvania Revenue Notes, Series 2018 | |
5.000% due 06/01/2025 | | | | | 1,500 | | | | | | 1,779 | |
|
Commonwealth of Pennsylvania General Obligation Notes, Series 2016 | |
5.000% due 01/15/2027 | | | | | 2,000 | | | | | | 2,525 | |
|
Delaware River Joint Toll Bridge Commission, Pennsylvania Revenue Notes, Series 2019 | |
5.000% due 07/01/2026 | | | | | 1,500 | | | | | | 1,883 | |
|
Delaware River Port Authority, Pennsylvania Revenue Notes, Series 2012 | |
5.000% due 01/01/2023 | | | | | 900 | | | | | | 949 | |
|
Geisinger Authority, Pennsylvania Revenue Bonds, Series 2020 | |
5.000% due 04/01/2043 | | | | | 4,500 | | | | | | 5,500 | |
|
Lehigh County, Pennsylvania Revenue Notes, Series 2019 | |
5.000% due 07/01/2029 | | | | | 1,310 | | | | | | 1,673 | |
|
Pennsylvania Economic Development Financing Authority Revenue Bonds, Series 2009 | |
2.800% due 12/01/2033 | | | | | 1,000 | | | | | | 1,025 | |
| | | | | | | | | | | | |
| | | | | PRINCIPAL
AMOUNT
(000S) | | | | | MARKET
VALUE
(000S) | |
|
Pennsylvania Higher Educational Facilities Authority Revenue Bonds, Series 2011 | |
5.250% due 06/15/2023 | | $ | | | 2,500 | | | $ | | | 2,608 | |
|
Pennsylvania Higher Educational Facilities Authority Revenue Bonds, Series 2015 | |
5.000% due 08/15/2029 | | | | | 340 | | | | | | 402 | |
5.000% due 08/15/2031 | | | | | 300 | | | | | | 352 | |
5.000% due 08/15/2033 | | | | | 1,000 | | | | | | 1,164 | |
|
Pennsylvania Higher Educational Facilities Authority Revenue Bonds, Series 2017 | |
5.000% due 08/15/2029 | | | | | 1,250 | | | | | | 1,558 | |
|
Philadelphia Gas Works, Co., Pennsylvania Revenue Bonds, Series 2015 | |
5.000% due 08/01/2027 | | | | | 750 | | | | | | 876 | |
|
Philadelphia Gas Works, Colorado, Pennsylvania Revenue Bonds, Series 2015 | |
5.000% due 08/01/2026 | | | | | 1,000 | | | | | | 1,170 | |
| | | | | | | | | | | | |
| | | | | | | | | | | 29,717 | |
| | | | | | | | | | | | |
| |
| PUERTO RICO 0.2% | |
|
Puerto Rico Electric Power Authority Revenue Bonds, (AGM Insured), Series 2007 | |
1.480% (0.67*US0003M + 0.520%) due 07/01/2029 ~ | | | | | 1,280 | | | | | | 1,130 | |
| | | | | | | | | | | | |
| |
| RHODE ISLAND 1.8% | |
|
Tobacco Settlement Financing Corp., Rhode Island Revenue Bonds, Series 2015 | |
5.000% due 06/01/2035 | | | | | 7,500 | | | | | | 8,343 | |
| | | | | | | | | | | | |
| |
| SOUTH DAKOTA 0.5% | |
|
South Dakota Health & Educational Facilities Authority Revenue Bonds, Series 2014 | |
5.000% due 11/01/2027 | | | | | 925 | | | | | | 1,063 | |
|
South Dakota Health & Educational Facilities Authority Revenue Bonds, Series 2015 | |
5.000% due 11/01/2028 | | | | | 900 | | | | | | 1,057 | |
| | | | | | | | | | | | |
| | | | | | | | | | | 2,120 | |
| | | | | | | | | | | | |
| |
| TENNESSEE 1.8% | |
|
Tennergy Corp., Tennessee Revenue Bonds, Series 2019 | |
5.000% due 02/01/2050 | | | | | 1,500 | | | | | | 1,735 | |
|
Tennessee Energy Acquisition Corp. Revenue Bonds, Series 2006 | |
5.000% due 02/01/2021 | | | | | 870 | | | | | | 887 | |
5.000% due 02/01/2027 | | | | | 3,000 | | | | | | 3,527 | |
5.250% due 09/01/2026 | | | | | 1,745 | | | | | | 2,063 | |
| | | | | | | | | | | | |
| | | | | | | | | | | 8,212 | |
| | | | | | | | | | | | |
| |
| TEXAS 6.0% | |
|
Corpus Christi Independent School District, Texas General Obligation Notes, (PSF Insured), Series 2016 | |
5.000% due 08/15/2025 | | | | | 2,115 | | | | | | 2,583 | |
|
Dallas, Texas Waterworks & Sewer System Revenue Bonds, Series 2012 | |
5.000% due 10/01/2023 | | | | | 1,000 | | | | | | 1,103 | |
|
El Paso Independent School District, Texas General Obligation Notes, (PSF Insured), Series 2020 | |
5.000% due 08/15/2026 | | | | | 500 | | | | | | 630 | |
5.000% due 08/15/2027 | | | | | 350 | | | | | | 453 | |
5.000% due 08/15/2028 | | | | | 300 | | | | | | 398 | |
|
Fort Bend Independent School District, Texas General Obligation Bonds, (PSF Insured), Series 2020 | |
5.000% due 08/15/2031 | | | | | 920 | | | | | | 1,230 | |
|
Harris County, Texas Cultural Education Facilities Finance Corp. Revenue Bonds, Series 2014 | |
5.000% due 12/01/2025 | | | | | 500 | | | | | | 581 | |
|
Houston, Texas Airport System Revenue Bonds, Series 2018 | |
5.000% due 07/01/2030 | | | | | 3,300 | | | | | | 4,149 | |
| | | | | | | | | | | | |
| | | | | PRINCIPAL
AMOUNT
(000S) | | | | | MARKET
VALUE
(000S) | |
|
Katy Independent School District, Texas General Obligation Bonds, (PSF Insured), Series 2018 | |
5.000% due 02/15/2029 | | $ | | | 1,435 | | | $ | | | 1,892 | |
|
Lower Colorado River Authority, Texas Revenue Bonds, Series 2020 | |
5.000% due 05/15/2033 | | | | | 1,250 | | | | | | 1,599 | |
|
Midway Independent School District/McLennan County, Texas General Obligation Notes, (PSF Insured), Series 2020 | |
5.000% due 08/15/2030 | | | | | 650 | | | | | | 876 | |
|
North Texas Tollway Authority Revenue Bonds, Series 2016 | |
5.000% due 01/01/2028 | | | | | 2,875 | | | | | | 3,457 | |
|
Pflugerville Independent School District, Texas General Obligation Bonds, (PSF Insured), Series 2012 | |
5.000% due 02/15/2024 | | | | | 1,165 | | | | | | 1,255 | |
|
San Antonio Public Facilities Corp., Texas Revenue Bonds, Series 2012 | |
5.000% due 09/15/2025 | | | | | 1,000 | | | | | | 1,090 | |
|
Texas Municipal Gas Acquisition & Supply Corp. Revenue Bonds, Series 2008 | |
6.250% due 12/15/2026 | | | | | 1,830 | | | | | | 2,128 | |
|
Texas Water Development Board Revenue Bonds, Series 2018 | |
5.000% due 04/15/2030 | | | | | 250 | | | | | | 330 | |
5.000% due 10/15/2030 | | | | | 3,010 | | | | | | 3,971 | |
|
University of Texas System Revenue Bonds, Series 2010 | |
5.000% due 08/15/2022 | | | | | 500 | | | | | | 550 | |
| | | | | | | | | | | | |
| | | | | | | | | | | 28,275 | |
| | | | | | | | | | | | |
| |
| UTAH 1.4% | |
|
University of Utah Revenue Bonds, Series 2020 | |
5.000% due 08/01/2033 | | | | | 1,000 | | | | | | 1,345 | |
|
Utah State General Obligation Bonds, Series 2020 | |
5.000% due 07/01/2031 | | | | | 4,000 | | | | | | 5,325 | |
| | | | | | | | | | | | |
| | | | | | | | | | | 6,670 | |
| | | | | | | | | | | | |
| |
| WASHINGTON 2.8% | |
|
Energy Northwest, Washington Revenue Bonds, Series 2018 | |
5.000% due 07/01/2031 | | | | | 3,035 | | | | | | 3,956 | |
|
Energy Northwest, Washington Revenue Bonds, Series 2020 | |
5.000% due 07/01/2033 | | | | | 2,000 | | | | | | 2,699 | |
|
Seattle, Washington Solid Waste Revenue Notes, Series 2014 | |
5.000% due 05/01/2024 | | | | | 545 | | | | | | 640 | |
|
Washington Health Care Facilities Authority Revenue Bonds, Series 2017 | |
1.180% (MUNIPSA + 1.050%) due 01/01/2042 ~ | | | | | 2,500 | | | | | | 2,508 | |
|
Washington Health Care Facilities Authority Revenue Bonds, Series 2020 | |
5.000% due 09/01/2032 (a) | | | | | 450 | | | | | | 575 | |
|
Washington Higher Education Facilities Authority Revenue Notes, Series 2020 | |
5.000% due 05/01/2025 (a) | | | | | 250 | | | | | | 290 | |
|
Washington State Revenue Bonds, Series 2012 | |
5.000% due 09/01/2023 | | | | | 2,000 | | | | | | 2,195 | |
| | | | | | | | | | | | |
| | | | | | | | | | | 12,863 | |
| | | | | | | | | | | | |
| |
| WEST VIRGINIA 0.4% | |
|
Mason County, West Virginia Revenue Bonds, Series 2003 | |
2.750% due 10/01/2022 | | | | | 2,000 | | | | | | 2,052 | |
| | | | | | | | | | | | |
| |
| WISCONSIN 1.5% | |
|
Wisconsin Environmental Improvement Fund State Revenue Bonds, Series 2020 | |
5.000% due 06/01/2033 | | | | | 3,500 | | | | | | 4,639 | |
| | | | | | | | |
| 84 | | PIMCO ETF TRUST | | | | | See Accompanying Notes | |
June 30, 2020
| | | | | | | | | | | | |
| | | | | PRINCIPAL
AMOUNT
(000S) | | | | | MARKET
VALUE
(000S) | |
|
Wisconsin Health & Educational Facilities Authority Revenue Notes, Series 2018 | |
5.000% due 04/01/2029 | | $ | | | 1,925 | | | $ | | | 2,470 | |
| | | | | | | | | | | | |
| | | | | | | | | | | 7,109 | |
| | | | | | | | | | | | |
Total Municipal Bonds & Notes (Cost $380,084) | | | | | | | | | | | 401,515 | |
| | | | | | | | | | | | |
| |
| SHORT-TERM INSTRUMENTS 13.7% | |
| |
| REPURCHASE AGREEMENTS (f) 0.1% | |
| | | | | | | | | | | 560 | |
| | | | | | | | | | | | |
| |
| SHORT-TERM NOTES 2.2% | |
| | | | |
Federal Home Loan Bank | | | | | | | | | | | | |
0.106% due 07/31/2020 (c)(d) | | | | | 6,400 | | | | | | 6,400 | |
0.167% due 09/04/2020 (c)(d) | | | | | 3,700 | | | | | | 3,699 | |
| | | | | | | | | | | | |
| | | | | | | | | | | 10,099 | |
| | | | | | | | | | | | |
| |
| U.S. TREASURY BILLS 9.7% | |
0.122% due 07/07/2020 - 09/24/2020 (b)(c) | | | | | 45,500 | | | | | | 45,496 | |
| | | | | | | | | | | | |
| | | | | | | | | | | | |
| | | | | PRINCIPAL
AMOUNT
(000S) | | | | | MARKET
VALUE
(000S) | |
| MUNICIPAL BONDS & NOTES 1.7% | |
|
New York State Dormitory Authority Revenue Notes, Series 2020 | |
5.000% due 03/31/2021 | | $ | | | 4,000 | | | $ | | | 4,141 | |
|
Suffolk County, New York General Obligation Notes, Series 2019 | |
2.500% due 07/23/2020 | | | | | 2,000 | | | | | | 2,002 | |
|
Suffolk County, New York General Obligation Notes, Series 2020 | |
5.000% due 03/19/2021 | | | | | 1,800 | | | | | | 1,842 | |
| | | | | | | | | | | | |
Total Municipal Bonds & Notes (Cost $7,947) | | | | | | | | | | | 7,985 | |
| | | | | | | | | | | | |
| Total Short-Term Instruments (Cost $64,102) | | | | | | | | | | | 64,140 | |
| | | | | | | | | | | | |
|
| |
| Total Investments in Securities (Cost $444,186) | | | | | | | | | | | 465,655 | |
| | | | | | | | | | | | |
|
| |
| Total Investments 99.4% (Cost $444,186) | | | | | | | | $ | | | 465,655 | |
| |
| Other Assets and Liabilities, net 0.6% | | | 3,007 | |
| | | | | | | | | | | | |
| Net Assets 100.0% | | | | | | | | $ | | | 468,662 | |
| | | | | | | | | | | | |
NOTES TO SCHEDULE OF INVESTMENTS:
| * | A zero balance may reflect actual amounts rounding to less than one thousand. |
| « | Security valued using significant unobservable inputs (Level 3). |
| ~ | Variable or Floating rate security. Rate shown is the rate in effect as of period end. Certain variable rate securities are not based on a published reference rate and spread, rather are determined by the issuer or agent and are based on current market conditions. Reference rate is as of reset date, which may vary by security. These securities may not indicate a reference rate and/or spread in their description. |
| (b) | Coupon represents a weighted average yield to maturity. |
| (d) | Coupon represents a yield to maturity. |
| (e) | Security becomes interest bearing at a future date. |
BORROWINGS AND OTHER FINANCING TRANSACTIONS
(f) REPURCHASE AGREEMENTS:
| | | | | | | | | | | | | | | | | | | | | | | | | | | | | | |
| Counterparty | | Lending
Rate | | | Settlement
Date | | | Maturity
Date | | | Principal
Amount | | | Collateralized By | | Collateral
(Received) | | | Repurchase
Agreements,
at Value | | | Repurchase
Agreement
Proceeds
to be
Received | |
| FICC | | | 0.000 | % | | | 06/30/2020 | | | | 07/01/2020 | | | $ | 560 | | | U.S. Treasury Inflation Protected Securities 0.125% due 07/15/2024 | | $ | (571 | ) | | $ | 560 | | | $ | 560 | |
| | | | | | | | | | | | | | | | | | | | | | | | | | | | | | |
Total Repurchase Agreements | | | | | $ | (571 | ) | | $ | 560 | | | $ | 560 | |
| | | | | | | | | | | | | | | | | | | | | | | | | | | | | | |
BORROWINGS AND OTHER FINANCING TRANSACTIONS SUMMARY
The following is a summary by counterparty of the market value of Borrowings and Other Financing Transactions and collateral pledged/(received) as of June 30, 2020:
| | | | | | | | | | | | | | | | | | | | | | | | |
| Counterparty | | Repurchase
Agreement
Proceeds
to be
Received | | | Payable for
Reverse
Repurchase
Agreements | | | Payable for
Sale-Buyback
Transactions | | | Total
Borrowings and
Other Financing
Transactions | | | Collateral
Pledged/(Received) | | | Net Exposure(1) | |
Global/Master Repurchase Agreement | |
FICC | | $ | 560 | | | $ | 0 | | | $ | 0 | | | $ | 560 | | | $ | (571 | ) | | $ | (11 | ) |
| | | | | | | | | | | | | | | | | | | | | | | | |
Total Borrowings and Other Financing Transactions | | $ | 560 | | | $ | 0 | | | $ | 0 | | | | | | | | | | | | | |
| | | | | | | | | | | | | | | | | | | | | | | | |
| (1) | Net Exposure represents the net receivable/(payable) that would be due from/to the counterparty in the event of default. Exposure from borrowings and other financing transactions can only be netted across transactions governed under the same master agreement with the same legal entity. See Note 8, Master Netting Arrangements, in the Notes to Financial Statements for more information. |
| | | | | | |
| See Accompanying Notes | | ANNUAL REPORT | | JUNE 30, 2020 | | 85 |
Schedule of Investments PIMCO Intermediate Municipal Bond Active Exchange-Traded Fund (Cont.)
June 30, 2020
FAIR VALUE MEASUREMENTS
The following is a summary of the fair valuations according to the inputs used as of June 30, 2020 in valuing the Fund’s assets and liabilities:
| | | | | | | | | | | | | | | | |
| Category and Subcategory | | Level 1 | | | Level 2 | | | Level 3 | | | Fair
Value at
06/30/2020 | |
Investments in Securities, at Value | |
Municipal Bonds & Notes | |
Alabama | | $ | 0 | | | $ | 5,647 | | | $ | 0 | | | $ | 5,647 | |
Arizona | | | 0 | | | | 5,764 | | | | 0 | | | | 5,764 | |
California | | | 0 | | | | 6,523 | | | | 0 | | | | 6,523 | |
Colorado | | | 0 | | | | 10,927 | | | | 0 | | | | 10,927 | |
Connecticut | | | 0 | | | | 29,523 | | | | 0 | | | | 29,523 | |
District of Columbia | | | 0 | | | | 2,373 | | | | 0 | | | | 2,373 | |
Florida | | | 0 | | | | 16,524 | | | | 0 | | | | 16,524 | |
Georgia | | | 0 | | | | 15,462 | | | | 0 | | | | 15,462 | |
Guam | | | 0 | | | | 851 | | | | 0 | | | | 851 | |
Hawaii | | | 0 | | | | 2,420 | | | | 0 | | | | 2,420 | |
Illinois | | | 0 | | | | 45,038 | | | | 0 | | | | 45,038 | |
Indiana | | | 0 | | | | 3,963 | | | | 4,507 | | | | 8,470 | |
Kentucky | | | 0 | | | | 8,546 | | | | 0 | | | | 8,546 | |
Louisiana | | | 0 | | | | 7,118 | | | | 0 | | | | 7,118 | |
Maine | | | 0 | | | | 1,002 | | | | 0 | | | | 1,002 | |
Maryland | | | 0 | | | | 1,717 | | | | 0 | | | | 1,717 | |
Massachusetts | | | 0 | | | | 8,279 | | | | 0 | | | | 8,279 | |
Michigan | | | 0 | | | | 10,351 | | | | 0 | | | | 10,351 | |
Minnesota | | | 0 | | | | 1,247 | | | | 0 | | | | 1,247 | |
Mississippi | | | 0 | | | | 1,572 | | | | 0 | | | | 1,572 | |
Missouri | | | 0 | | | | 1,241 | | | | 0 | | | | 1,241 | |
Nebraska | | | 0 | | | | 3,543 | | | | 0 | | | | 3,543 | |
| | | | | | | | | | | | | | | | |
| Category and Subcategory | | Level 1 | | | Level 2 | | | Level 3 | | | Fair
Value at
06/30/2020 | |
Nevada | | $ | 0 | | | $ | 1,748 | | | $ | 0 | | | $ | 1,748 | |
New Hampshire | | | 0 | | | | 1,242 | | | | 0 | | | | 1,242 | |
New Jersey | | | 0 | | | | 15,175 | | | | 0 | | | | 15,175 | |
New Mexico | | | 0 | | | | 3,530 | | | | 0 | | | | 3,530 | |
New York | | | 0 | | | | 47,670 | | | | 0 | | | | 47,670 | |
North Carolina | | | 0 | | | | 3,308 | | | | 0 | | | | 3,308 | |
Ohio | | | 0 | | | | 24,475 | | | | 0 | | | | 24,475 | |
Oregon | | | 0 | | | | 3,738 | | | | 0 | | | | 3,738 | |
Pennsylvania | | | 0 | | | | 29,717 | | | | 0 | | | | 29,717 | |
Puerto Rico | | | 0 | | | | 1,130 | | | | 0 | | | | 1,130 | |
Rhode Island | | | 0 | | | | 8,343 | | | | 0 | | | | 8,343 | |
South Dakota | | | 0 | | | | 2,120 | | | | 0 | | | | 2,120 | |
Tennessee | | | 0 | | | | 8,212 | | | | 0 | | | | 8,212 | |
Texas | | | 0 | | | | 28,275 | | | | 0 | | | | 28,275 | |
Utah | | | 0 | | | | 6,670 | | | | 0 | | | | 6,670 | |
Washington | | | 0 | | | | 12,863 | | | | 0 | | | | 12,863 | |
West Virginia | | | 0 | | | | 2,052 | | | | 0 | | | | 2,052 | |
Wisconsin | | | 0 | | | | 7,109 | | | | 0 | | | | 7,109 | |
Short-Term Instruments | |
Repurchase Agreements | | | 0 | | | | 560 | | | | 0 | | | | 560 | |
Short-Term Notes | | | 0 | | | | 10,099 | | | | 0 | | | | 10,099 | |
U.S. Treasury Bills | | | 0 | | | | 45,496 | | | | 0 | | | | 45,496 | |
Municipal Bonds & Notes | | | 0 | | | | 7,985 | | | | 0 | | | | 7,985 | |
| | | | | | | | | | | | | | | | |
| | | | |
Total Investments | | $ | 0 | | | $ | 461,148 | | | $ | 4,507 | | | $ | 465,655 | |
| | | | | | | | | | | | | | | | |
There were no significant transfers into or out of Level 3 during the period ended June 30, 2020.
| | | | | | | | |
| 86 | | PIMCO ETF TRUST | | | | | See Accompanying Notes | |
Schedule of Investments PIMCO Short Term Municipal Bond Active Exchange-Traded Fund
June 30, 2020
| | | | | | | | | | | | |
| | | | | PRINCIPAL
AMOUNT
(000S) | | | | | MARKET
VALUE
(000S) | |
| INVESTMENTS IN SECURITIES 102.6% | |
| | | | | | | | | | | | |
| MUNICIPAL BONDS & NOTES 79.7% | |
| | | | | | | | | | | | |
| ALABAMA 2.4% | |
|
Birmingham Airport Authority, Alabama Revenue Notes, (BAM Insured), Series 2020 | |
5.000% due 07/01/2023 (a) | | $ | | | 250 | | | $ | | | 279 | |
|
Industrial Development Board of the City of Mobile Alabama Revenue Bonds, Series 2007 | |
1.000% due 06/01/2034 | | | | | 1,250 | | | | | | 1,250 | |
|
Prattville Industrial Development Board, Alabama Revenue Bonds, Series 2019 | |
2.000% due 11/01/2033 | | | | | 450 | | | | | | 466 | |
|
Southeast Alabama Gas Supply District Revenue Bonds, Series 2018 | |
4.000% due 06/01/2049 | | | | | 2,000 | | | | | | 2,205 | |
| | | | | | | | | | | | |
| | | | | | | | | | | 4,200 | |
| | | | | | | | | | | | |
| |
| ARIZONA 0.9% | | | | | | | | | | | | |
|
Chandler Industrial Development Authority, Arizona Revenue Bonds, Series 2005 | |
2.400% due 12/01/2035 | | | | | 1,000 | | | | | | 1,038 | |
|
Industrial Development Authority of the City of Phoenix, Arizona Revenue Notes, Series 2018 | |
5.000% due 07/01/2024 | | | | | 200 | | | | | | 214 | |
|
Maricopa County, Arizona Special Health Care District General Obligation Notes, Series 2018 | |
5.000% due 07/01/2024 | | | | | 350 | | | | | | 408 | |
| | | | | | | | | | | | |
| | | | | | | | | | | 1,660 | |
| | | | | | | | | | | | |
| |
| CALIFORNIA 4.1% | | | | | | | | | | | | |
|
Bay Area Toll Authority, California Revenue Bonds, Series 2014 | |
2.000% due 04/01/2034 | | | | | 1,100 | | | | | | 1,105 | |
|
California County Tobacco Securitization Agency Revenue Notes, Series 2020 | |
5.000% due 06/01/2024 | | | | | 500 | | | | | | 581 | |
|
California Housing Finance Revenue Notes, Series 2020 | |
1.450% due 04/01/2024 | | | | | 1,000 | | | | | | 1,009 | |
|
California Municipal Finance Authority Revenue Bonds, Series 2010 | |
3.000% due 09/01/2021 | | | | | 2,000 | | | | | | 2,000 | |
|
Long Beach, California Harbor Revenue Notes, Series 2020 | |
4.000% due 07/15/2021 | | | | | 800 | | | | | | 828 | |
|
San Diego County, California Regional Airport Authority Revenue Bonds, Series 2010 | |
5.000% due 07/01/2040 | | | | | 1,000 | | | | | | 1,000 | |
|
Southern California Public Power Authority Revenue Bonds, Series 2018 | |
0.380% (MUNIPSA + 0.250%) due 07/01/2040 ~ | | | | | 750 | | | | | | 744 | |
| | | | | | | | | | | | |
| | | | | | | | | | | 7,267 | |
| | | | | | | | | | | | |
| |
| CONNECTICUT 6.2% | | | | | | | | | | | | |
|
Bridgeport, Connecticut General Obligation Notes, Series 2017 | |
5.000% due 11/01/2021 | | | | | 650 | | | | | | 691 | |
5.000% due 08/15/2023 | | | | | 500 | | | | | | 553 | |
|
Connecticut Special Tax Revenue State Special Tax Notes, Series 2020 | |
5.000% due 05/01/2023 | | | | | 675 | | | | | | 757 | |
5.000% due 05/01/2025 | | | | | 350 | | | | | | 419 | |
|
Connecticut Special Tax State Revenue Notes, Series 2018 | |
5.000% due 10/01/2025 | | | | | 1,000 | | | | | | 1,211 | |
|
Connecticut State General Obligation Bonds, Series 2013 | |
1.080% (MUNIPSA + 0.950%) due 03/01/2024 ~ | | | | | 1,020 | | | | | | 1,020 | |
| | | | | | | | | | | | |
| | | | | PRINCIPAL
AMOUNT
(000S) | | | | | MARKET
VALUE
(000S) | |
|
Connecticut State General Obligation Notes, Series 2014 | |
5.000% due 11/15/2022 | | $ | | | 250 | | | $ | | | 276 | |
|
Connecticut State General Obligation Notes, Series 2015 | |
5.000% due 08/01/2025 | | | | | 350 | | | | | | 422 | |
|
Connecticut State General Obligation Notes, Series 2020 | |
4.000% due 06/01/2023 | | | | | 425 | | | | | | 466 | |
5.000% due 01/15/2025 | | | | | 350 | | | | | | 415 | |
|
Connecticut State Health & Educational Facilities Authority Revenue Bonds, Series 1999 | |
2.000% due 07/01/2033 | | | | | 1,000 | | | | | | 1,026 | |
|
Connecticut State Health & Educational Facilities Authority Revenue Bonds, Series 2014 | |
1.100% due 07/01/2048 | | | | | 500 | | | | | | 509 | |
|
Connecticut State Health & Educational Facilities Authority Revenue Bonds, Series 2017 | |
5.000% due 07/01/2057 | | | | | 2,280 | | | | | | 2,550 | |
|
Metropolitan District, Connecticut General Obligation Notes, Series 2018 | |
5.000% due 07/15/2023 | | | | | 500 | | | | | | 565 | |
| | | | | | | | | | | | |
| | | | | | | | | | | 10,880 | |
| | | | | | | | | | | | |
| |
| DELAWARE 0.4% | | | | | | | | | | | | |
|
Delaware State Economic Development Authority Revenue Bonds, Series 2020 | |
1.050% due 01/01/2031 (a) | | | | | 750 | | | | | | 755 | |
| | | | | | | | | | | | |
| |
| DISTRICT OF COLUMBIA 0.8% | | | | | | | | | | | | |
|
District of Columbia Revenue Notes, Series 2016 | |
5.000% due 04/01/2022 | | | | | 500 | | | | | | 539 | |
|
Washington Metropolitan Area Transit Authority, District of Columbia Revenue Notes, Series 2020 | |
5.000% due 07/15/2026 | | | | | 655 | | | | | | 819 | |
| | | | | | | | | | | | |
| | | | | | | | | | | 1,358 | |
| | | | | | | | | | | | |
| |
| FLORIDA 4.9% | | | | | | | | | | | | |
|
Central Florida Expressway Authority Revenue Notes, Series 2018 | |
5.000% due 07/01/2023 | | | | | 700 | | | | | | 781 | |
|
Citizens Property Insurance Corp., Florida Revenue Notes, Series 2012 | |
5.000% due 06/01/2021 | | | | | 280 | | | | | | 291 | |
|
Florida Municipal Power Agency Revenue Notes, Series 2016 | |
5.000% due 10/01/2020 | | | | | 250 | | | | | | 253 | |
|
Florida Municipal Power Agency Revenue Notes, Series 2019 | |
5.000% due 10/01/2025 | | | | | 250 | | | | | | 301 | |
5.000% due 10/01/2026 | | | | | 470 | | | | | | 581 | |
|
Florida State General Obligation Notes, Series 2015 | |
5.000% due 06/01/2022 | | | | | 750 | | | | | | 818 | |
|
Jacksonville, Florida Revenue Notes, Series 2012 | |
5.000% due 10/01/2021 | | | | | 915 | | | | | | 962 | |
|
JEA Electric System, Florida Revenue Notes, Series 2017 | |
5.000% due 10/01/2024 | | | | | 1,030 | | | | | | 1,230 | |
|
Lee Memorial Health System, Florida Revenue Bonds, Series 2019 | |
5.000% due 04/01/2033 | | | | | 1,000 | | | | | | 1,152 | |
|
Miami-Dade County, Florida Water & Sewer System Revenue Notes, Series 2015 | |
5.000% due 10/01/2020 | | | | | 650 | | | | | | 658 | |
5.000% due 10/01/2024 | | | | | 710 | | | | | | 847 | |
|
Miami-Dade Seaport Department, Florida Revenue Notes, Series 2013 | |
5.000% due 10/01/2023 | | | | | 550 | | | | | | 620 | |
|
Tampa, Florida Revenue Notes, Series 2020 | |
5.000% due 07/01/2022 | | | | | 175 | | | | | | 189 | |
| | | | | | | | | | | | |
| | | | | | | | | | | 8,683 | |
| | | | | | | | | | | | |
| |
| | | | | | | | | | | | |
| | | | | PRINCIPAL
AMOUNT
(000S) | | | | | MARKET
VALUE
(000S) | |
| GEORGIA 1.8% | | | | | | | | | | | | |
|
Burke County, Georgia Development Authority Revenue Bonds, Series 2008 | |
2.925% due 11/01/2048 | | $ | | | 500 | | | $ | | | 524 | |
|
Burke County, Georgia Development Authority Revenue Bonds, Series 2012 | |
1.700% due 12/01/2049 | | | | | 500 | | | | | | 503 | |
|
Burke County, Georgia Development Authority Revenue Bonds, Series 2017 | |
3.000% due 11/01/2045 | | | | | 1,000 | | | | | | 1,038 | |
|
Main Street Natural Gas Inc., Georgia Revenue Bonds, Series 2018 | |
0.946% (0.67*US0001M + 0.830%) due 08/01/2048 ~ | | | | | 500 | | | | | | 497 | |
|
Main Street Natural Gas Inc., Georgia Revenue Notes, Series 2019 | |
5.000% due 05/15/2022 | | | | | 600 | | | | | | 640 | |
|
Main Street Natural Gas, Inc., Georgia Revenue Bonds, Series 2019 | |
4.000% due 03/01/2050 | | | | | 50 | | | | | | 57 | |
| | | | | | | | | | | | |
| | | | | | | | | | | 3,259 | |
| | | | | | | | | | | | |
| |
| ILLINOIS 6.0% | | | | | | | | | | | | |
|
Chicago, Illinois General Obligation Bonds, Series 2003 | |
5.000% due 01/01/2022 | | | | | 1,000 | | | | | | 1,026 | |
|
Chicago, Illinois General Obligation Bonds, Series 2012 | |
5.000% due 01/01/2023 | | | | | 1,000 | | | | | | 1,026 | |
|
Illinois Finance Authority Revenue Notes, Series 2015 | |
5.000% due 11/15/2020 | | | | | 540 | | | | | | 547 | |
|
Illinois Finance Authority Revenue Notes, Series 2020 | |
5.000% due 08/15/2026 | | | | | 250 | | | | | | 304 | |
|
Illinois State General Obligation Bonds, Series 2012 | |
5.000% due 08/01/2023 | | | | | 510 | | | | | | 539 | |
|
Illinois State General Obligation Notes, Series 2016 | |
5.000% due 06/01/2022 | | | | | 750 | | | | | | 780 | |
|
Illinois State General Obligation Notes, Series 2017 | |
5.000% due 11/01/2022 | | | | | 2,000 | | | | | | 2,094 | |
|
Illinois State General Obligation Notes, Series 2020 | |
5.125% due 05/01/2022 | | | | | 750 | | | | | | 780 | |
|
Illinois State Revenue Notes, Series 2013 | |
5.000% due 06/15/2023 | | | | | 750 | | | | | | 802 | |
|
Illinois State Revenue Notes, Series 2016 | |
5.000% due 06/15/2022 | | | | | 1,000 | | | | | | 1,047 | |
|
Illinois State Toll Highway Authority Revenue Notes, Series 2014 | |
5.000% due 12/01/2020 | | | | | 250 | | | | | | 254 | |
|
Illinois State Toll Highway Authority Revenue Notes, Series 2019 | |
5.000% due 01/01/2025 | | | | | 500 | | | | | | 589 | |
5.000% due 01/01/2026 | | | | | 375 | | | | | | 451 | |
|
Railsplitter Tobacco Settlement Authority, Illinois Revenue Notes, Series 2017 | |
5.000% due 06/01/2023 | | | | | 350 | | | | | | 387 | |
| | | | | | | | | | | | |
| | | | | | | | | | | 10,626 | |
| | | | | | | | | | | | |
| |
| INDIANA 1.7% | | | | | | | | | | | | |
|
Indiana Finance Authority Revenue Bonds, Series 2011 | |
1.650% due 03/01/2027 | | | | | 650 | | | | | | 659 | |
Indianapolis Local Public Improvement Bond Bank Revenue Notes, Series 2019 | |
1.450% due 06/01/2021 | | | | | 800 | | | | | | 800 | |
|
Rockport, Indiana Revenue Bonds, Series 2009 | |
3.050% due 06/01/2025 | | | | | 750 | | | | | | 819 | |
|
Whiting, Indiana Revenue Bonds, Series 2009 | |
5.250% due 01/01/2021 | | | | | 750 | | | | | | 765 | |
| | | | | | | | | | | | |
| | | | | | | | | | | 3,043 | |
| | | | | | | | | | | | |
| |
| IOWA 0.4% | | | | | | | | | | | | |
|
PEFA Inc, Iowa Revenue Bonds, Series 2019 | |
5.000% due 09/01/2049 | | | | | 650 | | | | | | 785 | |
| | | | | | | | | | | | |
| | | | | | |
| See Accompanying Notes | | ANNUAL REPORT | | JUNE 30, 2020 | | 87 |
Schedule of Investments PIMCO Short Term Municipal Bond Active Exchange-Traded Fund (Cont.)
| | | | | | | | | | | | |
| | | | | PRINCIPAL
AMOUNT
(000S) | | | | | MARKET
VALUE
(000S) | |
| KANSAS 1.4% | | | | | | | | | | | | |
|
Kansas Department of Transportation State Revenue Bonds, Series 2004 | |
0.621% (0.7*US0001M + 0.500%) due 09/01/2024 ~ | | $ | | | 2,500 | | | $ | | | 2,459 | |
| | | | | | | | | | | | |
| |
| KENTUCKY 1.2% | | | | | | | | | | | | |
|
Kentucky Public Energy Authority Revenue Bonds, Series 2020 | |
4.000% due 12/01/2050 | | | | | 500 | | | | | | 565 | |
|
Louisville & Jefferson County, Kentucky Metropolitan Government Revenue Bonds, Series 2007 | |
1.650% due 06/01/2033 | | | | | 500 | | | | | | 504 | |
|
Louisville & Jefferson County, Kentucky Metropolitan Sewer District Revenue Notes, Series 2016 | |
5.000% due 05/15/2021 | | | | | 1,000 | | | | | | 1,041 | |
| | | | | | | | | | | | |
| | | | | | | | | | | 2,110 | |
| | | | | | | | | | | | |
| |
| LOUISIANA 0.2% | | | | | | | | | | | | |
|
Parish of St John the Baptist, Louisiana Revenue Bonds, Series 2017 | |
2.100% due 06/01/2037 | | | | | 300 | | | | | | 294 | |
| | | | | | | | | | | | |
| |
| MARYLAND 1.4% | | | | | | | | | | | | |
|
Baltimore County, Maryland General Obligation Notes, Series 2018 | |
5.000% due 03/01/2025 | | | | | 1,500 | | | | | | 1,815 | |
|
Maryland Department of Transportation State Revenue Bonds, Series 2019 | |
4.000% due 10/01/2032 | | | | | 480 | | | | | | 569 | |
| | | | | | | | | | | | |
| | | | | | | | | | | 2,384 | |
| | | | | | | | | | | | |
| |
| MASSACHUSETTS 5.5% | | | | | | | | | | | | |
|
Commonwealth of Massachusetts General Obligation Bonds, Series 2014 | |
1.700% due 08/01/2043 | | | | | 1,150 | | | | | | 1,179 | |
|
Commonwealth of Massachusetts General Obligation Bonds, Series 2020 | |
5.000% due 06/01/2044 | | | | | 2,000 | | | | | | 2,259 | |
|
Massachusetts Development Finance Agency Revenue Bonds, Series 2017 | |
0.630% (MUNIPSA) due 07/01/2038 ~ | | | | | 1,000 | | | | | | 997 | |
|
Massachusetts Development Finance Agency Revenue Notes, Series 2018 | |
5.000% due 07/01/2021 | | | | | 575 | | | | | | 597 | |
|
Massachusetts Development Finance Agency Revenue Notes, Series 2020 | |
5.000% due 10/01/2022 (a) | | | | | 2,400 | | | | | | 2,648 | |
|
Massachusetts School Building Authority Revenue Bonds, Series 2015 | |
5.000% due 01/15/2029 | | | | | 750 | | | | | | 903 | |
|
Massachusetts Transportation Trust Fund Metropolitan Highway System Revenue Bonds, Series 2019 | |
5.000% due 01/01/2039 | | | | | 1,000 | | | | | | 1,108 | |
| | | | | | | | | | | | |
| | | | | | | | | | | 9,691 | |
| | | | | | | | | | | | |
| |
| MICHIGAN 2.1% | | | | | | | | | | | | |
|
Michigan Finance Authority Revenue Notes, Series 2010 | |
5.000% due 12/01/2020 | | | | | 780 | | | | | | 794 | |
|
Michigan State Hospital Finance Authority Revenue Bonds, Series 2010 | |
4.000% due 11/15/2047 | | | | | 1,500 | | | | | | 1,661 | |
|
University of Michigan Revenue Notes, Series 2020 | |
5.000% due 04/01/2025 | | | | | 1,000 | | | | | | 1,219 | |
| | | | | | | | | | | | |
| | | | | | | | | | | 3,674 | |
| | | | | | | | | | | | |
| |
| | | | | | | | | | | | |
| | | | | PRINCIPAL
AMOUNT
(000S) | | | | | MARKET
VALUE
(000S) | |
| MINNESOTA 1.2% | | | | | | | | | | | | |
|
Minneapolis, Minnesota Revenue Bonds, Series 2018 | |
0.110% due 11/15/2048 | | $ | | | 1,900 | | | $ | | | 1,900 | |
|
Minneapolis-St. Paul Metropolitan Airports Commission, Minnesota Revenue Notes, Series 2016 | |
4.000% due 01/01/2021 | | | | | 250 | | | | | | 254 | |
| | | | | | | | | | | | |
| | | | | | | | | | | 2,154 | |
| | | | | | | | | | | | |
| |
| MISSISSIPPI 0.5% | | | | | | | | | | | | |
|
Warren County, Mississippi Revenue Bonds, Series 2018 | |
2.900% due 09/01/2032 | | | | | 750 | | | | | | 793 | |
| | | | | | | | | | | | |
| |
| MISSOURI 0.6% | | | | | | | | | | | | |
|
Columbia, Missouri Water & Electric System Revenue Notes, Series 2019 | |
5.000% due 10/01/2020 | | | | | 1,000 | | | | | | 1,011 | |
| | | | | | | | | | | | |
| |
| MONTANA 0.6% | | | | | | | | | | | | |
|
Montana Facility Finance Authority Revenue Bonds, Series 2018 | |
0.680% (MUNIPSA) due 08/15/2037 ~ | | | | | 975 | | | | | | 973 | |
| | | | | | | | | | | | |
| |
| NEBRASKA 1.7% | | | | | | | | | | | | |
|
Douglas County, Nebraska Hospital Authority No 2 Revenue Bonds, Series 2020 | |
5.000% due 11/15/2053 | | | | | 1,000 | | | | | | 1,175 | |
|
Lincoln, Nebraska Electric System Revenue Notes, Series 2012 | |
5.000% due 09/01/2021 | | | | | 485 | | | | | | 512 | |
|
Public Power Generation Agency, Nebraska Revenue Notes, Series 2015 | |
5.000% due 01/01/2021 | | | | | 1,340 | | | | | | 1,370 | |
| | | | | | | | | | | | |
| | | | | | | | | | | 3,057 | |
| | | | | | | | | | | | |
| |
| NEVADA 1.6% | | | | | | | | | | | | |
|
Clark County, Nevada Revenue Bonds, Series 2017 | |
1.650% due 01/01/2036 | | | | | 850 | | | | | | 857 | |
|
Clark County, Nevada School District General Obligation Notes, (AGM Insured), Series 2020 | |
3.000% due 06/15/2023 | | | | | 500 | | | | | | 533 | |
|
Clark Department of Aviation, Nevada Revenue Notes, Series 2019 | |
5.000% due 07/01/2020 | | | | | 1,000 | | | | | | 1,000 | |
|
Washoe County, Nevada Revenue Bonds, Series 2016 | |
1.850% due 03/01/2036 | | | | | 500 | | | | | | 506 | |
| | | | | | | | | | | | |
| | | | | | | | | | | 2,896 | |
| | | | | | | | | | | | |
| |
| NEW JERSEY 1.5% | | | | | | | | | | | | |
|
New Jersey Economic Development Authority Revenue Notes, Series 2020 | |
1.000% due 06/01/2023 | | | | | 450 | | | | | | 450 | |
|
New Jersey Health Care Facilities Financing Authority Revenue Bonds, Series 2019 | |
5.000% due 07/01/2042 | | | | | 900 | | | | | | 1,072 | |
|
New Jersey Transportation Trust Fund Authority Revenue Bonds, (AGM/CR Insured), Series 2006 | |
5.250% due 12/15/2020 | | | | | 350 | | | | | | 357 | |
|
Tobacco Settlement Financing Corp., New Jersey Revenue Notes, Series 2018 | |
5.000% due 06/01/2022 | | | | | 750 | | | | | | 809 | |
| | | | | | | | | | | | |
| | | | | | | | | | | 2,688 | |
| | | | | | | | | | | | |
| |
| NEW MEXICO 0.7% | | | | | | | | | | | | |
|
New Mexico Municipal Energy Acquisition Authority Revenue Bonds, Series 2019 | |
5.000% due 11/01/2039 | | | | | 1,000 | | | | | | 1,177 | |
| | | | | | | | | | | | |
| |
| | | | | | | | | | | | |
| | | | | PRINCIPAL
AMOUNT
(000S) | | | | | MARKET
VALUE
(000S) | |
| NEW YORK 6.9% | | | | | | | | | | | | |
|
Long Island Power Authority, New York Revenue Notes, Series 2015 | |
5.000% due 09/01/2021 | | $ | | | 140 | | | $ | | | 147 | |
|
Long Island Power Authority, New York Revenue Notes, Series 2019 | |
5.000% due 09/01/2028 | | | | | 1,000 | | | | | | 1,293 | |
|
Metropolitan Transportation Authority, New York Revenue Bonds, Series 2013 | |
0.936% (0.67* US0001M + 0.820%) due 11/01/2026 ~ | | | | | 500 | | | | | | 481 | |
|
Metropolitan Transportation Authority, New York Revenue Notes, Series 2014 | |
5.000% due 11/15/2020 | | | | | 770 | | | | | | 778 | |
|
Metropolitan Transportation Authority, New York Revenue Notes, Series 2017 | |
5.000% due 11/15/2024 | | | | | 1,000 | | | | | | 1,107 | |
|
Metropolitan Transportation Authority, New York Revenue Notes, Series 2019 | |
5.000% due 09/01/2022 | | | | | 750 | | | | | | 789 | |
|
Nassau County, New York General Obligation Notes, Series 2010 | |
5.000% due 10/01/2020 | | | | | 500 | | | | | | 506 | |
|
New York City Housing Development Corp. Revenue Bonds, Series 2018 | |
2.750% due 05/01/2050 | | | | | 750 | | | | | | 785 | |
|
New York City Housing Development Corp. Revenue Bonds, Series 2019 | |
1.750% due 05/01/2059 | | | | | 750 | | | | | | 759 | |
|
New York City Transitional Finance Authority Future Tax Secured, New York Revenue Notes, Series 2019 | |
5.000% due 11/01/2020 | | | | | 500 | | | | | | 508 | |
|
New York City, New York Transitional Finance Authority Future Tax Secured Revenue Bonds, Series 2002 | |
5.000% due 11/01/2022 | | | | | 1,250 | | | | | | 1,383 | |
|
New York Power Authority Revenue Bonds, Series 2011 | |
5.000% due 11/15/2022 | | | | | 360 | | | | | | 400 | |
|
New York State Energy Research & Development Authority Revenue Bonds, Series 2004 | |
2.625% due 04/01/2034 | | | | | 1,045 | | | | | | 1,070 | |
|
Triborough Bridge & Tunnel Authority, New York Revenue Bonds, Series 2018 | |
0.554% (0.67*SOFRRATE + 0.500%) due 11/15/2038 ~ | | | | | 1,700 | | | | | | 1,698 | |
|
TSASC, Inc., New York Revenue Notes, Series 2017 | |
5.000% due 06/01/2021 | | | | | 500 | | | | | | 517 | |
| | | | | | | | | | | | |
| | | | | | | | | | | 12,221 | |
| | | | | | | | | | | | |
| |
| NORTH CAROLINA 1.2% | | | | | | | | | | | | |
|
University of North Carolina at Chapel Hill Revenue Bonds, Series 2012 | |
0.516% (0.67*US0001M + 0.400%) due 12/01/2041 ~ | | | | | 1,000 | | | | | | 990 | |
|
Wake County, North Carolina General Obligation Notes, Series 2018 | |
5.000% due 03/01/2024 | | | | | 1,025 | | | | | | 1,199 | |
| | | | | | | | | | | | |
| | | | | | | | | | | 2,189 | |
| | | | | | | | | | | | |
| |
| OHIO 0.7% | | | | | | | | | | | | |
|
American Municipal Power, Inc., Ohio Revenue Bonds, Series 2018 | |
2.250% due 02/15/2048 | | | | | 500 | | | | | | 504 | |
|
Butler County, Ohio Revenue Notes, Series 2017 | |
4.000% due 11/15/2023 | | | | | 500 | | | | | | 548 | |
|
Ohio Water Development Authority Revenue Notes, Series 2013 | |
5.000% due 06/01/2021 | | | | | 130 | | | | | | 136 | |
| | | | | | | | | | | | |
| | | | | | | | | | | 1,188 | |
| | | | | | | | | | | | |
| |
| | | | | | | | |
| 88 | | PIMCO ETF TRUST | | | | | See Accompanying Notes | |
June 30, 2020
| | | | | | | | | | | | |
| | | | | PRINCIPAL
AMOUNT
(000S) | | | | | MARKET
VALUE
(000S) | |
| OREGON 0.5% | | | | | | | | | | | | |
|
Oregon State Facilities Authority Revenue Notes, Series 2020 | |
5.000% due 10/01/2026 (a) | | $ | | | 145 | | | $ | | | 173 | |
|
Salem-Keizer School District No 24J, Oregon General Obligation Notes, Series 2020 | |
0.000% due 06/15/2025 (a)(e) | | | | | 275 | | | | | | 319 | |
0.000% due 06/15/2026 (a)(e) | | | | | 350 | | | | | | 417 | |
| | | | | | | | | | | | |
| | | | | | | | | | | 909 | |
| | | | | | | | | | | | |
| |
| PENNSYLVANIA 4.5% | | | | | | | | | | | | |
|
Berks County, Pennsylvania Municipal Authority Revenue Bonds, Series 2020 | |
5.000% due 02/01/2040 | | | | | 2,000 | | | | | | 2,294 | |
|
Bethlehem Area School District, Pennsylvania Revenue Bonds, Series 2017 | |
0.619% (0.7*US0001M + 0.490%) due 01/01/2030 ~ | | | | | 745 | | | | | | 739 | |
|
Lehigh County, Pennsylvania Revenue Notes, Series 2019 | |
5.000% due 07/01/2025 | | | | | 530 | | | | | | 624 | |
|
Luzerne County, Pennsylvania General Obligation Notes, (AGM Insured), Series 2017 | |
5.000% due 12/15/2022 | | | | | 500 | | | | | | 553 | |
|
Montgomery County, Pennsylvania Higher Education & Health Authority Revenue Bonds, Series 2018 | |
0.850% (MUNIPSA + 0.720%) due 09/01/2051 ~ | | | | | 500 | | | | | | 500 | |
|
Northampton County, Pennsylvania General Purpose Authority Revenue Bonds, Series 2018 | |
1.161% (0.7*US0001M + 1.040%) due 08/15/2048 ~ | | | | | 750 | | | | | | 746 | |
|
Pennsylvania Economic Development Financing Authority Revenue Bonds, Series 2009 | |
2.800% due 12/01/2033 | | | | | 1,000 | | | | | | 1,025 | |
|
Pennsylvania Turnpike Commission Revenue Notes, Series 2018 | |
0.730% (MUNIPSA + 0.600%) due 12/01/2023 ~ | | | | | 1,000 | | | | | | 980 | |
|
Philadelphia Gas Works, Co., Pennsylvania Revenue Notes, Series 2015 | |
5.000% due 08/01/2020 | | | | | 500 | | | | | | 502 | |
| | | | | | | | | | | | |
| | | | | | | | | | | 7,963 | |
| | | | | | | | | | | | |
| |
| SOUTH CAROLINA 0.8% | | | | | | | | | | | | |
|
South Carolina Jobs-Economic Development Authority Revenue Bonds, Series 2020 | |
5.000% due 12/01/2048 | | | | | 1,250 | | | | | | 1,457 | |
| | | | | | | | | | | | |
| |
| TENNESSEE 0.7% | | | | | | | | | | | | |
|
Greeneville Health & Educational Facilities Board, Tennessee Revenue Notes, Series 2018 | |
5.000% due 07/01/2023 | | | | | 600 | | | | | | 663 | |
| | | | |
Tennergy Corp., Tennessee Revenue Bonds, Series 2019 | | | | | | | | | | | | |
5.000% due 02/01/2050 | | | | | 500 | | | | | | 578 | |
| | | | | | | | | | | | |
| | | | | | | | | | | 1,241 | |
| | | | | | | | | | | | |
| |
| TEXAS 7.8% | | | | | | | | | | | | |
|
El Paso Independent School District, Texas General Obligation Notes, (PSF Insured), Series 2020 | |
5.000% due 08/15/2024 | | | | | 400 | | | | | | 474 | |
|
Fort Bend Independent School District, Texas General Obligation Bonds, (PSF Insured), Series 2019 | |
1.950% due 08/01/2049 | | | | | 750 | | | | | | 765 | |
|
Garland, Texas Electric Utility System Revenue Notes, Series 2019 | |
5.000% due 03/01/2025 | | | | | 500 | | | | | | 597 | |
|
Goose Creek Consolidated Independent School District, Texas General Obligation Bonds, (PSF Insured), Series 2019 | |
3.000% due 10/01/2049 | | | | | 1,000 | | | | | | 1,006 | |
| | | | | | | | | | | | |
| | | | | PRINCIPAL
AMOUNT
(000S) | | | | | MARKET
VALUE
(000S) | |
|
Harris County, Texas Cultural Education Facilities Finance Corp. Revenue Notes, Series 2019 | |
5.000% due 12/01/2024 | | $ | | | 350 | | | $ | | | 409 | |
|
Houston Independent School District, Texas General Obligation Bonds, (PSF Insured), Series 2012 | |
2.400% due 06/01/2030 | | | | | 1,000 | | | | | | 1,017 | |
|
Houston Independent School District, Texas General Obligation Bonds, (PSF Insured), Series 2014 | |
4.000% due 06/01/2039 | | | | | 1,500 | | | | | | 1,646 | |
|
Lower Colorado River Authority, Texas Revenue Notes, Series 2020 | |
5.000% due 05/15/2022 | | | | | 1,000 | | | | | | 1,083 | |
|
North Texas Tollway Authority Revenue Notes, Series 2014 | |
5.000% due 01/01/2022 | | | | | 720 | | | | | | 769 | |
|
North Texas Tollway Authority Revenue Notes, Series 2016 | |
5.000% due 01/01/2021 | | | | | 385 | | | | | | 394 | |
|
Northside Independent School District, Texas General Obligation Bonds, (PSF Insured), Series 2018 | |
2.750% due 08/01/2048 | | | | | 750 | | | | | | 792 | |
|
Northside Independent School District, Texas General Obligation Bonds, (PSF Insured), Series 2019 | |
1.600% due 08/01/2049 | | | | | 750 | | | | | | 773 | |
|
Pasadena Texas General Obligation Bonds, (PSF Insured), Series 2015 | |
1.500% due 02/15/2044 | | | | | 750 | | | | | | 773 | |
|
San Antonio, Texas Electric & Gas Systems Revenue Bonds, Series 2018 | |
2.750% due 02/01/2048 | | | | | 500 | | | | | | 526 | |
|
San Antonio, Texas Electric & Gas Systems Revenue Bonds, Series 2019 | |
1.750% due 12/01/2045 | | | | | 750 | | | | | | 767 | |
|
Texas Municipal Gas Acquisition & Supply Corp. III Revenue Notes, Series 2012 | |
5.000% due 12/15/2022 | | | | | 1,000 | | | | | | 1,086 | |
|
Texas Municipal Gas Acquisition & Supply Corp. Revenue Bonds, Series 2008 | |
6.250% due 12/15/2026 | | | | | 275 | | | | | | 320 | |
|
Texas Water Development Board Revenue Notes, Series 2018 | |
5.000% due 10/15/2024 | | | | | 500 | | | | | | 597 | |
| | | | | | | | | | | | |
| | | | | | | | | | | 13,794 | |
| | | | | | | | | | | | |
| |
| UTAH 0.3% | | | | | | | | | | | | |
|
Utah County, Utah Revenue Bonds, Series 2018 | |
5.000% due 05/15/2057 | | | | | 500 | | | | | | 576 | |
| | | | | | | | | | | | |
| |
| VIRGINIA 1.2% | | | | | | | | | | | | |
|
Louisa Industrial Development Authority, Virginia Revenue Bonds, Series 2008 | |
2.150% due 11/01/2035 | | | | | 1,000 | | | | | | 1,000 | |
|
Wise County, Virginia Industrial Development Authority Revenue Bonds, Series 2010 | |
1.200% due 11/01/2040 | | | | | 1,150 | | | | | | 1,154 | |
| | | | | | | | | | | | |
| | | | | | | | | | | 2,154 | |
| | | | | | | | | | | | |
| |
| WASHINGTON 4.0% | | | | | | | | | | | | |
|
Central Puget Sound Regional Transit Authority, Washington Revenue Bonds, Series 2015 | |
0.580% (MUNIPSA + 0.450%) due 11/01/2045 ~ | | | | | 750 | | | | | | 749 | |
|
Energy Northwest, Washington Revenue Notes, Series 2020 | |
5.000% due 07/01/2027 | | | | | 750 | | | | | | 966 | |
|
King County, Washington Sewer Revenue Bonds, Series 2012 | |
2.600% due 01/01/2043 | | | | | 750 | | | | | | 759 | |
|
Port of Seattle, Washington Revenue Notes, Series 2015 | |
5.000% due 03/01/2023 | | | | | 1,000 | | | | | | 1,106 | |
| | | | | | | | | | | | |
| | | | | PRINCIPAL
AMOUNT
(000S) | | | | | MARKET
VALUE
(000S) | |
|
Port of Tacoma, Washington General Obligation Notes, Series 2016 | |
4.000% due 12/01/2022 | | $ | | | 440 | | | $ | | | 480 | |
|
Seattle, Washington Municipal Light & Power Revenue Bonds, Series 2018 | |
0.620% (MUNIPSA + 0.490%) due 11/01/2046 ~ | | | | | 675 | | | | | | 668 | |
|
Washington Health Care Facilities Authority Revenue Bonds, Series 2017 | |
1.180% (MUNIPSA + 1.050%) due 01/01/2042 ~ | | | | | 1,000 | | | | | | 1,003 | |
|
Washington Health Care Facilities Authority Revenue Bonds, Series 2019 | |
5.000% due 08/01/2049 | | | | | 870 | | | | | | 978 | |
|
Washington Higher Education Facilities Authority Revenue Notes, Series 2020 | |
5.000% due 05/01/2023 (a) | | | | | 250 | | | | | | 275 | |
| | | | | | | | | | | | |
| | | | | | | | | | | 6,984 | |
| | | | | | | | | | | | |
| |
| WEST VIRGINIA 0.9% | | | | | | | | | | | | |
|
West Virginia Economic Development Authority Revenue Bonds, Series 2009 | |
2.625% due 12/01/2042 | | | | | 1,000 | | | | | | 1,017 | |
| | | | |
West Virginia University Revenue Notes, Series 2011 | | | | | | | | | | | | |
5.000% due 10/01/2020 | | | | | 500 | | | | | | 506 | |
| | | | | | | | | | | | |
| | | | | | | | | | | 1,523 | |
| | | | | | | | | | | | |
| |
| WISCONSIN 0.4% | | | | | | | | | | | | |
|
Wisconsin Health & Educational Facilities Authority Revenue Notes, Series 2018 | |
5.000% due 04/01/2022 | | | | | 650 | | | | | | 701 | |
| | | | | | | | | | | | |
Total Municipal Bonds & Notes (Cost $137,845) | | | 140,777 | |
| | | | |
| |
| U.S. TREASURY OBLIGATIONS 1.0% | |
| | | | |
U.S. Treasury Notes | | | | | | | | | | | | |
1.500% due 01/15/2023 | | | | | 600 | | | | | | 620 | |
1.500% due 11/30/2024 | | | | | 1,100 | | | | | | 1,161 | |
| | | | | | | | | | | | |
Total U.S. Treasury Obligations (Cost $1,708) | | | 1,781 | |
| | | | |
| |
| SHORT-TERM INSTRUMENTS 21.9% | |
| |
| REPURCHASE AGREEMENTS (f) 0.9% | | | | |
| | | | | | | | | | | 1,650 | |
| | | | | | | | | | | | |
| |
| SHORT-TERM NOTES 4.4% | |
| | | | |
Federal Home Loan Bank | | | | | | | | | | | | |
0.122% due 07/17/2020 (c)(d) | | | | | 5,100 | | | | | | 5,100 | |
0.139% due 08/21/2020 (c)(d) | | | | | 2,700 | | | | | | 2,699 | |
| | | | | | | | | | | | |
| | | | | | | | | | | 7,799 | |
| | | | | | | | | | | | |
| |
| U.S. TREASURY BILLS 9.8% | | | | | | | | | | | | |
0.108% due 07/02/2020—08/06/2020 (b)(c) | | | | | 17,300 | | | | | | 17,299 | |
| | | | | | | | | | | | |
| |
| U.S. TREASURY CASH MANAGEMENT BILLS 1.6% | |
0.134% due 09/29/2020 (c)(d) | | | | | 2,800 | | | | | | 2,799 | |
| | | | | | | | | | | | |
| |
| MUNICIPAL BONDS & NOTES 5.2% | |
|
Erie County, New York General Obligation Notes, Series 2020 | |
3.000% due 06/24/2021 | | | | | 1,000 | | | | | | 1,025 | |
|
Fredonia Central School District, New York General Obligation Notes, Series 2020 | |
1.250% due 06/17/2021 | | | | | 1,600 | | | | | | 1,610 | |
|
General Brown Central School District, New York General Obligation Notes, Series 2020 | |
1.250% due 06/25/2021 | | | | | 1,500 | | | | | | 1,512 | |
| | | | | | |
| See Accompanying Notes | | ANNUAL REPORT | | JUNE 30, 2020 | | 89 |
Schedule of Investments PIMCO Short Term Municipal Bond Active Exchange-Traded Fund (Cont.)
| | | | | | | | | | | | |
| | | | | PRINCIPAL
AMOUNT
(000S) | | | | | MARKET
VALUE
(000S) | |
|
New York State Dormitory Authority Revenue Notes, Series 2020 | |
5.000% due 03/31/2021 | | $ | | | 3,200 | | | $ | | | 3,313 | |
|
Suffolk County, New York General Obligation Notes, Series 2019 | |
2.500% due 07/23/2020 | | | | | 1,000 | | | | | | 1,001 | |
|
Suffolk County, New York General Obligation Notes, Series 2020 | |
5.000% due 03/19/2021 | | | | | 600 | | | | | | 614 | |
| | | | | | | | | | | | |
Total Municipal Bonds & Notes
(Cost $9,055) | | | 9,075 | |
| | | | |
| | | | |
| | | | | | | | | | | | |
Total Short-Term Instruments
(Cost $38,603) | | | | | | 38,622 | |
| | | | |
| | | | | | | | | | | | |
Total Investments in Securities
(Cost $178,156) | | | | | | 181,180 | |
| | | | |
| | | | | | | | | | | | |
Total Investments 102.6%
(Cost $178,156) | | | $ | | | 181,180 | |
| |
| Other Assets and Liabilities, net (2.6)% | | | (4,599 | ) |
| | | | |
| Net Assets 100.0% | | | $ | | | 176,581 | |
| | | | | | | |
NOTES TO SCHEDULE OF INVESTMENTS:
| * | A zero balance may reflect actual amounts rounding to less than one thousand. |
| ~ | Variable or Floating rate security. Rate shown is the rate in effect as of period end. Certain variable rate securities are not based on a published reference rate and spread, rather are determined by the issuer or agent and are based on current market conditions. Reference rate is as of reset date, which may vary by security. These securities may not indicate a reference rate and/or spread in their description. |
| (b) | Coupon represents a weighted average yield to maturity. |
| (d) | Coupon represents a yield to maturity. |
| (e) | Security becomes interest bearing at a future date. |
BORROWINGS AND OTHER FINANCING TRANSACTIONS
(f) REPURCHASE AGREEMENTS:
| | | | | | | | | | | | | | | | | | | | | | | | | | | | | | |
| Counterparty | | Lending
Rate | | | Settlement
Date | | | Maturity
Date | | | Principal
Amount | | | Collateralized By | | Collateral
(Received) | | | Repurchase
Agreements,
at Value | | | Repurchase
Agreement
Proceeds
to be
Received | |
| FICC | | | 0.000 | % | | | 06/30/2020 | | | | 07/01/2020 | | | $ | 1,650 | | | U.S. Treasury Inflation Protected Securities 0.125% due 07/15/2024 | | $ | (1,683 | ) | | $ | 1,650 | | | $ | 1,650 | |
| | | | | | | | | | | | | | | | | | | | | | | | | | | | | | |
Total Repurchase Agreements | | | | | $ | (1,683 | ) | | $ | 1,650 | | | $ | 1,650 | |
| | | | | | | | | | | | | | | |
BORROWINGS AND OTHER FINANCING TRANSACTIONS SUMMARY
The following is a summary by counterparty of the market value of Borrowings and Other Financing Transactions and collateral pledged/(received) as of June 30, 2020:
| | | | | | | | | | | | | | | | | | | | | | | | |
| Counterparty | | Repurchase
Agreement
Proceeds
to be
Received | | | Payable for
Reverse
Repurchase
Agreements | | | Payable for
Sale-Buyback
Transactions | | | Total
Borrowings and
Other Financing
Transactions | | | Collateral
Pledged/
(Received) | | | Net Exposure(1) | |
Global/Master Repurchase Agreement | |
FICC | | $ | 1,650 | | | $ | 0 | | | $ | 0 | | | $ | 1,650 | | | $ | (1,683 | ) | | $ | (33 | ) |
| | | | | | | | | | | | | | | | | | | | | | | | |
Total Borrowings and Other Financing Transactions | | $ | 1,650 | | | $ | 0 | | | $ | 0 | | | | | | | | | | | | | |
| | | | | | | | | | | | | | | | | | | | | | | | |
| (1) | Net Exposure represents the net receivable/(payable) that would be due from/to the counterparty in the event of default. Exposure from borrowings and other financing transactions can only be netted across transactions governed under the same master agreement with the same legal entity. See Note 8, Master Netting Arrangements, in the Notes to Financial Statements for more information. |
| | | | | | | | |
| 90 | | PIMCO ETF TRUST | | | | | See Accompanying Notes | |
June 30, 2020
FAIR VALUE MEASUREMENTS
The following is a summary of the fair valuations according to the inputs used as of June 30, 2020 in valuing the Fund’s assets and liabilities:
| | | | | | | | | | | | | | | | |
| Category and Subcategory | | Level 1 | | | Level 2 | | | Level 3 | | | Fair
Value at
06/30/2020 | |
Investments in Securities, at Value | |
Municipal Bonds & Notes | |
Alabama | | $ | 0 | | | $ | 4,200 | | | $ | 0 | | | $ | 4,200 | |
Arizona | | | 0 | | | | 1,660 | | | | 0 | | | | 1,660 | |
California | | | 0 | | | | 7,267 | | | | 0 | | | | 7,267 | |
Connecticut | | | 0 | | | | 10,880 | | | | 0 | | | | 10,880 | |
Delaware | | | 0 | | | | 755 | | | | 0 | | | | 755 | |
District of Columbia | | | 0 | | | | 1,358 | | | | 0 | | | | 1,358 | |
Florida | | | 0 | | | | 8,683 | | | | 0 | | | | 8,683 | |
Georgia | | | 0 | | | | 3,259 | | | | 0 | | | | 3,259 | |
Illinois | | | 0 | | | | 10,626 | | | | 0 | | | | 10,626 | |
Indiana | | | 0 | | | | 3,043 | | | | 0 | | | | 3,043 | |
Iowa | | | 0 | | | | 785 | | | | 0 | | | | 785 | |
Kansas | | | 0 | | | | 2,459 | | | | 0 | | | | 2,459 | |
Kentucky | | | 0 | | | | 2,110 | | | | 0 | | | | 2,110 | |
Louisiana | | | 0 | | | | 294 | | | | 0 | | | | 294 | |
Maryland | | | 0 | | | | 2,384 | | | | 0 | | | | 2,384 | |
Massachusetts | | | 0 | | | | 9,691 | | | | 0 | | | | 9,691 | |
Michigan | | | 0 | | | | 3,674 | | | | 0 | | | | 3,674 | |
Minnesota | | | 0 | | | | 2,154 | | | | 0 | | | | 2,154 | |
Mississippi | | | 0 | | | | 793 | | | | 0 | | | | 793 | |
Missouri | | | 0 | | | | 1,011 | | | | 0 | | | | 1,011 | |
Montana | | | 0 | | | | 973 | | | | 0 | | | | 973 | |
Nebraska | | | 0 | | | | 3,057 | | | | 0 | | | | 3,057 | |
Nevada | | | 0 | | | | 2,896 | | | | 0 | | | | 2,896 | |
| | | | | | | | | | | | | | | | |
| Category and Subcategory | | Level 1 | | | Level 2 | | | Level 3 | | | Fair
Value at
06/30/2020 | |
New Jersey | | $ | 0 | | | $ | 2,688 | | | $ | 0 | | | $ | 2,688 | |
New Mexico | | | 0 | | | | 1,177 | | | | 0 | | | | 1,177 | |
New York | | | 0 | | | | 12,221 | | | | 0 | | | | 12,221 | |
North Carolina | | | 0 | | | | 2,189 | | | | 0 | | | | 2,189 | |
Ohio | | | 0 | | | | 1,188 | | | | 0 | | | | 1,188 | |
Oregon | | | 0 | | | | 909 | | | | 0 | | | | 909 | |
Pennsylvania | | | 0 | | | | 7,963 | | | | 0 | | | | 7,963 | |
South Carolina | | | 0 | | | | 1,457 | | | | 0 | | | | 1,457 | |
Tennessee | | | 0 | | | | 1,241 | | | | 0 | | | | 1,241 | |
Texas | | | 0 | | | | 13,794 | | | | 0 | | | | 13,794 | |
Utah | | | 0 | | | | 576 | | | | 0 | | | | 576 | |
Virginia | | | 0 | | | | 2,154 | | | | 0 | | | | 2,154 | |
Washington | | | 0 | | | | 6,984 | | | | 0 | | | | 6,984 | |
West Virginia | | | 0 | | | | 1,523 | | | | 0 | | | | 1,523 | |
Wisconsin | | | 0 | | | | 701 | | | | 0 | | | | 701 | |
U.S. Treasury Obligations | | | 0 | | | | 1,781 | | | | 0 | | | | 1,781 | |
Short-Term Instruments | |
Repurchase Agreements | | | 0 | | | | 1,650 | | | | 0 | | | | 1,650 | |
Short-Term Notes | | | 0 | | | | 7,799 | | | | 0 | | | | 7,799 | |
U.S. Treasury Bills | | | 0 | | | | 17,299 | | | | 0 | | | | 17,299 | |
U.S. Treasury Cash Management Bills | | | 0 | | | | 2,799 | | | | 0 | | | | 2,799 | |
Municipal Bonds & Notes | | | 0 | | | | 9,075 | | | | 0 | | | | 9,075 | |
| | | | | | | | | | | | | | | | |
| | | | |
Total Investments | | $ | 0 | | | $ | 181,180 | | | $ | 0 | | | $ | 181,180 | |
| | | | | | | | | | | | | | | | |
There were no significant transfers into or out of Level 3 during the period ended June 30, 2020.
| | | | | | |
| See Accompanying Notes | | ANNUAL REPORT | | JUNE 30, 2020 | | 91 |
Notes to Financial Statements
1. ORGANIZATION
PIMCO ETF Trust (the “Trust”) was established as a Delaware statutory trust on November 14, 2008. The Trust is registered under the Investment Company Act of 1940, as amended (the “Act”), as an open-end management investment company. Information presented in these financial statements pertains to the funds (each a “Fund” and collectively the “Funds”) offered by the Trust. Pacific Investment Management Company LLC (“PIMCO” or “Manager”) serves as the investment adviser for the Funds.
Each Fund is an exchange-traded fund (“ETF”). ETFs are funds that trade like other publicly-traded securities and may be designed to track an index or to be actively managed. Unlike shares of a mutual fund, which can be bought from and redeemed by the issuing fund by all shareholders at a price based on net asset value (“NAV”), shares of a Fund may be directly purchased from and redeemed by a Fund at NAV solely by certain large institutional investors. Also unlike shares of a mutual fund, shares of each Fund are listed on a national securities exchange and trade in the secondary market at market prices that change throughout the day. Each Fund offers and issues shares only in aggregations of a specified number of shares (“Creation Units”).
2. SIGNIFICANT ACCOUNTING POLICIES
The following is a summary of significant accounting policies consistently followed by the Trust in the preparation of its financial statements in conformity with accounting principles generally accepted in the United States of America (“U.S. GAAP”). Each Fund is treated as an investment company under the reporting requirements of U.S. GAAP. The functional and reporting currency for the Funds is the U.S. dollar. The preparation of financial statements in accordance with U.S. GAAP requires management to make estimates and assumptions that affect the reported amounts of assets and liabilities and disclosure of contingent assets and liabilities at the date of the financial statements and the reported amounts of increases and decreases in net assets from operations during the reporting period. Actual results could differ from those estimates.
(a) Securities Transactions and Investment Income Securities transactions are recorded as of the trade date for financial reporting purposes. Securities purchased or sold on a when-issued or delayed-delivery basis may be settled beyond a standard settlement period for the security after the trade date. Realized gains (losses) from securities sold are recorded on the identified cost basis. Dividend income is recorded on the ex-dividend date, except certain dividends from foreign securities where the ex-dividend date may have passed, which are recorded as soon as a Fund is informed of the ex-dividend date. Interest income, adjusted for the accretion of discounts and amortization of premiums, is recorded on the accrual basis from
settlement date, with the exception of securities with a forward starting effective date, where interest income is recorded on the accrual basis from effective date. For convertible securities, premiums attributable to the conversion feature are not amortized. Estimated tax liabilities on certain foreign securities are recorded on an accrual basis and are reflected as components of interest income or net change in unrealized appreciation (depreciation) on investments on the Statements of Operations, as appropriate. Tax liabilities realized as a result of such security sales are reflected as a component of net realized gain (loss) on investments on the Statements of Operations. Paydown gains (losses) on mortgage-related and other asset-backed securities, if any, are recorded as components of interest income on the Statements of Operations. Income or short-term capital gain distributions received from registered investment companies, if any, are recorded as dividend income. Long-term capital gain distributions received from registered investment companies, if any, are recorded as realized gains.
Debt obligations may be placed on non-accrual status and related interest income may be reduced by ceasing current accruals and writing off interest receivable when the collection of all or a portion of interest has become doubtful based on consistently applied procedures. A debt obligation is removed from non-accrual status when the issuer resumes interest payments or when collectability of interest is probable.
(b) Foreign Currency Translation The market values of foreign securities, currency holdings and other assets and liabilities denominated in foreign currencies are translated into U.S. dollars based on the current exchange rates each business day. Purchases and sales of securities and income and expense items denominated in foreign currencies, if any, are translated into U.S. dollars at the exchange rate in effect on the transaction date. The Funds do not separately report the effects of changes in foreign exchange rates from changes in market prices on securities held. Such changes are included in net realized gain (loss) and net change in unrealized appreciation (depreciation) from investments on the Statements of Operations. The Funds may invest in foreign currency-denominated securities and may engage in foreign currency transactions either on a spot (cash) basis at the rate prevailing in the currency exchange market at the time or through a forward foreign currency contract. Realized foreign exchange gains (losses) arising from sales of spot foreign currencies, currency gains (losses) realized between the trade and settlement dates on securities transactions and the difference between the recorded amounts of dividends, interest, and foreign withholding taxes and the U.S. dollar equivalent of the amounts actually received or paid are included in net realized gain (loss) on foreign currency transactions on the Statements of Operations. Net unrealized foreign exchange gains (losses) arising from changes in foreign exchange rates on foreign denominated assets and liabilities other than investments in securities
June 30, 2020
held at the end of the reporting period are included in net change in unrealized appreciation (depreciation) on foreign currency assets and liabilities on the Statements of Operations.
(c) Distributions to Shareholders The following table shows the anticipated frequency of distributions from net investment income, if any, for each Fund.
| | | | | | | | | | | | |
| | | | | | Distribution Frequency | |
| | | |
| Fund Name | | | | | Declared | | | Distributed | |
| | | |
PIMCO 1-5 Year U.S. TIPS Index
Exchange-Traded Fund | | | | | | | Monthly | | | | Monthly | |
| | | |
PIMCO 15+ Year U.S. TIPS Index
Exchange-Traded Fund | | | | | | | Monthly | | | | Monthly | |
| | | |
PIMCO Broad U.S. TIPS Index Exchange-Traded Fund | | | | | | | Monthly | | | | Monthly | |
| | | |
PIMCO 0-5 Year High Yield Corporate Bond Index Exchange-Traded Fund | | | | | | | Monthly | | | | Monthly | |
| | | |
PIMCO Investment Grade Corporate Bond Index Exchange-Traded Fund | | | | | | | Monthly | | | | Monthly | |
| | | |
PIMCO Active Bond Exchange-Traded Fund | | | | | | | Monthly | | | | Monthly | |
| | | |
PIMCO Enhanced Low Duration Active
Exchange-Traded Fund | | | | | | | Monthly | | | | Monthly | |
| | | |
PIMCO Enhanced Short Maturity Active ESG
Exchange-Traded Fund | | | | | | | Monthly | | | | Monthly | |
| | | |
PIMCO Enhanced Short Maturity Active
Exchange-Traded Fund | | | | | | | Monthly | | | | Monthly | |
| | | |
PIMCO Intermediate Municipal Bond Active
Exchange-Traded Fund | | | | | | | Monthly | | | | Monthly | |
| | | |
PIMCO Short Term Municipal Bond Active
Exchange-Traded Fund | | | | | | | Monthly | | | | Monthly | |
| | | |
PIMCO 25+ Year Zero Coupon U.S. Treasury Index
Exchange-Traded Fund | | | | | | | Quarterly | | | | Quarterly | |
In addition, each Fund distributes any net capital gains it earns from the sale of portfolio securities to shareholders no less frequently than annually. Net short-term capital gains may be paid more frequently. The Trust does not provide an automatic dividend and/or distributions reinvestment service.
Income distributions and capital gain distributions are determined in accordance with income tax regulations which may differ from U.S. GAAP. Differences between tax regulations and U.S. GAAP may cause timing differences between income and capital gain recognition. Further, the character of investment income and capital gains may be different for certain transactions under the two methods of accounting. As a result, income distributions and capital gain distributions declared during a fiscal period may differ significantly from the net investment income (loss) and realized gains (losses) reported on each Fund’s annual financial statements presented under U.S. GAAP.
If a Fund estimates that a portion of its distribution may be comprised of amounts from sources other than net investment income in accordance with its policies and accounting practices, the Fund will notify shareholders of the estimated composition of such distribution through a Section 19 Notice. For these purposes, a Fund estimates the
source or sources from which a distribution is paid, to the close of the period as of which it is paid, in reference to its internal accounting records and related accounting practices. If, based on such accounting records and practices, it is estimated that a particular distribution does not include capital gains or paid-in surplus or other capital sources, a Section 19 Notice generally would not be issued. It is important to note that differences exist between a Fund’s daily internal accounting records and practices, a Fund’s financial statements presented in accordance with U.S. GAAP, and recordkeeping practices under income tax regulations. For instance, a Fund’s internal accounting records and practices may take into account, among other factors, tax-related characteristics of certain sources of distributions that differ from treatment under U.S. GAAP. Examples of such differences may include, among others, the treatment of paydowns on mortgage-backed securities purchased at a discount and periodic payments under interest rate swap contracts. Accordingly, among other consequences, it is possible that a Fund may not issue a Section 19 Notice in situations where the Fund’s financial statements prepared later and in accordance with U.S. GAAP and/or the final tax character of those distributions might later report that the sources of those distributions included capital gains and/or a return of capital. Please visit www.pimco.com for the most recent Section 19 Notice, if applicable, for additional information regarding the estimated composition of distributions. Final determination of a distribution’s tax character will be reported on Form 1099 DIV sent to shareholders for the calendar year.
Distributions classified as a tax basis return of capital at a Fund’s fiscal year end, if any, are reflected on the Statements of Changes in Net Assets and have been recorded to paid in capital on the Statements of Assets and Liabilities. In addition, other amounts have been reclassified between distributable earnings (accumulated loss) and paid in capital on the Statements of Assets and Liabilities to more appropriately conform U.S. GAAP to tax characterizations of distributions.
(d) New Accounting Pronouncements In August 2018, the Financial Accounting Standards Board (“FASB”) issued an Accounting Standards Update (“ASU”), ASU 2018-13, which modifies certain disclosure requirements for fair value measurements in Accounting Standards Codification 820. The ASU is effective for annual periods beginning after December 15, 2019, and interim periods within those annual periods. At this time, management has elected to early adopt the ASU and the changes are incorporated in the financial statements.
In March 2020, the FASB issued ASU 2020-04, which provides optional guidance to ease the potential accounting burden associated with transitioning away from the London Interbank Offered Rate and other reference rates that are expected to be discontinued. The ASU is effective immediately upon release of the update on March 12, 2020 through December 31, 2022. At this time, management is evaluating implications of these changes on the financial statements.
| | | | | | |
| | ANNUAL REPORT | | JUNE 30, 2020 | | 93 |
Notes to Financial Statements (Cont.)
3. INVESTMENT VALUATION AND FAIR VALUE MEASUREMENTS
(a) Investment Valuation Policies The NAV of the Fund’s shares is determined by dividing the total value of the Fund’s portfolio investments and other assets, less any liabilities attributable to that Fund, by the total number of shares outstanding.
On each day that the NYSE Arca is open, Fund shares are ordinarily valued as of the close of regular trading (normally 4:00 p.m., Eastern time) (“NYSE Close”). Information that becomes known to the Funds or their agents after the time as of which NAV has been calculated on a particular day will not generally be used to retroactively adjust the price of a security or the NAV determined earlier that day. Each Fund reserves the right to change the time as of which its respective NAV is calculated if the Fund closes earlier, or as permitted by the U.S. Securities and Exchange Commission (“SEC”).
For purposes of calculating a NAV, portfolio securities and other assets for which market quotes are readily available are valued at market value. Market value is generally determined on the basis of official closing prices or the last reported sales prices, or if no sales are reported, based on quotes obtained from established market makers or prices (including evaluated prices) supplied by the Funds’ approved pricing services, quotation reporting systems and other third-party sources (together, “Pricing Services”). The Funds will normally use pricing data for domestic equity securities received shortly after the NYSE Close and do not normally take into account trading, clearances or settlements that take place after the NYSE Close. If market value pricing is used, a foreign (non-U.S.) equity security traded on a foreign exchange or on more than one exchange is typically valued using pricing information from the exchange considered by the Manager to be the primary exchange. A foreign (non-U.S.) equity security will be valued as of the close of trading on the foreign exchange, or the NYSE Close, if the NYSE Close occurs before the end of trading on the foreign exchange. Domestic and foreign (non-U.S.) fixed income securities, non-exchange traded derivatives, and equity options are normally valued on the basis of quotes obtained from brokers and dealers or Pricing Services using data reflecting the earlier closing of the principal markets for those securities. Prices obtained from Pricing Services may be based on, among other things, information provided by market makers or estimates of market values obtained from yield data relating to investments or securities with similar characteristics. Certain fixed income securities purchased on a delayed-delivery basis are marked to market daily until settlement at the forward settlement date. Exchange-traded options, except equity options, futures and options on futures are valued at the settlement price determined by the relevant exchange. Swap agreements are valued on the basis of bid quotes obtained from brokers and dealers or market-based prices supplied by
Pricing Services. A Fund’s investments in open-end management investment companies, other than ETFs, are valued at the NAVs of such investments. Open-end management investment companies may include affiliated funds.
If a foreign (non-U.S.) equity security’s value has materially changed after the close of the security’s primary exchange or principal market but before the NYSE Close, the security may be valued at fair value based on procedures established and approved by the Board of Trustees of the Trust (the “Board”). Foreign (non-U.S.) equity securities that do not trade when the NYSE is open are also valued at fair value. With respect to foreign (non-U.S.) equity securities, a Fund may determine the fair value of investments based on information provided by Pricing Services and other third-party vendors, which may recommend fair value or adjustments with reference to other securities, indices or assets. In considering whether fair valuation is required and in determining fair values, a Fund may, among other things, consider significant events (which may be considered to include changes in the value of U.S. securities or securities indices) that occur after the close of the relevant market and before the NYSE Close. A Fund may utilize modeling tools provided by third-party vendors to determine fair values of foreign (non-U.S.) securities. For these purposes, any movement in the applicable reference index or instrument (“zero trigger”) between the earlier close of the applicable foreign market and the NYSE Close may be deemed to be a significant event, prompting the application of the pricing model (effectively resulting in daily fair valuations). Foreign exchanges may permit trading in foreign (non-U.S.) equity securities on days when the Trust is not open for business, which may result in a Fund’s portfolio investments being affected when shareholders are unable to buy or sell shares.
Senior secured floating rate loans for which an active secondary market exists to a reliable degree are valued at the mean of the last available bid/ask prices in the market for such loans, as provided by a Pricing Service. Senior secured floating rate loans for which an active secondary market does not exist to a reliable degree are valued at fair value, which is intended to approximate market value. In valuing a senior secured floating rate loan at fair value, the factors considered may include, but are not limited to, the following: (a) the creditworthiness of the borrower and any intermediate participants, (b) the terms of the loan, (c) recent prices in the market for similar loans, if any, and (d) recent prices in the market for instruments of similar quality, rate, period until next interest rate reset and maturity.
Investments valued in currencies other than the U.S. dollar are converted to the U.S. dollar using exchange rates obtained from Pricing Services. As a result, the value of such investments and, in turn, the NAV of a Fund’s shares may be affected by changes in the value of currencies in relation to the U.S. dollar. The value of investments traded
June 30, 2020
in markets outside the United States or denominated in currencies other than the U.S. dollar may be affected significantly on a day that the Trust is not open for business. As a result, to the extent that a Fund holds foreign (non-U.S.) investments, the value of those investments may change at times when shareholders are unable to buy or sell shares and the value of such investments will be reflected in the Fund’s next calculated NAV.
Investments for which market quotes or market based valuations are not readily available are valued at fair value as determined in good faith by the Board or persons acting at their direction. The Board has adopted methods for valuing securities and other assets in circumstances where market quotes are not readily available, and has delegated to the Manager the responsibility for applying the fair valuation methods. In the event that market quotes or market based valuations are not readily available, and the security or asset cannot be valued pursuant to a Board approved valuation method, the value of the security or asset will be determined in good faith by the Board. Market quotes are considered not readily available in circumstances where there is an absence of current or reliable market-based data (e.g., trade information, bid/ask information, indicative market quotations (“Broker Quotes”), Pricing Services’ prices), including where events occur after the close of the relevant market, but prior to the NYSE Close, that materially affect the values of a Fund’s securities or assets. In addition, market quotes are considered not readily available when, due to extraordinary circumstances, the exchanges or markets on which the securities trade do not open for trading for the entire day and no other market prices are available. The Board has delegated, to the Manager, the responsibility for monitoring significant events that may materially affect the values of a Fund’s securities or assets and for determining whether the value of the applicable securities or assets should be reevaluated in light of such significant events.
When a Fund uses fair valuation to determine the value of a portfolio security or other asset for purposes of calculating its NAV, such investments will not be priced on the basis of quotes from the primary market in which they are traded, but rather may be priced by another method that the Board or persons acting at their direction believe reflects fair value. Fair valuation may require subjective determinations about the value of a security. While the Trust’s policy is intended to result in a calculation of a Fund’s NAV that fairly reflects security values as of the time of pricing, the Trust cannot ensure that fair values determined by the Board or persons acting at their direction would accurately reflect the price that a Fund could obtain for a security if it were to dispose of that security as of the time of pricing (for instance, in a forced or distressed sale). The prices used by a Fund may differ from the value that would be realized if the securities were sold. The Funds’ use of fair valuation may also help to deter “stale price arbitrage” as discussed under the “Abusive Trading Practices” section in each Fund’s prospectus.
(b) Fair Value Hierarchy U.S. GAAP describes fair value as the price that a Fund would receive to sell an asset or pay to transfer a liability in an orderly transaction between market participants at the measurement date. It establishes a fair value hierarchy that prioritizes inputs to valuation methods and requires disclosure of the fair value hierarchy, separately for each major category of assets and liabilities, that segregates fair value measurements into levels (Level 1, 2, or 3). The inputs or methodology used for valuing securities are not necessarily an indication of the risks associated with investing in those securities. Levels 1, 2, and 3 of the fair value hierarchy are defined as follows:
| ∎ | | Level 1 — Quoted prices in active markets or exchanges for identical assets and liabilities. |
| ∎ | | Level 2 — Significant other observable inputs, which may include, but are not limited to, quoted prices for similar assets or liabilities in markets that are active, quoted prices for identical or similar assets or liabilities in markets that are not active, inputs other than quoted prices that are observable for the assets or liabilities (such as interest rates, yield curves, volatilities, prepayment speeds, loss severities, credit risks and default rates) or other market corroborated inputs. |
| ∎ | | Level 3 — Significant unobservable inputs based on the best information available in the circumstances, to the extent observable inputs are not available, which may include assumptions made by the Board or persons acting at their direction that are used in determining the fair value of investments. |
In accordance with the requirements of U.S. GAAP, the amounts of transfers into and out of Level 3, if material, are disclosed in the Notes to Schedule of Investments for each respective Fund.
For fair valuations using significant unobservable inputs, U.S. GAAP requires a reconciliation of the beginning to ending balances for reported fair values that presents changes attributable to realized gain (loss), unrealized appreciation (depreciation), purchases and sales, accrued discounts (premiums), and transfers into and out of the Level 3 category during the period. The end of period value is used for the transfers between Levels of a Fund’s assets and liabilities. Additionally, U.S. GAAP requires quantitative information regarding the significant unobservable inputs used in the determination of fair value of assets or liabilities categorized as Level 3 in the fair value hierarchy. In accordance with the requirements of U.S. GAAP, a fair value hierarchy, and if material, a Level 3 reconciliation and details of significant unobservable inputs, have been included in the Notes to Schedule of Investments for each respective Fund.
(c) Valuation Techniques and the Fair Value Hierarchy Level 1 and Level 2 trading assets and trading liabilities, at fair value The valuation methods (or “techniques”) and significant inputs
| | | | | | |
| | ANNUAL REPORT | | JUNE 30, 2020 | | 95 |
Notes to Financial Statements (Cont.)
used in determining the fair values of portfolio securities or other assets and liabilities categorized as Level 1 and Level 2 of the fair value hierarchy are as follows:
Fixed income securities including corporate, convertible and municipal bonds and notes, U.S. government agencies, U.S. treasury obligations, sovereign issues, bank loans, convertible preferred securities and non-U.S. bonds are normally valued on the basis of quotes obtained from brokers and dealers or Pricing Services that use broker-dealer quotations, reported trades or valuation estimates from their internal pricing models. The Pricing Services’ internal models use inputs that are observable such as issuer details, interest rates, yield curves, prepayment speeds, credit risks/spreads, default rates and quoted prices for similar assets. Securities that use similar valuation techniques and inputs as described above are categorized as Level 2 of the fair value hierarchy.
Fixed income securities purchased on a delayed-delivery basis or as a repurchase commitment in a sale-buyback transaction are marked to market daily until settlement at the forward settlement date and are categorized as Level 2 of the fair value hierarchy.
Mortgage-related and asset-backed securities are usually issued as separate tranches, or classes, of securities within each deal. These securities are also normally valued by Pricing Services that use broker-dealer quotations, reported trades or valuation estimates from their internal pricing models. The pricing models for these securities usually consider tranche-level attributes, current market data, estimated cash flows and market-based yield spreads for each tranche, and incorporate deal collateral performance, as available. Mortgage-related and asset-backed securities that use similar valuation techniques and inputs as described above are categorized as Level 2 of the fair value hierarchy.
Common stocks, ETFs, exchange-traded notes and financial derivative instruments, such as futures contracts, rights and warrants, or options on futures that are traded on a national securities exchange, are stated at the last reported sale or settlement price on the day of valuation. To the extent these securities are actively traded and valuation adjustments are not applied, they are categorized as Level 1 of the fair value hierarchy.
Valuation adjustments may be applied to certain securities that are solely traded on a foreign exchange to account for the market movement between the close of the foreign market and the NYSE Close. These securities are valued using Pricing Services that consider the correlation of the trading patterns of the foreign security to the intraday trading in the U.S. markets for investments. Securities using these valuation adjustments are categorized as Level 2 of the fair value hierarchy. Preferred securities and other equities traded on inactive markets or valued by reference to similar instruments are also categorized as Level 2 of the fair value hierarchy.
Equity exchange-traded options and over the counter financial derivative instruments, such as forward foreign currency contracts and options contracts derive their value from underlying asset prices, indices, reference rates, and other inputs or a combination of these factors. These contracts are normally valued on the basis of quotes obtained from a quotation reporting system, established market makers or Pricing Services (normally determined as of the NYSE Close). Depending on the product and the terms of the transaction, financial derivative instruments can be valued by Pricing Services using a series of techniques, including simulation pricing models. The pricing models use inputs that are observed from actively quoted markets such as quoted prices, issuer details, indices, bid/ask spreads, interest rates, implied volatilities, yield curves, dividends and exchange rates. Financial derivative instruments that use similar valuation techniques and inputs as described above are categorized as Level 2 of the fair value hierarchy.
Centrally cleared swaps and over the counter swaps derive their value from underlying asset prices, indices, reference rates, and other inputs or a combination of these factors. They are valued using a broker-dealer bid quotation or on market-based prices provided by Pricing Services (normally determined as of the NYSE Close). Centrally cleared swaps and over the counter swaps can be valued by Pricing Services using a series of techniques, including simulation pricing models. The pricing models may use inputs that are observed from actively quoted markets such as the overnight index swap rate, London Interbank Offered Rate forward rate, interest rates, yield curves and credit spreads. These securities are categorized as Level 2 of the fair value hierarchy.
Level 3 trading assets and trading liabilities, at fair value When a fair valuation method is applied by the Manager that uses significant unobservable inputs, investments will be priced by a method that the Board or persons acting at their direction believe reflects fair value and are categorized as Level 3 of the fair value hierarchy.
Short-term debt instruments (such as commercial paper) having a remaining maturity of 60 days or less may be valued at amortized cost, so long as the amortized cost value of such short-term debt instruments is approximately the same as the fair value of the instrument as determined without the use of amortized cost valuation. These securities are categorized as Level 2 or Level 3 of the fair value hierarchy depending on the source of the base price.
4. SECURITIES AND OTHER INVESTMENTS
(a) Investments in Affiliates
Each Fund eligible to participate in securities lending may invest the cash collateral received for securities out on loan in the PIMCO Government Money Market Fund under the Securities Lending
June 30, 2020
Agreement. All or a portion of Dividend Income as shown in the table below represents the income earned on the cash collateral invested in PIMCO Government Money Market Fund and is included on the Statements of Operations as a component of Securities Lending Income. PIMCO Government Money Market Fund is considered to be affiliated with the Funds. A complete schedule of portfolio holdings for each affiliate fund is filed with the SEC for the first and third quarters of each fiscal year on Form N-PORT and is available at the SEC’s website at www.sec.gov. A copy of each affiliate fund’s shareholder report is also available at the SEC’s website at www.sec.gov, on the Funds’ website at www.pimco.com, or upon request, as applicable. The table below shows the Funds’ transactions in and earnings from investments in the affiliated Fund for the period ended June 30, 2020 (amounts in thousands†):
| | | | | | | | | | | | | | | | | | | | | | | | | | | | | | | | | | | | |
| Investments in PIMCO Government Money Market Fund | | | | | | | | | | | | | | | | |
| Fund Name | | | | | Market Value
06/30/2019 | | | Purchases at Cost | | | Proceeds
from Sales | | | Net
Realized
Gain (Loss) | | | Change in
Unrealized
Appreciation
(Depreciation) | | | Market Value
06/30/2020 | | | Dividend
Income(1) | | | Realized Net
Capital Gain
Distributions(1) | |
| | | | | | | | | |
PIMCO 0-5 Year High Yield Corporate Bond Index
Exchange-Traded Fund | | | | | | $ | 32,287 | | | $ | 203,899 | | | $ | (208,066 | ) | | $ | 0 | | | $ | 0 | | | $ | 28,120 | | | $ | 478 | | | $ | 0 | |
| | | | | | | | | |
PIMCO Investment Grade Corporate Bond Index
Exchange-Traded Fund | | | | | | | 712 | | | | 1,472 | | | | (2,184 | ) | | | 0 | | | | 0 | | | | 0 | | | | 6 | | | | 0 | |
| | | | | | | | | |
PIMCO Enhanced Short Maturity Active
Exchange-Traded Fund | | | | | | | 0 | | | | 9,952 | | | | (9,437 | ) | | | 0 | | | | 0 | | | | 515 | | | | 3 | | | | 0 | |
| † | A zero balance may reflect actual amounts rounding to less than one thousand. |
| (1) | The tax characterization of distributions is determined in accordance with Federal income tax regulations and may contain a return of capital. The actual tax characterization of distributions received is determined at the end of the fiscal year of the affiliated fund. See Note 2, Distributions to Shareholders, in the Notes to Financial Statements for more information. |
(b) Investments in Securities
The Funds may utilize the investments and strategies described below to the extent permitted by each Fund’s respective investment policies.
Bank Obligations in which a Fund may invest include certificates of deposit, bankers’ acceptances, and fixed time deposits. Certificates of deposit are negotiable certificates issued against Funds deposited in a commercial bank for a definite period of time and earning a specified return. Bankers’ acceptances are negotiable drafts or bills of exchange, normally drawn by an importer or exporter to pay for specific merchandise, which are “accepted” by a bank, meaning, in effect, that the bank unconditionally agrees to pay the face value of the instrument on maturity. Fixed time deposits are bank obligations payable at a stated maturity date and bearing interest at a fixed rate. Fixed time deposits may be withdrawn on demand by the investor, but may be subject to early withdrawal penalties which vary depending upon market conditions and the remaining maturity of the obligation.
Inflation-Indexed Bonds are fixed income securities whose principal value is periodically adjusted by the rate of inflation. The interest rate on these bonds is generally fixed at issuance at a rate lower than typical bonds. Over the life of an inflation-indexed bond, however, interest will be paid based on a principal value which is adjusted for inflation. Any increase or decrease in the principal amount of an inflation-indexed bond will be included as interest income on the Statements of Operations, even though investors do not receive their principal until maturity. Repayment of the original bond principal upon maturity (as adjusted for inflation) is guaranteed in the case of U.S. Treasury Inflation-Protected Securities (“TIPS”). For bonds that do not
provide a similar guarantee, the adjusted principal value of the bond repaid at maturity may be less than the original principal.
Loans and Other Indebtedness, Loan Participations and Assignments are direct debt instruments which are interests in amounts owed to lenders or lending syndicates by corporate, governmental, or other borrowers. A Fund’s investments in loans may be in the form of participations in loans or assignments of all or a portion of loans from third parties or investments in or originations of loans by the Fund or Funds. A loan is often administered by a bank or other financial institution (the “agent”) that acts as agent for all holders. The agent administers the terms of the loan, as specified in the loan agreement. A Fund may invest in multiple series or tranches of a loan, which may have varying terms and carry different associated risks. When a Fund purchases assignments from agents it acquires direct rights against the borrowers of the loans. These loans may include participations in bridge loans, which are loans taken out by borrowers for a short period (typically less than one year) pending arrangement of more permanent financing through, for example, the issuance of bonds, frequently high yield bonds issued for the purpose of acquisitions.
The types of loans and related investments in which the Funds may invest include, among others, senior loans, subordinated loans (including second lien loans, B-Notes and mezzanine loans), whole loans, commercial real estate and other commercial loans and structured loans. The Funds may originate loans or acquire direct interests in loans through primary loan distributions and/or in private transactions. In the case of subordinated loans, there may be significant indebtedness ranking ahead of the borrower’s obligation to the holder of such a loan, including in the event of the borrower’s
| | | | | | |
| | ANNUAL REPORT | | JUNE 30, 2020 | | 97 |
Notes to Financial Statements (Cont.)
insolvency. Mezzanine loans are typically secured by a pledge of an equity interest in the mortgage borrower that owns the real estate rather than an interest in a mortgage.
Investments in loans may include unfunded loan commitments, which are contractual obligations for funding. Unfunded loan commitments may include revolving credit facilities, which may obligate a Fund to supply additional cash to the borrower on demand. Unfunded loan commitments represent a future obligation in full, even though a percentage of the committed amount may not be utilized by the borrower. When investing in a loan participation, a Fund has the right to receive payments of principal, interest and any fees to which it is entitled only from the agent selling the loan agreement and only upon receipt of payments by the agent from the borrower. A Fund may receive a commitment fee based on the undrawn portion of the underlying line of credit portion of a loan. In certain circumstances, a Fund may receive a penalty fee upon the prepayment of a loan by a borrower. Fees earned or paid are recorded as a component of interest income or interest expense, respectively, on the Statements of Operations. Unfunded loan commitments are reflected as a liability on the Statements of Assets and Liabilities.
Mortgage-Related and Other Asset-Backed Securities directly or indirectly represent a participation in, or are secured by and payable from, loans on real property. Mortgage-related securities are created from pools of residential or commercial mortgage loans, including mortgage loans made by savings and loan institutions, mortgage bankers, commercial banks and others. These securities provide a monthly payment which consists of both interest and principal. Interest may be determined by fixed or adjustable rates. The rate of prepayments on underlying mortgages will affect the price and volatility of a mortgage-related security, and may have the effect of shortening or extending the effective duration of the security relative to what was anticipated at the time of purchase. The timely payment of principal and interest of certain mortgage-related securities is guaranteed with the full faith and credit of the U.S. Government. Pools created and guaranteed by non-governmental issuers, including government-sponsored corporations, may be supported by various forms of insurance or guarantees, but there can be no assurance that private insurers or guarantors can meet their obligations under the insurance policies or guarantee arrangements. Many of the risks of investing in mortgage-related securities secured by commercial mortgage loans reflect the effects of local and other economic conditions on real estate markets, the ability of tenants to make lease payments, and the ability of a property to attract and retain tenants. These securities may be less liquid and may exhibit greater price volatility than other types of mortgage-related or other asset-backed securities. Other asset-backed securities are created from many types of assets, including, but not limited to, auto loans, accounts receivable, such as credit card
receivables and hospital account receivables, home equity loans, student loans, boat loans, mobile home loans, recreational vehicle loans, manufactured housing loans, aircraft leases, computer leases and syndicated bank loans.
Collateralized Debt Obligations (“CDOs”) include Collateralized Bond Obligations (“CBOs”), Collateralized Loan Obligations (“CLOs”) and other similarly structured securities. CBOs and CLOs are types of asset-backed securities. A CBO is a trust which is backed by a diversified pool of high risk, below investment grade fixed income securities. A CLO is a trust typically collateralized by a pool of loans, which may include, among others, domestic and foreign senior secured loans, senior unsecured loans, and subordinate corporate loans, including loans that may be rated below investment grade or equivalent unrated loans. The risks of an investment in a CDO depend largely on the type of the collateral securities and the class of the CDO in which a Fund invests. In addition to the normal risks associated with fixed income securities discussed elsewhere in this report and each Fund’s prospectus and statement of additional information (e.g., prepayment risk, credit risk, liquidity risk, market risk, structural risk, legal risk and interest rate risk (which may be exacerbated if the interest rate payable on a structured financing changes based on multiples of changes in interest rates or inversely to changes in interest rates)), CBOs, CLOs and other CDOs carry additional risks including, but not limited to, (i) the possibility that distributions from collateral securities will not be adequate to make interest or other payments, (ii) the quality of the collateral may decline in value or default, (iii) the risk that a Fund may invest in CBOs, CLOs, or other CDOs that are subordinate to other classes, and (iv) the complex structure of the security may not be fully understood at the time of investment and may produce disputes with the issuer or unexpected investment results.
Collateralized Mortgage Obligations (“CMOs”) are debt obligations of a legal entity that are collateralized by whole mortgage loans or private mortgage bonds and divided into classes. CMOs are structured into multiple classes, often referred to as “tranches”, with each class bearing a different stated maturity and entitled to a different schedule for payments of principal and interest, including prepayments. CMOs may be less liquid and may exhibit greater price volatility than other types of mortgage-related or asset-backed securities.
Stripped Mortgage-Backed Securities (“SMBS”) are derivative multi-class mortgage securities. SMBS are usually structured with two classes that receive different proportions of the interest and principal distributions on a pool of mortgage assets. An SMBS will have one class that will receive all of the interest (the interest-only or “IO” class), while the other class will receive the entire principal (the principal-only or “PO” class). Payments received for IOs are included in interest income on the Statements of Operations. Because no principal will be
June 30, 2020
received at the maturity of an IO, adjustments are made to the cost of the security on a monthly basis until maturity. These adjustments are included in interest income on the Statements of Operations. Payments received for POs are treated as reductions to the cost and par value of the securities.
Payment In-Kind Securities may give the issuer the option at each interest payment date of making interest payments in either cash and/or additional debt securities. Those additional debt securities usually have the same terms, including maturity dates and interest rates, and associated risks as the original bonds. The daily market quotations of the original bonds may include the accrued interest (referred to as a dirty price) and require a pro rata adjustment from the unrealized appreciation (depreciation) on investments to interest receivable on the Statements of Assets and Liabilities.
Perpetual Bonds are fixed income securities with no maturity date but pay a coupon in perpetuity (with no specified ending or maturity date). Unlike typical fixed income securities, there is no obligation for perpetual bonds to repay principal. The coupon payments, however, are mandatory. While perpetual bonds have no maturity date, they may have a callable date in which the perpetuity is eliminated and the issuer may return the principal received on the specified call date. Additionally, a perpetual bond may have additional features, such as interest rate increases at periodic dates or an increase as of a predetermined point in the future.
Restricted Investments are subject to legal or contractual restrictions on resale and may generally be sold privately, but may be required to be registered or exempted from such registration before being sold to the public. Private placement securities are generally considered to be restricted except for those securities traded between qualified institutional investors under the provisions of Rule 144A of the Securities Act of 1933. Disposal of restricted investments may involve time-consuming negotiations and expenses, and prompt sale at an acceptable price may be difficult to achieve. Restricted investments held by the Funds at June 30, 2020, as applicable, are disclosed in the Notes to Schedules of Investments.
Securities Issued by U.S. Government Agencies or Government-Sponsored Enterprises are obligations of and, in certain cases, guaranteed by, the U.S. Government, its agencies or instrumentalities. Some U.S. Government securities, such as Treasury bills, notes and bonds, and securities guaranteed by the Government National Mortgage Association, are supported by the full faith and credit of the U.S. Government; others, such as those of the Federal Home Loan Banks, are supported by the right of the issuer to borrow from the U.S. Department of the Treasury (the “U.S. Treasury”); and others, such as those of the Federal National Mortgage Association (“FNMA” or
“Fannie Mae”), are supported by the discretionary authority of the U.S. Government to purchase the agency’s obligations. U.S. Government securities may include zero coupon securities which do not distribute interest on a current basis and tend to be subject to a greater risk than interest-paying securities of similar maturities.
Government-related guarantors (i.e., not backed by the full faith and credit of the U.S. Government) include FNMA and the Federal Home Loan Mortgage Corporation (“FHLMC” or “Freddie Mac”). FNMA is a government-sponsored corporation. FNMA purchases conventional (i.e., not insured or guaranteed by any government agency) residential mortgages from a list of approved seller/servicers which include state and federally chartered savings and loan associations, mutual savings banks, commercial banks and credit unions and mortgage bankers. Pass-through securities issued by FNMA are guaranteed as to timely payment of principal and interest by FNMA, but are not backed by the full faith and credit of the U.S. Government. FHLMC issues Participation Certificates (“PCs”), which are pass-through securities, each representing an undivided interest in a pool of residential mortgages. FHLMC guarantees the timely payment of interest and ultimate collection of principal, but PCs are not backed by the full faith and credit of the U.S. Government.
In June 2019, under the Single Security Initiative, FNMA and FHLMC started issuing Uniform Mortgage Backed Securities in place of their current offerings of TBA-eligible securities. The Single Security Initiative seeks to support the overall liquidity of the TBA market and aligns the characteristics of FNMA and FHLMC certificates. The effects that the Single Security Initiative may have on the market for TBA and other mortgage-backed securities are uncertain.
Roll-timing strategies can be used where a Fund seeks to extend the expiration or maturity of a position, such as a TBA security on an underlying asset, by closing out the position before expiration and opening a new position with respect to substantially the same underlying asset with a later expiration date. TBA securities purchased or sold are reflected on the Statements of Assets and Liabilities as an asset or liability, respectively.
Separate Trading of Registered Interest and Principal of Securities (“STRIPS”) are U.S. Treasury fixed income securities in which the principal is separated, or stripped, from the interest and each takes the form of zero coupon securities. A STRIP is sold at a significant discount to face value and offers no interest payments; rather, investors receive payment at maturity. Zero coupon securities do not distribute interest on a current basis and tend to be subject to greater risk than interest-paying securities.
Warrants are securities that are usually issued together with a debt security or preferred security and that give the holder the right to buy a
| | | | | | |
| | ANNUAL REPORT | | JUNE 30, 2020 | | 99 |
Notes to Financial Statements (Cont.)
proportionate amount of common stock at a specified price. Warrants are freely transferable and are often traded on major exchanges. Warrants normally have a life that is measured in years and entitle the holder to buy common stock of a company at a price that is usually higher than the market price at the time the warrant is issued. Warrants may entail greater risks than certain other types of investments. Generally, warrants do not carry the right to receive dividends or exercise voting rights with respect to the underlying securities, and they do not represent any rights in the assets of the issuer. In addition, their value does not necessarily change with the value of the underlying securities, and they cease to have value if they are not exercised on or before their expiration date. If the market price of the underlying stock does not exceed the exercise price during the life of the warrant, the warrant will expire worthless. Warrants may increase the potential profit or loss to be realized from the investment as compared with investing the same amount in the underlying securities. Similarly, the percentage increase or decrease in the value of an equity security warrant may be greater than the percentage increase or decrease in the value of the underlying common stock. Warrants may relate to the purchase of equity or debt securities. Debt obligations with warrants attached to purchase equity securities have many characteristics of convertible securities and their prices may, to some degree, reflect the performance of the underlying stock. Debt obligations also may be issued with warrants attached to purchase additional debt securities at the same coupon rate. A decline in interest rates would permit a Fund to sell such warrants at a profit. If interest rates rise, these warrants would generally expire with no value.
When-Issued Transactions are purchases or sales made on a when-issued basis. These transactions are made conditionally because a security, although authorized, has not yet been issued in the market. Transactions to purchase or sell securities on a when-issued basis involve a commitment by a Fund to purchase or sell these securities for a predetermined price or yield, with payment and delivery taking place beyond the customary settlement period. A Fund may sell when-issued securities before they are delivered, which may result in a realized gain (loss).
5. BORROWINGS AND OTHER FINANCING TRANSACTIONS
The Funds may enter into the borrowings and other financing transactions described below to the extent permitted by each Fund’s respective investment policies.
The following disclosures contain information on a Fund’s ability to lend or borrow cash or securities to the extent permitted under the Act, which may be viewed as borrowing or financing transactions by a Fund. The location of these instruments in each Fund’s financial statements is described below.
(a) Repurchase Agreements Under the terms of a typical repurchase agreement, a Fund purchases an underlying debt obligation (collateral) subject to an obligation of the seller to repurchase, and a Fund to resell, the obligation at an agreed-upon price and time. In an open maturity repurchase agreement, there is no pre-determined repurchase date and the agreement can be terminated by the Fund or counterparty at any time. The underlying securities for all repurchase agreements are held by a Fund’s custodian or designated subcustodians under tri-party repurchase agreements and in certain instances will remain in custody with the counterparty. The market value of the collateral must be equal to or exceed the total amount of the repurchase obligations, including interest. Repurchase agreements, if any, including accrued interest, are included on the Statements of Assets and Liabilities. Interest earned is recorded as a component of interest income on the Statements of Operations. In periods of increased demand for collateral, a Fund may pay a fee for the receipt of collateral, which may result in interest expense to the Fund.
(b) Reverse Repurchase Agreements In a reverse repurchase agreement, a Fund delivers a security in exchange for cash to a financial institution, the counterparty, with a simultaneous agreement to repurchase the same or substantially the same security at an agreed upon price and date. In an open maturity reverse repurchase agreement, there is no pre-determined repurchase date and the agreement can be terminated by the Fund or counterparty at any time. A Fund is entitled to receive principal and interest payments, if any, made on the security delivered to the counterparty during the term of the agreement. Cash received in exchange for securities delivered plus accrued interest payments to be made by a Fund to counterparties are reflected as a liability on the Statements of Assets and Liabilities. Interest payments made by a Fund to counterparties are recorded as a component of interest expense on the Statements of Operations. In periods of increased demand for the security, a Fund may receive a fee for use of the security by the counterparty, which may result in interest income to the Fund. A Fund will segregate assets determined to be liquid by the Manager or will otherwise cover its obligations under reverse repurchase agreements.
(c) Sale-Buybacks A sale-buyback financing transaction consists of a sale of a security by a Fund to a financial institution, the counterparty, with a simultaneous agreement to repurchase the same or substantially the same security at an agreed-upon price and date. A Fund is not entitled to receive principal and interest payments, if any, made on the security sold to the counterparty during the term of the agreement. The agreed-upon proceeds for securities to be repurchased by a Fund are reflected as a liability on the Statements of Assets and Liabilities. A Fund will recognize net income represented by the price differential between the price received for the transferred security and the agreed-upon repurchase price. This is commonly referred to as the ‘price drop’. A price
June 30, 2020
drop consists of (i) the foregone interest and inflationary income adjustments, if any, a Fund would have otherwise received had the security not been sold and (ii) the negotiated financing terms between a Fund and counterparty. Foregone interest and inflationary income adjustments, if any, are recorded as components of interest income on the Statements of Operations. Interest payments based upon negotiated financing terms made by a Fund to counterparties are recorded as a component of interest expense on the Statements of Operations. In periods of increased demand for the security, a Fund may receive a fee for use of the security by the counterparty, which may result in interest income to the Fund. A Fund will segregate assets determined to be liquid by the Manager or will otherwise cover its obligations under sale-buyback transactions.
(d) Securities Lending The Funds listed below may seek to earn additional income by lending their securities to certain qualified broker-dealers and institutions on a short-term or long-term basis via a lending agent.
|
|
| Fund Name |
|
PIMCO 25+ Year Zero Coupon U.S. Treasury Index Exchange-Traded Fund |
|
PIMCO 1-5 Year U.S. TIPS Index Exchange-Traded Fund |
|
PIMCO 15+ Year U.S. TIPS Index Exchange-Traded Fund |
|
PIMCO Broad U.S. TIPS Index Exchange-Traded Fund |
|
PIMCO 0-5 Year High Yield Corporate Bond Index Exchange-Traded Fund |
|
PIMCO Investment Grade Corporate Bond Index Exchange-Traded Fund |
|
PIMCO Enhanced Low Duration Active Exchange-Traded Fund |
|
PIMCO Enhanced Short Maturity Active ESG Exchange-Traded Fund |
|
PIMCO Enhanced Short Maturity Active Exchange-Traded Fund |
Securities on loan are required to be secured by cash collateral at least equal to 102% of the domestic, or 105% of the foreign security’s market value. If the market value of the collateral at the close of trading on a business day is less than 100% of the market value of the loaned securities at the close of trading on that day, the borrower shall be required to deliver, by the close of business on the following business day, an additional amount of collateral, so that the total amount of posted collateral is equal to at least 100% of the market value of all the loaned securities as of such preceding day. The Funds will then invest the cash collateral received in the PIMCO Government Money Market Fund and record a liability for the return of the collateral during the period the securities are on loan. Each Fund is subject to a lending limit of 33.33% of total assets (including the value of collateral).
The loans are subject to termination at the option of the borrower or the Fund. Upon termination of the loan, the borrower will return to the lender securities identical to the loaned securities. Should the borrower of the securities fail to return loaned securities, the Fund has the right to repurchase the securities using the collateral in the open market.
The borrower pays fees at the Funds’ direction to the lending agent. The lending agent may retain a portion of the fees and interest earned
on the cash collateral invested as compensation for its services. Investments made with the cash collateral are disclosed on the Schedules of Investments, if applicable. The lending fees and the Funds’ portion of the interest income earned on cash collateral are included on the Statements of Operations as securities lending income, if applicable.
(e) Short Sales Short sales are transactions in which a Fund sells a security that it may not own. A Fund may make short sales of securities to (i) offset potential declines in long positions in similar securities, (ii) to increase the flexibility of the Fund, (iii) for investment return, (iv) as part of a risk arbitrage strategy, and (v) as part of its overall portfolio management strategies involving the use of derivative instruments. When a Fund engages in a short sale, it may borrow the security sold short and deliver it to the counterparty. A Fund will ordinarily have to pay a fee or premium to borrow a security and be obligated to repay the lender of the security any dividend or interest that accrues on the security during the period of the loan. Securities sold in short sale transactions and the dividend or interest payable on such securities, if any, are reflected as payable for short sales on the Statements of Assets and Liabilities. Short sales expose a Fund to the risk that it will be required to cover its short position at a time when the security or other asset has appreciated in value, thus resulting in losses to a Fund. A short sale is “against the box” if a Fund holds in its portfolio or has the right to acquire the security sold short, or securities identical to the security sold short, at no additional cost. A Fund will be subject to additional risks to the extent that it engages in short sales that are not “against the box.” A Fund’s loss on a short sale could theoretically be unlimited in cases where a Fund is unable, for whatever reason, to close out its short position.
(f) Interfund Lending In accordance with an exemptive order (the “Order”) from the SEC, the Funds of the Trust may participate in a joint lending and borrowing facility for temporary purposes (the “Interfund Lending Program”), subject to compliance with the terms and conditions of the Order, and to the extent permitted by each Funds’ investment policies and restrictions. The Funds are currently permitted to borrow under the Interfund Lending Program. A lending fund may lend in aggregate up to 15% of its current net assets at the time of the interfund loan, but may not lend more than 5% of its net assets to any one borrowing fund through the Interfund Lending Program. A borrowing fund may not borrow through the Interfund Lending Program or from any other source if its total outstanding borrowings immediately after the borrowing would be more than 33 1/3% of its total assets (or any lower threshold provided for by the funds’ investment restrictions). If a borrowing funds’ total outstanding borrowings exceed 10% of its total assets, each of its outstanding interfund loans will be subject to collateralization of at least 102% of the outstanding principal value of the loan. All interfund loans are for temporary or emergency purposes and the interfund loan rate to be
| | | | | | |
| | ANNUAL REPORT | | JUNE 30, 2020 | | 101 |
Notes to Financial Statements (Cont.)
charged will be the average of the highest current overnight repurchase agreement rate available to a lending fund and the bank loan rate, as calculated according to a formula established by the Board.
On March 23, 2020, the SEC issued an exemptive order (the “Temporary Order”) to provide temporary relief to the Funds of the Trust in relation to the Interfund Lending Program, and the Funds’ Board of Trustees has authorized the Funds to rely on the Temporary Order. With respect to interfund lending, the Temporary Order permits, under certain conditions, a lending fund to lend in aggregate up to 25% of its current net assets at the time of the interfund loan and to make interfund loans with term limits of up to the expiration of the Temporary Order, notwithstanding the current limit of seven business days under the Order. The SEC determined in June 2020 that the Temporary Order would not be extended after its expiration on June 30, 2020.
During the period ended June 30, 2020, the Funds did not participate in the Interfund Lending Program.
6. FINANCIAL DERIVATIVE INSTRUMENTS
The Funds may enter into the financial derivative instruments described below to the extent permitted by each Fund’s respective investment policies.
The following disclosures contain information on how and why the Funds use financial derivative instruments, and how financial derivative instruments affect the Funds’ financial position, results of operations and cash flows. The location and fair value amounts of these instruments on the Statements of Assets and Liabilities and the net realized gain (loss) and net change in unrealized appreciation (depreciation) on the Statements of Operations, each categorized by type of financial derivative contract and related risk exposure, are included in a table in the Notes to Schedules of Investments. The financial derivative instruments outstanding as of period end and the amounts of net realized gain (loss) and net change in unrealized appreciation (depreciation) on financial derivative instruments during the period, as disclosed in the Notes to Schedules of Investments, serve as indicators of the volume of financial derivative activity for the Funds.
(a) Forward Foreign Currency Contracts may be engaged, in connection with settling planned purchases or sales of securities, to hedge the currency exposure associated with some or all of a Fund’s securities or as part of an investment strategy. A forward foreign currency contract is an agreement between two parties to buy and sell a currency at a set price on a future date. The market value of a forward foreign currency contract fluctuates with changes in foreign currency exchange rates. Forward foreign currency contracts are marked to market daily, and the change in value is recorded by a Fund as an unrealized gain (loss). Realized gains (losses) are equal to the
difference between the value of the contract at the time it was opened and the value at the time it was closed and are recorded upon delivery or receipt of the currency. These contracts may involve market risk in excess of the unrealized gain (loss) reflected on the Statements of Assets and Liabilities. In addition, a Fund could be exposed to risk if the counterparties are unable to meet the terms of the contracts or if the value of the currency changes unfavorably to the U.S. dollar. To mitigate such risk, cash or securities may be exchanged as collateral pursuant to the terms of the underlying contracts.
(b) Futures Contracts are agreements to buy or sell a security or other asset for a set price on a future date and are traded on an exchange. A Fund may use futures contracts to manage its exposure to the securities markets or to movements in interest rates and currency values. The primary risks associated with the use of futures contracts are the imperfect correlation between the change in market value of the securities held by a Fund and the prices of futures contracts and the possibility of an illiquid market. Futures contracts are valued based upon their quoted daily settlement prices. Upon entering into a futures contract, a Fund is required to deposit with its futures broker an amount of cash, U.S. Government and Agency Obligations, or select sovereign debt, in accordance with the initial margin requirements of the broker or exchange. Futures contracts are marked to market daily and based on such movements in the price of the contracts, an appropriate payable or receivable for the change in value may be posted or collected by the Fund (“Futures Variation Margin”). Futures Variation Margins, if any, are disclosed within centrally cleared financial derivative instruments on the Statements of Assets and Liabilities. Gains (losses) are recognized but not considered realized until the contracts expire or close. Futures contracts involve, to varying degrees, risk of loss in excess of the Futures Variation Margin included within exchange traded or centrally cleared financial derivative instruments on the Statements of Assets and Liabilities.
(c) Options Contracts may be written or purchased to enhance returns or to hedge an existing position or future investment. A Fund may write call and put options on securities and financial derivative instruments it owns or in which it may invest. Writing put options tends to increase a Fund’s exposure to the underlying instrument. Writing call options tends to decrease a Fund’s exposure to the underlying instrument. When a Fund writes a call or put, an amount equal to the premium received is recorded and subsequently marked to market to reflect the current value of the option written. These amounts are included on the Statements of Assets and Liabilities. Premiums received from writing options which expire are treated as realized gains. Premiums received from writing options which are exercised or closed are added to the proceeds or offset against amounts paid on the underlying futures, swap, security or currency transaction to determine the realized gain (loss). Certain options may be written with premiums to be determined
June 30, 2020
on a future date. The premiums for these options are based upon implied volatility parameters at specified terms. A Fund as a writer of an option has no control over whether the underlying instrument may be sold (“call”) or purchased (“put”) and as a result bears the market risk of an unfavorable change in the price of the instrument underlying the written option. There is the risk a Fund may not be able to enter into a closing transaction because of an illiquid market.
Purchasing call options tends to increase a Fund’s exposure to the underlying instrument. Purchasing put options tends to decrease a Fund’s exposure to the underlying instrument. A Fund pays a premium which is included as an asset on the Statements of Assets and Liabilities and subsequently marked to market to reflect the current value of the option. Premiums paid for purchasing options which expire are treated as realized losses. Certain options may be purchased with premiums to be determined on a future date. The premiums for these options are based upon implied volatility parameters at specified terms. The risk associated with purchasing put and call options is limited to the premium paid. Premiums paid for purchasing options which are exercised or closed are added to the amounts paid or offset against the proceeds on the underlying investment transaction to determine the realized gain (loss) when the underlying transaction is executed.
Credit Default Swaptions may be written or purchased to hedge exposure to the credit risk of an investment without making a commitment to the underlying instrument. A credit default swaption is an option to sell or buy credit protection on a specific reference by entering into a pre-defined swap agreement by some specified date in the future.
Interest Rate Swaptions may be written or purchased to enter into a pre-defined swap agreement or to shorten, extend, cancel or otherwise modify an existing swap agreement, by some specified date in the future. The writer of the swaption becomes the counterparty to the swap if the buyer exercises. The interest rate swaption agreement will specify whether the buyer of the swaption will be a fixed-rate receiver or a fixed-rate payer upon exercise.
Options on Exchange-Traded Futures Contracts (“Futures Option”) may be written or purchased to hedge an existing position or future investment, for speculative purposes or to manage exposure to market movements. A Futures Option is an option contract in which the underlying instrument is a single futures contract.
Options on Securities may be written or purchased to enhance returns or to hedge an existing position or future investment. An option on a security uses a specified security as the underlying instrument for the option contract.
(d) Swap Agreements are bilaterally negotiated agreements between a Fund and a counterparty to exchange or swap investment cash flows,
assets, foreign currencies or market-linked returns at specified, future intervals. Swap agreements may be privately negotiated in the over the counter market (“OTC swaps”) or may be cleared through a third party, known as a central counterparty or derivatives clearing organization (“Centrally Cleared Swaps”). A Fund may enter into asset, credit default, cross-currency, interest rate, total return, variance and other forms of swap agreements to manage its exposure to credit, currency, interest rate, commodity, equity and inflation risk. In connection with these agreements, securities or cash may be identified as collateral or margin in accordance with the terms of the respective swap agreements to provide assets of value and recourse in the event of default or bankruptcy/insolvency.
Centrally Cleared Swaps are marked to market daily based upon valuations as determined from the underlying contract or in accordance with the requirements of the central counterparty or derivatives clearing organization. Changes in market value, if any, are reflected as a component of net change in unrealized appreciation (depreciation) on the Statements of Operations. Daily changes in valuation of centrally cleared swaps (“Swap Variation Margin”), if any, are disclosed within centrally cleared financial derivative instruments on the Statements of Assets and Liabilities. Centrally Cleared and OTC swap payments received or paid at the beginning of the measurement period are included on the Statements of Assets and Liabilities and represent premiums paid or received upon entering into the swap agreement to compensate for differences between the stated terms of the swap agreement and prevailing market conditions (credit spreads, currency exchange rates, interest rates, and other relevant factors). Upfront premiums received (paid) are initially recorded as liabilities (assets) and subsequently marked to market to reflect the current value of the swap. These upfront premiums are recorded as realized gain (loss) on the Statements of Operations upon termination or maturity of the swap. A liquidation payment received or made at the termination of the swap is recorded as realized gain (loss) on the Statements of Operations. Net periodic payments received or paid by a Fund are included as part of realized gain (loss) on the Statements of Operations.
For purposes of applying certain of a Fund’s investment policies and restrictions, swap agreements, like other derivative instruments, may be valued by a Fund at market value, notional value or full exposure value. In the case of a credit default swap, in applying certain of a Fund’s investment policies and restrictions, the Funds will value the credit default swap at its notional value or its full exposure value (i.e., the sum of the notional amount for the contract plus the market value), but may value the credit default swap at market value for purposes of applying certain of a Fund’s other investment policies and restrictions. For example, a Fund may value credit default swaps at full exposure value for purposes of a Fund’s credit quality guidelines (if any) because such value in general better reflects a Fund’s actual economic exposure
| | | | | | |
| | ANNUAL REPORT | | JUNE 30, 2020 | | 103 |
Notes to Financial Statements (Cont.)
during the term of the credit default swap agreement. As a result, a Fund may, at times, have notional exposure to an asset class (before netting) that is greater or lesser than the stated limit or restriction noted in a Fund’s prospectus. In this context, both the notional amount and the market value may be positive or negative depending on whether a Fund is selling or buying protection through the credit default swap. The manner in which certain securities or other instruments are valued by a Fund for purposes of applying investment policies and restrictions may differ from the manner in which those investments are valued by other types of investors.
Entering into swap agreements involves, to varying degrees, elements of interest, credit, market and documentation risk in excess of the amounts recognized on the Statements of Assets and Liabilities. Such risks involve the possibility that there will be no liquid market for these agreements, that the counterparty to the agreements may default on its obligation to perform or disagree as to the meaning of contractual terms in the agreements and that there may be unfavorable changes in interest rates or the values of the asset upon which the swap is based.
A Fund’s maximum risk of loss from counterparty credit risk is the discounted net value of the cash flows to be received from the counterparty over the contract’s remaining life, to the extent that amount is positive. The risk may be mitigated by having a master netting arrangement between a Fund and the counterparty and by the posting of collateral to a Fund to cover a Fund’s exposure to the counterparty.
To the extent a Fund has a policy to limit the net amount owed to or to be received from a single counterparty under existing swap agreements, such limitation only applies to counterparties to OTC swaps and does not apply to centrally cleared swaps where the counterparty is a central counterparty or derivatives clearing organization.
Credit Default Swap Agreements on corporate, loan, sovereign, U.S. municipal or U.S. Treasury issues are entered into to provide a measure of protection against defaults of the issuers (i.e., to reduce risk where a Fund owns or has exposure to the referenced obligation) or to take an active long or short position with respect to the likelihood of a particular issuer’s default. Credit default swap agreements involve one party making a stream of payments (referred to as the buyer of protection) to another party (the seller of protection) in exchange for the right to receive a specified return in the event that the referenced entity, obligation or index, as specified in the swap agreement, undergoes a certain credit event. As a seller of protection on credit default swap agreements, a Fund will generally receive from the buyer of protection a fixed rate of income throughout the term of the swap provided that there is no credit event. As the seller, a Fund would effectively add leverage to its portfolio because, in addition to its total net assets, a Fund would be subject to investment exposure on the notional amount of the swap.
If a Fund is a seller of protection and a credit event occurs, as defined under the terms of that particular swap agreement, a Fund will either (i) pay to the buyer of protection an amount equal to the notional amount of the swap and take delivery of the referenced obligation, other deliverable obligations or underlying securities comprising the referenced index or (ii) pay a net settlement amount in the form of cash or securities equal to the notional amount of the swap less the recovery value of the referenced obligation or underlying securities comprising the referenced index. If a Fund is a buyer of protection and a credit event occurs, as defined under the terms of that particular swap agreement, a Fund will either (i) receive from the seller of protection an amount equal to the notional amount of the swap and deliver the referenced obligation, other deliverable obligations or underlying securities comprising the referenced index or (ii) receive a net settlement amount in the form of cash or securities equal to the notional amount of the swap less the recovery value of the referenced obligation or underlying securities comprising the referenced index. Recovery values are estimated by market makers considering either industry standard recovery rates or entity specific factors and considerations until a credit event occurs. If a credit event has occurred, the recovery value is determined by a facilitated auction whereby a minimum number of allowable broker bids, together with a specified valuation method, are used to calculate the settlement value. The ability to deliver other obligations may result in a cheapest-to-deliver option (the buyer of protection’s right to choose the deliverable obligation with the lowest value following a credit event).
Credit default swap agreements on credit indices involve one party making a stream of payments to another party in exchange for the right to receive a specified return in the event of a write-down, principal shortfall, interest shortfall or default of all or part of the referenced entities comprising the credit index. A credit index is a basket of credit instruments or exposures designed to be representative of some part of the credit market as a whole. These indices are made up of reference credits that are judged by a poll of dealers to be the most liquid entities in the credit default swap market based on the sector of the index. Components of the indices may include, but are not limited to, investment grade securities, high yield securities, asset-backed securities, emerging markets, and/or various credit ratings within each sector. Credit indices are traded using credit default swaps with standardized terms including a fixed spread and standard maturity dates. An index credit default swap references all the names in the index, and if there is a default, the credit event is settled based on that name’s weight in the index. The composition of the indices changes periodically, usually every six months, and for most indices, each name has an equal weight in the index. A Fund may use credit default swaps on credit indices to hedge a portfolio of credit default swaps or bonds, which is less expensive than it would be to buy many credit default
June 30, 2020
swaps to achieve a similar effect. Credit default swaps on indices are instruments for protecting investors owning bonds against default, and traders use them to speculate on changes in credit quality.
Implied credit spreads, represented in absolute terms, utilized in determining the market value of credit default swap agreements on corporate, loan, sovereign, U.S. municipal or U.S. Treasury issues as of period end, if any, are disclosed in the Notes to Schedules of Investments. They serve as an indicator of the current status of payment/performance risk and represent the likelihood or risk of default for the reference entity. The implied credit spread of a particular referenced entity reflects the cost of buying/selling protection and may include upfront payments required to be made to enter into the agreement. Wider credit spreads represent a deterioration of the referenced entity’s credit soundness and a greater likelihood or risk of default or other credit event occurring as defined under the terms of the agreement. For credit default swap agreements on asset-backed securities and credit indices, the quoted market prices and resulting values serve as the indicator of the current status of the payment/performance risk. Increasing market values, in absolute terms when compared to the notional amount of the swap, represent a deterioration of the referenced entity’s credit soundness and a greater likelihood or risk of default or other credit event occurring as defined under the terms of the agreement.
The maximum potential amount of future payments (undiscounted) that a Fund as a seller of protection could be required to make under a credit default swap agreement equals the notional amount of the agreement. Notional amounts of each individual credit default swap agreement outstanding as of period end for which a Fund is the seller of protection are disclosed in the Notes to Schedules of Investments. These potential amounts would be partially offset by any recovery values of the respective referenced obligations, upfront payments received upon entering into the agreement, or net amounts received from the settlement of buy protection credit default swap agreements entered into by a Fund for the same referenced entity or entities.
Interest Rate Swap Agreements may be entered into to help hedge against interest rate risk exposure and to maintain a Fund’s ability to generate income at prevailing market rates. The value of the fixed rate bonds that the Funds hold may decrease if interest rates rise. To
help hedge against this risk and to maintain its ability to generate income at prevailing market rates, a Fund may enter into interest rate swap agreements. Interest rate swap agreements involve the exchange by a Fund with another party for their respective commitment to pay or receive interest on the notional amount of principal. Certain forms of interest rate swap agreements may include: (i) interest rate caps, under which, in return for a premium, one party agrees to make payments to the other to the extent that interest rates exceed a specified rate, or “cap”, (ii) interest rate floors, under which, in return for a premium, one party agrees to make payments to the other to the extent that interest rates fall below a specified rate, or “floor”, (iii) interest rate collars, under which a party sells a cap and purchases a floor or vice versa in an attempt to protect itself against interest rate movements exceeding given minimum or maximum levels, (iv) callable interest rate swaps, under which the buyer pays an upfront fee in consideration for the right to early terminate the swap transaction in whole, at zero cost and at a predetermined date and time prior to the maturity date, (v) spreadlocks, which allow the interest rate swap users to lock in the forward differential (or spread) between the interest rate swap rate and a specified benchmark, or (vi) basis swaps, under which two parties can exchange variable interest rates based on different segments of money markets.
Total Return Swap Agreements are entered into to gain or mitigate exposure to the underlying reference asset. Total return swap agreements involve commitments where single or multiple cash flows are exchanged based on the price of an underlying reference asset and on a fixed or variable interest rate. Total return swap agreements may involve commitments to pay interest in exchange for a market-linked return. One counterparty pays out the total return of a specific underlying reference asset, which may include a single security, a basket of securities, or an index, and in return receives a fixed or variable rate. At the maturity date, a net cash flow is exchanged where the total return is equivalent to the return of the underlying reference asset less a financing rate, if any. As a receiver, a Fund would receive payments based on any net positive total return and would owe payments in the event of a net negative total return. As the payer, a Fund would owe payments on any net positive total return, and would receive payments in the event of a net negative total return.
| | | | | | |
| | ANNUAL REPORT | | JUNE 30, 2020 | | 105 |
Notes to Financial Statements (Cont.)
7. PRINCIPAL AND OTHER RISKS
(a) Principal Risks
The principal risks of investing in a Fund, which could adversely affect its net asset value, yield and total return, are listed below.
| | | | | | | | | | | | | | | | | | | | | | | | | | | | |
| Risks | | | | | PIMCO 25+
Year Zero
Coupon U.S.
Treasury
Index
Exchange-
Traded Fund | | PIMCO 1-5
Year U.S.
TIPS Index
Exchange-
Traded Fund | | PIMCO 15+
Year U.S.
TIPS Index
Exchange-
Traded Fund | | PIMCO
Broad U.S.
TIPS Index
Exchange-
Traded Fund | | PIMCO 0-5
Year High
Yield
Corporate
Bond Index
Exchange-
Traded Fund | | PIMCO
Investment
Grade
Corporate
Bond Index
Exchange-
Traded Fund | | PIMCO
Active Bond
Exchange-
Traded Fund | | PIMCO
Enhanced
Low
Duration
Active
Exchange-
Traded Fund | | PIMCO Enhanced Short Maturity Active ESG Exchange- Traded Fund | | PIMCO
Enhanced
Short
Maturity
Active
Exchange-
Traded Fund | | PIMCO
Intermediate
Municipal
Bond Active
Exchange-
Traded Fund | | PIMCO Short
Term
Municipal
Bond Active
Exchange-
Traded Fund |
| | | | | | | | | | | | | |
New Fund | | | | | | — | | — | | — | | — | | — | | — | | — | | — | | X | | — | | — | | — |
| | | | | | | | | | | | | |
Small Fund | | | | | | — | | — | | — | | X | | — | | — | | — | | — | | X | | — | | — | | — |
| | | | | | | | | | | | | |
Market Trading | | | | | | X | | X | | X | | X | | X | | X | | X | | X | | X | | X | | X | | X |
| | | | | | | | | | | | | |
Interest Rate | | | | | | X | | X | | X | | X | | X | | X | | X | | X | | X | | X | | X | | X |
| | | | | | | | | | | | | |
Call | | | | | | X | | X | | X | | X | | X | | X | | X | | X | | X | | X | | X | | X |
| | | | | | | | | | | | | |
Inflation-Indexed Security | | | | | | — | | X | | X | | X | | — | | — | | — | | — | | — | | — | | — | | — |
| | | | | | | | | | | | | |
Credit | | | | | | X | | X | | X | | X | | X | | X | | X | | X | | X | | X | | X | | X |
| | | | | | | | | | | | | |
High Yield | | | | | | — | | — | | — | | — | | X | | — | | X | | X | | — | | — | | — | | — |
| | | | | | | | | | | | | |
Market | | | | | | X | | X | | X | | X | | X | | X | | X | | X | | X | | X | | X | | X |
| | | | | | | | | | | | | |
Municipal Bond | | | | | | — | | — | | — | | — | | — | | — | | — | | — | | — | | — | | X | | X |
| | | | | | | | | | | | | |
Issuer | | | | | | — | | — | | — | | — | | X | | X | | X | | X | | X | | X | | X | | X |
| | | | | | | | | | | | | |
Liquidity | | | | | | X | | X | | X | | X | | X | | X | | X | | X | | X | | X | | X | | X |
| | | | | | | | | | | | | |
Derivatives | | | | | | X | | X | | X | | X | | X | | X | | X | | X | | — | | — | | X | | X |
| | | | | | | | | | | | | |
Equity | | | | | | — | | — | | — | | — | | — | | — | | X | | — | | — | | — | | — | | — |
| | | | | | | | | | | | | |
Mortgage-Related and Other Asset Backed Securities | | | | | | — | | — | | — | | — | | — | | — | | X | | X | | X | | X | | — | | — |
| | | | | | | | | | | | | |
Foreign (Non-U.S.) Investment | | | | | | — | | — | | — | | — | | X | | X | | X | | X | | X | | X | | — | | — |
| | | | | | | | | | | | | |
Emerging Markets | | | | | | — | | — | | — | | — | | X | | X | | X | | X | | — | | — | | — | | — |
| | | | | | | | | | | | | |
Sovereign Debt | | | | | | — | | — | | — | | — | | X | | X | | — | | — | | — | | — | | — | | — |
| | | | | | | | | | | | | |
Currency | | | | | | — | | — | | — | | — | | — | | — | | X | | X | | X | | — | | — | | — |
| | | | | | | | | | | | | |
Leveraging | | | | | | X | | X | | X | | X | | X | | X | | X | | X | | X | | X | | X | | X |
| | | | | | | | | | | | | |
Management and Tracking Error | | | | | | X | | X | | X | | X | | X | | X | | — | | — | | — | | — | | — | | — |
| | | | | | | | | | | | | |
Indexing | | | | | | X | | X | | X | | X | | X | | X | | — | | — | | — | | — | | — | | — |
| | | | | | | | | | | | | |
Management | | | | | | — | | — | | — | | — | | — | | — | | X | | X | | X | | X | | X | | X |
| | | | | | | | | | | | | |
California State-Specific | | | | | | — | | — | | — | | — | | — | | — | | — | | — | | — | | — | | X | | — |
| | | | | | | | | | | | | |
New York State-Specific | | | | | | — | | — | | — | | — | | — | | — | | — | | — | | — | | — | | X | | — |
| | | | | | | | | | | | | |
Municipal Project-Specific | | | | | | — | | — | | — | | — | | — | | — | | — | | — | | — | | — | | X | | X |
| | | | | | | | | | | | | |
Short Exposure | | | | | | — | | — | | — | | — | | — | | — | | X | | X | | — | | — | | — | | — |
| | | | | | | | | | | | | |
Convertible Securities | | | | | | — | | — | | — | | — | | — | | — | | X | | — | | — | | — | | — | | — |
| | | | | | | | | | | | | |
Tax-Efficient Investing | | | | | | — | | — | | — | | — | | — | | — | | X | | X | | — | | — | | — | | — |
| | | | | | | | | | | | | |
Distribution Rate | | | | | | — | | — | | — | | — | | — | | — | | X | | X | | — | | — | | — | | — |
| | | | | | | | | | | | | |
Responsible Investing Risk | | | | | | — | | — | | — | | — | | — | | — | | — | | — | | X | | — | | — | | — |
Please see “Description of Principal Risks” in a Fund’s prospectus for a more detailed description of the risks of investing in a Fund.
New Fund Risk is the risk that a new fund’s performance may not represent how the fund is expected to or may perform in the long term. In addition, new funds have limited operating histories for investors to evaluate and new funds may not attract sufficient assets to achieve investment and trading efficiencies.
Small Fund Risk is the risk that a smaller Fund may not achieve investment or trading efficiencies. Additionally, a smaller Fund may be more adversely affected by large purchases or redemptions of Fund shares.
Market Trading Risk is the risk that an active secondary trading market for Fund shares does not continue once developed, that a Fund may not continue to meet a listing exchange’s trading or listing requirements, or that Fund shares trade at prices other than a Fund’s net asset value.
Interest Rate Risk is the risk that fixed income securities will decline in value because of an increase in interest rates; a fund with a longer average portfolio duration will be more sensitive to changes in interest rates than a fund with a shorter average portfolio duration.
Call Risk is the risk that an issuer may exercise its right to redeem a fixed income security earlier than expected (a call). Issuers may call
June 30, 2020
outstanding securities prior to their maturity for a number of reasons (e.g., declining interest rates, changes in credit spreads and improvements in the issuer’s credit quality). If an issuer calls a security that a Fund has invested in, a Fund may not recoup the full amount of its initial investment and may be forced to reinvest in lower-yielding securities, securities with greater credit risks or securities with other, less favorable features.
Inflation-Indexed Security Risk is the risk that the value of an inflation-indexed security (such as TIPS) tends to decrease when real interest rates increase and increase when real interest rates decrease and interest payments on inflation-indexed securities will vary along with changes in the CPI.
Credit Risk is the risk that a Fund could lose money if the issuer or guarantor of a fixed income security, or the counterparty to a derivative contract, is unable or unwilling, or is perceived (whether by market participants, rating agencies, pricing services or otherwise) as unable or unwilling, to meet its financial obligations.
High Yield Risk is the risk that high yield securities and unrated securities of similar credit quality (commonly known as “junk bonds”) are subject to greater levels of credit, call and liquidity risks. High yield securities are considered primarily speculative with respect to the issuer’s continuing ability to make principal and interest payments, and may be more volatile than higher-rated securities of similar maturity.
Market Risk is the risk that the value of securities owned by a Fund may go up or down, sometimes rapidly or unpredictably, due to factors affecting securities markets generally or particular industries.
Municipal Bond Risk is the risk that by investing in Municipal Bonds a Fund may be affected significantly by the economic, regulatory or political developments affecting the ability of issuers of Municipal Bonds to pay interest or repay principal.
Issuer Risk is the risk that the value of a security may decline for a reason directly related to the issuer, such as management performance, financial leverage and reduced demand for the issuer’s goods or services.
Liquidity Risk is the risk that a particular investment may be difficult to purchase or sell and that a Fund may be unable to sell illiquid investments at an advantageous time or price or achieve its desired level of exposure to a certain sector. Liquidity risk may result from the lack of an active market, reduced number and capacity of traditional market participants to make a market in fixed income securities, and may be magnified in a rising interest rate environment or other circumstances where investor redemptions from fixed income funds may be higher than normal, causing increased supply in the market due to selling activity.
Derivatives Risk is the risk of investing in derivative instruments (such as futures, swaps and structured securities), including leverage, liquidity, interest rate, market, credit and management risks, mispricing or valuation complexity. Changes in the value of the derivative may not correlate perfectly with, and may be more sensitive to market events than, the underlying asset, rate or index, and a Fund could lose more than the initial amount invested. A Fund’s use of derivatives may result in losses to a Fund, a reduction in a Fund’s returns and/or increased volatility. Over-the-counter (“OTC”) derivatives are also subject to the risk that a counterparty to the transaction will not fulfill its contractual obligations to the other party, as many of the protections afforded to centrally-cleared derivative transactions might not be available for OTC derivatives. For derivatives traded on an exchange or through a central counterparty, credit risk resides with a Fund’s clearing broker, or the clearinghouse itself, rather than with a counterparty in an OTC derivative transaction. Changes in regulation relating to a fund’s use of derivatives and related instruments could potentially limit or impact a Fund’s ability to invest in derivatives, limit a Fund’s ability to employ certain strategies that use derivatives and/or adversely affect the value of derivatives and a Fund’s performance.
Equity Risk is the risk that the value of equity or equity-related securities may decline due to general market conditions which are not specifically related to a particular company or to factors affecting a particular industry or industries. Equity or equity-related securities generally have greater price volatility than fixed income securities.
Mortgage-Related and Other Asset-Backed Securities Risk is the risk of investing in mortgage-related and other asset-backed securities, including interest rate risk, extension risk, prepayment risk, and credit risk.
Foreign (Non-U.S.) Investment Risk is the risk that investing in foreign (non-U.S.) securities may result in a Fund experiencing more rapid and extreme changes in value than a fund that invests exclusively in securities of U.S. companies, due to smaller markets, differing reporting, accounting and auditing standards, increased risk of delayed settlement of portfolio transactions or loss of certificates of portfolio securities, and the risk of unfavorable foreign government actions, including nationalization, expropriation or confiscatory taxation, currency blockage, or political changes or diplomatic developments. Foreign securities may also be less liquid and more difficult to value than securities of U.S. issuers.
Emerging Markets Risk is the risk of investing in emerging market securities, primarily increased foreign (non-U.S.) investment risk.
Currency Risk is the risk that foreign (non-U.S.) currencies will change in value relative to the U.S. dollar and affect a Fund’s investments in foreign (non-U.S.) currencies or in securities that trade in, and receive revenues in, or in derivatives that provide exposure to, foreign (non-U.S.) currencies.
| | | | | | |
| | ANNUAL REPORT | | JUNE 30, 2020 | | 107 |
Notes to Financial Statements (Cont.)
Sovereign Debt Risk is the risk that investments in fixed income instruments issued by sovereign entities may decline in value as a result of default or other adverse credit event resulting from an issuer’s inability or unwillingness to make principal or interest payments in a timely fashion.
Currency Risk is the risk that foreign (non-U.S.) currencies will change in value relative to the U.S. dollar and affect a Fund’s investments in foreign (non-U.S.) currencies or in securities that trade in, and receive revenues in, or in derivatives that provide exposure to, foreign (non-U.S.) currencies.
Leveraging Risk is the risk that certain transactions of a Fund, such as reverse repurchase agreements, loans of portfolio securities, and the use of when-issued, delayed delivery or forward commitment transactions, or derivative instruments, may give rise to leverage, magnifying gains and losses and causing a Fund to be more volatile than if it had not been leveraged. This means that leverage entails a heightened risk of loss.
Management and Tracking Error Risk is the risk that the portfolio manager’s investment decisions may not produce the desired results or that a Fund’s portfolio may not closely track the Underlying Index for a number of reasons. A Fund incurs operating expenses, which are not applicable to the Underlying Index, and the costs of buying and selling securities, especially when rebalancing a Fund’s portfolio to reflect changes in the composition of the Underlying Index. Performance of a Fund and the Underlying Index may vary due to asset valuation differences and differences between a Fund’s portfolio and the Underlying Index due to legal restrictions, cost or liquidity restraints. The risk that performance of a Fund and the Underlying Index may vary may be heightened during periods of increased market volatility or other unusual market conditions. In addition, a Fund’s use of a representative sampling approach may cause a Fund to be less correlated to the return of the Underlying Index than if a Fund held all of the securities in the Underlying Index.
Indexing Risk is the risk that a Fund is negatively affected by general declines in the asset classes represented by the Underlying Index.
Management Risk is the risk that the investment techniques and risk analyses applied by PIMCO will not produce the desired results and that legislative, regulatory, or tax restrictions, policies or developments may affect the investment techniques available to PIMCO and the individual portfolio manager in connection with managing a Fund. There is no guarantee that the investment objective of a Fund will be achieved.
California State-Specific Risk is the risk that by concentrating its investments in California Municipal Bonds, a Fund may be affected significantly by economic, regulatory or political developments affecting the ability of California issuers to pay interest or repay principal.
New York State-Specific Risk is the risk that by concentrating its investments in New York Municipal Bonds, a Fund may be affected significantly by economic, regulatory or political developments affecting the ability of New York issuers to pay interest or repay principal.
Municipal Project-Specific Risk is the risk that a Fund may be more sensitive to adverse economic, business or political developments if it invests a substantial portion of its assets in the bonds of similar projects (such as those relating to education, health care, housing, transportation, and utilities), industrial development bonds, or in bonds from issuers in a single state.
Short Exposure Risk is the risk of entering into short sales, including the potential loss of more money than the actual cost of the investment, and the risk that the third party to the short sale will not fulfill its contractual obligations, causing a loss to a Fund.
Convertible Securities Risk is the risk that arises when convertible securities share both fixed income and equity characteristics. Convertible securities are subject to risks to which fixed income and equity investments are subject. These risks include equity risk, interest rate risk and credit risk.
Tax-Efficient Investing Risk is the risk that investment strategies intended to manage capital gain distributions may not succeed, and that such strategies may reduce investment returns or result in investment losses.
Distribution Rate Risk is the risk that a Fund’s distribution rate may change unexpectedly as a result of numerous factors, including changes in realized and projected market returns, fluctuations in market interest rates, Fund performance and other factors.
Responsible Investing Risk is the risk that, because a Fund’s responsible investment strategy may select or exclude securities of certain issuers for reasons other than performance, the Fund may underperform funds that do not utilize a responsible investment strategy. Responsible investing is qualitative and subjective by nature, and there is no guarantee that the criteria utilized by PIMCO or any judgment exercised by PIMCO will reflect the beliefs or values of any particular investor.
(b) Other Risks
In general, a Fund may be subject to additional risks, including, but not limited to, risks related to government regulation and intervention in financial markets, operational risks, risks associated with financial, economic and global market disruptions, and cybersecurity risks. Please see a Fund’s prospectus and Statement of Additional Information for a more detailed description of the risks of investing in a Fund. Please see the Important Information section of this report for additional discussion of certain regulatory and market developments (such as the anticipated discontinuation of the London Interbank Offered Rate) that may impact a Fund’s performance.
June 30, 2020
Market Disruption Risk A Fund is subject to investment and operational risks associated with financial, economic and other global market developments and disruptions, including those arising from war, terrorism, market manipulation, government interventions, defaults and shutdowns, political changes or diplomatic developments, public health emergencies (such as the spread of infectious diseases, pandemics and epidemics) and natural/environmental disasters, which can all negatively impact the securities markets and cause a Fund to lose value. These events can also impair the technology and other operational systems upon which a Fund’s service providers, including PIMCO as a Fund’s investment adviser, rely, and could otherwise disrupt a Fund’s service providers’ ability to fulfill their obligations to a Fund. For example, the recent spread of an infectious respiratory illness caused by a novel strain of coronavirus (known as COVID-19) has caused volatility, severe market dislocations and liquidity constraints in many markets, including markets for the securities a Fund holds, and may adversely affect a Fund’s investments and operations. Please see the Important Information section for additional discussion of the COVID-19 pandemic.
Government Intervention in Financial Markets Federal, state, and other governments, their regulatory agencies, or self-regulatory organizations may take actions that affect the regulation of the instruments in which a Fund invests, or the issuers of such instruments, in ways that are unforeseeable. Legislation or regulation may also change the way in which a Fund itself is regulated. Such legislation or regulation could limit or preclude a Fund’s ability to achieve its investment objective. Furthermore, volatile financial markets can expose a Fund to greater market and liquidity risk and potential difficulty in valuing portfolio instruments held by the Fund. The value of a Fund’s holdings is also generally subject to the risk of future local, national, or global economic disturbances based on unknown weaknesses in the markets in which a Fund invests. In addition, it is not certain that the U.S. Government will intervene in response to a future market disturbance and the effect of any such future intervention cannot be predicted. It is difficult for issuers to prepare for the impact of future financial downturns, although companies can seek to identify and manage future uncertainties through risk management programs.
Regulatory Risk Financial entities, such as investment companies and investment advisers, are generally subject to extensive government regulation and intervention. Government regulation and/or intervention may change the way a Fund is regulated, affect the expenses incurred directly by a Fund and the value of its investments, and limit and/or preclude a Fund’s ability to achieve its investment objective. Government regulation may change frequently and may have significant adverse consequences. Moreover, government regulation may have unpredictable and unintended effects.
Operational Risk An investment in a Fund, like any fund, can involve operational risks arising from factors such as processing errors, human errors, inadequate or failed internal or external processes, failures in systems and technology, changes in personnel and errors caused by third-party service providers. The occurrence of any of these failures, errors or breaches could result in a loss of information, regulatory scrutiny, reputational damage or other events, any of which could have a material adverse effect on a Fund. While a Fund seeks to minimize such events through controls and oversight, there may still be failures that could cause losses to the Fund.
Cyber Security Risk As the use of technology has become more prevalent in the course of business, the Funds have become potentially more susceptible to operational and information security risks resulting from breaches in cyber security. A breach in cyber security refers to both intentional and unintentional cyber events that may, among other things, cause a Fund to lose proprietary information, suffer data corruption and/or destruction or lose operational capacity, result in the unauthorized release or other misuse of confidential information, or otherwise disrupt normal business operations. Cyber security failures or breaches may result in financial losses to a Fund and its shareholders. These failures or breaches may also result in disruptions to business operations, potentially resulting in financial losses; interference with a Fund’s ability to calculate its net asset value, process shareholder transactions or otherwise transact business with shareholders; impediments to trading; violations of applicable privacy and other laws; regulatory fines; penalties; reputational damage; reimbursement or other compensation costs; additional compliance and cyber security risk management costs and other adverse consequences. In addition, substantial costs may be incurred in order to prevent any cyber incidents in the future.
8. MASTER NETTING ARRANGEMENTS
A Fund may be subject to various netting arrangements (“Master Agreements”) with select counterparties. Master Agreements govern the terms of certain transactions, and are intended to reduce the counterparty risk associated with relevant transactions by specifying credit protection mechanisms and providing standardization that is intended to improve legal certainty. Each type of Master Agreement governs certain types of transactions. Different types of transactions may be traded out of different legal entities or affiliates of a particular organization, resulting in the need for multiple agreements with a single counterparty. As the Master Agreements are specific to unique operations of different asset types, they allow a Fund to close out and net its total exposure to a counterparty in the event of a default with respect to all the transactions governed under a single Master Agreement with a counterparty. For financial reporting purposes the Statements of Assets and Liabilities generally present derivative assets and liabilities on a gross basis, which reflects the full risks and exposures prior to netting.
| | | | | | |
| | ANNUAL REPORT | | JUNE 30, 2020 | | 109 |
Notes to Financial Statements (Cont.)
Master Agreements can also help limit counterparty risk by specifying collateral posting arrangements at pre-arranged exposure levels. Under most Master Agreements, collateral is routinely transferred if the total net exposure to certain transactions (net of existing collateral already in place) governed under the relevant Master Agreement with a counterparty in a given account exceeds a specified threshold, which typically ranges from zero to $250,000 depending on the counterparty and the type of Master Agreement. United States Treasury Bills and U.S. dollar cash are generally the preferred forms of collateral, although other securities may be used depending on the terms outlined in the applicable Master Agreement. Securities and cash pledged as collateral are reflected as assets on the Statements of Assets and Liabilities as either a component of Investments at value (securities) or Deposits with counterparty. Cash collateral received is not typically held in a segregated account and as such is reflected as a liability on the Statements of Assets and Liabilities as Deposits from counterparty. The market value of any securities received as collateral is not reflected as a component of NAV. A Fund’s overall exposure to counterparty risk can change substantially within a short period, as it is affected by each transaction subject to the relevant Master Agreement.
Master Repurchase Agreements and Global Master Repurchase Agreements (individually and collectively “Master Repo Agreements”) govern repurchase, reverse repurchase, and certain sale-buyback transactions between a Fund and select counterparties. Master Repo Agreements maintain provisions for, among other things, initiation, income payments, events of default, and maintenance of collateral. The market value of transactions under the Master Repo Agreement, collateral pledged or received, and the net exposure by counterparty as of period end are disclosed in the Notes to Schedules of Investments.
Master Securities Forward Transaction Agreements (“Master Forward Agreements”) govern certain forward settling transactions, such as TBA securities, delayed-delivery or certain sale-buyback transactions by and between a Fund and select counterparties. The Master Forward Agreements maintain provisions for, among other things, transaction initiation and confirmation, payment and transfer, events of default, termination, and maintenance of collateral. The market value of forward settling transactions, collateral pledged or received, and the net exposure by counterparty as of period end is disclosed in the Notes to Schedules of Investments.
Customer Account Agreements and related addenda govern cleared derivatives transactions such as futures, options on futures, and cleared OTC derivatives. Such transactions require posting of initial margin as determined by each relevant clearing agency which is segregated in an account at a futures commission merchant (“FCM”) registered with the Commodity Futures Trading Commission. In the United States, counterparty risk may be reduced as creditors of an FCM cannot have a
claim to Fund assets in the segregated account. Portability of exposure reduces risk to the Funds. Variation margin, or changes in market value, are generally exchanged daily, but may not be netted between futures and cleared OTC derivatives unless the parties have agreed to a separate arrangement in respect of portfolio margining. The market value or accumulated unrealized appreciation (depreciation), initial margin posted, and any unsettled variation margin as of period end are disclosed in the Notes to Schedules of Investments.
Prime Broker Arrangements may be entered into to facilitate execution and/or clearing of listed equity option transactions or short sales of equity securities between a Fund and selected counterparties. The arrangements provide guidelines surrounding the rights, obligations, and other events, including, but not limited to, margin, execution, and settlement. These agreements maintain provisions for, among other things, payments, maintenance of collateral, events of default, and termination. Margin and other assets delivered as collateral are typically in the possession of the prime broker and would offset any obligations due to the prime broker. The market values of listed options and securities sold short and related collateral are disclosed in the Notes to Schedules of Investments.
International Swaps and Derivatives Association, Inc. Master Agreements and Credit Support Annexes (“ISDA Master Agreements”) govern bilateral OTC derivative transactions entered into by a Fund with select counterparties. ISDA Master Agreements maintain provisions for general obligations, representations, agreements, collateral posting and events of default or termination. Events of termination include conditions that may entitle counterparties to elect to terminate early and cause settlement of all outstanding transactions under the applicable ISDA Master Agreement. Any election to terminate early could be material to the financial statements. In limited circumstances, the ISDA Master Agreement may contain additional provisions that add counterparty protection beyond coverage of existing daily exposure if the counterparty has a decline in credit quality below a predefined level. These amounts, if any, may be segregated with a third-party custodian. The market value of OTC financial derivative instruments, collateral received or pledged, and net exposure by counterparty as of period end are disclosed in the Notes to Schedules of Investments.
9. FEES AND EXPENSES
(a) Management Fee PIMCO, a majority-owned subsidiary of Allianz Asset Management of America L.P. (“Allianz Asset Management”), serves as the Manager to the Trust, pursuant to an investment management agreement. Each Fund pays PIMCO fees in return for providing investment advisory, supervisory and administrative services under an all-in fee structure. Each Fund will pay monthly management
June 30, 2020
fees to PIMCO at an annual rate based on average daily net assets (the “Management Fee”), at an annual rate as noted in the table below.
| | | | | | | | |
| Fund Name | | | | | Management Fee | |
| | |
PIMCO 25+ Year Zero Coupon
U.S. Treasury Index Exchange-Traded Fund | | | | | | | 0.15% | |
| | |
PIMCO 1-5 Year U.S. TIPS Index
Exchange-Traded Fund | | | | | | | 0.20% | |
| | |
PIMCO 15+ Year U.S. TIPS Index
Exchange-Traded Fund | | | | | | | 0.20% | |
| | |
PIMCO Broad U.S. TIPS Index Exchange-Traded Fund | | | | | | | 0.20% | |
| | |
PIMCO 0-5 Year High Yield Corporate Bond Index Exchange-Traded Fund | | | | | | | 0.55% | |
| | |
PIMCO Investment Grade Corporate Bond Index Exchange-Traded Fund | | | | | | | 0.20% | |
| | |
PIMCO Active Bond Exchange-Traded Fund | | | | | | | 0.55% | |
| | |
PIMCO Enhanced Low Duration Active
Exchange-Traded Fund(1) | | | | | | | 0.46% | |
| | |
PIMCO Enhanced Short Maturity Active ESG
Exchange-Traded Fund(2) | | | | | | | 0.36% | |
| | |
PIMCO Enhanced Short Maturity Active
Exchange-Traded Fund | | | | | | | 0.35% | |
| | |
PIMCO Intermediate Municipal Bond Active
Exchange-Traded Fund | | | | | | | 0.35% | |
| | |
PIMCO Short Term Municipal Bond Active
Exchange-Traded Fund | | | | | | | 0.35% | |
| (1) | PIMCO has contractually agreed, through October 31, 2020, to waive its management fee by 0.07% of the average daily net assets attributable to the Fund. |
| (2) | PIMCO has contractually agreed, through October 31, 2022, to waive its management fee by 0.12% of the average daily net assets attributable to the Fund. |
(b) Distribution and Servicing Fees PIMCO Investments LLC, a wholly-owned subsidiary of PIMCO, serves as the distributor (“Distributor”) of each Fund’s Creation Units. The Distributor does not maintain a secondary market in shares of the Funds. During the period ended June 30, 2020 each Fund was permitted to compensate the Distributor at an annual rate of up to 0.25% of a Fund’s average daily net assets (the “12b-1 Plan Fee”). However, the Board of Trustees has determined not to authorize payment of a 12b-1 Plan Fee at this time. The 12b-1 Plan Fee may only be imposed or increased when the Board determines that it is in the best interests of shareholders to do so. Because these fees are paid out of a Fund’s assets on an ongoing basis, to the extent that a fee is authorized, over time it will increase the cost of an investment in the Fund. The 12b-1 Plan Fee may cost an investor more than other types of sales charges.
(c) Fund Expenses PIMCO provides or procures supervisory and administrative services for shareholders and also bears the costs of various third-party services required by the Funds, including audit, custodial, portfolio accounting, legal, transfer agency and printing costs. The Funds bear other expenses which are not covered under the Management Fee which may vary and affect the total level of expenses paid by shareholders, such as (i) taxes and governmental fees; (ii) brokerage fees and commissions and other portfolio transaction expenses; (iii) costs of borrowing money, including interest expenses;
(iv) securities lending fees and expenses; (v) fees and expenses of the Trustees who are not “interested persons” of PIMCO or the Trust, and any counsel retained exclusively for their benefit; (vi) extraordinary expense, including costs of litigation and indemnification expenses; and (vii) organizational expenses. The ratio of expenses to average net assets, as disclosed on the Financial Highlights, may differ from the annual fund operating expenses as disclosed in the prospectus.
The Trust pays no compensation directly to any Trustee or any other officer who is affiliated with the Manager, all of whom receive remuneration for their services to the Trust from the Manager or its affiliates.
(d) Expense Limitation Pursuant to the Expense Limitation Agreement, PIMCO has agreed to waive a portion of the Funds’ Management Fee, or reimburse each Fund, to the extent that each Fund’s organizational expenses, pro rata share of expenses related to obtaining or maintaining a Legal Entity Identifier and pro rata share of Trustee Fees exceed 0.0049%, the “Expense Limit” (calculated as a percentage of the Fund’s average daily net assets). The Expense Limitation Agreement will automatically renew for one-year terms unless PIMCO provides written notice to the Trust at least 30 days prior to the end of the then current term.
Pursuant to a Fee Waiver Agreement, PIMCO has contractually agreed, through October 31, 2020, to waive or reduce its Management Fee for the PIMCO Active Bond Exchange-Traded Fund.
Pursuant to a Fee Waiver Agreement, PIMCO has contractually agreed, through October 31, 2020, to waive or reduce its Management Fee for the PIMCO Enhanced Low Duration Active Exchange-Traded Fund.
Pursuant to a Fee Waiver Agreement, PIMCO has contractually agreed, through October 31, 2022, to waive or reduce its Management Fee for the PIMCO Enhanced Short Maturity Active ESG Exchange-Traded Fund. The Fee Waiver Agreements will automatically renew for one-year terms unless PIMCO provides written notice to the Trust at least 30 days prior to the end of the then current term.
Each waiver is reflected on the Statements of Operations as a component of Waiver and/or Reimbursement by PIMCO.
In any month in which the investment management agreement is in effect, PIMCO is entitled to reimbursement by each Fund of any portion of the Management Fee and/or other expenses waived or reimbursed as set forth above (the “Reimbursement Amount”) during the previous thirty-six months from the date of the waiver, provided that such amount paid to PIMCO will not: i) together with any organizational expenses, pro rata share of expenses related to obtaining or maintaining a Legal Entity Identifier and pro rata Trustee fees, exceed, for such month, the Expense Limit (or the amount of the expense limit
| | | | | | |
| | ANNUAL REPORT | | JUNE 30, 2020 | | 111 |
Notes to Financial Statements (Cont.)
in place at the time the amount being recouped was originally waived if lower than the Expense Limit); ii) exceed the total Reimbursement Amount; or iii) include any amounts previously reimbursed to PIMCO. The total recoverable amounts to PIMCO at June 30, 2020, were as follows (amounts in thousands†):
| | | | | | | | | | | | | | | | | | | | |
| | | | | | Expiring within | | | | |
| | | | | |
| Fund Name | | | | | 12 months | | | 13-24 months | | | 25-36 months | | | Total | |
| | | | | |
PIMCO Enhanced Low Duration Active Exchange-Traded Fund | | | | | | $ | 99 | | | $ | 174 | | | $ | 309 | | | $ | 582 | |
| | | | | |
PIMCO Enhanced Short Maturity Active ESG
Exchange-Traded Fund | | | | | | | 0 | | | | 0 | | | | 128 | | | | 128 | |
| † | A zero balance may reflect actual amounts rounding to less than one thousand. |
10. RELATED PARTY TRANSACTIONS
The Manager and Distributor are related parties. Fees paid to these parties are disclosed in Note 9, Fees and Expenses, and the accrued related party fee amounts are disclosed on the Statements of Assets and Liabilities.
Certain Funds are permitted to purchase or sell securities from or to certain related affiliated funds under specified conditions outlined in procedures adopted by the Board. The procedures have been designed to ensure that any purchase or sale of securities by the Funds from or to another fund or portfolio that are, or could be, considered an affiliate, or an affiliate of an affiliate, by virtue of having a common investment adviser (or affiliated investment advisers), common Trustees and/or common officers complies with Rule 17a-7 under the Act. Further, as defined under the procedures, each transaction is effected at the current market price. Purchases and sales of securities pursuant to Rule 17a-7 under the Act for the period ended June 30, 2020, were as follows (amounts in thousands†):
| | | | | | | | | | | | |
| Fund Name | | | | | Purchases | | | Sales | |
| | | |
PIMCO 0-5 Year High Yield Corporate Bond Index Exchange-Traded Fund | | | | | | $ | 50,792 | | | $ | 1,081 | |
| | | |
PIMCO Investment Grade Corporate Bond Index Exchange-Traded Fund | | | | | | | 1,774 | | | | 6,905 | |
| | | |
PIMCO Active Bond Exchange-Traded Fund | | | | | | | 66,308 | | | | 0 | |
| | | |
PIMCO Enhanced Low Duration Active
Exchange-Traded Fund | | | | | | | 56,368 | | | | 57,335 | |
| | | |
PIMCO Enhanced Short Maturity Active ESG
Exchange-Traded Fund | | | | | | | 13,038 | | | | 5,231 | |
| | | |
PIMCO Enhanced Short Maturity Active
Exchange-Traded Fund | | | | | | | 1,658,624 | | | | 1,666,683 | |
| | | |
PIMCO Intermediate Municipal Bond Active Exchange-Traded Fund | | | | | | | 3,820 | | | | 0 | |
| † | A zero balance may reflect actual amounts rounding to less than one thousand. |
11. GUARANTEES AND INDEMNIFICATIONS
Under the Trust’s organizational documents, each Trustee or officer of the Trust is indemnified and each employee or other agent of the Trust (including the Trust’s investment manager) may be indemnified, to the extent permitted by the Act, against certain liabilities that may arise out of performance of their duties to the Funds. Additionally, in the normal course of business, the Funds enter into contracts that contain a variety of indemnification clauses. The Funds’ maximum exposure under these arrangements is unknown as this would involve future claims that may be made against the Funds that have not yet occurred. However, the Funds have not had prior claims or losses pursuant to these contracts.
12. PURCHASES AND SALES OF SECURITIES
The length of time a Fund has held a particular security is not generally a consideration in investment decisions. A change in the securities held by a Fund is known as “portfolio turnover.” Each Fund may engage in frequent and active trading of portfolio securities to achieve its investment objective, particularly during periods of volatile market movements. High portfolio turnover may involve correspondingly greater transaction costs, including brokerage commissions or dealer mark-ups and other transaction costs on the sale of securities and reinvestments in other securities, which are borne by the Fund. Such sales may also result in realization of taxable capital gains, including short-term capital gains (which are generally taxed at ordinary income tax rates when distributed to shareholders). The transaction costs associated with portfolio turnover may adversely affect a Fund’s performance. The portfolio turnover rates are reported in the Financial Highlights.
Purchases and sales of securities (excluding short-term investments) for the period ended June 30, 2020, were as follows (amounts in thousands†):
| | | | | | | | | | | | | | | | | | | | |
| | | | | | U.S. Government/Agency | | | All Other | |
| | | | | |
| Fund Name | | | | | Purchases | | | Sales | | | Purchases | | | Sales | |
| | | | | |
PIMCO 25+ Year Zero Coupon U.S. Treasury Index Exchange-Traded Fund | | | | | | $ | 45,363 | | | $ | 51,595 | | | $ | 0 | | | $ | 0 | |
| | | | | |
PIMCO 1-5 Year U.S. TIPS Index Exchange-Traded Fund | | | | | | | 207,908 | | | | 217,834 | | | | 0 | | | | 0 | |
| | | | | |
PIMCO 15+ Year U.S. TIPS Index Exchange-Traded Fund | | | | | | | 24,220 | | | | 26,993 | | | | 0 | | | | 0 | |
| | | | | |
PIMCO Broad U.S. TIPS Index Exchange-Traded Fund | | | | | | | 5,283 | | | | 5,158 | | | | 0 | | | | 0 | |
| | | | | |
PIMCO 0-5 Year High Yield Corporate Bond Index Exchange-Traded Fund | | | | | | | 0 | | | | 0 | | | | 448,908 | | | | 566,219 | |
| | | | | |
PIMCO Investment Grade Corporate Bond Index Exchange-Traded Fund | | | | | | | 0 | | | | 0 | | | | 114,287 | | | | 129,536 | |
| | | | | |
PIMCO Active Bond Exchange-Traded Fund | | | | | | | 5,298,710 | | | | 4,346,589 | | | | 773,433 | | | | 69,394 | |
June 30, 2020
| | | | | | | | | | | | | | | | | | | | |
| | | | | | U.S. Government/Agency | | | All Other | |
| | | | | |
| Fund Name | | | | | Purchases | | | Sales | | | Purchases | | | Sales | |
| | | | | |
PIMCO Enhanced Low Duration Active Exchange-Traded Fund | | | | | | $ | 2,017,841 | | | $ | 1,697,899 | | | $ | 277,330 | | | $ | 145,908 | |
| | | | | |
PIMCO Enhanced Short Maturity Active ESG Exchange-Traded Fund | | | | | | | 58,814 | | | | 35,627 | | | | 57,876 | | | | 10,862 | |
| | | | | |
PIMCO Enhanced Short Maturity Active Exchange-Traded Fund | | | | | | | 5,628,078 | | | | 4,631,037 | | | | 5,612,077 | | | | 4,038,529 | |
| | | | | |
PIMCO Intermediate Municipal Bond Active Exchange-Traded Fund | | | | | | | 0 | | | | 0 | | | | 235,524 | | | | 114,278 | |
| | | | | |
PIMCO Short Term Municipal Bond Active Exchange-Traded Fund | | | | | | | 3,320 | | | | 1,610 | | | | 116,311 | | | | 57,105 | |
| † | A zero balance may reflect actual amounts rounding to less than one thousand. |
13. CAPITAL SHARE TRANSACTIONS
Capital shares are issued and redeemed by a Fund only in Creation Units. Except when aggregated in Creation Units, shares of a Fund are not redeemable. Transactions in capital shares for a Fund are disclosed in detail on the Statements of Changes in Net Assets.
The consideration for the purchase of Creation Units of a Fund generally consists of a basket of cash and/or securities that the Fund specifies each business day. Authorized Participants may be charged transaction fees as set forth below. To offset transfer and other transaction costs associated with the issuance and redemption of Creation Units, Authorized Participants are subject to standard creation and redemption transaction fees payable directly to State Street Bank and Trust Company, the custodian of the Funds. These standard transactions fees are not payable to the Funds, and therefore, generally do not impact the Funds’ financial statements. PIMCO may, from time to time, at its own expense, compensate purchasers of Creation Units who have purchased substantial amounts of Creation Units and other financial institutions for administrative or marketing services. Creations and redemptions for cash (when cash creations and redemptions are available or specified) may be subject to an additional variable charge up to the maximum amount shown in the table below. To the extent a variable transaction fee is not charged, certain costs may be borne by a Fund.
| | | | | | | | | | |
Standard Creation/
Redemption
Transaction Fee* | | | Maximum
Variable Charge
for Cash Creations** | | | Maximum
Variable Charge
for Cash Redemptions** | |
| $ | 500 | | | | 3.00 | % | | | 2.00 | % |
| * | Applicable to in-kind contributions or redemptions only. |
| ** | As a percentage of the net asset value per Creation Unit purchased or redeemed, inclusive of the standard creation transaction fee (if imposed). |
14. INVESTMENT TRANSACTIONS
For the period ended June 30, 2020, certain Funds had in-kind contributions and in-kind redemptions as follows (amounts in thousands†):
| | | | | | | | | | | | |
| Fund Name | | | | | Contributions | | | Redemptions | |
| | | |
PIMCO 25+ Year Zero Coupon U.S. Treasury Index Exchange-Traded Fund | | | | | | $ | 263,904 | | | $ | 250,472 | |
| | | |
PIMCO 1-5 Year U.S. TIPS Index Exchange-Traded Fund | | | | | | | 36,788 | | | | 162,145 | |
| | | |
PIMCO 15+ Year U.S. TIPS Index Exchange-Traded Fund | | | | | | | 517,570 | | | | 132,463 | |
| | | |
PIMCO Broad U.S. TIPS Index Exchange-Traded Fund | | | | | | | 8,893 | | | | 2,900 | |
| | | |
PIMCO 0-5 Year High Yield Corporate Bond Index Exchange-Traded Fund | | | | | | | 1,553,106 | | | | 1,476,035 | |
| | | |
PIMCO Investment Grade Corporate Bond Index Exchange-Traded Fund | | | | | | | 121,493 | | | | 279,367 | |
| | | |
PIMCO Intermediate Municipal Bond Active Exchange-Traded Fund | | | | | | | 390 | | | | 0 | |
| † | A zero balance may reflect actual amounts rounding to less than one thousand. |
The in-kind contributions and in-kind redemptions in this table may not agree with the Fund Share Transactions on the Statements of Changes in Net Assets. The table represents the accumulation of each Fund’s daily net shareholder transactions while the Statements of Changes in Net Assets reflect gross shareholder transactions including any cash component of the transactions.
15. REGULATORY AND LITIGATION MATTERS
The Funds are not named as defendants in any material litigation or arbitration proceedings and are not aware of any material litigation or claim pending or threatened against them.
The foregoing speaks only as of the date of this report.
16. FEDERAL INCOME TAX MATTERS
Each Fund intends to qualify as a regulated investment company under Subchapter M of the Internal Revenue Code (the “Code”) and distribute all of its taxable income and net realized gains, if applicable, to shareholders. Accordingly, no provision for Federal income taxes has been made.
| | | | | | |
| | ANNUAL REPORT | | JUNE 30, 2020 | | 113 |
Notes to Financial Statements (Cont.)
A Fund may be subject to local withholding taxes, including those imposed on realized capital gains. Any applicable foreign capital gains tax is accrued daily based upon net unrealized gains, and may be payable following the sale of any applicable investments.
In accordance with U.S. GAAP, the Manager has reviewed the Funds’ tax positions for all open tax years. As of June 30, 2020, the Funds have recorded no liability for net unrecognized tax benefits relating to uncertain income tax positions they have taken or expect to take in future tax returns.
The Funds file U.S. federal, state, and local tax returns as required. The Funds’ tax returns are subject to examination by relevant tax authorities until expiration of the applicable statute of limitations, which is generally three years after the filing of the tax return but which can be extended to six years in certain circumstances. Tax returns for open years have incorporated no uncertain tax positions that require a provision for income taxes.
As of June 30, 2020, the components of distributable taxable earnings are as follows (amounts in thousands†):
| | | | | | | | | | | | | | | | | | | | | | | | | | | | | | | | | | | | |
| | | | | | Undistributed
Tax Exempt
Income | | | Undistributed
Ordinary
Income(1) | | | Undistributed
Long-Term
Capital Gains | | | Net Tax Basis
Unrealized
Appreciation/
(Depreciation)(2) | | | Other
Book-to-Tax
Accounting
Differences(3) | | | Accumulated
Capital
Losses(4) | | | Qualified
Late-
Year Loss
Deferral -
Capital(5) | | | Qualified
Late-Year
Loss
Deferral -
Ordinary(6) | |
| | | | | | | | | |
PIMCO 25+ Year Zero Coupon U.S. Treasury Index Exchange-Traded Fund | | | | | | $ | 0 | | | $ | 1,431 | | | $ | 0 | | | $ | 48,284 | | | $ | (18 | ) | | $ | (23,231 | ) | | $ | 0 | | | $ | 0 | |
| | | | | | | | | |
PIMCO 1-5 Year U.S. TIPS Index Exchange-Traded Fund | | | | | | | 0 | | | | 0 | | | | 0 | | | | 19,066 | | | | (15 | ) | | | (22,768 | ) | | | 0 | | | | 0 | |
| | | | | | | | | |
PIMCO 15+ Year U.S. TIPS Index Exchange-Traded Fund | | | | | | | 0 | | | | 0 | | | | 0 | | | | 39,613 | | | | (15 | ) | | | (14,294 | ) | | | 0 | | | | 0 | |
| | | | | | | | | |
PIMCO Broad U.S. TIPS Index Exchange-Traded Fund | | | | | | | 0 | | | | 0 | | | | 0 | | | | 4,252 | | | | (15 | ) | | | (1,201 | ) | | | 0 | | | | 0 | |
| | | | | | | | | |
PIMCO 0-5 Year High Yield Corporate Bond Index Exchange-Traded Fund | | | | | | | 0 | | | | 4,998 | | | | 0 | | | | (117,000 | ) | | | (26 | ) | | | (169,071 | ) | | | 0 | | | | 0 | |
| | | | | | | | | |
PIMCO Investment Grade Corporate Bond Exchange-Traded Fund | | | | | | | 0 | | | | 2,392 | | | | 0 | | | | 41,009 | | | | (26 | ) | | | 0 | | | | 0 | | | | 0 | |
| | | | | | | | | |
PIMCO Active Bond Exchange-Traded Fund | | | | | | | 0 | | | | 6,927 | | | | 0 | | | | 138,510 | | | | (45 | ) | | | (32,638 | ) | | | 0 | | | | 0 | |
| | | | | | | | | |
PIMCO Enhanced Low Duration Active Exchange-Traded Fund | | | | | | | 0 | | | | 2,675 | | | | 0 | | | | 2,275 | | | | (13 | ) | | | 0 | | | | 0 | | | | 0 | |
| | | | | | | | | |
PIMCO Enhanced Short Maturity Active ESG Exchange-Traded Fund | | | | | | | 0 | | | | 129 | | | | 0 | | | | 420 | | | | 0 | | | | 0 | | | | 0 | | | | 0 | |
| | | | | | | | | |
PIMCO Enhanced Short Maturity Active Exchange-Traded Fund | | | | | | | 0 | | | | 1,548 | | | | 0 | | | | (17,268 | ) | | | (22 | ) | | | 0 | | | | 0 | | | | 0 | |
| | | | | | | | | |
PIMCO Intermediate Municipal Bond Active Exchange-Traded Fund | | | | | | | 771 | | | | 0 | | | | 0 | | | | 21,469 | | | | (22 | ) | | | (4,899 | ) | | | 0 | | | | 0 | |
| | | | | | | | | |
PIMCO Short Term Municipal Bond Active Exchange-Traded Fund | | | | | | | 185 | | | | 0 | | | | 0 | | | | 3,023 | | | | (23 | ) | | | (1,282 | ) | | | 0 | | | | 0 | |
| † | A zero balance may reflect actual amounts rounding to less than one thousand. |
| (1) | Includes undistributed short-term capital gains, if any. |
| (2) | Adjusted for open wash sale loss deferrals and the accelerated recognition of unrealized gain (loss) on certain futures, options, and forward contracts for federal income tax purposes. Also adjusted for differences between book and tax realized and unrealized gain (loss) on swap contracts, Treasury Inflated Protected Securities (TIPS), Lehman securities, interest accrued on defaulted securities, and straddle loss deferrals. |
| (3) | Represents differences in income tax regulations and financial accounting principles generally accepted in the United States of America, mainly for organizational expenditures. |
| (4) | Capital losses available to offset future net capital gains expire in varying amounts as shown below. |
| (5) | Capital losses realized during the period November 1, 2019 through June 30, 2020 which the Funds elected to defer to the following taxable year pursuant to income tax regulations. |
| (6) | Specified losses realized during the period November 1, 2019 through June 30, 2020 and Ordinary losses realized during the period January 1, 2020 through June 30, 2020, which the Funds elected to defer to the following taxable year pursuant to income tax regulations. |
Under the Regulated Investment Company Act of 2010, a fund is permitted to carry forward any new capital losses for an unlimited period. Additionally, such capital losses that are carried forward will
retain their character as either short-term or long-term capital losses rather than being considered all short-term under previous law.
June 30, 2020
As of June 30, 2020, the Funds had the following post-effective capital losses with no expiration (amounts in thousands†):
| | | | | | | | | | | | |
| | | | | | Short-Term | | | Long-Term | |
| | | |
PIMCO 25+ Year Zero Coupon U.S. Treasury Index Exchange-Traded Fund | | | | | | $ | 13,171 | | | $ | 10,060 | |
| | | |
PIMCO 1-5 Year U.S. TIPS Index Exchange-Traded Fund | | | | | | | 5,723 | | | | 17,045 | |
| | | |
PIMCO 15+ Year U.S. TIPS Index Exchange-Traded Fund | | | | | | | 3,644 | | | | 10,650 | |
| | | |
PIMCO Broad U.S. TIPS Index Exchange-Traded Fund | | | | | | | 141 | | | | 1,060 | |
| | | |
PIMCO 0-5 Year High Yield Corporate Bond Index Exchange-Traded Fund | | | | | | | 52,115 | | | | 116,956 | |
| | | |
PIMCO Investment Grade Corporate Bond Exchange-Traded Fund | | | | | | | 0 | | | | 0 | |
| | | |
PIMCO Active Bond Exchange-Traded Fund | | | | | | | 0 | | | | 32,638 | |
| | | |
PIMCO Enhanced Low Duration Active Exchange-Traded Fund | | | | | | | 0 | | | | 0 | |
| | | |
PIMCO Enhanced Short Maturity Active ESG Exchange-Traded Fund | | | | | | | 0 | | | | 0 | |
| | | |
PIMCO Enhanced Short Maturity Active Exchange-Traded Fund | | | | | | | 0 | | | | 0 | |
| | | |
PIMCO Intermediate Municipal Bond Active Exchange-Traded Fund | | | | | | | 4,458 | | | | 441 | |
| | | |
PIMCO Short Term Municipal Bond Active Exchange-Traded Fund | | | | | | | 994 | | | | 288 | |
| † | A zero balance may reflect actual amounts rounding to less than one thousand. |
As of June 30, 2020, the aggregate cost and the net unrealized appreciation/(depreciation) of investments for federal income tax purposes are as follows (amounts in thousands†):
| | | | | | | | | | | | | | | | | | | | |
| | | | | | Federal
Tax Cost | | | Unrealized
Appreciation | | | Unrealized
(Depreciation) | | | Net Unrealized
Appreciation/
(Depreciation)(7) | |
| | | | | |
PIMCO 25+ Year Zero Coupon U.S. Treasury Index Exchange-Traded Fund | | | | | | $ | 327,473 | | | $ | 49,056 | | | $ | (772 | ) | | $ | 48,284 | |
| | | | | |
PIMCO 1-5 Year U.S. TIPS Index Exchange-Traded Fund | | | | | | | 608,994 | | | | 19,066 | | | | 0 | | | | 19,066 | |
| | | | | |
PIMCO 15+ Year U.S. TIPS Index Exchange-Traded Fund | | | | | | | 572,515 | | | | 39,613 | | | | 0 | | | | 39,613 | |
| | | | | |
PIMCO Broad U.S. TIPS Index Exchange-Traded Fund | | | | | | | 57,464 | | | | 4,252 | | | | 0 | | | | 4,252 | |
| | | | | |
PIMCO 0-5 Year High Yield Corporate Bond Index Exchange-Traded Fund | | | | | | | 1,294,085 | | | | 6,622 | | | | (123,621 | ) | | | (116,999 | ) |
| | | | | |
PIMCO Investment Grade Corporate Bond Exchange-Traded Fund | | | | | | | 605,038 | | | | 43,566 | | | | (2,559 | ) | | | 41,007 | |
| | | | | |
PIMCO Active Bond Exchange-Traded Fund | | | | | | | 3,795,582 | | | | 172,184 | | | | (33,591 | ) | | | 138,593 | |
| | | | | |
PIMCO Enhanced Low Duration Active Exchange-Traded Fund | | | | | | | 835,127 | | | | 8,500 | | | | (6,219 | ) | | | 2,281 | |
| | | | | |
PIMCO Enhanced Short Maturity Active ESG Exchange-Traded Fund | | | | | | | 92,952 | | | | 533 | | | | (114 | ) | | | 419 | |
| | | | | |
PIMCO Enhanced Short Maturity Active Exchange-Traded Fund | | | | | | | 13,882,084 | | | | 28,236 | | | | (45,502 | ) | | | (17,266 | ) |
| | | | | |
PIMCO Intermediate Municipal Bond Active Exchange-Traded Fund | | | | | | | 444,186 | | | | 21,725 | | | | (255 | ) | | | 21,470 | |
| | | | | |
PIMCO Short Term Municipal Bond Active Exchange-Traded Fund | | | | | | | 178,156 | | | | 3,130 | | | | (105 | ) | | | 3,025 | |
| † | A zero balance may reflect actual amounts rounding to less than one thousand. |
| (7) | Primary differences, if any, between book and tax net unrealized appreciation/(depreciation) are attributable to open wash sale loss deferrals, unrealized gain or loss on certain futures, options and forward contracts, realized and unrealized gain (loss) swap contracts, Treasury Inflated Protected Securities (TIPS), Lehman securities, interest accrued on defaulted securities, and straddle loss deferrals. |
| | | | | | |
| | ANNUAL REPORT | | JUNE 30, 2020 | | 115 |
Notes to Financial Statements (Cont.)
June 30, 2020
For the fiscal years ended June 30, 2020 and June 30, 2019, respectively, the Funds made the following tax basis distributions (amounts in thousands†):
| | | | | | | | | | | | | | | | | | | | | | | | | | | | | | | | | | | | |
| | | | | | June 30, 2020 | | | June 30, 2019 | |
| | | | | | | | | |
| | | | | | Tax-Exempt
Income
Distributions | | | Ordinary
Income
Distributions(8) | | | Long-Term
Capital Gain
Distributions | | | Return of
Capital(9) | | | Tax-Exempt
Income
Distributions | | | Ordinary
Income
Distributions(8) | | | Long-Term
Capital Gain
Distributions | | | Return of Capital(9) | |
| | | | | | | | | |
PIMCO 25+ Year Zero Coupon U.S. Treasury Index Exchange-Traded Fund | | | | | | $ | 0 | | | $ | 6,364 | | | $ | 0 | | | $ | 0 | | | $ | 0 | | | $ | 4,651 | | | $ | 0 | | | $ | 0 | |
| | | | | | | | | |
PIMCO 1-5 Year U.S. TIPS Index Exchange-Traded Fund | | | | | | | 0 | | | | 14,551 | | | | 0 | | | | 2,072 | | | | 0 | | | | 11,921 | | | | 0 | | | | 0 | |
| | | | | | | | | |
PIMCO 15+ Year U.S. TIPS Index Exchange-Traded Fund | | | | | | | 0 | | | | 5,557 | | | | 0 | | | | 0 | | | | 0 | | | | 4,419 | | | | 0 | | | | 0 | |
| | | | | | | | | |
PIMCO Broad U.S. TIPS Index Exchange-Traded Fund | | | | | | | 0 | | | | 955 | | | | 0 | | | | 189 | | | | 0 | | | | 738 | | | | 0 | | | | 0 | |
| | | | | | | | | |
PIMCO 0-5 Year High Yield Corporate Bond Index Exchange-Traded Fund | | | | | | | 0 | | | | 71,011 | | | | 0 | | | | 0 | | | | 0 | | | | 76,687 | | | | 0 | | | | 0 | |
| | | | | | | | | |
PIMCO Investment Grade Corporate Bond Exchange-Traded Fund | | | | | | | 0 | | | | 21,128 | | | | 0 | | | | 0 | | | | 0 | | | | 24,777 | | | | 0 | | | | 0 | |
| | | | | | | | | |
PIMCO Active Bond Exchange-Traded Fund | | | | | | | 0 | | | | 90,615 | | | | 0 | | | | 0 | | | | 0 | | | | 73,021 | | | | 0 | | | | 0 | |
| | | | | | | | | |
PIMCO Enhanced Low Duration Active Exchange-Traded Fund | | | | | | | 0 | | | | 12,814 | | | | 0 | | | | 0 | | | | 0 | | | | 7,088 | | | | 0 | | | | 0 | |
| | | | | | | | | |
PIMCO Enhanced Short Maturity Active ESG Exchange-Traded Fund | | | | | | | 0 | | | | 608 | | | | 0 | | | | 0 | | | | 0 | | | | 0 | | | | 0 | | | | 0 | |
| | | | | | | | | |
PIMCO Enhanced Short Maturity Active Exchange-Traded Fund | | | | | | | 0 | | | | 295,040 | | | | 0 | | | | 0 | | | | 0 | | | | 297,054 | | | | 0 | | | | 0 | |
| | | | | | | | | |
PIMCO Intermediate Municipal Bond Active Exchange-Traded Fund | | | | | | | 7,762 | | | | 253 | | | | 0 | | | | 0 | | | | 7,219 | | | | 288 | | | | 0 | | | | 0 | |
| | | | | | | | | |
PIMCO Short Term Municipal Bond Active Exchange-Traded Fund | | | | | | | 1,761 | | | | 121 | | | | 0 | | | | 0 | | | | 1,448 | | | | 56 | | | | 0 | | | | 0 | |
| † | A zero balance may reflect actual amounts rounding to less than one thousand. |
| (8) | Includes short-term capital gains distributed, if any. |
| (9) | A portion of the distributions made represents a tax return of capital. Return of capital distributions have been reclassified from undistributed net investment income to paid-in capital to more appropriately conform financial accounting to tax accounting. |
Report of Independent Registered Public Accounting Firm
To the Board of Trustees of PIMCO ETF Trust and Shareholders of PIMCO 25+ Year Zero Coupon U.S. Treasury Index Exchange-Traded Fund, PIMCO 1-5 Year U.S. TIPS Index Exchange-Traded Fund, PIMCO 15+ Year U.S. TIPS Index Exchange-Traded Fund, PIMCO Broad U.S. TIPS Index Exchange-Traded Fund, PIMCO 0-5 Year High Yield Corporate Bond Index Exchange-Traded Fund, PIMCO Investment Grade Corporate Bond Index Exchange-Traded Fund, PIMCO Active Bond Exchange-Traded Fund, PIMCO Enhanced Low Duration Active Exchange-Traded Fund, PIMCO Enhanced Short Maturity Active ESG Exchange-Traded Fund, PIMCO Enhanced Short Maturity Active Exchange-Traded Fund, PIMCO Intermediate Municipal Bond Active Exchange-Traded Fund and PIMCO Short Term Municipal Bond Active Exchange-Traded Fund
Opinions on the Financial Statements
We have audited the accompanying statements of assets and liabilities, including the schedules of investments, of PIMCO 25+ Year Zero Coupon U.S. Treasury Index Exchange-Traded Fund, PIMCO 1-5 Year U.S. TIPS Index Exchange-Traded Fund, PIMCO 15+ Year U.S. TIPS Index Exchange-Traded Fund, PIMCO Broad U.S. TIPS Index Exchange-Traded Fund, PIMCO 0-5 Year High Yield Corporate Bond Index Exchange-Traded Fund, PIMCO Investment Grade Corporate Bond Index Exchange-Traded Fund, PIMCO Active Bond Exchange-Traded Fund, PIMCO Enhanced Low Duration Active Exchange-Traded Fund, PIMCO Enhanced Short Maturity Active ESG Exchange-Traded Fund, PIMCO Enhanced Short Maturity Active Exchange-Traded Fund, PIMCO Intermediate Municipal Bond Active Exchange-Traded Fund and PIMCO Short Term Municipal Bond Active Exchange-Traded Fund (constituting PIMCO ETF Trust, hereafter collectively referred to as the “Funds”) as of June 30, 2020, the related statements of operations for the year ended June 30, 2020 (or for PIMCO Enhanced Short Maturity Active ESG Exchange-Traded Fund, for the period December 10, 2019 (inception date) through June 30, 2020), the statements of changes in net assets for each of the two years in the period ended June 30, 2020 (or for PIMCO Enhanced Short Maturity Active ESG Exchange-Traded Fund, for the period December 10, 2019 (inception date) through June 30, 2020), including the related notes, and the financial highlights for each of the periods indicated therein (collectively referred to as the “financial statements”). In our opinion, the financial statements present fairly, in all material respects, the financial position of each of the Funds as of June 30, 2020, the results of each of their operations for the year then ended (or for PIMCO Enhanced Short Maturity Active ESG Exchange-Traded Fund, for the period December 10, 2019 (inception date) through June 30, 2020), the changes in each of their net assets for each of the two years in the period ended June 30, 2020 (or for PIMCO Enhanced Short Maturity Active ESG Exchange-Traded Fund, for the period December 10, 2019 (inception date) through June 30, 2020) and each of the financial highlights for each of the periods indicated therein in conformity with accounting principles generally accepted in the United States of America.
Basis for Opinions
These financial statements are the responsibility of the Funds’ management. Our responsibility is to express an opinion on the Funds’ financial statements based on our audits. We are a public accounting firm registered with the Public Company Accounting Oversight Board (United States) (PCAOB) and are required to be independent with respect to the Funds in accordance with the U.S. federal securities laws and the applicable rules and regulations of the Securities and Exchange Commission and the PCAOB.
We conducted our audits of these financial statements in accordance with the standards of the PCAOB. Those standards require that we plan and perform the audit to obtain reasonable assurance about whether the financial statements are free of material misstatement, whether due to error or fraud.
Our audits included performing procedures to assess the risks of material misstatement of the financial statements, whether due to error or fraud, and performing procedures that respond to those risks. Such procedures included examining, on a test basis, evidence regarding the amounts and disclosures in the financial statements. Our audits also included evaluating the accounting principles used and significant estimates made by management, as well as evaluating the overall presentation of the financial statements. Our procedures included confirmation of securities owned as of June 30, 2020 by correspondence with the custodian, transfer agent, brokers and agent banks; when replies were not received from brokers or agent banks, we performed other auditing procedures. We believe that our audits provide a reasonable basis for our opinions.
/s/ PricewaterhouseCoopers LLP
Kansas City, Missouri
August 20, 2020
We have served as the auditor of one or more investment companies in PIMCO ETF Trust since 2009.
| | | | | | |
| | ANNUAL REPORT | | JUNE 30, 2020 | | 117 |
Glossary: (abbreviations that may be used in the preceding statements)
(Unaudited)
| | | | | | | | | | |
| | | | |
Counterparty Abbreviations: | | | | | | | | |
| | | | | |
| BCY | | Barclays Capital, Inc. | | DUB | | Deutsche Bank AG | | MYI | | Morgan Stanley & Co. International PLC |
| | | | | |
| BMO | | BMO Capital Markets Corp. | | FICC | | Fixed Income Clearing Corporation | | RDR | | RBC Capital Markets LLC |
| | | | | |
| BOA | | Bank of America N.A. | | GSC | | Goldman Sachs & Co. LLC | | SAL | | Citigroup Global Markets, Inc. |
| | | | | |
| BOS | | BofA Securities, Inc. | | GST | | Goldman Sachs International | | SCX | | Standard Chartered Bank, London |
| | | | | |
| BPG | | BNP Paribas Securities Corp. | | HUS | | HSBC Bank USA N.A. | | SGY | | Societe Generale, NY |
| | | | | |
| BPS | | BNP Paribas S.A. | | JPM | | JP Morgan Chase Bank N.A. | | TDM | | TD Securities (USA) LLC |
| | | | | |
| CBK | | Citibank N.A. | | JPS | | J.P. Morgan Securities LLC | | TOR | | The Toronto-Dominion Bank |
| | | | | |
| DEU | | Deutsche Bank Securities, Inc. | | MBC | | HSBC Bank Plc | | WFS | | Wells Fargo Securities, LLC |
| | | | |
Currency Abbreviations: | | | | | | | | |
| | | | | |
| AUD | | Australian Dollar | | EUR | | Euro | | USD (or $) | | United States Dollar |
| | | | | |
| CAD | | Canadian Dollar | | | | | | | | |
| | | | |
Exchange Abbreviations: | | | | | | | | |
| | | | | |
| CBOT | | Chicago Board of Trade | | OTC | | Over the Counter | | | | |
| | | | |
Index/Spread Abbreviations: | | | | | | | | |
| | | | | |
| CDX.HY | | Credit Derivatives Index - High Yield | | MUNIPSA | | Securities Industry and Financial Markets Association (SIFMA) Municipal Swap Index | | US0003M | | 3 Month USD Swap Rate |
| | | | | |
| CDX.IG | | Credit Derivatives Index - Investment Grade | | SOFRRATE | | Secured Overnight Financing Rate | | US0012M | | 12 Month USD Swap Rate |
| | | | | |
| LIBOR03M | | 3 Month USD-LIBOR | | US0001M | | 1 Month USD Swap Rate | | | | |
| | | | |
Municipal Bond or Agency Abbreviations: | | | | | | | | |
| | | | | |
| AGM | | Assured Guaranty Municipal | | CR | | Custodial Receipts | | PSF | | Public School Fund |
| | | | | |
| BAM | | Build America Mutual Assurance | | NPFGC | | National Public Finance Guarantee Corp. | | Q-SBLF | | Qualified School Bond Loan Fund |
| | | | |
Other Abbreviations: | | | | | | | | |
| | | | | |
| ABS | | Asset-Backed Security | | DAC | | Designated Activity Company | | PIK | | Payment-in-Kind |
| | | | | |
| ALT | | Alternate Loan Trust | | FDIC | | Federal Deposit Insurance Corp. | | REMIC | | Real Estate Mortgage Investment Conduit |
| | | | | |
| BABs | | Build America Bonds | | LIBOR | | London Interbank Offered Rate | | TBA | | To-Be-Announced |
| | | | | |
| CLO | | Collateralized Loan Obligation | | NCUA | | National Credit Union Administration | | TBD | | To-Be-Determined |
Federal Income Tax Information
(Unaudited)
As required by the Internal Revenue Code (“Code”) and Treasury Regulations, if applicable, shareholders must be notified within 60 days of the Funds’ fiscal year end regarding the status of qualified dividend income and the dividend received deduction.
Dividend Received Deduction. Corporate shareholders are generally entitled to take the dividend received deduction on the portion of a Funds’ dividend distribution that qualifies under tax law. The percentage of the following Funds’ Fiscal 2020 ordinary income dividend that qualifies for the corporate dividend received deduction is set forth below:
Qualified Dividend Income. Under the Jobs and Growth Tax Relief Reconciliation Act of 2003, the following percentage of ordinary dividends paid during the fiscal year ended June 30, 2020 was designated as ‘qualified dividend income’ as defined in the Jobs and Growth Tax Relief Reconciliation Act of 2003 subject to reduced tax rates in 2020:
Qualified Interest Income and Qualified Short-Term Capital Gain (for non-U.S. resident shareholders only). Under the American Jobs Creation Act of 2004, the following amounts of ordinary dividends paid during the fiscal year ended June 30, 2020 are considered to be derived from “qualified interest income,” as defined in Section 871(k)(1)(E) of the Code, and therefore are designated as interest-related dividends, as defined in Section 871(k)(1)(C) of the Code. Further, the following amounts of ordinary dividends paid during the fiscal year ended June 30, 2020 are considered to be derived from “qualified short-term capital gain,” as defined in Section 871(k)(2)(D) of the Code, and therefore are designated as qualified short-term gain dividends, as defined by Section 871(k)(2)(C) of the Code.
| | | | | | | | | | | | | | | | | | | | |
| | | | | | Dividend
Received
Deduction % | | | Qualified
Dividend
Income % | | | Qualified
Interest
Income
(000s† ) | | | Qualified
Short-Term
Capital Gain
(000s†) | |
| | | | | |
PIMCO 25+ Year Zero Coupon U.S. Treasury Index Exchange-Traded Fund | | | | | | | 0% | | | | 0% | | | $ | 6,364 | | | $ | 0 | |
| | | | | |
PIMCO 1-5 Year U.S. TIPS Index Exchange-Traded Fund | | | | | | | 0% | | | | 0% | | | | 14,551 | | | | 0 | |
| | | | | |
PIMCO 15+ Year U.S. TIPS Index Exchange-Traded Fund | | | | | | | 0% | | | | 0% | | | | 5,557 | | | | 0 | |
| | | | | |
PIMCO Broad U.S. TIPS Index Exchange-Traded Fund | | | | | | | 0% | | | | 0% | | | | 955 | | | | 0 | |
| | | | | |
PIMCO 0-5 Year High Yield Corporate Bond Index Exchange-Traded Fund | | | | | | | 0% | | | | 0% | | | | 67,460 | | | | 0 | |
| | | | | |
PIMCO Investment Grade Corporate Bond Exchange-Traded Fund | | | | | | | 0% | | | | 0% | | | | 18,170 | | | | 0 | |
| | | | | |
PIMCO Active Bond Exchange-Traded Fund | | | | | | | 0% | | | | 0% | | | | 84,272 | | | | 0 | |
| | | | | |
PIMCO Enhanced Low Duration Active Exchange-Traded Fund | | | | | | | 0% | | | | 0% | | | | 10,507 | | | | 0 | |
| | | | | |
PIMCO Enhanced Short Maturity Active ESG Exchange-Traded Fund | | | | | | | 0% | | | | 0% | | | | 480 | | | | 0 | |
| | | | | |
PIMCO Enhanced Short Maturity Active Exchange-Traded Fund | | | | | | | 0% | | | | 0% | | | | 230,132 | | | | 0 | |
| | | | | |
PIMCO Intermediate Municipal Bond Active Exchange-Traded Fund | | | | | | | 0% | | | | 0% | | | | 8,015 | | | | 0 | |
| | | | | |
PIMCO Short Term Municipal Bond Active Exchange-Traded Fund | | | | | | | 0% | | | | 0% | | | | 1,882 | | | | 0 | |
| † | A zero balance may reflect actual amounts rounding to less than one thousand. |
Shareholders are advised to consult their own tax advisor with respect to the tax consequences of their investment in the Trust. In January 2021, you will be advised on IRS Form 1099-DIV as to the federal tax status of the dividends and distributions received by you in calendar year 2020.
| | | | | | |
| | ANNUAL REPORT | | JUNE 30, 2020 | | 119 |
Management of the Trust
The charts below identify the Trustees and executive officers of the Trust. Unless otherwise indicated, the address of all persons below is 650 Newport Center Drive, Newport Beach, CA 92660.
The Funds’ Statement of Additional Information includes more information about the Trustees and Officers. To request a free copy, call PIMCO at (888) 400-4ETF or visit the Funds’ website at www.pimcoetfs.com.
| | | | | | | | |
Name, Year of Birth and
Position Held with Trust* | | Term of
Office and
Length of
Time Served† | | Principal Occupation(s) During Past 5 Years | | Number of Funds
in Fund Complex
Overseen by Trustee | | Other Public Company and Investment Company
Directorships Held by Trustee During the Past 5 Years |
| | | | |
| Interested Trustees1 | | | | | | | | |
| | | | |
Peter G. Strelow (1970) Chairman of the Board and Trustee | | 05/2017 to present Chairman 02/2019 to present | | Managing Director and Co-Chief Operating Officer, PIMCO. Senior Vice President of the Trust, PIMCO Funds, PIMCO Variable Insurance Trust, PIMCO Equity Series, PIMCO Equity Series VIT, PIMCO Managed Accounts Trust, PIMCO-Sponsored Interval Funds and PIMCO-Sponsored Closed-End Funds. Formerly, Chief Administrative Officer, PIMCO. | | 146 | | Chairman and Trustee, PIMCO Funds, PIMCO Variable Insurance Trust, PIMCO Equity Series, PIMCO Equity Series VIT. |
| | | | |
Brent R. Harris (1959) Trustee | | 02/2009 to present | | Managing Director, PIMCO. Senior Vice President of the Trust, PIMCO Funds, PIMCO Variable Insurance Trust, PIMCO Equity Series and PIMCO Equity Series VIT. Formerly, member of Executive Committee, PIMCO. | | 146 | | Trustee, PIMCO Funds, PIMCO Variable Insurance Trust, PIMCO Equity Series, PIMCO Equity Series VIT; Director, StocksPLUS® Management, Inc; and member of Board of Governors, Investment Company Institute. Formerly, Chairman, PIMCO Funds, PIMCO Variable Insurance Trust, PIMCO Equity Series, PIMCO Equity Series VIT. |
| | | | |
| Independent Trustees | | | | | | | | |
| | | | |
George E. Borst (1948) Trustee | | 04/2015 to present | | Executive Advisor, McKinsey & Company; Formerly, Executive Advisor, Toyota Financial Services; and CEO, Toyota Financial Services. | | 146 | | Trustee, PIMCO Funds, PIMCO Variable Insurance Trust, PIMCO Equity Series, PIMCO Equity Series VIT; Director, MarineMax Inc. |
| | | | |
Jennifer Holden Dunbar (1963) Trustee | | 04/2015 to present | | Managing Director, Dunbar Partners, LLC (business consulting and investments). Formerly, Partner, Leonard Green & Partners, L.P. | | 146 | | Trustee, PIMCO Funds, PIMCO Variable Insurance Trust, PIMCO Equity Series, PIMCO Equity Series VIT; Director, PS Business Parks; Director, Big 5 Sporting Goods Corporation. |
| | | | |
Kym M. Hubbard (1957) Trustee | | 02/2017 to present | | Formerly, Global Head of Investments, Chief Investment Officer and Treasurer, Ernst & Young. | | 146 | | Trustee, PIMCO Funds, PIMCO Variable Insurance Trust, PIMCO Equity Series, PIMCO Equity Series VIT; Director, State Auto Financial Corporation. |
| | | | |
Gary F. Kennedy (1955) Trustee | | 04/2015 to present | | Formerly, Senior Vice President, General Counsel and Chief Compliance Officer, American Airlines and AMR Corporation (now American Airlines Group). | | 146 | | Trustee, PIMCO Funds, PIMCO Variable Insurance Trust, PIMCO Equity Series, PIMCO Equity Series VIT. |
| | | | |
Peter B. McCarthy (1950) Trustee | | 04/2015 to present | | Formerly, Assistant Secretary and Chief Financial Officer, United States Department of Treasury; Deputy Managing Director, Institute of International Finance. | | 146 | | Trustee, PIMCO Funds, PIMCO Variable Insurance Trust, PIMCO Equity Series and PIMCO Equity Series VIT. |
| | | | |
Ronald C. Parker (1951) Lead Independent Trustee | | 07/2009 to present Lead Independent Trustee 02/2017 to present | | Director of Roseburg Forest Products Company. Formerly, Chairman of the Board, The Ford Family Foundation; and President, Chief Executive Officer, Hampton Affiliates (forestry products). | | 146 | | Lead Independent Trustee, PIMCO Funds and PIMCO Variable Insurance Trust, PIMCO Equity Series and PIMCO Equity Series VIT. |
| * | Unless otherwise noted, the information for the individuals listed is as of June 30, 2020. |
| 1 | Mr. Harris and Mr. Strelow are “interested persons” of the Trust (as that term is defined in the Investment Company Act of 1940, as amended) because of their affiliations with PIMCO. |
| † | Trustees serve until their successors are duly elected and qualified. |
(Unaudited)
Executive Officers
| | | | |
Name, Year of Birth and Position Held with Trust* | | Term of Office and Length of Time Served | | Principal Occupation(s) During Past 5 Years† |
| | |
Eric D. Johnson (1970) President | | 06/2019 to present | | Executive Vice President, PIMCO. President, PIMCO Funds, PIMCO Variable Insurance Trust, PIMCO Equity Series, PIMCO Equity Series VIT, PIMCO Managed Accounts Trust, PIMCO-Sponsored Interval Funds and PIMCO-Sponsored Closed-End Funds. |
| | |
David C. Flattum (1964) Chief Legal Officer | | 05/2019 to present | | Managing Director and General Counsel, PIMCO. Chief Legal Officer, PIMCO Funds, PIMCO Variable Insurance Trust, PIMCO Equity Series and PIMCO Equity Series VIT. Formerly, Managing Director, Chief Operating Officer and General Counsel, Allianz Asset Management of America L.P. |
| | |
Keisha Audain-Pressley (1975)** Chief Compliance Officer | | 01/2020 to present | | Executive Vice President and Deputy Chief Compliance Officer, PIMCO. Chief Compliance Officer, PIMCO Funds, PIMCO Variable Insurance Trust, PIMCO Equity Series, PIMCO Equity Series VIT, PIMCO Managed Accounts Trust, PIMCO-Sponsored Interval Funds and PIMCO-Sponsored Closed-End Funds. |
| | |
Brent R. Harris (1959) Senior Vice President | | 01/2015 to present | | Managing Director, PIMCO. Senior Vice President, PIMCO Funds, PIMCO Variable Insurance Trust, PIMCO Equity Series and PIMCO Equity Series VIT. Formerly, member of Executive Committee, PIMCO. |
| | |
Joshua D. Ratner (1976)** Senior Vice President | | 05/2019 to present | | Executive Vice President and Head of U.S. Operations, PIMCO. Senior Vice President, PIMCO Funds, PIMCO Variable Insurance Trust, PIMCO Equity Series, PIMCO Equity Series VIT, PIMCO Managed Accounts Trust, PIMCO-Sponsored Interval Funds and PIMCO-Sponsored Closed-End Funds. |
| | |
Peter G. Strelow (1970) Senior Vice President | | 06/2019 to present | | Managing Director and Co-Chief Operating Officer, PIMCO. Senior Vice President, PIMCO Funds, PIMCO Variable Insurance Trust, PIMCO Equity Series, PIMCO Equity Series VIT, PIMCO Managed Accounts Trust, PIMCO-Sponsored Interval Funds and PIMCO-Sponsored Closed-End Funds. Formerly, Chief Administrative Officer, PIMCO. |
| | |
Ryan G. Leshaw (1980) Vice President, Senior Counsel, Secretary | | 11/2018 to present | | Senior Vice President and Senior Counsel, PIMCO. Vice President, Senior Counsel and Secretary, PIMCO Funds, PIMCO Variable Insurance Trust, PIMCO Equity Series and PIMCO Equity Series VIT. Chief Legal Officer, PIMCO Managed Accounts Trust, PIMCO-Sponsored Interval Funds and PIMCO-Sponsored Closed-End Funds. Formerly, Associate, Willkie Farr & Gallagher LLP. |
| | |
Wu-Kwan Kit (1981) Assistant Secretary | | 08/2017 to present | | Senior Vice President and Senior Counsel, PIMCO. Assistant Secretary, PIMCO Funds, PIMCO Variable Insurance Trust, PIMCO Equity Series and PIMCO Equity Series VIT. Vice President, Senior Counsel and Secretary, PIMCO Managed Accounts Trust, PIMCO-Sponsored Interval Funds and PIMCO-Sponsored Closed-End Funds. Formerly, Assistant General Counsel, VanEck Associates Corp. |
| | |
Stacie D. Anctil (1969) Vice President | | 05/2015 to present | | Executive Vice President, PIMCO. Vice President, PIMCO Funds, PIMCO Variable Insurance Trust, PIMCO Equity Series, PIMCO Equity Series VIT, PIMCO Managed Accounts Trust, PIMCO-Sponsored Interval Funds and PIMCO-Sponsored Closed-End Funds. |
| | |
Jeffrey A. Byer (1976) Vice President | | 02/2020 to present | | Executive Vice President and Head of Americas Investment & Client Operations, PIMCO. Vice President, PIMCO Funds, PIMCO Variable Insurance Trust, PIMCO ETF Trust, PIMCO Equity Series, PIMCO Equity Series VIT, PIMCO Managed Accounts Trust, PIMCO-Sponsored Interval Funds and PIMCO-Sponsored Closed-End Funds. |
| | |
Brian J. Pittluck (1977) Vice President | | 01/2020 to present | | Senior Vice President, PIMCO. Vice President, PIMCO Funds, PIMCO Variable Insurance Trust, PIMCO Equity Series, PIMCO Equity Series VIT, PIMCO Managed Accounts Trust, PIMCO-Sponsored Interval Funds and PIMCO-Sponsored Closed-End Funds. |
| | |
Bradley A. Todd (1960) Treasurer | | 06/2019 to present | | Senior Vice President, PIMCO. Treasurer, PIMCO Funds, PIMCO Variable Insurance Trust, PIMCO Equity Series, PIMCO Equity Series VIT, PIMCO Managed Accounts Trust, PIMCO-Sponsored Interval Funds and PIMCO-Sponsored Closed-End Funds. Formerly, Consultant, EY. |
| | |
Bijal Y. Parikh (1978) Deputy Treasurer | | 01/2020 to present | | Senior Vice President, PIMCO. Deputy Treasurer, PIMCO Funds, PIMCO Variable Insurance Trust, PIMCO Equity Series and PIMCO Equity Series VIT. Assistant Treasurer, PIMCO Managed Accounts Trust, PIMCO-Sponsored Interval Funds and PIMCO-Sponsored Closed-End Funds. |
| | |
Erik C. Brown (1967)** Assistant Treasurer | | 02/2009 to present | | Executive Vice President, PIMCO. Assistant Treasurer, PIMCO Funds, PIMCO Variable Insurance Trust, PIMCO Equity Series, PIMCO Equity Series VIT, PIMCO Managed Accounts Trust, PIMCO-Sponsored Interval Funds and PIMCO-Sponsored Closed-End Funds. |
| | |
Brandon T. Evans (1982) Assistant Treasurer | | 05/2019 to present | | Vice President, PIMCO. Assistant Treasurer, Assistant Treasurer, PIMCO Funds, PIMCO Variable Insurance Trust, PIMCO Equity Series, PIMCO Equity Series VIT, PIMCO Managed Accounts Trust, PIMCO-Sponsored Interval Funds and PIMCO-Sponsored Closed-End Funds. |
| | |
Colleen D. Miller (1980)** Assistant Treasurer | | 02/2017 to present | | Senior Vice President, PIMCO. Assistant Treasurer, PIMCO Funds, PIMCO Variable Insurance Trust, PIMCO Equity Series, PIMCO Equity Series VIT, PIMCO Managed Accounts Trust, PIMCO-Sponsored Interval Funds and PIMCO-Sponsored Closed-End Funds. |
| | |
Christopher M. Morin (1980) Assistant Treasurer | | 08/2016 to present | | Senior Vice President, PIMCO. Assistant Treasurer, PIMCO Funds, PIMCO Variable Insurance Trust, PIMCO Equity Series, PIMCO Equity Series VIT, PIMCO Managed Accounts Trust, PIMCO-Sponsored Interval Funds and PIMCO-Sponsored Closed-End Funds. |
| | |
Jason J. Nagler (1982)** Assistant Treasurer | | 05/2015 to present | | Senior Vice President, PIMCO. Assistant Treasurer, PIMCO Funds, PIMCO Variable Insurance Trust, PIMCO Equity Series, PIMCO Equity Series VIT, PIMCO Managed Accounts Trust, PIMCO-Sponsored Interval Funds and PIMCO-Sponsored Closed-End Funds. |
| | | | | | |
| | ANNUAL REPORT | | JUNE 30, 2020 | | 121 |
Management of the Trust (Cont.)
(Unaudited)
| | | | |
Name, Year of Birth and Position Held with Trust* | | Term of Office and Length of Time Served | | Principal Occupation(s) During Past 5 Years† |
| | |
H. Jessica Zhang (1973)** Assistant Treasurer | | 01/2020 to present | | Senior Vice President, PIMCO. Assistant Treasurer, PIMCO Funds, PIMCO Variable Insurance Trust, PIMCO Equity Series, PIMCO Equity Series VIT, PIMCO Managed Accounts Trust, PIMCO-Sponsored Interval Funds and PIMCO-Sponsored Closed-End Funds. |
| * | Unless otherwise noted, the information for the individuals listed is as of June 30, 2020. |
| † | The term “PIMCO Closed-End Funds” as used herein includes: PIMCO California Municipal Income Fund, PIMCO California Municipal Income Fund II, PIMCO California Municipal Income Fund III, PIMCO Municipal Income Fund, PIMCO Municipal Income Fund II, PIMCO Municipal Income Fund III, PIMCO New York Municipal Income Fund, PIMCO New York Municipal Income Fund II, PIMCO New York Municipal Income Fund III, PCM Fund Inc., PIMCO Corporate & Income Opportunity Fund, PIMCO Corporate & Income Strategy Fund, PIMCO Dynamic Credit and Mortgage Income Fund, PIMCO Dynamic Income Fund, PIMCO Energy and Tactical Credit Opportunities Fund, PIMCO Global StocksPLUS® & Income Fund, PIMCO High Income Fund, PIMCO Income Opportunity Fund, PIMCO Income Strategy Fund, PIMCO Income Strategy Fund II and PIMCO Strategic Income Fund, Inc.; the term “PIMCO-Sponsored Interval Funds” as used herein includes: PIMCO Flexible Credit Income Fund and PIMCO Flexible Municipal Income Fund. |
| ** | The address of these officers is Pacific Investment Management Company LLC, 1633 Broadway, New York, New York 10019. |
Privacy Policy1
(Unaudited)
The Funds2,3 consider customer privacy to be a fundamental aspect of their relationships with shareholders and are committed to maintaining the confidentiality, integrity and security of their current, prospective and former shareholders’ non-public personal information. The Funds have developed policies that are designed to protect this confidentiality, while allowing shareholder needs to be served.
OBTAINING NON-PUBLIC PERSONAL INFORMATION
In the course of providing shareholders with products and services, the Funds and certain service providers to the Funds, such as the Funds’ investment advisers or sub-advisers (“Advisers”), may obtain non-public personal information about shareholders, which may come from sources such as account applications and other forms, from other written, electronic or verbal correspondence, from shareholder transactions, from a shareholder’s brokerage or financial advisory firm, financial professional or consultant, and/or from information captured on applicable websites.
RESPECTING YOUR PRIVACY
As a matter of policy, the Funds do not disclose any non-public personal information provided by shareholders or gathered by the Funds to non-affiliated third parties, except as required or permitted by law or as necessary for such third parties to perform their agreements with respect to the Funds. As is common in the industry, non-affiliated companies may from time to time be used to provide certain services, such as preparing and mailing prospectuses, reports, account statements and other information, conducting research on shareholder satisfaction and gathering shareholder proxies. The Funds or their affiliates may also retain non-affiliated companies to market Fund shares or products which use Fund shares and enter into joint marketing arrangements with them and other companies. These companies may have access to a shareholder’s personal and account information, but are permitted to use this information solely to provide the specific service or as otherwise permitted by law. In most cases, the shareholders will be clients of a third party, but the Funds may also provide a shareholder’s personal and account information to the shareholder’s respective brokerage or financial advisory firm and/or financial professional or consultant.
SHARING INFORMATION WITH THIRD PARTIES
The Funds reserve the right to disclose or report personal or account information to non-affiliated third parties in limited circumstances where the Funds believe in good faith that disclosure is required under law, to cooperate with regulators or law enforcement authorities, to protect their rights or property, or upon reasonable request by any Fund in which a shareholder has invested. In addition, the Funds may disclose information about a shareholder or a shareholder’s accounts to a non-affiliated third party at the shareholder’s request or with the consent of the shareholder.
SHARING INFORMATION WITH AFFILIATES
The Funds may share shareholder information with their affiliates in connection with servicing shareholders’ accounts, and subject to applicable law may provide shareholders with information about products and services that the Funds or their Advisers, distributors or their affiliates (“Service Affiliates”) believe may be of interest to such shareholders. The information that the Funds may share may include, for example, a shareholder’s participation in the Funds or in other investment programs sponsored by a Service Affiliate, a shareholder’s ownership of certain types of accounts (such as IRAs), information about the Funds’ experiences or transactions with a shareholder, information captured on applicable websites, or other data about a shareholder’s accounts, subject to applicable law. The Funds’ Service Affiliates, in turn, are not permitted to share shareholder information with non-affiliated entities, except as required or permitted by law.
PROCEDURES TO SAFEGUARD PRIVATE INFORMATION
The Funds take seriously the obligation to safeguard shareholder non-public personal information. In addition to this policy, the Funds have implemented procedures that are designed to restrict access to a shareholder’s non-public personal information to internal personnel who need to know that information to perform their jobs, such as servicing shareholder accounts or notifying shareholders of new products or services. Physical, electronic and procedural safeguards are in place to guard a shareholder’s non-public personal information.
INFORMATION COLLECTED FROM WEBSITES
The Funds or their service providers and partners may collect information from shareholders via websites they maintain. The information collected via websites maintained by the Funds or their service providers includes client non-public personal information.
CHANGES TO THE PRIVACY POLICY
From time to time, the Funds may update or revise this privacy policy. If there are changes to the terms of this privacy policy, documents containing the revised policy on the relevant website will be updated.
1 Amended as of June 25, 2020.
2 PIMCO Investments LLC (“PI”) serves as the Funds’ distributor and does not provide brokerage services or any financial advice to investors in the Funds solely because it distributes the Funds. This Privacy Policy applies to the activities of PI to the extent that PI regularly effects or engages in transactions with or for a shareholder of a series of a Trust who is the record owner of such shares. For purposes of this Privacy Policy, references to “the Funds” shall include PI when acting in this capacity.
3 When distributing this Policy, a Fund may combine the distribution with any similar distribution of its investment adviser’s privacy policy. The distributed, combined, policy may be written in the first person (i.e. by using “we” instead of “the Funds”).
| | | | | | |
| | ANNUAL REPORT | | JUNE 30, 2020 | | 123 |
Liquidity Risk Management Program
(Unaudited)
In compliance with Rule 22e-4 under the Investment Company Act of 1940, as amended (the “Liquidity Rule”), PIMCO ETF Trust (the “Trust”) has adopted and implemented a liquidity risk management program (the “Program”) for each series of the Trust (each a “Fund” and collectively, the “Funds”), which is reasonably designed to assess and manage the Funds’ liquidity risk. The Trust’s Board of Trustees (the “Board”) previously approved the designation of the PIMCO Liquidity Risk Committee (the “Administrator”) as Program administrator. The PIMCO Liquidity Risk Committee consists of senior members from certain PIMCO business areas, such as Portfolio Risk Management, Operations, Compliance, Funds Business Group, Account Management and Portfolio Management.
A Fund’s “liquidity risk” is the risk that the Fund could not meet requests to redeem shares issued by the Fund without significant dilution of the remaining investors’ interests in the Fund. In accordance with the Program, each Fund’s liquidity risk is assessed no less frequently than annually taking into consideration a variety of factors, including, as applicable the Fund’s investment strategy and liquidity of portfolio investments, cash flow projections, and holdings of cash and cash equivalents, as well as borrowing arrangements and other funding sources. Certain factors are considered under both normal and reasonably foreseeable stressed conditions. Each Fund portfolio investment is classified into one of four liquidity categories (including “highly liquid investments” and “illiquid investments,” discussed below) based on a determination of the number of days it is reasonably expected to take to convert the investment to cash, or sell or dispose of the investment, in current market conditions without significantly changing the investment’s market value. Each Fund has adopted a “Highly Liquid Investment Minimum” (or “HLIM”), which is a minimum amount of Fund net assets to be invested in highly liquid investments that are assets. As required under the Liquidity Rule, each Fund’s HLIM is periodically reviewed, no less frequently than annually, and the Funds have adopted policies and procedures for responding to a shortfall of a Fund’s highly liquid investments below its HLIM. The Liquidity Rule also limits the Funds’ investments in illiquid investments by prohibiting a Fund from acquiring any illiquid investment if, immediately after the acquisition, the Fund would have invested more than 15% of its net assets in illiquid investments that are assets. Certain non-public reporting is generally required if a Fund’s holdings of illiquid investments that are assets were to exceed 15% of Fund net assets.
At a meeting of the Board held on February 11-12, 2020, the Board received a report (the “Report”) from the Administrator addressing the Program’s operation and assessing the adequacy and effectiveness of its implementation for the period from December 1, 2018 through November 30, 2019. The Report noted that the Program is operating effectively to assess and manage each Fund’s liquidity risk and that the Program has been and continues to be adequately and effectively implemented to monitor and, as applicable, respond to the Funds’ liquidity developments. This has remained true for the 12-month reporting period ended June 30, 2020.
General Information
Investment Manager
Pacific Investment Management Company LLC
650 Newport Center Drive
Newport Beach, CA 92660
Distributor
PIMCO Investments LLC
1633 Broadway
New York, NY 10019
Custodian
State Street Bank & Trust Co
State Street Financial Center
One Lincoln Street
Boston, MA 02111
Transfer Agent
State Street Bank & Trust Co
State Street Financial Center
One Lincoln Street
Boston, MA 02111
Legal Counsel
Dechert LLP
1900 K Street N.W.
Washington, D.C. 20006
Independent Registered Public Accounting Firm
PricewaterhouseCoopers LLP
1100 Walnut Street, Suite 1300
Kansas City, MO 64106
This report is submitted for the general information of the shareholders of the Funds listed on the report cover.

ETF3001AR_063020
As of the end of the period covered by this report, the Registrant has adopted a code of ethics (the “Code”) that applies to the Registrant’s principal executive officer and principal financial officer. The Registrant did not grant any waivers, including implicit waivers, from any provisions of the Code to the principal executive officer or principal financial officer during the period covered by this report.
A copy of the Code is included as an exhibit to this report.
| Item 3. | Audit Committee Financial Expert. |
The Board of Trustees has determined that Peter B. McCarthy, who serves on the Board’s Audit Committee, qualifies as an “audit committee financial expert” as such term is defined in the instructions to this Item 3. The Board has also determined that Mr. McCarthy is “independent�� as such term is interpreted under this Item 3.
| Item 4. | Principal Accountant Fees and Services. |
| | | | | | | | | | |
| | | (a) | | | | Fiscal Year Ended | | Audit Fees | | |
| | June 30, 2020 | | $ 528,188 |
| | June 30, 2019 | | $ 465,810 |
| | | (b) | | Fiscal Year Ended | | Audit-Related Fees(1) |
| | June 30, 2020 | | $ — |
| | June 30, 2019 | | $ — |
| | | (c) | | Fiscal Year Ended | | Tax Fees(2) |
| | June 30, 2020 | | $ — |
| | June 30, 2019 | | $ — |
| | | (d) | | Fiscal Year Ended | | All Other Fees(3) |
| | June 30, 2020 | | $ — |
| | June 30, 2019 | | $ — |
“Audit Fees” represents aggregate fees billed for each of the last two fiscal years for professional services rendered for the audit of the PIMCO ETF Trust (the “Trust” or “Registrant”) annual financial statements or services that are normally provided by the accountant in connection with statutory or regulatory filings or engagements for those fiscal years.
“Audit-Related Fees” represents aggregate fees billed for each of the last two fiscal years for assurance and related services reasonably related to the performance of the audit of the Trust’s annual financial statements for those years.
“Tax Fees” represents aggregate fees billed for each of the last two fiscal years for professional services related to tax compliance, tax advice and tax planning, including review of federal and state income tax returns, review of excise tax distribution requirements and preparation of excise tax returns.
“All Other Fees” represents aggregate fees, if any, billed for other products and services rendered by the principal accountant to the Trust for the last two fiscal years.
_________
| | (1) | There were no “Audit-Related Fees” for the last two fiscal years. |
| | (2) | There were no “Tax Fees” for the last two fiscal years. |
| | (3) | There were no “All Other Fees” for the last two fiscal years. |
| | (e) | Pre-approval policies and procedures |
(1) The Registrant’s Audit Committee has adopted pre-approval policies and procedures (the “Procedures”) to govern the Audit Committee’s pre-approval of (i) all audit services and permissible non-audit services to be provided to the Registrant by its independent accountant, and (ii) all permissible non-audit services to be provided by such independent accountant to the Registrant’s investment adviser and to any entity controlling, controlled by, or under common control with the investment adviser that provides ongoing services to the Registrant (collectively, the “Service Affiliates”) if the services provided directly relate to the Registrant’s operations and financial reporting. In accordance with the Procedures, the Audit Committee is responsible for the engagement of the independent accountant to certify the Registrant’s financial statements for each fiscal year. With respect to the pre-approval of non-audit services provided to the Registrant and its Service Affiliates, the Procedures provide that the Audit Committee may annually pre-approve a list of types or categories of non-audit services that may be provided to the Registrant or its Service Affiliates, or the Audit Committee may pre-approve such services on a project-by-project basis as they arise. Unless a type of service has received general pre-approval, it will require specific pre-approval by the Audit Committee if it is to be provided by the independent accountant. The Procedures also permit the Audit Committee to delegate authority to one or more of its members to pre-approve any proposed non-audit services that have not been previously pre-approved by the Audit Committee, subject to the ratification by the full Audit Committee no later than its next scheduled meeting.
(2) With respect to the services described in paragraphs (b) through (d) of this Item 4, no amount was approved by the Audit Committee pursuant to paragraph (c)(7)(i)(C) of Rule 2-01 of Regulation S-X.
(g)
| | | | | | | | |
| | | Aggregate Non-Audit Fees Billed to Entity | |
| Entity | | June 30, 2020 | | | June 30, 2019 | |
PIMCO ETF Trust | | $ | — | | | $ | — | |
Pacific Investment Management Company LLC (“PIMCO”) | | | 18,842,940 | | | | 12,402,651 | |
| | | | |
Totals | | $ | 18,842,940 | | | $ | 12,402,651 | |
| | | | | | | | |
| | (h) | The Registrant’s Audit Committee has considered whether the provision of non-audit services that were rendered to the Registrant’s investment adviser, and any entity controlling, controlled by, or under common control with the investment adviser that provides ongoing services to the Registrant which were not pre-approved (not requiring pre-approval) is compatible with maintaining the principal accountant’s independence. |
| Item 5. | Audit Committee of Listed Registrants. |
The Registrant has a separately-designated standing Audit Committee established in accordance with Section 3(a)(58)(A) of the Securities Exchange Act of 1934, as amended. The Audit Committee is comprised of:
George E. Borst
Jennifer Holden Dunbar
Kym M. Hubbard
Gary F. Kennedy
Peter B. McCarthy
Ronald C. Parker
| Item 6. | Schedule of Investments. |
The information required by this Item 6 is included as part of the annual report to shareholders filed under Item 1 of this Form N-CSR.
| Item 7. | Disclosure of Proxy Voting Policies and Procedures for Closed-End Management Investment Companies. |
Not applicable to open-end investment companies.
| Item 8. | Portfolio Managers of Closed-End Management Investment Companies. |
Not applicable to open-end investment companies.
| Item 9. | Purchases of Equity Securities by Closed-End Management Investment Company and Affiliated Purchasers. |
Not applicable to open-end investment companies.
| Item 10. | Submission of Matters to a Vote of Security Holders. |
There have been no material changes to the procedures by which shareholders may recommend nominees to the Trust’s Board of Trustees since the Trust last provided disclosure in response to this item.
| Item 11. | Controls and Procedures. |
| | (a) | The principal executive officer and principal financial & accounting officer have concluded that the Registrant’s disclosure controls and procedures (as defined in Rule 30a-3(c) under the Act) provide reasonable assurances that material information relating to the Registrant is made known to them by the appropriate persons, based on their evaluation of these controls and procedures as of a date within 90 days of the filing of this report. |
| | (b) | There were no changes in the Registrant’s internal control over financial reporting (as defined in Rule 30a-3(d) under the Act) that occurred during the last fiscal quarter of the period covered by this report that have materially affected, or are reasonably likely to materially affect, the Registrant’s internal control over financial reporting. |
| Item 12. | Disclosure of Securities Lending Activities for Closed-End Management Investment Companies. |
Not applicable to open-end investment companies.
Signatures
Pursuant to the requirements of the Securities Exchange Act of 1934 and the Investment Company Act of 1940, the registrant has duly caused this report to be signed on its behalf by the undersigned, thereunto duly authorized.
| | |
| PIMCO ETF Trust |
| |
| By: | | /s/ Eric D. Johnson |
| | Eric D. Johnson |
| | President (Principal Executive Officer) |
| |
| Date: | | August 26, 2020 |
Pursuant to the requirements of the Securities Exchange Act of 1934 and the Investment Company Act of 1940, this report has been signed below by the following persons on behalf of the registrant and in the capacities and on the dates indicated.
| | |
| By: | | /s/ Eric D. Johnson |
| | Eric D. Johnson |
| | President (Principal Executive Officer) |
| |
| Date: | | August 26, 2020 |
| |
| By: | | /s/ Bradley Todd |
| | Bradley Todd |
| | Treasurer (Principal Financial & Accounting Officer) |
| |
| Date: | | August 26, 2020 |