Exhibit 99.2

J B S E N DS 3Q24 WITH EB IT D A O F R $11.9 B ILLI O N F R EE C ASH F LO W O F R $5 . 5 B ILLI O N AN D N E T IN C O ME O F R $ 3 .8 B ILLI O N São Paulo, November 13, 2024 – JBS S.A - (B3: JBSS3; OTCQX: JBSAY), announces today its 3Q24 results. The comments made herein are in Brazilian Reais, in accordance with international accounting standards (IFRS), unless otherwise specified. E AR N IN G S Release 3Q24 JB S ( JB SS3) P ri c e o n 11 . 13 . 2024 R$35.64 Ma rk e t C a p . o n 11 . 13 . 2024 R $ 7 9 . 1 B i ll i o n T o t a l S ha re s : 2,218,116,370 G u i l h e r me Cav a l can t i Chr i s t i a ne A ss i s P e d r o B u e no F e l i pe B r i ndo V i t o r F i g u e i r a Ama nda H a r u mi r i_ i r@ j b s. c o m . b r * E x c h a n g e r a t e of R $5.81 p er US $1.00 on 11/13/ 2024 IR C on t a c t 3Q 2 4 HI G HLIG H TS ( BRL) N et Sa l e s : R $110 . 5 bi ( + 20 . 9 % y / y ) Adj u ste d EBIT D A : R $11 . 9 bi ( + 120 . 7 % y / y ) Adjusted EBITDA Margin: 10.8% (+4.9 p.p. y/y) F ree C a s h F l ow : R $5 . 5 bi ( + 88 % y / y ) N et pr o fi t : R $3 . 8 bi ( + 571 % y / y ) O PERATI O N A L AN D F INA N C IAL H IGH LIG H TS I F R S PPC Ne t Sal e s : R $25 . 4 b i ( + 20 % y / y ) Adjust e d EB I T D A : R $4 . 3 b i ( + 96 % y / y ) EB I T D A Ma r g i n : 1 6 . 9 % ( + 6 . 6 p . p . y / y ) SEARA Ne t Sal e s : R $12 . 2 b i ( + 19 % y / y ) Adjust e d EB I T D A : R $2 . 6 b i ( + 352 % y / y ) EB I T D A Ma r g i n : 2 1 % ( + 15 . 5 p . p . y / y ) JBS B RA S IL Net S al es : R $18 . 1 b i ( + 25 % y / y) Adjust e d EB I T D A : R $2 . 1 b i ( + 332 % y / y ) EB I T D A Ma r g i n : 1 1 . 6 % ( + 8 . 2 p . p . y / y ) JBS B E E F NO R T H A M ER I C A Ne t Sal e s : R $35 b i ( + 21 % y / y ) Adjusted EBITDA: R$650.7 mi (+29% y/y) EB I T D A Ma r g i n : 1 . 9 % ( + 0 . 1 p . p . a/a) JBS AUSTRA L IA Ne t Sal e s : R $9 . 9 b i ( + 29 % y / y ) Adjusted EBITDA: R$966.8 mi (+46% y/y) EB I T D A Ma r g i n : 9 . 8 % ( + 1 . 1 p . p . y / y ) JBS US A P O RK Net S al es : R $11 . 3 bi ( + 15 % y / y) Adjust e d EB I T D A : R $1 . 4 b i ( + 34 % y / y ) EB I T D A Ma r g i n : 12 . 1 % ( + 1 . 8 p . p . y / y ) • JBS updated guidance for 2024 , with an estimated Net Revenue of R $ 412 billion (US $ 77 billion) and Adjusted EBITDA between R $ 37 billion (US $ 6 . 9 billion) and R $ 38 . 1 billion (US $ 7 . 1 billion) . • The Company paid dividends on October 7 in the amount of R $ 4 . 4 billion (US $ 812 million), equivalent to R $ 2 per share (US $ 0 . 37 ) . The Company also announced that it will pay the amount of R $ 2 . 2 billion, R $ 1 per share (US $ 0 . 17 *), on January 15 , 2025 . Additionally, it reopened its share buyback program for up to 113 million shares . • JBS reached 2 . 15 x leverage in dollars at the end of the 3 Q, a very comfortable level for this ratio . During the quarter, JBS issued R $ 1 . 5 billion in CRAs (Agribusiness Receivables Certificates) through its subsidiary Seara and redeemed R $ 3 . 9 billion in CRAs issued by JBS . During the quarter, it reduced its net debt by US $ 1 billion quarter - on - quarter and more than US $ 2 . 3 billion compared to the same period last year . C O NS O LID ATED
MES S AGE FROM T H E C EO G i l b e r to Tom a zon i , G l ob a l C EO J B S 2 The third quarter results for 2024 reaffirm our positive outlook for the year, highlighting once again the strength of JBS’ global, multi - protein platform, the quality of our team, and our focus on operational excellence . Net Revenue was a record US $ 19 . 9 billion . During this period, EBITDA reached US $ 2 . 2 billion, with a consolidated margin of 10 . 8 % – marking a nearly five percentage point increase compared to the same quarter in 2023 . The results presented this quarter allow us to announce that the Company will distribute dividends on January 15 , 2025 , of approximately US $ 0 . 17 per share, totaling around US $ 382 million . Last October, approximately US $ 815 million in dividends were distributed . Over the past six years, the Company has delivered an average total return to shareholders of approximately 20 % per year in U . S . dollars, demonstrating our commitment to growth and value distribution . Our poultry and pork operations in Brazil and the United States performed above expectations, especially Seara, which closed the quarter with a record - breaking 21 % margin . Strong global demand, favorable grain costs, and our agility in managing product and market mix, alongside our focus on high - value products and innovation, complement the results of already implemented operational improvements in efficiency, productivity, and commercial enhancements . Pilgrim’s reported a solid 16 . 9 % margin, driven by robust demand primarily in Europe, the U . S . and Mexico . Operational improvements and portfolio diversification into value - added products and brands also contributed to these results, along with partnerships with key customers aimed at delivering value to consumers . The business performance also reflects a focus on quality, service, and innovation . Our US Pork business posted a 12 . 1 % margin, driven by higher sales both in the U . S . and internationally, along with impressive growth in value - added products and strong gains across agricultural performance metrics . JBS’ multi - geography, multi - protein platform is unmatched in its resilience amid market challenges . While the U . S . operations are still feeling the effects of the cattle cycle, JBS Brazil posted one of its best performances, with an 11 . 6 % margin driven by the beef segment . Beyond the high export volume, Friboi results reflect the pursuit of operational excellence, the increase in domestic demand, the opening of new markets, and the improvement of the product mix, with a focus on value - added products, branding, and customer service . Australia continues to capture the benefits of the cattle cycle, with a 9 . 8 % margin in the third quarter despite rising livestock prices . The outlook for this business remains favorable in the coming quarters . We’re focused on growth fueled by diversification, innovation, value - added products, and strong branding . Recently, we announced an investment to expand Huon Aquaculture’s salmon production in Australia . And in Jeddah, Saudi Arabia, we’re finishing a new Seara facility that will quadruple local value - added chicken products capacity in the region . Our Q 3 performance underscores the strength of our financial management, as leverage dropped to 2 . 15 x in USD, net debt was reduced by US $ 1 billion, decreasing to US $ 13 . 7 billion, and Net Profit came in at US $ 693 million . With our global footprint, the expertise of our team, ongoing innovation, and a commitment to operational excellence, JBS is primed to continue delivering value to our customers, consumers, and stakeholders alike .
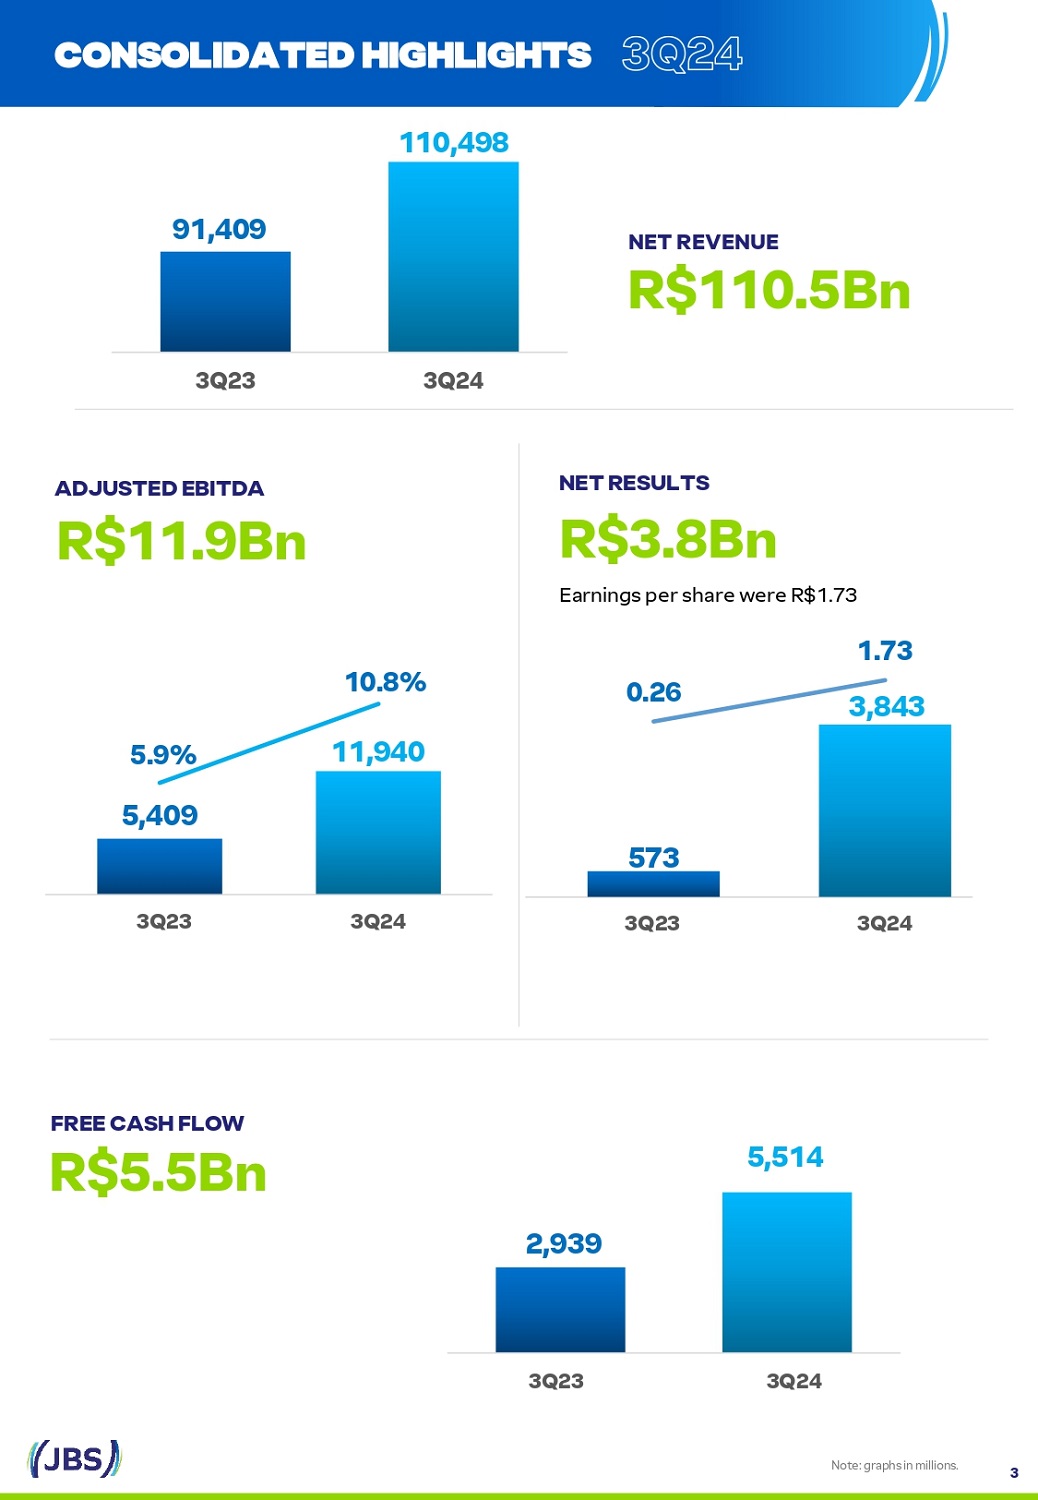
No t e : g r a p h s i n mi ll i o n s . N ET RE VENUE R$110.5Bn A DJUS T E D E B IT D A R$11.9Bn 91,409 110,498 3Q23 3Q24 F R E E C A SH F L OW R$5. 5Bn 3 3Q24 CONSOLI D A T E D HIGH L IGHTS 11,940 5.9% 5,409 1 0 .8 % 3T 2 3 3T 2 4 3Q23 3Q24 3Q23 3Q24 573 0. 2 6 1.73 3,843 N E T R E S U L TS R$3.8Bn E arn i n gs p e r shar e w e re R $1 . 73 2,939 5,514 3 Q 23 3 Q 24

∆ % 3Q23 ∆ % 2Q24 3Q24 R $ M illio n 507.5% 690.6 107.4% 2,023.0 4,195.7 Net income for the period (including non - controlling interest) 8.9% 1,839.1 - 36.0% 3,128.2 2,002.4 F i n a n c i al i n co m e ( e x p e ns e), n et - 100.4 - 778.3 2,442.8 C urr e n t a n d d eferred i n co m e ta x es 15.1% 2,615.6 5.6% 2,849.9 3,010.3 D e p rec i at i on a n d a m ort i z at i on 9.9% (19.7) 72.3% (12.5) (21.6) E q u i ty i n s u b s i d i ar i es - 5,226.1 32.7% 8,767.0 11,629.6 ( = ) E B I T D A - 62.3% 113.8 0.5% 42.7 43.0 Ot h er i n co m e / e x p e ns es - 4.6 - 11.9% 194.1 171.0 Reestructuring - (4.4) - 0.0 0.0 A ss et Im p a i r m e n t - 92.4% 51.2 - 99.0% 394.3 3.9 A n t i trust A g ree m e n ts 10.3% 18.0 - 20.2% 25.0 19.9 D o n at i o n s a n d s oc i al p ro j ects - 0.0 123.7% 32.5 72.6 R i o G ra n d e d o S ul I ns ura n ce C l a i m s - 0.0 - 426.6 0.0 T ax p ay m e n ts a n d i ns ta ll m e n ts 120.7% 5,409.4 20.8% 9,882.1 11,939.9 ( = ) A d j u s t e d E B I T D A L T M 3 Q 2 4 8,233.8 8,544.8 3,114.9 11,416.6 (0.3) 31,309.8 157.2 481.1 26.9 720.1 128.5 105.1 426.6 33,355.3 NET R E V E N UE A DJUS T E D EBITDA In 3Q24, JBS recorded a consolidated net revenue of R$110.5 billion, which represents an increase of 21% compared to 3Q23. During the period, around 74% of JBS' global sales were in the domestic markets in which the Company operates and 26% through exports. In the last 12 months, net revenue reached R$396.6 billion (US$76.7 billion). In 3 Q 24 , JBS's adjusted EBITDA reached R $ 11 . 9 billion, a growth of 121 % y/y, while the EBITDA margin reached 10 . 8 % , an increase of 490 basis points compared to the previous year . With the exception of JBS Beef North America, which is facing a challenging cattle cycle, all business units showed improvement compared to the same period last year, highlights goes to Seara, Pilgrim’s and JBS Brasil . This result reinforces the strength of the diversified global platform . In the last 12 months, adjusted EBITDA reached R $ 33 . 4 billion (U $ 6 . 4 billion), with an adjusted E B I TDA m a r g i n o f 8 . 4 % . 3Q24 4 CONSOLI D A T E D HIGH L IGHTS L T M 3 Q 2 4 ∆ % 3Q23 ∆ % 2Q24 3Q24 % NR R$ 3Q2 4 vs 3Q2 3 % NR R$ 3Q2 4 vs 2Q2 4 % NR R$ % NR R$ R$ M i llion 100.0% 396,592.0 20.9% 100.0% 91,409.5 9.8% 100.0% 100,606.3 100.0% 110,497.9 N e t R e v en u e - 85.8% (340,116.1) 14.9% - 87.9% (80,356.9) 8.5% - 84.6% (85,094.1) - 83.5% (92,309.5) C o st o f Goo d s S o l d 14.2% 56,475.9 64.6% 12.1% 11,052.6 17.3% 15.4% 15,512.2 16.5% 18,188.3 Gro s s P rofit - 6.1% (24,025.7) 22.5% - 6.0% (5,509.9) 16.0% - 5.8% (5,823.0) - 6.1% (6,751.9) Se lli n g Ex pe n s e s - 3.1% (12,394.9) - 7.0% - 3.2% (2,906.9) - 25.5% - 3.6% (3,631.2) - 2.4% (2,703.9) G e n e r al a n d Ad m . Ex pe n s e s - 2.2% (8,544.8) 8.9% - 2.0% (1,839.1) - 36.0% - 3.1% (3,128.2) - 1.8% (2,002.4) Ne t Fi n a n c i al In c o m e ( e x pe n s e ) 0.0% 0.3 9.9% 0.0% 19.7 72.3% 0.0% 12.5 0.0% 21.6 E q u i ty i n e a r n i n gs o f s u b s i d i a ri e s 0.0% (162.1) 349.4% 0.0% (25.2) - - 0.1% (141.0) - 0.1% (113.3) Ot h e r In c o m e ( e x pe n s e ) 2.9% 11,348.7 739.2% 0.9% 791.0 137.0% 2.8% 2,801.4 6.0% 6,638.5 P rofit ( lo ss ) b e fore t ax e s - 0.8% (3,114.9) - - 0.1% (100.4) - - 0.8% (778.3) - 2.2% (2,442.8) I n c o m e a n d s o c i al c on t ri b u t i o n ta x e s - 0.2% (947.4) 199.4% - 0.1% (118.0) 14.7% - 0.3% (307.8) - 0.3% (353.1) M i no ri ty i n t e r e st 1.8% 7,286.4 571.0% 0.6% 572.7 124.0% 1.7% 1,715.2 3.5% 3,842.5 N e t I n c o m e (L o ss ) 8.4% 33,355.3 120.7% 5.9% 5,409.4 20.8% 9.8% 9,882.1 10.8% 11,939.9 A d j us t e d E BIT D A 3.28 571.0% 0.26 124.0% 0.77 1.73 E a r n i n gs p e r S h a re

N E T F INA N C I A L RESULT In 3Q24, net debt financial expense was R$1.1 billion, corresponding to US$191 million. CONSOLI D A T E D R E S U LTS 3Q24 N E T R E S U L T In 3Q24, JBS recorded a net profit of R$3.8 billion. Excluding the non - recurring items described in the previous page, adjusted net income would be R$4 billion. C A SH F L OW FROM OPERATING A C TIV IT I E S A N D F R E E C A SH F L OW In 3 Q 24 , operating cash generation was R $ 10 . 3 billion, versus operating cash generation of R $ 6 . 3 billion in 3 Q 23 . This evolution is explained by the improvement in operating performance in virtually all business units . Free cash flow, after adding property, plant and equipment, interest paid and received, and leasing, was positive at R $ 5 . 5 billion, an improvement of 88 % compared to the same period of the previous year . N E T C A SH P R OV I D ED (U S E D ) B Y INV E ST I N G ACTIVITIES In 3 Q 24 , the total value of cash flow from JBS's investment activities was R $ 1 . 7 billion, with the main investment being the purchase of property, plant and equipment (CAPEX) . ∆ % 3Q23 ∆ % 2Q24 3Q24 R $ M illi o n 223.8 - - Exchange rate variation (381.1) 393.9 L T M F a i r v a l ue a d j u s t m e n ts o n d e r i v at i v e s 303 . 9 ( 1 , 734 . 5 ) - ( 2 , 253 . 5 ) - I n te re s t e x p e n s e ¹ ( 2 , 214 . 9 ) I n te re s t i n co m e ¹ 54 7 . 2 T a x e s , con tri b ut i o n , f e e s a n d o t h e rs F i na n c e i nc o m e ( e x p e n s e ) Interest expenses fro m loa I n te re s t i n co m e N e t d ¹Includes interest expense on loans and financing included under passive interest, and interest on financial investments included under active interest. 5
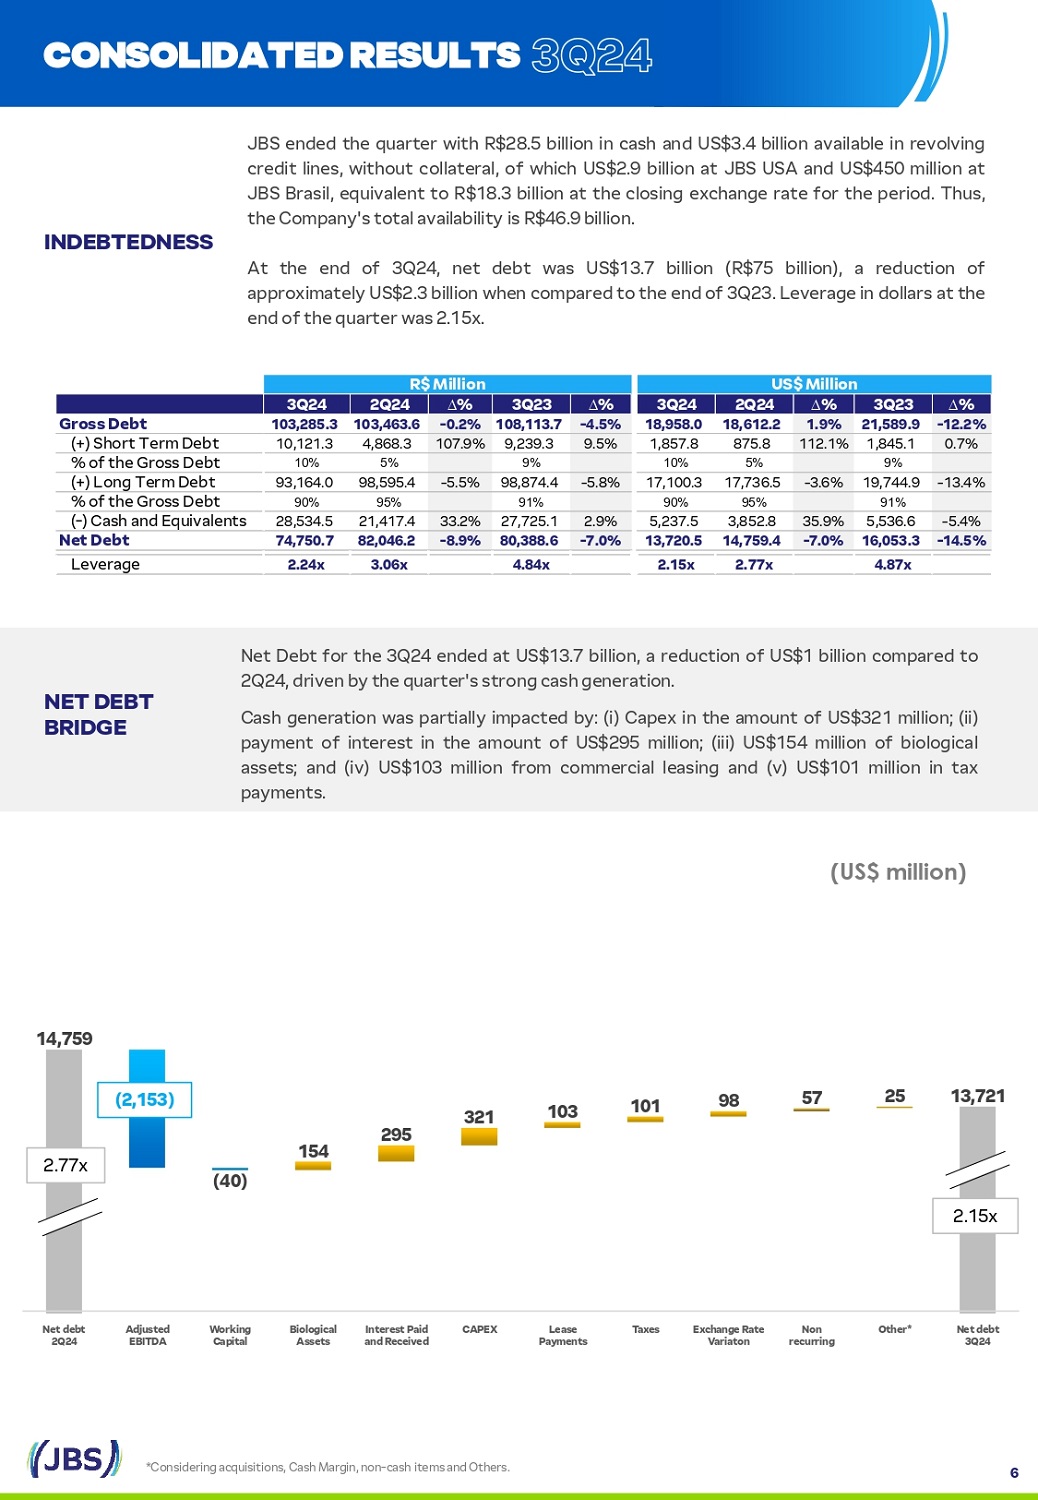
N E T D E B T BRIDGE Net Debt for the 3 Q 24 ended at US $ 13 . 7 billion, a reduction of US $ 1 billion compared to 2 Q 24 , driven by the quarter's strong cash generation . Cash generation was partially impacted by : (i) Capex in the amount of US $ 321 million ; (ii) payment of interest in the amount of US $ 295 million ; (iii) US $ 154 million of biological assets ; and (iv) US $ 103 million from commercial leasing and (v) US $ 101 million in tax payments . JBS ended the quarter with R $ 28 . 5 billion in cash and US $ 3 . 4 billion available in revolving credit lines, without collateral, of which US $ 2 . 9 billion at JBS USA and US $ 450 million at JBS Brasil, equivalent to R $ 18 . 3 billion at the closing exchange rate for the period . Thus, the Company's total availability is R $ 46 . 9 billion . INDEBTEDNESS At the end of 3 Q 24 , net debt was US $ 13 . 7 billion (R $ 75 billion), a reduction of approximately US $ 2 . 3 billion when compared to the end of 3 Q 23 . Leverage in dollars at the end o f t h e q u a r t er w a s 2 . 15 x . 6 (US$ million ) CONSOLI D A T E D R E S U LTS 3Q24 *Considering acquisitions, Cash Margin, non - cash items and Others. 154 265 321 103 101 68 57 25 13 , 721 14 , 756 ( 40 ) Ne t d e b t Other* Non E x c h a ng e R at e Taxes Lease CAPEX I nt e r es t P a i d Biological Working Adjusted Ne t d e b t 3Q24 recurring Variaton Payments a n d R ece i v e d Assets Capital EBITDA 2Q24 2.15x 2.77x (2,153)
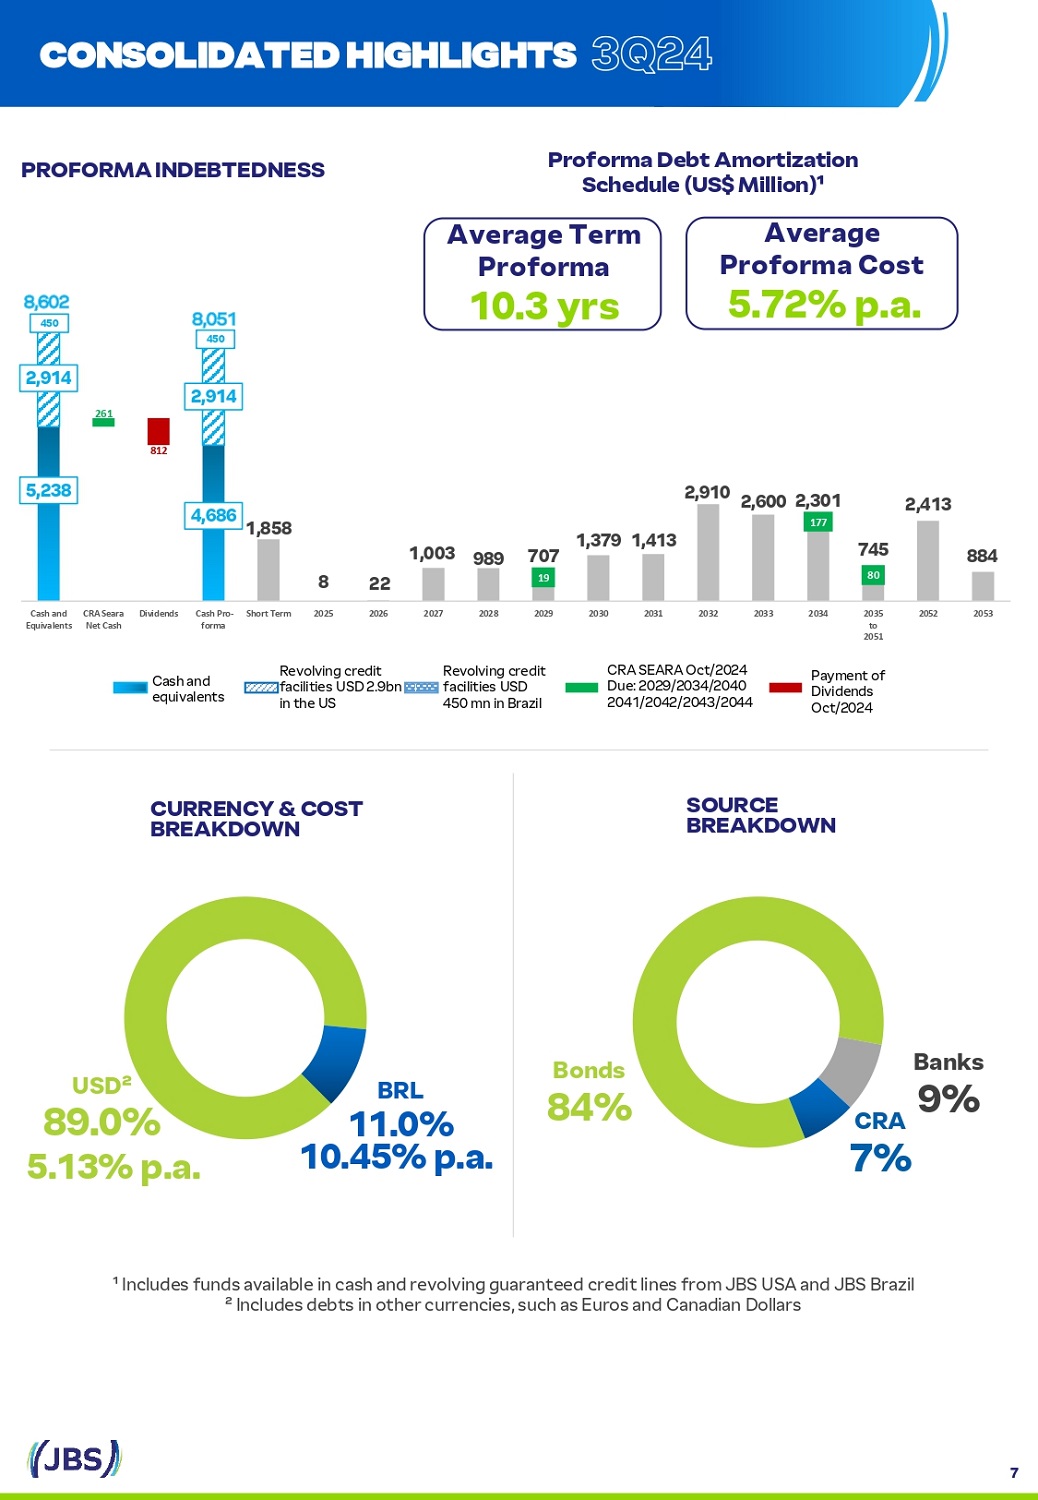
BRL 11.0% 10.45 % p . a. USD² 89.0% 5.13 % p . a . SOURCE B R E A K DOWN C U RR E N C Y & C OST BREAKDOWN P r ofo r ma Deb t A mor t i z a t i o n S c he du l e (U S $ Mi l l i o n)¹ P R OFOR M A INDE B T E DNE S S ¹ Includes funds available in cash and revolving guaranteed credit lines from JBS USA and JBS Brazil ² Includes debts in other currencies, such as Euros and Canadian Dollars CONSOLI D A T E D HIGH L IGHTS 3Q24 5,238 1 , 8 5 8 8 22 1,003 989 707 1,379 1,413 2,910 2,600 2,301 745 2,413 884 261 812 19 177 80 914 2, 2,914 4,686 450 Cash and E q u i va le n ts C RA S e a r a D i v i d e n d s C ash P r o - S h o r t T erm Net Cash forma 2025 2026 2027 2028 2029 2030 2031 2032 2033 2034 2035 to 2051 2052 2053 8, 602 8,051 450 C a sh a n d e q u i va l e n t s Revolving credit f a c i l i t i e s U S D 2 . 9 b n i n t he U S R e v o l v i ng c r e d i t facilities USD 450 m n i n Br a z i l C RA S EARA O c t / 2024 D u e : 2029 / 2034 / 2040 2041 / 2042 / 2043 / 2 044 Pa y m e nt o f Dividends Oct/2024 Bonds 84% Ba n ks 9% CRA 7% A v e r age Te r m Proforma 10.3 yrs Average Pro f o r m a Cost 5.72 % p.a . 7
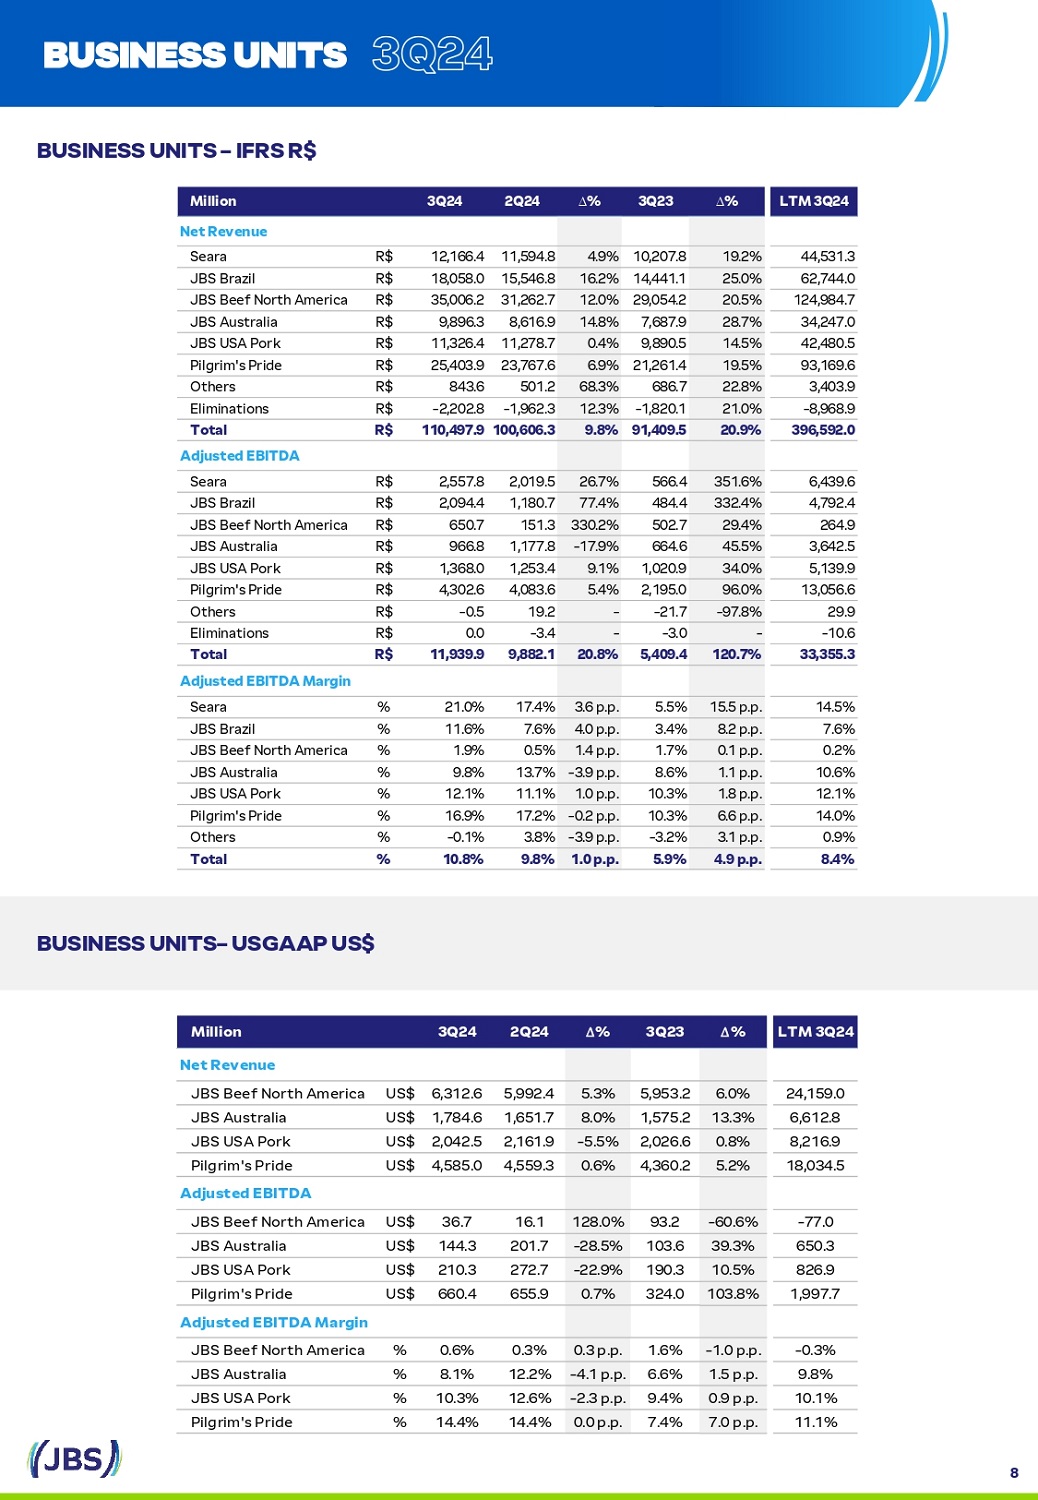
L T M 3 Q 2 4 ∆ % 3Q23 ∆ % 2Q24 3Q24 Million N e t R e v e nue 24,159.0 6.0% 5,953.2 5.3% 5,992.4 6,312.6 JBS Beef North America US$ 6,612.8 13.3% 1,575.2 8.0% 1,651.7 1,784.6 JBS Australia US$ 8,216.9 0.8% 2,026.6 - 5.5% 2,161.9 2,042.5 JBS USA Pork US$ 18,034.5 5.2% 4,360.2 0.6% 4,559.3 4,585.0 Pilgrim's Pride US$ A d j u s t e d E B I T D A - 77.0 - 60.6% 93.2 128.0% 16.1 36.7 JBS Beef North America US$ 650.3 39.3% 103.6 - 28.5% 201.7 144.3 JBS Australia US$ 826.9 10.5% 190.3 - 22.9% 272.7 210.3 JBS USA Pork US$ 1,997.7 103.8% 324.0 0.7% 655.9 660.4 Pilgrim's Pride US$ A d j u s t e d E B I T D A M a r g i n - 0.3% - 1 . 0 p . p . 1.6% 0 . 3 p . p . 0.3% 0.6% JBS Beef North America % 9.8% 1 . 5 p . p . 6.6% - 4 . 1 p . p . 12.2% 8.1% JBS Australia % 10.1% 0 . 9 p . p . 9.4% - 2 . 3 p . p . 12.6% 10.3% JBS USA Pork % 11.1% 7 . 0 p . p . 7.4% 0 . 0 p . p . 14.4% 14.4% Pilgrim's Pride % B U S I N E SS U N ITS – IFRS R $ B U S I N E SS U NIT S – U SG A A P U S$ BU S INE S S UNITS 3Q24 8 L T M 3 Q 2 4 ∆ % 3Q23 ∆ % 2Q24 3Q24 Million N e t R e v e nue 44,531.3 19.2% 10,207.8 4.9% 11,594.8 12,166.4 Seara R$ 62,744.0 25.0% 14,441.1 16.2% 15,546.8 18,058.0 JBS Brazil R$ 124,984.7 20.5% 29,054.2 12.0% 31,262.7 35,006.2 JBS Beef North America R$ 34,247.0 28.7% 7,687.9 14.8% 8,616.9 9,896.3 JBS Australia R$ 42,480.5 14.5% 9,890.5 0.4% 11,278.7 11,326.4 JBS USA Pork R$ 93,169.6 19.5% 21,261.4 6.9% 23,767.6 25,403.9 Pilgrim's Pride R$ 3,403.9 22.8% 686.7 68.3% 501.2 843.6 Others R$ - 8,968.9 21.0% - 1,820.1 12.3% - 1,962.3 - 2,202.8 Eliminations R$ 396,592.0 20.9% 91,409.5 9.8% 100,606.3 110,497.9 Total R$ A d j u s t e d E B I T DA 6,439.6 351.6% 566.4 26.7% 2,019.5 2,557.8 Seara R$ 4,792.4 332.4% 484.4 77.4% 1,180.7 2,094.4 JBS Brazil R$ 264.9 29.4% 502.7 330.2% 151.3 650.7 JBS Beef North America R$ 3,642.5 45.5% 664.6 - 17.9% 1,177.8 966.8 JBS Australia R$ 5,139.9 34.0% 1,020.9 9.1% 1,253.4 1,368.0 JBS USA Pork R$ 13,056.6 96.0% 2,195.0 5.4% 4,083.6 4,302.6 Pilgrim's Pride R$ 29.9 - 97.8% - 21.7 - 19.2 - 0.5 Others R$ - 10.6 - - 3.0 - - 3.4 0.0 Eliminations R$ 33,355.3 120.7% 5,409.4 20.8% 9,882.1 11,939.9 Total R$ A d j u s t e d E B I T DA Ma r g i n 14.5% 15 . 5 p . p . 5.5% 3 . 6 p . p . 17.4% 21.0% Seara % 7.6% 8 . 2 p . p . 3.4% 4 . 0 p . p . 7.6% 11.6% JBS Brazil % 0.2% 0 . 1 p . p . 1.7% 1 . 4 p . p . 0.5% 1.9% JBS Beef North America % 10.6% 1 . 1 p . p . 8.6% - 3 . 9 p . p . 13.7% 9.8% JBS Australia % 12.1% 1 . 8 p . p . 10.3% 1 . 0 p . p . 11.1% 12.1% JBS USA Pork % 14.0% 6 . 6 p . p . 10.3% - 0 . 2 p . p . 17.2% 16.9% Pilgrim's Pride % 0.9% 3 . 1 p . p . - 3.2% - 3 . 9 p . p . 3.8% - 0.1% Others % 8.4% 4 . 9 p . p . 5.9% 1 . 0 p . p . 9.8% 10.8% Total %

In 3 Q 24 , Seara recorded a net revenue of R $ 12 . 2 billion, a growth of 19 % in the annual comparison . The growth is explained by higher prices in the period . The significant increase of 15 . 5 percentage points in the EBITDA margin in 3 Q 24 in relation to 3 Q 23 results from better commercial and operational execution, strong global demand and expansion of the value - added portfolio . Sales in the domestic market, which accounted for 45 % of the unit's revenue in 3 Q 24 , totaled R $ 5 . 5 billion, 9 % higher than in 3 Q 23 , mainly due to higher prices compared to 3 Q 23 . Despite revenue growth in all categories (poultry, pork and prepared foods), the main highlight was the in natura category . The poultry category grew by 18 % y/y and the pork category grew by 17 % , driven by price increases . In relation to prepared foods, net revenue increased by 2 % , due to higher volumes sold . Seara continues with its strategy of winning consumer preference through product quality, innovation, execution and brand strengthening, achieving growth in penetration and repurchase rates . Despite the negative impact of Newcastle disease in the quarter, net revenue in dollars in the foreign market reached US $ 1 . 2 billion, representing an increase of 14 % compared to 3 Q 23 , as a result of management's ability to quickly redirect production to other states, which were able to continue exporting . S E A R A BU S INE S S UNITS 3Q24 9
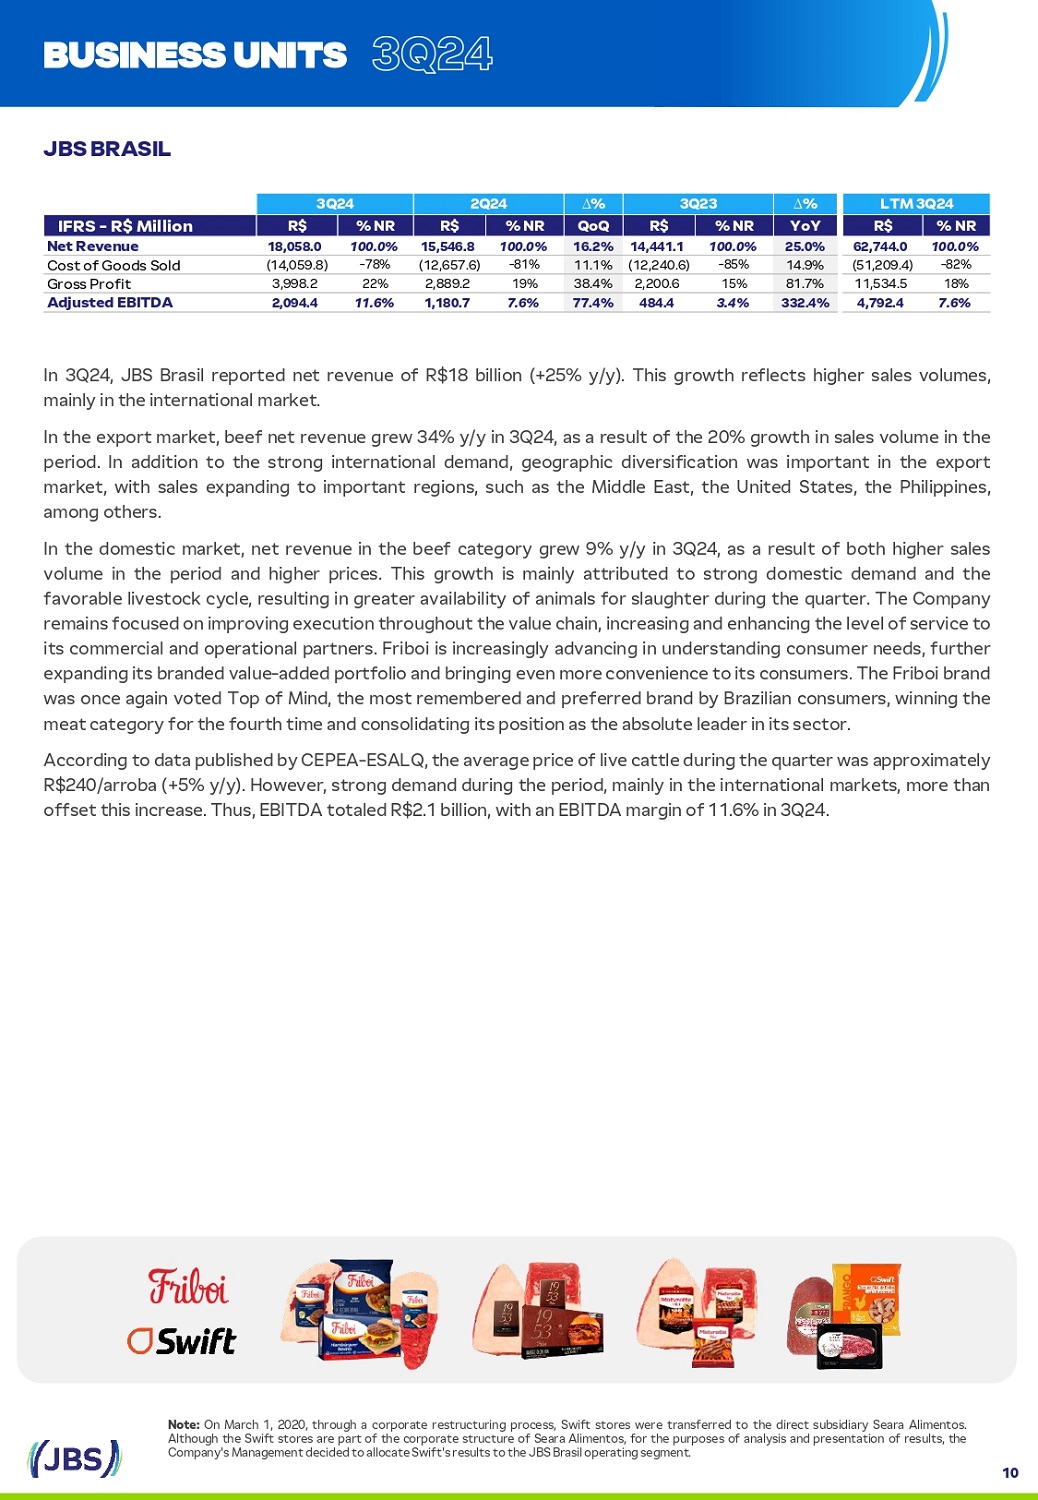
Note : On March 1 , 2020 , through a corporate restructuring process, Swift stores were transferred to the direct subsidiary Seara Alimentos . Although the Swift stores are part of the corporate structure of Seara Alimentos, for the purposes of analysis and presentation of results, the Company's Management decided to allocate Swift's results to the JBS Brasil operating segment . In 3 Q 24 , JBS Brasil reported net revenue of R $ 18 billion (+ 25 % y/y) . This growth reflects higher sales volumes, mainly in the international market . In the export market, beef net revenue grew 34 % y/y in 3 Q 24 , as a result of the 20 % growth in sales volume in the period . In addition to the strong international demand, geographic diversification was important in the export market, with sales expanding to important regions, such as the Middle East, the United States, the Philippines, among others . In the domestic market, net revenue in the beef category grew 9 % y/y in 3 Q 24 , as a result of both higher sales volume in the period and higher prices . This growth is mainly attributed to strong domestic demand and the favorable livestock cycle, resulting in greater availability of animals for slaughter during the quarter . The Company remains focused on improving execution throughout the value chain, increasing and enhancing the level of service to its commercial and operational partners . Friboi is increasingly advancing in understanding consumer needs, further expanding its branded value - added portfolio and bringing even more convenience to its consumers . The Friboi brand was once again voted Top of Mind, the most remembered and preferred brand by Brazilian consumers, winning the meat category for the fourth time and consolidating its position as the absolute leader in its sector . According to data published by CEPEA - ESALQ, the average price of live cattle during the quarter was approximately R $ 240 /arroba (+ 5 % y/y) . However, strong demand during the period, mainly in the international markets, more than offset this increase . Thus, EBITDA totaled R $ 2 . 1 billion, with an EBITDA margin of 11 . 6 % in 3 Q 24 . J B S B R A S I L BU S INE S S UNITS 3Q24 10
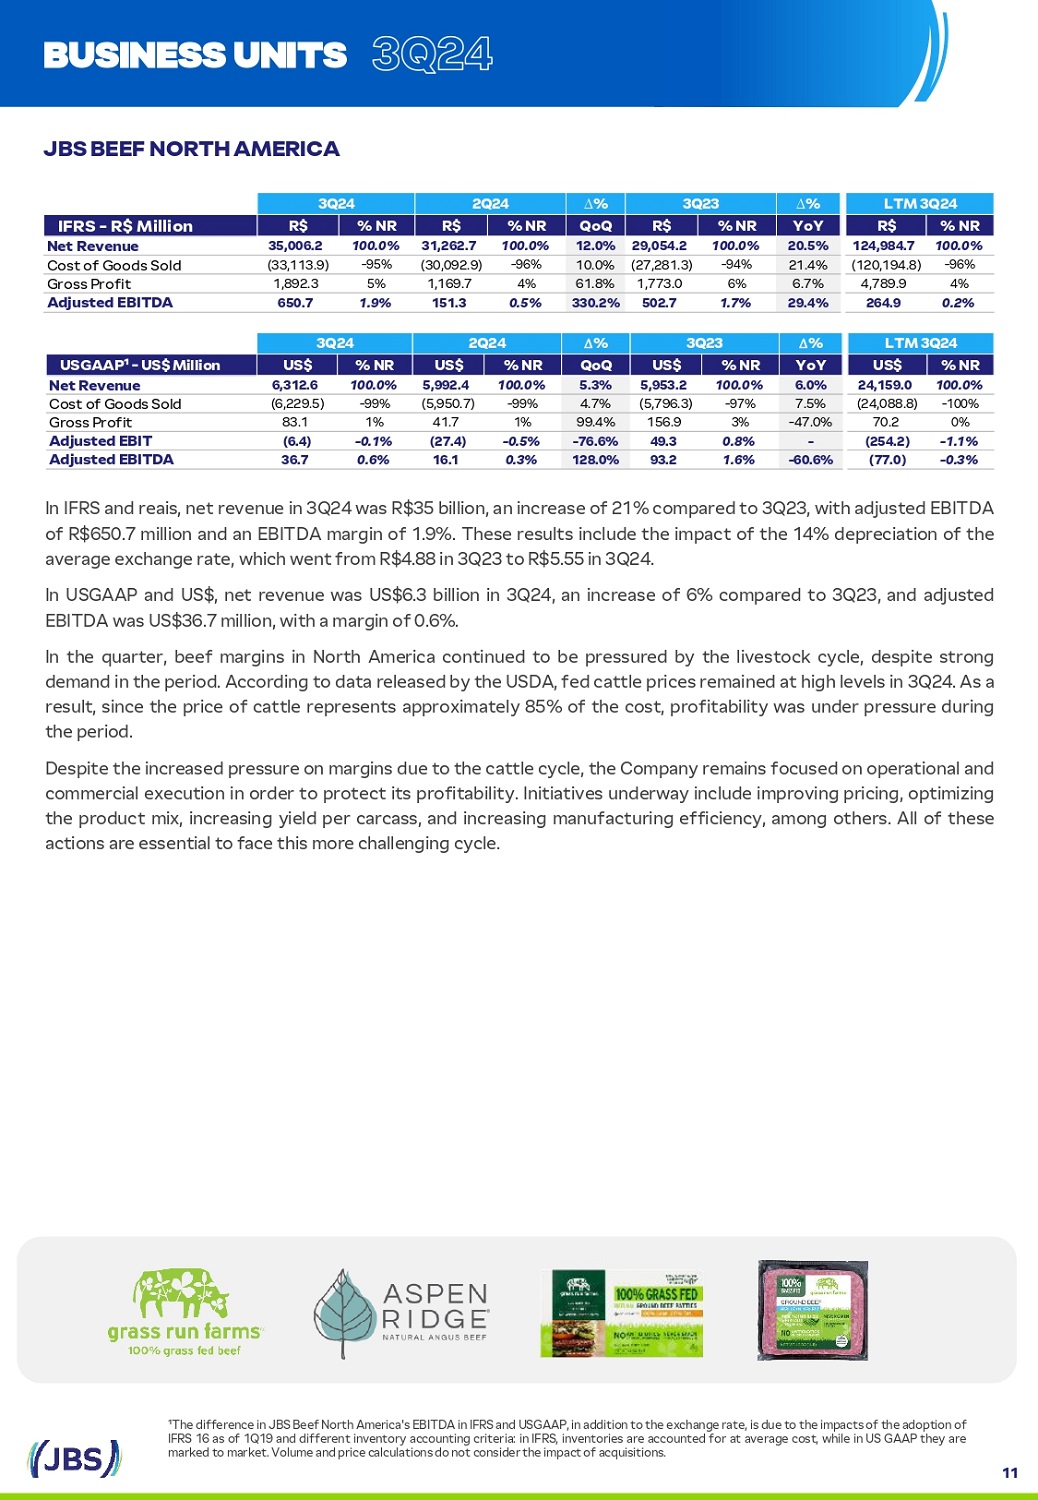
L T M 3 Q 2 4 ∆ % 3Q23 ∆ % 2Q24 3Q24 % NR US$ YoY % NR US$ QoQ % NR US$ % NR US$ US G AAP ¹ - US$ M illi o n 100.0% 24,159.0 6.0% 100.0% 5,953.2 5.3% 100.0% 5,992.4 100.0% 6,312.6 N e t R e v e nue - 100% (24,088.8) 7.5% - 97% (5,796.3) 4.7% - 99% (5,950.7) - 99% (6,229.5) C o s t of G oo d s So l d 70.2 0% - 47.0% 156.9 3% 99.4% 1% 41.7 1% 83.1 G ro s s P rof i t - 1.1% (254.2) - 0.8% 49.3 - 76.6% - 0.5% (27.4) - 0.1% (6.4) A d j u st e d E B I T - 0.3% (77.0) - 60.6% 1.6% 93.2 128.0% 0.3% 16.1 0.6% 36.7 A d j u st e d E B I T D A J B S B EE F N O RT H A M E R ICA BU S INE S S UNITS In IFRS and reais, net revenue in 3 Q 24 was R $ 35 billion, an increase of 21 % compared to 3 Q 23 , with adjusted EBITDA of R $ 650 . 7 million and an EBITDA margin of 1 . 9 % . These results include the impact of the 14 % depreciation of the average exchange rate, which went from R $ 4 . 88 in 3 Q 23 to R $ 5 . 55 in 3 Q 24 . In USGAAP and US $ , net revenue was US $ 6 . 3 billion in 3 Q 24 , an increase of 6 % compared to 3 Q 23 , and adjusted EBITDA was US $ 36 . 7 million, with a margin of 0 . 6 % . In the quarter, beef margins in North America continued to be pressured by the livestock cycle, despite strong demand in the period . According to data released by the USDA, fed cattle prices remained at high levels in 3 Q 24 . As a result, since the price of cattle represents approximately 85 % of the cost, profitability was under pressure during the period . Despite the increased pressure on margins due to the cattle cycle, the Company remains focused on operational and commercial execution in order to protect its profitability . Initiatives underway include improving pricing, optimizing the product mix, increasing yield per carcass, and increasing manufacturing efficiency, among others . All of these actions are essential to face this more challenging cycle . ¹The difference in JBS Beef North America's EBITDA in IFRS and USGAAP, in addition to the exchange rate, is due to the impacts of the adoption of IFRS 16 as of 1Q19 and different inventory accounting criteria: in IFRS, inventories are accounted for at average cost, while in US GAAP they are 3Q24 N e t R e v e nu e 35 , 006 . 2 100 . 0 % 31 , 262 . 7 100 . 0 % Cost of Goods Sold (33,113.9) - 95% ( G ro s s P ro f i t A d j u s t e d E L T M ∆ % 3Q23 ∆ % 2Q24 3Q24 % R$ QoQ % NR R$ % NR R$ I F RS - R$ Mi lli on marked to market. Volume and price calculations do not consider the impact of acquisitions. 11
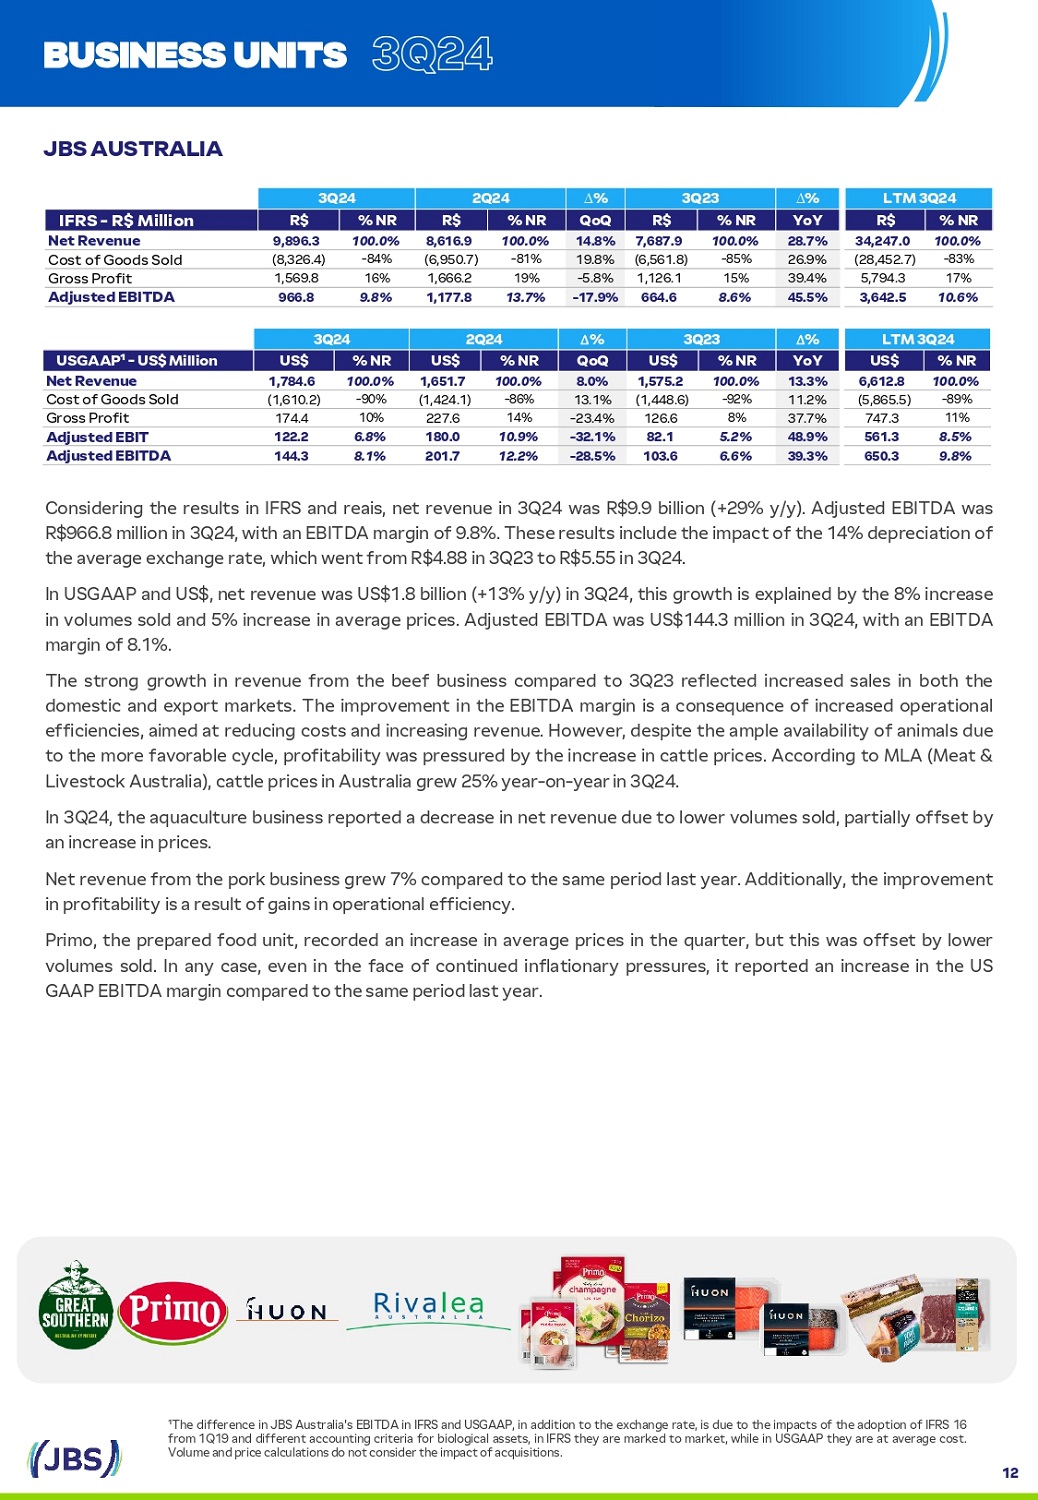
L T M 3 Q 2 4 ∆ % 3Q23 ∆ % 2Q24 3Q24 % NR US$ YoY % NR US$ QoQ % NR US$ % NR US$ US G AAP ¹ - US$ M illi o n 100.0% 6,612.8 13.3% 100.0% 1,575.2 8.0% 100.0% 1,651.7 100.0% 1,784.6 N e t R e v e nue - 89% (5,865.5) 11.2% - 92% (1,448.6) 13.1% - 86% (1,424.1) - 90% (1,610.2) C o s t of G oo d s So l d 747.3 11% 37.7% 126.6 8% - 23.4% 14% 227.6 10% 174.4 G ro s s P rof i t 8.5% 561.3 48.9% 5.2% 82.1 - 32.1% 10.9% 180.0 6.8% 122.2 A d j u st e d E B I T 9.8% 650.3 39.3% 6.6% 103.6 - 28.5% 12.2% 201.7 8.1% 144.3 A d j u st e d E B I T D A J B S A U ST R A L IA BU S INE S S UNITS Considering the results in IFRS and reais, net revenue in 3 Q 24 was R $ 9 . 9 billion (+ 29 % y/y) . Adjusted EBITDA was R $ 966 . 8 million in 3 Q 24 , with an EBITDA margin of 9 . 8 % . These results include the impact of the 14 % depreciation of the average exchange rate, which went from R $ 4 . 88 in 3 Q 23 to R $ 5 . 55 in 3 Q 24 . In USGAAP and US $ , net revenue was US $ 1 . 8 billion (+ 13 % y/y) in 3 Q 24 , this growth is explained by the 8 % increase in volumes sold and 5 % increase in average prices . Adjusted EBITDA was US $ 144 . 3 million in 3 Q 24 , with an EBITDA margin of 8 . 1 % . The strong growth in revenue from the beef business compared to 3 Q 23 reflected increased sales in both the domestic and export markets . The improvement in the EBITDA margin is a consequence of increased operational efficiencies, aimed at reducing costs and increasing revenue . However, despite the ample availability of animals due to the more favorable cycle, profitability was pressured by the increase in cattle prices . According to MLA (Meat & Livestock Australia), cattle prices in Australia grew 25 % year - on - year in 3 Q 24 . In 3 Q 24 , the aquaculture business reported a decrease in net revenue due to lower volumes sold, partially offset by an increase in prices . Net revenue from the pork business grew 7 % compared to the same period last year . Additionally, the improvement in profitability is a result of gains in operational efficiency . Primo, the prepared food unit, recorded an increase in average prices in the quarter, but this was offset by lower volumes sold . In any case, even in the face of continued inflationary pressures, it reported an increase in the US GAAP EBITDA margin compared to the same period last year . ¹The difference in JBS Australia's EBITDA in IFRS and USGAAP, in addition to the exchange rate, is due to the impacts of the adoption of IFRS 16 from 1Q19 and different accounting criteria for biological assets, in IFRS they are marked to market, while in USGAAP they are at average cost. 3Q24 Volume and price calculations do not consider the impact of acquisitions. 12 L T M 3 Q 2 4 ∆ % 3Q23 ∆ % 2Q24 3Q24 % NR R$ YoY % NR R$ QoQ % NR R$ % NR R$ I F RS - R$ Mi lli on 100.0% 34,247.0 28.7% 100.0% 7,687.9 14.8% 100.0% 8,616.9 100.0% 9,896.3 N e t R e v e nue - 83% (28,452.7) 26.9% - 85% (6,561.8) 19.8% - 81% (6,950.7) - 84% (8,326.4) C o s t of G oo d s So l d 17% 5,794.3 39.4% 15% 1,126.1 - 5.8% 19% 1,666.2 16% 1,569.8 G ro s s P rof i t 10.6% 3,642.5 45.5% 8.6% 664.6 - 17.9% 13.7% 1,177.8 9.8% 966.8 A d j u st e d E B I T D A
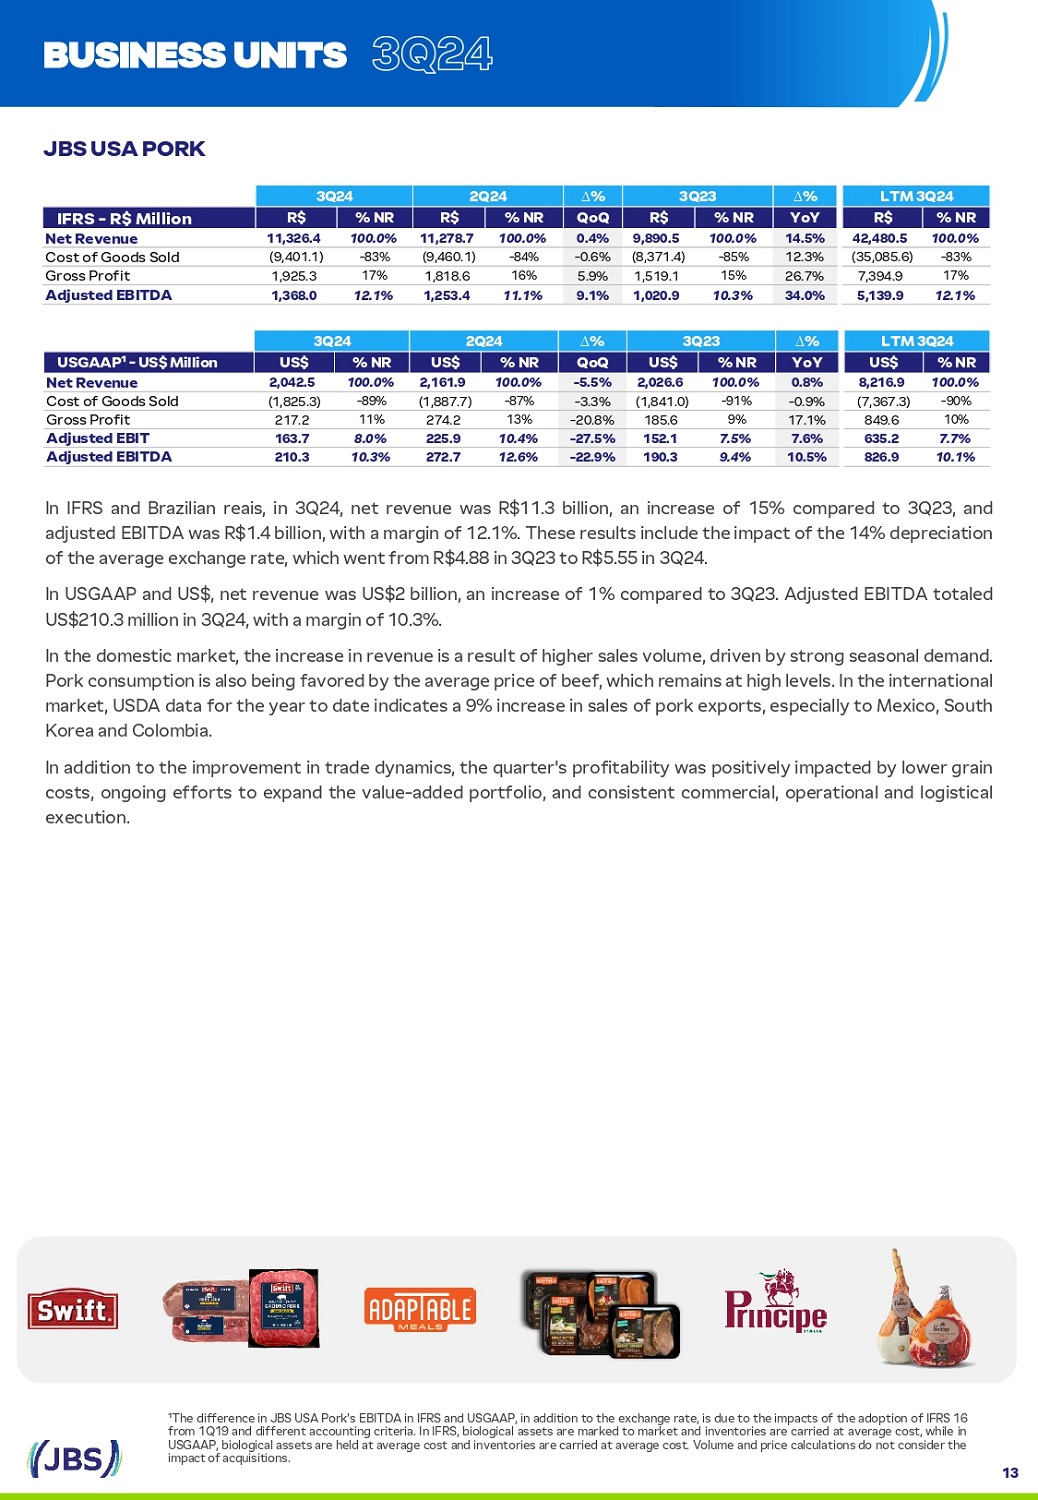
J B S U SA P O R K BU S INE S S UNITS ¹The difference in JBS USA Pork's EBITDA in IFRS and USGAAP, in addition to the exchange rate, is due to the impacts of the adoption of IFRS 16 from 1 Q 19 and different accounting criteria . In IFRS, biological assets are marked to market and inventories are carried at average cost, while in USGAAP, biological assets are held at average cost and inventories are carried at average cost . Volume and price calculations do not consider the In IFRS and Brazilian reais, in 3 Q 24 , net revenue was R $ 11 . 3 billion, an increase of 15 % compared to 3 Q 23 , and adjusted EBITDA was R $ 1 . 4 billion, with a margin of 12 . 1 % . These results include the impact of the 14 % depreciation of the average exchange rate, which went from R $ 4 . 88 in 3 Q 23 to R $ 5 . 55 in 3 Q 24 . In USGAAP and US $ , net revenue was US $ 2 billion, an increase of 1 % compared to 3 Q 23 . Adjusted EBITDA totaled U S $ 21 0 . 3 m i ll i o n i n 3 Q 24 , w i t h a m a r g i n o f 10 . 3 % . In the domestic market, the increase in revenue is a result of higher sales volume, driven by strong seasonal demand . Pork consumption is also being favored by the average price of beef, which remains at high levels . In the international market, USDA data for the year to date indicates a 9 % increase in sales of pork exports, especially to Mexico, South Korea and Colombia . In addition to the improvement in trade dynamics, the quarter's profitability was positively impacted by lower grain costs, ongoing efforts to expand the value - added portfolio, and consistent commercial, operational and logistical execution . 3Q24 L T M 3 Q 2 4 ∆ % 3Q23 ∆ % 2Q24 3Q24 % NR R$ YoY % NR R$ QoQ % NR R$ % NR R$ I F RS - R$ Mi lli on 100.0% 42,480.5 14.5% 100.0% 9,890.5 0.4% 100.0% 11,278.7 100.0% 11,326.4 N e t R e v e nue - 83% (35,085.6) 12.3% - 85% (8,371.4) - 0.6% - 84% (9,460.1) - 83% (9,401.1) C o s t of G oo d s So l d 17% 7,394.9 26.7% 15% 1,519.1 5.9% 16% 1,818.6 17% 1,925.3 G ro s s P rof i t 12.1% 5,139.9 34.0% 10.3% 1,020.9 9.1% 11.1% 1,253.4 12.1% 1,368.0 A d j u st e d E B I T D A i mp a ct of a c q ui si t i o n s . 13 L T M 3 Q 2 4 ∆ % 3Q23 ∆ % 2Q24 3Q24 % NR US$ YoY % NR US$ QoQ % NR US$ % NR US$ US G AAP ¹ - US$ M illi o n 100.0% 8,216.9 0.8% 100.0% 2,026.6 - 5.5% 100.0% 2,161.9 100.0% 2,042.5 N e t R e v e nue - 90% (7,367.3) - 0.9% - 91% (1,841.0) - 3.3% - 87% (1,887.7) - 89% (1,825.3) C o s t of G oo d s So l d 849.6 10% 17.1% 185.6 9% - 20.8% 13% 274.2 11% 217.2 G ro s s P rof i t 7.7% 635.2 7.6% 7.5% 152.1 - 27.5% 10.4% 225.9 8.0% 163.7 A d j u st e d E B I T 10.1% 826.9 10.5% 9.4% 190.3 - 22.9% 12.6% 272.7 10.3% 210.3 A d j u st e d E B I T D A
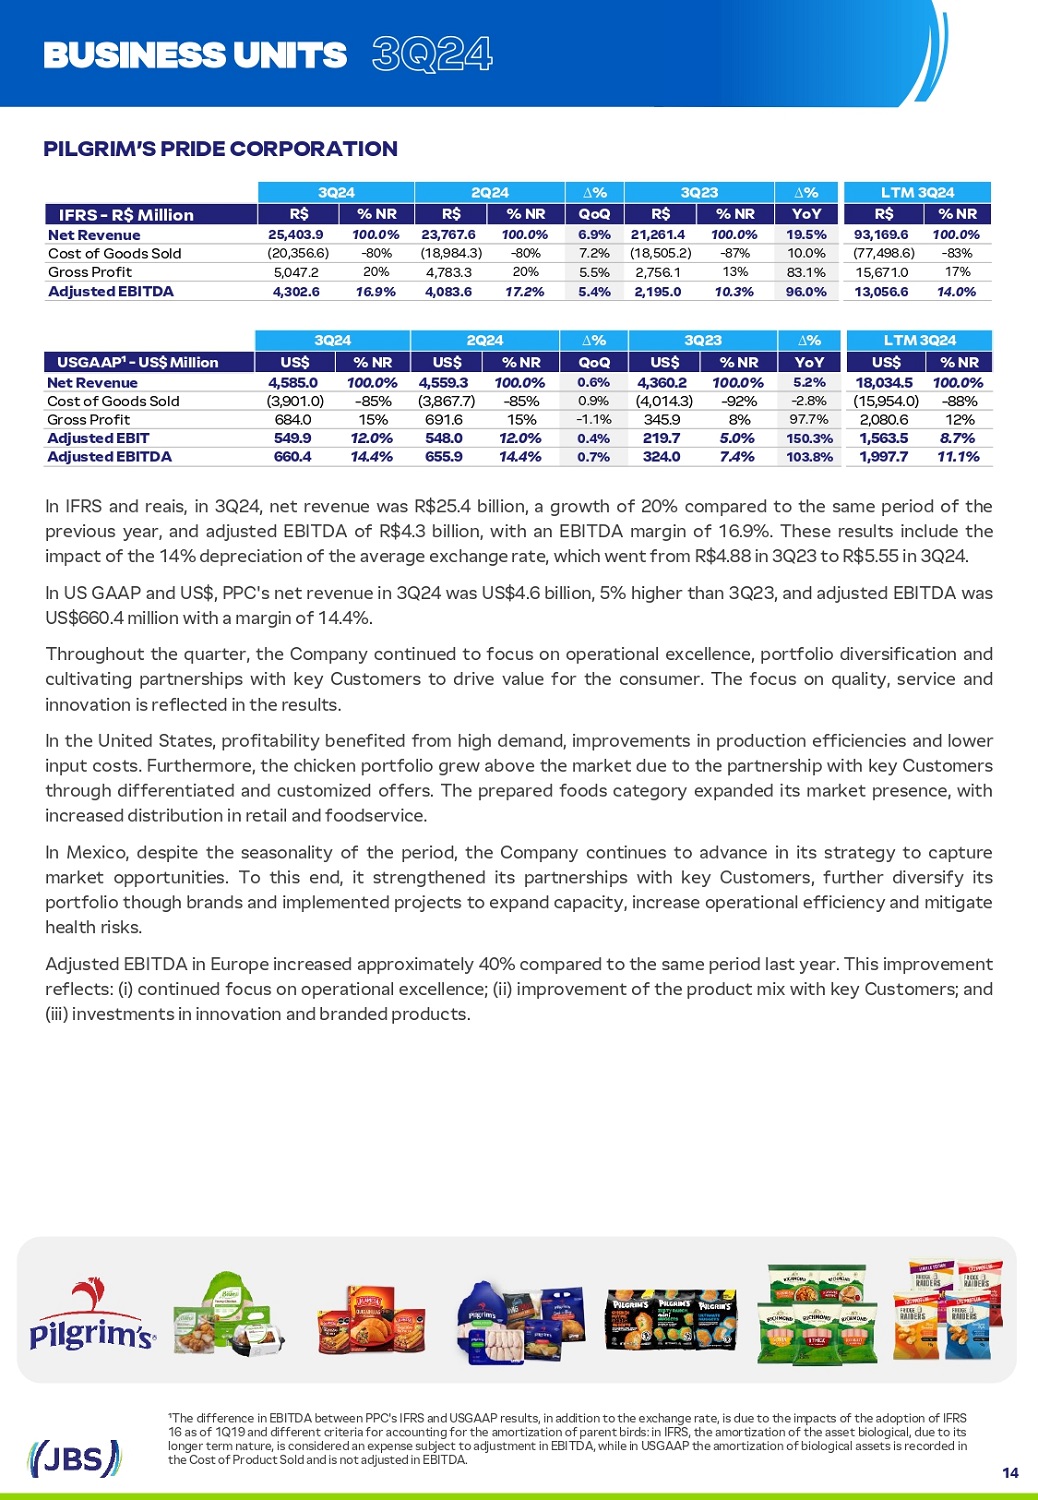
P I L GRI M’S P R I D E C O R P O R A TIO N BU S INE S S UNITS ¹The difference in EBITDA between PPC's IFRS and USGAAP results, in addition to the exchange rate, is due to the impacts of the adoption of IFRS 16 as of 1 Q 19 and different criteria for accounting for the amortization of parent birds : in IFRS, the amortization of the asset biological, due to its longer term nature, is considered an expense subject to adjustment in EBITDA, while in USGAAP the amortization of biological assets is recorded in In IFRS and reais, in 3 Q 24 , net revenue was R $ 25 . 4 billion, a growth of 20 % compared to the same period of the previous year, and adjusted EBITDA of R $ 4 . 3 billion, with an EBITDA margin of 16 . 9 % . These results include the impact of the 14 % depreciation of the average exchange rate, which went from R $ 4 . 88 in 3 Q 23 to R $ 5 . 55 in 3 Q 24 . In US GAAP and US $ , PPC's net revenue in 3 Q 24 was US $ 4 . 6 billion, 5 % higher than 3 Q 23 , and adjusted EBITDA was US $ 660 . 4 million with a margin of 14 . 4 % . Throughout the quarter, the Company continued to focus on operational excellence, portfolio diversification and cultivating partnerships with key Customers to drive value for the consumer . The focus on quality, service and innovation is reflected in the results . In the United States, profitability benefited from high demand, improvements in production efficiencies and lower input costs . Furthermore, the chicken portfolio grew above the market due to the partnership with key Customers through differentiated and customized offers . The prepared foods category expanded its market presence, with increased distribution in retail and foodservice . In Mexico, despite the seasonality of the period, the Company continues to advance in its strategy to capture market opportunities . To this end, it strengthened its partnerships with key Customers, further diversify its portfolio though brands and implemented projects to expand capacity, increase operational efficiency and mitigate health risks . Adjusted EBITDA in Europe increased approximately 40 % compared to the same period last year . This improvement reflects : (i) continued focus on operational excellence ; (ii) improvement of the product mix with key Customers ; and (i i i ) i nv es t m en t s in i nn o v a t i o n and b ra nded pro duc ts . 3Q24 L T M 3 Q 2 4 ∆ % 3Q23 ∆ % 2Q24 3Q24 % NR R$ YoY % NR R$ QoQ % NR R$ % NR R$ I F RS - R$ Mi lli on 100.0% 93,169.6 19.5% 100.0% 21,261.4 6.9% 100.0% 23,767.6 100.0% 25,403.9 N e t R e v e nue - 83% (77,498.6) 10.0% - 87% (18,505.2) 7.2% - 80% (18,984.3) - 80% (20,356.6) C o s t of G oo d s So l d 17% 15,671.0 83.1% 13% 2,756.1 5.5% 20% 4,783.3 20% 5,047.2 G ro s s P rof i t 14.0% 13,056.6 96.0% 10.3% 2,195.0 5.4% 17.2% 4,083.6 16.9% 4,302.6 A d j u st e d E B I T D A the Cost of Product Sold and is not adjusted in EBITDA. 14 L T M 3 Q 2 4 ∆ % 3Q23 ∆ % 2Q24 3Q24 % NR US$ YoY % NR US$ QoQ % NR US$ % NR US$ US G AAP ¹ - US$ M illi o n 100.0% 18,034.5 5.2% 100.0% 4,360.2 0.6% 100.0% 4,559.3 100.0% 4,585.0 N e t R e v e nue - 88% (15,954.0) - 2.8% - 92% (4,014.3) 0.9% - 85% (3,867.7) - 85% (3,901.0) C o s t of G oo d s So l d 12% 2,080.6 97.7% 345.9 8% - 1.1% 15% 691.6 15% 684.0 G ro s s P rof i t 8.7% 1,563.5 150.3% 5.0% 219.7 0.4% 12.0% 548.0 12.0% 549.9 A d j u st e d E B I T 11.1% 1,997.7 103.8% 7.4% 324.0 0.7% 14.4% 655.9 14.4% 660.4 A d j u st e d E B I T D A
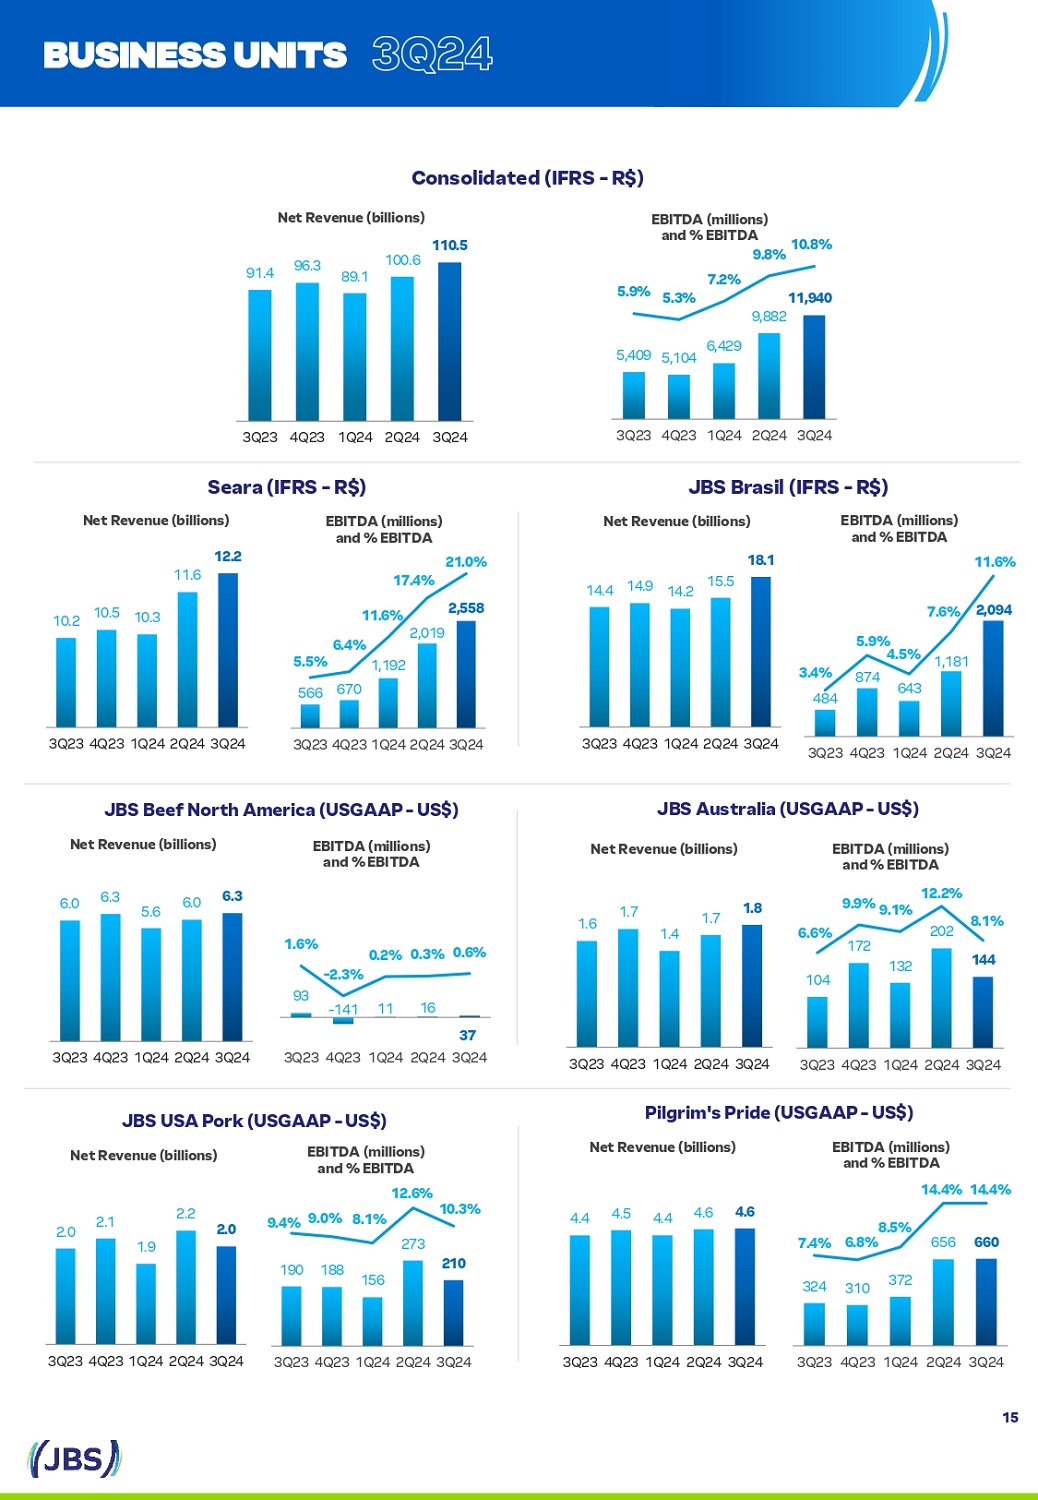
566 2 , 019 2,558 5.5% 11.6% 6.4% 1 , 192 670 17 . 4 % 21.0% 3Q23 4Q23 1Q24 2Q24 3Q24 104 172 132 202 144 6.6% 9.9% 9.1% 12.2% 8.1% 3Q23 4Q23 1Q24 2Q24 3Q24 14.4 14.9 14. 2 15 . 5 18.1 3Q23 4Q23 1Q24 2Q24 3Q24 Ne t Rev e n ue ( b il l i on s ) E B I T D A ( m il l i on s ) a n d % EBI TD A J B S B r a s il ( I F R S - R $) 10.2 10.5 10.3 11 . 6 12.2 3Q23 4Q23 1Q24 2Q24 3Q24 Ne t Rev e n ue ( b il l i on s ) EBI TD A ( m il l i on s ) a n d % EBI TD A S e ar a ( I F R S - R $) 324 310 372 656 660 7.4% 6.8% 8.5% E B I T D A ( m i l l i o n s ) a n d % EBI TD A 14.4% 14.4% 3Q23 4Q23 1Q24 2Q24 3Q24 4 . 4 4 . 5 4 . 4 4 . 6 4 .6 3Q23 4Q23 1Q24 2Q24 3Q24 N e t R e v e nue ( b i l l i o n s ) P il g ri m' s P ri d e ( U S G AA P - U S $) Ne t Rev e n ue ( b il l i on s ) JBS U S A P ork ( U S G AA P - U S $) EBI TD A ( m il l i on s ) a n d % EBI TD A 12.6% 9.4% 9.0% 8.1% 273 190 188 156 210 10.3% 3Q23 4Q23 1Q24 2Q24 3Q24 2. 0 2 . 1 1 . 9 2 . 2 2.0 3Q23 4Q23 1Q24 2Q24 3Q24 Ne t Rev e n ue ( b il l i on s ) EBI TD A ( m il l i on s ) a n d % EBI TD A 1 . 6 1 . 7 1 . 4 1 . 7 1.8 3Q23 4Q23 1Q24 2Q24 3Q24 JBS A u st r a li a ( U S G AA P - U S $) 93 - 2.3% - 141 11 16 1.6% 0.2% 0.3% 0.6% 37 3Q23 4Q23 1Q24 2Q24 3Q24 Ne t Rev e n ue ( b il l i on s ) EBI TD A ( m il l i on s ) a n d % EBI TD A 6 . 0 6 . 3 5 . 6 6 . 0 6.3 3Q23 4Q23 1Q24 2Q24 3Q24 JBS B ee f N ort h A m e ri c a ( U S G AA P - U S $) 874 643 1 , 181 2,094 3 . 4 % 484 5.9% 4.5% 7.6% 11.6% 3Q23 4Q23 1Q24 2Q24 3Q24 BU S INE S S UNITS 91 . 4 96. 3 89 . 1 100.6 110.5 3Q23 4Q23 1Q24 2Q24 3Q24 11,940 10.8% EBI TD A ( m il l i on s ) a nd % EBI TD A 9.8% 7.2% 5.9% 5.3% 9,882 5,409 5,104 6,429 3Q23 4Q23 1Q24 2Q24 3Q24 C o n s o lidat ed ( I F R S - R $) Ne t Rev e n ue ( b il l i on s ) 3Q24 15
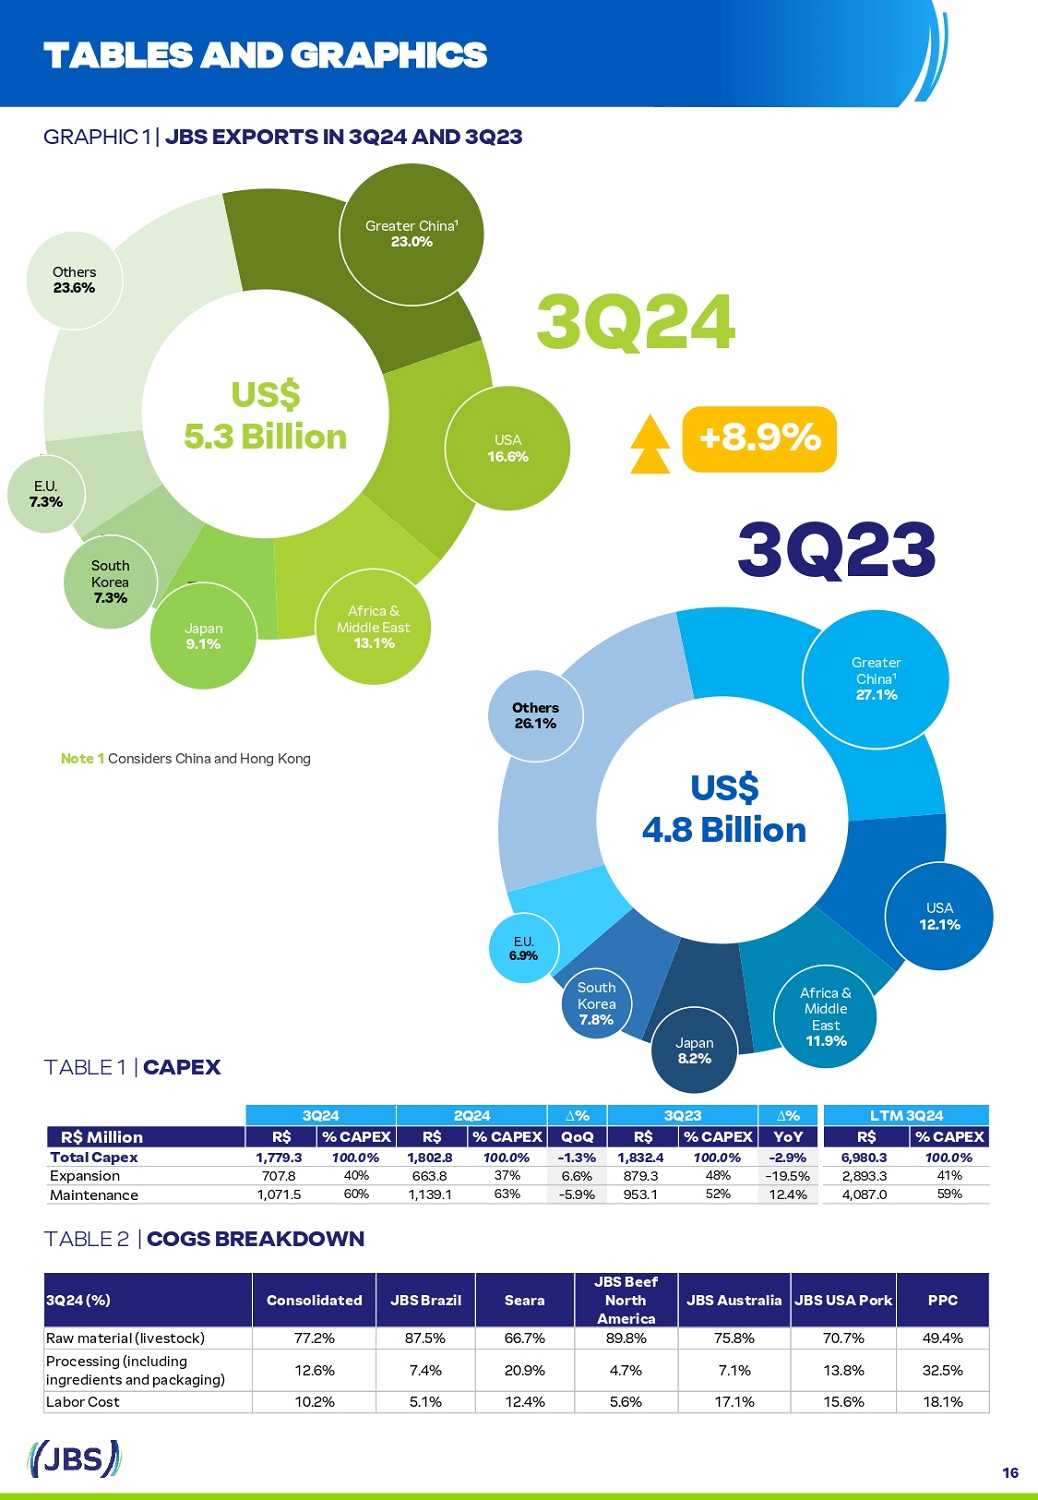
Gr e a t e r C h i n a ¹ 23.0% 16 USA 16.6% Africa & M i dd l e Ea st 13.1% Ja p an 9.1% S o u t h K o re a 7 . 3 % E.U. 7.3% O t h e rs 23.6% US$ 5 . 3 B i l l ion USA 12 . 1 % A f r i c a & Middle East 11.9% J a p a n 8.2% S o u t h Ko r e a 7 . 8 % E.U. 6. 9 % O t h e rs 26.1% US$ 4 . 8 B i l l ion 3Q23 Gr e a t er China¹ 27.1% No te 1 C o ns i d e rs C h i na a n d H o ng K o ng 3Q24 + 8 . 9 % T A B L E S A N D GRA PHICS G R A PH IC 1 | J B S E XPORTS IN 3Q24 A N D 3Q2 3 T A BLE 1 | C A P E X T A BLE 2 | C OGS B R E A K DOWN L T M 3Q2 4 ∆ % 3Q23 ∆ % 2Q24 3Q24 % C A P E X R$ YoY % C A P E X R$ QoQ % C A P E X R$ % C A P E X R$ R$ Mi lli on 100.0% 6,980.3 - 2.9% 100.0% 1,832.4 - 1.3% 100.0% 1,802.8 100.0% 1,779.3 To t al C a p e x 41% 2,893.3 - 19.5% 879.3 48% 6.6% 37% 663.8 40% 707.8 Expansion 59% 4,087.0 12.4% 953.1 52% - 5.9% 63% 1,139.1 60% 1,071.5 Maintenance PPC J BS U S A P o r k J BS A u st r a li a J BS Beef North A m e r i c a Seara J BS B r a z i l Consolidated 3 Q 24 ( % ) 49.4% 70.7% 75.8% 89.8% 66.7% 87.5% 77.2% R a w m a t e r i a l (li v e s t o c k ) 32.5% 13.8% 7.1% 4.7% 20.9% 7.4% 12.6% P ro c e ss i n g (i n c lu d i n g i n g r e d i e n t s an d p a c k a g i n g ) 18.1% 15.6% 17.1% 5.6% 12.4% 5.1% 10.2% L a b o r C o s t
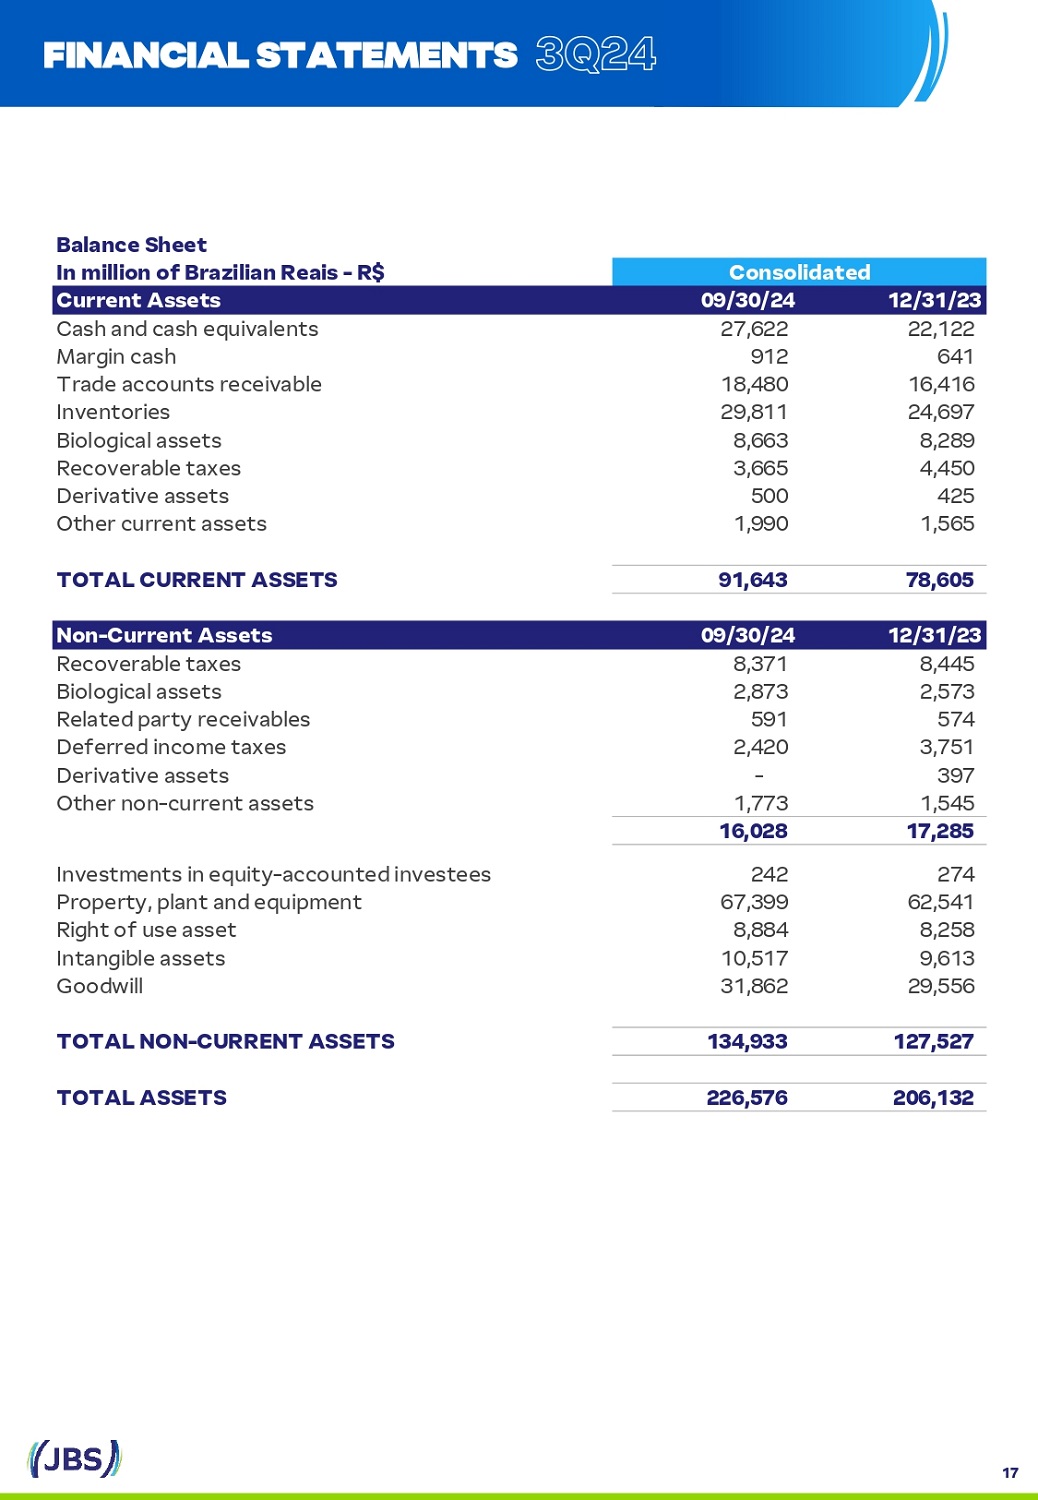
FINA N CIAL STA T E M E N T S 3Q24 17 B a l an c e S h e e t Consolidated I n m illio n o f Br a z ili a n R e a i s - R $ 12/31/23 09/30/24 Cu rr e n t A s s e t s 22,122 27,622 C a s h a nd c a s h e q u i v a l e nts 641 912 Ma r g i n c a s h 16,416 18,480 T r a d e a cc o u nts r e c e i v a b l e 24,697 29,811 Inventories 8,289 8,663 B i o l o g i c a l a ss e ts 4,450 3,665 R e c o v e r a b l e t a x e s 425 500 Derivative assets 1,565 1,990 O th e r c u rr e nt a ss e ts 78,605 91,643 T O T A L C U RR E N T A SS E TS 12/31/23 09/30/24 N o n - Cu rr e n t A s s e t s 8,445 8,371 R e c o v e r a b l e t a x e s 2,573 2,873 B i o l o g i c a l a ss e ts 574 591 R e l a t e d p a r ty r e c e i v a b l e s 3,751 2,420 D e f e rr e d i n c o m e t a x e s 397 - Derivative assets 1,545 1,773 O th e r n o n - c u rr e nt a ss e ts 17,285 16,028 274 242 I n v e s t m e nts i n e q u i t y - a cc o u nt e d i n v e s t e e s 62,541 67,399 P r o p e r t y , p l a nt a nd e q u i pm e nt 8,258 8,884 R i g ht o f u s e a ss e t 9,613 10,517 I nt a n g i b l e a ss e ts 29,556 31,862 Goodwill 127,527 134,933 T O T A L N O N - C U RR E N T A SS E TS 206,132 226,576 T O T A L A SS E TS
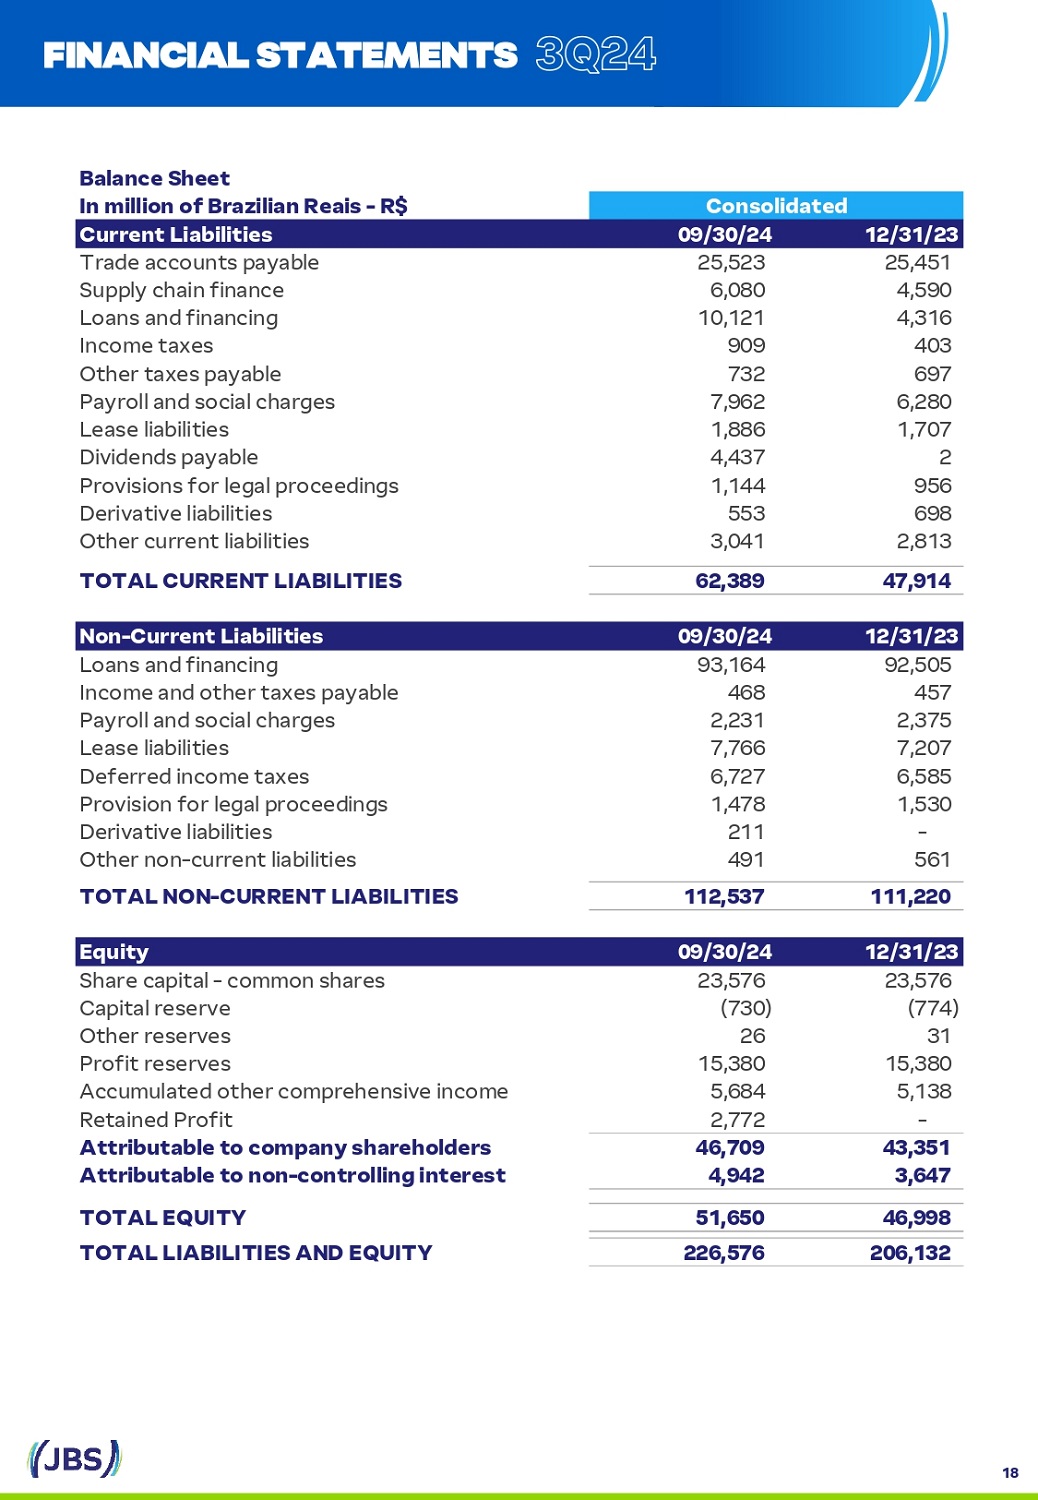
B a l an c e S h eet Consolidated I n m illi o n o f Br a z ili a n R e a i s - R $ 12/31/23 09/30/24 Cu rr e n t L i a b ili t i es 25,451 25,523 T r a d e a cc o u nts p a y a b l e 4,590 6,080 S u pp l y ch a i n f i n a nce 4,316 10,121 L o a ns a nd f i n a nc i ng 403 909 I nc o m e t a x e s 697 732 O th e r t a x e s p a y a b l e 6,280 7,962 P a y r o l l a nd s o c i a l ch a r g e s 1,707 1,886 L e a se li a b ili t i e s 2 4,437 Divi d e n d s p a y a b l e 956 1,144 P r o vi s i o ns f o r l e g a l p r o c ee d i n g s 698 553 D e riv a t iv e li a b ili t i e s 2,813 3,041 O th e r c u rr e nt li a b ili t i e s 47,914 62,389 T O T A L C U RR E N T L I A B I L I T I E S 12/31/23 09/30/24 N o n - Cu rr e n t L i a b ili t i es 92,505 93,164 L o a ns a nd f i n a nc i ng 457 468 I nc o m e a nd o th e r t a x e s p a y a b l e 2,375 2,231 P a y r o l l a nd s o c i a l ch a r g e s 7,207 7,766 L e a se li a b ili t i e s 6,585 6,727 D e f e rr e d i nc o m e t a x e s 1,530 1,478 P r o vi s i o n f o r l e g a l p r o c ee d i n g s - 211 D e riv a t iv e li a b ili t i e s 561 491 O th e r n o n - c u rr e nt li a b ili t i e s 111,220 112,537 T O T A L N O N - C U RR E N T L I A B I L I T I E S 12/31/23 09/30/24 Equity 23,576 23,576 S h a r e c a p i t a l - c o mm o n sh a r e s (774) (730) C a p i t a l r e s e rv e 31 26 O th e r r e s e rv e s 15,380 15,380 P r o f i t r e s e rv e s 5,138 5,684 Accumulated other comprehensive income - 2,772 R e t a i n e d P r o f i t 43,351 46,709 Attributable to company shareholders 3,647 4,942 A tt r i b u t a b l e to n o n - c o n t r o lli n g i n te r est 46,998 51,650 T O T A L E Q U I TY 206,132 226,576 T O T A L L I A B I L I T I E S A N D E Q U I TY 18 FINA N CIAL STA T E M E N T S 3Q24
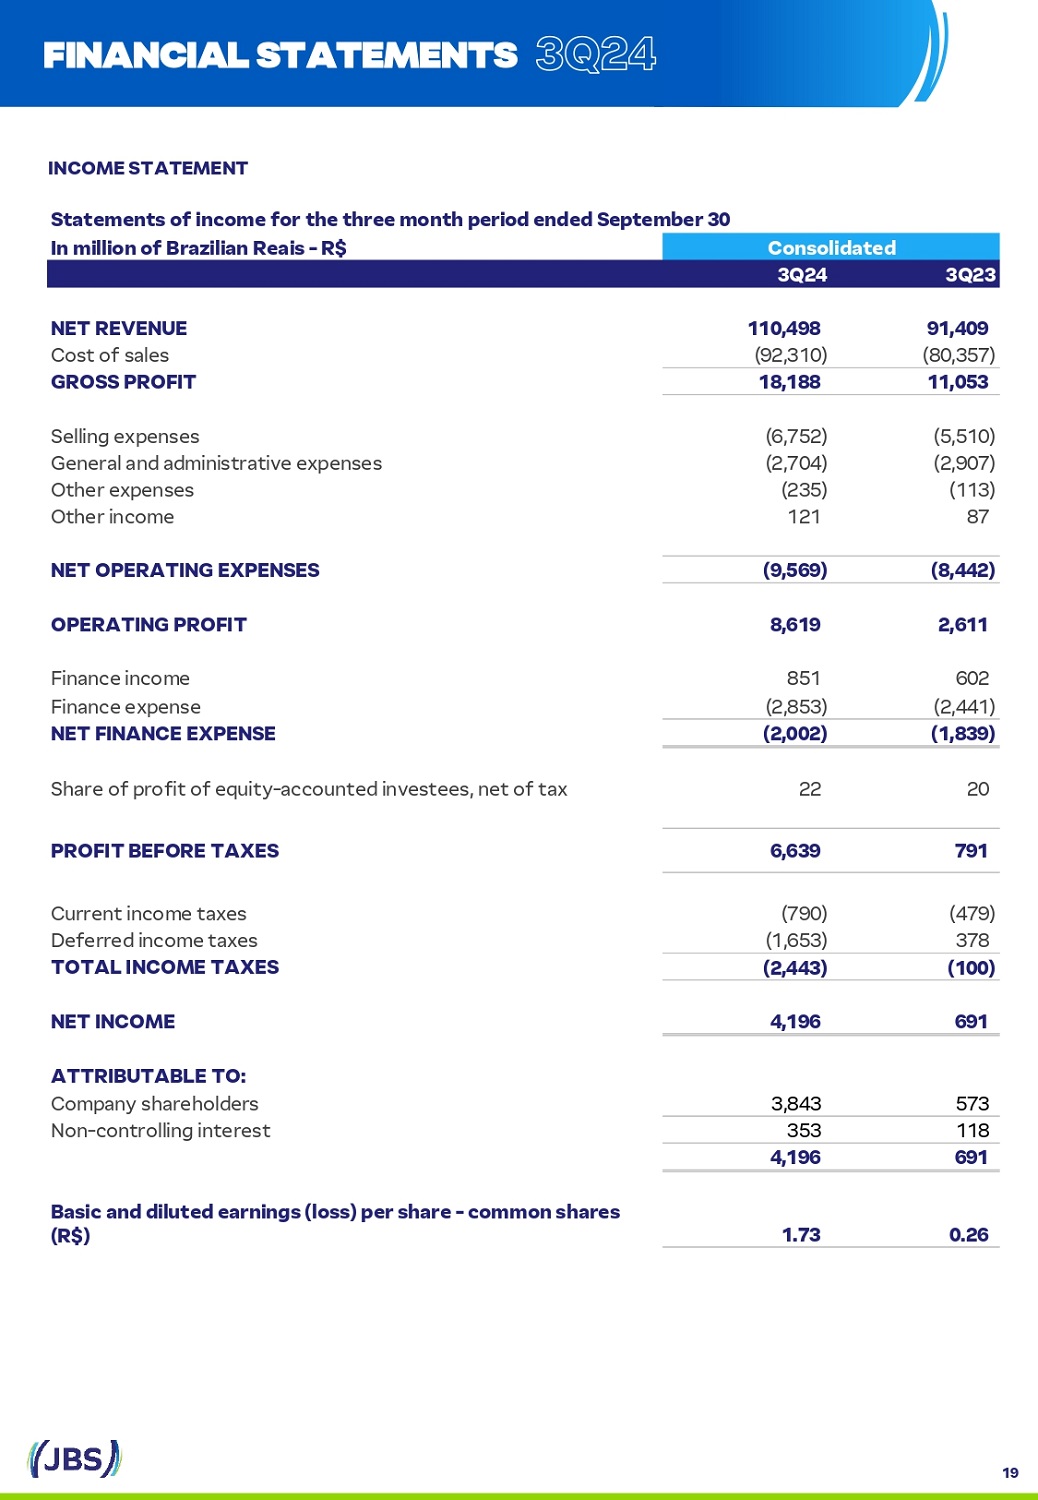
I NC O ME S T A T EM E NT Statements of income for the three month period ended September 30 Consolidated I n m illi o n o f Br a z ili a n R e a i s - R $ 3Q23 3Q24 91,409 110,498 N E T R E V E N U E (80,357) (92,310) C o st o f s a l e s 11,053 18,188 G R O S S P R O F I T (5,510) (6,752) S e lli ng e x p e ns e s (2,907) (2,704) General and administrative expenses (113) (235) O th e r e x p e ns e s 87 121 O th e r i nc o m e (8,442) (9,569) N E T O P E R A T I N G E XP E N S E S 2,611 8,619 O P E R A T I N G P R O F I T 602 851 F i n a nce i nc o m e (2,441) (2,853) F i n a nce e x p e nse (1,839) (2,002) N E T F I N A N C E E XP E N S E 20 22 Share of profit of equity - accounted investees, net of tax 791 6,639 P R O F I T B E F O R E T A X E S (479) (790) C u rr e nt i nc o m e t a x e s 378 (1,653) D e f e rr e d i nc o m e t a x e s (100) (2,443) T O T A L I N CO M E T A X E S 691 4,196 N E T I N CO M E A TT RI B U T A B L E T O : 573 3,843 Company shareholders 118 353 N o n - c o nt r o lli ng i nt e r e st 691 4,196 0.26 1.73 Basic and diluted earnings (loss) per share - common shares (R$) FINA N CIAL STA T E M E N T S 3Q24 19
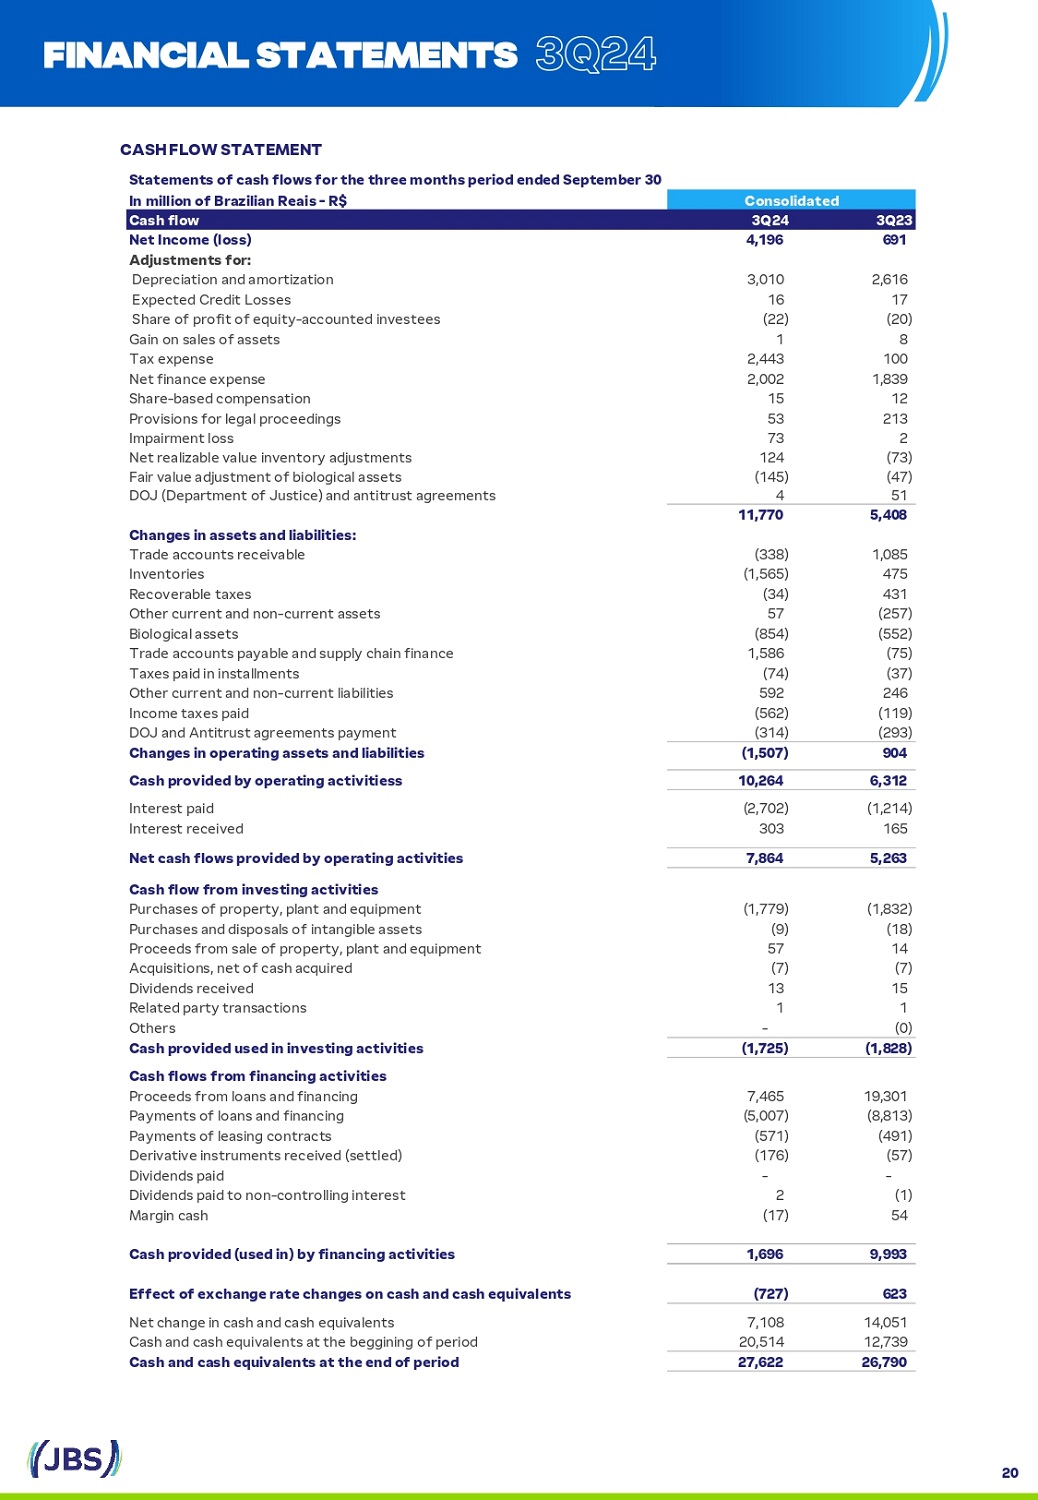
Statements of cash flows for the three months period ended September 30 Consolidated I n m illio n o f Br a z ili a n R e a i s - R $ 3Q23 3Q24 C a s h fl o w 691 4,196 N et I n c o m e ( loss ) A dj u st m e n ts f o r : 2,616 3,010 D e p r e c i a t i o n a nd a m o r t i z a t i o n 17 16 E x p e ct e d C r e d i t L o s s e s (20) (22) S h a r e o f p r o f i t o f e q u i t y - a cc o u nt e d i n v e s t ee s 8 1 Ga i n o n sa l e s o f a s s e ts 100 2,443 T a x e x p e nse 1,839 2,002 N e t f i n a nce e x p e nse 12 15 S h a r e - b a s e d c o mp e nsat i o n 213 53 P r o v i s i o ns f o r l e g a l p r o c ee d i n g s 2 73 I mp a ir m e nt l o ss (73) 124 Net realizable value inventory adjustments (47) (145) Fair value adjustment of biological assets 51 4 DOJ (Department of Justice) and antitrust agreements 5,408 11,770 C han g es i n a ss ets an d li a b ili t i es: 1,085 (338) T r a d e a cc o u nts r e c e i v a b l e 475 (1,565) Inventories 431 (34) R e c o v e r a b l e tax e s (257) 57 O th e r c u rr e nt a nd n o n - c u rr e nt a s s e ts (552) (854) B i o l o g i c a l a s s e ts (75) 1,586 T r a d e a cc o u nts p a y a b l e a nd s u pp l y ch a i n f i n a nce (37) (74) T a x e s p a i d i n i ns t a ll m e nts 246 592 O th e r c u rr e nt a nd n o n - c u rr e nt li a b ili t i e s (119) (562) I nc o m e tax e s p a i d (293) (314) D O J a nd Ant i t r u st a g r ee m e nts p a y m e nt 904 (1,507) Changes in operating assets and liabilities 6,312 10,264 Cash provided by operating activitiess (1,214) (2,702) I nt e r e st p a i d 165 303 I nt e r e st r e c e i v e d 5,263 7,864 Net cash flows provided by operating activities C a s h fl o w f ro m i nv es ti n g a c t i v i t i es (1,832) (1,779) Purchases of property, plant and equipment (18) (9) Purchases and disposals of intangible assets 14 57 Proceeds from sale of property, plant and equipment (7) (7) Ac q u i s i t i o ns, n e t o f c a sh a c q u ir e d 15 13 D i v i d e n d s r e c e i v e d 1 1 R e l a t e d p a r ty t r a nsact i o ns (0) - Others (1,828) (1,725) C a s h pr o v i d ed u se d i n i nv es ti n g a c t i v i t i es C a s h fl o w s f ro m fi nan c i n g a c t i v i t i es 19,301 7,465 P r o c ee d s f r o m l o a ns a nd f i n a nc i ng (8,813) (5,007) Pa y m e nts o f l o a ns a nd f i n a nc i ng (491) (571) Pa y m e nts o f l e a s i ng c o nt r a cts (57) (176) D e ri v a t i v e i ns tr u m e nts r e c e i v e d ( s e tt l e d ) - - D i v i d e n d s p a i d (1) 2 D i v i d e n d s p a i d to n o n - c o nt r o lli ng i nt e r e st 54 (17) Ma r g i n c a sh 9,993 1,696 Cash provided (used in) by financing activities 623 (727) E ffe c t o f e xc han g e r a te c han g es o n c a s h an d c a s h e q u i va l e n ts 14,051 7,108 N e t ch a n g e i n c a sh a nd c a sh e q u i v a l e nts 12,739 20,514 Cash and cash equivalents at the beggining of period 26,790 27,622 C a s h an d c a s h e q u i va l e n ts a t t h e e n d o f p e r io d 20 FINA N CIAL STA T E M E N T S 3Q24 C ASH FLO W ST AT E M ENT
D I SC L A I MER We make statements about future events that are subject to risks and uncertainties . Such statements are based on the beliefs and assumptions of our Management and information to which the Company currently has access . Statements about future events include information about our current intentions, beliefs or expectations, as well as those of the members of the Company's Board of Directors and Officers . Disclaimers with respect to forward - looking statements and information also include information on possible or presumed operating results, as well as statements that are preceded, followed or that include the words "believe,“ "may," "will," "continue," “expects,“ "predicts," "intends," "plans," "estimates," or similar expressions . Forward - looking statements and information are not guarantees of performance . They involve risks, uncertainties and assumptions because they refer to future events, depending, therefore, on circumstances that may or may not occur . Future results and shareholder value creation may differ materially from those expressed or implied by the forward - looking statements . Many of the factors that will determine these results and values are beyond our ability to control or predict . 21