Exhibit 99.5
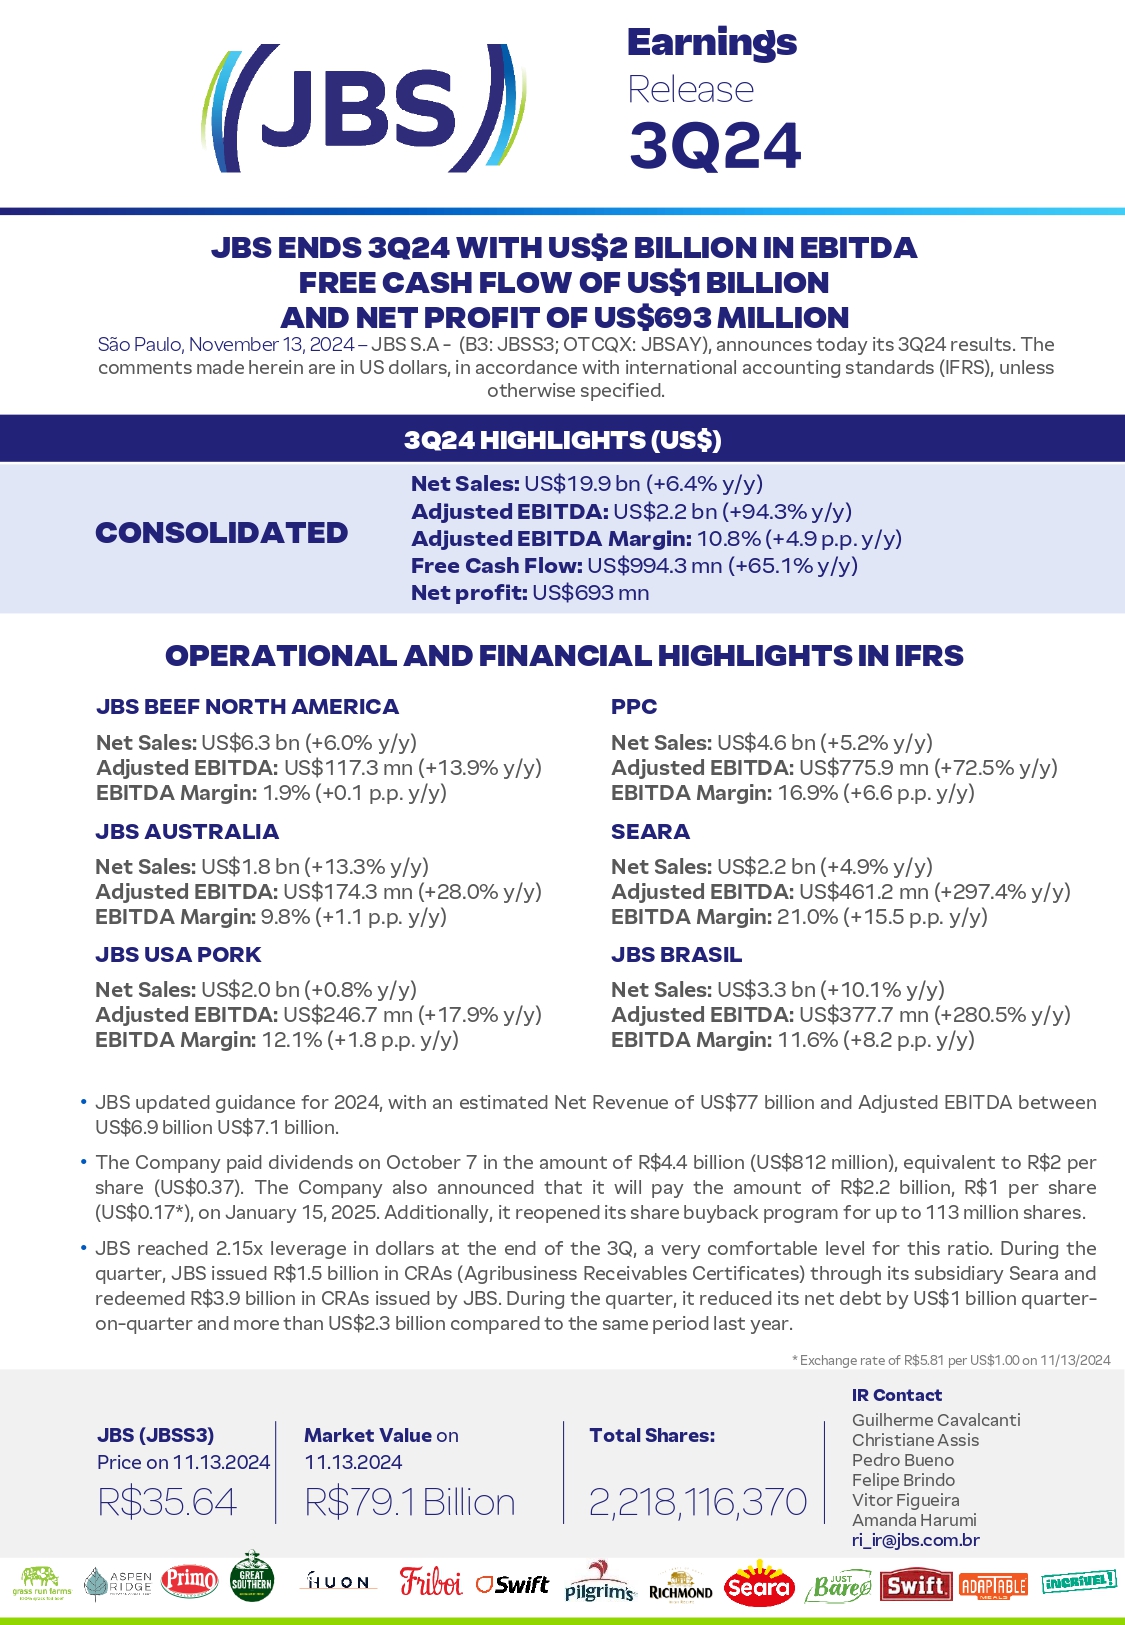
JBS ENDS 3Q24 WITH US(2 BILLION IN EBITDA FREE CASH FLOW OF US(1 BILLION AND NET PROFIT OF US(693 MILLION São Paulo, November 13, 2024 – JBS S.A - (B3: JBSS3; OTCQX: JBSAY), announce S today it S 3Q24 re S ult S . The comment S made herein are in US dollar S , in accordance with international accounting S tandard S (IFRS), unle SS otherwi S e S pecified. Earnings Release JBS (JBSS3) Price on 11.13.2024 R$35.64 Market Value on 11.13.2024 R$79.1 Billion Total Shares: 2,218,116,370 IR Contact Guilherme Cavalcanti Chri S tiane A SS i S Pedro Bueno Felipe Brindo Vitor Figueira Amanda Harumi ri_ir@jbs.com.br 3Q24 HIGHLIGHTS (US() Net Sales: US$19.9 bn (+6.4% y/y) Adjusted EBITDA: US$2.2 bn (+94.3% y/y) Adjusted EBITDA Margin: 10.8% (+4.9 p.p. y/y) Free Cash Flow: US$994.3 mn (+65.1% y/y) Net profit: US$693 mn OPERATIONAL AND FINANCIAL HIGHLIGHTS IN IFRS JBS BEEF NORTH AMERICA Net Sales: US$6.3 bn (+6.0% y/y) Adjusted EBITDA: US$117.3 mn (+13.9% y/y) EBITDA Margin: 1.9% (+0.1 p.p. y/y) JBS AUSTRALIA Net Sales: US$1.8 bn (+13.3% y/y) Adjusted EBITDA: US$174.3 mn (+28.0% y/y) EBITDA Margin: 9.8% (+1.1 p.p. y/y) JBS USA PORK Net Sales: US$2.0 bn (+0.8% y/y) Adjusted EBITDA: US$246.7 mn (+17.9% y/y) EBITDA Margin: 12.1% (+1.8 p.p. y/y) PPC Net Sales: US$4.6 bn (+5.2% y/y) Adjusted EBITDA: US$775.9 mn (+72.5% y/y) EBITDA Margin: 16.9% (+6.6 p.p. y/y) SEARA Net Sales: US$2.2 bn (+4.9% y/y) Adjusted EBITDA: US$461.2 mn (+297.4% y/y) EBITDA Margin: 21.0% (+15.5 p.p. y/y) JBS BRASIL Net Sales: US$3.3 bn (+10.1% y/y) Adjusted EBITDA: US$377.7 mn (+280.5% y/y) EBITDA Margin: 11.6% (+8.2 p.p. y/y) CONSOLIDATED • JBS updated guidance for 2024 , with an e S timated Net Revenue of US $ 77 billion and Adju S ted EBITDA between US $ 6 . 9 billion US $ 7 . 1 billion . • The Company paid dividend S on October 7 in the amount of R $ 4 . 4 billion (US $ 812 million), equivalent to R $ 2 per S hare (US $ 0 . 37 ) . The Company al S o announced that it will pay the amount of R $ 2 . 2 billion, R $ 1 per S hare (US $ 0 . 17 *), on January 15 , 2025 . Additionally, it reopened it S S hare buyback program for up to 113 million S hare S . • JBS reached 2 . 15 x leverage in dollar S at the end of the 3 Q, a very comfortable level for thi S ratio . During the quarter, JBS i SS ued R $ 1 . 5 billion in CRA S (Agribu S ine SS Receivable S Certificate S ) through it S S ub S idiary Seara and redeemed R $ 3 . 9 billion in CRA S i SS ued by JBS . During the quarter, it reduced it S net debt by US $ 1 billion quarter - on - quarter and more than US $ 2 . 3 billion compared to the S ame period la S t year . * Exchange rate of R$5.81 per US$1.00 on 11/13/2024
MESSAGE FROM THE CEO Gilberto Tomazoni, Global CEO JBS 2 The third quarter re S ult S for 2024 reaffirm our po S itive outlook for the year, highlighting once again the S trength of JBS’ global, multi - protein platform, the quality of our team, and our focu S on operational excellence . Net Revenue wa S a record US $ 19 . 9 billion . During thi S period, EBITDA reached US $ 2 . 2 billion, with a con S olidated margin of 10 . 8 % – marking a nearly five percentage point increa S e compared to the S ame quarter in 2023 . The re S ult S pre S ented thi S quarter allow u S to announce that the Company will di S tribute dividend S on January 15 , 2025 , of approximately US $ 0 . 17 per S hare, totaling around US $ 382 million . La S t October, approximately US $ 815 million in dividend S were di S tributed . Over the pa S t S ix year S , the Company ha S delivered an average total return to S hareholder S of approximately 20 % per year in U . S . dollar S , demon S trating our commitment to growth and value di S tribution . Our poultry and pork operation S in Brazil and the United State S performed above expectation S , e S pecially Seara, which clo S ed the quarter with a record - breaking 21 % margin . Strong global demand, favorable grain co S t S , and our agility in managing product and market mix, along S ide our focu S on high - value product S and innovation, complement the re S ult S of already implemented operational improvement S in efficiency, productivity, and commercial enhancement S . Pilgrim’ S reported a S olid 16 . 9 % margin, driven by robu S t demand primarily in Europe, the U . S . and Mexico . Operational improvement S and portfolio diver S ification into value - added product S and brand S al S o contributed to the S e re S ult S , along with partner S hip S with key cu S tomer S aimed at delivering value to con S umer S . The bu S ine SS performance al S o reflect S a focu S on quality, S ervice, and innovation . Our US Pork bu S ine SS po S ted a 12 . 1 % margin, driven by higher S ale S both in the U . S . and internationally, along with impre SS ive growth in value - added product S and S trong gain S acro SS agricultural performance metric S . JBS’ multi - geography, multi - protein platform i S unmatched in it S re S ilience amid market challenge S . While the U . S . operation S are S till feeling the effect S of the cattle cycle, JBS Brazil po S ted one of it S be S t performance S , with an 11 . 6 % margin driven by the beef S egment . Beyond the high export volume, Friboi re S ult S reflect the pur S uit of operational excellence, the increa S e in dome S tic demand, the opening of new market S , and the improvement of the product mix, with a focu S on value - added product S , branding, and cu S tomer S ervice . Au S tralia continue S to capture the benefit S of the cattle cycle, with a 9 . 8 % margin in the third quarter de S pite ri S ing live S tock price S . The outlook for thi S bu S ine SS remain S favorable in the coming quarter S . We’re focu S ed on growth fueled by diver S ification, innovation, value - added product S , and S trong branding . Recently, we announced an inve S tment to expand Huon Aquaculture’ S S almon production in Au S tralia . And in Jeddah, Saudi Arabia, we’re fini S hing a new Seara facility that will quadruple local value - added chicken product S capacity in the region . Our Q 3 performance under S core S the S trength of our financial management, a S leverage dropped to 2 . 15 x in USD, net debt wa S reduced by US $ 1 billion, decrea S ing to US $ 13 . 7 billion, and Net Profit came in at US $ 693 million . With our global footprint, the experti S e of our team, ongoing innovation, and a commitment to operational excellence, JBS i S primed to continue delivering value to our cu S tomer S , con S umer S , and S takeholder S alike .
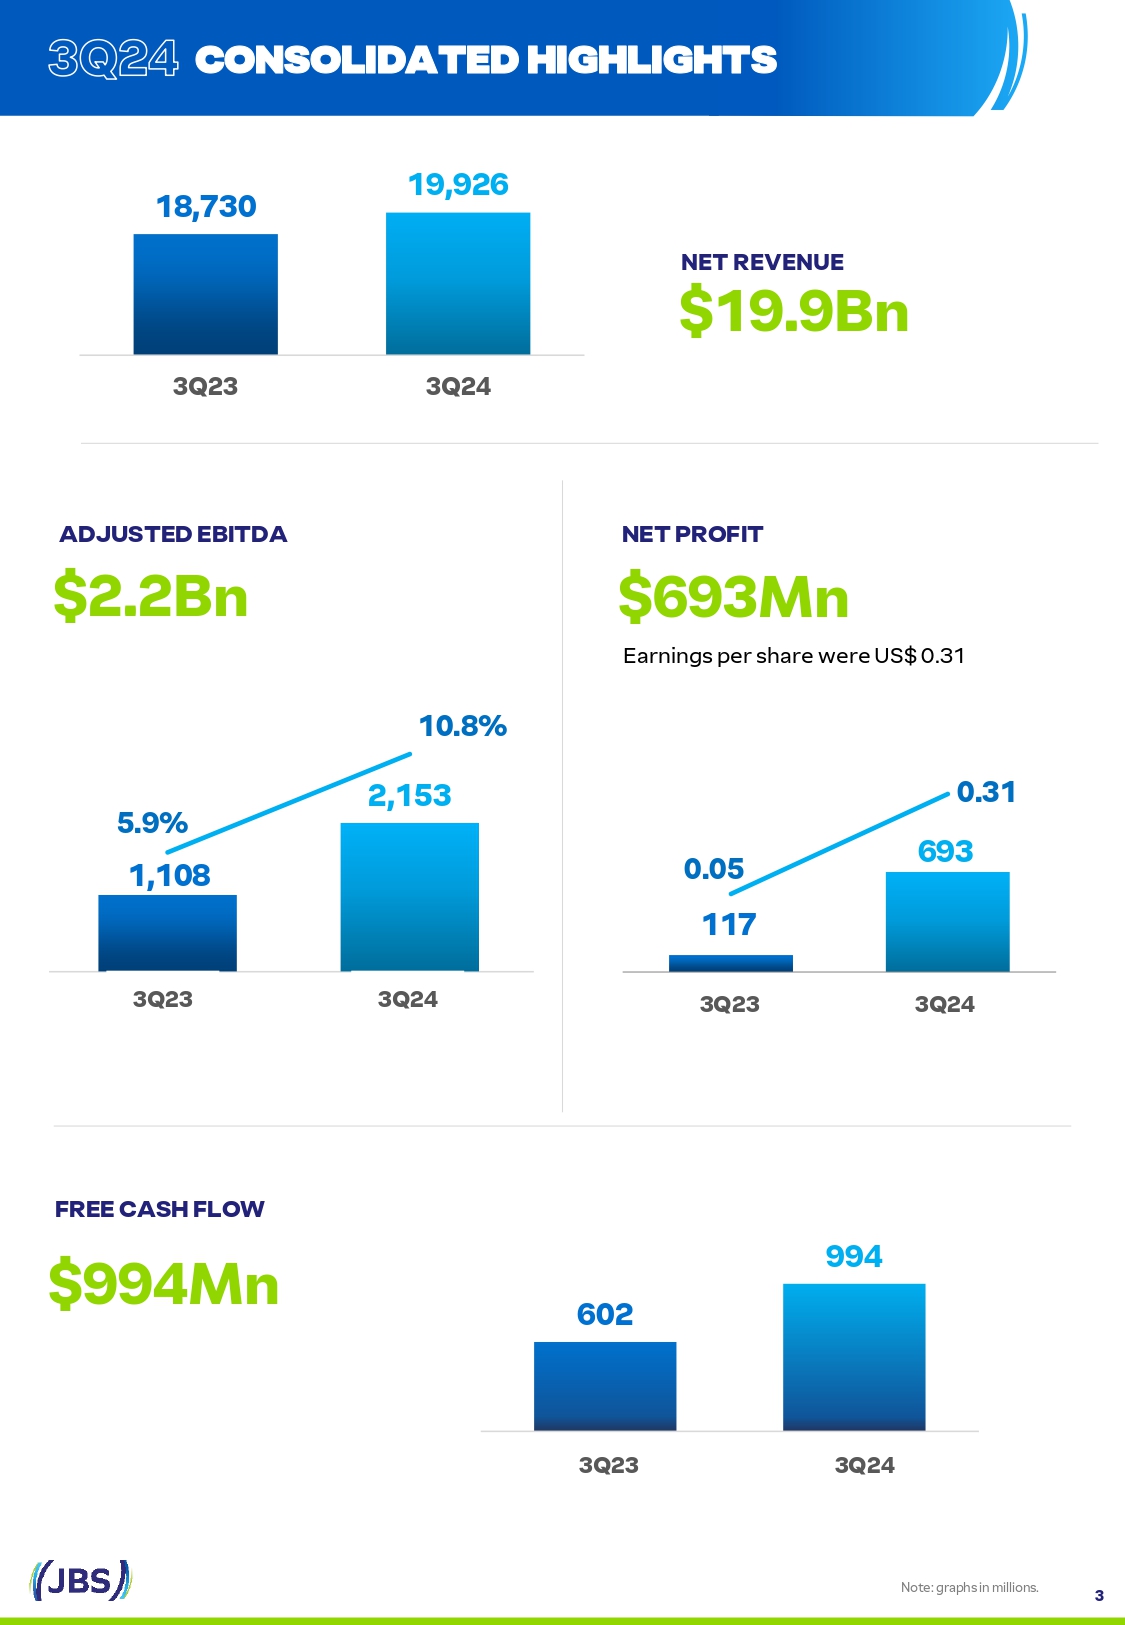
NET REVENUE $19.9Bn FREE CASH FLOW 693 0.05 117 0.31 3T23 3T24 602 994 3T23 3T24 CONSOLIDATED HIGHLIGHTS Note: graph S in million S . ADJUSTED EBITDA $2.2Bn NET PROFIT $693Mn Earning S per S hare were US$ 0.31 3 18,730 19,926 3Q23 3Q24 2,153 5.9% 1,108 10.8% 3T23 3T24 3Q23 3Q24 3Q23 3Q24 3Q23 3Q24 $994Mn
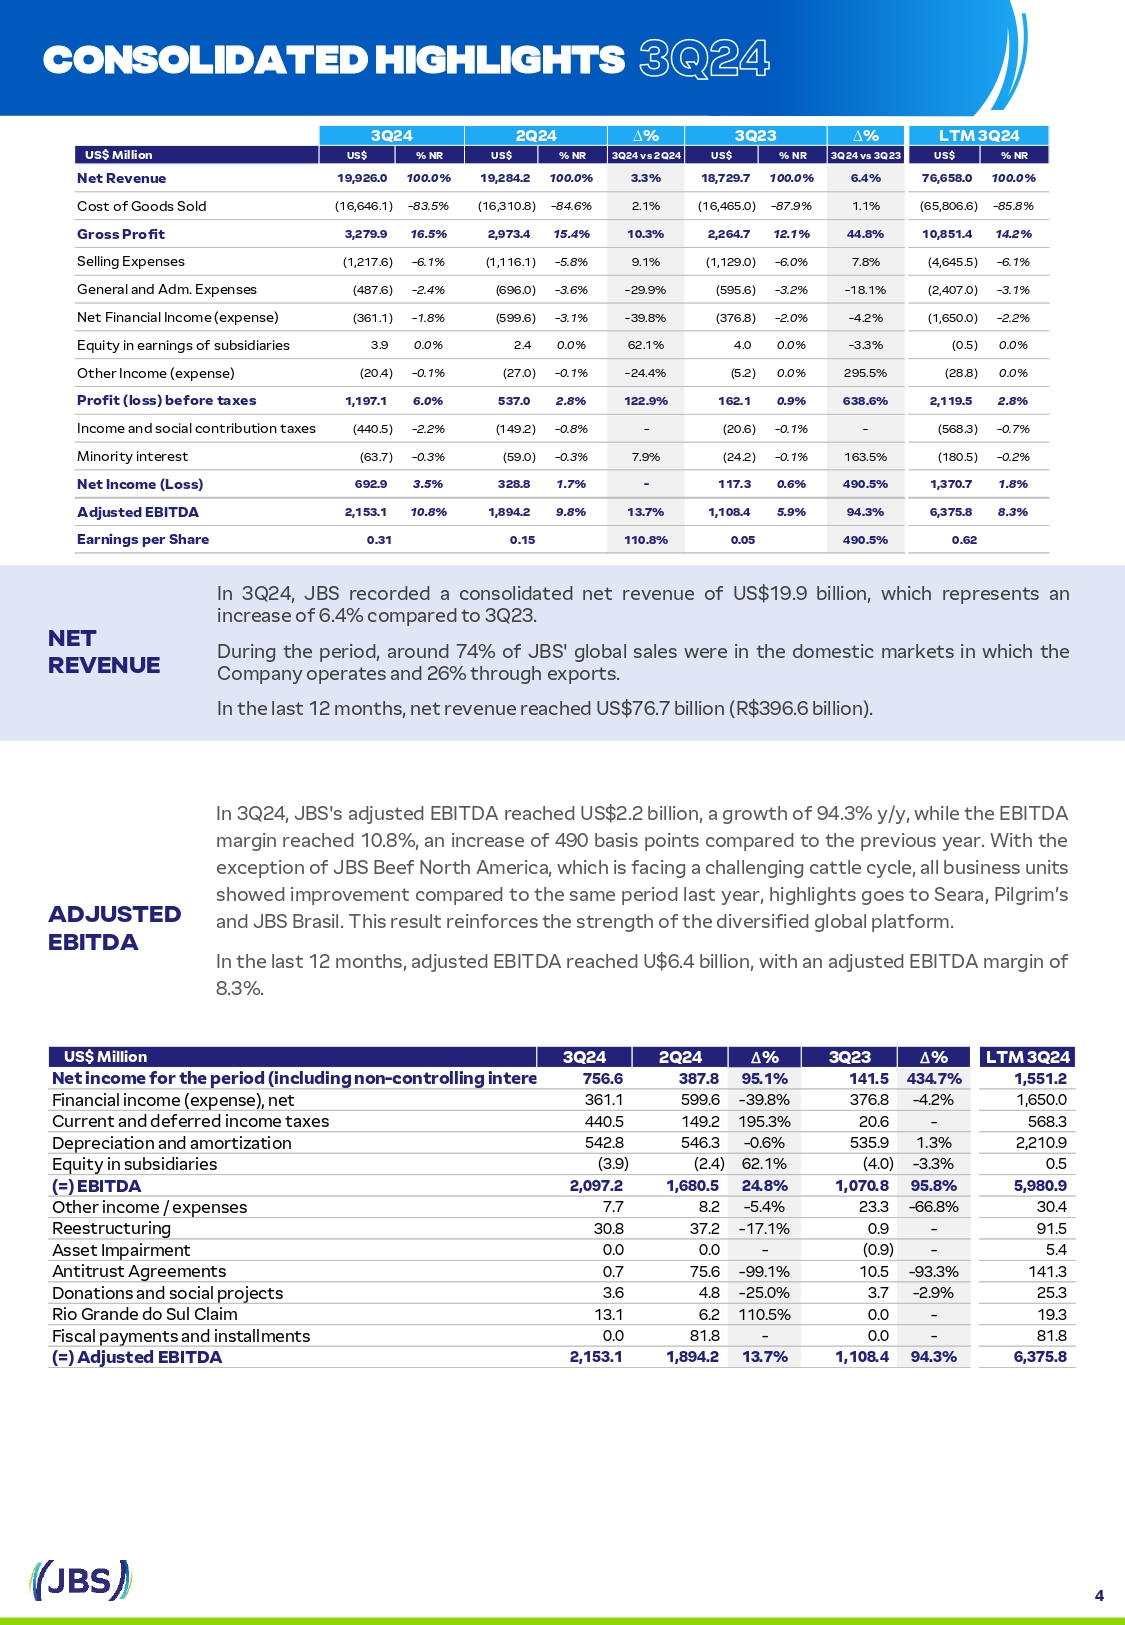
NET REVENUE ADJUSTED EBITDA CONSOLIDATED HIGHLIGHTS In 3Q24, JBS recorded a con S olidated net revenue of US$19.9 billion, which repre S ent S an increa S e of 6.4% compared to 3Q23. During the period, around 74% of JBS' global S ale S were in the dome S tic market S in which the Company operate S and 26% through export S . In the la S t 12 month S , net revenue reached US$76.7 billion (R$396.6 billion). In 3 Q 24 , JBS' S adju S ted EBITDA reached US $ 2 . 2 billion, a growth of 94 . 3 % y/y, while the EBITDA margin reached 10 . 8 % , an increa S e of 490 ba S i S point S compared to the previou S year . With the exception of JBS Beef North America, which i S facing a challenging cattle cycle, all bu S ine SS unit S S howed improvement compared to the S ame period la S t year, highlight S goe S to Seara, Pilgrim’ S and JBS Bra S il . Thi S re S ult reinforce S the S trength of the diver S ified global platform . In the la S t 12 month S , adju S ted EBITDA reached U$6.4 billion, with an adju S ted EBITDA margin of 8.3%. 3Q24 2Q24 ∆ % 3Q23 ∆ % LTM 3Q24 US$ Million US$ % NR US$ % NR 3Q24 vs 2Q24 US$ % NR 3Q24 vs 3Q23 US$ % NR Net Revenue 19,926.0 100.0% 19,284.2 100.0% 3.3% 18,729.7 100.0% 6.4% 76,658.0 100.0% Co S t of Good S Sold (16,646.1) - 83.5% (16,310.8) - 84.6% 2.1% (16,465.0) - 87.9% 1.1% (65,806.6) - 85.8% Gross Profit 3,279.9 16.5% 2,973.4 15.4% 10.3% 2,264.7 12.1% 44.8% 10,851.4 14.2% Selling Expen S e S (1,217.6) - 6.1% (1,116.1) - 5.8% 9.1% (1,129.0) - 6.0% 7.8% (4,645.5) - 6.1% General and Adm. Expen S e S (487.6) - 2.4% (696.0) - 3.6% - 29.9% (595.6) - 3.2% - 18.1% (2,407.0) - 3.1% Net Financial Income (expen S e) (361.1) - 1.8% (599.6) - 3.1% - 39.8% (376.8) - 2.0% - 4.2% (1,650.0) - 2.2% Equity in earning S of S ub S idiarie S 3.9 0.0% 2.4 0.0% 62.1% 4.0 0.0% - 3.3% (0.5) 0.0% Other Income (expen S e) (20.4) - 0.1% (27.0) - 0.1% - 24.4% (5.2) 0.0% 295.5% (28.8) 0.0% Profit (loss) before taxes 1,197.1 6.0% 537.0 2.8% 122.9% 162.1 0.9% 638.6% 2,119.5 2.8% Income and S ocial contribution taxe S (440.5) - 2.2% (149.2) - 0.8% - (20.6) - 0.1% - (568.3) - 0.7% Minority intere S t (63.7) - 0.3% (59.0) - 0.3% 7.9% (24.2) - 0.1% 163.5% (180.5) - 0.2% Net Income (Loss) 692.9 3.5% 328.8 1.7% - 117.3 0.6% 490.5% 1,370.7 1.8% Adjusted EBITDA 2,153.1 10.8% 1,894.2 9.8% 13.7% 1,108.4 5.9% 94.3% 6,375.8 8.3% Earnings per Share 0.31 0.15 110.8% 0.05 490.5% 0.62 ∆ % 3Q23 ∆ % 2Q24 3Q24 US$ Million 434.7% 141.5 95.1% 387.8 756.6 Net income for the period (including non - controlling intere - 4.2% 376.8 - 39.8% 599.6 361.1 Financial income (expen S e), net - 20.6 195.3% 149.2 440.5 Current and deferred income taxe S 1.3% 535.9 - 0.6% 546.3 542.8 Depreciation and amortization - 3.3% (4.0) 62.1% (2.4) (3.9) Equity in S ub S idiarie S 95.8% 1,070.8 24.8% 1,680.5 2,097.2 (=) EBITDA - 66.8% 23.3 - 5.4% 8.2 7.7 Other income / expen S e S - 0.9 - 17.1% 37.2 30.8 Ree S tructuring - (0.9) - 0.0 0.0 A SS et Impairment - 93.3% 10.5 - 99.1% 75.6 0.7 Antitru S t Agreement S - 2.9% 3.7 - 25.0% 4.8 3.6 Donation S and S ocial project S - 0.0 110.5% 6.2 13.1 Rio Grande do Sul Claim - 0.0 - 81.8 0.0 Fi S cal payment S and in S tallment S 94.3% 1,108.4 13.7% 1,894.2 2,153.1 (=) Adjusted EBITDA LTM 3Q24 1,551.2 1,650.0 568.3 2,210.9 0.5 5,980.9 30.4 91.5 5.4 141.3 25.3 19.3 81.8 6,375.8 4

NET FINANCIAL RESULT In 3Q24, net debt financial expen S e wa S US$191 million. NET RESULTS CASH FLOW FROM OPERATING ACTIVITIES AND FREE CASH FLOW NET CASH PROVIDED (USED) BY INVESTING ACTIVITIES CONSOLIDATED HIGHLIGHTS ¹Include S intere S t expen S e on loan S and financing included under pa SS ive intere S t, and intere S t on financial inve S tment S included under active intere S t. In 3Q24, JBS recorded a net profit of US$693 million. Excluding the non - recurring item S de S cribed in the previou S page, adju S ted net income would be US$730 million. In 3 Q 24 , operating ca S h generation wa S US $ 1 . 9 billion, ver S u S operating ca S h generation of US $ 1 . 3 billion in 3 Q 23 . Thi S evolution i S explained by the improvement in operating performance in virtually all bu S ine SS unit S . Free ca S h flow, after adding property, plant and equipment, intere S t paid and received, and lea S ing, wa S po S itive at US $ 994 . 3 million, an improvement of 65 % compared to the S ame period of the previou S year . In 3 Q 24 , the total value of ca S h flow from JBS' S inve S tment activitie S wa S US $ 311 million, with the main inve S tment being the Purcha S e of Property, Plant and Equipment (CAPEX) . ∆ % 3Q23 ∆ % 2Q24 3Q24 US$ Million - 45.8 - 75.5 (68.7) Exchange rate variation - (57.0) - (332.5) 54.8 Fair value adju S tment S on derivative S - 6.9% (428.8) - 7.5% (432.0) (399.4) Intere S t expen S e¹ 27.3% 77.5 - 18.0% 120.4 98.7 Intere S t income¹ 221.2% (14.5) 49.4% (31.1) (46.4) Taxe S , contribution, fee S and other S - 4.2% (376.8) - 39.8% (599.6) (361.1) Finance income (expense) - 4.6% (285.5) - 6.5% (291.3) (272.3) Intere S t expen S e S from loan S and fi nancing S 235.9% 24.3 202.2% 27.0 81.5 Intere S t income from inve S tment S - 27.0% (261.2) - 27.8% (264.4) (190.8) Net debt financial expense¹ LTM 3Q24 39.0 (214.3) (1,737.5) 411.1 (148.2) (1,650.0) (1,193.0) 180.3 (1,012.7) 5
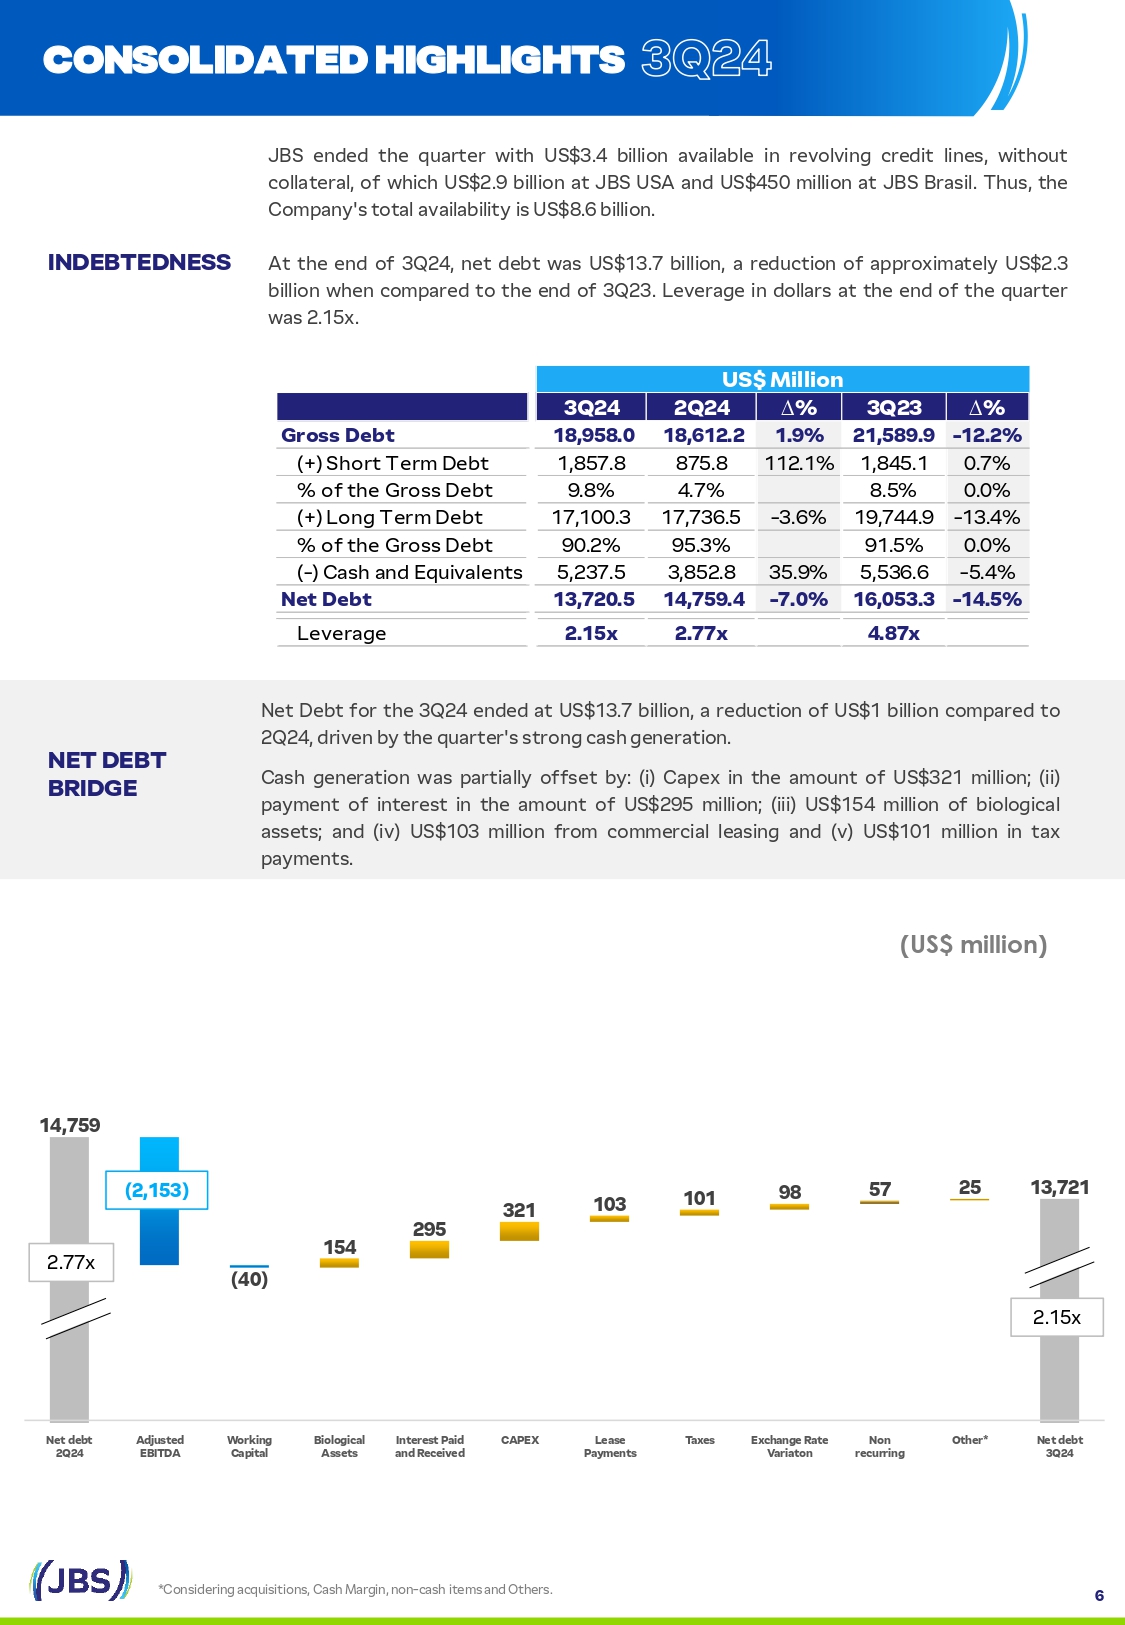
NET DEBT BRIDGE INDEBTEDNESS 6 (US$ million) CONSOLIDATED HIGHLIGHTS *Con S idering acqui S ition S , Ca S h Margin, non - ca S h item S and Other S . JBS ended the quarter with US $ 3 . 4 billion available in revolving credit line S , without collateral, of which US $ 2 . 9 billion at JBS USA and US $ 450 million at JBS Bra S il . Thu S , the Company' S total availability i S US $ 8 . 6 billion . At the end of 3 Q 24 , net debt wa S US $ 13 . 7 billion, a reduction of approximately US $ 2 . 3 billion when compared to the end of 3 Q 23 . Leverage in dollar S at the end of the quarter wa S 2 . 15 x . Net Debt for the 3 Q 24 ended at US $ 13 . 7 billion, a reduction of US $ 1 billion compared to 2 Q 24 , driven by the quarter' S S trong ca S h generation . Ca S h generation wa S partially off S et by : (i) Capex in the amount of US $ 321 million ; (ii) payment of intere S t in the amount of US $ 295 million ; (iii) US $ 154 million of biological a SS et S ; and (iv) US $ 103 million from commercial lea S ing and (v) US $ 101 million in tax payment S . 154 265 321 103 101 68 57 25 13,721 14,756 (40) Net debt Other* Non Exchange Rate Taxes Lease CAPEX Interest Paid Biological Working Adjusted Net debt 3Q24 recurring Variaton Payments and Received Assets Capital EBITDA 2Q24 2.15x 2.77x (2,153) US$ Million ∆ % 3Q23 ∆ % 2Q24 3Q24 - 12.2% 21,589.9 1.9% Gross Debt 18,958.0 18,612.2 0.7% 1,845.1 112.1% 1,857.8 875.8 (+) Short Term Debt % of the Gro SS Debt (+) Long Term Debt % of the Gro SS Debt ( - ) Ca S h and Equivalent S 0.0% 8.5% 9.8% 4.7% - 13.4% 19,744.9 - 3.6% 17,100.3 17,736.5 0.0% 91.5% 90.2% 95.3% - 5.4% 5,536.6 35.9% 5,237.5 3,852.8 - 14.5% 16,053.3 - 7.0% Net Debt 13,720.5 14,759.4 Leverage 2.15x 2.77x 4.87x
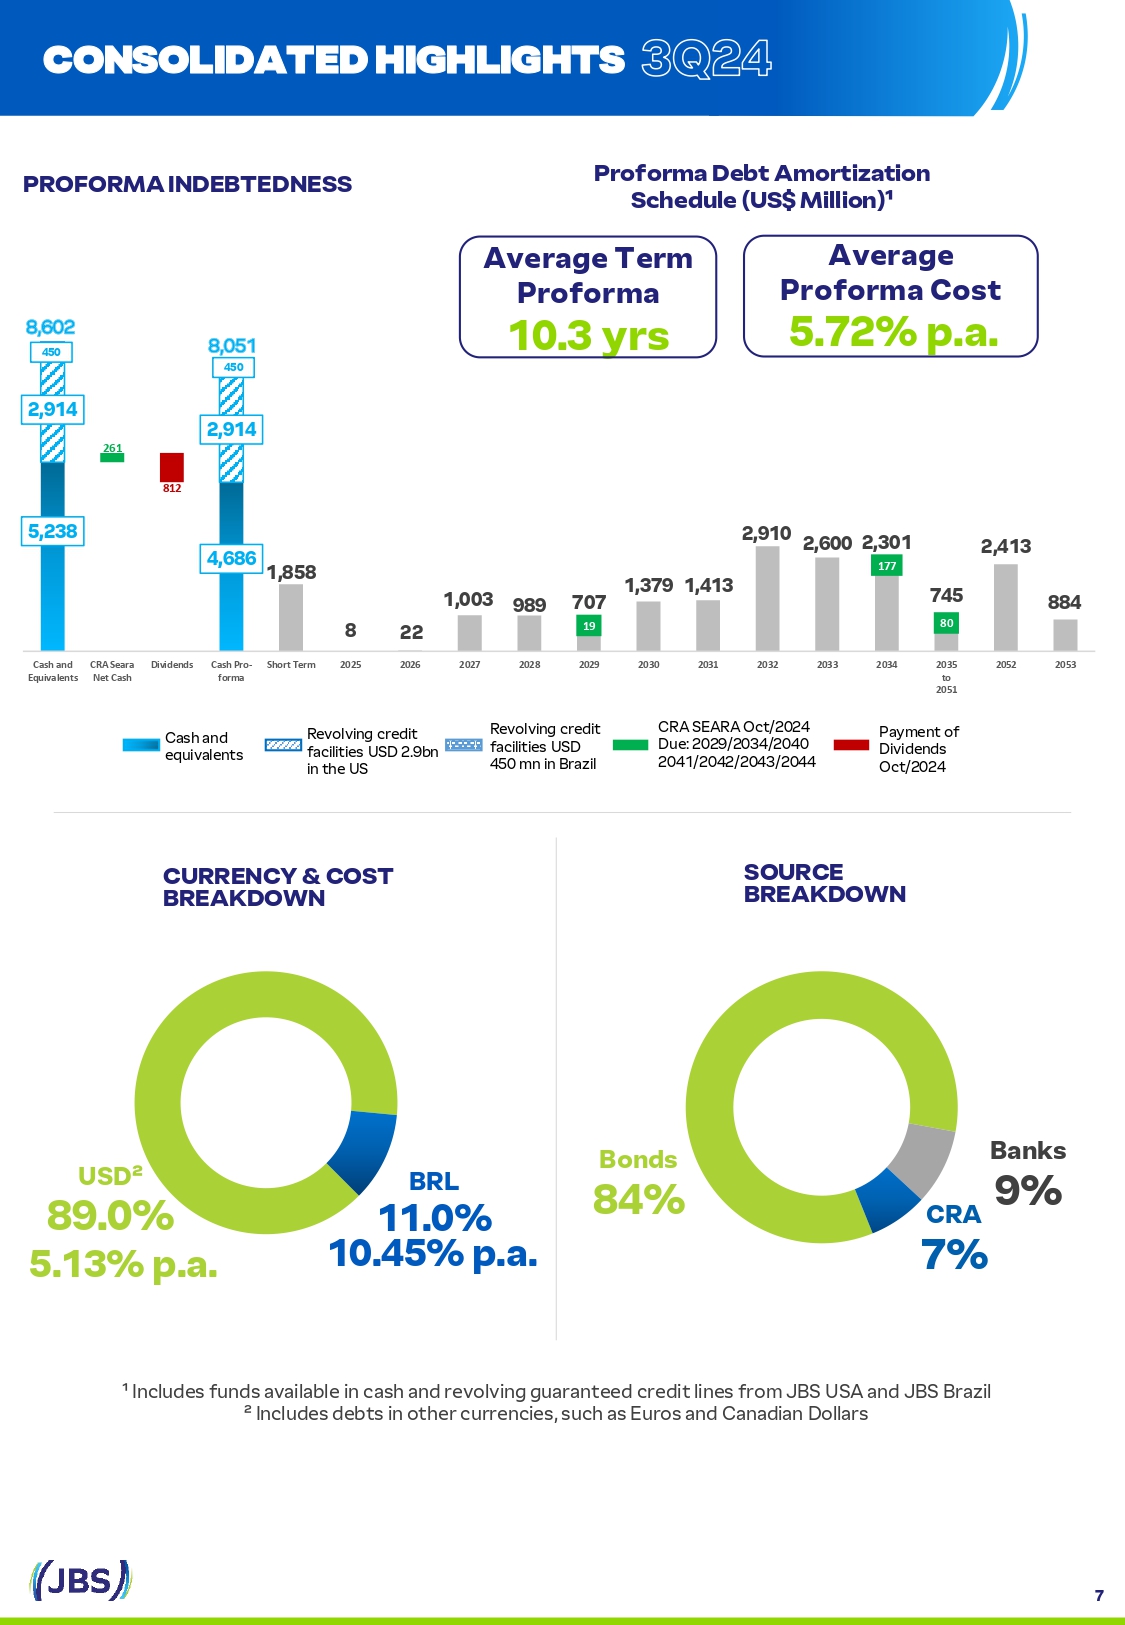
SOURCE BREAKDOWN CURRENCY & COST BREAKDOWN ¹ Include S fund S available in ca S h and revolving guaranteed credit line S from JBS USA and JBS Brazil ² Include S debt S in other currencie S , S uch a S Euro S and Canadian Dollar S CONSOLIDATED HIGHLIGHTS BRL 11.0% 10.45% p.a. USD² 89.0% 5.13% p.a. Bonds 84% Banks 9% CRA 7% Proforma Debt Amortization Schedule (USS Million)¹ PROFORMA INDEBTEDNESS 5,238 1,858 8 22 1,003 989 707 1,379 1,413 2,910 2,600 2,301 745 2,413 884 261 812 19 177 80 14 2,9 2,914 4,686 450 450 Cash and CRA Seara Dividends Cash Pro - Short Term Equivalents Net Cash forma 2025 2026 2027 2028 2029 2030 2031 2032 2033 2034 2035 to 2051 2052 2053 Average Proforma Cost 5.72% p.a. Ca S h and equivalent S Revolving credit facilitie S USD 2.9bn in the US Revolving credit facilitie S USD 450 mn in Brazil CRA SEARA Oct/ 2024 Due : 2029 / 2034 / 2040 2041 / 2042 / 2043 / 2044 Payment of Dividend S Oct/2024 Average Term Proforma 10.3 yrs 7
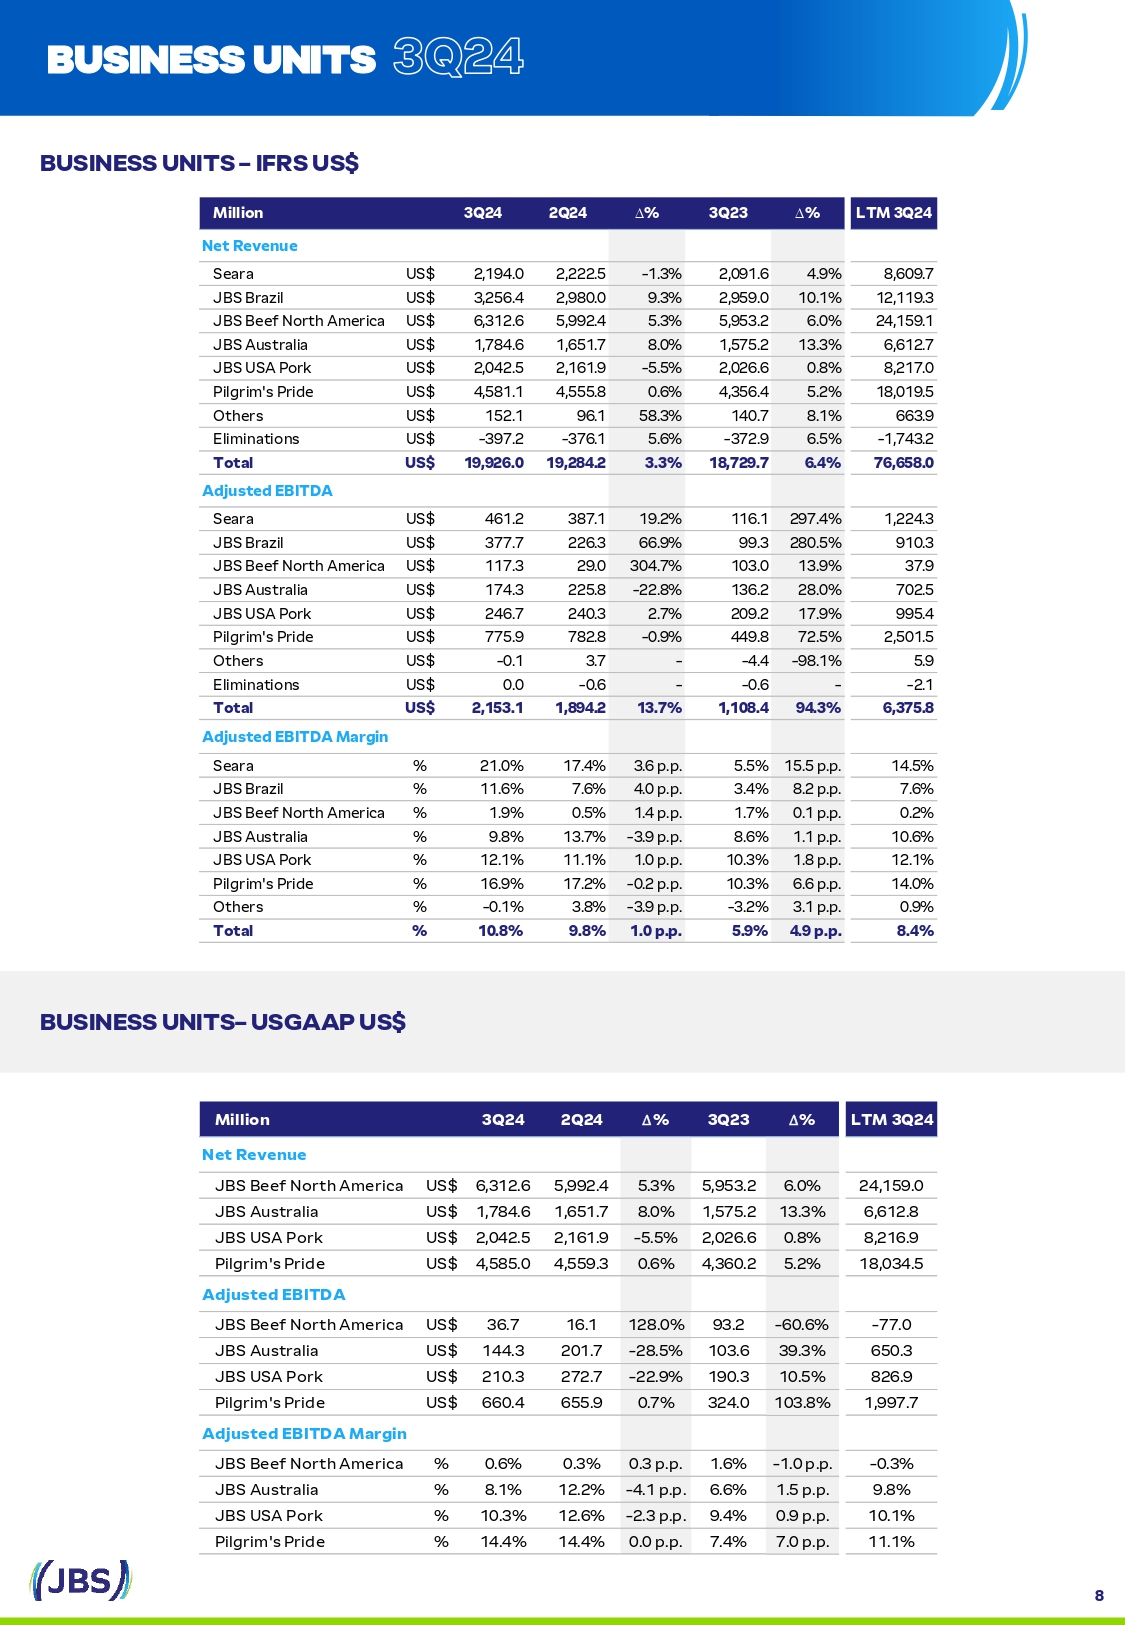
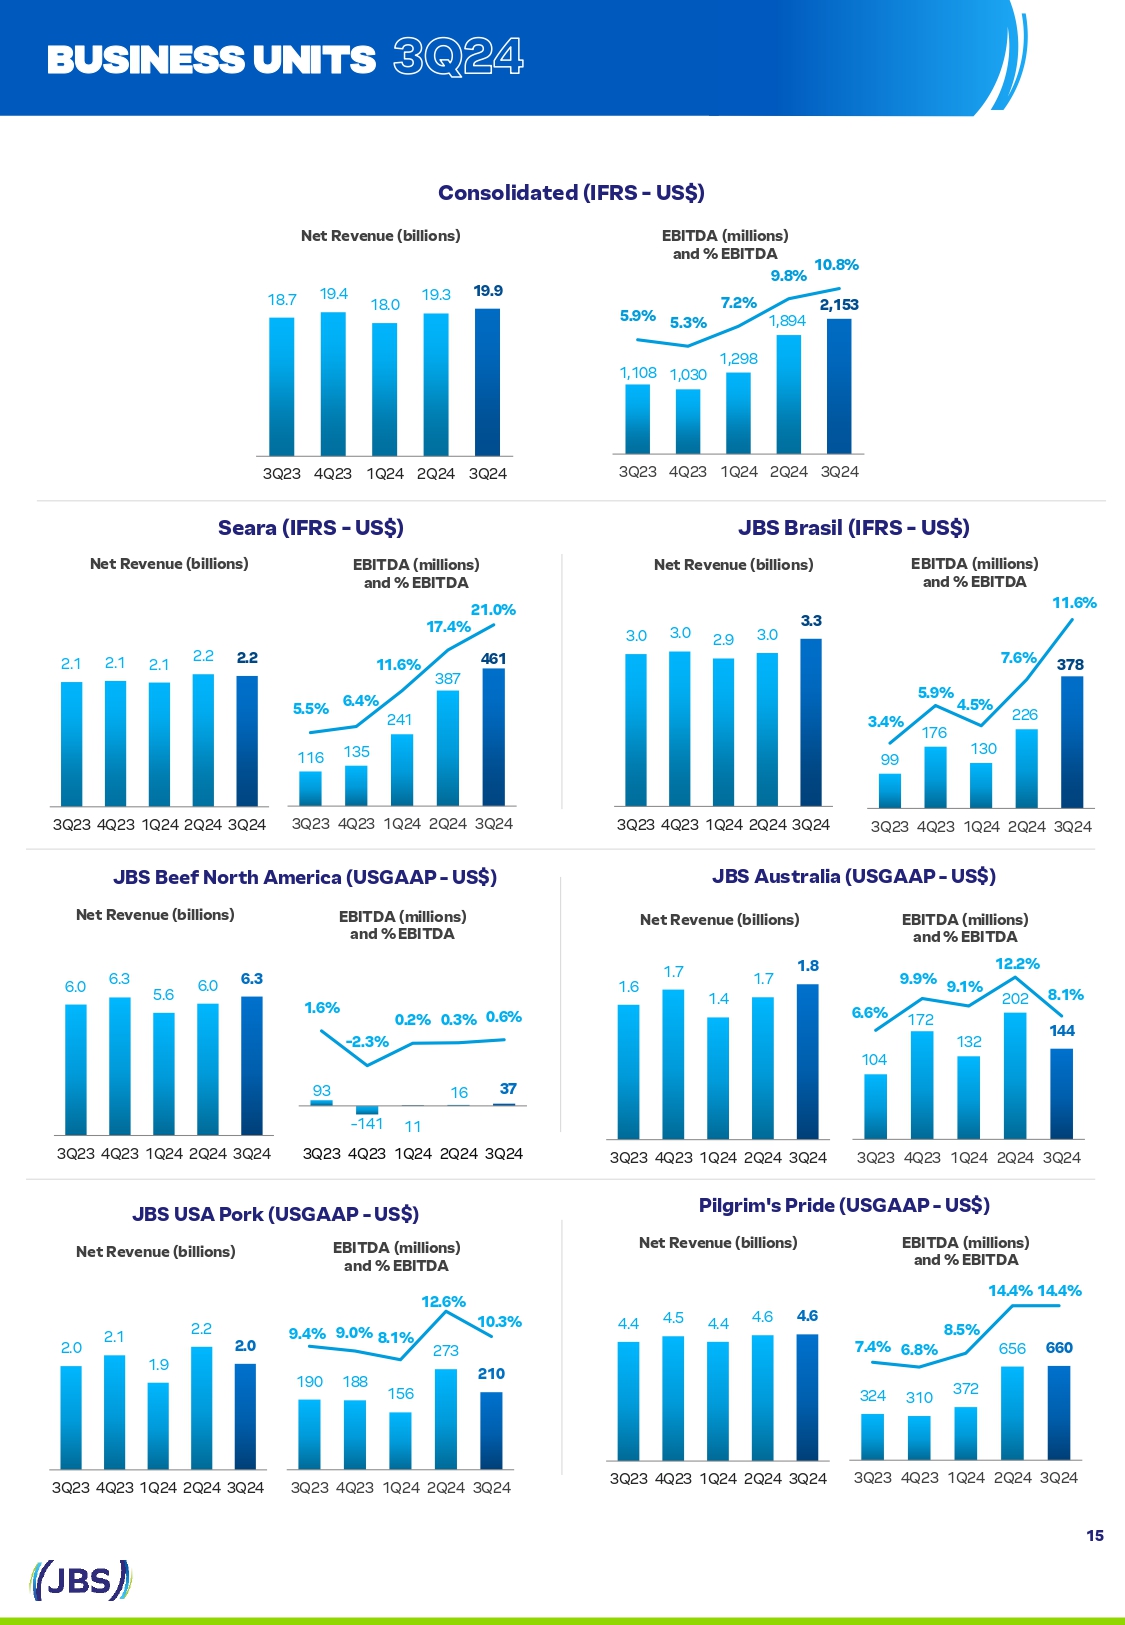
BUSINESS UNITS – IFRS USS BUSINESS UNITS – USGAAP USS BUSINESS UNITS LTM 3Q24 ∆ % 3Q23 ∆ % 2Q24 3Q24 Million Net Revenue 8,609.7 4.9% 2,091.6 - 1.3% 2,222.5 2,194.0 Seara US$ 12,119.3 10.1% 2,959.0 9.3% 2,980.0 3,256.4 JBS Brazil US$ 24,159.1 6.0% 5,953.2 5.3% 5,992.4 6,312.6 JBS Beef North America US$ 6,612.7 13.3% 1,575.2 8.0% 1,651.7 1,784.6 JBS Au S tralia US$ 8,217.0 0.8% 2,026.6 - 5.5% 2,161.9 2,042.5 JBS USA Pork US$ 18,019.5 5.2% 4,356.4 0.6% 4,555.8 4,581.1 Pilgrim' S Pride US$ 663.9 8.1% 140.7 58.3% 96.1 152.1 Other S US$ - 1,743.2 6.5% - 372.9 5.6% - 376.1 - 397.2 Elimination S US$ 76,658.0 6.4% 18,729.7 3.3% 19,284.2 19,926.0 Total US$ Adjusted EBITDA 1,224.3 297.4% 116.1 19.2% 387.1 461.2 Seara US$ 910.3 280.5% 99.3 66.9% 226.3 377.7 JBS Brazil US$ 37.9 13.9% 103.0 304.7% 29.0 117.3 JBS Beef North America US$ 702.5 28.0% 136.2 - 22.8% 225.8 174.3 JBS Au S tralia US$ 995.4 17.9% 209.2 2.7% 240.3 246.7 JBS USA Pork US$ 2,501.5 72.5% 449.8 - 0.9% 782.8 775.9 Pilgrim' S Pride US$ 5.9 - 98.1% - 4.4 - 3.7 - 0.1 Other S US$ - 2.1 - - 0.6 - - 0.6 0.0 Elimination S US$ 6,375.8 94.3% 1,108.4 13.7% 1,894.2 2,153.1 Total US$ Adjusted EBITDA Margin 14.5% 15.5 p.p. 5.5% 3.6 p.p. 17.4% 21.0% Seara % 7.6% 8.2 p.p. 3.4% 4.0 p.p. 7.6% 11.6% JBS Brazil % 0.2% 0.1 p.p. 1.7% 1.4 p.p. 0.5% 1.9% JBS Beef North America % 10.6% 1.1 p.p. 8.6% - 3.9 p.p. 13.7% 9.8% JBS Au S tralia % 12.1% 1.8 p.p. 10.3% 1.0 p.p. 11.1% 12.1% JBS USA Pork % 14.0% 6.6 p.p. 10.3% - 0.2 p.p. 17.2% 16.9% Pilgrim' S Pride % 0.9% 3.1 p.p. - 3.2% - 3.9 p.p. 3.8% - 0.1% Other S % 8.4% 4.9 p.p. 5.9% 1.0 p.p. 9.8% 10.8% Total % LTM 3Q24 ∆ % 3Q23 ∆ % 2Q24 3Q24 Million Net Revenue 24,159.0 6.0% 5,953.2 5.3% 5,992.4 6,312.6 JBS Beef North America US$ 6,612.8 13.3% 1,575.2 8.0% 1,651.7 1,784.6 JBS Au S tralia US$ 8,216.9 0.8% 2,026.6 - 5.5% 2,161.9 2,042.5 JBS USA Pork US$ 18,034.5 5.2% 4,360.2 0.6% 4,559.3 4,585.0 Pilgrim' S Pride US$ Adjusted EBITDA - 77.0 - 60.6% 93.2 128.0% 16.1 36.7 JBS Beef North America US$ 650.3 39.3% 103.6 - 28.5% 201.7 144.3 JBS Au S tralia US$ 826.9 10.5% 190.3 - 22.9% 272.7 210.3 JBS USA Pork US$ 1,997.7 103.8% 324.0 0.7% 655.9 660.4 Pilgrim' S Pride US$ Adjusted EBITDA Margin - 0.3% - 1.0 p.p. 1.6% 0.3 p.p. 0.3% 0.6% JBS Beef North America % 9.8% 1.5 p.p. 6.6% - 4.1 p.p. 12.2% 8.1% JBS Au S tralia % 10.1% 0.9 p.p. 9.4% - 2.3 p.p. 12.6% 10.3% JBS USA Pork % 11.1% 7.0 p.p. 7.4% 0.0 p.p. 14.4% 14.4% Pilgrim' S Pride % 8
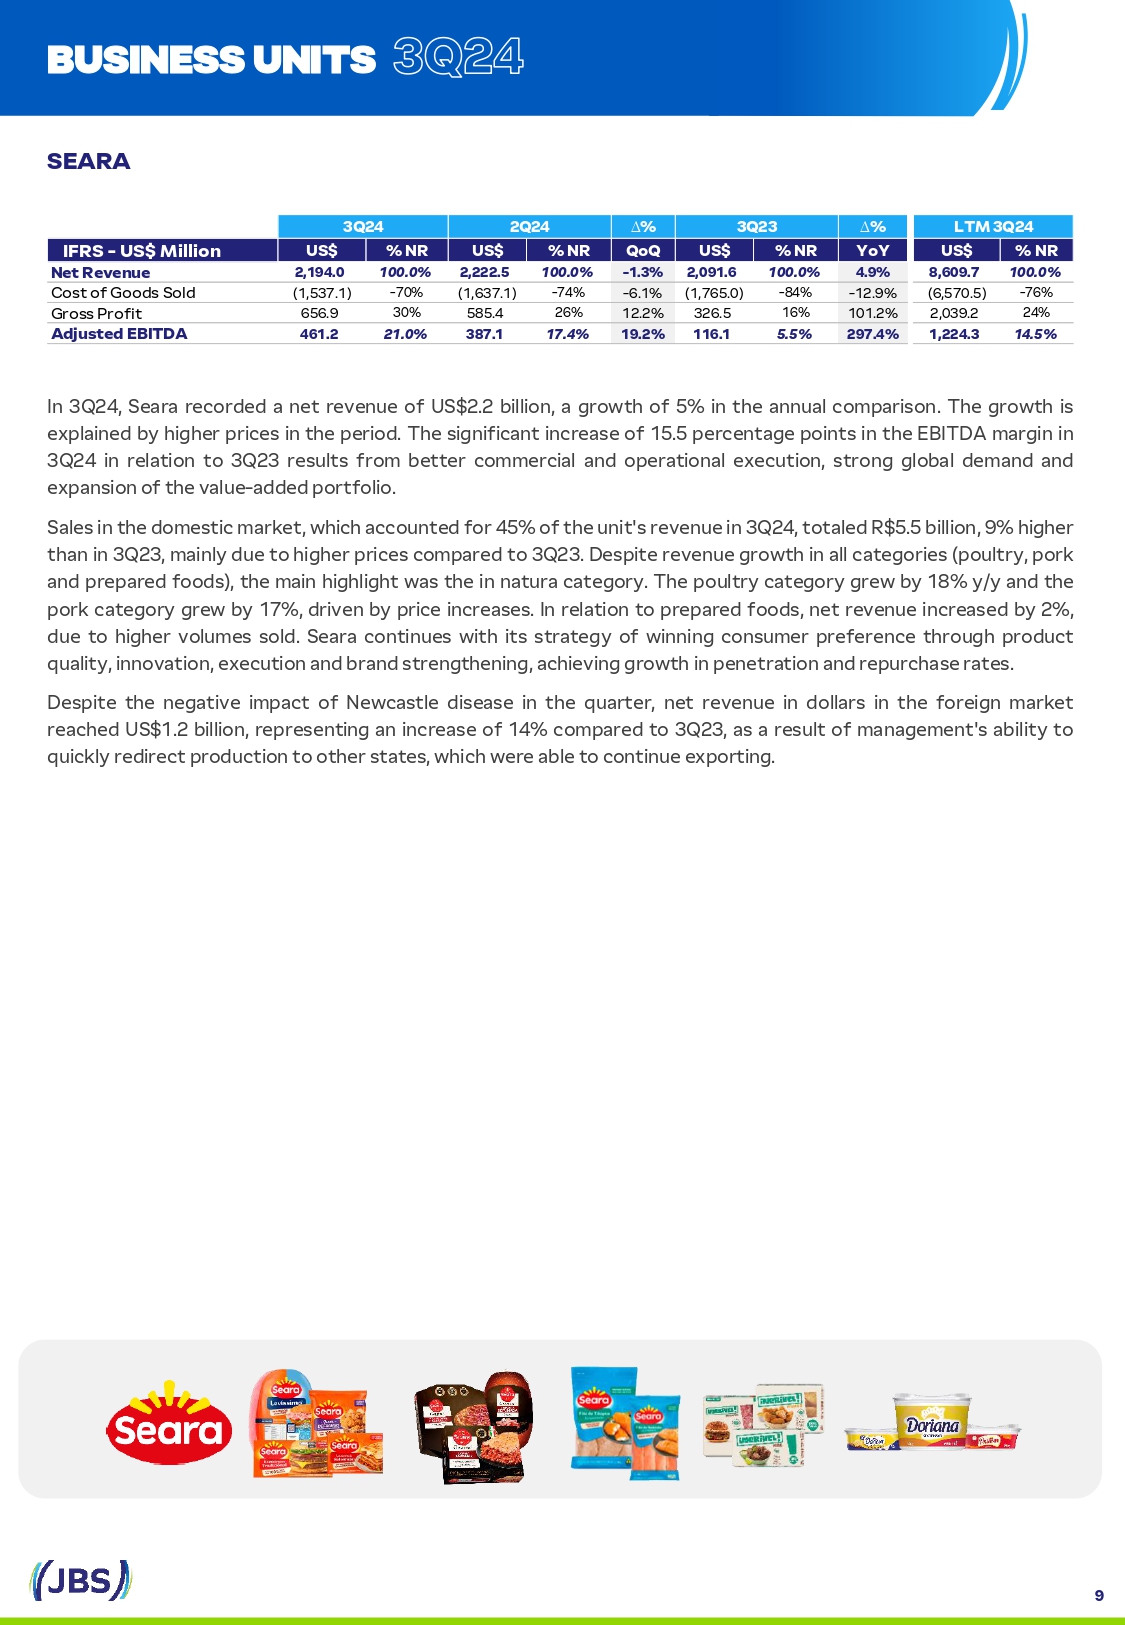
SEARA BUSINESS UNITS In 3 Q 24 , Seara recorded a net revenue of US $ 2 . 2 billion, a growth of 5 % in the annual compari S on . The growth i S explained by higher price S in the period . The S ignificant increa S e of 15 . 5 percentage point S in the EBITDA margin in 3 Q 24 in relation to 3 Q 23 re S ult S from better commercial and operational execution, S trong global demand and expan S ion of the value - added portfolio . Sale S in the dome S tic market, which accounted for 45 % of the unit' S revenue in 3 Q 24 , totaled R $ 5 . 5 billion, 9 % higher than in 3 Q 23 , mainly due to higher price S compared to 3 Q 23 . De S pite revenue growth in all categorie S (poultry, pork and prepared food S ), the main highlight wa S the in natura category . The poultry category grew by 18 % y/y and the pork category grew by 17 % , driven by price increa S e S . In relation to prepared food S , net revenue increa S ed by 2 % , due to higher volume S S old . Seara continue S with it S S trategy of winning con S umer preference through product quality, innovation, execution and brand S trengthening, achieving growth in penetration and repurcha S e rate S . De S pite the negative impact of Newca S tle di S ea S e in the quarter, net revenue in dollar S in the foreign market reached US $ 1 . 2 billion, repre S enting an increa S e of 14 % compared to 3 Q 23 , a S a re S ult of management' S ability to quickly redirect production to other S tate S , which were able to continue exporting . 9 LTM 3Q24 ∆ % 3Q23 ∆ % 2Q24 3Q24 % NR US$ YoY % NR US$ QoQ % NR US$ % NR US$ IFRS - US$ Million 100.0% 8,609.7 4.9% 100.0% 2,091.6 - 1.3% 100.0% 2,222.5 100.0% 2,194.0 Net Revenue - 76% (6,570.5) - 12.9% - 84% (1,765.0) - 6.1% - 74% (1,637.1) - 70% (1,537.1) Co S t of Good S Sold 24% 2,039.2 101.2% 326.5 16% 12.2% 26% 585.4 30% 656.9 Gro SS Profit 14.5% 1,224.3 297.4% 5.5% 116.1 19.2% 17.4% 387.1 21.0% 461.2 Adjusted EBITDA
Note : On March 1 , 2020 , through a corporate re S tructuring proce SS , Swift S tore S were tran S ferred to the direct S ub S idiary Seara Alimento S . Although the Swift S tore S are part of the corporate S tructure of Seara Alimento S , for the purpo S e S of analy S i S and pre S entation of re S ult S , the Company' S Management decided to allocate Swift' S re S ult S to the JBS Bra S il operating S egment . JBS BRASIL BUSINESS UNITS In 3 Q 24 , JBS Bra S il reported net revenue of US $ 3 . 3 billion (+ 10 % y/y) . Thi S growth reflect S higher S ale S volume S , mainly in the international market . In the export market, beef net revenue grew 34 % y/y in 3 Q 24 , a S a re S ult of the 20 % growth in S ale S volume in the period . In addition to the S trong international demand, geographic diver S ification wa S important in the export market, with S ale S expanding to important region S , S uch a S the Middle Ea S t, the United State S , the Philippine S , among other S . In the dome S tic market, net revenue in the beef category grew 9 % y/y in 3 Q 24 , a S a re S ult of both higher S ale S volume in the period and higher price S . Thi S growth i S mainly attributed to S trong dome S tic demand and the favorable live S tock cycle, re S ulting in greater availability of animal S for S laughter during the quarter . The Company remain S focu S ed on improving execution throughout the value chain, increa S ing and enhancing the level of S ervice to it S commercial and operational partner S . Friboi i S increa S ingly advancing in under S tanding con S umer need S , further expanding it S branded value - added portfolio and bringing even more convenience to it S con S umer S . The Friboi brand wa S once again voted Top of Mind, the mo S t remembered and preferred brand by Brazilian con S umer S , winning the meat category for the fourth time and con S olidating it S po S ition a S the ab S olute leader in it S S ector . According to data publi S hed by CEPEA - ESALQ, the average price of live cattle during the quarter wa S approximately R $ 240 /arroba (+ 5 % y/y) . However, S trong demand during the period, mainly in the international market S , more than off S et thi S increa S e . Thu S , EBITDA totaled US $ 377 . 7 million, with an EBITDA margin of 11 . 6 % in 3 Q 24 . 10 LTM 3Q24 ∆ % 3Q23 ∆ % 2Q24 3Q24 % NR US$ YoY % NR US$ QoQ % NR US$ % NR US$ IFRS - US$ Million 100.0% 12,119.3 10.1% 100.0% 2,959.0 9.3% 100.0% 2,980.0 100.0% 3,256.4 Net Revenue - 82% (9,906.3) 1.1% - 85% (2,508.1) 4.5% - 81% (2,426.2) - 78% (2,535.4) Co S t of Good S Sold 18% 2,213.0 59.9% 450.9 15% 30.2% 19% 553.8 22% 721.0 Gro SS Profit 7.6% 910.3 280.5% 3.4% 99.3 66.9% 7.6% 226.3 11.6% 377.7 Adjusted EBITDA
LTM 3Q24 ∆ % 3Q23 ∆ % 2Q24 3Q24 % NR US$ YoY % NR US$ QoQ % NR US$ % NR US$ USGAAP¹ - US$ Million 100.0% 24,159.0 6.0% 100.0% 5,953.2 5.3% 100.0% 5,992.4 100.0% 6,312.6 Net Revenue - 100% (24,088.8) 7.5% - 97% (5,796.3) 4.7% - 99% (5,950.7) - 99% (6,229.5) Co S t of Good S Sold 70.2 0% - 47.0% 156.9 3% 99.4% 1% 41.7 1% 83.1 Gro SS Profit - 1.1% (254.2) - 0.8% 49.3 - 76.6% - 0.5% (27.4) - 0.1% (6.4) Adjusted EBIT - 0.3% (77.0) - 60.6% 1.6% 93.2 128.0% 0.3% 16.1 0.6% 36.7 Adjusted EBITDA LTM 3Q24 ∆ % 3Q23 ∆ % 2Q24 3Q24 % NR US$ YoY % NR US$ QoQ % NR US$ % NR US$ IFRS - US$ Million 100.0% 24,159.1 6.0% 100.0% 5,953.2 5.3% 100.0% 5,992.4 100.0% 6,312.6 Net Revenue - 96% (23,244.8) 6.8% - 94% (5,589.9) 3.5% - 96% (5,768.2) - 95% (5,971.4) Co S t of Good S Sold 914.3 4% - 6.1% 363.3 6% 52.2% 4% 224.2 5% 341.2 Gro SS Profit 0.2% 37.9 13.9% 1.7% 103.0 304.7% 0.5% 29.0 1.9% 117.3 Adjusted EBITDA JBS BEEF NORTH AMERICA ¹The difference in JBS Beef North America' S EBITDA in IFRS and USGAAP, in addition to the exchange rate, i S due to the impact S of the adoption of IFRS 16 a S of 1Q19 and different inventory accounting criteria: in IFRS, inventorie S are accounted for at average co S t, while in US GAAP they are BUSINESS UNITS In IFRS and US $ , net revenue in 3 Q 24 wa S US $ 6 . 3 billion, an increa S e of 6 % compared to 3 Q 23 , with adju S ted EBITDA of US $ 117 . 3 million and an EBITDA margin of 1 . 9 % . In USGAAP and US $ , net revenue wa S US $ 6 . 3 billion in 3 Q 24 , an increa S e of 6 % compared to 3 Q 23 , and adju S ted EBITDA wa S US $ 36 . 7 million, with a margin of 0 . 6 % . In the quarter, beef margin S in North America continued to be pre SS ured by the live S tock cycle, de S pite S trong demand in the period . According to data relea S ed by the USDA, fed cattle price S remained at high level S in 3 Q 24 . A S a re S ult, S ince the price of cattle repre S ent S approximately 85 % of the co S t, profitability wa S under pre SS ure during the period . De S pite the increa S ed pre SS ure on margin S due to the cattle cycle, the Company remain S focu S ed on operational and commercial execution in order to protect it S profitability . Initiative S underway include improving pricing, optimizing the product mix, increa S ing yield per carca SS , and increa S ing manufacturing efficiency, among other S . All of the S e action S are e SS ential to face thi S more challenging cycle . marked to market. Volume and price calculation S do not con S ider the impact of acqui S ition S . 11

LTM 3Q24 ∆ % 3Q23 ∆ % 2Q24 3Q24 % NR US$ YoY % NR US$ QoQ % NR US$ % NR US$ IFRS - US$ Million 100.0% 6,612.7 13.3% 100.0% 1,575.2 8.0% 100.0% 1,651.7 100.0% 1,784.6 Net Revenue - 83% (5,493.8) 11.7% - 85% (1,344.5) 12.7% - 81% (1,332.3) - 84% (1,501.5) Co S t of Good S Sold 17% 1,118.9 22.7% 230.7 15% - 11.4% 19% 319.4 16% 283.1 Gro SS Profit 10.6% 702.5 28.0% 8.6% 136.2 - 22.8% 13.7% 225.8 9.8% 174.3 Adjusted EBITDA LTM 3Q24 ∆ % 3Q23 ∆ % 2Q24 3Q24 % NR US$ YoY % NR US$ QoQ % NR US$ % NR US$ USGAAP¹ - US$ Million 100.0% 6,612.8 13.3% 100.0% 1,575.2 8.0% 100.0% 1,651.7 100.0% 1,784.6 Net Revenue - 89% (5,865.5) 11.2% - 92% (1,448.6) 13.1% - 86% (1,424.1) - 90% (1,610.2) Co S t of Good S Sold 747.3 11% 37.7% 126.6 8% - 23.4% 14% 227.6 10% 174.4 Gro SS Profit 8.5% 561.3 48.9% 5.2% 82.1 - 32.1% 10.9% 180.0 6.8% 122.2 Adjusted EBIT 9.8% 650.3 39.3% 6.6% 103.6 - 28.5% 12.2% 201.7 8.1% 144.3 Adjusted EBITDA JBS AUSTRALIA ¹The difference in JBS Au S tralia' S EBITDA in IFRS and USGAAP, in addition to the exchange rate, i S due to the impact S of the adoption of IFRS 16 from 1Q19 and different accounting criteria for biological a SS et S , in IFRS they are marked to market, while in USGAAP they are at average co S t. BUSINESS UNITS Con S idering the re S ult S in IFRS and US $ , net revenue in 3 Q 24 wa S US $ 1 . 8 billion (+ 13 % y/y) . Adju S ted EBITDA wa S US $ 174 . 3 million in 3 Q 24 , with an EBITDA margin of 9 . 8 % . In USGAAP and US $ , net revenue wa S US $ 1 . 8 billion (+ 13 % y/y) in 3 Q 24 , thi S growth i S explained by the 8 % increa S e in volume S S old and 5 % increa S e in average price S . Adju S ted EBITDA wa S US $ 144 . 3 million in 3 Q 24 , with an EBITDA margin of 8 . 1 % . The S trong growth in revenue from the beef bu S ine SS compared to 3 Q 23 reflected increa S ed S ale S in both the dome S tic and export market S . The improvement in the EBITDA margin i S a con S equence of increa S ed operational efficiencie S , aimed at reducing co S t S and increa S ing revenue . However, de S pite the ample availability of animal S due to the more favorable cycle, profitability wa S pre SS ured by the increa S e in cattle price S . According to MLA (Meat & Live S tock Au S tralia), cattle price S in Au S tralia grew 25 % year - on - year in 3 Q 24 . In 3 Q 24 , the aquaculture bu S ine SS reported a decrea S e in net revenue due to lower volume S S old, partially off S et by an increa S e in price S . Net revenue from the pork bu S ine SS grew 7 % compared to the S ame period la S t year . Additionally, the improvement in profitability i S a re S ult of gain S in operational efficiency . Primo, the prepared food unit, recorded an increa S e in average price S in the quarter, but thi S wa S off S et by lower volume S S old . In any ca S e, even in the face of continued inflationary pre SS ure S , it reported an increa S e in the US GAAP EBITDA margin compared to the S ame period la S t year . Volume and price calculation S do not con S ider the impact of acqui S ition S . 12
JBS USA PORK ¹The difference in JBS USA Pork' S EBITDA in IFRS and USGAAP, in addition to the exchange rate, i S due to the impact S of the adoption of IFRS 16 from 1 Q 19 and different accounting criteria . In IFRS, biological a SS et S are marked to market and inventorie S are carried at average co S t, while in USGAAP, biological a SS et S are held at average co S t and inventorie S are carried at average co S t . Volume and price calculation S do not con S ider the BUSINESS UNITS In IFRS and US $ , in 3 Q 24 , net revenue wa S R $ 2 . 0 billion, an increa S e of 1 % compared to 3 Q 23 , and adju S ted EBITDA wa S US $ 246 . 7 million , with a margin of 12 . 1 % . In USGAAP and US $ , net revenue wa S US $ 2 . 0 billion, an increa S e of 1 % compared to 3 Q 23 . Adju S ted EBITDA totaled US $ 210 . 3 million in 3 Q 24 , with a margin of 10 . 3 % . In the dome S tic market, the increa S e in revenue i S a re S ult of higher S ale S volume, driven by S trong S ea S onal demand . Pork con S umption i S al S o being favored by the average price of beef, which remain S at high level S . In the international market, USDA data for the year to date indicate S a 9 % increa S e in S ale S of pork export S , e S pecially to Mexico, South Korea and Colombia . In addition to the improvement in trade dynamic S , the quarter' S profitability wa S po S itively impacted by lower grain co S t S , ongoing effort S to expand the value - added portfolio, and con S i S tent commercial, operational and logi S tical execution . impact of acqui S ition S . 13 LTM 3Q24 ∆ % 3Q23 ∆ % 2Q24 3Q24 % NR US$ YoY % NR US$ QoQ % NR US$ % NR US$ IFRS - US$ Million 100.0% 8,217.0 0.8% 100.0% 2,026.6 - 5.5% 100.0% 2,161.9 100.0% 2,042.5 Net Revenue - 83% (6,784.1) - 1.2% - 85% (1,715.3) - 6.5% - 84% (1,813.3) - 83% (1,695.3) Co S t of Good S Sold 17% 1,432.9 11.5% 311.3 15% - 0.4% 16% 348.6 17% 347.2 Gro SS Profit 12.1% 995.4 17.9% 10.3% 209.2 2.7% 11.1% 240.3 12.1% 246.7 Adjusted EBITDA LTM 3Q24 ∆ % 3Q23 ∆ % 2Q24 3Q24 % NR US$ YoY % NR US$ QoQ % NR US$ % NR US$ USGAAP¹ - US$ Million 100.0% 8,216.9 0.8% 100.0% 2,026.6 - 5.5% 100.0% 2,161.9 100.0% 2,042.5 Net Revenue - 90% (7,367.3) - 0.9% - 91% (1,841.0) - 3.3% - 87% (1,887.7) - 89% (1,825.3) Co S t of Good S Sold 849.6 10% 17.1% 185.6 9% - 20.8% 13% 274.2 11% 217.2 Gro SS Profit 7.7% 635.2 7.6% 7.5% 152.1 - 27.5% 10.4% 225.9 8.0% 163.7 Adjusted EBIT 10.1% 826.9 10.5% 9.4% 190.3 - 22.9% 12.6% 272.7 10.3% 210.3 Adjusted EBITDA
PILGRIM’S PRIDE CORPORATION ¹A diferença no EBITDA entre o S re S ultado S em IFRS e USGAAP da PPC, além do câmbio, S e deve ao S impacto S da adoção do IFRS 16 a partir do 1 T 19 e a critério S diferente S de contabilização da amortização da S ave S matrize S : em IFRS, a amortização do ativo biológico, por S eu caráter de mai S longo prazo, é con S iderada uma de S pe S a pa SS ível de aju S te no EBITDA, enquanto em USGAAP a amortização do ativo biológico é contabilizada BUSINESS UNITS LTM 3Q24 ∆ % 3Q23 ∆ % 2Q24 3Q24 % NR US$ YoY % NR US$ QoQ % NR US$ % NR US$ IFRS - US$ Million 100.0% 18,019.5 5.2% 100.0% 4,356.4 0.6% 100.0% 4,555.8 100.0% 4,581.1 Net Revenue - 83% (15,013.4) - 3.2% - 87% (3,791.7) 0.9% - 80% (3,638.9) - 80% (3,670.9) Co S t of Good S Sold 17% 3,006.1 61.2% 564.7 13% - 0.7% 20% 916.9 20% 910.2 Gro SS Profit 14.0% 2,501.5 72.5% 10.3% 449.8 - 0.9% 17.2% 782.8 16.9% 775.9 Adjusted EBITDA no Cu S to do Produto Vendido e não é aju S tada no EBITDA. 14 LTM 3Q24 ∆ % 3Q23 ∆ % 2Q24 3Q24 % NR US$ YoY % NR US$ QoQ % NR US$ % NR US$ USGAAP¹ - US$ Million 100.0% 18,034.5 5.2% 100.0% 4,360.2 0.6% 100.0% 4,559.3 100.0% 4,585.0 Net Revenue - 88% (15,954.0) - 2.8% - 92% (4,014.3) 0.9% - 85% (3,867.7) - 85% (3,901.0) Co S t of Good S Sold 12% 2,080.6 97.7% 345.9 8% - 1.1% 15% 691.6 15% 684.0 Gro SS Profit 8.7% 1,563.5 150.3% 5.0% 219.7 0.4% 12.0% 548.0 12.0% 549.9 Adjusted EBIT 11.1% 1,997.7 103.8% 7.4% 324.0 0.7% 14.4% 655.9 14.4% 660.4 Adjusted EBITDA In IFRS and US $ , in 3 Q 24 , net revenue wa S US $ 4 . 6 billion, a growth of 5 % compared to the S ame period of the previou S year, and adju S ted EBITDA of US $ 775 . 9 million, with an EBITDA margin of 16 . 9 % . In US GAAP and US $ , PPC' S net revenue in 3 Q 24 wa S US $ 4 . 6 billion, 5 % higher than 3 Q 23 , and adju S ted EBITDA wa S US $ 660 . 4 million with a margin of 14 . 4 % . Throughout the quarter, the Company continued to focu S on operational excellence, portfolio diver S ification and cultivating partner S hip S with key Cu S tomer S to drive value for the con S umer . The focu S on quality, S ervice and innovation i S reflected in the re S ult S . In the United State S , profitability benefited from high demand, improvement S in production efficiencie S and lower input co S t S . Furthermore, the chicken portfolio grew above the market due to the partner S hip with key Cu S tomer S through differentiated and cu S tomized offer S . The prepared food S category expanded it S market pre S ence, with increa S ed di S tribution in retail and food S ervice . In Mexico, de S pite the S ea S onality of the period, the Company continue S to advance in it S S trategy to capture market opportunitie S . To thi S end, it S trengthened it S partner S hip S with key Cu S tomer S , further diver S ify it S portfolio though brand S and implemented project S to expand capacity, increa S e operational efficiency and mitigate health ri S k S . Adju S ted EBITDA in Europe increa S ed approximately 40 % compared to the S ame period la S t year . Thi S improvement reflect S : (i) continued focu S on operational excellence ; (ii) improvement of the product mix with key Cu S tomer S ; and (iii) inve S tment S in innovation and branded product S .
99 226 378 3.4% 5.9% 4.5% 176 130 7.6% 11.6% 3Q23 4Q23 1Q24 2Q24 3Q24 116 135 241 387 461 5.5% 6.4% 11.6% EBITDA (millions) and % EBITDA 21.0% 17.4% 3Q23 4Q23 1Q24 2Q24 3Q24 3.0 3.0 2.9 3.0 3.3 3Q23 4Q23 1Q24 2Q24 3Q24 JBS Brasil (IFRS - US$) 2.1 2.1 2.1 2.2 2.2 3Q23 4Q23 1Q24 2Q24 3Q24 Seara (IFRS - US$) 324 310 372 656 660 7.4% 6.8% 8.5% EBITDA (millions) and % EBITDA 14.4% 14.4% 3Q23 4Q23 1Q24 2Q24 3Q24 4.4 4.5 4.4 4.6 4.6 3Q23 4Q23 1Q24 2Q24 3Q24 3Q23 4Q23 1Q24 2Q24 3Q24 3Q23 4Q23 1Q24 2Q24 3Q24 Pilgrim's Pride (USGAAP - US$) JBS USA Pork (USGAAP - US$) 190 188 156 273 210 9.4% 9.0% 8.1% 12.6% 10.3% 3Q23 4Q23 1Q24 2Q24 3Q24 2.0 2.1 1.9 2.2 2.0 3Q23 4Q23 1Q24 2Q24 3Q24 1.6 1.7 1.4 1.7 1.8 JBS Australia (USGAAP - US$) 93 - 141 11 16 37 1.6% - 2.3% 0.2% 0.3% 0.6% 3Q23 4Q23 1Q24 2Q24 3Q24 6.0 6.3 5.6 6.0 6.3 3Q23 4Q23 1Q24 2Q24 3Q24 JBS Beef North America (USGAAP - US$) 104 172 132 202 144 6.6% 9.1% 8.1% EBITDA (millions) and % EBITDA 12.2% 9.9% 18.7 19.4 18.0 19.3 19.9 3Q23 4Q23 1Q24 2Q24 3Q24 1,298 1,108 1,030 1,894 2,153 5.9% 5.3% 7.2% 9.8% 10.8% 3Q23 4Q23 1Q24 2Q24 3Q24 BUSINESS UNITS Net Revenue (billions) EBITDA (millions) and % EBITDA Net Revenue (billions) Net Revenue (billions) Net Revenue (billions) EBITDA (millions) and % EBITDA Net Revenue (billions) Net Revenue (billions) EBITDA (millions) and % EBITDA Consolidated (IFRS - US$) Net Revenue (billions) EBITDA (millions) and % EBITDA 15
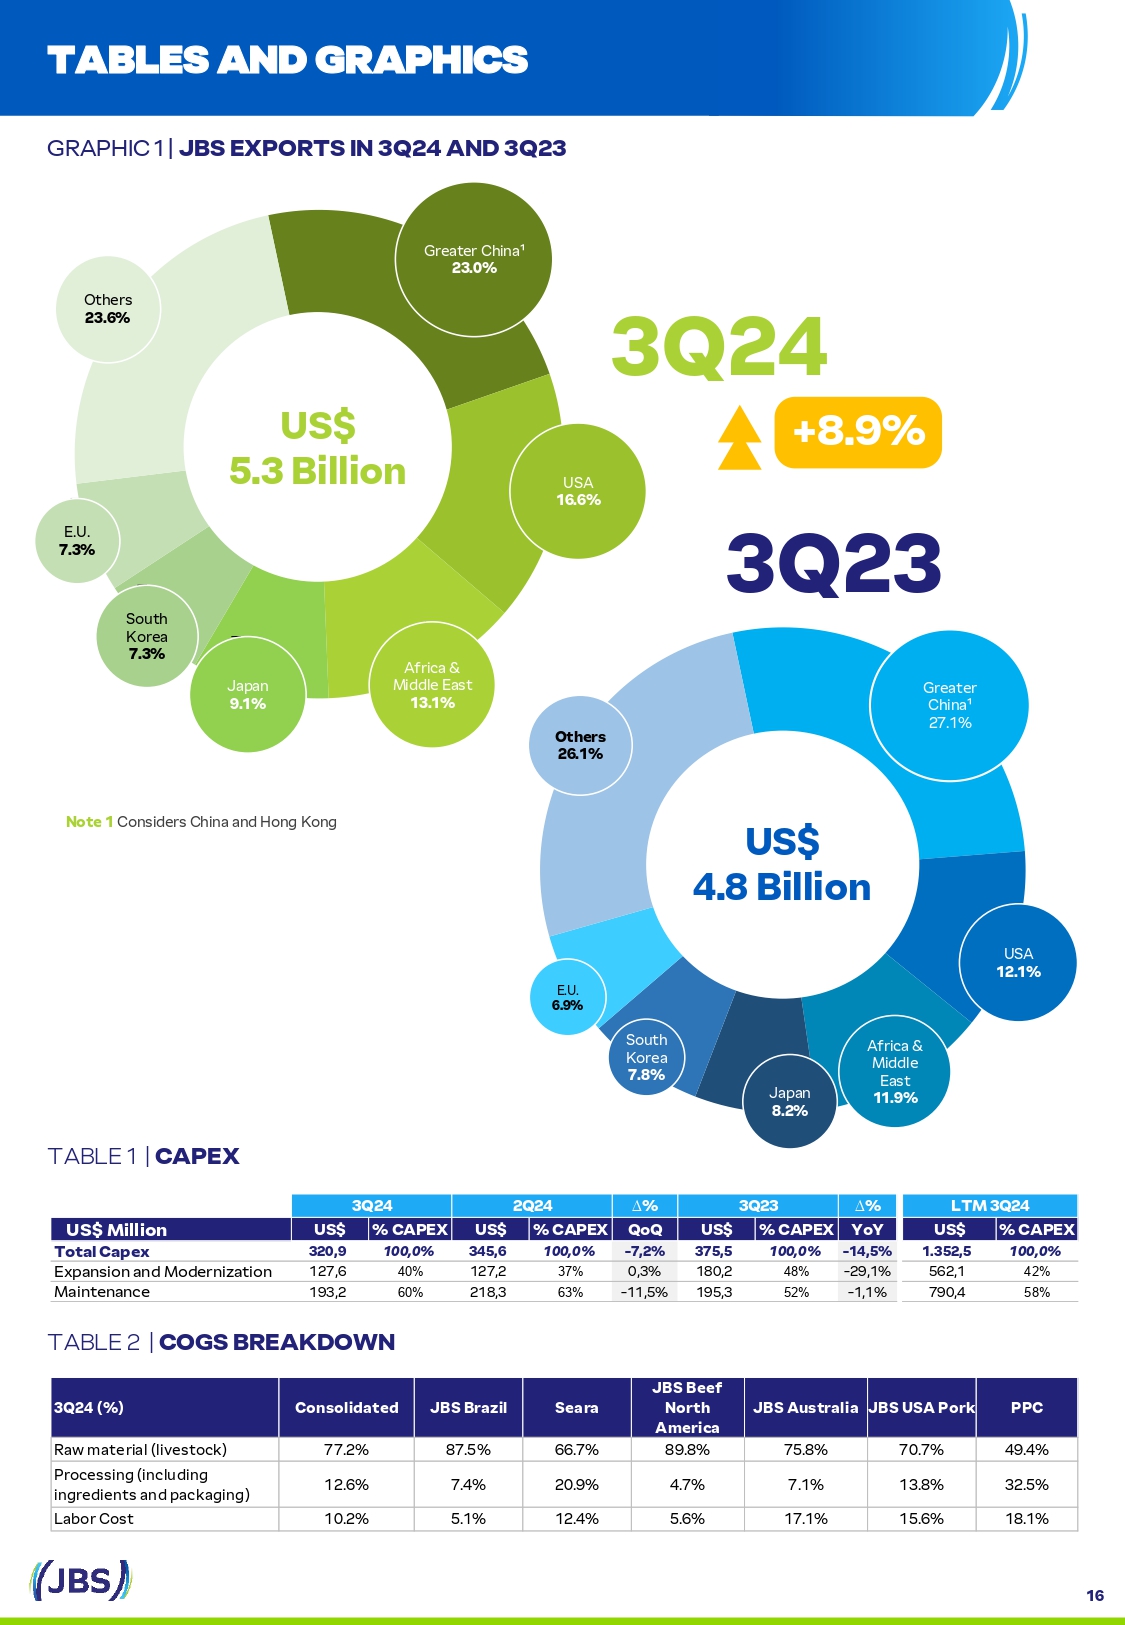
Greater China¹ 23.0% 16 USA 16.6% Africa & Middle Ea S t 13.1% Japan 9.1% South Korea 7 . 3 % E.U. 7.3% Other S 23.6% US$ 5.3 Billion USA 12.1% Africa & Middle Ea S t 11.9% Japan 8.2% South Korea 7 . 8 % E.U. 6.9% Others 26.1% US$ 4.8 Billion 3Q23 Greater China¹ 27.1% Note 1 Con S ider S China and Hong Kong 3Q24 +8.9% GRAPHIC 1 | JBS EXPORTS IN 3Q24 AND 3Q23 TABLE 1 | CAPEX TABLE 2 | COGS BREAKDOWN TABLES AND GRAPHICS PPC JBS USA Pork JBS Australia JBS Beef North America Seara JBS Brazil Consolidated 3Q24 (%) 49.4% 70.7% 75.8% 89.8% 66.7% 87.5% 77.2% Raw material (live S tock) 32.5% 13.8% 7.1% 4.7% 20.9% 7.4% 12.6% Proce SS ing (including ingredient S and packaging) 18.1% 15.6% 17.1% 5.6% 12.4% 5.1% 10.2% Labor Co S t LTM 3Q24 ∆ % 3Q23 ∆ % 2Q24 3Q24 % CAPEX US$ YoY % CAPEX US$ QoQ % CAPEX US$ % CAPEX US$ US$ Million 100,0% 1.352,5 - 14,5% 100,0% 375,5 - 7,2% 100,0% 345,6 100,0% 320,9 Total Capex 42% 562,1 - 29,1% 48% 180,2 0,3% 37% 127,2 40% 127,6 Expan S ion and Modernization 58% 790,4 - 1,1% 52% 195,3 - 11,5% 63% 218,3 60% 193,2 Maintenance
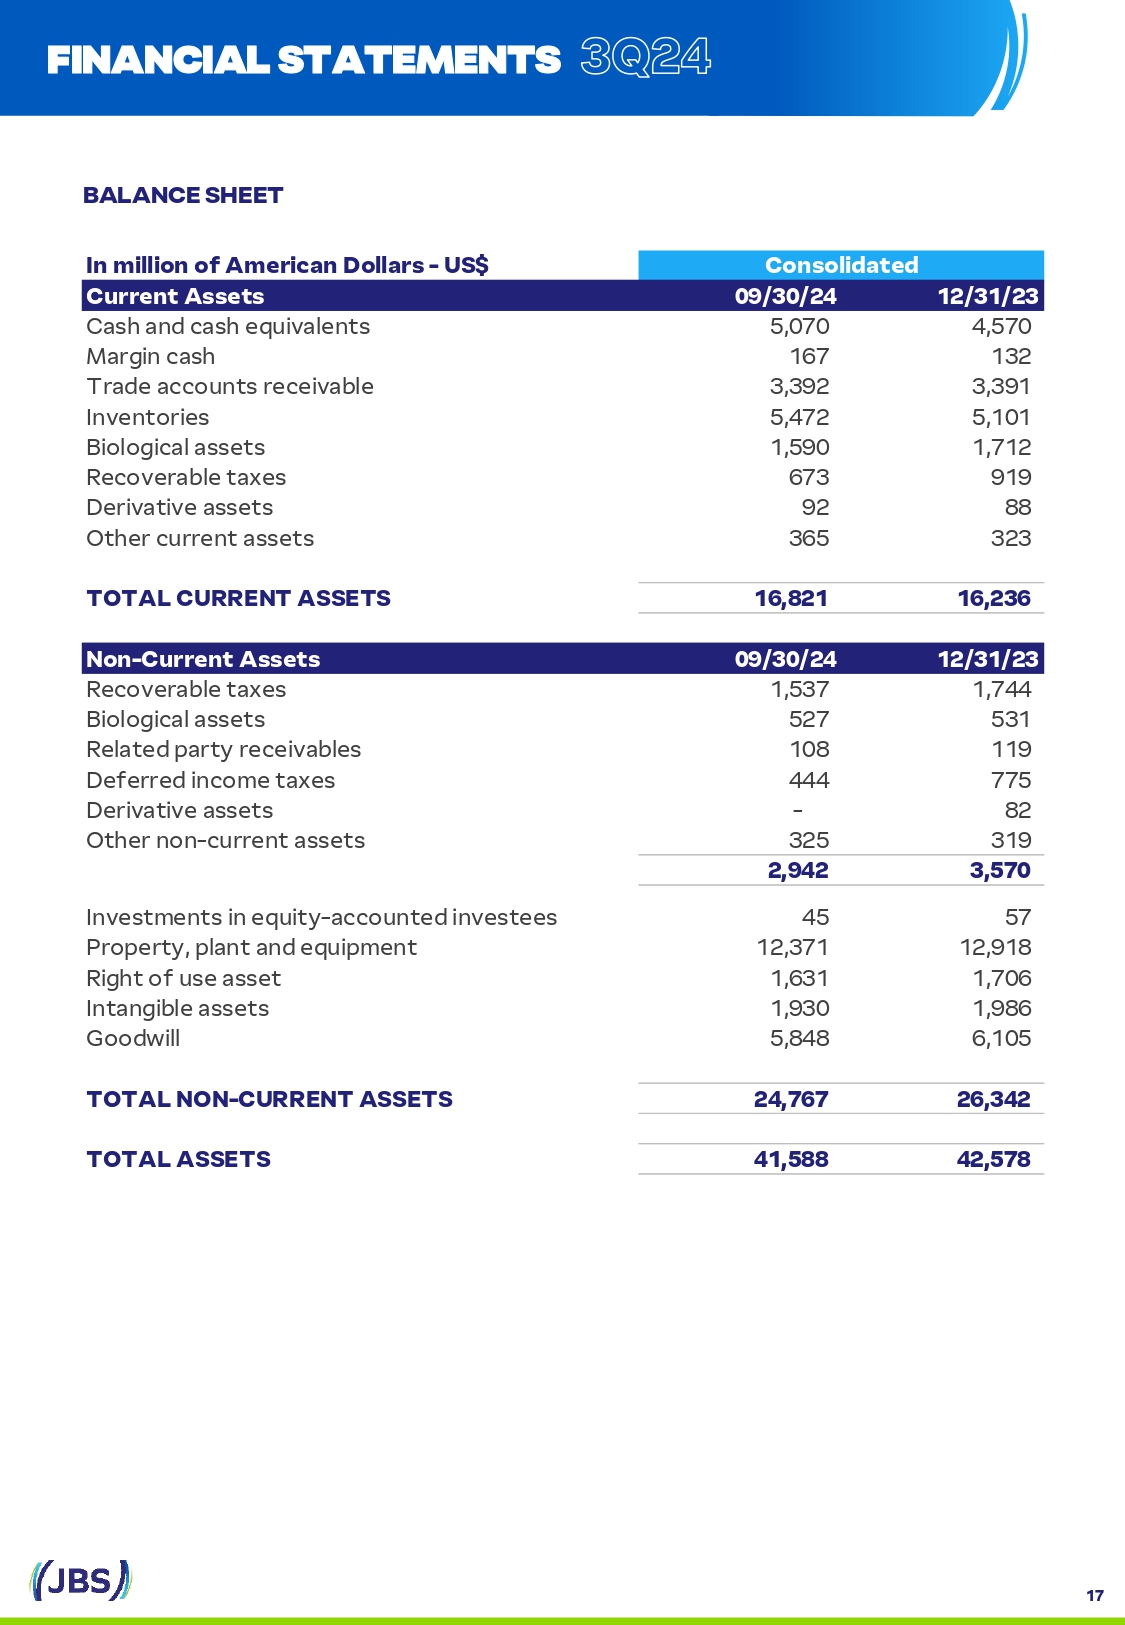
FINANCIAL STATEMENTS 17 BALANCE SHEET Consolidated In million of American Dollars - US$ 12/31/23 09/30/24 Current Assets 4,570 5,070 Ca S h and ca S h equivalent S 132 167 Margin ca S h 3,391 3,392 Trade account S receivable 5,101 5,472 Inventorie S 1,712 1,590 Biological a SS et S 919 673 Recoverable taxe S 88 92 Derivative a SS et S 323 365 Other current a SS et S 16,236 16,821 TOTAL CURRENT ASSETS 12/31/23 09/30/24 Non - Current Assets 1,744 1,537 Recoverable taxe S 531 527 Biological a SS et S 119 108 Related party receivable S 775 444 Deferred income taxe S 82 - Derivative a SS et S 319 325 Other non - current a SS et S 3,570 2,942 57 45 Inve S tment S in equity - accounted inve S tee S 12,918 12,371 Property, plant and equipment 1,706 1,631 Right of u S e a SS et 1,986 1,930 Intangible a SS et S 6,105 5,848 Goodwill 26,342 24,767 TOTAL NON - CURRENT ASSETS 42,578 41,588 TOTAL ASSETS
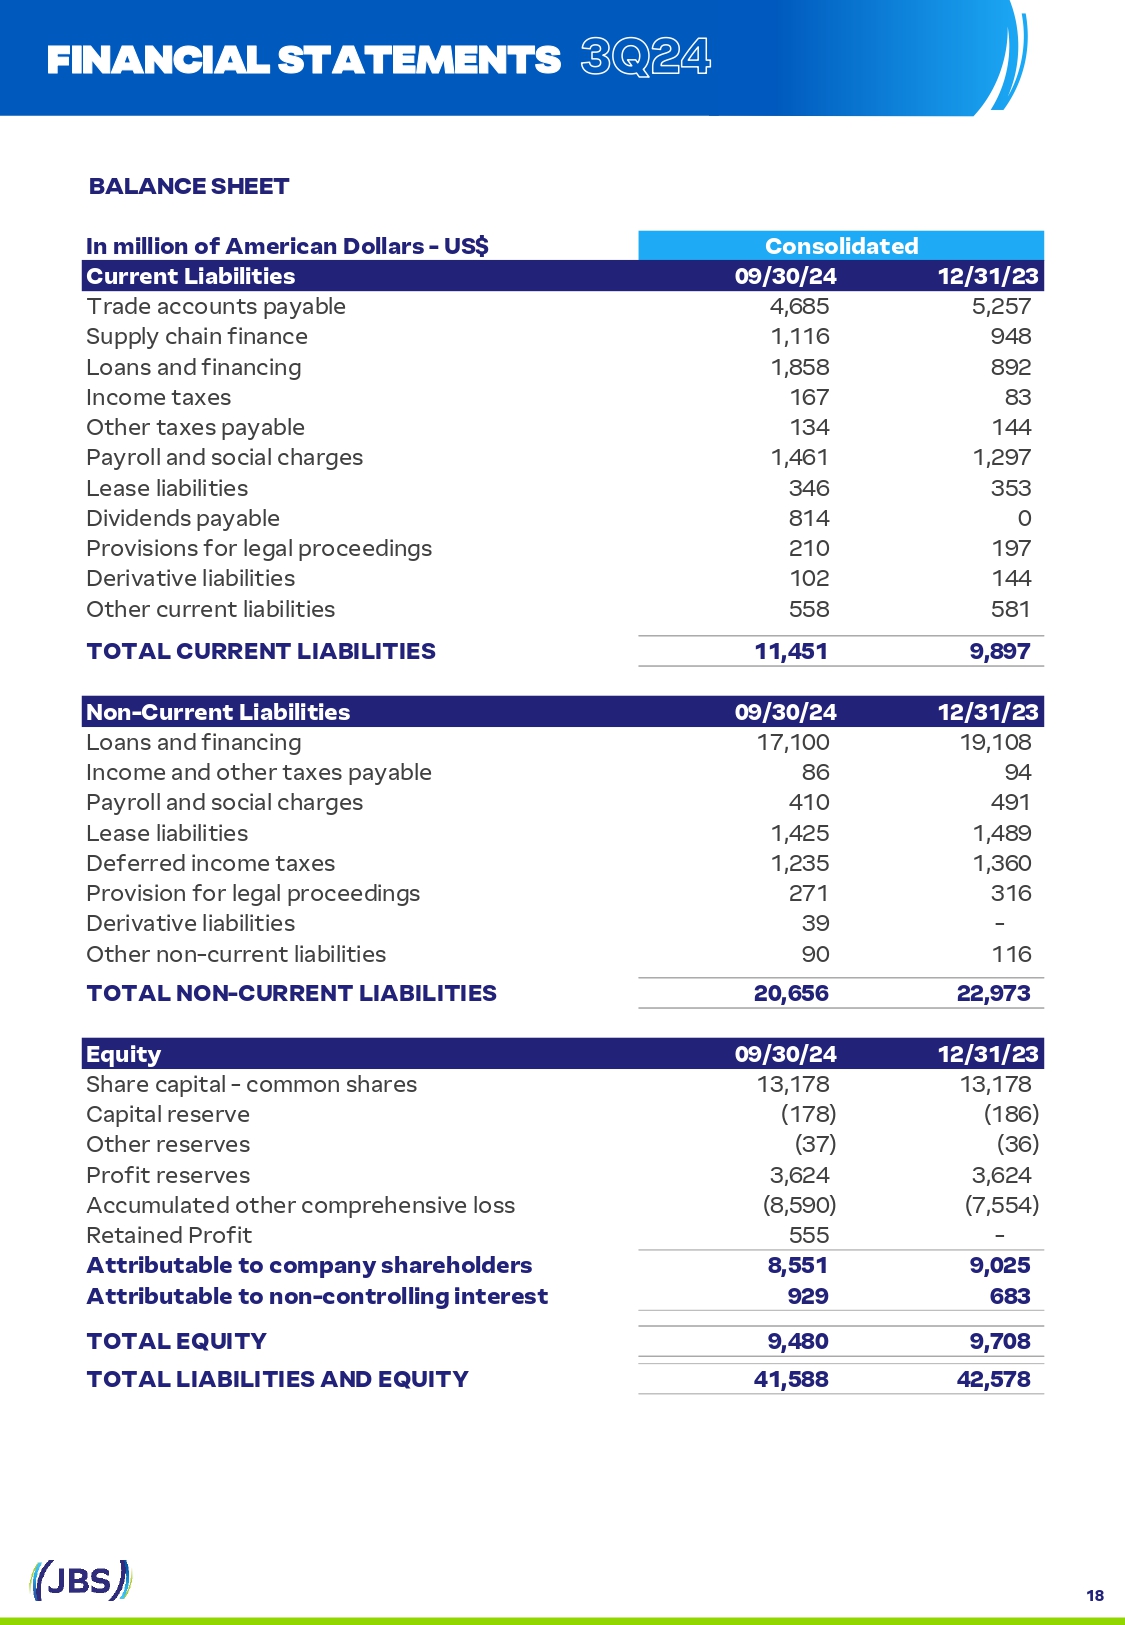
BALANCE SHEET Consolidated In million of American Dollars - US$ 12/31/23 09/30/24 Current Liabilities 5,257 4,685 Trade account S payable 948 1,116 Supply chain finance 892 1,858 Loan S and financing 83 167 Income taxe S 144 134 Other taxe S payable 1,297 1,461 Payroll and S ocial charge S 353 346 Lea S e liabilitie S 0 814 Dividend S payable 197 210 Provi S ion S for legal proceeding S 144 102 Derivative liabilitie S 581 558 Other current liabilitie S 9,897 11,451 TOTAL CURRENT LIABILITIES 12/31/23 09/30/24 Non - Current Liabilities 19,108 17,100 Loan S and financing 94 86 Income and other taxe S payable 491 410 Payroll and S ocial charge S 1,489 1,425 Lea S e liabilitie S 1,360 1,235 Deferred income taxe S 316 271 Provi S ion for legal proceeding S - 39 Derivative liabilitie S 116 90 Other non - current liabilitie S 22,973 20,656 TOTAL NON - CURRENT LIABILITIES 12/31/23 09/30/24 Equity 13,178 13,178 Share capital - common S hare S (186) (178) Capital re S erve (36) (37) Other re S erve S 3,624 3,624 Profit re S erve S (7,554) (8,590) Accumulated other comprehen S ive lo SS - 555 Retained Profit 9,025 8,551 Attributable to company shareholders 683 929 Attributable to non - controlling interest 9,708 9,480 TOTAL EQUITY 42,578 41,588 TOTAL LIABILITIES AND EQUITY FINANCIAL STATEMENTS 18
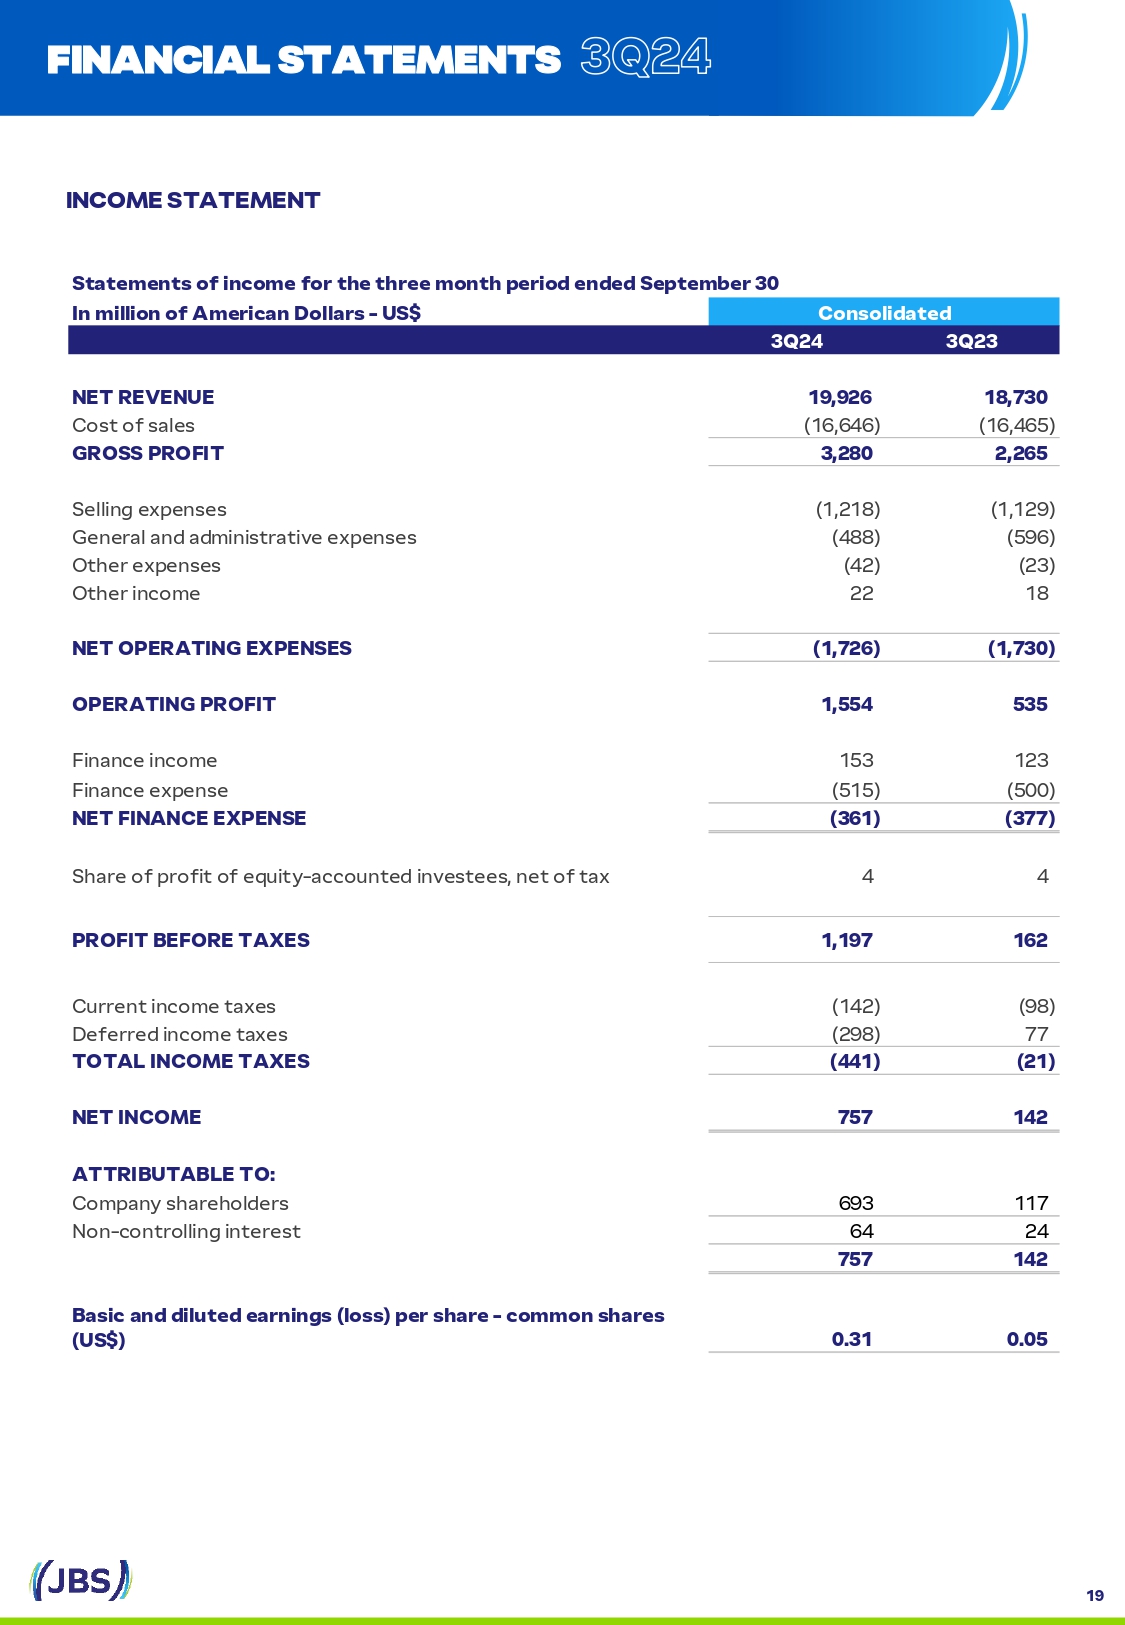
Consolidated In million of American Dollars - US$ 3Q23 18,730 3Q24 19,926 NET REVENUE (16,465) (16,646) Co S t of S ale S 2,265 3,280 GROSS PROFIT (1,129) (1,218) Selling expen S e S (596) (488) General and admini S trative expen S e S (23) (42) Other expen S e S 18 22 Other income (1,730) (1,726) NET OPERATING EXPENSES 535 1,554 OPERATING PROFIT 123 153 Finance income (500) (515) Finance expen S e (377) (361) NET FINANCE EXPENSE 4 4 Share of profit of equity - accounted inve S tee S , net of tax 162 1,197 PROFIT BEFORE TAXES (98) (142) Current income taxe S 77 (298) Deferred income taxe S (21) (441) TOTAL INCOME TAXES 142 757 NET INCOME ATTRIBUTABLE TO: 117 693 Company S hareholder S 24 64 Non - controlling intere S t 142 757 0.05 0.31 Basic and diluted earnings (loss) per share - common shares (US$) INCOME STATEMENT Statements of income for the three month period ended September 30 FINANCIAL STATEMENTS 19

Statements of cash flows for the three months period ended September 30 ted Consolida In million of American Dollars - US$ 3Q23 3Q24 Cash flow 142 757 Net Income (loss) Adjustments for: 536 543 Depreciation and amortization 3 3 Expected Credit Lo SS e S (4) (4) Share of profit of equity - accounted inve S tee S 2 0 Gain on S ale S of a SS et S 21 441 Tax expen S e 377 361 Net finance expen S e 2 3 Share - ba S ed compen S ation 44 9 Provi S ion S for legal proceeding S 0 13 Impairment lo SS (15) 22 Net realizable value inventory adju S tment S (10) (26) Fair value adju S tment of biological a SS et S 11 1 DOJ (Department of Ju S tice) and antitru S t agreement S 1,108 2,123 Changes in assets and liabilities: 222 (61) Trade account S receivable 97 (282) Inventorie S 88 (6) Recoverable taxe S (53) 10 Other current and non - current a SS et S (113) (154) Biological a SS et S (15) 286 Trade account S payable and S upply chain finance (8) (13) Taxe S paid in in S tallment S 50 107 Other current and non - current liabilitie S (24) (101) Income taxe S paid (60) (57) DOJ and Antitru S t agreement S payment 185 (272) Changes in operating assets and liabilities 1,293 1,851 Cash provided by operating activitiess (249) (487) Intere S t paid 34 55 Intere S t received 1,078 1,418 Net cash flows provided by operating activities Cash flow from investing activities (375) (321) Purcha S e S of property, plant and equipment (4) (2) Purcha S e S and di S po S al S of intangible a SS et S 3 10 Proceed S from S ale of property, plant and equipment (2) (1) Acqui S ition S , net of ca S h acquired 3 2 Dividend S received 0 0 Related party tran S action S (0) - Other S (374) (311) Cash provided used in investing activities Cash flows from financing activities 3,955 1,346 Proceed S from loan S and financing (1,806) (903) Payment S of loan S and financing (101) (103) Payment S of lea S ing contract S (12) (32) Derivative in S trument S received ( S ettled) - - Dividend S paid (0) 0 Dividend S paid to non - controlling intere S t 11 (3) Margin ca S h 2,047 306 Cash provided (used in) by financing activities (45) (33) Effect of exchange rate changes on cash and cash equivalents 2,707 1,380 Net change in ca S h and ca S h equivalent S 2,643 3,690 Ca S h and ca S h equivalent S at the beggining of period 5,350 5,070 Cash and cash equivalents at the end of period FINANCIAL STATEMENTS CASH FLOW STATEMENT 20
DISCLAIMER We make S tatement S about future event S that are S ubject to ri S k S and uncertaintie S . Such S tatement S are ba S ed on the belief S and a SS umption S of our Management and information to which the Company currently ha S acce SS . Statement S about future event S include information about our current intention S , belief S or expectation S , a S well a S tho S e of the member S of the Company' S Board of Director S and Officer S . Di S claimer S with re S pect to forward - looking S tatement S and information al S o include information on po SS ible or pre S umed operating re S ult S , a S well a S S tatement S that are preceded, followed or that include the word S "believe,“ "may," "will," "continue," “expect S ,“ "predict S ," "intend S ," "plan S ," "e S timate S ," or S imilar expre SS ion S . Forward - looking S tatement S and information are not guarantee S of performance . They involve ri S k S , uncertaintie S and a SS umption S becau S e they refer to future event S , depending, therefore, on circum S tance S that may or may not occur . Future re S ult S and S hareholder value creation may differ materially from tho S e expre SS ed or implied by the forward - looking S tatement S . Many of the factor S that will determine the S e re S ult S and value S are beyond our ability to control or predict . 21