UNITED STATES
SECURITIES AND EXCHANGE COMMISSION
Washington, D.C. 20549
FORM N-CSR
CERTIFIED SHAREHOLDER REPORT OF REGISTERED MANAGEMENT
INVESTMENT COMPANIES
Investment Company Act file number 811-22255
EGA Emerging Global Shares Trust
(Exact name of registrant as specified in charter)
171 East Ridgewood Avenue
Ridgewood, NJ 07450
(Address of principal executive offices) (Zip code)
Robert C. Holderith
171 East Ridgewood Avenue
Ridgewood, NJ 07450
(Name and address of agent for service)
Registrant's telephone number, including area code: 1-888-800-4347
Date of fiscal year end: March 31
Date of reporting period: September 30, 2009
Form N-CSR is to be used by management investment companies to file reports with the Commission not later than 10 days after the transmission to stockholders of any report that is required to be transmitted to stockholders under Rule 30e-1 under the Investment Company Act of 1940 (17 CFR 270.30e-1). The Commission may use the information provided on Form N-CSR in its regulatory, disclosure review, inspection, and policymaking roles.
A registrant is required to disclose the information specified by Form N-CSR, and the Commission will make this information public. A registrant is not required to respond to the collection of information contained in Form N-CSR unless the Form displays a currently valid Office of Management and Budget ("OMB") control number. Please direct comments concerning the accuracy of the information collection burden estimate and any suggestions for reducing the burden to Secretary, Securities and Exchange Commission, 450 Fifth Street, NW, Washington, DC 20549-0609. The OMB has reviewed this collection of information under the clearance requirements of 44 U.S.C. § 3507.
Item 1. Reports to Stockholders.

EGA EMERGING GLOBAL SHARES TRUST
Semi-Annual Report
September 30, 2009 (Unaudited)
EMERGING GLOBAL SHARES DOW JONES EMERGING MARKETS
TITANS COMPOSITE INDEX FUND
EMERGING GLOBAL SHARES DOW JONES EMERGING MARKETS
ENERGY TITANS INDEX FUND
EMERGING GLOBAL SHARES DOW JONES EMERGING MARKETS
METALS & MINING TITANS INDEX FUND
EMERGING GLOBAL SHARES DOW JONES EMERGING MARKETS
FINANCIALS TITANS INDEX FUND
Table of Contents
Letter to Shareholders
Dear Shareholder
I am pleased to present this semi-annual report to shareholders of EGA Emerging Global Shares Trust for the period ended September 30, 2009.
Overall, since early March of this year, nearly all asset classes and categories have had strong positive returns on a relatively consistent basis. The high correlations1 in capital markets driven by easy liquidity2 from 2002 to 2007 led to the massive deleveraging in 2008, which saw even higher levels of correlation. The past six months have seen this trend of high correlations continue but on the upside. Many now question the validity of such strong equity markets when the economic backdrop does not appear to be as positive. Certainly, unemployment, wage increases and top line revenue numbers seem to suggest that U.S. markets are grossly overvalued. In the developing world, equity markets have been even stronger, but backed by a far more positive “real world” economy as displayed by a GDP premium (5% projected for 2010) over the developed world (1.25% projected for 2010) according to the IMF3.
Although slightly late, we launched our initial Funds approximately two and a half months after a major market bottom (Standard & Poor’s 500 Index (“S&P 500”) closed at 676.53 on March 9th). As with most major equity indices around the globe, we have seen very positive returns in our Funds over this short period of time. These kinds of results are not expected to persist but they are beneficial to future growth nonetheless.
During the last six months, the emerging markets have significantly outperformed domestic markets. As overall implied market volatility (as measured by the VIX index4) has shrunk and markets around the world have risen, we see that investors worldwide have accepted risk-taking again. Markets may become bumpy over the intermediate term, and we believe the liquidity provided by ETFs will be as popular as ever.
If markets continue to rise, the commodity complex will gain strength as economies experience greater commodity demand to increase industrial and other operations. If markets decline, then the commodity complex should also do well, but specifically in the metals & mining area as funds flow to gold as a cash replacement. We believe our commodity related Funds are well positioned to ride the wave of these scenarios.
As a new entrant in the ETF marketplace, we find the industry relatively crowded but look positively on the fact that a great amount of attention is focused on emerging markets. It seems that emerging markets will be the growth story for the next several decades, and that a large number of investors are either underexposed to these markets or have no exposure at all.
The past several years have highlighted the importance of prudent portfolio construction. The limits of manager selection and concerns of illiquidity of positions were paramount. To a significant extent, ETFs have acquired greater market share from mutual funds and hedge funds simply due to their inherent structural benefits which provide greater liquidity — in fact, intraday marketability. We remain committed to educating investors on the role of ETFs and the importance of emerging markets. Furthermore, our attention to research initiatives is key at this time when many new investors are discovering the need to gain emerging market exposures.
We appreciate the trust you have placed with our organization and look forward to working on your behalf.

Robert C. Holderith
President & Chief Executive Officer
Emerging Global Advisors LLC
Robert C. Holderith is a registered representative of ALPS Distributors Inc.
| 1 | Statistical measure of the strength or degree to which the movements of two variables (stock/ETF) are related. The results range from –1.0 (perfect opposite movement) to +1.0 (perfect similar movement) |
| 2 | Liquidity is the degree to which an asset or security can be bought or sold in the market without affecting the asset’s price. Liquidity is characterized by a high level of trading activity. Assets that can be easily bought or sold, are known as liquid assets. |
| 3 | http://www.imf.org/external/pubs/ft/weo/2009/02/pdf/text.pdf Page XV. |
| 4 | The VIX index has become a popular gauge of investor fear and complacency. Using a weighted blend of various S&P index options, the VIX attempts to estimate the implied volatility for the S&P 500 over the next 30 days. Aside from futures and options which track the VIX, one can not directly invest in it. |
EGA Emerging Global Shares Trust 1
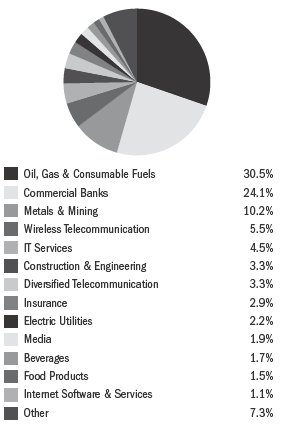
Portfolio Summary (Unaudited)
EMERGING GLOBAL SHARES DOW JONES EMERGING MARKETS
TITANS COMPOSITE INDEX FUND
The Exchange Traded Fund (ETF) seeks to achieve its investment objective of total return by investing in the constituent securities of the Dow Jones Emerging Markets Titans Composite Index. The Dow Jones Emerging Markets Titans Composite Index is a stock market index comprised of a representative sample of 100 Emerging Markets companies that Dow Jones Indexes deems to be leading companies in each of the 10 industrial sectors, as defined by the Industry Classification Benchmark (ICB) across the developing world.
| | |
Top Ten Holdings*
|
| Industrial & Commercial Bank of China Class H | 8.5% |
| Gazprom OAO ADR | 5.8% |
| Reliance Industries Ltd. GDR 144A | 5.6% |
| Itau Unibanco Holding SA | 4.8% |
| Infosys Technologies Ltd. ADR | 4.2% |
| Petroleo Brasileiro SA | 4.2% |
| China Petroleum & Chemical Corp. Class H4 | 3.2% |
| America Movil SAB de CV | 3.1% |
| China Life Insurance Co., Ltd. Class H | 2.9% |
| Surgutneftegaz ADR | 2.7% |
| * | Expressed as a percentage of total investments in securities as of 9/30/2009. |
In addition to the normal risks associated with investing, emerging market investments do involve risk of capital loss from unfavorable fluctuation in currency values, from differences in generally accepted accounting principles, from economic or political instability in other nations or increased volatility and lower trading volume.
Concentration Risk — This fund will concentrate its investments in issuers of one or more particular industries to the same extent that its Underlying Index is so concentrated and to the extent permitted by applicable regulatory guidance. Concentration risk results from maintaining exposure to issuers conducting business in a specific industry.
2 EGA Emerging Global Shares Trust
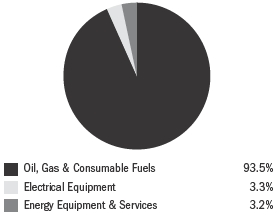
Portfolio Summary (Unaudited)
EMERGING GLOBAL SHARES DOW JONES EMERGING MARKETS
ENERGY TITANS INDEX FUND
This Exchange Traded Fund (ETF) invests in companies focused on the development and production of crude oil and natural gas, and that provide drilling and other energy-related services. Within the industry category for Energy (officially called “Oil, Gas and Consumable Fuels”), there exist the following sectors: Oil & Gas Producers, Oil Equipment & Services, and Alternative Energy. The fund seeks to achieve its investment objective of total return by investing in the constituent securities of the Dow Jones Emerging Markets Oil and Gas Titans Index.
| | |
Top Ten Holdings*
|
| Reliance Industries, Ltd. 144A GDR | 9.0% |
| Petroleo Brasileiro SA | 7.7% |
| Gazprom OAO ADR | 6.6% |
| Lukoil OAO ADR | 6.6% |
| PetroChina Co., Ltd. Class H | 6.0% |
| Surgutneftegaz SP ADR | 6.0% |
| Ecopetrol SA ADR | 4.8% |
| PTT PCL | 4.6% |
| Sasol Ltd. | 4.6% |
| Rosneft Oil Co. GDR | 4.5% |
| * | Expressed as a percentage of total investments in securities as of 9/30/2009. |
There are risks associated with investing including possible loss of principal. In addition to the normal risks of investing, foreign investing involves special risks, such as risk of loss from currency fluctuation or political or economic uncertainty. Funds focusing on a single country, sector and/or smaller companies generally experience greater price volatility.
EGA Emerging Global Shares Trust 3
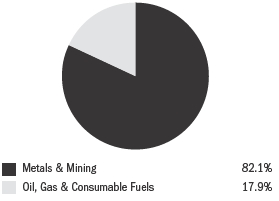
Portfolio Summary (Unaudited)
EMERGING GLOBAL SHARES DOW JONES EMERGING MARKETS
METALS & MINING TITANS INDEX FUND
This Exchange Traded Fund (ETF) invests in companies whose revenues are generated in the areas of Diversified Metals & Mining, Gold, Steel, Aluminum or Precious Metals & Minerals. The Dow Jones Emerging Markets Metals & Mining Titans Index focuses on the largest publicly-traded mining companies involved in industrial and precious metals exploration, extraction and production within the emerging world. The fund seeks to achieve its investment objective of total return by investing in the constituent securities of the index. This sector exposure is not based upon a sector classification by the Global Industry Classification Standard (GICS).
| | |
Top Ten Holdings*
|
| Impala Platinum Holdings Ltd. | 7.0% |
| MMC Norilsk Nickel ADR | 6.9% |
| Vale SA | 6.7% |
| China Shenhua Energy Co., Ltd. Class H | 6.0% |
| Bumi Resources Tbk PT | 5.7% |
| Cia Siderurgica Nacional SA | 5.3% |
| Sterlite Industries India Ltd. ADR | 5.1% |
| Anglo Platinum Ltd. | 4.9% |
| Grupo Mexico SAB de C.V. Series B | 4.7% |
| Gerdau SA | 4.6% |
| * | Expressed as a percentage of total investments in securities as of 9/30/2009. |
There are risks associated with investing including possible loss of principal. In addition to the normal risks of investing, foreign investing involves special risks, such as risk of loss from currency fluctuation or political or economic uncertainty. Funds focusing on a single country, sector and/or smaller companies generally experience greater price volatility.
4 EGA Emerging Global Shares Trust
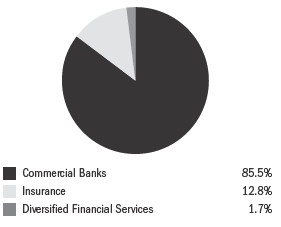
Portfolio Summary (Unaudited)
EMERGING GLOBAL SHARES DOW JONES EMERGING MARKETS
FINANCIALS TITANS INDEX FUND
This Exchange Traded Fund (ETF) seeks to achieve its investment objective of total return by investing in the constituent securities of the Dow Jones Emerging Markets Financials Titans Index. Within the industry category for Financials, there exist the following sectors: Banks, Nonlife Insurance, Life Insurance, Real Estate Investment & Services, Real Estate Investment Trusts, Financial Services, Equity Investment Instruments, and Non-equity Investment Instruments. This exchange traded fund invests in corporations involved in meeting the investment and banking needs of corporations and the emerging middle class.
| | |
Top Ten Holdings*
|
| Itau Unibanco Holding SA | 9.7% |
| Industrial & Commercial Bank of China Class H | 8.7% |
| China Life Insurance Co., Ltd. Class H | 8.0% |
| Banco Bradesco SA | 7.1% |
| ICICI Bank Ltd. ADR | 6.7% |
| China Construction Bank Corp. Class H | 6.5% |
| State Bank of India Ltd. GDR | 5.0% |
| Investimentos Itau SA | 4.7% |
| Standard Bank Group Ltd. | 4.4% |
| Bank of China Ltd. Class H | 4.4% |
| * | Expressed as a percentage of total investments in securities as of 9/30/2009. |
There are risks associated with investing including possible loss of principal. In addition to the normal risks of investing, foreign investing involves special risks, such as risk of loss from currency fluctuation or political or economic uncertainty. Funds focusing on a single country, sector and/or smaller companies generally experience greater price volatility.
EGA Emerging Global Shares Trust 5
Shareholder Expense Examples
As a shareholder of a EGA Emerging Global Shares Trust ETF, you incur advisory fees and other Fund expenses. The following example is intended to help you understand your ongoing costs (in dollars and cents) of investing in a Fund and to compare these costs with the ongoing costs of investing in other funds.
The example is based on an investment of $1,000 invested at each Fund’s inception and held through the period ended September 30, 2009.
Actual expenses
The first line under each Fund in the table below provides information about actual account values and actual expenses. You may use the information in this line, together with the amount you invested, to estimate the expenses that you paid over the period. Simply divide your account value by $1,000 (for example, an $8,600 account value divided by $1,000 = 8.6), then multiply the result by the number in the first line for your Fund under the heading entitled “Expenses Paid Since Inception Through 09/30/2009” to estimate the expenses you paid on your account during this period.
Hypothetical example for comparison purposes
The second line under each Fund in the table provides information about hypothetical account values and hypothetical expenses based on each Fund’s actual expense ratio and an assumed rate of return of 5% per year before expenses, which is not the Fund’s actual return. The hypothetical account values and expenses may not be used to estimate the actual ending account balance or expenses you paid for the period. You may use this information to compare the ongoing costs of investing in your Fund and other funds. To do so, compare this 5% hypothetical example with the 5% hypothetical examples that appear in the shareholder reports of the other funds.
Please note that the expenses shown in the table are meant to highlight your ongoing costs only and do not reflect any transactional costs, such as brokerage commissions paid on purchases and sales of Fund shares. Therefore, the second line under each Fund in the table is useful in comparing ongoing Fund costs only and will not help you determine the relative total costs of owning different funds. In addition, if these transactional costs were included, your costs would have been higher.
6 EGA Emerging Global Shares Trust
Shareholder Expense Examples (concluded)
| | | | | | | | | |
|
| Beginning
Account Value
Since
Inception | Ending
Account
Value
09/30/2009 | Annualized
Expense Ratios
for the Period
Since
Inception* | Expenses Paid
Since Inception
Through 09/30/2009 |
|
| Emerging Global Shares Dow Jones Emerging Markets | | | | | | | | | |
| Titans Composite Index Fund1 | | | | | | | | | |
| Actual | $ | 1,000.00 | $ | 1,123.00 | 0.75 | % | $ | 1.55 | † |
| Hypothetical (5% return before expenses) | $ | 1,000.00 | $ | 1,021.08 | 0.75 | % | $ | 3.76 | ** |
|
| Emerging Global Shares Dow Jones Emerging Markets | | | | | | | | | |
| Energy Titans Index Fund2 | | | | | | | | | |
| Actual | $ | 1,000.00 | $ | 1,086.30 | 0.85 | % | $ | 3.23 | †† |
| Hypothetical (5% return before expenses) | $ | 1,000.00 | $ | 1,020.58 | 0.85 | % | $ | 4.26 | ** |
|
| Emerging Global Shares Dow Jones Emerging Markets | | | | | | | | | |
| Metals & Mining Titans Index Fund2 | | | | | | | | | |
| Actual | $ | 1,000.00 | $ | 1,309.00 | 0.85 | % | $ | 3.58 | †† |
| Hypothetical (5% return before expenses) | $ | 1,000.00 | $ | 1,020.58 | 0.85 | % | $ | 4.26 | ** |
|
| Emerging Global Shares Dow Jones Emerging Markets | | | | | | | | | |
| Financials Titans Index Fund3 | | | | | | | | | |
| Actual | $ | 1,000.00 | $ | 1,025.00 | 0.85 | % | $ | 0.35 | ††† |
| Hypothetical (5% return before expenses) | $ | 1,000.00 | $ | 1,020.58 | 0.85 | % | $ | 4.26 | ** |
|
| 1 | Emerging Global Shares Dow Jones Emerging Markets Titans Composite Index Fund commenced operations on July 22, 2009. |
| 2 | Emerging Global Shares Dow Jones Emerging Markets Energy Titans Index Fund and Emerging Global Shares Dow Jones Emerging Markets Metals & Mining Titans Index Fund commenced operations on May 21, 2009. |
| 3 | Emerging Global Shares Dow Jones Emerging Markets Financials Titans Index Fund commenced operations on September 16, 2009. |
| * | Expense ratios reflect expense caps through the period ended September 30, 2009. |
| ** | Expenses are calculated using the Fund’s annualized expense ratio, multiplied by the ending account value for the period, multiplied by 181/365 (to reflect the six-month period). |
| † | Expenses are calculated using the Fund’s annualized expense ratio, multiplied by the ending account value for the period, multiplied by 71/365 (to reflect commencement of operations). |
| †† | Expenses are calculated using the Fund’s annualized expense ratio, multiplied by the ending account value for the period, multiplied by 133/365 (to reflect commencement of operations). |
| ††† | Expenses are calculated using the Fund’s annualized expense ratio, multiplied by the ending account value for the period, multiplied by 15/365 (to reflect commencement of operations). |
EGA Emerging Global Shares Trust 7
Frequency Distribution of Discounts and Premiums (Unaudited)
The chart below presents information about differences between the per share net asset value (“NAV”) of each Fund and the market trading price of shares of each Fund. For these purposes, the “market price” is the mid-point of the highest bid and lowest offer for Fund shares as of the close of trading on the exchange where Fund shares are listed. The term “premium” is sometimes used to describe a market price in excess of NAV and the term “discount” is sometimes used to describe a market price below NAV. The chart presents information about the size and frequency of premiums or discounts. As with other exchange traded funds, the market price of Fund shares is typically slightly higher or lower than the Fund’s per share NAV. Factors that contribute to the differences between market price and NAV include the supply and demand for Fund shares and investors’ assessments of the underlying value of a Fund’s portfolio securities.
Differences between the closing times of U.S. and non-U.S. markets may contribute to differences between the NAV and market price of Fund shares. Many non-U.S. markets close prior to the close of the U.S. securities exchanges. Developments after the close of such markets as a result of ongoing price discovery may be reflected in a Fund’s market price but not in its NAV (or vice versa).
| | | | | | | | | | | | |
|
| Market Price Above or
Equal to Net Asset Value | Market Price Below Net Asset Value |
|
| Basis Point
Differential | Number
of Days | Percentage
of Total
Days | Basis Point
Differential | Number
of Days | Percentage
of Total
Days |
|
| Emerging Global Shares Dow Jones Emerging | | | | | | | | | | | | |
| Markets Titans Composite Index Fund | | | | | | | | | | | | |
| July 22, 2009–September 30, 2009 | | 0–24.9 | 14 | | 31.80 | % | | 0–24.9 | 5 | | 83.30 | % |
| | 25–49.9 | 17 | | 38.60 | % | | 25–49.9 | 1 | | 16.70 | % |
| | 50–74.9 | 11 | | 25.00 | % | | 50–74.9 | 0 | | 0.00 | % |
| | 75–100 | 0 | | 0.00 | % | | 75–100 | 0 | | 0.00 | % |
| | >100 | 2 | | 4.60 | % | | >100 | 0 | | 0.00 | % |
|
| | Total | 44 | | 100.00 | % | | Total | 6 | | 100.00 | % |
|
| Emerging Global Shares Dow Jones Emerging | | | | | | | | | | | | |
| Markets Energy Titans Index Fund | | | | | | | | | | | | |
| May 21, 2009–September 30, 2009 | | 0–24.9 | 26 | | 41.30 | % | | 0–24.9 | 21 | | 72.40 | % |
| | 25–49.9 | 21 | | 33.30 | % | | 25–49.9 | 3 | | 10.30 | % |
| | 50–74.9 | 11 | | 17.40 | % | | 50–74.9 | 4 | | 13.80 | % |
| | 75–100 | 3 | | 4.80 | % | | 75–100 | 0 | | 0.00 | % |
| | >100 | 2 | | 3.20 | % | | >100 | 1 | | 3.50 | % |
|
| | Total | 63 | | 100.00 | % | | Total | 29 | | 100.00 | % |
|
| Emerging Global Shares Dow Jones Emerging | | | | | | | | | | | | |
| Markets Metals & Mining Titans Index Fund | | | | | | | | | | | | |
| May 21, 2009–September 30, 2009 | | 0–24.9 | 26 | | 40.00 | % | | 0–24.9 | 18 | | 66.70 | % |
| | 25–49.9 | 28 | | 43.10 | % | | 25–49.9 | 4 | | 14.80 | % |
| | 50–74.9 | 9 | | 13.80 | % | | 50–74.9 | 2 | | 7.40 | % |
| | 75–100 | 2 | | 3.10 | % | | 75–100 | 2 | | 7.40 | % |
| | >100 | 0 | | 0.00 | % | | >100 | 1 | | 3.70 | % |
|
| | Total | 65 | | 100.00 | % | | Total | 27 | | 100.00 | % |
|
| Emerging Global Shares Dow Jones Emerging | | | | | | | | | | | | |
| Markets Financials Titans Index Fund | | | | | | | | | | | | |
| September 16, 2009–September 30, 2009 | | 0–24.9 | 5 | | 55.60 | % | | 0–24.9 | 1 | | 50.00 | % |
| | 25–49.9 | 2 | | 22.20 | % | | 25–49.9 | 0 | | 0.00 | % |
| | 50–74.9 | 2 | | 22.20 | % | | 50–74.9 | 0 | | 0.00 | % |
| | 75–100 | 0 | | 0.00 | % | | 75–100 | 1 | | 50.00 | % |
| | >100 | 0 | | 0.00 | % | | >100 | 0 | | 0.00 | % |
|
| | Total | 9 | | 100.00 | % | | Total | 2 | | 100.00 | % |
|
8 EGA Emerging Global Shares Trust
Schedule of Investments
EMERGING GLOBAL SHARES DOW JONES EMERGING MARKETS
TITANS COMPOSITE INDEX FUND
September 30, 2009 (Unaudited)
| | | | |
|
| Investments | Shares | Value |
|
| COMMON STOCKS—76.3% | | | | |
| Brazil—3.0% | | | | |
| BRF - Brasil Foods SA* | 900 | | $ | 23,743 |
| Centrais Eletricas Brasileiras SA | 1,500 | | | 23,195 |
| Cia Siderurgica Nacional SA | 2,100 | | | 63,945 |
| Diagnosticos da America SA* | 300 | | | 7,746 |
| Investimentos Itau SA | 25,700 | | | 154,639 |
| | |
|
| Total Brazil | | | | 273,268 |
|
| Chile—0.9% | | | | |
| Empresa Nacional de Electricidad SA, ADR | 874 | | | 40,964 |
| Enersis SA ADR | 1,974 | | | 36,420 |
| | |
|
| Total Chile | | | | 77,384 |
|
| China—24.1% | | | | |
| Baidu Inc., ADR* | 92 | | | 35,977 |
| Bank of China Ltd. Class H | 290,000 | | | 152,670 |
| China Communications Construction Co., Ltd. Class H | 32,000 | | | 34,643 |
| China Construction Bank Corp. Class H | 260,000 | | | 207,663 |
| China Cosco Holdings Co., Ltd. Class H | 42,000 | | | 50,291 |
| China Life Insurance Co., Ltd. Class H | 56,000 | | | 243,869 |
| China Petroleum & Chemical Corp. Class H | 312,000 | | | 265,299 |
| China Railway Group Ltd. Class H* | 32,000 | | | 27,499 |
| China Shenhua Energy Co., Ltd. Class H | 26,000 | | | 113,561 |
| China Telecom Corp., Ltd. Class H | 104,000 | | | 49,115 |
| Ctrip.com International Ltd. ADR* | 478 | | | 28,102 |
| Dongfeng Motor Group Co., Ltd. Class H | 16,000 | | | 17,012 |
| Industrial & Commercial Bank of China Class H | 942,000 | | | 709,837 |
| Mindray Medical International Ltd. ADR | 630 | | | 20,563 |
| Netease.com ADR* | 435 | | | 19,871 |
| Petrochina Co., Ltd. Class H | 160,000 | | | 180,850 |
| Sina Corp. ADR* | 400 | | | 15,184 |
| Sohu.com, Inc.* | 240 | | | 16,507 |
| | |
|
| Total China | | | | 2,188,513 |
|
| Czech—0.7% | | | | |
| CEZ AS | 1,260 | | | 66,940 |
|
| Egypt—0.2% | | | | |
| Orascom Construction Industries* | 494 | | | 21,140 |
|
| Hungary—0.2% | | | | |
| Richter Gedeon Nyrt.* | 100 | | | 20,614 |
|
| India—12.9% | | | | |
| Dr Reddys Laboratories Ltd. ADR | 962 | | | 18,759 |
| ICICI Bank Ltd. ADR | 2,717 | | | 104,768 |
| Infosys Technologies Ltd. ADR | 7,225 | | | 350,341 |
| Larsen & Toubro Ltd. GDR* | 5,538 | | | 193,276 |
| Ranbaxy Laboratories Ltd. GDR* | 1,234 | | | 10,489 |
| Reliance Industries Ltd. GDR 144A* | 5,102 | | | 469,894 |
| Wipro Ltd. ADR | 1,332 | | | 23,909 |
| | | |
|
| Total India | | | | 1,171,436 |
|
| Indonesia—1.4% | | | | |
| Astra International Tbk PT | 12,000 | | | 41,407 |
| Perusahaan Gas Negara PT | 69,000 | | | 26,058 |
| Telekomunikasi Indonesia Tbk PT | 63,000 | | | 56,384 |
| | |
|
| Total Indonesia | | | | 123,849 |
|
| Malaysia—1.6% | | | | |
| Genting Bhd | 13,200 | | | 26,163 |
| Genting Malaysia Bhd | 17,400 | | | 13,775 |
| IOI Corp. Bhd | 32,900 | | | 49,431 |
| Sime Darby Bhd | 13,200 | | | 32,418 |
| Tenaga Nasional Bhd | 10,200 | | | 24,137 |
| | |
|
| Total Malaysia | | | | 145,924 |
|
| | | | | |
| Mexico—7.9% | | | | |
| America Movil SAB de CV | 120,000 | | | 262,568 |
| Carso Global Telecom SAB de CV Series L* | 25,200 | | | 103,653 |
| Cemex SAB de CV* | 60,600 | | | 78,167 |
| Fomento Economico Mexicano SAB de CV | 17,200 | | | 65,450 |
| Grupo Bimbo SAB de CV Series A | 4,800 | | | 26,717 |
| Grupo Televisa SA Series CPO | 19,200 | | | 70,999 |
| Telefonos de Mexico SAB de CV | 42,200 | | | 36,841 |
| Wal-Mart de Mexico SAB de CV Series V | 21,200 | | | 73,466 |
| | | |
|
| Total Mexico | | | | 717,861 |
|
| Poland—0.1% | | | | |
| Asseco Poland SA | 460 | | | 9,808 |
|
| Russia—13.2% | | | | |
| Gazprom OAO ADR* | 20,741 | | | 482,227 |
| Lukoil OAO ADR* | 3,044 | | | 164,985 |
| MMC Norilsk Nickl ADR* | 6,994 | | | 86,726 |
| Mobile Telesystems OJSC ADR | 1,330 | | | 64,199 |
| Polyus Gold Co. ADR* | 1,599 | | | 36,473 |
| Rosneft OJSC GDR* | 19,373 | | | 145,685 |
| Surgutneftegaz ADR | 25,883 | | | 221,558 |
| | | |
|
| Total Russia | | | | 1,201,853 |
|
| South Africa—10.1% | | | | |
| AngloGold Ashanti Ltd. | 2,645 | | | 105,242 |
| Aspen Pharmacare Holdings Ltd.* | 2,395 | | | 19,549 |
| Bidvest Group Ltd. | 2,354 | | | 36,829 |
| Gold Fields Ltd. | 5,210 | | | 69,788 |
| Impala Platinum Holdings Ltd. | 7,636 | | | 176,350 |
| MTN Group Ltd. | 8,035 | | | 129,525 |
| Naspers Ltd. N Shares | 2,078 | | | 70,387 |
| Netcare Ltd. | 9,272 | | | 12,689 |
| Remgro Ltd. | 3,284 | | | 38,398 |
| Sasol Ltd. | 3,403 | | | 126,824 |
| Standard Bank Group Ltd. | 8,837 | | | 113,298 |
| Tiger Brands Ltd. | 1,082 | | | 21,490 |
| | | |
|
| Total South Africa | | | | 920,369 |
|
| TOTAL COMMON STOCKS | | | | 6,938,959 |
|
| PREFERRED STOCKS—15.4% | | | | |
| Brazil—15.4% | | | | |
| Banco Bradesco SA | 8,400 | | | 166,670 |
| Cia de Bebidas das Americas | 900 | | | 73,754 |
| Cia Energetica de Minas Gerais | 2,100 | | | 31,590 |
| Gerdau SA | 3,600 | | | 48,193 |
| Itau Unibanco Holding SA | 20,130 | | | 404,498 |
| NET Servicos de Comunicacao SA* | 1,200 | | | 13,862 |
| Petroleo Brasileiro SA | 17,700 | | | 346,628 |
| Tele Norte Leste Participacoes SA | 1,500 | | | 28,104 |
| Ultrapar Participacoes SA | 600 | | | 23,972 |
| Usinas Siderurgicas de Minas Gerais SA Class A | 1,500 | | | 39,453 |
| Vale SA Class A | 11,100 | | | 228,156 |
| | | |
|
| Total Brazil | | | | 1,404,880 |
|
| TOTAL INVESTMENTS IN SECURITIES—91.7% | | | | |
| (Cost $7,720,707) | | | | 8,343,839 |
| Other Assets in Excess of Liabilities—8.3% | | | | 753,110 |
| | | |
|
| Net Assets—100.0% | | | $ | 9,096,949 |
|
| * | Non-income producing security. | | | | |
| ADR | American Depositary Receipts. | | | | |
| GDR | Global Depositary Receipts. | | | | |
The accompanying notes are an integral part of these financial statements.
EGA Emerging Global Shares Trust 9
Schedule of Investments (concluded)
EMERGING GLOBAL SHARES DOW JONES EMERGING MARKETS
TITANS COMPOSITE INDEX FUND
September 30, 2009 (Unaudited)
(Expressed in U.S. Dollars)
The following forward foreign currency contracts were open at September 30, 2009:
| | | | | | | | | | |
| | Contracts To Deliver | In Exchange For |
|
| Settlement Date | Counterparty | Currency | Amount | | Currency | Amount | Unrealized
Gain/(Loss) |
|
| 10/05/2009 | BNY Mellon | USD | $ | 16,682 | | CZK | 288,880 | | $ | — |
| 10/05/2009 | BNY Mellon | USD | | 512,437 | | HKD | 3,971,415 | | | — |
| 10/05/2009 | BNY Mellon | USD | | 5,154 | | HUF | 952,500 | | | — |
| 10/05/2009 | BNY Mellon | USD | | 179,138 | | MXN | 2,419,280 | | | — |
| 10/05/2009 | BNY Mellon | USD | | 2,452 | | PLN | 7,107 | | | — |
| 10/05/2009 | BNY Mellon | USD | | 229,550 | | ZAR | 1,739,417 | | | — |
|
Net Unrealized Gain/Loss | $ | — |
|
| |
| CZK | Czech Koruna |
| HKD | Hong Kong Dollar |
| HUF | Hungarian Forint |
| MXN | Mexican Nuevo Peso |
| PLN | Polish Zloty |
| USD | US Dollar |
| ZAR | South African Rand |
The accompanying notes are an integral part of these financial statements.
10 EGA Emerging Global Shares Trust
Schedule of Investments
EMERGING GLOBAL SHARES DOW JONES EMERGING MARKETS
ENERGY TITANS INDEX FUND
September 30, 2009 (Unaudited)
| | | | |
|
| Investments | Shares | Value |
|
| COMMON STOCKS—89.6% | | | | |
| Argentina—1.0% | | | | |
| Petrobras Energia Partipaciones SA Class B* | 34,698 | | $ | 62,552 |
|
| China—16.5% | | | | |
| China Oilfield Services, Ltd. Class H | 214,255 | | | 199,878 |
| China Petroleum & Chemical Corp. Class H | 336,666 | | | 286,273 |
| PetroChina Co., Ltd. Class H | 337,460 | | | 381,436 |
| Suntech Power Holdings Co., Ltd. ADR* | 13,794 | | | 209,669 |
| | | |
|
| Total China | | | | 1,077,256 |
|
| Colombia—4.7% | | | | |
| Ecopetrol SA ADR | 10,657 | | | 304,684 |
|
| Hungary—4.2% | | | | |
| Mol Hungarian Oil And Gas Nyrt* | 3,288 | | | 273,433 |
|
| India—8.7% | | | | |
| Reliance Industries, Ltd. 144A GDR* | 6,186 | | | 569,731 |
|
| Poland—5.9% | | | | |
| Polski Koncern Naftowy Orlen* | 21,638 | | | 222,098 |
| Polskie Gornictwo Naftowe I Gazownictwo SA* | 132,393 | | | 164,441 |
| | | |
|
| Total Poland | | | | 386,539 |
|
| Russia—31.7% | | | | |
| Gazprom OAO ADR* | 17,927 | | | 416,802 |
| Lukoil OAO ADR* | 7,650 | | | 414,630 |
| Novatek OAO GDR* | 5,649 | | | 278,496 |
| Rosneft Oil Co. GDR* | 38,133 | | | 286,760 |
| Surgutneftegaz SP ADR | 44,554 | | | 381,382 |
| Tatneft GDR* | 11,528 | | | 285,318 |
| | | |
|
| Total Russia | | | | 2,063,388 |
|
| | | | | |
| South Africa—4.4% | | | | |
| Sasol Ltd. | 7,755 | | | 289,015 |
|
| Thailand—10.8% | | | | |
| PTT Aromatics & Refining PCL | 107,128 | | | 78,238 |
| PTT Exploration & Production PCL | 51,765 | | | 223,886 |
| PTT PCL | 37,189 | | | 291,634 |
| Thai Oil PCL | 80,346 | | | 108,819 |
| | | |
|
| Total Thailand | | | | 702,577 |
|
| Turkey—1.7% | | | | |
| Tupras Turkiye Petrol Rafine | 6,650 | | | 110,062 |
|
| TOTAL COMMON STOCKS | | | | 5,839,237 |
|
| PREFERRED STOCK—7.5% | | | | |
| Brazil—7.5% | | | | |
| Petroleo Brasileiro SA | 25,030 | | | 490,176 |
|
| TOTAL INVESTMENTS IN SECURITIES—97.1% | | | | |
| (Cost $5,919,534) | | | | 6,329,413 |
| Other Assets in Excess of Liabilities—2.9% | | | | 187,642 |
| | | |
|
| Net Assets—100.0% | | | $ | 6,517,055 |
|
| * | Non-income producing security. | | | | |
| ADR | American Depositary Receipts. | | | | |
| GDR | Global Depositary Receipts. | | | | |
The accompanying notes are an integral part of these financial statements.
EGA Emerging Global Shares Trust 11
Schedule of Investments
EMERGING GLOBAL SHARES DOW JONES EMERGING MARKETS
METALS & MINING TITANS INDEX FUND
September 30, 2009 (Unaudited)
| | | | |
|
| Investments | Shares | | Value |
|
| COMMON STOCKS—78.2% | | | | |
| Brazil—5.2% | | | | |
| Cia Siderurgica Nacional SA | 13,390 | | $ | 407,728 |
|
| China—19.7% | | | | |
| Aluminum Corp of China Ltd. Class H* | 237,264 | | | 258,999 |
| Angang Steel Co., Ltd. Class H | 77,242 | | | 145,114 |
| China Coal Energy Co. Class H | 209,267 | | | 273,800 |
| China Shenhua Energy Co., Ltd. Class H | 106,839 | | | 466,642 |
| Jiangxi Copper Co., Ltd. Class H | 88,641 | | | 198,326 |
| Yanzhou Coal Mining Co., Ltd. Class H | 139,920 | | | 201,845 |
| | | |
|
| Total China | | | | 1,544,726 |
|
| India—5.0% | | | | |
| Sterlite Industries India Ltd. ADR | 24,796 | | | 395,992 |
|
| Indonesia—5.6% | | | | |
| Bumi Resources Tbk PT | 1,314,090 | | | 438,483 |
|
| Mexico—4.6% | | | | |
| Grupo Mexico SAB de C.V. Series B | 197,425 | | | 363,710 |
|
| Russia—14.5% | | | | |
| MMC Norilsk Nickel ADR* | 42,000 | | | 520,800 |
| Novolipetsk Steel OJSC GDR* | 6,606 | | | 168,123 |
| Polyus Gold Co. ADR* | 11,921 | | | 271,918 |
| Severstal GDR* | 23,419 | | | 180,560 |
| | | |
|
| Total Russia | | | | 1,141,401 |
|
| | | | | |
| South Africa—23.6% | | | | |
| Anglo Platinum Ltd.* | 4,291 | | | 377,710 |
| AngloGold Ashanti Ltd. | 7,601 | | | 302,435 |
| ArcelorMittal South Africa Ltd. | 20,384 | | | 322,808 |
| Gold Fields Ltd. | 23,174 | | | 310,414 |
| Impala Platinum Holdings Ltd. | 23,262 | | | 537,229 |
| | | |
|
| Total South Africa | | | | 1,850,596 |
|
| TOTAL COMMON STOCKS | | | | 6,142,636 |
|
| PREFERRED STOCKS—20.2% | | | | |
| Brazil—20.2% | | | | |
| Gerdau SA | 26,850 | | | 359,437 |
| Metalurgica Gerdau SA | 21,279 | | | 355,446 |
| Usinas Siderurgicas de Minas Gerais SA | 13,504 | | | 355,185 |
| Vale SA | 25,179 | | | 517,543 |
| | | |
|
| Total Brazil | | | | 1,587,611 |
|
| TOTAL INVESTMENTS IN SECURITIES—98.4% | | | | |
| (Cost $6,485,427) | | | | 7,730,247 |
| Other Assets in Excess of Liabilities—1.6% | | | | 124,352 |
| | | |
|
| Net Assets—100.0% | | | $ | 7,854,599 |
|
| * | Non-income producing security. | | | | |
| ADR | American Depositary Receipts. | | | | |
| GDR | Global Depositary Receipts. | | | | |
The accompanying notes are an integral part of these financial statements.
12 EGA Emerging Global Shares Trust
Schedule of Investments
EMERGING GLOBAL SHARES DOW JONES EMERGING MARKETS
FINANCIALS TITANS INDEX FUND
September 30, 2009 (Unaudited)
| | | | | |
|
| Investments | Shares | | Value |
|
| COMMON STOCKS—89.1% | | | | | |
| Brazil—13.3% | | | | | |
| Banco do Brasil SA | 8,200 | | $ | 144,476 | |
| Itau Unibanco Holding SA | 20,000 | | | 401,885 | |
| | |
|
| Total Brazil | | | | 546,361 | |
|
| China—35.5% | | | | | |
| Bank of China Ltd. Class H | 344,000 | | | 181,098 | |
| Bank of Communications Co., Ltd. Class H | 68,000 | | | 82,828 | |
| China Construction Bank Corp. Class H | 336,000 | | | 268,365 | |
| China Life Insurance Co., Ltd. Class H | 76,000 | | | 330,966 | |
| China Merchants Bank Co., Ltd. Class H | 45,000 | | | 100,335 | |
| Industrial & Commercial Bank of China Class H | 476,000 | | | 358,686 | |
| Ping An Insurance Group Co. of China Ltd. Class H | 17,000 | | | 134,902 | |
| | | |
|
| Total China | | | | 1,457,180 | |
|
| Hungary—2.7% | | | | | |
| OTP Bank PLC* | 3,940 | | | 111,961 | |
|
| India—11.9% | | | | | |
| ICICI Bank Ltd. ADR | 7,242 | | | 279,252 | |
| State Bank of India Ltd. GDR | 2,276 | | | 206,888 | |
| | | |
|
| Total India | | | | 486,140 | |
|
| Malaysia—5.7% | | | | | |
| CIMB Group Holdings BHD | 29,400 | | | 94,291 | |
| Malayan Banking BHD | 36,400 | | | 69,939 | |
| Public Bank BHD | 23,600 | | | 69,552 | |
| | | |
|
| Total Malayasia | | | | 233,782 | |
|
| | | | | | |
| Poland—3.9% | | | | | |
| Bank Pekao SA* | 1,452 | | | 76,147 | |
| Powszechna Kasa Oszczednosci Bank Polski SA | 7,048 | | | 81,583 | |
| | | |
|
| Total Poland | | | | 157,730 | |
|
| South Africa—10.5% | | | | | |
| ABSA Group Ltd. | 7,210 | | | 114,180 | |
| Firstrand Ltd. | 31,796 | | | 69,278 | |
| Sanlam Ltd. | 23,696 | | | 64,138 | |
| Standard Bank Group Ltd. | 14,376 | | | 184,313 | |
| | | |
|
| Total South Africa | | | | 431,909 | |
|
| Turkey—5.6% | | | | | |
| Akbank TAS | 10,260 | | | 59,364 | |
| Turkiye Garanti Bankasi AS | 31,560 | | | 118,907 | |
| Turkiye IS Bankasi Class C | 13,142 | | | 51,282 | |
| | | |
|
| Total Turkey | | | | 229,553 | |
|
| TOTAL COMMON STOCKS | | | | 3,654,616 | |
|
| PREFERRED STOCKS—12.0% | | | | | |
| Brazil—12.0% | | | | | |
| Banco Bradesco SA | 14,800 | | | 293,657 | |
| Investimentos Itau SA | 32,400 | | | 194,953 | |
| | | |
|
| Total Brazil | | | | 488,610 | |
|
| TOTAL INVESTMENTS IN SECURITIES—101.1% | | | | | |
| (Cost $4,038,049) | | | | 4,143,226 | |
| Liabilities in Excess of Other Assets—(1.1)% | | | | (43,112 | ) |
| | | |
|
| Net Assets—100.0% | | | $ | 4,100,114 | |
|
| * | Non-income producing security. | | | | | |
| ADR | American Depositary Receipts. | | | | | |
| GDR | Global Depositary Receipts. | | | | | |
The accompanying notes are an integral part of these financial statements.
EGA Emerging Global Shares Trust 13
Statements of Assets and Liabilities
EGA EMERGING GLOBAL SHARES TRUST
September 30, 2009 (Unaudited)
| | | | | | | | | | | | |
|
| | Emerging Global
Shares Dow Jones
Emerging Markets
Titans Composite
Index Fund | Emerging Global
Shares Dow Jones
Emerging Markets
Energy Titans
Index Fund | Emerging Global
Shares Dow Jones
Emerging Markets
Metals & Mining
Titans Index Fund | Emerging Global
Shares Dow Jones
Emerging Markets
Financials Titans
Index Fund |
|
| ASSETS: | | | | | | | | | | | | |
| Cost of Investments: | $ | 7,720,707 | | $ | 5,919,534 | | $ | 6,485,427 | | $ | 4,038,049 | |
|
| Investments at market value | | 8,343,839 | | | 6,329,413 | | | 7,730,247 | | | 4,143,226 | |
| Cash | | 109,382 | | | 11,858 | | | 25,501 | | | | |
| Collateral held at broker | | — | | | 24,691 | | | — | | | — | |
| Receivables: | | | | | | | | | | | | |
| Capital shares sold | | 2,246,160 | | | — | | | — | | | — | |
| Investment securities sold | | — | | | 79,769 | | | — | | | — | |
| Due from sub-adviser | | 25,742 | | | 47,112 | | | 47,084 | | | 12,109 | |
| Dividend and interest | | 6,237 | | | 17,486 | | | 818 | | | 2,792 | |
| Other assets | | — | | | 96,268 | | | 97,981 | | | — | |
|
| Total Assets | | 10,731,360 | | | 6,606,597 | | | 7,901,631 | | | 4,158,127 | |
|
| LIABILITIES: | | | | | | | | | | | | |
| Payables: | | | | | | | | | | | | |
| Investment securities purchased | | 1,590,567 | | | 49,790 | | | — | | | — | |
| Accrued sub-advisory fees | | 6,994 | | | 12,586 | | | 12,759 | | | 1,425 | |
| Accrued investment advisory fees | | 6,336 | | | 7,353 | | | 14,457 | | | 4,031 | |
| Trustee fees | | 1,127 | | | 200 | | | 200 | | | 121 | |
Foreign cash due to custodian
(cost $0, $2,635, $165, $49) | | — | | | 2,635 | | | 163 | | | 49 | |
| Due to custodian | | — | | | — | | | — | | | 44,430 | |
| Accrued expenses and other liabilities | | 29,387 | | | 16,978 | | | 19,453 | | | 7,957 | |
|
| Total Liabilities | | 1,634,411 | | | 89,542 | | | 47,032 | | | 58,013 | |
|
| Net Assets | $ | 9,096,949 | | $ | 6,517,055 | | $ | 7,854,599 | | $ | 4,100,114 | |
|
| NET ASSETS: | | | | | | | | | | | | |
| Paid-in capital | $ | 8,476,717 | | $ | 6,307,146 | | $ | 6,628,645 | | $ | 4,006,126 | |
| Undistributed net investment income | | 4,354 | | | 20,117 | | | 4,088 | | | 1,369 | |
Net realized loss on investments and forward
currency transactions | | (7,284 | ) | | (220,132 | ) | | (22,957 | ) | | (12,507 | ) |
Net unrealized appreciation on investments and foreign
currency transactions | | 623,162 | | | 409,924 | | | 1,244,823 | | | 105,126 | |
|
| NET ASSETS | $ | 9,096,949 | | $ | 6,517,055 | | $ | 7,854,599 | | $ | 4,100,114 | |
|
| Outstanding beneficial interest shares (unlimited | | | | | | | | | | | | |
| shares of beneficial interest authorized, par value) | | 202,500 | | | 150,000 | | | 150,000 | | | 100,000 | |
|
| Net asset value per share | $ | 44.92 | | $ | 43.45 | | $ | 52.36 | | $ | 41.00 | |
|
The accompanying notes are an integral part of these financial statements.
14 EGA Emerging Global Shares Trust
Statements of Operations
EGA EMERGING GLOBAL SHARES TRUST
For the Period Ended September 30, 2009 (Unaudited)
| | | | | | | | | | | | |
|
| | Emerging Global
Shares Dow Jones
Emerging Markets
Titans Composite
Index Fund | Emerging Global
Shares Dow Jones
Emerging Markets
Energy Titans
Index Fund | Emerging Global
Shares Dow Jones
Emerging Markets
Metals & Mining
Titans Index Fund | Emerging Global
Shares Dow Jones
Emerging Markets
Financials Titans
Index Fund |
|
| INVESTMENT INCOME: | | | | | | | | | | | | |
Dividend income (net foreign withholding tax of:
$458, $3,152, $1,263, and $376, respectively) | $ | 12,207 | | $ | 37,836 | | $ | 20,931 | | $ | 2,794 | |
|
| EXPENSES: | | | | | | | | | | | | |
| Investment advisory fees | | 28,175 | | | 61,887 | | | 61,826 | | | 4,031 | |
| Organization and offering fees | | 14,087 | | | 32,933 | | | 33,427 | | | 3,751 | |
| Administration and accounting fees | | 8,805 | | | 11,387 | | | 11,388 | | | 1,284 | |
| Sub-Advisory fees | | 7,853 | | | 17,719 | | | 16,842 | | | 1,425 | |
| Insurance fees | | 4,714 | | | 9,144 | | | 9,144 | | | 263 | |
| Pricing fees | | 4,226 | | | 5,093 | | | 5,093 | | | 617 | |
| Audit and Tax fees | | 3,663 | | | 6,425 | | | 6,425 | | | 995 | |
| Transfer agent fees | | 3,381 | | | 4,373 | | | 4,373 | | | 493 | |
| Custody fees | | 3,068 | | | 5,027 | | | 4,877 | | | 469 | |
| Calculating agent fees | | 2,817 | | | 3,644 | | | 3,644 | | | 411 | |
| Legal fees | | 1,173 | | | 2,277 | | | 2,277 | | | 771 | |
| Trustees’ fees and expenses | | 1,127 | | | 200 | | | 200 | | | 121 | |
| Exchange listing fees | | 1,127 | | | 883 | | | 883 | | | 164 | |
| Shareholder reporting fees | | 751 | | | 1,458 | | | 1,458 | | | 164 | |
|
| Total expenses before reimbursement | | 84,967 | | | 162,450 | | | 161,857 | | | 14,959 | |
|
| Less: Reimbursement of expenses from Sub-Adviser | | (77,114 | ) | | (144,731 | ) | | (145,014 | ) | | (13,534 | ) |
|
| Net expenses | | 7,853 | | | 17,719 | | | 16,843 | | | 1,425 | |
|
| Net investment income | | 4,354 | | | 20,117 | | | 4,088 | | | 1,369 | |
|
| REALIZED AND UNREALIZED GAIN (LOSS) ON | | | | | | | | | | | | |
INVESTMENTS AND FOREIGN CURRENCY
TRANSACTIONS: | | | | | | | | | | | | |
| Net realized gain (loss) on: | | | | | | | | | | | | |
| Investments | | — | | | (161,965 | ) | | (28,247 | ) | | — | |
| Foreign currency transactions | | (7,284 | ) | | (58,167 | ) | | 5,290 | | | (12,507 | ) |
|
| Net realized loss | | (7,284 | ) | | (220,132 | ) | | (22,957 | ) | | (12,507 | ) |
|
| Net unrealized appreciation (depreciation) on: | | | | | | | | | | | | |
| Investments | | 623,132 | | | 409,879 | | | 1,244,820 | | | 105,177 | |
| Foreign currency transactions | | 30 | | | 45 | | | 3 | | | (51 | ) |
|
| Net unrealized appreciation | | 623,162 | | | 409,924 | | | 1,244,823 | | | 105,126 | |
|
Net realized and unrealized gain on investments and
foreign currency transactions | | 615,878 | | | 189,792 | | | 1,221,866 | | | 92,619 | |
|
NET INCREASE IN NET ASSETS RESULTING
FROM OPERATIONS | $ | 620,232 | | $ | 209,909 | | $ | 1,225,954 | | $ | 93,988 | |
|
The accompanying notes are an integral part of these financial statements.
EGA Emerging Global Shares Trust 15
Statements of Changes in Net Assets (Unaudited)
EGA EMERGING GLOBAL SHARES TRUST
| | | | | | | | | | | | |
|
| Emerging Global
Shares Dow Jones
Emerging Markets
Titans Composite
Index Fund
| Emerging Global
Shares Dow Jones
Emerging Markets
Energy Titans
Index Fund
| Emerging Global
Shares Dow Jones
Emerging Markets
Metals & Mining
Titans Index Fund
| Emerging Global
Shares Dow Jones
Emerging Markets
Financials Titans
Index Fund |
|
| | For the Period
July 22, 20091
Through
September 30, 2009 | For the Period
May 21, 20091
Through
September 30, 2009 | For the Period
May 21, 20091
Through
September 30, 2009 | For the Period
September 16, 20091
Through
September 30, 2009 |
|
INCREASE IN NET ASSETS RESULTING FROM
OPERATIONS: | | | | | | | | | | | | |
| Net investment income | $ | 4,354 | | $ | 20,117 | | $ | 4,088 | | $ | 1,369 | |
Net realized loss on investments and foreign currency
transactions | | (7,284 | ) | | (220,132 | ) | | (22,957 | ) | | (12,507 | ) |
Net unrealized appreciation on investments and forward
currency transactions | | 623,162 | | | 409,924 | | | 1,244,823 | | | 105,126 | |
|
| Net increase in net assets resulting from operations | | 620,232 | | | 209,909 | | | 1,225,954 | | | 93,988 | |
|
| CAPITAL SHARE TRANSACTIONS: | | | | | | | | | | | | |
| Proceeds from sale of shares | | 8,376,717 | | | 6,307,141 | | | 6,628,645 | | | 4,006,126 | |
|
| Net Increase in Net Assets | | 8,996,949 | | | 6,517,055 | | | 7,854,599 | | | 4,100,114 | |
|
| NET ASSETS: | | | | | | | | | | | | |
| Beginning of period | | 100,000 | | | — | | | — | | | — | |
| End of period | $ | 9,096,949 | | $ | 6,517,055 | | $ | 7,854,599 | | $ | 4,100,114 | |
|
Undistributed net investment income included in net assets
at end of period | $ | 4,354 | | $ | 20,117 | | $ | 4,088 | | $ | 1,369 | |
|
| SHARES CREATED AND REDEEMED: | | | | | | | | | | | | |
| Shares outstanding, beginning of period | | 2,500 | | | — | | | — | | | — | |
| Shares sold | | 200,000 | | | 150,000 | | | 150,000 | | | 100,000 | |
|
| Shares outstanding, end of period | | 202,500 | | | 150,000 | | | 150,000 | | | 100,000 | |
|
| 1 | Commencement of operations. |
The accompanying notes are an integral part of these financial statements.
16 EGA Emerging Global Shares Trust
Financial Highlights
EGA EMERGING GLOBAL SHARES TRUST
September 30, 2009 (Unaudited)
Beneficial interest outstanding throughout the period is presented below:
| | | | | | | | | | | | |
|
| | Emerging Global
Shares Dow Jones
Emerging Markets
Titans Composite
Index Fund
| Emerging Global
Shares Dow Jones
Emerging Markets
Energy Titans
Index Fund
| Emerging Global
Shares Dow Jones
Emerging Markets
Metals & Mining
Titans Index Fund
| Emerging Global
Shares Dow Jones
Emerging Markets
Financials Titans
Index Fund |
|
| For the Period
July 22, 20091
Through
September 30, 2009 | For the Period
May 21, 20091
Through
September 30, 2009 | For the Period
May 21, 20091
Through
September 30, 2009 | For the Period
September 16, 20091
Through
September 30, 2009 |
|
| Net asset value, beginning of period | $ | 40.00 | | $ | 40.00 | | $ | 40.00 | | $ | 40.00 | |
|
| Investment operations: | | | | | | | | | | | | |
| Net investment income2 | | 0.03 | | | 0.14 | | | 0.03 | | | 0.01 | |
| Net realized and unrealized gain on investments | | 4.89 | | | 3.31 | | | 12.33 | | | 0.99 | |
|
| Total from investment operations | | 4.92 | | | 3.45 | | | 12.36 | | | 1.00 | |
|
| Net asset value, end of period | $ | 44.92 | | $ | 43.45 | | $ | 52.36 | | $ | 41.00 | |
|
| NET ASSET VALUE TOTAL RETURN3 | | 12.30 | % | | 8.63 | % | | 30.90 | % | | 2.50 | % |
|
| RATIOS/SUPPLEMENTAL DATA: | | | | | | | | | | | | |
| Net assets, end of period (000’s ommited) | $ | 9,097 | | $ | 6,517 | | $ | 7,855 | | $ | 4,100 | |
| Ratios to average net assets: | | | | | | | | | | | | |
| Expenses, net of expense reimbursements/waivers4 | | 0.75 | % | | 0.85 | % | | 0.85 | % | | 0.85 | % |
| Expenses, prior to expense reimbursements/waivers4 | | 8.11 | % | | 7.79 | % | | 8.17 | % | | 8.92 | % |
| Net investment income4 | | 0.42 | % | | 0.97 | % | | 0.21 | % | | 0.82 | % |
|
| Portfolio turnover rate5 | | 0 | % | | 52 | % | | 14 | % | | 0 | % |
|
| 1 | Commencement of operations. |
| 2 | Based on average shares outstanding. |
| 3 | Total return is calculated assuming an initial investment made at the net asset value at the beginning of the period, reinvestment of all dividends and distributions at net asset value during the period and redemption on the last day of the period. Total return calculated for a period of less than one year is not annualized. The total return would have been lower if certain expenses had not been reimbursed/waived by the investment advisor. |
| 4 | Annualized. |
| 5 | Not annualized. |
The accompanying notes are an integral part of these financial statements.
EGA Emerging Global Shares Trust 17
Notes to Financial Statements
September 30, 2009 (Unaudited)
1. ORGANIZATION
EGA Emerging Global Shares Trust (the “Trust”) is a Delaware statutory trust organized on September 12, 2008. The Trust is an open-end management investment company, registered under the Investment Company Act of 1940, as amended (the “1940 Act”). The Trust currently consists of twelve separate non-diversified series. As of the date of this Report, only the Emerging Global Shares Dow Jones Emerging Markets Titans Composite Index Fund, Emerging Global Shares Dow Jones Emerging Markets Energy Titans Index Fund, Emerging Global Shares Dow Jones Emerging Markets Metals & Mining Titans Index Fund, and Emerging Global Shares Dow Jones Emerging Markets Financial Titans Index Fund (each a “Fund” and collectively the “Funds”) are being publicly offered. The Emerging Global Shares Dow Jones Emerging Markets Energy Titans Index Fund and Emerging Global Shares Dow Jones Emerging Markets Metals & Mining Titans Index Fund commenced operations on May 21, 2009. The Emerging Global Shares Dow Jones Emerging Markets Titans Composite Index Fund and Emerging Global Shares Dow Jones Emerging Markets Financials Titans Index Fund commenced operations on July 22, 2009 and September 16, 2009, respectively.
The Emerging Global Shares Dow Jones Emerging Markets Titans Composite Index Fund seeks to achieve its investment objective of total return by investing in the constituent securities of the Dow Jones Emerging Markets Composite Titans 100 Index. The Dow Jones Emerging Markets Composite Titans 100 Index is a stock market index comprised of a representative sample of 100 emerging markets companies that Dow Jones Indexes deems to be the 10 leading companies in each of the 10 industrial sectors, as defined by the Industry classification Benchmark system (“ICB”), across the developing world. The Emerging Global Shares Dow Jones Emerging Markets Energy Titans Index Fund seeks to achieve its investment objective of total return by investing in the constituent securities of the Dow Jones Emerging Markets Oil and Gas Titans Index. The Dow Jones Emerging Markets Oil and Gas Titans Index is a stock market index comprised of 30 leading emerging markets companies that Dow Jones Indexes deems to be part of the Oil and Gas sector of the global economy, which also includes alternative energy sources other than oil and gas. The Emerging Global Shares Dow Jones Emerging Markets Metals & Mining Titans Index Fund seeks to achieve its investment objective of total return by investing in the constituent securities of the Dow Jones Emerging Markets Metals & Mining Titans Index. The Dow Jones Emerging Markets Metals & Mining Titans Index is a stock market index comprised of 30 leading emerging markets companies that Dow Jones Indexes deems to be in the Metals & Mining sector of the global economy. The Metals & Mining sector is a sub-sector of the Basic Materials industry, as defined by ICB. The Emerging Global Shares Dow Jones Emerging Markets Financials Titans Index Fund seeks to achieve its investment objective of total return by investing in the constituents securities of the Dow Jones Emerging Markets Financials Titans Index. The Dow Jones Emerging Markets Financials Titans Index is a stock market index comprised of 30 leading emerging markets companies that Dow Jones Index deems to be part of the Financials sector of the global economy.
2. SIGNIFICANT ACCOUNTING POLICIES
These financial statements are prepared in accordance with accounting principles generally accepted in the United States of America, which require management to make estimates and assumptions that affect the reported amounts of assets and liabilities, the disclosure of contingent assets and liabilities at the date of the financial statements, and the reported amounts of increases and decreases in net assets from operations during the fiscal period. Actual amounts could differ from these estimates. The following summarizes the significant accounting policies of the Funds.
Indemnifications
In the normal course of business, the Trust enters into contracts that contain a variety of representations that provide general indemnifications. The Trust’s maximum exposure under these arrangements cannot be known; however, the Trust expects any risk of loss to be remote.
Investment Valuation
The Net Asset Value (“NAV”) per share is computed as of the scheduled close of regular trading on the New York Stock Exchange (“NYSE”), ordinarily 4:00 p.m. Eastern time, on each day during which the NYSE is open for trading. The NAV per share of a Fund is computed by dividing the value of the Fund’s portfolio securities, cash and other assets (including accrued interest), less all liabilities (including accrued expenses), by the total number of shares outstanding at the time such computation is made.
Securities Valuation
The Funds’ portfolio securities are valued based on their last sale price. Price information on listed securities is taken from the exchange where the security is primarily traded as of the close of regular trading on the NYSE on the day the securities are being valued. Securities regularly traded in an over-the-counter market are valued at the latest quoted sale price in such market or, in the case of the NASDAQ, at the NASDAQ official closing price. Other portfolio securities and assets for which market quotations are not readily available are valued based on fair value as determined in good faith in accordance with procedures adopted by the Trust’s Board of Trustees (the “Board”).
18 EGA Emerging Global Shares Trust
Notes to Financial Statements (continued)
September 30, 2009 (Unaudited)
Forward Foreign Currency Contracts
The Funds are subject to foreign currency exchange risk in the normal course of pursuing their objectives. The Funds may enter into forward foreign currency contracts to take advantage of changes in currency values, to enhance investment returns or to hedge against foreign currency fluctuations. All commitments are “marked-to-market” daily at the applicable foreign exchange rate, and any resulting unrealized gains or losses are recorded accordingly. The Funds realize gains and losses at the time the forward contracts are settled. Unrealized gains or losses on outstanding positions in forward foreign currency contracts held at the close of the period are recognized as ordinary income or loss for Federal income tax purposes. The Funds could be exposed to risk if the counterparties to the contracts are unable to meet the terms of the contract and from unanticipated movements in the value of a foreign currency relative to the U.S. dollar or other foreign currencies in which it has invested. Finally, the risk exists that losses could exceed amounts disclosed on the Statements of Assets and Liabilities.
Foreign Currency Contracts
Investments denominated in foreign currencies are subject to additional risk factors as compared to investments denominated in U.S. dollars. The value of an investment denominated in a foreign currency could change significantly as foreign currencies strengthen or weaken relative to the U.S. dollar. Generally, when the U.S. dollar gains in value against a foreign currency, an investment traded in that foreign currency loses value because that currency is worth fewer U.S. dollars. Risks related to foreign currencies also include those related to economic or political developments, market inefficiencies or a higher risk that essential investment information may be incomplete, unavailable or inaccurate. A U.S. dollar investment in Depositary Receipts or Ordinary Shares of foreign issuers traded on U.S. exchanges is indirectly subject to foreign currency risk to the extent that the issuer conducts its principal business in markets where transactions are denominated in foreign currencies.
Security Transactions, Interest and Dividends
Investment transactions are recorded on trade date. The Funds determine the gain or loss realized from the investment transactions by comparing the identified cost, which is the same basis used for federal income tax purposes, with the net sales proceeds. Dividend income is recorded on the ex-dividend date. Interest income is recorded on the accrual basis and includes amortization of discounts and premiums.
Federal Income Taxes
Each Fund intends to qualify as a “regulated investment company” under Subchapter M of the Internal Revenue Code. If so qualified, a Fund will not be subject to federal income tax to the extent it distributes substantially all of its net investment income and capital gains to shareholders.
Accounting for Uncertainty in Income Taxes provides guidance for how uncertain tax positions should be recognized, measured, presented and disclosed in the financial statements, and prescribes a minimum threshold for financial statement and recognition of the benefit of tax positions taken or expected to be taken by the Funds, and whether the tax positions are “more-likely-than-not” of being sustained by the applicable tax authority. Tax positions not deemed to meet the more-likely-than-not threshold would be recorded as a tax benefit or expense in the current year. Accounting for Uncertainty in Income Taxes requires management of the Funds to analyze all open tax years as defined by IRS statute of limitations, for all major jurisdictions, including federal tax authorities and certain state tax authorities. Open tax years are those years that are open for examination by the relevant income taxing authority. As of September 30, 2009, the Funds have no examinations in progress.
There is no tax liability resulting from uncertain income tax positions taken or expected to be taken. The Funds are also not aware of any tax positions for which it is reasonably possible that the total amounts of unrecognized tax expense will significantly change in twelve months.
At September 30, 2009, the cost of investments and net unrealized appreciation/(depreciation) were as follows:
| | | | | | | | | | | | |
|
| Funds | Cost of
Investments | | Gross
Unrealized
Appreciation | | Gross
Unrealized
Depreciation | | Net
Unrealized
Appreciation |
|
| Emerging Global Shares Dow Jones Emerging Markets Titans Composite Index Fund | $ | 7,720,707 | | $ | 645,618 | | $ | (22,486 | ) | | $ | 623,132 |
|
| Emerging Global Shares Dow Jones Emerging Markets Energy Titans Index Fund | | 5,919,534 | | | 490,871 | | | (80,992 | ) | | | 409,879 |
|
| Emerging Global Shares Dow Jones Emerging Markets Metals & Mining Titans Index Fund | | 6,485,427 | | | 1,252,008 | | | (7,188 | ) | | | 1,244,820 |
|
| Emerging Global Shares Dow Jones Emerging Markets Financials Titans Index Fund | | 4,038,049 | | | 141,108 | | | (35,931 | ) | | | 105,177 |
|
Expenses
Expenses of the Trust, which are directly identifiable to a specific Fund, are applied to that Fund. Expenses which are not readily identifiable to a specific Fund are allocated in such a manner as deemed equitable, taking into consideration the nature and type of expense and the relative net assets of each Fund.
EGA Emerging Global Shares Trust 19
Notes to Financial Statements (continued)
September 30, 2009 (Unaudited)
3. FAIR VALUE MEASUREMENT
The authoritative guidance for fair value measurements and disclosures, establishes an authoritative framework for the measurement of fair value, and enhances disclosures about fair value measurements. The Funds utilized various inputs in determining the value of each Fund’s investments. The guidance also establishes a hierarchy for inputs used in measuring fair value that maximizes the use of observable inputs and minimizes the use of unobservable inputs by requiring the most observable inputs be used when available. Also included is guidance on identifying circumstances that indicate a transaction is not orderly and outlines additional disclosure based on investment type. These inputs are summarized in the three broad levels as follows:
Level 1 — quoted prices in active markets for identical securities
Level 2 — other significant observable inputs (including quoted prices for similar securities, interest rates, prepayment speeds, credit risk, etc.)
Level 3 — significant unobservable inputs (including the Fund’s own assumptions in determining the fair value of investments)
The inputs or methodology used for valuing securities are not necessarily an indication of the risk associated with investing in those securities.
The following summarizes inputs used as of September 30, 2009 in valuing the Funds’ assets carried at fair value:
| | | | | | | | |
|
Fund | Quoted Prices in
Active Market
(Level 1)
Common Stock | Other
Significant
Observable
Inputs
(Level 2) | Significant
Unobservable
Inputs
(Level 3) | Total |
|
Emerging Global Shares Dow Jones Emerging Markets
Titans Composite Index Fund | $ | 8,343,839 | $ | — | $ | — | $ | 8,343,839 |
|
Emerging Global Shares Dow Jones Emerging Markets
Energy Titans Index Fund | | 6,329,413 | | — | | — | | 6,329,413 |
|
Emerging Global Shares Dow Jones Emerging Markets
Metals & Mining Titans Index Fund | | 7,730,247 | | — | | — | | 7,730,247 |
|
Emerging Global Shares Dow Jones Emerging Markets
Financials Titans Index Fund | | 4,143,226 | | — | | — | | 4,143,226 |
|
The Funds did not hold any Level 2 or Level 3 securities during the period reported.
4. INVESTMENT TRANSACTIONS
During the period ended September 30, 2009, the aggregate purchases and sales of investments (excluding short-term investments) were:
|
| Funds | Purchases | | Sales |
|
| Emerging Global Shares Dow Jones Emerging Markets Titans Composite Index Fund | $ | 1,738,105 | | $ | — |
|
| Emerging Global Shares Dow Jones Emerging Markets Energy Titans Index Fund | | 4,193,450 | 2,902,613 |
|
| Emerging Global Shares Dow Jones Emerging Markets Metals & Mining Titans Index Fund | | 2,616,048 | 809,003 |
|
| Emerging Global Shares Dow Jones Emerging Markets Financials Titans Index Fund | | 1,664,829 | | | — |
|
For the period ended September 30, 2009, the cost of in-kind transactions and proceeds from in-kind sales were as follows:
| | | | | |
|
| Funds | Purchases | | Sales |
|
| Emerging Global Shares Dow Jones Emerging Markets Titans Composite Index Fund | $ | 5,982,602 | | $ | — |
|
| Emerging Global Shares Dow Jones Emerging Markets Energy Titans Index Fund | | 4,790,662 | | | — |
|
| Emerging Global Shares Dow Jones Emerging Markets Metals & Mining Titans Index Fund | | 4,712,641 | | | — |
|
| Emerging Global Shares Dow Jones Emerging Markets Financials Titans Index Fund | | 2,373,220 | | | — |
|
20 EGA Emerging Global Shares Trust
Notes to Financial Statements (continued)
September 30, 2009 (Unaudited)
5. DERIVATIVE INSTRUMENTS & HEDGING ACTIVITIES
Disclosures about Derivatives Instruments and Hedging Activities is intended to improve financial reporting for derivative instruments by requiring enhanced disclosure that enables investors to understand how and why a fund uses derivatives instruments, how derivatives instruments are accounted for and how derivative instruments affect a fund’s financial position and results of operations.
Each Fund uses derivative instruments as part of its principal investment strategy to achieve its investment objective. The following is a summary of the fair value of the derivative instruments utilized by the Funds, categorized by risk exposure, as of September 30, 2009:
| | | | | | | | | | |
|
Fund | Derivative Instruments | | Asset
Derivatives | | Liability
Derivatives | | Total |
|
Emerging Global Shares Dow Jones Emerging Markets
Titans Composite Index Fund | Forward Currency Contracts | | $ | 945,413 | | $ | 945,413 | | $ | — |
|
Emerging Global Shares Dow Jones Emerging Markets
Energy Titans Index Fund | Forward Currency Contracts | | | — | | | — | | | — |
|
Emerging Global Shares Dow Jones Emerging Markets
Metals & Mining Titans Index Fund | Forward Currency Contracts | | | — | | | — | | | — |
|
Emerging Global Shares Dow ones Emerging Markets
Financials Titans Index Fund | Forward Currency Contracts | | | — | | | — | | | — |
|
The following is a summary of the realized gains and losses of the derivative instruments utilized by the Funds as of September 30, 2009:
| | | | |
|
Fund | Derivative Instruments | Realized
Gains (Losses)
of Derivative
Instruments |
|
Emerging Global Shares Dow Jones Emerging Markets
Titans Composite Index Fund | Forward Currency Contracts | $ | 849 | |
|
Emerging Global Shares Dow Jones Emerging Markets
Energy Titans Index Fund | Forward Currency Contracts | | (54,181 | ) |
|
Emerging Global Shares Dow Jones Emerging Markets
Metals & Mining Titans Index Fund | Forward Currency Contracts | | (14,006 | ) |
|
Emerging Global Shares Dow Jones Emerging Markets
Financials Titans Index Fund | Forward Currency Contracts | | (12,735 | ) |
|
There were no unrealized gains and losses of the derivative instruments utilized by the Funds as of September 30, 2009.
6. INVESTMENT ADVISORY AND OTHER AGREEMENTS
The Trust has entered into an Investment Advisory Agreement (the “Advisory Agreement”) with ALPS Advisors, Inc. (“ALPS” or the “Adviser”). Pursuant to the Advisory Agreement, the Adviser has overall supervisory responsibility for the general management and investment of each Fund’s securities portfolio, and has ultimate responsibility (subject to oversight by the Board) for oversight of the Trust’s sub-advisers. For its services, the Trust pays the Adviser an annual management fee consisting of the greater of $400,000 or 0.10% of each Fund’s average daily net assets, but not to exceed $1,000,000 per year. From time to time, the Adviser may waive all or a portion of its fee.
Emerging Global Advisors, LLC (“EGA”) serves as the sub-adviser to the Funds and provides investment advice and management services to the Funds. EGA supervises the day-to-day investment and reinvestment of the assets in each Fund and is responsible for designating the Deposit Securities and for monitoring each Fund’s adherence to its investment mandate. For its investment sub-advisory services, EGA receives an annual fee equal to 0.75% of the average daily net assets of the Emerging Global Shares Dow Jones Emerging Markets Composite Titans Index Fund and 0.85% of the average daily nets assets of each of the other Funds.
Esposito Partners, LLC (“Esposito”) serves as a sub-adviser to the Funds and provides portfolio trading and index tracking services to the Funds under the supervision of EGA and the Adviser. Esposito is compensated for its services from the management fees paid to EGA by the Trust.
EGA Emerging Global Shares Trust 21
Notes to Financial Statements (concluded)
September 30, 2009 (Unaudited)
The Trust and EGA have entered into a written fee waiver and expense reimbursement agreement pursuant to which EGA has agreed to waive fees and/or reimburse expenses to the extent necessary to prevent the annual operating expenses of each Fund (excluding any taxes, interest, brokerage fees and non-routine expenses) from exceeding 0.85% of average daily net assets (0.75% for the Emerging Global Shares Dow Jones Emerging Markets Titans Composite Index Fund). Under this fee waiver and expense reimbursement agreement, EGA retains the right to seek recovery from each Fund of fees previously waived or expenses previously reimbursed to the extent such fees were waived or expenses were reimbursed within three years of such reimbursement, and provided such reimbursement does not cause a Fund to exceed any applicable fee waiver or expense limitation agreement that was in place at the time the fees were waived or expenses reimbursed.
| | |
|
Funds | Fees
Reimbursed/
Waived |
|
| Emerging Global Shares Dow Jones Emerging Markets Titans Composite Index Fund | $ | 77,114 |
|
| Emerging Global Shares Dow Jones Emerging Markets Energy Titans Index Fund | | 144,731 |
|
| Emerging Global Shares Dow Jones Emerging Markets Metals & Mining Titans Index Fund | | 145,014 |
|
| Emerging Global Shares Dow Jones Emerging Markets Financials Titans Index Fund | | 13,534 |
|
The Bank of New York Mellon serves as the Funds’ Administrator, Custodian, Fund Accountant and Transfer Agent pursuant to a Fund Administration and Accounting Agreement, a Custody Agreement and a Transfer Agency and Service Agreement, as the case may be.
ALPS Fund Services, Inc. (“AFS”), an affiliate of the Adviser and ALPS Distributors, Inc. (the “Distributor”), provides a Chief Compliance Officer and an Anti-Money Laundering Officer as well as certain additional compliance support functions under a Compliance Services Agreement. AFS also provides a Principal Financial Officer to the Trust under a PFO Services Agreement. As compensation for the foregoing services, AFS receives certain out of pocket costs, fixed and asset-based fees, which are accrued daily and paid monthly by the Funds.
7. CREATION AND REDEMPTION TRANSACTIONS
The Funds issue and redeem Shares on a continuous basis at NAV in blocks of 50,000 shares called “Creation Units.” Except when aggregated in Creation Units, shares are not redeemable securities of a Fund.
Only “Authorized Participants” may purchase or redeem shares directly from a Fund. An Authorized Participant is either (i) a broker-dealer or other participant in the clearing process through the Continuous Net Settlement System of the National Securities Clearing Corporation or (ii) a DTC participant and, in each case, must have executed a Participant Agreement with the Distributor. Most retail investors will not qualify as Authorized Participants or do not have the resources to buy and sell whole Creation Units. Therefore, they will be unable to purchase or redeem the shares directly from the Funds. Rather, most retail investors will purchase shares in the secondary market with the assistance of a broker and will be subject to customary brokerage commissions or fees.
8. DISTRIBUTION AGREEMENT
The Distributor serves as the distributor of Creation Units for the Funds pursuant to a distribution agreement. The Distributor does not maintain a secondary market in shares. The Funds have adopted a Distribution and Service Plan (the “Plan”) pursuant to Rule 12b-1 under the 1940 Act. In accordance with the Plan, each Fund is authorized to pay an amount up to 0.25% of its average daily net assets each year for certain distribution-related activities. No fees were paid by the Funds under the Plan, and there are no current plans to impose these fees.
9. TRUSTEES’ FEES
The Trust compensates each Trustee who is not an employee of the Adviser or its affiliates. The interested Trustees do not receive any compensation from the Trust for serving as Trustees.
10. SUBSEQUENT EVENTS
Management has evaluated the possibility of subsequent events existing in the Funds’ financial statements through November 24, 2009. Management has determined that there are no material events that would require disclosure in the Funds’ financial statements through this date.
11. NEW ACCOUNTING PRONOUNCEMENT
In June 2009, FASB released Statement of Financial Accounting Standard No. 166, Accounting for Transfers of Financial Assets (FAS 166) and Statement of Financial Accounting Standard 167, amendments to FASB Interpretation No. 46(R) (FAS 167), which change the ways entities account for securitizations and special purpose entities. FAS 166 will require more information about transfers of financial assets, including securitization transactions, and where entities have continuing exposure to the risks related to transferred financial assets. It eliminates the concept of a “qualifying special-purpose entity,” changes the requirements for derecognizing financial assets, and requires additional disclosures. FAS 167 changes how a company determines when an entity that is insufficiently capitalized or is not controlled through voting (or similar rights) should be consolidated. The application of FAS 166 and FAS 167 is required for fiscal years beginning after November 15, 2009 and interim periods within those fiscal years. At this time, management is evaluating the implications of FAS 166 and FAS 167 and their impact on the financial statements has not been determined.
22 EGA Emerging Global Shares Trust
Board Approval of Investment Advisory and Sub-Advisory Agreements
At a meeting held on April 17, 2009, the Board of Trustees (the “Board”) unanimously approved each Fund’s investment advisory agreement with ALPS Advisors, Inc. (“ALPS”) and sub-advisory agreements with Emerging Global Advisors, LLC (“EGA”) and Esposito Partners, LLC (“Esposito”). The Board considered all factors it deemed relevant, none of which was considered determinative by itself, including: the nature, quality, and extent of the services to be provided to each Fund by ALPS, EGA and Esposito; the personnel and operations of ALPS, EGA and Esposito; each Fund’s proposed expense levels; the anticipated profitability, if any, to ALPS, EGA and Esposito under the proposed investment advisory agreement and sub-advisory agreements; any “fall-out” benefits to ALPS, EGA and Esposito (i.e., the ancillary benefits realized due to a relationship with the Trust); the effect of asset growth on each Fund’s expenses; and possible conflicts of interest. The Board noted that, because the Funds had not yet commenced investment operations, there was no investment performance for the Funds to evaluate.
In considering the approval of the proposed agreements, the Board reviewed the materials provided for the meeting by ALPS, EGA and Esposito, including: (i) a copy of the form of investment advisory agreement with ALPS; (ii) a copy of the form of sub-advisory agreement between the Trust and EGA; (iii) a copy of the form of sub-advisory agreement between EGA and Esposito; (iv) information describing the nature, quality, and extent of the services to be provided by ALPS, EGA and Esposito to the Funds, and the fees that would be charged by ALPS, EGA and Esposito for such services; (v) information concerning ALPS’ business, operations, advisory personnel and compliance program; (vi) information concerning EGA’s business and operations, portfolio management team and compliance program; (vii) information concerning Esposito’s business and operations, portfolio management team and compliance program; (viii) a copy of the current Form ADV for each of ALPS, EGA and Esposito; (ix) information describing each Fund’s anticipated operating expenses; and (x) memoranda from legal counsel on the responsibilities of trustees in considering investment advisory arrangements under the Investment Company Act of 1940, as amended. The Board also considered presentations made by, and discussions held with, representatives of ALPS, EGA and Esposito. In addition, the Board received data compiled by Thomson Reuters comparing the proposed fee rate for advisory services to be charged to the Trust to fees paid by other exchange-traded funds with similar investment objectives and policies at various asset levels. The Board carefully evaluated the foregoing information, and was advised by legal counsel with respect to its deliberations. The Trustees who were not “interested persons” of the Funds (the “Independent Trustees”) were also advised by independent legal counsel.
In particular, the Board considered and discussed the following:
The nature, extent, and quality of services to be provided to each Fund by ALPS, EGA and Esposito. The Board reviewed the services that ALPS, EGA and Esposito would provide to each Fund and considered the experience, resources and strengths of ALPS, EGA and Esposito as they relate to the management of ETFs. In connection with the investment advisory services to be provided by ALPS, the Independent Trustees noted the responsibilities that ALPS would have as the Funds’ investment adviser, including overall supervisory responsibility for the general management and investment of each Fund’s securities portfolio, ultimate responsibility, subject to oversight by the Board, for oversight of the Trust’s sub-advisers, responsibility for daily monitoring of tracking error and quarterly reporting to the Board, and the implementation of Board directives as they relate to the Funds.
With respect to the sub-advisory services to be provided by EGA, the Independent Trustees noted the significant responsibilities that EGA would have as the Fund’s sub-adviser, including: supervision of the investment management program of each Fund; supervision of the process for determining daily baskets of deposit securities and cash components; making determinations with respect to alternative cash management vehicles and securities lending collateral investments; monitoring of Esposito’s investment performance and processes; oversight of Esposito’s compliance with the Fund’s investment objectives, policies, and limitations; review of brokerage matters; and oversight of general portfolio compliance with relevant law.
The Board considered the sub-advisory services to be provided by Esposito, including the provision of portfolio trading and index tracking services for each Fund and directing the purchase and sale of each Fund’s investment securities under the supervision of EGA. The Board also discussed the replication method to be employed by Esposito in adjusting each Fund’s portfolio in response to changes in the underlying index for each Fund and the qualifications of Esposito’s investment management team with regard to implementing a Fund’s investment mandate. In addition, the Board noted that Esposito would assume responsibility for making proxy voting decisions with respect to the Funds’ portfolio securities. Representatives from Esposito discussed how Fund brokerage allocation would be allocated and its ability and obligation to obtain best execution on behalf of the Funds, and confirmed that Esposito would not be utilizing any soft dollar arrangements. The Board discussed with representatives of Esposito the additional reporting and recordkeeping obligations Esposito would have with respect to any Fund trades that are placed with brokers that are affiliated with Esposito.
Based on their consideration and review of the foregoing information, the Board determined that each Fund was likely to benefit from the nature, quality, and extent of these services, as well as ALPS’, EGA’s and Esposito’s ability to render such services based on their experience, operations and resources.
Comparison of services provided and fees charged by ALPS, EGA and Esposito and other investment advisers to similar clients, and the cost of the services to be provided and profits to be realized by ALPS, EGA and Esposito from their relationships with the Funds.
The Board considered both the services to be rendered by ALPS, EGA and Esposito, and the proposed fees to be paid for such advisory or sub-advisory services to those of other investment advisers of similar ETFs. In particular, the Board compared each Fund’s proposed advisory and sub-advisory fees and projected expense ratio for its first year of operations to other ETFs considered to be in that Fund’s peer group, as
EGA Emerging Global Shares Trust 23
Board Approval of Investment Advisory and Sub-Advisory Agreements (concluded)
determined by Thomson Reuters (each a “Peer Group”). The Board noted that the Funds’ proposed management fees and expenses (after giving effect to the proposed fee waiver and expense limitation arrangements) were at the top of the range of the Funds’ Peer Group and discussed potential reasons therefor. In this regard, it was noted that each Fund had a narrower, concentrated strategy of investing in specific industry sectors rather than the more broad-based, non-concentrated strategies of the other Peer Group funds. The Board also acknowledged the difference in ALPS’ advisory fee for the Funds compared to other ETFs advised by ALPS arising from the different adviser and sub-adviser structure employed by the Funds and different services that ALPS would be providing to the Funds.
The Board noted that EGA does not have other investment advisory clients and, therefore, could not provide information regarding EGA’s fees for such activities. It considered the anticipated costs and projected profitability of EGA in connection with its serving as sub-adviser to each Fund, including operational costs and the costs of compensating Esposito as sub-adviser. The Independent Trustees noted EGA’s commitment to limit each Fund’s expenses through a contractual written fee waiver and expense reimbursement agreement with the Trust. The Board considered the selection and due diligence process employed by EGA in proposing Esposito and EGA’s reasons for concluding that the fees to be paid to EGA for its services to the Funds were reasonable.
The Board reviewed the sub-advisory fees to be paid to Esposito in light of its responsibility for the day-to-day portfolio management of the Funds. In particular, the Board noted that the sub-advisory agreement contemplated a one-year minimum fee to compensate Esposito for certain start-up costs, including investment in necessary trading technology and acquisition of software upgrades. The Board discussed with representatives from Esposito various other ETFs for which Esposito provides sub-advisory services, the fees that it charges for such services and any potential conflicts. The Board noted that the sub-advisory fees would be paid by EGA to Esposito and would not be additional fees to be borne by each Fund.
After comparing each Fund’s proposed fees with those of other funds in the Fund’s peer group, and in light of the nature, quality, and extent of services proposed to be provided by ALPS, EGA and Esposito and the costs expected to be incurred by ALPS, EGA and Esposito in rendering those services, the Board concluded that the level of fees proposed to be paid to ALPS, EGA and Esposito with respect to each Fund was fair and reasonable.
ALPS’, EGA’s and Esposito’s profitability and the extent to which economies of scale would be realized as each Fund grows and whether fee levels would reflect such economies of scale. The Board discussed with representatives of ALPS, EGA and Esposito potential economies of scale and the anticipated costs and projected profitability to be realized by ALPS, EGA and Esposito in connection with their serving as investment adviser or sub-adviser, as applicable, to each Fund, including operational costs. The Board noted that, because the Funds had not yet commenced operations, the eventual aggregate amount of assets was uncertain, and recognized the uncertainty in launching new investment products and estimating future asset levels. Based on these considerations, the Board concluded that economies of scale were difficult to consider at this time.
Conclusion
No single factor was determinative to the decision of the Board. Based on the foregoing and such other matters as were deemed relevant, the Board concluded that the proposed advisory and sub-advisory fee rates and projected total expense ratio are reasonable in relation to the services to be provided by each of ALPS, EGA and Esposito to each Fund, as well as the costs to be incurred and benefits to be gained by ALPS, EGA and Esposito in providing such services. As a result, the Board, including a majority of the Independent Trustees concluded that the initial approval of the investment advisory agreement with ALPS and the sub-advisory agreements with EGA and Esposito were in the best interests of each Fund.
24 EGA Emerging Global Shares Trust
Board of Trustees and Officers (Unaudited)
The Trustees and officers of the Trust, along with their principal occupations over the past five years and their affiliations, if any, with EGA, are listed below. Unless otherwise noted, the address of each Trustee of the Trust is 171 East Ridgewood Ave., Ridgewood, NJ 07450.
| | | | | | |
|
Name and Age | Position(s) Held
with Trust | Office and
Length of
Time Served | | Principal Occupation(s)
During Past 5 Years | Portfolios in
Fund Complex
Overseen by
Trustee | Other
Directorships
Held by Trustee |
|
| Independent Trustees | | | | | | |
| Robert Willens | Trustee | Since 2009 | | Robert Willens, LLC (tax consulting), | 4 | Daxor Corp. |
| Age: 63 | | | | President, since January, 2008; Lehman | | (Medical |
| | | | | Brothers, Inc., Managing Director, Equity | | Products and |
| | | | | Research Department, January 2004 to | | Biotechnology), |
| | | | | January 2008. | | since 2004. |
| |
| Ron Safir | Trustee | Since 2009 | | Retired, since 2008; UBS Wealth | 4 | None |
| Age: 58 | | | | Management, Chief Administrative Officer, | | |
| | | | | February 1971 to December 2008. | | |
| |
| Jeffrey D. Haroldson | Trustee | Since 2009 | | HDG Mansur Capital Group, LLC, President | 4 | None |
| Age: 52 | | | | and Chief Operating Officer, since 2004; | | |
| | | | | HSBC Securities (USA), Inc., Executive | | |
| | | | | Managing Director, Head of Investment and | | |
| | | | | Merchant Banking, 2000 to 2003. | | |
|
| Interested Trustees | | | | | | |
| Robert C. Holderith | Trustee and | Since 2008 | | Emerging Global Advisors, LLC, Managing | 4 | None |
| Age: 49 | President | | | Member and Chief Executive Officer, since | | |
| | | | | September 2008; ProFund Advisors, | | |
| | | | | Managing Director, Institutional Sales & | | |
| | | | | Investment Analytics, June 2006 to August | | |
| | | | | 2008; UBS Financial Services, Inc., Director, | | |
| | | | | January 2000 to May 2006. | | |
| |
| James J. Valenti | Trustee and | Since 2008 | | Emerging Global Advisors, LLC, Member | 4 | None |
| Age: 62 | Secretary | | | and Chief Administrative Officer, since | | |
| | | | | September 2008; Private Investor and | | |
| | | | | Independent Consultant, June 2007 to | | |
| | | | | September 2008; Senior Loan Consultant, | | |
| | | | | Bridgepoint Mortgage Company, June 2006 | | |
| | | | | to June 2007; Mercedes Benz, North | | |
| | | | | America, Sales Representative, November | | |
| | | | | 2000 to June 2006. | | |
|
| | | | |
|
Name, Address and Age | Position(s)
Held with
the Trust | Office and
Length of
Time Served | | Principal Occupation(s)
During Past 5 Years |
|
| Officers |
| Thomas A. Carter | Treasurer | Since 2009 | | ALPS Fund Services, Inc., Directors, since October 2005; ALPS Advisors, Inc., |
| ALPS Fund Services, Inc. | | | | President and Directors, since September 2008; ALPS Distributors, Inc., President |
| 1290 Broadway | | | | and Director, since September 2008; FTAM Funds Distributor, Inc., President and |
| Suite 1100 | | | | Director, since September 2008; ALPS Holdings, Inc., Director, since October |
| Denver, CO 80203 | | | | 2005; and ALPS ETF Trust, President and Trustee, since March 2008. |
| Age: 43 | | | | |
| |
| Michael T. Akins | Chief | Since 2009 | | ALPS ETF Trust, Chief Compliance Officer, since March 2008; ALPS Variable |
| ALPS Fund Services, Inc. | Compliance | | | Insurance Trust, Chief Compliance Officer, since April 2008; Clough Global |
| 1290 Broadway | Officer | | | Funds, Chief Compliance Officer, since September 2006; ALPS Fund Services, |
| Suite 1100 | | | | Deputy Compliance Officer, since April 2006; Reaves Utility Income Fund, Chief |
| Denver, CO 80203 | | | | Compliance Officer, since June 2006; Financial Investors Trust, Chief Compliance |
| Age: 33 | | | | Officer, since June 2006; UMB Financial Corp., AVP and Compliance Officer, |
| | | | | July 2003 to March 2006. |
|
EGA Emerging Global Shares Trust 25
General Information (Unaudited)
Proxy Voting Policies, Procedures and Record
You may obtain a description of the EGA Funds’ proxy voting policies, procedures and information regarding how each Fund voted proxies relating to portfolio securities during the 12-month period ending June 30 of each year (available by August 31 of that year) without charge, upon request, by calling 1-888-800-4347 or visiting the funds website www.egshares.com, or by accessing the SEC’s website at www.sec.gov. Such reports may be reviewed and copied at the SEC’s Public Reference Room in Washington, DC. Information on the operation of the Public Reference Room may be obtained by calling 202-942-8090.
Shareholder Reports and Quarterly Portfolio Disclosure
The Funds file complete schedules of the portfolio holdings with the SEC for the first and third quarters on Form N-Q. The Form N-Q is available without charge, upon request, by calling 1-800-SEC-0330, or by accessing the SEC’s website, at www.sec.gov. It may also be reviewed and copied at the SEC’s Public Reference Room in Washington, DC.
This report has been prepared for shareholders and may be distributed to others only if preceded or accompanied by an effective prospectus, which includes information regarding the Funds’ objectives and polices, experienced of its management, marketability of shares and other information.
There are risks associated with investing including possible loss of principal. In addition to the normal risks of investing, foreign investing involves special risks, such as risk of loss from currency fluctuation or political or economic uncertainty. Investments in real estate involve additional special risks, such as credit risk, interest rate fluctuations and the effect of varied economic conditions. Funds focusing on a single country, sector and/or smaller companies generally experience greater price volatility.
26 EGA Emerging Global Shares Trust

171 East Ridgewood Avenue
Ridgewood, NJ 07450
1-888-800-4347
www.egshares.com
EGA EMERGING GLOBAL SHARES TRUST
EMERGING GLOBAL SHARES DOW JONES EMERGING MARKETS
TITANS COMPOSITE INDEX FUND
EMERGING GLOBAL SHARES DOW JONES EMERGING MARKETS
ENERGY TITANS INDEX FUND
EMERGING GLOBAL SHARES DOW JONES EMERGING MARKETS
METALS & MINING TITANS INDEX FUND
EMERGING GLOBAL SHARES DOW JONES EMERGING MARKETS
FINANCIALS TITANS INDEX FUND
Emerging Global Shares are distributed by ALPS Distributors Inc.
Item 2. Code of Ethics.
Not Applicable for the semi-annual reporting period.
Item 3. Audit Committee Financial Expert.
Not Applicable for the semi-annual reporting period.
Item 4. Principal Accountant Fees and Services.
Not Applicable for the semi-annual reporting period.
Item 5. Audit Committee of Listed Registrants.
Not Applicable for the semi-annual reporting period.
Item 6. Schedule of Investments.
| | (a) | Schedule is included as part of the report to shareholders filed under Item 1 of this Form. |
| | | |
| | (b) | Not Applicable. |
Item 7. Disclosure of Proxy Voting Policies and Procedures for Closed-End Management Investment Companies.
Not Applicable.
Item 8. Portfolio Managers of Closed-End Management Investment Companies.
Not Applicable.
Item 9. Purchases of Equity Securities by Closed-End Management Investment Company & Affiliated Purchasers.
Not Applicable.
Item 10. Submission of Matters to a Vote of Security Holders.
Not Applicable.
Item 11. Controls and Procedures.
(a) The Chief Executive Officer and Chief Financial Officer have evaluated the Registrant's disclosure controls and procedures within 90 days of the filing date of this report and have concluded that these controls and procedures are effective.
(b) There were no significant changes in the Registrant’s internal controls over financial reporting or in other factors that could significantly affect these controls subsequent to the date of their evaluation.
Item 12. Exhibits.
(a) Any code of ethics, or amendment thereto, that is the subject of the disclosure required by Item 2, to the extent that the Registrant intends to satisfy the Item 2 requirements through filing of an exhibit: Not applicable at this time.
(b) Certifications for each Principal Executive Officer and Principal Financial Officer of the Registrant as required by Rule 30a-2(a) under the 1940 Act (17CFR 270.30a-(a)).
SIGNATURES
Pursuant to the requirements of the Securities Exchange Act of 1934 and the Investment Company Act of 1940, the Registrant has duly caused this report to be signed on its behalf by the undersigned, thereunto duly authorized.
Registrant: EGA Emerging Global Shares Trust
By: /s/ Robert C. Holderith
Robert C. Holderith, Chief Executive Officer
Date: November 24, 2009
Pursuant to the requirements of the Securities Exchange Act of 1934 and the Investment Company Act of 1940, this report has been signed below by the following persons on behalf of the Registrant and in the capacities and on the dates indicated.
Registrant: EGA Emerging Global Shares Trust
By: /s/ Robert C. Holderith
Robert C. Holderith, Chief Executive Officer
Date: November 24, 2009
By: /s/ Thomas A. Carter
Thomas A. Carter, Chief Financial Officer
Date: November 24, 2009